uniformity of thermoluminescence and optically ... - mdpi
TRANSCRIPT
materials
Article
Uniformity of Thermoluminescence and Optically StimulatedLuminescence Signals Over the Length of Doped LiMgPO4Crystal Rods Grown by Micro-Pulling-Down Method
Barbara Marczewska 1,* , Wojciech Gieszczyk 1 , Mariusz Kłosowski 1 , Marzanna Ksiazek 2 , Paweł Bilski 1
and Łukasz Boron 3
�����������������
Citation: Marczewska, B.; Gieszczyk,
W.; Kłosowski, M.; Ksiazek, M.;
Bilski, P.; Boron, Ł. Uniformity of
Thermoluminescence and Optically
Stimulated Luminescence Signals
Over the Length of Doped LiMgPO4
Crystal Rods Grown by
Micro-Pulling-Down Method.
Materials 2021, 14, 132.
https://doi.org/10.3390/ma14010132
Received: 10 November 2020
Accepted: 24 December 2020
Published: 30 December 2020
Publisher’s Note: MDPI stays neu-
tral with regard to jurisdictional clai-
ms in published maps and institutio-
nal affiliations.
Copyright: © 2020 by the authors. Li-
censee MDPI, Basel, Switzerland.
This article is an open access article
distributed under the terms and con-
ditions of the Creative Commons At-
tribution (CC BY) license (https://
creativecommons.org/licenses/by/
4.0/).
1 Institute of Nuclear Physics Polish Academy of Sciences, Radzikowskiego 152, 31-342 Krakow, Poland;[email protected] (W.G.); [email protected] (M.K.); [email protected] (P.B.)
2 Department of Non-Ferrous Metals, AGH University of Science and Technology, 30 Mickiewicza Ave.,30-059 Krakow, Poland; [email protected]
3 Łukasiewicz Research Network, Łukasiewicz—Krakow Institute of Technology, 73 Zakopianska St.,30-418 Krakow, Poland; [email protected]
* Correspondence: [email protected]
Abstract: The purpose of this work was to systematically assess the distribution of thermoluminescence(TL) and optically stimulated luminescence (OSL) properties along the length of crystals grown by themicro-pulling-down method, in relation to the microstructure and distribution of activators. We analyzedlithium magnesium phosphate (LiMgPO4; LMP) crystals doped with terbium (Tb; 0.8 mol%) or witha combination of thulium (Tm; 0.8 mol% or 1.2 mol%) and boron (B; 10 mol%). Crystals of severalcentimeters in length and 3 mm in diameter were cut into 20–40 slices, depending on length. For eachsample, TL glow curves and OSL decay curves were examined. Optical microscopy and scanningelectron microscopy were used to assess the microstructure and elemental composition of severalselected samples. Two-dimensional TL readouts were performed to identify the areas with higherand lower signal emission. Our study showed that there may be significant differences not onlyin LMP sensitivity along the crystal’s axis but also on the surface of the slice. The distribution ofactivators varies depending on the type of crystals and strongly affects luminescence properties.
Keywords: micro-pulling-down method; LiMgPO4 crystals; Tm or Tb doping; TL; OSL
1. Introduction
The micro-pulling-down (MPD) technique is a relatively new method of crystal growththat was developed in the 1990s in Fukuda Laboratory, Sendai, Japan. In contrast to thewell-known Czochralski method, in which the crystal is pulled up after the seed touch, theMPD method involves pulling of the melted material in a downward direction through amicrocapillary channel made in the bottom of a crucible [1,2]. This allows crystals to begrown at a relatively high speed and to obtain them within a few hours. The method alsoprovides an excellent opportunity to quickly assess the effects of a change in doping on theproperties of the modified material.
Crystals obtained by MPD methods are in the form of rods with a diameter of severalmillimeters and a length of several centimeters. The rods are commonly cut into smallerpieces with a wire saw. Usually, the feed raw material is not chemically homogeneous;rather, it constitutes a chemical compound or a mixture of compounds. Even if it is a singlecompound, it might be doped with other elements. The uniform distribution of admixturesin the input raw material does not remain constant during melting or during the crystalextraction process itself. It is hypothesized that there may be differences in the luminescenceproperties of individual slices cut out from the various sites of the same crystal rod obtainedby the MPD method. Research is currently ongoing to elucidate this effect.
Materials 2021, 14, 132. https://doi.org/10.3390/ma14010132 https://www.mdpi.com/journal/materials
Materials 2021, 14, 132 2 of 13
We examined the uniformity of luminescence properties along crystals grown by theMPD method, using a sample of lithium magnesium phosphate (LiMgPO4; LMP), which isone of the several relatively new luminescent materials that could be applied in dosimetrydue to high sensitivity to ionizing radiation. The LMP compound was shown to have a highradiosensitivity and a broad linear dose–response range [3]. Numerous research articles onluminescent properties of LMP doped with different elements have been published since2010 [3–31]. The LMP crystal codoped with terbium (Tb) and boron (B) has been mostextensively studied, but other rare earth dopants such as Sm, Tm, and Eu have also beentested [5,10,13,20].
Usually, individual samples are tested separately because it is assumed that theproperties are the same for the whole crystal. However, the problem arises when a groupof samples has to be examined to determine, for example, a dose response in a dose rangeor a signal change over time after irradiation by taking individual samples from the samplebatch for each measuring point. The characteristics of individual samples may vary andmay affect the measured values. This was also important when radioluminescence wastested using a single crystal rod to obtain samples for measurement [29]. To our knowledge,no such studies on LMP crystals have been conducted so far. Therefore, it seems crucial toinvestigate the properties of individual parts of crystal rods.
The aim of the present work was to systematically examine the individual parts ofcrystals grown by the MPD method with regard to thermoluminescence (TL) and opticallystimulated luminescence (OSL) properties along the length of the crystals. The study wasconducted using pieces of LMP crystals doped with Tb (0.8 mol%) and a combination of Tm(0.8 mol% or 1.2 mol%) and B (10 mol%). Thermoluminescence properties were investigatedboth with a conventional TL reader and a two-dimensional (2D) reader equipped with acharge-coupled device (CCD) camera. The structural properties as well as chemical and phasecomposition of LMP were examined by light microscopy and scanning electron microscopy.
2. Materials and Methods
Crystals were grown by the MPD method using a Cyberstar facility. The preparationof raw material and the process of crystal growth were described in detail previously [26].The starting feedstock for crystal production was LMP powder prepared according tothe standard procedure of a solid-state reaction in air. Lithium hydroxide (LiOH), hex-ahydrate magnesium nitrate (Mg(NO3)2·H2O), and ammonium dihydrogen phosphate(NH4H2PO4), were used as substrates. The solid-state chemical reaction was interruptedby several annealing cycles at a temperature ranging from 200 ◦C to 750 ◦C and to mix thereaction products. Boric acid (H3BO3), or borax (Na2B4O7·10H2O),was used for doping thephosphors with B ions, while Tb4O7, and Tm2O3, oxides were used for doping the phos-phors with Tb and Tm ions, respectively. The chemical composition and concentrations ofdopants are given in Table 1.
Table 1. Chemical composition and concentration of dopants of lithium magnesium phosphate (LMP)crystals and slice numbers tested by a given method.
Type and Concentration of Dopantsin LiMgPO4 (mol%) Slice Numbers Tested by A Given Method
Tb B Tm TL, OSL 2D TL LM, SEM
0.8 - - all (27 slices) 3, 16 2, 11- 10 0.8 all (25 slices) 14, 21 7, 22- 10 1.2 all (18 slices) 7, 17 5, 18
The raw materials were loaded into the graphite crucible and melted inside an inductivefurnace. The molybdenum overlay was placed around the crucible to improve the heatingconditions and thermal energy transfer to the raw material. A graphite after-heater, andtwo layers of alumina ceramic thermal isolation, were also applied to ensure an appropriatetemperature gradient within the growth zone. Finally, the melt was pulled down, using an
Materials 2021, 14, 132 3 of 13
iridium seed, at a constant rate of 0.2 mm/min in inert gas atmosphere (Ar). The obtainedrod-shaped crystals had a diameter of approximately 3 mm and a length of up to 60 mm.
In a previous experiment [26], an X-ray diffraction analysis was systematically con-ducted in a group of 14 LMP crystals: without admixture and with addition of Tb, Tm,and B in different proportions. The samples were powdered before the analysis. The studyshowed trace amounts of TbPO4, TmPO4, and MgO phases in Tb-doped LMP (0.8 mol%)and Tm-doped LMP (0.8 mol%), but no phases other than LiMgPO4 were observed insamples doped with B (either 1% or 10%).
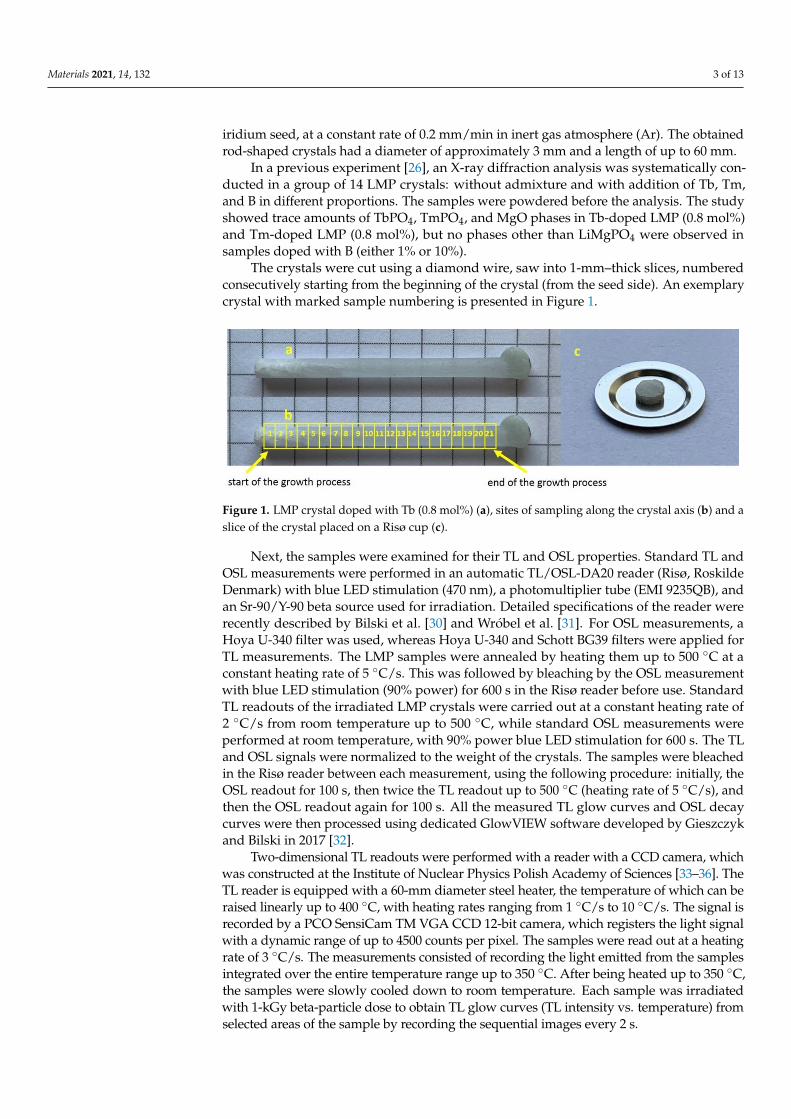
The crystals were cut using a diamond wire, saw into 1-mm–thick slices, numberedconsecutively starting from the beginning of the crystal (from the seed side). An exemplarycrystal with marked sample numbering is presented in Figure 1.
Materials 2021, 14, x FOR PEER REVIEW 3 of 15
The raw materials were loaded into the graphite crucible and melted inside an induc-
tive furnace. The molybdenum overlay was placed around the crucible to improve the
heating conditions and thermal energy transfer to the raw material. A graphite after-
heater, and two layers of alumina ceramic thermal isolation, were also applied to ensure
an appropriate temperature gradient within the growth zone. Finally, the melt was pulled
down, using an iridium seed, at a constant rate of 0.2 mm/min in inert gas atmosphere
(Ar). The obtained rod-shaped crystals had a diameter of approximately 3 mm and a
length of up to 60 mm.
In a previous experiment [26], an X-ray diffraction analysis was systematically con-
ducted in a group of 14 LMP crystals: without admixture and with addition of Tb, Tm,
and B in different proportions. The samples were powdered before the analysis. The study
showed trace amounts of TbPO4, TmPO4, and MgO phases in Tb-doped LMP (0.8 mol%)
and Tm-doped LMP (0.8 mol%), but no phases other than LiMgPO4 were observed in
samples doped with B (either 1% or 10%).
The crystals were cut using a diamond wire, saw into 1-mm–thick slices, numbered
consecutively starting from the beginning of the crystal (from the seed side). An exem-
plary crystal with marked sample numbering is presented in Figure 1.
Figure 1. LMP crystal doped with Tb (0.8 mol%) (a), sites of sampling along the crystal axis (b) and a slice of the crystal
placed on a Risø cup (c).
Next, the samples were examined for their TL and OSL properties. Standard TL and
OSL measurements were performed in an automatic TL/OSL-DA20 reader (Risø, Roskilde
Denmark) with blue LED stimulation (470 nm), a photomultiplier tube (EMI 9235QB), and
an Sr-90/Y-90 beta source used for irradiation. Detailed specifications of the reader were
recently described by Bilski et al. [30] and Wróbel et al. [31]. For OSL measurements, a
Hoya U-340 filter was used, whereas Hoya U-340 and Schott BG39 filters were applied for
TL measurements. The LMP samples were annealed by heating them up to 500 °C at a
constant heating rate of 5 °C/s. This was followed by bleaching by the OSL measurement
with blue LED stimulation (90% power) for 600 s in the Risø reader before use. Standard
TL readouts of the irradiated LMP crystals were carried out at a constant heating rate of 2
°C/s from room temperature up to 500 °C, while standard OSL measurements were per-
formed at room temperature, with 90% power blue LED stimulation for 600 s. The TL and
OSL signals were normalized to the weight of the crystals. The samples were bleached in
the Risø reader between each measurement, using the following procedure: initially, the
OSL readout for 100 s, then twice the TL readout up to 500 °C (heating rate of 5 °C/s), and
then the OSL readout again for 100 s. All the measured TL glow curves and OSL decay
curves were then processed using dedicated GlowVIEW software developed by
Gieszczyk and Bilski in 2017 [32].
Two-dimensional TL readouts were performed with a reader with a CCD camera,
which was constructed at the Institute of Nuclear Physics Polish Academy of Sciences [33–
36]. The TL reader is equipped with a 60-mm diameter steel heater, the temperature of
which can be raised linearly up to 400 °C, with heating rates ranging from 1 °C/s to 10
Figure 1. LMP crystal doped with Tb (0.8 mol%) (a), sites of sampling along the crystal axis (b) and aslice of the crystal placed on a Risø cup (c).
Next, the samples were examined for their TL and OSL properties. Standard TL andOSL measurements were performed in an automatic TL/OSL-DA20 reader (Risø, RoskildeDenmark) with blue LED stimulation (470 nm), a photomultiplier tube (EMI 9235QB), andan Sr-90/Y-90 beta source used for irradiation. Detailed specifications of the reader wererecently described by Bilski et al. [30] and Wróbel et al. [31]. For OSL measurements, aHoya U-340 filter was used, whereas Hoya U-340 and Schott BG39 filters were applied forTL measurements. The LMP samples were annealed by heating them up to 500 ◦C at aconstant heating rate of 5 ◦C/s. This was followed by bleaching by the OSL measurementwith blue LED stimulation (90% power) for 600 s in the Risø reader before use. StandardTL readouts of the irradiated LMP crystals were carried out at a constant heating rate of2 ◦C/s from room temperature up to 500 ◦C, while standard OSL measurements wereperformed at room temperature, with 90% power blue LED stimulation for 600 s. The TLand OSL signals were normalized to the weight of the crystals. The samples were bleachedin the Risø reader between each measurement, using the following procedure: initially, theOSL readout for 100 s, then twice the TL readout up to 500 ◦C (heating rate of 5 ◦C/s), andthen the OSL readout again for 100 s. All the measured TL glow curves and OSL decaycurves were then processed using dedicated GlowVIEW software developed by Gieszczykand Bilski in 2017 [32].
Two-dimensional TL readouts were performed with a reader with a CCD camera, whichwas constructed at the Institute of Nuclear Physics Polish Academy of Sciences [33–36]. TheTL reader is equipped with a 60-mm diameter steel heater, the temperature of which can beraised linearly up to 400 ◦C, with heating rates ranging from 1 ◦C/s to 10 ◦C/s. The signal isrecorded by a PCO SensiCam TM VGA CCD 12-bit camera, which registers the light signalwith a dynamic range of up to 4500 counts per pixel. The samples were read out at a heatingrate of 3 ◦C/s. The measurements consisted of recording the light emitted from the samplesintegrated over the entire temperature range up to 350 ◦C. After being heated up to 350 ◦C,the samples were slowly cooled down to room temperature. Each sample was irradiatedwith 1-kGy beta-particle dose to obtain TL glow curves (TL intensity vs. temperature) fromselected areas of the sample by recording the sequential images every 2 s.
Materials 2021, 14, 132 4 of 13
The microstructure observations were conducted using an AxioObserver Zm1 tabletopmetallographic microscope (Carl Zeiss), for observation in a bright field, dark field, polarizedlight, and interference contrast. The images were recorded with the AxioVisio software.
The chemical composition of doped LMP crystal slices was analyzed by a scanningelectron microscope SCIOS FEI, equipped with an energy-dispersive spectrometer usingpolished specimen cross-sections normal to the surface of the slices. The samples wereincluded in resin and sputtered with gold.
3. Results3.1. TL Signal along Crystal Length
The first step was to cut the slices perpendicular to the crystal axis and assign themnumbers starting from the initial segment of the newly grown crystal, yielding 27, 25, and18 samples for the LMP:Tb, LMP:Tb (0.8 mol%), B (10 mol%) and LMP:Tb (1.2 mol%),B (10 mol%) crystal, respectively (see Table 1). Next, the samples were placed on the readercarousel of the Risø reader, and TL and OSL measurements were performed. After taking theTL reading and before subsequent irradiation, the samples were bleached, first by the OSLreadout with blue diodes for 100 s, then twice annealed by the TL readout up to 500 ◦C withthe heating rate of 5 ◦C/s and then again by the OSL readout with blue diodes for 100 s.
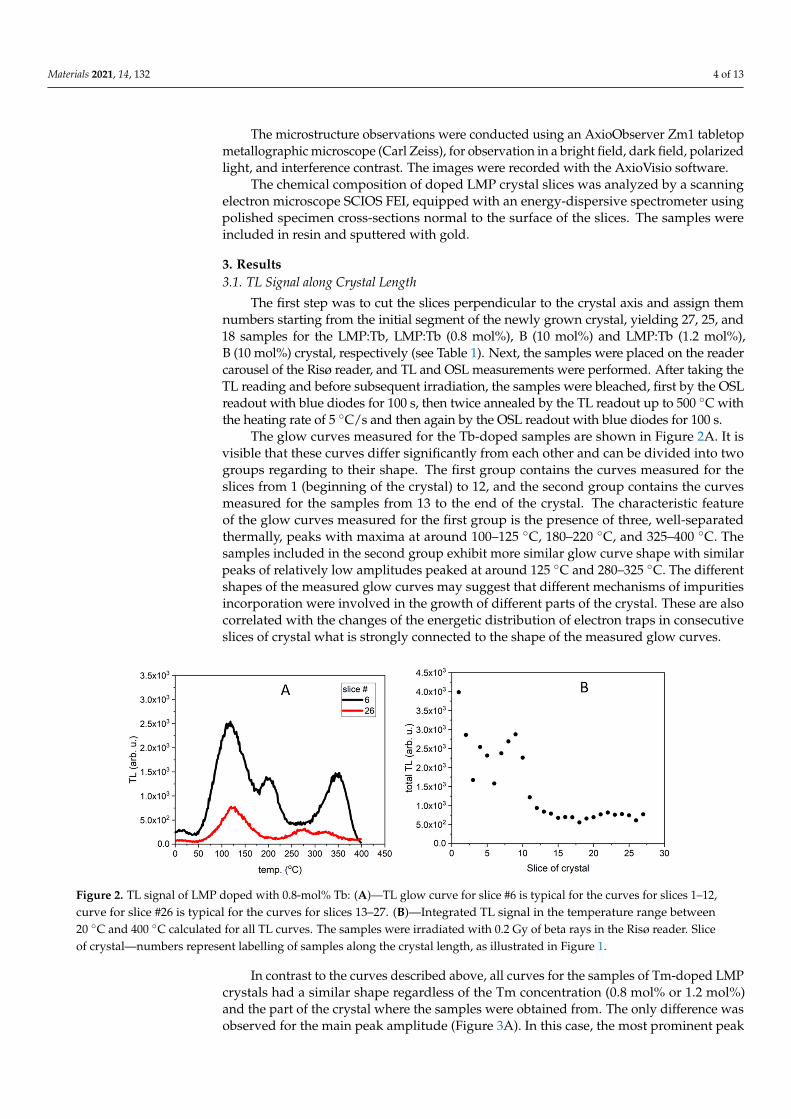
The glow curves measured for the Tb-doped samples are shown in Figure 2A. It isvisible that these curves differ significantly from each other and can be divided into twogroups regarding to their shape. The first group contains the curves measured for theslices from 1 (beginning of the crystal) to 12, and the second group contains the curvesmeasured for the samples from 13 to the end of the crystal. The characteristic featureof the glow curves measured for the first group is the presence of three, well-separatedthermally, peaks with maxima at around 100–125 ◦C, 180–220 ◦C, and 325–400 ◦C. Thesamples included in the second group exhibit more similar glow curve shape with similarpeaks of relatively low amplitudes peaked at around 125 ◦C and 280–325 ◦C. The differentshapes of the measured glow curves may suggest that different mechanisms of impuritiesincorporation were involved in the growth of different parts of the crystal. These are alsocorrelated with the changes of the energetic distribution of electron traps in consecutiveslices of crystal what is strongly connected to the shape of the measured glow curves.
Materials 2021, 14, x FOR PEER REVIEW 5 of 15
Figure 2. TL signal of LMP doped with 0.8-mol% Tb: (A)—TL glow curve for slice #6 is typical for the curves for slices 1–12, curve for slice #26 is typical for the curves for slices 13–27. (B)—Integrated TL signal in the temperature range between 20 °C and 400 °C calculated for all TL curves. The samples were irradiated with 0.2 Gy of beta rays in the Risø reader. Slice of crystal—numbers represent labelling of samples along the crystal length, as illustrated in Figure 1.
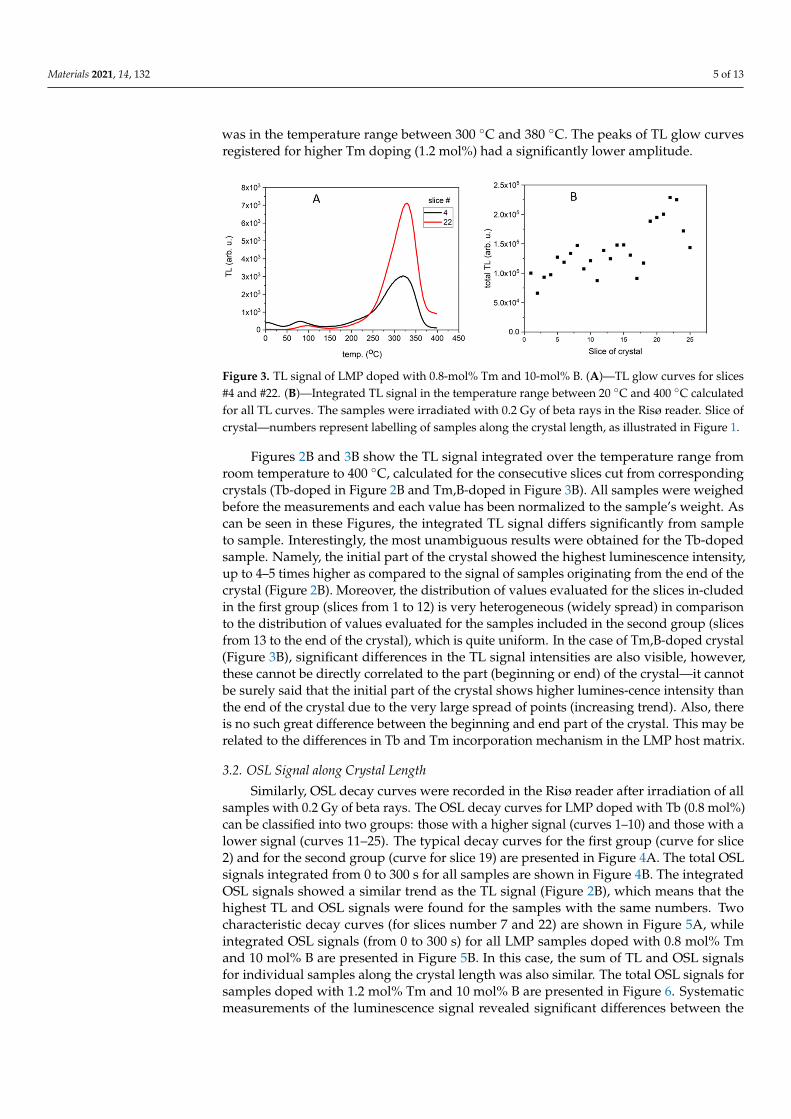
In contrast to the curves described above, all curves for the samples of Tm-doped LMP crystals had a similar shape regardless of the Tm concentration (0.8 mol% or 1.2 mol%) and the part of the crystal where the samples were obtained from. The only differ-ence was observed for the main peak amplitude (Figure 3A). In this case, the most prom-inent peak was in the temperature range between 300 °C and 380 °C. The peaks of TL glow curves registered for higher Tm doping (1.2 mol%) had a significantly lower amplitude.
Figure 3. TL signal of LMP doped with 0.8-mol% Tm and 10-mol% B. (A)—TL glow curves for slices #4 and #22. (B)—Integrated TL signal in the temperature range between 20 °C and 400 °C calculated for all TL curves. The samples were irradiated with 0.2 Gy of beta rays in the Risø reader. Slice of crystal—numbers represent labelling of samples along the crystal length, as illustrated in Figure 1.
Figures 2B and 3B show the TL signal integrated over the temperature range from room temperature to 400 °C, calculated for the consecutive slices cut from corresponding crystals (Tb-doped in Figure 2B and Tm,B-doped in Figure 3B). All samples were weighed before the measurements and each value has been normalized to the sample’s weight. As can be seen in these Figures, the integrated TL signal differs significantly from sample to sample. Interestingly, the most unambiguous results were obtained for the Tb-doped sam-ple. Namely, the initial part of the crystal showed the highest luminescence intensity, up to 4–5 times higher as compared to the signal of samples originating from the end of the crystal (Figure 2B). Moreover, the distribution of values evaluated for the slices in-cluded in the first group (slices from 1 to 12) is very heterogeneous (widely spread) in comparison
Figure 2. TL signal of LMP doped with 0.8-mol% Tb: (A)—TL glow curve for slice #6 is typical for the curves for slices 1–12,curve for slice #26 is typical for the curves for slices 13–27. (B)—Integrated TL signal in the temperature range between20 ◦C and 400 ◦C calculated for all TL curves. The samples were irradiated with 0.2 Gy of beta rays in the Risø reader. Sliceof crystal—numbers represent labelling of samples along the crystal length, as illustrated in Figure 1.
In contrast to the curves described above, all curves for the samples of Tm-doped LMPcrystals had a similar shape regardless of the Tm concentration (0.8 mol% or 1.2 mol%)and the part of the crystal where the samples were obtained from. The only difference wasobserved for the main peak amplitude (Figure 3A). In this case, the most prominent peak
Materials 2021, 14, 132 5 of 13
was in the temperature range between 300 ◦C and 380 ◦C. The peaks of TL glow curvesregistered for higher Tm doping (1.2 mol%) had a significantly lower amplitude.
Materials 2021, 14, x FOR PEER REVIEW 5 of 15
Figure 2. TL signal of LMP doped with 0.8-mol% Tb: (A)—TL glow curve for slice #6 is typical for the curves for slices 1–12, curve for slice #26 is typical for the curves for slices 13–27. (B)—Integrated TL signal in the temperature range between 20 °C and 400 °C calculated for all TL curves. The samples were irradiated with 0.2 Gy of beta rays in the Risø reader. Slice of crystal—numbers represent labelling of samples along the crystal length, as illustrated in Figure 1.
In contrast to the curves described above, all curves for the samples of Tm-doped LMP crystals had a similar shape regardless of the Tm concentration (0.8 mol% or 1.2 mol%) and the part of the crystal where the samples were obtained from. The only differ-ence was observed for the main peak amplitude (Figure 3A). In this case, the most prom-inent peak was in the temperature range between 300 °C and 380 °C. The peaks of TL glow curves registered for higher Tm doping (1.2 mol%) had a significantly lower amplitude.
Figure 3. TL signal of LMP doped with 0.8-mol% Tm and 10-mol% B. (A)—TL glow curves for slices #4 and #22. (B)—Integrated TL signal in the temperature range between 20 °C and 400 °C calculated for all TL curves. The samples were irradiated with 0.2 Gy of beta rays in the Risø reader. Slice of crystal—numbers represent labelling of samples along the crystal length, as illustrated in Figure 1.
Figures 2B and 3B show the TL signal integrated over the temperature range from room temperature to 400 °C, calculated for the consecutive slices cut from corresponding crystals (Tb-doped in Figure 2B and Tm,B-doped in Figure 3B). All samples were weighed before the measurements and each value has been normalized to the sample’s weight. As can be seen in these Figures, the integrated TL signal differs significantly from sample to sample. Interestingly, the most unambiguous results were obtained for the Tb-doped sam-ple. Namely, the initial part of the crystal showed the highest luminescence intensity, up to 4–5 times higher as compared to the signal of samples originating from the end of the crystal (Figure 2B). Moreover, the distribution of values evaluated for the slices in-cluded in the first group (slices from 1 to 12) is very heterogeneous (widely spread) in comparison
Figure 3. TL signal of LMP doped with 0.8-mol% Tm and 10-mol% B. (A)—TL glow curves for slices#4 and #22. (B)—Integrated TL signal in the temperature range between 20 ◦C and 400 ◦C calculatedfor all TL curves. The samples were irradiated with 0.2 Gy of beta rays in the Risø reader. Slice ofcrystal—numbers represent labelling of samples along the crystal length, as illustrated in Figure 1.
Figures 2B and 3B show the TL signal integrated over the temperature range fromroom temperature to 400 ◦C, calculated for the consecutive slices cut from correspondingcrystals (Tb-doped in Figure 2B and Tm,B-doped in Figure 3B). All samples were weighedbefore the measurements and each value has been normalized to the sample’s weight. Ascan be seen in these Figures, the integrated TL signal differs significantly from sampleto sample. Interestingly, the most unambiguous results were obtained for the Tb-dopedsample. Namely, the initial part of the crystal showed the highest luminescence intensity,up to 4–5 times higher as compared to the signal of samples originating from the end of thecrystal (Figure 2B). Moreover, the distribution of values evaluated for the slices in-cludedin the first group (slices from 1 to 12) is very heterogeneous (widely spread) in comparisonto the distribution of values evaluated for the samples included in the second group (slicesfrom 13 to the end of the crystal), which is quite uniform. In the case of Tm,B-doped crystal(Figure 3B), significant differences in the TL signal intensities are also visible, however,these cannot be directly correlated to the part (beginning or end) of the crystal—it cannotbe surely said that the initial part of the crystal shows higher lumines-cence intensity thanthe end of the crystal due to the very large spread of points (increasing trend). Also, thereis no such great difference between the beginning and end part of the crystal. This may berelated to the differences in Tb and Tm incorporation mechanism in the LMP host matrix.
3.2. OSL Signal along Crystal Length
Similarly, OSL decay curves were recorded in the Risø reader after irradiation of allsamples with 0.2 Gy of beta rays. The OSL decay curves for LMP doped with Tb (0.8 mol%)can be classified into two groups: those with a higher signal (curves 1–10) and those with alower signal (curves 11–25). The typical decay curves for the first group (curve for slice2) and for the second group (curve for slice 19) are presented in Figure 4A. The total OSLsignals integrated from 0 to 300 s for all samples are shown in Figure 4B. The integratedOSL signals showed a similar trend as the TL signal (Figure 2B), which means that thehighest TL and OSL signals were found for the samples with the same numbers. Twocharacteristic decay curves (for slices number 7 and 22) are shown in Figure 5A, whileintegrated OSL signals (from 0 to 300 s) for all LMP samples doped with 0.8 mol% Tmand 10 mol% B are presented in Figure 5B. In this case, the sum of TL and OSL signalsfor individual samples along the crystal length was also similar. The total OSL signals forsamples doped with 1.2 mol% Tm and 10 mol% B are presented in Figure 6. Systematicmeasurements of the luminescence signal revealed significant differences between the
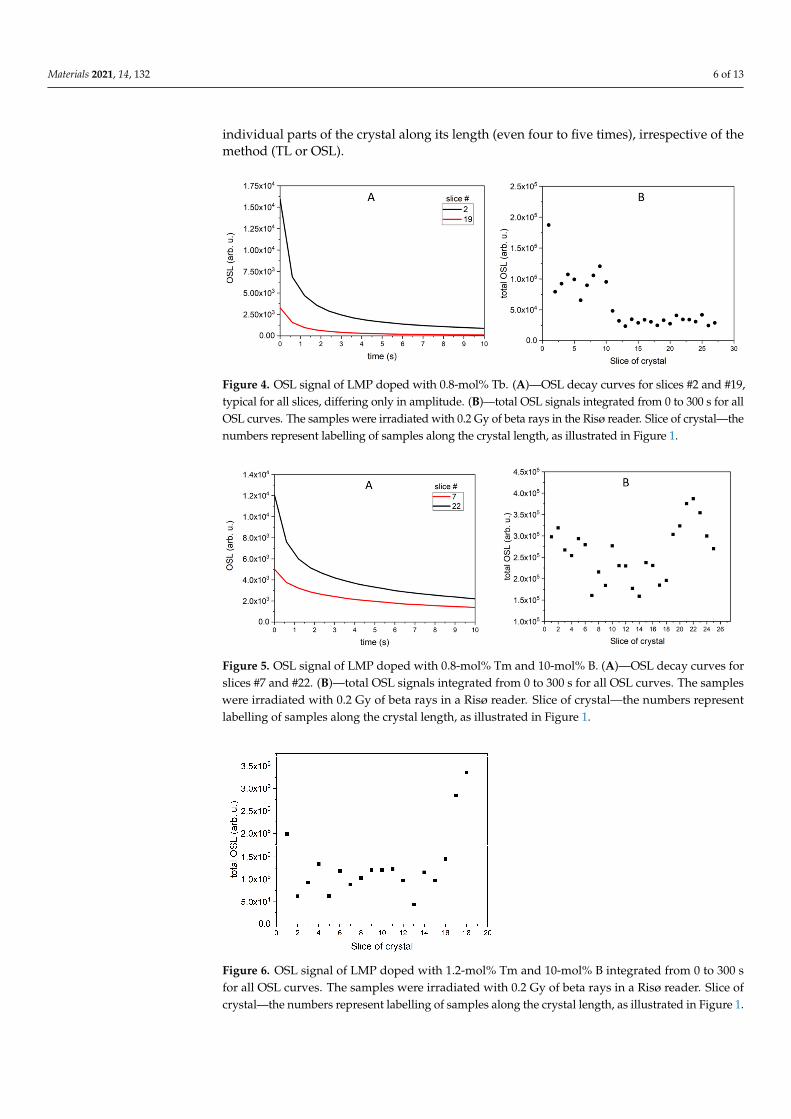
Materials 2021, 14, 132 6 of 13
individual parts of the crystal along its length (even four to five times), irrespective of themethod (TL or OSL).
Materials 2021, 14, x FOR PEER REVIEW 6 of 15
to the distribution of values evaluated for the samples included in the second group (slices from 13 to the end of the crystal), which is quite uniform. In the case of Tm,B-doped crystal (Figure 3B), significant differences in the TL signal intensities are also visible, however, these cannot be directly correlated to the part (beginning or end) of the crystal—it cannot be surely said that the initial part of the crystal shows higher lumines-cence intensity than the end of the crystal due to the very large spread of points (increasing trend). Also, there is no such great difference between the beginning and end part of the crystal. This may be related to the differences in Tb and Tm incorporation mechanism in the LMP host matrix.
3.2. OSL Signal along Crystal Length Similarly, OSL decay curves were recorded in the Risø reader after irradiation of all
samples with 0.2 Gy of beta rays. The OSL decay curves for LMP doped with Tb (0.8 mol%) can be classified into two groups: those with a higher signal (curves 1–10) and those with a lower signal (curves 11–25). The typical decay curves for the first group (curve for slice 2) and for the second group (curve for slice 19) are presented in Figure 4A. The total OSL signals integrated from 0 to 300 s for all samples are shown in Figure 4B. The inte-grated OSL signals showed a similar trend as the TL signal (Figure 2B), which means that the highest TL and OSL signals were found for the samples with the same numbers. Two characteristic decay curves (for slices number 7 and 22) are shown in Figure 5A, while integrated OSL signals (from 0 to 300 s) for all LMP samples doped with 0.8 mol% Tm and 10 mol% B are presented in Figure 5B. In this case, the sum of TL and OSL signals for individual samples along the crystal length was also similar. The total OSL signals for samples doped with 1.2 mol% Tm and 10 mol% B are presented in Figure 6. Systematic measurements of the luminescence signal revealed significant differences between the in-dividual parts of the crystal along its length (even four to five times), irrespective of the method (TL or OSL).
Figure 4. OSL signal of LMP doped with 0.8-mol% Tb. (A)—OSL decay curves for slices #2 and #19, typical for all slices, differing only in amplitude. (B)—total OSL signals integrated from 0 to 300 s for all OSL curves. The samples were irradi-ated with 0.2 Gy of beta rays in the Risø reader. Slice of crystal—the numbers represent labelling of samples along the crystal length, as illustrated in Figure 1.
Figure 4. OSL signal of LMP doped with 0.8-mol% Tb. (A)—OSL decay curves for slices #2 and #19,typical for all slices, differing only in amplitude. (B)—total OSL signals integrated from 0 to 300 s for allOSL curves. The samples were irradiated with 0.2 Gy of beta rays in the Risø reader. Slice of crystal—thenumbers represent labelling of samples along the crystal length, as illustrated in Figure 1.
Materials 2021, 14, x FOR PEER REVIEW 7 of 15
Figure 5. OSL signal of LMP doped with 0.8-mol% Tm and 10-mol% B. (A)—OSL decay curves for slices #7 and #22. (B)—total OSL signals integrated from 0 to 300 s for all OSL curves. The samples were irradiated with 0.2 Gy of beta rays in a Risø reader. Slice of crystal—the numbers represent labelling of samples along the crystal length, as illustrated in Figure 1.
Figure 6. OSL signal of LMP doped with 1.2-mol% Tm and 10-mol% B integrated from 0 to 300 s for all OSL curves. The samples were irradiated with 0.2 Gy of beta rays in a Risø reader. Slice of crystal—the numbers represent labelling of samples along the crystal length, as illustrated in Fig-ure 1.
3.3. TL Signal on the Surface of Crystal Slices (2D TL) In the case of conventional TL measurements, the signal is collected from the whole
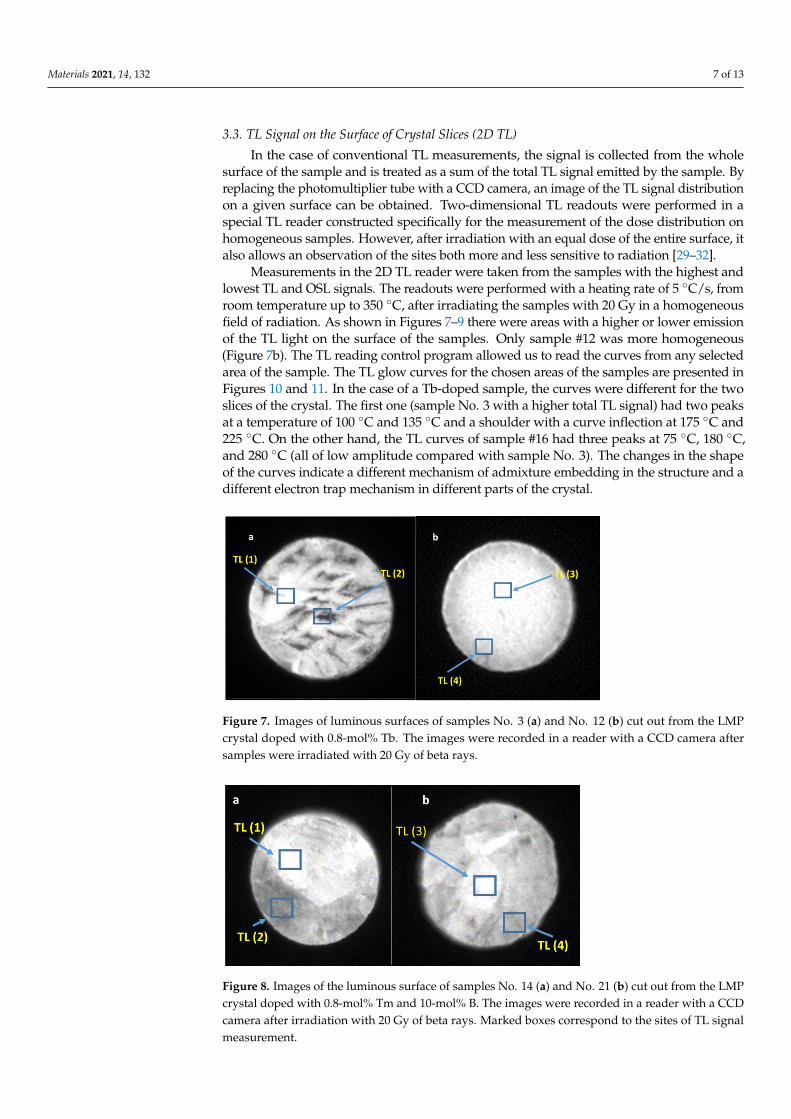
surface of the sample and is treated as a sum of the total TL signal emitted by the sample. By replacing the photomultiplier tube with a CCD camera, an image of the TL signal dis-tribution on a given surface can be obtained. Two-dimensional TL readouts were per-formed in a special TL reader constructed specifically for the measurement of the dose distribution on homogeneous samples. However, after irradiation with an equal dose of the entire surface, it also allows an observation of the sites both more and less sensitive to radiation [29–32].
Measurements in the 2D TL reader were taken from the samples with the highest and lowest TL and OSL signals. The readouts were performed with a heating rate of 5 °C/s, from room temperature up to 350 °C, after irradiating the samples with 20 Gy in a homo-geneous field of radiation. As shown in Figures 7–9 there were areas with a higher or
Figure 5. OSL signal of LMP doped with 0.8-mol% Tm and 10-mol% B. (A)—OSL decay curves forslices #7 and #22. (B)—total OSL signals integrated from 0 to 300 s for all OSL curves. The sampleswere irradiated with 0.2 Gy of beta rays in a Risø reader. Slice of crystal—the numbers representlabelling of samples along the crystal length, as illustrated in Figure 1.
Materials 2021, 14, x FOR PEER REVIEW 7 of 15
Figure 5. OSL signal of LMP doped with 0.8-mol% Tm and 10-mol% B. (A)—OSL decay curves for slices #7 and #22. (B)—total OSL signals integrated from 0 to 300 s for all OSL curves. The samples were irradiated with 0.2 Gy of beta rays in a Risø reader. Slice of crystal—the numbers represent labelling of samples along the crystal length, as illustrated in Figure 1.
Figure 6. OSL signal of LMP doped with 1.2-mol% Tm and 10-mol% B integrated from 0 to 300 s for all OSL curves. The samples were irradiated with 0.2 Gy of beta rays in a Risø reader. Slice of crystal—the numbers represent labelling of samples along the crystal length, as illustrated in Fig-ure 1.
3.3. TL Signal on the Surface of Crystal Slices (2D TL) In the case of conventional TL measurements, the signal is collected from the whole
surface of the sample and is treated as a sum of the total TL signal emitted by the sample. By replacing the photomultiplier tube with a CCD camera, an image of the TL signal dis-tribution on a given surface can be obtained. Two-dimensional TL readouts were per-formed in a special TL reader constructed specifically for the measurement of the dose distribution on homogeneous samples. However, after irradiation with an equal dose of the entire surface, it also allows an observation of the sites both more and less sensitive to radiation [29–32].
Measurements in the 2D TL reader were taken from the samples with the highest and lowest TL and OSL signals. The readouts were performed with a heating rate of 5 °C/s, from room temperature up to 350 °C, after irradiating the samples with 20 Gy in a homo-geneous field of radiation. As shown in Figures 7–9 there were areas with a higher or
Figure 6. OSL signal of LMP doped with 1.2-mol% Tm and 10-mol% B integrated from 0 to 300 sfor all OSL curves. The samples were irradiated with 0.2 Gy of beta rays in a Risø reader. Slice ofcrystal—the numbers represent labelling of samples along the crystal length, as illustrated in Figure 1.
Materials 2021, 14, 132 7 of 13
3.3. TL Signal on the Surface of Crystal Slices (2D TL)
In the case of conventional TL measurements, the signal is collected from the wholesurface of the sample and is treated as a sum of the total TL signal emitted by the sample. Byreplacing the photomultiplier tube with a CCD camera, an image of the TL signal distributionon a given surface can be obtained. Two-dimensional TL readouts were performed in aspecial TL reader constructed specifically for the measurement of the dose distribution onhomogeneous samples. However, after irradiation with an equal dose of the entire surface, italso allows an observation of the sites both more and less sensitive to radiation [29–32].
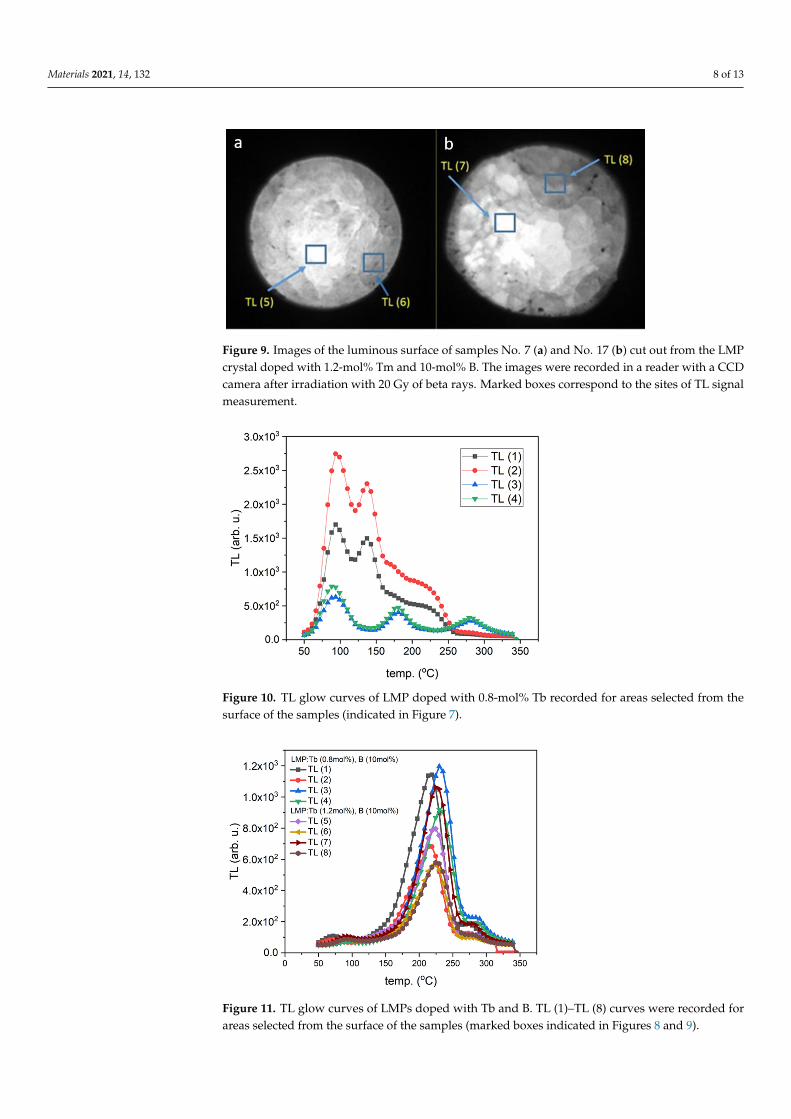
Measurements in the 2D TL reader were taken from the samples with the highest andlowest TL and OSL signals. The readouts were performed with a heating rate of 5 ◦C/s, fromroom temperature up to 350 ◦C, after irradiating the samples with 20 Gy in a homogeneousfield of radiation. As shown in Figures 7–9 there were areas with a higher or lower emissionof the TL light on the surface of the samples. Only sample #12 was more homogeneous(Figure 7b). The TL reading control program allowed us to read the curves from any selectedarea of the sample. The TL glow curves for the chosen areas of the samples are presented inFigures 10 and 11. In the case of a Tb-doped sample, the curves were different for the twoslices of the crystal. The first one (sample No. 3 with a higher total TL signal) had two peaksat a temperature of 100 ◦C and 135 ◦C and a shoulder with a curve inflection at 175 ◦C and225 ◦C. On the other hand, the TL curves of sample #16 had three peaks at 75 ◦C, 180 ◦C,and 280 ◦C (all of low amplitude compared with sample No. 3). The changes in the shapeof the curves indicate a different mechanism of admixture embedding in the structure and adifferent electron trap mechanism in different parts of the crystal.
Materials 2021, 14, x FOR PEER REVIEW 8 of 15
lower emission of the TL light on the surface of the samples. Only sample #12 was more
homogeneous (Figure 7b). The TL reading control program allowed us to read the curves
from any selected area of the sample. The TL glow curves for the chosen areas of the sam-
ples are presented in Figures 10 and 11. In the case of a Tb-doped sample, the curves were
different for the two slices of the crystal. The first one (sample No. 3 with a higher total
TL signal) had two peaks at a temperature of 100 °C and 135 °C and a shoulder with a
curve inflection at 175 °C and 225 °C. On the other hand, the TL curves of sample #16 had
three peaks at 75 °C, 180 °C, and 280 °C (all of low amplitude compared with sample No.
3). The changes in the shape of the curves indicate a different mechanism of admixture
embedding in the structure and a different electron trap mechanism in different parts of
the crystal.
Figure 7. Images of luminous surfaces of samples No. 3 (a) and No. 12 (b) cut out from the LMP
crystal doped with 0.8-mol% Tb. The images were recorded in a reader with a CCD camera after
samples were irradiated with 20 Gy of beta rays.
Figure 8. Images of the luminous surface of samples No. 14 (a) and No. 21 (b) cut out from the
LMP crystal doped with 0.8-mol% Tm and 10-mol% B. The images were recorded in a reader with
a CCD camera after irradiation with 20 Gy of beta rays. Marked boxes correspond to the sites of
TL signal measurement.
Figure 7. Images of luminous surfaces of samples No. 3 (a) and No. 12 (b) cut out from the LMPcrystal doped with 0.8-mol% Tb. The images were recorded in a reader with a CCD camera aftersamples were irradiated with 20 Gy of beta rays.
Materials 2021, 14, x FOR PEER REVIEW 8 of 15
lower emission of the TL light on the surface of the samples. Only sample #12 was more
homogeneous (Figure 7b). The TL reading control program allowed us to read the curves
from any selected area of the sample. The TL glow curves for the chosen areas of the sam-
ples are presented in Figures 10 and 11. In the case of a Tb-doped sample, the curves were
different for the two slices of the crystal. The first one (sample No. 3 with a higher total
TL signal) had two peaks at a temperature of 100 °C and 135 °C and a shoulder with a
curve inflection at 175 °C and 225 °C. On the other hand, the TL curves of sample #16 had
three peaks at 75 °C, 180 °C, and 280 °C (all of low amplitude compared with sample No.
3). The changes in the shape of the curves indicate a different mechanism of admixture
embedding in the structure and a different electron trap mechanism in different parts of
the crystal.
Figure 7. Images of luminous surfaces of samples No. 3 (a) and No. 12 (b) cut out from the LMP
crystal doped with 0.8-mol% Tb. The images were recorded in a reader with a CCD camera after
samples were irradiated with 20 Gy of beta rays.
Figure 8. Images of the luminous surface of samples No. 14 (a) and No. 21 (b) cut out from the
LMP crystal doped with 0.8-mol% Tm and 10-mol% B. The images were recorded in a reader with
a CCD camera after irradiation with 20 Gy of beta rays. Marked boxes correspond to the sites of
TL signal measurement.
Figure 8. Images of the luminous surface of samples No. 14 (a) and No. 21 (b) cut out from the LMPcrystal doped with 0.8-mol% Tm and 10-mol% B. The images were recorded in a reader with a CCDcamera after irradiation with 20 Gy of beta rays. Marked boxes correspond to the sites of TL signalmeasurement.
Materials 2021, 14, 132 8 of 13Materials 2021, 14, x FOR PEER REVIEW 9 of 15
Figure 9. Images of the luminous surface of samples No. 7 (a) and No. 17 (b) cut out from the LMP
crystal doped with 1.2-mol% Tm and 10-mol% B. The images were recorded in a reader with a
CCD camera after irradiation with 20 Gy of beta rays. Marked boxes correspond to the sites of TL
signal measurement.
Figure 10. TL glow curves of LMP doped with 0.8-mol% Tb recorded for areas selected from the
surface of the samples (indicated in Figure 7).
Figure 9. Images of the luminous surface of samples No. 7 (a) and No. 17 (b) cut out from the LMPcrystal doped with 1.2-mol% Tm and 10-mol% B. The images were recorded in a reader with a CCDcamera after irradiation with 20 Gy of beta rays. Marked boxes correspond to the sites of TL signalmeasurement.
Materials 2021, 14, x FOR PEER REVIEW 9 of 15
Figure 9. Images of the luminous surface of samples No. 7 (a) and No. 17 (b) cut out from the LMP crystal doped with 1.2-mol% Tm and 10-mol% B. The images were recorded in a reader with a CCD camera after irradiation with 20 Gy of beta rays. Marked boxes correspond to the sites of TL signal measurement.
Figure 10. TL glow curves of LMP doped with 0.8-mol% Tb recorded for areas selected from the surface of the samples (indicated in Figure 7). Figure 10. TL glow curves of LMP doped with 0.8-mol% Tb recorded for areas selected from thesurface of the samples (indicated in Figure 7).
Materials 2021, 14, x FOR PEER REVIEW 10 of 15
Figure 11. TL glow curves of LMPs doped with Tb and B. TL (1)–TL (8) curves were recorded for areas selected from the surface of the samples (marked boxes indicated in Figures 8 and 9).
In contrast, the samples doped with Tm and B, independent of the Tm concentration, presented one evident peak around the temperature of 225 °C, the amplitude and peak position of which changed depending on the sample and location on the sample (Figures 8 and 9). The shape of this TL glow curve was similar to that obtained in a conventional TL reader (Figure 3A).
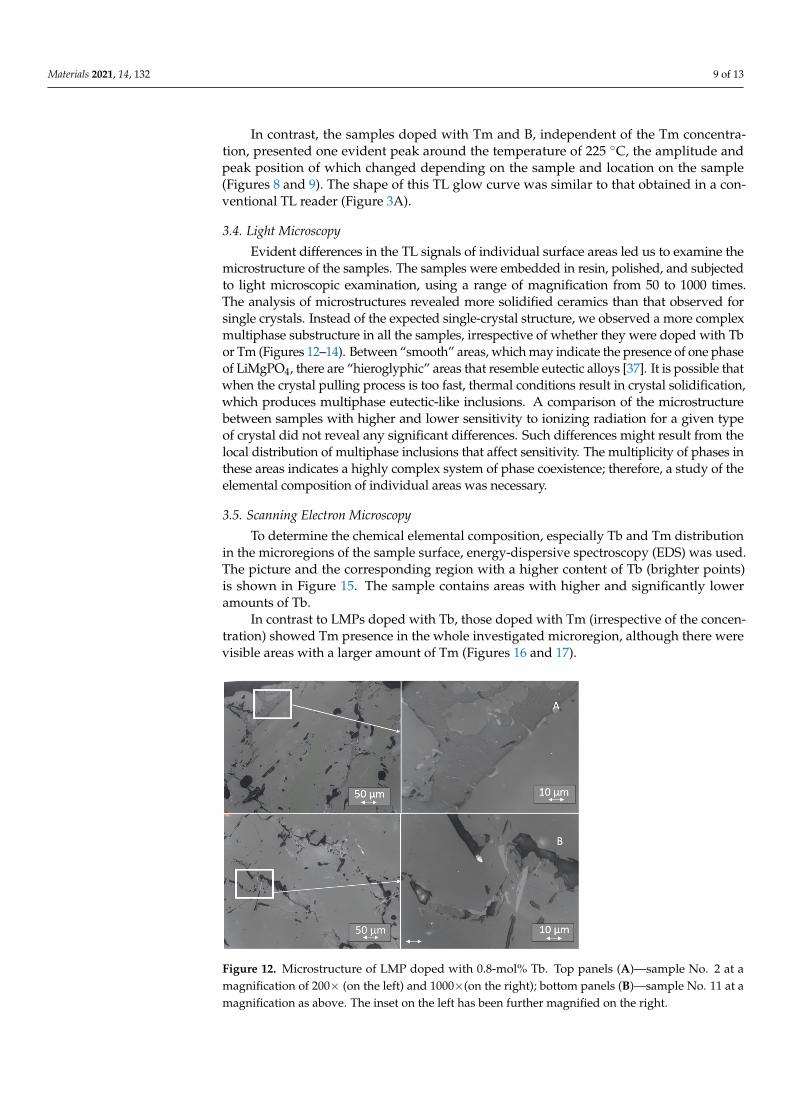
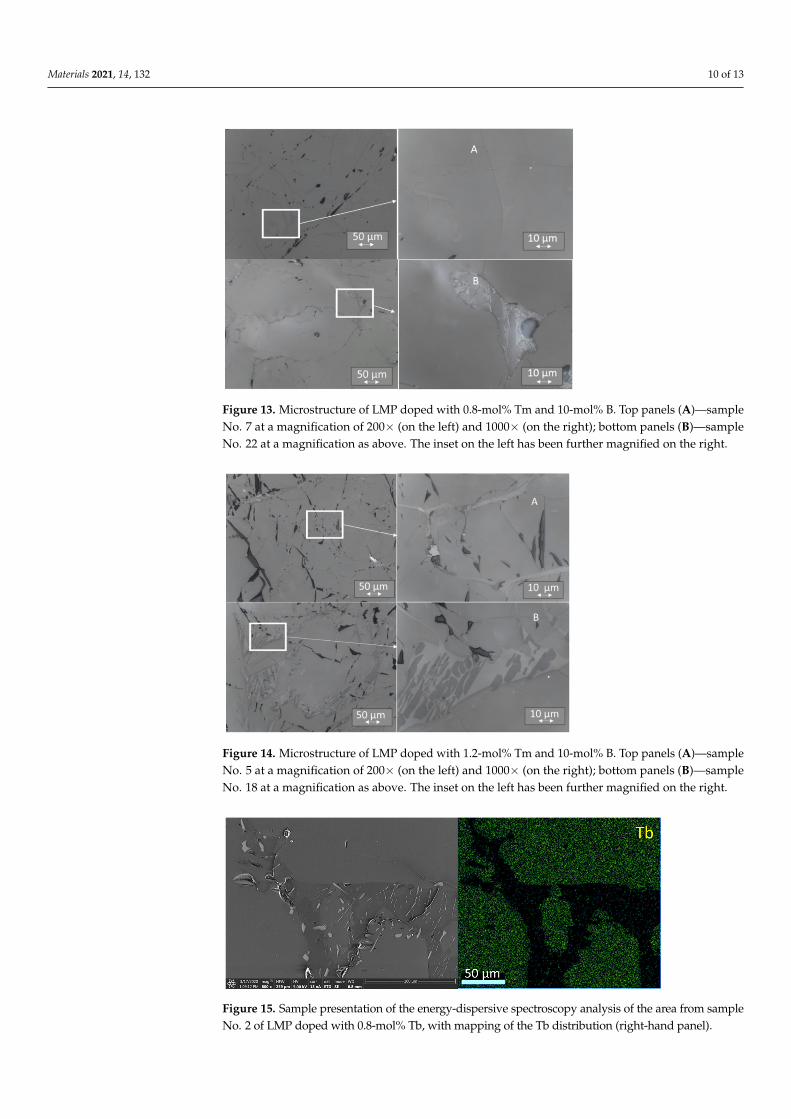
3.4. Light Microscopy Evident differences in the TL signals of individual surface areas led us to examine
the microstructure of the samples. The samples were embedded in resin, polished, and subjected to light microscopic examination, using a range of magnification from 50 to 1000 times. The analysis of microstructures revealed more solidified ceramics than that ob-served for single crystals. Instead of the expected single-crystal structure, we observed a more complex multiphase substructure in all the samples, irrespective of whether they were doped with Tb or Tm (Figures 12–14). Between “smooth” areas, which may indicate the presence of one phase of LiMgPO4, there are “hieroglyphic” areas that resemble eu-tectic alloys [37]. It is possible that when the crystal pulling process is too fast, thermal conditions result in crystal solidification, which produces multiphase eutectic-like inclu-sions. A comparison of the microstructure between samples with higher and lower sensi-tivity to ionizing radiation for a given type of crystal did not reveal any significant differ-ences. Such differences might result from the local distribution of multiphase inclusions that affect sensitivity. The multiplicity of phases in these areas indicates a highly complex system of phase coexistence; therefore, a study of the elemental composition of individual areas was necessary.
Figure 11. TL glow curves of LMPs doped with Tb and B. TL (1)–TL (8) curves were recorded forareas selected from the surface of the samples (marked boxes indicated in Figures 8 and 9).
Materials 2021, 14, 132 9 of 13
In contrast, the samples doped with Tm and B, independent of the Tm concentra-tion, presented one evident peak around the temperature of 225 ◦C, the amplitude andpeak position of which changed depending on the sample and location on the sample(Figures 8 and 9). The shape of this TL glow curve was similar to that obtained in a con-ventional TL reader (Figure 3A).
3.4. Light Microscopy
Evident differences in the TL signals of individual surface areas led us to examine themicrostructure of the samples. The samples were embedded in resin, polished, and subjectedto light microscopic examination, using a range of magnification from 50 to 1000 times.The analysis of microstructures revealed more solidified ceramics than that observed forsingle crystals. Instead of the expected single-crystal structure, we observed a more complexmultiphase substructure in all the samples, irrespective of whether they were doped with Tbor Tm (Figures 12–14). Between “smooth” areas, which may indicate the presence of one phaseof LiMgPO4, there are “hieroglyphic” areas that resemble eutectic alloys [37]. It is possible thatwhen the crystal pulling process is too fast, thermal conditions result in crystal solidification,which produces multiphase eutectic-like inclusions. A comparison of the microstructurebetween samples with higher and lower sensitivity to ionizing radiation for a given typeof crystal did not reveal any significant differences. Such differences might result from thelocal distribution of multiphase inclusions that affect sensitivity. The multiplicity of phases inthese areas indicates a highly complex system of phase coexistence; therefore, a study of theelemental composition of individual areas was necessary.
3.5. Scanning Electron Microscopy
To determine the chemical elemental composition, especially Tb and Tm distributionin the microregions of the sample surface, energy-dispersive spectroscopy (EDS) was used.The picture and the corresponding region with a higher content of Tb (brighter points)is shown in Figure 15. The sample contains areas with higher and significantly loweramounts of Tb.
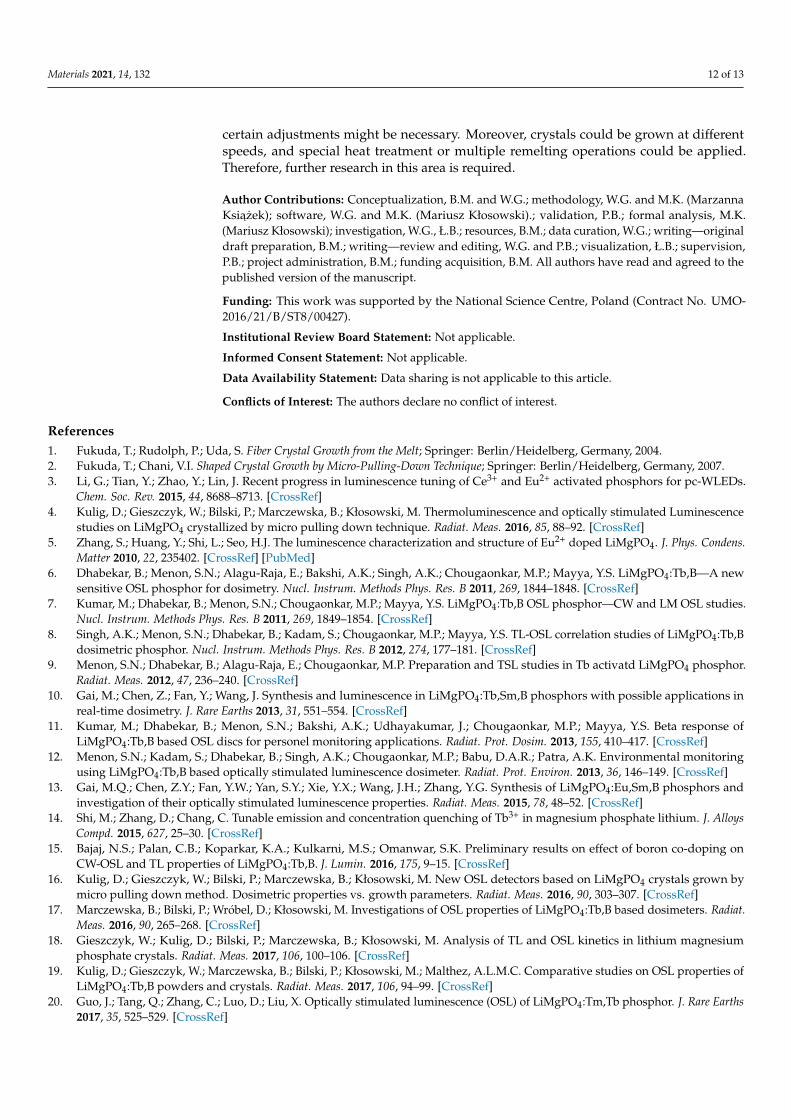
In contrast to LMPs doped with Tb, those doped with Tm (irrespective of the concen-tration) showed Tm presence in the whole investigated microregion, although there werevisible areas with a larger amount of Tm (Figures 16 and 17).
Materials 2021, 14, x FOR PEER REVIEW 11 of 15
Figure 12. Microstructure of LMP doped with 0.8-mol% Tb. Top panels (A)—sample No. 2 at a magnification of 200× (on the left) and 1000×(on the right); bottom panels (B)—sample No. 11 at a magnification as above. The inset on the left has been further magnified on the right.
Figure 13. Microstructure of LMP doped with 0.8-mol% Tm and 10-mol% B. Top panels (A)—sample No. 7 at a magnification of 200× (on the left) and 1000× (on the right); bottom panels (B)—sample No. 22 at a magnification as above. The inset on the left has been further magnified on the right.
Figure 12. Microstructure of LMP doped with 0.8-mol% Tb. Top panels (A)—sample No. 2 at amagnification of 200× (on the left) and 1000×(on the right); bottom panels (B)—sample No. 11 at amagnification as above. The inset on the left has been further magnified on the right.
Materials 2021, 14, 132 10 of 13
Materials 2021, 14, x FOR PEER REVIEW 11 of 15
Figure 12. Microstructure of LMP doped with 0.8-mol% Tb. Top panels (A)—sample No. 2 at a magnification of 200× (on the left) and 1000×(on the right); bottom panels (B)—sample No. 11 at a magnification as above. The inset on the left has been further magnified on the right.
Figure 13. Microstructure of LMP doped with 0.8-mol% Tm and 10-mol% B. Top panels (A)—sample No. 7 at a magnification of 200× (on the left) and 1000× (on the right); bottom panels (B)—sample No. 22 at a magnification as above. The inset on the left has been further magnified on the right.
Figure 13. Microstructure of LMP doped with 0.8-mol% Tm and 10-mol% B. Top panels (A)—sampleNo. 7 at a magnification of 200× (on the left) and 1000× (on the right); bottom panels (B)—sampleNo. 22 at a magnification as above. The inset on the left has been further magnified on the right.
Materials 2021, 14, x FOR PEER REVIEW 12 of 15
Figure 14. Microstructure of LMP doped with 1.2-mol% Tm and 10-mol% B. Top panels (A)—sample No. 5 at a magnification of 200× (on the left) and 1000× (on the right); bottom panels (B)—sample No. 18 at a magnification as above. The inset on the left has been further magnified on the right.
3.5. Scanning Electron Microscopy To determine the chemical elemental composition, especially Tb and Tm distribution
in the microregions of the sample surface, energy-dispersive spectroscopy (EDS) was used. The picture and the corresponding region with a higher content of Tb (brighter points) is shown in Figure 15. The sample contains areas with higher and significantly lower amounts of Tb.
Figure 15. Sample presentation of the energy-dispersive spectroscopy analysis of the area from sample No. 2 of LMP doped with 0.8-mol% Tb, with mapping of the Tb distribution (right-hand panel).
In contrast to LMPs doped with Tb, those doped with Tm (irrespective of the concen-tration) showed Tm presence in the whole investigated microregion, although there were visible areas with a larger amount of Tm (Figures 16 and 17).
Figure 14. Microstructure of LMP doped with 1.2-mol% Tm and 10-mol% B. Top panels (A)—sampleNo. 5 at a magnification of 200× (on the left) and 1000× (on the right); bottom panels (B)—sampleNo. 18 at a magnification as above. The inset on the left has been further magnified on the right.
Materials 2021, 14, x FOR PEER REVIEW 12 of 15
Figure 14. Microstructure of LMP doped with 1.2-mol% Tm and 10-mol% B. Top panels (A)—sample No. 5 at a magnification of 200× (on the left) and 1000× (on the right); bottom panels (B)—sample No. 18 at a magnification as above. The inset on the left has been further magnified on the right.
3.5. Scanning Electron Microscopy To determine the chemical elemental composition, especially Tb and Tm distribution
in the microregions of the sample surface, energy-dispersive spectroscopy (EDS) was used. The picture and the corresponding region with a higher content of Tb (brighter points) is shown in Figure 15. The sample contains areas with higher and significantly lower amounts of Tb.
Figure 15. Sample presentation of the energy-dispersive spectroscopy analysis of the area from sample No. 2 of LMP doped with 0.8-mol% Tb, with mapping of the Tb distribution (right-hand panel).
In contrast to LMPs doped with Tb, those doped with Tm (irrespective of the concen-tration) showed Tm presence in the whole investigated microregion, although there were visible areas with a larger amount of Tm (Figures 16 and 17).
Figure 15. Sample presentation of the energy-dispersive spectroscopy analysis of the area from sampleNo. 2 of LMP doped with 0.8-mol% Tb, with mapping of the Tb distribution (right-hand panel).
Materials 2021, 14, 132 11 of 13Materials 2021, 14, x FOR PEER REVIEW 13 of 15
Figure 16. Sample presentation of the energy-dispersive spectroscopy analysis of the area from samples of LMP doped with 0.8-mol% Tb and 10-mol% B, with mapping of the Tm distribution (right-hand panels); top panels—sample No. 7, bottom panels—sample No. 22.
Figure 17. Sample presentation of the energy-dispersive spectroscopy analysis of the area from sample No. 18 of LMP doped with 1.2-mol% Tb and 10-mol% B, with mapping of the Tm distribu-tion (right-hand panel).
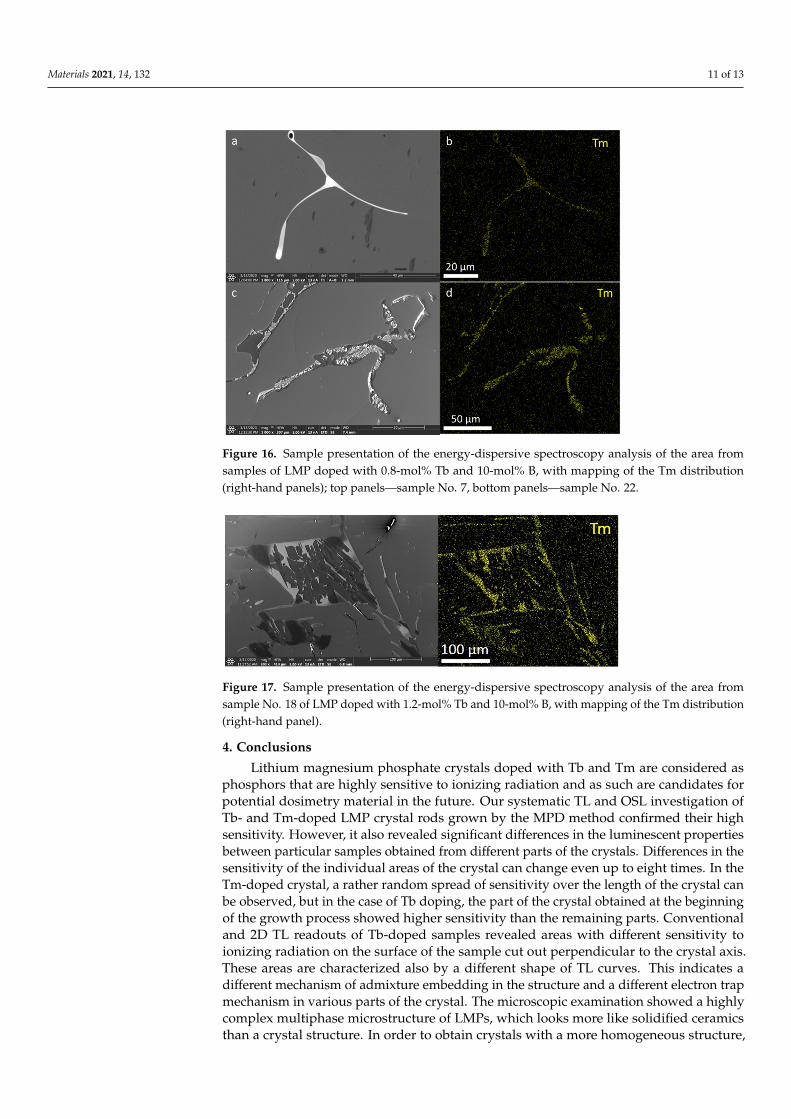
4. Conclusions Lithium magnesium phosphate crystals doped with Tb and Tm are considered as
phosphors that are highly sensitive to ionizing radiation and as such are candidates for potential dosimetry material in the future. Our systematic TL and OSL investigation of Tb- and Tm-doped LMP crystal rods grown by the MPD method confirmed their high sensitivity. However, it also revealed significant differences in the luminescent properties between particular samples obtained from different parts of the crystals. Differences in the sensitivity of the individual areas of the crystal can change even up to eight times. In the Tm-doped crystal, a rather random spread of sensitivity over the length of the crystal can be observed, but in the case of Tb doping, the part of the crystal obtained at the begin-ning of the growth process showed higher sensitivity than the remaining parts. Conven-tional and 2D TL readouts of Tb-doped samples revealed areas with different sensitivity to ionizing radiation on the surface of the sample cut out perpendicular to the crystal axis. These areas are characterized also by a different shape of TL curves. This indicates a dif-ferent mechanism of admixture embedding in the structure and a different electron trap mechanism in various parts of the crystal. The microscopic examination showed a highly complex multiphase microstructure of LMPs, which looks more like solidified ceramics
Figure 16. Sample presentation of the energy-dispersive spectroscopy analysis of the area fromsamples of LMP doped with 0.8-mol% Tb and 10-mol% B, with mapping of the Tm distribution(right-hand panels); top panels—sample No. 7, bottom panels—sample No. 22.
Materials 2021, 14, x FOR PEER REVIEW 13 of 15
Figure 16. Sample presentation of the energy-dispersive spectroscopy analysis of the area from samples of LMP doped with 0.8-mol% Tb and 10-mol% B, with mapping of the Tm distribution (right-hand panels); top panels—sample No. 7, bottom panels—sample No. 22.
Figure 17. Sample presentation of the energy-dispersive spectroscopy analysis of the area from sample No. 18 of LMP doped with 1.2-mol% Tb and 10-mol% B, with mapping of the Tm distribu-tion (right-hand panel).
4. Conclusions Lithium magnesium phosphate crystals doped with Tb and Tm are considered as
phosphors that are highly sensitive to ionizing radiation and as such are candidates for potential dosimetry material in the future. Our systematic TL and OSL investigation of Tb- and Tm-doped LMP crystal rods grown by the MPD method confirmed their high sensitivity. However, it also revealed significant differences in the luminescent properties between particular samples obtained from different parts of the crystals. Differences in the sensitivity of the individual areas of the crystal can change even up to eight times. In the Tm-doped crystal, a rather random spread of sensitivity over the length of the crystal can be observed, but in the case of Tb doping, the part of the crystal obtained at the begin-ning of the growth process showed higher sensitivity than the remaining parts. Conven-tional and 2D TL readouts of Tb-doped samples revealed areas with different sensitivity to ionizing radiation on the surface of the sample cut out perpendicular to the crystal axis. These areas are characterized also by a different shape of TL curves. This indicates a dif-ferent mechanism of admixture embedding in the structure and a different electron trap mechanism in various parts of the crystal. The microscopic examination showed a highly complex multiphase microstructure of LMPs, which looks more like solidified ceramics
Figure 17. Sample presentation of the energy-dispersive spectroscopy analysis of the area fromsample No. 18 of LMP doped with 1.2-mol% Tb and 10-mol% B, with mapping of the Tm distribution(right-hand panel).
4. Conclusions
Lithium magnesium phosphate crystals doped with Tb and Tm are considered asphosphors that are highly sensitive to ionizing radiation and as such are candidates forpotential dosimetry material in the future. Our systematic TL and OSL investigation ofTb- and Tm-doped LMP crystal rods grown by the MPD method confirmed their highsensitivity. However, it also revealed significant differences in the luminescent propertiesbetween particular samples obtained from different parts of the crystals. Differences in thesensitivity of the individual areas of the crystal can change even up to eight times. In theTm-doped crystal, a rather random spread of sensitivity over the length of the crystal canbe observed, but in the case of Tb doping, the part of the crystal obtained at the beginningof the growth process showed higher sensitivity than the remaining parts. Conventionaland 2D TL readouts of Tb-doped samples revealed areas with different sensitivity toionizing radiation on the surface of the sample cut out perpendicular to the crystal axis.These areas are characterized also by a different shape of TL curves. This indicates adifferent mechanism of admixture embedding in the structure and a different electron trapmechanism in various parts of the crystal. The microscopic examination showed a highlycomplex multiphase microstructure of LMPs, which looks more like solidified ceramicsthan a crystal structure. In order to obtain crystals with a more homogeneous structure,
Materials 2021, 14, 132 12 of 13
certain adjustments might be necessary. Moreover, crystals could be grown at differentspeeds, and special heat treatment or multiple remelting operations could be applied.Therefore, further research in this area is required.
Author Contributions: Conceptualization, B.M. and W.G.; methodology, W.G. and M.K. (MarzannaKsiazek); software, W.G. and M.K. (Mariusz Kłosowski).; validation, P.B.; formal analysis, M.K.(Mariusz Kłosowski); investigation, W.G., Ł.B.; resources, B.M.; data curation, W.G.; writing—originaldraft preparation, B.M.; writing—review and editing, W.G. and P.B.; visualization, Ł.B.; supervision,P.B.; project administration, B.M.; funding acquisition, B.M. All authors have read and agreed to thepublished version of the manuscript.
Funding: This work was supported by the National Science Centre, Poland (Contract No. UMO-2016/21/B/ST8/00427).
Institutional Review Board Statement: Not applicable.
Informed Consent Statement: Not applicable.
Data Availability Statement: Data sharing is not applicable to this article.
Conflicts of Interest: The authors declare no conflict of interest.
References1. Fukuda, T.; Rudolph, P.; Uda, S. Fiber Crystal Growth from the Melt; Springer: Berlin/Heidelberg, Germany, 2004.2. Fukuda, T.; Chani, V.I. Shaped Crystal Growth by Micro-Pulling-Down Technique; Springer: Berlin/Heidelberg, Germany, 2007.3. Li, G.; Tian, Y.; Zhao, Y.; Lin, J. Recent progress in luminescence tuning of Ce3+ and Eu2+ activated phosphors for pc-WLEDs.
Chem. Soc. Rev. 2015, 44, 8688–8713. [CrossRef]4. Kulig, D.; Gieszczyk, W.; Bilski, P.; Marczewska, B.; Kłosowski, M. Thermoluminescence and optically stimulated Luminescence
studies on LiMgPO4 crystallized by micro pulling down technique. Radiat. Meas. 2016, 85, 88–92. [CrossRef]5. Zhang, S.; Huang, Y.; Shi, L.; Seo, H.J. The luminescence characterization and structure of Eu2+ doped LiMgPO4. J. Phys. Condens.
Matter 2010, 22, 235402. [CrossRef] [PubMed]6. Dhabekar, B.; Menon, S.N.; Alagu-Raja, E.; Bakshi, A.K.; Singh, A.K.; Chougaonkar, M.P.; Mayya, Y.S. LiMgPO4:Tb,B—A new
sensitive OSL phosphor for dosimetry. Nucl. Instrum. Methods Phys. Res. B 2011, 269, 1844–1848. [CrossRef]7. Kumar, M.; Dhabekar, B.; Menon, S.N.; Chougaonkar, M.P.; Mayya, Y.S. LiMgPO4:Tb,B OSL phosphor—CW and LM OSL studies.
Nucl. Instrum. Methods Phys. Res. B 2011, 269, 1849–1854. [CrossRef]8. Singh, A.K.; Menon, S.N.; Dhabekar, B.; Kadam, S.; Chougaonkar, M.P.; Mayya, Y.S. TL-OSL correlation studies of LiMgPO4:Tb,B
dosimetric phosphor. Nucl. Instrum. Methods Phys. Res. B 2012, 274, 177–181. [CrossRef]9. Menon, S.N.; Dhabekar, B.; Alagu-Raja, E.; Chougaonkar, M.P. Preparation and TSL studies in Tb activatd LiMgPO4 phosphor.
Radiat. Meas. 2012, 47, 236–240. [CrossRef]10. Gai, M.; Chen, Z.; Fan, Y.; Wang, J. Synthesis and luminescence in LiMgPO4:Tb,Sm,B phosphors with possible applications in
real-time dosimetry. J. Rare Earths 2013, 31, 551–554. [CrossRef]11. Kumar, M.; Dhabekar, B.; Menon, S.N.; Bakshi, A.K.; Udhayakumar, J.; Chougaonkar, M.P.; Mayya, Y.S. Beta response of
LiMgPO4:Tb,B based OSL discs for personel monitoring applications. Radiat. Prot. Dosim. 2013, 155, 410–417. [CrossRef]12. Menon, S.N.; Kadam, S.; Dhabekar, B.; Singh, A.K.; Chougaonkar, M.P.; Babu, D.A.R.; Patra, A.K. Environmental monitoring
using LiMgPO4:Tb,B based optically stimulated luminescence dosimeter. Radiat. Prot. Environ. 2013, 36, 146–149. [CrossRef]13. Gai, M.Q.; Chen, Z.Y.; Fan, Y.W.; Yan, S.Y.; Xie, Y.X.; Wang, J.H.; Zhang, Y.G. Synthesis of LiMgPO4:Eu,Sm,B phosphors and
investigation of their optically stimulated luminescence properties. Radiat. Meas. 2015, 78, 48–52. [CrossRef]14. Shi, M.; Zhang, D.; Chang, C. Tunable emission and concentration quenching of Tb3+ in magnesium phosphate lithium. J. Alloys
Compd. 2015, 627, 25–30. [CrossRef]15. Bajaj, N.S.; Palan, C.B.; Koparkar, K.A.; Kulkarni, M.S.; Omanwar, S.K. Preliminary results on effect of boron co-doping on
CW-OSL and TL properties of LiMgPO4:Tb,B. J. Lumin. 2016, 175, 9–15. [CrossRef]16. Kulig, D.; Gieszczyk, W.; Bilski, P.; Marczewska, B.; Kłosowski, M. New OSL detectors based on LiMgPO4 crystals grown by
micro pulling down method. Dosimetric properties vs. growth parameters. Radiat. Meas. 2016, 90, 303–307. [CrossRef]17. Marczewska, B.; Bilski, P.; Wróbel, D.; Kłosowski, M. Investigations of OSL properties of LiMgPO4:Tb,B based dosimeters. Radiat.
Meas. 2016, 90, 265–268. [CrossRef]18. Gieszczyk, W.; Kulig, D.; Bilski, P.; Marczewska, B.; Kłosowski, M. Analysis of TL and OSL kinetics in lithium magnesium
phosphate crystals. Radiat. Meas. 2017, 106, 100–106. [CrossRef]19. Kulig, D.; Gieszczyk, W.; Marczewska, B.; Bilski, P.; Kłosowski, M.; Malthez, A.L.M.C. Comparative studies on OSL properties of
LiMgPO4:Tb,B powders and crystals. Radiat. Meas. 2017, 106, 94–99. [CrossRef]20. Guo, J.; Tang, Q.; Zhang, C.; Luo, D.; Liu, X. Optically stimulated luminescence (OSL) of LiMgPO4:Tm,Tb phosphor. J. Rare Earths
2017, 35, 525–529. [CrossRef]

Materials 2021, 14, 132 13 of 13
21. Rawat, N.S.; Dhabekar, B.; Muthe, K.P.; Koul, D.K.; Datta, D. Detection of sub micro Gray dose levels using OSL phosphorLiMgPO4:Tb,B. Nucl. Instrum. Methods Phys. Res. B 2017, 397, 27–32. [CrossRef]
22. Menon, S.N.; Dhabecar, B.S.; Kadam, S.; Koul, D.K. Fading studies in LiMgPO4:Tb,B and synthesis of new LiMgPO4 basedphosphor with better fading characteristics. Nucl. Instrum. Methods Phys. Res. B 2018, 436, 45–50. [CrossRef]
23. Palan, C.B.; Bajaj, N.S.; Soni, A.; Omanwar, S.K. Synthesis and luminescence properties of Tb-doped LiMgPO4 phosphor. Bull.Mater. Sci. 2016, 39, 1157–1163. [CrossRef]
24. Palan, C.B.; Bajaj, N.S.; Koparkar, K.A.; Soni, A.; Omanwar, S.K. TL/OSL properties of green emitting LiMgPO4:Tb3+,B (LMPTB)phosphor for radiation dosimetry. J. Inorg. Organomet. Polym. 2016, 26, 845–854. [CrossRef]
25. Gieszczyk, W.; Bilski, P.; Kłosowski, M.; Nowak, T.; Malinowski, L. Thermoluminescent response of differently doped lithiummagnesium phosphate (LiMgPO4, LMP) crystals to protons, neutrons and alpha particles. Radiat. Meas. 2018, 113, 14–19.[CrossRef]
26. Gieszczyk, W.; Marczewska, B.; Kłosowski, M.; Mrozik, A.; Bilski, P.; Sas-Bieniarz, A.; Goj, P.; Stoch, P. Thermoluminescenceenhancement of LiMgPO4 crystal host by Tb3+ and Tm3+ trivalent rare-earths ions co-doping. Materials 2019, 12, 2861. [CrossRef][PubMed]
27. Gieszczyk, W.; Bilski, P.; Mrozik, A.; Kłosowski, M.; Marczewska, B.; Sas-Bieniarz, A.; Zorenko, Y. Intrinsic and dopants-relatedluminescence of undoped and double doped lithium magnesium phosphate (LiMgPO4, LMP) crystals. Materials 2020, 13, 2032.[CrossRef] [PubMed]
28. Sas-Bieniarz, A.; Marczewska, B.; Kłosowski, M.; Gieszczyk, W.; Bilski, P. TL, OSL and RL emission spectra of RE-doped LiMgPO4crystals. J. Lumin. 2020, 218, 116839. [CrossRef]
29. Sas-Bieniarz, A.; Marczewska, B.; Bilski, P.; Gieszczyk, W.; Kłosowski, M. Study of radioluminescence in LiMgPO4 doped withTb, B and Tm. Radiat. Meas. 2020, 136, 106408. [CrossRef]
30. Bilski, P.; Gieszczyk, W.; Obryk, B.; Hodyr, K. Comparison of commercial thermoluminescent readers regarding high-dose hightemperature measurements. Radiat. Meas. 2014, 65, 8–13. [CrossRef]
31. Wróbel, D.; Bilski, P.; Marczewska, B.; Mrozik, A.; Kłosowski, M. Characterization of the Risø TL/OSL DA–20 reader forapplication in TL dosimetry. Radiat. Meas. 2015, 74, 1–5. [CrossRef]
32. Gieszczyk, W.; Bilski, P. A simplified numerical approach to non-radiation induced high-temperature signals in thermolumines-cence. GlowVIEW—Useful tool for a multiple glow-curve analysis. Radiat. Meas. 2017, 107, 102–110. [CrossRef]
33. Marczewska, B.; Bilski, P.; Olko, P.; Waligórski, M.P.R. Measurement of 2-D Dose Distributions by Large-Area ThermoluminescentDetectors. Radiat. Meas. 2004, 38, 833. [CrossRef]
34. Olko, P.; Marczewska, B.; Czopyk, Ł.; Czermak, A.; Kłosowski, M.; Waligórski, M.P.R. New 2-D dosimetric technique forradiotherapy based on planar thermoluminescent detectors. Radiat. Prot. Dosim. 2006, 118, 213. [CrossRef]
35. Olko, P.; Czopyk, Ł.; Kłosowski, M.; Waligórski, M.P.R. Thermoluminescence dosimetry using TL-readers equipped with CCDcameras. Radiat. Meas. 2008, 43, 864. [CrossRef]
36. Marczewska, B.; Bilski, P.; Gieszczyk, W.; Kłosowski, M. Two-dimensional thermoluminescence method for checking LiF crystalshomogeneity. J. Cryst. Grow. 2017, 457, 320–324. [CrossRef]
37. Song, C.; Wang, S.; Liu, J.; Zhai, S. Microstructure and Mechanical properties of Al2O3/Er3Al5O12 Binary Eutectic CeramicPrepared by Bridgman Method. Materials 2018, 11, 534. [CrossRef] [PubMed]