pull-out strength and bond behavior of prestressing strands in prestressed self-consolidating...
TRANSCRIPT

Materials 2014, 7, 6930-6946; doi:10.3390/ma7106930
materials ISSN 1996-1944
www.mdpi.com/journal/materials
Article
Pull-Out Strength and Bond Behavior of Prestressing Strands in
Prestressed Self-Consolidating Concrete
Wu-Jian Long 1,*, Kamal Henri Khayat 2, Guillaume Lemieux 3, Soo-Duck Hwang 2 and
Feng Xing 1,*
1 Guangdong Province Key Laboratory of Durability for Marine Civil Engineering,
College of Civil Engineering, Shenzhen University, Shenzhen 518060, Guangdong, China 2 Faculty of Civil, Architectural and Environmental Engineering, Missouri University of Science
and Technology, Rolla, MO 65409, USA; E-Mails: [email protected] (K.H.K.);
[email protected] (S.-D.H.) 3 Cement Association of Canada, Montreal, QC J7H 1S7, Canada; E-Mail: [email protected]
* Authors to whom correspondence should be addressed;
E-Mails: [email protected] (W.-J.L.); [email protected] (F.X.);
Tel.: +86-755-2691-7292 (W.-J.L.); Fax: +86-755-2653-4021 (W.-J.L.).
External Editor: Geminiano Mancusi
Received: 2 September 2014; in revised form: 25 September 2014 / Accepted: 29 September 2014 /
Published: 10 October 2014
Abstract: With the extensive use of self-consolidating concrete (SCC) worldwide, it is
important to ensure that such concrete can secure uniform in-situ mechanical properties
that are similar to those obtained with properly consolidated concrete of conventional
fluidity. Ensuring proper stability of SCC is essential to enhance the uniformity of in-situ
mechanical properties, including bond to embedded reinforcement, which is critical for
structural engineers considering the specification of SCC for prestressed applications.
In this investigation, Six wall elements measuring 1540 mm × 2150 mm × 200 mm were
cast using five SCC mixtures and one reference high-performance concrete (HPC) of
normal consistency to evaluate the uniformity of bond strength between prestressing
strands and concrete as well as the distribution of compressive strength obtained from cores
along wall elements. The evaluated SCC mixtures used for casting wall elements were
proportioned to achieve a slump flow consistency of 680 ± 15 mm and minimum caisson
filling capacity of 80%, and visual stability index of 0.5 to 1. Given the spreads in viscosity
and static stability of the SCC mixtures, the five wall elements exhibited different levels of
OPEN ACCESS

Materials 2014, 7 6931
homogeneity in in-situ compressive strength and pull-out bond strength. Test results also
indicate that despite the high fluidity of SCC, stable concrete can lead to more homogenous
in-situ properties than HPC of normal consistency subjected to mechanical vibration.
Keywords: pull-out bond strength; in-situ compressive strength; modification factor;
self-consolidating concrete; prestressed concrete; uniformity
1. Introduction
With the extensive use of self-consolidating concrete (SCC) worldwide [1–9], it is important to
ensure that such concrete can secure uniform in-situ mechanical properties that are similar to those
obtained with properly consolidated concrete of conventional fluidity. Ensuring proper stability of
SCC is essential to enhance the uniformity of in-situ mechanical properties, including bond to
embedded reinforcement, which is critical for structural engineers considering the specification of SCC
for prestressed applications [10,11]. Therefore, the stability of SCC is a key property in ensuring
uniform mechanical properties and adequate performance of prestressed structural elements [12].
1.1. Bond Strength
There is a controversy regarding bond strength of prestressing strands embedded in SCC.
The experiment conducted by Holschemacher and Klug [13] showed that bond to reinforcing bars and
prestressed tendons can be influenced by the flow properties of the SCC, grading of the aggregate,
and content of fines in the matrix. In general, the bond stress is improved when using SCC.
Koning et al. [14] reported that SCC can develop higher bond strength values compared with those
obtained with normal vibrated concrete. Studies carried out by Chan [15] have shown that for a given
compressive strength, reinforced concrete members made with SCC can develop higher bond strength
than in the case of normal concrete. This enhancement of bond strength is mainly due to the high
stability of SCC that can secure a denser microstructure with the reinforcement. Stability of SCC can
be enhanced by using a low w/cm, reducing the maximum size of coarse aggregate (MSA),
or incorporating a viscosity-modifying admixture (VMA) [16,17].
Measurement of bond strength conducted by Gibbs et al. [18] showed that the bonds to reinforcing
bars developed using SCC are equal to those obtained with a normal vibrated concrete. Similar results
were reported by Sonebi and Castel [19–22]. Other researchers, however, have found that the bond
strength of SCC to reinforcement can be lower than that of normal concrete. The German Committee
for Reinforced Concrete reported that pull-out test results revealed that slightly lower bond strength
can be obtained with SCC compared with normal vibrated concrete [23]. When measuring transfer
length on beam elements, tests revealed that the transfer length obtained on SCC beams is similar to
that observed with vibrated concrete beams. Studies carried out by José R. Martí-Vargas et al. [24] on
SCC and traditional concrete (TC) have shown that, compared with TC, a slightly higher loss of
pre-stressing force and slightly greater anchorage lengths in SCC with a low water/cement ratio;

Materials 2014, 7 6932
however, no differences in transfer or anchorage length were detected when high strength TC and SCC
were compared.
1.2. Top-Bar Effect
Despite its high fluidity, SCC can develop similar modification factor (top-bar effect) as that of
conventional concrete when it is proportioned with sufficient static stability [13,25–27]. In general,
properly designed SCC can exhibit high levels of workability and stability in order to ensure uniform
in-situ properties [16].
Decrease in top-bar effect results in reducing the difference between the bond stresses determined at
the top and bottom of the element. The improvement of cohesiveness, determined from surface
settlement measurements, can reduce the structural defects resulting from accumulation of bleed water,
rising air bubbles, and settlement of the plastic concrete around the top reinforcement. Therefore,
SCC with a high level of static stability can exhibit lower top-bar effect compared with that obtained
with conventional vibrated concrete [13,16,18,19,26,28].
Khayat et al. [16] evaluated the uniformity of bond strength of embedded reinforcing bars along the
height of experimental wall elements. The top-bar factor for reinforcing bars positioned at 1.4 m from
the bottom of the experimental walls was 1.4 ± 0.2 for seven of the SCC mixtures and approximately
2.0 for the control concrete and one of the SCC mixtures. In the case of highly stable concrete made
with 10 mm MSA, a lower top-bar factor of 1.0 to 1.2 was obtained. Khayat et al. [27] also
investigated the uniformity of bond strength to prestressing strands along the height of experimental
wall elements. Four SCC mixtures and two conventional flowable mixtures made with similar mix
proportions were used for casting experimental wall elements. All mixtures developed 1-day
compressive strength greater than 40 MPa. Uniform distribution of in-place compressive strength and
adequate bond to prestressing strands were obtained. The 1- and 28-day top-bar effect ratios varied
between 0.9 and 1.9. The top-bar effect was shown to be sensitive to the type of VMA in use.
Schiessl and Zilch [29] investigated the bond behavior of SCC and conventional concrete. Pull-out
tests were conducted in accordance to International Union of Laboratories and Experts in Construction
Materials, Systems and Structures (RILEM) recommendations using specimens measuring 300 mm in
height. As expected, higher bond stress was obtained when the pull-out test is carried out for
vertically-positioned bars than for horizontal bars when carried out in the opposite direction as the
casting direction. In terms of bond-slip relationship, specimens cast with SCC and conventional
concrete showed similar behavior. Specimens cast with SCC had uniform coarse aggregate distribution
and lower top-bar effect compared with the performance of conventional concrete. Significant top-bar
effect was observed in the case of conventional concrete specimens due to the settlement that can
occur under the effect of vibration during the casting process.
The main objective of this investigation is to evaluate the uniformity of bond strength between
prestressing strands and concrete as well as the distribution of compressive strength obtained from
cores along these elements.

Materials 2014, 7 6933
2. Experimental Program
2.1. Mixture Proportioning and Workability Characteristics
Based on the previous investigations on various stability levels of SCC mixtures [30], six wall
elements measuring 1540 mm × 2150 mm × 200 mm were selected and cast using five SCC mixtures
and one reference high-performance concrete (HPC) of normal consistency to evaluate the homogeneity
of bond strength between SCC and horizontally embedded prestressing strands positioned at various
heights in wall elements, as shown in Table 1.
Table 1. Selection of self-consolidating concrete (SCC) and high-performance concrete
(HPC) mixtures for strand bond test.
Type Wall No. Mix Proportions Descriptions
SCC
1 34-440-HE20%FA-S/A54-VMA
Highly viscous to simulate lack
of consolidation,
Plastic viscosity = 300 Pa.s
Maximum settlement = 0.44%
2 40-500-MS-S/A46-VMA *
Low viscosity,
Plastic viscosity = 20 Pa.s
Maximum settlement = 0.59%
3 40-440-MS-S/A54-VMA
Unstable mixture,
Plastic viscosity = 70 Pa.s
Maximum settlement = 0.62%
4 34-500-HE20%FA-S/A46-VMA **
Stable mixture,
Plastic viscosity = 80 Pa.s
Maximum settlement = 0.43%
5 34-440-HE20%FA-S/A46
Stable mixture,
Plastic viscosity = 150 Pa.s
Maximum settlement = 0.3%
HPC 6 34-MS
Stable mixture,
Plastic viscosity = 110 Pa.s
Maximum settlement = 0.29%
* 40-500-MS-S/A46-VMA = (0.40 w/cm, 500 kg/m3 of binder, Type MS (moderate sulfate) cement,
Sand-to-total Aggregate ratio = 0.46, incorporating of viscosity-modifying admixture (VMA));
** 34-500-HE20%FA-S/A46-VMA = (0.34 w/cm, 500 kg/m3 of binder, Type HE (high early strength)
cement + 20% fly ash, Sand-to-total Aggregate ratio = 0.46, incorporating of VMA).
The mixture proportioning and workability characteristics of the mixtures used to cast of wall
elements are summarized in Table 2. Despite different stability levels of the evaluated mixtures, five
SCC mixtures had similar level of slump flow consistency of 660 to 695 mm and adequate caisson
filling capacity of 82% to 93%. The surface settlement of the SCC mixtures ranged between 0.30%
and 0.62% with a target value of 0.50%. The maximum surface settlement of the HPC mixture
was 0.29%.
In addition to the pull-out strength test, three core samples measuring 95 mm in diameter and
200 mm in height were taken at each height corresponding to that of the embedded strand. In-place

Materials 2014, 7 6934
compressive strength results determined from core samples were compared with those of reference
cylinders cured in the same manner as wall element.
Table 2. Mixture proportioning and workability characteristics of tested concretes.
Wall No. SCC 1 SCC 2 SCC 3 SCC 4 SCC 5 HPC 6
Cement, kg/m3 Type HE Type MS Type MS Type HE Type HE Type MS
352 500 440 400 352 470
HRWRA * demand,
L/100 kg CM ** 3.35 0.60 1.00 2.00 3.00 0.50
VMA dosage,
L/100 kg CM 0.1 0.1 0.1 0.1 0 0
Class F fly ash, kg/m3 88 0 0 100 88 0
Water, kg/m3 139 196 172 161 139 160
w/cm 0.34 0.40 0.40 0.34 0.34 0.34
Sand, kg/m3 984 762 955 789 839 741
Coarse aggregate, kg/m3 838 894 814 927 985 1050
Sand/total aggregate,
by volume 0.54 0.46 0.54 0.46 0.46 0.41
Slump flow, mm 665 695 670 660 660 145 ***
T-50 mm, s 6.8 1.5 1.8 2.9 5.5 –
Visual stability index 0.5 1 1 0.5 0.5 0
Air content, % 2.4 2.3 1.9 2.0 1.1 2.7
Unit weight, kg/m³ 2343 2352 2365 2360 2409 2429
Temperature, °C 23 24 23 24.4 23.5 25
J-Ring, mm 630 640 605 630 605 –
Filling capacity, % 92 93 89 91 82 –
Maximum surface
settlement, % 0.44 0.59 0.62 0.43 0.30 0.29
Yield stress, Pa 5 32 37 25 12 575
Plastic viscosity, Pa.s 300 20 70 80 150 110
* HRWRA = high-range water-reducing admixture; ** CM = cementitious materials; *** Slump.
2.2. Bond Strength Measurement of Prestressing Strands
An experimental wall measuring 1540 mm × 2150 mm × 200 mm was used for the bond strength
testing. The formwork was divided in two parts, each cast with different concrete. Testing consisted of
determining the maximum pull-out load vs. the end slip response of strands that are horizontally
embedded in experimental wall elements. As presented in Figure 1, each wall had 16 Grade 270
low-relaxation prestressing strands of 15.2 mm diameter grouped in four strands per row. The strands
were positioned at four different heights. Rigid plastic sheathing was attached to the outer end of each
strand near the loaded end as bond breaker to minimize secondary confining stresses along the bonded
region, as shown in Figure 2.

Materials 2014, 7 6935
Figure 1. Prestressing strands embedded at various heights of wall element.
Figure 2. Polyvinyl chloride polymer (PVC) sheathing and installation of prestressing strands.
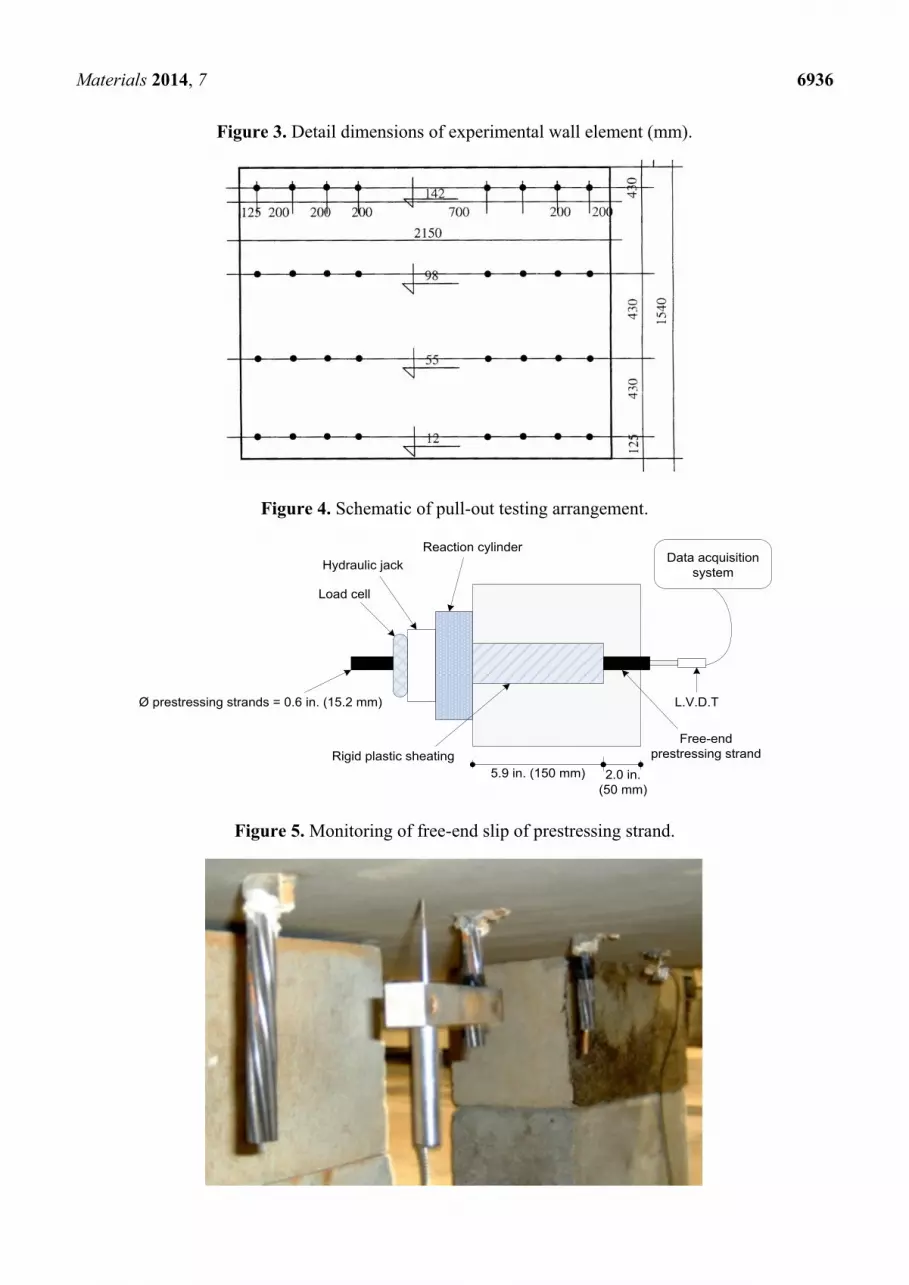
The clear cover over exterior strands was 125 mm, and the center-to-center spacing between
adjacent strands was 200 mm. The details of the wall section and the position of the prestressing
strands are given in Figure 3.
The wall elements were removed from the mold at the age of one day, moist-cured for 7 days, and
kept under ambient temperature conditions until the age of 56 days. Pull-out tests were carried out at
56 days after casting. The wall elements were gently tilted onto an elevated and horizontal platform to
facilitate testing. A hydraulic jack with 135-kN capacity was used for loading. As presented in
Figure 4, the hydraulic jack was attached to the prestressing strands, and a reaction cylinder was
positioned against the concrete. Pull-out load was applied gradually. The net slip of the prestressing
strand was monitored using an Linear Variable Differential Transformer (LVDT) attached to the
unloaded end of the strand (Figures 4 and 5). After debonding, the prestressing strands were
completely extracted to determine exact anchorage length necessary for calculation of bond stress.
Materials 2014, 7 6936
Figure 3. Detail dimensions of experimental wall element (mm).
Figure 4. Schematic of pull-out testing arrangement.
Figure 5. Monitoring of free-end slip of prestressing strand.
5.9 in. (150 mm) 2.0 in.
(50 mm)
Reaction cylinder
Hydraulic jack
Load cell
Rigid plastic sheating
L.V.D.T
Data acquisition
system
Ø prestressing strands = 0.6 in. (15.2 mm)
Free-end
prestressing strand

Materials 2014, 7 6937
Variations of pull-out load and free-end slip results for Wall No. 1 cast with SCC No. 4 are
presented in Figure 6. Mean values of pull-out load and free-end slip from four prestressing strands at
each height (120, 550, 980, and 1420 mm from the bottom) were plotted in Figure 6.
Figure 6. Pull-out load and free-end slip responses of prestressing strands embedded at
different heights along wall element (Wall No. 1).
3. Results and Discussion
3.1. In-Place Compressive Strength
In addition to the pull-out test, three core samples measuring 95 mm in diameter and 200 mm in
height were taken at each height corresponding to that of the embedded strand. In-place compressive
strength results determined from core samples were compared with those of reference cylinders cured
under similar conditions of the wall element. In-place compressive strength values of core samples
taken at various heights along the wall are presented in Figure 7 and Table 3. Walls No. 1, 4, and 5
exhibited higher in-place compressive strength values compared with Walls No. 2, 3, and 6. Wall
No. 4 showed uniform distribution of compressive strength along the height of the wall.
Figure 7. Distribution of in-place compressive strength at 56 days determined from core
samples along experimental wall elements.
0
3
6
9
12
15
18
0 1 2 3 4 5
Free end slip (mm)
Load
(k
N)
Wall No. 1120 mm from bottom
1420 mm from bottom
980 mm from bottom
550 mm from bottom
0
3
6
9
12
15
18
0 1 2 3 4 5
Free end slip (mm)
Load
(k
N)
Wall No. 1120 mm from bottom
1420 mm from bottom
980 mm from bottom
550 mm from bottom
0
30
60
90
120
150
40 50 60 70 80 90 100
Compressive strength (MPa)
Dis
t. f
rom
bo
tto
m (
cm)
2 3 14 56

Materials 2014, 7 6938
Table 3. In-place compressive strength of wall elements cast with SCC and HPC with
different stability levels.
Mix. No Distance from
Bottom, mm
Compressive Strength, MPa f'c core/
f'c cylinder (%) 1 2 3 Mean C.O.V. * (%)
Wall
No. 1
120 81.9 77.9 78.3 79.4 2.79 98
550 71.0 77.1 75.1 74.4 4.16 92
980 73.8 74.4 74.4 74.2 0.49 92
1420 75.1 63.1 76.5 71.5 10.27 88
Cylinder 81.3 80.7 80.6 80.9 0.48 100
Wall
No. 2
120 55.9 55.0 50.7 53.9 5.21 99
550 48.1 45.4 47.3 46.9 2.87 86
980 44.6 45.9 47.8 46.1 3.40 84
1420 43.3 45.9 45.5 44.9 3.23 82
Cylinder 54.1 53.8 55.7 54.6 1.86 100
Wall
No. 3
120 60.4 59.0 58.8 59.4 1.44 98
550 55.7 54.4 55.1 55.1 1.19 91
980 52.9 54.0 56.6 54.5 3.54 90
1420 51.4 51.4 51.7 51.5 0.25 85
Cylinder 60.8 59.7 60.5 60.3 0.90 100
Wall
No. 4
120 71.0 70.0 73.8 71.6 2.76 95
550 70.9 68.9 71.0 70.3 1.71 93
980 74.4 66.4 72.6 71.1 5.90 94
1420 72.2 69.8 69.7 70.6 1.97 94
Cylinder 76.8 78.3 71.3 75.5 4.86 100
Wall
No. 5
120 75.2 69.6 68.1 71.0 5.34 91
550 74.2 72.1 69.1 71.8 3.60 92
980 77.8 80.9 72.1 77.0 5.75 99
1420 74.3 74.8 76.2 75.1 1.33 96
Cylinder 78.9 78.0 76.8 77.9 1.37 100
Wall
No. 6
120 64.8 63.9 66.0 64.9 1.66 99
550 64.7 61.7 59.0 61.8 4.59 94
980 62.0 61.2 61.2 61.5 0.70 94
1420 62.0 58.3 62.5 60.9 3.79 93
Cylinder 64.4 64.5 68.3 65.7 3.36 100
* C.O.V. = coefficient of variation.
As presented in Figure 7, walls No. 1, 4, and 5 developed higher in-place compressive strength than
Wall No. 6. This is mainly due to the difference in binder type used (type HE and 20% of fly ash
comparatively to type MS).
In-place compressive strength values of core samples taken from various heights are compared with
those determined from companion cylinders (Figure 8), which were kept in their molds for one day
before being demolded. These cylinders were then stored in an environment similar to the wall sections
and were tested at the same age as cores. As expected, Walls No. 4, 5, and 6 cast with stable mixtures
exhibited more homogenous in-place compressive strength compared with Wall No. 1, 2, and 3.
On average, relative in-place compressive strength was about 90% of values obtained with the control

Materials 2014, 7 6939
cylinders. This is typical for the core samples tested in compression in a perpendicular direction to the
casting position. Walls No. 1 to 3 had in-place strength ratios lower than 90% at the top of the walls
given their lower level of stability that hinders uniform distribution of in-situ properties of
hardened concrete.
Figure 8. Variations in relative in-place compressive strengths with height (strength ratio
relative to reference cylinder).
Core strength values normalized to those of core samples taken near the bottom of the wall elements
are plotted in Figure 9. Wall elements 1, 2, and 3 cast with unstable mixtures had in-place compressive
strength of 90% ± 5% relative to strength values of core samples taken near the bottom. On the other
hand, these values were 100% ± 6% for Wall elements 4, 5, and 6 made with stable SCC and HPC
with conventional slump.
Figure 9. Variations in in-place compressive strengths with height (strength ratio relative
to bottom layer).
3.2. Pull-Out Bond Strength and Modification Factor (Top-Bar Factor)
Bond strength results of prestressing strands determined at 56 days of age are summarized in
Table 4. Three load levels are considered, as illustrated in Figure 10. The P1 load reflects the force
corresponding to de-cohesion and can be used to evaluate bond strength at the end of elastic region.
This de-cohesion is taken at a given deformation of 0.1 mm. After P1, there is an increase in load
0
30
60
90
120
150
80 85 90 95 100 105 110
f'c (core)/f'c (cylinder) (%)
Dis
t. f
rom
bo
tto
m (
cm) 2 13 4 56
0
30
60
90
120
150
80 85 90 95 100 105 110
f'c (core)/f'c (bottom) (%)
Dis
t. f
rom
bo
tto
m (
cm) 2 13 4 56

Materials 2014, 7 6940
carrying capacity and cracking surrounding concrete. The P2 load corresponds to the maximum load at
the free-end deformation less than 1 mm. Depending on the case, this load can be slightly higher than
1 mm deformation (P3). The P3 load at free-end slip of 1 mm is taken to calculate bond strength in the
post elastic cracked region. In general, the free-end slip corresponding to the P2 load was smaller than
that of the P3 load. In some mixtures, however, it was hard to select or find the peak point
corresponding to the P2 load due to the continuous increase in pull-out load. Therefore, the P3 load
corresponding to the free-end slip of 1mm was used to calculate bond strength in the post elastic
cracked region.
Table 4. Bond strength and top-bar effect of prestressing strands at 56 days of age.
Mix. No Distance From
Bottom, mm
Average Bond
Strength, MPa
Normalized Bond
Strength, MPa1/2
Normalized
Top-Bar Effect
P3 level UP3 P3 level
Wall
No. 1
120 5.5 0.62 1.00
550 3.3 0.37 1.61
980 3.1 0.36 1.75
1420 2.8 0.33 1.85
Wall
No. 2
120 4.7 0.64 1.00
550 4.1 0.60 1.05
980 2.7 0.40 1.57
1420 2.7 0.40 1.57
Wall
No. 3
120 5.7 0.74 1.00
550 5.4 0.73 1.02
980 4.0 0.54 1.37
1420 2.8 0.39 1.88
Wall
No. 4
120 5.3 0.63 1.00
550 5.5 0.66 0.96
980 5.6 0.66 0.95
1420 5.3 0.63 1.00
Wall
No. 5
120 7.3 0.87 1.00
550 7.4 0.87 1.00
980 7.0 0.80 1.10
1420 7.3 0.84 1.03
Wall
No. 6
120 8.7 1.08 1.00
550 8.3 1.06 1.02
980 7.1 0.91 1.19
1420 6.2 0.79 1.36

Materials 2014, 7 6941
Figure 10. Definition of pullout loads corresponding to bond strength comparisons.
Variations of bond strength at 1 mm end slip are presented in Figure 11. Walls No. 4 and 5 cast with
stable SCC mixtures exhibited more homogenous pull-out bond strengths along the height compared
with walls cast with unstable SCC. Walls No. 4 and 5 exhibited even better homogeneity in pull-out
strength than Wall No. 6 cast with HPC mixture. It is important to note that Wall No. 1 exhibited
relatively large spread in pull-out bond strength along the height. This can be attributed to the
significantly high plastic viscosity of 300 Pa.s, which seems to hinder self-consolidation. Among the
six tested walls, Wall No. 4 had more homogenous in-situ bond strength than the other walls. SCC
wall No. 4 had adequate level of plastic viscosity of 80 Pa.s and maximum settlement of 0.43%.
Figure 11. Variation in bond strength of prestressing strands along wall height.
Variations of the modification factors of bond strength between the concrete and prestressing
strands are illustrated in Figure 12. Bond strength values are normalized by the square root of
compressive strength determined from core samples at the corresponding strand heights. Normalized
bond strengths are compared with those from the bottom layer. From the previous experience on the
pull-out bond strength, top-bar effect can vary between 0.9 and 1.9 for the concrete of normal
consistency, and between 1.3 and 2.0 for the SCC [16,25].
0
3
6
9
12
15
0 0.5 1 1.5 2
Free end slip (mm)
Lo
ad
(K
N) P1
P2P3
0
30
60
90
120
150
2 3 4 5 6 7 8 9 10
Average bond strength at P3 load level (MPa)
Dis
t. f
rom
bo
tto
m (
cm) 1 3 2 4 56
Average bond strength at 1 mm end slip (MPa)

Materials 2014, 7 6942
Figure 12. Variation of modification factor of prestressing strands along wall height.
In general, Walls No. 4, 5, and 6 cast with stable SCC and HPC exhibited lower modification factor
of 1, 1, and 1.36, respectively, compared with 1.57 and 1.88 for Walls No. 2 and 3 cast with unstable
mixtures, respectively. Wall No. 1 exhibited a relatively large spread in modification factor values
along the height. Again, this can be attributed to the lack of consolidation leading to an undesirable
bond between concrete and prestressing strand. It is interesting to note that Walls No. 4 and 5 exhibited
lower modification factors than Wall No. 6 made with HPC mixture. Wall 6 had a higher modification
factor of 1.36 compared with 1.0 to 1.1 along height for Walls 4 and 5 cast with stable SCC mixtures.
This reflects the highly stable nature of these SCC mixtures of moderate viscosity levels that enabled
full adequate self-consolidation and reduction in surface settlement.
3.3. Effect of Stability on Homogeneity of In-Place Compressive and Bond Strength
As a static stability index, surface settlement of concrete was determined using PVC columns
filled with concrete of 660 mm as well as at the top of the wall element measuring
1540 mm × 2150 mm × 200 mm. Test results showed that, the maximum surface settlement
determined on the wall element was approximately four times lower than those obtained on the PVC
column testing (Figure 13). The two settlement values determined from different methods exhibited
very high correlation factor (R2 = 0.96), as presented in Figure 13. Thus, the determination of surface
settlement using the PVC test device can then be used to estimate the relative static stability of the
various mixtures cast in the wall elements.
Surface settlement of concrete was shown to have a considerable influence on the in-place
compressive strength ratio relative to reference cylinders. As presented in Figure 14, the relative
in-place compressive strength increased with the decrease in maximum surface settlement with a high
R2 value of 0.91. Given the relationship in Figure 14, concrete having a maximum surface settlement
lower than 0.5% can develop relative in-place compressive strength (core/cylinder) higher than 0.92.

Materials 2014, 7 6943
Figure 13. Relationship between surface settlement results determined on PVC columns
and wall elements.
Figure 14. Relationship between relative in-place compressive strength (strength ratio
relative to reference cylinder) and maximum surface settlement determined on PVC column.
4. Conclusions
Based on the test results and discussion above, the following conclusions can be drawn:
Wall elements cast with stable mixtures exhibited more homogenous in-place compressive
strengths and pull-out bond strengths compared with walls cast with unstable mixtures.
On average, relative in-place compressive strength was about 90% of values obtained with the
control cylinders.
Walls cast with stable SCC and HPC exhibited lower modification factor between 1 and 1.36,
whilst those cast with unstable mixtures exhibited a modification factor between 1.57 and 1.88.
Despite the high fluidity of SCC, stable concrete can lead to more homogenous in-situ
properties than HPC of normal consistency subjected to mechanical vibration.
(R² = 0.96)
N = 6
0.00
0.05
0.10
0.15
0.20
0.25
0.0 0.2 0.4 0.6 0.8 1.0
Maximum surface settlement on PVC column (%)
Max
imu
m s
urf
ace
sett
lem
ent
on..
wal
l el
emen
t (%
)
Maximum surface settlement
(R2 = 0.91)
N = 6
0
0.2
0.4
0.6
0.8
1
86 88 90 92 94 96 98 100 102
f'c core / f'c cylinder (%)
Max
imu
m s
urf
ace
sett
lem
ent
(%).

Materials 2014, 7 6944
The recommendations to ensure homogenous in-situ properties are as follows: the concrete
should have maximum surface settlement lower than 0.5%; plastic viscosity up to 160 Pa.s;
relative compressive strength ratio (core to cylinder) higher than 90%; and top-bar effect lower
or equal to 1.4. It is important to note that the selection of more viscous mixtures needs extra
care to ensure an acceptable consolidation of the concrete. The lack of consolidation can lead to
low bond stress between concrete and prestressing strand.
Acknowledgments
The authors gratefully acknowledge the financial support provided by the Transportation Research
Board of the National Academies of the United States of America for the National Cooperative
Highway Research Program (NCHRP) Project 18–12, the National Natural Science Foundation of
China (No. 51278306), the Science Industry Trade and Information Technology Commission of
Shenzhen Municipality (No. GJHZ20120614144906248).
Author Contributions
Wu-Jian Long designed and conducted the core experiments and wrote the draft of the manuscript.
Soo-Duck Hwang analysis workability characteristics by Guillaume Lemieux’s measured data.
Kamal Henri Khayat designed the project and Feng Xing supervised the research. All authors
contributed to the analysis for results and conclusions and revised the paper.
Conflicts of Interest
The authors declare no conflict of interest.
References
1. Self-Consolidating Concrete; ACI 237R-07; American Concrete Institute: Farmington Hills, MI,
USA, 2007.
2. Interim Guidelines for the Use of Self-Consolidating Concrete in Precast/Prestressed Concrete
Institute Member Plants; TR-6-03; Precast/Prestressed Concrete Institute: Chicago, IL, USA, 2003.
3. The European Guidelines for Self-Compacting Concrete; European Federation of National Trade
Associations (EFNARC): London, UK, 2005.
4. Nehdi, M.L. Only tall things cast shadows: Opportunities, challenges and research needs of
self-consolidating concrete in super-tall buildings. Constr. Build. Mater. 2013, 48, 80–90.
5. Juvas, K. The European experience of working with self-compacting concrete in the precast
concrete industry. In Proceedings of the Combining the Second North American Conference on
the Design and Use of Self-Consolidating Concrete and the Fourth International RILEM
Symposium on Self-Compacting Concrete, Chicago, IL, USA, 30 October–2 November 2005;
pp. 1105–1111.
6. Juvas, K. Experiences of working with self-compacting concrete in the precast industry.
In Proceedings of the 5th International RILEM Symposium on Self-Compacting Concrete, Ghent,
Belgium, 3–5 September 2007; pp. 933–938.

Materials 2014, 7 6945
7. Camacho, R.E.R.; Afif, R.U.; Corona, G.M.; Roman, H.M.; Sanchez, M. Applications of SCC
technology for precast/prestressed elements: The mexican experiences. In Proceedings of the 5th
International RILEM Symposium on Self-Compacting Concrete, Ghent, Belgium, 3–5 September
2007; pp. 1071–1078.
8. Ouchi, M.; Nakamura, S.; Osterson, T.; Hallberg, S.; Lwin, M. Applications of Self-Compacting
Concrete in Japan, Europe and the United States; RILEM Publications SARL: Bagneux, France,
2003; pp. 1–20.
9. Domone, P.L. Self-compacting concrete: An analysis of 11 years of case studies. Cem. Concr.
Compos. 2006, 28, 197–208.
10. Moustafa, S. Pull-out strength of strand and lifting loops. Concr. Technol. Assoc. Tech. Bull.
1974, 74-B5, 20.
11. Logan, D.R. Acceptance criteria for bond quality of strand for pretensioned prestressed concrete
applications. PCI J. 1997, 42, 52–90.
12. Long, W.J.; Khayat, K.H.; Lemieux, G.; Hwang, S.D.; Han, N.X. Performance-based
specifications of workability characteristics of prestressed, precast self-consolidating concrete—A
North American prospective. Materials 2014, 7, 2474–2489.
13. Holschemacher, K.; Klug, Y. A Database for the Evaluation of Hardened Properties of SCC;
Leipzig Annual Civil Engineering Report No. 7; Universität Leipzig: Leipzig, Germany, 2002;
pp. 123–134.
14. Koning, G.; Holschemacher, K.; Dehn, F.; Weibe, D. Self-compacting concrete-time development
of materials properties and bond behavior. In Proceedings of 2nd International Symposium on
Self-Compacting Concrete, Tokyo, Japan, 23–25 October 2001; pp. 507–516.
15. Chan, Y.W.; Chen, Y.S.; Liu, Y.S. Development of bond strength of reinforcement steel in SCC.
ACI Mater. J. 2003, 100, 490–498.
16. Khayat, K.H.; Manai, K.; Trudel, A. In-situ mechanical properties of wall elements cast using
self-consolidating concrete. ACI Mater. J. 1997, 94, 491–500.
17. Assaad, J.; Khayat, K.H.; Daczko, J. Evaluation of static stability of self-consolidating concrete.
ACI Mater. J. 2004, 101, 207–215.
18. Gibbs, J.C.; Zhu, W. Strength of hardened self-compacting concrete. In Proceedings of the 1st RILEM
International Symposium on SCC, Stockholm, Sweden, 9–12 September 1999; pp. 199–209.
19. Sonebi, M.; Bartos, P.J.M. Hardened SCC and its bond with reinforcement. In Proceedings of
the 1st RILEM International Symposium on Self-Compacting Concrete, Stockholm, Sweden,
9–12 September 1999; pp. 275–289.
20. Sonebi, M.; Rooney, M.; Bartos, P. In-situ compressive strength of self-compacting concrete.
Concrete 2002, 36, 48–49.
21. Castel, A.; Vidal, T.; Francois, R. Bond and cracking properties of self-consolidating concrete.
Constr. Build. Mater. 2010, 24, 1222–1231.
22. Castel, A.; Vidal, T.; Viriyametanont, K.; Francois, R. Effect of reinforcing bar orientation and
location on bond with self-compacting concrete. ACI Struct. J. 2006, 103, 559–567.
23. Hegger, J.; Gortz, S.G.; Kommer, B.; Tiggs, C.; Dross, C. Prestressed precast beams made of
self-compacting concrete. Betonwerk + Fertigteil-Technik (Concrete Plant + Precast Technology)
2003, 8, 40–46.

Materials 2014, 7 6946
24. Martí-Vargas, J.R.; Serna-Ros, P.; Arbeláez, C.A.; Rigueira-Victor, J.W. Transfer and anchorage
bond behaviour in self-compacting concrete. Mater. Constr. 2006, 56, 27–42.
25. Hwang, S.D.; Khayat, K.H. Comparison of in situ properties of wall elements cast using
self-consolidating concrete. Mater. Struct. 2012, 45, 123–141.
26. Attiogbe, E.K.; See, H.T.; Daczko, J.A. Engineering properties of self-consolidating concrete.
In Proceedings of the 1st North American Conference on the Design and Use of SCC, Chicago,
IL, USA, 9–12 November 2002; pp. 371–376.
27. Khayat, K.H.; Petrov, N.; Attiogbe, E.; See, H. Uniformity of bond strength of prestressing strands
in conventional flowable and self-consolidating concrete mixtures. In Proceedings of the 3rd
International Symposium on Self-Compacting Concrete, Reykjavik, Iceland, 17–20 August 2003;
pp. 703–712.
28. Valcuende, M.; Parra, C. Bond behaviour of reinforcement in self-compacting concretes. Constr.
Build. Mater. 2009, 23, 162–170.
29. Schiessl, A.; Zilch, K. The Effect of the modified composition of SCC on shear and bond
behavior. In Proceedings of the 2nd International Symposium on Self-Compacting Concrete,
Tokyo, Japan, 23–25 October 2001; pp. 501–506.
30. Long, W.J.; Lemieux, G.; Hwang, S.D.; Khayat, K.H. Statistical models to predict fresh and
hardened properties of self-consolidating concrete. Mater. Struct. 2012, 45, 1035–1052.
© 2014 by the authors; licensee MDPI, Basel, Switzerland. This article is an open access article
distributed under the terms and conditions of the Creative Commons Attribution license
(http://creativecommons.org/licenses/by/4.0/).