\u003ctitle\u003eload monitoring in multiwire strands by interwire ultrasonic...
TRANSCRIPT
Load monitoring in multiwire strands by interwire ultrasonic measurements
Ivan Bartolia, Robert Phillipsa, Francesco Lanza di Scaleaa,*, Salvatore Salamone a
Stefano Coccia a, Charles S. Sikorskyb
a NDE & Structural Health Monitoring Laboratory, Dept. of Structural Engineering, Univ. of California, San Diego, 9500 Gilman Drive, La Jolla, CA 92093-0085, USA
b Division of Engineering Services, California Department of Transportation 1801 30th Street, P.O. Box 168041, Sacramento, CA 95816-0001
ABSTRACT Nearly 90% of the bridges in California are post-tensioned box-girders. Prestressing (PS) tendons are the main load-
carrying components of these and other post-tensioned structures. Despite their criticality, much research is needed to develop and deploy techniques able to provide real-time information on the level of prestress and on the presence of structural defects (e.g. corrosion and broken wires) in the PS tendons. In collaboration with Caltrans, UCSD is investigating the combination of ultrasonic guided waves and embedded sensors as an approach to provide both prestress level monitoring and defect detection capabilities in concrete-embedded PS tendons.
This paper will focus on the prestress level monitoring by first discussing the behavior of ultrasonic guided waves propagating in seven-wire, 0.6-in diameter twisted strands typically used in post-tensioned concrete structures. A semi-analytical finite element analysis is used to predict modal and forced wave solutions as a function of the applied prestress level. This analysis accounts for the changing inter-wire contact as a function of applied loads. A feature shown sensitive to load levels is the inter-wire energy leakage. In order to monitor such feature, the method uses low-profile piezoelectric sensors able to probe the individual, 0.2-in wires comprising the strand. Results of load monitoring in free and embedded strands during laboratory tests will be presented.
Keywords: Semi-analytical finite element method, Prestressing strands, Structural Health Monitoring.
1. INTRODUCTION Multi-wire steel strands are used in civil engineering as the tensioning components of prestressed concrete structures
and in cable systems of cable-stayed and suspension bridges. As documented in several studies1,2,3,4, the tendon breakage or the presence of defects in the wires can induce serious consequences for these structures. Many techniques have been applied to the defect detection and load monitoring of prestressing tendons in prestressed concrete structures.
The visual inspection is the simplest, oldest and most common form of inspection technique5, although it is only efficient when the degradation is visible at the surface of the structure. Global approaches have been employed for the measurement of stay cable loads, which relies on modal-analysis techniques7,8,9. In this case the cable natural frequencies are correlated to the level of applied load, following the vibrating chord theory. The technique, unfortunately, is insensitive to small defects such as corrosion and it is not applicable to embedded PS tendons. Radiography6, was proved as a very effective technique in many applications for defect detection and stress measurement; however, it encounters several limitations in concrete structures due to the highly scattering nature of concrete and safety issues have dissuaded from its use in open and large areas. For the detection of small defects in stay-cable and suspension bridges cables, the Magnetic Flux Leakage (MFL) method has gained some interest especially in Europe10. The MFL method relies on the fact that a flaw in a ferromagnetic object introduces a localized discontinuity of the system magnetic properties. The MFL method cannot be used for continuous health monitoring and it does not provide any information on the level of stress in the cable. An alternative method11,12, based on measuring the magnetic permeability of tendons and cables, can
* [email protected]; phone 1 858 822-1458; fax 1 858 534-6373
Sensors and Smart Structures Technologies for Civil, Mechanical, and Aerospace Systems 2008,edited by Masayoshi Tomizuka, Proc. of SPIE Vol. 6932, 693209, (2008)
0277-786X/08/$18 · doi: 10.1117/12.775934
Proc. of SPIE Vol. 6932 693209-12008 SPIE Digital Library -- Subscriber Archive Copy

determine the applied stress. Nevertheless, current configurations of the magnetic permeability sensors do not allow their use in embedded PS tendons. Time-domain Reflectometry (TDR), a technique developed for locating discontinuities in electrical transmission lines, has been used to characterize and locate faults in suspended bridge cables13 and, more recently, to detect voids and corrosion in grouted PS tendons of post-tensioned bridges14. The method can be considered as the electrical equivalent of the known pulse-echo testing method of ultrasonic testing where an electric pulse substitutes the ultrasonic pulse. Although the potential for void detection, the TDR cannot be used to monitor prestress levels in the tendons.
Elastic stress waves techniques have been successfully used, particularly the Impact Echo (IE) method15,16, to detect voids in tendon ducts of post-tensioned concrete slabs. In IE, a short duration mechanical impact at a free surface of the slab generates low-frequency waves that propagate through the thickness; voids are detected by early wave echoes detected at the free surface. The IE method cannot detect defects within the tendons, e.g. corrosion or wire breakage, and it cannot monitor stress levels in the tendons.
A technique that shows promises for the simultaneous detection of defects and monitoring of prestress levels in PS tendons is based on Guided Ultrasonic Waves (GUWs). As opposed to the waves used in traditional IE that propagate in 3-D within the post-tensioned concrete, GUWs propagate along the tendon itself by exploiting its waveguide geometry. The advantages of this technique over the others mentioned above include: (1) the possibility of using transducers permanently attached to the strand for continuous structural monitoring, (2) the potential for providing simultaneous defect detection and stress monitoring capabilities for the strands with the same sensing system, and (3) the possibility for detecting both active defects and pre-existing defects toggling between the modes of “passive” acoustic emission testing and “active” ultrasonic testing within the same sensing system. Recent applications of the GUWs technique were demonstrated for the evaluation of stress levels in post-tensioning rods and multi-wire strands17,18;19;20;21, as well as for the detection of isolated defects in these components21,22,23. The GUWs technique can be also used in a passive mode, for the real-time monitoring of active defects using acoustic emission principles. Successful use of the passive approach has been demonstrated for both steel and composite cables22,24,25.
This paper presents recent advances in the area of multi-wire strand monitoring by Guided Ultrasonic Waves, focusing on the “active” mode involving external generation and detection of waves. Wave propagation models are first presented to predict the complicated dispersive solutions and forced solutions of the strand waveguide. Experimental results are also presented with application to the stress monitoring in free strands.
2. SAFE METHOD The Semi-Analytical Finite Element (SAFE) method is an effective tool to model waveguides of arbitrary cross-
section 26. In the SAFE method, at each frequency value ω=2πf (f=temporal frequency), a discrete number of guided modes are extracted. For the given frequency, each mode is characterized by a wavenumber, k, and by a displacement distribution over the cross-section (modeshape). The SAFE method can be used to obtain the dispersion properties as phase velocity, energy velocity and attenuation of the propagating GUW modes in beams, plates, circular bars and hollow cylinders. The method was implemented in a Matlab software using the PDE toolbox to generate the finite element mesh. A brief description of the adopted formulation follows.
At a frequency ω, each mode is represented by the wavenumber, k, and the displacement components u, v and w in the x, y and z directions respectively, where (x, y) is the cross-sectional plane and z is the axial direction of the waveguide (Figure 1(a)). Assuming that the wave propagation direction coincides with the z axis, the displacement vector u at any point of the waveguide can be approximated by the relations
( )
( )
( )
1
1
1
( , ) exp 1( , , , )
( , , , ) ( , , , ) ( , ) exp 1( , , , )
( , ) exp 1
n
j jj
n
j jj
n
j jj
N x y U kz tu x y z t
x y z t v x y z t N x y V kz tw x y z t
N x y W kz t
ω
ω
ω
=
=
=
⎡ ⎤⎡ ⎤− −⎢ ⎥⎣ ⎦⎢ ⎥⎡ ⎤ ⎢ ⎥⎢ ⎥ ⎡ ⎤= = − −⎢ ⎥⎢ ⎥ ⎣ ⎦⎢ ⎥⎢ ⎥⎣ ⎦ ⎢ ⎥
⎡ ⎤⎢ ⎥− −⎣ ⎦⎢ ⎥⎣ ⎦
∑
∑
∑
u (1)
In the above expressions, Nj represent the shape functions, Uj, Vj and Wj are the amplitudes of the nodal displacement components, and t is the time variable. It can be noted that the displacement components u, v and w are interpolated by the finite element approach only in the cross-sectional plane (x,y). No interpolation is needed in the
Proc. of SPIE Vol. 6932 693209-2

direction of propagation, where the harmonic motion is described by the term exp[ 1− (kz-ωt)]. The displacement field, discretized according to Eq. (1), can be used in the well known strain displacement relations, in the constitutive laws and in the principle of virtual work. The current SAFE analysis assumes linear elastic isotropic materials. For the steel strand, the following material properties were considered in the model: cL=5,960 km/sec, cS=3,260 km/sec and ρ=7932 kg/m3 where cL and cS are the bulk longitudinal and shear wave velocities and ρ is the material density. Employing the displacement hypothesis of Eq. (1), the following system of algebraic equations can be derived27:
( )k− =A B Q p (2)
Details on the calculation of the matrices A and B can be found in various studies26,27,29. The eigenvalue problem obtained assuming the nodal force vector equal to zero (p=0) can be solved in Matlab with standard subroutines. At each frequency ω, matrices A and B change and a new eigenvalue problem is solved obtaining 2M eigenvalues km and, consequently, 2M eigenvectors. The total number degrees of freedom in the system M depends on the discretization of the waveguide cross section. The eigenvectors represent the M forward and the corresponding M backward guided modes. The m-th eigenvalue km is the m-th wavenumber, and Φm
R is the corresponding right eigenvector in which the first M components describe the m-th mode shape Φm
Rup while the last M components are equal to kΦmRup. Once the
wavenumbers are known as a function of the frequency, the dispersion curves (phase velocity, group or energy velocity and attenuation) can be easily computed25,26,27. The displacement field induced in the waveguide by a point loading at z=zS on the outer surface, can be extracted as a combination of the modeshapes26. The displacement vector U induced by a harmonic excitation is given as:
( ) ( )1
, expM
Rupm m m S
m
z ik z zω α=
⎡ ⎤= Φ −⎣ ⎦∑U (3)
where Lm
m L Rm m
α Φ= −
Φ Φp
B (4)
and ΦmL is the m-th left eigenvector. The summation is extended to the M forward wave modes only and holds for wave
motion confined to z>zS 25,26. Eq. (3) represents the response to a pure harmonic excitation of unitary amplitude. The
response to an excitation with arbitrary time history can be computed as well. First, the frequency content of the excitation signal ( )F t must be computed by applying the Fourier transform:
( ) ( ) i tF F t e dtωω∞ −
−∞= ∫ (5)
The response of the waveguide in the frequency domain due to the above force can be computed as:
( ) ( ) ( ) ( ) ( )1
, , expM
Rupm m m S
m
z F z F ik z zω ω ω ω α=
⎡ ⎤= ⋅ = ⋅ Φ −⎣ ⎦∑V U (6)
Finally, the time-domain response is obtained using the inverse Fourier Transform,
( ) ( )1, ,2
i tz t z e dωω ωπ
∞
−∞
= ∫V V (7)
Standard Fast Fourier Transform algorithms can be employed to compute the integrals in Eqs. (5) and (7).
3. NUMERICAL AND EXPERIMENTAL RESULTS: UNLOADED STRAND
3.1 Geometry of the strand and test setup The strand specimens were provided by “Dsiamerica” and consist of Grade 270, 15.2mm (0.6”) diameter, seven-wire
strands with a cross sectional area of 140mm2. The strands are formed by 6 helical wires wrapped around a core. Each helical wire is assumed to have a circular cross section in a plane normal to its axis, whose diameter is smaller in comparison to the pitch p of the helix. Strands for post-tensioning concrete structures are under axial loading (pulling)
Proc. of SPIE Vol. 6932 693209-3

O 100 200 300 400Time (jtsec)
that is typically associated with torsion, depending on the boundary conditions. A detailed study of the static behavior of the strand, subjected to combined torsion and axial tension, was provided by Machida and Durelli28.
Principal geometric properties are dc=dh=0.2”=5.08mm being dc and dh diameters of core and helical wires, respectively; the lay angle β of the helical wire can be evaluated as:
arctan 7.9degRp
πβ⎛ ⎞
= =⎜ ⎟⎝ ⎠
2
(8)
where R=0.2”=5.08mm is the radius measured from the center of the strand to the centre of helical wire and p=230mm is the pitch of the helical wire.
0 100 200 300 400-6
-4
-2
0
2
4
6x 10⁻⁹
Time (µsec)
L(0,1)
L(0,2)
F(1,2)
F(1,1)
45
t
F(t)
F(t)
3µsec
y
x
z
-3 -2 -1 0 1 2 3
x 10-3
-2.5
-2
-1.5
-1
-0.5
0
0.5
1
1.5
2
2.5x 10
-3
y
x
(b)
(a)
(d)
(c)
Figure 1. (a) Core wire modeled with SAFE. (b) Discretization of the bar cross section. (c) Acceleration time history obtained with SAFE numerical simulation for a steel circular bar (Length=720mm) subjected to impulsive load. (d) Normalized Continuous wavelet scalogram of time waveform.
The following numerical and experimental results were extracted from a series of through transmission Laser Ultrasound (LU) tests. A pulsed Nd:Yag laser operating at 1064 mm with a pulse duration of ~8ns was used to generate the ultrasonic waves at one end of the strand, while at the other end, an ultra-mini broadband sensor provided by the Physical Acoustic Corporation (PICO type) detected the incoming waves. A similar approach was used by Rizzo and Lanza di Scalea20 who used a Michelson interferometer with balance detectors to acquire the ultrasonic guide waves generated by the pulsed laser.
3.2 Single wire Two wires, the straight core and a peripheral helical wire, were isolated by disassembling a 720mm long, 15.24mm
(0.6”) diameter strand and tested in a simply supported configuration. A SAFE numerical simulation was performed to predict the acceleration time history (Figure 2(c)) in the wires due to a broadband source and to help analyzing the
Proc. of SPIE Vol. 6932 693209-4

0.8
NI0.6
>C.)=a) flA
0.2
"0 100 200 300 400Time (jtsec)
0.8
iuen
cv (M
HZ
) 0 •0
)
0.2
experimental results shown in the following. The cross section of a 5.08mm diameter steel bar was meshed using 590 triangular elements. An impulsive concentrated force was applied in the central node of the circular section and inclined of 45deg with respect to the y-z plane, to excite longitudinal and flexural modes. The computational effort was reduced considering the symmetry of the problem. The acceleration time history and its continuous wavelet scalogram are shown in Figure 1(c)-(d). To represent the response of the PICO sensors, the acceleration was computed as the sum of the nodes acceleration at z=0.72m. The acceleration of each node was computed by numerically differentiating the displacement time histories evaluated as in Equations (6) and (7).
0 100 200 300 400
-0.2
-0.1
0
0.1
0.2
0.3
Time (µsec)0 100 200 300 400
-0.03
-0.02
-0.01
0
0.01
0.02
0.03
Time (µsec)
L(0,1) F(1,1)
F(1,2)
Reflected L(0,1)
(a) (c)
Time (µsec)
L(0,1
L(0,2
F(1,1)
F(1,2)
Reflected
(b) (d)
Figure 2. (a) Measured time waveform from Laser Ultrasound testing of single steel wire (central core, Length=720mm). (b) Normalized (Complex Morlet) Continuous Wavelet Transform scalogram of time waveform. Theoretical arrival times are superimposed to experimental time-frequency transform. (c) Measured time waveform from Laser Ultrasound testing of single steel wire (helical wire, Length=720mm). (d) Normalized (Complex Morlet) Continuous Wavelet Transform scalogram of time waveform. The joint time frequency scalogram shown in Figure 1(d) was carried out adopting the Complex Morlet Wavelet (center frequency equal to 5, bandwidth parameter equal to 2) of the numerical signal. As shown in the scalogram, the Complex Morlet Wavelet transform successfully isolates the first two longitudinal L(0,1), L(0,2) and the flexural F(1,1) modes. The strong dispersive behavior of the first flexural mode F(1,1) at low frequency can be noted in the scalogram as well as the sudden velocity change of the fundamental longitudinal mode L(0,1) at around 600kHz. From Figure 1(d), the group velocity dispersion curve can be extracted for all the modes excited by the impulsive force shown in Figure 1(a) as
/ ( )gc D t f= (9)
Proc. of SPIE Vol. 6932 693209-5
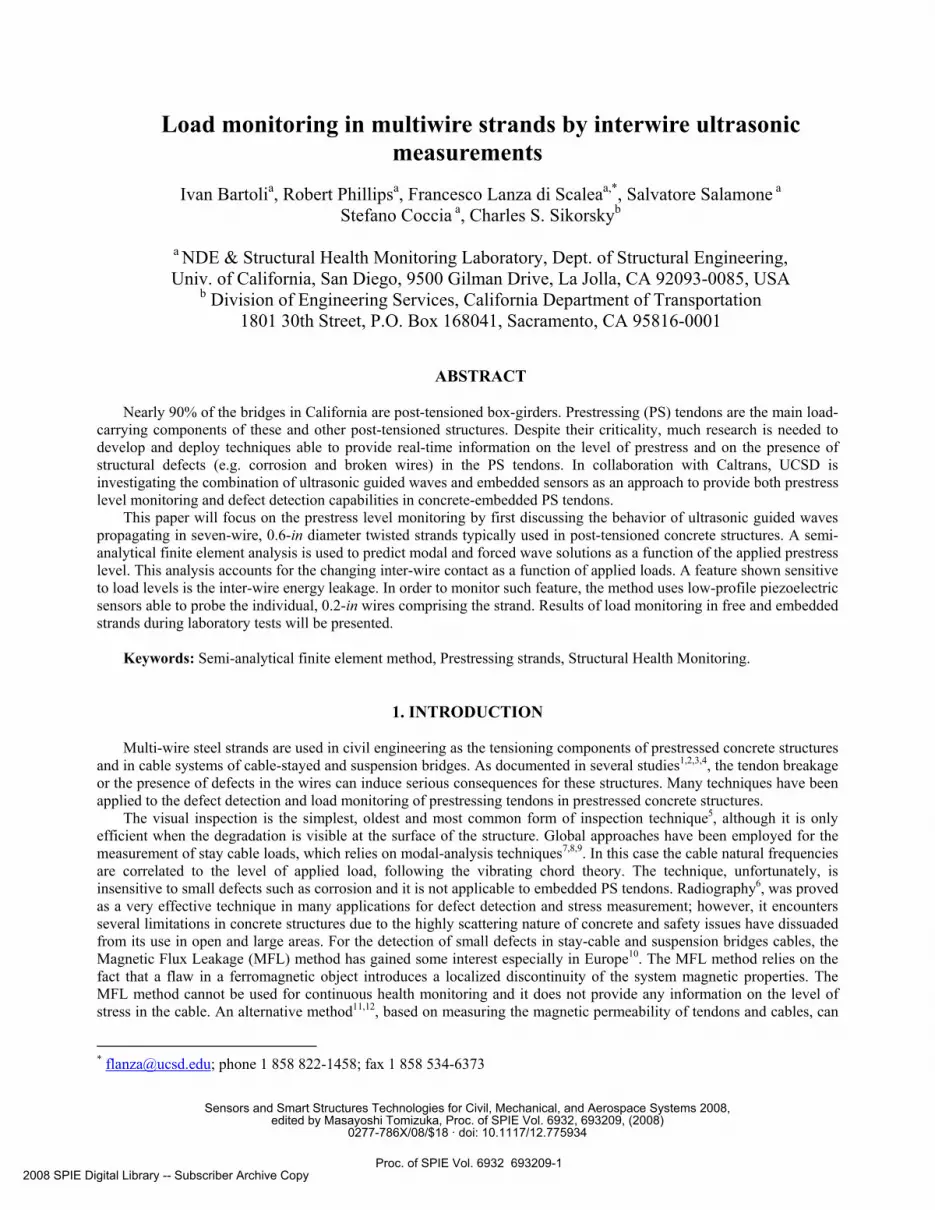
where t(f) is the arrival time of the scalogram local peak, corresponding to the generic mode at frequency f, and D is the length of the rod.
Theoretical arrival times were also computed directly from the dispersion group velocities obtained with the SAFE method. The extracted curves were superimposed to the scalogram of the experimental signals. The time waveforms and the scalograms recorded by the LU through-transmission setup are shown in Figure 2 for a single straight wire (central core) and helical (peripheral) wire.
Both time histories include a reflection from the wire end of the fastest fundamental longitudinal mode L(0,1). The reflection appears at about 420µsec in Figure 2(a) and in Figure 2(c). The reflected L(0,1) mode is also evident in the continuous wavelet scalogram where it can be noted that only the low frequency portion appears. The higher but slower frequency portion of the L(0,1) mode (f>300kHz) arrives after 450µsec and consequently is not captured by the considered time window. It should be noted that reflections cannot be predicted by the SAFE numerical simulation. The simulated response is in fact a summation of all the modes carrying energy and propagating in the right direction in a semi-infinite circular rod.
From the scalograms shown in Figure 2(b) and Figure 2(d) it is observed that the modes signatures are, as expected, slightly more scattered when compared to the correspondent traces in the scalogram of Figure 1(d). The differences depend mainly on the uncertainty introduced by the coupling between PICO sensors and wire surface. Furthermore, the sensors are affected by reflections and mode conversions occurring at the wire end that are not predicted by the theoretical SAFE model. Finally, laser excitation is another source of uncertainty. However, the simulated scalograms successfully identify at least four propagating modes, measured in the experiment.
It should also be noted that the arrival times predicted by the SAFE method (black curves) match considerably well the scalogram traces of the two measured fundamental modes L(0,1), F(1,1) and higher order modes L(0,2) and F(1,2).
0 100 200 300 400-0.03
-0.02
-0.01
0
0.01
0.02
0.03
Time (µsec)
L(0,1)
L(0,2)
F(1,1)
0 100 200 300 400-6
-4
-2
0
2
4
6
8x 10⁻³
Time (µsec)
(b)
(a) (c)
L(0,1)
L(0,2)
Time (µsec)
(d)
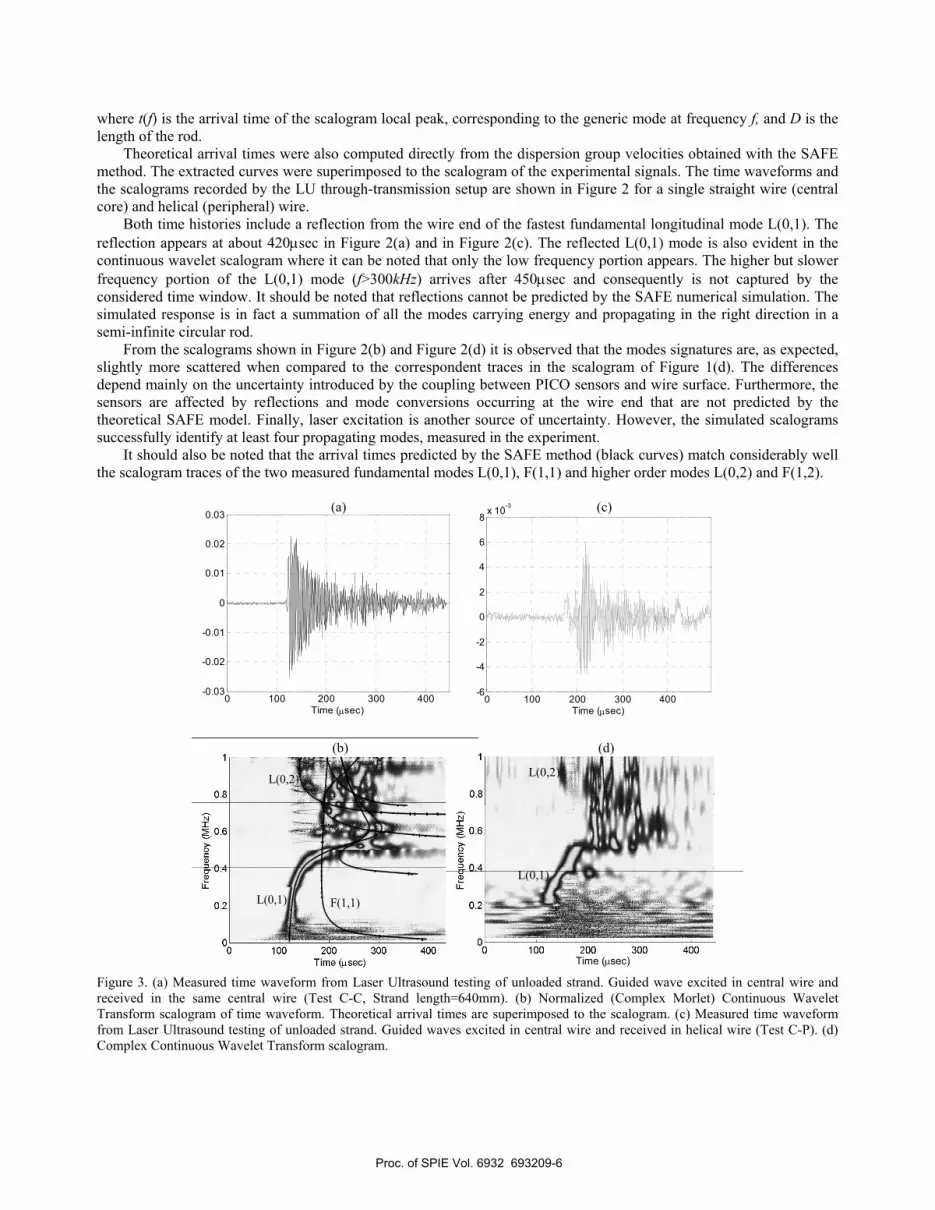
Figure 3. (a) Measured time waveform from Laser Ultrasound testing of unloaded strand. Guided wave excited in central wire and received in the same central wire (Test C-C, Strand length=640mm). (b) Normalized (Complex Morlet) Continuous Wavelet Transform scalogram of time waveform. Theoretical arrival times are superimposed to the scalogram. (c) Measured time waveform from Laser Ultrasound testing of unloaded strand. Guided waves excited in central wire and received in helical wire (Test C-P). (d) Complex Continuous Wavelet Transform scalogram.
Proc. of SPIE Vol. 6932 693209-6

Differences between simulated and measured arrival times are more significant for the case of the peripheral helical wire. However, comparing the scalograms in Figures 2(b) and 2(d) it can be concluded that in the frequency range considered, the helical waveguide has dispersion properties very similar to those of the straight central core waveguide.
In the next section, waveforms acquired by the LU testing of a free unloaded strand will be shown along with their joint time-frequency transforms.
3.3 Seven wire unloaded Strand The study of an unloaded, seven wire strand was performed by exciting only the central core wire. The strand
considered is free and simply supported without wedge tendon couplers that could produce some additional effects on the waveguide behavior (analyzed later).
The experiments shown here, include a C-C (central-central) test where the wave is generated and detected in the central core and a C-P test where the wave is received with the PICO sensor positioned on the helical wire. The waveforms recorded for tests C-C and C-P are considerably different (compare Figure 3(a) to Figure 3(c)). For example, even though it could be argued that different testing conditions can affect the strength of the signals, the peak to peak amplitude of the waveform acquired in the C-P test is considerably smaller than the corresponding feature computed on the C-C test signal. Moreover, while the scalogram of the waveform recorded during test C-C (Figure 3(b)) isolates the two principal longitudinal modes and partially the flexural F(1,1) mode, the scalogram of the signal from C-P test, shown in Figure 3(d), is extremely scattered and the identification of guided modes is no longer trivial. Portion of the two longitudinal modes are still visible in Figure 3(d) but longitudinal and flexural modes are either poorly excited by the test configuration or severely attenuated.
It can be concluded that when the cable is unloaded, each wire of the pretwisted seven-wire strand behaves as an independent waveguide. Energy introduced in one of the wires can leak in the adjacent ones but it stays mainly confined within the excited wire. A completely different behavior is expected when load is applied to the strand. In the next section a brief discussion on the inter-wire contact stresses generated in a loaded strand will be provided.
4. NUMERICAL AND EXPERIMENTAL RESULTS: LOADED STRAND
Several papers have studied experimentally the influence of applied load on the properties of ultrasonic guided waves propagating in strands20,21,30. Kwun et al30 and Rizzo and Lanza di Scalea20 reported that in unloaded strands, the wave propagation properties were the same as those seen in individual wires, while under tensile loading a different behavior was observed.
In a previous study28, the authors obtained the dispersion curves using the SAFE method for the seven wire loaded strand, modeling the waveguide as a pretwisted structural component and considering the cross section formed by all the cross sections of the seven wires. The contact between wires was considered by imposing the same displacement to the common node of neighbor elements pertaining to the cross sections of two adjacent wires. The simulations previously performed by the authors29 did not consider variations of the axial load and the deformation due to contact forces between wires. The dispersion solutions, theoretically, depend on the uniform rate of pretwist in the axial direction β. However, for the strand considered, dispersion properties are only marginally affected by the lay angle and, consequently, the waveguide will be assumed straight rather than pretwisted. The effect of contact forces between the wires will be accounted for, in order to study the energy leakage occurring when ultrasonic guided waves travel in loaded strands.
4.1 Forced solution for the free strand
The system model is shown in Figure 4. The ultrasonic guided waves are generated using a PZT actuator bonded to the external surface of a peripheral wire. The incoming wave is recorded by a pair of PICO sensors located at the strand’s free end, 0.889m from the source. The structural coupling between the strand and the PZT actuator was modeled assuming a couple of pin forces, with opposite sign, applied at the PZT ends (pin force model)31. The response was computed by averaging the longitudinal acceleration components of the peripheral and central wire cross sections respectively. Response at each node was computed by using the SAFE expressions for the forced solution shown in Equations (6) and (7). The numerical approach simulated the frequency sweep performed experimentally; a total of 66 narrowband tonebursts with central frequencies varying from 50 to 700kHz were generated. A typical 3-cycle narrowband toneburst is shown in Figure 4(a). A total of 66 signals in were obtained for each SAFE simulation. The
Proc. of SPIE Vol. 6932 693209-7

effect of the two pin forces representing the PZT actuator was considered separately and the total response was finally achieved by superimposing the two separate contributions.
PZT actuator
Pico Peripheral
Pico Central
Generated Toneburst
t V(t)
y
x
(a) (b)
Figure 4. (a) Guided waves excited in seven wire strand by a PZT actuator and detected with PICO sensors at the end. (b) Mesh of the strand cross section employed in SAFE model.
The described approach was repeated for 4 different cases corresponding to 4 axial loading conditions, respectively
equal to the 5%, 20%, 60% and 100% of the maximum load (70% of the Ultimate load). Different loads were simulated using the SAFE by changing the length of the contact arc between the cross sections of adjacent wires. Consequently, the mesh adopted to discretize the cross section (see Figure 4(b)) was updated for each loading case, maintaining, however, the same number of finite elements. The length of the contact arc was computed using Hertz’s contact theory and the contact loads between wires were estimated following the study of Machida and Durelli28.
Figure 5 shows the ratio between the predicted Root Mean Square (RMS) spectra for the PICO sensor attached to the central wire and the one attached to the peripheral wire. The RMS was computed on the gated time histories containing only the first arrival of the wave packets. The gates were the same (tmin=150µsec, tmax=250µsec) adopted for the experimental waveforms. The curves in Figure 5 refers to a different percentage of the maximum load applied (70% of the Ultimate tensile load). The curves do not show any appreciable difference among different loading conditions. This feature seems unaffected by the change of the contact arc between the wires. However, experimental tests have shown that the RMS ratio is dependent on the axial load applied to the strand, indicating that inter-wire contact is not the only parameter influencing wave propagation in loaded strands.
It should be noted that the SAFE model considered the deformation of the cross section due to the radial contact forces generated by the axial load28. Other effects as elongation of the strand showed marginal variations of the SAFE results and are not presented here. Simulations were attempted to consider also the Acoustoelastic effect. According to Acoustoelastic theory, the velocities of ultrasonic waves in prestressed solids show measurable variations with respect to their counterparts in stress free bodies17,18,19. Many studies observed that the sensitivity of the ultrasonic speed to a preexistent stress field is very small. The SAFE numerical simulations performed including the acoustoelastic change of ultrasonic bulk waves, did not show significant variations in the dispersion behavior of the modeled loaded strand.
RATIO PICO(C) / PICO(P)
0
0.2
0.4
0.6
0.8
1
1.2
1.4
50 250 450 650
Freq [kHz]
Rat
io C
/P (R
MS) 20%
40%
60%
80%
100%
Figure 5. SAFE predictions of the Ratio between RMS spectra of Pico Central and Pico Peripheral. (100% Load=70% of Ultimate load).
Proc. of SPIE Vol. 6932 693209-8

In conclusion, the SAFE method can be used to model completely-unloaded and loaded strands. However, the model appears insensitive to load variations. In the next section, though, it will be demonstrated that by considering the strand anchorage, SAFE could capture the propagation behavior observed in experimental tests of loaded strands.
4.2 Forced solution for the free strand: effect of anchorages Previous studies showed the effect of anchorages on the wave attenuation of ultrasonic guided waves in prestressed
seven-wire strands19 and in carbon-fiber-reinforced-polymer bridge stay cables24. In the mentioned works, the authors concluded that the anchorages were responsible of a significant energy leakage of the ultrasonic guided wave packets traveling in loaded strands. Furthermore, the leakage in the anchorages was also exploited using sensors mounted on their external surface, to perform acoustic emission (AE) monitoring of damage evolution in strands progressively loaded to failure.
The SAFE method is here used to predict the effect of the ultrasonic leakage into the anchorages. The considered loading condition is the same as in Section 4.1. A couple of opposite forces located at the ends of the PZT actuator generates the ultrasonic pulse. The forced solution is initially obtained for all the nodes of the strand cross section immediately before the anchorage using Eq. (6). The distance between PZT actuator and anchorage is 0.56m (22”). The nodal displacement components uB’(ω) computed on the cross section preceding the anchorage, are used to compute the nodal forces FB’’(ω) that the incoming wave applies to the neighbor waveguide (see Figure 6(a)). Obviously, if two waveguides with the same cross section and physical properties are connected in series, their global behavior has to be the same of the waveguide with equivalent length.
In order to consider the effect of the anchorage, a waveguide of larger diameter was coupled to the seven wire strand waveguide (see Figure 6(a)). The larger waveguide is represented by a strand surrounded by a 60mm long cylinder, shown in Figure 6 that has an external diameter of 50mm (2”). Contact between the ring (anchorage) and the strand was assumed equal to the length of the indentation induced by the tendon couplers during the experimental tests. As an example, the maximum indentation created by the wedges (due to the maximum axial stress = 70% of U.T.S.) on each peripheral wire was 2mm long. The tendon couplers consisted of three-pieced steel wedges (Coupler Type D, Dywidag System international).
Pico Central
Pico Peripheral
PZT actuator
Anchorage
F (ω)B''
u (ω)B'A'u (ω) F (ω)
PZT
F (ω)PZT
(ω)
(a) (c)
(b)
Figure 6. SAFE simulation of guided waves leaking into the strand anchorage: (a) guided wave excited by the PZT actuator and received by the PICO sensors. (b) Mesh of the strand cross section coupled to the anchorage and (c) mesh of the seven wire strand employed in SAFE method.
In general, when the waveguides combined together have different cross section, the simple application of the equivalent nodal forces vector FB’’(ω) to the right end side of the second waveguide introduces an approximation. Part of
Proc. of SPIE Vol. 6932 693209-9

the wave energy, in fact, is reflected back due to the discontinuity of the waveguide cross section. For the scope of the present study, the reflected waves are neglected. This approximation does not substantially affect the response on the left end side cross section of the anchored area uA’(ω), because, in the actual structure, severe mode conversion and energy leakage in the loading machine jags prevent such reflections.
The simulations used a total of 538 elements to discretize the cross section of the strand (Figure 6(b)) and a total of 538+320=858 triangular elements to mesh the cross section of the constrained strand (Figure 6(c)). For obvious reasons, the geometry and the discretization of the seven wire strand are exactly the same in both the cross sections. Once the displacement uA’(ω) in section A’ was computed, the inverse Fast Fourier Transform was applied to compute the time histories of each node of the cross section A’. The time history of the PICO peripheral (central) sensor was numerically predicted by summing the response of the of the peripheral (central) wire cross section nodes.
Figure 7(a) shows the ratio between RMS spectra of signals from the Pico Central and the Pico Peripheral sensors. This ratio is sensitive to the level of applied load. For example, at f=500kHz, the RMS Ratio varies between 0.4 and 0.55 for axial loads in the strand varying between 20% and 100% of the maximum load (70% U.T.S.). A large jump is observed between the case of the free strand (“No wedge”), where the RMS Ratio is equal to 0.15, and the 20% case. This result depends on the leakage of guided wave energy into the anchorage. The guided wave generated by the PZT is nearly unaffected by the change of axial loads in the strand along the path between the wedges. A considerable amount of wave energy carried in the peripheral wires, leaks into the wedge reducing the strength of the signal (RMS) recorded in the peripheral wire in the cross section A’.
0
0.1
0.2
0.30.4
0.5
0.60.7
0.80.9
1
300 400 500 600 700
Freq [kHz]
Rat
io C
/P (R
MS)
start0%
up20%up40%up60%
up80%up100%
Increasing Load
0
0.1
0.2
0.3
0.4
0.5
0.6
0.7
0.8
300 400 500 600 700
Freq [kHz]
Rat
io C
/P (R
MS)
NoWedge
20%
40%60%
80%
100%
Increasing Load
(a) (b)
Figure 7. Strand with anchorage: (a) SAFE predictions of the Ratio between RMS spectra of Pico Central and Pico Peripheral. Waveforms are recorded on the left hand side of the anchorage. 100% Load=70% of Ultimate load. (b) Experimental results.
4.3 Experimental Study of Prestress Level Monitoring in Free Strands Tests were performed at UCSD’s Powell Labs on the SATEC M600XWHVL, 600 kip capacity, pneumatic test
apparatus, configured for tensile loading. The specimen tested was a Grade 270, 15.2mm (0.6”) diameter, seven-wire strand having an U.T.S. of 1.86GPa (270ksi), an yield stress of 1.67GPa (243ksi), and 1.82m (72”) in length. A 10° serrated wedge was placed on the tendon and inserted into a corresponding collar that was clamped pneumatically into the machine to transfer loads. The tested length was 1.4m (56”) with 0.33m (13”) extending on one end and 76mm (3”) at the other end to allow for the wedge, collar and sensor placement. Load-unload cycles were performed with 11 load steps in each cycle. The steps were based on a percentage of 70% of ultimate load 182.4kN (41kip), consisting of a 0%, 20% (8.2kip), 40%(16.4kip), 60% (24.6kip), 80% (32.8kip), 100% (41.0kip), and down to 80% (32.8kip), 60% (24.6kip), 40% (16.4kip), 20% (8.2kip), and 0%. Three different test protocols were adopted. Attention here is focused on Test 3 configuration where a PZT sensor placed at 35” from the strand end, was used as the transmitter. The configuration is the same modeled with SAFE and described in the previous section. Signals were acquired by two PICO sensors at the strand end. Seven load-unload cycles were performed in Test 3 for the full frequency range of 50kHz-700kHz and 700kHz-2MHz.
Figure 7(b) shows the ratio between signal strengths (RMS) of the central and peripheral PICO sensors as a function of the axial load acting on the strand. Results are similar to the SAFE numerical results shown in Figure 7(a). It can be concluded that one of the main sources of change in the ultrasonic strength of transmission is the wave leakage into the anchorage wedges. The RMS ratio can be considered a suitable feature for load monitoring in the strands and potentially, does not require a base-line. However, particular attention has to be taken for the experimental set-up. In fact, even
Proc. of SPIE Vol. 6932 693209-10

though during the experimental tests consistent results were obtained during all the loading cycles, it was observed that changes of the coupling conditions between PICO sensors and strand end, as well as different frequency response of the PICO sensors can substantially skew the results27.
5. CONCLUSIONS This paper presents a technique based on ultrasonic guided waves to monitor the prestress level in multi-wire steel
strands. A semi-analytical finite element (SAFE) method was used to model (a) the multimode and dispersive behavior in a free unloaded seven-wire strand and (b) the ultrasonic leakage in the loaded strand occurring at the anchorages.
For the unloaded free strand, it was shown that each wire behaves as an independent waveguide and the wave attenuation is small compared to the loaded case. Furthermore, the waves excited in a single wire remain predominantly confined within that wire. These findings were confirmed by a series of Laser ultrasound tests performed on free strands and individual wires obtained by disassembling the seven-wire strand.
For the loaded case, the leakage induced by the anchorages that transfer the load to the strand was numerically predicted. The SAFE was successfully used to model the strand-wedge interaction, by coupling two waveguides of different cross section, while neglecting waves reflected at the strand-wedge interface. For stress monitoring purposes, piezoelectric transducers probing the individual wires near the strand’s end were used. The best transducer lay-out was realized when the ultrasound excitation was provided on a peripheral wire and ultrasound detection was performed on the central and peripheral wires at the strand’s end. The most promising feature, suitable for stress monitoring, is the inter-wire leakage between the peripheral and the central wire, occurring at the anchorages. The feature theoretically does not require a baseline, and in the 400 kHz – 500 kHz range it appears effective not only to detect a complete loss of stress, but also to quantify the level of applied stress.
ACKNOWLEDGMENTS The strand monitoring project is funded at UCSD by the U.S. National Science Foundation under grant # 0221707
(Dr. S-C. Liu, Program Manager), and by the California Department of Transportation under contract # 59A0538 (Dr. C. Sikorsky, Program Manager).
REFERENCES [1] Watson, S.C. and Stafford, D., “Cables in Trouble,” Civil Engineering 58, 38-41 (1988). [2] Woodward, R.J., “Collapse of Ynys-y-Gwas Bridge, West Glamorgan,” Proceedings - Institution of Civil
Engineers 84, 635-669 (1988). [3] Parker, D., “Tropical overload,” New Civil Engineer 18-21, (1996). [4] Chase, S.B., “Smarter bridges, why and how?,” Smart Maerials Bulletin 2, 9-13 (2001). [5] Williams, H.T. and Hulse, M.E., “From theory to experience with inspection of post-tensioned bridges,”
Proceedings of the Sixth International Conference on Structural Faults and Repairs, M.C. Forde, Ed. 1, Engineering Techniques Press, 199-202, (1995).
[6] Casas, J.R., “A combined method for measuring cable forces: the cable-stayed Alamillo bridge, Spain,” Structural Engineering International 4(4), 235-240 (1994).
[7] Tabatabai, H., Mehrabi, A.B. and Yen, W.P., “Bridge Stay Cable Condition Assessment Using Vibration Measurement Techniques,” Structural Materials Technology III, SPIE Vol. 3400, Medlock, R.D., and Laffrey, D.C. Eds., San Antonio, TX, 194-204 (1998).
[8] Cunha, A., Caetano E. and Delgado, R., “Dynamic Tests on Large Cable-Stayed Bridge,” Journal of Bridge Engineering, January/February, 54-62 (2001).
[9] Weischedel, H.R., “Quantitative Nondestructive In-Service Evaluation of Stay Cables of Cable-Stayed Bridges: Methods and Practical Experience,” Nondestructive Evaluation of Aging Bridges and Highways, Proceedings of SPIE, Vol. 2456, Oakland, 122-128 (1995).
Proc. of SPIE Vol. 6932 693209-11

[10] Bouchilloux, P., Lhermet N. and Claeyssen, F., “Electromagnetic Stress Sensor for Bridge Cables and Prestressed Concrete Structures,” Journal of Intelligent Material Systems and Structures 10, 397-401 (1999).
[11] Wang, M., Lloyd, G.M. and Hovorka, O., “Development of a Remote Coil Magnetoelastic Stress Sensor for Steel Cables,” Health Monitoring and Management of Civil Infrastructure Systems, SPIE Vol. 4337, 122-128 (2001).
[12] Liu, W., Hunsperger, R.G., Folliard, K., Chajes, M.J., Barot, J., Jhaveri, D. and Kunz, E. “Detection and characterization of corrosion of bridge cables by time domain reflectometry,” Nondestructive Evaluation of Bridges and Highways III, SPIE Vol. 3587, 28-39 (1998).
[13] Chajes, M., Hunsperger, R., Liu, W., Li, J. and Kunz, E., “Void detection in grouted post-tensioned bridges using time domain reflectometry,” Proceedings of the Transportation Research Board, Vol. 3853 (2003).
[14] Sansalone, M., Jaeger, B.J. and Randall, W.P., “Detecting Voids in Grouted Tendons of Post-Tensioned Concrete Structures Using Impact-Echo Method,” ACI Structural Journal 93(4), 462-472 (1996).
[15] Watanabe, T., Ohtsu, M. and Nakayama, Y., “Impact-Echo NDT for Grouting Performance in Post-Tensioning Tendon Duct,” CD-ROM Proceedings of the 8th International Conference on Structural Faults and Repair, M.C. Forsem, Ed., Engineering Technics Press, (1999).
[16] Kwun, H. and Teller, C.M., “Detection of fractured wires in steel cables using magnetostrictive sensors,” Materials Evaluation 52, 503-507 (1994).
[17] Chen, H-L. and Wissawapaisal, K. “Application of Wigner-Ville Transform to Evaluate Tensile Forces in Seven-wire Prestressing Strands,” ASCE Journal of Engineering Mechanics 128, 1206-1214.
[18] Washer, G., “The Acoustoelastic Effect in Prestressing Tendons,” Ph.D. Dissertation, Johns Hopkins University, Baltimore, MD, (2001).
[19] Lanza di Scalea, F., Rizzo, P. and Seible, F., “Stress measurement and defect detection in steel strands by guided stress waves,” ASCE Journal of Materials in Civil Engineering 15, 219-227 (2003).
[20] Rizzo, P. and Lanza di Scalea, F., “Wave propagation in multi-wire strands by wavelet-based laser ultrasound,” Experimental Mechanics 44, 407-415 (2004).
[21] Kwun, H. and Teller, C.M., “Nondestructive Evaluation of Steel Cables and Ropes Using Magnetostrictively Induced Ultrasonic Waves and Magnetostrictively Detected Acoustic Emissions,” U.S. Patent No. 5,456,113, (1995).
[22] Beard, M.D., Lowe, M.J.S. and Cawley, P., “Ultrasonic guided waves for inspection of grouted tendons and bolts,” ASCE Journal of Materials in Civil Engineering 15, 212-218 (2003).
[23] Casey, N.F. and Laura, P.A.A., “A review of the acoustic-emission monitoring of wire ropes,” Ocean Engineering 24, 935-947 (1997).
[24] Rizzo, P. and Lanza di Scalea, F., “Acoustic emission monitoring of carbon-fiber-reinforced-polymer bridge stay cables in large-scale testing,” Experimental Mechanics 41, 282-290 (2001).
[25] Hayashi, T., Song, W.J. and Rose, J.L., “Guided wave dispersion curves for a bar with an arbitrary cross-section, a rod and rail example,” Ultrasonics 41, 175-183 (2003).
[26] Bartoli, I., Marzani, A., Lanza di Scalea, F. and Viola, E., “Modeling wave propagation in damped waveguides of arbitrary cross-section,” Journal of Sound and Vibration 295, 685-707 (2006).
[27] Bartoli, I., Structural health monitoring by ultrasonic guided waves, Ph.D. Dissertation, University of California San Diego, (2007).
[28] Machida, S. and Durelli, A.J., “Response of a Strand to Axial and Torsional Displacement,” Journal of Mechanical Engineering Science 15(4), 241-251 (1973).
[29] Bartoli, I., Marzani, A., Lanza di Scalea, F., Rizzo, P., Viola, E., Sorrivi, E. and Phillips, R. “SAFE modeling of waves for the structural health monitoring of prestressing tendons,” Proceedings of SPIE, Vol. 65320D, San Diego, (2007).
[30] Kwun, H., Bartels, K.A. and Hanley, J.J., “Effect of tensile loading on the properties of elastic-wave in a strand,” Journal of the Acoustical Society of America 103, 3370-3375 (1998).
[31] Giurgiutiu, V., “Tuned Lamb wave excitation and detection with piezoelectric wafer active sensors for structural health monitoring,” Journal of Intelligent Material Systems and Structures 16, 291-305 (2005).
[32] Johnson, K.L., Contact Mechanics, Cambridge University Press, (1987).
Proc. of SPIE Vol. 6932 693209-12