ultrasonic nondestructive evaluation using laser transducers
TRANSCRIPT

ULTRASONIC NONDESTRUCTIVE EVALUATION
USING LASER TRANSDUCERS
Michael J. Rudd
Bolt Beranek and Newman Inc.
Cambridge, MA 02238
ABSTRACT
A program is described which employs lasers for ultrasonic NDE. A high-power laser is used to generate a brief sound pulse in the test specimen. A second low-power laser then measures the response of the specimen to that sound pulse.
The response of the specimen is measured by a "Laser Vibrometer." This is a novel type of heterodyne interferometer which focuses a Helium-Neon laser beam onto the surface of the specimen and measures its displacement. Displacements as small as 2xlo-12 meters on a 0.15 sec averaging time can be detected and also displacements of 1.5xlO-9 meters on a lO-MHz bandwidth. The Laser Vibrometer has a well defined frequency response and does not introduce distortion.
The sound generating laser is either a pulsed carbon dioxide TEA laser or a YAG laser. The peak power exceeds 10 M watt. Two mechanisms for generating the sound are discussed. The thermoelastic mechanism relies on the thermal expansion of the surface, causing it to move. The reaction to this causes a pressure pulse in the specimen. Another mechanism allows a small amount of the surface to be ablated and the reaction to this causes a substantial pressure pulse in the specimen.
Both laser beams can be scanned over the surface of the specimen by a microprocessor controlled mirror. The microprocessor generates a raster scan of arbitrary size, number of lines, step size and speed.
1763
1764 M.J.RUDD
Eventually this technique will allow the inspection of complex specimens without direct contact. This will eliminate the tedium and contact reliability problems associated with conventional piezo-ceramic NDE.
INTRODUCTION
For many years, ultrasonic surface vibrations have been measured with piezoelectric transducers. However, at a frequency of 10 MHz, the wavelength of the ultrasound is about 0.5 mm, and the transducer may be 12 mm in diameter. This size makes the transducer very directional, and it may have an erratic response if the coupling is not uniform. Further, the mass, or rather the impedance, of the transducer can modify the response of the surface.
The solution to this problem is to use a transducer of very small diameter (less than 0.5 mm) and very small impedance, or an optical transducer. A laser beam focused on the surface to be measured is such a transducer. An optical transducer also has a tremendous advantage: It can be readily scanned across the surface by simply moving a mirror.
Work is being conducted on two complementary laser transducers:
1) A Laser Vibrometer to measure the response of the surface
2) A Laser sound source to induce an ultrasonic pulse in the test specimen.
LASER VIBROMETER
Introduction
The Laser Vibrometer measures very small vibrations induced by ultrasonic waves. These waves have an amplitude of only a few Angstroms. This is very much less than a wavelength of light; however, by measuring phase changes which are small, these amplitudes can be measured. Phase changes as small as one microradian can be measured, and this corresponds to an amplitude of only 10-11 cm.
The interferometer measures 24 x 6 in. and employs a s-mw Helium-Neon gas laser. The output is split into two beams separated in frequency by 40 MHz by an acoustic-optic modulator. One is focused on the vibrating surface and the other falls on a photo-diode. The back-scattered light from the surface is collected, returned to the laser, reflected off the end mirror, and returned to the photo-diode. The original and scattered light beat

ULTRASONIC NDE USING LASER TRANSDUCERS 1765
together. This radio frequency is phase-modulated by the vibrations. The signal is demodulated by a phase-locked loop. This interferometer has a minimum number of components and is very easy to set up and align. Most importantly, it is completed unaffected by thermal drift.
Background
Michelson Interferometer. The first measurements of small amplitude vibrations made with a laser interferometer were conducted by Defferrari and Andrews in 1966 and 1967. Previous measurements with a microscope interferometer and mercury lamp illumination had been made by Schmidt, Edelman, Smith, and Jones in 1961. However, Defferrari and Andrews achieved greater sensitivity with the brighter Helium-Neon laser source. The arrangement was that of a Michelson interferometer with the vibrating target in one of the arms (Fig. 1). Vibration amplitudes as small as 10-9 cm and as large as 1/2 mm could be measured. The vibrations were all at audio frequencies.
One major problem manifests with the technique itself. The output signal is proportional to cos ['O~(t)], where '0 is the difference in phase of the two light beams in the two arms of the
REFERENCE MIRROR ..a...;:o..,.;>"""- (ADJUSTABLE)
PHOTO-DIODE
Fig. 1. Michelson Interferometer.
~ ...... VIBRATING '/. SURFACE I

1766 M.J. RUDD
interferometer and ,(t) is the vibration. Now, if '0 is close to n/2, small changes in ,(t) will produce significant changes in the signal amplitude. However, if '0 is close to 0, small changes in ,(t) will not produce any signficant change in the amplitude. Thus, the sensitivity depends upon the mean phase difference between the two interfering light beams. Now in practice, due to thermal expansion, this phase difference is continually changing. A change in temperature of only a few hundredths of a degree will produce a phase change of n/2 between the two light beams. Temperature fluctuations of this magnitude occur naturally, due to convection currents or general warming or cooling trends, over a period of seconds to tens of seconds. In the above experiments, the author just had to wait until the signal reached a maximum and take that value.
Stabilized apd Heterodyne Interferometers. In later measurements by Khanna, Tonndorf, and Walcott (1968) and Sizgoric and Gundjian (1969), provision was made for adjusting the relative phase of the two beams in order to maximize the signal. However, the adjustment was not automatic and thus could not handle the thermal drift discussed above. Tonndorf and Khanna (1969) had a very interesting application for this very delicate measurement technique. They measured the motion of the eardrum of a cat.
The first authors to overcome the thermal drift problem were Kwaaitaal (1970) and Eberhadt and Andrews (1970). The first author used a microphone diaphram as the "stationary" reflector. The displacement of this diaphram was then used to compensate for phase differences between the two arms of the Michelson interferometer. An alternative technique was used by Eberhadt and Andrews. They inserted a Bragg cell into the output of the laser. This produces two beams separated in frequency by a few MHz. One beam is reflected off the vibrating target and then interfered with the other. We now have a beat frequency of a few MHz, which is phasemodulated by the vibration. This eliminates the thermal drift problem since the beat signal amplitude no longer changes with the phase difference between the beams since the beams are continually changing relative phase at a MHz rate.
On a point of nomenclature, when the two interfering light beams have the same frequency, it is referred to as "Homodyne Interferometry." However, if the two beams are offset in frequency, it is referred to as "Heterodyne Interferometry." Thus, the Eberhadt and Andrews paper was the first description of "Heterodyne Interferometry" applied to the measurement of small vibrations.
The theoretical sensitivity of these techniques should provide a minimum detectable amplitude of about 10-12 cm on a 3-sec time

ULTRASONIC NDE USING LASER TRANSDUCERS 1767
constant (Sizgoric and Gundjian, 1969). However, the miminum observed amplitudes were more like 10-10 cm, two orders of magnitude larger. The cause of this is thought to be ambient noise and vibration. However, ambient levels are very much less in the 1- to 10-MHz range in which we are concerned in this program.
Both Dragsten, Webb, Paton, and Capriana (1976) and Nokes, Hill, and Barelli (1978) have recently used these laser interferometer techniques for measuring eardrum motions. Joyeux (1976) modified the technique and used two intersecting laser beams, instead of one, so that motions transverse to the line of sight can be measured.
Choice of Technique. The only two appropriate techniques for measured ultrasonic waves are
1. Stabilized Michelson Interferometer (or variant)
2. Heterodyne Michelson Interferometer (or variant).
The Fabry Perot Interferometer requires grinding, polishing, and coating of the surface to be measured, and the electronic speckle pattern interferometer does not have the sensitivity required.
The stabilized interferometer requires a mechanical servo to stabilize the light path phase difference. This is done by putting a jitter on the reference mirror and applying a dc voltage to it until the photo-diode signal is in phase with the drive signal. One potential difficulty is that under conditions of continuous thermal expansion, the servo can run out of voltage to apply to the mirror servo. The servo then has to jump half a wavelength in order to stay in lock. The heterodyne interferometer does not have this problem and is actually simpler. It requires only the addition of a single "Bragg cell," which is commercially available. The interferometer is easy to align, compact, rugged, inexpensive, and completely insensitive to thermal drift. Further, the sensitivity of the interferometer is not a function of laser light level or photo-diode sensitivity (only the noise is affected). Thus, larger changes in laser power do not affect the signal level.
Development of the Laser Vibrometer. The Laser Vibrometer is able to measure very small-amplitude high-frequency vibrations. The amplitudes can be a small fraction of an Angstrom up to a quarter of a wavelength of light (1582 A). This is achieved by an Optical Heterodyne Interferometer (Fig. 2). Light scattered from the vibrating surface is caused to interfere with a reference beam. This beam has been shifted in frequency, giving a carrier frequency of 40 MHz. This frequency shift eliminates problems of thermal drift of the interferometer. The amplitude of the vibration is determined by measuring the phase modulation of the
1768 M. J. RUDD
LASER
DOVE PRISM
ACOUSTOOPTIC
MOOULATOR I------------:M::I:cR:o:S~CO.PE
PHOTODIODE
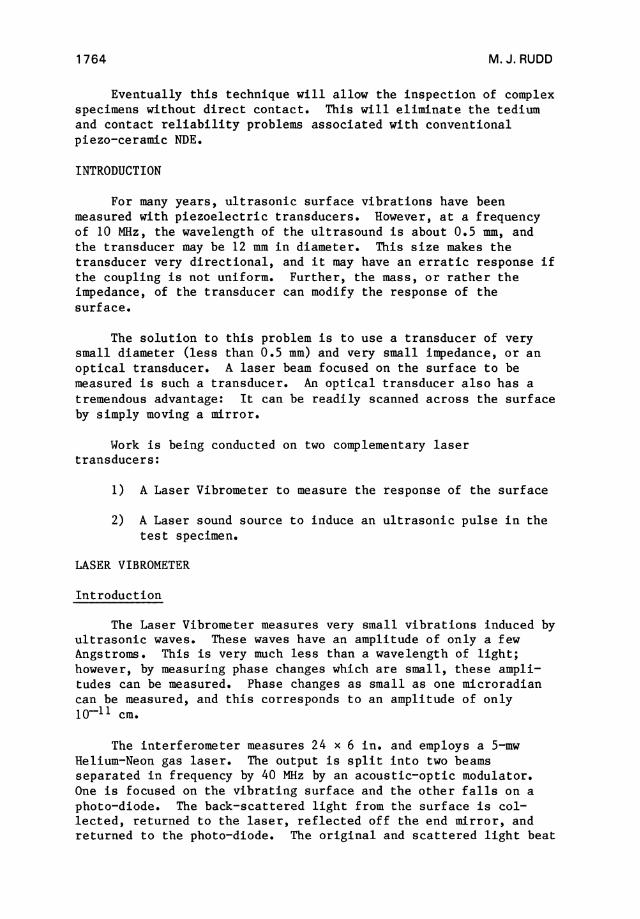
Fig. 2. Optical system.
OBJECTIVE
FOCUS
40-MHz carrier. The signal processor puts out an analog signal proportional to the vibration displacement.
The whole optical system is mounted on an optical bench. It includes a laser; an acousto-optic modulator, which is screwed onto the end; a Dove prism to fold the laser beam; a microscope lens on a translation stage to focus the laser beam on the target; a separating mirror M and a silicon avalanche photo-diode and preamplifier. The power applied to the acousto-optic modulator is a maximum so that most of the optical power is in the beam shifted by 40 MHz. This eliminates problems with optical feedback. The main beam is centered on the microscope objective, which focuses it on the target. The reflected light retraces the path and is reflected off the laser end mirror. It then combines with the weaker beam, which is separated by the mirror M and falls on the photo-diode. The photo-diode generates a 40-MHz output that is phase-modulated in the same way as the optical beam.
Signal Processing
The 40-MHz phase-modulated signal is demodulated by the phaselocked loop shown in Fig. 3. The incoming signal is amplified and hard clipped. It is then fed into a phase-locked loop with a local VCO. The result is that this voltage-controlled oscillator is locked to the incoming signal. However, the loop has a finite bandwidth (100 kHz). Thus the VCO only tracks phase modulation

ULTRASONIC NDE USING LASER TRANSDUCERS 1769
~ N Hard r---.. Mixer H.P. Out ~
Clipper Filter (Phase R.F. Demodulation) Amp
Voltage Controlled Oscillator
(F1requency Demodulation)
L.P. Filter
Fig. 3. Signal processing.
below 100 kHz. Modulation above 100 kHz shows up as an error in the phase-locked loop. Thus, by looking at the output of the loop multiplier we see loop errors and see the high-frequency modulation. Because of the hard clipping, the output is independent of the input signal amplitude and only a function of the phase difference. The instrument is calibrated by unlocking the loop and measuring the amplitude of the triangle wave produced by the beating of the input signal and the yeo.
Note that if we were interested in low-frequency signals (vibrations), we can look at the drive voltage for the yeo. This is a measure of the frequency modulation of the signal at low frequencies.
Laser Vibrometer Sensitivity
The sensitivity of the Laser Vibrometer is characterized by its noise floor on a given bandwidth. This noise level, a I-Hz bandwidth, is shown as a function of frequency in Fig. 4. The noise was measured with a PAR Lock-In Amplifier tuned to a particular frequency. The integration time was 0.1 sec corresponding to a 1.6-Hz bandwidth. The results were divided by 1.26 to produce Fig. 4. The 10-MHz bandwidth shot-noise level gives displacement noise of 15 A rms, which is only about 1000 times the level of the I-Hz noise. With a 10-MHz bandwidth we would expect a level 3000

1770 M. J. RUDD
0.04 ,----........ ---,---.....,...----r---,....------t ~ ~ c i 0.03 C z ~ N
~ 0.02 .... z o
0« I
w 0.01 (/)
o z
o 2 4 6 MHz
8 10
Fig. 4. Noise level of laser vibrometer.
12
times greater. This means that the I-Hz levels may be really lower than measurements indicate and that the measured noise is partly due to noise or pick-up in the Lock-In Amplifier.
If the noise is truly "white," then its power is proportional to its bandwidth or its voltage is proportional to the square root of the bandwidth. Thus, the equivalent noise for the displacement is proportional to the square root of the bandwidth (BW). Thus
1/2 Equivalent displacement noise • .005 (BW) A
For an averaging time t, BW = 1/21Tt and 1/2
Equivalent displacement noise • .006/t A.
Pulse Response of Laser Vibrometer
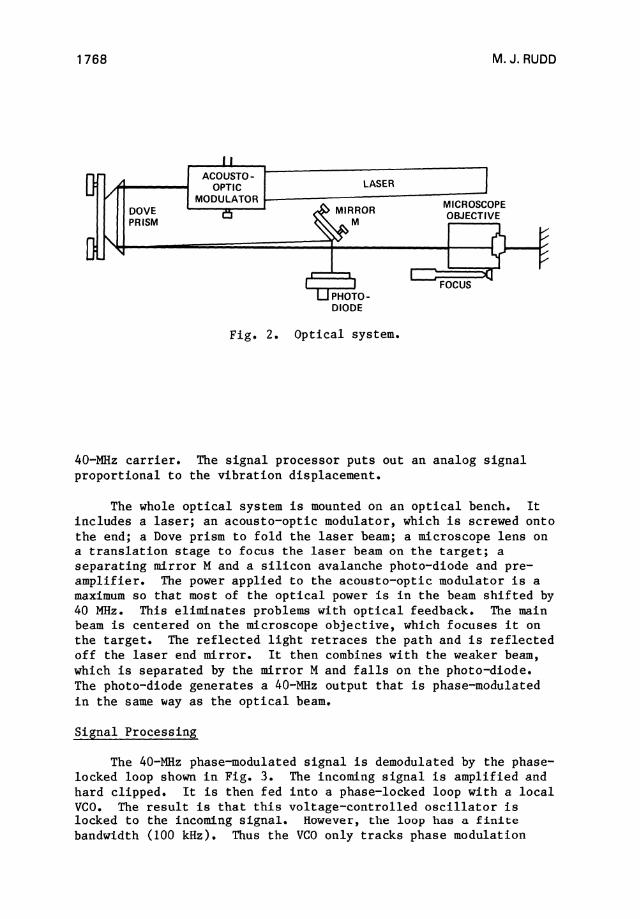
Figure 5 shows the output of the Laser Vibrometer when measuring the response of a PZT driver to a 60-V, 50-nsec impulse. The data were acquired by a Tektronix computing oscilloscope and averaged over 512 pulses. The transducer was nominally a 5-MHz transducer but in fact rang at 2.8 MHz. The peak displacement was
ULTRASONIC NDE USING LASER TRANSDUCERS 1771
N 0 ... )(
>
1.58 r----r--'"T"""-"""T'"--,...--,---'T--'T-'""""T---,--,
1.17
0.35
-0.06
-0.47
)21.6 A -0.88
-1.29
-1.70 '-_-'-_......L.._---.;;a __ "--_-'-_......1.._......&. ........ .......Ii.-_ ...... ---1
0.00 0.20 0.40 0.60 0.80 1.00 1.20 1.40 1.60 1.80 2.00 psec
Fig. 5. Impulse response of PZT transducer.
130 A. Because of the absolute nature of the instrument, we can have a great deal of confidence in the value of this number.
Effects of Surface Finish on Signal-to-Noise Ratio
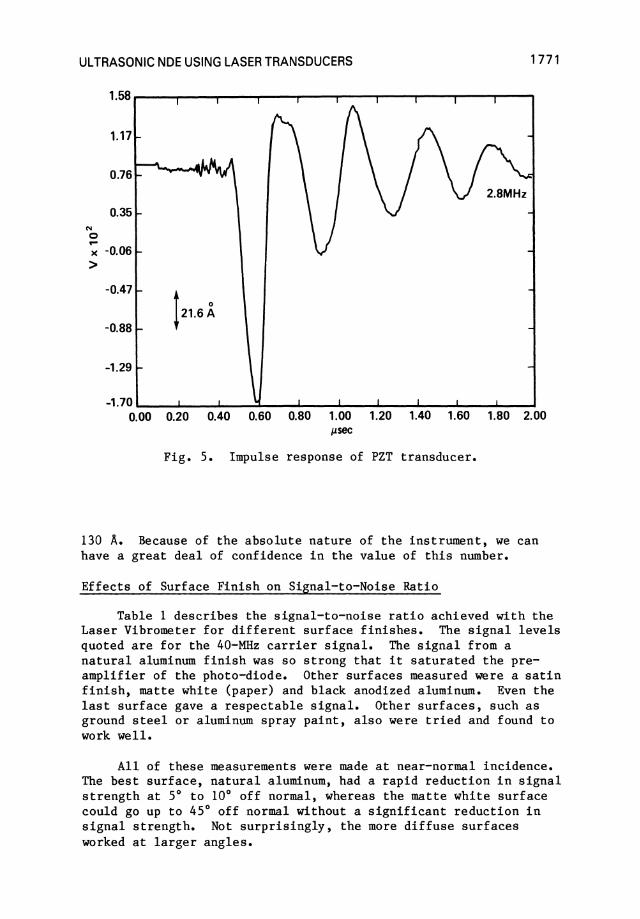
Table 1 describes the signal-to-noise ratio achieved with the Laser Vibrometer for different surface finishes. The signal levels quoted are for the 40-MHz carrier signal. The signal from a natural aluminum finish was so strong that it saturated the preamplifier of the photo-diode. Other surfaces measured were a satin finish, matte white (paper) and black anodized aluminum. Even the last surface gave a respectable signal. Other surfaces, such as ground steel or aluminum spray paint, also were tried and found to work well.
All of these measurements were made at near-normal incidence. The best surface, natural aluminum, had a rapid reduction in signal strength at 50 to 100 off normal, whereas the matte white surface could go up to 450 off normal without a significant reduction in signal strength. Not surprisingly, the more diffuse surfaces worked at larger angles.
1772 M. J. RUDD
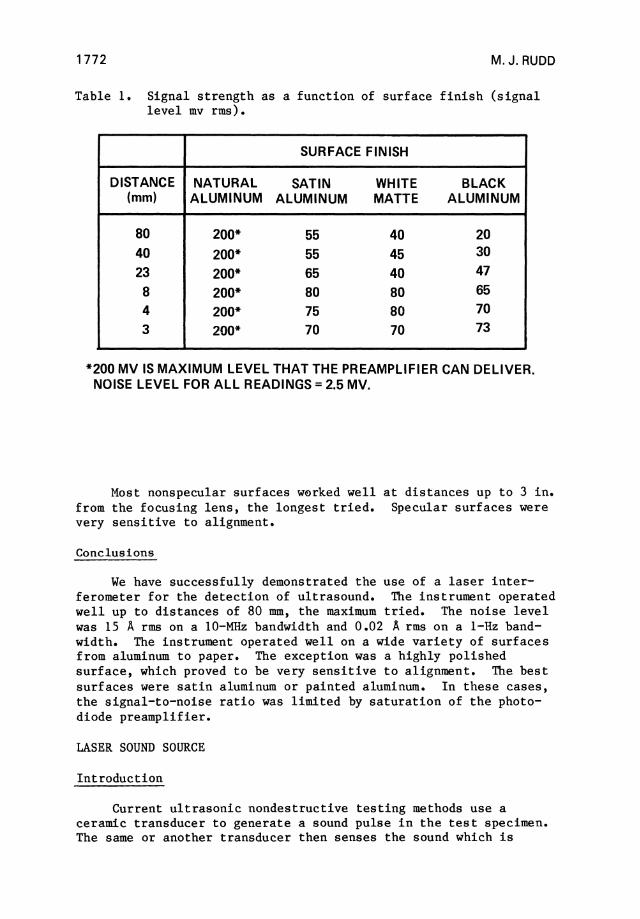
Table 1. Signal strength as a function of surface finish (signal level mv rms).
SURFACE FINISH
DISTANCE NATURAL SATIN WHITE BLACK (mm) ALUMINUM ALUMINUM MATTE ALUMINUM
80 200* 55 40 20
40 200* 55 45 30
23 200* 65 40 47
8 200* 80 80 65
4 200* 75 80 70
3 200* 70 70 73
*200 MV IS MAXIMUM LEVEL THAT THE PREAMPLIFIER CAN DELIVER. NOISE LEVEL FOR ALL READINGS = 2.5 MV.
Most nonspecular surfaces worked well at distances up to 3 in. from the focusing lens, the longest tried. Specular surfaces were very sensitive to alignment.
Conclusions
We have successfully demonstrated the use of a laser interferometer for the detection of ultrasound. The instrument operated well up to distances of 80 mm, the maximum tried. The noise level was 15 A rms on a 10-MHz bandwidth and 0.02 A rms on a I-Hz bandwidth. The instrument operated well on a wide variety of surfaces from aluminum to paper. The exception was a highly polished surface, which proved to be very sensitive to alignment. The best surfaces were satin aluminum or painted aluminum. In these cases, the signal-to-noise ratio was limited by saturation of the photodiode preamplifier.
LASER SOUND SOURCE
Introduction
Current ultrasonic nondestructive testing methods use a ceramic transducer to generate a sound pulse in the test specimen. The same or another transducer then senses the sound which is

ULTRASONIC NDE USING LASER TRANSDUCERS 1773
reflected from a defect. The problems with this technique generally arise from contact between the transducer and the surface. Even when a coupling gel is used, reproducibility can be a problem. Accordingly, the use of noncontacting techniques has been proposed to eliminate these problems. This consists of two aspects -generation of the acoustic pressure pulse and measuring the resulting surface motion. It is the first of these that-we will address here.
Background
The use of lasers to induce high-pressure pulses in a solid has been proposed for many years. The applications have primarily been in studying laser damage and for laser weapons. In the current application we wish to avoid such laser damage. This is achieved either by reducing the laser power levels or by applying a protective coating.
The basic mechanism for the generation of sound, which we shall discuss here, is thermo-elastic. The laser heats the surface of the material and causes it to expand. This in turn causes a stress in the material which then propagates as sound. In order to achieve sufficiently high resolution for NOT, we require very short pulses, less than 50 nsecs. In order to achieve the powers in excess of 10 M watts which we require, and the short pulse duration, we need a 'Q' switch neodymium or ruby laser or a carbon dioxide TEA (Transverse Electric Atmospheric) laser. The first two operate in the visible or near infrared and the last in the mid infrared. The TEA laser gives the most power per dollar and operates at a wavelength where many materials, including water, are good absorbers.
Previous work on the use of thermoelastic waves for nondestructive testing was carried out by von Gutfeld (1980). He conducted experiments on flaw detection using a relatively lowpower nitrogen laser with a peak power of 100 watts. This was focused on an area of about 10-4 cm2 to give peak power of 106 watts/cm2 • The total energy in each pulse was only 10-6 joules, and much of the acoustic energy was above the response of the 10-MHz transducer. We are proposing a I-joule pulse from a TEA laser, which is much better matched to the bandwidth of the transducer. However, in spite of his low energy, von Gutfeld was able to identify flaws in test specimens. In later experiments he used a frequency doubled 'Q' switched laser with a peak power of 6 KW, an energy of 0.2 millijoules and a wavelength of 0.532 ~m. The laser was frequency doubled because no suitable absorber could be found for the fundamental wavelength of 1.06~. This problem does not exist for carbon dioxide lasers with a wavelength of 10.6 ~m. Von Gutfeld focused the laser to a I-mm diameter spot to give a power
1774 M. J. RUDD
density of 106 W/cm2• The acoustic power levels achieved by von Gutfeld were very low, about 10-6 watts.
Sound Generation by Lasers
A very high-power laser pulse, of the order of 15 megawatts, is fired at a surface and a pressure pulse is generated. There are several mechanisms for generating the pressure pulse and these are discussed below. These are, in order of increasing efficiency,
1) Radiation pressure
2) Thermo-elastic
3) Ablation.
Radiation Pressure. When any electromagnetic wave strikes a surface, there is pressure due to the momentum of the wave. This pressure p is given by
p = ~ (1+R) ,
where W = power density of the laser pulse, c = speed of li~ht and R = reflectivity of the surface. For a power density of 10 watts/cm2 (lOll watts/m2) c = 3 x 10⁸ m/sec, and R = 0.9, then
p = 633 newtons/m2•
The radiated acoustic power S is
S = KA p2 pv '
where K = radiation efficiency, A = area of illuminated area, and pv = acoustic impedance of medium. At high frequencies (above 1 MHz), K ~ 1, A = 5 x 10⁻⁴m2 and a = 14 x 106 rayl for aluminum.
Hence, S = 14 x 10-6 watts.
S K W The efficiency = - = - - (1+R)2 WA pv 2 c
= 3 x 10-13 •
The efficiency of radiation pressure is extremely low. It is a function of the laser power density W but this cannot be increased much further without the risk of surface damage.
Thermo-Elastic Generation. The conversion efficiency is greatly increased when we consider the thermal expansion of the

ULTRASONIC NDE USING LASER TRANSDUCERS 1775
surface. When the laser radiation is absorbed by the surface, its temperature is increased at a rate given by
dT W (l-R) dt = d--po-
where d = absorption depth, p = density of surface, and a = specific heat. This ignores thermal diffusion, for the time being.
dT Wa(l-R) The velocity of the surface V = ad dt = 0 ,where a =
linear coefficient of thermal expansion. p
There are now two mechanisms for the generation of sound. The first was considered by von Gutfeld (1980). Here the absorber is in intimate contact with the sound propagating medium. The expansion of the absorber causes the medium to move, and this in turn generates a sound wave. The sound power so generated
s = KAV2p dV d' me me
where p d' v d are the density and sound velocity of the medium me me respectively. Then the efficiency n is
n = L = W (aO-R»)2 WA po Pmed vmed
For aluminum a = 3 x l0-5/°c, a = 103 j/kg/OC, p = 2.7 x
103kg/m3 and
1.sO-R)2W x densities of
for water Pmedvmed = 1.5 x 10⁶•
10-16 where W is in watts/m2• lOll watts/m2 and a reflection
n = 1.5 x 10'--6
This gives n =
Thus for power coefficient of 70%
which is comparable to the factors quoted by von Gutfeld (1980).
However, this model is not relevant to the present application. It is desired to fire a laser at a free surface and generate a pressure pulse underneath. Now the pressure is equal to the rate of change of momentum of the surface, per unit area,
dV p = pd dt
= :~ ad (l-R)la.
The pressure is proportional to the rate of change of the incident dW power density, rather than the power density itself. dt is
incredibly high for a laser pulse. Let us consider aluminum again dW 18 2 and take dt = 10 watts/m Isec.

1776 M. J. RUDD
p = 1010d newtons/m2 •
A typical absorption depth is probably l0-6m, giving
p == 104 newtons 1m2
=1.5 psi.
The sound power
s .. KAp2 = KA (ad(1-R)W) 2/ v pv a ~t /P
where ~t = rise time of the laser pulse. Using aluminum and a rise time of 30 nsec,
n == 10-20 W
= 10-9
for a power density of 107W/cml. This is about 100 times lower than the "loaded" surface discussed above. This is because the mass of aluminum involved is so small.
However, if we are to use a plastic instead of aluminum, typical values are
R .. 0 pv = 3 x 10⁶ Ray1s.
The absorption depth at a wavelength is typically 50 pm, giving
n = 1O-14W,
which is 1 million times more efficient than for aluminum. This comes about because the absorption depth is 50 times greater, there is no loss due to reflection, the expansion coefficient is 3 times larger, and the acoustic impedance is only lIS that of aluminum.
Thus for a power density of 1011W/ml, the efficiency is
n .. 10-3,
which is quite a respectable number.
Ablation. Maccabee, Bell, and Hickman (1980a, 1980b) have proposed and used a C02 TEA laser to induce sound in water. The laser radiation, with a wavelength of 10.6 pm, is absorbed in a very thin (1/2-mi1) layer and vaporizes it. The steam so generated
ULTRASONIC NDE USING LASER TRANSDUCERS 1777
is blasted off the surface, and the reaction causes a pressure on the water surface. Very high localized pressures have been achieved in this manner. In addition, work on laser weapons has been looking at methods for generating intense shock waves inside structures using comparable power densities to those discussed here. The model in this case is that some of the metal surface is vaporized and driven off at high velocities, again causing high reaction pressures.
This technique may be applicable to nondestructive testing. For example, a damp tissue might be laid over the metal surface and the water vaporized. The induced pressure
w p = L Vm
where L = latent heat of vaporization and Vm = ejection velocity. For water, these are 2xl06 joules/kg and 420 m/sec respectively. Thus
p = 2.1 x 10⁻⁴ w 2 x 10⁷ newtons/m2 for W
The sound power
s 2
KAL = pv
S KWV~ and efficiency = WA = ---
L2pv
3 x 10⁻⁴ for W = 10 -11watts/m2. *
The maximum temperature reached is the critical temperature of the ablator, 3S0°C in the case of water. This would not cause any surface damage on aluminum.
If very high power levels (lOll W/mf) are incident upon a contaminated aluminum surface, the absorption length can be extremely short (10-7 m). Then extemely high temperatures are reached, and the surface layer is not only vaporized but even ionized. The plasma continues to absorb energy and increase its velocity. Velocities of the order of 10,000 m/sec can be obtained. This is 2S times higher than for the steam described above. However, the energy required to heat the plasma is also very much
*The efficiency can be increased even further by placing a transparent polyethylene cover over the steam to prevent its escape.
1778 M. J. RUDD
higher than for steam. Reilly, Ballantine, and Woodroffe (1979) have modeled this mechanism, and they predict pressures of about 107 newtons/m2 for this mechanism for power densities of lOll W/m2• This is very comparable to the steam ablation predictions. The amount of the aluminum removed is so small (10-7 m thick) as to be almost invisible. Thus, although the surface is damaged, the damage is so small as to be virtually insignificant.
Laser Damage
The damage done by the laser beam to the surface it is impacting is determined by the temperature rise produced on that surface. Since the laser pulse is so brief, there is no time for thermal diffusion to take place. The heat is then absorbed within the optical absorption depth. The temperature rise 6T is given by
W6t 6T =-. pad
For an energy density of 104 J/m2, the temperature rise is 1000D C for aluminum but only 30DC for a plastic, since the absorption depth is much larger.
This is indeed confirmed by experiments. The laser was found to scorch aluminum, but no obvious damage occurred in most plastics.
Conclusions
Three mechanisms exist whereby a laser can generate ultrasonic pulses:
1) Radiation pressure, which is very inefficient
2) Thermoelastic, which is very inefficient for metals because of their small absorption depth. Plastics are 1 million times more efficient for this transduction
3) Ablation, which is relatively efficient, but inherently produces some surface damage.
By applying a thin plastic film over the test specimen, the efficiency of generating ultrasonic pulses with a laser is greatly enhanced without producing any damage to the plastic.

ULTRASONIC NDE USING LASER TRANSDUCERS 1779
REFERENCES
Laser Vibrometer
H.A. Defferrari and F.A. Andrews (1966). J. Acoust. Soc. Amer. 39, pp. 979-980.
H.A. Defferrari, R.A. Darby, and F .A. Andrews (1967). "Vibrational Displacement and Mode-Shape Measurement by Laser Interferometer," J. Acoust. Soc. Amer. 42, pp. 982-990.
V.A. Schmidt, S. Edelman, E.R. Smith, and E. Jones (1961). "Optical Calibration of Vibration Pickups at Small Amplitudes," J. Acoust. Soc. Amer. 33, pp. 748-751.
J. Tonndorf and S.M. Khanna (1968). "Submicroscopic Displacement Amplitudes of the Tympanic Membrane (Cat) Measured by a Laser Interferometer," J. Acoust. Soc. Amer. 44, pp. 1546-1554.
S.M. Khanna, J. Tonndorf, and W.W. Walcott (1968). "Laser Interferometer for the Measurement of Sub-Microscopic Displacement Amplitudes and Their Phases in Small Biologic Structures," J. Acoust. Soc. Amer. 44, pp. 1555-1565. -
S. Sizgoric and A.A. Gundjian (1969). "An Optical Homodyne Technique for Measurement of Amplitude and Phase of Subangstrom Ultrasonic Vibrations," Proc. IEEE 57, pp. 1313-1314.
F.J. Eberhadt and F.A. Andrews (1970). "Laser Heterodyne System for Measurement and Analysis of Vibration," J. Acoust. Soc. Amer. 48, pp. 603-609.
Th Kwvaaitaal (1970). "Contribution to the Interferometric Measurement of Sub-angstrom Vibrations," Rev. Sci. Instr. 45, pp. 39-41.
P.R. Dragsten, W.W. Webb, J.A. Paton, and R.R. Capriana (1976). "Light-Scattering Heterodyne Interferometer for Vibration Measurement in Auditory Organs," J. Acoust. Soc. Amer. 60, pp. 665-671.
Laser Sound Source
R.J. VonGutfeld (1980), "Laser Generated Elastic Waves for Ultrasonic Generation," Naval Air Development Center Report No. NADC-28240-60.
1780 M. J. RUDD
G.D. Hickman, B.S. Maccabee and C.E. Bell (1980a), "Feasibility Study of Airborne Bathymetric Sensing Using the C02 Laser/Acoustic Technique," Office of Naval Research Report No. AST-R-070580.
B.S. Maccabee, C.E. Bell, and G.D. Hickman (1980b), "Beneath and Above Water Echo Detection Using a Laser Induced Sound Source," Report on NAVAIR Task A035370K/009B/OF-371-000.
C.E. Bell and B.S. Maccabee (1974), "Shock Wave Generation in Air and in Water by C02 TEA Laser Radiation Applied Optics," Vol. 13, pp. 605-609.
J.P. Reilly, A. Ballantine, and J.A. Woodroffe (1979), "Modeling of Momentum Transfer to a Surface by Laser-Supported Absorption Waves," AIAA Journal Vol. 17, pp. 1098-1105.
ACKNOWLEDGEMENT
The work reported here was performed under support from the Naval Air Development Center, Warminster, PA, Contract Number N62269-80-6-0260.
ULTRASONIC NDE USING LASER TRANSDUCERS 1781
DISCUSSION
R.J. von Gutfeld (IBM): In regard to the teflon, there was an experiment done about 20 years ago where a fluid was used in which a dye was put. That fluid in turn was put in contact with a second fluid separated by a membrane and then the detection was of that second fluid. Now, by varying the CC'.:(,~lltration of the dye, we can vary the length over which the sound is generated. If your model is indeed correct and it's just a volume distribution, those results would be very nicely compared, I think, by using this double liquid arrangement, where you can vary the absorption length. That would be a way of comparing your results; or you might have to use a visible laser to do it.
M.J. Rudd (Bolt, Beranek and Newman): Yes. That's quite correct. The measurements we are making are infrared wavelengths where most materials absorb quite nicely, and indeed we would like to look at the optical case where you can control the absorption by dye concentration.
D.J. Green (Rockwell International Science Center): Is the reason you don't show any waveform because you don't have the proper equipment? I can hardly believe that--Bolt, Beranek and Newman have a lot of that equipment, so it must be some other reason. Have you tried things like spraying a teflon spray on the surface of the metals; would that work?
M.J. Rudd: The first reason is that we're limited primarily by the 3,000 ASA speed of the polaroid film.
D.J. Green: But you use the transmitter recorder?
M.J. Rudd: That's not a trivial operation to set up. We haven't done that. We are, however, in the process of obtaining the new 20,000 ASA polaroid film which we feel will give us results we can publish. As far as spraying the teflon coating on the surface, yes, that would be practical. But that would leave a permanent coating which would have to be removed on any practical specimen. What we are looking at is an adhesive teflon film which can be peeled off the surface after it has been used.
G. De Massi (USA ARRADCOM): You would enforce the advantages of heterodyne in optical techniques. However, all the heterodyne optical techniques which were applied in the past operate on the principle that you remove the sensitivity surface displacement. You lose the phase information out of the optical signal, so you either have a velocity or acceleration term. You haven't mentioned that. How does your heterodyne system work?

1782 M. J. RUDD
M.J. Rudd: The heterodyne system doesn't lose the phase information. It translates the phase information from the optical frequency to the shift frequency, which in this case is 40 MHz. Now, there are electronic circuits you can use to demodulate the 40 MHz signal, and indeed the system you described uses the frequency information in that there are two places in the phase lock loop where you can take out the data. One is a drive voltage to the voltage control oscillator which is related to the frequency shift, and that is the velocity information that you mentioned. We are taking the error of the phase detector itself, so that what the phase lock loop does is keep the electronic oscillator in lock with the signal coming in, so that we do not see any signal for low frequencies where the vibrations or thermal expansion take place. However, the phase lock loop is incapable of tracing very high frequencies, and we look at the error which occurs above about 100 KHz and the error in the phase lock loop is the ultrasonic signal. You can run them either way and, in fact, for differ.ent applications we built the circuitry to operate either. For low frequency application, the velocity tracking technique tends to be better because you get ambiguity if you have more than one wavelength of displacement. If you go beyond a thousand Angstroms, the phase starts to fold over on itself, and you don't know how many cycles you've tracked, so people tend to track the velocity information. But for very small displacements the phase information is better. Both are practical.