comparing and consolidating two heuristic metaschemas
TRANSCRIPT

Available online at www.sciencedirect.com
www.elsevier.com/locate/yjbin
Journal of Biomedical Informatics 41 (2008) 293–317
Comparing and consolidating two heuristic metaschemas
Yan Chen a,b,*, Yehoshua Perl a, James Geller a, George Hripcsak c, Li Zhang d
a New Jersey Institute of Technology, Newark, NJ 07102, USAb Computer Information Systems Department, Borough of Manhattan Community College, CUNY, New York, NY 10007, USA
c Department of Medical Informatics, Columbia University, New York, NY 10032, USAd Business and Computer Science Department, College of The Sequoias, Visalia, CA 93277, USA
Received 5 May 2007Available online 17 November 2007
Abstract
A metaschema is an Abstraction Network of the UMLS’s Semantic Network (SN) obtained from a connected partition into its col-lections of semantic types. A metaschema can support comprehension, visualization and navigation of the SN. In this paper, a method-ology is presented to evaluate and compare two given metaschemas, based on their structural properties. This methodology was appliedto the top-down metaschema and the bottom-up metaschema, derived from two studies involving two groups of UMLS experts. By theCronbach alpha estimate, the bottom-up metaschema is reliable, while the top-down metaschema is not. An algorithm was designed toyield a consolidated metaschema enjoying the best and avoiding the worst of the two given metaschemas. The consolidation algorithmwas applied to the above two metaschemas, The resulting consolidated metaschema has better structural properties than either of the twometaschemas and better supports user orientation visualization, and navigation of the Semantic Network.� 2007 Elsevier Inc. All rights reserved.
Keywords: UMLS; Semantic Network; Abstraction Network; Metaschema; Comparison; Consolidation; Evaluation
1. Introduction
The Metathesaurus (META) [1,2] and the SemanticNetwork (SN) [3–6] are two knowledge resources of theUnified Medical Language System (UMLS) [7–9]. TheMETA is a valuable concept repository containing morethan 1,300,000 (2006 AC) biomedical concepts from vari-ous source terminologies. The SN provides a high-levelabstraction of the biomedical domain and consists of 135broad categories called semantic types (STs), by which allconcepts of the META are categorized. The SN can helpwith user orientation and navigation in the large METAknowledge base and with interaction with the knowledgeembedded in the UMLS.
Although the SN provides a high-level abstraction of theMETA, it is still difficult for a user to obtain full compre-
1532-0464/$ - see front matter � 2007 Elsevier Inc. All rights reserved.
doi:10.1016/j.jbi.2007.11.001
* Corresponding author. Address: New Jersey Institute of Technology,Newark, NJ 07102, USA.
E-mail address: [email protected] (Y. Chen).
hension of the SN, since there are about 7000 non-IS-Asemantic relationships connecting pairs of STs. Previousresearch has been conducted on reducing the complexityof the SN. McCray et al. [10] developed a methodologyfor aggregating STs into 15 groups based on 6 general prin-ciples: semantic validity, parsimony, completeness, exclu-sivity, naturalness and utility. Kumar et al. [11] used aderivation formalized in predicate logic to reduce the com-plexity of the SN. We have developed partitioning tech-niques to obtain a metaschema [12], which serves as acompact abstraction of the SN.
According to the definition in [12], a metaschema is anabstraction based on an underlying partition of the SN intoconnected groups of STs. Each group is represented by asingle metasemantic type (MST). The purpose of a meta-schema is to present a compact abstraction-level networkof the SN, where each MST represents a subject area ofthe SN. That is, the STs of each subject area constitute agroup in the partition underlying the metaschema. Similarto the SN itself, a metaschema of the SN is formally a

1 Semantic types will be written in bold style and MSTs will be written in‘‘small caps’’ style.
294 Y. Chen et al. / Journal of Biomedical Informatics 41 (2008) 293–317
directed network which consists of a set of nodes, theMSTs, connected via hierarchical meta-child-of relation-
ships and semantic meta-relationships. For more detailssee Section 2.1. In [13], we extended the notion of a meta-schema to a Directed Acyclic Graph (DAG) network,rather than the tree structure of the SN. We then obtainedtwo different metaschemas from the Enriched SemanticNetwork [14], which is an extension of the SN having aDAG structure.
We designed algorithms to generate two different metas-chemas, the cohesive metaschema [12], and the lexical meta-
schema [15]. Each of these two metaschemas can serve as ahigher-level abstract view of the SN to help users’ under-standing of the complex SN. An important assumptionunderlying the construction of these two metaschemas isthat even though they are generated by algorithmic pro-cesses, they effectively yield subject areas meaningful anduseful to a human. In order to evaluate the validity of thisassumption, we conducted a heuristic top-down study [16].In this study, a group of experts, who published on UMLSresearch or related subjects, was recruited, with each expertcharged to derive his/her own metaschema. A consensusmetaschema of all the experts’ metaschemas was thenderived.
However, the result of the top-down study was disap-pointing, since the metaschemas obtained by the expertsvaried widely while we expected a good degree of agree-ment among experts. As a consequence, we introduce inthis paper an alternative bottom-up approach. We reportin this paper on a second study of experts applying thisapproach.
Naturally, one wants to compare the top-down and thebottom-up consensus metaschemas to find out which is bet-ter fitting for evaluating the algorithmatically obtainedmetaschemas. Since the two consensus metaschemas areresults of human considerations, only a comparison andevaluation of their structural properties can be objective.In this paper, we present methods for comparing two metas-chemas. We will further introduce several measures to help inassessing the quality of a metaschema for supporting userorientation into the SN. These measures are structural mea-sures, intended to reflect the ease of comprehension and ori-entation. Those structural measures were used for evaluatingthe two metaschemas. As will be shown, each of them haspros and cons, in terms of its structural properties. We desirea metaschema that can best facilitate user orientation intothe SN, by enjoying the advantages of each of the consensusmetaschemas and avoiding their disadvantages. To this end,we have developed an algorithm to obtain a consolidatedmetaschema of the two given metaschemas. The consoli-dated metaschema obtained can serve as a yardstick for themeasurement of the quality of the metaschemas generatedby algorithms [12,15], since it is derived from experts’ metas-chemas. We include a glossary of the different metaschemasmentioned in this paper.
In [17], Gu et al. use the metaschema paradigm to locateconcepts with high likelihood of errors. A metaschema pro-
vides various compact partial views of the SN to help userswith visualization, orientation and navigation in the SN[12].
The metaschema framework can be extended beyond theUMLS to any dual level terminological system which con-sists of an upper level terminology of broad categories, inaddition to the concept repository, with assignment of cat-egories for every concept. Such a terminological system willhave advantages in supporting abstraction, navigation andintegration. Metaschemas and their consolidation can fur-ther support abstraction of the upper level terminology.
One effort in this direction appears with regard to theIEEE Standard Upper Ontology (SUO) [18,19] as an upperlevel terminology for the WordNet terminology [20].Assignment of the SUO categories for the WordNet termi-nology is described in [21].
Another related dual level terminology is suggested in[22] for the Medical Entity Dictionary (MED) [23]. Theupper level terminology there is called schema (followingthe Object-Oriented database paradigm [24]). A partitionfor this schema is suggested in [25]. This partition can prob-ably serve as a basis for a metaschema of a different kindbut further research is needed.
In addition to the notion of metaschema, other previouswork has focused on different methods to facilitate UMLSknowledge comprehension and visualization. Bodenreiderand McCray described how to use visualization of semanticrelationships as important indicators to explore coherenceof semantic groups and help in auditing and validatingthe SN [26]. In [27] Nelson et al. presented the Hypercardbrowser MetaCard to enable users to extend the browsingprocess from META to a variety of different knowledgesources. In [28], knowledge exploration tools using levelsof indentation to represent items standing in hierarchicalrelationships were used for displaying biomedical hierar-chies in environments such as Protege-2000. A review ofknowledge visualization and navigation in the medicaldomain was presented by Tuttle et al. in [29].
2. Background
2.1. A metaschema of the SN
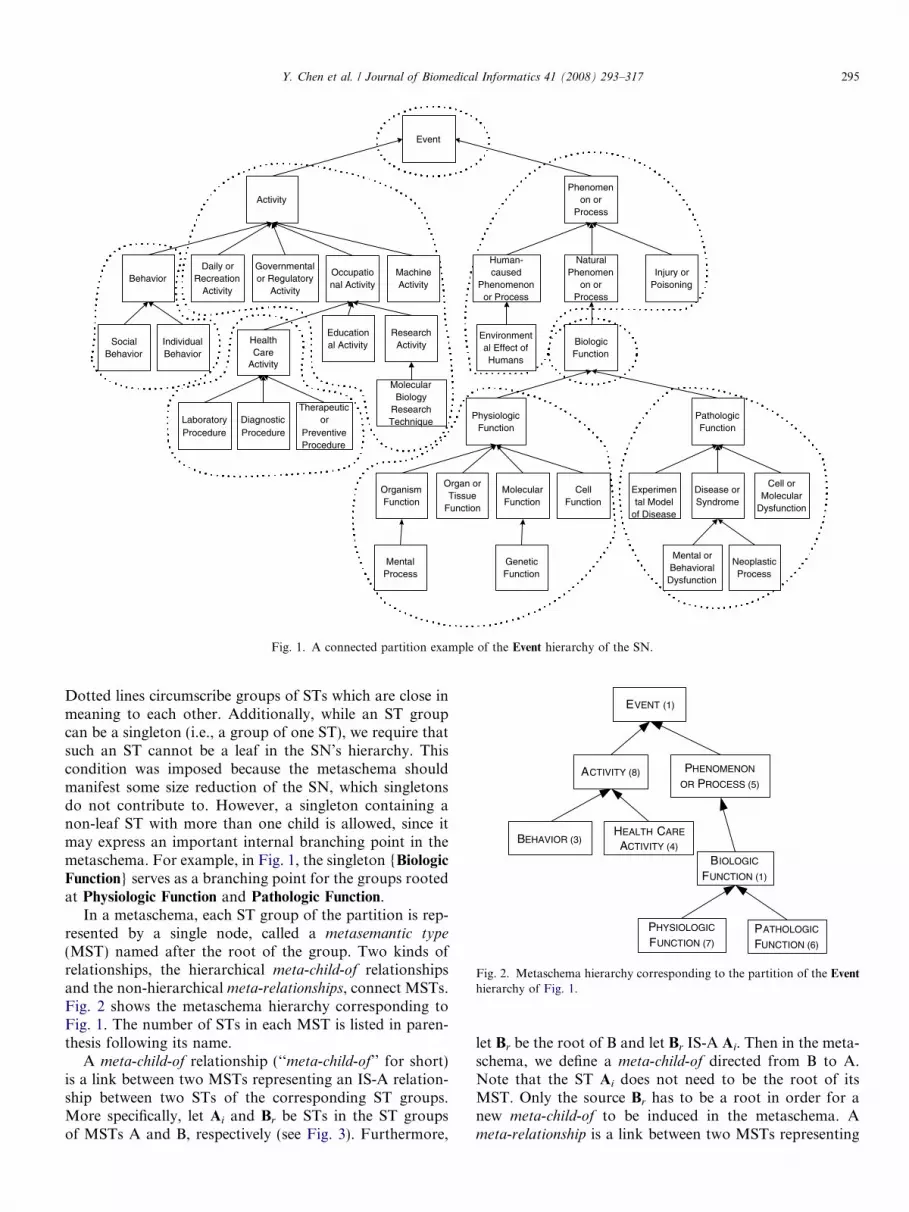
The notion of a metaschema was introduced in [12] as anabstraction of the SN. An ST group is called connected if itsSTs together with their respective IS-A links constitute aconnected subgraph of the SN hierarchy with a uniqueroot. A partition is called connected if each of its ST groupsis connected. A metaschema is based on a connected parti-tion of the SN, where the SN’s IS-A hierarchy is parti-tioned into disjoint ST groups. Fig. 1 shows a partitionof the Event1 portion of the UMLS SN hierarchy. Eachbox represents an ST. Each arrow represents an IS-A link.
Event
Governmentalor Regulatory
Activity
Daily orRecreation
Activity
Occupational Activity
MachineActivity
Activity
Behavior
SocialBehavior
IndividualBehavior
HealthCare
Activity
Educational Activity
ResearchActivity
Environmental Effect ofHumans
BiologicFunction
Human-caused
Phenomenonor Process
NaturalPhenomen
on orProcess
Phenomenon or
Process
NeoplasticProcess
OrganismFunction
MentalProcess
LaboratoryProcedure
DiagnosticProcedure
Therapeuticor
PreventiveProcedure
MolecularBiology
ResearchTechnique
PhysiologicFunction
Injury orPoisoning
PathologicFunction
MolecularFunction
CellFunction
Disease orSyndrome
Experimental Model
of Disease
Cell orMolecular
Dysfunction
Organ orTissue
Function
GeneticFunction
Mental orBehavioral
Dysfunction
Fig. 1. A connected partition example of the Event hierarchy of the SN.
PHENOMENON
OR PROCESS (5)
HEALTH CARE
ACTIVITY (4)BEHAVIOR (3)
EVENT (1)
PATHOLOGIC
FUNCTION (6)
BIOLOGIC
FUNCTION (1)
ACTIVITY (8)
PHYSIOLOGIC
FUNCTION (7)
Fig. 2. Metaschema hierarchy corresponding to the partition of the Event
hierarchy of Fig. 1.
Y. Chen et al. / Journal of Biomedical Informatics 41 (2008) 293–317 295
Dotted lines circumscribe groups of STs which are close inmeaning to each other. Additionally, while an ST groupcan be a singleton (i.e., a group of one ST), we require thatsuch an ST cannot be a leaf in the SN’s hierarchy. Thiscondition was imposed because the metaschema shouldmanifest some size reduction of the SN, which singletonsdo not contribute to. However, a singleton containing anon-leaf ST with more than one child is allowed, since itmay express an important internal branching point in themetaschema. For example, in Fig. 1, the singleton {Biologic
Function} serves as a branching point for the groups rootedat Physiologic Function and Pathologic Function.
In a metaschema, each ST group of the partition is rep-resented by a single node, called a metasemantic type
(MST) named after the root of the group. Two kinds ofrelationships, the hierarchical meta-child-of relationshipsand the non-hierarchical meta-relationships, connect MSTs.Fig. 2 shows the metaschema hierarchy corresponding toFig. 1. The number of STs in each MST is listed in paren-thesis following its name.
A meta-child-of relationship (‘‘meta-child-of’’ for short)is a link between two MSTs representing an IS-A relation-ship between two STs of the corresponding ST groups.More specifically, let Ai and Br be STs in the ST groupsof MSTs A and B, respectively (see Fig. 3). Furthermore,
let Br be the root of B and let Br IS-A Ai. Then in the meta-schema, we define a meta-child-of directed from B to A.Note that the ST Ai does not need to be the root of itsMST. Only the source Br has to be a root in order for anew meta-child-of to be induced in the metaschema. Ameta-relationship is a link between two MSTs representing

A
B
Ar
Br
Ai
B j
meta-child-of IS-A relationship
Ai
Fig. 3. Interpretation of the definition of meta-child-of.
296 Y. Chen et al. / Journal of Biomedical Informatics 41 (2008) 293–317
a specific semantic relationship (non-IS-A relationship)between the two corresponding ST groups (for details see[12]). The derivation of the meta-child-ofs and the meta-
relationships is motivated in detail in [12].For example, the hierarchy of the Event portion of the
SN could be partitioned into the eight ST groups shownin Fig. 1. Each semantic-type group is represented by anMST in the corresponding metaschema. An MST PHENOM-
ENON OR PROCESS is defined to represent the ST group rootedat Phenomenon or Process in Fig. 1. The metaschema hier-archy derived from the partition in Fig. 1 was shown inFig. 2.
Overall, a diagram of a metaschema serves as a goodvisualization mechanism supporting orientation to the SNand, in turn, the META, and helps in the navigation ofthe UMLS knowledge. In [12] we introduced various par-tial graphical views of groups of STs supported by themetaschema paradigm. These views can help in orientationof a user to the full scope of the SN’s semanticrelationships.
2.2. Top-down heuristic metaschema
An important assumption underlying the constructionof the algorithmically generated metaschemas in previousresearch [12,15] is that the resulting subject areas of theSN are natural to a human. In order to validate thisassumption, we conducted the following study [15]. A num-ber of experts with reputation in the UMLS research areaor related areas were selected. We sent each expert a dia-gram of the SN’s IS-A hierarchy, i.e., the two trees rootedat Event and Entity.
The experts were asked to partition the SN starting atthe roots (i.e., top-down). The design of the study follows
the Aristotelian [30] paradigm, where species are specifiedaccording to genus and differentiate. Partitioning is donebased on the extent of the difference between the childST and its more general parent ST. Details of this studyhave appeared in previous publications [12,16] and areomitted.
The design of the metaschema utilizes the one-to-onecorrespondence between the ST groups underlying theMSTs, and their root STs. By selecting a set of STs thatare ‘‘important and quite different’’ from their parents, aparticipating expert induces a partition of the SN, whereeach selected semantic type is a root of its group, implyinga corresponding ‘‘expert metaschema.’’
While studying responses from our 11 UMLS experts,we found that individual participants’ responses variedgreatly both in the choice of STs marked as roots of groupsand their numbers. For example, experts 1 and 2 chose 21and 34 STs to name MSTs in their expert metaschemas,respectively. Table 1 shows the number of MSTs for eachexpert metaschema, corresponding to the number of STsmarked by that expert with a minimum, maximum andaverage numbers of 12, 36 and about 26, respectively.The standard deviation is 10.23.
We were interested in quantifying the variability of theexperts’ responses. Towards this end, we computed theX-by-X agreement matrix, among X experts, to examinethe agreement between any two experts in the same studygroup. In the agreement matrix, the number in row i andcolumn j indicates how many MSTs expert i and expert j
agree on. The agreement matrix of all 11 experts (Table2) demonstrates the high variability of participantresponses. For instance, participants 2 and 5 both marked34 STs and agreed on 27 of them. The average inter-partic-ipant agreement is 16.76 (only about 63% of the averagenumber of marked STs, 26.73), with a high of 30 and alow of 6. The large range shows the high variability of par-ticipant responses.
It was expected that some choices would be made bymany participating experts. We were interested in metasch-emas that represent a kind of aggregation of the experts’responses rather than in the expert metaschemas of theindividuals. In particular, we constructed a sequence ofcumulative metaschemas, each of which reflects a specificlevel of aggregation of the experts. Suppose we have X
experts’ responses. We define a threshold value N in therange (1, X) to represent the level of aggregation. We con-struct the cumulative metaschema for a given N as follows.For each ST marked by at least N participating experts, anMST is defined and given the name of the ST. Then meta-
child-of’s and meta-relationships are derived as describedbefore.
In our study, we received responses from 11 experts(X = 11) and thus obtained 11 cumulative metaschemasby varying N over the range (1,11). For N = 8, for exam-ple, the same 16 STs were marked by at least 8 out of the11 experts, and so the corresponding cumulative metasche-ma has 16 MSTs. Table 3 shows the number of semantic

Table 1Number of MSTs each expert chose in the top-down study
Participant 1 2 3 4 5 6 7 8 9 10 11 Average
# MSTs (expert) 21 34 21 35 34 35 25 26 12 15 36 26.73
Table 2Inter-participant agreement matrix; average = 16.76
1 2 3 4 5 6 7 8 9 10 11
1 19 15 16 15 19 12 11 11 12 202 18 28 27 27 20 19 12 14 283 16 16 17 14 9 10 10 184 28 26 23 21 8 10 305 27 20 20 8 10 276 19 22 10 14 277 14 8 7 248 6 9 189 9 11
10 13
Table 3Number of semantic types marked by at least N participants
Threshold (N) 1 2 3 4 5 6 7 8 9 10 11
# Marked MSTs 45 45 45 42 36 26 20 16 10 7 2
Y. Chen et al. / Journal of Biomedical Informatics 41 (2008) 293–317 297
types marked for each N. Obviously, the larger the value ofN, the smaller the common number of MSTs.
As we can see from Table 3, the number of MSTs variesfrom 2 (for N = 11) to 45 (for N = 1, 2 and 3). The corre-sponding metaschema for the N = 11 case contains onlytwo MSTs ENTITY and EVENT, each spanning the whole cor-responding tree of the SN. For the N 6 3 cases, each non-leaf ST names an MST. The metaschema that emerges inthose cases is effectively just the SN itself, without itsleaves. No real grouping of related STs occurs. Obviouslysuch extreme metaschemas are not interesting.
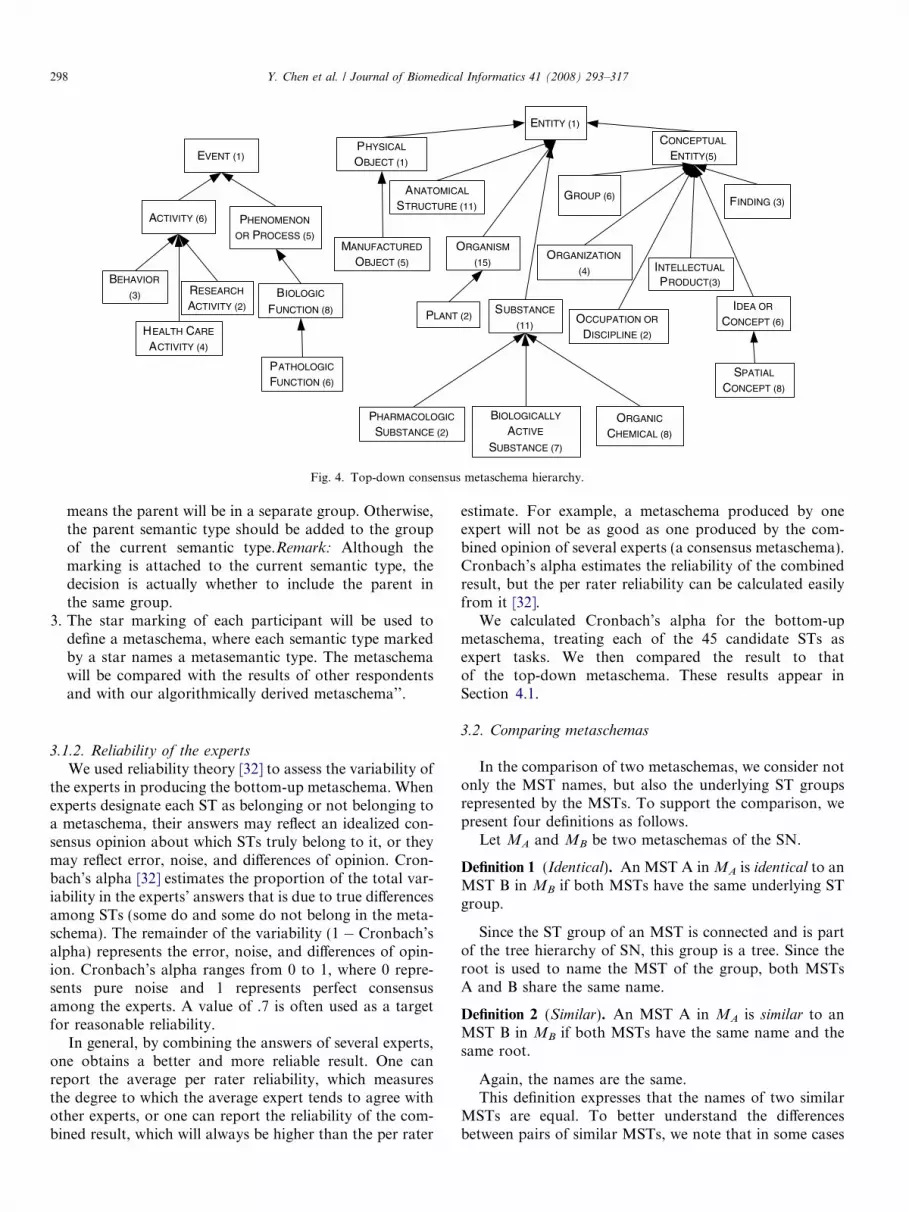
We denote the cumulative metaschema with the thresh-old value N representing a simple majority of the experts(i.e., N = ØX/2ø) as the consensus metaschema [31]. Forthe top-down study, the consensus metaschema (N = 6)contains 26 MSTs. Its hierarchy is shown in Fig. 4. We callthis metaschema the top-down consensus metaschema. Nev-ertheless, we were not satisfied by this semantic metasche-ma as reflecting experts’ opinions. The variations amongthe various experts’ metaschemas were too wide. For exam-ple, there were no STs that all experts chose, except for theroots, Entity and Event which were dictated by the top-down approach. We note that in the study, the numberof MSTs varied greatly. Also, important MSTs such asMOLECULAR SEQUENCE(4), which appears in the lexical meta-schema, or ANATOMICAL ABNORMALITY(3), ANIMAL(9), andPLANT(2) which appear in the cohesive metaschema, aremissing from the top-down consensus metaschema,although we expected them.
One possible explanation for the large variations and thelack of expected MSTs is that the instructions we providedto the experts were deficient. The decision of choosing an
ST to head a group is made without considering the groupmembers (which are further down in the tree of SN) andthus were not scanned yet, in the top-down scanning.The decision is made solely based on comparing the currentST to its parent (P) and deciding whether it is too impor-tant and different from P to be in P’s group. The exactinstruction given was ‘‘while scanning, marked by starsemantic types which you judge as important and quite dif-ferent from their parent semantic types’’. No further elab-oration was given.
In other words, the domain experts were asked to iden-tify substantial or unusual shifts of granularity in the tax-onomy of SN. The lower level of agreement seems to becaused by the need of the expert to make such decisionswithout full knowledge. By this we refer to the inherentproblem of choosing the current ST to represent a groupof descendant STs, without knowing who will be the mem-bers of the group since they were not scanned yet. Further-more, although it is known that the group members aredescendants of the current ST, it is not known whichdescendants, as some of them may be selected later for sub-sequent groups.
This problem led us to consider an alternative approach,where the SN is scanned bottom-up and a decision regard-ing a root of a group is made by an expert considering thewhole group as well as the comparison to its parent. Thiswas expected to enable experts to create a better metasche-ma based on semantic considerations, as their decisionswould be based on more knowledge. In the next section,we present the bottom-up approach.
3. Methods
3.1. Design of bottom-up heuristic metaschema
3.1.1. The bottom-up study
In order to find a better way for validating algorithmi-cally generated metaschemas, we conducted a bottom-upstudy with 13 participants. Instead of scanning the STs ofSN from the roots to the leaves as in the top-down study,the participants in the bottom-up study were instructed toscan the two SN trees from the leaves up to the roots. Thedetailed instructions are as follows:
1. ‘‘A leaf (semantic type without children) is not chosen tohead a group.
2. When processing the current semantic type, consider towhat extent the descendant semantic types of its groupare more specific than its parent semantic type. If it ismuch more specific, then choose the current semantictype to head its group by marking it with a star. That
ENTITY (1)
SUBSTANCE
(11)
BIOLOGICALLY
ACTIVE
SUBSTANCE (7)
ORGANIC
CHEMICAL (8)
ORGANIZATION
(4)
GROUP (6)
OCCUPATION OR
DISCIPLINE (2)
IDEA OR
CONCEPT (6)
FINDING (3)
PLANT (2)
ORGANISM
(15)
MANUFACTURED
OBJECT (5)
ANATOMICAL
STRUCTURE (11)
PHENOMENON
OR PROCESS (5)
HEALTH CARE
ACTIVITY (4)
BEHAVIOR
(3)
EVENT (1)
PATHOLOGIC
FUNCTION (6)
BIOLOGIC
FUNCTION (8)
ACTIVITY (6)
SPATIAL
CONCEPT (8)
RESEARCH
ACTIVITY (2)
PHYSICAL
OBJECT (1)
CONCEPTUAL
ENTITY(5)
INTELLECTUAL
PRODUCT(3)
PHARMACOLOGIC
SUBSTANCE (2)
Fig. 4. Top-down consensus metaschema hierarchy.
298 Y. Chen et al. / Journal of Biomedical Informatics 41 (2008) 293–317
means the parent will be in a separate group. Otherwise,the parent semantic type should be added to the groupof the current semantic type.Remark: Although themarking is attached to the current semantic type, thedecision is actually whether to include the parent inthe same group.
3. The star marking of each participant will be used todefine a metaschema, where each semantic type markedby a star names a metasemantic type. The metaschemawill be compared with the results of other respondentsand with our algorithmically derived metaschema’’.
3.1.2. Reliability of the experts
We used reliability theory [32] to assess the variability ofthe experts in producing the bottom-up metaschema. Whenexperts designate each ST as belonging or not belonging toa metaschema, their answers may reflect an idealized con-sensus opinion about which STs truly belong to it, or theymay reflect error, noise, and differences of opinion. Cron-bach’s alpha [32] estimates the proportion of the total var-iability in the experts’ answers that is due to true differencesamong STs (some do and some do not belong in the meta-schema). The remainder of the variability (1 � Cronbach’salpha) represents the error, noise, and differences of opin-ion. Cronbach’s alpha ranges from 0 to 1, where 0 repre-sents pure noise and 1 represents perfect consensusamong the experts. A value of .7 is often used as a targetfor reasonable reliability.
In general, by combining the answers of several experts,one obtains a better and more reliable result. One canreport the average per rater reliability, which measuresthe degree to which the average expert tends to agree withother experts, or one can report the reliability of the com-bined result, which will always be higher than the per rater
estimate. For example, a metaschema produced by oneexpert will not be as good as one produced by the com-bined opinion of several experts (a consensus metaschema).Cronbach’s alpha estimates the reliability of the combinedresult, but the per rater reliability can be calculated easilyfrom it [32].
We calculated Cronbach’s alpha for the bottom-upmetaschema, treating each of the 45 candidate STs asexpert tasks. We then compared the result to thatof the top-down metaschema. These results appear inSection 4.1.
3.2. Comparing metaschemas
In the comparison of two metaschemas, we consider notonly the MST names, but also the underlying ST groupsrepresented by the MSTs. To support the comparison, wepresent four definitions as follows.
Let MA and MB be two metaschemas of the SN.
Definition 1 (Identical). An MST A in MA is identical to anMST B in MB if both MSTs have the same underlying STgroup.
Since the ST group of an MST is connected and is partof the tree hierarchy of SN, this group is a tree. Since theroot is used to name the MST of the group, both MSTsA and B share the same name.
Definition 2 (Similar). An MST A in MA is similar to anMST B in MB if both MSTs have the same name and thesame root.
Again, the names are the same.This definition expresses that the names of two similar
MSTs are equal. To better understand the differencesbetween pairs of similar MSTs, we note that in some cases

Y. Chen et al. / Journal of Biomedical Informatics 41 (2008) 293–317 299
the difference reflects various levels of granularity in thepartition, rather than major disagreements between themetaschemas. An MST in one metaschema may be splitinto several MSTs in the other metaschema.
We now define ‘‘refinement’’ as follows. Let GM(A)denote the ST group represented by the MST A in themetaschema M.
Definition 3 (Refinement). Let A be an MST in metasche-ma MA. If there exists a set of MSTs {B1,B2, . . . ,Bk}(k P 2) in metaschema MB such that A and B1 (which isthe root of {Bi}) are similar (that is, the STs A and B1 areequal) and GMAðAÞ ¼ [k
i¼1GMBðBiÞ, then the set{B1,B2, . . . ,Bk} is called a refinement of A.
Definition 4 (Refinable). Two similar MSTs A in meta-schema MA and B in the metaschema MB are called refin-able if either A has a refinement in MB or B has arefinement in MA.
Definition 5 (Non-refinable). Two similar MSTs A in themetaschema MA and B in the metaschema MB, neither ofwhich has a refinement in the other metaschema, are callednon-refinable.
To illustrate these definitions, Fig. 5 demonstrates anabstract Semantic Network S of STs (Fig. 5a) and thetwo abstract metaschemas MA (Fig. 5b) and MB (Fig. 5c).
A black shadow for two MSTs with identical names inthe two metaschemas MA and MB indicates identicalMSTs. For example, the ST set for MST S1 is {S1} for
IdenticalMST
SimilarMST
S3
S8
S10
S7
S11
S13
S14
S17
S15
S16
S18 S19
S12
S1
S2
S4
S5
S6
S9
(a) Abstract SemanticNetwork S
Fig. 5. The abstract Semantic Net
both MA and MB. Both MSTs S2 and S3 for the metasch-emas MA and MB are similar. But their characteristics dif-fer. The occurrences of S2 in both metaschemas define arefinement. More precisely, {S2(3),S5(2)} in MA is a refine-ment of S2(5) in MB, since the ST group of S2(5) ={S2,S4,S6,S5,S9} is equal to the union S2(3) [ S5(2) ={S2,S4,S6} [ {S5,S9}. The occurrences of S2 in bothmetaschemas are refinable. The occurrences of S3 in bothmetaschemas are non-refinable.
We compare two metaschemas using the above threeterms to measure the similarity between their ST coverages.To capture cases of either identical MSTs or MSTs whichreflect only granularity differences between two metasch-emas, we introduce another term, correspondable MSTs.
Definition 6 (Correspondable). An MST A in MA is corre-
spondable to an MST B in MB if A and B are eitheridentical or refinable.
Definition 7 (Corresponding MST groups). Two groups ofMSTs in two metaschemas MA and MB, respectively, arecorresponding MST groups if either both groups are sin-gletons of identical MSTs or one group is a singletonand the other group is a refinement of the MST of thesingleton.
For example, in Fig. 5 there are two pairs of correspond-ing MST groups, shown by broken lines circumscribingthem. They are the identical S1(1) in MA and S1(1) inMB and the groups S2(3) [ S5(2) in MA and S2(5) in MB
of which the first is a refinement of the second.
S3(3)
S10(10)
(b) Metaschema MA
S2(3)
S5(2)
S1(1)
S3(8)
S14(2) S16(3)
(c) Metaschema MB
S1(1)
S2(5)
CorrespondingMST groups
work and input metaschemas.

300 Y. Chen et al. / Journal of Biomedical Informatics 41 (2008) 293–317
3.3. Structural properties of metaschemas
We will now list several structural metrics for character-izing a metaschema M.
(1) Cardinality C: The number of MSTs in ametaschema.
(2) Complexity: The ratio of the number of relationships(both hierarchical and semantic relationships) to thecardinality.For convenience we will refer to the num-ber of STs represented by an MST Mi, i = 1, . . . ,C asthe weight W(Mi) of the MST.
(3) Maximum weight MAXW = max16i6CW(Mi).(4) Minimum weight MINW = min16i6CW(Mi).(5) Weight spread WS = MAXW �MINW.(6) Average weight AVGW ¼ 1
C
PCi¼1W ðMiÞ.
(7) Standard deviation of the weights of the MSTs.
r ¼ffiffiffiffiffiffiffiffiffiffiffiffiffiffiffiffiffiffiffiffiffiffiffiffiffiffiffiffiffiffiffiffiffiffiPC
i¼1ðW ðMiÞ�AVGW Þ2
C
r.
Note that the standard deviation’s contribution of anMST Mi, defined as SDC(Mi) = (W(Mi) � AVGW)2,is evaluated when comparing the standard deviations,
since r ¼ffiffiffiffiffiffiffiffiffiffiffiffiffiffiffiffiffiffiffiffiffiffiPC
i¼1SDCðMiÞC
r.
(8) Coverage: Percentage of SN semantic relationshipscovered by the meta-relationships of the metaschema.This measure is based on [15,16] and will be usedsparingly in this paper.
From the structural point of view, in an ideal partitionof n elements into k groups, each group will have an almostequal weight (WS is at most 1). Such a partition is called auniform partition. However, if the elements are nodes of atree and the partition is into connected subtrees, then dueto the structure of the tree, a uniform partition is notalways possible. Thus, as an approximation to a uniformpartition, we are looking for a partition with a minimumweight spread. Other alternatives are a partition with aminimum heaviest weight (MIN–MAX partition) or a par-tition with a maximum lightest weight (MAX–MIN parti-tion). For algorithms to construct a MAX–MINpartition and a MIN–MAX partition of a weighted tree,see [33,34]. Beyond the two extreme measures, MAXW
and MINW, of the partition, we would like all its weightsto be as close as possible to the average weight. For thispurpose, we want the standard deviation of the weightsto be as small as possible.
Furthermore, the partition underlying a metaschemawill probably not be uniform due to its need to capturedifferent subject areas correctly. This is a much moreimportant consideration than the equal size of theMST groups. Nevertheless, there are cases where onecan choose between two options regarding the grouping,for which there is no clear-cut semantic reason to decidebetween them. In such a case, we should follow thestructural criteria and prefer the option which tends to
equalize the weights of the groups, avoiding groupswhich are too large or too small.
3.4. Consolidation
We have developed an algorithm which takes two givenmetaschemas MA = {A1,A2, . . . ,Am} and MB ={B1,B2, . . . ,Bn} for an abstract Semantic Network S asinput, and generates an output MC, a consolidatedmetaschema.
When constructing the consolidated metaschema, thealgorithm attempts to minimize the MAXW and the weights’standard deviation, while maximizing the MINW for thismetaschema. In doing this, the algorithm tries to improvethe structural properties of the consolidated metaschemaby choosing MSTs of the given metaschemas accordingly.
In the process of the algorithm, we will construct asequence of auxiliary Semantic Networks and auxiliarymetaschemas derived from the original Semantic NetworkS and metaschemas MA and MB. In the description of thealgorithm, we will use the previously defined terms: identi-cal MSTs, similar MSTs, refinable MSTs, correspondableMSTs, non-refinable MSTs and corresponding MSTgroups. We will need a few more definitions.
Definition 8 (Auxiliary induced metaschema). Given ametaschema MA defined for a Semantic Network S, anauxiliary induced metaschema M 0A is obtained from MA bydeleting some selected MSTs of MA or by combining somegroups of MSTs of MA such that all the child-of in theoriginal metaschema MA among MSTs of M 0A exist in M 0A.
Definition 9 (Expanded Semantic Network). Let M 0A be an
auxiliary induced metaschema of the metaschema MA
defined for Semantic Network S. The expanded SemanticNetwork S 0 of the metaschema M 0
A contains all the STsof all MSTs of M 0
A and all IS-A relationships in the originalSemantic Network S among the STs of S 0.
We note that S may consist of several connected compo-nents (as for the UMLS SN). In such a case the algorithmworks independently on each component. The algorithmMAIN-CONSOLIDATE (MA,MB,S,MC) takes twostages. It first invokes its core procedure R-CONSOLI-DATE (MA,MB,S,MC) to obtain an initial consolidatedmetaschema MC, and then further modifies MC to com-plete the consolidation. We will now present a high-leveldescription of the algorithm MAIN-CONSOLIDATE(MA,MB,S,MC), followed by a step-by-step description.
The procedure R-CONSOLIDATE (MA,MB,S,MC) isa recursive procedure to create a consolidated metaschemaMC from two given metaschemas MA and MB of a Seman-tic Network S. The procedure starts by selecting all theidentical MSTs of MA and MB for MC. It continues byselecting from each pair of corresponding MST groups ofMA and MB, an MST or a group of MSTs, which mini-mizes the standard deviation contributions, to be addedto MC. The identical MSTs and corresponding MST

Y. Chen et al. / Journal of Biomedical Informatics 41 (2008) 293–317 301
groups of both input metaschemas are deleted from MA
and MB in such a way that auxiliary induced metaschemasM 0
A and M 0B are generated. Next we create the expanded
Semantic Network S 0 of M 0A (and of M 0
B, which is identical).At this stage, all root MSTs of M 0
A and M 0B are non-refin-
able. Let Ai and Bj be two similar root MSTs of M 0A and
M 0B, respectively. We add to MC the one of Ai and Bj which
minimizes the standard deviation contribution. Withoutloss of generality, assume that MST Ai of M 0
A was selectedfor adding to MC. We derive the induced auxiliary meta-schema M 00
A by removing MST Ai from M 0A. Next, we obtain
the expanded Semantic Network S00 from M 00A. If M 00
A (andS00) are empty, we return MC and the algorithm is finished.
If M 00A is not empty, we face a difficulty. We cannot
obtain the auxiliary metaschema M 00B from M 0
B by deletingAi, since Ai is not an MST in M 0
B, neither does it have arefinement in M 0
B, since the MST Ai of M 0A is non-refinable.
As a result, we will obtain M 00B in an indirect way, following
the derivation of several auxiliary induced metaschemas ofM 0
B and their expanded Semantic Networks.First we obtain the auxiliary induced metaschema M�
B
from M 0B which will include all the MSTs of M 0
B for whichall their STs are in S00. The expanded Semantic Network S*
of M�B is derived. The Semantic Network D is derived by
deleting from S 0 all the STs of S*. Next, we derive an aux-iliary induced metaschema SD for the Semantic Network Dconsisting of the connected components of D. Each com-ponent is represented by one MST, named after the root.Finally, we derive the desired auxiliary induced metasche-ma M 00
B by combining the metaschemas M�B and SD. At this
stage, we are ready for a recursive call of the procedure R-CONSOLIDATE (M 00
A, M 00B, S00, MC), to update the meta-
schema MC. After receiving the updated MC, we return itas a partial result. If MC contains an MST of one ST, withat most one child, it is added to its parent MST.
We will now describe this algorithm as a series of sepa-rate steps. To keep track of this fairly complicated process,we provide in Fig. 6 a diagram, which reflects the process
MA MA’ MA’’
S’ S’’
MB’ MB*
S’’’
S
MB
MC MC
MCNumbers in the
1, 2
1, 2
3
3
4
4
6
5
7
7
8
89
9
10
1
Fig. 6. The flow chart of cons
described in R-CONSOLIDATE and the reader may useit as a road map. The procedure’s steps are labeled by num-bers. By necessity some of the numbers occur twice in thediagram, because they describe operations with two inputsor because the described operation may occur for eitherone of the two input metaschemas. Following the step-by-step algorithm description, there is an example. Thereader is advised to review the example in parallel to read-ing the algorithm.
Procedure R-CONSOLIDATE (MA,MB,S,MC)
Step 1: All MSTs that are identical (as defined above) inboth input metaschemas MA, MB are included inthe output metaschema MC.
Step 2: When given an ST in one input metaschema andits refinement in the other input metaschema, forexample, the set {B1,B2, . . . ,Bk} with a refine-
ment of Aj, then ifPk
i¼1SDCðBiÞ < SDCðAjÞ,include the set {B1,B2, . . . ,Bk} in the outputmetaschema MC. Otherwise, include Aj inMC.The same rule applies to an MST Bl with arefinement {A1,A2, . . . ,Am}.We note that in case of different cardinalities forMA and MB we use the average of the two car-dinalities for calculating the contribution tothe standard deviation.
Step 3: We construct two auxiliary induced metasch-emas M 0
A ðM 0BÞ from MA (MB) by removing from
MA (MB) all corresponding MST groups (identi-fied in the two previous steps).
Step 4: We construct an expanded Semantic Network S 0
of M 0A and the given Semantic Network S.
Step 5: Choosing from non-refinable similar root MSTsAi and Bj (in M 0
A and M 0B, respectively), (i) if
SDC(Ai) < SDC(Bj), include Ai in the consoli-dated metaschema MC. Otherwise, (ii) includeBj in MC. If there are several roots, such a choiceis made for each root.
D
MB’’
SD
diagram are step numbers.
11 12
2
13
13
Recurse
13
olidation numbered steps.

302 Y. Chen et al. / Journal of Biomedical Informatics 41 (2008) 293–317
Step 6: Assuming without loss of generality that Ai ofM 0
A was selected (case (i)), we construct an aux-iliary induced metaschema M 00
A from M 0A by
removing from M 0A the root MST Ai. If M 00
A isempty then return. Note that, if Bj was selectedfor case (ii), the respective role reversal of M 0
A
and M 0B would follow.
Step 7: We construct an expanded Semantic Network S00
of M 00A and the Semantic Network S 0.
Step 8: We construct an auxiliary induced metaschemaM�
B from M 0B as follows. Only those MSTs (from
M 0B) which have all their semantic types in S00 are
included in M�B.
Step 9: We construct an expanded Semantic Network S*
of M�B and the Semantic Network S00.
Step 10: We construct the difference D of S00 and S* asfollows. D contains all the STs of S00 which arenot in S*, i.e., we use traditional set difference.
Step 11: We construct an auxiliary induced metaschemaSD, which consists of the maximally connectedcomponents of D, with each component corre-sponding to one MST, named after its root.
Step 12: We construct the auxiliary induced metaschemaM 00
B as follows. We combine SD with M�B using
appropriate meta-child-of relationships fromthe MSTs of M�
B up to the MSTs of SD.Step 13: If the metaschemas M 00
A and M 00B consist of one
connected component then recursively call R-CONSOLIDATE (M 00
A, M 00B, S00,MC). Otherwise,
recursively call R-CONSOLIDATE for everypair of connected components (M 00
Ai, M 00
Bj), such
that M 00Ai
and M 00Bj
have similar MST roots, Ai
and Bj, with their corresponding expandedSemantic Network.Return the partially consolidated metaschemaMC.
END Procedure R-CONSOLIDATE
Algorithm MAIN-CONSOLIDATE (MA,MB,S,MC)
Stage 1: Invoke R-CONSOLIDATE (MA,MB,S,MC).Stage 2: (Modification): Each MST in MC with only one
ST (such MSTs are called singletons) is combinedwith its parent MST whenever this child MST is aleaf or has a single child in MC.Return the completely consolidated metaschemaMC.
END Algorithm MAIN-CONSOLIDATE
3.4.1. Example
We demonstrate the MAIN-CONSOLIDATE(MA,MB,S,MC) algorithm for MA, MB and S given inFig. 5.
The algorithm first invokes procedure R-CONSOLI-DATE, passing MA, MB, S and MC as arguments. The
following Steps 1–13 show the process of R-CONSOLIDATE.
Step 1: S1 is an identical MST in MA and MB and isincluded in MC (Fig. 7a–c).There are 19 STs in the abstract Semantic Net-work S, and 5 MSTs in both MA and MB. Thus,the average MST’s weight for both metaschemasis 3.8, which is used for computing the SDC.
Step 2: S2(5) in MB (Fig. 7b) contributes 1.44 to thestandard deviation, while its refinement{S2(3),S5(2)} in MA (Fig. 7a) contributes0.64 + 3.24 = 3.88. In this case, S2(5) of MB ischosen for MC (Fig. 7c).
Step 3: S1(1), S2(3) and S5(2) are removed from MA toyield M 0
A. S1(1) and S2(5) are removed from MB
to yield M 0B (Fig. 7d and e).
Step 4: We construct S 0 by expanding of S3(3) andS10(10) of M 0
A (Fig. 7f).Step 5: For our example, S3(3) in M 0
A (Fig. 7d), whichcontributes 0.64 to the standard deviation, ischosen, rather than S3(8), in M 0
B (Fig. 7e), whichcontributes 17.64.
Step 6: The MST S3(3) of M 0A is deleted as is indicated
in Fig. 8a by dotted lines, to obtain M 00A as shown
in Fig. 8d.Step 7: S00 is generated by reexpanding M 00
A, which hasone MST S10(10) (see Fig. 8e).
Step 8: For M 0B of Fig. 9a and S00 of Fig. 9b,
M�B ¼ fS14ð2Þ; S16ð3Þg, see Fig. 9c. S3(8) is not
included in M�B, because S3 is not in S00.
Step 9: We expand M�B to get S*. For the M�
B of Fig. 9c,S* is shown in Fig. 9d.
Step 10: D is constructed by removing S14(2) and S16(3)from S00 (Fig. 9e).
Step 11: As there is only one component, the inducedauxiliary metaschema SD consists of S10(5) only(Fig. 9f).
Step 12: S10(5) is combined with S14(2) and S16(3)into M 00
B (Fig. 9g). We note that the MSTS10(5) was not an MST in the original MB
metaschema.What have we achieved now? M 00B
is a metaschema for S00. M 00A has been a meta-
schema of S00 all along. Most importantly, nei-ther M 00
A nor M 00B represent any semantic types
which are represented by the MSTs in MC.Thus, we have extended the output metasche-ma, while the two input metaschemas havebeen shrunk correctly, and they correctly sum-marize their corresponding ‘‘shrunk’’ SemanticNetwork.
Step 13: The MST group S10(5), S14(2), S16(3) of M 00B, in
Fig. 9g, is the refinement of S10(10) of M 00A in
Fig. 8d. In this case the refinement in M 00B has a
lower standard deviation contribution thanS10(10) and is chosen for the consolidated meta-schema. After the deletion of the corresponding

S3(3)
S10(10)
(a) MA
S2(3)
S5(2)
S1(1)
S3(8)
S14(2) S16(3)
(b) M B
S1(1)
S2(5)
IdenticalMST
SimilarMST
(f) S’
S3(3)
S10(10)
(d) MA
S3(8)
S14(2) S16(3)
(e) MB’’
S3
S8
S10
S7
S11
S13
S14
S17
S15S16
S18 S19
S12
S1(1)
S2(5)
(c) Partial consolidated MC
CorrespondingMST groups
Fig. 7. Consolidating and deleting corresponding MSTs.
Y. Chen et al. / Journal of Biomedical Informatics 41 (2008) 293–317 303
MSTs, the resulting metaschemas are empty andthe procedure returns.At this point, the MC is a partially consolidatedmetaschema and the first stage of the MAIN-CONSOLIDATE algorithm is done. At the sec-ond stage, we see S1(1) is a singleton MST, but ithas two children, thus it is legitimate and nomodification occurs. The consolidated meta-schema MC for the given metaschemas MA andMB for the abstract Semantic Network S isshown in Fig. 10.
4. Results
4.1. Bottom-up heuristic metaschema
In the bottom-up study, we received responses from 13experts. Individual participants’ responses varied both inthe choice of STs marked and their numbers. For example,experts 1 and 3 chose 28 and 17 STs, respectively, to nameMSTs in their expert metaschemas. Table 4 shows the num-ber of MSTs for each expert metaschema, corresponding tothe number of STs marked by that expert. The averagenumber of MSTs marked is 23, with minimum and maxi-mum numbers of 16 and 30, respectively. The standarddeviation is 4.56.
Each expert’s response can be used to construct oneexpert’s metaschema. We obtained 13 cumulative metasch-emas, from the 13 experts’ (X = 13) metaschemas, by vary-ing N over the range (1,13). In the Nth cumulativemetaschema, N = 1, . . . , 13, each MST was chosen by atleast N experts. For N = 8, for example, there were 16STs marked by at least 8 out of the 13 experts, and sothe corresponding cumulative metaschema has 16 MSTs.Table 5 shows the number of STs marked for each N.
As we can see from the table, the number of MSTs var-ies from 3 (for N = 13) to 41 (for N = 1 and 2). Obviouslysuch extreme metaschemas are not interesting. The consen-sus metaschema (N = 7) contains 25 MSTs. Its hierarchy isshown in Fig. 11.
We observed that in the bottom-up study too, individualparticipants’ responses varied greatly, both in the choice ofSTs marked and their numbers. To substantiate this, weconstructed the agreement matrix of all 13 experts (Table6) that demonstrates the agreement as well as the high var-iability of participant responses. For instance, participants1 and 4 marked 28 and 25 STs, respectively, and agreed ononly 16 of them. The average inter-participant agreement is14.41 (only 67% of the average number of 23 marked STs),with a high of 25 and a low of 6.
Cronbach’s alpha for the consensus bottom-up meta-schema was .79. This implies that the consensus metasche-

S10(10)
(d) MA’’
S10
S11
S13
S14
S17
S15S16
S18 S19
S12
(e) S’’
(c) S’
S10(10)
(a) MA ‘
S3(8)
S14(2) S16(3)
(b) MB’
S3
S8
S10
S7
S11
S13
S14
S17
S15
S16
S18 S19
S12
S3(3)
MST to be deleted
Fig. 8. Constructing M 00A and S00.
304 Y. Chen et al. / Journal of Biomedical Informatics 41 (2008) 293–317
ma is sufficiently reliable (greater than .7; see Section 3.1.2).For the consensus top-down metaschema, Cronbach’salpha was .62, which is lower than the threshold, but stillreasonable.
By looking at the per rater reliability, one can correct forthe fact that the bottom-up metaschema had more expertsthan the top-down one. The per rater reliability for the bot-tom-up metaschema was .23, and for the top-down meta-schema it was .13. The difference was borderline(p = .053). These results imply that a metaschema pro-duced by a single expert by either method is insufficientlyreliable (i.e., both are well below .7) and that the bottom-up approach is probably more reliable than the top-downapproach, although the difference did not quite achieve sta-tistical significance.
Another way to understand the results is to ask howmany experts’ answers would need to be combined toachieve the target reliability of .7. The bottom-up approachwould require 8 experts on average, whereas the top-downapproach would require 16.
4.2. Results of metaschema comparison
To facilitate the comparison between the consensusmetaschemas obtained from the two studies, we show boththeir hierarchies in Fig. 12. MSTs identical in both metas-chemas are indicated by black shadows. Similar MSTs aredenoted by gray shadow.
There are 12 MSTs identical for the two metaschemas.For example PATHOLOGICAL FUNCTION(6) is an MST in bothmetaschemas, representing the same underlying ST group.Table 7 lists all the identical MSTs and their sizes. Hence,both metaschemas agree that these 12 MSTs representimportant subject areas in the SN. Altogether, they cover47 STs (i.e., 34.8% of the SN).
There are seven similar MSTs. For example, BIOLOGI-
CAL FUNCTION(8) in the top-down study metaschema issimilar to BIOLOGICAL FUNCTION(1) in the bottom-up meta-schema. Table 8 shows these similar MSTs along withtheir sizes in each of the two metaschemas. In the top-down study metaschema, these seven MSTs cover 60

(b) S’’
S3(8)
S14(2) S16(3)
(a) M B’
S10
S11
S13
S14
S17
S15S16
S18 S19
S12
S14(2) S16(3)
(c) M B*
S14
S17
S16
S18 S19
(d) S *
S10
S11
S13 S15
S12
(e) D (f) SD
S10(5)
S10(5)
S14(2) S16(3)
(g) M B’’
Fig. 9. Constructing M 00B.
S10(5)
S14(2) S16(3)
S1(1)
S2(5) S3(3)
Fig. 10. Consolidated metaschema.
Y. Chen et al. / Journal of Biomedical Informatics 41 (2008) 293–317 305
STs, which is about 44% of the SN. In the bottom-upstudy metaschema, these seven MSTs cover 38 STs,which is about 28%.
Table 4Number of MSTs each expert chose in the bottom-up study
Participant 1 2 3 4 5 6 7
# MSTs 28 25 17 25 22 25 1
Table 5Number of MSTs chosen by at least N participants
Threshold (N) 1 2 3 4 5 6
# MSTs 41 41 36 35 33 32
To better understand the nature of the similarity repre-sented in Table 8, we will explore refinements in both direc-tions. As a refinement of the top-down consensusmetaschema, consider the MST ORGANISM(15) in the top-down consensus metaschema. This MST is split into twoseparate MSTs, ORGANISM(6), and ANIMAL(9), in the bot-tom-up consensus metaschema. In other words, {ORGAN-
ISM(6), ANIMAL(9)} in the bottom-up consensusmetaschema is a refinement of ORGANISM(15) in the top-down consensus metaschema. The refinement cases cover42 STs in both metaschemas. Table 9 lists the cases ofrefinement of the top-down consensus metaschema.
Considering refinements in the other direction of thebottom-up consensus metaschema, there is one case.{ACTIVITY(6), RESEARCH ACTIVITY(2)} in the top-down studymetaschema is the refinement of ACTIVITY(8) in the bottom-up study metaschema.
8 9 10 11 12 13 Average
9 16 19 24 20 29 30 23
7 8 9 10 11 12 13
25 22 14 8 6 4 3

ENTITY
(14)
SUBSTANCE
(3)
BIOLOGICALLY ACTIVE
SUBSTANCE (7)
CHEMICAL
(18)
ORGANIZATION
(4)
GROUP (6)
OCCUPATION OR
DISCIPLINE (2)
FINDING
(3)
ORGANISM
ATTRIBUTE (2)
ANATOMICAL
ABNORMALITY (3)
ANIMAL
(9)
PLANT
(2)
ORGANISM
(6)
MANUFACTURED
OBJECT (5)
ANATOMICAL
STRUCTURE (8)
PHENOMENON
OR PROCESS (5)
HEALTH CARE
ACTIVITY (4)
BEHAVIOR
(3)
EVENT (1)
PATHOLOGIC
FUNCTION (6)
BIOLOGIC
FUNCTION (1)
ACTIVITY (8)
SPATIAL
CONCEPT (4)
MOLECULAR
SEQUENCE (4)
PHYSIOLOGIC
FUNCTION (7)
Fig. 11. Bottom-up consensus metaschema hierarchy.
Table 6Inter-participant agreement matrix; average = 14.41
1 2 3 4 5 6 7 8 9 10 11 12 13
1 20 12 16 19 16 15 13 13 18 25 20 232 13 14 17 15 16 12 11 17 17 18 243 8 13 13 6 9 10 11 12 15 164 12 14 12 8 14 18 14 19 165 11 13 9 7 17 15 19 226 14 12 16 16 13 19 177 7 9 14 10 16 168 11 9 9 9 149 14 11 20 13
10 15 20 2611 16 1912 22
306 Y. Chen et al. / Journal of Biomedical Informatics 41 (2008) 293–317
4.3. Results of structural evaluation
In Table 10, we show the values of the eight structuralmeasures for both the consensus metaschemas. For exam-ple, the top-down consensus metaschema has the cardinal-ity 26, while the bottom-up consensus metaschema has thecardinality 25. Table 11 shows the distribution of theweights for both metaschemas. For example, both metas-chemas contain three MSTs of weight six. Here, weightsix means there are six STs in the group represented bythe MST.
4.4. Consolidated metaschema
Following the MAIN-CONSOLIDATE algorithm (seeSection 3.4), we may derive a consolidated metaschema
of the two consensus metaschemas as follows. Steps 1–13show the process of the R-CONSOLIDATE procedure.
4.4.1. Step 1
All identical 12 MSTs in both metaschemas (markedwith black shadows in Fig. 12) are included in the consol-idated metaschema.
4.4.2. Step 2
We selected the MST or its refinement whichever mini-mizes the SDC. The two consensus metaschemas have dif-ferent cardinalities, 25 and 26. Thus, in calculating thecontribution to the standard deviation, the average 25.5of the two cardinalities is used. For example, on one hand,BIOLOGICAL FUNCTION(8) in the top-down consensus meta-schema contributes to the standard deviation 7.3, whilethe refinement {BIOLOGICAL FUNCTION(1), PHYSIOLOGICAL

ENTITY (1)
SUBSTANCE
(11)
BIOLOGICALLY
ACTIVE
S UBSTANCE (7)O RGANIC
CHEMICAL (8)
ORGANIZATION
(4)
GROUP
(6)
OCCUPATION OR
DISCIPLINE (2)
IDEA OR
CONCEPT (6)
F INDING
(3)
PLANT (2)
ORGANISM
(15)
MANUFACTURED
O BJECT (5)
ANATOMICAL
STRUCTURE (11)
PHENOMENON
OR PROCESS (5)
HEALTH CARE
ACTIVITY (4)
BEHAVIOR
(3)
EVENT (1)
PATHOLOGIC
FUNCTION (6)
BIOLOGIC
FUNCTION (8)
ACTIVITY (6)
SPATIAL
CONCEPT (8)
RESEARCH
ACTIVITY (2)
PHYSICAL
OBJECT (1)
CONCEPTUAL
ENTITY(5)
INTELLECTUAL
PRODUCT(3)
PHARMACOLOGIC
SUBSTANCE (2)
TOP-DOWN CONSENSUS METASCHEMA: 26 MSTs
BOTTOM-UP CONSENSUS METASCHEMA: 25 MSTs
ENTITY
(14)
SUBSTANCE
(3)
BIOLOGICALLY
ACTIVE
SUBSTANCE (7)
CHEMICAL
(18)
O RGANIZATION
(4)
G ROUP (6)
OCCUPATION OR
DISCIPLINE (2)
FINDING
(3)
ORGANISM
ATTRIBUTE (2)
ANATOMICAL
ABNORMALITY (3)
ANIMAL
(9)
PLANT
(2)
ORGANISM
(6)
MANUFACTURED
OBJECT (5)
ANATOMICAL
STRUCTURE (8)
PHENOMENON
OR PROCESS (5)
HEALTH CARE
ACTIVITY (4)
BEHAVIOR
(3)
EVENT (1)
PATHOLOGIC
FUNCTION (6)
BIOLOGIC
FUNCTION (1)
ACTIVITY (8)
SPATIAL
CONCEPT (4)
MOLECULAR
SEQUENCE (4)
PHYSIOLOGIC
FUNCTION (7)
IDENTICAL
MSTSIMILAR
MSTOTHER
MST
Fig. 12. Comparison of consensus metaschemas.
Y. Chen et al. / Journal of Biomedical Informatics 41 (2008) 293–317 307
FUNCTION(7)} in the bottom-up consensus metaschema con-tributes 21.4. In this case, BIOLOGICAL FUNCTION (8) isselected for the consolidated metaschema. On the otherhand, ORGANISM(15) in the top-down consensus metaschemacontributes 94.1, but its refinement in the bottom-up
metaschema {ORGANISM(6), ANIMAL(9)} only contributes14.2. This refinement is selected for the consolidated meta-schema. The corresponding MSTs are marked either byblack shadows for identical MSTs or are marked withdashed borders for similar MSTs with refinements (see

Table 7Identical MSTs in both metaschemas
MST Size
BEHAVIOR 3BIOLOGICALLY ACTIVE SUBSTANCE 7EVENT 1FINDING 3GROUP 6HEALTH CARE ACTIVITY 4MANUFACTURED OBJECT 5OCCUPATION OR DISPLIN 2ORGANIZATION 4PATHOLOGIC FUNCTION 6PHENOMENON OR PROCESS 5PLANT 2
Total: 12 47
Table 8Similar MSTs in both metaschemas
MST Weight in top-downstudy metaschema
Weight in bottom-upstudy metaschema
ANATOMICAL STRUCTURE 11 8ACTIVITY 6 8BIOLOGICAL FUNCTION 8 1ENTITY 1 8ORGANISM 15 6SPATIAL CONCEPT 8 4SUBSTANCE 11 3
Total: 7 60 38
Table 9Refinements in bottom-up consensus metaschema
MST in top-down metaschema Refinement in thebottom-up metaschema
ANATOMICAL STRUCTURE(11) {ANATOMICAL STRUCTURE(8),ANATOMICAL ABNORMALITY(3)}
BIOLOGICAL FUNCTION(8) {BIOLOGICAL FUNCTION(1),PHYSIOLOGICAL FUNCTION(7)}
ORGANISM(15) {ORGANISM(6), ANIMAL(9)}SPATIAL CONCEPT(8) {SPATIAL CONCEPT(4),
MOLECULAR SEQUENCE(4)}
Total: 4 42
Table 10Values for the structural measures for the two consensus metaschemas
Measures Top-down Bottom-up
Cardinality 26 25Complexity 4.3 4.72Maximum weight 15 18Minimum weight 1 1Weight spread 14 17Average weight 5.19 5.40Standard deviation 3.49 3.93Coverage (%) 70.6 75.93
308 Y. Chen et al. / Journal of Biomedical Informatics 41 (2008) 293–317
Fig. 13a and b). Fig. 14 shows the partial consolidatedmetaschema after selecting corresponding MSTs, wherethe MST corresponding groups selected for the consoli-dated metaschema to minimize the SDC, are circumscribedby broken lines.
4.4.3. Step 3
We construct two auxiliary metaschemas M 0A and M 0
B
by deleting from MA and MB the identical MSTs andthe corresponding MST groups, as shown in Fig. 15aand b.
4.4.4. Step 4An expanded Semantic Network SN 0 is derived using
all STs summarized by all MSTs of M 0A together with the
IS-A relationships directed to them in SN. Fig. 15cshows SN 0, which consists of two subtrees, one rootedat Substance and the other at Entity. Each of the twoauxiliary metaschemas M 0
A and M 0B is a metaschema of
SN 0. The consolidation of each of the subtrees is nowdescribed independently. We note that at this stage theEvent portion of the consolidated metaschema is fullydetermined.
4.4.5. Step 5 for SubstanceFor the subtree of SN 0 rooted at Substance (Fig. 15c),
based on the SDC, SUBSTANCE(3) in the bottom-up meta-schema M 0
B is chosen, rather than SUBSTANCE(11) in thetop-down metaschema M 0
A.
4.4.6. Step 6 for ChemicalSince SUBSTANCE(3) in the bottom-up metaschema is
selected for the consolidated metaschema, an auxiliaryinduced metaschema M 00
A is obtained, which contains onlyone MST, CHEMICAL(18).
4.4.7. Step 7 for ChemicalSN00 is the expanded Semantic Network for M 00
A. Forbrevity, we will omit figures for some steps.
4.4.8. Step 8 for SubstanceSince SUBSTANCE(3) is not an MST of the top-down
metaschema, M�B needs to be constructed from M 0
B in orderto obtain M 00
B. M�B contains the MSTs from M 0
B which haveall their STs in SN00, in this case, PHARMACOLOGIC SUB-
STANCE(2) and ORGANIC CHEMICAL(8).
4.4.9. Step 9 for Pharmacologic Substance and OrganicChemical
We construct an expanded Semantic Network SN* fromthe metaschema M�
B.
4.4.10. Step 10 for ChemicalThe difference D of SN00 and SN* is constructed.
4.4.11. Step 11 for ChemicalThe SD now consists of CHEMICAL(8) obtained from the
grouping of the STs which are contained in D.
4.4.12. Step 12 for ChemicalOnce M�
B and SD are obtained, M 00B can be derived. It
contains all MSTs from SD and M�B, CHEMICAL(8), PHARMA-
COLOGIC SUBSTANCE(2) and ORGANIC CHEMICAL(8), as well as

Table 11Weight distribution of the top-down and bottom-up metaschemas
Weight 1 2 3 4 5 6 7 8 9 10 11 12 13 14 15 16 17 18
Top-down 3 4 3 2 3 3 1 3 0 0 1 0 0 0 1 0 0 0Bottom-up 1 3 4 4 2 3 7 2 1 0 0 0 0 1 0 0 0 1
ENTITY
(1)
SUBSTANCE
(11)
BIOLOGICALLY ACTIVE
SUBSTANCE (7)
ORGANIC
CHEMICAL (8)
ORGANIZATION
(4)
G ROUP (6)
O CCUPATION OR
DISCIPLINE (2)
IDEA OR
CONCEPT (6)
F INDING
(3)
PLANT (2)
ORGANISM(15)
MANUFACTUREDOBJECT (5)
A NATOMICALSTRUCTURE (11)
PHENOMENON
OR P ROCESS (5)
HEALTH CARE
ACTIVITY (4)
BEHAVIOR (3)
E VENT (1)
PATHOLOGIC
FUNCTION (6)
BIOLOGIC
FUNCTION (8)
ACTIVITY
(6)
SPATIAL
CONCEPT (8)
RESEARCH
ACTIVITY (2)
P HYSICAL
OBJECT (1)
CONCEPTUAL
ENTITY(5)
INTELLECTUAL
PRODUCT(3)
PHARMACOLOGIC
SUBSTANCE (2)
(a) Top-down Consensus metaschema: 26 MSTs
(b) Bottom-up Consensus metaschema: 25 MSTs
ENTITY (14)
SUBSTANCE(3)
BIOLOGICALLYACTIVE
SUBSTANCE (7)
CHEMICAL
(18)
ORGANIZATION(4)
GROUP (6)
OCCUPATION OR
DISCIPLINE (2)
F INDING
(3)
ORGANISM
ATTRIBUTE (2)
ANATOMICAL
ABNORMALITY (3)
ANIMAL
(9)PLANT
(2)
ORGANISM
(6)
MANUFACTUREDO BJECT (5)
ANATOMICAL
STRUCTURE (8)
PHENOMENON
OR PROCESS (5)
HEALTH CARE
ACTIVITY (4)
BEHAVIOR
(3)
EVENT (1)
PATHOLOGICFUNCTION (6)
BIOLOGICFUNCTION (1)
ACTIVITY (8)
SPATIAL
CONCEPT (4)
MOLECULAR
SEQUENCE (4)
P HYSIOLOGIC
FUNCTION (7)
IdenticalMST
SimilarMST
OtherMST
correspondingMST
Fig. 13. The consolidation of corresponding MSTs.
Y. Chen et al. / Journal of Biomedical Informatics 41 (2008) 293–317 309

BIOLOGICALLY ACTIVESUBSTANCE (7)
ORGANIZATION
(4)
GROUP (6)
OCCUPATION OR
DISCIPLINE (2)
F INDING
(3)
ANATOMICAL
ABNORMALITY (3)
ANIMAL (9)PLANT(2)
O RGANISM
(6)
MANUFACTURED
OBJECT (5)
ANATOMICALS TRUCTURE (8)
PHENOMENON
OR PROCESS (5)
HEALTH CARE
ACTIVITY (4)
BEHAVIOR
(3)
EVENT (1)
PATHOLOGIC
FUNCTION (6)
BIOLOGIC
FUNCTION (8)
ACTIVITY
(8)
SPATIAL
CONCEPT (4)
MOLECULAR
SEQUENCE (4)
IdenticalMST
SimilarMST
OtherMST
CorrespondingMST groups
Fig. 14. The partial consolidated metaschema with corresponding MSTs.
310 Y. Chen et al. / Journal of Biomedical Informatics 41 (2008) 293–317
the meta-child-of relationships from the last two MSTs toCHEMICAL(8).
4.4.13. Step 13 for ChemicalComparing M 00
A, which consists of CHEMICAL(18), of thebottom-up metaschema and M 00
B, consisting of CHEMI-
CAL(8), PHARMACOLOGIC SUBSTANCE(2) and ORGANIC CHEMI-
CAL(8), we see that this is a case of similar MSTs witha refinement. This situation is handled as discussed inStep 3. The refinement {CHEMICAL(8), PHARMACOLOGIC
SUBSTANCE(2), ORGANIC CHEMICAL(8)} is selected for theconsolidated metaschema rather than CHEMICAL(18)
because it contributes less to the standard deviation,compared to CHEMICAL(18). Note that the only MST ofthe consolidated metaschema (of the SUBSTANCE compo-nent) which is not an MST of a given metaschema isCHEMICAL(8).
4.4.14. Step 5 for EntityFor the subtree rooted at Entity, ENTITY(1) is less expen-
sive than ENTITY(14) (see Fig. 16), in terms of the standarddeviation contribution. Therefore ENTITY(1) in the top-down metaschema is chosen (see Fig. 16a).
4.4.15. Step 6 for EntityENTITY(1) will be removed from the top-down metasche-
ma together with the two meta-child-of relationships direc-ted to it, as shown in Fig. 16a. An M 00
A, which is {PHYSICAL
OBJECT(1), CONCEPTUAL ENTITY(5), INTELLECTUAL PRODUCT(3),IDEA OR CONCEPT(6)} (Fig. 17a), is obtained as a result of thedeletion. The metaschema M 00
A consists of two disconnected
MST subtrees, one rooted at PHYSICAL OBJECT(1) and theother at CONCEPTUAL ENTITY(3).
4.4.16. Step 7 for Physical Object and Conceptual EntityThe expanded Semantic Network SN00 constructed from
M 00A, consists of two subtrees rooted at Physical Object and
Conceptual Entity, respectively (Fig. 17b).
4.4.17. Summary of Steps 8–13
Since ENTITY(1) is not an MST of the bottom-up meta-schema, an M�
B needs to be derived, which consists ofORGANISM ATTRIBUTES(2) only (see Fig. 17c). The SemanticNetwork SN* constructed from M�
B includes Organism
Attribute and Clinical Attribute (Fig. 17d). We can thenobtain SD as {PHYSICAL OBJECT(1), CONCEPTUAL
ENTITY(12)} as a grouping of the difference D of SN00
and SN* into maximally connected components(Fig. 17e). The resulting M 00
B combining M�B and SD and
all meta-child-of links connecting them is therefore {PHYS-
ICAL OBJECT(1), CONCEPTUAL ENTITY(12), ORGANISM ATTRI-
BUTE(2)} (Fig. 17f). Since M 00A and M 00
B are not empty,we apply the R-CONSOLIDATE procedure recursivelyto the M 00
A of the top-down metaschema and the M 00B of
the bottom-up metaschema and their common SemanticNetwork SN00. For space reasons, we omit the detailsof this recursive call.
4.4.18. Obtaining completely consolidated metaschema MC
In the modification stage of the MAIN-CONSOLI-DATE algorithm, we scan the entire consolidated meta-schema, looking for singleton MSTs which are not

Substance(3)
Chemical(18)
(b) Bottom-up Consensus Metaschema MB’
Substance (11)
Pharmacologic Substance(2)
Organic Chemical(8)
(a) Top-down Consensus Metaschema MA’
Entity14)
Organism (2)
Entity(1)
Physical object (1)
Conceptual Entity (5)
Idea or Concept (6)
Intellectual Product(3)
Entity
Physical object
Conceptual Entity
Idea or Concept
Functional Concept
Body System
Temporal Concept
QualitativeConcept
Quantitative Concept
Intellectual Product
ClassificationRegulation or
Law
LanguageGroup
AttributeOrganism Attribute
Clinicial Attribute
Substance
FoodChemicalBody
Substance
Chemical Viewed
Functionally
Hazardous or Poisonous Substance
Pharmacologic Substance
Antibiotic
Biomedical or Dental
Material
Indicator, Reagent, or Diagnostic
Aid
Organic Chemical
Inorganic Chemical
Element, Ion, or Isotope
Amino Acid, Peptide, or
Protein
Organopjosphorus Compound
Nucleic Acid, Nucleoside,
or NucleotideCarbohydrate Lipid
Steroid
Chemical Viewed
Structurally
Eicosanoid
(c) SN’
Fig. 15. Auxiliary metaschemas M 0A, M 0
B and expanded Semantic Network SN 0.
Y. Chen et al. / Journal of Biomedical Informatics 41 (2008) 293–317 311
branching points in the metaschema. We see that the sin-gleton MST PHYSICAL OBJECT(1) is not a branching pointin the metaschema. Therefore, PHYSICAL OBJECT(1) ismerged with its parent ENTITY(1) to create the MSTENTITY(2). The MST MANUFACTURED OBJECT(5) whichwas meta-child-of PHYSICAL OBJECT(1), is now meta-child-
of ENTITY(2).
4.5. Final consolidated metaschema
The consolidated metaschema is shown in Fig. 18. Thereare 28 MSTs in the consolidated metaschema. TwelveMSTs come from the identical MSTs in the two originalconsensus metaschemas. Eight MSTs are taken from casesof the refinements, seven of which come from the bottom-

Entity(14)
Organism (2)
(b) M B’
Physicalobject (1)
Conceptualobject (5)
Idea orConcept (6)
IntellectualProduct(3)
(a) M A’
Entity(1)
Fig. 16. M 0A and M 0
B for Entity.
312 Y. Chen et al. / Journal of Biomedical Informatics 41 (2008) 293–317
up consensus metaschema. Only BIOLOGICAL FUNCTION(8)comes from the top-down consensus metaschema. Theremaining 8 MSTs come from the two subtrees rooted in
PHYSICAL
OBJECT (1)
CONCEPTUAL
ENTITY (5)
IDEA OR
CONCEPT (6)
INTELLECTUAL
PRODUCT(3)
(a) M A ’’
FunctionalConcept
BodySystem
OrganisAttribut
ClinicialAttribute
ORGANISM (2)
(c ) M B *
Physicalobject
ConceptualEntity
Idea orConcept
FunctionalConcept
BodySystem
TemporalConcept
QualitativeConcept
QuantitativeConcept
IntellectualProduct
ClassificationR
LanguGroup
Attribute
(e) D (The difference between SN’’ and SN*)
Fig. 17. Processin
non-refinable similar MSTs, namely Entity and Substance.Among those 8 MSTs, CONCEPTUAL ENTITY(5), INTELLEC-
TUAL PRODUCT(3), IDEA OR CONCEPT(6), ORGANIC CHEMICAL(8)and PHARMACOLOGIC SUBSTANCE(2) are from the top-downconsensus metaschema, while only SUBSTANCE(3) is fromthe bottom-up consensus metaschema. ENTITY(2) andCHEMICAL(8) are the only two MSTs, of the consolidatedmetaschema which do not appear as MSTs in the top-downor bottom-up metaschemas. They are still similar to MSTs,in the two given metaschemas, respectively, but with differ-ent groups. The structural properties of the consolidatedmetaschema will be compared to those of the consensusmetaschemas in Section 5.
We now turn our attention to non-IS-A, i.e., associativerelationships. An occurrence of an associative relationshipat an MST is called an introduction occurrence for this
Physicalobject
ConceptualEntity
Idea orConcept
TemporalConcept
QualitativeConcept
QuantitativeConcept
IntellectualProduct
ClassificationRegulation
or Law
LanguageGroup
Attributeme
(b) SN’’
OrganismAttribute
ClinicialAttribute
(d) SN*
egulationor Law
age
ORGANISM
ATTRIBUTE(2)
PHYSICAL
OBJECT(1)
CONCEPTUAL
ENTITY (12)
(f ) M B’’
g for Entity.

ENTITY (2)
SUBSTANCE
(3)
BIOLOGICALLY
ACTIVE
SUBSTANCE (7)ORGANIC
CHEMICAL (8)
ORGANIZATION
(4)
GROUP
(6)
OCCUPATION OR
DISCIPLINE (2)
IDEA OR
CONCEPT (6)
FINDING
(3)
PLANT
(2)
ORGANISM
(6)
MANUFACTURED
OBJECT (5)
ANATOMICAL
STRUCTURE (8)
PHENOMENON
OR PROCESS (5)
HEALTH CARE
ACTIVITY (4)
BEHAVIOR
(3)
EVENT (1)
PATHOLOGIC
FUNCTION (6)
BIOLOGIC
FUNCTION (8)
ACTIVITY (8)
SPATIAL
CONCEPT (4)
CONCEPTUAL
ENTITY(5)INTELLECTUAL
PRODUCT(3)
PHARMACOLOGIC
SUBSTANCE (2)
ANIMAL
(9)
MOLECULAR
SEQUENCE (4)
CHEMICAL
(8)ANATOMICAL
ABNORMALITY (3)
MST FROM BOTH
METASCHEMAS
MST FROM THE
TOP-DOWN
METASCHEMA
MST FROM THE
BOTTOM-UP
METASCHEMA
NEWLY
GENERATED MST
Fig. 18. Consolidated metaschema hierarchy.
Y. Chen et al. / Journal of Biomedical Informatics 41 (2008) 293–317 313
kind of relationship if this kind of relationship is notdefined for the parent of this MST. We note that the samekind of relationship, e.g. ‘‘issue in’’ may have several intro-duction occurrences at several MSTs, none of which is anancestor of another. All other occurrences of this kind ofrelationship are inherited from some introduction occur-rence of this kind of relationships. The complete presenta-tion of the consolidated metaschema including theintroduction occurrences of associative (semantic) relation-ships appears in Fig. 19. For space reasons, we had to codeeach relationship name as a number (see Table 12). Theinherited relationships are omitted from Fig. 19 to reduceits graphical complexity, as they can be deduced due tothe inheritance. However, the inherited associative rela-tionships are taken into account in calculating the com-plexity of the metaschema (see Section 5).
5. Discussion
The purpose of our research was to obtain a highquality metaschema. As discussed in the background
section, the motivation for conducting the bottom-upmetaschema study came from our dissatisfaction withthe large variations in the top-down experts’ metasch-emas. We hoped that the bottom-up heuristics wouldlead experts to produce metaschemas with less variabil-ity and higher agreement due to the higher amount ofdata considered in the bottom-up process comparedwith the top-down approach. The results indeed showlower variations among the experts (Table 13). Notethat although the average inter-participant agreementis higher for the top-down study (16.76 vs. 14.41), thisis misleading due to larger cardinalities for the top-down study. When the average agreement is measuredrelative to the average cardinality (26.73 vs. 23), thehigher proportion of agreement is obtained for the bot-tom-up study (0.67 vs. 0.63).
Although the variability of the experts’ metaschemas islower in the bottom-up study than in the top-down study,it is still quite high. The large range shows the high variabil-ity of participant responses. Thus, there is a problem whenusing any individual expert’s metaschema to evaluate an

Event(1)
Entity(2)
Finding(3)
Organization(4)
Anatomical Structure(11)
SpatialConcept (4)
Organic Chemical (8)
Pharmacologic Substance(2)
Biologically Active
Substance(7)
Occupation Discipline(2)
Idea or Concept(6)
Substance(3)
Organism(17)
Pathologic Function(6)
Biologic Function(8)
Phenomenon or Process(5)
Activity(8)
Manufactured Object(5)
MolecularSequence(4)
Behavior(3) Health Care
Activity(4)
Conceptual Entity(5)
IntellectualProduct(3)
Group(6)Plant(2)
Animal(9)
Anatomical Abnormality(3)
2, 5
3
4
5, 9
6
1, 3, 7
8
3
5
10
4
5
4
4
4
3, 5, 9
9
5, 12
11
11
7
13
7
Chemical(8)
14
5
15
15
4
4, 9
4, 9
1
16
9, 16
14
17
11, 18
11, 18
19
4
4
5
4
3
2010
20
20
217, 13
21
21
20
14
11
8,22
1, 4, 7, 6, 9, 23, 24
1, 5, 6,7, 9, 12
6
1,7
93
3
4
8
28
21
21
5, 12
21
25, 26, 27
7,26
26
7,13
7,26
13
4
3
3
Fig. 19. Consolidated metaschema with relationships.
Table 12Relationship number codes
Number Relationship Number Relationship Number Relationship
1 co-occurs_with 2 part_of 3 result_of4 associated_with 5 affects 6 occurs_in7 complicates 8 location_of 9 manifestation_of
10 exhibits 11 produces 12 process_of13 disrupts 14 interacts_with 15 issue_in16 evaluation_of 17 performs 18 uses19 method_of 20 conceptual_part_of 21 causes22 carries_out 23 precedes 24 degree_of25 diagnoses_of 26 treats 27 prevents28 ingredient_of
314 Y. Chen et al. / Journal of Biomedical Informatics 41 (2008) 293–317
algorithmically derived metaschema, as experts vary somuch in their opinions (Section 2).
It seems that one cannot rely on any one expert to pro-vide an authoritative metaschema for SN. At first thissounds quite disappointing. However, this phenomenon isunderstandable when one realizes that there is an exponen-tial number of connected partitions for the SN, each ofwhich would lead to a different metaschema. Furthermore,the experts are asked to make choices of importance anddistinctions which are subjective and are influenced by their
experience, background, specialty and personal prefer-ences. Therefore we derived the consensus metaschemasfor both studies, to overcome the variability of the individ-ual experts’ metaschemas.
The two consensus metaschemas, the top-down meta-schema and the bottom-up metaschema, reflect humanconsiderations, since they are metaschemas resulting fromseveral human experts’ input. At the same time, theircumulative nature helped to overcome the variability men-tioned above. However, as their evaluations show, each of

Table 13Comparing experts’ metaschemas of both studies
Experts’ metaschema properties Top-downstudy
Bottom-upstudy
Lowest cardinality 12 16Highest cardinality 36 30Cardinality range 25 15Average cardinality 26.73 23Cardinality standard deviation 10.23 4.56Upper threshold 45 41Lower threshold 2 3Threshold range 44 39Average inter-participant agreement 16.76 14.41Ratio of average agreement to average
cardinality0.63 0.67
Table 14Comparison of the structural measures for the top-down, bottom-up andconsolidated metaschemas
Measures Top-down Bottom-up Consolidated
Cardinality 26 25 28Complexity 4.3 4.72 3.92Maximum weight 15 18 9Minimum weight 1 1 1Weight spread 14 17 8Average weight 5.19 5.40 4.89Standard deviation 3.49 3.93 2.25Coverage (%) 70.6 75.93 75.05
Y. Chen et al. / Journal of Biomedical Informatics 41 (2008) 293–317 315
them has pros and cons, in term of its structural properties.Thus, we constructed the consolidated metaschema thatcan best facilitate user orientation into the SN, by enjoyingthe advantages of each of the consensus metaschemas andavoiding their disadvantages.
Altogether, in the consolidated metaschema, the groupsidentical to both input metaschemas contain 48 (36%) STs,the groups identical only to those in the bottom-up consen-sus metaschema contain 45 (33%) STs and the groups iden-tical only to the top-down consensus metaschema contain32 (24%) STs. Only 10 (7%) STs are contained in MSTswhich did not appear in the given metaschemas, althoughthey are similar to such MSTs (according to the definitionof similar MSTs in Section 3.2). Hence, in the consolidatedmetaschema, 93% of the STs from the SN appear in MSTsselected by human experts. In [10], McCray et al. define thenaturalness property of a partition of the SN as the condi-tion that ‘‘the groups must characterize the domain in away that is acceptable to a domain expert.’’ As we saw,all MSTs except for two satisfy the naturalness property,as required for a partition of the SN by McCray et al. [10].
From the semantic viewpoint, we can see that importantMSTs, missing in either of the consensus metaschemas butoccurring in the other, are now in the consolidated meta-schema. For example MOLECULAR SEQUENCE(4), ANATOMICAL
ABNORMALITY(3) and ANIMAL(9) are missing from the top-down consensus metaschema. Similarly, ORGANIC CHEMI-
CAL(8), INTELLECTUAL PRODUCT(3), IDEA OR CONCEPT(6),PHARMACOLOGIC SUBSTANCE(2) and CONCEPTUAL ENTITY(5)are missing from the bottom-up consensus metaschema.All these MSTs appear in the consolidated metaschema.In addition, the consolidated metaschema shows betterstructural properties than either of the input metaschema(see Table 14). In particular, the consolidated metaschemahas a lower weight range and a lower standard deviation.
There were no statistically significant differences of theaverage weights among the top-down, bottom-up and con-solidated metaschemas.
By an F test for equality of variance [35], the standarddeviations of the top-down and bottom-up metaschemasdid not differ, but both were greater than that of the con-solidated metaschema (p < .05). Using a bootstrap estima-
tor [36], the maximum weight of the top-down metaschemawas determined to be statistically significantly greater thanthat of the consolidated metaschema, but the other differ-ences among the maxima did not achieve statisticalsignificance.
As can be seen, the bottom-up consensus metaschemacontributed more of its groups to the consolidated meta-schema than the top-down metaschema. On one hand, thisis in line with the bottom-up study being based on provid-ing the experts with more data and the lower variability ofthis study. On the other hand, this is surprising in view of(Table 13) better structural measures of the top-down con-sensus metaschema with regard to maximum weight andstandard deviation. However, as mentioned before, thesedifferences are not statistically significant. In spite of themuch lower variability of the bottom-up experts’ metasch-emas, the advantage of the bottom-up study disappearedwhen we obtained the consensus metaschemas. We attri-bute this phenomenon to the largest MST, CHEMICAL(18)in the bottom-up consensus metaschema. Working bot-tom-up, most of the experts did not identify any ST inthe group CHEMICAL(18), while experts scanning the SNtop-down, identified ORGANIC CHEMICAL(8) and PHARMACO-
LOGIC SUBSTANCE(2). This largest weight contributed muchmore to the weight range and standard deviation thanthe largest MST ORGANISM(15) in the top-down consensusmetaschema. However, this does not imply better qualityof the top-down consensus metaschema for the otherMSTs. Interestingly, the MAIN-CONSOLIDATE algo-rithm avoided selecting any large MSTs, and instead chosesmaller natural MSTs covering the STs of the large MSTsin the other metaschema.
6. Conclusions
In this paper, we compared, from a structural point ofview, two heuristic metaschemas, the top-down and bot-tom-up consensus metaschemas, derived from two studiesinvolving two groups of UMLS experts. We defined differ-ent levels of similarity. Using these definitions, we foundthat both heuristic metaschemas agree in almost half (12)of the MSTs. There are seven similar MSTs, five of whichare cases of refinement. We defined several structural prop-erties of a metaschema, such as, cardinality, complexity,maximum weight, minimum weight, weight spread, average

316 Y. Chen et al. / Journal of Biomedical Informatics 41 (2008) 293–317
weight, standard deviation and coverage percentage. Weused them for evaluation of both consensus metaschemas.Second, we designed an algorithm to construct a consoli-dated metaschema from two given metaschemas, enjoyingthe advantages and avoiding the disadvantages of both.The consolidated metaschema has better structural proper-ties, such as lower weight range as well as lower standarddeviation than its inputs. It can better serve as an abstractnetwork and support user orientation and navigation ofthe Semantic Network, due to its naturalness in identifyingmany groups selected by most experts in either of the stud-ies. Furthermore, the relative structural uniformity of theconsolidated metaschema, as expressed in the low weightrange and standard deviation, will also support user orien-tation and navigation when accessing the underlying STgroups using various SN graphical views described in[12,15].
In previous research we had derived algorithmically gen-erated metaschemas. The consolidated metaschema, beinga digest of many domain experts’ input, can be used toevaluate the naturalness of the algorithmic cohesive [12]and lexical [15] metaschemas, rather than the top-downconsensus metaschema used for their evaluation in [12]and [16], respectively.
Acknowledgments
We thank the following researchers who have publishedon the UMLS or related topics for participating in any ofthe reported studies. The list is in alphabetical order. Weapologize for possible inaccuracies caused by some respon-dents sending their responses in unnamed self-addressedenvelopes: G. Octo Barnett, Charles Barr, James Brinkley,Christopher G. Chute, James J. Cimino, Gregory F. Coo-per, Gai Elhanan, Mark Erlbaum, Carol Friedman, RobertA. Greenes, Stephen Johnson, Kenric Hammond, WilliamR. Hersh, Pat Malholt, Jose L. Mejino, Perry L. Miller,Randolph Miller, Nels E. Olsen, Cornelius Rosse, BarrySmith and Kent A. Spackman.
References
[1] Tuttle MS, Sherertz DD, Olson NE, Erlbaum MS, SperzelWD, Fuller LF et al. Using META-1, the first version of theUMLS Metathesaurus. In: Proc. fourteenth annual SCAMC; 1990.p. 131–5.
[2] Schuyler PL, Hole WT, Tuttle MS, Sheretz DD. The UMLSMetathesaurus: representing different views of biomedical concepts.Bull Med Libr Assoc 1993;81(2):217–22.
[3] McCray AT. UMLS Semantic Network. In: Proc. thirteenth annualSCAMC. Washington, DC; 1989. p. 503–7.
[4] McCray AT, Hole WT. The scope and structure of the first version ofthe UMLS Semantic Network. In: Proc. fourteenth annual SCAMC,November 1990. Los Alamitos, CA; 1990. p. 126–30.
[5] McCray AT. Representing biomedical knowledge in the UMLSSemantic Network. In: Broering NC, editor. High-performancemedical libraries: advances in information management for thevirtual era. Westport, CT: Mekler; 1993. p. 45–55.
[6] McCray AT. An upper-level ontology for the biomedical domain.Comp Func Genom 2003;4:80–4.
[7] Campbell KE, Oliver DE, Shortliffe EH. The Unified MedicalLanguage System: toward a collaborative approach for solvingterminologic problems. JAMIA 1998;5(1):12–6.
[8] Humphreys BL, Lindberg DAB, Schoolman HM, Barnett GO. TheUnified Medical Language System: an informatics research collabo-ration. JAMIA 1998;5(1):1–11.
[9] U.S. Department of Health and Human Services, National Institutesof Health, National Library of Medicine. Unified Medical LanguageSystem (UMLS); 2006. Available from: www.nlm.nih.gov/research/umls.
[10] McCray AT, Burgun A, Bodenreider O. Aggregating UMLS seman-tic types for reducing conceptual complexity. In: Proc. medinfo,September 2001. London, UK; 2001. p. 171–5.
[11] Kumar A, Smith B, Stefanelli M, Quaglinia S, Piazza M. Imple-menting clinical guidelines in an organizational setup. Proceedings ofthe workshop on model-based and qualitative reasoning in biomed-icine, p. 39–44.
[12] Perl Y, Chen Z, Halper M, Geller J, Zhang L, Peng Y. The cohesivemetaschema: a higher-level abstraction of the UMLS SemanticNetwork. J Biomed Inform 2003;35(3):194–212.
[13] Zhang L, Perl Y, Halper M, Geller J. Designing metaschemas for theUMLS Enriched Semantic Network. J Biomed Inform2003;36(6):433–49.
[14] Zhang L, Perl Y, Geller J, Halper M, Cimino JJ. An enriched UMLSSemantic Network with a multiple inheritance hierarchy. J Am MedInform Assoc 2004;11(3):195–206.
[15] Zhang L, Perl Y, Halper M, Geller J, Hripcsak G. A lexicalmetaschema for the UMLS Semantic Network. Artif Intell Med2005;33:41–59.
[16] Zhang L, Hripcsak G, Perl Y, Halper M, Geller J. An expert studyevaluating the UMLS lexical metaschema. Artif Intell Med2005;34(3):219–33.
[17] Gu H, Perl Y, Elhanan G, Min H, Zhang L, Peng Y. Auditingconcept categorizations in the UMLS. Artif Intell Med2004;31(1):29–44.
[18] Niles I, Pease A. Origins of the IEEE standard upper ontology. In:Working notes of the IJCAI-2001 workshop on the IEEE standardupper ontology, August 2001. Seattle, WA; 2001.
[19] Niles I, Pease A. Towards a standard upper ontology. In: Proc. FOIS,October 2001. Ogunquit, MA; 2001.
[20] Fellbaum C, editor. WordNet: an electronic lexical database (lan-guage, speech, and communication). The MIT Press; 1998.
[21] Niles I, Pease A. Linking lexicons and ontologies: mapping wordnetto the suggested upper merged ontology. In: Proc. internationalconference on information and knowledge engineering, June 2003(IKE’03). Las Vegas, NV; 2003.
[22] Gu H, Halper M, Geller J, Perl Y. Benefits of an object-orienteddatabase representation for controlled medical terminologies. JAMI-A 1999;6(4):283–303.
[23] Cimino JJ, Clayton PD, Hripcsack GJ, Johnson SB. Knowledge-based approaches to the maintenance of a large controlled medicalterminology. JAMIA 1994;1(1):35–50.
[24] Liu L, Halper M, Geller J, Perl Y. Controlled vocabularies inOODBs: modeling issues and implementation. Distrib ParallelDatabases 1999;7(1):37–65.
[25] Gu H, Perl Y, Halper M, Geller J, Kuo F, Cimino JJ. Partitioning anobject-oriented terminology schema. Methods Med Inform2001;40:204–12.
[26] Bodenreider O, McCray AT. Exploring semantic groups throughvisual approaches. J Biomed Inform 2003;36(6):414–32.
[27] Nelson SJ, Sheretz DD, Tuttle MS, Erlbaum MS. Using MetaCard: ahypercard browser for biomedical knowledge sources. In: Proc. annusymp comput appl med care; 1990. p. 151–4.
[28] Li Q, Shilane P, Noy NF, Musen MA. Ontology acquisition from on-line knowledge sources. In: Proc. 2000 AMIA annual symposium,November 2000. Los Angeles, CA; 2000. p. 497–501.
[29] Tuttle MS, Cole WG, Sheretz DD, Nelson SJ. Navigating toknowledge. Methods Inf Med 1995;34(1–2):214–31.

Y. Chen et al. / Journal of Biomedical Informatics 41 (2008) 293–317 317
[30] Aristotle. The categories. Cambridge, MA: Harvard UniversityPress; 1973.
[31] Hripcsak G, Friedman C, Anderson P, DuMouchel W, Johnson S,Clayton P. Unlocking clinical data from narrative reports: a study ofnatural language processing. Ann Intern Med 1995;122:681–8.
[32] Dunn G. Design and analysis of reliability studies. New York: Ox-ford University Press; 1989.
[33] Perl Y, Schach SR. Max–min tree partitioning. JACM1981;28(1):5–15.
[34] Perl Y, Becker R, Schach S. A shifting algorithm for min max treepartitioning. JACM 1982;29:58–76.
[35] Snedecor GW, Cochran WG. Statistical methods. 8th ed. Ames,IA: Iowa State University Press; 1989.
[36] Efron B, Tibshirani R. An introduction to the bootstrap. NewYork: Chapman & Hall; 1993.
Glossary of metaschemas
Metaschema: A compact, acyclic Abstraction Network of the SN basedon a partition of the IS-A hierarchy of the SN into connected components.The nodes of the metaschema, called metasemantic types (MSTs), repre-sent connected groups of semantic types of the SN. The MSTs are linkedby hierarchical meta-child-of relationships and non-hierarchical meta-
relationships.
Cohesive metaschema: A metaschema created by an algorithm based onstructural considerations, described in [12].Lexical metaschema: A metaschema created by an algorithm based onlexical considerations, described in [15].Expert metaschema: A metaschema created by a domain expert.Top-down expert metaschema: An expert metaschema created using aheuristic methodology, processing the SN starting at its roots andproceeding down the tree. It is described in [16] and reviewed inSection 2.2.Bottom-up expert metaschema: An expert metaschema created using aheuristic methodology processing the SN starting at its leaves and pro-ceeding up the tree. It is described in Section 3.1.Cumulative metaschema: A metaschema resulting from aggregating ex-perts’ metaschemas according to a threshold value.Consensus metaschema: The cumulative metaschema resulting fromaggregating the experts’ metaschemas according to a threshold of a simplemajority of experts.Top-down consensus metaschema: A consensus metaschema of the top-down expert metaschemas.Bottom-up consensus metaschema: A consensus metaschema of the bot-tom-up expert metaschemas.Consolidated metaschema: A metaschema created by the MAIN-CON-SOLIDATE algorithm, combining the best features of the top-down con-sensus metaschema and the bottom-up consensus metaschema. This is themain result of this paper.