heuristic coarsening for generating multiscale transport
TRANSCRIPT
Delft University of Technology
Heuristic Coarsening for Generating Multiscale Transport Networks
Krishnakumari, Panchamy; Cats, Oded; van Lint, Hans
DOI10.1109/TITS.2019.2912430Publication date2019Document VersionFinal published versionPublished inIEEE Transactions on Intelligent Transportation Systems
Citation (APA)Krishnakumari, P., Cats, O., & van Lint, H. (2019). Heuristic Coarsening for Generating Multiscale TransportNetworks. IEEE Transactions on Intelligent Transportation Systems, 21(6), 2240-2253. [8701619].https://doi.org/10.1109/TITS.2019.2912430
Important noteTo cite this publication, please use the final published version (if applicable).Please check the document version above.
CopyrightOther than for strictly personal use, it is not permitted to download, forward or distribute the text or part of it, without the consentof the author(s) and/or copyright holder(s), unless the work is under an open content license such as Creative Commons.
Takedown policyPlease contact us and provide details if you believe this document breaches copyrights.We will remove access to the work immediately and investigate your claim.
This work is downloaded from Delft University of Technology.For technical reasons the number of authors shown on this cover page is limited to a maximum of 10.

Green Open Access added to TU Delft Institutional Repository
‘You share, we take care!’ – Taverne project
https://www.openaccess.nl/en/you-share-we-take-care
Otherwise as indicated in the copyright section: the publisher is the copyright holder of this work and the author uses the Dutch legislation to make this work public.
This article has been accepted for inclusion in a future issue of this journal. Content is final as presented, with the exception of pagination.
IEEE TRANSACTIONS ON INTELLIGENT TRANSPORTATION SYSTEMS 1
Heuristic Coarsening for Generating MultiscaleTransport Networks
Panchamy Krishnakumari , Oded Cats, and Hans van Lint
Abstract— Graphs at different scales are essential tools formany transportation applications. Notwithstanding their rele-vance, these graphs are created and maintained manually formost applications, in both research and practice. In this paper,we develop a heuristic method for automatically generating mul-tiscale graph representations without significantly compromisingtheir topological properties. This makes the resulting graphswidely applicable. The method is demonstrated on the open streetmap network of Amsterdam with four different application cases.Various graph metrics are used for evaluating the performanceof coarsening on the topological characteristics of the network.Our results show that the method is able to successfully reducethe Amsterdam network by up to 96% of its original size at acomputation time of no more than 15 min with a limited lossof information, indicated by the preservation of key networkcharacteristics. For example, the method maintains trip lengthdistributions and limits the maximum shortest path deteriorationbetween any major origin and destination nodes to no morethan 0.025% for the coarsest graph. Moreover, by setting itsparameters it can cater for preservation of important networkelements or entire sub-networks, which is of special importancein multiscale traffic modeling and simulation. The versatility ofthe algorithm—in contrast to algorithms dedicated to for exampletraffic assignment applications—makes it useful for a wide rangeof applications within the transportation domain and beyond.To support further research an open-source implementation ofthe algorithm is made available.
Index Terms— Multiscale graph, heuristic, coarsening,geographic data, opensource, transport networks.
I. INTRODUCTION
D IRECTED graphs are vital tools in many areas oftransportation science and practice. Particularly for the
design and study of ITS; accurate graph representations at theappropriate level of detail are of quintessential importance.There are many readily available detailed directed graphrepresentations. These representations are based on structured,reusable and standardized geographic and dynamic data suchas open street map (OSM), and dedicated maps maintained bypublic administrations and road and rail operators. However,multiscale representations of these networks are more difficultto come by, despite their relevance.
Manuscript received October 23, 2018; revised March 11, 2019 andApril 10, 2019; accepted April 14, 2019. This work was supported by theSETA Project funded by the European Union’s Horizon 2020 Research andInnovation Program under Grant 688082. The Associate Editor for this paperwas S. C. Wong. (Corresponding author: Panchamy Krishnakumari.)
The authors are with the Department of Transport and Planning,Delft University of Technology, 2628 Delft, The Netherlands (e-mail:[email protected]).
Digital Object Identifier 10.1109/TITS.2019.2912430
Multiscale graph decomposition has been studied exten-sively in different fields such as scientific computing, gaming,Very Large Scale Integration (VLSI) system design, to namea few, using methods based on random walks, diffusion maps,spectral graph theory and various coarsening schemes [1]–[3].In transportation, studies involving graph decompositioningfocus mainly on graph partitioning problems for speedingup shortest path routing [3]–[6], and applications in thecontext of traffic assignment and/or equilibrium sensitivityanalysis [7]–[11]. However, there are many other transportapplications that may benefit from consistent network rep-resentations at different levels of scale, obtained from eitherdetailed graph data (e.g. OSM) or coarse schematics. Exam-ples include multiscale modeling and simulation [12], [13];traffic estimation and prediction [14]–[18]; and even publictransport service network analysis [19] to name but a few.In fact, there are very few areas within transportation science,where no schematic graph representation of either the physicalor service network is needed. In practice today, such simplifiedschematic representations are often created and maintainedmanually, which is time consuming and error prone.
Given the wide range of applications for transportationnetwork analysis, automation of the process of generating suchcoarser graphs from whatever data available offers scientistsand practitioners large benefits in terms of effort spent. Thiscalls for the development of a generic simple solution forgenerating and maintaining a set of mutually consistent andaccurate directed graphs on the basis of the available geo-graphic data.
Definition 1: A multiscale graph is a set of increasinglycoarser graphs Gi , Gi+k ,..., k = 1,2,3; representing the sametransport infrastructure (or service network).
We propose that a consistently coarsened graph Gi+1 withrespect to some finer base graph Gi should match the follow-ing criteria:• Gi+1 has considerably fewer links and nodes than Gi
• Gi+1 preserves important global topological characteris-tics of Gi (connectivity, shortest path distribution, diam-eter, total network length, centrality)
• Gi+1 preserves important domain specific link and nodeattributes encoded in (or defined on) Gi
• Gi+1 preserves consistent and accurate local (dynamic)topological attributes of Gi such as the shortest pathsbetween origins and destinations (at approximately thesame locations)
Note that where we use the words “preserve” (certain prop-erties), one may also read “gracefully degrades”, in the sense
1524-9050 © 2019 IEEE. Personal use is permitted, but republication/redistribution requires IEEE permission.See http://www.ieee.org/publications_standards/publications/rights/index.html for more information.
This article has been accepted for inclusion in a future issue of this journal. Content is final as presented, with the exception of pagination.
2 IEEE TRANSACTIONS ON INTELLIGENT TRANSPORTATION SYSTEMS
that in some cases, some degradation of information densityis inevitable when cutting out nodes and/or links. We returnto this point in more detail in the validation experiments weprovide.
To this end, we propose a heuristic coarsening techniquebased on topological and/or data-driven information of thedirected graphs. A constrained version of this coarseningapproach using data-driven parameter is briefly noted in [17].Here, we present a more detailed and generic frameworkthat supports more widespread application. What makes ourapproach different from existing coarsening techniques tai-lored for specific transport applications—e.g. routing andassignment, which we discuss below—is that it provides ageneric and flexible tool to simplify large transport networksinto consistent coarser ones for many applications, rangingfrom topological analysis, modeling, simulation or visualisa-tion, to name just a few. In our research lab this method hassignificantly reduced the effort in generating graphs for thesecommon research tasks, and to the best of our knowledge nosuch generic method has been reported in the transportationliterature and/or made available in code. We demonstratethe framework for four such applications on the large scalenetwork of Amsterdam city. We use readily available topologyinformation like the length, type, node-density, or other phys-ical attributes of the graph to assign the weights and definethe coarsening rules. The detailed graph representation andthe physical attributes are obtained from Open Street Map(OSM), an open-source geographic data source. To support theresearch community in using and further developing efficienttools for graph coarsening we offer an open-source version ofthe code that implements our framework.1
The paper is organized as follows: Section II firstoverviews the basics of network coarsening, using related workin (mostly) disciplines other than transportation. In section IIIwe then discuss the proposed coarsening framework and thealgorithms that will be applied to transportation networks.In section IV we discuss the (Amsterdam) data; and themethods and performance indicators to assess how well ourapproach succeeds in generating consistent coarsened graphrepresentations of the Amsterdam, the Netherlands. We quan-titatively and qualitatively discuss the results in section V andconclude the paper in section VI.
II. RELATED WORKS
Within transportation, a limited number of studies reportexplicit algorithmic work on graph coarsening. In [8] and [10]a bush-based approach is proposed for replacing a regionalnetwork with a smaller one, containing all of the sub-network,and zones. Artificial arcs are created to represent “all paths”between each origin and sub-network boundary node, underthe assumption that the set of equilibrium routes does notchange. Similarly, [9] and [11] present method(s) for networkaggregation under Stochastic User Equilibrium (SUE), usingsensitivity analysis, in which the measure for assessing theresulting coarse network representation is based on howwell perturbations in either demand or supply characteristics
1https://github.com/Panchamy/Heuristic-Coarsening/wiki
(i.e. changes in the OD matrix and/or changes in the linkcost functions respectively) affect the result of the assignment.These methods are insightful, but based on a huge set ofassumptions specific (and relevant) to the assignment problem,but not to other transportation problems. This hinders theirrelevance and transferability to other application domains.A second and related class of transportation problems forwhich graph coarsening plays an important role is speeding upshortest path routing algorithms [3]–[6], [20]. Bast et al. [21]gives an extensive overview of the multilevel methods for rout-ing in transport networks. They conclude out that there are notmany studies available within the transportation domain thatdiscuss how—for a much broader range of applications otherthan assignment and speeding up routing problems—the topo-logical characteristics of multiscale graphs differ with respectto the original fine-scaled graph. There is, however, a richbody of work available in other domains. Here, we presentan abridged overview on coarsening research that is directlyrelevant for this work.
Multilevel methods were introduced during the 1990’s toimprove efficiency and quality of combinatorial optimisationproblems [2]. Multilevel based algorithms try to solve complexproblems by creating a hierarchy of problems that represent theoriginal problem with fewer degrees of freedom. This processis coined coarsening. These hierarchies at different scalescan be sequentially projected back to reconstruct the originalproblem space, known as uncoarsening. The coarsening anduncoarsening stages together constitute the multilevel frame-work. There are a couple of papers that provide an overviewof multilevel techniques [22], [23]. In this work, we are onlyinterested in the coarsening phase of the framework. Coars-ening can be broadly classified into two types - strict andweighted coarsening. In strict coarsening, nodes are aggregatedtogether to form a single node in the “coarsened space”.The nodes in the coarsened space are called aggregates [2].In weighted coarsening, each node is divided into fractionsand these fractions can belong to different aggregates in thecoarsened space [24]. More details on the principal differencesbetween these two methods in graph terms can be foundin [23].
Multilevel algorithms have been used in many disciplinesincluding games [25], [26], mechanical engineering [27],infectious disease spread studies [28] and graph opti-misation problems [23]. The graph partitioning problemsand graph optimisation applications within transporta-tion that focus on speeding up shortest path routingalgorithms [3]–[5], [20], [21], [29]–[31] typically use strictcoarsening for generating the hierarchies. That most multilevelmethods for transport networks use hierarchical techniquesmakes sense, since road networks are inherently hierarchical.This was first fully exploited in the highway hierarchies(HHs) [4] method. The highway hierarchies contains two mainbuilding blocks - edge reduction and node reduction. Edgereduction preserves the edges in the middle of long distancepaths and node reduction contracts nodes of degree one andtwo (i.e. nodes that only connect one or two adjacent links).
A simpler version of HHs are so-called contraction hierar-chies (CHs), introduced by Geisberger et al. [3], [32], which
This article has been accepted for inclusion in a future issue of this journal. Content is final as presented, with the exception of pagination.
KRISHNAKUMARI et al.: HEURISTIC COARSENING FOR GENERATING MULTISCALE TRANSPORT NETWORKS 3
are among the most effective (shortest route) speedup tech-niques. In general, coarsening techniques work by replacingedges in the graph with so-called shortcuts. In CHs, the short-cuts are added iteratively by contracting nodes following agiven order of importance. The node ordering eliminates oneof the major drawbacks of classical methods - the unpre-dictability of the contraction results. The main reason for thiscan be attributed to the random choice of nodes for the coarselevel graph in classic methods [2]. Edge reduction is used inHHs to minimise the explosion of average node degree in thecoarsened network but in CHs, this shortcoming is eliminatedusing a more sophisticated node contraction. Node contractionin CHs adds shortcuts only if shortest paths are preservedin the coarse scale after each node contraction. However,checking if the shortest path is preserved is time consuming.There are various solutions to speed up this process includinglimiting the space for shortest path search [3], using GPU [33]and customizable contraction hierarchies [26].
All these studies are based on graph methods that havenot (yet) been explored in the traffic domain other thanfor routing applications. In this paper, we seek a (heuristic)approach for network coarsening that can be used (insofarpossible) in most transportation applications where graphcoarsening might be useful. This method should offer a genericmechanism to assess the quality of the procedure based ontopological information and/or data available in the applicationat hand. Based on the simplicity and success of CHs, we pro-pose a heuristic approach with some of the building blocks ofCHs—node ordering and node contraction. In [17], we brieflyshow how a constrained version of CHs can be easily usedfor network complexity reduction for traffic predictions. In thecurrent contribution we further develop, formalize, apply andtest the proposed approach to provide a more generic heuristicframework based on CHs that can be deployed in variousapplications.
III. HEURISTIC COARSENING FRAMEWORK FOR
MULTISCALE GRAPH GENERATION
The general idea of coarsening is that, given graph G with nnodes, a more compact graph with a smaller number of nodescan be found which yields a good representation of the originalgraph. The multiscale graph Gi+1 is constructed from theprevious finer scale graph Gi by collapsing together the nodesand edges that have similar matching criteria. The matchingcan be computed in different ways, for example, by usingaggregates [2]; by considering dominant route flows [34]; orbased on node density [35]. In this work, the matching is basedon the edge difference or variance of the edge weights. On topof the building blocks of CHs, we also use pruning to furtherreduce the network. This section will detail the steps requiredto derive these multiscale graphs. The coarsened graph canbe constructed using the following four steps [2]. Note thateach step may be detailed according to application-specificrequirements or constraints.
1) Assign weights to the links in the directed graph;2) Prioritize the nodes so that they can be removed in a
strict order for generating the next coarsened level;
TABLE I
GRAPH NOTATIONS. EXAMPLES ARE BASED ON FIGURE 1
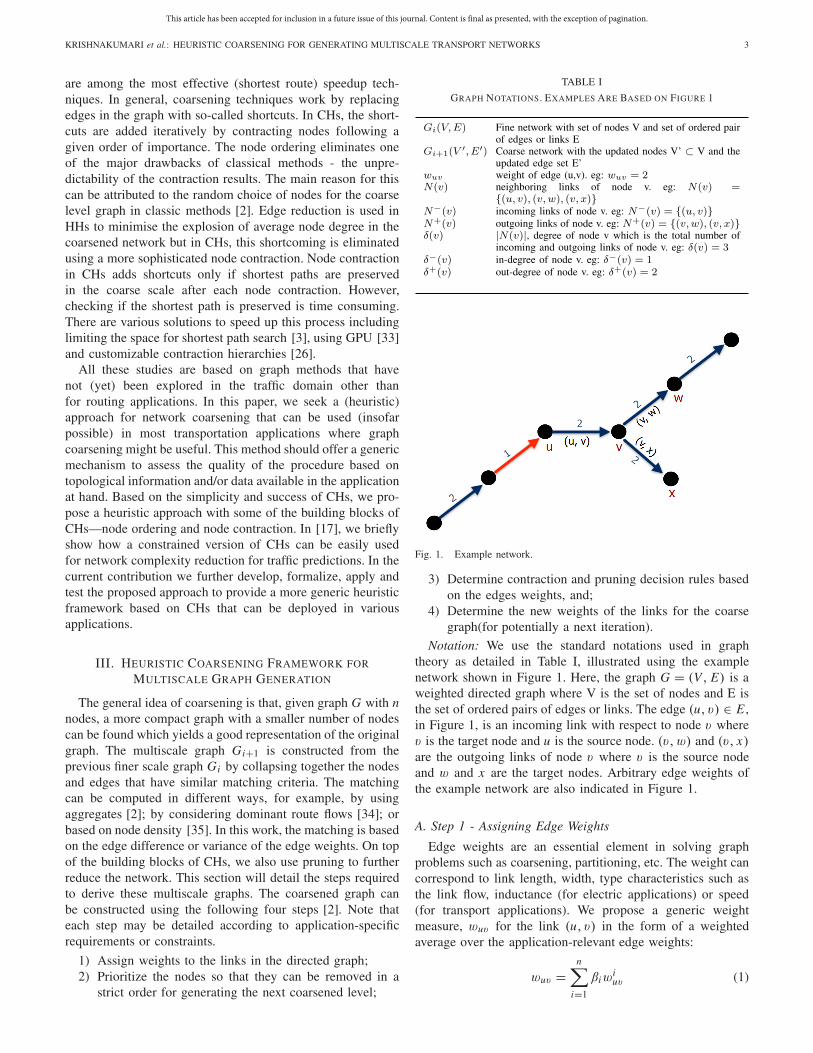
Fig. 1. Example network.
3) Determine contraction and pruning decision rules basedon the edges weights, and;
4) Determine the new weights of the links for the coarsegraph(for potentially a next iteration).
Notation: We use the standard notations used in graphtheory as detailed in Table I, illustrated using the examplenetwork shown in Figure 1. Here, the graph G = (V , E) is aweighted directed graph where V is the set of nodes and E isthe set of ordered pairs of edges or links. The edge (u, v) ∈ E ,in Figure 1, is an incoming link with respect to node v wherev is the target node and u is the source node. (v,w) and (v, x)are the outgoing links of node v where v is the source nodeand w and x are the target nodes. Arbitrary edge weights ofthe example network are also indicated in Figure 1.
A. Step 1 - Assigning Edge Weights
Edge weights are an essential element in solving graphproblems such as coarsening, partitioning, etc. The weight cancorrespond to link length, width, type characteristics such asthe link flow, inductance (for electric applications) or speed(for transport applications). We propose a generic weightmeasure, wuv for the link (u, v) in the form of a weightedaverage over the application-relevant edge weights:
wuv =n∑
i=1
βiwiuv (1)
This article has been accepted for inclusion in a future issue of this journal. Content is final as presented, with the exception of pagination.
4 IEEE TRANSACTIONS ON INTELLIGENT TRANSPORTATION SYSTEMS
where n is the number of attributes, β varies typically between0 and 1 and reflects the influence of these attributes onthe generic edge weight, and wi
uv is the i th attribute of thelink (u, v). Clearly, the value of β may differ based on theapplication.
B. Step 2 - Ranking the Nodes
The order in which the nodes are removed is importantfor graph coarsening for computational reasons (only) [2].In general, the seed nodes (nodes in the original graphconsidered for collapsing) are chosen randomly. In this work,we use a deterministic approach based on node orderingsuch that the nodes from the priority queue are contractedacross the network in a uniform way, rather than contractingnodes randomly. For example, nodes can be ordered based ongeographical scale (e.g. metropolitan areas; cities; neighbour-hoods); traffic hierarchy function (freeways; motorways; mainarterials; etc); spatial subdivision types such as grid-based [36]and polygon-based (e.g. clustering based on postal codes).
To illustrate this process, we use node degree (i.e. thenumber of edges connected to a node) as the decision rulefor prioritising the nodes. The more neighbours the node has,the higher the rank, and the node will be contracted later.The underlying assumption is that a node that connects a lotof edges is likely to be more important for the transportationnetwork and flow distribution—at least locally. Thus, the nodesare contracted by increasing order of node degree. Suppose,(u, v) ∈ E where u, v ∈ V then the rank of the nodes u andv will satisfy the following condition:
r(u) > r(v), i f δ(u) > δ(v) (2)
where δ(u) and δ(v) are the degree of node u and v respec-tively. Thus, based on the contraction rule, v will be contractedbefore u. Node contraction affects the priorities of othernodes. Therefore, the priority queue is rebuilt after eachnode collapse. Since this process can become computationallyexpensive, we have implemented an iterative approach insteadof re-evaluating the priorities, which is more efficient and pro-vides robust results. In the iterative approach, we evaluate thepriority once at the beginning of the iteration and collapse thenodes according to this queue. The neighbours of the nodes areupdated at the end of the iteration. The iteration ends when allthe nodes are visited at least once for collapsing consideration.The method converges when the iteration provides the sameresult as the previous iteration.
C. Step 3 - Defining the Contraction and Pruning Rules
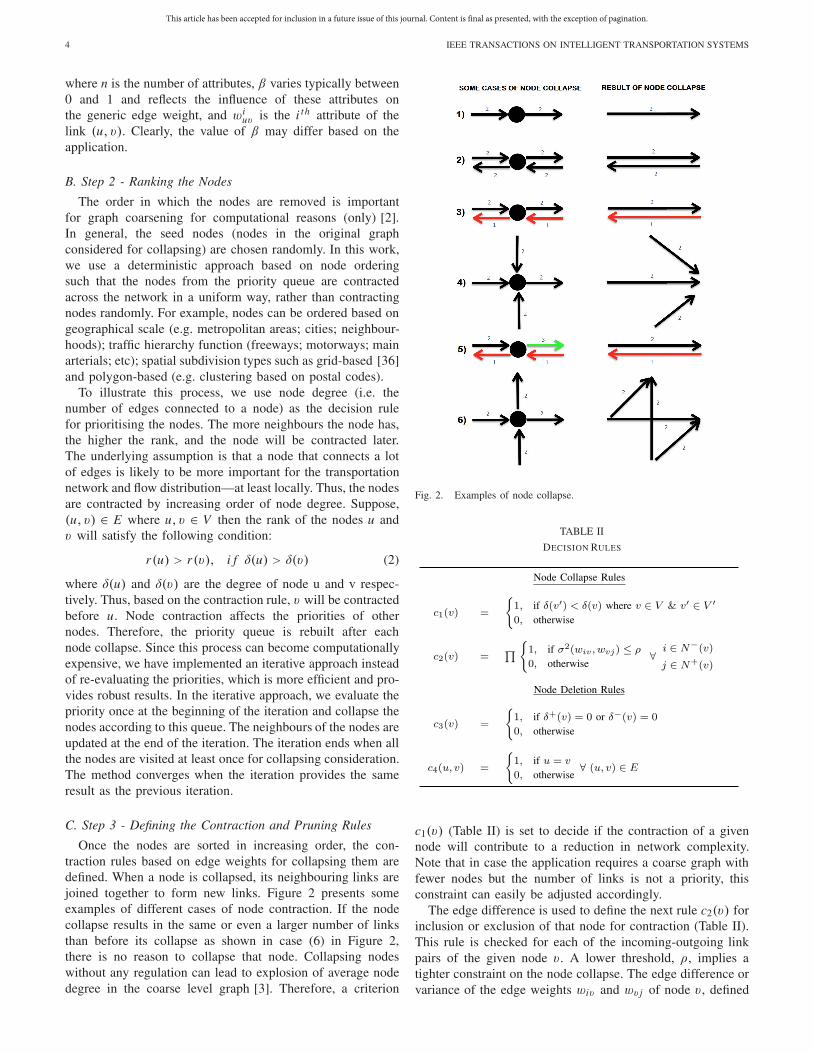
Once the nodes are sorted in increasing order, the con-traction rules based on edge weights for collapsing them aredefined. When a node is collapsed, its neighbouring links arejoined together to form new links. Figure 2 presents someexamples of different cases of node contraction. If the nodecollapse results in the same or even a larger number of linksthan before its collapse as shown in case (6) in Figure 2,there is no reason to collapse that node. Collapsing nodeswithout any regulation can lead to explosion of average nodedegree in the coarse level graph [3]. Therefore, a criterion
Fig. 2. Examples of node collapse.
TABLE II
DECISION RULES
c1(v) (Table II) is set to decide if the contraction of a givennode will contribute to a reduction in network complexity.Note that in case the application requires a coarse graph withfewer nodes but the number of links is not a priority, thisconstraint can easily be adjusted accordingly.
The edge difference is used to define the next rule c2(v) forinclusion or exclusion of that node for contraction (Table II).This rule is checked for each of the incoming-outgoing linkpairs of the given node v. A lower threshold, ρ, implies atighter constraint on the node collapse. The edge difference orvariance of the edge weights wiv and wv j of node v, defined
This article has been accepted for inclusion in a future issue of this journal. Content is final as presented, with the exception of pagination.
KRISHNAKUMARI et al.: HEURISTIC COARSENING FOR GENERATING MULTISCALE TRANSPORT NETWORKS 5
Fig. 3. Example cases of pruning (a) Dead-ends (b) Self-loops.
in equation (3), is used as the matching criterion.
σ 2(wiv , wv j ) = |wiv − μ|2 + |wv j − μ|2, where
μ = wiv +wv j
2, (3)
This is based on the idea that nodes should not be collapsed ifthey serve as the connection between two inherently differentlinks. For example, a node that is connecting a highway and acity road is topologically important and results in small edgedifference. If the ρ is set to 0 then this node would not becollapsed. If the ρ is set higher then the nodes that connectlinks with a smaller weight difference will be collapsed. Forexample, a node that connects a highway and a service road ishierarchically and topologically informative and hence shouldnot be collapsed. Setting a proper ρ can prevent this. In thecase (5) in Figure 2, if the ρ is set to 0, the node will notbe collapsed as the edge difference is not 0. (i.e. there is achange in hierarchical level)
The most expensive computation for most of the methodsmentioned in the literature, including CHs, relates to check-ing whether the shortest path is preserved after each nodecollapse [3]. This condition is not included in our heuristicapproach under the premise that if the node collapse is per-formed according to the proposed method, there will only beminimal deterioration in the shortest path, which is acceptablefor most applications. In section V, we will explicitly examinethe validity of this assumption.
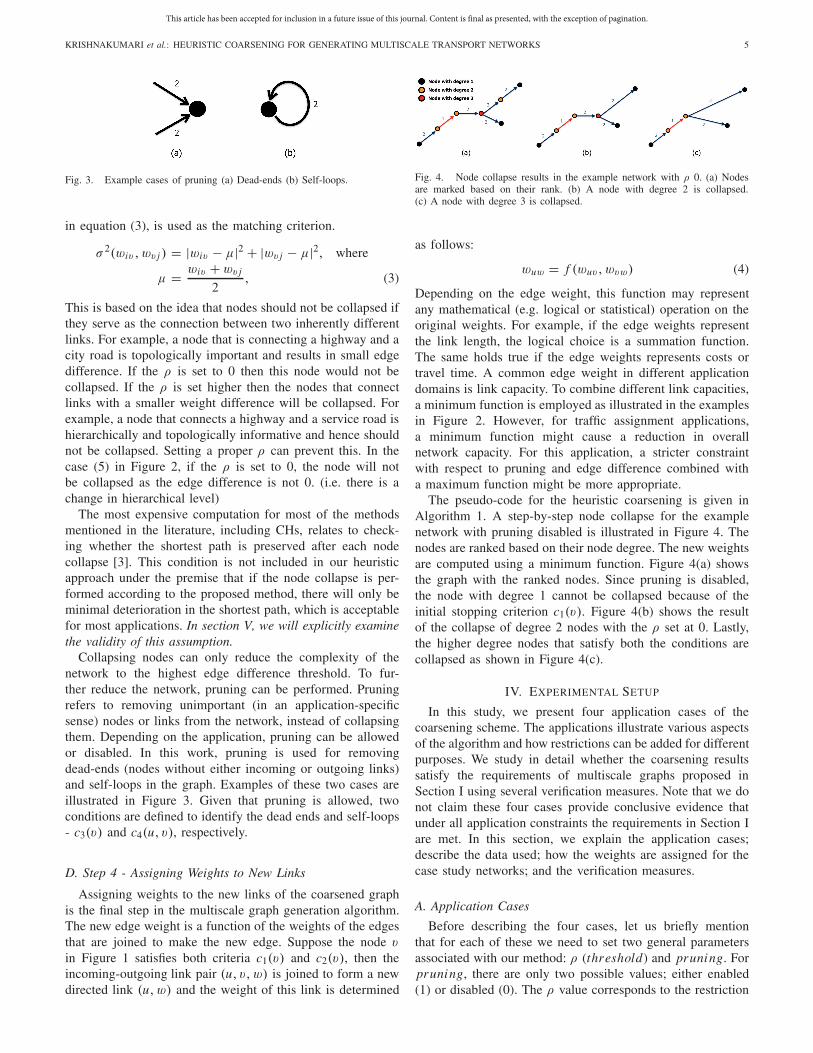
Collapsing nodes can only reduce the complexity of thenetwork to the highest edge difference threshold. To fur-ther reduce the network, pruning can be performed. Pruningrefers to removing unimportant (in an application-specificsense) nodes or links from the network, instead of collapsingthem. Depending on the application, pruning can be allowedor disabled. In this work, pruning is used for removingdead-ends (nodes without either incoming or outgoing links)and self-loops in the graph. Examples of these two cases areillustrated in Figure 3. Given that pruning is allowed, twoconditions are defined to identify the dead ends and self-loops- c3(v) and c4(u, v), respectively.
D. Step 4 - Assigning Weights to New Links
Assigning weights to the new links of the coarsened graphis the final step in the multiscale graph generation algorithm.The new edge weight is a function of the weights of the edgesthat are joined to make the new edge. Suppose the node vin Figure 1 satisfies both criteria c1(v) and c2(v), then theincoming-outgoing link pair (u, v,w) is joined to form a newdirected link (u, w) and the weight of this link is determined
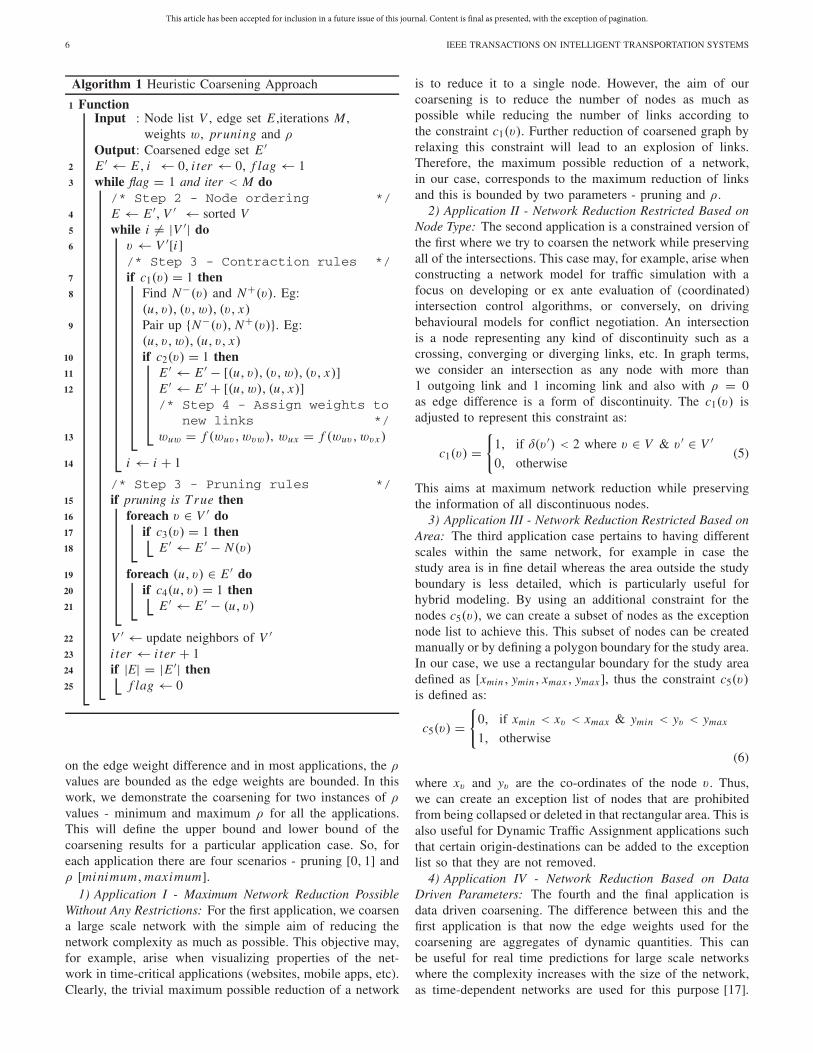
Fig. 4. Node collapse results in the example network with ρ 0. (a) Nodesare marked based on their rank. (b) A node with degree 2 is collapsed.(c) A node with degree 3 is collapsed.
as follows:wuw = f (wuv , wvw) (4)
Depending on the edge weight, this function may representany mathematical (e.g. logical or statistical) operation on theoriginal weights. For example, if the edge weights representthe link length, the logical choice is a summation function.The same holds true if the edge weights represents costs ortravel time. A common edge weight in different applicationdomains is link capacity. To combine different link capacities,a minimum function is employed as illustrated in the examplesin Figure 2. However, for traffic assignment applications,a minimum function might cause a reduction in overallnetwork capacity. For this application, a stricter constraintwith respect to pruning and edge difference combined witha maximum function might be more appropriate.
The pseudo-code for the heuristic coarsening is given inAlgorithm 1. A step-by-step node collapse for the examplenetwork with pruning disabled is illustrated in Figure 4. Thenodes are ranked based on their node degree. The new weightsare computed using a minimum function. Figure 4(a) showsthe graph with the ranked nodes. Since pruning is disabled,the node with degree 1 cannot be collapsed because of theinitial stopping criterion c1(v). Figure 4(b) shows the resultof the collapse of degree 2 nodes with the ρ set at 0. Lastly,the higher degree nodes that satisfy both the conditions arecollapsed as shown in Figure 4(c).
IV. EXPERIMENTAL SETUP
In this study, we present four application cases of thecoarsening scheme. The applications illustrate various aspectsof the algorithm and how restrictions can be added for differentpurposes. We study in detail whether the coarsening resultssatisfy the requirements of multiscale graphs proposed inSection I using several verification measures. Note that we donot claim these four cases provide conclusive evidence thatunder all application constraints the requirements in Section Iare met. In this section, we explain the application cases;describe the data used; how the weights are assigned for thecase study networks; and the verification measures.
A. Application Cases
Before describing the four cases, let us briefly mentionthat for each of these we need to set two general parametersassociated with our method: ρ (threshold) and pruning. Forpruning, there are only two possible values; either enabled(1) or disabled (0). The ρ value corresponds to the restriction
This article has been accepted for inclusion in a future issue of this journal. Content is final as presented, with the exception of pagination.
6 IEEE TRANSACTIONS ON INTELLIGENT TRANSPORTATION SYSTEMS
Algorithm 1 Heuristic Coarsening Approach
1 FunctionInput : Node list V , edge set E ,iterations M ,
weights w, pruning and ρOutput: Coarsened edge set E �
2 E � ← E, i ← 0, i ter ← 0, f lag← 13 while flag = 1 and iter < M do
/* Step 2 - Node ordering */4 E ← E �, V � ← sorted V5 while i �= |V �| do6 v ← V �[i ]
/* Step 3 - Contraction rules */7 if c1(v) = 1 then8 Find N−(v) and N+(v). Eg:
(u, v), (v,w), (v, x)9 Pair up {N−(v), N+(v)}. Eg:
(u, v,w), (u, v, x)10 if c2(v) = 1 then11 E � ← E � − [(u, v), (v,w), (v, x)]12 E � ← E � + [(u, w), (u, x)]
/* Step 4 - Assign weights tonew links */
13 wuw = f (wuv , wvw), wux = f (wuv , wvx )
14 i ← i + 1
/* Step 3 - Pruning rules */15 if pruning is T rue then16 foreach v ∈ V � do17 if c3(v) = 1 then18 E � ← E � − N(v)
19 foreach (u, v) ∈ E � do20 if c4(u, v) = 1 then21 E � ← E � − (u, v)
22 V � ← update neighbors of V �23 i ter ← i ter + 124 if |E| = |E �| then25 f lag← 0
on the edge weight difference and in most applications, the ρvalues are bounded as the edge weights are bounded. In thiswork, we demonstrate the coarsening for two instances of ρvalues - minimum and maximum ρ for all the applications.This will define the upper bound and lower bound of thecoarsening results for a particular application case. So, foreach application there are four scenarios - pruning [0, 1] andρ [minimum, maximum].
1) Application I - Maximum Network Reduction PossibleWithout Any Restrictions: For the first application, we coarsena large scale network with the simple aim of reducing thenetwork complexity as much as possible. This objective may,for example, arise when visualizing properties of the net-work in time-critical applications (websites, mobile apps, etc).Clearly, the trivial maximum possible reduction of a network
is to reduce it to a single node. However, the aim of ourcoarsening is to reduce the number of nodes as much aspossible while reducing the number of links according tothe constraint c1(v). Further reduction of coarsened graph byrelaxing this constraint will lead to an explosion of links.Therefore, the maximum possible reduction of a network,in our case, corresponds to the maximum reduction of linksand this is bounded by two parameters - pruning and ρ.
2) Application II - Network Reduction Restricted Based onNode Type: The second application is a constrained version ofthe first where we try to coarsen the network while preservingall of the intersections. This case may, for example, arise whenconstructing a network model for traffic simulation with afocus on developing or ex ante evaluation of (coordinated)intersection control algorithms, or conversely, on drivingbehavioural models for conflict negotiation. An intersectionis a node representing any kind of discontinuity such as acrossing, converging or diverging links, etc. In graph terms,we consider an intersection as any node with more than1 outgoing link and 1 incoming link and also with ρ = 0as edge difference is a form of discontinuity. The c1(v) isadjusted to represent this constraint as:
c1(v) ={
1, if δ(v �) < 2 where v ∈ V & v � ∈ V �
0, otherwise(5)
This aims at maximum network reduction while preservingthe information of all discontinuous nodes.
3) Application III - Network Reduction Restricted Based onArea: The third application case pertains to having differentscales within the same network, for example in case thestudy area is in fine detail whereas the area outside the studyboundary is less detailed, which is particularly useful forhybrid modeling. By using an additional constraint for thenodes c5(v), we can create a subset of nodes as the exceptionnode list to achieve this. This subset of nodes can be createdmanually or by defining a polygon boundary for the study area.In our case, we use a rectangular boundary for the study areadefined as [xmin , ymin, xmax , ymax ], thus the constraint c5(v)is defined as:
c5(v) ={
0, if xmin < xv < xmax & ymin < yv < ymax
1, otherwise
(6)
where xv and yv are the co-ordinates of the node v. Thus,we can create an exception list of nodes that are prohibitedfrom being collapsed or deleted in that rectangular area. This isalso useful for Dynamic Traffic Assignment applications suchthat certain origin-destinations can be added to the exceptionlist so that they are not removed.
4) Application IV - Network Reduction Based on DataDriven Parameters: The fourth and the final application isdata driven coarsening. The difference between this and thefirst application is that now the edge weights used for thecoarsening are aggregates of dynamic quantities. This canbe useful for real time predictions for large scale networkswhere the complexity increases with the size of the network,as time-dependent networks are used for this purpose [17].
This article has been accepted for inclusion in a future issue of this journal. Content is final as presented, with the exception of pagination.
KRISHNAKUMARI et al.: HEURISTIC COARSENING FOR GENERATING MULTISCALE TRANSPORT NETWORKS 7
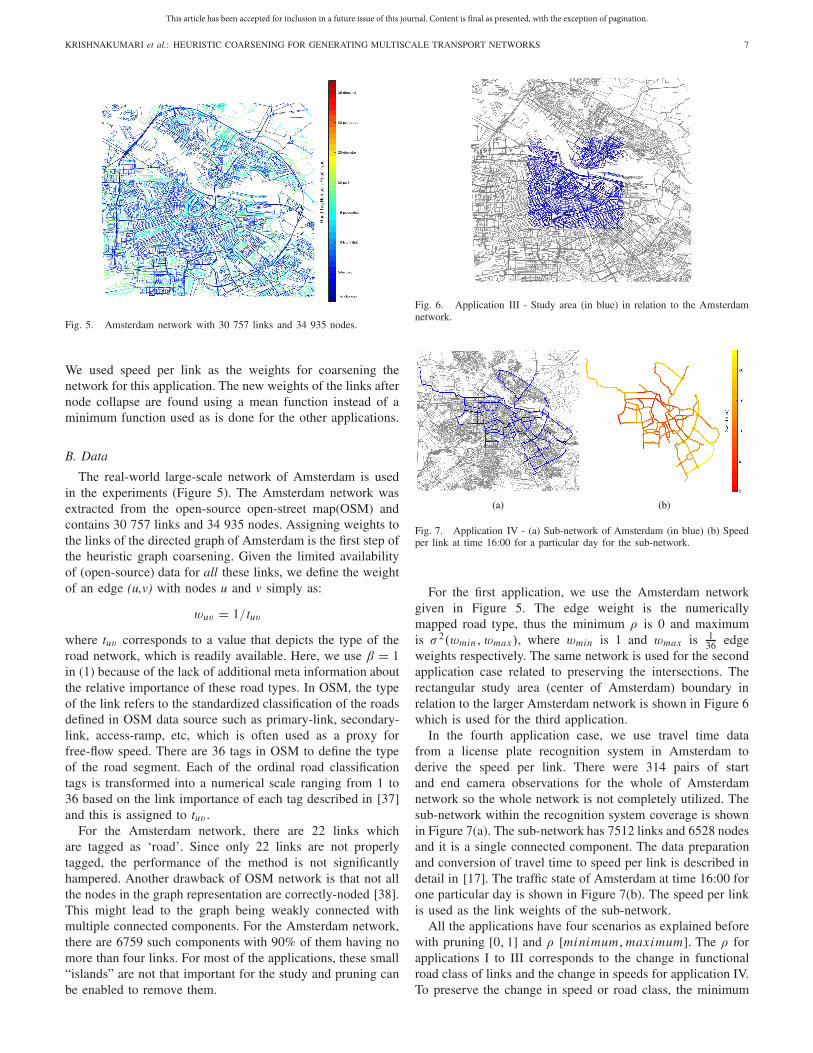
Fig. 5. Amsterdam network with 30 757 links and 34 935 nodes.
We used speed per link as the weights for coarsening thenetwork for this application. The new weights of the links afternode collapse are found using a mean function instead of aminimum function used as is done for the other applications.
B. Data
The real-world large-scale network of Amsterdam is usedin the experiments (Figure 5). The Amsterdam network wasextracted from the open-source open-street map(OSM) andcontains 30 757 links and 34 935 nodes. Assigning weights tothe links of the directed graph of Amsterdam is the first step ofthe heuristic graph coarsening. Given the limited availabilityof (open-source) data for all these links, we define the weightof an edge (u,v) with nodes u and v simply as:
wuv = 1/tuv
where tuv corresponds to a value that depicts the type of theroad network, which is readily available. Here, we use β = 1in (1) because of the lack of additional meta information aboutthe relative importance of these road types. In OSM, the typeof the link refers to the standardized classification of the roadsdefined in OSM data source such as primary-link, secondary-link, access-ramp, etc, which is often used as a proxy forfree-flow speed. There are 36 tags in OSM to define the typeof the road segment. Each of the ordinal road classificationtags is transformed into a numerical scale ranging from 1 to36 based on the link importance of each tag described in [37]and this is assigned to tuv .
For the Amsterdam network, there are 22 links whichare tagged as ‘road’. Since only 22 links are not properlytagged, the performance of the method is not significantlyhampered. Another drawback of OSM network is that not allthe nodes in the graph representation are correctly-noded [38].This might lead to the graph being weakly connected withmultiple connected components. For the Amsterdam network,there are 6759 such components with 90% of them having nomore than four links. For most of the applications, these small“islands” are not that important for the study and pruning canbe enabled to remove them.
Fig. 6. Application III - Study area (in blue) in relation to the Amsterdamnetwork.
Fig. 7. Application IV - (a) Sub-network of Amsterdam (in blue) (b) Speedper link at time 16:00 for a particular day for the sub-network.
For the first application, we use the Amsterdam networkgiven in Figure 5. The edge weight is the numericallymapped road type, thus the minimum ρ is 0 and maximumis σ 2(wmin , wmax), where wmin is 1 and wmax is 1
36 edgeweights respectively. The same network is used for the secondapplication case related to preserving the intersections. Therectangular study area (center of Amsterdam) boundary inrelation to the larger Amsterdam network is shown in Figure 6which is used for the third application.
In the fourth application case, we use travel time datafrom a license plate recognition system in Amsterdam toderive the speed per link. There were 314 pairs of startand end camera observations for the whole of Amsterdamnetwork so the whole network is not completely utilized. Thesub-network within the recognition system coverage is shownin Figure 7(a). The sub-network has 7512 links and 6528 nodesand it is a single connected component. The data preparationand conversion of travel time to speed per link is described indetail in [17]. The traffic state of Amsterdam at time 16:00 forone particular day is shown in Figure 7(b). The speed per linkis used as the link weights of the sub-network.
All the applications have four scenarios as explained beforewith pruning [0, 1] and ρ [minimum, maximum]. The ρ forapplications I to III corresponds to the change in functionalroad class of links and the change in speeds for application IV.To preserve the change in speed or road class, the minimum
This article has been accepted for inclusion in a future issue of this journal. Content is final as presented, with the exception of pagination.
8 IEEE TRANSACTIONS ON INTELLIGENT TRANSPORTATION SYSTEMS
ρ is set to 0. The maximum ρ was set at 10000 (an arbitrarilyhigh value) for applications I, III and IV whereas for applica-tion II the maximum ρ is also set at 0. This is because of ourdefinition of intersection which prohibits coarsening nodes thathave discontinuities in edge difference. The maximum numberof iterations for all the applications was set at 10000, althoughthe process stopped in all cases well before that.
C. Evaluation Metrics
The multiscale graphs generated using our node collapseand pruning for the four applications are evaluated based onthe five criteria proposed in Section I, we use several graphmeasures and the computational performance for creatingthese graphs is also considered. All runs were done on a64-bit computer with Intel Xeon CPU E5-1620 v3 processorof 3.5GHz, 16.0GB RAM and no GPU. In this section,we revisit the criteria for multiscale graphs and detail the fourgraph aspects used to quantify these.
1) Network Reduction: The reduction in the network com-plexity is computed based on the reduction in the number oflinks. The network reduction, r Gi+1 , for a coarsened graphGi+1 in relation to the original graph Gi is defined as:
r Gi+1 = |E | − |E�|
|E �| ∗ 100 % (7)
where |E | and |E �| are the number of links in the originalgraph and coarsened graph, respectively.
2) Global Topological Characteristics: The desirable prop-erty of collapsing nodes and edges is that the topologicalcharacteristics of the graph are preserved, except when prun-ing is enabled which alters the topology of the network.For evaluating the global topological characteristics of thecoarsened graph, we use five metrics: connectivity, trip lengthdistribution, diameter, total network length and centrality.
Graph connectivity is measured using the number of con-nected components in a network. The connected componentsare found using depth first search based algorithm [39].
Trip length distribution is equal to the shortest pathdistribution (in distance) given that only the shortest path isconsidered between origins and destinations. The influence ofcoarsening on the shortest path between two arbitrary nodes isimportant since large shifts in shortest paths between originsand destinations imply fundamental changes in network topol-ogy relevant for many applications in transportation, rangingfrom simulation, to planning and to applied ITS tailoredat providing information of the network state to travelers,operators and service providers. Checking this requirement isparticularly interesting as this check is not built in the methoditself. Assuming that there are N number of nodes in the coarsenetwork, there are N × N OD (origin-destination) pairs inthat graph and hence, N × N shortest paths. By comparingthe distribution of these N × N shortest path cost of theseODs in the coarse and fine scale, we can observe the effect ofcoarsening on these shortest paths. The shortest path is foundusing Dijkstra’s algorithm for weighted directed graphs [40]and the weights can be distance or travel time based on theapplication.
Diameter is the shortest path between the two most distantnodes in the network and is measured for a given networkas maximum of all calculated trip length between all theorigin-destination pairs in that network.
Total network length is the total length of the transportnetwork (in km) and measured by summation of the length ofall links in the network.
Centrality characterizes the (global) importance of a nodein a network. In this work, we use betweenness centrality g(v)as defined in [41] and [42]:
g(v) =∑
s �=t
σst (v)
σst(8)
where σst is the number of shortest paths going from s tot and σst (v) is the number of shortest paths from s to tthrough node v. Betweenness centrality can be considered asa proxy for flow throughput as a node is said to have highcentrality if a large number of the shortest paths in the networkgo through that node. Thus, a similar betweenness centralitydistribution needs to be maintained for the different scales asthis implies similar hierarchy among nodes at different scales.This distribution is known to follow a power law for mosttransport networks, defined as:
g(v) ∼ v−η (9)
where η is the power law exponent [41]. The value of powerlaw exponent is typically in the range 2 < η < 3 for scale-freenetworks, although not in all cases [43]. Our assumption is thatthe exponent value should not degrade significantly betweendifferent scales, at least for coarsening without pruning. So,if a network is originally scale-free, it is desired to maintainthis property also for the coarsened network. Other than thepower law exponent, it is also important to maintain the qualityof the power law fit. In this work, we use the R2 value as thegoodness-of-fit measure for the regression model which variesbetween 0 and 1. A value of 1 implies a perfect fit to the data.
3) Domain Specific Characteristics: Depending on theapplication, the domain specific attributes of the networkare either static link attributes such as functional road class,speed limits, capacities, geo-information or accurate aggre-gates/averages of dynamic quantities such as average flows,average speeds, travel times at a particular time for the net-work. These attributes define the link weights of the networkwhich is then used for coarsening. In the algorithm, we have ahard constraint c2(v) (see Table II), in which the ρ determinesto what degree the attributes are preserved while coarsening.If ρ is 0 in c2(v),
|wiv − μ|2 + |wv j − μ|2 = 0 �⇒ wiv = wv j (10)
Thus, for links (i, v) and (v, j), the links are coarsened onlyif the link weights are the same and hence the link weightsare fully preserved for ρ = 0 and by mathematical induction,it holds for all links in the network and for different ρ values.
4) Local Topological Characteristics: While the trip lengthdistribution shows the global trend of shortest paths in thatnetwork, it does not show if the same shortest path is main-tained in the coarsened graph as the original graph. To observe
This article has been accepted for inclusion in a future issue of this journal. Content is final as presented, with the exception of pagination.
KRISHNAKUMARI et al.: HEURISTIC COARSENING FOR GENERATING MULTISCALE TRANSPORT NETWORKS 9
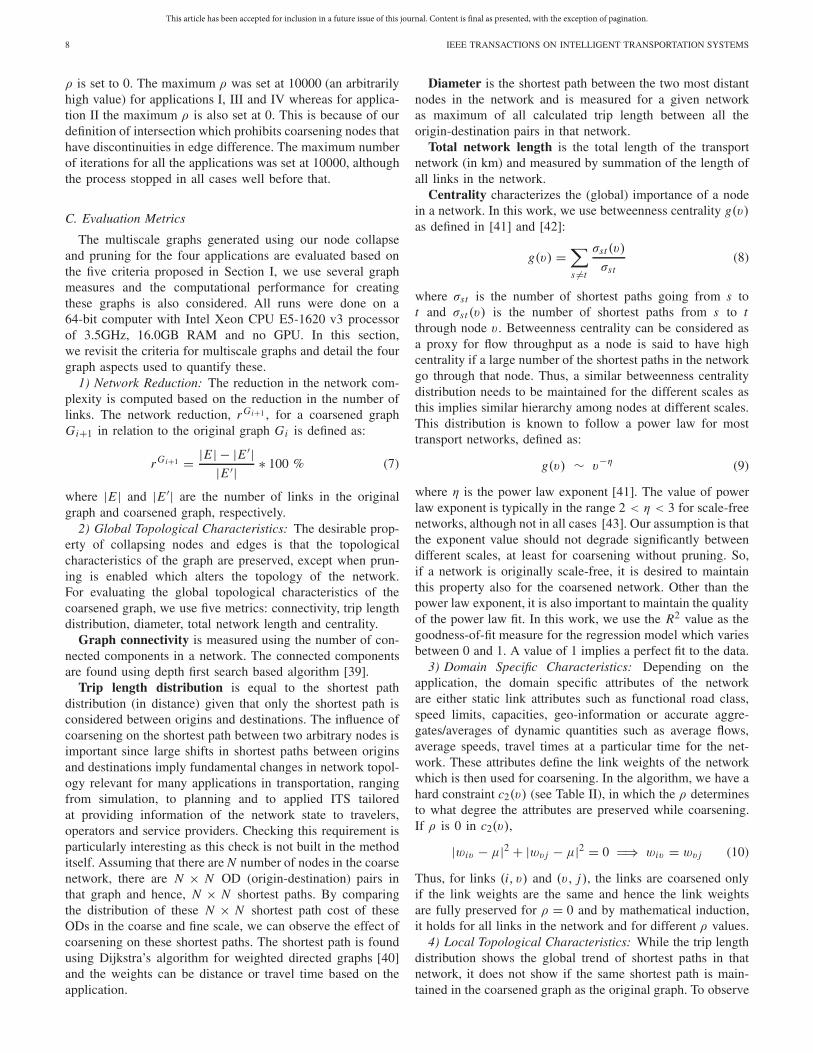
Fig. 8. Evolution of the Amsterdam network during 12 iterations for scenario2 of application I (without pruning), with network reduction ranging from 21%to 47%.
this, we use the shortest path deterioration of each OD pairst of N × N OD pairs for a given coarse scale graph Gi+1defined as:
DGi+1st = cGi+1
st − cGist
cGist
∗ 100 % (11)
where cGi+1st and cGi
st is the shortest path cost between nodess and t in the coarsened graph Gi+1 and the original graphGi respectively.
V. RESULTS AND DISCUSSION
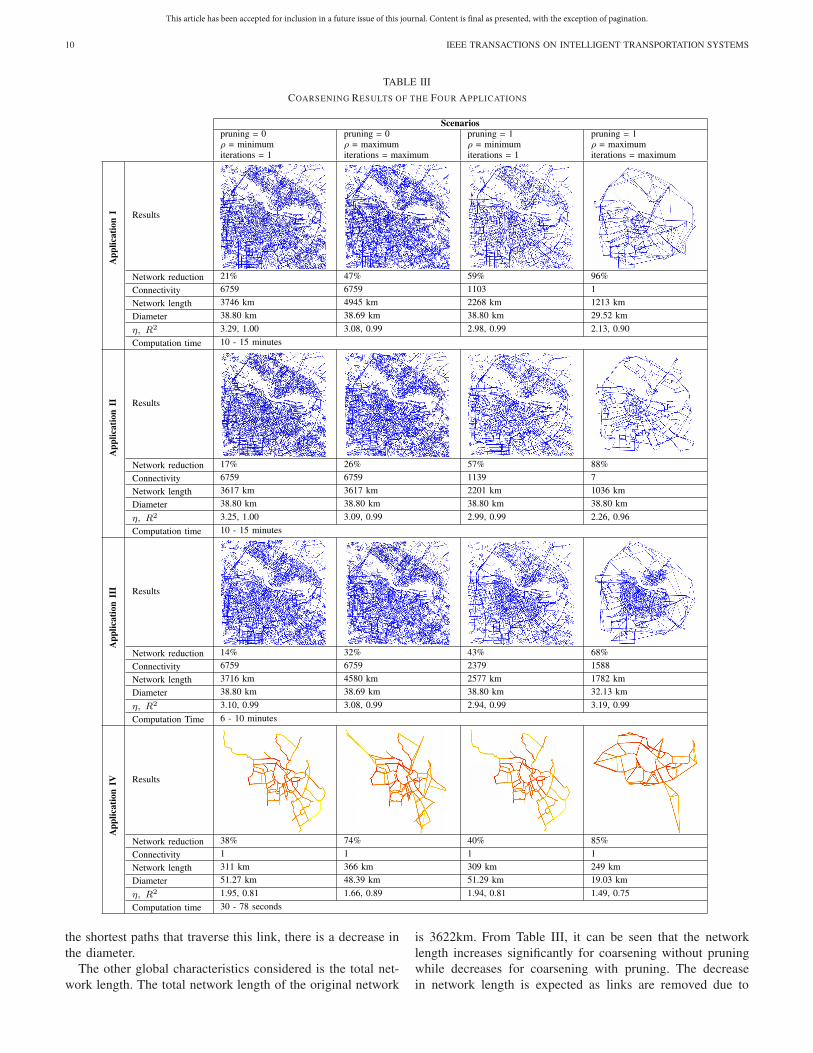
In this section, we present the results of the four applicationsand their corresponding scenarios. We evaluate application I indepth in relation to the evaluation metrics since this applicationaims at the maximum possible reduction of network size with-out any restrictions using our coarsening framework. Hence,it is expected to manifest the maximum deterioration of thetopological properties and thus offers the most conservativeperformance assessment. We discuss the other applicationsmore briefly. Table III shows the coarsening results for thefour applications and their scenarios.
For application I, the node coarsening leads to a networkedge reduction of 21− 47% without pruning giving the samenumber of connected components as in the original net-work (6759 components). Thus, the connectivity is preservedwithout pruning. Since the approach is iterative, the 47%reduction is achieved after 12 iterations. This implies thereare 12 multiscale graphs available with a reduction within therange of 21 − 47% respectively compared to the completeAmsterdam network as shown in Figure 8. With pruning,the edge reduction ranges between 59 − 96%, resulting in amore compact network of 1103 components for the minimumρ and a single component for the maximum ρ after 15 iter-ations as shown in Figure 9. (Note that only pruning has aneffect on the number of components, node collapsing has noinfluence on the network connectivity.) The computation timefor coarsening is 10 to 15 minutes with and without pruningrespectively. We return to the results of the other applicationslisted in Table III further below.
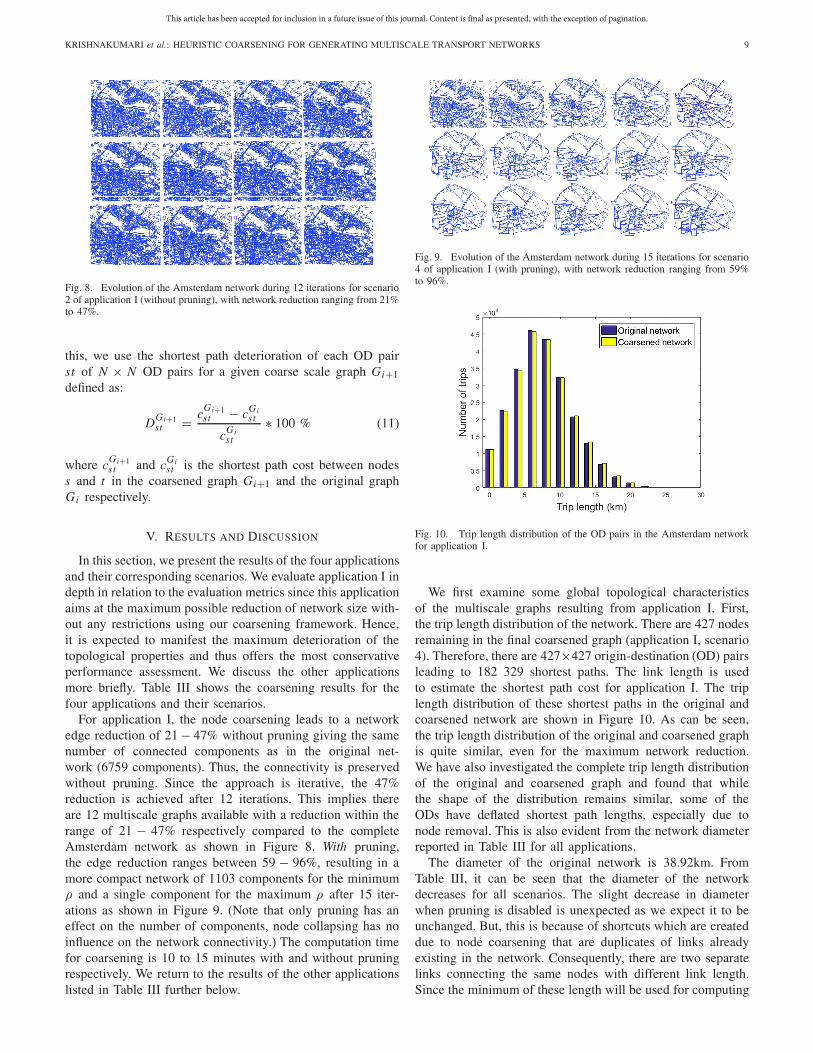
Fig. 9. Evolution of the Amsterdam network during 15 iterations for scenario4 of application I (with pruning), with network reduction ranging from 59%to 96%.
Fig. 10. Trip length distribution of the OD pairs in the Amsterdam networkfor application I.
We first examine some global topological characteristicsof the multiscale graphs resulting from application I. First,the trip length distribution of the network. There are 427 nodesremaining in the final coarsened graph (application I, scenario4). Therefore, there are 427×427 origin-destination (OD) pairsleading to 182 329 shortest paths. The link length is usedto estimate the shortest path cost for application I. The triplength distribution of these shortest paths in the original andcoarsened network are shown in Figure 10. As can be seen,the trip length distribution of the original and coarsened graphis quite similar, even for the maximum network reduction.We have also investigated the complete trip length distributionof the original and coarsened graph and found that whilethe shape of the distribution remains similar, some of theODs have deflated shortest path lengths, especially due tonode removal. This is also evident from the network diameterreported in Table III for all applications.
The diameter of the original network is 38.92km. FromTable III, it can be seen that the diameter of the networkdecreases for all scenarios. The slight decrease in diameterwhen pruning is disabled is unexpected as we expect it to beunchanged. But, this is because of shortcuts which are createddue to node coarsening that are duplicates of links alreadyexisting in the network. Consequently, there are two separatelinks connecting the same nodes with different link length.Since the minimum of these length will be used for computing
This article has been accepted for inclusion in a future issue of this journal. Content is final as presented, with the exception of pagination.
10 IEEE TRANSACTIONS ON INTELLIGENT TRANSPORTATION SYSTEMS
TABLE III
COARSENING RESULTS OF THE FOUR APPLICATIONS
the shortest paths that traverse this link, there is a decrease inthe diameter.
The other global characteristics considered is the total net-work length. The total network length of the original network
is 3622km. From Table III, it can be seen that the networklength increases significantly for coarsening without pruningwhile decreases for coarsening with pruning. The decreasein network length is expected as links are removed due to
This article has been accepted for inclusion in a future issue of this journal. Content is final as presented, with the exception of pagination.
KRISHNAKUMARI et al.: HEURISTIC COARSENING FOR GENERATING MULTISCALE TRANSPORT NETWORKS 11
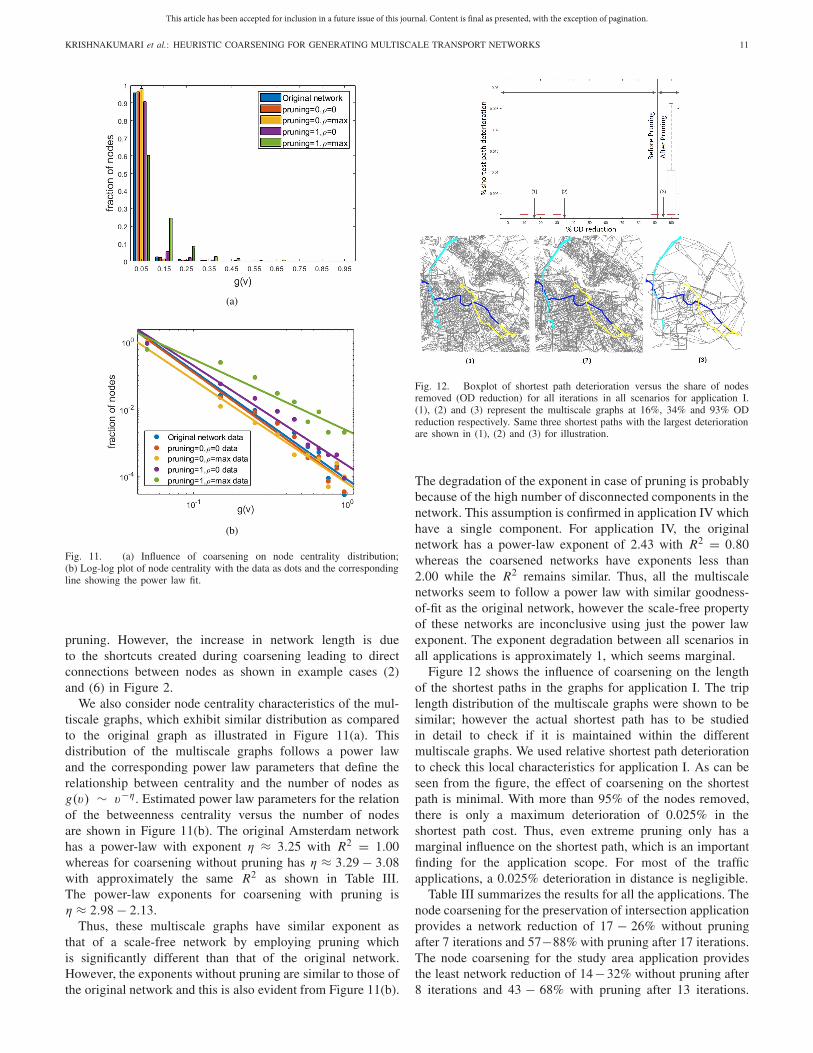
Fig. 11. (a) Influence of coarsening on node centrality distribution;(b) Log-log plot of node centrality with the data as dots and the correspondingline showing the power law fit.
pruning. However, the increase in network length is dueto the shortcuts created during coarsening leading to directconnections between nodes as shown in example cases (2)and (6) in Figure 2.
We also consider node centrality characteristics of the mul-tiscale graphs, which exhibit similar distribution as comparedto the original graph as illustrated in Figure 11(a). Thisdistribution of the multiscale graphs follows a power lawand the corresponding power law parameters that define therelationship between centrality and the number of nodes asg(v) ∼ v−η. Estimated power law parameters for the relationof the betweenness centrality versus the number of nodesare shown in Figure 11(b). The original Amsterdam networkhas a power-law with exponent η ≈ 3.25 with R2 = 1.00whereas for coarsening without pruning has η ≈ 3.29− 3.08with approximately the same R2 as shown in Table III.The power-law exponents for coarsening with pruning isη ≈ 2.98− 2.13.
Thus, these multiscale graphs have similar exponent asthat of a scale-free network by employing pruning whichis significantly different than that of the original network.However, the exponents without pruning are similar to those ofthe original network and this is also evident from Figure 11(b).
Fig. 12. Boxplot of shortest path deterioration versus the share of nodesremoved (OD reduction) for all iterations in all scenarios for application I.(1), (2) and (3) represent the multiscale graphs at 16%, 34% and 93% ODreduction respectively. Same three shortest paths with the largest deteriorationare shown in (1), (2) and (3) for illustration.
The degradation of the exponent in case of pruning is probablybecause of the high number of disconnected components in thenetwork. This assumption is confirmed in application IV whichhave a single component. For application IV, the originalnetwork has a power-law exponent of 2.43 with R2 = 0.80whereas the coarsened networks have exponents less than2.00 while the R2 remains similar. Thus, all the multiscalenetworks seem to follow a power law with similar goodness-of-fit as the original network, however the scale-free propertyof these networks are inconclusive using just the power lawexponent. The exponent degradation between all scenarios inall applications is approximately 1, which seems marginal.
Figure 12 shows the influence of coarsening on the lengthof the shortest paths in the graphs for application I. The triplength distribution of the multiscale graphs were shown to besimilar; however the actual shortest path has to be studiedin detail to check if it is maintained within the differentmultiscale graphs. We used relative shortest path deteriorationto check this local characteristics for application I. As can beseen from the figure, the effect of coarsening on the shortestpath is minimal. With more than 95% of the nodes removed,there is only a maximum deterioration of 0.025% in theshortest path cost. Thus, even extreme pruning only has amarginal influence on the shortest path, which is an importantfinding for the application scope. For most of the trafficapplications, a 0.025% deterioration in distance is negligible.
Table III summarizes the results for all the applications. Thenode coarsening for the preservation of intersection applicationprovides a network reduction of 17 − 26% without pruningafter 7 iterations and 57−88% with pruning after 17 iterations.The node coarsening for the study area application providesthe least network reduction of 14−32% without pruning after8 iterations and 43 − 68% with pruning after 13 iterations.
This article has been accepted for inclusion in a future issue of this journal. Content is final as presented, with the exception of pagination.
12 IEEE TRANSACTIONS ON INTELLIGENT TRANSPORTATION SYSTEMS
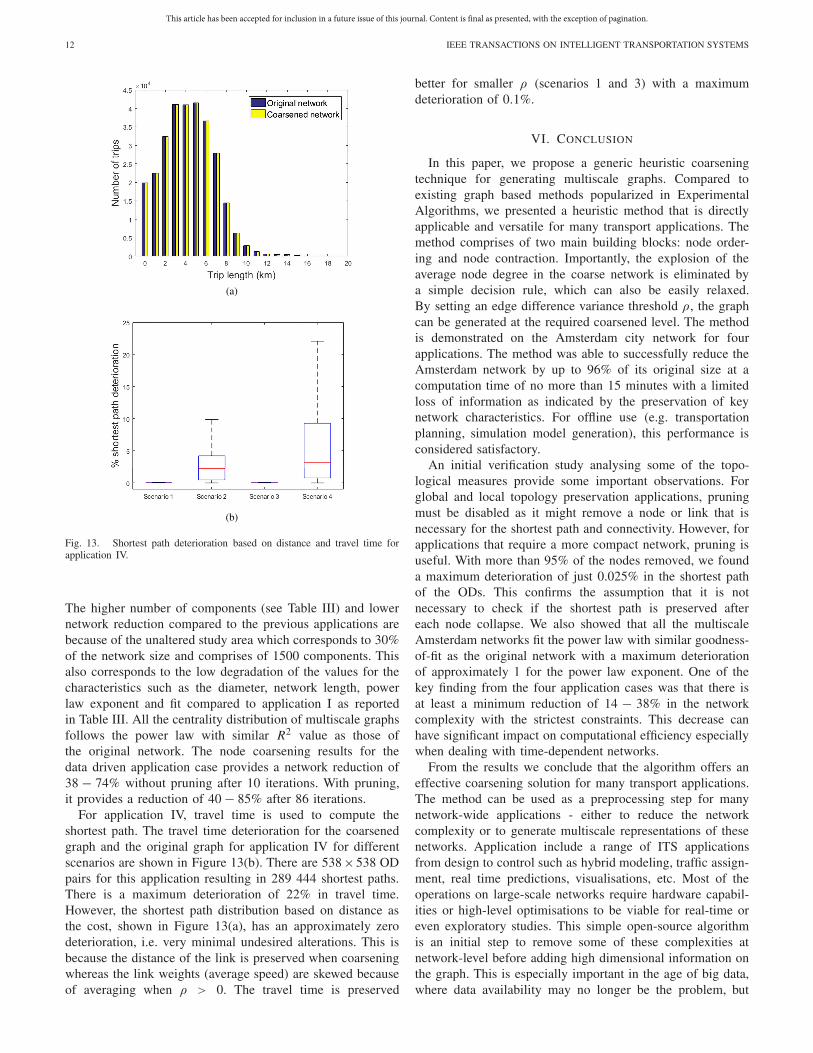
Fig. 13. Shortest path deterioration based on distance and travel time forapplication IV.
The higher number of components (see Table III) and lowernetwork reduction compared to the previous applications arebecause of the unaltered study area which corresponds to 30%of the network size and comprises of 1500 components. Thisalso corresponds to the low degradation of the values for thecharacteristics such as the diameter, network length, powerlaw exponent and fit compared to application I as reportedin Table III. All the centrality distribution of multiscale graphsfollows the power law with similar R2 value as those ofthe original network. The node coarsening results for thedata driven application case provides a network reduction of38 − 74% without pruning after 10 iterations. With pruning,it provides a reduction of 40− 85% after 86 iterations.
For application IV, travel time is used to compute theshortest path. The travel time deterioration for the coarsenedgraph and the original graph for application IV for differentscenarios are shown in Figure 13(b). There are 538×538 ODpairs for this application resulting in 289 444 shortest paths.There is a maximum deterioration of 22% in travel time.However, the shortest path distribution based on distance asthe cost, shown in Figure 13(a), has an approximately zerodeterioration, i.e. very minimal undesired alterations. This isbecause the distance of the link is preserved when coarseningwhereas the link weights (average speed) are skewed becauseof averaging when ρ > 0. The travel time is preserved
better for smaller ρ (scenarios 1 and 3) with a maximumdeterioration of 0.1%.
VI. CONCLUSION
In this paper, we propose a generic heuristic coarseningtechnique for generating multiscale graphs. Compared toexisting graph based methods popularized in ExperimentalAlgorithms, we presented a heuristic method that is directlyapplicable and versatile for many transport applications. Themethod comprises of two main building blocks: node order-ing and node contraction. Importantly, the explosion of theaverage node degree in the coarse network is eliminated bya simple decision rule, which can also be easily relaxed.By setting an edge difference variance threshold ρ, the graphcan be generated at the required coarsened level. The methodis demonstrated on the Amsterdam city network for fourapplications. The method was able to successfully reduce theAmsterdam network by up to 96% of its original size at acomputation time of no more than 15 minutes with a limitedloss of information as indicated by the preservation of keynetwork characteristics. For offline use (e.g. transportationplanning, simulation model generation), this performance isconsidered satisfactory.
An initial verification study analysing some of the topo-logical measures provide some important observations. Forglobal and local topology preservation applications, pruningmust be disabled as it might remove a node or link that isnecessary for the shortest path and connectivity. However, forapplications that require a more compact network, pruning isuseful. With more than 95% of the nodes removed, we founda maximum deterioration of just 0.025% in the shortest pathof the ODs. This confirms the assumption that it is notnecessary to check if the shortest path is preserved aftereach node collapse. We also showed that all the multiscaleAmsterdam networks fit the power law with similar goodness-of-fit as the original network with a maximum deteriorationof approximately 1 for the power law exponent. One of thekey finding from the four application cases was that there isat least a minimum reduction of 14 − 38% in the networkcomplexity with the strictest constraints. This decrease canhave significant impact on computational efficiency especiallywhen dealing with time-dependent networks.
From the results we conclude that the algorithm offers aneffective coarsening solution for many transport applications.The method can be used as a preprocessing step for manynetwork-wide applications - either to reduce the networkcomplexity or to generate multiscale representations of thesenetworks. Application include a range of ITS applicationsfrom design to control such as hybrid modeling, traffic assign-ment, real time predictions, visualisations, etc. Most of theoperations on large-scale networks require hardware capabil-ities or high-level optimisations to be viable for real-time oreven exploratory studies. This simple open-source algorithmis an initial step to remove some of these complexities atnetwork-level before adding high dimensional information onthe graph. This is especially important in the age of big data,where data availability may no longer be the problem, but
This article has been accepted for inclusion in a future issue of this journal. Content is final as presented, with the exception of pagination.
KRISHNAKUMARI et al.: HEURISTIC COARSENING FOR GENERATING MULTISCALE TRANSPORT NETWORKS 13
rather the efficient capabilities to use the data may prove anew bottleneck for modelers and analysts.
ACKNOWLEDGMENT
Map data copyrighted OpenStreetMap contributors andavailable from https://www.openstreetmap.org.
REFERENCES
[1] G. Karypis and V. Kumar, “Multilevel graph partitioning schemes,”in Proc. ICPP, vol. 3, Aug. 1995, pp. 113–122.
[2] C. Chevalier and I. Safro, “Comparison of coarsening schemes formultilevel graph partitioning,” in Proc. Int. Conf. Learn. Intell. Optim.,Jan. 2009, pp. 191–205.
[3] R. Geisberger, P. Sanders, D. Schultes, and D. Delling, “Contractionhierarchies: Faster and simpler hierarchical routing in road networks,”in Proc. Int. Workshop Exp. Efficient Algorithms. Berlin, Germany:Springer, May 2008, pp. 319–333.
[4] P. Sanders and D. Schultes, “Engineering highway hierarchies,” in Proc.ESA. Berlin, Germany: Springer, Sep. 2006, pp. 804–816.
[5] D. Delling, P. Sanders, D. Schultes, and D. Wagner, “Engineering routeplanning algorithms,” in Algorithmics of Large and Complex Networks.Berlin, Germany: Springer, 2009, pp. 117–139.
[6] Z. Cao, H. Guo, J. Zhang, D. Niyato, and U. Fastenrath, “Findingthe shortest path in stochastic vehicle routing: A cardinality mini-mization approach,” IEEE Trans. Intell. Transp. Syst., vol. 17, no. 6,pp. 1688–1702, Jun. 2016.
[7] B. N. Janson, “Dynamic traffic assignment for urban road net-works,” Transp. Res. B, Methodol., vol. 25, nos. 2–3, pp. 143–161,Apr./Jun. 1991.
[8] E. Jafari and S. D. Boyles, “Improved bush-based methods for networkcontraction,” Transp. Res. B, Methodol., vol. 83, pp. 298–313, Jan. 2016.
[9] R. D. Connors and D. P. Watling, “Assessing the demand vulnerabilityof equilibrium traffic networks via network aggregation,” Netw. SpatialEcon., vol. 15, no. 2, pp. 367–395, Jun. 2015.
[10] S. D. Boyles, “Bush-based sensitivity analysis for approximating subnet-work diversion,” Transp. Res. B, Methodol., vol. 46, no. 1, pp. 139–155,Jan. 2012.
[11] R. D. Connors and D. P. Watling, “Aggregation of transport networksusing sensitivity analysis,” in Proc. Eur. Transp. Conf., 2008, p. 13.
[12] M. Joueiai, L. Leclercq, H. van Lint, and S. P. Hoogendoorn, “Multiscaletraffic flow model based on the mesoscopic lighthill–whitham andrichards models,” Transp. Res. Record, vol. 2491, no. 1, pp. 98–106,Jan. 2015.
[13] Y. Xu, W. Cai, H. Aydt, and M. Lees, “Efficient graph-based dynamicload-balancing for parallel large-scale agent-based traffic simulation,”in Proc. Winter Simulation Conf., Dec. 2014, pp. 3483–3494.
[14] M. Ben-Akiva, M. Bierlaire, D. Burton, H. N. Koutsopoulos, andR. Mishalani, “Network state estimation and prediction for real-time traffic management,” Netw. Spatial Econ., vol. 1, nos. 3–4,pp. 293–318, Sep. 2001.
[15] Y. Yuan, J. W. C. Van Lint, R. E. Wilson, F. van Wageningen-Kessels,and S. P. Hoogendoorn, “Real-time lagrangian traffic state estimator forfreeways,” IEEE Trans. Intell. Transp. Syst., vol. 13, no. 1, pp. 59–70,Mar. 2012.
[16] C. Lopez, L. Leclercq, P. Krishnakumari, N. Chiabaut, and H. van Lint,“Revealing the day-to-day regularity of urban congestion patterns with3D speed maps,” Sci. Rep., vol. 7, no. 1, Oct. 2017, Art. no. 14029.
[17] C. Lopez, P. Krishnakumari, L. Leclercq, N. Chiabaut, and H. VanLint, “Spatiotemporal partitioning of transportation network using traveltime data,” Transp. Res. Rec., J. Transp. Res. Board, vol. 2623, no. 1,pp. 98–107, 2017.
[18] X. Chen, S. Zhang, L. Li, and L. Li, “Adaptive rolling smoothing withheterogeneous data for traffic state estimation and prediction,” IEEETrans. Intell. Transp. Syst., vol. 20, no. 4, pp. 1247–1258, Apr. 2019.
[19] S. D. Dimitrov and A. Ceder, “A method of examining the structureand topological properties of public-transport networks,” Phys. A, Stat.Mech. Appl., vol. 451, pp. 373–387, Jun. 2016.
[20] D. Schultes, “Route planning in road networks,” in Proc. AusgezeichneteInformatikdissertationen, Feb. 2008, pp. 271–280.
[21] H. Bast et al., “Route planning in transportation networks,” in AlgorithmEngineering. Cham, Switzerland: Springer, 2016, pp. 19–80.
[22] A. Brandt and D. Ron, “Multigrid solvers and multilevel optimizationstrategies,” in Multilevel Optimization in VLSICAD, vol. 14. Boston,MA, USA: Springer, 2013, p. 1.
[23] I. Safro, D. Ron, and A. Brandt, “Multilevel algorithms for linearordering problems,” J. Experim. Algorithmics, vol. 13, p. 4, Feb. 2009.
[24] A. Brandt, “General highly accurate algebraic coarsening,” Electron.Trans. Numer. Anal., vol. 10, no. 1, p. 21, Feb. 2000.
[25] S. Storandt, “Contraction hierarchies on grid graphs,” in Proc.Annu. Conf. Artif. Intell. Berlin, Germany: Springer, Sep. 2013,pp. 236–247.
[26] J. Dibbelt, B. Strasser, and D. Wagner, “Customizable contractionhierarchies,” J. Exp. Algorithmics, vol. 21, pp. 1–5, 2016.
[27] C. Ollivier-Gooch, “Coarsening unstructured meshes by edge contrac-tion,” Int. J. Numer. Methods Eng., vol. 57, no. 3, pp. 391–414,May 2003.
[28] A. Gutfraind, I. Safro, and L. A. Meyers, “Multiscale networkgeneration,” in Proc. IEEE 18th Int. Conf. Inf. Fusion, Jul. 2015,pp. 158–165.
[29] J. Dibbelt, B. Strasser, and D. Wagner. (2015). “Fast exact shortestpath and distance queries on road networks with parametrized costs.”[Online]. Available: https://arxiv.org/abs/1509.03165
[30] D. Delling, A. V. Goldberg, T. Pajor, and R. F. Werneck, “Customiz-able route planning in road networks,” Transp. Sci., vol. 51, no. 2,pp. 566–591, May 2017.
[31] S. Funke, A. Nusser, and S. Storandt, “On k-path covers and theirapplications,” Int. J. Very Large Data Bases,, vol. 25, no. 1, pp. 103–123,Feb. 2016.
[32] R. Geisberger, P. Sanders, D. Schultes, and C. Vetter, “Exact routing inlarge road networks using contraction hierarchies,” Transp. Sci., vol. 46,no. 3, pp. 388–404, Aug. 2012.
[33] B. F. Auer and R. H. Bisseling, “Graph coarsening and clusteringon the gpu,” Graph Partitioning Graph Clustering, vol. 588, p. 223,Feb. 2012.
[34] I. Safro, P. Sanders, and C. Schulz, “Advanced coarsening schemesfor graph partitioning,” J. Exp. Algorithmics, vol. 19, p. 2,Feb. 2015.
[35] N. Tatti and A. Gionis, “Density-friendly graph decomposition,”in Proc. 24th Int. Conf. World Wide Web, ACM, May 2015,pp. 1089–1099.
[36] L. Moreira-Matias, J. Mendes-Moreira, J. Gama, and M. Ferreira,“On improving operational planning and control in public transporta-tion networks using streaming data: A machine learning approach,”Ph.D. dissertation, Dept. Inform. Eng., Univ. Porto, Porto, Portugal,2014.
[37] Openstreet Maps Highway Tag Wiki. Accessed: Aug. 15, 2016. [Online].Available: https://wiki.openstreetmap.org/wiki/Key:highway
[38] Wrongly-Noded Graph in Openstreet Maps. Accessed: Aug. 15,2016. [Online] Available: https://www.gaia-gis.it/fossil/spatialite-tools/wiki?name=graphs-intro
[39] R. Tarjan, “Depth-first search and linear graph algorithms,” SIAMJ. Comput., vol. 1, no. 2, pp. 146–160, Jun. 1972.
[40] E. W. Dijkstra, “A note on two problems in connexion with graphs,”Numerische Math., vol. 1, no. 1, pp. 269–271, Dec. 1959.
[41] M. Barthélemy, “Betweenness centrality in large complex networks,”Eur. Phys. J. B, vol. 38, no. 2, pp. 163–168, Mar. 2004.
[42] M. Barthélemy, “Spatial networks,” Phys. Rep., vol. 499, nos. 1–3,pp. 1–101, Feb. 2011.
[43] K. Choromanski, M. Matuszak, and J. Miekisz, “Scale-free graph withpreferential attachment and evolving internal vertex structure,” J. Statist.Phys., vol. 151, no. 6, pp. 1175–1183, Jun. 2013.
Panchamy Krishnakumari received the M.Sc.degrees in computer science from the KTH RoyalInstitute of Technology, Sweden, and the Delft Uni-versity of Technology, The Netherlands, as part ofan European Master’s program, EIT Digital, in 2015,where she is currently pursuing the Ph.D. degreewith the Department of Transport and Planning.Her main research focuses on applying patternrecognition techniques on large scale transportationnetworks.
This article has been accepted for inclusion in a future issue of this journal. Content is final as presented, with the exception of pagination.
14 IEEE TRANSACTIONS ON INTELLIGENT TRANSPORTATION SYSTEMS
Oded Cats received the dual Ph.D. degrees from theKTH Royal Institute of Technology, Stockholm, andthe Technion—Israel Institute of Technology. He co-directs the Smart Public Transport Lab, TU Delft,leading a research group that works closely withpublic transport authorities and operators. He iscurrently an Assistant Professor of public transportwith the Delft University of Technology (TU Delft).He has coauthored more than 55 peer-reviewedjournal publications. His research develops methodsand models of multi-modal metropolitan passenger
transport systems by combining advancements from behavioral sciences,operations research, and complex network theory. His research contributionsfocus on the development of dynamic transit assignment models, the opti-mization of passenger service operations, network robustness analysis, andreal-time control methods. He is a member of several prestigious internationalcommittees including three Transportation Research Board committees andPTV Scientific Advisory Board. He is an Associate Editor of the EuropeanJournal of Transport and Infrastructure Research.
Hans van Lint received the M.Sc. degree in civilengineering informatics and the Ph.D. degree intransportation from the Delft University of Tech-nology in 1997 and 2004, respectively. He was anInformation Analyst and a Transport Engineer atvarious organizations. Nine years after receiving thePh.D. degree, he was appointed as an Anthonie vanLeeuwenhoek (AvL) Full Professor by the ExecutiveBoard of TU Delft in 2013 (an honor reserved foronly a few young scientists and educators). Hisexpertise lies on the interface between traffic flow
theory and simulation, data analytics, and machine learning techniques. He hasco-promoted eight Ph.D. students and has currently ten Ph.D.s, five postdocs,and two programmers under supervision in his lab. He has coauthored morethan 55 peer reviewed journal articles. He is active in many internationalprojects and collaborations. He serves as an Associate Editor for the IEEETRANSACTIONS ON INTELLIGENT TRANSPORTATION SYSTEMS.