protein kinase a type i and type ii define distinct intracellular signaling compartments
TRANSCRIPT

Protein Kinase A Type I and Type II Define DistinctIntracellular Signaling Compartments
Giulietta Di Benedetto, Anna Zoccarato, Valentina Lissandron, Anna Terrin, Xiang Li,Miles D. Houslay, George S. Baillie, Manuela Zaccolo
Abstract—Protein kinase A (PKA) is a key regulatory enzyme that, on activation by cAMP, modulates a wide variety ofcellular functions. PKA isoforms type I and type II possess different structural features and biochemical characteristics,resulting in nonredundant function. However, how different PKA isoforms expressed in the same cell manage to performdistinct functions on activation by the same soluble intracellular messenger, cAMP, remains to be established. Here, weprovide a mechanism for the different function of PKA isoforms subsets in cardiac myocytes and demonstrate thatPKA-RI and PKA-RII, by binding to AKAPs (A kinase anchoring proteins), are tethered to different subcellular locales,thus defining distinct intracellular signaling compartments. Within such compartments, PKA-RI and PKA-RII respondto distinct, spatially restricted cAMP signals generated in response to specific G protein–coupled receptor agonists andregulated by unique subsets of the cAMP degrading phosphodiesterases. The selective activation of individual PKAisoforms thus leads to phosphorylation of unique subsets of downstream targets. (Circ Res. 2008;103:836-844.)
Key Words: cAMP � compartmentalization � compartmentation � adrenergic stimulation� prostaglandin � protein kinase A
Protein kinase A (PKA) is a key regulatory enzyme in theheart that is involved in the catecholamine-mediated
control of excitation–contraction coupling, as well as in amyriad of other functions including activation of transcrip-tion factors and control of metabolic enzymes. The secondmessenger cAMP activates PKA by binding to the regula-tory (R) subunits, causing release of the activated catalytic(C) subunits.
The fact that, following cAMP-engagement, PKA mediatesa plethora of cellular responses has raised the question of howspecificity is maintained. In recent years, features of thispathway that contribute to specificity have been uncovered.1
A key role is played by AKAPs (A kinase anchoringproteins), a family of proteins that act as molecular scaffoldsto anchor PKA in the vicinity of specific substrate mole-cules,2 thus focusing PKA activity toward relevant substrates.
A second mechanism contributing to specificity revolvesaround the spatial control of the cAMP signal itself. Restric-tion of intracellular diffusion of cAMP has been shown byusing a variety of approaches,3–5 including direct imaging ofgradients of cAMP in response to activation of various Gprotein–coupled receptors (GPCRs).6 A key role in shapingcAMP intracellular pools is played by phosphodiesterases(PDEs), the enzymes that hydrolyze cAMP.7 Indeed, individ-ual PDE isoforms have been shown to be functionally
coupled to specific GPCRs to degrade cAMP selectively inresponse to a given stimulus.8
Cardiac myocytes express all four types of PKA isozymes,PKA-RI�, PKA-RII�, PKA-RI�, and PKA-RII�.9 PKA iso-forms show different subcellular localization, with PKA-RIIbeing mainly associated with the particulate fraction of celllysates whereas PKA-RI has been found preferentially in thecytosol.10,11 PKA isoforms also show different biochemicalproperties. PKA-RI is more readily dissociated by cAMP thanPKA-RII,12,13 and the recent structure solution of holoenzymecomplexes14,15 shows critical isoform-specific features thatspecifically regulate inhibition and cAMP-induced activationof PKA-RI and PKA-RII. Given the distinct biochemicalproperties and the specific subcellular localization of PKAisozymes, it is not surprising that the biological role ofPKA-RI and PKA-RII is nonredundant, as demonstrated bygenetic and biochemical studies (reviewed elsewhere16).However, how individual PKA isoforms serve to deliver aspecific response remains unknown. In particular, it remainsto be established how spatial control of the cAMP signal andactivation of individual PKA isoforms are coordinated toperform a specific biological function.
Here, we set out to answer the question of whetherconfined pools of cAMP elicited in response of specificextracellular stimuli selectively activate individual PKA iso-
Original received February 28, 2008; revision received August 14, 2008; accepted August 19, 2008.From the Dulbecco Telethon Institute (G.D.B., A.Z., V.L., M.Z.), Venetian Institute of Molecular Medicine, Padova, Italy; and Neuroscience and
Molecular Pharmacology (A.T., X.L., M.D.H., G.S.B., M.Z.), Faculty of Biomedical & Life Sciences, University of Glasgow, Scotland, UnitedKingdom.
Correspondence to Dr Manuela Zaccolo, Neuroscience and Molecular Pharmacology, Faculty of Biomedical and Life Sciences, University Avenue,G12 8QQ, Glasgow, UK. E-mail [email protected]
© 2008 American Heart Association, Inc.
Circulation Research is available at http://circres.ahajournals.org DOI: 10.1161/CIRCRESAHA.108.174813
836 by guest on February 22, 2016http://circres.ahajournals.org/Downloaded from by guest on February 22, 2016http://circres.ahajournals.org/Downloaded from by guest on February 22, 2016http://circres.ahajournals.org/Downloaded from by guest on February 22, 2016http://circres.ahajournals.org/Downloaded from by guest on February 22, 2016http://circres.ahajournals.org/Downloaded from by guest on February 22, 2016http://circres.ahajournals.org/Downloaded from by guest on February 22, 2016http://circres.ahajournals.org/Downloaded from by guest on February 22, 2016http://circres.ahajournals.org/Downloaded from by guest on February 22, 2016http://circres.ahajournals.org/Downloaded from by guest on February 22, 2016http://circres.ahajournals.org/Downloaded from by guest on February 22, 2016http://circres.ahajournals.org/Downloaded from by guest on February 22, 2016http://circres.ahajournals.org/Downloaded from by guest on February 22, 2016http://circres.ahajournals.org/Downloaded from by guest on February 22, 2016http://circres.ahajournals.org/Downloaded from by guest on February 22, 2016http://circres.ahajournals.org/Downloaded from

forms. By using FRET- and FRAP-based imaging approacheswe show that, in cardiomyocytes, PKA-RI and PKA-RII, byanchoring to endogenous AKAPs, define distinct compart-ments within which cAMP is specifically controlled bydifferent subsets of PDEs. In addition, we demonstrate thatcAMP levels rise selectively in the PKA-RI and PKA-RIIcompartments in a stimulus-specific manner, leading to thephosphorylation of unique subsets of downstream PKA tar-gets. The generation of distinct pools of cAMP within cellsthat allows for the selective activation of individual PKAisoforms is instrumental for the cell to modulate specificphysiological functions and points to means for developingstrategies for selective pharmacological intervention.
Materials and MethodsPrimary cultures of neonatal cardiac ventriculocytes from 1- to 3-dayold rats were prepared as described.6 All the details concerninggeneration of constructs, cells transfection, Western blotting, immu-nostaining and confocal imaging, FRAP experiments, FRET imagingand RT-PCR are described in the expanded Materials and Methodssection in the online data supplement, available at http://circres.ahajournals.org.
ResultsGeneration of cAMP Sensors Selectively Targetedto the PKA-RI and PKA-RII CompartmentsWe set out to assess whether PKA-RI and PKA-RII areselectively and independently activated by specific extracel-lular stimuli and generated 2 FRET-based probes that, byselectively targeting to the same subcellular compartments asthe endogenous PKA isoforms, monitor the cAMP signalsgenerated at these sites. We took advantage of the uniquedimerization/docking domain sequences that have beenshown17 to mediate anchoring of PKA-RI and PKA-RIIsubunits to AKAPs. Thus, by fusing the dimerization/dockingdomain from either RI� (amino acids 1 to 64) or RII� (aminoacids 1 to 49) to the N terminus of the soluble Epac-1sensor,18 we generated the sensors RI_epac and RII_epac(Figure IA in the online data supplement). For both sensors,it is believed that the binding of cAMP to the cAMP-bindingdomain will result in a conformational change that causes anincrease in the distance of the cyan fluorescent protein andyellow fluorescent protein moieties, with a consequent reduc-tion of the FRET signal, as shown for the parent sensor.18 Themodified sensors have been tested with respect to maximalFRET response and to dose-response behavior (supplemen-tary materials and supplemental Figure I). We found thatRI_epac and RII_epac are equally sensitive to cAMPchanges.
RI_epac and RII_epac Show a Different andAKAP-Mediated Localization in Cardiac MyocytesTo assess the ability of the modified sensors to effectivelybind to AKAPs, we coexpressed RI_epac with ezrin andRII_epac with AKAP79. Ezrin is a dual-specificity AKAPlocalized at the cortical cytoskeleton and at microvilli,19
whereas AKAP79 localizes at the plasma membrane (Figure1).20 Coexpression in CHO cells of RI_epac with ezrin resultsin the relocalization of the sensor to the sub–plasma mem-brane region and to microvilli, whereas coexpression of
RII_epac with AKAP79 results in the relocalization of thesensor at the plasma membrane, confirming that the modifiedsensors localize within the cell where AKAPs are present.
To verify if RI_epac and RII_epac are targeted to differentsubcellular compartments in neonatal cardiac myocytes, thelocalization of the sensors was analyzed by confocal micros-copy. As a localization marker, the Z-line protein Zasp fusedto the red fluorescent protein mRFP (zasp-RFP) was coex-pressed in combination with either RI_epac or RII_epac. Asillustrated in Figure 2A and 2I, RI_epac shows a tight striatedpattern overlaying with both the Z and the M sarcomeric lines(see line intensity profiles at the bottom of Figure 2). Incontrast, the distribution of RII_epac shows a very stronglocalization that corresponds to the M line and a much weakerlocalization overlaying the Z line (Figure 2B and 2L). Suchlocalization is identical to the localization of overexpressedfull-length RI and RII subunits and corresponds to thelocalization of endogenous RI and RII subunits (supplementalFigure II). To assess whether the differences in localizationwere attributable to anchoring of the sensors to endogenousAKAPs, we used the AKAP-competing peptides RIAD21 andSuperAKAP-IS.22 These peptides have been shown to com-pete selectively with the binding of PKA-RI and PKA-RII toendogenous AKAPs. In particular, the RIAD peptide displaysmore than 1000-fold selectivity for RI over RII,21 whereas thepeptide SuperAKAP-IS is 10 000-fold more selective for theRII isoform relative to RI.22 Challenge of cells expressingRI_epac with RIAD and of cells expressing RII_epac withSuperAKAP-IS completely abolished the striated pattern oflocalization of the sensors (Figure 2C and 2D), whereasRIAD and SuperAKAP-IS did not have any effect on thelocalization pattern of, respectively, RII_epac and RI_epac(not shown).
The accepted paradigm for the PKA signaling pathwayis that type II PKA is associated with particulate subcel-lular fractions via binding to AKAPs, whereas type I PKAis primarily cytoplasmic.11 Our confocal imaging studies
Figure 1. Targeted FRET-based cAMP sensors. Confocalimages of CHO cells expressing either RI_epac or RII_epacalone (left panels) or in combination with ezrin and AKAP 79,respectively (right images). The middle images show the local-ization of green fluorescent protein (GFP)-tagged ezrin andGFP-tagged AKAP79 in CHO cells. Scale bars�10 �m.
Di Benedetto et al Compartmentalized Signaling by PKA Isoforms 837
by guest on February 22, 2016http://circres.ahajournals.org/Downloaded from
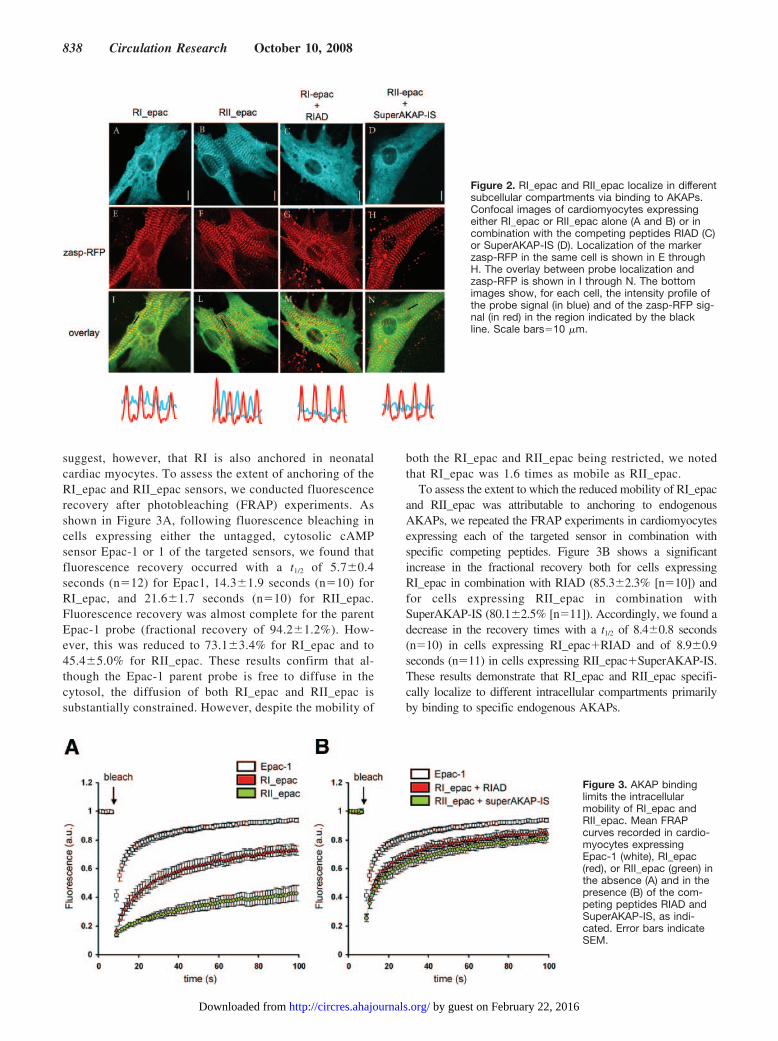
suggest, however, that RI is also anchored in neonatalcardiac myocytes. To assess the extent of anchoring of theRI_epac and RII_epac sensors, we conducted fluorescencerecovery after photobleaching (FRAP) experiments. Asshown in Figure 3A, following fluorescence bleaching incells expressing either the untagged, cytosolic cAMPsensor Epac-1 or 1 of the targeted sensors, we found thatfluorescence recovery occurred with a t1/2 of 5.7�0.4seconds (n�12) for Epac1, 14.3�1.9 seconds (n�10) forRI_epac, and 21.6�1.7 seconds (n�10) for RII_epac.Fluorescence recovery was almost complete for the parentEpac-1 probe (fractional recovery of 94.2�1.2%). How-ever, this was reduced to 73.1�3.4% for RI_epac and to45.4�5.0% for RII_epac. These results confirm that al-though the Epac-1 parent probe is free to diffuse in thecytosol, the diffusion of both RI_epac and RII_epac issubstantially constrained. However, despite the mobility of
both the RI_epac and RII_epac being restricted, we notedthat RI_epac was 1.6 times as mobile as RII_epac.
To assess the extent to which the reduced mobility of RI_epacand RII_epac was attributable to anchoring to endogenousAKAPs, we repeated the FRAP experiments in cardiomyocytesexpressing each of the targeted sensor in combination withspecific competing peptides. Figure 3B shows a significantincrease in the fractional recovery both for cells expressingRI_epac in combination with RIAD (85.3�2.3% [n�10]) andfor cells expressing RII_epac in combination withSuperAKAP-IS (80.1�2.5% [n�11]). Accordingly, we found adecrease in the recovery times with a t1/2 of 8.4�0.8 seconds(n�10) in cells expressing RI_epac�RIAD and of 8.9�0.9seconds (n�11) in cells expressing RII_epac�SuperAKAP-IS.These results demonstrate that RI_epac and RII_epac specifi-cally localize to different intracellular compartments primarilyby binding to specific endogenous AKAPs.
Figure 2. RI_epac and RII_epac localize in differentsubcellular compartments via binding to AKAPs.Confocal images of cardiomyocytes expressingeither RI_epac or RII_epac alone (A and B) or incombination with the competing peptides RIAD (C)or SuperAKAP-IS (D). Localization of the markerzasp-RFP in the same cell is shown in E throughH. The overlay between probe localization andzasp-RFP is shown in I through N. The bottomimages show, for each cell, the intensity profile ofthe probe signal (in blue) and of the zasp-RFP sig-nal (in red) in the region indicated by the blackline. Scale bars�10 �m.
Figure 3. AKAP bindinglimits the intracellularmobility of RI_epac andRII_epac. Mean FRAPcurves recorded in cardio-myocytes expressingEpac-1 (white), RI_epac(red), or RII_epac (green) inthe absence (A) and in thepresence (B) of the com-peting peptides RIAD andSuperAKAP-IS, as indi-cated. Error bars indicateSEM.
838 Circulation Research October 10, 2008
by guest on February 22, 2016http://circres.ahajournals.org/Downloaded from

cAMP Levels Are Specifically Regulated in thePKA-RI and PKA-RII CompartmentsIn a first set of experiments, we wanted to assess whether thePKA-RI and PKA-RII compartments have equal access tocAMP. Cardiac myocytes expressing either RI_epac or RII_epacwere challenged with 5 �mol/L forskolin. As shown in Figure4A and 4F, the 2 sensors detected a comparable rise in [cAMP]with �R/R0�2.1�0.4% (n�7) for RI_epac and �R/R0�2.9�0.4% (n�14) for RII_epac (P�0.24), indicating thatthe compartments hosting PKA-RI and PKA-RII are equallyassociated to adenylyl cyclases and have potentially access tocomparable cAMP levels.
Next, we wanted to assess the role of PDEs in thecontrol of cAMP levels in both PKA compartments. Whenmyocytes were challenged with isobutylmethylxanthine(IBMX) (100 �mol/L), no significant difference wasdetected in the level of cAMP in the 2 compartments(�R/R0�4.5�0.3%; n�20 for RI_epac and �R/R0�4.9�0.4%; n�15 for RII_epac; P�0.45) (Figure 4Band 4F), suggesting that the basal level of cAMP is undercomparable levels of PDE control in both PKA-RI andPKA-RII compartments in these cells.
To determine whether specific subsets of PDEs control thecAMP signal in the 2 PKA compartments, cardiac myocytesexpressing either RI_epac or RII_epac were treated withselective PDE inhibitors. As shown in Figure 4C and 4F,PDE3 inhibition assessed using the selective inhibitor cilos-tamide (10 �mol/L) generated a small and similar cAMP risein both PKA compartments (�R/R0�0.8�0.2%; n�9 forRI_epac and �R/R0�0.6�0.2%; n�11 for RII_epac;P�0.58). PDE2 inhibition assessed using the selective inhib-
itor, EHNA (10 �mol/L) resulted in a �R/R0�2.2�0.8%(n�15) when detected by RI_epac and in a �R/R0�0.3�0.2% (n�12) when detected by RII_epac(P�0.04), indicating that, in basal conditions, PDE2 ac-tivity is prominent in the PKA-RI compartment but verylow in the RII_epac compartment (Figure 4D and 4F).PDE4 inhibition, assessed using the selective inhibitorrolipram (10 �mol/L), generated a �R/R0�0.7�0.2%(n�13) when detected by RI_epac and a �R/R0�2.6�0.7% (n�16) when detected with RII_epac(P�0.02) (Figure 4E and 4F), indicating that, contrary toPDE2, PDE4 exerts its activity mainly in the PKA-RIIdomain and to a much lower extent in the PKA-RIcompartment. These results show that cAMP levels aredifferently regulated in the PKA-RI and PKA-RII compart-ments and point to a specific association of individual PKAisoforms with selected subsets of PDEs in these cells.
Individual GPCRs Generate a cAMP SignalSelectively in the PKA-RI orPKA-RII CompartmentsWe next asked whether the PKA-RI and PKA-RII compart-ments may be coupled to specific GPCRs such that individualPKA isoforms respond selectively to cAMP signals elicitedby different agonists. As shown in Figure 5A, the applicationof isoproterenol (10 nmol/L), a specific activator of �-adre-noreceptors, generated a rise in [cAMP] more pronounced inthe PKA II domain as compared to the PKA I domain(�R/R0�2.5�0.5% [n�13] for RI_epac and �R/R0�4.5�0.7% [n�9] for RII_epac; P�0.007). Addition ofIBMX (100 �mol/L) abolishes such a difference. This result
Figure 4. Cyclase and PDE activity in the PKA-RI and PKA-RII compartments. Representative kinetics of FRET changes recorded incardiomyocytes expressing either RI_epac (gray circles) or RII_epac (black circles) in response to the application of 5 �mol/L forskolin(A), 100 �mol/L IBMX (B), 10 �mol/L cilostamide (C), 10 �mol/L EHNA (D), and 10 �mol/L rolipram (E). F, Summary of all the experi-ments performed in the above conditions. Error bars indicate SEM. *0.01 � P�0.05. ns indicates not significant.
Di Benedetto et al Compartmentalized Signaling by PKA Isoforms 839
by guest on February 22, 2016http://circres.ahajournals.org/Downloaded from

is in agreement with our previous studies showing that�-adrenergic stimulation generates a restricted pool of cAMPthat activates selectively AKAP-anchored PKA-RII.6 Bycontrast, challenging the myocytes with GLP-1 (100 nmol/L)resulted in a larger [cAMP] increase in the PKA-RI compart-ment as compared to the PKA-RII compartment (�R/R0�3.7�0.8%, n�15 for RI_epac and �R/R0�1.0�0.4%,n�12, for RII_epac; P�0.008) (Figure 5B). Similarly, 300nmol/L glucagon (Figure 5C) and 1 �mol/L prostaglandin E1
(PGE1) (Figure 5D) generated a higher [cAMP] increase inthe PKA-RI associated compartment than in the PKA-RIIcompartment, showing �R/R0�1.3�0.4% (n�7) for RI_epacand �R/R0�0.2�0.1% (n�6) for RII_epac (P�0.017) in thecase of glucagon and �R/R0�1.4�0.2% (n�35) for RI_epacand �R/R0�0.6�0.2% (n�30) for RII_epac (P�0.01) in thecase of PGE1. In the presence of the specific competingpeptide RIAD, the cAMP signal generated by the applicationof isoproterenol (10 nmol/L) was now clearly detected byRI_epac (�R/R0�5.0�1.0% [n�9]; P�0.008 versus RI_epac
alone; Figure 5F). Coexpression of SuperAKAP-IS andRII_epac did not affect RII_epac ability to detect theisoproterenol-induced cAMP signal (Figure 5F). Similarly,when RII_epac was coexpressed with the selective competingpeptide SuperAKAP-IS, the amplitude of the cAMP signalgenerated by application of 1 �mol/L PGE1 was now clearlydetected by RII_epac (�R/R0�2.8�0.7% [n�17]; P�0.0001versus RII_epac alone; Figure 5G), whereas coexpression ofRIAD and RI_epac had no effect on the amplitude of thesignal detected on PGE1 application (Figure 5G). In addition,we found that treatment with RIAD significantly reduced thevelocity of the FRET change of RI_epac to PGE1 (supple-mental Figure III).
Taken together, these results demonstrate that individualGPCR agonists generate spatially restricted pools of cAMPthat selectively activate individual AKAP-anchored PKAisoforms. Removal of PKA isoforms from their anchoringsites allows them to diffuse and to be activated by pools ofcAMP that would not normally affect them.
Figure 5. Effect of GPCR stimula-tion on the cAMP signal in thePKA-RI and PKA-RII compart-ments. Representative kinetics ofFRET change on application of 10nmol/L isoproterenol (A), 100nmol/L GLP-1 (B), 300 nmol/Lglucagon (C), and 1 �mol/L PGE1
(D) recorded in cardiomyocytesexpressing RI_epac (gray circles)of RII_epac (black circles). E,Summary of the experiments per-formed in the above conditions. Fand G, FRET change detected incardiomyocytes coexpressingeither RI_epac in combination withthe competing peptide RIAD (graybars) or RII_epac in combinationwith SuperAKAP-IS (black bars)and stimulated with 10 nmol/Lisoproterenol (F) or with 1 �mol/LPGE1 (G). Error bars indicateSEM. *0.01�P�0.05;**0.001�P�0.01; ***P�0.001.
840 Circulation Research October 10, 2008
by guest on February 22, 2016http://circres.ahajournals.org/Downloaded from

Compartmentalized PKA Isozymes PhosphorylateSelected Subsets of Downstream TargetsWe next wanted to assess whether the selectivity of the cAMPsignals generated in the PKA-RI and PKA-RII compartmentson stimulation of individual GPCRs has a functional rele-vance and results in a specific pattern of PKA-mediatedphosphorylation of downstream targets. To this aim, westudied the phosphorylation level of several PKA targets afterstimulation with either isoproterenol or PGE1. The phosphor-ylation level of phospholamban (PLB), troponin (Tn)I, andthe � adrenergic receptor type 2 (�2AR) was markedlyincreased (Figure 6A) on stimulation with isoproterenol (1nmol/L) but not on stimulation with PGE1 (10 �mol/L).Stimulation of myocytes with isoproterenol in the presence ofthe PKA inhibitor KT5720 (2 �mol/L) completely abolishedthe increased phosphorylation level of both PLB and TnI(Figure 6B), confirming the involvement of PKA. Unexpect-edly, PGE1-stimulated cells showed a reduction in the phos-phorylation level of PLB and TnI as compared to untreatedcells. Further analysis indicated that the reduced phosphory-lation of these targets was dependent on the activity ofphosphatases (supplemental Figure IV).
Based on these results we can conclude that individualagonists, via activation of specific PKA isoforms, affectdistinct subsets of downstream targets.
A Gi-Mediated Mechanism Contributes to Controlthe cAMP Signal, Leading to the Phosphorylationof PLB and TnIFour different receptors for PGE have been described (EP1 toEP4) with EP2 and EP4 being coupled to G�s and EP3 being
coupled to G�i.23 We asked whether the reduction in thephosphorylation level of PBL and TnI observed on PGE1
stimulation may be attributable to activation of an EP3
receptor and subsequent G�i-mediated inhibition of cyclaseactivity. RT-PCR analysis of mRNA extracted from neo-natal rat cardiomyocytes confirmed that these cells expresshigh levels of message for the G�i-coupled EP3 receptor, aswell as message for the G�s-coupled EP2 and EP4 receptors(Figure 7A).
To evaluate the occurrence and the relevance of Gi activa-tion on the local control of the cAMP signal generated byPGE1, we performed imaging experiments applying PGE1 oncardiomyocytes that had been pretreated with the Gi-inhibitorpertussis toxin (PTX). As shown in Figure 7B, application of1 �mol/L PGE1 following 2 to 4 hours pretreatment with 2�g/mL PTX generated a comparable cAMP increase in thePKA-RI and PKA-RII compartments. In particular, PTXpretreatment results in a much-increased cAMP signal in thePKA-RII compartment (�R/R0�1.7�0.4% [n�11] versus0.6�0.2% [n�30] in the absence of PTX; P�0.006). Indeed,this equals the amplitude of the signal generated in thePKA-RI compartment (�R/R0�1.4�0.2%; P�0.54; see Fig-ure 7B). No significant effect of PTX pretreatment wasobserved on the amplitude of the cAMP signal observed inthe PKA-RI compartment (�R/R0�2.1�0.5% [n�8] as com-pared to �R/R0�1.4%�0.2% in control cells; P�0.13).
To assess the functional relevance of such a G�i-mediatedcontrol of the cAMP signal, we measured the level ofphosphorylation of PLB and TnI in cardiomyocytes pre-treated with PTX for 1, 2, or 4 hours before the application of
Figure 6. Specific GPCR agonist stimula-tion results in a different pattern of down-stream PKA targets phosphorylation. A,Western blots of cardiac myocyte lysatesprobed for PLB, TnI, and the �2AR withcorresponding phosphoblots after treat-ment with 10 nmol/L isoproterenol and1 �mol/L PGE1. Quantifications are meansof at least 3 separate experiments. Errorbars indicate SEM. **0.001�P�0.01;*0.01�P�0.05. B, Representative Westernblots of cardiac myocyte lysates probedfor PLB and TnI with corresponding phos-phoblots after treatment with isoproterenol10 nmol/L with and without pretreatmentwith KT5720 (2 �mol/L).
Di Benedetto et al Compartmentalized Signaling by PKA Isoforms 841
by guest on February 22, 2016http://circres.ahajournals.org/Downloaded from

PGE1. Figure 7C shows that, on inhibition of G�i, PGE1
stimulation induce a significant increase in the phosphoryla-tion level of both these PKA-RII–specific targets (compareFigures 6 and 7C). Thus, a G�i-mediated mechanism appearsto contribute significantly to the control of the cAMP signalgenerated by PGE1 stimulation in the PKA-RII domain.
DiscussionThe organization of the signaling machinery in discretecompartments is increasingly recognized as a critical featurefor the specificity of the cAMP/PKA system in cardiomyo-cytes.24 Here, we used real-time imaging of cAMP to studyhow the diversity of PKA isoforms may contribute to thetransduction of specific downstream signals. We did this bytargeting FRET-based reporters of cAMP concentration atintracellular sites where endogenous PKA-RI and PKA-RIIisoforms localize. We demonstrate that PKA-RI and PKA-RIIreside in physically segregated and distinct compartmentswithin which the level of cAMP appears to be selectively
regulated by different subsets of PDEs, although the exactcontribution of individual PDEs would require simultaneousinhibition of combinations of different isoforms. We showthat the cAMP signal is specifically generated either in thePKA-RI or in the PKA-RII compartment depending on theGPCR agonist applied and that cAMP does not diffuse fromone compartment to the other so as to cross-activate PKAisozymes, allowing fidelity of the response (Figure 8). Onefunctional consequence of such compartmentalization is thatisoproterenol stimulation leads to the specific phosphoryla-tion of PLB, TnI, and �2AR, whereas PGE1 stimulation doesnot affect these substrates, demonstrating that individual PKAisoforms are coupled with defined subsets of targets and thatPKA isoforms activity is not promiscuous.
Our findings are consistent with previous work25–27 show-ing that, in cardiac myocytes, there is a clear dichotomybetween the effects of PGE1 and isoproterenol on a variety ofcAMP-dependent events. These studies demonstrated thatisoproterenol generates an increase in contractile force25
Figure 7. A Gi-mediated mechanism contributes to the control of the cAMP signal in the PKA II compartment. A, RT-PCR analysis ofthe EP receptors expressed in neonatal rat cardiomyocytes. Hypoxanthine phosphoribosyltransferase (HPRT) is used as a control forinput mRNA concentration. B, FRET changes recorded in cardiomyocytes expressing either RI_epac (gray bars) or RII_epac (black bars)with or without pretreatment with PTX (2 �g/mL for 2 to 4 hours) and challenged with 1 �mol/L PGE1. C, Western blots of cardiac myo-cyte lysates probed for PLB and TnI with corresponding phosphoblots after treatment with 1 or 10 nmol/L isoprenaline and 1 �mol/LPGE1 with and without pretreatment with PTX (2 �g/mL for 1, 2, and 4 hours) Quantifications are means of at least 3 separate experi-ments. Error bars indicate SEM. *0.01�P�0.05.
842 Circulation Research October 10, 2008
by guest on February 22, 2016http://circres.ahajournals.org/Downloaded from

enhances ventricular pressure development and induces phos-phorylation of target proteins such as phosphorylase kinaseand TnI,26 whereas PGE1, although elevating cAMP tocomparable levels and inducing activation of PKA similar toisoproterenol, does not show any effect on contractility or onthe phosphorylation of these target proteins.
The general notion concerning subcellular localization ofPKA isoforms in cardiac myocytes is that PKA-RII holoen-zyme is localized whereas PKA-RI is mainly cytosolic.Biochemical studies on cell homogenates showed that PKA-RII subunits are bound to particulate material in heart cells,whereas RI subunits are largely soluble.10,11 Interestingly, theselective effects of �-adrenergic stimulation on heart functionhas been shown to correlate with activation of a membrane-bound fraction of PKA, whereas PGE1 stimulation increasesthe activity of a soluble pool of PKA.26 Our data now providea mechanism for these observation by showing that catechol-amines generate restricted pools of cAMP that selectivelyengage PKA-RII isoforms. However, the notion of a PKA-RImigrating freely in the cytosol, as suggested on the basis ofprevious biochemical studies, is difficult to reconcile withany selectivity in the activation of PKA isozymes, particu-larly considering that PKA-RI is more readily activated bycAMP as compared to PKA-RII.13 In tissues other than theheart, dual-specificity AKAPs capable of binding PKA-RIand -RII have been described,28 and AKAP-mediated local-ization of PKA-RI to the neuromuscular junction29 or tointerphase microtubules and specific regions of the mitoticspindle has been shown.30 The discovery in Caenorhabditiselegans of a specific RI-binding AKAP that does not interactwith RII subunits31 suggests the potential for nonredundantPKA-RI localization and function and a specific role forlocalized PKA-RI in modulating T-cell receptor signaling hasbeen demonstrated.32 Thus, by performing FRAP experi-ments on intact cells, here we find that neonatal cardiacmyocytes express a considerable amount of PKA-RI anchorsites, as shown by the slow fluorescence recovery time andthe large immobile fraction detected in cells expressing theRI_epac sensor. This suggests that a large fraction of the
PKA-RI isozyme may in fact be anchored in the heart in vivo.The fact that PKA-RI is found mainly in the supernatant ofheart cell homogenates may reflect relatively low affinityinteractions between PKA-RI and the protein binding part-ners that are lost during the homogenization and washingsteps. Notwithstanding this, the nature of the PKA-RI anchor-ing proteins in cardiac myocytes remains to be established.
Catecholamine-mediated sympathetic control of cardiac stim-ulation is a major compensatory mechanism that maintains oraugments systolic and diastolic ventricular function duringphysiological stress or pathological conditions. In particular,catecholamines selectively improve diastolic function by reduc-ing myofilament calcium sensitivity through phosphorylation ofproteins such as TnI and accelerate sequestration of calcium intothe sarcoplasmic reticulum through phosphorylation of PLB andrelease of its inhibitory effect on the SERCA pump.33 Enhancedand sustained cardiac adrenergic drive, however, is known to bedeleterious and to contribute, in part, to development andprogression of pathological states such as heart failure.34 Ourresults indicate that key proteins involved in the catecholamine-mediated regulation of cardiac contractility are under the controlof a restricted pool of cAMP that selectively activates a subset ofPKA-RII isozymes, thus leading to a coordinated and specificresponse. In addition, we show that a supplementary elementcontributing to specificity is provided by a Gi-mediated mecha-nism that contributes to keep the PKA-RII compartment clear ofcAMP unless the appropriate catecholaminergic stimulus im-pinges on the cell. Such a mechanism may indeed serve toprotect the heart from excessive adrenergic stimulation in patho-logical conditions. Interestingly, PGE1 stimulation is known toprotect myocardial tissue from injury following ischemia andreperfusion,35 an effect that has been suggested to depend onPGE-mediated stimulation of EP3 receptors in cardiac myo-cytes36 and the consequent Gi-mediated inhibition of cAMPsynthesis.37
In summary, the present work provides original insight intothe mechanisms that underpin cAMP/PKA specificity of re-sponse by demonstrating that, in cardiac myocytes, bothPKA-RI and PKA-RII isoforms subsets anchor to subcellular
Figure 8. Model of PKA isoforms compartmentalization. A, Activation of the PGE recep-tor system leads to the generation of a restricted cAMP pool affecting PKAI. The signalin the specific PKA-RII compartments may be switched off with the contribution of anEP3-dependent, Gi-mediated mechanisms. B, Only when the �AR is activated via bind-ing of the appropriate agonist a cAMP pool is generated in the PKA-RII compartmentand this isoform is activated to phosphorylate a specific subset of downstream targets.
Di Benedetto et al Compartmentalized Signaling by PKA Isoforms 843
by guest on February 22, 2016http://circres.ahajournals.org/Downloaded from

sites via binding to endogenous AKAPs. This defines exclusivesignaling domains within which the cAMP signal is uniquelygenerated via activation of specific GPCR and their associated Gproteins and is uniquely modulated by the activity of differentsubsets of PDEs, resulting in stimulus-specific phosphorylationof downstream protein targets. These results provide a mecha-nism for the different function of PKA-RI and PKA-RII subsetsand provide a functional rationale for the design of isoform-specific activators and inhibitors of PKA.
AcknowledgmentsWe thank Martin Lohse for providing Epac-1, John Scott and KjetilTasken for the constructs for RIAD and for SuperAKAP-IS, KjetilTasken for ezrin and ezrin-GFP, Matteo Vatta for wt-Cypher/ZASP-GFP, and Marc Dell’Acqua for AKAP-79 and AKAP-79-GFP.
Sources of FundingThis work was supported by Telethon Italy grant GGP05113; HumanFrontier Science Program Organization grant RGP0001/2005-C (toM.Z.); Fondation Leducq grant O6 CVD 02 (to M.Z.); and theEuropean Commission grant LSHB-CT-2006-037189 (to M.Z.,G.S.B., and M.D.H.); and Medical Research Council grantG0600765 (to M.D.H. and G.S.B.).
DisclosuresNone.
References1. Tasken K, Aandahl EM. Localized effects of cAMP mediated by distinct
routes of protein kinase A. Physiol Rev. 2004;84:137–167.2. Wong W, Scott JD. AKAP signalling complexes: focal points in space
and time. Nat Rev Mol Cell Biol. 2004;5:959–970.3. Jurevicius J, Fischmeister R. cAMP compartmentation is responsible for
a local activation of cardiac Ca2� channels by beta-adrenergic agonists.Proc Natl Acad Sci U S A. 1996;93:295–299.
4. Barnes AP, Livera G, Huang P, Sun C, O’Neal WK, Conti M, Stutts MJ,Milgram SL. Phosphodiesterase 4D forms a cAMP diffusion barrier at theapical membrane of the airway epithelium. J Biol Chem. 2005;280:7997–8003.
5. Rich TC, Fagan KA, Nakata H, Schaack J, Cooper DM, Karpen JW.Cyclic nucleotide-gated channels colocalize with adenylyl cyclase inregions of restricted cAMP diffusion. J Gen Physiol. 2000;116:147–161.
6. Zaccolo M, Pozzan T. Discrete microdomains with high concentration ofcAMP in stimulated rat neonatal cardiac myocytes. Science. 2002;295:1711–1715.
7. Houslay MD, Baillie GS, Maurice DH. cAMP-Specificphosphodiesterase-4 enzymes in the cardiovascular system: a moleculartoolbox for generating compartmentalized cAMP signaling. Circ Res.2007;100:950–966.
8. Mongillo M, McSorley T, Evellin S, Sood A, Lissandron V, Terrin A,Huston E, Hannawacker A, Lhose MJ, Pozzan T, Houslay MD, ZaccoloM. Fluorescence resonance energy transfer-based analysis of cAMPdynamics in live neonatal rat cardiac myocytes reveals distinct functionsof compartmentalized phosphodiesterases. Circ Res. 2004;95:67–75.
9. Scholten A, van Veen TA, Vos MA, Heck AJ. Diversity of cAMP-dependent protein kinase isoforms and their anchoring proteins in mouseventricular tissue. J Proteome Res. 2007;6:1705–1717.
10. Corbin JD, Sugden PH, Lincoln TM, Keely SL. Compartmentalization ofadenosine 3�:5�-monophosphate and adenosine 3�:5�-monophosphate-dependent protein kinase in heart tissue. J Biol Chem. 1977;252:3854–3861.
11. Brunton LL, Hayes JS, Mayer SE. Functional compartmentation of cyclicAMP and protein kinase in heart. Adv Cyclic Nucleotide Res. 1981;14:391–397.
12. Dostmann WR, Taylor SS, Genieser HG, Jastorff B, Doskeland SO,Ogreid D. Probing the cyclic nucleotide binding sites of cAMP-dependentprotein kinases I and II with analogs of adenosine 3�,5�-cyclic phospho-rothioates. J Biol Chem. 1990;265:10484–10491.
13. Cummings DE, Brandon EP, Planas JV, Motamen K, Idzerda RL,McKnight GS. Genetically lean mice result from targeted disruption ofthe RII beta subunit of protein kinase A. Nature. 1996;382:622–626.
14. Wu J, Brown SH, von Daake S, Taylor SS. PKA type II alphaholoenzyme reveals a combinatorial strategy for isoform diversity.Science. 2007;318:274–279.
15. Kim C, Cheng CY, Saldanha SA, Taylor SS. PKA-I holoenzyme structurereveals a mechanism for cAMP-dependent activation. Cell. 2007;130:1032–1043.
16. Skalhegg BS, Tasken K. Specificity in the cAMP/PKA signalingpathway. Differential expression, regulation, and subcellular localizationof subunits of PKA. Front Biosci. 2000;5:D678–D693.
17. Carr DW, Stofko-Hahn RE, Fraser ID, Bishop SM, Acott TS, BrennanRG, Scott JD. Interaction of the regulatory subunit (RII) of cAMP-dependent protein kinase with RII-anchoring proteins occurs through anamphipathic helix binding motif. J Biol Chem. 1991;266:14188–14192.
18. Nikolaev VO, Bunemann M, Hein L, Hannawacker A, Lhose MJ. Novelsingle chain cAMP sensors for receptor-induced signal propagation.J Biol Chem. 2004;279:37215–37218.
19. Algrain M, Turunen O, Vaheri A, Louvard D, Arpin M. Ezrin containscytoskeleton and membrane binding domains accounting for its proposedrole as a membrane-cytoskeletal linker. J Cell Biol. 1993;120:129–139.
20. Klauck TM, Faux MC, Labudda K, Langeberg LK, Jaken S, Scott JD.Coordination of three signaling enzymes by AKAP79, a mammalianscaffold protein. Science. 1996;271:1589–1592.
21. Carlson CR, Lygren B, Berge T, Hoshi N, Wong W, Tasken K, Scott JD.Delineation of type I protein kinase A-selective signaling events using anRI anchoring disruptor. J Biol Chem. 2006;281:21535–21545.
22. Gold MG, Lygren B, Dokurno P, Hoshi N, McConnachie G, Tasken K,Carlson CR, Scott JD, Bardford D. Molecular basis of AKAP specificityfor PKA regulatory subunits. Mol Cell. 2006;24:383–395.
23. Narumiya S, Sugimoto Y, Ushikubi F. Prostanoid receptors: structures,properties, and functions. Physiol Rev. 1999;79:1193–1226.
24. Bornfeldt KE. A single second messenger: several possible cellularresponses depending on distinct subcellular pools. Circ Res. 2006;99:790–792.
25. Keely SL. Prostaglandin E1 activation of heart cAMP-dependent proteinkinase: apparent dissociation of protein kinase activation from increases inphosphorylase activity and contractile force. Mol Pharmacol. 1979;15:235–245.
26. Hayes JS, Brunton LL, Mayer SE. Selective activation of particulatecAMP-dependent protein kinase by isoproterenol and prostaglandin E1.J Biol Chem. 1980;255:5113–5119.
27. Brunton LL, Hayes JS, Mayer SE. Hormonally specific phosphorylationof cardiac troponin I and activation of glycogen phosphorylase. Nature.1979;280:78–80.
28. Huang LJ, Durick K, Weiner JA, Chun J, Taylor SS. D-AKAP2, a novelprotein kinase A anchoring protein with a putative RGS domain. ProcNatl Acad Sci U S A. 1997;94:11184–11189.
29. Imaizumi-Scherrer T, Faust DM, Benichou JC, Hellio R, Weiss MC.Accumulation in fetal muscle and localization to the neuromuscularjunction of cAMP-dependent protein kinase A regulatory and catalyticsubunits RI alpha and C alpha. J Cell Biol. 1996;134:1241–1254.
30. Imaizumi-Scherrer T, Faust DM, Barradeau S, Hellio R, Weiss MC. TypeI protein kinase a is localized to interphase microtubules and stronglyassociated with the mitotic spindle. Exp Cell Res. 2001;264:250–265.
31. Angelo R, Rubin CS. Molecular characterization of an anchor protein(AKAPCE) that binds the RI subunit (RCE) of type I protein kinase Afrom Caenorhabditis elegans. J Biol Chem. 1998;273:14633–14643.
32. Skalhegg BS, Tasken K, Hansson V, Huitfeldt HS, Jahnsen T, Lea T.Location of cAMP-dependent protein kinase type I with the TCR-CD3complex. Science. 1994;263:84–87.
33. MacLennan DH, Kranias EG. Phospholamban: a crucial regulator ofcardiac contractility. Nat Rev Mol Cell Biol. 2003;4:566–577.
34. Sabbah HN. Biologic rationale for the use of beta-blockers in thetreatment of heart failure. Heart Fail Rev. 2004;9:91–97.
35. Hohlfeld T, Zucker TP, Meyer J, Schror K. Expression, function, andregulation of E-type prostaglandin receptors (EP3) in the nonischemicand ischemic pig heart. Circ Res. 1997;81:765–773.
36. Hohlfeld T, Meyer-Kirchrath J, Vogel YC, Schror K. Reduction of infarctsize by selective stimulation of prostaglandin EP(3)receptors in thereperfused ischemic pig heart. J Mol Cell Cardiol. 2000;32:285–296.
37. Yamamoto T, Habuchi Y, Tanaka H, Suto F, Morikawa J, Kashima K,Yoshimura M. EP receptor-mediated inhibition by prostaglandin E(1) ofcardiac L-type Ca(2�) current of rabbits. Am J Physiol. 1999;277:H1369–H1374.
844 Circulation Research October 10, 2008
by guest on February 22, 2016http://circres.ahajournals.org/Downloaded from

Houslay, George S. Baillie and Manuela ZaccoloGiulietta Di Benedetto, Anna Zoccarato, Valentina Lissandron, Anna Terrin, Xiang Li, Miles D.
CompartmentsProtein Kinase A Type I and Type II Define Distinct Intracellular Signaling
Print ISSN: 0009-7330. Online ISSN: 1524-4571 Copyright © 2008 American Heart Association, Inc. All rights reserved.is published by the American Heart Association, 7272 Greenville Avenue, Dallas, TX 75231Circulation Research
doi: 10.1161/CIRCRESAHA.108.1748132008;103:836-844; originally published online August 28, 2008;Circ Res.
http://circres.ahajournals.org/content/103/8/836World Wide Web at:
The online version of this article, along with updated information and services, is located on the
http://circres.ahajournals.org/content/suppl/2008/08/28/CIRCRESAHA.108.174813.DC1.htmlData Supplement (unedited) at:
http://circres.ahajournals.org//subscriptions/
is online at: Circulation Research Information about subscribing to Subscriptions:
http://www.lww.com/reprints Information about reprints can be found online at: Reprints:
document. Permissions and Rights Question and Answer about this process is available in the
located, click Request Permissions in the middle column of the Web page under Services. Further informationEditorial Office. Once the online version of the published article for which permission is being requested is
can be obtained via RightsLink, a service of the Copyright Clearance Center, not theCirculation Researchin Requests for permissions to reproduce figures, tables, or portions of articles originally publishedPermissions:
by guest on February 22, 2016http://circres.ahajournals.org/Downloaded from

Online Supplement Di Benedetto et al., Protein kinase A type I and type II…
Supplemental Materials and Methods Reagents DMEM-Hepes, Medium 199, PBS, FBS, L-glutamine, penicillin and TRIzol
reagent were purchased from Invitrogen. Prostaglandin E1 (PGE1),
isoproterenol, glucagon-like peptide 1 (GLP1), glucagon, forskolin, erythro-9-
(2-hydroxy-3-nonyl) adenine (EHNA), cilostamide, rolipram, isobutyl-methyl-
xanthine (IBMX), pertussis toxin (PTX), okadaic acid and KT 5720 were
obtained from Sigma-Aldrich. All chemicals were analytical grade. Restriction
enzymes, T4 ligase, and shrimp alkaline phosphatase (SAP) were purchased
from New England Biolabs, Taq polymerase from Euroclone. Transfectin Lipid
Reagent and Superscript IIITM were obtained from BioRAD.
Constructs generation The Epac-1 genetically encoded sensor for cAMP1 was kindly provided by M.
Lohse (Institute of Pharmacology and Toxicology, University of Würzburg,
Germany). RI_epac and RII_epac were generated by fusion to the N-terminus
of Epac-1 of the sequence encoding for the dimerization-docking (DD) domain
of RIα (64 aa) or RIIβ (49 aa), respectively. Between the DD domain and
Epac-1, the 27 aa linker A (EAAAK)5A was inserted. Such a linker was
chosen because it folds as a monomeric hydrophilic α-helix and is effective in
separating heterofunctional domains in a fusion protein, avoiding inadequate
interactions between the domains and allowing them to work independently 2.
The mRFP-ZASP and CFP-ZASP constructs were generated by substituting
the mRFP3 and ECFP fluorophores to the GFP in the wt-Cypher/ZASP-GFP4,
kindly provided by Dr M. Vatta. The RI-ECFP construct was generated by
substituting the RIα to the RIIβ in the RII-ECFP5. Finally, RI-RFP and RII-RFP
were constructed by substituting The mRFP fluorophore to the ECFP in the
RI-ECFP and RII-ECFP.
The constructs containing the cDNA for RIAD and SuperAKAP-IS were
generated by external PCR starting from the RIAD-GFP and SuperAKAP-IS-
GFP constructs that were kindly provided from Dr. J.D. Scott (Oregon Health
and Science University, U.S.A.)
Online Supplement Di Benedetto et al., Protein kinase A type I and type II…
Cell culture and transfection Primary cultures of cardiac ventricular myocytes from 1- to 3-day old Sprague
Dawley rats (Charles River Laboratories, Wilmington, MA) were prepared as
described5 and transfected with Transfectin Lipid Reagent (BioRAD), following
the supplier instruction. Imaging experiments were performed 24–48 h after
transfection.
Western blotting Treated cardiac myocytes were washed twice with ice cold PBS (phosphate
buffered saline) before cellular lysates were prepared. Cellular lysates were
prepared in lysis buffer containing 25mM Hepes, pH 7.5, 2.5 mM EDTA, 50
mM NaCl, 30 mM sodium pyrophosphate, 10% (v/v) glycerol and 1% (v/v)
Triton X-100 and Complete TM EDTA-free protease inhibitor cocktail tablets
(Roche).Protein concentration of lysates were quantified using the Bradford
assay and all samples were equalised for protein concentration. Proteins were
separated by gel electrophoresis and transferred to nitrocellulose. The
following antibodies were used to detect phospho-proteins and native proteins
in lysates from control and treated cells: Phospho-Troponin I (cardiac)
Ser23/24 (Cell Signaling, product code 4004), Troponin I (Cell Signaling,
product code 4002), Phospho-phospholamban Ser 16 (Upstate, product code
07-052), Phospholamban (Upstate, product code 05-205), Phospho-
βadrenergic receptor2 Ser345/346 (Santa Cruz, product code sc-16718), -
βadrenergic receptor2 (Santa Cruz, product code sc-569). Quantification of
phospho-proteins was done using densitometry software Quantity One.
Arbitrary phosphorylation units were calculated and results plotted against
controls. Plotted results represent the mean of at least three independent
experiments with standard errors.
Immunostaining and Confocal Imaging Cardiac ventricular myocytes were co-transfected with different combination
of constructs or decorated with anti-PKA RI or anti-PKA RIIβ antibodies (BD
Transduction Laboratories). Alexa fluor 568-conjugated antimouse antibody
(Molecular Probes) were used as secondary antibodies. CHO cells were
transfected with either RI_epac or RII_epac, alone or in combination with,
respectively, ezrin and AKAP79. Confocal images were acquired 24-48 hours

Online Supplement Di Benedetto et al., Protein kinase A type I and type II…
after transfection by using the broadband confocal Leica TCS SP5 system
(Leica Microsystems) and a HCX PL APO 63x1.4NA oil-immersion objective.
Cells were maintained in Hepes-buffered, calcium-free, Ringer-modified saline
(125 mM NaCl, 5 mM KCl, 1 mM Na3PO4, 1 mM MgS04, 5.5 mM glucose and
20 mM Hepes, pH 7.5), at room temperature (20-22°C), and excited using the
458-nm line of an argon laser for imaging CFP and the 543-nm line of a
helium-neon laser for imaging mRFP.
FRAP experiments FRAP experiments were performed 24-48 hours after transfection on a Leica
TCS SP5 confocal system. Experiments and data analysis were performed by
using the Leica FRAP application wizard. Cardiomyocytes trasfected with
either RI_epac or RII_epac were maintained in the Ringer-modified saline
described for confocal imaging, with the addition of 1 mM CaCl2, at room
temperature, and excited using the 514-nm line of an argon laser for imaging
YFP. Image acquisition was performed by using a HCX PL APO 63x1.4NA oil-
immersion objective. Each experiment was conducted at 100% laser power,
acquiring 5 images with AOTF set to 5%, one bleaching image with AOTF set
to 100%, and 70 images of fluorescence recovery with AOTF set to 5%. The
time between frames was minimized.
The fluorescence recovery half-time, t1/2, was calculated as the time
necessary for the fluorescence signal to recover to 50% of the asymptote
intensity. Values are expressed as the mean ± the standard error of the mean
(SEM). To determine the mobile fraction we compared the fluorescence in the
bleached region after full recovery (F∞ROI) with the fluorescence before
bleaching (Fi) and immediately after bleaching (F0). The mobile fraction Mf
was calculated as:
( )
( )( )0i
0ROI
tCELL
PRE-CELL
F-FF - F
F F
100 ∞∗∗
where F PRE-CELL is the mean fluorescence intensity in the whole cell before
bleaching and ( ) F tCELL is the fluorescence outside the bleached area at each
time point. The first term in the above equation contains a correction for
photobleaching during the acquisition of the post-bleach images.

Online Supplement Di Benedetto et al., Protein kinase A type I and type II…
Fluorescence Resonance Energy Transfer Imaging FRET imaging experiments were performed 24-48 h after cardiomyocytes
transfection. Cells were maintained at room temperature in the Ringer-
modified saline (see above) additioned of CaCl2 (1 mM), and imaged on an
inverted microscope (Olympus IX50) with a FLUAR 100xNA1.3 oil-immersion
objective (Zeiss). The microscope was equipped with a CCD camera
(Sensicam QI, PCO, U.S.A.), a software-controlled monochromator
(Polychrome IV, TILL Photonics, Germany), and a beam-splitter optical device
(Multispec Microimager; Optical Insights, U.S.A.). Images were acquired using
custom-made software and processed using ImageJ
(http://rsb.info.nih.gov/ij/). FRET changes were measured as changes in the
background-subtracted 480/545-nm fluorescence emission intensity on
excitation at 430 nm and expressed as either R/R0, where R is the ratio at
time t and R0 is the ratio at time = 0 sec, or ΔR/R0, where ΔR = R – R0. Values
are expressed as the mean ± SEM.
RT-PCR Total RNA was isolated from cultured rat neonatal cardiac myocytes and from
freshly isolated rat adipocytes from epididymal fat pads by using the TRIzol
reagent (Invitrogen). An aliquot of total RNA was retrotranscribed by
Superscript IIITM (Invitrogen) to generate cDNA. mRNAs for the four EP
receptors genes and for the hypoxanthine-guanine phosphoribosyltransferase
(HPRT) gene were amplified from the cDNA. For the oligonucleotide
sequences used for the detection of cDNA specific for the EP1, EP2, EP3, EP4
and HPRT see the supplementary materials. Each amplification reaction,
containing all reagents except the primers, was split in two. Primers to amplify
one of the four EP receptors were added to one half of the reaction, whereas
in the primers to amplify the HPRT gene were added to the other half. Cycling
conditions were: 94°C for 30 s, Tann (68°C for EP1 and EP4, 60°C for EP3 and
56°C for EP2 and HPRT) for 30 s, 72°C for 30 s, 35 cycles. The predicted
sizes of the amplified fragments were of 135 bp for EP1, 126 bp for EP2, 122
bp for EP3, 130 bp for EP4 and 160 bp for HPRT.
Oligonucleotides used for the detection of cDNA specific for the EP1, EP2,
EP3, EP4 and HPRT genes are shown below, together with the annealing
temperature used for each amplification.

Online Supplement Di Benedetto et al., Protein kinase A type I and type II…
EP1 Fwd 5’-GAGCCCCCTGCTGGTATTGG-3’ Tann: 68°C Rev 5’-GCGCAGCAGGATGTACACCC-3’ EP2 Fwd 5’-CTGCCTTTCACAATCTTTGC-3’ Tann: 56°C Rev 5’- TCTAAGGATGACAAAAACCC-3’ EP3 Fwd 5’-GCCGCTATTGATAATGATGC-3’ Tann: 60°C Rev 5’-GCGAAGCCAGGCGAACGGCG-3’ EP4 Fwd 5’-TCCATTCCGCTCGTGGTGCG-3’ Tann: 68°C Rev 5’-TCCAAGGGTCCAGGATGGGG-3’ HPRT Fwd 5’-AGTCCCAGCGTCGTGATTAG-3’ Tann: 56°C Rev 5’-CCATCTCCTTCATGACATCTCG-3’
Supplemental Information RI_epac and RII_epac are equally sensitive to cAMP. In order to test the performance of the modified sensors, CHO cells
expressing either the original Epac-1 or one of the novel targeted sensors
were challenged with the direct activator of adenylyl cyclase, forskolin (5 μM)
together with the non-selective PDE inhibitor, IBMX (100 μM) so as to elicit a
saturating cAMP response8. The average maximal FRET change for the three
sensors is shown in Online Fig IB. When compared to Epac-1 (ΔR/R0 = 1.00
± 0.08, n = 11), both targeted probes show a 50% reduction in the maximal
FRET response, with a ΔR/R0 = 0.51 ± 0.03 (n = 35) for RI_epac and a
ΔR/R0 = 0.49 ± 0.04 (n = 20) for RII_epac, respectively. This indicates that
fusion of the DD domain to Epac-1 roughly halves the maximal FRET change.
We found that such a reduction in FRET response is likely due to the
presence of the DD domain (see below).
A dose-response curve generated by challenging CHO cells
expressing either RI_epac or RII_epac with increasing concentrations of
forskolin shows a complete overlap for the two sensors with an EC50 of about
1 μM (Online Fig IC). These results show that although fusion of the DD
domain to the cAMP sensor affects its performance, the resulting RI_epac
and RII_epac probes maintain a reasonable maximal FRET response (about
10%) and are equally sensitive to cAMP changes.

Online Supplement Di Benedetto et al., Protein kinase A type I and type II…
Fusion of the DD domain to the Epac-1 sensor is responsible for the observed reduction of its maximal FRET change. Fusion of the DD domain to Epac-1 resulted in a 50% reduction of the
maximal FRET change for both targeted sensors. We wondered if this
reduction was due to anchoring of the sensors to endogenous AKAPs and the
consequent steric hindrance which would limit the conformational change
needed for maximal FRET. To test this hypothesis, we coexpressed RI_epac
and RII_epac with the AKAP competing peptides RIAD6 and SuperAKAP-IS7,
respectively. These peptides have been shown to compete selectively with
the binding of PKA-RI and PKA-RII to endogenous AKAPs. Challenge of CHO
cells expressing either RI_epac in combination with RIAD or RII_epac in
combination with SuperAKAP-IS resulted in a maximal FRET change not
significantly different from the maximal FRET change recorded in cells
expressing the sensor alone (Online Fig ID). These results indicate that the
N-terminal fusion of the DD domains per se is responsible for the reduction in
the maximal FRET change of the targeted sensors.
Mobilization of the RI_epac sensor reduces the speed of FRET change in response to PGE1. Our results demonstrate that application of selected GPCR agonists
generates distinct pools of cAMP that are sensed selectively by either
RI_epac or RII_Epac. It is expected that mobilization of the targeted sensor
from their anchoring sites results in a slower FRET change in response to the
specific stimulus as a consequence of the increased distance of the sensor
from the selected pool of cAMP. Indeed, we found that the response to PGE1
is much slower if detected by RI_epac in the presence of RIAD than the FRET
change detected by RI_epac alone (P = 0.0008) (see Online Fig III). The
same effect was not found in the case RII_epac. In this case the response to
isoproterenol resulted to be equally fast when detected by RII_epac alone or
by RII_epac in the presence of SuperAKAP-IS (P = 0.98). The t/2 of the
response (i.e. the time to reach half-maximal FRET change) was of about 40
seconds in both cases. It should be noted, however, that the response to
isoproterenol is one order of magnitude faster than the response to PGE1.

Online Supplement Di Benedetto et al., Protein kinase A type I and type II…
Nikolaev et al.1, in their description of the parent cAMP sensor Epac-1,
reported that, in HEK-β1AR cells challenged with isoprenaline 1 μM, the t/2 of
the sensor response is about 50 seconds. In addition, even when cells were
treated with saturating stimuli (e.g. 25μM forskolin in the presence of 100mM
IBMX) we were not able to detect a t/2 faster than 40 s. Thus, a t/2 of about
40 seconds for the response to isoproterenol, either detected by RII_epac or
by RII_epac in the presence of SuperAKAP-IS, seems to be the fastest
possible detectable by the sensor. Therefore, a faster cAMP increase
generated by isoproterenol in the PKA type II microdomain can not be
appreciated due to limiting probe activation time.
References 1. Nikolaev VO, Bunemann M, Hein L, Hannawacker A, Lhose MJ. Novel
single chain cAMP sensors for receptor-induced signal propagation. J Biol Chem. 2004;279:37215-37218.
2. Arai R, Ueda H, Kitayama A, Kamiya N, Nagamune T. Design of the linkers which effectively separate domains of a bifunctional fusion protein. Protein Eng. 2001;14:529-532.
3. Campbell RE, Tour O, Palmer AE, Steinbach PA, Baird GS, Zacharias DA, Tsien RY. A monomeric red fluorescent protein. Proc Natl Acad Sci U S A. 2002;99:7877-7882.
4. Vatta M, Mohapatra B, Jimenez S, Sanchez X, Faulkner G, Perles Z, Sinagra G, Lin JH, Vu TM, Zhou Q, Bowles KR, Di Lenarda A, Schimmenti L, Fox M, Chrisco MA, Murphy RT, McKenna W, Elliott P, Bowles NE, Chen J, Valle G, Towbin JA. Mutations in Cypher/ZASP in patients with dilated cardiomyopathy and left ventricular non-compaction. J Am Coll Cardiol. 2003;42:2014-2027.
5. Zaccolo M, Pozzan T. Discrete microdomains with high concentration of cAMP in stimulated rat neonatal cardiac myocytes. Science. 2002;295:1711-1715.
6. Carlson CR, Lygren B, Berge T, Hoshi N, Wong W, Taskén K, Scott JD. Delineation of type I protein kinase A-selective signaling events using an RI anchoring disruptor. J Biol Chem. 2006;281:21535-21545.
7. Gold MG, Lygren B, Dokurno P, Hoshi N, McConnachie G, Taskén K, Carlson CR, Scott JD, Bardford D. Molecular basis of AKAP specificity for PKA regulatory subunits. Mol Cell. 2006;24:383-395.

Online Supplement Di Benedetto et al., Protein kinase A type I and type II…
Online Figure Legends
Online Fig I. (A) Schematic representation of RI_epac and RII_epac (B)
Average maximal FRET change for Epac-1 (white), RI_epac (gray) and
RII_epac (black), elicited by forskolin 5 μM and IBMX 100 μM in CHO cells.
Error bars indicate SEM. ***, P < 0.001. (C) Dose-response curves for
RI_epac (gray circles) and RII_epac (black circles), expressed in CHO cells
treated with forskolin concentration ranging from 2.5 nM to 100 μM. Error bars
indicate SEM. (D) Average maximal FRET changes detected in
cardiomyocytes co-expressing either RI_epac in combination with the
competing peptide RIAD (gray bars) or RII_epac in combination with
SuperAKAP-IS (black bars) and stimulated with forskolin 5 μM and IBMX 100
μM. Error bars indicate SEM.
Online Fig II. A) Localization of endogenous R subunits. Confocal images of
neonatal cardiac myopcytes decorated with antibodies specific for for RI (RI
end) and RII (RII end). B) Confocal images of cardiomyocytes co-expressing
either the full-length, CFP-tagged, RI or RII (in blue) and zasp-RFP (in red).
The overlay is shown in green. Panels on the right show, for each cell, the
intensity profile of the RI/RII-CFP signal (in blue) and of the zasp-RFP signal
(in red) in the region indicated by the black line. C) Confocal images of
cardiomyocytes co-expressing either RI_epac or RII_epac (in blue) and the
full-length, RFP-tagged, PKA RI or RII (in red). The overlay is shown in green
Right panels show, for each cell, the intensity profile of the probe signal (in
blue) and of the RI/RII-RFP signal (in red) in the region indicated by the black
line.
Online Fig III. t/2 of FRET changes detected in cardiomyocytes co-
expressing either RI_epac in combination with the competing peptide RIAD
and stimulated with 1 μM PGE1 (gray bars), or RII_epac in combination with
SuperAKAP-IS and stimulated with 10 nM isoproterenol (black bars). Error
bars indicate SEM. ***, P < 0.001.

Online Supplement Di Benedetto et al., Protein kinase A type I and type II…
Online Fig IV. Phosphatase inhibitors rescue Gi-mediated reduction in basal
levels of phospho-Tn I and phospho-PLB. Representative western blots of
cardiac myocyte lysates probed for phospholamban and Troponin I with
corresponding phospho-blots after treatment with 1 μM PGE1 with and without
pre-treatment of okadaic acid (100 nM).


Online Figure IV