a standard operating procedure to define typical poultry farms
TRANSCRIPT
Poultry Network
Petra Thobe Craig Chibanda Mohamad Isam Almadani Lena Schickramm
A standard operating procedure to define typical poultry farms
August 2020
1
Content
1 Introduction 2
2 Define the purpose of your exercise/analysis 2
3 Select regions and locations 2
4 Define the relevant farm population 4
5 Identify the prevailing production systems in the country and the regions chosen 4
6 Define the farm sizes of the typical farm(s) 6
6.1 Different farm sizes and different production systems 6
6.2 Management, performance and yield levels 7
6.3 Number of farms required per country 7
6.4 Minimum-standards to define typical farms 8
7 Data collection and updating 9
8 Summary 11
2
1 Introduction
The agri benchmark poultry network focuses on the production of broilers, layers (egg pro-
duction), turkeys, ducks, guinea fowl, geese, quail, pigeons, ostriches and pheasants.
This paper describes the agri benchmark approach which is used for the identification and
definition of data sets of typical farms. It is based on the experience gained in the agri bench-
mark network and questions raised by agri benchmark partners and supporters during the
existence of the network.
The aims of this SOP are to:
1. Make transparent to the network and the outside world, how typical farms are selected.
2. Elaborate to the network and the outside world, how typical farms can be described rela-
tive to the rest of the farm population.
3. Make sure that irrespective of the availability of statistical data, scientific standards in se-
lecting farms are respected.
4. In the long run: allow the drawing of conclusions regarding the entire sector based on
results derived from farm-level analysis.
In order to keep it simple, the SOP refers to the standard situation, in which data from the
farms selected will contribute to the global agri benchmark network.If there are any questions
left unanswered, every partner is kindly invited to contact the agri benchmark headquarters
in Braunschweig for any clarifications.
2 Define the purpose of your exercise/analysis
Since the purpose of an international farm comparison analysis has a significant impact on the
selection process for typical farms, it is assumed that competitiveness and potential of re-
gions are the objectives of the research.
3 Select regions and locations
This step can be done by the country’s agri benchmark researcher/partner using available sta-
tistics. It entails the identification of the most important regions in terms of production of a
specific poultry product (eggs or meat).
This means that the researcher/partner is looking for the spatial distribution of the product
and/or the farms producing it. The researcher/partner is probably looking for regions with a
substantial size and a relatively high poultry density. For this, they have to use the appropriate
reference unit for the indicator.
3
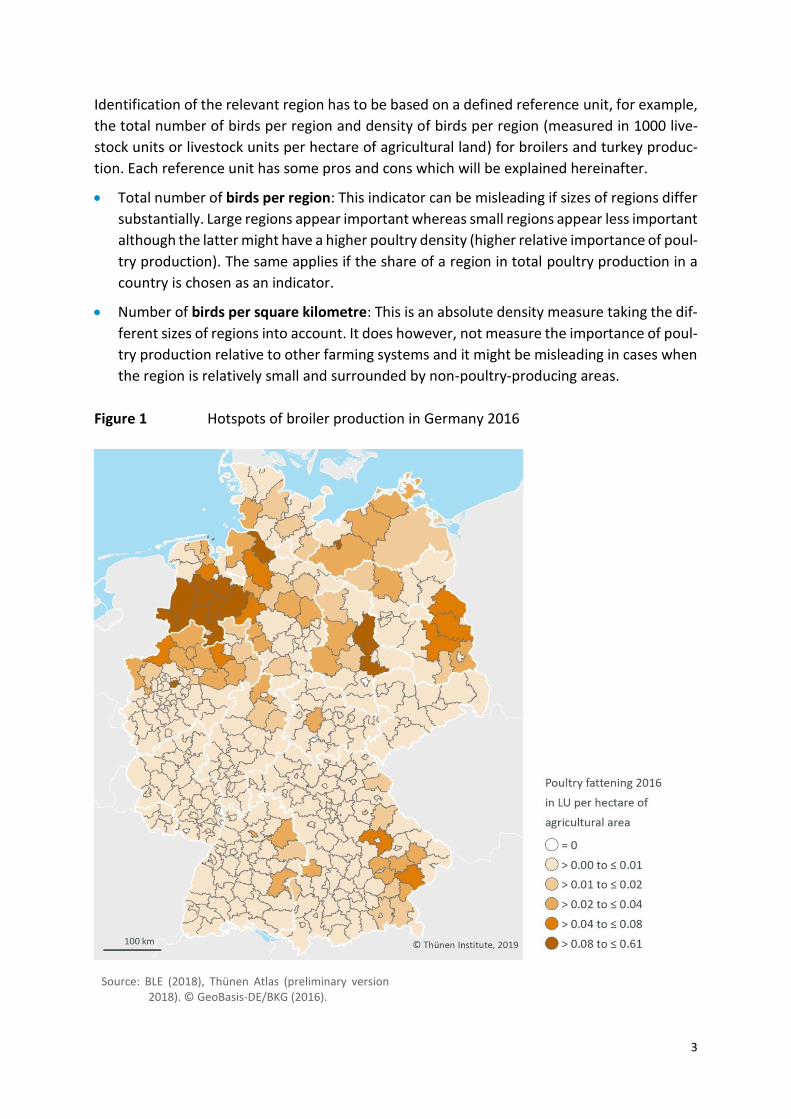
Identification of the relevant region has to be based on a defined reference unit, for example,
the total number of birds per region and density of birds per region (measured in 1000 live-
stock units or livestock units per hectare of agricultural land) for broilers and turkey produc-
tion. Each reference unit has some pros and cons which will be explained hereinafter.
• Total number of birds per region: This indicator can be misleading if sizes of regions differ
substantially. Large regions appear important whereas small regions appear less important
although the latter might have a higher poultry density (higher relative importance of poul-
try production). The same applies if the share of a region in total poultry production in a
country is chosen as an indicator.
• Number of birds per square kilometre: This is an absolute density measure taking the dif-
ferent sizes of regions into account. It does however, not measure the importance of poul-
try production relative to other farming systems and it might be misleading in cases when
the region is relatively small and surrounded by non-poultry-producing areas.
Figure 1 Hotspots of broiler production in Germany 2016
Source: BLE (2018), Thünen Atlas (preliminary version 2018). © GeoBasis-DE/BKG (2016).
4
4 Define the relevant farm population
Once the relevant regions have been identified, it needs to be checked whether the entire
population of farms is considered to be relevant for the analysis. Because agri benchmark is
aiming to focus on those farms which are producing the bulk of products, the relevant farm
population is characterized by the ability to generate at least 50 percent of the farm income
or to feed at least one person/family. This means that we are presently excluding part-time
farms. This could be reconsidered if there is a situation whereby say 70% of regional produc-
tion came from part-time farmers.
5 Identify the prevailing production systems in the country and the re-gions chosen
Once the relevant region(s) have been identified, the question arises, what type(s) of a farm(s)
should be selected. In order to make sure that the most important production systems are
represented in the typical farm network, several different systems need to be checked
whether or not they make a difference in the results.
This step can be done by the researcher based on literature and statistical analysis and/or
together with local advisors. A stepwise approach appears to be appropriate, starting with a
slightly rough classification and refining it in the next steps.
The following list of criteria is meant to be a proposal for a checklist, which should be amended
depending on the regional conditions in the different member networks. In many cases, a
number of these criteria will be meaningless for the selection procedure and should, there-
fore, be ignored.
• Specialised poultry (broiler/turkey) finishing or layer (egg) production vs. mixed systems,
examples:
− specialised poultry finishing farm, perhaps with some cash crop farming
− specialised layers (egg) farm, perhaps with some cash crop farming
− closed system
• High productivity vs. low productivity farm (in terms of physical productivity)
• Extent of purchase feed
• Family labour vs. hired labour farms
The result of this clarification procedure could look like this: We go for a poultry farm with a
broiler finishing enterprise (closed system) in single operator (i.e., not integrated), which pro-
duces on a capital and labour intensive system. This typical farm in region xyz is not making
5
any cash crop farming and is purchasing all feed. The farm has established a hired labour re-
gime.
There is a list of issues that must be addressed when defining typical farms and collecting their
data. We should be aware that due to the voluntary participation of producers in agri bench-
mark, we will – irrespective of the specific sampling rules – probably get a bias towards farms
with above-average size, management and performance.
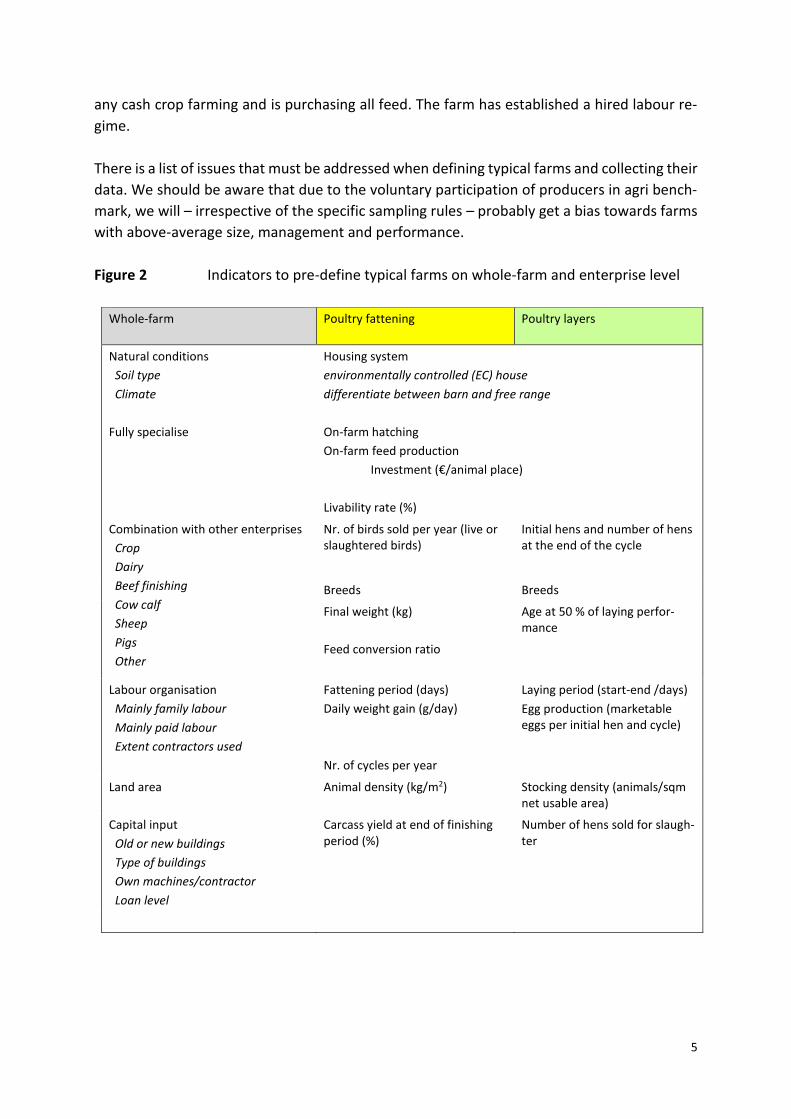
Figure 2 Indicators to pre-define typical farms on whole-farm and enterprise level
Whole-farm Poultry fattening Poultry layers
Natural conditions
Soil type
Climate
Fully specialise
Housing system
environmentally controlled (EC) house
differentiate between barn and free range
On-farm hatching
On-farm feed production
Investment (€/animal place)
Livability rate (%)
Combination with other enterprises
Crop
Dairy
Beef finishing
Cow calf
Sheep
Pigs
Other
Nr. of birds sold per year (live or slaughtered birds)
Initial hens and number of hens at the end of the cycle
Breeds Breeds
Final weight (kg)
Feed conversion ratio
Age at 50 % of laying perfor-mance
Labour organisation
Mainly family labour
Mainly paid labour
Extent contractors used
Fattening period (days)
Daily weight gain (g/day)
Nr. of cycles per year
Laying period (start-end /days)
Egg production (marketable eggs per initial hen and cycle)
Land area Animal density (kg/m2) Stocking density (animals/sqm net usable area)
Capital input
Old or new buildings
Type of buildings
Own machines/contractor
Loan level
Carcass yield at end of finishing period (%)
Number of hens sold for slaugh-ter
6
6 Define the farm sizes of the typical farm(s)
Once the relevant type of farms producing poultry (broilers/layers/turkeys) and the respective
production systems are identified, a decision regarding the farm size of the typical farm, has
to be made. Size, in the course of this paper, shall be measured as follows:
• in poultry finishing: total number of finished birds sold per year
• in layer production: average number of eggs per year
Furthermore, we should make the position of our typical farms in the total farm population
transparent. How many farms are in the same size category and how many are larger or
smaller than the typical farm? This can be done by using data of the farm population (which
will usually not be available to the detail required) or using representative random samples
providing key indicators to measure the frequency of certain farm types and sizes (like the
Farm Accountancy Data Network of the EU).
6.1 Different farm sizes and different production systems
As time and resources are usually limited, it is not always possible to reflect all farm sizes and
production systems in a region. Based on the experience of the agri benchmark work, the
following recommendations can be given:
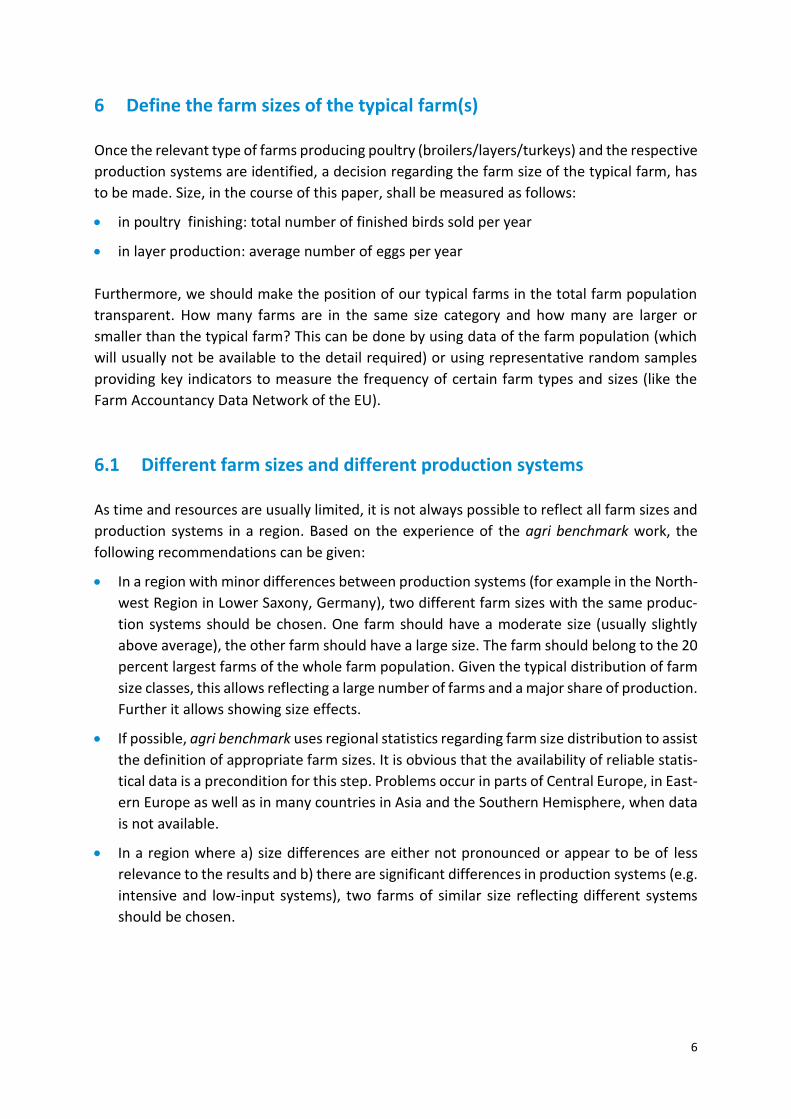
• In a region with minor differences between production systems (for example in the North-
west Region in Lower Saxony, Germany), two different farm sizes with the same produc-
tion systems should be chosen. One farm should have a moderate size (usually slightly
above average), the other farm should have a large size. The farm should belong to the 20
percent largest farms of the whole farm population. Given the typical distribution of farm
size classes, this allows reflecting a large number of farms and a major share of production.
Further it allows showing size effects.
• If possible, agri benchmark uses regional statistics regarding farm size distribution to assist
the definition of appropriate farm sizes. It is obvious that the availability of reliable statis-
tical data is a precondition for this step. Problems occur in parts of Central Europe, in East-
ern Europe as well as in many countries in Asia and the Southern Hemisphere, when data
is not available.
• In a region where a) size differences are either not pronounced or appear to be of less
relevance to the results and b) there are significant differences in production systems (e.g.
intensive and low-input systems), two farms of similar size reflecting different systems
should be chosen.
7
Figure 3 Farm size distribution and selection of typical farm sizes
Source: Own illustration
6.2 Management, performance and yield levels
The typical farm should have an average level of management; this allows us to draw conclu-
sions regarding the bulk of the output generated in a given region.
In order to explore the potentials of a region/country we strongly recommend adding one
large farm with top management to the set of farms, if possible. The definition of top man-
agement is based on the economic success. The top management farm should belong to the
top 10 percent performers in terms of economic success. Economic success should be meas-
ured in terms of profit. If this information is not available, gross margins or even productivity
measures can be used as a proxy.
6.3 Number of farms required per country
The question of how many typical farm models are required to represent the poultry produc-
tion of a given country is frequently asked. In quantitative terms, there is no general answer
to this question. Our own experience from Germany indicates that with increasing number of
typical farms there is a diminishing knowledge gain. Further, the number of farms required
also depends on the research questions asked and the preferences of possible clients.
For example, we assess that for standard international comparisons in Germany, 4-6 farms
appears to be sufficient and for specific analysis like animal welfare, 12 farms would be suffi-
cient to reflect all relevant farming situations.
8
The number of farms required per country mainly depends on
• Diversity of production systems (natural conditions, economic conditions, infrastructure
conditions) – usually the more diversity the more farms required.
• Diversity of farm size structure within the production system– usually the more diverse
the more farms are required. (number of animals produced per year)
• Size of the country – usually the smaller the country, the less farm types required.
• On the other hand, very big countries with a great variety of farming systems might be
subdivided into different regions, this is probably required in countries like the U.S., Brazil,
Russia, China and Australia.
• Regional level of analysis – usually the more international, the less farms are required
(usually 2-4 farms per country, exceptions see previous point). For national comparison
more farms are needed but less for international comparison.
• Type of analysis you perform – usually the more farm adjustments you analyse the more
farms you need.
• Financial resources to set up and maintain (!) a network of typical farms in a country (fea-
sibility)
The experience so far has revealed that establishing a national network of typical farms in
each country is the best way to get more detailed differentiation of production systems with
a higher number of farms. Based on the national network, a procedure with the agri bench-
mark headquarters to select a number of farms from your national network for the interna-
tional comparisons must be implemented to ensure the selection of the most relevant farm
types for the international comparison.
6.4 Minimum-standards to define typical farms
In case statistics and resources to define typical farms are scarce or not available, a minimum
criteria-list is defined here to allow the first steps in defining a typical farm.
• Select the region with the highest importance of poultry population (density xxx).
• In the region identified, select the production system with the highest proportion in the
regional poultry/ poultry production.
• Select the farm size that produces the highest share of meat / eggs within the production
system identified.
In any case, make transparent where on the distribution the typical farm is located (in the
sense of points 6.1 and 6.3), even if it is expert-based estimation. It is important that this pro-
cedure must be revised over time to improve the accuracy and relevance of the data.
9
7 Data collection and updating
Data collection is done together with a local advisor and producers who have in-depth
knowledge of: the region, the farms and the production systems. Agri benchmark uses a focus-
group consisting of the responsible researcher, an advisor and 3-6 producers. The focus-group
is a round table meeting where all required farm data are collected based on a standard ques-
tionnaire applied globally. The focus-group creates a consensus on each figure to properly
describe how a typical farm would look. Thus, in the focus group, we do not record averages
from the participating producers. The most frequent question raised in the focus-group must
be: “Can this figure be considered typical for the type of farm we want to describe?”
There are different intensity levels of producers’ participation:
• We aim to establish a complete focus group with 3-6 producers because it usually provides
a broader data basis with better feedback from the actors. Such a group is particularly
important when farm adjustments to changes in the framework conditions or farm strat-
egies are to be discussed and defined. The main reason is that with a larger group a
broader variety of adjustments and scenarios can be reflected. For this purpose, the data
and the analysis derived from an individual, typified farm as described below can be used
as a basis for discussion.
• In some cases and countries, it can be difficult to establish a focus group. Reasons might
be the regional extension of countries (long traveling distances) but also cultural peculiar-
ities like willingness to share information with others. In these cases it is possible to base
the typical farm data on individual farm data. Regardless, it is necessary (a) to identify and
correct the particularities of individual farm data (to make individual farm data typical
farm data) and (b) to make farm visits to two to three farms similar to the typical farm.
This process is called ‘typification’ of farms. In any case, the producers involved have to
run farms themselves which are similar to the envisaged typical farm.
Once the data is collected, it will be computed with the analysis tools used in agri benchmark
(mainly the simulation model TIPI-CAL) and the results will be returned to the focus-group and
the advisor for validation. This process is repeated until the focus-group agrees on the results
obtained. At the end of this process there is a typical farm model.
In a final step the results have to be evaluated with results from other economic analysis, for
example by comparing the whole-farm profit of the typical farms with representative survey
results. By doing this cross-check we can make sure that our calculation and the selection of
the typical farms are in line with other researchers’ results.
10
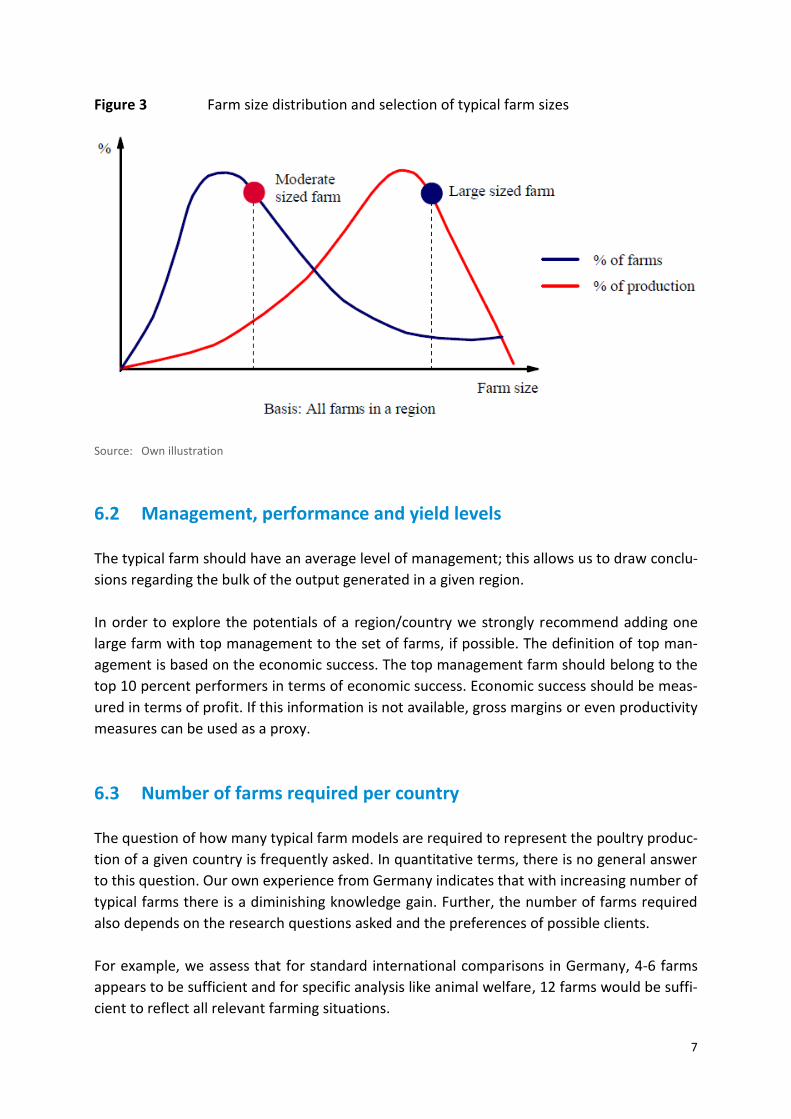
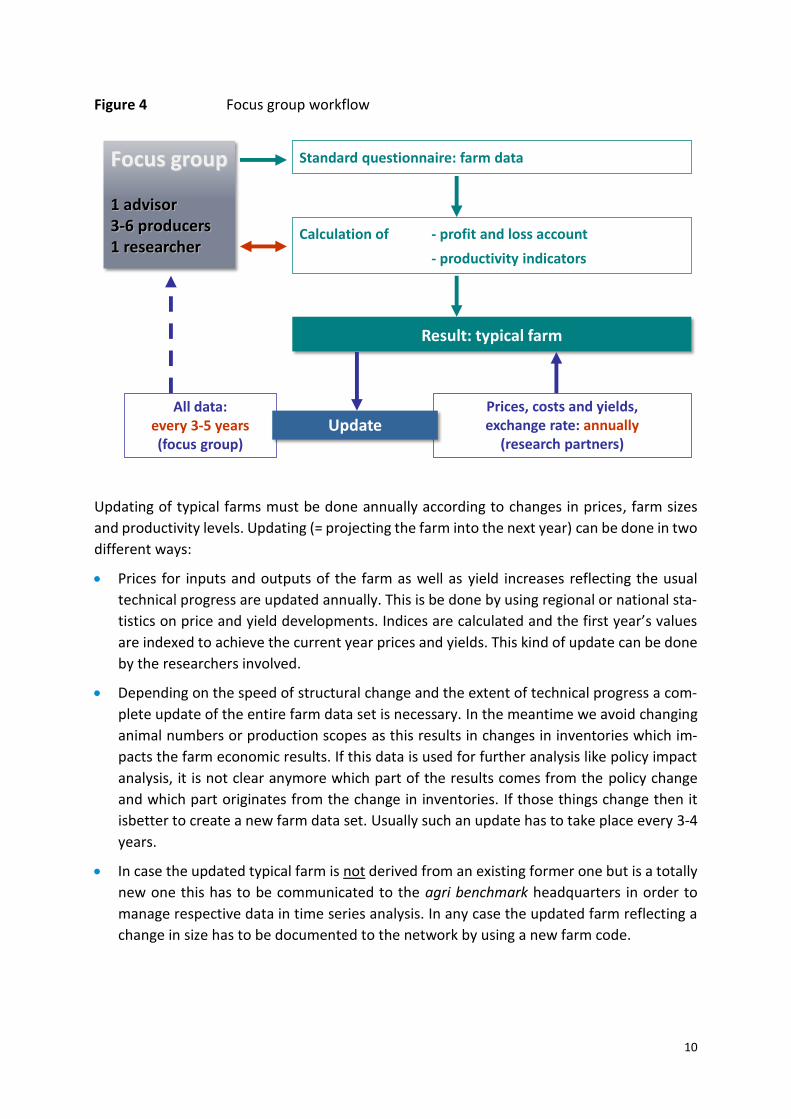
Figure 4 Focus group workflow
Updating of typical farms must be done annually according to changes in prices, farm sizes
and productivity levels. Updating (= projecting the farm into the next year) can be done in two
different ways:
• Prices for inputs and outputs of the farm as well as yield increases reflecting the usual
technical progress are updated annually. This is be done by using regional or national sta-
tistics on price and yield developments. Indices are calculated and the first year’s values
are indexed to achieve the current year prices and yields. This kind of update can be done
by the researchers involved.
• Depending on the speed of structural change and the extent of technical progress a com-
plete update of the entire farm data set is necessary. In the meantime we avoid changing
animal numbers or production scopes as this results in changes in inventories which im-
pacts the farm economic results. If this data is used for further analysis like policy impact
analysis, it is not clear anymore which part of the results comes from the policy change
and which part originates from the change in inventories. If those things change then it
isbetter to create a new farm data set. Usually such an update has to take place every 3-4
years.
• In case the updated typical farm is not derived from an existing former one but is a totally
new one this has to be communicated to the agri benchmark headquarters in order to
manage respective data in time series analysis. In any case the updated farm reflecting a
change in size has to be documented to the network by using a new farm code.
All data:every 3-5 years(focus group)
Standard questionnaire: farm data
Result: typical farm
Calculation of - profit and loss account
- productivity indicators
Focus group
1 advisor 3-6 producers1 researcher
Prices, costs and yields, exchange rate: annually
(research partners)Update
11
8 Summary
Defining typical farms as described in this paper refers to the process of collecting farm data
for the comparison of production systems, their economics as well as for practice change anal-
ysis and adaptation strategies concerning changes in a political and legal framework. This sum-
mary provides a brief description of the necessary steps for the definition of typical poultry
farms. All the steps are based on the assumption that all required statistics are available. In
case statistics are not available, chapter 6.4 provides a minimum standard to define farms.
The agri benchmark poultry network focuses on the production of broilers, layers (egg pro-
duction), turkeys, ducks, guinea fowl, geese, quail, pigeons, ostriches and pheasants.
1 Selection of regions and locations
The selection of the most important regions and locations in terms of poultry production is
crucial. For this purpose, maps showing the spatial distribution of production are created. Dif-
ferent regional reference units of production are considered to arrive at a conclusion on the
most crucial production regions in a country. The most frequent indicators used are the total
number of poultry birds (e.g. the number of broilers or eggs produced) and the regional den-
sity of poultry birds per ha.
2 Identify the prevailing production systems
Once the regions are identified, the relevant farm population, the production systems, and
farm types to be analysed must be determined. This step can be done by a researcher based
on existing literature and statistical analysis and/or together with local advisors. For this pur-
pose, a checklist is used to identify the degree of specialisation, the land, capital and labour
structure and organisation, productivity levels, technologies, intensity levels and further indi-
cators.
3 Define the size and management level of the typical farms
Typical farm size is defined as the total number of birds per year for poultry production. The
typical farms should have less than 50 percent off-farm income and/or sustain at least the
living of one person. Regional statistics on farm size distribution or representative surveys are
used to determine the position of the farms in the distribution of the farm population. To start
with, agri benchmark defines a moderate size farm with average management. In the next
steps, if more resources and time are available, we aim at establishing additional farms from
which we can expect different results when compared to the first farm. Different results can
arise from different farm sizes, different production systems and technologies as well as dif-
ferent management levels.
12
4 Data collection, cross-checking and updating
Data is collected through “focus groups” comprising of producers and local experts. A standard
questionnaire covering production and economic figures is used, and each figure is checked
and confirmed to reflect the typical situation. Once the data is collected, it is computed, and
the results are returned to the focus group/advisor for cross-checking. Additionally, economic
performance is cross-checked against other economic analysis from the region, if available.
For standard comparisons, we can also use data from individual farms that resemble the farm
type identified in step 2. In that case, farm-specific particularities must be ‘typified’, i.e. re-
placed by more common figures of that system to remove any anomalies specific to that actual
farm. Updating of prices and yields is done annually; the whole data set is updated every 2-4
years, depending on the pace of structural change and productivity changes.