prostate cancer - repub, erasmus university repository
TRANSCRIPT

NUNO M. PEREIRA AZEVEDO
PROSTATE CANCER EARLY DETECTION 2.0P r e d i c t i o n M o d e l s a n d e H e a l t h

Prostate Cancer Early Detection 2.0: Prediction models and eHealth
Nuno Miguel Pereira Azevedo

Prostate Cancer Early Detection 2.0: Prediction models and eHealth
Nuno Miguel Pereira Azevedo

ISBN: 978-94-6361-170-1 Layout: Ydeal (www.ydeal.net) Printing: Optima Grafische Communicatie (www.ogc.nl)
Prostate Cancer Early Detection 2.0: Prediction models and eHealth
Prostaatkanker vroegdetectie 2.0:
Predictiemodellen en eHealth
Proefschrift
ter verkrijging van de graad van doctor
aan de Erasmus Universiteit Rotterdam
op gezag van de rector magnificus
Prof.dr. R.C.M.E. Engels
en volgens besluit van het college voor Promoties.
De openbare verdediging zal plaatsvinden op woensdag 7 november 2018 om 09.30 uur
door
Nuno Miguel Pereira Azevedo
geboren te Porto, Portugal

Promotiecommissie Promotor: Prof.dr. M.J. Roobol-Bouts Overige leden: Prof.dr. C.H. Bangma Prof.dr. L. Lechner Prof.dr. R. Pelger Copromotor: Dr. L.D.F. Venderbos

Promotiecommissie Promotor: Prof.dr. M.J. Roobol-Bouts Overige leden: Prof.dr. C.H. Bangma Prof.dr. L. Lechner Prof.dr. R. Pelger Copromotor: Dr. L.D.F. Venderbos

Printing of this thesis was supported by:
Erasmus Universiteit Rotterdam
Stichting Wetenschappelijk Onderzoek Prostaakanker (SWOP)
Contents
Chapter 1 General Introduction 11
Part I eHealth Chapter 2 eHealth and mHealth in prostate cancer detection and active
surveillance Translational Andrology and Urology, 2018
23
Chapter 3 mHealth in Urology: A Review of Experts’ Involvement in App
Development PLOS ONE, 2015
43
Chapter 4 Expert Involvement Predicts mHealth App Downloads: Multivariate
Regression Analysis of Urology Apps Journal of Medical Internet Research mHealth and uHealth, 2016
65
Chapter 5 Rotterdam Prostate Cancer Risk Calculator: Development and
Usability Testing of the Mobile Phone App Journal of Medical Internet Research Cancer, 2017
83
Part II Prediction Models Chapter 6 Performance of the DRE-based RPCRC in a setting with low
intensity PSA-based screening International Journal of Urology, 2017
103
Chapter 7 Head-to-head comparison of prostate cancer risk calculators
predicting biopsy outcome Translational Andrology and Urology, 2018
121
Chapter 8 General Discussion 143
Part III Appendices Chapter 9 Summary 199 Hoofdstuk 9 Samenvatting 205 About the author 213 List of publications 217 Dankwoord 221 PhD Portfolio 227


Chapter 1
General Introduction
11

General Introduction
“Medicine is of all the Arts the most noble” – Hippocrates (1). It probably is the most
interdisciplinary, combining multiple areas of knowledge, linking scattered sources of data into
a structured clinical evaluation, before making choices with a purpose: to improve health. The
World Health Organization (WHO) defines health as “a state of complete physical, mental and
social well-being and not merely the absence of disease or infirmity” (2). This generic definition
should be tailored to individual patients, and what is meaningful to that particular person, in
concordance with the principle of high quality of the Institute of Medicine: patient-centred care
(3). Moreover, one of the cores of the WHO’s Constitution is that “Informed opinion and active
co-operation on the part of the public are of the utmost importance in the improvement of the
health of the people” (2). The themes of interdisciplinary cooperation and informed shared
decision making are rooted in this thesis.
Prostate cancer is the most common noncutaneous cancer diagnosed in men, with
more than one million new diagnoses in 2012, accounting for 15% of the cancers diagnosed
in men, 70% of which occurred in developed regions (4). In Europe, prostate cancer is the
most frequent cancer in men, affecting over 1.4 million citizens, and it was responsible for 10%
of all cancer-related deaths in 2012 (5, 6). The American Cancer Society (ACS) estimates that
in 2018 in the United States 164,690 men will be diagnosed with prostate cancer, representing
19% of all new cancers, and 29,430 will die from the illness, representing 9% of all cancer
deaths in men (7).
The epidemiology of prostate cancer motivated the initiation of several studies
exploring different ways to tackle this public health concern, including secondary prevention
(i.e., screening). Screening aims to detect and treat a disease before the patient is clinically
aware of it. For the majority of cancer patients, a diagnosis is only made after symptoms
become clinically apparent. However, in the case of prostate cancer, there is a window of
opportunity for screening, because there is a long interval between the detectable phase of
the disease and its symptomatic phase (which may never occur in low risk disease). The
largest study investigating the effect of repeated screening on mortality was the European
Randomized study of Screening for Prostate Cancer (ERSPC), which randomized almost
200,000 men (with ages between 50 and 74 years-old), in eight European countries (Belgium,
Finland, France, Italy, the Netherlands, Spain, Sweden and Switzerland), into a screening or
a control arm (8). Men in the screening arm underwent prostate specific antigen (PSA) testing
every two to four years, and those with elevated PSA (i.e., PSA >3.0 ng/mL) underwent a
systematic prostate biopsy (8).
13

Recently, the ERSPC results were updated after 13 years of follow-up, showing that
systematic screening, as compared to no or limited screening, reduces prostate cancer
mortality by 21% (8). Moreover, with increased follow-up there was a further reduction in the
numbers needed to screen (i.e., from 1,410 at nine years follow-up to 781 at 13 years follow-
up), and to treat (i.e., from 48 at nine years follow-up to 27 at 13 years follow-up), to avoid one
prostate cancer death. These numbers are now in the range of those in breast cancer trials
(9, 10). For a man fully compliant with the ERSPC protocol, screening can achieve a 50%
reduction in disease specific mortality, in comparison to no screening at all (11).
However, screening for prostate cancer is controversial, mainly because of the risk of
overdiagnosis and overtreatment (12). Overdiagnosis is the detection of prostate cancers that
would have never been diagnosed had it not been for screening (i.e., patients with cancer that
would have remained asymptomatic) (13). It is estimated that screening might overdiagnose
up to 50% of all prostate cancers (14). If these men undergo treatment, it is considered
overtreatment (13). Therefore, the joint guidelines on prostate cancer of the European
Association of Urology (EAU), European Society for Radiotherapy & Oncology (ESTRO),
European Society of Urogenital Radiology (ESUR), and International Society of Geriatric
Oncology (SIOG) recommend an individualised risk-adapted strategy for early detection to a
well-informed man with a good performance status and a life-expectancy of at least ten years
(12, 15). Moreover, if that well-informed man with a good performance status and a life-
expectancy of at least ten years chooses to undergo screening, the same guidelines
recommend that his risk should be stratified using, in addition to PSA, a multivariable
approach, often presented as a risk calculator, such as the ERSPC Rotterdam Prostate
Cancer Risk Calculator (RPCRC), which can be used as a smartphone application for Android
and iOS devices, or accessed for free online (http://www.prostatecancer-riskcalculator.com)
(12).
Self-management of health issues by citizens is contingent on public awareness, as
well as on the information made available to lay people. In the particular case of prostate
cancer, in addition to a constantly increasing incidence, its public awareness has surged,
which thrives patients requests for PSA testing (12). However, patients may lack knowledge
about prostate cancer risk, its signs and symptoms, as well as available screening and
treatment options, which precludes a true shared decision with their healthcare professional.
By definition, in shared decision making, “clinicians and patients share the best available
evidence when faced with the task of making decisions, and patients are supported to consider
options, to achieve informed preferences” (16). It has been shown that patients who take a
more active part in their healthcare decisions have better health outcomes and healthcare
experiences (17).
Engaging patients is ethically important, and is promoted by health policies and
endorsed by scientific guidelines, even though the implementation of shared decision making
is infrequent in clinical care (18). Common obstacles to the implementation of shared decision
making by the physician include time constraints and insufficient training (19), whereas
patients mention anxiety, unwillingness or inability to participate (20). Moreover, many of these
decisions are “preference sensitive” because they do not have a single “one size fits all”
correct answer, either because there is insufficient evidence about outcomes, or a trade-off
between benefits and harms (17).
In a recent review on the effects of shared decision making on cancer screening in
general, 18 out of the 23 included trials assessed prostate cancer screening (in particular,
whether or not to undergo prostate cancer screening with PSA) (21). The authors found a
moderate strength of evidence that shared decision making increased patient knowledge, but
low evidence that these interventions reduce decisional conflict or improve decision
satisfaction (21).
Decision aids, which the International Patient Decision Aids Standards Collaboration
defines as “evidence-based tools designed to help patients make specific and deliberate
choices among healthcare options” (22), can facilitate shared decision making by explicitly
stating the decision that needs to be taken, providing the patient with a detailed, specific and
personalized focus on available options and subsequent outcomes (23). A 2017 Cochrane
review found that patients facing screening decisions who used decision aids had improved
knowledge of their options, had more accurate expectations of benefits and harms, and were
more likely to talk about the decision with their clinician when using the decision aid (23).
In the European Commission eHealth 2020 Action Plan, eHealth, “the use of
information and communication technologies for health”, is fostered with great potential, as “it
can benefit citizens, patients, health and care professionals, as well as health organizations
and public authorities” (24). The same expectation is true for mobile health (mHealth), “the
delivery of healthcare services via mobile communication devices”, particularly in the domain
of self-management and shared decision making (25).
Becoming knowledgeable will empower patients, allowing them to decide according to
their personal preferences, and, in addition, could protect them from superfluous tests, harmful
interventions or unnecessary stress (26). It has been extensively shown that self-management
promotes shared decision making with healthcare professionals (23). eHealth and mHealth
can be used to achieve that goal: they democratize healthcare delivery, allowing ubiquitous
access while surpassing cultural and geographical barriers.
14

Recently, the ERSPC results were updated after 13 years of follow-up, showing that
systematic screening, as compared to no or limited screening, reduces prostate cancer
mortality by 21% (8). Moreover, with increased follow-up there was a further reduction in the
numbers needed to screen (i.e., from 1,410 at nine years follow-up to 781 at 13 years follow-
up), and to treat (i.e., from 48 at nine years follow-up to 27 at 13 years follow-up), to avoid one
prostate cancer death. These numbers are now in the range of those in breast cancer trials
(9, 10). For a man fully compliant with the ERSPC protocol, screening can achieve a 50%
reduction in disease specific mortality, in comparison to no screening at all (11).
However, screening for prostate cancer is controversial, mainly because of the risk of
overdiagnosis and overtreatment (12). Overdiagnosis is the detection of prostate cancers that
would have never been diagnosed had it not been for screening (i.e., patients with cancer that
would have remained asymptomatic) (13). It is estimated that screening might overdiagnose
up to 50% of all prostate cancers (14). If these men undergo treatment, it is considered
overtreatment (13). Therefore, the joint guidelines on prostate cancer of the European
Association of Urology (EAU), European Society for Radiotherapy & Oncology (ESTRO),
European Society of Urogenital Radiology (ESUR), and International Society of Geriatric
Oncology (SIOG) recommend an individualised risk-adapted strategy for early detection to a
well-informed man with a good performance status and a life-expectancy of at least ten years
(12, 15). Moreover, if that well-informed man with a good performance status and a life-
expectancy of at least ten years chooses to undergo screening, the same guidelines
recommend that his risk should be stratified using, in addition to PSA, a multivariable
approach, often presented as a risk calculator, such as the ERSPC Rotterdam Prostate
Cancer Risk Calculator (RPCRC), which can be used as a smartphone application for Android
and iOS devices, or accessed for free online (http://www.prostatecancer-riskcalculator.com)
(12).
Self-management of health issues by citizens is contingent on public awareness, as
well as on the information made available to lay people. In the particular case of prostate
cancer, in addition to a constantly increasing incidence, its public awareness has surged,
which thrives patients requests for PSA testing (12). However, patients may lack knowledge
about prostate cancer risk, its signs and symptoms, as well as available screening and
treatment options, which precludes a true shared decision with their healthcare professional.
By definition, in shared decision making, “clinicians and patients share the best available
evidence when faced with the task of making decisions, and patients are supported to consider
options, to achieve informed preferences” (16). It has been shown that patients who take a
more active part in their healthcare decisions have better health outcomes and healthcare
experiences (17).
Engaging patients is ethically important, and is promoted by health policies and
endorsed by scientific guidelines, even though the implementation of shared decision making
is infrequent in clinical care (18). Common obstacles to the implementation of shared decision
making by the physician include time constraints and insufficient training (19), whereas
patients mention anxiety, unwillingness or inability to participate (20). Moreover, many of these
decisions are “preference sensitive” because they do not have a single “one size fits all”
correct answer, either because there is insufficient evidence about outcomes, or a trade-off
between benefits and harms (17).
In a recent review on the effects of shared decision making on cancer screening in
general, 18 out of the 23 included trials assessed prostate cancer screening (in particular,
whether or not to undergo prostate cancer screening with PSA) (21). The authors found a
moderate strength of evidence that shared decision making increased patient knowledge, but
low evidence that these interventions reduce decisional conflict or improve decision
satisfaction (21).
Decision aids, which the International Patient Decision Aids Standards Collaboration
defines as “evidence-based tools designed to help patients make specific and deliberate
choices among healthcare options” (22), can facilitate shared decision making by explicitly
stating the decision that needs to be taken, providing the patient with a detailed, specific and
personalized focus on available options and subsequent outcomes (23). A 2017 Cochrane
review found that patients facing screening decisions who used decision aids had improved
knowledge of their options, had more accurate expectations of benefits and harms, and were
more likely to talk about the decision with their clinician when using the decision aid (23).
In the European Commission eHealth 2020 Action Plan, eHealth, “the use of
information and communication technologies for health”, is fostered with great potential, as “it
can benefit citizens, patients, health and care professionals, as well as health organizations
and public authorities” (24). The same expectation is true for mobile health (mHealth), “the
delivery of healthcare services via mobile communication devices”, particularly in the domain
of self-management and shared decision making (25).
Becoming knowledgeable will empower patients, allowing them to decide according to
their personal preferences, and, in addition, could protect them from superfluous tests, harmful
interventions or unnecessary stress (26). It has been extensively shown that self-management
promotes shared decision making with healthcare professionals (23). eHealth and mHealth
can be used to achieve that goal: they democratize healthcare delivery, allowing ubiquitous
access while surpassing cultural and geographical barriers.
15

Objectives of this thesis
This thesis has two main purposes. The first objective is to map e/mHealth Urology
applications in general, and in particular applications in the field of prostate cancer screening.
The second objective is to evaluate and compare the performance of several freely available
prostate cancer risk prediction models.
17

Outline of research questions addressed in this thesis
The first part of the thesis relates to e/mHealth in Urology and is divided into four
chapters. These four chapters address the following research questions:
• What is the status-quo of eHealth and mHealth in Urology? o Chapter 2: eHealth and mHealth in prostate cancer detection and active
surveillance
o Chapter 3: mHealth in Urology: A Review of Experts’ Involvement in App
Development
• Does expert involvement in mHealth app development influence downloads? o Chapter 4: Expert Involvement Predicts mHealth App Downloads:
Multivariate Regression Analysis of Urology Apps
• How to design and develop a smartphone app for prostate cancer early detection, and assess its usability?
o Chapter 5: Rotterdam Prostate Cancer Risk Calculator: Development and
Usability Testing of the Mobile Phone App
The second part of the thesis will focus on the use of risk prediction models in prostate
cancer early detection, and will address external validation and performance comparison. The
following research questions will be addressed:
• What is the effect on performance with the inclusion of a subjective test in a risk prediction model?
o Chapter 6: Performance of the DRE-based RPCRC in a setting with low
intensity PSA-based screening
• Are there differences in performance, namely discrimination, calibration, and clinical impact, in a head-to-head comparison between the most well-known risk calculators developed to predict prostate biopsy outcome?
o Chapter 7: Head-to-head comparison of prostate cancer risk calculators
predicting biopsy outcome
19

References
1. Hippocrates. The oath and law of Hippocrates. Vol. XXXVIII, Part 1. The Harvard Classics. New York: P.F. Collier & Son, 1909–14
2. World Health Organization. Constitution of the World Health Organization: Principles. Accessed through: http://www.who.int/about/mission/en on January 1, 2018.
3. Institute of Medicine. Crossing the Quality Chasm: A new health system for the 21st century. Washington. DC: The National Academies Press. 2001 Accessed through: https://doi.org/10.17226/10027 on January 1, 2018.
4. Globocan 2012. Prostate Cancer. Estimated Cancer Incidence, Mortality and Prevalence in 2012. Accessed through: http://globocan.iarc.fr/old/FactSheets/cancers/prostate-new.asp on January 1, 2018.
5. Bray F, Ren JS, Masuyer E, Ferlay J. Global estimates of cancer prevalence for 27 sites in the adult population in 2008. Int J Cancer. 2013;132(5):1133-45.
6. Globocan 2012. Estimated cancer incidence, mortality and prevalence worldwide in 2012. Accessed through: http://globocan.iarc.fr on January 1, 2018.
7. Siegel RL, Miller KD, Jemal A. Cancer statistics, 2018. CA Cancer J Clin. 2018;68(1):7-30. 8. Schröder FH, Hugosson J, Roobol MJ, Tammela TL, Zappa M, Nelen V, et al. Screening and prostate
cancer mortality: results of the European Randomised Study of Screening for Prostate Cancer (ERSPC) at 13 years of follow-up. Lancet. 2014;384(9959):2027-35.
9. Alberts AR, Schoots IG, Bokhorst LP, van Leenders GJ, Bangma CH, Roobol MJ. Risk-based patient selection for magnetic resonance imaging-targeted prostate biopsy after negative transrectal ultrasound-guided random biopsy avoids unnecessary magnetic resonance imaging scans. Eur Urol. 2016;69(6):1129-34.
10. Roobol MJ, Steyerberg EW, Kranse R, Wolters T, van den Bergh RC, Bangma CH, et al. A risk-based strategy improves prostate-specific antigen-driven detection of prostate cancer. Eur Urol. 2010;57(1):79-85.
11. Bokhorst LP, Bangma CH, van Leenders GJ, Lous JJ, Moss SM, Schröder FH, et al. PSA-based prostate cancer screening: reduction of prostate cancer mortality after correction for nonattendance and contamination in the Rotterdam section of the ERSPC. Eur Urol. 2014;65(2):329-36.
12. Mottet N, van den Bergh RCN, Briers E, Bourke L, Cornford P, De Santis M, et al. EAU-ESUR-ESTRO-SIOG Guidelines on Prostate Cancer – 2018 Update. European Association of Urology.
13. Draisma G, Boer R, Otto SJ, van der Cruijsen IW, Damhuis RA, Schröder FH, et al. Lead times and overdetection due to prostate-specific antigen screening: estimates from the European Randomized study of Screening for Prostate Cancer. J Natl Cancer Inst. 2003;95(12):868-78.
14. Draisma G, Etzioni R, Tsodikov A, Mariotto A, Wever E, Gulati R, et al. Lead time and overdiagnosis in prostate-specific antigen screening: importance of methods and context. J Natl Cancer Inst. 2009;101(6):374-83.
15. Loeb S. Guideline of guidelines: prostate cancer screening. BJU Int. 2014;114(3):323-5. 16. Elwyn G, Coulter A, Laitner S, Walker E, Watson P, Thomson R. Implementing shared decision
making in the NHS. BMJ. 2010;341:c5146. 17. Hibbard JH, Greene J. What the evidence shows about patient activation: better health outcomes
and care experiences; fewer data on costs. Health Aff. 2013;32(2):207-14. 18. Stiggelbout AM, Van der Weijden T, De Wit MP, Frosch D, Légaré F, Montori VM, et al. Shared
decision making: really putting patients at the centre of healthcare. BMJ. 2012;344:e256.
19. Légaré F, Ratté S, Gravel K, Graham ID. Barriers and facilitators to implementing shared decision-making in clinical practice: update of a systematic review of health professionals' perceptions. Patient Educ Couns. 2008;73(3):526-35.
20. Pieterse AH, Baas-Thijssen MCM, Marijnen CAM, Stiggelbout AM. Clinician and cancer patient views on patient participation in treatment decision-making: a quantitative and qualitative exploration. Br J Cancer. 2008;99(6): 875-82.
21. Lillie SE, Partin MR, Rice K, Fabbrini AE, Greer NL, Patel SS, et al. The effects of shared decision making on cancer screening – a systematic review. Washington (DC): Department of Veterans Affairs (US). 2014. Accessed through: https://www.ncbi.nlm.nih.gov/pubmedhealth/PMH0078885/ on August 27, 2018.
22. Elwyn G, O'Connor A, Stacey D, Volk R, Edwards A, Coulter A, et al. Developing a quality criteria framework for patient decision aids: online international Delphi consensus process. BMJ. 2006;333(7565):417.
23. Stacey D, Légaré F, Col NF, Bennett CL, Barry MJ, Eden KB, et al. Decision aids for people facing health treatment or screening decisions. Cochrane Database Syst Rev. 2017;(1):CD001431.
24. European Commission. eHealth action plan 2012-2020: Innovative healthcare for the 21st century. Accessed through: https://ec.europa.eu/digital-single-market/en/news/ehealth-action-plan-2012-2020-innovative-healthcare-21st-century on January 1, 2018.
25. Torgan C. The mHealth summit: local & global converge. Kinetics; 2009 Accessed through: http://www.webcitation.org/6frcGVx3F on April 8, 2018.
26. Coulter A, Jenkinson C. European patients' views on the responsiveness of health systems and healthcare providers. Eur J Public Health. 2005;15(4):355-60.
20

References
1. Hippocrates. The oath and law of Hippocrates. Vol. XXXVIII, Part 1. The Harvard Classics. New York: P.F. Collier & Son, 1909–14
2. World Health Organization. Constitution of the World Health Organization: Principles. Accessed through: http://www.who.int/about/mission/en on January 1, 2018.
3. Institute of Medicine. Crossing the Quality Chasm: A new health system for the 21st century. Washington. DC: The National Academies Press. 2001 Accessed through: https://doi.org/10.17226/10027 on January 1, 2018.
4. Globocan 2012. Prostate Cancer. Estimated Cancer Incidence, Mortality and Prevalence in 2012. Accessed through: http://globocan.iarc.fr/old/FactSheets/cancers/prostate-new.asp on January 1, 2018.
5. Bray F, Ren JS, Masuyer E, Ferlay J. Global estimates of cancer prevalence for 27 sites in the adult population in 2008. Int J Cancer. 2013;132(5):1133-45.
6. Globocan 2012. Estimated cancer incidence, mortality and prevalence worldwide in 2012. Accessed through: http://globocan.iarc.fr on January 1, 2018.
7. Siegel RL, Miller KD, Jemal A. Cancer statistics, 2018. CA Cancer J Clin. 2018;68(1):7-30. 8. Schröder FH, Hugosson J, Roobol MJ, Tammela TL, Zappa M, Nelen V, et al. Screening and prostate
cancer mortality: results of the European Randomised Study of Screening for Prostate Cancer (ERSPC) at 13 years of follow-up. Lancet. 2014;384(9959):2027-35.
9. Alberts AR, Schoots IG, Bokhorst LP, van Leenders GJ, Bangma CH, Roobol MJ. Risk-based patient selection for magnetic resonance imaging-targeted prostate biopsy after negative transrectal ultrasound-guided random biopsy avoids unnecessary magnetic resonance imaging scans. Eur Urol. 2016;69(6):1129-34.
10. Roobol MJ, Steyerberg EW, Kranse R, Wolters T, van den Bergh RC, Bangma CH, et al. A risk-based strategy improves prostate-specific antigen-driven detection of prostate cancer. Eur Urol. 2010;57(1):79-85.
11. Bokhorst LP, Bangma CH, van Leenders GJ, Lous JJ, Moss SM, Schröder FH, et al. PSA-based prostate cancer screening: reduction of prostate cancer mortality after correction for nonattendance and contamination in the Rotterdam section of the ERSPC. Eur Urol. 2014;65(2):329-36.
12. Mottet N, van den Bergh RCN, Briers E, Bourke L, Cornford P, De Santis M, et al. EAU-ESUR-ESTRO-SIOG Guidelines on Prostate Cancer – 2018 Update. European Association of Urology.
13. Draisma G, Boer R, Otto SJ, van der Cruijsen IW, Damhuis RA, Schröder FH, et al. Lead times and overdetection due to prostate-specific antigen screening: estimates from the European Randomized study of Screening for Prostate Cancer. J Natl Cancer Inst. 2003;95(12):868-78.
14. Draisma G, Etzioni R, Tsodikov A, Mariotto A, Wever E, Gulati R, et al. Lead time and overdiagnosis in prostate-specific antigen screening: importance of methods and context. J Natl Cancer Inst. 2009;101(6):374-83.
15. Loeb S. Guideline of guidelines: prostate cancer screening. BJU Int. 2014;114(3):323-5. 16. Elwyn G, Coulter A, Laitner S, Walker E, Watson P, Thomson R. Implementing shared decision
making in the NHS. BMJ. 2010;341:c5146. 17. Hibbard JH, Greene J. What the evidence shows about patient activation: better health outcomes
and care experiences; fewer data on costs. Health Aff. 2013;32(2):207-14. 18. Stiggelbout AM, Van der Weijden T, De Wit MP, Frosch D, Légaré F, Montori VM, et al. Shared
decision making: really putting patients at the centre of healthcare. BMJ. 2012;344:e256.
19. Légaré F, Ratté S, Gravel K, Graham ID. Barriers and facilitators to implementing shared decision-making in clinical practice: update of a systematic review of health professionals' perceptions. Patient Educ Couns. 2008;73(3):526-35.
20. Pieterse AH, Baas-Thijssen MCM, Marijnen CAM, Stiggelbout AM. Clinician and cancer patient views on patient participation in treatment decision-making: a quantitative and qualitative exploration. Br J Cancer. 2008;99(6): 875-82.
21. Lillie SE, Partin MR, Rice K, Fabbrini AE, Greer NL, Patel SS, et al. The effects of shared decision making on cancer screening – a systematic review. Washington (DC): Department of Veterans Affairs (US). 2014. Accessed through: https://www.ncbi.nlm.nih.gov/pubmedhealth/PMH0078885/ on August 27, 2018.
22. Elwyn G, O'Connor A, Stacey D, Volk R, Edwards A, Coulter A, et al. Developing a quality criteria framework for patient decision aids: online international Delphi consensus process. BMJ. 2006;333(7565):417.
23. Stacey D, Légaré F, Col NF, Bennett CL, Barry MJ, Eden KB, et al. Decision aids for people facing health treatment or screening decisions. Cochrane Database Syst Rev. 2017;(1):CD001431.
24. European Commission. eHealth action plan 2012-2020: Innovative healthcare for the 21st century. Accessed through: https://ec.europa.eu/digital-single-market/en/news/ehealth-action-plan-2012-2020-innovative-healthcare-21st-century on January 1, 2018.
25. Torgan C. The mHealth summit: local & global converge. Kinetics; 2009 Accessed through: http://www.webcitation.org/6frcGVx3F on April 8, 2018.
26. Coulter A, Jenkinson C. European patients' views on the responsiveness of health systems and healthcare providers. Eur J Public Health. 2005;15(4):355-60.
21


Chapter 2
eHealth and mHealth in prostate cancer detection and active surveillance
Nuno M. Pereira-Azevedo and Lionne D. F. Venderbos
Translational Andrology and Urology (2018) 7(1):170-181
23

Transl Androl Urol 2018;7(1):170-181tau.amegroups.com© Translational Andrology and Urology. All rights reserved.
eHealth and mobile health (mHealth)
Information and communication technologies (ICT) offer patients and healthcare providers new ways to improve wellness, practice prevention and reduce suffering from diseases. eHealth is defined by the World Health Organization as “the use of ICT for health” (1). ICT represents
a new opportunity to enhance care, which is also true for the field of Urology. The term eHealth was first used in 1999 and has become a neologism, i.e., an umbrella term
that includes many items ranging from the infrastructure to access the images from a computer tomography scan via the picture archiving and communication system (PACS),
to the implementation of telemedicine, and even the use of augmented reality or machine learning algorithms (2).
In 2012 the European Commission published an eHealth
Action Plan 2012–2020 as a roadmap to empower patients and healthcare workers, to link up devices and technologies,
and to invest in research towards the personalized medicine
of the future (3). The European Commission feels eHealth holds great potential as “it can benefit citizens, patients, health and care professionals, as well as health organizations and public authorities”. When eHealth is applied effectively, it is thought to deliver more personalized ‘citizen-centric’ healthcare, i.e., healthcare that is more targeted, effective and efficient and helps reduce errors, as well as the
Review Article
eHealth and mHealth in prostate cancer detection and active surveillance
Nuno M. Pereira-Azevedo1,2, Lionne D. F. Venderbos¹
1Department of Urology, Erasmus University Medical Center, Rotterdam, The Netherlands; 2Department of Urology, Centro Hospitalar do Porto,
Porto, Portugal
Contributions: (I) Conception and design: All authors; (II) Administrative support: None; (III) Provision of study material or patients: None; (IV)
Collection and assembly of data: None; (V) Data analysis and interpretation: None; (VI) Manuscript writing: All authors; (VII) Final approval of
manuscript: All authors.
Correspondence to: Dr. Nuno M. Pereira-Azevedo, MD. Department of Urology, Erasmus University Medical Center, Department of Urology,
Room NA-1706, P.O. Box 2040, Erasmus MC, University Medical Center Rotterdam, Rotterdam, 3000 CA Rotterdam, The Netherlands.
Email: [email protected].
Abstract: eHealth and mobile health (mHealth) offer patients, healthcare providers, researchers, and policy makers new potential to improve wellness, practice prevention and reduce suffering from diseases. While the eHealth market is growing to an expected US $26 billion, its potential in the field of Urology is still underused. Research has shown that currently only 176 apps (of the 300,000 medical apps available) were found in the Apple App Store and Google Play Store, of which 20 were prostate cancer related. Three good examples of eHealth/mHealth applications are the Rotterdam Prostate Cancer Risk Calculator (RPCRC) website and app, the Prostate cancer Research International Active Surveillance (PRIAS) website and the
Follow MyPSA app for men on active surveillance for prostate cancer: they are tools with a clear vision that offer true added value in daily clinical practice and which positively influence healthcare beyond borders. To increase the uptake of eHealth applications in the coming years, it is important to involve professionals in their design and development, and to guarantee the safety and privacy of its users and their data.
Keywords: Active surveillance; e-Health; information and communication technologies (ICT); m-Health; prostate
cancer
Submitted Dec 13, 2017. Accepted for publication Dec 18, 2017.
doi: 10.21037/tau.2017.12.22
View this article at: http://dx.doi.org/10.21037/tau.2017.12.22
Abstract
eHealth and mobile health (mHealth) offer patients, healthcare providers, researchers,
and policy makers new potential to improve wellness, practice prevention and reduce suffering
from diseases. While the eHealth market is growing to an expected US $26 billion, its potential
in the field of Urology is still underused. Research has shown that currently only 176 apps (of
the 300,000 medical apps available) were found in the Apple App Store and Google Play
Store, of which 20 were prostate cancer related.
Three good examples of eHealth/mHealth applications are the Rotterdam Prostate
Cancer Risk Calculator (RPCRC) website and app, the Prostate cancer Research
International Active Surveillance (PRIAS) website and the Follow MyPSA app for men on
active surveillance for prostate cancer: they are tools with a clear vision that offer true added
value in daily clinical practice and which positively influence healthcare beyond borders. To
increase the uptake of eHealth applications in the coming years, it is important to involve
professionals in their design and development, and to guarantee the safety and privacy of its
users and their data.
24

Transl Androl Urol 2018;7(1):170-181tau.amegroups.com© Translational Andrology and Urology. All rights reserved.
eHealth and mobile health (mHealth)
Information and communication technologies (ICT) offer patients and healthcare providers new ways to improve wellness, practice prevention and reduce suffering from diseases. eHealth is defined by the World Health Organization as “the use of ICT for health” (1). ICT represents
a new opportunity to enhance care, which is also true for the field of Urology. The term eHealth was first used in 1999 and has become a neologism, i.e., an umbrella term
that includes many items ranging from the infrastructure to access the images from a computer tomography scan via the picture archiving and communication system (PACS),
to the implementation of telemedicine, and even the use of augmented reality or machine learning algorithms (2).
In 2012 the European Commission published an eHealth
Action Plan 2012–2020 as a roadmap to empower patients and healthcare workers, to link up devices and technologies,
and to invest in research towards the personalized medicine
of the future (3). The European Commission feels eHealth holds great potential as “it can benefit citizens, patients, health and care professionals, as well as health organizations and public authorities”. When eHealth is applied effectively, it is thought to deliver more personalized ‘citizen-centric’ healthcare, i.e., healthcare that is more targeted, effective and efficient and helps reduce errors, as well as the
Review Article
eHealth and mHealth in prostate cancer detection and active surveillance
Nuno M. Pereira-Azevedo1,2, Lionne D. F. Venderbos¹
1Department of Urology, Erasmus University Medical Center, Rotterdam, The Netherlands; 2Department of Urology, Centro Hospitalar do Porto,
Porto, Portugal
Contributions: (I) Conception and design: All authors; (II) Administrative support: None; (III) Provision of study material or patients: None; (IV)
Collection and assembly of data: None; (V) Data analysis and interpretation: None; (VI) Manuscript writing: All authors; (VII) Final approval of
manuscript: All authors.
Correspondence to: Dr. Nuno M. Pereira-Azevedo, MD. Department of Urology, Erasmus University Medical Center, Department of Urology,
Room NA-1706, P.O. Box 2040, Erasmus MC, University Medical Center Rotterdam, Rotterdam, 3000 CA Rotterdam, The Netherlands.
Email: [email protected].
Abstract: eHealth and mobile health (mHealth) offer patients, healthcare providers, researchers, and policy makers new potential to improve wellness, practice prevention and reduce suffering from diseases. While the eHealth market is growing to an expected US $26 billion, its potential in the field of Urology is still underused. Research has shown that currently only 176 apps (of the 300,000 medical apps available) were found in the Apple App Store and Google Play Store, of which 20 were prostate cancer related. Three good examples of eHealth/mHealth applications are the Rotterdam Prostate Cancer Risk Calculator (RPCRC) website and app, the Prostate cancer Research International Active Surveillance (PRIAS) website and the
Follow MyPSA app for men on active surveillance for prostate cancer: they are tools with a clear vision that offer true added value in daily clinical practice and which positively influence healthcare beyond borders. To increase the uptake of eHealth applications in the coming years, it is important to involve professionals in their design and development, and to guarantee the safety and privacy of its users and their data.
Keywords: Active surveillance; e-Health; information and communication technologies (ICT); m-Health; prostate
cancer
Submitted Dec 13, 2017. Accepted for publication Dec 18, 2017.
doi: 10.21037/tau.2017.12.22
View this article at: http://dx.doi.org/10.21037/tau.2017.12.22
Abstract
eHealth and mobile health (mHealth) offer patients, healthcare providers, researchers,
and policy makers new potential to improve wellness, practice prevention and reduce suffering
from diseases. While the eHealth market is growing to an expected US $26 billion, its potential
in the field of Urology is still underused. Research has shown that currently only 176 apps (of
the 300,000 medical apps available) were found in the Apple App Store and Google Play
Store, of which 20 were prostate cancer related.
Three good examples of eHealth/mHealth applications are the Rotterdam Prostate
Cancer Risk Calculator (RPCRC) website and app, the Prostate cancer Research
International Active Surveillance (PRIAS) website and the Follow MyPSA app for men on
active surveillance for prostate cancer: they are tools with a clear vision that offer true added
value in daily clinical practice and which positively influence healthcare beyond borders. To
increase the uptake of eHealth applications in the coming years, it is important to involve
professionals in their design and development, and to guarantee the safety and privacy of its
users and their data.
25

eHealth and mHealth
Information and communication technologies (ICT) offer patients and healthcare
providers new ways to improve wellness, practice prevention and reduce suffering from
diseases. eHealth is defined by the World Health Organization as “the use of ICT for health”
(1). ICT represents a new opportunity to enhance care, which is also true for the field of
Urology. The term eHealth was first used in 1999 and has become a neologism, i.e., an
umbrella term that includes many items ranging from the infrastructure to access the images
from a computer tomography scan via the picture archiving and communication system
(PACS), to the implementation of telemedicine, and even the use of augmented reality or
machine learning algorithms (2).
In 2012 the European Commission published an eHealth Action Plan 2012-2020 as a
roadmap to empower patients and healthcare workers, to link up devices and technologies,
and to invest in research towards the personalized medicine of the future (3). The European
Commission feels eHealth holds great potential as “it can benefit citizens, patients, health and
care professionals, as well as health organizations and public authorities”. When eHealth is
applied effectively, it is thought to deliver more personalized ‘citizen-centric’ healthcare, i.e.,
healthcare that is more targeted, effective and efficient and helps reduce errors, as well as the
length of hospitalization. Furthermore, it facilitates socio-economic inclusion and equality,
quality of life and patient empowerment through greater transparency, access to services and
information, and the use of social media for health (3).
Mobile Health (mHealth) is a subset of eHealth which can be characterized as “mobile
wireless technologies for public health” (1). Because of its ease of use and broad acceptance,
mHealth is considered a valuable tool in the implementation of patient-centred care (patient-
reported preferences, experiences and outcomes), which has become a goal of contemporary
healthcare systems and international standards (4). There is evidence of successful
implementations of mHealth in different contexts, ranging from mobile phone-based clinical
guidance for rural health providers in India, to apps that help pregnant women with gestational
diabetes in Oxford (5, 6). Moreover, its demographic reach transcends generations with
various successful examples, including the promotion of physical activity and its acceptance
by both young and older adults (7, 8).
One of the most popular aspects of mHealth are smartphone applications (“apps”).
Currently, there are almost 300,000 mHealth apps available in the Apple App Store and
Google Play Store (9). These two virtual stores cover more than 90% of the smartphone
ecosystem (9).
mHealth interventions can furthermore be implemented using basic phones (e.g.,
sending health advice via SMS), tablets (e.g., replacing bedside paper-based medical charts)
and wearables (e.g., fitness monitoring with an Apple Watch). The total mHealth market
revenue alone is expected to reach US$26 billion at the end of 2017 (9).
Advantages and concerns related to the use of eHealth and mHealth
eHealth and mHealth can be useful for treating patients, but also for conducting
research, educating professionals, monitoring public health, and tracking chronic diseases.
They are thought to be cost-effective alternatives to more traditional face-to-face ways of
providing medical care and therefore hold a great potential in the ever growing world of
healthcare expenditure. mHealth has the ability to provide access to healthcare as well as
timely sharing of data.
Real-time monitoring devices can gather live data from sensors and send inputs into a
mobile medical app on a smartphone, a server or network to support clinical decision making.
It does so regardless of geographical barriers, environmental circumstances and traditional
infrastructures; currently there are places where people are more likely to have access to a
mobile phone than to clean water or electricity (10). However, to avoid harm, it is critical that,
among other concerns, scientific accuracy, patient privacy and user safety of mHealth
applications are assured.
Literature has shown a lack of involvement of healthcare professionals in app
development in all medical specialties, including Urology. This is concerning as it has also
been proven that their participation and contribution in the elaboration of apps increases
content accuracy, app downloads and buy-in (11, 12, 13). Because most mHealth apps are
not considered medical devices by their developers, they bypass strict regulation such as the
European Union MEDDEV 2.1/6 (July 2016) “Guidelines on the qualification and classification
of standalone software used in healthcare within the regulatory framework of medical devices”,
which states: "it is necessary to clarify that software in its own right, when specifically intended
by the manufacturer to be used for one or more of the medical purposes set out in the definition
of a medical device, is a medical device".
Few mHealth apps have been scientifically reviewed and/or approved by the European
Medicines Agency or the USA Food and Drug Administration (14). This can have serious
clinical consequences. As an example, in Dermatology, where smartphones are commonly
used as clinical diagnostic tools – and therefore would be a medical device according to
MEDDEV for which certification is necessary – an app that claimed to quantify skin cancer risk
mislabelled 80% of textbook melanomas (15, 16).
26

eHealth and mHealth
Information and communication technologies (ICT) offer patients and healthcare
providers new ways to improve wellness, practice prevention and reduce suffering from
diseases. eHealth is defined by the World Health Organization as “the use of ICT for health”
(1). ICT represents a new opportunity to enhance care, which is also true for the field of
Urology. The term eHealth was first used in 1999 and has become a neologism, i.e., an
umbrella term that includes many items ranging from the infrastructure to access the images
from a computer tomography scan via the picture archiving and communication system
(PACS), to the implementation of telemedicine, and even the use of augmented reality or
machine learning algorithms (2).
In 2012 the European Commission published an eHealth Action Plan 2012-2020 as a
roadmap to empower patients and healthcare workers, to link up devices and technologies,
and to invest in research towards the personalized medicine of the future (3). The European
Commission feels eHealth holds great potential as “it can benefit citizens, patients, health and
care professionals, as well as health organizations and public authorities”. When eHealth is
applied effectively, it is thought to deliver more personalized ‘citizen-centric’ healthcare, i.e.,
healthcare that is more targeted, effective and efficient and helps reduce errors, as well as the
length of hospitalization. Furthermore, it facilitates socio-economic inclusion and equality,
quality of life and patient empowerment through greater transparency, access to services and
information, and the use of social media for health (3).
Mobile Health (mHealth) is a subset of eHealth which can be characterized as “mobile
wireless technologies for public health” (1). Because of its ease of use and broad acceptance,
mHealth is considered a valuable tool in the implementation of patient-centred care (patient-
reported preferences, experiences and outcomes), which has become a goal of contemporary
healthcare systems and international standards (4). There is evidence of successful
implementations of mHealth in different contexts, ranging from mobile phone-based clinical
guidance for rural health providers in India, to apps that help pregnant women with gestational
diabetes in Oxford (5, 6). Moreover, its demographic reach transcends generations with
various successful examples, including the promotion of physical activity and its acceptance
by both young and older adults (7, 8).
One of the most popular aspects of mHealth are smartphone applications (“apps”).
Currently, there are almost 300,000 mHealth apps available in the Apple App Store and
Google Play Store (9). These two virtual stores cover more than 90% of the smartphone
ecosystem (9).
mHealth interventions can furthermore be implemented using basic phones (e.g.,
sending health advice via SMS), tablets (e.g., replacing bedside paper-based medical charts)
and wearables (e.g., fitness monitoring with an Apple Watch). The total mHealth market
revenue alone is expected to reach US$26 billion at the end of 2017 (9).
Advantages and concerns related to the use of eHealth and mHealth
eHealth and mHealth can be useful for treating patients, but also for conducting
research, educating professionals, monitoring public health, and tracking chronic diseases.
They are thought to be cost-effective alternatives to more traditional face-to-face ways of
providing medical care and therefore hold a great potential in the ever growing world of
healthcare expenditure. mHealth has the ability to provide access to healthcare as well as
timely sharing of data.
Real-time monitoring devices can gather live data from sensors and send inputs into a
mobile medical app on a smartphone, a server or network to support clinical decision making.
It does so regardless of geographical barriers, environmental circumstances and traditional
infrastructures; currently there are places where people are more likely to have access to a
mobile phone than to clean water or electricity (10). However, to avoid harm, it is critical that,
among other concerns, scientific accuracy, patient privacy and user safety of mHealth
applications are assured.
Literature has shown a lack of involvement of healthcare professionals in app
development in all medical specialties, including Urology. This is concerning as it has also
been proven that their participation and contribution in the elaboration of apps increases
content accuracy, app downloads and buy-in (11, 12, 13). Because most mHealth apps are
not considered medical devices by their developers, they bypass strict regulation such as the
European Union MEDDEV 2.1/6 (July 2016) “Guidelines on the qualification and classification
of standalone software used in healthcare within the regulatory framework of medical devices”,
which states: "it is necessary to clarify that software in its own right, when specifically intended
by the manufacturer to be used for one or more of the medical purposes set out in the definition
of a medical device, is a medical device".
Few mHealth apps have been scientifically reviewed and/or approved by the European
Medicines Agency or the USA Food and Drug Administration (14). This can have serious
clinical consequences. As an example, in Dermatology, where smartphones are commonly
used as clinical diagnostic tools – and therefore would be a medical device according to
MEDDEV for which certification is necessary – an app that claimed to quantify skin cancer risk
mislabelled 80% of textbook melanomas (15, 16).
27

Because of the intrinsic nature of eHealth and, in particular mHealth, sensitive health
data can be exchanged via wireless networks, which raises new safety concerns. Cyber
security attacks are a contemporary concern: in a recent European Union Agency for Network
and Information Security (ENISA) study, two-thirds of the European Member States
considered healthcare a critical sector (17). Therefore, measures should be taken to protect
the data integrity, assure data protection and guarantee patient confidentiality. This can be
assured in various ways, depending on the specific scenario, but may include cryptography
(i.e., saving the information in a coded form), role-based access control (i.e., each user can
only read and/or edit certain data, according to his/her professional role) or watermarking (i.e.,
embedding hidden medical data in medical images).
In the European Union, the Data Protection Regulation Act (EU2016/679) reforms the
data protection rules on processing personal data of natural persons and on the free
movement of such data. Together with the MEDDEV 2.1/6 (July 2016) guideline, they form
some sort of a European Union legal framework, providing some legal clarity on the status of
health and wellbeing mobile applications. Because of the legal aspects related to patient
security and data privacy governments are, based on the European Union legal framework,
expected to introduce clear cyber security guidelines for the protection of eHealth
infrastructures and services. Therefore, eHealth providers should assure that they respect
these guidelines. Finally, the importance of cyber security training and specific
recommendations should also be promoted among healthcare organizations and users.
Implementation of eHealth and mHealth – clinicians and patients’ perspective
The integration of eHealth and mHealth into clinical practice has to be tailored to a
specific goal and try to meet the patients’ and the healthcare professionals’ expectations.
Research in the Netherlands has shown that the uptake of eHealth and mHealth applications
is only to increase when applications are built with a vision and fulfil a certain necessity (18).
From the patients’ perspective, in the specific case of prostate cancer, depending on his level
of comfort with technology and willingness for eHealth/mHealth interactions, this can range
from a simple appointment reminder sent via SMS to virtual evaluation as an alternative to in-
person interaction.
For the healthcare professional, eHealth and mHealth may be another opportunity to
provide care, as a complement to the standard clinical appointment or perhaps even as a
replacement to some outpatient visits. As with social media, caution is needed in the
interaction between the clinician and patient through eHealth or mHealth.
To assure a high level of professionalism and setting boundaries, scientific organizations
are issuing guidelines and publishing recommendations on how to communicate with patients
through eHealth and mHealth (19). For example, it is recommended that all direct patient-
professional contact should take place during regular working hours (19).
eHealth and mHealth in prostate cancer and active surveillance
Prostate cancer has the second highest incidence among men worldwide and is a
concern in many healthcare systems. Several studies have been designed to improve the
current care paradigm, and the European Randomized study of Screening for Prostate Cancer
(ERSPC) showed that mortality could be lowered via screening. After 13 years of follow-up,
the results confirm a reduction of 21% in prostate cancer mortality attributable to screening
with prostate specific antigen (PSA).
The absolute risk reduction of death from prostate cancer at 13 years was 0.11 per 1,000
person-years or 1.28 per 1,000 men randomized, which is equivalent to one prostate cancer
death averted per 781 screened men and one per 27 diagnosed men. Moreover, there was a
substantial increased absolute effect compared with findings after nine and 11 years of follow-
up (20).
The ERSPC study has also shown that population-based screening would lead to
overdiagnosis (i.e., detecting cancers that would not cause symptoms or death), and
consequently, could also promote overtreatment (i.e., overdiagnosed cancers that are actively
treated and their possible side-effects, namely incontinence and erectile dysfunction) (21).
While research is focusing on how to improve the screening algorithm and reduce the
rate of overdiagnosis, active surveillance was developed as an alternative to immediate radical
treatment.
Active surveillance aims to delay or completely avoid unnecessary treatment of
potentially indolent tumours (e.g., Gleason 3+3) and avoid treatment related side-effects, and
consequently preserve the patients’ quality of life.
With active surveillance, patients with apparent low-risk tumours enter a strict follow-up
schedule consisting of clinical visits, PSA, multi-parametric magnetic resonance imaging
(mpMRI) and re-biopsy, to ensure that if there is disease progression (i.e., clinically significant
prostate cancer Gleason ≥3+4) the patient can switch to active treatment while the disease is
still in a “curable” stage (i.e., before the cancer has grown or spread beyond control).
28

Because of the intrinsic nature of eHealth and, in particular mHealth, sensitive health
data can be exchanged via wireless networks, which raises new safety concerns. Cyber
security attacks are a contemporary concern: in a recent European Union Agency for Network
and Information Security (ENISA) study, two-thirds of the European Member States
considered healthcare a critical sector (17). Therefore, measures should be taken to protect
the data integrity, assure data protection and guarantee patient confidentiality. This can be
assured in various ways, depending on the specific scenario, but may include cryptography
(i.e., saving the information in a coded form), role-based access control (i.e., each user can
only read and/or edit certain data, according to his/her professional role) or watermarking (i.e.,
embedding hidden medical data in medical images).
In the European Union, the Data Protection Regulation Act (EU2016/679) reforms the
data protection rules on processing personal data of natural persons and on the free
movement of such data. Together with the MEDDEV 2.1/6 (July 2016) guideline, they form
some sort of a European Union legal framework, providing some legal clarity on the status of
health and wellbeing mobile applications. Because of the legal aspects related to patient
security and data privacy governments are, based on the European Union legal framework,
expected to introduce clear cyber security guidelines for the protection of eHealth
infrastructures and services. Therefore, eHealth providers should assure that they respect
these guidelines. Finally, the importance of cyber security training and specific
recommendations should also be promoted among healthcare organizations and users.
Implementation of eHealth and mHealth – clinicians and patients’ perspective
The integration of eHealth and mHealth into clinical practice has to be tailored to a
specific goal and try to meet the patients’ and the healthcare professionals’ expectations.
Research in the Netherlands has shown that the uptake of eHealth and mHealth applications
is only to increase when applications are built with a vision and fulfil a certain necessity (18).
From the patients’ perspective, in the specific case of prostate cancer, depending on his level
of comfort with technology and willingness for eHealth/mHealth interactions, this can range
from a simple appointment reminder sent via SMS to virtual evaluation as an alternative to in-
person interaction.
For the healthcare professional, eHealth and mHealth may be another opportunity to
provide care, as a complement to the standard clinical appointment or perhaps even as a
replacement to some outpatient visits. As with social media, caution is needed in the
interaction between the clinician and patient through eHealth or mHealth.
To assure a high level of professionalism and setting boundaries, scientific organizations
are issuing guidelines and publishing recommendations on how to communicate with patients
through eHealth and mHealth (19). For example, it is recommended that all direct patient-
professional contact should take place during regular working hours (19).
eHealth and mHealth in prostate cancer and active surveillance
Prostate cancer has the second highest incidence among men worldwide and is a
concern in many healthcare systems. Several studies have been designed to improve the
current care paradigm, and the European Randomized study of Screening for Prostate Cancer
(ERSPC) showed that mortality could be lowered via screening. After 13 years of follow-up,
the results confirm a reduction of 21% in prostate cancer mortality attributable to screening
with prostate specific antigen (PSA).
The absolute risk reduction of death from prostate cancer at 13 years was 0.11 per 1,000
person-years or 1.28 per 1,000 men randomized, which is equivalent to one prostate cancer
death averted per 781 screened men and one per 27 diagnosed men. Moreover, there was a
substantial increased absolute effect compared with findings after nine and 11 years of follow-
up (20).
The ERSPC study has also shown that population-based screening would lead to
overdiagnosis (i.e., detecting cancers that would not cause symptoms or death), and
consequently, could also promote overtreatment (i.e., overdiagnosed cancers that are actively
treated and their possible side-effects, namely incontinence and erectile dysfunction) (21).
While research is focusing on how to improve the screening algorithm and reduce the
rate of overdiagnosis, active surveillance was developed as an alternative to immediate radical
treatment.
Active surveillance aims to delay or completely avoid unnecessary treatment of
potentially indolent tumours (e.g., Gleason 3+3) and avoid treatment related side-effects, and
consequently preserve the patients’ quality of life.
With active surveillance, patients with apparent low-risk tumours enter a strict follow-up
schedule consisting of clinical visits, PSA, multi-parametric magnetic resonance imaging
(mpMRI) and re-biopsy, to ensure that if there is disease progression (i.e., clinically significant
prostate cancer Gleason ≥3+4) the patient can switch to active treatment while the disease is
still in a “curable” stage (i.e., before the cancer has grown or spread beyond control).
29

Rotterdam Prostate Cancer Risk Calculator
One way of reducing overdiagnosis is to apply risk stratification in the prostate cancer
diagnostic phase. Based on data from 3,624 previously unscreened men and 2,896 men with
a previous negative prostate biopsy in ERSPC Rotterdam, the Rotterdam Prostate Cancer
Risk Calculator (RPCRC) nomogram was developed. The RPCRC predicts the risk of a
biopsy-detectable prostate cancer and also of potentially high-risk prostate cancer (Gleason
score ≥7 and clinical stage >T2b).
The different RPCRC algorithms, combining information on PSA level, previous negative
prostate biopsy, digital rectal examination (DRE), prostate volume measurement, and
transrectal ultrasonography (TRUS), provide an increasingly accurate risk estimation (area
under the curve (AUC)). In previously unscreened men, the AUCs ranged from 0.69 to 0.79
for any prostate cancer, and from 0.74 to 0.86 for serious prostate cancer (22). In the
previously screened group (men with at least one previous negative prostate biopsy), applying
the same models, AUCs ranged from 0.62 to 0.69 for predicting prostate cancer and from 0.72
to 0.81 for predicting serious prostate cancer (22). By applying the RPCRC, 30-35% of
prostate biopsies are averted, while missing only a small percentage of cancers and none of
the high risk prostate cancers (22). The RPCRC risk predictions aid in decreasing the rate of
overdiagnosis and overtreatment, and have been externally validated multiple times,
confirming their good predictive capability (23).
The nomogram was designed into a graphical device and published online
(http://www.prostatecancer-riskcalculator.com/seven-prostate-cancer-risk-calculators) in
2007 (24). After its publication, an implementation study in five Dutch hospitals was initiated
to assess the RPCRC in daily clinical practice, and whether the RPCRC recommendations
were followed by urologists and patients. In 83% of cases, both urologists and patients
complied with the RPCRC recommendation (25). If a man is diagnosed with prostate cancer,
risk calculator 5 calculates the chance of having an indolent prostate cancer. An indolent
tumour is a cancer that may not require immediate treatment. Such a man can start and
continue active surveillance as long as no upgrading is seen. When the probability of having
indolent disease was >70%, active surveillance was recommended, and active treatment
otherwise. 82% of patients with an active surveillance recommendation were compliant with
that recommendation while 29% of patients with an active treatment recommendation chose
active surveillance instead (26). Both studies indicate that the RPCRC is a valuable eHealth
tool which can inform decision making and decrease the rate of overdiagnosis and potential
subsequent overtreatment. Furthermore, the RPCRC has been externally validated to assess
its capabilities in other patient cohorts and healthcare systems.
Results confirm the good discriminative ability of the risk calculator and show how such
an eHealth tool positively influences cross border healthcare, which is one of the pillars of the
European Unions’ eHealth Action Plan 2012-2020. Validation studies confirm that the use of
the RPCRC should be favoured in the decision of whether or not to perform prostate biopsies
over the conventional diagnostic pathway. This advice has been incorporated into the
European Association of Urology prostate cancer guideline, as well as the Dutch General
Practitioners guideline. It confirms that the RPCRC is an example of an eHealth tool with a
vision, a true added value in daily clinical practice that positively influences cross border
healthcare.
To increase the usability and accessibility of the web-based RPCRC, it has been
redesigned into an app, using the same algorithms as for the available web-based risk
calculators (figure 1). While the web-based RPCRC was working with a graphical display, the
app uses a decision tree structure. The amount of information available induces which
algorithm is used. Ninety-two participants, including urologists, medical students, and general
practitioners, evaluated the usability of the app through the Post-Study System Usability
Questionnaire (PSSUQ, developed by IBM). Scores on system usefulness ranged from 88-
98%, information quality from 78-92%, and interface quality from 80-95% (27). These results
show that overall the participants were satisfied with the usability of the app. In 2015, the
RPCRC app won the British Journal of Urology International award for Best Urology App,
which was presented at the American Urological Association Annual Meeting. In clinical
practice, numerous urologists worldwide use the RPCRC-app on a daily basis.
Figure 1. Initial screen of the Rotterdam Prostate Cancer Risk Calculator app: “What is your PSA level, in ng/mL?”
30

Rotterdam Prostate Cancer Risk Calculator
One way of reducing overdiagnosis is to apply risk stratification in the prostate cancer
diagnostic phase. Based on data from 3,624 previously unscreened men and 2,896 men with
a previous negative prostate biopsy in ERSPC Rotterdam, the Rotterdam Prostate Cancer
Risk Calculator (RPCRC) nomogram was developed. The RPCRC predicts the risk of a
biopsy-detectable prostate cancer and also of potentially high-risk prostate cancer (Gleason
score ≥7 and clinical stage >T2b).
The different RPCRC algorithms, combining information on PSA level, previous negative
prostate biopsy, digital rectal examination (DRE), prostate volume measurement, and
transrectal ultrasonography (TRUS), provide an increasingly accurate risk estimation (area
under the curve (AUC)). In previously unscreened men, the AUCs ranged from 0.69 to 0.79
for any prostate cancer, and from 0.74 to 0.86 for serious prostate cancer (22). In the
previously screened group (men with at least one previous negative prostate biopsy), applying
the same models, AUCs ranged from 0.62 to 0.69 for predicting prostate cancer and from 0.72
to 0.81 for predicting serious prostate cancer (22). By applying the RPCRC, 30-35% of
prostate biopsies are averted, while missing only a small percentage of cancers and none of
the high risk prostate cancers (22). The RPCRC risk predictions aid in decreasing the rate of
overdiagnosis and overtreatment, and have been externally validated multiple times,
confirming their good predictive capability (23).
The nomogram was designed into a graphical device and published online
(http://www.prostatecancer-riskcalculator.com/seven-prostate-cancer-risk-calculators) in
2007 (24). After its publication, an implementation study in five Dutch hospitals was initiated
to assess the RPCRC in daily clinical practice, and whether the RPCRC recommendations
were followed by urologists and patients. In 83% of cases, both urologists and patients
complied with the RPCRC recommendation (25). If a man is diagnosed with prostate cancer,
risk calculator 5 calculates the chance of having an indolent prostate cancer. An indolent
tumour is a cancer that may not require immediate treatment. Such a man can start and
continue active surveillance as long as no upgrading is seen. When the probability of having
indolent disease was >70%, active surveillance was recommended, and active treatment
otherwise. 82% of patients with an active surveillance recommendation were compliant with
that recommendation while 29% of patients with an active treatment recommendation chose
active surveillance instead (26). Both studies indicate that the RPCRC is a valuable eHealth
tool which can inform decision making and decrease the rate of overdiagnosis and potential
subsequent overtreatment. Furthermore, the RPCRC has been externally validated to assess
its capabilities in other patient cohorts and healthcare systems.
Results confirm the good discriminative ability of the risk calculator and show how such
an eHealth tool positively influences cross border healthcare, which is one of the pillars of the
European Unions’ eHealth Action Plan 2012-2020. Validation studies confirm that the use of
the RPCRC should be favoured in the decision of whether or not to perform prostate biopsies
over the conventional diagnostic pathway. This advice has been incorporated into the
European Association of Urology prostate cancer guideline, as well as the Dutch General
Practitioners guideline. It confirms that the RPCRC is an example of an eHealth tool with a
vision, a true added value in daily clinical practice that positively influences cross border
healthcare.
To increase the usability and accessibility of the web-based RPCRC, it has been
redesigned into an app, using the same algorithms as for the available web-based risk
calculators (figure 1). While the web-based RPCRC was working with a graphical display, the
app uses a decision tree structure. The amount of information available induces which
algorithm is used. Ninety-two participants, including urologists, medical students, and general
practitioners, evaluated the usability of the app through the Post-Study System Usability
Questionnaire (PSSUQ, developed by IBM). Scores on system usefulness ranged from 88-
98%, information quality from 78-92%, and interface quality from 80-95% (27). These results
show that overall the participants were satisfied with the usability of the app. In 2015, the
RPCRC app won the British Journal of Urology International award for Best Urology App,
which was presented at the American Urological Association Annual Meeting. In clinical
practice, numerous urologists worldwide use the RPCRC-app on a daily basis.
Figure 1. Initial screen of the Rotterdam Prostate Cancer Risk Calculator app: “What is your PSA level, in ng/mL?”
31

The Prostate cancer Research International Active Surveillance (PRIAS) study
Men diagnosed with low-risk prostate cancer (i.e., PSA ≤10, Gleason 3+3, T1c-T2a) can
choose between active treatment and active surveillance. In 2006 the PRIAS study was
initiated to validate the management of prostate cancer with active surveillance. More
information on the PRIAS-protocol can be found on www.prias-project.org.
The PRIAS study is an entirely web-based study. Physicians can log in the website to
enter patient inclusion and follow-up data. Urological clinical practice can benefit from the use
of this tool; the follow-up data entered by the physician generates a graphical display of the
PSA measurements and PSA-doubling time. Furthermore, a recommendation on whether the
patient should continue on active surveillance or switch to curative treatment is automatically
presented. Such information facilitates direct evidence-based decision making for the patient
and the physician when considering active surveillance (28).
As said, active surveillance is a monitoring strategy and consists of a range of clinical
visits including PSA measurement, mpMRI, and re-biopsy. The low-risk nature of the tumour
combined with the long follow-up trajectory make it more of a chronic condition. The diagnosis
of disease and the medical mills they end up in can cause patients to feel they have lost control
over the situation and their bodies. This may cause restlessness for patients and their
spouses/partners/families and a feeling of uncertainty. Within the PRIAS study the ‘MyPSA’-
app is being developed to guide patients. Such an eHealth application provides patients with
the opportunity to monitor their disease, plan and manage appointments and questions for
their urologists. It is hypothesized that the use of such a tool will encourage active participation
and can have a positive effect on the quality of life of the patient. Furthermore, it can improve
the quality of care as it can focus on patients’ needs more specifically (29).
Urology apps
The RPCRC (website and app), the PRIAS website and the ‘MyPSA’-app are three
examples of eHealth applications in the field of Urology. In 2015, Pereira-Azevedo et al.
reviewed the number of Urology apps available in the Apple App Store and Google Play Store.
They identified 150 unique Urology apps, of which 34 were urological cancer apps. It should
be noted that these 150 Urology apps represented less than 1% of the total number of
smartphone medical apps available. At the time, there seemed to be an untapped potential
for Urology apps, especially taking into account that there were more breast cancer apps
(n=178; 118 for Android, 59 for iOS) than all available Urology apps in total (30).
For the current article, an updated review of urology apps available in the Apple App
Store and Google Play Store was performed, using the methods previously described (30).
175 unique urology apps were found (+17%); 67 (38%) for Android, 62 (35%) for iOS, and 47
(27%) available on both stores (table 1). Only 20 (11%) apps were related to prostate cancer,
and the majority (60%) were developed with a healthcare professional (figure 2): Briganti
Nomogram, CPC Risk Calculator, IPCRC (Prostate Cancer Calculator), itsaMANTHING -
Prostate Cancer, iURO Prostate Pro, MyPSA, Partin Tables, PI-RADS Prostate MRI, Prostate
Cancer, Prostate Cancer Calculator, Prostate Cancer Clinical Risk Classification Tool,
Prostate Cancer Counselor, Prostate Cancer Imaging, Prostate Cancer Update, Prostate
Health, Prostate In Focus, Prostate International, Prostate Pal 3, RPCRC, and Understanding
and Treating Prostate Cancer.
Table 1. Currently available Urology apps in the Google Play and Apple App stores.
App Name Mobile platform Healthcare professional
involvement American Urological Association Journals Apple App Store Yes ASMIUA 2017 Google Play Store Yes Astellas UroLog Apple App Store No AUA 2014 Annual Meeting Google Play Store Yes AUA Annual Meeting Apps Both Yes AUA Guidelines at a Glance Google Play Store Yes AUA Journals Google Play Store Yes AUA Medical Student Curriculum Google Play Store Yes AUA Member Search Both Yes AUA Men's Health Checklist Both Yes AUA University Both Yes BAUN16 Apple App Store Yes BAUS 2016 Apple App Store Yes BAUS 2017 Google Play Store Yes Bedwetting solutions Google Play Store No Bedwetting Trainer Google Play Store Yes Besins UroMedica Google Play Store Yes BJUI Journal Apple App Store Yes BJUI Knowledge Google Play Store Yes Bladder Pal 2 Apple App Store Yes BMC Urology Both Yes Brazial Journal of Urology Both Yes Briganti Nomogram Google Play Store No BSC Urology Events Apple App Store No CalcuLithiasis Apple App Store Yes
32

The Prostate cancer Research International Active Surveillance (PRIAS) study
Men diagnosed with low-risk prostate cancer (i.e., PSA ≤10, Gleason 3+3, T1c-T2a) can
choose between active treatment and active surveillance. In 2006 the PRIAS study was
initiated to validate the management of prostate cancer with active surveillance. More
information on the PRIAS-protocol can be found on www.prias-project.org.
The PRIAS study is an entirely web-based study. Physicians can log in the website to
enter patient inclusion and follow-up data. Urological clinical practice can benefit from the use
of this tool; the follow-up data entered by the physician generates a graphical display of the
PSA measurements and PSA-doubling time. Furthermore, a recommendation on whether the
patient should continue on active surveillance or switch to curative treatment is automatically
presented. Such information facilitates direct evidence-based decision making for the patient
and the physician when considering active surveillance (28).
As said, active surveillance is a monitoring strategy and consists of a range of clinical
visits including PSA measurement, mpMRI, and re-biopsy. The low-risk nature of the tumour
combined with the long follow-up trajectory make it more of a chronic condition. The diagnosis
of disease and the medical mills they end up in can cause patients to feel they have lost control
over the situation and their bodies. This may cause restlessness for patients and their
spouses/partners/families and a feeling of uncertainty. Within the PRIAS study the ‘MyPSA’-
app is being developed to guide patients. Such an eHealth application provides patients with
the opportunity to monitor their disease, plan and manage appointments and questions for
their urologists. It is hypothesized that the use of such a tool will encourage active participation
and can have a positive effect on the quality of life of the patient. Furthermore, it can improve
the quality of care as it can focus on patients’ needs more specifically (29).
Urology apps
The RPCRC (website and app), the PRIAS website and the ‘MyPSA’-app are three
examples of eHealth applications in the field of Urology. In 2015, Pereira-Azevedo et al.
reviewed the number of Urology apps available in the Apple App Store and Google Play Store.
They identified 150 unique Urology apps, of which 34 were urological cancer apps. It should
be noted that these 150 Urology apps represented less than 1% of the total number of
smartphone medical apps available. At the time, there seemed to be an untapped potential
for Urology apps, especially taking into account that there were more breast cancer apps
(n=178; 118 for Android, 59 for iOS) than all available Urology apps in total (30).
For the current article, an updated review of urology apps available in the Apple App
Store and Google Play Store was performed, using the methods previously described (30).
175 unique urology apps were found (+17%); 67 (38%) for Android, 62 (35%) for iOS, and 47
(27%) available on both stores (table 1). Only 20 (11%) apps were related to prostate cancer,
and the majority (60%) were developed with a healthcare professional (figure 2): Briganti
Nomogram, CPC Risk Calculator, IPCRC (Prostate Cancer Calculator), itsaMANTHING -
Prostate Cancer, iURO Prostate Pro, MyPSA, Partin Tables, PI-RADS Prostate MRI, Prostate
Cancer, Prostate Cancer Calculator, Prostate Cancer Clinical Risk Classification Tool,
Prostate Cancer Counselor, Prostate Cancer Imaging, Prostate Cancer Update, Prostate
Health, Prostate In Focus, Prostate International, Prostate Pal 3, RPCRC, and Understanding
and Treating Prostate Cancer.
Table 1. Currently available Urology apps in the Google Play and Apple App stores.
App Name Mobile platform Healthcare professional
involvement American Urological Association Journals Apple App Store Yes ASMIUA 2017 Google Play Store Yes Astellas UroLog Apple App Store No AUA 2014 Annual Meeting Google Play Store Yes AUA Annual Meeting Apps Both Yes AUA Guidelines at a Glance Google Play Store Yes AUA Journals Google Play Store Yes AUA Medical Student Curriculum Google Play Store Yes AUA Member Search Both Yes AUA Men's Health Checklist Both Yes AUA University Both Yes BAUN16 Apple App Store Yes BAUS 2016 Apple App Store Yes BAUS 2017 Google Play Store Yes Bedwetting solutions Google Play Store No Bedwetting Trainer Google Play Store Yes Besins UroMedica Google Play Store Yes BJUI Journal Apple App Store Yes BJUI Knowledge Google Play Store Yes Bladder Pal 2 Apple App Store Yes BMC Urology Both Yes Brazial Journal of Urology Both Yes Briganti Nomogram Google Play Store No BSC Urology Events Apple App Store No CalcuLithiasis Apple App Store Yes
33

App Name Mobile platform Healthcare professional
involvement Canadian Urological Association Apple App Store Yes CKD Chronic Kidney Disease Google Play Store Yes Clinicians Drug Reference 2016 Google Play Store Yes CPC Risk Calculator Google Play Store Yes CUA Google Play Store Yes CURE-UAB Both Yes DoubleJTracker Apple App Store Yes drawMD® Patient Education Both Yes DutasT Both Yes E-UROLOGICAL TOOLS Google Play Store Yes EAU Events Both Yes EAU Guidelines Both Yes EAU Pocket Guidelines Google Play Store Yes EAU16 Google Play Store Yes EAUN15 Google Play Store Yes EMUC 2016 Both Yes EMUC 2017 Both Yes ESPU Both Yes Esurge Apple App Store No European Urology Both Yes European Urology Journals Google Play Store Yes Exercise UI in Women Apple App Store No Fertility and Sterility® Google Play Store Yes Follow MyPSA Google Play Store Yes Foundation Urology Google Play Store Yes GeSRU Uro Emergency Google Play Store Yes HapPee Time Google Play Store No Human Body : Genitourinary System Trivia Apple App Store No Human Body Parts : Kidneys Quiz Apple App Store No Human Urinary System Quiz Apple App Store No InformedUrology Both Yes International Urogynecology Journal Both Yes iP Voiding Diary Apple App Store No IPCRC (Prostate Cancer Calculator) Google Play Store Yes IPSS Prostate Score Apple App Store No iReflux Risk Calculator Both No itsaMANTHING - Prostate Cancer Both No iURO Andrology Both Yes iURO Andrology Pro Both Yes iURO General Practicioner Pro Both Yes iURO Kidney Lite Both Yes iURO Kidney Pro Both Yes
App Name Mobile platform Healthcare professional
involvement iURO Oncology Both Yes iURO Oncology Pro Both Yes iURO Pelvic Floor Both Yes iURO Pelvic Floor Pro Both Yes iURO Prostate Pro Both Yes Journal of Renal Care Apple App Store Yes JUS - Journal of the Urological Surgery Google Play Store Yes Kidney Cancer Google Play Store No Kidney Cancer Planner Apple App Store No Kidney Disease Assistant Apple App Store No Kids' Guide to Using a Catheter Apple App Store Yes Learning Urology Quiz Both Yes Male Infertility Microsurgery Apple App Store Yes Medical Arts Xperience ("MAX") Apple App Store Yes Men's App - Take care of men's health Apple App Store Yes Men's Health Checklist Google Play Store Yes Men's Sexual Medicine PRO Apple App Store Yes MSK Urologic Conference Google Play Store Yes Neurourology and Urodynamics Apple App Store Yes NMIBC Toolbox Apple App Store Yes NUF2017 Both Yes Nurse Urologic Registered Google Play Store Yes Oral Board Study Guide Apple App Store Yes Oxford HB Urology Both Yes Partin Tables Apple App Store No Pediatric Urologic Surgery QA Review Apple App Store No Pediatric Urology Exam Review Apple App Store No Perioperative Care Apple App Store Yes PI-RADS Prostate MRI Google Play Store Yes Practical Urology Both Yes AUA Primary Care Guidelines for Urology Apple App Store Yes Prostate Cancer Google Play Store No Prostate Cancer Calculator Google Play Store No Prostate Cancer Clinical Risk Classification Tool Apple App Store Yes Prostate Cancer Counselor Apple App Store No Prostate Cancer Imaging Apple App Store Yes Prostate Cancer Update Apple App Store No Prostate Health Google Play Store No Prostate In Focus Google Play Store Yes PROSTATE INTERNATIONAL Both Yes Prostate Pal 3 Apple App Store Yes
34

App Name Mobile platform Healthcare professional
involvement Canadian Urological Association Apple App Store Yes CKD Chronic Kidney Disease Google Play Store Yes Clinicians Drug Reference 2016 Google Play Store Yes CPC Risk Calculator Google Play Store Yes CUA Google Play Store Yes CURE-UAB Both Yes DoubleJTracker Apple App Store Yes drawMD® Patient Education Both Yes DutasT Both Yes E-UROLOGICAL TOOLS Google Play Store Yes EAU Events Both Yes EAU Guidelines Both Yes EAU Pocket Guidelines Google Play Store Yes EAU16 Google Play Store Yes EAUN15 Google Play Store Yes EMUC 2016 Both Yes EMUC 2017 Both Yes ESPU Both Yes Esurge Apple App Store No European Urology Both Yes European Urology Journals Google Play Store Yes Exercise UI in Women Apple App Store No Fertility and Sterility® Google Play Store Yes Follow MyPSA Google Play Store Yes Foundation Urology Google Play Store Yes GeSRU Uro Emergency Google Play Store Yes HapPee Time Google Play Store No Human Body : Genitourinary System Trivia Apple App Store No Human Body Parts : Kidneys Quiz Apple App Store No Human Urinary System Quiz Apple App Store No InformedUrology Both Yes International Urogynecology Journal Both Yes iP Voiding Diary Apple App Store No IPCRC (Prostate Cancer Calculator) Google Play Store Yes IPSS Prostate Score Apple App Store No iReflux Risk Calculator Both No itsaMANTHING - Prostate Cancer Both No iURO Andrology Both Yes iURO Andrology Pro Both Yes iURO General Practicioner Pro Both Yes iURO Kidney Lite Both Yes iURO Kidney Pro Both Yes
App Name Mobile platform Healthcare professional
involvement iURO Oncology Both Yes iURO Oncology Pro Both Yes iURO Pelvic Floor Both Yes iURO Pelvic Floor Pro Both Yes iURO Prostate Pro Both Yes Journal of Renal Care Apple App Store Yes JUS - Journal of the Urological Surgery Google Play Store Yes Kidney Cancer Google Play Store No Kidney Cancer Planner Apple App Store No Kidney Disease Assistant Apple App Store No Kids' Guide to Using a Catheter Apple App Store Yes Learning Urology Quiz Both Yes Male Infertility Microsurgery Apple App Store Yes Medical Arts Xperience ("MAX") Apple App Store Yes Men's App - Take care of men's health Apple App Store Yes Men's Health Checklist Google Play Store Yes Men's Sexual Medicine PRO Apple App Store Yes MSK Urologic Conference Google Play Store Yes Neurourology and Urodynamics Apple App Store Yes NMIBC Toolbox Apple App Store Yes NUF2017 Both Yes Nurse Urologic Registered Google Play Store Yes Oral Board Study Guide Apple App Store Yes Oxford HB Urology Both Yes Partin Tables Apple App Store No Pediatric Urologic Surgery QA Review Apple App Store No Pediatric Urology Exam Review Apple App Store No Perioperative Care Apple App Store Yes PI-RADS Prostate MRI Google Play Store Yes Practical Urology Both Yes AUA Primary Care Guidelines for Urology Apple App Store Yes Prostate Cancer Google Play Store No Prostate Cancer Calculator Google Play Store No Prostate Cancer Clinical Risk Classification Tool Apple App Store Yes Prostate Cancer Counselor Apple App Store No Prostate Cancer Imaging Apple App Store Yes Prostate Cancer Update Apple App Store No Prostate Health Google Play Store No Prostate In Focus Google Play Store Yes PROSTATE INTERNATIONAL Both Yes Prostate Pal 3 Apple App Store Yes
35

App Name Mobile platform Healthcare professional
involvement Renal & Urology News Both Yes Renal Mass - Bosniak Google Play Store Yes Reviews in Urology Apple App Store Yes Rotterdam Prostate Cancer Risk Google Play Store Yes Salvador Gil Vernet Collection of Urology Drawings Google Play Store Yes Semi-Live Apple App Store Yes Signs & Symptoms Urinay Incontinence Apple App Store No SIU Academy® Both Yes SIU2016 Apple App Store Yes STOP UTI Google Play Store Yes SUNA uroLogic Google Play Store Yes Surgery Urologic Pediatric Google Play Store Yes Surgery Urologic QA Review Google Play Store Yes Szusicon2017 Google Play Store Yes Testicular Cancer Staging Both No The 5 Minute Urology Consult 3 Both Yes Turkish Journal of Urology Apple App Store Yes UAA 2017 Both Yes UAA Congress 2016 Google Play Store Yes Understanding and Treating Prostate Cancer Apple App Store Yes Ureteral Stent Tracker System Both No Urinary/Renal System Exam Review Apple App Store No Uro Challenge Apple App Store Yes UroBladderDiary Apple App Store No Urocon 2017 Google Play Store Yes UroLift® for BPH Apple App Store No Urolithiasis Assist Google Play Store Yes Urologic Oncology Both Yes Urologic Surgery QA Review Apple App Store No Urological Emergencies Both Yes Urological Surgery Google Play Store Yes Urological Ultrasound Google Play Store Yes Urology Google Play Store No Urology Apple App Store No Urology - Medical Dictionary Google Play Store Yes Urology Board Review Manual Apple App Store Yes Urology Case Reports Both Yes Urology Courses Google Play Store No Urology Exam Review & Test Bank Apple App Store No Urology Flashcards 2.0 Both Yes Urology Flashcards 2018 Google Play Store No
App Name Mobile platform Healthcare professional
involvement Urology Glossary Google Play Store No Urology Guide Google Play Store No Urology Guidelines PrimaryCare Google Play Store Yes Urology Lectures Google Play Store No Urology Nation Both Yes Urology NBI Atlas by Olympus Apple App Store Yes Urology News Both Yes Urology Planet Apple App Store Yes Urology Procedures Google Play Store No Urology Specialty Care Google Play Store Yes Urology Study Google Play Store No Urology Times Google Play Store Yes Urology, the Gold Journal Both Yes Urology, Courses Apple App Store Yes USICON Google Play Store Yes USICON 2014 Google Play Store Yes USICON 2016 Apple App Store Yes USICON 2017 Apple App Store Yes USICON 2018 Apple App Store Yes UTI Tracker Google Play Store Yes Vasectomy Reversal Google Play Store No Voiding Diary Google Play Store Yes Volume Diary Apple App Store No WCE 2014 Google Play Store Yes WCE 2016 Apple App Store Yes WCE 2017 Apple App Store Yes What is Urology? Apple App Store Yes
Even though there was an increase in the number of apps, there still seems to persist
an untapped potential for the participation of the urological community in app development, as
one in four apps were developed without a healthcare professional, which is slightly worse
than in 2015 (30).
Conclusions
eHealth and mHealth are becoming ubiquitous in our day-to-day life. Possible use in
Urology ranges from educational, clinical or surgical purposes, and may include such diverse
tools as health promoting apps, electronic diaries that aid in treatment monitoring or
augmented reality apps.
36

App Name Mobile platform Healthcare professional
involvement Renal & Urology News Both Yes Renal Mass - Bosniak Google Play Store Yes Reviews in Urology Apple App Store Yes Rotterdam Prostate Cancer Risk Google Play Store Yes Salvador Gil Vernet Collection of Urology Drawings Google Play Store Yes Semi-Live Apple App Store Yes Signs & Symptoms Urinay Incontinence Apple App Store No SIU Academy® Both Yes SIU2016 Apple App Store Yes STOP UTI Google Play Store Yes SUNA uroLogic Google Play Store Yes Surgery Urologic Pediatric Google Play Store Yes Surgery Urologic QA Review Google Play Store Yes Szusicon2017 Google Play Store Yes Testicular Cancer Staging Both No The 5 Minute Urology Consult 3 Both Yes Turkish Journal of Urology Apple App Store Yes UAA 2017 Both Yes UAA Congress 2016 Google Play Store Yes Understanding and Treating Prostate Cancer Apple App Store Yes Ureteral Stent Tracker System Both No Urinary/Renal System Exam Review Apple App Store No Uro Challenge Apple App Store Yes UroBladderDiary Apple App Store No Urocon 2017 Google Play Store Yes UroLift® for BPH Apple App Store No Urolithiasis Assist Google Play Store Yes Urologic Oncology Both Yes Urologic Surgery QA Review Apple App Store No Urological Emergencies Both Yes Urological Surgery Google Play Store Yes Urological Ultrasound Google Play Store Yes Urology Google Play Store No Urology Apple App Store No Urology - Medical Dictionary Google Play Store Yes Urology Board Review Manual Apple App Store Yes Urology Case Reports Both Yes Urology Courses Google Play Store No Urology Exam Review & Test Bank Apple App Store No Urology Flashcards 2.0 Both Yes Urology Flashcards 2018 Google Play Store No
App Name Mobile platform Healthcare professional
involvement Urology Glossary Google Play Store No Urology Guide Google Play Store No Urology Guidelines PrimaryCare Google Play Store Yes Urology Lectures Google Play Store No Urology Nation Both Yes Urology NBI Atlas by Olympus Apple App Store Yes Urology News Both Yes Urology Planet Apple App Store Yes Urology Procedures Google Play Store No Urology Specialty Care Google Play Store Yes Urology Study Google Play Store No Urology Times Google Play Store Yes Urology, the Gold Journal Both Yes Urology, Courses Apple App Store Yes USICON Google Play Store Yes USICON 2014 Google Play Store Yes USICON 2016 Apple App Store Yes USICON 2017 Apple App Store Yes USICON 2018 Apple App Store Yes UTI Tracker Google Play Store Yes Vasectomy Reversal Google Play Store No Voiding Diary Google Play Store Yes Volume Diary Apple App Store No WCE 2014 Google Play Store Yes WCE 2016 Apple App Store Yes WCE 2017 Apple App Store Yes What is Urology? Apple App Store Yes
Even though there was an increase in the number of apps, there still seems to persist
an untapped potential for the participation of the urological community in app development, as
one in four apps were developed without a healthcare professional, which is slightly worse
than in 2015 (30).
Conclusions
eHealth and mHealth are becoming ubiquitous in our day-to-day life. Possible use in
Urology ranges from educational, clinical or surgical purposes, and may include such diverse
tools as health promoting apps, electronic diaries that aid in treatment monitoring or
augmented reality apps.
37

The future will include the use of innovative and ground-breaking ICT solutions and the
challenge will be to define a clear vision for them. To increase the uptake of eHealth
applications, it is important that healthcare professionals are involved in their design, assuring
usability, and also their development, promoting evidence-based views. To reach their full
potential healthcare apps must integrate seamlessly into urological practice, while fulfilling the
clinical needs of professionals and patients.
References
1. World Health Organization. eHealth at WHO. Accessed through: http://www.who.int/ehealth/about/en on November 30, 2017.
2. Oh H, Rizo C, Enkin M, Jadad A. What is eHealth (3): a systematic review of published definitions. J Med Internet Res. 2005;7(1):e1.
3. European Commission. eHealth Action Plan 2012-2020: Innovative healthcare for the 21st century. 2012 December 7. Accessed through: https://ec.europa.eu/digital-single-market/en/news/ehealth-action-plan-2012-2020-innovative-healthcare-21st-century on November 30, 2017.
4. Witteman HO, Dansokho SC, Colquhoun H, Coulter A, Dugas M, Fagerlin A, et al. User- centred design and the development of patient decision aids: protocol for a systematic review. Syst Rev. 2015;4:11.
5. Gautham M, Iyengar MS, Johnson CW. Mobile phone-based clinical guidance for rural health providers in India. Health Informatics J. 2015;21(4):253-66.
6. Hirst JE, Mackillop L, Loerup L, Kevat DA, Bartlett K, Gibson O, et al. Acceptability and user satisfaction of a smartphone-based, interactive blood glucose management system in women with gestational diabetes mellitus. J Diabetes Sci Technol. 2015;9(1):111-5.
7. Hong Y, Goldberg D, Dahlke DV, Ory MG, Cargill JS, Coughlin R, et al. Testing usability and acceptability of a web application to promote physical activity (iCanFit) among older adults. JMIR Hum Factors. 2014;1(1):e2.
8. Al Ayubi SU, Parmanto B, Branch R, Ding D. A persuasive and social mHealth application for physical activity: a usability and feasibility study. JMIR Mhealth Uhealth. 2014;2(2):e25.
9. Reseach2Guidance. mHealth App Developer Economics 2016: The Current Status and Trends of the mHealth App Market. 2016 Oct. Accessed through: https://research2guidance.com/r2g/r2g-mHealth-App-Developer-Economics-2016.pdf on April 12, 2017.
10. The World Bank. ‘Maximizing Mobile’ Report Highlights Development Potential of Mobile Communications. 2012 July. Accessed through: http://web.worldbank.org/WBSITE/EXTERNAL/TOPICS/EXTINFORMATIONANDCOMMUNICATIONANDTECHNOLOGIES/0,,contentMDK:23242711~pagePK:210058~piPK:210062~theSitePK:282823,00.html on May 20, 2016.
11. Pereira-Azevedo N, Osório L, Cavadas V, Fraga A, Carrasquinho E, Cardoso de Oliveira E, et al. Expert involvement predicts mHealth app downloads: multivariate regression analysis of urology apps. JMIR Mhealth Uhealth. 2016;4(3):e86.
12. Subhi Y, Todsen T, Ringstd C, Konge L. Designing web-apps for smartphones can be easy as making slideshow presentations. BMC Res Notes. 2014;7:94.
13. Barton AJ. The regulation of mobile health applications. BMC Med. 2012;10:46. 14. Pelletier SG. Explosive growth in health care apps raises oversight questions. AAMC Reporter
2012, Oct. Accessed through: https://www.aamc.org/newsroom/reporter/october2012/308516/health-care-apps.html on November 30, 2017.
15. Brewer AC, Endly DC, Henley J, Amir M, Sampson BP, Moreau JF, et al. Mobile Applications in dermatology. JAMA Dermatol. 2013;149(11):1300-4.
38

The future will include the use of innovative and ground-breaking ICT solutions and the
challenge will be to define a clear vision for them. To increase the uptake of eHealth
applications, it is important that healthcare professionals are involved in their design, assuring
usability, and also their development, promoting evidence-based views. To reach their full
potential healthcare apps must integrate seamlessly into urological practice, while fulfilling the
clinical needs of professionals and patients.
References
1. World Health Organization. eHealth at WHO. Accessed through: http://www.who.int/ehealth/about/en on November 30, 2017.
2. Oh H, Rizo C, Enkin M, Jadad A. What is eHealth (3): a systematic review of published definitions. J Med Internet Res. 2005;7(1):e1.
3. European Commission. eHealth Action Plan 2012-2020: Innovative healthcare for the 21st century. 2012 December 7. Accessed through: https://ec.europa.eu/digital-single-market/en/news/ehealth-action-plan-2012-2020-innovative-healthcare-21st-century on November 30, 2017.
4. Witteman HO, Dansokho SC, Colquhoun H, Coulter A, Dugas M, Fagerlin A, et al. User- centred design and the development of patient decision aids: protocol for a systematic review. Syst Rev. 2015;4:11.
5. Gautham M, Iyengar MS, Johnson CW. Mobile phone-based clinical guidance for rural health providers in India. Health Informatics J. 2015;21(4):253-66.
6. Hirst JE, Mackillop L, Loerup L, Kevat DA, Bartlett K, Gibson O, et al. Acceptability and user satisfaction of a smartphone-based, interactive blood glucose management system in women with gestational diabetes mellitus. J Diabetes Sci Technol. 2015;9(1):111-5.
7. Hong Y, Goldberg D, Dahlke DV, Ory MG, Cargill JS, Coughlin R, et al. Testing usability and acceptability of a web application to promote physical activity (iCanFit) among older adults. JMIR Hum Factors. 2014;1(1):e2.
8. Al Ayubi SU, Parmanto B, Branch R, Ding D. A persuasive and social mHealth application for physical activity: a usability and feasibility study. JMIR Mhealth Uhealth. 2014;2(2):e25.
9. Reseach2Guidance. mHealth App Developer Economics 2016: The Current Status and Trends of the mHealth App Market. 2016 Oct. Accessed through: https://research2guidance.com/r2g/r2g-mHealth-App-Developer-Economics-2016.pdf on April 12, 2017.
10. The World Bank. ‘Maximizing Mobile’ Report Highlights Development Potential of Mobile Communications. 2012 July. Accessed through: http://web.worldbank.org/WBSITE/EXTERNAL/TOPICS/EXTINFORMATIONANDCOMMUNICATIONANDTECHNOLOGIES/0,,contentMDK:23242711~pagePK:210058~piPK:210062~theSitePK:282823,00.html on May 20, 2016.
11. Pereira-Azevedo N, Osório L, Cavadas V, Fraga A, Carrasquinho E, Cardoso de Oliveira E, et al. Expert involvement predicts mHealth app downloads: multivariate regression analysis of urology apps. JMIR Mhealth Uhealth. 2016;4(3):e86.
12. Subhi Y, Todsen T, Ringstd C, Konge L. Designing web-apps for smartphones can be easy as making slideshow presentations. BMC Res Notes. 2014;7:94.
13. Barton AJ. The regulation of mobile health applications. BMC Med. 2012;10:46. 14. Pelletier SG. Explosive growth in health care apps raises oversight questions. AAMC Reporter
2012, Oct. Accessed through: https://www.aamc.org/newsroom/reporter/october2012/308516/health-care-apps.html on November 30, 2017.
15. Brewer AC, Endly DC, Henley J, Amir M, Sampson BP, Moreau JF, et al. Mobile Applications in dermatology. JAMA Dermatol. 2013;149(11):1300-4.
39

16. Wolf JA, Moreau JF, Akilov O, Patton T, English JC 3rd, Ho J, et al. Diagnostic inaccuracy of smartphone applications for melanoma detection. JAMA Dermatol. 2013;149(4):422-6.
17. Mattioli R, Levy-Bencheton C. Methodologies for the identification of critical information infrastructure assets and services. ENISA. 2015. Accessed through: https://www.enisa.europa.eu/publications/methodologies-for-the-identification-of-ciis on November 30, 2017.
18. Nictiz. eHealth-monitor 2017. Accessed through: https://www.nictiz.nl/ehealth/ehealth-monitor/ehealth-monitor-2017 on November 30, 2017.
19. Hilty DM, Chan S, Torous J, Matmahur J, Mucic D. New frontiers in healthcare and technology: Internet- and web-based mental options emerge to complement in-person and telepsychiatric care options. J Health Med Informatics. 2015;6:1-14.
20. Schröder FH, Hugosson J, Roobol MJ, Tammela TL, Zappa M, Nelen V, et al. Screening and prostate cancer mortality: results of the European Randomised Study of Screening for Prostate Cancer (ERSPC) at 13 years of follow-up. Lancet. 2014;384(9959):2027-35.
21. Draisma G, Boer R, Otto SJ, van der Cruijsen IW, Damhuis RA, Schröder FH, et al. Lead times and overdetection due to prostate-specific antigen screening: estimates from the European Randomized Study of Screening for Prostate Cancer. J Natl Cancer Inst. 2003;95(12):868-78.
22. Roobol MJ, van Vugt HA, Loeb S, Zhu X, Bul M, Bangma CH, et al. Prediction of prostate cancer risk: the role of prostate volume and digital rectal examination in the ERSPC risk calculators. Eur Urol. 2012;61(3):577-83.
23. Louie KS, Seigneurin A, Cathcart P, Sasieni P. Do prostate cancer risk models improve the predictive accuracy of PSA screening? A meta-analysis. Ann Oncol. 2015;26(5):848-64.
24. Kranse R, Roobol M, Schröder FH. A graphical device to represent the outcomes of a logistic regression analysis. Prostate. 2008;68(15):1674-80.
25. van Vugt HA, Roobol MJ, Busstra M, Kil P, Oomens EH, de Jong IJ, et al. Compliance with biopsy recommendations of a prostate cancer risk calculator. BJU Int. 2012;109(10):1480-8.
26. van Vugt HA, Roobol MJ, van der Poel HG, van Muilekom EH, Busstra M, Kil P, Oomens EH, et al. Selecting men diagnosed with prostate cancer for active surveillance using a risk calculator: a prospective impact study. BJU Int. 2012;110(2):180-7.
27. Pereira-Azevedo N, Osório L, Fraga A, Roobol MJ. Rotterdam prostate cancer risk calculator: development and usability testing of the mobile phone app. JMIR Cancer. 2017;3(1):e1.
28. van den Bergh RC, Roemeling S, Roobol MJ, Roobol W, Schröder FH, Bangma CH. Prospective validation of active surveillance in prostate cancer: the PRIAS study. Eur Urol. 2007;52(6):1560-3.
29. Venderbos LDF, Roobol MJ. m-PRIAS: an e-health technology for men on active surveillance for prostate cancer. Qual Life Res. 2017;26(Suppl.1):99.
30. Pereira-Azevedo N, Carrasquinho E, Cardoso de Oliveira E, Cavadas V, Osório L, Fraga A, et al. mHealth in urology: a review of experts' involvement in app development. PLoS One. 2015;10(5):e0125547.
40

16. Wolf JA, Moreau JF, Akilov O, Patton T, English JC 3rd, Ho J, et al. Diagnostic inaccuracy of smartphone applications for melanoma detection. JAMA Dermatol. 2013;149(4):422-6.
17. Mattioli R, Levy-Bencheton C. Methodologies for the identification of critical information infrastructure assets and services. ENISA. 2015. Accessed through: https://www.enisa.europa.eu/publications/methodologies-for-the-identification-of-ciis on November 30, 2017.
18. Nictiz. eHealth-monitor 2017. Accessed through: https://www.nictiz.nl/ehealth/ehealth-monitor/ehealth-monitor-2017 on November 30, 2017.
19. Hilty DM, Chan S, Torous J, Matmahur J, Mucic D. New frontiers in healthcare and technology: Internet- and web-based mental options emerge to complement in-person and telepsychiatric care options. J Health Med Informatics. 2015;6:1-14.
20. Schröder FH, Hugosson J, Roobol MJ, Tammela TL, Zappa M, Nelen V, et al. Screening and prostate cancer mortality: results of the European Randomised Study of Screening for Prostate Cancer (ERSPC) at 13 years of follow-up. Lancet. 2014;384(9959):2027-35.
21. Draisma G, Boer R, Otto SJ, van der Cruijsen IW, Damhuis RA, Schröder FH, et al. Lead times and overdetection due to prostate-specific antigen screening: estimates from the European Randomized Study of Screening for Prostate Cancer. J Natl Cancer Inst. 2003;95(12):868-78.
22. Roobol MJ, van Vugt HA, Loeb S, Zhu X, Bul M, Bangma CH, et al. Prediction of prostate cancer risk: the role of prostate volume and digital rectal examination in the ERSPC risk calculators. Eur Urol. 2012;61(3):577-83.
23. Louie KS, Seigneurin A, Cathcart P, Sasieni P. Do prostate cancer risk models improve the predictive accuracy of PSA screening? A meta-analysis. Ann Oncol. 2015;26(5):848-64.
24. Kranse R, Roobol M, Schröder FH. A graphical device to represent the outcomes of a logistic regression analysis. Prostate. 2008;68(15):1674-80.
25. van Vugt HA, Roobol MJ, Busstra M, Kil P, Oomens EH, de Jong IJ, et al. Compliance with biopsy recommendations of a prostate cancer risk calculator. BJU Int. 2012;109(10):1480-8.
26. van Vugt HA, Roobol MJ, van der Poel HG, van Muilekom EH, Busstra M, Kil P, Oomens EH, et al. Selecting men diagnosed with prostate cancer for active surveillance using a risk calculator: a prospective impact study. BJU Int. 2012;110(2):180-7.
27. Pereira-Azevedo N, Osório L, Fraga A, Roobol MJ. Rotterdam prostate cancer risk calculator: development and usability testing of the mobile phone app. JMIR Cancer. 2017;3(1):e1.
28. van den Bergh RC, Roemeling S, Roobol MJ, Roobol W, Schröder FH, Bangma CH. Prospective validation of active surveillance in prostate cancer: the PRIAS study. Eur Urol. 2007;52(6):1560-3.
29. Venderbos LDF, Roobol MJ. m-PRIAS: an e-health technology for men on active surveillance for prostate cancer. Qual Life Res. 2017;26(Suppl.1):99.
30. Pereira-Azevedo N, Carrasquinho E, Cardoso de Oliveira E, Cavadas V, Osório L, Fraga A, et al. mHealth in urology: a review of experts' involvement in app development. PLoS One. 2015;10(5):e0125547.


Nuno Pereira-Azevedo, Eduardo Carrasquinho, Eduardo Cardoso de Oliveira, Vítor Cavadas,
Luís Osório, Avelino Fraga,Miguel Castelo-Branco, and Monique J. Roobol
PLOS ONE (2015) 10(5):e0125547
Chapter 3
mHealth in Urology: A Review of Experts’ Involvement in App Development
43

RESEARCH ARTICLE
mHealth in Urology: A Review of Experts’Involvement in App DevelopmentNuno Pereira-Azevedo1,3*, Eduardo Carrasquinho2, Eduardo Cardoso de Oliveira2,Vitor Cavadas3, Luís Osório3, Avelino Fraga3, Miguel Castelo-Branco1, MoniqueJ. Roobol4
1 Faculty of Health Sciences, University of Beira Interior, Covilhã, Portugal, 2 Department of Urology,Espírito Santo Hospital, Évora, Portugal, 3 Department of Urology, Porto Hospital Centre, Porto, Portugal,4 Erasmus University, Erasmus Medical Centre, Rotterdam, The Netherlands
Abstract
Introduction
Smartphones are increasingly playing a role in healthcare and previous studies assessing
medical applications (apps) have raised concerns about lack of expert involvement and low
content accuracy. However, there are no such studies in Urology. We reviewed Urology
apps with the aim of assessing the level of participation of healthcare professionals (HCP)
and scientific Urology associations in their development.
Material and Methods
A systematic search was performed on PubMed, Apple's App Store and Google's Play
Store, for Urology apps, available in English. Apps were reviewed by three graders to deter-
mine the app’s platform, target customer, developer, app type, app category, price and the
participation of a HCP or a scientific Urology association in the development.
Results
The search yielded 372 apps, of which 150 were specific for Urology. A fifth of all apps had
no HCP involvement (20.7%) and only a third had been developed with a scientific Urology
association (34.7%). The lowest percentage of HCP (13.4%) and urological association
(1.9%) involvement was in apps designed for the general population. Furthermore,
there was no contribution from an Urology society in "Electronic Medical Record" nor in
"Patient Information" apps. A limitation of the study is that only Android and iOS apps
were reviewed.
Conclusions
Despite the increasing Mobile Health (mHealth) market, this is the first study that demon-
strates the lack of expert participation in the design of Urology apps, particularly in apps de-
signed for the general public. Until clear regulation is enforced, the urological community
should help regulate app development. Maintaining a register of certified apps or issuing an
PLOSONE | DOI:10.1371/journal.pone.0125547 May 18, 2015 1 / 14
OPEN ACCESS
Citation: Pereira-Azevedo N, Carrasquinho E,Cardoso de Oliveira E, Cavadas V, Osório L, FragaA, et al. (2015) mHealth in Urology: A Review ofExperts’ Involvement in App Development. PLoSONE 10(5): e0125547. doi:10.1371/journal.pone.0125547
Academic Editor: Robert Hurst, OklahomaUniversity Health Sciences Center, UNITED STATES
Received: February 9, 2015
Accepted: March 14, 2015
Published: May 18, 2015
Copyright: © 2015 Pereira-Azevedo et al. This is anopen access article distributed under the terms of theCreative Commons Attribution License, which permitsunrestricted use, distribution, and reproduction in anymedium, provided the original author and source arecredited.
Data Availability Statement: The informationunderlying this study is publicly available from theiTunes App Store and on Google Play Store, andanyone can access it. A complete assessment of allurology apps, including its description and informationabout its creators, is available in file S1 Table, andcan be accessed at (http://dx.doi.org/10.6084/m9.figshare.1363120).
Funding: The authors have no support or funding toreport.
Abstract
Introduction
Smartphones are increasingly playing a role in healthcare and previous studies
assessing medical applications (apps) have raised concerns about lack of expert involvement
and low content accuracy. However, there are no such studies in Urology. We reviewed
Urology apps with the aim of assessing the level of participation of healthcare professionals
(HCP) and scientific Urology associations in their development.
Material and Methods
A systematic search was performed on PubMed, Apple's App Store and Google's Play
Store, for Urology apps, available in English. Apps were reviewed by three graders to
determine the app’s platform, target customer, developer, app type, app category, price and
the participation of a HCP or a scientific Urology association in the development.
Results
The search yielded 372 apps, of which 150 were specific for Urology. A fifth of all apps
had no HCP involvement (20.7%) and only a third had been developed with a scientific Urology
association (34.7%). The lowest percentage of HCP (13.4%) and urological association (1.9%)
involvement was in apps designed for the general population. Furthermore, there was no
contribution from an Urology society in "Electronic Medical Record" nor in "Patient Information"
apps. A limitation of the study is that only Android and iOS apps were reviewed.
Conclusions
Despite the increasing Mobile Health (mHealth) market, this is the first study that
demonstrates the lack of expert participation in the design of Urology apps, particularly in apps
designed for the general public. Until clear regulation is enforced, the urological community
should help regulate app development. Maintaining a register of certified apps or issuing an
official scientific seal of approval could improve overall app quality. We propose that urologists
become stakeholders in mHealth, shaping future app design and promoting peer-review app
validation.
44

RESEARCH ARTICLE
mHealth in Urology: A Review of Experts’Involvement in App DevelopmentNuno Pereira-Azevedo1,3*, Eduardo Carrasquinho2, Eduardo Cardoso de Oliveira2,Vitor Cavadas3, Luís Osório3, Avelino Fraga3, Miguel Castelo-Branco1, MoniqueJ. Roobol4
1 Faculty of Health Sciences, University of Beira Interior, Covilhã, Portugal, 2 Department of Urology,Espírito Santo Hospital, Évora, Portugal, 3 Department of Urology, Porto Hospital Centre, Porto, Portugal,4 Erasmus University, Erasmus Medical Centre, Rotterdam, The Netherlands
Abstract
Introduction
Smartphones are increasingly playing a role in healthcare and previous studies assessing
medical applications (apps) have raised concerns about lack of expert involvement and low
content accuracy. However, there are no such studies in Urology. We reviewed Urology
apps with the aim of assessing the level of participation of healthcare professionals (HCP)
and scientific Urology associations in their development.
Material and Methods
A systematic search was performed on PubMed, Apple's App Store and Google's Play
Store, for Urology apps, available in English. Apps were reviewed by three graders to deter-
mine the app’s platform, target customer, developer, app type, app category, price and the
participation of a HCP or a scientific Urology association in the development.
Results
The search yielded 372 apps, of which 150 were specific for Urology. A fifth of all apps had
no HCP involvement (20.7%) and only a third had been developed with a scientific Urology
association (34.7%). The lowest percentage of HCP (13.4%) and urological association
(1.9%) involvement was in apps designed for the general population. Furthermore,
there was no contribution from an Urology society in "Electronic Medical Record" nor in
"Patient Information" apps. A limitation of the study is that only Android and iOS apps
were reviewed.
Conclusions
Despite the increasing Mobile Health (mHealth) market, this is the first study that demon-
strates the lack of expert participation in the design of Urology apps, particularly in apps de-
signed for the general public. Until clear regulation is enforced, the urological community
should help regulate app development. Maintaining a register of certified apps or issuing an
PLOSONE | DOI:10.1371/journal.pone.0125547 May 18, 2015 1 / 14
OPEN ACCESS
Citation: Pereira-Azevedo N, Carrasquinho E,Cardoso de Oliveira E, Cavadas V, Osório L, FragaA, et al. (2015) mHealth in Urology: A Review ofExperts’ Involvement in App Development. PLoSONE 10(5): e0125547. doi:10.1371/journal.pone.0125547
Academic Editor: Robert Hurst, OklahomaUniversity Health Sciences Center, UNITED STATES
Received: February 9, 2015
Accepted: March 14, 2015
Published: May 18, 2015
Copyright: © 2015 Pereira-Azevedo et al. This is anopen access article distributed under the terms of theCreative Commons Attribution License, which permitsunrestricted use, distribution, and reproduction in anymedium, provided the original author and source arecredited.
Data Availability Statement: The informationunderlying this study is publicly available from theiTunes App Store and on Google Play Store, andanyone can access it. A complete assessment of allurology apps, including its description and informationabout its creators, is available in file S1 Table, andcan be accessed at (http://dx.doi.org/10.6084/m9.figshare.1363120).
Funding: The authors have no support or funding toreport.
Abstract
Introduction
Smartphones are increasingly playing a role in healthcare and previous studies
assessing medical applications (apps) have raised concerns about lack of expert involvement
and low content accuracy. However, there are no such studies in Urology. We reviewed
Urology apps with the aim of assessing the level of participation of healthcare professionals
(HCP) and scientific Urology associations in their development.
Material and Methods
A systematic search was performed on PubMed, Apple's App Store and Google's Play
Store, for Urology apps, available in English. Apps were reviewed by three graders to
determine the app’s platform, target customer, developer, app type, app category, price and
the participation of a HCP or a scientific Urology association in the development.
Results
The search yielded 372 apps, of which 150 were specific for Urology. A fifth of all apps
had no HCP involvement (20.7%) and only a third had been developed with a scientific Urology
association (34.7%). The lowest percentage of HCP (13.4%) and urological association (1.9%)
involvement was in apps designed for the general population. Furthermore, there was no
contribution from an Urology society in "Electronic Medical Record" nor in "Patient Information"
apps. A limitation of the study is that only Android and iOS apps were reviewed.
Conclusions
Despite the increasing Mobile Health (mHealth) market, this is the first study that
demonstrates the lack of expert participation in the design of Urology apps, particularly in apps
designed for the general public. Until clear regulation is enforced, the urological community
should help regulate app development. Maintaining a register of certified apps or issuing an
official scientific seal of approval could improve overall app quality. We propose that urologists
become stakeholders in mHealth, shaping future app design and promoting peer-review app
validation.
45

Introduction
Smartphones and tablets are almost ubiquitous in our society and represent a popular
method of accessing information. Smartphone applications (apps) are increasingly playing a
role in healthcare (1). Mobile Health (mHealth) comprises "medical and public health practice
supported by mobile devices" (2). The total mHealth market revenue is estimated to grow by
about 61% to reach US$26 billion, by the end of 2017 (3). Moreover, previous studies report
close to 100,000 medical apps available on the two leading software platforms, iOS (Apple)
and Android (Google) (3). That number is expected to grow even further, as both Apple and
Google have announced mHealth to be a top-priority (4, 5). With the increasing number of
available apps, there is a growing concern about their quality and safety, as there are no
industry standards, no scientific guidelines and no independent medical app regulation (6 - 8).
Recently, papers assessing apps in various medical fields have been published,
detailing the myriad of options available, which range from health and fitness apps for the
general public, to medical education and teaching aids, as well as electronic health records
and even augmented reality (1, 9 - 12). The clinical use of smartphones as diagnostic tools in
Dermatology is one of the most common, but it is not without pitfalls: an app that claimed to
quantify skin cancer risk mislabeled 80% of textbook melanomas (13, 14).
Apps designed for surgical specialties, such as Anaesthesiology, Plastic Surgery and
Neurosurgery, have also been scrutinized, with similar conclusions: app development offers
great potential, but lacks standardized regulatory procedures (15 - 17). Even though there
have been papers demonstrating the use of apps in Urology, to our knowledge, there are no
published studies reviewing healthcare professional involvement in apps specifically designed
for Urology (18, 19). This study had two aims. First, to review Urology apps, mainly in regards
to mobile platform, target audience, developer, type of app, app category and price. Second,
to identify which apps had documented HCP involvement and which were developed in
collaboration with a scientific Urology association.
Methods
Three graders (an Urology resident and two Urology specialists) conducted a systematic
review on PubMed, Apple App Store (iOS) and Google Play Store (Android), for Urology-
themed apps, between September of 2014 and January of 2015. On PubMed, the searched
terms were "Urology" and "mobile", "application", "app", "apps", "mHealth", "eHealth", "iOS",
"iPhone", "iPad", "Android", "tablet" and "smartphone".
Results were filtered for articles related with Urology apps that were available for
download on the Apple App Store and on Google Play Store. A similar query was also
performed on both stores, for Urology-related apps. Android apps were searched at the
Google Play online store. For iOS-based applications, the search was performed using iTunes
v11.3.1 for Mac OS X (Apple Inc., Cupertino, CA, USA). All apps with "Urology" in their
metadata (title, description, keywords and version history) were scrutinized. From the search
results, graders included all apps that were available in English and designed specifically for
Urology (e.g., "AUA Core Curriculum Mobile"). Exclusion criteria include those related with
general medicine (e.g., "Clinical Tests & Procedures") or other fields (e.g., "Anatomy Flash
Cards"), and apps that only had product advertisement, i.e., apps that only promoted
pharmaceutical or medical equipment (e.g., "Actient Pharmaceuticals"). All three graders had
to agree on the criteria.
Based on all available information, the three reviewers decided on one of the following
apps' type: Reference, Guidelines, and Quiz/Exam (e.g., Textbooks, Guidelines from an
urological association); Conferences, Urological Societies/Associations, Journals and
Institutions (e.g., "EAU Stockholm 2014"); Calculators (e.g., "TNM Urology"); Electronic
Medical Record/Diaries (e.g., "Bladder Pal"); and Patient Information (e.g., "Dealing with
Prostate Cancer") (table 1). They also determined the target audience (i.e., apps designed
specifically for healthcare professionals or suitable for the general public). Moreover, they
gathered data on the type of developer (i.e., apps developed by an individual or an
organization) and the app's category. The app's category is chosen by the developer from a
predetermined list of options, and represents the category where the app is available in the
Store. Developers are required to select the category that best describes the app. Possible
categories are Medical, Books & Reference, Education, Health & Fitness, Business, News &
Magazines, Social, Utilities, Entertainment and Games. The app price (free or paid) and the
actual price in dollars were also recorded. Graders considered that there was involvement by
HCP (e.g., urologists, other medical doctors, pharmacists, and specialist nurses) or a scientific
Urology association in the apps’ design when it was mentioned in the app's description or
website. Apps were not purchased or downloaded. As an example, the app "AUA 2014
Meeting" would be recorded in the database as: platform (Android and iOS), Target (Health
professionals), Developer (Organization), Type (Conferences, Urological
Societies/Associations, Journals and Institutions), Category (Medical), Price (Free), Actual
price (0.0$), HCP involvement (Yes), scientific Urology association involvement (Yes).
First, a descriptive overview of available apps was performed. Second, all apps included
in this review were assessed regardless of being available on both platforms or exclusively on
Apple App Store or Google Play Store.
46

Introduction
Smartphones and tablets are almost ubiquitous in our society and represent a popular
method of accessing information. Smartphone applications (apps) are increasingly playing a
role in healthcare (1). Mobile Health (mHealth) comprises "medical and public health practice
supported by mobile devices" (2). The total mHealth market revenue is estimated to grow by
about 61% to reach US$26 billion, by the end of 2017 (3). Moreover, previous studies report
close to 100,000 medical apps available on the two leading software platforms, iOS (Apple)
and Android (Google) (3). That number is expected to grow even further, as both Apple and
Google have announced mHealth to be a top-priority (4, 5). With the increasing number of
available apps, there is a growing concern about their quality and safety, as there are no
industry standards, no scientific guidelines and no independent medical app regulation (6 - 8).
Recently, papers assessing apps in various medical fields have been published,
detailing the myriad of options available, which range from health and fitness apps for the
general public, to medical education and teaching aids, as well as electronic health records
and even augmented reality (1, 9 - 12). The clinical use of smartphones as diagnostic tools in
Dermatology is one of the most common, but it is not without pitfalls: an app that claimed to
quantify skin cancer risk mislabeled 80% of textbook melanomas (13, 14).
Apps designed for surgical specialties, such as Anaesthesiology, Plastic Surgery and
Neurosurgery, have also been scrutinized, with similar conclusions: app development offers
great potential, but lacks standardized regulatory procedures (15 - 17). Even though there
have been papers demonstrating the use of apps in Urology, to our knowledge, there are no
published studies reviewing healthcare professional involvement in apps specifically designed
for Urology (18, 19). This study had two aims. First, to review Urology apps, mainly in regards
to mobile platform, target audience, developer, type of app, app category and price. Second,
to identify which apps had documented HCP involvement and which were developed in
collaboration with a scientific Urology association.
Methods
Three graders (an Urology resident and two Urology specialists) conducted a systematic
review on PubMed, Apple App Store (iOS) and Google Play Store (Android), for Urology-
themed apps, between September of 2014 and January of 2015. On PubMed, the searched
terms were "Urology" and "mobile", "application", "app", "apps", "mHealth", "eHealth", "iOS",
"iPhone", "iPad", "Android", "tablet" and "smartphone".
Results were filtered for articles related with Urology apps that were available for
download on the Apple App Store and on Google Play Store. A similar query was also
performed on both stores, for Urology-related apps. Android apps were searched at the
Google Play online store. For iOS-based applications, the search was performed using iTunes
v11.3.1 for Mac OS X (Apple Inc., Cupertino, CA, USA). All apps with "Urology" in their
metadata (title, description, keywords and version history) were scrutinized. From the search
results, graders included all apps that were available in English and designed specifically for
Urology (e.g., "AUA Core Curriculum Mobile"). Exclusion criteria include those related with
general medicine (e.g., "Clinical Tests & Procedures") or other fields (e.g., "Anatomy Flash
Cards"), and apps that only had product advertisement, i.e., apps that only promoted
pharmaceutical or medical equipment (e.g., "Actient Pharmaceuticals"). All three graders had
to agree on the criteria.
Based on all available information, the three reviewers decided on one of the following
apps' type: Reference, Guidelines, and Quiz/Exam (e.g., Textbooks, Guidelines from an
urological association); Conferences, Urological Societies/Associations, Journals and
Institutions (e.g., "EAU Stockholm 2014"); Calculators (e.g., "TNM Urology"); Electronic
Medical Record/Diaries (e.g., "Bladder Pal"); and Patient Information (e.g., "Dealing with
Prostate Cancer") (table 1). They also determined the target audience (i.e., apps designed
specifically for healthcare professionals or suitable for the general public). Moreover, they
gathered data on the type of developer (i.e., apps developed by an individual or an
organization) and the app's category. The app's category is chosen by the developer from a
predetermined list of options, and represents the category where the app is available in the
Store. Developers are required to select the category that best describes the app. Possible
categories are Medical, Books & Reference, Education, Health & Fitness, Business, News &
Magazines, Social, Utilities, Entertainment and Games. The app price (free or paid) and the
actual price in dollars were also recorded. Graders considered that there was involvement by
HCP (e.g., urologists, other medical doctors, pharmacists, and specialist nurses) or a scientific
Urology association in the apps’ design when it was mentioned in the app's description or
website. Apps were not purchased or downloaded. As an example, the app "AUA 2014
Meeting" would be recorded in the database as: platform (Android and iOS), Target (Health
professionals), Developer (Organization), Type (Conferences, Urological
Societies/Associations, Journals and Institutions), Category (Medical), Price (Free), Actual
price (0.0$), HCP involvement (Yes), scientific Urology association involvement (Yes).
First, a descriptive overview of available apps was performed. Second, all apps included
in this review were assessed regardless of being available on both platforms or exclusively on
Apple App Store or Google Play Store.
47

When an app was available in both Stores, it was evaluated only once. However, some
apps available in both platforms had differences between the two versions, namely in price
and app category. When the price of the app was not the same on both Stores, the average
price was calculated. When the app category was not the same on both platforms, the most
recent version was considered. To evaluate an association between targeted audience and
healthcare professional or urological association involvement in the app development, the app
price, and the developer, we used the chi-square test of association. To analyse a relationship
between the type of application and the involvement of a healthcare professional or an
urological association in the development of the app, we calculated the chi-square test of
association. Analyses were performed using SPSS v20 (IBM Corp., Armonk, NY, USA).
Statistical significance was set at p<0.05 for all analyses.
Results
From the initial 372 (Android 250, iOS 122), apps that were not available in English, not
specific for Urology and that were product advertisement were excluded (figure 1).
Figure 1. Search methodology for Urology apps.
Table 1 lists all included apps and table 2 displays the main characteristics of the
surveyed apps. A complete assessment of all apps, including its description and information
about its creators can be accessed at http://dx.doi.org/10.6084/m9. figshare.1363120.
Table 1. List of all included Urology apps.
App Name Platform UA HCP
@Hand: Urology iOS No Yes
28 Congreso de Urologia 2014 Android Yes Yes
3 Prostate Diseases (Tanzania) Android No No
Abnormal Urine Guide iOS No No
Advanced Urology Android and iOS No No
AUA 2011 Courses Android Yes Yes
AUA 2012 Annual Meeting Android Yes Yes
AUA 2013 Annual Meeting Android and iOS Yes Yes
AUA 2014 Annual Meeting Android and iOS Yes Yes
AUA Annual Meeting Android Yes Yes
AUA Core Curriculum Mobile Both Yes Yes
AUA EBJC - Evidence-Based JC Android Yes Yes
AUA Guidelines at a Glance Android Yes Yes
AUA Medical Student Curriculum Android and iOS Yes Yes
AUA Member Search Android and iOS Yes Yes
AUA Men's Health Checklist Android Yes Yes
AURO.it Nazionale 2013 iOS Yes Yes
Bedwetting Info Android No No
Bedwetting solutions Android No No
Bedwetting Trainer Android No Yes
BJUI Journal iOS Yes Yes
Bladder Cancer Prognosis Calc iOS Yes Yes
Bladder Pal Android No Yes
Braz J Urol Android and iOS Yes Yes
48

When an app was available in both Stores, it was evaluated only once. However, some
apps available in both platforms had differences between the two versions, namely in price
and app category. When the price of the app was not the same on both Stores, the average
price was calculated. When the app category was not the same on both platforms, the most
recent version was considered. To evaluate an association between targeted audience and
healthcare professional or urological association involvement in the app development, the app
price, and the developer, we used the chi-square test of association. To analyse a relationship
between the type of application and the involvement of a healthcare professional or an
urological association in the development of the app, we calculated the chi-square test of
association. Analyses were performed using SPSS v20 (IBM Corp., Armonk, NY, USA).
Statistical significance was set at p<0.05 for all analyses.
Results
From the initial 372 (Android 250, iOS 122), apps that were not available in English, not
specific for Urology and that were product advertisement were excluded (figure 1).
Figure 1. Search methodology for Urology apps.
Table 1 lists all included apps and table 2 displays the main characteristics of the
surveyed apps. A complete assessment of all apps, including its description and information
about its creators can be accessed at http://dx.doi.org/10.6084/m9. figshare.1363120.
Table 1. List of all included Urology apps.
App Name Platform UA HCP
@Hand: Urology iOS No Yes
28 Congreso de Urologia 2014 Android Yes Yes
3 Prostate Diseases (Tanzania) Android No No
Abnormal Urine Guide iOS No No
Advanced Urology Android and iOS No No
AUA 2011 Courses Android Yes Yes
AUA 2012 Annual Meeting Android Yes Yes
AUA 2013 Annual Meeting Android and iOS Yes Yes
AUA 2014 Annual Meeting Android and iOS Yes Yes
AUA Annual Meeting Android Yes Yes
AUA Core Curriculum Mobile Both Yes Yes
AUA EBJC - Evidence-Based JC Android Yes Yes
AUA Guidelines at a Glance Android Yes Yes
AUA Medical Student Curriculum Android and iOS Yes Yes
AUA Member Search Android and iOS Yes Yes
AUA Men's Health Checklist Android Yes Yes
AURO.it Nazionale 2013 iOS Yes Yes
Bedwetting Info Android No No
Bedwetting solutions Android No No
Bedwetting Trainer Android No Yes
BJUI Journal iOS Yes Yes
Bladder Cancer Prognosis Calc iOS Yes Yes
Bladder Pal Android No Yes
Braz J Urol Android and iOS Yes Yes
49

App Name Platform UA HCP
Briganti Nomogram Android No No
BSC Urology Events Android and iOS No No
CalcuLithiasis iOS Yes Yes
CAU2014 Android Yes Yes
CROJ Android No Yes
CRPC Nomogram App Android No Yes
CURE-UAB Android and iOS No Yes
Current Opinion in Urology iOS No Yes
Daily-P Android and iOS No Yes
Daily-P Pro Android and iOS No Yes
Dealing with Prostate Cancer Android No No
Dealing with Prostate Cancer Free Android No No
DGU 2012 Android and iOS Yes Yes
DGU 2014 iOS Yes Yes
DGU 2014 - Kongress App Android Yes Yes
drawMD Female Pelvic Surgery iOS No Yes
drawMD Urology - Patient Education by Drawing on
Medical
iOS No Yes
DutasT Android and iOS No Yes
e-URO Tools Android and iOS Yes Yes
EAU 2012 Android and iOS Yes Yes
EAU Milan 2013 Android and iOS Yes Yes
EAU Pocket Guidelines Android and iOS Yes Yes
EAU Stockholm 2014 Android and iOS Yes Yes
EAU Vienna 2011 Android and iOS Yes Yes
EAUN Milan 2013 Android and iOS Yes Yes
EAUN Stockholm 2014 Android and iOS Yes Yes
ESPU 2012 Android and iOS Yes Yes
ESPU 2013 Android and iOS Yes Yes
App Name Platform UA HCP
European Urology app Android and iOS Yes Yes
EurUro SiM iOS Yes Yes
Female Pelvic Medicine & Reconstructive Surgery iOS Yes Yes
Foundation Urology Android No Yes
GU Path I iOS No Yes
GU Path Lite iOS No Yes
HapPee Time Android No No
iCU Evora 2011 iOS Yes Yes
iDry iOS No Yes
Int'l Urogynecology Journal Android Yes Yes
iP Voiding Diary iOS No Yes
iReflux Risk Calculator Android and iOS No No
itsaMANTHING - Prostate Cancer Android No No
iURO Andrology Android and iOS No Yes
iURO Andrology PRO Android and iOS No Yes
iURO General Practicioner iOS No Yes
iURO Kidney Android and iOS No Yes
iURO Oncology Android and iOS No Yes
iURO Oncology Pro Android and iOS No Yes
iURO Pelvic Floor Android and iOS No Yes
iURO Pelvic Floor Pro Android and iOS No Yes
iURO Prostate Pro Android and iOS No Yes
Kidney and Bladder Problems Android and iOS No No
Kidney Cancer Android No No
Kidney Disease Assistant iOS No No
Kidney Diseases iOS No No
Kidney Urology - Simulations and behaviours of Kidney
diseases
iOS No Yes
kidneystoneMD iOS No Yes
50

App Name Platform UA HCP
Briganti Nomogram Android No No
BSC Urology Events Android and iOS No No
CalcuLithiasis iOS Yes Yes
CAU2014 Android Yes Yes
CROJ Android No Yes
CRPC Nomogram App Android No Yes
CURE-UAB Android and iOS No Yes
Current Opinion in Urology iOS No Yes
Daily-P Android and iOS No Yes
Daily-P Pro Android and iOS No Yes
Dealing with Prostate Cancer Android No No
Dealing with Prostate Cancer Free Android No No
DGU 2012 Android and iOS Yes Yes
DGU 2014 iOS Yes Yes
DGU 2014 - Kongress App Android Yes Yes
drawMD Female Pelvic Surgery iOS No Yes
drawMD Urology - Patient Education by Drawing on
Medical
iOS No Yes
DutasT Android and iOS No Yes
e-URO Tools Android and iOS Yes Yes
EAU 2012 Android and iOS Yes Yes
EAU Milan 2013 Android and iOS Yes Yes
EAU Pocket Guidelines Android and iOS Yes Yes
EAU Stockholm 2014 Android and iOS Yes Yes
EAU Vienna 2011 Android and iOS Yes Yes
EAUN Milan 2013 Android and iOS Yes Yes
EAUN Stockholm 2014 Android and iOS Yes Yes
ESPU 2012 Android and iOS Yes Yes
ESPU 2013 Android and iOS Yes Yes
App Name Platform UA HCP
European Urology app Android and iOS Yes Yes
EurUro SiM iOS Yes Yes
Female Pelvic Medicine & Reconstructive Surgery iOS Yes Yes
Foundation Urology Android No Yes
GU Path I iOS No Yes
GU Path Lite iOS No Yes
HapPee Time Android No No
iCU Evora 2011 iOS Yes Yes
iDry iOS No Yes
Int'l Urogynecology Journal Android Yes Yes
iP Voiding Diary iOS No Yes
iReflux Risk Calculator Android and iOS No No
itsaMANTHING - Prostate Cancer Android No No
iURO Andrology Android and iOS No Yes
iURO Andrology PRO Android and iOS No Yes
iURO General Practicioner iOS No Yes
iURO Kidney Android and iOS No Yes
iURO Oncology Android and iOS No Yes
iURO Oncology Pro Android and iOS No Yes
iURO Pelvic Floor Android and iOS No Yes
iURO Pelvic Floor Pro Android and iOS No Yes
iURO Prostate Pro Android and iOS No Yes
Kidney and Bladder Problems Android and iOS No No
Kidney Cancer Android No No
Kidney Disease Assistant iOS No No
Kidney Diseases iOS No No
Kidney Urology - Simulations and behaviours of Kidney
diseases
iOS No Yes
kidneystoneMD iOS No Yes
51

App Name Platform UA HCP
Learning Urology Quiz Android and iOS No Yes
Male impotence risk evaluation Android No No
male_Japanese iOS No Yes
Men's App iOS No Yes
Men's Guide To Prostate Health Android No No
Miniatlas Erectile Dysfunction iOS No Yes
My BladderDiary Android No No
NMIBC Toolbox Android No Yes
Oxford Handbook Urology 2nd Ed Android and iOS No Yes
Partin/Han Tables iOS No Yes
PI-RADS Prostate MRI Android No Yes
Prac. Urology for Primary Care Android and iOS No Yes
Practical Urology Android and iOS No Yes
Practical Urology for Gynecologists iOS No Yes
Prevent Prostate Cancer Android No No
Primary Care Guidelines for Urology Android and iOS Yes Yes
Prostate Cancer Android No Yes
Prostate Cancer Calculator Android No No
Prostate Cancer Calculator (Seoul National University) Android No Yes
Prostate Cancer v2 Android No Yes
Prostate Health Android and iOS No Yes
Prostate In Focus Android No Yes
PROSTATE INTERNATIONAL Android Yes Yes
Prostate Pal 2 Android No Yes
ProstateMD Android No Yes
Renal & Urology News Android and iOS No Yes
Reviews in Urology iOS No Yes
Rotterdam Prostate Cancer Risk Android and iOS Yes Yes
РОУ (Russian Society of Urology) Android Yes Yes
App Name Platform UA HCP
Show Me OAB iOS No No
SIU 2013 Android and iOS Yes Yes
SMU 2014 Android Yes Yes
Testicle pain, testicle tumors Android No No
Testicular Cancer Android No No
Testicular Cancer Checker iOS No No
The Journal of Urology®, Official Journal of AUA iOS Yes Yes
Three Diseases of the Prostate Android No No
TNM Urology iOS No Yes
Turkish Journal of Urology iOS Yes Yes
Understanding Prostate Cancer Android No Yes
UrinaryAlmanac iOS No Yes
Uro Challenge Android and iOS Yes Yes
UroBladderDiary iOS No No
Urolithiasis Assist Android Yes Yes
Urologic Nurse CURN, 800 MCQs Android No Yes
Urologic Oncology: Seminars and Original
Investigation
iOS Yes Yes
Urological Surgery Android No Yes
Urological Ultrasound Android No Yes
Urology iOS No No
Urology - Pediatric, 1000 MCQs Android No Yes
Urology Board Review Manual Android and iOS No Yes
Urology Case Reports iOS Yes Yes
Urology Flashcards Android and iOS No Yes
Urology for Gynecologists Android No Yes
Urology Glossary Android and iOS No No
Urology Nation Android and iOS No Yes
Urology NBI Atlas by Olympus iOS No Yes
52

App Name Platform UA HCP
Learning Urology Quiz Android and iOS No Yes
Male impotence risk evaluation Android No No
male_Japanese iOS No Yes
Men's App iOS No Yes
Men's Guide To Prostate Health Android No No
Miniatlas Erectile Dysfunction iOS No Yes
My BladderDiary Android No No
NMIBC Toolbox Android No Yes
Oxford Handbook Urology 2nd Ed Android and iOS No Yes
Partin/Han Tables iOS No Yes
PI-RADS Prostate MRI Android No Yes
Prac. Urology for Primary Care Android and iOS No Yes
Practical Urology Android and iOS No Yes
Practical Urology for Gynecologists iOS No Yes
Prevent Prostate Cancer Android No No
Primary Care Guidelines for Urology Android and iOS Yes Yes
Prostate Cancer Android No Yes
Prostate Cancer Calculator Android No No
Prostate Cancer Calculator (Seoul National University) Android No Yes
Prostate Cancer v2 Android No Yes
Prostate Health Android and iOS No Yes
Prostate In Focus Android No Yes
PROSTATE INTERNATIONAL Android Yes Yes
Prostate Pal 2 Android No Yes
ProstateMD Android No Yes
Renal & Urology News Android and iOS No Yes
Reviews in Urology iOS No Yes
Rotterdam Prostate Cancer Risk Android and iOS Yes Yes
РОУ (Russian Society of Urology) Android Yes Yes
App Name Platform UA HCP
Show Me OAB iOS No No
SIU 2013 Android and iOS Yes Yes
SMU 2014 Android Yes Yes
Testicle pain, testicle tumors Android No No
Testicular Cancer Android No No
Testicular Cancer Checker iOS No No
The Journal of Urology®, Official Journal of AUA iOS Yes Yes
Three Diseases of the Prostate Android No No
TNM Urology iOS No Yes
Turkish Journal of Urology iOS Yes Yes
Understanding Prostate Cancer Android No Yes
UrinaryAlmanac iOS No Yes
Uro Challenge Android and iOS Yes Yes
UroBladderDiary iOS No No
Urolithiasis Assist Android Yes Yes
Urologic Nurse CURN, 800 MCQs Android No Yes
Urologic Oncology: Seminars and Original
Investigation
iOS Yes Yes
Urological Surgery Android No Yes
Urological Ultrasound Android No Yes
Urology iOS No No
Urology - Pediatric, 1000 MCQs Android No Yes
Urology Board Review Manual Android and iOS No Yes
Urology Case Reports iOS Yes Yes
Urology Flashcards Android and iOS No Yes
Urology for Gynecologists Android No Yes
Urology Glossary Android and iOS No No
Urology Nation Android and iOS No Yes
Urology NBI Atlas by Olympus iOS No Yes
53

App Name Platform UA HCP
Urology Patient Education by CoherentRx iOS No Yes
Urology Planet iOS No No
Urology Times Android and iOS No Yes
Urology, 1000 MCQs Android No Yes
Urology, The Gold Journal iOS Yes Yes
UrologyMatch Android and iOS No Yes
UroSketch 3D Explore iOS No Yes
UroSketch 3D Professional iOS No Yes
USICON Android Yes Yes
USICON 2014 Android and iOS Yes Yes
Vasectomy Reversal Android No Yes
WCE 2013 Annual Meeting Android Yes Yes
UWPEN iOS No No
Table 2. Summary of descriptive statistics of Urology apps.
Factors Description Statistics Platforma Google 37.3% Apple 29.3% Both 33.3% Target audiencea Specific for health professionals 72.7% Designed for the general public 27.3% Developera Individual 12.0% Organization
(Company/Association/University/Etc.) 88.0%
Apps’ typea Reference, Guidelines, Quiz/Exam 36.7% Conferences, Urological
Societies/Associations, Journals and Institutions
29.3%
Calculator 8.7% Electronic Medical Record/Diaries 6.7% Patient information 18.7% Apps’ category in the Storea
Medical 68.7%
Books & Reference 9.3% Education 8.7% Health & Fitness 8.7% Business 1.3% News & Magazines 0.7% Social 0.7% Productivity 1.3% Games 0.7% Free or Paida Free 71.3% Paid 28.7% Actual app price($)b Max price $71.94 Minimum price (of paid) $0.99 Mean price SD for paid apps $9.15
$14.09 Mean price SD for all apps $2.62 $8.55 Involvement of health No 20.7% professional in app’ designac
Yes 79.3%
Involvement of Urological No 65.3% Association in app’ designad
Yes 34.7%
± ±
± ±
54

App Name Platform UA HCP
Urology Patient Education by CoherentRx iOS No Yes
Urology Planet iOS No No
Urology Times Android and iOS No Yes
Urology, 1000 MCQs Android No Yes
Urology, The Gold Journal iOS Yes Yes
UrologyMatch Android and iOS No Yes
UroSketch 3D Explore iOS No Yes
UroSketch 3D Professional iOS No Yes
USICON Android Yes Yes
USICON 2014 Android and iOS Yes Yes
Vasectomy Reversal Android No Yes
WCE 2013 Annual Meeting Android Yes Yes
UWPEN iOS No No
Table 2. Summary of descriptive statistics of Urology apps.
Factors Description Statistics Platforma Google 37.3% Apple 29.3% Both 33.3% Target audiencea Specific for health professionals 72.7% Designed for the general public 27.3% Developera Individual 12.0% Organization
(Company/Association/University/Etc.) 88.0%
Apps’ typea Reference, Guidelines, Quiz/Exam 36.7% Conferences, Urological
Societies/Associations, Journals and Institutions
29.3%
Calculator 8.7% Electronic Medical Record/Diaries 6.7% Patient information 18.7% Apps’ category in the Storea
Medical 68.7%
Books & Reference 9.3% Education 8.7% Health & Fitness 8.7% Business 1.3% News & Magazines 0.7% Social 0.7% Productivity 1.3% Games 0.7% Free or Paida Free 71.3% Paid 28.7% Actual app price($)b Max price $71.94 Minimum price (of paid) $0.99 Mean price SD for paid apps $9.15
$14.09 Mean price SD for all apps $2.62 $8.55 Involvement of health No 20.7% professional in app’ designac
Yes 79.3%
Involvement of Urological No 65.3% Association in app’ designad
Yes 34.7%
± ±
± ±
55

Summary of descriptive statistics of Urology apps and information regarding their platform, target audience, developer type, app type, app category, cost and involvement of a healthcare professional or a urological society. aThe percentages frequency distributions are reported for nominal and ordinal variables. bThe maximum, minimum, and mean values are presented for the actual price. cThe involvement of a healthcare professional was assumed if there was reference to a urologist, other medical doctors, pharmacists or specialist nurses in the app. dThe involvement of a Urology association was assumed if there was reference to a Urology association.
We found 44 apps exclusive to Apple App Store, 56 uniquely on Google Play Store and
50 available on both stores, for a total of 150 Urology apps. Of the 150 individual apps, there
were more apps targeted at healthcare professionals (72.7%) and published by organizations
(88.0%). The most common type of app was "References, Guidelines, and Quiz/Exam"
(36.7%), which included, for example, Urology textbooks and atlas. Regarding app category,
most were classified as "Medical" (68.7%), but many were available in the "Books &
Reference" section (9.3%).
The vast majority of apps were free (71.3%). The average price of paid applications was
$9.15 ±14.09, but there was a large range, from $0.99 (five apps) to $71.94 ("Urological
Surgery", $71.94). The most expensive apps were "References, Guidelines, and Quiz/Exam".
Taking into account the available free apps, the average app price dropped to $2.62 ± 8.55.
One in five apps had no documented HCP involvement in their design (20.7%).
Moreover, only one-third of all reviewed apps had been developed in collaboration with a
scientific Urology association (34.7%). Furthermore, there was a statistically significant
difference between target audience and HCP involvement in apps’ design (p<0.001): only
13.4% of all apps designed with input from a HCP were targeted for the general population.
Additionally, there was a statistically significant difference between target audience and
urological association involvement in the apps’ design (p<0.001). Similarly, the lowest
percentage of urological association involvement in apps’ design was in apps designed for the
general population (1.9%) (table 3).
Table 3. Association between target audience and expert involvement.
Target audience
Healthcare professional involvement in app’ development
Urological association involvement in app’ development
No (0) Yes (1) p-value No (0) Yes (1) p-value
Health
professionals
10
(27.8%)
94
(74.6%)
<0.001 54
(48.6%)
50
(98.0%)
<0.001
General 26
(72.2%)
32
(25.4%)
57
(51.4%)
1
(2%)
Association (assessed by Chi square test) between targeted audience and healthcare professional or urological association involvement in the app development.
Moreover, there was statistically significant differences between apps’ type and HCP
(p<0.001) and urological association (p<0.001) involvement in apps' design. The lack of HCP
involvement in app development was highest in Patient Information apps (64.3%) and
Electronic Medical Record/Diaries (40%). No Electronic Medical Record/Diaries nor Patient
Information apps were developed with documented involvement by any scientific Urology
association (table 4). There were no statistically significant differences between target
audience and cost (free or paid, p=0.13) nor developer type (individual or organization,
p=0.08).
Table 4. Association between type of application and expert involvement
Healthcare professional involvement in app’ development
Urological association involvement in app’ development
Apps’ type No (0) Yes (1) p-value No (0) Yes (1) p-value 1 - Reference, Guidelines, Quiz/Exam
8 14%
49 86%
<0.001 45 78.9%
12 21.1%
<0.001
2 - Conferences, Urological Societies/Associations, Journals and Institutions
0 0%
51 100%
18 35.3%
33 64.7%
3 - Calculator 5 38.5%
8 61.5%
7 53.8%
6 46.2%
4 - Electronic Medical Record/Diaries
4 44.4%
5 55.6%
9 100.0%
0 0.0%
5 - Patient Information 19 59.4%
13 40.6%
32 100.0%
0 0.0%
Association (assessed by Chi square test) between the type of application and the involvement of a healthcare professional or a urological association in the development of the app.
56

Summary of descriptive statistics of Urology apps and information regarding their platform, target audience, developer type, app type, app category, cost and involvement of a healthcare professional or a urological society. aThe percentages frequency distributions are reported for nominal and ordinal variables. bThe maximum, minimum, and mean values are presented for the actual price. cThe involvement of a healthcare professional was assumed if there was reference to a urologist, other medical doctors, pharmacists or specialist nurses in the app. dThe involvement of a Urology association was assumed if there was reference to a Urology association.
We found 44 apps exclusive to Apple App Store, 56 uniquely on Google Play Store and
50 available on both stores, for a total of 150 Urology apps. Of the 150 individual apps, there
were more apps targeted at healthcare professionals (72.7%) and published by organizations
(88.0%). The most common type of app was "References, Guidelines, and Quiz/Exam"
(36.7%), which included, for example, Urology textbooks and atlas. Regarding app category,
most were classified as "Medical" (68.7%), but many were available in the "Books &
Reference" section (9.3%).
The vast majority of apps were free (71.3%). The average price of paid applications was
$9.15 ±14.09, but there was a large range, from $0.99 (five apps) to $71.94 ("Urological
Surgery", $71.94). The most expensive apps were "References, Guidelines, and Quiz/Exam".
Taking into account the available free apps, the average app price dropped to $2.62 ± 8.55.
One in five apps had no documented HCP involvement in their design (20.7%).
Moreover, only one-third of all reviewed apps had been developed in collaboration with a
scientific Urology association (34.7%). Furthermore, there was a statistically significant
difference between target audience and HCP involvement in apps’ design (p<0.001): only
13.4% of all apps designed with input from a HCP were targeted for the general population.
Additionally, there was a statistically significant difference between target audience and
urological association involvement in the apps’ design (p<0.001). Similarly, the lowest
percentage of urological association involvement in apps’ design was in apps designed for the
general population (1.9%) (table 3).
Table 3. Association between target audience and expert involvement.
Target audience
Healthcare professional involvement in app’ development
Urological association involvement in app’ development
No (0) Yes (1) p-value No (0) Yes (1) p-value
Health
professionals
10
(27.8%)
94
(74.6%)
<0.001 54
(48.6%)
50
(98.0%)
<0.001
General 26
(72.2%)
32
(25.4%)
57
(51.4%)
1
(2%)
Association (assessed by Chi square test) between targeted audience and healthcare professional or urological association involvement in the app development.
Moreover, there was statistically significant differences between apps’ type and HCP
(p<0.001) and urological association (p<0.001) involvement in apps' design. The lack of HCP
involvement in app development was highest in Patient Information apps (64.3%) and
Electronic Medical Record/Diaries (40%). No Electronic Medical Record/Diaries nor Patient
Information apps were developed with documented involvement by any scientific Urology
association (table 4). There were no statistically significant differences between target
audience and cost (free or paid, p=0.13) nor developer type (individual or organization,
p=0.08).
Table 4. Association between type of application and expert involvement
Healthcare professional involvement in app’ development
Urological association involvement in app’ development
Apps’ type No (0) Yes (1) p-value No (0) Yes (1) p-value 1 - Reference, Guidelines, Quiz/Exam
8 14%
49 86%
<0.001 45 78.9%
12 21.1%
<0.001
2 - Conferences, Urological Societies/Associations, Journals and Institutions
0 0%
51 100%
18 35.3%
33 64.7%
3 - Calculator 5 38.5%
8 61.5%
7 53.8%
6 46.2%
4 - Electronic Medical Record/Diaries
4 44.4%
5 55.6%
9 100.0%
0 0.0%
5 - Patient Information 19 59.4%
13 40.6%
32 100.0%
0 0.0%
Association (assessed by Chi square test) between the type of application and the involvement of a healthcare professional or a urological association in the development of the app.
57

Discussion
To our knowledge, this is the first study that completely identifies healthcare professional
involvement in apps specifically designed for Urology and hence can serve as a trigger for
urological societies to further explore the opportunities and overcome potential pitfalls of
mHealth in Urology.
The mHealth market is mostly self-regulated, but there is a need for an independent
assessment of available apps, to prevent both healthcare professionals and the general public
using unknown reliability apps. The current study shows that there is clearly a deficit of expert
input in Urology apps, as more than one-fifth of all available apps did not mention any
involvement of healthcare professionals. These results are coherent with those from other
areas, which shows that this may be an issue across multiple medical fields (20-22).
Google Play Store has slightly more Urology apps than Apple App Store. One possible
explanation for this difference is the contrasting app approval process on both platforms:
Android apps are automatically approved. However, iOS apps need to respect Apple's Review
Guidelines and are only published in the App Store after approval by official reviewers (4). For
example, apps that share user data acquired via HealthKit with third parties without user
consent are rejected (4).
The present study shows that the most common type of apps was "References,
Guidelines, and Quiz/Exam" and most apps were available in the "Medical" category of the
store, which is consistent with other reviews (13, 20). Even though most apps were targeted
at professionals, one-fifth off all apps in our review are designed for patient information, which
stresses the importance of safety even further, knowing that these users often lack scientific
judgment. Moreover, the involvement of commercial companies in this type of media has been
questioned before, with worries about their funding and purpose (23). A particular concern is
the potential bias in product promotion, which can ultimately create conflicts of interest
between the developer, healthcare professionals and the end user.
Development of health apps should always involve healthcare experts. However, in our
review, calculators had an unexpectedly low proportion of medical professional participation
in their design. This weak involvement of healthcare professionals in app design is even more
flagrant in patient-targeted apps, particularly in Electronic Medical Records and Patient
Information apps. Even when there was reference to a healthcare professional or an urological
society involvement in the app design, it was not possible to systematically assess their level
of responsibility, either as an external advisor, major stakeholder or sole author. Moreover, we
could not find any available tools or evidence on how to quantify this information in a
reproducible method.
This issue has raised attention of some public entities, namely the National Health
Service in England, which curates an online Health Apps Library, and also private companies
(e.g., Happtique MobileHealth Source), which are developing certification processes for
mobile apps, with the aim of regulating the mHealth market (24). With the growing number of
available apps, the challenge is finding safe and well-designed apps.
Healthcare professional and urological association involvement can act as a quality
check, which is of paramount importance, not only for healthcare-targeted apps, but even
more so in apps designed for the general public. In the same way that doctors involvement in
social media (SoMe) has been the focus of attention and recommendation by urological
societies, medical app development is starting to become subject to the same regulation, and
Urology should not be left out (25 - 29). mHealth has the potential to be an important tool in
the future of Urology. However, it is critical that accuracy, privacy and safety are assured.
Even though some of the issues may not be within the competence of urological associations,
they can still take an active role in this subject.
mHealth app development should be seen by urologists as an opportunity to provide
greater care to our patients and better software and knowledge to our peers. Even though this
paradigm might require learning some new tools and skills, engaging in app development can
be a fulfilling opportunity for an alternative medical interaction.
The present study certifies the lack of healthcare professional involvement in Urology
apps. Considering that apps included in this review represent less than 0.2% of available
medical apps and that there are more breast cancer (total = 178, Android = 118, iOS = 59)
than Urology apps, mHealth is an untapped potential in our field and further investigation is
mandatory to clarify the role that apps may play in Urology (30).
This study has some limitations. We could not perform analyses on the mobile stores'
rating and review data because, unlike Google Play Store, the Apple App Store does not show
the rating of all apps. Another limitation is that only the Android and iOS apps were reviewed,
even though there are other mobile app stores, namely Microsoft and Samsung. However,
Apple's App Store and Google's Play Store are by far the most popular platforms. We only
searched for apps that included "Urology" in their metadata. Therefore, some Urology apps,
which did not include it in the description of the app, were not taken into account. Even though
all graders had to agree on the app's type classification, it remains subjective, which is a
potential limitation. However, there is no standardized classification scheme available.
Healthcare professional and urological society involvement was structured as a binary variable
(i.e., yes/no), but was not quantified.
58

Discussion
To our knowledge, this is the first study that completely identifies healthcare professional
involvement in apps specifically designed for Urology and hence can serve as a trigger for
urological societies to further explore the opportunities and overcome potential pitfalls of
mHealth in Urology.
The mHealth market is mostly self-regulated, but there is a need for an independent
assessment of available apps, to prevent both healthcare professionals and the general public
using unknown reliability apps. The current study shows that there is clearly a deficit of expert
input in Urology apps, as more than one-fifth of all available apps did not mention any
involvement of healthcare professionals. These results are coherent with those from other
areas, which shows that this may be an issue across multiple medical fields (20-22).
Google Play Store has slightly more Urology apps than Apple App Store. One possible
explanation for this difference is the contrasting app approval process on both platforms:
Android apps are automatically approved. However, iOS apps need to respect Apple's Review
Guidelines and are only published in the App Store after approval by official reviewers (4). For
example, apps that share user data acquired via HealthKit with third parties without user
consent are rejected (4).
The present study shows that the most common type of apps was "References,
Guidelines, and Quiz/Exam" and most apps were available in the "Medical" category of the
store, which is consistent with other reviews (13, 20). Even though most apps were targeted
at professionals, one-fifth off all apps in our review are designed for patient information, which
stresses the importance of safety even further, knowing that these users often lack scientific
judgment. Moreover, the involvement of commercial companies in this type of media has been
questioned before, with worries about their funding and purpose (23). A particular concern is
the potential bias in product promotion, which can ultimately create conflicts of interest
between the developer, healthcare professionals and the end user.
Development of health apps should always involve healthcare experts. However, in our
review, calculators had an unexpectedly low proportion of medical professional participation
in their design. This weak involvement of healthcare professionals in app design is even more
flagrant in patient-targeted apps, particularly in Electronic Medical Records and Patient
Information apps. Even when there was reference to a healthcare professional or an urological
society involvement in the app design, it was not possible to systematically assess their level
of responsibility, either as an external advisor, major stakeholder or sole author. Moreover, we
could not find any available tools or evidence on how to quantify this information in a
reproducible method.
This issue has raised attention of some public entities, namely the National Health
Service in England, which curates an online Health Apps Library, and also private companies
(e.g., Happtique MobileHealth Source), which are developing certification processes for
mobile apps, with the aim of regulating the mHealth market (24). With the growing number of
available apps, the challenge is finding safe and well-designed apps.
Healthcare professional and urological association involvement can act as a quality
check, which is of paramount importance, not only for healthcare-targeted apps, but even
more so in apps designed for the general public. In the same way that doctors involvement in
social media (SoMe) has been the focus of attention and recommendation by urological
societies, medical app development is starting to become subject to the same regulation, and
Urology should not be left out (25 - 29). mHealth has the potential to be an important tool in
the future of Urology. However, it is critical that accuracy, privacy and safety are assured.
Even though some of the issues may not be within the competence of urological associations,
they can still take an active role in this subject.
mHealth app development should be seen by urologists as an opportunity to provide
greater care to our patients and better software and knowledge to our peers. Even though this
paradigm might require learning some new tools and skills, engaging in app development can
be a fulfilling opportunity for an alternative medical interaction.
The present study certifies the lack of healthcare professional involvement in Urology
apps. Considering that apps included in this review represent less than 0.2% of available
medical apps and that there are more breast cancer (total = 178, Android = 118, iOS = 59)
than Urology apps, mHealth is an untapped potential in our field and further investigation is
mandatory to clarify the role that apps may play in Urology (30).
This study has some limitations. We could not perform analyses on the mobile stores'
rating and review data because, unlike Google Play Store, the Apple App Store does not show
the rating of all apps. Another limitation is that only the Android and iOS apps were reviewed,
even though there are other mobile app stores, namely Microsoft and Samsung. However,
Apple's App Store and Google's Play Store are by far the most popular platforms. We only
searched for apps that included "Urology" in their metadata. Therefore, some Urology apps,
which did not include it in the description of the app, were not taken into account. Even though
all graders had to agree on the app's type classification, it remains subjective, which is a
potential limitation. However, there is no standardized classification scheme available.
Healthcare professional and urological society involvement was structured as a binary variable
(i.e., yes/no), but was not quantified.
59

Conclusion
Apps represent a new opportunity to enhance care in Urology. Possible uses range from
augmented reality apps that can be helpful in a clinical or surgical setting, to electronic diaries
that aid in treatment monitoring and even health promoting apps. Even though there are, at
the moment, 162 Urology apps, covering a wide range of subjects and directed at a diverse
audience, there is room for improvement.
Until clear regulation is enforced, either by government health authorities or independent
organizations, the urological community should adopt an active role as soon as possible, in a
manner similar to what was done regarding SoMe (25 - 28). Even though it is impossible to
verify all available apps, maintaining a peer-reviewed register of certified Urology apps or
issuing an official seal of approval, could influence overall app design and, consequently,
improve urological mHealth solutions.
References
1. Kwok R. Mobile apps: A conference in your pocket. Nature. 2013;498(7454):395-7. 2. World Health Organization. mHealth: New horizons for health through mobile technologies
(Global Observatory for eHealth series - Volume 3). Geneva, Switzerland: World Health Organization. 2011.
3. Research2Guidance. The mobile health global market report 2013–2017: the commercialisation of mHealth apps (Vol. 3). Accessed through: http://www.research2guidance.com/shop/index.php/downloadable/download/sample/sample_id/273/ on September 1, 2014.
4. Apple HealthKit. Accessed through: https://developer.apple.com/healthkit on September 1, 2014.
5. Google Fit. Accessed through: https://developers.google.com/fit on September 1, 2014. 6. Buijink AW, Visser BJ, Marshall L. Medical apps for smartphones: lack of evidence undermines
quality and safety. Evid Based Med. 2013;18(3):90-2. 7. McCartney M. How do we know whether medical apps work? BMJ. 2013;346:f1811. 8. Boxall NE. Mobile apps: are we culturally out of signal? Emerg Med J. 2014;31(5):432-3. 9. Pellegrini CA, Duncan JM, Moller AC, Buscemi J, Sularz A, DeMott A, et al. A smartphone-
supported weight loss program: design of the ENGAGED randomized controlled trial. BMC Public Health. 2012;12:1041.
10. Gaglani SM, Topol EJ. iMedEd: The role of mobile health technologies in medical education. Acad Med. 2014;89(9):1207-9.
11. Lin Y-H, Chang L-R, Lee Y-H, Tseng H-W, Kuo TBJ, Chen SH. Development and validation of the Smartphone Addiction Inventory (SPAI). PLoS One. 2014;9(6):e98312.
12. Bahsoun AN, Malik MM, Ahmed K, El-Hage O, Jaye P, Dasgupta P. Tablet based simulation provides a new solution to accessing laparoscopic skills training. J Surg Educ. 2013;70(1):161-3.
13. Brewer AC, Endly DC, Henley J, Amir M, Sampson BP, Moreau JF, et al. Mobile applications in dermatology. JAMA Dermatol. 2013;149(11):1300-4.
14. Wolf JA, Moreau JF, Akilov O, Patton T, English JC 3rd, Ho J, et al. Diagnostic inaccuracy of smartphone applications for melanoma detection. JAMA Dermatol. 2013;149(4):422-6
15. de la Vega R, Miró J. mHealth: A strategic field without a solid scientific soul. A systematic review of pain-related apps. PLoS One. 2014;9(7):e101312.
16. Kiranantawat K, Sitpahul N, Taeprasartsit P, Constantinides J, Kruavit A, Srimuninnimit V, et al. The first smartphone application for microsurgery monitoring: SilpaRamanitor. Plast Reconstr Surg. 2014;134(1):130-9.
17. Jensen Ang WJ, Hopkins ME, Partridge R, Hennessey I, Brennan PM, Fouyas I, et al. Validating the use of smartphone-based accelerometers for performance assessment in a simulated neurosurgical task. Neurosurgery. 2014;10(Suppl.1):57-64; discussion 64-5.
18. Johnson EK, Estrada CR, Johnson KL, Nguyen HT, Rosoklija I, Nelson CP. Evaluation of a mobile voiding diary for pediatric patients with voiding dysfunction: a prospective comparative study. J Urol. 2014;192(3):908-13.
60

Conclusion
Apps represent a new opportunity to enhance care in Urology. Possible uses range from
augmented reality apps that can be helpful in a clinical or surgical setting, to electronic diaries
that aid in treatment monitoring and even health promoting apps. Even though there are, at
the moment, 162 Urology apps, covering a wide range of subjects and directed at a diverse
audience, there is room for improvement.
Until clear regulation is enforced, either by government health authorities or independent
organizations, the urological community should adopt an active role as soon as possible, in a
manner similar to what was done regarding SoMe (25 - 28). Even though it is impossible to
verify all available apps, maintaining a peer-reviewed register of certified Urology apps or
issuing an official seal of approval, could influence overall app design and, consequently,
improve urological mHealth solutions.
References
1. Kwok R. Mobile apps: A conference in your pocket. Nature. 2013;498(7454):395-7. 2. World Health Organization. mHealth: New horizons for health through mobile technologies
(Global Observatory for eHealth series - Volume 3). Geneva, Switzerland: World Health Organization. 2011.
3. Research2Guidance. The mobile health global market report 2013–2017: the commercialisation of mHealth apps (Vol. 3). Accessed through: http://www.research2guidance.com/shop/index.php/downloadable/download/sample/sample_id/273/ on September 1, 2014.
4. Apple HealthKit. Accessed through: https://developer.apple.com/healthkit on September 1, 2014.
5. Google Fit. Accessed through: https://developers.google.com/fit on September 1, 2014. 6. Buijink AW, Visser BJ, Marshall L. Medical apps for smartphones: lack of evidence undermines
quality and safety. Evid Based Med. 2013;18(3):90-2. 7. McCartney M. How do we know whether medical apps work? BMJ. 2013;346:f1811. 8. Boxall NE. Mobile apps: are we culturally out of signal? Emerg Med J. 2014;31(5):432-3. 9. Pellegrini CA, Duncan JM, Moller AC, Buscemi J, Sularz A, DeMott A, et al. A smartphone-
supported weight loss program: design of the ENGAGED randomized controlled trial. BMC Public Health. 2012;12:1041.
10. Gaglani SM, Topol EJ. iMedEd: The role of mobile health technologies in medical education. Acad Med. 2014;89(9):1207-9.
11. Lin Y-H, Chang L-R, Lee Y-H, Tseng H-W, Kuo TBJ, Chen SH. Development and validation of the Smartphone Addiction Inventory (SPAI). PLoS One. 2014;9(6):e98312.
12. Bahsoun AN, Malik MM, Ahmed K, El-Hage O, Jaye P, Dasgupta P. Tablet based simulation provides a new solution to accessing laparoscopic skills training. J Surg Educ. 2013;70(1):161-3.
13. Brewer AC, Endly DC, Henley J, Amir M, Sampson BP, Moreau JF, et al. Mobile applications in dermatology. JAMA Dermatol. 2013;149(11):1300-4.
14. Wolf JA, Moreau JF, Akilov O, Patton T, English JC 3rd, Ho J, et al. Diagnostic inaccuracy of smartphone applications for melanoma detection. JAMA Dermatol. 2013;149(4):422-6
15. de la Vega R, Miró J. mHealth: A strategic field without a solid scientific soul. A systematic review of pain-related apps. PLoS One. 2014;9(7):e101312.
16. Kiranantawat K, Sitpahul N, Taeprasartsit P, Constantinides J, Kruavit A, Srimuninnimit V, et al. The first smartphone application for microsurgery monitoring: SilpaRamanitor. Plast Reconstr Surg. 2014;134(1):130-9.
17. Jensen Ang WJ, Hopkins ME, Partridge R, Hennessey I, Brennan PM, Fouyas I, et al. Validating the use of smartphone-based accelerometers for performance assessment in a simulated neurosurgical task. Neurosurgery. 2014;10(Suppl.1):57-64; discussion 64-5.
18. Johnson EK, Estrada CR, Johnson KL, Nguyen HT, Rosoklija I, Nelson CP. Evaluation of a mobile voiding diary for pediatric patients with voiding dysfunction: a prospective comparative study. J Urol. 2014;192(3):908-13.
61

19. Hsi RS, Hotaling JM, Hartzier AL, Holt SK, Walsh TJ. Validity and reliability of a smartphone application for the assessment of penile deformity in Peyronie's disease. J Sex Med. 2013;10(7):1867-73.
20. Cantudo-Cuenca MR, Robustillo-Cortés MA, Cantudo-Cuenca MD, Morillo-Verdugo R. A better regulation is required in viral hepatitis smartphone applications. Farm Hosp. 2014;38(2):112-7.
21. Carter T, O'Neill S, Johns N, Brady RR. Contemporary vascular smartphone medical applica- tions. Ann Vasc Surg. 2013;27(6):804-9.
22. Visvanathan A, Hamilton A, Brady RR. Smartphone apps in microbiology—is better regulation required? Clin Microbiol Infect. 2012;18(7):E218-20.
23. Greene JA, Kesselheim AS. Pharmaceutical marketing and the new social media. N Engl J Med. 2010;363(22):2087-9.
24. Happtique Mobile Health Source. Accessed through: http://www.happtique.com on September 1, 2014.
25. Matta R, Doiron C, Leveridge MJ. The dramatic increase in social media in urology. J Urol. 2014;192(2):494-8.
26. Rouprêt M, Morgan TM, Bostrom PJ, Cooperberg MR, Kutikov A, Linton KD, et al. European Association of Urology (@Uroweb) recommendations on the appropriate use of social media. Eur Urol. 2014;66(4):628-32.
27. Murphy DG, Loeb S, Basto MY, Challacombe B, Trinh QD, Leveridge M, et al. Engaging responsibly with social media: the BJUI guidelines. BJU Int. 2014;114(1):9-11.
28. American Urological Association. Social media best practices. Accessed through: https://www.auanet.org/ press-media/social-media-bp.cfm on September 1, 2014.
29. Food and Drug Administration. FDA proposes health 'app' guidelines (Updated 2013). Accessed through: http://www.fda.gov/ForConsumers/ConsumerUpdates/ucm263332.htm on September 1, 2014.
30. Mobasheri M, Johnston M, King D, Leff D, Thiruchelvam P, Darzi A. Smartphone breast applications - what's the evidence? Breast. 2014;23(5):683-9.
62

19. Hsi RS, Hotaling JM, Hartzier AL, Holt SK, Walsh TJ. Validity and reliability of a smartphone application for the assessment of penile deformity in Peyronie's disease. J Sex Med. 2013;10(7):1867-73.
20. Cantudo-Cuenca MR, Robustillo-Cortés MA, Cantudo-Cuenca MD, Morillo-Verdugo R. A better regulation is required in viral hepatitis smartphone applications. Farm Hosp. 2014;38(2):112-7.
21. Carter T, O'Neill S, Johns N, Brady RR. Contemporary vascular smartphone medical applica- tions. Ann Vasc Surg. 2013;27(6):804-9.
22. Visvanathan A, Hamilton A, Brady RR. Smartphone apps in microbiology—is better regulation required? Clin Microbiol Infect. 2012;18(7):E218-20.
23. Greene JA, Kesselheim AS. Pharmaceutical marketing and the new social media. N Engl J Med. 2010;363(22):2087-9.
24. Happtique Mobile Health Source. Accessed through: http://www.happtique.com on September 1, 2014.
25. Matta R, Doiron C, Leveridge MJ. The dramatic increase in social media in urology. J Urol. 2014;192(2):494-8.
26. Rouprêt M, Morgan TM, Bostrom PJ, Cooperberg MR, Kutikov A, Linton KD, et al. European Association of Urology (@Uroweb) recommendations on the appropriate use of social media. Eur Urol. 2014;66(4):628-32.
27. Murphy DG, Loeb S, Basto MY, Challacombe B, Trinh QD, Leveridge M, et al. Engaging responsibly with social media: the BJUI guidelines. BJU Int. 2014;114(1):9-11.
28. American Urological Association. Social media best practices. Accessed through: https://www.auanet.org/ press-media/social-media-bp.cfm on September 1, 2014.
29. Food and Drug Administration. FDA proposes health 'app' guidelines (Updated 2013). Accessed through: http://www.fda.gov/ForConsumers/ConsumerUpdates/ucm263332.htm on September 1, 2014.
30. Mobasheri M, Johnston M, King D, Leff D, Thiruchelvam P, Darzi A. Smartphone breast applications - what's the evidence? Breast. 2014;23(5):683-9.


Chapter 4
Expert Involvement Predicts mHealth App Downloads: Multivariate Regression Analysis of Urology Apps
Nuno Pereira-Azevedo, Luís Osório,Vítor Cavadas, Avelino Fraga, Eduardo
Carrasquinho, Eduardo Cardoso de Oliveira, Miguel Castelo-Branco, and Monique J. Roobol
JMIR mHealth and uHealth (2016) 4(3):e86
65

Original Paper
Expert Involvement Predicts mHealth App Downloads: MultivariateRegression Analysis of Urology Apps
Nuno Pereira-Azevedo1,2, MSc, MD; Luís Osório2, MD; Vitor Cavadas2, MD; Avelino Fraga2, MD; EduardoCarrasquinho3, MD; Eduardo Cardoso de Oliveira3, MD; Miguel Castelo-Branco4, MD, PhD; Monique J Roobol1,PhD1Department of Urology, Erasmus University Medical Centre, Rotterdam, Netherlands2Urology Department, Porto Hospital Centre, Porto, Portugal3Urology Department, Hospital Espírito Santo, Évora, Portugal4Faculty of Health Sciences, Beira Interior University, Covilhã, Portugal
Corresponding Author:Nuno Pereira-Azevedo, MSc, MDDepartment of UrologyErasmus University Medical CentreDepartment of Urology, Room NH-224, P.O. Box 2040Erasmus MC, University Medical Center RotterdamRotterdam, 3000 CA RotterdamNetherlandsPhone: 31 107032240Fax: 31 107035315Email: [email protected]
AbstractBackground: Urological mobile medical (mHealth) apps are gaining popularity with both clinicians and patients. mHealth isa rapidly evolving and heterogeneous field, with some urology apps being downloaded over 10,000 times and others not at all.The factors that contribute to medical app downloads have yet to be identified, including the hypothetical influence of expertinvolvement in app development.Objective: The objective of our study was to identify predictors of the number of urology app downloads.Methods: We reviewed urology apps available in the Google Play Store and collected publicly available data. Multivariateordinal logistic regression evaluated the effect of publicly available app variables on the number of apps being downloaded.Results: Of 129 urology apps eligible for study, only 2 (1.6%) had >10,000 downloads, with half having ≤100 downloads and4 (3.1%) having none at all. Apps developed with expert urologist involvement (P=.003), optional in-app purchases (P=.01),higher user rating (P<.001), and more user reviews (P<.001) were more likely to be installed. App cost was inversely related tothe number of downloads (P<.001). Only data from the Google Play Store and the developers’ websites, but not other platforms,were publicly available for analysis, and the level and nature of expert involvement was not documented.Conclusions: The explicit participation of urologists in app development is likely to enhance its chances to have a higher numberof downloads. This finding should help in the design of better apps and further promote urologist involvement in mHealth. Officialcertification processes are required to ensure app quality and user safety.
(JMIR Mhealth Uhealth 2016;4(3):e86) doi:10.2196/mhealth.5738
KEYWORDSeHealth; mHealth; urology; mobile apps; new technologies
IntroductionMedicine is constantly evolving, and medical research anddevelopment are greatly influenced by available and newtechnology. Mobile health (mHealth), defined as “the delivery
of healthcare services via mobile communication devices” [1],is a new element of eHealth based on mobile phone and tabletapps. Apple and Google provide the leading mHealth platforms(iOS and Android, respectively), with over 160,000 medicalapps between them [2]. The number of mHealth apps is expected
JMIR Mhealth Uhealth 2016 | vol. 4 | iss. 3 | e86 | p.1http://mhealth.jmir.org/2016/3/e86/(page number not for citation purposes)
Pereira-Azevedo et alJMIR MHEALTH AND UHEALTH
XSL•FORenderX
Abstract
Background
Urological mobile medical (mHealth) apps are gaining popularity with both clinicians and
patients. mHealth is a rapidly evolving and heterogeneous field, with some urology apps being
downloaded over 10,000 times and others not at all. The factors that contribute to medical app
downloads have yet to be identified, including the hypothetical influence of expert involvement
in app development.
Objective
The objective of our study was to identify predictors of the number of urology app
downloads.
Methods
We reviewed urology apps available in the Google Play Store and collected publicly
available data. Multivariate ordinal logistic regression evaluated the effect of publicly available
app variables on the number of apps being downloaded.
Results
Of 129 urology apps eligible for study, only two (1.6%) had >10,000 downloads, with
half having ≤100 downloads and four (3.1%) having none at all. Apps developed with expert
urologist involvement (p=0.003), optional in-app purchases (p=0.01), higher user rating
(p<0.001), and more user reviews (p<0.001) were more likely to be installed. App cost was
inversely related to the number of downloads (p<0.001). Only data from the Google Play Store
and the developers’ websites, but not other platforms, were publicly available for analysis, and
the level and nature of expert involvement was not documented.
Conclusions
The explicit participation of urologists in app development is likely to enhance its
chances to have a higher number of downloads. This finding should help in the design of better
apps and further promote urologist involvement in mHealth. Official certification processes are
required to ensure app quality and user safety.
66

Original Paper
Expert Involvement Predicts mHealth App Downloads: MultivariateRegression Analysis of Urology Apps
Nuno Pereira-Azevedo1,2, MSc, MD; Luís Osório2, MD; Vitor Cavadas2, MD; Avelino Fraga2, MD; EduardoCarrasquinho3, MD; Eduardo Cardoso de Oliveira3, MD; Miguel Castelo-Branco4, MD, PhD; Monique J Roobol1,PhD1Department of Urology, Erasmus University Medical Centre, Rotterdam, Netherlands2Urology Department, Porto Hospital Centre, Porto, Portugal3Urology Department, Hospital Espírito Santo, Évora, Portugal4Faculty of Health Sciences, Beira Interior University, Covilhã, Portugal
Corresponding Author:Nuno Pereira-Azevedo, MSc, MDDepartment of UrologyErasmus University Medical CentreDepartment of Urology, Room NH-224, P.O. Box 2040Erasmus MC, University Medical Center RotterdamRotterdam, 3000 CA RotterdamNetherlandsPhone: 31 107032240Fax: 31 107035315Email: [email protected]
AbstractBackground: Urological mobile medical (mHealth) apps are gaining popularity with both clinicians and patients. mHealth isa rapidly evolving and heterogeneous field, with some urology apps being downloaded over 10,000 times and others not at all.The factors that contribute to medical app downloads have yet to be identified, including the hypothetical influence of expertinvolvement in app development.Objective: The objective of our study was to identify predictors of the number of urology app downloads.Methods: We reviewed urology apps available in the Google Play Store and collected publicly available data. Multivariateordinal logistic regression evaluated the effect of publicly available app variables on the number of apps being downloaded.Results: Of 129 urology apps eligible for study, only 2 (1.6%) had >10,000 downloads, with half having ≤100 downloads and4 (3.1%) having none at all. Apps developed with expert urologist involvement (P=.003), optional in-app purchases (P=.01),higher user rating (P<.001), and more user reviews (P<.001) were more likely to be installed. App cost was inversely related tothe number of downloads (P<.001). Only data from the Google Play Store and the developers’ websites, but not other platforms,were publicly available for analysis, and the level and nature of expert involvement was not documented.Conclusions: The explicit participation of urologists in app development is likely to enhance its chances to have a higher numberof downloads. This finding should help in the design of better apps and further promote urologist involvement in mHealth. Officialcertification processes are required to ensure app quality and user safety.
(JMIR Mhealth Uhealth 2016;4(3):e86) doi:10.2196/mhealth.5738
KEYWORDSeHealth; mHealth; urology; mobile apps; new technologies
IntroductionMedicine is constantly evolving, and medical research anddevelopment are greatly influenced by available and newtechnology. Mobile health (mHealth), defined as “the delivery
of healthcare services via mobile communication devices” [1],is a new element of eHealth based on mobile phone and tabletapps. Apple and Google provide the leading mHealth platforms(iOS and Android, respectively), with over 160,000 medicalapps between them [2]. The number of mHealth apps is expected
JMIR Mhealth Uhealth 2016 | vol. 4 | iss. 3 | e86 | p.1http://mhealth.jmir.org/2016/3/e86/(page number not for citation purposes)
Pereira-Azevedo et alJMIR MHEALTH AND UHEALTH
XSL•FORenderX
Abstract
Background
Urological mobile medical (mHealth) apps are gaining popularity with both clinicians and
patients. mHealth is a rapidly evolving and heterogeneous field, with some urology apps being
downloaded over 10,000 times and others not at all. The factors that contribute to medical app
downloads have yet to be identified, including the hypothetical influence of expert involvement
in app development.
Objective
The objective of our study was to identify predictors of the number of urology app
downloads.
Methods
We reviewed urology apps available in the Google Play Store and collected publicly
available data. Multivariate ordinal logistic regression evaluated the effect of publicly available
app variables on the number of apps being downloaded.
Results
Of 129 urology apps eligible for study, only two (1.6%) had >10,000 downloads, with
half having ≤100 downloads and four (3.1%) having none at all. Apps developed with expert
urologist involvement (p=0.003), optional in-app purchases (p=0.01), higher user rating
(p<0.001), and more user reviews (p<0.001) were more likely to be installed. App cost was
inversely related to the number of downloads (p<0.001). Only data from the Google Play Store
and the developers’ websites, but not other platforms, were publicly available for analysis, and
the level and nature of expert involvement was not documented.
Conclusions
The explicit participation of urologists in app development is likely to enhance its
chances to have a higher number of downloads. This finding should help in the design of better
apps and further promote urologist involvement in mHealth. Official certification processes are
required to ensure app quality and user safety.
67

Introduction
Medicine is constantly evolving, and medical research and development are greatly
influenced by available and new technology. Mobile health (mHealth), defined as “the delivery
of healthcare services via mobile communication devices” (1), is a new element of eHealth
based on mobile phone and tablet apps. Apple and Google provide the leading mHealth
platforms (iOS and Android, respectively), with over 160,000 medical apps between them (2).
The number of mHealth apps is expected to grow, not least because both companies have
announced mHealth to be a top priority (3, 4).
mHealth has had an impact in several medical specialties, including anaesthesia (5),
cardiology (6), and psychiatry (7). Moreover, it has been applied to a diverse set of problems
facing both health care professionals (HCPs) and patients, including apps that use augmented
reality in the operating room (8), risk calculators for clinical practice (9), and digital diaries that
aid in patient monitoring (10). The apps available for urological practice were summarized in
a recent review (11), which highlighted that not all urology apps share the same popularity;
while some apps are downloaded very infrequently, other apps have been downloaded over
10,000 times. To date, the factors that contribute to the number of downloads of a medical
app have not been characterized.
The economic literature indicates several factors that affect app downloads, with price
being one of the significant predictors (12, 13). Even though some users are willing to pay for
more sophisticated features in better-quality apps and see the price as a marker of quality,
others only download free apps, sometimes with limited features. In fact, some users
download a paid version only after trying the free version or use in-app purchases to get
access to additional features. It has been shown that the option of in-app purchases can affect
a user’s decision to download the app (12). The exchange of opinions and experiences online,
that is, online word-of-mouth, influences ecommerce sales (14). Word-of-mouth has two main
characteristics: volume (the total amount of word-of-mouth) and valence (whether the attitude
is positive or negative). Word-of-mouth volume generates the cognitive consequence of
awareness, while word-of-mouth valence produces the cognitive consequence of attitude (15).
In the mobile apps market, to predict the number of downloads, authors use the number of
user reviews as the volume and the user rating as the valence (12). Previous studies have
shown that app demand decreases with the app file size. As apps become more complex they
increase in size, meaning that they take longer to download and for users to try them.
Moreover, they occupy additional space in the device memory (12, 13). App availability on
both platforms (Apple App Store and Google Play Store) may raise awareness about the app,
influencing the number of downloads (12).
The developer’s textual and visual description of an app can undoubtedly contribute to
the willingness of users to download it. Prior studies have shown that textual information and
visual images affect consumer purchase decisions (16, 17). For mobile apps, the app
description’s length and the number of screenshots significantly affect app demand (12). Other
factors that may positively influence the number of downloads are the app’s age (i.e., how
long the app has been available) and availability of updates (i.e., whether the app has been
updated since launch) because these are surrogates of the app’s evolution (12).
Availability of an update also raises awareness for the app because updates allow the
app to be featured in the “New & Updated Apps” category of the Google Play Store. In contrast,
age-restricted content in an app will have a negative impact on the number of downloads
because it limits the number of potential users (12).
The delivery of mHealth in urology will, as in all medical fields, largely depend on app
availability, benefits, and user friendliness. Although economic studies have identified some
of the factors that influence app downloads (12 - 18), given the specificity of medical apps, we
hypothesized that the involvement of a health care expert could be a significant determinant
in the ultimate number of downloads of a urology app. Therefore, we aimed to determine the
predictors of the number of urology app downloads, including the contribution made by HCP
involvement.
Methods
Search Strategy
We conducted a commercial review of all urology apps for the Android mobile operating
system in the Google Play Store (Google Inc, Mountain View, CA, USA) up to August 31,
2015: we examined all apps containing the term “urology” in their metadata (i.e., the title,
description, keywords, or version history). We included only urology-specific apps in this study;
hence, we excluded apps containing content related to other medical specialties (i.e., generic
apps targeting multiple subjects; e.g., an anatomy atlas), product advertisements (i.e., apps
only promoting pharmaceuticals or clinical equipment), and apps solely allowing the user to
schedule private appointments.
We selected only Android apps for study because, in contrast to Google, Apple does not
report the number of individual app downloads. Furthermore, Apple only lists the top 200
medical apps ranked by a nondisclosed proprietary algorithm. However, no urology apps were
present in the top 200 medical apps listed in either app store.
68

Introduction
Medicine is constantly evolving, and medical research and development are greatly
influenced by available and new technology. Mobile health (mHealth), defined as “the delivery
of healthcare services via mobile communication devices” (1), is a new element of eHealth
based on mobile phone and tablet apps. Apple and Google provide the leading mHealth
platforms (iOS and Android, respectively), with over 160,000 medical apps between them (2).
The number of mHealth apps is expected to grow, not least because both companies have
announced mHealth to be a top priority (3, 4).
mHealth has had an impact in several medical specialties, including anaesthesia (5),
cardiology (6), and psychiatry (7). Moreover, it has been applied to a diverse set of problems
facing both health care professionals (HCPs) and patients, including apps that use augmented
reality in the operating room (8), risk calculators for clinical practice (9), and digital diaries that
aid in patient monitoring (10). The apps available for urological practice were summarized in
a recent review (11), which highlighted that not all urology apps share the same popularity;
while some apps are downloaded very infrequently, other apps have been downloaded over
10,000 times. To date, the factors that contribute to the number of downloads of a medical
app have not been characterized.
The economic literature indicates several factors that affect app downloads, with price
being one of the significant predictors (12, 13). Even though some users are willing to pay for
more sophisticated features in better-quality apps and see the price as a marker of quality,
others only download free apps, sometimes with limited features. In fact, some users
download a paid version only after trying the free version or use in-app purchases to get
access to additional features. It has been shown that the option of in-app purchases can affect
a user’s decision to download the app (12). The exchange of opinions and experiences online,
that is, online word-of-mouth, influences ecommerce sales (14). Word-of-mouth has two main
characteristics: volume (the total amount of word-of-mouth) and valence (whether the attitude
is positive or negative). Word-of-mouth volume generates the cognitive consequence of
awareness, while word-of-mouth valence produces the cognitive consequence of attitude (15).
In the mobile apps market, to predict the number of downloads, authors use the number of
user reviews as the volume and the user rating as the valence (12). Previous studies have
shown that app demand decreases with the app file size. As apps become more complex they
increase in size, meaning that they take longer to download and for users to try them.
Moreover, they occupy additional space in the device memory (12, 13). App availability on
both platforms (Apple App Store and Google Play Store) may raise awareness about the app,
influencing the number of downloads (12).
The developer’s textual and visual description of an app can undoubtedly contribute to
the willingness of users to download it. Prior studies have shown that textual information and
visual images affect consumer purchase decisions (16, 17). For mobile apps, the app
description’s length and the number of screenshots significantly affect app demand (12). Other
factors that may positively influence the number of downloads are the app’s age (i.e., how
long the app has been available) and availability of updates (i.e., whether the app has been
updated since launch) because these are surrogates of the app’s evolution (12).
Availability of an update also raises awareness for the app because updates allow the
app to be featured in the “New & Updated Apps” category of the Google Play Store. In contrast,
age-restricted content in an app will have a negative impact on the number of downloads
because it limits the number of potential users (12).
The delivery of mHealth in urology will, as in all medical fields, largely depend on app
availability, benefits, and user friendliness. Although economic studies have identified some
of the factors that influence app downloads (12 - 18), given the specificity of medical apps, we
hypothesized that the involvement of a health care expert could be a significant determinant
in the ultimate number of downloads of a urology app. Therefore, we aimed to determine the
predictors of the number of urology app downloads, including the contribution made by HCP
involvement.
Methods
Search Strategy
We conducted a commercial review of all urology apps for the Android mobile operating
system in the Google Play Store (Google Inc, Mountain View, CA, USA) up to August 31,
2015: we examined all apps containing the term “urology” in their metadata (i.e., the title,
description, keywords, or version history). We included only urology-specific apps in this study;
hence, we excluded apps containing content related to other medical specialties (i.e., generic
apps targeting multiple subjects; e.g., an anatomy atlas), product advertisements (i.e., apps
only promoting pharmaceuticals or clinical equipment), and apps solely allowing the user to
schedule private appointments.
We selected only Android apps for study because, in contrast to Google, Apple does not
report the number of individual app downloads. Furthermore, Apple only lists the top 200
medical apps ranked by a nondisclosed proprietary algorithm. However, no urology apps were
present in the top 200 medical apps listed in either app store.
69

Predictor Variables for the Number of Downloads
For each app, two reviewers (NP-A and MR) recorded all available information according
to 12 predetermined variables: 1) number of downloads, the dependent variable; 2), number
of written user reviews; 3) price in euros; 4) average user rating (number of stars from one to
five); 5) app size (in megabytes); 6) number of screenshots (i.e., an actual app image that
showcased its features and functionality); 7) length of app description (number of characters
in the app description, not including spaces); 8) app availability in the Apple App Store (i.e.,
whether the app was available for iOS mobile phones or tablets); 9) new versions available
(i.e., whether the app had been updated since launch); 10) app age (number of days available
in the Google Play Store); 11) absence of age restriction (i.e., defined by the developer as
having content appropriate for all ages); and 12) availability of in-app purchases (i.e., the
opportunity to buy extra content). Table 1 lists these variables and their descriptions. We did
not download the apps.
To test the hypothesis that urologist involvement influences app downloads, we added
a further variable to our model: HCP participation. We identified HCP participation by
examining the app’s description and considered it to be present only when explicitly
mentioned. We classified the participating HCP as urologist (i.e., urologist or urological
association), other HCPs (i.e., other medical doctors, pharmacists, or nurses), or no HCP (i.e.,
no explicit mention of an HCP). The two reviewers gathered download data based on the
classification system of level of downloads used by Google in the Play Store (table 1). At the
time of final review (August 31, 2015), no urology apps had been downloaded over 50,000
times.
Statistical Analyses
Analyses were performed using IBM SPSS Statistics v20 (IBM Corp). We considered
p<0.05 to be statistically significant in all analyses. Descriptive analyses and multivariate
ordinal logistic regression identified the factors predicting app downloads.
Table 1. Variables included in the model to predict the number of downloads of urology apps.
Variables Description
Level of downloadsa Level 0: no downloads; Level 1: 1 to 5 downloads; Level 2: 6 to 10 downloads; Level 3: 11 to 50 downloads; Level 4: 51 to 100 downloads; Level 5: 101 to 500 downloads; Level 6: 501 to 1,000 downloads; Level 7: 1,001 to 5,000 downloads; Level 8: 5,001 to 10,000 downloads; Level 9: 10,001 to 50,000 downloads.
Urologist participation 0: Other 1: Urologist or urological association participation
Other HCP 0: Other 1: Other HCPs
No HCP 0: Other 1: No HCPs mentioned
Number of reviews Number of reviews in the Google Play Store
Actual price Actual price of the app in euros
Average user rating User evaluation on a scale from 1 to 5 stars
App size App file size in megabytes
No age restriction 0: Age restriction 1: No age restriction (i.e., appropriate for all ages)
Number of screenshots Number of screenshots in the Google Play Store
Length of description Number of characters (without spaces) in the textual app description in the Google Play Store
Availability in the Apple App Store 0: Not available. 1: Available.
Version 0: One version 1: New version exist
App age Number of days available on the market.
In-app purchases 0: No in-app purchase. 1: In-app purchase available.
aThe exact number of downloads is not available from the Google Play Store. We categorized it according to the system used by Google in the Play Store.
bHCP = health care professional.
cAvailable for iOS mobile phones or tablets.
70

Predictor Variables for the Number of Downloads
For each app, two reviewers (NP-A and MR) recorded all available information according
to 12 predetermined variables: 1) number of downloads, the dependent variable; 2), number
of written user reviews; 3) price in euros; 4) average user rating (number of stars from one to
five); 5) app size (in megabytes); 6) number of screenshots (i.e., an actual app image that
showcased its features and functionality); 7) length of app description (number of characters
in the app description, not including spaces); 8) app availability in the Apple App Store (i.e.,
whether the app was available for iOS mobile phones or tablets); 9) new versions available
(i.e., whether the app had been updated since launch); 10) app age (number of days available
in the Google Play Store); 11) absence of age restriction (i.e., defined by the developer as
having content appropriate for all ages); and 12) availability of in-app purchases (i.e., the
opportunity to buy extra content). Table 1 lists these variables and their descriptions. We did
not download the apps.
To test the hypothesis that urologist involvement influences app downloads, we added
a further variable to our model: HCP participation. We identified HCP participation by
examining the app’s description and considered it to be present only when explicitly
mentioned. We classified the participating HCP as urologist (i.e., urologist or urological
association), other HCPs (i.e., other medical doctors, pharmacists, or nurses), or no HCP (i.e.,
no explicit mention of an HCP). The two reviewers gathered download data based on the
classification system of level of downloads used by Google in the Play Store (table 1). At the
time of final review (August 31, 2015), no urology apps had been downloaded over 50,000
times.
Statistical Analyses
Analyses were performed using IBM SPSS Statistics v20 (IBM Corp). We considered
p<0.05 to be statistically significant in all analyses. Descriptive analyses and multivariate
ordinal logistic regression identified the factors predicting app downloads.
Table 1. Variables included in the model to predict the number of downloads of urology apps.
Variables Description
Level of downloadsa Level 0: no downloads; Level 1: 1 to 5 downloads; Level 2: 6 to 10 downloads; Level 3: 11 to 50 downloads; Level 4: 51 to 100 downloads; Level 5: 101 to 500 downloads; Level 6: 501 to 1,000 downloads; Level 7: 1,001 to 5,000 downloads; Level 8: 5,001 to 10,000 downloads; Level 9: 10,001 to 50,000 downloads.
Urologist participation 0: Other 1: Urologist or urological association participation
Other HCP 0: Other 1: Other HCPs
No HCP 0: Other 1: No HCPs mentioned
Number of reviews Number of reviews in the Google Play Store
Actual price Actual price of the app in euros
Average user rating User evaluation on a scale from 1 to 5 stars
App size App file size in megabytes
No age restriction 0: Age restriction 1: No age restriction (i.e., appropriate for all ages)
Number of screenshots Number of screenshots in the Google Play Store
Length of description Number of characters (without spaces) in the textual app description in the Google Play Store
Availability in the Apple App Store 0: Not available. 1: Available.
Version 0: One version 1: New version exist
App age Number of days available on the market.
In-app purchases 0: No in-app purchase. 1: In-app purchase available.
aThe exact number of downloads is not available from the Google Play Store. We categorized it according to the system used by Google in the Play Store.
bHCP = health care professional.
cAvailable for iOS mobile phones or tablets.
71

Results
A total of 250 Google Play apps contained the term urology in their metadata. We
excluded 121 apps: 109 were generic apps (i.e., not designed specifically for urology, e.g.,
ArchieMD 3D Health: PREVIEW), 11 were for making appointments (e.g., Dr Fateh Singh
Appointments), and one app was designed solely for product advertisement (Actient
Pharmaceuticals). Of the 129 included apps (Multimedia Appendix 1, Multimedia Appendix 2),
90 (69.8%) were free. Of the paid apps, the prices ranged from €0.68 (Urology Glossary) to
€83.15 (The 5 Minute Urology Consult 3), with an average price of €8.45. The average app
rating was <3 stars (mean 2.65), and 92 (71.3%) had no written review. There were five
screenshots per app on average, and the length of the description varied from three to 3,348
characters (without spaces). The number of days since publishing varied from one to 1,733
(average 721 days) (table 2).
Table 2. Summary descriptive statistics for continuous variables for apps containing the term urology.
Variable Mean SD Range Median
Number of reviews 0.84 2.08 0-12 0
Actual price in euros All apps: Paid apps:
2.55 8.45
9.89
16.68
0-83.15
0.68-83.15
0
2.69
Average user rating 2.65 2.13 0-5 3.5
App size 7.37 10.36 0.01-48 3.2
Number of screenshots 5.4 3.86 1-25 4
Length of description 896.08 872.24 3-3,348 531
App age 721.18 425.76 1-1,733 699 SD = standard deviation.
Figure 1 shows the number of apps in each level of downloads and HCP participation.
The proportion of apps with HCP participation was greater in the higher levels of downloads.
Moreover, in the two highest levels (>5,000 downloads), only apps designed with the
participation of urological experts were present. Even though two apps (1.6%) had >10,000
downloads (level 9), half of all urology apps had ≤100 downloads (level 4 or less). At the time
of this review, four apps (3.1%) had not been downloaded (table 3).
Figure 1. Number of urology apps per level of downloads and health care professional
participation.
Although most apps, that is, 86 of 129 (66.7%), were developed with specialist urological
input and other HCPs were involved in a further 18 apps (14.0%), 25 apps (19.4%) had no
documented HCP involvement. A total of 57 apps (44.2%) had no age restriction. Only 11
apps (8.5%) had in-app purchases available.
Multivariate logistic regression revealed the factors contributing to urology app
downloads (table 4). Apps developed with urologist involvement were more likely to be
installed than those without expert involvement (p=0.003). Availability of in-app purchases
(p=0.01), a higher user rating (p<0.001), and a higher number of written reviews (p<0.001)
were also significantly associated with app downloads.
The app price was inversely related to the number of downloads (p<0.001). The other
evaluated factors (app age, app size, absence of age restriction, number of screenshots,
length of description, availability in the Apple App Store, and new published versions) were
not significantly associated with app downloads. The Nagelkerke R2 statistic, which measures
the strength of the association between the dependent variable and the predictor variables,
was satisfactory.
72

Results
A total of 250 Google Play apps contained the term urology in their metadata. We
excluded 121 apps: 109 were generic apps (i.e., not designed specifically for urology, e.g.,
ArchieMD 3D Health: PREVIEW), 11 were for making appointments (e.g., Dr Fateh Singh
Appointments), and one app was designed solely for product advertisement (Actient
Pharmaceuticals). Of the 129 included apps (Multimedia Appendix 1, Multimedia Appendix 2),
90 (69.8%) were free. Of the paid apps, the prices ranged from €0.68 (Urology Glossary) to
€83.15 (The 5 Minute Urology Consult 3), with an average price of €8.45. The average app
rating was <3 stars (mean 2.65), and 92 (71.3%) had no written review. There were five
screenshots per app on average, and the length of the description varied from three to 3,348
characters (without spaces). The number of days since publishing varied from one to 1,733
(average 721 days) (table 2).
Table 2. Summary descriptive statistics for continuous variables for apps containing the term urology.
Variable Mean SD Range Median
Number of reviews 0.84 2.08 0-12 0
Actual price in euros All apps: Paid apps:
2.55 8.45
9.89
16.68
0-83.15
0.68-83.15
0
2.69
Average user rating 2.65 2.13 0-5 3.5
App size 7.37 10.36 0.01-48 3.2
Number of screenshots 5.4 3.86 1-25 4
Length of description 896.08 872.24 3-3,348 531
App age 721.18 425.76 1-1,733 699 SD = standard deviation.
Figure 1 shows the number of apps in each level of downloads and HCP participation.
The proportion of apps with HCP participation was greater in the higher levels of downloads.
Moreover, in the two highest levels (>5,000 downloads), only apps designed with the
participation of urological experts were present. Even though two apps (1.6%) had >10,000
downloads (level 9), half of all urology apps had ≤100 downloads (level 4 or less). At the time
of this review, four apps (3.1%) had not been downloaded (table 3).
Figure 1. Number of urology apps per level of downloads and health care professional
participation.
Although most apps, that is, 86 of 129 (66.7%), were developed with specialist urological
input and other HCPs were involved in a further 18 apps (14.0%), 25 apps (19.4%) had no
documented HCP involvement. A total of 57 apps (44.2%) had no age restriction. Only 11
apps (8.5%) had in-app purchases available.
Multivariate logistic regression revealed the factors contributing to urology app
downloads (table 4). Apps developed with urologist involvement were more likely to be
installed than those without expert involvement (p=0.003). Availability of in-app purchases
(p=0.01), a higher user rating (p<0.001), and a higher number of written reviews (p<0.001)
were also significantly associated with app downloads.
The app price was inversely related to the number of downloads (p<0.001). The other
evaluated factors (app age, app size, absence of age restriction, number of screenshots,
length of description, availability in the Apple App Store, and new published versions) were
not significantly associated with app downloads. The Nagelkerke R2 statistic, which measures
the strength of the association between the dependent variable and the predictor variables,
was satisfactory.
73

Table 3. Frequencies for the categorical and binary variables.
Frequency Percent Cumulative Percent
Level of downloads
Level 0 – no downloads; 4 3.1 3.1 Level 1 – 1 to 5 downloads; 6 4.7 7.8 Level 2 – 6 to 10 downloads; 3 2.3 10.1 Level 3 – 11 to 50 downloads; 35 27.1 37.2 Level 4 – 51 to 100 downloads; 16 12.4 49.6 Level 5 – 101 to 500 downloads; 33 25.6 75.2 Level 6 – 501 to 1,000 downloads; 10 7.8 82.9 Level 7 – 1,001 to 5,000 downloads; 18 14 96.9 Level 8 – 5,001 to 10,000 downloads; 2 1.6 98.4 Level 9 – 10,001 to 50,000 downloads. 2 1.6 100
No HCP participation
Other; 104 80.6 80.6 No HCP mentioned. 25 19.4 100
Other HCP participation
Other; 111 86 86 Other HCP, pharmacists, and nurses. 18 14 100
Urologist participation
Other; 43 33.3 33.3 Urologist or urological association participation.
86 66.7 100
No age restriction
Age restriction; 72 55.8 55.8 No age restriction . 57 44.2 100
Availability in Apple App Store
Not available; 36 27.9 27.9 Available. 93 72.1 100
Version
One version; 66 51.2 51.2 New version exist. 63 48.8 100
In-app purchases
No in-app purchase. 118 91.5 91.5 In-app purchase available. 11 8.5 100
aHCP = healthcare professional.
Table 4. Multivariate ordinal logistic regression.a-c
Variables Estimatesc S.E. p-value 95% CI
App age 0.001 0.0004 0.24 [-0.0003; 0.001] Other HCP participation 0.469 0.602 0.44 [-0.71; 1.65] Urologist participation 1.43 0.479 0.003 [ 0.49; 2.37] Number of reviews 0.440 0.102 <0.001 [ 0.24; 0.64] Actual price in euros -0.071 0.020 <0.001 [-0.11; -0.03] Average user rating 0.337 0.089 <0.001 [ 0.16; 0.51] App size 0.018 0.017 0.30 [-0.02; 0.05] No age restriction 0.498 0.346 0.15 [-0.18; 1.18] Number of screenshots 0.047 0.048 0.33 [-0.05; 0.14] Length of description -0.0004 0.0002 0.09 [-0.001; 6.35E] Availability in the Apple App Store
-0.641 0.441 0.15 [-1.5; 0.22]
Version -0.372 0.340 0.27 [-1.04; 0.29] In-app purchases 1.67 0.682 0.01 [0.33; 3.0] Nagelkerke R2 0.48
aThe dependent variable is the level of downloads. bThe reference level for HCP participation is “No HCP participation”. cEstimates are the ordered log-odds regression coefficients and they show the relative magnitude (i.e., relative impact of the factor) and direction (i.e., positive or negative) of impact of the listed variables on the level of downloads.
Discussion
Principal Findings
The lack of studies on the predictors of the number of downloads for medical apps in
the PubMed database suggests that this is the first study of its kind in mHealth. However,
economic studies determined the predictors of downloads for generic apps, which we tested
in this study. We showed that inexpensive apps developed with expert urological input and
with optional in-app purchases were more likely to be installed. Furthermore, apps with higher
user ratings and with a larger number of written user reviews were more likely to have a greater
level of downloads. These results confirmed, for the first time, that urologist participation in
app development positively influences urology app downloads.
Although the availability of various medical apps has been thoroughly documented, the
factors that predict their downloads have, until now, not been studied. Given that mHealth is
a rapidly evolving and novel field, these data are useful for practitioners and app developers
interested in developing urology apps. Furthermore, the data are important for mHealth policy
makers and regulators because no best practice guidelines exist with respect to medical app
development.
74

Table 3. Frequencies for the categorical and binary variables.
Frequency Percent Cumulative Percent
Level of downloads
Level 0 – no downloads; 4 3.1 3.1 Level 1 – 1 to 5 downloads; 6 4.7 7.8 Level 2 – 6 to 10 downloads; 3 2.3 10.1 Level 3 – 11 to 50 downloads; 35 27.1 37.2 Level 4 – 51 to 100 downloads; 16 12.4 49.6 Level 5 – 101 to 500 downloads; 33 25.6 75.2 Level 6 – 501 to 1,000 downloads; 10 7.8 82.9 Level 7 – 1,001 to 5,000 downloads; 18 14 96.9 Level 8 – 5,001 to 10,000 downloads; 2 1.6 98.4 Level 9 – 10,001 to 50,000 downloads. 2 1.6 100
No HCP participation
Other; 104 80.6 80.6 No HCP mentioned. 25 19.4 100
Other HCP participation
Other; 111 86 86 Other HCP, pharmacists, and nurses. 18 14 100
Urologist participation
Other; 43 33.3 33.3 Urologist or urological association participation.
86 66.7 100
No age restriction
Age restriction; 72 55.8 55.8 No age restriction . 57 44.2 100
Availability in Apple App Store
Not available; 36 27.9 27.9 Available. 93 72.1 100
Version
One version; 66 51.2 51.2 New version exist. 63 48.8 100
In-app purchases
No in-app purchase. 118 91.5 91.5 In-app purchase available. 11 8.5 100
aHCP = healthcare professional.
Table 4. Multivariate ordinal logistic regression.a-c
Variables Estimatesc S.E. p-value 95% CI
App age 0.001 0.0004 0.24 [-0.0003; 0.001] Other HCP participation 0.469 0.602 0.44 [-0.71; 1.65] Urologist participation 1.43 0.479 0.003 [ 0.49; 2.37] Number of reviews 0.440 0.102 <0.001 [ 0.24; 0.64] Actual price in euros -0.071 0.020 <0.001 [-0.11; -0.03] Average user rating 0.337 0.089 <0.001 [ 0.16; 0.51] App size 0.018 0.017 0.30 [-0.02; 0.05] No age restriction 0.498 0.346 0.15 [-0.18; 1.18] Number of screenshots 0.047 0.048 0.33 [-0.05; 0.14] Length of description -0.0004 0.0002 0.09 [-0.001; 6.35E] Availability in the Apple App Store
-0.641 0.441 0.15 [-1.5; 0.22]
Version -0.372 0.340 0.27 [-1.04; 0.29] In-app purchases 1.67 0.682 0.01 [0.33; 3.0] Nagelkerke R2 0.48
aThe dependent variable is the level of downloads. bThe reference level for HCP participation is “No HCP participation”. cEstimates are the ordered log-odds regression coefficients and they show the relative magnitude (i.e., relative impact of the factor) and direction (i.e., positive or negative) of impact of the listed variables on the level of downloads.
Discussion
Principal Findings
The lack of studies on the predictors of the number of downloads for medical apps in
the PubMed database suggests that this is the first study of its kind in mHealth. However,
economic studies determined the predictors of downloads for generic apps, which we tested
in this study. We showed that inexpensive apps developed with expert urological input and
with optional in-app purchases were more likely to be installed. Furthermore, apps with higher
user ratings and with a larger number of written user reviews were more likely to have a greater
level of downloads. These results confirmed, for the first time, that urologist participation in
app development positively influences urology app downloads.
Although the availability of various medical apps has been thoroughly documented, the
factors that predict their downloads have, until now, not been studied. Given that mHealth is
a rapidly evolving and novel field, these data are useful for practitioners and app developers
interested in developing urology apps. Furthermore, the data are important for mHealth policy
makers and regulators because no best practice guidelines exist with respect to medical app
development.
75

mHealth is still a relatively new concept, and its full potential has yet to be fully explored.
The number of downloads of mHealth apps will depend not only on available technologies,
but also on the apps and their safety, effectiveness, and usability. However, concerns have
been raised about medical apps, namely their scientific accuracy and user security (5, 7),
which are exacerbated by the lack of regulation. The level of regulation should be proportional
to the degree of clinical implication derived from the app, ranging from low (e.g., apps that
give access to online medical journals, which only show content that has already been peer
reviewed) to high (e.g., apps that dispense clinical advice).
Apps have the potential to be hazardous to uninformed users, either by error, such as
miscalculation when using an opioid dose calculator (19), or by making false claims, such as
dermatology apps that claim to diagnose skin cancer in spite of evidence that they misclassify
80% of textbook melanomas (20) and apps that guarantee to cure breast cancer (21).
Although these concerns have attracted the attention of public entities such as the European
Union, which has published a green paper on mHealth (22), and the US Food and Drug
Administration, which has issued some nonbinding suggestions (23), there is still no
mandatory certification for mHealth apps.
To address the lack of official guidelines, urological societies could participate in the
regulatory process by publishing mHealth recommendations similar to those issued for social
media (24-26). In this way, app safety and accuracy can be improved by the involvement of
medical experts at the early stages of app development and by promoting peer review.
Our results confirm our initial hypothesis that the explicit participation of an expert in
urology in the app development process increases its chances to be downloaded. Given the
lack of external certification of mHealth apps, one possible explanation for this result is that
users are reassured to know that a health care specialist collaborated in the app design.
Expert involvement could be equivalent to a “quality mark,” guaranteeing that the app is
safe and scientifically valid. However, users must be aware that, because there is no official
way to authenticate the veracity or the extent of the expert participation, unscrupulous
developers could potentially misuse this approach via deceptive advertising or false
endorsement.
Interestingly, however, our findings also indicated that there is still a deficit of HCP
participation in urology app development, with only two-thirds of apps having expert
participation. This is consistent with previous reports on expert involvement in app
development in other disciplines, perhaps signifying a wider trend across mHealth that needs
to be addressed (27, 28).
Cheaper apps with optional in-app purchases were associated with a greater level of
downloads. As with mobile game users, mHealth users seem to prefer to pay less initially but
to have the opportunity to buy additional benefits, features, or functionalities via in-app
purchases, rather than paying a higher upfront price (12). An app’s chance of having a higher
number of downloads also increased with a higher number of reviews or average user rating,
which is consistent with other fields in which published reviews have been shown to affect the
choices of new users (12, 16). Although customer reviews were a significant determinant of
downloads, they were lacking in most apps, making it harder for potential users to learn about
the app without purchasing it themselves. To ameliorate this issue, developers should provide
comprehensive details about the app in their description.
A systematic review has shown that eHealth adoption by HCPs is dependent on multiple
factors, namely the involvement of users in the development and implementation phases,
ease of use, demonstrated advantages of the system, and adequate training and support (29).
The security of the eHealth system was the most important factor in the acceptance of eHealth
by patients (30). Even though, in the generic mobile market, factors such as app size, number
of screenshots, length of description, app age, availability in other mobile stores, availability
of new versions, and absence of age restriction have a significant impact on the number of
downloads, we found that it was not the case in urology apps. Further studies are needed to
determine whether this trend is specific to urology apps or also happens in other medical
fields.
Future research may consider the number of positive or negative reviews as a potential
factor to predict app downloads. It should also focus on what types of urological apps and
what segments of this specific market (i.e., patients, HCPs, or both) have higher downloads.
Furthermore, subsequent investigations should compare the number of downloads of
urological apps with those in other medical fields in order to gain insights into the state of
mHealth.
Limitations
This study has some limitations. We limited our commercial review of urology apps to
the search term “urology.” We included only urology-related apps and collected app data
solely from information available in the Google Play Store and developers’ websites.
Nevertheless, the Google Play Store and developers’ websites are the main sources of
information available to potential new users before downloading the app; therefore, our study
mimics the real-life information available to the user before purchase.
76

mHealth is still a relatively new concept, and its full potential has yet to be fully explored.
The number of downloads of mHealth apps will depend not only on available technologies,
but also on the apps and their safety, effectiveness, and usability. However, concerns have
been raised about medical apps, namely their scientific accuracy and user security (5, 7),
which are exacerbated by the lack of regulation. The level of regulation should be proportional
to the degree of clinical implication derived from the app, ranging from low (e.g., apps that
give access to online medical journals, which only show content that has already been peer
reviewed) to high (e.g., apps that dispense clinical advice).
Apps have the potential to be hazardous to uninformed users, either by error, such as
miscalculation when using an opioid dose calculator (19), or by making false claims, such as
dermatology apps that claim to diagnose skin cancer in spite of evidence that they misclassify
80% of textbook melanomas (20) and apps that guarantee to cure breast cancer (21).
Although these concerns have attracted the attention of public entities such as the European
Union, which has published a green paper on mHealth (22), and the US Food and Drug
Administration, which has issued some nonbinding suggestions (23), there is still no
mandatory certification for mHealth apps.
To address the lack of official guidelines, urological societies could participate in the
regulatory process by publishing mHealth recommendations similar to those issued for social
media (24-26). In this way, app safety and accuracy can be improved by the involvement of
medical experts at the early stages of app development and by promoting peer review.
Our results confirm our initial hypothesis that the explicit participation of an expert in
urology in the app development process increases its chances to be downloaded. Given the
lack of external certification of mHealth apps, one possible explanation for this result is that
users are reassured to know that a health care specialist collaborated in the app design.
Expert involvement could be equivalent to a “quality mark,” guaranteeing that the app is
safe and scientifically valid. However, users must be aware that, because there is no official
way to authenticate the veracity or the extent of the expert participation, unscrupulous
developers could potentially misuse this approach via deceptive advertising or false
endorsement.
Interestingly, however, our findings also indicated that there is still a deficit of HCP
participation in urology app development, with only two-thirds of apps having expert
participation. This is consistent with previous reports on expert involvement in app
development in other disciplines, perhaps signifying a wider trend across mHealth that needs
to be addressed (27, 28).
Cheaper apps with optional in-app purchases were associated with a greater level of
downloads. As with mobile game users, mHealth users seem to prefer to pay less initially but
to have the opportunity to buy additional benefits, features, or functionalities via in-app
purchases, rather than paying a higher upfront price (12). An app’s chance of having a higher
number of downloads also increased with a higher number of reviews or average user rating,
which is consistent with other fields in which published reviews have been shown to affect the
choices of new users (12, 16). Although customer reviews were a significant determinant of
downloads, they were lacking in most apps, making it harder for potential users to learn about
the app without purchasing it themselves. To ameliorate this issue, developers should provide
comprehensive details about the app in their description.
A systematic review has shown that eHealth adoption by HCPs is dependent on multiple
factors, namely the involvement of users in the development and implementation phases,
ease of use, demonstrated advantages of the system, and adequate training and support (29).
The security of the eHealth system was the most important factor in the acceptance of eHealth
by patients (30). Even though, in the generic mobile market, factors such as app size, number
of screenshots, length of description, app age, availability in other mobile stores, availability
of new versions, and absence of age restriction have a significant impact on the number of
downloads, we found that it was not the case in urology apps. Further studies are needed to
determine whether this trend is specific to urology apps or also happens in other medical
fields.
Future research may consider the number of positive or negative reviews as a potential
factor to predict app downloads. It should also focus on what types of urological apps and
what segments of this specific market (i.e., patients, HCPs, or both) have higher downloads.
Furthermore, subsequent investigations should compare the number of downloads of
urological apps with those in other medical fields in order to gain insights into the state of
mHealth.
Limitations
This study has some limitations. We limited our commercial review of urology apps to
the search term “urology.” We included only urology-related apps and collected app data
solely from information available in the Google Play Store and developers’ websites.
Nevertheless, the Google Play Store and developers’ websites are the main sources of
information available to potential new users before downloading the app; therefore, our study
mimics the real-life information available to the user before purchase.
77

Android leads the mobile phone market with over 80% of market share, and there are
more apps available in the Google Play Store. This is in part explained by the two platforms’
different approval processes: iOS apps have to undergo a thorough review process developed
by Apple, but Android apps are immediately published online (3). This distinct method may
also influence the quality of the apps, which could be the subject of further research. We were
unable to perform a similar analysis for the Apple App Store because Apple does not disclose
the number of app downloads, instead only listing the top 200 medical apps using their
proprietary algorithm. However, we noted no urology apps in the top 200 medical apps listed
in either the Apple App Store or the Google Play Store at the time of data collection. Other
mobile app platforms make up <5% of the overall market share (31) and, at the time of our
research, no urology apps were available in the Blackberry Market and only three urology
apps were available in the Microsoft Store Marketplace; the numbers of downloads of these
apps were not publicly available. Displayed information about the level of downloads in the
Google Play Store can in itself influence downloads: if a user has to choose between two
similar apps, most of the time they will download the most popular app first. For the sake of
clarity, we studied only explicit expert participation, and it is possible that some app developers
consulted medical experts during app design but did not mention it; there is a risk of
misclassification for this variable. However, when medical involvement was reported, there
was no objective way to determine the extent of participation. The lack of a standardized
format for the disclosure of expert participation and the absence of readily available tools to
quantify it requires further study and future recommendations.
Conclusions
To our knowledge, this is the first study to determine predictors of urology app
downloads. The explicit participation of urologists in app development is likely to enhance its
chances of having a greater number of downloads. Furthermore, in-app purchases, cheaper
apps, and those with higher user ratings and number of written reviews are more likely to have
more downloads. Until a regulated approval process is implemented by government health
authorities, analogous to the one that exists for medical devices, two pragmatic changes to
urology mHealth app publishing could promote user safety and assure content quality: first,
medical apps should include a full disclosure, similar to that provided in scientific papers; and
second, urological societies could be involved with certifying the scientific integrity of mHealth
apps by issuing a professional, peer reviewed app quality mark or standard. The efforts of the
Health on the Net Foundation to guide users toward trustworthy health information online were
justified by the results of 10th HON survey (32).
References
1. Torgan C. The mHealth summit: local & global converge. Kinetics; 2009 Nov 06. Accessed through: http://caroltorgan.com/mhealth-summit on March 8, 2016.
2. Reseach2Guidance. mHealth app developer Economics 2015: the current status and trends of the mHealth app market. 2015 Nov. Accessed through: http://research2guidance.com/r2g/r2g-mHealth-App-Developer-Economics-2015.pdf on March 8, 2016.
3. HealthKit: Develop Health and Fitness Apps That Work Together. Cuppertino, CA: Apple; 2016. Accessed through: https://developer.apple.com/healthkit on March 8, 2016.
4. Google Fit: The Google Fit SDK. 2015 Dec 30. Accessed through: https://developers.google.com/fit on March 8, 2016.
5. Kraidin J, Ginsberg SH, Solina A. Anesthesia apps: overview of current technology and intelligent search techniques. J Cardiothorac Vasc Anesth. 2012;26(2):322-6.
6. Martínez-Pérez B, de la Torre-Díez I, López-Coronado M, Herreros-González J. Mobile apps in cardiology: review. JMIR Mhealth Uhealth. 2013;1(2):e15.
7. Shen N, Levitan M, Johnson A, Bender JL, Hamilton-Page M, Jadad AR, et al. Finding a depression app: a review and content analysis of the depression app marketplace. JMIR Mhealth Uhealth. 2015;3(1):e16.
8. Rassweiler J, Rassweiler M, Müller M, Kenngott H, Meinzer H, Teber D, ESUT Expert Group. Surgical navigation in urology: European perspective. Curr Opin Urol. 2014;24(1):81-97.
9. Roobol M, Azevedo N. The Rotterdam prostate cancer risk calculator: improved prediction with more relevant pre-biopsy information, now in the palm of your hand. 2014 May 19 Presented at: 2014 Annual Meeting of the American Urological Association; May 16-21, 2014; Orlando, FL p. e546-7. Accessed through: https://www.jurology.com/article/S0022-5347(14)01780-7/abstract on March 8, 2016.
10. Pepper J, Zhang A, Li R, Wang XH. Usage results of a mobile app for managing urinary incontinence. J Urol. 2015;193(4):1292-7.
11. Pereira-Azevedo N, Carrasquinho E, Cardoso de Oliveira E, Cavadas V, Osório L, Fraga A, et al. mHealth in urology: a review of experts' involvement in app development. PLoS One. 2015;10(5):e0125547.
12. Ghose A, Han SP. Estimating demand for mobile applications in the new economy. Manage Sci 2014;60(6):1470-88.
13. Telang R, Garg R. Estimating app demand from publicly available data. Pittsburgh, PA: Carnegie Mellon University; 2011 Sep 01. Accessed through: http://repository.cmu.edu/heinzworks/331 on March 8, 2016.
14. Davis A, Khazanchi D. An empirical study of online word of mouth as a predictor for multi-product category e-commerce sales. Electronic Markets. 2008;18(2):130-41.
15. Liu Y. Word of mouth for movies: its dynamics and impact on box office revenue. J Marketing. 2006;70(3):74-89.
16. Decker R, Trusov M. Estimating aggregate consumer preferences from online product reviews. Int J Res Marketing. 2010;27(4):293-307.
17. Ghose A, Ipeirotis PG, Li B. Designing ranking systems for hotels on travel search engines by mining user-generated and crowd-sourced content. Marketing Sci. 2012;31(3):493-520.
18. Sinkinson M. The determinants of supply and demand for mobile applications: Working Paper #12-27.: Net Institute; 2012 Sep. Accessed through: http://www.netinst.org/Sinkinson_12-27.pdf on July 5, 2016.
78

Android leads the mobile phone market with over 80% of market share, and there are
more apps available in the Google Play Store. This is in part explained by the two platforms’
different approval processes: iOS apps have to undergo a thorough review process developed
by Apple, but Android apps are immediately published online (3). This distinct method may
also influence the quality of the apps, which could be the subject of further research. We were
unable to perform a similar analysis for the Apple App Store because Apple does not disclose
the number of app downloads, instead only listing the top 200 medical apps using their
proprietary algorithm. However, we noted no urology apps in the top 200 medical apps listed
in either the Apple App Store or the Google Play Store at the time of data collection. Other
mobile app platforms make up <5% of the overall market share (31) and, at the time of our
research, no urology apps were available in the Blackberry Market and only three urology
apps were available in the Microsoft Store Marketplace; the numbers of downloads of these
apps were not publicly available. Displayed information about the level of downloads in the
Google Play Store can in itself influence downloads: if a user has to choose between two
similar apps, most of the time they will download the most popular app first. For the sake of
clarity, we studied only explicit expert participation, and it is possible that some app developers
consulted medical experts during app design but did not mention it; there is a risk of
misclassification for this variable. However, when medical involvement was reported, there
was no objective way to determine the extent of participation. The lack of a standardized
format for the disclosure of expert participation and the absence of readily available tools to
quantify it requires further study and future recommendations.
Conclusions
To our knowledge, this is the first study to determine predictors of urology app
downloads. The explicit participation of urologists in app development is likely to enhance its
chances of having a greater number of downloads. Furthermore, in-app purchases, cheaper
apps, and those with higher user ratings and number of written reviews are more likely to have
more downloads. Until a regulated approval process is implemented by government health
authorities, analogous to the one that exists for medical devices, two pragmatic changes to
urology mHealth app publishing could promote user safety and assure content quality: first,
medical apps should include a full disclosure, similar to that provided in scientific papers; and
second, urological societies could be involved with certifying the scientific integrity of mHealth
apps by issuing a professional, peer reviewed app quality mark or standard. The efforts of the
Health on the Net Foundation to guide users toward trustworthy health information online were
justified by the results of 10th HON survey (32).
References
1. Torgan C. The mHealth summit: local & global converge. Kinetics; 2009 Nov 06. Accessed through: http://caroltorgan.com/mhealth-summit on March 8, 2016.
2. Reseach2Guidance. mHealth app developer Economics 2015: the current status and trends of the mHealth app market. 2015 Nov. Accessed through: http://research2guidance.com/r2g/r2g-mHealth-App-Developer-Economics-2015.pdf on March 8, 2016.
3. HealthKit: Develop Health and Fitness Apps That Work Together. Cuppertino, CA: Apple; 2016. Accessed through: https://developer.apple.com/healthkit on March 8, 2016.
4. Google Fit: The Google Fit SDK. 2015 Dec 30. Accessed through: https://developers.google.com/fit on March 8, 2016.
5. Kraidin J, Ginsberg SH, Solina A. Anesthesia apps: overview of current technology and intelligent search techniques. J Cardiothorac Vasc Anesth. 2012;26(2):322-6.
6. Martínez-Pérez B, de la Torre-Díez I, López-Coronado M, Herreros-González J. Mobile apps in cardiology: review. JMIR Mhealth Uhealth. 2013;1(2):e15.
7. Shen N, Levitan M, Johnson A, Bender JL, Hamilton-Page M, Jadad AR, et al. Finding a depression app: a review and content analysis of the depression app marketplace. JMIR Mhealth Uhealth. 2015;3(1):e16.
8. Rassweiler J, Rassweiler M, Müller M, Kenngott H, Meinzer H, Teber D, ESUT Expert Group. Surgical navigation in urology: European perspective. Curr Opin Urol. 2014;24(1):81-97.
9. Roobol M, Azevedo N. The Rotterdam prostate cancer risk calculator: improved prediction with more relevant pre-biopsy information, now in the palm of your hand. 2014 May 19 Presented at: 2014 Annual Meeting of the American Urological Association; May 16-21, 2014; Orlando, FL p. e546-7. Accessed through: https://www.jurology.com/article/S0022-5347(14)01780-7/abstract on March 8, 2016.
10. Pepper J, Zhang A, Li R, Wang XH. Usage results of a mobile app for managing urinary incontinence. J Urol. 2015;193(4):1292-7.
11. Pereira-Azevedo N, Carrasquinho E, Cardoso de Oliveira E, Cavadas V, Osório L, Fraga A, et al. mHealth in urology: a review of experts' involvement in app development. PLoS One. 2015;10(5):e0125547.
12. Ghose A, Han SP. Estimating demand for mobile applications in the new economy. Manage Sci 2014;60(6):1470-88.
13. Telang R, Garg R. Estimating app demand from publicly available data. Pittsburgh, PA: Carnegie Mellon University; 2011 Sep 01. Accessed through: http://repository.cmu.edu/heinzworks/331 on March 8, 2016.
14. Davis A, Khazanchi D. An empirical study of online word of mouth as a predictor for multi-product category e-commerce sales. Electronic Markets. 2008;18(2):130-41.
15. Liu Y. Word of mouth for movies: its dynamics and impact on box office revenue. J Marketing. 2006;70(3):74-89.
16. Decker R, Trusov M. Estimating aggregate consumer preferences from online product reviews. Int J Res Marketing. 2010;27(4):293-307.
17. Ghose A, Ipeirotis PG, Li B. Designing ranking systems for hotels on travel search engines by mining user-generated and crowd-sourced content. Marketing Sci. 2012;31(3):493-520.
18. Sinkinson M. The determinants of supply and demand for mobile applications: Working Paper #12-27.: Net Institute; 2012 Sep. Accessed through: http://www.netinst.org/Sinkinson_12-27.pdf on July 5, 2016.
79

19. Haffey F, Brady RR, Maxwell S. A comparison of the reliability of smartphone apps for opioid conversion. Drug Saf. 2013;36(2):111-7.
20. Wolf JA, Moreau JF, Akilov O, Patton T, English JC, Ho J, et al. Diagnostic inaccuracy of smartphone applications for melanoma detection. JAMA Dermatol. 2013;149(4):422-6.
21. Mobasheri MH, Johnston M, King D, Leff D, Thiruchelvam P, Darzi A. Smartphone breast applications: what's the evidence? Breast. 2014;23(5):683-9.
22. European Commission. Green paper on mobile health (“mHealth”). 2014 Apr 10. Accessed through: https://ec.europa.eu/digital-single-market/news/green-paper-mobile-health-mhealth on March 8, 2016.
23. U.S. Department of Health and Human Services, Food and Drug Administration. A mobile medical applications guidance for industry and food and drug administration staff. 2015 Feb 9. Accessed through: http://www.fda.gov/downloads/MedicalDevices/.../UCM263366.pdf on March 8, 2016.
24. Rouprêt M, Morgan TM, Bostrom PJ, Cooperberg MR, Kutikov A, Linton KD, et al. European Association of Urology (@Uroweb) recommendations on the appropriate use of social media. Eur Urol. 2014;66(4):628-32.
25. Matta R, Doiron C, Leveridge MJ. The dramatic increase in social media in urology. J Urol. 2014;192(2):494-8.
26. American Urological Association. Social media best practices. Linthicum, MD: AUA Accessed through: http://www.auanet.org/ press-media/social-media-bp.cfm on April 4, 2016.
27. Carter T, O'Neill S, Johns N, Brady RW. Contemporary vascular smartphone medical applications. Ann Vasc Surg. 2013;27(6):804-9.
28. Visvanathan A, Hamilton A, Brady RW. Smartphone apps in microbiology: is better regulation required? Clin Microbiol Infect. 2012;18(7):E218-20.
29. Gagnon M, Desmartis M, Labrecque M, Car J, Pagliari C, Pluye P, et al. Systematic review of factors influencing the adoption of information and communication technologies by healthcare professionals. J Med Syst. 2012;36(1):241-77.
30. Chhanabhai P, Holt A. Consumers are ready to accept the transition to online and electronic records if they can be assured of the security measures. MedGenMed. 2007;9(1):8.
31. IDC Analyze the Future. Smartphone OS market share, 2015 Q2. Framingham, MA: IDC Research, Inc; 2016. Accessed through: http://www.idc.com/prodserv/smartphone-os-market-share.jsp on March 8, 2016.
32. Pletneva N, Cruchet S, Simonet M, Kajiwara M, Boyer C. Results of the 10th HON survey on health and medical Internet use. Chêne-Bourg, Switzerland: Health on the Net Foundation. Accessed through: https://www.hon.ch/Global/pdf/CONF10898/Results10thHONSurvey.pdf on May 12, 2016.
80

19. Haffey F, Brady RR, Maxwell S. A comparison of the reliability of smartphone apps for opioid conversion. Drug Saf. 2013;36(2):111-7.
20. Wolf JA, Moreau JF, Akilov O, Patton T, English JC, Ho J, et al. Diagnostic inaccuracy of smartphone applications for melanoma detection. JAMA Dermatol. 2013;149(4):422-6.
21. Mobasheri MH, Johnston M, King D, Leff D, Thiruchelvam P, Darzi A. Smartphone breast applications: what's the evidence? Breast. 2014;23(5):683-9.
22. European Commission. Green paper on mobile health (“mHealth”). 2014 Apr 10. Accessed through: https://ec.europa.eu/digital-single-market/news/green-paper-mobile-health-mhealth on March 8, 2016.
23. U.S. Department of Health and Human Services, Food and Drug Administration. A mobile medical applications guidance for industry and food and drug administration staff. 2015 Feb 9. Accessed through: http://www.fda.gov/downloads/MedicalDevices/.../UCM263366.pdf on March 8, 2016.
24. Rouprêt M, Morgan TM, Bostrom PJ, Cooperberg MR, Kutikov A, Linton KD, et al. European Association of Urology (@Uroweb) recommendations on the appropriate use of social media. Eur Urol. 2014;66(4):628-32.
25. Matta R, Doiron C, Leveridge MJ. The dramatic increase in social media in urology. J Urol. 2014;192(2):494-8.
26. American Urological Association. Social media best practices. Linthicum, MD: AUA Accessed through: http://www.auanet.org/ press-media/social-media-bp.cfm on April 4, 2016.
27. Carter T, O'Neill S, Johns N, Brady RW. Contemporary vascular smartphone medical applications. Ann Vasc Surg. 2013;27(6):804-9.
28. Visvanathan A, Hamilton A, Brady RW. Smartphone apps in microbiology: is better regulation required? Clin Microbiol Infect. 2012;18(7):E218-20.
29. Gagnon M, Desmartis M, Labrecque M, Car J, Pagliari C, Pluye P, et al. Systematic review of factors influencing the adoption of information and communication technologies by healthcare professionals. J Med Syst. 2012;36(1):241-77.
30. Chhanabhai P, Holt A. Consumers are ready to accept the transition to online and electronic records if they can be assured of the security measures. MedGenMed. 2007;9(1):8.
31. IDC Analyze the Future. Smartphone OS market share, 2015 Q2. Framingham, MA: IDC Research, Inc; 2016. Accessed through: http://www.idc.com/prodserv/smartphone-os-market-share.jsp on March 8, 2016.
32. Pletneva N, Cruchet S, Simonet M, Kajiwara M, Boyer C. Results of the 10th HON survey on health and medical Internet use. Chêne-Bourg, Switzerland: Health on the Net Foundation. Accessed through: https://www.hon.ch/Global/pdf/CONF10898/Results10thHONSurvey.pdf on May 12, 2016.


Chapter 5
Rotterdam Prostate Cancer Risk Calculator: Development and Usability Testing of the Mobile Phone App
Nuno Pereira-Azevedo, Luís Osório, Avelino Fraga, and Monique J. Roobol
JMIR Cancer JMIR Cancer (2017) 3(1):e1
83

Original Paper
Rotterdam Prostate Cancer Risk Calculator: Development andUsability Testing of the Mobile Phone App
Nuno Pereira-Azevedo1,2, MSc, MD; Luís Osório2, MD; Avelino Fraga2, MD; Monique J Roobol1, PhD1Department of Urology, Erasmus University Medical Center, Rotterdam, Netherlands2Urology Department, Porto Hospital Centre, Porto, Portugal
Corresponding Author:
Nuno Pereira-Azevedo, MSc, MDDepartment of UrologyErasmus University Medical CenterRoom NA-1706, PO Box 2040Erasmus MC, University Medical Center RotterdamRotterdam, 3000 CA RotterdamNetherlandsPhone: 31 107032240Fax: 31 107035315Email: [email protected]
AbstractBackground: The use of prostate cancer screening tools that take into account relevant prebiopsy information (ie, risk calculators)is recommended as a way of determining the risk of cancer and the subsequent need for a prostate biopsy. This has the potentialto limit prostate cancer overdiagnosis and subsequent overtreatment. mHealth apps are gaining traction in urological practice andare used by both practitioners and patients for a variety of purposes.Objective: The impetus of the study was to design, develop, and assess a smartphone app for prostate cancer screening, basedon the Rotterdam Prostate Cancer Risk Calculator (RPCRC).Methods: The results of the Rotterdam arm of the European Randomized Study of Screening for Prostate Cancer (ERSPC)study were used to elaborate several algorithms that allowed the risk of prostate cancer to be estimated. A step-by-step workflowwas established to ensure that depending on the available clinical information the most complete risk model of the RPCRC wasused. The user interface was designed and then the app was developed as a native app for iOS. The usability of the app wasassessed using the Post-Study System Usability Questionnaire (PSSUQ) developed by IBM, in a group of 92 participants comprisingurologists, general practitioners, and medical students.Results: A total of 11 questions were built into the app, and, depending on the answers, one of the different algorithms of theRPCRC could be used to predict the risk of prostate cancer and of clinically significant prostate cancer (Gleason score ≥7 andclinical stage >T2b). The system usefulness, information quality, and interface quality scores were high—92% (27.7/30), 87%(26.2/30), and 89% (13.4/15), respectively. No usability problems were identified.Conclusions: The RPCRC app is helpful in predicting the risk of prostate cancer and, even more importantly, clinically significantprostate cancer. Its algorithms have been externally validated before and the usability score shows the app’s interface is welldesigned. Further usability testing is required in different populations to verify these results and ensure that it is easy to use, towarrant a broad appeal, and to provide better patient care.
(JMIR Cancer 2017;3(1):e1) doi:10.2196/cancer.6750
KEYWORDS
mHealth; prostate cancer; nomogram
IntroductionProstate cancer is a serious health issue, accounting for 14% ofall new cancers and 6% of total cancer deaths in men worldwide
[1]. With the expected increase in life expectancy, the disease’sburden is projected to increase substantially [2]. However,neither the optimal balance between screening intensity and therisk of overdiagnosis (ie, detecting indolent disease) nor the
JMIR Cancer 2017 | vol. 3 | iss. 1 | e1 | p.1http://cancer.jmir.org/2017/1/e1/(page number not for citation purposes)
Pereira-Azevedo et alJMIR CANCER
XSL•FORenderX
Abstract
Background
The use of prostate cancer screening tools that take into account relevant pre-biopsy
information (i.e., risk calculators), is recommended as a way of determining the risk of cancer
and the subsequent need for a prostate biopsy. mHealth apps are gaining traction in urological
practice and are used by both practitioners and patients for a variety of purposes.
Objective
The impetus of the study was to design, develop and assess a smartphone application
(app) for prostate cancer screening, based on the Rotterdam Prostate Cancer Risk Calculator
(RPCRC).
Methods
The results of the Rotterdam arm of the European Randomized Study of Screening for
Prostate Cancer (ERSPC) study were used to elaborate several algorithms that allowed the
risk of prostate cancer to be estimated based on different clinical information. A workflow was
developed to assure that depending on the available clinical information, the most complete
risk model of the RPCRC was used. The user interface was designed and then the app was
developed as a native application for iOS. The usability of the app was assessed using the
Post-Study System Usability Questionnaire (PSSUQ) developed by IBM, in a group of 92
participants comprised of urologists, general practitioners and medical students.
Results
Eleven questions were built into the app, and, depending on the answers, one of the
different algorithms of the RPCRC could be used to predict the risk of prostate cancer and of
significant prostate cancer. The system usefulness, information quality and interface quality
scores were high – 92%, 87% and 89% respectively. No usability problems were identified.
Conclusions
The RPCRC app is helpful in predicting the risk of a prostate cancer and significant
prostate cancer. Its algorithms have been externally validated before and the usability score
shows the app’s interface is well designed. Further usability testing is required in different
populations to verify these results.
84

Original Paper
Rotterdam Prostate Cancer Risk Calculator: Development andUsability Testing of the Mobile Phone App
Nuno Pereira-Azevedo1,2, MSc, MD; Luís Osório2, MD; Avelino Fraga2, MD; Monique J Roobol1, PhD1Department of Urology, Erasmus University Medical Center, Rotterdam, Netherlands2Urology Department, Porto Hospital Centre, Porto, Portugal
Corresponding Author:
Nuno Pereira-Azevedo, MSc, MDDepartment of UrologyErasmus University Medical CenterRoom NA-1706, PO Box 2040Erasmus MC, University Medical Center RotterdamRotterdam, 3000 CA RotterdamNetherlandsPhone: 31 107032240Fax: 31 107035315Email: [email protected]
AbstractBackground: The use of prostate cancer screening tools that take into account relevant prebiopsy information (ie, risk calculators)is recommended as a way of determining the risk of cancer and the subsequent need for a prostate biopsy. This has the potentialto limit prostate cancer overdiagnosis and subsequent overtreatment. mHealth apps are gaining traction in urological practice andare used by both practitioners and patients for a variety of purposes.Objective: The impetus of the study was to design, develop, and assess a smartphone app for prostate cancer screening, basedon the Rotterdam Prostate Cancer Risk Calculator (RPCRC).Methods: The results of the Rotterdam arm of the European Randomized Study of Screening for Prostate Cancer (ERSPC)study were used to elaborate several algorithms that allowed the risk of prostate cancer to be estimated. A step-by-step workflowwas established to ensure that depending on the available clinical information the most complete risk model of the RPCRC wasused. The user interface was designed and then the app was developed as a native app for iOS. The usability of the app wasassessed using the Post-Study System Usability Questionnaire (PSSUQ) developed by IBM, in a group of 92 participants comprisingurologists, general practitioners, and medical students.Results: A total of 11 questions were built into the app, and, depending on the answers, one of the different algorithms of theRPCRC could be used to predict the risk of prostate cancer and of clinically significant prostate cancer (Gleason score ≥7 andclinical stage >T2b). The system usefulness, information quality, and interface quality scores were high—92% (27.7/30), 87%(26.2/30), and 89% (13.4/15), respectively. No usability problems were identified.Conclusions: The RPCRC app is helpful in predicting the risk of prostate cancer and, even more importantly, clinically significantprostate cancer. Its algorithms have been externally validated before and the usability score shows the app’s interface is welldesigned. Further usability testing is required in different populations to verify these results and ensure that it is easy to use, towarrant a broad appeal, and to provide better patient care.
(JMIR Cancer 2017;3(1):e1) doi:10.2196/cancer.6750
KEYWORDS
mHealth; prostate cancer; nomogram
IntroductionProstate cancer is a serious health issue, accounting for 14% ofall new cancers and 6% of total cancer deaths in men worldwide
[1]. With the expected increase in life expectancy, the disease’sburden is projected to increase substantially [2]. However,neither the optimal balance between screening intensity and therisk of overdiagnosis (ie, detecting indolent disease) nor the
JMIR Cancer 2017 | vol. 3 | iss. 1 | e1 | p.1http://cancer.jmir.org/2017/1/e1/(page number not for citation purposes)
Pereira-Azevedo et alJMIR CANCER
XSL•FORenderX
Abstract
Background
The use of prostate cancer screening tools that take into account relevant pre-biopsy
information (i.e., risk calculators), is recommended as a way of determining the risk of cancer
and the subsequent need for a prostate biopsy. mHealth apps are gaining traction in urological
practice and are used by both practitioners and patients for a variety of purposes.
Objective
The impetus of the study was to design, develop and assess a smartphone application
(app) for prostate cancer screening, based on the Rotterdam Prostate Cancer Risk Calculator
(RPCRC).
Methods
The results of the Rotterdam arm of the European Randomized Study of Screening for
Prostate Cancer (ERSPC) study were used to elaborate several algorithms that allowed the
risk of prostate cancer to be estimated based on different clinical information. A workflow was
developed to assure that depending on the available clinical information, the most complete
risk model of the RPCRC was used. The user interface was designed and then the app was
developed as a native application for iOS. The usability of the app was assessed using the
Post-Study System Usability Questionnaire (PSSUQ) developed by IBM, in a group of 92
participants comprised of urologists, general practitioners and medical students.
Results
Eleven questions were built into the app, and, depending on the answers, one of the
different algorithms of the RPCRC could be used to predict the risk of prostate cancer and of
significant prostate cancer. The system usefulness, information quality and interface quality
scores were high – 92%, 87% and 89% respectively. No usability problems were identified.
Conclusions
The RPCRC app is helpful in predicting the risk of a prostate cancer and significant
prostate cancer. Its algorithms have been externally validated before and the usability score
shows the app’s interface is well designed. Further usability testing is required in different
populations to verify these results.
85

Introduction
Prostate cancer is a serious health issue, accounting for 14% of all new cancers and 6%
of total cancer deaths in men worldwide (1). With the expected increase in life expectancy, the
disease’s burden is projected to increase substantially (2). However, neither the optimal
balance between screening intensity and the risk of overdiagnosis (i.e., detecting indolent
disease) nor the ideal prostate cancer screening test or combination of tests have been
determined (3).
To address these issues, screening trials were initiated. Recently, the third analysis of
the European Randomized Study of Screening for Prostate Cancer (ERSPC), the world’s
largest prostate cancer screening study, has been published. Currently, with more than 13
years of follow-up, the updated results show a stable relative benefit of screening (relative risk
= 0.79, i.e., a 21% prostate cancer mortality reduction in favor of screening) but a still
increasing absolute benefit (3). The recently published findings show that to avoid one
prostate cancer death, 781 men would need to be invited to screening and 27 additional
prostate cancer cases will be diagnosed compared with no screening, both decreasing as
compared with previous reports with shorter follow-up (3). In summary, the number needed to
screen and to treat to avoid one death from prostate cancer is decreasing and is now lower
than the reported number needed to screen in trials for breast cancer (4).
Currently, the decision to perform a prostate biopsy is mostly based on the outcome of
the serum prostate-specific antigen (PSA) test. However, the serum PSA level can increase
in many situations, including benign (e.g., benign prostatic hyperplasia) and inflammatory
conditions (e.g., acute prostatitis). Moreover, the optimal cutoff value has not yet been
established (5).
Leveraging the decision of performing prostate biopsy solely on the PSA value, using a
PSA value greater than 3.0 ng/mL as indication for Bx, resulted in 76% negative biopsy results
(6). Conversely, using a higher PSA threshold can neglect prostate cancer cases (7). To
address this lack of specificity, it is recommended that the PSA value should be combined
with other relevant patient characteristics, using so-called risk calculators (2).
Even though many are available, currently it is not possible to provide a clear
recommendation about which one to use in which situation (e.g., first prostate biopsy,
repeated prostate biopsy, patient with small prostate) because there are no direct head-to-
head comparisons (8). One scientifically sound and extensively validated risk calculator is the
Rotterdam Prostate Cancer Risk Calculator (RPCRC), based on the ERSPC Rotterdam data
(9).
The RPCRC predicts the risk of a biopsy-detectable prostate cancer and also of
potentially high-risk prostate cancer, defined as Gleason score ≥7 and clinical stage >T2b.
This has important clinical implications as a way of decreasing overdiagnosis and
overtreatment (3). The different RPCRC algorithms provide an increasingly accurate risk
estimation (i.e., adding variables to the model increases its area under the curve, AUC). The
algorithm uses information on PSA level, previous negative prostate biopsy, digital rectal
examination (DRE) findings, prostate volume measurement, and transrectal ultrasonography
(TRUS) findings. Additionally, the Prostate Health Index (phi), which aggregates the results
from the Hybritech PSA, free PSA, and p2PSA (the [-2] form of proPSA), can also be used to
further stratify prostate cancer risk (10). All these different prediction models are available on
the website of the Prostate Cancer Research Foundation (figure 1) (11).
Figure 1. Screenshot of the Prostate Cancer Research Foundation website showing the
prostate cancer risk calculators.
86

Introduction
Prostate cancer is a serious health issue, accounting for 14% of all new cancers and 6%
of total cancer deaths in men worldwide (1). With the expected increase in life expectancy, the
disease’s burden is projected to increase substantially (2). However, neither the optimal
balance between screening intensity and the risk of overdiagnosis (i.e., detecting indolent
disease) nor the ideal prostate cancer screening test or combination of tests have been
determined (3).
To address these issues, screening trials were initiated. Recently, the third analysis of
the European Randomized Study of Screening for Prostate Cancer (ERSPC), the world’s
largest prostate cancer screening study, has been published. Currently, with more than 13
years of follow-up, the updated results show a stable relative benefit of screening (relative risk
= 0.79, i.e., a 21% prostate cancer mortality reduction in favor of screening) but a still
increasing absolute benefit (3). The recently published findings show that to avoid one
prostate cancer death, 781 men would need to be invited to screening and 27 additional
prostate cancer cases will be diagnosed compared with no screening, both decreasing as
compared with previous reports with shorter follow-up (3). In summary, the number needed to
screen and to treat to avoid one death from prostate cancer is decreasing and is now lower
than the reported number needed to screen in trials for breast cancer (4).
Currently, the decision to perform a prostate biopsy is mostly based on the outcome of
the serum prostate-specific antigen (PSA) test. However, the serum PSA level can increase
in many situations, including benign (e.g., benign prostatic hyperplasia) and inflammatory
conditions (e.g., acute prostatitis). Moreover, the optimal cutoff value has not yet been
established (5).
Leveraging the decision of performing prostate biopsy solely on the PSA value, using a
PSA value greater than 3.0 ng/mL as indication for Bx, resulted in 76% negative biopsy results
(6). Conversely, using a higher PSA threshold can neglect prostate cancer cases (7). To
address this lack of specificity, it is recommended that the PSA value should be combined
with other relevant patient characteristics, using so-called risk calculators (2).
Even though many are available, currently it is not possible to provide a clear
recommendation about which one to use in which situation (e.g., first prostate biopsy,
repeated prostate biopsy, patient with small prostate) because there are no direct head-to-
head comparisons (8). One scientifically sound and extensively validated risk calculator is the
Rotterdam Prostate Cancer Risk Calculator (RPCRC), based on the ERSPC Rotterdam data
(9).
The RPCRC predicts the risk of a biopsy-detectable prostate cancer and also of
potentially high-risk prostate cancer, defined as Gleason score ≥7 and clinical stage >T2b.
This has important clinical implications as a way of decreasing overdiagnosis and
overtreatment (3). The different RPCRC algorithms provide an increasingly accurate risk
estimation (i.e., adding variables to the model increases its area under the curve, AUC). The
algorithm uses information on PSA level, previous negative prostate biopsy, digital rectal
examination (DRE) findings, prostate volume measurement, and transrectal ultrasonography
(TRUS) findings. Additionally, the Prostate Health Index (phi), which aggregates the results
from the Hybritech PSA, free PSA, and p2PSA (the [-2] form of proPSA), can also be used to
further stratify prostate cancer risk (10). All these different prediction models are available on
the website of the Prostate Cancer Research Foundation (figure 1) (11).
Figure 1. Screenshot of the Prostate Cancer Research Foundation website showing the
prostate cancer risk calculators.
87

At present, mobile health (mHealth), the delivery of health care services via mobile
communication devices, is a growing trend with more than 160,000 medical apps available,
and the number is expected to grow even further, expedited by the ubiquitous presence of
mobile phones and the continuous improvements in hardware and software (12, 13). To
increase its usability and accessibility, the originally Web-based RPCRC (11) has been
redesigned as an app, which has several benefits for the user.
Even though the app uses the same algorithms as the available Web-based risk
calculators (11), the app’s proprietary step-by-step workflow ensures that, depending on the
available information, the most complete algorithm is always used. In contrast, the website
user has to initially choose a specific RPCRC, which may not be the most comprehensive
available and inadvertently dismiss known clinical data.
Another strength of the app is that the calculations are performed in the user’s mobile
phone (i.e., it works offline), which ensures a safe user experience, bypassing issues with
website blocking (e.g., some facilities constrain Internet access) and with infrastructure and
Internet service providers (e.g., slow intranet or low-speed Internet access).
Several studies have shown that mHealth was well received by users, including health
care professionals and patients, in both urban and rural settings. Some examples include the
use of mobile phone–based guidance for rural health providers in Tamil Nadu, India (14), and
the use of a gestational diabetes app by pregnant women in Oxford, United Kingdom (15).
Moreover, it has been documented not only in young adults (16), but also in older adults - both
had a high degree of acceptance of apps that promoted physical activity (17).
The aim of this study was to design and develop a mobile phone app for prostate cancer
screening, based on the RPCRC algorithms. Moreover, we sought to evaluate the usability of
the developed app using IBM’s Post-Study System Usability Questionnaire (PSSUQ) (18).
Methods
This study was structured according to the standard life cycle of system development:
analysis, design, implementation, and evaluation, as shown in figure 2.
Figure 2. Study outline and research procedure.
PSSUQ = Post-Study System Usability Questionnaire.
System Analysis
Knowledge and functional requirements for system implementation were assessed.
Knowledge Requirements
All risk calculator algorithms used in the app were developed based on the Rotterdam
arm of the ERSPC, using the clinical data and prostate biopsy outcome from 3,624 previously
unscreened men and 2,896 men with previous negative prostate biopsy. The following four
models were built, with cumulative clinical information:
Model 1: PSA alone;
Model 2: PSA and DRE (normal/abnormal);
Model 3: PSA, DRE (normal/abnormal) and DRE-assessed volume;
Model 4: PSA, DRE (normal/abnormal), TRUS (volume and normal/abnormal).
88

At present, mobile health (mHealth), the delivery of health care services via mobile
communication devices, is a growing trend with more than 160,000 medical apps available,
and the number is expected to grow even further, expedited by the ubiquitous presence of
mobile phones and the continuous improvements in hardware and software (12, 13). To
increase its usability and accessibility, the originally Web-based RPCRC (11) has been
redesigned as an app, which has several benefits for the user.
Even though the app uses the same algorithms as the available Web-based risk
calculators (11), the app’s proprietary step-by-step workflow ensures that, depending on the
available information, the most complete algorithm is always used. In contrast, the website
user has to initially choose a specific RPCRC, which may not be the most comprehensive
available and inadvertently dismiss known clinical data.
Another strength of the app is that the calculations are performed in the user’s mobile
phone (i.e., it works offline), which ensures a safe user experience, bypassing issues with
website blocking (e.g., some facilities constrain Internet access) and with infrastructure and
Internet service providers (e.g., slow intranet or low-speed Internet access).
Several studies have shown that mHealth was well received by users, including health
care professionals and patients, in both urban and rural settings. Some examples include the
use of mobile phone–based guidance for rural health providers in Tamil Nadu, India (14), and
the use of a gestational diabetes app by pregnant women in Oxford, United Kingdom (15).
Moreover, it has been documented not only in young adults (16), but also in older adults - both
had a high degree of acceptance of apps that promoted physical activity (17).
The aim of this study was to design and develop a mobile phone app for prostate cancer
screening, based on the RPCRC algorithms. Moreover, we sought to evaluate the usability of
the developed app using IBM’s Post-Study System Usability Questionnaire (PSSUQ) (18).
Methods
This study was structured according to the standard life cycle of system development:
analysis, design, implementation, and evaluation, as shown in figure 2.
Figure 2. Study outline and research procedure.
PSSUQ = Post-Study System Usability Questionnaire.
System Analysis
Knowledge and functional requirements for system implementation were assessed.
Knowledge Requirements
All risk calculator algorithms used in the app were developed based on the Rotterdam
arm of the ERSPC, using the clinical data and prostate biopsy outcome from 3,624 previously
unscreened men and 2,896 men with previous negative prostate biopsy. The following four
models were built, with cumulative clinical information:
Model 1: PSA alone;
Model 2: PSA and DRE (normal/abnormal);
Model 3: PSA, DRE (normal/abnormal) and DRE-assessed volume;
Model 4: PSA, DRE (normal/abnormal), TRUS (volume and normal/abnormal).
Figure 2. Study outline and research procedure.
PSSUQ = Post-Study System Usability Questionnaire.
System Analysis
Knowledge and functional requirements for system implementation were assessed.
Knowledge Requirements
All risk calculator algorithms used in the app were developed based on the Rotterdam
arm of the ERSPC, using the clinical data and prostate biopsy outcome from 3,624 previously
unscreened men and 2,896 men with previous negative prostate biopsy. The following four
models were built, with cumulative clinical information:
Model 1: PSA alone;
Model 2: PSA and DRE (normal/abnormal);
Model 3: PSA, DRE (normal/abnormal) and DRE-assessed volume;
Model 4: PSA, DRE (normal/abnormal), TRUS (volume and normal/abnormal).
89

The predictive capability of the models within the RPCRC app were assessed in terms
of discrimination (C statistic) for predicting the probability of both prostate cancer on biopsy
and serious prostate cancer (defined as >T2b and Gleason score ≥7) (19). Further details
about the construction and the validation of the RPCRC algorithms have been previously
published (19).
Functional Requirements
The system’s functional requirements were based on the available risk calculator
algorithms that were developed by the Rotterdam ERSPC. To improve the RPCRC app
usability, a unique decision tree was devised, with a multistep approach, to gather available
clinical information: previous negative prostate biopsy, PSA value, DRE evaluation, TRUS
evaluation, and phi value.
System Design
The app’s user interface was designed to ensure the best possible experience,
according to Apple’s design guidelines. The interface was based on the RPCRC decision tree,
taking into account the clarity and ease of use, and was designed using the GNU Image
Manipulation Program (GIMP).
System Implementation
To ensure the best performance, a native iOS version was developed using Apple’s
Xcode (Apple Inc), an integrated development environment that comprises a suite of software
development tools, including debugging functions.
System Usability Evaluation
Usability is defined as the measure of the ease with which a system can be learned and
used, including its safety, effectiveness, and efficiency (20). Usability is also a measure of the
effectiveness of the interaction between humans and computer systems (i.e., how do users
perform tasks in the system) (21). The usability of the RPCRC app was evaluated using IBM’s
PSSUQ, which is currently in its third revision and consists of three domains: system
usefulness, information quality, and interface quality (18). These three domains cover 16
questions, rated on a Likert scale from one (I strongly disagree) to five (I strongly agree; table
1). In addition, users also had the option to write their own comments.
The PSSUQ was chosen because it is a popular usability testing instrument that was
validated and showed discriminative validity, discerning applications with recognizably
different quality (22). Moreover, it has been used in several other mHealth studies (16, 23-25).
Urologists, medical students, and general practitioners (GPs) were selected as end
users; GPs were included because they are the first gatekeepers for prostate cancer
screening, making the decision of whether or not to refer the patient to a urologist. Medical
students’ evaluation is pertinent because they will be the urologists and GPs of tomorrow. An
invitation to participate in the study was sent via email. For the quantitative measurements
(baseline characteristics, PSSUQ), means and standard deviations were calculated using
software package IBM SPSS v20 (IBM Corporation)
Results
System Analysis
Knowledge Requirements
All risk calculator algorithms used in the app were developed based on the Rotterdam
arm of the ERSPC, using the clinical data and prostate biopsy outcome from 3,624 previously
unscreened men and 2,896 men with previous negative prostate biopsy (19).
In the original previously unscreened men, applying model 1 to model 4 resulted in AUCs
from 0.69 to 0.79, respectively, for predicting prostate cancer and from 0.74 to 0.86,
respectively, for predicting serious prostate cancer. In the previously screened group (men
with at least one previous negative prostate biopsy), applying the same models, AUCs ranged
from 0.62 to 0.69 for predicting prostate cancer and from 0.72 to 0.81 for predicting serious
prostate cancer (19). Several related papers that validate the algorithm of the RPCRC in
different cohorts and compare the RPCRC with other calculators have been previously
published, with good performance in the various settings (26 - 33).
Functional Requirements
A unique decision tree was designed to ensure the app would always use the most
powerful risk calculator model, depending on the available information (figure 3). This ensures
that the most significant available data is used in the most complete algorithm to compute with
greater reliability the probability of a positive prostate biopsy and the risk of aggressive
prostate cancer.
90

The predictive capability of the models within the RPCRC app were assessed in terms
of discrimination (C statistic) for predicting the probability of both prostate cancer on biopsy
and serious prostate cancer (defined as >T2b and Gleason score ≥7) (19). Further details
about the construction and the validation of the RPCRC algorithms have been previously
published (19).
Functional Requirements
The system’s functional requirements were based on the available risk calculator
algorithms that were developed by the Rotterdam ERSPC. To improve the RPCRC app
usability, a unique decision tree was devised, with a multistep approach, to gather available
clinical information: previous negative prostate biopsy, PSA value, DRE evaluation, TRUS
evaluation, and phi value.
System Design
The app’s user interface was designed to ensure the best possible experience,
according to Apple’s design guidelines. The interface was based on the RPCRC decision tree,
taking into account the clarity and ease of use, and was designed using the GNU Image
Manipulation Program (GIMP).
System Implementation
To ensure the best performance, a native iOS version was developed using Apple’s
Xcode (Apple Inc), an integrated development environment that comprises a suite of software
development tools, including debugging functions.
System Usability Evaluation
Usability is defined as the measure of the ease with which a system can be learned and
used, including its safety, effectiveness, and efficiency (20). Usability is also a measure of the
effectiveness of the interaction between humans and computer systems (i.e., how do users
perform tasks in the system) (21). The usability of the RPCRC app was evaluated using IBM’s
PSSUQ, which is currently in its third revision and consists of three domains: system
usefulness, information quality, and interface quality (18). These three domains cover 16
questions, rated on a Likert scale from one (I strongly disagree) to five (I strongly agree; table
1). In addition, users also had the option to write their own comments.
The PSSUQ was chosen because it is a popular usability testing instrument that was
validated and showed discriminative validity, discerning applications with recognizably
different quality (22). Moreover, it has been used in several other mHealth studies (16, 23-25).
Urologists, medical students, and general practitioners (GPs) were selected as end
users; GPs were included because they are the first gatekeepers for prostate cancer
screening, making the decision of whether or not to refer the patient to a urologist. Medical
students’ evaluation is pertinent because they will be the urologists and GPs of tomorrow. An
invitation to participate in the study was sent via email. For the quantitative measurements
(baseline characteristics, PSSUQ), means and standard deviations were calculated using
software package IBM SPSS v20 (IBM Corporation)
Results
System Analysis
Knowledge Requirements
All risk calculator algorithms used in the app were developed based on the Rotterdam
arm of the ERSPC, using the clinical data and prostate biopsy outcome from 3,624 previously
unscreened men and 2,896 men with previous negative prostate biopsy (19).
In the original previously unscreened men, applying model 1 to model 4 resulted in AUCs
from 0.69 to 0.79, respectively, for predicting prostate cancer and from 0.74 to 0.86,
respectively, for predicting serious prostate cancer. In the previously screened group (men
with at least one previous negative prostate biopsy), applying the same models, AUCs ranged
from 0.62 to 0.69 for predicting prostate cancer and from 0.72 to 0.81 for predicting serious
prostate cancer (19). Several related papers that validate the algorithm of the RPCRC in
different cohorts and compare the RPCRC with other calculators have been previously
published, with good performance in the various settings (26 - 33).
Functional Requirements
A unique decision tree was designed to ensure the app would always use the most
powerful risk calculator model, depending on the available information (figure 3). This ensures
that the most significant available data is used in the most complete algorithm to compute with
greater reliability the probability of a positive prostate biopsy and the risk of aggressive
prostate cancer.
91

Figure 3. The Rotterdam Prostate Cancer Risk Calculator decision tree. PSA = prostate-
specific antigen; DRE = digital rectal examination; phi = Prostate Health Index.
System Design
The app design can be divided into six interface categories: disclaimer, question,
explanation, language, results, and about (figure 4). The disclaimer must be accepted by the
user before using the app. A total of 11 questions were built into the app, and, depending on
the answers, one of the different algorithms could be used to predict the risk of prostate cancer
and of significant prostate cancer. All question interfaces are designed in a similar way. For
every question, there is an interface with an explanation of the question. The results (i.e., risk
of prostate cancer and risk of aggressive prostate cancer) are shown in numerical
(percentage) and graphic forms.
The “about” screen details the scientific background of the risk calculators and lists all
contributions. The user also has the option to choose the default language: Chinese, Dutch,
English, German, Portuguese, and Spanish.
Figure 4. Screenshots of the Rotterdam Prostate Cancer Risk Calculator app, showing “About,” “Disclaimer,” “Explanation,” “Question,” “Results,” and “Language” screens.
92

Figure 3. The Rotterdam Prostate Cancer Risk Calculator decision tree. PSA = prostate-
specific antigen; DRE = digital rectal examination; phi = Prostate Health Index.
System Design
The app design can be divided into six interface categories: disclaimer, question,
explanation, language, results, and about (figure 4). The disclaimer must be accepted by the
user before using the app. A total of 11 questions were built into the app, and, depending on
the answers, one of the different algorithms could be used to predict the risk of prostate cancer
and of significant prostate cancer. All question interfaces are designed in a similar way. For
every question, there is an interface with an explanation of the question. The results (i.e., risk
of prostate cancer and risk of aggressive prostate cancer) are shown in numerical
(percentage) and graphic forms.
The “about” screen details the scientific background of the risk calculators and lists all
contributions. The user also has the option to choose the default language: Chinese, Dutch,
English, German, Portuguese, and Spanish.
Figure 4. Screenshots of the Rotterdam Prostate Cancer Risk Calculator app, showing “About,” “Disclaimer,” “Explanation,” “Question,” “Results,” and “Language” screens.
93

System Implementation
The debugging of the app was performed within the Apple Xcode environment. All code
errors were identified in a step-by-step approach, through the use of the intrinsic debugging
tools, and were corrected according to Apple’s guidelines. The functionalities of the app were
assessed in various devices in the usability evaluation stage. Care was taken to ensure a
consistent user experience across all devices.
System Usability Evaluation
A total of 92 participants evaluated the usability of the app (response rate = 11%), among
whom 28 (30%) were urologists, 29 (32%) were medical students, and 35 (38%) were GPs.
The mean age of participants was 31 years and 62% were female. The calculated mean and
standard deviation of the PSSUQ 16 questions are presented in table 1. “It was simple to use
this application” and “It was easy to learn to use this application” had the highest rating among
the 16 items, with 4.80 out of five possible points.
The final scores of the three domains evaluated (i.e., system usefulness, information
quality, and interface quality) are presented in table 2. The highest score (92%) was reported
for system usefulness, and information quality got the lowest score (87%). These results show
that the participants were, overall, satisfied with the usability of the app. Figure 5 shows the
percentage of actual scores given by urologists, GPs, and medical students for system
usefulness, information quality, and interface quality. The highest score was given for the
system usefulness category by urologists.
Figure 5. Percentage of actual score per item category and occupation of participants. GP = general practitioner. Med Stu = Medical Student. Urol = Urologist.
Table 1. Means and standard deviations of the Post-Study System Usability Questionnaire
results.
Category No. Item Mean SD System Usefulness
1 Overall, I am satisfied with how easy it is to use this application
4.67 0.557
2 It was simple to use this application 4.80 0.399 3 I was able to complete the tasks and
scenarios quickly using this application
4.53 0.601
4 I felt comfortable using this application
4.55 0.747
5 It was easy to learn to use this application
4.80 0.426
6 I believe I could become productive quickly using this application
4.34 0.905
Information Quality
7 The application gave error messages that clearly told me how to fix problems
3.85 1.398
8 Whenever I made a mistake using the application, I could recover easily and quickly
4.16 1.067
9 The information (such as on-line help, on-screen messages and other documentation) provided with this application was clear
4.43 0.701
10 It was easy to find the information I needed
4.47 0.654
11 The information was effective in helping me complete the tasks and scenarios
4.52 0.673
12 The organization of information on the application screens was clear
4.76 0.477
Interface Quality
13 The interface of this application was pleasant
4.57 0.789
14 I liked using the interface of this application
4.51 0.819
15 This application has all the functions and capabilities I expected it to have
4.29 1.064
Overall 16 Overall, I am satisfied with this
application 4.42 0.880
Total 4.48 0.832
System Implementation
The debugging of the app was performed within the Apple Xcode environment. All code
errors were identified in a step-by-step approach, through the use of the intrinsic debugging
tools, and were corrected according to Apple’s guidelines. The functionalities of the app were
assessed in various devices in the usability evaluation stage. Care was taken to ensure a
consistent user experience across all devices.
System Usability Evaluation
A total of 92 participants evaluated the usability of the app (response rate = 11%), among
whom 28 (30%) were urologists, 29 (32%) were medical students, and 35 (38%) were GPs.
The mean age of participants was 31 years and 62% were female. The calculated mean and
standard deviation of the PSSUQ 16 questions are presented in table 1. “It was simple to use
this application” and “It was easy to learn to use this application” had the highest rating among
the 16 items, with 4.80 out of five possible points.
The final scores of the three domains evaluated (i.e., system usefulness, information
quality, and interface quality) are presented in table 2. The highest score (92%) was reported
for system usefulness, and information quality got the lowest score (87%). These results show
that the participants were, overall, satisfied with the usability of the app. Figure 5 shows the
percentage of actual scores given by urologists, GPs, and medical students for system
usefulness, information quality, and interface quality. The highest score was given for the
system usefulness category by urologists.
Figure 5. Percentage of actual score per item category and occupation of participants. GP = general practitioner. Med Stu = Medical Student. Urol = Urologist.
94

System Implementation
The debugging of the app was performed within the Apple Xcode environment. All code
errors were identified in a step-by-step approach, through the use of the intrinsic debugging
tools, and were corrected according to Apple’s guidelines. The functionalities of the app were
assessed in various devices in the usability evaluation stage. Care was taken to ensure a
consistent user experience across all devices.
System Usability Evaluation
A total of 92 participants evaluated the usability of the app (response rate = 11%), among
whom 28 (30%) were urologists, 29 (32%) were medical students, and 35 (38%) were GPs.
The mean age of participants was 31 years and 62% were female. The calculated mean and
standard deviation of the PSSUQ 16 questions are presented in table 1. “It was simple to use
this application” and “It was easy to learn to use this application” had the highest rating among
the 16 items, with 4.80 out of five possible points.
The final scores of the three domains evaluated (i.e., system usefulness, information
quality, and interface quality) are presented in table 2. The highest score (92%) was reported
for system usefulness, and information quality got the lowest score (87%). These results show
that the participants were, overall, satisfied with the usability of the app. Figure 5 shows the
percentage of actual scores given by urologists, GPs, and medical students for system
usefulness, information quality, and interface quality. The highest score was given for the
system usefulness category by urologists.
Figure 5. Percentage of actual score per item category and occupation of participants. GP = general practitioner. Med Stu = Medical Student. Urol = Urologist.
Table 1. Means and standard deviations of the Post-Study System Usability Questionnaire
results.
Category No. Item Mean SD System Usefulness
1 Overall, I am satisfied with how easy it is to use this application
4.67 0.557
2 It was simple to use this application 4.80 0.399 3 I was able to complete the tasks and
scenarios quickly using this application
4.53 0.601
4 I felt comfortable using this application
4.55 0.747
5 It was easy to learn to use this application
4.80 0.426
6 I believe I could become productive quickly using this application
4.34 0.905
Information Quality
7 The application gave error messages that clearly told me how to fix problems
3.85 1.398
8 Whenever I made a mistake using the application, I could recover easily and quickly
4.16 1.067
9 The information (such as on-line help, on-screen messages and other documentation) provided with this application was clear
4.43 0.701
10 It was easy to find the information I needed
4.47 0.654
11 The information was effective in helping me complete the tasks and scenarios
4.52 0.673
12 The organization of information on the application screens was clear
4.76 0.477
Interface Quality
13 The interface of this application was pleasant
4.57 0.789
14 I liked using the interface of this application
4.51 0.819
15 This application has all the functions and capabilities I expected it to have
4.29 1.064
Overall 16 Overall, I am satisfied with this
application 4.42 0.880
Total 4.48 0.832
System Implementation
The debugging of the app was performed within the Apple Xcode environment. All code
errors were identified in a step-by-step approach, through the use of the intrinsic debugging
tools, and were corrected according to Apple’s guidelines. The functionalities of the app were
assessed in various devices in the usability evaluation stage. Care was taken to ensure a
consistent user experience across all devices.
System Usability Evaluation
A total of 92 participants evaluated the usability of the app (response rate = 11%), among
whom 28 (30%) were urologists, 29 (32%) were medical students, and 35 (38%) were GPs.
The mean age of participants was 31 years and 62% were female. The calculated mean and
standard deviation of the PSSUQ 16 questions are presented in table 1. “It was simple to use
this application” and “It was easy to learn to use this application” had the highest rating among
the 16 items, with 4.80 out of five possible points.
The final scores of the three domains evaluated (i.e., system usefulness, information
quality, and interface quality) are presented in table 2. The highest score (92%) was reported
for system usefulness, and information quality got the lowest score (87%). These results show
that the participants were, overall, satisfied with the usability of the app. Figure 5 shows the
percentage of actual scores given by urologists, GPs, and medical students for system
usefulness, information quality, and interface quality. The highest score was given for the
system usefulness category by urologists.
Figure 5. Percentage of actual score per item category and occupation of participants. GP = general practitioner. Med Stu = Medical Student. Urol = Urologist.
95

Table 2. Scores per evaluation category of the Post-Study System Usability Questionnaire.
Item category Actual score Possible score % Actual score
System Usefulness 27.7 30 92%
Information Quality 26.2 30 87%
Interface Quality 13.4 15 89%
Discussion
Principal Findings
Risk calculators are increasingly being used to stratify men at risk of prostate cancer.
The RPCRC, previously only available digitally on the website http://www.prostatecancer-
riskcalculator.com/seven-prostate-cancer-risk-calculators (11), was based on the Rotterdam
arm of the ERSPC, which started in 1993 in Europe to study the feasibility of population-based
screening for prostate cancer and its effect on mortality (34). This new app is publicly available
on the Apple App Store (35).
To facilitate its use in clinical practice, we decided to create an mHealth version using
the RPCRC algorithms. However, to simplify its use, a unique decision tree was created that
offers a streamlined user experience, while incorporating additional information at every step.
The app was well received by urologists and won the British Journal of Urology (BJUI) award
for Best Urology App in 2015, presented at the American Urological Association Annual
Meeting.
Starting with the total PSA value, a more complete assessment is built based on
supplementary information regarding a previous negative prostate biopsy, DRE and TRUS
findings, as well as phi value. Multiple external validations and comparisons of the RPCRC
have shown that including more relevant information increases predictive capability (9).
This app builds on the ubiquitous presence of mobile phones to provide doctors and
patients with a new way of using the RPCRC. Moreover, it maintains the ERSPC’s original
goal to optimize prostate cancer screening, reducing unnecessary prostate biopsies and
preventing the overtreatment of indolent prostate cancer while avoiding underdiagnosis.
mHealth offers the opportunity to change the paradigm of health services, and prostate
cancer, the second most common cancer worldwide, must be included in that effort (1).
In addition, the RPCRC app was designed and developed from day one by a
multidisciplinary team, which included not only urologists but also other healthcare
professionals, which has been shown to influence significantly the number of app downloads
(36). The strength of the RPCRC app is its development based on high-quality health
information extracted from various published studies that validate the outcome of ERSPC risk
calculator in multiple cohorts.
The IBM Computer Usability Satisfaction Questionnaire allowed the authors to obtain
quantitative information regarding the app usability, which offered strong measures of
usability. Moreover, taking into consideration that tests with only 5 participants are able to
uncover 85% of usability issues, we believe most usability issues would be identified in this
study, which included 92 users (37).
Limitations
In this study, we only discuss the development of the iOS app, but further studies are
under way to replicate this for other mobile platforms. Only medical students and health care
professionals took part in the usability testing, which may represent a selection bias. In the
near future, a similar evaluation will be done for patients.
Conclusions
We created a scientifically valid and convenient mobile app for the RPCRC. The RPCRC
has been designed to help patients and to assist health care professionals in the decision
making process. The app was found to be easy to use and, therefore, can be useful in the
daily management of patients. The RPCRC app can be used in a clinical setting to better
stratify the risk of prostate cancer, avoiding unnecessary biopsies and, consequently, reducing
overdiagnosis and overtreatment.
96

Table 2. Scores per evaluation category of the Post-Study System Usability Questionnaire.
Item category Actual score Possible score % Actual score
System Usefulness 27.7 30 92%
Information Quality 26.2 30 87%
Interface Quality 13.4 15 89%
Discussion
Principal Findings
Risk calculators are increasingly being used to stratify men at risk of prostate cancer.
The RPCRC, previously only available digitally on the website http://www.prostatecancer-
riskcalculator.com/seven-prostate-cancer-risk-calculators (11), was based on the Rotterdam
arm of the ERSPC, which started in 1993 in Europe to study the feasibility of population-based
screening for prostate cancer and its effect on mortality (34). This new app is publicly available
on the Apple App Store (35).
To facilitate its use in clinical practice, we decided to create an mHealth version using
the RPCRC algorithms. However, to simplify its use, a unique decision tree was created that
offers a streamlined user experience, while incorporating additional information at every step.
The app was well received by urologists and won the British Journal of Urology (BJUI) award
for Best Urology App in 2015, presented at the American Urological Association Annual
Meeting.
Starting with the total PSA value, a more complete assessment is built based on
supplementary information regarding a previous negative prostate biopsy, DRE and TRUS
findings, as well as phi value. Multiple external validations and comparisons of the RPCRC
have shown that including more relevant information increases predictive capability (9).
This app builds on the ubiquitous presence of mobile phones to provide doctors and
patients with a new way of using the RPCRC. Moreover, it maintains the ERSPC’s original
goal to optimize prostate cancer screening, reducing unnecessary prostate biopsies and
preventing the overtreatment of indolent prostate cancer while avoiding underdiagnosis.
mHealth offers the opportunity to change the paradigm of health services, and prostate
cancer, the second most common cancer worldwide, must be included in that effort (1).
In addition, the RPCRC app was designed and developed from day one by a
multidisciplinary team, which included not only urologists but also other healthcare
professionals, which has been shown to influence significantly the number of app downloads
(36). The strength of the RPCRC app is its development based on high-quality health
information extracted from various published studies that validate the outcome of ERSPC risk
calculator in multiple cohorts.
The IBM Computer Usability Satisfaction Questionnaire allowed the authors to obtain
quantitative information regarding the app usability, which offered strong measures of
usability. Moreover, taking into consideration that tests with only 5 participants are able to
uncover 85% of usability issues, we believe most usability issues would be identified in this
study, which included 92 users (37).
Limitations
In this study, we only discuss the development of the iOS app, but further studies are
under way to replicate this for other mobile platforms. Only medical students and health care
professionals took part in the usability testing, which may represent a selection bias. In the
near future, a similar evaluation will be done for patients.
Conclusions
We created a scientifically valid and convenient mobile app for the RPCRC. The RPCRC
has been designed to help patients and to assist health care professionals in the decision
making process. The app was found to be easy to use and, therefore, can be useful in the
daily management of patients. The RPCRC app can be used in a clinical setting to better
stratify the risk of prostate cancer, avoiding unnecessary biopsies and, consequently, reducing
overdiagnosis and overtreatment.
97

References
1. Jemal A, Bray F, Center MM, Ferlay J, Ward E, Forman D. Global cancer statistics. CA Cancer J Clin. 2011;61(2):69-90.
2. Mottet N, Bellmunt J, Briers E, van den Bergh RCN, Bolla M, van Casteren N. Guidelines on prostate cancer. European Association of Urology. 2015. Accessed through: https://uroweb.org/wp-content/uploads/EAU-Guidelines-Prostate-Cancer-2015-v2.pdf on July 26, 2016.
3. Schröder FH, Hugosson J, Roobol MJ, Tammela TL, Zappa M, Nelen V, et al. Screening and prostate cancer mortality: results of the European Randomised Study of Screening for Prostate Cancer (ERSPC) at 13 years of follow-up. Lancet. 2014;384(9959):2027-35.
4. Independent UK Panel on Breast Cancer Screening. The benefits and harms of breast cancer screening: an independent review. Lancet. 2012;380(9855):1778-86.
5. Roobol MJ, Carlsson SV. Risk stratification in prostate cancer screening. Nat Rev Urol. 2013;10(1):38-48.
6. Schröder FH, Hugosson J, Roobol MJ, Tammela TL, Ciatto S, Nelen V, et al. Screening and prostate-cancer mortality in a randomized european study. N Engl J Med. 2009;360(13):1320-8.
7. Thompson IM, Ankerst DP, Chi C, Lucia MS, Goodman PJ, Crowley JJ, et al. Operating characteristics of prostate-specific antigen in men with an initial PSA level of 3.0 ng/ml or lower. JAMA. 2005;294(1):66-70.
8. Louie K, Seigneurin A, Cathcart P. Do prostate cancer risk models improve the predictive accuracy of PSA screening? A meta-analysis. Ann Oncol. 2014;17.
9. Roobol MJ, Schröder FH, Hugosson J, Jones JS, Kattan MW, Klein EA, et al. Importance of prostate volume in the European Randomised Study of Screening for Prostate Cancer (ERSPC) risk calculators: results from the prostate biopsy collaborative group. World J Urol. 2012;30(2):149-55.
10. Roobol M, Nieboer D, Houlgatte A, Vincendeau S, Lazzeri M, Guazzoni G. Reducing unnecessary biopsies for suspicion of prostate cancer: extension and validation of an ERSPC based risk calculator with phi and comparison with the PCPT Risk Calculator including %free and -2propsa. The J Urol Suppl abstract. 2013;189(4):e843.
11. SWOP - The Prostate Cancer Research Foundation. Your Prostate Cancer Risk Calculator. Accessed through: http://www.prostatecancer-riskcalculator.com/assess-your-risk-of-prostate-cancer on October 27, 2016.
12. Torgan CE. The mHealth summit: local and global converge. Kinetics. Accessed through: http://caroltorgan.com/mhealth-summit on March 8, 2016.
13. Research2Guidance. mHealth app developer Economics 2015: The current status and trends of the mHealth app market. 2015 Nov. Accessed through: http://research2guidance.com/r2g/r2g-mHealth-App-Developer-Economics-2015.pdf on December 23, 2016.
14. Gautham M, Iyengar MS, Johnson CW. Mobile phone-based clinical guidance for rural health providers in India. Health Informatics J. 2015;21(4):253-66.
15. Hirst JE, Mackillop L, Loerup L, Kevat DA, Bartlett K, Gibson O, et al. Acceptability and user satisfaction of a smartphone-based, interactive blood glucose management system in women with gestational diabetes mellitus. J Diabetes Sci Technol. 2015;9(1):111-5.
16. Al Ayubi SU, Parmanto B, Branch R, Ding D. A persuasive and social mHealth application for physical activity: a usability and feasibility study. JMIR Mhealth Uhealth. 2014;2(2):e25.
17. Hong Y, Goldberg D, Dahlke DV, Ory MG, Cargill JS, Coughlin R, et al. Testing usability and acceptability of a web application to promote physical activity (iCanFit) among older adults. JMIR Hum Factors. 2014;1(1):e2.
18. Lewis JR. Psychometric evaluation of the PSSUQ using data from five years of usability studies. Int J Hum-Comput Int. 2002;14(3-4):463-88.
19. Roobol MJ, van Vugt HA, Loeb S, Zhu X, Bul M, Bangma CH, et al. Prediction of prostate cancer risk: the role of prostate volume and digital rectal examination in the ERSPC risk calculators. Eur Urol. 2012;61(3):577-83.
20. Preece J, Rogers Y, Sharp H, Benyon D, Holland S, Carey T. Human-computer interaction. Workingham, England: Addison-Wesley Publishing Co; 1994.
21. Butler KA. Usability engineering turns 10. Interactions. 1996;3(1):58-75. 22. Rosa A, Martins A, Costa V, Queirós A, Silva A, Pacheco RN. European Portuguese validation
of the Post-Study System Usability Questionnaire (PSSUQ). 2015 Presented at: Proceedings of the 10th Iberian Conference on Information Systems and Technologies (CISTI); 2015; Aveiro p.17-20.
23. Landman A, Neri PM, Robertson A, McEvoy D, Dinsmore M, Sweet M, et al. Efficiency and usability of a near field communication-enabled tablet for medication administration. JMIR Mhealth Uhealth. 2014;2(2):e26.
24. Steele GC, Wodchis WP, Upshur R, Cott C, McKinstry B, Mercer S, project collaborators and technology partner‚ QoC Health Inc. Supporting goal-oriented primary health care for seniors with complex care needs using mobile technology: evaluation and implementation of the health system performance research network, bridgepoint electronic patient reported outcome tool. JMIR Res Protoc. 2016;5(2):e126.
25. Stellefson M, Chaney B, Chaney D, Paige S, Payne-Purvis C, Tennant B, et al. Engaging community stakeholders to evaluate the design, usability, and acceptability of a chronic obstructive pulmonary disease social media resource center. JMIR Res Protoc. 2015;4(1):e17.
26. Cavadas V, Osório L, Sabell F, Teves F, Branco F, Silva-Ramos M. Prostate cancer prevention trial and European randomized study of screening for prostate cancer risk calculators: a performance comparison in a contemporary screened cohort. Eur Urol. 2010;58(4):551-8.
27. Jeong CW, Lee S, Jung J, Lee BK, Jeong SJ, Hong SK, et al. Mobile application-based Seoul National University Prostate Cancer Risk Calculator: development, validation, and comparative analysis with two Western risk calculators in Korean men. PLoS One. 2014;9(4):e94441.
28. van den Bergh RC, Roobol MJ, Wolters T, van Leeuwen PJ, Schröder FH. The Prostate Cancer Prevention Trial and European Randomized Study of Screening for Prostate Cancer risk calculators indicating a positive prostate biopsy: a comparison. BJU Int. 2008;102(9):1068-73.
29. Trottier G, Roobol MJ, Lawrentschuk N, Boström PJ, Fernandes KA, Finelli A, et al. Comparison of risk calculators from the Prostate Cancer Prevention Trial and the European Randomized Study of Screening for Prostate Cancer in a contemporary Canadian cohort. BJU Int. 2011;108(8 Pt 2):E237-44.
30. Oliveira M, Marques V, Carvalho AP, Santos A. Head-to-head comparison of two online nomograms for prostate biopsy outcome prediction. BJU Int. 2011;107(11):1780-3.
31. Lee DH, Jung HB, Park JW, Kim KH, Kim J, Lee SH, et al. Can Western based online prostate cancer risk calculators be used to predict prostate cancer after prostate biopsy for the Korean population? Yonsei Med J. 2013;54(3):665-71.
32. Yoon DK, Park JY, Yoon S, Park MS, Moon DG, Lee JG, et al. Can the prostate risk calculator based on Western population be applied to Asian population? Prostate. 2012;72(7):721-9.
98

References
1. Jemal A, Bray F, Center MM, Ferlay J, Ward E, Forman D. Global cancer statistics. CA Cancer J Clin. 2011;61(2):69-90.
2. Mottet N, Bellmunt J, Briers E, van den Bergh RCN, Bolla M, van Casteren N. Guidelines on prostate cancer. European Association of Urology. 2015. Accessed through: https://uroweb.org/wp-content/uploads/EAU-Guidelines-Prostate-Cancer-2015-v2.pdf on July 26, 2016.
3. Schröder FH, Hugosson J, Roobol MJ, Tammela TL, Zappa M, Nelen V, et al. Screening and prostate cancer mortality: results of the European Randomised Study of Screening for Prostate Cancer (ERSPC) at 13 years of follow-up. Lancet. 2014;384(9959):2027-35.
4. Independent UK Panel on Breast Cancer Screening. The benefits and harms of breast cancer screening: an independent review. Lancet. 2012;380(9855):1778-86.
5. Roobol MJ, Carlsson SV. Risk stratification in prostate cancer screening. Nat Rev Urol. 2013;10(1):38-48.
6. Schröder FH, Hugosson J, Roobol MJ, Tammela TL, Ciatto S, Nelen V, et al. Screening and prostate-cancer mortality in a randomized european study. N Engl J Med. 2009;360(13):1320-8.
7. Thompson IM, Ankerst DP, Chi C, Lucia MS, Goodman PJ, Crowley JJ, et al. Operating characteristics of prostate-specific antigen in men with an initial PSA level of 3.0 ng/ml or lower. JAMA. 2005;294(1):66-70.
8. Louie K, Seigneurin A, Cathcart P. Do prostate cancer risk models improve the predictive accuracy of PSA screening? A meta-analysis. Ann Oncol. 2014;17.
9. Roobol MJ, Schröder FH, Hugosson J, Jones JS, Kattan MW, Klein EA, et al. Importance of prostate volume in the European Randomised Study of Screening for Prostate Cancer (ERSPC) risk calculators: results from the prostate biopsy collaborative group. World J Urol. 2012;30(2):149-55.
10. Roobol M, Nieboer D, Houlgatte A, Vincendeau S, Lazzeri M, Guazzoni G. Reducing unnecessary biopsies for suspicion of prostate cancer: extension and validation of an ERSPC based risk calculator with phi and comparison with the PCPT Risk Calculator including %free and -2propsa. The J Urol Suppl abstract. 2013;189(4):e843.
11. SWOP - The Prostate Cancer Research Foundation. Your Prostate Cancer Risk Calculator. Accessed through: http://www.prostatecancer-riskcalculator.com/assess-your-risk-of-prostate-cancer on October 27, 2016.
12. Torgan CE. The mHealth summit: local and global converge. Kinetics. Accessed through: http://caroltorgan.com/mhealth-summit on March 8, 2016.
13. Research2Guidance. mHealth app developer Economics 2015: The current status and trends of the mHealth app market. 2015 Nov. Accessed through: http://research2guidance.com/r2g/r2g-mHealth-App-Developer-Economics-2015.pdf on December 23, 2016.
14. Gautham M, Iyengar MS, Johnson CW. Mobile phone-based clinical guidance for rural health providers in India. Health Informatics J. 2015;21(4):253-66.
15. Hirst JE, Mackillop L, Loerup L, Kevat DA, Bartlett K, Gibson O, et al. Acceptability and user satisfaction of a smartphone-based, interactive blood glucose management system in women with gestational diabetes mellitus. J Diabetes Sci Technol. 2015;9(1):111-5.
16. Al Ayubi SU, Parmanto B, Branch R, Ding D. A persuasive and social mHealth application for physical activity: a usability and feasibility study. JMIR Mhealth Uhealth. 2014;2(2):e25.
17. Hong Y, Goldberg D, Dahlke DV, Ory MG, Cargill JS, Coughlin R, et al. Testing usability and acceptability of a web application to promote physical activity (iCanFit) among older adults. JMIR Hum Factors. 2014;1(1):e2.
18. Lewis JR. Psychometric evaluation of the PSSUQ using data from five years of usability studies. Int J Hum-Comput Int. 2002;14(3-4):463-88.
19. Roobol MJ, van Vugt HA, Loeb S, Zhu X, Bul M, Bangma CH, et al. Prediction of prostate cancer risk: the role of prostate volume and digital rectal examination in the ERSPC risk calculators. Eur Urol. 2012;61(3):577-83.
20. Preece J, Rogers Y, Sharp H, Benyon D, Holland S, Carey T. Human-computer interaction. Workingham, England: Addison-Wesley Publishing Co; 1994.
21. Butler KA. Usability engineering turns 10. Interactions. 1996;3(1):58-75. 22. Rosa A, Martins A, Costa V, Queirós A, Silva A, Pacheco RN. European Portuguese validation
of the Post-Study System Usability Questionnaire (PSSUQ). 2015 Presented at: Proceedings of the 10th Iberian Conference on Information Systems and Technologies (CISTI); 2015; Aveiro p.17-20.
23. Landman A, Neri PM, Robertson A, McEvoy D, Dinsmore M, Sweet M, et al. Efficiency and usability of a near field communication-enabled tablet for medication administration. JMIR Mhealth Uhealth. 2014;2(2):e26.
24. Steele GC, Wodchis WP, Upshur R, Cott C, McKinstry B, Mercer S, project collaborators and technology partner‚ QoC Health Inc. Supporting goal-oriented primary health care for seniors with complex care needs using mobile technology: evaluation and implementation of the health system performance research network, bridgepoint electronic patient reported outcome tool. JMIR Res Protoc. 2016;5(2):e126.
25. Stellefson M, Chaney B, Chaney D, Paige S, Payne-Purvis C, Tennant B, et al. Engaging community stakeholders to evaluate the design, usability, and acceptability of a chronic obstructive pulmonary disease social media resource center. JMIR Res Protoc. 2015;4(1):e17.
26. Cavadas V, Osório L, Sabell F, Teves F, Branco F, Silva-Ramos M. Prostate cancer prevention trial and European randomized study of screening for prostate cancer risk calculators: a performance comparison in a contemporary screened cohort. Eur Urol. 2010;58(4):551-8.
27. Jeong CW, Lee S, Jung J, Lee BK, Jeong SJ, Hong SK, et al. Mobile application-based Seoul National University Prostate Cancer Risk Calculator: development, validation, and comparative analysis with two Western risk calculators in Korean men. PLoS One. 2014;9(4):e94441.
28. van den Bergh RC, Roobol MJ, Wolters T, van Leeuwen PJ, Schröder FH. The Prostate Cancer Prevention Trial and European Randomized Study of Screening for Prostate Cancer risk calculators indicating a positive prostate biopsy: a comparison. BJU Int. 2008;102(9):1068-73.
29. Trottier G, Roobol MJ, Lawrentschuk N, Boström PJ, Fernandes KA, Finelli A, et al. Comparison of risk calculators from the Prostate Cancer Prevention Trial and the European Randomized Study of Screening for Prostate Cancer in a contemporary Canadian cohort. BJU Int. 2011;108(8 Pt 2):E237-44.
30. Oliveira M, Marques V, Carvalho AP, Santos A. Head-to-head comparison of two online nomograms for prostate biopsy outcome prediction. BJU Int. 2011;107(11):1780-3.
31. Lee DH, Jung HB, Park JW, Kim KH, Kim J, Lee SH, et al. Can Western based online prostate cancer risk calculators be used to predict prostate cancer after prostate biopsy for the Korean population? Yonsei Med J. 2013;54(3):665-71.
32. Yoon DK, Park JY, Yoon S, Park MS, Moon DG, Lee JG, et al. Can the prostate risk calculator based on Western population be applied to Asian population? Prostate. 2012;72(7):721-9.
99

33. Poyet C, Nieboer D, Bhindi B, Kulkarni GS, Wiederkehr C, Wettstein MS, et al. Prostate cancer risk prediction using the novel versions of the European Randomised Study for Screening of Prostate Cancer (ERSPC) and Prostate Cancer Prevention Trial (PCPT) risk calculators: independent validation and comparison in a contemporary European cohort. BJU Int. 2016;117(3):401-8.
34. Schröder FH, Denis LJ, Roobol M, Nelen V, Auvinen A, Tammela T, et al. The story of the European Randomized Study of Screening for Prostate Cancer. BJU Int. 2003;92(Suppl. 2):1-13.
35. iTunes. Rotterdam Prostate Cancer Risk Calculator. Accessed through: https://itunes.apple.com/us/app/rotterdam-prostate-cancer/id729313737?mt=8 on October 31, 2016.
36. Pereira-Azevedo N, Osório L, Cavadas V, Fraga A, Carrasquinho E, Cardoso de Oliveira E, et al. Expert involvement predicts mHealth app downloads: multivariate regression analysis of urology apps. JMIR Mhealth Uhealth. 2016;4(3):e86.
37. Nielsen J. Why you only need to test with 5 users. Nielsen Norman Group. Accessed through: https://www.nngroup.com/articles/why-you-only-need-to-test-with-5-users on July 26, 2016.
100

33. Poyet C, Nieboer D, Bhindi B, Kulkarni GS, Wiederkehr C, Wettstein MS, et al. Prostate cancer risk prediction using the novel versions of the European Randomised Study for Screening of Prostate Cancer (ERSPC) and Prostate Cancer Prevention Trial (PCPT) risk calculators: independent validation and comparison in a contemporary European cohort. BJU Int. 2016;117(3):401-8.
34. Schröder FH, Denis LJ, Roobol M, Nelen V, Auvinen A, Tammela T, et al. The story of the European Randomized Study of Screening for Prostate Cancer. BJU Int. 2003;92(Suppl. 2):1-13.
35. iTunes. Rotterdam Prostate Cancer Risk Calculator. Accessed through: https://itunes.apple.com/us/app/rotterdam-prostate-cancer/id729313737?mt=8 on October 31, 2016.
36. Pereira-Azevedo N, Osório L, Cavadas V, Fraga A, Carrasquinho E, Cardoso de Oliveira E, et al. Expert involvement predicts mHealth app downloads: multivariate regression analysis of urology apps. JMIR Mhealth Uhealth. 2016;4(3):e86.
37. Nielsen J. Why you only need to test with 5 users. Nielsen Norman Group. Accessed through: https://www.nngroup.com/articles/why-you-only-need-to-test-with-5-users on July 26, 2016.


Nuno Pereira-Azevedo, Isaac Braga, Jan F. M. Verbeek, Luís Osório, Vítor Cavadas,
Avelino Fraga, Eduardo Carrasquinho, Eduardo Cardoso de Oliveira,
Daan Nieboer, and Monique J. Roobol
International Journal of Urology (2017) 24:826-832
Chapter 6
Performance of the DRE-based RPCRC in a setting with low intensity PSA-based screening
103

Original Article: Clinical Investigation
Prospective evaluation on the effect of interobserver variability ofdigital rectal examination on the performance of the RotterdamProstate Cancer Risk CalculatorNuno Pereira-Azevedo,1,2 Isaac Braga,2,3 Jan FM Verbeek,1 Lu�ıs Os�orio,2 V�ıtor Cavadas,2
Avelino Fraga,2 Eduardo Carrasquinho,4 Eduardo Cardoso de Oliveira,4 Daan Nieboer1 and Monique J Roobol1
1Department of Urology, Erasmus University Medical Center, Rotterdam, the Netherlands, 2Urology Department, Porto HospitalCentre, Porto, 3Life and Health Sciences Research Institute, School of Health Sciences, University of Minho and ICVS/3B’s, Braga/Guimar~aes, and 4Urology Department, Hospital Esp�ırito Santo, �Evora, Portugal
Abbreviations & AcronymsAUC = area under the curveBx = prostate biopsyDRE = digital rectalexaminationERSPC = EuropeanRandomized Study ofScreening for Prostate CancerGP = general practitionerHG = high-gradeMRI = magnetic resonanceimagingNB = net benefitNR = net reductionPCa = prostate cancerPSA = prostate-specificantigenROC = receiver operatingcharacteristicRPCRC = Rotterdam ProstateCancer Risk Calculatorr = Spearman’s rhocorrelation coefficienttPSA = total PSATRUS = transrectalultrasonographyVol = prostate volumej = Cohen’s kappa
Correspondence: Nuno Pereira-Azevedo M.Sc., M.D.,Department of Urology,Erasmus University MedicalCenter, Room NA-1706, P.O.Box 2040, 3000 Rotterdam, theNetherlands.Email: [email protected]
Received 2 May 2017; accepted2 August 2017.Online publication 13September 2017
Objectives: To assess the level of agreement between digital rectal examination
findings of two urologists and its effect on risk prediction using the digital rectal
examination-based Rotterdam Prostate Cancer Risk Calculator.
Methods: The study sample consisted of a prospective cohort of asymptomatic
unscreened men with prostate-specific antigen ≤50.0 ng/mL and transrectal ultrasound
volume ≤110 mL who underwent transrectal ultrasound-guided prostate biopsy. Both
urologists’ digital rectal examination findings were graded normal or abnormal
(nodularity and/or induration), and volume classified as 25, 40 or 60 mL, according to the
risk calculator algorithm. Interrater agreement analysis using Cohen’s kappa (j) statisticwas carried out to determine consistency of digital rectal examination outcome and
volume assessment. Receiver operating characteristic curve analysis and calibration plots
were constructed to determine the effect of interrater differences. Decision curve
analysis was applied to evaluate the clinical usefulness of the model.
Results: Of the 241 men included in the study, 41% (n = 98) had prostate cancer (81
were clinically significant, i.e. Gleason ≥3 + 4). There was substantial agreement in the
digital rectal examination (abnormal/normal; j = 0.78; P < 0.001) and volume estimation
(j = 0.79; P < 0.001). Receiver operating characteristic analyses showed good
discrimination (0.75–0.78) and were comparable for both urologists. In the high-risk
cohort, at a probability threshold of 25%, the risk calculator reduced the prostate biopsy
rate by 9%, without missing cancers.
Conclusions: Slight differences in digital rectal examination findings seem to have very
limited impact on the performance of the Rotterdam Prostate Cancer Risk Calculator.
Therefore, this can be considered a useful prostate biopsy outcome prediction tool.
Key words: biopsy, decision curve analysis, digital rectal examination, prostate cancer,
risk calculator.
Introduction
To reduce overdiagnosis and overtreatment, a prostate Bx should only be offered to menat increased risk of having a potentially life-threatening PCa.1 The optimal algorithmremains a debatable issue in urology.2 Even though the serum PSA test is the mainstayin the decision to carry out a Bx, the outcome of a DRE is also often considered.1 How-ever, to compensate for their intrinsic lack of specificity, a multivariate approach, takinginto account other relevant pre-biopsy information is advised.1 This can be done using so-called risk calculators, such as the RPCRC, based on biopsy data from the ERSPC sectionRotterdam.3
With PSA being the basis of decision-making, prostate volume becomes an important pre-dictor of biopsy outcome, as benign prostatic hyperplasia also alters PSA values. It has beenshown that including a DRE-based estimate of prostate volume allows for a more accuraterisk prediction, in comparison with just PSA and the outcome of the functional DRE (AUC0.69 vs 0.63; P = 0.008).4
826 © 2017 The Japanese Urological Association
International Journal of Urology (2017) 24, 826--832 doi: 10.1111/iju.13442
Abstract
Objectives
To assess the level of agreement between digital rectal examination findings of two
urologists and its effect on risk prediction using the digital rectal examination-based Rotterdam
Prostate Cancer Risk Calculator.
Methods
The study sample consisted of a prospective cohort of asymptomatic unscreened men
with prostate-specific antigen ≤50.0 ng/mL and transrectal ultrasound volume ≤110 mL who
underwent transrectal ultrasound-guided prostate biopsy. Both urologists’ digital rectal
examination findings were graded normal or abnormal (nodularity and/or induration), and
volume classified as 25, 40 or 60 mL, according to the risk calculator algorithm. Interrater
agreement analysis using Cohen’s kappa (k) statistic was carried out to determine consistency
of digital rectal examination outcome and volume assessment. Receiver operating
characteristic curve analysis and calibration plots were constructed to determine the effect of
interrater differences. Decision curve analysis was applied to evaluate the clinical usefulness
of the model.
Results
Of the 241 men included in the study, 41% (n = 98) had prostate cancer (81 were
clinically significant, i.e., Gleason ≥3 + 4). There was substantial agreement in the digital rectal
examination (abnormal/normal; k = 0.78; p<0.001) and volume estimation (k = 0.79; p<0.001).
Receiver operating characteristic analyses showed good discrimination (0.75-0.78) and were
comparable for both urologists. In the high-risk cohort, at a probability threshold of 25%, the
risk calculator reduced the prostate biopsy rate by 9%, without missing cancers.
Conclusions
Slight differences in digital rectal examination findings seem to have very limited impact
on the performance of the Rotterdam Prostate Cancer Risk Calculator. Therefore, this can be
considered a useful prostate biopsy outcome prediction tool.
104

Original Article: Clinical Investigation
Prospective evaluation on the effect of interobserver variability ofdigital rectal examination on the performance of the RotterdamProstate Cancer Risk CalculatorNuno Pereira-Azevedo,1,2 Isaac Braga,2,3 Jan FM Verbeek,1 Lu�ıs Os�orio,2 V�ıtor Cavadas,2
Avelino Fraga,2 Eduardo Carrasquinho,4 Eduardo Cardoso de Oliveira,4 Daan Nieboer1 and Monique J Roobol1
1Department of Urology, Erasmus University Medical Center, Rotterdam, the Netherlands, 2Urology Department, Porto HospitalCentre, Porto, 3Life and Health Sciences Research Institute, School of Health Sciences, University of Minho and ICVS/3B’s, Braga/Guimar~aes, and 4Urology Department, Hospital Esp�ırito Santo, �Evora, Portugal
Abbreviations & AcronymsAUC = area under the curveBx = prostate biopsyDRE = digital rectalexaminationERSPC = EuropeanRandomized Study ofScreening for Prostate CancerGP = general practitionerHG = high-gradeMRI = magnetic resonanceimagingNB = net benefitNR = net reductionPCa = prostate cancerPSA = prostate-specificantigenROC = receiver operatingcharacteristicRPCRC = Rotterdam ProstateCancer Risk Calculatorr = Spearman’s rhocorrelation coefficienttPSA = total PSATRUS = transrectalultrasonographyVol = prostate volumej = Cohen’s kappa
Correspondence: Nuno Pereira-Azevedo M.Sc., M.D.,Department of Urology,Erasmus University MedicalCenter, Room NA-1706, P.O.Box 2040, 3000 Rotterdam, theNetherlands.Email: [email protected]
Received 2 May 2017; accepted2 August 2017.Online publication 13September 2017
Objectives: To assess the level of agreement between digital rectal examination
findings of two urologists and its effect on risk prediction using the digital rectal
examination-based Rotterdam Prostate Cancer Risk Calculator.
Methods: The study sample consisted of a prospective cohort of asymptomatic
unscreened men with prostate-specific antigen ≤50.0 ng/mL and transrectal ultrasound
volume ≤110 mL who underwent transrectal ultrasound-guided prostate biopsy. Both
urologists’ digital rectal examination findings were graded normal or abnormal
(nodularity and/or induration), and volume classified as 25, 40 or 60 mL, according to the
risk calculator algorithm. Interrater agreement analysis using Cohen’s kappa (j) statisticwas carried out to determine consistency of digital rectal examination outcome and
volume assessment. Receiver operating characteristic curve analysis and calibration plots
were constructed to determine the effect of interrater differences. Decision curve
analysis was applied to evaluate the clinical usefulness of the model.
Results: Of the 241 men included in the study, 41% (n = 98) had prostate cancer (81
were clinically significant, i.e. Gleason ≥3 + 4). There was substantial agreement in the
digital rectal examination (abnormal/normal; j = 0.78; P < 0.001) and volume estimation
(j = 0.79; P < 0.001). Receiver operating characteristic analyses showed good
discrimination (0.75–0.78) and were comparable for both urologists. In the high-risk
cohort, at a probability threshold of 25%, the risk calculator reduced the prostate biopsy
rate by 9%, without missing cancers.
Conclusions: Slight differences in digital rectal examination findings seem to have very
limited impact on the performance of the Rotterdam Prostate Cancer Risk Calculator.
Therefore, this can be considered a useful prostate biopsy outcome prediction tool.
Key words: biopsy, decision curve analysis, digital rectal examination, prostate cancer,
risk calculator.
Introduction
To reduce overdiagnosis and overtreatment, a prostate Bx should only be offered to menat increased risk of having a potentially life-threatening PCa.1 The optimal algorithmremains a debatable issue in urology.2 Even though the serum PSA test is the mainstayin the decision to carry out a Bx, the outcome of a DRE is also often considered.1 How-ever, to compensate for their intrinsic lack of specificity, a multivariate approach, takinginto account other relevant pre-biopsy information is advised.1 This can be done using so-called risk calculators, such as the RPCRC, based on biopsy data from the ERSPC sectionRotterdam.3
With PSA being the basis of decision-making, prostate volume becomes an important pre-dictor of biopsy outcome, as benign prostatic hyperplasia also alters PSA values. It has beenshown that including a DRE-based estimate of prostate volume allows for a more accuraterisk prediction, in comparison with just PSA and the outcome of the functional DRE (AUC0.69 vs 0.63; P = 0.008).4
826 © 2017 The Japanese Urological Association
International Journal of Urology (2017) 24, 826--832 doi: 10.1111/iju.13442
Abstract
Objectives
To assess the level of agreement between digital rectal examination findings of two
urologists and its effect on risk prediction using the digital rectal examination-based Rotterdam
Prostate Cancer Risk Calculator.
Methods
The study sample consisted of a prospective cohort of asymptomatic unscreened men
with prostate-specific antigen ≤50.0 ng/mL and transrectal ultrasound volume ≤110 mL who
underwent transrectal ultrasound-guided prostate biopsy. Both urologists’ digital rectal
examination findings were graded normal or abnormal (nodularity and/or induration), and
volume classified as 25, 40 or 60 mL, according to the risk calculator algorithm. Interrater
agreement analysis using Cohen’s kappa (k) statistic was carried out to determine consistency
of digital rectal examination outcome and volume assessment. Receiver operating
characteristic curve analysis and calibration plots were constructed to determine the effect of
interrater differences. Decision curve analysis was applied to evaluate the clinical usefulness
of the model.
Results
Of the 241 men included in the study, 41% (n = 98) had prostate cancer (81 were
clinically significant, i.e., Gleason ≥3 + 4). There was substantial agreement in the digital rectal
examination (abnormal/normal; k = 0.78; p<0.001) and volume estimation (k = 0.79; p<0.001).
Receiver operating characteristic analyses showed good discrimination (0.75-0.78) and were
comparable for both urologists. In the high-risk cohort, at a probability threshold of 25%, the
risk calculator reduced the prostate biopsy rate by 9%, without missing cancers.
Conclusions
Slight differences in digital rectal examination findings seem to have very limited impact
on the performance of the Rotterdam Prostate Cancer Risk Calculator. Therefore, this can be
considered a useful prostate biopsy outcome prediction tool.
105

Introduction
To reduce overdiagnosis and overtreatment, a prostate Bx should only be offered to
men at increased risk of having a potentially life-threatening PCa (1). The optimal algorithm
remains a debatable issue in urology (2). Even though the serum PSA test is the mainstay in
the decision to carry out a Bx, the outcome of a DRE is also often considered (1). However,
to compensate for their intrinsic lack of specificity, a multivariate approach, taking into account
other relevant pre-biopsy information is advised (1). This can be done using so-called risk
calculators, such as the RPCRC, based on biopsy data from the ERSPC section Rotterdam
(3).
With PSA being the basis of decision making, prostate volume becomes an important
predictor of biopsy outcome, as benign prostatic hyperplasia also alters PSA values. It has
been shown that including a DRE-based estimate of prostate volume allows for a more
accurate risk prediction, in comparison with just PSA and the outcome of the functional DRE
(AUC 0.69 vs. 0.63; p=0.008) (4). The ERSPC DRE-based risk calculator, which includes
PSA, DRE outcome and DRE-assessed prostate volume as predictors, suitable for men facing
initial biopsy, was developed to include information on prostate volume but to circumvent the
need for imaging studies (e.g., TRUS or MRI), enabling easier implementation into the daily
practice of both urologists and GPs (4). Furthermore, although some men might benefit from
additional characterization with MRI or biomarkers, using PSA and DRE as initial risk
stratification can control healthcare costs.
Although the TRUS-based RPCRC has been externally validated in various patient
populations with good results, the DRE-based RPCRC has not (5). DRE has been shown to
correlate with TRUS-assessed prostate volume, but it is a subjective test that requires external
validation (6 - 8). Therefore, we assessed the level of agreement between the DRE findings
(both on abnormalities and estimation of prostate volume) of two urologists in men with a
suspicion of PCa, and subsequently examined the potential effect on calculated risks when
using the DRE-based RPCRC 3.
Methods
Study population
All men who were referred for Bx at the urology department of a university hospital in
Portugal, between July 2014 and June 2015, were evaluated by two urologists, with >10 years
of clinical experience, who had no previous contact with the patients nor their clinical records.
Methods
After a complete explanation of the procedure, all patients provided written consent for
the data collection. Before the TRUS-guided Bx, two urologists (NPA and IB), blinded from
each other’s findings, carried out a DRE, with the patient in the left lateral decubitus position,
to detect prostate induration/nodularity and to estimate prostate volume. Afterwards, prostate
volume was assessed by TRUS (NPA), again blinded from DRE results, and patients were
submitted to a 16-core TRUS-guided systematic biopsy under local anaesthesia (NPA).
Symptoms, clinical staging and tPSA value were obtained from the patient’s clinical file.
According to the RPCRC 3 (DRE-based), only asymptomatic men with no previous prostate
biopsy, with total PSA ≤50.0 ng/mL and a TRUS-measured prostate volume ≤110 mL at the
time of biopsy were included in the prospective cohort (4).
DRE findings of both physicians were classified as normal or abnormal. A DRE was
considered abnormal if there was any induration and/or nodularity. Prostate volume was
assessed by DRE, and recorded as <25 mL, 40-60 mL or >60 mL, according to the RPCRC
algorithm (3, 4). Patients were subsequently submitted to a 16-core TRUS-guided systematic
biopsy under local anaesthesia.
Statistical analysis
Statistically significant differences in men with and without PCa detected at biopsy were
assessed using the Mann-Whitney U-test for continuous data, and the Chi-square test for
categorical data. An interrater agreement for DRE examination, which included DRE outcome
(abnormal/normal) and prostate volume assessment, between two urologists was estimated
using Cohen's kappa coefficient k. In addition, r was calculated to evaluate the association
between DRE-assessed volume and TRUS-assessed volume. The diagnostic accuracy of the
RPCRC for any-grade and HG (i.e., Gleason ≥3 + 4) PCa was quantified using ROC analysis.
Calibration of the RPCRC for any-grade and HG PCa was explored graphically by the
construction of validation plots for both urologists. In addition, we applied decision curve
analysis to evaluate the potential clinical usefulness of making decisions based on the models,
and to compare the DRE-based RPCRC with and without DRE-assessed prostate volume
included in the model (i.e., comparing it with a strategy based on PSA and DRE outcome only)
(9, 10). Analyses were carried out using SPSS v20 (IBM Corporation, Armonk, NY, USA), and
the R statistical package, version 3.2.2 (https://www.r-project.org/) was applied to develop
calibration plots and decision curve analysis. Statistical significance was set at p<0.05 for all
analyses.
106

Introduction
To reduce overdiagnosis and overtreatment, a prostate Bx should only be offered to
men at increased risk of having a potentially life-threatening PCa (1). The optimal algorithm
remains a debatable issue in urology (2). Even though the serum PSA test is the mainstay in
the decision to carry out a Bx, the outcome of a DRE is also often considered (1). However,
to compensate for their intrinsic lack of specificity, a multivariate approach, taking into account
other relevant pre-biopsy information is advised (1). This can be done using so-called risk
calculators, such as the RPCRC, based on biopsy data from the ERSPC section Rotterdam
(3).
With PSA being the basis of decision making, prostate volume becomes an important
predictor of biopsy outcome, as benign prostatic hyperplasia also alters PSA values. It has
been shown that including a DRE-based estimate of prostate volume allows for a more
accurate risk prediction, in comparison with just PSA and the outcome of the functional DRE
(AUC 0.69 vs. 0.63; p=0.008) (4). The ERSPC DRE-based risk calculator, which includes
PSA, DRE outcome and DRE-assessed prostate volume as predictors, suitable for men facing
initial biopsy, was developed to include information on prostate volume but to circumvent the
need for imaging studies (e.g., TRUS or MRI), enabling easier implementation into the daily
practice of both urologists and GPs (4). Furthermore, although some men might benefit from
additional characterization with MRI or biomarkers, using PSA and DRE as initial risk
stratification can control healthcare costs.
Although the TRUS-based RPCRC has been externally validated in various patient
populations with good results, the DRE-based RPCRC has not (5). DRE has been shown to
correlate with TRUS-assessed prostate volume, but it is a subjective test that requires external
validation (6 - 8). Therefore, we assessed the level of agreement between the DRE findings
(both on abnormalities and estimation of prostate volume) of two urologists in men with a
suspicion of PCa, and subsequently examined the potential effect on calculated risks when
using the DRE-based RPCRC 3.
Methods
Study population
All men who were referred for Bx at the urology department of a university hospital in
Portugal, between July 2014 and June 2015, were evaluated by two urologists, with >10 years
of clinical experience, who had no previous contact with the patients nor their clinical records.
Methods
After a complete explanation of the procedure, all patients provided written consent for
the data collection. Before the TRUS-guided Bx, two urologists (NPA and IB), blinded from
each other’s findings, carried out a DRE, with the patient in the left lateral decubitus position,
to detect prostate induration/nodularity and to estimate prostate volume. Afterwards, prostate
volume was assessed by TRUS (NPA), again blinded from DRE results, and patients were
submitted to a 16-core TRUS-guided systematic biopsy under local anaesthesia (NPA).
Symptoms, clinical staging and tPSA value were obtained from the patient’s clinical file.
According to the RPCRC 3 (DRE-based), only asymptomatic men with no previous prostate
biopsy, with total PSA ≤50.0 ng/mL and a TRUS-measured prostate volume ≤110 mL at the
time of biopsy were included in the prospective cohort (4).
DRE findings of both physicians were classified as normal or abnormal. A DRE was
considered abnormal if there was any induration and/or nodularity. Prostate volume was
assessed by DRE, and recorded as <25 mL, 40-60 mL or >60 mL, according to the RPCRC
algorithm (3, 4). Patients were subsequently submitted to a 16-core TRUS-guided systematic
biopsy under local anaesthesia.
Statistical analysis
Statistically significant differences in men with and without PCa detected at biopsy were
assessed using the Mann-Whitney U-test for continuous data, and the Chi-square test for
categorical data. An interrater agreement for DRE examination, which included DRE outcome
(abnormal/normal) and prostate volume assessment, between two urologists was estimated
using Cohen's kappa coefficient k. In addition, r was calculated to evaluate the association
between DRE-assessed volume and TRUS-assessed volume. The diagnostic accuracy of the
RPCRC for any-grade and HG (i.e., Gleason ≥3 + 4) PCa was quantified using ROC analysis.
Calibration of the RPCRC for any-grade and HG PCa was explored graphically by the
construction of validation plots for both urologists. In addition, we applied decision curve
analysis to evaluate the potential clinical usefulness of making decisions based on the models,
and to compare the DRE-based RPCRC with and without DRE-assessed prostate volume
included in the model (i.e., comparing it with a strategy based on PSA and DRE outcome only)
(9, 10). Analyses were carried out using SPSS v20 (IBM Corporation, Armonk, NY, USA), and
the R statistical package, version 3.2.2 (https://www.r-project.org/) was applied to develop
calibration plots and decision curve analysis. Statistical significance was set at p<0.05 for all
analyses.
107

Results
A total of 241 men were evaluated, with a median age of 66 years, a median PSA of 6.9
ng/mL and a median prostate volume of 40 mL (as evaluated by DRE) or 47 mL (as evaluated
by TRUS; table 1).
Table 1. Clinical characteristics of patient cohort and differences between patients with and
without positive Bx.
Variable All Patients Negative Bx Positive Bx p-value Number of patients, n (%) 241 143 (59) 98 (41) Age at biopsy, years, mean (SD) 66 (8) 64 (8) 68 (8) Age at biopsy, years, median (25th percentile; 75th percentile)
66 (59; 71) 65 (59; 69) 69 (63; 74) <0.001a
Total PSA, ng/mL, mean (SD) 8.7 (6.8) 7.14 (3.8) 10.95 (9.1) Total PSA, ng/mL, median (25th percentile; 75th percentile)
6.9 (4.9; 9.8) 6.6 (4.4; 9) 7.4 (5.3; 14.1) 0.005a
Not suspicious DRE – 1st Urol, n (%) 137 102 (75) 35 (25) <0.001b
Suspicious DRE – 1st Urol, n (%) 104 41 (39) 63 (61)
Not suspicious DRE – 2nd Urol, n (%) 158 114 (72) 44 (28) <0.001b Suspicious DRE – 2nd Urol, n (%) 83 29 (35) 54 (65) Prostate vol.– 1st Urol, mL, mean (SD) 47 (19.6) 53 (19.9) 40 (16.5) Prostate vol. – 1st Urol, mL, median (25th percentile; 75th percentile)
40 (30; 60) 50 (40; 60) 40 (30; 50) <0.001a
Prostate vol. – 2nd Urol, mL, mean (SD) 46 (20.3) 52 (20.7) 39 (16.8)
Prostate vol. – 2nd Urol, mL, median (25th percentile; 75th percentile)
40 (30; 60) 50 (35; 60) 35 (30; 45) <0.001a
Prostate vol. TRUS, mL, mean (SD) 51 (21.2) 57 (21.6) 43 (17.6) Prostate vol. TRUS, mL, median (25th percentile; 75th percentile)
47 (35; 65) 53 (41; 70) 39 (32; 50) <0.001a
DRE prostate vol. <25 mL – 1st Urol, n (%) 26 10 (38) 16 (62) <0.001b
DRE prostate vol. 40 mL – 1st Urol, n (%) 103 47 (46) 56 (54) DRE prostate vol. >60 mL – 1st Urol, n% 112 86 (77) 26 (23) DRE prostate vol. <25 mL – 2nd Urol, n (%) 28 6 (21) 22 (79) <0.001b DRE prostate vol. 40 mL – 2nd Urol, n (%) 111 57 (51) 54 (49) DRE prostate vol. >60 mL – 2nd Urol, n (%) 102 80 (78) 22 (22)
Number of cores, n, mean (SD) 15 (2.8) 15 (3.5) 16 (0.8) Number of cores, n, median (25th percentile; 75th percentile)
16 (16; 16) 16 (16; 16) 16 (16; 16) 0.531a
DRE = digital rectal examination; PSA = prostate-specific antigen; SD = standard deviation; TRUS = transrectal ultrasound. a Mann-Whitney test. b Chi-square test.
PCa was diagnosed in 98 of 241 patients (41%), and 81 (34%) men had significant PCa
defined as >T2b and/or Gleason ≥7. PCa patients were significantly older (median age 69 vs.
65 years for non-PCa patients; p<0.001), and had significantly smaller prostate glands
(median TRUS-assessed prostate volume 39 vs. 53mL; p<0.001). Median tPSA was
significantly higher for men with PCa than without PCa (7.4 vs. 6.6 ng/mL; p=0.005).
Considering the DRE examination (abnormal/normal), there was substantial agreement
between the two urologists (k = 0.783; p<0.001). A similar outcome was found when
comparing DRE-based volume estimations (k = 0.790; p<0.001). DRE-assessed volume (<25
mL, 40–60 mL or >60 mL) was significantly correlated with TRUS-assessed volume for both
urologists (urologist 1: r = 0.876; p<0.001; urologist 2: r = 0.843; p<0.001; table 2).
Table 2. DRE estimated volume performed by two urologists compared with TRUS volume.
TRUS volume, median (range) DRE estimated volume (mL) Urologist 1 Urologist 2 25 25 (23 - 27) 25 (23 - 31) 40 39 (33 - 43) 40 (34 - 45) 60 67 (55 - 76) 67 (56 - 81)
Urologist 1: r = 0.876; p<0.001; Urologist 2: r = 0.843; p<0.001. DRE = digital rectal examination; TRUS = transrectal ultrasound; r = Spearman's rho correlation coefficient.
ROC analyses showed good discrimination in predicting both any-grade cancer (AUC
0.77 and 0.78) and HG PCa (AUC 0.75 and 0.76), and were highly comparable between
urologists (table 3). Figures 1 and 2 show DRE-based RPCRC calibration plots for both
urologists and for PCa and HG PCa, respectively. DRE-based RPCRC showed adequate
calibration, and only slight underestimations between predicted and observed probabilities of
PCa for both urologists. DRE-based RPCRC for PCa had better calibration than DRE-based
RPCRC for HG PCa.
Table 3. Discrimination of the DRE-based RPCRC.
Urologist 1 Urologist 2 Any-grade PCa 0.774 (95% CI, 0.712-0.836) 0.784 (95% CI, 0.723-0.845) HG PCa 0.746 (95% CI, 0.676-0.815) 0.762 (95% CI, 0.694-0.829) Performance of the Rotterdam Prostate Cancer Risk Calculator. AUC = area under the curve; CI = confidence interval; PCa = prostate cancer; RPCRC = Rotterdam Prostate Cancer Risk Calculator.
108

Results
A total of 241 men were evaluated, with a median age of 66 years, a median PSA of 6.9
ng/mL and a median prostate volume of 40 mL (as evaluated by DRE) or 47 mL (as evaluated
by TRUS; table 1).
Table 1. Clinical characteristics of patient cohort and differences between patients with and
without positive Bx.
Variable All Patients Negative Bx Positive Bx p-value Number of patients, n (%) 241 143 (59) 98 (41) Age at biopsy, years, mean (SD) 66 (8) 64 (8) 68 (8) Age at biopsy, years, median (25th percentile; 75th percentile)
66 (59; 71) 65 (59; 69) 69 (63; 74) <0.001a
Total PSA, ng/mL, mean (SD) 8.7 (6.8) 7.14 (3.8) 10.95 (9.1) Total PSA, ng/mL, median (25th percentile; 75th percentile)
6.9 (4.9; 9.8) 6.6 (4.4; 9) 7.4 (5.3; 14.1) 0.005a
Not suspicious DRE – 1st Urol, n (%) 137 102 (75) 35 (25) <0.001b
Suspicious DRE – 1st Urol, n (%) 104 41 (39) 63 (61)
Not suspicious DRE – 2nd Urol, n (%) 158 114 (72) 44 (28) <0.001b Suspicious DRE – 2nd Urol, n (%) 83 29 (35) 54 (65) Prostate vol.– 1st Urol, mL, mean (SD) 47 (19.6) 53 (19.9) 40 (16.5) Prostate vol. – 1st Urol, mL, median (25th percentile; 75th percentile)
40 (30; 60) 50 (40; 60) 40 (30; 50) <0.001a
Prostate vol. – 2nd Urol, mL, mean (SD) 46 (20.3) 52 (20.7) 39 (16.8)
Prostate vol. – 2nd Urol, mL, median (25th percentile; 75th percentile)
40 (30; 60) 50 (35; 60) 35 (30; 45) <0.001a
Prostate vol. TRUS, mL, mean (SD) 51 (21.2) 57 (21.6) 43 (17.6) Prostate vol. TRUS, mL, median (25th percentile; 75th percentile)
47 (35; 65) 53 (41; 70) 39 (32; 50) <0.001a
DRE prostate vol. <25 mL – 1st Urol, n (%) 26 10 (38) 16 (62) <0.001b
DRE prostate vol. 40 mL – 1st Urol, n (%) 103 47 (46) 56 (54) DRE prostate vol. >60 mL – 1st Urol, n% 112 86 (77) 26 (23) DRE prostate vol. <25 mL – 2nd Urol, n (%) 28 6 (21) 22 (79) <0.001b DRE prostate vol. 40 mL – 2nd Urol, n (%) 111 57 (51) 54 (49) DRE prostate vol. >60 mL – 2nd Urol, n (%) 102 80 (78) 22 (22)
Number of cores, n, mean (SD) 15 (2.8) 15 (3.5) 16 (0.8) Number of cores, n, median (25th percentile; 75th percentile)
16 (16; 16) 16 (16; 16) 16 (16; 16) 0.531a
DRE = digital rectal examination; PSA = prostate-specific antigen; SD = standard deviation; TRUS = transrectal ultrasound. a Mann-Whitney test. b Chi-square test.
PCa was diagnosed in 98 of 241 patients (41%), and 81 (34%) men had significant PCa
defined as >T2b and/or Gleason ≥7. PCa patients were significantly older (median age 69 vs.
65 years for non-PCa patients; p<0.001), and had significantly smaller prostate glands
(median TRUS-assessed prostate volume 39 vs. 53mL; p<0.001). Median tPSA was
significantly higher for men with PCa than without PCa (7.4 vs. 6.6 ng/mL; p=0.005).
Considering the DRE examination (abnormal/normal), there was substantial agreement
between the two urologists (k = 0.783; p<0.001). A similar outcome was found when
comparing DRE-based volume estimations (k = 0.790; p<0.001). DRE-assessed volume (<25
mL, 40–60 mL or >60 mL) was significantly correlated with TRUS-assessed volume for both
urologists (urologist 1: r = 0.876; p<0.001; urologist 2: r = 0.843; p<0.001; table 2).
Table 2. DRE estimated volume performed by two urologists compared with TRUS volume.
TRUS volume, median (range) DRE estimated volume (mL) Urologist 1 Urologist 2 25 25 (23 - 27) 25 (23 - 31) 40 39 (33 - 43) 40 (34 - 45) 60 67 (55 - 76) 67 (56 - 81)
Urologist 1: r = 0.876; p<0.001; Urologist 2: r = 0.843; p<0.001. DRE = digital rectal examination; TRUS = transrectal ultrasound; r = Spearman's rho correlation coefficient.
ROC analyses showed good discrimination in predicting both any-grade cancer (AUC
0.77 and 0.78) and HG PCa (AUC 0.75 and 0.76), and were highly comparable between
urologists (table 3). Figures 1 and 2 show DRE-based RPCRC calibration plots for both
urologists and for PCa and HG PCa, respectively. DRE-based RPCRC showed adequate
calibration, and only slight underestimations between predicted and observed probabilities of
PCa for both urologists. DRE-based RPCRC for PCa had better calibration than DRE-based
RPCRC for HG PCa.
Table 3. Discrimination of the DRE-based RPCRC.
Urologist 1 Urologist 2 Any-grade PCa 0.774 (95% CI, 0.712-0.836) 0.784 (95% CI, 0.723-0.845) HG PCa 0.746 (95% CI, 0.676-0.815) 0.762 (95% CI, 0.694-0.829) Performance of the Rotterdam Prostate Cancer Risk Calculator. AUC = area under the curve; CI = confidence interval; PCa = prostate cancer; RPCRC = Rotterdam Prostate Cancer Risk Calculator.
109

Figure 1. Calibration plot showing the agreement between predicted and observed any-grade
PCa for the DRE-based RPCRC for (a) urologist 1 and (b) urologist 2.
Figure 2. Calibration plot showing the agreement between predicted and observed HG PCa
for the DRE-based RPCRC for (a) urologist 1 and (b) urologist 2.
Figure 3 shows the decision curves for DRE-based RPCRC, with and without prostate
volume included in the algorithm for predicting any-grade PCa (figure 3a) and HG PCa (figure
3b). The use of the DRE-based RPCRC model with prostate volume information has a higher
NB than the PSA and DRE normal/abnormal model for both urologists. Taking into account
prostate volume assessment with DRE, improved NB was obtained for any-grade PCa, but
not for HG PCa.
Figure 3. Decision curve analyses adjusted for DRE volume-based and no volume RPCRCs.
(a) Any-grade PCa and (b) HG PCa.
As part of assessing the usefulness of the DRE volume-based RPCRC, we analysed
whether using this risk calculator to identify patients with and without cancer would help reduce
unnecessary biopsies. Tables 4 and 5 show the values of each urologist per model at a given
threshold probability for biopsy carried out/saved, prostate cancer detected/missed, NB and
NR in avoidable biopsies per 100 patients for any-grade PCa and HG PCa, respectively.
For illustration, a threshold of 25% for any PCa could be used, meaning, respectively,
four men should undergo a biopsy to find any PCa. For HG PCa, a lower threshold might be
used, for example 5%, allowing 20 men to be biopsied to find one HG PCa.
Urologist 1 would have saved 43.6% (n = 105) biopsies and would have missed 23.5%
(n = 23) of any PCa when using the DRE-based RPCRC, whereas the numbers for a model
without information on volume would be less: 35.3% (n = 85) biopsies saved and 22.4% (n =
22) PCa missed, respectively. To observe the difference between the DRE-assessed prostate
volume-based RPCRC and RPCRC without prostate volume, both urologist results were
pooled together.
110

Figure 1. Calibration plot showing the agreement between predicted and observed any-grade
PCa for the DRE-based RPCRC for (a) urologist 1 and (b) urologist 2.
Figure 2. Calibration plot showing the agreement between predicted and observed HG PCa
for the DRE-based RPCRC for (a) urologist 1 and (b) urologist 2.
Figure 3 shows the decision curves for DRE-based RPCRC, with and without prostate
volume included in the algorithm for predicting any-grade PCa (figure 3a) and HG PCa (figure
3b). The use of the DRE-based RPCRC model with prostate volume information has a higher
NB than the PSA and DRE normal/abnormal model for both urologists. Taking into account
prostate volume assessment with DRE, improved NB was obtained for any-grade PCa, but
not for HG PCa.
Figure 3. Decision curve analyses adjusted for DRE volume-based and no volume RPCRCs.
(a) Any-grade PCa and (b) HG PCa.
As part of assessing the usefulness of the DRE volume-based RPCRC, we analysed
whether using this risk calculator to identify patients with and without cancer would help reduce
unnecessary biopsies. Tables 4 and 5 show the values of each urologist per model at a given
threshold probability for biopsy carried out/saved, prostate cancer detected/missed, NB and
NR in avoidable biopsies per 100 patients for any-grade PCa and HG PCa, respectively.
For illustration, a threshold of 25% for any PCa could be used, meaning, respectively,
four men should undergo a biopsy to find any PCa. For HG PCa, a lower threshold might be
used, for example 5%, allowing 20 men to be biopsied to find one HG PCa.
Urologist 1 would have saved 43.6% (n = 105) biopsies and would have missed 23.5%
(n = 23) of any PCa when using the DRE-based RPCRC, whereas the numbers for a model
without information on volume would be less: 35.3% (n = 85) biopsies saved and 22.4% (n =
22) PCa missed, respectively. To observe the difference between the DRE-assessed prostate
volume-based RPCRC and RPCRC without prostate volume, both urologist results were
pooled together.
111

Table 4. Decision analytic evaluation for any-grade prostate cancer.
Threshold probability, %
Biopsy Any-grade PCa Clinical importance
Performed,
No.
Saved,
No. (%)
Detected,
No. (%)
Missed
No. (%)
NB NR:
Bx/100a DRE-based 1st Urol
Total 241 0 98 (40.7) 0 - - 15 196 45 (18.7) 91 (46.4) 7 (7.1) 0.300 -1 20 165 76 (31.5) 83 (50.3) 15
(15.3) 0.259 0
25 136 105 (43.6)
75 (55.1) 23 (23.5)
0.227 5
30 116 125 (51.9)
73 (62.9) 25 (25.5)
0.226 17
DRE-based 2nd Urol
15 192 49 (20.3) 90 (46.9) 8 (8.2) 0.299 -2 20 162 79 (32.8) 83 (51.2) 15
(15.3) 0.262 2
25 129 112 (46.5) 74 (57.4) 24
(24.5) 0.230 7
30 110 131 (54.4) 72 (65.4) 26
(26.5) 0.231 18
No vol. based 1st Urol
15 223 18 (7.5) 95 (42.6) 3 (3.1) 0.300 -1 20 191 50 (20.7) 85 (44.5) 13
(13.3) 0.226 -6
25 156 85 (35.3) 76 (48.7) 22 (22.4)
0.205 -1
30 127 114 (47.3) 68 (54.5) 30
(30.6) 0.177 6
No vol. based 2nd Urol
15 222 19 (7.9) 95 (42.8) 3 (3.1) 0.301 0 20 187 54 (22.4) 84 (44.9) 14
(14.3) 0.242 -7
25 146 95 (39.4) 71 (48.6) 27 (27.6)
0.191 -5
30 113 128 (53.1) 62 (54.9) 36
(36.7) 0.167 3
DRE = digital rectal examination; NB = net benefit; NR = net reduction; PCa = prostate cancer; Urol = urologist; Vol = prostate volume. aNet reduction in unnecessary biopsy per 100 patients.
Table 5. Decision analytic evaluation for high grade prostate cancer.
Threshold probability, %
Biopsy HG PCa Clinical importance
Preformed, No.
Saved, No. (%)
Detected, No. (%)
Missed, No. (%)
NB NR: Bx/100a
DRE-based 1st Urol
Total 241 0 81 (33.6) 0 - - 3 214 27 (11.2) 78 (36.4) 3 (3.7) 0.306 -30 5 171 70 (29.0) 69 (40.4) 12 (14.8) 0.264 -70 10 122 119
(49.9) 62 (50.8) 19 (23.5) 0.230 -29
15 102 139 (57.7) 57 (55.8) 24 (29.6) 0.204 -9
DRE-based 2nd Urol
3 211 30 (12.4) 77 (36.5) 4 (4.9) 0.302 -43 5 164 77 (32.0) 69 (42.1) 12 (14.8) 0.266 -67 10 110 131
(54.4) 60 (54.5) 21 (25.9) 0.226 -33
15 87 154 (63.9) 54 (62.1) 27 (33.3) 0.200 -11
No vol. based 1st Urol
3 228 13 (5.4) 79 (34.6) 2 (2.5) 0.309 -22 5 202 39 (16.2) 73 (36.1) 8 (9.9) 0.275 -50 10 133 108
(44.8) 59 (44.4) 22 (27.2) 0.211 -54
15 106 135 (56.0) 53 (50.0) 28 (34.6) 0.181 -21
No vol. based 2nd Urol
3 228 13 (5.4) 79 (34.6) 2 (2.5) 0.309 -22 5 198 43 (17.8) 73 (36.9) 8 (9.9) 0.276 -49 10 118 123
(51.0) 56 (47.4) 25 (30.9) 0.204 -53
15 87 154 (63.9) 49 (56.3) 32 (39.5) 0.175 -25
DRE = digital rectal examination; HG PCa = high-grade prostate cancer; NB = net benefit; NR = net reduction; PCa = prostate cancer; Urol = urologist; Vol = prostate volume. aNet reduction in unnecessary biopsy per 100 patients.
Weighing the benefits (avoided biopsies) versus the harms (missed diagnosis) for both
urologists, at the given threshold probability of 25%, DRE-assessed prostate volume-based
RPCRC lowers the biopsy rate for nine out of 100 patients, without missing any PCa when
compared with the RPCRC without prostate volume. For HG PCa, the negative NR implies
that the best clinical outcome would be achieved by biopsy in all men irrespective of the risk
calculator results (11). Only for a threshold of ≥20% was the NB for risk calculator higher than
for carrying out a biopsy in all.
112

Table 4. Decision analytic evaluation for any-grade prostate cancer.
Threshold probability, %
Biopsy Any-grade PCa Clinical importance
Performed,
No.
Saved,
No. (%)
Detected,
No. (%)
Missed
No. (%)
NB NR:
Bx/100a DRE-based 1st Urol
Total 241 0 98 (40.7) 0 - - 15 196 45 (18.7) 91 (46.4) 7 (7.1) 0.300 -1 20 165 76 (31.5) 83 (50.3) 15
(15.3) 0.259 0
25 136 105 (43.6)
75 (55.1) 23 (23.5)
0.227 5
30 116 125 (51.9)
73 (62.9) 25 (25.5)
0.226 17
DRE-based 2nd Urol
15 192 49 (20.3) 90 (46.9) 8 (8.2) 0.299 -2 20 162 79 (32.8) 83 (51.2) 15
(15.3) 0.262 2
25 129 112 (46.5) 74 (57.4) 24
(24.5) 0.230 7
30 110 131 (54.4) 72 (65.4) 26
(26.5) 0.231 18
No vol. based 1st Urol
15 223 18 (7.5) 95 (42.6) 3 (3.1) 0.300 -1 20 191 50 (20.7) 85 (44.5) 13
(13.3) 0.226 -6
25 156 85 (35.3) 76 (48.7) 22 (22.4)
0.205 -1
30 127 114 (47.3) 68 (54.5) 30
(30.6) 0.177 6
No vol. based 2nd Urol
15 222 19 (7.9) 95 (42.8) 3 (3.1) 0.301 0 20 187 54 (22.4) 84 (44.9) 14
(14.3) 0.242 -7
25 146 95 (39.4) 71 (48.6) 27 (27.6)
0.191 -5
30 113 128 (53.1) 62 (54.9) 36
(36.7) 0.167 3
DRE = digital rectal examination; NB = net benefit; NR = net reduction; PCa = prostate cancer; Urol = urologist; Vol = prostate volume. aNet reduction in unnecessary biopsy per 100 patients.
Table 5. Decision analytic evaluation for high grade prostate cancer.
Threshold probability, %
Biopsy HG PCa Clinical importance
Preformed, No.
Saved, No. (%)
Detected, No. (%)
Missed, No. (%)
NB NR: Bx/100a
DRE-based 1st Urol
Total 241 0 81 (33.6) 0 - - 3 214 27 (11.2) 78 (36.4) 3 (3.7) 0.306 -30 5 171 70 (29.0) 69 (40.4) 12 (14.8) 0.264 -70 10 122 119
(49.9) 62 (50.8) 19 (23.5) 0.230 -29
15 102 139 (57.7) 57 (55.8) 24 (29.6) 0.204 -9
DRE-based 2nd Urol
3 211 30 (12.4) 77 (36.5) 4 (4.9) 0.302 -43 5 164 77 (32.0) 69 (42.1) 12 (14.8) 0.266 -67 10 110 131
(54.4) 60 (54.5) 21 (25.9) 0.226 -33
15 87 154 (63.9) 54 (62.1) 27 (33.3) 0.200 -11
No vol. based 1st Urol
3 228 13 (5.4) 79 (34.6) 2 (2.5) 0.309 -22 5 202 39 (16.2) 73 (36.1) 8 (9.9) 0.275 -50 10 133 108
(44.8) 59 (44.4) 22 (27.2) 0.211 -54
15 106 135 (56.0) 53 (50.0) 28 (34.6) 0.181 -21
No vol. based 2nd Urol
3 228 13 (5.4) 79 (34.6) 2 (2.5) 0.309 -22 5 198 43 (17.8) 73 (36.9) 8 (9.9) 0.276 -49 10 118 123
(51.0) 56 (47.4) 25 (30.9) 0.204 -53
15 87 154 (63.9) 49 (56.3) 32 (39.5) 0.175 -25
DRE = digital rectal examination; HG PCa = high-grade prostate cancer; NB = net benefit; NR = net reduction; PCa = prostate cancer; Urol = urologist; Vol = prostate volume. aNet reduction in unnecessary biopsy per 100 patients.
Weighing the benefits (avoided biopsies) versus the harms (missed diagnosis) for both
urologists, at the given threshold probability of 25%, DRE-assessed prostate volume-based
RPCRC lowers the biopsy rate for nine out of 100 patients, without missing any PCa when
compared with the RPCRC without prostate volume. For HG PCa, the negative NR implies
that the best clinical outcome would be achieved by biopsy in all men irrespective of the risk
calculator results (11). Only for a threshold of ≥20% was the NB for risk calculator higher than
for carrying out a biopsy in all.
113

Discussion
This is the first study to externally validate the DRE version of the RPCRC, in which
there is no need to carry out invasive imaging to assess prostate volume, as volume
assessment is based on a DRE estimate. The primary outcome of the present study was the
effect of the interobserver variability of a subjective predictor, such as DRE and DRE-
assessed volume. To the best of our knowledge, this is the first cohort that used DRE-
assessed volume classes (<25 mL, 40-60 mL or >60 mL, according to the RPCRC algorithm)
and not recoded values from TRUS examinations (3). Even though there were differences in
performance between the two urologists, this had little impact on the performance of the DRE-
based RPCRC for PCa (AUC 0.77 vs 0.78) and for HG PCa (AUC 0.75 vs 0.76).
An abnormal DRE is a putative indication for Bx, and carrying out a DRE is useful in a
pre-biopsy setting (1). A meta-analysis of DRE as a screening test for PCa has shown a
sensitivity of 53.2% and positive predictive value of 17.8% (12). This was confirmed in an
analysis of the DRE-based RPCRC, clearly showing the added value of combining DRE with
other clinical information (4). Furthermore, the DRE-assessed prostate volumes were highly
correlated with TRUS-assessed volumes in both urologists. Even though prostate volume can
vary according to age and race, and the DRE is not an objective test, it has been shown that
when it is carried out in an organized method, there is little interobserver variability (13 - 15).
Furthermore, it has been shown that there is little variation between consultants and trainees,
and the DRE learning curve is short (16).
The TRUS-based RPCRC has been thoroughly validated and compared with other risk
calculators in several cohorts with good performance (17 - 20). Estimation of prostate volume
by TRUS is, however, invasive, time-consuming and has added costs, even if carried out by
the attending urologist during the clinical visit. Furthermore, when risk assessment is applied
in the first line of care, which is recommendable to decrease unnecessary referrals,
assessment of prostate volume by TRUS, similar to a MRI and/or more complex biomarker
information, warrants an external referral.
This can be circumvented by using a DRE-based multivariate assessment tool for initial
risk stratification (1). In a recent study, in which 122 consecutive men received a
multiparametric MRI scan and subsequent MRI-TRUS fusion targeted biopsy in case of
suspicious lesions (Prostate Imaging Reporting and Data System 3) after a negative TRUS-
guided random biopsy, it was concluded that using the RPCRC for risk stratification can
economize half the number of multiparametric MRI (21). Future research is, however,
necessary to confirm the applicability of the DRE-based RPCRC in a GP setting.
Using decision curve analysis, the DRE-based RPCRC showed better NB gains relative
to the RPCRC without prostate volume for prediction of any-grade PCa. It also showed that
by using the RPCRC, the number of unnecessary biopsies in the patients without PCa can be
reduced with no increase in the number of patients with PCa left unscreened. Using the risk
calculator for selective detection of HG PCa showed no additional benefit. This might be due
to the fact that the model slightly underestimated HG PCa risk, reducing the NB (22).
It must be noted that in the current study, the prevalence for overall and HG PCa was
high; irrespective of the outcome of a risk model, 34% HG PCa was present. The added benefit
of multivariate risk stratification can be expected to be higher in a screening population, where
the prevalence of HG PCa is lower and hence the potential to save unnecessary biopsies is
higher.
Currently, no single multivariate tool has proven its superiority, among the many
available alternatives (1, 2, 5, 23), although one meta-analysis showed that the RPCRC
performed very well (5). Further studies, preferably with head-to-head comparisons, are
required to further clarify this issue. Until then, using the DRE-based RPCRC or another
specific risk calculator remains a personal choice of the clinician.
For added convenience, the DRE-based RPCRC is available online
(http://www.prostatecancer-riskcalculator.com/seven-prostate-cancer-risk-calculators), and
also as a smartphone app, for both Android and iOS devices, where in addition to individual
probabilities, recommendations on interpretation are provided.
The present study had some limitations. First, our study cohort was relatively small,
comprised of men referred to our academic center from GPs and other hospitals, on the basis
of a clinical suspicion, because screening is not common in our region, which could explain
the elevated proportion of men with clinically significant PCa, and also limit the statistical
significance and the generalization of our findings related to calibration and NB.
Second, the DRE evaluation, which was carried out without access to previous medical
information, was implemented by experienced clinicians. Younger trainees and GPs might
obtain different results, as it has been shown that there can be a learning curve for DRE (24).
Hence, further validation might be necessary for these particular settings.
In summary, this is the first external validation of the DRE-based version of the RPCRC,
a PSA - and DRE - based multivariable risk assessment tool, which uses DRE to assess both
prostate abnormalities as well as volume. Even though there were slight differences in DRE
outcomes between the two urologists, this had little impact on the performance of the RPCRC.
114

Discussion
This is the first study to externally validate the DRE version of the RPCRC, in which
there is no need to carry out invasive imaging to assess prostate volume, as volume
assessment is based on a DRE estimate. The primary outcome of the present study was the
effect of the interobserver variability of a subjective predictor, such as DRE and DRE-
assessed volume. To the best of our knowledge, this is the first cohort that used DRE-
assessed volume classes (<25 mL, 40-60 mL or >60 mL, according to the RPCRC algorithm)
and not recoded values from TRUS examinations (3). Even though there were differences in
performance between the two urologists, this had little impact on the performance of the DRE-
based RPCRC for PCa (AUC 0.77 vs 0.78) and for HG PCa (AUC 0.75 vs 0.76).
An abnormal DRE is a putative indication for Bx, and carrying out a DRE is useful in a
pre-biopsy setting (1). A meta-analysis of DRE as a screening test for PCa has shown a
sensitivity of 53.2% and positive predictive value of 17.8% (12). This was confirmed in an
analysis of the DRE-based RPCRC, clearly showing the added value of combining DRE with
other clinical information (4). Furthermore, the DRE-assessed prostate volumes were highly
correlated with TRUS-assessed volumes in both urologists. Even though prostate volume can
vary according to age and race, and the DRE is not an objective test, it has been shown that
when it is carried out in an organized method, there is little interobserver variability (13 - 15).
Furthermore, it has been shown that there is little variation between consultants and trainees,
and the DRE learning curve is short (16).
The TRUS-based RPCRC has been thoroughly validated and compared with other risk
calculators in several cohorts with good performance (17 - 20). Estimation of prostate volume
by TRUS is, however, invasive, time-consuming and has added costs, even if carried out by
the attending urologist during the clinical visit. Furthermore, when risk assessment is applied
in the first line of care, which is recommendable to decrease unnecessary referrals,
assessment of prostate volume by TRUS, similar to a MRI and/or more complex biomarker
information, warrants an external referral.
This can be circumvented by using a DRE-based multivariate assessment tool for initial
risk stratification (1). In a recent study, in which 122 consecutive men received a
multiparametric MRI scan and subsequent MRI-TRUS fusion targeted biopsy in case of
suspicious lesions (Prostate Imaging Reporting and Data System 3) after a negative TRUS-
guided random biopsy, it was concluded that using the RPCRC for risk stratification can
economize half the number of multiparametric MRI (21). Future research is, however,
necessary to confirm the applicability of the DRE-based RPCRC in a GP setting.
Using decision curve analysis, the DRE-based RPCRC showed better NB gains relative
to the RPCRC without prostate volume for prediction of any-grade PCa. It also showed that
by using the RPCRC, the number of unnecessary biopsies in the patients without PCa can be
reduced with no increase in the number of patients with PCa left unscreened. Using the risk
calculator for selective detection of HG PCa showed no additional benefit. This might be due
to the fact that the model slightly underestimated HG PCa risk, reducing the NB (22).
It must be noted that in the current study, the prevalence for overall and HG PCa was
high; irrespective of the outcome of a risk model, 34% HG PCa was present. The added benefit
of multivariate risk stratification can be expected to be higher in a screening population, where
the prevalence of HG PCa is lower and hence the potential to save unnecessary biopsies is
higher.
Currently, no single multivariate tool has proven its superiority, among the many
available alternatives (1, 2, 5, 23), although one meta-analysis showed that the RPCRC
performed very well (5). Further studies, preferably with head-to-head comparisons, are
required to further clarify this issue. Until then, using the DRE-based RPCRC or another
specific risk calculator remains a personal choice of the clinician.
For added convenience, the DRE-based RPCRC is available online
(http://www.prostatecancer-riskcalculator.com/seven-prostate-cancer-risk-calculators), and
also as a smartphone app, for both Android and iOS devices, where in addition to individual
probabilities, recommendations on interpretation are provided.
The present study had some limitations. First, our study cohort was relatively small,
comprised of men referred to our academic center from GPs and other hospitals, on the basis
of a clinical suspicion, because screening is not common in our region, which could explain
the elevated proportion of men with clinically significant PCa, and also limit the statistical
significance and the generalization of our findings related to calibration and NB.
Second, the DRE evaluation, which was carried out without access to previous medical
information, was implemented by experienced clinicians. Younger trainees and GPs might
obtain different results, as it has been shown that there can be a learning curve for DRE (24).
Hence, further validation might be necessary for these particular settings.
In summary, this is the first external validation of the DRE-based version of the RPCRC,
a PSA - and DRE - based multivariable risk assessment tool, which uses DRE to assess both
prostate abnormalities as well as volume. Even though there were slight differences in DRE
outcomes between the two urologists, this had little impact on the performance of the RPCRC.
115

In our high-risk cohort, the DRE-based RPCRC showed good discrimination, but NB
was limited. A DRE-based RPCRC can be considered as a cost-effective, quick to use, broadly
deployable tool to aid in identifying men at risk of having (clinically significant) PCa, especially
in a screening setting.
References
1. Mottet N, Bellmunt J, Bolla M, Briers E, Cumberbatch MG, De Santis M, et al. EAU-ESTRO-SIOG guidelines on prostate cancer. Part 1: screening, diagnosis, and local treatment with curative intent. Eur Urol. 2017;71(4):618-29.
2. Loeb S. Guideline of guidelines: prostate cancer screening. BJU Int. 2014;114(3):323-5. 3. Roobol MJ, Schröder FH, Hugosson J, Jones JS, Kattan MW, Klein EA, et al. Importance of
prostate volume in the European Randomised Study of Screening for Prostate Cancer (ERSPC) risk calculators: results from the prostate biopsy collaborative group. World J Urol. 2012;30(2):149-55.
4. Roobol MJ, van Vugt HA, Loeb S, Zhu X, Bul M, Bangma CH, et al. Prediction of prostate cancer risk: the role of prostate volume and digital rectal examination in the ERSPC risk calculators. Eur Urol. 2012;61(3):577-83.
5. Louie KS, Seigneurin A, Cathcart P, Sasieni P. Do prostate cancer risk models improve the predictive accuracy of PSA screening? A meta-analysis. Ann Oncol. 2015;26(5):848-64.
6. Bleeker SE, Moll HA, Steyerberg EW, Donders AR, Derksen-Lubsen G, Grobbee DE, et al. External validation is necessary in prediction research: a clinical example. J. Clin. Epidemiol. 2003;56(9):826-32.
7. Roehrborn CG, Girman CJ, Rhodes T, Hanson KA, Collins GN, Sech SM, et al. Correlation between prostate size estimated by digital rectal examination and measured by transrectal ultrasound. Urology. 1997;49(4):548-57.
8. Bosch JL, Bohnen AM, Groeneveld FP. Validity of digital rectal examination and serum prostate specific antigen in the estimation of prostate volume in community-based men aged 50 to 78 years: the Krimpen Study. Eur. Urol. 2004;46(6):753-9.
9. Vickers AJ, Elkin EB. Decision curve analysis: a novel method for evaluating prediction models. Med. Decis. Making. 2006;26(6):565-74.
10. Steyerberg EW, Vickers AJ, Cook NR, Gerds T, Gonen M, Obuchowski N, et al. Assessing the performance of prediction models: a framework for traditional and novel measures. Epidemiology. 2010;21(1):128-38.
11. Vickers AJ, Van Calster B, Steyerberg EW. Net benefit approaches to the evaluation of prediction models, molecular markers, and diagnostic tests. BMJ 2016;352:i6.
12. Mistry K, Cable G. Meta-analysis of prostate-specific antigen and digital rectal examination as screening tests for prostate carcinoma. J Am Board Fam Pract. 2003;16(2):95-101.
13. Hattangadi JA, Chen MH, D’Amico AV. Early detection of high-grade prostate cancer using digital rectal examination (DRE) in men with a prostate-specific antigen level of <2.5 ng/mL and the risk of death. BJU Int. 2012;110(11):1636-41.
14. Gosselaar C, Kranse R, Roobol MJ, Roemeling S, Schröder FH. The interobserver variability of digital rectal examination in a large randomized trial for the screening of prostate cancer. Prostate 2008;68(9):985-93.
15. Varenhorst E, Berglund K, Lofman O, Pedersen K. Inter-observer variation in assessment of the prostate by digital rectal examination. Br. J. Urol. 1993;72(2):173-6.
16. Ahmad S, Manecksha RP, Cullen IM, Flynn RJ, McDermott TE, Grainger R, et al. Estimation of clinically significant prostate volumes by digital rectal examination: a comparative prospective study. Can. J. Urol. 2011;18(6):6025-30.
116

In our high-risk cohort, the DRE-based RPCRC showed good discrimination, but NB
was limited. A DRE-based RPCRC can be considered as a cost-effective, quick to use, broadly
deployable tool to aid in identifying men at risk of having (clinically significant) PCa, especially
in a screening setting.
References
1. Mottet N, Bellmunt J, Bolla M, Briers E, Cumberbatch MG, De Santis M, et al. EAU-ESTRO-SIOG guidelines on prostate cancer. Part 1: screening, diagnosis, and local treatment with curative intent. Eur Urol. 2017;71(4):618-29.
2. Loeb S. Guideline of guidelines: prostate cancer screening. BJU Int. 2014;114(3):323-5. 3. Roobol MJ, Schröder FH, Hugosson J, Jones JS, Kattan MW, Klein EA, et al. Importance of
prostate volume in the European Randomised Study of Screening for Prostate Cancer (ERSPC) risk calculators: results from the prostate biopsy collaborative group. World J Urol. 2012;30(2):149-55.
4. Roobol MJ, van Vugt HA, Loeb S, Zhu X, Bul M, Bangma CH, et al. Prediction of prostate cancer risk: the role of prostate volume and digital rectal examination in the ERSPC risk calculators. Eur Urol. 2012;61(3):577-83.
5. Louie KS, Seigneurin A, Cathcart P, Sasieni P. Do prostate cancer risk models improve the predictive accuracy of PSA screening? A meta-analysis. Ann Oncol. 2015;26(5):848-64.
6. Bleeker SE, Moll HA, Steyerberg EW, Donders AR, Derksen-Lubsen G, Grobbee DE, et al. External validation is necessary in prediction research: a clinical example. J. Clin. Epidemiol. 2003;56(9):826-32.
7. Roehrborn CG, Girman CJ, Rhodes T, Hanson KA, Collins GN, Sech SM, et al. Correlation between prostate size estimated by digital rectal examination and measured by transrectal ultrasound. Urology. 1997;49(4):548-57.
8. Bosch JL, Bohnen AM, Groeneveld FP. Validity of digital rectal examination and serum prostate specific antigen in the estimation of prostate volume in community-based men aged 50 to 78 years: the Krimpen Study. Eur. Urol. 2004;46(6):753-9.
9. Vickers AJ, Elkin EB. Decision curve analysis: a novel method for evaluating prediction models. Med. Decis. Making. 2006;26(6):565-74.
10. Steyerberg EW, Vickers AJ, Cook NR, Gerds T, Gonen M, Obuchowski N, et al. Assessing the performance of prediction models: a framework for traditional and novel measures. Epidemiology. 2010;21(1):128-38.
11. Vickers AJ, Van Calster B, Steyerberg EW. Net benefit approaches to the evaluation of prediction models, molecular markers, and diagnostic tests. BMJ 2016;352:i6.
12. Mistry K, Cable G. Meta-analysis of prostate-specific antigen and digital rectal examination as screening tests for prostate carcinoma. J Am Board Fam Pract. 2003;16(2):95-101.
13. Hattangadi JA, Chen MH, D’Amico AV. Early detection of high-grade prostate cancer using digital rectal examination (DRE) in men with a prostate-specific antigen level of <2.5 ng/mL and the risk of death. BJU Int. 2012;110(11):1636-41.
14. Gosselaar C, Kranse R, Roobol MJ, Roemeling S, Schröder FH. The interobserver variability of digital rectal examination in a large randomized trial for the screening of prostate cancer. Prostate 2008;68(9):985-93.
15. Varenhorst E, Berglund K, Lofman O, Pedersen K. Inter-observer variation in assessment of the prostate by digital rectal examination. Br. J. Urol. 1993;72(2):173-6.
16. Ahmad S, Manecksha RP, Cullen IM, Flynn RJ, McDermott TE, Grainger R, et al. Estimation of clinically significant prostate volumes by digital rectal examination: a comparative prospective study. Can. J. Urol. 2011;18(6):6025-30.
117

17. Cavadas V, Osório L, Sabell F, Teves F, Branco F, Silva-Ramos M. Prostate cancer prevention trial and European randomized study of screening for prostate cancer risk calculators: a performance comparison in a contemporary screened cohort. Eur. Urol. 2010;58(4):551-8.
18. Trottier G, Roobol MJ, Lawrentschuk N, Boström PJ, Fernandes KA, Finelli A, et al. Comparison of risk calculators from the Prostate Cancer Prevention Trial and the European Randomized Study of Screening for Prostate Cancer in a contemporary Canadian cohort. BJU Int. 2011;108(8 Pt 2):E237-44.
19. van Vugt HA, Roobol MJ, Kranse R, Määttänen L, Finne P, Hugosson J, et al. Prediction of prostate cancer in unscreened men: external validation of a risk calculator. Eur. J. Cancer. 2011;47(6):903-9.
20. Yoon DK, Park JY, Yoon S, Park MS, Moon du G, Lee JG, et al. Can the prostate risk calculator based on Western population be applied to Asian population? Prostate. 2012;72(7):721-9.
21. Alberts AR, Schoots IG, Bokhorst LP, van Leenders GJ, Bangma CH, Roobol MJ. Risk-based patient selection for magnetic resonance imaging-targeted prostate biopsy after negative transrectal ultrasound-guided random biopsy avoids unnecessary magnetic resonance imaging scans. Eur. Urol. 2016;69(6):1129-34.
22. Kerr KF, Brown MD, Zhu K, Janes H. Assessing the clinical impact of risk prediction models with decision curves: guidance for correct interpretation and appropriate use. J. Clin. Oncol. 2016;34(21):2534-40.
23. Carter HB, Albertsen PC, Barry MJ, Etzioni R, Freedland SJ, Greene KL, et al. Early detection of prostate cancer: AUA guideline. Accessed through: https://www.aua net.org/education/guidelines/prostate-cancer-detection.cfm on August 31, 2016.
24. Carvalhal G, Smith DS, Mager DE, Ramos C, Catalona WJ. Digital rectal examination for detecting prostate cancer at prostate specific antigen levels of 4 ng/ml or less. J. Urol. 1999;161(3):835-9.
118

17. Cavadas V, Osório L, Sabell F, Teves F, Branco F, Silva-Ramos M. Prostate cancer prevention trial and European randomized study of screening for prostate cancer risk calculators: a performance comparison in a contemporary screened cohort. Eur. Urol. 2010;58(4):551-8.
18. Trottier G, Roobol MJ, Lawrentschuk N, Boström PJ, Fernandes KA, Finelli A, et al. Comparison of risk calculators from the Prostate Cancer Prevention Trial and the European Randomized Study of Screening for Prostate Cancer in a contemporary Canadian cohort. BJU Int. 2011;108(8 Pt 2):E237-44.
19. van Vugt HA, Roobol MJ, Kranse R, Määttänen L, Finne P, Hugosson J, et al. Prediction of prostate cancer in unscreened men: external validation of a risk calculator. Eur. J. Cancer. 2011;47(6):903-9.
20. Yoon DK, Park JY, Yoon S, Park MS, Moon du G, Lee JG, et al. Can the prostate risk calculator based on Western population be applied to Asian population? Prostate. 2012;72(7):721-9.
21. Alberts AR, Schoots IG, Bokhorst LP, van Leenders GJ, Bangma CH, Roobol MJ. Risk-based patient selection for magnetic resonance imaging-targeted prostate biopsy after negative transrectal ultrasound-guided random biopsy avoids unnecessary magnetic resonance imaging scans. Eur. Urol. 2016;69(6):1129-34.
22. Kerr KF, Brown MD, Zhu K, Janes H. Assessing the clinical impact of risk prediction models with decision curves: guidance for correct interpretation and appropriate use. J. Clin. Oncol. 2016;34(21):2534-40.
23. Carter HB, Albertsen PC, Barry MJ, Etzioni R, Freedland SJ, Greene KL, et al. Early detection of prostate cancer: AUA guideline. Accessed through: https://www.aua net.org/education/guidelines/prostate-cancer-detection.cfm on August 31, 2016.
24. Carvalhal G, Smith DS, Mager DE, Ramos C, Catalona WJ. Digital rectal examination for detecting prostate cancer at prostate specific antigen levels of 4 ng/ml or less. J. Urol. 1999;161(3):835-9.


Chapter 7
Head-to-head comparison of prostate cancer risk calculators predicting biopsy outcome
Nuno Pereira-Azevedo,Jan F. M. Verbeek,
Daan Nieboer, Chris H. Bangma, and Monique J. Roobol
Translational Andrology and Urology (2018) 7(1):18-26
121

Transl Androl Urol 2018;7(1):18-26tau.amegroups.com© Translational Andrology and Urology. All rights reserved.
Introduction
Prostate cancer (PCa) is the most prevalent cancer in the
western world for men and the second most common cause of death in men worldwide (1). Long-term follow-up from the European Randomised Study of Screening for Prostate
Cancer (ERSPC) has shown a significant reduction in PCa specific mortality applying prostate-specific antigen (PSA) based screening (2). This, next to the fact that PSA is a well-developed, easy to implement, and cheap test,
made PSA testing the mainstay in the decision for further
Original Article
Head-to-head comparison of prostate cancer risk calculators predicting biopsy outcome
Nuno Pereira-Azevedo1,2
*, Jan F. M. Verbeek1*, Daan Nieboer
1,3
, Chris H. Bangma1
, Monique J. Roobol1
1Department of Urology, Erasmus University Medical Center, Rotterdam, The Netherlands; 2Department of Urology, Centro Hospitalar do Porto,
Porto, Portugal; 3Department of Public Health, Erasmus University Medical Center, Rotterdam, The Netherlands
Contributions: (I) Concept and design: N Pereira-Azevedo, JF Verbeek, MJ Roobol; (II) Administrative support: None; (III) Provision of study
material or patients: N Pereira-Azevedo; (IV) Collection and assembly of data: N Pereira-Azevedo; (V) Data analysis and interpretation: JF Verbeek,
D Nieboer, N Pereira-Azevedo, MJ Roobol; (VI) Manuscript writing: All authors; (VII) Final approval of manuscript: All authors.
*These authors contributed equally to this work.
Correspondence to: Dr. Nuno Pereira-Azevedo, MD. Department of Urology, Room NA-1706, P.O. Box 2040, Erasmus MC, University Medical
Center Rotterdam, Rotterdam, 3000 CA Rotterdam, The Netherlands. Email: [email protected].
Background: Multivariable risk calculators (RCs) predicting prostate cancer (PCa) aim to reduce
unnecessary workup (e.g., MRI and biopsy) by selectively identifying those men at risk for PCa or clinically significant PCa (csPCa) (Gleason ≥7). The lack of an adequate comparison makes choosing between RCs difficult for patients, clinicians and guideline developers. We aim to perform a head-to-head comparison of seven well known RCs predicting biopsy outcome.
Methods: Our study comprised 7,199 men from ten independent contemporary cohorts in Europe and Australia, who underwent prostate biopsy between 2007 and 2015. We evaluated the performance of the ERSPC RPCRC, Finne, Chun, ProstataClass, Karakiewicz, Sunnybrook, and PCPT 2.0 (HG) RCs in
predicting the presence of any PCa and csPCa. Performance was assessed by discrimination, calibration and net benefit analyses. Results: A total of 3,458 (48%) PCa were detected; 1,784 (25%) men had csPCa. No particular RC stood out predicting any PCa: pooled area under the ROC-curve (AUC) ranged between 0.64 and 0.72. The ERSPC RPCRC had the highest pooled AUC 0.77 (95% CI: 0.73–0.80) when predicting csPCa. Decision curve analysis (DCA) showed limited net benefit in the detection of csPCa, but that can be improved by a simple calibration step. The main limitation is the retrospective design of the study.Conclusions: No particular RC stands out when predicting biopsy outcome on the presence of any PCa. The ERSPC RPCRC is superior in identifying those men at risk for csPCa. Net benefit analyses show that a multivariate approach before further workup is advisable.
Keywords: Prostate biopsy; prostate cancer (PCa); prostate-specific antigen (PSA); risk calculators (RCs);
overdiagnosis
Submitted Dec 22, 2017. Accepted for publication Dec 22, 2017.
doi: 10.21037/tau.2017.12.21
View this article at: http://dx.doi.org/10.21037/tau.2017.12.21
Abstract
Background
Multivariable risk calculators (RCs) predicting prostate cancer (PCa) aim to reduce
unnecessary workup (e.g., MRI and biopsy) by selectively identifying those men at risk for
PCa or clinically significant PCa (csPCa) (Gleason ≥7). The lack of an adequate comparison
makes choosing between RCs difficult for patients, clinicians and guideline developers. We
aim to perform a head-to-head comparison of seven well-known RCs predicting biopsy
outcome.
Methods
Our study comprised 7,199 men from ten independent contemporary cohorts in Europe
and Australia, who underwent prostate biopsy between 2007 and 2015. We evaluated the
performance of the ERSPC RPCRC, Finne, Chun, ProstataClass, Karakiewicz, Sunnybrook,
and PCPT 2.0 (HG) RCs in predicting the presence of any PCa and csPCa. Performance was
assessed by discrimination, calibration and net benefit analyses.
Results
A total of 3,458 (48%) PCa were detected; 1,784 (25%) men had csPCa. No particular
RC stood out predicting any PCa: pooled area under the ROC-curve (AUC) ranged between
0.64 and 0.72. The ERSPC RPCRC had the highest pooled AUC 0.77 (95% CI: 0.73–0.80)
when predicting csPCa. Decision curve analysis (DCA) showed limited net benefit in the
detection of csPCa, but that can be improved by a simple calibration step. The main limitation
is the retrospective design of the study.
Conclusions
No particular RC stands out when predicting biopsy outcome on the presence of any
PCa. The ERSPC RPCRC is superior in identifying those men at risk for csPCa. Net benefit
analyses show that a multivariate approach before further workup is advisable.
122

Transl Androl Urol 2018;7(1):18-26tau.amegroups.com© Translational Andrology and Urology. All rights reserved.
Introduction
Prostate cancer (PCa) is the most prevalent cancer in the
western world for men and the second most common cause of death in men worldwide (1). Long-term follow-up from the European Randomised Study of Screening for Prostate
Cancer (ERSPC) has shown a significant reduction in PCa specific mortality applying prostate-specific antigen (PSA) based screening (2). This, next to the fact that PSA is a well-developed, easy to implement, and cheap test,
made PSA testing the mainstay in the decision for further
Original Article
Head-to-head comparison of prostate cancer risk calculators predicting biopsy outcome
Nuno Pereira-Azevedo1,2
*, Jan F. M. Verbeek1*, Daan Nieboer
1,3
, Chris H. Bangma1
, Monique J. Roobol1
1Department of Urology, Erasmus University Medical Center, Rotterdam, The Netherlands; 2Department of Urology, Centro Hospitalar do Porto,
Porto, Portugal; 3Department of Public Health, Erasmus University Medical Center, Rotterdam, The Netherlands
Contributions: (I) Concept and design: N Pereira-Azevedo, JF Verbeek, MJ Roobol; (II) Administrative support: None; (III) Provision of study
material or patients: N Pereira-Azevedo; (IV) Collection and assembly of data: N Pereira-Azevedo; (V) Data analysis and interpretation: JF Verbeek,
D Nieboer, N Pereira-Azevedo, MJ Roobol; (VI) Manuscript writing: All authors; (VII) Final approval of manuscript: All authors.
*These authors contributed equally to this work.
Correspondence to: Dr. Nuno Pereira-Azevedo, MD. Department of Urology, Room NA-1706, P.O. Box 2040, Erasmus MC, University Medical
Center Rotterdam, Rotterdam, 3000 CA Rotterdam, The Netherlands. Email: [email protected].
Background: Multivariable risk calculators (RCs) predicting prostate cancer (PCa) aim to reduce
unnecessary workup (e.g., MRI and biopsy) by selectively identifying those men at risk for PCa or clinically significant PCa (csPCa) (Gleason ≥7). The lack of an adequate comparison makes choosing between RCs difficult for patients, clinicians and guideline developers. We aim to perform a head-to-head comparison of seven well known RCs predicting biopsy outcome.
Methods: Our study comprised 7,199 men from ten independent contemporary cohorts in Europe and Australia, who underwent prostate biopsy between 2007 and 2015. We evaluated the performance of the ERSPC RPCRC, Finne, Chun, ProstataClass, Karakiewicz, Sunnybrook, and PCPT 2.0 (HG) RCs in
predicting the presence of any PCa and csPCa. Performance was assessed by discrimination, calibration and net benefit analyses. Results: A total of 3,458 (48%) PCa were detected; 1,784 (25%) men had csPCa. No particular RC stood out predicting any PCa: pooled area under the ROC-curve (AUC) ranged between 0.64 and 0.72. The ERSPC RPCRC had the highest pooled AUC 0.77 (95% CI: 0.73–0.80) when predicting csPCa. Decision curve analysis (DCA) showed limited net benefit in the detection of csPCa, but that can be improved by a simple calibration step. The main limitation is the retrospective design of the study.Conclusions: No particular RC stands out when predicting biopsy outcome on the presence of any PCa. The ERSPC RPCRC is superior in identifying those men at risk for csPCa. Net benefit analyses show that a multivariate approach before further workup is advisable.
Keywords: Prostate biopsy; prostate cancer (PCa); prostate-specific antigen (PSA); risk calculators (RCs);
overdiagnosis
Submitted Dec 22, 2017. Accepted for publication Dec 22, 2017.
doi: 10.21037/tau.2017.12.21
View this article at: http://dx.doi.org/10.21037/tau.2017.12.21
Abstract
Background
Multivariable risk calculators (RCs) predicting prostate cancer (PCa) aim to reduce
unnecessary workup (e.g., MRI and biopsy) by selectively identifying those men at risk for
PCa or clinically significant PCa (csPCa) (Gleason ≥7). The lack of an adequate comparison
makes choosing between RCs difficult for patients, clinicians and guideline developers. We
aim to perform a head-to-head comparison of seven well-known RCs predicting biopsy
outcome.
Methods
Our study comprised 7,199 men from ten independent contemporary cohorts in Europe
and Australia, who underwent prostate biopsy between 2007 and 2015. We evaluated the
performance of the ERSPC RPCRC, Finne, Chun, ProstataClass, Karakiewicz, Sunnybrook,
and PCPT 2.0 (HG) RCs in predicting the presence of any PCa and csPCa. Performance was
assessed by discrimination, calibration and net benefit analyses.
Results
A total of 3,458 (48%) PCa were detected; 1,784 (25%) men had csPCa. No particular
RC stood out predicting any PCa: pooled area under the ROC-curve (AUC) ranged between
0.64 and 0.72. The ERSPC RPCRC had the highest pooled AUC 0.77 (95% CI: 0.73–0.80)
when predicting csPCa. Decision curve analysis (DCA) showed limited net benefit in the
detection of csPCa, but that can be improved by a simple calibration step. The main limitation
is the retrospective design of the study.
Conclusions
No particular RC stands out when predicting biopsy outcome on the presence of any
PCa. The ERSPC RPCRC is superior in identifying those men at risk for csPCa. Net benefit
analyses show that a multivariate approach before further workup is advisable.
123

Introduction
Prostate cancer (PCa) is the most prevalent cancer in the western world for men and
the second most common cause of death in men worldwide (1). Long-term follow-up from the
European Randomised Study of Screening for Prostate Cancer (ERSPC) has shown a
significant reduction in PCa specific mortality applying prostate-specific antigen (PSA) based
screening (2). This, next to the fact that PSA is a well-developed, easy to implement, and
cheap test, made PSA testing the mainstay in the decision for further clinical workup (i.e.,
prostate biopsy). However, any choice of a PSA cut-off involves a trade-off between sensitivity
and specificity. Lowering the PSA cut-off would improve test sensitivity, but also reduce
specificity, leading to far more false-positive tests and unnecessary interventions. Additionally,
many of the cancers detected may never become clinically evident, thereby leading to
overdiagnosis and overtreatment (3, 4).
Other relevant pre-biopsy clinical information, next to the serum PSA level, has been
incorporated into so-called risk calculators (RCs) to enable a more accurate assessment of a
patient’s individual PCa risk (5). A recent systematic review identified 127 unique RCs in the
field of PCa. The conclusion was that RCs outperform PSA alone in avoiding unnecessary
biopsies, that not all of the RCs have the ability to selectively identify those men at risk of
having clinically significant PCa (csPCa) (defined as Gleason score ≥3+4) and that external
validation studies and head-to-head comparisons are lacking (6). RCs are part of the
European Association of Urology (EAU), European Society for Radiotherapy & Oncology
(ESTRO), European Society of Urogenital Radiology (ESUR), and International Society of
Geriatric Oncology (SIOG) joint guidelines on PCa screening and early detection (5) but it
remains a matter of personal choice whether and/or which RC to use in one’s daily clinical
practice.
We aimed to address this lack of information by evaluating the performance
(discrimination, calibration, and clinical impact) of the most well-known RCs developed to
predict prostate biopsy outcome in a head-to-head comparison.
Methods
Participants
Our study cohort comprises of 8,649 men from ten independent contemporary cohorts
(nine in Europe and one in Australia) who underwent a transrectal ultrasound (TRUS)-guided
prostate biopsy between January 2007 and November 2015 (table 1 and Acknowledgements).
Table 1. Overview of the included predictors per RC to discriminate men at risk for any PCa
and csPCa.
Risk Calculator,
Any PCa
PSA Age PV DRE Free
PSA
Fam. Race Prev
Bx
IPSS SD
ERSPC RPCRC + + + +
Finne + + + +
Chun + + + + +
Karakiewicz + + + +
PCPT 1·0 + + + +
PCPT 2·0 + + + + + +
PCPT 2·0 + freePSA + + + + + + +
ProstataClass + + + + +
Sunnybrook + + + + + + +
Risk Calculator,
Clinical significant PCa
ERSPC RPCRC + + + +
PCPT HG + + + + + +
PCPT 2·0 + + + +* + + +
Sunnybrook + + + + + + +
Age in years; csPCa = clinically significant prostate cancer; DRE = digital rectal examination
suspicious or not; ERSPC = European Randomised Study of Screening for Prostate Cancer;
Fam = family history or not of prostate cancer; free PSA = free proportion of total PSA; IPSS
= International Prostate Symptom Score (0-35); PCPT = Prostate Cancer Prevention Trial;
Prev bx = previous negative biopsy; PSA = prostate-specific antigen in ng/mL; PV = prostate
volume in mL; RPCRC = Rotterdam Prostate Cancer Risk Calculator; SD = sample density
(prostate volume/number of biopsy cores taken).
The cohorts were unrelated to the RCs development. Pre-biopsy clinical data and the
pathological biopsy results were obtained from electronic and paper medical charts. Data on
age, previous negative biopsy, DRE (digital rectal examination; benign/suspicious), prostate
volume (assessed by TRUS in mL), total PSA (tPSA), free PSA (fPSA), and biopsy outcome
(PCa detected yes/no and Gleason grade) were collected for all men. Patients were included
into the analyses if they met the aggregated criteria of all RCs: age between 50 and 89 years
old, PSA <50.0 ng/mL, prostate volume between 10 and 110 mL (table S1).
124

Introduction
Prostate cancer (PCa) is the most prevalent cancer in the western world for men and
the second most common cause of death in men worldwide (1). Long-term follow-up from the
European Randomised Study of Screening for Prostate Cancer (ERSPC) has shown a
significant reduction in PCa specific mortality applying prostate-specific antigen (PSA) based
screening (2). This, next to the fact that PSA is a well-developed, easy to implement, and
cheap test, made PSA testing the mainstay in the decision for further clinical workup (i.e.,
prostate biopsy). However, any choice of a PSA cut-off involves a trade-off between sensitivity
and specificity. Lowering the PSA cut-off would improve test sensitivity, but also reduce
specificity, leading to far more false-positive tests and unnecessary interventions. Additionally,
many of the cancers detected may never become clinically evident, thereby leading to
overdiagnosis and overtreatment (3, 4).
Other relevant pre-biopsy clinical information, next to the serum PSA level, has been
incorporated into so-called risk calculators (RCs) to enable a more accurate assessment of a
patient’s individual PCa risk (5). A recent systematic review identified 127 unique RCs in the
field of PCa. The conclusion was that RCs outperform PSA alone in avoiding unnecessary
biopsies, that not all of the RCs have the ability to selectively identify those men at risk of
having clinically significant PCa (csPCa) (defined as Gleason score ≥3+4) and that external
validation studies and head-to-head comparisons are lacking (6). RCs are part of the
European Association of Urology (EAU), European Society for Radiotherapy & Oncology
(ESTRO), European Society of Urogenital Radiology (ESUR), and International Society of
Geriatric Oncology (SIOG) joint guidelines on PCa screening and early detection (5) but it
remains a matter of personal choice whether and/or which RC to use in one’s daily clinical
practice.
We aimed to address this lack of information by evaluating the performance
(discrimination, calibration, and clinical impact) of the most well-known RCs developed to
predict prostate biopsy outcome in a head-to-head comparison.
Methods
Participants
Our study cohort comprises of 8,649 men from ten independent contemporary cohorts
(nine in Europe and one in Australia) who underwent a transrectal ultrasound (TRUS)-guided
prostate biopsy between January 2007 and November 2015 (table 1 and Acknowledgements).
Table 1. Overview of the included predictors per RC to discriminate men at risk for any PCa
and csPCa.
Risk Calculator,
Any PCa
PSA Age PV DRE Free
PSA
Fam. Race Prev
Bx
IPSS SD
ERSPC RPCRC + + + +
Finne + + + +
Chun + + + + +
Karakiewicz + + + +
PCPT 1·0 + + + +
PCPT 2·0 + + + + + +
PCPT 2·0 + freePSA + + + + + + +
ProstataClass + + + + +
Sunnybrook + + + + + + +
Risk Calculator,
Clinical significant PCa
ERSPC RPCRC + + + +
PCPT HG + + + + + +
PCPT 2·0 + + + +* + + +
Sunnybrook + + + + + + +
Age in years; csPCa = clinically significant prostate cancer; DRE = digital rectal examination
suspicious or not; ERSPC = European Randomised Study of Screening for Prostate Cancer;
Fam = family history or not of prostate cancer; free PSA = free proportion of total PSA; IPSS
= International Prostate Symptom Score (0-35); PCPT = Prostate Cancer Prevention Trial;
Prev bx = previous negative biopsy; PSA = prostate-specific antigen in ng/mL; PV = prostate
volume in mL; RPCRC = Rotterdam Prostate Cancer Risk Calculator; SD = sample density
(prostate volume/number of biopsy cores taken).
The cohorts were unrelated to the RCs development. Pre-biopsy clinical data and the
pathological biopsy results were obtained from electronic and paper medical charts. Data on
age, previous negative biopsy, DRE (digital rectal examination; benign/suspicious), prostate
volume (assessed by TRUS in mL), total PSA (tPSA), free PSA (fPSA), and biopsy outcome
(PCa detected yes/no and Gleason grade) were collected for all men. Patients were included
into the analyses if they met the aggregated criteria of all RCs: age between 50 and 89 years
old, PSA <50.0 ng/mL, prostate volume between 10 and 110 mL (table S1).
125

Table S1. Inclusion criteria of the different risk calculators.
RC Age
(years)
No. of biopsy
cores
PSA Prostate volume
ERSPC RPCRC 50 - 74 >= 6 < 50.0 ng/mL 10 - 110 mL
Finne 55 - 67 >= 6 - -
Chun - >= 10 - -
Karakiewicz - >= 6 < 50.0 ng/mL -
PCPT 1.0 > 55 >= 6 - -
PCPT 2.0 > 55 >= 6 - -
Prostataclass < 89 >= 6 < 25.0 ng/mL -
Sunnybrook - 12 < 50.0 ng/mL -
PSA = prostate-specific antigen; RC = risk calculator.
Participants in the study underwent a TRUS-guided biopsy according to the standard
clinical practice used at each participating site, which was on average 12 cores (interquartile
range (IQR): 12–14) per biopsy session in the European cohorts and 30 cores (IQR: 12–30)
in the Australian cohort.
Statistical analysis
Baseline characteristics of the study cohort are presented as median and interquartile
range (M-IQR) or percentage for proportion type features. Missing data was imputed using
Multivariate Imputation by Chained Equations (MICE) using only the values from the
corresponding cohort and was imputed five times (7).
Three parameters were completely missing in certain cohorts: free PSA (Den Bosch,
Sydney, Breda), International Prostate Symptom Score (Den Bosch, Porto, Bordeaux,
Munster, Paris, Hamburg, Rennes, Milan), and family history of PCa (Den Bosch, Porto,
Bordeaux, Munster, Paris, Rennes). These missing values were imputed by using the
complete information from the other cohorts in the imputation model. This strategy leads to
more precise estimates of the predicted probabilities (8).
After imputation, the probabilities were calculated on the basis of the predictions rules
from each RC. Individual patient data was compared for men with csPCa and men without
PCa using the Mann-Whitney test for continuous variables.
Risk calculators
For this meta-analysis we included seven well-known RCs: Chun (9), ERSPC RPCRC
(10), Finne (11), Karakiewcz (12), ProstataClass (13), PCPT 1.0 and 2.0 +/– free-PSA (14),
and Sunnybrook (15). The first six have been externally validated in over five studies (6). All
RCs use PSA and DRE as predictive factors, and the other predictors are displayed in table
1. The RPCRC for initial and repeat biopsy (16) was adapted to the contemporary Rotterdam
clinical setting (17). For each patient, the probabilities of having a biopsy detectable PCa and,
if applicable, csPCa, were calculated. The probabilities of the ProstataClass artificial neural
network were obtained by sending a blinded database for biopsy outcome to its developers
(13). Four models were able to predict csPCa (RPCRC, PCPT 2.0 +/– freePSA and
Sunnybrook).
Comparison of risk calculator models
The predictive accuracy (predicting PCa and csPCa) was quantified using the area
under the curve (AUC) for the receiver operator characteristic (ROC) analysis (18). A
multivariable meta-analysis was performed to pool the AUCs in predicting any PCa and
csPCa. Within-study correlations of the AUCs were estimated using bootstrapping. To analyse
statistically significant differences in the models and taking into account the between-study
heterogeneity we subsequently estimated the probability that a model has the highest AUC in
a subsequent validation study.
We simulated 10,000 samples from the posterior distribution to estimate this probability
(19). Calibration of the RCs was pooled and explored graphically using calibrations plots. For
comparison, the per center sensitivity and specificity of detecting csPCa with applying a PSA
cut-off ≥4.0 ng/mL was calculated and graphically displayed.
In addition, the clinical impact was assessed with decision curve analysis (DCA) and
clinical impact curves. DCA represents the net benefit ratio, which weighs the benefits
(detecting cancer) versus the harms (unnecessary biopsy) over a range of thresholds (20).
Clinical impact curves show the estimated number who would be declared eligible for biopsy
for each risk threshold, and show the proportion of those who are cases (21).
In addition, to show the potential of multivariate risk stratification when adapting to, for
example, one’s own hospital data, we calculated net benefit after calibration of each of the
models predicting csPCa using the largest series cohort (Den Bosch; n = 2,053). Analyses
were performed using R statistical package, version 3.3.1, R Foundation for Statistical
Computing, Vienna, Austria.
126

Table S1. Inclusion criteria of the different risk calculators.
RC Age
(years)
No. of biopsy
cores
PSA Prostate volume
ERSPC RPCRC 50 - 74 >= 6 < 50.0 ng/mL 10 - 110 mL
Finne 55 - 67 >= 6 - -
Chun - >= 10 - -
Karakiewicz - >= 6 < 50.0 ng/mL -
PCPT 1.0 > 55 >= 6 - -
PCPT 2.0 > 55 >= 6 - -
Prostataclass < 89 >= 6 < 25.0 ng/mL -
Sunnybrook - 12 < 50.0 ng/mL -
PSA = prostate-specific antigen; RC = risk calculator.
Participants in the study underwent a TRUS-guided biopsy according to the standard
clinical practice used at each participating site, which was on average 12 cores (interquartile
range (IQR): 12–14) per biopsy session in the European cohorts and 30 cores (IQR: 12–30)
in the Australian cohort.
Statistical analysis
Baseline characteristics of the study cohort are presented as median and interquartile
range (M-IQR) or percentage for proportion type features. Missing data was imputed using
Multivariate Imputation by Chained Equations (MICE) using only the values from the
corresponding cohort and was imputed five times (7).
Three parameters were completely missing in certain cohorts: free PSA (Den Bosch,
Sydney, Breda), International Prostate Symptom Score (Den Bosch, Porto, Bordeaux,
Munster, Paris, Hamburg, Rennes, Milan), and family history of PCa (Den Bosch, Porto,
Bordeaux, Munster, Paris, Rennes). These missing values were imputed by using the
complete information from the other cohorts in the imputation model. This strategy leads to
more precise estimates of the predicted probabilities (8).
After imputation, the probabilities were calculated on the basis of the predictions rules
from each RC. Individual patient data was compared for men with csPCa and men without
PCa using the Mann-Whitney test for continuous variables.
Risk calculators
For this meta-analysis we included seven well-known RCs: Chun (9), ERSPC RPCRC
(10), Finne (11), Karakiewcz (12), ProstataClass (13), PCPT 1.0 and 2.0 +/– free-PSA (14),
and Sunnybrook (15). The first six have been externally validated in over five studies (6). All
RCs use PSA and DRE as predictive factors, and the other predictors are displayed in table
1. The RPCRC for initial and repeat biopsy (16) was adapted to the contemporary Rotterdam
clinical setting (17). For each patient, the probabilities of having a biopsy detectable PCa and,
if applicable, csPCa, were calculated. The probabilities of the ProstataClass artificial neural
network were obtained by sending a blinded database for biopsy outcome to its developers
(13). Four models were able to predict csPCa (RPCRC, PCPT 2.0 +/– freePSA and
Sunnybrook).
Comparison of risk calculator models
The predictive accuracy (predicting PCa and csPCa) was quantified using the area
under the curve (AUC) for the receiver operator characteristic (ROC) analysis (18). A
multivariable meta-analysis was performed to pool the AUCs in predicting any PCa and
csPCa. Within-study correlations of the AUCs were estimated using bootstrapping. To analyse
statistically significant differences in the models and taking into account the between-study
heterogeneity we subsequently estimated the probability that a model has the highest AUC in
a subsequent validation study.
We simulated 10,000 samples from the posterior distribution to estimate this probability
(19). Calibration of the RCs was pooled and explored graphically using calibrations plots. For
comparison, the per center sensitivity and specificity of detecting csPCa with applying a PSA
cut-off ≥4.0 ng/mL was calculated and graphically displayed.
In addition, the clinical impact was assessed with decision curve analysis (DCA) and
clinical impact curves. DCA represents the net benefit ratio, which weighs the benefits
(detecting cancer) versus the harms (unnecessary biopsy) over a range of thresholds (20).
Clinical impact curves show the estimated number who would be declared eligible for biopsy
for each risk threshold, and show the proportion of those who are cases (21).
In addition, to show the potential of multivariate risk stratification when adapting to, for
example, one’s own hospital data, we calculated net benefit after calibration of each of the
models predicting csPCa using the largest series cohort (Den Bosch; n = 2,053). Analyses
were performed using R statistical package, version 3.3.1, R Foundation for Statistical
Computing, Vienna, Austria.
127

Results
Of the total of 8,649 men 7,199 men (83.2%) were included in analyses. Median age
was 65 years old, median PSA 6.9 ng/mL, median prostate volume 45 mL (as evaluated by
TRUS) and 1,496 men (21%) underwent a previous biopsy (table 2). PCa was diagnosed in
3,458 of 7,199 patients (48%) and 1,784 (25%) men had csPCa. PCa patients were older
(median age: 65 vs. 64 years for non PCa patients, p<0.001), had smaller prostate glands (41
vs. 50 mL, p<0.001), and higher PSA (6.7 vs. 7.0 ng/mL, p<0.001) (table 3).
Table 2. Baseline characteristics of the independent cohorts.
Cohort - City No. of cases (%)
Age M-IQR
PSA M-IQR
Abnormal DRE No. (%)
Previous Bx No. (%)
Any PCa No. (%)
csPCa No. (%)
Porto - PT 568 (8) 66 (61-70) 6.6 (4.8-8.9) 243 (43) 73 (13) 235 (41) 164 (29)
Bordeaux - FR 1,568 (22) 65 (61-69) 7.0 (5.4-9.5) 616 (39) 202 (13) 845 (54) 370 (24)
Paris - FR 116 (1) 65 (60-71) 4.4 (3.4-5.7) 38 (33) 16 (13) 66 (59) 25 (24)
Rennes - FR 218 (3) 62 (58-68) 4.5 (3.4-5.8) 135 (62) 34 (16) 128 (59) 41 (20)
Milan - IT 715 (10) 65 (59-70) 6.1 (4.4-8.6) 128 (18) 246 (34) 281 (38) 135 (18)
Hamburg - DU 270 (4) 68 (62-71) 6.6 (4.6-9.5) 74 (27) 101 (37) 143 (52) 86 (31)
Munster - DU 513 (7) 63 (59-69) 5.2 (4.1-6.4) 59 (12) 211 (41) 253 (49) 213 (42)
Den Bosch - NL 2,053 (29) 64 (60-69) 7.9 (6.1-11.0) 566 (28) 428 (21) 847 (41) 368 (18)
Breda - NL 664 (9) 66 (62-71) 9.4 (6.9-13.5) 219 (32) 157 (24) 298 (47) 124 (20)
Sydney - AU 534 (7) 65 (58-69) 5.7 (4.1-8.3) 206 (39) 28 (5) 362 (68) 258 (48)
Total 7,199 65 (60-69) 6.9 (5.1-9.6) 2,268 (32) 1,491 (21) 3,458 (48) 1,784 (25)
Bx = biopsy; csPCa = clinically significant prostate cancer; DRE = digital rectal examination;
M-IQR = median and interquartile range; PSA = prostate-specific antigen.
Table 3. Characteristics of men with csPCa compared with men without PCa and lrPCa.
Variable No. PCa 3,741 (52%)
lrPCa 1,674 (23%)
csPCa 1,784 (25%)
Age at biopsy (years), median (IQR) 64 (59-68) 65 (60-69) 67 (62-72) Total PSA (ng/mL), median (IQR) 6.7 (5.0-9.2) 6.6 (5.0-9.0) 7.4 (5.4-11.6) Free PSA ratio, median (IQR) 0.16 (0.12-0.21) 0.14 (0.10-0.18) 0.12 (0.08-0.16) Abnormal DRE, n (%) 673 (18%) 559 (33%) 1,036 (58%) PV (mL), median (IQR) 50 (38-66) 41 (31-55) 39 (30-50) Positive family history 594 (16) 319 (19) 347 (20) IPSS/AUA, median (IQR) 3 (1-9) 2 (1-10) 3 (1-8) Previous biopsy, n (%) 977 (26) 316 (19) 198 (11) Number of cores, median (IQR) 12 (12-15) 12 (12-14) 12 (12-16)
csPCa = clinically significant prostate cancer; DRE = digital rectal examination; IPSS = International Prostate Symptom Score; IQR = interquartile range; lrPCa = low risk prostate cancer;
PSA = prostate-specific antigen; PV = prostate volume.
In predicting any PCa no particular RC stood out and the pooled area under the ROC-
curve (AUC) ranged between 0.64 and 0.72 (figure 1) with Finne having the highest AUC.
Substantial heterogeneity in the AUC was found between the different cohorts (range I2 66 to
89%). In predicting csPCa the ERSPC RPCRC had the highest pooled AUC of 0.77 (95% CI:
0.73-0.80; figure 1). After repeating this comparative analysis 10,000 times the ERSPC
RPCRC had the highest probability (89%) of having the highest AUC. The probabilities of
having the highest AUC in our study cohort were 6%, 3%, and 2% for PCPT 2.0 + freePSA,
PCPT 2.0, and Sunnybrook RCs respectively.
Figure 1. Meta-analysis of the pooled area under the curve (AUC) and 95% CI of various PCa
risk calculators to discriminate men diagnosed with any prostate cancer (above) and clinically
significant PCa (below).
AUC = area under the curve; CI = confidence interval; PCa = prostate cancer.
128

Results
Of the total of 8,649 men 7,199 men (83.2%) were included in analyses. Median age
was 65 years old, median PSA 6.9 ng/mL, median prostate volume 45 mL (as evaluated by
TRUS) and 1,496 men (21%) underwent a previous biopsy (table 2). PCa was diagnosed in
3,458 of 7,199 patients (48%) and 1,784 (25%) men had csPCa. PCa patients were older
(median age: 65 vs. 64 years for non PCa patients, p<0.001), had smaller prostate glands (41
vs. 50 mL, p<0.001), and higher PSA (6.7 vs. 7.0 ng/mL, p<0.001) (table 3).
Table 2. Baseline characteristics of the independent cohorts.
Cohort - City No. of cases (%)
Age M-IQR
PSA M-IQR
Abnormal DRE No. (%)
Previous Bx No. (%)
Any PCa No. (%)
csPCa No. (%)
Porto - PT 568 (8) 66 (61-70) 6.6 (4.8-8.9) 243 (43) 73 (13) 235 (41) 164 (29)
Bordeaux - FR 1,568 (22) 65 (61-69) 7.0 (5.4-9.5) 616 (39) 202 (13) 845 (54) 370 (24)
Paris - FR 116 (1) 65 (60-71) 4.4 (3.4-5.7) 38 (33) 16 (13) 66 (59) 25 (24)
Rennes - FR 218 (3) 62 (58-68) 4.5 (3.4-5.8) 135 (62) 34 (16) 128 (59) 41 (20)
Milan - IT 715 (10) 65 (59-70) 6.1 (4.4-8.6) 128 (18) 246 (34) 281 (38) 135 (18)
Hamburg - DU 270 (4) 68 (62-71) 6.6 (4.6-9.5) 74 (27) 101 (37) 143 (52) 86 (31)
Munster - DU 513 (7) 63 (59-69) 5.2 (4.1-6.4) 59 (12) 211 (41) 253 (49) 213 (42)
Den Bosch - NL 2,053 (29) 64 (60-69) 7.9 (6.1-11.0) 566 (28) 428 (21) 847 (41) 368 (18)
Breda - NL 664 (9) 66 (62-71) 9.4 (6.9-13.5) 219 (32) 157 (24) 298 (47) 124 (20)
Sydney - AU 534 (7) 65 (58-69) 5.7 (4.1-8.3) 206 (39) 28 (5) 362 (68) 258 (48)
Total 7,199 65 (60-69) 6.9 (5.1-9.6) 2,268 (32) 1,491 (21) 3,458 (48) 1,784 (25)
Bx = biopsy; csPCa = clinically significant prostate cancer; DRE = digital rectal examination;
M-IQR = median and interquartile range; PSA = prostate-specific antigen.
Table 3. Characteristics of men with csPCa compared with men without PCa and lrPCa.
Variable No. PCa 3,741 (52%)
lrPCa 1,674 (23%)
csPCa 1,784 (25%)
Age at biopsy (years), median (IQR) 64 (59-68) 65 (60-69) 67 (62-72) Total PSA (ng/mL), median (IQR) 6.7 (5.0-9.2) 6.6 (5.0-9.0) 7.4 (5.4-11.6) Free PSA ratio, median (IQR) 0.16 (0.12-0.21) 0.14 (0.10-0.18) 0.12 (0.08-0.16) Abnormal DRE, n (%) 673 (18%) 559 (33%) 1,036 (58%) PV (mL), median (IQR) 50 (38-66) 41 (31-55) 39 (30-50) Positive family history 594 (16) 319 (19) 347 (20) IPSS/AUA, median (IQR) 3 (1-9) 2 (1-10) 3 (1-8) Previous biopsy, n (%) 977 (26) 316 (19) 198 (11) Number of cores, median (IQR) 12 (12-15) 12 (12-14) 12 (12-16)
csPCa = clinically significant prostate cancer; DRE = digital rectal examination; IPSS = International Prostate Symptom Score; IQR = interquartile range; lrPCa = low risk prostate cancer;
PSA = prostate-specific antigen; PV = prostate volume.
In predicting any PCa no particular RC stood out and the pooled area under the ROC-
curve (AUC) ranged between 0.64 and 0.72 (figure 1) with Finne having the highest AUC.
Substantial heterogeneity in the AUC was found between the different cohorts (range I2 66 to
89%). In predicting csPCa the ERSPC RPCRC had the highest pooled AUC of 0.77 (95% CI:
0.73-0.80; figure 1). After repeating this comparative analysis 10,000 times the ERSPC
RPCRC had the highest probability (89%) of having the highest AUC. The probabilities of
having the highest AUC in our study cohort were 6%, 3%, and 2% for PCPT 2.0 + freePSA,
PCPT 2.0, and Sunnybrook RCs respectively.
Figure 1. Meta-analysis of the pooled area under the curve (AUC) and 95% CI of various PCa
risk calculators to discriminate men diagnosed with any prostate cancer (above) and clinically
significant PCa (below).
AUC = area under the curve; CI = confidence interval; PCa = prostate cancer.
In predicting any PCa no particular RC stood out and the pooled area under the ROC-
curve (AUC) ranged between 0.64 and 0.72 (figure 1) with Finne having the highest AUC.
Substantial heterogeneity in the AUC was found between the different cohorts (range I2 66 to
89%). In predicting csPCa the ERSPC RPCRC had the highest pooled AUC of 0.77 (95% CI:
0.73-0.80; figure 1). After repeating this comparative analysis 10,000 times the ERSPC
RPCRC had the highest probability (89%) of having the highest AUC. The probabilities of
having the highest AUC in our study cohort were 6%, 3%, and 2% for PCPT 2.0 + freePSA,
PCPT 2.0, and Sunnybrook RCs respectively.
Figure 1. Meta-analysis of the pooled area under the curve (AUC) and 95% CI of various PCa
risk calculators to discriminate men diagnosed with any prostate cancer (above) and clinically
significant PCa (below).
AUC = area under the curve; CI = confidence interval; PCa = prostate cancer.
129

The calibration plots for those RCs predicting csPCa for the pan-European data set
(including all cohorts except Sydney, Australia; n = 6,665) are displayed in figure 2. Three
models underestimated the probability of csPCa, while the ERSPC RPCRC was more
accurate at low probabilities and mainly overestimated at probabilities >10%.
Figure 2. Pooled calibration plots for clinical significant prostate cancer using ERSPC RPCRC (a), Sunnybrook (b), PCPT 2.0 (c) and PCPT 2.0 + freePSA (d) risk calculators in the nine European cohorts.
CI = confidence interval; free PSA = free proportion of total prostate-specific antigen.
Figure S1 displays the decision curves and clinical impact plots per cohort applying the
4 RCs predicting csPCa. Overall the ERSPC RPCRC has the highest net benefit followed by
the PCPT 2.0. Clinical impact is negligible to small starting at probabilities >10% for detecting
csPCa.
The calibration plots for those RCs predicting csPCa for the pan-European data set
(including all cohorts except Sydney, Australia; n = 6,665) are displayed in figure 2. Three
models underestimated the probability of csPCa, while the ERSPC RPCRC was more
accurate at low probabilities and mainly overestimated at probabilities >10%.
Figure 2. Pooled calibration plots for clinical significant prostate cancer using ERSPC RPCRC (a), Sunnybrook (b), PCPT 2.0 (c) and PCPT 2.0 + freePSA (d) risk calculators in the nine European cohorts.
CI = confidence interval; free PSA = free proportion of total prostate-specific antigen.
130

The calibration plots for those RCs predicting csPCa for the pan-European data set
(including all cohorts except Sydney, Australia; n = 6,665) are displayed in figure 2. Three
models underestimated the probability of csPCa, while the ERSPC RPCRC was more
accurate at low probabilities and mainly overestimated at probabilities >10%.
Figure 2. Pooled calibration plots for clinical significant prostate cancer using ERSPC RPCRC (a), Sunnybrook (b), PCPT 2.0 (c) and PCPT 2.0 + freePSA (d) risk calculators in the nine European cohorts.
CI = confidence interval; free PSA = free proportion of total prostate-specific antigen.
Figure S1 displays the decision curves and clinical impact plots per cohort applying the
4 RCs predicting csPCa. Overall the ERSPC RPCRC has the highest net benefit followed by
the PCPT 2.0. Clinical impact is negligible to small starting at probabilities >10% for detecting
csPCa.
The calibration plots for those RCs predicting csPCa for the pan-European data set
(including all cohorts except Sydney, Australia; n = 6,665) are displayed in figure 2. Three
models underestimated the probability of csPCa, while the ERSPC RPCRC was more
accurate at low probabilities and mainly overestimated at probabilities >10%.
Figure 2. Pooled calibration plots for clinical significant prostate cancer using ERSPC RPCRC (a), Sunnybrook (b), PCPT 2.0 (c) and PCPT 2.0 + freePSA (d) risk calculators in the nine European cohorts.
CI = confidence interval; free PSA = free proportion of total prostate-specific antigen.
131

132

133

Figure S1. Decision curve for the four models predicting clinically significant prostate cancer in all the individual cohorts (left panel) and clinical impact plots (right panel) for predicting clinical significant prostate cancer (csPCa) with the ERSPC RPCRC. Of the 1,000 patients, the black solid line shows the total number of men who would receive a biopsy for each risk threshold. The orange dashed line shows how many of those would be detected with any prostate and the black dashed line shows how many of those would be detected with csPCa. The space between the two dashed lines indicates the number of men with indolent PCa.
Figure S2 displays the differences in sensitivity and specificity of the PSA test (cut-off
≥4.0 ng/mL) per center. Sensitivity and specificity range from 76% to 98% and 4% to 44%
respectively.
Cohort Sensitivity Specificity Porto 0.90 0.14 Bordeaux 0.95 0.08 Paris 0.84 0.44 Rennes 0.76 0.41 Milan 0.87 0.18 Hamburg 0.87 0.21 Munster 0.80 0.26 Den Bosch 0.98 0.05 Groningen 0.98 0.04
Figure S2. Sensitivity and specificity per study cohort of the biomarker PSA applying a cut-off for biopsy of ≥ 4.0 ng/mL and predicting the presence of clinically significant prostate cancer (defined as Gleason Score ≥ 7).
Table 4 shows net benefit when each of the four RCs are calibrated. At a 4% threshold
for csPCa using the ERSPC RPCRC the number of biopsies can be reduced by 32% while
keeping a 95% sensitivity for detecting csPCa. Reduction and sensitivity are 8% and 99% for
PCPT2.0 + freePSA, 16% and 97% for PCPT 2.0, and 25% and 95% for Sunnybrook.
Table 4. Net benefit, biopsy reduction of and missed prostate cancers with the use of four risk calculators predicting csPCa at a 4 and 10% risk threshold in the Den Bosch cohort.
Risk Calculator Threshold 4%
Biopsy reduction (% of total
biopsy)
Missed prostate cancers
Net benefit
Indolent (% of total
indolent PCa)
csPCa (% of total
csPCa)
0.145 ERSPC RPCRC 665 (32) 118 (25) 17 (5) 0.150 PCPT 2·0 + freePSA 162 (8) 32 (7) 3 (1)
0.147
PCPT 2·0 319 (16) 73 (15) 12 (3) 0.145 Sunnybrook 516 (25) 105 (22) 20 (5) 0.145 Threshold 10%
0.088
ERSPC RPCRC 1,202 (59) 247 (52) 60 (16) 0.127 PCPT 2·0 + freePSA 890 (43) 216 (45) 61 (17)
0.103
PCPT 2·0 957 (47) 231 (48) 52 (14) 0.112 Sunnybrook 1,164 (57) 277 (58) 58 (16) 0.120
csPCa = clinically significant prostate cancer; PCa = prostate cancer.
Discussion
In this head-to-head comparison of seven well-known RCs predicting prostate biopsy
outcome it is shown that all RCs have a moderate to well discriminatory ability when predicting
any PCa (AUCs ranging from 0.64 to 0.72). Those RCs that can selectively predict csPCa
show AUCs in the range of 0.71 to 0.77 with small clinical benefit in this pan-European cohort
of contemporary daily clinical practice and clinical study data. Adjusting calibration shows the
added value of incorporating multivariable risk prediction tools next to clinical expertise in
clinical decision making.
These results confirm earlier analyses on the use of multivariable prediction tools (6)
and considering the substantial harm related to overdiagnosis of low risk PCa (3, 22), the use
of those RCs that selectively can predict csPCa is recommended. The balance between
benefit and harm of early detection of PCa is still a topic of ongoing debate.
134

Figure S1. Decision curve for the four models predicting clinically significant prostate cancer in all the individual cohorts (left panel) and clinical impact plots (right panel) for predicting clinical significant prostate cancer (csPCa) with the ERSPC RPCRC. Of the 1,000 patients, the black solid line shows the total number of men who would receive a biopsy for each risk threshold. The orange dashed line shows how many of those would be detected with any prostate and the black dashed line shows how many of those would be detected with csPCa. The space between the two dashed lines indicates the number of men with indolent PCa.
Figure S2 displays the differences in sensitivity and specificity of the PSA test (cut-off
≥4.0 ng/mL) per center. Sensitivity and specificity range from 76% to 98% and 4% to 44%
respectively.
Cohort Sensitivity Specificity Porto 0.90 0.14 Bordeaux 0.95 0.08 Paris 0.84 0.44 Rennes 0.76 0.41 Milan 0.87 0.18 Hamburg 0.87 0.21 Munster 0.80 0.26 Den Bosch 0.98 0.05 Groningen 0.98 0.04
Figure S2. Sensitivity and specificity per study cohort of the biomarker PSA applying a cut-off for biopsy of ≥ 4.0 ng/mL and predicting the presence of clinically significant prostate cancer (defined as Gleason Score ≥ 7).
Table 4 shows net benefit when each of the four RCs are calibrated. At a 4% threshold
for csPCa using the ERSPC RPCRC the number of biopsies can be reduced by 32% while
keeping a 95% sensitivity for detecting csPCa. Reduction and sensitivity are 8% and 99% for
PCPT2.0 + freePSA, 16% and 97% for PCPT 2.0, and 25% and 95% for Sunnybrook.
Table 4. Net benefit, biopsy reduction of and missed prostate cancers with the use of four risk calculators predicting csPCa at a 4 and 10% risk threshold in the Den Bosch cohort.
Risk Calculator Threshold 4%
Biopsy reduction (% of total
biopsy)
Missed prostate cancers
Net benefit
Indolent (% of total
indolent PCa)
csPCa (% of total
csPCa)
0.145 ERSPC RPCRC 665 (32) 118 (25) 17 (5) 0.150 PCPT 2·0 + freePSA 162 (8) 32 (7) 3 (1)
0.147
PCPT 2·0 319 (16) 73 (15) 12 (3) 0.145 Sunnybrook 516 (25) 105 (22) 20 (5) 0.145 Threshold 10%
0.088
ERSPC RPCRC 1,202 (59) 247 (52) 60 (16) 0.127 PCPT 2·0 + freePSA 890 (43) 216 (45) 61 (17)
0.103
PCPT 2·0 957 (47) 231 (48) 52 (14) 0.112 Sunnybrook 1,164 (57) 277 (58) 58 (16) 0.120
csPCa = clinically significant prostate cancer; PCa = prostate cancer.
Discussion
In this head-to-head comparison of seven well-known RCs predicting prostate biopsy
outcome it is shown that all RCs have a moderate to well discriminatory ability when predicting
any PCa (AUCs ranging from 0.64 to 0.72). Those RCs that can selectively predict csPCa
show AUCs in the range of 0.71 to 0.77 with small clinical benefit in this pan-European cohort
of contemporary daily clinical practice and clinical study data. Adjusting calibration shows the
added value of incorporating multivariable risk prediction tools next to clinical expertise in
clinical decision making.
These results confirm earlier analyses on the use of multivariable prediction tools (6)
and considering the substantial harm related to overdiagnosis of low risk PCa (3, 22), the use
of those RCs that selectively can predict csPCa is recommended. The balance between
benefit and harm of early detection of PCa is still a topic of ongoing debate.
135

Due to the initiation of PSA screening in combination with TRUS guided systematic
prostate biopsy the incidence of predominantly low risk PCa increased enormously in the
1990s. This eventually resulted in guidelines recommending no screening at all (23).
However, with the available data from longitudinal studies and randomized PCa
screening trials we currently have, the knowledge to improve the balance between harm and
benefit recommendations have changed to using shared decision making with an individual
approach towards how to screen best (24). While both discrimination and calibration are
important statistics to evaluate performance of a prediction tool we must note that
discrimination cannot be easily improved while calibration can (6).
An example of potentially adjusting calibration to a particular setting is shown in (25)
where a model was first tested using part of the available data (calibration phase) where
subsequently performance was assessed in the rest of the data (validation cohort). Based on
the wide calibration prediction intervals in the current analyses it is advisable to follow such
an approach where the aim should be to assess moderate calibration on the basis of center
specific retrospective data on prostate biopsy outcome with a minimum of 200 prostate
cancers cases (26).
Subsequently these center specific adjustments for the calculated probabilities could be
incorporated, for example, in the RPCRC. It is in this context important to realize that when
using a purely PSA-based approach considerable variation in sensitivity and specificity also
exists, as was shown in figure S2, something that is ignored in recommendations on applying
a cut-off value to trigger prostate biopsy.
When predicting biopsy outcome, it must also be noted that especially the use of the
multiparametric magnetic resonance imaging (mpMRI) in the detection of PCa and csPCa has
increased considerably showing very promising results. However, while the mpMRI is advised
to be used after a negative TRUS guided systematic prostate biopsy (often solely based on
an elevated PSA level), the mpMRI is more and more used before the first biopsy (27).
Previous analyses with the RPCRC have however shown that upfront risk stratification on the
basis of easy (and cheap) to get relevant pre-biopsy information can avoid half of mpMRIs
(17).
This study has some limitations. First, it is a retrospective study design using ten
different cohorts from populations with different background risk and different referral patterns
(daily clinical practice cohorts with the risk of selective outcome reporting and clinical study
cohorts with predefined eligibility criteria) as reflected in the heterogeneity of our results. On
the other hand, evaluating performance of these RCs in this pan-European setting can be
seen as a strength and support their use in Europe.
Second, we mainly used the original RCs which were all virtually developed in the 1990s.
This implies that they do not use later developed biomarkers (e.g., PHI, PCA3, the 4K panel).
All these biomarkers have shown to have additional predictive value when incorporated into a
prediction model and as such might be able to positively influence results (28 - 30).
Finally, all RCs use as endpoint csPCa based on the original Gleason grading (31). It
has been shown that the new Gleason grading system better reflects disease burden (32) as
does the inclusion of cribriform growth patterns in the classification of Gleason 7 PCa (16, 33).
In conclusion, we performed the first head-to-head comparison of RCs predicting
prostate biopsy outcome using a multicenter European and Australian population. No
particular RC stood out in the discrimination of men with and without PCa. The ERSPC
RPCRC showed highest discrimination when predicting clinically significant PCa. Net benefit
in the available clinical cohorts was limited but can be increased by applying a simple
calibration step. These outcomes support implementing next to clinical expertise a
multivariable risk prediction tool before further workup (e.g., MRI and biopsy) in men
suspicious for having a clinically significant PCa.
136

Due to the initiation of PSA screening in combination with TRUS guided systematic
prostate biopsy the incidence of predominantly low risk PCa increased enormously in the
1990s. This eventually resulted in guidelines recommending no screening at all (23).
However, with the available data from longitudinal studies and randomized PCa
screening trials we currently have, the knowledge to improve the balance between harm and
benefit recommendations have changed to using shared decision making with an individual
approach towards how to screen best (24). While both discrimination and calibration are
important statistics to evaluate performance of a prediction tool we must note that
discrimination cannot be easily improved while calibration can (6).
An example of potentially adjusting calibration to a particular setting is shown in (25)
where a model was first tested using part of the available data (calibration phase) where
subsequently performance was assessed in the rest of the data (validation cohort). Based on
the wide calibration prediction intervals in the current analyses it is advisable to follow such
an approach where the aim should be to assess moderate calibration on the basis of center
specific retrospective data on prostate biopsy outcome with a minimum of 200 prostate
cancers cases (26).
Subsequently these center specific adjustments for the calculated probabilities could be
incorporated, for example, in the RPCRC. It is in this context important to realize that when
using a purely PSA-based approach considerable variation in sensitivity and specificity also
exists, as was shown in figure S2, something that is ignored in recommendations on applying
a cut-off value to trigger prostate biopsy.
When predicting biopsy outcome, it must also be noted that especially the use of the
multiparametric magnetic resonance imaging (mpMRI) in the detection of PCa and csPCa has
increased considerably showing very promising results. However, while the mpMRI is advised
to be used after a negative TRUS guided systematic prostate biopsy (often solely based on
an elevated PSA level), the mpMRI is more and more used before the first biopsy (27).
Previous analyses with the RPCRC have however shown that upfront risk stratification on the
basis of easy (and cheap) to get relevant pre-biopsy information can avoid half of mpMRIs
(17).
This study has some limitations. First, it is a retrospective study design using ten
different cohorts from populations with different background risk and different referral patterns
(daily clinical practice cohorts with the risk of selective outcome reporting and clinical study
cohorts with predefined eligibility criteria) as reflected in the heterogeneity of our results. On
the other hand, evaluating performance of these RCs in this pan-European setting can be
seen as a strength and support their use in Europe.
Second, we mainly used the original RCs which were all virtually developed in the 1990s.
This implies that they do not use later developed biomarkers (e.g., PHI, PCA3, the 4K panel).
All these biomarkers have shown to have additional predictive value when incorporated into a
prediction model and as such might be able to positively influence results (28 - 30).
Finally, all RCs use as endpoint csPCa based on the original Gleason grading (31). It
has been shown that the new Gleason grading system better reflects disease burden (32) as
does the inclusion of cribriform growth patterns in the classification of Gleason 7 PCa (16, 33).
In conclusion, we performed the first head-to-head comparison of RCs predicting
prostate biopsy outcome using a multicenter European and Australian population. No
particular RC stood out in the discrimination of men with and without PCa. The ERSPC
RPCRC showed highest discrimination when predicting clinically significant PCa. Net benefit
in the available clinical cohorts was limited but can be increased by applying a simple
calibration step. These outcomes support implementing next to clinical expertise a
multivariable risk prediction tool before further workup (e.g., MRI and biopsy) in men
suspicious for having a clinically significant PCa.
137

Acknowledgements
We would like to thank the investigators, researchers and hospitals for providing the
required data (listed according to the number of men they enrolled):
• H. Beerlage, Jeroen Bosch Hospital, ‘s-Hertogenbosch, The Netherlands;
• R. Gaston, T. Piechaud, Clinique St. Augustin, Bordeaux, France;
• M. Lazzeri, San Raffaele Hospital-Turro, Milan, Italy;
• S. Roemeling, University Medical Center Groningen: Amphia Hospital Breda, The
Netherlands;
• D van der Schoot, Amphia Hospital, Breda, The Netherlands;
• I. Braga, L. Osório, V. Cavadas, A. Fraga, Porto Hospital Center, Porto, Portugal.
• E. Carrasquinho, E. Cardoso de Oliveira, Hospital Espírito Santo, Évora, Portugal;
• P. Stricker, J. Thompson, P. van Leeuwen, Garvan Institute of Medical Research,
University of New South Wales, Sydney, Australia;
• A. Semjonow, University Hospital Munster, Munster, Germany;
• C. Stephan, Charite-Universitaetsmedizin, Berlin and Berlin Institute for Urologic
Research, Berlin, Germany;
• A. Haese and M. Graefen, Prostate Cancer Center, Martini Clinic, University
Hamburg-Eppendorf, Hamburg, Germany;
• S. Vincendeau, Hospital Pontchaillou, Rennes, France;
• A. Houlgatte, HIA Du Val De Grace, Paris, France.
Special thanks to H. Cammann, Universitätsmedizin Berlin, Berlin, Germany, for
calculating the predicted probabilities for ProstataClass ANN.
References
1. Ferlay J, Soerjomataram I, Dikshit R, Eser S, Mathers C, Rebelo M, et al. Cancer incidence and mortality worldwide: sources, methods and major patterns in GLOBOCAN 2012. Int J Cancer. 2015;136(5):E359-86.
2. Schröder FH, Hugosson J, Roobol MJ, Tammela TL, Zappa M, Nelen V, et al. Screening and prostate cancer mortality: results of the European Randomised Study of Screening for Prostate Cancer (ERSPC) at 13 years of follow-up. Lancet. 2014;384(9959):2027-35.
3. Heijnsdijk EA, Wever EM, Auvinen A, Hugosson J, Ciatto S, Nelen V, et al. Quality-of- life effects of prostate-specific antigen screening. N Engl J Med. 2012;367(7):595-605.
4. Loeb S, Vellekoop A, Ahmed HU, Catto J, Emberton M, Nam R, et al. Systematic review of complications of prostate biopsy. Eur Urol. 2013;64(6):876-92.
5. Mottet N, Bellmunt J, Bolla M, Briers E, Cumberbatch MG, De Santis M, et al. EAU-ESTRO- SIOG Guidelines on Prostate Cancer. Part 1: Screening, Diagnosis, and Local Treatment with Curative Intent. Eur Urol. 2017;71(4):618-29.
6. Louie KS, Seigneurin A, Cathcart P, Sasieni P. Do prostate cancer risk models improve the predictive accuracy of PSA screening? A meta-analysis. Ann Oncol 2015;26(5):848-64.
7. van Buuren SG, Groothuis-Oudshoorn K. Multivariate Imputation by Chained Equations in R. J Stat Softw. 2011;45(3).
8. Nieboer D, Vergouwe Y, Ankerst DP, Roobol MJ, Steyerberg EW. Improving prediction models with new markers: a comparison of updating strategies. BMC Med Res Methodol. 2016;16(1):128.
9. Chun FK, Steuber T, Erbersdobler A, Currlin E, Walz J, Schlomm T, et al. Development and internal validation of a nomogram predicting the probability of prostate cancer Gleason sum upgrading between biopsy and radical prostatectomy pathology. Eur Urol. 2006;49(5):820-6.
10. Roobol MJ, Steyerberg EW, Kranse R, Wolters T, van den Bergh RC, Bangma CH, et al. A risk- based strategy improves prostate-specific antigen-driven detection of prostate cancer. Eur Urol. 2010;57(1):79-85.
11. Finne P, Finne R, Bangma C, Hugosson J, Hakama M, Auvinen A, et al. Algorithms based on prostate-specific antigen (PSA), free PSA, digital rectal examination and prostate volume reduce false-positive PSA results in prostate cancer screening. Int J Cancer 2004;111(2):310-5.
12. Karakiewicz PI, Benayoun S, Kattan MW, Perrotte P, Valiquette L, Scardino PT, et al. Development and validation of a nomogram predicting the outcome of prostate biopsy based on patient age, digital rectal examination and serum prostate specific antigen. J Urol. 2005;173(6):1930-4.
13. Stephan C, Cammann H, Semjonow A, Diamandis EP, Wymenga LF, Lein M, et al. Multicenter evaluation of an artificial neural network to increase the prostate cancer detection rate and reduce unnecessary biopsies. Clin Chem. 2002;48(8):1279-87.
14. Ankerst DP, Hoefler J, Bock S, Goodman PJ, Vickers A, Hernandez J, et al. Prostate Cancer Prevention Trial risk calculator 2.0 for the prediction of low- vs high-grade prostate cancer. Urology. 2014;83(6):1362-7.
15. Nam RK, Toi A, Klotz LH, Trachtenberg J, Jewett MA, Appu S, et al. Assessing individual risk for prostate cancer. J Clin Oncol. 2007;25(24):3582-8.
16. Roobol MJ, Verbeek JF, van der Kwast T, Kümmerlin IP, Kweldam CF, van Leenders GJLH. Improving the rotterdam european randomized study of screening for prostate cancer risk calculator for initial prostate biopsy by incorporating the 2014 International Society of Urological Pathology Gleason Grading and Cribriform growth. Eur Urol. 2017;72(1):45-51.
138

Acknowledgements
We would like to thank the investigators, researchers and hospitals for providing the
required data (listed according to the number of men they enrolled):
• H. Beerlage, Jeroen Bosch Hospital, ‘s-Hertogenbosch, The Netherlands;
• R. Gaston, T. Piechaud, Clinique St. Augustin, Bordeaux, France;
• M. Lazzeri, San Raffaele Hospital-Turro, Milan, Italy;
• S. Roemeling, University Medical Center Groningen: Amphia Hospital Breda, The
Netherlands;
• D van der Schoot, Amphia Hospital, Breda, The Netherlands;
• I. Braga, L. Osório, V. Cavadas, A. Fraga, Porto Hospital Center, Porto, Portugal.
• E. Carrasquinho, E. Cardoso de Oliveira, Hospital Espírito Santo, Évora, Portugal;
• P. Stricker, J. Thompson, P. van Leeuwen, Garvan Institute of Medical Research,
University of New South Wales, Sydney, Australia;
• A. Semjonow, University Hospital Munster, Munster, Germany;
• C. Stephan, Charite-Universitaetsmedizin, Berlin and Berlin Institute for Urologic
Research, Berlin, Germany;
• A. Haese and M. Graefen, Prostate Cancer Center, Martini Clinic, University
Hamburg-Eppendorf, Hamburg, Germany;
• S. Vincendeau, Hospital Pontchaillou, Rennes, France;
• A. Houlgatte, HIA Du Val De Grace, Paris, France.
Special thanks to H. Cammann, Universitätsmedizin Berlin, Berlin, Germany, for
calculating the predicted probabilities for ProstataClass ANN.
References
1. Ferlay J, Soerjomataram I, Dikshit R, Eser S, Mathers C, Rebelo M, et al. Cancer incidence and mortality worldwide: sources, methods and major patterns in GLOBOCAN 2012. Int J Cancer. 2015;136(5):E359-86.
2. Schröder FH, Hugosson J, Roobol MJ, Tammela TL, Zappa M, Nelen V, et al. Screening and prostate cancer mortality: results of the European Randomised Study of Screening for Prostate Cancer (ERSPC) at 13 years of follow-up. Lancet. 2014;384(9959):2027-35.
3. Heijnsdijk EA, Wever EM, Auvinen A, Hugosson J, Ciatto S, Nelen V, et al. Quality-of- life effects of prostate-specific antigen screening. N Engl J Med. 2012;367(7):595-605.
4. Loeb S, Vellekoop A, Ahmed HU, Catto J, Emberton M, Nam R, et al. Systematic review of complications of prostate biopsy. Eur Urol. 2013;64(6):876-92.
5. Mottet N, Bellmunt J, Bolla M, Briers E, Cumberbatch MG, De Santis M, et al. EAU-ESTRO- SIOG Guidelines on Prostate Cancer. Part 1: Screening, Diagnosis, and Local Treatment with Curative Intent. Eur Urol. 2017;71(4):618-29.
6. Louie KS, Seigneurin A, Cathcart P, Sasieni P. Do prostate cancer risk models improve the predictive accuracy of PSA screening? A meta-analysis. Ann Oncol 2015;26(5):848-64.
7. van Buuren SG, Groothuis-Oudshoorn K. Multivariate Imputation by Chained Equations in R. J Stat Softw. 2011;45(3).
8. Nieboer D, Vergouwe Y, Ankerst DP, Roobol MJ, Steyerberg EW. Improving prediction models with new markers: a comparison of updating strategies. BMC Med Res Methodol. 2016;16(1):128.
9. Chun FK, Steuber T, Erbersdobler A, Currlin E, Walz J, Schlomm T, et al. Development and internal validation of a nomogram predicting the probability of prostate cancer Gleason sum upgrading between biopsy and radical prostatectomy pathology. Eur Urol. 2006;49(5):820-6.
10. Roobol MJ, Steyerberg EW, Kranse R, Wolters T, van den Bergh RC, Bangma CH, et al. A risk- based strategy improves prostate-specific antigen-driven detection of prostate cancer. Eur Urol. 2010;57(1):79-85.
11. Finne P, Finne R, Bangma C, Hugosson J, Hakama M, Auvinen A, et al. Algorithms based on prostate-specific antigen (PSA), free PSA, digital rectal examination and prostate volume reduce false-positive PSA results in prostate cancer screening. Int J Cancer 2004;111(2):310-5.
12. Karakiewicz PI, Benayoun S, Kattan MW, Perrotte P, Valiquette L, Scardino PT, et al. Development and validation of a nomogram predicting the outcome of prostate biopsy based on patient age, digital rectal examination and serum prostate specific antigen. J Urol. 2005;173(6):1930-4.
13. Stephan C, Cammann H, Semjonow A, Diamandis EP, Wymenga LF, Lein M, et al. Multicenter evaluation of an artificial neural network to increase the prostate cancer detection rate and reduce unnecessary biopsies. Clin Chem. 2002;48(8):1279-87.
14. Ankerst DP, Hoefler J, Bock S, Goodman PJ, Vickers A, Hernandez J, et al. Prostate Cancer Prevention Trial risk calculator 2.0 for the prediction of low- vs high-grade prostate cancer. Urology. 2014;83(6):1362-7.
15. Nam RK, Toi A, Klotz LH, Trachtenberg J, Jewett MA, Appu S, et al. Assessing individual risk for prostate cancer. J Clin Oncol. 2007;25(24):3582-8.
16. Roobol MJ, Verbeek JF, van der Kwast T, Kümmerlin IP, Kweldam CF, van Leenders GJLH. Improving the rotterdam european randomized study of screening for prostate cancer risk calculator for initial prostate biopsy by incorporating the 2014 International Society of Urological Pathology Gleason Grading and Cribriform growth. Eur Urol. 2017;72(1):45-51.
139

17. Alberts AR, Schoots IG, Bokhorst LP, van Leenders GJ, Bangma CH, Roobol MJ. Risk-based patient selection for MRI-targeted prostate biopsy after negative TRUS-guided random biopsy avoids unnecessary magnetic resonance imaging scans. Eur Urol. 2016;69(6):1129-34.
18. Steyerberg EW, Vickers AJ, Cook NR, Gerds T, Gonen M, Obuchowski N, et al. Assessing the performance of prediction models: a framework for traditional and novel measures. Epidemiology. 2010;21(1):128-38.
19. van Houwelingen HC, Arends LR, Stijnen T. Advanced methods in meta-analysis: multivariate approach and meta- regression. Stat Med. 2002;21:589-624.
20. Vickers AJ, Van Calster B, Steyerberg EW. Net benefit approaches to the evaluation of prediction models, molecular markers, and diagnostic tests. BMJ 2016;352:i6.
21. Kerr KF, Brown MD, Zhu K, Janes H. Assessing the clinical impact of risk prediction models with decision curves: guidance for correct interpretation and appropiate use. J Clin Oncol. 2016;34(21):2534-40.
22. Carlsson SV, de Carvalho TM, Roobol MJ, Hugosson J, Auvinen A, Kwiatkowski M, et al. Estimating the harms and benefits of prostate cancer screening as used in common practice versus recommended good practice: A microsimulation screening analysis. Cancer. 2016;122(21):3386-93.
23. Moyer VA, Force USPST. Screening for prostate cancer: U.S. Preventive Services Task Force recommendation statement. Ann Intern Med 2012;157(2):120-34.
24. Bibbins-Domingo K, Grossman DC, Curry SJ. The US Preventive Services Task Force 2017 draft recommendation statement on screening for prostate cancer: an invitation to review and comment. JAMA 2017;317(19):1949-50.
25. Parekh DJ, Punnen S, Sjoberg DD, Asroff SW, Bailen JL, Cochran JS, et al. A multi-institutional prospective trial in the USA confirms that the 4kscore accurately identifies men with high-grade prostate cancer. Eur Urol 2015;68(3):464-70.
26. Van Calster B, Nieboer D, Vergouwe Y, De Cock B, Pencina MJ, Steyerberg EW. A calibration hierarchy for risk models was defined: from utopia to empirical data. J Clin Epidemiol 2016;74:167-76.
27. Schoots IG, Roobol MJ, Nieboer D, Bangma CH, Steyerberg EW, Hunink MG. Magnetic resonance imaging-targeted biopsy may enhance the diagnostic accuracy of significant prostate cancer detection compared to standard transrectal ultrasound-guided biopsy: a systematic review and meta-analysis. Eur Urol. 2015;68(3):438-50.
28. Roobol MJ, Vedder MM, Nieboer D, Houlgatte A, Vincendeau S, Lazzeri M, et al. Comparison of two prostate cancer risk calculators that include the prostate health index. Eur Urol Focus. 2015;1(2):185-90.
29. Vedder MM, de Bekker-Grob EW, Lilja HG, Vickers AJ, van Leenders GJ, Steyerberg EW, et al. The added value of percentage of free to total prostate-specific antigen, PCA3, and a kallikrein panel to the ERSPC risk calculator for prostate cancer in prescreened men. Eur Urol. 2014;66(6):1109-15.
30. Perdonà S, Cavadas V, Di Lorenzo G, Damiano R, Chiappetta G, Del Prete P, et al. Prostate cancer detection in the "grey area" of prostate-specific antigen below 10 ng/ml: head-to-head comparison of the updated PCPT calculator and Chun's nomogram, two risk estimators incorporating prostate cancer antigen 3. Eur Urol. 2011;59(1):81-7.
31. Gleason DF, Mellinger GT. Prediction of prognosis for prostatic adenocarcinoma by combined histological grading and clinical staging. J Urol 1974;111(1):58-64.
32. Loeb S, Folkvaljon Y, Robinson D, Lissbrant IF, Egevad L, Stattin P. Evaluation of the 2015 Gleason Grade Groups in a Nationwide Population-based Cohort. Eur Urol. 2016;69(6):1135-41.
33. Kweldam. CF, Kümmerlin. IP, Nieboer. D, Verhoef EI, Steyerberg EW, Incrocci L, et al. Prostate cancer outcomes of men with biopsy Gleason score 6 and 7 without cribriform or intraductal carcinoma. Eur J Cancer. 2016;66:26-33.
140

17. Alberts AR, Schoots IG, Bokhorst LP, van Leenders GJ, Bangma CH, Roobol MJ. Risk-based patient selection for MRI-targeted prostate biopsy after negative TRUS-guided random biopsy avoids unnecessary magnetic resonance imaging scans. Eur Urol. 2016;69(6):1129-34.
18. Steyerberg EW, Vickers AJ, Cook NR, Gerds T, Gonen M, Obuchowski N, et al. Assessing the performance of prediction models: a framework for traditional and novel measures. Epidemiology. 2010;21(1):128-38.
19. van Houwelingen HC, Arends LR, Stijnen T. Advanced methods in meta-analysis: multivariate approach and meta- regression. Stat Med. 2002;21:589-624.
20. Vickers AJ, Van Calster B, Steyerberg EW. Net benefit approaches to the evaluation of prediction models, molecular markers, and diagnostic tests. BMJ 2016;352:i6.
21. Kerr KF, Brown MD, Zhu K, Janes H. Assessing the clinical impact of risk prediction models with decision curves: guidance for correct interpretation and appropiate use. J Clin Oncol. 2016;34(21):2534-40.
22. Carlsson SV, de Carvalho TM, Roobol MJ, Hugosson J, Auvinen A, Kwiatkowski M, et al. Estimating the harms and benefits of prostate cancer screening as used in common practice versus recommended good practice: A microsimulation screening analysis. Cancer. 2016;122(21):3386-93.
23. Moyer VA, Force USPST. Screening for prostate cancer: U.S. Preventive Services Task Force recommendation statement. Ann Intern Med 2012;157(2):120-34.
24. Bibbins-Domingo K, Grossman DC, Curry SJ. The US Preventive Services Task Force 2017 draft recommendation statement on screening for prostate cancer: an invitation to review and comment. JAMA 2017;317(19):1949-50.
25. Parekh DJ, Punnen S, Sjoberg DD, Asroff SW, Bailen JL, Cochran JS, et al. A multi-institutional prospective trial in the USA confirms that the 4kscore accurately identifies men with high-grade prostate cancer. Eur Urol 2015;68(3):464-70.
26. Van Calster B, Nieboer D, Vergouwe Y, De Cock B, Pencina MJ, Steyerberg EW. A calibration hierarchy for risk models was defined: from utopia to empirical data. J Clin Epidemiol 2016;74:167-76.
27. Schoots IG, Roobol MJ, Nieboer D, Bangma CH, Steyerberg EW, Hunink MG. Magnetic resonance imaging-targeted biopsy may enhance the diagnostic accuracy of significant prostate cancer detection compared to standard transrectal ultrasound-guided biopsy: a systematic review and meta-analysis. Eur Urol. 2015;68(3):438-50.
28. Roobol MJ, Vedder MM, Nieboer D, Houlgatte A, Vincendeau S, Lazzeri M, et al. Comparison of two prostate cancer risk calculators that include the prostate health index. Eur Urol Focus. 2015;1(2):185-90.
29. Vedder MM, de Bekker-Grob EW, Lilja HG, Vickers AJ, van Leenders GJ, Steyerberg EW, et al. The added value of percentage of free to total prostate-specific antigen, PCA3, and a kallikrein panel to the ERSPC risk calculator for prostate cancer in prescreened men. Eur Urol. 2014;66(6):1109-15.
30. Perdonà S, Cavadas V, Di Lorenzo G, Damiano R, Chiappetta G, Del Prete P, et al. Prostate cancer detection in the "grey area" of prostate-specific antigen below 10 ng/ml: head-to-head comparison of the updated PCPT calculator and Chun's nomogram, two risk estimators incorporating prostate cancer antigen 3. Eur Urol. 2011;59(1):81-7.
31. Gleason DF, Mellinger GT. Prediction of prognosis for prostatic adenocarcinoma by combined histological grading and clinical staging. J Urol 1974;111(1):58-64.
32. Loeb S, Folkvaljon Y, Robinson D, Lissbrant IF, Egevad L, Stattin P. Evaluation of the 2015 Gleason Grade Groups in a Nationwide Population-based Cohort. Eur Urol. 2016;69(6):1135-41.
33. Kweldam. CF, Kümmerlin. IP, Nieboer. D, Verhoef EI, Steyerberg EW, Incrocci L, et al. Prostate cancer outcomes of men with biopsy Gleason score 6 and 7 without cribriform or intraductal carcinoma. Eur J Cancer. 2016;66:26-33.


Chapter 8
General Discussion
143

General Discussion
In the introduction (Chapter 1), the two aims of this thesis were described. The first
aim was to describe the current state of eHealth and mHealth in Urology and, in particular, to
develop and assess the usability of the European Randomized study of Screening for Prostate
Cancer (ERSPC) Rotterdam Prostate Cancer Risk Calculator (RPCRC) mobile health
(mHealth) application. The second aim is related to the external validation of the ERSPC
RPCRC, and the comparison of its performance with several other prostate biopsy outcome
prediction tools.
In this chapter, answers to the research questions are provided and further discussion
is presented, including directions for future research.
145

Part 1: eHealth and mHealth in Urology What is the status-quo of eHealth in Urology?
The World Health Organization (WHO) defines eHealth as “the use of information and
communication technologies (ICT) for health” (1), but to date, no standardized definition of
mHealth has been established (2). mHealth, which is a subset of eHealth, is described by the
WHO Global Observatory for eHealth “as medical and public health practice supported by
mobile devices, such as mobile phones, patient monitoring devices, personal digital assistants
(PDAs), and other wireless devices” (2). Therefore, mHealth has a broad range of
presentations, which includes not only the latest smartphone devices with cutting edge
characteristics (e.g., augmented reality), but also simpler devices. mHealth services may use
basic phone functions like speech (e.g., via a phone call or voicemail), short messaging
service (SMS), or global positioning system (GPS) (2). Successful evidence-based mHealth
interventions include medication adherence (e.g., improving the cardiometabolic profile of
prehypertensionists in a low-resource setting), and promoting smoking cessation (e.g., via text
messaging) (3, 4).
One of the biggest strengths of mHealth is that it envisions healthcare delivery that
overcomes geographical, temporal, as well as organizational barriers, and is becoming
ubiquitous, thanks to contemporary advances in mobile hardware and software. Even though
there appears to be a lot of potential for mHealth, and it may even become disruptive for
healthcare, currently there is limited evidence to support its use (5). Disruptive innovation is a
theory about innovation-driven growth, introduced by Clayton M. Christensen in 1995 (6). This
concept, which has been refined over time, describes “a process whereby a smaller company
with fewer resources is able to successfully challenge established incumbent businesses.” (7).
To be disruptive, innovators must either arise in the low-end foothold of the market,
which is less important for the established companies, since it is also less profitable (e.g.,
Netflix and traditional cable broadcasting), or from a new market, where none previously
existed (e.g., 3D printers and the manufacturing industry) (7). In a recent article, the author
welcomes a long-overdue disruptive approach to healthcare, describing how innovative
primary-care strategies are improving the outcomes of patients, while bringing down costs, by
focusing on a combination of delivery and payment schemes, instead of expensive biotech,
pharmacological and device investments, which still comprise more than 99% of healthcare
venture capital (8). By focusing on patient empowerment, through a whole-person approach
and the promotion of health, disruption in healthcare can be a much needed breath of fresh
air in our present resource constrained times.
In the Discussion of Chapter 6 “Prospective evaluation on the effect of interobserver
variability of digital rectal examination on the performance of the Rotterdam Prostate Cancer
Risk Calculator”, and Chapter 7 “Head-to-head comparison of prostate cancer risk calculators
predicting biopsy outcome”, the need for innovation in prostate cancer screening is also
debated. Even though mobile technology revolutionized many activities, in the case of
healthcare we have not yet seen a disruptive presentation, but mainly e/mHealth-tailored ways
of doing the same (8).
A context that may benefit from an innovative approach is clinical decision making in
tumour boards (9). During the management of cancer patients, many decisions have to be
made by multidisciplinary healthcare teams (i.e., tumour boards), where the patient’s clinical
data (e.g., comorbidities, imaging tests, pathology results and genomic evaluations) are
presented in a sequential, but frequently unstandardized and heterogeneous fashion (9).
Therefore, tumour boards can be complex and cumbersome, and there is an opportunity
for eHealth to improve decision making in this setting, by enabling the integration of
quantifiable clinical data into algorithms, and by optimizing the visualisation and analysis of
the heterogeneous information needed in a holistic clinical decision process (9).
One such example is the so-called ongoing “PROVISION project – Visual technology
integrating quantitative patient outcomes to support multidisciplinary clinical decision making”
(9). PROVISION will allow for objective quantitation of imaging (e.g., multi-parametric
magnetic resonance imaging (mpMRI)) and pathology (e.g., Gleason score) outcomes (9).
Even though it will be initially conceived for prostate cancer tumour boards, this know-how can
be applied to other tumours, optimizing the process of multidisciplinary heterogeneous
decision making, and consequently improving individual healthcare (9).
In essence, the PROVISION project will develop objectively assessed quantitative
patient outcomes captured in visual technology, figure 1, which will be combined with
algorithms to support multidisciplinary clinical decision making (9). An extensive group of
users, including healthcare professionals and patients, will analyse which method of
presentation is preferable (9).
Even though patients are not present in the multidisciplinary meeting, a PROVISION
platform can also be used in the outpatient clinic (i.e., when the multidisciplinary decision is
communicated to the patient) (9). Therefore, it is paramount to assure the usability of a tool
like PROVISION in this setting, facilitating the patient’s interpretation of the multidisciplinary
assessment and promoting a cognisant discussion (9).
146

Part 1: eHealth and mHealth in Urology What is the status-quo of eHealth in Urology?
The World Health Organization (WHO) defines eHealth as “the use of information and
communication technologies (ICT) for health” (1), but to date, no standardized definition of
mHealth has been established (2). mHealth, which is a subset of eHealth, is described by the
WHO Global Observatory for eHealth “as medical and public health practice supported by
mobile devices, such as mobile phones, patient monitoring devices, personal digital assistants
(PDAs), and other wireless devices” (2). Therefore, mHealth has a broad range of
presentations, which includes not only the latest smartphone devices with cutting edge
characteristics (e.g., augmented reality), but also simpler devices. mHealth services may use
basic phone functions like speech (e.g., via a phone call or voicemail), short messaging
service (SMS), or global positioning system (GPS) (2). Successful evidence-based mHealth
interventions include medication adherence (e.g., improving the cardiometabolic profile of
prehypertensionists in a low-resource setting), and promoting smoking cessation (e.g., via text
messaging) (3, 4).
One of the biggest strengths of mHealth is that it envisions healthcare delivery that
overcomes geographical, temporal, as well as organizational barriers, and is becoming
ubiquitous, thanks to contemporary advances in mobile hardware and software. Even though
there appears to be a lot of potential for mHealth, and it may even become disruptive for
healthcare, currently there is limited evidence to support its use (5). Disruptive innovation is a
theory about innovation-driven growth, introduced by Clayton M. Christensen in 1995 (6). This
concept, which has been refined over time, describes “a process whereby a smaller company
with fewer resources is able to successfully challenge established incumbent businesses.” (7).
To be disruptive, innovators must either arise in the low-end foothold of the market,
which is less important for the established companies, since it is also less profitable (e.g.,
Netflix and traditional cable broadcasting), or from a new market, where none previously
existed (e.g., 3D printers and the manufacturing industry) (7). In a recent article, the author
welcomes a long-overdue disruptive approach to healthcare, describing how innovative
primary-care strategies are improving the outcomes of patients, while bringing down costs, by
focusing on a combination of delivery and payment schemes, instead of expensive biotech,
pharmacological and device investments, which still comprise more than 99% of healthcare
venture capital (8). By focusing on patient empowerment, through a whole-person approach
and the promotion of health, disruption in healthcare can be a much needed breath of fresh
air in our present resource constrained times.
In the Discussion of Chapter 6 “Prospective evaluation on the effect of interobserver
variability of digital rectal examination on the performance of the Rotterdam Prostate Cancer
Risk Calculator”, and Chapter 7 “Head-to-head comparison of prostate cancer risk calculators
predicting biopsy outcome”, the need for innovation in prostate cancer screening is also
debated. Even though mobile technology revolutionized many activities, in the case of
healthcare we have not yet seen a disruptive presentation, but mainly e/mHealth-tailored ways
of doing the same (8).
A context that may benefit from an innovative approach is clinical decision making in
tumour boards (9). During the management of cancer patients, many decisions have to be
made by multidisciplinary healthcare teams (i.e., tumour boards), where the patient’s clinical
data (e.g., comorbidities, imaging tests, pathology results and genomic evaluations) are
presented in a sequential, but frequently unstandardized and heterogeneous fashion (9).
Therefore, tumour boards can be complex and cumbersome, and there is an opportunity
for eHealth to improve decision making in this setting, by enabling the integration of
quantifiable clinical data into algorithms, and by optimizing the visualisation and analysis of
the heterogeneous information needed in a holistic clinical decision process (9).
One such example is the so-called ongoing “PROVISION project – Visual technology
integrating quantitative patient outcomes to support multidisciplinary clinical decision making”
(9). PROVISION will allow for objective quantitation of imaging (e.g., multi-parametric
magnetic resonance imaging (mpMRI)) and pathology (e.g., Gleason score) outcomes (9).
Even though it will be initially conceived for prostate cancer tumour boards, this know-how can
be applied to other tumours, optimizing the process of multidisciplinary heterogeneous
decision making, and consequently improving individual healthcare (9).
In essence, the PROVISION project will develop objectively assessed quantitative
patient outcomes captured in visual technology, figure 1, which will be combined with
algorithms to support multidisciplinary clinical decision making (9). An extensive group of
users, including healthcare professionals and patients, will analyse which method of
presentation is preferable (9).
Even though patients are not present in the multidisciplinary meeting, a PROVISION
platform can also be used in the outpatient clinic (i.e., when the multidisciplinary decision is
communicated to the patient) (9). Therefore, it is paramount to assure the usability of a tool
like PROVISION in this setting, facilitating the patient’s interpretation of the multidisciplinary
assessment and promoting a cognisant discussion (9).
147

Another patient focused eHealth initiative is the “MyPSA” online platform and
smartphone app, a personalized healthcare service under development to empower patients,
where they can keep an integrated record of all their relevant medical information, including
prostate cancer family history, screening (e.g., prostate specific antigen (PSA)), diagnostic
tools (e.g., mpMRI, prostate biopsy), and treatment decisions (e.g., active surveillance,
curative intent or palliative choices) (10).
Based on that information, MyPSA will provide targeted health recommendations,
depending on patient status and available options (10). This new eHealth tool will avoid the
“one size fits all” approach by delivering patient tailored alternatives, using predictive
modelling and supporting innovative add-ons (10). MyPSA will be available for all men
pondering PSA testing, not just for prostate cancer patients (10). This will enable the patient
to monitor his personal serum PSA level over time, and discuss this with his general
practitioner (GP) or Urologist (10). Having this data readily available will make the patient a
more equal interlocutor at the outpatient consultation, which in turn has a positive impact on
the quality of care (11).
A B Figure 1. Examples of prostate cancer related eHealth concepts. A. Potential template of an electronic dashboard, combining clinical, imaging, and pathology data (Screenshot: PROVISION project). B. Proposed interface of the tablet version of the MyPSA app.
An ongoing behavioral clinical trial is studying an interactive mHealth decision aid for
men with advanced prostate cancer in a community setting, designed to engage and support
patients, facilitating informed shared decisions about treatments that affect their quality of life,
promoting health-related decision making for providers and patients, and examining patient
outcomes for healthcare improvement (12). This addresses a necessity acknowledged in a
recent systematic review, which identified thousands of studies involving cancer-focused
mobile phone apps on prostate cancer patients’ quality of life and well-being, but a lack of
rigorous clinical trials (13).
Since most cancer patients are treated as outpatients, and they may experience
disease-related symptoms or treatment-related side effects outside of a healthcare facility, it
is important to facilitate and improve patient-clinician communication (14). Therefore, there is
a need to enhance our understanding about how to develop person-centred care using mobile
technology, namely implementations of patient-clinician communication to support symptom
management and self-care (14). In another prospective randomised trial, the effects of using
an interactive communications platform will be assessed in patients who underwent curative
radiotherapy for locally advanced prostate cancer (14).
e/mHealth in Urology is, like in other medical disciplines, in its infancy. Currently, the
technology is mostly used to optimize existing medical activities, but two of the most promising
areas where e/mHealth could be developed are multidisciplinary medical clinical care teams
and patient self-management. As was mentioned in the introduction, the implementation of
shared decision making is still infrequent in clinical care, even though engaging patients is
considered ethically important, and is promoted by health policies and endorsed by scientific
guidelines (15).
A Cochrane review of interventions to increase the use of shared decision making, which
encompassed a total of 45,641 patients and 3,113 healthcare professionals in 87 studies,
found that it was uncertain if active interventions (e.g., decision aids, explicit training) targeting
patients, healthcare professionals, or both, increased shared decision making when compared
with usual care, because the level of evidence was low (16). In addition, because there are
still several gaps in knowledge about the effectiveness of interventions focused on increasing
shared decision making, future trials should be designed with enough power to estimate the
effects of active interventions on the use of shared decision making, assess the same
intervention across multiple clinical contexts, and determine the cost of such interventions
(16).
Moreover, a review that evaluated the measurement quality of existing shared decision
making instruments found an overall lack of evidence (17). This does not mean that existing
instruments lack quality, but only that their quality could not be evaluated, either because the
measurement properties have not been assessed, or because the validation studies are of
poor quality (e.g., lack of insight into the ability to measure change) (17). Because this
hampers the choice for the most appropriate instrument, the authors suggest alternatives
(e.g., choosing the most adequate instrument based on its content), and recommend that
future studies should thrive to improve instrument quality, namely by following the COnsensus-
based Standards for the selection of health status Measurement Instruments (COSMIN)
guidelines (17).
148

Another patient focused eHealth initiative is the “MyPSA” online platform and
smartphone app, a personalized healthcare service under development to empower patients,
where they can keep an integrated record of all their relevant medical information, including
prostate cancer family history, screening (e.g., prostate specific antigen (PSA)), diagnostic
tools (e.g., mpMRI, prostate biopsy), and treatment decisions (e.g., active surveillance,
curative intent or palliative choices) (10).
Based on that information, MyPSA will provide targeted health recommendations,
depending on patient status and available options (10). This new eHealth tool will avoid the
“one size fits all” approach by delivering patient tailored alternatives, using predictive
modelling and supporting innovative add-ons (10). MyPSA will be available for all men
pondering PSA testing, not just for prostate cancer patients (10). This will enable the patient
to monitor his personal serum PSA level over time, and discuss this with his general
practitioner (GP) or Urologist (10). Having this data readily available will make the patient a
more equal interlocutor at the outpatient consultation, which in turn has a positive impact on
the quality of care (11).
A B Figure 1. Examples of prostate cancer related eHealth concepts. A. Potential template of an electronic dashboard, combining clinical, imaging, and pathology data (Screenshot: PROVISION project). B. Proposed interface of the tablet version of the MyPSA app.
An ongoing behavioral clinical trial is studying an interactive mHealth decision aid for
men with advanced prostate cancer in a community setting, designed to engage and support
patients, facilitating informed shared decisions about treatments that affect their quality of life,
promoting health-related decision making for providers and patients, and examining patient
outcomes for healthcare improvement (12). This addresses a necessity acknowledged in a
recent systematic review, which identified thousands of studies involving cancer-focused
mobile phone apps on prostate cancer patients’ quality of life and well-being, but a lack of
rigorous clinical trials (13).
Since most cancer patients are treated as outpatients, and they may experience
disease-related symptoms or treatment-related side effects outside of a healthcare facility, it
is important to facilitate and improve patient-clinician communication (14). Therefore, there is
a need to enhance our understanding about how to develop person-centred care using mobile
technology, namely implementations of patient-clinician communication to support symptom
management and self-care (14). In another prospective randomised trial, the effects of using
an interactive communications platform will be assessed in patients who underwent curative
radiotherapy for locally advanced prostate cancer (14).
e/mHealth in Urology is, like in other medical disciplines, in its infancy. Currently, the
technology is mostly used to optimize existing medical activities, but two of the most promising
areas where e/mHealth could be developed are multidisciplinary medical clinical care teams
and patient self-management. As was mentioned in the introduction, the implementation of
shared decision making is still infrequent in clinical care, even though engaging patients is
considered ethically important, and is promoted by health policies and endorsed by scientific
guidelines (15).
A Cochrane review of interventions to increase the use of shared decision making, which
encompassed a total of 45,641 patients and 3,113 healthcare professionals in 87 studies,
found that it was uncertain if active interventions (e.g., decision aids, explicit training) targeting
patients, healthcare professionals, or both, increased shared decision making when compared
with usual care, because the level of evidence was low (16). In addition, because there are
still several gaps in knowledge about the effectiveness of interventions focused on increasing
shared decision making, future trials should be designed with enough power to estimate the
effects of active interventions on the use of shared decision making, assess the same
intervention across multiple clinical contexts, and determine the cost of such interventions
(16).
Moreover, a review that evaluated the measurement quality of existing shared decision
making instruments found an overall lack of evidence (17). This does not mean that existing
instruments lack quality, but only that their quality could not be evaluated, either because the
measurement properties have not been assessed, or because the validation studies are of
poor quality (e.g., lack of insight into the ability to measure change) (17). Because this
hampers the choice for the most appropriate instrument, the authors suggest alternatives
(e.g., choosing the most adequate instrument based on its content), and recommend that
future studies should thrive to improve instrument quality, namely by following the COnsensus-
based Standards for the selection of health status Measurement Instruments (COSMIN)
guidelines (17).
149

Previous studies have shown that cancer patients who are more engaged in their health
decisions are more likely to be satisfied with their choices (18), and it appears that shared
decision making is positively associated with quality of life outcomes, even though another
review acknowledged that the poor methodological quality and heterogeneity of available
studies could limit these conclusions (19). Implementing a shared decision model process
changes the quality of patient-provider communication, and can improve patients’ satisfaction
not only with the health decision, but also with the process (18).
Currently, there is also a growing interest in shared decision making training programs
(20), and a conceptual model for the implementation of shared decision making in cancer
treatment is proposed in a recent article (18). One of their recommendations is to “capitalize
on health information technology”, and Urology can be at the forefront of this effort (18),
namely with the development of decision aids, which can be used in the process of shared
decision making, to improve patients’ knowledge regarding options, promote a more active
role in decision making, and increase their risk perception (21).
What is the status-quo of Urology mHealth smartphone applications?
The urge for mobile computer devices is not new: a previous iteration was the PDA, a
portable computer device that could serve as a personal information manager (22). The term
PDA was first used on the launch of the Apple Newton in 1992, although rudimentary devices
had been available since the 1980s: in 1984 the Psion Organizer was marketed as “the world's
first practical pocket computer” (23). The introduction of these mobile devices enabled patients
and healthcare professionals, for the first time, to store electronic medical records, download
lab results, or upload vital signs, in a convenient portable device. Subsequent hardware and
software developments, lower costs and improved mobile communication networks allowed
for the increasing generalization of mobile computing devices: today, there are several places
where people are more likely to have access to a smartphone than to fresh running water (24).
In January of 2007, Apple’s founder Steve Jobs unveiled the iPhone with an enticing
preamble: “Every once in a while, a revolutionary product comes along that changes
everything”. This had a dramatic effect on smartphone design and consumer expectations,
and 20 months later, in September of 2008, the first device from its major competing platform
(i.e., Google Android) was released: the HTC Dream (25, 26). In addition to the powerful
hardware and innovative software features of each device, both Apple and Google promoted
specific integrated development environments for their operating systems (i.e., iOS and
Android) and online application markets, i.e., the Apple App Store and the Google Play Store.
These platforms encouraged the development of apps, by companies and individuals,
that could be made available directly to the end user, increasing the potential of their device,
in comparison to what was available when it was bought. This stimulated the development of
ground breaking ideas in various fields, including healthcare, which was one of the original
app categories (initially described as “Health & Fitness”, then spun-off into “Medical”).
Consequently, there is a plethora of iOS and Android mHealth apps available, for both
healthcare professionals and lay people. Therefore, privacy, security and reliability are of
paramount importance. However, there is no worldwide standard medical app regulation, nor
compulsory scientific guidelines, neither industry putative standards: in fact, there is a
substantial contrast between Google’s app review process (i.e., Android apps are
automatically accepted), and Apple’s (i.e., iOS apps are only made available after technical
approval by Apple staff) (27). For example, iOS apps that try to access personal data (e.g.,
phone calls, SMS or location services) without user consent are rejected (27).
150

Previous studies have shown that cancer patients who are more engaged in their health
decisions are more likely to be satisfied with their choices (18), and it appears that shared
decision making is positively associated with quality of life outcomes, even though another
review acknowledged that the poor methodological quality and heterogeneity of available
studies could limit these conclusions (19). Implementing a shared decision model process
changes the quality of patient-provider communication, and can improve patients’ satisfaction
not only with the health decision, but also with the process (18).
Currently, there is also a growing interest in shared decision making training programs
(20), and a conceptual model for the implementation of shared decision making in cancer
treatment is proposed in a recent article (18). One of their recommendations is to “capitalize
on health information technology”, and Urology can be at the forefront of this effort (18),
namely with the development of decision aids, which can be used in the process of shared
decision making, to improve patients’ knowledge regarding options, promote a more active
role in decision making, and increase their risk perception (21).
What is the status-quo of Urology mHealth smartphone applications?
The urge for mobile computer devices is not new: a previous iteration was the PDA, a
portable computer device that could serve as a personal information manager (22). The term
PDA was first used on the launch of the Apple Newton in 1992, although rudimentary devices
had been available since the 1980s: in 1984 the Psion Organizer was marketed as “the world's
first practical pocket computer” (23). The introduction of these mobile devices enabled patients
and healthcare professionals, for the first time, to store electronic medical records, download
lab results, or upload vital signs, in a convenient portable device. Subsequent hardware and
software developments, lower costs and improved mobile communication networks allowed
for the increasing generalization of mobile computing devices: today, there are several places
where people are more likely to have access to a smartphone than to fresh running water (24).
In January of 2007, Apple’s founder Steve Jobs unveiled the iPhone with an enticing
preamble: “Every once in a while, a revolutionary product comes along that changes
everything”. This had a dramatic effect on smartphone design and consumer expectations,
and 20 months later, in September of 2008, the first device from its major competing platform
(i.e., Google Android) was released: the HTC Dream (25, 26). In addition to the powerful
hardware and innovative software features of each device, both Apple and Google promoted
specific integrated development environments for their operating systems (i.e., iOS and
Android) and online application markets, i.e., the Apple App Store and the Google Play Store.
These platforms encouraged the development of apps, by companies and individuals,
that could be made available directly to the end user, increasing the potential of their device,
in comparison to what was available when it was bought. This stimulated the development of
ground breaking ideas in various fields, including healthcare, which was one of the original
app categories (initially described as “Health & Fitness”, then spun-off into “Medical”).
Consequently, there is a plethora of iOS and Android mHealth apps available, for both
healthcare professionals and lay people. Therefore, privacy, security and reliability are of
paramount importance. However, there is no worldwide standard medical app regulation, nor
compulsory scientific guidelines, neither industry putative standards: in fact, there is a
substantial contrast between Google’s app review process (i.e., Android apps are
automatically accepted), and Apple’s (i.e., iOS apps are only made available after technical
approval by Apple staff) (27). For example, iOS apps that try to access personal data (e.g.,
phone calls, SMS or location services) without user consent are rejected (27).
151

At the time of the first published review of expert’s involvement in Urology mHealth app
development, in January of 2015 (Chapter 3), there were close to 100,000 medical apps
available on the two leading software platforms, iOS and Android, and that number was
expected to grow even further, as both Apple and Google had announced mHealth to be a
top-priority (27 - 29). In that review, we identified 150 Urology-specific apps available on the
Apple App Store and Google Play Store, of which 20% had no explicit healthcare professional
involvement in their development (30). Moreover, studies in other medical specialties had
shown a lack of participation from healthcare professionals in app development, which could
indicate that this is a widespread issue among mHealth apps (31 - 33).
For the “eHealth and mHealth in prostate cancer detection and active surveillance”
article (Chapter 2), an updated review of the available Urology apps in both the Apple App
Store and Google Play Store was performed in December of 2017 (34). After three years (i.e.,
from January 2015 to December 2017), the total number of mHealth apps available on the
Apple App Store and the Google Play Store had increased to almost 300,000, and together
they represented more than 90% of the medical smartphone app ecosystem (35).
Using the same methods as in 2015, a total of 176 unique urology apps were found
(+17%); 67 (38%) for Android, 62 (35%) for iOS, and 47 (27%) available on both stores (table
1) (34). Even though there was an increase in the number of Urology specific apps (+17%), it
was insignificant when compared with the global increase in medical apps (+200%) (34).
Moreover, there still seems to persist an untapped potential for the participation of the
urological community, as a quarter of all apps were developed without a healthcare
professional, which is slightly worse than in 2015 (-6%) (34). This lack of healthcare
participation was even more pronounced in the 20 (11%) apps directly related to prostate
cancer: 40% were developed without a healthcare professional (complete list in the original
article (Chapter 2)) (34).
Our initial 2015 review also showed the discrepancy among the number of downloads:
while some apps had not been downloaded, others had been downloaded over 10,000 times
(30). At that time, the factors that contributed to the number of downloads of medical
smartphone apps had not been characterized (30). Additionally, as was mentioned, that
seminal article also showed a lack of scientific expert participation in app development (30).
In conjunction, these findings prompted us to perform the subsequent study in this
dissertation, “Expert Involvement Predicts mHealth App Downloads: Multivariate Regression
Analysis of Urology Apps” (Chapter 4), investigating which factors influenced the number of
Urology app downloads (36), which will be discussed in further detail in the next section.
Table 1. Comparison of available apps between January 2015 and December 2017.
January 2015 December 2017 Change over time
Total number of apps 100,000 300,000 (+200%)
Urology apps 150 176 (+17%)
Apple 44 (29%) 62 (35%) (+21%)
Android 56 (37%) 67 (38%) (+3%)
Both 50 (33%) 47 (27%) (-18%)
Healthcare
participation
119 (80%) 132 (75%) (-6%)
152

At the time of the first published review of expert’s involvement in Urology mHealth app
development, in January of 2015 (Chapter 3), there were close to 100,000 medical apps
available on the two leading software platforms, iOS and Android, and that number was
expected to grow even further, as both Apple and Google had announced mHealth to be a
top-priority (27 - 29). In that review, we identified 150 Urology-specific apps available on the
Apple App Store and Google Play Store, of which 20% had no explicit healthcare professional
involvement in their development (30). Moreover, studies in other medical specialties had
shown a lack of participation from healthcare professionals in app development, which could
indicate that this is a widespread issue among mHealth apps (31 - 33).
For the “eHealth and mHealth in prostate cancer detection and active surveillance”
article (Chapter 2), an updated review of the available Urology apps in both the Apple App
Store and Google Play Store was performed in December of 2017 (34). After three years (i.e.,
from January 2015 to December 2017), the total number of mHealth apps available on the
Apple App Store and the Google Play Store had increased to almost 300,000, and together
they represented more than 90% of the medical smartphone app ecosystem (35).
Using the same methods as in 2015, a total of 176 unique urology apps were found
(+17%); 67 (38%) for Android, 62 (35%) for iOS, and 47 (27%) available on both stores (table
1) (34). Even though there was an increase in the number of Urology specific apps (+17%), it
was insignificant when compared with the global increase in medical apps (+200%) (34).
Moreover, there still seems to persist an untapped potential for the participation of the
urological community, as a quarter of all apps were developed without a healthcare
professional, which is slightly worse than in 2015 (-6%) (34). This lack of healthcare
participation was even more pronounced in the 20 (11%) apps directly related to prostate
cancer: 40% were developed without a healthcare professional (complete list in the original
article (Chapter 2)) (34).
Our initial 2015 review also showed the discrepancy among the number of downloads:
while some apps had not been downloaded, others had been downloaded over 10,000 times
(30). At that time, the factors that contributed to the number of downloads of medical
smartphone apps had not been characterized (30). Additionally, as was mentioned, that
seminal article also showed a lack of scientific expert participation in app development (30).
In conjunction, these findings prompted us to perform the subsequent study in this
dissertation, “Expert Involvement Predicts mHealth App Downloads: Multivariate Regression
Analysis of Urology Apps” (Chapter 4), investigating which factors influenced the number of
Urology app downloads (36), which will be discussed in further detail in the next section.
Table 1. Comparison of available apps between January 2015 and December 2017.
January 2015 December 2017 Change over time
Total number of apps 100,000 300,000 (+200%)
Urology apps 150 176 (+17%)
Apple 44 (29%) 62 (35%) (+21%)
Android 56 (37%) 67 (38%) (+3%)
Both 50 (33%) 47 (27%) (-18%)
Healthcare
participation
119 (80%) 132 (75%) (-6%)
153

Does expert involvement in mHealth development influence downloads?
Previous studies in Economics indicated that some of the significant predictors of the
number of app downloads were the price, available in-app purchases, total file size, quantity
of textual and visual descriptions, apps’ age (i.e., how long it had been published), and the
number of version updates (37 - 43). However, there were no studies on the predictors of the
number of downloads for medical apps on PubMed (36). In addition, we also postulated that
the involvement of a healthcare expert could impact the number of downloads (36). Identifying
the factors that influence the number of downloads of commercial apps can help in future
mHealth app developments (36). Moreover, it has been hypothesized that establishing
scientific evidence for commercial mHealth apps could promote their adoption in healthcare
practice and improve clinical outcomes (44).
Even though the methodology was described in detail in the original article, it is pertinent
to explain that to evaluate whether expert participation influenced app downloads, we added
a nominal variable to our model (i.e., healthcare professional participation), with three
categories: urologist (i.e., either a single urologist or the participation of a scientific urological
association); other healthcare professionals participation (i.e., the participation of other
medical doctors, bioresearchers, or nurses); or no healthcare professional participation (i.e.,
no explicit mention) (Chapter 4) (36).
Regrettably, we could only evaluate the importance of these factors in apps available on
the Google Play Store because Apple does not publish an individual’s app number of
downloads, which limited our study sample (36). Instead, Apple only lists the “Top 200 Medical
Apps”, but they are ranked by a non-disclosed proprietary algorithm from Apple, which
prevented further analysis to be performed, as there was no way of inferring the number of
downloads from the position within that list. Furthermore, at the time of the review, there were
no Urology apps in that “Top 200 Medical Apps” list (36).
For that review, a search for Urology-specific applications on the Google Play Store
identified 129 apps, and via multivariate ordinal logistic regression we concluded that apps
developed with expert urological input, free or with lower price, with optional in-app purchases,
higher user ratings, and a larger number of written user reviews, were more likely to have a
higher level of downloads (36). All other tested variables did not influence the number of
downloads. These results indicate, for the first time, that healthcare professional participation
involvement positively influence the number of app downloads (36). In fact, only apps with
explicit contribution from a urologist reached >5,000 downloads (36).
It might be a personal bias, but it seems intuitive to include healthcare professionals in
mHealth development. However, in our Android Play Store limited Urology specific app
sample, there was no explicit scientific expert input acknowledged in one of every five apps
(36). As was mentioned before, this concern is widespread in mHealth (i.e., it is not limited to
the field of Urology). Moreover, when healthcare participation was mentioned, there was no
objective method to measure the extent of that involvement, neither a guaranteed method to
assess if it was actually true (36). These two issues could potentially be resolved by requiring
mHealth apps to have a full disclosure form, similar to the one provided in scientific papers, or
by implementing an independent certification of healthcare professional participation (36).
Another solution might be to assure the functional certification and content regulation of
mHealth apps (36).
We propose that the level of regulation should be proportional to the degree of clinical
implication derived from the app (i.e., lifestyle recommendations vs. drug dosage calculators)
and the target audience (i.e., potentially lower for healthcare professionals than for lay
persons). According to directive 2007/47/EC of the European Parliament, a “medical device”
means any instrument, apparatus, appliance, software, material or other article, whether used
alone or in combination, together with any accessories, including the software intended by its
manufacturer to be used specifically for diagnostic and/or therapeutic purposes and necessary
for its proper application, intended by the manufacturer to be used for human beings for the
purpose of, for example, diagnosis, prevention, monitoring, treatment or alleviation of disease
(45).
Currently, to get the CE-mark (“Conformité Européenne”, i.e., European Conformity), a
medical device must follow the Medical Device Directive (MDD) 93/42/EEC (46). The MDD
defines the requirements that every medical product has to fulfil, according to the class that
they belong to (46). Based on this legislation, a biopsy outcome prediction model, which is a
non-invasive device, would be categorized in class I, per rule 12 of Annex IX to MDD, and
would require the preparation of the technical documentation to support a declaration of
conformity (46). Moreover, because it is not a sterile device, and has a measuring function, it
would be classified as class Im (46). Therefore, it would be necessary to assess its compliance
with metrological requirements, and compile a declaration of conformity, before registering it
with the competent authority (46).
While mHealth apps are becoming increasingly popular, for both professionals and
patients, several pitfalls have been identified, such as apps crammed with outdated
(mis)information, created by lay people, with disregard for usability and scientific evidence,
not to mention possible charlatans (47 - 49).
154

Does expert involvement in mHealth development influence downloads?
Previous studies in Economics indicated that some of the significant predictors of the
number of app downloads were the price, available in-app purchases, total file size, quantity
of textual and visual descriptions, apps’ age (i.e., how long it had been published), and the
number of version updates (37 - 43). However, there were no studies on the predictors of the
number of downloads for medical apps on PubMed (36). In addition, we also postulated that
the involvement of a healthcare expert could impact the number of downloads (36). Identifying
the factors that influence the number of downloads of commercial apps can help in future
mHealth app developments (36). Moreover, it has been hypothesized that establishing
scientific evidence for commercial mHealth apps could promote their adoption in healthcare
practice and improve clinical outcomes (44).
Even though the methodology was described in detail in the original article, it is pertinent
to explain that to evaluate whether expert participation influenced app downloads, we added
a nominal variable to our model (i.e., healthcare professional participation), with three
categories: urologist (i.e., either a single urologist or the participation of a scientific urological
association); other healthcare professionals participation (i.e., the participation of other
medical doctors, bioresearchers, or nurses); or no healthcare professional participation (i.e.,
no explicit mention) (Chapter 4) (36).
Regrettably, we could only evaluate the importance of these factors in apps available on
the Google Play Store because Apple does not publish an individual’s app number of
downloads, which limited our study sample (36). Instead, Apple only lists the “Top 200 Medical
Apps”, but they are ranked by a non-disclosed proprietary algorithm from Apple, which
prevented further analysis to be performed, as there was no way of inferring the number of
downloads from the position within that list. Furthermore, at the time of the review, there were
no Urology apps in that “Top 200 Medical Apps” list (36).
For that review, a search for Urology-specific applications on the Google Play Store
identified 129 apps, and via multivariate ordinal logistic regression we concluded that apps
developed with expert urological input, free or with lower price, with optional in-app purchases,
higher user ratings, and a larger number of written user reviews, were more likely to have a
higher level of downloads (36). All other tested variables did not influence the number of
downloads. These results indicate, for the first time, that healthcare professional participation
involvement positively influence the number of app downloads (36). In fact, only apps with
explicit contribution from a urologist reached >5,000 downloads (36).
It might be a personal bias, but it seems intuitive to include healthcare professionals in
mHealth development. However, in our Android Play Store limited Urology specific app
sample, there was no explicit scientific expert input acknowledged in one of every five apps
(36). As was mentioned before, this concern is widespread in mHealth (i.e., it is not limited to
the field of Urology). Moreover, when healthcare participation was mentioned, there was no
objective method to measure the extent of that involvement, neither a guaranteed method to
assess if it was actually true (36). These two issues could potentially be resolved by requiring
mHealth apps to have a full disclosure form, similar to the one provided in scientific papers, or
by implementing an independent certification of healthcare professional participation (36).
Another solution might be to assure the functional certification and content regulation of
mHealth apps (36).
We propose that the level of regulation should be proportional to the degree of clinical
implication derived from the app (i.e., lifestyle recommendations vs. drug dosage calculators)
and the target audience (i.e., potentially lower for healthcare professionals than for lay
persons). According to directive 2007/47/EC of the European Parliament, a “medical device”
means any instrument, apparatus, appliance, software, material or other article, whether used
alone or in combination, together with any accessories, including the software intended by its
manufacturer to be used specifically for diagnostic and/or therapeutic purposes and necessary
for its proper application, intended by the manufacturer to be used for human beings for the
purpose of, for example, diagnosis, prevention, monitoring, treatment or alleviation of disease
(45).
Currently, to get the CE-mark (“Conformité Européenne”, i.e., European Conformity), a
medical device must follow the Medical Device Directive (MDD) 93/42/EEC (46). The MDD
defines the requirements that every medical product has to fulfil, according to the class that
they belong to (46). Based on this legislation, a biopsy outcome prediction model, which is a
non-invasive device, would be categorized in class I, per rule 12 of Annex IX to MDD, and
would require the preparation of the technical documentation to support a declaration of
conformity (46). Moreover, because it is not a sterile device, and has a measuring function, it
would be classified as class Im (46). Therefore, it would be necessary to assess its compliance
with metrological requirements, and compile a declaration of conformity, before registering it
with the competent authority (46).
While mHealth apps are becoming increasingly popular, for both professionals and
patients, several pitfalls have been identified, such as apps crammed with outdated
(mis)information, created by lay people, with disregard for usability and scientific evidence,
not to mention possible charlatans (47 - 49).
155

To overcome these hazards, it has been suggested healthcare professionals should
have a pivotal position in the development, review and recommendation of mHealth apps (49).
Scientific societies should help to coordinate this effort. A pragmatic example has been set by
the American Psychiatric Association (APA), which devised a step-by-step App Evaluation
Model (50), in which Psychiatrists are advised to:
1) Start by collecting background information on the app (e.g., who is the developer,
what is the business model?);
2) Exclude risk, privacy and security issues (e.g., is there a privacy policy, or is personal
data collected?);
3) Evaluate the evidence (e.g., is there peer-reviewed, published evidence about the
app or the science behind it?);
4) How easy is it to use (i.e., measure its usability – please see next section of this
discussion);
5) Assess interoperability (i.e., how easy is it to share the data in the app with other
healthcare software?).
This step-wise approach is built so that if, for example, there are any privacy concerns,
the app is excluded, and it is not necessary to consider other factors (50).
Given its particularities, content analysis (i.e., comparing app features with clinical
guidelines and evidence-based protocols) should be performed on every mHealth app before
it is made available to the general public, even if the app was developed with contributions
from a healthcare professional, and level of scrutiny be proportional to the potential health
hazards.
However, most mHealth apps are not developed by large enterprises: one-third is
developed by single individuals, and another third by small companies (i.e., with staff between
two and nine employees) (51). Some developers might not have the resources to include a
healthcare professional in the app’s team.
Developing a scientifically valid and appropriately designed mHealth app might require
input from experts in several fields of Science, and healthcare professionals have the
deontological duty to remain stakeholders in this process. By taking an active role in mHealth
development, healthcare professionals can apply Hippocratic principles, assuring that apps
“first do no harm”, by safeguarding their up-to-date scientific evidence, and concurrent
preservation of user safety and privacy.
Is it possible to design and develop a smartphone app for prostate cancer
early detection, based on the ERSPC Rotterdam Prostate Cancer Risk
Calculator, and assess its usability?
Risk stratification in prostate cancer screening is paramount to detect clinically
significant disease, while limiting unnecessary biopsies and exams, preventing overdiagnosis
and precluding overtreatment. For that purpose, the joint guidelines on prostate cancer of the
European Association of Urology (EAU), European Society for Radiotherapy & Oncology
(ESTRO), European Society of Urogenital Radiology (ESUR), and International Society of
Geriatric Oncology (SIOG) recommend, in the screening and early detection of asymptomatic
men with total PSA between 2.0 and 10.0 ng/mL, further risk stratification with the use of either
risk calculators, biological markers or imaging studies, before proceeding to a prostate biopsy
(52).
One of such risk calculators is the ERSPC RPCRC, developed by the Urology
Department of the Erasmus University Medical Center, representing the Dutch part of the
ERSPC. This risk prediction model combines available pre-biopsy information to calculate the
risk of prostate cancer and also of clinically significant prostate cancer (i.e., Gleason score ≥7)
at time of biopsy.
The various algorithms of the risk calculator use information on PSA level, previous
negative prostate biopsy, digital rectal examination (DRE) anatomical (i.e., estimate on
prostate volume) and functional (i.e., normal or abnormal - nodule or induration) findings, as
well as transrectal ultrasonography (TRUS) findings (e.g., abnormal if hypoechoic lesions) and
volume measurement. Additionally, the Prostate Health Index (PHI), which aggregates the
results from the Hybritech PSA, free PSA, and p2PSA (the [-2] form of proPSA), can also be
used to further stratify prostate cancer risk. The various versions of the ERSPC RPCRC have
been extensively validated across multiple settings, with good overall performance, and they
are available online (http://www.prostatecancer-riskcalculator.com) (53 - 58).
However, there were two issues with the implementation of this web version. First, as it
is based on a textual description, it requires the user to decide upfront which version of the
risk calculator to use. However, the user selected model may not be the most appropriate
model for that specific situation (e.g., is it the man’s first prostate biopsy or not), because the
lay person might not understand the differences between risk calculators. It might also not be
the most accurate choice, due to a lack of availability on clinical information needed for a
specific risk calculator (figure 2).
156

To overcome these hazards, it has been suggested healthcare professionals should
have a pivotal position in the development, review and recommendation of mHealth apps (49).
Scientific societies should help to coordinate this effort. A pragmatic example has been set by
the American Psychiatric Association (APA), which devised a step-by-step App Evaluation
Model (50), in which Psychiatrists are advised to:
1) Start by collecting background information on the app (e.g., who is the developer,
what is the business model?);
2) Exclude risk, privacy and security issues (e.g., is there a privacy policy, or is personal
data collected?);
3) Evaluate the evidence (e.g., is there peer-reviewed, published evidence about the
app or the science behind it?);
4) How easy is it to use (i.e., measure its usability – please see next section of this
discussion);
5) Assess interoperability (i.e., how easy is it to share the data in the app with other
healthcare software?).
This step-wise approach is built so that if, for example, there are any privacy concerns,
the app is excluded, and it is not necessary to consider other factors (50).
Given its particularities, content analysis (i.e., comparing app features with clinical
guidelines and evidence-based protocols) should be performed on every mHealth app before
it is made available to the general public, even if the app was developed with contributions
from a healthcare professional, and level of scrutiny be proportional to the potential health
hazards.
However, most mHealth apps are not developed by large enterprises: one-third is
developed by single individuals, and another third by small companies (i.e., with staff between
two and nine employees) (51). Some developers might not have the resources to include a
healthcare professional in the app’s team.
Developing a scientifically valid and appropriately designed mHealth app might require
input from experts in several fields of Science, and healthcare professionals have the
deontological duty to remain stakeholders in this process. By taking an active role in mHealth
development, healthcare professionals can apply Hippocratic principles, assuring that apps
“first do no harm”, by safeguarding their up-to-date scientific evidence, and concurrent
preservation of user safety and privacy.
Is it possible to design and develop a smartphone app for prostate cancer
early detection, based on the ERSPC Rotterdam Prostate Cancer Risk
Calculator, and assess its usability?
Risk stratification in prostate cancer screening is paramount to detect clinically
significant disease, while limiting unnecessary biopsies and exams, preventing overdiagnosis
and precluding overtreatment. For that purpose, the joint guidelines on prostate cancer of the
European Association of Urology (EAU), European Society for Radiotherapy & Oncology
(ESTRO), European Society of Urogenital Radiology (ESUR), and International Society of
Geriatric Oncology (SIOG) recommend, in the screening and early detection of asymptomatic
men with total PSA between 2.0 and 10.0 ng/mL, further risk stratification with the use of either
risk calculators, biological markers or imaging studies, before proceeding to a prostate biopsy
(52).
One of such risk calculators is the ERSPC RPCRC, developed by the Urology
Department of the Erasmus University Medical Center, representing the Dutch part of the
ERSPC. This risk prediction model combines available pre-biopsy information to calculate the
risk of prostate cancer and also of clinically significant prostate cancer (i.e., Gleason score ≥7)
at time of biopsy.
The various algorithms of the risk calculator use information on PSA level, previous
negative prostate biopsy, digital rectal examination (DRE) anatomical (i.e., estimate on
prostate volume) and functional (i.e., normal or abnormal - nodule or induration) findings, as
well as transrectal ultrasonography (TRUS) findings (e.g., abnormal if hypoechoic lesions) and
volume measurement. Additionally, the Prostate Health Index (PHI), which aggregates the
results from the Hybritech PSA, free PSA, and p2PSA (the [-2] form of proPSA), can also be
used to further stratify prostate cancer risk. The various versions of the ERSPC RPCRC have
been extensively validated across multiple settings, with good overall performance, and they
are available online (http://www.prostatecancer-riskcalculator.com) (53 - 58).
However, there were two issues with the implementation of this web version. First, as it
is based on a textual description, it requires the user to decide upfront which version of the
risk calculator to use. However, the user selected model may not be the most appropriate
model for that specific situation (e.g., is it the man’s first prostate biopsy or not), because the
lay person might not understand the differences between risk calculators. It might also not be
the most accurate choice, due to a lack of availability on clinical information needed for a
specific risk calculator (figure 2).
157

Figure 2. Screenshot of the Prostate Cancer Research Foundation website showing the prostate cancer risk calculators.
In the original cohort of previously unscreened men, applying model 1 (i.e., just PSA,
see figure 2) to model 4 (i.e., PSA, DRE normal or abnormal, TRUS assessed prostate volume
and TRUS normal or abnormal) resulted in an increase in the area under the curve (AUC) of
14% (i.e., from 0.69 to 0.79) for predicting any grade prostate cancer, and 16% (i.e., from 0.74
to 0.86) for predicting clinically significant prostate cancer. Analogously, in the previously
screened group (i.e., men with at least one previous negative prostate biopsy), there was an
increase in the AUC of 11% (from 0.62 to 0.69) for predicting prostate cancer, and 13% (i.e.,
from 0.72 to 0.81) for clinically significant prostate cancer (59).
Second, the original web version of the ERSPC RPCRC interface was based on rotating
disks (figure 3). These disks had been designed for desktop computer screens, and were built
using Adobe Flash technology, which has a significant handicap: it is not available by default
on the most popular smartphone devices (i.e., Android and iOS).
Figure 3. Original web version of the ERSPC RPCRC interface, based on rotating disks.
Even though Adobe Flash was commonly used in website animation, it was never
popular in mobile devices (60). In an open letter, Steve Jobs justified this by detailing some of
the limitations of Flash technology which prevented its widespread use in mobile devices,
namely its resource-intensive requirements, proprietary (i.e., closed) nature, and security
issues (60).
To overcome these two problems, first, a specific decision tree was conceived (figure
4), assuring that all available data is used in the most complete model (i.e., with the highest
predictive capability), as it has been shown that the ERSPC RPCRC’s AUC increases with the
addition of clinical information (59). Second, a specific unique interface for the smartphone
version of the ERSPC RPCRC was conceived by a multidisciplinary team of healthcare
professionals and information technology experts.
158

Figure 2. Screenshot of the Prostate Cancer Research Foundation website showing the prostate cancer risk calculators.
In the original cohort of previously unscreened men, applying model 1 (i.e., just PSA,
see figure 2) to model 4 (i.e., PSA, DRE normal or abnormal, TRUS assessed prostate volume
and TRUS normal or abnormal) resulted in an increase in the area under the curve (AUC) of
14% (i.e., from 0.69 to 0.79) for predicting any grade prostate cancer, and 16% (i.e., from 0.74
to 0.86) for predicting clinically significant prostate cancer. Analogously, in the previously
screened group (i.e., men with at least one previous negative prostate biopsy), there was an
increase in the AUC of 11% (from 0.62 to 0.69) for predicting prostate cancer, and 13% (i.e.,
from 0.72 to 0.81) for clinically significant prostate cancer (59).
Second, the original web version of the ERSPC RPCRC interface was based on rotating
disks (figure 3). These disks had been designed for desktop computer screens, and were built
using Adobe Flash technology, which has a significant handicap: it is not available by default
on the most popular smartphone devices (i.e., Android and iOS).
Figure 3. Original web version of the ERSPC RPCRC interface, based on rotating disks.
Even though Adobe Flash was commonly used in website animation, it was never
popular in mobile devices (60). In an open letter, Steve Jobs justified this by detailing some of
the limitations of Flash technology which prevented its widespread use in mobile devices,
namely its resource-intensive requirements, proprietary (i.e., closed) nature, and security
issues (60).
To overcome these two problems, first, a specific decision tree was conceived (figure
4), assuring that all available data is used in the most complete model (i.e., with the highest
predictive capability), as it has been shown that the ERSPC RPCRC’s AUC increases with the
addition of clinical information (59). Second, a specific unique interface for the smartphone
version of the ERSPC RPCRC was conceived by a multidisciplinary team of healthcare
professionals and information technology experts.
159

Figure 4. The Rotterdam Prostate Cancer Risk Calculator decision tree. DRE = digital rectal examination; PHI = Prostate Health Index; PSA = prostate-specific antigen.
Usability can be defined as the measure of the effortlessness with which a system can
be learned and operated, including its safety, effectiveness (i.e., the accuracy and
completeness with which users complete a task), and efficiency (i.e., the swiftness with which
users complete a task) (61). In practical terms, an app is considered to have adequate usability
if it performs in accordance to its perceived function (61). As mHealth is still a developing field,
the usability of most health apps has not been evaluated (62), and there is no universally
accepted practice to quantify it, nor what to measure specifically (i.e., assess the usability of
the software or the hardware products per se, or asses it based on feedback from users) (63).
There are various methods to evaluate an app’s usability including laboratory testing
(i.e., users performing specific tasks in a controlled environment), reviewing ratings and user
reviews from the app’s online marketplace (i.e., reviewing the feedback from those users who
downloaded and probably used the app), and field-based evaluations (i.e., observing how the
app is used in the real world) (44, 64). During the development of the ERSPC RPCRC
smartphone app, usability laboratory testing was performed by a multidisciplinary team. The
app was designed according to a user-centred perspective, using an iterative process,
alternating between design and evaluation. In this prototyping phase, user needs analyses
were performed to assess their experience and inquiry about subsequent requirements, which
were implemented on the publicly available version of the app.
To complete the assessment of the app, we decided to perform a usability field test.
Even though field testing can provide large amounts of data, it can be cumbersome and this
method is infrequently used in mHealth (65). Moreover, if the sample size is too small, or too
homogenous, the results might not be valid in other real world situations. To test the ERSPC
RPCRC usability in a quasi-clinical setting, we decided to perform a field evaluation with 92
participants (28 urologists, 35 GPs and 29 final year medical students), using a validated
survey (i.e., IBM’s Post-Study System Usability Questionnaire (PSSUQ)) that measures three
domains: system usefulness, information quality, and interface quality (66). System
usefulness assesses how easy to learn and use the system is (i.e., how quickly can the user
become productive); information quality evaluates if the information of the system is easy to
understand, including feedback (e.g., error messages); and interface quality measures how
satisfied the user was with the system (i.e., if it was enjoyable and if corresponded to the user’s
expectations) (66).
The ERSPC RPCRC smartphone app interface was developed in such a way that it
seemly fits the needs of the different user groups (i.e., healthcare professionals and patients),
as well as the setting under which they have to be used (i.e., primary care or urology outpatient
clinic). During our usability evaluation, users felt comfortable with the app, perhaps because
of its intuitive design and streamlined user experience, which prevents error prone actions. In
our sample survey, the app got high scores in all the domains of IBM’s PSSUQ (i.e., 92% on
system usefulness, 87% on information quality, and 89% on interface quality). We found that
the highest score was given by urologists for system usefulness (i.e., 98%), and the lowest
was given by GPs for information quality (i.e., 78%). Overall, these are high scores, and taking
into account the size (n = 92) and heterogeneity of the healthcare cohort included in our
sample, we believe this validates the effort that went into the usability design of the ERPSC
RPCRC smartphone app, which was conceived by healthcare professionals, including
clinicians.
The study of human-computer interactions has shown that including users in the design
and development of technology increases its usability (67). In a recent systematic review of
the factors that determine the success and failure of eHealth interventions, a causality
between design and outcome was demonstrated (68). Moreover, the involvement of users
(i.e., user-centred design), either healthcare professionals or lay people, during the design
was central to the eHealth intervention’s success (68). As a commentary, it should be
mentioned that the current website version of the ERSPC RPCRC has been updated using
an open standard, the 5th major revision of the core language of the World Wide Web (WWW):
Hypertext Markup Language 5 (HTLM5), and its interface has been updated to the one initially
designed by a multidisciplinary team for the smartphone app (69).
160

Figure 4. The Rotterdam Prostate Cancer Risk Calculator decision tree. DRE = digital rectal examination; PHI = Prostate Health Index; PSA = prostate-specific antigen.
Usability can be defined as the measure of the effortlessness with which a system can
be learned and operated, including its safety, effectiveness (i.e., the accuracy and
completeness with which users complete a task), and efficiency (i.e., the swiftness with which
users complete a task) (61). In practical terms, an app is considered to have adequate usability
if it performs in accordance to its perceived function (61). As mHealth is still a developing field,
the usability of most health apps has not been evaluated (62), and there is no universally
accepted practice to quantify it, nor what to measure specifically (i.e., assess the usability of
the software or the hardware products per se, or asses it based on feedback from users) (63).
There are various methods to evaluate an app’s usability including laboratory testing
(i.e., users performing specific tasks in a controlled environment), reviewing ratings and user
reviews from the app’s online marketplace (i.e., reviewing the feedback from those users who
downloaded and probably used the app), and field-based evaluations (i.e., observing how the
app is used in the real world) (44, 64). During the development of the ERSPC RPCRC
smartphone app, usability laboratory testing was performed by a multidisciplinary team. The
app was designed according to a user-centred perspective, using an iterative process,
alternating between design and evaluation. In this prototyping phase, user needs analyses
were performed to assess their experience and inquiry about subsequent requirements, which
were implemented on the publicly available version of the app.
To complete the assessment of the app, we decided to perform a usability field test.
Even though field testing can provide large amounts of data, it can be cumbersome and this
method is infrequently used in mHealth (65). Moreover, if the sample size is too small, or too
homogenous, the results might not be valid in other real world situations. To test the ERSPC
RPCRC usability in a quasi-clinical setting, we decided to perform a field evaluation with 92
participants (28 urologists, 35 GPs and 29 final year medical students), using a validated
survey (i.e., IBM’s Post-Study System Usability Questionnaire (PSSUQ)) that measures three
domains: system usefulness, information quality, and interface quality (66). System
usefulness assesses how easy to learn and use the system is (i.e., how quickly can the user
become productive); information quality evaluates if the information of the system is easy to
understand, including feedback (e.g., error messages); and interface quality measures how
satisfied the user was with the system (i.e., if it was enjoyable and if corresponded to the user’s
expectations) (66).
The ERSPC RPCRC smartphone app interface was developed in such a way that it
seemly fits the needs of the different user groups (i.e., healthcare professionals and patients),
as well as the setting under which they have to be used (i.e., primary care or urology outpatient
clinic). During our usability evaluation, users felt comfortable with the app, perhaps because
of its intuitive design and streamlined user experience, which prevents error prone actions. In
our sample survey, the app got high scores in all the domains of IBM’s PSSUQ (i.e., 92% on
system usefulness, 87% on information quality, and 89% on interface quality). We found that
the highest score was given by urologists for system usefulness (i.e., 98%), and the lowest
was given by GPs for information quality (i.e., 78%). Overall, these are high scores, and taking
into account the size (n = 92) and heterogeneity of the healthcare cohort included in our
sample, we believe this validates the effort that went into the usability design of the ERPSC
RPCRC smartphone app, which was conceived by healthcare professionals, including
clinicians.
The study of human-computer interactions has shown that including users in the design
and development of technology increases its usability (67). In a recent systematic review of
the factors that determine the success and failure of eHealth interventions, a causality
between design and outcome was demonstrated (68). Moreover, the involvement of users
(i.e., user-centred design), either healthcare professionals or lay people, during the design
was central to the eHealth intervention’s success (68). As a commentary, it should be
mentioned that the current website version of the ERSPC RPCRC has been updated using
an open standard, the 5th major revision of the core language of the World Wide Web (WWW):
Hypertext Markup Language 5 (HTLM5), and its interface has been updated to the one initially
designed by a multidisciplinary team for the smartphone app (69).
161

In summary, it is possible to develop a smartphone app for prostate cancer early
detection, based on the ERSPC Rotterdam Prostate Cancer Risk Calculator, although it is
important to include a multidisciplinary team of scientists, healthcare professionals and
information technology experts, in the design phase, to ensure its usability.
Conclusion
eHealth already provides innovative services and applications, and its impact is
expected to grow: with improvements in mobile devices hardware and software,
communication infrastructure and cloud computing, we can anticipate new services and an
increase in consumer interest. eHealth and mHealth have transformed patient monitoring and
alert systems, clinical and administrative data collection, and the same ought to be true for
healthcare delivery programs, disease awareness and health promotion interventions.
Currently, there is a need for a personalized approach to prostate cancer screening via
decision support tools. The patients’ perspective on the current standard of care of prostate
cancer screening can be improved: in the Prostate Cancer UK survey, one of every four men
felt they had insufficient information and received unsatisfactory support for their specific
needs (70). To address this issue, healthcare professionals and authorities must strive to
make information about personal prostate cancer risk, the benefits of screening, and the
harms of subsequent treatment options widely available to patients: ignoring it is transforming
shared informed decision making into a fallacy (71).
It has been documented that patients feel empowered when they take an active part in
their healthcare decisions, which in turn increases their adherence to care plans, improves
outcomes and reduces healthcare costs (e.g., a successful eHealth implementation improved
the glycaemic control of diabetic patients) (72, 73). Moreover, previous studies have
demonstrated that patients prefer decision support tools over usual care, as it improves their
confidence regarding available options, while reducing their knowledge gap (21).
Theoretically, eHealth and mHealth seem appropriate for the current trend of patient-centred
care, and it has been hypothesized how these new health delivery paradigms might need to
be adjusted to promote patient empowerment (74 - 76).
Even though “the future of patient empowerment may lie in technological advancements
and better access of patients to these technologies” (77), a recent review identified issues with
the definition of “patient empowerment” (i.e., absence of concept operationalization), and the
lack of an accepted standard to measure such empowerment, which preclude its rigorous
assessment (78, 79).
In January of 2018, Apple unveiled a new plan with the title “Empower your patients with
Health Records on iPhone.”, asking organizations to allow patients to download their medical
data into their smartphones (80). This is a free service, for both patients and institutions, but
is currently only available for U.S. healthcare institutions (80).
162

In summary, it is possible to develop a smartphone app for prostate cancer early
detection, based on the ERSPC Rotterdam Prostate Cancer Risk Calculator, although it is
important to include a multidisciplinary team of scientists, healthcare professionals and
information technology experts, in the design phase, to ensure its usability.
Conclusion
eHealth already provides innovative services and applications, and its impact is
expected to grow: with improvements in mobile devices hardware and software,
communication infrastructure and cloud computing, we can anticipate new services and an
increase in consumer interest. eHealth and mHealth have transformed patient monitoring and
alert systems, clinical and administrative data collection, and the same ought to be true for
healthcare delivery programs, disease awareness and health promotion interventions.
Currently, there is a need for a personalized approach to prostate cancer screening via
decision support tools. The patients’ perspective on the current standard of care of prostate
cancer screening can be improved: in the Prostate Cancer UK survey, one of every four men
felt they had insufficient information and received unsatisfactory support for their specific
needs (70). To address this issue, healthcare professionals and authorities must strive to
make information about personal prostate cancer risk, the benefits of screening, and the
harms of subsequent treatment options widely available to patients: ignoring it is transforming
shared informed decision making into a fallacy (71).
It has been documented that patients feel empowered when they take an active part in
their healthcare decisions, which in turn increases their adherence to care plans, improves
outcomes and reduces healthcare costs (e.g., a successful eHealth implementation improved
the glycaemic control of diabetic patients) (72, 73). Moreover, previous studies have
demonstrated that patients prefer decision support tools over usual care, as it improves their
confidence regarding available options, while reducing their knowledge gap (21).
Theoretically, eHealth and mHealth seem appropriate for the current trend of patient-centred
care, and it has been hypothesized how these new health delivery paradigms might need to
be adjusted to promote patient empowerment (74 - 76).
Even though “the future of patient empowerment may lie in technological advancements
and better access of patients to these technologies” (77), a recent review identified issues with
the definition of “patient empowerment” (i.e., absence of concept operationalization), and the
lack of an accepted standard to measure such empowerment, which preclude its rigorous
assessment (78, 79).
In January of 2018, Apple unveiled a new plan with the title “Empower your patients with
Health Records on iPhone.”, asking organizations to allow patients to download their medical
data into their smartphones (80). This is a free service, for both patients and institutions, but
is currently only available for U.S. healthcare institutions (80).
163

Coincidently, a few days later, Amazon, Berkshire Hathaway, and JPMorgan Chase & Co.,
announced a non-profit business partnership dedicated to improve their U.S. employee’s
wellbeing and healthcare satisfaction, while reducing overall costs (81). Even though no
specific plans were detailed to the public at the time, Warren Buffett, Berkshire Hathaway
Chairman and Chief Executive Officer, summed up their impetus to act: “The ballooning costs
of healthcare act as a hungry tapeworm on the American economy” (81).
These two initiatives are a clear statement that future healthcare will have a strong
technological tonic. In the case of eHealth and mHealth, it is expected that we move beyond
the current separate insulated platforms and single apps, and into a true health ecosystem
(82). I praise this change in paradigm in global healthcare, and expect a parallel shift in
prostate cancer early detection.
Future Perspectives
I believe that eHealth and mHealth will help in the transition from isolated healthcare
sources with inaccessible proprietary information silos to an integrated paradigm of continuous
care and symbiotic services, built around the individual, with an improvement in health
outcomes and reduction in costs. For that to happen, cooperation is paramount, and should
include patients and scientists, namely doctors, biologists, chemists, epidemiologists and
informaticians, and also decision makers. In the past, research was based on clinical data that
was mostly produced by the healthcare professional; currently, we have access to vast
amounts of patient produced data, not only from apps, but also from online platforms and
wearable devices. It’s imperative to take advantage of all this new information, and provide
better personalized care. A recent article provides a pragmatic view on the future of prostate
cancer research by endorsing the globalization of datasets, sharing medical information in a
scientifically selfless style, overcoming academic egos to achieve clinical breakthroughs (83).
From its conclusions I quote: “In order to perform screening, tumour identification, and
targeted therapies better, we need integration of information from imaging, genomics, and
biomarkers; To involve stakeholders convincingly we have to ‘team up’ and provide our
common strategy for innovation there where we think it is most needed” (83).
Multivariate predictive models, such as the ERSPC RPCRC have shown that in prostate
cancer screening, the sum can be greater than the parts. This combination of data should be
automatized, so that it could then be used to power advanced decision support systems,
facilitating, for example, diagnostic choices for prostate cancer patients, by integrating diverse
sources of heterogeneous data, namely clinical, imaging, pathology, and genomics. In this
paradigm, eHealth prostate cancer screening solutions can strive for a true personal predictive
risk assessment, constantly combining existing clinical information with new available
research data. This multistep dynamic approach will improve the individualized management
and follow-up of patients.
Future eHealth developments should focus on usability, credibility, and safety.
Moreover, developers should strive for future-proofing designs, by allowing their solutions to
be able to incorporate new practices and pioneering research, therefore becoming resilient
via innovation. In the near future, we expect eHealth and mHealth to become indissociable
from healthcare as a whole, with shift in the focus from providers to patients. This new wave
of data powering personalized risk assessment tools will help patients and healthcare
professionals make enhanced shared decisions. However, both lay and professional users
should be aware that e/mHealth tools are designed to help and enhance, but will probably
never fully replace a direct consultation with a healthcare expert.
164

Coincidently, a few days later, Amazon, Berkshire Hathaway, and JPMorgan Chase & Co.,
announced a non-profit business partnership dedicated to improve their U.S. employee’s
wellbeing and healthcare satisfaction, while reducing overall costs (81). Even though no
specific plans were detailed to the public at the time, Warren Buffett, Berkshire Hathaway
Chairman and Chief Executive Officer, summed up their impetus to act: “The ballooning costs
of healthcare act as a hungry tapeworm on the American economy” (81).
These two initiatives are a clear statement that future healthcare will have a strong
technological tonic. In the case of eHealth and mHealth, it is expected that we move beyond
the current separate insulated platforms and single apps, and into a true health ecosystem
(82). I praise this change in paradigm in global healthcare, and expect a parallel shift in
prostate cancer early detection.
Future Perspectives
I believe that eHealth and mHealth will help in the transition from isolated healthcare
sources with inaccessible proprietary information silos to an integrated paradigm of continuous
care and symbiotic services, built around the individual, with an improvement in health
outcomes and reduction in costs. For that to happen, cooperation is paramount, and should
include patients and scientists, namely doctors, biologists, chemists, epidemiologists and
informaticians, and also decision makers. In the past, research was based on clinical data that
was mostly produced by the healthcare professional; currently, we have access to vast
amounts of patient produced data, not only from apps, but also from online platforms and
wearable devices. It’s imperative to take advantage of all this new information, and provide
better personalized care. A recent article provides a pragmatic view on the future of prostate
cancer research by endorsing the globalization of datasets, sharing medical information in a
scientifically selfless style, overcoming academic egos to achieve clinical breakthroughs (83).
From its conclusions I quote: “In order to perform screening, tumour identification, and
targeted therapies better, we need integration of information from imaging, genomics, and
biomarkers; To involve stakeholders convincingly we have to ‘team up’ and provide our
common strategy for innovation there where we think it is most needed” (83).
Multivariate predictive models, such as the ERSPC RPCRC have shown that in prostate
cancer screening, the sum can be greater than the parts. This combination of data should be
automatized, so that it could then be used to power advanced decision support systems,
facilitating, for example, diagnostic choices for prostate cancer patients, by integrating diverse
sources of heterogeneous data, namely clinical, imaging, pathology, and genomics. In this
paradigm, eHealth prostate cancer screening solutions can strive for a true personal predictive
risk assessment, constantly combining existing clinical information with new available
research data. This multistep dynamic approach will improve the individualized management
and follow-up of patients.
Future eHealth developments should focus on usability, credibility, and safety.
Moreover, developers should strive for future-proofing designs, by allowing their solutions to
be able to incorporate new practices and pioneering research, therefore becoming resilient
via innovation. In the near future, we expect eHealth and mHealth to become indissociable
from healthcare as a whole, with shift in the focus from providers to patients. This new wave
of data powering personalized risk assessment tools will help patients and healthcare
professionals make enhanced shared decisions. However, both lay and professional users
should be aware that e/mHealth tools are designed to help and enhance, but will probably
never fully replace a direct consultation with a healthcare expert.
165
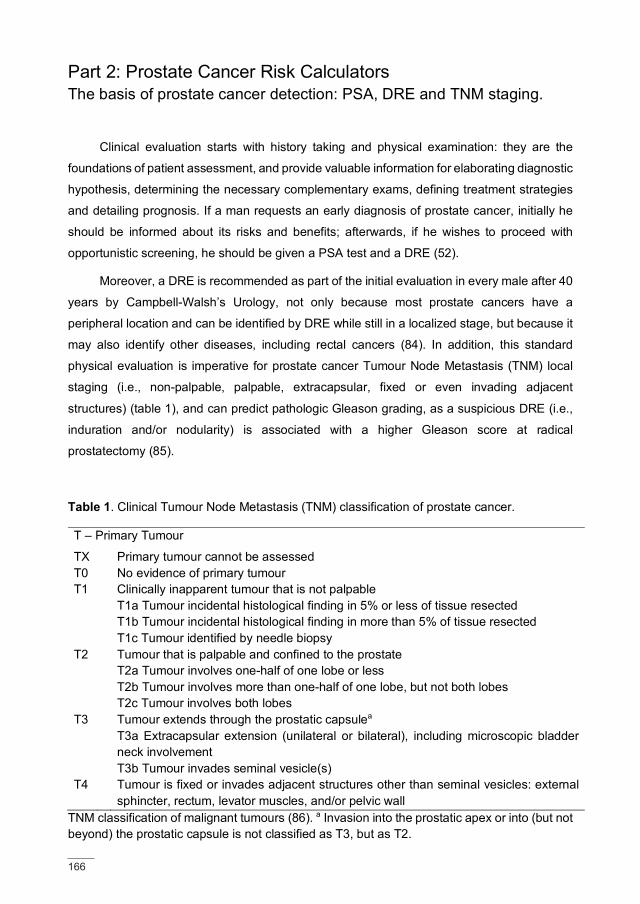
Part 2: Prostate Cancer Risk Calculators The basis of prostate cancer detection: PSA, DRE and TNM staging.
Clinical evaluation starts with history taking and physical examination: they are the
foundations of patient assessment, and provide valuable information for elaborating diagnostic
hypothesis, determining the necessary complementary exams, defining treatment strategies
and detailing prognosis. If a man requests an early diagnosis of prostate cancer, initially he
should be informed about its risks and benefits; afterwards, if he wishes to proceed with
opportunistic screening, he should be given a PSA test and a DRE (52).
Moreover, a DRE is recommended as part of the initial evaluation in every male after 40
years by Campbell-Walsh’s Urology, not only because most prostate cancers have a
peripheral location and can be identified by DRE while still in a localized stage, but because it
may also identify other diseases, including rectal cancers (84). In addition, this standard
physical evaluation is imperative for prostate cancer Tumour Node Metastasis (TNM) local
staging (i.e., non-palpable, palpable, extracapsular, fixed or even invading adjacent
structures) (table 1), and can predict pathologic Gleason grading, as a suspicious DRE (i.e.,
induration and/or nodularity) is associated with a higher Gleason score at radical
prostatectomy (85).
Table 1. Clinical Tumour Node Metastasis (TNM) classification of prostate cancer.
T – Primary Tumour
TX Primary tumour cannot be assessed T0 No evidence of primary tumour T1 Clinically inapparent tumour that is not palpable T1a Tumour incidental histological finding in 5% or less of tissue resected T1b Tumour incidental histological finding in more than 5% of tissue resected T1c Tumour identified by needle biopsy T2 Tumour that is palpable and confined to the prostate T2a Tumour involves one-half of one lobe or less T2b Tumour involves more than one-half of one lobe, but not both lobes T2c Tumour involves both lobes T3 Tumour extends through the prostatic capsulea T3a Extracapsular extension (unilateral or bilateral), including microscopic bladder
neck involvement T3b Tumour invades seminal vesicle(s) T4 Tumour is fixed or invades adjacent structures other than seminal vesicles: external
sphincter, rectum, levator muscles, and/or pelvic wall TNM classification of malignant tumours (86). a Invasion into the prostatic apex or into (but not beyond) the prostatic capsule is not classified as T3, but as T2.
Independently, an elevated PSA outperforms the outcome of a DRE in predicting the
presence of prostate cancer. The subjective DRE examination has, in comparison with an
elevated PSA (i.e., >4.0 ng/mL), a lower sensitivity (53% vs. 72%), specificity (84% vs. 93%),
and positive predictive value (25% vs. 18%), as was shown in a meta-analysis (87). However,
one in five cases of prostate cancer can be detected by DRE alone, and an abnormal DRE is
an indication for biopsy (52).
The development of an assay measuring PSA in human serum by Kuriyama et al in
1980 changed the paradigm for prostate cancer screening, and PSA has since become the
most commonly used tumour marker for early diagnosis, and is credited with halving the
incidence of metastatic disease in the United States (88, 89). Even though a higher total PSA
is associated with a greater probability of prostate cancer, it is an organ-specific and not a
cancer-specific biomarker, which limits its specificity (e.g., total PSA increases with benign
prostatic hyperplasia (BPH), inflammation and infection) (90). Its sensitivity is also subpar:
there is no PSA value below which we can exclude cancer (e.g., in the Prostate Cancer
Prevention Trial (PCPT) study, 7% of men with a PSA <0.5 ng/mL had prostate cancer) (91).
In an effort to improve PSA’s sensitivity and specificity, further risk assessment is
important to preclude unnecessary biopsies (i.e., which would only identify benign disease)
and mitigate overdiagnosis (i.e., the detection of cancers that would have never been
diagnosed had it not been for screening). Currently, the joint guidelines on prostate cancer of
the EAU, ESTRO, ESUR, and SIOG recommend, in the screening and early detection of
asymptomatic men with total PSA between 2.0 and 10.0 ng/mL, further risk stratification with
the use of either risk calculators, biological markers or imaging studies, before pondering a
prostate biopsy (52).
166

Part 2: Prostate Cancer Risk Calculators The basis of prostate cancer detection: PSA, DRE and TNM staging.
Clinical evaluation starts with history taking and physical examination: they are the
foundations of patient assessment, and provide valuable information for elaborating diagnostic
hypothesis, determining the necessary complementary exams, defining treatment strategies
and detailing prognosis. If a man requests an early diagnosis of prostate cancer, initially he
should be informed about its risks and benefits; afterwards, if he wishes to proceed with
opportunistic screening, he should be given a PSA test and a DRE (52).
Moreover, a DRE is recommended as part of the initial evaluation in every male after 40
years by Campbell-Walsh’s Urology, not only because most prostate cancers have a
peripheral location and can be identified by DRE while still in a localized stage, but because it
may also identify other diseases, including rectal cancers (84). In addition, this standard
physical evaluation is imperative for prostate cancer Tumour Node Metastasis (TNM) local
staging (i.e., non-palpable, palpable, extracapsular, fixed or even invading adjacent
structures) (table 1), and can predict pathologic Gleason grading, as a suspicious DRE (i.e.,
induration and/or nodularity) is associated with a higher Gleason score at radical
prostatectomy (85).
Table 1. Clinical Tumour Node Metastasis (TNM) classification of prostate cancer.
T – Primary Tumour
TX Primary tumour cannot be assessed T0 No evidence of primary tumour T1 Clinically inapparent tumour that is not palpable T1a Tumour incidental histological finding in 5% or less of tissue resected T1b Tumour incidental histological finding in more than 5% of tissue resected T1c Tumour identified by needle biopsy T2 Tumour that is palpable and confined to the prostate T2a Tumour involves one-half of one lobe or less T2b Tumour involves more than one-half of one lobe, but not both lobes T2c Tumour involves both lobes T3 Tumour extends through the prostatic capsulea T3a Extracapsular extension (unilateral or bilateral), including microscopic bladder
neck involvement T3b Tumour invades seminal vesicle(s) T4 Tumour is fixed or invades adjacent structures other than seminal vesicles: external
sphincter, rectum, levator muscles, and/or pelvic wall TNM classification of malignant tumours (86). a Invasion into the prostatic apex or into (but not beyond) the prostatic capsule is not classified as T3, but as T2.
Independently, an elevated PSA outperforms the outcome of a DRE in predicting the
presence of prostate cancer. The subjective DRE examination has, in comparison with an
elevated PSA (i.e., >4.0 ng/mL), a lower sensitivity (53% vs. 72%), specificity (84% vs. 93%),
and positive predictive value (25% vs. 18%), as was shown in a meta-analysis (87). However,
one in five cases of prostate cancer can be detected by DRE alone, and an abnormal DRE is
an indication for biopsy (52).
The development of an assay measuring PSA in human serum by Kuriyama et al in
1980 changed the paradigm for prostate cancer screening, and PSA has since become the
most commonly used tumour marker for early diagnosis, and is credited with halving the
incidence of metastatic disease in the United States (88, 89). Even though a higher total PSA
is associated with a greater probability of prostate cancer, it is an organ-specific and not a
cancer-specific biomarker, which limits its specificity (e.g., total PSA increases with benign
prostatic hyperplasia (BPH), inflammation and infection) (90). Its sensitivity is also subpar:
there is no PSA value below which we can exclude cancer (e.g., in the Prostate Cancer
Prevention Trial (PCPT) study, 7% of men with a PSA <0.5 ng/mL had prostate cancer) (91).
In an effort to improve PSA’s sensitivity and specificity, further risk assessment is
important to preclude unnecessary biopsies (i.e., which would only identify benign disease)
and mitigate overdiagnosis (i.e., the detection of cancers that would have never been
diagnosed had it not been for screening). Currently, the joint guidelines on prostate cancer of
the EAU, ESTRO, ESUR, and SIOG recommend, in the screening and early detection of
asymptomatic men with total PSA between 2.0 and 10.0 ng/mL, further risk stratification with
the use of either risk calculators, biological markers or imaging studies, before pondering a
prostate biopsy (52).
167

Refining clinical assessment: The quest for PSA density using
biomarkers, imaging, and nomograms. The balance between
performance, usability, availability, and costs.
Biomarkers
Since the mainstay of prostate cancer detection is the PSA test, which is influenced by
prostate size, assessing information on volume is crucial. Additionally, as was mentioned in
the previous section, a low PSA does not preclude prostate cancer. In the PCPT trial, one in
ten men with PSA <1.0 ng/mL had prostate cancer, of whom 10% had high-grade Gleason
≥3+4 disease (91). In a pilot study evaluating the role of mpMRI in screening within the
Göteborg trial, one in nine men with a PSA <3.0 ng/mL had prostate cancer, half of which was
high-grade disease (92).
It is also pertinent to follow-up on men with initially low PSA: in the ERSPC Rotterdam
cohort, from 1993 to 2008, 6% of all prostate cancer cases were diagnosed in men with an
initial PSA <3.0 ng/mL. Moreover, in this study, the hazard ratio for prostate cancer in men
with initial PSA between 1.0 - 1.9 ng/mL and 2.0 - 2.9 ng/mL was, respectively, four times and
ten times higher than with men with PSA <1.0 ng/mL (93).
While PSA is a very good marker for initial risk stratification it becomes less predictive
in the so-called “grey-zone”, i.e., roughly between 2.0 - 10.0 ng/mL. The main reason for this
is the fact that PSA levels in the blood are also influenced by the presence of BPH (i.e., higher
prostate volume is associated with an elevated PSA) (52).
Hence, correcting the measured PSA value in a man for his prostate volume is most
likely the strongest predictor currently available (59). This volume correction can be done in
several ways differing in the level of objectivity, availability and cost.
In an effort to improve its accuracy, total PSA has been combined with other PSA-
derivatives: the PHI test, which combines total and free PSA with the (-2) pro-PSA isoform
(p2PSA) (94); and the four kallikrein test (4K), which integrates total, intact and free PSA with
peptidase 2 (hK2), in combination with clinical data (i.e., age, DRE, and prior negative biopsy)
(95). The idea of including these sub forms into the prediction is similar: it is an attempt to
correct for the benign elevation (e.g., due to BPH) of the serum PSA value. Intact PSA has
been associated with benign tissue, while proPSA was found in prostate cancer tissue (96).
In addition, in men with PSA levels ranging between 4.0 and 10.0 ng/mL, the free to total PSA
ratio is more sensitive in discriminating prostate cancer from benign tissues (97).
In a head-to-head comparison, the performance of the PHI and the 4K test was similar,
and both outperformed total PSA in the detection of prostate cancer, while reducing
unnecessary biopsies (98). With increasing technology other genomic-based tests were
developed in an effort to improve diagnostic accuracy.
Examples include the Prostate Cancer Gene 3 (PCA3), a test based on prostate-specific
noncoding messenger Ribonucleic Acid (mRNA) which is overexpressed in cancer tissue (99).
The mRNA is quantified in the urine after prostatic massage during DRE (99). The test is
meant to be used when considering a repeat biopsy in men with elevated PSA and shows an
AUC in the range of 0.71 - 0.75 (99). PCA3 has lower sensitivity than PSA, but higher
specificity, positive and negative predictive values (100).
SelectMDx is a risk score based on the urinary mRNA signatures of HOXC6 and DLX1,
combined with PSA, PSA density (i.e., total PSA divided by prostate volume), DRE, age, prior
cancer-negative biopsies and family history, with an AUC of 0.86 for high-grade prostate
cancer (101). Of note here is the fact that to reach this high AUC, PSA density had to be
included. Its hypothetical cost-effectiveness was evaluated in a scenario in which SelectMDx
was used as a reflex text to decide which men with PSA >3.0 ng/mL underwent biopsy (i.e.,
instead of a systematic biopsy for all strategy): over an 18-year period, this proposed pathway
would result in savings of €128 and gains of 0.025 Quality-Adjusted Life-Year (QALY) per
patient (102). However, this economic analysis was based on 2015 costs from a tertiary center
in The Netherlands (i.e., Radboud University Medical Center), which may limit its
generalization (102). In addition, it would also require upfront imaging studies to assess
information on prostate volume (101).
Another alternative is the so-called Stockholm 3 Model (S3M), a combination of plasma
protein biomarkers (PSA, free PSA, intact PSA, hK2, MSMB, MIC1), genetic polymorphisms
(232 SNPs), clinical variables (age, family, history, previous prostate biopsy, DRE prostate
exam), and again PSA density (i.e., PSA divided by prostate volume), which aims to
outperform PSA in the identification of clinically significant prostate cancer (103).
In its initial formulation, it was shown to have an AUC of 0.74, and could reduce the
number of prostate biopsies by 32%, in an ethnically homogeneous population (i.e., northern
Europeans) (103). An updated model was recently published: in a cohort of patients with PSA
>= 3.0 ng/mL, with an AUC of 0.75, the S3M could save 34% of biopsies, with the same
sensitivity as PSA (104). In this latter publication, the authors also analysed the importance of
each parameter in the S3M algorithm, and determined that the most important predictor was
prostate volume (AUC of 0.67, in bivariate combination with PSA), and the least important was
intact PSA (AUC of 0.58, in bivariate combination with PSA) (104).
168

Refining clinical assessment: The quest for PSA density using
biomarkers, imaging, and nomograms. The balance between
performance, usability, availability, and costs.
Biomarkers
Since the mainstay of prostate cancer detection is the PSA test, which is influenced by
prostate size, assessing information on volume is crucial. Additionally, as was mentioned in
the previous section, a low PSA does not preclude prostate cancer. In the PCPT trial, one in
ten men with PSA <1.0 ng/mL had prostate cancer, of whom 10% had high-grade Gleason
≥3+4 disease (91). In a pilot study evaluating the role of mpMRI in screening within the
Göteborg trial, one in nine men with a PSA <3.0 ng/mL had prostate cancer, half of which was
high-grade disease (92).
It is also pertinent to follow-up on men with initially low PSA: in the ERSPC Rotterdam
cohort, from 1993 to 2008, 6% of all prostate cancer cases were diagnosed in men with an
initial PSA <3.0 ng/mL. Moreover, in this study, the hazard ratio for prostate cancer in men
with initial PSA between 1.0 - 1.9 ng/mL and 2.0 - 2.9 ng/mL was, respectively, four times and
ten times higher than with men with PSA <1.0 ng/mL (93).
While PSA is a very good marker for initial risk stratification it becomes less predictive
in the so-called “grey-zone”, i.e., roughly between 2.0 - 10.0 ng/mL. The main reason for this
is the fact that PSA levels in the blood are also influenced by the presence of BPH (i.e., higher
prostate volume is associated with an elevated PSA) (52).
Hence, correcting the measured PSA value in a man for his prostate volume is most
likely the strongest predictor currently available (59). This volume correction can be done in
several ways differing in the level of objectivity, availability and cost.
In an effort to improve its accuracy, total PSA has been combined with other PSA-
derivatives: the PHI test, which combines total and free PSA with the (-2) pro-PSA isoform
(p2PSA) (94); and the four kallikrein test (4K), which integrates total, intact and free PSA with
peptidase 2 (hK2), in combination with clinical data (i.e., age, DRE, and prior negative biopsy)
(95). The idea of including these sub forms into the prediction is similar: it is an attempt to
correct for the benign elevation (e.g., due to BPH) of the serum PSA value. Intact PSA has
been associated with benign tissue, while proPSA was found in prostate cancer tissue (96).
In addition, in men with PSA levels ranging between 4.0 and 10.0 ng/mL, the free to total PSA
ratio is more sensitive in discriminating prostate cancer from benign tissues (97).
In a head-to-head comparison, the performance of the PHI and the 4K test was similar,
and both outperformed total PSA in the detection of prostate cancer, while reducing
unnecessary biopsies (98). With increasing technology other genomic-based tests were
developed in an effort to improve diagnostic accuracy.
Examples include the Prostate Cancer Gene 3 (PCA3), a test based on prostate-specific
noncoding messenger Ribonucleic Acid (mRNA) which is overexpressed in cancer tissue (99).
The mRNA is quantified in the urine after prostatic massage during DRE (99). The test is
meant to be used when considering a repeat biopsy in men with elevated PSA and shows an
AUC in the range of 0.71 - 0.75 (99). PCA3 has lower sensitivity than PSA, but higher
specificity, positive and negative predictive values (100).
SelectMDx is a risk score based on the urinary mRNA signatures of HOXC6 and DLX1,
combined with PSA, PSA density (i.e., total PSA divided by prostate volume), DRE, age, prior
cancer-negative biopsies and family history, with an AUC of 0.86 for high-grade prostate
cancer (101). Of note here is the fact that to reach this high AUC, PSA density had to be
included. Its hypothetical cost-effectiveness was evaluated in a scenario in which SelectMDx
was used as a reflex text to decide which men with PSA >3.0 ng/mL underwent biopsy (i.e.,
instead of a systematic biopsy for all strategy): over an 18-year period, this proposed pathway
would result in savings of €128 and gains of 0.025 Quality-Adjusted Life-Year (QALY) per
patient (102). However, this economic analysis was based on 2015 costs from a tertiary center
in The Netherlands (i.e., Radboud University Medical Center), which may limit its
generalization (102). In addition, it would also require upfront imaging studies to assess
information on prostate volume (101).
Another alternative is the so-called Stockholm 3 Model (S3M), a combination of plasma
protein biomarkers (PSA, free PSA, intact PSA, hK2, MSMB, MIC1), genetic polymorphisms
(232 SNPs), clinical variables (age, family, history, previous prostate biopsy, DRE prostate
exam), and again PSA density (i.e., PSA divided by prostate volume), which aims to
outperform PSA in the identification of clinically significant prostate cancer (103).
In its initial formulation, it was shown to have an AUC of 0.74, and could reduce the
number of prostate biopsies by 32%, in an ethnically homogeneous population (i.e., northern
Europeans) (103). An updated model was recently published: in a cohort of patients with PSA
>= 3.0 ng/mL, with an AUC of 0.75, the S3M could save 34% of biopsies, with the same
sensitivity as PSA (104). In this latter publication, the authors also analysed the importance of
each parameter in the S3M algorithm, and determined that the most important predictor was
prostate volume (AUC of 0.67, in bivariate combination with PSA), and the least important was
intact PSA (AUC of 0.58, in bivariate combination with PSA) (104).
169

There is a constant development of biological markers or combinations of existing
markers, and even though they might have superior sensitivity or specificity as compared to
total PSA, their clinical application might be limited due to availability, usability, or cost.
However, it is important to stress that increased performance is actually linked to the inclusion
of the relation between PSA and prostate volume (i.e., PSA density), questioning the clinical
value of these often limited available, relatively expensive tests.
In the foreseeable healthcare cost conscious times, both clinical benefits and economic
costs should be taken into consideration (105). Moreover, it has been noted that all these new
options might make the already controversial subject of prostate screening prohibitively
expensive (105). This apparent complex choice can be simplified by the existence of an
equally valid (i.e., AUC of 0.86 for predicting clinically significant cancer) freely available
alternative: the ERSPC RPCRC (59).
Imaging
TRUS is frequently used before pondering a biopsy to assess prostate volume, and
when there is a clinical suspicion of prostate cancer, most centers perform a TRUS-guided
biopsy (106). A TRUS biopsy should be done according to a systematic pattern, but is
ultimately executed in a blind random fashion, because ultrasound cannot accurately
distinguish prostate cancer lesions (106).
In addition to prostate volume evaluation, contemporary mpMRI can be used as a
screening exam for prostate cancer and even image targeted biopsy, in the case of suspicious
MRI findings, even though a recent literature review failed to identify a universally accepted
definition of what constitutes an indeterminate lesion on mpMRI (i.e., “PI-RADS 3”) (107). MRI
targeted biopsy can be performed using an in-bore technique, via cognitive fusion, or
ultrasound/mpMRI fusion software - all have similar performance, and result in a higher
detection rate of clinically significant prostate cancer than TRUS systematic biopsy (52, 89,
108).
However, MRI-targeted biopsy does not detect up to 20% of clinically significant prostate
cancer, which precludes the withdrawal of TRUS systematic biopsy (109). In a recent review,
the negative predictive value of mpMRI for excluding cancer at biopsy, ranging from 69% to
98%, was influenced by study design, prevalence of prostate cancer, variability of mpMRI
protocol, and the definition of positive mpMRI (110). However, these results were obtained in
high-volume centers, with expert radiologists (110). Current prostate cancer guidelines
recommend the use of mpMRI when considering a repeat biopsy, but not yet in biopsy-naïve
patients (52).
The PROMIS study demonstrated that a diagnostic strategy consisting of upfront
mpMRI, performed by radiology experts, along with a review by an independent clinical
research organization, and, in case of suspicious findings, up to two subsequent MRI-targeted
TRUS biopsies, was the more likely approach to be cost-effective in the UK healthcare system,
considering cost-effectiveness thresholds both at and below £30,000 (in comparison with
different pathways consisting of combinations of MRI, transrectal and template prostate
mapping biopsies) (111). However, even though the authors state that these findings could be
generalised to international settings, they also warn that this could vary according to
healthcare system, pricing, and disease prevalence (111).
In our opinion, other limitations should be mentioned. Considering the current worldwide
lack of available mpMRI, this strategy would not be feasible in several healthcare settings (52).
170

There is a constant development of biological markers or combinations of existing
markers, and even though they might have superior sensitivity or specificity as compared to
total PSA, their clinical application might be limited due to availability, usability, or cost.
However, it is important to stress that increased performance is actually linked to the inclusion
of the relation between PSA and prostate volume (i.e., PSA density), questioning the clinical
value of these often limited available, relatively expensive tests.
In the foreseeable healthcare cost conscious times, both clinical benefits and economic
costs should be taken into consideration (105). Moreover, it has been noted that all these new
options might make the already controversial subject of prostate screening prohibitively
expensive (105). This apparent complex choice can be simplified by the existence of an
equally valid (i.e., AUC of 0.86 for predicting clinically significant cancer) freely available
alternative: the ERSPC RPCRC (59).
Imaging
TRUS is frequently used before pondering a biopsy to assess prostate volume, and
when there is a clinical suspicion of prostate cancer, most centers perform a TRUS-guided
biopsy (106). A TRUS biopsy should be done according to a systematic pattern, but is
ultimately executed in a blind random fashion, because ultrasound cannot accurately
distinguish prostate cancer lesions (106).
In addition to prostate volume evaluation, contemporary mpMRI can be used as a
screening exam for prostate cancer and even image targeted biopsy, in the case of suspicious
MRI findings, even though a recent literature review failed to identify a universally accepted
definition of what constitutes an indeterminate lesion on mpMRI (i.e., “PI-RADS 3”) (107). MRI
targeted biopsy can be performed using an in-bore technique, via cognitive fusion, or
ultrasound/mpMRI fusion software - all have similar performance, and result in a higher
detection rate of clinically significant prostate cancer than TRUS systematic biopsy (52, 89,
108).
However, MRI-targeted biopsy does not detect up to 20% of clinically significant prostate
cancer, which precludes the withdrawal of TRUS systematic biopsy (109). In a recent review,
the negative predictive value of mpMRI for excluding cancer at biopsy, ranging from 69% to
98%, was influenced by study design, prevalence of prostate cancer, variability of mpMRI
protocol, and the definition of positive mpMRI (110). However, these results were obtained in
high-volume centers, with expert radiologists (110). Current prostate cancer guidelines
recommend the use of mpMRI when considering a repeat biopsy, but not yet in biopsy-naïve
patients (52).
The PROMIS study demonstrated that a diagnostic strategy consisting of upfront
mpMRI, performed by radiology experts, along with a review by an independent clinical
research organization, and, in case of suspicious findings, up to two subsequent MRI-targeted
TRUS biopsies, was the more likely approach to be cost-effective in the UK healthcare system,
considering cost-effectiveness thresholds both at and below £30,000 (in comparison with
different pathways consisting of combinations of MRI, transrectal and template prostate
mapping biopsies) (111). However, even though the authors state that these findings could be
generalised to international settings, they also warn that this could vary according to
healthcare system, pricing, and disease prevalence (111).
In our opinion, other limitations should be mentioned. Considering the current worldwide
lack of available mpMRI, this strategy would not be feasible in several healthcare settings (52).
171

Furthermore, we need to take into consideration that the scarcity of mpMRI is a triad of
few scanners available, along with a noticeable learning curve, and the lack of standardized
protocols (i.e., devised in an effort to improve specificity and inter-reader reproducibility).
There is an ongoing debate comparing PI-RADS version one and two, and studies evaluating
the reproducibility of mpMRI findings (i.e., comparing expert and non-expert centers) are
lacking. There are reports that up to 30% of MRI scans performed in a community setting can
be subpar (e.g., no scoring system, no apparent diffusion coefficient maps, dynamic contrast-
enhanced images with poor temporal resolution) (112).
In the recently published PRECISION study, a multicenter trial, conducted across 25
centers in 11 countries, 500 biopsy-naïve men were randomized to either standard TRUS-
guided 10-12 core biopsy, or risk assessment with MRI before biopsy and, if suggestive
findings, which happened in 72% of these men, subsequent MRI-targeted biopsy only (113).
There was merely moderate agreement between the local site and the central radiologist
reading (78%), even though the participating radiologists evaluated a high quantity of MRIs
per year (median, 300 MRIs per year) (113).
The PRECISION protocol defined clinically significant cancer as a single core Gleason
≥3+4, and it was found in 38% of the men in the MRI-targeted biopsy group, but only in 26%
of the standard-biopsy group, and the authors concluded that risk assessment with MRI, and,
if needed, subsequent MRI-targeted biopsy, was superior to the standard of care (i.e., upfront
TRUS biopsy) (113). In addition, the MRI-targeted biopsy pathway halved the diagnosis of
clinically insignificant cancer (9% vs. 22%), in comparison with the upfront TRUS biopsy group
(113). However, in this study, the initial indication for MRI was based on elevated PSA (median
6.75 in the MRI-targeted group and 6.50 in the standard biopsy group) and/or suspicious DRE
(14% in the MRI-targeted group and 15% in the standard biopsy group) (113).
Currently, mpMRI is still not recommended for the preliminary assessment of biopsy
naïve patients (52). Although mpMRI has high sensitivity for identifying clinically aggressive
prostate cancer in expert centers, there are several shortcomings to the use of mpMRI as an
initial evaluation tool, not to mention considerations about its learning curve, quality
assurance, cost and scarcity, which could preclude its swift use in several contexts. As
mentioned before, there appears to be an advantage in determining upfront the risk of clinically
significant prostate cancer with a risk calculator before pondering a mpMRI, as the negative
predictive value of a test decreases when the prevalence of the disease increases. The price
for mpMRI depends per country, healthcare system, reimbursement, among other factors: it
might range from €345 in The Netherlands to $900 in Canada (114, 115). Moreover, as
mentioned before, its use might be precluded by lack of availability (i.e., mpMRI scanners or
radiology experts).
MRI was an added welcome to a previously inadequate prostate imaging
armamentarium. After assessing this brief synoptic overview of MRI in prostate cancer
screening, one might get the impression that all men with an elevated PSA should undergo a
mpMRI, and, eventually, a targeted biopsy. Such strategy has even been recently promoted
in mainstream media: quote “‘one-stop shops’ aimed at speeding up cancer diagnosis are
being piloted in ten hospitals across England” (116).
However, because of the abovementioned limitations, and putting aside mpMRI clinical
fallibilities, in our opinion this strategy lacks feasibility. Not only would an "elevated PSA =
mpMRI" recommendation put an added strain on already scarce MRI resources, it would also
create a bottleneck effect on prostate cancer screening.
Therefore, a more pragmatic screening workflow should start with easy, fast and
inexpensive testing to obtain clinical information (e.g., PSA and DRE), and readily available,
scientifically validated tools that allow prostate cancer risk assessment (e.g., ERSPC RPCRC,
namely the DRE-based version RC3).
Consequently, a more sensible strategy might be to consider mpMRI only after initial
risk stratification, both in biopsy-naïve and repeat biopsy settings. Alberts et al. demonstrated
that upfront risk stratification with available pre-biopsy information using the RPCRC could
halve mpMRI requests in a repeat biopsy setting (117). Therefore, instead of a one size fits
all approach, integrating available clinical data has been recommended in a possible
algorithm, starting with risk stratification: 1 - in patients with very low prostate cancer risk,
circumvent mpMRI and do not perform biopsy; 2 - in patients with low risk, use mpMRI to
decide whether or not to perform (systematic, targeted or combined) biopsy; 3 - in patients
with high risk, perform biopsy even if negative mpMRI (110).
A recent prospective study compared the detection rates of prostate cancer with mpMRI
targeted (if PIRADS v2 ≥3) versus standard 12-core biopsy in 200 biopsy-naïve men with
elevated PSA level and/or abnormal DRE: for Gleason ≥3+4, 26% vs. 33%, and for Gleason
3+3, 7% vs. 13%, respectively (109). Upfront risk stratification with the ERSPC RPCRC would
have saved 37% mpMRI and missed 4% Gleason ≥3+4 prostate cancers (in the targeted
biopsy group), and also avoided 37% biopsies and missed 5% Gleason ≥3+4 prostate cancers
(in the standard biopsy group) (118).
These results suggest that multivariable risk based patient selection with the RPCRC
can safely avoid about a third of the procedures (i.e., either mpMRI or standard biopsy) in
biopsy-naïve men triggered because of an elevated PSA level and/or abnormal DRE (118).
172

Furthermore, we need to take into consideration that the scarcity of mpMRI is a triad of
few scanners available, along with a noticeable learning curve, and the lack of standardized
protocols (i.e., devised in an effort to improve specificity and inter-reader reproducibility).
There is an ongoing debate comparing PI-RADS version one and two, and studies evaluating
the reproducibility of mpMRI findings (i.e., comparing expert and non-expert centers) are
lacking. There are reports that up to 30% of MRI scans performed in a community setting can
be subpar (e.g., no scoring system, no apparent diffusion coefficient maps, dynamic contrast-
enhanced images with poor temporal resolution) (112).
In the recently published PRECISION study, a multicenter trial, conducted across 25
centers in 11 countries, 500 biopsy-naïve men were randomized to either standard TRUS-
guided 10-12 core biopsy, or risk assessment with MRI before biopsy and, if suggestive
findings, which happened in 72% of these men, subsequent MRI-targeted biopsy only (113).
There was merely moderate agreement between the local site and the central radiologist
reading (78%), even though the participating radiologists evaluated a high quantity of MRIs
per year (median, 300 MRIs per year) (113).
The PRECISION protocol defined clinically significant cancer as a single core Gleason
≥3+4, and it was found in 38% of the men in the MRI-targeted biopsy group, but only in 26%
of the standard-biopsy group, and the authors concluded that risk assessment with MRI, and,
if needed, subsequent MRI-targeted biopsy, was superior to the standard of care (i.e., upfront
TRUS biopsy) (113). In addition, the MRI-targeted biopsy pathway halved the diagnosis of
clinically insignificant cancer (9% vs. 22%), in comparison with the upfront TRUS biopsy group
(113). However, in this study, the initial indication for MRI was based on elevated PSA (median
6.75 in the MRI-targeted group and 6.50 in the standard biopsy group) and/or suspicious DRE
(14% in the MRI-targeted group and 15% in the standard biopsy group) (113).
Currently, mpMRI is still not recommended for the preliminary assessment of biopsy
naïve patients (52). Although mpMRI has high sensitivity for identifying clinically aggressive
prostate cancer in expert centers, there are several shortcomings to the use of mpMRI as an
initial evaluation tool, not to mention considerations about its learning curve, quality
assurance, cost and scarcity, which could preclude its swift use in several contexts. As
mentioned before, there appears to be an advantage in determining upfront the risk of clinically
significant prostate cancer with a risk calculator before pondering a mpMRI, as the negative
predictive value of a test decreases when the prevalence of the disease increases. The price
for mpMRI depends per country, healthcare system, reimbursement, among other factors: it
might range from €345 in The Netherlands to $900 in Canada (114, 115). Moreover, as
mentioned before, its use might be precluded by lack of availability (i.e., mpMRI scanners or
radiology experts).
MRI was an added welcome to a previously inadequate prostate imaging
armamentarium. After assessing this brief synoptic overview of MRI in prostate cancer
screening, one might get the impression that all men with an elevated PSA should undergo a
mpMRI, and, eventually, a targeted biopsy. Such strategy has even been recently promoted
in mainstream media: quote “‘one-stop shops’ aimed at speeding up cancer diagnosis are
being piloted in ten hospitals across England” (116).
However, because of the abovementioned limitations, and putting aside mpMRI clinical
fallibilities, in our opinion this strategy lacks feasibility. Not only would an "elevated PSA =
mpMRI" recommendation put an added strain on already scarce MRI resources, it would also
create a bottleneck effect on prostate cancer screening.
Therefore, a more pragmatic screening workflow should start with easy, fast and
inexpensive testing to obtain clinical information (e.g., PSA and DRE), and readily available,
scientifically validated tools that allow prostate cancer risk assessment (e.g., ERSPC RPCRC,
namely the DRE-based version RC3).
Consequently, a more sensible strategy might be to consider mpMRI only after initial
risk stratification, both in biopsy-naïve and repeat biopsy settings. Alberts et al. demonstrated
that upfront risk stratification with available pre-biopsy information using the RPCRC could
halve mpMRI requests in a repeat biopsy setting (117). Therefore, instead of a one size fits
all approach, integrating available clinical data has been recommended in a possible
algorithm, starting with risk stratification: 1 - in patients with very low prostate cancer risk,
circumvent mpMRI and do not perform biopsy; 2 - in patients with low risk, use mpMRI to
decide whether or not to perform (systematic, targeted or combined) biopsy; 3 - in patients
with high risk, perform biopsy even if negative mpMRI (110).
A recent prospective study compared the detection rates of prostate cancer with mpMRI
targeted (if PIRADS v2 ≥3) versus standard 12-core biopsy in 200 biopsy-naïve men with
elevated PSA level and/or abnormal DRE: for Gleason ≥3+4, 26% vs. 33%, and for Gleason
3+3, 7% vs. 13%, respectively (109). Upfront risk stratification with the ERSPC RPCRC would
have saved 37% mpMRI and missed 4% Gleason ≥3+4 prostate cancers (in the targeted
biopsy group), and also avoided 37% biopsies and missed 5% Gleason ≥3+4 prostate cancers
(in the standard biopsy group) (118).
These results suggest that multivariable risk based patient selection with the RPCRC
can safely avoid about a third of the procedures (i.e., either mpMRI or standard biopsy) in
biopsy-naïve men triggered because of an elevated PSA level and/or abnormal DRE (118).
173

It stands to reason that if this upfront risk classification with, e.g., the ERSPC RPCRC,
had been used in both the PROMIS and the PRECISION trials, the clinical benefits could have
been superior.
Even though contemporary TRUS and MRI are widely used to evaluate prostate volume,
they increase healthcare costs, as well as time expended by the patient and potential physical
or psychological discomfort. In contrast, DRE is swift and low cost, but, because it is
subjective, may not provide adequate information. Studies have shown that if doctors lack a
standardized examination technique, their DRE prostate volume estimate correlate poorer
than TRUS volume assessment with surgical prostatic specimen weight (119).
However, in our research, with experienced Urologists trained in the same institution,
we found a high correlation between DRE estimated and TRUS assessed prostate size.
Similar levels of concordance have been found when the DRE evaluation was compared
among Urologists with different levels of preparation (i.e., young residents, senior residents,
and specialists) and between Urologists and GPs, when a structured DRE protocol was
implemented (120).
Therefore, using a systematic technique, such as the one we described in the original
article (Chapter 6), is paramount, and this can be passed on to unexperienced healthcare
professionals by using standardized clinical estimation of prostate size, 3D models,
mannequins, virtual reality-based simulations, standardized patients, or supervised patient
examination (121-123). The importance of DRE can also be inferred by its use as a predictor
in the seven most well-known risk calculators predicting prostate biopsy outcome, as will be
discussed in the following section.
The ERSPC RPCRC
The ERSPC RPCRC DRE-based risk calculator was designed for biopsy-naïve men
(i.e., RC3), and combines total PSA with DRE findings, namely anatomical (i.e., estimate on
prostate volume) and functional (i.e., normal or abnormal – nodule or induration) data. It was
developed to include information on prostate volume, while circumventing the need for
additional imaging studies, and, therefore, allowing an easier implementation into everyday
clinical practice (59). It allows for a more accurate risk prediction than just total PSA or PSA
combined with DRE functional outcome (59).
In the original ERSPC RPCRC RC3 article, the AUC for predicting prostate cancer was
0.69, 0.73 and 0.77 for PSA, PSA+DRE and DRE-based risk calculator respectively (59). The
ERSPC RPCRC, which does not increase appointments’ duration (i.e., because DRE is
already an integral part of the physical evaluation), nor requires additional tests or referrals
(i.e., since the ERSPC RPCRC is readily available online and on smartphones), is as such
suitable for these challenging times in which contemporary healthcare is faced with
unprecedented productivity pressure, time constraints, and cost-cutting goals.
In the ERSPC RPCRC a prostate volume measurement is done on the basis of DRE,
and even though DRE assessment requires experience and is subjective, it can be performed
during the physical examination of a standard visit at the outpatient clinic by a medical doctor
(i.e., not just by a Urologist) (120), since only a relatively rough estimate is needed to increase
predictive capability as compared to PSA alone (124, 125).
A DRE assessment does not need specific imaging equipment or external referrals,
contrary to a TRUS or MRI prostate volume measurement. While the TRUS-based ERSPC
RPCRC has been validated in various patient populations with good results, this was the first
study to externally validate the DRE-based version of the ERSPC RPCRC, using DRE-
assessed prostate volume.
174

It stands to reason that if this upfront risk classification with, e.g., the ERSPC RPCRC,
had been used in both the PROMIS and the PRECISION trials, the clinical benefits could have
been superior.
Even though contemporary TRUS and MRI are widely used to evaluate prostate volume,
they increase healthcare costs, as well as time expended by the patient and potential physical
or psychological discomfort. In contrast, DRE is swift and low cost, but, because it is
subjective, may not provide adequate information. Studies have shown that if doctors lack a
standardized examination technique, their DRE prostate volume estimate correlate poorer
than TRUS volume assessment with surgical prostatic specimen weight (119).
However, in our research, with experienced Urologists trained in the same institution,
we found a high correlation between DRE estimated and TRUS assessed prostate size.
Similar levels of concordance have been found when the DRE evaluation was compared
among Urologists with different levels of preparation (i.e., young residents, senior residents,
and specialists) and between Urologists and GPs, when a structured DRE protocol was
implemented (120).
Therefore, using a systematic technique, such as the one we described in the original
article (Chapter 6), is paramount, and this can be passed on to unexperienced healthcare
professionals by using standardized clinical estimation of prostate size, 3D models,
mannequins, virtual reality-based simulations, standardized patients, or supervised patient
examination (121-123). The importance of DRE can also be inferred by its use as a predictor
in the seven most well-known risk calculators predicting prostate biopsy outcome, as will be
discussed in the following section.
The ERSPC RPCRC
The ERSPC RPCRC DRE-based risk calculator was designed for biopsy-naïve men
(i.e., RC3), and combines total PSA with DRE findings, namely anatomical (i.e., estimate on
prostate volume) and functional (i.e., normal or abnormal – nodule or induration) data. It was
developed to include information on prostate volume, while circumventing the need for
additional imaging studies, and, therefore, allowing an easier implementation into everyday
clinical practice (59). It allows for a more accurate risk prediction than just total PSA or PSA
combined with DRE functional outcome (59).
In the original ERSPC RPCRC RC3 article, the AUC for predicting prostate cancer was
0.69, 0.73 and 0.77 for PSA, PSA+DRE and DRE-based risk calculator respectively (59). The
ERSPC RPCRC, which does not increase appointments’ duration (i.e., because DRE is
already an integral part of the physical evaluation), nor requires additional tests or referrals
(i.e., since the ERSPC RPCRC is readily available online and on smartphones), is as such
suitable for these challenging times in which contemporary healthcare is faced with
unprecedented productivity pressure, time constraints, and cost-cutting goals.
In the ERSPC RPCRC a prostate volume measurement is done on the basis of DRE,
and even though DRE assessment requires experience and is subjective, it can be performed
during the physical examination of a standard visit at the outpatient clinic by a medical doctor
(i.e., not just by a Urologist) (120), since only a relatively rough estimate is needed to increase
predictive capability as compared to PSA alone (124, 125).
A DRE assessment does not need specific imaging equipment or external referrals,
contrary to a TRUS or MRI prostate volume measurement. While the TRUS-based ERSPC
RPCRC has been validated in various patient populations with good results, this was the first
study to externally validate the DRE-based version of the ERSPC RPCRC, using DRE-
assessed prostate volume.
175

Performance of the DRE-based RPCRC in a setting with low intensity PSA-based screening.
As was mentioned in the thesis introduction, the incidence of prostate cancer diagnosis
varies worldwide, and there are discrepancies among European Union countries, which had,
in 2012, a combined incidence of 345,000 cases, and 72,000 deaths (126). In Portugal,
prostate cancer is the most common cancer in men, with an estimated incidence of 108.81
cases per 100,000 habitants, which is higher than the average in Europe (83.69 cases per
100,000 habitants) (127). The yearly mortality per 100,000 habitants in Portugal is presented
in table 2:
Table 2. Yearly mortality of prostate cancer per 100,000 habitants in Portugal.
2011 2012 2013 2014 2015
Total number
of deaths
1,815 1,806 1,714 1,787 1,723
Number of
deaths per
100,000
habitants
21.9 21.5 20.0 20.3 19.3
The performance of the DRE-based ERSPC RPCRC was evaluated at Centro
Hospitalar do Porto, an academic center in Porto. The Urology Department has a staff of 14
urologists and seven residents, and performs around 22,000 outpatient consultations and
2,000 surgical procedures per year. Patients are mostly referred from their GP to our prostate
clinic, but also from other Urology Departments.
Regarding the methodology, while the original ERSPC RPCRC RC3 was developed
using a sextant biopsy, in the current study, a 16 core scheme was used, which is standard
practice since 2010 in our Department in biopsy naïve-patients (128). For comparison, the
cohort used for the development of the original DRE-based risk calculator RC (RC 3) and the
cohort used in this study are shown in table 3:
Table 3. Comparison between the original RC 3 and the Porto cohorts.
Original RC 3 Porto cohort Ratio Porto/Original
Total number of
patients
3,616 241
Total number of PCa
cases
885 (25%) 98 (41%) 0.41/0.25 (1.64)
Total number of HG
cases
431 (49%) 81 (83%) 0.83/0.49 (1.69)
Age years
(Mean; median)
66;66 66;66 66/66 (1)
PSA ng/mL
Mean
Median
6.1
4.3
8.7
6.9
8.7/6.1 (1.43)
6.9/4.2 (1.60)
Suspicious DRE 35%
39% 0.39/0.35 (1.11)
Prostate volume
Mean
Median
46.2
41.0
51.0
47.0
51.0/46.2 (1.10)
47.0/41.0 (1.15)
Even though men in both cohorts had similar age, the men in Porto’s cohort had 61%
higher PSA, 15% bigger prostates and 11% more had a suspicious DRE. The overall
measures of discrimination, calibration and clinical usefulness of the model were already
detailed in the “Prospective evaluation on the effect of interobserver variability of digital rectal
examination on the performance of the Rotterdam Prostate Cancer Risk Calculator” article,
but some aspects are worth discussing further.
176

Performance of the DRE-based RPCRC in a setting with low intensity PSA-based screening.
As was mentioned in the thesis introduction, the incidence of prostate cancer diagnosis
varies worldwide, and there are discrepancies among European Union countries, which had,
in 2012, a combined incidence of 345,000 cases, and 72,000 deaths (126). In Portugal,
prostate cancer is the most common cancer in men, with an estimated incidence of 108.81
cases per 100,000 habitants, which is higher than the average in Europe (83.69 cases per
100,000 habitants) (127). The yearly mortality per 100,000 habitants in Portugal is presented
in table 2:
Table 2. Yearly mortality of prostate cancer per 100,000 habitants in Portugal.
2011 2012 2013 2014 2015
Total number
of deaths
1,815 1,806 1,714 1,787 1,723
Number of
deaths per
100,000
habitants
21.9 21.5 20.0 20.3 19.3
The performance of the DRE-based ERSPC RPCRC was evaluated at Centro
Hospitalar do Porto, an academic center in Porto. The Urology Department has a staff of 14
urologists and seven residents, and performs around 22,000 outpatient consultations and
2,000 surgical procedures per year. Patients are mostly referred from their GP to our prostate
clinic, but also from other Urology Departments.
Regarding the methodology, while the original ERSPC RPCRC RC3 was developed
using a sextant biopsy, in the current study, a 16 core scheme was used, which is standard
practice since 2010 in our Department in biopsy naïve-patients (128). For comparison, the
cohort used for the development of the original DRE-based risk calculator RC (RC 3) and the
cohort used in this study are shown in table 3:
Table 3. Comparison between the original RC 3 and the Porto cohorts.
Original RC 3 Porto cohort Ratio Porto/Original
Total number of
patients
3,616 241
Total number of PCa
cases
885 (25%) 98 (41%) 0.41/0.25 (1.64)
Total number of HG
cases
431 (49%) 81 (83%) 0.83/0.49 (1.69)
Age years
(Mean; median)
66;66 66;66 66/66 (1)
PSA ng/mL
Mean
Median
6.1
4.3
8.7
6.9
8.7/6.1 (1.43)
6.9/4.2 (1.60)
Suspicious DRE 35%
39% 0.39/0.35 (1.11)
Prostate volume
Mean
Median
46.2
41.0
51.0
47.0
51.0/46.2 (1.10)
47.0/41.0 (1.15)
Even though men in both cohorts had similar age, the men in Porto’s cohort had 61%
higher PSA, 15% bigger prostates and 11% more had a suspicious DRE. The overall
measures of discrimination, calibration and clinical usefulness of the model were already
detailed in the “Prospective evaluation on the effect of interobserver variability of digital rectal
examination on the performance of the Rotterdam Prostate Cancer Risk Calculator” article,
but some aspects are worth discussing further.
177

In previous studies with the ERSPC RPCRC it has been shown that when applying a
risk cut-off ≥12.5% for any cancer, the multivariate risk assessment can save 33% of biopsies,
while missing 14% of potential cancer diagnoses, of which 70% can be considered indolent
cancer (129). These numbers are based on the TRUS volume based ERSPC risk calculators,
but comparative analyses have shown a non-significant difference in the discriminative ability
of the TRUS-based versus the DRE-based versions of the ERSPC RPCRC (59).
Considering the high-risk nature of our study cohort, in which 83% of the all cancers
detected were clinically significant, in this particular setting it is of less importance to reduce
potential unnecessary biopsies (i.e., those with benign result or those with low-risk prostate
cancer). The data showed that at a probability threshold of 25% for any grade prostate cancer,
it was possible to avoid 9% biopsies, without missing any cancer. This is most likely not a
threshold that will be accepted in daily clinical practice. There was no net benefit when using
the DRE-based ERSPC RPCRC for high grade prostate cancer. Although the added value of
a multivariable risk prediction tool was limited it confirms the importance of selecting men at
high risk for further assessment.
Are there differences in performance, namely discrimination, calibration, and clinical impact, in a head-to-head comparison between the most well-known and validated risk calculators developed to predict prostate biopsy outcome?
In many scientific guidelines the use of risk calculators is encouraged, but they are
underappreciated, in part because the statistical foundations of nomogram construction, their
precise interpretation, and the evidence supporting their use is commonly misunderstood.
Moreover, it can be difficult to decide which individual model to use in a specific clinical setting,
which is indeed crucial, as we have shown in Chapter 7 (Head-to-head comparison of prostate
cancer risk calculators predicting biopsy outcome). To grade them, it is possible to compare
risk calculators in regards to their discrimination, calibration, and net benefit.
The discrimination ability of a model is its predictive accuracy: how much different is the
risk prediction between patients with and without a positive prostate biopsy? This can be
quantified via the model’s sensitivity (i.e., the true positive rate, the ability of the model to
correctly identify those patients with the disease), specificity (i.e., the true negative rate, the
ability of the model to correctly identify those patients without the disease), and the area under
the Receiver Operating Characteristic (ROC) curve (i.e., its accuracy, in which an area of one
represents a perfect test and an area of 0.5 represents a meaningless test, equivalent to
tossing a coin) (130).
The calibration (i.e., correlation between predicted and observed risk throughout the
entire range of predictions) of a model is the magnitude of correct matches between predicted
(i.e., calculated) and observed (i.e., real) outcomes, either positive or negative. A well
calibrated model can be considered as a reliable model (131). In practical terms, the model’s
calibration is determined by how close to X number out of 100 patients with a risk of X% have
the expected (i.e., predicted) outcome, either negative or positive (130)?
Net benefit is an analytical concept, similar to net profit in business, which allows for the
direct analytical comparison of harms and benefits, by using an “exchange rate”, which is the
acceptable trade-off (132):
Benefit – (Harm * Exchange Rate)
Plotting the net benefit within a predetermined probability threshold range creates a
decision curve graph (132).
178

In previous studies with the ERSPC RPCRC it has been shown that when applying a
risk cut-off ≥12.5% for any cancer, the multivariate risk assessment can save 33% of biopsies,
while missing 14% of potential cancer diagnoses, of which 70% can be considered indolent
cancer (129). These numbers are based on the TRUS volume based ERSPC risk calculators,
but comparative analyses have shown a non-significant difference in the discriminative ability
of the TRUS-based versus the DRE-based versions of the ERSPC RPCRC (59).
Considering the high-risk nature of our study cohort, in which 83% of the all cancers
detected were clinically significant, in this particular setting it is of less importance to reduce
potential unnecessary biopsies (i.e., those with benign result or those with low-risk prostate
cancer). The data showed that at a probability threshold of 25% for any grade prostate cancer,
it was possible to avoid 9% biopsies, without missing any cancer. This is most likely not a
threshold that will be accepted in daily clinical practice. There was no net benefit when using
the DRE-based ERSPC RPCRC for high grade prostate cancer. Although the added value of
a multivariable risk prediction tool was limited it confirms the importance of selecting men at
high risk for further assessment.
Are there differences in performance, namely discrimination, calibration, and clinical impact, in a head-to-head comparison between the most well-known and validated risk calculators developed to predict prostate biopsy outcome?
In many scientific guidelines the use of risk calculators is encouraged, but they are
underappreciated, in part because the statistical foundations of nomogram construction, their
precise interpretation, and the evidence supporting their use is commonly misunderstood.
Moreover, it can be difficult to decide which individual model to use in a specific clinical setting,
which is indeed crucial, as we have shown in Chapter 7 (Head-to-head comparison of prostate
cancer risk calculators predicting biopsy outcome). To grade them, it is possible to compare
risk calculators in regards to their discrimination, calibration, and net benefit.
The discrimination ability of a model is its predictive accuracy: how much different is the
risk prediction between patients with and without a positive prostate biopsy? This can be
quantified via the model’s sensitivity (i.e., the true positive rate, the ability of the model to
correctly identify those patients with the disease), specificity (i.e., the true negative rate, the
ability of the model to correctly identify those patients without the disease), and the area under
the Receiver Operating Characteristic (ROC) curve (i.e., its accuracy, in which an area of one
represents a perfect test and an area of 0.5 represents a meaningless test, equivalent to
tossing a coin) (130).
The calibration (i.e., correlation between predicted and observed risk throughout the
entire range of predictions) of a model is the magnitude of correct matches between predicted
(i.e., calculated) and observed (i.e., real) outcomes, either positive or negative. A well
calibrated model can be considered as a reliable model (131). In practical terms, the model’s
calibration is determined by how close to X number out of 100 patients with a risk of X% have
the expected (i.e., predicted) outcome, either negative or positive (130)?
Net benefit is an analytical concept, similar to net profit in business, which allows for the
direct analytical comparison of harms and benefits, by using an “exchange rate”, which is the
acceptable trade-off (132):
Benefit – (Harm * Exchange Rate)
Plotting the net benefit within a predetermined probability threshold range creates a
decision curve graph (132).
179

At any specific threshold probability, the model with the highest net benefit would be the
reasonable choice (132), ignoring other potential factors, such as cost or accessibility. In the
setting of prostate cancer screening, the benefit is the detection of cancer, the harm is the
undertaking of an unnecessary biopsy, and the exchange rate the acceptable number of
biopsied men to identify one cancer patient.
The use of risk calculators is recommended by the EAU, ESTRO, ESUR, and SIOG joint
guidelines on prostate cancer screening and early detection for asymptomatic men with a PSA
between 2.0 and 10.0 ng/mL, prior to performing a prostate biopsy (52). However, these
guidelines also state that “Since none has clearly shown superiority it is impossible to provide
a recommendation and it remains a personal decision which one to use” (52). Although many
nomograms predict prostate cancer detection by means of a systematic biopsy, few have been
extensively validated in multiple settings (133).
In a recent meta-analysis, 127 singular prostate cancer risk prediction nomograms were
identified, and the authors found that these prediction models had the potential to double the
sensitivity of PSA (44% versus 21%) (133). The Prostataclass and the ERSPC RPCRC had
the highest discriminative value to predict prostate cancer (AUC of 0.79), which might
anticipate a better overall performance (133).
However, a direct comparison between the models was not available since their different
AUC were based on different study populations (133). Hence, it was unknown whether there
were significant differences in performance, namely clinical impact, among the most well-
known and corroborated models in Urology and a direct assessment between available risk
calculators was recommended (133). Chapter 7 of the current thesis addresses these issues.
A head-to-head comparison represents an unbiased analysis of the objective attributes
of the various risk calculators developed to predict prostate biopsy outcome. In an effort to
determine if any model was superior, the performance of the seven most well-known and
extensively externally validated nomograms to predict the risk of prostate cancer in a biopsy
was directly compared in a population of 8,649 men from ten independent centers (nine in
Europe and one in Australia). To overcome the eventual heterogeneity (i.e., case-mix) effect
of the development and validation cohorts, these populations were unrelated to those used to
develop and validate the original risk calculators’ models. We found that even though these
risk calculators had a good discriminatory ability to predict any grade prostate cancer (i.e.,
pathologic classification ranging from Gleason 3+3 to 5+5), with an AUC ranging from 0.64
(PCPT 2.0) to 0.71 - 0.72 (ERSPC RPCRC and Finne), there was a substantial heterogeneity
between the different cohorts (range I2 66% to 89%).
Of the four models that predicted clinically significant prostate cancer, the ERSPC
RPCRC had the highest pooled AUC (0.77), followed by Sunnybrook (0.72), PCPT 2.0 +
freePSA (0.72) and PCPT 2.0 (0.71). In the context of this comparison, the ERSPC RPCRC
had the highest net benefit: considering a 4% risk of clinically significant prostate cancer
biopsy threshold, a third of the biopsies could be avoided, while keeping a 95% sensitivity for
detecting clinically significant disease. In this large international cohort, these three models
underestimated the probability of clinically significant prostate cancer, while the ERSPC
RPCRC was more accurate at low probabilities and slightly overestimated when the threshold
for biopsy was more than 10% risk of clinically significant prostate cancer.
In summary, it is reasonable to assume that prediction tools should be adapted to local
epidemiological features, as well as particular patients’ preferences or characteristics (e.g.,
medical metal device precluding mpMRI). A simple, easy to perform calibration step can
considerably improve the performance in a particular healthcare setting and will help further
implementation into daily clinical practice of these valuable instruments. Using retrospective
data from a significant number of previous prostate biopsies, the original model would be
evaluated (calibration phase). Afterwards, center-specific adjustments could be made to the
existing nomogram, which would then be assessed (validation cohort). Besides cohort-specific
calibration, there may also be a need for chrono-specific calibration, as a way for these tools
to adapt to different clinical patterns over time, morphing risk calculators into dynamic tools.
This could be achieved via the recalibration of the risk calculator or even the development of
a new model based on logistic regression. Using an international population comprised of five
cohorts, it was shown that a simple annual recalibration of an existing prostate cancer risk
calculator improved its accuracy (134).
While this may sound cumbersome, it is good to realise that also the highly trusted PSA
test, and its generally recommended cut-off value of 4.0 ng/mL, have similar problems. The
sensitivity and specificity of the fixed PSA cut-off in our study was evaluated per center (figure
S2 in Chapter 7), and ranged from 76% to 98%, and 4% to 44%, respectively. Uncertainty
about whether to use these risk calculators is often related to calibration issues, and the fear
that it might lead to wrong decisions. It is important to realise that decisions made on a
generally accepted single biomarker, such as PSA, coincides with comparable uncertainties.
Considering a mutual shared decision with an individual patient, it is comfortable to
preclude a biopsy if the risk of clinically significant prostate cancer is almost null (i.e., low risk
of missing aggressive disease), and easy to accept the hassles of a biopsy if the probability
is elevated (i.e., high risk of harmful disease). The difficult shared decision is when the risk is
in a “grey zone”.
180

At any specific threshold probability, the model with the highest net benefit would be the
reasonable choice (132), ignoring other potential factors, such as cost or accessibility. In the
setting of prostate cancer screening, the benefit is the detection of cancer, the harm is the
undertaking of an unnecessary biopsy, and the exchange rate the acceptable number of
biopsied men to identify one cancer patient.
The use of risk calculators is recommended by the EAU, ESTRO, ESUR, and SIOG joint
guidelines on prostate cancer screening and early detection for asymptomatic men with a PSA
between 2.0 and 10.0 ng/mL, prior to performing a prostate biopsy (52). However, these
guidelines also state that “Since none has clearly shown superiority it is impossible to provide
a recommendation and it remains a personal decision which one to use” (52). Although many
nomograms predict prostate cancer detection by means of a systematic biopsy, few have been
extensively validated in multiple settings (133).
In a recent meta-analysis, 127 singular prostate cancer risk prediction nomograms were
identified, and the authors found that these prediction models had the potential to double the
sensitivity of PSA (44% versus 21%) (133). The Prostataclass and the ERSPC RPCRC had
the highest discriminative value to predict prostate cancer (AUC of 0.79), which might
anticipate a better overall performance (133).
However, a direct comparison between the models was not available since their different
AUC were based on different study populations (133). Hence, it was unknown whether there
were significant differences in performance, namely clinical impact, among the most well-
known and corroborated models in Urology and a direct assessment between available risk
calculators was recommended (133). Chapter 7 of the current thesis addresses these issues.
A head-to-head comparison represents an unbiased analysis of the objective attributes
of the various risk calculators developed to predict prostate biopsy outcome. In an effort to
determine if any model was superior, the performance of the seven most well-known and
extensively externally validated nomograms to predict the risk of prostate cancer in a biopsy
was directly compared in a population of 8,649 men from ten independent centers (nine in
Europe and one in Australia). To overcome the eventual heterogeneity (i.e., case-mix) effect
of the development and validation cohorts, these populations were unrelated to those used to
develop and validate the original risk calculators’ models. We found that even though these
risk calculators had a good discriminatory ability to predict any grade prostate cancer (i.e.,
pathologic classification ranging from Gleason 3+3 to 5+5), with an AUC ranging from 0.64
(PCPT 2.0) to 0.71 - 0.72 (ERSPC RPCRC and Finne), there was a substantial heterogeneity
between the different cohorts (range I2 66% to 89%).
Of the four models that predicted clinically significant prostate cancer, the ERSPC
RPCRC had the highest pooled AUC (0.77), followed by Sunnybrook (0.72), PCPT 2.0 +
freePSA (0.72) and PCPT 2.0 (0.71). In the context of this comparison, the ERSPC RPCRC
had the highest net benefit: considering a 4% risk of clinically significant prostate cancer
biopsy threshold, a third of the biopsies could be avoided, while keeping a 95% sensitivity for
detecting clinically significant disease. In this large international cohort, these three models
underestimated the probability of clinically significant prostate cancer, while the ERSPC
RPCRC was more accurate at low probabilities and slightly overestimated when the threshold
for biopsy was more than 10% risk of clinically significant prostate cancer.
In summary, it is reasonable to assume that prediction tools should be adapted to local
epidemiological features, as well as particular patients’ preferences or characteristics (e.g.,
medical metal device precluding mpMRI). A simple, easy to perform calibration step can
considerably improve the performance in a particular healthcare setting and will help further
implementation into daily clinical practice of these valuable instruments. Using retrospective
data from a significant number of previous prostate biopsies, the original model would be
evaluated (calibration phase). Afterwards, center-specific adjustments could be made to the
existing nomogram, which would then be assessed (validation cohort). Besides cohort-specific
calibration, there may also be a need for chrono-specific calibration, as a way for these tools
to adapt to different clinical patterns over time, morphing risk calculators into dynamic tools.
This could be achieved via the recalibration of the risk calculator or even the development of
a new model based on logistic regression. Using an international population comprised of five
cohorts, it was shown that a simple annual recalibration of an existing prostate cancer risk
calculator improved its accuracy (134).
While this may sound cumbersome, it is good to realise that also the highly trusted PSA
test, and its generally recommended cut-off value of 4.0 ng/mL, have similar problems. The
sensitivity and specificity of the fixed PSA cut-off in our study was evaluated per center (figure
S2 in Chapter 7), and ranged from 76% to 98%, and 4% to 44%, respectively. Uncertainty
about whether to use these risk calculators is often related to calibration issues, and the fear
that it might lead to wrong decisions. It is important to realise that decisions made on a
generally accepted single biomarker, such as PSA, coincides with comparable uncertainties.
Considering a mutual shared decision with an individual patient, it is comfortable to
preclude a biopsy if the risk of clinically significant prostate cancer is almost null (i.e., low risk
of missing aggressive disease), and easy to accept the hassles of a biopsy if the probability
is elevated (i.e., high risk of harmful disease). The difficult shared decision is when the risk is
in a “grey zone”.
181

Most currently available risk calculators were developed more than 20 years ago, and
it has been shown that their predictive value can be increased by incorporating newer
biomarkers and imaging studies, even though there are availability and cost issues (135 -
138). Moreover, it should be noted that each risk factor has an intrinsic discriminatory
capability, and, consequently, there is a limit to their combined discriminatory potential, which
translates into a plateau of the AUC, even with additional information derived from new cases
(135). In such circumstances, the only way to increase the discrimination of existing risk
calculators is by adding new predictors.
Every day, new studies are being published demonstrating the advantages of pioneering
tests, but their clinical external validation in diverse populations is mandatory to enhance their
implementation, and, perhaps even more pertinent, their real world availability and affordability
are paramount to assure, if not equal healthcare for all, at least appropriate healthcare for all
men seeking an early diagnosis. In most countries, GPs are the gatekeepers to prostate
cancer detection, so we should strive to assure that multivariable risk stratification is available
in a primary care setting, and therefore accessible to the majority of the population, and not
just limited to those few that have privileged access to expensive markers and imaging studies,
which may be prohibitively resource intensive for general routine use (105). As an example,
the ERSPC RPCRC, is available as a smartphone app for both iOS and Android devices, and
also online, for free (http://www.prostatecancer-riskcalculator.com).
Genomic biomarkers can aid in the delivery of personalized diagnostic and treatment
choices, which can be helpful in such a heterogeneous disease as prostate cancer. Many
novel biomarkers have risen over the last decade and a recent review identified several that,
either alone or in combination with clinical findings, could assist decision making (139).
SelectMDx, MiProstate Score and ExoDx are urine tests that can be used to predict which
patients have a higher risk of aggressive disease, while PCA3 and Confirm MDx can be helpful
in patients with a high suspicion of prostate cancer after an initial negative biopsy (139).
Genomics, in addition to clinical and pathological variables, will probably help reduce the
number of unnecessary biopsies, stratify high risk patients and guide personalized treatment
decisions. However, even though genomic biomarkers can be incorporated into existing
prediction models, their current role and cost-benefit are still being evaluated (52). For
reference, the list price of PHI, PCA3, and SelectMDx is $500, while the 4KScore is $1,500
(140). Moreover, as was mentioned before, most are heavily dependent on clinical variables,
which questions their cost effectiveness. Using “PSA density” (i.e., PSA divided by prostate
volume) instead of total PSA is beneficial for risk stratification, but requires imaging tests.
Conclusion
Contemporary Medicine strives for an evidence-based approach, and accurate
estimates, for both physician and patient, are desirable: knowing the likelihood of a positive
diagnosis with an exam, understanding treatment success rate with a new drug, or accepting
the morbidity and mortality associated with a procedure can aid in this endeavour. For these
reasons objective predictive and prognostic tools, based on large cohorts of retrospective data
and statistical modelling, have been developed.
Prostate cancer is a major health issue worldwide, representing the second most
frequently detected cancer in men (141). Even though early detection can reduce cancer
specific mortality, prostate cancer screening is one of the most controversial topics in Urology,
because it is associated with overdiagnosis and overtreatment (142). To overcome these
issues, early detection should be tailored to well informed men using a personalized risk-
based strategy, and while we lack organised population-based screening programs, this
should start at the primary care setting (i.e., with the patient and the GP) (52). A multivariable
individual approach should always be included.
Our focus as scientists and healthcare professionals should be to selectively identify
those man that can benefit from early detection (143). However, it has been shown that GPs
currently don’t have an individually-based systematic workflow for prostate cancer screening,
which precludes a standardized evidence-based approach for all men seeking individual care
(144, 145). This could be improved by implementing prostate cancer risk-stratification with the
ERSPC RPCRC: a recent study in a primary health care facility prevented almost half of the
referrals of men with PSA ≥3.0 ng/mL to the urologist (146).
Moreover, the patients’ life expectancy should also be taken into account: even though
the risk of clinically significant prostate cancer increases with age, an older patient, or with
comorbidities, will benefit less from curative treatment (147). To address this issue, a
prediction tool that provides GP advice (i.e., whether to refer a man for further assessment),
by combining individualised information on the risk of detecting clinically significant prostate
cancer and the potential overall survival benefit from its treatment, could be used in a primary
care setting, reducing both unnecessary testing and overdiagnosis (147).
In summary, there seems to be an untapped potential for refining prostate cancer
screening, which is still largely centred on an unsophisticated PSA-based one size fits all
model. An enhanced pragmatic strategy is to combine e/mHealth expertise, patient
empowerment, and clinical knowledge on true individual risk prediction, designing an
innovative and improved approach to prostate cancer early detection, aptly named version
2.0, as depicted in the workflow.
182

Most currently available risk calculators were developed more than 20 years ago, and
it has been shown that their predictive value can be increased by incorporating newer
biomarkers and imaging studies, even though there are availability and cost issues (135 -
138). Moreover, it should be noted that each risk factor has an intrinsic discriminatory
capability, and, consequently, there is a limit to their combined discriminatory potential, which
translates into a plateau of the AUC, even with additional information derived from new cases
(135). In such circumstances, the only way to increase the discrimination of existing risk
calculators is by adding new predictors.
Every day, new studies are being published demonstrating the advantages of pioneering
tests, but their clinical external validation in diverse populations is mandatory to enhance their
implementation, and, perhaps even more pertinent, their real world availability and affordability
are paramount to assure, if not equal healthcare for all, at least appropriate healthcare for all
men seeking an early diagnosis. In most countries, GPs are the gatekeepers to prostate
cancer detection, so we should strive to assure that multivariable risk stratification is available
in a primary care setting, and therefore accessible to the majority of the population, and not
just limited to those few that have privileged access to expensive markers and imaging studies,
which may be prohibitively resource intensive for general routine use (105). As an example,
the ERSPC RPCRC, is available as a smartphone app for both iOS and Android devices, and
also online, for free (http://www.prostatecancer-riskcalculator.com).
Genomic biomarkers can aid in the delivery of personalized diagnostic and treatment
choices, which can be helpful in such a heterogeneous disease as prostate cancer. Many
novel biomarkers have risen over the last decade and a recent review identified several that,
either alone or in combination with clinical findings, could assist decision making (139).
SelectMDx, MiProstate Score and ExoDx are urine tests that can be used to predict which
patients have a higher risk of aggressive disease, while PCA3 and Confirm MDx can be helpful
in patients with a high suspicion of prostate cancer after an initial negative biopsy (139).
Genomics, in addition to clinical and pathological variables, will probably help reduce the
number of unnecessary biopsies, stratify high risk patients and guide personalized treatment
decisions. However, even though genomic biomarkers can be incorporated into existing
prediction models, their current role and cost-benefit are still being evaluated (52). For
reference, the list price of PHI, PCA3, and SelectMDx is $500, while the 4KScore is $1,500
(140). Moreover, as was mentioned before, most are heavily dependent on clinical variables,
which questions their cost effectiveness. Using “PSA density” (i.e., PSA divided by prostate
volume) instead of total PSA is beneficial for risk stratification, but requires imaging tests.
Conclusion
Contemporary Medicine strives for an evidence-based approach, and accurate
estimates, for both physician and patient, are desirable: knowing the likelihood of a positive
diagnosis with an exam, understanding treatment success rate with a new drug, or accepting
the morbidity and mortality associated with a procedure can aid in this endeavour. For these
reasons objective predictive and prognostic tools, based on large cohorts of retrospective data
and statistical modelling, have been developed.
Prostate cancer is a major health issue worldwide, representing the second most
frequently detected cancer in men (141). Even though early detection can reduce cancer
specific mortality, prostate cancer screening is one of the most controversial topics in Urology,
because it is associated with overdiagnosis and overtreatment (142). To overcome these
issues, early detection should be tailored to well informed men using a personalized risk-
based strategy, and while we lack organised population-based screening programs, this
should start at the primary care setting (i.e., with the patient and the GP) (52). A multivariable
individual approach should always be included.
Our focus as scientists and healthcare professionals should be to selectively identify
those man that can benefit from early detection (143). However, it has been shown that GPs
currently don’t have an individually-based systematic workflow for prostate cancer screening,
which precludes a standardized evidence-based approach for all men seeking individual care
(144, 145). This could be improved by implementing prostate cancer risk-stratification with the
ERSPC RPCRC: a recent study in a primary health care facility prevented almost half of the
referrals of men with PSA ≥3.0 ng/mL to the urologist (146).
Moreover, the patients’ life expectancy should also be taken into account: even though
the risk of clinically significant prostate cancer increases with age, an older patient, or with
comorbidities, will benefit less from curative treatment (147). To address this issue, a
prediction tool that provides GP advice (i.e., whether to refer a man for further assessment),
by combining individualised information on the risk of detecting clinically significant prostate
cancer and the potential overall survival benefit from its treatment, could be used in a primary
care setting, reducing both unnecessary testing and overdiagnosis (147).
In summary, there seems to be an untapped potential for refining prostate cancer
screening, which is still largely centred on an unsophisticated PSA-based one size fits all
model. An enhanced pragmatic strategy is to combine e/mHealth expertise, patient
empowerment, and clinical knowledge on true individual risk prediction, designing an
innovative and improved approach to prostate cancer early detection, aptly named version
2.0, as depicted in the workflow.
183


PR
IMA
RY
CA
RE
SE
CO
ND
AR
Y A
ND
TE
RTI
AR
Y C
AR
E
< 60 yr
Follow-upin 5 yr
G3+3 or low risk G3+4*6
Active Surveillance
PRIAS / MyPSA
csPCa
Discuss Options*7
Active Treatment
PROSTATE CANCER EARLY DETECTION 2.0Prediction models and eHealth
Prostate biopsy
< 12% PCa< 4% csPCa
No furtherfollow-up
> 12% PCa> 4% csPCa
> 60 yr
Age RiskStratification
< 1.0 ng/mL 1.0-2.0 ng/mL
Follow-up in 2 yr
> 2.0 ng/mL
Well informed biopsy naïve*1 men > 50 yr*2 Life expectancy > 10 yr
PSA
Refer to Urologist
*1. If elevated prostate specific antigen (PSA) and previous negative biopsy, perform multi-parametric magnetic resonance imaging (mpMRI);*2. While awaiting the results of the PROBASE trial, a randomized control trial of prostate cancer screening in men aged 45 or 50 yrs;*3. Available online (prostatecancer-riskcalculator.com) and for smartphones (Apple App Store and Google Play Store);*4. If easy access to mpMRI, consider pre-biopsy mpMRI, with potential targeted biopsy, in addition to standard systematic biopsy scheme;*5. Incorporate tumor board dashboards and risk prediction tools, e.g., PROVISION;*6. Low risk Gleason score 3+4: absence of invasive cribiform growth pattern and intraductal carcinoma;*7. Treatment decisions should be made in a multidisciplinary team (i.e., urologists, oncologists, radiologists, and radiation oncologists), after
the patient understands the benefits and side-effects of appropriate alternatives.
csPCa = clinically significant PCa; DRE = digital rectal examination; G = Gleason score; mpMRI = multi-parametric magnetic resonance imaging; PCa = prostate cancer; PRIAS = Prostate Cancer Research International Active Surveillance; PSA = prostate specific antigen; RPCRC = Rotterdam Prostate Cancer Risk Calculator; yr = year.
RPCRC DRE-based*3
PCa riskcsPCa risk
Pre-biopsympMRI*4
Multidisciplinary team*5

Future Perspectives
Individual patients should receive individualized care. Precision Medicine (or
Personalized Medicine) is a growing trend and risk stratification has become an important part
of prostate cancer screening, where it can act as a gatekeeper, helping to identify men with
potentially incapacitating or even deadly illness, while at the same time preventing the
detection of indolent disease.
Current risk calculators have proven their superiority over PSA-based and DRE-based
strategies in predicting positive biopsy in multiple external validation cohorts, and their use in
clinical practice is supported by vast evidence and recommended by scientific guidelines.
However, their contrasting performance in different settings beckons that contemporary
multivariate prediction models still have the potential to improve their ability to predict the
outcome of prostate biopsy.
Several areas of research and multiple efforts could contribute to a more precise and
patient-centred risk prediction model:
1. Incorporate local, cohort-derived, adjustments to existing risk calculators (i.e., center-
specific calibration);
2. Integrate new biomarkers, imaging studies, or other relevant clinical information; but
always keep in mind availability and costs;
3. Develop dynamic risk calculators based on robust multi-institutional contemporary big-
data, up-to-date diagnostic practices and contemporary pathological classification
(e.g., deep learning approach for MRI interpretation and Gleason grading);
4. Incorporate these tools into electronic patient files and clinical dashboards, used in
multidisciplinary setting (e.g., tumour board review – the PROVISION project);
5. Empower patients and promote shared decision making by designing personalized
decision aids, and determine their impact with appropriate research, using evidence-
based quality measurement instruments;
6. Assess eHealth interventions influence in patient outcome, in parallel with their user
friendliness and acceptance by both clinicians and patients, and adapt accordingly.
Motivated by these endeavours, multivariable risk prediction models are expected to
continue to improve their ability to identify clinically significant prostate cancer, while
decreasing unnecessary biopsies, and therefore reducing the identification of clinically
insignificant cancer (i.e., overdiagnosis), and furthermore, preventing detrimental procedures
(i.e., overtreatment).
187

Future research should be dedicated to the original ERSPC goal: “optimize prostate
cancer screening, reducing unnecessary biopsies, preventing overtreatment of indolent
prostate cancers, while at the same time avoiding underdiagnosis”. One way to achieve this
is via the design, development, and improvement of dynamic and progressive prostate cancer
risk calculators, influenced by technology, propelled by scientific innovation, fuelled by medical
ingenuity and multidisciplinary cooperation, in comprehensive and inclusive cohorts,
promoting their forthcoming routine use.
References
1. World Health Organization. Global diffusion of eHealth: Making universal health coverage achievable. Accessed through: http://www.who.int/ehealth/en on May 1, 2018.
2. World Health Organization. mHealth: New horizons for health through mobile technologies: second global survey on eHealth. Accessed through: http://www.who.int/goe/publications/goe_mhealth_web.pdf on May 1, 2018.
3. Rubinstein A, Miranda JJ, Beratarrechea A, Diez-Canseco F, Kanter R, Gutierrez L, et al. Effectiveness of an mHealth intervention to improve the cardiometabolic profile of people with prehypertension in low-resource urban settings in Latin America: a randomised controlled trial. Lancet Diabetes Endocrinol. 2016;4(1):52-63.
4. Scott-Sheldon LAJ, Lantini R, Jennings EG, Thind H, Rosen RK, Salmoirago-Blotcher E, et al. Text Messaging-Based Interventions for Smoking Cessation: A Systematic Review and Meta-Analysis. JMIR Mhealth Uhealth. 2016;4(2):e49.
5. Sondaal SF, Browne JL, Amoakoh-Coleman M, Borgstein A, Miltenburg AS, Verwijs M, et al. Assessing the Effect of mHealth Interventions in Improving Maternal and Neonatal Care in Low- and Middle-Income Countries: A Systematic Review. PLoS One. 2016;11(5):e0154664.
6. Bower JL, Christensen CM. Disruptive Technologies: Catching the Wave. Harvard Business Review. Accessed through: https://hbr.org/1995/01/disruptive-technologies-catching-the-wave on May 1, 2018.
7. Christensen CM, Raynor ME, McDonald R. What Is Disruptive Innovation? Harvard Business Review. Accessed through: https://hbr.org/2015/12/what-is-disruptive-innovation on May 1, 2018.
8. Christensen CM, Waldeck A, Fogg R. The Innovation Health Care Really Needs: Help People Manage Their Own Health. Harvard Business Review. Accessed through: https://hbr.org/2017/10/the-innovation-health-care-really-needs-help-people-manage-their-own-health on April 30, 2018.
9. NWO Toegepaste en Technische Wetenschappen. Visual technology integrating quantitative patient outcomes to support multidisciplinary clinical decision making. 2016. Accessed through: http://www.stw.nl/nl/content/visual-technology-integrating-quantitative-patient-outcomes-support-multidisciplinary on June 13, 2018.
10. Venderbos L, Roobol M. MyPSA: an e-health technology for men on active surveillance for prostate cancer. Qual Life Res. 2017;26(Suppl.1):99.
11. Venderbos L, Roobol M. m-PRIAS: an e-health technology for men on active surveillance for prostate cancer. Qual Life Res. 2017;26(Suppl.1):99.
12. University of Virginia. Decision Navigation for Advanced Prostate Cancer Treatment Options Using mHealth. 2017. ClinicalTrials.gov Identifier: NCT03327103. Accessed through: https://clinicaltrials.gov/ct2/show/study/NCT03327103 on August 28, 2018.
13. Rincon E, Monteiro-Guerra F, Rivera-Romero O, Dorronzoro-Zubiete E, Sanchez-Bocanegra CL, Gabarron E. Mobile phone apps for quality of life and well-being assessment in breast and prostate cancer patients: systematic review. JMIR Mhealth Uhealth. 2017;5(12):e187.
14. Langius-Eklöf A, Crafoord MT, Christiansen M, Fjell M, Sundberg K. Effects of an interactive mHealth innovation for early detection of patient-reported symptom distress with focus on participatory care: protocol for a study based on prospective, randomised, controlled trials in patients with prostate and breast cancer. BMC Cancer. 2017;17(1):466.
188

Future research should be dedicated to the original ERSPC goal: “optimize prostate
cancer screening, reducing unnecessary biopsies, preventing overtreatment of indolent
prostate cancers, while at the same time avoiding underdiagnosis”. One way to achieve this
is via the design, development, and improvement of dynamic and progressive prostate cancer
risk calculators, influenced by technology, propelled by scientific innovation, fuelled by medical
ingenuity and multidisciplinary cooperation, in comprehensive and inclusive cohorts,
promoting their forthcoming routine use.
References
1. World Health Organization. Global diffusion of eHealth: Making universal health coverage achievable. Accessed through: http://www.who.int/ehealth/en on May 1, 2018.
2. World Health Organization. mHealth: New horizons for health through mobile technologies: second global survey on eHealth. Accessed through: http://www.who.int/goe/publications/goe_mhealth_web.pdf on May 1, 2018.
3. Rubinstein A, Miranda JJ, Beratarrechea A, Diez-Canseco F, Kanter R, Gutierrez L, et al. Effectiveness of an mHealth intervention to improve the cardiometabolic profile of people with prehypertension in low-resource urban settings in Latin America: a randomised controlled trial. Lancet Diabetes Endocrinol. 2016;4(1):52-63.
4. Scott-Sheldon LAJ, Lantini R, Jennings EG, Thind H, Rosen RK, Salmoirago-Blotcher E, et al. Text Messaging-Based Interventions for Smoking Cessation: A Systematic Review and Meta-Analysis. JMIR Mhealth Uhealth. 2016;4(2):e49.
5. Sondaal SF, Browne JL, Amoakoh-Coleman M, Borgstein A, Miltenburg AS, Verwijs M, et al. Assessing the Effect of mHealth Interventions in Improving Maternal and Neonatal Care in Low- and Middle-Income Countries: A Systematic Review. PLoS One. 2016;11(5):e0154664.
6. Bower JL, Christensen CM. Disruptive Technologies: Catching the Wave. Harvard Business Review. Accessed through: https://hbr.org/1995/01/disruptive-technologies-catching-the-wave on May 1, 2018.
7. Christensen CM, Raynor ME, McDonald R. What Is Disruptive Innovation? Harvard Business Review. Accessed through: https://hbr.org/2015/12/what-is-disruptive-innovation on May 1, 2018.
8. Christensen CM, Waldeck A, Fogg R. The Innovation Health Care Really Needs: Help People Manage Their Own Health. Harvard Business Review. Accessed through: https://hbr.org/2017/10/the-innovation-health-care-really-needs-help-people-manage-their-own-health on April 30, 2018.
9. NWO Toegepaste en Technische Wetenschappen. Visual technology integrating quantitative patient outcomes to support multidisciplinary clinical decision making. 2016. Accessed through: http://www.stw.nl/nl/content/visual-technology-integrating-quantitative-patient-outcomes-support-multidisciplinary on June 13, 2018.
10. Venderbos L, Roobol M. MyPSA: an e-health technology for men on active surveillance for prostate cancer. Qual Life Res. 2017;26(Suppl.1):99.
11. Venderbos L, Roobol M. m-PRIAS: an e-health technology for men on active surveillance for prostate cancer. Qual Life Res. 2017;26(Suppl.1):99.
12. University of Virginia. Decision Navigation for Advanced Prostate Cancer Treatment Options Using mHealth. 2017. ClinicalTrials.gov Identifier: NCT03327103. Accessed through: https://clinicaltrials.gov/ct2/show/study/NCT03327103 on August 28, 2018.
13. Rincon E, Monteiro-Guerra F, Rivera-Romero O, Dorronzoro-Zubiete E, Sanchez-Bocanegra CL, Gabarron E. Mobile phone apps for quality of life and well-being assessment in breast and prostate cancer patients: systematic review. JMIR Mhealth Uhealth. 2017;5(12):e187.
14. Langius-Eklöf A, Crafoord MT, Christiansen M, Fjell M, Sundberg K. Effects of an interactive mHealth innovation for early detection of patient-reported symptom distress with focus on participatory care: protocol for a study based on prospective, randomised, controlled trials in patients with prostate and breast cancer. BMC Cancer. 2017;17(1):466.
189

15. Stiggelbout AM, Van der Weijden T, De Wit MP, Frosch D, Légaré F, Montori VM, et al. Shared decision making: really putting patients at the centre of healthcare. BMJ 2012;344:e256.
16. Légaré F, Adekpedjou R, Stacey D, Turcotte S, Kryworuchko J, Graham ID, et al. Interventions for increasing the use of shared decision making by healthcare professionals.
Cochrane Database Syst Rev. 2018;7:CD006732. 17. Gärtner FR, Bomhof-Roordink H, Smith IP, Scholl I, Stiggelbout AM, Pieterse AH. The quality
of instruments to assess the process of shared decision making: A systematic review. PLoS One. 13(2):e0191747.
18. Kane HL, Halpern MT, Squiers LB, Treiman KA, McCormack LA. Implementing and evaluating shared decision making in oncology practice. CA Cancer J Clin. 2014;64(6):377-88.
19. Kashaf MS, McGill E. Does shared decision making in cancer treatment improve quality of life? A systematic literature review. Med Decis Making. 2015;35(8):1037-48.
20. Diouf NT, Menear M, Robitaille H, Painchaud Guérard G, Légaré F. Training health professionals in shared decision making: Update of an international environmental scan. Patient Educ Couns. 2016;99(11):1753-8.
21. Stacey D, Légaré F, Col NF, Bennett CL, Barry MJ, Eden KB, et al. Decision aids for people facing health treatment or screening decisions. Cochrane Database Syst Rev. 2017;(1):CD001431.
22. Viken A. The history of personal digital sssistants 1980 – 2000. Agile Mobility. 2009. Accessed through: https://web.archive.org/web/20131030153659/http://agilemobility.net/2009/04/the-history-of-personal-digital-assistants1 on May 1, 2018.
23. The Psion Organiser 1. Pocket Computer. Accessed through: http://archive.psion2.org/org2/psion1 on May 1, 2018.
24. The World Bank. ‘Maximizing Mobile’ Report Highlights Development Potential of Mobile Communications. Accessed through: http://www.worldbank.org/en/news/feature/2012/07/17/maximizing-mobile-development-potential-mobile-communications on May 1, 2018.
25. Kerris N, Dowling S. Apple Reinvents the Phone with iPhone. Apple Newsroom. 2007. Accessed through: https://www.apple.com/newsroom/2007/01/09Apple-Reinvents-the-Phone-with-iPhone on May 1, 2018.
26. Holson L, Helft M. T-mobile to offer first phone with Google software. 2008. Accessed through: http://www.nytimes.com/2008/08/15/technology/15google.html?_r=1&ref=technology&oref=slogin on May 1, 2018.
27. Apple HealthKit. Develop health and fitness apps that work together. Accessed through: https://developer.apple.com/healthkit on May 1, 2018.
28. Research2Guidance. The mobile health global market report 2013-2017: the commercialisation of mHealth apps (Vol. 3). 2013. Accessed through: https://research2guidance.com/product/mobile-health-market-report-2013-2017 on May 1, 2018.
29. Google Fit. Accessed through: https://developers.google.com/fit on May 1, 2018. 30. Pereira-Azevedo N, Carrasquinho E, Cardoso de Oliveira E, Cavadas V, Osório L, Fraga A, et
al. mHealth in Urology: A Review of Experts’ Involvement in App Development. PLoS One. 2015;10(5):e0125547.
31. Cantudo-Cuenca MR, Robustillo-Cortés MA, Cantudo-Cuenca MD, Morillo-Verdugo R. A better regulation is required in viral hepatitis smartphone applications. Farm Hosp. 2014;38(2):112-7.
32. Carter T, O'Neill S, Johns N, Brady RR. Contemporary vascular smartphone medical applications. Ann Vasc Surg. 2013;27(6):804-9.
33. Visvanathan A, Hamilton A, Brady RR. Smartphone apps in microbiology—is better regulation required? Clin Microbiol Infect. 2012;18(7):E218-20.
34. Pereira-Azevedo NM, Venderbos LDF. eHealth and mHealth in prostate cancer detection and active surveillance. Transl Androl Urol. 2018;7(1):170-81.
35. Research2Guidance. mHealth App Developer Economics 2016: The Current Status and Trends of the mHealth App Market. 2016 Oct. Accessed through: https://research2guidance.com/r2g/r2g-mHealth-App-Developer-Economics-2016.pdf on May 1, 2018.
36. Pereira-Azevedo N, Osório L, Cavadas V, Fraga A, Carrasquinho E, Cardoso de Oliveira E, et al. Expert involvement predicts mHealth app downloads: multivariate regression analysis of urology apps. JMIR Mhealth Uhealth. 2016;4(3):e86.
37. Ghose A, Han SP. Estimating demand for mobile applications in the new economy. Manage Sci. 2014;60(6):1470-88.
38. Telang R, Garg R. Estimating app demand from publicly available data. Pittsburgh, PA: Carnegie Mellon University; 2011 Sep 01. Accessed through: http://repository.cmu.edu/heinzworks/331 on May 1, 2018.
39. Davis A, Khazanchi D. An empirical study of online word of mouth as a predictor for multi-product category e-commerce sales. Electronic Markets.2008;18(2):130-41.
40. Liu Y. Word of mouth for movies: its dynamics and impact on box office revenue. J Marketing. 2006;70(3):74-89.
41. Decker R, Trusov M. Estimating aggregate consumer preferences from online product reviews. Int J Res Marketing. 2010;27(4):293-307.
42. Ghose A, Ipeirotis PG, Li B. Designing ranking systems for hotels on travel search engines by mining user-generated and crowd-sourced content. Marketing Sci. 2012;31(3):493-520.
43. Sinkinson M. The Determinants of supply and demand for mobile applications: Working Paper #12-27.: Net Institute; 2012 Sep. Accessed through: http://www.netinst.org/Sinkinson_12-27.pdf on May 1, 2018.
44. Jake-Schoffman DE, Silfee VJ, Waring ME, Boudreaux ED, Sadasivam RS, Mullen SP, et al. Methods for evaluating the content, usability, and efficacy of commercial mobile health apps. JMIR Mhealth Uhealth. 2017;5(12):e190.
45. Council of the European Union, European Parliament. Directive 2007/47/EC. Official Journal of the European Union. 2007,L247/25.
46. Council of the European Communities. Directive 93/42/EEC. Official Journal of the European Union. 1993L0042.
47. Schoffman DE, Turner-McGrievy G, Jones SJ, Wilcox S. Mobile apps for pediatric obesity prevention and treatment, healthy eating, and physical activity promotion: just fun and games? Transl Behav Med. 2013;3(3):320-5.
48. Pagoto S, Schneider K, Jojic M, DeBiasse M, Mann D. Evidence-based strategies in weight-loss mobile apps. Am J Prev Med. 2013;45(5):576-82.
49. Boudreaux ED, Waring ME, Hayes RB, Sadasivam RS, Mullen S, Pagoto S. Evaluating and selecting mobile health apps: strategies for healthcare providers and healthcare organizations. Transl Behav Med. 2014;4(4):363-71.
190

15. Stiggelbout AM, Van der Weijden T, De Wit MP, Frosch D, Légaré F, Montori VM, et al. Shared decision making: really putting patients at the centre of healthcare. BMJ 2012;344:e256.
16. Légaré F, Adekpedjou R, Stacey D, Turcotte S, Kryworuchko J, Graham ID, et al. Interventions for increasing the use of shared decision making by healthcare professionals.
Cochrane Database Syst Rev. 2018;7:CD006732. 17. Gärtner FR, Bomhof-Roordink H, Smith IP, Scholl I, Stiggelbout AM, Pieterse AH. The quality
of instruments to assess the process of shared decision making: A systematic review. PLoS One. 13(2):e0191747.
18. Kane HL, Halpern MT, Squiers LB, Treiman KA, McCormack LA. Implementing and evaluating shared decision making in oncology practice. CA Cancer J Clin. 2014;64(6):377-88.
19. Kashaf MS, McGill E. Does shared decision making in cancer treatment improve quality of life? A systematic literature review. Med Decis Making. 2015;35(8):1037-48.
20. Diouf NT, Menear M, Robitaille H, Painchaud Guérard G, Légaré F. Training health professionals in shared decision making: Update of an international environmental scan. Patient Educ Couns. 2016;99(11):1753-8.
21. Stacey D, Légaré F, Col NF, Bennett CL, Barry MJ, Eden KB, et al. Decision aids for people facing health treatment or screening decisions. Cochrane Database Syst Rev. 2017;(1):CD001431.
22. Viken A. The history of personal digital sssistants 1980 – 2000. Agile Mobility. 2009. Accessed through: https://web.archive.org/web/20131030153659/http://agilemobility.net/2009/04/the-history-of-personal-digital-assistants1 on May 1, 2018.
23. The Psion Organiser 1. Pocket Computer. Accessed through: http://archive.psion2.org/org2/psion1 on May 1, 2018.
24. The World Bank. ‘Maximizing Mobile’ Report Highlights Development Potential of Mobile Communications. Accessed through: http://www.worldbank.org/en/news/feature/2012/07/17/maximizing-mobile-development-potential-mobile-communications on May 1, 2018.
25. Kerris N, Dowling S. Apple Reinvents the Phone with iPhone. Apple Newsroom. 2007. Accessed through: https://www.apple.com/newsroom/2007/01/09Apple-Reinvents-the-Phone-with-iPhone on May 1, 2018.
26. Holson L, Helft M. T-mobile to offer first phone with Google software. 2008. Accessed through: http://www.nytimes.com/2008/08/15/technology/15google.html?_r=1&ref=technology&oref=slogin on May 1, 2018.
27. Apple HealthKit. Develop health and fitness apps that work together. Accessed through: https://developer.apple.com/healthkit on May 1, 2018.
28. Research2Guidance. The mobile health global market report 2013-2017: the commercialisation of mHealth apps (Vol. 3). 2013. Accessed through: https://research2guidance.com/product/mobile-health-market-report-2013-2017 on May 1, 2018.
29. Google Fit. Accessed through: https://developers.google.com/fit on May 1, 2018. 30. Pereira-Azevedo N, Carrasquinho E, Cardoso de Oliveira E, Cavadas V, Osório L, Fraga A, et
al. mHealth in Urology: A Review of Experts’ Involvement in App Development. PLoS One. 2015;10(5):e0125547.
31. Cantudo-Cuenca MR, Robustillo-Cortés MA, Cantudo-Cuenca MD, Morillo-Verdugo R. A better regulation is required in viral hepatitis smartphone applications. Farm Hosp. 2014;38(2):112-7.
32. Carter T, O'Neill S, Johns N, Brady RR. Contemporary vascular smartphone medical applications. Ann Vasc Surg. 2013;27(6):804-9.
33. Visvanathan A, Hamilton A, Brady RR. Smartphone apps in microbiology—is better regulation required? Clin Microbiol Infect. 2012;18(7):E218-20.
34. Pereira-Azevedo NM, Venderbos LDF. eHealth and mHealth in prostate cancer detection and active surveillance. Transl Androl Urol. 2018;7(1):170-81.
35. Research2Guidance. mHealth App Developer Economics 2016: The Current Status and Trends of the mHealth App Market. 2016 Oct. Accessed through: https://research2guidance.com/r2g/r2g-mHealth-App-Developer-Economics-2016.pdf on May 1, 2018.
36. Pereira-Azevedo N, Osório L, Cavadas V, Fraga A, Carrasquinho E, Cardoso de Oliveira E, et al. Expert involvement predicts mHealth app downloads: multivariate regression analysis of urology apps. JMIR Mhealth Uhealth. 2016;4(3):e86.
37. Ghose A, Han SP. Estimating demand for mobile applications in the new economy. Manage Sci. 2014;60(6):1470-88.
38. Telang R, Garg R. Estimating app demand from publicly available data. Pittsburgh, PA: Carnegie Mellon University; 2011 Sep 01. Accessed through: http://repository.cmu.edu/heinzworks/331 on May 1, 2018.
39. Davis A, Khazanchi D. An empirical study of online word of mouth as a predictor for multi-product category e-commerce sales. Electronic Markets.2008;18(2):130-41.
40. Liu Y. Word of mouth for movies: its dynamics and impact on box office revenue. J Marketing. 2006;70(3):74-89.
41. Decker R, Trusov M. Estimating aggregate consumer preferences from online product reviews. Int J Res Marketing. 2010;27(4):293-307.
42. Ghose A, Ipeirotis PG, Li B. Designing ranking systems for hotels on travel search engines by mining user-generated and crowd-sourced content. Marketing Sci. 2012;31(3):493-520.
43. Sinkinson M. The Determinants of supply and demand for mobile applications: Working Paper #12-27.: Net Institute; 2012 Sep. Accessed through: http://www.netinst.org/Sinkinson_12-27.pdf on May 1, 2018.
44. Jake-Schoffman DE, Silfee VJ, Waring ME, Boudreaux ED, Sadasivam RS, Mullen SP, et al. Methods for evaluating the content, usability, and efficacy of commercial mobile health apps. JMIR Mhealth Uhealth. 2017;5(12):e190.
45. Council of the European Union, European Parliament. Directive 2007/47/EC. Official Journal of the European Union. 2007,L247/25.
46. Council of the European Communities. Directive 93/42/EEC. Official Journal of the European Union. 1993L0042.
47. Schoffman DE, Turner-McGrievy G, Jones SJ, Wilcox S. Mobile apps for pediatric obesity prevention and treatment, healthy eating, and physical activity promotion: just fun and games? Transl Behav Med. 2013;3(3):320-5.
48. Pagoto S, Schneider K, Jojic M, DeBiasse M, Mann D. Evidence-based strategies in weight-loss mobile apps. Am J Prev Med. 2013;45(5):576-82.
49. Boudreaux ED, Waring ME, Hayes RB, Sadasivam RS, Mullen S, Pagoto S. Evaluating and selecting mobile health apps: strategies for healthcare providers and healthcare organizations. Transl Behav Med. 2014;4(4):363-71.
191

50. American Psychiatric Association. App evaluation model. Accessed through: https://www.psychiatry.org/psychiatrists/practice/mental-health-apps/app-evaluation-model on May 1, 2018.
51. IDC Analyze the future. Worldwide and U.S. Mobile applications, storefronts, developer, and in-app advertising 2011-2015 forecast: emergence of postdownload business models. Accessed through: https://www.idc.com on May 1, 2018.
52. Mottet N, van den Bergh RCN, Briers E, Bourke L, Cornford P, De Santis M, et al. EAU-ESUR-ESTRO-SIOG Guidelines on Prostate Cancer – 2018 Update. European Association of Urology.
53. Jeong CW, Lee S, Jung J, Lee BK, Jeong SJ, Hong SK, et al. Mobile application-based Seoul National University Prostate Cancer Risk Calculator: development, validation, and comparative analysis with two Western risk calculators in Korean men. PLoS One. 2014;9(4):e94441.
54. van den Bergh RC, Roobol MJ, Wolters T, van Leeuwen PJ, Schröder FH. The Prostate Cancer Prevention Trial and European Randomized Study of Screening for Prostate Cancer risk calculators indicating a positive prostate biopsy: a comparison. BJU Int. 2008;102(9):1068-73.
55. Trottier G, Roobol MJ, Lawrentschuk N, Boström PJ, Fernandes KA, Finelli A, et al. Comparison of risk calculators from the Prostate Cancer Prevention Trial and the European Randomized Study of Screening for Prostate Cancer in a contemporary Canadian cohort. BJU Int. 2011;108(8 Pt 2):E237-44.
56. Lee DH, Jung HB, Park JW, Kim KH, Kim J, Lee SH, et al. Can Western based online prostate cancer risk calculators be used to predict prostate cancer after prostate biopsy for the Korean population? Yonsei Med J. 2013;54(3):665-71.
57. Yoon DK, Park JY, Yoon S, Park MS, Moon DG, Lee JG, et al. Can the prostate risk calculator based on Western population be applied to Asian population? Prostate. 2012;72(7):721-9.
58. Poyet C, Nieboer D, Bhindi B, Kulkarni GS, Wiederkehr C, Wettstein MS, et al. Prostate cancer risk prediction using the novel versions of the European Randomised Study for Screening of Prostate Cancer (ERSPC) and Prostate Cancer Prevention Trial (PCPT) risk calculators: independent validation and comparison in a contemporary European cohort. BJU Int. 2016;117(3):401-8.
59. Roobol MJ, van Vugt HA, Loeb S, Zhu X, Bul M, Bangma CH, et al. Prediction of prostate cancer risk: the role of prostate volume and digital rectal examination in the ERSPC risk calculators. Eur Urol. 2012;61(3):577-83.
60. Jobs S. Thoughts on Flash. 2010. Accessed through: https://www.apple.com/hotnews/thoughts-on-flash on May 1, 2018.
61. Preece J, Rogers Y, Sharp H, Benyon D, Holland S, Carey T. Human-computer interaction: concepts and design. Workingham, England: Addison-Wesley Publishing Co; 1994.
62. Boulos MNK, Brewer AC, Karimkhani C, Buller DB, Dellavalle RP. Mobile medical and health apps: state of the art, concerns, regulatory control and certification. Online J Public Health Inform. 2014;5(3):229.
63. BinDhim NF, Hawkey A, Trevena L. A systematic review of quality assessment methods for smartphone health apps. Telemed J E Health. 2015;21(2):97-104.
64. Zhang D, Adipat B. Challenges, methodologies, and issues in the usability testing of mobile applications. Int J Hum Comput Interact. 2005;18(3):293-308.
65. Martínez-Pérez B, de la Torre-Díez I, López-Coronado M. Experiences and results of applying tools for assessing the quality of a mHealth app named Heartkeeper. J Med Syst. 2015;39(11):142.
66. Lewis JR. Psychometric evaluation of the PSSUQ using data from five years of usability studies. Int J Hum-Comput Int. 2002;14(3-4):463-88.
67. Frauenberger C, Good J, Fitzpatrick G, Iversen OS. In pursuit of rigour and accountability in participatory design. Int J Hum Comput Stud. 2015;74:93-106.
68. Granja C, Janssen W, Johansen MA. Factors determining the success and failure of eHealth interventions: systematic review of the literature. J Med Internet Res. 2018;20(5):e10235.
69. W3C recommendations. HTML 5.2. Accessed through: https://www.w3.org/TR/html5 on May 1, 2018.
70. The Prostate Cancer Charity UK. The Prostate Cancer Charity releases results of ground breaking survey on quality care in prostate cancer. Accessed through: https://prostatecanceruk.org/about-us/news-and-views/2012/6/quality-care-report on May 1, 2018.
71. Grol R, Wensing M, Mainz J, Jung PH, Ferreira P, Hearnshaw H, et al. Patients in Europe evaluate general practice care: an international comparison. Br J Gen Pract. 2000;50(460):882-7.
72. Martin LR, DiMatteo MR, Lepper HS. Facilitation of patient involvement in care: development and validation of a scale. Behav Med. 2001;27(3):111-20.
73. Lau M, Campbell H, Tang T, Thompson DJ, Elliott T. Impact of patient use of an online patient portal on diabetes outcomes. Can J Diabetes. 2014;38(1):17-21.
74. Bravo P, Edwards A, Barr PJ, Scholl I, Elwyn G, McAllister M, et al. Conceptualising patient empowerment: a mixed methods study. BMC Health Serv Res. 2015;15:252.
75. Calvillo J, Román I, Roa LM. How technology is empowering patients? A literature review. Health Expect. 2015;18(5):643-52.
76. Lettieri E, Fumagalli LP, Radaelli G, Bertele' P, Vogt J, Hammerschmidt R, et al. Empowering patients through eHealth: a case report of a pan-European project. BMC Health Serv Res. 2015;15:309.
77. Health literacy. National network of libraries of medicine. Accessed through: https://nnlm.gov/initiatives/topics/health-literacy on May 1, 2018.
78. Risling T, Martinez J, Young J, Thorp-Froslie N. Evaluating patient empowerment in association with eHealth technology: scoping review. J Med Internet Res. 2017;19(9):e329.
79. Kambhampati S, Ashvetiya T, Stone NJ, Blumenthal RS, Martin SS. Shared decision-making and patient empowerment in preventive cardiology. Curr Cardiol Rep. 2016;18(5):49.
80. Apple. Empower your patients with Health Records on iPhone. Accessed through: https://www.apple.com/healthcare/health-records on May 1, 2018.
81. Amazon. Amazon, Berkshire Hathaway and JPMorgan Chase & Co. to partner on U.S. employee healthcare. Accessed through: http://www.berkshirehathaway.com/news/jan3018.pdf on May 1, 2018.
82. Mechael P, Batavia H, Kaonga N, Searle S, Kwan A, Goldberger A, et al. Barriers and gaps affecting mHealth in low and middle income countries: Policy White Paper, 2010. Accessed through: http://www.globalproblems-globalsolutions-files.org/pdfs/mHealth_Barriers_White_Paper.pdf on May 1, 2018.
83. Bangma C, Obbink H. The future of prostate cancer research: bringing data together, looking back and forward. Transl Androl Urol. 2018;7(1):188-194.
84. Wein AJ, Kavoussi LR, Partin AW, Peters CA. Evaluation of the urologic patient: history, physical examination and urinalysis, In Campbell-Walsh Urology, 2016. 11th Edition, Chapter 1, Elsevier, Philadelphia, p.11.
192

50. American Psychiatric Association. App evaluation model. Accessed through: https://www.psychiatry.org/psychiatrists/practice/mental-health-apps/app-evaluation-model on May 1, 2018.
51. IDC Analyze the future. Worldwide and U.S. Mobile applications, storefronts, developer, and in-app advertising 2011-2015 forecast: emergence of postdownload business models. Accessed through: https://www.idc.com on May 1, 2018.
52. Mottet N, van den Bergh RCN, Briers E, Bourke L, Cornford P, De Santis M, et al. EAU-ESUR-ESTRO-SIOG Guidelines on Prostate Cancer – 2018 Update. European Association of Urology.
53. Jeong CW, Lee S, Jung J, Lee BK, Jeong SJ, Hong SK, et al. Mobile application-based Seoul National University Prostate Cancer Risk Calculator: development, validation, and comparative analysis with two Western risk calculators in Korean men. PLoS One. 2014;9(4):e94441.
54. van den Bergh RC, Roobol MJ, Wolters T, van Leeuwen PJ, Schröder FH. The Prostate Cancer Prevention Trial and European Randomized Study of Screening for Prostate Cancer risk calculators indicating a positive prostate biopsy: a comparison. BJU Int. 2008;102(9):1068-73.
55. Trottier G, Roobol MJ, Lawrentschuk N, Boström PJ, Fernandes KA, Finelli A, et al. Comparison of risk calculators from the Prostate Cancer Prevention Trial and the European Randomized Study of Screening for Prostate Cancer in a contemporary Canadian cohort. BJU Int. 2011;108(8 Pt 2):E237-44.
56. Lee DH, Jung HB, Park JW, Kim KH, Kim J, Lee SH, et al. Can Western based online prostate cancer risk calculators be used to predict prostate cancer after prostate biopsy for the Korean population? Yonsei Med J. 2013;54(3):665-71.
57. Yoon DK, Park JY, Yoon S, Park MS, Moon DG, Lee JG, et al. Can the prostate risk calculator based on Western population be applied to Asian population? Prostate. 2012;72(7):721-9.
58. Poyet C, Nieboer D, Bhindi B, Kulkarni GS, Wiederkehr C, Wettstein MS, et al. Prostate cancer risk prediction using the novel versions of the European Randomised Study for Screening of Prostate Cancer (ERSPC) and Prostate Cancer Prevention Trial (PCPT) risk calculators: independent validation and comparison in a contemporary European cohort. BJU Int. 2016;117(3):401-8.
59. Roobol MJ, van Vugt HA, Loeb S, Zhu X, Bul M, Bangma CH, et al. Prediction of prostate cancer risk: the role of prostate volume and digital rectal examination in the ERSPC risk calculators. Eur Urol. 2012;61(3):577-83.
60. Jobs S. Thoughts on Flash. 2010. Accessed through: https://www.apple.com/hotnews/thoughts-on-flash on May 1, 2018.
61. Preece J, Rogers Y, Sharp H, Benyon D, Holland S, Carey T. Human-computer interaction: concepts and design. Workingham, England: Addison-Wesley Publishing Co; 1994.
62. Boulos MNK, Brewer AC, Karimkhani C, Buller DB, Dellavalle RP. Mobile medical and health apps: state of the art, concerns, regulatory control and certification. Online J Public Health Inform. 2014;5(3):229.
63. BinDhim NF, Hawkey A, Trevena L. A systematic review of quality assessment methods for smartphone health apps. Telemed J E Health. 2015;21(2):97-104.
64. Zhang D, Adipat B. Challenges, methodologies, and issues in the usability testing of mobile applications. Int J Hum Comput Interact. 2005;18(3):293-308.
65. Martínez-Pérez B, de la Torre-Díez I, López-Coronado M. Experiences and results of applying tools for assessing the quality of a mHealth app named Heartkeeper. J Med Syst. 2015;39(11):142.
66. Lewis JR. Psychometric evaluation of the PSSUQ using data from five years of usability studies. Int J Hum-Comput Int. 2002;14(3-4):463-88.
67. Frauenberger C, Good J, Fitzpatrick G, Iversen OS. In pursuit of rigour and accountability in participatory design. Int J Hum Comput Stud. 2015;74:93-106.
68. Granja C, Janssen W, Johansen MA. Factors determining the success and failure of eHealth interventions: systematic review of the literature. J Med Internet Res. 2018;20(5):e10235.
69. W3C recommendations. HTML 5.2. Accessed through: https://www.w3.org/TR/html5 on May 1, 2018.
70. The Prostate Cancer Charity UK. The Prostate Cancer Charity releases results of ground breaking survey on quality care in prostate cancer. Accessed through: https://prostatecanceruk.org/about-us/news-and-views/2012/6/quality-care-report on May 1, 2018.
71. Grol R, Wensing M, Mainz J, Jung PH, Ferreira P, Hearnshaw H, et al. Patients in Europe evaluate general practice care: an international comparison. Br J Gen Pract. 2000;50(460):882-7.
72. Martin LR, DiMatteo MR, Lepper HS. Facilitation of patient involvement in care: development and validation of a scale. Behav Med. 2001;27(3):111-20.
73. Lau M, Campbell H, Tang T, Thompson DJ, Elliott T. Impact of patient use of an online patient portal on diabetes outcomes. Can J Diabetes. 2014;38(1):17-21.
74. Bravo P, Edwards A, Barr PJ, Scholl I, Elwyn G, McAllister M, et al. Conceptualising patient empowerment: a mixed methods study. BMC Health Serv Res. 2015;15:252.
75. Calvillo J, Román I, Roa LM. How technology is empowering patients? A literature review. Health Expect. 2015;18(5):643-52.
76. Lettieri E, Fumagalli LP, Radaelli G, Bertele' P, Vogt J, Hammerschmidt R, et al. Empowering patients through eHealth: a case report of a pan-European project. BMC Health Serv Res. 2015;15:309.
77. Health literacy. National network of libraries of medicine. Accessed through: https://nnlm.gov/initiatives/topics/health-literacy on May 1, 2018.
78. Risling T, Martinez J, Young J, Thorp-Froslie N. Evaluating patient empowerment in association with eHealth technology: scoping review. J Med Internet Res. 2017;19(9):e329.
79. Kambhampati S, Ashvetiya T, Stone NJ, Blumenthal RS, Martin SS. Shared decision-making and patient empowerment in preventive cardiology. Curr Cardiol Rep. 2016;18(5):49.
80. Apple. Empower your patients with Health Records on iPhone. Accessed through: https://www.apple.com/healthcare/health-records on May 1, 2018.
81. Amazon. Amazon, Berkshire Hathaway and JPMorgan Chase & Co. to partner on U.S. employee healthcare. Accessed through: http://www.berkshirehathaway.com/news/jan3018.pdf on May 1, 2018.
82. Mechael P, Batavia H, Kaonga N, Searle S, Kwan A, Goldberger A, et al. Barriers and gaps affecting mHealth in low and middle income countries: Policy White Paper, 2010. Accessed through: http://www.globalproblems-globalsolutions-files.org/pdfs/mHealth_Barriers_White_Paper.pdf on May 1, 2018.
83. Bangma C, Obbink H. The future of prostate cancer research: bringing data together, looking back and forward. Transl Androl Urol. 2018;7(1):188-194.
84. Wein AJ, Kavoussi LR, Partin AW, Peters CA. Evaluation of the urologic patient: history, physical examination and urinalysis, In Campbell-Walsh Urology, 2016. 11th Edition, Chapter 1, Elsevier, Philadelphia, p.11.
193

85. Gosselaar C, Roobol MJ, Roemeling S, Schröder FH. The role of the digital rectal examination in subsequent screening visits in the European randomized study of screening for prostate cancer (ERSPC), Rotterdam. Eur Urol. 2008;54(3):581-8.
86. Brierley JD, Gospodarowicz MK, Wittekind C. The TNM classification of malignant tumours 8th edition. UICC International Union Against Cancer. 2017.
87. Mistry K, Cable G. Meta-analysis of prostate-specific antigen and digital rectal examination as screening tests for prostate carcinoma. J Am Board Fam Pract. 2003;16(2):95-101.
88. Kuriyama M, Wang MC, Papsidero LD, Killian CS, Shimano T, Valenzuela L, et al. Quantitation of prostate-specific antigen in serum by a sensitive enzyme immunoassay. Cancer Res. 1980;40(12):4658-62.
89. Welch HG, Gorski DH, Albertsen PC. Trends in metastatic breast and prostate cancer--lessons in cancer dynamics. N Engl J Med. 2015;373(18):1685-7.
90. Stamey TA, Yang N, Hay AR, McNeal JE, Freiha FS, Redwine E. Prostate-specific antigen as a serum marker for adenocarcinoma of the prostate. N Engl J Med. 1987;317(15):909-16.
91. Thompson IM, Pauler DK, Goodman PJ, Tangen CM, Lucia MS, Parnes HL, et al. Prevalence of prostate cancer among men with a prostate-specific antigen level ≤4.0 ng per Milliliter. N Engl J Med. 2004;350(22):2239-46.
92. Grenabo Bergdahl A, Wilderang U, Aus G, Carlsson S, Damber JE, Franlund M, et al. Role of magnetic resonance imaging in prostate cancer screening: a pilot study within the Goteborg Randomised Screening Trial. Eur Urol. 2016;70(4):566-73.
93. Bul M, van Leeuwen PJ, Zhu X, Schröder FH, Roobol MJ. Prostate cancer incidence and disease-specific survival of men with initial prostate-specific antigen less than 3.0 ng/ml who are participating in ERSPC Rotterdam. Eur Urol. 2011;59(4):498-505.
94. Loeb S, Sokoll LJ, Broyles DL, Bangma CH, van Schaik RH, Klee GG, et al. Prospective multicenter evaluation of the Beckman Coulter Prostate Health Index using WHO calibration. J Urol. 2013;189(5):1702-6.
95. Konety B, Zappala SM, Parekh DJ, Osterhout D, Schock J, Chudler RM, et al. The 4Kscore® test reduces prostate biopsy rates in community and academic urology practices. Rev Urol. 2015;17(4):231-40.
96. Filella X, Gimenez N. Evaluation of [-2] proPSA and prostate health index (phi) for the detection of prostate cancer: a systematic review and meta-analysis. Clin Chem Lab Med. 2013;51(4):729-39.
97. Makarov DV, Loeb S, Getzenberg RH, Partin AW. Biomarkers for prostate cancer. Annu Rev Med. 2009;60:139-51.
98. Nordström T, Vickers A, Assel M, Lilja H, Grönberg H, Eklund M. Comparison between the four-kallikrein panel and Prostate Health Index for predicting prostate cancer. Eur Urol. 2015;68(1):139-46.
99. Auprich M, Bjartell A, Chun FK, de la Taille A, Freedland SJ, Haese A, et al. Contemporary role of prostate cancer antigen 3 in the management of prostate cancer. Eur Urol. 2011;60(5):1045-54.
100. Vlaeminck-Guillem V, Ruffion A, Andre J. Place du test urinaire PCA3 pour le diagnostic du cancer de prostate. Prog Urol. 2008;18(5): 259-65.
101. Van Neste L, Hendriks RJ, Dijkstra S, Trooskens G, Cornel EB, Jannink SA, et al. Detection of high-grade prostate cancer using a urinary molecular biomarker-based risk score. Eur Urol. 2016;70(5):740-8.
102. Dijkstra S, Govers TM, Hendriks RJ, Schalken JA, Van Criekinge W, Van Neste L, et al. Cost-effectiveness of a new urinary biomarker-based risk score compared to standard of care in prostate cancer diagnostics – a decision analytical model. BJU Int. 2017;120(5):659-65.
103. Grönberg H, Adolfsson J, Aly M, Nordström T, Wiklund P, Brandberg Y, et al. Prostate cancer screening in men aged 50-69 years (STHLM3): a prospective population-based diagnostic study. Lancet Oncol. 2015;16(16):1667-76.
104. Ström P, Nordström T, Grönberg H, Eklund M. The Stockholm-3 Model for Prostate Cancer Detection: Algorithm Update, Biomarker Contribution, and Reflex Test Potential. Eur Urol. 2018. pii: S0302-2838(17)31096-5.
105. Eggener S. Prostate Cancer Screening Biomarkers: An Emerging Embarrassment of ‘Riches’? Eur Urol. 2016;70(1):54-5.
106. Smeenge M, Barentsz J, Cosgrove D, de la Rosette J, de Reijke T, Eggener S, et al. Role of transrectal ultrasonography (TRUS) in focal therapy of prostate cancer: report from a Consensus Panel. BJU Int. 2012;110(7):942-8.
107. Gómez Rivas J, Giganti F, Álvarez-Maestro M, Freire MJ, Kasivisvanathan V, Martinez-Piñeiro L, et al. Prostate indeterminate lesions on magnetic resonance imaging-biopsy versus surveillance: A literature review. Eur Urol Focus. 2018. pii: S2405-4569(18)30074-9.
108. van Hove A, Savoie PH, Maurin C, Brunelle S, Gravis G, Salem N, et al. Comparison of image-guided targeted biopsies versus systematic randomized biopsies in the detection of prostate cancer: a systematic literature review of well-designed studies. World J Urol. 2014;32(4):847-58.
109. Wegelin O, van Melick HH, Hooft L, Bosch JL, Reitsma HB, Barentsz JO, et al. Comparing three different techniques for magnetic resonance imaging-targeted prostate biopsies: a systematic review of in-bore versus magnetic resonance imaging-transrectal ultrasound fusion versus cognitive registration. Is there a preferred technique? Eur Urol. 2017;71(4):517-31.
110. Moldovan PC, Van den Broeck T, Sylvester R, Marconi L, Bellmunt J, van den Bergh RCN, et al. What Is the negative predictive of multiparametric magnetic resonance imaging in excluding prostate cancer at biopsy? A systematic review and meta-analysis from the European Association of Urology prostate cancer guidelines panel. Eur Urol. 2017;72(2):250-66.
111. Faria R, Soares MO, Spackman E, Ahmed HU, Brown LC, Kaplan R, et al. Optimising the diagnosis of prostate cancer in the era of multiparametric magnetic resonance imaging: A cost-effectiveness analysis based on the Prostate MR Imaging Study (PROMIS). Eur Urol. 2018;73(1):23-30.
112. Renard-Penna R, Rouvière O, Puech P, Borgogno C, Abbas L, Roy C, et al. Current practice and access to prostate MR imaging in France. Diagn Interv Imaging. 2016;97(11):1125-9.
113. Kasivisvanathan V, Rannikko AS, Borghi M, Panebianco V, Mynderse LA, Vaarala MH, et al. MRI-Targeted or Standard Biopsy for Prostate-Cancer Diagnosis. N Engl J Med. 2018;378(19):1767-77.
114. de Rooij M, Crienen S, Witjes JA, Barentsz JO, Rovers MM, Grutters JP. Cost-effectiveness of magnetic resonance (MR) imaging and MR-guided targeted biopsy versus systematic transrectal ultrasound-guided biopsy in diagnosing prostate cancer: a modelling study from a health care perspective. Eur Urol. 2014;66(3):430-6.
115. Cerantola Y, Dragomir A, Tanguay S, Bladou F, Aprikian A, Kassouf W. Cost-effectiveness of multiparametric magnetic resonance imaging and targeted biopsy in diagnosing prostate cancer. Urol Oncol. 2016;34(3):119.e1-9.
194

85. Gosselaar C, Roobol MJ, Roemeling S, Schröder FH. The role of the digital rectal examination in subsequent screening visits in the European randomized study of screening for prostate cancer (ERSPC), Rotterdam. Eur Urol. 2008;54(3):581-8.
86. Brierley JD, Gospodarowicz MK, Wittekind C. The TNM classification of malignant tumours 8th edition. UICC International Union Against Cancer. 2017.
87. Mistry K, Cable G. Meta-analysis of prostate-specific antigen and digital rectal examination as screening tests for prostate carcinoma. J Am Board Fam Pract. 2003;16(2):95-101.
88. Kuriyama M, Wang MC, Papsidero LD, Killian CS, Shimano T, Valenzuela L, et al. Quantitation of prostate-specific antigen in serum by a sensitive enzyme immunoassay. Cancer Res. 1980;40(12):4658-62.
89. Welch HG, Gorski DH, Albertsen PC. Trends in metastatic breast and prostate cancer--lessons in cancer dynamics. N Engl J Med. 2015;373(18):1685-7.
90. Stamey TA, Yang N, Hay AR, McNeal JE, Freiha FS, Redwine E. Prostate-specific antigen as a serum marker for adenocarcinoma of the prostate. N Engl J Med. 1987;317(15):909-16.
91. Thompson IM, Pauler DK, Goodman PJ, Tangen CM, Lucia MS, Parnes HL, et al. Prevalence of prostate cancer among men with a prostate-specific antigen level ≤4.0 ng per Milliliter. N Engl J Med. 2004;350(22):2239-46.
92. Grenabo Bergdahl A, Wilderang U, Aus G, Carlsson S, Damber JE, Franlund M, et al. Role of magnetic resonance imaging in prostate cancer screening: a pilot study within the Goteborg Randomised Screening Trial. Eur Urol. 2016;70(4):566-73.
93. Bul M, van Leeuwen PJ, Zhu X, Schröder FH, Roobol MJ. Prostate cancer incidence and disease-specific survival of men with initial prostate-specific antigen less than 3.0 ng/ml who are participating in ERSPC Rotterdam. Eur Urol. 2011;59(4):498-505.
94. Loeb S, Sokoll LJ, Broyles DL, Bangma CH, van Schaik RH, Klee GG, et al. Prospective multicenter evaluation of the Beckman Coulter Prostate Health Index using WHO calibration. J Urol. 2013;189(5):1702-6.
95. Konety B, Zappala SM, Parekh DJ, Osterhout D, Schock J, Chudler RM, et al. The 4Kscore® test reduces prostate biopsy rates in community and academic urology practices. Rev Urol. 2015;17(4):231-40.
96. Filella X, Gimenez N. Evaluation of [-2] proPSA and prostate health index (phi) for the detection of prostate cancer: a systematic review and meta-analysis. Clin Chem Lab Med. 2013;51(4):729-39.
97. Makarov DV, Loeb S, Getzenberg RH, Partin AW. Biomarkers for prostate cancer. Annu Rev Med. 2009;60:139-51.
98. Nordström T, Vickers A, Assel M, Lilja H, Grönberg H, Eklund M. Comparison between the four-kallikrein panel and Prostate Health Index for predicting prostate cancer. Eur Urol. 2015;68(1):139-46.
99. Auprich M, Bjartell A, Chun FK, de la Taille A, Freedland SJ, Haese A, et al. Contemporary role of prostate cancer antigen 3 in the management of prostate cancer. Eur Urol. 2011;60(5):1045-54.
100. Vlaeminck-Guillem V, Ruffion A, Andre J. Place du test urinaire PCA3 pour le diagnostic du cancer de prostate. Prog Urol. 2008;18(5): 259-65.
101. Van Neste L, Hendriks RJ, Dijkstra S, Trooskens G, Cornel EB, Jannink SA, et al. Detection of high-grade prostate cancer using a urinary molecular biomarker-based risk score. Eur Urol. 2016;70(5):740-8.
102. Dijkstra S, Govers TM, Hendriks RJ, Schalken JA, Van Criekinge W, Van Neste L, et al. Cost-effectiveness of a new urinary biomarker-based risk score compared to standard of care in prostate cancer diagnostics – a decision analytical model. BJU Int. 2017;120(5):659-65.
103. Grönberg H, Adolfsson J, Aly M, Nordström T, Wiklund P, Brandberg Y, et al. Prostate cancer screening in men aged 50-69 years (STHLM3): a prospective population-based diagnostic study. Lancet Oncol. 2015;16(16):1667-76.
104. Ström P, Nordström T, Grönberg H, Eklund M. The Stockholm-3 Model for Prostate Cancer Detection: Algorithm Update, Biomarker Contribution, and Reflex Test Potential. Eur Urol. 2018. pii: S0302-2838(17)31096-5.
105. Eggener S. Prostate Cancer Screening Biomarkers: An Emerging Embarrassment of ‘Riches’? Eur Urol. 2016;70(1):54-5.
106. Smeenge M, Barentsz J, Cosgrove D, de la Rosette J, de Reijke T, Eggener S, et al. Role of transrectal ultrasonography (TRUS) in focal therapy of prostate cancer: report from a Consensus Panel. BJU Int. 2012;110(7):942-8.
107. Gómez Rivas J, Giganti F, Álvarez-Maestro M, Freire MJ, Kasivisvanathan V, Martinez-Piñeiro L, et al. Prostate indeterminate lesions on magnetic resonance imaging-biopsy versus surveillance: A literature review. Eur Urol Focus. 2018. pii: S2405-4569(18)30074-9.
108. van Hove A, Savoie PH, Maurin C, Brunelle S, Gravis G, Salem N, et al. Comparison of image-guided targeted biopsies versus systematic randomized biopsies in the detection of prostate cancer: a systematic literature review of well-designed studies. World J Urol. 2014;32(4):847-58.
109. Wegelin O, van Melick HH, Hooft L, Bosch JL, Reitsma HB, Barentsz JO, et al. Comparing three different techniques for magnetic resonance imaging-targeted prostate biopsies: a systematic review of in-bore versus magnetic resonance imaging-transrectal ultrasound fusion versus cognitive registration. Is there a preferred technique? Eur Urol. 2017;71(4):517-31.
110. Moldovan PC, Van den Broeck T, Sylvester R, Marconi L, Bellmunt J, van den Bergh RCN, et al. What Is the negative predictive of multiparametric magnetic resonance imaging in excluding prostate cancer at biopsy? A systematic review and meta-analysis from the European Association of Urology prostate cancer guidelines panel. Eur Urol. 2017;72(2):250-66.
111. Faria R, Soares MO, Spackman E, Ahmed HU, Brown LC, Kaplan R, et al. Optimising the diagnosis of prostate cancer in the era of multiparametric magnetic resonance imaging: A cost-effectiveness analysis based on the Prostate MR Imaging Study (PROMIS). Eur Urol. 2018;73(1):23-30.
112. Renard-Penna R, Rouvière O, Puech P, Borgogno C, Abbas L, Roy C, et al. Current practice and access to prostate MR imaging in France. Diagn Interv Imaging. 2016;97(11):1125-9.
113. Kasivisvanathan V, Rannikko AS, Borghi M, Panebianco V, Mynderse LA, Vaarala MH, et al. MRI-Targeted or Standard Biopsy for Prostate-Cancer Diagnosis. N Engl J Med. 2018;378(19):1767-77.
114. de Rooij M, Crienen S, Witjes JA, Barentsz JO, Rovers MM, Grutters JP. Cost-effectiveness of magnetic resonance (MR) imaging and MR-guided targeted biopsy versus systematic transrectal ultrasound-guided biopsy in diagnosing prostate cancer: a modelling study from a health care perspective. Eur Urol. 2014;66(3):430-6.
115. Cerantola Y, Dragomir A, Tanguay S, Bladou F, Aprikian A, Kassouf W. Cost-effectiveness of multiparametric magnetic resonance imaging and targeted biopsy in diagnosing prostate cancer. Urol Oncol. 2016;34(3):119.e1-9.
195

116. Roberts K. News digest: Sugar tax, ‘one-stop diagnosis shops’, high-tech MRI and…cancer’s genetic roots? Cancer Research UK. Accessed through: http://scienceblog.cancerresearchuk.org/2018/04/07/news-digest-sugar-tax-one-stop-diagnosis-shops-high-tech-mri-andcancers-genetic-roots on April, 2018.
117. Alberts AR, Schoots IG, Bokhorst LP, van Leenders GJ, Bangma CH, Roobol MJ. Risk-based patient selection for magnetic resonance imaging-targeted prostate biopsy after negative transrectal ultrasound-guided random biopsy avoids unnecessary magnetic resonance imaging scans. Eur Urol. 2016;69(6):1129-34.
118. Mannaerts C,Gayet M, Verbeek J, Engelbrecht M, Savci-Heijink C, Jager G et al. Prostate cancer risk-assessment for multiparametric MRI targeted and systematic biopsy: Balancing harms and benefit in biopsy naïve men using the Rotterdam Prostate Cancer Risk Calculator. Eur Urol Suppl. 2018; 17(2): e697-8.
119. Loeb S, Han M, Roehl KA, Antenor JA, Catalona WJ. Accuracy of prostate weight estimation by digital rectal examination versus transrectal ultrasonography. J Urol. 2005; 173(1):63-5.
120. Cheng WC, Ng FC, Chan KC, Cheung YH, Chan WL, Wong SW. Interobserver variation of prostatic volume estimation with digital rectal examination by urological staffs with different experiences. Int Braz J Urol. 2004; 30(6):466-71.
121. Grayhack JT, Mcvary KT, Kozlowski JM. Benign prostatic hyperplasia. In: Gillenwater JY, editor. 4th ed. USA: Lippincott Williams and Wilkins; 2002.
122. Popadiuk C, Pottle M, Curran V. Teaching digital rectal examinations to medical students: an evaluation study of teaching methods. Acad Med. 2002; 77(11):1140-6.
123. Low-Beer N, Kinnison T, Baillie S, Bello F, Kneebone R, Higham J. Hidden practice revealed: using task analysis and novel simulator design to evaluate the teaching of digital rectal examination. Am J Surg. 2011; 201(1):46-53.
124. Roehrborn CG, Girman CJ, Rhodes T, Hanson KA, Collins GN, Sech SM, et al. Correlation between prostate size estimated bydigital rectal examination and measured by transrectal ultrasound. Urology. 1997;49(4):548-57.
125. Bosch JL, Bohnen AM, Groeneveld FP. Validity of digital rectal examination and serum prostate specific antigen in the estimation of prostate volume in community-based men aged 50 to 78 years: the Krimpen study. Eur Urol. 2004;46(6):753-9.
126. Globocan 2012. Estimated cancer incidence, mortality and prevalence worldwide in 2012. Accessed through: http://globocan.iarc.fr/old/FactSheets/cancers/prostate-new.asp on January 1, 2018.
127. Direção Geral da Saúde. Programa nacional para as doenças oncológicas 2017. Accessed through: https://www.dgs.pt/portal-da-estatistica-da-saude/diretorio-de-informacao/diretorio-de-informacao/por-serie-880762-pdf.aspx?v=11736b14-73e6-4b34-a8e8-d22502108547 on April 30, 2018.
128. Scattoni V, Raber M, Abdollah F, Roscigno M, Dehò F, Angiolilli D, et al. Biopsy schemes with the fewest cores for detecting 95% of the prostate cancers detected by a 24-core biopsy. Eur Urol. 2010;57(1):1-8.
129. Roobol MJ, Steyerberg EW, Kranse R, Wolters T, van den Bergh RC, Bangma CH, et al. A risk-based strategy improves prostate-specific antigen-driven detection of prostate cancer. Eur Urol. 2010;57(1):79-85.
130. Steyerberg EW, Vickers AJ, Cook NR, Gerds T, Gonen M, Obuchowski N, et al. Assessing the performance of prediction models: a framework for traditional and novel measures. Epidemiology. 2010;21(1):128-38.
131. Hand DJ. Statistical methods in diagnosis. Stat Methods Med Res. 1992;1(1);49-67.
132. Vickers AJ, Van Calster B, Steyerberg EW. Net benefit approaches to the evaluation of prediction models, molecular markers, and diagnostic tests. BMJ. 2016;352:i6.
133. Louie KS, Seigneurin A, Cathcart P, Sasieni P. Do prostate cancer risk models improve the predictive accuracy of PSA screening? A meta-analysis. Ann Oncol. 2015;26(5):848-64.
134. Strobl AN, Vickers AJ, Van Calster B, Steyerberg E, Leach RJ, Thompson IM, et al. Improving patient prostate cancer risk assessment: Moving from static, globally-applied to dynamic, practice-specific risk calculators. J Biomed Inform. 2015;56:87-93.
135. Ankerst DP, Koniarski T, Liang Y, Leach RJ, Feng Z, Sanda MG, et al., Updating risk prediction tools: a case study in prostate cancer. Biom J. 2012;54(1):127-42.
136. Roobol MJ, Vedder MM, Nieboer D, Houlgatte A, Vincendeau S, Lazzeri M, et al. Comparison of two prostate cancer risk calculators that include the prostate health index. Eur Urol Focus. 2015;1(2);185-90.
137. Vedder MM, de Bekker-Grob EW, Lilja HG, Vickers AJ, van Leenders GJ, Steyerberg EW, et al. The added of percentage of free to total PSA, PCA3, and a kallikrein panel to the ERSPC risk calculator for prostate cancer in prescreened men. Eur Urol. 2014;66(6):1109-15.
138. Alberts A. Magnetic resonance imaging and multivariable risk-stratification in prostate cancer screening and active surveillance. Erasmus University Rotterdam, 2018. Accessed through: http://hdl.handle.net/1765/103866 on April 30, 2018.
139. Cucchiara V, Cooperberg MR, Dall'Era M, Lin DW, Montorsi F, Schalken JA, et al. Genomic Markers in Prostate Cancer Decision Making. Eur Urol. 2018;73(4):572-82.
140. Crawford ED, Rosenberg MT, Partin AW, Cooperberg MR, Maccini M, Loeb S, et al. An approach using PSA levels of 1.5 ng/ml as the cutoff for prostate cancer screening in primary care. Urology. 2016;96:116-20.
141. Ferlay J, Soerjomataram I, Dikshit R, Eser S, Mathers C, Rebelo M et al. Cancer incidence and mortality worldwide: sources, methods and major patterns in GLOBOCAN 2012. Int J Cancer. 2015;136(5):E359-86.
142. Loeb S. Guideline of guidelines: prostate cancer screening. BJU Int. 2014;114(3):323-5. 143. Roobol MJ. Re: Re-evaluating PSA testing rates in the PLCO trial. Eur Urol. 2016;70(4):700-
1. 144. Pickles K, Carter SM, Rychetnik L, McCaffery K, Entwistle VA. General practitioners'
experiences of, and responses to, uncertainty in prostate cancer screening: insights from a qualitative study. PLoS One. 2016;11(4):e0153299.
145. Pickles K, Carter SM, Rychetnik L. Doctors' approaches to PSA testing and overdiagnosis in primary healthcare: a qualitative study. BMJ Open. 2015;5(3):e006367.
146. Osses DF, Alberts AR, Bausch GCF, Roobol MJ. Multivariable risk-based patient selection for prostate biopsy in a primary health care setting: referral rate and biopsy results from a urology outpatient clinic. Transl Androl Urol. 2018;7(1):27-33.
147. Verbeek J, Roobol M, Parker C, Kattan M, Nieboer D, Steyerberg E. Refer for prostate biopsy? A prediction tool combining risk of significant prostate cancer and life expectancy for UK primary care. Eur Urol Suppl. 2018;17(2);e387-8.
196

116. Roberts K. News digest: Sugar tax, ‘one-stop diagnosis shops’, high-tech MRI and…cancer’s genetic roots? Cancer Research UK. Accessed through: http://scienceblog.cancerresearchuk.org/2018/04/07/news-digest-sugar-tax-one-stop-diagnosis-shops-high-tech-mri-andcancers-genetic-roots on April, 2018.
117. Alberts AR, Schoots IG, Bokhorst LP, van Leenders GJ, Bangma CH, Roobol MJ. Risk-based patient selection for magnetic resonance imaging-targeted prostate biopsy after negative transrectal ultrasound-guided random biopsy avoids unnecessary magnetic resonance imaging scans. Eur Urol. 2016;69(6):1129-34.
118. Mannaerts C,Gayet M, Verbeek J, Engelbrecht M, Savci-Heijink C, Jager G et al. Prostate cancer risk-assessment for multiparametric MRI targeted and systematic biopsy: Balancing harms and benefit in biopsy naïve men using the Rotterdam Prostate Cancer Risk Calculator. Eur Urol Suppl. 2018; 17(2): e697-8.
119. Loeb S, Han M, Roehl KA, Antenor JA, Catalona WJ. Accuracy of prostate weight estimation by digital rectal examination versus transrectal ultrasonography. J Urol. 2005; 173(1):63-5.
120. Cheng WC, Ng FC, Chan KC, Cheung YH, Chan WL, Wong SW. Interobserver variation of prostatic volume estimation with digital rectal examination by urological staffs with different experiences. Int Braz J Urol. 2004; 30(6):466-71.
121. Grayhack JT, Mcvary KT, Kozlowski JM. Benign prostatic hyperplasia. In: Gillenwater JY, editor. 4th ed. USA: Lippincott Williams and Wilkins; 2002.
122. Popadiuk C, Pottle M, Curran V. Teaching digital rectal examinations to medical students: an evaluation study of teaching methods. Acad Med. 2002; 77(11):1140-6.
123. Low-Beer N, Kinnison T, Baillie S, Bello F, Kneebone R, Higham J. Hidden practice revealed: using task analysis and novel simulator design to evaluate the teaching of digital rectal examination. Am J Surg. 2011; 201(1):46-53.
124. Roehrborn CG, Girman CJ, Rhodes T, Hanson KA, Collins GN, Sech SM, et al. Correlation between prostate size estimated bydigital rectal examination and measured by transrectal ultrasound. Urology. 1997;49(4):548-57.
125. Bosch JL, Bohnen AM, Groeneveld FP. Validity of digital rectal examination and serum prostate specific antigen in the estimation of prostate volume in community-based men aged 50 to 78 years: the Krimpen study. Eur Urol. 2004;46(6):753-9.
126. Globocan 2012. Estimated cancer incidence, mortality and prevalence worldwide in 2012. Accessed through: http://globocan.iarc.fr/old/FactSheets/cancers/prostate-new.asp on January 1, 2018.
127. Direção Geral da Saúde. Programa nacional para as doenças oncológicas 2017. Accessed through: https://www.dgs.pt/portal-da-estatistica-da-saude/diretorio-de-informacao/diretorio-de-informacao/por-serie-880762-pdf.aspx?v=11736b14-73e6-4b34-a8e8-d22502108547 on April 30, 2018.
128. Scattoni V, Raber M, Abdollah F, Roscigno M, Dehò F, Angiolilli D, et al. Biopsy schemes with the fewest cores for detecting 95% of the prostate cancers detected by a 24-core biopsy. Eur Urol. 2010;57(1):1-8.
129. Roobol MJ, Steyerberg EW, Kranse R, Wolters T, van den Bergh RC, Bangma CH, et al. A risk-based strategy improves prostate-specific antigen-driven detection of prostate cancer. Eur Urol. 2010;57(1):79-85.
130. Steyerberg EW, Vickers AJ, Cook NR, Gerds T, Gonen M, Obuchowski N, et al. Assessing the performance of prediction models: a framework for traditional and novel measures. Epidemiology. 2010;21(1):128-38.
131. Hand DJ. Statistical methods in diagnosis. Stat Methods Med Res. 1992;1(1);49-67.
132. Vickers AJ, Van Calster B, Steyerberg EW. Net benefit approaches to the evaluation of prediction models, molecular markers, and diagnostic tests. BMJ. 2016;352:i6.
133. Louie KS, Seigneurin A, Cathcart P, Sasieni P. Do prostate cancer risk models improve the predictive accuracy of PSA screening? A meta-analysis. Ann Oncol. 2015;26(5):848-64.
134. Strobl AN, Vickers AJ, Van Calster B, Steyerberg E, Leach RJ, Thompson IM, et al. Improving patient prostate cancer risk assessment: Moving from static, globally-applied to dynamic, practice-specific risk calculators. J Biomed Inform. 2015;56:87-93.
135. Ankerst DP, Koniarski T, Liang Y, Leach RJ, Feng Z, Sanda MG, et al., Updating risk prediction tools: a case study in prostate cancer. Biom J. 2012;54(1):127-42.
136. Roobol MJ, Vedder MM, Nieboer D, Houlgatte A, Vincendeau S, Lazzeri M, et al. Comparison of two prostate cancer risk calculators that include the prostate health index. Eur Urol Focus. 2015;1(2);185-90.
137. Vedder MM, de Bekker-Grob EW, Lilja HG, Vickers AJ, van Leenders GJ, Steyerberg EW, et al. The added of percentage of free to total PSA, PCA3, and a kallikrein panel to the ERSPC risk calculator for prostate cancer in prescreened men. Eur Urol. 2014;66(6):1109-15.
138. Alberts A. Magnetic resonance imaging and multivariable risk-stratification in prostate cancer screening and active surveillance. Erasmus University Rotterdam, 2018. Accessed through: http://hdl.handle.net/1765/103866 on April 30, 2018.
139. Cucchiara V, Cooperberg MR, Dall'Era M, Lin DW, Montorsi F, Schalken JA, et al. Genomic Markers in Prostate Cancer Decision Making. Eur Urol. 2018;73(4):572-82.
140. Crawford ED, Rosenberg MT, Partin AW, Cooperberg MR, Maccini M, Loeb S, et al. An approach using PSA levels of 1.5 ng/ml as the cutoff for prostate cancer screening in primary care. Urology. 2016;96:116-20.
141. Ferlay J, Soerjomataram I, Dikshit R, Eser S, Mathers C, Rebelo M et al. Cancer incidence and mortality worldwide: sources, methods and major patterns in GLOBOCAN 2012. Int J Cancer. 2015;136(5):E359-86.
142. Loeb S. Guideline of guidelines: prostate cancer screening. BJU Int. 2014;114(3):323-5. 143. Roobol MJ. Re: Re-evaluating PSA testing rates in the PLCO trial. Eur Urol. 2016;70(4):700-
1. 144. Pickles K, Carter SM, Rychetnik L, McCaffery K, Entwistle VA. General practitioners'
experiences of, and responses to, uncertainty in prostate cancer screening: insights from a qualitative study. PLoS One. 2016;11(4):e0153299.
145. Pickles K, Carter SM, Rychetnik L. Doctors' approaches to PSA testing and overdiagnosis in primary healthcare: a qualitative study. BMJ Open. 2015;5(3):e006367.
146. Osses DF, Alberts AR, Bausch GCF, Roobol MJ. Multivariable risk-based patient selection for prostate biopsy in a primary health care setting: referral rate and biopsy results from a urology outpatient clinic. Transl Androl Urol. 2018;7(1):27-33.
147. Verbeek J, Roobol M, Parker C, Kattan M, Nieboer D, Steyerberg E. Refer for prostate biopsy? A prediction tool combining risk of significant prostate cancer and life expectancy for UK primary care. Eur Urol Suppl. 2018;17(2);e387-8.
197


Chapter 9
Summary
199

Summary
Chapter 1: General Introduction
This thesis starts with a brief overview of prostate cancer, namely its epidemiology and
screening, including the European Randomized study of Screening for Prostate Cancer
(ERSPC), and the Rotterdam Prostate Cancer Risk Calculator (RPCRC). In addition, Chapter 1 also features a concise mention of eHealth and mHealth. Several research questions are
formulated, which are answered in the following chapters, and further discussed in Chapter 8 (General Discussion).
Chapter 2: eHealth and mHealth in prostate cancer detection and active surveillance
eHealth and mHealth have changed the way in which professionals and patients access
and manage health information, by, for example, facilitating self-management tools to patients,
and simplifying the process of shared decision making with healthcare professionals.
However, erroneous information can have a deleterious effect. Therefore, the scientific validity
of the available content should be assured, which may require certification.
These issues are discussed in the setting of prostate cancer in Chapter 2. eHealth and
mHealth can be used to promote healthy habits and raise awareness among patients and
healthcare professionals, sharing data and improving outcomes, and should be seen by
healthcare professionals as another way of providing the highest level of advanced prostate
cancer screening in both academical and clinical settings.
Chapter 3: mHealth in Urology: A Review of Experts’ Involvement in App Development
Smartphone apps are becoming ubiquitous in healthcare, but the lack of expert
healthcare involvement has been recognised in some medical specialities. To assess if that
was true in Urology, in Chapter 3, a review of available Apple iOS and Google Android
smartphone apps was performed, detailing their characteristics, namely the explicit
contribution from healthcare professionals in their development, either individually or via a
scientific association.
In concordance with findings from other fields, two-thirds of all apps had no input from a
scientific Urology association, and a fifth had no healthcare professional involvement at all.
This was even more disconcerting as there were no mandatory industry standards, scientific
guidelines or compulsory independent medical app regulation.
201

Chapter 4: Expert Involvement Predicts mHealth App Downloads: Multivariate Regression Analysis of Urology Apps
Identifying the factors that influence the number of downloads of commercial apps can
help in future mHealth app developments. In Chapter 4, using a multivariate ordinal logistic
regression it was shown that apps developed with expert urological input, with a lower price
(including free apps), optional in-app purchases, higher user ratings, and a larger number of
written user reviews, were more likely to have a higher level of downloads.
Chapter 5: Rotterdam Prostate Cancer Risk Calculator: Development and Usability Testing of the Mobile Phone App
Prostate cancer is a major public health issue, and its epidemiological importance is
expected to grow. Therefore, even though new imaging modalities and biomarkers may prove
to be clinically relevant, they lack the affordability, availability, and scalability to address the
magnitude of the problem. In contrast, prostate cancer risk prediction models, such as the
ERSPC RPCRC, are currently available, and are recommended by international guidelines.
Even though the ERSPC RPCRC website was available online, in Chapter 5, the design
and development of the smartphone application version of the ERSPC RPCRC is described.
This new addition to the Urology mHealth armamentarium aims to help patients and
healthcare professionals use the ERSPC RPCRC risk models on their own smartphone
devices, for added convenience.
Chapter 6: Performance of the DRE-based RPCRC in a setting with low intensity PSA-based screening
Even though imaging studies have become an important component in prostate cancer
diagnosis and management, they are time and resource consuming. In Chapter 6, the DRE-
based version of the ERSPC RPCRC, which only requires a standard physical examination
during the patient visit, is validated in an academic teaching hospital.
Even in that particular cohort, with a large proportion of clinically significant disease, risk
stratification could save unnecessary biopsies in one of every eleven men. The DRE-based
version of the ERSPC RPCRC can be useful in a clinical setting, improving prostate cancer
screening in the present cost-effectiveness focused culture, in a less invasive, time consuming
and costly manner, without the need for imaging tests or biomarkers.
Chapter 7: Head-to-head comparison of prostate cancer risk calculators predicting biopsy outcome
Risk stratification with multivariate prediction models is recommended by scientific
guidelines in asymptomatic men as a way of overcoming the limitations of elevated prostate
specific antigen (PSA) and/or suspicious DRE triggered biopsy. However, because no single
risk calculator proved its superiority, it remained a personal decision which one to use. In
Chapter 7, the results of the first international head-to-head comparison of risk calculators
predicting prostate biopsy outcome, proved that the ERSPC RPCRC had the highest
discrimination when predicting clinically significant prostate cancer. Additionally, calibration to
a specific setting is advised to extend clinical benefit, and this process is explained.
Founded on this head-to-head comparison, in asymptomatic men, the choice of which
risk calculator to use to evaluate risk-assessment for clinically significant prostate cancer
before a biopsy can be made in an evidence-based way. Proven on the results of this first
transnational head-to-head comparison, both in biopsy-naïve and in repeat-biopsy (i.e., after
previous negative biopsy) patients, the ERSPC RPCRC can be implemented to improve
prostate cancer diagnosis.
Chapter 8: General Discussion
eHealth has become a part of Urology practice, and its impact is expected to grow,
supported by software and hardware improvements, innovative services and original
applications. In the case of prostate cancer screening, this can be materialized via decision
support tools, empowering patients and assisting healthcare professionals, promoting true
informed shared decisions.
Early detection of prostate cancer should be tailored to well informed men using a
personalized strategy, supported by multivariable individual risk-stratification. Risk calculators
are superior to PSA-based strategies, and their use is supported by evidence.
In the end of Chapter 8, a pragmatic screening strategy, starting in the primary care
setting, based on the readily available and easy to use ERSPC RPCRC smartphone app, is
proposed. Several areas of research are expected to improve current risk prediction models,
including big-data, biomarkers, and imaging studies. This new paradigm of personalized risk
assessment should improve individualized management and follow-up, promoting early
detection of clinically significant prostate cancer, while reducing overdiagnosis and
overtreatment.
202

Chapter 4: Expert Involvement Predicts mHealth App Downloads: Multivariate Regression Analysis of Urology Apps
Identifying the factors that influence the number of downloads of commercial apps can
help in future mHealth app developments. In Chapter 4, using a multivariate ordinal logistic
regression it was shown that apps developed with expert urological input, with a lower price
(including free apps), optional in-app purchases, higher user ratings, and a larger number of
written user reviews, were more likely to have a higher level of downloads.
Chapter 5: Rotterdam Prostate Cancer Risk Calculator: Development and Usability Testing of the Mobile Phone App
Prostate cancer is a major public health issue, and its epidemiological importance is
expected to grow. Therefore, even though new imaging modalities and biomarkers may prove
to be clinically relevant, they lack the affordability, availability, and scalability to address the
magnitude of the problem. In contrast, prostate cancer risk prediction models, such as the
ERSPC RPCRC, are currently available, and are recommended by international guidelines.
Even though the ERSPC RPCRC website was available online, in Chapter 5, the design
and development of the smartphone application version of the ERSPC RPCRC is described.
This new addition to the Urology mHealth armamentarium aims to help patients and
healthcare professionals use the ERSPC RPCRC risk models on their own smartphone
devices, for added convenience.
Chapter 6: Performance of the DRE-based RPCRC in a setting with low intensity PSA-based screening
Even though imaging studies have become an important component in prostate cancer
diagnosis and management, they are time and resource consuming. In Chapter 6, the DRE-
based version of the ERSPC RPCRC, which only requires a standard physical examination
during the patient visit, is validated in an academic teaching hospital.
Even in that particular cohort, with a large proportion of clinically significant disease, risk
stratification could save unnecessary biopsies in one of every eleven men. The DRE-based
version of the ERSPC RPCRC can be useful in a clinical setting, improving prostate cancer
screening in the present cost-effectiveness focused culture, in a less invasive, time consuming
and costly manner, without the need for imaging tests or biomarkers.
Chapter 7: Head-to-head comparison of prostate cancer risk calculators predicting biopsy outcome
Risk stratification with multivariate prediction models is recommended by scientific
guidelines in asymptomatic men as a way of overcoming the limitations of elevated prostate
specific antigen (PSA) and/or suspicious DRE triggered biopsy. However, because no single
risk calculator proved its superiority, it remained a personal decision which one to use. In
Chapter 7, the results of the first international head-to-head comparison of risk calculators
predicting prostate biopsy outcome, proved that the ERSPC RPCRC had the highest
discrimination when predicting clinically significant prostate cancer. Additionally, calibration to
a specific setting is advised to extend clinical benefit, and this process is explained.
Founded on this head-to-head comparison, in asymptomatic men, the choice of which
risk calculator to use to evaluate risk-assessment for clinically significant prostate cancer
before a biopsy can be made in an evidence-based way. Proven on the results of this first
transnational head-to-head comparison, both in biopsy-naïve and in repeat-biopsy (i.e., after
previous negative biopsy) patients, the ERSPC RPCRC can be implemented to improve
prostate cancer diagnosis.
Chapter 8: General Discussion
eHealth has become a part of Urology practice, and its impact is expected to grow,
supported by software and hardware improvements, innovative services and original
applications. In the case of prostate cancer screening, this can be materialized via decision
support tools, empowering patients and assisting healthcare professionals, promoting true
informed shared decisions.
Early detection of prostate cancer should be tailored to well informed men using a
personalized strategy, supported by multivariable individual risk-stratification. Risk calculators
are superior to PSA-based strategies, and their use is supported by evidence.
In the end of Chapter 8, a pragmatic screening strategy, starting in the primary care
setting, based on the readily available and easy to use ERSPC RPCRC smartphone app, is
proposed. Several areas of research are expected to improve current risk prediction models,
including big-data, biomarkers, and imaging studies. This new paradigm of personalized risk
assessment should improve individualized management and follow-up, promoting early
detection of clinically significant prostate cancer, while reducing overdiagnosis and
overtreatment.
203


Hoofdstuk 9
Samenvatting
205

Samenvatting
Hoofdstuk 1: introductie
Dit proefschrift start met een kort overzicht van de epidemiologie van prostaatkanker,
screening naar prostaatkanker en de Europese gerandomiseerde studie naar de waarde van
vroegopsporing prostaatkanker (ERSPC) en de Prostaatwijzer (Rotterdam Prostate Cancer
Risk Calculator). In dit eerste hoofdstuk is verder een korte beschrijving van eHealth en
mHealth opgenomen en worden de onderzoeksvragen die aan dit proefschrift ten grondslag
liggen geformuleerd. Deze onderzoeksvragen zullen in de verschillende hoofdstukken van dit
proefschrift worden beantwoord en verder worden besproken in de discussie (hoofdstuk 8).
Hoofdstuk 2: eHealth en mHealth in de detectie van prostaatkanker en active surveillance
eHealth en mHealth hebben de manier veranderd waarop professionals en patiënten
toegang hebben tot gezondheidsinformatie en deze beheren. Denk hierbij aan het faciliteren
van zelfmanagementtools voor patiënten en het vereenvoudigen van het proces van gedeelde
besluitvorming tussen de patiënt en de zorgprofessional. Verkeerde informatie kan een
schadelijk effect hebben. Het is daarom van belang dat de wetenschappelijke validiteit van de
beschikbare inhoud wordt gewaarborgd. Hiervoor is certificering vereist.
In hoofdstuk 2 worden deze problemen besproken in de setting van prostaatkanker.
eHealth en mHealth kunnen worden toegepast om gezonde gewoonten te bevorderen,
patiënten en beroepsbeoefenaren in de gezondheidszorg bewust te maken, gegevens te
delen en de resultaten te verbeteren. eHealth en mHealth kunnen door beroepsbeoefenaren
in de gezondheidszorg verder worden ingezet voor het aanbieden van
prostaatkankerscreening in zowel de academische alsook de klinische setting.
Hoofdstuk 3: mHealth binnen de urologie: een review naar de mate waarin professionals betrokken zijn geweest in de ontwikkeling van apps
Het gebruik van smartphone-apps in de gezondheidszorg is alomtegenwoordig. Het
gebrek aan betrokkenheid van medisch professionals bij de ontwikkeling van apps wordt
binnen bepaalde specialismen erkend. In hoofdstuk 3 wordt onderzocht of er ook binnen de
urologie een gebrek aan betrokkenheid bestaat. Hiervoor werden alle urologie-apps
beschikbaar in de Apple App Store (iOS) en de Google Play Store (Android) bekeken. Er werd
gelet op de kenmerken van de app, en in het bijzonder op de expliciete bijdrage van medisch
207

professionals aan de ontwikkeling van de app, hetzij op individuele basis, hetzij via een
wetenschappelijke vereniging.
Voor tweederde van de gereviewde apps geldt dat er geen sprake was van inbreng
vanuit een wetenschappelijke urologievereniging. Dit is in overeenstemming met de resultaten
gezien bij andere specialismen. Bij eenvijfde van de urologie-apps was bij de ontwikkeling van
de app helemaal geen medisch professional betrokken. Dit is verontrustend omdat er tot op
heden ook geen verplichte industriestandaarden, geen wetenschappelijke richtlijnen of
verplichte regelgeving voor onafhankelijke medische apps zijn opgesteld.
Hoofdstuk 4: De betrokkenheid van professionals voorspelt het aantal downloads van mHealth apps: multivariate regressieanalyse van urologie-apps
Het identificeren van factoren die het aantal downloads van commerciële apps
beïnvloeden, kan helpen bij het ontwikkelen van toekomstige mHealth-apps. In hoofdstuk 4 werd met behulp van een multivariate ordinale logistische regressie aangetoond dat apps die
werden ontwikkeld met urologische deskundige input meer kans hadden om gedownload te
worden. Andere factoren die zorgden voor meer downloads waren: een lage prijs (inclusief
gratis apps), het doen van optionele aankopen binnen de app, hogere
gebruikersbeoordelingen en een groter aantal geschreven gebruikersrecensies.
Hoofdstuk 5: De Rotterdam Prostate Cancer Risk Calculator: de ontwikkeling en het testen van de mobiele applicatie
Prostaatkanker vormt een belangrijk probleem voor de volksgezondheid. Naar
verwachting zal de incidentie en prevalentie van de ziekte de komende jaren toenemen.
Onderzoek laat zien dat nieuwe beeldvormingstechnieken en biomarkers voor de kliniek
relevant zijn. Echter kunnen ze op dit moment nog maar beperkt worden ingezet vanwege de
beperkte betaalbaarheid en beschikbaarheid. Prostaatkankerpredictiemodellen, zoals de
Prostaatwijzer (de ERSPC Rotterdam Prostate Cancer Risk Calculator), zijn vrijelijk op het
internet beschikbaar. Internationale richtlijnen stimuleren het gebruik van dergelijke
prostaatkankerpredictiemodellen in de verschillende fasen van de ziekte.
Hoewel de Prostaatwijzer (de ERSPC Rotterdam Prostate Cancer Risk Calculator) via
een webpagina online vrijelijk beschikbaar is, wordt in hoofdstuk 5 het ontwerp en de
ontwikkeling van de mobiele applicatie van de Prostaatwijzer (de ERSPC Rotterdam Prostate
Cancer Risk Calculator) beschreven. De mobiele applicatie biedt de zorgprofessionals, en op
den duur ook patiënten, een stukje extra gemak bij het toepassen van een
prostaatkankerpredictiemodel in de dagelijkse klinische praktijk.
Hoofdstuk 6: Prestatie van de op DRE-gebaseerde Prostaatwijzer in een setting van laag-intensieve PSA beoordeling
Beeldvormingstechnieken zijn een belangrijk onderdeel gaan uitmaken van het
diagnostische proces en de follow-up van prostaatkanker. Het ondergaan van dergelijke
beeldvormingstechnieken is echter tijdrovend en de uitkomsten zijn relatief kostbaar. In
hoofdstuk 6 wordt de op digitaal rectaal toucher (DRE) gebaseerde versie van de
Prostaatwijzer (de ERSPC Rotterdam Prostate Cancer Risk Calculator) gevalideerd in een
academische setting. Om de op DRE-gebaseerde versie van de Prostaatwijzer te kunnen
gebruiken wordt de uroloog alleen gevraagd een standaard lichamelijk onderzoek uit te
voeren.
Door het toepassen van risicostratificatie in een dergelijk cohort - een hoog risico cohort
met daarin een groot deel klinisch significante prostaatkankers - kunnen nog steeds onnodige
biopten worden voorkomen, namelijk bij één op de elf mannen. In hoofdstuk 6 concluderen
we dan ook dat het gebruik van de op DRE-gebaseerde Prostaatwijzer nuttig kan zijn in een
klinische setting. Het screenen op prostaatkanker kan door het gebruik van de wijzer worden
verbeterd, mede doordat het gebruik van de wijzer minder invasief is, minder tijdrovend en
minder kostbaar in vergelijking met de nieuwe beeldvormingstechnieken en biomarkers.
Hoofdstuk 7: Een directe onderlinge vergelijking van prostaatkankerpredictiemodellen die de uitkomst van een biopsie voorspellen
Wetenschappelijke richtlijnen raden de toepassing van risicostratificatie met behulp van
prostaatkankerpredictiemodellen aan bij asymptomatische mannen met een verhoogd PSA.
Omdat geen van de prostaatkankerpredictiemodellen genoemd in de richtlijn zijn superioriteit
heeft bewezen in de wetenschappelijke literatuur, blijft het voor urologen een persoonlijke
beslissing welke zij toepassen in hun praktijk. In hoofdstuk 7 worden de resultaten getoond
van de eerste directe onderlinge vergelijking van prostaatkankerpredictiemodellen die de
uitkomst van een prostaatbiopsie voorspellen. De Prostaatwijzer heeft de grootste
discriminerende waarde in het voorspellen van klinisch significante prostaatkanker op biopt.
Daarnaast wordt de kalibratie van een specifieke setting aanbevolen om zo het klinisch te
behalen voordeel te vergroten. Dit proces wordt in dit hoofdstuk uitgelegd.
208

professionals aan de ontwikkeling van de app, hetzij op individuele basis, hetzij via een
wetenschappelijke vereniging.
Voor tweederde van de gereviewde apps geldt dat er geen sprake was van inbreng
vanuit een wetenschappelijke urologievereniging. Dit is in overeenstemming met de resultaten
gezien bij andere specialismen. Bij eenvijfde van de urologie-apps was bij de ontwikkeling van
de app helemaal geen medisch professional betrokken. Dit is verontrustend omdat er tot op
heden ook geen verplichte industriestandaarden, geen wetenschappelijke richtlijnen of
verplichte regelgeving voor onafhankelijke medische apps zijn opgesteld.
Hoofdstuk 4: De betrokkenheid van professionals voorspelt het aantal downloads van mHealth apps: multivariate regressieanalyse van urologie-apps
Het identificeren van factoren die het aantal downloads van commerciële apps
beïnvloeden, kan helpen bij het ontwikkelen van toekomstige mHealth-apps. In hoofdstuk 4 werd met behulp van een multivariate ordinale logistische regressie aangetoond dat apps die
werden ontwikkeld met urologische deskundige input meer kans hadden om gedownload te
worden. Andere factoren die zorgden voor meer downloads waren: een lage prijs (inclusief
gratis apps), het doen van optionele aankopen binnen de app, hogere
gebruikersbeoordelingen en een groter aantal geschreven gebruikersrecensies.
Hoofdstuk 5: De Rotterdam Prostate Cancer Risk Calculator: de ontwikkeling en het testen van de mobiele applicatie
Prostaatkanker vormt een belangrijk probleem voor de volksgezondheid. Naar
verwachting zal de incidentie en prevalentie van de ziekte de komende jaren toenemen.
Onderzoek laat zien dat nieuwe beeldvormingstechnieken en biomarkers voor de kliniek
relevant zijn. Echter kunnen ze op dit moment nog maar beperkt worden ingezet vanwege de
beperkte betaalbaarheid en beschikbaarheid. Prostaatkankerpredictiemodellen, zoals de
Prostaatwijzer (de ERSPC Rotterdam Prostate Cancer Risk Calculator), zijn vrijelijk op het
internet beschikbaar. Internationale richtlijnen stimuleren het gebruik van dergelijke
prostaatkankerpredictiemodellen in de verschillende fasen van de ziekte.
Hoewel de Prostaatwijzer (de ERSPC Rotterdam Prostate Cancer Risk Calculator) via
een webpagina online vrijelijk beschikbaar is, wordt in hoofdstuk 5 het ontwerp en de
ontwikkeling van de mobiele applicatie van de Prostaatwijzer (de ERSPC Rotterdam Prostate
Cancer Risk Calculator) beschreven. De mobiele applicatie biedt de zorgprofessionals, en op
den duur ook patiënten, een stukje extra gemak bij het toepassen van een
prostaatkankerpredictiemodel in de dagelijkse klinische praktijk.
Hoofdstuk 6: Prestatie van de op DRE-gebaseerde Prostaatwijzer in een setting van laag-intensieve PSA beoordeling
Beeldvormingstechnieken zijn een belangrijk onderdeel gaan uitmaken van het
diagnostische proces en de follow-up van prostaatkanker. Het ondergaan van dergelijke
beeldvormingstechnieken is echter tijdrovend en de uitkomsten zijn relatief kostbaar. In
hoofdstuk 6 wordt de op digitaal rectaal toucher (DRE) gebaseerde versie van de
Prostaatwijzer (de ERSPC Rotterdam Prostate Cancer Risk Calculator) gevalideerd in een
academische setting. Om de op DRE-gebaseerde versie van de Prostaatwijzer te kunnen
gebruiken wordt de uroloog alleen gevraagd een standaard lichamelijk onderzoek uit te
voeren.
Door het toepassen van risicostratificatie in een dergelijk cohort - een hoog risico cohort
met daarin een groot deel klinisch significante prostaatkankers - kunnen nog steeds onnodige
biopten worden voorkomen, namelijk bij één op de elf mannen. In hoofdstuk 6 concluderen
we dan ook dat het gebruik van de op DRE-gebaseerde Prostaatwijzer nuttig kan zijn in een
klinische setting. Het screenen op prostaatkanker kan door het gebruik van de wijzer worden
verbeterd, mede doordat het gebruik van de wijzer minder invasief is, minder tijdrovend en
minder kostbaar in vergelijking met de nieuwe beeldvormingstechnieken en biomarkers.
Hoofdstuk 7: Een directe onderlinge vergelijking van prostaatkankerpredictiemodellen die de uitkomst van een biopsie voorspellen
Wetenschappelijke richtlijnen raden de toepassing van risicostratificatie met behulp van
prostaatkankerpredictiemodellen aan bij asymptomatische mannen met een verhoogd PSA.
Omdat geen van de prostaatkankerpredictiemodellen genoemd in de richtlijn zijn superioriteit
heeft bewezen in de wetenschappelijke literatuur, blijft het voor urologen een persoonlijke
beslissing welke zij toepassen in hun praktijk. In hoofdstuk 7 worden de resultaten getoond
van de eerste directe onderlinge vergelijking van prostaatkankerpredictiemodellen die de
uitkomst van een prostaatbiopsie voorspellen. De Prostaatwijzer heeft de grootste
discriminerende waarde in het voorspellen van klinisch significante prostaatkanker op biopt.
Daarnaast wordt de kalibratie van een specifieke setting aanbevolen om zo het klinisch te
behalen voordeel te vergroten. Dit proces wordt in dit hoofdstuk uitgelegd.
209

De uitkomsten van deze directe onderlinge vergelijking bieden een basis waarop een
aanbeveling kan worden gemaakt welk prostaatkankerpredictiemodel te gebruiken. Zowel bij
mannen die niet eerder een biopsie ondergingen alsook bij mannen die eerder biopten
ondergingen en bij wie geen prostaatkanker werd gevonden, bleek de Prostaatwijzer (de
ERSPC Rotterdam Prostate Cancer Risk Calculator) de best voorspellende waarde te
hebben. De Prostaatwijzer kan dan ook worden geïmplementeerd om het diagnostische
proces te verbeteren.
Hoofdstuk 8: Discussie
eHealth is een onderdeel geworden van de dagelijkse urologische praktijk en verwacht
wordt dat de impact de komende jaren alleen maar zal toenemen, ondersteund door software-
en hardwareverbeteringen, innovatieve services en nieuw te ontwikkelen originele applicaties.
Op het gebied van prostaatkankerscreening kan dit worden gerealiseerd door de toepassing
van beslisondersteunende instrumenten, zoals de Prostaatwijzer. Deze ondersteunen zowel
de patiënt als de medisch professional en dragen bij aan het maken van een goed
geïnformeerde keuze.
Vroegdetectie van prostaatkanker kan een goed geïnformeerde man niet worden
onthouden. Het is wel van belang te kiezen voor een gepersonaliseerde strategie,
ondersteund door multivariabele individuele risicostratificatie. Het gebruik van een
prostaatkankerpredictiemodel is superieur ten opzichte van het gebruik van enkel een PSA
waarde; dit wordt ondersteund door de wetenschappelijke literatuur.
Aan het einde van hoofdstuk 8 wordt een pragmatische screeningstrategie
beschreven, waarbij de eerste lijn als uitgangspunt wordt genomen waarbinnen de vrij
beschikbare en gebruiksvriendelijke Prostaatwijzer-app (ERSPC Rotterdam Prostate Cancer
Risk Calculator) wordt toegepast. Verwacht wordt dat verschillende onderzoeksgebieden de
huidige predictiemodellen de komende jaren zullen verbeteren. Denk hierbij aan de
toepassing van big-data, verder te ontwikkelen biomarkers en beeldvormingstechnieken. Dit
nieuwe paradigma van gepersonaliseerde risicobeoordeling zal het individuele management
en follow-up van de ziekte prostaatkanker gaan verbeteren, vroegdetectie van uitsluitend
klinisch significante kankers bevorderen en overdiagnose en overbehandeling van laag-risico
kankers verminderen.
210

De uitkomsten van deze directe onderlinge vergelijking bieden een basis waarop een
aanbeveling kan worden gemaakt welk prostaatkankerpredictiemodel te gebruiken. Zowel bij
mannen die niet eerder een biopsie ondergingen alsook bij mannen die eerder biopten
ondergingen en bij wie geen prostaatkanker werd gevonden, bleek de Prostaatwijzer (de
ERSPC Rotterdam Prostate Cancer Risk Calculator) de best voorspellende waarde te
hebben. De Prostaatwijzer kan dan ook worden geïmplementeerd om het diagnostische
proces te verbeteren.
Hoofdstuk 8: Discussie
eHealth is een onderdeel geworden van de dagelijkse urologische praktijk en verwacht
wordt dat de impact de komende jaren alleen maar zal toenemen, ondersteund door software-
en hardwareverbeteringen, innovatieve services en nieuw te ontwikkelen originele applicaties.
Op het gebied van prostaatkankerscreening kan dit worden gerealiseerd door de toepassing
van beslisondersteunende instrumenten, zoals de Prostaatwijzer. Deze ondersteunen zowel
de patiënt als de medisch professional en dragen bij aan het maken van een goed
geïnformeerde keuze.
Vroegdetectie van prostaatkanker kan een goed geïnformeerde man niet worden
onthouden. Het is wel van belang te kiezen voor een gepersonaliseerde strategie,
ondersteund door multivariabele individuele risicostratificatie. Het gebruik van een
prostaatkankerpredictiemodel is superieur ten opzichte van het gebruik van enkel een PSA
waarde; dit wordt ondersteund door de wetenschappelijke literatuur.
Aan het einde van hoofdstuk 8 wordt een pragmatische screeningstrategie
beschreven, waarbij de eerste lijn als uitgangspunt wordt genomen waarbinnen de vrij
beschikbare en gebruiksvriendelijke Prostaatwijzer-app (ERSPC Rotterdam Prostate Cancer
Risk Calculator) wordt toegepast. Verwacht wordt dat verschillende onderzoeksgebieden de
huidige predictiemodellen de komende jaren zullen verbeteren. Denk hierbij aan de
toepassing van big-data, verder te ontwikkelen biomarkers en beeldvormingstechnieken. Dit
nieuwe paradigma van gepersonaliseerde risicobeoordeling zal het individuele management
en follow-up van de ziekte prostaatkanker gaan verbeteren, vroegdetectie van uitsluitend
klinisch significante kankers bevorderen en overdiagnose en overbehandeling van laag-risico
kankers verminderen.


About the author
213

About the author
Nuno Miguel Pereira Azevedo was born in Porto on January 28, 1985. He completed
his secondary education at Santa Maria da Feira High School in 2003, after which he started
medical school at Universidade da Beira Interior. He finished his Master of Science in Medicine
in 2009.
After obtaining his medical degree, he worked as a resident at Centro Hospitalar do
Porto and Hospital Espírito Santo Évora, and as a fellow at Clinique St. Augustin Bordeaux.
During his residency training in Urology, he started working on this PhD project at the Urology
Department of the Erasmus University Medical Center, under the supervision of Prof. Dr. M.
J. Roobol-Bouts.
Currently, Nuno Azevedo is working as a urologist at Centro Hospitalar de Entre Douro
e Vouga. In addition to his academical and clinical duties, he is also the Chief Executive Officer
of Ydeal, a software company focused on eHealth solutions.
215


List of Publications
217

List of Publications
1. mHealth in Urology: A Review of Experts’ Involvement in App Development Pereira-Azevedo N, Carrasquinho E, Cardoso de Oliveira E, Cavadas V, Osório L, Fraga
A, Castelo-Branco M, Roobol MJ
PLOS ONE (2015) 10(5): e0125547 2. Expert Involvement Predicts mHealth App Downloads: Multivariate
Regression Analysis of Urology Apps
Pereira-Azevedo N, Osório L, Cavadas V, Fraga A, Carrasquinho E, Cardoso de Oliveira
E, Castelo-Branco M, Roobol MJ
JMIR mHealth and uHealth 2016;4(3):e86 3. Rotterdam Prostate Cancer Risk Calculator: Development and Usability Testing
of the Mobile Phone App Pereira-Azevedo N, Osório L, Fraga A, Roobol MJ
JMIR Cancer JMIR Cancer 2017;3(1):e1
4. Prospective evaluation on the effect of interobserver variability of digital rectal
examination on the performance of the Rotterdam Prostate Cancer Risk Calculator Pereira-Azevedo N, Braga I, Verbeek J, Osório L, Cavadas V, Fraga A, Carrasquinho
E, Cardoso de Oliveira E, Nieboer D, Roobol MJ
International Journal of Urology (2017) 24, 826-832
5. Head-to-head comparison of prostate cancer risk calculators predicting biopsy
outcome Pereira-Azevedo N, Verbeek J, Nieboer D, Bangma CH, Roobol MJ
Translational Andrology and Urology (2018) 7(1):18-26
6. eHealth and mHealth in prostate cancer detection and active surveillance
Pereira Azevedo N, Venderbos L
Translational Andrology and Urology (2018) 7(1):170-181
219


Dankwoord
221

Dankwoord
I am very thankful for the opportunity to complete my Doctoral studies at Erasmus
University Medical Center Rotterdam, the largest medical school in the Netherlands, one of
the top ten best medical institutes in Europe and one of the top twenty cited medicine clinics
worldwide. The enterprise of combining my residency in Urology with this PhD project was
enriching: merging academic and clinical challenges increased my medical repertoire, and
helped me along the path to become a more complete urologist.
This scientific growth surpassed what I had anticipated when this journey began, and
the successes and challenges associated with it foster my motivation for excellence: the well-
being of patients. Everything that is explicit in this thesis was only possible with the help,
support and advice of many. At the risk of omitting some, I must express my gratitude to those
who have stimulated and contributed to its completion.
To Mariana, Nuno Francisco, and Maria Victória, for being my purpose and my
motivation. To my family, for their love and unconditional support and understanding.
A special thanks to Prof. dr. Monique J. Roobol-Bouts, my promotor, for encouraging
me to start this challenge and for her guidance and wisdom along the way in the pursuit of
new goals. Her sagacity, dedication and care were relentless: she has become a mentor and
a friend.
To Prof. dr. Chris H. Bangma, who accepted me into his department: throughout the
years, he always fostered innovation and cooperation. To Prof. dr. Fritz. H. Schröder, for the
enthusiasm with which he heard a young resident promote smartphone apps: it was my first
contact with the Erasmus MC team. To Dr. Lionne D.F. Venderbos, my copromotor, for
candidly stimulating my progress: her enthusiasm, encouragement, and camaraderie are
indissociable from this thesis.
I acknowledge the jury members, Prof. dr. L. Lechner and Prof. dr. R. Pelger, for their
contributions to this thesis. It is an honour to have you in the committee, and I look forward to
the debate during the public defence.
To all the colleagues working at the research bureau of the department of Urology:
Conja, Daan, Daniël, Frank-Jan, Henk, Jozien, Leonard, Maaike, and Marlies. A special
thanks to Dr. Arnout Alberts and Drs. Jan Verbeek, for their mutual help and support, which
created a pleasant academic environment. I am happy you both will stand by my side during
the defence.
223

This PhD project was only feasible with the stimulus and understanding of my Urology
colleagues. A special acknowledgment to Dr. Eduardo Carrasquinho and Dr. Eduardo
Cardoso de Oliveira, who welcomed me into my Urology training, and to Dr. Luís Osório and
Prof. dr. Avelino Fraga, with whom I concluded my residency: in addition to clinical teachings
and technical skills they gave me, they incited my scientific production as an intrinsic
component of a complete contemporary training. All my peers were supportive of this
endeavour, in particular, Dr. Isaac Braga, Dr. João Cabral, Dr. Richard Gaston, Dr. Severino
Ribeiro, and Dr. Vítor Cavadas, who were unsurpassed in their empathy and rapport.
Being a Urologist with a special interest in prostate pathology, I will always treasure the
opportunity of working within the Erasmus MC Department of Urology team. They have a
leading role in prostate cancer screening research, and I anticipate that the completion of this
PhD is a starting point for a new journey, with innovative and complementary insights, as is
the way in Medicine, because ...
... "The doctor who only knows Medicine, not even Medicine knows."
Abel Salazar
224

This PhD project was only feasible with the stimulus and understanding of my Urology
colleagues. A special acknowledgment to Dr. Eduardo Carrasquinho and Dr. Eduardo
Cardoso de Oliveira, who welcomed me into my Urology training, and to Dr. Luís Osório and
Prof. dr. Avelino Fraga, with whom I concluded my residency: in addition to clinical teachings
and technical skills they gave me, they incited my scientific production as an intrinsic
component of a complete contemporary training. All my peers were supportive of this
endeavour, in particular, Dr. Isaac Braga, Dr. João Cabral, Dr. Richard Gaston, Dr. Severino
Ribeiro, and Dr. Vítor Cavadas, who were unsurpassed in their empathy and rapport.
Being a Urologist with a special interest in prostate pathology, I will always treasure the
opportunity of working within the Erasmus MC Department of Urology team. They have a
leading role in prostate cancer screening research, and I anticipate that the completion of this
PhD is a starting point for a new journey, with innovative and complementary insights, as is
the way in Medicine, because ...
... "The doctor who only knows Medicine, not even Medicine knows."
Abel Salazar


PhD Portfolio
227

PhD Portfolio Name Nuno Miguel Pereira Azevedo
PhD period January 2014 – January 2018
Erasmus MC department Urology
Research school NIHES – Netherlands Institute for Health Sciences
Promotor Prof. dr. M. J. Roobol-Bouts
Copromotor Dr. L. Venderbos
Year Workload (ECTS)
1. PhD training
General courses
• PhD Course: (1) Ethics, (2) Epidemiology, (3) Research methods and biostatistics, (4) Healthcare management, (5) Hormones and mechanisms of action, (6) Medical research.
2014 40.0
• Erasmus MC Scientific Integrity Course 2016 0.3 • European Urology Residents Education Programme 2016 1.7
Seminars and workshops • Department of Urology Journal Club 2014-2017 1.0 • Department of Urology Annual Course 2014-2017 1.0
Presentations • American Urological Association Annual Meeting,
Florida 2014 1.0
• European Multidisciplinary Congress on Urological Cancers Annual Meeting, Lisbon
2014 1.0
• Portuguese Association of Urology Annual Meeting, Albufeira
2014 1.0
• European Association of Urology Annual Congress, Stockholm
2014 1.0
• Angola Health and Science Congress, Luanda 2015 1.0 • Portuguese Association of Urology Annual Meeting,
Braga 2015 1.0
• European Association of Urology Section of Urolithiasis Annual Meeting, Alicante
2015 1.0
• European School of Oncology Active Surveillance Meeting, Milan
2016 1.0
• Portuguese Association of Urology Annual Meeting, Tróia
2016 1.0
• European Association of Urology Annual Congress, London
2017 1.0
• American Urological Association Annual Meeting, Boston
2017 1.0
• Challenges in Endourology, Paris 2017 1.0
229

Year Workload (ECTS)
International conferences • American Urological Association Annual Meetings 2014-2017 1.0 • European Association of Urology Annual
Congresses 2014-2017 1.0
• Portuguese Association of Urology Annual Meeting 2014-2017 1.0 • European Association of Urology Section of
Urological Imaging Annual Meeting 2014 1.0
• European Multidisciplinary Congress on Urological Cancers Annual Meeting
2014 1.0
• European Association of Urology Section of Urolithiasis Annual Meeting
2015 1.0
• Angola Health and Science Congress 2015 1.0 • European School of Oncology Active Surveillance
Meeting 2016 1.0
• Urotechnology: A bridge to the future 2017 1.0 • Challenges in Endourology 2017 1.0
Other • European Board of Urology Exam 2017 2.0
2. Teaching Medical Students and Residents
• Clinical education of medical students and residents
2014-2017 1.0
Total ECTS (European Credit Transfer and Accumulation System)
69