measuring worker well-being - erasmus universiteit rotterdam
TRANSCRIPT

Measuring Worker Well-beingAn Evaluation of Closed and Open-Ended Survey Questions
Indy Wijngaards
An Evaluation of Closed and O
pen-Ended Survey Questions
An Evaluation of Closed and Open-Ended Survey Questions
Indy Wijngaards
THESIS
MEASURING WORKER
WELL-BEING
MEA
SURIN
G W
ORK
ER WELL-BEIN
GIndy W
ijngaards
W orker well-being is a hot topic in organizations and
academia, causing the interest for its measurement
using surveys to spike. However, scholars and practitioners are
struggling to rigorously measure well-being in the workplace.
The main aim of this thesis is to provide conceptual and empirical
guidance on how researchers can deal with the technical and
practical challenges they are facing and, thereby, contribute to
the rigor of worker well-being measurement in organizations.
Indy Wijngaards (1994) graduated from the master Human Resource Studies (cum laude) and the master Data Science: Business & Governance (with distinction)
at Tilburg University, the Netherlands.
WORKER

Measuring Worker Well-beingAn Evaluation of Closed and Open-Ended Survey Questions
Indy Wijngaards

Lay-out and printing by Optima Grafische Communicatie (www.ogc.nl)
Measuring Worker Well-BeingAn evaluation of closed and open-ended survey questions
Meten van medewerkerswelzijnEen beschouwing van gesloten en open vragenlijst vragen
Thesis
to obtain the degree of Doctor from theErasmus University Rotterdam
by command of therector magnificus
Prof.dr. A.L. Bredenoord
and in accordance with the decision of the Doctorate Board.The public defence shall be held on
Thursday, 18 November 2021at 15:30 hrs
by
Indy Wijngaardsborn in Roosendaal en Nispen
Doctoral coMMittee
Promotors: prof.dr. N.J.A. van Exelprof.dr.ir. J.C. van Ours
other members: prof.dr.ir. C.B.T. Ahausprof.dr. M. van Woerkomprof.dr. M.J.P.M. van Veldhoven
copromotor: prof. dr. M.J. Burger
taBle of contents
Chapter 1 | General introduction 9 1.1. Worker well-being: A hot topic 11 1.2. The promise of survey measurement to improve worker well-being 12 1.3. The principles of rigorous measurement of worker well-being 14 1.4. The challenges of rigorous worker well-being measurement 17 1.5. Research objectives 18 1.6. Thesis outline 20
Chapter 2 | What is worker well-being, and how it should be measured 25 2.1. Introduction 27 2.2. What is worker well-being? 30 2.3. How can worker well-being constructs be measured? 35 2.4. How should a worker well-being measure be selected? 41 2.5. Discussion 51
Chapter 3 | Steering towards happiness 55 3.1. Introduction 57 3.2. Theory 59 3.3. Methods 66 3.4. Results 73 3.5. Discussion 76
Chapter 4 | Cognitive crafting and work engagement in the healthcare industry 85 during the COVID-19 pandemic 4.1. Introduction 87 4.2. Theory 89 4.3. Methods 92 4.4. Results 94 4.5. Discussion 97
Chapter 5 | For whom and under what circumstances does email batching work? 103 5.1. Introduction 105 5.2. Methods 109 5.3. Results 113 5.4. Discussion 119
Chapter 6 | The promise of open survey questions for measuring job satisfaction 125 6.1. Introduction 127 6.2. Methods 135 6.3. Results 143 6.4. Discussion 146
Chapter 7 | Unpacking the potential of semi-open-ended job satisfaction questions 151 7.1. Introduction 153 7.2. Methods 160 7.3. Results 165 7.4. Discussion 170
Chapter 8 | General discussion 179 8.1. Main findings 182 8.2. Strengths and limitations 185 8.3. Implications for scholar and practitioners in organizations 190 8.4. General conclusion 192
Bibliography 195
Acknowledgements 239
About the author 243
Portfolio 247
Summary 255
Samenvatting 261


1General introduction

1
11
1.1. Worker Well-BeinG: a hot toPic
Worker well-being is a hot topic in organizations. A 2018 study of 250 UK organizations showed that 45% had a general well-being strategy in place, and that 84% of the ones that did not were planning to install one within the next three years (REBA, 2018). Like-wise, the Chartered Institute of Personnel and Development (CIPD) revealed that in 2017 55% of the surveyed UK executives had worker well-being on their strategic agendas and in 2018 this percentage had risen to 61% (CIPD, 2019). PricewaterhouseCoopers’ Health and Well-being Touchstone Surveys (2019, 2020) demonstrated that present-day organizations typically offer a wide range of well-being programs to help workers with specific aspects of their well-being, e.g., employee assistance programs, resiliency programs, weight management, fitness challenges, smoking cessation, stress manage-ment, mediation resources and financial coaching. Perhaps unsurprisingly, the current workplace wellness market is worth more than $45 billion and is projected to grow in the decades to come (Allied Market Research, 2020; Global Wellness Institute, 2016). As an illustration, Fidelity Investments and National Business Group on Health’s 10th Annual Health and Well-being Survey estimated the average per-worker expenditure on health and well-being to be $762 in 2019 (Fidelity investments, 2019).
The interest in worker well-being is also widespread in the scientific community. A mul-titude of scholars have concentrated on the definition and measurement of worker well-being (Page & Vella-Brodrick, 2009; Sonnentag, 2015). Others have worked on mapping its determinants, including management practices (e.g., leadership style, Inceoglu et al., 2018; pay, Judge et al., 2010; job design, Wegman et al., 2018; restructuring, De Jong et al., 2016), sociodemographic factors (e.g., age, Ng & Feldman, 2010; employment con-tract, Wilkin, 2013) and personality (Bruk-Lee et al., 2009). Again others focused on the development and evaluation of interventions that promote worker well-being (Briner & Walshe, 2015; Nielsen, Randall, et al., 2010). As an illustration, the academic literature on job satisfaction dates back more than a century and has developed into a wide range of subfields (Judge et al., 2017), counting more than 60 distinct job satisfaction measures (Hora et al., 2018).
Numerous instrumental reasons support the popularity of worker well-being in organizations and academia. A myriad of studies have linked worker well-being to key performance indicators (Taris & Schaufeli, 2015). For instance, a meta-analysis of available evidence showed that satisfaction with the company is favorably related to objective measures of organizational and individual productivity, customer loyalty and staff turnover (Krekel et al., 2019). Longitudinal research revealed that subjective well-being is related to workplace performance and productivity (Bryson et al., 2017; DiMaria et al., 2020). Experimental research demonstrated that the relationship between
chapter 1 | General introduction
12
worker well-being and productivity is, in fact, causal in nature. For example, a laboratory study reported that a happiness intervention resulted in a 12% increase in productivity (Oswald et al., 2015). A more recent quasi-experiment among call center workers in a large UK telecommunications firm showed that workers make around 13% more sales in weeks where they report being happy compared to weeks when they report being unhappy (Bellet et al., 2020).
Besides instrumental reasons to pursue worker well-being, there is a pertinent moral im-perative for it (Guest, 2017). Among the many things that might be thought to be good in themselves, human well-being is perhaps the one object most highly regarded as such (Aristotle, 340 C.E.; Kraut, 2009; Mill, 1859; Raz, 1986; Sidgwick, 1874). The moral case for protecting worker well-being is strengthened by the great challenges that characterize today’s workplaces, e.g., market globalization, rapid technological innovation, work intensification and increased job uncertainty, and the toll these challenges can take on the well-being of workers (Barley et al., 2017; World Bank, 2018). The coronavirus disease 2019 (COVID-19) pandemic presented a new set of demands that also put well-being in jeopardy, e.g., social isolation, issues with work-life balance and the fear of unemploy-ment (Collings et al., 2021; Kniffin et al., 2020). Indeed, research by Qualtrics and SAP in the early days of the pandemic showed that, of the 2700 employees surveyed, 75% felt more socially isolated and 53% reported greater emotional exhaustion (R. Smith, 2020). A global survey fielded between August and September 2020 indicated that 62% of employees consider mental health issues to be a top challenge during the pandemic (McKinsey & Company, 2020).
1.2. the ProMise of survey MeasureMent to iMProve Worker Well-BeinG
With worker well-being getting higher on the agendas of organizations and scholars, the interest for assessing worker well-being and its drivers and consequences in organi-zations is spiking. Surveys have always been the most popular instrument for assessing worker well-being (Gerrad & Hyland, 2020; Jarden & Jarden, 2017). As an illustration, the Engagement Institute reported that over 80% of the organizations worldwide survey their workers regularly (Ray et al., 2013). A survey of 414 HR professionals in 2019 revealed that surveys are the most popular tool for measuring employee engagement and 72% of large US organizations administer one annually (hr.com, 2019). Besides administering annual surveys, more and more organizations are using pulse surveys – frequent, short surveys to capture fluctuations in job attitudes over time (Mayo, 2016; Welbourne, 2016). In support of this, the study by hr.com demonstrated that 36% of organizations measure employee engagement using pulse surveys and that 21% do so at least every quarter.
1
13
The widespread acceptance of survey instruments is not without reason: They are rela-tively easy to administer and hold great potential for advancing worker well-being in organizations (Jarden & Jarden, 2017; Nielsen, Randall, et al., 2010). On a general level, administering a survey signals that an organization cares about its workers and can, in turn, improve their morale (Jarden & Jarden, 2017). However, the greatest value of survey instruments lies in the data they produce. Data about worker well-being, work experiences, preferences and complaints contains information that organizations can use to make evidence-based decisions about improving worker well-being in the orga-nization (Briner & Walshe, 2015). Below, several functions of worker well-being surveys are listed, and examples are provided.(1) Survey data can be used as a diagnostic tool to spot individual workers or groups
of workers that are suffering from low well-being or to identify aspects of well-being that need attention. For example, Sutton et al. (2016) used a corporate survey administered in a European financial services organization to show that workers and team leaders had significantly lower well-being than workers higher up in the organizational hierarchy. In addition, the survey revealed that not all components of worker well-being were at risk; only sleep problems emerged as a pertinent concern across all levels of the organization.
(2) Survey data can help advance the understanding of what factors drive well-being. For example, De Neve et al. (2018) analyzed survey data from workers nested in thou-sands of organizations worldwide and found that importance rankings of workplace quality indicators differed across subgroups in the working population. For example, the perceived usefulness of work turned out to be a significantly more important predictor of job satisfaction for highly educated workers than for lowly educated workers.
(3) Survey data can pinpoint to the cause and possible solutions to certain well-being problems in an organization. For example, Nielsen et al. (2014) used a tailored survey to uncover specific well-being problems in a postal service organization and to ob-tain input for interventions to address them. An analysis of the survey data showed that problems associated with the unrealistic computer-generated delivery routes were easily solved by hanging up a board in the sorting room that workers could use to fine-tune the preplanned route layout.
(4) Survey data can help in the evaluation of organizational interventions. For example, Randall et al. (2009) illustrated how surveys can be used to evaluate a team working intervention and can provide insight into the reasons that drive an interventions’ success or failure. They found that the intervention had a positive effect on worker well-being, especially in teams with managers that had a positive attitude towards the intervention and good social cohesion.
chapter 1 | General introduction
14
1.3. the PrinciPles of riGorous MeasureMent of Worker Well-BeinG
A prerequisite for an effective worker well-being survey is the rigorous measurement of the concept of worker well-being itself. After all, data-driven insights on well-being problems, outcomes and interventions will be biased and, thus, of limited value for evidence-based decision making, if data on the concept of worker well-being is unreli-able or incomplete. Three principles of rigorous worker well-being measurement are (i) the examination of a broad selection of worker well-being constructs (or variables), (ii) the use of valid closed survey questions and (iii) the consideration of open-ended survey questions.
1.3.1. the examination of a broad selection of worker well-being constructsA comprehensive selection of constructs is essential for the identification of well-being problems in the workforce and the selection and evaluation of interventions to resolve such problems (P. Y. Chen & Cooper, 2014; F. R. Goodman et al., 2020). With worker well-being being a multifaceted phenomenon1, the constructs that fall under its con-ceptual umbrella can differ in the direction and magnitude of their relationships with other variables (Briner & Walshe, 2015; Grant et al., 2007). A variable can, for instance, be positively related to one well-being construct, but negatively related or not at all related to another. Consequently, the adoption of a narrow operationalization of worker well-being (e.g., measuring just one well-being variable) may lead to overgeneralized claims about favorable, unfavorable or nonexistent effects of particular variables on worker well-being in general.
There are numerous studies that illustrate this point. Kushlev and Dunn (2015), for example, showed that an intervention aimed at improving email use had a direct effect on daily stress levels at work, but not on daily and weekly levels of positive and negative affect, social connectedness, sleep quality and meaningfulness. Coffeng et al. (2014) revealed that an office refurbishment had an effect on workers’ perceived absorption at work but not on their enthusiasm and energy in the workplace. Guerci et al. (2019) showed that pay-for-performance can improve workers’ psychological well-being, but deplete relational well-being. The authors also demonstrated that job enrichment may lead to higher psychological well-being in the short term but may deter physical well-
1 For example, contemporary models of worker well-being include general constructs such as life satisfac-tion (Erdogan et al., 2012; Ilies et al., 2007), fluctuant constructs such as job affect (Beal & Ghandour, 2011; Ilies & Judge, 2004) and state work engagement (Breevaart et al., 2012), and constructs with alternative philosophical underpinnings such as eudaimonic well-being at work (Kożusznik et al., 2019; Page & Vella-Brodrick, 2009) and flow (Moneta, 2012, 2017).
1
15
being in the long term. Halbesleben (2011) evidenced that, under certain conditions, high levels of work engagement are positively associated with work-family conflict and poor family satisfaction.
1.3.2. the use of valid closed question survey measuresOnce a comprehensive set of well-being constructs is selected, it is key to select valid survey instruments to measure them and verify the quality of the survey data when it has been collected (Arthur Jr et al., 2020; Flake & Fried, 2020). Doing this allows a researcher to maximize the likelihood that a measure contains a limited amount of measurement error and captures the well-being construct that (s)he aims to measure. Scholars have developed a vast array of closed survey questions to measure worker well-being con-structs (Jarden & Jarden, 2017) and statistical techniques for psychometric validation of the collected survey data (e.g., internal consistency, test-retest reliability, factor structure, measurement invariance, Borsboom et al., 2004; Zickar, 2020). Most validated closed question measures comprise multiple items because single-item measures are of limited value for measuring multidimensional constructs and often deemed unreliable because internal consistency and reliability cannot be estimated (G. G. Fisher et al., 2016; Nunnally & Bernstein, 1994). For example, Breevaart et al. (2012) showed that the 9-item Utrecht Work Engagement Scale (Schaufeli et al., 2006) measuring dispositional work engagement can be validly used to measure daily work engagement by customizing the item stem (i.e. using ‘today’ instead of ‘in general’). Drawing from validity statistics from 79 samples, Kinicki et al. (2002) showed that the 72-item Job Descriptive Index (P. C. Smith et al., 1969) has reasonable psychometric properties. Using a similar research design, Bowling and Hammond (2008) showed that the 4-item Michigan Organizational Assessment Job Satisfaction Subscale (Cammann et al., 1979) is a reliable and construct-valid measure of job satisfaction.
There are examples abound of why both careful selection of a measure and the valida-tion of survey data is important to ensure the validity of research findings. Below, two examples for each aspect are provided. Concerning the selection of measures, an accu-mulating body of research has shown that the full version of the Maslach Burnout Inven-tory (Maslach & Jackson, 1981) should not be used to scan for burnout in a workforce, as the ‘exhaustion’ and ‘cynicism’ subscales capture burnout and the ‘lack of professional efficacy’ subscale does not (Qiao & Schaufeli, 2011). Another strand of research has dem-onstrated that overall job satisfaction is better measured using a general measure of job satisfaction (e.g., “How satisfied are you with your job as a whole?”) rather than a composite of job facet measures (e.g., “How satisfied are you with your relationships at work?”) because the aggregation of job facet satisfaction scores into an overall scores is
chapter 1 | General introduction
16
problematic (Dalal, 2012; Ferratt, 1981; Ironson et al., 1989; Mikes & Hulin, 1968; Quinn & Mangione, 1973; for counterevidence, see Bowling & Zelazny, 2021).
Concerning the validation of survey data, a study of burnout among professors by Fernet et al. (2004) illustrated that it is essential to check the item-level descriptive statistics and internal consistency of a scale. They showed that two items in the Maslach Burnout Inven-tory’s exhaustion subscale (i.e., “Working with people directly puts too much stress on me” and “Working with people all day is really a strain for me”) had extremely low means in their sample and attenuated the scales’ internal consistency. The authors concluded that most respondents perceived these items to be irrelevant and decided to drop the items. A methodological study by Kam and Meyer (2015) offered an illustration of why it is important to check for response styles in survey data. Using a shortened version of the Illinois Job Satisfaction Index (Chernyshenko et al., 2003; Credé et al., 2009), the authors revealed that two response styles (i.e., careless responding and acquiescence) can lead to bias in factor analytical results and can affect bivariate correlations. For example, the correlation between job satisfaction and organizational citizenship behavior was 0.38 for careful respondents and 0.51 for careless respondents.
1.3.3. the consideration of open-ended survey questionsOpen-ended survey questions have the promise of increasing the rigor of worker well-being surveys and are increasingly used to measure worker well-being constructs, especially job satisfaction (e.g., Borg & Zuell, 2012; Gilles et al., 2017; Poncheri et al., 2008). First, administering both kinds of questions facilitates triangulation of methods (Turner et al., 2017). As careless responding could introduce bias in closed question scales (Meade & Craig, 2012; for examples for well-being, see Espinoza et al., 2018; Kam & Meyer, 2015), and open-ended questions force respondents into a more intensive and therefore arguably more careful form of cognitive processing (Krosnick, 1999), textual measures could be used to cross-validate closed survey questions or as an additional data source for hypothesis testing (Mossholder et al., 1995; Taber, 1991).
Second, textual data can be leveraged to obtain a more holistic perspective on the construct of study in particular contexts (Jick, 1979; Turner et al., 2017). For example, the responses can be used to assess when, why and how a construct is manifested and unravel the psychological processes that influence the self-report responses to closed survey questions (Edwards, 2008; Spector & Pindek, 2016). For example, Gilles et al.’s (2017) textual analysis of open survey comments from healthcare workers showed that certain issues were common across all professional groups (e.g., tight scheduling), while others were more group-specific (e.g., lack of skill recognition for administrative work-ers).
1
17
1.4. the challenGes of riGorous Worker Well-BeinG MeasureMent
The rigorous measurement of worker well-being thus ideally consists of the wide selection of worker well-being constructs, the administration of both validated closed and open-ended survey questions and the judicious analysis of the survey data. Yet, scholars and practitioners concerned with well-being assessment in organizations, such as experts from consultancy firms, in-house organizational behavior specialists and hu-man resource (HR) professionals, do not seem to invariably adhere to the principles of rigorous worker well-being measurement. As an illustration, practitioners often focus on a narrow selection of well-being constructs, e.g., job satisfaction and engagement (Saks & Gruman, 2014), use idiosyncratic, single-item measures, and rarely engage in measure validation (Jarden & Jarden, 2017; Spence, 2015). Systematic literature reviews suggest that, despite the advances in the conceptualization of worker well-being, many scholars also study a limited set of (mostly work-related) well-being constructs and traditionally use cross-sectional designs to collect survey data (e.g., Erdogan et al., 2012; Inceoglu et al., 2018; Mäkikangas et al., 2016). Both practitioners and scholars often include one or two open-ended survey questions, but rarely use the textual data they produce for the construction and validation of measures or systematic qualitative analyses (Borg & Zuell, 2012).
Two challenges may explain this trend. The first issue relates to the practical chal-lenges of rigorous worker well-being measurement in organizations. Due to a fear of high opportunity costs, backlash from workers and low-quality data, organizations are rarely keen to participate in studies that put a heavy burden on the time of workers, e.g., studies with intensive repeated measurement and studies using lengthy batteries of questions (Lapierre et al., 2018). As a result, scholars and practitioners are forced to make their surveys as time-efficient as possible. It should be noted that the worries of organizations are not unjustified. Scientific research shows that workers are regularly disinclined to complete surveys (i.e., average response rate in organizational studies = 52.3%; Anseel et al., 2010). Lengthy surveys can lead to more careless responding (Bowl-ing et al., 2020; Eisele et al., 2020; Gibson & Bowling, 2019) and nonresponse (Yan et al., 2011), especially among workers with negative job attitudes (Fauth et al., 2013; Mueller et al., 2011; Rogelberg et al., 2000, 2003). Following workers over time with repeated measurements will inevitably lead to attrition (Ployhart & Vandenberg, 2010). As an il-lustration, in a ten-year study of burnout of primary healthcare physicians, Schaufeli et al. (2011) invited a random sample of 801 physicians for a survey. Of the physicians in the sampling frame, 567 provided a valid response in the first survey wave, 299 in the second wave and 165 in the third wave. Yaldiz et al.’s (2018) longitudinal study on the determinants of stress in US public works departments started off with a sampling frame
chapter 1 | General introduction
18
of 520 workers. In the end, 348 workers filled out the first survey and 243 completed the 12-month follow-up survey.
The second challenge relates to technical challenges of rigorous worker well-being mea-surement. Academic researchers are theory-minded (Aguinis & Vandenberg, 2014) and trained in psychological methods, such as test construction, research design, multiple regression analysis, analysis of variance and basic psychometric analyses (Aiken et al., 2008). This background allows them to leverage theory to identify the relevant well-being constructs, to select well-established closed question measures to capture them, and to evaluate the data’s validity once it has been collected. However, research shows that many scholars still find it difficult to navigate the “conceptual jungle” (Mäkikangas et al., 2016, p. 62) that characterizes the worker well-being literature and to identify the most suitable constructs and measures (F. R. Goodman et al., 2020; Zheng et al., 2015). Due to lack of professional training, many scholars are not comfortable with deploying statistical techniques required for constructing textual measures (Kobayashi et al., 2017) and struggle with the rapid developments in advanced research methodology (Aguinis et al., 2018; Aiken et al., 2008). Such technical challenges seem even more pertinent for practitioners. In contrast to scholars, practitioners often do not have access to scientific literature (e.g., recent evidence on the measurement of worker well-being, measure vali-dation practices and textual measure creation), are not adequately trained to process such content, or both (Briner et al., 2009; C. Gill, 2018; Rynes, 2012). Additionally, even though an increasing number of practitioners is comfortable with performing basic statistical analyses of numerical data (e.g., creating a dashboard with descriptive data), most practitioners have received little to no training in statistics whatsoever (Angrave et al., 2016; Marler & Boudreau, 2017; Rynes & Bartunek, 2017).
1.5. research oBjectives
In summary, despite the widespread interest in measuring worker well-being using surveys, many scholars and practitioners are currently not following the principles of rigorous worker well-being measurement, e.g., operationalizing worker well-being as narrow concept, not using scientific literature to select of a closed question survey measure, forgetting to validate survey data once collected and ignoring textual data from open-ended survey questions. Here above, it was argued that this trend can be explained by two challenges: (1) practical challenges in organizations and (2) technical challenges for scholars and, in specific, practitioners.
These challenges have several consequences. First, technical challenges, such as a dif-ficulty navigating scientific literature and the lack of access thereto, make it difficult for

1
19
scholars and practitioners to grasp the full breath of the concept of worker well-being and consider all relevant constructs that could fall under its conceptual umbrella. Sec-ond, the practical challenges in organizations, such as the disinclination to administer time-inefficient surveys in the workforce, may complicate the study of a wide array of constructs and incentivize scholars and practitioners to focus on a small selection of constructs. Third, these practical challenges also disincentivize scholars and practitio-ners to administer psychometrically sound, but lengthy survey scales and do intensive longitudinal research. On top of that, technical challenges hamper the identification of the most appropriate closed question survey measures and the validation of survey data. Fourth, technical challenges lead to the low perceived value and the neglect of open-ended survey question data.
The central aim of this thesis is to offer scholars and practitioners guidance on how to deal with the practical and technical challenges of rigorous worker well-being surveys. These efforts hopefully contribute to the promotion of worker well-being survey re-search that is both rigorous and realistic. I do this by providing both conceptual and practical guidance. First, I develop a conceptual framework of worker well-being and an accessible synthesis of established as well as more innovative survey instruments that could be used for measuring worker well-being reliably and validly. Beyond conceptual guidance in the operationalization of worker well-being, I describe the most important approaches for validating well-being data and creating textual measures from responses to open-ended questions. Second, I demonstrate how these recommendations can be applied in practical research contexts and reflect on the challenges that I have come across in doing this empirical work.
Notably, this thesis does not intend to provide a definitive conceptual model of worker well-being, a gold standard measure for capturing it or an exhaustive list of best practices for measure construction and validation. Attempting this would be ostentatious because every research context is different, and the literature of worker well-being is scattered and continuously expanding. Instead, this thesis offers practitioners a thorough intro-duction to the science of worker well-being measurement, evidence that highlights the importance of rigorous measurement and examples on how methodological rigor can realistically be improved in organizations. This thesis offers scholars and practitioners a roadmap to navigate the ever-expanding literature on worker well-being and a primer to the construction of textual survey measures from open-ended survey questions.
This thesis is organized around four research questions:(1) How can the concept of worker well-being be defined and operationalized into
constructs?(2) Which worker well-being constructs should be focused on in a survey?
chapter 1 | General introduction
20
(3) What kind of closed survey questions are suitable for measuring worker well-being constructs in organizations?
(4) How can open-ended survey questions contribute to measuring worker-well-being in organizations?
1.6. thesis outline
This thesis consists of six substantive chapters, preceded by this introduction chapter and concluded with a discussion chapter. chapter 2 provides the theoretical foundation for addressing the first three research questions of this thesis, explaining what worker well-being is, how worker well-being constructs can be measured, and how a worker well-being measure should be selected. To maximize the relevance to practitioners, scientific terminology is explained as much as possible in this chapter.
Chapters 3 to 5 report on three studies that were conducted in a diverse set of organi-zations in the Netherlands. The chapters address the first three research questions by providing an empirical showcase of survey measurement using closed questions. For example, how were well-being constructs selected? Which measures were chosen and why? What techniques were used to validate the well-being measure? It should be noted that these chapters do not provide a conclusive answer to the research questions. As suggested in the previous sections, the choice of appropriate well-being variables and suitable instruments to measure them is a complex task and depends on a large range of factors, e.g., the research question at hand and acceptable survey duration. The chapters thus serve as case studies that illustrate the scientific study of worker well-being.
chapter 3 provides an overview of the antecedents of momentary happiness at work for truck drivers. Drawing upon job demands-resources theory (Bakker & Demerouti, 2007, 2017; Demerouti et al., 2001), this study predicts that five job resources and five job demands influence momentary happiness at work. These assumptions are tested based on daily survey data and the results from a baseline questionnaire.
chapter 4 details a study conducted in the healthcare sector in the midst of the CO-VID-19 pandemic. This study examines the relationship between cognitive job crafting and work engagement (e.g., Buonocore et al., 2020; Vuori et al., 2012; Wrzesniewski et al., 2003), and hypothesizes that cognitive job crafting has a stronger effect on work engagement for workers working from home than those working in the hospital. A cross-sectional survey is used to test this hypothesis.
chapter 5 describes the effectiveness of an organizational intervention that stimulated workers to check their email only three times a day. Using literature on work interrup-
1
21
tions (Puranik et al., 2020; Sonnentag et al., 2018; Ten Brummelhuis et al., 2012) and email management strategies (Jerejian et al., 2013; Kushlev & Dunn, 2015; Mark et al., 2016), it predicts that the intervention reduces email interruptions and emotional exhaustion and improves work engagement. Survey data from remote workers in the financial services industry collected across five waves is used to test these effects.
Chapters 6 and 7 report on two studies that demonstrate the added value of open-ended survey questions for investigating worker well-being and therefore primarily relate to the fourth research question. As the studies measure multiple well-being variables and use validated instruments for measurement, they are also used to address the other research questions.
chapter 6 describes a study on the potential of open-ended and semi-open-ended sur-vey questions for measuring worker’s job satisfaction. The study elaborates on the vari-ous approaches for inferring sentiment from textual data and the types of measurement error in text-based measures. In addition, it formulates a range of hypotheses relating to the construct validity of text-based measures. The hypotheses are tested based on cross-sectional and time-lagged data from a sample of crowd-sourced English-speaking workers.
chapter 7 builds on the previous chapter by zooming in on the promise of semi-open-ended survey questions in the study of job satisfaction. It elaborates on how computer-aided sentiment analysis based on dictionaries works. Using the sampling procedure from Chapter 6, we replicate the analyses conducted in the previous chapter and conduct various qualitative analyses to show the complementary value of semi-open-ended questions.
chapter 8 summarizes the findings in relation to the research questions of this thesis and provides a general discussion of these findings, a critical reflection on the strengths and limitations of this thesis, and a summary of implications for scholars and practitio-ners in organizations. It ends with a general conclusion.
Notably, this thesis comprises published articles and submitted manuscripts in peer-reviewed scientific journals. As such, the chapters can be read independently, and some content of the chapters may overlap. All chapters were developed in collaboration with co-authors. In all chapters, I was responsible for conceptualization of the research idea and the writing of the initial draft. My co-authors were responsible for reviewing and editing. In all chapters but Chapter 4, I conducted the empirical analyses used for hypothesis testing.
In several instances, the code and the data used for constructing measures, validating these measures and hypothesis testing can be found in the Online Supplementary
chapter 1 | General introduction
22
Materials to the published article versions of the chapters. These resources can be used by practitioners as inspiration and starting point for their own analyses and by scholars to replicate the results that are presented in this thesis.


2What is worker well-being, and
how it should be measured
Based on paper: Wijngaards, I., King, O.C., Burger, M.J., & Van Exel, N.J.A. (2021). What is worker well-being, and how it should be
measured. Applied Research in Quality of Life, 1-38.

2
27
2.1. introDuction
“What we measure affects what we do; and if our measurements are flawed, decisions may be distorted.” - Stiglitz et al. (2009, p. 7)
In light of changes in the conditions and nature of work, along with wider appreciation of the importance of social responsibility, organizations and consultancy firms have taken a serious interest in worker well-being (Scott & Spievack, 2019). Indeed, an article in Forbes magazine on the human resources (HR) trends of 2020 suggests that worker well-being should be HR’s top priority, explaining, “Many companies concerned about the future of work focus on the massive disruption of jobs, automation, and workforce demographics. All of this is important but as HR leaders we need to start with making worker wellbeing a priority in 2020!” (Meister, 2020). A lot of buzz surrounds worker well-being.
Numerous good reasons support widespread interest in worker well-being. The Forbes article highlights the purported role of worker well-being in workforce resilience and healthy organizational culture. Indeed, worker well-being may be an indicator of orga-nizational ethics (Giacalone & Promislo, 2010), and it has been found to predict other key indicators of organizational performance (Salas et al., 2017; Taris & Schaufeli, 2015), such as productivity (Bellet et al., 2019; Oswald et al., 2015), absenteeism (Kuoppala et al., 2008), job performance (Judge et al., 2001a) and voluntary turnover (Judge, 1993; Wright & Bonett, 2007; Wright & Cropanzano, 1998). In addition to all of these ways in which worker well-being may be instrumentally valuable for advancing organizational objectives, worker well-being has great intrinsic value. Among the many things that might be thought to be good in themselves, human well-being is perhaps the one object most highly regarded as such (Aristotle, 340 C.E.; Mill, 1859; Raz, 1986; Sidgwick, 1874). In sum, for many different reasons, the well-being of workers (and anyone else) is well worth pursuing.
Not only is there great interest in worker well-being by practitioners in organizations, academic researchers have also been paying much attention to the subject matter (P. Y. Chen & Cooper, 2014; Zheng et al., 2015). Over many decades, a rich and mature field of research has emerged, with thousands of psychological studies that conceptually and empirically study worker well-being constructs such as job satisfaction (Judge et al., 2017) and engagement (Macey & Schneider, 2008; Purcell, 2014). More recently, researchers from outside the psychological sciences have started to embrace the topic, including economics (Bellet et al., 2019; Bryson et al., 2013; Golden & Wiens-Tuers, 2006; Oswald et al., 2015), information systems (Gelbard et al., 2018; Jung & Suh, 2019) and
chapter 2 | What is worker well-being, and how it should be measured
28
machine learning (Lawanot et al., 2019; LiKamWa et al., 2013). However, buzz about worker well-being, enthusiasm for new programs to promote it and interest to research it have not been accompanied by universal enthusiasm for scientific measurement on the work floor. Hence, there remains a gap between the buzz surrounding worker well-being and the science needed to support it. However, pushes to research and influence worker well-being without careful scientific measurement may be ineffective (Bartels et al., 2019). Even worse, these endeavors may be genuinely problematic: If research-ers conceptualize or measure worker well-being inadequately, a scientific study may impede rather than advance the science that surrounds it (Podsakoff et al., 2016). If an organization touts purported improvements in well-being when, in fact, there has been no real improvement, it amounts to a case of “ethics washing” (Bietti, 2020; Wagner, 2018), and may hide the need for actual meaningful improvement.
We believe that the gap between the burgeoning psychological science of worker well-being and the buzz around it in other domains is caused by the complexity of worker well-being itself and the vast array of approaches to measuring it, combined with the variety of goals stakeholders may have for studying it. For many, it can be difficult to choose, let alone confidently justify, the selection of a particular research strategy for studying worker well-being. The primary goal of this paper is to help close the gap by offering a conceptual overview of the science of worker well-being and practical guid-ance for leveraging it in light of the particular objectives motivating the study of worker well-being.
This work will be useful for researchers of various stripes. First and foremost, this work will be relevant for research practitioners in organizations and academics outside psychological sciences. After all, it is not straightforward to move from intuitions about the need to pay more attention to worker well-being to adequate conceptualization and rigorous measurement. Insufficient scientific rigor prevents policy and research initiatives from being as relevant as they could be. In addition, even experienced psy-chological researchers who have been administrating well-being surveys – currently still the preferred instrument for measuring well-being (Nave et al., 2008) – for years may benefit from a synthesis of conceptual approaches and an enlargement of their inventory of approaches to measurement. As most psychologists are trained primarily in classic psychological methods (Aiken et al., 2008), a foray outside their comfort zone that updates them on the methodological developments across other fields may prove useful. Inspiration to use new, innovative measures helps researchers to address calls for increased attention to the construction of better well-being measures (Brulé & Mag-gino, 2017; Diener, 2012; Schneider & Schimmack, 2009) and facilitates collaborative interdisciplinary research.
2
29
We build on prior work that offers direction through “the conceptual jungle that current-ly characterizes the employee wellbeing literature” (Mäkikangas et al., 2016, p. 62). For example, Johnson et al. (2018) and Zheng et al. (2015) offered conceptual overviews on employee well-being and provide a handful of examples of validated survey instruments that can be readily used. Focusing on particular well-being constructs, other academics have reviewed existing traditional survey measures (Cooke et al., 2016; Roscoe, 2009; Schaufeli & Bakker, 2010; Van Saane et al., 2003; Veenhoven, 2017), non-survey measures (Luhmann, 2017; Rossouw & Greyling, 2020), or both (Diener, 1994, 2012). Going beyond both disciplinary and construct borders, other academics have concentrated on the promise of certain devices (e.g., wearable devices, Chaffin et al., 2017; Eatough, Shock-ley, & Yu, 2016), and measure categories for measurement of psychological constructs in general (Ganster et al., 2017; Luciano et al., 2017). A commonality among these works is that they each have a focus on specific instruments or constructs. Such specificity is both a blessing and a curse. It is helpful for researchers wanting an overview of the state-of-the-science of a particular instrument (e.g., the use of physiological measures in organizational science) or construct (e.g., survey measures of job satisfaction), but of limited use for readers interested in the bigger picture. In our work, we therefore offer a comprehensive field guide, which we hope will have broad appeal. Notably, in its broad scope, our work is not meant as an exhaustive overview, but rather as illustrative synthe-sis that maps the lay of the land and directs researchers to more specialized research. We structure our synthesis around three research questions:(1) What is worker well-being?(2) How can worker well-being be measured?(3) How should a worker well-being measure be selected?
We will address the first question by offering a rationale about how to think about the concept of worker well-being and proposing a construct taxonomy that researchers can draw from to operationalize the concept of worker well-being. In doing so, we intend to disentangle the conceptual jungle that we find in the current literature. The second question will be addressed by creating an illustrative overview of measures for ten constructs that fall under the conceptual umbrella of worker well-being: life satisfac-tion, dispositional affect, moods, emotions, psychological well-being, job satisfaction, dispositional job affect, job moods, job emotions and work engagement. Looking beyond disciplinary borders, we will show that innovative, non-survey measures show promise for measuring worker well-being and, thereby, hopefully inspire researchers to enrich their methodological toolbox. The third question will be answered by reviewing different conceptual, methodological, practical and ethical considerations for selecting a measure and doing so in ways that are responsive to the motivations driving research-
chapter 2 | What is worker well-being, and how it should be measured
30
ers and practitioners to take an interest in worker well-being. These considerations are summarized into a checklist.
2.2. What is Worker Well-BeinG?
2.2.1. Worker well-being and related conceptsWe assume that worker well-being, at the most inclusive level, comes down to the gen-eral well-being of working people. To ensure clear conceptual boundaries, it is useful to differentiate worker well-being from concepts that relate to it. Worker well-being differs from employee well-being, as not all working people are employed by organizations, e.g., volunteers, independent contractors, executives and business owners. Even though most well-being constructs are relevant for both employees and non-employed working people, there may be some exceptions. For instance, the construct of satisfaction with pay will be inapplicable to volunteers. Satisfaction with co-workers and satisfaction with supervisor will likely be irrelevant concepts for independent contractors. Worker well-being differs from work-specific well-being, as constructs falling under that conceptual umbrella have their origin and application distinctively within the work context. For example, the construct of satisfaction with colleagues has its origin in the work context. Work-specific well-being’s manifestation can be within and outside the work context, e.g., a worker can feel content about social relationships at work at the dinner table or before going to bed too, which can impact other parts of worker well-being. Worker well-being differs also from well-being at work, as this concept merely concerns the experience or state of well-being in the work setting or when working. Notably, the source of well-being at work can be unrelated to work. Workers could, for instance, be contemplating fights with their spouses or reliving a fun weekend while being at work. Finally, worker well-being differs from general individual-level well-being, as, in contrast to general individual-level well-being, it pertains specifically to the lives and experiences of working people.
2.2.2. a taxonomy of worker well-being constructsMany constructs have been proposed to operationalize the concept of worker well-being. We propose a theory-driven construct taxonomy that can be used to categorize constructs and map construct boundaries. We have drawn on eight other conceptual works on worker well-being (i.e. C. D. Fisher, 2014; Ilies et al., 2007; S. Johnson et al., 2018; Page & Vella-Brodrick, 2009; Taris & Schaufeli, 2015; Warr, 2012; Warr & Nielsen, 2018;
2
31
Zheng et al., 2015) to do this.2 We constructed our taxonomy along four dimensions: (i) philosophical foundation, (ii) temporal stability, (iii) scope and (iv) valence.3
First, researchers have been adopting different philosophical foundations for conceptu-alizing well-being (Forgeard et al., 2011; Kashdan et al., 2008) and worker well-being (Taris & Schaufeli, 2015). Among the most prevalent are the philosophical traditions of hedonia and eudaimonia (Linley et al., 2009; Ryan & Deci, 2001). The hedonic approach regards well-being as the subjective experience of happiness (Diener et al., 1999; Veen-hoven, 2000); the eudaimonic approach focuses on the realization of human potential (Ryff, 1989b; Ryff & Keyes, 1995). The classification of constructs on the hedonic and eudaimonic continuum is not an easy task because the different philosophical traditions are partially overlapping (C. D. Fisher, 2014; Waterman, 2008) and also empirically re-lated (Linley et al., 2009; Pancheva et al., 2020). We categorize a construct as eudaimonic, if intrinsic motivation, activation, purpose and meaningfulness are at its core (Ryan & Deci, 2001). However, it is important that researchers acknowledge that a eudaimonic construct often contains a hedonic component.
Second, a classification can be made based on constructs’ temporal stability (S. Johnson et al., 2018; Mäkikangas et al., 2016). Well-being researchers have developed state-like and trait-like well-being constructs (C. D. Fisher, 2014). State-like constructs are character-ized by high variability over time due to high state variance, whereas trait-like constructs are characterized by greater stability over time (Schimmack et al., 2010). Some state-like constructs are truly momentary and last for a few minutes at most, while others remain somewhat stable (Kashdan et al., 2008). Some traits are inherited and are unlikely to change over a lifetime, while others are subject to some change over months or years (S. Johnson et al., 2018).
Third, two levels of scope of worker well-being constructs can be distinguished: context-free and domain-specific constructs (Ilies et al., 2007). Context-free constructs concern the worker’s life and experience in general, whereas domain-specific well-being constructs concern well-being within particular life domains (e.g., work, leisure, health,
2 For reasons of parsimony, we were not able to incorporate all theoretical debates and nuances within the social sciences (Huta & Waterman, 2014; Rojas, 2017; Warr & Nielsen, 2018) and philosophy of well-being (e.g., Brey, 2012; Parfit, 1984) in our categorization of well-being constructs.
3 Readers interested in the ethics of worker well-being may wonder why we have not considered the capa-bility approach to well-being (Robeyns, 2005). The reason, in short, is that we are addressing readers who are interested in well-being outcomes, in contrast to the general capabilities that support those outcomes. Although capabilities (and their distribution) have been held to be fundamentally important for justice (Nussbaum, 2011), and thus central to politics and public policy, we are more concerned with the effects of conditions and policies of work and employment. Hence, we focus on well-being, as a lived outcome, rather than the capability for living well (cf. Veenhoven, 2000).
chapter 2 | What is worker well-being, and how it should be measured
32
finance). Context-free and domain-specific (especially work-specific) constructs capture the bigger picture and subtleties of worker well-being, respectively (Page & Vella-Brodrick, 2009).
Fourth, the valence of a construct can be considered. Some constructs are indicators of ill-being or the absence of well-being (e.g., burnout, negative affect), whereas others are indicators of well-being (e.g., engagement, positive affect). Intuitively, the realization of constructs with positive valence is desirable, while the realization of those with negative valence is undesirable.
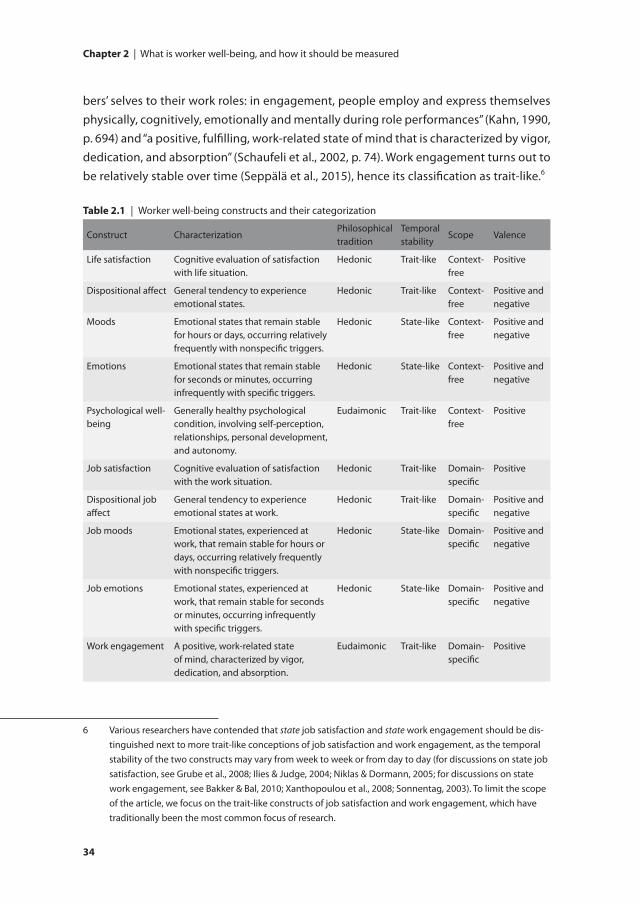
To illustrate, we describe eight worker well-being constructs that together span the breath of the taxonomy.4 In light of its broad scope and alignment with our understand-ing of worker well-being, we build on Page and Vella-Brodrick’s (2009) Framework of Employee Mental Health. It revolves around three concepts: subjective well-being (SWB), psychological well-being (PWB) and workplace well-being (WWB). As made explicit by Page and Vella-Brodrick, the model does not include eudaimonic WWB constructs. To overcome this limitation, we have included work engagement as an eudaimonic WWB construct. The constructs and their categorization are summarized in Table 2.1. Table 2.1. also contains a brief characterization based on the academic literature surrounding the individual constructs.
2.2.2.1. Subjective well-beingSWB encompasses diverse aspects of people’s evaluations of how their lives are going (Diener et al., 1999) Life satisfaction, the cognitive evaluation of satisfaction with life circumstances, is a trait-like, context-free, positive well-being construct (Diener et al., 1999). Affect, “people’s on-line evaluations of the events that occur in their lives” (Diener et al., 1999, p. 277), is constituted by both trait-like and state-like components, which can vary in their valence as well as their degree of arousal (active vs. passive, Barrett & Russell, 1999). Some aspects of a person’s affect are relatively stable over time. Ac-cordingly, dispositional affect is a trait-like construct and has been defined as “durable dispositions or long-term, stable individual differences that reflect a person’s general tendency to experience a particular affective state” (Gray & Watson, 2007, p. 172). Other affect-related constructs within SWB follow a fluctuating course and classify as state-like (Gray & Watson, 2007). For instance, moods are emotional states that can last days or even a week, occur relatively frequently, have nonspecific triggers and manifestations
4 We excluded hybrid constructs from our discussion – broad constructs that integrate hedonic and eudai-monic constructs – such as human flourishing (Huta & Waterman, 2014) and thriving (Spreitzer et al., 2005), from our selection of worker well-being constructs. Considering their broad scope, hybrid constructs often lack clear theoretical justification and are characterized by fuzzy construct boundaries (Martela, 2017).
2
33
(e.g., positive mood), and are primarily manifested in behavior and subjective experi-ences of people. Emotions can last seconds to, at most, a few minutes, are intense, occur infrequently, have specific triggers and manifestations (e.g., anger, joy), and are manifested in different forms, e.g., behavior, subjective experiences, brain activity, and physiological response (Gray & Watson, 2007).
2.2.2.2. Psychological well-beingAlthough its various aspects can be studied individually, we treat PWB as a single con-struct concerning the “formulations of human development and existential challenges of life” (Keyes et al., 2002, p. 1007). PWB is often represented by Ryff’s (1989b) six-factor model, including self-acceptance, personal growth, purpose in life, positive relations with others, environment mastery, and autonomy. PWB is grounded in the eudaimonic well-being tradition, and is a trait-like, context-free, positive well-being construct (Page & Vella-Brodrick, 2009; Ryan & Deci, 2001).
2.2.2.3. Workplace well-beingWithin WWB, we consider the constructs of job satisfaction, dispositional job affect, job emotions, job moods and work engagement. Job satisfaction can be defined as ‘‘a positive (or negative) evaluative judgment one makes about one’s job or job situation’’ (H. M. Weiss, 2002, p. 175). Job satisfaction is a domain-specific, hedonic and trait-like construct (Bowling et al., 2005, 2010; C. D. Fisher, 2014). As such, job satisfaction is the work-specific counterpart to the context-free life satisfaction construct we described above.5 Dispositional job affect, job moods and job emotions are equivalent to context-free conceptions of dispositional affect, moods and emotions, except for their narrower, work-specific focus. For example, we could be narrowly interested in a worker’s general affect while working (dispositional job affect) or more broadly interested in the worker’s general affect across life domains (dispositional affect, Ilies & Judge, 2004). In contrast to these hedonistic constructs, work engagement is an eudaimonic construct (C. D. Fisher, 2014) concerned with how workers experience the exercise of their capacities at work. Work engagement has been defined in various ways, but is generally described as a domain-specific construct characterized by high levels of identification with work, posi-tive affect, enthusiasm and energy (Bakker et al., 2008) and is theoretically distinct from other constructs, such as job satisfaction and organizational commitment (Schaufeli & Bakker, 2010). Work engagement could be defined as “harnessing of organization mem-
5 Although it is most common to consider job satisfaction in terms of a workers’ cognitive evaluations of their jobs, it is also worthwhile to examine worker’s affective psychological responses or feelings speci-fically regarding their jobs (E. R. Thompson & Phua, 2012). If the affective component is emphasized, the resulting job satisfaction construct comes close to the dispositional job affect construct we discuss next, which also concerns workers’ feelings while at work, though not necessarily about work.
chapter 2 | What is worker well-being, and how it should be measured
34
bers’ selves to their work roles: in engagement, people employ and express themselves physically, cognitively, emotionally and mentally during role performances” (Kahn, 1990, p. 694) and “a positive, fulfilling, work-related state of mind that is characterized by vigor, dedication, and absorption” (Schaufeli et al., 2002, p. 74). Work engagement turns out to be relatively stable over time (Seppälä et al., 2015), hence its classification as trait-like.6
6 Various researchers have contended that state job satisfaction and state work engagement should be dis-tinguished next to more trait-like conceptions of job satisfaction and work engagement, as the temporal stability of the two constructs may vary from week to week or from day to day (for discussions on state job satisfaction, see Grube et al., 2008; Ilies & Judge, 2004; Niklas & Dormann, 2005; for discussions on state work engagement, see Bakker & Bal, 2010; Xanthopoulou et al., 2008; Sonnentag, 2003). To limit the scope of the article, we focus on the trait-like constructs of job satisfaction and work engagement, which have traditionally been the most common focus of research.
table 2.1 | Worker well-being constructs and their categorization
Construct CharacterizationPhilosophicaltradition
Temporalstability
Scope Valence
Life satisfaction Cognitive evaluation of satisfaction with life situation.
Hedonic Trait-like Context-free
Positive
Dispositional affect General tendency to experience emotional states.
Hedonic Trait-like Context-free
Positive and negative
Moods Emotional states that remain stable for hours or days, occurring relatively frequently with nonspecific triggers.
Hedonic State-like Context-free
Positive and negative
Emotions Emotional states that remain stable for seconds or minutes, occurring infrequently with specific triggers.
Hedonic State-like Context-free
Positive and negative
Psychological well-being
Generally healthy psychological condition, involving self-perception, relationships, personal development, and autonomy.
Eudaimonic Trait-like Context-free
Positive
Job satisfaction Cognitive evaluation of satisfaction with the work situation.
Hedonic Trait-like Domain-specific
Positive
Dispositional job affect
General tendency to experience emotional states at work.
Hedonic Trait-like Domain-specific
Positive and negative
Job moods Emotional states, experienced at work, that remain stable for hours or days, occurring relatively frequently with nonspecific triggers.
Hedonic State-like Domain-specific
Positive and negative
Job emotions Emotional states, experienced at work, that remain stable for seconds or minutes, occurring infrequently with specific triggers.
Hedonic State-like Domain-specific
Positive and negative
Work engagement A positive, work-related state of mind, characterized by vigor, dedication, and absorption.
Eudaimonic Trait-like Domain-specific
Positive
2
35
2.3. hoW can Worker Well-BeinG constructs Be MeasureD?
2.3.1. Measure classificationConstructs, like each of those just discussed, are put together to study real phenomena that cannot be observed directly and perfectly (Edwards & Bagozzi, 2000). A measure, “an observed score gathered through self-report, interview, observation or some other means” (Edwards & Bagozzi, 2000, p. 156), can therefore be regarded as the empirical equivalent of a construct. A measure thus does not necessarily perfectly reflect the well-being construct it is intended to measure; rather it provides an instrument-dependent representation of it. In this article, we introduce two classifications that will prove important for selecting the most appropriate measure for a given construct. The first classification concerns the extent to which obtaining a measure interferes with the workers’ affairs and experience, and the second considers the different types of data a researcher can obtain.
2.3.1.1. Measure obtrusivenessRegarding the extent of interference with a workers’ affairs and experience, we dis-tinguish between three measurement approaches for worker well-being: unobtrusive measurement, reaction-based obtrusive measurement and observation-based obtru-sive measurement. Unobtrusive measures are methods that allow researchers to gain insights about subjects without the researcher, the subject, or others intruding into the research context and draw their data from naturally occurring circumstances and events (Hill et al., 2014; Webb et al., 1966). Obtrusive measures, methods characterized by active cooperation of subjects (Hill et al., 2014; Webb et al., 1966), come in two forms. Reaction-based obtrusive measures are based on the instruments that ask subjects for conscious, subjective input, whereas observation-based obtrusive measures are based on instruments that collect data automatically but require subjects to operate them. In other words, observation-based measures rely solely on the practical cooperation of subjects, and reaction-based measures rely both on practical cooperation and subjects’ effort to offer responses.
2.3.1.2. Measure typesWe distinguish between four types of measures: closed question measures, word mea-sures, behavioral measures and physiological measures (Luciano et al., 2017). We will describe both the general characteristics of these types, as well as their relations to the obtrusiveness classifications just discussed.
chapter 2 | What is worker well-being, and how it should be measured
36
Closed survey question measures are obtained from workers’ responses to one or more survey questions or statements with a finite number of answer categories, as with mul-tiple-choice questions and discrete number scales. Most often, self-report closed survey question measures are used, which are inherently reaction-based obtrusive. In light of common method biases associated with self-report measures, well-being researchers have used other-report (e.g., spouses, friends, children, colleagues) well-being measures to validate self-report measures (Schneider & Schimmack, 2010). Other-report measures are observation-based obtrusive because, even though subjects do not have to exert cognitive effort, they must cooperate with a researcher to identify and contact relevant others who can fill out a survey.
Two classes of survey measures are distinguished: attitudinal or experience-based measures (Grube et al., 2008). Attitudinal measures are designed to uncover a person’s overall, usually retrospective assessment of trait-like attitudes, such as life and job sat-isfaction. Experience-based measures are designed to measure a person’s momentary state, e.g., moods and emotions. Typical experience-based survey instruments prompt questions about whereabouts, events, company, activity and feelings of the respondent for several days, either multiple times during the day (i.e. experience sampling method) or at the end of the day (i.e. day reconstruction method; Kahneman et al., 2004).
Word measures are derived from spoken or written text, and can represent the relevant semantic content of the speech or writing (i.e., meaning), or the pattern of speech (Luciano et al., 2017). Word data can be manually analyzed by independent coders or processed automatically by computer software and can be collected either obtrusively (e.g., administering open-ended survey questions) or unobtrusively (e.g., scraping social media data).
Behavioral measures consist of observations of individual behavior, and come in many forms, e.g., data on movement, position, body posture, facial expression, online be-havior, substance abuse, etc. (Luciano et al., 2017). Behavioral measures can be either unobtrusive (e.g., publicly available video data) or observation-based obtrusive (e.g., video data obtained from a lab experiment).
Physiological measures are markers that reveal the state of a person’s body or its subsys-tems (Luciano et al., 2017). Building on the work of Akinola (2010) on the most widely used physiological measures in organizational sciences, we distinguish four prominent subcategories: endocrine activity (e.g., cortisol, testosterone, oxytocin, dopamine and serotonin), electrodermal activity (e.g., skin conductance response, skin conductance level), cardiovascular activity (e.g., blood pressure, heart rate, cardiac efficiency) and neurological activity (e.g., frontal lobe activation). These markers reflect changes in the autonomic nervous system, a part of the peripheral nervous system that serves regu-
2
37
latory functions by helping the human body adapt to internal and external demands (Akinola, 2010).
Because physiological data is not recorded naturally, researchers typically rely on observation-based obtrusive measures. The obtrusiveness of these instruments varies substantially (Eatough et al., 2016; Ilies et al., 2016). Devices such as arm-cuff digital blood pressure monitors, fingertip pulse oximeters and cotton swab saliva sampling require substantial effort for subjects (e.g., attaching a device to the body) and can be uncomfortable in use (e.g., some activities could be inhibited by the device), while devices such as wearable bracelets and smartphone applications are almost completely hassle-free.
2.3.2. illustrations of measuresBelow, we provide illustrations of measures for constructs falling into the framework that we used for illustrating our construct taxonomy. We echo our previous disclaimer that the list of measurement options is non-exhaustive and will not cover all potential conceptual nuances. In addition, we want to note that the different measures vary in their degree to which they are valid for the constructs they are purported to measure. For example, evaluative constructs such as job satisfaction and life satisfaction are likely best measured using subjective measures, while affective constructs such as emotions and moods can validly be gauged with both subjective and objective measures (Brulé & Maggino, 2017). We will discuss the validity of measures in the next section.
2.3.2.1. Life satisfactionLife satisfaction is most often measured using closed question survey measures (Veen-hoven, 2017). These measures can be either single-item (Abdel-Khalek, 2006; Cantril, 1965; Commission of the European Communities, 2017; OECD, 2013) or multiple-item, e.g., Satisfaction With Life Scale (Diener et al., 1985), Happiness-Unhappiness Scale (Andrews & Withey, 1976), Gurin Scale (Gurin et al., 1960), and the Happiness Measure (Fordyce, 1977). In general, convergence exists between self-report and other-report measures of life satisfaction (Heller et al., 2006; Judge & Locke, 1993; Lucas et al., 1996; Nave et al., 2008; Pavot et al., 1991; Sandvik et al., 1993, 1993; Schneider et al., 2010; Sch-neider & Schimmack, 2010; Zou et al., 2013). For other closed question survey measures of life satisfaction and reflections on their validity, see Veenhoven (2017, 2020).
Beyond closed question survey measures, life satisfaction has been measured by analyz-ing naturally occurring texts on social media sites such as Facebook and Twitter (Collins et al., 2015; P. Liu et al., 2015; Schwartz et al., 2016; Yang & Srinivasan, 2016) and tran-scripts from clinical life satisfaction interviews (Frisch, 1988; Nave et al., 2008; Neugarten et al., 1961; Thomas & Chambers, 1989). Facial expression data obtained from pictures
chapter 2 | What is worker well-being, and how it should be measured
38
have been linked to later life satisfaction (Harker & Keltner, 2001; Seder & Oishi, 2012). Unobtrusive data on online behavior has also been linked to life satisfaction (S. Collins et al., 2015; Kosinski et al., 2013). Some studies have found correlations between self-report life satisfaction scores and peripheral systolic and mean arterial blood pressure (Thege et al., 2014).
2.3.2.2. Dispositional affectDispositional affect has been measured mostly with closed question survey measures, e.g., the Affect Balance Scale (ABS, Bradburn, 1969), Differential Emotions Scale (DES, Izard et al., 1974), Positive and Negative Affect Schedule (PANAS; Watson et al., 1988), the Multiple Affect Adjective Check-List-Revised (Zuckerman & Lubin, 1985), State-Trait Anxiety Inventory (Spielberger & Gorsuch, 1983), Scale of Positive and Negative Experi-ence (SPANE, Diener et al., 2010) and Affectometer 2 (Kammann & Flett, 1983). Often, self-report measures of dispositional affect converge substantially with other-report measures (Lucas et al., 1996; Pavot et al., 1991; Watson et al., 2000). For more complete overviews on closed question measures of dispositional affect, see Gray and Watson (2007) and Boyle et al. (2015). There is only limited research on measures of dispositional affect other than closed question surveys. Self-reported dispositional affect has been linked to the content in answers to open-ended questions (Sandvik et al., 1993) and salivary cholesterol (Ryff et al., 2004).
2.3.2.3. MoodsMoods are also typically measured using survey scales. These are either specially designed to measure moods, e.g., Profile of Mood States (POMS, McNair et al., 1981), Shortened POMS (Shacham, 1983), Multidimensional Mood State Inventory (Boyle, 1992), Four Dimension Mood Scale (Huelsman et al., 1998) and Affect Grid (Russel et al., 1989), or adaptations of general affect scales, e.g., PANAS, SPANE and DES. Self-report and other-report measures tend to converge (Bleidorn & Peters, 2011; Pavot et al., 1991). Considering mood’s cyclic nature (Gray & Watson, 2007), scholars have often used experience-based survey instruments, e.g., adopting experience sampling method (e.g., Dockray et al., 2010; Ilies & Judge, 2004) and day reconstruction method designs (e.g., Dockray et al., 2010; Kahneman et al., 2004).
Concerning non-survey measures, various researchers have shown that word measures can be used to measure mood, e.g., sentiment in blog posts (Bollen et al., 2011; Keshtkar & Inkpen, 2009; Mishne, 2005), social media updates (Dodds et al., 2011; Golder & Macy, 2011; Greyling et al., 2019; Iacus et al., 2020; Jaidka et al., 2020) and responses to open-ended questions (Amabile et al., 2005). Other studies have shown that behaviors can be
2
39
used as a proxy for moods, e.g., facial behavior (Kulkarni et al., 2009) and online activity (Drake et al., 2013; LiKamWa et al., 2013).
2.3.2.4. EmotionsLike moods, emotions are typically measured using experience-based closed question survey measures like the DES and PANAS (Verduyn et al., 2009; Zelenski & Larsen, 2000). Non-survey researchers have shown that emotions can be inferred from short instant messaging texts (A. J. Gill et al., 2008; Hancock et al., 2007). Other research has shown that social media (Greyling et al., 2019) and online search behavior can be used to monitor specific emotional states (Brodeur et al., 2021; Ford et al., 2018). Lab research has shown that emotions can be inferred from observation-based obtrusive measures, such speech characteristics (Dasgupta, 2017; B. L. Smith et al., 1975; C. E. Williams & Stevens, 1972), combinations of acoustic variables (Banse & Scherer, 1996) and voice pitch (Mauss & Robinson, 2009). Researchers have found that data on body postures (Mauss & Robinson, 2009; Tracy & Matsumoto, 2007) and facial expressions can be used to infer emotions (Ekman et al., 1990; Mauss et al., 2005). There is, however, controversy about the use of facial expression behavior, as certain facial expressions may be as-sociated with multiple emotions and the meaning of them varies substantially across cultures and situations (Barrett et al., 2019). Physiological measures are regularly used to measure emotions. For instance, emotional valence and arousal have been linked to neuroendocrine activity, e.g., cortisol levels (Denson et al., 2009; Dickerson & Kemeny, 2004), testosterone (Mazur & Booth, 1998; Mehta & Josephs, 2006; Zilioli et al., 2014), oxytocin (Grewen et al., 2005; Kosfeld et al., 2005), dopamine (Depue & Collins, 1999) and serotonin (Katz, 1999), electrodermal activity, e.g., skin conductance response and skin conductance level (Akinola, 2010; Kreibig, 2010; Sequeira et al., 2009; Weinberger et al., 1979), cardiovascular activity, e.g., systolic and diastolic blood pressure, heart rate, heart rate variability, cardiac efficiency and respiration (Akinola, 2010; Kreibig, 2010; Shiota et al., 2011) and neurological activity (Sato et al., 2004; Vytal & Hamann, 2010).
2.3.2.5. Psychological well-beingPWB is most often measured by Ryff’s (1989a) attitudinal closed question survey mea-sure: Scales of Psychological Well-being. These scales have been linked to measures of psychological functioning and physical health, e.g., neuroendocrine, cardiovascular, immune (Ryff et al., 2004), cardiorespiratory (Thege et al., 2014), neurological (Urry et al., 2004). Behavioral markers (e.g., expressive face, voice or gestures, social skills, awkward interpersonal style) and clinical ratings after an in-depth interview (e.g., productivity, as-piration level) also correlated to self-report measures of PWB (Nave et al., 2008).
chapter 2 | What is worker well-being, and how it should be measured
40
2.3.2.6. Job satisfactionJob satisfaction is most often measured using attitudinal single-item and multiple-item survey scales (D. G. Gardner et al., 1998; Nagy, 2002; Wanous et al., 1997). It is either measured by aggregating the scores on several job facets or by asking respondents directly about a general evaluation of their job (H. M. Weiss, 2002). Frequently used job facet scales include the Job Satisfaction Survey (Spector, 1985), Facet Satisfaction Scale (Bowling et al., 2018) and Job Diagnostic Survey (Hackman & Oldham, 1974), and overall job satisfaction scales include the Minnesota Satisfaction Questionnaire (D. J. Weiss et al., 1967), Job in General Scale (Ironson et al., 1989), Abridged Job in General scale (Russell et al., 2004), Job Satisfaction Scale (Warr et al., 1979), Job Satisfaction Index (Brayfield & Rothe, 1951), Michigan Organizational Assessment Questionnaire (Cam-mann et al., 1979), Faces scale (Kunin, 1955) and Brief Index of Affective Job Satisfaction (E. R. Thompson & Phua, 2012).7 Self-report measures and other-report measures of job satisfaction have been found to converge (Ilies et al., 2006; MacEwen & Barling, 1988; Spector et al., 1988; Trice & Tillapaugh, 1991).
Obtrusive, reaction-based word measures have also been used, for example, open and semi-open-ended questions about job satisfaction (Borg & Zuell, 2012; Gilles et al., 2017; Poncheri et al., 2008; Taber, 1991; Wijngaards et al., 2019; Young & Gavade, 2018). Job satisfaction has also been inferred from unobtrusive textual data sources such as job review websites (Jung & Suh, 2019; Moniz & Jong, 2014) and social media (Hernandez et al., 2015). Other research found that job satisfaction can be inferred from an overall impression of behavior (Glick et al., 1986).
2.3.2.7. Job affectBecause most research on job affect has been based on closed question measures, we group dispositional job affect, job moods and job emotions in one paragraph. In line with their conceptual distinction, dispositional job affect is generally measured using attitudinal measures (Brief et al., 1988; Van Katwyk et al., 2000) and job moods and job emotions are generally measured using experience-based measures (e.g., Beal & Ghandour, 2011; Dimotakis et al., 2011; Miner et al., 2005). For this, dedicated job affect scales are most often used, e.g., Job Emotions Scale (C. D. Fisher, 2000), Warr’s (1990) and Van Katwyk et al.’s (2000) Job-related Affective Well-being Scale, Job Affect Scale (Burke et al., 1989) and Affective Well-Being scale (Daniels, 2000). Different versions of such
7 In light of the conceptual difference between affective and cognitive job satisfaction (E. R. Thompson & Phua, 2012; H. M. Weiss, 2002), researchers have to be mindful that some measures of job satisfaction relate more strongly to the cognitive component and others more to the affective component (Kaplan et al., 2009). Researchers thus can view job satisfaction measures on a continuum from primarily tapping into cognitive job satisfaction to primarily tapping into affective job satisfaction (C. D. Fisher, 2000).
2
41
measures can be used to accommodate the temporal dimension of the target construct (e.g., changing the reference frame from the “in the last four weeks” to “today”).
2.3.2.8. Work engagementWork engagement has mostly been measured using attitudinal closed question survey measures (Bakker et al., 2008; Schaufeli & Bakker, 2010), e.g., Maslach Burnout Inven-tory (MBI; Maslach et al., 1986), the Oldenburg Burnout Inventory (OBI; Demerouti et al., 2002), Utrecht Work Engagement Scale (UWES-17; Schaufeli et al., 2002, UWES-9; 2006, UWES-3, 2019), Job Engagement Scale (Rich et al., 2010), and the Gallup Q12 (Harter et al., 2002). A handful of studies have considered measures other than self-report surveys. For example, studies have linked work engagement to cardiovascular activity (Seppälä et al., 2012; Van Doornen et al., 2009).
2.4. hoW shoulD a Worker Well-BeinG Measure Be selecteD?
With such a wide assortment of measures for worker well-being constructs, the next question is how to choose one in your research. In this section, we will show why dem-onstrating measurement fit, “the degree of alignment between how a construct is con-ceptualized and measured” (Luciano et al., 2017, p. 593), is a challenging task. Luciano et al.’s (2017) framework of measurement fit illustrates that researchers have to go through various (iterative) steps to make well-reasoned measurement decisions: researchers must explicate the construct thoroughly (e.g., map a construct’s content, dimensional-ity, stability and hypothesized manifestation), determine measurement features (e.g., identify a measure’s content, source and aggregation strategy), consider the research context (e.g., state-of-the-science and research purpose), ethics of a proposed research plan (e.g., privacy, discrimination, paternalism) and feasibility, accuracy and complete-ness of a measure. Considering space concerns, we cannot follow Luciano et al.’s full model for each worker well-being construct. Instead, we sketch a high-level picture of the various relevant considerations for choosing a measure and refer the reader to dedicated works for more elaborate discussion. We summarize this overview in the form of a checklist in Table 2.2.
2.4.1. conceptualizationOne must decide on the construct or constructs of study before a measure can be selected. This decision is driven by many factors, e.g., the objective of the research, the employment situation of the workers you study, the research context and the research question(s). For example, when researchers are interested in evaluating the well-being
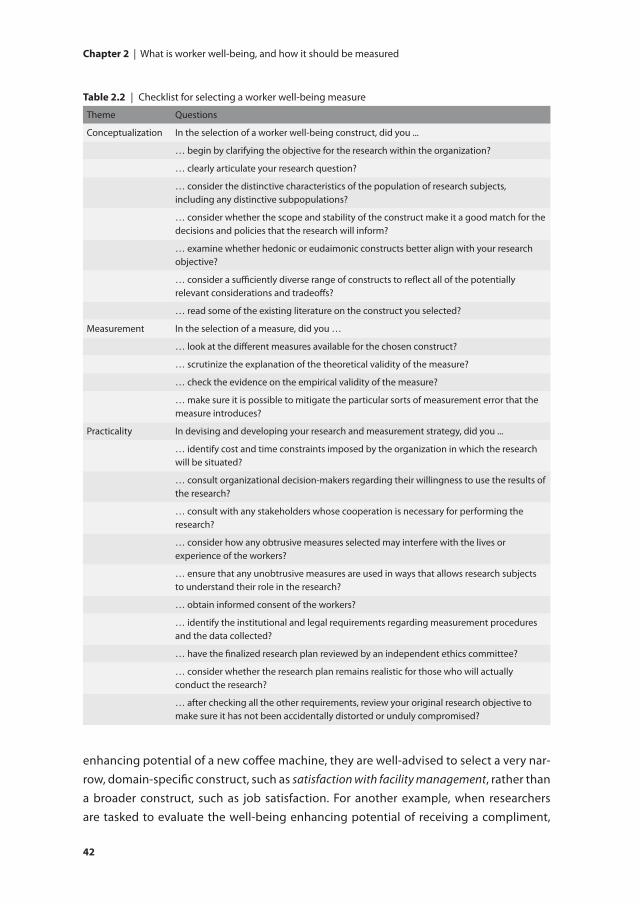
chapter 2 | What is worker well-being, and how it should be measured
42
enhancing potential of a new coffee machine, they are well-advised to select a very nar-row, domain-specific construct, such as satisfaction with facility management, rather than a broader construct, such as job satisfaction. For another example, when researchers are tasked to evaluate the well-being enhancing potential of receiving a compliment,
table 2.2 | Checklist for selecting a worker well-being measure
Theme Questions
Conceptualization In the selection of a worker well-being construct, did you ...
… begin by clarifying the objective for the research within the organization?
… clearly articulate your research question?
… consider the distinctive characteristics of the population of research subjects, including any distinctive subpopulations?
… consider whether the scope and stability of the construct make it a good match for the decisions and policies that the research will inform?
… examine whether hedonic or eudaimonic constructs better align with your research objective?
… consider a sufficiently diverse range of constructs to reflect all of the potentially relevant considerations and tradeoffs?
… read some of the existing literature on the construct you selected?
Measurement In the selection of a measure, did you …
… look at the different measures available for the chosen construct?
… scrutinize the explanation of the theoretical validity of the measure?
… check the evidence on the empirical validity of the measure?
… make sure it is possible to mitigate the particular sorts of measurement error that the measure introduces?
Practicality In devising and developing your research and measurement strategy, did you ...
… identify cost and time constraints imposed by the organization in which the research will be situated?
… consult organizational decision-makers regarding their willingness to use the results of the research?
… consult with any stakeholders whose cooperation is necessary for performing the research?
… consider how any obtrusive measures selected may interfere with the lives or experience of the workers?
… ensure that any unobtrusive measures are used in ways that allows research subjects to understand their role in the research?
… obtain informed consent of the workers?
… identify the institutional and legal requirements regarding measurement procedures and the data collected?
… have the finalized research plan reviewed by an independent ethics committee?
… consider whether the research plan remains realistic for those who will actually conduct the research?
… after checking all the other requirements, review your original research objective to make sure it has not been accidentally distorted or unduly compromised?
2
43
they may want to consider a more dynamic, state-like well-being construct, such as job emotions, rather than a stable, trait-like well-being construct, such as job satisfaction, because the effects of compliments will likely be only temporary.
For the selection of appropriate worker well-being construct, we recommend research-ers measure as many well-being constructs as possible and maximize diversity. As the measures on different constructs are not easily aggregated, we urge researchers to report well-being measures individually, in the spirit of a dashboard (Forgeard et al., 2011). Such broad measurement of worker well-being is relevant for several reasons.
First, since most researchers’ goals for studying worker well-being will be largely moti-vated by moral considerations and general goodwill, it is important to ensure sufficient breadth of measurement. The reason for this is that constructs vary in their intrinsic value.8 Most context-free well-being constructs reflect theoretically and philosophically grounded conceptions of human value, e.g., PWB (Aristotle, 340 C.E.; Zagzebski, 1996), life satisfaction (Sumner, 1996) and dispositional affect (Bentham, 1789; De Lazari-Radek & Singer, 2014; F. Feldman, 2004). For domain-specific constructs such as job satisfaction and work engagement, the moral case favoring attention to these constructs is slightly harder to make, as they do not necessarily and inherently contribute to worker well-being. Work engagement, for instance, could have a dark side (Bakker et al., 2011; Dolan et al., 2012), as illustrated by research showing that it, in some cases, may instigate work-family conflict (Halbesleben, 2011; Halbesleben et al., 2009). None of this is to deny that varieties of domain-specific well-being may frequently, or even usually, drive general well-being, and thus are valuable. It is just that the value of domain-specific well-being constructs depends on the contingencies of their causal interplay with context-free well-being constructs, which better reflect a worker’s overall well-being.
Researchers can mind such well-being trade-offs by measuring a diverse set of con-structs. To illustrate, it may be necessary to study constructs with negative valence, such as burnout or work addiction, to uncover downsides of policies driven by the goal of increasing positive affect at work. An organization’s increasing focus on social respon-sibility may increase engagement, but with the unintended effect of enticing some workers to be too engaged in their work, giving rise to work addiction (Brieger et al., 2019). A dashboard covering a variety of domain-specific and context-free constructs allows researchers to keep all possible tradeoffs in view. However, if the selection of
8 In ethical theory, it is common to distinguish between what is intrinsically valuable and what is instru-mentally valuable. Objects are intrinsically valuable when they are good in themselves and worth pursuing independent of any other goals. In contrast, objects are merely instrumentally valuable when their value depends on their capacity to help realize other things that are valuable. Of course, a single object can have both intrinsic and instrumental value (for discussion and finer distinctions, see Korsgaard, 1983).
chapter 2 | What is worker well-being, and how it should be measured
44
constructs must be constrained, researchers may prioritize constructs that are most likely to uncover those tradeoffs.
Second, for researchers who are motivated to study worker well-being in the service of other objectives, keeping an open mind to the measurement of multiple worker well-being constructs will likely pay off. This holds for researchers with various research objectives, e.g., academics interested in testing theory or practitioners aiming at ad-vancing organizational performance through the enhancement of worker well-being. The reason is that worker well-being constructs can be related to other constructs and factors in unexpected ways. To illustrate, concerning antecedents of worker well-being, a meta-analysis of Steffens et al. (2017) showed that social identification processes relate more strongly to positive well-being constructs than to negative well-being constructs. Regarding outcomes, a meta-analysis by Erdogan et al. (2012) demonstrated that life satisfaction correlates significantly stronger to organizational commitment and turn-over intention than to job performance. In conclusion, having a sufficiently broad mea-surement scope will enable researchers to uncover the most interesting and important relationships among variables.
For researchers interested in making an academic contribution, there is an additional impetus for measuring multiple constructs. Like many research fields in social sciences, the field of worker well-being is burdened with the problem of construct proliferation: “research streams are built around ostensibly new constructs that are theoretically or empirically indistinguishable from existing constructs” (Shaffer et al., 2016, p. 81). For example, research suggested that employee engagement is not distinct from constructs like job burnout (Cole et al., 2012) and job satisfaction (Christian et al., 2011). Measuring multiple, ostensibly distinct constructs will help researchers to demonstrate or refute the theoretical and empirical distinctiveness of well-being constructs and thereby ad-vance the science of worker well-being.
Once one or more constructs have been chosen, researchers are well-advised to turn to established literature to carefully define the construct and understand the conceptual nuances to it. Articles covering best practices for construct definition (Podsakoff et al., 2016) and conceptual works on the conceptualization and categorization of worker well-being (e.g., our current work, S. Johnson et al., 2018; Page & Vella-Brodrick, 2009; Zheng et al., 2015) could be helpful. When constructs have been selected and adequately conceptualized, researchers can move into the constructs’ ideal measurement strategy.
2.4.2. MeasurementOne of the most important considerations in choosing a suitable measure is a measure’s validity. Validity can be described as “the degree to which scores on an appropriately
2
45
administered instrument support inferences about variation in the characteristic that the instrument was developed to measure” (Cizek, 2012, p. 35). A measure must be the causal outcome of a construct (Borsboom et al., 2004), which means that it has to satisfy the following four conditions for causality: (i) definition of a construct must be chosen and articulated independently and prior to the measure, so that the relationship between the two is not merely tautological, (ii) substantial association (or covariation) between the construct and the measure, (iii) realization of the construct temporally prior to the measurement, and (iv) elimination of rival explanations that could explain the relationship between a construct and a measure, such as history and instrumenta-tion (Edwards & Bagozzi, 2000). In summary, for a measure to be valid for a hypothesized construct, it must be the hypothesized construct – and only the hypothesized construct – that causes the measure.
Proving that a measure is a valid requires a process of theoretical and empirical validation (Borsboom et al., 2004), “the ongoing process of gathering, summarizing, and evaluating relevant evidence concerning the degree to which that evidence supports the intended meaning of scores yielded by an instrument and inferences about stand-ing on the characteristic it was designed to measure” (Cizek, 2012, p. 35). Researchers interested in using a previously developed measure are therefore advised to understand how that measure has been validated and assess the adequacy of the validation process. Researchers aiming to innovate in the development of a new measure must accept the responsibility of performing, or otherwise ensuring, a proper process of measure valida-tion. Either way, understanding the validation process is essential to avoid relying on misleading indicators of the relevant constructs and drawing specious conclusions.
Theoretical validation starts with a logical analysis of measure-construct fit, often performed by academic and/or practitioner subject matter experts (Bornstein, 2011; Luciano et al., 2017). This is where the preparatory work from the conceptualization phase comes into play: a high-quality conceptual definition and deep understanding of conceptual nuances are useful for making methodological decisions. For instance, as the definition of life satisfaction suggests that a valid measure of this construct should be based on a cognitive evaluation and will typically remain stable over time (Diener, 1994; Shin & Johnson, 1978), one can safely forego dynamic, unobtrusive or observation-based obtrusive word, behavioral or physiological measures, and narrow the methodological scope to reaction-based obtrusive, subjective measures, such as surveys and interviews. In sharp contrast, one is well advised to consider more objective behavioral and physiological measures when the measurement of affective states or other state-like constructs is of interest, as their conceptual definition permits it (Mauss & Robinson, 2009). In case the research contexts necessitates survey measurement of
chapter 2 | What is worker well-being, and how it should be measured
46
affect, one would need to accommodate the state-like nature of affect by focusing on experience-based measures instead of attitudinal measures (C. D. Fisher, 2000).
After theoretical validation, a measure must be empirically validated. This is traditionally done by demonstrating adequate reliability of a measure and demonstrating appropri-ate statistical associations between a new measure and measures of related or unrelated constructs (Bornstein, 2011; for early examples, see Campbell & Fiske, 1959; Cronbach & Meehl, 1955). More specifically, one can examine a new measure’s convergent validity, discriminant validity, predictive validity and incremental validity, in relation to other vali-dated measures, or design experiments to uncover biases in measures and to unravel the underlying mechanisms causing the measurements observed (Bornstein, 2011; Edwards, 2003). Often, one can draw on existing validation research to substantiate the empiri-cal validity of a measure and pick appropriate validation tests (e.g., confirmatory factor analysis, internal consistency analysis, Edwards, 2003). For example, in the development of new closed question job satisfaction measures, Ironson et al. (1989), Thompson and Phua (2012) and Bowling et al. (2018) all followed common practice (e.g., Clark & Watson, 1995; Edwards, 2003; Hinkin, 1998) by examining the new measures’ convergent validity (i.e., alignment with) with existing job satisfaction scales and their discriminant validity (i.e., departure from) with measures of related, but distinct constructs.
During empirical validation, one should pay serious attention to the various kinds of measurement error that measures are susceptible to. For instance, closed question survey measures, word measures based on social media and physiological measures obtained from wearable sensors are all vulnerable to selection bias: subjects self-select themselves into participating to a survey, using social media and utilizing a wearable sensor (Ganster et al., 2017; Kern et al., 2016; Landers & Behrend, 2015). Closed ques-tion survey measures and word based social media measures are both susceptible to social desirability biases (Marwick & Boyd, 2011; Podsakoff et al., 2003; N. Wang et al., 2014), while physiological data is not. Other sources of measurement error are relevant for specific measurement instruments. Surveys are vulnerable to careless responding, the tendency to respond to questions without regard to the content of items (Meade & Craig, 2012; e.g., an intense experience sampling study, Beal, 2015; lengthy batteries of job satisfaction questions, Kam & Meyer, 2015). Word measures obtained through computer-aided textual analyses will be vulnerable to algorithm error, the pattern of error observed when multiple computer-aided textual analysis techniques produce dif-ferent measures using the same methods and texts (McKenny et al., 2018; Short et al., 2010). Instruments collecting physiological data will inescapably introduce noisy data (Chaffin et al., 2017; Ganster et al., 2017). Researchers should ensure that they have the appropriate expertise to catch and mitigate the relevant sorts of errors.
2
47
We conclude with a note on the varying complexity of theoretically and empirically vali-dating measures. As previously indicated, obtrusive measures such as closed questions, open-ended questions and interviews are relatively straightforward to validate. For theoretical validation, this mainly is due to the deliberate alignment of the measure with the construct definition (e.g., during item pool generation and item purification, Brod et al., 2009; Hinkin, 1998). By maximizing the semantic equivalence of the questions and the construct definition, researchers are able to eliminate alternative explanations prior to the collection of data. The theoretical validation of an unobtrusive measure is much less straightforward because one has little to no influence over the way data is col-lected. With an unobtrusive measure we have much less guarantee that the cause of the measurements is limited to factors relevant to the construct to be measured. Because of inherent differences between the instrument and the intended construct, one is forced to rely heavily on theory to make a case for why the content of a measure best resembles the construct of interest rather than related, but distinct constructs (Hill et al., 2014). The same pattern of difficulty holds for empirical validation. Empirical validation of obtrusive measures is relatively convenient, as a multitude of validation guidelines and validated measures have accumulated over time. Empirically validating an unobtrusive measure is much more challenging, as it is often impossible to find a well-validated unobtrusive measure for comparison and introducing a validated obtrusive (e.g., survey) measure in an obtrusive measurement design takes away the valuable unobtrusive nature of the data (Hill et al., 2014).
2.4.3. PracticalityAfter conceptualization and measurement, researchers must consider the practicality of a measurement strategy in a given research context. In some way, all researchers must accommodate the preferences and demands of stakeholders, e.g., organizations, employees and institutions. At the same time, they must safeguard their scientific and ethical integrity. Finally, they must always remain mindful of their own resource limita-tions.
2.4.3.1. OrganizationsOrganizations may use their position as facilitator of worker well-being research to put pressure on researchers to do research as cheaply and efficiently as possible (Lapierre et al., 2018). For example, organizations may be hesitant to facilitate physiological measure-ment, as purchasing and distributing wearable devices are still much more costly than administering questionnaires (Akinola, 2010; Ganster et al., 2017). Relatedly, organiza-tions may prefer single-item measures over their psychometrically superior multiple-item counterparts, as the opportunity costs associated with filling out multiple-item measures are expected to be too high (G. G. Fisher et al., 2016; D. G. Gardner et al., 1998).

chapter 2 | What is worker well-being, and how it should be measured
48
Beyond the need to deal with unequal power relations, it is important for researchers to be wary of the values and leadership in an organization. In particular, for well-being research to have an effect on the well-being of workers, an organization’s leadership has to value both research and well-being (Nielsen et al., 2006; Nielsen & Noblet, 2018). Without commitment from senior management, worker well-being research, regardless of its rigor, will be of limited value, as any resulting policy recommendations will not be implemented. Hence, it is advisable to start well-being research only if the topic is a strategic topic in the organization and there is a culture of receptivity to research and evidence-based practices. On the other hand, organizational change must always begin somewhere, and we should not lose hope that well-presented, well-timed research on a topic of moral importance may occasionally prove pivotal.
2.4.3.2. WorkersResearcher on worker well-being is, of course, typically motivated by a moral interest in the lives and experiences of workers. However, when striving to obtain valid measure-ments of worker well-being, researchers must not lose sight of the impact of measure-ment on those very workers whose well-being is to be measured. For choosing a well-being measurement strategy, the rights and interests of the research subjects matter for both practical and ethical reasons. Practically, without satisfactory buy-in from them, measures will be subject to substantial non-response or validity issues (Rogelberg et al., 2000). It is therefore advisable to accommodate workers’ tendency to dislike lengthy bat-teries of questions or long interviews, as participation can be unpleasant and distracting. Further ethical considerations emerge in light of the inherent moral significance of well well-being research and the increasing convenience of collecting (big) data (see Israel & Hay, 2006 for an extensive overview of research ethics for social science; Metcalf & Crawford, 2016). Here we briefly touch upon important ethical considerations and direct readers to referenced works for more information.
First of all, there is an obligation that will be obvious to academic researchers but per-haps less familiar to professionals in organizations: In order to ensure that research does not harm the workers who are the research subjects, researchers must adhere to the principles of research ethics (e.g., American Psychological Association, 2017). In most instances, a review by an independent ethics committee is highly advisable (Wassenaar & Mamotte, 2012), as any research conducted by an organization on employees of that same organization presents special problems, due to pressure employees may feel to “volunteer” for the research (P. T. Kim, 1996). In cooperation with the ethics commit-tee, researchers must be prepared to justify any measurement choices for which a less obtrusive, invasive or burdensome alternative might have been available.
2
49
Second, although it is sometimes neglected with novel forms of social research (Flick, 2016), the informed consent of research subjects is of paramount importance. This requires that researchers adequately inform workers about the study, thereby taking into account their expectations and social norms (Brody et al., 2000; Manson & O’Neill, 2007), and ensuring that their participation is voluntary, not coerced (Faden & Beau-champ, 1986). The imperative of informed consent has implications for measurement strategies. When practical, it is advisable to use measures that have a clear and intuitive connection to the constructs to be measured (high face validity), as is the case with most survey measures. This makes it more straightforward to fully inform workers about the connection between the research and their well-being, and hence reduces barriers to consent and willing participation. Where experimental design precludes full transpar-ency in advance, a thorough debriefing session after the experiment becomes critically important (Brody et al., 2000; S. S. Smith & Richardson, 1983; Sommers & Miller, 2013). Novel or esoteric measurement techniques require extra care with regard to informing and debriefing, simply because these techniques may run contrary to workers’ expecta-tions of the research process.
Third, it is essential to mind ethical considerations regarding autonomy and privacy, as respectively associated with obtrusive and unobtrusive measurement. Since obtrusive measures, by their nature, interfere with workers’ work and other experience, use of such measures implicates the autonomy of workers. Significant interference with their lives should be limited as much as possible and explained clearly. This ensures that workers’ abilities to make sure their own choices are not unduly diminished, and not affected beyond the participation to which they have consented (Faden & Beauchamp, 1986). On the flip side, unobtrusive measures raise special concerns about the privacy of workers because, by the very design of the measurement methods, the subjects may not be aware of the information collected about them (Motro et al., 2020). Hence, it is incumbent upon researchers to ensure that workers are not monitored beyond what is relevant to the study, or beyond that to which they have consented. In general, pitfalls of both obtrusive and unobtrusive measures can be largely mitigated by diligent proce-dures for informed consent.
2.4.3.3. InstitutionsResearchers must also navigate institutional pressure and legal requirements. The relevant regulations are very much dependent on the type of study and the location where the study is conducted. For instance, the General Data Privacy Regulation (GDPR, European Parliament and Council, 2016) has outlined strict rules on the analysis, col-lection, sharing and storage of individual-level data and, in particular, health data (e.g., biometric data, survey data on mental health, Guzzo et al., 2015). If the analysis of
chapter 2 | What is worker well-being, and how it should be measured
50
health data is of interest, researchers within an organization may want to consider a col-laboration with external researchers who specialize in managing such data securely and responsibly. Finally, if the workers are unionized, proactive communication with union representatives is advisable. Although unions support initiatives to advance worker well-being, they may well be wary of measurement procedures that appear to diminish worker autonomy or privacy.
2.4.3.4. ResearchersIn light of the many, often divergent preferences and demands of various stakehold-ers, researchers are forced to be pragmatic and accommodating. Making concessions, however, does not mean that the researchers’ own objectives should be discounted. The responsibility falls to researchers themselves to ensure that well-being is measured in a valid way and that, therefore, research questions are answered adequately. In ad-dition, as researchers’ time, skills, and resources are finite, certain well-being measures will be infeasible in certain contexts. For instance, if an organization wants to evaluate a company-wide vitality promotion program using wearable devices and dynamic survey-ing, researchers must be certain to have enough time and resources available to prepare data collection (e.g., selecting vendors, customizing instruments, training subjects) and to analyze the data (e.g., collaborating with researchers in other fields, learning new analytical techniques Chaffin et al., 2017; Eatough et al., 2016). Being pragmatic and minding resource limitations does not have to undermine the validity of measures. Researchers can draw from extant literature to select validated alternatives to the more time-consuming and costly measures. If one wants to measure job affect using the ex-perience sampling method, and an organization suggests a cross-sectional survey to do this, researchers can suggest day reconstruction method as a valid alternative (Dockray et al., 2010; Kahneman et al., 2004). If one wants to use well-established multiple-item scales to measure well-being constructs, and an organization rejects this idea, research-ers might want to suggest validated single-item measures (e.g., G. G. Fisher et al., 2016; Wanous et al., 1997) or shortened scales (e.g., Russell et al., 2004; Schaufeli et al., 2006, 2019). This may allow investigation of several constructs with satisfactory precision in-stead of a single construct with higher precision, which should be a desirable trade-off in many contexts, for the reasons noted above.
In the process of managing stakeholders, good communication is key. Organizations, in particular, are not easily convinced by the presentation of statistical or theoretical evidence (Hodgkinson, 2012). For this reason, it is key to communicate about topics such as instrument validity, research design and construct choice in an understand-able and persuasive manner (Lapierre et al., 2018). We refer the reader to research on the communication of evidence-based practice (Baughman et al., 2011; Highhouse et
2
51
al., 2017; Hodgkinson, 2012; Lapierre et al., 2018; D. C. Zhang, 2018) and bridging the academia-practice gap (Banks et al., 2016; Rynes, 2012) for best practices.
2.5. Discussion
Our work aimed at answering three questions that are relevant for the study of worker well-being. We addressed the first question, What is worker well-being?, by proposing a construct taxonomy based on four dimensions: philosophical foundation, scope, stabil-ity and valence. We illustrated the taxonomy by classifying the ten worker well-being constructs. By synthesizing the many conceptual models of worker well-being, the taxonomy helps researchers to make sense of the burgeoning but messy field of worker well-being.
To answer the question, How can worker well-being constructs be measured?, we offered a multi-disciplinary overview of traditional (e.g., surveys and interviews) and novel data sources (e.g., wearable sensors) that can be leveraged to measure worker well-being. Therein, we distinguished four broad types of data sources: closed question survey, word, behavioral and physiological measures, and further classified them as either unobtrusive, reaction-based obtrusive or observation-based obtrusive.
Taken together, our construct taxonomy and our overview of existing measurement approaches uncovered some notable gaps in the current science of worker well-being. In particular, we showed that several of the most important work-specific well-being constructs have been measured primarily using closed question surveys. In light of the fact that the context-free counterparts of these constructs have undergone innovation in measurement methodology, we encourage researchers to draw from other research strands to develop new measures of these important work-specific constructs. More generally, we hope that our overview inspires researchers to think outside their current methodological toolboxes and to foster collaborations outside the social sciences to leverage new measurement and data collection techniques.
To address the final question, How should a worker well-being construct measure be se-lected?, we described the importance of good conceptualization, rigorous operational-ization and pragmatic stakeholder management. Because of its broad scope, this discus-sion was not intended to be exhaustive. Instead, we hope that the discussion provides a useful map of the most important considerations and guidance to detailed references on particular topics (e.g., construct definition, validation, ethics, and communication).
In conclusion, with our work, we intended to bridge the gap between the popular buzz about worker well-being and the extant scientific research about it. Our work has
chapter 2 | What is worker well-being, and how it should be measured
52
provided guidelines to go beyond the ad-hoc study of worker well-being and conduct rigorous, responsible research. It is our hope that researchers, whether working in organizations, in academia or both, will feel more competent to take the well-being of workers into account, eventually permitting them to better understand what drives worker well-being and design policies to promote it accordingly.


3steering towards happiness
Based on paper: Wijngaards, I., Hendriks, M., & Burger, M.J. (2019). Steering towards happiness: An experience sampling study on the determinants of happiness of truck drivers. Transportation
research part A: policy and practice, 128, 131-148.

3
57
3.1. introDuction
Truck drivers continue to play an integral part within the world economy. However, due to high job demands, truck drivers are at high risk for anxiety (Apostolopoulos et al., 2016; De Croon et al., 2004), depression (Da Silva-Júnior et al., 2009), and fatigue (Boyce, 2016). More generally, data on subjective well-being (SWB) show that employees working in the transportation sector score well below average on life satisfaction and job satisfaction (De Neve & Ward, 2017). The struggles of truck drivers are powerfully illustrated by an interview subject of Apostolopoulos et al. (2016): “It’s rough and rugged … It’s hard and it’s stressful. You know, maybe that’s why I turn to drugs, I don’t know. It’s not the type of life I really want to live but, you know, it gives me what I need to maintain my family and to maintain me and my lifestyle” (p. 55).
Low levels of well-being among truck drivers can have various adverse effects, including lower work productivity (Stewart et al., 2003), poor health outcomes (Apostolopoulos et al., 2013) and reduced personal and public safety (Apostolopoulos et al., 2016). In ad-dition, due to the prospect of low truck driver happiness, logistics companies have dif-ficulties attracting new talent. These adverse effects are particularly pertinent because many Western countries currently face a shortage of transportation workers caused by a combination of high voluntary turnover (Prockl et al., 2017; Staats et al., 2017), a rapidly aging workforce (American Trucking Association, 2018), and difficulties finding young, capable drivers (Rauwald & Schmidt, 2012; Schulz et al., 2014). For instance, the United States currently faces a shortage of 50,000 drivers, a figure that could increase to 174,000 drivers by 2026 (American Trucking Association, 2017). Similarly, it is expected that in Germany, 40% of truck drivers on the road today will retire in the next ten years, leading to a large shortage of drivers (R. Weiss, 2013). As noted by Suzuki et al. (2009) and Fournier et al. (2012), these low retention rates and labor shortages turn out to be a very costly issue for transportation companies.
To adequately address these issues faced by the transportation industry, it is crucial to better understand the subjective experience of its employees (Schulz et al., 2014). Various studies have addressed truck drivers’ job satisfaction and its antecedents (e.g., De Croon et al., 2002; J. C. Johnson et al., 2011; McElroy et al., 1993; Prockl et al., 2017), but, to the best of the authors’ knowledge, no studies have investigated truck drivers’ momentary happiness and its antecedents. This gap in the literature is deemed significant because the sole focus on job satisfaction is unwarranted. First, although overall job satisfaction provides some useful information about truck drivers’ overall happiness at work, studies focusing exclusively on statically measured job satisfaction ignore much of the variation in happiness that takes place over the course of a day (C. D. Fisher, 2000; Ilies & Judge, 2002), and they fail to examine the effects of specific (work) events (Miner et al., 2005).
chapter 3 | Steering towards happiness
58
Second, past studies’ close attention to job satisfaction may be disproportionate, since it only constitutes one dimension of subjective well-being (Diener, 1984; Diener et al., 1999) and affective states (e.g., moods and emotions) are better predictors of certain work outcomes than evaluative states (e.g., job satisfaction, Bakker & Oerlemans, 2011; Van Katwyk et al., 2000).
In light of this, the current study contributes to the existing literature in several ways. First, this study intends to build on current studies on the well-being of truck drivers by focusing on the momentary happiness (i.e., affective and transient feelings) of truck drivers. Specifically, this study examines the differences in momentary happiness during various job and off-job activities and assesses the impact of occupation-relevant job characteristics on the momentary happiness of truck drivers. The consideration of off-job activities is important because happiness during off-job activities can spill over to the work context and vice versa (Ten Brummelhuis & Bakker, 2012), and plays an important role in a person’s general happiness set-point (Diener et al., 2006). The findings of this study can offer logistics companies insights about what makes truck drivers happy and unhappy, and this information can be used to improve the well-being of truck drivers and address commonplace problems in the transportation sector, such as difficulties to attract new staff and employee turnover.
Second, this study tests whether the core proposition of the job demands-resources (JD-R) model (Demerouti et al., 2001) that job demands (e.g., long working hours and job insecurity) and job resources (e.g., social support and job variety) are negative and positive determinants of well-being in every occupation, respectively, by examin-ing how momentary happiness relates to several core job demands and resources of truck drivers. Additionally, to the best of the author’s knowledge, this study is the first to not only investigate how truck drivers’ happiness relates to relatively stable trait job demands and resources (e.g., job insecurity and pay), but also the role of various highly fluctuating state job demands and resources (e.g., road congestion and road quality dur-ing a specific trip or work day). These state-like variables are important, as they can play a significant mediating role in the relationship between trait job demands and resources and trait well-being (Schaufeli & Van Rhenen, 2006) and may have particularly strong and unique effects on transient feelings of happiness.
Third, this study offers a methodological contribution to the transportation literature by capturing momentary happiness and state-like job characteristics using an experience sampling method measure (ESM, Csikszentmihalyi & Hunter, 2003), a method that asks respondents to report on their moods and time spending several times per day, thereby explicitly incorporating the dynamic aspect of day-to-day happiness and activities (Scol-lon et al., 2009). This type of multiple moment assessments method reduces memory
3
59
bias, relies less on global heuristics, increases ecological validity, controls for the top-down effect in the assessment of SWB, and allows for a better view on the situational circumstances that influence an experience (Kahneman et al., 2004; Scollon et al., 2009).
In summary, this study intends to answer the following three research questions:(1) How do the momentary happiness levels of truck drivers differ across job and off-job
activities?(2) How do trait-like job demands and job resources moderate the relationship between
truck-drivers work-related job activities and momentary happiness?(3) How do state-like job demands and job resources moderate the relationship be-
tween truck driving and momentary happiness?
The remainder of this paper is structured as follows. First, a conceptualization of SWB is provided, and multiple sets of hypotheses are presented. Next, the study’s sample and research procedure, survey instruments, and approach to statistical analyses are discussed, followed by a presentation of the research findings. Finally, a discussion of the research findings and conclusions are offered.
3.2. theory
3.2.1. subjective well-beingThe concept of SWB concerns the appreciation of one’s personal condition and comprises affective experiences (i.e., moods, emotions, affectivity) and cognitive comparisons (Diener, 1984; e.g., life satisfaction, Diener et al., 1999; Veenhoven, 2000).9 SWB comprises context-free states (e.g., life satisfaction or general mood) as well as context-specific states (e.g., job satisfaction and job affect, Taris & Schaufeli, 2015). This study focuses on context-free states by considering truck drivers’ moods: “diffuse affect states, characterized by a relative enduring predominance of certain types of subjective feelings that affect the experience and behavior of a person” (Scherer, 2005, p. 705). These affective states are also often characterized as momentary happiness (e.g., Bryson & MacKerron, 2017; Csikszentmihalyi & Hunter, 2003; Howell et al., 2011). Momentary happiness encapsulates various positive (e.g., joyful, engaged) and negative states (e.g., stressed, angry, Bakker & Oerlemans, 2011). Although SWB constructs generally show significant intercorrelations (Bowling et al., 2010; Krueger & Schkade, 2008), the correlations between affective SWB and cognitive SWB and between context-free and context-specific states are only modest. For example, affectivity’s relationships with job
9 SWB should therefore be considered a general concept or field of study rather than a metric in and of itself that can be operationalized by aggregating construct scores (Diener et al., 1999).
chapter 3 | Steering towards happiness
60
satisfaction (Bowling et al., 2010), job facet satisfaction (Bowling et al., 2008) and life satisfaction (Kahneman & Deaton, 2010) are typically below 0.4.
3.2.2. activities and momentary happinessThe truck driving occupation is characterized by high job demands (De Croon et al., 2004), including frequently working overtime and low task variety amongst other de-mands, and a lack of recovery opportunities (C. Chen & Xie, 2014; Morrow & Crum, 2004; for evidence from the Netherlands, see Van Zenderen et al., 2017). Both can be expected to negatively affect happiness, possibly leading to momentary happiness levels below a driver’s happiness set-point (Kuykendall, Tay, & Ng, 2015). Their combined negative effect may go beyond their individual negative effects because recovery in the form of leisure activities plays an important role in mitigating the effects of job demands on job stress (Sonnentag & Fritz, 2015) and happiness more generally (Kuykendall et al., 2015), and vice versa for a lack of recovery. Many theories have been proposed that underlie this notion (for an extensive reviews, see Newman et al., 2014; Sonnentag & Fritz, 2015). A prominent example in this regard is the conservation of resources (COR) theory (Hob-foll, 1989), which proposes that individuals build resources (e.g., energy, concentration, motivation) during leisure activities that, in turn, can be used at work. Another example is activity theory (Havighurst, 1963), which argues that happiness is increased by the engagement in meaningful and social leisure activities outside work, such as meeting others and doing volunteering work. Accordingly, in most occupations, people gener-ally feel happier during leisure activities than during work activities (Bryson & MacKer-ron, 2017) and we believe truck drivers are no exception given the relatively high job demands and lack of recovery opportunities in this occupation. For these reasons, the following hypothesis is posed:
hypothesis 1a: Off-job activities are associated with higher momentary happiness than job activities among truck drivers.
While truck drivers mostly engage in work-related job activities during work time (e.g., driving, deliveries, and pick-ups), they also engage in some non-work-related job activi-ties (typically eating and resting breaks). COR theory as well as the effort-recovery model (Meijman & Mulder, 1998) predict that the buffering effect of engaging in recovery ac-tivities such as breaks also holds for recovery activities during the work day (Hunter & Wu, 2016). Empirical studies confirm that lunch breaks (Hunter & Wu, 2016; Trougakos et al., 2014) and micro-breaks (S. Kim et al., 2017) can help people to recover from daily stressors (e.g., by satisfying the basic need to interact with other people). Some studies suggest that these theories could also apply to the truck driving occupation, as breaks reduce fatigue and crash risks (C. Chen & Xie, 2014) and improve overall occupational health (Apostolopoulos et al., 2012). As such, it is expected that non-work-related job
3
61
activities (i.e. breaks) trigger higher momentary happiness than work-related job activi-ties. Therefore, the following hypothesis is posed:
hypothesis 1b: Non-work-related job activities are associated with higher momentary happiness than work-related job activities among truck drivers.
3.2.3. job characteristics and momentary happinessThis study draws on the JD-R model (Bakker et al., 2004; Bakker & Demerouti, 2017; Demerouti et al., 2001) to further expand upon hypothesis 1a. The negative relationship between work-related job activities and momentary happiness is likely to be dependent on the favorability of truck drivers’ job characteristics.
The JD-R model posits that every job characteristic can be classified in two general categories: job demands and job resources (Schaufeli & Taris, 2014). Job demands refer to “those physical, social, or organizational aspects of the job that require sustained physical or mental effort and are therefore associated with certain physiological and psychological costs (e.g., exhaustion)” (Demerouti et al., 2001, p. 501). Job resources can be defined as “those physical, psychological, social or organizational aspects of the job that may do any of the following: be functional in achieving work goals, reduce job demands at the associated physiological and psychological costs or stimulate personal growth and development” (Demerouti et al., 2001, p. 501). This theoretical model posits that both job demands and job resources work as proximal determinants of various aspects of employee well-being. Although the traditional focus is on motivational states (e.g., work engagement) and health states (e.g., stress, burnout), the model can also be applied to affective feelings of (un)happiness (Bakker & Oerlemans, 2011). Typically, job demands negatively affect employee well-being, and job resources positively affect employee well-being. In turn, employee well-being determines organizational outcome variables, such as productivity, absenteeism and turnover (Bakker & Demerouti, 2007; for empirical evidence, see Crawford et al., 2010). Because this study is interested in the relationship between activities and momentary happiness, it does not follow the tradition of examining the direct impact of job demands and resources on well-being, but instead looks into their alleviating or aggravating potential in the hypothesized negative relationship between work-related job activities and momentary happiness.
The JD-R model is a flexible model, as at its core lies the proposition that while there may be occupation-specific job demands and resources, their general relationships with well-being are relevant across all sectors and occupations (Korunka et al., 2009; Van Droogenbroeck & Spruyt, 2016). It is however vital to select job demands and resources that are relevant or specific to the occupation, since their exact manifestation can be highly dependent on the occupational setting (e.g., De Croon et al., 2002).
chapter 3 | Steering towards happiness
62
Furthermore, JD-R theory distinguishes between state-like and trait-like job demands, job resources, and well-being variables (Bakker, 2015). States mirror a person’s feelings about the environment (e.g., job demands and resources) and the self (e.g., well-being) at particular moments in time and are considered to be highly fluctuant (Kühnel et al., 2012; Xanthopoulou et al., 2008). In contrast, traits are regarded as individual disposi-tions or global experiences that remain relatively stable over time (Bakker, 2015). This distinction is important because stable long-term effects and transient short-term ef-fects can have divergent determinants and consequences due to differences in their phenomenological nature. For instance, trip duration can both be state-like (e.g., mak-ing a longer trip than usual) and trait-like (e.g., making long trips on a daily basis) and these may have unique effects on momentary happiness.
The current study focuses on a selection of state-like and trait-like job demands and job resources that are relevant for the truck driving occupation. This selection was made by reviewing the truck driving literature and in consultation with the Dutch Sector Institute of Transportation and Logistics (in Dutch: Sectorinstituut Transport en Logistiek), thereby focusing on the issues that truck drivers commonly mention in their interactions with the Sector Institute. However, given the large number of potentially relevant job de-mands and resources, this selection is inevitably incomplete.
3.2.3.1. Trait job demandsThis study focuses on three trait job demands: the frequency of working overtime, job insecurity, and average trip duration.
The high frequency of working overtime, often associated with long driving hours and extreme workloads, is a straining job demand for truck drivers (Morrow & Crum, 2004; for evidence from the Netherlands, see Boeijinga et al., 2017). Working overtime can interfere with truck drivers’ ability to balance their work and private lives (P. Berg et al., 2003), hamper people’s ability to recover from work (Beckers et al., 2008), and disturb their sleeping rhythms (Kanazawa et al., 2006), which can in turn reduce their well-being (Beckers et al., 2008) and result in chronic fatigue (Hege et al., 2015).
Job insecurity functions as another job demand for truck drivers, as in recent years more and more Dutch truck drivers started working under temporary employment contracts (Wagenaar, 2018). While truck drivers are generally in high demand (J. C. Johnson et al., 2011), job insecurity can fosters feelings of powerlessness and uncontrollability (De Witte, 1999), which in turn can lead to increased work stress (De Witte, 1999), lower job satisfaction (De Cuyper & De Witte, 2006), and lower life satisfaction (Silla et al., 2009).
Truck drivers’ average duration of a trip is a likely occupation-specific job demand. Even though many just-in-time deliveries in a working day can be stressful (Kemp et al., 2013),
3
63
it is expected that, compared to short-haul truck drivers, truck drivers that have longer average trip durations tend to experience resource depletion by increased feelings of social isolation and monotonous work as well as work overload and work-family conflicts (Apostolopoulos et al., 2013; Crizzle et al., 2017). In line with the above argumentations, the following hypotheses are posited:
hypothesis 2a: Having to work overtime frequently aggravates the negative relationship between work-related job activities and truck drivers’ momentary happiness.
hypothesis 2b: Job insecurity aggravates the negative relationship between work-related job activities and momentary happiness.
hypothesis 2c: Having long average trip duration aggravates the negative relationship between work-related job activities and momentary happiness.
3.2.3.2. Trait job resourcesThis study examines the role of four resources that are relevant for the truck driving occupation: pay, colleague support, flexibility of work hours, and task variety. Pay, or income more generally, tends to have a positive relationship with emotional well-being for people with relatively low or modest incomes, such as truck drivers (Kahneman and Deaton, 2010). This is illustrated by the fact that truck drivers have indicated that better salary is the most important factor for changing jobs (Van Zenderen et al., 2017) The positive effect of receiving a relatively high pay may be reinforced by the controversy surrounding the pay of Dutch truck drivers. Dutch employers have used the trend that more and more truckers from low-income European Union countries (Hilal, 2008; Pijpers, 2010) have started participating in the international transportation market as an excuse to underpay Dutch truck drivers (Cremers, 2014). The effort-reward imbalance model (Siegrist & Peter, 1996; Van Vegchel et al., 2005) predicts that employee perceptions of being insufficiently rewarded based on his or her efforts reduces employee well-being. The salience of pay unfairness in the truck driving setting might make pay a particularly important determinant of truck drivers’ well-being.
The individualistic nature of the truck driving occupation could cause truck drivers to feel socially isolated, and experience limited social support (Crizzle et al., 2017; Orris et al., 1997), resulting in mental health complaints (Kemp, Kopp, & Kemp Jr., 2013; Shattell, Apostolopoulos, Sönmez, & Griffin, 2010). Social support works as resource for truck drivers (Van Zenderen et al., 2017), as it satisfies individuals’ desire for relatedness (e.g., social interactions with colleagues are pleasant), facilitates coping (e.g., blowing off steam after a stressful situation) and can be used to decrease workload (e.g., a colleague takes over a ride, Bakker & Demerouti, 2007).
chapter 3 | Steering towards happiness
64
Further, truck drivers regularly deal with tight and sometimes unrealistic schedules (Apostolopoulos et al., 2016; Hege et al., 2015) and extended periods away from home (Shattell et al., 2010). This lack of flexibility in work schedules is likely to diminish truck drivers’ sense of autonomy (C. A. Thompson & Prottas, 2006) and well-being (Bakker & Demerouti, 2007). In accordance, it is expected that flexible work hours help alleviate truck driver stress, as they facilitate the reduction of role conflicts and work-life conflict (Rau & Hyland, 2002).
Task variety of truck drivers is generally considered low, as truck drivers often engage in driving for long periods of time (Shattell et al., 2010). This monotonous driving could di-minish the meaningfulness of the job (Hackman & Oldham, 1974) and increase feelings of boredom (Parker et al., 2008). Hence, following the assumption that job resources have a positive effect on happiness, the following hypotheses are posed:
hypothesis 3a: High pay alleviates the negative relationship between work-related job activities and momentary happiness.
hypothesis 3b: Social support of colleagues alleviates the negative relationship between work-related job activities and momentary happiness.
hypothesis 3c: Having flexible work hours alleviates the negative relationship between work-related job activities and momentary happiness.
hypothesis 3d: Task variety alleviates the negative relationship between work-related job activities and momentary happiness.
3.2.3.3. State job demandsSo far, this study hypothesized the moderating effect of job demands and resources in the relationship between work-related job activities and momentary happiness. Yet, it is pivotal to also examine job demands and resources that are specifically relevant during individual job activities, in particular those related to the main task of truck driv-ers: driving a truck. One prominent source of job demands relevant to this activity are environmental conditions (Crizzle et al., 2017; Shattell et al., 2010), and we will focus here on two such environmental conditions: road congestion and poor road conditions.
Road congestion functions as job demand (Rowden et al., 2011; Shattell et al., 2010), as it often result negative emotions (Eckenrode, 1984; Hennessy & Wiesenthal, 1999; Rowden et al., 2011), such as frustration and aggression (Shinar & Compton, 2004). Besides, busy roads force truck drivers to deplete energy resources to concentrate on the road (Shat-tell et al., 2010).
3
65
Poor road conditions may also act as job demand (Shattell et al., 2010), although the road quality in the Netherlands is generally good (Bruntlett & Bruntlett, 2018). For example, driving on roads with many potholes results in increased levels of whole body vibration, in turn causing discomfort and, if sufficiently continuous, pain (Bovenzi, 2009). Driving on poorly lit roads make truck drivers drowsy and pressure them to pay extra attention. Following this argumentation, two hypotheses are put forward:
hypothesis 4a: Road congestion aggravates the negative relationship between truck driving and momentary happiness.
hypothesis 4b: Poor road conditions aggravate the negative relationship between truck driving momentary happiness.
3.2.3.4. State job resourcesSocial support can also be viewed as a state job resource. Truck drivers typically spend most of their working hours on the road without any physical company and lack the op-portunity to virtually connect. The situations when drivers have passengers in the truck provide a valuable opportunity for social support and distraction. For instance, when a driver has passengers with whom he or she can interact, he or she will be “more occu-pied with something” (R. P. Smith, 1981) and distracted from the “boring road” (Ettema et al., 2012). Some evidence from commuting studies suggests that the negative emotions resulting from job stressors can be attenuated by the presence of passengers (Ettema et al., 2012; Lancée et al., 2017). In a study among truck drivers, Hatami et al. (2019) have shown that having a co-driver decreases feelings of stress and loneliness, and thereby increases SWB. As such, the following hypothesis is posited:
hypothesis 5: Having passengers alleviates the negative relationship between truck driving and momentary happiness.
In Figure 3.1, a conceptual model is presented that summarizes all hypotheses. Hypoth-esis 1a represents the top arrow, and hypothesis 1b represents bottom arrow, respec-tively. Hypothesis 2 to 5 concern the arrow in the middle. Hypotheses 2 and 3 involve the moderating effect of trait job demands and trait job resources on the relationship between work-related job activities and momentary happiness. Hypotheses 4 and 5 summarize the argumentation about the moderating effect of state job demands and resources in the relationship between work-related job activities and momentary hap-piness.
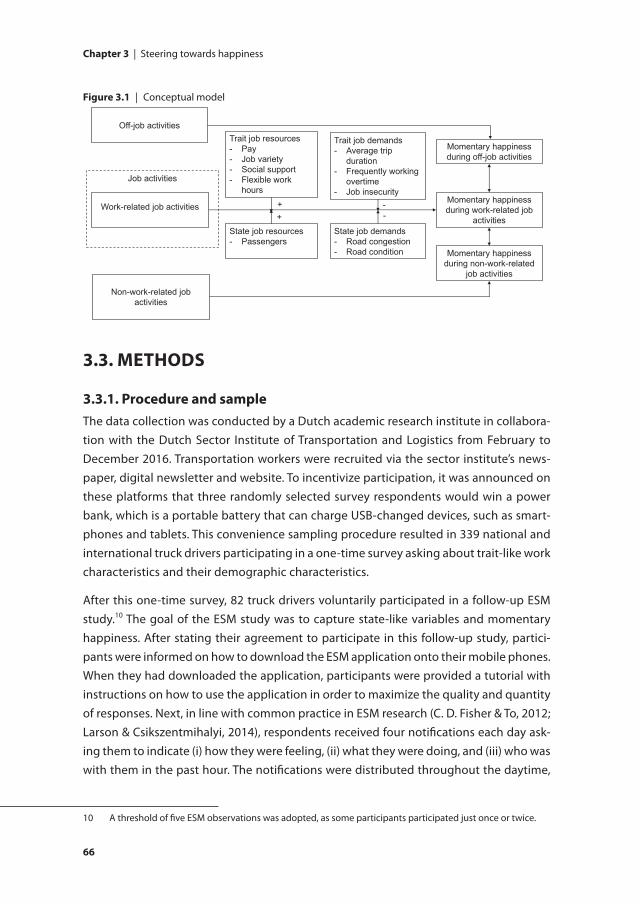
chapter 3 | Steering towards happiness
66
3.3. MethoDs
3.3.1. Procedure and sampleThe data collection was conducted by a Dutch academic research institute in collabora-tion with the Dutch Sector Institute of Transportation and Logistics from February to December 2016. Transportation workers were recruited via the sector institute’s news-paper, digital newsletter and website. To incentivize participation, it was announced on these platforms that three randomly selected survey respondents would win a power bank, which is a portable battery that can charge USB-changed devices, such as smart-phones and tablets. This convenience sampling procedure resulted in 339 national and international truck drivers participating in a one-time survey asking about trait-like work characteristics and their demographic characteristics.
After this one-time survey, 82 truck drivers voluntarily participated in a follow-up ESM study.10 The goal of the ESM study was to capture state-like variables and momentary happiness. After stating their agreement to participate in this follow-up study, partici-pants were informed on how to download the ESM application onto their mobile phones. When they had downloaded the application, participants were provided a tutorial with instructions on how to use the application in order to maximize the quality and quantity of responses. Next, in line with common practice in ESM research (C. D. Fisher & To, 2012; Larson & Csikszentmihalyi, 2014), respondents received four notifications each day ask-ing them to indicate (i) how they were feeling, (ii) what they were doing, and (iii) who was with them in the past hour. The notifications were distributed throughout the daytime,
10 A threshold of five ESM observations was adopted, as some participants participated just once or twice.
figure 3.1 | Conceptual model
Job activities
Momentary happinessduring work-related job
activitiesWork-related job activities
Trait job resources- Pay- Job variety- Social support- Flexible work
hours
Trait job demands- Average trip
duration- Frequently working
overtime- Job insecurity
Off-job activities
State job resources- Passengers
State job demands- Road congestion- Road condition
+
Momentary happinessduring off-job activities
Non-work-related jobactivities
Momentary happinessduring non-work-related
job activities
+--
3
67
covering the entire waking day. Two consecutive signals were always more than an hour apart. Out of safety considerations, the truck drivers were instructed to answer this ques-tion when they were off the road (e.g., on a break or at a drop-off or pick-up location).11 The total number of observations in the utilized ESM dataset was 4175, and the median number of responses was 30. The data were fully anonymized and treated confidentially.
Table 3.1 summarizes the demographic composition and well-being of the sample of ESM respondents and compares these to the Dutch truck driver population and the at-trition sample (i.e., those who participated in the initial study but not in the follow-up ESM study). The sample of ESM participants was generally representative in terms of demographic composition and well-being of the attrition sample and general popula-tion, with some exceptions. For reasons of anonymity, respondents were not asked to indicate for which company they worked. However, as the sector institute is a coop-eration of the main employers’ associations and employees’ organizations in the Dutch transportation and logistics sector, the survey respondents likely worked for a great variety of companies in the transportation and logistics sector.
3.3.2. MeasuresTrait-like variables were measured using survey instruments in a cross-sectional survey because they were expected to be rather stable over time. Because of their transient nature, state-like variables were measured through survey instruments in the ESM pro-cedure. The items were presented in Dutch. A list of all the current study’s variables and the number of observations per category is provided in Table 3.2.
Except for momentary happiness, all scales were collapsed into fewer categories based on the logical ordering of answer categories (e.g., merging “Strongly agree” and “Agree” into “Agree”). Most variables were measured on ordinal Likert-scales. Likert scales are commonly treated as interval variables in statistical analyses and should generally not be collapsed into fewer categories, as it can result in, for instance, information, power and effect size loss (MacCallum et al., 2002). Yet, because Shapiro-Wilk’s test of normal-ity showed that all variables followed a non-normal distribution (p < 0.05), variables had to be treated as ordinal. Further, since the skewness of the variables was extreme and certain categories were infrequently or almost completely unused, collapsing the scales into fewer categories was deemed necessary (Agresti, 2018). Without collapsing the scales, statistical tests would have been conducted with limited statistical power, and the results could have mistakenly pointed towards statistically insignificant effects, while effects were in fact economically (or practically) significant.
11 For this reason, we were unable to collect data on true momentary activities, feelings or company (e.g., “What are you doing right now?”) and had to prompt a question that allowed more flexibility.
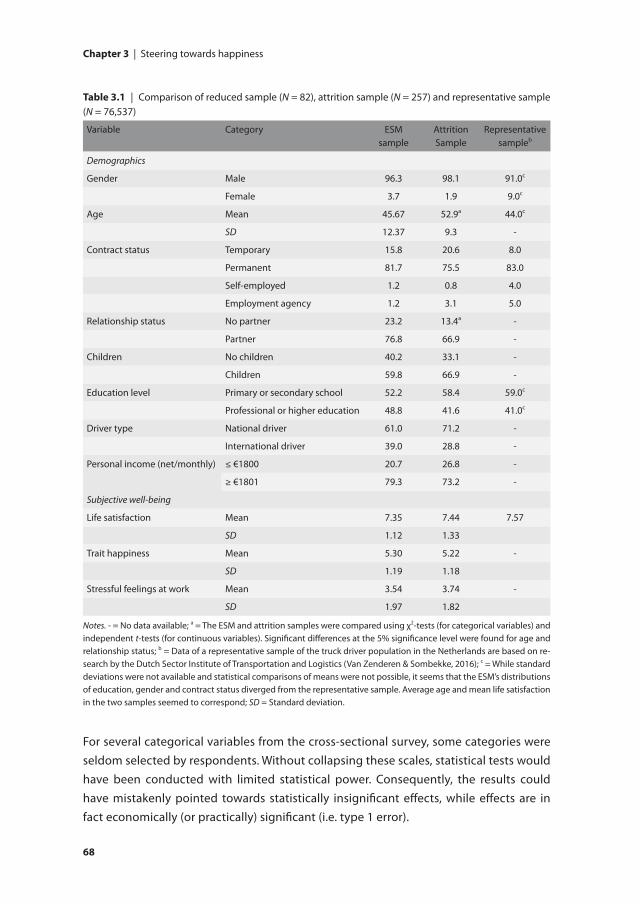
chapter 3 | Steering towards happiness
68
For several categorical variables from the cross-sectional survey, some categories were seldom selected by respondents. Without collapsing these scales, statistical tests would have been conducted with limited statistical power. Consequently, the results could have mistakenly pointed towards statistically insignificant effects, while effects are in fact economically (or practically) significant (i.e. type 1 error).
table 3.1 | Comparison of reduced sample (N = 82), attrition sample (N = 257) and representative sample (N = 76,537)
Variable Category ESMsample
AttritionSample
Representativesampleb
Demographics
Gender Male 96.3 98.1 91.0c
Female 3.7 1.9 9.0c
Age Mean 45.67 52.9a 44.0c
SD 12.37 9.3 -
Contract status Temporary 15.8 20.6 8.0
Permanent 81.7 75.5 83.0
Self-employed 1.2 0.8 4.0
Employment agency 1.2 3.1 5.0
Relationship status No partner 23.2 13.4a -
Partner 76.8 66.9 -
Children No children 40.2 33.1 -
Children 59.8 66.9 -
Education level Primary or secondary school 52.2 58.4 59.0c
Professional or higher education 48.8 41.6 41.0c
Driver type National driver 61.0 71.2 -
International driver 39.0 28.8 -
Personal income (net/monthly) ≤ €1800 20.7 26.8 -
≥ €1801 79.3 73.2 -
Subjective well-being
Life satisfaction Mean 7.35 7.44 7.57
SD 1.12 1.33
Trait happiness Mean 5.30 5.22 -
SD 1.19 1.18
Stressful feelings at work Mean 3.54 3.74 -
SD 1.97 1.82
Notes. - = No data available; a = The ESM and attrition samples were compared using χ2-tests (for categorical variables) and independent t-tests (for continuous variables). Significant differences at the 5% significance level were found for age and relationship status; b = Data of a representative sample of the truck driver population in the Netherlands are based on re-search by the Dutch Sector Institute of Transportation and Logistics (Van Zenderen & Sombekke, 2016); c = While standard deviations were not available and statistical comparisons of means were not possible, it seems that the ESM’s distributions of education, gender and contract status diverged from the representative sample. Average age and mean life satisfaction in the two samples seemed to correspond; SD = Standard deviation.
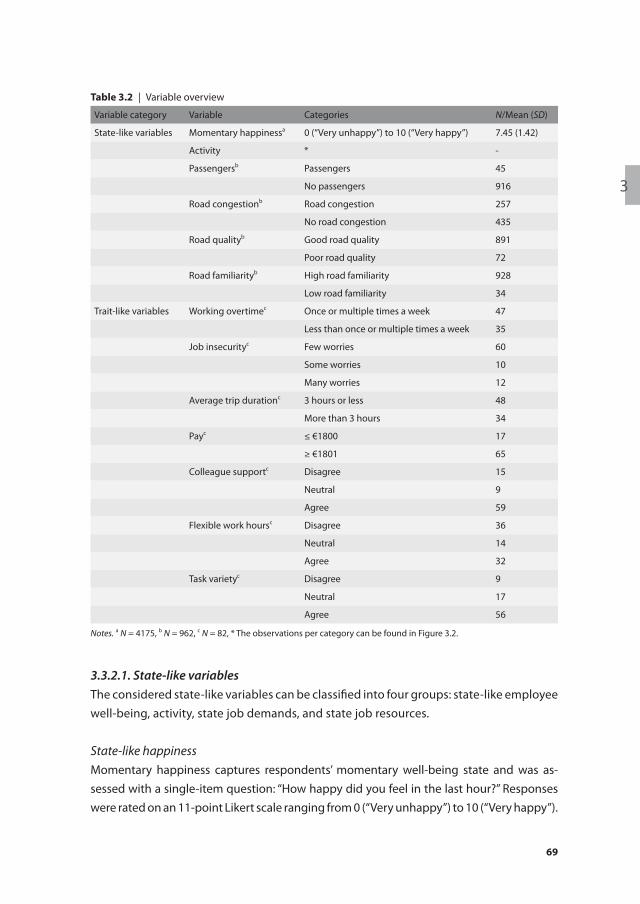
3
69
3.3.2.1. State-like variablesThe considered state-like variables can be classified into four groups: state-like employee well-being, activity, state job demands, and state job resources.
State-like happinessMomentary happiness captures respondents’ momentary well-being state and was as-sessed with a single-item question: “How happy did you feel in the last hour?” Responses were rated on an 11-point Likert scale ranging from 0 (“Very unhappy”) to 10 (“Very happy”).
table 3.2 | Variable overview
Variable category Variable Categories N/Mean (SD)
State-like variables Momentary happinessa 0 (“Very unhappy”) to 10 (“Very happy”) 7.45 (1.42)
Activity * -
Passengersb Passengers 45
No passengers 916
Road congestionb Road congestion 257
No road congestion 435
Road qualityb Good road quality 891
Poor road quality 72
Road familiarityb High road familiarity 928
Low road familiarity 34
Trait-like variables Working overtimec Once or multiple times a week 47
Less than once or multiple times a week 35
Job insecurityc Few worries 60
Some worries 10
Many worries 12
Average trip durationc 3 hours or less 48
More than 3 hours 34
Payc ≤ €1800 17
≥ €1801 65
Colleague supportc Disagree 15
Neutral 9
Agree 59
Flexible work hoursc Disagree 36
Neutral 14
Agree 32
Task varietyc Disagree 9
Neutral 17
Agree 56
Notes. a N = 4175, b N = 962, c N = 82, * The observations per category can be found in Figure 3.2.
chapter 3 | Steering towards happiness
70
ActivityRespondents were asked to report what they had been primarily doing in the last hour. They first had to select whether they were engaged in a job or an off-job activity. For job activities, they could subsequently select one of the following activities: driving, eating, delivery and pick-up, rest/relaxation, administrative task, logistics task, or other. The cat-egories eating and rest/relaxation were combined into a category of non-work-related job activities. For off-job activities, subjects could choose one of the following activities: sleeping, taking care of oneself, taking care of another person, travelling, studying, do-ing household tasks, eating, communicating with another person, relaxing, watching TV or using a computer, working out, engaging in outdoor activity, or other.
State job demandsWhen respondents answered driving as an activity, they were asked how busy the road was (1 = “Very unbusy”, 2 = “Reasonably unbusy”, 3 = “Reasonably busy”, 4 = “Very busy”) and what the quality of the road was (1 = “Very bad”, 2 = “Reasonably bad”, 3 = “Reason-ably good”, 4 = “Very good”). The 4-point Likert scales were dichotomized (e.g., 0 = “No road congestion”, 1 = “Road congestion”) by combining the lowest two scores and the and highest two scores.
State job resourcesAs a follow-up to the activity question, respondents were asked if they were alone or with colleagues, customers or friends. This variable was dichotomized to having pas-sengers or not while driving (0 = “No”, 1 = “Yes”).12
3.3.2.2. Trait-like variablesThe considered trait-like variables can be classified into two groups: trait job demands and trait job resources.
Trait job demandsWorking overtime was measured with the item “How often do you have to work over-time for your job?” This categorical variable was dichotomized to working overtime one or multiple times per week or not (0 = “No”, 1 = “Yes”) in order to have two categories of approximately the same sample size. Following the same rationale, average trip dura-tion assessed using the question “In general, how long does an average trip from your pick-up location to your drop-off location take you?” was dichotomized (0 = “3 hours or less”, 1 = “More than 3 hours”). Job insecurity was measured with the item “To what
12 The most frequent passengers were colleagues (26 observations), followed by customers (9 observations), friends/acquaintances (5 observations) and others (5 observations).
3
71
extent do you worry about the possibility of losing your job?” with answer categories on a 7-point Likert scale (1 = “No worrying at all” to 7 = “Worrying a lot”). The variable was re-coded into three categories (1 = “Few worries”, 2 = “Some worries”, 3 = “Many worries”) by combining the lowest three scores and the highest three scores.
Trait job resourcesPay was assessed with the item “To what category does your net monthly income belong?” For the analysis, this categorical variable was dichotomized to create two ap-proximately equally large groups (0 = “€1800 or less”, 1 = “€1801 or more”). Colleague support was assessed with the item “Do you have the feeling that you can count on the support and help of your colleagues?” Flexibility in work hours was assessed with “To what extent do you have the feeling that you have flexibility in determining your work hours?” Task variety was measured by the question “Do you have enough variation in your work?” These three questions had answer categories on a 7-point Likert scale (1 = “Totally disagree” to 7 = “Totally agree”). The variables were re-coded into three catego-ries (1 = “Disagree”, 2 = “Neutral”, 3 = “Agree”) by combining the lowest three scores and the highest three scores.
3.3.3. statistical analysesWithin-subject fixed-effects regressions were performed to test the hypotheses. The results were organized in three parts. First, the authors provided an overview of mo-mentary happiness during various activities using descriptive statistics and three fixed-effects models. A major advantage of fixed-effects models is the exclusion of top-down effects of a person’s general well-being on momentary happiness (Bryson & MacKerron, 2017; Lancée et al., 2017; Morris & Guerra, 2015). In other words, individual fixed effects control for individual-specific characteristics that remain constant over time, including people’s baseline or reference happiness level. This distortion is caused by the recipro-cal relationship between state-like and trait-like SWB constructs. As an explanation, momentary happiness adds to overall satisfaction with life (bottom-up effect), while general life satisfaction also affects momentary happiness during different activities (top-down effect; Headey et al., 1991; for evidence from transportation research, see De Vos, 2018).13 Since the authors are most interested in the types of activities that affect the momentary happiness of truck drivers, it is important to account for this top-down effect.
13 Examining the relationships in the SWB model, the Pearson correlation coefficients between momen-tary happiness, job satisfaction, life satisfaction, self-reported health and stress at work were computed. Because this was a between-subject analysis, experience-sampled momentary happiness was aggregated into average scores. The results can be found in Table A3.1. The analyses substantiated the relationships hypothesized by the SWB model.
chapter 3 | Steering towards happiness
72
All fixed-effects models were estimated using individual-clustered robust standard er-rors. The first model concerned the difference between momentary happiness at work and off work. The second model distinguished between momentary happiness during work-related job activities, non-work-related job activities, other job activities and off-job activities. The last model was identical to the second model, but it instead estimated the impact of specific work-related job activities (i.e., driving, pick-up/drop-off, logistical tasks and administrative tasks).
Subsequently, several fixed-effects models were estimated to explore what trait-like job characteristics moderate the relationship between work-related job activities and momentary happiness. In particular, these models were used to investigate whether specific trait job demands and job resources increase or decrease the difference in momentary happiness between work-related job activities and off-job activities. These models controlled for specific job and off-job activities (driving, relaxing, etc.) to capture variation in momentary happiness caused by these specific activities. Off-job activities were included as a reference category to eliminate the possible confounding effect of between-person differences in affective disposition, which became relevant when trait job characteristics were introduced to the model.
Notably, job demands and resources could theoretically also influence happiness levels during off-job activities and could thus bias the fixed-effect model estimates. To test this, a between-subject linear regression that assessed the influence of different job characteristics on an individual’s average happiness during off-job activities was con-ducted. As shown in Table A3.2, the results of this linear regression model indicate that job characteristics play basically no significant role in predicting momentary happiness during off-job activities. Therefore, the presented differences between job and off-job activities can be interpreted as the influence of job characteristics on momentary happi-ness during work-related job activities.
Additionally, four fixed-effects models were estimated to assess the extent to which state job demands and resources experienced while driving have the potential to decrease or increase the difference in momentary happiness between driving and off-job activities.
For all models, this study controlled for time of day (i.e., morning, afternoon, evening, night) and day of the week to capture common daily and weekly happiness patterns that are unrelated to specific activities or job characteristics.
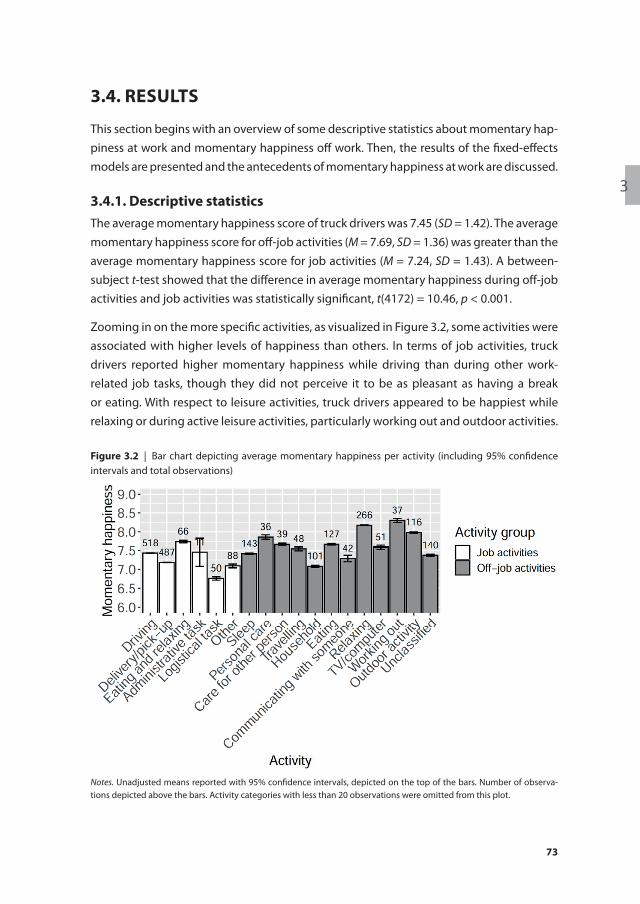
3
73
3.4. results
This section begins with an overview of some descriptive statistics about momentary hap-piness at work and momentary happiness off work. Then, the results of the fixed-effects models are presented and the antecedents of momentary happiness at work are discussed.
3.4.1. Descriptive statisticsThe average momentary happiness score of truck drivers was 7.45 (SD = 1.42). The average momentary happiness score for off-job activities (M = 7.69, SD = 1.36) was greater than the average momentary happiness score for job activities (M = 7.24, SD = 1.43). A between-subject t-test showed that the difference in average momentary happiness during off-job activities and job activities was statistically significant, t(4172) = 10.46, p < 0.001.
Zooming in on the more specific activities, as visualized in Figure 3.2, some activities were associated with higher levels of happiness than others. In terms of job activities, truck drivers reported higher momentary happiness while driving than during other work-related job tasks, though they did not perceive it to be as pleasant as having a break or eating. With respect to leisure activities, truck drivers appeared to be happiest while relaxing or during active leisure activities, particularly working out and outdoor activities.
figure 3.2 | Bar chart depicting average momentary happiness per activity (including 95% confidence intervals and total observations)
Notes. Unadjusted means reported with 95% confidence intervals, depicted on the top of the bars. Number of observa-tions depicted above the bars. Activity categories with less than 20 observations were omitted from this plot.
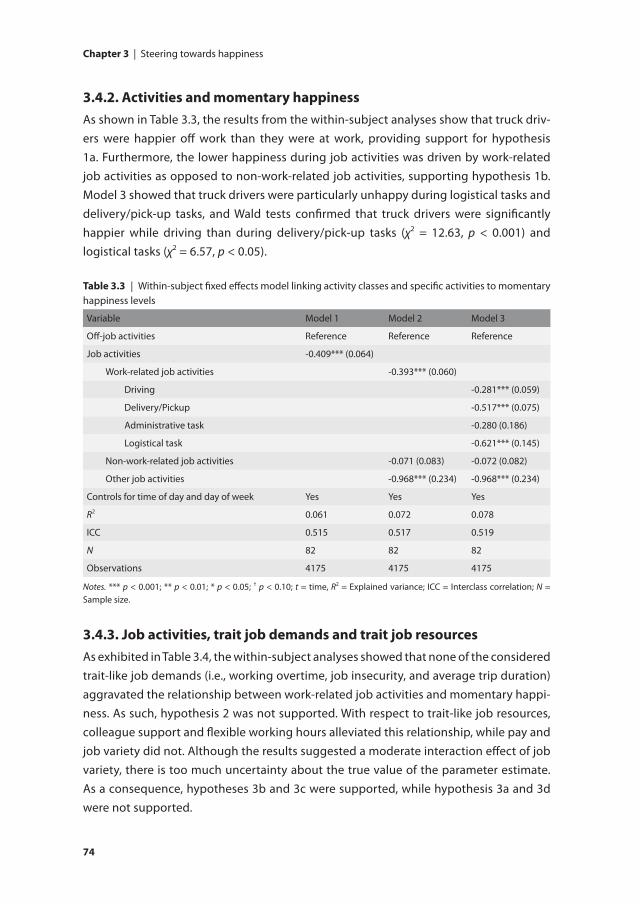
chapter 3 | Steering towards happiness
74
3.4.2. activities and momentary happinessAs shown in Table 3.3, the results from the within-subject analyses show that truck driv-ers were happier off work than they were at work, providing support for hypothesis 1a. Furthermore, the lower happiness during job activities was driven by work-related job activities as opposed to non-work-related job activities, supporting hypothesis 1b. Model 3 showed that truck drivers were particularly unhappy during logistical tasks and delivery/pick-up tasks, and Wald tests confirmed that truck drivers were significantly happier while driving than during delivery/pick-up tasks (χ2 = 12.63, p < 0.001) and logistical tasks (χ2 = 6.57, p < 0.05).
3.4.3. job activities, trait job demands and trait job resourcesAs exhibited in Table 3.4, the within-subject analyses showed that none of the considered trait-like job demands (i.e., working overtime, job insecurity, and average trip duration) aggravated the relationship between work-related job activities and momentary happi-ness. As such, hypothesis 2 was not supported. With respect to trait-like job resources, colleague support and flexible working hours alleviated this relationship, while pay and job variety did not. Although the results suggested a moderate interaction effect of job variety, there is too much uncertainty about the true value of the parameter estimate. As a consequence, hypotheses 3b and 3c were supported, while hypothesis 3a and 3d were not supported.
table 3.3 | Within-subject fixed effects model linking activity classes and specific activities to momentary happiness levels
Variable Model 1 Model 2 Model 3
Off-job activities Reference Reference Reference
Job activities -0.409*** (0.064)
Work-related job activities -0.393*** (0.060)
Driving -0.281*** (0.059)
Delivery/Pickup -0.517*** (0.075)
Administrative task -0.280 (0.186)
Logistical task -0.621*** (0.145)
Non-work-related job activities -0.071 (0.083) -0.072 (0.082)
Other job activities -0.968*** (0.234) -0.968*** (0.234)
Controls for time of day and day of week Yes Yes Yes
R2 0.061 0.072 0.078
ICC 0.515 0.517 0.519
N 82 82 82
Observations 4175 4175 4175
Notes. *** p < 0.001; ** p < 0.01; * p < 0.05; † p < 0.10; t = time, R2 = Explained variance; ICC = Interclass correlation; N = Sample size.
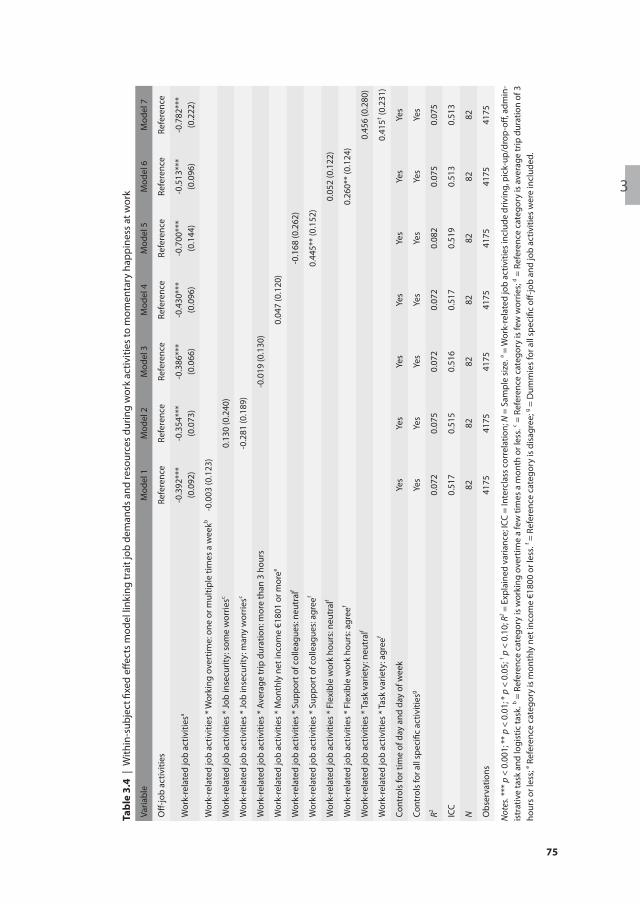
3
75
tabl
e 3.
4 |
With
in-s
ubje
ct fi
xed
effec
ts m
odel
link
ing
trai
t job
dem
ands
and
reso
urce
s du
ring
wor
k ac
tiviti
es to
mom
enta
ry h
appi
ness
at w
ork
Varia
ble
Mod
el 1
Mod
el 2
Mod
el 3
Mod
el 4
Mod
el 5
Mod
el 6
Mod
el 7
Off-
job
activ
ities
Refe
renc
eRe
fere
nce
Refe
renc
eRe
fere
nce
Refe
renc
eRe
fere
nce
Refe
renc
e
Wor
k-re
late
d jo
b ac
tiviti
esa
-0.3
92**
* (0
.092
)-0
.354
***
(0.0
73)
-0.3
86**
* (0
.066
)-0
.430
***
(0.0
96)
-0.7
00**
* (0
.144
)-0
.513
***
(0.0
96)
-0.7
82**
* (0
.222
)
Wor
k-re
late
d jo
b ac
tiviti
es *
Wor
king
ove
rtim
e: o
ne o
r mul
tiple
tim
es a
wee
kb-0
.003
(0.1
23)
Wor
k-re
late
d jo
b ac
tiviti
es *
Job
inse
curit
y: s
ome
wor
riesc
0.13
0 (0
.240
)
Wor
k-re
late
d jo
b ac
tiviti
es *
Job
inse
curit
y: m
any
wor
riesc
-0.2
81 (0
.189
)
Wor
k-re
late
d jo
b ac
tiviti
es *
Ave
rage
trip
dur
atio
n: m
ore
than
3 h
ours
-0.0
19 (0
.130
)
Wor
k-re
late
d jo
b ac
tiviti
es *
Mon
thly
net
inco
me
€180
1 or
mor
ee0.
047
(0.1
20)
Wor
k-re
late
d jo
b ac
tiviti
es *
Sup
port
of c
olle
ague
s: n
eutr
alf
-0.1
68 (0
.262
)
Wor
k-re
late
d jo
b ac
tiviti
es *
Sup
port
of c
olle
ague
s: a
gree
f0.
445*
* (0
.152
)
Wor
k-re
late
d jo
b ac
tiviti
es *
Fle
xibl
e w
ork
hour
s: n
eutr
alf
0.05
2 (0
.122
)
Wor
k-re
late
d jo
b ac
tiviti
es *
Fle
xibl
e w
ork
hour
s: a
gree
f0.
260*
* (0
.124
)
Wor
k-re
late
d jo
b ac
tiviti
es *
Tas
k va
riety
: neu
tral
f0.
456
(0.2
80)
Wor
k-re
late
d jo
b ac
tiviti
es *
Tas
k va
riety
: agr
eef
0.41
5† (0.2
31)
Cont
rols
for t
ime
of d
ay a
nd d
ay o
f wee
kYe
sYe
sYe
sYe
sYe
sYe
sYe
s
Cont
rols
for a
ll sp
ecifi
c ac
tiviti
esg
Yes
Yes
Yes
Yes
Yes
Yes
Yes
R20.
072
0.07
50.
072
0.07
20.
082
0.07
50.
075
ICC
0.51
70.
515
0.51
60.
517
0.51
90.
513
0.51
3
N82
8282
8282
8282
Obs
erva
tions
4175
4175
4175
4175
4175
4175
4175
Not
es. *
** p
< 0
.001
; **
p <
0.01
; * p
< 0
.05;
† p <
0.1
0; R
2 = E
xpla
ined
var
ianc
e; IC
C =
Inte
rcla
ss c
orre
latio
n; N
= S
ampl
e si
ze. a =
Wor
k-re
late
d jo
b ac
tiviti
es in
clud
e dr
ivin
g, p
ick-
up/d
rop-
off, a
dmin
-is
trat
ive
task
and
logi
stic
task
. b = R
efer
ence
cat
egor
y is
wor
king
ove
rtim
e a
few
tim
es a
mon
th o
r les
s. c =
Ref
eren
ce c
ateg
ory
is fe
w w
orrie
s; d =
Ref
eren
ce c
ateg
ory
is a
vera
ge tr
ip d
urat
ion
of 3
ho
urs
or le
ss; e R
efer
ence
cat
egor
y is
mon
thly
net
inco
me
€180
0 or
less
. f = R
efer
ence
cat
egor
y is
dis
agre
e; g =
Dum
mie
s fo
r all
spec
ific
off-jo
b an
d jo
b ac
tiviti
es w
ere
incl
uded
.
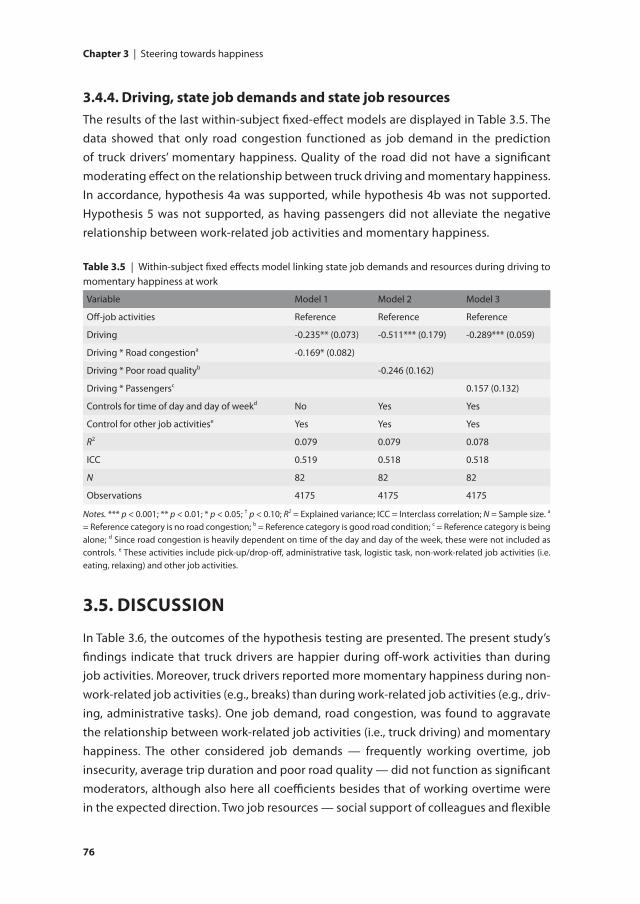
chapter 3 | Steering towards happiness
76
3.4.4. Driving, state job demands and state job resourcesThe results of the last within-subject fixed-effect models are displayed in Table 3.5. The data showed that only road congestion functioned as job demand in the prediction of truck drivers’ momentary happiness. Quality of the road did not have a significant moderating effect on the relationship between truck driving and momentary happiness. In accordance, hypothesis 4a was supported, while hypothesis 4b was not supported. Hypothesis 5 was not supported, as having passengers did not alleviate the negative relationship between work-related job activities and momentary happiness.
3.5. Discussion
In Table 3.6, the outcomes of the hypothesis testing are presented. The present study’s findings indicate that truck drivers are happier during off-work activities than during job activities. Moreover, truck drivers reported more momentary happiness during non-work-related job activities (e.g., breaks) than during work-related job activities (e.g., driv-ing, administrative tasks). One job demand, road congestion, was found to aggravate the relationship between work-related job activities (i.e., truck driving) and momentary happiness. The other considered job demands — frequently working overtime, job insecurity, average trip duration and poor road quality — did not function as significant moderators, although also here all coefficients besides that of working overtime were in the expected direction. Two job resources — social support of colleagues and flexible
table 3.5 | Within-subject fixed effects model linking state job demands and resources during driving to momentary happiness at work
Variable Model 1 Model 2 Model 3
Off-job activities Reference Reference Reference
Driving -0.235** (0.073) -0.511*** (0.179) -0.289*** (0.059)
Driving * Road congestiona -0.169* (0.082)
Driving * Poor road qualityb -0.246 (0.162)
Driving * Passengersc 0.157 (0.132)
Controls for time of day and day of weekd No Yes Yes
Control for other job activitiese Yes Yes Yes
R2 0.079 0.079 0.078
ICC 0.519 0.518 0.518
N 82 82 82
Observations 4175 4175 4175
Notes. *** p < 0.001; ** p < 0.01; * p < 0.05; † p < 0.10; R2 = Explained variance; ICC = Interclass correlation; N = Sample size. a = Reference category is no road congestion; b = Reference category is good road condition; c = Reference category is being alone; d Since road congestion is heavily dependent on time of the day and day of the week, these were not included as controls. e These activities include pick-up/drop-off, administrative task, logistic task, non-work-related job activities (i.e. eating, relaxing) and other job activities.
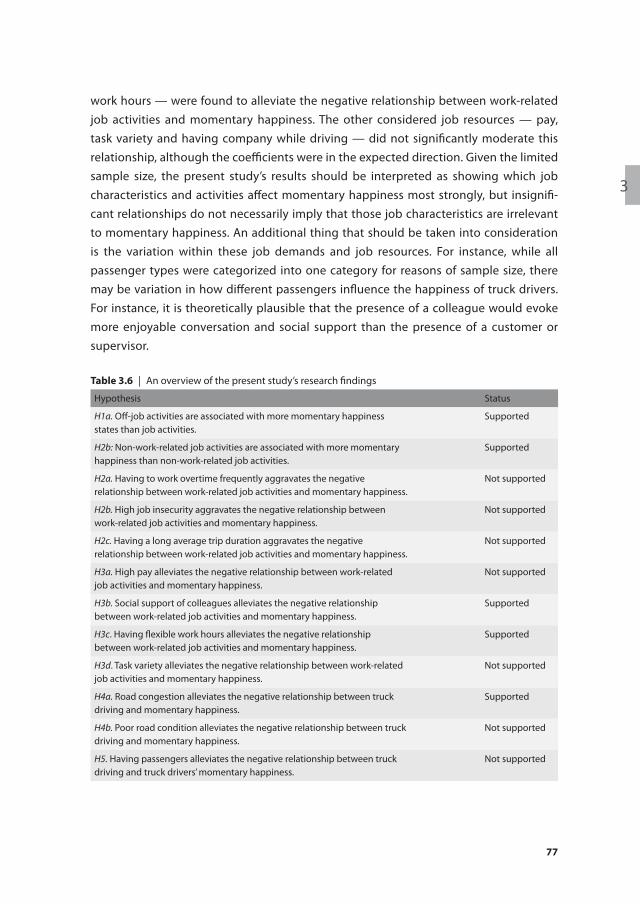
3
77
work hours — were found to alleviate the negative relationship between work-related job activities and momentary happiness. The other considered job resources — pay, task variety and having company while driving — did not significantly moderate this relationship, although the coefficients were in the expected direction. Given the limited sample size, the present study’s results should be interpreted as showing which job characteristics and activities affect momentary happiness most strongly, but insignifi-cant relationships do not necessarily imply that those job characteristics are irrelevant to momentary happiness. An additional thing that should be taken into consideration is the variation within these job demands and job resources. For instance, while all passenger types were categorized into one category for reasons of sample size, there may be variation in how different passengers influence the happiness of truck drivers. For instance, it is theoretically plausible that the presence of a colleague would evoke more enjoyable conversation and social support than the presence of a customer or supervisor.
table 3.6 | An overview of the present study’s research findings
Hypothesis Status
H1a. Off-job activities are associated with more momentary happiness states than job activities.
Supported
H2b: Non-work-related job activities are associated with more momentary happiness than non-work-related job activities.
Supported
H2a. Having to work overtime frequently aggravates the negative relationship between work-related job activities and momentary happiness.
Not supported
H2b. High job insecurity aggravates the negative relationship between work-related job activities and momentary happiness.
Not supported
H2c. Having a long average trip duration aggravates the negative relationship between work-related job activities and momentary happiness.
Not supported
H3a. High pay alleviates the negative relationship between work-related job activities and momentary happiness.
Not supported
H3b. Social support of colleagues alleviates the negative relationship between work-related job activities and momentary happiness.
Supported
H3c. Having flexible work hours alleviates the negative relationship between work-related job activities and momentary happiness.
Supported
H3d. Task variety alleviates the negative relationship between work-related job activities and momentary happiness.
Not supported
H4a. Road congestion alleviates the negative relationship between truck driving and momentary happiness.
Supported
H4b. Poor road condition alleviates the negative relationship between truck driving and momentary happiness.
Not supported
H5. Having passengers alleviates the negative relationship between truck driving and truck drivers’ momentary happiness.
Not supported

chapter 3 | Steering towards happiness
78
The present study found mixed evidence for the robustness of the JD-R model in a truck driving occupation. More specifically, half of the hypotheses about trait job resources were supported by the data. On the contrary, while road congestion turned out to be an important moderator in the relationship between truck driving and momentary happiness, no other significant interaction effects of job demands were found. This finding demonstrates the importance of selecting job aspects that are relevant for the target population (Bakker & Demerouti, 2007; De Croon et al., 2004). To illustrate, the insignificant interaction of having to work working overtime frequently may have been explained by the fact that the truck driving profession is typically characterized by long and overtime working hours (Beckers et al., 2008), as corroborated in the present study’s data, i.e. only 17% of truck drivers never work overtime. Because apparently truck driv-ers are used to working overtime, they most likely have accepted this job stressor and have adjusted to the situation, which in turn could have reduced the stressor’s negative impact on their happiness (Diener et al., 2006; Ritter et al., 2016).
3.5.1. limitations and future research directionsThe present study’s limitations regarding the (i) selection of variables, (ii) validity of the measures, and (iii) generalizability of the sample can be addressed in future research.
First, this study only considered a limited selection of job demands and resources that are potentially relevant to the truck driving occupation. Other job demands and resources could also play an important role in predicting truck driver well-being dur-ing work activities, and job demands and resources may interact with each other in influencing well-being (Bakker & Demerouti, 2007). For instance, the negative effect of road congestion on well-being may be aggravated when truck drivers deal with very tight schedules or buffered when they have the autonomy to plan their own routes. Valuable future research directions would be the consideration of a complementary or larger set of job demands and resources, an explicit test of interactions between specific job demands and job resources, as well as testing considering other well-being variables such as state work engagement, momentary fatigue and stress.
Second, all survey measures in this study were single-item measures. Single-item mo-mentary happiness measures are considered valid (Tadić et al., 2013), and the use of too many items in an ESM study is even undesirable (Scollon et al., 2009); however, the measurement of the trait-like variables in particular could have been better if multiple-item survey measures had been used. For instance, the Work Design Questionnaire (Morgeson & Humphrey, 2006) could function as means to more reliably and validly measure task variety, social support and working overtime. In addition, most measures used in this study were subjective in nature. As objective data and subjective evaluations of a phenomenon (e.g., heavy traffic) are often complementary (Jahedi & Méndez, 2014),
3
79
future researchers are encouraged to triangulate subjective and objective measures. For instance, administrative records (e.g., when and where truck drivers often work) combined with open-source traffic data can be used as objective indicators of road familiarity, road congestion, and road quality. Even more ambitiously, behavioral and physiological data generated by sensors (e.g., a smart watch, cameras in trucks) could help researchers measure the interactions between employee well-being and driving behavior (for an example, see B. G. Lee et al., 2015). One specific issue regarding the reporting of activities was that respondents were asked about their primary activity in the past hour. However, drivers may engage in several activities within an hour and the duration of the activity may not always have the strongest effect on their happiness.
Third, the study’s sample is subject to limitations. Although the sample was reason-ably representative of the Dutch truck driving population in terms of demographic characteristics and well-being, the generalizability of the results to truck drivers in other countries remains an open-ended question and merits attention in future research. In addition, as discussed, the limited sample size sets the bar high for finding supporting evidence for the hypotheses.
3.5.2. Practical recommendationsWithin the aforementioned limitations, this study offers practitioners several interesting guidelines for policy making. As expected, truck drivers reported higher momentary happiness during work breaks than during work-related job activities. In line with research that evidenced the importance of high-quality work breaks (Hunter & Wu, 2016; Trougakos et al., 2014), transportation companies are urged to free up enough time and resources to facilitate relaxing breaks for truck drivers. Truck drivers indicated that busy roads take a great toll and negatively affect their momentary happiness at work. Although it may be inevitable that truck drivers must occasionally deal with road congestion, practitioners can prioritize investments in clever scheduling of deliveries to avoid extremely busy roads, such as during rush hour (Kok et al., 2012). As indicated by Johnson et al. (2011), adequate on-the-road training could also make a difference in making truck drivers feel more confident and capable on busier roads. Furthermore, the results show that practitioners can positively influence truck driver happiness by facilitating colleague support and making sure that truck drivers have some flexibility in their scheduling. For example, truck driving companies can create a platform for col-league support by organizing team events and creating social media groups (Kemp et al., 2013; Z. Williams et al., 2011). On a more general level, truck driving companies are advised to pay more attention to the well-being of truck drivers (Boyce, 2016), in turn reducing their turnover intentions (Kemp et al., 2013). This can be done by starting a
chapter 3 | Steering towards happiness
80
dialogue and asking truck drivers for feedback about their jobs, their experiences and, more generally, their lives as a whole (Kemp et al., 2013).
3.5.3. conclusionTransportation companies are at a turning point. With a growing shortage of truck drivers and considerable turnover rates, there is a strong incentive to start making the well-being of truck drivers a priority. Although measuring work stress, fatigue and other health-related constructs functions as a good starting point, it is pivotal to adopt a more comprehensive approach to truck driver well-being. Particularly by tracking the momentary happiness of truck drivers over time, transportation companies can better understand when, with whom and why truck drivers are happy. In this regard, this study shows that social support from colleagues and a flexible work schedule are pivotal job resources for feeling happy at work, while road congestion is a particularly important factor that impairs truck drivers’ happiness at work.
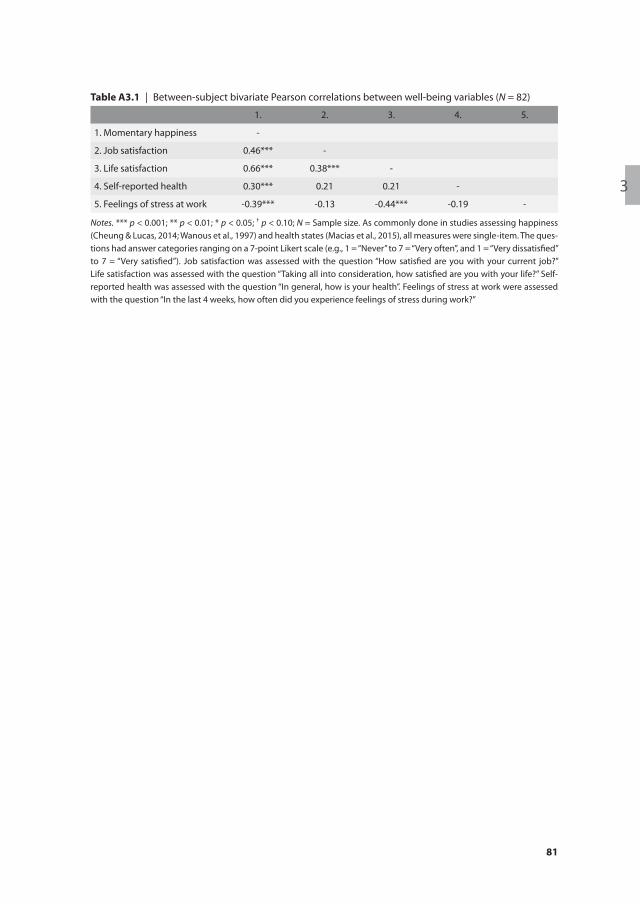
3
81
table a3.1 | Between-subject bivariate Pearson correlations between well-being variables (N = 82)
1. 2. 3. 4. 5.
1. Momentary happiness -
2. Job satisfaction 0.46*** -
3. Life satisfaction 0.66*** 0.38*** -
4. Self-reported health 0.30*** 0.21 0.21 -
5. Feelings of stress at work -0.39*** -0.13 -0.44*** -0.19 -
Notes. *** p < 0.001; ** p < 0.01; * p < 0.05; † p < 0.10; N = Sample size. As commonly done in studies assessing happiness (Cheung & Lucas, 2014; Wanous et al., 1997) and health states (Macias et al., 2015), all measures were single-item. The ques-tions had answer categories ranging on a 7-point Likert scale (e.g., 1 = “Never” to 7 = “Very often”, and 1 = “Very dissatisfied” to 7 = “Very satisfied”). Job satisfaction was assessed with the question “How satisfied are you with your current job?” Life satisfaction was assessed with the question “Taking all into consideration, how satisfied are you with your life?” Self-reported health was assessed with the question “In general, how is your health”. Feelings of stress at work were assessed with the question “In the last 4 weeks, how often did you experience feelings of stress during work?”
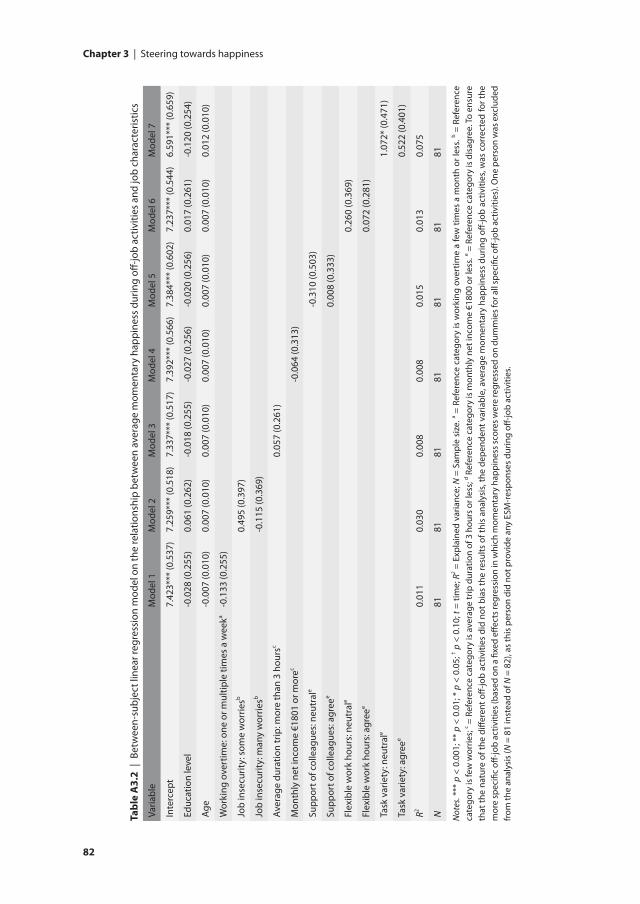
chapter 3 | Steering towards happiness
82
tabl
e a
3.2
| Be
twee
n-su
bjec
t lin
ear r
egre
ssio
n m
odel
on
the
rela
tions
hip
betw
een
aver
age
mom
enta
ry h
appi
ness
dur
ing
off-jo
b ac
tiviti
es a
nd jo
b ch
arac
teris
tics
Varia
ble
Mod
el 1
Mod
el 2
Mod
el 3
Mod
el 4
Mod
el 5
Mod
el 6
Mod
el 7
Inte
rcep
t7.
423*
** (0
.537
)7.
259*
** (0
.518
)7.
337*
** (0
.517
)7.
392*
** (0
.566
)7.
384*
** (0
.602
)7.
237*
** (0
.544
)6.
591*
** (0
.659
)
Educ
atio
n le
vel
-0.0
28 (0
.255
)0.
061
(0.2
62)
-0.0
18 (0
.255
)-0
.027
(0.2
56)
-0.0
20 (0
.256
)0.
017
(0.2
61)
-0.1
20 (0
.254
)
Age
-0.0
07 (0
.010
)0.
007
(0.0
10)
0.00
7 (0
.010
)0.
007
(0.0
10)
0.00
7 (0
.010
)0.
007
(0.0
10)
0.01
2 (0
.010
)
Wor
king
ove
rtim
e: o
ne o
r mul
tiple
tim
es a
wee
ka-0
.133
(0.2
55)
Job
inse
curit
y: s
ome
wor
riesb
0.49
5 (0
.397
)
Job
inse
curit
y: m
any
wor
riesb
-0.1
15 (0
.369
)
Aver
age
dura
tion
trip
: mor
e th
an 3
hou
rsc
0.05
7 (0
.261
)
Mon
thly
net
inco
me
€180
1 or
mor
ec-0
.064
(0.3
13)
Supp
ort o
f col
leag
ues:
neu
tral
e-0
.310
(0.5
03)
Supp
ort o
f col
leag
ues:
agr
eee
0.00
8 (0
.333
)
Flex
ible
wor
k ho
urs:
neu
tral
e0.
260
(0.3
69)
Flex
ible
wor
k ho
urs:
agr
eee
0.07
2 (0
.281
)
Task
var
iety
: neu
tral
e1.
072*
(0.4
71)
Task
var
iety
: agr
eee
0.52
2 (0
.401
)
R20.
011
0.03
00.
008
0.00
80.
015
0.01
30.
075
N81
8181
8181
8181
Not
es. *
** p
< 0
.001
; **
p <
0.01
; * p
< 0
.05;
† p <
0.1
0; t
= tim
e; R
2 = E
xpla
ined
var
ianc
e; N
= S
ampl
e si
ze. a =
Ref
eren
ce c
ateg
ory
is w
orki
ng o
vert
ime
a fe
w ti
mes
a m
onth
or l
ess.
b = R
efer
ence
ca
tego
ry is
few
wor
ries;
c = R
efer
ence
cat
egor
y is
ave
rage
trip
dur
atio
n of
3 h
ours
or l
ess;
d Ref
eren
ce c
ateg
ory
is m
onth
ly n
et in
com
e €1
800
or le
ss. e =
Ref
eren
ce c
ateg
ory
is d
isag
ree.
To e
nsur
e th
at th
e na
ture
of t
he d
iffer
ent o
ff-jo
b ac
tiviti
es d
id n
ot b
ias
the
resu
lts o
f thi
s an
alys
is, t
he d
epen
dent
var
iabl
e, a
vera
ge m
omen
tary
hap
pine
ss d
urin
g off
-job
activ
ities
, was
cor
rect
ed fo
r the
m
ore
spec
ific
off-jo
b ac
tiviti
es (b
ased
on
a fix
ed e
ffect
s reg
ress
ion
in w
hich
mom
enta
ry h
appi
ness
scor
es w
ere
regr
esse
d on
dum
mie
s for
all
spec
ific
off-jo
b ac
tiviti
es).
One
per
son
was
exc
lude
d fr
om th
e an
alys
is (N
= 8
1 in
stea
d of
N =
82)
, as
this
per
son
did
not p
rovi
de a
ny E
SM-r
espo
nses
dur
ing
off-jo
b ac
tiviti
es.


6the promise of open survey questions for measuring job
satisfaction
Based on paper: Wijngaards, I., Burger, M.J., & Van Exel, N.J.A. (2019). The promise of open survey questions—The validation of text-based job
satisfaction measures. PLoS ONE, 15(7), e0236900.


6
127
6.1. introDuction
Organizational scientists have been leveraging written texts in their study of psycho-logical constructs and business phenomena for decades (Duriau et al., 2007; Hayes & Krippendorff, 2007; Short et al., 2018). While manual human coding of texts continues to be the gold standard for annotating text, rapid advances in computer-aided text analysis (CATA) have opened up a venue for analyzing open texts in a drastically more efficient but still reliable manner (Short et al., 2010). CATA is a kind of content analysis that facilitates the measurement of constructs by converting text into quantitative data based on word frequencies (Short et al., 2010). One of the most popular applications of CATA is sentiment analysis, the practice of automatically detecting opinions, sentiments, attitudes and emotions about certain objects in human-generated texts (R. Feldman, 2013; B. Liu, 2015). Social scientists typically perform computer-aided sentiment analysis on bodies of relatively lengthy texts (e.g., Tov et al., 2013; N. Wang et al., 2014), probably because detecting sentiment in short informal texts is more challenging than sentiment detection in lengthier texts (Kiritchenko et al., 2014; Thelwall et al., 2010). It is therefore not surprising that research on performing CATA on brief responses to open survey questions thin on the ground within the organizational sciences (Gilles et al., 2017). This is unfortunate, as surveys still have a prominent place in organizational scientists’ meth-odological toolboxes (Aguinis et al., 2009; Bono & McNamara, 2011), open survey ques-tions can function as valuable supplements to their closed counterparts (Mossholder et al., 1995; Singer & Couper, 2017; Spector & Pindek, 2016), and researchers outside the discipline have proposed a multitude of promising solutions for mining textual survey data (Esuli et al., 2019; Li & Yamanishi, 2001; Patil & Palshikar, 2013; Rosell & Velupillai, 2008; Schonlau & Couper, 2016; Zehner et al., 2016).
Complementing closed questions with open-ended questions may have various ben-efits. First, open-ended questions can function as a counter to common method biases in questionnaires that primarily contain closed questions (Podsakoff et al., 2003). For instance, closed question survey scales can suffer from careless responding (Meade & Craig, 2012). We believe the inclusion of open-ended questions could be used to get respondents to respond more carefully, as open questions force respondents into a different and possibly more intensive form of cognitive processing (Krosnick, 1999). Sec-ond, complementing closed questions with open questions facilitates triangulation of methods (Turner et al., 2017). Next to using open questions to determine the construct validity of closed questions (and vice versa), researchers could leverage the responses to open-ended questions to obtain a more holistic perspective on the construct of study (Jick, 1979; Turner et al., 2017). Researchers could, for example, use the responses to as-sess when, why and how a construct is manifested (Spector & Pindek, 2016) and unravel the psychological processes that influence the self-report responses to closed survey
chapter 6 | The promise of open survey questions for measuring job satisfaction
128
questions (Edwards, 2008) because open-ended questions naturally prompt more spon-taneous and elaborate responses (Reja et al., 2003).
Job satisfaction is a construct that organizational researchers typically study with closed questions (for examples, see Kaplan et al., 2009), and it has gained considerable atten-tion in the literature (Judge et al., 2017). Job satisfaction has rarely been studied using text-based measures based on responses to open-ended questions (Gilles et al., 2017). We argue that this is a missed opportunity, as evidence suggests that the measurement of job satisfaction is complex (H. M. Weiss, 2002) and that closed question job satisfac-tion measures tend to suffer from careless responding (Kam & Meyer, 2015). Sentiment analysis appears to be a suitable method for the creation of a text-based measure. As suggested by several empirical studies (e.g., Borg & Zuell, 2012; Moniz & Jong, 2014; Poncheri et al., 2008; Taber, 1991; Young & Gavade, 2018), the sentiment found in texts seems to be a natural manifestation of the pleasant and unpleasant emotions, beliefs and cognitions employees have – factors that jointly constitute job satisfaction (e.g., Judge et al., 2012; Locke & Dunnette, 1976; H. M. Weiss, 2002).
We address two issues in this paper to illustrate the promise of open job satisfaction questions: (1) we investigate the reliability of computer-aided sentiment analysis for constructing text-based job satisfaction measures, and (2) carry out an initial test of the measures’ construct validity. We focus on two open-ended response formats: a substitution open job satisfaction question (called hereafter: open-ended question) and a substitution semi-open job satisfaction question (called hereafter: semi-open-ended question). The two questions, “How do you think about your job as a whole?”, and “What three to five adjectives come to mind when you think of your job?”, are similar in the sense that both are designed to measure general job satisfaction, and are intended as equivalents of closed survey questions (cf. O’Cathain & Thomas, 2004). The questions pri-marily differ in the degree to which they stimulate respondents to generate structured textual responses. Open-ended questions allow respondents to decide on the length of their textual response, while semi-open-ended questions are much more constraining.
While to date semi-open-ended questions have rarely been used to measure attitudes (Glerum et al., 2014), they may have several advantages over open-ended questions. Respondents may prefer semi-open-ended questions because it takes less time and ef-fort to write down several words that readily come to mind than to write down elaborate sentences (for some descriptive statistics about response burden of different question types, see Axhausen & Weis, 2010). In addition, researchers interested in quantitatively measuring constructs may favor semi-open-ended questions over open-ended ques-tions, as responses to semi-open-ended questions are more convenient for computer-aided sentiment analysis methods to analyze. Even though structured responses to
6
129
semi-open-ended questions are inherently short, these responses are likely to contain a higher proportion of useful and easy-to-process text than the unstructured texts that open-ended questions generate. Structured texts are likely to contain limited syntax and mainly useful, emotion-loaded words, e.g., adjectives generally carry subjective content (Taboada et al., 2011), whereas unstructured informal texts typically contain a high proportion of irrelevant words, e.g., articles, conjunctions, typing mistakes and negations, which are difficult to deal with using computer-aided sentiment analysis methods (Thelwall et al., 2010).
We contribute to the survey methodology literature by addressing the methodologi-cal dilemma of choosing between human and computer-aided content analysis. Even though human coding remains the gold standard for content analysis (Short et al., 2010), e.g., sentiment detection in text (Mohammad, 2016), it can be very time-consuming and expensive (Singer & Couper, 2017) and therefore sometimes unfeasible (Borg & Zuell, 2012). CATA methods are considerably more efficient and can save resources, but inevitably produce measures with attenuated reliability (McKenny et al., 2018). To assist organizational researchers that face this trade-off, we systematically assessed the degree of measurement error in text-based measures by following the guidelines set by McKenny et al. (2018). In particular, we studied the three sources of measurement error that are relevant for CATA research: specific factor error, algorithm error and transient error (McKenny et al., 2018). Additionally, we are among the first to use CATA to con-struct text-based job satisfaction measures from responses to an open-ended question (hereafter called: open text-based measure) and a semi-open-ended question (hereafter called: semi-open text-based measure) and to test their convergent and discriminant validity by means of closed question measures.
This paper is structured as follows. In the remainder of this section, we discuss the three computer-aided sentiment analysis techniques that were used in this study and formu-late hypotheses. Next, we describe our sample, procedures and analytical strategy. We then present our comparative analysis and test our hypotheses. Finally, we discuss our findings and provide an agenda for future research.
6.1.1. sentiment analysis approachesManual and computer-aided sentiment analysis can be used to construct a measure from the responses to open-ended questions (Borg & Zuell, 2012; Mossholder et al., 1995). Human coders subjectively rate text in terms of sentiment. To date, ratings by human coders have been treated as the gold standard and benchmark for computer-aided sentiment analysis (Mohammad, 2016; Taboada et al., 2011; Thelwall et al., 2010). However, when large volumes of texts have to be analyzed, complete reliance on human coders to analyze texts manually may become infeasible (McKenny et al., 2018). More-
chapter 6 | The promise of open survey questions for measuring job satisfaction
130
over, humans may introduce bias in sentiment ratings (Mossholder et al., 1995; Zamith & Lewis, 2015), e.g., through individual differences in evaluation strategies (Mikhaylov et al., 2012) and in annotation experience and education (Snow et al., 2008). To mitigate these biases, researchers often make sure that multiple individuals independently an-notate the same texts, calculate an inter-rater reliability score and compute an average rater score (Mikhaylov et al., 2012; Poncheri et al., 2008; Taber, 1991).
Two general streams of methods can be identified in computer-aided sentiment analysis: lexicon-based (or CATA-based) and learning-based techniques (Taboada et al., 2011). Lexicon-based methods involve the detection of sentiment in texts based on a dictionary of words that are labeled to reflect their semantic orientation, i.e., polarity and strength of words. Learning-based methods make use of labeled instances of text to build classifiers. Put differently, these methods use textual data that are already labeled with their semantic orientation to train an algorithm, with the purpose of predicting (i.e. classifying) unlabeled textual instances.
Both methods have certain advantages and disadvantages. Learning-based techniques often perform well in the domain that they have been trained, but lack accuracy when training data are small or the classifier is used in another domain (Cambria, 2016; Taboada et al., 2011). Lexicon-based methods do not suffer from these problems, as they do not rely on training data (Cambria, 2016), and domain-specific words can be added to a general dictionary to make a dictionary perform well in specific contexts (Taboada et al., 2011). However, their accuracy typically drops when textual data contains semantic rules and linguistic nuances like sarcasm (Cambria, 2016).
In this study, we relied on lexicon-based methods, as no appropriate dataset was available to train a learning-based sentiment analysis algorithm. We employed Linguistic Inquiry and Word Count (LIWC) 2015 (Pennebaker, Chung, et al., 2015), SentiStrength (Thelwall et al., 2010) and SentimentR (Rinker, 2019) to construct the text-based measures. We describe the similarities and differences between the software programs below.
6.1.1.1. LIWC 2015The LIWC software is arguably the most widely used CATA technique in the organiza-tional sciences (Short et al., 2018), and has been systematically validated in a large num-ber of studies (Pennebaker, Boyd, et al., 2015). The LIWC software generates scores on a wide variety of constructs, e.g., social orientation, honesty, affective tone, by looking up words in an English dictionary of 6400 words, word stems, and emoticons. Turning to sentiment analysis, the LIWC 2015 software includes a transparent dictionary for positive emotion (620 words) and negative emotion (744 words, Pennebaker, Boyd, et al., 2015), and contains a commercially licensed, non-transparent emotional tone variable (Cohn
6
131
et al., 2004) that summarizes the positive and negative emotion variables into one senti-ment score (Pennebaker, Boyd, et al., 2015).
6.1.1.2. SentimentRSentimentR is a sentiment analysis software package that is freely available on CRAN (R Core Team, 2014). Various studies outside the organizational sciences have successfully adopted this software for sentiment classification tasks (e.g., J. Chen et al., 2015; Ikoro et al., 2018), and proved its superior performance to other software programs, such as LIWC (Naldi, 2019; Rinker, 2019; Weissman et al., 2019). By default, SentimentR uses Jockers’ (2017) English dictionary which contains 10,739 words (Rinker, 2019). Besides being open-access, non-commercialized and specially designed for sentiment analysis, it differs from LIWC in one major way. SentimentR does not just count individual words; the algorithm considers valence shifters to improve the accuracy of its semantic polar-ity recognition. Valence shifters can be split into negators, amplifiers, deamplifiers, and adversative clauses. A negator changes the sign of a sentiment-loaded word (e.g., “I do not enjoy my work”); an amplifier enhances the impact of a sentiment-loaded word on the overall sentiment score (e.g., “I truly enjoy my job”); a deamplifier reduces the impact (e.g., “I hardly enjoy my work”); an adversative conjunction overrides a sentiment-loaded clause (e.g., “I enjoy my work, but hate my boss”). In SentimentR, the valence shifters are considered by weighting the valence shifters found four words before and two words after the polarized word.
6.1.1.3. SentiStrengthJust like SentimentR, SentiStrength is a software program that is specially designed to detect sentiment in texts and is freely available for non-commercial users (Thelwall et al., 2010). It is optimized for sentiment analysis of short informal texts (e.g., tweets, Ab-basi et al., 2014; Thelwall et al., 2010), and has found to be reliable (Araujo et al., 2016; Gonçalves et al., 2013; Islam & Zibran, 2017). The SentiStrength dictionary is constructed from several well-validated, English dictionaries – LIWC 2003 (Pennebaker et al., 2003) and the General Inquirer (Stone et al., 1966) – and contains 2310 words (Thelwall, 2017). The developers of SentiStrength deployed a learning-based sentiment analysis tech-nique to optimize the software’s performance. As a consequence, the software considers textual aspects such as punctuation (e.g., exclamation marks), the use of multiple vowels (e.g., “haaappy”), frequently used idioms (e.g., “I am like you” and “I like you”) and valence shifters in its sentiment score calculation.
6.1.2. Measurement error in text-based measuresIn general, three categories of CATA measurement error exist: specific factor error, algo-rithm error and transient error (McKenny et al., 2018). Specific factor error relates to the
chapter 6 | The promise of open survey questions for measuring job satisfaction
132
word lists that the CATA method uses, and the extent to which they are fit for the task at hand. Specific factor error can be assessed by computing the parallel forms reliability. In our case, this meant examining the convergence between computer-generated and human-coded sentiment measures. Algorithm error is related to the extent to which the measures produced by different CATA techniques vary. The more the measures diverge, the higher the algorithm error will be. This can be thought of as ‘interalgorithm’ error and can be assessed with Krippendorff’s alpha (α) interrater agreement estimate (Hayes & Krippendorff, 2007; Krippendorff, 1980). Transient error is caused by the temporal fac-tors that can impact the responses by a respondent. For instance, mood states can affect the overall valence in a textual response. Transient error can be measured by calculating test-retest reliability.
6.1.2.1. Specific factor errorOpen-ended questions inevitably produce more unstructured texts than semi-open-ended questions because of the absence of answering constraints. These texts are likely to contain a high proportion of non-emotion loaded words, misspellings, semantic rules and valence shifters and linguistic characteristics that are generally difficult for lexicon-based sentiment analysis to process (Thelwall et al., 2010). As humans are typically the most competent to detect sentiment from natural, unstructured texts (Thelwall, 2017) and individual adjectives that the semi-open-ended question produces are relatively straight-forward to look-up in sentiment dictionaries, we hypothesized that:
hypothesis 1a: The specific factor error in open text-based measures will be higher than the specific factor error in semi-open text-based measures.
As the selected software packages vary in their suitability to analyze short informal texts, we predicted that the specific factor error in open text-based measure varies from one software package to the other. We expected that SentiStrength will have the highest accuracy because it was designed for the sentiment analysis of short informal texts, has the most advanced algorithm of the three and has outperformed LIWC 2007 in the analysis of short texts (Gonçalves et al., 2013; Shalunts & Backfried, 2015). Further, we predicted that SentimentR would produce more reliable measures than LIWC 2015, because, contrary to LIWC 2015, SentimentR considers valence shifters in its algorithm. As such, we hypothesized that:
hypothesis 1b: The specific factor error will vary across open text-based measures, with LIWC 2015 performing the worst and SentiStrength performing the best.
Semi-open-ended questions only generate context-free words that CATA methods can conveniently look up in their dictionaries without any substantial pre-processing, e.g., stemming and removing stop words. For this reason, the accuracy of a semi-open

6
133
text-based measure almost exclusively depends on the quality and completeness of the dictionary. We deemed two competing hypotheses plausible. One the one hand, we could hypothesize that SentiStrength and LIWC 2015 will outperform SentimentR because the LIWC dictionary is more systematically validated than Jockers’ dictionary. On the other hand, we could hypothesize the SentimentR measure to be most reliable, since the Jockers’ dictionary is at least four times bigger than the dictionaries of the other software programs and its overall word coverage is the highest of the methods discussed here. We expected that these benefits cancel each other out, and therefore predicted that:
hypothesis 1c: The specific factor error in semi-open text-based measures will not vary across software packages.
6.1.2.2. Algorithm errorThe LIWC 2015, SentimentR and SentiStrength software all use different dictionaries and algorithms for their sentiment analysis, which inevitably causes their measures to vary. The respective dictionaries varied in size, the sentiment coding schemes differed, and the algorithms diverged in their capability to control for semantic rules and nuances. As such, we expected that the agreement between algorithms would not exceed the lower bound for acceptable agreement for human coders, i.e., 80% (Lacy et al., 2015).
hypothesis 2: Substantial algorithm error exists between LIWC 2015, SentimentR and SentiStrength measures, as demonstrated by an average agreement of lower than 80%.
6.1.2.3. Transient errorWe did not expect complete consistency of language over time, as demonstrated in very high test-retest reliabilities because the open-ended questions were designed to mea-sure job satisfaction. Test-retest reliability of job satisfaction measures after one year is typically below 0.6 and above 0.2 (Dormann & Zapf, 2001). For this reason, we moved beyond an assessment of absolute test-retest reliability and examined the relative test-retest reliability of the text-based measures. We did this by comparing the text-based measures’ test-retest reliabilities with the test-retest reliabilities of the human-coded measures and closed question job satisfaction measure. We hypothesized that:
hypothesis 3a: The test-retest reliability of the text-based measures will deviate less than 0.2 from the test-retest reliability of the human-coded measures.
hypothesis 3b:The test-retest reliability of the text-based measures will deviate less than 0.2 from the test-retest reliability of the closed question job satisfaction measure.
chapter 6 | The promise of open survey questions for measuring job satisfaction
134
6.1.3. validity as measure of job satisfactionThe open-ended and semi-open-ended questions from this study were designed to measure general job satisfaction. This is why it is pivotal to assess the construct validity of the measures. We did this by examining their convergent and discriminant validity.
First, we tested the measures’ convergent validity, the extent to which the two measures that purport to measure the same construct show strong empirical agreement. The few studies that linked text-based measures to closed job satisfaction measures found mod-erate correlations (Borg & Zuell, 2012; e.g., Gilles et al., 2017; Poncheri et al., 2008; Taber, 1991). Hence, we predicted that the text-based measures and closed question measures of both general job satisfaction and measures of job facet satisfaction would converge. In addition, we expected that the correlations between the text-based measures and the general job satisfaction measure would be higher than the ones between the text-based measures and the job facet satisfaction measures. We therefore hypothesized:
hypothesis 4a: The open and semi-open text-based measures will converge with closed question measures of job satisfaction, as demonstrated in positive, significant correlations.
hypothesis 4b: The open and semi-open text-based measure will converge more strongly with the closed question measure of general job satisfaction than with the measures of individual job facet satisfaction.
Discriminant validity, the degree to which the measures correspond to measures of related but distinct constructs, was assessed by comparing the correlations between the text-based measures and the closed question measure of general job satisfaction with the correlations between the text-based measures and two antecedents, i.e., person-organization (P-O) fit and virtuous leadership, and three outcomes, i.e., life satisfaction, flourishing and organizational citizenship behavior (OCB).
P-O fit, “the compatibility between people and organisations that occurs when: (a) at least one entity provides what the other needs, or (b) they share similar fundamental characteristics, or (c) both” (Kristof, 1996, p. 5) is likely to contribute to job satisfaction, as feelings of fit spark feelings of need fulfilment. Virtuous leadership is a positive leadership characterized by six cardinal virtues: courage, temperance, justice, prudence, humanity and truthfulness (Hackett & Wang, 2012; G. Wang & Hackett, 2016). It is a likely determinant of job satisfaction, as virtuous leadership behaviors are likely to be ethical (Hackett & Wang, 2012) and ethical leadership positively affects job satisfaction (Neubert et al., 2009). We further predicted that job satisfaction is positively related to context-free well-being constructs, such as life satisfaction “the global assessment of a person’s quality of life according to his own criteria” (Shin & Johnson, 1978, p. 478) and
6
135
flourishing, a multi-dimensional construct that concerns “important aspects of human functioning ranging from positive relationships, to feelings of competence, to having meaning and purpose in life” (Diener et al., 2010), as domain-specific well-being tends to spill over into context-free well-being, and vice versa (Judge & Watanabe, 1994). Finally, we expected that job satisfaction will also be associated with OCB, “helpful, constructive gestures exhibited by organisation members and valued or appreciated by officials, but not related directly to individual productivity nor inherently in the enforceable require-ments of the individuals role” (Organ, 1988, p. 548), because employees feel that they have to reciprocate good treatment by the organization (e.g., having a careful leader and doing an interesting job).
hypothesis 5a: The open and semi-open text-based measures correlate positively with closed question measures of P-O fit, virtuous leadership, life satisfaction, flourishing and OCB.
hypothesis 5b: The open and semi-open text-based measures will converge more strongly with a closed question measure of general job satisfaction than with closed question measures of P-O fit, virtuous leadership, life satisfaction, flourishing and OCB.
In light of our hypotheses about the higher reliability of the semi-open text-based measures, and the importance of reliability for a measure’s validity (Hinkin, 1998), we also hypothesized that:
hypothesis 6a: The semi-open text-based measure will show better convergent validity than the open text-based measure.
hypothesis 6b: The semi-open text-based measure will show better discriminant validity than the open text-based measure.
6.2. MethoDs
6.2.1. Procedure and sampleAs we desired to obtain input from a large variety of respondents, we outsourced the data collection to Prolific. Prolific is a virtual crowdsourcing platform where people can complete paid tasks, in a similar manner to that of Amazon’s Mechanical Turk. Prolific has been found to collect good quality data (Peer et al., 2017). Qualtrics was used for survey administration.
We used a two-wave time-lagged survey design to test our hypotheses. The demo-graphic characteristics of the respondents that participated in our study are presented
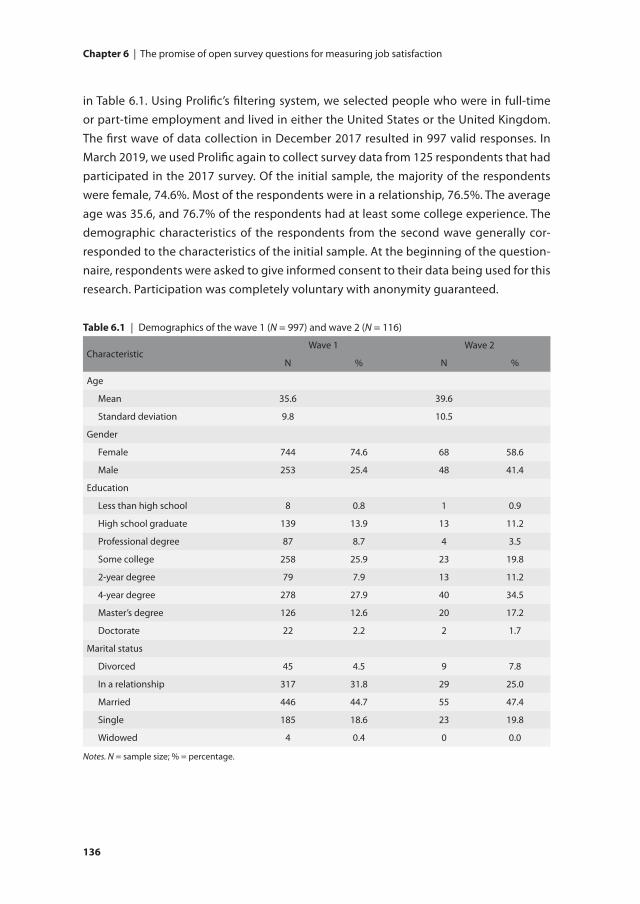
chapter 6 | The promise of open survey questions for measuring job satisfaction
136
in Table 6.1. Using Prolific’s filtering system, we selected people who were in full-time or part-time employment and lived in either the United States or the United Kingdom. The first wave of data collection in December 2017 resulted in 997 valid responses. In March 2019, we used Prolific again to collect survey data from 125 respondents that had participated in the 2017 survey. Of the initial sample, the majority of the respondents were female, 74.6%. Most of the respondents were in a relationship, 76.5%. The average age was 35.6, and 76.7% of the respondents had at least some college experience. The demographic characteristics of the respondents from the second wave generally cor-responded to the characteristics of the initial sample. At the beginning of the question-naire, respondents were asked to give informed consent to their data being used for this research. Participation was completely voluntary with anonymity guaranteed.
table 6.1 | Demographics of the wave 1 (N = 997) and wave 2 (N = 116)
CharacteristicWave 1 Wave 2
N % N %
Age
Mean 35.6 39.6
Standard deviation 9.8 10.5
Gender
Female 744 74.6 68 58.6
Male 253 25.4 48 41.4
Education
Less than high school 8 0.8 1 0.9
High school graduate 139 13.9 13 11.2
Professional degree 87 8.7 4 3.5
Some college 258 25.9 23 19.8
2-year degree 79 7.9 13 11.2
4-year degree 278 27.9 40 34.5
Master’s degree 126 12.6 20 17.2
Doctorate 22 2.2 2 1.7
Marital status
Divorced 45 4.5 9 7.8
In a relationship 317 31.8 29 25.0
Married 446 44.7 55 47.4
Single 185 18.6 23 19.8
Widowed 4 0.4 0 0.0
Notes. N = sample size; % = percentage.
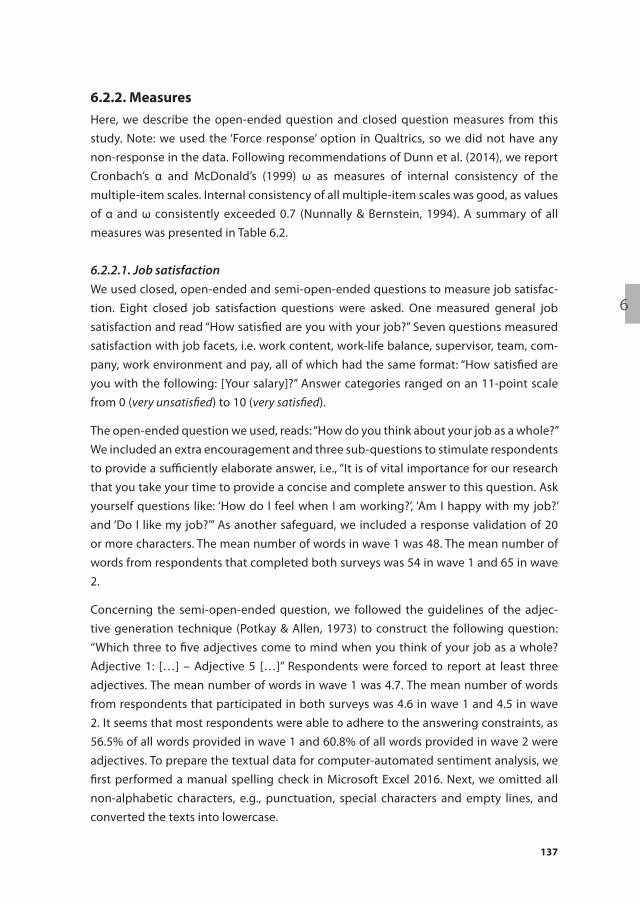
6
137
6.2.2. MeasuresHere, we describe the open-ended question and closed question measures from this study. Note: we used the ‘Force response’ option in Qualtrics, so we did not have any non-response in the data. Following recommendations of Dunn et al. (2014), we report Cronbach’s α and McDonald’s (1999) ω as measures of internal consistency of the multiple-item scales. Internal consistency of all multiple-item scales was good, as values of α and ω consistently exceeded 0.7 (Nunnally & Bernstein, 1994). A summary of all measures was presented in Table 6.2.
6.2.2.1. Job satisfactionWe used closed, open-ended and semi-open-ended questions to measure job satisfac-tion. Eight closed job satisfaction questions were asked. One measured general job satisfaction and read “How satisfied are you with your job?” Seven questions measured satisfaction with job facets, i.e. work content, work-life balance, supervisor, team, com-pany, work environment and pay, all of which had the same format: “How satisfied are you with the following: [Your salary]?” Answer categories ranged on an 11-point scale from 0 (very unsatisfied) to 10 (very satisfied).
The open-ended question we used, reads: “How do you think about your job as a whole?” We included an extra encouragement and three sub-questions to stimulate respondents to provide a sufficiently elaborate answer, i.e., “It is of vital importance for our research that you take your time to provide a concise and complete answer to this question. Ask yourself questions like: ‘How do I feel when I am working?’, ‘Am I happy with my job?’ and ‘Do I like my job?’” As another safeguard, we included a response validation of 20 or more characters. The mean number of words in wave 1 was 48. The mean number of words from respondents that completed both surveys was 54 in wave 1 and 65 in wave 2.
Concerning the semi-open-ended question, we followed the guidelines of the adjec-tive generation technique (Potkay & Allen, 1973) to construct the following question: “Which three to five adjectives come to mind when you think of your job as a whole? Adjective 1: […] – Adjective 5 […]” Respondents were forced to report at least three adjectives. The mean number of words in wave 1 was 4.7. The mean number of words from respondents that participated in both surveys was 4.6 in wave 1 and 4.5 in wave 2. It seems that most respondents were able to adhere to the answering constraints, as 56.5% of all words provided in wave 1 and 60.8% of all words provided in wave 2 were adjectives. To prepare the textual data for computer-automated sentiment analysis, we first performed a manual spelling check in Microsoft Excel 2016. Next, we omitted all non-alphabetic characters, e.g., punctuation, special characters and empty lines, and converted the texts into lowercase.
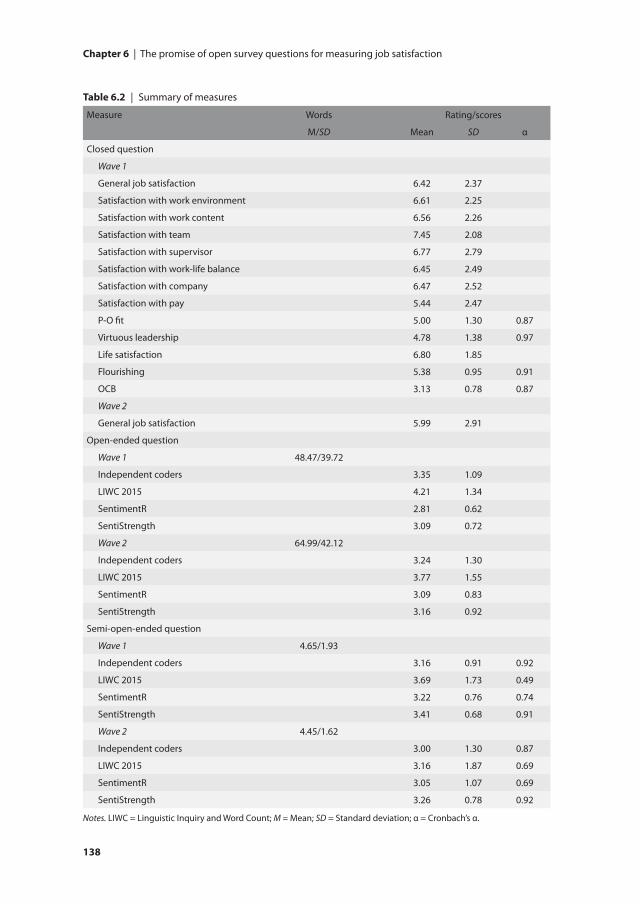
chapter 6 | The promise of open survey questions for measuring job satisfaction
138
table 6.2 | Summary of measures
Measure Words Rating/scores
M/SD Mean SD α
Closed question
Wave 1
General job satisfaction 6.42 2.37
Satisfaction with work environment 6.61 2.25
Satisfaction with work content 6.56 2.26
Satisfaction with team 7.45 2.08
Satisfaction with supervisor 6.77 2.79
Satisfaction with work-life balance 6.45 2.49
Satisfaction with company 6.47 2.52
Satisfaction with pay 5.44 2.47
P-O fit 5.00 1.30 0.87
Virtuous leadership 4.78 1.38 0.97
Life satisfaction 6.80 1.85
Flourishing 5.38 0.95 0.91
OCB 3.13 0.78 0.87
Wave 2
General job satisfaction 5.99 2.91
Open-ended question
Wave 1 48.47/39.72
Independent coders 3.35 1.09
LIWC 2015 4.21 1.34
SentimentR 2.81 0.62
SentiStrength 3.09 0.72
Wave 2 64.99/42.12
Independent coders 3.24 1.30
LIWC 2015 3.77 1.55
SentimentR 3.09 0.83
SentiStrength 3.16 0.92
Semi-open-ended question
Wave 1 4.65/1.93
Independent coders 3.16 0.91 0.92
LIWC 2015 3.69 1.73 0.49
SentimentR 3.22 0.76 0.74
SentiStrength 3.41 0.68 0.91
Wave 2 4.45/1.62
Independent coders 3.00 1.30 0.87
LIWC 2015 3.16 1.87 0.69
SentimentR 3.05 1.07 0.69
SentiStrength 3.26 0.78 0.92
Notes. LIWC = Linguistic Inquiry and Word Count; M = Mean; SD = Standard deviation; α = Cronbach’s α.
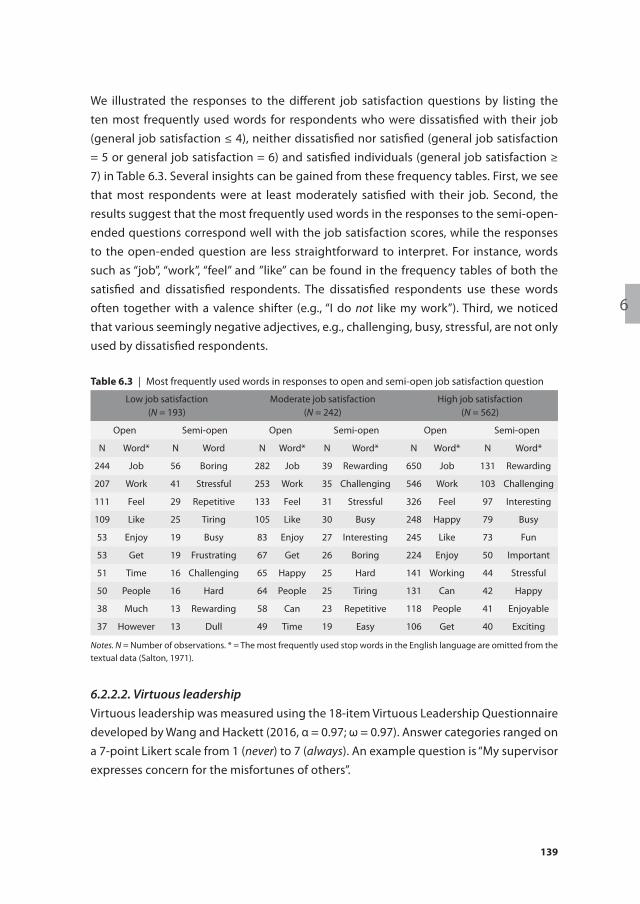
6
139
We illustrated the responses to the different job satisfaction questions by listing the ten most frequently used words for respondents who were dissatisfied with their job (general job satisfaction ≤ 4), neither dissatisfied nor satisfied (general job satisfaction = 5 or general job satisfaction = 6) and satisfied individuals (general job satisfaction ≥ 7) in Table 6.3. Several insights can be gained from these frequency tables. First, we see that most respondents were at least moderately satisfied with their job. Second, the results suggest that the most frequently used words in the responses to the semi-open-ended questions correspond well with the job satisfaction scores, while the responses to the open-ended question are less straightforward to interpret. For instance, words such as “job”, “work”, “feel” and ”like” can be found in the frequency tables of both the satisfied and dissatisfied respondents. The dissatisfied respondents use these words often together with a valence shifter (e.g., “I do not like my work”). Third, we noticed that various seemingly negative adjectives, e.g., challenging, busy, stressful, are not only used by dissatisfied respondents.
6.2.2.2. Virtuous leadershipVirtuous leadership was measured using the 18-item Virtuous Leadership Questionnaire developed by Wang and Hackett (2016, α = 0.97; ω = 0.97). Answer categories ranged on a 7-point Likert scale from 1 (never) to 7 (always). An example question is “My supervisor expresses concern for the misfortunes of others”.
table 6.3 | Most frequently used words in responses to open and semi-open job satisfaction question
Low job satisfaction(N = 193)
Moderate job satisfaction(N = 242)
High job satisfaction(N = 562)
Open Semi-open Open Semi-open Open Semi-open
N Word* N Word N Word* N Word* N Word* N Word*
244 Job 56 Boring 282 Job 39 Rewarding 650 Job 131 Rewarding
207 Work 41 Stressful 253 Work 35 Challenging 546 Work 103 Challenging
111 Feel 29 Repetitive 133 Feel 31 Stressful 326 Feel 97 Interesting
109 Like 25 Tiring 105 Like 30 Busy 248 Happy 79 Busy
53 Enjoy 19 Busy 83 Enjoy 27 Interesting 245 Like 73 Fun
53 Get 19 Frustrating 67 Get 26 Boring 224 Enjoy 50 Important
51 Time 16 Challenging 65 Happy 25 Hard 141 Working 44 Stressful
50 People 16 Hard 64 People 25 Tiring 131 Can 42 Happy
38 Much 13 Rewarding 58 Can 23 Repetitive 118 People 41 Enjoyable
37 However 13 Dull 49 Time 19 Easy 106 Get 40 Exciting
Notes. N = Number of observations. * = The most frequently used stop words in the English language are omitted from the textual data (Salton, 1971).
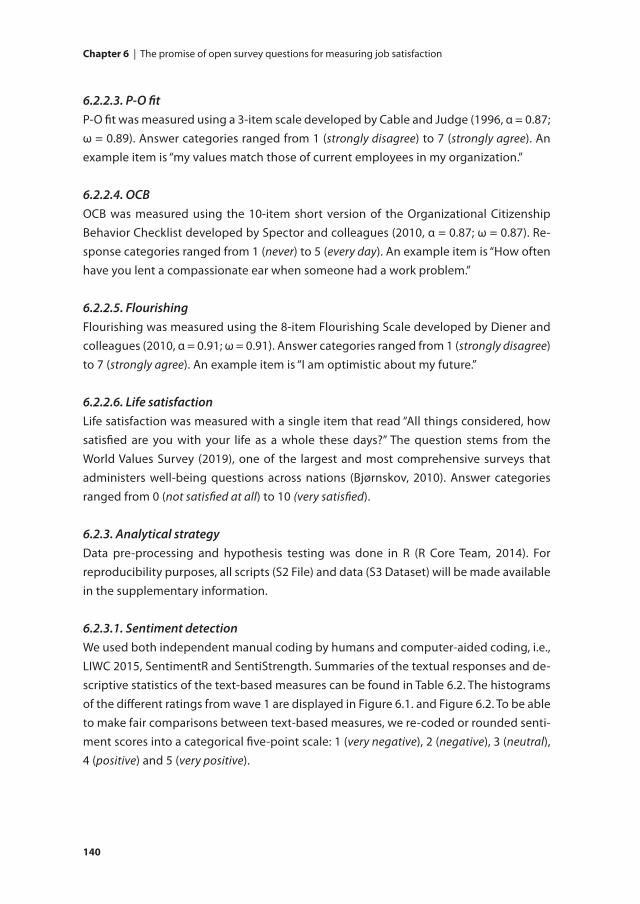
chapter 6 | The promise of open survey questions for measuring job satisfaction
140
6.2.2.3. P-O fitP-O fit was measured using a 3-item scale developed by Cable and Judge (1996, α = 0.87; ω = 0.89). Answer categories ranged from 1 (strongly disagree) to 7 (strongly agree). An example item is “my values match those of current employees in my organization.”
6.2.2.4. OCBOCB was measured using the 10-item short version of the Organizational Citizenship Behavior Checklist developed by Spector and colleagues (2010, α = 0.87; ω = 0.87). Re-sponse categories ranged from 1 (never) to 5 (every day). An example item is “How often have you lent a compassionate ear when someone had a work problem.”
6.2.2.5. FlourishingFlourishing was measured using the 8-item Flourishing Scale developed by Diener and colleagues (2010, α = 0.91; ω = 0.91). Answer categories ranged from 1 (strongly disagree) to 7 (strongly agree). An example item is “I am optimistic about my future.”
6.2.2.6. Life satisfactionLife satisfaction was measured with a single item that read “All things considered, how satisfied are you with your life as a whole these days?” The question stems from the World Values Survey (2019), one of the largest and most comprehensive surveys that administers well-being questions across nations (Bjørnskov, 2010). Answer categories ranged from 0 (not satisfied at all) to 10 (very satisfied).
6.2.3. Analytical strategyData pre-processing and hypothesis testing was done in R (R Core Team, 2014). For reproducibility purposes, all scripts (S2 File) and data (S3 Dataset) will be made available in the supplementary information.
6.2.3.1. Sentiment detectionWe used both independent manual coding by humans and computer-aided coding, i.e., LIWC 2015, SentimentR and SentiStrength. Summaries of the textual responses and de-scriptive statistics of the text-based measures can be found in Table 6.2. The histograms of the different ratings from wave 1 are displayed in Figure 6.1. and Figure 6.2. To be able to make fair comparisons between text-based measures, we re-coded or rounded senti-ment scores into a categorical five-point scale: 1 (very negative), 2 (negative), 3 (neutral), 4 (positive) and 5 (very positive).
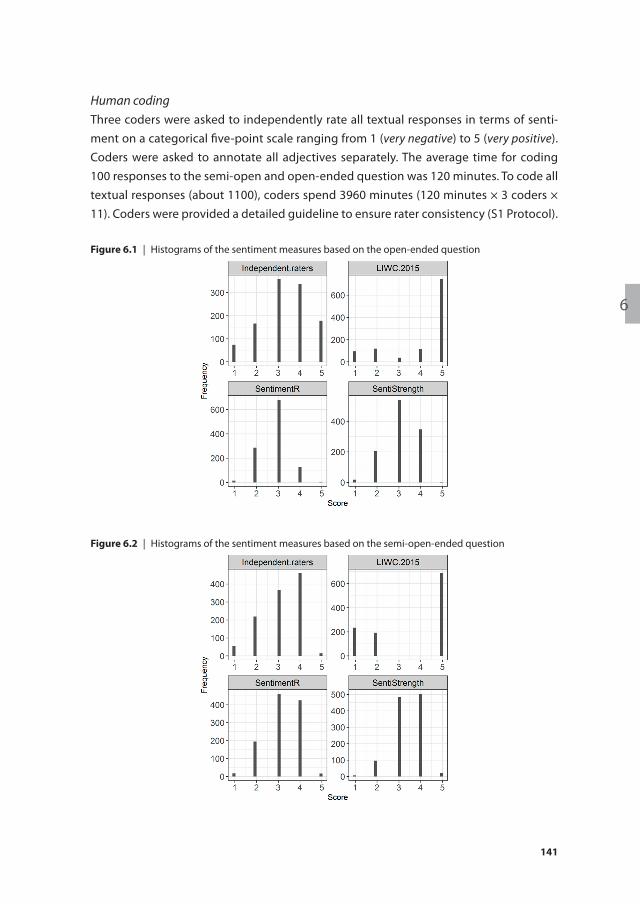
6
141
Human codingThree coders were asked to independently rate all textual responses in terms of senti-ment on a categorical five-point scale ranging from 1 (very negative) to 5 (very positive). Coders were asked to annotate all adjectives separately. The average time for coding 100 responses to the semi-open and open-ended question was 120 minutes. To code all textual responses (about 1100), coders spend 3960 minutes (120 minutes × 3 coders × 11). Coders were provided a detailed guideline to ensure rater consistency (S1 Protocol).
figure 6.1 | Histograms of the sentiment measures based on the open-ended question
figure 6.2 | Histograms of the sentiment measures based on the semi-open-ended question

chapter 6 | The promise of open survey questions for measuring job satisfaction
142
Following the recommendations of Hallgren (2012), we used a two-way model, average-measures unit interclass correlation to determine inter-rater reliability. We deemed an interclass correlation of 0.6 to be minimally acceptable (Boyer & Verma, 2000). For waves 1 and 2, respectively, the interclass correlation scores for the first adjective (0.994 and 0.920), second adjective (0.902 and 0.914), third adjective (0.904 and 0.936), fourth adjec-tive (0.817 and 0.904), fifth adjective (0.903 and 0.916), complete semi-open text-based measure (0.934 and 0.936) and open text-based measure (0.921 and 0.951) exceeded this threshold. The human coding measure of the semi-open-ended question was cre-ated by first averaging the sentiment ratings of the individual adjectives provided by the individual independent coders, and then taking the mean of the aggregated sentiment ratings. The human coding measure of the open-ended question was generated by ag-gregating the sentiment ratings provided by the independent coders.
We verified the reliability of this independent coding procedure by correlating the generated measures with the evaluations from respondents themselves. We asked respondents the following question after they completed the open-ended questions: “How would you rate your previous answer in terms of sentiment/emotion?” The answer categories ranged from 1 (very negative) to 5 (very positive). The results showed that the semi-open measure based on independent coding correlated strongly with the respondent-generated semi-open measure (r = 0.794). We found the same pattern for the open text-based measures (r = 0.785).
Computer-aided codingThe LIWC 2015 measure originally ranged on a continuous scale from 1, extremely nega-tive emotional tone, to 100, extremely positive emotional tone. SentimentR produced sentiment scores from -2 to 2. SentiStrength was not programmed to produce overall sentiment scores but was instead designed to generate scores for negative sentiment, range from -1 to -5, and positive sentiment, range from 1 to 5. The overall sentiment score was created by summing up the positive and negative scores.
6.2.3.2. Hypothesis testingThe guidelines provided by McKenny et al. (2018) were followed to assess measurement error in text-based measures. Pearson correlation analyses were used to assess specific factor error, i.e., examining the convergence between the individual text-based mea-sures and the human ratings. The data from wave 1 and wave 2 were combined because the software packages analyze texts as independent observations. To test hypothesis 1a, we first conducted a Fisher (1915) z-transformation of all correlations between the individual text-based measures and the human-coded measures. Using a t-test, the correlations between the open text-based measures and the human-coded measures
6
143
were compared with the average correlation between the semi-open text-based and the human-coded measures. To test hypotheses 1b and 1c, statistical differences in con-vergence between the separate text-based measures and the human-coded measures were assessed by means of Steiger’s (1980) z. Algorithm error and the corresponding hypothesis 2 were assessed by computing Krippendorff’s α among the text-based mea-sures. Transient error was examined by correlating the text-based measure from wave 1 with the text-based measure from wave 2. The test of hypothesis 3 was based on the comparison of the test-retest reliability of the text-based measures with the test-retest reliability of the human-coded measures (H3a) and with the test-retest reliability of the general closed job satisfaction measure (H3b).
Moving on to construct validity, hypothesis 4a was tested by computing the correlations between the text-based measures and the closed job satisfaction measures. Hypoth-esis 4b was assessed by z-transforming all correlations and comparing the correlation between text-based measures and the general job satisfaction measures with the correlations between the text-based measures and the job facet satisfaction measures by means of a t-test. Hypothesis 5a was tested by examining the correlations between the job satisfaction measures and the measures of the related constructs. Hypothesis 5b concerned comparisons between two sets of correlations, i.e. correlations between text-based measures and closed job satisfaction measure vs. correlations between text-based measures and measures of related but distinct constructs. We used Steiger z tests to assess whether these differences were significant. Hypothesis 6a was supported if the closed question measures of job satisfaction correlated more strongly with the semi-open text-based measures than with the open text-based measures. We tested this hypothesis by z-transforming all correlations and comparing them using a t-test. Hypothesis 6b would be supported if the semi-open text-based measures’ average de-viation with measures of the other constructs was higher than the average deviation of the open text-based measures’ deviation with these measures. The correlation analyses used for testing hypothesis 4 to 6 were based on the data from wave 1, as the job facet satisfaction questions and measures of the related constructs were not administered in wave 2.
6.3. results
6.3.1. Measurement errorThe text-based measures suffered from specific factor error to different degrees, as demonstrated in a wide range of parallel forms reliability values (rmin = 0.189 to rmax = 0.775). The correlations between the open text-based measures and the human-coded
chapter 6 | The promise of open survey questions for measuring job satisfaction
144
measure were lower (raverage = 0.508) than the correlations between the semi-open text-based and the human-coded measure (raverage = 0.774), as shown in Table 6.4. and 6.5. We accepted hypothesis 1a because this difference was statistically significant (t = 0.563, p < 0.01). As hypothesized, in the analysis of the responses to the open-ended questions, the SentiStrength measure (r = 0.587) suffered less from specific factor error than the LIWC 2015 measure (r = 0.508, t = 3.38, p < 0.01) and the SentimentR measure (r = 0.532, t = 2.33, p < 0.05). Contrary to our expectations, the SentimentR measure did not suffer less from specific factor error than the LIWC 2015 measure (t = 1.00, ns). Therefore, we partially accepted hypothesis 1b. Regarding the semi-open-ended question, the results showed that the SentiStrength measure (r = 0.695) suffered more from specific factor error than the LIWC 2015 measure (r = 0.775, t = 5.63, p < 0.01) and the SentimentR measure (r = 0.772, t = 5.21, p < 0.01). In addition, our results suggested that the specific factor error in the LIWC 2015 measure and SentimentR measure are equivalent (t = 0.16, ns). These findings provided only partial support for hypothesis 1c.
Algorithm error was high, as Krippendorff’s α was generally low, i.e., α < 0.65, confirm-ing hypothesis 2. Notably, the algorithm error was lower for the semi-open text-based measures, i.e., αall CATA = 0.506, αLIWC2015-SentimentR = 0.471, αLIWC2015-SentiStrength = 0.495 and αSentimentR-SentiStrength = 0.631) than for the open text-based measures (i.e., αall CATA = 0.187, αLIWC2015-SentimentR = 0.010, αLIWC2015-SentiStrength = 0.159. and αSentimentR-SentiStrength = 0.434).
In our test of transient error, we discovered that the test-retest reliability of the open text-based measures (average rtt = 0.255) was more than 0.2 lower than the human-coded measure (rtt = 0.543). The test-retest reliability of the semi-open text-based measure (average rtt = 0.268) deviated less than 0.2 from the test-retest reliability of its corresponding human-coded measure (rtt = 0.314). In accordance, we could only partially accept hypothesis 3a. The test-retest reliability of the open and semi-open text-based measures diverged substantially from the test-retest reliability of the measure based on the closed job satisfaction question. As a result, we rejected hypothesis 3b.
table 6.4 | Correlations between open text-based measures and closed job satisfaction question (N = 1113) and test-retest reliability (N = 116)
Human coding LIWC 2015 SentimentR SentiStrength Closed question
Human coding 0.543
LIWC 2015 0.508 0.249
SentimentR 0.532 0.512 0.329
SentiStrength 0.587 0.510 0.487 0.189
Closed question 0.726 0.393 0.407 0.464 0.502
Notes. Test-retest reliability values are displayed on the diagonal; All correlations significant at the level of p < 0.05; LIWC = Linguistic Inquiry and Word Count.
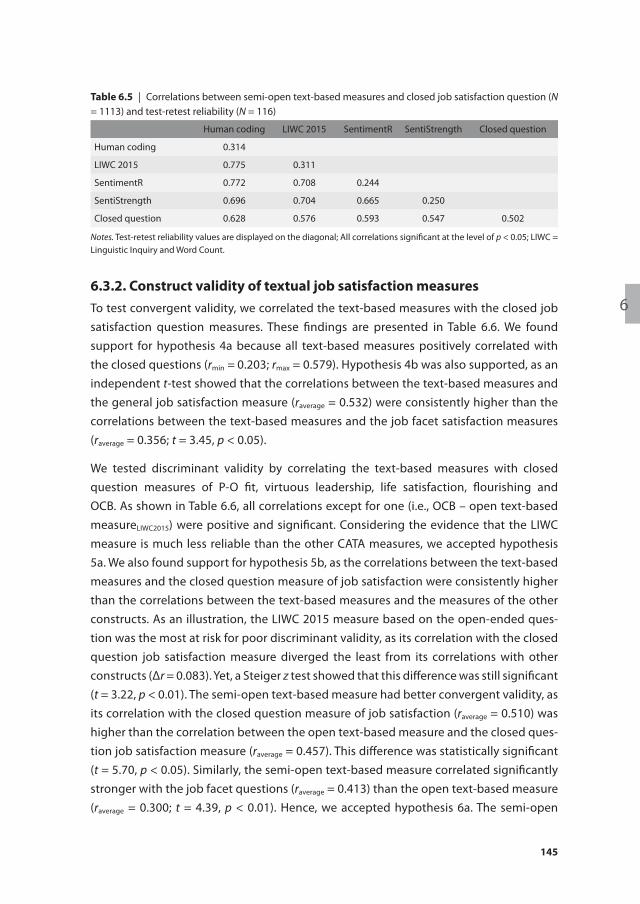
6
145
6.3.2. construct validity of textual job satisfaction measuresTo test convergent validity, we correlated the text-based measures with the closed job satisfaction question measures. These findings are presented in Table 6.6. We found support for hypothesis 4a because all text-based measures positively correlated with the closed questions (rmin = 0.203; rmax = 0.579). Hypothesis 4b was also supported, as an independent t-test showed that the correlations between the text-based measures and the general job satisfaction measure (raverage = 0.532) were consistently higher than the correlations between the text-based measures and the job facet satisfaction measures (raverage = 0.356; t = 3.45, p < 0.05).
We tested discriminant validity by correlating the text-based measures with closed question measures of P-O fit, virtuous leadership, life satisfaction, flourishing and OCB. As shown in Table 6.6, all correlations except for one (i.e., OCB – open text-based measureLIWC2015) were positive and significant. Considering the evidence that the LIWC measure is much less reliable than the other CATA measures, we accepted hypothesis 5a. We also found support for hypothesis 5b, as the correlations between the text-based measures and the closed question measure of job satisfaction were consistently higher than the correlations between the text-based measures and the measures of the other constructs. As an illustration, the LIWC 2015 measure based on the open-ended ques-tion was the most at risk for poor discriminant validity, as its correlation with the closed question job satisfaction measure diverged the least from its correlations with other constructs (Δr = 0.083). Yet, a Steiger z test showed that this difference was still significant (t = 3.22, p < 0.01). The semi-open text-based measure had better convergent validity, as its correlation with the closed question measure of job satisfaction (raverage = 0.510) was higher than the correlation between the open text-based measure and the closed ques-tion job satisfaction measure (raverage = 0.457). This difference was statistically significant (t = 5.70, p < 0.05). Similarly, the semi-open text-based measure correlated significantly stronger with the job facet questions (raverage = 0.413) than the open text-based measure (raverage = 0.300; t = 4.39, p < 0.01). Hence, we accepted hypothesis 6a. The semi-open
table 6.5 | Correlations between semi-open text-based measures and closed job satisfaction question (N = 1113) and test-retest reliability (N = 116)
Human coding LIWC 2015 SentimentR SentiStrength Closed question
Human coding 0.314
LIWC 2015 0.775 0.311
SentimentR 0.772 0.708 0.244
SentiStrength 0.696 0.704 0.665 0.250
Closed question 0.628 0.576 0.593 0.547 0.502
Notes. Test-retest reliability values are displayed on the diagonal; All correlations significant at the level of p < 0.05; LIWC = Linguistic Inquiry and Word Count.
chapter 6 | The promise of open survey questions for measuring job satisfaction
146
text-based measure also displayed better discriminant validity, as its average deviation with measures of the other constructs (Δraverage = 0.267) was almost 0.09 higher than the average deviation of the open text-based measures’ deviation with these measures (Δraverage = 0.178). Hence, we found support for hypothesis 6b.
We conducted a robustness check that assess whether the reliability and validity of CATA measures differed across lowly educated (2-year degree or lower) and highly edu-cated respondents (4-year degree or higher). A comparison of correlations showed that parallel-forms reliability was 0.05 higher and convergent validity was 0.06 higher for the lowly educated respondents. These differences were not significant though (t = 0.77 and t = 1.12, respectively, p = ns).
6.4. Discussion
In recent years, CATA is being used increasingly often within and outside the organiza-tional sciences (Short et al., 2018). In the case of sentiment analysis, most studies have created measures based on collections of lengthy texts. Consequently, computer-aided sentiment analysis has rarely been used to construct measures from responses to open survey questions, while such questions can be an informative complement to closed survey measures. In our study, we have started to fill this gap by demonstrating the reliability of lexicon-based sentiment analysis methods for constructing text-based job satisfaction measures and looking at their validity. We tested our hypotheses on cross-sectional data from 997 workers in the US and the UK and longitudinal data from 116 workers. In particular, we constructed text-based measures from open and semi-open job satisfaction questions using three CATA techniques, LIWC 2015, SentimentR and SentiStrength, and a human coding procedure. As expected, measure construction by CATA methods took a negligible amount of the time (i.e., under half a minute). In sharp contrast, three manual coders required about 66 hours to annotate all texts. Next, we investigated the degree of measurement error in the different text-based measures (specific factor error, algorithm error and transient error) and examined their convergent and discriminant validity.
Concerning reliability, we demonstrated that specific factor error, the degree of con-vergence between the measures produced by CATA and the human coders, was lowest for the semi-open text-based measures and parallel forms reliability varied substantially across software packages. Algorithm error, the degree of disagreement between text-based measures, was generally high. This lack of agreement is likely to be related to our decision to recode the software programs’ original sentiment ratings into comparable 5-point Likert scales. This decision was problematic for our LIWC 2015 measure, as the
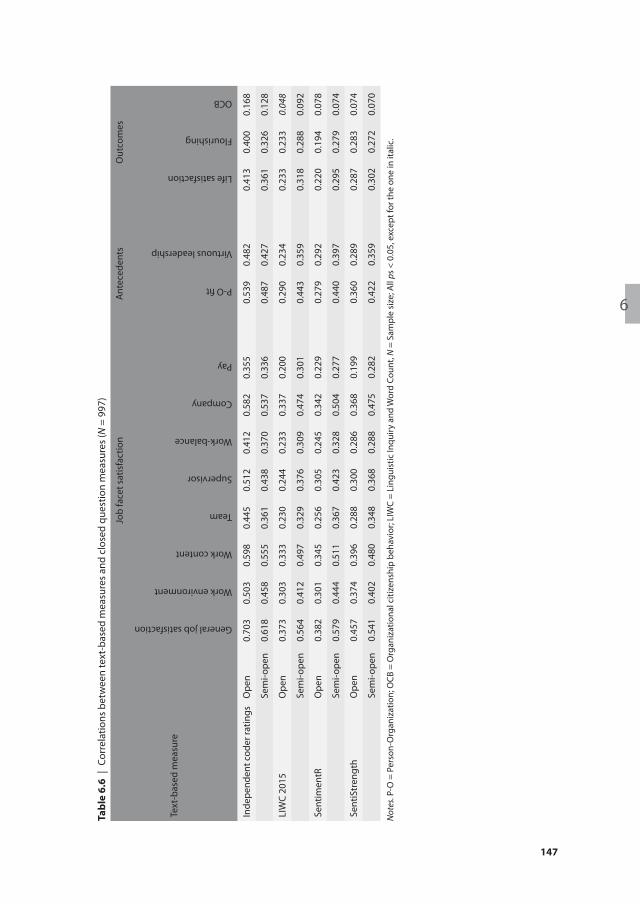
6
147
tabl
e 6.
6 |
Corr
elat
ions
bet
wee
n te
xt-b
ased
mea
sure
s an
d cl
osed
que
stio
n m
easu
res
(N =
997
)
Text
-bas
ed m
easu
re
Job
face
t sat
isfa
ctio
nA
ntec
eden
tsO
utco
mes
General job satisfaction
Work environment
Work content
Team
Supervisor
Work-balance
Company
Pay
P-O fit
Virtuous leadership
Life satisfaction
Flourishing
OCB
Inde
pend
ent c
oder
ratin
gsO
pen
0.70
30.
503
0.59
80.
445
0.51
20.
412
0.58
20.
355
0.53
90.
482
0.41
30.
400
0.16
8
Sem
i-ope
n0.
618
0.45
80.
555
0.36
10.
438
0.37
00.
537
0.33
60.
487
0.42
70.
361
0.32
60.
128
LIW
C 20
15O
pen
0.37
30.
303
0.33
30.
230
0.24
40.
233
0.33
70.
200
0.29
00.
234
0.23
30.
233
0.04
8
Sem
i-ope
n0.
564
0.41
20.
497
0.32
90.
376
0.30
90.
474
0.30
10.
443
0.35
90.
318
0.28
80.
092
Sent
imen
tRO
pen
0.38
20.
301
0.34
50.
256
0.30
50.
245
0.34
20.
229
0.27
90.
292
0.22
00.
194
0.07
8
Sem
i-ope
n0.
579
0.44
40.
511
0.36
70.
423
0.32
80.
504
0.27
70.
440
0.39
70.
295
0.27
90.
074
Sent
iStr
engt
hO
pen
0.45
70.
374
0.39
60.
288
0.30
00.
286
0.36
80.
199
0.36
00.
289
0.28
70.
283
0.07
4
Sem
i-ope
n0.
541
0.40
20.
480
0.34
80.
368
0.28
80.
475
0.28
20.
422
0.35
90.
302
0.27
20.
070
Not
es. P
-O =
Per
son-
Org
aniz
atio
n; O
CB =
Org
aniz
atio
nal c
itize
nshi
p be
havi
or; L
IWC
= Li
ngui
stic
Inqu
iry a
nd W
ord
Coun
t, N
= S
ampl
e si
ze; A
ll ps
< 0
.05,
exc
ept f
or th
e on
e in
ital
ic.
chapter 6 | The promise of open survey questions for measuring job satisfaction
148
re-coding of its 1 to 100 scale resulted in a distribution of only very negative, moder-ately negative scores and very positive scores (see Figure 6.1). As the SentiStrength and SentimentR software produced ratings that were largely neutral or moderately positive, their agreement with the LIWC 2015 measures was very low and attenuated the average algorithm error. The transient error of the text-based measures was mostly in line with the transient error in the human-coded text-based measure, but consistently diverged from the transient error in the closed question job satisfaction measure.
Our initial test of construct validity showed that the open and, in particular, semi-open text-based measures have satisfactory convergent and discriminant validity. We found that the text-based measures based on the semi-open-ended question correlated more strongly with closed question measures of general job satisfaction and job facet satisfaction and diverged more strongly from related but distinct constructs than the text-based measure based on the open-ended question. This finding can be interpreted in various ways. If we assume that closed questions are the most suitable instrument for quantifying job satisfaction and consider the greater convergence and divergence of the semi-open text-based measure over the open text-based measure, we could argue that semi-open-ended questions should be preferred for measuring job satisfac-tion. Alternatively, if we assume that closed job satisfaction questions inevitably fail to measure the construct in its entirety, the lack of convergence and divergence between the open text-based measure and closed job satisfaction measures can also refer to the complementary nature of open-ended questions. Perhaps, the responses to open-ended questions contain information about job characteristics that are not measured by closed questions.
6.4.1 limitations and future researchWhile our context-free sentiment dictionaries already produced reasonably reliable measures, future research would benefit from employing deductive and inductive dictionary-generation techniques to create a job satisfaction specific dictionary and thereby further boost reliability and, in turn, validity (Short et al., 2010). For example, researchers could look beyond unigrams, i.e., single words, and study the added value of multigrams, sequences of adjacent words (Taboada et al., 2011). Using the data from this study, researchers may discover that some words have different meanings in different contexts, e.g., the word ‘challenging’ may have very different connotations when it is used in combinations with words such as ‘gratifying’, ‘motivating’ and ‘engaging’ than with words such as ‘busy’, ‘stressful’ and ‘exhausting’. Furthermore, scholars could explore the added value of learning-based sentiment analysis methods (see Kobayashi et al., 2017 for practical text mining guidelines), for example, by training algorithms on our reliably labeled textual data. We note that high quality training data is costly to attain,
6
149
as it usually involves tasking multiple coders to annotate texts. Survey researchers could ask respondents to rate their own textual responses in terms of sentiment toward the end of online surveys to have a reliable and time-saving alternative to a manual coding procedure. After all, respondents’ own perceptions of sentiment are likely to come clos-est to the ‘true’, measurement-error-free sentiment score.
Our validation procedure suffered from several limitations. In our assessment of conver-gent validity, we, for example, did not examine the text-based measures’ convergence with validated multiple-item job satisfaction scales or control for same-source variance. Therefore, we recommend future researchers to conduct an even more systematic vali-dation of the new measures. The validation approach from Fisher et al. (2016) could be followed, because the open and semi-open-ended questions are single-item measures. In addition, future research could investigate whether the choice to produce text-based measures by means of sentiment analysis causes the measures to be more affect-oriented than cognition-oriented (Kaplan et al., 2009; E. R. Thompson & Phua, 2012). Scholars could test this by correlating the text-based measures with a closed question measure of job affect and a measure of job cognition (Bowling et al., 2018). Our ex-amination of discriminant validity was limited, as the selection of constructs was small, all constructs were measured at one point in time and all measures were self-report. Future studies could look into the text-based measures’ relationships with a wider range of antecedents, objective outcome variables such as sickness absence and turnover, and supervisor-rated performance constructs such as productivity and creativity. In light of this, it could prove useful to assess the incremental validity of the text-based measures over the closed question measures.
6.4.2 conclusionThe initial evidence from our study has opened interesting research venues for mixed method research. Open-ended and, in particular, semi-open-ended questions show great promise for measuring job satisfaction because textual responses can reliably and swiftly be translated into text-based measures of job satisfaction, exhibit substantial convergence with closed question measures and display significant divergence with closed question measures of related but distinct constructs. We stress that semi-open-ended and open-ended questions should not just be regarded as another method to quantitatively measure a psychological construct. The information richness of the responses to open-ended questions and semi-open-ended questions can help scholars to unravel new insights about the sources and context of constructs. Whether used for cross-validation, contextualization or both, we believe that semi-open-ended and open-ended questions have the potential to further the science and practice of measuring and theorizing about psychological constructs.

7unpacking the potential of semi-
open-ended job satisfaction questions
Based on paper: Wijngaards, I., Burger, M.J., & Van Exel, N.J.A. (2021). Unpacking the quantifying and qualifying potential of
semi-open job satisfaction questions through computer-aided sentiment analysis. Journal of Well-being Assessment, 1-27.

7
153
7.1. introDuction
Job satisfaction, ‘‘a positive (or negative) evaluative judgment one makes about one’s job or job situation’’ (H. M. Weiss, 2002, p. 175), continues to be closely monitored in corporate surveys (Macey & Schneider, 2008) and has a long history of scientific study (Judge et al., 2017). There are good reasons for its popularity; job satisfaction has proven to be a robust correlate of subjective well-being (Bowling et al., 2010), health (Faragher et al., 2005) and job performance outcomes (Judge et al., 2001b). Over the past few de-cades of scholarly and practitioner attention, a plethora of survey question instruments have been developed to cover conceptual nuances, e.g., affect-oriented vs. cognition-oriented scales (Kaplan et al., 2009; Organ & Near, 1985) and job facet satisfaction vs. general job satisfaction (Scarpello & Campbell, 1983; Spector, 1997; H. M. Weiss, 2002). Others have aimed at reducing response burden by shortening multiple-item scales (e.g., Russell et al., 2004) of developing single-item measures of job satisfaction (e.g., G. G. Fisher et al., 2016; D. G. Gardner et al., 1998; Wanous et al., 1997).
The majority of survey instruments share one commonality: they typically comprise of closed questions or items (e.g., “Overall, I am satisfied with my job.”, G. G. Fisher et al., 2016, p. 8) rather than open-ended questions (e.g., “Please give us feedback or com-ments about your job.” Gilles et al., 2017, p. 4; “How do you think about your job as a whole?”, Wijngaards et al., 2019, p. 5) or semi-open-ended questions (e.g., “What three to five adjectives come to mind when you think of your job as a whole?”, Wijngaards et al., 2019, p. 5). Closed questions have several advantages over open-ended questions, as they typically pose less burden for respondents than open-ended questions (Krosnick, 1999; Vinten, 1995; Zehner et al., 2016) and they prove to be more straight-forward to code and validate than open-ended questions (Maxwell & Delaney, 1985; Tausczik & Pennebaker, 2010).
The unpopularity of semi-open or open job satisfaction questions is unfortunate be-cause semi-open or open-ended questions hold great potential as a complement to closed questions in surveys. A semi-open or open-ended question can, for example, be used to better quantify job satisfaction, as weaknesses of individual methods are likely off-set by the use of multiple methods (Bryman, 2006; Jick, 1979; Turner et al., 2017). Measuring job satisfaction with both closed and open-ended response formats in a single questionnaire could help mitigate common method error, as respondents are forced into different forms of cognitive processing (Podsakoff et al., 2003). Semi-open or open-ended questions can also be used to qualify job satisfaction and thereby obtain a more complete and deeper understanding of a construct (Fielding, 2012; Jick, 1979; Mauceri, 2016; Turner et al., 2017). Textual responses can be leveraged to contextualize responses to closed questions and obtain insights into the causes and sources of job
chapter 7 | Unpacking the potential of semi-open-ended job satisfaction questions
154
(dis)satisfaction (Spector & Pindek, 2016; Taber, 1991). Moreover, they can illustrate and clarify the results from quantitative data analyses to non-expert audiences (Borg & Zuell, 2012; D. C. Zhang et al., 2019). Furthermore, the practical disadvantages of constructing textual job satisfaction measures are becoming increasingly obsolete, as computer-aided text analysis, which is a form of content analysis that facilitates the measurement of constructs by converting text into quantitative data based on word frequencies, make the creation of text measures more convenient than ever (McKenny et al., 2018; Short et al., 2010, 2018).
In this article, we aim to unpack the quantifying and qualifying potential of a semi-open job satisfaction question. We focus on a semi-open rather than a completely open job satisfaction question because semi-open-ended questions impose answering constraints on responses and therefore produce more structured texts than completely open-ended questions e.g., fewer meaningless words and less semantic nuance in textm (Glerum et al., 2014; Wijngaards et al., 2019). This makes text measures based semi-open-ended questions produced by computer-aided sentiment analysis methods probably more suitable for quantifying the level of job satisfaction than text measures based on completely open-ended questions produced by computer-aided sentiment analysis methods (Wijngaards et al., 2019). We investigate the semi-open-ended ques-tions’ quantifying potential by creating text measures using computer-aided sentiment analysis, the practice of automatically detecting opinions, sentiments, attitudes and emotions about certain objects in human-generated texts (R. Feldman, 2013; B. Liu, 2015), and validating this measure using standardized closed-ended questions. We investigate the semi-open-ended questions’ qualifying potential by examining which sentiment ratings in sentiment-dictionaries are context-dependent and what unfavor-able job characteristics are taken for granted if favorable job characteristics are present.
This study contributes to the literature by building on and extending existing meth-odological work on validation of textual job satisfaction measures. Previous studies on textual job satisfaction measures lack a systematic validation approach, neglecting content validity and using ad-hoc, single-item job satisfaction measures to test con-vergent validity (Borg & Zuell, 2012; Poncheri et al., 2008; Wijngaards et al., 2019), as well as discriminant validity (Borg & Zuell, 2012; Gilles et al., 2017; Poncheri et al., 2008). It is essential to systematically examine the validity of a text measure, as researchers with a preference for traditional survey measures are unlikely to accept text measures as fruitful complement to a closed question if there is no convincing evidence for their validity available. Therefore, we discuss the content validity of the semi-open job satis-faction question. Using correlational analyses and confirmatory factor analyses (CFAs), we also test its fit with a closed question job satisfaction scale. In addition, we assess the semi-open-ended question’ correlations with variables falling within and outside
7
155
job satisfaction’s nomological network. As computer-aided text analysis techniques produce measures with attenuated reliability (McKenny et al., 2018), we benchmark the text measures generated by computer-aided sentiment analysis techniques with a text measure with the least possible measurement error, a text measure based on respon-dents’ own sentiment annotations (henceforth: benchmark measure).15
The qualitative analysis on context-dependency of sentiment ratings help advance the field of computer-aided sentiment analysis, while the exploration on the weight of dif-ferent job characteristics contributes to scientists and practitioners’ understanding of job satisfaction and its causes.
7.1.1 using computer-aided sentiment analysis to create a textual job satisfaction measureMuch of the research on constructing text measures from responses to semi-open-ended or open-ended job satisfaction questions have made use of computer-aided sentiment analysis techniques. The techniques’ popularity is not surprising, as it is much faster than manual sentiment annotation (Wijngaards et al., 2019) and an individual’s choice of words is a plausible manifestation of thoughts and opinions (Pennebaker et al., 2003; Short et al., 2010). As mentioned earlier, computer-aided sentiment analysis is particularly suitable for constructing a job satisfaction measure from text, as job sat-isfaction classifies as a job attitude and comprises cognitive appraisals, emotions, and beliefs (H. M. Weiss, 2002). Sentiment analysis software typically classifies respondents that mainly use positive words in their written responses as satisfied individuals, and classifies respondents that mainly use a negative tone as dissatisfied respondents (B. Liu, 2015; Poncheri et al., 2008).
To construct the text measure in this study, we use lexicon-based computer-aided sentiment analysis software, a type of sentiment analysis that annotates texts using dictionaries of words with pre-labelled sentiment orientation. Sentiment orientation concerns words’ sentiment polarity (e.g., “good” vs. “bad”) and sentiment strength (e.g., “good” vs. “great”). The lexicon-based sentiment analysis approach is characterized by two stages. In the first stage, software is used to pre-process raw textual data. Steps involved in pre-processing are removing stop words, such as “the”, “from” and “as”, cor-recting language mistakes, converting words to lowercase and removing punctuation and white spaces (Meyer et al., 2008; Pandey & Pandey, 2019). Once this has been done,
15 This measure is likely a more reliable measure of sentiment than measures produced by independent coders. Independent coders introduce unique measurement errors through individual differences in eva-luation strategies (Mikhaylov et al., 2012) and in annotation experience and education (Snow et al., 2008) and, in the end, are mere forecasters of the sentiment rating a respondent would have decided upon.
chapter 7 | Unpacking the potential of semi-open-ended job satisfaction questions
156
software can be employed to classify words into sentiment classes, e.g., very negative (-2), negative (-1), neutral (0), positive (+1) and very positive (+2). Contemporary senti-ment analysis software does not only consider an individual words’ sentiment rating, but also considers words in the context that they are used in. For example, contemporary software considers negators, such as “not” and “never”, as they reverse the semantic polarity and amplifiers, such as “very”, and de-amplifiers, such as “reasonably”, as they offer an indication of the sentiment strength. After this, the software automatically adds up (and weighs) all the individual ratings and computes an overall sentiment rating. The rating can, in turn, be used as a measure of job satisfaction.
To illustrate this two-stage procedure, we use a response from a semi-open-ended ques-tion and a response to an open job satisfaction question, both obtained from the open-access data from Wijngaards et al. (2019). The sample answer to the semi-open-ended question was a list of three adjectives: “Interesting”, “Stressful” and “Helpful”. The sample answer to the open-ended question was a statement: “I am extremely proud of the work I do and think I do it very well, but I don’t enjoy how hard and tiring it is and the people I work with are difficult to work with”.
The pre-processing of the response to the semi-open-ended question only involves converting all words into lowercase (i.e., “interesting”, “stressful” and “helpful”). Then, the software searches in the pre-processed text for words that either contain non-zero senti-ment ratings or sentiment strength and draws from its dictionary to assign sentiment ratings. As the semi-open-ended question asks respondents to come up with individual adjectives, it is important to treat the individual words as separate, de-contextualized textual instances. In this example, all words carry a non-zero sentiment loading: “inter-esting” (+1) “stressful” (-1) and “helpful” (+1). The three sentiment scores can be summed into a single score (i.e., 1 + -1 + 1 = 1) and the response would be classified as positive. As an illustration, SentimentR (Rinker, 2019), a sentiment analysis software program that by default uses a dictionary of words with 20 sentiment classes (e.g., -0.25, 0, 0.75, scale ranges from -2.0 to 2.0) and considers negators, amplifiers and deamplifiers in its algorithm, assigns the following sentiment ratings to each word: “interesting” (+0.75), “stressful” (-0.50) and “interesting” (+0.75). The final sentiment rating would be 1.0.
The pre-processing and sentiment calculation of the example response to the open-end-ed question is more complex. To pre-process the sentence, the software has to convert all words into lowercase, omit punctuation and remove stop words. The pre-processed text would then read “extremely proud do work think do very well but don’t enjoy hard tiring people work difficult work”. As the response is a sentence, it is important to con-sider the context in which words are used (e.g., valence shifters and amplifiers). In this text, the following terms do not have a non-zero sentiment score or sentiment strength
7
157
score: “extremely proud” (+2), “very well” (+2), “don’t enjoy” (-1), “hard” (-1), “tiring” (-1) and “difficult” (-1). Finally, the software solves the equation (i.e., 2 + 2 + -1 + -1 + -1 + -1 = 0) and classifies the response as neutral. In accordance with this example, SentimentR would classify the response as slightly positive (0.3).
7.1.2. Quantifying job satisfactionNow that we have explained how a textual response to a semi-open or open-ended question can be converted into a text measure, we move to a justification of the semi-open-ended question’s suitability as a job satisfaction measure. We discuss the measure’s theoretical validity and provide a description of our empirical validation procedure.
7.1.2.1. Theoretical validityWe use the following semi-open-ended question in our study: “What three to five adjec-tives come to mind when you think of your job as a whole?” (Wijngaards et al., 2019, p. 5). Being based on the fundamentals of the adjective generation technique, a psychological method initially used for personality assessment (Potkay & Allen, 1973), the question was designed to tap into both to the affective and cognitive component of job satisfaction and thus measure the construct as a whole (Judge et al., 2012; H. M. Weiss, 2002). The verb “think” likely spurs both affective and cognitive thoughts and is presumably more suitable than more specific verbs like “appraise”, “evaluate” and “feel”. The first two words would primarily elicit cognitive evaluations of the job, while the third word would likely tap more into the affective component of job satisfaction. The “as a whole” at the end of the question was included, as the semi-open-ended question is purported to measure gen-eral job satisfaction. The clause likely triggers respondents into thinking more inclusively (Scarpello & Campbell, 1983; H. M. Weiss, 2002). We restricted the number of words to (i) reduce required effort for respondents and (ii) get an idea of the most salient thoughts.
7.1.2.2. Empirical validity
Convergent validityTurning to empirical validity, the text measure based on the responses to the semi-open job satisfaction question has to converge with an existing measure of job satisfaction (Edwards, 2003; Hinkin, 1998). However, we do not expect perfect convergence between the two types of job satisfaction measures because closed and open-ended questions have divergent epistemological foundations and introduce different sources of mea-surement error (Fielding, 2012; Mauceri, 2016; McKenny et al., 2018).
In line with this expectation, previous research on open comment boxes in surveys has demonstrated moderate correlations between sentiment ratings and overall job satisfaction. For example, in a study among military personnel, Poncheri et al. (2008)
chapter 7 | Unpacking the potential of semi-open-ended job satisfaction questions
158
documented a correlation of 0.41 between comments’ affective tone and a closed ques-tion measure of general job satisfaction. Drawing upon data from a large corporate sur-vey from an information technology organization, Borg and Zuell (2012) documented a correlation between affective comment tone and closed question job satisfaction measures of 0.38, on average. In a study by Wijngaards et al. (2019), similar correlations were found between the text measures based on a completely open-ended question and a closed question measure of general job satisfaction: raverage = 0.40. The average correlation between the text measures based on the responses to the semi-open-ended question and the closed question measure was significantly higher, raverage = 0.56. As we use a semi-open-ended question in this study, we expect that the text measures cor-relate positively with a closed question measure of job satisfaction. Even though neither of these studies provided factor analytic evidence for the convergent validity of the text measures, we expect that the text measures of job satisfaction fit well with closed ques-tion job satisfaction measures.
Discriminant validityTo have satisfactory discriminant validity, a text measure must fit within a constructs’ nomological network, the abstract representation of constructs, their measures and the interrelationships among them (Cronbach & Meehl, 1955). In our case, discriminant validity could be demonstrated by testing the bivariate correlations between the text measures of job satisfaction and theoretically related antecedents, correlates and outcomes of job satisfaction, and looking into its relationship with constructs that fall outside the job satisfaction’s broader theoretical context (Edwards, 2003; Shaffer et al., 2016). Drawing on the many nomological networks that have been developed in the many decades of job satisfaction research (e.g., Bowling & Hammond, 2008; Brief, 1998; Crede et al., 2007), we identify various antecedents, correlates, outcomes and unrelated constructs. Research suggests that skill variety, task autonomy and person-environment fit are pertinent examples of antecedents of job satisfaction. Theorists have argued that job variety, “the degree to which a job requires employees to perform a wide range of tasks on the job” (Morgeson & Humphrey, 2006, p. 1324), and job autonomy, “the extent to which a job allows freedom, independence, and discretion to schedule work, make decisions, and choose the methods used to perform tasks” (Morgeson & Humphrey, 2006, p. 1324), contribute to an employee’s experienced meaningfulness and responsibility, respectively (Hackman & Oldham, 1976). They reasoned that the sense of meaningful-ness and responsibility have the potential to boost intrinsic motivation, which in turn positively correlates with job satisfaction (Fried & Ferris, 1987; Hackman & Oldham, 1976). Person-organization fit refers to the fit between employees and organizations that oc-curs when one offers what the other wants, they share similar important characteristics, or both (Kristof, 1996). Therefore, person-organization fit is likely associated with job
7
159
satisfaction (Kristof, 1996). Life satisfaction, “a global assessment of a person’s quality of life according to his own criteria” (Shin & Johnson, 1978, p. 478), is among the most fun-damental correlates of job satisfaction because job satisfaction contributes to a person’s overall satisfaction with life, and vice versa (Judge et al., 2012; Judge & Watanabe, 1994; for empirical evidence, see Bowling et al., 2010). Organizational citizenship behavior and turnover intention are two relevant performance indicators for organizations (G. Cohen et al., 2016; Koys, 2001). Organizational citizenship behavior concerns supportive gestures from employees that are valued by organizations, but are not linked directly to individual productivity or their contractual role expectations (Organ, 1988). Theory sug-gests that satisfied employees exhibit organizational citizenship behavior to reciprocate the favorable job conditions organizations offer (Organ, 1988). Meta-analytical evidence supports this theoretical contention (Dalal, 2005; LePine et al., 2002). Turnover intention, the intention to willingly change jobs or companies (Schyns et al., 2007), is a likely out-come from job dissatisfaction, as employees tend to avoid unpleasant work situations by displaying withdrawal behaviors. When job dissatisfaction persists, individuals tend to withdraw for good and leave (Hanisch & Hulin, 1991). Indeed, previous research sug-gests that the relationship between job satisfaction and turnover intention is negative (Bowling & Hammond, 2008; Tett & Meyer, 1993). Personality traits are also related to job satisfaction (Judge et al., 2002), but empirical studies indicate that this is not the case for all traits (Bowling et al., 2018; Bui, 2017; Harvey & Martinko, 2009; Judge et al., 2002). Two examples are need for cognition, “the need to structure relevant situations in meaningful, integrated ways” (A. R. Cohen et al., 1955, p. 291), and openness, “the breadth, depth, and permeability of consciousness, and in the recurrent need to enlarge and examine experience” (McCrae & Costa Jr, 1997, p. 826). A plausible explanation for this nonsignificant correlation is that openness to experience and need for cognition are positively related to job satisfaction for some jobs (e.g., entrepreneurs and jobs where one can learn), while it may be negatively correlated to job satisfaction in other jobs (e.g., boring and uncreative jobs), rendering the overall correlation between the two personality traits and job satisfaction nonsignificant (Bui, 2017).
Taking theoretical justifications and empirical evidence into consideration, we expect that text measures of job satisfaction will significantly correlate with measures of task variety, job autonomy, person-organization fit, life satisfaction, organizational citizen-ship behavior and turnover intention, while we do not expect it to correlate significantly with measures of need for cognition and openness.
7.1.3. Qualifying job satisfactionIn this part of the study, we want to show that semi-open-ended questions can be used to obtain insights that closed questions may not provide. As respondents themselves
chapter 7 | Unpacking the potential of semi-open-ended job satisfaction questions
160
know best what the sentiment in their responses is, we use their ratings for our analyses on qualifying job satisfaction.
7.1.3.1. Context-dependency of sentiment ratingsCan all words be assigned a single sentiment rating or are sentiment ratings gener-ally context-dependent? Previous research indicates that the answer to this question is probably somewhere in the middle (McKenny et al., 2018; Short et al., 2010). Some words are likely to have a less ambiguous meaning across contexts, such as “love” and “enjoy”. Other words evoke divergent sentiments depending on the sentiment of the words that they are used along with. As an illustration, the word “challenging” might evoke a positive meaning when it is used with adjectives, such as “engaging” and/or “satisfying”, rather than when it is used with adjectives, such as “stressful” and/or “overwhelming”. Following this reasoning, we expect that words will vary substantially depending on the extent to which they can reliably be assigned a single sentiment score.
7.1.3.2. Balancing job characteristicsEven if our semi-open-ended question does not produce detailed information about the cognitive appraisal of job facets, it may offer some ideas about the job characteristics that influence it. One avenue of research we found particularly interesting is: examining the unfavorable job characteristics that respondents are willing to accept in light of unfavorable job characteristics. For instance, respondents may accept the boring nature of their job if it gives them job security.
7.2. MethoDs
7.2.1. Participants and data collectionWe collected our data through Prolific, a virtual crowdsourcing platform where people get compensated to complete tasks Prolific workers tend to provide reliable data and turned out to be more honest and more diverse in terms in terms of geographical location and ethnicity than respondents from other crowdsourcing platforms, such as Amazon’s Mechanical Turk (Peer et al., 2017). Using Prolific’s filtering system, we selected people from the United States of America, who worked at least 20 hours a week and had an approval rate of 80% or higher. We followed recommendations from Prolific for the height of the respondent compensation and paid respondents an amount of $1.31 for 10 minutes of work. The data collection procedure resulted in 395 responses. Most respondents were male (56.0%). The large majority of respondents had at least some college experience (94.2%). Most respondents had a permanent employment contract (76.5%). The average age was 35.1 (SD = 10.2). The average number of work hours and
7
161
number of years of experience within their organization were 37.7 (SD = 7.8) and 5.2 (SD = 5.0), respectively. Of all the respondents, 32.6% had a managerial position in an organization.
The research context classifies as a low-stake environment, which may have introduced the issue of careless responding in our data (Curran, 2016; Fleischer et al., 2015). To ad-dress this problem, we flagged careless respondents based on three criteria: average response time per item, item consistency on a semantic antonym and Mahalonobis distance (Curran, 2016; Meade & Craig, 2012). We adopted the cut scores set for 95% specificity from Goldammer et al. (2020) for average response time per item and the Mehalonobis distance. We considered responses to be inconsistent if the absolute differ-ence between the two reverse-item scored items was equal or larger than 2. The criteria pointed towards three different samples of careless respondents. We constructed three reduced samples based on the omission of the three samples of careless respondents.
The first sample contained individuals who excluded respondents who took less than 5.56 seconds to complete a survey item, on average (N = 232). The second sample ex-cluded respondents where the absolute difference in scores to the following two items measuring openness (i.e., “I tend to vote for liberal political candidates.” and “I tend to vote for conservative political candidates.”), each rated on a 5-point Likert scale, was higher or equal to 2 (N = 290). We deemed this item suitable for careless responding analyses, as the two items are antonyms and the bivariate correlation between the items in the whole sample was high (r = -0.79). The third sample excluded respondents with a Mehalonobis distance higher than 94.81, computed over 52 items (N = 381).
7.2.2. MeasuresInternal consistency of the instruments was tested using McDonald’s (1999) omega (ω) (Dunn et al., 2014). The closed question survey scales’ internal consistency statistics were considered sufficient, as all the values were equal to or above 0.80 (Nunnally & Bernstein, 1994), see Table 7.3. We constructed measures by computing unweighted averages of all items, unless specified differently.
7.2.2.1. Job satisfactionJob satisfaction was measured using the 3-item Michigan Organizational Assessment Questionnaire Job Satisfaction Subscale (MOAQ-JSS, Cammann et al., 1979). The MOAQ-JSS has been validated (Bowling & Hammond, 2008). The answer categories from the MOAQ-JSS ranged on a scale from 1 (strongly disagree) to 7 (strongly agree). An example item is “All in all, I am satisfied with my job.” In addition, we measured job satisfaction using a semi-open-ended question, which reads “Which three to five adjectives come to mind when you think of your job as a whole?”
chapter 7 | Unpacking the potential of semi-open-ended job satisfaction questions
162
7.2.2.2. Task varietyTask variety was measured using a 4-item scale from the Work Design Questionnaire (Morgeson & Humphrey, 2006), with response categories ranging from 1 (strongly agree) to 5 (strongly disagree). A sample item is “The job involves a great deal of task variety.”
7.2.2.3. Job autonomyJob autonomy was measured using a 3-item scale from the Work Design Questionnaire with response categories ranging from 1 (strongly agree) to 5 (strongly disagree). A sample item is “The job allows me to make a lot of decisions on my own.”
7.2.2.4. Person-organization fitPerson-organization fit was measured using a 3-item scale developed by Cable and Judge (1996), with response categories ranging from 1 (not at all) to 5 (completely). A sample item is “My values match those of current employees in my organization.”
7.2.2.5. Life satisfactionLife satisfaction was measured using the 5-item Satisfaction With Life Scale (SWLS, Die-ner et al., 1985), with response categories ranging from 1 (strongly disagree) to 7 (strongly agree). The item scores were summed up into one aggregate measure. A sample item is “In most ways my life is close to ideal.”
7.2.2.6. Organizational citizenship behaviorOrganizational citizenship behavior was measured using the 10-item short version of the Organizational Citizenship Behavior Checklist (Spector et al., 2010). The scale had response categories ranging from 1 (never) to 5 (every day). A sample item is “I worked weekends or other days off to complete a project or task”.
7.2.2.7. Turnover intentionTurnover intention was measured using the 3-item turnover intention subscale in the MOAQ (Cammann et al., 1979), where the questions had to be answered using catego-ries ranging from 1 (strongly disagree) to 5 (strongly agree). A sample item is “How likely is it that you will actively look for a new job in the next year?”
7.2.2.8. Need for cognitionNeed for cognition was measured using the 10-item Need For Cognition Scale (Cacioppo & Petty, 1982). Answer categories ranged from 1 (strongly disagree) to 5 (strongly agree). A sample item is: “I like to solve complex problems”.
7
163
7.2.2.9. OpennessOpenness was measured using a 10-item scale from the NEO Personality Inventory (Costa & McCrae, 1985), and had response categories ranging from 1 (strongly disagree) to 5 (strongly agree). A sample item is “I have a vivid imagination”.
7.2.3. Data processing and statistical analysisData pre-processing and validity testing was done in the software program R (R Core Team, 2018). All scripts and the data are made available as supplementary material.
7.2.3.1. Analyses for text measure constructionIn our study, we used SentimentR (Rinker, 2019) and Linguistic Inquiry and Word Count (LIWC) 201516 (Pennebaker, Boyd, et al., 2015) to compute the sentiment ratings of the semi-open-ended questions. We selected these software packages, as Wijngaards et al. (2019) found that sentiment scores from these software packages most closely resembled the sentiment scores produced by independent human coders (rSentimentR =.77 and rLIWC2015 = 0.78).
SentimentR is a freely available sentiment analysis package written in R (R Core Team, 2018). It uses, by default, the English sentiment dictionary of Jockers (2017), which con-tains 10,739 annotated words. This software package has been successfully deployed in several studies outside the survey methodology domain (e.g., Ikoro et al., 2018; Naldi, 2019; Rinker, 2019; Weissman et al., 2019). As SentimentR software incorporates the context of words in its sentiment ratings and the semi-open-ended questions ask re-spondents about three to five disconnected adjectives, we constructed the SentimentR measure in three steps: (1) classifying the individual adjectives in terms of sentiment, (2) re-coding these individual sentiment scores onto a scale from 1 (very negative), 2 (negative), 3 (neutral), 4 (positive) to 5 (very positive), and (3) averaging the scores into a final sentiment score.
The LIWC software is one of the most widely used computer-aided text analysis tech-niques in the organizational sciences (Short et al., 2018), and has been validated across a large number of studies (Pennebaker, Boyd, et al., 2015). LIWC2015 draws from an English dictionary of 620 positive words and 744 negative words. LIWC2015 does not explicitly contextualize the valence loadings of individual words. As we wanted to maximize the comparability of the LIWC2015 measure and SentimentR measure, we adopted the afore-mentioned three-step sentiment calculation procedure to create the LIWC2015 measure.
16 The Emotional Tone summary variable from LIWC 2015 was used (Cohn et al., 2004).
chapter 7 | Unpacking the potential of semi-open-ended job satisfaction questions
164
We tested the reliability of the SentimentR measure and the LIWC2015 measure in the current data by examining their convergence with text measures produced by humans (i.e., parallel-forms reliability, McKenny et al., 2018). We used the benchmark measure for this procedure. At the end of the survey, we asked respondents to separately an-notate all adjectives they previously used on a scale from 1 (very negative), 2 (negative), 3 (neutral), 4 (positive) to 5 (very positive). The question read: “How would you rate your previous answer in terms of sentiment/emotion?”
7.2.3.2. Analyses for empirical validationCorrelational analyses and single-factor CFAs were used to test the convergent validity of the text measures. The fit of a single-item CFA was considered adequate if the χ2-test is significant, the comparative fit index (CFI) value was above 0.95 and the standard-ized root mean square residuals (SRMR) and root mean square error of approximation (RMSEA) values were less than 0.06 (T. A. Brown, 2014; L. Hu & Bentler, 1999; Kline, 2015). Standardized factor loadings of the text measures should exceed 0.6 to be satisfactory (Matsunaga, 2010). Correlational analyses were used to test discriminant validity.
7.2.3.3. Analyses for contextualization of job satisfactionFor this part of the study, we only used the responses to the semi-open-ended question and the benchmark measure. For the analyses concerning the context-dependency of sentiment ratings, we computed the frequency of individual words and calculated the mean and SD of the sentiment ratings associated with each individual word. This dictionary allowed us to discover which words had divergent sentiment connotations depending on the sentiment of the other words provided by the respondent. We pro-duced three sub-dictionaries by splitting the complete dictionary based on the average sentiment rating by respondents: negative (mean < 2.5), neutral (2.5 ≤ mean ≤ 3.5) and positive (mean > 3.5).
For the analyses on the antecedents of job satisfaction, we concentrated on individual respondents’ word use and associated sentiment ratings. In specific, we averaged the individual sentiment ratings for each respondent and calculated the SD for each mean score. To illustrate this, let us consider two hypothetical respondents that responded with two adjectives. Respondent A used the adjectives “Bored” and “Safe” and, at the end of the survey, classified them as 1 (very negative), and 4 (positive), respectively. Respondent B used “Bored” and “Unhappy” and classified them as 1 (very negative) and 2 (negative), respectively. The mean sentiment (and SD) for rating for Respondent A and B would be 2.5 (2.12) and 1.5 (0.71), respectively. A high SD, in this context, thus points towards the use of both positive and negative words in a single answer. In our study, we reported findings based on a threshold for SD of 1.5, but checked the sensitivity of our

7
165
findings for a SD threshold of 1.0 and 2.0. We manually qualified the responses to the semi-open-ended question to map the job conditions that respondents with a high SD generally had to deal with and discussed its relationship with job satisfaction.
7.3. results
7.3.1. construction of textual job satisfaction measuresThe semi-open-ended question was generally understood well, as 61.6% of all words provided by respondents were adjectives. Nouns and verbs were the second and third most popular word categories, which is 22.0% and 12.8% of the total words, respectively. We did not omit any textual data, as many verbs and nouns have affective loadings too. The mean number of words per respondent was 4.5 with a SD of 1.2 words. The median was 5 words. Table 7.1 presents the fifteen most common words used by respondents who are dissatisfied with their job (MOAQ-JSS ≤ 3) as well as the respondents who are satisfied with their jobs (MOAQ-JSS ≥ 5).
To test whether SentimentR and LIWC2015 are appropriate software packages for senti-ment analysis in our context, we compared the text measures based on the two algo-rithms and the benchmark measure. Parallel-forms reliability for both the SentimentR measure (r = 0.80) and the LIWC2015 measure turned out to be satisfactory (r = 0.62). As apparent in the 0.18 difference in correlation coefficient and as visualized in Figure 7.1, the SentimentR measure more closely resembles the density plot from the benchmark
table 7.1 | Most frequently used words amongst satisfied and dissatisfied respondents
Dissatisfied with their job Satisfied with their job
Word N Word N
Boring 28 Fun 57
Stressful 13 Interesting 46
Tedious 9 Challenging 41
Annoying 8 Rewarding 28
Frustrating 6 Stressful 27
Demanding 5 Easy 21
Dull 5 Flexible 20
Exhausting 5 Fulfilling 17
Pointless 4 Helpful 17
Repetitive 4 Good 15
Underpaid 4 Busy 15
Slow 4 Important 14
Notes. N = Sample size.
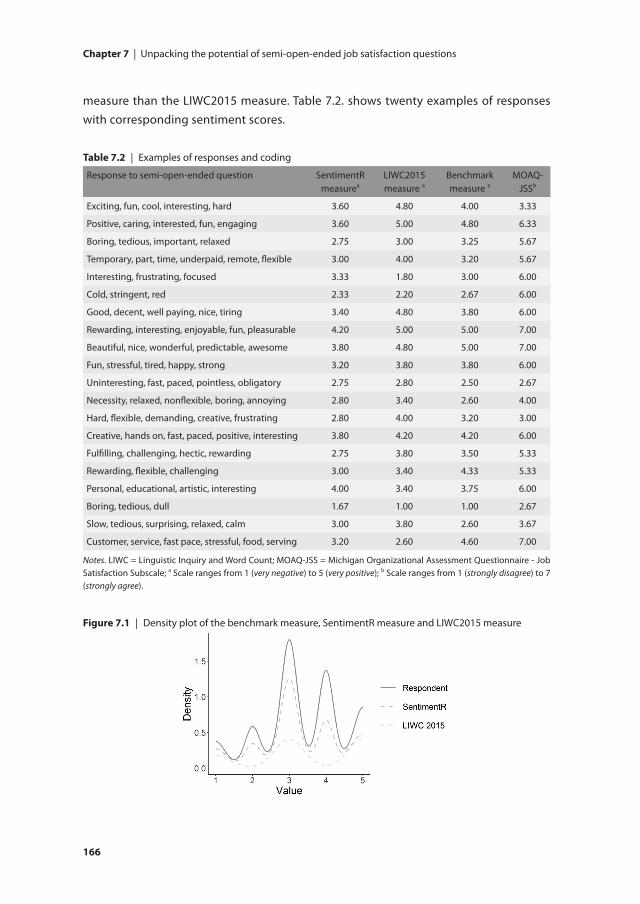
chapter 7 | Unpacking the potential of semi-open-ended job satisfaction questions
166
measure than the LIWC2015 measure. Table 7.2. shows twenty examples of responses with corresponding sentiment scores.
table 7.2 | Examples of responses and coding
Response to semi-open-ended question SentimentR measurea
LIWC2015 measure a
Benchmark measure a
MOAQ-JSSb
Exciting, fun, cool, interesting, hard 3.60 4.80 4.00 3.33
Positive, caring, interested, fun, engaging 3.60 5.00 4.80 6.33
Boring, tedious, important, relaxed 2.75 3.00 3.25 5.67
Temporary, part, time, underpaid, remote, flexible 3.00 4.00 3.20 5.67
Interesting, frustrating, focused 3.33 1.80 3.00 6.00
Cold, stringent, red 2.33 2.20 2.67 6.00
Good, decent, well paying, nice, tiring 3.40 4.80 3.80 6.00
Rewarding, interesting, enjoyable, fun, pleasurable 4.20 5.00 5.00 7.00
Beautiful, nice, wonderful, predictable, awesome 3.80 4.80 5.00 7.00
Fun, stressful, tired, happy, strong 3.20 3.80 3.80 6.00
Uninteresting, fast, paced, pointless, obligatory 2.75 2.80 2.50 2.67
Necessity, relaxed, nonflexible, boring, annoying 2.80 3.40 2.60 4.00
Hard, flexible, demanding, creative, frustrating 2.80 4.00 3.20 3.00
Creative, hands on, fast, paced, positive, interesting 3.80 4.20 4.20 6.00
Fulfilling, challenging, hectic, rewarding 2.75 3.80 3.50 5.33
Rewarding, flexible, challenging 3.00 3.40 4.33 5.33
Personal, educational, artistic, interesting 4.00 3.40 3.75 6.00
Boring, tedious, dull 1.67 1.00 1.00 2.67
Slow, tedious, surprising, relaxed, calm 3.00 3.80 2.60 3.67
Customer, service, fast pace, stressful, food, serving 3.20 2.60 4.60 7.00
Notes. LIWC = Linguistic Inquiry and Word Count; MOAQ-JSS = Michigan Organizational Assessment Questionnaire - Job Satisfaction Subscale; a Scale ranges from 1 (very negative) to 5 (very positive); b Scale ranges from 1 (strongly disagree) to 7 (strongly agree).
figure 7.1 | Density plot of the benchmark measure, SentimentR measure and LIWC2015 measure
7
167
7.3.2. empirical validationThe results of our correlation analyses, shown in Table 7.3, indicated convergence between the MOAQ-JSS and the text measures in varying degrees: the SentimentR mea-sure (r = 0.70, p < 0.01), the LIWC2015 measure (r = 0.55, p < 0.01) and the benchmark measure (r = 0.80, p < 0.01). The CFAs further corroborated convergent validity because the CFA model that included the SentimentR measure (χ2 [2] = 3.70, p = ns, CFI = 1.00, SRMR = 0.01, RMSEA = 0.05), the LIWC2015 measure (χ2 [2] = 0.54, p = ns, CFI = 1.00, SRMR = 0.00, RMSEA = 0.00) and the benchmark measure (χ2 [2] 0.45, p = ns, CFI = 1.00, SRMR = 0.00, RMSEA = 0.00) fitted the data very well. The standardized factor loadings of the SentimentR measure (λ = 0.72) and the benchmark measure (λ = 0.83) exceeded 0.60, while the standardized factor loading of the LIWC2015 measure did not (λ = 0.57). Notably, the factor loadings of the SentimentR measure and, in particular, the benchmark measure were generally in line with the loadings of the MOAQ-JSS items (CFA model including the SentimentR measure: λMOAQ-JSS1 = 0.93, λMOAQ-JSS2 = 0.85, λMOAQ-JSS3 = 0.92; CFA model including the benchmark measure: λMOAQ-JSS1 = 0.94, λMOAQ-JSS2 = 0.84, λMOAQ-JSS3 = 0.92). The factor loading of the LIWC2015 measure diverged quite substantially (λMOAQ-JSS1 = 0.94, λMOAQ-JSS2 = 0.84, λMOAQ-JSS3 = 0.92). Taken together, the convergent validity analyses showed that the SentimentR measure has better properties than the LIWC2015 measure, and that neither measure performed as well as the benchmark measure.
With respect to discriminant validity, the results indicated that the relationships between the text measures and their hypothesized antecedents (i.e., skill variety, autonomy and person-organization fit), correlate (i.e., life satisfaction), and outcomes (i.e., turnover intention and organizational citizenship behavior) were significant and in the expected direction (e.g., positive association with life satisfaction and negative association with turnover intention). The data also suggested that the SentimentR measure, the LIWC2015 measure and the benchmark measure only marginally correlated with need for cogni-tion and openness measure. All convergent correlations were higher than the average discriminant correlations. The results remained robust when testing our hypotheses on survey data from respondents who have not been flagged as careless.
7.3.3. contextualizing job satisfaction
7.3.3.1. Context-dependency of sentiment ratingsThe descriptive statistics in Table 7.4 show that words vary in the extent to which their sentiment rating is context dependent. Eight words, “overwhelming”, “uncertain”, “un-derpaid”, “complex”, “academic”, “official”, “educational”, and “rewarding”, had a SD of 0, and thus an unequivocal meaning. Put differently, we can be quite certain that these words can have a single sentiment rating assigned to them: positive, neutral or negative. Other words had much higher SDs, such as “demanding”, “exhausting”, “repetitive”, “differ-
chapter 7 | Unpacking the potential of semi-open-ended job satisfaction questions
168
ent”, “variable” and “easy”, implying that the meaning, and thus the sentiment rating of these words depend on the words they are used in conjunction with.
To illustrate this point, let us consider the word “easy”. With a mean score of 3.72, it was generally rated as positive. When we focused on individual responses and considered the SD of 0.96, we noticed that the word was rated as negative when combined with words such as “boring”, “repetitive”, “unchallenging”, “tedious” and “monotonous”. When used in conjunction with words such as “stress-free”, “easy-going”, “fun”, “safe”, “relaxing” and “slow”, it was rated more positively.
7.3.3.2. Balancing job characteristicsFor this part of the analysis, we were interested in respondents who provided words with varying sentiment meanings, as demonstrated in a SD of 1.5 to the average sentiment rating.17 Two examples of responses with high SDs were “Boring, Easy, Slow, Secure” and “Flexible, Challenging, Unpredictable, Stressful”. The respondent that provided the first example indicated that the first and third word are negative, the second word is neutral, and the fourth word is positive. The respondent that provided the second example indi-cated that the first two words are positive and the last two are negative. The mean (and SD) sentiment ratings for the two responses were 2.75 (1.48) and 3.00 (1.58), respectively.Looking at word frequencies, we noticed that certain words were used particularly often. Organized from the most to the least frequently used (count between brackets), respondents used the following positive words: “interesting” (15), “fun” (15), “challeng-ing” (14), “rewarding” (10), “flexible” (9), “easy” (9), “creative” (7), “engaging” (5), “social” (5), “fast” (5), “helpful” (5), “important” (4), “fulfilling” (4), “exciting” (4), “technical” (4) and “satisfying” (4).
The following negative words were most often used: “stressful” (23), “boring” (13), “frus-trating” (10), “tiring” (9), “underpaid” (6), “exhausting” (5), “demanding” (5), “slow” (4) and “repetitive” (4).
A qualitative analysis of these instances suggests that the common factor behind a substantial part of the most frequently occurring positive words is intrinsic motiva-tion (Hackman & Oldham, 1976). People either enjoy doing their work tasks (e.g., “fun”, “interesting”, “challenging” and “engaging”) or believe that their work is important (e.g., “rewarding”, “fulfilling”, “important” and “helpful”).
The negative words can also be categorized into higher-order categories. Except for the word “underpaid”, all words have either a connotation with a job that is too demanding or a job that is not demanding enough. Overall, these findings suggest that a segment of
17 A sensitivity analysis for other SD cut-off values (i.e., 1.0 and 2.0) did not alter the results.
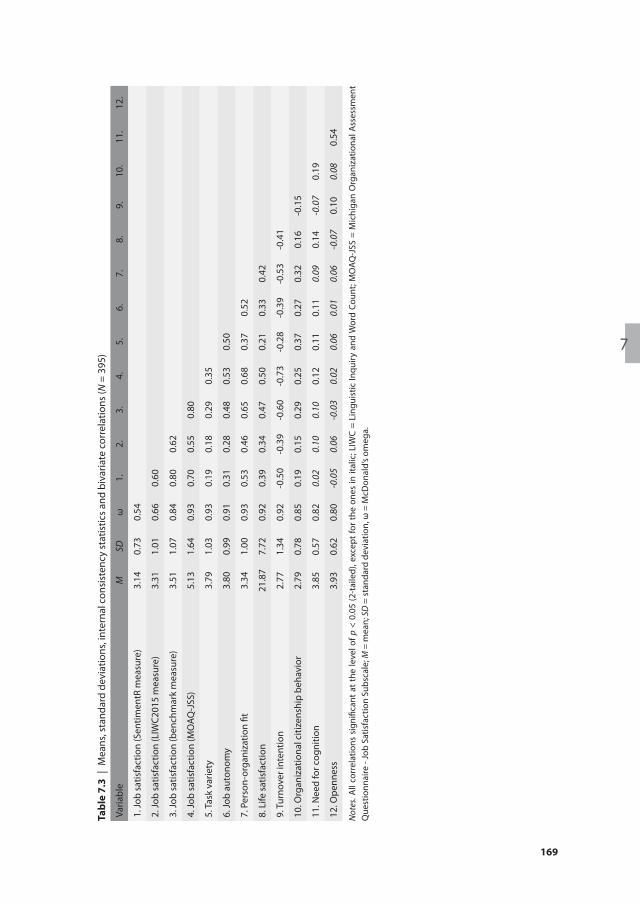
7
169
tabl
e 7.
3 |
Mea
ns, s
tand
ard
devi
atio
ns, i
nter
nal c
onsi
sten
cy s
tatis
tics
and
biva
riate
cor
rela
tions
(N =
395
)
Varia
ble
MSD
ω1.
2.3.
4.5.
6.7.
8.9.
10.
11.
12.
1. Jo
b sa
tisfa
ctio
n (S
entim
entR
mea
sure
)3.
140.
730.
54
2. Jo
b sa
tisfa
ctio
n (L
IWC2
015
mea
sure
)3.
311.
010.
660.
60
3. Jo
b sa
tisfa
ctio
n (b
ench
mar
k m
easu
re)
3.51
1.07
0.84
0.80
0.62
4. Jo
b sa
tisfa
ctio
n (M
OAQ
-JSS
)5.
131.
640.
930.
700.
550.
80
5. T
ask
varie
ty3.
791.
030.
930.
190.
180.
290.
35
6. Jo
b au
tono
my
3.80
0.99
0.91
0.31
0.28
0.48
0.53
0.50
7. P
erso
n-or
gani
zatio
n fit
3.34
1.00
0.93
0.53
0.46
0.65
0.68
0.37
0.52
8. L
ife s
atis
fact
ion
21.8
77.
720.
920.
390.
340.
470.
500.
210.
330.
42
9. T
urno
ver i
nten
tion
2.77
1.34
0.92
-0.5
0-0
.39
-0.6
0-0
.73
-0.2
8-0
.39
-0.5
3-0
.41
10. O
rgan
izat
iona
l citi
zens
hip
beha
vior
2.79
0.78
0.85
0.19
0.15
0.29
0.25
0.37
0.27
0.32
0.16
-0.1
5
11. N
eed
for c
ogni
tion
3.85
0.57
0.82
0.02
0.10
0.10
0.12
0.11
0.11
0.09
0.14
-0.0
70.
19
12. O
penn
ess
3.93
0.62
0.80
-0.0
50.
06-0
.03
0.02
0.06
0.01
0.06
-0.0
70.
100.
080.
54
Not
es. A
ll co
rrel
atio
ns s
igni
fican
t at
the
leve
l of p
< 0
.05
(2-t
aile
d), e
xcep
t fo
r the
one
s in
ital
ic; L
IWC
= Li
ngui
stic
Inqu
iry a
nd W
ord
Coun
t; M
OAQ
-JSS
= M
ichi
gan
Org
aniz
atio
nal A
sses
smen
t Q
uest
ionn
aire
- Jo
b Sa
tisfa
ctio
n Su
bsca
le; M
= m
ean;
SD
= s
tand
ard
devi
atio
n, ω
= M
cDon
ald’
s om
ega.
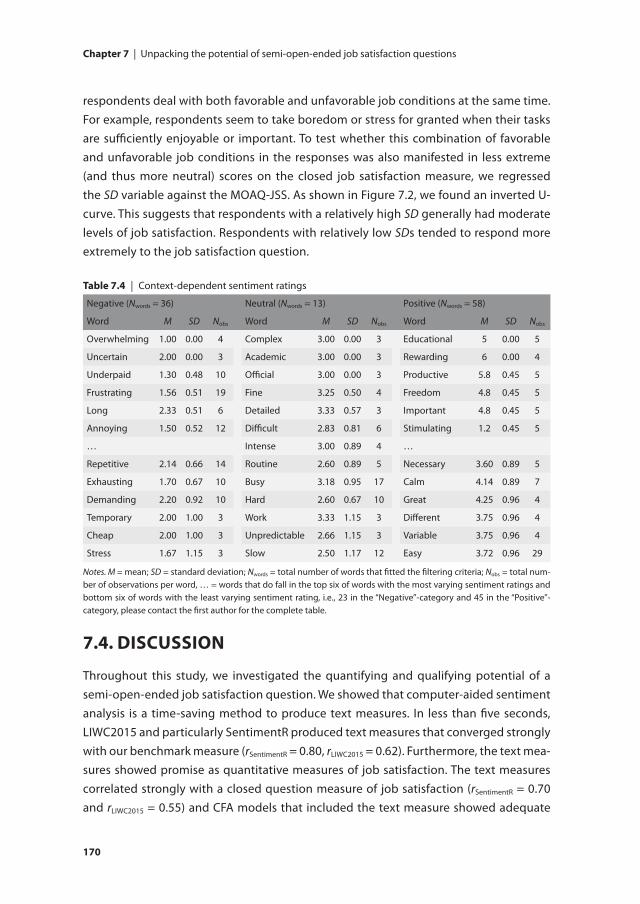
chapter 7 | Unpacking the potential of semi-open-ended job satisfaction questions
170
respondents deal with both favorable and unfavorable job conditions at the same time. For example, respondents seem to take boredom or stress for granted when their tasks are sufficiently enjoyable or important. To test whether this combination of favorable and unfavorable job conditions in the responses was also manifested in less extreme (and thus more neutral) scores on the closed job satisfaction measure, we regressed the SD variable against the MOAQ-JSS. As shown in Figure 7.2, we found an inverted U-curve. This suggests that respondents with a relatively high SD generally had moderate levels of job satisfaction. Respondents with relatively low SDs tended to respond more extremely to the job satisfaction question.
7.4. Discussion
Throughout this study, we investigated the quantifying and qualifying potential of a semi-open-ended job satisfaction question. We showed that computer-aided sentiment analysis is a time-saving method to produce text measures. In less than five seconds, LIWC2015 and particularly SentimentR produced text measures that converged strongly with our benchmark measure (rSentimentR = 0.80, rLIWC2015 = 0.62). Furthermore, the text mea-sures showed promise as quantitative measures of job satisfaction. The text measures correlated strongly with a closed question measure of job satisfaction (rSentimentR = 0.70 and rLIWC2015 = 0.55) and CFA models that included the text measure showed adequate
table 7.4 | Context-dependent sentiment ratings
Negative (Nwords = 36) Neutral (Nwords = 13) Positive (Nwords = 58)
Word M SD Nobs Word M SD Nobs Word M SD Nobs
Overwhelming 1.00 0.00 4 Complex 3.00 0.00 3 Educational 5 0.00 5
Uncertain 2.00 0.00 3 Academic 3.00 0.00 3 Rewarding 6 0.00 4
Underpaid 1.30 0.48 10 Official 3.00 0.00 3 Productive 5.8 0.45 5
Frustrating 1.56 0.51 19 Fine 3.25 0.50 4 Freedom 4.8 0.45 5
Long 2.33 0.51 6 Detailed 3.33 0.57 3 Important 4.8 0.45 5
Annoying 1.50 0.52 12 Difficult 2.83 0.81 6 Stimulating 1.2 0.45 5
… Intense 3.00 0.89 4 …
Repetitive 2.14 0.66 14 Routine 2.60 0.89 5 Necessary 3.60 0.89 5
Exhausting 1.70 0.67 10 Busy 3.18 0.95 17 Calm 4.14 0.89 7
Demanding 2.20 0.92 10 Hard 2.60 0.67 10 Great 4.25 0.96 4
Temporary 2.00 1.00 3 Work 3.33 1.15 3 Different 3.75 0.96 4
Cheap 2.00 1.00 3 Unpredictable 2.66 1.15 3 Variable 3.75 0.96 4
Stress 1.67 1.15 3 Slow 2.50 1.17 12 Easy 3.72 0.96 29
Notes. M = mean; SD = standard deviation; Nwords = total number of words that fitted the filtering criteria; Nobs = total num-ber of observations per word, … = words that do fall in the top six of words with the most varying sentiment ratings and bottom six of words with the least varying sentiment rating, i.e., 23 in the “Negative”-category and 45 in the “Positive”-category, please contact the first author for the complete table.
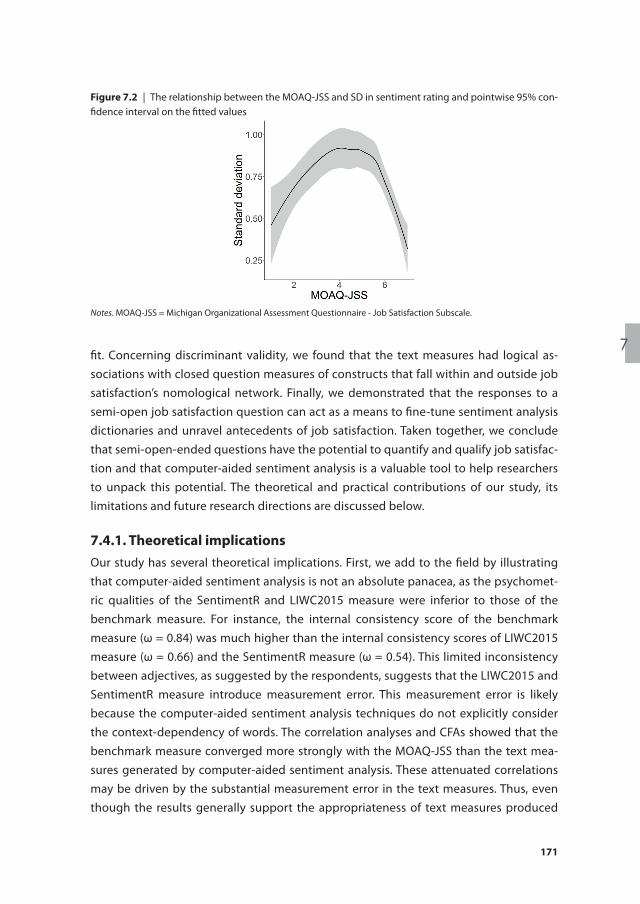
7
171
fit. Concerning discriminant validity, we found that the text measures had logical as-sociations with closed question measures of constructs that fall within and outside job satisfaction’s nomological network. Finally, we demonstrated that the responses to a semi-open job satisfaction question can act as a means to fine-tune sentiment analysis dictionaries and unravel antecedents of job satisfaction. Taken together, we conclude that semi-open-ended questions have the potential to quantify and qualify job satisfac-tion and that computer-aided sentiment analysis is a valuable tool to help researchers to unpack this potential. The theoretical and practical contributions of our study, its limitations and future research directions are discussed below.
7.4.1. theoretical implicationsOur study has several theoretical implications. First, we add to the field by illustrating that computer-aided sentiment analysis is not an absolute panacea, as the psychomet-ric qualities of the SentimentR and LIWC2015 measure were inferior to those of the benchmark measure. For instance, the internal consistency score of the benchmark measure (ω = 0.84) was much higher than the internal consistency scores of LIWC2015 measure (ω = 0.66) and the SentimentR measure (ω = 0.54). This limited inconsistency between adjectives, as suggested by the respondents, suggests that the LIWC2015 and SentimentR measure introduce measurement error. This measurement error is likely because the computer-aided sentiment analysis techniques do not explicitly consider the context-dependency of words. The correlation analyses and CFAs showed that the benchmark measure converged more strongly with the MOAQ-JSS than the text mea-sures generated by computer-aided sentiment analysis. These attenuated correlations may be driven by the substantial measurement error in the text measures. Thus, even though the results generally support the appropriateness of text measures produced
figure 7.2 | The relationship between the MOAQ-JSS and SD in sentiment rating and pointwise 95% con-fidence interval on the fitted values
Notes. MOAQ-JSS = Michigan Organizational Assessment Questionnaire - Job Satisfaction Subscale.
chapter 7 | Unpacking the potential of semi-open-ended job satisfaction questions
172
by computer-aided sentiment analysis as a job satisfaction measure, our findings also suggest that its reliability still has considerable room for improvement.
Secondly, to the best of our knowledge, we are among the first to systematically test the content, convergent, and discriminant validity of text measures of job satisfaction. Most previous research investigated the convergence between text measures and the responses to ad-hoc job satisfaction measures (e.g., Borg & Zuell, 2012; Poncheri et al., 2008; Taber, 1991; Wijngaards et al., 2019) or did not consider convergent validity at all (e.g., Jung & Suh, 2019; Moniz & Jong, 2014; Young & Gavade, 2018). In our study, we adopted a traditional instrument validation approach. We tested the text measures’ va-lidity with well-established multiple-item survey instruments and employed techniques that control for same-source variance. Based on our findings, we tentatively argue that semi-open-ended questions can be used to measure the level of job satisfaction.
Finally, we examined the qualitative value of semi-open-ended questions over closed question measures. We found that the responses to our semi-open-ended question could be used to fine-tune the reliability of a computer-aided sentiment analysis dic-tionary. Analyses showed that words differ in the degree to which they can be labelled with a single sentiment rating. More specifically, certain words can have both positive and negative connotations depending on the words they are used in conjunction with. For instance, words such as “stressful” and “busy” often do not represent stressors that are harmful for well-being if they are combined with more positive words such as “en-thusiastic” and “fulfilling”. By contrast, words such as “underpaid” and “overwhelming” always have negative connotations. This finding supports the proposition that stress-ful job demands such as job complexity and work pressure do not necessarily lead to reduced subjective well-being (Bakker & Demerouti, 2017; Van den Broeck et al., 2010). These results highlight the importance of transforming context-free dictionaries into domain-specific dictionaries to guarantee optimal reliability of text measures (e.g., treat-ing “challenging” as a slightly positive word, McKenny et al., 2018; Short et al., 2010). Finally, the semi-open-ended question allowed us to discover that respondents who use both positive and negative words are often striking a balance between experiencing boredom or stress, on the one hand, and intrinsic motivation, on the other. This illus-trates the intricate ways in which job characteristics contribute to employee well-being, for example, some occupations might be deemed highly meaningful, but at the same time have unfavorable job characteristics (Allan et al., 2018), e.g., nursing (Zangaro & Soeken, 2007).
7.4.2. Practical implicationsIn today’s competitive and fast-paced economy, organizations are compelled to maxi-mize employee well-being (Guest, 2017). To design high-quality well-being interven-
7
173
tions, organizations must first obtain adequate insights about their employees’ work-related well-being and its drivers (Macey & Schneider, 2008). To obtain this information, human resource practitioners typically request employees to complete surveys about their work experience and job attitudes (Gerrad & Hyland, 2020). In the design of such surveys, they typically face a challenging trade-off between information richness and the minimization of respondent burden (G. G. Fisher et al., 2016; Fuchs & Diamantopou-los, 2009). For example, practitioners may be reluctant to administer surveys containing multiple, lengthy closed question scales with good measurement quality because they are associated with considerable opportunity costs and provide no opportunity for contextualization (Krosnick, 1999). On the other hand, practitioners may be hesitant to use open-ended questions that may provide valuable context to a survey because converting raw textual data into reliable text measures is a challenging task and may feel daunting to many. We argue that the semi-open job satisfaction question has the promise to quantify and qualify job satisfaction, and that it therefore functions as a valu-able addition to an employee survey. Practitioners can leverage existing code (e.g., our code included in the supplementary materials) and well-established sentiment analysis software to construct text measures, which can be used both as a valid quantitative measure of job satisfaction, as well as input for the qualification of other quantitative measures. As an illustration of the latter, responses can be used to identify the most pertinent antecedents of job satisfaction in a particular group of employees (e.g., Table 7.1). Additionally, responses to the semi-open-ended question may help organizational researchers to communicate research findings to individuals with limited experience with quantitative analysis (Borg & Zuell, 2012). An anecdote obtained from a semi-open-ended question can, for example, provide an intuitive illustration of improvement areas and make abstract research findings feel more relatable (Glaser et al., 2009; Rynes, 2012).
7.4.3. limitations and future researchThis study has several limitations that should be noted. For instance, even though the correspondence of the text measures were substantial, the validation evidence gener-ally corresponded with the evidence of the benchmark measure, as reliability of text measures produced by computer-aided sentiment analysis was not perfect. Considering the importance of the accuracy of a computer-aided text analysis technique in the valid-ity of a text measure (McKenny et al., 2018; Short et al., 2010), we recommend research-ers to develop more reliable techniques to construct text measures and come closer to the measurement-error-free sentiment measure. One approach would be to tailor generic dictionaries like the one of Jockers (2017) or the LIWC (Pennebaker, Boyd, et al., 2015), so that text measures better align with the construct they intend or context of study (Taboada et al., 2011; for guidelines, see Short et al., 2010). The results of our study indicate that certain words will inherently differ in their sentiment rating depending on
chapter 7 | Unpacking the potential of semi-open-ended job satisfaction questions
174
their context. Therefore, it would therefore be valuable to move beyond lexicon-based sentiment analysis and to employ machine learning approaches to sentiment analysis (Zehner et al., 2016). Such approaches leverage pre-labeled texts to train algorithms, with the purpose of predicting (i.e. classifying) unlabeled textual instances, and are particularly useful for recognizing context-specific nuances (Taboada et al., 2011; for guidelines, see Kobayashi et al., 2017). Our data, which is included as supplementary material, can be used as training data for such endeavors. Alternatively, researchers could use publicly available self-rated job reviews from online platforms like Glassdoor (Jung & Suh, 2019; Moniz & Jong, 2014) or manually annotated texts as training data (Sheehan, 2018).
We did not leverage the full potential of the textual data, as we only constructed a measure of job satisfaction from the textual responses. We expect that the informa-tion derived from texts could also be used to measure other constructs, such as work engagement, job affect or emotional exhaustion. For example, theory-driven or data-driven dictionaries of particular job affect dimensions can be created (Short et al., 2010). A theory-driven lexicon could be produced by reviewing items taken from the Job-related Affective Well-being Scale (Van Katwyk et al., 2000) and consulting a thesaurus to create emotion-specific dictionaries. The Job-related Affective Well-being Scale’s boredom dimension could, for instance, be measured using a dictionary containing words such as “bored”, “monotonous”, “tedious”, “pointless”, “dull” and “dreary”. Using a more qualitative and data-driven approach, a dictionary could be generated by looking at the most frequently used words, and manually assigning them to word categories or themes. Software programs such as ATLAS.ti, NVivo and CAT Scanner can be used to help researchers annotate texts and create custom dictionaries (Short et al., 2018).
Furthermore, we cannot generalize our conclusions to open-ended questions in general. It is plausible that different kinds of open-ended questions provide different kinds of insights. Our study showed that a semi-open-ended question seems useful for measuring the level of job satisfaction, arguably more suitable than a completely open-ended question (Wijngaards et al., 2019). We expect that the responses to our semi-open-ended question are more suitable for quantifying job satisfaction than responses to an open-ended question, as they are more straightforward to process and analyze. However, the lack of complexity in responses to semi-open-ended ques-tions concurrently functions as its most important limitation compared to responses to entirely open-ended questions: they do not allow respondents to fully contextualize their responses. We, therefore, encourage researchers to investigate the qualifying and quantifying potential of completely open-ended questions and examine the reliability of computer-aided sentiment analysis techniques.
7
175
While entirely open-ended questions may be more useful for qualitative research, we expect that semi-open-ended questions could have additional potential for helping researchers quantify and qualify well-being. For example, our semi-open job satisfaction question could easily be reframed into a semi-open life satisfaction question (change ‘job as a whole’ to ‘life as a whole’). Questions, such as “What five aspects of your job contribute the most to your job satisfaction and how do they rank?” and “What words do you associate with work engagement?” could help organizational researchers unravel the constituents of multi-dimensional constructs such as work engagement (Briner, 2014; Purcell, 2014) and job satisfaction (Hsieh, 2012; Mastekaasa, 1984). A question like “In a best-case scenario, what job function would have in this organization in five years?” could aid practitioners to map the preferences of employees and design policies aimed at improving well-being.
Our validation procedure is subject to certain limitations. Even though some initial evidence suggests that text measures of job satisfaction have sufficient test-retest reliability (Wijngaards et al., 2019), we did not address it in this study. In addition, our reliance on self-report cross-sectional data is likely to have introduced measurement error, although mixing up different answering formats in theory mitigates the risk for common method bias (Podsakoff et al., 2003) and CFA helps control for same-source variance. Therefore, we recommend future researchers to combine self-report data with other-report data, like supervisor ratings of organizational citizenship behavior, and adopt a longitudinal research design. This data can be used to more robustly test the hypotheses from this study and explore other components of validity, such as predictive and incremental validity.
Our choice to collect data through Prolific limits the generalizability of our research find-ings. First and foremost, respondents did not come from the same professional context or company. The findings are therefore not generalizable to a typical employment sur-vey context. Second, respondents from online survey platforms such as Prolific often are very experienced survey takers and thus may have lost their naivety (Peer et al., 2017). This issue may not have biased our results too much because the purpose of our study was not immediately obvious for Prolific workers and employees in organizations are increasingly often asked to complete employee surveys (Gerrad & Hyland, 2020). Third, the motivation of the respondents in our sample to provide high-quality data may be unrepresentative for an average sample in a traditional employee survey. In our study, we did not have any item non-response because we paid Prolific workers to answer all questions and only considered workers with a high approval rating. In a traditional (corporate) survey context where respondents are not financially compensated, there is likely a higher risk of missing (text) data (Anseel et al., 2010; Scholz & Zuell, 2012). For these reasons, it would be interesting to replicate our validation study in other,
chapter 7 | Unpacking the potential of semi-open-ended job satisfaction questions
176
more natural contexts, such as an employee satisfaction survey in an organization, and investigate the generalizability of our results in subpopulations (e.g., blue-collar vs. white-collar workers, different industries) and across nations.
7.4.4. conclusionWe want to emphasize that closed questions are likely still the best strategy for quanti-fying well-being because the comparability of closed question measures is high, non-response is relatively low and validation is straightforward. However, we believe that semi-open (and open) survey questions can be asked alongside closed questions to fully realize the closed questions’ potential. As complements of closed questions, semi-open-ended questions could serve as a source of qualitative insights and means to cross-validate closed questions. Opportunely, computer-aided text analysis has the promise to mitigate the traditional obstacles, such as labor-intensiveness, that are typically associated with using textual data to study psychological constructs. We expect that the rapid advances in computational linguistics and its applications in psychological science will make computer-aided text analysis more reliable and spur new research avenues on the parallel use of the different types of survey instruments. It is not expected that any particular multiple-item survey scale will soon be labelled the gold standard for measur-ing all aspects of a psychological construct, such as job satisfaction, in every context. Therefore, we expect that “opening up of standardized surveys” (Singer & Couper, 2017, p. 128) and looking at constructs from different epistemological angles (Mauceri, 2016) will eventually allow researchers and employers to capture employees’ job evaluations and feelings more validly, and to generate better insights into what employees really thinking influences their job attitudes. This could be crucial for the development of more context-specific and allegedly more effective strategies to improve employee well-being.


8General discussion

8
181
Worker well-being is a hot topic in organizations and academia. More and more orga-nizations have a well-being strategy in place and invest in programs to improve worker well-being, giving rise to a billion-dollar industry. The scientific literature on worker well-being dates back more than a century, but is expanding rapidly. In particular, the popularity of survey assessment systems that capture well-being and its drivers is spiking. Perhaps unsurprisingly, a prerequisite for an effective worker well-being sur-vey is the rigorous measurement of the concept of worker well-being itself. After all, without sound data on worker well-being, data-driven insights on well-being problems, outcomes and interventions will be biased and, thus, be of limited value for evidence-based decision making. Three principles of rigorous worker well-being measurement were identified: (i) the examination of a broad selection of worker well-being constructs (or variables), (ii) the use of valid closed survey questions and (iii) the consideration of open-ended survey questions.
Yet, scholars and practitioners concerned with well-being assessment in organizations, such as experts from consultancy firms, in-house organizational behavior specialists and HR professionals, do not seem to invariably adhere to these principles, often focusing on a very narrow range of constructs, not using valid closed questions and disregarding open-ended questions. There is a practical and a technical challenge that may explain this discrepancy. The practical challenge for scholars and practitioners is that organiza-tions are regularly disinclined to administer surveys that put a heavy burden on their workers’ time and, therefore, obligate researchers to focus on a limited set of constructs and prioritize time-efficient measurement over valid measurement. The technical chal-lenge is that scholars and, in specific, practitioners lack the training to navigate the vast and scattered literature on the definition, operationalization and measurement of worker well-being, lack access to this literature, or both. The goal of this thesis is to offer scholars and practitioners conceptual and empirical guidance on how to deal with these practical and technical challenges and, thereby, improve the rigor of their worker well-being measurement in organizations. This guidance is organized around four research questions.(1) How can the concept of worker well-being be defined and operationalized into
constructs?(2) Which worker well-being constructs should be focused on in a survey?(3) What kind of closed survey questions are suitable for measuring worker well-being
constructs in organizations?(4) How can open-ended survey questions contribute to measuring worker-well-being
in organizations?
In this chapter, I use the insight from Chapters 2 to 7 to formulate an answer to these research questions. The answers to the first three research questions are based on
chapter 8 | General discussion
182
conceptual insights from Chapter 2 and empirical examples from Chapter 3 to 7. The answer to the fourth research question is based on theoretical overviews and empirical results from Chapters 6 and 7. After discussing the main findings, I reflect on this thesis’ strengths and limitations and discuss implications for scholars and practitioners in organizations. I conclude with a general conclusion.
8.1. Main finDinGs
8.1.1. how can the concept of worker well-being be defined and operationalized into constructs?Chapter 2 offered help with overcoming the technical challenges of navigating the scat-tered and vast literature on the definition and operationalization of worker well-being. This was done by offering two pieces of conceptual guidance.
First, Chapter 2 drew up conceptual boundaries of the term worker well-being and offered a holistic definition. It proposed that, at the most inclusive level, worker well-being can be understood as the general well-being of working people. It discussed the differences between worker well-being and other related concepts, such as employee well-being, well-being at work, work-specific well-being and general individual-level well-being. For example, worker well-being differs from employee well-being, as not all working people are employed by organizations. And, although most well-being con-structs are relevant for both employees and non-employed working people, there may be some exceptions. For instance, the construct of satisfaction with supervisor will be irrelevant for independent contractors and chief executive officers.
Second, Chapter 2 developed a comprehensive construct taxonomy that can be used to navigate the wide assortment of related, but distinct constructs that fall under the conceptual umbrella of worker well-being. This construct taxonomy distinguishes four construct dimensions: philosophical underpinning (hedonic vs. eudaimonia), temporal stability (trait-like vs. state-like), scope (context-free vs. domain-specific) and valence (positive vs. negative). For example, life satisfaction would classify as a hedonic, trait-like, context-free and positive worker well-being construct, while negative job emotions at work, such as anger and fear, would classify as a hedonic, domain-specific, state-like and negative worker well-being constructs.
Chapters 3 to 7 – summarized in terms of population, survey research design and stud-ied well-being constructs and measures in Table 8.1 – illustrated how many faces worker well-being has, studying a total of nine worker well-being constructs, i.e., job satisfac-tion, job facet satisfaction, work engagement, emotional exhaustion, perceived stress

8
183
at work, mood, life satisfaction, self-reported health and flourishing. In addition, these chapters exemplified that worker well-being constructs are empirically distinct, but related. For example, Chapter 3 and Chapter 7 reported a positive significant correlation between measures of life satisfaction and job satisfaction of r = 0.38 and r = 0.42, respec-tively. Linear regression analyses in Chapter 4 revealed that a person’s momentary mood on the day of completing the survey is a robust predictor of general work engagement (B = 0.36, SE = 0.06, p < 0.01). Chapter 6 showed that correlations between measures of general job satisfaction and measures of satisfaction with work content, pay, colleagues and other job facets ranged between r = 0.34 and r = 0.70.
8.1.2. Which worker well-being constructs should be focused on in a survey?Chapter 2 reiterated the importance of maximizing the number and diversity of well-being constructs to unravel well-being trade-offs and offered readers conceptual guid-ance in overcoming the practical and technical challenges that complicate this maxi-mization process. With an extremely broad operationalization being unfeasible in most organizational settings, Chapter 2 argued in favor of conceptual focus. It explained that this focus should be based on the careful analysis of the study objectives, the research questions and the employment situation of the workers of study as well as a thorough search for relevant constructs in scientific literature. Once a list of relevant constructs is composed, Chapter 2 recommended the selection of only those constructs that are con-ceptually and empirically distinct and could theoretically uncover well-being trade-offs. The proposed construct taxonomy could be a useful tool for unraveling the conceptual distinctiveness of worker well-being constructs and making a deliberate choice. For ex-ample, when evaluating the well-being enhancing potential of a new coffee machine, it would be logical to consider domain-specific constructs, such as satisfaction with facility management, and state-like constructs, such as momentary happiness while drinking coffee, in addition to broader constructs, such as job satisfaction.
Chapters 3 to 7 offered practical examples of how an evaluation of the research con-text and an analysis of established theory can be used to select relevant well-being constructs. In addition, several of these chapters offered support for the existence of well-being trade-offs. For example, drawing upon different strands of literature in oc-cupational and cognitive psychology, Chapter 5 selected perceived email interruptions as proximal well-being outcome variable, and emotional exhaustion and work engage-ment as distant well-being outcome variables. The analysis showed that the treatment – an intervention that stimulated participants to check their email only three times a day – had a significant effect on perceived email interruptions and emotional exhaus-tion, but not on work engagement. Chapter 7 made use of previous measure validation
chapter 8 | General discussion
184
research and well-established nomological networks to identify relevant determinants, outcomes and correlates as well as unrelated constructs. A correlational analysis showed that turnover intention was more strongly related to job satisfaction (r = -0.73) than to life satisfaction (r = -0.41), while the bivariate correlations between organizational citizenship behavior and the two well-being constructs differed only marginally (r = 0.24 and r = 0.16, respectively).
8.1.3. What kind of closed survey questions are suitable for measuring worker well-being constructs in organizations?Chapter 2 underlined the importance of selecting valid closed survey questions and validating collected survey data, and provided readers conceptual guidance on how to do this in practice. With lengthy multiple-item scales and intense longitudinal surveys being impractical in most settings, Chapter 2 recommended the reader to be pragmatic and search the literature for validated, time-efficient alternatives to the more time-consuming and costly measures. For example, if one wants to measure job affect using the experience sampling method, and an organization suggests a cross-sectional survey to do this, researchers can suggest the day reconstruction method as a valid alternative. If one wants to use well-established multiple-item scales to measure certain well-being constructs, and an organization rejects this idea because they want to keep the survey as short as possible, researchers might want to suggest validated single-item measures or shortened scales. As the literature on well-being measurement is not easily accessible to many practitioners and difficult to oversee for scholars, Chapter 2 composed a list of potentially useful closed question survey measures. In addition, as some may not be comfortable with survey data validation, Chapter 2 elucidated a number of important terms relating to measurement error, e.g., social desirability and careless responding, and validity testing, e.g., content, convergent, discriminant, predictive and incremental validity.
Chapters 3 to 7 contained examples of time-efficient, but valid measures of worker well-being constructs and different validation procedures. Readers can use the code and data, as provided in the Online Supplementary Materials of the published versions of the chapters, to learn about and experiment with data validation. As an illustration, Chapters 4 and 5 measured work engagement using the 3-item Utrecht Work Engage-ment Scale, a short and valid survey scale that matched the operational definition of work engagement used in the two studies. The use of a shortened scale was a necessity. Chapter 4 took place in the healthcare sector during the COVID-19 pandemic. The par-ticipating hospital demanded that the survey had to be as short as possible to keep the burden on the already heavily burdened workforce to a minimum. Chapter 5 required remote workers to report their work engagement in multiple bi-weekly surveys. The
8
185
participating financial services organization desired a very brief survey because it feared substantial survey fatigue.
8.1.4. how can open-ended survey questions contribute to measuring worker-well-being in organizations?Chapters 6 and 7 offered readers technical guidance on how to process textual data collected through open-ended survey questions and illustrated their relevance for measuring job satisfaction. Chapter 6 provided a rationale for why open-ended survey questions are a useful complement to closed questions for quantifying job satisfaction, discussed the differences between a completely open and a semi-open survey question and elaborated on the pros and cons of lexicon-based and learning-based computer-aided sentiment analysis techniques. Furthermore, it reflected on the various kinds of measurement error that may be introduced when constructing a textual measure (algorithm error, transient error, specific factor error). Chapter 7 zoomed in on the added value of the semi-open survey question for quantifying and qualifying job satisfaction and provided a basic introduction on how lexicon-based sentiment analysis works.
The empirical findings reported in the two chapters confirmed the hypothesized added value of open-ended questions. The textual measures based on completely open-ended and, in particular, semi-open-ended survey questions contained little measurement error and seemed to be valid measures of job satisfaction. Notably, the comparison of human-generated and computer-generated textual measures presented in Chapter 6 revealed that, although the human-generated measures are relatively more robust, computer-generated measures are sufficiently robust in absolute terms. This finding is encouraging, as readily available and relatively easily deployable lexicon-based senti-ment analysis techniques were used in the analyses, and the creation of a computer-generated measure is much less time-consuming that the production of a human-generated measure. In addition to verifying the quantifying potential of a semi-open survey question, Chapter 7 illustrated that the responses to this type of question can be used to tailor sentiment lexicons to particular study contexts and inductively examine sources of job satisfaction.
8.2. strenGths anD liMitations
This thesis has several strengths. This thesis in its entirety features a vast number of worker well-being operationalizations, measurement instruments and validation pro-cedures and, thereby, exemplifies that rigorous well-being measurement is possible in real-life, dynamic organizational settings. Below, the strengths of the individual chapters are discussed.
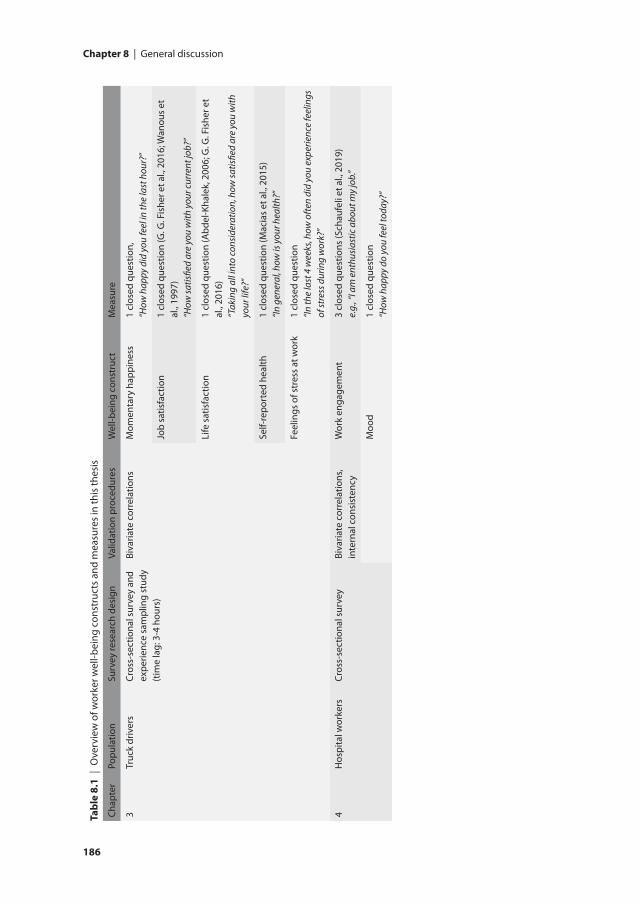
chapter 8 | General discussion
186
8
187
tabl
e 8.
1 |
Ove
rvie
w o
f wor
ker w
ell-b
eing
con
stru
cts
and
mea
sure
s in
this
thes
is
Chap
ter
Popu
latio
nSu
rvey
rese
arch
des
ign
Valid
atio
n pr
oced
ures
Wel
l-bei
ng c
onst
ruct
Mea
sure
3Tr
uck
driv
ers
Cros
s-se
ctio
nal s
urve
y an
d ex
perie
nce
sam
plin
g st
udy
(tim
e la
g: 3
-4 h
ours
)
Biva
riate
cor
rela
tions
Mom
enta
ry h
appi
ness
1 cl
osed
que
stio
n,“H
ow h
appy
did
you
feel
in th
e la
st h
our?
”
Job
satis
fact
ion
1 cl
osed
que
stio
n (G
. G. F
ishe
r et a
l., 2
016;
Wan
ous
et
al.,
1997
)“H
ow sa
tisfie
d ar
e yo
u w
ith y
our c
urre
nt jo
b?”
Life
sat
isfa
ctio
n1
clos
ed q
uest
ion
(Abd
el-K
hale
k, 2
006;
G. G
. Fis
her e
t al
., 20
16)
“Tak
ing
all i
nto
cons
ider
atio
n, h
ow sa
tisfie
d ar
e yo
u w
ith
your
life
?”
Self-
repo
rted
hea
lth1
clos
ed q
uest
ion
(Mac
ias
et a
l., 2
015)
“In g
ener
al, h
ow is
you
r hea
lth?”
Feel
ings
of s
tres
s at
wor
k1
clos
ed q
uest
ion
“In th
e la
st 4
wee
ks, h
ow o
ften
did
you
expe
rienc
e fe
elin
gs
of st
ress
dur
ing
wor
k?”
4H
ospi
tal w
orke
rsCr
oss-
sect
iona
l sur
vey
Biva
riate
cor
rela
tions
, in
tern
al c
onsi
sten
cyW
ork
enga
gem
ent
3 cl
osed
que
stio
ns (S
chau
feli
et a
l., 2
019)
e.g.
, “I a
m e
nthu
sias
tic a
bout
my
job.
”
Moo
d1
clos
ed q
uest
ion
“How
hap
py d
o yo
u fe
el to
day?
”
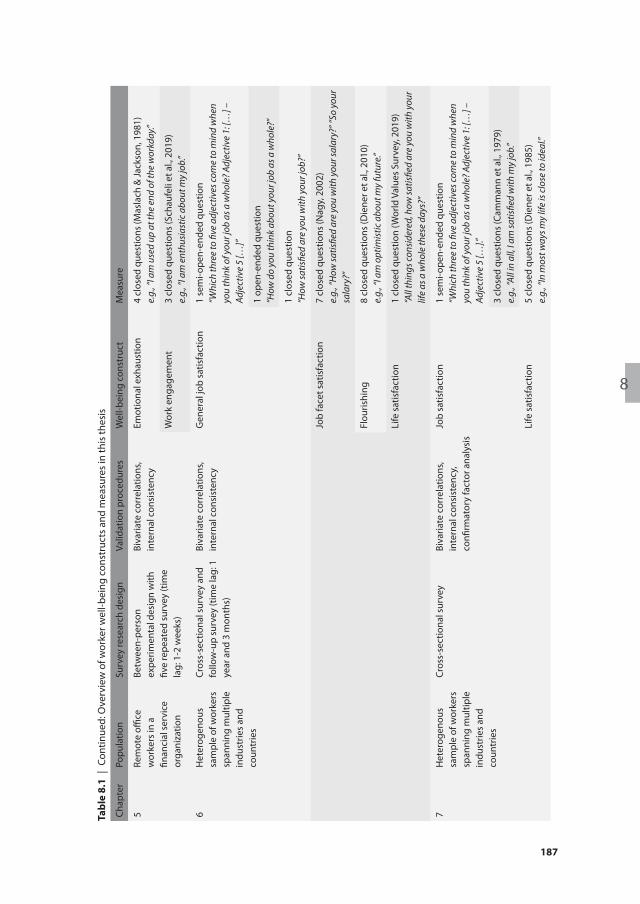
chapter 8 | General discussion
186
8
187
tabl
e 8.
1 |
Cont
inue
d: O
verv
iew
of w
orke
r wel
l-bei
ng c
onst
ruct
s an
d m
easu
res
in th
is th
esis
Chap
ter
Popu
latio
nSu
rvey
rese
arch
des
ign
Valid
atio
n pr
oced
ures
Wel
l-bei
ng c
onst
ruct
Mea
sure
5Re
mot
e offi
ce
wor
kers
in a
fin
anci
al s
ervi
ce
orga
niza
tion
Betw
een-
pers
on
expe
rimen
tal d
esig
n w
ith
five
repe
ated
sur
vey
(tim
e la
g: 1
-2 w
eeks
)
Biva
riate
cor
rela
tions
, in
tern
al c
onsi
sten
cyEm
otio
nal e
xhau
stio
n4
clos
ed q
uest
ions
(Mas
lach
& Ja
ckso
n, 1
981)
e.g.
, “I a
m u
sed
up a
t the
end
of t
he w
orkd
ay.”
Wor
k en
gage
men
t3
clos
ed q
uest
ions
(Sch
aufe
li et
al.,
201
9)e.
g., “
I am
ent
husi
astic
abo
ut m
y jo
b.”
6H
eter
ogen
ous
sam
ple
of w
orke
rs
span
ning
mul
tiple
in
dust
ries
and
coun
trie
s
Cros
s-se
ctio
nal s
urve
y an
d fo
llow
-up
surv
ey (t
ime
lag:
1
year
and
3 m
onth
s)
Biva
riate
cor
rela
tions
, in
tern
al c
onsi
sten
cyG
ener
al jo
b sa
tisfa
ctio
n1
sem
i-ope
n-en
ded
ques
tion
“Whi
ch th
ree
to fi
ve a
djec
tives
com
e to
min
d w
hen
you
thin
k of
you
r job
as a
who
le? A
djec
tive
1: […
] –
Adje
ctiv
e 5
[…]”
1 op
en-e
nded
que
stio
n“H
ow d
o yo
u th
ink
abou
t you
r job
as a
who
le?”
1 cl
osed
que
stio
n“H
ow sa
tisfie
d ar
e yo
u w
ith y
our j
ob?”
Job
face
t sat
isfa
ctio
n7
clos
ed q
uest
ions
(Nag
y, 2
002)
e.g.
, “H
ow sa
tisfie
d ar
e yo
u w
ith y
our s
alar
y?” ”
So y
our
sala
ry?”
Flou
rishi
ng8
clos
ed q
uest
ions
(Die
ner e
t al.,
201
0)e.
g., “
I am
opt
imis
tic a
bout
my
futu
re.”
Life
sat
isfa
ctio
n1
clos
ed q
uest
ion
(Wor
ld V
alue
s Su
rvey
, 201
9)“A
ll th
ings
cons
ider
ed, h
ow sa
tisfie
d ar
e yo
u w
ith y
our
life
as a
who
le th
ese
days
?”
7H
eter
ogen
ous
sam
ple
of w
orke
rs
span
ning
mul
tiple
in
dust
ries
and
coun
trie
s
Cros
s-se
ctio
nal s
urve
yBi
varia
te c
orre
latio
ns,
inte
rnal
con
sist
ency
, co
nfirm
ator
y fa
ctor
ana
lysi
s
Job
satis
fact
ion
1 se
mi-o
pen-
ende
d qu
estio
n“W
hich
thre
e to
five
adj
ectiv
es co
me
to m
ind
whe
n yo
u th
ink
of y
our j
ob a
s a w
hole
? Adj
ectiv
e 1:
[…] –
Ad
ject
ive
5 […
].”
3 cl
osed
que
stio
ns (C
amm
ann
et a
l., 1
979)
e.g.
, “Al
l in
all,
I am
satis
fied
with
my
job.
”
Life
sat
isfa
ctio
n5
clos
ed q
uest
ions
(Die
ner e
t al.,
198
5)e.
g., “
In m
ost w
ays m
y lif
e is
clo
se to
idea
l.”
chapter 8 | General discussion
188
First, Chapter 2 adopted a particularly inclusive approach towards synthesizing the vast and ever-expanding literature on definition, operationalization and measurement of worker well-being. Most previous research aimed at synthesizing this literature either restricted itself to a specific subfield, focused on either definition or measurement issues, or ignored the practical and ethical considerations surrounding the study of worker well-being. By adopting this broad, multi-disciplinary scope, Chapter 2 serves as a comprehensive guidebook of the most important considerations for selecting worker well-being constructs and closed question measures and points to dedicated references on specific topics.
Second, Chapters 3 to 5 exemplified the value of scholar-practitioner collaborations. For example, Chapter 3 originated from a research collaboration between our research team and the Dutch Sector Institute of Transportation and Logistics. This institute struggled with attracting new truck drivers and a major outflow of current drivers and wished for a deeper understanding of the problems in the workforce. Our collaboration resulted in a win-win situation: We were able to leverage the institute’s extensive network to recruit study participants and the sector instituted could benefit from our experience with studying well-being in organizations. Chapter 5 was based on a successful collaboration with a financial services organization that wanted to facilitate better working conditions for their remote workforce during the COVID-19 pandemic but lacked the capability to develop an adequate research methodology and intervention. With the help of our research team, the organization was able to implement an established intervention and make a well-informed decision on its effectiveness in their specific organizational context.
In addition, Chapters 3 to 5 offered robust evidence for the significance of considering moderators in the relationship between worker well-being and other variables. This is in line with recent propositions that suggest scholars should move from answering the question “what works?” to “what works for whom in which circumstances?” to instigate positive change in organizations (Nielsen & Miraglia, 2017, p. 40; Nielsen & Noblet, 2018; Nielsen, Randall, et al., 2010). Specifically, Chapter 3 showed that the degree to which driving the road contributes to the momentary happiness of truck drivers depends on traffic conditions. Chapter 4 revealed that cognitive crafting, a form of bottom-up work design, positively relates to the work engagement of remote healthcare workers, but not to the work engagement of frontline healthcare workers. Chapter 5 concluded that email batching – processing online messages only at certain times of the day – will only be beneficial for the well-being of remote office workers that receive many emails dur-ing the week.
8
189
Third, Chapter 6 and 7 introduced the reader to a potentially fruitful way of measur-ing worker well-being that is not yet widely embraced. Scholars can use this work to answer calls “to take measurement more seriously and to devote more attention to the creation of better well-being measures” (Schneider & Schimmack, 2009, p. 374; Brulé & Maggino, 2017; Diener, 2012). Practitioners in organization can use the insights from these chapters as inspiration to put the textual data that is already available in their organization to work.
This thesis also has various limitations that are worth mentioning. It has proven to be extremely challenging to follow all the thesis’ recommendations for rigorous worker well-being measurement in the individual chapters. An explanation for this is that in-dividual chapters were written as journal articles and thus had narrow research scopes and were subject to strict word limits. Additionally, my research practice has taught me that organizations are often not keen on fulfilling all scholars’ methodological desires (e.g., longitudinal or experimental research design, comprehensive well-being measure-ment). For example, Chapters 3, 4, 6 and 7 did not use the available data on different well-being constructs to unravel well-being trade-offs. Chapters 4, 5 and 6 only evalu-ated the internal consistency of the multiple-item measures but ignored other forms of validity testing; Chapter 7 was the only chapter that looked at careless response ten-dencies. Certain aspects of validity, such as measurement invariance and incremental validity, were not considered at all. Chapters 6 and 7 did not get around investigating the potential of learning-based sentiment analysis techniques.
Furthermore, the survey designs used in Chapters 3 to 7 were subject to a range of limi-tations. The first limitation concerns the use of different kinds of convenience samples, each subject to specific limitations (Landers & Behrend, 2015). The samples in Chapters 3 to 5 were drawn from single organizations or specific industries in the Netherlands, which limits the generalizability of results to other organizations, industries and countries. Af-ter all, research suggests that worker well-being differs significantly between countries, sectors and organizations, and that the importance of work characteristics differs across people (De Neve et al., 2018). Chapters 6 and 7 made use of Prolific, a virtual crowdsourc-ing platform where people can complete paid tasks, to obtain survey data. The fact that respondents are paid for their (complete) response is atypical for a traditional worker well-being survey in an organization, where survey participation is voluntary (Aguinis et al., 2020). Furthermore, Chapters 3 to 5 faced some of the methodological issues that were introduced in Chapter 1, such as survey non-response, panel attrition and care-less responding. In Chapter 3, for example, 24% of the truck drivers participating in the baseline survey participated in the subsequent experience sampling method study. In Chapter 4, 12% of the invited healthcare workers completed the survey. In Chapter 5,
chapter 8 | General discussion
190
51% of the selected employees completed both the pre- and the post-test. In Chapter 7, one analysis flagged 41% of the respondents as careless responders.
8.3. iMPlications for scholar anD Practitioners in orGanizations
This thesis has several implications for scholars and practitioners in organizations. The implications for both stakeholders are combined because the substantial practical and technical challenges associated with the rigorous measurement of worker well-being can most effectively be overcome if scholars and practitioners collaborate (D. J. Cohen, 2007; Huffman & Benson, 2021). For example, with scholars being trained and incentiv-ized to stay informed about the latest conceptual developments in the scientific litera-ture and to enrich and deploy their methodological toolboxes, practitioners will likely have to depend on scholars to ensure rigor in their measurement efforts (C. Gill, 2018; Marler & Boudreau, 2017). Practitioners’ time and resource investments, on the other hand, will remain indispensable to put worker well-being and data-driven decisions on organizations’ strategic agendas, to ensure that surveys are sufficiently time-efficient and tailored to the study context, but also to motivate workers to participate in survey research (Aguinis et al., 2014; Banks et al., 2016; Lapierre et al., 2018).
Against this background, I propose two specific areas for future scholar-practitioner col-laborations that directly follow from this thesis. First, this thesis demonstrated that the field of worker well-being is rife with constructs and closed question measures and that their suitability in a worker well-being survey depends on a large variety of factors, such as the research question, population of study and research design. This suggests that a gold standard for measuring worker well-being is and will probably remain lacking and that researchers should therefore take a ‘best fit’ approach. In practice, this means that scholars and practitioners are advised to leverage previous research to select fea-sible and valid closed questions and validate the data once collected and administer multiple measures in parallel. After the research, the parties are encouraged to share study results publicly so that individuals in the research community can learn from each other. In the end, these efforts will help well-being researchers to understand which constructs and measures are relevant in specific research contexts and uncover well-being trade-offs. As an additional benefit, these efforts offer opportunities to examine the empirical distinctiveness of worker well-being constructs and address the pervasive issue of construct proliferation, “research streams are built around ostensibly new con-structs that are theoretically or empirically indistinguishable from existing constructs” (Shaffer et al., 2016, p. 81), that characterizes the worker well-being field (Shuck et al., 2013, 2017). As an illustration, research suggested that employee engagement is not
8
191
clearly distinct from constructs like job burnout (Cole et al., 2012) and job satisfaction (Christian et al., 2011).
Second, future research is encouraged to replicate the results about the quantifying and qualifying value of open-ended questions in Chapters 6 and 7 in more natural contexts, such as an organizational survey, and look into other functions of open-ended survey questions. Two additional functions are already hinted upon in Chapters 3 to 5. Open-ended questions can help researchers to make the survey results more actionable for decision-makers (Borg & Zuell, 2012; Gilles et al., 2017; Stoneman et al., 2013). For exam-ple, an analysis of job activities and momentary happiness in Chapter 3 showed that the job category “Other” brought respondents the least happiness of all job activities. It is plausible that the inclusion of an open-ended question that asked respondents to label the job activities that were not mentioned in the fixed response categories would have helped decision-makers to get a better idea of the issues in truck drivers’ job description and develop more relevant interventions. The conclusion of Chapter 4 that cognitive crafting behavior is positively associated with remote workers’ work engagement, would probably have been more actionable for decision-makers if an open-ended question al-lowed respondents to specify the kinds of cognitive crafting behaviors they displayed at work. In addition, open-ended questions can help researchers to communicate survey results. Research from communication sciences suggests that narrative evidence – “the use of case stories or examples to indicate that the conclusions offered by the com-municator is true” (Allen & Preiss, 1997, p. 125) – may be more effective for changing attitudes than statistical evidence (Dunlop et al., 2010; Zebregs et al., 2015), especially when recipients are skeptical about the evidence in the first place (Slater, 2002). Anec-dotes from open-ended questions may therefore be used to convince decision makers of the importance of acting on survey results (Borg & Zuell, 2012) and sharing research findings with the mainstream media (Silber et al., 2020; D. C. Zhang, 2018). This point is illustrated by the interview quotes in the first paragraphs of Chapters 3 and 5 and the open-ended question responses in the Results section of Chapter 5.
There are two areas of research that were not explicitly covered in this thesis but are not less important for future research. Foremost, research is urged to also pay attention to the other prerequisites for effective worker well-being survey studies. For example, in most survey studies, it is not necessarily worker well-being per se that is of inter-est, but rather its relationship with other variables (e.g., well-being over time or across departments, well-being in relation to job characteristics). As a result, a typical worker well-being survey contains questions on work experience, work behaviors, preferences, suggestions and complaints (see the Method sections in Chapters 3 to 7 for examples). The selection of these measures arguably is even more challenging than the selection of well-being measures, as worker well-being measures are most often relevant for all
chapter 8 | General discussion
192
populations while measures on work experiences are not. For example, research shows that Utrecht Work Engagement Scale is a highly stable indicator of occupational well-being across occupations (Seppälä et al., 2009) and cultures (Balducci et al., 2010), while general questions about work experience may be open to interpretation (Choi et al., 2012) and may be perceived as irrelevant by certain workers (Nielsen et al., 2014). In addition, the choice of non-well-being measures may heavily affect the overall survey duration and burden on workers. For example, the time savings from using a brief well-being survey will be completely negated, if a researcher decides to also include a 100-item battery of questions asking about job characteristics and personality of work-ers. Furthermore, the actions that follow the design, collection and validation of survey data are pivotal in making a survey study count (Gerrad & Hyland, 2020). For example, survey data should be analyzed with state-of-the-art analytical techniques to ensure the robustness of research findings. Additionally, it is important to pay attention to the translation of the findings into policy proposals and encouragement of organizations to use these proposals for their policy making.
Furthermore, research can benefit from examining the complementary value of non-survey measures for capturing worker well-being. The triangulation of multiple mea-sures will enable researchers to offset the weaknesses of a single measure and obtain a more complete, deeper understanding of their constructs of study (Turner et al., 2017). For example, experience sampling produces measures of emotional well-being that are subject to careless response tendencies (Eisele et al., 2020), but not to recollection bias (Beal, 2015). In contrast, by their very nature, physiological indicators of emotional well-being, such as heart rate and blood pressure, are immune to response tendencies, but distorted by irrelevant variables, such as physical activity, coffee intake and alcohol consumption (Ilies et al., 2010). As another example, open-questions will, to a certain extent, be subject to social desirability biases (Silber et al., 2013; Vinten, 1995), while anonymous textual data published on job review websites are not (Jung & Suh, 2019; Moniz & Jong, 2014). Compared to open survey questions, the relevance of the anony-mous job reviews for identifying specific well-being problems in an organization and formulating relevant policies to solve them is debatable. The overview of measures in Chapter 2 describes a wide range of word, behavioral and physiological measures that may be used for future research and points the reader to relevant validity and feasibility considerations.
8.4. General conclusion
The already widespread interest in worker well-being and its measurement in organiza-tions is expected to grow in the years to come. In this thesis, I argued that it is important
8
193
to rigorously measure the concept of worker well-being itself, but that this is often chal-lenging in practice. This thesis was dedicated to helping scholars and, in specific, practi-tioners to overcome their challenges and, thereby, improve the rigor of their well-being assessment. Specifically, this thesis offered a general definition of worker well-being, a tool for understanding conceptual nuances of individual well-being constructs and a strategy for selecting a limited, but sufficiently diverse set of constructs. In addition, it provided a list of validated closed question survey measures, guidance for selecting appropriate measures, and an introduction to survey data validation. Finally, it dem-onstrated how these principles and measures could be put into practice. This thesis hopefully helps future worker well-being survey research to contribute more effectively and efficiently to protecting and improving the well-being of workers.


Bibliography

B
197
aAbbasi, A., Hassan, A., & Dhar, M. (2014). Bench-
marking Twitter sentiment analysis tools. LREC, 14, 26–31.
ABC. (2020a). “Once a nurse, always a nurse”: 20,000 former UK medics return to battle coronavi-rus. https://abcnews.go.com/Internation-al/nurse-nurse-20000-uk-medics-return-battle-coronavirus/story?id=69872577
ABC. (2020b). Europeans clap from balconies in show of appreciation to health care workers during COVID-19 pandemic. https://abc11.com/stimulus-checks-trump-government-coronavirus/6029388/
Abdel-Khalek, A. M. (2006). Measuring happiness with a single-item scale. Social Behavior and Personality: An International Journal, 34(2), 139–150.
Adobe. (2019). Email usage study. https://cmo.adobe.com/articles/2019/9/if-you-think-email-is-dead--think-again.html
Agresti, A. (2018). An introduction to categorical data analysis. Wiley.
Aguinis, H., Pierce, C. A., Bosco, F. A., & Muslin, I. S. (2009). First decade of Organizational Research Methods: Trends in design, mea-surement, and data-analysis topics. Orga-nizational Research Methods, 12(1), 69–112.
Aguinis, H., Ramani, R. S., & Alabduljader, N. (2018). What you see is what you get? Enhancing methodological transparency in manage-ment research. Academy of Management Annals, 12(1), 83–110.
Aguinis, H., Shapiro, D. L., Antonacopoulou, E. P., & Cummings, T. G. (2014). Scholarly impact: A pluralist conceptualization. Academy of Management Learning & Education, 13(4), 623–639.
Aguinis, H., & Vandenberg, R. J. (2014). An ounce of prevention is worth a pound of cure: Improving research quality before data collection. Annual Review of Organizational Psychology and Organizational Behavior, 1(1), 569–595.
Aguinis, H., Villamor, I., & Ramani, R. S. (2020). MTurk Research: Review and Recommen-dations. Journal of Management, 47(4), 823–837.
Aiken, L. S., West, S. G., & Millsap, R. E. (2008). Doctoral training in statistics, measure-ment, and methodology in psychology: Replication and extension of Aiken, West, Sechrest, and Reno’s (1990) survey of PhD programs in North America. American Psychologist, 63(1), 32.
Akbar, F., Bayraktaroglu, A. E., Buddharaju, P., Da Cunha Silva, D. R., Gao, G., Grover, T., Gutierrez-Osuna, R., Jones, N. C., Mark, G., Pavlidis, I., & others. (2019). Email makes you sweat: Examining email interruptions and stress using thermal imaging. Proceed-ings of the 2019 CHI Conference on Human Factors in Computing Systems, 1–14.
Akinola, M. (2010). Measuring the pulse of an organization: Integrating physiological measures into the organizational scholar’s toolbox. Research in Organizational Behav-ior, 30, 203–223.
Allan, B. A., Dexter, C., Kinsey, R., & Parker, S. (2018). Meaningful work and mental health: Job satisfaction as a moderator. Journal of Mental Health, 27(1), 38–44.
Allen, M., & Preiss, R. W. (1997). Comparing the persuasiveness of narrative and statistical evidence using meta-analysis. Communi-cation Research Reports, 14(2), 125–131.
Allied Market Research. (2020). Increase in prevalence of chronic diseases, and surge in awareness and implementation of wellness programs by employers drive the growth of the global workplace wellness market. https://www.globenewswire.com/news-release/2020/08/25/2083396/0/en/Workplace-Wellness-Market-to-Reach-Valuation-of-74-00-Billion-by-2026-at-6-1-CAGR.html
Altmann, E. M., & Trafton, J. G. (2002). Memory for goals: An activation-based model. Cogni-tive Science, 26(1), 39–83.
198
Bibliography
Altmann, E. M., & Trafton, J. G. (2007). Timecourse of recovery from task interruption: Data and a model. Psychonomic Bulletin & Re-view, 14(6), 1079–1084.
Altmann, E. M., Trafton, J. G., & Hambrick, D. Z. (2014). Momentary interruptions can derail the train of thought. Journal of Ex-perimental Psychology: General, 143(1), 215.
Amabile, T. M., Barsade, S. G., Mueller, J. S., & Staw, B. M. (2005). Affect and creativity at work. Administrative Science Quarterly, 50(3), 367–403.
American Psychological Association. (2017). Ethical principles of psychologists and code of conduct. https://www.apa.org/ethics/code/
American Trucking Association. (2017). ATA Truck Driver Shortage Report. http://progres-sive1.acs.playstream.com/truckline/pro-gressive/ATAs%20Driver%20Shortage%20Report%202017.pdf
American Trucking Association. (2018). Turnover rate at large truckload carriers rises in first quarter. Accelerating churn rate indicates continued tightness in driver market. http://www.trucking.org/article/Turnover-Rate-at-Large-Truckload-Carriers-Rises-in-First-Quarter
Andrews, F. A., & Withey, S. B. (1976). Social indicators of well-being in America: The de-velopment and measurement of perceptual indicators. Plenum Press.
Angrave, D., Charlwood, A., Kirkpatrick, I., Law-rence, M., & Stuart, M. (2016). HR and analytics: Why HR is set to fail the big data challenge. Human Resource Management Journal, 26(1), 1–11.
Anseel, F., Lievens, F., Schollaert, E., & Choragwicka, B. (2010). Response rates in organizational science, 1995–2008: A meta-analytic re-view and guidelines for survey researchers. Journal of Business and Psychology, 25(3), 335–349.
Antoinette Bargagliotti, L. (2012). Work engage-ment in nursing: A concept analysis. Jour-nal of Advanced Nursing, 68(6), 1414–1428.
Apostolopoulos, Y., Shattell, M. M., Sönmez, S., Strack, R., Haldeman, L., & Jones, V. (2012). Active living in the trucking sector: Envi-ronmental barriers and health promotion strategies. Journal of Physical Activity and Health, 9(2), 259–269.
Apostolopoulos, Y., Sönmez, S., Hege, A., & Lemke, M. (2016). Work strain, social isolation and mental health of long-haul truckers. Oc-cupational Therapy in Mental Health, 32(1), 50–69.
Apostolopoulos, Y., Sönmez, S., Shattell, M. M., Gonzales, C., & Fehrenbacher, C. (2013). Health survey of US long-haul truck drivers: Work environment, physical health, and healthcare access. Work, 46(1), 113–123.
Araujo, M., Reis, J., Pereira, A., & Benevenuto, F. (2016). An evaluation of machine transla-tion for multilingual sentence-level sentiment analysis. Proceedings of the 31st Annual ACM Symposium on Applied Com-puting, 1140–1145.
Aristotle. (340 C.E.). Nicomachean Ethics (R. Crisp, Trans.). Cambridge University Press.
Arthur Jr, W., Hagen, E., & George Jr, F. (2020). The lazy or dishonest respondent: Detection and prevention. Annual Review of Orga-nizational Psychology and Organizational Behavior, 8.
Axhausen, K. W., & Weis, C. (2010). Predicting re-sponse rate: A natural experiment. Survey Practice, 3(2).
BBaethge, A., & Rigotti, T. (2013). Interruptions to
workflow: Their relationship with irritation and satisfaction with performance, and the mediating roles of time pressure and men-tal demands. Work & Stress, 27(1), 43–63.
Bakker, A. B. (2014). The job demands–resources questionnaire. Rotterdam: Erasmus Univer-sity.
Bakker, A. B. (2015). Towards a multilevel approach of employee well-being. European Journal
B
199
of Work and Organizational Psychology, 24(6), 839–843.
Bakker, A. B., Albrecht, S. L., & Leiter, M. P. (2011). Work engagement: Further reflections on the state of play. European Journal of Work and Organizational Psychology, 20(1), 74–88.
Bakker, A. B., & Bal, P. M. (2010). Weekly work engagement and performance: A study among starting teachers. Journal of Oc-cupational and Organizational Psychology, 83(1), 189–206.
Bakker, A. B., & Demerouti, E. (2007). The job demands-resources model: State of the art. Journal of Managerial Psychology, 22(3), 309–328.
Bakker, A. B., & Demerouti, E. (2017). Job de-mands–resources theory: Taking stock and looking forward. Journal of Occupational Health Psychology, 22(3), 273.
Bakker, A. B., Demerouti, E., & Verbeke, W. (2004). Using the Job Demands-Resources model to predict burnout and performance. Hu-man Resource Management, 43(1), 83–104.
Bakker, A. B., & Oerlemans, W. (2011). Subjective well-being in organizations. In K. S. Cam-eron & G. M. Spreitzer (Eds.), The Oxford Handbook of Positive Organizational Schol-arship (pp. 178–189). Oxford University Press.
Bakker, A. B., Schaufeli, W. B., Leiter, M. P., & Taris, T. W. (2008). Work engagement: An emerging concept in occupational health psychol-ogy. Work & Stress, 22(3), 187–200.
Balducci, C., Fraccaroli, F., & Schaufeli, W. B. (2010). Psychometric properties of the Italian version of the Utrecht Work Engagement Scale (UWES-9): A cross-cultural analysis. European Journal of Psychological Assess-ment, 26(2), 143.
Banks, G. C., Pollack, J. M., Bochantin, J. E., Kirkman, B. L., Whelpley, C. E., & O’Boyle, E. H. (2016). Management’s science–practice gap: A grand challenge for all stakeholders. Academy of Management Journal, 59(6), 2205–2231.
Banse, R., & Scherer, K. R. (1996). Acoustic profiles in vocal emotion expression. Journal of Personality and Social Psychology, 70(3), 614–636.
Bapuji, H., Patel, C., Ertug, G., & Allen, D. G. (2020). Corona crisis and inequality: Why manage-ment research needs a societal turn. SAGE Publications.
Barber, L. K., & Santuzzi, A. M. (2015). Please respond ASAP: Workplace telepressure and employee recovery. Journal of Occupa-tional Health Psychology, 20(2), 172.
Bargh, J. A. (2002). Losing consciousness: Auto-matic influences on consumer judgment, behavior, and motivation. Journal of Consumer Research, 29(2), 280–285.
Barley, S. R., Bechky, B. A., & Milliken, F. J. (2017). The changing nature of work: Careers, identities, and work lives in the 21st cen-tury. Academy of Management Discoveries, 3(2), 111–115.
Barley, S. R., Meyerson, D. E., & Grodal, S. (2011). E-mail as a source and symbol of stress. Organization Science, 22(4), 887–906.
Barrett, L. F., Adolphs, R., Marsella, S., Martinez, A. M., & Pollak, S. D. (2019). Emotional expres-sions reconsidered: Challenges to inferring emotion from human facial movements. Psychological Science in the Public Interest, 20(1), 1–68.
Barrett, L. F., & Russell, J. A. (1999). The structure of current affect: Controversies and emerging consensus. Current Directions in Psychologi-cal Science, 8(1), 10–14.
Barrouillet, P., Bernardin, S., & Camos, V. (2004). Time constraints and resource sharing in adults’ working memory spans. Journal of Experimental Psychology: General, 133(1), 83.
Bartels, A. L., Peterson, S. J., & Reina, C. S. (2019). Understanding well-being at work: Devel-opment and validation of the eudaimonic workplace well-being scale. PloS One, 14(4), e0215957.
Baughman, W. A., Dorsey, D. W., & Zarefsky, D. (2011). Putting evidence in its place: A
200
Bibliography
means not an end. Industrial and Organiza-tional Psychology, 4(1), 62–64.
Baumeister, R. F., Bratslavsky, E., Muraven, M., & Tice, D. M. (1998). Ego depletion: Is the active self a limited resource? Journal of Personality and Social Psychology, 74(5), 1252.
Baumeister, R. F., & Vohs, K. D. (2007). Self-Regula-tion, ego depletion, and motivation. Social and Personality Psychology Compass, 1(1), 115–128.
Beal, D. J. (2015). ESM 2.0: State of the art and future potential of experience sampling methods in organizational research. An-nual Review of Organizational Psychology and Organizational Behavior, 2(1), 383–407.
Beal, D. J., & Ghandour, L. (2011). Stability, change, and the stability of change in daily work-place affect. Journal of Organizational Behavior, 32(4), 526–546.
Becker, W. J., Belkin, L. Y., Conroy, S. A., & Tuskey, S. (2021). Killing me softly: Organizational e-mail monitoring expectations’ impact on employee and significant other well-being. Journal of Management, 47(4), 1024–1052.
Beckers, D. G., van der Linden, D., Smulders, P. G., Kompier, M. A., Taris, T. W., & Geurts, S. A. (2008). Voluntary or involuntary? Control over overtime and rewards for overtime in relation to fatigue and work satisfaction. Work & Stress, 22(1), 33–50.
Bellet, C., De Neve, J. E., & Ward, G. (2019). Does employee happiness have an impact on productivity? SSRN Electronic Journal, 13.
Bellet, C., De Neve, J.-E., & Ward, G. (2020). Does employee happiness have an impact on productivity?
Bennett, C. L., James, A. H., & Kelly, D. (2020). Beyond tropes: Towards a new image of nursing in the wake of Covid-19. Journal of Clinical Nursing, 29, 2753–2755.
Bentham, J. (1789). An Introduction to the Principles of Morals and Legislation. Clarendon Press.
Berg, J. M., Dutton, J. E., & Wrzesniewski, A. (2013). Job crafting and meaningful work. In B. J. Dik, Z. S. Byrne, & M. F. Steger (Eds.), Purpose
and meaning in the workplace (pp. 81–104). American Psychological Association.
Berg, J. M., Wrzesniewski, A., & Dutton, J. E. (2010). Perceiving and responding to challenges in job crafting at different ranks: When proactivity requires adaptivity. Journal of Organizational Behavior, 31(2–3), 158–186.
Berg, P., Kalleberg, A. L., & Appelbaum, E. (2003). Balancing work and family: The role of high‐commitment environments. Indus-trial Relations: A Journal of Economy and Society, 42(2), 168–188.
Bernerth, J. B., Cole, M. S., Taylor, E. C., & Walker, H. J. (2018). Control variables in leadership research: A qualitative and quantitative review. Journal of Management, 44(1), 131–160.
Bietti, E. (2020). From ethics washing to ethics bashing: A view on tech ethics from within moral philosophy. Proceedings of the 2020 Conference on Fairness, Accountability, and Transparency, 210–219.
Bindl, U. K., Unsworth, K. L., Gibson, C. B., & Stride, C. B. (2019). Job crafting revisited: Implications of an extended framework for active changes at work. Journal of Applied Psychology, 104(5), 605.
Bjørnskov, C. (2010). How comparable are the Gallup World Poll life satisfaction data? Journal of Happiness Studies, 11(1), 41–60.
Black, J. R., Bailey, C., Przewrocka, J., Dijkstra, K. K., & Swanton, C. (2020). COVID-19: The case for health-care worker screening to prevent hospital transmission. The Lancet, 395(10234), 1418–1420.
Blank, C., Zaman, S., Wesley, A., Tsiamyrtzis, P., Da Cunha Silva, D. R., Gutierrez-Osuna, R., Mark, G., & Pavlidis, I. (2020). Emotional Footprints of Email Interruptions. Proceed-ings of the 2020 CHI Conference on Human Factors in Computing Systems, 1–12.
Bleidorn, W., & Peters, A. L. (2011). A multilevel multitrait‐multimethod analysis of self‐and peer‐reported daily affective experiences. European Journal of Personality, 25(5), 398–408.
B
201
Boeijinga, A., Hoeken, H., & Sanders, J. (2017). An analysis of health promotion materials for Dutch truck drivers: Off target and too complex? Work, 56(4), 539–549.
Bollen, J., Mao, H., & Pepe, A. (2011). Modeling pub-lic mood and emotion: Twitter sentiment and socio-economic phenomena. Fifth International AAAI Conference on Weblogs and Social Media.
Bono, J. E., & McNamara, G. (2011). Publishing in AMJ—part 2: Research design. Academy of Management.
Borg, I., & Zuell, C. (2012). Write-in comments in employee surveys. International Journal of Manpower, 33(2), 206–220.
Bornstein, R. F. (2011). Toward a process-focused model of test score validity: Improving psychological assessment in science and practice. Psychological Assessment, 23(2), 532.
Borsboom, D., Mellenbergh, G. J., & van Heerden, J. (2004). The concept of validity. Psychologi-cal Review, 111(4), 1061–1071.
Bovenzi, M. (2009). Metrics of whole-body vibra-tion and exposure–response relationship for low back pain in professional drivers: A prospective cohort study. International Ar-chives of Occupational and Environmental Health, 82(7), 893–917.
Bowling, N. A., Beehr, T. A., Wagner, S. H., & Libku-man, T. M. (2005). Adaptation-level theory, opponent process theory, and disposi-tions: An integrated approach to the sta-bility of job satisfaction. Journal of Applied Psychology, 90(6), 1044–1053.
Bowling, N. A., Eschleman, K. J., & Wang, Q. (2010). A meta‐analytic examination of the relationship between job satisfaction and subjective well‐being. Journal of Oc-cupational and Organizational Psychology, 83(4), 915–934.
Bowling, N. A., Gibson, A. M., Houpt, J. W., & Brower, C. K. (2020). Will the questions ever end? Person-level increases in careless responding during questionnaire comple-
tion. Organizational Research Methods, 1094428120947794.
Bowling, N. A., & Hammond, G. D. (2008). A meta-analytic examination of the construct validity of the Michigan Organizational As-sessment Questionnaire Job Satisfaction Subscale. Journal of Vocational Behavior, 73(1), 63–77.
Bowling, N. A., Hendricks, E. A., & Wagner, S. H. (2008). Positive and negative affectiv-ity and facet satisfaction: A meta-analysis. Journal of Business and Psychology, 23(3–4), 115–125.
Bowling, N. A., Wagner, S. H., & Beehr, T. A. (2018). The Facet Satisfaction Scale: An effective affective measure of job satisfaction facets. Journal of Business and Psychology, 33(3), 383–403.
Bowling, N. A., & Zelazny, L. (2021). Measuring General Job Satisfaction: Which Is More Construct Valid—Global Scales or Facet-Composite Scales? Journal of Business and Psychology, 1–15.
Boyce, W. S. (2016). Does truck driver health and wellness deserve more attention? Journal of Transport & Health, 3(1), 124–128.
Boyer, K. K., & Verma, R. (2000). Multiple raters in survey-based operations management research: A review and tutorial. Produc-tion and Operations Management, 9(2), 128–140.
Boyle, G. J. (1992). Multidimensional Mood State Inventory (MMSI). Unpublished, Department of Psychology, University of Queensland.
Boyle, G. J., Helmes, E., Matthews, G., & Izard, C. E. (2015). Measures of affect dimensions. In G. J. Boyle, D. H. Saklofske, & G. Matthews (Eds.), Measures of personality and social psychological constructs (pp. 190–224). Elsevier Academic Press.
Bradburn, N. M. (1969). The structure of psychologi-cal well-being. Aldine.
Bradley, A., Brumby, D., Cox, A. L., & Bird, J. (2013). How to manage your inbox: Is a once a day strategy best? Proceedings of the 27th
202
Bibliography
International BCS Human Computer Inter-action Conference.
Brayfield, A. H., & Rothe, H. F. (1951). An index of job satisfaction. Journal of Applied Psychol-ogy, 35(5), 307–311.
Breevaart, K., Bakker, A. B., Demerouti, E., & Het-land, J. (2012). The measurement of state work engagement. European Journal of Psychological Assessment, 28, 305–312.
Brey, P. (2012). Well-being in philosophy, psychol-ogy, and economics. In The good life in a technological age (pp. 33–52). Routledge.
Brief, A. P. (1998). Attitudes in and around organiza-tions. Sage Publications.
Brief, A. P., Burke, M. J., George, J. M., Robinson, B. S., & Webster, J. (1988). Should negative af-fectivity remain an unmeasured variable in the study of job stress? Journal of Applied Psychology, 73(2), 193–198.
Brieger, S. A., Anderer, S., Fröhlich, A., Bäro, A., & Meynhardt, T. (2019). Too much of a good thing? On the relationship between CSR and employee work addiction. Journal of Business Ethics, 1–19.
Briner, R. B. (2014). What is employee engagement and does it matter? An evidence-based approach. In D. Robinson & J. Gifford (Eds.), The Future of Engagement Thought Piece Collection, Engage for Success Peer-Reviewed Thought Leadership Series. Engage for Success.
Briner, R. B., Denyer, D., & Rousseau, D. M. (2009). Evidence-based management: Concept cleanup time? Academy of Management Perspectives, 23(4), 19–32.
Briner, R. B., & Walshe, N. D. (2015). An evidence-based approach to improving the quality of resource-oriented well-being interven-tions at work. Journal of Occupational and Organizational Psychology, 88(3), 563–586.
Brod, M., Tesler, L. E., & Christensen, T. L. (2009). Qualitative research and content valid-ity: Developing best practices based on science and experience. Quality of Life Research, 18(9), 1263.
Brodeur, A., Clark, A., Fleche, S., & Powdthavee, N. (2021). Covid-19, lockdowns and well-being: Evidence from google trends. Journal of Public Economics, 193(104346).
Brody, J. L., Gluck, J. P., & Aragon, A. S. (2000). Par-ticipants’ understanding of the process of psychological research: Debriefing. Ethics & Behavior, 10(1), 13–25.
Brookings. (2020). Essential but undervalued: Mil-lions of health care workers aren’t getting the pay or respect they deserve in the CO-VID-19 pandemic. https://www.brookings.edu/research/essential-but-undervalued-millions-of-health-care-workers-arent-getting-the-pay-or-respect-they-deserve-in-the-covid-19-pandemic/
Brown, R., Duck, J., & Jimmieson, N. (2014). E-mail in the workplace: The role of stress apprais-als and normative response pressure in the relationship between e-mail stressors and employee strain. International Journal of Stress Management, 21(4), 325.
Brown, T. A. (2014). Confirmatory factor analysis for applied research. Guilford Publications.
Bruk-Lee, V., Khoury, H. A., Nixon, A. E., Goh, A., & Spector, P. E. (2009). Replicating and ex-tending past personality/job satisfaction meta-analyses. Human Performance, 22(2), 156–189.
Brulé, G., & Maggino, F. (2017). Metrics of subjec-tive well-being: Limits and improvements. Springer.
Bruntlett, M., & Bruntlett, C. (2018). Building the Cycling City: The Dutch Blueprint for Urban Vitality. Island Press.
Bryman, A. (2006). Integrating quantitative and qualitative research: How is it done? Quali-tative Research, 6(1), 97–113.
Bryson, A., Barth, E., & Dale-Olsen, H. (2013). The effects of organizational change on worker well-being and the moderating role of trade unions. ILR Review, 66(4), 989–1011.
Bryson, A., Forth, J., & Stokes, L. (2017). Does employees’ subjective well-being affect workplace performance? Human Relations, 70(8), 1017–1037.
B
203
Bryson, A., & MacKerron, G. (2017). Are you happy while you work? The Economic Journal, 127(599), 106–125.
Bui, H. T. (2017). Big Five personality traits and job satisfaction: Evidence from a national sample. Journal of General Management, 42(3), 21–30.
Buonocore, F., de Gennaro, D., Russo, M., & Salva-tore, D. (2020). Cognitive job crafting: A possible response to increasing job inse-curity and declining professional prestige. Human Resource Management Journal, 30(2), 244–259.
Burke, M. J., Brief, A. P., George, J. M., Roberson, L., & Webster, J. (1989). Measuring affect at work: Confirmatory analyses of competing mood structures with conceptual linkage to cortical regulatory systems. Journal of Personality and Social Psychology, 57(6), 1091.
cCable, D. M., & Judge, T. A. (1996). Person–organi-
zation fit, job choice decisions, and organi-zational entry. Organizational Behavior and Human Decision Processes, 67(3), 294–311.
Cacioppo, J. T., & Petty, R. E. (1982). The need for cognition. Journal of Personality and Social Psychology, 42(1), 116.
Cambria, E. (2016). Affective computing and sentiment analysis. IEEE Intelligent Systems, 31(2), 102–107.
Cammann, C., Fichman, M., Jenkins, D., & Klesh, J. (1979). The Michigan organizational assessment questionnaire. Unpublished manuscript. University of Michigan, Ann Arbor.
Campbell, D. T., & Fiske, D. W. (1959). Convergent and discriminant validation by the mul-titrait-multimethod matrix. Psychological Bulletin, 56(2), 81.
Cantril, H. (1965). The pattern of human concerns. Rutgers University.
Carver, C. S., & Scheier, M. F. (1990). Origins and functions of positive and negative affect: A control-process view. Psychological Review, 97(1), 19.
CDC. (2020, May 5). Employees: How to Cope with Job Stress and Build Resilience During the COVID-19 Pandemic. https://www.cdc.gov/coronavirus/2019-ncov/community/mental-health-non-healthcare.html
Chaffin, D., Heidl, R., Hollenbeck, J. R., Howe, M., Yu, A., Voorhees, C., & Calantone, R. (2017). The promise and perils of wearable sensors in organizational research. Organizational Research Methods, 20(1), 3–31.
Chen, C., & Xie, Y. (2014). The impacts of multiple rest-break periods on commercial truck driver’s crash risk. Journal of Safety Re-search, 48, 87–93.
Chen, J., Chai, A., Goel, M., Lieu, D., Mohamed, F., Nahm, D., & Wu, B. (2015). Predicting stock prices from news articles. The Undergradu-ate Statistics Association-Project Committee Journal.
Chen, P. Y., & Cooper, C. (2014). Wellbeing: A com-plete reference guide, work and wellbeing (Vol. 3). John Wiley & Sons.
Chernyshenko, O., Stark, S., Crede, M., Wadlington, P., & Lee, W. (2003). Improving the mea-surement of job attitudes: The develop-ment of the IJSI. 18th Annual Conference of the Society of Industrial and Organizational Psychologists, Orlando, FL.
Cheung, F., & Lucas, R. E. (2014). Assessing the validity of single-item life satisfaction mea-sures: Results from three large samples. Quality of Life Research, 23(10), 2809–2818.
Choi, B., Kurowski, A., Bond, M., Baker, D., Clays, E., De Bacquer, D., & Punnett, L. (2012). Occupation-differential construct validity of the Job Content Questionnaire (JCQ) psychological job demands scale with physical job demands items: A mixed methods research. Ergonomics, 55(4), 425–439.
Christian, M. S., Garza, A. S., & Slaughter, J. E. (2011). Work engagement: A quantitative
204
Bibliography
review and test of its relations with task and contextual performance. Personnel Psychology, 64(1), 89–136.
CIPD. (2019). Health and Well-being at Work—Sur-vey raport. https://www.cipd.co.uk/Im-ages/health-and-well-being-at-work-2019.v1_tcm18-55881.pdf
Cizek, G. J. (2012). Defining and distinguishing validity: Interpretations of score meaning and justifications of test use. Psychological Methods, 17(1), 31.
Clark, L. A., & Watson, D. (1995). Constructing valid-ity: Basic issues in objective scale develop-ment. Psychological Assessment, 7(3), 309.
Coffeng, J. K., Hendriksen, I. J., Duijts, S. F., Twisk, J. W., van Mechelen, W., & Boot, C. R. (2014). Effectiveness of a combined social and physical environmental intervention on presenteeism, absenteeism, work perfor-mance, and work engagement in office employees. Journal of Occupational and Environmental Medicine, 56(3), 258–265.
Cohen, A. R., Stotland, E., & Wolfe, D. M. (1955). An experimental investigation of need for cognition. The Journal of Abnormal and Social Psychology, 51(2), 291.
Cohen, D. J. (2007). The very separate worlds of academic and practitioner publications in human resource management: Reasons for the divide and concrete solutions for bridging the gap. Academy of Management Journal, 50(5), 1013–1019.
Cohen, G., Blake, R. S., & Goodman, D. (2016). Does turnover intention matter? Evaluating the usefulness of turnover intention rate as a predictor of actual turnover rate. Review of Public Personnel Administration, 36(3), 240–263.
Cohn, M. A., Mehl, M. R., & Pennebaker, J. W. (2004). Linguistic markers of psychological change surrounding September 11, 2001. Psychological Science, 15(10), 687–693.
Cole, M. S., Walter, F., Bedeian, A. G., & O’Boyle, E. H. (2012). Job burnout and employee engagement: A meta-analytic examina-
tion of construct proliferation. Journal of Management, 38(5), 1550–1581.
Collings, D. G., Nyberg, A. J., Wright, P. M., & McMackin, J. (2021). Leading through paradox in a COVID-19 world: Human resources comes of age. Human Resource Management Journal.
Collins, S., Sun, Y., Kosinski, M., Stillwell, D., & Markuzon, N. (2015). Are you satisfied with life?: Predicting satisfaction with life from Facebook. In N. Agarwal, K. Xu, & N. Os-good (Eds.), Social Computing, Behavioral-Cultural Modeling, and Prediction. SBP 2015. Lecture Notes in Computer Science (Vol. 9021, pp. 24–33). Springer.
Collopy, F. (1996). Biases in retrospective self-reports of time use: An empirical study of computer users. Management Science, 42(5), 758–767.
Commision of the European Communities. (2017). Eurobarometer. Cologne: GESIS Data Archive.
Cooke, P. J., Melchert, T. P., & Connor, K. (2016). Measuring well-being: A review of instru-ments. The Counseling Psychologist, 44(5), 730–757.
Costa, P. T., & McCrae, R. R. (1985). The NEO Per-sonality Inventory Manual. Psychological Assessment Resources.
Cowden, J., Crane, L., Lezotte, D., Glover, J., & Nyquist, A.-C. (2010). Pre-pandemic plan-ning survey of healthcare workers at a tertiary care children’s hospital: Ethical and workforce issues. Influenza and Other Respiratory Viruses, 4(4), 213–222.
Crawford, E. R., LePine, J. A., & Rich, B. L. (2010). Linking job demands and resources to employee engagement and burnout: A theoretical extension and meta-analytic test. Journal of Applied Psychology, 95(5), 834–848.
Credé, M., Chernyshenko, O. S., Bagraim, J., & Sully, M. (2009). Contextual performance and the job satisfaction–dissatisfaction distinction: Examining artifacts and utility. Human Performance, 22(3), 246–272.
B
205
Crede, M., Chernyshenko, O. S., Stark, S., Dalal, R. S., & Bashshur, M. (2007). Job satisfaction as mediator: An assessment of job satisfac-tion’s position within the nomological network. Journal of Occupational and Organizational Psychology, 80(3), 515–538.
Cremers, J. (2014). Schijnconstructies in het in-ternationaal wegtransport. Tijdschrift over Arbeidsverhoudingen, 25(1), 32–34.
Crizzle, A. M., Bigelow, P., Adams, D., Gooderham, S., Myers, A. M., & Thiffault, P. (2017). Health and wellness of long-haul truck and bus drivers: A systematic literature review and directions for future research. Journal of Transport & Health, 7, 90–109.
Cronbach, L. J., & Meehl, P. E. (1955). Construct validity in psychological tests. Psychologi-cal Bulletin, 52(4), 281.
Csikszentmihalyi, M., & Csikszentmihalyi, I. (1988). Optimal experience: Psychological studies of flow in consciousness. Cambridge Univer-sity Press.
Csikszentmihalyi, M., & Hunter, J. (2003). Happiness in everyday life: The uses of experience sampling. Journal of Happiness Studies, 4(2), 185–199.
Curran, P. G. (2016). Methods for the detection of carelessly invalid responses in survey data. Journal of Experimental Social Psychology, 66, 4–19.
DDa Silva-Júnior, F. P., de Pinho, R. S. N., de Mello,
M. T., de Bruin, V. M. S., & De Bruin, P. F. C. (2009). Risk factors for depression in truck drivers. Social Psychiatry and Psychiatric Epidemiology, 44(2), 125–129.
Dabbish, L. A., & Kraut, R. E. (2006). Email overload at work: An analysis of factors associated with email strain. Proceedings of the 2006 20th Anniversary Conference on Computer Supported Cooperative Work, 431–440.
Dalal, R. S. (2005). A meta-analysis of the relation-ship between organizational citizenship
behavior and counterproductive work behavior. Journal of Applied Psychology, 90(6), 12–41.
Dalal, R. S. (2012). Job attitudes: Cognition and affect. In I. B. Weiner, N. Schmitt, & S. High-house (Eds.), Handbook of Psychology: Vol. 12. Industrial and Organizational Psychol-ogy (pp. 341–366). John Wiley & Sons.
Daniels, K. (2000). Measures of five aspects of affective well-being at work. Human Rela-tions, 53(2), 275–294.
Dasgupta, P. B. (2017). Detection and Analysis of Human Emotions through Voice and Speech Pattern Processing. International Journal of Computational Trends Technol-ogy, 51(1), 1–3.
Day, A., Paquet, S., Scott, N., & Hambley, L. (2012). Perceived information and communica-tion technology (ICT) demands on em-ployee outcomes: The moderating effect of organizational ICT support. Journal of Occupational Health Psychology, 17(4), 473.
De Croon, E. M., Blonk, R. W., De Zwart, B. C., Frings-Dresen, M. H., & Broersen, J. P. (2002). Job stress, fatigue, and job dissatisfaction in Dutch lorry drivers: Towards an occupa-tion specific model of job demands and control. Occupational and Environmental Medicine, 59(6), 356–361.
De Croon, E. M., Sluiter, J. K., Blonk, R. W., Broersen, J. P., & Frings-Dresen, M. H. (2004). Stressful work, psychological job strain, and turn-over: A 2-year prospective cohort study of truck drivers. Journal of Applied Psychology, 89(3), 442–452.
De Cuyper, N., & De Witte, H. (2006). The impact of job insecurity and contract type on atti-tudes, well‐being and behavioural reports: A psychological contract perspective. Journal of Occupational and Organizational Psychology, 79(3), 395–409.
De Jong, T., Wiezer, N., De Weerd, M., Nielsen, K., Mattila-Holappa, P., & Mockałło, Z. (2016). The impact of restructuring on employee well-being: A systematic review of longitu-dinal studies. Work & Stress, 30(1), 91–114.
206
Bibliography
De Lazari-Radek, K., & Singer, P. (2014). The point of view of the universe: Sidgwick and contem-porary ethics. Oxford University Press.
De Neve, J. E., Krekel, C., & Ward, G. (2018). Work and well-being: A global perspective. Global Happiness Policy Report, 74–128.
De Neve, J. E., & Ward, G. (2017). Happiness at Work (CEP Discussion Paper No 1474).
De Vos, J. (2018). Analysing the effect of trip satisfaction on satisfaction with the leisure activity at the destination of the trip, in relationship with life satisfaction. Transpor-tation, 1–23.
De Witte, H. D. (1999). Job insecurity and psycho-logical well-being: Review of the literature and exploration of some unresolved issues. European Journal of Work and Orga-nizational Psychology, 8(2), 155–177.
Demerouti, E., Bakker, A. B., & Ebbinghaus, M. (2002). From mental strain to burnout. Eu-ropean Journal of Work and Organizational Psychology, 11(4), 423–441.
Demerouti, E., Bakker, A. B., Nachreiner, F., & Schaufeli, W. B. (2001). The job demands-resources model of burnout. Journal of Applied Psychology, 86(3), 499–512.
Denson, T. F., Spanovic, M., & Miller, N. (2009). Cognitive appraisals and emotions predict cortisol and immune responses: A meta-analysis of acute laboratory social stressors and emotion inductions. Psychological Bulletin, 135(6), 823–853.
Depue, R. A., & Collins, P. F. (1999). Neurobiology of the structure of personality: Dopamine, facilitation of incentive motivation, and extraversion. Behavioral and Brain Sciences, 22(3), 491–517.
Derks, D., Bakker, A. B., & Gorgievski, M. (2021). Private smartphone use during worktime: A diary study on the unexplored costs of integrating the work and family domains. Computers in Human Behavior, 114.
Devotto, R. P. de, Machado, W. de L., Vazquez, A. C. S., & Freitas, C. P. P. de. (2020). Work engagement and job crafting of Brazilian
professionals. Revista Psicologia Organiza-ções e Trabalho, 20(1), 869–876.
Dickerson, S. S., & Kemeny, M. E. (2004). Acute stressors and cortisol responses: A theoretical integration and synthesis of laboratory research. Psychological Bulletin, 130(3), 355–391.
Diener, E. (1984). Subjective well-being. Psycho-logical Bulletin, 95(3), 542–575.
Diener, E. (1994). Assessing subjective well-being: Progress and opportunities. Social Indica-tors Research, 31(2), 103–157.
Diener, E. (2012). New findings and future direc-tions for subjective well-being research. American Psychologist, 67(8), 590–597.
Diener, E., Emmons, R. A., Larsen, R. J., & Griffin, S. (1985). The satisfaction with life scale. Jour-nal of Personality Assessment, 49(1), 71–75.
Diener, E., Lucas, R. E., & Scollon, C. N. (2006). Be-yond the hedonic treadmill: Revising the adaptation theory of well-being. American Psychologist, 61, 305–314.
Diener, E., Suh, E. M., Lucas, R. E., & Smith, H. L. (1999). Subjective well-being: Three decades of progress. Psychological Bulletin, 125(2), 276–302.
Diener, E., Wirtz, D., Tov, W., Kim-Prieto, C., Choi, D., Oishi, S., & Biswas-Diener, R. (2010). New well-being measures: Short scales to as-sess flourishing and positive and negative feelings. Social Indicators Research, 97(2), 143–156.
DiMaria, C. H., Peroni, C., & Sarracino, F. (2020). Happiness matters: Productivity gains from subjective well-being. Journal of Hap-piness Studies, 21(1), 139–160.
Dimotakis, N., Scott, B. A., & Koopman, J. (2011). An experience sampling investigation of workplace interactions, affective states, and employee well‐being. Journal of Orga-nizational Behavior, 32(4), 572–588.
Dockray, S., Grant, N., Stone, A. A., Kahneman, D., Wardle, J., & Steptoe, A. (2010). A com-parison of affect ratings obtained with ecological momentary assessment and the
B
207
day reconstruction method. Social Indica-tors Research, 99(2), 269–283.
Dodds, P. S., Harris, K. D., Kloumann, I. M., Bliss, C. A., & Danforth, C. M. (2011). Temporal patterns of happiness and information in a global social network: Hedonometrics and Twitter. PloS One, 6(12), e26752.
Dolan, S. L., Burke, R. J., & Moodie, S. (2012). Is there a “dark side” to work engagement? Effective Executive, 15(4), 12.
Dormann, C., & Zapf, D. (2001). Job satisfaction: A meta-analysis of stabilities. Journal of Organizational Behavior: The International Journal of Industrial, Occupational and Organizational Psychology and Behavior, 22(5), 483–504.
Drake, G., Csipke, E., & Wykes, T. (2013). Assessing your mood online: Acceptability and use of Moodscope. Psychological Medicine, 43(7), 1455–1464.
Dunlop, S. M., Wakefield, M., & Kashima, Y. (2010). Pathways to persuasion: Cognitive and ex-periential responses to health-promoting mass media messages. Communication Research, 37(1), 133–164.
Dunn, T. J., Baguley, T., & Brunsden, V. (2014). From alpha to omega: A practical solution to the pervasive problem of internal consistency estimation. British Journal of Psychology, 105(3), 399–412.
Duriau, V. J., Reger, R. K., & Pfarrer, M. D. (2007). A content analysis of the content analysis literature in organization studies: Research themes, data sources, and methodologi-cal refinements. Organizational Research Methods, 10(1), 5–34.
Dutton, J. E., & Wrzesniewski, A. (2020). What job crafting looks like. https://hbr.org/2020/03/what-job-crafting-looks-like
Dykema, J., Jones, N. R., Piche, T., & Stevenson, J. (2013). Surveying clinicians by web: Cur-rent issues in design and administration. Evaluation & the Health Professions, 36(3), 352–381.
eEatough, E., Shockley, K., & Yu, P. (2016). A review
of ambulatory health data collection methods for employee experience sam-pling research. Applied Psychology, 65(2), 322–354.
Eckenrode, J. (1984). Impact of chronic and acute stressors on daily reports of mood. Journal of Personality and Social Psychology, 46(4), 907.
Edwards, J. R. (2003). Construct validation in orga-nizational behavior research. In J. Green-berg (Ed.), Organizational behavior: The state of the science (2nd ed., pp. 327–371). Lawrence Erlbaum Associates Publishers.
Edwards, J. R. (2008). To prosper, organizational psychology should… overcome method-ological barriers to progress. Journal of Organizational Behavior, 29(4), 469–491.
Edwards, J. R., & Bagozzi, R. P. (2000). On the nature and direction of relationships between constructs and measures. Psychological Methods, 5(2), 155–174.
Eisele, G., Vachon, H., Lafit, G., Kuppens, P., Houben, M., Myin-Germeys, I., & Viecht-bauer, W. (2020). The effects of sampling frequency and questionnaire length on perceived burden, compliance, and care-less responding in experience sampling data in a student population. Assessment, 1073191120957102.
Ekman, P., Davidson, R. J., & Friesen, W. V. (1990). The Duchenne smile: Emotional expres-sion and brain physiology: II. Journal of Personality and Social Psychology, 58(2), 342.
Erdogan, B., Bauer, T. N., Truxillo, D. M., & Mansfield, L. R. (2012). Whistle while you work: A review of the life satisfaction literature. Journal of Management, 38(4), 1038–1083.
Espinoza, J. A., Meyer, J. P., Anderson, B. K., Vaters, C., & Politis, C. (2018). Evidence for a bifac-tor structure of the scales of psychological well-being using exploratory structural
208
Bibliography
equation modeling. Journal of Well-Being Assessment, 2(1), 21–40.
Esuli, A., Moreo, A., & Sebastiani, F. (2019). Building automated survey coders via interactive machine learning. ArXiv.
Ettema, D., Friman, M., Gärling, T., Olsson, L. E., & Fujii, S. (2012). How in-vehicle activities affect work commuters’ satisfaction with public transport. Journal of Transport Geography, 24, 215–222.
European Parliament and Council. (2016). Ggeneral Data Protection Regulation. Official Journal of the European Union.
fFaden, R. R., & Beauchamp, T. L. (1986). A history
and theory of informed consent. Oxford Uni-versity Press.
Faragher, E. B., Cass, M., & Cooper, C. L. (2005). The relationship between job satisfaction and health: A meta-analysis. Occupational Environmental Medicine, 62, 105–112.
Fauth, T., Hattrup, K., Mueller, K., & Roberts, B. (2013). Nonresponse in employee attitude surveys: A group-level analysis. Journal of Business and Psychology, 28(1), 1–16.
Feldman, F. (2004). Pleasure and the good life: Con-cerning the nature, varieties, and plausibility of hedonism. Oxford University Press on Demand.
Feldman, R. (2013). Techniques and applications for sentiment analysis. Communications of the ACM, 56(4), 82–89.
Fernet, C., Guay, F., & Senécal, C. (2004). Adjusting to job demands: The role of work self-de-termination and job control in predicting burnout. Journal of Vocational Behavior, 65(1), 39–56.
Ferratt, T. W. (1981). Overall job satisfaction: Is it a linear function of facet satisfaction? Hu-man Relations, 34(6), 463–473.
Festinger, L. (1954). A theory of social comparison processes. Human Relations, 7(2), 117–140.
Fidelity investments. (2019). As the scope of corporate well-being programs continues to expand, large employers experted to spend an average of $3.6 million in 2019. https://s2.q4cdn.com/997146844/files/doc_news/archive/88150356-0c7e-4f0c-9d5e-8a8aa45131b0.pdf
Fielding, N. G. (2012). Triangulation and mixed methods designs: Data integration with new research technologies. Journal of Mixed Methods Research, 6(2), 124–136.
Fisher, C. D. (2000). Mood and emotions while working: Missing pieces of job satisfac-tion? Journal of Organizational Behavior, 185–202.
Fisher, C. D. (2014). Conceptualizing and Measur-ing Wellbeing at Work. In P. Y. Chen & C. L. Cooper (Eds.), Wellbeing: A Complete Refer-ence Guide (3rd ed., pp. 9–33). John Wiley & Sons Ltd.
Fisher, C. D., & To, M. L. (2012). Using experience sampling methodology in organizational behavior. Journal of Organizational Behav-ior, 33(7), 865–877.
Fisher, G. G., Matthews, R. A., & Gibbons, A. M. (2016). Developing and investigating the use of single-item measures in organiza-tional research. Journal of Occupational Health Psychology, 21(1), 3.
Fisher, R. A. (1915). Frequency distribution of the values of the correlation coefficient in samples from an indefinitely large popula-tion. Biometrika, 10(4), 507–521.
Fitz, N., Kushlev, K., Jagannathan, R., Lewis, T., Paliwal, D., & Ariely, D. (2019). Batching smartphone notifications can improve well-being. Computers in Human Behavior, 101, 84–94.
Flake, J. K., & Fried, E. I. (2020). Measurement schmeasurement: Questionable measure-ment practices and how to avoid them. Advances in Methods and Practices in Psychological Science, 3(4), 456–465.
Fleischer, A., Mead, A. D., & Huang, J. (2015). Inat-tentive responding in MTurk and other on-
B
209
line samples. Industrial and Organizational Psychology, 8(2), 196–202.
Flick, C. (2016). Informed consent and the Facebook emotional manipulation study. Research Ethics, 12(1), 14–28.
Fonner, K. L., & Roloff, M. E. (2012). Testing the connectivity paradox: Linking telework-ers’ communication media use to social presence, stress from interruptions, and organizational identification. Communica-tion Monographs, 79(2), 205–231.
Ford, M. T., Jebb, A. T., Tay, L., & Diener, E. (2018). Internet searches for affect-related terms: An indicator of subjective well-being and predictor of health outcomes across US states and metro areas. Applied Psychology: Health and Well-Being, 10(1), 3–29.
Fordyce, M. W. (1977). The happiness measures: A sixty-second index of emotional well-being and mental health. Unpublished manu-script, Edison Community College.
Forgeard, M. J., Jayawickreme, E., Kern, M. L., & Seligman, M. E. (2011). Doing the right thing: Measuring wellbeing for public policy. International Journal of Wellbeing, 1(1).
Fournier, P.-S., Lamontagne, S., & Gagnon, J. (2012). Interactions between dispatchers and truck drivers in a high turnover context. Relations Industrielles/Industrial Relations, 67(2), 263–282.
Fried, Y., & Ferris, G. R. (1987). The validity of the job characteristics model: A review and meta-analysis. Personnel Psychology, 40(2), 287–322.
Frisch, M. (1988). Life Satisfaction Interview. Un-published Manuscript.
Fuchs, C., & Diamantopoulos, A. (2009). Using single-item measures for construct mea-surement in management research: Con-ceptual issues and application guidelines. Die Betriebswirtschaft, 69(2), 195.
GGanster, D. C., Crain, T. L., & Brossoit, R. M. (2017).
Physiological measurement in the organizational sciences: A review and recommendations for future use. Annual Review of Organizational Psychology and Organizational Behavior, 5(1), 267–293.
Gardner, B. (2015). A review and analysis of the use of ‘habit’ in understanding, predicting and influencing health-related behaviour. Health Psychology Review, 9(3), 277–295.
Gardner, D. G., Cummings, L. L., Dunham, R. B., & Pierce, J. L. (1998). Single-item versus multiple-item measurement scales: An empirical comparison. Educational and Psy-chological Measurement, 58(6), 898–915.
Gelbard, R., Ramon-Gonen, R., Carmeli, A., Bit-tmann, R. M., & Talyansky, R. (2018). Sentiment analysis in organizational work: Towards an ontology of people analytics. Expert Systems, 35(5), e12289.
Geldenhuys, M., Bakker, A. B., & Demerouti, E. (2020). How task, relational and cogni-tive crafting relate to job performance: A weekly diary study on the role of mean-ingfulness. European Journal of Work and Organizational Psychology, 1–12.
Gerber, J., Wheeler, L., & Suls, J. (2018). A social comparison theory meta-analysis 60+ years on. Psychological Bulletin, 144(2), 177.
Gerrad, L., & Hyland, P. (2020). Employee survey research: A critical review of theory and practice. In W. H. Macey & A. A. Fink (Eds.), Employee Surveys and Sensing: Challenges and Opportunities (pp. 374–390). Oxford University Press.
Giacalone, R. A., & Promislo, M. D. (2010). Unethical and unwell: Decrements in well-being and unethical activity at work. Journal of Busi-ness Ethics, 91(2), 275–297.
Gibson, A. M., & Bowling, N. A. (2019). The effects of questionnaire length and behavioral consequences on careless responding. Eu-ropean Journal of Psychological Assessment.
210
Bibliography
Gill, A. J., Gergle, D., French, R. M., & Oberlander, J. (2008). Emotion rating from short blog texts. Proceedings of the SIGCHI Conference on Human Factors in Computing Systems, 1121–1124.
Gill, C. (2018). Don’t know, don’t care: An explora-tion of evidence based knowledge and practice in human resource management. Human Resource Management Review, 28(2), 103–115.
Gilles, I., Mayer, M., Courvoisier, N., & Peytremann-Bridevaux, I. (2017). Joint analyses of open comments and quantitative data: Added value in a job satisfaction survey of hospital professionals. PloS ONE, 12(3), e0173950.
Giusti, E. M., Pedroli, E., D’Aniello, G. E., Badiale, C. S., Pietrabissa, G., Manna, C., Badiale, M. S., Riva, G., Castelnuovo, G., & Molinari, E. (2020). The psychological impact of the COVID-19 outbreak on health profession-als: A cross-sectional study. Frontiers in Psychology, 11.
Glaser, M., Garsoffky, B., & Schwan, S. (2009). Narrative-based learning: Possible ben-efits and problems. Communications, 34(4), 429–447.
Glerum, A., Atasoy, B., & Bierlaire, M. (2014). Using semi-open questions to integrate percep-tions in choice models. Journal of Choice Modelling, 10, 11–33.
Glick, W. H., Jenkins, G. D., & Gupta, N. (1986). Method versus substance: How strong are underlying relationships between job characteristics and attitudinal outcomes? Academy of Management Journal, 29(3), 441–464.
Global Wellness Institute. (2016). The Future of Wellness at Work. https://globalwellnessin-stitute.org/industry-research/the-future-of-wellness-at-work/
Goldammer, P., Annen, H., Stöckli, P. L., & Jonas, K. (2020). Careless responding in ques-tionnaire measures: Detection, impact, and remedies. The Leadership Quarterly, 101384.
Golden, L., & Wiens-Tuers, B. (2006). To your hap-piness? Extra hours of labor supply and worker well-being. The Journal of Socio-Economics, 35(2), 382–397.
Golder, S. A., & Macy, M. W. (2011). Diurnal and seasonal mood vary with work, sleep, and daylength across diverse cultures. Science, 333(6051), 1878–1881.
Gonçalves, P., Araújo, M., Benevenuto, F., & Cha, M. (2013). Comparing and combining sentiment analysis methods. Proceedings of the First ACM Conference on Online Social Networks, 27–38.
Goodman, F. R., Disabato, D. J., & Kashdan, T. B. (2020). Reflections on unspoken problems and potential solutions for the well-being juggernaut in positive psychology. The Journal of Positive Psychology, 1–7.
Goodman, J. S., & Blum, T. C. (1996). Assessing the non-random sampling effects of subject attrition in longitudinal research. Journal of Management, 22(4), 627–652.
Gordon, H. J., Demerouti, E., Le Blanc, P. M., Bakker, A. B., Bipp, T., & Verhagen, M. A. (2018). Indi-vidual job redesign: Job crafting interven-tions in healthcare. Journal of Vocational Behavior, 104, 98–114.
Goštautaitė, B., & Bučiūnienė, I. (2015). Work engagement during life-span: The role of interaction outside the organization and task significance. Journal of Vocational Behavior, 89, 109–119.
Grant, A. M., Christianson, M. K., & Price, R. H. (2007). Happiness, health, or relationships? Managerial practices and employee well-being tradeoffs. Academy of Management Perspectives, 21(3), 51–63.
Grant, A. M., & Parker, S. K. (2009). 7 redesigning work design theories: The rise of relational and proactive perspectives. Academy of Management Annals, 3(1), 317–375.
Gray, E. K., & Watson, D. (2007). Assessing positive and negative affect via self-report. In J. A. Coan & J. J. B. Allen (Eds.), Handbook of emotional elicitation and assessment (pp. 171–183). Oxford University Press.
B
211
Grewen, K. M., Girdler, S. S., Amico, J., & Light, K. C. (2005). Effects of partner support on resting oxytocin, cortisol, norepinephrine, and blood pressure before and after warm partner contact. Psychosomatic Medicine, 67(4), 531–538.
Greyling, T., Rossouw, S., & Afstereo. (2019). Gross national happiness index. The University of Johannesburg and Afstereo [producers].
Grube, A., Schroer, J., Hentzschel, C., & Hertel, G. (2008). The event reconstruction method: An efficient measure of experience‐based job satisfaction. Journal of Occupational and Organizational Psychology, 81(4), 669–689.
Guerci, M., Hauff, S., & Gilardi, S. (2019). High per-formance work practices and their associa-tions with health, happiness and relational well-being: Are there any tradeoffs? The International Journal of Human Resource Management, 1–31.
Guest, D. E. (2017). Human resource management and employee well-being: Towards a new analytic framework. Human Resource Man-agement Journal, 27(1), 22–38.
Gupta, A., Sharda, R., & Greve, R. A. (2011). You’ve got email! Does it really matter to process emails now or later? Information Systems Frontiers, 13(5), 637–653.
Gurin, G., Veroff, J., & Feld, S. (1960). Americans view their mental health: A nationwide interview survey.
Guzzo, R. A., Fink, A. A., King, E., Tonidandel, S., & Landis, R. S. (2015). Big data recom-mendations for industrial–organizational psychology. Industrial and Organizational Psychology, 8(4), 491–508.
hHacker, W. (2003). Action regulation theory: A
practical tool for the design of modern work processes? European Journal of Work and Organizational Psychology, 12(2), 105–130.
Hackett, R. D., & Wang, G. (2012). Virtues and leadership: An integrating conceptual framework founded in Aristotelian and Confucian perspectives on virtues. Man-agement Decision, 50(5), 868–899.
Hackman, J. R., & Oldham, G. R. (1974). The job diagnostic survey: An instrument for the diagnosis of jobs and the evaluation of job redesign projects. Yale University, Depart-ment of Administrative Sciences.
Hackman, J. R., & Oldham, G. R. (1976). Motiva-tion through the design of work: Test of a theory. Organizational Behavior and Hu-man Performance, 16(2), 250–279.
Halbesleben, J. R. B. (2011). The consequences of engagement: The good, the bad, and the ugly. European Journal of Work and Organi-zational Psychology, 20(1), 68–73.
Halbesleben, J. R. B., Harvey, J., & Bolino, M. C. (2009). Too engaged? A conservation of re-sources view of the relationship between work engagement and work interference with family. Journal of Applied Psychology, 94(6), 1452.
Halbesleben, J. R. B., Wheeler, A. R., & Paustian-Underdahl, S. C. (2013). The impact of fur-loughs on emotional exhaustion, self-rated performance, and recovery experiences. Journal of Applied Psychology, 98(3), 492.
Hale, T., Petherick, A., Phillips, T., & Webster, S. (2020). Variation in government responses to COVID-19. Blavatnik School of Govern-ment Working Paper, 31. www.bsg.ox.ac.uk/covidtracker
Hallgren, K. A. (2012). Computing inter-rater reli-ability for observational data: An overview and tutorial. Tutorials in Quantitative Meth-ods for Psychology, 8(1), 23.
Hamilton, R., Vohs, K. D., Sellier, A.-L., & Meyvis, T. (2011). Being of two minds: Switch-ing mindsets exhausts self-regulatory resources. Organizational Behavior and Human Decision Processes, 115(1), 13–24.
Hancock, J. T., Landrigan, C., & Silver, C. (2007). Expressing emotion in text-based com-munication. Proceedings of the SIGCHI
212
Bibliography
Conference on Human Factors in Computing Systems, 929–932.
Hanisch, K. A., & Hulin, C. L. (1991). General at-titudes and organizational withdrawal: An evaluation of a causal model. Journal of Vocational Behavior, 39(1), 110–128.
Harker, L., & Keltner, D. (2001). Expressions of positive emotion in women’s college yearbook pictures and their relationship to personality and life outcomes across adulthood. Journal of Personality and Social Psychology, 80(1), 112–124.
Harter, J. K., Schmidt, F. L., & Hayes, T. L. (2002). Business-unit-level relationship between employee satisfaction, employee engage-ment, and business outcomes: A meta-analysis. Journal of Applied Psychology, 87(2), 268–279.
Harvey, P., & Martinko, M. J. (2009). An empirical examination of the role of attributions in psychological entitlement and its out-comes. Journal of Organizational Behavior: The International Journal of Industrial, Oc-cupational and Organizational Psychology and Behavior, 30(4), 459–476.
Hatami, A., Vosoughi, S., Hosseini, A. F., & Ebrahami, H. (2019). Effect of co-driver on job content and depression of truck drivers. Safety and Health at Work, 10, 75–79.
Havighurst, R. J. (1963). Successful aging. Processes of Aging: Social and Psychological Perspec-tives, 1, 299–320.
Hayes, A. F., & Krippendorff, K. (2007). Answering the call for a standard reliability measure for coding data. Communication Methods and Measures, 1(1), 77–89.
Headey, B., Veenhoven, R., & Wearing, A. (1991). Top-down versus bottom-up theories of subjective well-being. Social Indicators Research, 24(1), 81–100.
Hege, A., Perko, M., Johnson, A., Yu, C. H., Sönmez, S., & Apostolopoulos, Y. (2015). Surveying the impact of work hours and schedules on commercial motor vehicle driver sleep. Safety and Health at Work, 6(2), 104–113.
Heller, D., Watson, D., & Ilies, R. (2006). The dynamic process of life satisfaction. Journal of Per-sonality, 74(5), 1421–1450.
Hennekam, S., Ladge, J., & Shymko, Y. (2020). From zero to hero: An exploratory study examining sudden hero status among nonphysician health care workers during the COVID-19 pandemic. Journal of Applied Psychology, 105(10), 1088.
Hennessy, D. A., & Wiesenthal, D. L. (1999). Traffic congestion, driver stress, and driver ag-gression. Aggressive Behavior: Official. Journal of the International Society for Research on Aggression, 25(6), 409–423.
Hernandez, I., Newman, D. A., & Jeon, G. (2015). Twitter analysis: Methods for data man-agement and a word count dictionary to measure city-level job satisfaction. In S. Tonidandel, J. Cortina, & E. King (Eds.), Data at Work: The Data Science Revolution and Organizational Psychology. Routledge.
Hicks, J. A., Schlegel, R. J., & King, L. A. (2010). Social threats, happiness, and the dynamics of meaning in life judgments. Personal-ity and Social Psychology Bulletin, 36(10), 1305–1317.
Highhouse, S., Brooks, M. E., Nesnidol, S., & Sim, S. (2017). Is a. 51 validity coefficient good? Value sensitivity for interview validity. International Journal of Selection and As-sessment, 25(4), 383–389.
Hilal, N. (2008). Unintended effects of deregulation in the European Union: The case of road freight transport. Sociologie Du Travail, 50, e19–e29.
Hill, A. D., White, M. A., & Wallace, J. C. (2014). Unobtrusive measurement of psychologi-cal constructs in organizational research. Organizational Psychology Review, 4(2), 148–174.
Hinkin, T. R. (1998). A brief tutorial on the devel-opment of measures for use in survey questionnaires. Organizational Research Methods, 1(1), 104–121.
Hirschi, A. (2012). Callings and work engagement: Moderated mediation model of work
B
213
meaningfulness, occupational identity, and occupational self-efficacy. Journal of Counseling Psychology, 59(3), 479.
Hobfoll, S. E. (1989). Conservation of resources: A new attempt at conceptualizing stress. American Psychologist, 44(3), 513.
Hobfoll, S. E. (2001). The influence of culture, community, and the nested-self in the stress process: Advancing conservation of resources theory. Applied Psychology, 50(3), 337–421.
Hobfoll, S. E., Halbesleben, J. R. B., Neveu, J.-P., & Westman, M. (2018). Conservation of resources in the organizational context: The reality of resources and their conse-quences. Annual Review of Organizational Psychology and Organizational Behavior, 5, 103–128.
Hodgkinson, G. P. (2012). The politics of evidence-based decision making. The Oxford Handbook of Evidence-Based Management, 404–419.
Hoekman, L. M., Smits, M. M. V., & Koolman, X. (2020). The Dutch COVID-19 approach: Regional differences in a small country. Health Policy and Technology, 443.
Holmes, E. A., O’Connor, R. C., Perry, V. H., Tracey, I., Wessely, S., Arseneault, L., Ballard, C., Christensen, H., Silver, R. C., Everall, I., & others. (2020). Multidisciplinary research priorities for the COVID-19 pandemic: A call for action for mental health science. The Lancet Psychiatry, 7, 547–560.
Holtbrügge, D., Weldon, A., & Rogers, H. (2013). Cultural determinants of email communi-cation styles. International Journal of Cross Cultural Management, 13(1), 89–110.
Hommelhoff, S., Weseler, D., & Niessen, C. (2021). The role of cognitive job crafting in the relationship between turnover intentions, negative affect, and task mastery. Anxiety, Stress, & Coping, 1–15.
Hora, G. P. R., Ribas Júnior, R., & Souza, M. A. de. (2018). State of the art of job satisfaction measures: A systematic review. Temas Em Psicologia, 26(2), 971–986.
Howell, R. T., Chenot, D., Hill, G., & Howell, C. J. (2011). Momentary happiness: The role of psychological need satisfaction. Journal of Happiness Studies, 12(1), 1–15.
hr.com. (2019). The State of Employee Engagement in 2019. https://info.glintinc.com/rs/586-OTD -288/ images/The_State_of_Em -ployee_Engagement_2019_ResearchRe-port_hrdotcom_Glint.pdf
Hsieh, C. M. (2012). Importance is not unimport-ant: The role of importance weighting in QoL measures. Social Indicators Research, 109(2), 267–278.
Hu, L., & Bentler, P. M. (1999). Cutoff criteria for fit indexes in covariance structure analysis: Conventional criteria versus new alterna-tives. Structural Equation Modeling: A Multidisciplinary Journal, 6(1), 1–55.
Hu, Q., Taris, T. W., Dollard, M. F., & Schaufeli, W. B. (2020). An exploration of the component validity of job crafting. European Journal of Work and Organizational Psychology, 29(5), 776–793.
Huelsman, T. J., Nemanick Jr, R. C., & Munz, D. C. (1998). Scales to measure four dimen-sions of dispositional mood: Positive energy, tiredness, negative activation, and relaxation. Educational and Psychological Measurement, 58(5), 804–819.
Huffman, B., & Benson, J. (2021). Businesspeople: Academics Need Your Help to Make Busi-ness Research Relevant. Business Horizons.
Hunter, E. M., & Wu, C. (2016). Give me a better break: Choosing workday break activities to maximize resource recovery. Journal of Applied Psychology, 101(2), 302.
Huta, V., & Waterman, A. S. (2014). Eudaimonia and its distinction from hedonia: Developing a classification and terminology for un-derstanding conceptual and operational definitions. Journal of Happiness Studies, 15(6), 1425–1456.
214
Bibliography
iIacus, S., Porro, G., Salini, S., & Siletti, E. (2020). An
Italian composite subjective well-being index: The voice of Twitter users from 2012 to 2017. Social Indicators Research, 1–19.
Iida, M., Watanabe, K., Imamura, K., Sakuraya, A., Asaoka, H., Sato, N., Nozawa, K., & Kawakami, N. (2021). Development and validation of the Japanese version of the team job crafting scale for nurses. Research in Nursing & Health, 44(2), 329–343.
IJbema, J., & Brenninkmeijer, V. (2018). Cognitive job crafting: A daily diary study. Manuscript in Preparation.
Ikoro, V., Sharmina, M., Malik, K., & Batista-Navarro, R. (2018). Analyzing sentiments expressed on Twitter by UK energy company consum-ers. 2018 Fifth International Conference on Social Networks Analysis, Management and Security (SNAMS), 95–98.
Ilies, R., Aw, S. S., & Lim, V. K. (2016). A naturalistic multilevel framework for studying tran-sient and chronic effects of psychosocial work stressors on employee health and well-being. Applied Psychology, 65(2), 223–258.
Ilies, R., Dimotakis, N., & Watson, D. (2010). Mood, blood pressure, and heart rate at work: An experience-sampling study. Journal of Occupational Health Psychology, 15(2), 120.
Ilies, R., & Judge, T. A. (2002). Understanding the dynamic relationships among personal-ity, mood, and job satisfaction: A field experience sampling study. Organizational Behavior and Human Decision Processes, 89(2), 1119–1139.
Ilies, R., & Judge, T. A. (2004). An experience-sampling measure of job satisfaction and its relationships with affectivity, mood at work, job beliefs, and general job satisfaction. European Journal of Work and Organizational Psychology, 13(3), 367–389.
Ilies, R., Schwind, K. M., & Heller, D. (2007). Em-ployee well-being: A multilevel model linking work and nonwork domains. Euro-
pean Journal of Work and Organizational Psychology, 16(3), 326–341.
Ilies, R., Scott, B. A., & Judge, T. A. (2006). The interactive effects of personal traits and experienced states on intraindividual pat-terns of citizenship behavior. Academy of Management Journal, 49(3), 561–575.
Imamura, K., Kawakami, N., Furukawa, T. A., Matsuyama, Y., Shimazu, A., Umanodan, R., Kawakami, S., & Kasai, K. (2015). Effects of an internet-based cognitive behavioral therapy intervention on improving work engagement and other work-related out-comes: An analysis of secondary outcomes of a randomized controlled trial. Journal of Occupational and Environmental Medicine, 57(5), 578–584.
Inceoglu, I., Thomas, G., Chu, C., Plans, D., & Gerbasi, A. (2018). Leadership behavior and employee well-being: An integrated review and a future research agenda. The Leadership Quarterly, 29(1), 179–202.
International Labour Organization. (2020). ILO Sectoral Brief: COVID-19 and the health sec-tor. https://www.ilo.org/wcmsp5/groups/public/---ed_dialogue/---sector/docu-ments/briefingnote/wcms_741655.pdf
Ipsen, C., Kirchner, K., & Hansen, J. P. (2020). Experi-ences of working from home in times of covid-19 International survey conducted the first months of the national lockdowns March-May, 2020. International Journal of Environmental Research and Public Health, 18(4).
Ironson, G. H., Smith, P. C., Brannick, M. T., Gibson, W. M., & Paul, K. B. (1989). Construction of a Job in General scale: A comparison of global, composite, and specific measures. Journal of Applied Psychology, 74(2), 193–200.
Islam, M. R., & Zibran, M. F. (2017). A comparison of dictionary building methods for sentiment analysis in software engineering text. 2017 ACM/IEEE International Symposium on Empirical Software Engineering and Measurement (ESEM), 478–479.
B
215
Israel, M., & Hay, I. (2006). Research ethics for social scientists. Sage.
Izard, C. E., Dougherty, F. E., Bloxom, B. M., & Kotsch, N. E. (1974). The Differential Emotions Scale: A Method of Measuring the Subjective Experience of Discrete Emotions. Vanderbilt Univ. Press.
jJahedi, S., & Méndez, F. (2014). On the advantages
and disadvantages of subjective measures. Journal of Economic Behavior & Organiza-tion, 98, 97–114.
Jaidka, K., Giorgi, S., Schwartz, H. A., Kern, M. L., Un-gar, L. H., & Eichstaedt, J. C. (2020). Estimat-ing geographic subjective well-being from Twitter: A comparison of dictionary and data-driven language methods. Proceed-ings of the National Academy of Sciences, 117(19), 10165–10171.
Jarden, A., & Jarden, R. (2017). Positive psychologi-cal assessment for the workplace. The Wiley Blackwell Handbook of the Psychology of Positivity and Strengths-Based Approaches at Work, 415–437.
Jerejian, A. C., Reid, C., & Rees, C. S. (2013). The contribution of email volume, email management strategies and propensity to worry in predicting email stress among academics. Computers in Human Behavior, 29(3), 991–996.
Jick, T. D. (1979). Mixing qualitative and quantita-tive methods: Triangulation in action. Administrative Science Quarterly, 24(4), 602–611.
Jockers, M. (2017). syuzhet: Extracts sentiment and sentiment-derived plot arcs from text. Pack-age ‘Syuzhet.’ https://cran.r-project.org/web/packages/syuzhet/syuzhet.pdf
Johnson, J. C., Bristow, D. N., McClure, D. J., & Schneider, K. C. (2011). Determinants of job satisfaction among long-distance truck drivers: An interview study in the United
States. International Journal of Manage-ment, 28(1), 203–217.
Johnson, S., Robertson, I., & Cooper, C. L. (2018). Well-being. Productivity and happiness at work. Palgrave Macmillan.
Judge, T. A. (1993). Does affective disposition moderate the relationship between job satisfaction and voluntary turnover? Jour-nal of Applied Psychology, 78(3), 395.
Judge, T. A., Heller, D., & Mount, M. K. (2002). Five-factor model of personality and job satisfaction: A meta-analysis. Journal of Applied Psychology, 87(3), 530.
Judge, T. A., Hulin, C. L., & Dalal, R. S. (2012). Job satisfaction and job affect. In S. W. J. Kozlowski (Ed.), Oxford library of psychol-ogy. The Oxford handbook of organizational psychology (Vol. 1, pp. 496–525). Oxford University Press.
Judge, T. A., & Locke, E. A. (1993). Effect of dysfunc-tional thought processes on subjective well-being and job satisfaction. Journal of Applied Psychology, 78(3), 475–490.
Judge, T. A., Piccolo, R. F., Podsakoff, N. P., Shaw, J. C., & Rich, B. L. (2010). The relationship between pay and job satisfaction: A meta-analysis of the literature. Journal of Vocational Behavior, 77(2), 157–167.
Judge, T. A., Thoresen, C. J., Bono, J. E., & Patton, G. K. (2001a). The job satisfaction–job per-formance relationship: A qualitative and quantitative review. Psychological Bulletin, 127(3), 376.
Judge, T. A., Thoresen, C. J., Bono, J. E., & Patton, G. K. (2001b). The job satisfaction–job per-formance relationship: A qualitative and quantitative review. Psychological Bulletin, 127(3), 376.
Judge, T. A., & Watanabe, S. (1994). Individual dif-ferences in the nature of the relationship between job and life satisfaction. Journal of Occupational and Organizational Psy-chology, 67(2), 101–107.
Judge, T. A., Weiss, H. M., Kammeyer-Mueller, J. D., & Hulin, C. L. (2017). Job attitudes, job satisfaction, and job affect: A century of
216
Bibliography
continuity and of change. Journal of Ap-plied Psychology, 102(3), 356–374.
Jung, Y., & Suh, Y. (2019). Mining the voice of employees: A text mining approach to identifying and analyzing job satisfaction factors from online employee reviews. Decision Support Systems, 113074.
kKahn, W. A. (1990). Psychological conditions of
personal engagement and disengagement at work. Academy of Management Journal, 33(4), 692–724.
Kahneman, D., & Deaton, A. (2010). High income improves evaluation of life but not emotional well-being. Proceedings of the National Academy of Sciences, 107, 16489–16493.
Kahneman, D., Krueger, A. B., Schkade, D. A., Schwarz, N., & Stone, A. A. (2004). A survey method for characterizing daily life experi-ence: The day reconstruction method. Science, 306(5702), 1776–1780.
Kam, C. C. S., & Meyer, J. P. (2015). How careless re-sponding and acquiescence response bias can influence construct dimensionality: The case of job satisfaction. Organizational Research Methods, 18(3), 512–541.
Kammann, R., & Flett, R. (1983). Affectometer 2: A scale to measure current level of general happiness. Australian Journal of Psychol-ogy, 35(2), 259–265.
Kanazawa, H., Suzuki, M., Onoda, T., & Yokozawa, N. (2006). Excess workload and sleep-related symptoms among commercial long-haul truck drivers. Sleep and Biological Rhythms, 4(2), 121–128.
Kaplan, S. A., Warren, C. R., Barsky, A. P., & Thoresen, C. J. (2009). A note on the relationship between affect(ivity) and differing con-ceptualizations of job satisfaction: Some unexpected meta-analytic findings. Euro-
pean Journal of Work and Organizational Psychology, 18(1), 29–54.
Karanika-Murray, M., & Biron, C. (2015). Derailed organizational interventions for stress and well-being. Springer.
Kashdan, T. B., Biswas-Diener, R., & King, L. A. (2008). Reconsidering happiness: The costs of distinguishing between hedonics and eudaimonia. The Journal of Positive Psychol-ogy, 3(4), 219–233.
Katz, L. D. (1999). Dopamine and serotonin: Inte-grating current affective engagement with longer-term goals. Behavioral and Brain Sciences, 22(3), 527–527.
Kelleher, D. (2013). Survey: 81% of U.S. Employees Check their Work Mail outside Work Hours. https://techtalk.gfi.com/survey-81-of-u-s-employees-check-their-work-mail-outside-work-hours/
Kemp, E., Kopp, S. W., & Kemp Jr., E. C. (2013). Take this job and shove it: Examining the influence of role stressors and emotional exhaustion on organizational commit-ment and identification in professional truck drivers. Journal of Business Logistics, 34(1), 33–45.
Kern, M. L., Park, G., Eichstaedt, J. C., Schwartz, H. A., Sap, M., Smith, L. K., & Ungar, L. H. (2016). Gaining insights from social media language: Methodologies and challenges. Psychological Methods, 21(4), 507.
Keshtkar, F., & Inkpen, D. (2009). Using sentiment orientation features for mood classifica-tion in blogs. 2009 International Conference on Natural Language Processing and Knowl-edge Engineering, 1–6.
Keyes, C. L., Shmotkin, D., & Ryff, C. D. (2002). Op-timizing well-being: The empirical encoun-ter of two traditions. Journal of Personality and Social Psychology, 82(6), 1007.
Kilroy, S., Flood, P. C., Bosak, J., & Chênevert, D. (2017). Perceptions of high-involvement work practices, person-organization fit, and burnout: A time-lagged study of health care employees. Human Resource Management, 56(5), 821–835.
B
217
Kim, H., Im, J., & Qu, H. (2018). Exploring anteced-ents and consequences of job crafting. International Journal of Hospitality Man-agement, 75, 18–26.
Kim, P. T. (1996). Privacy rights, public policy, and the employment relationship. Ohio St. LJ, 57, 671.
Kim, S., Park, Y., & Niu, Q. (2017). Micro-break activities at work to recover from daily work demands. Journal of Organizational Behavior, 38(1), 28–44.
Kinicki, A. J., McKee-Ryan, F. M., Schriesheim, C. A., & Carson, K. P. (2002). Assessing the construct validity of the job descriptive index: A review and meta-analysis. Journal of Applied Psychology, 87(1), 14.
Kiritchenko, S., Zhu, X., & Mohammad, S. M. (2014). Sentiment analysis of short informal texts. Journal of Artificial Intelligence Research, 50, 723–762.
Kline, R. B. (2015). Principles and practice of struc-tural equation modeling. Guilford publica-tions.
Kniffin, K. M., Narayanan, J., Anseel, F., Antonakis, J., Ashford, S. J., Bakker, A. B., Bamberger, P., Bapuji, H., Bhave, D. P., Choi, V. K., Creary, S., & Van Vugt, M. (2020). COVID-19 and the Workplace: Implications, Issues, and Insights for Future Research and Action. American Psychologist, 76(1), 63.
Knight, C., Patterson, M., & Dawson, J. (2019). Work engagement interventions can be effec-tive: A systematic review. European Journal of Work and Organizational Psychology, 28(3), 348–372.
Kobayashi, V. B., Mol, S. T., Berkers, H. A., Kismihók, G., & Den Hartog, D. N. (2017). Text mining in organizational research. Organizational Research Methods, 21(3), 733–765.
Kok, A. L., Hans, E. W., & Schutten, J. M. (2012). Ve-hicle routing under time-dependent travel times: The impact of congestion avoid-ance. Computers & Operations Research, 39(5), 910–918.
Korsgaard, C. M. (1983). Two distinctions in goodness. The Philosophical Review, 92(2), 169–195.
Korunka, C., Kubicek, B., Schaufeli, W. B., & Hoon-akker, P. (2009). Work engagement and burnout: Testing the robustness of the Job Demands-Resources model. The Journal of Positive Psychology, 4(3), 243–255.
Kosfeld, M., Heinrichs, M., Zak, P. J., Fischbacher, U., & Fehr, E. (2005). Oxytocin increases trust in humans. Nature, 435(7042), 673–676.
Kosinski, M., Stillwell, D., & Graepel, T. (2013). Private traits and attributes are predictable from digital records of human behavior. Proceedings of the National Academy of Sciences, 110, 5802–5805.
Koys, D. J. (2001). The effects of employee satisfac-tion, organizational citizenship behavior, and turnover on organizational effective-ness: A unit-level, longitudinal study. Personnel Psychology, 54(1), 101–114.
Kożusznik, M. W., Peiró, J. M., & Soriano, A. (2019). Daily eudaimonic well-being as a predictor of daily performance: A dynamic lens. PloS One, 14(4), e0215564.
Kraut, R. (2009). What is good and why: The ethics of well-being. Harvard University Press.
Kreibig, S. D. (2010). Autonomic nervous system activity in emotion: A review. Biological Psychology, 84(3), 394–421.
Krekel, C., Ward, G., & De Neve, J. E. (2019). Em-ployee well-being, productivity, and firm performance: Evidence and case studies. Global Happiness and Wellbeing.
Krippendorff, K. (1980). Content Analysis: An Introduction to Its Methodology (Commtext Series). SAGE Publications.
Kristof, A. L. (1996). Person-organization fit: An in-tegrative review of its conceptualizations, measurement, and implications. Personnel Psychology, 49(1), 1–49.
Krosnick, J. A. (1999). Survey research. Annual Review of Psychology, 50(1), 537–567.
Krueger, A. B., & Schkade, D. A. (2008). The reliability of subjective well-being measures. Journal of Public Economics, 92(8–9), 1833–1845.
218
Bibliography
Kühnel, J., Sonnentag, S., & Bledow, R. (2012). Resources and time pressure as day-level antecedents of work engagement. Journal of Occupational and Organizational Psy-chology, 85(1), 181–198.
Kulkarni, S. S., Reddy, N. P., & Hariharan, S. I. (2009). Facial expression (mood) recognition from facial images using committee neural networks. Biomedical Engineering Online, 8(1), 16.
Kunin, T. (1955). The construction of a new type of attitude measure. Personnel Psychology, 8(1), 65–77.
Kuoppala, J., Lamminpää, A., Liira, J., & Vainio, H. (2008). Leadership, job well-being, and health effects—A systematic review and a meta-analysis. Journal of Occupational and Environmental Medicine, 50(8), 904–915.
Kushlev, K., & Dunn, E. W. (2015). Checking email less frequently reduces stress. Computers in Human Behavior, 43, 220–228.
Kuykendall, L., Tay, L., & Ng, V. (2015). Leisure engagement and subjective well-being: A meta-analysis. Psychological Bulletin, 141(2), 364–403.
lLacy, S., Watson, B. R., Riffe, D., & Lovejoy, J. (2015).
Issues and best practices in content analysis. Journalism & Mass Communication Quarterly, 92(4), 791–811.
Lagu, T., Goff, S. L., Hannon, N. S., Shatz, A., & Lindenauer, P. K. (2013). A mixed-methods analysis of patient reviews of hospital care in England: Implications for public reporting of health care quality data in the United States. The Joint Commission Journal on Quality and Patient Safety, 39(1), 7-AP4.
Lam, C. K., Walter, F., & Huang, X. (2017). Supervi-sors’ emotional exhaustion and abusive supervision: The moderating roles of perceived subordinate performance and
supervisor self-monitoring. Journal of Organizational Behavior, 38(8), 1151–1166.
Lancée, S., Veenhoven, R., & Burger, M. (2017). Mood during commute in the Netherlands: What way of travel feels best for what kind of people? Transportation Research Part A: Policy and Practice, 104(C), 195–208.
Landers, R. N., & Behrend, T. S. (2015). An inconve-nient truth: Arbitrary distinctions between organizational, Mechanical Turk, and other convenience samples. Industrial and Orga-nizational Psychology, 8(2), 142–164.
Lapierre, L. M., Matthews, R. A., Eby, L. T., Truxillo, D. M., Johnson, R. E., & Major, D. A. (2018). Recommended practices for academics to initiate and manage research partnerships with organizations. Industrial and Organi-zational Psychology, 11(4), 543–581.
Larson, R., & Csikszentmihalyi, M. (2014). The expe-rience sampling method. In M. Csikszent-mihalyi (Ed.), Flow and the foundations of positive psychology (pp. 21–34). Springer.
Lavie, N. (2010). Attention, distraction, and cogni-tive control under load. Current Directions in Psychological Science, 19(3), 143–148.
Lavie, N., & De Fockert, J. (2005). The role of work-ing memory in attentional capture. Psycho-nomic Bulletin & Review, 12(4), 669–674.
Lavie, N., Hirst, A., De Fockert, J. W., & Viding, E. (2004). Load theory of selective attention and cognitive control. Journal of Experi-mental Psychology: General, 133(3), 339.
Lawanot, W., Inoue, M., Yokemura, T., Mongkol-nam, P., & Nukoolkit, C. (2019). Daily stress and mood recognition system using deep learning and fuzzy clustering for promot-ing better well-being. 2019 IEEE Interna-tional Conference on Consumer Electronics (ICCE), 1–6.
Lazazzara, A., Tims, M., & De Gennaro, D. (2020). The process of reinventing a job: A meta–synthesis of qualitative job crafting research. Journal of Vocational Behavior, 116, 103267.
Lee, B. G., Lee, B. L., & Chung, W. Y. (2015). Smart-watch-based driver alertness monitoring
B
219
with wearable motion and physiological sensor. Engineering in Medicine and Biology Society (EMBC), 2015 37th Annual Interna-tional Conference of the IEEE, 6126–6129.
Lee, S. H., Shin, Y., & Baek, S. I. (2017). The impact of job demands and resources on job craft-ing. Journal of Applied Business Research (JABR), 33(4), 829–842.
LePine, J. A., Erez, A., & Johnson, D. E. (2002). The nature and dimensionality of organiza-tional citizenship behavior: A critical re-view and meta-analysis. Journal of Applied Psychology, 87(1), 52–65.
Leroy, S. (2009). Why is it so hard to do my work? The challenge of attention residue when switching between work tasks. Organi-zational Behavior and Human Decision Processes, 109(2), 168–181.
Letona-Ibañez, O., Carrasco, M., Martinez-Rodri-guez, S., Amillano, A., & Ortiz-Marques, N. (2019). Cognitive, relational and task crafting: Spanish adaptation and analysis of psychometric properties of the Job Crafting Questionnaire. PloS One, 14(10), e0223539.
Li, H., & Yamanishi, K. (2001). Mining from open answers in questionnaire data. Proceedings of the Seventh ACM SIGKDD International Conference on Knowledge Discovery and Data Mining, 443–449.
Lichtenthaler, P. W., & Fischbach, A. (2019). A meta-analysis on promotion-and prevention-focused job crafting. European Journal of Work and Organizational Psychology, 28(1), 30–50.
Liefooghe, B., Barrouillet, P., Vandierendonck, A., & Camos, V. (2008). Working memory costs of task switching. Journal of Experimental Psychology: Learning, Memory, and Cogni-tion, 34(3), 478.
LiKamWa, R., Liu, Y., Lane, N. D., & Zhong, L. (2013). Moodscope: Building a mood sensor from smartphone usage patterns. Proceeding of the 11th Annual International Conference on Mobile Systems, Applications, and Services, 389–402.
Lin, B. C., Kain, J. M., & Fritz, C. (2013). Don’t interrupt me! An examination of the rela-tionship between intrusions at work and employee strain. International Journal of Stress Management, 20(2), 77.
Linley, P. A., Maltby, J., Wood, A. M., Osborne, G., & Hurling, R. (2009). Measuring happi-ness: The higher order factor structure of subjective and psychological well-being measures. Personality and Individual Differ-ences, 47(8), 878–884.
Liu, B. (2015). Sentiment analysis: Mining opinions, sentiments, and emotions. Cambridge University Press.
Liu, P., Tov, W., Kosinski, M., Stillwell, D. J., & Qiu, L. (2015). Do Facebook status updates reflect subjective well-being? Cyberpsychol-ogy, Behavior, and Social Networking, 18(7), 373–379.
Liu, Q., Luo, D., Haase, J. E., Guo, Q., Wang, X. Q., Liu, S., Xia, L., Liu, Z., Yang, J., & Yang, B. X. (2020). The experiences of health-care providers during the COVID-19 crisis in China: A qualitative study. The Lancet Global Health, 8, e790-98.
Locke, E. A., & Dunnette, M. D. (1976). Handbook of Industrial and Organizational Psychology. Holt, Reinhart & Winston.
Lowry, P. B., Romano, N. C., Jenkins, J. L., & Guthrie, R. W. (2009). The CMC interactivity model: How interactivity enhances communica-tion quality and process satisfaction in lean-media groups. Journal of Manage-ment Information Systems, 26(1), 155–196.
Lucas, R. E., Diener, E., & Suh, E. (1996). Discriminant validity of well-being measures. Journal of Personality and Social Psychology, 71(3), 616–628.
Luciano, M. M., Mathieu, J. E., Park, S., & Tannen-baum, S. I. (2017). A fitting approach to construct and measurement alignment: The role of big data in advancing dynamic theories. Organizational Research Methods, 21(3), 1–41.
Luhmann, M. (2017). Using big data to study subjective well-being. Current opinion in
220
Bibliography
behavioral. Current Opinion in Behavioral Sciences, 18, 28–33.
Lyubomirsky, S., Dickerhoof, R., Boehm, J. K., & Sheldon, K. M. (2011). Becoming hap-pier takes both a will and a proper way: An experimental longitudinal intervention to boost well-being. Emotion, 11(2), 391.
MMacCallum, R. C., Zhang, S., Preacher, K. J., &
Rucker, D. D. (2002). On the practice of dichotomization of quantitative variables. Psychological Methods, 7(1), 19.
MacEwen, K. E., & Barling, J. (1988). Interrole conflict, family support and marital adjust-ment of employed mothers: A short term, longitudinal study. Journal of Organiza-tional Behavior, 9(3), 241–250.
Macey, W. H., & Schneider, B. (2008). The meaning of employee engagement. Industrial and Organizational Psychology, 1(1), 3–30.
Macias, C., Gold, P. B., Öngür, D., Cohen, B. M., & Panch, T. (2015). Are single-item global ratings useful for assessing health status? Journal of Clinical Psychology in Medical Settings, 22(4), 251–264.
Maenhout, B., & Vanhoucke, M. (2013). An integrat-ed nurse staffing and scheduling analysis for longer-term nursing staff allocation problems. Omega, 41(2), 485–499.
Mäkikangas, A., Kinnunen, U., Feldt, T., & Schaufeli, W. (2016). The longitudinal development of employee well-being: A systematic review. Work & Stress, 30(1), 46–70.
Mano, R. S., & Mesch, G. S. (2010). E-mail charac-teristics, work performance and distress. Computers in Human Behavior, 26(1), 61–69.
Manson, N. C., & O’Neill, O. (2007). Rethinking informed consent in bioethics. Cambridge University Press.
Mark, G., Iqbal, S. T., Czerwinski, M., Johns, P., Sano, A., & Lutchyn, Y. (2016). Email duration,
batching and self-interruption: Patterns of email use on productivity and stress. Proceedings of the 2016 CHI Conference on Human Factors in Computing Systems, 1717–1728.
Mark, G., Voida, S., & Cardello, A. (2012). “A pace not dictated by electrons” an empirical study of work without email. Proceedings of the SIGCHI Conference on Human Factors in Computing Systems, 555–564.
Marler, J. H., & Boudreau, J. W. (2017). An evidence-based review of HR Analytics. The International Journal of Human Resource Management, 28(1), 3–26.
Martela, F. (2017). Can good life be measured? The dimensions and measurability of a life worth living. In G. Brulé & F. Maggino (Eds.), Metrics of Subjective Well-Being: Limits and Improvements (pp. 21–42). Springer.
Marwick, A. E., & Boyd, D. (2011). I tweet honestly, I tweet passionately: Twitter users, context collapse, and the imagined audience. New Media & Society, 13(1), 114–133.
Maslach, C., & Jackson, S. E. (1981). The measure-ment of experienced burnout. Journal of Organizational Behavior, 2(2), 99–113.
Maslach, C., Jackson, S. E., Leiter, M. P., Schaufeli, W. B., & Schwab, R. L. (1986). Maslach burnout inventory (Vol. 21). Consulting Psycholo-gists Press.
Mastekaasa, A. (1984). Multiplicative and additive models of job and life satisfaction. Social Indicators Research, 14(2), 141–163.
Matsunaga, M. (2010). How to factor-analyze your data right: Do’s, don’ts, and how-to’s. Inter-national Journal of Psychological Research, 3(1), 97–110.
Mauceri, S. (2016). Integrating quality into quantity: Survey research in the era of mixed methods. Quality & Quantity, 50(3), 1213–1231.
Mauss, I. B., Levenson, R. W., McCarter, L., Wilhelm, F. H., & Gross, J. J. (2005). The tie that binds? Coherence among emotion experience, behavior, and physiology. Emotion, 5(2), 175.
B
221
Mauss, I. B., & Robinson, M. D. (2009). Measures of emotion: A review. Cognition and Emotion, 23(2), 209–237.
Maxwell, S. E., & Delaney, H. D. (1985). Measure-ment and statistics: An examination of construct validity. Psychological Bulletin, 97(1), 85.
May, D. R., Gilson, R. L., & Harter, L. M. (2004). The psychological conditions of meaningful-ness, safety and availability and the engagement of the human spirit at work. Journal of Occupational and Organizational Psychology, 77(1), 11–37.
Mayo, A. (2016). The measurement of engage-ment. Strategic HR Review, 15(2), 83–89.
Mazur, A., & Booth, A. (1998). Testosterone and dominance in men. Behavioral and Brain Sciences, 21(3), 353–363.
McColl, E., Jacoby, A., Thomas, L., Soutter, J., Bamford, C., Steen, N., Thomas, R., Harvey, E., Garratt, A., & Bond, J. (2001). Design and use of questionnaires: A review of best practice applicable to surveys of health service staff and patients. Health Technol-ogy Assessment, 5(31), 1–256.
McCrae, R. R., & Costa Jr, P. T. (1997). Conceptions and correlates of openness to experience. In S. R. Briggs, R. Hogan, & W. H. Jones (Eds.), Handbook of personality psychology (pp. 825–847). Academic Press.
McDonald, R. P. (1999). Test theory: A unified treat-ment. Erlbaum.
McElroy, J. C., Rodriguez, J. M., Griffin, G. C., Morrow, P. C., & Wilson, M. G. (1993). Career stage, time spent on the road, and truckload driver attitudes. Transportation Journal, 33(1), 5–14.
McKenny, A. F., Aguinis, H., Short, J. C., & Anglin, A. H. (2018). What doesn’t get measured does exist: Improving the accuracy of computer-aided text analysis. Journal of Management, 44(7), 2909–2933.
McKinsey & Company. (2020). Diverse employees are struggling the most during COVID-19—Here’s how companies can respond. https://www.mckinsey.com/featured-insights/di-
versity-and-inclusion/diverse-employees-are-struggling-the-most-during-covid-19-heres-how-companies-can-respond
McNair, D. M., Lorr, M., & Droppleman, L. F. (1981). Profile of mood states: EdITS manual. Educa-tional and Industrial Testing Service.
Meade, A. W., & Craig, S. B. (2012). Identifying care-less responses in survey data. Psychological Methods, 17(3), 437–455.
Mehta, P. H., & Josephs, R. A. (2006). Testosterone change after losing predicts the decision to compete again. Hormones and Behavior, 50(5), 684–692.
Meijman, T. F., & Mulder, G. (1998). Psychological aspects of workload. Handbook of Work and Organizational Psychology. Volume, 2.
Meister, J. (2020). Top 10 HR Trends That Matter Most In The 2020 Workplace. Forbes. https://www.forbes.com/sites/jeannemeister/2020/01/15/top-10-hr-trends-that-matter-most-in-the-2020-workplace/
Melo, N., Dourado, D., & Andrade, J. (2021). Re-claiming cognitive crafting: An integrative model of behavioral and cognitive prac-tices in job crafting. International Journal of Organizational Analysis.
Metcalf, J., & Crawford, K. (2016). Where are human subjects in big data research? The emerg-ing ethics divide. Big Data & Society, 3(1), 2053951716650211.
Meyer, D., Hornik, K., & Feinerer, I. (2008). Text min-ing infrastructure in R. Journal of Statistical Software, 25(5), 1–54.
Michaelson, C., Pratt, M. G., Grant, A. M., & Dunn, C. P. (2014). Meaningful work: Connecting business ethics and organization studies. Journal of Business Ethics, 121(1), 77–90.
Microsoft. (2021). 2021 Work Trend Index: Annual Report. https://ms-worklab.azureedge.net/files/reports/hybridWork/pdf/2021_Micro-soft_WTI_Report_March.pdf
Mikes, P. S., & Hulin, C. L. (1968). Use of importance as a weighting component of job satisfac-tion. Journal of Applied Psychology, 52(5), 394.
222
Bibliography
Mikhaylov, S., Laver, M., & Benoit, K. R. (2012). Coder reliability and misclassification in the human coding of party manifestos. Political Analysis, 20(1), 78–91.
Mill, J. S. (1859). Utilitarianism and on liberty (2nd ed.) (M. Warnock, Ed.). Blackwell Publish-ing.
Miner, A., Glomb, T., & Hulin, C. (2005). Experience sampling mood and its correlates at work. Journal of Occupational and Organizational Psychology, 78(2), 171–193.
Mishne, G. (2005). Experiments with mood clas-sification in blog posts. Proceedings of ACM SIGIR, 19, 321–327.
Mitchell, J., Stanimirovic, R., Klein, B., & Vella-Bro-drick, D. (2009). A randomised controlled trial of a self-guided internet intervention promoting well-being. Computers in Hu-man Behavior, 25(3), 749–760.
Mohammad, S. M. (2016). Sentiment analysis: Detecting valence, emotions, and other affectual states from text. In Emotion mea-surement (pp. 201–237). Elsevier.
Moneta, G. B. (2012). On the measurement and conceptualization of flow. In S. Engeser (Ed.), Advances in flow research (pp. 23–50). Springer.
Moneta, G. B. (2017). Validation of the short flow in work scale (SFWS). Personality and Indi-vidual Differences, 109, 83–88.
Moniz, A., & Jong, F. (2014). Sentiment analysis and the impact of employee satisfaction on firm earnings. Proceedings of Euro-pean Conference on Information Retrieval, 519–527.
Morgeson, F. P., & Humphrey, S. E. (2006). The Work Design Questionnaire (WDQ): Developing and validating a comprehensive measure for assessing job design and the nature of work. Journal of Applied Psychology, 91(6), 1321.
Morris, E. A., & Guerra, E. (2015). Mood and mode: Does how we travel affect how we feel? Transportation, 42(1), 25–43.
Morrow, P. C., & Crum, M. R. (2004). Antecedents of fatigue, close calls, and crashes among
commercial motor-vehicle drivers. Journal of Safety Research, 35(1), 59–69.
Mossholder, K. W., Settoon, R. P., Harris, S. G., & Armenakis, A. A. (1995). Measuring emo-tion in open-ended survey responses: An application of textual data analysis. Journal of Management, 21(2), 335–355.
Motro, D., Ye, B., Kugler, T., & Noussair, C. N. (2020). Measuring emotions in the digital age. MIT Sloan Management Review, 61(2), 1–4.
Mueller, K., Voelkle, M. C., & Hattrup, K. (2011). On the relationship between job satisfaction and non-response in employee attitude surveys: A longitudinal field study. Journal of Occupational and Organizational Psy-chology, 84(4), 780–798.
nNagy, M. S. (2002). Using a single-item approach to
measure facet job satisfaction. Journal of Occupational and Organizational Psychol-ogy, 75(1), 77–86.
Naldi, M. (2019). A review of sentiment computa-tion methods with R packages. ArXiv.
Nave, C. S., Sherman, R. A., & Funder, D. C. (2008). Beyond self-report in the study of hedonic and eudaimonic well-being: Correlations with acquaintance reports, clinician judgments and directly observed social behavior. Journal of Research in Personality, 42(3), 643–659.
Neubert, M. J., Carlson, D. S., Kacmar, K. M., Roberts, J. A., & Chonko, L. B. (2009). The virtuous influence of ethical leadership behavior: Evidence from the field. Journal of Business Ethics, 90(2), 157–170.
Neugarten, B. L., Havighurst, R. J., & Tobin, S. S. (1961). The measurement of life satisfac-tion. Journal of Gerontology.
Newman, D. B., Tay, L., & Diener, E. (2014). Leisure and subjective well-being: A model of psychological mechanisms as mediating factors. Journal of Happiness Studies, 15(3), 555–578.

B
223
Ng, T. W., & Feldman, D. C. (2010). The relationships of age with job attitudes: A meta-analysis. Personnel Psychology, 63(3), 677–718.
Nielsen, K. (2013). How can we make organiza-tional interventions work? Employees and line managers as actively crafting interven-tions. Human Relations, 66(8), 1029–1050.
Nielsen, K., Abildgaard, J. S., & Daniels, K. (2014). Putting context into organizational inter-vention design: Using tailored question-naires to measure initiatives for worker well-being. Human Relations, 67(12), 1537–1560.
Nielsen, K., Fredslund, H., Christensen, K. B., & Albertsen, K. (2006). Success or failure? In-terpreting and understanding the impact of interventions in four similar worksites. Work & Stress, 20(3), 272–287.
Nielsen, K., & Miraglia, M. (2017). What works for whom in which circumstances? On the need to move beyond the ‘what works?’ question in organizational intervention research. Human Relations, 70(1), 40–62.
Nielsen, K., & Noblet, A. (2018). Organizational Interventions for Health and Well-being: A Handbook for Evidence-based Practice. Routledge.
Nielsen, K., Randall, R., Holten, A.-L., & González, E. R. (2010). Conducting organizational-level occupational health interventions: What works? Work & Stress, 24(3), 234–259.
Nielsen, K., Taris, T. W., & Cox, T. (2010). The future of organizational interventions: Addressing the challenges of today’s organizations. Work & Stress, 24(3), 219–233.
Niessen, C., Weseler, D., & Kostova, P. (2016). When and why do individuals craft their jobs? The role of individual motivation and work characteristics for job crafting. Human Relations, 69(6), 1287–1313.
Niklas, C. D., & Dormann, C. (2005). The impact of state affect on job satisfaction. European Journal of Work and Organizational Psy-chology, 14(4), 367–388.
Nunnally, J. C., & Bernstein, I. H. (1994). Psychomet-ric theory (3rd ed.). McGraw-Hill.
Nussbaum, M. C. (2011). Creating capabilities. Harvard University Press.
oO’Cathain, A., & Thomas, K. J. (2004). “Any other
comments?” Open questions on question-naires–a bane or a bonus to research? BMC Medical Research Methodology, 4(1), 25.
OECD. (2013). OECD guidelines on measuring sub-jective well-being. OECD publishing.
Organ, D. W. (1988). A restatement of the satisfac-tion-performance hypothesis. Journal of Management, 14(4), 547–557.
Organ, D. W., & Near, J. P. (1985). Cognition vs affect in measures of job satisfaction. International Journal of Psychology, 20(2), 241–253.
Orris, P., Hartman, D. E., Strauss, P., Anderson, R. J., Collins, J., Knopp, C., Xu, Y., & Melius, J. (1997). Stress among package truck driv-ers. American Journal of Industrial Medicine, 31(2), 202–210.
Oswald, A. J., Proto, E., & Sgroi, D. (2015). Happi-ness and productivity. Journal of Labor Economics, 33(4), 789–822.
Ouweneel, E., Le Blanc, P. M., & Schaufeli, W. B. (2013). Do-it-yourself. Career Development International.
PPage, K. M., & Vella-Brodrick, D. A. (2009). The ‘what’,
‘why’ and ‘how’ of employee well-being: A new model. Social Indicators Research, 90(3), 441–458.
Pancheva, M. G., Ryff, C. D., & Lucchini, M. (2020). An integrated look at well-being: Topologi-cal clustering of combinations and corre-lates of hedonia and eudaimonia. Journal of Happiness Studies, 1–23.
Pandey, S., & Pandey, S. K. (2019). Applying natural language processing capabilities in com-puterized textual analysis to measure
224
Bibliography
organizational culture. Organizational Research Methods, 22(3), 765–797.
Pappa, S., Ntella, V., Giannakas, T., Giannakoulis, V. G., Papoutsi, E., & Katsaounou, P. (2020). Prevalence of depression, anxiety, and insomnia among healthcare workers dur-ing the COVID-19 pandemic: A systematic review and meta-analysis. Brain, Behavior, and Immunity.
Parfit, D. (1984). Reasons and persons. OUP Oxford.Parke, M. R., Weinhardt, J. M., Brodsky, A., Tangirala,
S., & DeVoe, S. E. (2018). When daily plan-ning improves employee performance: The importance of planning type, engage-ment, and interruptions. Journal of Applied Psychology, 103(3), 300.
Parker, S. K. (2014). Beyond motivation: Job and work design for development, health, ambidexterity, and more. Annual Review of Psychology, 65.
Parker, S. K., Morgeson, F. P., & Johns, G. (2017). One hundred years of work design research: Looking back and looking forward. Journal of Applied Psychology, 102(3), 403.
Parker, S. K., Ohly, S., Kanfer, R., Chen, G., & Pritchard, R. D. (2008). Designing motivat-ing jobs: An expanded framework for link-ing work characteristics and motivation. In R. Kanfer, G. Chen, & R. D. Pritchard (Eds.), The organizational frontiers series: Vol. 27. Work motivation: Past, present, and future. (pp. 233–284). Routledge/Taylor & Francis Group.
Patil, S., & Palshikar, G. K. (2013). Surveycoder: A system for classification of survey responses. International Conference on Application of Natural Language to Informa-tion Systems, 417–420.
Pavot, W., Diener, E., Colvin, C. R., & Sandvik, E. (1991). Further validation of the Satisfac-tion with Life Scale: Evidence for the cross-method convergence of well-being measures. Journal of Personality Assess-ment, 57(1), 149–161.
Peer, E., Brandimarte, L., Samat, S., & Acquisti, A. (2017). Beyond the Turk: Alternative
platforms for crowdsourcing behavioral research. Journal of Experimental Social Psychology, 70, 153–163.
Pennebaker, J. W., Boyd, R. L., Jordan, K., & Black-burn, K. (2015). The development and psychometric properties of LIWC2015.
Pennebaker, J. W., Chung, C. K., Ireland, M., Gon-zales, A., & Booth, R. J. (2015). Linguistic Inquiry and Word Count: LIWC 2015 [Com-puter software]. Pennebaker Conglomerates. http://liwc. wpengine. com
Pennebaker, J. W., Mehl, M. R., & Niederhoffer, K. G. (2003). Psychological aspects of natural language use: Our words, our selves. An-nual Review of Psychology, 54(1), 547–577.
Pignata, S., Lushington, K., Sloan, J., & Buchanan, F. (2015). Employees’ perceptions of email communication, volume and management strategies in an Australian university. Jour-nal of Higher Education Policy and Manage-ment, 37(2), 159–171.
Ployhart, R. E., & Vandenberg, R. J. (2010). Longi-tudinal research: The theory, design, and analysis of change. Journal of Management, 36(1), 94–120.
Podsakoff, P. M., MacKenzie, S. B., Lee, J. Y., & Podsakoff, N. P. (2003). Common method biases in behavioral research: A critical review of the literature and recommended remedies. Journal of Applied Psychology, 88(5), 879–903.
Podsakoff, P. M., MacKenzie, S. P., & Podsakoff, N. P. (2016). Recommendations for creating better concept definitions in the organi-zational, behavioral, and social sciences. Organizational Research Methods, 19(2), 159–203.
Poncheri, R. M., Lindberg, J. T., Thompson, L. F., & Surface, E. A. (2008). A comment on employee surveys: Negativity bias in open-ended responses. Organizational Research Methods, 11(3), 614–630.
Poposki, E. M., & Oswald, F. L. (2010). The multitask-ing preference inventory: Toward an im-proved measure of individual differences
B
225
in polychronicity. Human Performance, 23(3), 247–264.
Potkay, C. R., & Allen, B. P. (1973). The Adjective Generation Technique: An alternative to adjective check lists. Psychological Reports, 32(2), 457–458.
Prockl, G., Teller, C., Kotzab, H., & Angell, R. (2017). Antecedents of Truck Drivers’ Job Satisfac-tion and Retention Proneness. Journal of Business Logistics, 38(3), 184–196.
Puranik, H., Koopman, J., & Vough, H. C. (2020). Pardon the interruption: An integrative review and future research agenda for research on work interruptions. Journal of Management, 46(6), 806–842.
Purcell, J. (2014). Disengaging from engagement. Human Resource Management Journal, 24(3), 241–254.
PwC. (2019). Health and Well-being Touchstone Survey results. https://www.pwc.com/us/en/services/hr-management/assets/pwc-touchstone-2019.pdf
PwC. (2020). Health and Well-being Touchstone Survey results. https://www.pwc.com/us/en/services/hr-management/assets/pwc-touchstone-2020-report.pdf
QQiao, H., & Schaufeli, W. B. (2011). The convergent
validity of four burnout measures in a Chinese sample: A confirmatory factor-analytic approach. Applied Psychology, 60(1), 87–111.
Quinn, R. P., & Mangione, T. W. (1973). Evaluating weighted models of measuring job satis-faction: A Cinderella story. Organizational Behavior and Human Performance, 10(1), 1–23.
rR Core Team. (2014). R: A Language and Environ-
ment for Statistical Computing. R Founda-
tion for Statistical Computing. http://www.R-project.org/
R Core Team. (2018). R: A language and environ-ment for statistical computing. R Founda-tion for Statistical Computing. https://www.R-project.org/
Ragan. (2020). The State of Corporate Communica-tions. https://cdn.ragan.com/wp-content/uploads/2020/08/PM_stateComms-1.pdf
Randall, R., Nielsen, K., & Tvedt, S. D. (2009). The development of five scales to measure em-ployees’ appraisals of organizational-level stress management interventions. Work & Stress, 23(1), 1–23.
Rau, B. L., & Hyland, M. A. M. (2002). Role conflict and flexible work arrangements: The effects on applicant attraction. Personnel Psychology, 55(1), 111–136.
Rauwald, C., & Schmidt, N. (2012). Wanted in Europe: More truck drivers. Wall Street Journal.
Ray, R., Hyland, P. K., Dye, D., Kaplan, J., & Pressman, A. (2013). The DNA of Engagement. www.conference-board.org/councils/councilde-tail.cfm?councilid=1058
Raz, J. (1986). The morality of freedom. Clarendon Press.
REBA. (2018). REBA/Punter Southall Health & Protec-tion Employee Wellbeing Research 2018. https://reba.global/reports/reba-punter-southall-health-protection-employee-wellbeing-research-2018
Reinke, K., & Chamorro-Premuzic, T. (2014). When email use gets out of control: Understand-ing the relationship between personality and email overload and their impact on burnout and work engagement. Comput-ers in Human Behavior, 36, 502–509.
Reja, U., Manfreda, K. L., Hlebec, V., & Vehovar, V. (2003). Open-ended vs. Close-ended ques-tions in web questionnaires. Developments in Applied Statistics, 19(1), 160–117.
Rich, B. L., Lepine, J. A., & Crawford, E. R. (2010). Job engagement: Antecedents and effects on job performance. Academy of Management Journal, 53(3), 617–635.
226
Bibliography
Riedl, E. M., & Thomas, J. (2019). The moderating role of work pressure on the relationships between emotional demands and tension, exhaustion, and work engagement: An experience sampling study among nurses. European Journal of Work and Organiza-tional Psychology, 28(3), 414–429.
Rinker, T. W. (2019). sentimentr: Calculate Text Polar-ity Sentiment. University at Buffalo/SUNY, Buffalo, New York. Version 2.7.1.
Ritter, K. J., Matthews, R. A., Ford, M. T., & Hen-derson, A. A. (2016). Understanding role stressors and job satisfaction over time using adaptation theory. Journal of Applied Psychology, 101(12), 1655–1669.
Robbins, S. (2004). Tips for mastering e-mail overload. Harvard Business School Working Knowledge.
Robeyns, I. (2005). The capability approach: A theoretical survey. Journal of Human Devel-opment, 6(1), 93–117.
Rogelberg, S. G., Conway, J. M., Sederburg, M. E., Spitzmüller, C., Aziz, S., & Knight, W. E. (2003). Profiling active and passive non-respondents to an organizational survey. Journal of Applied Psychology, 88(6), 1104.
Rogelberg, S. G., Luong, A., Sederburg, M. E., & Cris-tol, D. S. (2000). Employee attitude surveys: Examining the attitudes of noncompliant employees. Journal of Applied Psychology, 85(2), 284.
Rojas, M. (2017). The subjective object of well-being studies: Well-being as the experi-ence of being well. In G. Brulé & F. Maggino (Eds.), Metrics of Subjective Well-Being: Lim-its and Improvements (pp. 43–62). Springer.
Roscoe, L. J. (2009). Wellness: A review of theory and measurement for counselors. Journal of Counseling & Development, 87(2), 216–226.
Rosell, M., & Velupillai, S. (2008). Revealing Rela-tions between Open and Closed Answers in Questionnaires through Text Clustering Evaluation. LREC.
Rosen, C. C., Simon, L. S., Gajendran, R. S., Johnson, R. E., Lee, H. W., & Lin, S.-H. J. (2019). Boxed
in by your inbox: Implications of daily e-mail demands for managers’ leadership behaviors. Journal of Applied Psychology, 104(1), 19.
Rossouw, S., & Greyling, T. (2020). Big Data and Happiness. In K. F. Zimmermann (Ed.), Handbook of Labor, Human Resources and Population Economics (pp. 1–35). Springer.
Rowden, P., Matthews, G., Watson, B., & Biggs, H. (2011). The relative impact of work-related stress, life stress and driving environment stress on driving outcomes. Accident Analysis & Prevention, 43(4), 1332–1340.
Rudolph, C. W., Katz, I. M., Lavigne, K. N., & Zacher, H. (2017). Job crafting: A meta-analysis of relationships with individual differences, job characteristics, and work outcomes. Journal of Vocational Behavior, 102, 112–138.
Russel, J. A., Weiss, A., & Mendelsohn, G. A. (1989). Affect grid: A single-item scale of pleasure and arousal. Journal of Personality and Social Psychology, 57(3), 493–502.
Russell, S. S., Spitzmuller, C., Lin, L. F., Stanton, J. M., Smith, P. C., & Ironson, G. H. (2004). Shorter can also be better: The abridged job in general scale. Educational and Psychologi-cal Measurement, 64, 878–893.
Ryan, R. M., & Deci, E. L. (2001). On happiness and human potentials: A review of research on hedonic and eudaimonic well-being. An-nual Review of Psychology, 52(1), 141–166.
Ryff, C. D. (1989a). Beyond Ponce de Leon and life satisfaction: New directions in quest of successful ageing. International Journal of Behavioral Development, 12(1), 35–55.
Ryff, C. D. (1989b). Happiness is everything, or is it? Explorations on the meaning of psycho-logical well-being. Journal of Personality and Social Psychology, 57(6), 1069–1081.
Ryff, C. D., & Keyes, C. L. M. (1995). The structure of psychological well-being revisited. Journal of Personality and Social Psychology, 69(4), 719–727.
Ryff, C. D., Singer, B. H., & Love, G. D. (2004). Posi-tive health: Connecting well-being with
B
227
biology. Research Transactions of the Royal Society B: Biological Sciences, 359(1449), 1383–1394.
Rynes, S. L. (2012). The research-practice gap in I/O psychology and related fields: Chal-lenges and potential solutions. The Oxford Handbook of Organizational Psychology, 1, 409–452.
Rynes, S. L., & Bartunek, J. M. (2017). Evidence-based management: Foundations, devel-opment, controversies and future. Annual Review of Organizational Psychology and Organizational Behavior, 4, 235–261.
sSaks, A. M., & Gruman, J. A. (2014). What do we re-
ally know about employee engagement? Human Resource Development Quarterly, 25(2), 155–182.
Sakuraya, A., Shimazu, A., Imamura, K., & Kawakami, N. (2020). Effects of a job crafting intervention program on work engagement among Japanese employees: A randomized controlled trial. Frontiers in Psychology, 11, 235.
Sakuraya, A., Shimazu, A., Imamura, K., Namba, K., & Kawakami, N. (2016). Effects of a job crafting intervention program on work engagement among Japanese employees: A pretest-posttest study. BMC Psychology, 4(1), 49.
Salas, E., Kozlowski, S. W., & Chen, G. (2017). A century of progress in industrial and orga-nizational psychology: Discoveries and the next century. Journal of Applied Psychology, 102(3), 589–598.
Salton, G. (1971). The SMART retrieval system. Prentice-Hall.
Sandvik, E., Diener, E., & Seidlitz, L. (1993). Subjec-tive well‐being: The convergence and stability of self‐report and non‐self‐report measures. Journal of Personality, 61(3), 317–342.
Sato, W., Kochiyama, T., Yoshikawa, S., Naito, E., & Matsumura, M. (2004). Enhanced neural activity in response to dynamic facial expressions of emotion: An fMRI study. Cognitive Brain Research, 20(1), 81–91.
Scarpello, V., & Campbell, J. P. (1983). Job satisfac-tion: Are all the parts there? Personnel Psychology, 36(3), 577–600.
Schachler, V., Epple, S. D., Clauss, E., Hoppe, A., Slemp, G. R., & Ziegler, M. (2019). Measur-ing job crafting across cultures: Lessons learned from comparing a German and an Australian sample. Frontiers in Psychology, 10, 991.
Schaufeli, W. B., & Bakker, A. B. (2010). Defining and measuring work engagement: Bring-ing clarity to the concept. In A. B. Bakker & M. P. Leiter (Eds.), Work engagement: A handbook of essential theory and research (pp. 10–24). Psychology Press.
Schaufeli, W. B., Bakker, A. B., & Salanova, M. (2006). The measurement of work engagement with a short questionnaire: A cross-na-tional study. Educational and Psychological Measurement, 66(4), 701–716.
Schaufeli, W. B., Maassen, G. H., Bakker, A. B., & Sixma, H. J. (2011). Stability and change in burnout: A 10-year follow-up study among primary care physicians. Journal of Occupa-tional and Organizational Psychology, 84(2), 248–267.
Schaufeli, W. B., Salanova, M., González-Romá, V., & Bakker, A. B. (2002). The measurement of engagement and burnout: A two sample confirmatory factor analytic approach. Journal of Happiness Studies, 3(1), 71–92.
Schaufeli, W. B., Shimazu, A., Hakanen, J., Salanova, M., & De Witte, H. (2019). An Ultra-Short Measure for Work Engagement: The UWES-3 validation across five countries. European Journal of Psychological Assessment, 34(4), 577–591.
Schaufeli, W. B., & Taris, T. W. (2014). A critical review of the job demands-resources model: Implications for improving work and health. In G. Bauer & O. Hämmig (Eds.),
228
Bibliography
Bridging Occupational, Organizational and Public Health (pp. 43–68). Springer.
Schaufeli, W. B., & Van Dierendonck, D. (2001). Utrechtse Burnout Schaal (UBOS) Psycho-diagnostisch gereedschap. De Psycholoog, 36(1), 9–12.
Schaufeli, W. B., & Van Rhenen, W. (2006). Over de rol van positieve en negatieve emoties bij het welbevinden van managers: Een studie met de Job-related Affective Well-being Scale (JAWS)[About the role of positive and negative emotions in managers’ well-being: A study using the Job-related Affective Well-being Scale (JAWS)]. Gedrag & Organisatie, 19(4), 223–244.
Scherer, K. R. (2005). What are emotions? And how can they be measured? Social Science Information, 44(4), 695–729.
Schimmack, U., Krause, P., Wagner, G. G., & Schupp, J. (2010). Stability and change of well-being: An experimentally enhanced latent state-trait-error analysis. Social Indicators Research, 95(1), 19.
Schneider, L., & Schimmack, U. (2009). Self-infor-mant agreement in well-being ratings: A meta-analysis. Social Indicators Research, 94(3), 363.
Schneider, L., & Schimmack, U. (2010). Examining sources of self-informant agreement in life-satisfaction judgments. Journal of Research in Personality, 44(2), 207–212.
Schneider, L., Schimmack, U., Petrican, R., & Walker, S. (2010). Acquaintanceship length as a moderator of self-informant agreement in life-satisfaction ratings. Journal of Research in Personality, 44(1), 146–150.
Scholz, E., & Zuell, C. (2012). Item non-response in open-ended questions: Who does not answer on the meaning of left and right? Social Science Research, 41(6), 1415–1428.
Schonlau, M., & Couper, M. P. (2016). Semi-automated categorization of open-ended questions. Survey Research Methods, 10, 143–152.
Schulz, S. A., Luthans, K. W., & Messersmith, J. G. (2014). Psychological capital: A new tool
for driver retention. International Journal of Physical Distribution & Logistics Manage-ment, 44(8/9), 621–634.
Schwartz, H. A., Sap, M., Kern, M. L., Eichstaedt, J. C., Kapelner, A., Agrawal, M., & Kosinski, M. (2016). Predicting individual well-being through the language of social media. Bio-computing 2016: Proceedings of the Pacific Symposium, 516–527.
Schyns, B., Torka, N., & Gössling, T. (2007). Turnover intention and preparedness for change: Exploring leader-member exchange and occupational self-efficacy as antecedents of two employability predictors. Career Development International, 12(7), 660–679.
Scollon, C. N., Prieto, C. K., & Diener, E. (2009). Ex-perience sampling: Promises and pitfalls, strength and weaknesses. In E. Diener (Ed.), Assessing well-being (pp. 157–180). Springer.
Scott, M. M., & Spievack, N. (2019). Making the Busi-ness Case for Employee Well-Being.
Seder, J. P., & Oishi, S. (2012). Intensity of smiling in Facebook photos predicts future life satis-faction. Social Psychological and Personality Science, 3(4), 407–413.
Seidler, A., Thinschmidt, M., Deckert, S., Then, F., Hegewald, J., Nieuwenhuijsen, K., & Riedel-Heller, S. G. (2014). The role of psychosocial working conditions on burnout and its core component emotional exhaustion–a systematic review. Journal of Occupational Medicine and Toxicology, 9(1), 10.
Seppälä, P., Hakanen, J., Mauno, S., Perhoniemi, R., Tolvanen, A., & Schaufeli, W. (2015). Stabil-ity and change model of job resources and work engagement: A seven-year three-wave follow-up study. European Journal of Work and Organizational Psychology, 24(3), 360–375.
Seppälä, P., Mauno, S., Feldt, T., Hakanen, J., Kin-nunen, U., Tolvanen, A., & Schaufeli, W. (2009). The construct validity of the Utre-cht Work Engagement Scale: Multisample and longitudinal evidence. Journal of Happiness Studies, 10(4), 459.
B
229
Seppälä, P., Mauno, S., Kinnunen, M. L., Feldt, T., Juuti, T., Tolvanen, A., & Rusko, H. (2012). Is work engagement related to healthy cardiac autonomic activity? Evidence from a field study among Finnish women work-ers. The Journal of Positive Psychology, 7(2), 95–106.
Sequeira, H., Hot, P., Silvert, L., & Delplanque, S. (2009). Electrical autonomic correlates of emotion. International Journal of Psycho-physiology, 71(1), 50–56.
Shacham, S. (1983). A shortened version of the Profile of Mood States. Journal of Personal-ity Assessment, 47(3), 305–306.
Shaffer, J. A., DeGeest, D., & Li, A. (2016). Tackling the problem of construct proliferation: A guide to assessing the discriminant validity of conceptually related constructs. Organizational Research Methods, 19(1), 80–110.
Shalunts, G., & Backfried, G. (2015). SentiSAIL: sentiment analysis in English, German and Russian. International Workshop on Ma-chine Learning and Data Mining in Pattern Recognition, 87–97.
Shattell, M., Apostolopoulos, Y., Sönmez, S., & Griffin, M. (2010). Occupational stressors and the mental health of truckers. Issues in Mental Health Nursing, 31(9), 561–568.
Sheehan, K. B. (2018). Crowdsourcing research: Data collection with Amazon’s Mechanical Turk. Communication Monographs, 85(1), 140–156.
Sheer, V. C., & Rice, R. E. (2017). Mobile instant messaging use and social capital: Direct and indirect associations with employee outcomes. Information & Management, 54(1), 90–102.
Shin, D. C., & Johnson, D. M. (1978). Avowed hap-piness as an overall assessment of the quality of life. Social Indicators Research, 5(1–4), 475–492.
Shinar, D., & Compton, R. (2004). Aggressive driving: An observational study of driver, vehicle, and situational variables. Accident Analysis & Prevention, 36(3), 429–437.
Shiota, M. N., Neufeld, S. L., Yeung, W. H., Moser, S. E., & Perea, E. F. (2011). Feeling good: Auto-nomic nervous system responding in five positive emotions. Emotion, 11(6), 1368.
Short, J. C., Broberg, J. C., Cogliser, C. C., & Brigham, K. H. (2010). Construct validation using computer-aided text analysis (CATA): An illustration using entrepreneurial orienta-tion. Organizational Research Methods, 13(2), 320–347.
Short, J. C., McKenny, A. F., & Reid, S. W. (2018). More than words? Computer-aided text analysis in organizational behavior and psychology research. Annual Review of Organizational Psychology and Organizational Behavior, 5, 415–435.
Shuck, B., Ghosh, R., Zigarmi, D., & Nimon, K. (2013). The jingle jangle of employee engagement: Further exploration of the emerging construct and implications for workplace learning and performance. Hu-man Resource Development Review, 12(1), 11–35.
Shuck, B., Osam, K., Zigarmi, D., & Nimon, K. (2017). Definitional and conceptual muddling: Identifying the positionality of employee engagement and defining the construct. Human Resource Development Review, 16(3), 263–293.
Sidgwick, H. (1874). The methods of ethics (7th ed.). Hackett Publishing.
Siegrist, J., & Peter, R. (1996). Measuring effort-reward imbalance at work: Guidelines. Hein-rich Heine University.
Silber, H., Lischewski, J., & Leibold, J. (2013). Comparing different types of web surveys: Examining drop-outs, non-response and social desirability. Metodolški Zvezki, 10(2), 121–143.
Silber, H., Zuell, C., & Kuehnel, S.-M. (2020). What can we learn from open questions in sur-veys? A case study on non-voting reported in the 2013 German longitudinal election study. Methodology, 16(1), 41–58.
Silla, I., De Cuyper, N., Gracia, F. J., Peiró, J. M., & De Witte, H. (2009). Job insecurity and
230
Bibliography
well-being: Moderation by employability. Journal of Happiness Studies, 10(6), 739.
Singer, E., & Couper, M. P. (2017). Some method-ological uses of responses to open ques-tions and other verbatim comments in quantitative surveys. Methods, Data, Analy-ses: A Journal for Quantitative Methods and Survey Methodology (Mda), 11(2), 115–134.
Slater, M. D. (2002). Involvement as goal-directed strategic processing. In J. Dillard & M. Pfau (Eds.), The Persuasion Handbook: Develop-ments in Theory and Practice (pp. 175–194).
Slemp, G. R., & Vella-Brodrick, D. A. (2013). The Job Crafting Questionnaire: A new scale to measure the extent to which employees engage in job crafting. International Jour-nal of Wellbeing, 3(2).
Slemp, G. R., Zhao, Y., Hou, H., & Vallerand, R. J. (2020). Job crafting, leader autonomy support, and passion for work: Testing a model in Australia and China. Motivation and Emotion, 1–15.
Smith, B. L., Brown, B. L., Strong, W. J., & Rencher, A. C. (1975). Effects of speech rate on per-sonality perception. Language and Speech, 18(2), 145–152.
Smith, P. C., Kendall, L. M., & Hulin, C. L. (1969). The measurement of satisfaction in work and retirement: A strategy for the study of attitudes. Rand McNally.
Smith, R. (2020). How CEOs Can Support Em-ployee Mental Health in a Crisis. https://hbr.org/2020/05/how-ceos-can-support-employee-mental-health-in-a-crisis
Smith, R. P. (1981). Boredom: A review. Human Fac-tors, 23(3), 329–340.
Smith, S. S., & Richardson, D. (1983). Amelioration of deception and harm in psychological research: The important role of debriefing. Journal of Personality and Social Psychol-ogy, 44(5), 1075.
Snow, R., O’Connor, B., Jurafsky, D., & Ng, A. Y. (2008). Cheap and fast—But is it good?: Evaluating non-expert annotations for natural language tasks. Proceedings of the
Conference on Empirical Methods in Natural Language Processing, 254–263.
Sommers, R., & Miller, F. G. (2013). Forgoing debriefing in deceptive research: Is it ever ethical? Ethics & Behavior, 23(2), 98–116.
Sonnentag, S. (2003). Recovery, work engage-ment, and proactive behavior: A new look at the interface between non-work and work. Journal of Applied Psychology, 88(3), 518–528.
Sonnentag, S. (2015). Dynamics of well-being. An-nual Review of Organizational Psychology and Organizational Behavior, 2(1), 261–203.
Sonnentag, S., & Fritz, C. (2015). Recovery from job stress: The stressor-detachment model as an integrative framework. Journal of Organizational Behavior, 36(S1), S72–S103.
Sonnentag, S., Reinecke, L., Mata, J., & Vorderer, P. (2018). Feeling interrupted—Being responsive: How online messages relate to affect at work. Journal of Organizational Behavior, 39(3), 369–383.
Spector, P. E. (1985). Measurement of human ser-vice staff satisfaction: Development of the Job Satisfaction Survey. American Journal of Community Psychology, 13(6), 693–713.
Spector, P. E. (1997). Job satisfaction: Application, assessment, causes, and consequences (Vol. 3). Sage Publications.
Spector, P. E., Bauer, J. A., & Fox, S. (2010). Mea-surement artifacts in the assessment of counterproductive work behavior and organizational citizenship behavior: Do we know what we think we know? Journal of Applied Psychology, 95(4), 781–790.
Spector, P. E., Dwyer, D. J., & Jex, S. M. (1988). Rela-tion of job stressors to affective, health, and performance outcomes: A comparison of multiple data sources. Journal of Applied Psychology, 73(1), 11.
Spector, P. E., & Pindek, S. (2016). The future of re-search methods in work and occupational health psychology. Applied Psychology, 65(2), 412–431.
B
231
Spence, G. B. (2015). Workplace wellbeing pro-grams: If you build it they may NOT come... Because it’s not what they really need!
Spielberger, C. D., & Gorsuch, R. L. (1983). State-trait anxiety inventory for adults: Manual and sample: Manual, instrument and scoring guide. Consulting Psychologists Press.
Spreitzer, G., Sutcliffe, K., Dutton, J., Sonenshein, S., & Grant, A. M. (2005). A socially embedded model of thriving at work. Organization Science, 16(5), 537–549.
Staats, U., Lohaus, D., Christmann, A., & Woitschek, M. (2017). Fighting against a shortage of truck drivers in logistics: Measures that employers can take to promote drivers’ work ability and health. Work, 58(3), 383–397.
Steffens, N. K., Haslam, S. A., Schuh, S. C., Jetten, J., & Van Dick, R. (2017). A meta-analytic review of social identification and health in organizational contexts. Personality and Social Psychology Review, 21(4), 303–335.
Steger, M. F., Dik, B. J., & Duffy, R. D. (2012). Measur-ing meaningful work: The work and mean-ing inventory (WAMI). Journal of Career Assessment, 20(3), 322–337.
Steiger, J. H. (1980). Tests for comparing elements of a correlation matrix. Psychological Bul-letin, 87(2), 245.
Stewart, W. F., Ricci, J. A., Chee, E., Hahn, S. R., & Morganstein, D. (2003). Cost of lost pro-ductive work time among US workers with depression. JAMA, 289(23), 3135–3144.
Stiglitz, J. E., Sen, A., Fitoussi, J.-P., & others. (2009). Report by the commission on the measure-ment of economic performance and social progress. Citeseer.
Stone, P. J., Dunphy, D. C., Smith, M. S., & Ogilvie, D. M. (1966). Associates: The General Inquirer: A Computer Approach to Content Analysis. The MIT Press.
Stoneman, P., Sturgis, P., & Allum, N. (2013). Explor-ing public discourses about emerging technologies through statistical clustering of open-ended survey questions. Public Understanding of Science, 22(7), 850–868.
Sturges, J. (2012). Crafting a balance between work and home. Human Relations, 65(12), 1539–1559.
Sumner, L. W. (1996). Welfare, happiness, and ethics. Clarendon Press.
Sutton, A., Evans, M., Davies, C., & Lawson, C. (2016). The development and longitudinal evaluation of a wellbeing program: An or-ganisation case study. International Journal of Wellbeing, 6.
Suzuki, Y., Crum, M. R., & Pautsch, G. R. (2009). Predicting truck driver turnover. Trans-portation Research Part E: Logistics and Transportation Review, 45(4), 538–550.
tTaber, T. D. (1991). Triangulating job attitudes with
interpretive and positivist measurement methods. Personnel Psychology, 44(3), 577–600.
Taboada, M., Brooke, J., Tofiloski, M., Voll, K., & Stede, M. (2011). Lexicon-based methods for sentiment analysis. Computational Linguistics, 37(2), 267–307.
Tadić, M., Bakker, A. B., & Oerlemans, W. G. (2013). Work happiness among teachers: A day reconstruction study on the role of self-concordance. Journal of School Psychology, 51(6), 735–750.
Taris, T. W., & Schaufeli, W. (2015). Individual well-being and performance at work: A conceptual and theoretical overview. In M. Van Veldhoven & R. Peccei (Eds.), Well-being and performance at work: The role of context. (pp. 24–43). Psychology Press.
Tausczik, Y. R., & Pennebaker, J. W. (2010). The psychological meaning of words: LIWC and computerized text analysis methods. Journal of Language and Social Psychology, 29(1), 24–54.
Taylor, H., Fieldman, G., & Altman, Y. (2008). E-mail at work: A cause for concern? The implica-tions of the new communication technolo-gies for health, wellbeing and productivity
232
Bibliography
at work. Journal of Organisational Transfor-mation & Social Change, 5(2), 159–173.
Taylor, T., & Scott, A. (2019). Do physicians prefer to complete online or mail surveys? Findings from a national longitudinal survey. Evalu-ation & the Health Professions, 42(1), 41–70.
Ten Brummelhuis, L. L., & Bakker, A. B. (2012). A resource perspective on the work–home interface: The work–home resources model. American Psychologist, 67(7), 545.
Ten Brummelhuis, L. L., Bakker, A. B., Hetland, J., & Keulemans, L. (2012). Do new ways of working foster work engagement? Psico-thema, 24(1), 113–120.
Tett, R. P., & Meyer, J. P. (1993). Job satisfaction, organizational commitment, turnover intention, and turnover: Path analyses based on meta-analytic findings. Personnel Psychology, 46(2), 259–293.
Thege, B. K., Tarnoki, A. D., Tarnoki, D. L., Garami, Z., Berczi, V., Horvath, I., & Veress, G. (2014). Is flourishing good for the heart? Relation-ships between positive psychology char-acteristics and cardiorespiratory health. Annals of Psychology, 31(1), 55–65.
Thelwall, M. (2017). The heart and soul of the web? Sentiment strength detection in the social web with SentiStrength. In Cyberemotions (pp. 119–134). Springer.
Thelwall, M., Buckley, K., Paltoglou, G., Cai, D., & Kappas, A. (2010). Sentiment strength detection in short informal text. Journal of the American Society for Information Science and Technology, 61(12), 2544–2558.
Thomas, L. E., & Chambers, K. O. (1989). Phenom-enology of life satisfaction among elderly men: Quantitative and qualitative views. Psychology and Aging, 4(3), 284.
Thompson, C. A., & Prottas, D. J. (2006). Relation-ships among organizational family sup-port, job autonomy, perceived control, and employee well-being. Journal of Oc-cupational and Organizational Psychology, 11(1), 100–118.
Thompson, E. R., & Phua, F. T. (2012). A brief index of affective job satisfaction. Group & Orga-nization Management, 37(3), 275–307.
Tims, M., Bakker, A. B., & Derks, D. (2012). Develop-ment and validation of the job crafting scale. Journal of Vocational Behavior, 80(1), 173–186.
Today. (2020). Dove’s “Courage is Beautiful” ad honors medical workers during coronavirus. https://www.today.com/style/dove-s-courage-beautiful-ad-honors-medical-workers-during-coronavirus-t178272
Tov, W., Ng, K. L., Lin, H., & Qiu, L. (2013). Detect-ing well-being via computerized content analysis of brief diary entries. Psychological Assessment, 25(4), 1069.
Tracy, J. L., & Matsumoto, D. (2007). More than a thrill: Cross cultural evidence for spontane-ous displays of pride in response to ath-letic success. Proceedings of the National Academy of Sciences, 105, 11655–11660.
Trafton, J. G., Altmann, E. M., Brock, D. P., & Mintz, F. E. (2003). Preparing to resume an inter-rupted task: Effects of prospective goal encoding and retrospective rehearsal. International Journal of Human-Computer Studies, 58(5), 583–603.
Trice, A. D., & Tillapaugh, P. (1991). Children’s estimates of their parents’ job satisfaction. Psychological Reports, 69(1), 63–66.
Trougakos, J. P., Hideg, I., Cheng, B. H., & Beal, D. J. (2014). Lunch breaks unpacked: The role of autonomy as a moderator of recovery during lunch. Academy of Management Journal, 57(2), 405–421.
Turner, S. F., Cardinal, L. B., & Burton, R. M. (2017). Research design for mixed methods: A triangulation-based framework and road-map. Organizational Research Methods, 20(2), 243–267.
uUrry, H. L., Nitschke, J. B., Dolski, I., Jackson, D. C.,
Dalton, K. M., Mueller, C. J., & Davidson, R.
B
233
J. (2004). Making a life worth living: Neural correlates of well-being. Psychological Sci-ence, 15(6), 367–372.
vVan den Broeck, A., De Cuyper, N., De Witte, H.,
& Vansteenkiste, M. (2010). Not all job demands are equal: Differentiating job hindrances and job challenges in the Job Demands–Resources model. European Journal of Work and Organizational Psy-chology, 19(6), 735–759.
Van den Heuvel, M., Demerouti, E., & Peeters, M. C. (2015). The job crafting intervention: Effects on job resources, self-efficacy, and affective well-being. Journal of Occupa-tional and Organizational Psychology, 88(3), 511–532.
Van Doornen, L. J., Houtveen, J. H., Langelaan, S., Bakker, A. B., van Rhenen, W., & Schaufeli, W. B. (2009). Burnout versus work en-gagement in their effects on 24‐hour ambulatory monitored cardiac autonomic function. Stress and Health, 25(4), 323–331.
Van Droogenbroeck, F., & Spruyt, B. (2016). I ain’t gonna make it. Comparing job demands-Resources and attrition intention between senior teachers and senior employees of six other occupational categories in Flan-ders. The International Journal of Aging and Human Development, 83(2), 128–155.
Van Katwyk, P. T., Fox, S., Spector, P. E., & Kelloway, E. K. (2000). Using the Job-Related Affec-tive Well-Being Scale (JAWS) to investigate affective responses to work stressors. Journal of Occupational Health Psychology, 5(2), 219.
Van Roekel, H., Van der Fels, I., Bakker, A. B., & Tum-mers, L. G. (2021). Healthcare Workers Who Work With COVID-19 Patients Are More Physically Exhausted and Have More Sleep Problems. Frontiers in Psychology, 11, 3843.
Van Saane, N., Sluiter, J., Verbeek, J., & Frings-Dresen, M. (2003). Reliability and validity of
instruments measuring job satisfaction—A systematic review. Occupational Medicine, 53(3), 191–200.
Van Vegchel, N., De Jonge, J., Bosma, H., & Schaufe-li, W. (2005). Reviewing the effort–reward imbalance model: Drawing up the balance of 45 empirical studies. Social Science & Medicine, 60(5), 1117–1131.
Van Wingerden, J., Bakker, A. B., & Derks, D. (2017a). Fostering employee well-being via a job crafting intervention. Journal of Vocational Behavior, 100, 164–174.
Van Wingerden, J., Bakker, A. B., & Derks, D. (2017b). The longitudinal impact of a job crafting intervention. European Journal of Work and Organizational Psychology, 26(1), 107–119.
Van Wingerden, J., Derks, D., & Bakker, A. B. (2017). The impact of personal resources and job crafting interventions on work engage-ment and performance. Human Resource Management, 56(1), 51–67.
Van Wingerden, J., Van der Stoep, J., & Poell, R. F. (2018). Meaningful work and work engagement: The mediating role of perceived opportunity to craft and job crafting behavior. International Journal of Human Resource Studies, 8(2), 1–15.
Van Zenderen, K., & Sombekke, E. (2016). Arbeids-marktrapportage beroepsgoederenvervoer over de weg en logistiek 2016: Instroom en inzetbaarheid.
Van Zenderen, K., Sombekke, E., & Van de Pol, G. (2017). Arbeidsmarktrapportage beroeps-goederenvervoer over de weg en logistiek 2017: Instroom en inzetbaarheid. https://www.stlwerkt.nl/Media/media/Corporate/Over%20ons/Arbeidsmarktrapportage-2017-Web.pdf
Veenhoven, R. (2000). The four qualities of life: Or-dering concepts and measures of the good life. Journal of Happiness Studies, 1(1), 1–39.
Veenhoven, R. (2017). Measures of happiness: Which to choose? In G. Brulé & F. Maggino (Eds.), Metrics of Subjective Well-Being: Lim-its and Improvements (pp. 65–84). Springer.
234
Bibliography
Veenhoven, R. (2020). Measures of happiness. World Database of Happiness, Erasmus University Rotterdam, The Netherlands. https://worlddatabaseofhappiness.eur.nl/hap_quer/hqi_fp.htm
Verduyn, P., Delvaux, E., Van Coillie, H., Tuerlinckx, F., & Van Mechelen, I. (2009). Predicting the duration of emotional experience: Two experience sampling studies. Emotion, 9(1), 83.
Vinten, G. (1995). Open versus closed questions–An open issue. Management Decision, 33(4), 27–31.
Vuori, T., San, E., & Kira, M. (2012). Meaningfulness-making at work. Qualitative Research in Organizations and Management: An Inter-national Journal.
Vytal, K., & Hamann, S. (2010). Neuroimaging sup-port for discrete neural correlates of basic emotions: A voxel-based meta-analysis. Journal of Cognitive Neuroscience, 22(12), 2864–2885.
WWagenaar, S. (2018). Kansen voor vrachtwagen-
chauffeurs. https://www.werk.nl/arbeids-marktinformatie/images/Notitie_Kan-sen_voor_vrachtwagenchauffeurs.pdf
Wagner, B. (2018). Ethics as an escape from regulation: From ethics-washing to ethics-shopping. Being Profiling. Cogitas Ergo Sum, 84–90.
Wajcman, J., & Rose, E. (2011). Constant connec-tivity: Rethinking interruptions at work. Organization Studies, 32(7), 941–961.
Walton, M., Murray, E., & Christian, M. D. (2020). Mental health care for medical staff and affiliated healthcare workers during the COVID-19 pandemic. European Heart Journal: Acute Cardiovascular Care, 9(3), 241–247.
Wang, G., & Hackett, R. D. (2016). Conceptualiza-tion and measurement of virtuous leader-
ship: Doing well by doing good. Journal of Business Ethics, 137(2), 321–345.
Wang, N., Kosinski, M., Stillwell, D. J., & Rust, J. (2014). Can well-being be measured us-ing Facebook status updates? Validation of Facebook’s Gross National Happiness Index. Social Indicators Research, 115(1), 483–491.
Wanous, J. P., Reichers, A. E., & Hudy, M. J. (1997). Overall job satisfaction: How good are single-item measures? Journal of Applied Psychology, 82(2), 247–252.
Warr, P. (1990). The measurement of well-being and other aspects of mental health. Journal of Occupational Psychology, 63(3), 193–210.
Warr, P. (2012). How to think about and measure psychological well-being. In M. Wang, R. R. Sinclair, & L. E. Tetrick (Eds.), Research methods in occupational health psychology (pp. 76–90). Routledge.
Warr, P., Cook, J., & Wall, T. (1979). Scales for the measurement of some work attitudes and aspects of psychological well‐being. Journal of Occupational and Organizational Psychology, 52(2), 129–148.
Warr, P., & Nielsen, K. (2018). Wellbeing and work performance. In E. Diener, S. Oishi, & L. Tay (Eds.), Handbook of well-being. DEF Publishers.
Wassenaar, D. R., & Mamotte, N. (2012). Ethical issues and ethics reviews in social science research. The Oxford Handbook of Interna-tional Psychological Ethics, 268–282.
Waterman, A. S. (2008). Reconsidering happiness: A eudaimonist’s perspective. Journal of Positive Psychology, 3(4), 234–252.
Watson, D., Clark, L. A., & Tellegen, A. (1988). Devel-opment and validation of brief measures of positive and negative affect: The PANAS scales. Journal of Personality and Social Psychology, 54(6), 1063–1070.
Watson, D., Hubbard, B., & Wiese, D. (2000). General traits of personality and affectivity as pre-dictors of satisfaction in intimate relation-ships: Evidence from self‐and partner‐rat-ings. Journal of Personality, 68(3), 413–449.
B
235
Webb, E. J., Campbell, D. T., Schwartz, R. D., & Sechrest, L. (1966). Unobtrusive measures: Nonreactive research in the social sciences. (Vol. 2). Rand McNally.
Wegman, L. A., Hoffman, B. J., Carter, N. T., Twenge, J. M., & Guenole, N. (2018). Placing job characteristics in context: Cross-temporal meta-analysis of changes in job character-istics since 1975. Journal of Management, 44(1), 352–386.
Weinberger, D. A., Schwartz, G. E., & Davidson, R. J. (1979). Low-anxious, high-anxious, and repressive coping styles: Psychometric patterns and behavioral and physiological responses to stress. Journal of Abnormal Psychology, 88(4), 369.
Weiss, D. J., Dawis, R. V., & England, G. W. (1967). Manual for the Minnesota Satisfaction Questionnaire.: Vol. Minnesota studies in vocational rehabilitation. University of Min-nesota, Industrial Relations Center.
Weiss, H. M. (2002). Deconstructing job satisfac-tion: Separating evaluations, beliefs and affective experiences. Human Resource Management Review, 12(2), 173–194.
Weiss, H. M., & Cropanzano, R. (1996). Affective events theory: A theoretical discussion of the structure, causes and consequences of affective experiences at work. Research in Organizational Behavior, 18, 1–74.
Weiss, R. (2013). Germany wants more truck drivers. https://www.bloomberg.com/news/ar-ticles/2013-08-29/germany-wants-more-truck-drivers.
Weissman, G. E., Ungar, L. H., Harhay, M. O., Courtright, K. R., & Halpern, S. D. (2019). Construct validity of six sentiment analysis methods in the text of encounter notes of patients with critical illness. Journal of Biomedical Informatics, 89, 114–121.
Welbourne, T. M. (2016). The potential of pulse surveys: Transforming surveys into leader-ship tools. Employment Relations Today, 43(1), 33–39.
Wheeler, A. R., Halbesleben, J. R. B., & Whitman, M. V. (2013). The interactive effects of abusive
supervision and entitlement on emotional exhaustion and co-worker abuse. Journal of Occupational and Organizational Psy-chology, 86(4), 477–496.
Wijngaards, I., Burger, M., & Van Exel, J. (2019). The promise of open survey questions—The validation of text-based job satisfaction measures. PloS ONE, 14(12). https://doi.org/10.1371/journal.pone.0226408
Wijngaards, I., King, O. C., Burger, M. J., & van Exel, J. (2021). Worker Well-Being: What it Is, and how it Should Be Measured. Applied Research in Quality of Life, 1–38.
Wilkin, C. L. (2013). I can’t get no job satisfaction: Meta-analysis comparing permanent and contingent workers. Journal of Organiza-tional Behavior, 34(1), 47–64.
Williams, C. E., & Stevens, K. N. (1972). Emotions and speech: Some acoustical correlates. The Journal of the Acoustical Society of America, 52(4), 1238–1250.
Williams, Z., Garver, M. S., & Stephen Taylor, G. (2011). Understanding truck driver need‐based segments: Creating a strategy for retention. Journal of Business Logistics, 32(2), 194–208.
Wood, W., Tam, L., & Witt, M. G. (2005). Changing circumstances, disrupting habits. Journal of Personality and Social Psychology, 88(6), 918.
World Bank. (2018). World development report 2019: The changing nature of work. The World Bank.
World Values Survey. (2019). World values survey database. http://worldvaluessurvey.org
Wright, T. A., & Bonett, D. G. (2007). Job satisfaction and psychological well-being as nonad-ditive predictors of workplace turnover. Journal of Management, 33(2), 141–160.
Wright, T. A., & Cropanzano, R. (1998). Emotional exhaustion as a predictor of job perfor-mance and voluntary turnover. Journal of Applied Psychology, 83(3), 486.
Wrzesniewski, A., & Dutton, J. E. (2001). Crafting a job: Revisioning employees as active craft-
ers of their work. Academy of Management Review, 26(2), 179–201.
Wrzesniewski, A., Dutton, J. E., & Debebe, G. (2003). Interpersonal sensemaking and the mean-ing of work. Research in Organizational Behavior, 25, 93–135.
XXanthopoulou, D., Bakker, A. B., Heuven, E.,
Demerouti, E., & Schaufeli, W. B. (2008). Working in the sky: A diary study on work engagement among flight attendants. Journal of Occupational Health Psychology, 13, 345–356.
yYaldiz, L. M., Truxillo, D. M., Bodner, T., & Hammer,
L. B. (2018). Do resources matter for em-ployee stress? It depends on how old you are. Journal of Vocational Behavior, 107, 182–194.
Yan, T., Conrad, F. G., Tourangeau, R., & Couper, M. P. (2011). Should I stay or should I go: The effects of progress feedback, promised task duration, and length of questionnaire on completing web surveys. International Journal of Public Opinion Research, 23(2), 131–147.
Yang, C., & Srinivasan, P. (2016). Life satisfaction and the pursuit of happiness on Twitter. PloS ONE, 11(3), e0150881.
Young, L. M., & Gavade, S. R. (2018). Translating emotional insights from hospitality employees’ comments: Using sentiment analysis to understand job satisfaction. In-ternational Hospitality Review, 32(1), 75–92.
zZagzebski, L. T. (1996). Virtues of the mind: An
inquiry into the nature of virtue and the ethi-
cal foundations of knowledge. Cambridge University Press.
Zamith, R., & Lewis, S. C. (2015). Content analysis and the algorithmic coder: What computa-tional social science means for traditional modes of media analysis. The Annals of the American Academy of Political and Social Science, 659(1), 307–318.
Zangaro, G. A., & Soeken, K. L. (2007). A meta-analysis of studies of nurses’ job satisfac-tion. Research in Nursing & Health, 30(4), 445–458.
Zebregs, S., van den Putte, B., Neijens, P., & de Graaf, A. (2015). The differential impact of statistical and narrative evidence on beliefs, attitude, and intention: A meta-analysis. Health Communication, 30(3), 282–289.
Zehner, F., Sälzer, C., & Goldhammer, F. (2016). Automatic coding of short text responses via clustering in educational assessment. Educational and Psychological Measure-ment, 76(2), 280–303.
Zelenski, J. M., & Larsen, R. J. (2000). The distribu-tion of basic emotions in everyday life: A state and trait perspective from experi-ence sampling data. Journal of Research in Personality, 34(2), 178–197.
Zhang, D. C. (2018). Art of the sale: Recommenda-tions for sharing research with mainstream media and senior leaders. Industrial and Organizational Psychology, 11(4), 589–593.
Zhang, D. C., Zhu, X., Ritter, K.-J., & Thiele, A. (2019). Telling stories to communicate the value of the pre-employment structured job interview. International Journal of Selection and Assessment, 27(4), 299–314.
Zhang, F., & Parker, S. K. (2019). Reorienting job crafting research: A hierarchical structure of job crafting concepts and integrative review. Journal of Organizational Behavior, 40(2), 126–146.
Zheng, X., Zhu, W., Zhao, H., & Zhang, C. (2015). Employee well-being in organizations: Theoretical model, scale development,
B
237
and cross-cultural validation. Journal of Organizational Behavior, 36(5), 621–644.
Zickar, M. J. (2020). Measurement Development and Evaluation. Annual Review of Orga-nizational Psychology and Organizational Behavior, 7, 213–232.
Zilioli, S., Caldbick, E., & Watson, N. V. (2014). Testosterone reactivity to facial display of emotions in men and women. Hormones and Behavior, 65(5), 461–468.
Zou, C., Schimmack, U., & Gere, J. (2013). The validity of well-being measures: A multiple-indicator–multiple-rater model. Psychological Assessment, 25(4), 1247.
Zuckerman, M., & Lubin, B. (1985). Manual for the MAACL-R: The Multiple Affect Adjective Check List Revised. Educational and Indus-trial Testing Service.


acknowledgements

A
241
Four years ago, straight from university, I ambitiously joined an interdisciplinary 4-year research project called The New Science of Existential Well-being (NEWEL): Concepts, Ethics and Responsible Algorithms. For me, the NEWEL project ticked every box. I would be able to collaborate with bright researchers from the Erasmus University Rotterdam, the University of Twente and the University of Amsterdam, studying a range of academic discplines, such as artificial intelligence, philosophy, economics and psychology. In ad-dition, I would be able to conduct practically relevant scientific research within Ahold Delhaize, a multinational grocery retail company employing over 400,000 employees.
The goals of my research track were ambitious from the start. I was tasked to “explore and predict what the labor force of tomorrow looks like”, “identify significant elements of work-related well-being from survey and multisource performance data collected by Ahold’s HR department” and “find causal relationships between organizational and job characteristics, well-being, and performance in the context of intervention experiments”.
As the years went by, I learned that I would not able to achieve all these objectives. Inter-disciplinary collaboration turned out to be very difficult in practice. Large-scale field ex-periments were mostly infeasible. Existing datasets were rarely suitable for scientifically relevant research. Privacy regulations complicated the collection of high-quality data.
Does this mean that NEWEL was a failure for me? No, on the contrary. It allowed me to become a pragmatic, confident and resilient researcher. For a large part, my successes can be attributed to the people that helped me along the way.
Martijn Burger and Job van Exel, words cannot express how grateful I am for your flex-ibility, patience, inspiration and humor over the last four years. I have always felt I could count on you.
EHERO team, I cannot thank you enough for the terrific research collaborations, the inspiring brainstorm sessions, the fun team gatherings and memorable conferences.
Bart Voorn, I also owe you a lot. I feel that your dedication, courage, business savviness and mentorship have been pivotal for obtaining buy-in from senior leaders within Ahold Delhaize and encouraging brands to foster research collaborations.
I am grateful to numerous associates from Ahold Delhaize. Abbe Luersman, Casper Assinck and the rest of the GSO HR team, thank you for the time and resources you have invested in me and, more generally, the NEWEL project. Colleagues from the R&D team and NEWEL team, thank you for treating me as one of your own. HR professionals at Delhaize Le Lion, Albert Heijn, Albert, Etos and European Business Services, thank you for allowing me to study worker well-being in your brands.
Last, but certainly not least, I want to thank my fiancé, Laura, my family and my closest friends for the continued support and love.


about the author

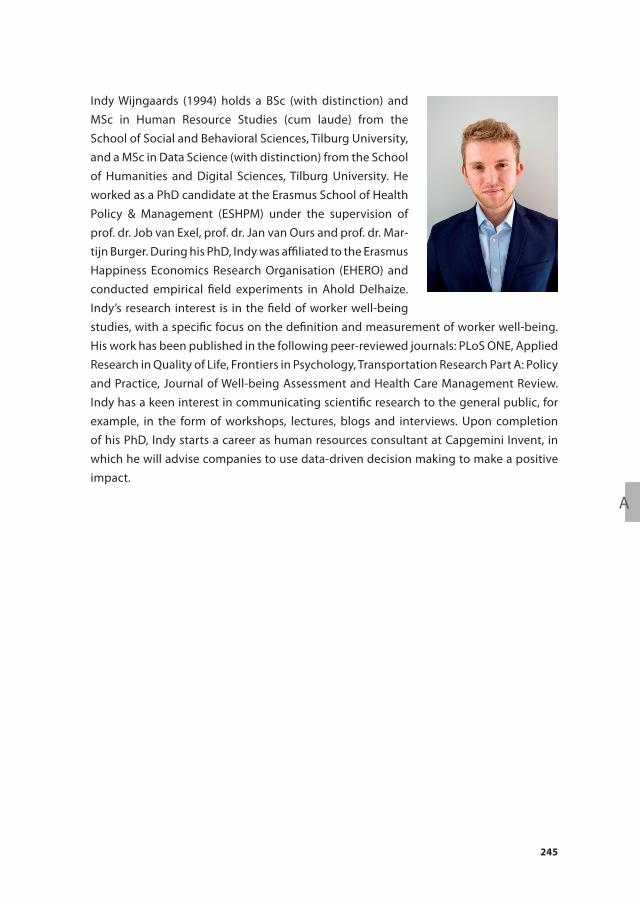
A
245
Indy Wijngaards (1994) holds a BSc (with distinction) and MSc in Human Resource Studies (cum laude) from the School of Social and Behavioral Sciences, Tilburg University, and a MSc in Data Science (with distinction) from the School of Humanities and Digital Sciences, Tilburg University. He worked as a PhD candidate at the Erasmus School of Health Policy & Management (ESHPM) under the supervision of prof. dr. Job van Exel, prof. dr. Jan van Ours and prof. dr. Mar-tijn Burger. During his PhD, Indy was affiliated to the Erasmus Happiness Economics Research Organisation (EHERO) and conducted empirical field experiments in Ahold Delhaize. Indy’s research interest is in the field of worker well-being studies, with a specific focus on the definition and measurement of worker well-being. His work has been published in the following peer-reviewed journals: PLoS ONE, Applied Research in Quality of Life, Frontiers in Psychology, Transportation Research Part A: Policy and Practice, Journal of Well-being Assessment and Health Care Management Review. Indy has a keen interest in communicating scientific research to the general public, for example, in the form of workshops, lectures, blogs and interviews. Upon completion of his PhD, Indy starts a career as human resources consultant at Capgemini Invent, in which he will advise companies to use data-driven decision making to make a positive impact.


Portfolio

P
249
Peer-revieWeD PuBlications
Wijngaards, I. Pronk, F.R., Bakker, A.B., & Burger, M.J. (2021). Cognitive Crafting and Work Engagement: A Study among Remote and Frontline Healthcare Workers during the COVID-19 Pandemic. Health Care Management Review.
Wijngaards, I., Burger, M.J., & Van Exel, N.J.A. (2021). Unpacking the quantifying and qualifying potential of semi-open job satisfaction questions through computer-aided sentiment analysis. Journal of Well-being Assessment. 1-27.
Wijngaards, I., King, O.C., Burger, M.J. & Van Exel, N.J.A. (2021). What is worker well-being, and how it should be measured. Applied Research in Quality of Life. 1-37.
Wijngaards, I., Sisouw de Zilwa, S. C. S., & Burger, M. J. (2020). Extraversion moderates the relationship between the stringency of COVID-19 protective measures and depressive symptoms. Frontiers in Psychology, 11.
Wijngaards, I., Burger, M.J., & Van Exel, N.J.A. (2019). The promise of open survey ques-tions – The validation of text-based job satisfaction measures. PLoS ONE, 15(7), e0236900.
Wijngaards, I., Hendriks, M., & Burger, M. J. (2019). Steering towards happiness: An expe-rience sampling study on the determinants of happiness of truck drivers. Transportation research part A: policy and practice, 128, 131-148.
WorkinG PaPers, rePorts, coluMns anD BloGs
Wijngaards, I. (2021). A multilevel investigation of the impact of transformational leader-ship on positive job affect: The mediating role of leader and work-group identification.
Wijngaards, I., Del Pozo Cruz, B., Gebel, K., & Ding, D. (2021). Leisure-time physical activity during the COVID-19 pandemic: A longitudinal probability survey of the US population.
Wijngaards, I. Pronk, F.R., & Burger, M.J. (2021). For whom and under what circumstances does email batching work?
Voorn, B.C.M. & Wijngaards, I. (2021). Do unattainable goals of middle managers spark abusive supervision towards subordinates? The roles of emotional exhaustion and egoistic work climate.
Sisouw de Zilwa, S.C.S., Wijngaards, I., & Burger, M.J. (2021). Werken aan werkgeluk: wat is het en wat levert het op? (deel 1) BG Magazine.
Sisouw de Zilwa, S.C.S., Wijngaards, I., & Burger, M.J. (2021). Werken aan werkgeluk: 5 belangrijkste voorspellers (deel 2) BG Magazine.
250
Portfolio
Sisouw de Zilwa, S.C.S., Wijngaards, I., & Burger, M.J. (2021). Werken aan werkgeluk: hoe meet je werkgeluk? (deel 3) BG Magazine.
Sisouw de Zilwa, S.C.S., Wijngaards, I., & Burger, M.J. (2021). Werken aan werkgeluk: Hoe zet ik een werkgeluktraject op in mijn organisatie? (deel 4) BG Magazine.
Pleeging, E., Wijngaards, I. & Burger, M.J. (2020). Hoop, corona en prosociaal gedrag. Hoopbarometer Rapport. The Hope Project.
Wijngaards, I. Burger, M.J. & Van Liempt, G. (2020). Remote working: how to best keep a pulse on employee well-being. Analytics in HR.
Wijngaards, I. (2020). Wil je evidence-based HR introduceren op de werkvloer? Vertel een verhaal! Tijdschrift voor HRM.
Wijngaards, I. (2020). Introverte mensen profiteren meer van lockdown maatregelen. Erasmus Happiness Economics Research Organisation.
Wijngaards, I., Sisouw de Zilwa, S.C.S. & Pronk, F.R. (2020). COVID-19 onderzoek: Tips & Tricks op het gebied van vrijetijdsbesteding. Erasmus Happiness Economics Research Organisation.
Wijngaards, I., Sisouw de Zilwa, S.C.S. & Pronk, F.R. (2020). COVID-19 onderzoek: Tips & Tricks op het gebied van (thuis)werken. Erasmus Happiness Economics Research Organi-sation.
Wijngaards, I., Sisouw de Zilwa, S.C.S. & Pronk, F.R. (2020). COVID-19 onderzoek: Tips & Tricks op het gebied van sociale relaties en familie. Erasmus Happiness Economics Re-search Organisation.
Wijngaards, I., Sisouw de Zilwa, S.C.S., Pronk, F.R. & Burger, M.J. (2020). Geluk ten tijde van COVID-19: Nederlandse bevolking ongelukkiger, vooral ouders en mensen met inkomensonzekerheid. Erasmus Happiness Economics Research Organisation.
Wijngaards, I. & King, O. (2018). Well-being at Ahold Delhaize: Taking stock. A final syn-thesis of qualitative and quantitative data. Internal document for Ahold Delhaize.
Wijngaards, I. (2018). ‘Hey, how are you?’ Developing a scientific approach to assess as-sociate well-being. Internal document for Ahold Delhaize.
MeDia aPPearances
Ruijters, V. (2020). Bewegen is sleutel tot geluk in ongelukkige tijden. Running.nl.
P
251
Rispens, M. (2020). Thuiswerkers voelen zich autonomer en vrijer. Erasmus Economics & Business Executive Education.
Domevscek, E. (2020). ‘Stoor ik?’ Waarom een lockdown géén prikkelloos paradijs is voor introverten. RTL Nieuws.
Stam, I. Geluk is blijven verlangen naar wat je al hebt. GezondNU.
Venhuizen, G. (2020). Wat maakt dat sommige mensen tijdens deze crisis zelfs beter gedijen? We zitten in een groot psychisch experiment. NRC.
Kneepkens, E. (2020). Het nieuwe normaal als studiemateriaal: Waar halen meeuwen hun friet vandaan? Volkskrant.
Ter Huurne, B. (2020). Een interessante kijk op ons geluksgevoel in crisistijd. Men’s Health.
Consultancy.nl. (2020). Nederlanders flink ongelukkiger door coronacrisis. Consultancy.nl.
Vriend, R. (2020). ‘Nederlanders minder gelukkig sinds uitbraak coronavirus’. Radio Rijnmond.
Stax, D. & Van Peperstraten, P. (2020). Door de coronacrisis is ons gelukscijfer gedaald. Radio 1.
Dijkhuis, D. (2020). Hoe (on)gelukkig maakt de coronacrisis ons? Nu.nl.
conferences, WorkshoPs anD Presentations
Happy and Productive Remote Working, AIRLab, 2020, virtual (workshop).
Effective coping in times of crisis: Evidence from the COVID-19 pandemic, 18th Annual Con-ference of the International Society for Quality-of-Life Studies, 2020, virtual (workshop).
Unpacking the quantifying and qualifying potential of semi-open job satisfaction ques-tions through computer-aided textual analysis, 18th Annual Conference of the Interna-tional Society for Quality-of-Life Studies, 2020, virtual (oral presentation).
Geluksonderzoek EBS, European Business Services, 2020, virtual (oral presentation).
Geluk @EBS, European Business Services, 2019, Zaandam, the Netherlands (oral presentation).
Steering towards happiness: An experience sampling study on the momentary happi-ness of truck drivers, 17th Annual Conference of the International Society for Quality-of-Life Studies, 2019, Granada, Spain (oral presentation).
How to measure employee well-being: A taxonomy of constructs and review of mea-sures, 19th EAWOP Congress, 2019, Turin, Italy (oral presentation).
252
Portfolio
Steering towards happiness: An experience sampling study on the momentary happi-ness of truck drivers, 19th EAWOP Congress, 2019, Turin, Italy (oral presentation).
Evidence-based HR, Etos, 2018, Utrecht, the Netherlands (workshop)
Evidence-based HR and Associate Well-being, Ahold Delhaize, 2018, Brussels, Belgium (workshop)
Steering towards happiness: An experience sampling study on the momentary hap-piness of truck drivers, Erasmus Happiness Economics Research Organization, 2018, Rotterdam, the Netherlands (oral presentation).
Break it open – the validity of open and semi-open job satisfaction questions, 16th Annual Conference of the International Society for Quality-of-Life Studies, 2018, Hong Kong, Hong Kong (oral presentation).
Work to Well-Being, Albert, 2018, Prague, Czech Republic (workshop).
How to measure and boost happiness at work, People Analytics Academy Conference, 2018, Tilburg, the Netherlands (poster presentation).
courses
Analytic Storytelling training, Analytic Storytelling, 2019, Rotterdam, the Netherlands.
Masterclass the Secrets of Employee Engagement & Happy Workplaces, Erasmus School of Accounting & Assurance, Erasmus University Rotterdam, 2019, Garderen, the Netherlands.
Field Experiments, Faculty of Science, University of Copenhagen, 2018, Copenhagen, Denmark.
Basic Didactics, Risbo - Research-Training-Consultancy, Erasmus University Rotterdam, 2018, Rotterdam, the Netherlands.
Professionalism and integrity in research, Erasmus Graduate School of Social Sciences and the Humanities, Erasmus University Rotterdam, 2018, Rotterdam, the Netherlands.
Data collections
Two-wave survey among 1937 individuals to unravel the effects of the COVID-19 crisis on happiness in the Netherlands, 2020.
P
253
Cross-sectional survey among 20 academics to tailor a workshop on productive and happy remote working to the audience, 2020.
Two-wave survey among 112 office workers to identify well-being problems in the organization, 2019-2020.
Cross-sectional survey among 1768 workers working in a retail organization to map well-being levels across departments, functions and stores, 2019.
Cross-sectional survey among 84 office workers to evaluate a participatory office refur-bishment intervention, 2019.
Two-wave survey in 20 stores to evaluate the effectiveness of a break room renovation, 2019.
Two-wave survey among 82 store managers to evaluate the effectiveness of an e-coaching program, 2019.
Cross-sectional survey among 395 workers using Prolific to test the hypotheses in Chap-ter 7, 2019.
Semi-structured among eight senior leaders to obtain a better understanding of the importance of worker well-being in the organization, 2019.
Cross-sectional survey among 997 workers using Prolific to test the hypotheses in Chap-ter 6, 2018.
teachinG
Minor Quality of Life and Happiness Economics (Bachelor 3 program, Erasmus School of Economics) - Module 3 ‘Quality of Life & Work’, 2019-2020.
Supervision of various master’s theses at the Erasmus School of Economics, 2019-2020.
acaDeMic DeGrees
MSc Data Science: Business and Governance, Tilburg University, 2016-2017.
MSc Human Resource Studies, Tilburg University, 2015-2016.
BSc Human Resource Studies, Tilburg University, 2012-2015.

summary

S
257
“What we measure affects what we do; and if our measurements are flawed, decisions may be distorted.” - Stiglitz et al. (2009, p. 7)
Worker well-being is a hot topic in organizations and academia. More and more orga-nizations have a well-being strategy in place and invest in programs to improve worker well-being. The scientific literature on worker well-being is expanding rapidly and the popularity of surveys that capture well-being and its drivers is rapidly increasing. A prerequisite for an effective worker well-being survey is the rigorous measurement of the concept of worker well-being itself. Rigorous worker well-being measurement encompasses (i) the examination of a broad selection of well-being constructs, (ii) the use of valid closed survey questions, and (iii) the consideration of open-ended survey questions. After all, data-driven insights on well-being problems, outcomes and inter-ventions will be biased and, thus, of limited value for evidence-based decision making, if data on the concept of worker well-being is unreliable or incomplete.
In practice, however, rigorous well-being measurement comes with significant practical and technical challenges. The practical challenge is that organizations are often reluc-tant to administer surveys that put a heavy burden on their workers’ time and, therefore, demand scholars and practitioners to focus on a limited set of constructs and prioritize time-efficient measurement over valid measurement. The technical challenge is that scholars and, in specific, practitioners lack the training to navigate the vast and scattered literature on the definition, operationalization and measurement of worker well-being, or lack access to this literature. The main aim of this thesis is to provide conceptual and empirical guidance to scholars and practitioners on how to deal with these challenges and, thereby, contribute to the rigor of worker well-being measurement in organiza-tions.
I organize this thesis around four research questions and provide answers to these ques-tions in six chapters. The first chapter provides the conceptual foundation for this thesis (Chapter 2); the five subsequent chapters report on empirical studies on the determi-nants, outcomes and measurement of worker well-being. The empirical studies span a wide range of academic strands of research and target different study populations, i.e., truck drivers (Chapter 3), healthcare workers (Chapter 4), workers in financial services (Chapter 5) and crowdsourced workers (Chapters 6 and 7).
First, I address the question “How can the concept of worker well-being be defined and operationalized into constructs?” I find that, at the most inclusive level, worker well-being can be defined as the general well-being of working people, and that it differs from concepts, such as works-specific well-being and well-being at work. After reviewing the state-of-the-science, I propose a conceptual taxonomy that can be used to navigate
258
summary
the wide assortment of related, but distinct constructs that fall under the conceptual umbrella of worker well-being. In the following five empirical chapters, I illustrate the many faces of worker well-being, studying a total of nine worker well-being constructs. Overall, I find support for the idea that worker well-being constructs are empirically distinct, but related.
Second, I address the question “Which worker well-being constructs should be focused on in a survey?” I conclude that, even though it is essential to maximize the number and diversity of well-being constructs to uncover well-being trade-offs, it is often impossible to measure a multitude of constructs in organizations. Against this background, I argue in favor of a well-justified conceptual focus. Specifically, I suggest that the initial list of relevant constructs should be based on a careful analysis of the study objectives, the research questions, and workers’ employment situation as well as a thorough scanning of the scientific literature. Furthermore, the eventual selection should contain con-structs that are conceptually and empirically distinct, are directly related to the study object, and could theoretically uncover well-being trade-offs. In five empirical chapters, I exemplify how this conceptual focus can be attained in practice and, in three chapters, I find support for the existence of well-being trade-offs.
Third, I explore the question “What kind of closed survey questions are suitable for measuring worker well-being constructs in organizations?’” I conclude that, despite their methodological superiority, lengthy multiple-item scales and intense repeated survey designs are impractical in many organizational settings and that, therefore, a measure’s time-efficiency should be considered as important selection criterion next to traditional criteria, such as reliability and validity. To help with the selection, I compose a list of promising survey measures of ten popular worker well-being constructs and introduce several procedures that play a central role in the validation of survey measures. In the empirical chapters, I illustrate the use of time-efficient, but valid closed well-being ques-tions and several validation procedures.
Fourth, I address the question “How can open-ended survey questions contribute to measuring worker-well-being in organizations?” I explain how different sentiment analysis techniques can be utilized to produce measures from responses to open-ended survey questions and what kinds of measurement error they introduce. Furthermore, I develop a rationale for using open-ended survey questions as means of quantifying and qualifying well-being constructs. I find that completely open-ended and, in specific, semi-open-ended survey questions contain little measurement error and can safely be used to measure job satisfaction. In addition, I find that, although the human-generated measures are relatively more robust compared to their much more time-efficient com-puter-generated counterparts, computer-generated measures are robust by absolute
S
259
standards. Finally, I find that the responses to a semi-open-ended question can be used to improve the performance of sentiment analysis techniques and to study the determi-nants of job satisfaction.
In sum, this thesis contributes to the promotion of worker well-being survey research that is both rigorous and realistic. Next to offering conceptual guidance to scholars and practitioners on defining, operationalizing and measuring worker well-being, this thesis offers a comprehensive showcase of how these guidelines can be applied in applied research contexts and reflects on the typical challenges in empirical work. Improved methodological rigor combined with an eye for practice will help scholars and prac-titioners to make their well-being measurements count and, in the end, contribute to evidence-based decision making in organizations that protects and improves the well-being of workers.


samenvatting

S
263
“Wat we meten beïnvloedt wat we doen; en als onze metingen gebrekkig zijn, kunnen beslissingen verslechteren.” - Stiglitz et al. (2009, p. 7)
Het welzijn van medewerkers is een hot topic in organisaties en de academische we-reld. Steeds meer organisaties hebben een strategie omtrent medewerkerswelzijn en investeren in programma’s om het te verbeteren. De wetenschappelijke literatuur over het welzijn van medewerkers breidt zich snel uit. De populariteit van vragenlijsten om welzijn en de drijvende krachten daarachter in kaart brengen, neemt gestaag toe. Een voorwaarde voor een effectieve vragenlijst is een grondige meting van het concept medewerkerswelzijn zelf. Een goede meting wordt gekenmerkt door het gebruik van (i) een brede selectie van welzijnsconstructen, (ii) valide multiple-choice-vragenlijsten, en (iii) open vragen. Als gegevens over het welzijn onbetrouwbaar of onvolledig zijn, zullen data-gedreven inzichten over problemen, gevolgen en interventies op het gebied van het medewerkerswelzijn immers vertekend zijn en dus van beperkte waarde zijn voor empirisch onderbouwde besluitvorming.
In de praktijk brengt een grondige meting van het welzijn van medewerkers aanzienlijke praktische en technische uitdagingen met zich mee. De praktische uitdaging is dat organisaties vaak terughoudend zijn met het uitsturen van tijdrovende vragenlijsten naar hun medewerkers. Hierdoor moeten wetenschappers en mensen in de praktijk zich focussen op een beperkte set constructen en prioriteit geven aan tijdsefficiënte meting boven valide meting. De technische uitdaging is dat wetenschappers en, in het bijzonder, mensen in de praktijk niet opgeleid zijn om de uitgebreide literatuur over de definitie, operationalisering en meting van medewerkerswelzijn te doorgronden of hier geen toegang tot hebben. Het hoofddoel van dit proefschrift is om wetenschappers en mensen in de praktijk conceptuele en empirische richtlijnen te bieden over hoe om te gaan met deze uitdagingen en zo bij te dragen aan de nauwkeurigheid van welzijnsme-tingen in organisaties.
In dit proefschrift ga ik in op vier onderzoeksvragen en baseer mijn antwoorden op zes hoofdstukken. Het eerste hoofdstuk biedt de conceptuele basis voor dit proefschrift (hoofdstuk 2); de vijf daaropvolgende hoofdstukken doen verslag van empirische studies naar de determinanten, de gevolgen en het meten van het welzijn van medewerkers. De empirische studies bestrijken een breed scala aan academische onderzoeksvelden en hebben verschillende onderzoekspopulaties, namelijk vrachtwagenchauffeurs (hoofdstuk 3), ziekenhuismedewerkers (hoofdstuk 4), kantoormedewerkers in de finan-ciële dienstverlening (hoofdstuk 5) en individuen die werken voor een crowdsourcing platform (hoofdstukken 6 en 7).
264
samenvatting
Ten eerste ga ik in op de vraag “Hoe kan het concept medewerkerswelzijn worden ge-definieerd en geoperationaliseerd in constructen?” Ik ontdek dat medewerkerswelzijn in de meest algemene zin zou moeten worden begrepen als het algemene welzijn van werkende mensen, en dat het verschilt van concepten, zoals werk-specifiek welzijn en welzijn op het werk. Op basis van een analyse van de wetenschappelijke literatuur presenteer ik een conceptuele taxonomie die kan worden gebruikt om overeenkomsten en verschillen tussen de constructen die onder de conceptuele noemer van mede-werkerswelzijn vallen, te duiden. In de vijf daaropvolgende empirische hoofdstukken illustreer ik de vele gezichten van medewerkerswelzijn door in totaal negen concepten te bestuderen. In het algemeen vind ik bewijs voor het idee dat welzijnsconstructen empirisch van elkaar verschillen, maar verwant zijn.
Ten tweede beantwoord ik de vraag “Op welke welzijnsconstructen moet in een vragen-lijst de nadruk worden gelegd?” Ik concludeer dat het vaak onmogelijk is om een groot aantal constructen in organisaties te meten, ondanks het belang om het aantal en de diversiteit van welzijnsconstructen te maximaliseren om dilemma’s op het gebied van welzijn bloot te leggen. Daarom pleit ik voor een goed onderbouwde conceptuele focus. Meer specifiek stel ik voor dat de initiële lijst met relevante constructen gebaseerd zou moeten worden op een zorgvuldige analyse van de studiedoelen, de onderzoeksvragen, de werksituatie van medewerkers en een grondige scan van de wetenschappelijke lite-ratuur. Ik beargumenteer dat de uiteindelijke selectie constructen zou moeten bevatten die conceptueel en empirisch van elkaar verschillen, een direct verband houden met het studieobject en theoretisch welzijnsdilemma’s aan het licht kunnen brengen. In vijf em-pirische hoofdstukken illustreer ik hoe deze conceptuele focus in de praktijk kan worden bereikt, en in drie hoofdstukken vind ik bewijs voor het bestaan van welzijnsdilemma’s.
Ten derde onderzoek ik de vraag: “Welk soort multiple-choice-vragenlijsten zijn geschikt om welzijnsconstructen in organisaties te meten?” Ik concludeer dat, ondanks hun me-thodologische superioriteit, lange multiple-choice-vragenlijsten en intensief longitudi-naal vragenlijstonderzoek onpraktisch zijn in veel organisatiecontexten. Om deze reden stel ik dat de tijdsefficiëntie van een instrument moet worden meegenomen als een belangrijk selectiecriterium naast traditionele criteria, zoals betrouwbaarheid en validi-teit. Om te helpen bij de selectie stel ik een lijst samen met geschikte instrumenten voor tien populaire constructen en introduceer ik verschillende procedures die belangrijk zijn bij de validatie van vragenlijstmetingen. In de empirische hoofdstukken illustreer ik het gebruik van tijdsefficiënte, maar valide gesloten welzijnsvragen en verschillende validatieprocedures.
Ten vierde ga ik in op de vraag “Hoe kunnen open vragen in een vragenlijst bijdragen aan het meten van het welzijn van medewerkers in organisaties?” Ik leg uit hoe verschil-
S
265
lende sentiment-analysetechnieken gebruikt kunnen worden om maatstaven te creëren op basis van antwoorden op open vragen en met welke soorten meetfouten zij gepaard gaan. Verder beargumenteer ik hoe open vragen gebruikt kunnen worden als middel om welzijnsconstructen te kwantificeren en te kwalificeren. Ik vind bewijs dat volledig open vraag en, in het bijzonder, een semi-open vraag over baantevredenheid weinig meetfouten introduceren en veilig gebruikt kunnen worden om het construct te meten. Verder ontdek ik dat, hoewel de door mensen gegenereerde maatstaven robuuster zijn dan hun veel tijdsefficiëntere door de computer gegenereerde tegenhangers, de door de computer gegenereerde maatstaven robuust zijn naar absolute maatstaven. Tenslotte concludeer ik dat de antwoorden op een semi-open vraag over baantevreden-heid gebruikt kunnen worden om de prestaties van sentiment-analysetechnieken te verbeteren en om de determinanten van baantevredenheid te bestuderen.
Kortom, dit proefschrift draagt bij aan de verbetering van vragenlijstonderzoek naar medewerkerswelzijn. Naast het bieden van conceptuele richtlijnen over het definiëren, operationaliseren en meten van medewerkerswelzijn, biedt dit proefschrift een uitge-breide illustratie van hoe deze richtlijnen kunnen worden toegepast in organisatiecon-texten en reflecteert dit proefschrift op de typische uitdagingen van empirisch werk in organisaties. Wanneer wetenschappers en mensen in de praktijk een methodologische nauwkeurigheid en oog voor de praktijk combineren, zullen hun welzijnsmetingen beter worden en bijdrage aan de verbetering van medewerkerswelzijn in organisaties.
Measuring Worker Well-beingAn Evaluation of Closed and Open-Ended Survey Questions
Indy Wijngaards
An Evaluation of Closed and O
pen-Ended Survey Questions
An Evaluation of Closed and Open-Ended Survey Questions
Indy Wijngaards
THESIS
MEASURING WORKER
WELL-BEING
MEA
SURIN
G W
ORK
ER WELL-BEIN
GIndy W
ijngaards
W orker well-being is a hot topic in organizations and
academia, causing the interest for its measurement
using surveys to spike. However, scholars and practitioners are
struggling to rigorously measure well-being in the workplace.
The main aim of this thesis is to provide conceptual and empirical
guidance on how researchers can deal with the technical and
practical challenges they are facing and, thereby, contribute to
the rigor of worker well-being measurement in organizations.
Indy Wijngaards (1994) graduated from the master Human Resource Studies (cum laude) and the master
Data Science: Business & Governance (with distinction) at Tilburg University, the Netherlands.
WORKER