when chinese animations meet globalization - erasmus
TRANSCRIPT
When Chinese Animations meet Globalization
A quantitative study of whether and how the Chinese domestic animation industry is affected by
globalization
Erasmus University Rotterdam
Faculty of Arts and History
Liu Qing Fang
Student No. 305823
Supervisor: Dr. Wouter de Nooy
Second reader: Dr. B.J. Langenberg
A thesis submitted in partial fulfilment of the requirements for the Degree of Master of Cultural
Economics and Cultural Entrepreneurship at the Erasmus University Rotterdam
July 2007
1
Acknowledgement
I would like to thank my tutor Dr. de Nooy who kindly reviews my thesis for many times and gives me
very good suggestions. Furthermore, I would like to thank my study partner who always encourages me
during the writing process and also my parents who send me useful information regarding the Chinese
animation industry from China.
2
Abstract
Cultural economics is recognized as a new field of economics. It offers a new perspective for looking at
the characteristics of cultural goods and services, implementation of cultural policies, finance of the art
and diverse forms of cultural industries. Due to the unequal socioeconomic development among different
countries, many global-scale cultural industries are mainly dominated by a few developed countries.
Today through the advanced communication and transportation technologies that globalization provides,
cultural tastes seem to be homogenized and the economic power seems to be centralized. This paper
focuses on the development of cultural industry in a developing country. It takes the Chinese animation
industry as an example and uses a quantitative method to explore whether and how the Chinese animation
industry is affected by globalization between different market periods. It suggests that in the presence of
globalization, the development of the Chinese domestic animation industry is affected. To be more
specific, the volume of the Chinese animation is increased across different market periods; the technique
to make animations in China is shifted from the traditional to computer technique; the content of the
domestic animations in China is changed and more foreign like; the amount of merchandise produced
from the Chinese animations is increased across periods and the labour market of the Chinese domestic
animation industry is destructed by the increased international trade.
3

Table of Contents
Chapter 1 Introduction 7
1.1 Research motivation 7
1.2 Aim of research 8
1.3 Research question 9
Central research question 9
Sub research question 9
1.4 Thesis structure 9
Chapter 2 Theoretical Focus 11
2.1 Introduction 11
2.2 Cultural globalization 11
Cultural imperialism/homogenization model 11
Cultural flow model 13
Cultural reception model 14
2.3 International Trade and Regulation 15
International trade theory 15
Impact of the international trade 16
2.4 Cultural industry 18
Definition of cultural industry 18
Cultural industries in industrialized countries 19
Cultural industry in the developing country 20
Structure of the cultural industry 21
Chapter 3 Animation Industry 24
3.1 Introduction 24
3.2 Animation industry in North America 24
3.3 Animation industry in Japan 26
3.4 Animation industry in Korea 27
4
3.5 Case Study: animation industry in China 28
Overview 28
History 29
Labor market 30
Government support 31
3.6 Hypotheses 32
Chapter 4 Data Collection 37
4.1 Introduction 37
4.2 Methodological choice 37
4.3 Data collection process 38
4.4 Define variables 39
Dependent variables 40
Independent variable 44
4.5 Statistic analysis plan 45
Chapter 5 Data Analysis 46
5.1 Introduction 46
5.2 Data Overview 46
5.3 Period 46
5.4 Technique 49
Test the hypothesis 1: 50
5.5 Volume 53
Test the hypothesis 2: 54
5.6 Content: characters’ images 56
Test the hypothesis 3: 57
5.7 Content: subject matter 58
Test the hypothesis 4: 59
5.8 Content: story line origin 61
Test the hypothesis 5: 62
5.9 Merchandise 64
5
Test the hypothesis 6: 64
5.10 Director 65
Test the hypothesis 7: 65
5.11 Producer 67
Test the hypothesis 8 67
Chapter 6 Conclusions 69
6.1 Overview of the theoretical support 69
6.2 Conclusion 69
Central research question 69
Sub research question 70
6.3 Limitations and discussions 71
6.4 Suggestions for further research 71
Bibliography 73
Appendix A Frequencies tables 77
Appendix B Cross tabulations 79
Appendix C List of Chinese animation directors 84
Appendix D List of Chinese animation producers 85
6
Chapter 1 Introduction
1.1 Research motivation
I am a pure and simple animation fan. I was born in the 80’s, I have grown up in the 90’s and I am
currently studying abroad. Watching animations, as well as collecting cartoon products has been very
important to me and my life. Generally speaking, my childhood, as well as that of many of my fellows,
was spent growing up with Japanese and American animations. I still clearly remember in the 80’s and
90’s how popular Japanese animations and American cartoon products were among Chinese teenagers. In
my memory, there were no profound impressions of any successful animation products that came from my
own country China. While I have been living and studying here in the Netherlands, animation TV
channels and internet have provided me with an even more diverse animation world. Animation characters
from Japan, Korea and North America can be seen everywhere, such as on the large streets and small
lanes of Europe. These Asian animation characters like Pikachu, Dolaamon, Puka etc. are just as popular
with the European consumers as they are with the American ones. However I can hardly find any
animation characters which originally come from China.
Historically speaking, during the 1950’s and 1960’s, good Chinese animations were being produced.
Apart from other animation products, Chinese animation has its unique Confucian content and distinct
techniques such as the ink painting and paper cut. Regrettably, before the Chinese government carried out
strict cultural policies in 2000 to limit the broadcasting of foreign animations on TV, the Chinese
animation market had been unfairly monopolized by the Japanese, American and Korean producers.
Because of the impact of globalization, today animation products, as well as many other commercial
goods, are easily transferred across the nations and borders. Nowadays, in China an intense debate is
going on among scholars about whether the Chinese domestic animation industry is affected by
globalization. Many Chinese parents, scholars, and government officers feel threatened by the contents of
foreign animations which are seen by children and young people. In addition, the economic value of the
Chinese animation field has also been affected and damaged foreign animations. In response, the local
governments have begun to carry out different cultural policies to limit the importation of foreign
animations, they have also started to allocate funds to support exploring good domestic animations and
developing a complete animation production chain in order to compete with foreign ones and regain the
market. From 1999 onwards, China has produced several high-budget features, however, even though the
average volume have become higher, the techniques have improved and the images have changed, these
animations still receive a poor reception from the public. I believe the reasons behind this result are not
7

difficult to understand. There may be many causes behind it, however, in this paper I will be investigating
the impact of globalization.
1.2 Aim of research
This research is aimed at examining whether and how the Chinese domestic animation industry is affected
by globalization. Due to the unique historical and political background, Chinese economic system has
shifted from a centrally planned economy to a more market-oriented economy, and its market has also
changed from a closed to a more opened situation and in some cases to a more protected situation. Since
China has had an unusual economic system for many years and across many economic periods, it would
be interesting to test the effects of market closure and market protection on its cultural industry by taking
the animation industry as an example. To be more specific, this paper will try to analyze whether the
content, technique, volume, production chain and labour market of Chinese domestic animations have
changed across three different periods, namely, the closed market period, the opened market period and
the protected market period. In this research, domestic animations produced between 1972 and 2006 will
be taken as the sample to analyze the research questions.
Years 1972 to 1980 will be categorized as period 1. Initially, I wanted to make the starting year to be
1966-the year of the Cultural Revolution in the People’s Republic of China. However, no animations were
produced between 1966 and 1972. Therefore, 1972 is taken as the starting year of the first period. From
1966 until 1976, China was threatened for ten years by the Cultural Revolution. During these ten years the
Chinese economy was nearly driven into the depths of collapse and students were used as Red Guards and
encouraged to do manual work in the countryside, neglecting their studies. Almost all the Chinese suffered
severely during these ten years; today the painful memories still remain among many of them. There was
no development in the Chinese animation industry during this time, because it was a closed market period.
Between 1967 and 1971 there were no animations produced because all the industries stopped production
and joined in the Cultural Revolution. In 1972 the Shanghai Animation Film Studio restarted production
(Qin, 2006), but between 1972 and 1980, animations were mainly made as propaganda to express the
thoughts of the government to the younger generation. The second period starts in 1981 and ends in 1999.
It is categorized as the opened market period. In 1981 the first imported animation from Japan called 鉄腕
アトム (Astro Boy) came to China (Qin, 2006). This animation series was considered a classic one and
paved the way for importing more animations to China in the future. Since Astro Boy had been such a
great success, animations from different countries entered China in large numbers and, later on, dominated
the Chinese animation market. During this period, Japanese and American animations had the biggest
8
influence on Chinese youth and seriously challenged the Chinese domestic animation industry. This
situation has gradually changed since the State Administration of Radio Film and Television (SARFT) in
China implemented the policy limiting foreign animations and supporting local animations in 2000. Thus
the period 2000 to 2006 is categorized as the protected period. During this period many policies
concerning the protection of domestic animations were carried out which will be discussed in the section
of the Chinese animation industry later on.
1.3 Research question
In China, animation did not attract much attention from the government before the year 2000. In the
academic field, the culture effect of foreign animations on the Chinese youth have been written and
discussed by a few Chinese scholars, however, articles which examine the relationship between
globalization and the development of the Chinese animation industry are limited. Therefore, this paper
will use a different angle to investigate this relationship from the perspective of Cultural Economics,
which leads to the following research questions:
• Central research question
Whether and how does globalization influence the development of the Chinese domestic animation
industry?
• Sub research question
How does the content, techniques, volume, production chain and the labour market of the Chinese
animation industry change across different periods?
1.4 Thesis structure
Chapter 1 is the introduction, setting out the issues and raising questions. In chapter 2, I will provide a
discussion of the theoretical framework to analyze the phenomenon of cultural globalization by using
different models. This chapter will also discuss the issues of international trade and cultural policies,
giving a general view of industries in cultural sectors and looking closely at the relationship between
culture globalization and cultural industry. Chapter 3 will focus on the animation industry in a world wide
scale by looking at the top three animation countries, namely North America, Japan and Korea. In
addition, a case study of the Chinese domestic animation industry will be followed up, which includes its
background information, history and labour market as well as the relevant government policies. At the end
9

of this chapter, eight hypotheses will be derived for further analysis. In chapter 4, I will try to explain why
the quantitative method is adopted for carrying out this research and how and where does all the data
come from. This chapter will also present readers with the dependent and independent variables for the
later statistical analysis, and each variable will be carefully defined and categorized. At the end of this
chapter, a statistic analysis plan will be given to explain which statistic tests will be used and why they are
suitable for the purpose of this research. In chapter 5, a thorough analysis and discussion concerning the
research results will be provided together with graphics and tables. Based on the results, the hypotheses
will be tested to see whether they ought to be accepted or rejected. Finally, chapter 6 will summarize the
findings and make suggestions for further research.
10
Chapter 2 Theoretical Focus
2.1 Introduction
Globalization as an intense debate is now under wide discussion. Castles and Miller (2003) in their book
point out that the growth of cross-border flows of goods and people become the most striking features of
globalization. Together with its positive and negative influences, globalization brings an information
revolution, it creates a borderless world (Throsby, 2001) and results in increased transnationalism (Castles
and Miller, 2003). Recently, many scholars, politicians and ordinary people have realized the advantages
as well as the potential threats behind the expansion of globalization, not only in the economic
perspectives, but also in many of the cultural sectors. This chapter will focus on the impact of
globalization on cultural issues and provides a theoretical framework in regard to the culture, technology,
labor market and government regulations within the creative industries across nations.
2.2 Cultural globalization
According to Rothkop (1997: 38), ‘globalization has economic roots and political consequences, but it
also has brought into focus the power of culture in this global environment’. Boli and Lechner (2002) in
their article point out that the content of world culture is mainly dominated by the USA, they state that
American popular culture and products, such as rock music, fast foods, Hollywood movies etc. proliferate
throughout the world and the globalization of tastes in every respect promote a global identity model.
Nowadays, it is more likely that culture globalization is an inevitable result of the intense interconnections
in various forms across nations. According to Crane (2002), cultural globalization has three basic models
known as cultural imperialism, cultural flow and cultural reception. These three different models will be
presented in the following separate sections and the model of cultural imperialism will be taken as the
theoretical relevance to analyze the quantitative research later on.
• Cultural imperialism/homogenization model
Cultural imperialism model views globalization as a kind of threat to the national identity and to the shape
of the ethnic culture (Crane, 2002). It believes that the flow of diverse goods, culture and messages
originate from the world’s core regions, particularly from North America to the periphery regions such as
the Third World countries. This one way flow results in a domination of certain culture over others.
According to Acheson (2003), the increased trade in cultural goods has also increased cultural
11
homogeneity. Questions such as whether cultural identities will be blurred among the future generations
and how the global cultural industries will be developed have risen.
Throsby (2001) in his book Economics and Culture suggests that the world may become more efficient
and productive, however, it will be less fair between different countries. Furthermore, he points out that
the gap between the rich and poor is widening, and the cultural imperialism instead of cultural
homogenization is more likely to be more obvious in today’s world and, the phenomenon of cultural
imperialism blurs the specific cultural identities. Likely, Inda and Rosaldo (2002: 13) in their books state
that the discourse of cultural imperialism indicates the traffic in culture moves primarily in one direction,
‘from the West to the rest’. In addition, Crane (2003) in her research applies different models to analyze
the production and dissemination of fashion and clothing as a form of cultural globalization. It indicates
that, in contrast to political or economic globalization, cultural globalization refers to the diffusion of
media and arts across the national borders. It concludes that the dissemination of fashion and clothing as a
form of industry is dominated by many western companies, which corresponds to a ‘centre-periphery
configuration’ (Crane, 2003: 13).
In respect of the film and music industries, the frequency of sharing the same cultural content, taste and
the same language has also dramatically increased cross nations. Cowen (2002) in his book Creative
Destruction points out that cinema is one of the hard cases for globalization. He argues why Hollywood
rules the world’s filmmaking and whether cultural consumers should care about it. According to him,
global culture is rather a threat than a promise in respect of cinema. Furthermore, Lanza (2001) in his
research examines the effects of globalization on music. According to him, music as a way to express the
human emotions has the ability to identify a culture and spread its original thoughts through
communication, which plays a key role of processing globalization.
Hamburger and Cardoso (1994) in the study of youth and media in Brazil argue that young people are the
main consumers within the culture industry and are preferred the target of diverse musical manifestations.
They believe that young people are most easily to be influenced by the changing of entertainments.
Especially in today’s world, as they remark, the result of global cultural integration from mass media and
expanded consumption directly affects all young people from all social strata in different ways.
Likely, another research regarding youth and the global cultural products was done in Hong Kong. Poon
(2001) conducted a research concerning the contemporary influence of Japanese animation on Hong Kong
teenagers. The aim of her study is to describe the history of Japanese animations, how they entered into
the Hong Kong market and became the most popular culture and how Hong Kong teenagers consume
12
these kinds of cultural commodities. She adopts questionnaires, interviews and observations to gather
information and divides her samples according to the income level, sex and location. In conclusion, she
finds out that Hong Kong teenagers prefer to watch Japanese animation mostly in comparison to other
animations. Among them, girls spend relatively more time than boys and the income level of these
teenagers’ families enable different animation related consumptions for Japanese animations. In addition,
the cultural impact as well as the economic impact that Japanese animations bring to most of the Hong
Kong teenagers are enormous. According to her research, most Hong Kong teenagers like to learn about
the daily habits of Japanese, including their dressing, eating styles and language through watching
Japanese animations. Girls pay more attention on the Japanese fashion styles and think that their clothing
styles and daily habits have changed after watching these Japanese animations. At the same time, boys pay
more attention to the daily habits in Japan and admit that their eating habits are changed after watching
Japanese animations and intend to travel to Japan and learn Japanese when they have the chances.
Besides, high income teenagers focus more on the clothing in Japan than low income teenagers who focus
more on Japanese eating habits.
Based on the empirical studies in this model, it appears that the consequence of cultural homogenization is
seriously concerned within the cultural field across nations. With respect to the cultural industry, taking
the Chinese animation industry as an example, the debate regarding whether the frequent imported
animation products will homogenize the ethnic cultural identity of Chinese youth is intensely discussed.
Therefore, this paper supports the model of cultural imperialism and will use it as the theoretical relevance
to analyze the impact of globalization on the animation industry in China and make a theoretical
comparison between the empirical studies and the practical quantitative research.
• Cultural flow model
Unlike the cultural homogenization model, the cultural flow model perceives the process of culture
transmission in two-way flows in instead of one-way flow, which as Crane (2002) suggests, is more likely
to have cultural hybridization as the consequence. Therefore, when it comes to the global culture
influence, the west is not the only player, because people in the periphery regions are not passive in their
encounters with foreign cultural products. Nowadays, there are also a lot of Third World countries that
exert a powerful cultural influence around the world. In Larkin’s article (2002) Indian films and Nigerian
Lovers, he explains how Indian film as an example of modernity became popular among Nigerians by
providing them with meaningful cultural alternatives to the mass medias from the western countries. Most
importantly, this alternative choice of cultural products helps the local Nigerians without being weighed
down by the western cultural imperialism. In addition, other examples of cultural and commercial goods
are also rapidly flowing across geographic regions, such as the increasing interest of studying Asian
13
languages and customs in the West and the transformation of original African arts to many European
countries.
• Cultural reception model
The cultural reception model, as Crane (2003) remarks, refers to active response rather than passive
response of audiences to the mass media productions. This theory encourages and appreciates
multiculturalism rather than cultural imperialism (Crane, 2003). Michaels (2002) in his article Hollywood
Iconography shows how Warlpiri Aborigines in the western Central Desert region of Australia actively
participate in constructing the meaning of any given American/western films and television programs they
watch but do not simply absorb its values. According to him, the diverse imported video and television
programs are not a way to destruct the ethnic culture among Aborigines unless the traditions and
preferences in graphics are ignored by the local society.
Furthermore, John Tomlinson (1999) in his book Globalization and Culture studies the relationship
between globalization and contemporary culture. He explains globalization of times and spaces, cultural
imperialism, de-territorialization, the impact of the media and communication technologies, and the
possible growth of more cosmopolitan culture. He believes that a genuinely cosmopolitan culture is
unlikely to emerge if people respect cultural differences and share a common sense of commitment about
the world.
Moreover, Aoyama (2007) in his paper takes the case of flamenco (a Spanish musical genre embodying a
complex musical and cultural tradition) as an example to examine the role of consumption in shaping
flamenco both in the forms of an art and industry. As he points out (2007), although Japan and the United
States are the two major markets of the flamenco industry, they do not purely absorb the original flamenco
as it is but they re-appropriate the meaning of flamenco to suit their own demand. It suggests on one side,
local culture and art should retain its own identity, and on the other side, it is necessary for regional
cultures and arts to link to the outside world and to export diverse markets for their future survival.
Besides, it also shows that the change of contemporary culture is not a one way flow from the core to the
periphery regions and should not be considered as the process of a global invasion. Instead, it can be seen
as a process of consumers ‘interpreting, appropriating, and adopting a cultural commodity in their own
terms’ (Aoyama, 2007: 103).
To summarize, these three different models have their own points of view to look at the specific
phenomenon of cultural globalization. The cultural imperialism model emphasizes the one-way-flow from
14
the centre to the periphery and is most likely to have cultural homogenization as a result, which is taken as
the theoretical relevance for this paper. In contrast, the cultural flow model focuses on two-way instead of
one-way-flow and the possible consequence of this model is the hybridization of culture. Finally the
cultural reception pays attention to a multidirectional process of cultural transmission and focuses more on
what audiences interpret certain cultural context according to their own cultural background instead of
merely accept the intended meaning of a certain cultural product.
2.3 International Trade and Regulation
In the late 20th century, the inexorable progress of globalization in the world economy has shifted to affect
the formation of cultural policy (Throsby, 2001). Nowadays, along with the advanced transportation and
communication technologies available, the mobility of cultural goods with their symbols of cultural
expressions moves rapidly across nations. Since the international trade concerns the basic benefits of each
nation, it is necessary to pay attention to the impact of the international trade on the process of
globalization, in both economic and cultural contexts. This section will focus on the international trade, its
regulations and the results of implementing different policies on cultural goods.
• International trade theory
International trade has long time been an intense discussion between countries, many different or opposing
opinions about it have been put forward. Dixit and Norman (1980) in their book mention two broad
themes in the international trade theory. One is quantitative and the other one is qualitative. According to
them, the quantitative theme focuses more on the terms of trade, such as the import/export prices, policies
and technologies. The standard theory of the qualitative one is about the comparative advantage. This
theory discusses about the opportunity cost and considers that it will be beneficial for both trade parities
within free trade equilibrium, because each country will have some advantages in certain production and
can specialize in producing what it can produce best.
Gandolfo (1998) in his book briefly summarized three main models of international trade. They are the
classical theory, Heckscher- Ohlin theory and neoclassical theory. The first one is also known as Ricardian
trade theory, which focuses on the comparative advantage and the benefits of trade. It considers that the
technology differences between countries are the determinants of international trade and specialization.
However, according to Zhang (2000), this theory failed to determine the terms of trade, because it only
accounts for the supply side but not the demand side. The second theory stresses that the pattern of
international trade is determined by differences in factor endowments between countries, such as labour
15
and capital. The third one, according to Gandolfo, has a longer gestation which emphasizes the technology
differences, factor endowments and the tastes of different countries. All these three models contribute to
the development of international trade theory and are proposed to predict the patterns of international trade
differently. In this paper, the theory of neoclassical theory is more relevant to the research of the Chinese
animation industry. Because this theory takes multi-determinants into account while analyzing the
international trade, which ranges from the technology, labour and most importantly the taste of animation
works between the export and the import countries.
• Impact of the international trade
The main purposes of international trade are about the exchange of goods and services and to benefit both
trade parties. Nowadays, the major impact of advanced technology, globalized transportation and
communication cast the economic and cultural considerations in international trade into an entirely new
context than decades ago (Throsby, 2001). On the production side, the international trade contributes a
significant GDP for the exporting countries. At present, due to the imbalanced economic power,
international trade seems providing a more absolute advantage for a few industrialized countries to export
more goods and to accumulate more capital rather than to benefit many of the poor importing countries in
the third world. As a result, poor countries become even poorer and rich countries become even richer. For
example, throughout the world American cultural products are tremendously popular (Mayer, 1947). In a
world wide scale, American motion picture attendance estimated at 235,000,000 per week (Mayer, 1947),
which reflects the economic value of the American motion picture industry from foreign markets.
Similarly, Tyner (1998) in his book also points out that the United States exports more cultural products
than any nation on the earth. According to him, media, as the third largest economic contributor in the U.S
by the middle 90’s, with the total sales of its domestic films, TV and other home video products abroad
totalled over $18 billion, and this number is continuously increasing. In Europe, American cultural
product sales are at least $8 billion in comparison with $4 billion European-produced products (Tyner,
1998). Besides, according to the online UNESCO institute for Statistics, during the 1990’s, the United
Kingdom became the world's leading exporter of visual arts; the United States became the world's main
exporter of newspapers and periodicals and since the mid-1990s, Ireland has become the world's second
largest exporter of sound recordings (www.uis.unesco.org).
On the receiving side, the appearance of cultural commodities in the international trade market is also
concerned with the cultural impacts in consumption and is ‘arguably one of the most internationalized’
(Schulze, 2003:269). Because the cultural expressions from the imported cultural goods might threaten the
local cultural identity, or as mentioned in the previous section, will even homogenize the local culture.
16
Overall, trading cultural commodities in the international market has impact on both economic and
cultural fields.
• International trade and regulation
There is no other area where the relationship between economics and culture is more direct that in the
arena of public policy.
______ Throsby (2001:137)
Cultural industry and cultural policy have a variety of relationships. In the international market, if
exporters oppose to any intervention that limit their market access, the importers should adopt some form
of protection to against the potential threats of both economic and cultural influences (Throsby, 2001). As
indicated in the previous section, cultural goods contain unique cultural values unlike other types of
goods. Thus, questions concerning whether cultural goods should be treated differently have arisen.
Colell (1999) points out two different types of international trade restrictions that are invoked in policy
debates of cultural commodities. The first one is known as the ‘cultural exception’ claim (Colell, 1999),
which states that cultural goods should be treated differently than other types of goods, because the
protection for local culture is needed. This claim was first introduced in 1993 by France in GATT
negotiations. The second one is about the restrictions on exports of cultural artifacts, which emphasizes
more on the preservation of export cultural heritage than to import it (Colell, 1999). These two different
types of restrictions, as Colell (1999) remarks, point to the fact that cultural goods deserve special
protections.
If special protection is needed for cultural goods, who is responsible for this protection and what are the
specific policies and regulations? Towse (2003) points out that at a national level government plays a
significant role in protecting national cultural identity and heritage. In order to restrict international trade,
governments often use different forms of trade barriers such as investment incentives, tax concessions,
regulations, education, training and provision of subsidies etc. (Throsby, 2001).
Based on Marvasti’s (1994) research of motion picture in the international trade, although historically
speaking, both industrialized and developing countries have applied different trade regulations to protect
their domestic cultural industries, the trade barriers do lead to higher net export of films from rich to poor
countries. In addition, he points out that the market size, measured by the population is an important factor
in increasing net exports, and tariffs are effective trade barriers in the motion picture industry.
17
Ou Yang (2006) in his book studies the cultural policies implemented in France. He points out that the
French government plays an important role in exploring, protecting and using its domestic cultural
industries. In this book he points out three main strategies that the French government has applied to
support its domestic cultural industries. The first strategy is to enhance employment and domestic
economy through increased government subsidy. The second strategy is to attach importance to the
protection of cultural monuments. And the third strategy is to resist foreign cultural invasions, especially
American cultural invasion. In order to limit the perpetration and invasion of the American cultural
industries, the French government stipulated the overall percentage of domestic-made programs and spent
a huge amount of money on subsidizing the domestic culturally-related programs (Ou Yang, 2006). In
1992, the European Union as an economic entity signed the Maastricht Treaty, they agreed with the intent
‘desiring to deepen the solidarity between their peoples while respecting their history, their culture and
their traditions…’ (OuYang, 2006, pp: 10). In 1993’s GATT negotiation in Uruguay, France emphasized
the problem of cultural particularity and opposed the U.S to bring media products into the content of the
negotiation in order to protect its domestic film industry. As a result, it helped France to use tariffs /quotas
to protect its domestic cultural market from other cultural products and according to the online data
(http://en.wikipedia.org/wiki/Cultural_exception), the outcome shows a dramatic low market share of
American products in the French film market (65%) than in other European film markets (90%). In the
next chapter, more examples of cultural policies concerning the Japanese, Korean and Chinese animation
industries will be presented.
Generally, the international trade provides opportunities and platforms for countries to trade their goods
and services. With respect to the cultural commodity, since the combination entity of both goods and
service has strong cultural values, it has an untouchable border, once the border is overstepped, different
trade barriers will be used to prevent the local cultural identity to be harmed by the symbolic messages
that are brought from the imported cultural products (Throsby, 2001).
2.4 Cultural industry
• Definition of cultural industry
In the middle of the 20th century, the term cultural industry was introduced in a pejorative way to suggest
the erosion of the arts by mass culture (Towse, 2003). Before clearly define what cultural industry is, it is
interesting to understand the concepts of culture and industry separately. Culture, based on the definition
of Collins Cobuild Dictionary (2005:342), consists of activities that are important to the development of
civilization and of people’s mind. Industry, despite of different terms of economic activities, it can be
18
understood by the process of industrialization (Claude, 2004), which refer to the usage of technology,
labour division, increases in production and consumption, and finally the existence of markets for
exchanging goods. Thus, based on the empirical definitions of culture and industry, it is clear that those
two concepts refer to different areas and are somehow contradictory (Claude, 2004). Morin (1962) points
out, ‘cultural industry means bureaucratic control over creation’. Because each culture has its unique
feature and it is distinguishable from the others, however, once culture is put into the context of industry,
its free development will be controlled by the production process. According to Throsby’s definition
(2001: 111), cultural industry is also called the creative industry, ‘it carries a sense of the economic
potential of cultural production to generate output, employment, revenue and to satisfy the demands of
consumers’. Similarly, Towse (2003) in her book also believes that the essential feature of cultural
industry is their industrial-scale production combined with cultural content.
• Cultural industries in industrialized countries
Diverse cultural industries as a means of representing cultural activity in economic terms are
indispensable. According to Throsby (2001), the potential for cultural industries to contribute to the
economic development in the developing world is enormous. Across different countries, especially among
some developed countries, a series of mature cultural industries have been established and become the
main contributor for the national GDP. This section will provide a general overview of the cultural
industries in the United States, Europe, and Japan.
Although the U.S. cannot be represented by having fruitful cultural resources as many other countries, it
has the strongest economic power in the current world and is the biggest exporter of its cultural products.
With the support of top technologies, powerful capital accumulations and a long-term exploitation, the
U.S. has formed a system of complete organization and management for their cultural industries, which
have contributed significantly to its annual GDP. In the North America, as Ou yang (2006) points out,
there are more than 1,500 daily newspapers, about 8,000 weekly papers, 12, 2 thousand magazines
and1440 TV programs. In addition, its advanced technology, complete film production chain and the
mature commercial operation systems have helped Hollywood to establish a monopoly position on a
world wide scale. As a result, the economic value from these diverse cultural industries is enormous. For
example, in 2000 the annual sales of Warner Bros. achieved 300 billion US dollars (OuYang, 2006) and
among the top 400 richest companies in the U.S, 72 of them are culturally-related (OuYang, 2006). Due to
the rapid development of globalization, American cultural industries are continuously expanding across
nations. In 1996, the export of American cultural products was for the first time greater than the car,
agriculture, navigation and ammunition industries, and thus became the champion of export goods
(OuYang, 2006). Besides, in 2001 the American IT industry made over 6000 billion US dollars, which
19
comprised 75% of the world’s IT industry. All these numbers clearly indicate that in the 21st century,
cultural industry has become one of the most important expanding strategies for the U.S. to accumulate
economic value in a global scope.
In Europe a rich historical background has provided a favourable cultural environment and its advanced
technologies and managerial skills have helped to push its cultural industries forward. In Europe, the main
sectors of cultural industries are performing arts, publications, film industry, tourism, crafts, video, lottery
etc. (Ou Yang, 2006). Based on the online resource, European culture industry was increased by 19.7%
between 1999 and 2003. Furthermore, in 2003 the turnover of the cultural industry in Europe reached 654
billion Euros, which was twice of its auto industry (www.flandernews.be).
Japan, by means of having its unique Asian cultural background has developed its cultural industries in
different angles compared with other western countries. For the post-war-age-group, Japan appears as the
country of Toyota, Honda, and Sony. Nowadays, pop culture such as comics, animation and video games
has become the new face of Japan. According to Nakamura (2003), comics, animation and video games
look like a bounded family. They share 10% of the Japanese media entertainment market or 30% if
character products are included. Nowadays, the image of Japan, which consists of national culture and
global brands, is influencing the world’s public opinion.
In general, cultural industries in these developed countries have generated enormous profits and have
become more internationalized, however, questions regarding how cultural industries are organized and
how they operate economically are not yet discussed. Thus, the coming section will provide reader a
general structure of the cultural industry and use diagrams to explain its economic operation.
• Cultural industry in the developing country
While cultural industries have become the mainstay contributors in many developed countries, in many
developing countries, they are still experiencing a preliminary stage. This section will take China as an
example to look at the cultural industry in the developing country. The Chinese cultural industry stepped
into the commercial market since the 90’s (Ou Yang, 2006). Since the establishment of the new People’s
Republic of China the cultural department has existed as a government propaganda tool which has been
financed by the state. People who work in this field all have strong political background and cultural
consumption has long time been treated as a public service. This organizational system, as Ou Yang (2006)
remarks, has restricted the future industrial development of the Chinese cultural industry. However, after
the Economic Reform, due to the change of market system and the increased demand of cultural
consumption, the cultural industry in China has finally began to step into the commercial market and now
it is growing rapidly. On 11th Dec 2001, China officially joined the WTO. This movement provides
important development opportunities for China as well as bringing it many challenges. The access of
20

WTO encourages more imported capital, products and services to enter into the Chinese market, and has a
great impact on the fields of domestic industry, especially in the field of cultural industry (Ou Yang, 2006).
Although China has long been known as a country with affluent culture and history, it rarely has profound
and competitive cultural products in the international market in comparison with Northern America and its
close neighbor Japan. Besides, Keane at al. (2005: 329) in their report point out that there is a lack of
synergy between creative inputs and financial outputs among the Chinese cultural industries and the
cultural sectors in China ‘reflect the problem of developing countries in targeting high value international
markets-an emphasis on national cultural identity restricts export focus’.
• Structure of the cultural industry
Cultural industry is about the usage of cultural goods to make production and generate economic value.
Since it is titled as a type of industry, the four dimensions of the process of industrialization (usage of
technology, labour division, production and consumption increase, existence of markets) should be taken
into consideration. Empirical studies show that the change of technology has profound effects on both
production and consumption patterns within the cultural industry (Thorsby, 2001). Taking motion picture
as an example, nowadays, the advanced computer technology and sound reproduction have not only
lowered the costs dramatically, but also increased the overall outputs. Besides, the popular usages of
internet and TV have provided wide range of opportunities in the demand side.
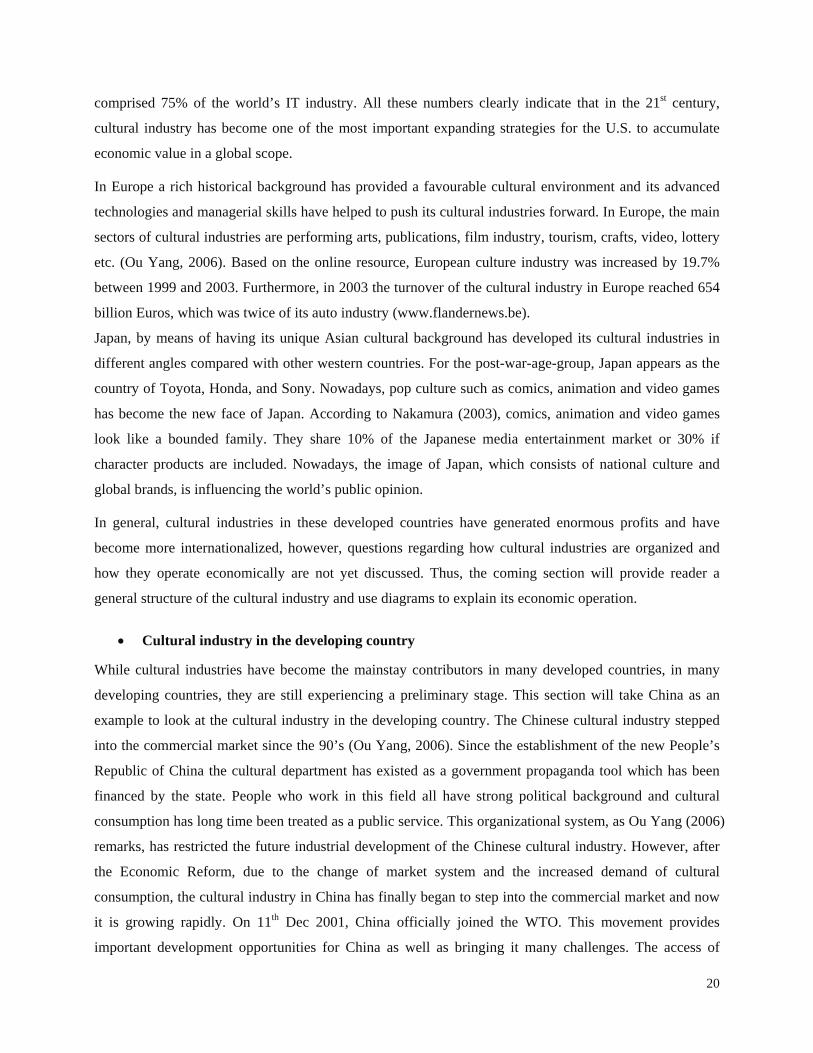
In respect of labour division, this paper shall use the diagram of Claude (2004) to explain how labour is
divided within the general structure of the cultural industries. Figure 1 indicates how to use the industrial
processes to generate four directions of economic values within the cultural industries. In the beginning,
earning is generated from cultural commodity (C1) through creation process. It is mainly contributed by
creative labour. Then, the first cultural commodity (C1) can be put into the process of production in
combination with the help of creative and technical or even non creative labour to generate second cultural
commodity (C2). Through the advertising process (A) and public diffusion (G) economic values can be
obtained. Finally, the second cultural commodity (C2) in combination with non creative work and other
inputs can gain another earning at the end through commercial distribution process. When it comes to the
Chinese animation industry, the same process can be applied. For example, in the initial process, the
combination of investment provided by animation producer and the creative work provided by creative
labour (e.g. animation director) can gain earning through creation process. After that, the original
animation product will be able to generate different animation merchandise (C2), such as comic books,
video games and clothes in combination with different labour work and inputs. This labour work contains
creative, secondarily creative and non creative work. For example, animators and directors can be
21

considered as the mainly creative labour; people who work in the colouring sector can be considered as
secondarily creative labour and ordinary labour such as cleaning and packaging can be considered as non
creative work. Finally, C2 (animation merchandise) can obtain earnings though three different channels,
namely advertising, public diffusion and commercial distribution. By doing that, the animation industry
requires to have market strategies to elicit desired responses from its target markets and make profit
(Kotler, 2000).
The term marketing mix was introduced in the 1960’s, which includes four P components: Product, Price,
Promotion and Place (Kotler, 2000). Product is the result of purchase, which refers to the quality, design
services, features etc that can be obtained by consumers. The wider and deeper the product mix is, the
more target groups can be reached. Price strategy includes discounts, allowances, payment periods etc.
(Kotler, 2000). In respect of the cultural industry, the price of any cultural commodity should be set up
according to the demand side of the cultural market (Ou Yang, 2006). The term place refers to the right
location and transportation channels. Strategies such as how to sell the products in the right time and right
place determine the future market position of certain commodity. Promotion is about the communication
between consumers and producers, which has become the most important among the 4P marketing mix
(Kotler, 2000) has become the most important among the 4P marketing mix (Kolter, 2000). This strategy,
through activities such as advertising and public relations stimulate the amount of purchase among
consumers.
To sum up, cultural industry is the combination of intellectual property and economic value. In many
developed countries, the cultural industries have become the main contributors of the national GDP,
whereas in many developing countries, for example China, this type of industry is still exploiting.
Furthermore, according to the empirical studies the structure of cultural industry is very much influenced
by the technological change and the division of labour force. Finally, cultural industry as well as other
type of industries should apply different strategies in order to survive and compete in the international
commercial market.
22
Figure 1 Generally Structure of the Cultural Industries
($+) MCW C C1 $*
A $*
$ (C1+MCW+SCW+NCW+I) P C2
G $*
$ (C2+NCW+I) D $*
C = creation process $ = investment
P = production process C = commodity
A = advertising process I = other inputs
G = collective (public, government) diffusion
D = commercial distribution process $* = earning at the end (better if $* > $)
MCW = mainly creative work
SCW = secondarily creative work
NCW = ordinary (non creative) work
Sources: Cultural Industries Economics (Claude, 2004: 4)
23
Chapter 3 Animation Industry
3.1 Introduction
Animation is one of the most influential, active and rapidly developing cultural industries in the world.
According to Milic and Mc Conville (2006: 224), ‘it is one of the fastest-growing fields in film and
television, and it is also integral to video games and web development’. In the past, animations were
aimed at children aged below 10, however, recently, the content and styles of animations have been
expanded towards more diverse audiences including teenagers, adults and family. During the same time,
the demand for animated entertainment has expanded with the increase in broadcasting hours by cable and
satellite TV along with the growing popularity of the Internet. At present, North America, Japan and
Korea control an animation triangle dominating the market on a world wide scale. These are the world’s
top three animation producers and profit gainers. This chapter will first provide an overview of the
animation industries in these three countries which includes their well-known animation products, typical
characters’ images, development directions and government policies. Furthermore, a case study of the
Chinese animation industry will be presented. This case study will focus on the history, development,
labor market as well as the government support concerning the Chinese domestic animation industry.
Moreover, different hypotheses will be derived in the end of this chapter.
3.2 Animation industry in North America
In North America, there are eight major animation producers (these are Disney, Dream Work SKG,
Warner Brother, Sony Picture Entertainment, Fox Entertainment Group, Paramount Pictures, Lucas Film
and Universal Studio). They are very dominant in the market and make the U.S. the world’s largest
animation kingdom. Within this sector, the annual income exceeds 1,000 hundred million dollars (Qin,
2006). In 1907, North America produced its first ever animation by J. Stuart Blackton (Solomon, 1989).
This is when the history of North American animation started. This history has passed through five stages
to the present day (Solomon, 1989). 1907-1937 was the exploring stage, many animations were about five
minutes long and the quality was rather rough. However, during this period, animation moved from black
and white image to multicolor. This was from the silent to sound era. 1937-1949 was the fundamental
stage. During this period, the appearance of Disney brought to prominence the manufacture of animations
in America, and Snow White, the first ever feature length animation was produced. 1950-1966 was the
first prosperous stage after the war. In this stage, Walt Disney produced a classical animation almost every
24

year, such as Cinderella (1950), Alice in Wonderland (1951), Sleeping Beauty (1959) etc. In the mean
time, many other animation companies were edged out by Disney. 1967-1988 was the TV stage. During
this time, television animation gradually developed with the appearance of some television series, like
Tom and Jerry. 1989 until the present has produced the second prosperous period for American animation.
During this phase, many new works with advanced computer technologies became top box office hits. For
example, The Lion King (1994) won several awards and grabbed $783,841,776 in gross profits throughout
the world. Moreover, the first entire computer made animation Toy Story (1995) produced by Pixar
Animation Studios took a grand total of $358,100,000 worldwide.
After passing through a long development period, American animation has formed its own features. The
emphasis is primarily on a good plot, vivid characters, interesting stories, and fine music background. It
especially pays a great attention to portraying the details, which appear to be favoured by families.
Furthermore, many of the American animations end up with happily ever after endings instead of tragic
ones, which cater to the psychological demand of many audiences. In addition, the human images of North
American animation characters are very similar to the real life. However, the animal images often have
big head, eyes, limbs and cute faces, which has become a widespread cartoon model in the world.
Recently, due to the combination of 3D computer technology and improved animation manufacture, the
overall image and quality of animation has increased dramatically.
In addition to its artistic and technological success, America is also the first country to bring animation
into the commercial market and form a large scale world industry. According to Qin (2006), the American
animation industry has a very careful labour division and complete production chain. However, this sector
is not under the control of an individual institution. Instead, it is united by the eight top animation
companies which were mentioned before. These eight companies have their own newspapers, magazines,
TV stations and satellite cables, which enable them to produce their work as independent transmitter.
Disney, for instance, is the most successful animation producers in North America and the world. It
produces animations, forms famous animated cartoon characters and even builds its own animation
kingdom – Disney land. It has the achieved dream of transferring joys into the monetary terms and it has
gained a great deal of success in the world.
25
3.3 Animation industry in Japan
Currently, Japan is the second largest animation industry in the world and has gained great success since
the 90’s. According to Qin (2006), in 2003, Japan’s exports of cartoon merchandise to America exceeded
43.59 hundred million dollars, which was four times more than steel exports in the same period.
Japanese animation started in the 20th century. In the beginning, Japan was merely helping the western
animation filmmakers to process their work with their techniques. After a long time of exploration and
development, Japan produced its first widely popular animation series, known as Astro Boy in 1963. After
the 70’s, Japan was no longer doing non creative work for the western animation filmmakers but it had
created its own drawing styles and unique genres, which were significantly different from the western
style. From the 1990’s onwards, Japanese animations have been exported to overseas markets, series like
Sailor Moon and Dragon Ball Z won world wide successes. In 2001, Spirited Away (2001) pushed
Japanese animation into the spotlight. It received many awards, including the second Oscar ever awarded
for Best Animated Feature. It was also the first animation film to win an Academy Award (Qin, 2006).
If there is only one word to describe the image of Japanese animated characters it would be elegance.
Japanese animations have very beautiful images, and the varied uses of animation have allowed artists to
create settings that do not look like the Japanese in the real life at all. For example, female animation
images often have big, round colourful eyes, which make them look innocent and friendly. They also have
sharp face, perfect beautiful body shape and dress in uniforms. Male animation characters often have very
handsome images with a great glamour; cool expressions and stylish dressing. Animals are often portrayed
with cute faces/ behaviours and have magic weapons. In addition, the content of Japanese animation is
more complex than the American ones. It emphasizes reflection on the character’s inner senses,
psychological struggles and complex social realities. The most peculiar characteristic of the Japanese
animation market is its diversity and detailed subdivision among audiences (Nakamura, 2003). In Japan,
there are animations and Manga that are able to satisfy all types of audiences with diverse occupations and
lifestyles. They are automatically divided up by producers themselves.
The Japanese animation industry, just like that of North America, has a perfect industrial chain. However,
its starting point is different from that of North America. Most Japanese animations are derived from the
top selling comic books, known as “Manga” in Japanese, which lowers the risk of having a low viewing
rate after broadcasting and at the same time stimulates the development of Manga and other animation-
26
related merchandise. In Japan, a company does not have to have the finance to produce an animation; all
they have to do is to look for sponsors, including TV stations, magazines, AV publications etc. In this way
of investing in animation, the project will be evaluated or suggested by specialists in this field in its
preliminary stages, which lowers the investors’ risks. Moreover, government support has also helped the
development of Japanese animation. According to Qin (2006), the Japanese government imposed low
taxation on exporting domestic animations; established the Tokyo Animation Centre in 2003 and many
other similar institutions in order to promote the development of domestic animation and it has financed
them when necessary. In the mean time, Japanese animation fans organize different activities such as
Costume Play (Cosplay) to create a platform to stimulate their own favourite animation characters. Every
year, Cosplay shops make a lot of valuable profits from this type of animation-related activity. Until now,
Cosplay has had a great impact in many other Asian countries.
3.4 Animation industry in Korea
Korea is the most famous Asian animation manufacture after Japan. In 2003, the output of the Korean
animation industry reached around 2.7 hundred million dollars, which occupied 0.4% of the world market
(Qin, 2006). Although this number is not comparable with Japanese animations, the Korean animation
industry is still growing and forming its own style and operation system. Instead of putting animations on
TV and cinema, Korean animators and producers take advantage of the global communication platform-
internet, and extensively produce Korean made Flashes by using 2D and 3D computer technologies. A
famous flash example is a rabbit called Mashimaro, which occupies 21% of the animation market and has
become the richest rabbit in the world (Qin, 2006).
The success of the Korean animation industry is attributed to the fully support of the government.
According to Qin (2006), in the 1980’s the Korean government had already started to assist domestic
animation in order to expand its cultural industry. In 2003, the Korean government provided 2 hundred
million dollars to help increase the output of domestic animations and established a non-government
organization to analyze the domestic market and give advice to investors and producers. Moreover, along
with other Asian countries, Korea also confronts the challenges of imported animations from Japan and
America. In order to create a fine industrial environment for the domestic animation, the Korean
government once again implemented a policy on limiting the broadcasting rates between Korean, Japanese
and other animations as 45%, 33%, 22%. In addition, in 2005, the Korean government stipulated that each
TV station needed to use 1%-1.5% of total time to broadcast domestic animation in order to protect
27
Korean animations. The government also controls the content and divisions among animation products,
which is called Korea Media Rating Board (KMRB).
3.5 Case Study: animation industry in China
• Overview
Animation is targeted as one of the most important industries for pushing Chinese cultural economics
forward. According to China’s Animation Industry Report (2004-2005), animations have a large market
sector, and its derivatives are tremendously beneficial. In recent times, the animation industry has grown
rapidly in mainland China. From 1993 on until 2003, the total output of domestic animation was about
46,000 minutes. For 2004, it was 21,800 minutes, one year later; the total output of domestic animation
was once again increased. In 2006, the amount was 82,000 minutes, which is a dramatic growth. However,
the flourishing surface hides awkwardness in the background. Although between 2004 and 2005, the gross
income of the Chinese animation industry already exceeded that of the film industry, because of its
tremendous market and lack of creativity, more than 80 percent of the profits that generated from
animation industry were trapped into the pockets of Japanese and Americans. As a result, China became
the world's largest import country for animation products. Many world-famous cartoon characters such as
Snoopy, Mickey Mouse and Hello Kitty grabbed RMB 600 million from China in one single year (China
Animation Industry Report, 2004-2005).
According to the Report of Chinese Cultural Industry Development (2007), currently, under the impact of
globalization, the development of Chinese domestic animations has fallen into two strange loops. These
are economic and cultural loops. First of all, along with the expansion of globalization, because animation
is a unique form of artistic expression, it crosses national and cultural borders, and spreads out across the
world. After Japan and America won a great deal of success and reclaimed the initial costs for making
animations domestically, they sat out to explore the international market and by ways of low or free price
strategy entered into the Chinese market, which has left the Chinese domestic animation industry falling
into an economic loop.
For example, when Chinese TV stations can import foreign animations at a rather low price, they will not
spend money on purchasing the domestic ones. As a result, domestic animations will not be able to
reclaim their initial costs back, which affect investors’ interests. Without substantial investment and
government support, there can hardly be any good animation produced. If there is no good quality
domestic animation produced, audiences will automatically choose the imported animations instead.
Therefore, the output of domestic animation will fall, because there is simply no audience, and therefore
28
no market. Once the output drops down, the supply and demand curves of domestic animation will be
imbalanced. This further limits animation supply in mainland China and increases the demand for
imported animations. The consequences of the economic loop are: the imported animations aggressively
occupy the Chinese market; the overall scale of the Chinese domestic animation industry drops
significantly; many domestic animators give up making original work and work for foreign animation
producers instead.
Secondly, the imported animations, at the same time as creating an economic loop in the Chinese
animation market, also bring about a cultural loop. In the last 20 years, these imported animation works
have changed the desires and tendencies of Chinese audiences. Following the popularity of televisions in
the late 80’s, more and more foreign-styled entertainments have emerged into China. When imported
animation characters and plot styles are deeply engraved on Chinese audiences’ memories, they
unconsciously change the aesthetic standards among audiences. In turn they become the referential
standards for audiences to judge the quality of animations and guide them to consume in the future. In
China, many adults still narrow mindedly consider animation as an entertainment for children. However,
they neglect the impact of imported animations on the younger generations. By consuming imported
animations, children and young people will unconsciously accept the value and life styles that foreign
animations present to them. In the long term, the values of foreign cultures and life styles from imported
animations may play a dominant role and further replace the original cultural values among Chinese
youth.
In general, the economic loop has reduced the scale and output of the Chinese domestic animation
industry. It also intensifies the huge demand of imported animation products and enables foreign values
and life styles to spread out in the Chinese society. When this kind of cultural dissemination accumulates
to a certain degree, it changes the tastes for animation products among Chinese audiences and further
encourages the consumption of foreign animation products. Therefore, just as the economic loop may
destroy the Chinese domestic animation industry, the cultural loop in the long term might also destroy or
even replace the cultural sustainability in China (Qin, 2006).
• History
From the beginning of the 1920’s until the present, the history of Chinese domestic animation has passed
through six different stages (Qin, 2006). 1922-1945 was the exploration stage. During this period, the first
black and white image animation was produced by Wan brothers (the originators of Chinese animation) as
a form of commercial called Shuzhendong Chinese Typewriter (1922). In 1935, the first sound animation
29
was produced and six years later, the famous animation Princess Iron Fan was released, which became
the first feature length animation in China and Asia. The characteristics of animations at this stage were
significantly different from the western styles. Many animations emphasized a reflection on the hardships
of Chinese ordinary people and the feudal systems, which in some extent, overlooked humour and
entertainment. As a result, this starting point severely restricted the future development of Chinese
domestic animation. 1946-1956 was the stable stage. During this stage, Chinese animation experienced
many ‘firsts’ (Qin, 2006), such as the first fairy tale animation, the first colour puppet show and the first
colour animation series. In addition, on 1st April 1957, China established the first animation studio which
was later known as the famous Shanghai Animation Film Studio. During this period, educational content
played a dominant role among domestic animations. 1957-1965 was the first prosperous time. Animations
that were produced during this stage had diverse styles and subject matters. Most importantly, a Chinese
animation style was formed, which displayed traditional Chinese cultural value to their audiences. 1966-
1976 was the Cultural Revolution stage. During these ten years, only a few animations with strong
revolutionary background were produced. 1977-1986 was the second prosperous time. During this period,
more than ten different animation studios were established; advanced animation techniques were used; the
overall output increased and the content and image had strong Chinese ethnic features. 1987- the present is
the transitional stage. The techniques, scale of industry, output as well as the content of Chinese domestic
animations have changed along with the flourishing trade in mass imported animations on the domestic
market. From 1995 on, Chinese animations have no longer been purchased and sold by an institutional
monopoly. Instead, animation has been pushed on to the commercial market, which changed its
production and management styles. During the 90’s, domestic animations in China produced many series
compared with decades before. With respect to manufacture, computer techniques have been extensively
used on domestic animations, 2D and 3D animations provide audiences with better visual impressions.
Moreover, the number of animations produced with merchandise was increased during this stage.
• Labor market
According to the statistic of Chinese Animation Association, in 2005, there were 7,000-10,000 specialists
working in the field of domestic animation while the actual demand was about more than 15,000. Among
them, only a few young animators and directors were mentioned in comparison to the rest whose general
age was above 50 years (Qin, 2006). As it was discussed earlier, economic and cultural loops have
become tremendous disadvantages for the Chinese domestic animation industry. In the same time, they
have also caused a labour loop. Producing animation is a labour and time consuming work. When it comes
to labour, a traditional animation (hand drawing) needs at least scenarist, animator, director, sound dubber,
merchandise designers etc. Nowadays, cheap labour in China has attracted many foreign animation
30
producers. Many talented animators in China work in uncreative sectors such as colouring and animating
for foreign companies instead of creating new animations for the domestic market. In addition, shortage
of labour brings another problem for Chinese domestic animation. In comparison to five or six animation
related institutions three years ago, in 2002 (Qin, 2006), China has already more than 200 academic
institutions that provide students with animation related subjects. However, due to the stagnancy of the
domestic animation industry, many Chinese animated specialists are unemployed and transfer into other
more profitable sectors. As a consequence, this flow of labour becomes an enormous obstacle to the
development of the Chinese domestic animation industry.
• Government support
Government plays a decisive role in helping a new industry to develop, especially in its preliminary stage.
In China, whether animation can develop as an industry in the future has been questioned for a long time.
Although in the 90’s, the Chinese government paid close attention to the development of domestic
animation, in 2000, this field was officially defined as an industry by the government and in 2001 the state
decided to develop it in the long term as a part of the domestic economy. On 20th March 2000 (Qin,
2006), the State Administration of Radio Film and Television (SARFT) stipulated that national TV
stations could not broadcast more than 40% of imported animations. In addition, every imported
animation must be checked first by the regional government and then reviewed again by the SARFT
before it is broadcasted. Moreover, any international animation related activities must be permitted by the
SARFT, otherwise, they are considered as illegal. Three years later, on 20th April 2004, SARFT produced
an official document, which indicated that each permitted animation channel must broadcast at least 50%
of animated programs within 24 hours/day and that among them domestic animations should not be less
than 60% of the broadcasted material.
Furthermore, SARFT allowed 30 seconds of advertisements after broadcasting 30 minutes domestic
animations between 17:00 and 19:00 in order to help popularize domestic animations amongst audiences.
One year later, on 1st Jan. 2005, SARFT officially implemented license systems to control the content of
all the animations. The content and image of each animation that is intended to be broadcasted should be
checked out by SARFT. On 29th April 2006, the state council officially determined the animation industry
as a high technology industry, and started to reduce its taxation. The recent issued principle referring to
the protection of the development of domestic animation industry in China was on 1st September 2006,
when SARFT officially forbade any TV station to broadcast imported animations between 17:00 and
20:00 (based on the general school schedule in China, where students are out of school between 16:30 and
31
17:00. They are allowed to watch TV by their parents until 20:00 or 21:00). Therefore, when no imported
animations are broadcast during this “Golden Time”, the only option is to watch the domestic ones.
Moreover, in order to address different principles and regulations to protect the domestic animation
industry, the Chinese government also allocates funds to encourage establishing animation academies;
exploring more diverse animation bases within the country and launching national animation shows
annually since 2001.
3.6 Hypotheses
• Hypothesis 1: The techniques of making Chinese domestic animations vary between the different
market periods. Here periods refer to the closed market period (1972-1980), opened market period
(1981-1999) and the protected market period (2000-2006).
Technical innovation stimulates the development of cultural industry. Regarding the global animation
industry, the technology to produce animations has also been changed and gradually replaced the
traditional ways to make animations. There are many techniques available to make animations. The
following three main techniques can be distinguished as most prominent. Namely: the traditional/hand-
drawing, the stop motion and the computer technology-2D or 3D (Qin, 2006). The traditional way of
making animation is by making thousands of drawings which are shown one after another in a very fast
speed on the screen. This technique is extremely time - and labour- consuming. However, it brings very
good visual impression for the audience. The stop motion technique involves the use of puppets or any
other form of models. It requires animators to alter the scene physically and then to shoot a frame, after
this to alter the scene again and to shoot the next frame and so on. It is a rather hard work for animators
and also very time consuming. The last and most advanced technology is the computer animation. Digital
technology is a much cheaper and easier method to mold vivid animation characters and to complete the
whole film. In China, the traditional ways of producing animation are hand drawn and stop motion.
However, since the end of the 1990’s, China has opened the market for importing animations all over the
world. This open door policy has encouraged the flow of imported animations into China and in a way has
helped improve the traditional technologies of making animations within the country. Since the 1990’s on,
2D and 3D computer animations have appeared more and more often on the market and have been
favoured by many animation audiences in China. Therefore, this paper assumes that in the protected
market period, by using computer technologies to produce the Chinese domestic animations is
significantly higher than in the closed and opened market periods.
32
• Hypothesis 2: The volume of Chinese domestic animations varies between different market
periods.
The volume of Chinese domestic animations is measured by their running times, which is an important
factor to analyze the development of the Chinese animation industry. Historically, due to having low
average volume, Chinese domestic animations can simply not satisfy the huge demand of the domestic
market and this cultural and economic gap is naturally filled by the diverse imported animation products.
However, according to the policies and principles issued by the Chinese government in recent years
regarding the domestic animation market, it is clear that animation will be developed as an industry to
serve the wider audiences instead of being treated as only children’s entertainment. In order to regain the
lost domestic animation market in both economic and cultural respects, the Chinese government requires
an increased volume of domestic animations as a strategy to develop the domestic animation industry.
Thus, this paper assumes that the volume of Chinese domestic animations is dramatically higher in the
protected market period than in the closed and opened market periods.
• Hypothesis 3: The characters’ images in Chinese domestic animations change over different
market periods.
• Hypothesis 4: The subject matters of Chinese domestic animations change over different market
differ periods.
• Hypothesis 5: The story line origins in Chinese domestic animations change over different market
periods.
Generally many animations are produced in light of their own cultural background, such as traditional
festivals, old mythologies, histories, famous hero/heroine or diverse reflections on certain issues or events.
However, today the transformation of culture diversifies the content of animation. In some countries this
leads to homogenizing the original story lines. But appropriating cultural products of others into their own
cultural meanings also appears more frequently. For example, the famous Disney movies Mulan (1998)
and Aladdin (1992) depict a Chinese historical heroine and an Arabic tale respectively as the basis of the
stories. In addition to their original images and basic plots, these two Eastern stories have been endued
with strong American humor and typical American expressions which to some extent promote the
American culture and can lead to the Americanization of foreign cultures. Although in the process of
cultural transformation only cultural products which have typical ethnic contents will be mostly
33
appreciated and praised. Due to the imbalanced power of cultural dissemination, many problems have
arisen between the mighty and weak cultures and economics. In this research, images, subject matters and
the story lines of the animation products are all being considered as the content of the animation. In the
early 60’s and 70’s, Chinese animations rarely contained foreign images or subject matters beyond the
educational purposes and the reflection of reality, nor took stories from the western cultures. However,
recently, along with the open trade policy in China and the membership of WTO, increased international
trade in cultural products, especially from western countries have entered into the Chinese market. For
example, imported animation products have grabbed huge profits from China since the end of the 1980’s
and have generated strong economic and cultural impact among Chinese youth. According to a research
done by a famous cartoon magazine in China _man dong zuo, in 2004 the top 20 most favourite animation
images among Chinese youth contained 19 foreign animation images (Qin, 2006).
Thus, it is likely that this “invasion” of imported animations, to some extent, just as the impacts of
Japanese comic and animations have had among Hong Kong teenagers, will homogenize the taste of
animations among audiences in mainland China and further change the content of Chinese domestic
animation in the long term. Because of the fact that animation artists engage not only in producing fine
animations, they also engage in cultural transactions with producers and consumers, the content of
Chinese domestic animations might be changed according to the evaluations from producers and
consumers through the influence of imported animations. Thus, this paper assumes the characters’
images, subject matters and story line origins of Chinese domestic animations become more foreign
like in the protected and opened market periods than in the closed market period.
• Hypothesis 6: The amount of merchandise produced for Chinese domestic animation differs
between different market periods.
The merchandise from animation products generates huge profits for the animation industry which they
use to finance themselves and to be able to run as a complete production chain in the future. However, in
the history of Chinese animation, due to the ignorance of its value in the early period, animation has
neither been industrialized nor treated as a commercial product until Japanese and American animations
flooded the Chinese market, and gathered huge profits from their animation derivatives (e.g. games, toys
and clothes) after the market was opened. In 2004, the output of global digital animation industry reached
222.8 hundred million U.S dollars (Qin, 2006). Most surprisingly, the related merchandise which is
derived from those animations has exceeded 5000 hundred million U.S dollars (Qin, 2006). Although this
result still falls behind foreign animation industries, it has already improved compared with the previous
decades. Thus, this paper assumes that the amount of merchandise produced for Chinese domestic
34

animation is significantly higher in the protected market period than in the closed and opened
market periods.
• Hypothesis 7: The number of animations produced per director differs between periods
The animation directors are responsible for developing and supervising the behaviour and motion of all
animated characters that appear on the screen (Goulekas, 2001). They are the soul of the animation and
are brought in at the beginning of the stage when the script is being written and the initial process of visual
development is being done (Wands, 2002). Moreover, they are the people who contributing to the main
creative work within the animation industry. In China, although animation industry was not developed as
an industry in the closed market period, its labour market was very stable. However, after the Economic
Reform, China opened the door for diverse foreign goods and services. In the opened market period, many
imported animations entered into China with very low prices and had great impact on the supply side of
the Chinese animations. During this period, the effects of imported animations widen the set of animation
products available for Chinese consumers and also fostered competition. Based on the empirical study,
there is a clear perception that international trade leads to labour destruction in North America (Klein et.al.
2003). With respect to the Chinese animation industry, it is likely that during the opened market period,
along with the increased international trade, the Chinese labour market (here refer to the animation
directors) will be destructed as well and the number of animations produced per director will be decreased.
However, in the protected market period, due to having government regulations on imported animation
products, the international competition in the domestic animation field will be decreased and by means of
government support, more job opportunities in the domestic animation sector will be created. Thus, this
paper assumes that in the opened market period, the average number of animations produced per
director will be significantly lower than in the closed and protected market periods. Moreover, in
the closed market period, the average number of animations produced per director will be the
highest.
• Hypothesis 8: The number of animations produced per producer differs between periods.
If the directors are considered as the artistic managers within the animation field, the producers are
unquestionably the business managers, because they are involved in the financial management of the
project. In China, it is noticeable that the animation industry is very much controlled by the national
government and the major producers are all state owned, such as the Shanghai Animation Film Studio and
CCTV. Although the Shanghai Animation Film Studio is up to now the biggest animation producer in
China, nowadays along with the open trade policy, Chinese animation field has attracted many private and
even foreign producers to join in this field. According to the China Animation Industry Annual Report
35

2004-2005, in 2004 there were 52 different animation producers and one year later the amount had been
increased to 68. Among them many of these new arrived animation producers are private, which have no
sufficient knowledge of the domestic animation field. Due to this problem, they are very cautious about
investing on the animation products, this problem of investment may lead to a low average output of
animations as a result. Thus, this paper assumes that the number of animations produced per producer
is lower in the protected market period than in the opened and closed market periods.
36
Chapter 4 Data Collection
4.1 Introduction
This chapter deals with data collection. It gives the reader an idea of how the data has been collected and
how different variables are defined and which statistical methods are going to be used in order to analyze
the numerical results. To be more specific, this chapter will explain to the reader why a certain
methodology has been chosen and will describe and justify the choice of dates and sources for the data.
The list of the Chinese domestic animations produced from the year 1972 onto 2006 has been compiled as
a data matrix in SPSS that can easily be analyzed statistically. This data matrix includes the year, content,
technique, volume, merchandise as well as the name of the director and producer. In addition, the specific
determinations and divisions under each of these variables will be explained and listed.
4.2 Methodological choice
A research methodology defines what the research activity is, how to proceed, how to measure progress
and what constitutes success. In scientific research three main epistemological models have been very
common. The first one is called the empiricist/positivist method. Its primary field concerns natural
sciences. The aim of this epistemology model focuses on social facts and is used to describe laws and
rules. It favours facts outside the mind and treats concepts as general references. Its methodology is to set
up hypotheses and to verify theories by using a quantitative method. This epistemology model replies on
the result’s reliability and validity. Scientists who apply this kind of epistemology model use it to find out
numerical evidence in order to support their hypotheses. The second epistemology model is known as the
interpretivist/reconciliation. This methodological choice is used in the field of humanity studies. It collects
data by interpreting facts, concepts and theories. Its aim is to understand human behaviour from intentions
and motivations. By using the qualitative method, the research results will be generated. Moreover, this
method often uses interviews (open-ended questionnaires) to obtain opinions from the interviewees and
interpret their answers by coding verbal data. The third epistemology method is called constructivist. It is
mainly used in the field of philosophical studies. The feature of this one is that neither facts nor
measurements are used. The concepts of this method are constructs. Researchers who use this
methodological choice aim to evoke a possible world or to deconstruct a discourse, ideas etc.
37
According to Seale (2004), the empiricist model derives knowledge from observation. This paper deals
with hard facts and observable phenomena of the development of The Chinese domestic animation
industry and focuses on its volume, content, production chain and many other observable facts, therefore,
the empiricist epistemological model will be used to carry out this research. Furthermore, the primary goal
of this paper is not only to describe how the animation industry in China changes through the years, but
also has an emphasis on predicting and analyzing the hypotheses. Finally this paper will make use of the
quantitative method and draw on measurable evidence to support or to reject the hypotheses, for which it
is necessary to collect numerical data. Although in the beginning I hoped and planned to use the
interpretivist method to carry out this research, In have to come to terms that an in depth interview by
sampling different groups in China is an unrealistic idea due to the very great distance to China and the
limited study time.
4.3 Data collection process
This paper gathers information from both primary and secondary sources, which include the animations
produced in China from 1972 until 2006, annual reports, books, newspapers and academic journals. All
these resources are used to construct the research framework and provide the informative background for
understanding the development of the Chinese animation industry. In order to carry out this research it is
necessary to collect different animations that have been produced in mainland China.
Due to the great distance to China and the time pressure it is impossible to find out by a questionnaire
whether, and how far, the diverse factors of globalization have an influence or an impact on the
development of the animation industry in China. However, by collecting animations via archive/internet
and by carrying out content/visual analysis, a concrete view of the development of the Chinese animation
industry can be given to the readers and from this it can also be decided in principal whether and how this
industry has been affected by globalization. However, since China started to produce its animation in the
beginning of the 50’s, many data have been lost and today hardly any copy of it can be found anymore. In
addition, the 10 years of the Cultural Revolution severely halted the economic development between May
1966 and October 1976. China then became a totally closed country in every respect. There were only a
few animations produced during this period. Nevertheless, 3 years after the restoration, in 1979 Deng Xiao
Pin pointed out the idea of the Economic Reform and led China to a brand new stage that continues until
the present. Both animation and other industries have begun production as was normal in former times.
Therefore, since this paper focuses on comparisons of closed, opened and protected animation market
situations in mainland China, the beginning of the Cultural Revolution in 1966 will be the starting point
38
for collecting the data. Due to the fact that from 1966 until 1971 no animation was produced, this paper
will start with the collection of data from 1972.
During the process of collection, about eighty percent of the animations that have been used in the
previously mentioned statistical analysis have officially been published on the website of Shanghai
Animation Studio and in the annual report of Chinese Animation Industry. Short clips and descriptions of
many of these animations can be found on the internet, including the years of production, the running
time, and also the names of directors and producers. However, for the remaining twenty percent it took a
lot of time to find and to collect the relevant information. In order to get more valid sets of data, a great
effort has been put in searching for information from the online animation club and related websites. For
example, the research depends on the information provided by the official website of the Shanghai
Animation Film Studio for all animations that have been produced from the 50’s until 2006 which should
be reliable. However, some of the well-known animations, even those that have been broadcasted before,
are missing due to unknown reasons. The attempt has been made to obtain a collection with as much
possible information for this paper in order to compensate for the animation cases which are missing due
to collection problems or errors. Some animations from certain periods might still be missing. If the reader
would be interested in checking out the validity of the data, it can be found on both www.ani-sh.com and
in the annual report of the Chinese Animation Industry.
4.4 Define variables
In this research the central question is to find out whether or not the contents, techniques, volume, amount
of merchandise and the labour market of the domestic animation industry in China during the three
different market periods were affected by globalization. To be more specific, this research predicts that
along with the expansion of both economic and cultural globalization the content of Chinese animations
will become more foreign-like, ranging from their main characters’ images, and story lines to the subject
matters that have been broadcasted through the media to the audience. Moreover, the volume (here
regarded as the average time length of animations) has gradually increased during the 70’s until the
present. Furthermore, the technology and the communication transformation provided by globalization
make the techniques of making animations more advanced. In addition, to have a complete production
chain (here regarded as the emphasis lies on producing franchised products from the domestic animations)
in order to actualize animation as an industry is becoming easier to achieve today than it was before.
Finally, the intensive labour market in the Chinese animation field has changed into more decentralized
one. This point will take animation director and producer as examples to analyze this phenomenon to
39
examine this change. Thus, dependent variables in this research are the Content, Techniques, Volume,
Amount of Merchandise, Director and Producer of Chinese domestic animations and independent variable
is Periods.
Dependent variables
• Content
The content of animation consists of abstract and qualitative data. In this paper three sub-variables are
determined to analyze the content of each animation by dividing up and categorizing the different aspects
within this variable. Namely: the character image, the story line origin and the subject matter. Since the
reliability of the coding process is important in content analysis (Seale, 2004), a test of inter-coder
reliability is used. Due to the language limitation, the coders require having good knowledge of Chinese.
These are two Chinese university students joined in this coding process. They both like animations and
engage in the development of Chinese domestic animation products. They are required to review the same
list of animations and use the same set of coding categories to code. As a result, our opinions concerning
the belongingness of these three sub-variables are more or less identical.
- Image
The image refers to the appearance of the main characters that appear on the screen, such as the eye color,
hair color, clothing, body shape and facial features. For example, Chinese animation characters normally
have black eyes and hair; a small body size and a meager body shape. American animations portray their
characters with diverse hair colors, larger facial and body lineament, dressed in typical luxury palace-like
clothes and with typical American comic expressions. In contrast to this Japanese animation characters, as
mentioned in the previous section, have diverse types, which range from children to adults. Japanese
animation generally pictures its characters as having unrealistic beautiful body shape; exaggerate facial
ratio (sometimes with unique hair color); ideal Asian faces and fashionably dressed. In Figure 1 the well-
known animation images from Japan, America and China are presented, and the differences between these
images are very obvious. In the data set the variable Image has been divided into three main sorts: 1-
Chinese like, 2-American like and 3-Japanese like.
40
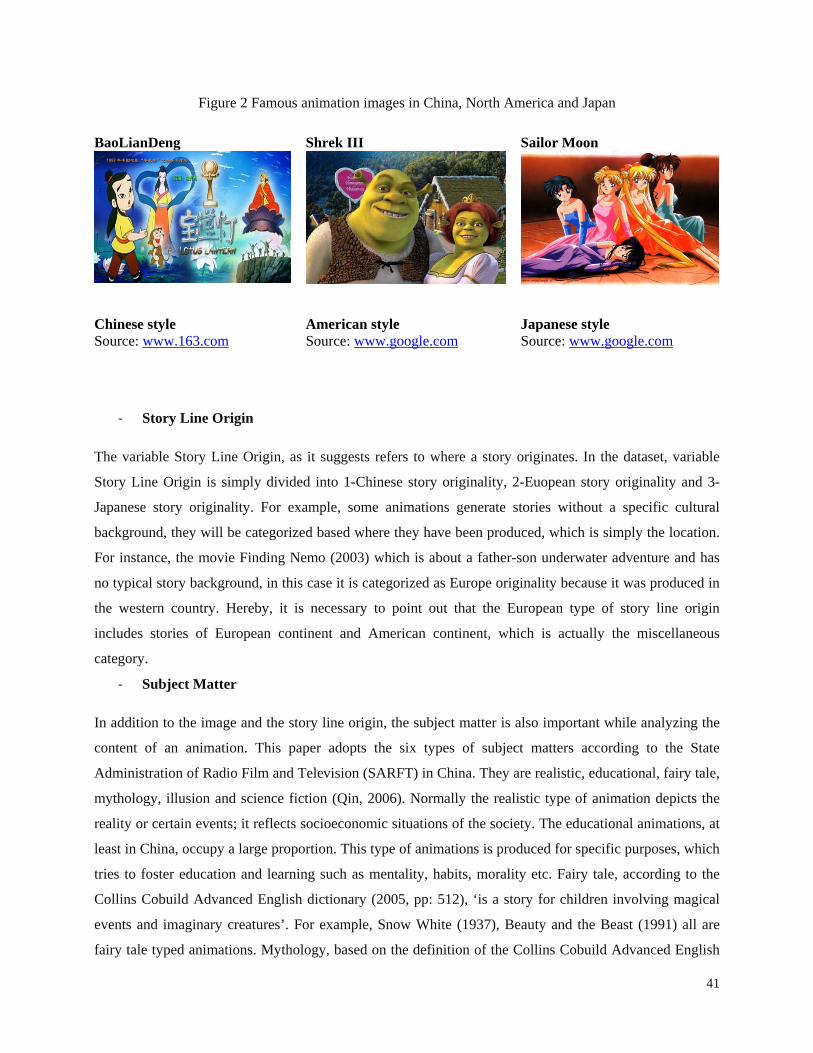
Figure 2 Famous animation images in China, North America and Japan
BaoLianDeng
Shrek III Sailor Moon
Chinese style Source: www.163.com
American style Source: www.google.com
Japanese style Source: www.google.com
‐ Story Line Origin
The variable Story Line Origin, as it suggests refers to where a story originates. In the dataset, variable
Story Line Origin is simply divided into 1-Chinese story originality, 2-Euopean story originality and 3-
Japanese story originality. For example, some animations generate stories without a specific cultural
background, they will be categorized based where they have been produced, which is simply the location.
For instance, the movie Finding Nemo (2003) which is about a father-son underwater adventure and has
no typical story background, in this case it is categorized as Europe originality because it was produced in
the western country. Hereby, it is necessary to point out that the European type of story line origin
includes stories of European continent and American continent, which is actually the miscellaneous
category.
‐ Subject Matter
In addition to the image and the story line origin, the subject matter is also important while analyzing the
content of an animation. This paper adopts the six types of subject matters according to the State
Administration of Radio Film and Television (SARFT) in China. They are realistic, educational, fairy tale,
mythology, illusion and science fiction (Qin, 2006). Normally the realistic type of animation depicts the
reality or certain events; it reflects socioeconomic situations of the society. The educational animations, at
least in China, occupy a large proportion. This type of animations is produced for specific purposes, which
tries to foster education and learning such as mentality, habits, morality etc. Fairy tale, according to the
Collins Cobuild Advanced English dictionary (2005, pp: 512), ‘is a story for children involving magical
events and imaginary creatures’. For example, Snow White (1937), Beauty and the Beast (1991) all are
fairy tale typed animations. Mythology, based on the definition of the Collins Cobuild Advanced English
41
dictionary (2005, pp: 945), ‘is a group of myths, especially all the myths from a particular country,
religion, or culture’. This type of animations has strong cultural content and has been made up in the past
to explain natural events or to justify religious beliefs or social customs, which has been passed down
from one generation to the next one and has been interpreted according to people’s own cultural
conventions. The illusion type of animations portrays something that seems to exist, but it does not
actually exist or it is in reality something else. Typical examples of this type of animation are The Polar
Express (2004) and Charlie and the Chocolate Factory (2005). Finally, the science fiction types of
animations are relatively new. The main themes of this kind of animations consist of events that take place
in the future or in other parts of the universe. Many of the stories are about traveling to other fantastic
planets or into outer space. They provide a showcase for advanced technology gadgets, such as robots and
spaceships. In the dataset the subject matters are divided into six different categories according to the
SARFT. Due to the fact that each animation may contain more than one subject matter, the author has
reviewed most of the animations or video clips and has picked up and counts the frequency of key words
based on the descriptions of animations from online and primary resources. In the end, variable subject
matter for each animation which appears in the dataset is coded as 1- realistic, 2-educational, 3-fairy tale,
4-mythology, 5-illusion and 6-science fiction.
• Volume
The variable volume is measured by the running time of each animation and it is important for the
development of the Chinese animation industry. In comparison of the animation volume between Japan
and China, in 2005 the average time of Japanese made animations was about 5-8 seconds per person.
However, in China the average time of a domestic animation per person is only about 0.02 seconds (Qin,
2006). It should be considered that this was the result even after the Chinese government had implemented
policies on enlarging the running time for broadcast animations. Therefore, by looking at this variable it is
possible to find out whether the total volume of Chinese domestic animations is influenced by the frequent
imported animations during the opened market period and protected market period. Since the variable
volume is measure in scale, it will not be coded within different ranges unless it is needed.
• Technique
Animation technique as mentioned before has three main types: the traditional/hand-drawing, the stop
motion and the computer technology-2D or 3D. Therefore, the variable technique concerning Chinese
domestic animations will be based on these three techniques for the purpose of proceeding with the
statistic analysis and finding out if these techniques of making animations in the mainland China have
been changed in the different periods. In the dataset, it is coded as: 1-Traditional/hand –drawing
technique, 2- stop motion technique, 3-computer technique.
42

• Merchandise
Animation is not merely an isolated type of art it is also a close-knit industry. However, due to the fact
that Chinese animation industry has an incomplete production chain and that there is a lack of the
government support, the economic operating system of the Chinese animation industry lags behind
countries like North America, Japan and Korea. In some developed countries comics and games have
already become a triangle cycle to promote the development of animation industry. In the U.S, Donald
Duck and Mickey Mouse have been making profits for Disney by having diverse merchandise since the
20’s. In the same matter, in Japan the animation industry has reached its peak after finding out their own
style, which has also generated a lot of profits and has spread its influences all over the world. In contrast
to this the Chinese animation industry is still in the phase of exploring and developing. However, by
observing the successes of foreign animation industries, many Chinese animation producers and investors
have gradually realized the potential market in this field. According to Qin (2006), AV (audio & video)
products, toys, comic books and clothes etc. can all be included as animation merchandise. In this paper
the decision regarding whether a certain domestic animation has its related merchandise or not will be
based on these four main dimensions which were originally introduced by Qin. They are the AV products,
toys, comic books and clothes. If a domestic animation satisfies any of the four types of merchandise, it
will be categorized as animation with merchandise. In the dataset, Merchandise is coded as dummy
variable. For example, an animation has at least one merchandise is coded as 0 and an animation without
any merchandise is coded as 1.
• Director
Animation is a labour-intensive cultural industry and the contribution of animation director within this
creative industry is enormous. In the dataset the variable Director refers to the name of directors and each
of them has at least directed one animation from 1972 unto 2006. The purpose of considering this variable
is to focus on the labour market and to find out whether the creative labour, taking animation director as
an example, is influenced in different market situations. In the dataset, Director is coded as nominal
variable.
• Producer
Producer is responsible for overseeing the entire production from the very beginning up to the end and
owns the financial power. In China, most animation producers are state owned, which are very much
politic related. However, nowadays many private and foreign animation producers start to appear in the
Chinese market and in one way or another contribute to the development of Chinese animation industry.
43
In the dataset, Producer is also coded as nominal variable, for example, Shang Hai animation film studio is
coded as 1, Xian Film Production is coded a 2 & so forth.
Independent variable
• Period
As mentioned in the previous section the year 1972 will be the starting point of the collection of the
Chinese domestic animations and the year 2006 will be the end of this data analysis. The period between
1972 unto 2006 will be divided into three main periods based on the historical development of the Chinese
animation industry. Period 1 goes from 1972 unto 1980. During this period China experienced the Cultural
Revolution and the beginning of the economic reform. During the Cultural Revolution the Chinese
economy was severely halted, education was banned, industries were stopped and many people were
oppressed and jailed. Animation also reached a low point with little access to outside influences.
Therefore, in respect of the development of the Chinese animation industry this period is considered as a
closed market. In 1979 the Economic Reform was started, which promoted the opening up of China to the
outside world. Period 2 begins at 1980 and end in 1999, which is considered as the period of an open and
free market. In 1981 China officially imported the very first animation from Japan called 鉄腕アトム
(Astro Boy) (Qin, 2006). From then on a mass of animation products from different countries have entered
China and they have dominated the domestic animation market in mainland China. Among them the
Japanese animations have the biggest influence on it. This situation has gradually changed since the State
Administration of Radio Film and Television implemented a policy in the year 2000. This policy
stipulated that every imported animation need to have permission before broadcasting on the TV could
take place. Moreover, every TV station must limit the proportions to broadcast imported animations. From
2000 unto the present the Chinese government has implemented even more strict policies to limit the
broadcasting of imported animations. For that reason the animation market in China is strictly restricted
between 2000 and 2006. In the dataset, the closed market period (1972-1980) is coded as 1, the opened
market period (1981-1999) is coded as 2 and finally the protected market period (2000-2006) is coded as
3. In the next chapter this paper will based on these three different periods to analyze the research
questions.
44
4.5 Statistic analysis plan
Since this is a quantitative research, all the data will be analyzed by SPSS program. For continuous data,
such as variables Volume and Year, the mean and median will be calculated. Histograms with normal
distribution curve will be requested to check whether the distributions are symmetric or skewed. For
nominal data frequency tables will be used to summarize the categorical variables and to display the
number of times a certain value occurs. Furthermore, a pie chart will be used to display a visual analysis
with percentage for the categorical data. In order to test the hypotheses, crosstabs with chi-square will be
used in the analysis. Crosstabs serves to summarize variables and their relationships. Chi-square measures
test the hypothesis whether the row and column variables in a crosstab are independent or not. Finally, the
null hypothesis will be rejected when the significance level (p value) appears in the chi-square as being
smaller than or equal to 0.05.
45
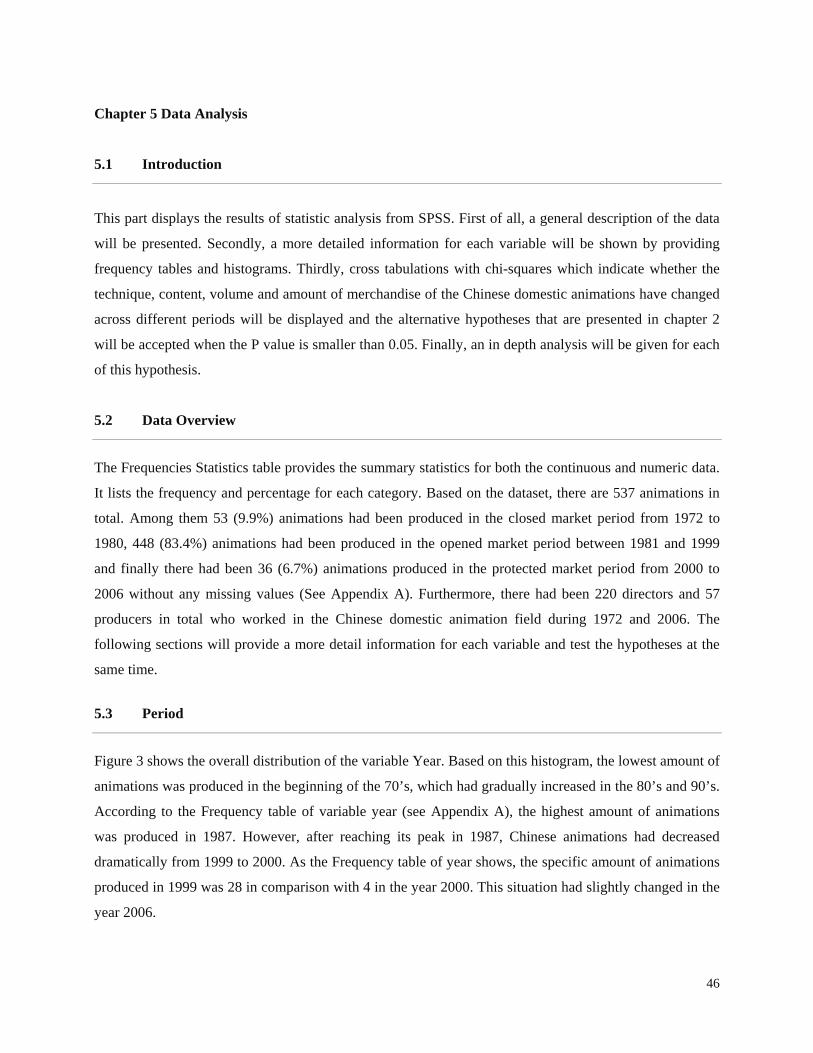
Chapter 5 Data Analysis
5.1 Introduction
This part displays the results of statistic analysis from SPSS. First of all, a general description of the data
will be presented. Secondly, a more detailed information for each variable will be shown by providing
frequency tables and histograms. Thirdly, cross tabulations with chi-squares which indicate whether the
technique, content, volume and amount of merchandise of the Chinese domestic animations have changed
across different periods will be displayed and the alternative hypotheses that are presented in chapter 2
will be accepted when the P value is smaller than 0.05. Finally, an in depth analysis will be given for each
of this hypothesis.
5.2 Data Overview
The Frequencies Statistics table provides the summary statistics for both the continuous and numeric data.
It lists the frequency and percentage for each category. Based on the dataset, there are 537 animations in
total. Among them 53 (9.9%) animations had been produced in the closed market period from 1972 to
1980, 448 (83.4%) animations had been produced in the opened market period between 1981 and 1999
and finally there had been 36 (6.7%) animations produced in the protected market period from 2000 to
2006 without any missing values (See Appendix A). Furthermore, there had been 220 directors and 57
producers in total who worked in the Chinese domestic animation field during 1972 and 2006. The
following sections will provide a more detail information for each variable and test the hypotheses at the
same time.
5.3 Period
Figure 3 shows the overall distribution of the variable Year. Based on this histogram, the lowest amount of
animations was produced in the beginning of the 70’s, which had gradually increased in the 80’s and 90’s.
According to the Frequency table of variable year (see Appendix A), the highest amount of animations
was produced in 1987. However, after reaching its peak in 1987, Chinese animations had decreased
dramatically from 1999 to 2000. As the Frequency table of year shows, the specific amount of animations
produced in 1999 was 28 in comparison with 4 in the year 2000. This situation had slightly changed in the
year 2006.
46
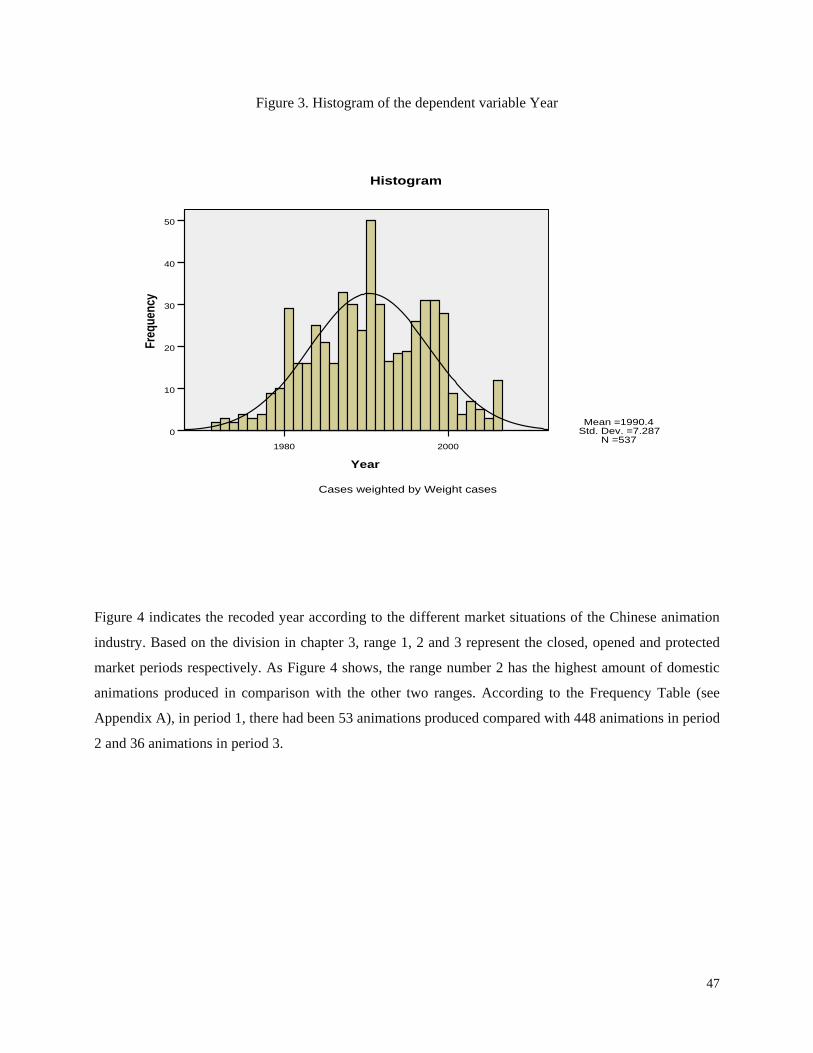
Figure 3. Histogram of the dependent variable Year
20001980
Year
50
40
30
20
10
0
Freq
uenc
y
Mean =1990.4 Std. Dev. =7.287
N =537
Histogram
Cases weighted by Weight cases
Figure 4 indicates the recoded year according to the different market situations of the Chinese animation
industry. Based on the division in chapter 3, range 1, 2 and 3 represent the closed, opened and protected
market periods respectively. As Figure 4 shows, the range number 2 has the highest amount of domestic
animations produced in comparison with the other two ranges. According to the Frequency Table (see
Appendix A), in period 1, there had been 53 animations produced compared with 448 animations in period
2 and 36 animations in period 3.
47

Figure 4. Histogram of the dependent variable recoded Year-known as variable Period
3.532.521.510.5
Recoded Year
600
500
400
300
200
100
0
Freq
uenc
y
Mean =1.97 Std. Dev. =0.406
N =537
Histogram
Cases weighted by Weight cases
Based on Figure 3 and 4, it is clear that the differences between period 1, 3 and 2 are significant.
However, this result is mainly due to the unbalanced intervals within these three periods. For example in
period 1 and 3, there are 9 and 7 years are included respectively, whereas in period 2 there are 19 years
included, which makes a big difference. In addition to the unequal intervals within these three periods, the
Economic Reform in China after the 80’s should also be considered as another important reason to explain
this dramatic high amount of animations produced in period 2. From the 1980’s on until the 1990’s,
according to Qin (2006), it has been considered as the second peak period in the history of Chinese
animation after the 1950’s. During this period the Chinese animation industry was back to the production
as it was in the former time, more and more diverse animation film studios were established which ended
up the monopoly situation of the Shanghai Animation Film studio being active in the animation field in
China. Although many animations were imported and broadcasted during the opened market period, there
were still many classic domestic animations produced, such as the 《三毛流浪记》1984 (Wandering of
Sanmao), the 《葫芦兄弟》1986-1987 (Cucurbit Brothers) and the《黑猫警长》1987 (Black Cat
Detective).
48
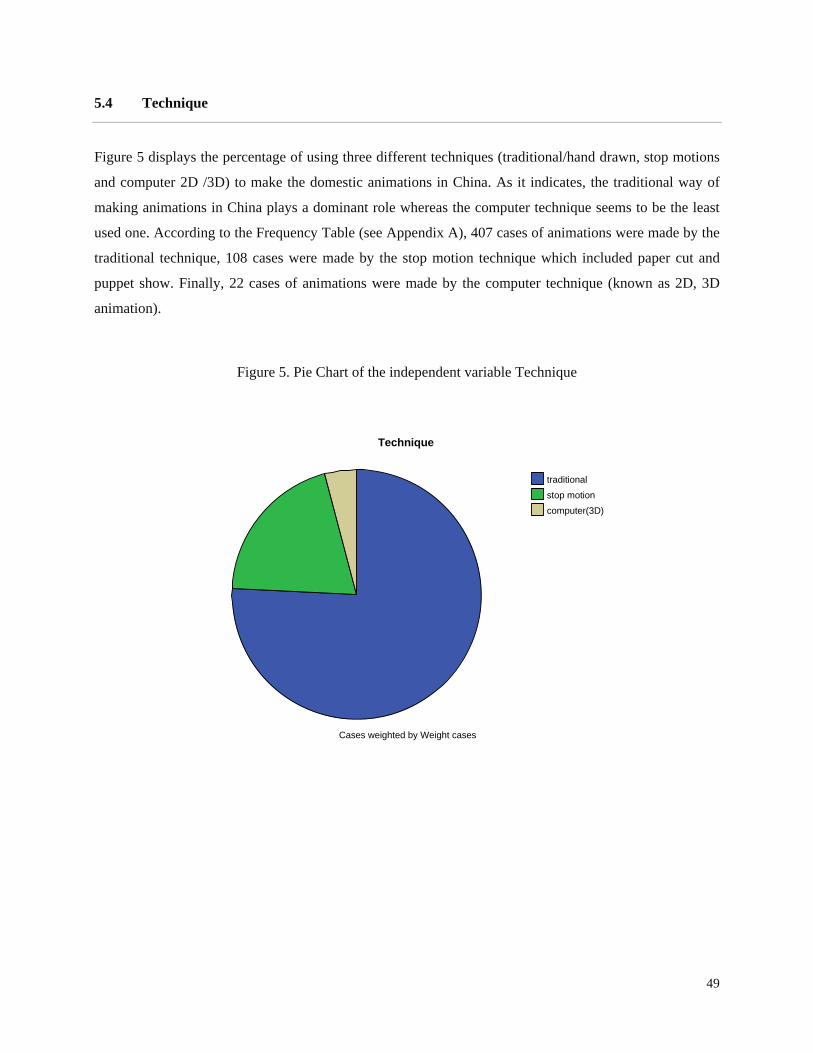
5.4 Technique
Figure 5 displays the percentage of using three different techniques (traditional/hand drawn, stop motions
and computer 2D /3D) to make the domestic animations in China. As it indicates, the traditional way of
making animations in China plays a dominant role whereas the computer technique seems to be the least
used one. According to the Frequency Table (see Appendix A), 407 cases of animations were made by the
traditional technique, 108 cases were made by the stop motion technique which included paper cut and
puppet show. Finally, 22 cases of animations were made by the computer technique (known as 2D, 3D
animation).
Figure 5. Pie Chart of the independent variable Technique
computer(3D)
stop motion
traditional
Technique
Cases weighted by Weight cases
49
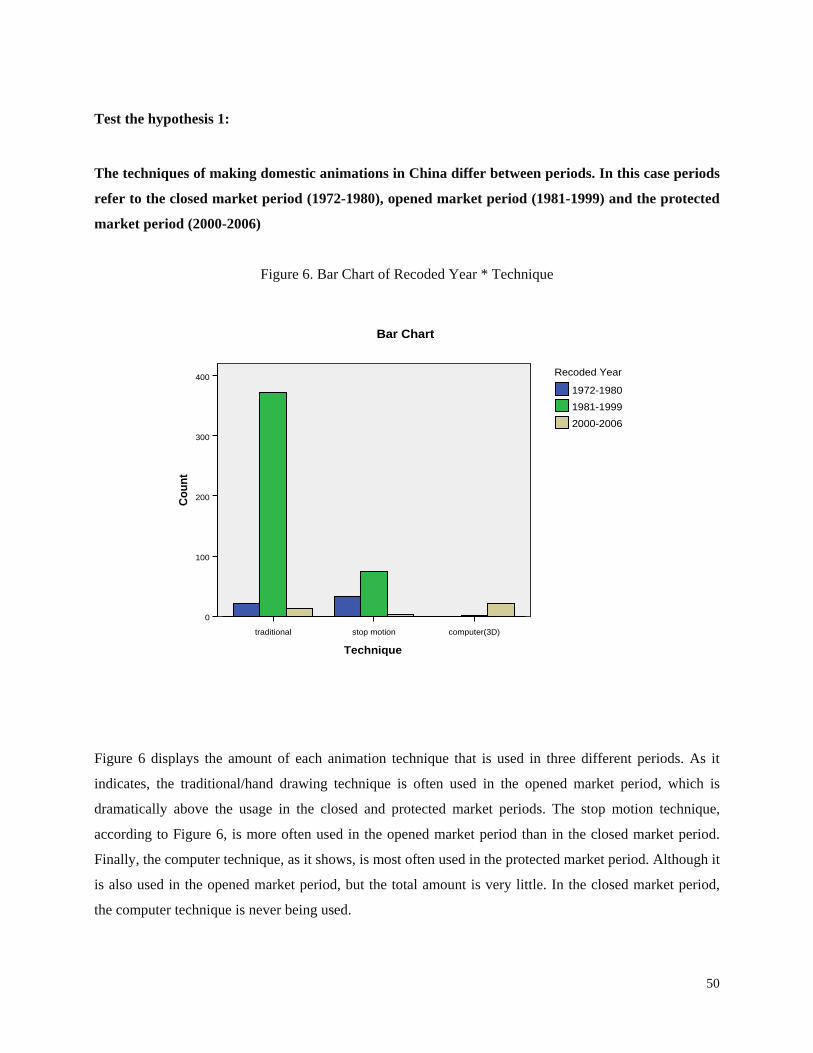
Test the hypothesis 1:
The techniques of making domestic animations in China differ between periods. In this case periods
refer to the closed market period (1972-1980), opened market period (1981-1999) and the protected
market period (2000-2006)
Figure 6. Bar Chart of Recoded Year * Technique
computer(3D)stop motiontraditional
Technique
400
300
200
100
0
Cou
nt
Bar Chart
2000-2006
1981-1999
1972-1980
Recoded Year
Figure 6 displays the amount of each animation technique that is used in three different periods. As it
indicates, the traditional/hand drawing technique is often used in the opened market period, which is
dramatically above the usage in the closed and protected market periods. The stop motion technique,
according to Figure 6, is more often used in the opened market period than in the closed market period.
Finally, the computer technique, as it shows, is most often used in the protected market period. Although it
is also used in the opened market period, but the total amount is very little. In the closed market period,
the computer technique is never being used.
50
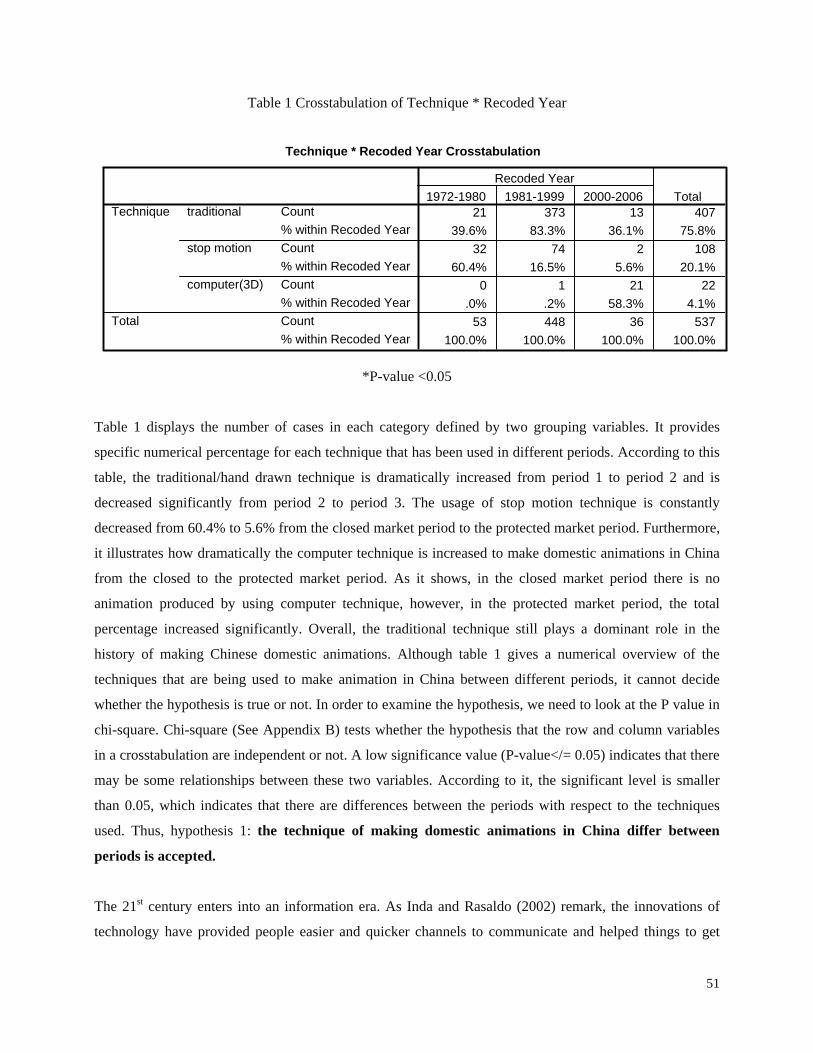
Table 1 Crosstabulation of Technique * Recoded Year
Technique * Recoded Year Crosstabulation
21 373 13 40739.6% 83.3% 36.1% 75.8%
32 74 2 10860.4% 16.5% 5.6% 20.1%
0 1 21 22.0% .2% 58.3% 4.1%
53 448 36 537100.0% 100.0% 100.0% 100.0%
Count% within Recoded YearCount% within Recoded YearCount% within Recoded YearCount% within Recoded Year
traditional
stop motion
computer(3D)
Technique
Total
1972-1980 1981-1999 2000-2006Recoded Year
Total
*P-value <0.05
Table 1 displays the number of cases in each category defined by two grouping variables. It provides
specific numerical percentage for each technique that has been used in different periods. According to this
table, the traditional/hand drawn technique is dramatically increased from period 1 to period 2 and is
decreased significantly from period 2 to period 3. The usage of stop motion technique is constantly
decreased from 60.4% to 5.6% from the closed market period to the protected market period. Furthermore,
it illustrates how dramatically the computer technique is increased to make domestic animations in China
from the closed to the protected market period. As it shows, in the closed market period there is no
animation produced by using computer technique, however, in the protected market period, the total
percentage increased significantly. Overall, the traditional technique still plays a dominant role in the
history of making Chinese domestic animations. Although table 1 gives a numerical overview of the
techniques that are being used to make animation in China between different periods, it cannot decide
whether the hypothesis is true or not. In order to examine the hypothesis, we need to look at the P value in
chi-square. Chi-square (See Appendix B) tests whether the hypothesis that the row and column variables
in a crosstabulation are independent or not. A low significance value (P-value</= 0.05) indicates that there
may be some relationships between these two variables. According to it, the significant level is smaller
than 0.05, which indicates that there are differences between the periods with respect to the techniques
used. Thus, hypothesis 1: the technique of making domestic animations in China differ between
periods is accepted.
The 21st century enters into an information era. As Inda and Rasaldo (2002) remark, the innovations of
technology have provided people easier and quicker channels to communicate and helped things to get
51

around. In the industrial point of view, technological change has strong effect on the production pattern,
with many innovations over the centuries having significantly effect on the production processes and on
the type of output produced (Throsby, 2001). Taking the Chinese animation industry as example, the
international trade has stimulated the Chinese animations to have contact with many foreign animation
works and to take example by their merits. Furthermore, the new technique of making animations provides
a new animation world in China and also helps explore the new markets.
When looking back at the development of the Chinese animation industry in the closed market period,
especially during the ten years Cultural Revolution, China had almost no contact with the rest of the world
and its animation industry was in a very slow and close stage. Traditional and stop motions were the most
often used techniques to make animations during this period. In the opened market period, China issued
open door policy to stimulate its economic development and mass imported goods such as animation
products flowed into the Chinese market without strict trade barriers. During this period, many well-
known animations from North America and Japan entered into the Chinese market, which were very much
favoured by the demand side. In 1995 the first 3D computer animation Toy Story I (1995) produced by the
Disney and Pixar was released in China, this innovative animation technique convulsed the Chinese
audiences by having many shocking visual effects, which makes the traditional techniques incomparable.
This new animation technique inspired the Chinese animations as well. In 1999 China in its first time used
digital sound record and 3D computer technology produced its first 3D computer animation - the Lotus
Lantern (1999). In addition, it adopted the international commercial patterns of manufacture, divided up
detailed labour work for each production sector, applied music conversation and dubbed by famous pop
starts. After its release, the box office has reached 20 million Yuan (Qin, 2006) and its merchandise has
also gained valuable profits. Since Lotus Lantern was such a great success in terms of both artistic and
commercial aspects, after year 2000 more and more computer animations have been produced in China
until at present.
52
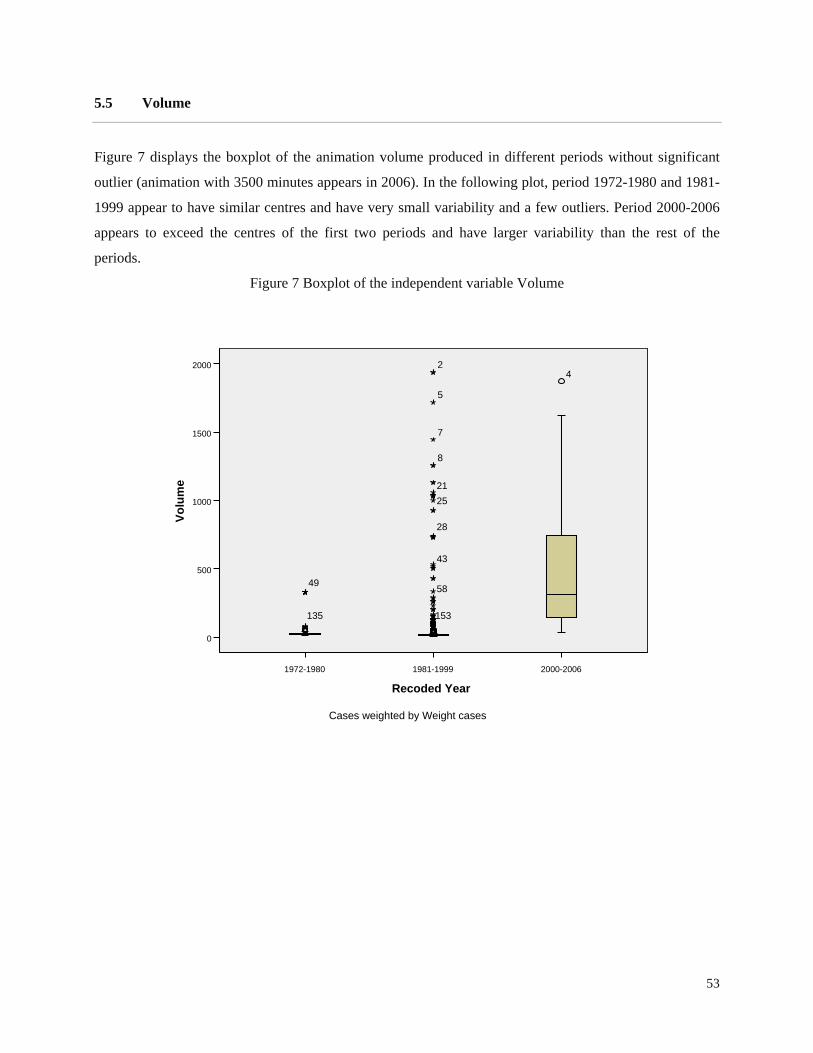
5.5 Volume
Figure 7 displays the boxplot of the animation volume produced in different periods without significant
outlier (animation with 3500 minutes appears in 2006). In the following plot, period 1972-1980 and 1981-
1999 appear to have similar centres and have very small variability and a few outliers. Period 2000-2006
appears to exceed the centres of the first two periods and have larger variability than the rest of the
periods.
Figure 7 Boxplot of the independent variable Volume
2000-20061981-19991972-1980
Recoded Year
2000
1500
1000
500
0
Vol
ume
2
5
7
8
21
25
28
43
58
153
49
135
4
Cases weighted by Weight cases
53

Test the hypothesis 2:
The volume (measured by the running time of animations) of Chinese domestic animations differs
between periods.
Table 2 Crosstabulation of the Recoded Volume and Recoded Year
Crosstab
43 367 1 41181.1% 81.9% 2.8% 76.5%
8 12 1 2115.1% 2.7% 2.8% 3.9%
1 25 5 311.9% 5.6% 13.9% 5.8%
0 12 2 14.0% 2.7% 5.6% 2.6%
0 2 0 2.0% .4% .0% .4%
0 4 2 6.0% .9% 5.6% 1.1%
0 1 1 2.0% .2% 2.8% .4%
1 25 24 501.9% 5.6% 66.7% 9.3%
53 448 36 537100.0% 100.0% 100.0% 100.0%
Count% within Recoded YearCount% within Recoded YearCount% within Recoded YearCount% within Recoded YearCount% within Recoded YearCount% within Recoded YearCount% within Recoded YearCount% within Recoded YearCount% within Recoded Year
1-39
40-78
79-117
118-156
157-195
196-234
235-272
273 thru hi
RecodeTime
Total
1972-1980 1981-1999 2000-2006Recoded Year
Total
Table 2 provides the specific numerical percentage for the volume of the domestic animations produced in
different periods. Due to the large intervals within the minimum running time (1 minute) to the maximum
running time (1940 minutes), variable Volume is recoded into eight different categorizes. As table 2
indicates, in the closed and opened market periods animations with short running time between 1-39
minutes appear to have the highest percentage. Furthermore, in the protected market period more and
more animations appear to have longer running time than in the closed and opened market periods.
Besides, there shows a dramatic drop of short running time animations (1-39 minutes) within this period.
54
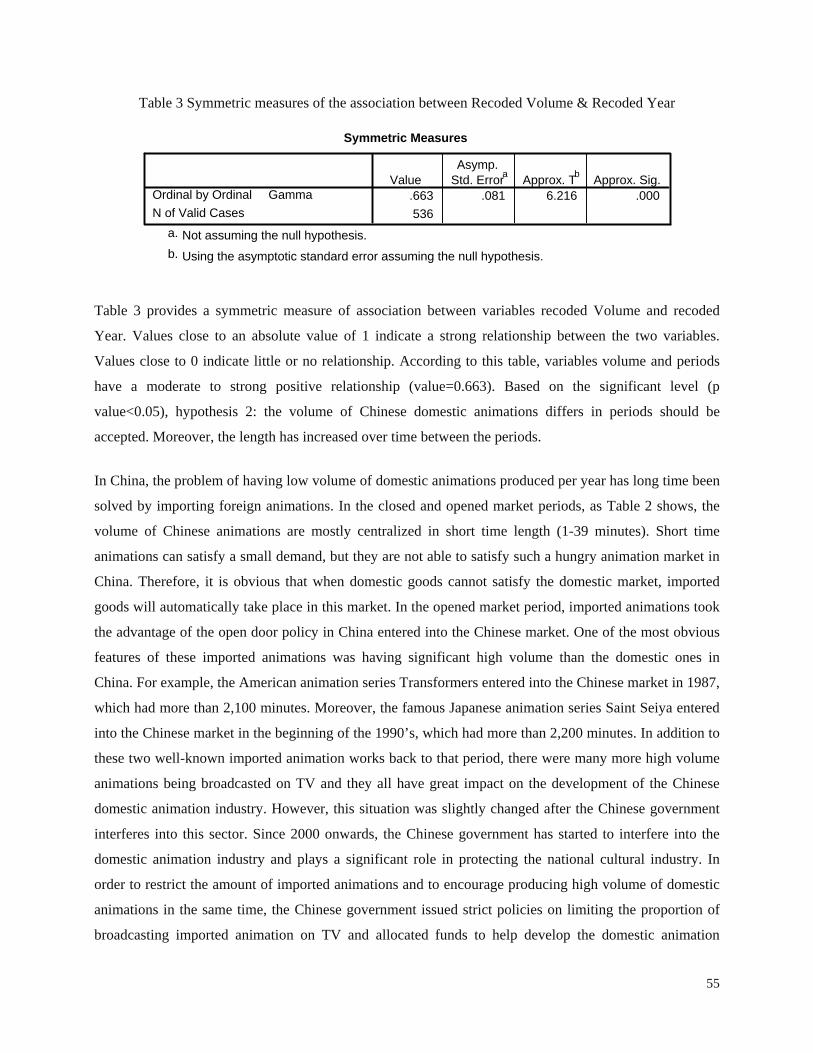
Table 3 Symmetric measures of the association between Recoded Volume & Recoded Year
Symmetric Measures
.663 .081 6.216 .000536
GammaOrdinal by OrdinalN of Valid Cases
ValueAsymp.
Std. Errora Approx. Tb Approx. Sig.
Not assuming the null hypothesis.a.
Using the asymptotic standard error assuming the null hypothesis.b.
Table 3 provides a symmetric measure of association between variables recoded Volume and recoded
Year. Values close to an absolute value of 1 indicate a strong relationship between the two variables.
Values close to 0 indicate little or no relationship. According to this table, variables volume and periods
have a moderate to strong positive relationship (value=0.663). Based on the significant level (p
value<0.05), hypothesis 2: the volume of Chinese domestic animations differs in periods should be
accepted. Moreover, the length has increased over time between the periods.
In China, the problem of having low volume of domestic animations produced per year has long time been
solved by importing foreign animations. In the closed and opened market periods, as Table 2 shows, the
volume of Chinese animations are mostly centralized in short time length (1-39 minutes). Short time
animations can satisfy a small demand, but they are not able to satisfy such a hungry animation market in
China. Therefore, it is obvious that when domestic goods cannot satisfy the domestic market, imported
goods will automatically take place in this market. In the opened market period, imported animations took
the advantage of the open door policy in China entered into the Chinese market. One of the most obvious
features of these imported animations was having significant high volume than the domestic ones in
China. For example, the American animation series Transformers entered into the Chinese market in 1987,
which had more than 2,100 minutes. Moreover, the famous Japanese animation series Saint Seiya entered
into the Chinese market in the beginning of the 1990’s, which had more than 2,200 minutes. In addition to
these two well-known imported animation works back to that period, there were many more high volume
animations being broadcasted on TV and they all have great impact on the development of the Chinese
domestic animation industry. However, this situation was slightly changed after the Chinese government
interferes into this sector. Since 2000 onwards, the Chinese government has started to interfere into the
domestic animation industry and plays a significant role in protecting the national cultural industry. In
order to restrict the amount of imported animations and to encourage producing high volume of domestic
animations in the same time, the Chinese government issued strict policies on limiting the proportion of
broadcasting imported animation on TV and allocated funds to help develop the domestic animation
55
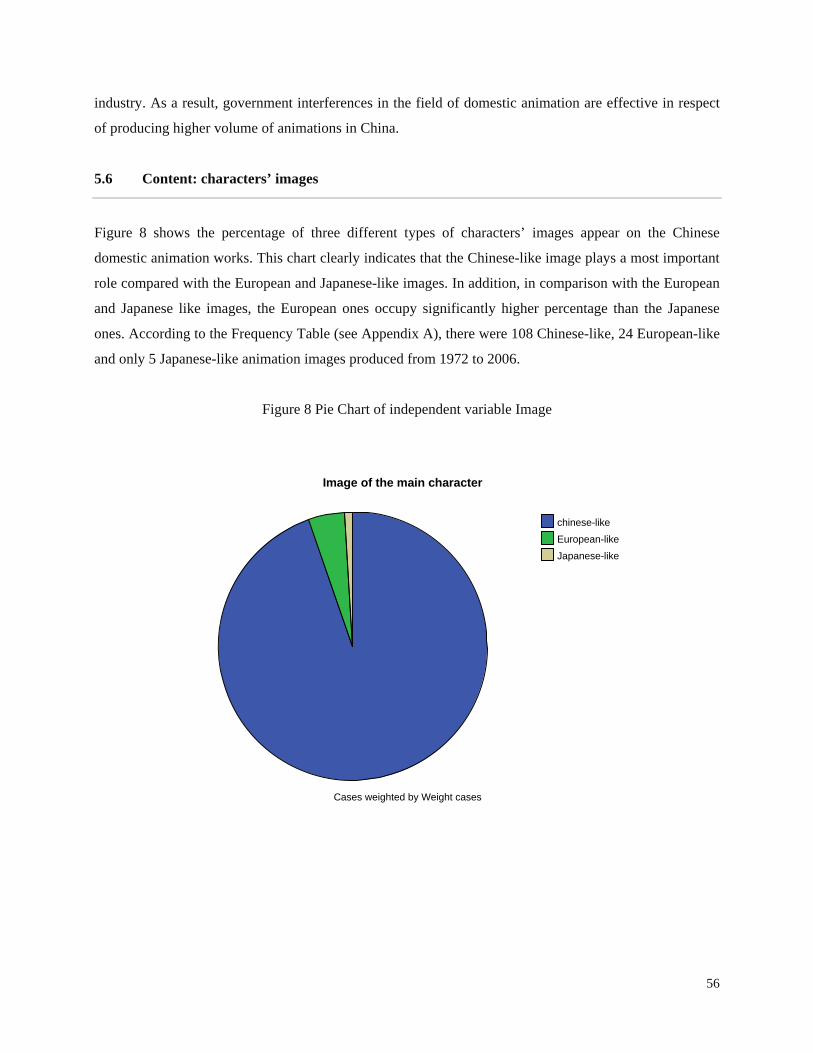
industry. As a result, government interferences in the field of domestic animation are effective in respect
of producing higher volume of animations in China.
5.6 Content: characters’ images
Figure 8 shows the percentage of three different types of characters’ images appear on the Chinese
domestic animation works. This chart clearly indicates that the Chinese-like image plays a most important
role compared with the European and Japanese-like images. In addition, in comparison with the European
and Japanese like images, the European ones occupy significantly higher percentage than the Japanese
ones. According to the Frequency Table (see Appendix A), there were 108 Chinese-like, 24 European-like
and only 5 Japanese-like animation images produced from 1972 to 2006.
Figure 8 Pie Chart of independent variable Image
Japanese-like
European-like
chinese-like
Image of the main character
Cases weighted by Weight cases
56
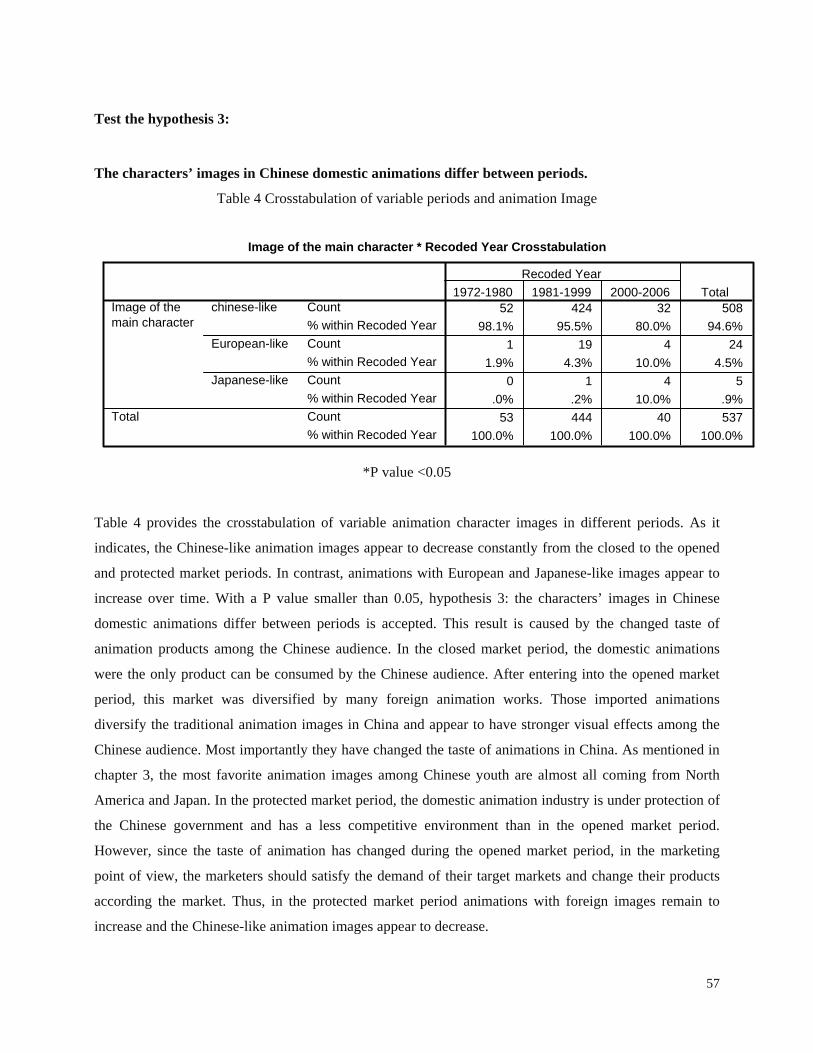
Test the hypothesis 3:
The characters’ images in Chinese domestic animations differ between periods.
Table 4 Crosstabulation of variable periods and animation Image
Image of the main character * Recoded Year Crosstabulation
52 424 32 50898.1% 95.5% 80.0% 94.6%
1 19 4 241.9% 4.3% 10.0% 4.5%
0 1 4 5.0% .2% 10.0% .9%
53 444 40 537100.0% 100.0% 100.0% 100.0%
Count% within Recoded YearCount% within Recoded YearCount% within Recoded YearCount% within Recoded Year
chinese-like
European-like
Japanese-like
Image of themain character
Total
1972-1980 1981-1999 2000-2006Recoded Year
Total
*P value <0.05
Table 4 provides the crosstabulation of variable animation character images in different periods. As it
indicates, the Chinese-like animation images appear to decrease constantly from the closed to the opened
and protected market periods. In contrast, animations with European and Japanese-like images appear to
increase over time. With a P value smaller than 0.05, hypothesis 3: the characters’ images in Chinese
domestic animations differ between periods is accepted. This result is caused by the changed taste of
animation products among the Chinese audience. In the closed market period, the domestic animations
were the only product can be consumed by the Chinese audience. After entering into the opened market
period, this market was diversified by many foreign animation works. Those imported animations
diversify the traditional animation images in China and appear to have stronger visual effects among the
Chinese audience. Most importantly they have changed the taste of animations in China. As mentioned in
chapter 3, the most favorite animation images among Chinese youth are almost all coming from North
America and Japan. In the protected market period, the domestic animation industry is under protection of
the Chinese government and has a less competitive environment than in the opened market period.
However, since the taste of animation has changed during the opened market period, in the marketing
point of view, the marketers should satisfy the demand of their target markets and change their products
according the market. Thus, in the protected market period animations with foreign images remain to
increase and the Chinese-like animation images appear to decrease.
57

5.7 Content: subject matter
Figure 9 displays the percentages of six different subject matters appear in Chinese animations. As it
indicates, the educational, realistic and illusion types of subject matters are often appeared in Chinese
animations in comparison with fairy tale, science fiction and mythological types of subject matters.
According to the Frequency Table (see Appendix A), from 1972 to 2006, 171 animations were with
educational subject matter, 125 animations were with realistic subject matter, 100 animations were with
illusion subject matter, 77 animations were with fairy tale subject matter, 50 cases were with mythological
subject matter and finally 14 animations were with science fiction subject matter.
Figure 9 Pie Chart of independent variable Subject Matter
science fiction
illusion
mythology
fairy tale
educational
realistic
Subject matter
Cases weighted by Weight cases
58
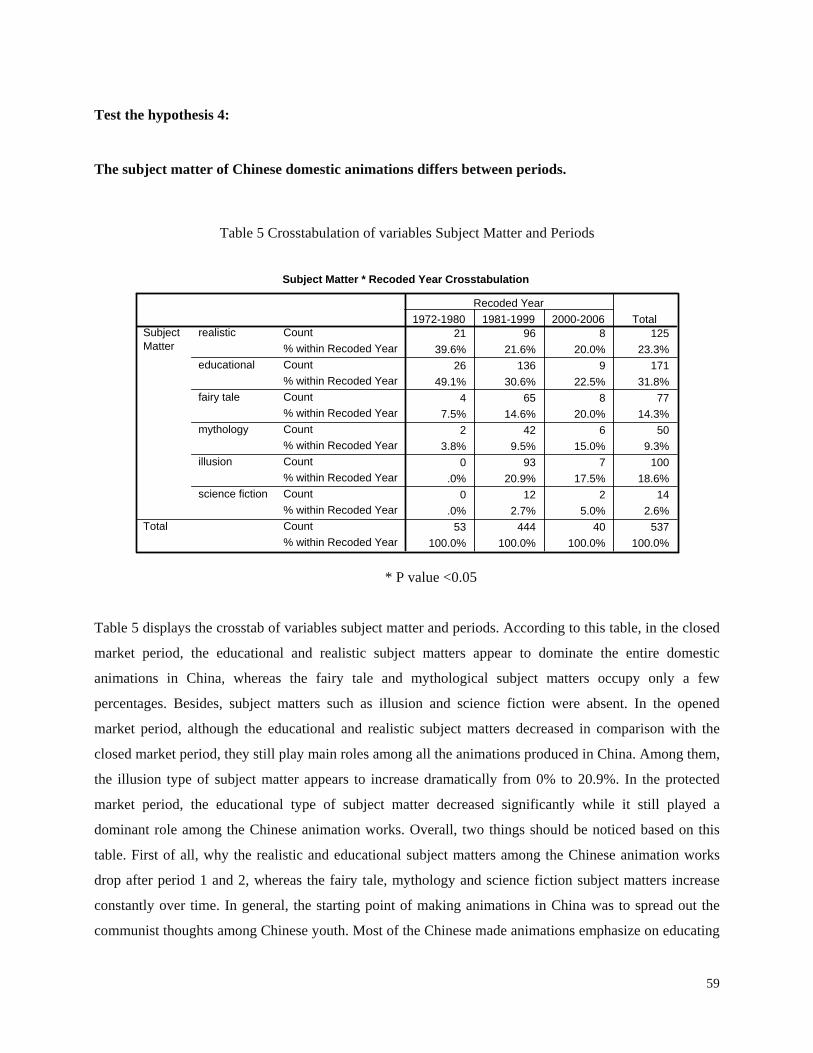
Test the hypothesis 4:
The subject matter of Chinese domestic animations differs between periods.
Table 5 Crosstabulation of variables Subject Matter and Periods
Subject Matter * Recoded Year Crosstabulation
21 96 8 12539.6% 21.6% 20.0% 23.3%
26 136 9 17149.1% 30.6% 22.5% 31.8%
4 65 8 777.5% 14.6% 20.0% 14.3%
2 42 6 503.8% 9.5% 15.0% 9.3%
0 93 7 100.0% 20.9% 17.5% 18.6%
0 12 2 14.0% 2.7% 5.0% 2.6%
53 444 40 537100.0% 100.0% 100.0% 100.0%
Count% within Recoded YearCount% within Recoded YearCount% within Recoded YearCount% within Recoded YearCount% within Recoded YearCount% within Recoded YearCount% within Recoded Year
realistic
educational
fairy tale
mythology
illusion
science fiction
SubjectMatter
Total
1972-1980 1981-1999 2000-2006Recoded Year
Total
* P value <0.05
Table 5 displays the crosstab of variables subject matter and periods. According to this table, in the closed
market period, the educational and realistic subject matters appear to dominate the entire domestic
animations in China, whereas the fairy tale and mythological subject matters occupy only a few
percentages. Besides, subject matters such as illusion and science fiction were absent. In the opened
market period, although the educational and realistic subject matters decreased in comparison with the
closed market period, they still play main roles among all the animations produced in China. Among them,
the illusion type of subject matter appears to increase dramatically from 0% to 20.9%. In the protected
market period, the educational type of subject matter decreased significantly while it still played a
dominant role among the Chinese animation works. Overall, two things should be noticed based on this
table. First of all, why the realistic and educational subject matters among the Chinese animation works
drop after period 1 and 2, whereas the fairy tale, mythology and science fiction subject matters increase
constantly over time. In general, the starting point of making animations in China was to spread out the
communist thoughts among Chinese youth. Most of the Chinese made animations emphasize on educating
59
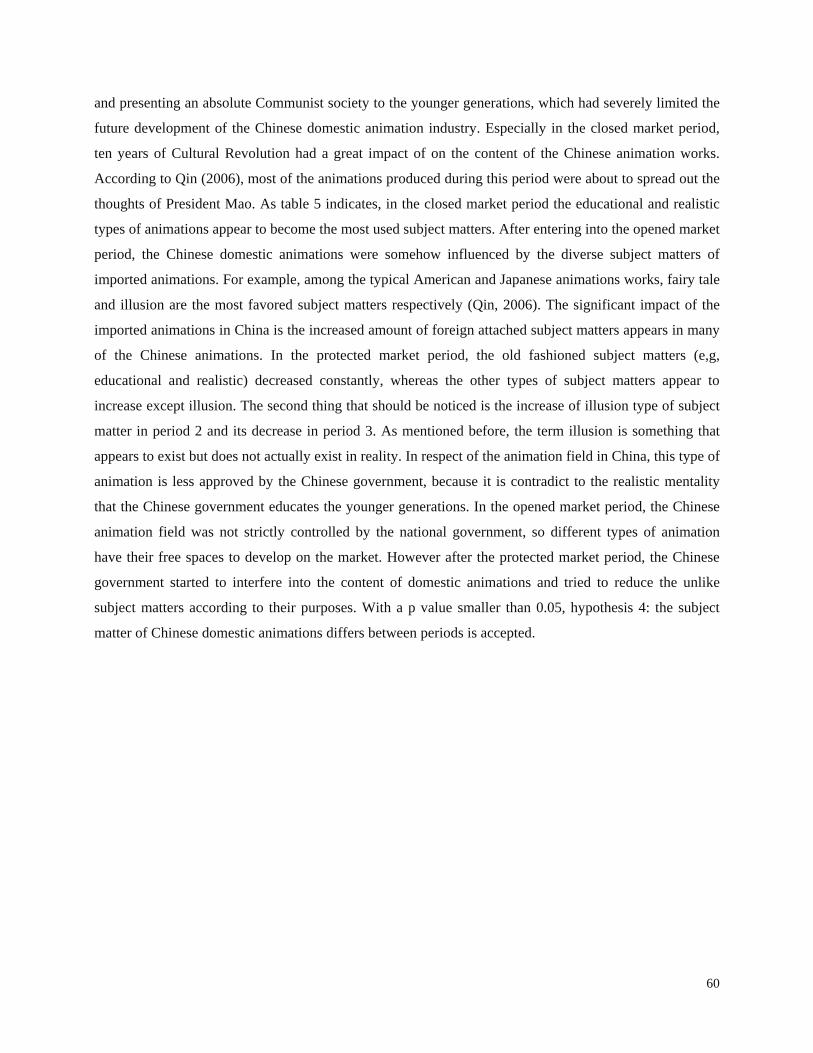
and presenting an absolute Communist society to the younger generations, which had severely limited the
future development of the Chinese domestic animation industry. Especially in the closed market period,
ten years of Cultural Revolution had a great impact of on the content of the Chinese animation works.
According to Qin (2006), most of the animations produced during this period were about to spread out the
thoughts of President Mao. As table 5 indicates, in the closed market period the educational and realistic
types of animations appear to become the most used subject matters. After entering into the opened market
period, the Chinese domestic animations were somehow influenced by the diverse subject matters of
imported animations. For example, among the typical American and Japanese animations works, fairy tale
and illusion are the most favored subject matters respectively (Qin, 2006). The significant impact of the
imported animations in China is the increased amount of foreign attached subject matters appears in many
of the Chinese animations. In the protected market period, the old fashioned subject matters (e,g,
educational and realistic) decreased constantly, whereas the other types of subject matters appear to
increase except illusion. The second thing that should be noticed is the increase of illusion type of subject
matter in period 2 and its decrease in period 3. As mentioned before, the term illusion is something that
appears to exist but does not actually exist in reality. In respect of the animation field in China, this type of
animation is less approved by the Chinese government, because it is contradict to the realistic mentality
that the Chinese government educates the younger generations. In the opened market period, the Chinese
animation field was not strictly controlled by the national government, so different types of animation
have their free spaces to develop on the market. However after the protected market period, the Chinese
government started to interfere into the content of domestic animations and tried to reduce the unlike
subject matters according to their purposes. With a p value smaller than 0.05, hypothesis 4: the subject
matter of Chinese domestic animations differs between periods is accepted.
60
5.8 Content: story line origin
Figure 10 shows the percentage of story line origin in the Chinese domestic animations. It indicates that
stories that are originated from China have the largest percentage. In addition to that, a small percentage of
European stories are used to make the Chinese animations but no Japanese stories are used. According to
the Frequency Table (see Appendix A), there are 514 cases of Chinese story line origins and 23 cases of
European story line origins produced from 1972-2006 in China.
Figure 10 Pie Chart of the independent variable Story Line Origin
European-originality
chinese-originality
Story line origin
Cases weighted by Weight cases
61
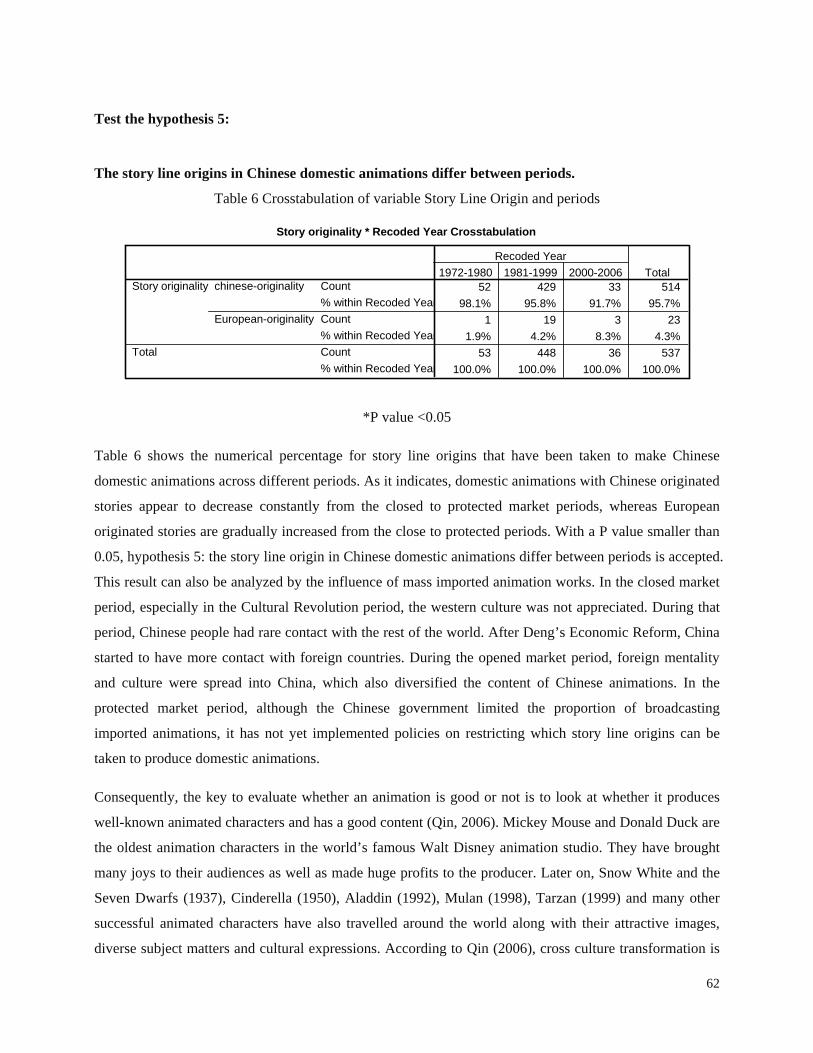
Test the hypothesis 5:
The story line origins in Chinese domestic animations differ between periods.
Table 6 Crosstabulation of variable Story Line Origin and periods
Story originality * Recoded Year Crosstabulation
52 429 33 51498.1% 95.8% 91.7% 95.7%
1 19 3 231.9% 4.2% 8.3% 4.3%
53 448 36 537100.0% 100.0% 100.0% 100.0%
Count% within Recoded YearCount% within Recoded YearCount% within Recoded Year
chinese-originality
European-originality
Story originality
Total
1972-1980 1981-1999 2000-2006Recoded Year
Total
*P value <0.05
Table 6 shows the numerical percentage for story line origins that have been taken to make Chinese
domestic animations across different periods. As it indicates, domestic animations with Chinese originated
stories appear to decrease constantly from the closed to protected market periods, whereas European
originated stories are gradually increased from the close to protected periods. With a P value smaller than
0.05, hypothesis 5: the story line origin in Chinese domestic animations differ between periods is accepted.
This result can also be analyzed by the influence of mass imported animation works. In the closed market
period, especially in the Cultural Revolution period, the western culture was not appreciated. During that
period, Chinese people had rare contact with the rest of the world. After Deng’s Economic Reform, China
started to have more contact with foreign countries. During the opened market period, foreign mentality
and culture were spread into China, which also diversified the content of Chinese animations. In the
protected market period, although the Chinese government limited the proportion of broadcasting
imported animations, it has not yet implemented policies on restricting which story line origins can be
taken to produce domestic animations.
Consequently, the key to evaluate whether an animation is good or not is to look at whether it produces
well-known animated characters and has a good content (Qin, 2006). Mickey Mouse and Donald Duck are
the oldest animation characters in the world’s famous Walt Disney animation studio. They have brought
many joys to their audiences as well as made huge profits to the producer. Later on, Snow White and the
Seven Dwarfs (1937), Cinderella (1950), Aladdin (1992), Mulan (1998), Tarzan (1999) and many other
successful animated characters have also travelled around the world along with their attractive images,
diverse subject matters and cultural expressions. According to Qin (2006), cross culture transformation is
62
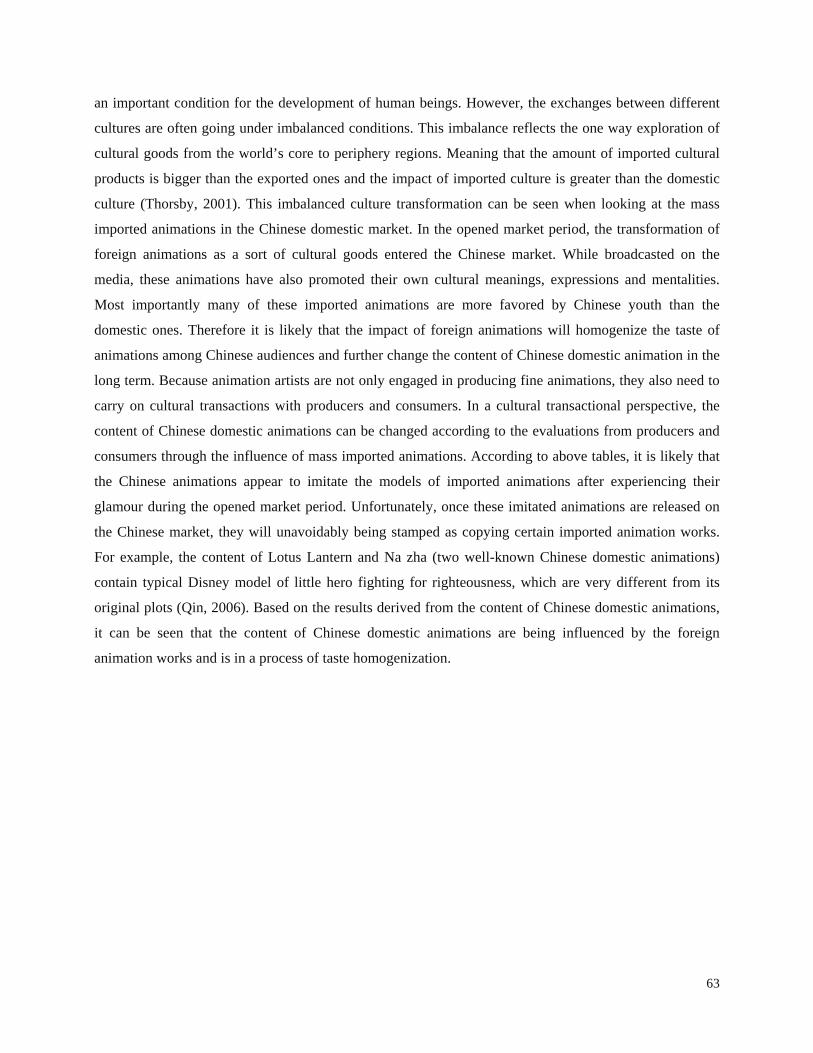
an important condition for the development of human beings. However, the exchanges between different
cultures are often going under imbalanced conditions. This imbalance reflects the one way exploration of
cultural goods from the world’s core to periphery regions. Meaning that the amount of imported cultural
products is bigger than the exported ones and the impact of imported culture is greater than the domestic
culture (Thorsby, 2001). This imbalanced culture transformation can be seen when looking at the mass
imported animations in the Chinese domestic market. In the opened market period, the transformation of
foreign animations as a sort of cultural goods entered the Chinese market. While broadcasted on the
media, these animations have also promoted their own cultural meanings, expressions and mentalities.
Most importantly many of these imported animations are more favored by Chinese youth than the
domestic ones. Therefore it is likely that the impact of foreign animations will homogenize the taste of
animations among Chinese audiences and further change the content of Chinese domestic animation in the
long term. Because animation artists are not only engaged in producing fine animations, they also need to
carry on cultural transactions with producers and consumers. In a cultural transactional perspective, the
content of Chinese domestic animations can be changed according to the evaluations from producers and
consumers through the influence of mass imported animations. According to above tables, it is likely that
the Chinese animations appear to imitate the models of imported animations after experiencing their
glamour during the opened market period. Unfortunately, once these imitated animations are released on
the Chinese market, they will unavoidably being stamped as copying certain imported animation works.
For example, the content of Lotus Lantern and Na zha (two well-known Chinese domestic animations)
contain typical Disney model of little hero fighting for righteousness, which are very different from its
original plots (Qin, 2006). Based on the results derived from the content of Chinese domestic animations,
it can be seen that the content of Chinese domestic animations are being influenced by the foreign
animation works and is in a process of taste homogenization.
63
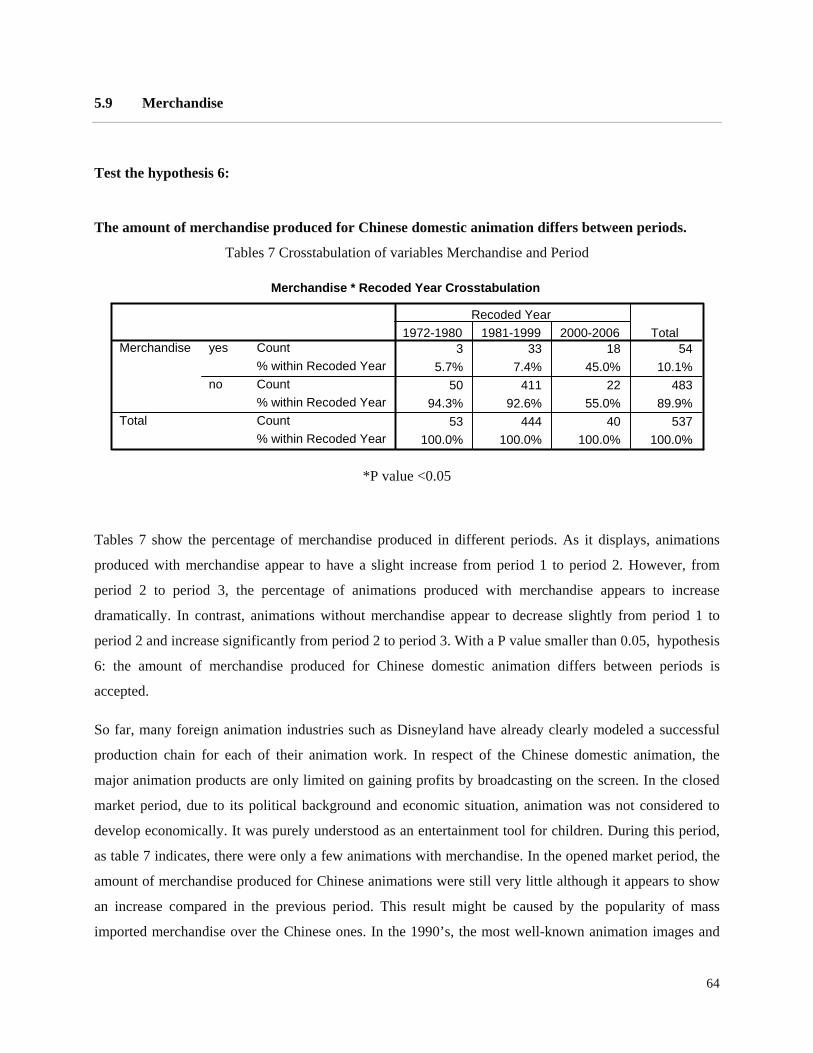
5.9 Merchandise
Test the hypothesis 6:
The amount of merchandise produced for Chinese domestic animation differs between periods.
Tables 7 Crosstabulation of variables Merchandise and Period
Merchandise * Recoded Year Crosstabulation
3 33 18 545.7% 7.4% 45.0% 10.1%
50 411 22 48394.3% 92.6% 55.0% 89.9%
53 444 40 537100.0% 100.0% 100.0% 100.0%
Count% within Recoded YearCount% within Recoded YearCount% within Recoded Year
yes
no
Merchandise
Total
1972-1980 1981-1999 2000-2006Recoded Year
Total
*P value <0.05
Tables 7 show the percentage of merchandise produced in different periods. As it displays, animations
produced with merchandise appear to have a slight increase from period 1 to period 2. However, from
period 2 to period 3, the percentage of animations produced with merchandise appears to increase
dramatically. In contrast, animations without merchandise appear to decrease slightly from period 1 to
period 2 and increase significantly from period 2 to period 3. With a P value smaller than 0.05, hypothesis
6: the amount of merchandise produced for Chinese domestic animation differs between periods is
accepted.
So far, many foreign animation industries such as Disneyland have already clearly modeled a successful
production chain for each of their animation work. In respect of the Chinese domestic animation, the
major animation products are only limited on gaining profits by broadcasting on the screen. In the closed
market period, due to its political background and economic situation, animation was not considered to
develop economically. It was purely understood as an entertainment tool for children. During this period,
as table 7 indicates, there were only a few animations with merchandise. In the opened market period, the
amount of merchandise produced for Chinese animations were still very little although it appears to show
an increase compared in the previous period. This result might be caused by the popularity of mass
imported merchandise over the Chinese ones. In the 1990’s, the most well-known animation images and
64
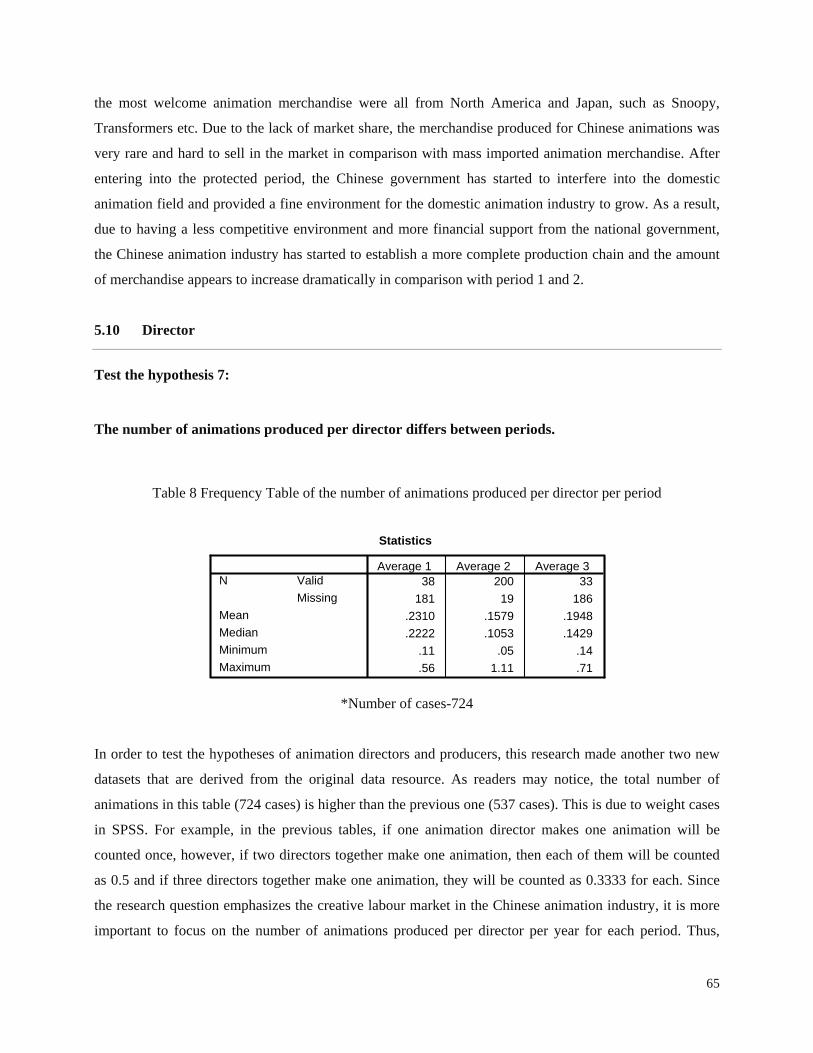
the most welcome animation merchandise were all from North America and Japan, such as Snoopy,
Transformers etc. Due to the lack of market share, the merchandise produced for Chinese animations was
very rare and hard to sell in the market in comparison with mass imported animation merchandise. After
entering into the protected period, the Chinese government has started to interfere into the domestic
animation field and provided a fine environment for the domestic animation industry to grow. As a result,
due to having a less competitive environment and more financial support from the national government,
the Chinese animation industry has started to establish a more complete production chain and the amount
of merchandise appears to increase dramatically in comparison with period 1 and 2.
5.10 Director
Test the hypothesis 7:
The number of animations produced per director differs between periods.
Table 8 Frequency Table of the number of animations produced per director per period
Statistics
38 200 33181 19 186
.2310 .1579 .1948
.2222 .1053 .1429.11 .05 .14.56 1.11 .71
ValidMissing
N
MeanMedianMinimumMaximum
Average 1 Average 2 Average 3
*Number of cases-724
In order to test the hypotheses of animation directors and producers, this research made another two new
datasets that are derived from the original data resource. As readers may notice, the total number of
animations in this table (724 cases) is higher than the previous one (537 cases). This is due to weight cases
in SPSS. For example, in the previous tables, if one animation director makes one animation will be
counted once, however, if two directors together make one animation, then each of them will be counted
as 0.5 and if three directors together make one animation, they will be counted as 0.3333 for each. Since
the research question emphasizes the creative labour market in the Chinese animation industry, it is more
important to focus on the number of animations produced per director per year for each period. Thus,
65
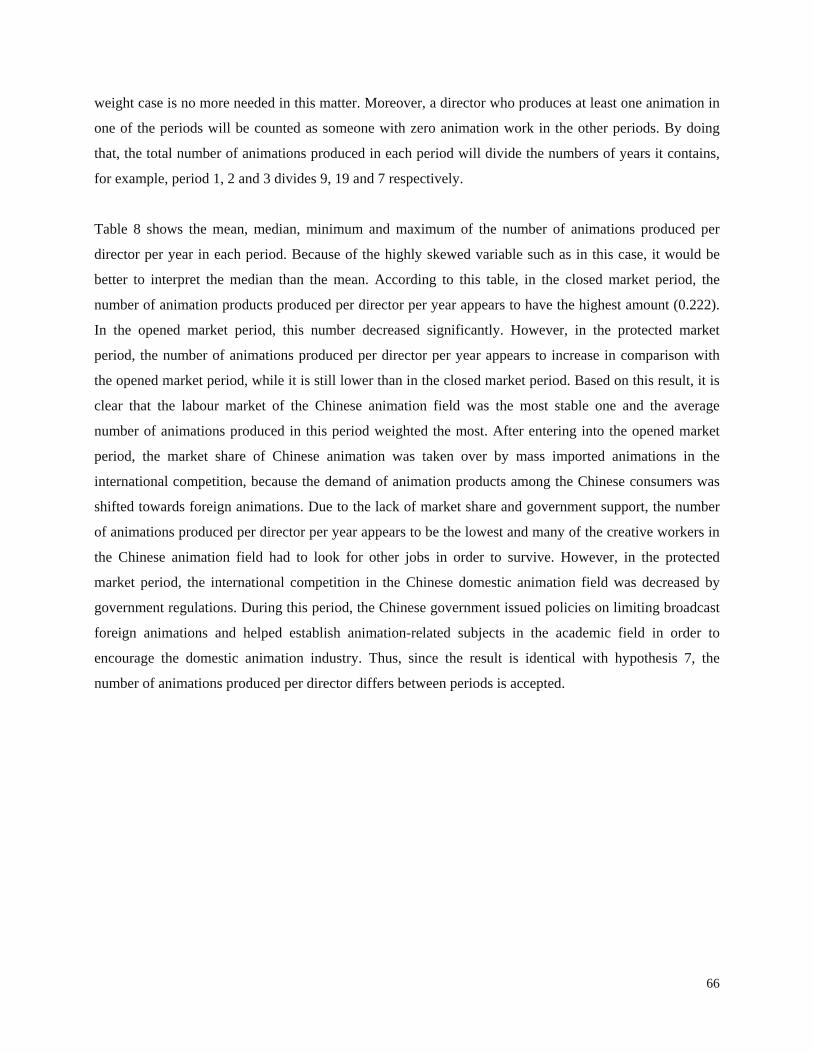
weight case is no more needed in this matter. Moreover, a director who produces at least one animation in
one of the periods will be counted as someone with zero animation work in the other periods. By doing
that, the total number of animations produced in each period will divide the numbers of years it contains,
for example, period 1, 2 and 3 divides 9, 19 and 7 respectively.
Table 8 shows the mean, median, minimum and maximum of the number of animations produced per
director per year in each period. Because of the highly skewed variable such as in this case, it would be
better to interpret the median than the mean. According to this table, in the closed market period, the
number of animation products produced per director per year appears to have the highest amount (0.222).
In the opened market period, this number decreased significantly. However, in the protected market
period, the number of animations produced per director per year appears to increase in comparison with
the opened market period, while it is still lower than in the closed market period. Based on this result, it is
clear that the labour market of the Chinese animation field was the most stable one and the average
number of animations produced in this period weighted the most. After entering into the opened market
period, the market share of Chinese animation was taken over by mass imported animations in the
international competition, because the demand of animation products among the Chinese consumers was
shifted towards foreign animations. Due to the lack of market share and government support, the number
of animations produced per director per year appears to be the lowest and many of the creative workers in
the Chinese animation field had to look for other jobs in order to survive. However, in the protected
market period, the international competition in the Chinese domestic animation field was decreased by
government regulations. During this period, the Chinese government issued policies on limiting broadcast
foreign animations and helped establish animation-related subjects in the academic field in order to
encourage the domestic animation industry. Thus, since the result is identical with hypothesis 7, the
number of animations produced per director differs between periods is accepted.
66
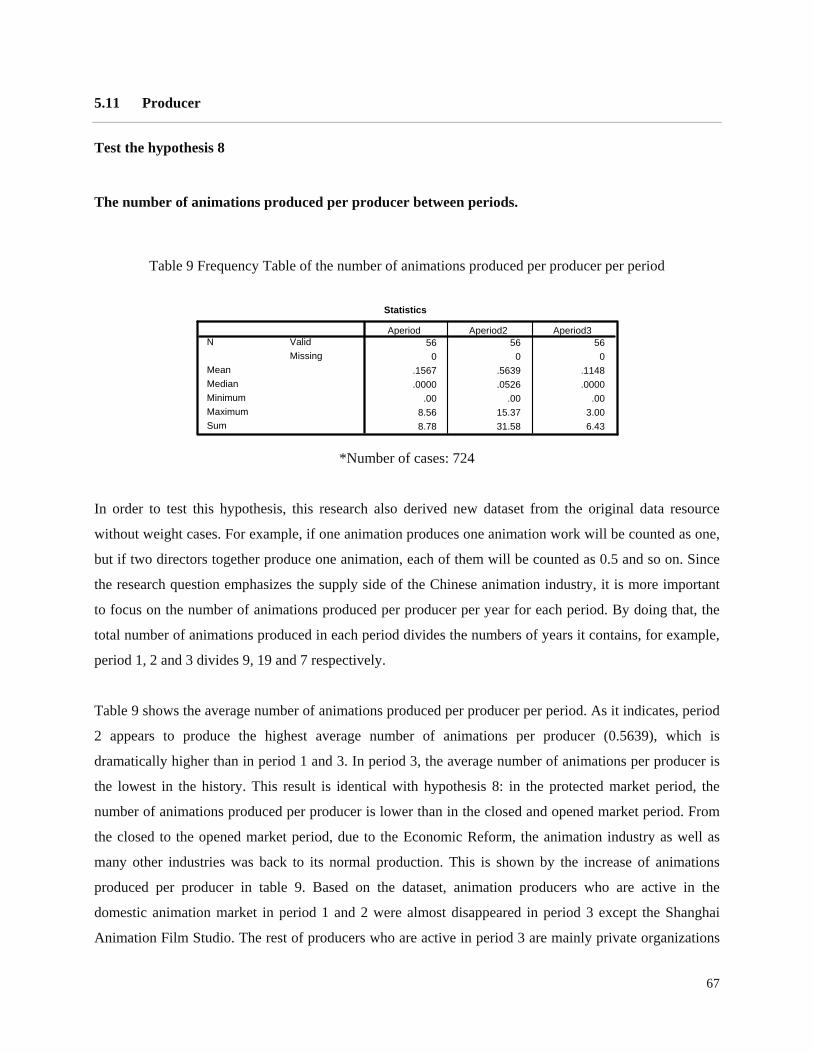
5.11 Producer
Test the hypothesis 8
The number of animations produced per producer between periods.
Table 9 Frequency Table of the number of animations produced per producer per period
Statistics
56 56 560 0 0
.1567 .5639 .1148
.0000 .0526 .0000.00 .00 .00
8.56 15.37 3.008.78 31.58 6.43
ValidMissing
N
MeanMedianMinimumMaximumSum
Aperiod Aperiod2 Aperiod3
*Number of cases: 724
In order to test this hypothesis, this research also derived new dataset from the original data resource
without weight cases. For example, if one animation produces one animation work will be counted as one,
but if two directors together produce one animation, each of them will be counted as 0.5 and so on. Since
the research question emphasizes the supply side of the Chinese animation industry, it is more important
to focus on the number of animations produced per producer per year for each period. By doing that, the
total number of animations produced in each period divides the numbers of years it contains, for example,
period 1, 2 and 3 divides 9, 19 and 7 respectively.
Table 9 shows the average number of animations produced per producer per period. As it indicates, period
2 appears to produce the highest average number of animations per producer (0.5639), which is
dramatically higher than in period 1 and 3. In period 3, the average number of animations per producer is
the lowest in the history. This result is identical with hypothesis 8: in the protected market period, the
number of animations produced per producer is lower than in the closed and opened market period. From
the closed to the opened market period, due to the Economic Reform, the animation industry as well as
many other industries was back to its normal production. This is shown by the increase of animations
produced per producer in table 9. Based on the dataset, animation producers who are active in the
domestic animation market in period 1 and 2 were almost disappeared in period 3 except the Shanghai
Animation Film Studio. The rest of producers who are active in period 3 are mainly private organizations
67

who are engaged in the commercial sectors. Due to having insufficient knowledge of the domestic
animation field, many of these private producers are very cautious about investing on the domestic
animation works, which lead to a low amount of animations produced per producer in period 3.
68
Chapter 6 Conclusions
6.1 Overview of the theoretical support
‘Because of the origin of so many of these cultural symbols is the West, or more specifically the United
States, the process of globalization is often referred to not so much as one of cultural homogenization but
rather as cultural imperialism, an imposition or at least a diffusion of a dominant culture throughout the
world. However, the result is ought to be the same: a blurring of specific cultural identities’.
_______ David Throsby, 2001: 156
6.2 Conclusion
In conclusion, this paper gives an overview of the current world’s top three animation industries. Each of
them has different industrial operation systems which form their unique contents, divisions and images.
However, they have one thing in common. For each their successes are not spreadable from the support of
the local government. In China, animation as an industry is still in the exploring stages and is therefore
experiencing many problems and setbacks. Most importantly, the Chinese domestic animation industry
lacks a complete industrial value chain in order to develop, explore and promote this industry by using
diverse platforms. In the closed market period, Chinese animations had little contact with foreign
animation. After the opened market period this situation changed. The Chinese animation market was full
of low price imported animations and the mass merchandise products which are based on them. These had
a great impact on both cultural and economic sectors in China. After 2000, the Chinese government
officially implemented policies to encourage the domestic animation industry by limiting the import and
broadcasting foreign animations and further gave more spaces for some private companies to invest and
explore this field. Finally, I have conducted a quantitative research in order to find out whether the
Chinese domestic animation industry is affected by the trade of animation in a global scale and whether
the advanced communication and transportation technologies provided by globalization have impact on
this industry during these three different market periods. Here I shall use the outcomes of the quantitative
method to answer the research questions:
• Central research question
Whether and how does globalization influence the development of the Chinese domestic animation
industry?
69
• Sub research question
How does the content, techniques, volume, merchandise and the labor market of the Chinese animation
industry change between different periods?
According to numerical results, it is apparent that the development of the Chinese domestic animation
industry is actually affected by globalization, which influences its techniques, volume, content, labor
market as well as the amount of merchandise it produced in different periods. In the closed market period,
the Chinese animation industry was developing in its own way, because it had very rare contact with the
rest of the world. During this period, the Chinese animation field could not even be considered as an
industry. After the Economic Reform, China opened its door for foreign goods and service. During this
time, imported animations flooded China and gained a lot of profits from this hungry market. As a result,
as Acheson (2003) has noted, the increased trade in cultural goods has also increased cultural
homogeneity. Since the tastes of animation content among Chinese children and young people are
influenced by mass imported animations, it was considered as a threat to the Chinese national identity. In
order to diminish the foreign cultural impact among Chinese youth and fill its hungry domestic animation
market in the same time, in 2000 the Chinese government applied trade regulations to limit broadcasting
imported animations and allocated funds to support the development of the domestic animation industry.
Although this policy has only issued for six and half years, the results are very positive. According to the
outcomes of this research, the content of the animations in China is homogenized by the increased
international trade, which is in a process of globalization. This finding is consistent with Hamburger and
Cardoso’s (1994) findings on the impact of global culture integration on youth in Brazil and Poon’s
(2001) finding of how Japanese comic and animations homogenize the taste of Hong Kong teenagers. This
is considered as a negative result of this research. Moreover, the outcomes of the protected market period,
as Throsby (2001) has pointed out, shows how powerful a national government can be in reaction to
protect its own cultural and economic development. Furthermore, based on the results of content, we can
see how important the role of taste on the demand side is during the international trade process, which is
relevant to the neoclassical international trade theory. Besides, according to the diagram of the structure of
cultural industries from Claude (2004), in the labour market of the Chinese animation industry, animation
director can be categorized as the most creative labour, and the actual animation products can be
understood as the first cultural commodity. Once a successful and renowned animation character is
portrayed on the screen, merchandise such as comic books, toys, clothes etc. can be followed up to make
even more profits for this animation product, which is known as the second cultural commodity. Like
other types of cultural goods, the copyright of animation image can be repeatedly used in the long run.
Once the relative merchandise is produced for certain animation product, the initial cost will be lower by
70
the economic value of this merchandise. Finally, through the advertising process and public diffusion,
more diverse economic values can be obtained from the initial cultural commodity.
According to the statistical outcomes, during the shift from the closed and opened market periods to the
protected market period, the techniques of making domestic animations in China has changed from hand
drawn and stop motions towards computer animations. Moreover, under the frequent influence of
imported animations after the opening of the market, the overall volume of Chinese domestic animations
increased dramatically. As a result, many of the animations with running time of more than 200 minutes
appear more frequently in the domestic market whereas animations with low volume (1-39 minutes) have
decreased dramatically. With respect to the content of Chinese domestic animations, based on the results,
there is a tendency towards a taste homogenization of animation products from North American and Japan
over time. This is because the images and subject matters that appear in many of the Chinese domestic
animations are more foreign-influenced than in the closed market period. Moreover, the amount of
merchandise produced from the Chinese domestic animation products has also increased from the closed
market period to opened market period, and had a dramatic growth in the protected market period. This
dramatic increase has a reflection on the improvement of having a more complete production chain in the
Chinese animation industry, which helps it to operate more economically and become more profitable. In
addition, due to the shortage of new animation directors appearing in the Chinese animation field, the
number of animations produced per director appears to be the lowest in the protected market period.
Likely, due to the cautious investment of new private animation producers, the number of animation
produced per producer also appear to be lowest in the protected market period.
6.3 Limitations and discussions
This paper tried to provide the data of Chinese animations produced from 1972 to 2006 as complete as
possible. However, due to the great distance and the limitations of recourses, it is possible that some of the
animations produced within this time length are excluded and since the author left China in 2001 some of
the up to date information concerning the new animation products might have been left out and
overlooked.
6.4 Suggestions for further research
Although the Chinese government issued strict policies on limiting the broadcast ratios of foreign
animations, today, internet and cheap copied CDs and DVDs appear more frequently on the Chinese
71
market and give provided opportunities for consumers to purchase foreign animations through illegal
channels. Therefore it would be interesting to conduct another research to find out whether the national
policies on limiting broadcasting foreign animations in China change audiences’ preferences. If not, where
and how can audiences obtain these forbidden animation products. By doing that, the researchers should
have a more up to date dataset of the Chinese animations produced in the history, focus on the problem of
copyright law in the animation industry and conduct a quantitative research with questionnaires among the
Chinese audiences.
72
Bibliography
Acheson, K. 2003. Globalization. In Towse. R. (eds). A Handbook of Cultural Economics. Cheltenham,
Northamption: Edward Elgar Publishing, pp. 248-254.
Aoyama, Y. 2007. The Role of Consumption and Globalization in a Cultural Industry the case of
Flamenco. Geoforum 38(1) , pp. 103-113.
Boli, J. & Lechner, F. J. 2002. Globalization and World Culture., International Encyclopedia of the
Social & Behavioral Sciences Volume 20. Oxford: Elsevier, pp. 61-65.
Castles , S. & Miller, M. J. 2003. The Age of Migration 3ed. New York: Palgrave Macmillan.
China Youth Daily 2004, May 18. Retrieved July 19, 2007, from www.cyol.net
China’s Animation Industry Report 2004-2005. 2006. Beijing: HaiYang Press.
Claude, M. 2004. Cultural Industries Economics. 6th World Media Economics Conference. Retrieved
July 19, 2007, from www.cmrcccrm.ca.
Colell, A. M. 1999. Should Cultural Goods be Treated Differently? Journal of Cultural Economics 23 (1),
pp. 87-92.
Collins Cobuild Advanced Learner's English Dictionary. 2005. Birmingham: The University of
Birmingham Press.
Cowen, T. 2002. Creative Destruction: How Globalization Is Changing the World’s Cultures. Princeton:
Princeton University Press.
Crane, D. 2002. Culture and Globalization: Theoretical Models and Emerging Trends. In C. Diana, N.
Kawashima, & K. Kawasaki, Global Culture: Media, Arts, Policy, and Globalization. New York:
Routledge, pp. 1-25.
73
Crane, D. 2003. Culture and Globalization:The Fashion Industry as a Case Study. In E. Salmi, & J.
Lantto, Cumulus Working Papers TALLINN. Helsinki: University of Art and Design Helsinki, pp. 11-15.
Dixit, A., & Norman, V. 1980. Theory of International Trade: A Dual, General Equilibrium Approach .
Cambridge: Cambridge University Press.
Flandernews. (2007, July 10). Retrieved July 19, 2007, from www.flandernews.be
Free encyclopedia. 2005, May 2. Retrieved July 18, 2007, from http://en.wikipedia.org
Gandolfo, G. 1998. International Trade Theory and Policy. Berlin: Springer Press.
Goulekas, K. 2001. Visual Effects in A Digital World: A Comprehensive Glossary of Over 7000 Visual
Effects . San Diego: Morgan Kaufmann Press.
Hamburger, E. I. & Cardoso, R. C. L. 1994. Youth and Media in Brazil. International Social Science
Journal 46 (3), pp. 455-462.
Inda, J. X. & Rosaldo,R. 2002. The Anthropology of Globalization. Oxford: Blackwell.
Keane, M. & Cunningham, S. 2005. Worlds apart? Finance and investment in creative industries in the
People’s Republic of China and Latin America. Telematics and Informatics, pp. 309-331.
Klein, M. W., Schuh, S. & Triest, R.K. 2003. Job Creation, Job Destruction, and International
Competition. Journal of International Economics 59, pp. 350-378.
Kotler, P. 2000. Marketing Management. New Jersey: Prentice Hall Press.
Lanza, A. 2001. Globalization and Music. Retrieved July 17, 2007, from www.wowessays.com
Larkin, B. 2002. Indian Films and Nigerian Lovers: Media and the Creation of Parallel Modernities. In I.
J. Xavier, & R. Rosaldo, Anthropology of Globalization a Reader. Oxford: Blackwell, pp. 350-378.
74
Marvasti, A. 1994. International trade in cultural goods: A cross-sectional analysis . Journal of Cultural
Economics 18(2) , pp. 135-148.
Mayer, G. M. 1947. American motion pictures in world trade. The ANNALS of the American Academy of
Political and Social Science 254(1) , pp. 31-36.
Michaels, E. 2002. Hollywood Iconography: A Warlpiri Reading. In J. Inda, & R. Rosaldo, The
Anthropology of Globalization a Reader. Oxford: Blackwell, pp. 311-324.
Milic, L. & McConville, Y. 2006. Animation producer’s handbook. McGraw-Hill Press.
Morin, E. 1962. L'industrie culturelle. L'esprit du temps. Névrose. Paris: Grasset Press.
Nakamura, I. 2003. Japanese Pop Industry. Stanford: Stanford University Press.
Ouyang, Y. 2006. Cultural Industry Theory. Hunan: Hunan People's public Press.
Poon, M. W. 2001. Cultural globalization? : the contemporary influence of Japanese animation on Hong
Kong teenagers. Hong kong, P.R.China: University of Hong Kong, pp. 1-138.
Qin, X. J. 2006. Zhong Guo Dong Hua Pian de Chan Ye Jing Ji Xue Yan jiu. Beijing: China Market
Press.
Report of Chinese Cultural Industry Development. 2007. Beijing: Chinese social Science Instutition.
Rothkop, D. 1997. In praise of cultural imperialism? Effects of globalization on culture. Foreign Policy,
pp.1-10. Retrieved May 12, 2002 from www.globalpolicy.org
Schulze, G. 2003. International trade. In Towse. R. (eds), A Handbook of Cultural Economics.
Cheltenham, Northamption: Edward Elgar Publishing, pp. 269-275.
Seale, C. 2004. Researching Society and Culture. California: SAGE Press.
75
Solomon, C. 1989. Enchanted Drawings: The History of Animation . Random House Value Publishing
Press.
Throsby, D. 2001. Economics and Culture. Cambridge: Cambridge University Press.
Tomlinson, D. J. 1999. Globalization and Culture. Cambridge: Polity Press.
Towse, R. 2003. A handbook of Cultural Economics. London: Edward Elgar.
Tyner, K. 1998. Literacy in a Digital World: Teaching and Learning in the Age of Information. Lawrence
Erlbaum Press.
UNESCO Institute for Statistics. 2001, February. Retrieved July 18, 2007, from http://www.uis.unesco.org
Wands, B. 2002. Digital Creativity: Techniques for Digital Media and the Internet. New Jersey: Wiley
Press.
Zhang, W. 2000. A Theory of International Trade: Capital, Knowledge, and Economic Structures .
Berlin: Springer Press.
76
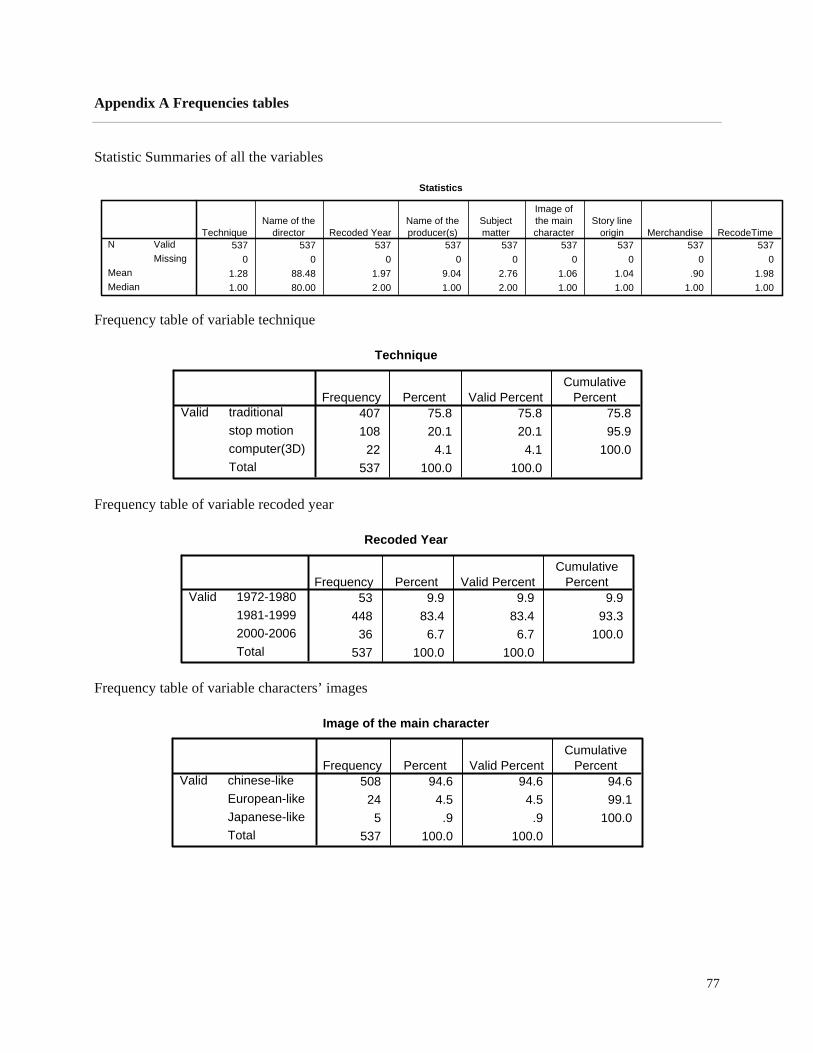
Appendix A Frequencies tables
Statistic Summaries of all the variables
Statistics
537 537 537 537 537 537 537 537 5370 0 0 0 0 0 0 0 0
1.28 88.48 1.97 9.04 2.76 1.06 1.04 .90 1.981.00 80.00 2.00 1.00 2.00 1.00 1.00 1.00 1.00
ValidMissing
N
MeanMedian
TechniqueName of the
director Recoded YearName of theproducer(s)
Subjectmatter
Image ofthe maincharacter
Story lineorigin Merchandise RecodeTime
Frequency table of variable technique
Technique
407 75.8 75.8 75.8108 20.1 20.1 95.922 4.1 4.1 100.0
537 100.0 100.0
traditionalstop motioncomputer(3D)Total
ValidFrequency Percent Valid Percent
CumulativePercent
Frequency table of variable recoded year
Recoded Year
53 9.9 9.9 9.9448 83.4 83.4 93.336 6.7 6.7 100.0
537 100.0 100.0
1972-19801981-19992000-2006Total
ValidFrequency Percent Valid Percent
CumulativePercent
Frequency table of variable characters’ images
Image of the main character
508 94.6 94.6 94.624 4.5 4.5 99.15 .9 .9 100.0
537 100.0 100.0
chinese-likeEuropean-likeJapanese-likeTotal
ValidFrequency Percent Valid Percent
CumulativePercent
77

Frequency table of variable story line origin
Story line origin
514 95.7 95.7 95.723 4.3 4.3 100.0
537 100.0 100.0
chinese-originalityEuropean-originalityTotal
ValidFrequency Percent Valid Percent
CumulativePercent
Frequency table of variable merchandise
Merchandise
54 10.1 10.1 10.1483 89.9 89.9 100.0537 100.0 100.0
yesnoTotal
ValidFrequency Percent Valid Percent
CumulativePercent
Frequency table of variable recoded time
RecodeTime
411 76.5 76.5 76.521 3.9 3.9 80.431 5.8 5.8 86.214 2.6 2.6 88.8
2 .4 .4 89.26 1.1 1.1 90.32 .4 .4 90.7
50 9.3 9.3 100.0537 100.0 100.0
1-3940-7879-117118-156157-195196-234235-272273 thru hiTotal
ValidFrequency Percent Valid Percent
CumulativePercent
78
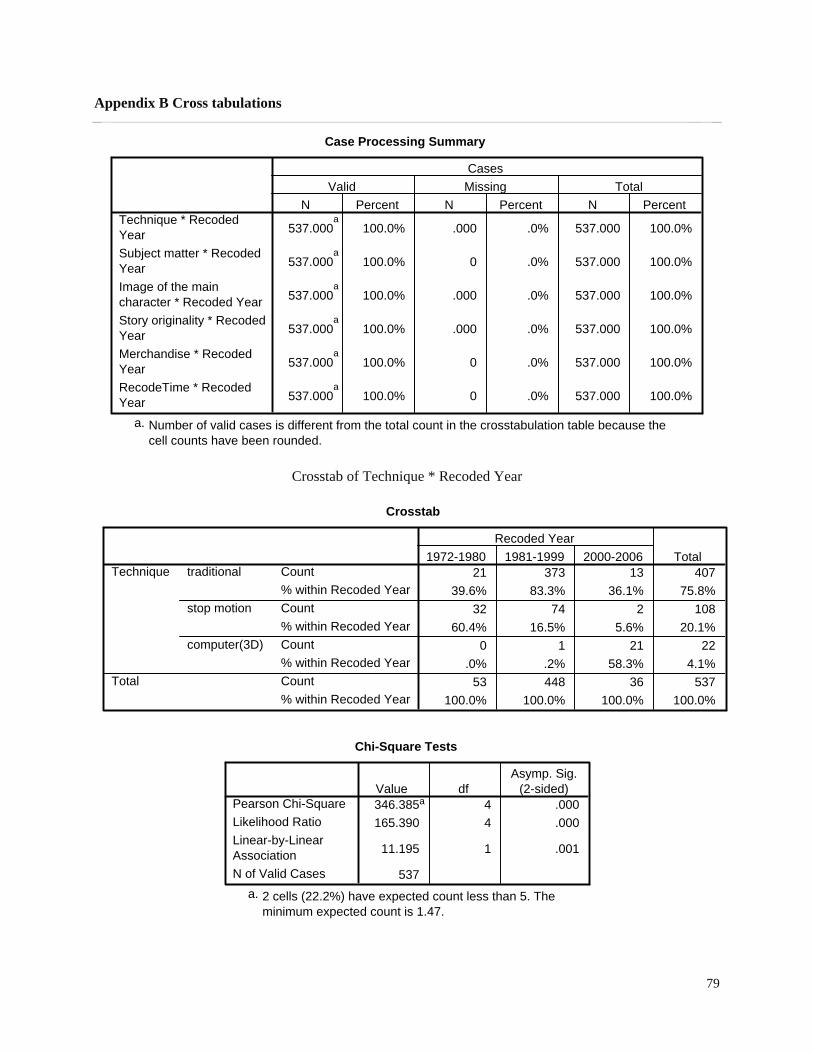
Appendix B Cross tabulations
Case Processing Summary
537.000a
100.0% .000 .0% 537.000 100.0%
537.000a
100.0% 0 .0% 537.000 100.0%
537.000a
100.0% .000 .0% 537.000 100.0%
537.000a
100.0% .000 .0% 537.000 100.0%
537.000a
100.0% 0 .0% 537.000 100.0%
537.000a
100.0% 0 .0% 537.000 100.0%
Technique * RecodedYearSubject matter * RecodedYearImage of the maincharacter * Recoded YearStory originality * RecodedYearMerchandise * RecodedYearRecodeTime * RecodedYear
N Percent N Percent N PercentValid Missing Total
Cases
Number of valid cases is different from the total count in the crosstabulation table because thecell counts have been rounded.
a.
Crosstab of Technique * Recoded Year
Crosstab
21 373 13 40739.6% 83.3% 36.1% 75.8%
32 74 2 10860.4% 16.5% 5.6% 20.1%
0 1 21 22.0% .2% 58.3% 4.1%
53 448 36 537100.0% 100.0% 100.0% 100.0%
Count% within Recoded YearCount% within Recoded YearCount% within Recoded YearCount% within Recoded Year
traditional
stop motion
computer(3D)
Technique
Total
1972-1980 1981-1999 2000-2006Recoded Year
Total
Chi-Square Tests
346.385a 4 .000165.390 4 .000
11.195 1 .001
537
Pearson Chi-SquareLikelihood RatioLinear-by-LinearAssociationN of Valid Cases
Value dfAsymp. Sig.
(2-sided)
2 cells (22.2%) have expected count less than 5. Theminimum expected count is 1.47.
a.
79
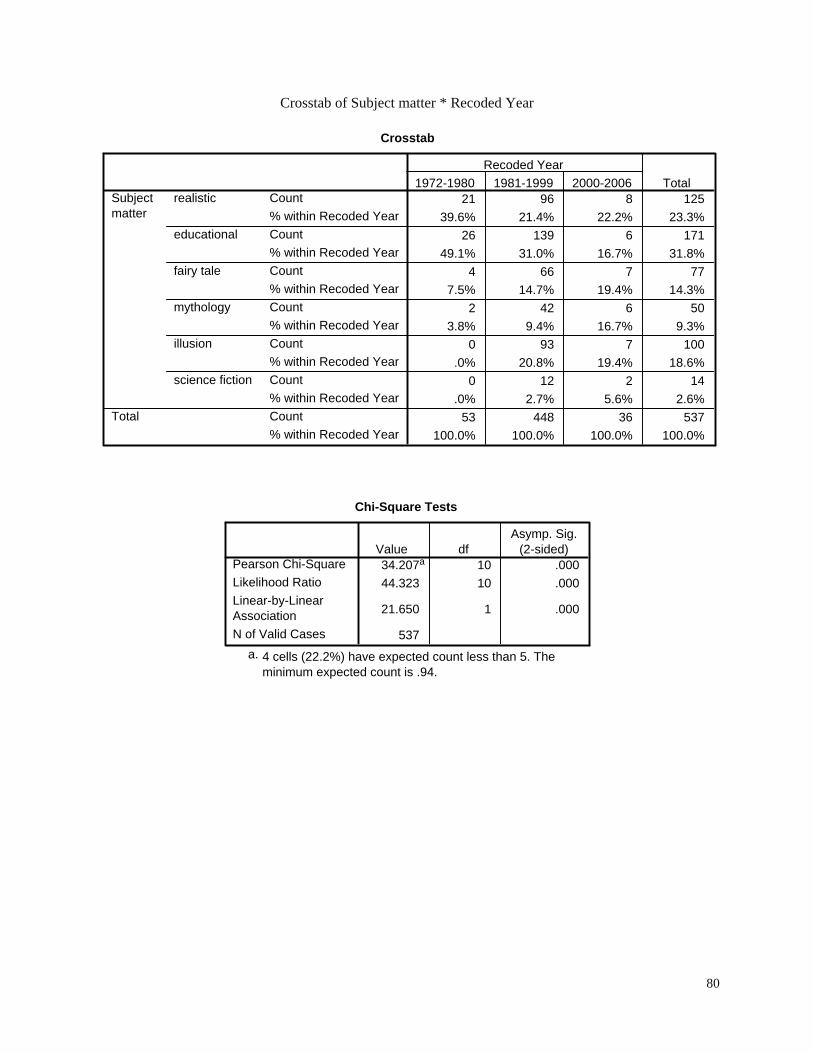
Crosstab of Subject matter * Recoded Year
Crosstab
21 96 8 12539.6% 21.4% 22.2% 23.3%
26 139 6 17149.1% 31.0% 16.7% 31.8%
4 66 7 777.5% 14.7% 19.4% 14.3%
2 42 6 503.8% 9.4% 16.7% 9.3%
0 93 7 100.0% 20.8% 19.4% 18.6%
0 12 2 14.0% 2.7% 5.6% 2.6%
53 448 36 537100.0% 100.0% 100.0% 100.0%
Count% within Recoded YearCount% within Recoded YearCount% within Recoded YearCount% within Recoded YearCount% within Recoded YearCount% within Recoded YearCount% within Recoded Year
realistic
educational
fairy tale
mythology
illusion
science fiction
Subjectmatter
Total
1972-1980 1981-1999 2000-2006Recoded Year
Total
Chi-Square Tests
34.207a 10 .00044.323 10 .000
21.650 1 .000
537
Pearson Chi-SquareLikelihood RatioLinear-by-LinearAssociationN of Valid Cases
Value dfAsymp. Sig.
(2-sided)
4 cells (22.2%) have expected count less than 5. Theminimum expected count is .94.
a.
80
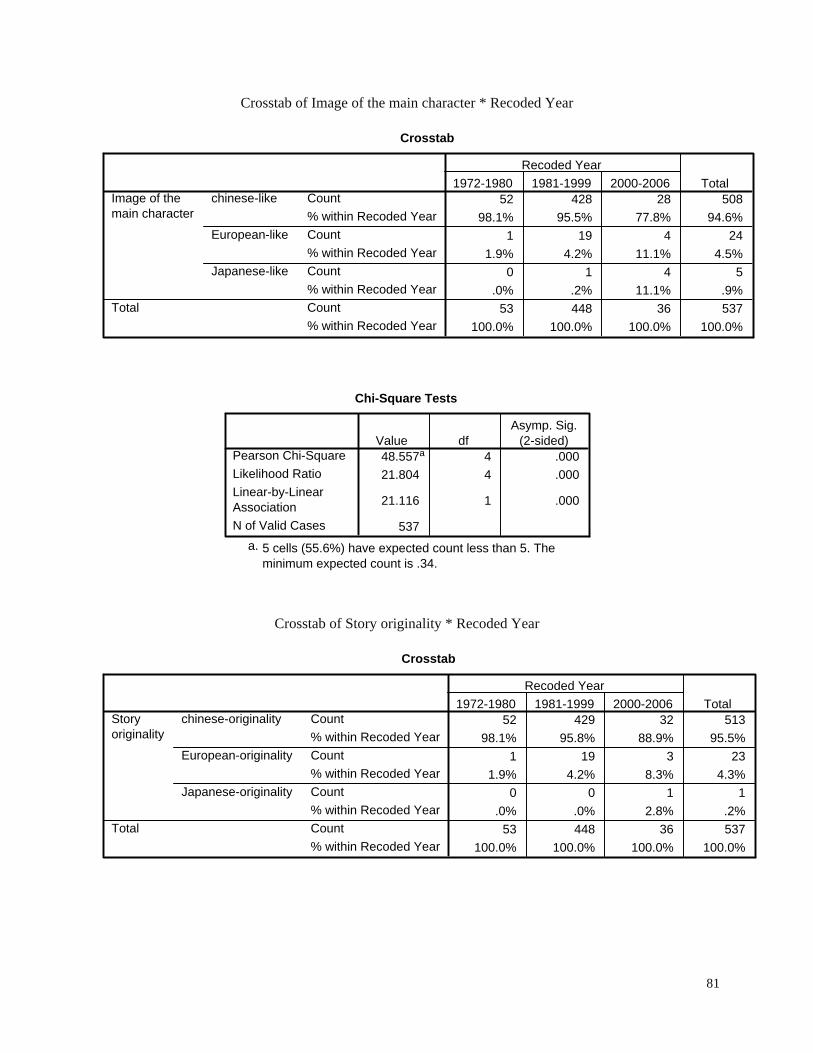
Crosstab of Image of the main character * Recoded Year
Crosstab
52 428 28 50898.1% 95.5% 77.8% 94.6%
1 19 4 241.9% 4.2% 11.1% 4.5%
0 1 4 5.0% .2% 11.1% .9%
53 448 36 537100.0% 100.0% 100.0% 100.0%
Count% within Recoded YearCount% within Recoded YearCount% within Recoded YearCount% within Recoded Year
chinese-like
European-like
Japanese-like
Image of themain character
Total
1972-1980 1981-1999 2000-2006Recoded Year
Total
Chi-Square Tests
48.557a 4 .00021.804 4 .000
21.116 1 .000
537
Pearson Chi-SquareLikelihood RatioLinear-by-LinearAssociationN of Valid Cases
Value dfAsymp. Sig.
(2-sided)
5 cells (55.6%) have expected count less than 5. Theminimum expected count is .34.
a.
Crosstab of Story originality * Recoded Year
Crosstab
52 429 32 51398.1% 95.8% 88.9% 95.5%
1 19 3 231.9% 4.2% 8.3% 4.3%
0 0 1 1.0% .0% 2.8% .2%
53 448 36 537100.0% 100.0% 100.0% 100.0%
Count% within Recoded YearCount% within Recoded YearCount% within Recoded YearCount% within Recoded Year
chinese-originality
European-originality
Japanese-originality
Storyoriginality
Total
1972-1980 1981-1999 2000-2006Recoded Year
Total
81
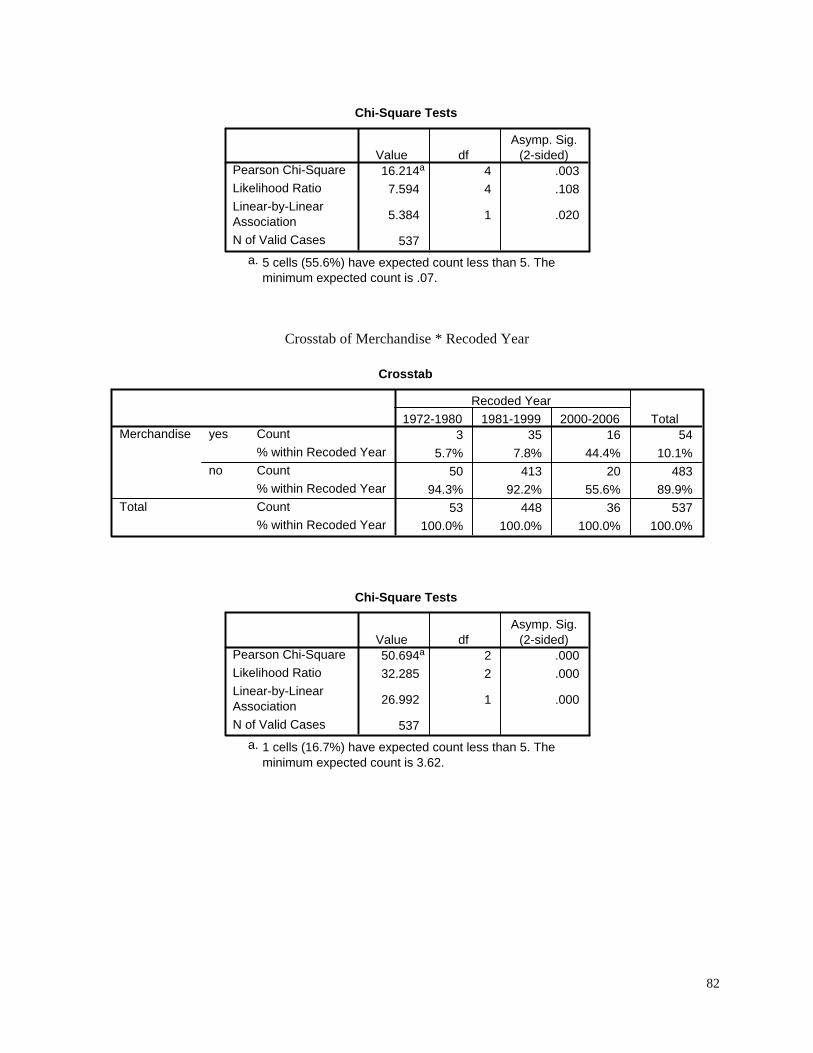
Chi-Square Tests
16.214a 4 .0037.594 4 .108
5.384 1 .020
537
Pearson Chi-SquareLikelihood RatioLinear-by-LinearAssociationN of Valid Cases
Value dfAsymp. Sig.
(2-sided)
5 cells (55.6%) have expected count less than 5. Theminimum expected count is .07.
a.
Crosstab of Merchandise * Recoded Year
Crosstab
3 35 16 545.7% 7.8% 44.4% 10.1%
50 413 20 48394.3% 92.2% 55.6% 89.9%
53 448 36 537100.0% 100.0% 100.0% 100.0%
Count% within Recoded YearCount% within Recoded YearCount% within Recoded Year
yes
no
Merchandise
Total
1972-1980 1981-1999 2000-2006Recoded Year
Total
Chi-Square Tests
50.694a 2 .00032.285 2 .000
26.992 1 .000
537
Pearson Chi-SquareLikelihood RatioLinear-by-LinearAssociationN of Valid Cases
Value dfAsymp. Sig.
(2-sided)
1 cells (16.7%) have expected count less than 5. Theminimum expected count is 3.62.
a.
82

Crosstab of Recode Time * Recoded Year
Crosstab
43 367 1 41181.1% 81.9% 2.8% 76.5%
8 12 1 2115.1% 2.7% 2.8% 3.9%
1 25 5 311.9% 5.6% 13.9% 5.8%
0 12 2 14.0% 2.7% 5.6% 2.6%
0 2 0 2.0% .4% .0% .4%
0 4 2 6.0% .9% 5.6% 1.1%
0 1 1 2.0% .2% 2.8% .4%
1 25 24 501.9% 5.6% 66.7% 9.3%
53 448 36 537100.0% 100.0% 100.0% 100.0%
Count% within Recoded YearCount% within Recoded YearCount% within Recoded YearCount% within Recoded YearCount% within Recoded YearCount% within Recoded YearCount% within Recoded YearCount% within Recoded YearCount% within Recoded Year
1-39
40-78
79-117
118-156
157-195
196-234
235-272
273 thru hi
RecodeTime
Total
1972-1980 1981-1999 2000-2006Recoded Year
Total
Chi-Square Tests
204.976a 14 .000142.682 14 .000
99.064 1 .000
537
Pearson Chi-SquareLikelihood RatioLinear-by-LinearAssociationN of Valid Cases
Value dfAsymp. Sig.
(2-sided)
16 cells (66.7%) have expected count less than 5. Theminimum expected count is .13.
a.
83

Appendix C List of Chinese animation directors
严定宪 胡进庆 邬强 李安棣 燕平孝 王树忱 胡雄华 尤磊 周克勤 钱家辛 唐澄 何玉门 靳夕 刘惠仪 特伟 沈祖慰 方润南 浦家祥 矫野松 阿达 林文肖 陈正鸿 章超群 戴铁郎 王柏荣 徐景达 詹同 阿曲 葛桂云 范马迪 熊南清
石梅音 孙立军 仲尔 阿福 高毅 刘书卫 陆松茂 罗慰 王一通 赵建华 戴岱 崔世昱
阎善春 付海龙 胡依红 孙总清 曲建方 蔡渊兰 金芳铃 虞哲光 金锡林 孙能子 木侧 钱家骏 熊耕发 周树民 高尔丰 吕衡 胡进华 夏秉钧 朱屺瞻 安平 常光希 左容倌 金雪林 王刚毅 武隽 朱康林 泮积耀 陈三伟 黄磷 段佳 华方方
周一愚 刘积昆 佳祺 曾伟京 孙哲 木朵 范本新 陈令长 陈玉清 王立平 方博 孙铁峰 屠斌
杜建国 赦谨 梅君 施仲兴 周生伟 马克萱 黄玮 程中岳 李荣中 马克勤 车慧 陈光明 杨凯华 张信 刘左峰 王磷 段炼 符世深 钟汉超 秦宝宜 张天晓 杨凯 方澎 吕善 李耕 张小安 郭兵 查侃 刘向东 钟泉 周立志
武寒青 钟耀庭 孟军 江左亚 张蓝 李捷 顾子易 何明 常伟力 任世焦 胡浩 冯焕斌
李珍 经霞云 许庙 胡甜 坚谷 川本喜八郎 孙大衡 龚玉兰 薛梅君 朱义民 吴克明 康宝金 李忠良 蔡子君 陈家奇 纪清河 张景源 乔元正 瞿永宝 曹小卉 耿康 殷齐美 温德斌 王强 彭戈 朱冰 沈如东 伍仲文 龚金福
钱运达
徐克 张紫
陈士宏 王建 赵刚 张纪平 赵叔桂 周凤英 何云 孙力峰 王川
陈信松 王加世 陆成法 吴钧 邹勤 沈寿林 冯建男 王启中 王刚 张松林 蒋友毅 凌纡 江爱群 吴云初 攸扬 龙路生 贾否 晓宵 晓欧 蔡志军 胡军 杨素英 白浪 史国光 姚光华 王根发 樊傲霜 戴福林 经莉莉 庄敏瑾 Manfred Durniok 蔡明钦 李剑平 Glenn Chaik 林继东 李景 张扬 邓本勤 王宏
温得斌 舒莉娟 速达 曾蓁 陶欣 肖刚 钱家铎 秦明亮
84
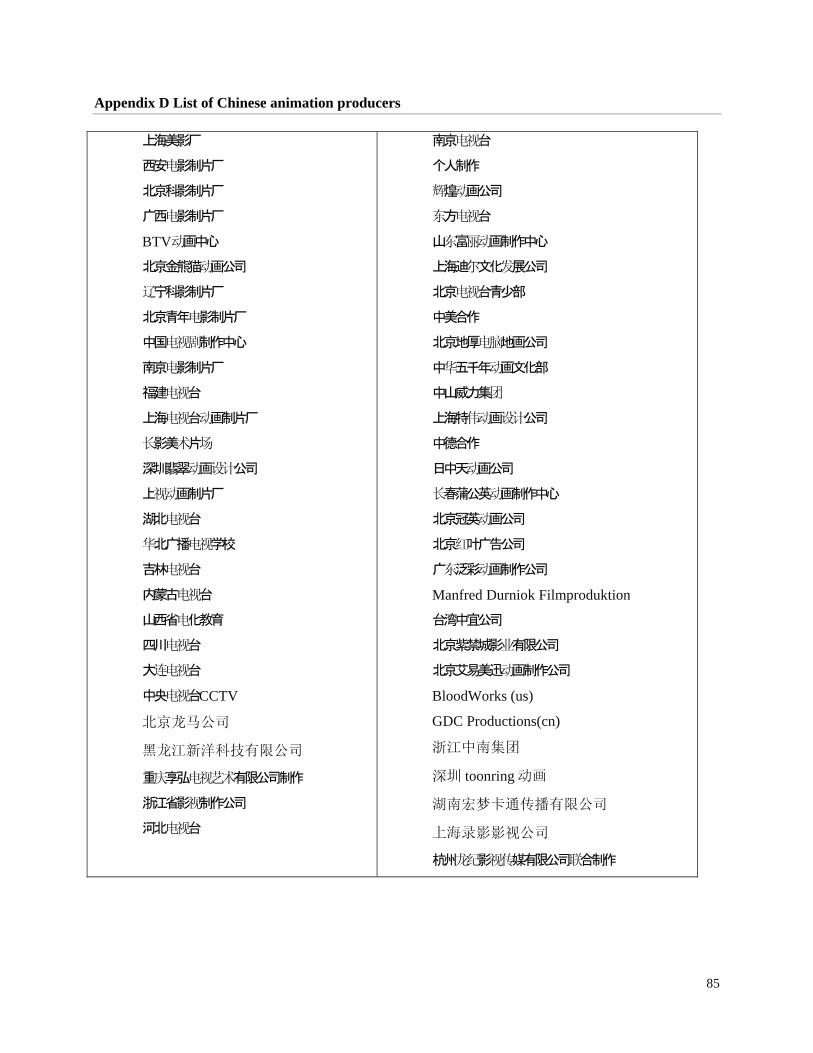
85
Appendix D List of Chinese animation producers
上海美影厂
西安 影制片厂电
北京科影制片厂
广西 影制片厂电
BTV 画中心动
北京金熊猫 画公司动
宁科影制片厂辽
北京青年 影制片厂电
中国 制作中心电视剧
南京 影制片厂电
福建 台电视
上海 台 画制片厂电视 动
影美 片长 术 场
深圳翡翠 画 公司动 设计
上 画制片厂视动
湖北 台电视
北广播 学校华 电视
吉林 台电视
内蒙古 台电视
山西省 化教育电
四川 台电视
大 台连电视
中央 台电视 CCTV
北京龙马公司
黑龙江新洋科技有限公司
重 享弘 有限公司庆 电视艺术 制作
浙江省影 制作公司视
河北 台电视
南京 台电视
个人制作
煌 画公司辉 动
方 台东 电视
山 富 画制作中心东 丽动
上海迪 文化 展公司尔 发
北京 台青少部电视
中美合作
北京地厚 地画公司电脑
中 五千年 画文化部华 动
中山威力集团
上海特 画 公司伟动 设计
中德合作
日中天 画公司动
春蒲公英 画制作中心长 动
北京冠英 画公司动
北京 叶广告公司红
广 泛彩 画制作公司东 动
Manfred Durniok Filmproduktion
台湾中宜公司
北京紫禁城影 有限公司业
北京艾易美迅 画制作公司动
BloodWorks (us)
GDC Productions(cn)
浙江中南集团
深圳 toonring 动画
湖南宏梦卡通传播有限公司
上海录影影视公司
杭州 影 媒有限公司 合制作龙纪 视传 联