what determines success in initial coin offerings? - repub
TRANSCRIPT
Electronic copy available at: https://ssrn.com/abstract=3250035
What determines success in Initial Coin Offerings?
Abe de Jong
Monash University and Rotterdam School of Management, Erasmus University
Peter Roosenboom*
Rotterdam School of Management, Erasmus University
Tom van der Kolk
Rotterdam School of Management, Erasmus University
Abstract
In this paper, we analyse the determinants of success for 630 ICOs performed between
August 2015 and December 2017. We find evidence that ICOs are more successful in raising
funding when they disclose more information to investors (i.e. have higher transparency
rating), have a higher quality rating by cryptocurrency experts, organise a presale, have a pre-
ICO GitHub repository, refrain from offering bonus schemes, have shorter planned token sale
durations and have a larger project team. Depending on the measure used, these ICOs also
have improved ex-post performance. We conclude that for entrepreneurs it is important to
make the ICO as transparent as possible and that expert ratings are a valuable means to
overcome the information asymmetry problems associated with token sales.
JEL Codes: G24, G32
Keywords: Initial Coin Offerings; token sales; entrepreneurial finance
* Corresponding author. Finance Department, Rotterdam School of Management, Erasmus
University. Burgemeester Oudlaan 50, 3062 PA Rotterdam, The Netherlands. Email:
[email protected], Phone: +31 10 4081255.
Electronic copy available at: https://ssrn.com/abstract=3250035
2
1. Introduction
Initial Coin Offerings (ICOs) have become an increasingly popular way to raise capital for
blockchain technology startups. In an ICO, entrepreneurs raise money for their venture by
selling newly created cryptocurrency tokens to investors in exchange for fiat currency such as
US dollars or cryptocurrencies such as Ethereum or Bitcoin (Chohan, 2017; Kastelein, 2017).
At the time of the ICO, the project is mostly at the idea stage and the actual launch of the
product or service is expected within one to two years after the ICO (EY, 2017). The
cryptocurrency tokens typically act as a digital medium of exchange to access the firm’s
digital platform and services. After completing the ICO, the tokens can be traded on an
online exchange and increase in value with the success of the project. One advantage for
entrepreneurs is that ICOs allow them to raise capital by selling tokens rather than shares and
therefore do not require them to give up ownership and control rights to investors as would
be the case with venture capital or equity-based crowdfunding.
The total amount of funding through ICOs in 2017 equalled $5.38 billion, surpassing
early-stage venture capital investments in blockchain startups (Sunnarborg, 2017) and $12
billion in the 16 months since January 2017 (Benedetti and Kostovetsky, 2018). Some
blockchain startups have been able to raise capital via token sales at record speed, largely
because of investors’ fear of missing out (also known as FOMO). For example, the company
Gnosis was able to raise $12 million in less than 10 minutes (Cointelegraph, 2017). At the
same time, the number of blockchain startups reaching their maximum fundraising goal has
declined since the last quarter of 2017 and regulators are pointing out the risks associated
with largely unregulated ICOs such as fraud, exaggeration of expected returns and lack of
transparency (EY, 2017; SEC, 2017).
In this paper, we aim to answer the question why some projects succeed in raising
funding in ICOs and get their tokens listed on CoinmarketCap, a leading website for tracking
exchange-traded cryptocurrencies, whereas others do not. In our analysis, we include both
uncapped and capped ICOs. In an uncapped ICO the token supply is not limited or the token
price is not known beforehand. This contrasts with capped ICOs in which the company sells a
limited supply of tokens at a fixed priced. The vast majority of ICOs are capped. In a capped
ICO the company may set two funding goals: a minimum fundraising goal (softcap) as well
as a maximum fundraising goal (hardcap). The company only keeps the money it has raised
in case the amount raised exceeds the pre-set softcap (“all-or-nothing”). Once the softcap has
been reached the company keeps all the money it raises even if the hardcap has not been
Electronic copy available at: https://ssrn.com/abstract=3250035
3
reached (“keep–it-all”). In our analyses we use several dependent variables to measure
funding success in order to reflect the different ways ICOs can be structured: a binary
variable indicating whether the ICO reaches its softcap (if any), the amount of money raised
as a percentage of the hardcap (only in capped ICOs), the log of the amount of money raised
in the ICO, and a binary variable indicating whether the ICO is tracked on CoinmarketCap.
In addition, we look beyond funding success and also investigate whether the project
is successful afterwards or has ended up on what Varshneya (2018) calls the “digital
graveyard”. We investigate whether the projects survive up to July 2018. We use four
measures of ex-post success: whether the project has recently been active on Twitter, the
number of Tweets per week since the ICO commenced, whether the project has recently
updated its repositories on the software development platform GitHub and whether the
project’s website is still online in July 2018. We employ a large sample of 630 capped and
uncapped ICOs from August 2015 until December 2017. We stop in December 2017 in order
to measure success as survival for a period of at least half a year. Our results show that ICOs
with a higher transparency and expert rating are more successful in raising funds and perform
better in the post-ICO period. We find evidence that having a pre-ICO GitHub repository,
organising a presale for early investors, a shorter planned token sale duration, not having a
bonus scheme, and having a larger project team is positively associated to fundraising
success and depending on the measure used, also to ex-post project success. Moreover, the
percentage of tokens retained by the project team is positively related to two of our measures
of ex-post performance.
Our paper adds to the literature on entrepreneurial finance and the emerging literature
on ICOs. Existing studies on ICOs model the choice between ICO and venture capital
funding (Catalini and Gans, 2018; Chod and Lyandres, 2018), investigate the need for
legislation of ICOs (Kaal, 2018), the geography of ICOs (Huang, Meoli and Vismara, 2018),
the liquidity and trading volume of exchange-traded ICOs (Howell, Niessner and Yermack,
2018) and returns to investors in ICOs (Benedetti and Kostovetsky, 2018). We are aware of
three other (working) papers on the determinants of funding success of ICOs. First, Adhami,
Giudici and Martinazzi (2018) investigate 253 ICOs from 2014 until August 2017 of which
81 percent reaches the softcap. They find that ICOs are more likely to reach the softcap in
case their programming code is (partially) available in an online GitHub repository
(measured after the ICO), when the company has presold tokens to early-stage investors and
when tokens come with the right to access services or in some cases to a share in the profits.
Second, Fisch (2018) examines 238 ICOs in 2016 and 2017. He finds that the dollar amount
Electronic copy available at: https://ssrn.com/abstract=3250035
4
raised in the ICO is positively impacted by a larger token supply, having a cryptocurrency
token that is Ethereum-based, and the number of endorsements (stars) received on
programming code repository GitHub (measured after the ICO). Third, Amsden and
Schweizer (2018) look at the large sample of 1,009 ICOs (573 of which have data on funding
amounts) from 2015 until March 2018 and use token tradability on CoinmarketCap as their
main success measure. They report that venture uncertainty is negatively correlated with
success while venture quality has a positive impact on ICO success.
We extend the thin literature on ICOs fourfold. First, we investigate a number of
previously unexplored determinants (most importantly, expert and transparency ratings,
GitHub presence measured at the time of the ICO, and planned ICO duration in days).
Second, we use various fundraising success measures that distinguish between capped versus
uncapped ICOs and take into account the softcap and hardcap fundraising goals. Also, we use
a funding success measure that captures whether the ICO is trading on an exchange
recognized by CoinmarketCap, a tracking website for exchange-traded cryptocurrencies.
Adhami et al. (2018) only look at whether the softcap has been reached and Fisch (2018)
merely uses the log of the amount raised as the dependent variable. Amsden and Schweizer
(2018) use token tradability as their key measure of success. Third, we make use of the
largest slice of the ICO universe for which data is available. We use eleven ICO databases1 to
obtain this data, as no single database covers the full ICO universe. One issue that all ICO
studies face is that many of the ICOs that end up being unsuccessful delete their data. These
ICOs are thus less likely to be included in the analysis. However, we only miss out on a few
unsuccessful ICOs. Our sample includes 630 out of the 682 ICOs listed on ICObench, a
respected rating website for ICOs, during our sample period. This allows us to paint a more
comprehensive picture of the determinants of fundraising success in ICOs compared to these
previous studies. Fourth, we extend the existing papers on ICO funding success by adding an
analysis of ex-post success of ICOs.
The remainder of this paper is structured as follows. Section 2 discusses ICOs in more
detail. Section 3 derives our hypotheses. We describe our sample in Section 4. Section 5
presents our results. We conclude in Section 6.
2. A primer on ICOs
1 Databases accessed: www.tokendata.io, www.icotracker.net, www.cryptocompare.com/ico,
www.smithandcrown.com/icos, https://elementus.io/token-sales-history, www.icomarketdata.com, www.icodata.io,
www.coindesk.com/ico-tracker/, www.icobench.com/ico, www.coinschedule.com, www.ico-list.com, www.icostats.com
Electronic copy available at: https://ssrn.com/abstract=3250035
5
Cryptocurrencies are digital assets that can be used as a medium of exchange, using
cryptography to secure and verify transactions. Tokens are a type of cryptocurrency
representing an asset or utility, without creating a new blockchain or protocol. Instead, these
tokens reside on top of another blockchain such as Bitcoin or Ethereum. Tokens are used in
most ICO campaigns and ICOs are therefore sometimes referred to as token sales. The first
ever ICO was launched in 2013 when Mastercoin (currently called Omni), was able to raise
over 5000 Bitcoins, at that time worth $500,000 (Jaffe, 2018). The crowdsale of Ethereum in
2014 raised $18 million and has been very influential in shaping the present-day ICO
landscape, as many applications are based on its blockchain. Ethereum created a new
decentralised platform that incorporated smart contracts. Smart contracts are pre-written
computer protocols that can be executed by the distributed ledger technology itself. It allows
for entirely self-executing clauses from a contract, without any party verifying or performing
the contract (Rosic, 2017). The most commonly used one for raising capital is ERC-20, a
smart contract that creates a new cryptocurrency token and allows for transferring
cryptocurrency from one person to another. This unique capability allows developers to build
a wide variety of innovative applications on top of the Ethereum blockchain, becoming the
most popular blockchain for ICOs (The Economist, 2017).
In 2017, one of the first uncapped ICOs ran into trouble. Tezos raised $232 million in
its uncapped ICO but soon after faced several class-action suits accusing the company of
selling unregistered securities, misrepresenting on how funds would be spent,
misrepresenting when the platform would go live, false advertising, and engaging in
misleading trade practices. This triggered criticism regarding ‘uncapped sale’ models, a
model that does not pre-specify the maximum about of funding raised during the ICO and in
which entrepreneurs would only set a start and end-date, awaiting the number of coins that
would be bought by investors. According to critics the uncapped model shows greed of the
promoters trying to sell as many tokens as possible and provides a significant concern for
investors as they expose themselves to high uncertainty about the cryptocurrency valuation
(Buterin, 2017). Because of this, ICOs have more often become ‘capped’, predetermining the
number of tokens for sale before ICO launch and setting a fixed price for the tokens.
However, capped ICOs are more likely to be oversubscribed in case of strong investor
interest, resulting in a more substantial incentive for investors to getting in first out of Fear of
Missing Out (FOMO). Examples of successfully capped token sales are BAT and Gnosis,
which were sold out 30 seconds and 10 minutes respectively (Buterin, 2017).
Electronic copy available at: https://ssrn.com/abstract=3250035
6
Since the inception of ICOs, regulators have expressed concerns about fraud, lack of
transparency, and lack of investor protection. Unlike traditional shareholders, investors in
ICOs often have no control over the project or its promotors (Kaal, 2018). However, at the
time of writing only a few countries explicitly prohibit ICO campaigns. Most countries are
using existing laws to regulate cryptocurrencies or assume a reactive stance by awaiting other
countries’ actions before taking regulatory actions themselves. The chairman of the SEC, Jay
Clayton, recently argued that some ICOs constitute the sale of securities and should,
therefore, be registered with and regulated by the SEC (Marks, 2018). Several blockchain
projects create a not-for-profit foundation in e.g., Switzerland or offshore corporations in, for
example, the Cayman Islands, Gibraltar or Singapore to avoid taxation on the ICO proceeds.
Huang, Meoli and Vismara (2018) examine the geography of ICOs and find that ICOs
primarily come from countries with developed financial markets and advanced digital
technologies.
The ICO process starts with a pre-announcement on several relevant cryptocurrency
forums (i.e. Reddit, Bitcointalk) and contains an executive summary of the projects’
objectives, team members and most notable features of the product. At this pre-ICO phase,
tokens are sold privately to early bird investors who receive bonuses for investing during the
presale. This allows the project developers to test market demand and estimate a price for the
token. Comments made by early bird investors are considered when drafting the whitepaper,
a document that contains more in-depth information about the project to support later
investors in their decision-making process (Kaal and Dell’Erba, 2017; Yadav, 2017).
Nowadays, more sophisticated blockchain ventures also publish a yellow paper, or a second
whitepaper, that details the (in many cases tested and peer-reviewed) technology and
innovations the venture has created or plans to create. However, companies that launch an
ICO campaign face no mandatory disclosures. Whitepapers issued at the time of the ICO tend
to be very technical and difficult to read for most investors and the content of the whitepaper
has little if any impact on fundraising success (Fisch, 2018). Whitepapers are not audited or
certified by any authority (Deloitte, 2017) and sometimes even lack the justification for using
blockchain technology (EY, 2017).
At the launch of the ICO, the project team announces the starting date of the public token
sale. Typically, a marketing campaign is set up to address a broader group of potential
investors (including smaller retail investors), playing a crucial role in the success of a
campaign. Subsequently, the project team launches the public ICO and releases the
cryptocurrencies. As there is no regulation concerning ICO structure, there are numerous
Electronic copy available at: https://ssrn.com/abstract=3250035
7
possibilities for project developers in the design of the campaign. For example, the project
developers can opt for a capped versus uncapped sale, make use of minimum fundraising
goals (softcaps) and/or maximum fundraising goals (hardcaps) and accept payment in fiat
currency and/or (multiple) digital currencies (Buterin, 2017). The initial value and supply of
the tokens are entirely at the discretion of the project developers, and often arbitrarily
determined. Also, similar to the presale, some ventures reward early investors in the public
ICO with free tokens or discounts.
When an ICO is completed, the tokens will be available for trading usually two weeks
after the end of the funding campaign. Benedetti and Kostovetsky (2018) find that tokens are
on average underpriced by 179% from the ICO price to the opening price on the first trading
day to compensate investors for the high risks associated with investing in ICOs. Currently,
there are more than 40 exchanges, serving as secondary markets, available for cryptocurrency
trading (Lea, 2017). Depending on the relation between the project developers and
management of the cryptocurrency exchange, a newly issued token is listed. Often, project
teams should pay a fee to register their cryptocurrency on an exchange – with higher costs for
higher volumes. Howell et al. (2018) report that liquidity and trading volume of exchange-
traded tokens are higher when project developers disclose more information about the
project, show a strong commitment to the project and signal quality.
3. Hypotheses development
Information asymmetry is one important barrier to the financing of early-stage ventures
(Chod and Lyandres, 2018). At the time of the ICO, there are no compulsory or audited
disclosures and the project is mostly at the idea stage with the actual launch of the product or
service only expected within one to two years after the ICO (EY, 2017). Moreover, there is
no or little regulation and investor protection. In theory, this context would impair successful
fundraising by blockchain technology startups.
The two typical asymmetric information problems of adverse selection (hidden
information) and moral hazard (hidden action) plague the relationship between project
developers and potential investors respectively before (“ex-ante”) and after (“ex-post”) the
ICO. The first information problem of hidden information or adverse selection (Akerlof,
1970) cannot be addressed by high-quality ICOs simply stating that they are of the high-
quality type. Also, a low-quality ICO could (falsely) claim to be of the high-quality type and
therefore investors would ignore this “cheap talk”. Another possibility is to fully disclose
Electronic copy available at: https://ssrn.com/abstract=3250035
8
information directly to potential investors. Investors use several information sources to assess
the quality of the token sale such as GitHub, Twitter, Telegram/Slack/Discord, Bitcoinwiki,
Facebook, Bitcointalk, whitepapers, videos, and LinkedIn. We hypothesize that voluntary
disclosure acts as a quality signal. Project teams of high-quality projects are more willing to
disclose information whereas project teams of poor quality projects are less willing to share
information with potential investors, especially when they face penalties if the disclosure
proves to be fraudulent ex-post (e.g., see the theoretical model of Hughes, 1986). We
hypothesize:
Hypothesis 1A: More extensive disclosure (i.e., a higher transparency rating) has a positive
influence on fundraising success
Hypothesis 1B: More extensive disclosure (i.e., a higher transparency rating) has a positive
influence on subsequent project success
At the same time, projects might be hesitant to share technical proprietary information in
whitepapers or in a public GitHub repository with a wider circle of investors. Moreover, at
the time of the ICO, the product or service still needs to be developed and intellectual
property rights by patents and/or trademarks are not (yet) in place. Also, the technical
information in whitepapers seems difficult to comprehend by most investors in ICOs and
most investors do not have the time and expertise to conduct a due diligence of the project
themselves. One solution to this problem is to make use of ratings by experts. In the crypto-
sphere, a respected rating website, consisting of experts who voluntarily review ICOs, is
ICObench. To become an expert one must show a thorough knowledge of cryptocurrencies
and its underlying market dynamics. Reviewers obtain no compensation.2 We expect that
highly rated ICOs are more likely to be successful in raising funds and in the period after the
ICO. Therefore, we hypothesise that:
Hypothesis 2A: Higher ratings by expert reviewers have a positive influence on fundraising
success
Hypothesis 2B: Higher ratings by expert reviewers have a positive influence on subsequent
project success
2 https://medium.com/@ICObench/icobench-experts-the-importance-of-being-just-bbe07e00f73e
Electronic copy available at: https://ssrn.com/abstract=3250035
9
Another way to mitigate the adverse selection problem is signaling (Spence, 1973). In the
case of signaling the project deliberately makes use of positive and observable indicators of
otherwise not directly observable qualities in an attempt to mitigate the ex-ante information
problem with investors (Spence, 2002). In order to be effective, a signal needs to be costly
and correlate strongly with the quality it plans to indicate. High-quality ICOs are better able
to absorb the higher costs of signaling. Low-quality projects will not imitate the signal of
high-quality projects because they are not able or willing to bear the high costs associated
with the signal. The benefits of being correctly identified as a high-quality ICO would
outweigh the high costs only in case the project is truly of the high-quality type. The decision
to post the programming code underlying the project on software development platform and
repository GitHub can be seen as such a signal. It would allow experts to review the
programming code and information about the technical side of the project before the ICO and
collaborate on further improving it also in the period after the ICO. Only companies that are
confident about the technical side of their project would subject it to expert scrutiny on
GitHub before the ICO. We hypothesize:
Hypothesis 3A: Posting programming code or technical information on software repository
GitHub before the ICO has a positive influence on fundraising success
Hypothesis 3B: Posting programming code or technical information on software repository
GitHub before the ICO has a positive impact on subsequent project success
The distribution of tokens to insiders may be another important signal to investors. In ICOs,
the percentage of tokens owned by the insiders after the ICO is known at the time of the ICO.
These exchange-traded tokens can be sold in the future at a higher price in case the project is
successful and needs to raise fresh capital. This signals that project developers are confident
about the future success of the project and refrain from raising as much capital as possible
from gullible investors at the time of the ICO. The percentage of tokens held by insiders may
also mitigate the ex-post information or moral hazard problem. If insiders continue to own a
significant percentage of the tokens they have a strong incentive to work hard towards a
successful launch the blockchain project.
Hypothesis 4A: A higher percentage of tokens retained by insiders positively impacts
fundraising success
Electronic copy available at: https://ssrn.com/abstract=3250035
10
Hypothesis 4B: A higher percentage of tokens retained by insiders positively impacts
subsequent project success
An ICO can take place in multiple stages, i.e. a pre-ICO can be launched to test market
demand and estimate a price for the token. Before opening the ICO to the public, early bird
investors are typically able to obtain bonuses (e.g. deep discounts for early investors without
lockups or vesting periods) to encourage early participation and to generate momentum.
Typically there is a higher minimum investment amount compared to the public sale that
follows afterwards. The ICO presale tends to be smaller than the public phase of the ICO and
is intended to show to the public that the project team was able to have a pool of (befriended)
cornerstone investors willing to invest in the project already.
Hypothesis 5: ICOs preceded by a presale are more likely to successfully raise funds in the
public phase of the ICO
The public ICO follows suit, is open for everyone to invest in, and often has a lower
minimum investment amount compared to the presale. Early investors in public token sales
can also qualify for bonuses and price discounts albeit lower compared to the presale. This
creates an incentive for investors to invest as soon as possible out of fear of missing out.
However, having to make use of bonus schemes in the public phase of the ICO may also
signal that the project team is struggling to attract sufficient interest in the presale (if
organized) or in the ICO itself and that, despite the bullish market for ICOs in our sample
period, it needs to resort to bonuses and price discounts to attract public investors. Moreover,
potential investors may be afraid that too many bonus participants can engage in flipping and
sell the tokens at a profit (at ICO price) once the tokens launch on a secondary market,
driving the price down. We hypothesize that the use of bonus schemes in the public part of
the ICO has a negative effect:
Hypothesis 6: The use of bonus schemes in the public phase of the ICO negatively impacts
fundraising success
At the launch of the ICO, the project team announces the number of days the campaign will
accept funding. In the context of reward-based crowdfunding, Mollick (2014) reports that
campaigns with a longer duration have a lower probability of reaching their funding goals.
Electronic copy available at: https://ssrn.com/abstract=3250035
11
Planning on a longer duration may signal a lack of confidence in the project to potential
investors (Mollick, 2014). We, therefore, hypothesize that a longer planned duration of the
ICO campaign at the time of its launch negatively impacts fundraising success.
Hypothesis 7: Longer planned campaign durations have a negative influence on fundraising
success
Investors may appreciate larger project teams, as it may show that a larger number of people
are willing to work on bringing the project to fruition, speeding up the time to the actual
launch of the blockchain project. Ahlers, Cumming, Gunther and Schweizer (2015) show that
human capital (proxied by the number of board members) is positively related to funding
success on one of the first crowdinvestment platforms, the Australian Small Scale Offerings
Board. In addition, a larger project team implies a larger network of contacts it can mobilize
to promote the ICO and assist in the project´s future development. We hypothesize:
Hypothesis 8A: Having a larger project team positively impacts fundraising success
Hypothesis 8B: Having a larger project team positively impacts subsequent project success
4. Data and methods
We start with an initial dataset consisting of 682 ICOs from ICObench and other sources
during the period August 2015 until December 20173. We stop in December 2017 in order to
measure success as survival for a period of at least half a year. Because information is widely
dispersed on the internet and most databases often include only partial information, we
identify these ICOs from eleven databases.4 Out of the available databases, ICObench
provides the most thorough and highest quality information on ICO campaigns and therefore
serves as the core of our sample. By using the Application Programming Interface (API), it is
possible to draw information from the database directly. Even though we consider ICObench
the most comprehensive database, it still lacks key information which we manually
complemented with data from other databases, websites, forum threads and whitepapers.
3 See: https://icobench.com/stats 4 Databases accessed: www.tokendata.io, www.icotracker.net, www.cryptocompare.com/ico,
www.smithandcrown.com/icos, https://elementus.io/token-sales-history, www.icomarketdata.com, www.icodata.io,
www.coindesk.com/ico-tracker/, www.icobench.com/ico, www.coinschedule.com, www.ico-list.com, www.icostats.com
Electronic copy available at: https://ssrn.com/abstract=3250035
12
For 52 out of 682 ICOs, it is not possible to find relevant information on the Internet,
because websites, forum posts and Twitter accounts have been deleted or never took place. In
case insufficient data is available online, we exclude the ICO from the dataset. In a handful of
cases where we could not obtain the amounts of capital raised directly from ICObench or
other sources, we have analysed the transactions on the blockchain during the ICO period to
calculate the funding amount ourselves.5 This resulted in a sample consisting of 630 ICOs.
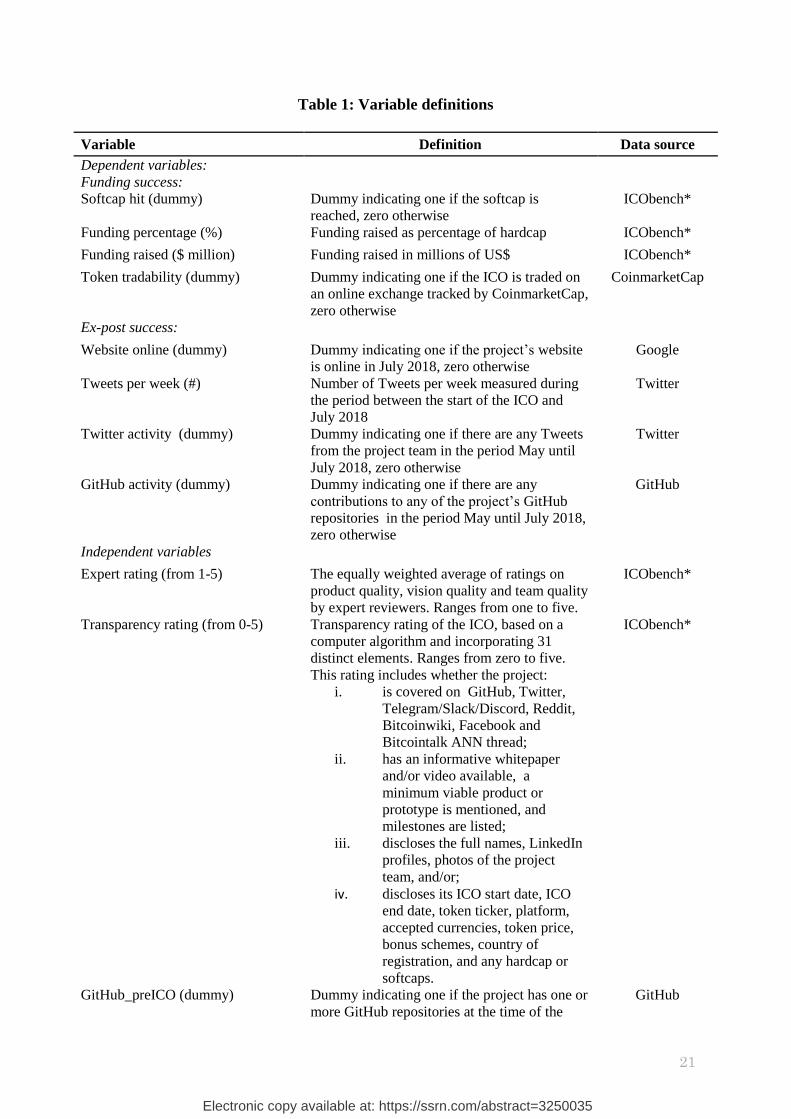
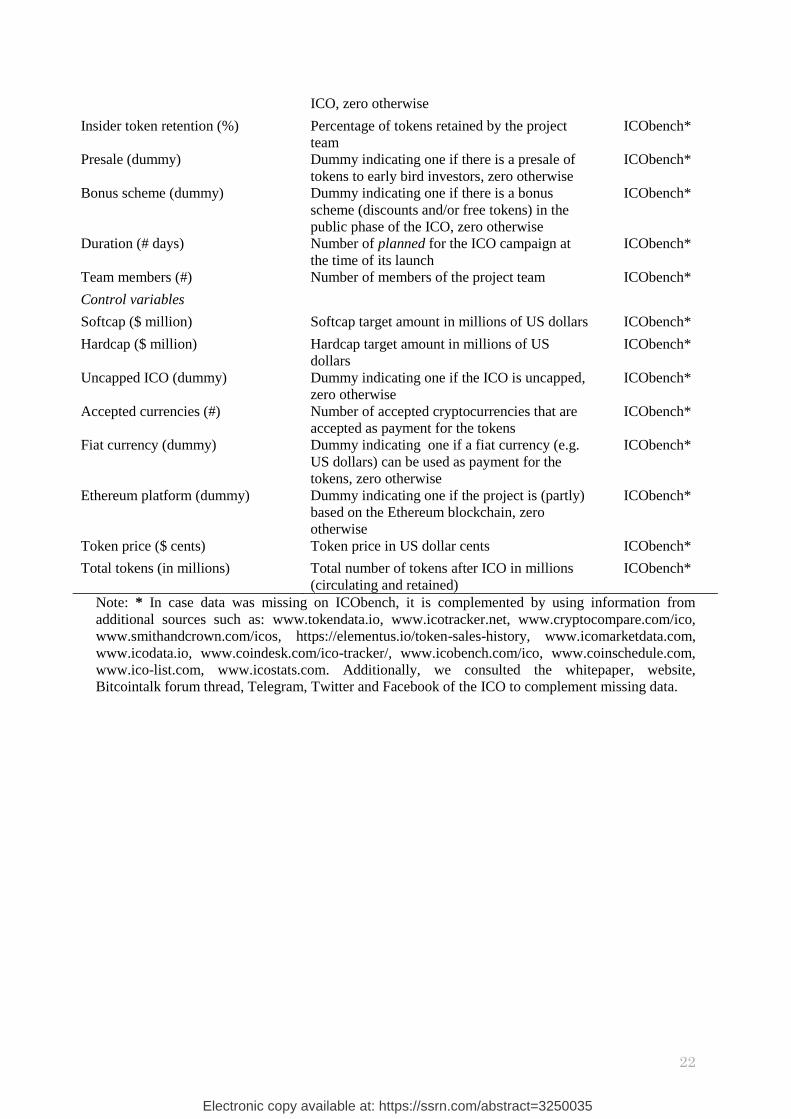
In our analyses we use four measures of funding success as our dependent variables,
reflecting the different ways in which ICOs are structured. Table 1 shows the variable
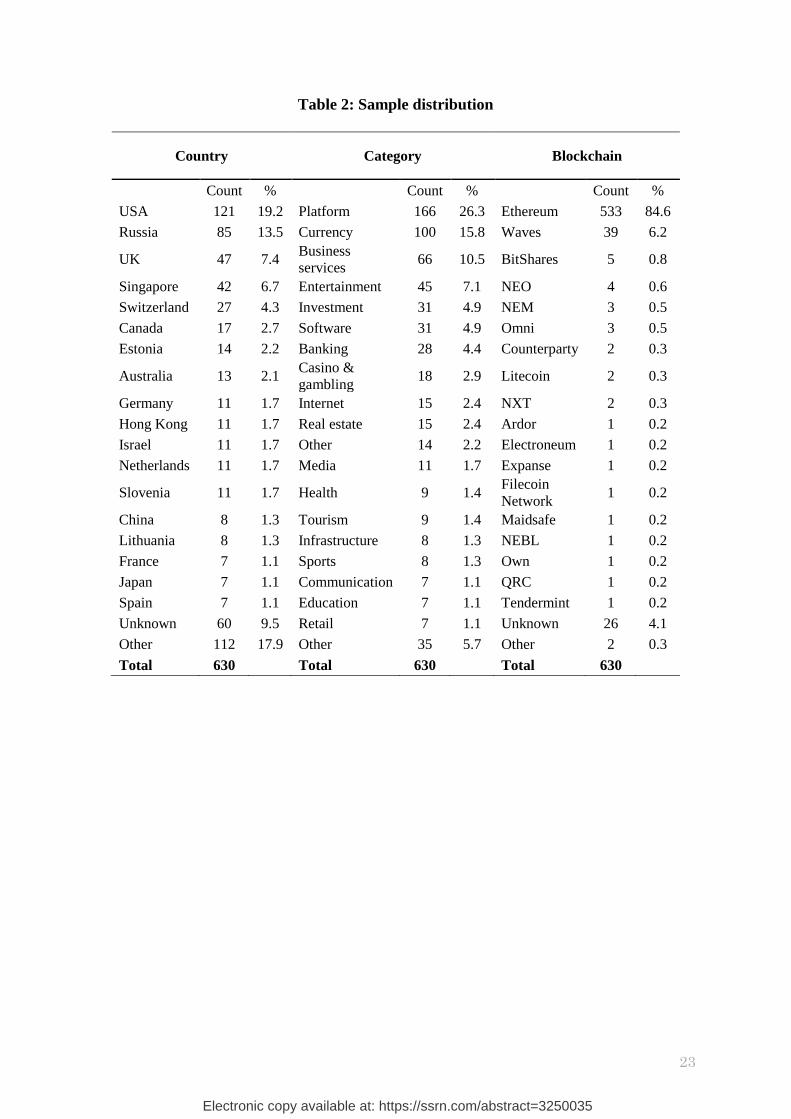
definitions. Table 2 provides an overview of the ICO distribution (country of origin, project
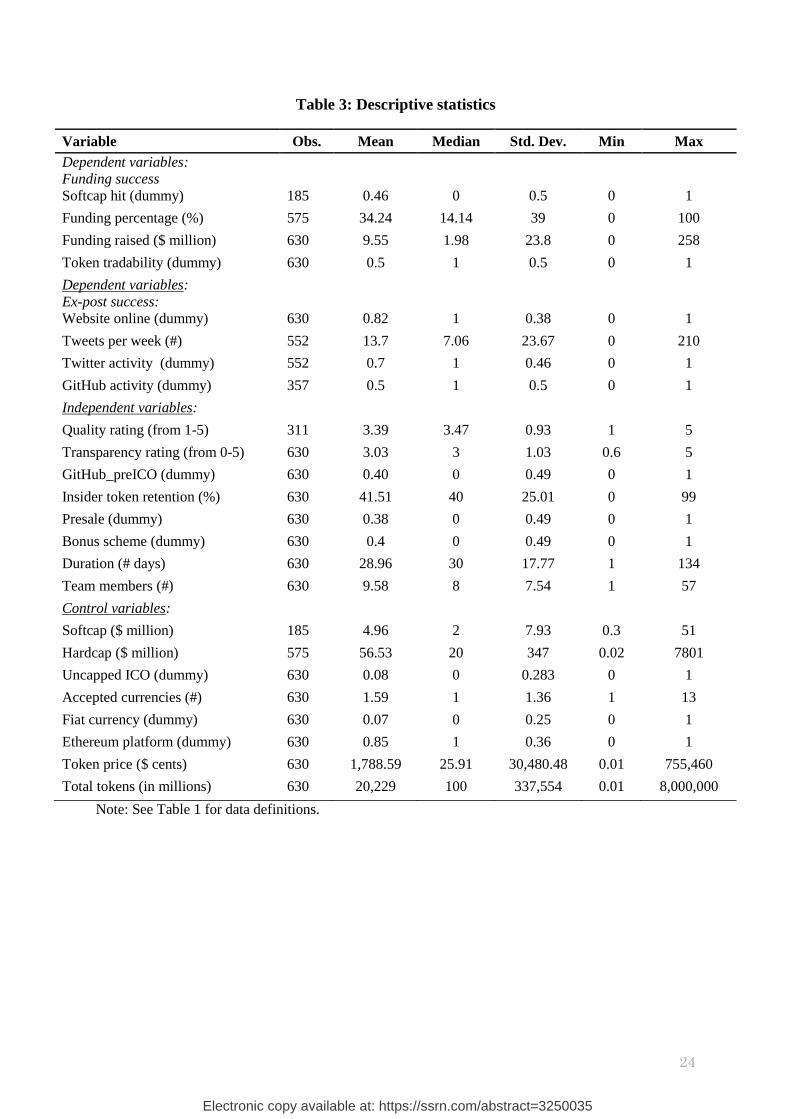
category and blockchain used) in our sample. Table 3 presents the descriptive statistics. We
measure funding success with a dummy variable indicating whether the softcap (i.e. the
minimum funding goal) has been reached, the amount of capital raised as a percentage of the
hardcap (i.e., the maximum funding goal), the log of the amount of capital raised, and a
dummy variable indicating whether the ICO was admitted to trading on an online exchange
that is tracked by CoinmarketCap. Table 3 shows that 185 ICOs make use of a softcap (29%
of the sample). The softcap averages $4.96 million and 85 ICOs with softcaps (46% of the
sample with softcaps) manage to raise more capital than the minimum target amount. Our
sample contains 575 capped ICOs (91.3% of the sample) and 55 uncapped ICOs (8.7% of the
sample). The average hardcap is set at $56.5 million for the capped ICOs. On average, a
capped ICO raises 34% of its hardcap. The average amount of capital raised amounts to $9.55
million with a minimum of zero and a maximum of $258 million. Cryptocurrencies more
frequently accepted as payment are Ethereum (in 533 ICOs, 85% of the sample), followed by
Bitcoin (in 184 ICOs, 29% of the sample). Fiat currency is only accepted in 41 ICOs (6.5%
of the sample). In our sample 163 ICOs accept multiple currencies as means of payment for
the tokens (26% of the sample). Half of the ICOs in our sample are admitted to trading on an
online exchange tracked by CoinmarketCap.
We also use four dependent variables to measure the success of the project
afterwards. We look at whether the website of the project is still online in July 2018, the
Tweets from the project team per week in the period between the start of the ICO and July
2018, whether there have been any Tweets by the project team in the period May until July
2018, and whether there any contributions on software repository GitHub during that same
period. There are 518 project websites still online in July 2018 (82% of the sample). The
5 Using the following websites: www.etherscan.io, https://wavesexplorer.com, https://blockexplorer.com/
Electronic copy available at: https://ssrn.com/abstract=3250035
13
average (median) Tweet activity of the project team equals 13.7 (7.06) Tweets per week
during the period between the end of the ICO and July 2018. There are 387 projects with
recent Tweets (70% of 552 projects with Twitter accounts), and 181 projects with recent
activity on GitHub (about half of the 357 projects with GitHub repositories at any point in
time).
Our independent variables include the expert ratings and transparency ratings on
rating website ICObench, a dummy variable indicating whether the project created a GitHub
repository before the ICO (retrieved via a Chrome extension), the percentage of tokens
retained by insiders, a dummy variable whether a presale takes place before the public phase
of the ICO, a dummy variable indicating whether a bonus scheme is used in the public token
sale, the planned duration of the ICO in days and the number of project team members. Table
3 documents that the average (median) expert rating on ICObench equals 3.39 (3.47). The
highest possible rating is five, corresponding to high-quality ICOs, whereas the lowest
possible score is one, implying a weak investment opportunity. The rating consists of three
elements: team, vision and product, and is available for 311 observations. The expert rating is
based on the review of an average of 2.7 cryptocurrency experts. The transparency rating is
available for all ICOs in the dataset and yields an average (median) of 3.03 (3). This rating is
based on a computer algorithm and reflects the disclosure on ICObench for 31 distinct
elements, such as the presence of GitHub, Twitter, Facebook etc. (for an extensive
description consult Table 1). There are 253 projects with GitHub software repositories at the
time of the ICO (40% of the sample). Insiders retain an average (median) of 42% (40%) of
tokens. Presales happen in 241 cases (38.3% of the sample) and bonus schemes such as price
discounts and free tokens are used in the public part of the ICO in 252 ICOs (40% of the
sample). Table 3 shows that the average (median) duration of the ICO campaign is planned to
be 29 days (30 days). The average (median) project team consists of 9.6 (8) members.
We include several control variables in our regressions. In regressions using the
funding percentage as the dependent variable, we control for the log of the hardcap (i.e., the
maximum funding goal). Mollick (2014) reports that higher funding goals reduce the
likelihood of funding success for reward-based crowdfunding campaigns on Kickstarter. In
regressions using the log of the funding amount as the dependent variable, we control for a
dummy that indicates whether the ICO was uncapped or not. In uncapped ICOs, the investors
are uncertain about how many tokens will be sold or about the cryptocurrency valuation. This
could signal opportunistic behaviour or even greed on the part of the project developers as
Electronic copy available at: https://ssrn.com/abstract=3250035
14
they sell as many tokens as investors want to buy (Buterin, 2017). In contrast, in capped ICOs
the maximum amount of funding is fixed. There are 55 uncapped ICOs (8.7% of the sample).
In addition, we control for the token price (excluding any bonuses and price
discounts) and the log of the number of tokens created (i.e. the total of tokens that are sold
and held by insiders). Investors might be more interested in tokens with lower prices and
lower supply because they anticipate a more upward potential for these lower priced and
scarce tokens. The average (median) token price equals $17.9 but the median token price
equals only 26 dollar cents. The average (median) number of tokens created amounts to more
than 20 billion (100 million). The large difference between average and median values
indicates the presence of outliers. Therefore, we log transform the variables token price and
token supply. Furthermore, we include the number of accepted currencies for payment, a
dummy variable indicating if paying with fiat currency was possible and a dummy variable
related to whether the project is (partly) based on the Ethereum platform as control variables
in our models.
In the next section, we report our regression results. In case of binary dependent
variables we make use of logistic regressions, otherwise OLS regressions are used.
5. Results
5.1. Transparency and expert ratings
In this section, we examine the effect of transparency and expert ratings on funding and ex-
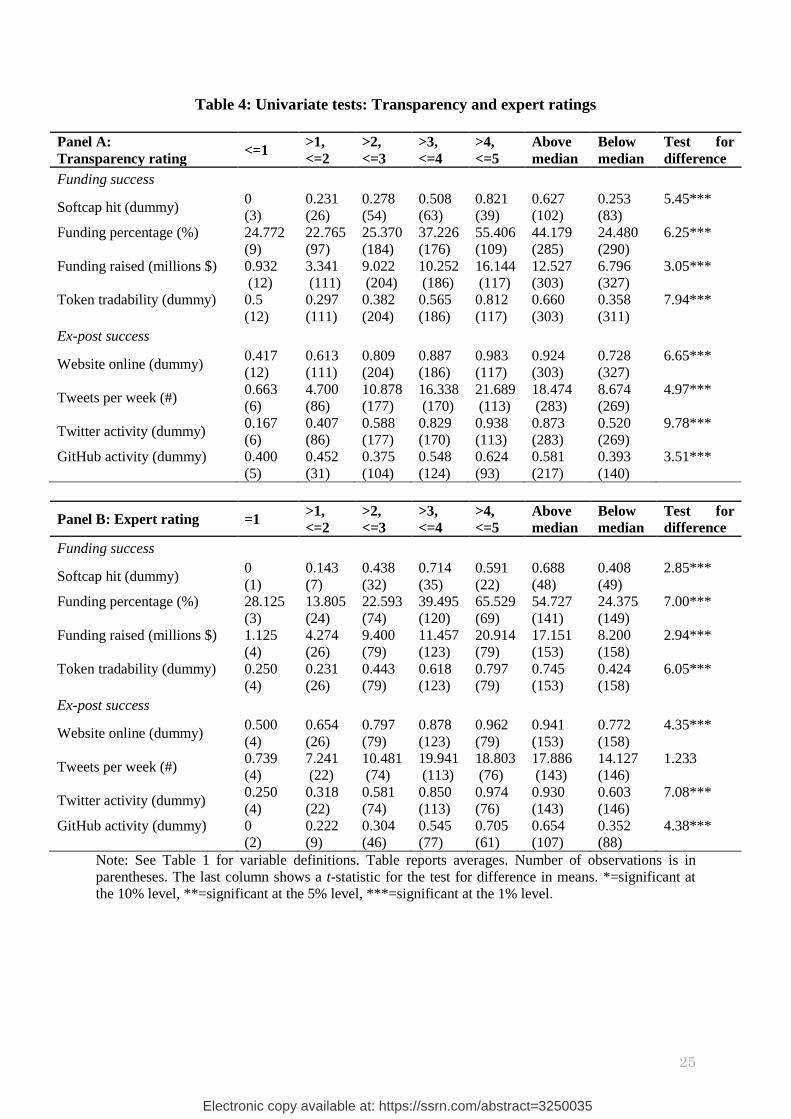
post success measures. We start with a univariate analysis presented in Table 4. Panel A
shows the funding and ex-post success measures split by the transparency rating categories
(ranging from 0 to 5). Panel B displays these success measures split by expert rating
categories (ranging from1 to 5). A clear pattern emerges showing that both higher
transparency and expert ratings are associated with more funding as well as better ex-post
project performance. Table 4 also shows the difference in means between ICOs with a
transparency or expert rating above the median or below the median. Regarding funding
success, ICOs with an above median transparency and expert rating are significantly more
successful in reaching the softcap and raise more capital (both expressed as a percentage of
the hardcap as well as the dollar amount) compared to ICOs with below median transparency
or expert ratings. ICOs with an above median transparency and expert ratings are also more
likely to have their tokens listed on CoinmarketCap than ICOs with a below median score on
Electronic copy available at: https://ssrn.com/abstract=3250035
15
these ratings. For ex-post success, Table 4 shows that ICOs with above median ratings
perform superior compared to below median rated token sales. We find that ICOs with an
above median transparency and expert rating have a significantly higher likelihood of their
website being online in July 2018 and are more likely to have post-ICO Twitter and GitHub
activity in the period between May and July 2018. The number of Tweets per week in the
period from the start of the ICO until July 2018 is significantly higher for ICOs with above
median transparency ratings compared to the ICOs with below median scores. However, we
do not find a significant difference in the number of Tweets per week when comparing the
ICOs with above and below median expert ratings even though the smaller categories with
the lowest rating (up to 3) clearly have fewer Tweets.
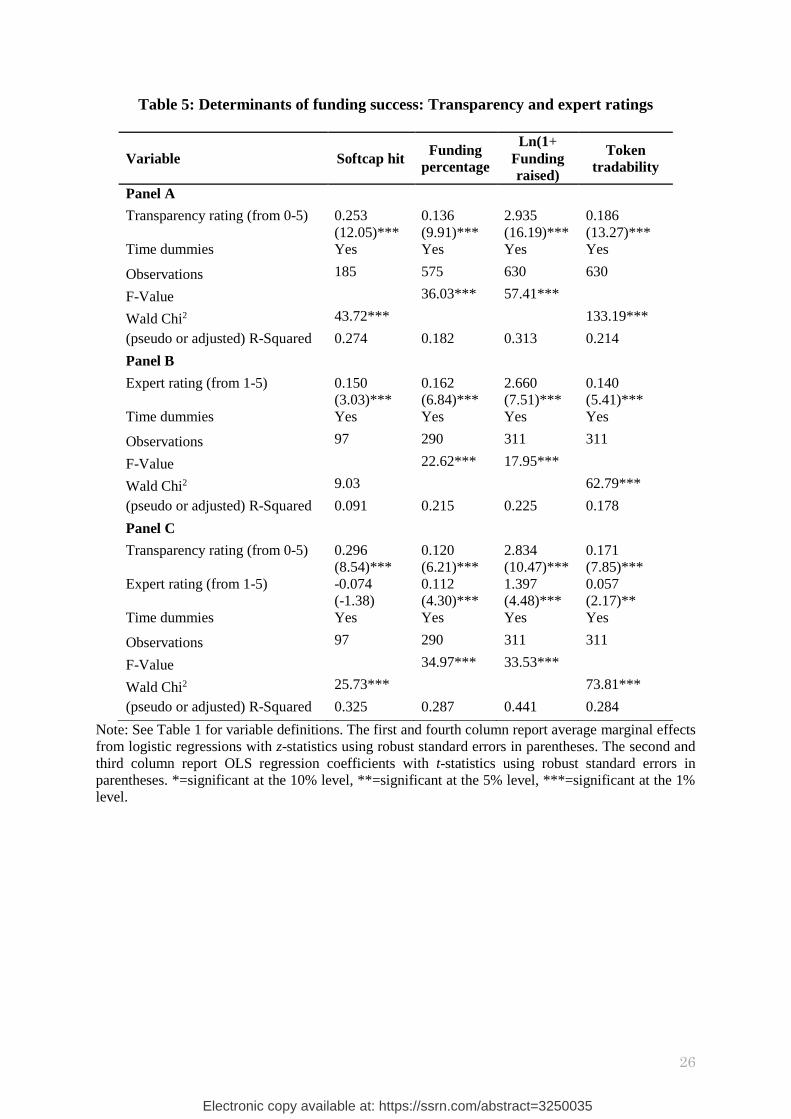
Next, we conduct multivariate regression analyses. Table 5 shows that the
transparency and expert rating have a positive and highly significant impact on funding
success, both when run separately (Panels A and B) and jointly in a regression (Panel C)
together with time dummies. The only exception relates to the expert rating which is no
longer significantly associated with the probability of reaching the softcap target amount in
Panel C of Table 5. However, it should be noted that the number of observations in the other
models is much higher. The effects are both statistically and economically important: for
example, in the second column of Table 5 we find that a one-point increase in the
transparency or the expert rating will increase the funding percentage by more than ten
percentage-points.
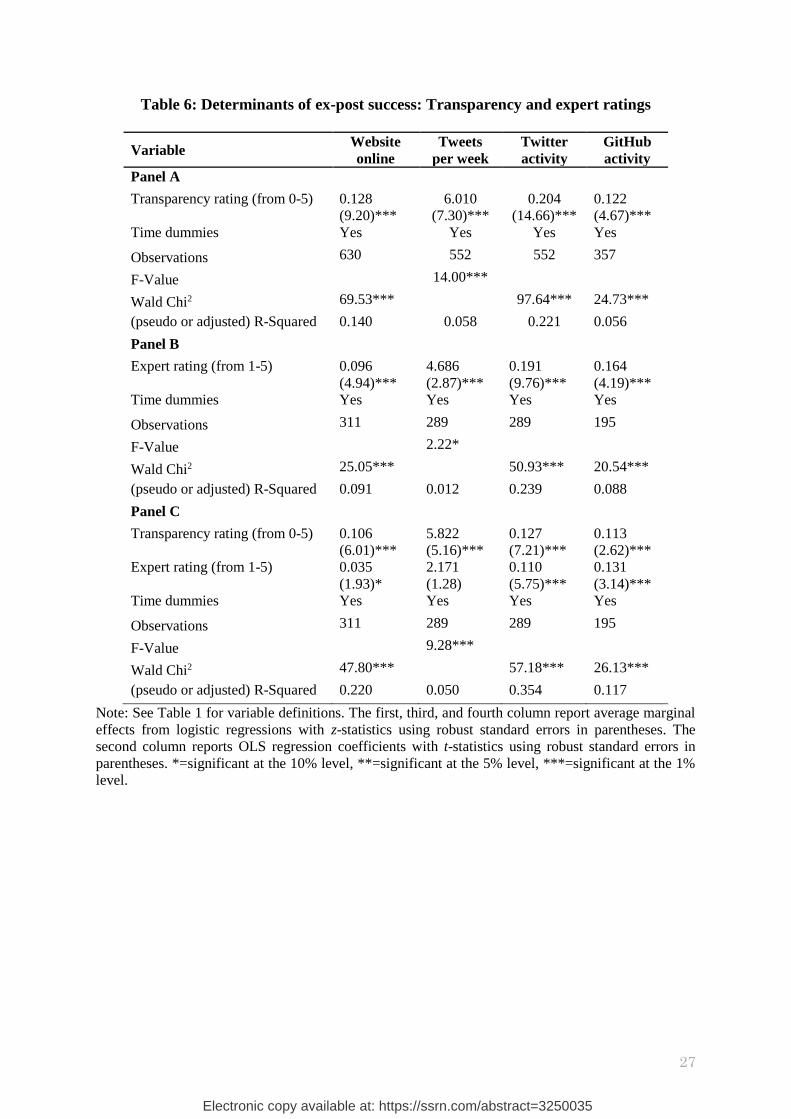
Table 6 shows the effect of the transparency and expert ratings on ex-post success
measures. We find that both types of ratings matter and have a positive and significant impact
on how well the project performs in the post-ICO period. Only the expert rating loses its
significance in the regression using Tweets per week as the dependent variable (Panel C),
which is consistent with our univariate results.
In line with our first two hypotheses, our results show that both transparency and
expert ratings are statistically and economically important determinants of funding and ex-
post project success. These ratings serve as aggregated measures on the transparency and
quality of ICOs and each is an important determinant in its own right. In the next subsection,
we further delve into the underlying determinants of success.
5.2. Success determinants
Electronic copy available at: https://ssrn.com/abstract=3250035
16
In this section, we investigate several determinants that, based on theory, we expect to impact
funding and/or ex-post project performance (see Section 3). It is important to note that in our
multivariate analyses we do not include the ratings. The reason is that many of the success
determinants we look at are also components of the ratings (also see our variable description
in Table 1). For example, the availability of a pre-ICO GitHub repository is also part of the
transparency rating. None of the regressions in Tables 8 and 9 suffer from multicollinearity
problems (Variance Inflation Factors are below two).
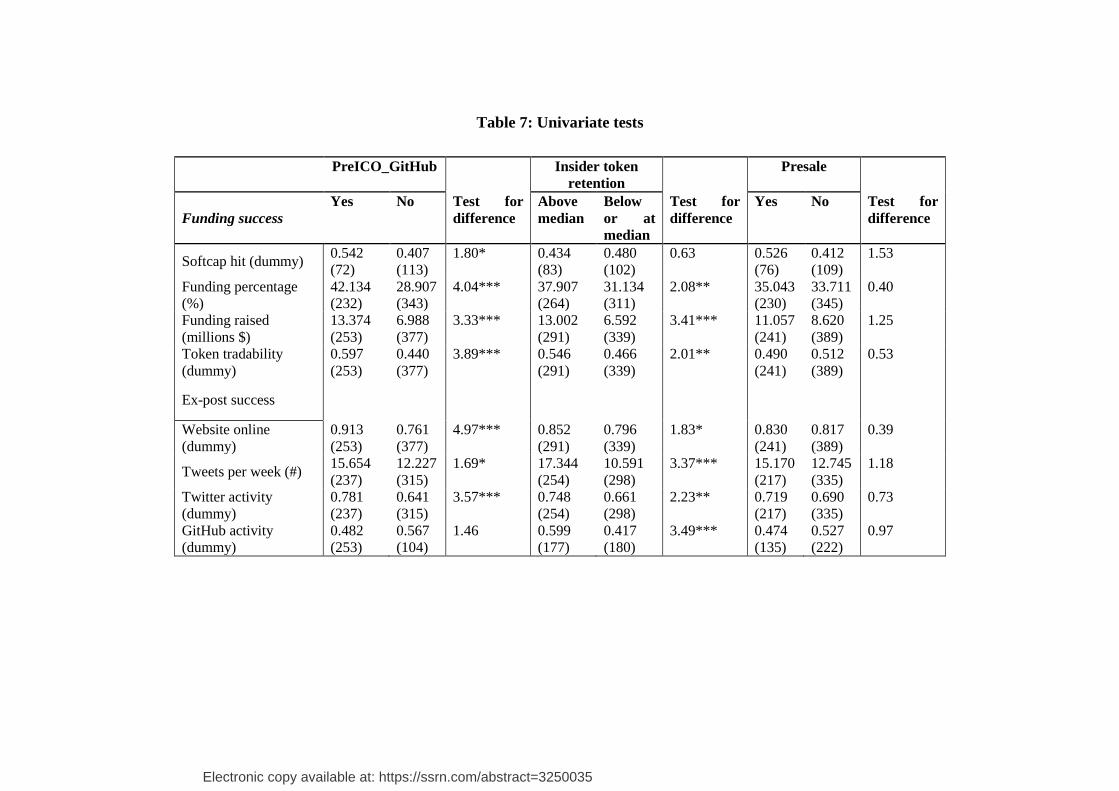
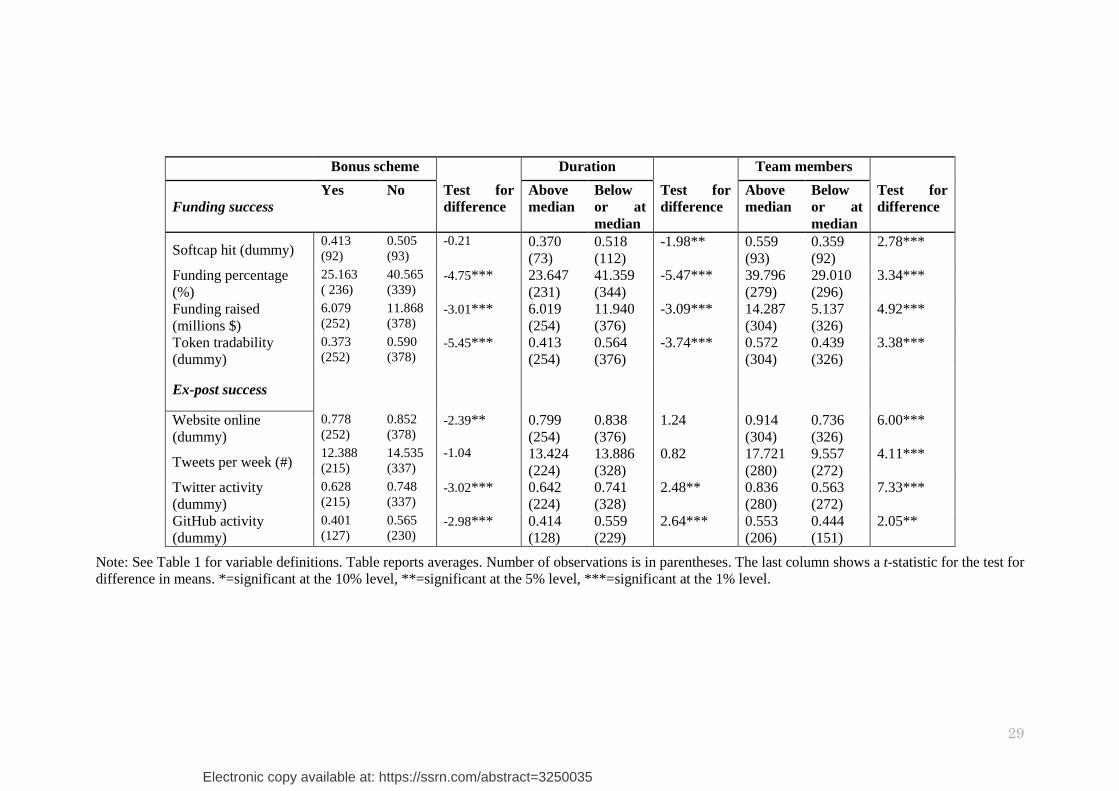
As in the previous section, we start with a univariate analysis. Table 7 shows that, on
average, a significantly higher fraction of ICOs reaches its softcap in case the project has one
or more GitHub repositories at the time of the ICO, it has a below median duration, and an
above median number of project team members. On average, an ICO raises a higher
percentage of its hardcap, raises more money and is more likely to trade on an online
exchange in case there is at least one pre-ICO GitHub repository, an above median retention
of tokens by the project team, a below median planned duration of the campaign, and an
above median number of people participating in the project team. ICOs with a bonus scheme
in the public phase of the ICO experience less funding success on average. We find no
statistical difference in average funding success between ICOs with and without a presale.
Regarding the ex-post success measures, we find that, on average, a higher fraction of
projects have their website online in July 2018 and generate more Tweets per week when
they have one or more GitHub repositories at the launch of their ICO, the project team retains
a percentage of tokens above the sample median and the project team has an above median
number of team members. We report that fewer ICOs have their website online in July 2018
in case they offered bonuses to investors in the public phase of the token sale. A higher
fraction of projects have recent Twitter and GitHub activity when they have above median
token retention by insiders, they do not offer a bonus scheme, a planned duration of their
campaign below the sample median, and their team consists of an above median number of
members. On average, a higher fraction of projects has recent Twitter activity in case they
have one or more GitHub repositories at the launch of their ICO.
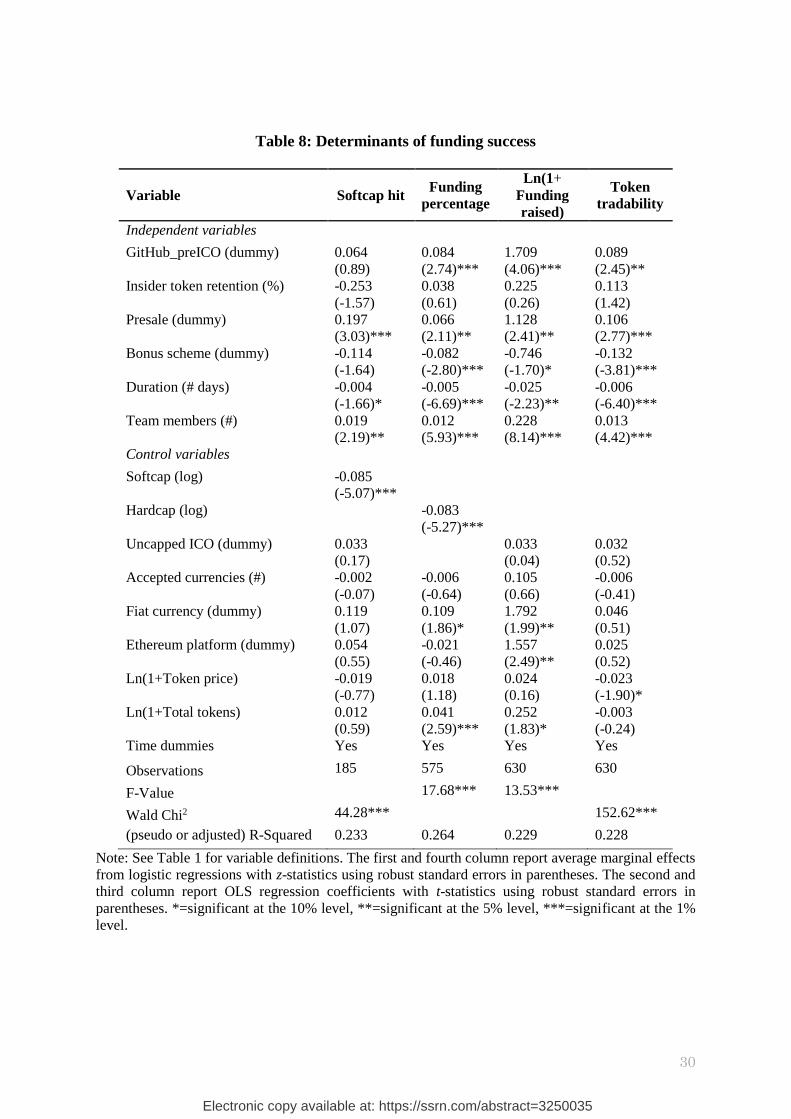
The multivariate results using the four funding success measures as the dependent
variable are presented in Table 8. The first column shows that having a presale, a shorter
planned duration and a higher number of team members positively impact the probability of
hitting the softcap target amount. Funding as a percentage of the hardcap target amount, the
amount of funding and the probability of getting the token traded on an online exchange are
all positively impacted by having one or more GitHub repositories before the ICO, having a
Electronic copy available at: https://ssrn.com/abstract=3250035
17
presale but not having a bonus scheme in the public phase of the ICO, having a shorter
planned duration of the campaign, and having more members on the project team. These
findings are in line with our hypotheses 3A, 5, 6, 7 and 8A. However, in contrast with our
hypothesis 4A insider token retention is insignificant. Considering the control variables, we
observe that setting a higher target amount for the softcap reduces the probability of reaching
that target and a setting a higher target amount for the hardcap negatively impacts funds
raised as a percentage of that hardcap. These findings are in line with Mollick (2014) who
finds similar results in the context of reward-based crowdfunding. In some model
specifications, we also find the fiat currency dummy, the Ethereum dummy and the total
token supply to be significant.
The multivariate results using the four ex-post success measures are reported in Table
9. The number of team members positively impacts all ex-post performance measures,
consistent with hypothesis 8B. There is some support for Hypotheses 3B and 4B. Pre-ICO
GitHub repositories are positively associated with the probability of having the project’s
website online in July 2018 and the project team being active on Twitter in the period May
until July 2018. Token retention by the project team is positively related to GitHub activity in
the period May until July 2018 as well as the number of Tweets per week in the period from
the ICO start until July 2018.
Although we did not develop specific hypotheses concerning the ex-post performance
for the other dependent variables, we do find that ICO campaigns that have been open for
funding for a shorter period of time generate more Tweets in the period from the start of the
ICO until July 2018 and are more likely to still be active on Twitter and GitHub in the period
of May until July 2018. ICOs with a bonus scheme in the public phase of the selling process
are associated with a lower probability of having the website online and Twitter activity in
the period of May until July 2018. Several of the control variables (fiat currency dummy,
token price and total token supply) are significant in some model specifications.
We have also conducted several additional analyses (unreported). We have included
dummies for the countries and categories listed in Table 2. Our results are robust to the
inclusion of these dummies. Instead of time dummies, we controlled for investor sentiment
by either the log of the number of ICOs in the month of the token sale or the volatility and
return of Ethereum in the month preceding the month in which the ICO commenced. Our
results are robust to controlling for these investor sentiment measures.
6. Conclusions
Electronic copy available at: https://ssrn.com/abstract=3250035
18
Initial Coin Offerings (ICOs) have become an increasingly popular way for entrepreneurs to
raise money for early-stage blockchain projects. ICOs are fraught with asymmetric
information problems between the project team vis-à-vis potential investors that are
considering buying the tokens. This paper is the first to test whether ratings from rating
websites such as ICObench can help to bridge this information gap. We find that projects that
disclose more extensive information to investors (i.e. have a higher transparency rating) are
more successful in fundraising and experience more post-ICO project success. In addition, a
higher rating by cryptocurrency experts on the quality of the project and project team is
associated with more success in fundraising and better ex-post performance.
Our results further show that having one or more pre-ICO GitHub repository, a
presale, not making use of bonus schemes in the public phase of the ICO, a shorter planned
duration of the ICO campaign, and a larger project team are positively related to funding
success. Depending on model specification, we also find that having at least one GitHub
repository at the time of the ICO, the percentage of tokens retained by the project team, not
having a bonus scheme in the public part of the ICO, a shorter planned period during which
tokens are sold, and a larger number of project team members positively impact ex-post
project performance.
We conclude that for entrepreneurs it is important to make the ICO as transparent as
possible and that, also for investors, expert ratings are a useful way in which to overcome the
information asymmetry problems associated with token sales. Project teams that provide
more and useful information to investors are more likely to successfully raise money from
investors and perform superior afterwards.
Our research demonstrates that in the ICO setting economic theory provides
meaningful determinants of success, including disclosure and ratings that can reduce the
information gap. However, we also demonstrate many elements that are specific to ICOs with
strong effects on the success in raising funding and sustaining the business. Although our
study presents tests of hypotheses and detailed information on the ICOs, future research will
be needed to build theory specifically for ICOs, as well as empirical work assessing the
longer-term viability of ICO-funded businesses.
Electronic copy available at: https://ssrn.com/abstract=3250035
19
References
Adhami, S., Giudici, G., & Martinazzi, S., 2018, “Why do businesses go crypto? An
empirical analysis of Initial Coin Offerings”, Journal of Economics and Business,
forthcoming.
Ahlers, G. K., Cumming, D., Günther, C., and Schweizer, D., 2015, “Signaling in equity
Crowdfunding”, Entrepreneurship Theory and Practice 39, 955-980.
Akerlof, G. A., 1970, “The market for "Lemons": Quality uncertainty and the market
mechanism”, Quarterly Journal of Economics 84, 488-500.
Amsden, R. and Schweizer D., 2018, Are blockchain crowdsales the new ‘gold rush’?
Success determinants of Initial Coin Offerings. Available at SSRN:
https://papers.ssrn.com/sol3/papers.cfm?abstract_id=3163849
Benedetti, H. and Kostovetsky, L., 2018, Digital tulips? Returns to investors in Initial Coin
Offerings. Available at SSRN:
https://papers.ssrn.com/sol3/papers.cfm?abstract_id=3182169.
Buterin, V., 2017, Analyzing Token Sale Models. Available at:
http://vitalik.ca/general/2017/06/09/sales.html. Accessed: 16 February 2018.
Catalini, C. and Gans, J.S., 2018, Initial Coin Offerings and the value of crypto tokens.
Available at SSRN: https://papers.ssrn.com/sol3/papers.cfm?abstract_id=3143343.
Chod, J., and Lyandres, E., 2018, A theory of ICOs: Diversification, agency and information
asymmetry. Available at SSRN:
https://papers.ssrn.com/sol3/papers.cfm?abstract_id=3159528.
Chohan, U.W., 2017, Initial Coin Offerings (ICOs): Risks, regulation, and accountability,
Discussion Paper Series: Notes on the 21st Century. Available at
SSRN: https://ssrn.com/abstract=3080098.
Cointelegraph, 2017, Fastest-Ever ICO: Ethereum-based Gnosis creates $300 million in
minutes, raising $12 million. Available at https://cointelegraph.com/news/fastest-
ever-ico-ethereum-based-gnosis-creates-300-mln-in-minutes-raising-12-mln.
Accessed: 13 February 2018.
EY, 2017, EY Research: Initial Coin Offerings (ICOs). Report.
Fisch, C., 2018, Initial Coin Offerings (ICOs) to finance new ventures: An exploratory study.
Available at SSRN: https://ssrn.com/abstract=3147521
Howell, S.T., Niessner, M. and Yermack, D., 2018, Initial Coin Offerings: Financing growth
with cryptocurrency token sales. Available at SSRN:
https://papers.ssrn.com/sol3/papers.cfm?abstract_id=3201259.
Huang, W., Meoli, M. and Vismara, S., 2018, The geography of Initial Coin Offerings.
Available at SSRN: https://papers.ssrn.com/sol3/papers.cfm?abstract_id=3206234.
Hughes, P.J., 1986, “Signalling by direct disclosure under asymmetric information”, Journal
of Accounting and Economics 8, 119-142.
Jaffe, J., 2018, Initial Coin Offerings, Explained. CNET. Available at:
https://www.cnet.com/how-to/initial-coin-offerings-explained/. Accessed: 17
February 2018.
Kaal, W., 2018, Initial Coin Offerings: The top 25 jurisdictions and their comparative
regulatory responses. Available at SSRN: https://ssrn.com/abstract=3117224.
Kaal, W., and Dell'Erba, M., 2017, Initial Coin Offerings: Emerging practices, risk factors,
and red flags. Forthcoming in F. Möslein & S. Omlor (Eds.), Fintech Handbook,
Verlag C.H. Beck.
Kastelein R., 2017, What Initial Coin Offerings are, and why VC firms care. Harvard
Business Review. Available at: https://hbr.org/2017/03/what-initial-coin-offerings-
are-and-why-vc-firms-care. Accessed: 30 January 2018.
Electronic copy available at: https://ssrn.com/abstract=3250035
20
Lea T., 2017, Venture Capital 3.0: The Initial Coin Offering explained. AFR Online.
Available at: http://www.afr.com/technology/venture-capital-30-the-initial-coin-
offering-explained-20170502-gvxhos. Accessed: 20 February 2018.
Marks, H., 2018, The ICO is dead: Long live the ICO 2.0. Available at:
https://hackernoon.com/the-ico-is-dead-long-live-the-ico-2-0-7bb269987513.
Accessed: 10 June 2018.
Mollick, E., 2014, “The dynamics of crowdfunding: An exploratory study”, Journal of
Business Venturing 29, 1-16.
Rosic, A, 2017, Smart Contracts: The Blockchain technology that will replace lawyers.
Available at: http://blockgeeks.com/guides/smart-contracts/. Accessed: 16 February
2018.
SEC, 2017, Investor Bulletin: Initial Coin Offerings. Available at:
https://www.sec.gov/oiea/investor-alerts-and-bulletins/ib_coinofferings. Accessed 25
January 2018.
Spence, M., 1973, “Job market signaling”, Quarterly Journal of Economics 87, 355-374.
Spence, M., 2002, “Signaling in retrospect and the informational structure of markets”,
American Economic Review 92, 434-459.
Sunnarborg, A., 2017, ICO investments pass VC funding in blockchain market first.
Coindesk. Available at: https://www.coindesk.com/ico-investments-pass-vc-
funding-in-blockchain-market-first/. Accessed: 18 February 2018.
The Economist, 2017, The market in Initial Coin Offerings risks becoming a bubble. Volume
413, issue 9034, 29 April 2017.
Varshneya, R., 2018, Should you launch an ICO to raise money for your startup? Available
at: https://www.entrepreneur.com/article/315873. Accessed: 10 June 2018.
Yadav, M., 2017, Exploring signals for investing in an Initial Coin Offering (ICO). Available
at SSRN: https://ssrn.com/abstract=3037106.
Electronic copy available at: https://ssrn.com/abstract=3250035
21
Table 1: Variable definitions
Variable Definition Data source
Dependent variables:
Funding success:
Softcap hit (dummy) Dummy indicating one if the softcap is
reached, zero otherwise
ICObench*
Funding percentage (%) Funding raised as percentage of hardcap ICObench*
Funding raised ($ million) Funding raised in millions of US$ ICObench*
Token tradability (dummy) Dummy indicating one if the ICO is traded on
an online exchange tracked by CoinmarketCap,
zero otherwise
CoinmarketCap
Ex-post success:
Website online (dummy) Dummy indicating one if the project’s website
is online in July 2018, zero otherwise
Tweets per week (#) Number of Tweets per week measured during
the period between the start of the ICO and
July 2018
Twitter activity (dummy) Dummy indicating one if there are any Tweets
from the project team in the period May until
July 2018, zero otherwise
GitHub activity (dummy) Dummy indicating one if there are any
contributions to any of the project’s GitHub
repositories in the period May until July 2018,
zero otherwise
GitHub
Independent variables
Expert rating (from 1-5) The equally weighted average of ratings on
product quality, vision quality and team quality
by expert reviewers. Ranges from one to five.
ICObench*
Transparency rating (from 0-5) Transparency rating of the ICO, based on a
computer algorithm and incorporating 31
distinct elements. Ranges from zero to five.
This rating includes whether the project:
i. is covered on GitHub, Twitter,
Telegram/Slack/Discord, Reddit,
Bitcoinwiki, Facebook and
Bitcointalk ANN thread;
ii. has an informative whitepaper
and/or video available, a
minimum viable product or
prototype is mentioned, and
milestones are listed;
iii. discloses the full names, LinkedIn
profiles, photos of the project
team, and/or;
iv. discloses its ICO start date, ICO
end date, token ticker, platform,
accepted currencies, token price,
bonus schemes, country of
registration, and any hardcap or
softcaps.
ICObench*
GitHub_preICO (dummy) Dummy indicating one if the project has one or
more GitHub repositories at the time of the
GitHub
Electronic copy available at: https://ssrn.com/abstract=3250035
22
ICO, zero otherwise
Insider token retention (%) Percentage of tokens retained by the project
team
ICObench*
Presale (dummy) Dummy indicating one if there is a presale of
tokens to early bird investors, zero otherwise
ICObench*
Bonus scheme (dummy) Dummy indicating one if there is a bonus
scheme (discounts and/or free tokens) in the
public phase of the ICO, zero otherwise
ICObench*
Duration (# days) Number of planned for the ICO campaign at
the time of its launch
ICObench*
Team members (#) Number of members of the project team ICObench*
Control variables
Softcap ($ million) Softcap target amount in millions of US dollars ICObench*
Hardcap ($ million) Hardcap target amount in millions of US
dollars
ICObench*
Uncapped ICO (dummy) Dummy indicating one if the ICO is uncapped,
zero otherwise
ICObench*
Accepted currencies (#) Number of accepted cryptocurrencies that are
accepted as payment for the tokens
ICObench*
Fiat currency (dummy) Dummy indicating one if a fiat currency (e.g.
US dollars) can be used as payment for the
tokens, zero otherwise
ICObench*
Ethereum platform (dummy) Dummy indicating one if the project is (partly)
based on the Ethereum blockchain, zero
otherwise
ICObench*
Token price ($ cents) Token price in US dollar cents ICObench*
Total tokens (in millions) Total number of tokens after ICO in millions
(circulating and retained)
ICObench*
Note: * In case data was missing on ICObench, it is complemented by using information from
additional sources such as: www.tokendata.io, www.icotracker.net, www.cryptocompare.com/ico,
www.smithandcrown.com/icos, https://elementus.io/token-sales-history, www.icomarketdata.com,
www.icodata.io, www.coindesk.com/ico-tracker/, www.icobench.com/ico, www.coinschedule.com,
www.ico-list.com, www.icostats.com. Additionally, we consulted the whitepaper, website,
Bitcointalk forum thread, Telegram, Twitter and Facebook of the ICO to complement missing data.
Electronic copy available at: https://ssrn.com/abstract=3250035
23
Table 2: Sample distribution
Country Category Blockchain
Count % Count % Count %
USA 121 19.2 Platform 166 26.3 Ethereum 533 84.6
Russia 85 13.5 Currency 100 15.8 Waves 39 6.2
UK 47 7.4 Business
services 66 10.5 BitShares 5 0.8
Singapore 42 6.7 Entertainment 45 7.1 NEO 4 0.6
Switzerland 27 4.3 Investment 31 4.9 NEM 3 0.5
Canada 17 2.7 Software 31 4.9 Omni 3 0.5
Estonia 14 2.2 Banking 28 4.4 Counterparty 2 0.3
Australia 13 2.1 Casino &
gambling 18 2.9 Litecoin 2 0.3
Germany 11 1.7 Internet 15 2.4 NXT 2 0.3
Hong Kong 11 1.7 Real estate 15 2.4 Ardor 1 0.2
Israel 11 1.7 Other 14 2.2 Electroneum 1 0.2
Netherlands 11 1.7 Media 11 1.7 Expanse 1 0.2
Slovenia 11 1.7 Health 9 1.4 Filecoin
Network 1 0.2
China 8 1.3 Tourism 9 1.4 Maidsafe 1 0.2
Lithuania 8 1.3 Infrastructure 8 1.3 NEBL 1 0.2
France 7 1.1 Sports 8 1.3 Own 1 0.2
Japan 7 1.1 Communication 7 1.1 QRC 1 0.2
Spain 7 1.1 Education 7 1.1 Tendermint 1 0.2
Unknown 60 9.5 Retail 7 1.1 Unknown 26 4.1
Other 112 17.9 Other 35 5.7 Other 2 0.3
Total 630 Total 630 Total 630
Electronic copy available at: https://ssrn.com/abstract=3250035
24
Table 3: Descriptive statistics
Variable Obs. Mean Median Std. Dev. Min Max
Dependent variables:
Funding success
Softcap hit (dummy) 185 0.46 0 0.5 0 1
Funding percentage (%) 575 34.24 14.14 39 0 100
Funding raised ($ million) 630 9.55 1.98 23.8 0 258
Token tradability (dummy) 630 0.5 1 0.5 0 1
Dependent variables:
Ex-post success:
Website online (dummy) 630 0.82 1 0.38 0 1
Tweets per week (#) 552 13.7 7.06 23.67 0 210
Twitter activity (dummy) 552 0.7 1 0.46 0 1
GitHub activity (dummy) 357 0.5 1 0.5 0 1
Independent variables:
Quality rating (from 1-5) 311 3.39 3.47 0.93 1 5
Transparency rating (from 0-5) 630 3.03 3 1.03 0.6 5
GitHub_preICO (dummy) 630 0.40 0 0.49 0 1
Insider token retention (%) 630 41.51 40 25.01 0 99
Presale (dummy) 630 0.38 0 0.49 0 1
Bonus scheme (dummy) 630 0.4 0 0.49 0 1
Duration (# days) 630 28.96 30 17.77 1 134
Team members (#) 630 9.58 8 7.54 1 57
Control variables:
Softcap ($ million) 185 4.96 2 7.93 0.3 51
Hardcap ($ million) 575 56.53 20 347 0.02 7801
Uncapped ICO (dummy) 630 0.08 0 0.283 0 1
Accepted currencies (#) 630 1.59 1 1.36 1 13
Fiat currency (dummy) 630 0.07 0 0.25 0 1
Ethereum platform (dummy) 630 0.85 1 0.36 0 1
Token price ($ cents) 630 1,788.59 25.91 30,480.48 0.01 755,460
Total tokens (in millions) 630 20,229 100 337,554 0.01 8,000,000
Note: See Table 1 for data definitions.
Electronic copy available at: https://ssrn.com/abstract=3250035
25
Table 4: Univariate tests: Transparency and expert ratings
Panel A:
Transparency rating <=1
>1,
<=2
>2,
<=3
>3,
<=4
>4,
<=5
Above
median
Below
median
Test for
difference
Funding success
Softcap hit (dummy) 0
(3)
0.231
(26)
0.278
(54)
0.508
(63)
0.821
(39)
0.627
(102)
0.253
(83)
5.45***
Funding percentage (%) 24.772
(9)
22.765
(97)
25.370
(184)
37.226
(176)
55.406
(109)
44.179
(285)
24.480
(290)
6.25***
Funding raised (millions $) 0.932
(12)
3.341
(111)
9.022
(204)
10.252
(186)
16.144
(117)
12.527
(303)
6.796
(327)
3.05***
Token tradability (dummy) 0.5
(12)
0.297
(111)
0.382
(204)
0.565
(186)
0.812
(117)
0.660
(303)
0.358
(311)
7.94***
Ex-post success
Website online (dummy) 0.417
(12)
0.613
(111)
0.809
(204)
0.887
(186)
0.983
(117)
0.924
(303)
0.728
(327)
6.65***
Tweets per week (#) 0.663
(6)
4.700
(86)
10.878
(177)
16.338
(170)
21.689
(113)
18.474
(283)
8.674
(269)
4.97***
Twitter activity (dummy) 0.167
(6)
0.407
(86)
0.588
(177)
0.829
(170)
0.938
(113)
0.873
(283)
0.520
(269)
9.78***
GitHub activity (dummy) 0.400
(5)
0.452
(31)
0.375
(104)
0.548
(124)
0.624
(93)
0.581
(217)
0.393
(140)
3.51***
Panel B: Expert rating =1 >1,
<=2
>2,
<=3
>3,
<=4
>4,
<=5
Above
median
Below
median
Test for
difference
Funding success
Softcap hit (dummy) 0
(1)
0.143
(7)
0.438
(32)
0.714
(35)
0.591
(22)
0.688
(48)
0.408
(49)
2.85***
Funding percentage (%) 28.125
(3)
13.805
(24)
22.593
(74)
39.495
(120)
65.529
(69)
54.727
(141)
24.375
(149)
7.00***
Funding raised (millions $) 1.125
(4)
4.274
(26)
9.400
(79)
11.457
(123)
20.914
(79)
17.151
(153)
8.200
(158)
2.94***
Token tradability (dummy) 0.250
(4)
0.231
(26)
0.443
(79)
0.618
(123)
0.797
(79)
0.745
(153)
0.424
(158)
6.05***
Ex-post success
Website online (dummy) 0.500
(4)
0.654
(26)
0.797
(79)
0.878
(123)
0.962
(79)
0.941
(153)
0.772
(158)
4.35***
Tweets per week (#) 0.739
(4)
7.241
(22)
10.481
(74)
19.941
(113)
18.803
(76)
17.886
(143)
14.127
(146)
1.233
Twitter activity (dummy) 0.250
(4)
0.318
(22)
0.581
(74)
0.850
(113)
0.974
(76)
0.930
(143)
0.603
(146)
7.08***
GitHub activity (dummy) 0
(2)
0.222
(9)
0.304
(46)
0.545
(77)
0.705
(61)
0.654
(107)
0.352
(88)
4.38***
Note: See Table 1 for variable definitions. Table reports averages. Number of observations is in
parentheses. The last column shows a t-statistic for the test for difference in means. *=significant at
the 10% level, **=significant at the 5% level, ***=significant at the 1% level.
Electronic copy available at: https://ssrn.com/abstract=3250035
26
Table 5: Determinants of funding success: Transparency and expert ratings
Variable Softcap hit Funding
percentage
Ln(1+
Funding
raised)
Token
tradability
Panel A
Transparency rating (from 0-5) 0.253
(12.05)***
0.136
(9.91)***
2.935
(16.19)***
0.186
(13.27)***
Time dummies Yes Yes Yes Yes
Observations 185 575 630 630
F-Value 36.03*** 57.41***
Wald Chi2 43.72*** 133.19***
(pseudo or adjusted) R-Squared 0.274 0.182 0.313 0.214
Panel B
Expert rating (from 1-5) 0.150
(3.03)***
0.162
(6.84)***
2.660
(7.51)***
0.140
(5.41)***
Time dummies Yes Yes Yes Yes
Observations 97 290 311 311
F-Value 22.62*** 17.95***
Wald Chi2 9.03 62.79***
(pseudo or adjusted) R-Squared 0.091 0.215 0.225 0.178
Panel C
Transparency rating (from 0-5) 0.296
(8.54)***
0.120
(6.21)***
2.834
(10.47)***
0.171
(7.85)***
Expert rating (from 1-5) -0.074
(-1.38)
0.112
(4.30)***
1.397
(4.48)***
0.057
(2.17)**
Time dummies Yes Yes Yes Yes
Observations 97 290 311 311
F-Value 34.97*** 33.53***
Wald Chi2 25.73*** 73.81***
(pseudo or adjusted) R-Squared 0.325 0.287 0.441 0.284
Note: See Table 1 for variable definitions. The first and fourth column report average marginal effects
from logistic regressions with z-statistics using robust standard errors in parentheses. The second and
third column report OLS regression coefficients with t-statistics using robust standard errors in
parentheses. *=significant at the 10% level, **=significant at the 5% level, ***=significant at the 1%
level.
Electronic copy available at: https://ssrn.com/abstract=3250035
27
Table 6: Determinants of ex-post success: Transparency and expert ratings
Variable Website
online
Tweets
per week
activity
GitHub
activity
Panel A
Transparency rating (from 0-5) 0.128
(9.20)***
6.010
(7.30)***
0.204
(14.66)***
0.122
(4.67)***
Time dummies Yes Yes Yes Yes
Observations 630 552 552 357
F-Value 14.00***
Wald Chi2 69.53*** 97.64*** 24.73***
(pseudo or adjusted) R-Squared 0.140 0.058 0.221 0.056
Panel B
Expert rating (from 1-5) 0.096
(4.94)***
4.686
(2.87)***
0.191
(9.76)***
0.164
(4.19)***
Time dummies Yes Yes Yes Yes
Observations 311 289 289 195
F-Value 2.22*
Wald Chi2 25.05*** 50.93*** 20.54***
(pseudo or adjusted) R-Squared 0.091 0.012 0.239 0.088
Panel C
Transparency rating (from 0-5) 0.106
(6.01)***
5.822
(5.16)***
0.127
(7.21)***
0.113
(2.62)***
Expert rating (from 1-5) 0.035
(1.93)*
2.171
(1.28)
0.110
(5.75)***
0.131
(3.14)***
Time dummies Yes Yes Yes Yes
Observations 311 289 289 195
F-Value 9.28***
Wald Chi2 47.80*** 57.18*** 26.13***
(pseudo or adjusted) R-Squared 0.220 0.050 0.354 0.117
Note: See Table 1 for variable definitions. The first, third, and fourth column report average marginal
effects from logistic regressions with z-statistics using robust standard errors in parentheses. The
second column reports OLS regression coefficients with t-statistics using robust standard errors in
parentheses. *=significant at the 10% level, **=significant at the 5% level, ***=significant at the 1%
level.
Electronic copy available at: https://ssrn.com/abstract=3250035
Table 7: Univariate tests
PreICO_GitHub Insider token
retention
Presale
Funding success
Yes No Test for
difference
Above
median
Below
or at
median
Test for
difference
Yes No Test for
difference
Softcap hit (dummy) 0.542
(72)
0.407
(113)
1.80* 0.434
(83)
0.480
(102)
0.63 0.526
(76)
0.412
(109)
1.53
Funding percentage
(%)
42.134
(232)
28.907
(343)
4.04*** 37.907
(264)
31.134
(311)
2.08** 35.043
(230)
33.711
(345)
0.40
Funding raised
(millions $)
13.374
(253)
6.988
(377)
3.33*** 13.002
(291)
6.592
(339)
3.41*** 11.057
(241)
8.620
(389)
1.25
Token tradability
(dummy)
0.597
(253)
0.440
(377)
3.89*** 0.546
(291)
0.466
(339)
2.01** 0.490
(241)
0.512
(389)
0.53
Ex-post success
Website online
(dummy)
0.913
(253)
0.761
(377)
4.97*** 0.852
(291)
0.796
(339)
1.83* 0.830
(241)
0.817
(389)
0.39
Tweets per week (#) 15.654
(237)
12.227
(315)
1.69* 17.344
(254)
10.591
(298)
3.37*** 15.170
(217)
12.745
(335)
1.18
Twitter activity
(dummy)
0.781
(237)
0.641
(315)
3.57*** 0.748
(254)
0.661
(298)
2.23** 0.719
(217)
0.690
(335)
0.73
GitHub activity
(dummy)
0.482
(253)
0.567
(104)
1.46 0.599
(177)
0.417
(180)
3.49*** 0.474
(135)
0.527
(222)
0.97
Electronic copy available at: https://ssrn.com/abstract=3250035
29
Note: See Table 1 for variable definitions. Table reports averages. Number of observations is in parentheses. The last column shows a t-statistic for the test for
difference in means. *=significant at the 10% level, **=significant at the 5% level, ***=significant at the 1% level.
Bonus scheme Duration Team members
Funding success
Yes No Test for
difference
Above
median
Below
or at
median
Test for
difference
Above
median
Below
or at
median
Test for
difference
Softcap hit (dummy) 0.413
(92) 0.505
(93) -0.21 0.370
(73)
0.518
(112)
-1.98** 0.559
(93)
0.359
(92)
2.78***
Funding percentage
(%)
25.163
( 236) 40.565
(339) -4.75*** 23.647
(231)
41.359
(344)
-5.47*** 39.796
(279)
29.010
(296)
3.34***
Funding raised
(millions $)
6.079
(252) 11.868
(378) -3.01*** 6.019
(254)
11.940
(376)
-3.09*** 14.287
(304)
5.137
(326)
4.92***
Token tradability
(dummy)
0.373
(252) 0.590
(378) -5.45*** 0.413
(254)
0.564
(376)
-3.74*** 0.572
(304)
0.439
(326)
3.38***
Ex-post success
Website online
(dummy)
0.778
(252) 0.852
(378) -2.39** 0.799
(254)
0.838
(376)
1.24 0.914
(304)
0.736
(326)
6.00***
Tweets per week (#) 12.388
(215) 14.535
(337) -1.04 13.424
(224)
13.886
(328)
0.82 17.721
(280)
9.557
(272)
4.11***
Twitter activity
(dummy)
0.628
(215) 0.748
(337) -3.02*** 0.642
(224)
0.741
(328)
2.48** 0.836
(280)
0.563
(272)
7.33***
GitHub activity
(dummy)
0.401
(127) 0.565
(230) -2.98*** 0.414
(128)
0.559
(229)
2.64*** 0.553
(206)
0.444
(151)
2.05**
Electronic copy available at: https://ssrn.com/abstract=3250035
30
Table 8: Determinants of funding success
Variable Softcap hit Funding
percentage
Ln(1+
Funding
raised)
Token
tradability
Independent variables
GitHub_preICO (dummy) 0.064
(0.89)
0.084
(2.74)***
1.709
(4.06)***
0.089
(2.45)**
Insider token retention (%) -0.253
(-1.57)
0.038
(0.61)
0.225
(0.26)
0.113
(1.42)
Presale (dummy) 0.197
(3.03)***
0.066
(2.11)**
1.128
(2.41)**
0.106
(2.77)***
Bonus scheme (dummy) -0.114
(-1.64)
-0.082
(-2.80)***
-0.746
(-1.70)*
-0.132
(-3.81)***
Duration (# days) -0.004
(-1.66)*
-0.005
(-6.69)***
-0.025
(-2.23)**
-0.006
(-6.40)***
Team members (#) 0.019
(2.19)**
0.012
(5.93)***
0.228
(8.14)***
0.013
(4.42)***
Control variables
Softcap (log) -0.085
(-5.07)***
Hardcap (log) -0.083
(-5.27)***
Uncapped ICO (dummy) 0.033
(0.17)
0.033
(0.04)
0.032
(0.52)
Accepted currencies (#) -0.002
(-0.07)
-0.006
(-0.64)
0.105
(0.66)
-0.006
(-0.41)
Fiat currency (dummy) 0.119
(1.07)
0.109
(1.86)*
1.792
(1.99)**
0.046
(0.51)
Ethereum platform (dummy) 0.054
(0.55)
-0.021
(-0.46)
1.557
(2.49)**
0.025
(0.52)
Ln(1+Token price) -0.019
(-0.77)
0.018
(1.18)
0.024
(0.16)
-0.023
(-1.90)*
Ln(1+Total tokens) 0.012
(0.59)
0.041
(2.59)***
0.252
(1.83)*
-0.003
(-0.24)
Time dummies Yes Yes Yes Yes
Observations 185 575 630 630
F-Value 17.68*** 13.53***
Wald Chi2 44.28*** 152.62***
(pseudo or adjusted) R-Squared 0.233 0.264 0.229 0.228
Note: See Table 1 for variable definitions. The first and fourth column report average marginal effects
from logistic regressions with z-statistics using robust standard errors in parentheses. The second and
third column report OLS regression coefficients with t-statistics using robust standard errors in
parentheses. *=significant at the 10% level, **=significant at the 5% level, ***=significant at the 1%
level.
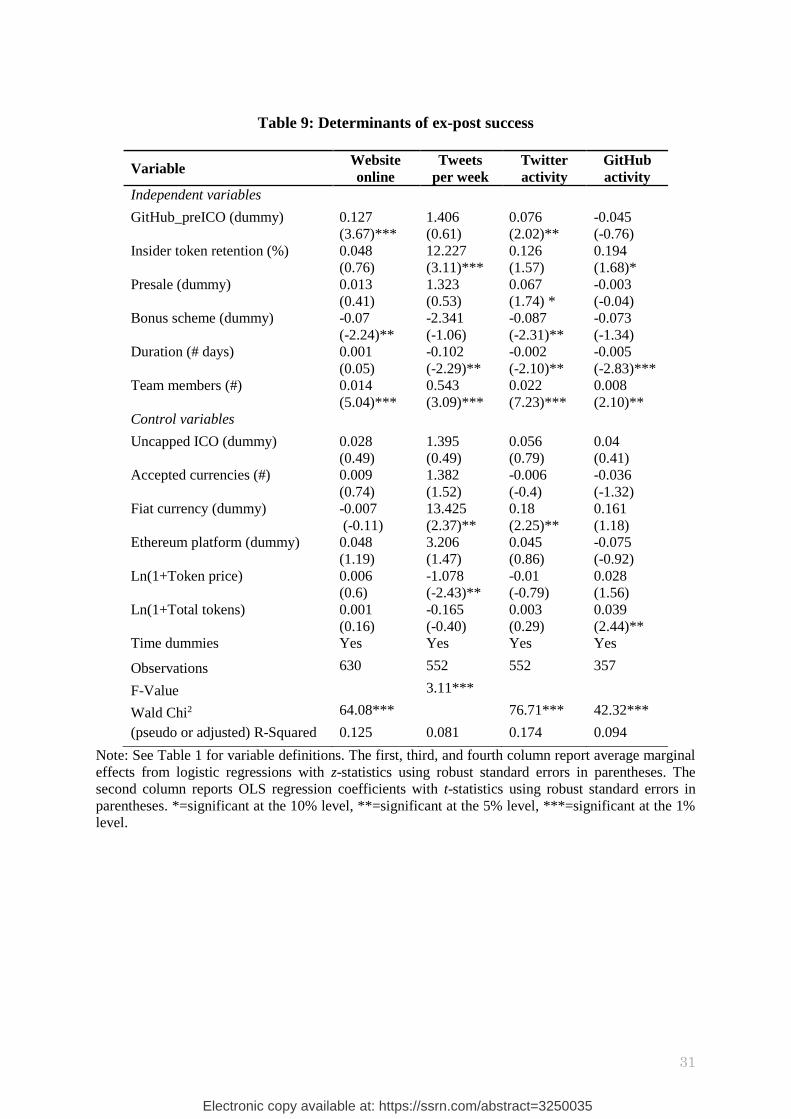
Electronic copy available at: https://ssrn.com/abstract=3250035
31
Table 9: Determinants of ex-post success
Variable Website
online
Tweets
per week
activity
GitHub
activity
Independent variables
GitHub_preICO (dummy) 0.127
(3.67)***
1.406
(0.61)
0.076
(2.02)**
-0.045
(-0.76)
Insider token retention (%) 0.048
(0.76)
12.227
(3.11)***
0.126
(1.57)
0.194
(1.68)*
Presale (dummy) 0.013
(0.41)
1.323
(0.53)
0.067
(1.74) *
-0.003
(-0.04)
Bonus scheme (dummy) -0.07
(-2.24)**
-2.341
(-1.06)
-0.087
(-2.31)**
-0.073
(-1.34)
Duration (# days) 0.001
(0.05)
-0.102
(-2.29)**
-0.002
(-2.10)**
-0.005
(-2.83)***
Team members (#) 0.014
(5.04)***
0.543
(3.09)***
0.022
(7.23)***
0.008
(2.10)**
Control variables
Uncapped ICO (dummy) 0.028
(0.49)
1.395
(0.49)
0.056
(0.79)
0.04
(0.41)
Accepted currencies (#) 0.009
(0.74)
1.382
(1.52)
-0.006
(-0.4)
-0.036
(-1.32)
Fiat currency (dummy) -0.007
(-0.11)
13.425
(2.37)**
0.18
(2.25)**
0.161
(1.18)
Ethereum platform (dummy) 0.048
(1.19)
3.206
(1.47)
0.045
(0.86)
-0.075
(-0.92)
Ln(1+Token price) 0.006
(0.6)
-1.078
(-2.43)**
-0.01
(-0.79)
0.028
(1.56)
Ln(1+Total tokens) 0.001
(0.16)
-0.165
(-0.40)
0.003
(0.29)
0.039
(2.44)**
Time dummies Yes Yes Yes Yes
Observations 630 552 552 357
F-Value 3.11***
Wald Chi2 64.08*** 76.71*** 42.32***
(pseudo or adjusted) R-Squared 0.125 0.081 0.174 0.094
Note: See Table 1 for variable definitions. The first, third, and fourth column report average marginal
effects from logistic regressions with z-statistics using robust standard errors in parentheses. The
second column reports OLS regression coefficients with t-statistics using robust standard errors in
parentheses. *=significant at the 10% level, **=significant at the 5% level, ***=significant at the 1%
level.