proposal 2009462572
TRANSCRIPT
PROPOSAL OF RESEARCH: A STUDY ON DETERMINANTS OF SAVING IN MALAYSIA 2011
CHAPTER 1: INTRODUCTION
1.0 INTRODUCTION OF STUDY
Understanding the nature of savings behavior is critical in
designing policies to promote savings and investment. Given the
differences in the economic environment of the developing and
industrial countries there should be substantial variation in the
household behavior.
The topic that researcher will be discuss in this research paper
is A Study on Determinants of Saving in Malaysia. This research paper
is starts with introduction. For introduction it includes background
of the study, statement of problem, objectives of study, scope of
study, theoretical framework, research hypothesis, limitations of
study, significance of study and definition of terms.
Next chapter is about literature review which discuss of each
dependent and independent variables. Chapter three in this report
consists of methodologies which discuss about the research methods
that used for this study. For the chapter four, it discuss about the
findings that found from the data collected. Last chapter, it discuss
about conclusion and some recommendations from researcher.
1 | P a g e
PROPOSAL OF RESEARCH: A STUDY ON DETERMINANTS OF SAVING IN MALAYSIA 2011
1.1 BACKGROUND OF STUDY
Proper analysis of savers’ behavior requires household or micro
level data on saving patterns and preferences as well as direct
estimates of household savings. Such information will help financial
institutions and policy makers mobilize savings and increase
investments.
Savings play an important role in economic development. Growth
theories have shown that savings is a necessary ingredient to finance
investment which will enhance a country’s productivity. Thus, it would
be important to look at the determinants of people’s saving to fully
understand economic growth.
Saving is the amount of current income which is not spent on
current consumption but reserved for use in the future. In its
simplest form, saving is usually in cash or other bankable deposits.
2 | P a g e
PROPOSAL OF RESEARCH: A STUDY ON DETERMINANTS OF SAVING IN MALAYSIA 2011
In broader terms, a comprehensive definition of saving would be the
value of all assets held, including financial assets, inventories,
livestock, equipment, land and landed assets.
The degree or extent to which these saved assets can be mobilized
for use in the future date differs. For example, bank deposits and
other liquid forms of savings can be readily mobilized in financial
markets in that the savers fund can be easily transformed by the
financial intermediaries to meet the needs of potential borrowers.
On the other hand, savings held in the form of assets, such as
equipments and land may not be as liquid for immediate mobilization.
By contrast, cash may be readily available for use by the savers, but
this is not accessible in the market for lending to other people.
1.1.1 History of Saving Environment in Malaysia
The mobilization of savings is an important prerequisite for
capital formation and hence, national development. Economic
growth can be sustained only if resources are mobilized
efficiently and transformed effectively into productive
activities.
Historically, Malaysia had managed to sustain a high level
of savings. On the whole, the country saved an average of 24% of
3 | P a g e
PROPOSAL OF RESEARCH: A STUDY ON DETERMINANTS OF SAVING IN MALAYSIA 2011
GNP a year over the last three decades, a level amongst the
highest in the world. Because of the availability of adequate
savings for productive long-term investment, Malaysia had
consistently achieved a high rate of growth with relative price
stability.
Growth in the gross domestic product (GDP) at constant
prices had accelerated from an average annual rate of about 5%
(inflation of less than 1% annually) in the 1960s, to 8% in the
1970s (inflation was higher, averaging about6%), but slackened to
5.2% during the 1981-85 period (inflation averaged 4.6% during
this period). This reflected the prolonged global recession in
the early 1980s.
However, the Malaysian economy had since rebounded through
the rest of the 1980s with remarkable resilience in terms of
performance. Real economic growth picked up to average 6.9% per
annum during the 1986-90 period (9.2% a year in 1988-90), with
inflation averaging 2.8% annually.
Throughout the past three decades, Malaysia had basically
relied on the use of realistic 5-year plans to implement its
development strategy, the main aim being to ensure that
4 | P a g e
PROPOSAL OF RESEARCH: A STUDY ON DETERMINANTS OF SAVING IN MALAYSIA 2011
sufficient domestic resources will be forthcoming to meet the
goals of national development.
However, Malaysia is a small and open economy and as such,
fluctuations in its international terms of trade and their impact
on export earnings (and hence, national income) have a
significant influence on the rate and level of its domestic and
national savings.
Consequently, periodic imbalances were reflected in the form
of deficits or surpluses in the current account of the balance of
payments, which were usually "financed" through sufficient
inflows of long term foreign capital so that overall national
external reserves even rose significantly in most of the "lean"
years.
1.2 PROBLEM STATEMENT
The rapid demographic shift in Malaysia is expected to raise both
micro and macro-economic issues. On the microeconomic front, health
care, housing, and other related services for the purpose of improving
the welfare of the elderly need to be addressed. In addition,
5 | P a g e
PROPOSAL OF RESEARCH: A STUDY ON DETERMINANTS OF SAVING IN MALAYSIA 2011
macroeconomic issues related to saving, labor productivity, and
capital flows also need to receive attention.
To derive the saving implications of this economic change, the
determinants of the people’s saving ratio in Malaysia are investigated
using the hypothesis of saving behavior. The saving behavior
hypothesis is tested with the Malaysian data. The investigation deals
with an unresolved issue of the growth rate effect on the saving
ratio.
Malaysia has achieved remarkable growth and development since
independence. During the 1970s, the economy registered a rate of
growth of Gross Domestic Products (GDP) at 7.6 percent per annum
despite the setbacks due to the oil crisis in 1972-1973 and 1979.
Subsequently, growth was somewhat hampered by the recession which
began in late 1979. However, economic growth of the GDP during the
period of 1981 to 1985 managed to sustain at 5.8 percent per annum
(Fourth Malaysia Plan, 1981).
Since the growth in some of these economies is often considered
resource intensive rather than technology intensive (Rosegrant and
Evenson (1992), The World Bank (2007), savings are likely to play a
very important role in promoting real growth. Several empirical
studies found a positive effect of the saving rate on the long term
6 | P a g e
PROPOSAL OF RESEARCH: A STUDY ON DETERMINANTS OF SAVING IN MALAYSIA 2011
growth (Cardenas and Escobar (1998), Motely (1994) and Krieckhaus
(2002) though the growth theory predicted only temporary positive
effect of increased saving rate on the growth rate in the economy due
to corresponding negative effect on capital productivity.
People’s savings, in particular, assist in smoothing out
unexpected variations in income, minimizing the impact of shocks on
consumption. In a country like the Malaysia, where a lot of resident
in rural area are engaged in agriculture and face uncertainty from
weather and natural calamities, it would be helpful to understand how
people deal with fluctuations in incomes. Further, savings serve as a
vehicle of social mobility and of enhancing future income earning
possibilities. Savings indeed have implications in the welfare of
households, macroeconomic, growth and development.
In the Malaysia, however, it has been noted that the savings rate
is becomes fluctuate overtime. On the other hand, there is a
possibility that Malaysian are actually saving more but not through
formal financial instruments. Previous studies on savings look at
differences in the saving behavior of urban and rural households. Some
studies focus on the forms and determinants of rural savings. Due to
the inadequacy of recent and comprehensive data and information
7 | P a g e
PROPOSAL OF RESEARCH: A STUDY ON DETERMINANTS OF SAVING IN MALAYSIA 2011
regarding the behavior of household savers through time, the study
designed to increase savings interest.
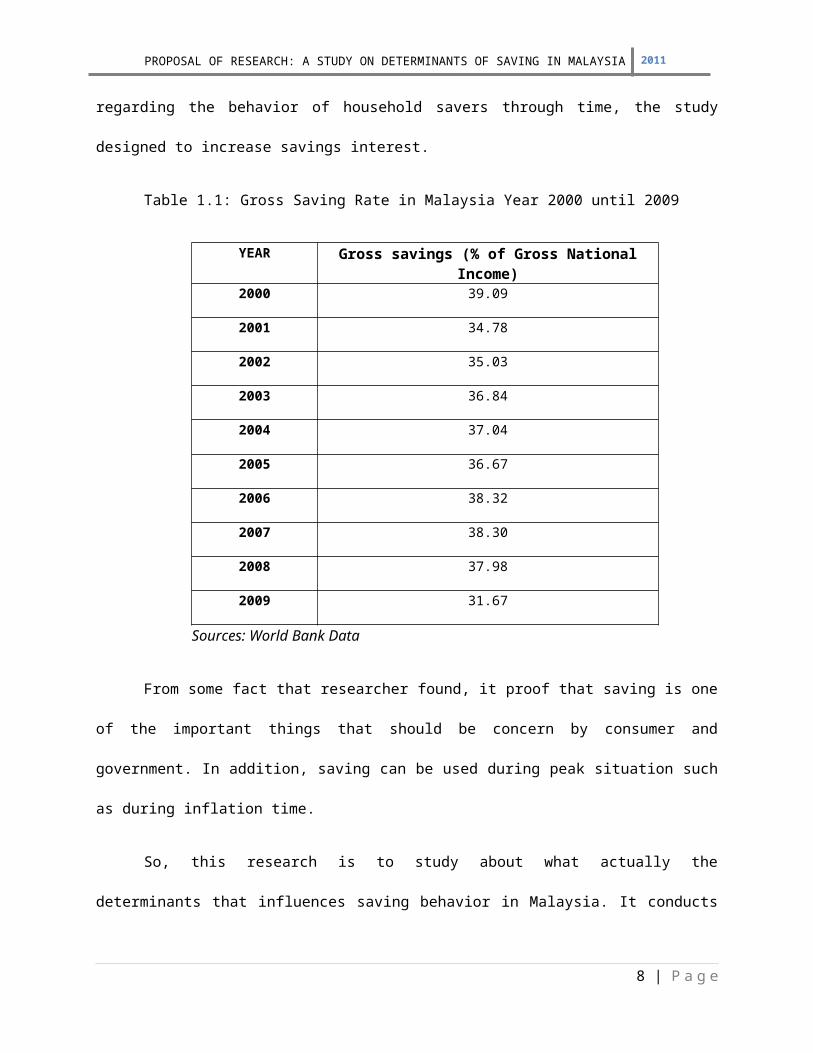
Table 1.1: Gross Saving Rate in Malaysia Year 2000 until 2009
YEAR Gross savings (% of Gross NationalIncome)
2000 39.09
2001 34.78
2002 35.03
2003 36.84
2004 37.04
2005 36.67
2006 38.32
2007 38.30
2008 37.98
2009 31.67
Sources: World Bank Data
From some fact that researcher found, it proof that saving is one
of the important things that should be concern by consumer and
government. In addition, saving can be used during peak situation such
as during inflation time.
So, this research is to study about what actually the
determinants that influences saving behavior in Malaysia. It conducts
8 | P a g e
PROPOSAL OF RESEARCH: A STUDY ON DETERMINANTS OF SAVING IN MALAYSIA 2011
to determine is there relationship between of income, rate of return,
inflation, and consumption on saving in Malaysia.
1.3 OBJECTIVES OF STUDY
The research attempts to achieve several objectives. All of these
objectives must be considered to ensure that the findings are precise
with what researcher is trying to search out.
9 | P a g e
PROPOSAL OF RESEARCH: A STUDY ON DETERMINANTS OF SAVING IN MALAYSIA 2011
Below are the objectives that are essential to be achieved for
the purpose of completing the ultimate intention of this research
which is as follow:
i. To give background information about saving.
ii. To study about relationship of income level on saving.
iii. To study about relationship rate of return on saving.
iv. To study about relationship of inflation on saving.
v. To study about relationship of consumption on saving.
10 | P a g e
PROPOSAL OF RESEARCH: A STUDY ON DETERMINANTS OF SAVING IN MALAYSIA 2011
1.4 SCOPE OF STUDY
This research paper will discuss about saving in Malaysia.
Malaysia is one of develop country regarding of their economy. The
Malaysian economy has demonstrated strong resilience in the face of
external uncertainties. Economic growth continues to be broad-based
with all sectors registering higher output.
This study using secondary data as a source to get information
about saving behavior and literature review was founded from internet
materials such as journal and articles that need supported to all
dependent and independent variable to conduct this research.
The research focus is about the income level, rate of return,
inflation, and consumption in Malaysia. The Malaysia data collected is
time series data about 41 years which range from year 1967 until 2007.
Researcher use real Gross Domestic Product (GDP) constant local
currency as income indicator, Deposit Interest Rate as measurement of
rate of return, Consumer Price Index (CPI) for inflation, and Gross
National Expenditure constant local currency for consumption, while
for saving behavior, researcher use Gross Domestic Saving constant
local currency as measurement.
11 | P a g e
PROPOSAL OF RESEARCH: A STUDY ON DETERMINANTS OF SAVING IN MALAYSIA 2011
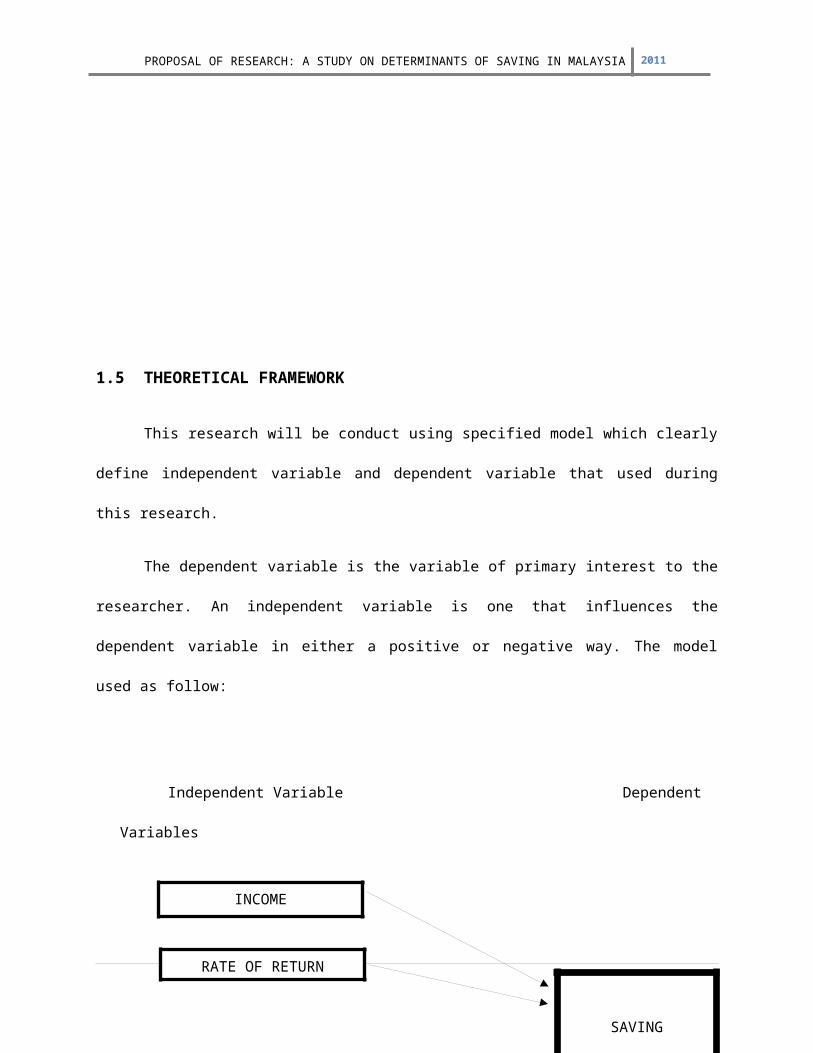
1.5 THEORETICAL FRAMEWORK
This research will be conduct using specified model which clearly
define independent variable and dependent variable that used during
this research.
The dependent variable is the variable of primary interest to the
researcher. An independent variable is one that influences the
dependent variable in either a positive or negative way. The model
used as follow:
Independent Variable Dependent
Variables
12 | P a g e
INCOME
RATE OF RETURN
SAVING
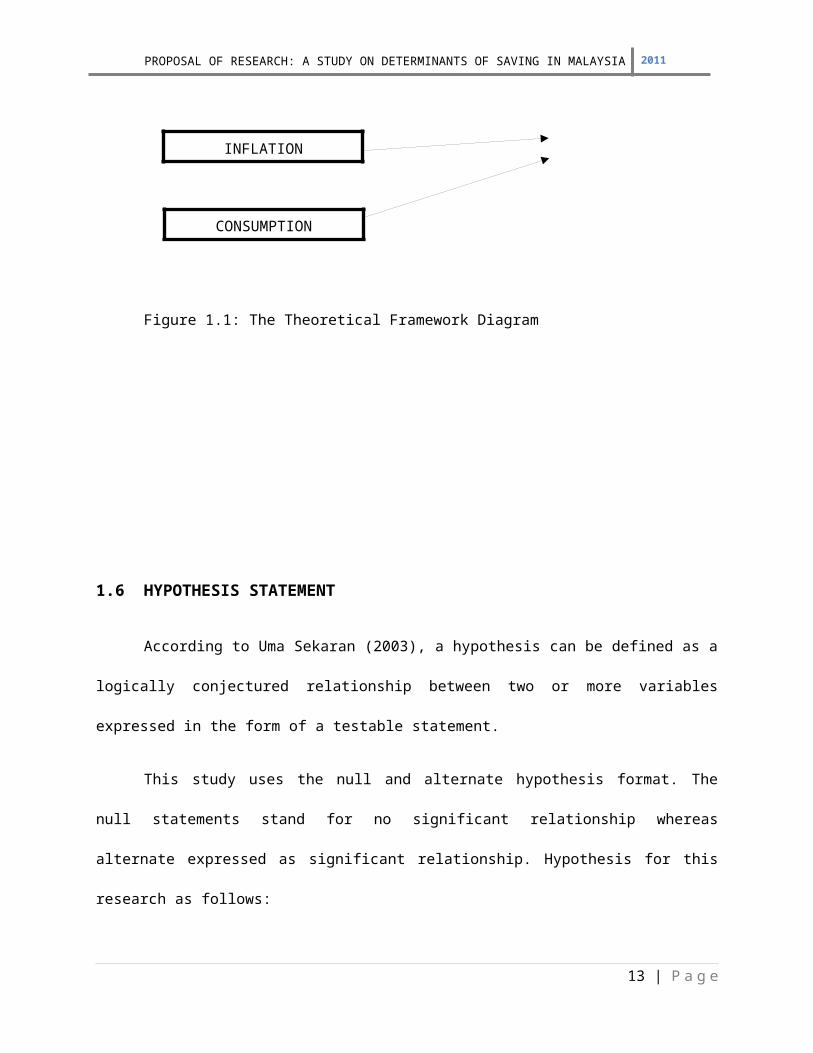
PROPOSAL OF RESEARCH: A STUDY ON DETERMINANTS OF SAVING IN MALAYSIA 2011
Figure 1.1: The Theoretical Framework Diagram
1.6 HYPOTHESIS STATEMENT
According to Uma Sekaran (2003), a hypothesis can be defined as a
logically conjectured relationship between two or more variables
expressed in the form of a testable statement.
This study uses the null and alternate hypothesis format. The
null statements stand for no significant relationship whereas
alternate expressed as significant relationship. Hypothesis for this
research as follows:
13 | P a g e
INFLATION
CONSUMPTION
PROPOSAL OF RESEARCH: A STUDY ON DETERMINANTS OF SAVING IN MALAYSIA 2011
Hypothesis 1
H0: There is no significant relationship between income and
saving.
H1: There is significant relationship between income and saving.
Hypothesis 2
H0: There is no significant relationship between rate of return
and saving.
H1: There is significant relationship between rate of return and
saving.
Hypothesis 3
H0: There is no significant relationship between inflation and
saving.
H1: There is significant relationship between inflation and
saving.
Hypothesis 4
14 | P a g e
PROPOSAL OF RESEARCH: A STUDY ON DETERMINANTS OF SAVING IN MALAYSIA 2011
H0: There is no significant relationship between consumption and
saving.
H1: There is significant relationship between consumption and
saving.
Hypothesis 5
H0: There is no significant relationship between income, rate of
return, inflation, consumption, and saving.
H1: There is significant relationship between income, rate of
return, inflation, consumption, and saving.
15 | P a g e
PROPOSAL OF RESEARCH: A STUDY ON DETERMINANTS OF SAVING IN MALAYSIA 2011
1.7 LIMITATIONS OF STUDY
This study has some of limitation as follows:
1.7.1 Time Constraint
Time factor is one of the limitations for the researcher to
conduct this study. Since the researcher is in final year and
last semester of study, the schedule is quite tight because have
to attend industrial training. So, the time that researcher have
is only in weekend to conduct this research.
1.7.2 Data Collection
In term of data collection, since this paper is fully use
secondary data as a data collection, the researcher have to find
the most accurate data. However, this data can be obtained in
DataStream System but some of data that researcher need is not
16 | P a g e
PROPOSAL OF RESEARCH: A STUDY ON DETERMINANTS OF SAVING IN MALAYSIA 2011
available and researcher have to find other sources to fulfill
data needed.
1.7.3 Sources of Information
This research information is mainly come from internet
sources. Some articles, journal and web pages are directly
download from internet. So, researcher does not know the
information level of accuracy.
1.8 SIGNIFICANCE OF STUDY
This study gives some benefits to the following parties such as:
1.8.1 Researcher
This report is very important to the researcher itself. The
study is conduct by researcher because to identify the
determinants about the saving in Malaysia. The researcher also
wants to give some information about what factors influences
saving pattern in Malaysia.
17 | P a g e
PROPOSAL OF RESEARCH: A STUDY ON DETERMINANTS OF SAVING IN MALAYSIA 2011
1.8.2 Government
This research would help the government to identify which
factors that influence the level and proportion of national
savings. The information provided by the researcher could help
the government to remain concerned about the economic conditions
regarding the inflation rate and rate of return.
1.8.3 Consumer
This report also gives some information to the consumer. As
we already know, saving is important for future purpose. We did
not know what will happen in next day, so saving is quite
important things that should be concern especially by consumer.
This report will give some information to the consumer about what
factor that actually influences their saving behavior.
1.8.4 Future Researcher
This research also can give information to other researcher
who wants to conduct research regarding this area of interest and
also for other researcher whom want to further this research in
the future. This study can give some information and statistical
regarding saving behavior in Malaysia.
18 | P a g e
PROPOSAL OF RESEARCH: A STUDY ON DETERMINANTS OF SAVING IN MALAYSIA 2011
1.9 DEFINITION OF TERM
Determinant - Factor or element that limits or defines
a decision or condition.
Saving - Portion of disposable income not spent on
consumption of consumer goods.
Gross domestic product - Gross Domestic Product refers to the
market value of all goods and services
produced within a country in a given
period. It is often considered an indicator
of a country's standard of living.
Gross National Expenditure - Gross National Expenditure is total
of all expenditure of all kinds within the
economy, public and private. It is usually
different from Gross Domestic Product (GDP)
because expenditures on imports are
included, but exports (goods produced
within the economy but sold outside of it)
are not.
Deposit Interest Rate - The interest rate paid by financial
institutions to deposit account holders.
19 | P a g e
PROPOSAL OF RESEARCH: A STUDY ON DETERMINANTS OF SAVING IN MALAYSIA 2011
Deposit accounts include certificates of
deposit, savings accounts and self-directed
deposit retirement accounts.
CHAPTER 2: LITERATURE REVIEW
2.0 CHAPTER INTRODUCTION
In this chapter, researcher wills discuss some of literature
survey that will support each relationship of each independent
variable for this study. Based on Uma Sekaran (2003), literature
survey is the documentation of a comprehensive review of the published
and unpublished work from secondary sources of data in the areas of
specific interest to the researcher. It includes books, journal,
articles, newspapers, magazine, theses, and government publications.
2.1 PREVIOUS STUDY: SAVING
In pervious study, research paper about saving behavior already
done by many researchers. According to Gavin, Hausmann et al. (1997)
in their research paper Saving Behavior in Latin America: Overview and
Policy Issues, which presents an alternative perspective on the
relationship between saving and growth, saving and inflation
20 | P a g e
PROPOSAL OF RESEARCH: A STUDY ON DETERMINANTS OF SAVING IN MALAYSIA 2011
stabilization, saving and structural reform, and saving and capital
inflows, drawing on the experience of East Asia and Latin America in
the last twenty five years.
In paper named Empirical Analysis of Savings Behavior in European
Countries: New Insights, by Cristina Ruza & Jose M. Montero (2003),
the primary aim of this paper is to carry out an analysis of the
savings behavior by separately analyzing its public and private
components and the private savings components as well. Particularly,
the authors will devote attention to appraise the extent to which the
substitution effect between those magnitudes has held for the last few
decades in the European context.
Other than that, The (Dis)Saving Behavior of the Aged in Japan
paper written by Charles Y. Horioka (2009) also discuss about saving
behavior. In this paper, the researcher survey the previous literature
on the saving behavior of the aged in Japan and then present some
survey data on the saving behavior of the aged in Japan that became
available recently.
In research paper Differences in Household Savings Behavior:
Evidence from Industrial and Developing Countries by Muradoglu G., &
Taskin. F.(1996), The purpose of their study was to learn more about
21 | P a g e
PROPOSAL OF RESEARCH: A STUDY ON DETERMINANTS OF SAVING IN MALAYSIA 2011
the differences in the nature of the household savings behavior in
industrial versus developing countries.
Ferrucci & Miralles (2007), in their working paper series named
Saving Behavior and Global Imbalances the Role of Emerging Market
Economies discus about reduced-form model that relates private saving
to a set of economic fundamentals, while controlling for structural
and institutional differences across countries.
In paper titled Consumption and Saving Behavior: Modeling Recent
Trends illustrates recent trends in household consumption and personal
savings in the UK and the US and discusses some theoretical models
that can be used to interpret them. The trends in these two countries
are interesting for several reasons (Orazio Attanasio, 1997).
Based on Naziruddin & M. Shabri (2003), in paper The Influence of
Religiosity, Income and Consumption on Saving Behavior:The Case of
International Islamic University Malaysia, attempts to measure the
influence of religiosity, income and consumption on saving behavior.
From the empirical results, it is found that the religiosity and other
variables have a significant impact on the students saving behavior.
22 | P a g e
PROPOSAL OF RESEARCH: A STUDY ON DETERMINANTS OF SAVING IN MALAYSIA 2011
2.2 INCOME AND SAVING
Income means the maximum amount an individual can spend during a
period without being any worse off. For the average individual, income
is earned through earning wages by working or making investments into
financial assets. In most countries, the amount of income that an
individual receives is taxed by the government before it is received.
The revenue generated by income taxes is used to finance government
actions and programs as determined by the federal budget.
Theories have shown that income and wealth play a very important
role in determining the level of saving. Other findings in the field
of saving behavior reveal that different sector of population have
different savings motives and behavior and capacities to smooth shocks
and build assets. Savings may depend on education level, age,
macroeconomic environment, demographics, region, and family structure,
labor participation, and access to pension funds system (Attanasio and
Szekely, 2000).
According to Province British Columbia (1994), the relationship
between personal income and savings is one of the key economic
indicators reported in the income and expenditure accounts. Personal
income (the total of labor, transfer and unincorporated business
23 | P a g e
PROPOSAL OF RESEARCH: A STUDY ON DETERMINANTS OF SAVING IN MALAYSIA 2011
income) may be saved, used to purchase goods and services, or
transferred to other individuals, corporations or the government. In
turn, the savings of the personal sector permit investment and
borrowing by businesses and governments. Savings are affected by
factors such as general economic conditions, age, and individual
preferences. However, income is probably the most important
determinant of the savings behavior of individuals. With decreases in
the percentage of personal income retained by consumers (disposable
income) over time, one might wonder whether there has been an effect
on the savings rate of British Columbians.
The life-cycle hypothesis of saving is tested with pooled cross-
age time series data of Korean household survey data from 1977 to
2002. The investigation reveals that real saving rates increase when
the duration of life span and per household real disposable income
rise, whereas they decrease when the growth rate of income and net
worth to GDP ratio rises (Kwack, Sung Yeung, 2003).
Coombs& Freedman (1970) in their economic theory suggested that
income is positively related to savings. Thus, the higher the income
growth rate the higher is the savings rate.
According to Lachlan McGregor (1998), the personal disposable
income is often used for purposes of spending money on goods and
24 | P a g e
PROPOSAL OF RESEARCH: A STUDY ON DETERMINANTS OF SAVING IN MALAYSIA 2011
services that are desired by an individual. However it may also be
used for the purposes of saving as well by not spending a particular
amount of money for consumption. The personal disposable income of a
person could be used for the purposes of investing in saving options
like insurance plans.
The incomes received by households may be categorized into the
part that they spend on consumption goods, the part that they save,
and the part that they are required to pay in taxes. Thus aggregate
income may be represented as a sum of consumption (C), saving (S) and
taxation (T). Bearing in mind that we can represent aggregate income
by GDP, we can summaries the components of income as GDP equal C plus
S plus T (Lachlan McGregor, 1998).
A study by Davis and Schumm (1987), using 1739 low and high
income married couples in both rural and urban states, investigated
savings behavior and satisfaction. Results indicated no relationship
between income and savings among low income families, but it was
related among high income families.
Keynes in economic theory, Income has been considered the most
important factor in the determination of the saving behavior of an
individual. More income means, normally, more saving and vice versa.
25 | P a g e
PROPOSAL OF RESEARCH: A STUDY ON DETERMINANTS OF SAVING IN MALAYSIA 2011
Different forms of the functional relationship between saving and
income have been tested. Some studies found a statistically
significant effect of income on saving, and other studies found no
significant effects of income.
Both the Keynesian savings function (1936) and the permanent
income hypothesis indicates a positive effect of income on savings.
Using time series data for forty nine countries, Rossi (1988), for
example, indicated the positive impact of current income levels on
savings rate without differentiating types of income.
According to the permanent income hypothesis by Friedman (1957),
which distinguishes between permanent and transitory components of
income, households will spend mainly the permanent income and
therefore the transitory income will immediately be channeled to
savings with marginal propensity of savings from this income
approaching unity.
Studying a group of developing countries, Gupta (1987) observed
that savings respond positively to transitory income.
Koskela and Viren (1982) studying a group of industrial countries
and defining transitory income as unanticipated changes also concluded
that unanticipated real income had a positive effect on savings.
26 | P a g e
PROPOSAL OF RESEARCH: A STUDY ON DETERMINANTS OF SAVING IN MALAYSIA 2011
Based on the survey of consumer finances, Avery and Kennickell
(1991) indicated that in the United States, families with higher real
income and families that received support or large gifts, which is an
alternative definition of transitory income, experienced a higher
level of savings. In addition to permanent and transitory income
components, the rate of growth in income is used as an additional
explanatory variable in empirical savings studies. Increased growth
rates in income are also expected to have a positive effect on
household savings.
Collins (1989), for example, found that income growth would
increase savings especially if it were concentrated in higher saving
households. In this study all three definitions of income, namely,
permanent income, transitory income, and growth rate of income, were
used as explanatory variables.
They do however find a positive relationship between income
growth and saving and this is in line with the findings of Attanasio
(2000).
In other words, the factors other than income generally have a
relatively small effect on consumption and saving of households as a
whole though they might be of importance for individual economic
units. The consideration of income in a functional relationship with
27 | P a g e
PROPOSAL OF RESEARCH: A STUDY ON DETERMINANTS OF SAVING IN MALAYSIA 2011
consumption and saving is therefore the first step to a study of
consumption and savings behaviour of the households. It means, faster
rise in saving than income as income rises (Uma Datta, 1997).
2.3 RATE OF RETURN AND SAVING
In finance, rate of return (ROR), also known as return on
investment (ROI), rate of profit or sometimes just return, is the
ratio of money gained or lost (whether realized or unrealized) on an
investment relative to the amount of money invested. The amount of
money gained or lost may be referred to as interest, profit or loss,
28 | P a g e
PROPOSAL OF RESEARCH: A STUDY ON DETERMINANTS OF SAVING IN MALAYSIA 2011
gain or loss, or net income or loss. The money invested may be
referred to as the asset, capital, principal, or the cost basis of the
investment. ROI is usually expressed as a percentage.
Carmen and Ostry (1995) which generate higher real interest
rates, that means higher return will result in greater savings by
households only if the later decide to defer consumption, in other
words, if the sensitivity of consumption and saving is significant.
According Ostry and M. Reinhart (1996) there is little consensus
in the empirical literature on the interaction between saving and the
real rate of interest in developing countries, Some studies have
concluded that, for a large number of developing countries, there does
not appear to be any systematic relationship between rates of return
and saving behavior which others have suggested that there may be
considerable regional variation in this elasticity.
Saving responds positively to rises in the interest rate only if
the substitution effect is stronger than the income effect. It could
be argued that, for the typical developing economy the net impact of a
change in real interest rate on saving is likely to be positive
( Athukorala,1998 and Sen, 2002).
29 | P a g e
PROPOSAL OF RESEARCH: A STUDY ON DETERMINANTS OF SAVING IN MALAYSIA 2011
The effect of interest rates on savings was inconclusive in the
previous empirical studies. According to consumption decision, an
increase in the rates of return increases savings but real income
effect of higher rates of return can affect savings adversely. In his
survey article, Balassa (1992) argued that the effect of real interest
rates on savings is positive for developing countries.
Examining the household savings behavior in Australia, Ouliaris
(1992) indicated that real interest rates exert a negative influence
on the savings ratio and the fall in real interest rates contributes
to the rise in savings ratio.
According to the Gulnur and Fatma (1996), a cross-section time
series sample from developing countries provides evidence that in the
majority of the cases the response of savings growth to real rates is
not different from zero.
Loayza (2000) find no positive relationship between financial
deepening and saving or between higher real interest rates and saving.
Hussain (2002) in examined the impact of financial liberalization
on resource mobilization and investment in 25 African Countries,
including Ghana and found that the real interest rate does not seem to
be an important factor in the determinant of financial saving and
30 | P a g e
PROPOSAL OF RESEARCH: A STUDY ON DETERMINANTS OF SAVING IN MALAYSIA 2011
total saving but the activities of the informal financial market is an
important determinant of financial savings.
Masson (1998), in an attempt to discover the determinants of
savings across a large number of developed and developing countries
over time finds that the interest rate is a significant explanatory
variable for developed countries in determining savings rates. However
this is not the case in developing countries. They found that growth
in income was associated with higher rates of saving but beyond a
certain point, as income increases savings ratios fall.
Giovannini (1985) in an empirical study found that in most
countries, the response of savings growth to real rates is no
different from zero. He argued that in developing countries,
assumptions about elasticity of substitution may not hold because a
significant proportion of the population may not be able to borrow
even at black market rates.
2.4 INFLATION AND SAVING
In mainstream economics, the word “inflation” refers to a general
rise in prices measured against a standard level of purchasing power.
Previously the term was used to refer to an increase in the money
31 | P a g e
PROPOSAL OF RESEARCH: A STUDY ON DETERMINANTS OF SAVING IN MALAYSIA 2011
supply, which is now referred to as expansionary monetary policy or
monetary inflation. Inflation is measured by comparing two sets of
goods at two points in time, and computing the increase in cost not
reflected by an increase in quality. There are, therefore, many
measures of inflation depending on the specific circumstances. The
Consumer Price Index (CPI) measures the percentage change through time
in the cost of purchasing a constant basket of goods and services
representing the average pattern of purchases made by a particular
population group in a specified time period
Changes in behavior may be related to factors such as economic
growth, unemployment, interest, and inflation rates, all of which can
affect consumer confidence in the economy. This section examines two
of these factors, unemployment and interest rates, as they relate to
the savings of Columbians (British Province British Columbia, 1994).
Studying a group of industrial countries Koskela and Viren (1982)
also observed that savings increase as real rates of interest
increase. The effect of interest rates may also be explained by the
inflation effect: assuming that nominal rates of interest are
constant, a rise in the inflation rate lowers the real cost of
borrowing and hence has a positive effect on consumers’ expenditure
and a negative effect on savings.
32 | P a g e
PROPOSAL OF RESEARCH: A STUDY ON DETERMINANTS OF SAVING IN MALAYSIA 2011
The consumption argument suggests that inflation expectations may
encourage expenditures on durables at the expense of savings. On the
contrary, it is also suggested that inflation decreases the real value
of financial wealth fixed in nominal terms, and households trying to
restore their wealth-income position will increase their savings.
Empirical literature on the effect of inflation on savings provides
evidence that supports both views. Gupta (1987), for example, found
that in a group of Asian countries, both expected and unexpected
components of inflation had a positive effect on savings.
Lahiri’s (1988) results were inconclusive that inflation had
positive effect on savings.
Kauffmann (1990), on the other hand compared the United States
and Germany, and suggested that the lower savings activity of U.S.
households was due to the higher inflation rates in the United States
than in Germany.
Bovenberg and Evans (1990), analyzing personal savings in the
United States, concluded that due to reduced inflation during the
1980s the personal savings rate was reduced.
The most recent study by Zorklu and Barbie (2003), the results of
this study show that because the inflationary pressures in Ghana
33 | P a g e
PROPOSAL OF RESEARCH: A STUDY ON DETERMINANTS OF SAVING IN MALAYSIA 2011
during the reform period resulted in negative real deposit interest
rates and as a result, the savings response was weak.
This confirms earlier work (Aryeetey and Gockel, 1991, Gockel and
Brownbridge, 1998, Gockel and Akoena, 2002). A major lesson from
Ghana's experience high inflationary pressures has a reduced chance of
increasing savings mobilization.
Gulnur and Fatma (1996) in their study said that when savings
rates were estimated for all countries the model used in this study
performed reasonably well, accounting for 35 per cent of the total
variation. In this equation only income growth and inflation rate
variables showed significant coefficients. As income growth increased,
savings rates increased and as inflation increased, savings rates
decreased.
Literature suggests inflation as one such factor contribute to
the saving rate (Deaton, 1977, Chopra, 1988, Haslag, 1997, Heer and
Suessmuth, 2006).
The effect of inflation on savings, however, is ambiguous both in
theory and practice (Heer and Suessmuth, 2006, and Deaton and Paxson,
1993).
34 | P a g e
PROPOSAL OF RESEARCH: A STUDY ON DETERMINANTS OF SAVING IN MALAYSIA 2011
Craig and Mark (2006), in their study result stated the
relationship between the savings rate and inflation is positively
correlated. As such, when inflation is high it appears that people
save more, and when the inflation rate is low people save less.
2.5 CONSUMPTION AND SAVING
Consumption means expenditure during a particular period on goods
and services used in satisfaction of needs and wants
35 | P a g e
PROPOSAL OF RESEARCH: A STUDY ON DETERMINANTS OF SAVING IN MALAYSIA 2011
John Maynard Keynes developed a theory of consumption that
focused primarily on the importance of people’s disposable income in
determining their spending. A rise in real income gives people greater
financial resources to spend or save. The rate at which consumers
increase demand as income rises is called the marginal propensity to
consume.
Savings, investment and consumption are closely related. There
will be no investment without savings. Investment, in turn, creates
employment and income for people. Without it and, therefore, without
income, we shall have nothing to save and nothing to spend on consumer
goods and services. What we do not spend is what is saved.
Consumption, therefore, is affected by decisions to spend. If we spend
all our income, there will be no capital accumulation for saving
investment (Funom Makama, 2009).
According to Rose and Kolari (1995), savings is referred to the
postponement of current consumptions. The volume of savings by
individuals’ consumers is a function of number of factors, including
the amount of current and expected income, the stock wealth held by
the individual, the level of interest rate, expectations concerning
the future rate of inflations and other variables.
36 | P a g e
PROPOSAL OF RESEARCH: A STUDY ON DETERMINANTS OF SAVING IN MALAYSIA 2011
Regina Chang (1994) noted that, the idea of consumption smoothing
gives a positive correlation between current consumption and saving
because transitory income shocks lead to a higher current income and
increased saving.
As was pointed out by Caroll (1992), this may create a
significant correlation between consumption growth, lagged income and
saving ratio.
Russian households saved much the same in the 1990s, which was
higher than savings in 1976 (Gregory et al. 1999). This finding is
contrary to expectations since there is widespread belief that savings
were actually relatively high in the Soviet era because of shortages
of consumption goods (a form of forced saving) and that saving was
lower with price liberalization.
According to the William and Micheal (2006) in their Economics
book state that both consumption function and saving function have
positive slope. As disposable income rises, consumption and saving
rise. Consumption and saving then are positive functions of disposable
income.
37 | P a g e
PROPOSAL OF RESEARCH: A STUDY ON DETERMINANTS OF SAVING IN MALAYSIA 2011
Loayza and Shankar (2000), advocate the use of measures of
savings that correct for consumer durables. In their study stated
that, saving and consumer spending have positive relationship.
W.S.Woytinsky (1948) remarks on the relationship between
consumers’ expenditures, savings and disposable income. He said that
these three indicators have positive relationship.
There are several reasons why one may be interested to study the
saving and consumption behavior of households in developing countries.
Saving is related to growth and economic development. There is a close
link between household consumption and national saving rates over time
(Deaton, 1997).
Athukorala (1998) and Sen (2002) noted that higher interest rate
increases the present price of consumption relative to the future
price (the substitution effect), and thus provides an incentive to
increase saving. However, if the household is a net lender, the
interest rate rise also raises lifetime income, and thus tends to
increase consumption and decrease saving (the income effect).
CHAPTER 3: METHODOLOGY
38 | P a g e
PROPOSAL OF RESEARCH: A STUDY ON DETERMINANTS OF SAVING IN MALAYSIA 2011
3.0 CHAPTER INTRODUCTION
In this chapter, researcher will discuss about the data that
researcher use for this research. Research methodology will discuss
the Research Design, Data Collection Method, and Interpretation that
researcher uses in conducting this study. It is Important for a
researcher to select and determining the appropriate research design
to be choose for providing the framework in conducting the study.
Data can be obtained from primary or secondary resources. To
achieve the objectives of this research which is to identify the
determinants of saving behavior in Malaysia, researcher used secondary
data as data collection methods.
3.1 RESEARCH DESIGN
Research design is a blueprint that provides the detail of
necessary procedure in obtaining the information needed in order to
structure or solve marketing research problem. The researcher used the
secondary data to complete this study.
According to Malhotra (2007), research design is a framework for
conducting the marketing research project. That means research design
39 | P a g e
PROPOSAL OF RESEARCH: A STUDY ON DETERMINANTS OF SAVING IN MALAYSIA 2011
will show the details of the procedures that needed in order for
obtaining the information needed to structure of solving marketing
research problems.
3.2 DATA COLLECTION METHOD
Data collection methods are an integral part of research design
as shown in the shaded portion in the figure. Data can be collected in
a variety of ways, either from primary or secondary resources. To
achieve the objectives of this research which is to identify the
determinants of saving behavior in Malaysia, researcher used secondary
data as data collection methods.
3.2.1 Secondary Data
Data that are collected to be analyzed in this study is by
using the main source that is the secondary data. According to
Malhohotra K. Naresh (2007), secondary data is the data that had
been collected for the purposed other than the problem at the
hand. These data can be lactated quickly and inexpensively,
whereas according to Uma Sekaran (2003), secondary data refer to
40 | P a g e
PROPOSAL OF RESEARCH: A STUDY ON DETERMINANTS OF SAVING IN MALAYSIA 2011
information gathered from sources already existing for examples
journal, articles, government publication, web pages, and book.
The data that researcher collect to conduct this study is
time series data. It uses Malaysia data from year 1967 until
2007, which is 41 years to see the trend whether this dependent
variable has positive or negative relationship between the other
variables. To complete this study, data about income, rate of
return, inflation and consumption are collected from DataStream
database, World Bank data, Malaysia Department of Statistics, and
Malaysia Economy webpage.
There are two types of secondary data which is as follows:
3.2.1.1 Internal Sources
Internal sources consist of sources within the
organization such as annual report of the company and other
report. The sources were obtained from company itself.
3.2.1.2 External Sources
It refers to the sources outside the organization. The
sources that are usually uses for obtaining information are
book, journal, articles, newspaper, magazine, internet,
printed media and pamphlets. Since this research is related
41 | P a g e
PROPOSAL OF RESEARCH: A STUDY ON DETERMINANTS OF SAVING IN MALAYSIA 2011
with Economics and Finance area, the information can be
gathering from Journal of Marketing, Finance and Economy
articles.
3.3 PROCEDURE FOR DATA ANALYSIS
The researcher analyzed the data using the Statistical Package
for the Social Science (SPSS 17.0). This programme can be used to
analyze data collected from surveys, tests, observation or even
secondary data. It can perform a variety of data analysis and
presentation functions including statistical analysis and graphical
presentation of data. Among its features are modules for statistical
data analysis that induce descriptive statistics, analysis of
variance, factor analysis, multivariate analysis, categorical data
analysis and many more. SPSS can also provide a method for examining
the adequacy of the regression model that covers checking assumption
in regression.
In this study, this programme help the researcher to run the
secondary data that already collect. This programme also helps to
facilitate data clearing, and checking for logical inconsistencies. In
addition, by using this program, it can analyze the data collection to
42 | P a g e
PROPOSAL OF RESEARCH: A STUDY ON DETERMINANTS OF SAVING IN MALAYSIA 2011
identify the relationship and correlation between saving with income,
rate of return, inflation and consumption. It also involves in the
process of hypothesis testing.
3.3.1 Descriptive Statistics
Descriptive statistics are used to describe the basic
features of the data in a study. They provide simple summaries
about the sample and the measures. Together with simple graphics
analysis, they form the basis of virtually every quantitative
analysis of data.
3.3.1.1 Measures of Central Tendency
Measures of central tendency provide information about
the most typical or average values of a variable. It
presents the minimum and maximum value, mean, the average,
mode and the median.
Minimum value is the lowest value in the data that
have been collected. In contrast, maximum value is the
highest value in the data that have been collect.
43 | P a g e
PROPOSAL OF RESEARCH: A STUDY ON DETERMINANTS OF SAVING IN MALAYSIA 2011
The mean is defined as the sum of a series of
observations divided by the number of observations in the
series. It is commonly used to describe the central tendency
of variables.
The median is limitation of the mean as an indicator
of central tendency is that its value is greatly affected
when a few observations have very large or very low values.
The median is the middle value in a series of values.
The mode is defined as the most frequent value of a
variable. This indicator might convey more information about
the central tendency of a series when variables have certain
values that are much more frequent than the others.
3.3.1.2 Measures of Dispersion
Measures of dispersion provide information about the
distribution of the values of a variable. They tell us how
widely values are dispersed around their measures of central
tendency. It presents variance, standard deviation, the
skewness and the kurtosis and histograms.
44 | P a g e
PROPOSAL OF RESEARCH: A STUDY ON DETERMINANTS OF SAVING IN MALAYSIA 2011
The variance measures the amount of variation in a
distribution, in some sense, its “width”. It measures the
average of the square of the distance from the mean for each
value.
The standard deviation is a measure of dispersion that
is calculated based on the values of the data. It allows us
to see how widely the data are dispersed around the mean.
Skewness is a measure of whether the peak is centered
in the middle of the distribution. A symmetrical
distribution has a skewness of zero. An asymmetrical
distribution with a long tail to the right (higher values)
has a positive skew. An asymmetrical distribution with a
long tail to the left (lower values) has a negative skew.
Any threshold or rule of thumb is arbitrary, but here
is one, if the skewness is greater than 1.0 (or less than -
1.0), the skewness is substantial and the distribution is
far from symmetrical.
Kurtosis is a measure of the extent to which data are
concentrated in the peak versus the tail. A positive value
indicates that data are concentrated in the peak, while a
45 | P a g e
PROPOSAL OF RESEARCH: A STUDY ON DETERMINANTS OF SAVING IN MALAYSIA 2011
negative value indicates that data are concentrated in the
tail.
Values of skewness and kurtosis have little inherent
meaning, other than large values indicate greater asymmetry.
A rule of thumb is that the absolute value of the ratio of
skewness to its standard error and of kurtosis to its
standard error should be less than 2.
Histograms show the number of observations in each
category. They are very useful because they give a quick
visual of the central tendency, the extent of dispersion,
and also whether any unusually large or small observations
are present.
3.3.2 Reliability Analysis
Zikmund (2000) defined reliability as the degree to which
measures are free from error and therefore yield consistent
results. Sekaran (2003) in other words states that reliability of
a measure established by testing for both consistency and
stability. Cronbach’s alpha is a reliability coefficient that
indicates how well the item in a set is positively correlated to
46 | P a g e
PROPOSAL OF RESEARCH: A STUDY ON DETERMINANTS OF SAVING IN MALAYSIA 2011
one another. As suggested by Sekaran (2003), the reliability less
than 0.60 are generally considered to be poor, those in the range
of 0.70 to be acceptable and those over 0.80 to be good.
The closer Cronbach’s alpha to 1, the higher the internal
consistency reliability is. Hair et al. (2003) reports that the
Cronbach’s alpha higher than 0.7 is considered as good and
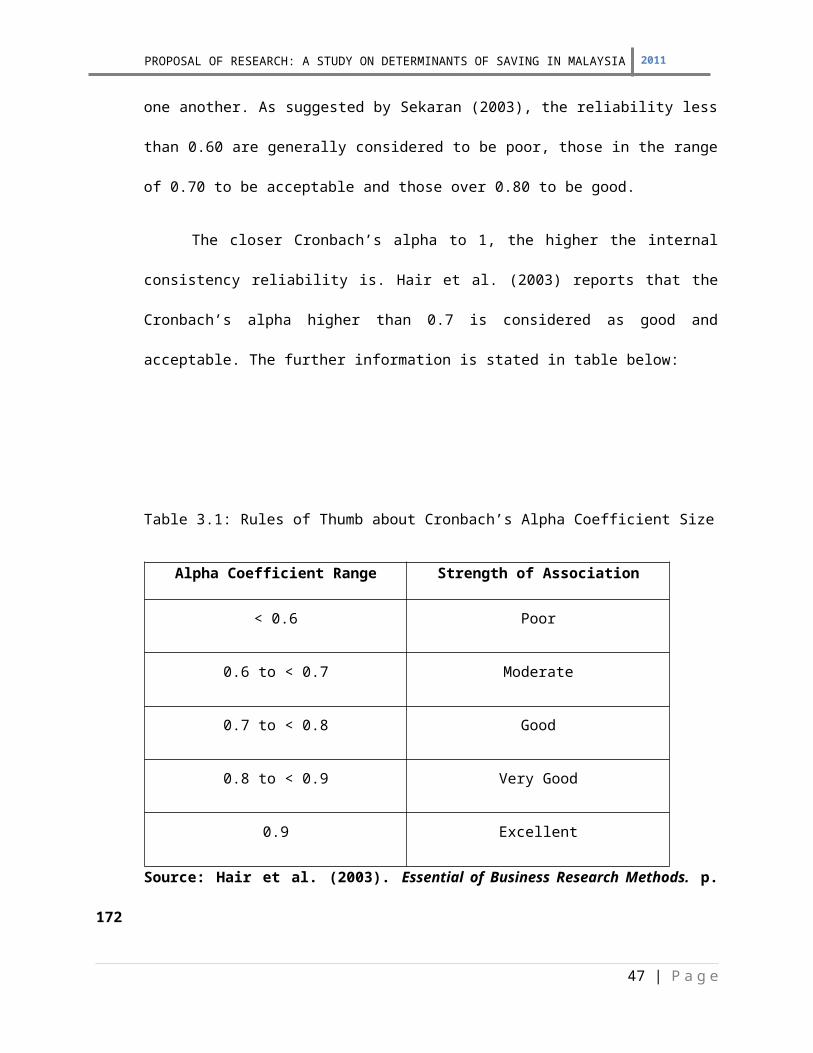
acceptable. The further information is stated in table below:
Table 3.1: Rules of Thumb about Cronbach’s Alpha Coefficient Size
Alpha Coefficient Range Strength of Association
< 0.6 Poor
0.6 to < 0.7 Moderate
0.7 to < 0.8 Good
0.8 to < 0.9 Very Good
0.9 Excellent
Source: Hair et al. (2003). Essential of Business Research Methods. p.
172
47 | P a g e
PROPOSAL OF RESEARCH: A STUDY ON DETERMINANTS OF SAVING IN MALAYSIA 2011
3.3.3 Multiple Regression Model
In order to test the hypothesis of this study, the
researcher used Multiple Regression Model. This technique of
regression is commonly used in business and economics for testing
the relationship between the dependent and independent variables.
The correlation analysis should be applied to obtain a
measurement of the degree of association or correlation between
the two variables.
The Multiple Regression is a statistical tool to measure the
type of relationship exists between two or more variables. The
relationship is expressed in a mathematical equation, which gives
the basis of estimating the values of a dependent variable based
on the values of an independent variable.
The model derived from the Multiple Regression Model analysis is
as follow:
Y=β0+β1x1+β2x2+β3x3+β4x4+ε
Where:
Y = Dependent Variable
48 | P a g e
PROPOSAL OF RESEARCH: A STUDY ON DETERMINANTS OF SAVING IN MALAYSIA 2011
β0 = Constant
β1 = Coefficient describes how changes in income affect the
value of saving.
β2 = Coefficient describes how changes in rate of return affect
the value of saving.
β3 = Coefficient describes how changes in inflation affect the
value of saving.
β4 = Coefficient describes how changes in consumption affect
the value of saving
ε = random error term
3.3.4 Correlation Test
Correlation is a statistical technique that can show whether
and how strongly pairs of variables are related.
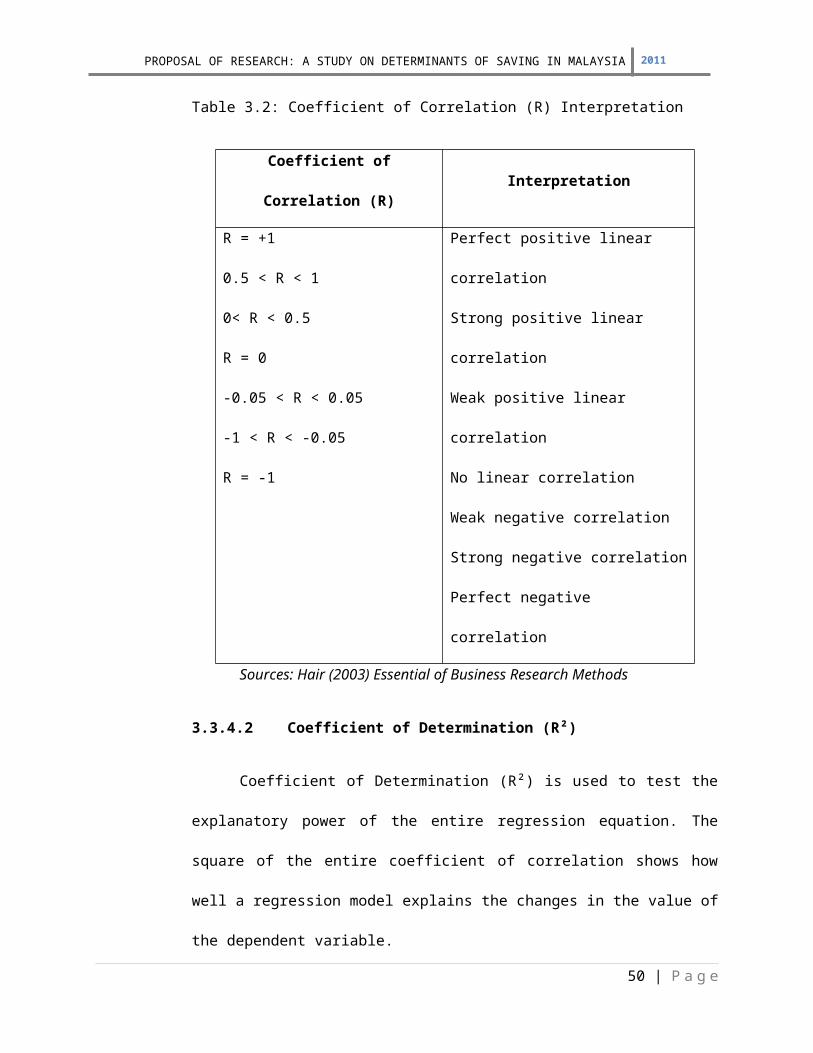
3.3.4.1 Correlation Coefficient (R)
A correlation coefficient (R) shows how much and in
what direction the two variables move together. The
tabulated interpretation mentioned is as follows:
49 | P a g e
PROPOSAL OF RESEARCH: A STUDY ON DETERMINANTS OF SAVING IN MALAYSIA 2011
Table 3.2: Coefficient of Correlation (R) Interpretation
Coefficient of
Correlation (R)Interpretation
R = +1
0.5 < R < 1
0< R < 0.5
R = 0
-0.05 < R < 0.05
-1 < R < -0.05
R = -1
Perfect positive linear
correlation
Strong positive linear
correlation
Weak positive linear
correlation
No linear correlation
Weak negative correlation
Strong negative correlation
Perfect negative
correlation
Sources: Hair (2003) Essential of Business Research Methods
3.3.4.2 Coefficient of Determination (R²)
Coefficient of Determination (R²) is used to test the
explanatory power of the entire regression equation. The
square of the entire coefficient of correlation shows how
well a regression model explains the changes in the value of
the dependent variable.
50 | P a g e
PROPOSAL OF RESEARCH: A STUDY ON DETERMINANTS OF SAVING IN MALAYSIA 2011
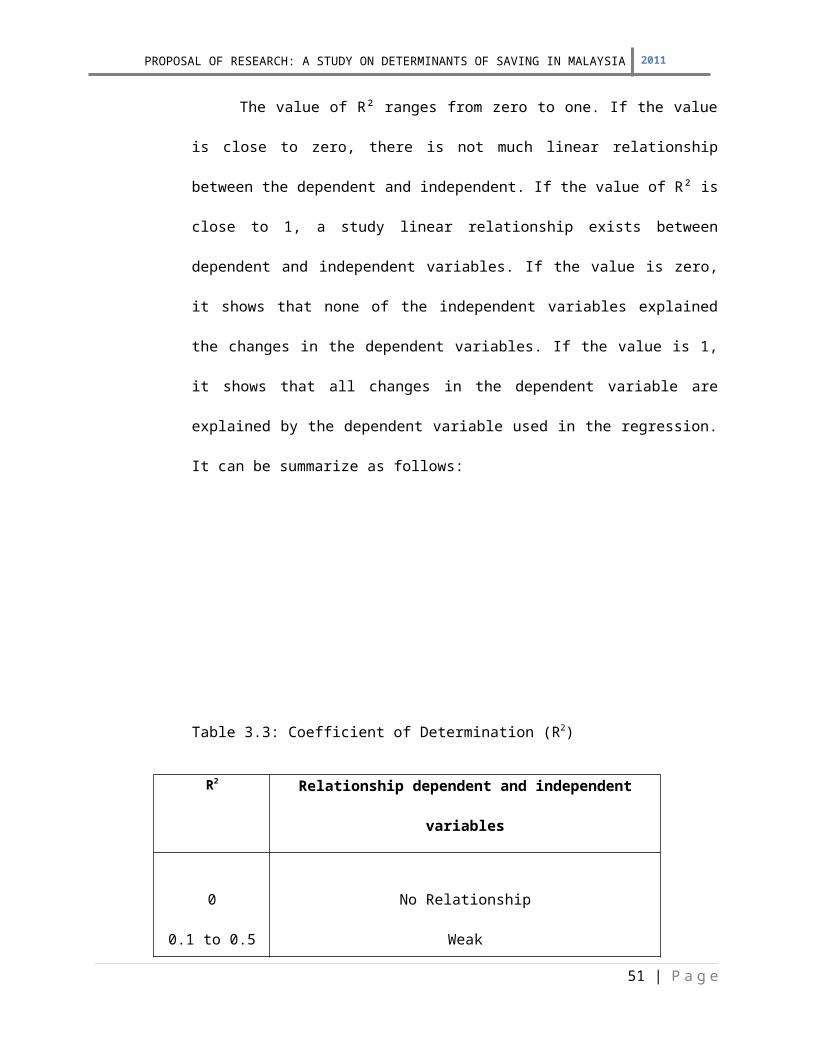
The value of R² ranges from zero to one. If the value
is close to zero, there is not much linear relationship
between the dependent and independent. If the value of R² is
close to 1, a study linear relationship exists between
dependent and independent variables. If the value is zero,
it shows that none of the independent variables explained
the changes in the dependent variables. If the value is 1,
it shows that all changes in the dependent variable are
explained by the dependent variable used in the regression.
It can be summarize as follows:
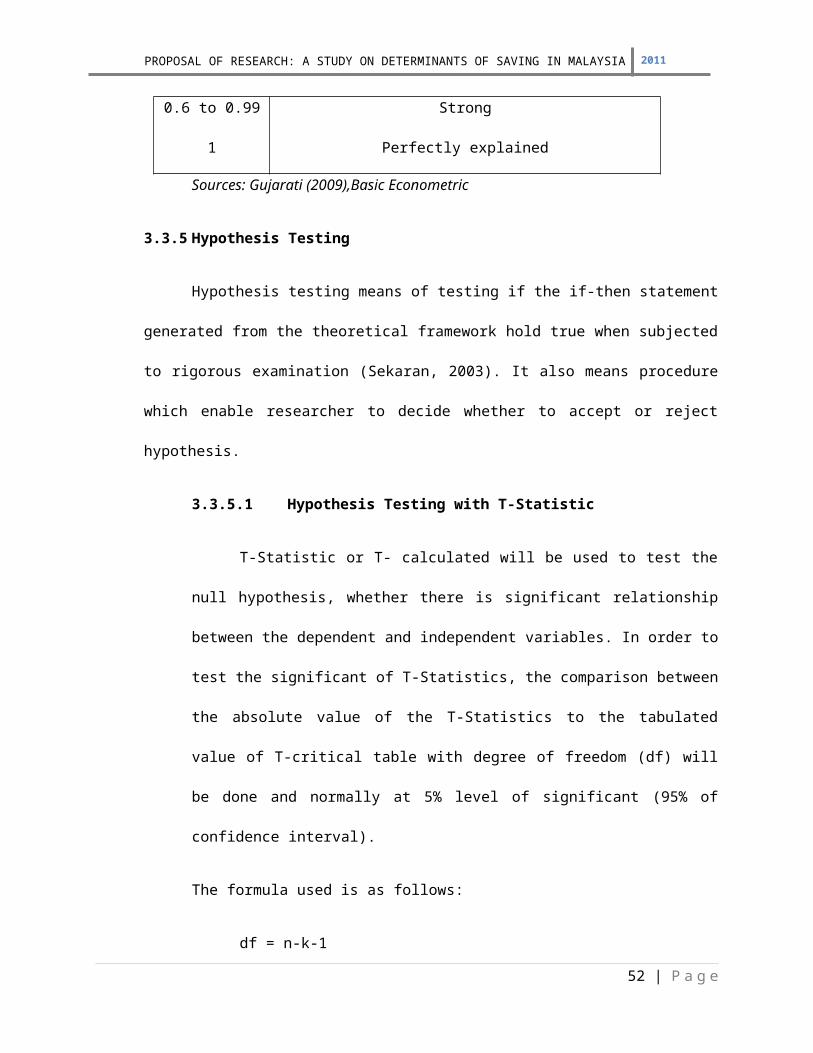
Table 3.3: Coefficient of Determination (R2)
R2 Relationship dependent and independent
variables
0
0.1 to 0.5
No Relationship
Weak
51 | P a g e
PROPOSAL OF RESEARCH: A STUDY ON DETERMINANTS OF SAVING IN MALAYSIA 2011
0.6 to 0.99
1
Strong
Perfectly explained
Sources: Gujarati (2009),Basic Econometric
3.3.5 Hypothesis Testing
Hypothesis testing means of testing if the if-then statement
generated from the theoretical framework hold true when subjected
to rigorous examination (Sekaran, 2003). It also means procedure
which enable researcher to decide whether to accept or reject
hypothesis.
3.3.5.1 Hypothesis Testing with T-Statistic
T-Statistic or T- calculated will be used to test the
null hypothesis, whether there is significant relationship
between the dependent and independent variables. In order to
test the significant of T-Statistics, the comparison between
the absolute value of the T-Statistics to the tabulated
value of T-critical table with degree of freedom (df) will
be done and normally at 5% level of significant (95% of
confidence interval).
The formula used is as follows:
df = n-k-1
52 | P a g e
PROPOSAL OF RESEARCH: A STUDY ON DETERMINANTS OF SAVING IN MALAYSIA 2011
Where,
df = degree of freedom (from output regression)
n = no of observation
k = no of independent variable
Therefore, the decision rule is:
At 95%, confidence interval;
T-statistics > t-critical value, reject H0 and
accept H1.
T-statistics < t-critical value, reject H1 and
accept H0.
If the numerical value of the statistics is greater
than the critical value of T or less than –t, it is fall in
the rejection region, where the null hypothesis is rejected
and the alternate hypothesis is accepted.
3.3.5.2 Hypothesis with F-Statistic
The study use F-Statistic in order to know how
reliable the overall model. F-Statistics provides an overall
appraisal of the regression equation appeased to evaluating
the significant of each individual component of the entire
53 | P a g e
PROPOSAL OF RESEARCH: A STUDY ON DETERMINANTS OF SAVING IN MALAYSIA 2011
regression model. Besides that, f-statistic is whether a
significant proportion of total variation independent is
explained by the estimated regression equation. If
calculated F-Statistics more than critical value of F, the
regression equation is significant to explain the changes in
dependent variable.
• If calculated F-statistics > 5%, there is a
significant relationship between independent variable
and dependent variable.
• If calculated F-statistics < 5%, the model is not
valid for forecasting.
In the determination of rejection region of F-
Statistics, the one tail used in order to determine the
significant of the combination among the variables. Through
one tail test, it will explain the direction of relationship
between both independent variable and dependent variable. It
is computed as the ratio of two samples variance if the F-
Statistics is bigger than the critical value of F; the
regression equation is significant to explain the change in
dependent variable.
54 | P a g e
PROPOSAL OF RESEARCH: A STUDY ON DETERMINANTS OF SAVING IN MALAYSIA 2011
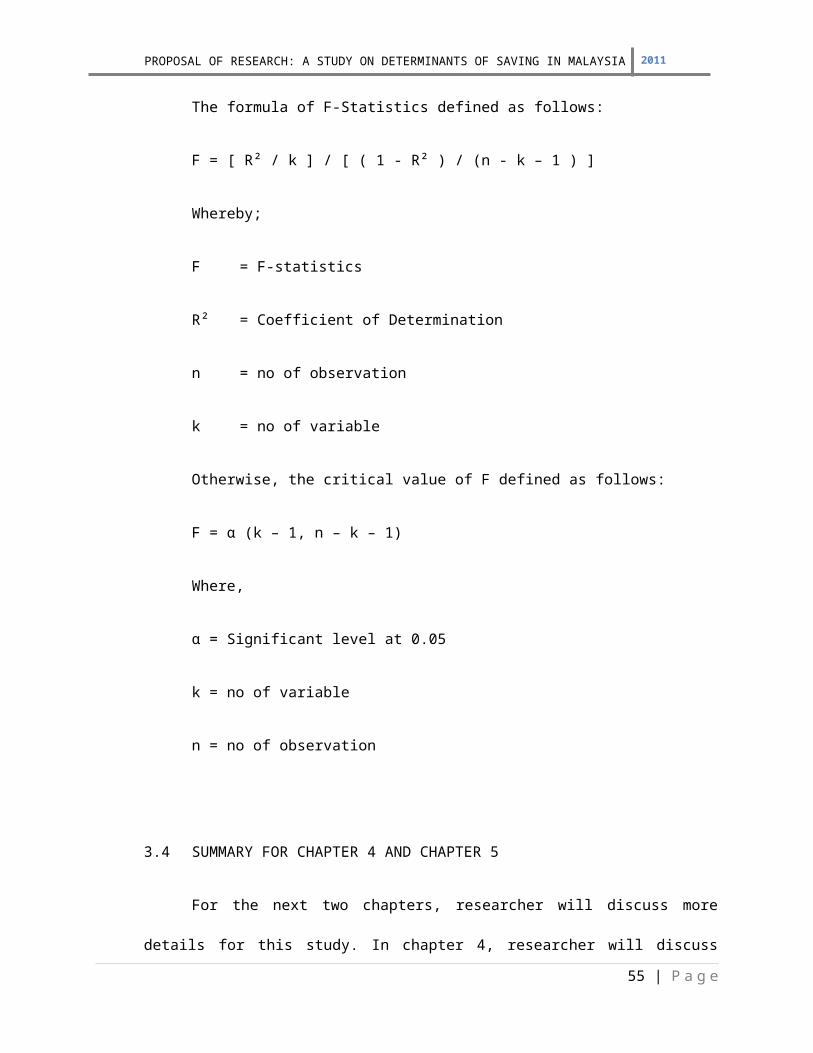
The formula of F-Statistics defined as follows:
F = [ R² / k ] / [ ( 1 - R² ) / (n - k – 1 ) ]
Whereby;
F = F-statistics
R² = Coefficient of Determination
n = no of observation
k = no of variable
Otherwise, the critical value of F defined as follows:
F = α (k – 1, n – k – 1)
Where,
α = Significant level at 0.05
k = no of variable
n = no of observation
3.4 SUMMARY FOR CHAPTER 4 AND CHAPTER 5
For the next two chapters, researcher will discuss more
details for this study. In chapter 4, researcher will discuss
55 | P a g e
PROPOSAL OF RESEARCH: A STUDY ON DETERMINANTS OF SAVING IN MALAYSIA 2011
about the result from the data collected. In this section,
researcher will clearly explain the result based on the procedure
for data analysis in chapter 3. Researcher will discuss the
relationship between dependent variable and independent variable
based on this study. Furthermore, in chapter 5, researcher will
make conclusion based on the finding in chapter 4. After that
researcher will provides some recommendations based on this
study. Finally, researcher will make overall conclusion for this
study.
56 | P a g e