polymetallic nodule valuation - international seabed authority
TRANSCRIPT
Polymetallic nodule valuation A report for the International Seabed Authority
CRU Consulting
CRU Reference: C -07177
16 October 2020 Page i
This report is supplied on a private and confidential basis to the customer. It must not be disclosed in whole or in part, directly or
indirectly or in any other format to any other company, organisation or individual without the prior written permission of CRU
International Limited.
Permission is given for the disclosure of this report to a company’s majority owned subsidiaries and its parent organisation. However,
where the report is supplied to a client in his capacity as a manager of a joint venture or partnership, it may not be disclosed to the
other participants without further permission.
CRU International Limited’s responsibility is solely to its direct client. Its liability is limited to the amount of the fees actually paid for the
professional services involved in preparing this report. We accept no liability to third parties, howsoever arising. Although reasonable
care and diligence has been used in the preparation of this report, we do not guarantee the accuracy of any data, assumptions,
forecasts or other forward-looking statements.
Copyright CRU International Limited 2019. All rights reserved.
CRU Consulting, Chancery House, 53-64 Chancery Lane, London, WC2A 1QS, UK
Tel: +44 (0)20 7903 2000, Fax: +44 (0)20 7903 2172, Website: www.crugroup.com

16 October 2020 Page ii
Table of Contents
1. Executive summary .............................................................................................................. 1
2. Introduction and scope of this report ............................................................................... 14
2.1. Background ..................................................................................................... 14
2.2. Methodology ................................................................................................... 15
3. An introduction to fair value pricing ................................................................................. 18
3.1. The concept of fair market value ..................................................................... 18
3.2. Bargaining zone .............................................................................................. 20
3.3. Transfer pricing in the MIT royalty and valuation model ................................. 21
4. A framework for finding comparable materials ............................................................... 23
4.1. Nodule metal content and gross value ............................................................ 23
4.2. Describing the analysis process ..................................................................... 24
4.3. Seabed nodules value chain and products ..................................................... 25
4.4. Seabed nodules comparative framework ........................................................ 26
5. Comparable materials pricing and value .......................................................................... 31
5.1. Metal-containing material pricing theory ......................................................... 31
6. Copper ................................................................................................................................. 32
6.1. Copper concentrates ....................................................................................... 32
6.2. Copper cathode .............................................................................................. 36
6.3. Value add analysis .......................................................................................... 37
6.4. Takeaways from copper analysis .................................................................... 40
7. Nickel ................................................................................................................................... 41
7.1. Value chain overview ...................................................................................... 41
7.2. Reference prices ............................................................................................. 41
7.3. Nickel laterite ore ............................................................................................ 43
7.4. Nickel-cobalt intermediates ............................................................................. 49
7.5. Nickel sulphide concentrates .......................................................................... 52
7.6. Takeaways from nickel analysis ..................................................................... 55
8. Manganese .......................................................................................................................... 56
8.1. Value chain overview ...................................................................................... 56
8.2. Manganese ore ............................................................................................... 59
8.3. Value add ........................................................................................................ 61
8.4. Downstream manganese products ................................................................. 62
8.5. Value basis for land-based royalties ............................................................... 64
8.6. Takeaways from manganese analysis ............................................................ 65
16 October 2020 Page iii
9. Cobalt ................................................................................................................................... 67
9.1. Reference prices ............................................................................................. 67
9.2. Cobalt-containing concentrates ...................................................................... 69
9.3. Cobalt hydroxide ............................................................................................. 70
9.4. Takeaways from cobalt analysis ..................................................................... 71
10. Pricing and value summary ............................................................................................... 71
11. Conclusions & recommendations ..................................................................................... 74
A note on optimality ....................................................................................................... 84
Index of Tables Table 1 Typical recoverable metal content in polymetallic nodules and other unfinished materials ................... 5
Table 2 Breakdown of gross value of nodule by metal, based on annual average prices 2000-2020................. 23
Table 3 Typical recoverable metal content in polymetallic nodules and other unfinished materials ................. 27
Table 4 Key jurisdictions for comparable materials ............................................................................................... 30
Table 5 Cobalt raw material pricing basis ................................................................................................................ 70
Table 6 Summary of pricing basis for key non-finished materials ........................................................................ 71
Index of Figures Figure 1 Gross value of nodule metal content based on historical prices, real 2019 $/tonne nodule .................. 1
Figure 2 Schematic of theoretical valuation bases ................................................................................................... 4
Figure 3 Typical attribution of price across mine and processor (% of finished product price) .......................... 7
Figure 4 Mine shares of combined mine and processor costs and margins ......................................................... 8
Figure 5 Indicative historical nodule values ($/t nodule, real US$2020 terms) ................................................. 11
Figure 6 Royalty rates needed to obtain equivalent payments under different value bases .............................. 11
Figure 7 Illustrative seabed mining supply chain ................................................................................................... 16
Figure 8 Price transparency of materials through seabed mining supply chain .................................................. 16
Figure 9 Schematic of theoretical valuation bases ................................................................................................. 22
Figure 10 Gross value of nodule metal content based on historical prices, real 2019 $/tonne nodule .............. 24
Figure 11 Analysis process ....................................................................................................................................... 25
Figure 12 Illustrative value chain diagram ............................................................................................................... 26
Figure 13 Global copper mine production by type (m tonnes contained Cu) ....................................................... 32
Figure 14 Copper concentrate annual spot TC/RCs; ¢/lb Cu ................................................................................. 34
Figure 15 Realised price for a 25% copper concentrate as a % of LME, quarterly .............................................. 35
Figure 16 Copper cathodes average premiums over LME $/t (LHS) ...................................................................... 36
Figure 17 Breakdown of copper value attribution between mine and processor, 2019 average ........................ 38
Figure 18 Nickel ore types and finished products .................................................................................................. 41
16 October 2020 Page iv
Figure 19 Nickel content of different materials vs approximate typical value as % of LME ................................ 43
Figure 20 Trade in nickel ore (m tonnes, gross weight) ......................................................................................... 44
Figure 21 Nickel laterite ore prices, value of Ni content as % of LME (monthly averages) ................................. 44
Figure 22 Comparison of simplified value chains for nickel laterite and polymetallic nodules .......................... 46
Figure 23 NPI production costs, Shandong ($/t Ni) ................................................................................................. 47
Figure 24 Laterite ore prices as % of LME and ore as % of NPI production costs ............................................... 48
Figure 25 LME nickel price ($/t Ni, 2019 basis) ........................................................................................................ 48
Figure 26 Ni-Co intermediates value attribution, 2019 average, high and low cost operations .......................... 51
Figure 27 Trade in nickel concentrates, quarterly (tonnes Ni) ............................................................................... 53
Figure 28 Nickel in concentrates value attribution, 2019 basis, $/t Ni ................................................................... 54
Figure 29 Manganese ore consumption by product, 2017 ..................................................................................... 57
Figure 30 Manganese ore and ferroalloy value chain ............................................................................................. 58
Figure 31 Manganese monoxide and manganese sulphate supply chain ............................................................ 58
Figure 32 Manganese ore prices, monthly delivered China ($/dmtu) .................................................................... 59
Figure 33 Manganese ore types ................................................................................................................................ 60
Figure 34 Manganese ore price as % of SiMn price (China, Mn content basis, annual averages) ...................... 61
Figure 35 Breakdown of value attribution for Mn ore in SiMn ($/t Mn contained, 2019 basis) ............................ 61
Figure 36 EMM production costs vs. prices, 2008-2025 ($/t) .................................................................................. 63
Figure 37 Cobalt demand by application and product form, 2019 ......................................................................... 67
Figure 38 Example of regional arbitrage in Chinese and EU cobalt metal prices, $/lb ........................................ 68
Figure 39 Cobalt value chain ..................................................................................................................................... 69
Figure 40 Typical attribution of price across mine and processor (% of finished product price) ..................... 72
Figure 41 Mine shares of combined mine and processor costs and margins ..................................................... 73
Figure 42 Indicative historical nodule values ($/t nodule, real US$2020 terms) ................................................ 76
Figure 43 Royalty rates needed to obtain equivalent payments under different value bases ............................ 76
Figure 44 Price risk / value add spectrum ............................................................................................................... 79
Figure 45 Nodule processing flowsheet and possible cost allowances .............................................................. 84
16 October 2020 Page v
Acronyms used in this report
DRC Democratic Republic of the Congo.
EMM Electrolytic manganese metal, a highly pure form of manganese metal
FeMn. SiMn Ferromanganese and silicomanganese; manganese alloys used in the production of
carbon, stainless and specialty steels.
HPAL High pressure acid leach, a hydrometallurgical method for processing laterite nickel
ore
IRR Internal rate of return, a discount rate that makes the net present value of all cash
flows equal to zero in a discounted cash flow analysis.
ISA International Seabed Authority
LME London Metal Exchange, the world’s largest market in options and futures contracts
which provides worldwide reference prices for base and other metals
MHP, MSP
Mixed hydroxide precipitate / mixed sulphide precipitate, intermediate nickel and
cobalt containing materials produced from the hydrometallurgical processing of
nickel ores.
MRS Manganese-rich slag, a by-product of polymetallic nodule processing with similar
characteristics to manganese ore.
NiSO4 / MnSO4
/ CoSO4
Nickel / manganese / cobalt sulphate, a chemical form of these metals primarily
used in the production of lithium ion batteries.
NPI Nickel pig iron, a low grade form of ferronickel produced and consumed in Indonesia
and China in the production of stainless steel
NSR Net smelter return, a valuation concept in which allowable processing operating and
capital costs are deducted from the gross value of an unfinished material
RRT Resource rent taxes, a taxation concept in which profits above a certain level are
more heavily taxed
SHFE Shanghai Futures Exchange, a source of reference pricing for metals within China
SXEW Solvent extraction / electrowinning, a hydrometallurgical process for the production
of refined copper from oxide ores.
TC/RCs Treatment and refining charges, fees levied by processors of base metal
concentrates which to a large extent determine the processors’ margins
16 October 2020 Page 1 of 85
1. Executive summary
This report has been commissioned by the International Seabed Authority (ISA) as part of the
ongoing development of a financial regime for the collection of payments in return for the right to
collect polymetallic nodules on the seabed.
CRU Consulting has been commissioned to address one specific part of the overall study: to
advise on the most appropriate valuation methodology for undersea polymetallic nodules
for the extraction of royalties, while meeting the above objectives for the regime.
This executive summary provides an overview of the key findings, conclusions and
recommendations from CRU’s analysis.
Polymetallic nodules are unique; the gross value of the metal content of the nodule
is high, and displays significant historical volatility
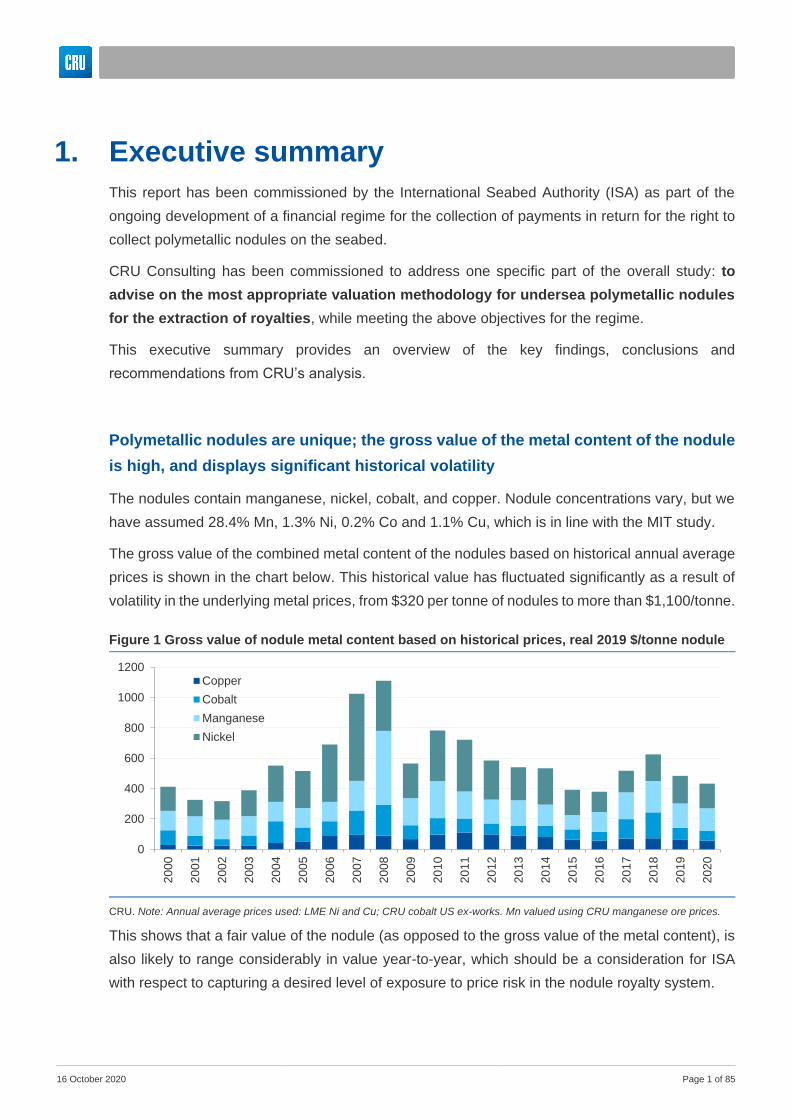
The nodules contain manganese, nickel, cobalt, and copper. Nodule concentrations vary, but we
have assumed 28.4% Mn, 1.3% Ni, 0.2% Co and 1.1% Cu, which is in line with the MIT study.
The gross value of the combined metal content of the nodules based on historical annual average
prices is shown in the chart below. This historical value has fluctuated significantly as a result of
volatility in the underlying metal prices, from $320 per tonne of nodules to more than $1,100/tonne.
This shows that a fair value of the nodule (as opposed to the gross value of the metal content), is
also likely to range considerably in value year-to-year, which should be a consideration for ISA
with respect to capturing a desired level of exposure to price risk in the nodule royalty system.
Figure 1 Gross value of nodule metal content based on historical prices, real 2019 $/tonne nodule
CRU. Note: Annual average prices used: LME Ni and Cu; CRU cobalt US ex-works. Mn valued using CRU manganese ore prices.
0
200
400
600
800
1000
1200
2000
2001
2002
2003
20
04
2005
2006
2007
2008
2009
2010
2011
2012
2013
2014
2015
2016
2017
2018
2019
2020
Copper
Cobalt
Manganese
Nickel
16 October 2020 Page 2 of 85
At 2019 average prices, the gross value of the nodule is estimated to be $484/tonne, which would
be equivalent to the gross metal content value of a theoretical 8% copper ore. As most run of mine
copper grades are around or even below 1% Cu, it is clear that the in-situ value of the nodules is
comparatively very high.
For comparison with prices for unfinished products (as opposed to in-situ ores), on a 2019 basis
these are about $1,000-1,300/tonne for 20-25% copper concentrates, $247/tonne for 44%
manganese ore, and $93/tonne for standard 62% iron ore. This demonstrates that the gross value
of the metal content of the nodules is also high compared to bulk materials, but lower than base
metal concentrates. The nodules clearly have a high gross metal content value, and this should
be kept in mind while developing the royalty system.
The gross metal content value of the nodules does not represent their fair value
In land-based mining, a purchaser of raw materials, i.e. those that require further processing to be
transformed into finished products, will not pay for the full value of the metal contained within those
raw materials. Explicit (i.e. contractually established using a formula or specific terms) or implicit
(i.e. factored into price negotiations but not broken down into individual components in a contract)
deductions against the reference price for the metallic content of a raw material (e.g. for copper
concentrates this would be the LME copper price) will account for, at a minimum, metallurgical
recoveries, processing costs, and realisation costs1. Beyond these minimum deductions, a
price will be driven by factors such as market dynamics, the ratio of operating and capital costs
between buyer and seller, the risk taken by each party, etc. For lower value, bulk materials, such
as iron ore, manganese ore and nickel laterite ore, these are typically sold on a fixed price basis
per tonne of ore, with no explicit reference to a reference price for the finished product itself.
Determining a fair value for polymetallic nodules is highly challenging
It is particularly challenging to determine the value of the nodules, as:
• There are no current transactions involving this material
• There are no existing operations from which to estimate costs
• There are no precedents for the allocation of price risk between collector and processor
• There are no direct analogues in land-based mining and processing
Even after polymetallic nodule collection and processing facilities begin operating, reported
transaction prices may well not provide a fair representation of the nodule value. For a transaction
1 Realisation costs reflect that fact that e.g. a producer of LME grade copper will not receive exactly the LME price for their output at the factory gate. Instead there are logistics and handling costs in delivering the products to the customer, other costs such as financing, and also regional premiums that will determine the actual netback price received relative to the LME. Collectively, these are termed realisation costs.
16 October 2020 Page 3 of 85
to be considered a fair representation of the value of a particular material, a willing buyer and a
willing seller, acting at arm’s length, in a competitive market is required. These criteria are
unlikely to be met in the case of the nodules, even if the collector and processor are acting at
arm’s length and not co-owned. Given the unique nature of the nodules, and the likely custom
design of the processing plant to refine the material, neither party has a reasonable alternative to
selling to each other. This last point is important, as bargaining zones between parties can
sometimes be established by looking at Next Best Alternatives. In this case, it is likely that both
parties next best alternative would not be economically feasible. There are a few smelters with
polymetallic processing capabilities worldwide that might (though this is very much unproven) be
able to process the nodules, but have their own sources of raw materials and little incentive to
take the nodules, from which they would probably extract less value than a custom-designed
facility, and therefore offtake of the full volume of nodules would be difficult and the realized price
would be substantially lower. Similarly, the processor would not have a ready source of raw
materials other than the nodules and would be in a weak bargaining position to secure what
concentrates or intermediates might be available.
From a metallurgical standpoint, the manganese content of the nodule creates additional
challenges with respect to determining fair value. Manganese ore (as described below, this likely
provides the most suitable benchmark for Mn content of the nodule) is typically sold on a fixed
price per tonne, whereas the remaining components of the nodule collectively resemble a nickel
concentrate, which would be sold (though there is very little actual trade) on the basis of the
reference prices for each of the finished products (nickel, copper, cobalt) minus various relatively
fixed deductions. In the former, the processor would take the finished product price risk, in the
latter, the miner takes the price risk. Furthermore, the final product form of manganese as sold by
a nodule processor is much less certain than that of the other materials2, which has implications
for selecting an appropriate reference price for the manganese content.
In the absence of transparent pricing, prices can be determined by analysis of the producer-consumer bargaining zone
While less preferable than establishing value based on actual or closely comparable transactions,
it is possible to construct a transfer price by establishing a bargaining zone, bounded by the
producer and consumer’s operating and capital costs. This approach then involves allocating part
of the bargaining zone to the buyer and the rest to the seller, based on a variety of criteria such
2 Manganese in the nodule would most likely be converted into a manganese-rich silicate slag (MRS) by-product through the smelting of nodules. MRS closely resembles manganese ore, and could be sold as a substitute for this material, though this is not market-tested. However, the MRS could be further processed into high grade manganese metal, or a manganese alloy. These products are much higher value than manganese ore.
16 October 2020 Page 4 of 85
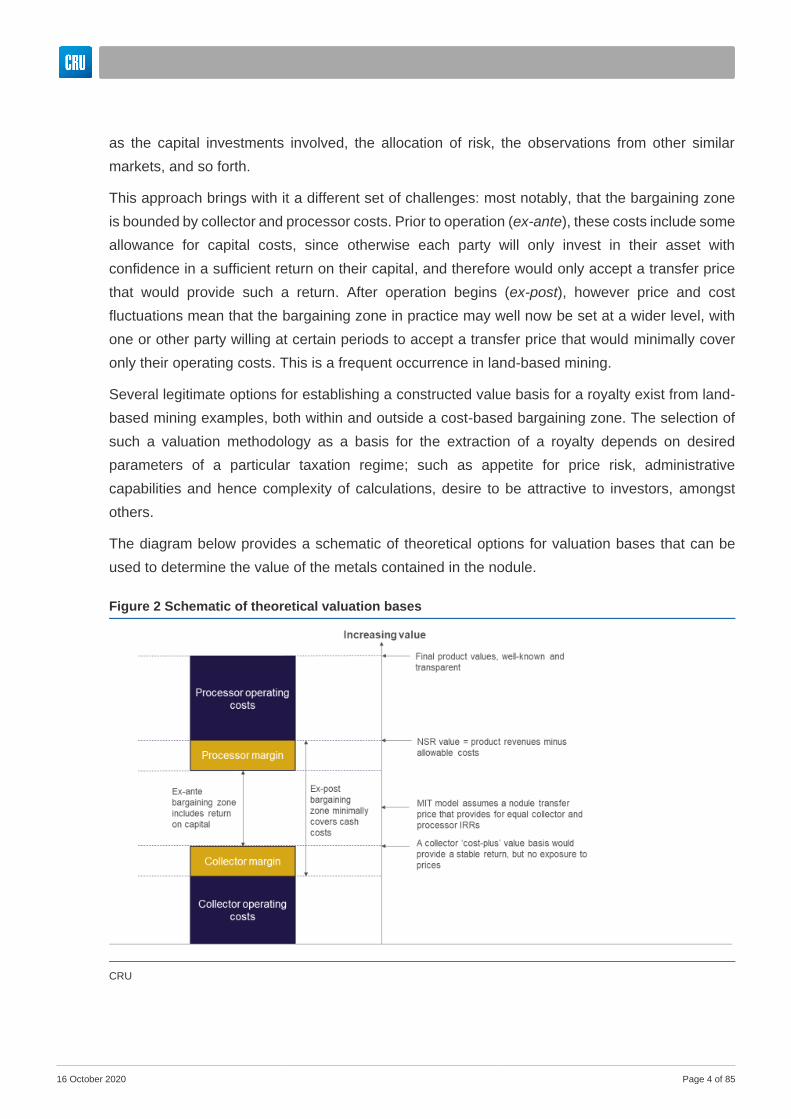
as the capital investments involved, the allocation of risk, the observations from other similar
markets, and so forth.
This approach brings with it a different set of challenges: most notably, that the bargaining zone
is bounded by collector and processor costs. Prior to operation (ex-ante), these costs include some
allowance for capital costs, since otherwise each party will only invest in their asset with
confidence in a sufficient return on their capital, and therefore would only accept a transfer price
that would provide such a return. After operation begins (ex-post), however price and cost
fluctuations mean that the bargaining zone in practice may well now be set at a wider level, with
one or other party willing at certain periods to accept a transfer price that would minimally cover
only their operating costs. This is a frequent occurrence in land-based mining.
Several legitimate options for establishing a constructed value basis for a royalty exist from land-
based mining examples, both within and outside a cost-based bargaining zone. The selection of
such a valuation methodology as a basis for the extraction of a royalty depends on desired
parameters of a particular taxation regime; such as appetite for price risk, administrative
capabilities and hence complexity of calculations, desire to be attractive to investors, amongst
others.
The diagram below provides a schematic of theoretical options for valuation bases that can be
used to determine the value of the metals contained in the nodule.
Figure 2 Schematic of theoretical valuation bases
CRU
16 October 2020 Page 5 of 85
Observation of this schematic may raise the question: why not use the simplest formulation of
an ad valorem royalty on the gross value of the contained minerals in the ore? The problem
with this is that the burden of such a royalty depends on the value added by the mine (in the value
chain that ends with the reference price). Taking the example of a simple 3% royalty. Assume two
metals, each selling at $1,000/tonne. In metal A, the mine adds just 20% of the value, while in
metal B the mine adds 80% of the value. For metal A the burden of the royalty on the mine is
30/200 – 15%, whereas for metal B, the burden is 30/800 – 3.75%.
Thus, even if the owner of mineral rights opts for the simplest form of ad valorem royalty,
understanding the value added by the mine (or in this case, the nodule collector) is
necessary in setting the royalty rate.
Land-based mining provides examples that can help us analyse the nodule
bargaining zone
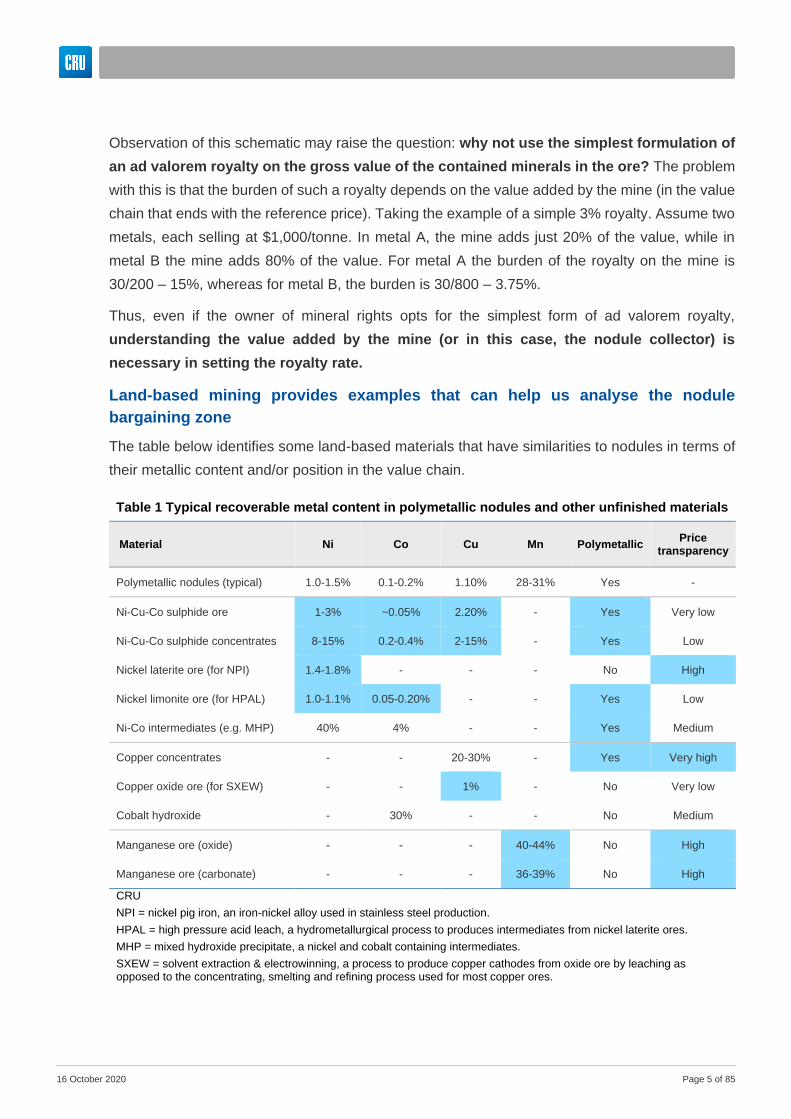
The table below identifies some land-based materials that have similarities to nodules in terms of
their metallic content and/or position in the value chain.
Table 1 Typical recoverable metal content in polymetallic nodules and other unfinished materials
Material Ni Co Cu Mn Polymetallic Price
transparency
Polymetallic nodules (typical) 1.0-1.5% 0.1-0.2% 1.10% 28-31% Yes -
Ni-Cu-Co sulphide ore 1-3% ~0.05% 2.20% - Yes Very low
Ni-Cu-Co sulphide concentrates 8-15% 0.2-0.4% 2-15% - Yes Low
Nickel laterite ore (for NPI) 1.4-1.8% - - - No High
Nickel limonite ore (for HPAL) 1.0-1.1% 0.05-0.20% - - Yes Low
Ni-Co intermediates (e.g. MHP) 40% 4% - - Yes Medium
Copper concentrates - - 20-30% - Yes Very high
Copper oxide ore (for SXEW) - - 1% - No Very low
Cobalt hydroxide - 30% - - No Medium
Manganese ore (oxide) - - - 40-44% No High
Manganese ore (carbonate) - - - 36-39% No High
CRU
NPI = nickel pig iron, an iron-nickel alloy used in stainless steel production.
HPAL = high pressure acid leach, a hydrometallurgical process to produces intermediates from nickel laterite ores.
MHP = mixed hydroxide precipitate, a nickel and cobalt containing intermediates.
SXEW = solvent extraction & electrowinning, a process to produce copper cathodes from oxide ore by leaching as opposed to the concentrating, smelting and refining process used for most copper ores.
16 October 2020 Page 6 of 85
Of the above materials, the following provide us with particularly pertinent reference points when
analysing the nodule bargaining zone, and these are the materials analysed in the most detail in
this report:
• Copper concentrates: Very high degree of price transparency provides a strong
benchmark for analysing value add in unfinished raw materials, and share of price between
buyer and seller over time
• Nickel laterite ores: comparable nickel content to nodules, lowest nickel content material
that is traded with a moderately transparent price
• Nickel concentrates: Similar Ni-Co-Cu ratio to the nodules, informative for how these
materials are sold, priced and valued in combination, though trade is limited and not highly
transparent
• Nickel-cobalt intermediates: Intermediate step material that is contains nickel and cobalt,
albeit in relatively high concentrates compared to nodules, but provide another example of
these metals being sold together, through an entirely different processing route
• Manganese ore: Primary reference point for valuing the manganese content of the nodule,
widely traded and with a transparent price.
Pricing mechanisms for these materials vary
The formulae by which unfinished materials are valued (and the corresponding price risk afforded
to the buyer and seller) differs, but can broadly be categorised as follows:
• Lower value bulk materials (e.g. iron ore, coal, industrial minerals, and in the case of the
comparable materials above: manganese ore and nickel laterite ore) are sold at prices per
gross tonne of material or per unit contained metal, which may be linked to indices that
track spot prices for benchmark materials. Mines assume no direct final product price risk.
While manganese ore prices may be fairly well correlated with manganese alloy (the main
product into which ore is processed) prices, there is no direct linkage between the alloy
and ore price in ore sales contracts. Similarly, nickel laterite ore prices tend to fluctuate
between 15-30% of the nickel LME price, but may move entirely independently of the LME
nickel price, no allowance for which is included in the ore price.
• Base metal concentrates sold as high payable percentage (e.g. 90-95%, broadly reflecting
the recovery rate in processing) of finished product price (e.g. LME nickel or copper) minus
treatment and refining charges (TC/RCs). As these charges are not directly driven by the
metal prices themselves, and are much less volatile than the metal prices, this means that
mines take all the price risk in such contracts.
16 October 2020 Page 7 of 85
• Other materials, e.g. Ni-Co intermediates, do not make explicit deductions like a treatment
charge, but are sold at a comparatively low % of reference price (e.g. 70-80%, significantly
lower than actual processing recovery rates) which shares price risk between buyer and
seller, since both are getting paid as a proportion of the final metal price.
• Other intermediate formulations are possible with price risk sharing between buyer and
seller, e.g. escalation according to price index for mine, price participation for smelter.
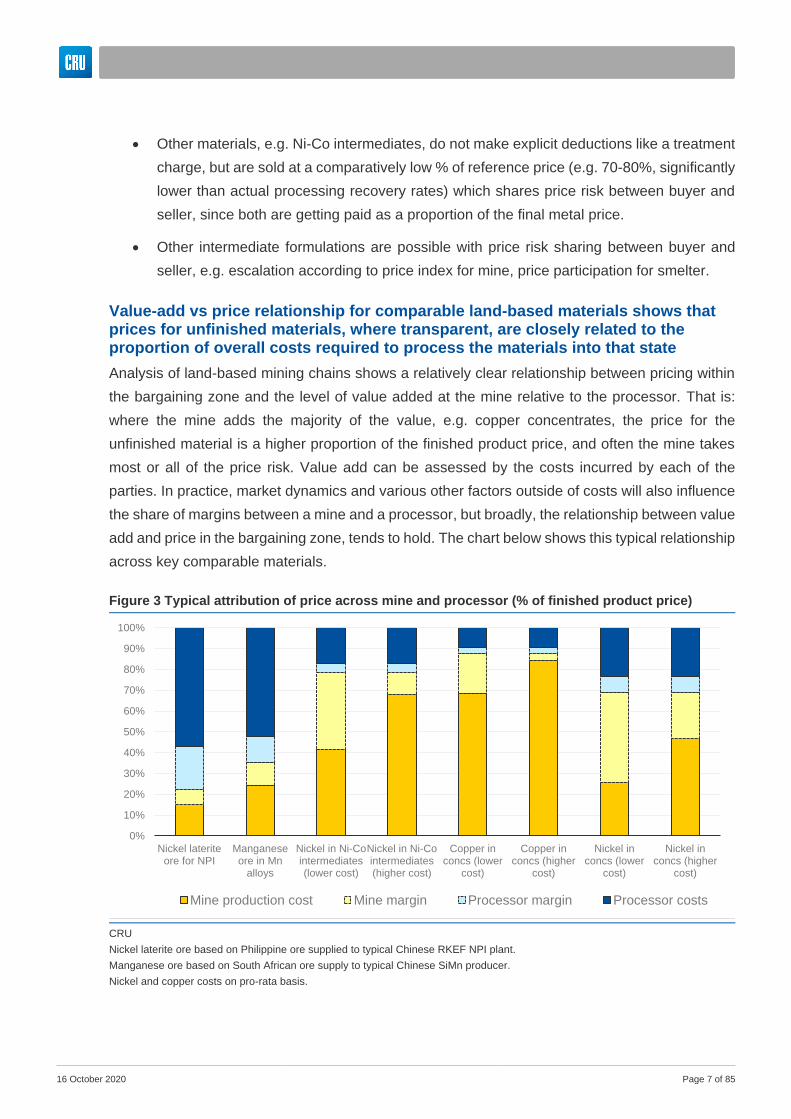
Value-add vs price relationship for comparable land-based materials shows that prices for unfinished materials, where transparent, are closely related to the proportion of overall costs required to process the materials into that state
Analysis of land-based mining chains shows a relatively clear relationship between pricing within
the bargaining zone and the level of value added at the mine relative to the processor. That is:
where the mine adds the majority of the value, e.g. copper concentrates, the price for the
unfinished material is a higher proportion of the finished product price, and often the mine takes
most or all of the price risk. Value add can be assessed by the costs incurred by each of the
parties. In practice, market dynamics and various other factors outside of costs will also influence
the share of margins between a mine and a processor, but broadly, the relationship between value
add and price in the bargaining zone, tends to hold. The chart below shows this typical relationship
across key comparable materials.
Figure 3 Typical attribution of price across mine and processor (% of finished product price)
CRU
Nickel laterite ore based on Philippine ore supplied to typical Chinese RKEF NPI plant.
Manganese ore based on South African ore supply to typical Chinese SiMn producer.
Nickel and copper costs on pro-rata basis.
0%
10%
20%
30%
40%
50%
60%
70%
80%
90%
100%
Nickel lateriteore for NPI
Manganeseore in Mn
alloys
Nickel in Ni-Cointermediates(lower cost)
Nickel in Ni-Cointermediates(higher cost)
Copper inconcs (lower
cost)
Copper inconcs (higher
cost)
Nickel inconcs (lower
cost)
Nickel inconcs (higher
cost)
Mine production cost Mine margin Processor margin Processor costs

16 October 2020 Page 8 of 85
We can see that for the lower value bulks, mining costs are only a small proportion of the overall
finished material price, as compared to the higher value unfinished materials (Ni-Co intermediates,
Ni and Cu concentrates) where the mine is adding much more of the value.
The following chart shows, for the same materials, how the split of costs and margins between
mines and processors remains similar across materials – i.e. where the mine adds more value, it
tends to take a greater share of the bargaining zone.
While these examples give us an indication of where a ‘fair value’ might lie for nodules between collector and processor, this is not necessarily the best option as a value basis for the nodules for the purposes of extracting a royalty
Attempting to calculate the ‘fairest’ point in the bargaining zone between collector and processor
in the case of the nodules can be undertaken, and the analysis above provides some indication of
a reasonable range based on comparable materials and mine/processor value-add. The MIT
model already makes an estimation of nodule value based on the exact midpoint of the bargaining
zone3, and this could potentially be adjusted to reflect the analysis shown above for comparable
materials. However, this methodology to calculate nodule value is not readily usable for the
determination of royalties in practice, for the following reasons:
3 It is important to note that the nodule value in the MIT model is not intended to be an assessment of the nodule’s fair value, rather a necessary step in the calculation of royalty returns under different input assumptions, which was the main purpose of the MIT model and study
Figure 4 Mine shares of combined mine and processor costs and margins
0%
10%
20%
30%
40%
50%
60%
70%
80%
90%
100%
Nickel lateriteore for NPI
Manganeseore in Mn
alloys
Nickel in Ni-Cointermediates(lower cost)
Nickel in Ni-Cointermediates(higher cost)
Copper inconcs (lower
cost)
Copper inconcs (higher
cost)
Nickel inconcs (lower
cost)
Nickel inconcs (higher
cost)
Mine share of combined margins Mine share of total costs

16 October 2020 Page 9 of 85
• It is reliant on costs which are not known with sufficient accuracy ex-ante;
• Capture of repayment on capital costs is factored into the calculations ex-ante, but this
assumption may not be reasonable ex-post;
• It requires both collector and processor operating and capital costs as inputs, increasing
the number of variables and therefore uncertainty and margin of error;
• In practice, relative collector to processor costs will vary over time, therefore the fair value
position in bargaining zone would require constant monitoring and recalculating (potentially
using complex models like the one constructed by MIT) if this metric is used to drive the
royalty value basis. This would be difficult and not highly transparent to monitor, administer,
or predict in advance, and therefore would create uncertainty around royalty revenues. The
high level of complexity could also make the system more vulnerable to manipulation, as
the information disadvantage to the ISA would be greater.
Therefore, CRU recommends that alternative valuation bases might be considered that are
simpler, more transparent, and easier to monitor on an ongoing basis.
Value basis and royalty rate are inter-dependent, and cannot be fully assessed independent of each other
In addition to the complexity of a calculation estimating the fair value point for nodules in the
collector-processor bargaining zone, it is important to remember that this is only half of the
equation, the other half being the royalty rate itself. CRU recommends that the ISA consider the
primary metric to be determined as the total desired burden to place on the collector, as a function
of whichever valuation metric may be used, as opposed to establishing a nodule value using
complex calculations and then using this as the basis for the royalty rate.
Relatedly, to provide an equivalent payment, a royalty rate should be lower when extracted upon
a higher value basis. This is important for two reasons:
• Firstly, when drawing examples from land-based royalty regimes that might indicative an
appropriate royalty rate for the metallic content of the nodules, it is important to include
the value basis for raw materials to ensure that the valuation basis is like-for-like before
establishing the royalty rate as a useful data point. For example, if a 2% ad valorem royalty
on the gross value of contained metal in an ore is used in a land-based regime, this
should not be assumed to be a reasonable rate for a nodule royalty with an entirely
different value basis such as NSR.
• Secondly, in the case of the manganese content stream from the nodule, the potential
reference price for the final product is unknown and could be dramatically different if the
16 October 2020 Page 10 of 85
manganese is sold as manganese-rich slag (MRS), an ore equivalent, compared to a
much higher value downstream product such as manganese metal or manganese
sulphate. As such, it would not be reasonable to use the same royalty rate on the
manganese content sold as MRS than as downstream products, since the downstream
value is being added outside of the ISA’s jurisdiction. In general, the reference price for
the manganese content in the nodule should reflect the first product form sold by the
processor – if this is MRS, then the manganese ore price is most relevant, if a downstream
product is produced then the price for this material should be the reference.
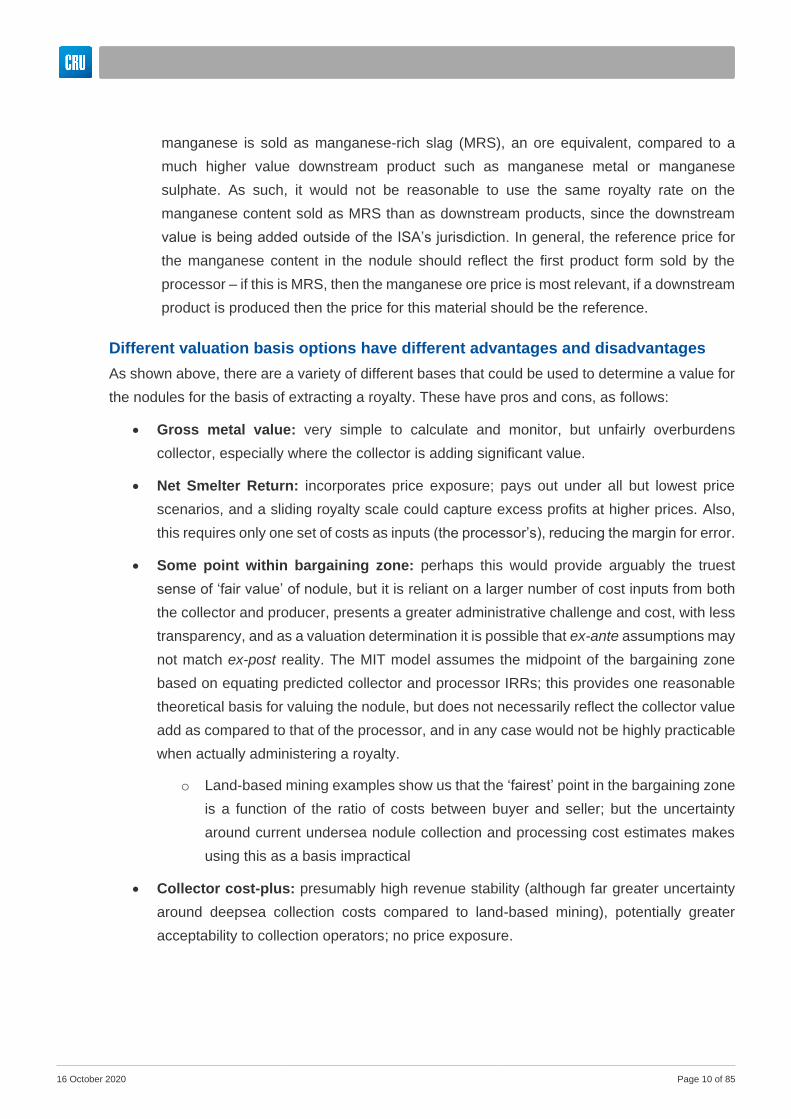
Different valuation basis options have different advantages and disadvantages
As shown above, there are a variety of different bases that could be used to determine a value for
the nodules for the basis of extracting a royalty. These have pros and cons, as follows:
• Gross metal value: very simple to calculate and monitor, but unfairly overburdens
collector, especially where the collector is adding significant value.
• Net Smelter Return: incorporates price exposure; pays out under all but lowest price
scenarios, and a sliding royalty scale could capture excess profits at higher prices. Also,
this requires only one set of costs as inputs (the processor’s), reducing the margin for error.
• Some point within bargaining zone: perhaps this would provide arguably the truest
sense of ‘fair value’ of nodule, but it is reliant on a larger number of cost inputs from both
the collector and producer, presents a greater administrative challenge and cost, with less
transparency, and as a valuation determination it is possible that ex-ante assumptions may
not match ex-post reality. The MIT model assumes the midpoint of the bargaining zone
based on equating predicted collector and processor IRRs; this provides one reasonable
theoretical basis for valuing the nodule, but does not necessarily reflect the collector value
add as compared to that of the processor, and in any case would not be highly practicable
when actually administering a royalty.
o Land-based mining examples show us that the ‘fairest’ point in the bargaining zone
is a function of the ratio of costs between buyer and seller; but the uncertainty
around current undersea nodule collection and processing cost estimates makes
using this as a basis impractical
• Collector cost-plus: presumably high revenue stability (although far greater uncertainty
around deepsea collection costs compared to land-based mining), potentially greater
acceptability to collection operators; no price exposure.

16 October 2020 Page 11 of 85
• Profit-based: this has least impact on project economics, more attractive to investors;
payments may be delayed until pre-production costs paid off; increases chance of no
payment in low price environments; more susceptible to manipulation
• Production based: similar to a cost-plus basis, this is a specific royalty (as opposed to ad
valorem) which provides even greater confidence in future royalty earnings, but no
exposure to prices.
The charts below provide illustrative analysis of the historical combined value of the metal content
of the nodules under different valuation metric, and also the corresponding royalty rates required
to provide an equivalent payout under these different metrics over time. It shows that an NSR
valuation provides a high degree of price exposure, and would provide a greater return than a
cost-plus basis under all but the lowest prices seen in the past 20 years.
Based on the analysis described above, CRU makes the following recommendations:
• CRU believes that the ISA need to establish more parameters around their desired royalty
system goals, most importantly:
○ Determine a targeted royalty return, as opposed to a specific rate on an as-yet
undetermined valuation basis.
Figure 5 Indicative historical nodule values
($/t nodule, real US$2020 terms)
CRU, MIT
Note: Using processing and collection costs from MIT model
Figure 6 Royalty rates needed to obtain
equivalent payments under different value bases
CRU
0
200
400
600
800
1000
1200
200
0200
1200
2200
3200
4200
5200
6200
7200
8200
9201
0201
1201
2201
3201
4201
5201
6201
7201
8201
9202
0
Nodule metal content gross value
NSR (processing costs deducted only)
Collection cost + 15%
0%
2%
4%
6%
8%
10%
12%
14%
16%
18%
200
0
200
1
200
2
200
3
200
4
200
5
200
6
200
7
200
8
200
9
201
0
201
1
201
2
201
3
201
4
201
5
201
6
201
7
201
8
201
9
202
0
Gross value royalty rate Equivalent NSR royalty
Equivalent cost+ royalty
16 October 2020 Page 12 of 85
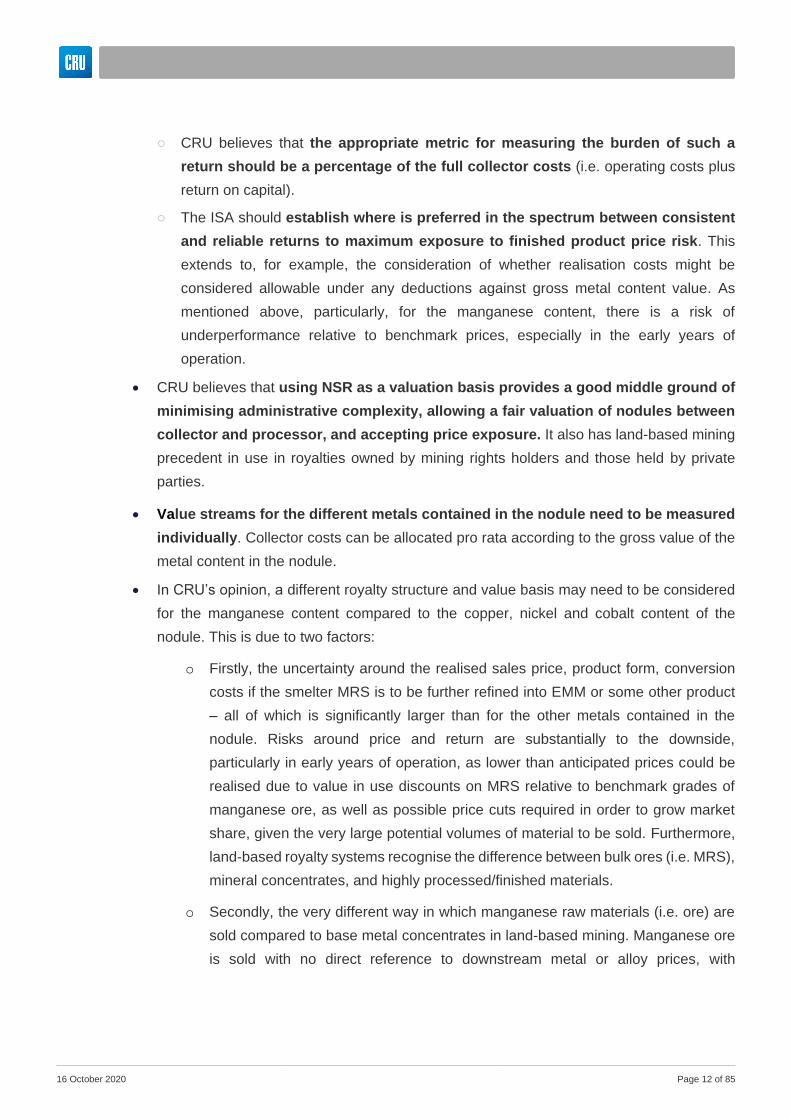
○ CRU believes that the appropriate metric for measuring the burden of such a
return should be a percentage of the full collector costs (i.e. operating costs plus
return on capital).
○ The ISA should establish where is preferred in the spectrum between consistent
and reliable returns to maximum exposure to finished product price risk. This
extends to, for example, the consideration of whether realisation costs might be
considered allowable under any deductions against gross metal content value. As
mentioned above, particularly, for the manganese content, there is a risk of
underperformance relative to benchmark prices, especially in the early years of
operation.
• CRU believes that using NSR as a valuation basis provides a good middle ground of
minimising administrative complexity, allowing a fair valuation of nodules between
collector and processor, and accepting price exposure. It also has land-based mining
precedent in use in royalties owned by mining rights holders and those held by private
parties.
• Value streams for the different metals contained in the nodule need to be measured
individually. Collector costs can be allocated pro rata according to the gross value of the
metal content in the nodule.
• In CRU’s opinion, a different royalty structure and value basis may need to be considered
for the manganese content compared to the copper, nickel and cobalt content of the
nodule. This is due to two factors:
o Firstly, the uncertainty around the realised sales price, product form, conversion
costs if the smelter MRS is to be further refined into EMM or some other product
– all of which is significantly larger than for the other metals contained in the
nodule. Risks around price and return are substantially to the downside,
particularly in early years of operation, as lower than anticipated prices could be
realised due to value in use discounts on MRS relative to benchmark grades of
manganese ore, as well as possible price cuts required in order to grow market
share, given the very large potential volumes of material to be sold. Furthermore,
land-based royalty systems recognise the difference between bulk ores (i.e. MRS),
mineral concentrates, and highly processed/finished materials.
o Secondly, the very different way in which manganese raw materials (i.e. ore) are
sold compared to base metal concentrates in land-based mining. Manganese ore
is sold with no direct reference to downstream metal or alloy prices, with
16 October 2020 Page 13 of 85
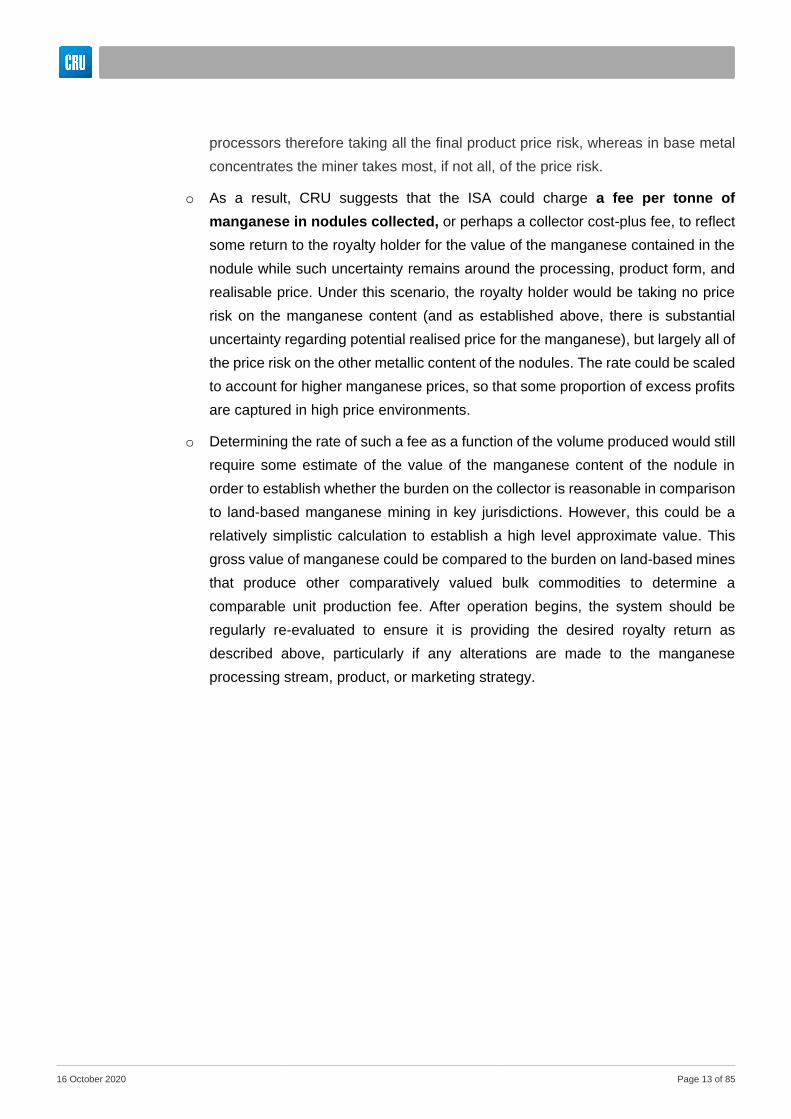
processors therefore taking all the final product price risk, whereas in base metal
concentrates the miner takes most, if not all, of the price risk.
o As a result, CRU suggests that the ISA could charge a fee per tonne of
manganese in nodules collected, or perhaps a collector cost-plus fee, to reflect
some return to the royalty holder for the value of the manganese contained in the
nodule while such uncertainty remains around the processing, product form, and
realisable price. Under this scenario, the royalty holder would be taking no price
risk on the manganese content (and as established above, there is substantial
uncertainty regarding potential realised price for the manganese), but largely all of
the price risk on the other metallic content of the nodules. The rate could be scaled
to account for higher manganese prices, so that some proportion of excess profits
are captured in high price environments.
o Determining the rate of such a fee as a function of the volume produced would still
require some estimate of the value of the manganese content of the nodule in
order to establish whether the burden on the collector is reasonable in comparison
to land-based manganese mining in key jurisdictions. However, this could be a
relatively simplistic calculation to establish a high level approximate value. This
gross value of manganese could be compared to the burden on land-based mines
that produce other comparatively valued bulk commodities to determine a
comparable unit production fee. After operation begins, the system should be
regularly re-evaluated to ensure it is providing the desired royalty return as
described above, particularly if any alterations are made to the manganese
processing stream, product, or marketing strategy.

16 October 2020 Page 14 of 85
2. Introduction and scope of this report
2.1. Background
This report has been commissioned by the International Seabed Authority (ISA) as part of the
ongoing development of a financial payment regime for the collection of payments in return for the
right to collect polymetallic nodules on the seabed.
The UN Convention on the Law of the Sea (LOSC) and the 1994 Implementation Agreement
define the objectives and principles that should underpin the design of the financial payment
regime. CRU notes that the following are key relevant objectives of the ultimate financial payments
regime:
• The regime must optimise revenues for the ISA, while not disincentivizing investment.
• The regime should ensure equality of financial treatment and comparable financial
obligations for each contractor.
• The regime should ensure that contractors do not receive a competitive advantage or
disadvantage with respect to land-based miners for the same or similar minerals.
To meet the third objective, the rates of payments defined by the regime should be “within the
range of those prevailing in respect of land-based mining of the same or similar minerals in order
to avoid giving seabed miners an artificial competitive advantage or imposing on them a
competitive disadvantage.”
The decision was made to commission a study that would include the identification of:
• The royalty rates;
• The taxable base in those jurisdictions representing the bulk of production for the same or
similar minerals and/or ores, e.g., manganese, copper, cobalt and nickel;
• Any environmental levies;
• Any administrative fees.
CRU Consulting has been commissioned to address one specific part of the overall study, to
advise on the most appropriate valuation methodology for undersea polymetallic nodules
for the imposition of royalties, while meeting the above objectives for the regime.
The remaining aspects of the study are being completed by RMG Group, and where relevant CRU
will refer to this as the RMG report.
16 October 2020 Page 15 of 85
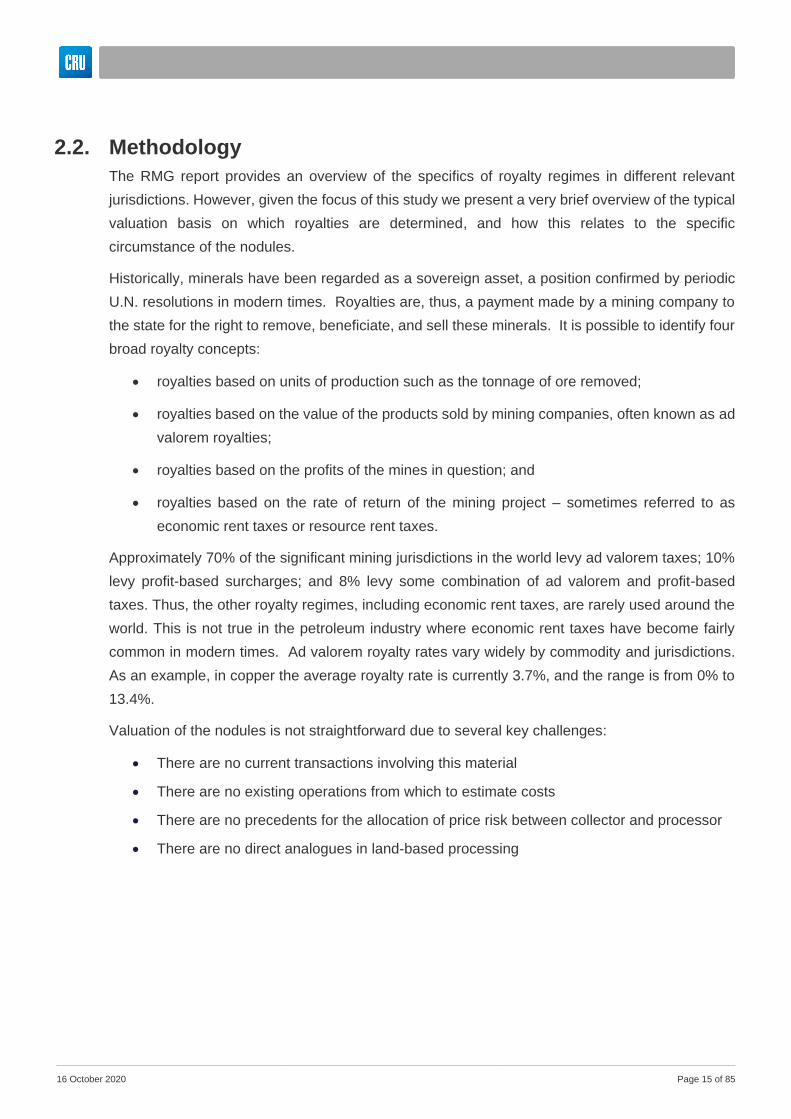
2.2. Methodology
The RMG report provides an overview of the specifics of royalty regimes in different relevant
jurisdictions. However, given the focus of this study we present a very brief overview of the typical
valuation basis on which royalties are determined, and how this relates to the specific
circumstance of the nodules.
Historically, minerals have been regarded as a sovereign asset, a position confirmed by periodic
U.N. resolutions in modern times. Royalties are, thus, a payment made by a mining company to
the state for the right to remove, beneficiate, and sell these minerals. It is possible to identify four
broad royalty concepts:
• royalties based on units of production such as the tonnage of ore removed;
• royalties based on the value of the products sold by mining companies, often known as ad
valorem royalties;
• royalties based on the profits of the mines in question; and
• royalties based on the rate of return of the mining project – sometimes referred to as
economic rent taxes or resource rent taxes.
Approximately 70% of the significant mining jurisdictions in the world levy ad valorem taxes; 10%
levy profit-based surcharges; and 8% levy some combination of ad valorem and profit-based
taxes. Thus, the other royalty regimes, including economic rent taxes, are rarely used around the
world. This is not true in the petroleum industry where economic rent taxes have become fairly
common in modern times. Ad valorem royalty rates vary widely by commodity and jurisdictions.
As an example, in copper the average royalty rate is currently 3.7%, and the range is from 0% to
13.4%.
Valuation of the nodules is not straightforward due to several key challenges:
• There are no current transactions involving this material
• There are no existing operations from which to estimate costs
• There are no precedents for the allocation of price risk between collector and processor
• There are no direct analogues in land-based processing
16 October 2020 Page 16 of 85
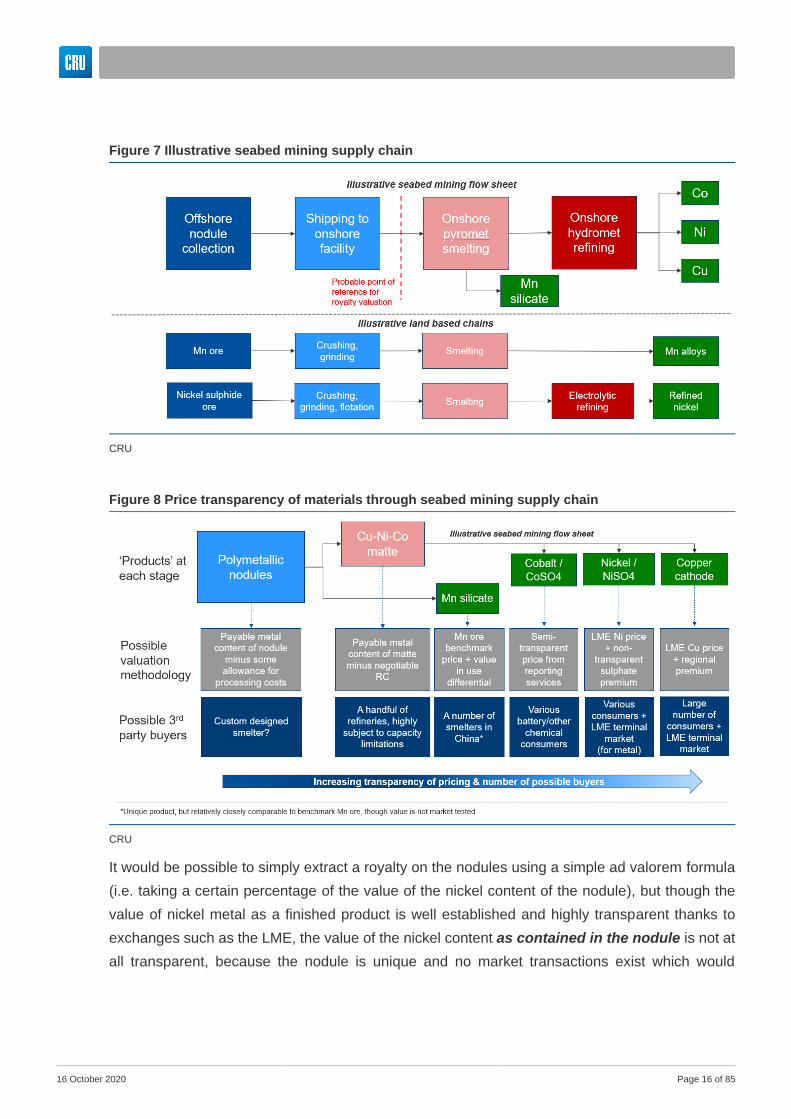
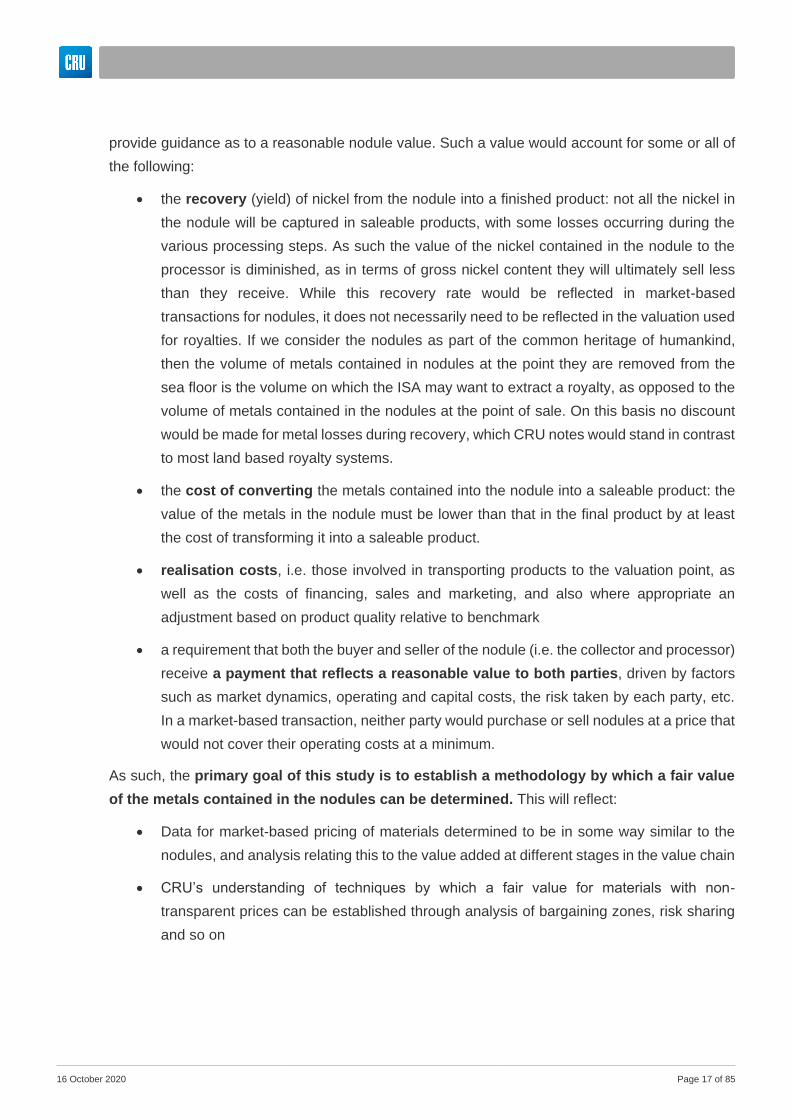
It would be possible to simply extract a royalty on the nodules using a simple ad valorem formula
(i.e. taking a certain percentage of the value of the nickel content of the nodule), but though the
value of nickel metal as a finished product is well established and highly transparent thanks to
exchanges such as the LME, the value of the nickel content as contained in the nodule is not at
all transparent, because the nodule is unique and no market transactions exist which would
Figure 7 Illustrative seabed mining supply chain
CRU
Figure 8 Price transparency of materials through seabed mining supply chain
CRU
16 October 2020 Page 17 of 85
provide guidance as to a reasonable nodule value. Such a value would account for some or all of
the following:
• the recovery (yield) of nickel from the nodule into a finished product: not all the nickel in
the nodule will be captured in saleable products, with some losses occurring during the
various processing steps. As such the value of the nickel contained in the nodule to the
processor is diminished, as in terms of gross nickel content they will ultimately sell less
than they receive. While this recovery rate would be reflected in market-based
transactions for nodules, it does not necessarily need to be reflected in the valuation used
for royalties. If we consider the nodules as part of the common heritage of humankind,
then the volume of metals contained in nodules at the point they are removed from the
sea floor is the volume on which the ISA may want to extract a royalty, as opposed to the
volume of metals contained in the nodules at the point of sale. On this basis no discount
would be made for metal losses during recovery, which CRU notes would stand in contrast
to most land based royalty systems.
• the cost of converting the metals contained into the nodule into a saleable product: the
value of the metals in the nodule must be lower than that in the final product by at least
the cost of transforming it into a saleable product.
• realisation costs, i.e. those involved in transporting products to the valuation point, as
well as the costs of financing, sales and marketing, and also where appropriate an
adjustment based on product quality relative to benchmark
• a requirement that both the buyer and seller of the nodule (i.e. the collector and processor)
receive a payment that reflects a reasonable value to both parties, driven by factors
such as market dynamics, operating and capital costs, the risk taken by each party, etc.
In a market-based transaction, neither party would purchase or sell nodules at a price that
would not cover their operating costs at a minimum.
As such, the primary goal of this study is to establish a methodology by which a fair value
of the metals contained in the nodules can be determined. This will reflect:
• Data for market-based pricing of materials determined to be in some way similar to the
nodules, and analysis relating this to the value added at different stages in the value chain
• CRU’s understanding of techniques by which a fair value for materials with non-
transparent prices can be established through analysis of bargaining zones, risk sharing
and so on
16 October 2020 Page 18 of 85
CRU has structured this report as follows:
• An overview of fair value pricing theory from land-based mining, and the way in which
non-transparent transactions involving niche materials can be valued
• A description of a framework that allows CRU to identify materials in land-based mining
value chains that could be considered “same or similar” to the polymetallic nodules
• Overviews of these “same or similar” materials showing how they are priced, and how
this relates to costs, bargaining zones, and positioning in the value chain.
• Conclusions and recommendations from the above analysis that may assist the ISA
with developing a system that fairly reflects the nodule value for the purposes of extracting
a royalty.
3. An introduction to fair value pricing
The subsequent chapters describe how relevant materials in land-based mining value chains are
priced and valued in practice. This section describes approaches to establishing a reasonable
price for materials where this is not possible due to e.g. a lack of arms-length transactions, and
how this could apply to the polymetallic nodules.
3.1. The concept of fair market value
There is general international consensus among economists that the fair market value of a
commodity is the price that is established in a transaction between a willing buyer and a willing
seller, acting at arm’s length, in a competitive market. The three key attributes are, therefore, the
following:
• willing buyer and willing seller; this implies that neither party is under any unusual or
temporary pressures to complete a transaction and, specifically, that there is no element
of a distressed sale or a forced purchase; thus, transactions arising from events of force
majeure, bankruptcy, legal and government actions, and so forth may be excluded;
• arm’s length; this implies that each party is acting to maximize its own economic interest;
thus, transactions where there are significant ownership or beneficial interest connections
between the buyer and the seller or where there are any potential conflicts of interest may
be excluded; and
• competitive market; this implies there are many different buyers and sellers of the same
commodity or a close substitute, that pricing information and other contract terms are
16 October 2020 Page 19 of 85
transparent, and that all parties are equally well informed; thus, transactions between
monopoly sellers and their customers or between suppliers and monopsony buyers,
transactions in markets where the terms of business are not standardized or are subject to
excessive secrecy, and transactions where one party has a clear informational advantage
over the other may be excluded.
Where a transaction has all three of the above attributes – willingness, arm’s length, and
competitiveness, most tax authorities will accept the actual invoice paid as definitive evidence of
the fair market value of the transaction.
It is clear that in the case of polymetallic undersea nodules, all three attributes are unlikely to be
met. The material is unique and would not be part of a competitive market, which also increases
the likelihood of integration between nodule collectors and processors (though this will not
necessarily be the case), thereby preventing arm’s length transactions between collector and
processor.
Where a transaction does not meet the three criteria mentioned above, the value stated on the
invoice cannot be relied upon as definitive. In that case, there are a number of alternative
approaches available to determine fair value. In order of preference, these are:
• third party transactions; it is sometimes possible to use the value stated on the invoice
of another company’s transaction when this involves an essentially similar product in terms
of quality, quantity, and time etc.; this approach relies, of course, on those third party
transactions conforming to the three criteria mentioned above;
• comparable transactions; this approach uses the value from a transaction that may have
taken place for a different amount at a different point in time and possibly involving a
different quality and a different delivery point or basis, all of which can be adjusted to
replicate as much as possible the actual amounts, times, and qualities involved; this
assumes that a reasonable technical and economic basis can be found for making this
comparison; and
• constructed prices; this approach constructs a price by evaluating the alternative options
available to the buyer and the seller in order to establish a bargaining zone; this approach
then establishes a transfer price by allocating part of the bargaining zone to the buyer and
the rest to the seller, all based on a variety of criteria such as the capital investments
involved, the allocation of risk, the observations from other similar markets, and so forth.
Third party transactions will not be available in the case of the polymetallic nodules, as they are
novel and unique. This report discusses comparable materials and describes how they relate
to the potential valuation of polymetallic nodules, and ultimately recommends a
16 October 2020 Page 20 of 85
constructed prices approach to determining the nodules’ value. Therefore, we consider both
comparable transactions and constructed prices as a basis for valuing the polymetallic nodules.
3.2. Bargaining zone
Within constructed prices, one methodology that can be used to understand reasonable fair value
pricing is developing a bargaining zone, consisting of a maximum and minimum price defined as
follows:
• The minimum price is the price which will enable the collector to cover its operating costs,
plus a reasonable return on its investment. The price of the nodules should not be less
than this at any time.
• The maximum price is the maximum price the onshore processor can afford to pay for
the nodules, while covering its operating costs, as well as making a reasonable return on
its investment. If this were not the case, then we assume the processing plant would not
have been built.
If generating a constructed price based on the bargaining zone, some point should be picked that
reflects the different operating and capital costs and risks of the two players, as well as their next-
best alternative. As we describe individual comparable commodity value chains later in this report,
this provides an indication of how a point might be chosen in the case of the polymetallic nodules.
In practice, the next-best alternatives in the case of a theoretical polymetallic nodule collector and
processor are likely to be prohibitive to funding the operations, at least prior to the establishment
of a liquid traded market for nodules, which would be a low likelihood and long term possibility.
Assuming this is not the case, CRU’s view on the next-best alternatives are set out below:
• Collector’s next-best alternative: attempt to sell nodules to polymetallic smelter-
refineries not custom-designed to process this material. A handful of smelters that process
e-waste, polymetallic nickel concentrates, or other complex metallic materials might be
able to take the nodules. It is likely the nodules would be substantially discounted
(compared to a theoretical transfer price), as the smelters might be unable to get full value
from the contained metal without significant adaptions to their processes, and are unlikely
to be seeking feedstock in the large volumes associated with undersea polymetallic nodule
collection, and as such would have a very strong bargaining position against the collector.
• Processor’s next-best alternative: seek feedstock of a somewhat similar nature to the
nodules. Arguably the risk here is slightly lower than that of the nodules, given the
processes at the smelter-refinery could probably be more readily adapted to alternative
raw materials than nodules could find alternative processing capacity. Alternative

16 October 2020 Page 21 of 85
feedstocks could include nickel and other polymetallic concentrates, and perhaps e-waste,
depending on the exact nature of the constructed smelter-refinery. This could be done
under a tolling arrangement, diminishing margin risk. Generally speaking, CRU would not
expect the potential volume of available raw material to be consistently large enough to
allow sufficient throughput to cover the repayment of the high capital cost of a smelter-
refinery, and the processor would again be in a weak bargaining position given knowledge
of its spare capacity in this scenario.
Both of these options contain a high degree of technical and market risk, and are unlikely to be
sufficiently profitable to justify funding the investments. As such, the most likely case, particularly
in the early years of undersea nodule collection commencing operations, is a single system in
which the collector supplies only the one processor, and the processor purchases only nodules
supplied by the collector. We cannot necessarily assume that the collector and processor are co-
owned, nor that they would be entirely separate companies.
It is important to distinguish between the ex-ante and the ex-post bargaining zone, i.e. the zone
as it is conceived prior to operation, and the zone as it may work in practice. Neither the buyer nor
seller would fund an operation that fails to provide a return on capital in addition to covering its
operating costs. However, in practice, unforeseen fluctuations in prices or costs that occur after
operation begins (or an overrun in capital costs prior to expectations) may result in those planned
margins not being met, i.e. ex-post each party would seek to minimally cover cash costs. Even a
negative cash margin may be accepted by an operator for a short period of time before an
operation will cut back output or shut down, due to for example expectations of the market
improving, or a desire to avoid the costs of shutting down and restarting. As such, in practice the
ex-post bargaining zone for market-priced commodities may be substantially wider than the ex-
ante bargaining zone.
3.3. Transfer pricing in the MIT royalty and valuation model
The ‘constructed prices’ valuation theory mentioned above broadly describes the methodology
used in the model created by MIT for the calculation, forecasting and analysis of royalty payments
to the ISA under different example royalty regimes and price scenarios. In this model, the nodule
value is calculated as the value that provides an equivalent IRR between the collector and
processor at a given set of price and cost forecasts – essentially an estimate of the exact midpoint
of the ex-ante bargaining zone described above. This valuation is determined as a necessary step
in the estimation of royalty payments, but CRU’s understanding is that MIT in no way is seeking
to reflect an estimated market value of the nodules or to take a position on various arguments
around a fair value transfer price for the material.

16 October 2020 Page 22 of 85
In the case of polymetallic nodules, as no existing collecting or processing operations exist, the
operating and capital cost inputs to these calculations are reliant on estimates from contractors’
feasibility studies and cannot be independently confirmed or compared against actual costs. This
creates uncertainty and risk around the reliance on such information as a key determinant of the
value of the nodules. As contractors move closer towards beginning operating, more detailed
technical studies may minimize the uncertainty around cost figures. As operation begins, costs
should be significantly more transparent, but there remains the possibility of massaging of reported
cost figures, particularly if reliant on costs from both the collector and processor, and especially if
those entities are co-owned, as may well be the case.
A constructed price based on collector and processor IRR’s cannot, in practice, be used to readily
and transparently compute a nodule transactional price at a given set of reference metal prices.
Therefore, while the MIT model provides a good basis for forecasting royalty payments under
different possible regimes, material prices and other scenarios, it does not provide a methodology
by which a nodule transfer price or value can be determined.
The diagram below shows a theoretical schematic of bargaining zones and valuation bases as a
function of the costs of nodule collection and processing.
Figure 9 Schematic of theoretical valuation bases
CRU
16 October 2020 Page 23 of 85
As will be described later in this report, an alternative valuation basis for the determination of
royalties is that of net smelter return. This method would take the individual metal revenue
streams from the processor and deduct allowable costs. Typically, such costs would predominately
consist of the actual operating costs involved in transforming raw materials (i.e. the nodules) into
the products sold by the processor, though there may also be some allowance for recovery of
capital costs.
4. A framework for finding comparable materials
4.1. Nodule metal content and gross value
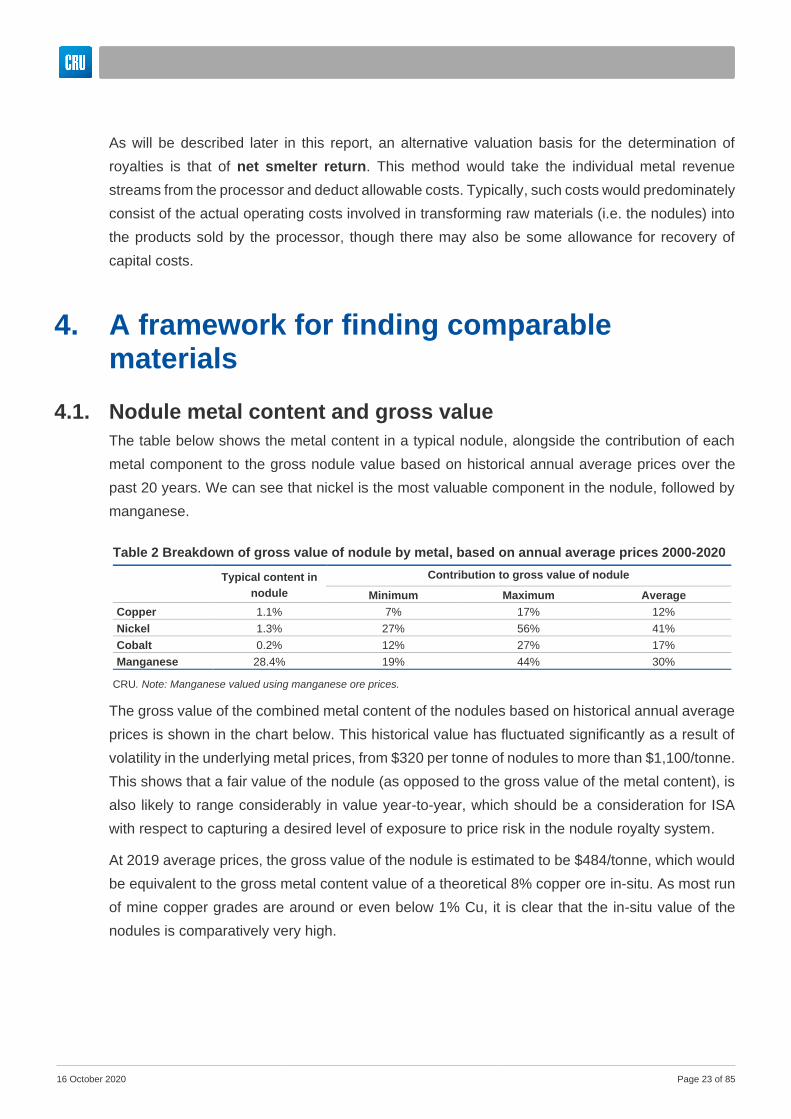
The table below shows the metal content in a typical nodule, alongside the contribution of each
metal component to the gross nodule value based on historical annual average prices over the
past 20 years. We can see that nickel is the most valuable component in the nodule, followed by
manganese.
Table 2 Breakdown of gross value of nodule by metal, based on annual average prices 2000-2020
Typical content in
nodule
Contribution to gross value of nodule
Minimum Maximum Average
Copper 1.1% 7% 17% 12%
Nickel 1.3% 27% 56% 41%
Cobalt 0.2% 12% 27% 17%
Manganese 28.4% 19% 44% 30%
CRU. Note: Manganese valued using manganese ore prices.
The gross value of the combined metal content of the nodules based on historical annual average
prices is shown in the chart below. This historical value has fluctuated significantly as a result of
volatility in the underlying metal prices, from $320 per tonne of nodules to more than $1,100/tonne.
This shows that a fair value of the nodule (as opposed to the gross value of the metal content), is
also likely to range considerably in value year-to-year, which should be a consideration for ISA
with respect to capturing a desired level of exposure to price risk in the nodule royalty system.
At 2019 average prices, the gross value of the nodule is estimated to be $484/tonne, which would
be equivalent to the gross metal content value of a theoretical 8% copper ore in-situ. As most run
of mine copper grades are around or even below 1% Cu, it is clear that the in-situ value of the
nodules is comparatively very high.

16 October 2020 Page 24 of 85
For comparison with prices for unfinished products (as opposed to in-situ ores), on a 2019 basis
these are about $1,000-1,300/tonne for 20-25% copper concentrates, $247/tonne for 44%
manganese ore, and $93/tonne for standard 62% iron ore. This demonstrates that the gross value
of the metal content of the nodules is also high compared to bulk materials, but lower than base
metal concentrates. The nodules clearly have a high gross metal content value, and this should
be kept in mind while developing the royalty system.
4.2. Describing the analysis process
A key condition in defining a royalty scheme for seabed nodule collection is that it does not favor
sea-based mining over land-based mine operations. We note that the royalty is a function of both
the rate and the value basis, and the two cannot be developed independently. CRU believes that
a better metric for comparability with land-based mining would be the burden of the royalty
payments as a percentage of the full collector costs (i.e. operating costs plus return on capital).
In this estimation of comparability, the royalty rate and value basis must be considered together,
rather than independently. Nonetheless, though this report focuses only on the value basis for a
royalty, we describe those that are used in land-based mining, important examples that can be
taken from particular comparable materials, and provides various recommendations for the ISA
with respect to defining a value basis and royalty system for the polymetallic nodules.
With this in consideration, in this section we establish a framework by which we can select
appropriate comparable materials and value chains. For this purpose and as summarized in the
figure below, a three-step analysis process was used.
Figure 10 Gross value of nodule metal content based on historical prices, real 2019 $/tonne nodule
CRU. Note: Annual average prices used: LME Ni and Cu; CRU cobalt US ex-works. Mn valued using CRU manganese ore prices.
0
200
400
600
800
1000
12002
00
0
20
01
20
02
20
03
20
04
20
05
20
06
20
07
20
08
20
09
20
10
20
11
20
12
20
13
20
14
20
15
20
16
20
17
20
18
20
19
20
20
Copper
Cobalt
Manganese
Nickel

16 October 2020 Page 25 of 85
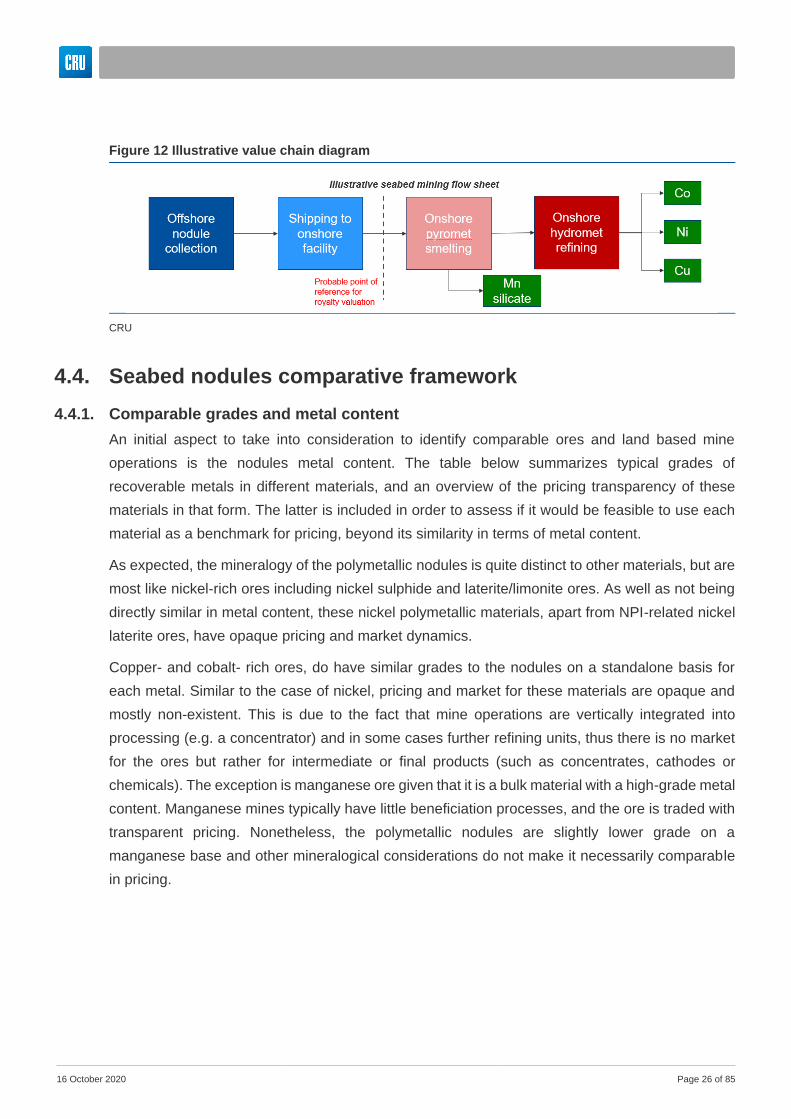
4.3. Seabed nodules value chain and products
As reported by the ISA, the organization has entered into 15-year contracts for exploration for
polymetallic nodules, polymetallic sulphides and cobalt-rich ferromanganese crusts in the deep
seabed with 30 different contracts. These contractors in collaboration with engineering &
technology firms and other organizations have carried out different assessments, not only to
determine resources, but also to define proposed processing flowsheets. It is not the objective of
this study to provide an opinion on the merits of any particular processing route. Therefore, a
simplified value chain for collection and processing was used as reference and which CRU
interprets as an overall consensus.
The figure below illustrates the key processing stages, materials and most likely final products.
Figure 11 Analysis process
CRU
1
Seabed value chain selection
Assess probable nodule processing value-chain configuration and technologies to be considered in a future seabed operation.
Output: Description of seabed processing route, intermediate and final products
Land based conceptual comparable framework
Based on products for the selected seabed value chain configuration, identify comparable existing land based ore and deposit types, processing routes, and value
chain considerations. Output: Comparable value chains, pricing terms and value basis for these materials
under different royalty schemes and jurisdictions
Valuation metrics
Benchmark pricing and valuation metrics for the comparable land based mine operations, providing a base for royalty calculations and further recommendations.
Output: Pricing and valuation considerations for future royalty calculations
2
3
16 October 2020 Page 26 of 85
4.4. Seabed nodules comparative framework
4.4.1. Comparable grades and metal content
An initial aspect to take into consideration to identify comparable ores and land based mine
operations is the nodules metal content. The table below summarizes typical grades of
recoverable metals in different materials, and an overview of the pricing transparency of these
materials in that form. The latter is included in order to assess if it would be feasible to use each
material as a benchmark for pricing, beyond its similarity in terms of metal content.
As expected, the mineralogy of the polymetallic nodules is quite distinct to other materials, but are
most like nickel-rich ores including nickel sulphide and laterite/limonite ores. As well as not being
directly similar in metal content, these nickel polymetallic materials, apart from NPI-related nickel
laterite ores, have opaque pricing and market dynamics.
Copper- and cobalt- rich ores, do have similar grades to the nodules on a standalone basis for
each metal. Similar to the case of nickel, pricing and market for these materials are opaque and
mostly non-existent. This is due to the fact that mine operations are vertically integrated into
processing (e.g. a concentrator) and in some cases further refining units, thus there is no market
for the ores but rather for intermediate or final products (such as concentrates, cathodes or
chemicals). The exception is manganese ore given that it is a bulk material with a high-grade metal
content. Manganese mines typically have little beneficiation processes, and the ore is traded with
transparent pricing. Nonetheless, the polymetallic nodules are slightly lower grade on a
manganese base and other mineralogical considerations do not make it necessarily comparable
in pricing.
Figure 12 Illustrative value chain diagram
CRU
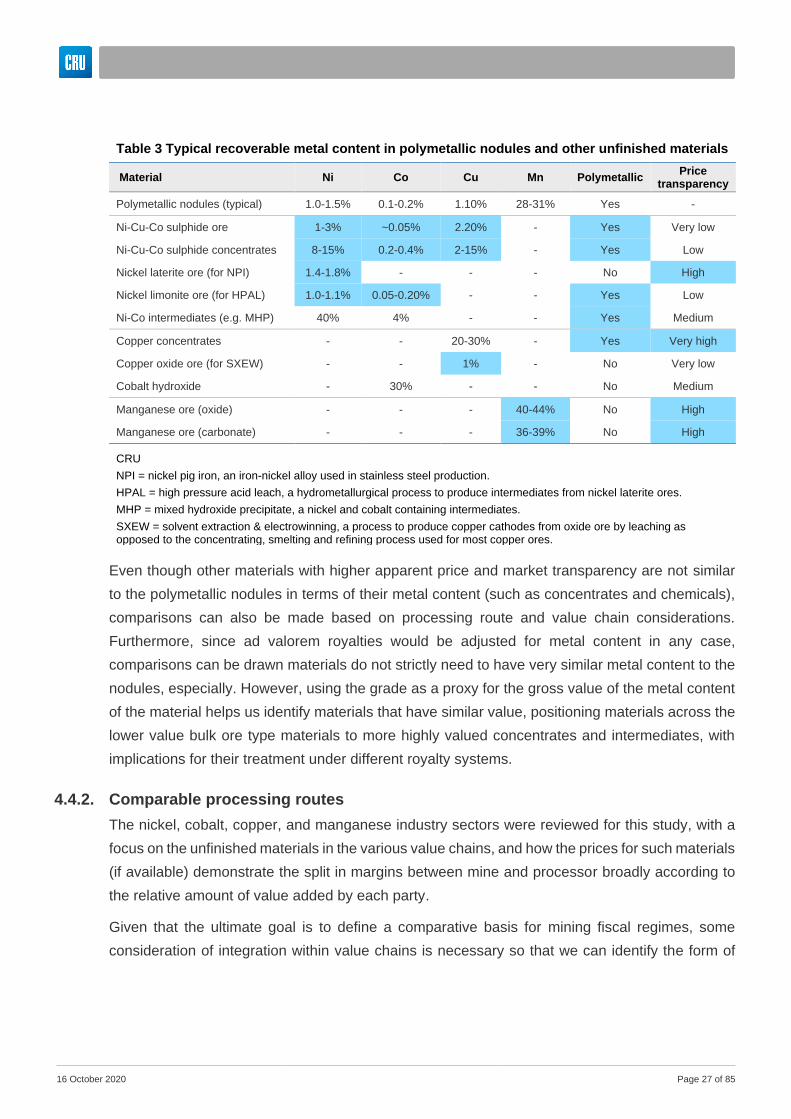
16 October 2020 Page 27 of 85
Table 3 Typical recoverable metal content in polymetallic nodules and other unfinished materials
Material Ni Co Cu Mn Polymetallic Price
transparency
Polymetallic nodules (typical) 1.0-1.5% 0.1-0.2% 1.10% 28-31% Yes -
Ni-Cu-Co sulphide ore 1-3% ~0.05% 2.20% - Yes Very low
Ni-Cu-Co sulphide concentrates 8-15% 0.2-0.4% 2-15% - Yes Low
Nickel laterite ore (for NPI) 1.4-1.8% - - - No High
Nickel limonite ore (for HPAL) 1.0-1.1% 0.05-0.20% - - Yes Low
Ni-Co intermediates (e.g. MHP) 40% 4% - - Yes Medium
Copper concentrates - - 20-30% - Yes Very high
Copper oxide ore (for SXEW) - - 1% - No Very low
Cobalt hydroxide - 30% - - No Medium
Manganese ore (oxide) - - - 40-44% No High
Manganese ore (carbonate) - - - 36-39% No High
CRU
NPI = nickel pig iron, an iron-nickel alloy used in stainless steel production.
HPAL = high pressure acid leach, a hydrometallurgical process to produce intermediates from nickel laterite ores.
MHP = mixed hydroxide precipitate, a nickel and cobalt containing intermediates.
SXEW = solvent extraction & electrowinning, a process to produce copper cathodes from oxide ore by leaching as opposed to the concentrating, smelting and refining process used for most copper ores.
Even though other materials with higher apparent price and market transparency are not similar
to the polymetallic nodules in terms of their metal content (such as concentrates and chemicals),
comparisons can also be made based on processing route and value chain considerations.
Furthermore, since ad valorem royalties would be adjusted for metal content in any case,
comparisons can be drawn materials do not strictly need to have very similar metal content to the
nodules, especially. However, using the grade as a proxy for the gross value of the metal content
of the material helps us identify materials that have similar value, positioning materials across the
lower value bulk ore type materials to more highly valued concentrates and intermediates, with
implications for their treatment under different royalty systems.
4.4.2. Comparable processing routes
The nickel, cobalt, copper, and manganese industry sectors were reviewed for this study, with a
focus on the unfinished materials in the various value chains, and how the prices for such materials
(if available) demonstrate the split in margins between mine and processor broadly according to
the relative amount of value added by each party.
Given that the ultimate goal is to define a comparative basis for mining fiscal regimes, some
consideration of integration within value chains is necessary so that we can identify the form of

16 October 2020 Page 28 of 85
products as they leave the battery limit of an operation for reference to prices and as a basis for
royalty valuation4.
• For copper: the hydrometallurgical processing route composed of leaching and SXEW as
major processing stages, is typically integrated on site with the mine operation. There is
negligible trade in oxide ore, and the product passing over the site’s battery limit would
normally be copper cathode. In the case of sulphide deposits, mines generally concentrate
the ore on site. Some mines also are integrated further downstream into smelting and
refining, but this is not necessarily the case, and concentrates are very widely traded,
though there is negligible trade in sulphide ore. Therefore, the first product to leave a typical
mine’s battery limit would be copper concentrates. Copper smelting and refining processes
are mostly integrated within a single operation, though some trade in smelter products,
often high grade but unrefined products such as copper blister or anodes occurs where
smelting and refining capacity do not perfectly match, however these products have little
illustrative value as a comparison with the nodules.
• For nickel: the hydrometallurgical processing of laterite ore is integrated into mine supply
in nearly all cases. In the case of ferronickel and nickel pig iron (NPI) production from the
pyrometallurgical smelting of laterite ore, integration with the mine is not always the case,
most notably in China where large volumes of NPI are produced using imported ore.
Hydrometallurgical plants may or may not have on-site refining capacity. If not, they will
typically sell a mixed hydroxide or mixed sulphide precipitate (MHP or MSP), which is a
nickel-cobalt intermediate product. In several cases, the same company owns a hydromet
plant and a refinery, but these are in different countries. For the purposes of the royalty,
this is based on the value of the metal content when it leaves the mine & hydromet plant
jurisdiction, even if fully arm’s-length trade is not occurring. If refining is on-site, the
downstream product would be separate refined nickel and cobalt products, in the form of
high purity metal or chemicals. Integrated nickel and cobalt sulphate capacity is becoming
more common due to demand for these products in lithium-ion battery manufacturing.
Nickel sulphide ores are concentrated on site. Most concentrates also undergo smelting
and refining within the same company and country (although not necessarily on the same
site). There is far less trade in nickel concentrates than copper concentrates, and
transactions are highly opaque. As such, the nickel sulphide value chain, though from a
metal content standpoint displays high similarities to the nodule in terms of combined Ni-
Co-Cu content, unfortunately displays limited price transparency for unfinished products
due to the high degree of integration through the value chain.
4 As a clarification, the product that passes the battery limit of an operation doesn’t necessarily have to be the basis for a royalty, e.g. royalties may be set at mine mouth value, even if there is processing on site.

16 October 2020 Page 29 of 85
• Most of the African copper-cobalt sulphide deposits (which also contain weathered cobalt
oxide mineralization) are processed to produce an impure cobalt hydroxide precipitate.
This is then shipped to China’s chemical refineries, where a range of cobalt products
including cobalt oxide, sulphate and hydroxide are produced for use in multiple
applications. Elsewhere, cobalt metal and chemical products are most commonly produced
either as a by-product of Ni-Co-Cu sulphide ore processing (as described above this value
chain is typically fully integrated from mine to finished product), or from hydrometallurgical
processing of laterite ores, in which case cobalt may be refined on-site or sold as an
intermediate product.
• Manganese ore is relatively simple compared to the other metal value chains. Though
some mines are integrated into ferroalloy or other downstream products, there are many
mines that are not integrated, and ore trade is widespread and transparent. The
beneficiation process at the mine site is relatively simple when compared to the other
metals, normally composed of crushing and mechanical/magnetic separation units. The
mine site product is therefore a bulk product that has undergone little processing and has
a lower value than, for example copper concentrates or Ni-Co intermediates.
In terms of processing, the proposed seabed nodule value processing route involves an initial
pyrometallurgical smelting step, though as the MIT study mentions a first step could instead
involve leaching with some similarities to the Caron process for nickel laterite ores. This smelting
step would produce a Cu-Ni-Co matte, which would not be highly comparable with existing
materials. Some nickel matte products are traded, but in limited volumes and with little
transparency. At the nodule onshore processing operation, the next step would be refining of the
matte into separate nickel, cobalt and copper products. These refining processes are comparable
with those in use in land-based value chains. The nickel sulphide concentrate smelting-refining
route provides arguably the closest land-based comparison to onshore nodule processing in terms
of the methodologies employed and the materials being processed. However, as mentioned above
the high degree of integration in this value chain makes it difficult to determine the value add at
each step and draw comparisons with the value of the unprocessed nodules.
4.4.3. Relevant jurisdictions
Below we present a table of key jurisdictions for the comparable materials within the relevant value
chains. A fair point of benchmark to define a royalty for seabed mining will have to be comparable
with top producing jurisdictions of relevant materials. We make high level references to royalty
systems in these jurisdictions where appropriate later in this report, but note that an overview of
royalty regimes is not within the remit of this report, and is the purpose of the wider RMG study.
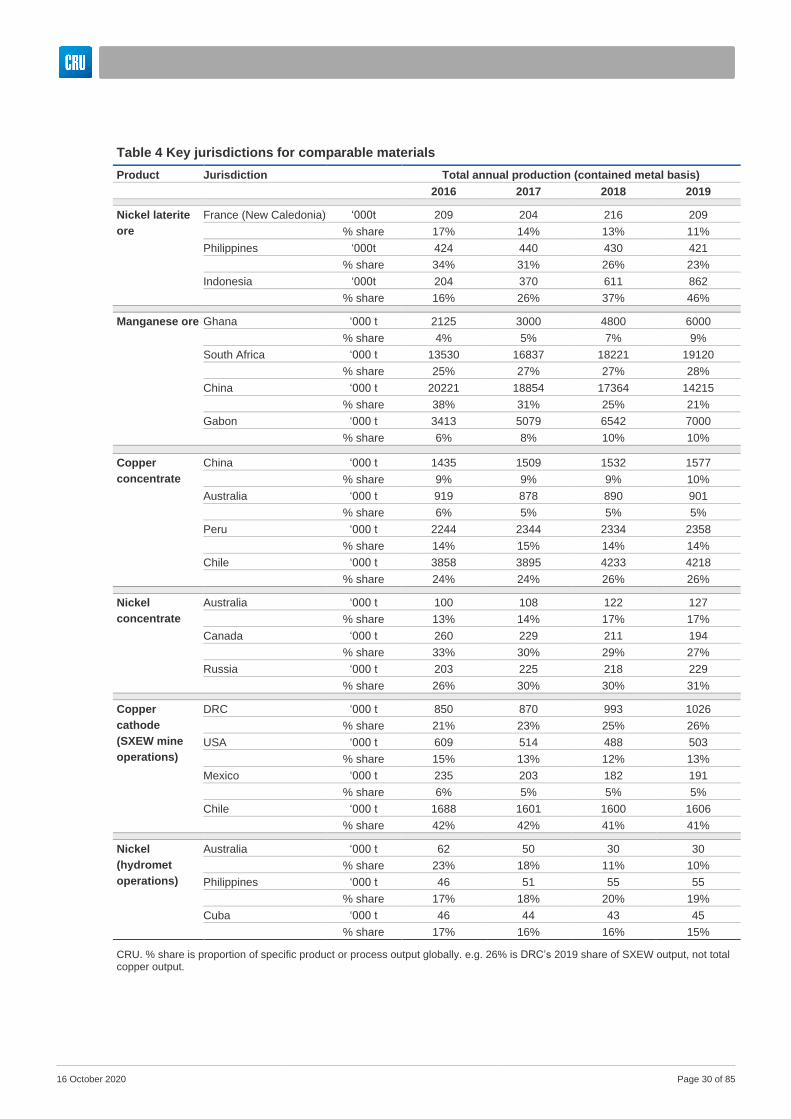
16 October 2020 Page 30 of 85
Table 4 Key jurisdictions for comparable materials
Product Jurisdiction Total annual production (contained metal basis)
2016 2017 2018 2019
Nickel laterite
ore
France (New Caledonia) ‘000t 209 204 216 209
% share 17% 14% 13% 11%
Philippines ‘000t 424 440 430 421
% share 34% 31% 26% 23%
Indonesia ‘000t 204 370 611 862
% share 16% 26% 37% 46%
Manganese ore Ghana ‘000 t 2125 3000 4800 6000
% share 4% 5% 7% 9%
South Africa ‘000 t 13530 16837 18221 19120
% share 25% 27% 27% 28%
China ‘000 t 20221 18854 17364 14215
% share 38% 31% 25% 21%
Gabon ‘000 t 3413 5079 6542 7000
% share 6% 8% 10% 10%
Copper
concentrate
China ‘000 t 1435 1509 1532 1577
% share 9% 9% 9% 10%
Australia ‘000 t 919 878 890 901
% share 6% 5% 5% 5%
Peru ‘000 t 2244 2344 2334 2358
% share 14% 15% 14% 14%
Chile ‘000 t 3858 3895 4233 4218
% share 24% 24% 26% 26%
Nickel
concentrate
Australia ‘000 t 100 108 122 127
% share 13% 14% 17% 17%
Canada ‘000 t 260 229 211 194
% share 33% 30% 29% 27%
Russia ‘000 t 203 225 218 229
% share 26% 30% 30% 31%
Copper
cathode
(SXEW mine
operations)
DRC ‘000 t 850 870 993 1026
% share 21% 23% 25% 26%
USA ‘000 t 609 514 488 503
% share 15% 13% 12% 13%
Mexico ‘000 t 235 203 182 191
% share 6% 5% 5% 5%
Chile ‘000 t 1688 1601 1600 1606
% share 42% 42% 41% 41%
Nickel
(hydromet
operations)
Australia ‘000 t 62 50 30 30
% share 23% 18% 11% 10%
Philippines ‘000 t 46 51 55 55
% share 17% 18% 20% 19%
Cuba ‘000 t 46 44 43 45
% share 17% 16% 16% 15%
CRU. % share is proportion of specific product or process output globally. e.g. 26% is DRC’s 2019 share of SXEW output, not total copper output.
16 October 2020 Page 31 of 85
5. Comparable materials pricing and value
In the following sections, we discuss the pricing of each of the comparator materials in turn to see
how these are valued and paid for in practice. We also describe the transparency of available
prices, and how prices relate to the materials’ positions in their respective value chains, and in
turn how this relates to operating costs incurred through the chain
5.1. Metal-containing material pricing theory
The pricing of metal-containing raw materials, concentrates and intermediates typically takes three
main forms:
1. Priced per tonne with no direct reference to a benchmark metal price. This is most often
the case for raw materials at the earliest part of the value chain, and prices often correlate
quite closely with the price of the relevant metal. e.g. nickel laterite ores, manganese ore.
In this case, the risk of differentials between the prices of these raw materials and the price
of the finished product is taken entirely by the processor. Typically this is the case for lower
value bulk materials, including iron ore, coal, industrial minerals, and bauxite.
2. Priced as a high payable percentage (often >90%) of a benchmark metal price minus
additional treatment and refining charges (TC/RCs). This system is most commonly seen
with copper concentrates. In this case ostensibly the payability reflects processing
recovery rates, and the TCRC reflects the cost of transformation into a finished product,
though in reality this can vary quite significantly as a result of market dynamics that may
have little to do with costs. For example, a surplus of smelting capacity and shortage of
concentrates will likely result in smaller TC/RCs, other things being equal. In this case, the
seller of the concentrates is effectively taking all of the price risk and exposure, with the
processor’s margin being set by the agreed upon TC/RCs. Price participation (PP) terms
in contracts may allow for some price risk to be taken by the processor. These are no
longer used for copper concentrates, but in the case of nickel concentrates they may still
be in place.
3. Priced on a lower payable basis (perhaps 70%) of a benchmark metal price, with this larger
discount reflecting both the expected recovery of metal from the raw material as well as
the cost of transformation. e.g. nickel-cobalt intermediates, zinc concentrates.

16 October 2020 Page 32 of 85
6. Copper
6.1. Copper concentrates
The share of copper concentrates as a proportion of a total global mine output has been 75-80%
over the past 20 years. There was a steady decline in this proportion as a result of increasing
SXEW output from 1998 to 2014, which sharply reversed as oxide ore depletion began occurring
at a fast rate, resulting in the share of concentrates growing.
The market value of a copper concentrate follows a transparent formula, differences in contractual
terms may exist in different transactions. The value can be calculated as the total payable metals
minus treatment and refining charges, penalties and transportation costs. The majority of traded
copper products are priced against the LME benchmark, though other exchange prices may be
used such as the SHFE for domestic Chinese transactions.
In most concentrate contracts, copper, gold and silver are specified as the only payable metals.
Normally no payables are specified for other metals though some are penalised. Payables are
usually for less than 100% of the metal content of the concentrate, in part reflecting that a small
proportion of the copper will be lost during the remaining processing steps. For copper, typically
96.5-96.75% of the copper content is paid for, subject to a minimum deduction of 1 unit. However,
this might vary from contract to contract and many contracts now specify a sliding scale, so that
the higher the copper content the higher the percentage paid for.
Figure 13 Global copper mine production by type (m tonnes contained Cu)
CRU
73%
74%
75%
76%
77%
78%
79%
80%
81%
82%
0
5000
10000
15000
20000
25000
Copper in concentrates SXEW Other % Cu concs

16 October 2020 Page 33 of 85
A typical contract might specify:
• If the copper content is less than 22%, deduct 1.1%. This means that if the concentrate
only grades 21%, then 19.9% will be paid for which is only 94.8% of the copper content.
• If the copper content is less than 32%, pay for 96.5% subject to a minimum deduction of 1
unit. For concentrates grading 29% or more, the percentage payable formula applies. For
concentrates grading less than 29% the 1 unit deduction applies.
• For higher grade concentrates: if the Cu content is greater than or equal to 32%, then
96.65% is paid for, and for concentrates grading more than 38%, 96.75% is paid for.
For silver and gold present in the concentrate, different sliding scale or formulas are used in
different markets. In general terms gold is paid for >1g/t content (between 90% and 100% of the
contained gold is paid), and in the case of silver, for >30g/t content (between 90% and 100% of
the contained silver is paid).
Deductions for a concentrate product include: A Treatment Charge or TC (expressed in US$/dmt
of concentrates) and a Refining Charge or RC (expressed in US$ cents/lb of copper) and for Gold
and Silver a Refining Charge (expressed in US$/troy ounce). Again, Treatment and Refining
Charges (TC/RCs) are “commercial terms” and do not represent the actual costs of smelting and
refining. Treatment and refining charges for copper vary according to prevailing market conditions.
Producers typically have a mixture of spot and long-term contractual arrangements, and those will
vary between traders or direct smelter contracts.
TC/RCs on copper concentrates provide a clear example of a well-defined bargaining zone
between the miner and smelter which is illustrative when considering the valuation of the nodules
between collector and processor.
Industry costs and revenues set the upper and lower limits for TC/RCs, with the upper limit defined
by mine costs and the lower limit defined by smelter costs. The supply/demand balance in
concentrates will determine whether the upper or lower limits apply – if the market is in deficit,
terms will move towards the lower limit and vice versa. However, as TC/RCs are agreed in annual
negotiations, a number of more qualitative factors also come into play. For example, spot market
developments can have a key influence on the terms that are agreed in the contract negotiations.
In the short to medium term the main drivers of treatment and refining charges are the market
balance for concentrates and smelters’ operating margins. A shortage of material will tend to push
terms lower as buyers compete for material and offer lower bids in order to secure material.
Conversely, in a well-supplied market, sellers may need to offer more attractive terms in order to
place material with buyers who can afford to be more selective, and terms will rise. The floor is set
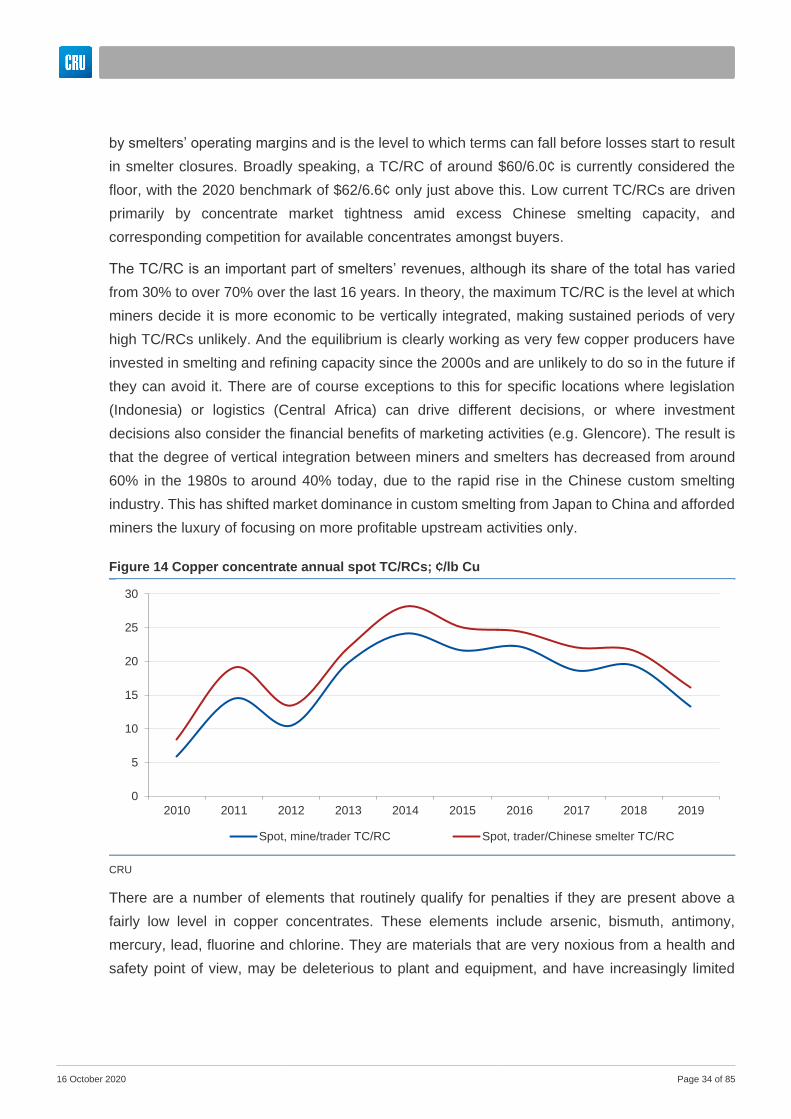
16 October 2020 Page 34 of 85
by smelters’ operating margins and is the level to which terms can fall before losses start to result
in smelter closures. Broadly speaking, a TC/RC of around $60/6.0¢ is currently considered the
floor, with the 2020 benchmark of $62/6.6¢ only just above this. Low current TC/RCs are driven
primarily by concentrate market tightness amid excess Chinese smelting capacity, and
corresponding competition for available concentrates amongst buyers.
The TC/RC is an important part of smelters’ revenues, although its share of the total has varied
from 30% to over 70% over the last 16 years. In theory, the maximum TC/RC is the level at which
miners decide it is more economic to be vertically integrated, making sustained periods of very
high TC/RCs unlikely. And the equilibrium is clearly working as very few copper producers have
invested in smelting and refining capacity since the 2000s and are unlikely to do so in the future if
they can avoid it. There are of course exceptions to this for specific locations where legislation
(Indonesia) or logistics (Central Africa) can drive different decisions, or where investment
decisions also consider the financial benefits of marketing activities (e.g. Glencore). The result is
that the degree of vertical integration between miners and smelters has decreased from around
60% in the 1980s to around 40% today, due to the rapid rise in the Chinese custom smelting
industry. This has shifted market dominance in custom smelting from Japan to China and afforded
miners the luxury of focusing on more profitable upstream activities only.
There are a number of elements that routinely qualify for penalties if they are present above a
fairly low level in copper concentrates. These elements include arsenic, bismuth, antimony,
mercury, lead, fluorine and chlorine. They are materials that are very noxious from a health and
safety point of view, may be deleterious to plant and equipment, and have increasingly limited
Figure 14 Copper concentrate annual spot TC/RCs; ¢/lb Cu
CRU
0
5
10
15
20
25
30
2010 2011 2012 2013 2014 2015 2016 2017 2018 2019
Spot, mine/trader TC/RC Spot, trader/Chinese smelter TC/RC
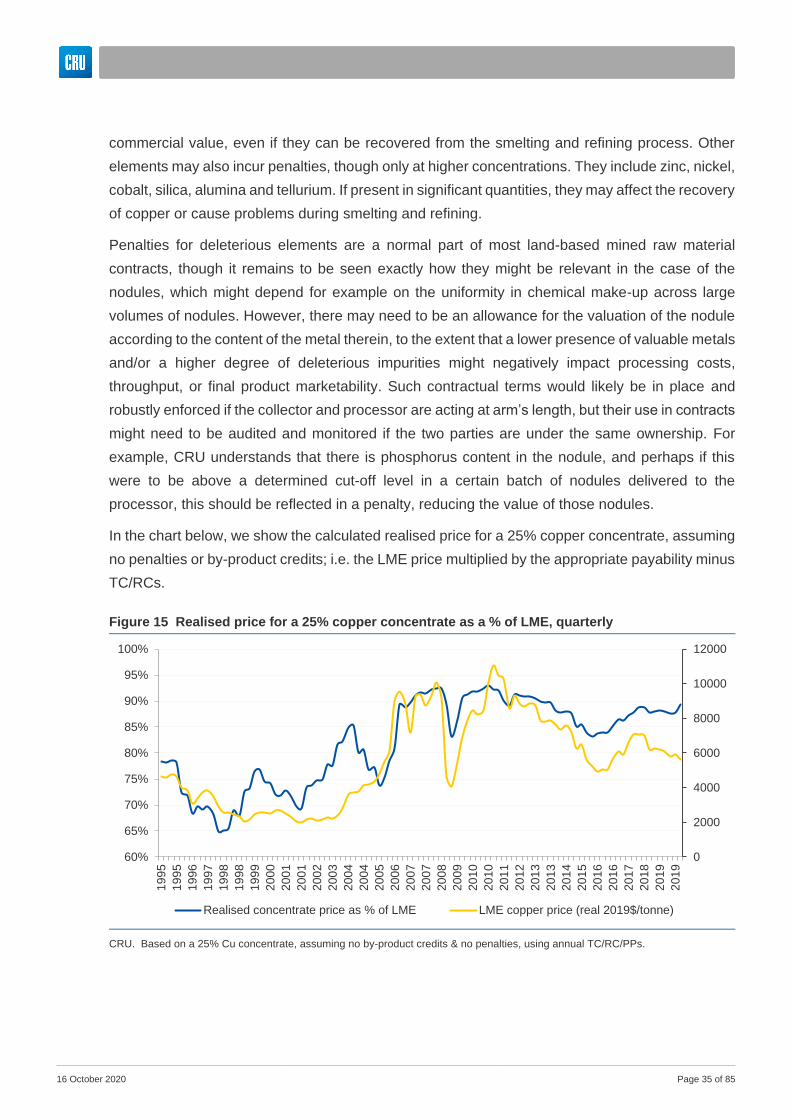
16 October 2020 Page 35 of 85
commercial value, even if they can be recovered from the smelting and refining process. Other
elements may also incur penalties, though only at higher concentrations. They include zinc, nickel,
cobalt, silica, alumina and tellurium. If present in significant quantities, they may affect the recovery
of copper or cause problems during smelting and refining.
Penalties for deleterious elements are a normal part of most land-based mined raw material
contracts, though it remains to be seen exactly how they might be relevant in the case of the
nodules, which might depend for example on the uniformity in chemical make-up across large
volumes of nodules. However, there may need to be an allowance for the valuation of the nodule
according to the content of the metal therein, to the extent that a lower presence of valuable metals
and/or a higher degree of deleterious impurities might negatively impact processing costs,
throughput, or final product marketability. Such contractual terms would likely be in place and
robustly enforced if the collector and processor are acting at arm’s length, but their use in contracts
might need to be audited and monitored if the two parties are under the same ownership. For
example, CRU understands that there is phosphorus content in the nodule, and perhaps if this
were to be above a determined cut-off level in a certain batch of nodules delivered to the
processor, this should be reflected in a penalty, reducing the value of those nodules.
In the chart below, we show the calculated realised price for a 25% copper concentrate, assuming
no penalties or by-product credits; i.e. the LME price multiplied by the appropriate payability minus
TC/RCs.
Figure 15 Realised price for a 25% copper concentrate as a % of LME, quarterly
CRU. Based on a 25% Cu concentrate, assuming no by-product credits & no penalties, using annual TC/RC/PPs.
0
2000
4000
6000
8000
10000
12000
60%
65%
70%
75%
80%
85%
90%
95%
100%
1995
1995
1996
1997
1998
1998
1999
2000
2001
2001
2002
2003
2004
2004
2005
2006
2007
20
07
2008
2009
2010
2010
2011
2012
20
13
2013
2014
2015
2016
2016
2017
2018
2019
2019
Realised concentrate price as % of LME LME copper price (real 2019$/tonne)
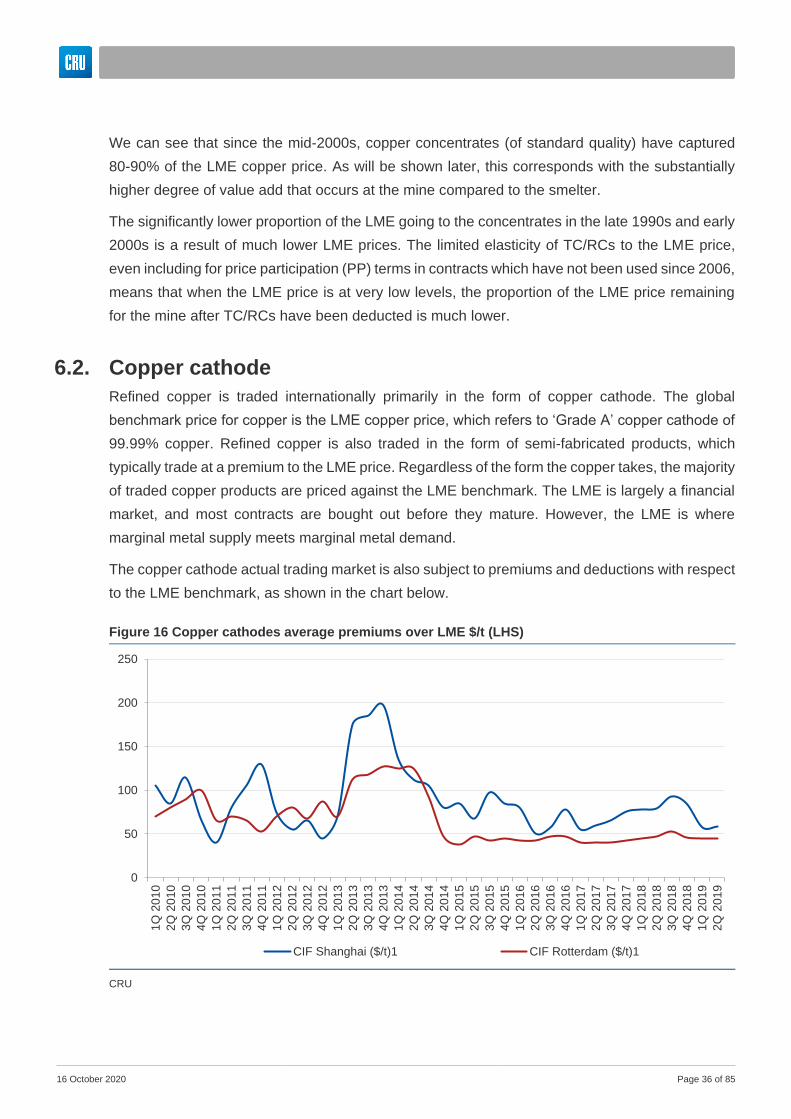
16 October 2020 Page 36 of 85
We can see that since the mid-2000s, copper concentrates (of standard quality) have captured
80-90% of the LME copper price. As will be shown later, this corresponds with the substantially
higher degree of value add that occurs at the mine compared to the smelter.
The significantly lower proportion of the LME going to the concentrates in the late 1990s and early
2000s is a result of much lower LME prices. The limited elasticity of TC/RCs to the LME price,
even including for price participation (PP) terms in contracts which have not been used since 2006,
means that when the LME price is at very low levels, the proportion of the LME price remaining
for the mine after TC/RCs have been deducted is much lower.
6.2. Copper cathode
Refined copper is traded internationally primarily in the form of copper cathode. The global
benchmark price for copper is the LME copper price, which refers to ‘Grade A’ copper cathode of
99.99% copper. Refined copper is also traded in the form of semi-fabricated products, which
typically trade at a premium to the LME price. Regardless of the form the copper takes, the majority
of traded copper products are priced against the LME benchmark. The LME is largely a financial
market, and most contracts are bought out before they mature. However, the LME is where
marginal metal supply meets marginal metal demand.
The copper cathode actual trading market is also subject to premiums and deductions with respect
to the LME benchmark, as shown in the chart below.
Figure 16 Copper cathodes average premiums over LME $/t (LHS)
CRU
0
50
100
150
200
250
1Q
2010
2Q
2010
3Q
2010
4Q
20
10
1Q
2011
2Q
2011
3Q
2011
4Q
2011
1Q
2012
2Q
2012
3Q
2012
4Q
2012
1Q
2013
2Q
2013
3Q
2013
4Q
2013
1Q
2014
2Q
2014
3Q
2014
4Q
2014
1Q
2015
2Q
2015
3Q
20
15
4Q
2015
1Q
2016
2Q
2016
3Q
2016
4Q
2016
1Q
2017
2Q
2017
3Q
2017
4Q
2017
1Q
2018
2Q
2018
3Q
2018
4Q
2018
1Q
20
19
2Q
2019
CIF Shanghai ($/t)1 CIF Rotterdam ($/t)1
16 October 2020 Page 37 of 85
The premiums are generally negotiated based on stock inventories, material availability and
contract considerations. Fundamentally, consumers are willing to pay above the LME price for
physical purchases of copper cathode, as removal from a warehouse and delivery to a consumer
will entail fees and handling costs. Deductions are applied to non-Grade A cathodes, and also if
the product is not LME registered.
6.3. Value add analysis
6.3.1. Methodological considerations
The added value can be defined as the difference between the output value and input value of a
product after going through one or multiple processes (operations), and thus is strongly linked to
the value chain concept. Under this concept, it is important to calculate the added value for each
operation or process, which can be defined as the added cost to the product or to the obtained
profit. CRU builds and maintains cost models for copper, nickel and manganese which can be
used to provide insights into value add for comparable land based unfinished mined materials.
CRU’s value based costing (VBC)TM system is a proprietary methodology for analysing the
business performance and competitive position of individual production facilities such as mines,
refineries, smelters and downstream facilities in the international metals, chemicals and fertilizers
industries. For the purposes of this study, CRU has measured costs on a pro rata basis. Pro rata
costing means that the total production costs are divided between all the payable metals produced
based on their relative shares of total revenue. For example, if a mining operation’s revenue is
made up of 80% from copper product sales and 20% from gold product sales, then pro rata costs
would attribute 80% of the total costs to copper.
This methodology is the most useful when attempting to benchmark operations against each other,
where at least some of those are polymetallic producers. Since the costs are assigned pro rata to
each metal in an operation in proportion to the value of different product streams, then we can
evaluate the cost efficiency of an operation against others producing the same metal, despite
possible differences in the type and amount of by-products produced. It is particularly useful when
benchmarking costs at operations that produce several metals, such as Ni-Cu-Co-PGM operations
or Cu-Mo mines with payable gold and silver. This methodology precludes negative costs which
might otherwise be calculated for operations with substantial by- or co-product sales on a net-of-
by-product costing basis.
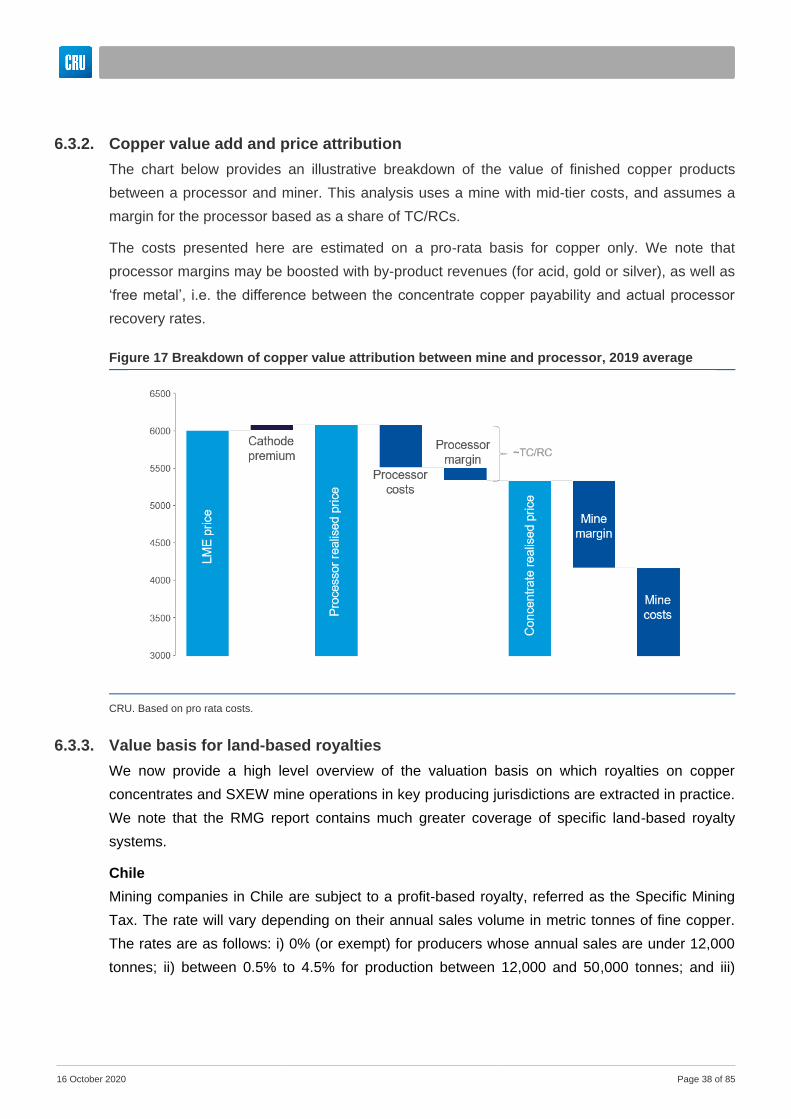
16 October 2020 Page 38 of 85
6.3.2. Copper value add and price attribution
The chart below provides an illustrative breakdown of the value of finished copper products
between a processor and miner. This analysis uses a mine with mid-tier costs, and assumes a
margin for the processor based as a share of TC/RCs.
The costs presented here are estimated on a pro-rata basis for copper only. We note that
processor margins may be boosted with by-product revenues (for acid, gold or silver), as well as
‘free metal’, i.e. the difference between the concentrate copper payability and actual processor
recovery rates.
6.3.3. Value basis for land-based royalties
We now provide a high level overview of the valuation basis on which royalties on copper
concentrates and SXEW mine operations in key producing jurisdictions are extracted in practice.
We note that the RMG report contains much greater coverage of specific land-based royalty
systems.
Chile
Mining companies in Chile are subject to a profit-based royalty, referred as the Specific Mining
Tax. The rate will vary depending on their annual sales volume in metric tonnes of fine copper.
The rates are as follows: i) 0% (or exempt) for producers whose annual sales are under 12,000
tonnes; ii) between 0.5% to 4.5% for production between 12,000 and 50,000 tonnes; and iii)
Figure 17 Breakdown of copper value attribution between mine and processor, 2019 average
CRU. Based on pro rata costs.
16 October 2020 Page 39 of 85
between 5% and 14% for sales above 50,000 tonnes. In this case, the determination depends on
the mining operational margin.
Peru
In 2011 Peru established a profit-base royalty for mine operations. The Modified Mining Royalty
(MMR) is payable on a quarterly basis with progressive rates ranging from 1% to 12% of the
operating profit margin. In addition, the Special Mining Tax (SMT) has progressive rates raging 2-
8.4% of the operating income; and the Special Mining Burden (SMB), 4-13.12% of operating
income (for companies with mining stabilization agreements before 1 October 2011). Peru’s
original mining royalty was established in 2004, and it required holders of mining concessions to
pay 1-3% of the commercial value of mineral sales for the exploitation of metallic and non-metallic
mineral resources.
Indonesia
Indonesia recently raised its royalties on copper mines from 3.75% to 4%. This royalty is based
on the higher of the deemed benchmark price or the realized sale value. ‘Special Mining Business
License’ holders are also required to pay an additional 0 - 5% profit-based royalty (taken into
account as a tax) for concentrates with over 15% Cu content. This additional tax varies depending
of the physical progress stage of the refining facility’s development.
Australia
Western Australia has a three-tiered royalty system that was introduced in 1981. It applies one of
three royalty rates depending on the form in which the mineral is sold (ore, concentrate or final
form), and the extent to which it is processed. In the case of copper, the royalty rates on an ad
valorem basis are: i) crushed or screened ore 7.5% of the royalty value; ii) concentrate material
5% of the royalty value; and ii) metal (cathodes) 2.5% of the royalty value. Queensland on another
hand, under the Mineral Resources Regulation 2013, establishes a variable royalty rate between
2.5% and 5% (varying in 0.02% increments), depending on average metal prices. The value of a
mineral is calculated by determining the gross value of the mineral and deducting certain permitted
expenses.
Democratic Republic of Congo (DRC)
In 2018, the Democratic Republic of Congo completed its new mining code after a lengthy review
process. Under the new code, all nonferrous metals, including copper, are subject to a 3.5% gross
commercial value royalty (previously, the royalty was 2%). In addition, a super profits tax of 50%
when commodity prices exceed base value (the price used in the feasibility study) by 25% was
established. The base is defined as the “difference between the amount of the gross operating
income for the accounting year less the amount of the gross operating income generated by the
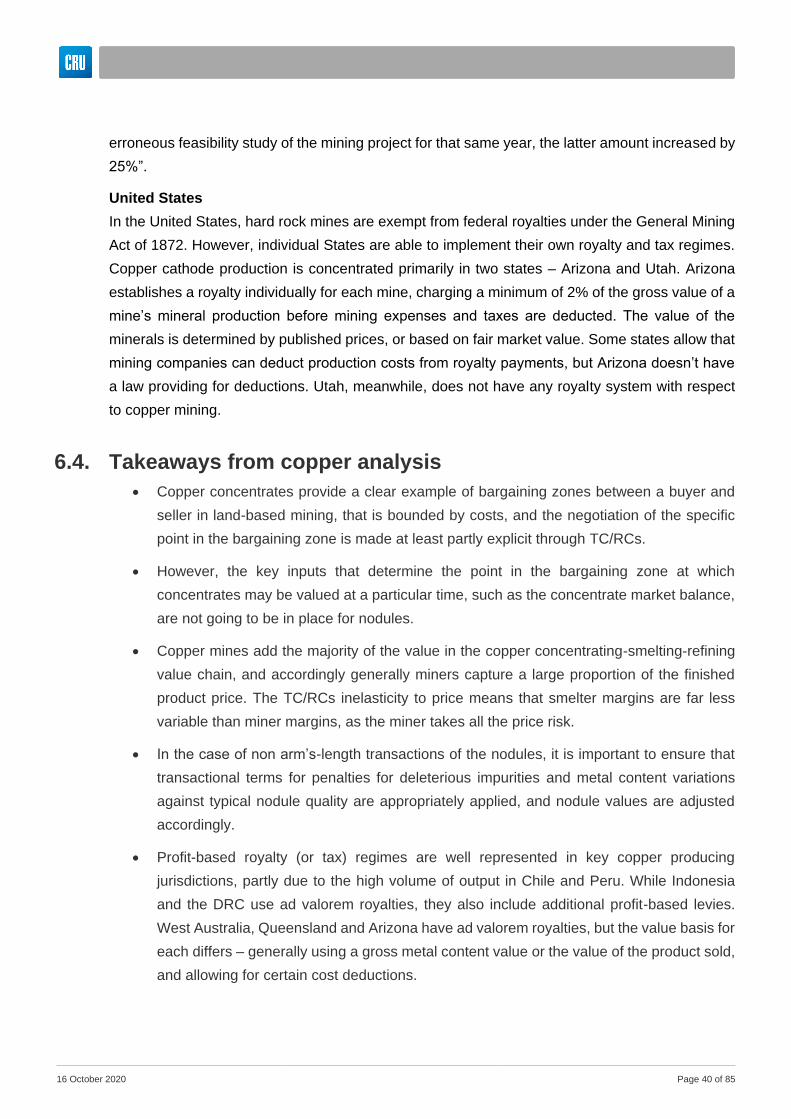
16 October 2020 Page 40 of 85
erroneous feasibility study of the mining project for that same year, the latter amount increased by
25%”.
United States
In the United States, hard rock mines are exempt from federal royalties under the General Mining
Act of 1872. However, individual States are able to implement their own royalty and tax regimes.
Copper cathode production is concentrated primarily in two states – Arizona and Utah. Arizona
establishes a royalty individually for each mine, charging a minimum of 2% of the gross value of a
mine’s mineral production before mining expenses and taxes are deducted. The value of the
minerals is determined by published prices, or based on fair market value. Some states allow that
mining companies can deduct production costs from royalty payments, but Arizona doesn’t have
a law providing for deductions. Utah, meanwhile, does not have any royalty system with respect
to copper mining.
6.4. Takeaways from copper analysis
• Copper concentrates provide a clear example of bargaining zones between a buyer and
seller in land-based mining, that is bounded by costs, and the negotiation of the specific
point in the bargaining zone is made at least partly explicit through TC/RCs.
• However, the key inputs that determine the point in the bargaining zone at which
concentrates may be valued at a particular time, such as the concentrate market balance,
are not going to be in place for nodules.
• Copper mines add the majority of the value in the copper concentrating-smelting-refining
value chain, and accordingly generally miners capture a large proportion of the finished
product price. The TC/RCs inelasticity to price means that smelter margins are far less
variable than miner margins, as the miner takes all the price risk.
• In the case of non arm’s-length transactions of the nodules, it is important to ensure that
transactional terms for penalties for deleterious impurities and metal content variations
against typical nodule quality are appropriately applied, and nodule values are adjusted
accordingly.
• Profit-based royalty (or tax) regimes are well represented in key copper producing
jurisdictions, partly due to the high volume of output in Chile and Peru. While Indonesia
and the DRC use ad valorem royalties, they also include additional profit-based levies.
West Australia, Queensland and Arizona have ad valorem royalties, but the value basis for
each differs – generally using a gross metal content value or the value of the product sold,
and allowing for certain cost deductions.
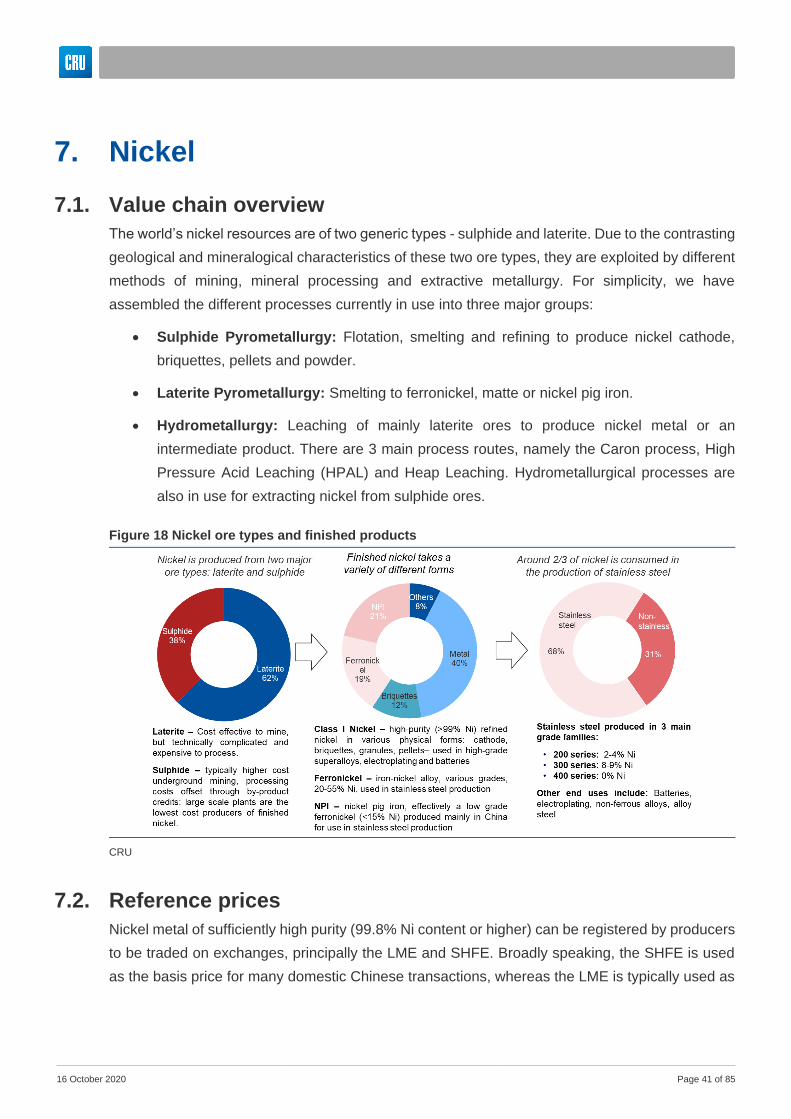
16 October 2020 Page 41 of 85
7. Nickel
7.1. Value chain overview
The world’s nickel resources are of two generic types - sulphide and laterite. Due to the contrasting
geological and mineralogical characteristics of these two ore types, they are exploited by different
methods of mining, mineral processing and extractive metallurgy. For simplicity, we have
assembled the different processes currently in use into three major groups:
• Sulphide Pyrometallurgy: Flotation, smelting and refining to produce nickel cathode,
briquettes, pellets and powder.
• Laterite Pyrometallurgy: Smelting to ferronickel, matte or nickel pig iron.
• Hydrometallurgy: Leaching of mainly laterite ores to produce nickel metal or an
intermediate product. There are 3 main process routes, namely the Caron process, High
Pressure Acid Leaching (HPAL) and Heap Leaching. Hydrometallurgical processes are
also in use for extracting nickel from sulphide ores.
7.2. Reference prices
Nickel metal of sufficiently high purity (99.8% Ni content or higher) can be registered by producers
to be traded on exchanges, principally the LME and SHFE. Broadly speaking, the SHFE is used
as the basis price for many domestic Chinese transactions, whereas the LME is typically used as
Figure 18 Nickel ore types and finished products
CRU

16 October 2020 Page 42 of 85
the benchmark nickel price for transactions made elsewhere. These are highly transparent prices
which provide a widely recognized benchmark of nickel prices. Differentials between exchange
prices, most importantly the SHFE and the LME, can emerge, but are limited by arbitrage. As
China has moved to become a net importer of exchange traded nickel products, the SHFE has
tended to trade at a discount to the LME – this broadly reflects the cost of transferring material
from an LME warehouse to China, including transportation and other costs.
As a financial derivative, nickel exchange prices may be distorted by non-physical market balance,
i.e. the actions of financial positions in the market held by parties that do not participate in the
physical market.
Other nickel products and intermediates generally do not have prices that are as clearly
transparent as the exchange traded refined nickel. Often such products are priced relative to the
LME, either directly or indirectly. For example, the nickel in intermediate products such as matte
or MHP may be priced at 70-80% of the LME price; ferronickel and NPI are typically priced at
around 3-7% above or below the LME. Conversely, nickel laterite ore is priced per tonne, although
this price translates into a relatively consistent proportion of the LME, between 20-30%.
The point in the processing value chain is important to note with respect to comparing the value
of nickel contained in different nickel raw materials, intermediates and products. NPI contains 5-
15% Ni, and ferronickel contains typically 20-35% Ni, but these are finished products that require
no further processing before use. The remainder of the products’ compositions is predominately
metallic iron, which is of value to stainless steel mill consumers. Therefore, while some nickel
intermediates might contain more nickel per tonne gross weight, the value of that nickel as a % of
the LME may in fact be lower than in some finished products.
The chart below provides a summary of key nickel raw materials, intermediates and products,
showing their value as a proportion of the LME compared to their nickel content. Unsurprisingly,
higher nickel content materials obtain a higher proportion of the LME price (excluding FeNi and
NPI as mentioned above). This reflects the cost of transforming the raw materials and
intermediates into finished products, plus a margin for the processor that will fluctuate according
to various market dynamics.
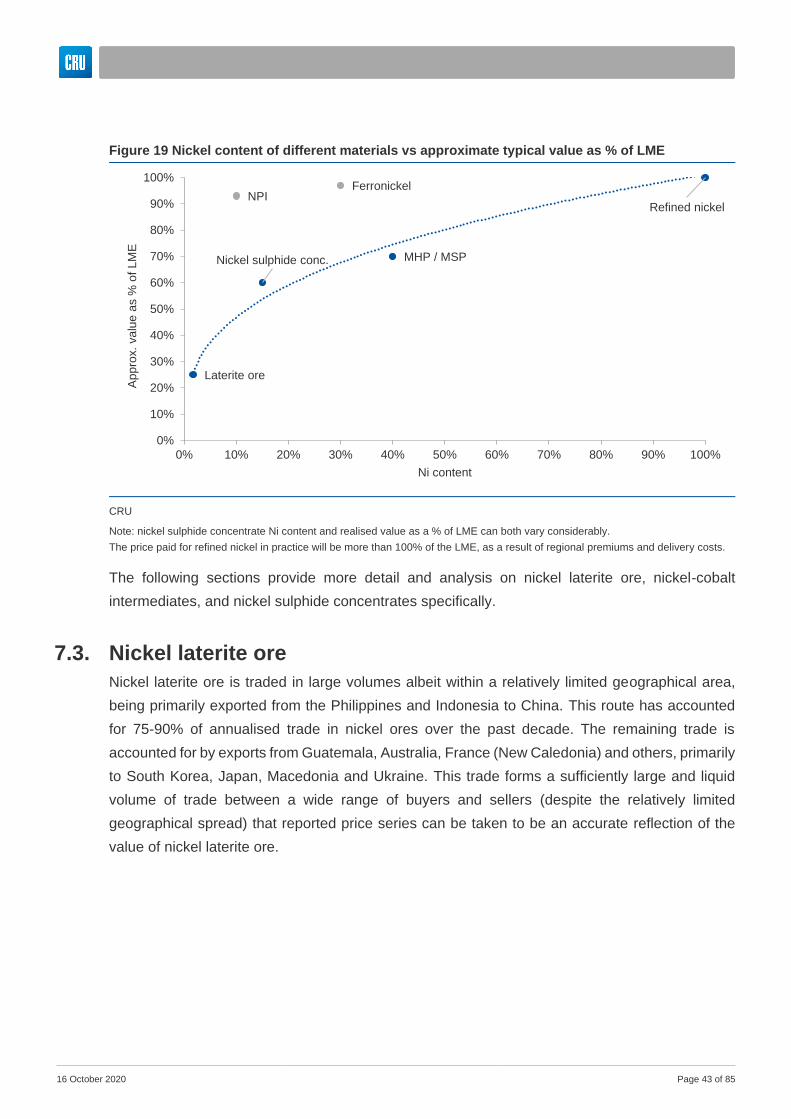
16 October 2020 Page 43 of 85
The following sections provide more detail and analysis on nickel laterite ore, nickel-cobalt
intermediates, and nickel sulphide concentrates specifically.
7.3. Nickel laterite ore
Nickel laterite ore is traded in large volumes albeit within a relatively limited geographical area,
being primarily exported from the Philippines and Indonesia to China. This route has accounted
for 75-90% of annualised trade in nickel ores over the past decade. The remaining trade is
accounted for by exports from Guatemala, Australia, France (New Caledonia) and others, primarily
to South Korea, Japan, Macedonia and Ukraine. This trade forms a sufficiently large and liquid
volume of trade between a wide range of buyers and sellers (despite the relatively limited
geographical spread) that reported price series can be taken to be an accurate reflection of the
value of nickel laterite ore.
Figure 19 Nickel content of different materials vs approximate typical value as % of LME
CRU
Note: nickel sulphide concentrate Ni content and realised value as a % of LME can both vary considerably.
The price paid for refined nickel in practice will be more than 100% of the LME, as a result of regional premiums and delivery costs.
Laterite ore
Nickel sulphide conc. MHP / MSP
Refined nickelNPI
Ferronickel
0%
10%
20%
30%
40%
50%
60%
70%
80%
90%
100%
0% 10% 20% 30% 40% 50% 60% 70% 80% 90% 100%
App
rox.
va
lue a
s %
of
LM
E
Ni content

16 October 2020 Page 44 of 85
Laterite ore is generally priced in RMB/tonne gross weight on a delivered China basis. This value
can be converted to reflect the nickel content of the ore, and then can be measured as a proportion
of the LME, as shown in the below chart.
Laterite ore prices for 1.7-1.8% Ni ore have generally ranged between 20-35% of the LME. The
price that consumers will pay for nickel laterite ore is primarily a function of the market balance for
ore. The largest variance in the laterite ore price in recent years has occurred as a result of
Figure 20 Trade in nickel ore (m tonnes, gross weight)
CRU, GTIS
Figure 21 Nickel laterite ore prices, value of Ni content as % of LME (monthly averages)
CRU
0
10
20
30
40
50
60
70
80
90
2010 2011 2012 2013 2014 2015 2016 2017 2018 2019
China imports from Indonesia China imports from Philippines Other China imports Non-China trade
10%
15%
20%
25%
30%
35%
40%
Jul-12
Oct-
12
Jan-1
3
Ap
r-1
3
Jul-13
Oct-
13
Jan-1
4
Ap
r-1
4
Jul-14
Oct-
14
Jan-1
5
Ap
r-1
5
Jul-15
Oct-
15
Jan-1
6
Ap
r-1
6
Jul-16
Oct-
16
Jan-1
7
Ap
r-1
7
Jul-17
Oct-
17
Jan-1
8
Ap
r-1
8
Jul-18
Oct-
18
Jan-1
9
Ap
r-1
9
Jul-19
Oct-
19
Jan-2
0
Ap
r-2
0
1.4-1.6% Ni 1.7-1.8% Ni

16 October 2020 Page 45 of 85
Indonesian policies prohibiting the export of unprocessed ores, which can clearly be seen in the
trade chart above. When this policy initially came into effect in January 2014, it resulted in a very
sharp decline in the availability of ore, with prices increasing accordingly, jumping from just below
20% of the LME to 35%. The policy was relaxed through 2018 and 2019, before being reintroduced
from the start of 2020; the resultant variance in the availability of Indonesian ore to Chinese
consumers has been the main driver of the prices of ore as a percentage of the LME during this
period.
Nickel laterite ore prices are informative as they provide us with a reasonably transparent actual
market price for a material that has a very similar nickel content to undersea polymetallic nodules.
However, these prices are clearly affected by fluctuations in an underlying subsegment of the
market in which undersea polymetallic nodules will not compete directly, i.e. laterite ore for NPI
production5; with Indonesia and the Philippines as the producers of ore and China as the
consumer. Furthermore, though NPI prices are reliably reported by price discovery services, NPI
is not itself an LME-deliverable product, and though it is typically priced relatively close to the LME
and SHFE, NPI prices can fluctuate by more than 10% above and below exchange prices
according to NPI and stainless steel supply and demand dynamics. NPI is produced and
consumed almost exclusively in China and Indonesia, and therefore the NPI price relative to
exchange prices is predominately driven by dynamics within these two countries, and not the wider
nickel market.
From a processing standpoint: polymetallic nodules would not be used in direct place of laterite
ore by participants in this part of the nickel market, as NPI plants would not be able to process it.
Refined nickel metal that could ultimately be produced from polymetallic nodules would compete
with NPI to some extent – as stainless steel mills will use different proportions of NPI and refined
metal and there is a technical operating window within which these proportions can be adjusted
to allow the purchase of the most economic nickel feedstocks at a particular time.
5 Laterite ore, of mostly lower nickel content limonite type ore (0.9-1.1% Ni), is also used to produce refined nickel metal after undergoing hydrometallurgical (HPAL) processing. This type of laterite ore could be seen as a slightly closer competitor of polymetallic nodules in terms of their positions in the wider nickel value chain compared to ore used to produce NPI. However, HPAL process plants are generally integrated with one or a small number of sources of ore; often from a mine that they themselves own and/or operate. This is because the highly technical nature of the HPAL process makes it sensitive to variations in the composition of the ore used as feedstock, resulting in a preference for a single consistent ore feedstock. Therefore, there is little trade in laterite ore for hydrometallurgical processing, and as such prices for traded laterite ores are effectively showing the price of NPI feedstock material only, and are therefore a part of the Class 2 rather than the Class 1 supply chain.

16 October 2020 Page 46 of 85
Nonetheless, one conclusion that can certainly be taken away from this analysis is that in practice,
it is clear that the pricing of the metal content materials with a comparable nickel content to the
polymetallic nodules occurs at a significant discount to the LME, reflecting the cost of transforming
ore into finished product and fluctuating according to supply and demand volatility within a specific
subsegment of the overall nickel market.
7.3.1. Value basis for land-based royalties
We now provide a high level overview of the valuation basis on which royalties on laterite ores in
key producing jurisdictions are extracted in practice:
Indonesia
Indonesia recently raised its royalties on the sale of nickel ore from 5% to 10%. This royalty is
based on the higher of the deemed benchmark price or the realized sale value. ‘Special Mining
Business License’ holders are also required to pay an additional 10% profit-based royalty (taken
into account as a tax) for concentrates with less than 1.7% Ni content. The rate change, which
took place in late 2019, was introduced in order to achieve more balanced rates between ore
miners and those who produce refined products. This was part of a broader effort aiming to build
in-country smelting capacity for nickel, bauxite, and copper.
Figure 22 Comparison of simplified value chains for nickel laterite and polymetallic nodules
CRU
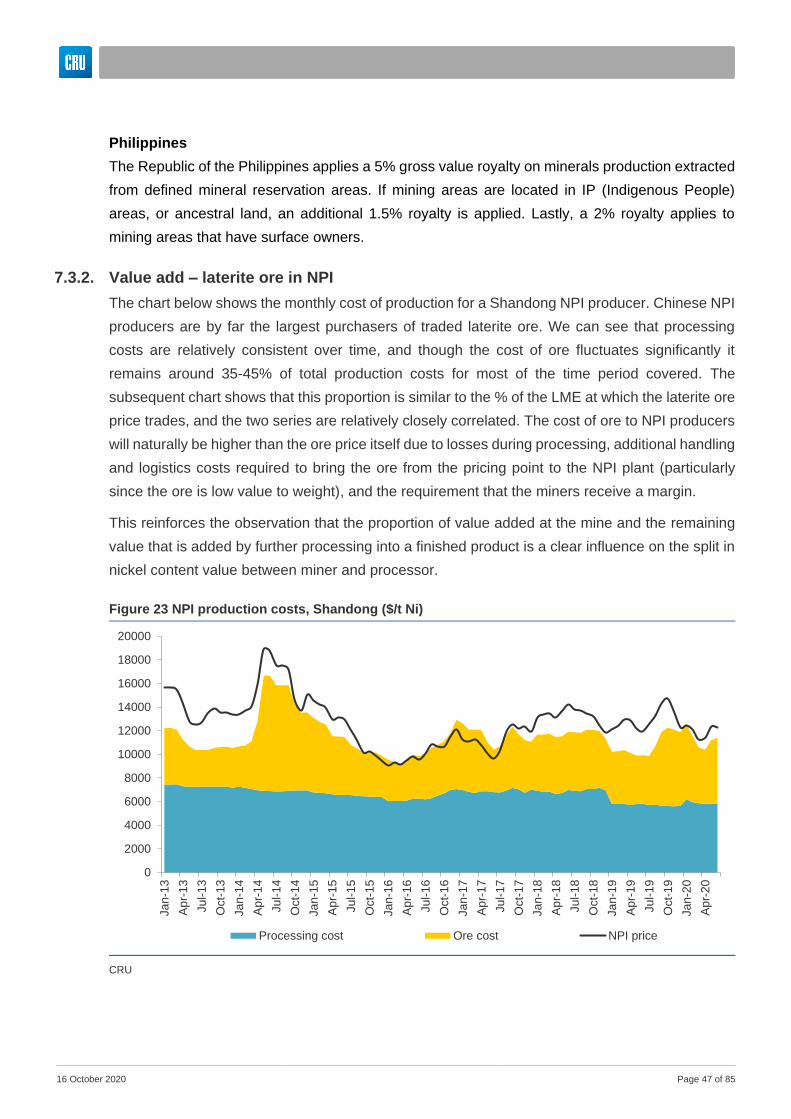
16 October 2020 Page 47 of 85
Philippines
The Republic of the Philippines applies a 5% gross value royalty on minerals production extracted
from defined mineral reservation areas. If mining areas are located in IP (Indigenous People)
areas, or ancestral land, an additional 1.5% royalty is applied. Lastly, a 2% royalty applies to
mining areas that have surface owners.
7.3.2. Value add – laterite ore in NPI
The chart below shows the monthly cost of production for a Shandong NPI producer. Chinese NPI
producers are by far the largest purchasers of traded laterite ore. We can see that processing
costs are relatively consistent over time, and though the cost of ore fluctuates significantly it
remains around 35-45% of total production costs for most of the time period covered. The
subsequent chart shows that this proportion is similar to the % of the LME at which the laterite ore
price trades, and the two series are relatively closely correlated. The cost of ore to NPI producers
will naturally be higher than the ore price itself due to losses during processing, additional handling
and logistics costs required to bring the ore from the pricing point to the NPI plant (particularly
since the ore is low value to weight), and the requirement that the miners receive a margin.
This reinforces the observation that the proportion of value added at the mine and the remaining
value that is added by further processing into a finished product is a clear influence on the split in
nickel content value between miner and processor.
Figure 23 NPI production costs, Shandong ($/t Ni)
CRU
0
2000
4000
6000
8000
10000
12000
14000
16000
18000
20000
Jan-1
3
Ap
r-1
3
Jul-13
Oct-
13
Jan-1
4
Ap
r-1
4
Jul-14
Oct-
14
Jan-1
5
Ap
r-1
5
Jul-15
Oct-
15
Jan-1
6
Ap
r-1
6
Jul-16
Oct-
16
Jan-1
7
Ap
r-1
7
Jul-17
Oct-
17
Jan-1
8
Ap
r-1
8
Jul-
18
Oct-
18
Jan-1
9
Ap
r-1
9
Jul-19
Oct-
19
Jan-2
0
Ap
r-2
0
Processing cost Ore cost NPI price

16 October 2020 Page 48 of 85
The final chart in this section provides a breakdown of the LME nickel price between a laterite ore
mine and an NPI producer (based on a typical Chinese plant). We can see that the processor adds
the majority of the costs, and also obtains the larger share of the available margins.
Figure 24 Laterite ore prices as % of LME and ore as % of NPI production costs
CRU
Figure 25 LME nickel price ($/t Ni, 2019 basis)
CRU
0%
10%
20%
30%
40%
50%
60%
70%
Ja
n-1
3
Ap
r-1
3
Ju
l-1
3
Oct-
13
Ja
n-1
4
Ap
r-1
4
Ju
l-1
4
Oct-
14
Ja
n-1
5
Ap
r-1
5
Ju
l-1
5
Oct-
15
Ja
n-1
6
Ap
r-1
6
Ju
l-1
6
Oct-
16
Ja
n-1
7
Ap
r-1
7
Ju
l-1
7
Oct-
17
Ja
n-1
8
Ap
r-1
8
Ju
l-1
8
Oct-
18
Ja
n-1
9
Ap
r-1
9
Ju
l-1
9
Oct-
19
Ja
n-2
0
Ap
r-2
0
1.4-1.6% Ni ore price 1.7-1.8% Ni ore price Ore costs as a % of total NPI costs
16 October 2020 Page 49 of 85
7.4. Nickel-cobalt intermediates
7.4.1. Pricing
Nickel-cobalt intermediates, specifically those produced from the hydrometallurgical processing
(heap leach, bioleach, or most commonly HPAL) of laterite ores, often referred to as mixed
hydroxide precipitates (MHP) or mixed sulphide precipitates (MSP), provide an interesting case
study with respect to valuation, as they contain both nickel and cobalt.
The composition of MHP is usually around 40-50% nickel, and 4-5% cobalt. Historically, the trade
of these intermediates has been fairly limited as most MHP has been processed at refineries that
are either directly integrated with the hydrometallurgical plant, or at refineries owned by the same
company. For example, Sumitomo Metals and Mining (SMM) is the majority owner of two HPAL
plants in the Philippines, and the intermediate these operations produce is converted into finished
products at SMM’s Niihama refinery in Japan. Similarly, Sherritt operate the Moa Bay
hydrometallurgical plant in Cuba, which produces an intermediate to be refined at Sherritt’s Fort
Saskatchewan refinery in Canada. Other plants, such as Ambatovy in Madagascar and Murrin
Murrin in Australia, have an onsite refinery attached to the hydrometallurgical processing plant.
The relatively limited volume of trade between third parties means that pricing for intermediates is
not highly transparent. Nonetheless, CRU understands that Ni-Co intermediates are generally sold
as a proportion of benchmark nickel and cobalt prices; commonly 70% of the LME for nickel and
70% of the cobalt metal price for cobalt. No additional treatment or refining charge is included.
Demand for Ni-Co intermediates has grown sharply in the past 2-3 years as a result of the rapid
expansion of the lithium ion battery sector driven by uptake of electric vehicles. These
intermediates have proven to be particularly desirable for this application for several reasons:
• The nickel content in MHP and MSP is significantly discounted compared to the LME, but
conversion costs from intermediates to nickel sulphate are similar to the cost of buying
LME grade nickel in the form of powder or briquettes and converting this more expensive
material to nickel sulphate.
• The intermediates contain nickel and cobalt together, and as these both form part of the
main precursor materials for lithium ion batteries (i.e. NCM and NCA cathodes, where the
Ni:Co ratio is not dissimilar to that of the Ni-Co intermediates themselves), this further
improves the economics of using Ni-Co intermediates as a feedstock for the battery sector
compared to buying other nickel and cobalt containing raw materials separately.
• The cobalt is also desirable from a security of supply perspective, given the risks round
securing this material from by far the largest source of cobalt raw materials – the DRC.
16 October 2020 Page 50 of 85
This growth in demand for intermediates driven by the battery sector has reportedly led to
increases in the payable percentages of the corresponding metal price, however it is not clear how
widespread, or how sustainable this change may have been.
Trade in Ni-Co intermediates is due to increase substantially over the next five years with the
development of several HPAL projects in Indonesia. CRU forecasts that three such plants will
come on stream by 2023, with others at earlier stages of development. These plants may also
include refineries that would convert the intermediate to nickel sulphate for use in batteries (and
therefore would not contribute to third party trade in MHP or MSP), but CRU expects that this will
not be the case for all of the output, and therefore the volume of MHP and MSP trade will grow,
and with it price transparency may increase compared to current levels.
Ni-Co intermediate pricing provides an indication of the current value of nickel raw materials driven
principally by the Class 1 (i.e. refined nickel) side of the nickel market, as opposed to the Class 2
(i.e. iron-nickel alloys used in stainless steel) side. As described above, laterite ore prices provide
a clear and relatively transparent indication of the value of nickel raw materials for use in stainless
steel. The two sides of the nickel market are currently closely related, as a sufficiently large volume
of refined nickel can be used in either market, preventing significant price disparity across nickel
products. However, there is a possibility in the future that – driven by exponential growth in nickel
usage in batteries – prices for materials across the two markets could diverge, as a result of refined
nickel only being used in stainless steel at an absolute minimum, and battery demand for nickel
absorbing a large proportion of all Class 1 nickel products. Under this scenario, the price as a %
of LME for laterite ore would not necessarily bear a strong relationship with the valuation of
feedstocks for batteries and other Class 1 applications. Given that the polymetallic nodules will
likely be most suited for the production of refined nickel or nickel sulphate which would go into
such Class 1 applications, we can see that the reliance on laterite ore prices as an indication of
the value of nodules presents some risk under this scenario.
Therefore, the pricing of Ni-Co intermediates, though the nickel and cobalt content is substantially
higher to that of the composition of polymetallic nodules (around 40% Ni and 4% Co compared to
1.5% Ni and 0.13% Co), does provide an illustrative data point with reference to nodule valuation.
However, the usefulness and reliability of this data point with reference to determining the value
of the nodules is currently limited by a relative lack of transparency in intermediate pricing.
7.4.2. Value basis for land-based royalties
We now provide a high level overview of how royalties on nickel-cobalt intermediates in key
producing jurisdictions are extracted:

16 October 2020 Page 51 of 85
Australia
Ad valorem royalty rates for mining in Western Australia are outlined in the Mining Regulations
1981 legislation. In the case of nickel and nickel by-products the rate is defined as 2.5% of the
royalty value. The royalty value is determinate as the units of nickel (and cobalt or copper as is
relevant) metal in the nickel containing material sold multiplied by the contracted list price or
reference price minus allowable deductions.
Philippines
See nickel laterite ores section 7.3.1
Cuba
In the case of Cuba, royalties are viewed as excise or complementary taxes, and relevant provision
are embodied in the country’s fiscal code. Nickel-cobalt operations pay the Cuban state a royalty
calculated on the basis of 5% of the net sales value of the production of nickel and cobalt contained
in mixed sulphides.
Indonesia
As reviewed in 7.3.1, Indonesia recently changed its royalty regime. On an ad valorem basis, and
based on the higher of the deemed benchmark price or the realized sale value, royalties for
ferronickel and nickel matte were cut in half from 4% to 2%. Other nickel products, such as
hydroxide precipitate and nickel sulphide also have a royalty of 2%.
7.4.3. Value add
The chart below provides a breakdown of the value of the nickel contained in nickel-cobalt
intermediates between the mine and the processor, for both a higher and a lower cost mine.
Figure 26 Ni-Co intermediates value attribution, 2019 average, high and low cost operations
CRU. Based on pro rata costs.

16 October 2020 Page 52 of 85
Here, for clarity, we mean the mine and hydrometallurgical plant together, and the processor
represents refineries converting the intermediate to a finished nickel product. We can see that the
share of value attributable to the processor is consistent in both cases, but the mine’s margin
differs substantially according to their costs.
7.5. Nickel sulphide concentrates
7.5.1. Pricing
Nickel sulphide concentrates are generally priced in a similar manner to copper concentrates, i.e.
a high percentage of the nickel content in the concentrate is paid for, and a treatment charge is
deducted. However, such trade in third party nickel concentrates is limited, as the significant
majority of nickel sulphide mine production is integrated with smelting and refining capacity either
on-site or within the same company and country. Furthermore, producers and developers of nickel
sulphide projects that do not have downstream smelting capacity (which comes at a high capital
cost) often find themselves with a weak negotiating position with respect to treatment charges,
given the small number of purchasers of custom concentrates who are not highly incentivized to
accept third party concentrates due to:
• Technical issues that may arise from the use of concentrates with different specifications
to typical feedstock. Nickel concentrate compositions can vary significantly – major mines
produce concentrates ranging from 5-25% nickel content, with differing contents of
valuable by-products such as precious or platinum group metals, as well as impurities.
Adapting a smelter operation to adjust to these different inputs – maximizing recovery of
nickel and by-products while ensuring that impurities are removed – can be a significant
undertaking.
• Third party concentrates may only form a relatively small proportion of a smelter’s overall
purchases as most smelters already have an integrated source of feedstock, diminishing
the ‘size of the prize’ of accepting new material.
• The small existing volume of trade, most of which occurs between a small number of well
established buyers and sellers, means that new suppliers of concentrate may substantially
increase availability, causing oversupply and negatively impacting the price that may be
realized.
Nickel concentrate trade between third parties is nearly all accounted for by three main individual
purchasers and a handful number of sellers.
• China: Jinchuan imports concentrates from Australia, South Africa, Russia and Zimbabwe.

16 October 2020 Page 53 of 85
• Finland: Boliden’s Harjavalta smelter processes concentrates from their own mines but
also some imported third party material, which in recent years has mostly come from
Canada.
• Australia: Mines without downstream smelting capacity, most importantly IGO’s Nova
operation and Western Areas’ Forrestania operation, sell their material to BHP’s Nickel
West operations within Australia and also export to Jinchuan in China. BHP smelts a mix
of concentrates from their own mines and third parties.
International trade in nickel concentrates accounts for around 70-75,000 tonnes of nickel
contained per year. Domestic third party trade within Australia accounts for another 10,000 tonnes
of nickel per year. Collectively, this means that only 11% of the total volume of nickel concentrate
production is traded between third parties, or around ~3% of the total nickel market.
Given the limited volume of trade, the transparency and reliability of pricing for nickel concentrates
is low, and pricing can vary significantly between individual deals given depending on each parties’
bargaining power. By comparison, the results of major negotiations over treatment and refining
charges on copper concentrates are reported by price discovery services such as CRU’s as well
as in the general press, and tend to be used as a figure against which all other trade is then
benchmarked. Therefore, while the TC on copper concentrates of similar composition is likely to
be highly similar across volumes sold in different regions, a buyer of nickel concentrates may be
Figure 27 Trade in nickel concentrates, quarterly (tonnes Ni)
CRU, IHS
-
5,000
10,000
15,000
20,000
25,000
2Q2018 3Q2018 4Q2018 1Q2019 2Q2019 3Q2019
China from Australia China from South Africa China from Zimbabwe
China from Russia Finland from Canada Finland from South Africa
Finland from USA Australia internal trade
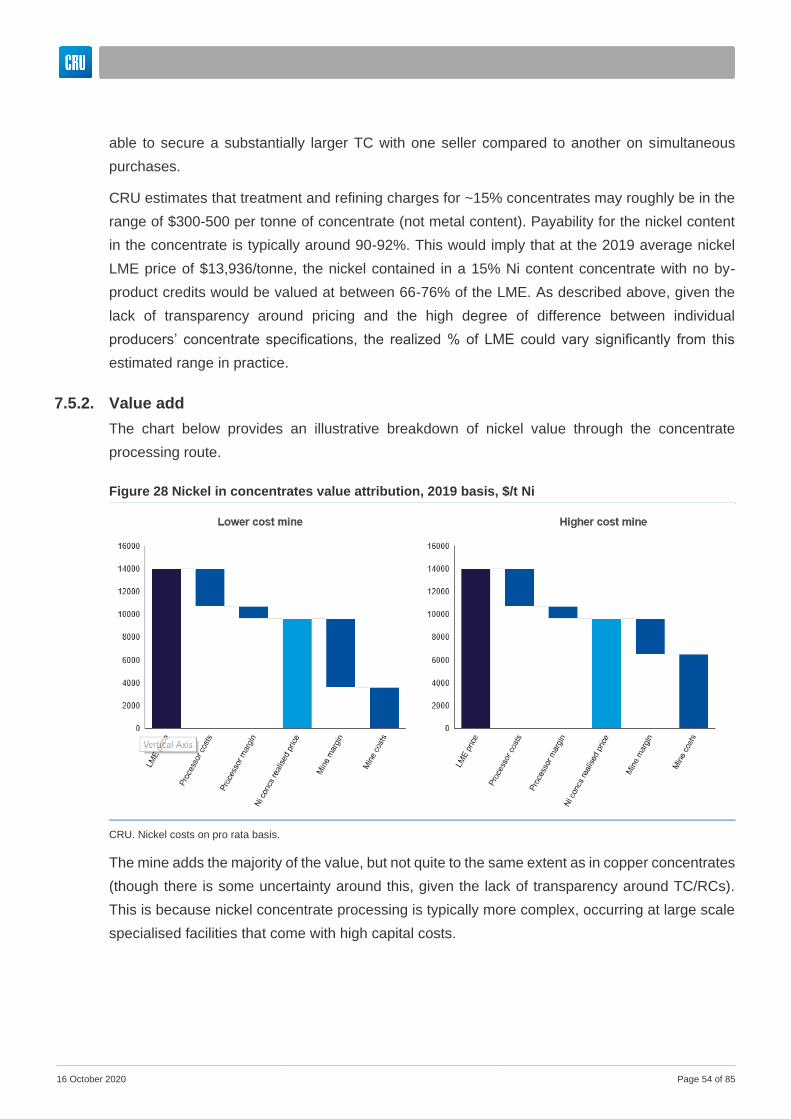
16 October 2020 Page 54 of 85
able to secure a substantially larger TC with one seller compared to another on simultaneous
purchases.
CRU estimates that treatment and refining charges for ~15% concentrates may roughly be in the
range of $300-500 per tonne of concentrate (not metal content). Payability for the nickel content
in the concentrate is typically around 90-92%. This would imply that at the 2019 average nickel
LME price of $13,936/tonne, the nickel contained in a 15% Ni content concentrate with no by-
product credits would be valued at between 66-76% of the LME. As described above, given the
lack of transparency around pricing and the high degree of difference between individual
producers’ concentrate specifications, the realized % of LME could vary significantly from this
estimated range in practice.
7.5.2. Value add
The chart below provides an illustrative breakdown of nickel value through the concentrate
processing route.
The mine adds the majority of the value, but not quite to the same extent as in copper concentrates
(though there is some uncertainty around this, given the lack of transparency around TC/RCs).
This is because nickel concentrate processing is typically more complex, occurring at large scale
specialised facilities that come with high capital costs.
Figure 28 Nickel in concentrates value attribution, 2019 basis, $/t Ni
CRU. Nickel costs on pro rata basis.

16 October 2020 Page 55 of 85
7.5.3. Value basis for land-based royalties
We now provide a high level overview of how royalties on nickel sulphide concentrates in key
producing jurisdictions are extracted:
Canada
Canada determines royalty rates at the provincial/state level rather than at a national one. The
largest nickel concentrate deposits are found in Ontario, Newfoundland and Labrador, Alberta,
and Manitoba. A summary of rates for each province is as follows:
1. Ontario: the mining tax is levied at a rate of 10% on annual taxable profits in excess of
CAD$500,000 from all mines. For remote areas, this is lowered to 5%.
2. Newfoundland and Labrador: A 15% mining tax is imposed on the net income of the
mine operator. Net income equals gross revenue less allowable expenses.
Russia:
The tax base is the value of the extracted mineral based on quantity and either sales price net of
VAT, customs duty, and customs clearance fees (reduced by freight costs and refining costs) or
the cost of production, as per the tax accounting records maintained for profit tax purposes. The
applicable rate to non-ferrous ores is 8%.
Australia:
See nickel-cobalt intermediates section 7.4.2
South Africa:
The Mineral and Petroleum Resources Development Act (“MPRDA”) applies variable royalty
percentage rates based on whether the mineral is refined or unrefined. The royalty liability is equal
to the tax base (gross sales) multiplied by the royalty percentage rate. Refined mineral resources
are mineral resources that have undergone a comprehensive level of beneficiation and are listed
in Schedule 1 to the MPRDA. The minimum royalty percentage in the case of refined minerals is
0.5% and the maximum royalty percentage is 5%. And, in the case of unrefined minerals, the
minimum royalty percentage is 0.5% and the maximum royalty percentage is 7%.
7.6. Takeaways from nickel analysis
• Nickel has a complex flowsheet, and is sold in a variety of forms. Of those, most of the
intermediate and other unfinished forms have limited price transparency, as there is a high
degree of integration between mining, smelting and refining, so little trade in e.g.
concentrates or matte occurs. Unfinished products are sold with reference to the LME
nickel price (or another widely reported exchange such as the SHFE), subject to
deductions for payability and TC/RCs, but the deductions themselves are opaque. Nickel
16 October 2020 Page 56 of 85
laterite ore, which is traded by miners in Philippines and Indonesia for production of nickel
pig iron (for use in stainless steel production), is an exception to this.
• Laterite ore is a bulk product sold at a fixed price, without reference to NPI or LME nickel
prices. Therefore, the processor takes all of the finished product price risk. However, ore
prices are relatively well correlated with LME nickel prices, fluctuating around 15-30% of
the LME. This percentage lines up with the proportion of value added at the mine from
observation at mine and processor costs.
• CRU estimates that the % of the LME nickel price captured in sales of nickel concentrates
and Ni-Co intermediates is around 60-80%. This also reflects the substantially larger value
add occurring at the mine in these cases relative to laterite ore for use in NPI.
8. Manganese
8.1. Value chain overview
Manganese (Mn) is a relatively common element in the earth’s crust, averaging a concentration of
nearly 0.1% to make it the twelfth most abundant element and fourth most abundant of the metals
in commercial use. Manganese is a greyish-white chemical element. It is hard and brittle,
resembles iron in appearance and occurs in nature in the form of mineral ore.
Manganese ore describes any type of rock that contains minerals with manganese elements. The
most commonly occurring ore types that bear manganese in significant quantities occur as oxides
and carbonates. Manganese ore is typically classified into one of the three following grades
according to the manganese content of the product - low grade (25-35% Mn), medium grade (35-
44% Mn); and high grade (>44% Mn). Manganese ore can also be classified into one of the
following types according to the size of the ore particles, lump (typical size <75mm and >6mm),
fines (<6mm), and sinter (<63mm and >6mm). Fines are produced when crushing manganese
ore. Sinter is produced by agglomerating fines.
Manganese has several end use applications. The most important by far is in steelmaking,
accounting for around 90% of ore consumption, with the remainder used as an input in the
production of portable batteries and aluminum beverage cans, as well as a range of other minor
end uses. In each case manganese plays a vital role in improving the properties of the alloys and
compounds involved in each specific application.
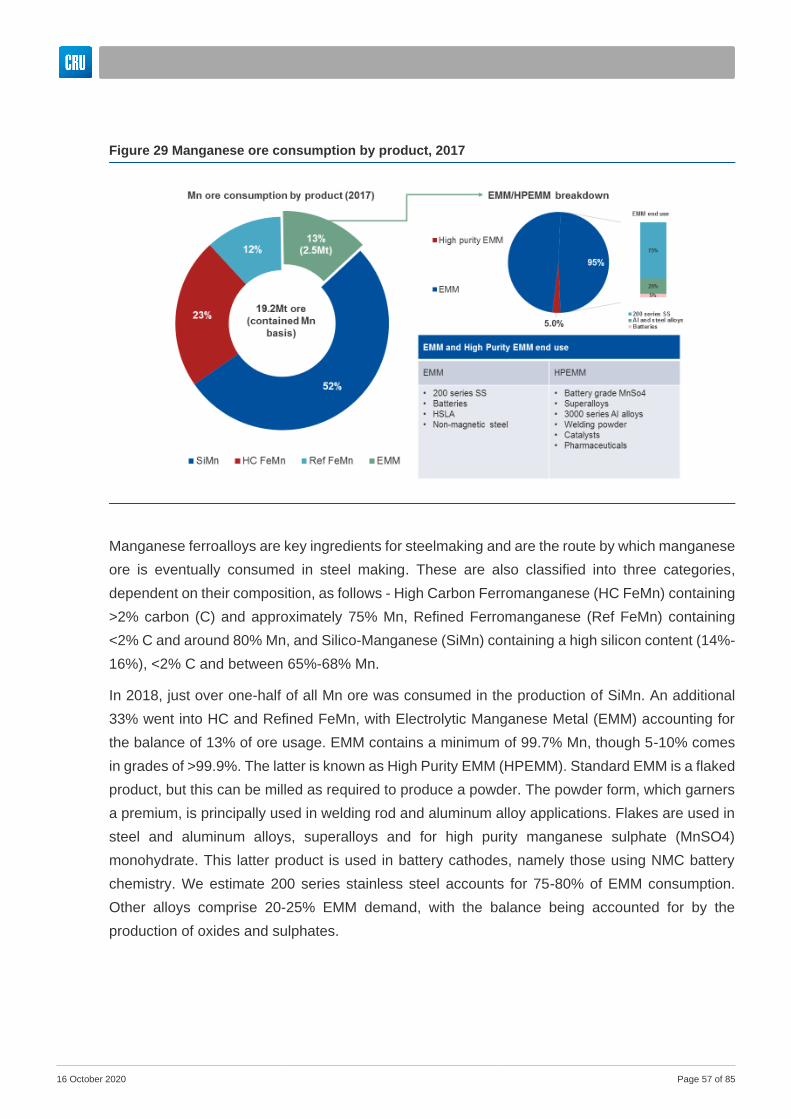
16 October 2020 Page 57 of 85
Manganese ferroalloys are key ingredients for steelmaking and are the route by which manganese
ore is eventually consumed in steel making. These are also classified into three categories,
dependent on their composition, as follows - High Carbon Ferromanganese (HC FeMn) containing
>2% carbon (C) and approximately 75% Mn, Refined Ferromanganese (Ref FeMn) containing
<2% C and around 80% Mn, and Silico-Manganese (SiMn) containing a high silicon content (14%-
16%), <2% C and between 65%-68% Mn.
In 2018, just over one-half of all Mn ore was consumed in the production of SiMn. An additional
33% went into HC and Refined FeMn, with Electrolytic Manganese Metal (EMM) accounting for
the balance of 13% of ore usage. EMM contains a minimum of 99.7% Mn, though 5-10% comes
in grades of >99.9%. The latter is known as High Purity EMM (HPEMM). Standard EMM is a flaked
product, but this can be milled as required to produce a powder. The powder form, which garners
a premium, is principally used in welding rod and aluminum alloy applications. Flakes are used in
steel and aluminum alloys, superalloys and for high purity manganese sulphate (MnSO4)
monohydrate. This latter product is used in battery cathodes, namely those using NMC battery
chemistry. We estimate 200 series stainless steel accounts for 75-80% of EMM consumption.
Other alloys comprise 20-25% EMM demand, with the balance being accounted for by the
production of oxides and sulphates.
Figure 29 Manganese ore consumption by product, 2017
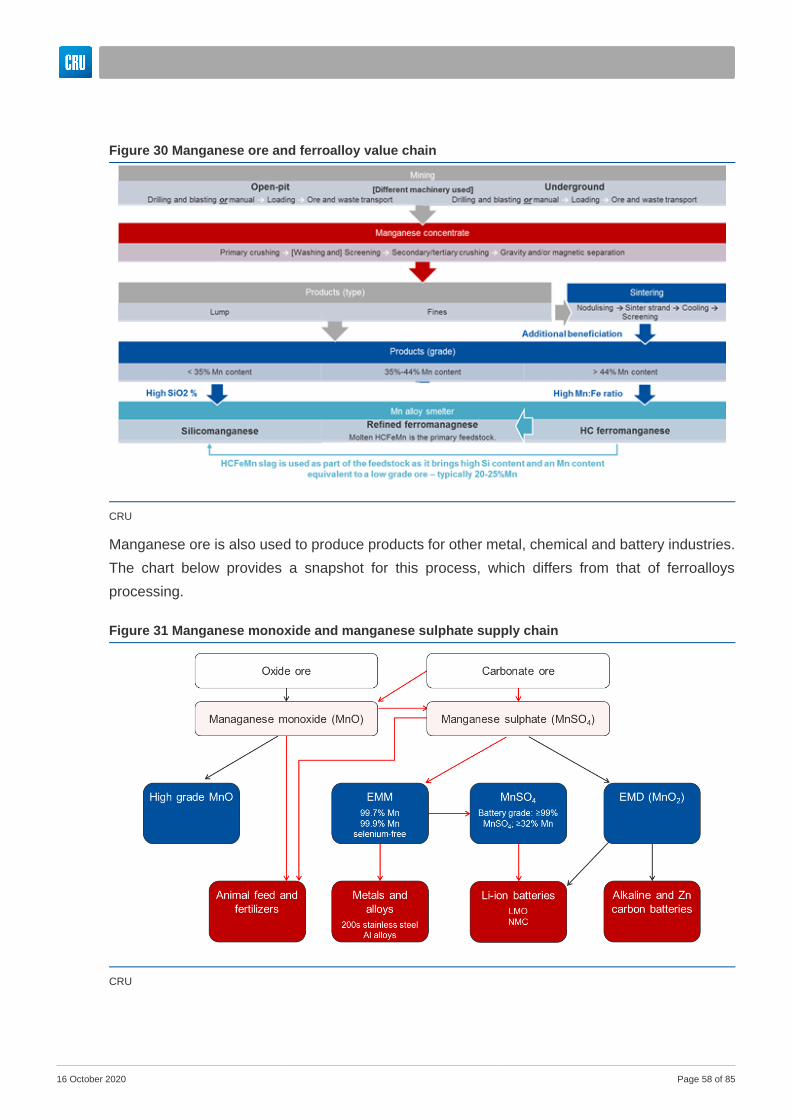
16 October 2020 Page 58 of 85
Manganese ore is also used to produce products for other metal, chemical and battery industries.
The chart below provides a snapshot for this process, which differs from that of ferroalloys
processing.
Figure 30 Manganese ore and ferroalloy value chain
CRU
Figure 31 Manganese monoxide and manganese sulphate supply chain
CRU

16 October 2020 Page 59 of 85
8.2. Manganese ore
The pricing of manganese ore is notably different compared to the other metals contained in the
polymetallic nodules. Where nickel, copper, and cobalt are sold in intermediate and concentrate
form, it is with reference to a finished metal price, e.g. the LME. The one exception to this is nickel
laterite ore, which is priced on a fixed basis with no direct linkage to the LME nickel (or NPI) price.
Manganese ore is sold on a fixed price basis per unit contained manganese, often linked to an
index of spot manganese prices collected by a third party pricing service.
Manganese is mined as a bulk commodity from two main deposit types, carbonate and oxide. Like
nickel laterite ore, but unlike nickel and copper concentrates, the ore undergoes relatively little
beneficiation before sale. The largest volume of ore trade occurs between South Africa and China,
and this trade route forms the basis of the price series on which much of the industry relies:
Fastmarkets FOB South Africa prices. Manganese ore displays a similarity to (traded) nickel
laterite ore in terms of its pricing: it is sold at a fixed price negotiated between a buyer and seller,
that is not directly linked to downstream product prices. This is distinct from base metal
concentrates and intermediates, where the metal content of those concentrates rather than linked
to a reference product price (e.g. LME copper or nickel) minus certain charges, as with a base
metal concentrate. One difference: manganese ore is usually priced per unit of Mn content in the
ore6, rather than per gross tonne of ore which is more common for laterite ore.
6 Mn ore prices are usually expressed as $/dmtu, which is $ per dry metric tonne unit, where a ‘unit’ is 1/100th of a tonne. So a price of $5/dmtu for a 44% Mn ore expressed in $ per gross dry tonnes of ore, would be 5 x 0.44 x 100 = $220/tonne.
Figure 32 Manganese ore prices, monthly delivered China ($/dmtu)
CRU
0
2
4
6
8
10
12
14
16
18
20
2005 2006 2007 2008 2009 2010 2011 2012 2013 2014 2015 2016 2017 2018 2019
CIF China, spot import (44% Mn) CIF China (36-38%)

16 October 2020 Page 60 of 85
Manganese ore prices spiked dramatically in 2006/7, as rapidly growing steel output driven by
China caused severe tightness in the manganese alloy and ore sectors. Over the past 10 years,
monthly average prices have ranged between $2-9/dmtu, but largely staying between $4-7/dmtu
for the majority of that period.
Importantly, though manganese ore is priced per unit of manganese content, this price is lower for
lower value manganese ores. Value here means ore value in use, which encapsulates various
characteristics of the ore that may increase or reduce the value of the ore to a processor.
Furthermore, this value in use may depend on whether the buyer is producing HC FeMn, SiMn, or
EMM or some other manganese product, as certain ore characteristics may be beneficial in one
application, but harmful in another.
Broadly speaking, manganese content itself is the most important determinant of value, but the
Mn:Fe ratio is also important, as is the Mn:P ratio. The key takeaway here is that if the manganese
content of the nodule is sold as manganese-rich slag (MRS), though this material has similar
chemical specifications to widely traded ores, the ISA cannot assume that a benchmark
manganese ore price will be directly applicable to the MRS, as in practice the MRS may be priced
at a higher or lower level according to its value in use relative to benchmark material. Such an
adjustment remains an uncertainty (though estimates can be made), and will require some kind of
market testing – MOUs or commitments to purchase from potential offtakers, and associated
pricing levels – in order for the ISA to be confident ex-ante in the most likely sale price for the MRS
relative to benchmark ore prices. Provided the data can be made available by the processor, this
can be captured ex-post from actual transaction data, rather than the ISA trying to estimate the
value relative to benchmark price series.
Figure 33 Manganese ore types
CRU
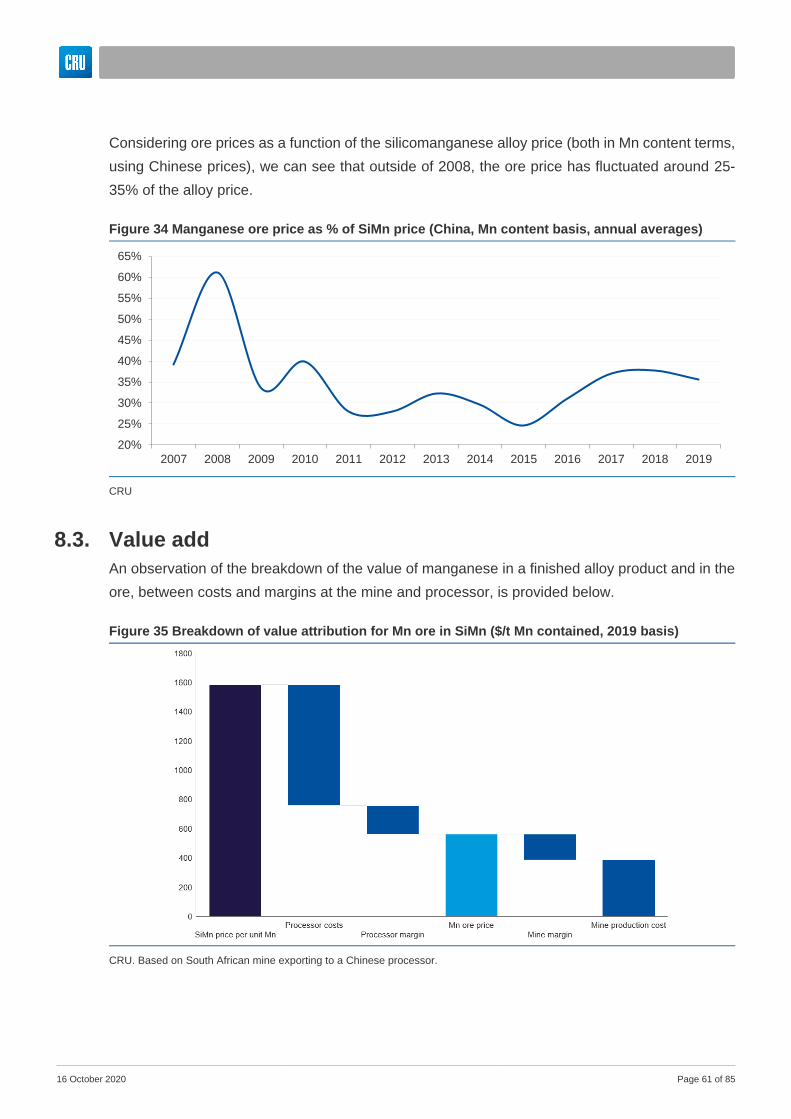
16 October 2020 Page 61 of 85
Considering ore prices as a function of the silicomanganese alloy price (both in Mn content terms,
using Chinese prices), we can see that outside of 2008, the ore price has fluctuated around 25-
35% of the alloy price.
8.3. Value add
An observation of the breakdown of the value of manganese in a finished alloy product and in the
ore, between costs and margins at the mine and processor, is provided below.
Figure 34 Manganese ore price as % of SiMn price (China, Mn content basis, annual averages)
CRU
Figure 35 Breakdown of value attribution for Mn ore in SiMn ($/t Mn contained, 2019 basis)
CRU. Based on South African mine exporting to a Chinese processor.
20%
25%
30%
35%
40%
45%
50%
55%
60%
65%
2007 2008 2009 2010 2011 2012 2013 2014 2015 2016 2017 2018 2019
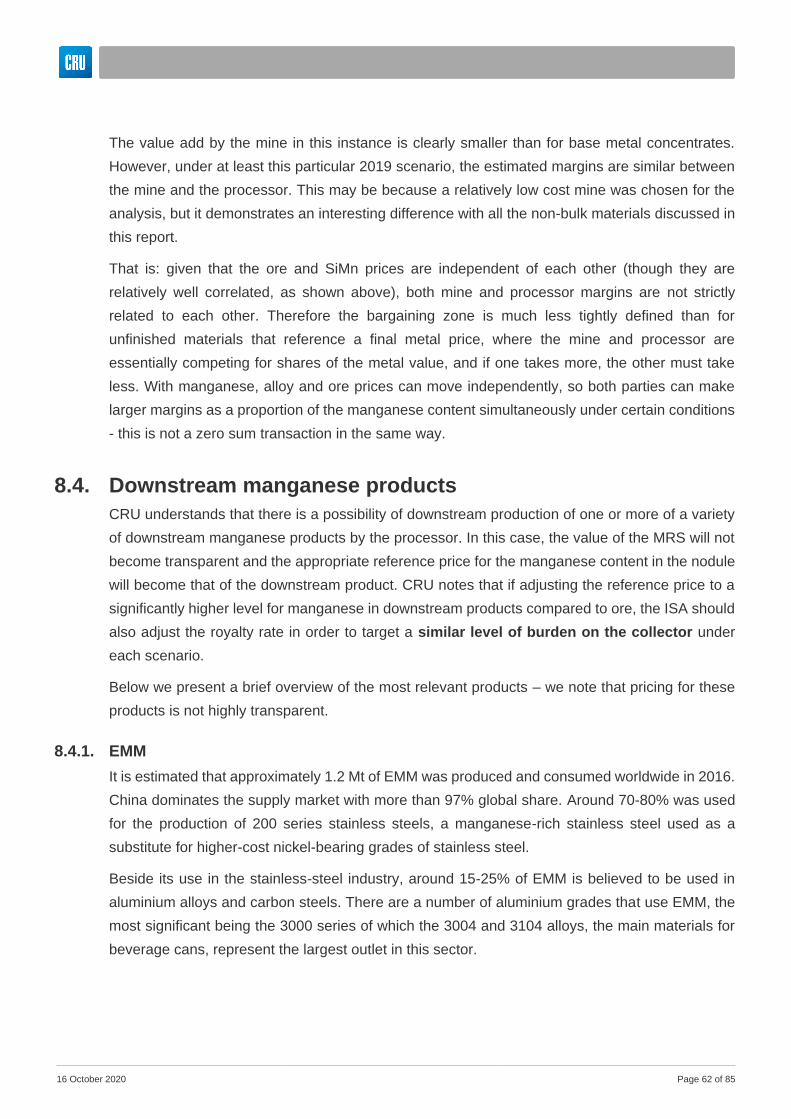
16 October 2020 Page 62 of 85
The value add by the mine in this instance is clearly smaller than for base metal concentrates.
However, under at least this particular 2019 scenario, the estimated margins are similar between
the mine and the processor. This may be because a relatively low cost mine was chosen for the
analysis, but it demonstrates an interesting difference with all the non-bulk materials discussed in
this report.
That is: given that the ore and SiMn prices are independent of each other (though they are
relatively well correlated, as shown above), both mine and processor margins are not strictly
related to each other. Therefore the bargaining zone is much less tightly defined than for
unfinished materials that reference a final metal price, where the mine and processor are
essentially competing for shares of the metal value, and if one takes more, the other must take
less. With manganese, alloy and ore prices can move independently, so both parties can make
larger margins as a proportion of the manganese content simultaneously under certain conditions
- this is not a zero sum transaction in the same way.
8.4. Downstream manganese products
CRU understands that there is a possibility of downstream production of one or more of a variety
of downstream manganese products by the processor. In this case, the value of the MRS will not
become transparent and the appropriate reference price for the manganese content in the nodule
will become that of the downstream product. CRU notes that if adjusting the reference price to a
significantly higher level for manganese in downstream products compared to ore, the ISA should
also adjust the royalty rate in order to target a similar level of burden on the collector under
each scenario.
Below we present a brief overview of the most relevant products – we note that pricing for these
products is not highly transparent.
8.4.1. EMM
It is estimated that approximately 1.2 Mt of EMM was produced and consumed worldwide in 2016.
China dominates the supply market with more than 97% global share. Around 70-80% was used
for the production of 200 series stainless steels, a manganese-rich stainless steel used as a
substitute for higher-cost nickel-bearing grades of stainless steel.
Beside its use in the stainless-steel industry, around 15-25% of EMM is believed to be used in
aluminium alloys and carbon steels. There are a number of aluminium grades that use EMM, the
most significant being the 3000 series of which the 3004 and 3104 alloys, the main materials for
beverage cans, represent the largest outlet in this sector.
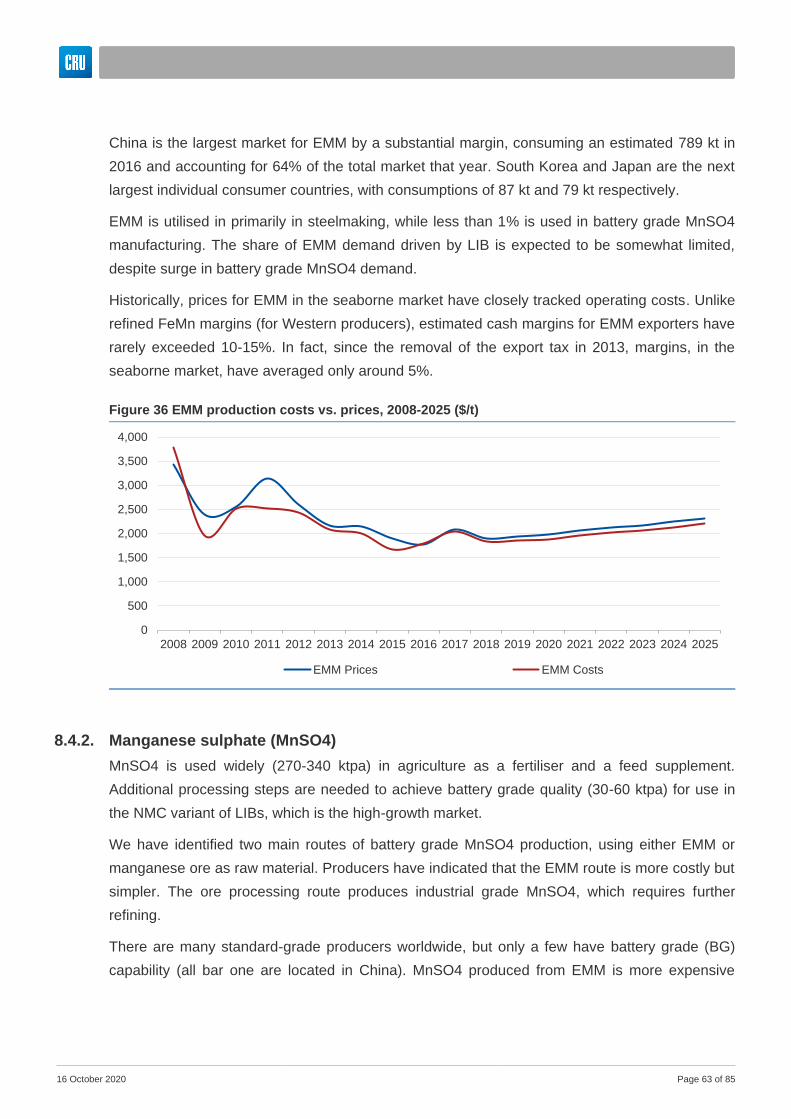
16 October 2020 Page 63 of 85
China is the largest market for EMM by a substantial margin, consuming an estimated 789 kt in
2016 and accounting for 64% of the total market that year. South Korea and Japan are the next
largest individual consumer countries, with consumptions of 87 kt and 79 kt respectively.
EMM is utilised in primarily in steelmaking, while less than 1% is used in battery grade MnSO4
manufacturing. The share of EMM demand driven by LIB is expected to be somewhat limited,
despite surge in battery grade MnSO4 demand.
Historically, prices for EMM in the seaborne market have closely tracked operating costs. Unlike
refined FeMn margins (for Western producers), estimated cash margins for EMM exporters have
rarely exceeded 10-15%. In fact, since the removal of the export tax in 2013, margins, in the
seaborne market, have averaged only around 5%.
8.4.2. Manganese sulphate (MnSO4)
MnSO4 is used widely (270-340 ktpa) in agriculture as a fertiliser and a feed supplement.
Additional processing steps are needed to achieve battery grade quality (30-60 ktpa) for use in
the NMC variant of LIBs, which is the high-growth market.
We have identified two main routes of battery grade MnSO4 production, using either EMM or
manganese ore as raw material. Producers have indicated that the EMM route is more costly but
simpler. The ore processing route produces industrial grade MnSO4, which requires further
refining.
There are many standard-grade producers worldwide, but only a few have battery grade (BG)
capability (all bar one are located in China). MnSO4 produced from EMM is more expensive
Figure 36 EMM production costs vs. prices, 2008-2025 ($/t)
0
500
1,000
1,500
2,000
2,500
3,000
3,500
4,000
2008 2009 2010 2011 2012 2013 2014 2015 2016 2017 2018 2019 2020 2021 2022 2023 2024 2025
EMM Prices EMM Costs
16 October 2020 Page 64 of 85
compared to the standard ore-based product; however Chinese producers are taking advantage
of excess local EMM manufacturing capacity to produce BG MnSO4, incentivised by higher prices
for this product compared to regular grades.
Prince Minerals, with plants in Belgium and Mexico, is a leading producer of MnSO4 in Western
Europe and North America. Over the past 10 to 15 years, several big producers have emerged in
China and India with capacities comparable to and sometimes exceeding those of the Prince
Minerals plants. Notable examples are Hunan Huitong Technology (30,000 tpa) in China and Atul
(36,000 tpa) in India.
The table below provides estimated prices for MnSO4 based on historical trade data, using Belgian
data as it a key exporter.
Table 26 Average annual battery grade MnSO4 export prices, 2012 - June 2017, US$/tonne
2012 2013 2014 2015 2016 2017
Belgium 1,404 1,285 1,187 1,185 1,279 1,336
Data: IHS, CRU Consulting estimates. Note: FOB prices
8.5. Value basis for land-based royalties
We now provide a high level overview of how royalties on manganese ore in key producing
jurisdictions are extracted:
China
China’s mining royalty scheme was established under the 1994 Provisions on the Administration
of Collection of the Mineral Resources Compensation. Article 5 outlines how royalties are
calculated:
1. Amount of the mineral resources compensation to be collected = sales income of
mineral products X compensation rate X coefficient of mining recovery rate.
2. Where coefficient of mining recovery rate = approved mining recovery rate/actual
mining recovery rate.
3. The approved mining recovery rate shall be the rate prescribed in the mine design that
has been approved in accordance with the relevant provisions of the state.
The rate of mineral resources compensation for manganese, copper, cobalt, and nickel is 2%.
Gabon
Gabon re-wrote its mining code in 2015 with the hopes of attracting new investment, and boosting
the percentage of its GDP that comes from mining. Currently the country is very oil dependent.
The new code includes a sliding royalty rate which varies according to the type of metal and the
16 October 2020 Page 65 of 85
project’s complexity in terms of geology, location, and associated infrastructure development. This
ad valorem royalty will be determined at the end of each year for each exploitation on the basis of
the “carreau-mine” value of the ore sold under a mining title. For exportations, the “carreau-mine”
value is the difference between the official selling price and the costs incurred to get the product
to its point of delivery in Gabon.
Interestingly, rather than determining the official selling price via benchmark or other traditional
route, the new mining code provides that a “Joint Technical Committee” will be created to
determine the official selling price for each ore. Their determination will be made based on the real
market price of the ore in transactions between independent buyers and sellers. Allowable
deductions include exit taxes, such as harbour dues, transportation costs, quality assessment
costs, and marketing fees. Failing determination of the actual allowable deductions, the ad valorem
royalty will be calculated on 70% of FOB price for exportations and 60% of the sale price for local
sales. The rate of the ad-valorem royalty will be set in each mining convention, but is required to
remain within a specific range for each mineral, as follows: i) base metals and other substance (3-
5%); precious metals (5-8%); and precious stones: 8-10%
South Africa
See nickel concentrates section 0
8.6. Takeaways from manganese analysis
• Manganese ore is priced as a bulk commodity, with no reference to alloy or other
downstream product prices. The processor therefore takes all of the price risk relative to
the finished product price. This also means that the bargaining zone between mine and
processor is more loosely defined than for e.g. base metal concentrates, since the two
parties are not competing with each other for a share of a single price, so the transaction
is not zero sum in the way that e.g. a TC/RC negotiation would be.
• Manganese ore mines add a lower proportion of value to the final product than base metal
concentrates or producers of Ni-Co intermediates. This aligns with manganese ore’s lower
value position as a proportion of the finished product price, and with the way that they are
priced.
• If the manganese content of the nodule is sold as manganese-rich slag (MRS), though this
material is expected to have similar chemical specifications to widely traded ores, the ISA
cannot assume that a benchmark manganese ore price will be directly applicable.
Therefore, while manganese ore prices would be the appropriate reference price for a
royalty, it also could allow for adjustments based on the material’s value in use – e.g. such
16 October 2020 Page 66 of 85
a differential could be included in allowable cost deductions under an NSR basis. This can
be estimated, with a possibility of a wide margin of error given the novelty of the material
and the potentially very large volumes that may need to be placed into the market. Ideally
the realised prices for MRS sales would be reported from actual arm’s length transactions
by the processor for full transparency. However, if the processor is not integrated with the
collector they would be entirely outside the ISA’s jurisdiction and may have no obligation
to report such information. In this case the nodule transaction would be at arm’s length and
the collector would be strongly incentivised to maximise the payment for nodules and
therefore ensure that they themselves would not be underpaid for manganese content of
the nodules due to an overestimation of VIU deductions on the MRS by the processor.
• This points to a further, more philosophical counter-argument: if the nodule collector and
processor produce sufficiently large volumes of manganese in any form, the sales price is
likely to diminish in order for the market to absorb excess volumes. From the perspective
of recognising the manganese content in the nodules as part of the common heritage of
humankind, the fact that this sales value may be diminished by the scale of nodule removal
may not be acceptable – from this perspective the obligation would be for the maximum
amount of potential value (itself a very arguable figure) to be captured by the royalty, even
if it is not being captured by the processor. In the same way, it might not be considered
acceptable for the royalty to diminish as a result of e.g. poor marketing or technical issues
resulting in a reduction in product quality on the part of the processor. On the other hand,
to maintain a higher degree of royalty that does not factor in a lower realised final product
sales price from the processor may unfairly burden the nodule collector. In this scenario,
the collector’s royalty burden would remain the same, though they may be paid less for the
nodules by the processor as a result of the processor’s inability to capture full value for
their product(s).
• CRU would suggest that royalties on the manganese content of the nodules may need to
be subject to a different system than the nickel, copper and cobalt content, largely due to
the substantially larger uncertainty around both the product form in which manganese
might be sold (thus the appropriate reference price for the Mn content in the ore), and the
value that could be obtained for those products. Given this high degree of uncertainty, a
unit production specific royalty, i.e. a fee per tonne of Mn in nodules produced, may be a
more attractive position at this stage. This could be adjusted to an ad valorem royalty based
on NSR when such uncertainties are sufficiently reduced either closer to the operation start
date or ex post – with the understanding that the targeted burden of the royalty on the
collector (to be determined by the ISA as described in other recommendations within this
report) would remain the same.
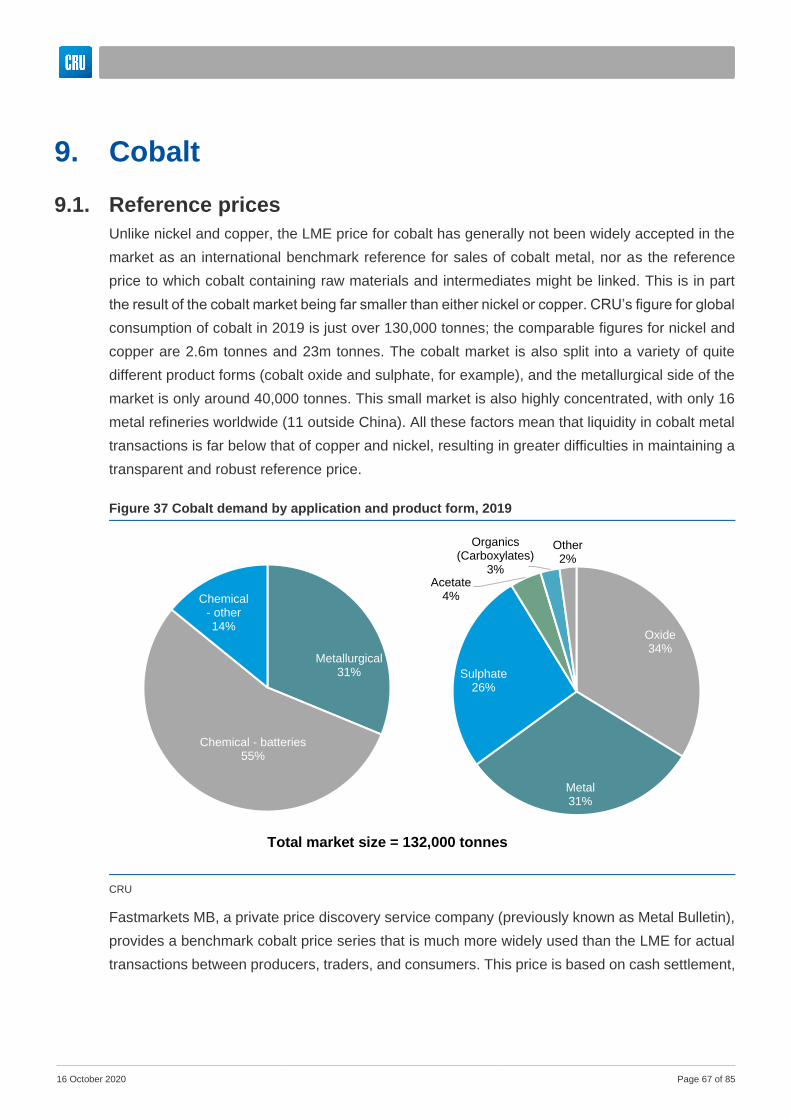
16 October 2020 Page 67 of 85
9. Cobalt
9.1. Reference prices
Unlike nickel and copper, the LME price for cobalt has generally not been widely accepted in the
market as an international benchmark reference for sales of cobalt metal, nor as the reference
price to which cobalt containing raw materials and intermediates might be linked. This is in part
the result of the cobalt market being far smaller than either nickel or copper. CRU’s figure for global
consumption of cobalt in 2019 is just over 130,000 tonnes; the comparable figures for nickel and
copper are 2.6m tonnes and 23m tonnes. The cobalt market is also split into a variety of quite
different product forms (cobalt oxide and sulphate, for example), and the metallurgical side of the
market is only around 40,000 tonnes. This small market is also highly concentrated, with only 16
metal refineries worldwide (11 outside China). All these factors mean that liquidity in cobalt metal
transactions is far below that of copper and nickel, resulting in greater difficulties in maintaining a
transparent and robust reference price.
Fastmarkets MB, a private price discovery service company (previously known as Metal Bulletin),
provides a benchmark cobalt price series that is much more widely used than the LME for actual
transactions between producers, traders, and consumers. This price is based on cash settlement,
Figure 37 Cobalt demand by application and product form, 2019
CRU
Oxide34%
Metal31%
Sulphate26%
Acetate4%
Organics (Carboxylates)
3%
Other2%
Metallurgical31%
Chemical - batteries55%
Chemical - other14%
Total market size = 132,000 tonnes
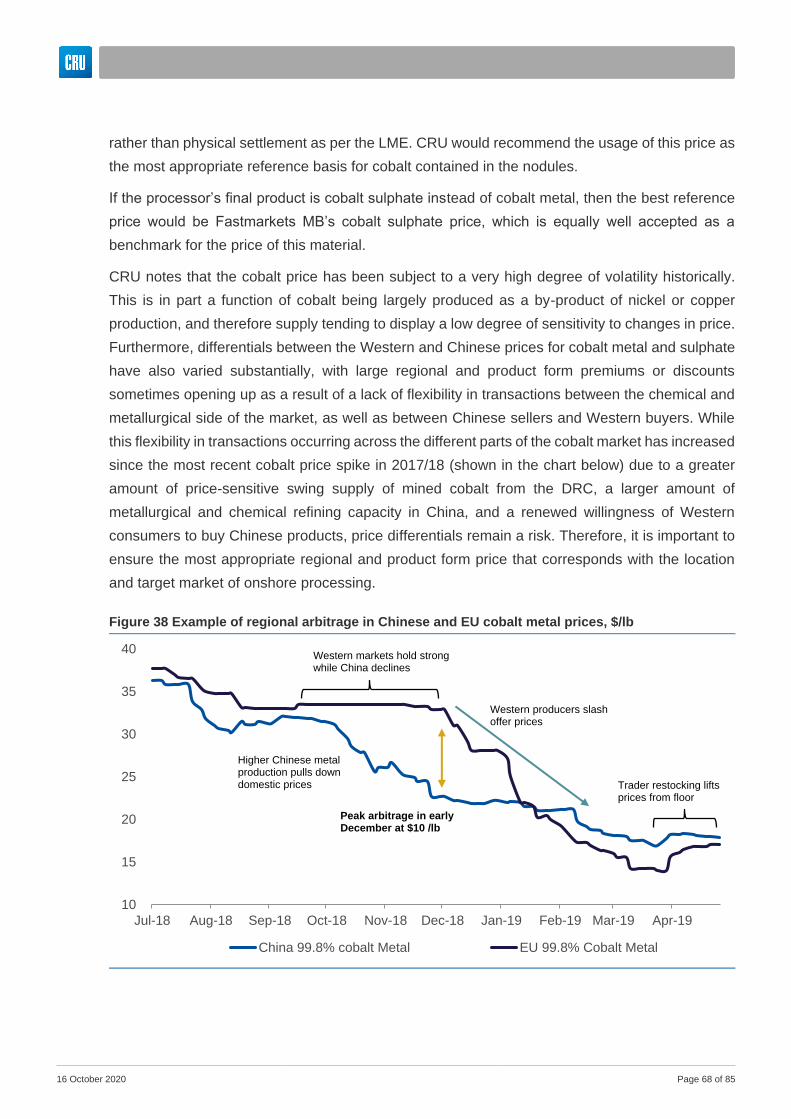
16 October 2020 Page 68 of 85
rather than physical settlement as per the LME. CRU would recommend the usage of this price as
the most appropriate reference basis for cobalt contained in the nodules.
If the processor’s final product is cobalt sulphate instead of cobalt metal, then the best reference
price would be Fastmarkets MB’s cobalt sulphate price, which is equally well accepted as a
benchmark for the price of this material.
CRU notes that the cobalt price has been subject to a very high degree of volatility historically.
This is in part a function of cobalt being largely produced as a by-product of nickel or copper
production, and therefore supply tending to display a low degree of sensitivity to changes in price.
Furthermore, differentials between the Western and Chinese prices for cobalt metal and sulphate
have also varied substantially, with large regional and product form premiums or discounts
sometimes opening up as a result of a lack of flexibility in transactions between the chemical and
metallurgical side of the market, as well as between Chinese sellers and Western buyers. While
this flexibility in transactions occurring across the different parts of the cobalt market has increased
since the most recent cobalt price spike in 2017/18 (shown in the chart below) due to a greater
amount of price-sensitive swing supply of mined cobalt from the DRC, a larger amount of
metallurgical and chemical refining capacity in China, and a renewed willingness of Western
consumers to buy Chinese products, price differentials remain a risk. Therefore, it is important to
ensure the most appropriate regional and product form price that corresponds with the location
and target market of onshore processing.
Figure 38 Example of regional arbitrage in Chinese and EU cobalt metal prices, $/lb
10
15
20
25
30
35
40
Jul-18 Aug-18 Sep-18 Oct-18 Nov-18 Dec-18 Jan-19 Feb-19 Mar-19 Apr-19
China 99.8% cobalt Metal EU 99.8% Cobalt Metal
Higher Chinese metal production pulls down domestic prices
Western markets hold strong while China declines
Peak arbitrage in early December at $10 /lb
Western producers slash offer prices
Trader restocking lifts prices from floor

16 October 2020 Page 69 of 85
The cobalt value chain is shown below. It is arguably the most complex of any of the metals
discussed, with numerous types of raw materials, intermediates and finished products.
9.2. Cobalt-containing concentrates
In the following section, we describe the structure and composition of a typical “cobalt concentrate”
sales agreement. We make the point here that a “cobalt concentrate” probably does not exist.
There are several cobalt containing concentrates that are sold and processed but these contain
important amounts of zinc and copper if derived from the African copper belt, or significant
proportions of nickel if coming from Australia, South Africa or Canada.
As with copper concentrates, purchasers of cobalt-containing concentrates pay for the
accountable contained metal, less deductions for treatment and refining charges and penalties.
The typical payment terms for contained metals, along with accountability, charges and
quotational periods tend to differ between Western and Chinese approaches to these topics.
Western smelters and refineries have a treatment charge for the bulk material and then a refining
charge for each metal to be recovered, whereas the Chinese smelters and refineries quote on a
percentage of the payable metal contained in the shipment.
Dealing with Western smelters and refineries, with the PMs and PGMs there would be and
minimum deduction in grams per tonne, accountability would be around 80% and a refining charge
Figure 39 Cobalt value chain
CRU

16 October 2020 Page 70 of 85
made for each metal recovered. For the nickel, copper and cobalt, the accountability for nickel and
copper would be above 90%, cobalt could be as low as 50% and the treatment charge around
$100-150 per tonne. There would also be a refining charge for each metal which would involve
some level of price participation from the smelter/refinery as the metal price increases. Such price
participation is no longer in use for copper concentrates.
Concentrates would also incur penalties in $/tonne would also be defined based on the content
levels for problem elements such as arsenic, fluoride, calcium, magnesium, manganese and zinc.
9.3. Cobalt hydroxide
Most cobalt hydroxide sales are made with Chinese counterparties and are based on material
from the DRC in Africa. The structure of these contracts is very similar to the cobalt containing
concentrate agreement outlined above. Most of the headings in the concentrate agreement are
used but there are generally three significant differences.
Firstly, the payment system is much simpler and secondly, the tolerances on the quality of the
material will be much tighter. As a result, thirdly, the penalties become significant. Elements such
as iron, manganese, silica and zinc are problematical and if they exceed certain levels, the
shipment can be rejected. Once a shipment is rejected, it is not covered by the contract so
becomes the responsibility of the seller.
A common cobalt hydroxide contract with a Chinese processor would be for 30% cobalt content
(dry basis), moisture levels less than 20% but generally 12-13%. Iron content would be less than
1%, and manganese 5-6% max. The payable cobalt would be in the scale 65% to 80% depending
on reliability in terms of quality and delivery and be agreed on 6 to 12 month contracts. Initial
contracts would start with around 65% payables. Departures from the above levels of cobalt and
impurities would mean lower payables and, in some cases, where the assay results show quality
to be outside contractual limits, penalties and claw-back payments.
Table 5 Cobalt raw material pricing basis
Raw Materials Cobalt content
(%)
Typical Payable
(%)
Estimated other
payables
Basis of other
payables (Metal
content)
Charges
Cobalt concentrates (DRC) 8 55 copper nil China: nil
West: TC, RC, PP
Cobalt concentrates
(N.America) 20 70 copper, various 60% of Cu (20%)
China: nil
West: TC, RC, PP
Cobalt hydroxide 30 70 none nil Nil
CRU
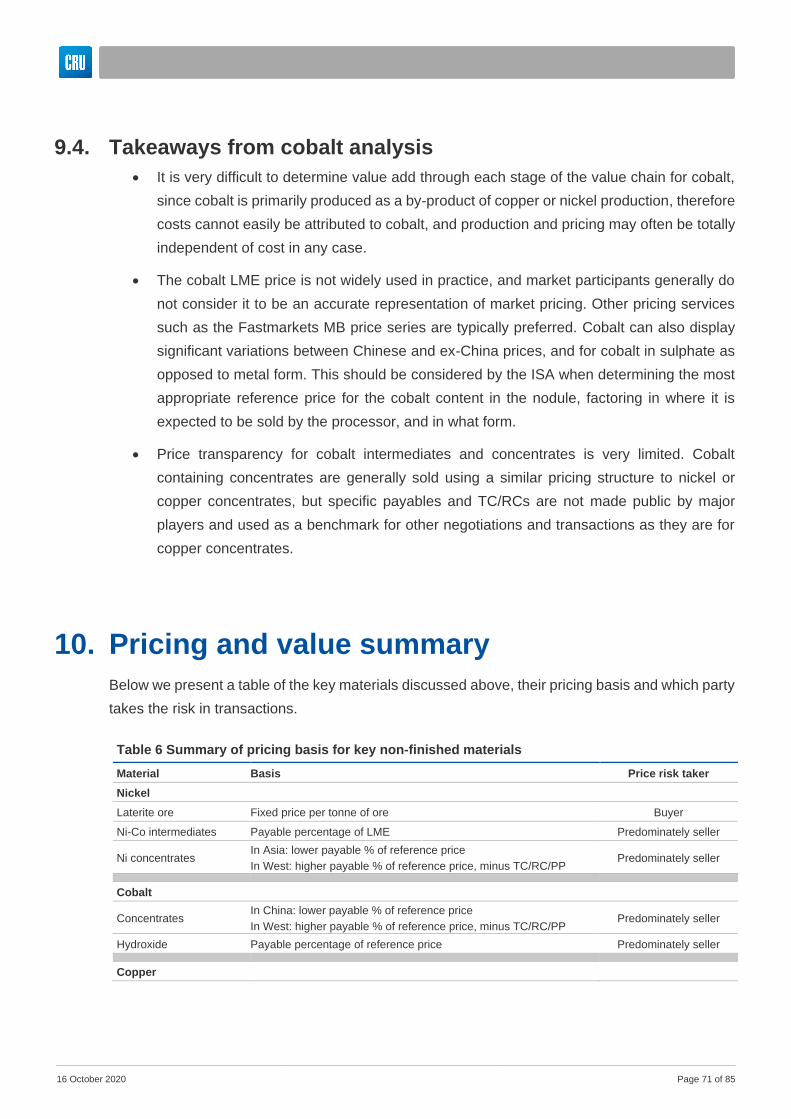
16 October 2020 Page 71 of 85
9.4. Takeaways from cobalt analysis
• It is very difficult to determine value add through each stage of the value chain for cobalt,
since cobalt is primarily produced as a by-product of copper or nickel production, therefore
costs cannot easily be attributed to cobalt, and production and pricing may often be totally
independent of cost in any case.
• The cobalt LME price is not widely used in practice, and market participants generally do
not consider it to be an accurate representation of market pricing. Other pricing services
such as the Fastmarkets MB price series are typically preferred. Cobalt can also display
significant variations between Chinese and ex-China prices, and for cobalt in sulphate as
opposed to metal form. This should be considered by the ISA when determining the most
appropriate reference price for the cobalt content in the nodule, factoring in where it is
expected to be sold by the processor, and in what form.
• Price transparency for cobalt intermediates and concentrates is very limited. Cobalt
containing concentrates are generally sold using a similar pricing structure to nickel or
copper concentrates, but specific payables and TC/RCs are not made public by major
players and used as a benchmark for other negotiations and transactions as they are for
copper concentrates.
10. Pricing and value summary
Below we present a table of the key materials discussed above, their pricing basis and which party
takes the risk in transactions.
Table 6 Summary of pricing basis for key non-finished materials
Material Basis Price risk taker
Nickel
Laterite ore Fixed price per tonne of ore Buyer
Ni-Co intermediates Payable percentage of LME Predominately seller
Ni concentrates In Asia: lower payable % of reference price
In West: higher payable % of reference price, minus TC/RC/PP Predominately seller
Cobalt
Concentrates In China: lower payable % of reference price
In West: higher payable % of reference price, minus TC/RC/PP Predominately seller
Hydroxide Payable percentage of reference price Predominately seller
Copper
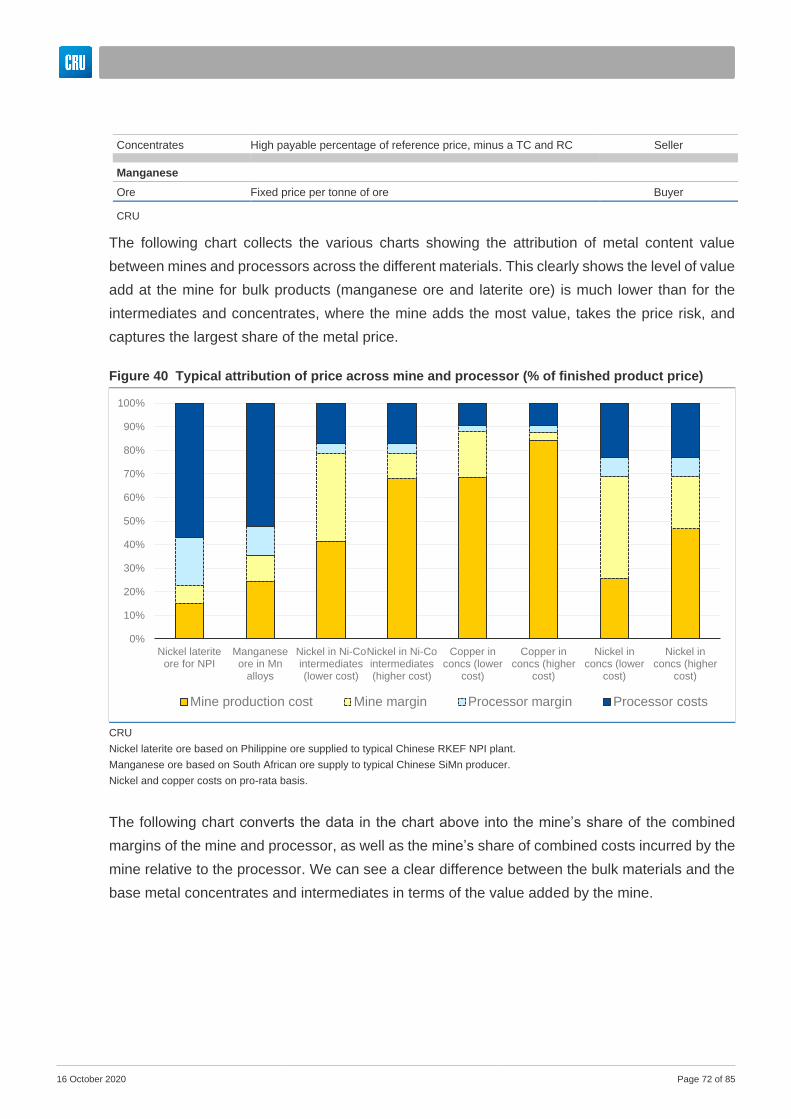
16 October 2020 Page 72 of 85
Concentrates High payable percentage of reference price, minus a TC and RC Seller
Manganese
Ore Fixed price per tonne of ore Buyer
CRU
The following chart collects the various charts showing the attribution of metal content value
between mines and processors across the different materials. This clearly shows the level of value
add at the mine for bulk products (manganese ore and laterite ore) is much lower than for the
intermediates and concentrates, where the mine adds the most value, takes the price risk, and
captures the largest share of the metal price.
The following chart converts the data in the chart above into the mine’s share of the combined
margins of the mine and processor, as well as the mine’s share of combined costs incurred by the
mine relative to the processor. We can see a clear difference between the bulk materials and the
base metal concentrates and intermediates in terms of the value added by the mine.
Figure 40 Typical attribution of price across mine and processor (% of finished product price)
CRU
Nickel laterite ore based on Philippine ore supplied to typical Chinese RKEF NPI plant.
Manganese ore based on South African ore supply to typical Chinese SiMn producer.
Nickel and copper costs on pro-rata basis.
0%
10%
20%
30%
40%
50%
60%
70%
80%
90%
100%
Nickel lateriteore for NPI
Manganeseore in Mn
alloys
Nickel in Ni-Cointermediates(lower cost)
Nickel in Ni-Cointermediates(higher cost)
Copper inconcs (lower
cost)
Copper inconcs (higher
cost)
Nickel inconcs (lower
cost)
Nickel inconcs (higher
cost)
Mine production cost Mine margin Processor margin Processor costs
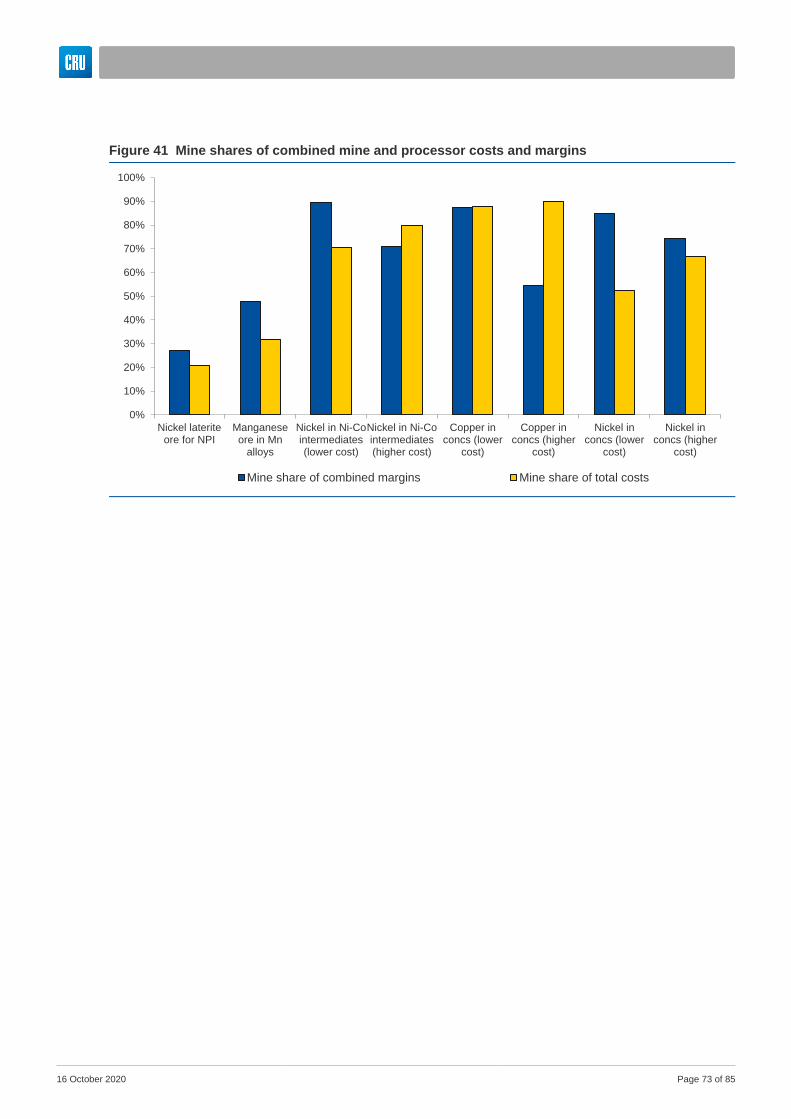
16 October 2020 Page 73 of 85
Figure 41 Mine shares of combined mine and processor costs and margins
0%
10%
20%
30%
40%
50%
60%
70%
80%
90%
100%
Nickel lateriteore for NPI
Manganeseore in Mn
alloys
Nickel in Ni-Cointermediates(lower cost)
Nickel in Ni-Cointermediates(higher cost)
Copper inconcs (lower
cost)
Copper inconcs (higher
cost)
Nickel inconcs (lower
cost)
Nickel inconcs (higher
cost)
Mine share of combined margins Mine share of total costs
16 October 2020 Page 74 of 85
11. Conclusions & recommendations
In this section, CRU sets out the key findings from the analysis presented so far, and makes some
recommendations for an appropriate valuation basis for the polymetallic nodules for the purposes
of extracting a royalty.
Revenue streams from nodules will need to be valued separately
Because there are no close land-based analogues for polymetallic seabed nodules we conclude
that the revenue streams from each metal will need to be valued individually. A key reason for this
is that the objective of comparability with land-based tax burdens can only be made on a metal-
by-metal, or at least product-by-product, basis.
The choice of comparability metric
When comparing land based and sea based royalties it is not sufficient to consider headline royalty
rates. There are two main reasons for this.
• The tax burden of a royalty depends on both the royalty rate and the value base on which
it is levied. This is explained below.
• When comparing different metals, the tax burden of a royalty depends on the value-added
by the mine as a proportion of the reference price used to calculate the royalty. This is also
explained below.
In order to compare royalties it is therefore suggested that the appropriate metric is the effective
rate of tax on the value added by the mine. This is to standardise the tax base so we are
comparing like with like. For each of the metal or product value chains it is therefore necessary to
calculate the value added by the mine. This is similar to calculating the Net Smelter Return for the
mine, although as we will see the NSR is just one point on a risk spectrum based on mine value
added.
The value basis and royalty rate are inter-dependent
The value base for a mineral royalty varies according to how many deductions are made for
allowable costs. The simplest basis, and the easiest to compute is the gross value of minerals
contained in the ore7. From this simple start, various deductions can be made which reduce the
value basis. Deductions can be made for:
• Recovery: allowance can be made for recoveries in mineral beneficiation, smelting and
refining – thus reducing the value base
7 Gross value would be the metal content in the ore multiplied by the relevant finished metal reference price. For example, if the nickel content is 1.5%, then 1.5% multiplied by the LME nickel price. For polymetallic materials this gross value would simply be summed across the different contained metals.

16 October 2020 Page 75 of 85
• Realisation costs: deductions can be made for costs involved in delivering product to the
relevant pricing point, for example the pricing point may be FOB at the port of export. Such
costs may include transport, insurance, and port charges.
• Smelting and refining costs: deductions are made for smelting and refining costs. Where
this occurs the royalty is based on a Net Smelter Return
The above formulations can all be applied to a basic ad valorem royalty. In the case of a profit
based royalty deductions are also made for allowable mine costs to arrive at net profits.
From the above there are at least five possible value bases plus permutations. If the owner of the
mineral resource (usually the State), has a target revenue for the royalty8 then it should be clear
that to achieve the same revenue the royalty rate will differ according to the value base. The lowest
royalty rate will apply to the gross value, and progressively higher rates will be needed as the
value base is reduced. The highest royalty rate will apply to the net profit royalty. Thus, royalty
rates cannot be compared between jurisdictions without consideration of the value base because
the royalty rate and value base are inter-dependent.
For example, consider a copper concentrate. If the LME copper price is $6,000/tonne, this could
also be considered the gross value of the copper content of the concentrate. If a 2% ad valorem
royalty were extracted using this value basis, it would equate to $120/tonne of contained copper.
Now, if allowable smelting/refining costs are $1,000/tonne, then the NSR value of the concentrate
would be $5,000/tonne. In order to extract the same royalty payment using this lower value basis
the rate would need to be 2.4%.
In considering this inverse relationship between the value base and the royalty rate two other
points arise.
• As the value base narrows the royalty calculation becomes more complex, involving higher
administration and compliance costs, and greater risk of dispute.
• The value bases with the higher cost allowances, in particular NSR and net profit royalties
involve greater risk, including the risk that no royalty is payable in some years.
This relationship is illustrated in the two charts below. The left hand chart shows an estimate of
the value of the nodule using historical metal prices, based on the gross value of the contained
metal, as well as on a NSR basis where the processing costs are deducted, and also on a cost-
plus type basis, for simplicity taking collection costs + 15%. Here we can see that the cost-plus
value basis is constant over time (in reality, collection costs would fluctuate year-to-year due to
changes in oil and other input costs, but likely by far less than prices), whereas the gross and NSR
values are far more volatile. We can also see that under these broad estimations, and relying on
8 As an example, the West Australian government has a policy which states that revenue returned from royalties should be broadly equivalent to 10% of the total mine-head value of the mineral.
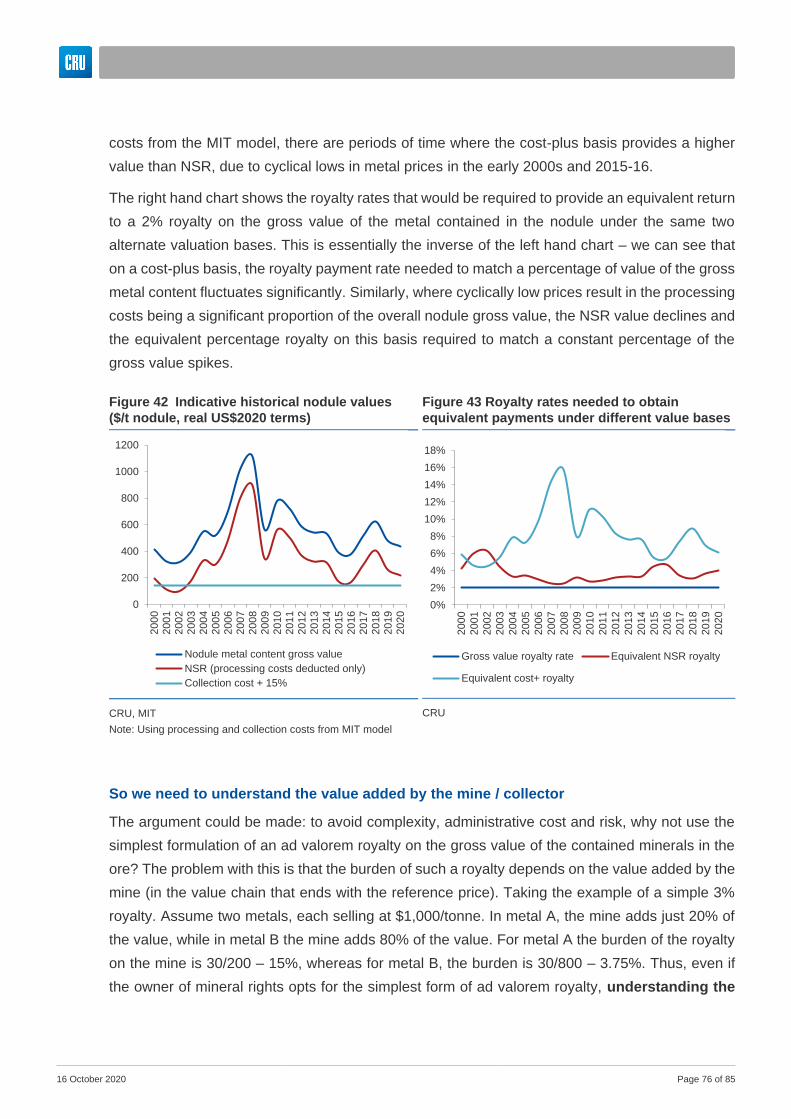
16 October 2020 Page 76 of 85
costs from the MIT model, there are periods of time where the cost-plus basis provides a higher
value than NSR, due to cyclical lows in metal prices in the early 2000s and 2015-16.
The right hand chart shows the royalty rates that would be required to provide an equivalent return
to a 2% royalty on the gross value of the metal contained in the nodule under the same two
alternate valuation bases. This is essentially the inverse of the left hand chart – we can see that
on a cost-plus basis, the royalty payment rate needed to match a percentage of value of the gross
metal content fluctuates significantly. Similarly, where cyclically low prices result in the processing
costs being a significant proportion of the overall nodule gross value, the NSR value declines and
the equivalent percentage royalty on this basis required to match a constant percentage of the
gross value spikes.
So we need to understand the value added by the mine / collector
The argument could be made: to avoid complexity, administrative cost and risk, why not use the
simplest formulation of an ad valorem royalty on the gross value of the contained minerals in the
ore? The problem with this is that the burden of such a royalty depends on the value added by the
mine (in the value chain that ends with the reference price). Taking the example of a simple 3%
royalty. Assume two metals, each selling at $1,000/tonne. In metal A, the mine adds just 20% of
the value, while in metal B the mine adds 80% of the value. For metal A the burden of the royalty
on the mine is 30/200 – 15%, whereas for metal B, the burden is 30/800 – 3.75%. Thus, even if
the owner of mineral rights opts for the simplest form of ad valorem royalty, understanding the
Figure 42 Indicative historical nodule values
($/t nodule, real US$2020 terms)
CRU, MIT
Note: Using processing and collection costs from MIT model
Figure 43 Royalty rates needed to obtain
equivalent payments under different value bases
CRU
0
200
400
600
800
1000
1200
200
0200
1200
2200
3200
4200
5200
6200
7200
8200
9201
0201
1201
2201
3201
4201
5201
6201
7201
8201
9202
0
Nodule metal content gross value
NSR (processing costs deducted only)
Collection cost + 15%
0%
2%
4%
6%
8%
10%
12%
14%
16%
18%200
0
200
1
200
2
200
3
200
4
200
5
200
6
200
7
200
8
200
9
201
0
201
1
201
2
201
3
201
4
201
5
201
6
201
7
201
8
201
9
202
0
Gross value royalty rate Equivalent NSR royalty
Equivalent cost+ royalty
16 October 2020 Page 77 of 85
value added by the mine (or in this case, the nodule collector) is necessary in setting the
royalty rate.
Estimating value added by the mine / collector
Valuation of mine output is most straightforward when the ore or concentrate is sold at a fixed
price, such as $30/tonne, which can be verified in arms’ length and transparent transactions. Next
best is where the mine product is set by a transparent reference price for the final marketable
product, less a reasonably transparent processing fee. In the absence of such market information,
estimates must be made of mine value added, using two factors:
• The proportion of costs (operating and capital) borne by the mine and processing steps
• The allocation of price risk between the mine and smelter (or further processor)
To illustrate the variance in the proportion of value added at the mine, consider the case of bauxite
and copper as extremes. The value of bauxite is approximately 7-8% of primary aluminium – so
the mine value added is very low. For copper, copper concentrates are valued on average at
around 90% of refined copper. Bauxite is an abundant mineral, containing a high grade of alumina
(around 50%). It is easy to mine by open cut methods, under a shallow overburden. The ore is
soft and requires minimal beneficiation. Aluminium smelting, by contrast is highly energy-intensive
and hence costly. For copper the opposite applies. Grades are low (often less than 1%), requiring
hard rock mining in deep open pits or underground mines, and several beneficiation steps to
produce concentrate. Copper smelting and refining is relatively inexpensive.
The allocation of price risk can also be illustrated using the same examples. In copper the mine
bears almost all the price risk because of the way contracts between mines and smelters are
structured. In effect the mine receives almost all the residual value of the copper after deducting
a processing fee (i.e. the TC/RC), which is largely fixed. Therefore, the mine revenue is highly
geared to the copper price, but the smelter revenue is not. Bauxite is usually sold at a fixed price
per tonne on an FOB or CIF9 basis. This means that nearly all of the price risk is borne by the
smelter (given that the intermediate product – alumina- is also mostly sold at a fixed price). Thus,
in contrast to copper, the mine bears little or no price risk, while the smelter bears most of it.
Polymetallic nodules sit between the two above examples. According to existing estimates a
greater degree of operating and capital cost is expected to occur in the onshore processing of the
nodules than in their collection. Though reported pre-feasibility cost estimates range significantly,
the review of costs provided in the MIT work estimates that collection is estimated to account for
46% and 37% of capex and opex respectively. Arguably, this does not capture less tangible
9 FOB = free on board, CIF = cost, insurance and freight. These are trade terms (“Incoterms”) which specify the point at which transfer of ownership occurs. In simplest terms, FOB means the sale occurs at the seller’s port of departure, and CIF means sale occurs at the buyer’s receiving port; the main difference between the two from a pricing perspective is therefore the cost of ocean freight.

16 October 2020 Page 78 of 85
differences in risk between collector and processor, such as that inherent in establishing and
operating a novel deep sea nodule collection process.
In terms of some of the component metals within nodules, nickel laterite ore and manganese ore
are more comparable to the bauxite example shown above. They are mined relatively cheaply and
sold at a fixed price. The cost of smelting or hydrometallurgical refining accounts for a much larger
share of total costs to produce finished nickel products from this ore. Their prices are a slightly
higher proportion of finished product prices than bauxite is of aluminum, with laterite ore around
15-25% of the LME nickel price, and manganese ore around 20-25% of standard grade
manganese alloy prices.
In considering the above examples, we can see a general rule – the higher the proportion of
value added in the mine, the more likely it is that the mine will bear most of the price risk.
This is not an iron rule, and other factors come into play such as traditions in each industry and
the relative bargaining strength of mines and processors. Note that the theoretical valuation in the
MIT model constitutes a special case where price risk is shared equally between the mine
(collector) and processor, due to the requirement that both should make an equal return on capital.
Such an arrangement in practice would require mine and processor each to receive a fixed
proportion of total revenue. CRU do not know of any such arrangements being used in practice.
The issue of who bears price risk is connected with the idea of economic rent (above normal
profits). In mining economic rent occurs due to the quality of the natural resource. If the price of
copper is determined by the marginal mine, then mines that have lower costs will earn economic
rent. The economic rent derives from the quality of the resource, such as its grade, ease of mining,
location, topography and so forth. Each mine is therefore unique and not replicable. By contrast
processing plants may have standard technology which is easily replicable. Processing plants
may be able to capture more rent where technology is unique, or where a key input such as
electricity or natural gas confers a significant cost advantage.
Estimation of value in collecting undersea nodules
In estimating the value of undersea nodules we have the following problems:
• There are no current transactions involving this material
• There are no existing operations from which to estimate costs
• There are no precedents for the allocation of price risk between collector and processor
• There are no close analogues in land-based processing10
10 The smelting and refining of nickel concentrates – itself a complex process carried out in a variety of ways at different operations – arguably provides a relatively similar set of processing options compared to the nodules. However, the unique nature of the nodules, most notably the presence of a substantial manganese content, means that such processes will need to be adapted for the nodules. CRU also

16 October 2020 Page 79 of 85
There is therefore no alternative but to estimate value based on cost estimates which by their
nature involve a wide margin of error. This is the approach taken by the MIT study, which further
made the simplifying assumption that price risk is shared equally between the collector and
processor.
CRU’s understanding is that most contractors are at a pre-feasibility study level or earlier in
development; and that contractor estimates of processing and collection costs differ significantly
from each other, suggesting that a wide margin of error is certainly possible. However, while
unknown now, many of these variables (capital costs, operating costs) will become clear once the
operation begins production. So, while the valuation of the nodules cannot be determined
accurately ex ante a method can be specified for establishing a value ex post. The method
suggested by CRU is calculation of a Net Smelter Return. NSR is calculated as sales revenue
(of the marketable products after processing) less costs involved in realisation and processing.
Processing costs will include operating cost plus an allowance for return on capital. As mentioned,
we note that NSR is just one case of a spectrum of valuations based on mine value added – as
seen in the diagram below.
The formulation of NSR allows the processor to recover its operating costs and a guaranteed rate
of return. Thus the mine takes on the price risk and the royalty base is highly sensitive to price.
We note that within the closest analogues in land-based processing identified in this report, out of
the seven products five allocate price risk mainly to the seller (mine), while two (manganese ore
and nickel laterites) allocate risk mainly to the buyer (processor).
An alternative formulation, whereby the processor would take on most of the price risk would be
to value the nodules on the basis of a cost-plus formula – operating cost plus allowable rate of
return. In this case the processor takes on the price risk and the royalty value base would be much
more stable. In the middle of these two extremes would be a revenue sharing arrangement
whereby each party receives a fixed share of the revenue, where the shares are based on relative
understands that different contractors are considering a range of processing options; no fixed approach has been determined.
Figure 44 Price risk / value add spectrum
CRU

16 October 2020 Page 80 of 85
costs. Note that all these examples are based on a mine value added valuation, but with differing
allocations of price risk.
The choice of position on this risk distribution spectrum, in the absence of any precedents,
depends on the risk appetite of each party. For the ISA the NSR formula offers a more volatile
royalty with more leverage to price movements. The other extreme (mine cost plus) offers a more
stable and guaranteed royalty flow. If the nodule and processing operations are integrated, the
formula is only important insofar as it affects the royalty payment. The choice would be much more
important if collecting and processing were not integrated. In the case of the integrated operation
the operator’s preference would probably be for the NSR formula, whereby the mine accepts more
of the price risk.
The key conclusion is that ex ante the valuation of the nodules can only be estimated with a wide
margin of error, but a valuation formula can be specified ex ante that will give an accurate valuation
ex post. Ex post costs will be known, and the main choice to be made is the allocation of price
risk11.
NSR use in land-based mining
The use of Net Smelter Return as a value basis for royalties determined by the state is not very
common in land-based mining. In the 15 countries reviewed by RMG as part of their report
commissioned by the ISA, only Papua New Guinea uses an NSR value basis for royalties.
Specifically, a 2% royalty on net smelter returns is extracted in that case. CRU also understands
that other nations, such as Botswana, Tanzania, and Zambia, also use NSR as the value basis for
royalties on non-bulk materials.
NSR is not in highly common use by mining jurisdictions because there is typically a simpler, more
transparent valuation basis that might be used for ad valorem royalties, for example:
• Metal contained in the ore at the mine mouth
• Metal contained in the first product sold (such as a concentrate)
• Determined by the gross revenues derived from sales
• Determined by the gross revenues derived from sales less certain allowable costs, such
as transportation, insurance, and handling
The absence of market transparency of nodule value or pricing means that the first product sold
valuation is not readily applicable in this case, and would rely upon a complex constructed price
11 CRU notes a counter argument to this conclusion might be this formulation may leave too much to be determined ex post, which is unappealing from a planning perspective, and such uncertainty may be unattractive to investors. However, there is no reason the royalty rate could not be set ex ante, with reference to the average effective tax rate on value added at land-based mines.

16 October 2020 Page 81 of 85
which may not be practicable. As mentioned above, gross revenues or metal contained in ore (i.e.
gross metal content value) would not reflect differential value add between the collector and
processor, unfairly burdening the collector.
We note that NSR is relatively common as the value basis on which privately held royalties are
calculated. Private royalties differ from those imposed by a state in that the royalty is held by a
corporation rather than a governmental authority. In these situations, a company typically makes
an up-front investment and receives a certain percentage or other denomination of a mine’s
production in return. The return may be a function of NSR, gross revenues, profits, or throughput.
Selling a private royalty can help a mine or deposit owner finance the initial development and
construction or expansion of a mining operation, but may also help avoid a shortfall of cash at a
temporarily loss-making operation, or simply because both buyer and seller see such a deal as
mutually beneficial.
Manganese downstream optionality and royalty basis
While nickel, copper and cobalt all have relatively clear reference prices, the optionality around
the product form of the manganese contained in the nodules presents an issue when selecting an
appropriate reference price. The manganese as a first step would likely (but not definitively) be
converted into a manganese silicate by-product (or manganese rich slag, “MRS”) as a result of
the smelting of the nodules. This material would be sufficiently closely comparable to manganese
ore in terms of its metallurgical content and most likely end market (i.e. the production of
silicomanganese) if it were to be sold in this form for the ore price to serve as an appropriate
reference price for the manganese content in the nodules. CRU notes that it would be important
to closely observe transactions of this material in order to determine whether it is being
appropriately priced; in reality sales of MRS could well be discounted against benchmark
manganese ore prices for the following reasons:
• While the metal content of MRS is closely comparable to widely traded manganese ores,
and other manganese slag by-products are traded in small volumes, this product would be
novel in the market, and may require discounting to secure market share, especially in
early years of operation.
• Undersea nodule collection and processing at scale would involve the production of a
sufficiently large volume of manganese units that their sale in any form could potentially
impact the overall market balance, having a negative effect on prices. This surplus of
material from a single operation would also weaken the seller’s bargaining power.
There is a possibility that the MRS could be further processed into a higher value-add product,
such as manganese metal. This could occur at an integrated onshore refining unit, and therefore

16 October 2020 Page 82 of 85
the MRS at would not be subject to arms-length transactions. In this case it would be more
appropriate to use the downstream product price for the determination of a royalty as a reference,
i.e. the actual sales price of the manganese in its product form.
In CRU’s opinion the ISA’s royalty system should return a similar payment on nodule collection
regardless of the extent of value add that occurs outside of the ISA’s jurisdiction. Value add beyond
this is relevant only to the extent that it helps determine the value of the nodule within the material
itself relative to the price of the material in its sold state; i.e. if a higher value product is sold, the
proportion of this value that was added by the collector is smaller, and the implied value of the
manganese content remains the same.
Therefore, the royalty rate on manganese converted into MRS (and manganese ore prices are
correspondingly used as the reference price for valuing the metal content) ought to be higher than
if it is instead converted into a higher value add product, all other things being equal. As the price
of electrolytic manganese metal (EMM) is 3 to as much as 10 times as high as that of manganese
ore, then the rate extracted on the manganese content of the nodule ought to provide an inverse
of this relationship.
For simplicity, the ISA may favor a single royalty rate across the combined metal revenue streams.
However, the manganese content presents issues highly distinct to those of the other contained
metals, as follows:
• Greater uncertainty about the likely form in which the manganese will be sold by the
processor, with significant implications for the product’s value.12
• Within each product form, greater uncertainty about price that might be obtained relative
to reference prices (e.g. Mn ore or EMM), due to differences in specification and value-in-
use
• Risk around the impact an operation itself might have on the price at which products are
sold due to its large scale of output, and relatedly, the likelihood of lower realized prices in
the early years of operation in order to gain market share
• Looking to land-based comparables, manganese raw materials (i.e. ore) is sold in a very
different way compared to base metal concentrates. Manganese ore is sold with no direct
reference to downstream metal or alloy prices, with processors therefore taking all the final
12 In the case of nickel and cobalt, it is possible these could be produced in sulphate form rather than metal. However, prices for nickel and cobalt sulphate are relatively transparent, and generally are at most 20% outside of the value of the corresponding metal. Therefore a royalty rate established based on the assumption of nickel metal production would provide a similar return if in fact the operation produced nickel sulphate.
16 October 2020 Page 83 of 85
product price risk, whereas in base metal concentrates the miner takes most, if not all, of
the price risk
As such, alternate royalty rates or systems might be considered for the manganese stream
compared to those of nickel, copper and cobalt. For example, a system may be designed that
captures a low value of the manganese content under all price and cost scenarios but also allows
for higher payments at significantly higher revenues due to product value add. This may be
connected to resource rent taxes described below.
Specifically, CRU raises the possibility that the ISA could charge a fee per tonne of manganese in
nodules collected, or perhaps a collector cost-plus fee, to reflect some return to the royalty holder
for the value of the manganese contained in the nodule while such uncertainty remains around
the processing, product form, and realisable price. Under this scenario, the royalty holder would
be taking no price risk on the manganese content (and as established above, there is substantial
uncertainty regarding potential realised price for the manganese), but largely all of the price risk
on the other metallic content of the nodules. The rate could be scaled to account for higher
manganese prices, so that some proportion of excess profits are captured in high price
environments.
Determining the rate of such a fee as a function of the volume produced would still require some
estimate of the value of the manganese content of the nodule in order to establish whether the
burden on the collector is reasonable in comparison to land-based manganese mining in key
jurisdictions. However, this could be a relatively simplistic calculation to establish a high level
approximate value. This gross value of manganese could be compared to the burden on land-
based mines that produce other comparatively valued bulk commodities to determine a
comparable unit production fee. After operation begins, the system should be regularly re-
evaluated to ensure it is providing the desired royalty return as described above, particularly if any
alterations are made to the manganese processing stream, product, or marketing strategy.
The diagram below shows a possible nodule processing flowsheet, highlighting the costs that
could be deducted on a pro rata basis for NSR valuations for the nickel, copper and cobalt content
in the nodule (but not manganese) – i.e. the smelting and refining steps. For simplicity, CRU would
suggest a pro rata proportioning of the refining costs amongst all three metals rather than
attempting to match costs attributable within the refining processes to each stream individually,
when calculating deductable costs.

16 October 2020 Page 84 of 85
A note on optimality
As noted in the introduction, one of the principles guiding the ISA is that the regime must optimise
revenues for the ISA, while not disincentivizing investment. The optimisation of revenue was one
of the key factors behind the idea of Resource Rent Taxes. The RRT in general allows the mine
to make an acceptable rate of return, but then levies a high tax rate on any return (“rent”) in excess
of this. However, as noted RRTs are now very rare in the mining (but not the petroleum) sector
and some of the countries that pioneered them have abandoned them. Some of the key reasons
RRTs have not taken off include:
• Possibility that no revenue is raised because the mine does not earn its allowed rate of
return and therefore does not exceed the threshold for RRT. By definition, if the threshold
rate of return is based on the industry’s cost of capital then a significant number of projects
will fail to trigger the RRT.
• Revenue is back-end loaded. The RRT is a cash flow-based tax and so only becomes
payable once the threshold rate of return (based on discounted cash flow) has been
Figure 45 Nodule processing flowsheet and possible cost allowances
CRU

16 October 2020 Page 85 of 85
exceeded. This will usually be several years into production, meaning several years of no
revenue which can be economically and politically difficult.
• Enthusiasm for RRT has tended to peak in times of commodity price booms, when the
targeting of “windfall” profits becomes attractive. But it also declines in the long periods of
low commodity prices such as the early 1980s, and most of the 1990s.
Given these problems even where it has been tried, the RRT has often been combined with a low
ad valorem royalty to ensure some guaranteed minimum level of revenue for the state.
The example of RRT suggests that taxation that may be optimal in theory may not be easy to
implement. In practice resource taxation always involves some degree of compromise between
different objectives including optimality, administrative costs, revenue risk and political
acceptability.
Another point about optimality is the extent to which it may conflict with the objective which we
might summarise as having a level playing field – i.e. that the tax take should be ““within the range
of those prevailing in respect of land-based mining of the same or similar minerals in order to avoid
giving seabed miners an artificial competitive advantage or imposing on them a competitive
disadvantage.” In other words, if the land based royalty regimes are sub-optimal, then the two
objectives cannot be simultaneously satisfied.