kinetic and isotherm studies of cadmium adsorption on manganese nodule residue
TRANSCRIPT
A
baceereatsl©
K
1
iaathimc[dpam
0d
Journal of Hazardous Materials B137 (2006) 915–924
Kinetic and isotherm studies of cadmium adsorption onmanganese nodule residue
Archana Agrawal ∗, K.K. SahuMetal Extraction and Forming Division, National Metallurgical Laboratory, Jamshedpur 831007, India
Received 17 October 2005; received in revised form 8 March 2006; accepted 8 March 2006Available online 30 March 2006
bstract
The adsorption equilibrium and kinetics studies of cadmium (Cd) ions from aqueous solutions on manganese nodule residue were carried outy considering the influence of various parameters, such as contact time, solution pH and initial metal concentration in solution, temperature anddsorbent quantity. The adsorption of Cd increased with an increase in the concentrations of this metal in solution. Presence of manganese and ironontent in manganese nodule residue (MNR) played a significant role in Cd(II) ions removal. The linear forms of the Langmuir and Freundlichquations were utilized for experiments with metal concentrations of 200 mg/L for Cd(II) as functions of solution pH (2.0–6.0). First-order ratequation and pseudo second-order rate equations were applied to study adsorption kinetics. Mass transfer study was also done to know the reactionate. Thermodynamic parameters, such as standard Gibb’s free energy (�G◦), standard enthalpy (�H◦) and standard entropy (�S◦), were alsovaluated by Van’t Hoff equation. Thus, adsorption of Cd on this adsorbent was found to be spontaneous and exothermic thermodynamically. The
dsorption capacity for Cd was found to be 19.8 mg/g of MNR. Under the optimised conditions, cadmium level was brought down from 100 mg/Lo Cd less than detection limits and from 200 to 2 mg/L. Thus, the wastewater after cadmium removal could be safely disposed off on to land orewage. Finally, the metal loaded adsorbent was subjected to desorption using different mineral acids and leaching by using toxicity characteristiceaching procedure (TCLP), synthetic precipitation leaching procedure (SPLP) tests for its further treatment or its safe disposal.2006 Elsevier B.V. All rights reserved.
l; Fre
eptmetwiTbria
eywords: Adsorption; Cadmium; Manganese nodule residue; Langmuir mode
. Introduction
Environmental pollution due to developments in technologys one of the most critical problems of this century. Heavy met-ls, such as cadmium, etc., having several industrial applicationsre the potential pollutants widely found in industrial wastewa-ers [1,2]. Its toxicity affects the ecosystem and presents humanealth risk. Cadmium as a pollutant is found in cadmium plat-ng, alkaline batteries, copper alloys, paints, plastics and paper
anufacturing industries [1,2]. In India, the tolerance limit foradmium for discharge into inland surface waters is 2.0 mg/L3] and for drinking water is 0.01 mg/L [4]. Safe and effectiveisposal of heavy metal-bearing wastewater is a difficult task
artly owing to the fact that cost-effective treatment alternativesre seldom available. Conventional methods for removing toxicetal ions from wastewater include chemical reduction, ion∗ Corresponding author. Tel.: +91 657 2271709; fax: +91 657 2270527.E-mail address: [email protected] (A. Agrawal).
tatppaw
304-3894/$ – see front matter © 2006 Elsevier B.V. All rights reserved.oi:10.1016/j.jhazmat.2006.03.039
undlich model
xchange, reverse osmosis, co-precipitation, coagulation, com-lexation, electrodeposition, solvent extraction, electrochemicalreatment and adsorption on activated charcoal. Such processes
ay be ineffective or extremely expensive for the treatment offfluents with low heavy metal concentrations ranging from 10o 100 g/m3 [5]. Many of these methods also produce a sludge,hich results in further disposal problem. Hence, industries are
n search of low cost alternative ways of treating wastewater.o compete with conventional procedures, new methods muste economically viable as well as successful in contaminantemoval. Of these methods, adsorption of metal ions presentn low levels on to the solid can prove to be a cost-effectivend better option for treating industrial effluents and wastewa-er streams. Numerous researchers have investigated the use ofctivated carbon to remove heavy metals from aqueous solu-ions [6–9]. Granular activated carbon (GAC) used in a column
rocess can eliminate separation problems and minimize sludgeroduction. Activated carbon, however, has a relatively smalldsorption capacity and affinity for metals. Oxides have beenidely discussed for metals removal from aqueous solutions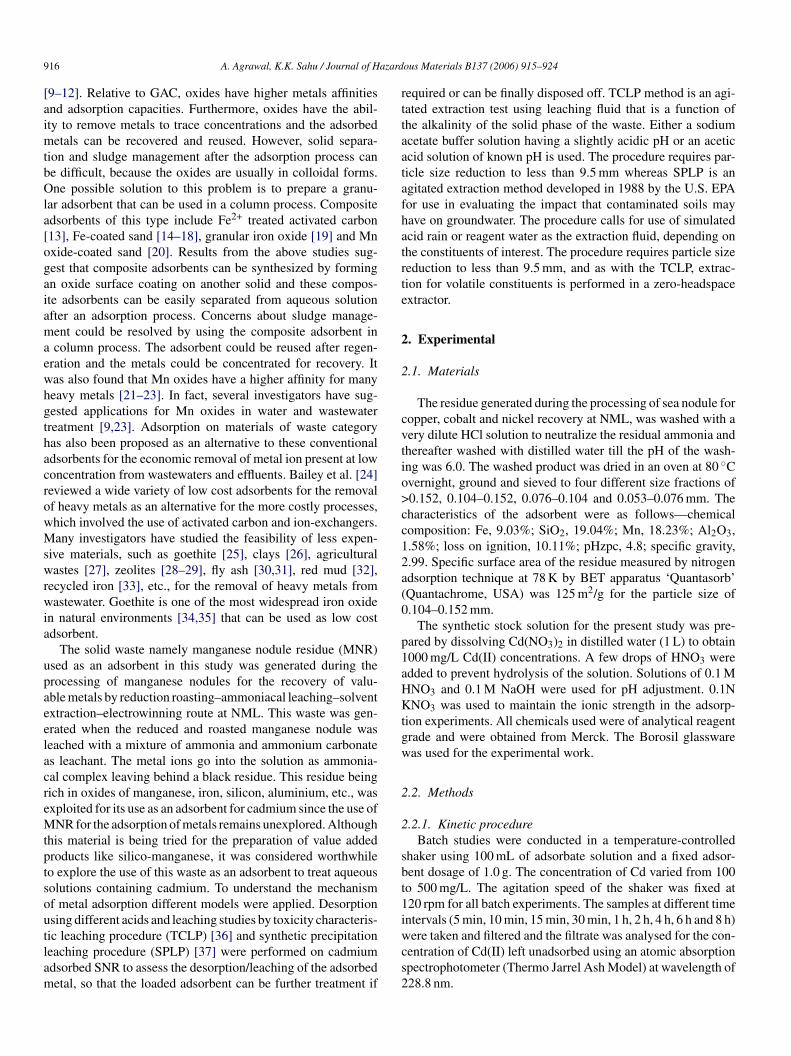
9 azard
[aimtbOla[ogaiamaewhgthacrowMswrwia
upaeelacreMtptsoutlam
rttaatafhatrte
2
2
cvtio>cc12a(0
p1aHKtgw
2
2
sbt1i
16 A. Agrawal, K.K. Sahu / Journal of H
9–12]. Relative to GAC, oxides have higher metals affinitiesnd adsorption capacities. Furthermore, oxides have the abil-ty to remove metals to trace concentrations and the adsorbed
etals can be recovered and reused. However, solid separa-ion and sludge management after the adsorption process cane difficult, because the oxides are usually in colloidal forms.ne possible solution to this problem is to prepare a granu-
ar adsorbent that can be used in a column process. Compositedsorbents of this type include Fe2+ treated activated carbon13], Fe-coated sand [14–18], granular iron oxide [19] and Mnxide-coated sand [20]. Results from the above studies sug-est that composite adsorbents can be synthesized by formingn oxide surface coating on another solid and these compos-te adsorbents can be easily separated from aqueous solutionfter an adsorption process. Concerns about sludge manage-ent could be resolved by using the composite adsorbent incolumn process. The adsorbent could be reused after regen-
ration and the metals could be concentrated for recovery. Itas also found that Mn oxides have a higher affinity for manyeavy metals [21–23]. In fact, several investigators have sug-ested applications for Mn oxides in water and wastewaterreatment [9,23]. Adsorption on materials of waste categoryas also been proposed as an alternative to these conventionaldsorbents for the economic removal of metal ion present at lowoncentration from wastewaters and effluents. Bailey et al. [24]eviewed a wide variety of low cost adsorbents for the removalf heavy metals as an alternative for the more costly processes,hich involved the use of activated carbon and ion-exchangers.any investigators have studied the feasibility of less expen-
ive materials, such as goethite [25], clays [26], agriculturalastes [27], zeolites [28–29], fly ash [30,31], red mud [32],
ecycled iron [33], etc., for the removal of heavy metals fromastewater. Goethite is one of the most widespread iron oxide
n natural environments [34,35] that can be used as low costdsorbent.
The solid waste namely manganese nodule residue (MNR)sed as an adsorbent in this study was generated during therocessing of manganese nodules for the recovery of valu-ble metals by reduction roasting–ammoniacal leaching–solventxtraction–electrowinning route at NML. This waste was gen-rated when the reduced and roasted manganese nodule waseached with a mixture of ammonia and ammonium carbonates leachant. The metal ions go into the solution as ammonia-al complex leaving behind a black residue. This residue beingich in oxides of manganese, iron, silicon, aluminium, etc., wasxploited for its use as an adsorbent for cadmium since the use ofNR for the adsorption of metals remains unexplored. Although
his material is being tried for the preparation of value addedroducts like silico-manganese, it was considered worthwhileo explore the use of this waste as an adsorbent to treat aqueousolutions containing cadmium. To understand the mechanismf metal adsorption different models were applied. Desorptionsing different acids and leaching studies by toxicity characteris-
ic leaching procedure (TCLP) [36] and synthetic precipitationeaching procedure (SPLP) [37] were performed on cadmiumdsorbed SNR to assess the desorption/leaching of the adsorbedetal, so that the loaded adsorbent can be further treatment ifwcs2
ous Materials B137 (2006) 915–924
equired or can be finally disposed off. TCLP method is an agi-ated extraction test using leaching fluid that is a function ofhe alkalinity of the solid phase of the waste. Either a sodiumcetate buffer solution having a slightly acidic pH or an aceticcid solution of known pH is used. The procedure requires par-icle size reduction to less than 9.5 mm whereas SPLP is angitated extraction method developed in 1988 by the U.S. EPAor use in evaluating the impact that contaminated soils mayave on groundwater. The procedure calls for use of simulatedcid rain or reagent water as the extraction fluid, depending onhe constituents of interest. The procedure requires particle sizeeduction to less than 9.5 mm, and as with the TCLP, extrac-ion for volatile constituents is performed in a zero-headspacextractor.
. Experimental
.1. Materials
The residue generated during the processing of sea nodule foropper, cobalt and nickel recovery at NML, was washed with aery dilute HCl solution to neutralize the residual ammonia andhereafter washed with distilled water till the pH of the wash-ng was 6.0. The washed product was dried in an oven at 80 ◦Cvernight, ground and sieved to four different size fractions of0.152, 0.104–0.152, 0.076–0.104 and 0.053–0.076 mm. Theharacteristics of the adsorbent were as follows—chemicalomposition: Fe, 9.03%; SiO2, 19.04%; Mn, 18.23%; Al2O3,.58%; loss on ignition, 10.11%; pHzpc, 4.8; specific gravity,.99. Specific surface area of the residue measured by nitrogendsorption technique at 78 K by BET apparatus ‘Quantasorb’Quantachrome, USA) was 125 m2/g for the particle size of.104–0.152 mm.
The synthetic stock solution for the present study was pre-ared by dissolving Cd(NO3)2 in distilled water (1 L) to obtain000 mg/L Cd(II) concentrations. A few drops of HNO3 weredded to prevent hydrolysis of the solution. Solutions of 0.1 MNO3 and 0.1 M NaOH were used for pH adjustment. 0.1NNO3 was used to maintain the ionic strength in the adsorp-
ion experiments. All chemicals used were of analytical reagentrade and were obtained from Merck. The Borosil glasswareas used for the experimental work.
.2. Methods
.2.1. Kinetic procedureBatch studies were conducted in a temperature-controlled
haker using 100 mL of adsorbate solution and a fixed adsor-ent dosage of 1.0 g. The concentration of Cd varied from 100o 500 mg/L. The agitation speed of the shaker was fixed at20 rpm for all batch experiments. The samples at different timentervals (5 min, 10 min, 15 min, 30 min, 1 h, 2 h, 4 h, 6 h and 8 h)
ere taken and filtered and the filtrate was analysed for the con-entration of Cd(II) left unadsorbed using an atomic absorptionpectrophotometer (Thermo Jarrel Ash Model) at wavelength of28.8 nm.
azardous Materials B137 (2006) 915–924 917
2
mflcemtc0pwtpciEkF
wrotw
2
fdaaT2f
3
3
3t
vbemtotwaa4ctd
FM
fgaii8eewiaiStuctbbaat
3
pTsssiesmm
A. Agrawal, K.K. Sahu / Journal of H
.2.2. Equilibrium experimentsIsotherm studies were conducted in a batch mode to deter-
ine the adsorption of Cd(II) on MNR, using stoppered conicalasks. In these experiments, 100 mL of Cd solution with a Cdoncentration varying from 100 to 500 mg/L, were poured intoach flask to which 1 g of MNR was added. The solution–MNRixtures were stirred at 120 rpm in the pH range of 2.0–7.0 at
emperatures varying from 303 to 323 K, using a temperature-ontrolled water bath shaker. Ionic strength was maintained with.1 M KNO3. At the end of predetermined time intervals, sam-les were withdrawn, their contents were filtered and the filtrateas analysed for Cd(II) left unadsorbed. The difference between
he initial and the final value gives the amount of Cd adsorbeder gram of the adsorbent. Effect of various parameters, such asontact time, pH of the aqueous feed, initial metal concentrationn solution and adsorbent to solution volume ratio, were studied.xperiments were also conducted at three different temperatureseeping other variables constant in order to study Langmuir andreundlich adsorption isotherms.
In order to find out the possibility of any adsorption on thealls of the glass conical flask, control experiments were car-
ied out with Cd(II) solution in the absence of adsorbent. It wasbserved that there was no adsorption by the container wall. Allhe experiments were performed in duplicate and mean valuesere presented with a maximum deviation of 5%.
.2.3. Desorption of Cd(II) from the loaded adsorbentThe adsorbent after the adsorption of metal ion was tested
or the leaching of cadmium from the point of view of the safeisposal of the spent adsorbent. One gram of the metal loadeddsorbent was agitated with a solution of 0.01 M of differentcids like HCl, H2SO4 and HNO3 for 4 h, acetate buffer forCLP test for 18 h and sulphuric acid solution for SPLP for4 h. The slurry was then filtered and the filtrate was analysedor cadmium ion eluted/leached.
. Results and discussion
.1. Kinetic study
.1.1. Effect of initial cadmium concentration and shakingime on adsorption
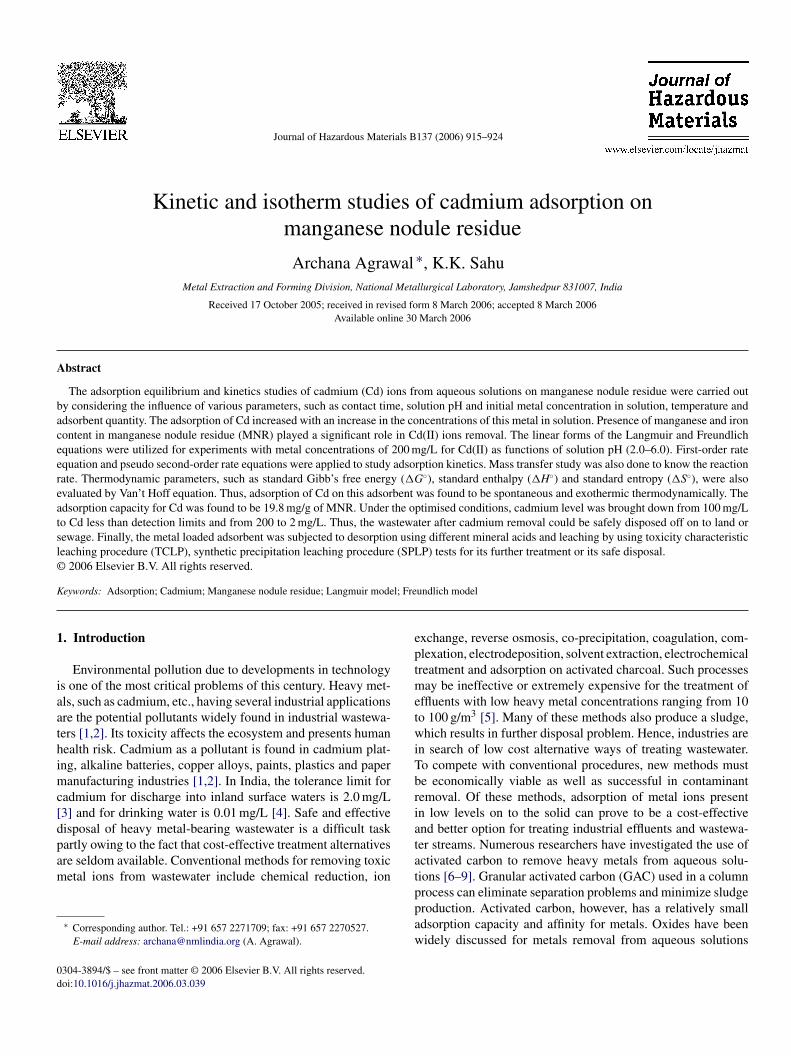
Several experiments were carried out to study the effect ofarying initial cadmium concentration on cadmium removaly MNR. One hundred millilitres of Cd(II) solution of differ-nt concentrations ranging from 100 to 500 mg/L with 1 g ofixed fraction of MNR (as obtained) was stirred at ambient
emperature (303 K) for a contact period of 24 h. The resultsbtained are shown in Fig. 1 and indicate that all the curves havehe same shape. Percentage of cadmium adsorption increasedith increase in agitation time and attained equilibrium at vari-
ble time according to the initial concentration of cadmium:bout 0.5 h (C0 = 200 mg/L), 2 h (C0 = 300 and 400 mg/L) and
h (C0 = 500 mg/L). It was also noticed that the capacity ofadmium removal by MNR at the equilibrium increases withhe initial concentration of cadmium but the percent removalecreases with the increase in initial cadmium concentrationaapa
ig. 1. Effect of initial concentration and shaking time on adsorption of Cd onNR at 303 K: S/L, 1/100; pH 5.5; PS, 0.104 mm.
rom 99.75% for 200 mg/L of Cd to 85% for 500 mg/L of Cd. Ineneral, the percentage of metal removal increased rapidly up topproximately 30 min and thereafter, rose slowly before attain-ng a saturation value. Fig. 1 also shows that the metal removaln the first 30 min was approximately equal to 99, 96, 90 and3% for 200, 300, 400 and 500 mg/L of Cd(II). All subsequentxperiments were done with 200 mg/L of cadmium solution andquilibrium time was maintained at 4 h unless stated otherwise,hich was considered as sufficient for the removal of Cd(II)
ons by this adsorbent. The time curves in Fig. 1 are smoothnd continuous, leading to saturation suggesting the possibil-ty of monolayer coverage of Cd(II) on the adsorbent surface.ince the uptake of cadmium is highly dependent on the ini-
ial concentration of the metal ion in the solution, the higherptake at low concentration can be explained as: at higher initialoncentrations, the ratio of initial number of moles of Cd(II) tohe available surface area is high, hence fractional adsorptionecomes dependent on initial concentration. For fixed adsor-ent dose, the total available adsorption sites are limited therebydsorbing almost the same amount of adsorbate, thus resulting indecrease in percentage removal of the adsorbate corresponding
o an increase in initial adsorbate.
.1.2. Effect of particle sizeThe surface of contact between any sorbent and the liquid
hase plays an important role in the phenomena of sorption.he effect of particle size of MNR on the cadmium removal wastudied using the size ranging 0.053–0.152 mm at 303 K. Fig. 2hows a series of contact time curves at different MNR particleizes. As can be seen, the curves of kinetics obtained have andentical shape, and that the capacity of cadmium sorption at thequilibrium increases with the decrease of the adsorbent particleizes indicating that cadmium ion sorption occurs by a surfaceechanism. Similar results have been reported for the sorption ofetal ions by natural polymers and their derivatives [38]. It was
lso observed that the variation in particle size appears to haven influence on the time required to reach equilibrium. Thus, forarticle size 0.053 mm, the time required to reach equilibrium isbout 1 h and the cadmium adsorption was about 98.1%; while

918 A. Agrawal, K.K. Sahu / Journal of Hazardous Materials B137 (2006) 915–924
F5
fcsvl
3
3
tabekg
l
wala
4Los
3
te
ap
wac
TP
P
T
3
3
3
ig. 2. Effect of particle size of MNR on Cd adsorption: [Cd], 200 mg/L; pH.5; S/L, 1/100; temperature, 303K.
or particle sizes 0.152 mm, the time necessary is about 4 h withadmium adsorption of 99%. Consequently, increasing particleize increases the time needed to reach equilibrium. These obser-ations suggest that the cadmium sorption kinetic by MNR isargely determined by the particle size.
.2. Modeling adsorption kinetics
.2.1. First-order kinetic modelKinetics and the equilibrium of adsorption are the two impor-
ant factors for the evaluation of the adsorption parameter. Thedsorption of heavy metals from liquid phase to solid phase cane considered as a reversible reaction with equilibrium beingstablished between the two phases [27]. A simple first-orderinetic model is represented by the Lagergren equation [39] asiven below:
og(qe − qt) = log qe − kadt
2.303(1)
here kad is the rate constant of adsorption, qt and qe are themounts of Cd(II) adsorbed (mg/g) at time t (min) and at equi-ibrium time, respectively. Linear plots of log(qe − qt) versus tt different temperatures on MNR (Fig. 3, figures for 300 and
vtfia
able 1seudo second-order rate constants and Lagergren constants for cadmium adsorption
seudo second-order rate constants
emperature (K) Cd (mg/L) qe k
03 200 196.08 6.669 × 10⁻³
300 285.71 1.531 × 10⁻³
400 344.83 1.078 × 10⁻³
500 476.19 0.416 × 10⁻³
13 200 200 2.5 × 10⁻²
300 294.12 6.8 × 10⁻³
400 370.37 2.35 × 10⁻³
500 434.78 2.3 × 10⁻³
23 200 200 4.17 × 10⁻³
300 303.03 2.14 × 10⁻³
400 384.62 3.07 × 10⁻³
500 476.19 0.85 × 10⁻³
Fig. 3. Lagergren plot for Cd (200 mg/L) adsorption on MNR.
00 mg/L not given to save space) indicate the applicability ofagergren equation. The kad values calculated from the slopesf these plots for different cadmium concentrations (Table 1)how that the adsorption is a first-order reaction.
.2.2. Pseudo second-order modelA pseudo second-order model [40] was also applied to assess
he kinetics of adsorption of cadmium on MNR. The differentialquation for this reaction is given as:
dq
dt= k′
2(qe − q)2 (2)
Integrating Eq. (8) for the boundary conditions t = 0 to >0nd q = 0 to >0 and rearranging it gives the linearized form ofseudo second-order rate kinetics, which is shown as follows:
t
qt
= 1
K′2qe
2 + 1
qet (3)
here qt and q0 are the amount of metal ion adsorbed (mg/g) atny time t and at equilibrium, K2 the pseudo second-order rateonstant and t is the time (min). The kinetic plots between t/q
ersus time were plotted for different initial cadmium concentra-ion at three different temperatures gave a straight line (Fig. 4,gure for 313 and 323 K are not given to save space). Slopend intercept values were solved to give the value of pseudoon MNR at different temperature and initial concentration
Lagergren constants
ho R2 k R2
256.41 1.0 0.32 0.9988125.0 1.0 0.69 0.9935128.21 0.9999 1.34 0.9873
94.34 0.9997 – –
1000.0 1.0 0.74 0.9573588.24 1.0 1.57 0.9611322.58 1.0 1.83 0.9661434.78 1.0 – –
1666.66 1.0 0.90 0.9317196.08 1.0 1.34 0.9627454.55 1.0 1.77 0.9526192.31 0.9998 – –
A. Agrawal, K.K. Sahu / Journal of Hazardous Materials B137 (2006) 915–924 919
Fb
sveofi
3
tfta
q
wassbwTtticb
F2
Fp
ff
D
woDctoscr
3
(
l
w
ig. 4. Pseudo second-order kinetics plots for different initial cadmium sorptiony MNR at 303 K.
econd-order rate constant (Table 1). It was observed that the R2
alues (Table 1), in case of pseudo second-order kinetics, werequal to 1. Thus, it could be inferred that cadmium adsorptionn MNR obeys pseudo second-order rate kinetics more than therst-order rate kinetics.
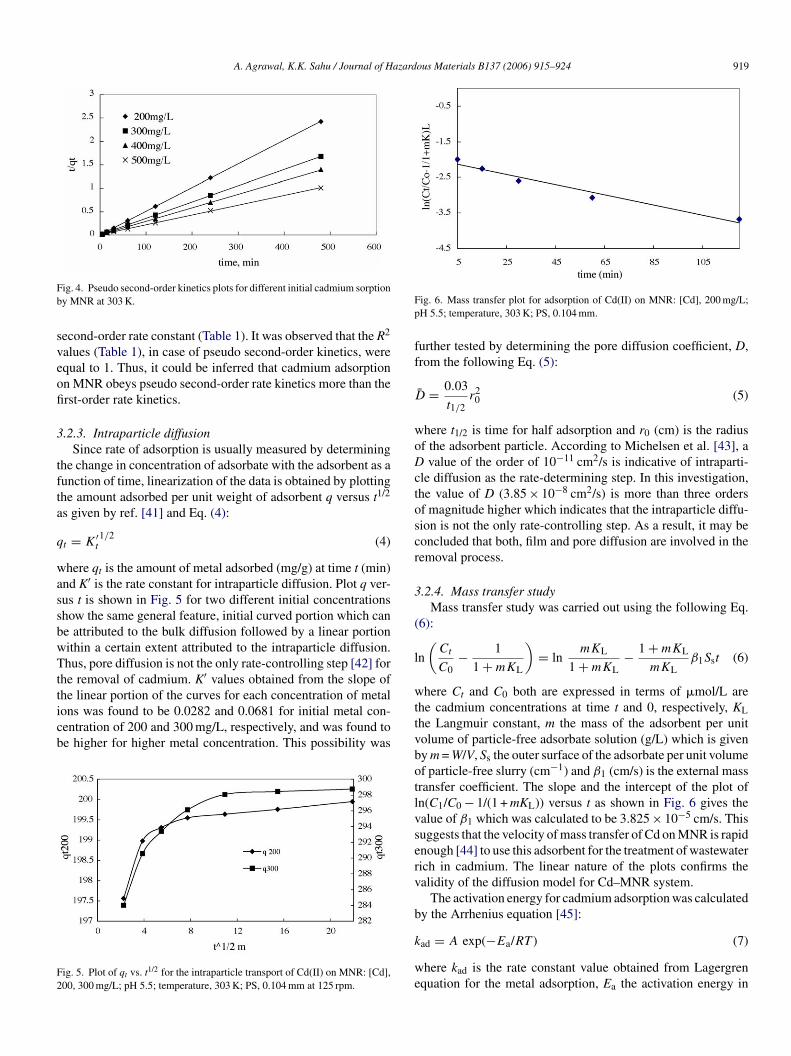
.2.3. Intraparticle diffusionSince rate of adsorption is usually measured by determining
he change in concentration of adsorbate with the adsorbent as aunction of time, linearization of the data is obtained by plottinghe amount adsorbed per unit weight of adsorbent q versus t1/2
s given by ref. [41] and Eq. (4):
t = K′t1/2 (4)
here qt is the amount of metal adsorbed (mg/g) at time t (min)nd K′ is the rate constant for intraparticle diffusion. Plot q ver-us t is shown in Fig. 5 for two different initial concentrationshow the same general feature, initial curved portion which cane attributed to the bulk diffusion followed by a linear portionithin a certain extent attributed to the intraparticle diffusion.hus, pore diffusion is not the only rate-controlling step [42] for
he removal of cadmium. K′ values obtained from the slope of
he linear portion of the curves for each concentration of metalons was found to be 0.0282 and 0.0681 for initial metal con-entration of 200 and 300 mg/L, respectively, and was found toe higher for higher metal concentration. This possibility wasig. 5. Plot of qt vs. t1/2 for the intraparticle transport of Cd(II) on MNR: [Cd],00, 300 mg/L; pH 5.5; temperature, 303 K; PS, 0.104 mm at 125 rpm.
ttvbotlvserv
b
k
we
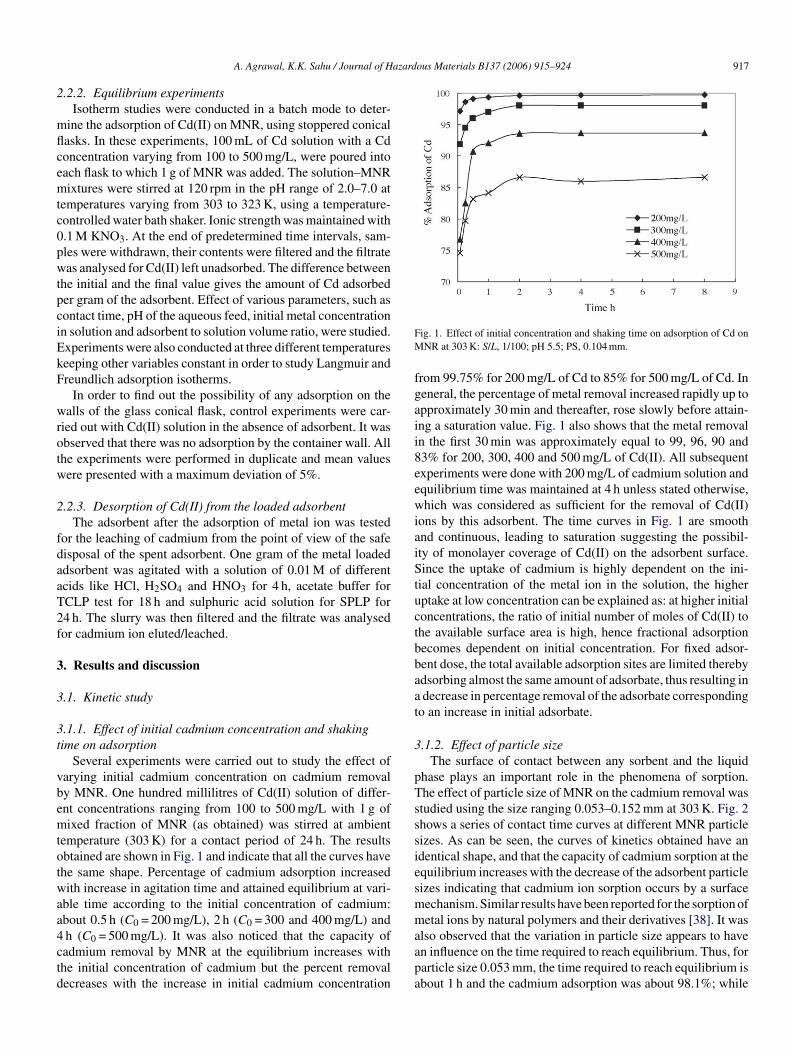
ig. 6. Mass transfer plot for adsorption of Cd(II) on MNR: [Cd], 200 mg/L;H 5.5; temperature, 303 K; PS, 0.104 mm.
urther tested by determining the pore diffusion coefficient, D,rom the following Eq. (5):
¯ = 0.03
t1/2r2
0 (5)
here t1/2 is time for half adsorption and r0 (cm) is the radiusf the adsorbent particle. According to Michelsen et al. [43], a
value of the order of 10−11 cm2/s is indicative of intraparti-le diffusion as the rate-determining step. In this investigation,he value of D (3.85 × 10⁻⁸ cm2/s) is more than three ordersf magnitude higher which indicates that the intraparticle diffu-ion is not the only rate-controlling step. As a result, it may beoncluded that both, film and pore diffusion are involved in theemoval process.
.2.4. Mass transfer studyMass transfer study was carried out using the following Eq.
6):
n
(Ct
C0− 1
1 + mKL
)= ln
mKL
1 + mKL− 1 + mKL
mKLβ1Sst (6)
here Ct and C0 both are expressed in terms of �mol/L arehe cadmium concentrations at time t and 0, respectively, KLhe Langmuir constant, m the mass of the adsorbent per unitolume of particle-free adsorbate solution (g/L) which is giveny m = W/V, Ss the outer surface of the adsorbate per unit volumef particle-free slurry (cm−1) and β1 (cm/s) is the external massransfer coefficient. The slope and the intercept of the plot ofn(C1/C0 − 1/(1 + mKL)) versus t as shown in Fig. 6 gives thealue of β1 which was calculated to be 3.825 × 10⁻⁵ cm/s. Thisuggests that the velocity of mass transfer of Cd on MNR is rapidnough [44] to use this adsorbent for the treatment of wastewaterich in cadmium. The linear nature of the plots confirms thealidity of the diffusion model for Cd–MNR system.
The activation energy for cadmium adsorption was calculatedy the Arrhenius equation [45]:
ad = A exp(−Ea/RT ) (7)
here kad is the rate constant value obtained from Lagergrenquation for the metal adsorption, Ea the activation energy in
920 A. Agrawal, K.K. Sahu / Journal of Hazardous Materials B137 (2006) 915–924
kvsf[m
33AbrpTir9ph1ao
3ts
F3
F3
ima5at2liaFatatarsic
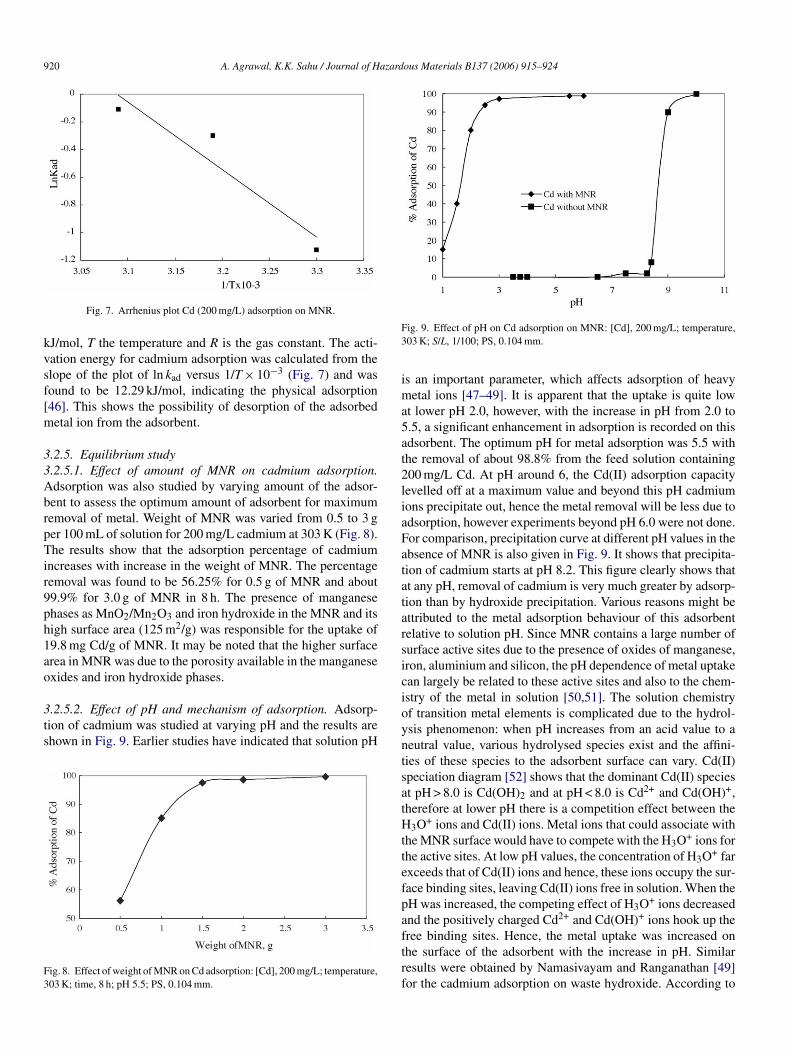
Fig. 7. Arrhenius plot Cd (200 mg/L) adsorption on MNR.
J/mol, T the temperature and R is the gas constant. The acti-ation energy for cadmium adsorption was calculated from thelope of the plot of ln kad versus 1/T × 10−3 (Fig. 7) and wasound to be 12.29 kJ/mol, indicating the physical adsorption46]. This shows the possibility of desorption of the adsorbedetal ion from the adsorbent.
.2.5. Equilibrium study
.2.5.1. Effect of amount of MNR on cadmium adsorption.dsorption was also studied by varying amount of the adsor-ent to assess the optimum amount of adsorbent for maximumemoval of metal. Weight of MNR was varied from 0.5 to 3 ger 100 mL of solution for 200 mg/L cadmium at 303 K (Fig. 8).he results show that the adsorption percentage of cadmium
ncreases with increase in the weight of MNR. The percentageemoval was found to be 56.25% for 0.5 g of MNR and about9.9% for 3.0 g of MNR in 8 h. The presence of manganesehases as MnO2/Mn2O3 and iron hydroxide in the MNR and itsigh surface area (125 m2/g) was responsible for the uptake of9.8 mg Cd/g of MNR. It may be noted that the higher surfacerea in MNR was due to the porosity available in the manganesexides and iron hydroxide phases.
.2.5.2. Effect of pH and mechanism of adsorption. Adsorp-ion of cadmium was studied at varying pH and the results arehown in Fig. 9. Earlier studies have indicated that solution pH
ig. 8. Effect of weight of MNR on Cd adsorption: [Cd], 200 mg/L; temperature,03 K; time, 8 h; pH 5.5; PS, 0.104 mm.
ioyntsatHttefpaftrf
ig. 9. Effect of pH on Cd adsorption on MNR: [Cd], 200 mg/L; temperature,03 K; S/L, 1/100; PS, 0.104 mm.
s an important parameter, which affects adsorption of heavyetal ions [47–49]. It is apparent that the uptake is quite low
t lower pH 2.0, however, with the increase in pH from 2.0 to.5, a significant enhancement in adsorption is recorded on thisdsorbent. The optimum pH for metal adsorption was 5.5 withhe removal of about 98.8% from the feed solution containing00 mg/L Cd. At pH around 6, the Cd(II) adsorption capacityevelled off at a maximum value and beyond this pH cadmiumons precipitate out, hence the metal removal will be less due todsorption, however experiments beyond pH 6.0 were not done.or comparison, precipitation curve at different pH values in thebsence of MNR is also given in Fig. 9. It shows that precipita-ion of cadmium starts at pH 8.2. This figure clearly shows thatt any pH, removal of cadmium is very much greater by adsorp-ion than by hydroxide precipitation. Various reasons might bettributed to the metal adsorption behaviour of this adsorbentelative to solution pH. Since MNR contains a large number ofurface active sites due to the presence of oxides of manganese,ron, aluminium and silicon, the pH dependence of metal uptakean largely be related to these active sites and also to the chem-stry of the metal in solution [50,51]. The solution chemistryf transition metal elements is complicated due to the hydrol-sis phenomenon: when pH increases from an acid value to aeutral value, various hydrolysed species exist and the affini-ies of these species to the adsorbent surface can vary. Cd(II)peciation diagram [52] shows that the dominant Cd(II) speciest pH > 8.0 is Cd(OH)2 and at pH < 8.0 is Cd2+ and Cd(OH)+,herefore at lower pH there is a competition effect between the
3O+ ions and Cd(II) ions. Metal ions that could associate withhe MNR surface would have to compete with the H3O+ ions forhe active sites. At low pH values, the concentration of H3O+ farxceeds that of Cd(II) ions and hence, these ions occupy the sur-ace binding sites, leaving Cd(II) ions free in solution. When theH was increased, the competing effect of H3O+ ions decreasednd the positively charged Cd2+ and Cd(OH)+ ions hook up the
ree binding sites. Hence, the metal uptake was increased onhe surface of the adsorbent with the increase in pH. Similaresults were obtained by Namasivayam and Ranganathan [49]or the cadmium adsorption on waste hydroxide. According to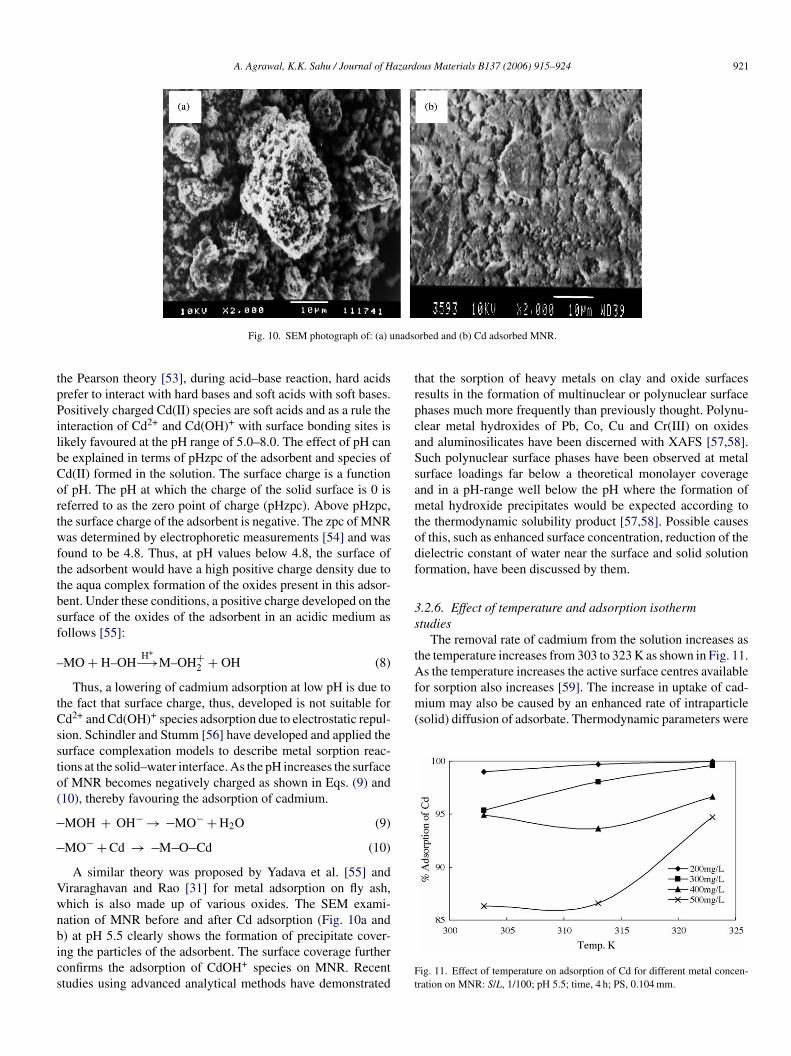
A. Agrawal, K.K. Sahu / Journal of Hazardous Materials B137 (2006) 915–924 921
nadso
tpPilbCortwfttbsf
–
tCssto(
Vwnbics
trpcaSsamtodf
3s
tAfor sorption also increases [59]. The increase in uptake of cad-mium may also be caused by an enhanced rate of intraparticle(solid) diffusion of adsorbate. Thermodynamic parameters were
Fig. 10. SEM photograph of: (a) u
he Pearson theory [53], during acid–base reaction, hard acidsrefer to interact with hard bases and soft acids with soft bases.ositively charged Cd(II) species are soft acids and as a rule the
nteraction of Cd2+ and Cd(OH)+ with surface bonding sites isikely favoured at the pH range of 5.0–8.0. The effect of pH cane explained in terms of pHzpc of the adsorbent and species ofd(II) formed in the solution. The surface charge is a functionf pH. The pH at which the charge of the solid surface is 0 iseferred to as the zero point of charge (pHzpc). Above pHzpc,he surface charge of the adsorbent is negative. The zpc of MNRas determined by electrophoretic measurements [54] and was
ound to be 4.8. Thus, at pH values below 4.8, the surface ofhe adsorbent would have a high positive charge density due tohe aqua complex formation of the oxides present in this adsor-ent. Under these conditions, a positive charge developed on theurface of the oxides of the adsorbent in an acidic medium asollows [55]:
MO + H–OHH+
−→M–OH+2 + OH (8)
Thus, a lowering of cadmium adsorption at low pH is due tohe fact that surface charge, thus, developed is not suitable ford2+ and Cd(OH)+ species adsorption due to electrostatic repul-
ion. Schindler and Stumm [56] have developed and applied theurface complexation models to describe metal sorption reac-ions at the solid–water interface. As the pH increases the surfacef MNR becomes negatively charged as shown in Eqs. (9) and10), thereby favouring the adsorption of cadmium.
MOH + OH− → MO− + H2O (9)
MO− + Cd → M O Cd (10)
A similar theory was proposed by Yadava et al. [55] andiraraghavan and Rao [31] for metal adsorption on fly ash,hich is also made up of various oxides. The SEM exami-ation of MNR before and after Cd adsorption (Fig. 10a and
) at pH 5.5 clearly shows the formation of precipitate cover-ng the particles of the adsorbent. The surface coverage furtheronfirms the adsorption of CdOH+ species on MNR. Recenttudies using advanced analytical methods have demonstratedFt
rbed and (b) Cd adsorbed MNR.
hat the sorption of heavy metals on clay and oxide surfacesesults in the formation of multinuclear or polynuclear surfacehases much more frequently than previously thought. Polynu-lear metal hydroxides of Pb, Co, Cu and Cr(III) on oxidesnd aluminosilicates have been discerned with XAFS [57,58].uch polynuclear surface phases have been observed at metalurface loadings far below a theoretical monolayer coveragend in a pH-range well below the pH where the formation ofetal hydroxide precipitates would be expected according to
he thermodynamic solubility product [57,58]. Possible causesf this, such as enhanced surface concentration, reduction of theielectric constant of water near the surface and solid solutionormation, have been discussed by them.
.2.6. Effect of temperature and adsorption isothermtudies
The removal rate of cadmium from the solution increases ashe temperature increases from 303 to 323 K as shown in Fig. 11.s the temperature increases the active surface centres available
ig. 11. Effect of temperature on adsorption of Cd for different metal concen-ration on MNR: S/L, 1/100; pH 5.5; time, 4 h; PS, 0.104 mm.
922 A. Agrawal, K.K. Sahu / Journal of Hazardous Materials B137 (2006) 915–924
a
K
wctc
�
w
l
�
espcimianwmIiadtb
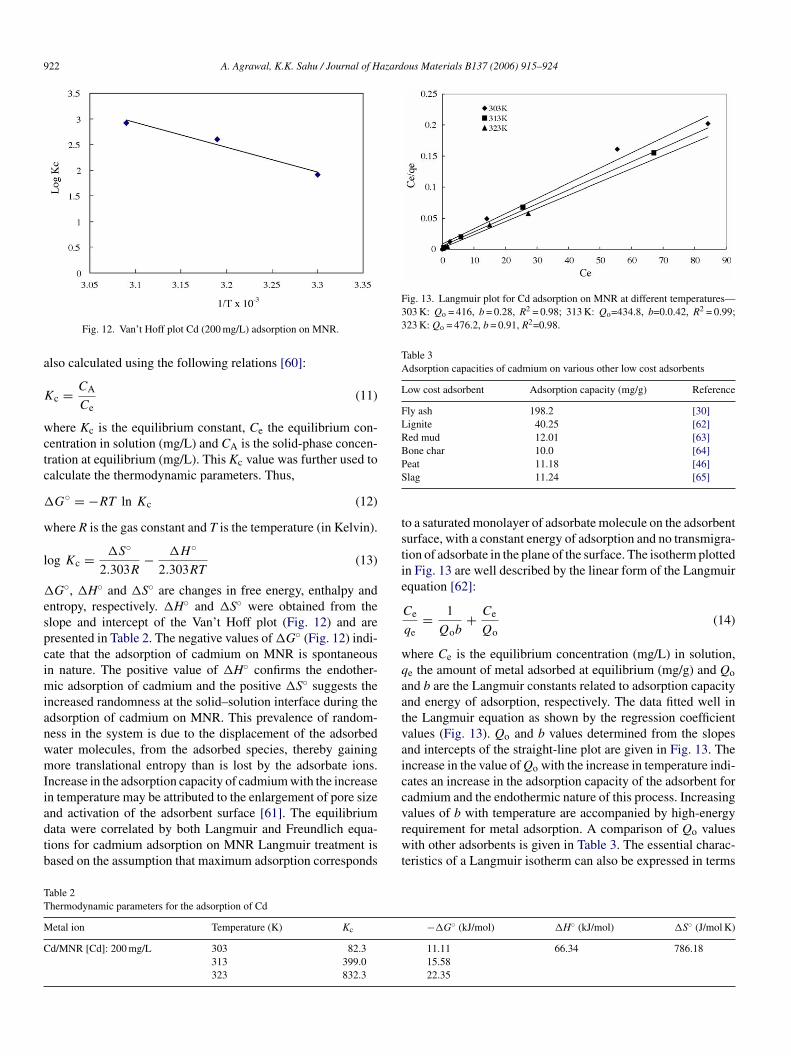
Fig. 13. Langmuir plot for Cd adsorption on MNR at different temperatures—303 K: Qo = 416, b = 0.28, R2 = 0.98; 313 K: Qo=434.8, b=0.0.42, R2 = 0.99;323 K: Qo = 476.2, b = 0.91, R2=0.98.
Table 3Adsorption capacities of cadmium on various other low cost adsorbents
Low cost adsorbent Adsorption capacity (mg/g) Reference
Fly ash 198.2 [30]Lignite 40.25 [62]Red mud 12.01 [63]Bone char 10.0 [64]PS
tstie
wqaatvaicc
TT
M
C
Fig. 12. Van’t Hoff plot Cd (200 mg/L) adsorption on MNR.
lso calculated using the following relations [60]:
c = CA
Ce(11)
here Kc is the equilibrium constant, Ce the equilibrium con-entration in solution (mg/L) and CA is the solid-phase concen-ration at equilibrium (mg/L). This Kc value was further used toalculate the thermodynamic parameters. Thus,
G◦ = −RT ln Kc (12)
here R is the gas constant and T is the temperature (in Kelvin).
og Kc = �S◦
2.303R− �H◦
2.303RT(13)
G◦, �H◦ and �S◦ are changes in free energy, enthalpy andntropy, respectively. �H◦ and �S◦ were obtained from thelope and intercept of the Van’t Hoff plot (Fig. 12) and areresented in Table 2. The negative values of �G◦ (Fig. 12) indi-ate that the adsorption of cadmium on MNR is spontaneousn nature. The positive value of �H◦ confirms the endother-
ic adsorption of cadmium and the positive �S◦ suggests thencreased randomness at the solid–solution interface during thedsorption of cadmium on MNR. This prevalence of random-ess in the system is due to the displacement of the adsorbedater molecules, from the adsorbed species, thereby gainingore translational entropy than is lost by the adsorbate ions.
ncrease in the adsorption capacity of cadmium with the increasen temperature may be attributed to the enlargement of pore size
nd activation of the adsorbent surface [61]. The equilibriumata were correlated by both Langmuir and Freundlich equa-ions for cadmium adsorption on MNR Langmuir treatment isased on the assumption that maximum adsorption correspondsvrwt
able 2hermodynamic parameters for the adsorption of Cd
etal ion Temperature (K) Kc
d/MNR [Cd]: 200 mg/L 303 82.3313 399.0323 832.3
eat 11.18 [46]lag 11.24 [65]
o a saturated monolayer of adsorbate molecule on the adsorbenturface, with a constant energy of adsorption and no transmigra-ion of adsorbate in the plane of the surface. The isotherm plottedn Fig. 13 are well described by the linear form of the Langmuirquation [62]:
Ce
qe= 1
Qob+ Ce
Qo(14)
here Ce is the equilibrium concentration (mg/L) in solution,e the amount of metal adsorbed at equilibrium (mg/g) and Qond b are the Langmuir constants related to adsorption capacitynd energy of adsorption, respectively. The data fitted well inhe Langmuir equation as shown by the regression coefficientalues (Fig. 13). Qo and b values determined from the slopesnd intercepts of the straight-line plot are given in Fig. 13. Thencrease in the value of Qo with the increase in temperature indi-ates an increase in the adsorption capacity of the adsorbent foradmium and the endothermic nature of this process. Increasing
alues of b with temperature are accompanied by high-energyequirement for metal adsorption. A comparison of Qo valuesith other adsorbents is given in Table 3. The essential charac-eristics of a Langmuir isotherm can also be expressed in terms
−�G◦ (kJ/mol) �H◦ (kJ/mol) �S◦ (J/mol K)
11.11 66.34 786.1815.5822.35
A. Agrawal, K.K. Sahu / Journal of Hazardous Materials B137 (2006) 915–924 923
Table 4Equilibrium parameter RL for the adsorption of Cd
Temperature (K) Cd–MNR
200 mg/L 300 mg/L 400 mg/L 500 mg/L
303 0.0175 0.0117 0.0088 0.007133
of
R
wet
phttatic
o
l
waaboMc0
F11
Table 5Desorption of adsorbed metal ions from MNR with different acids and leachingby TCLP and SPLP test
System Metal desorbed/leached (%)
0.01 M HCl 3.20.01 M HNO3 10.650.01 M H2SO4 7.6TCLP 58.9SPLP Nfa
TCLP limits (mg/L) 2.0
M(
3a
4
ositctEEtt
5
•
13 0.0118 0.0079 0.0059 0.004923 0.0054 0.0036 0.0027 0.0021
f a dimensionless constant separation factor RL, given by theollowing equation [63]:
L = 1
1 + bCi(15)
here Ci is the initial metal concentration (mg/L) and b is thenergy of interaction at the surface. For a favourable adsorption,he separation factor RL lies between 0 and 1.
Thus, RL values of 0.002–0.0175 calculated at different tem-erature and concentration lie between 0 and 1.0 indicating aighly favourable adsorption (Table 4). It is interesting to notehat RL values decreases with the increase in initial concentra-ion of the metal ion in the solution at each temperature andlso at any initial metal concentration, RL value decreases withhe increase in temperature from 303 to 323 K. Thus, it can benferred that MNR is a very effective adsorbent for 200 mg/L ofadmium at 303 K.
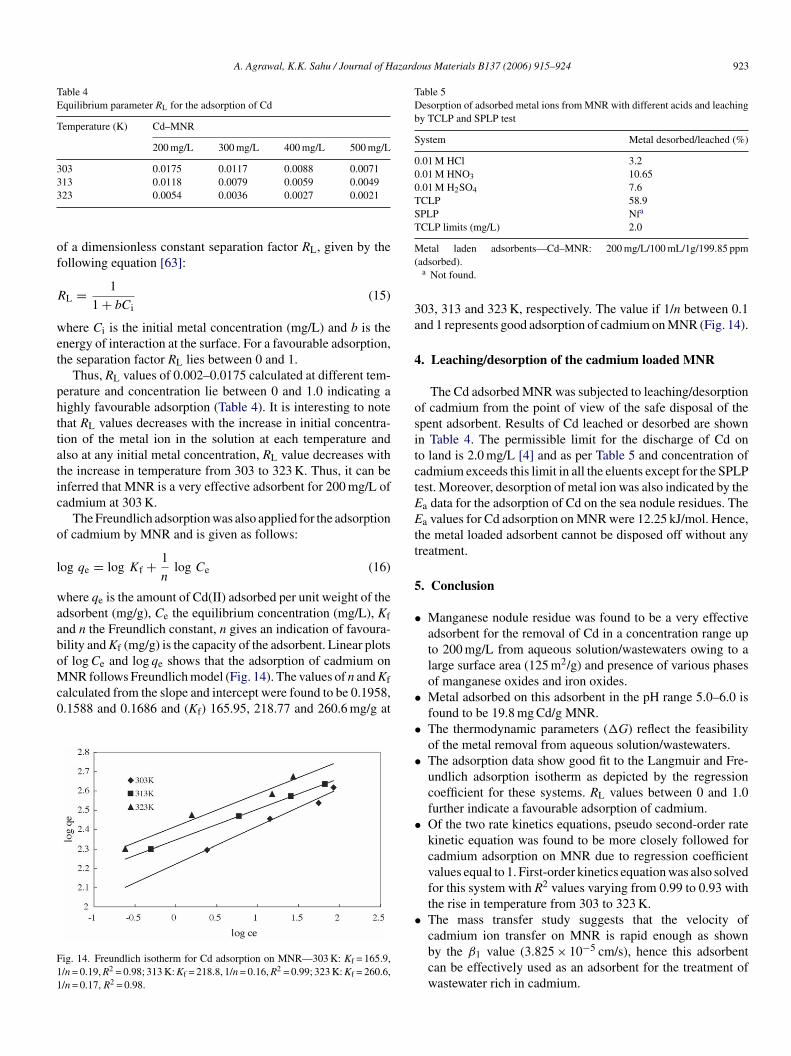
The Freundlich adsorption was also applied for the adsorptionf cadmium by MNR and is given as follows:
og qe = log Kf + 1
nlog Ce (16)
here qe is the amount of Cd(II) adsorbed per unit weight of thedsorbent (mg/g), Ce the equilibrium concentration (mg/L), Kfnd n the Freundlich constant, n gives an indication of favoura-ility and Kf (mg/g) is the capacity of the adsorbent. Linear plots
f log Ce and log qe shows that the adsorption of cadmium onNR follows Freundlich model (Fig. 14). The values of n and Kfalculated from the slope and intercept were found to be 0.1958,.1588 and 0.1686 and (Kf) 165.95, 218.77 and 260.6 mg/g at
ig. 14. Freundlich isotherm for Cd adsorption on MNR—303 K: Kf = 165.9,/n = 0.19, R2 = 0.98; 313 K: Kf = 218.8, 1/n = 0.16, R2 = 0.99; 323 K: Kf = 260.6,/n = 0.17, R2 = 0.98.
•
•
•
•
•
etal laden adsorbents—Cd–MNR: 200 mg/L/100 mL/1g/199.85 ppmadsorbed).
a Not found.
03, 313 and 323 K, respectively. The value if 1/n between 0.1nd 1 represents good adsorption of cadmium on MNR (Fig. 14).
. Leaching/desorption of the cadmium loaded MNR
The Cd adsorbed MNR was subjected to leaching/desorptionf cadmium from the point of view of the safe disposal of thepent adsorbent. Results of Cd leached or desorbed are shownn Table 4. The permissible limit for the discharge of Cd ono land is 2.0 mg/L [4] and as per Table 5 and concentration ofadmium exceeds this limit in all the eluents except for the SPLPest. Moreover, desorption of metal ion was also indicated by thea data for the adsorption of Cd on the sea nodule residues. Thea values for Cd adsorption on MNR were 12.25 kJ/mol. Hence,
he metal loaded adsorbent cannot be disposed off without anyreatment.
. Conclusion
Manganese nodule residue was found to be a very effectiveadsorbent for the removal of Cd in a concentration range upto 200 mg/L from aqueous solution/wastewaters owing to alarge surface area (125 m2/g) and presence of various phasesof manganese oxides and iron oxides.Metal adsorbed on this adsorbent in the pH range 5.0–6.0 isfound to be 19.8 mg Cd/g MNR.The thermodynamic parameters (�G) reflect the feasibilityof the metal removal from aqueous solution/wastewaters.The adsorption data show good fit to the Langmuir and Fre-undlich adsorption isotherm as depicted by the regressioncoefficient for these systems. RL values between 0 and 1.0further indicate a favourable adsorption of cadmium.Of the two rate kinetics equations, pseudo second-order ratekinetic equation was found to be more closely followed forcadmium adsorption on MNR due to regression coefficientvalues equal to 1. First-order kinetics equation was also solvedfor this system with R2 values varying from 0.99 to 0.93 withthe rise in temperature from 303 to 323 K.The mass transfer study suggests that the velocity of
cadmium ion transfer on MNR is rapid enough as shownby the β1 value (3.825 × 10⁻⁵ cm/s), hence this adsorbentcan be effectively used as an adsorbent for the treatment ofwastewater rich in cadmium.
9 azard
•
A
ct
R
[[
[[[
[[[[[[[[
[[
[[[[
[
[[[
[
[
[
[[
[[[[[[
[
[[
[
[[[[
[
[[[
[
[
[
[[[[[
24 A. Agrawal, K.K. Sahu / Journal of H
The desorption of metals from the loaded adsorbent (MNR)shows partial removal of the loaded cadmium with 0.01 M ofmineral acids. TCLP and SPLP test indicates that the loadedadsorbent can be dumped only after desorption of the loadedcadmium or immobilization of the adsorbed cadmium on theadsorbent.
cknowledgement
The authors are thankful to the Director, National Metallurgi-al Laboratory, Jamshedpur, for his kind permission to publishhis work.
eferences
[1] Z.R. Holan, B. Volesky, I. Prasetyo, Biotechnol. Bioeng. 41 (1993) 819.[2] B. Volesky, H. May, Z.R. Holan, Biotechnol. Bioeng. 41 (1993) 826.[3] ISI, Tolerance Limits for Industrial Effluents: ISI 2490, Part I. Indian Stan-
dard Institutions, 1982.[4] ISI, Drinking Water Specifications, IS 10500, 1991.[5] C.P.C. Poon, Removal of cadmium from wastewaters, in: H. Mislin, O. Rav-
era (Eds.), Cadmium in the Environment, Birkha User, Basel, Switzerland,1986, pp. 46–55.
[6] S. Park, Y. Kim, Mater. Sci. Eng. A 391 (2005) 121.[7] M. Sekar, V. Sakthi, S. Rengaraj, J. Colloid Interface Sci. 279 (2004) 307.[8] A.M. Youssef, T. El-Nabarawy, S.E. Samra, Colloids Surf. A: Physic-
ochem. Eng. Aspects 235 (2004) 153.[9] D.G. Kinniburgh, M.L. Jackson, in: M.A. Anderson, A.J. Rubin (Eds.),
Adsorption of Organics at Solid–Liquid Interfaces, Ann Arbor SciencePublishers, Ann Arbor, MI, 1981, p. 91.
10] D. Dong, et al., Microchem. J. 69 (2001) 89.11] M. Edwards, M.M. Benjamin, J. Water Pollut. Contr. Fed. 61 (1989)
481–490.12] C.A. Cristophi, L. Axe, J. Environ. Eng. (2000) 67–74.13] C.P. Huang, L.M. Van, J. WPCF 61 (9) (1989) 1596–1603.14] M. Edwards, M.M. Benjamin, J. Water Pollut. Contr. Fed. 61 (1989)
1523.15] R.S. Stahl, B.R. James, Soil Sci. Soc. Am. J. 55 (1991) 1287.16] S.L. Lo, H.T. Jeng, C.H. Lai, Water Sci. Technol. 35 (7) (1997) 63.17] C.H. Lai, S.L. Lo, C.F. Lin, Water Sci. Technol. 30 (9) (1994) 175.18] J.K. Satpathy, M. Chaudhuri, Water Environ. Res. 67 (5) (1995) 788.19] T.L. Theis, R. Lyer, S.K. Ellis, J. AWWA (1992) 101.20] R.S. Stahl, B.R. James, Soil Sci. Soc. Am. J. 55 (1991) 1291.21] R.G. McLaren, D.V. Crawford, J. Soil Sci. 24 (4) (1973) 443.22] S.M. Oakley, P.O. Nelson, K.J. Williamson, Environ. Sci. Technol. 15
(1981) 474.23] R.N. Shaoo, et al., Hydrometallurgy 62 (2001) 185.24] S.E. Bailey, T.J. Olin, R.M. Bricka, D.D. Adrian, Water Res. 33 (11) (1999)
2469.25] D.P. Rodda, B.B. Johnson, J. Wells, J. Colloid Interface Sci. 61 (1993) 57.26] T. Tasi, P.A. Vesilind, J. Environ. Sci. Health A 34 (1999) 103.
27] Y. Orhan, H. Buyukgunor, Water Sci. Technol. 28 (1993) 247.28] S. Kesraoui-Ouki, C. Cheeseman, R. Perry, J. Chem. Technol. Biotechnol.59 (1994) 121.29] S. Kesraoui-Ouki, C. Cheesman, R. Perry, Environ. Sci. Technol. 27 (1993)
1108.
[
[
ous Materials B137 (2006) 915–924
30] R. Apak, E. Tuten, M. Hugul, J. Hazel, Water Res. 32 (1998) 430.31] T. Viraraghavan, G.A.K. Rao, J. Environ. Sci. Health 26 (1991) 721.32] E. Lopez, B. Soto, M. Arias, A. Nunez, D. Rubinos, M.T. Barral, Water
Res. 32 (1998) 1314.33] U. Schwertmann, R.M. Cornell, Iron Oxides in the Laboratory,
Wiley–VCH, Weinheim, 2000.34] R. Strauss, G.W. Brummer, N.J. Barrow, Eur. J. Soil Sci. 48 (1997)
87.35] A. Manceau, K.L. Nagy, L. Spadini, K.V. Ragnarsdottir, J. Colloids Inter-
face Sci. 228 (2000) 306.36] M. Ali Yukselen, B. Alpaslan, J. Hazard. Mater. B 87 (2001) 289.37] U.S. EPA, Characterization of Municipal Solid Waste in the United States:
1992 update, EPA, 530-R-92-019, U.S. Environmental Protection Agency,Washington, DC, 1992.
38] T.C. Yang, R.R. Zall, Ind. Eng. Chem. Prod. Res. Dev. 23 (1984) 168.39] K. Periyasamy, C. Namasivayam, Ind. Eng. Chem. Res. 33 (1994) 317.40] Y.S. Ho, G. McKay, Process Biochem. 34 (5) (1999) 451.41] C.P. Huang, F.B. Ostovic, J. Environ. Eng. Div. ASCE 104 (1978) 863.42] C.P. Huang, J.H. Oliver, J. Environ. Technol. Lett. 10 (1989) 863.43] L.D. Michelsen, P.G. Gideon, E.G Pace, L.H. Kutal, USDI, Office, Water
Res. Technol. Bull. 14 (1975).44] D.B. Singh, G. Prasad, D.C. Rupainwar, V.N. Singh, Water, Air, Soil Pollut.
42 (1988) 373.45] A. Agrawal, K.K. Sahu, J.P. Rawat, Solvent Extr. Ion Exch. 21 (2003) 763.46] P.W. Atkins, Physical Chemistry, Oxford University Press, Oxford, 1982,
p. 1015.47] M. Weltrowski, B. Martel, M. Morcellet, J. Appl. Polym. Sci. 59 (1996)
647.48] J.T. Matheickal, Q. Yu, G.M. Woodburn, Water Res. 33 (1999) 335.49] C. Namasivayam, K. Ranganathan, Water Res. 29 (1995) 1737.50] H.A. Elliot, C.M. Denneny, J. Environ. Qual. 11 (1982) 658.51] C.H. Weng, C.P. Huang, in: C.R. O’Melia (Ed.), Proceedings of the Envi-
ronmental Engineering Specialty Conference ASCE, New York, 1990, p.923.
52] R.L. Ramos, J.R.R. Mendez, J.M. Barron, L.F. Rubio, R.M.G. Coronado,Water Sci. Technol. 35 (1997) 205.
53] R.G. Pearson, Inorg. Chem. 27 (1988) 734.54] K.M. Parida, J. Electrochem. Soc. India 2 (1988) 3.55] K.P. Yadava, B.S. Tyagi, K.K. Pandey, V.N. Singh, Environ. Technol. Lett.
8 (1987) 220.56] P.W. Schindler, W. Stumm, The surface chemistry of oxides, hydroxides,
and oxide minerals, in: W. Stumm (Ed.), Aquatic Surface Chemistry, Wiley,1987, p. 83.
57] P.A. O’Day, C.J. Chisholm-Brause, S.N. Towle, G.A. Parks, G.E. BrownJr., X-ray absorption spectroscopy of Co(II) sorption complexes on quartz(a-SiO2) and rutile (TiO2), Geochim. Cosmochim. Acta 60 (1996) 2515.
58] C. Papelis, K.F. Hayes, Distinguishing between interlayer and externalsorption sites of clay minerals using X-ray absorption spectroscopy, Col-loids Surf. 107 (1996) 89.
59] K.A. Krishnan, T.S. Anirudhan, J. Hazard. Mater. 92 (2) (2002) 161.60] L.K. Fraiji, D.M. Hayer, T.C. Werner, J. Chem. Educ. 69 (1992) 205.61] P.P. Vishwakarma, K.P. Yadava, V.N. Singh, Pertanika 12 (1989) 357.62] S.J. Allen, P.J. Brown, Chem. Technol. Biotechnol. 62 (1995) 17.63] T.K. Budinova, K.M. Gergova, N.V. Petrov, V.N. Minkova, J. Chem. Tech-
nol. Biotechnol. 60 (1994) 177.64] S.J. Allen, L.J. Whitten, M. Murray, O. Duggan, J. Chem. Technol. Biotech-
nol. 68 (1997) 442.65] V.K. Gupta, A. Rastogi, M.K. Diwivedi, D. Mohan, Sep. Sci. Technol. 32
(1997) 2883.