lungs nodule detection using semantic segmentation and
TRANSCRIPT

Lungs Nodule Detection using SemanticSegmentation and Classification with OptimalFeatures
Talha Meraj1 · Arslan Hassan2 ·Saliha Zahoor3 · Hafiz Tayyab Rauf4 ·M.IkramUllah Lali 5 · liaqat Ali6 · SyedAhmad Chan Bukhari*7
Abstract Lung cancer is a deadly disease if not diagnosed in its early stages. However, early detection of lung cancer is a challenging task due to the shape and size of its nodules. Radiologists need support from automated tools for precise opinion. Automated detection of the affected lungs nodule is difficult because of the shape similarity among healthy tissues. Over the years, several expert systems have been developed that help radiologists to diagnose lung cancer. In this article, we propose a framework to precisely detect lungs cancer by classifying it between benign and malignant nodules.
Talha Meraj 1
Department of Computer Science, University of Gujrat, Gujrat, Pakistan.E-mail: [email protected]
Arslan Hassan2
Department of Computer Science, University of Gujrat, Gujrat, Pakistan.E-mail: [email protected]
Saliha Zahoor 3
Department of Computer Science, University of Gujrat, Gujrat, Pakistan.E-mail: [email protected]
Hafiz Tayyab Rauf 4
Department of Computer Science, University of Gujrat, Gujrat, Pakistan.E-mail: [email protected]
M.IkramUllah Lali 5
Department of Computer Science, University of Gujrat, Gujrat, Pakistan.E-mail: [email protected]
liaqat Ali 6
School of Information and Communication Engineering, University of Electronic Science andTechnology of China (UESTC), Chengdu 611731, China.E-mail: engr [email protected]
Syed Ahmad Chan Bukhari*7 ( )Division of Computer Science, Mathematics and Science (Healthcare Informatics), College ofProfessional Studies, St. John’s University, New York.Corresponding should be addressed to Syed Ahmad Chan Bukhari ([email protected])
Preprints (www.preprints.org) | NOT PEER-REVIEWED | Posted: 14 September 2019
© 2019 by the author(s). Distributed under a Creative Commons CC BY license.
Preprints (www.preprints.org) | NOT PEER-REVIEWED | Posted: 14 September 2019 doi:10.20944/preprints201909.0139.v1
© 2019 by the author(s). Distributed under a Creative Commons CC BY license.
2
The framework is tested using the subset of the publicly available at theLung Image Database Consortium image collection (LIDC-IDRI). Multipletechniques including filtering and noise removing are applied for pre-processing.Subsequently, the OTSU and the semantic segmentation are used to accuratelydetect the unhealthy lungs nodules. In total, 13 nodules features were extractedusing Principal Components Analysis (PCA) algorithm. Four optimal featuresare selected based on the classification performance. In the classification phase,9 different classifiers are used along with two types of validation schemes i.e.train test holdout validation with 70-30 data split and 10 fold cross-validation.Our experiments show that the proposed system provides 99.23% accuracyusing logic boost classifier.
Keywords Computer-aided detection (CAD) system · ComputerizedTomography (CT) scan · acquisition · Segmentation · Classification · PrincipalComponents Analysis (PCA)
1 Introduction
Cancer is the second leading cause of death as 9.6 million deaths have beenrecorded in the year 2018 alone [1]. According to the World Health Organization(WHO), on average 2.09 million new lung cancer cases reported each year andthe death toll associated with lung cancer reaches to 1.76 million [1]. Over thepast decade, lung cancer cases declined by 2% per year in men and almostremains stable in women [30]. However, the survival rate can be increased ifthe cancer is detected in its early stages [20]. For the early detection of lungcancer, several modalities are used such as Computed Tomography (CT) scan,X-rays and the Magnetic Resonance Imaging (MRI). The CT scans are themost recommended technique for lungs visualization as it provides the 3D viewof the lungs [3]. The lungs nodules of different sizes are categorized on thebasis of their size. The nodules with a diameter in between 3mm to 30mm areknown as “focal opacity”. Nodules with diameter less than 3mm are known as“micro” whereas with size larger than 30mm is known as “mass” [33]. Lungsnodules are broadly divided into two types, i.e., ”malignant” and ”benign”.To detect the nodules accurately is a challenging task, researchers developedseveral computer-aided detection (CAD) systems which are mainly categorizedinto a shape-based system and intensity-based detection system [22]. Computer-aided detection (CAD) systems, in general, comprise of the predefined stagessuch as pre-processing, segmentation, feature extraction, and classification.In pre-processing, multiple filters such as Median, Gaussian, Erosion, Gaborand various other techniques are used to get sharp image [33]. Good contrastshelp in optimal segmentation. In later stages, parameters such as statistical,geometric, HOG etc are extracted using Principal Component Analysis(PCA),Independent Component Analysis(ICA), Linear Discriminant Analysis(LDA),etc. The last stage is classification, where the previously extracted features areclassified using machine learning models such as SVM, Logit Boost, fine KNN,etc.
Preprints (www.preprints.org) | NOT PEER-REVIEWED | Posted: 14 September 2019 Preprints (www.preprints.org) | NOT PEER-REVIEWED | Posted: 14 September 2019 doi:10.20944/preprints201909.0139.v1
3
1.1 Problem statement and contributions
Precise segmentation of nodules from the lobes region is a challenging task. Inthe lobes region, there are some vessels & trachea which is hard to differentiate.There are many noisy and less improved features used in existing CAD systemswhich cause a compromised accuracy. In this article, we introduce a noveltechnique to accurately segment nodules from the lobes using semantic seg-mentation. As a result, accurate size and location calculation of the geometricfeatures of the lesion area are made possible. Additionally, we propose a newframework for nodules extraction and classification using CT scans. Our othersignificant contributions are:
1. The dataset design from LIDC includes high intensity based images. Weperformed the pre-processing for OTSU segmentation. The proposed meth-ods of segmentation are OTSU and Semantic Segmentation using CNNthat are more helpful for better results of segmentation.
2. Optimal features have been used to classify the malignant and benignnodules using size measurement of nodules and the other texture, statisticalfeatures of nodules. In proposed methodology, segmentation & classificationof nodules is improved.
3. Using the semantic segmentation the accuracy of classification is improvedin term of recall, reduction of false positive, miss-classification and theaccuracy which is increased upto 99.23% using 10 cross fold with dataset of110 images.The rest article is divided into 4 sections, Section 2 explains the literaturereview and Section 3 explains the proposed methodology whereas Section 4& 5 exhibits the results and concludes the research.
AbbreviationDescription AbbreviationDescription
CT Computerized Tomography HU Hounsfield Unit
CAD Computer-Aided Detection RD Rose Diagram
LIDC Lung Image Database Consortium SVM Support Vector Machine
CNN Convolutional Neural Network ANN Artificial Neural Network
PCA Principal Components Analysis PSO Particle Swarm Optimization
GN Genetic Algorithm FLD Fisher Linear Discriminant
ELCAP Early Lung Cancer Action ProgramDICOM Digital Imaging and Communications
ACF Active Contour Filter GLCM Gray-level Co-occurrence Matrix
ROI Region of Interest PCA Principal Component Analysis
TNR True Negative Rate FNR False Negative Rate
Table 1: Abbreviation of different words used in the article.
Preprints (www.preprints.org) | NOT PEER-REVIEWED | Posted: 14 September 2019 Preprints (www.preprints.org) | NOT PEER-REVIEWED | Posted: 14 September 2019 doi:10.20944/preprints201909.0139.v1
4
2 Literature Review
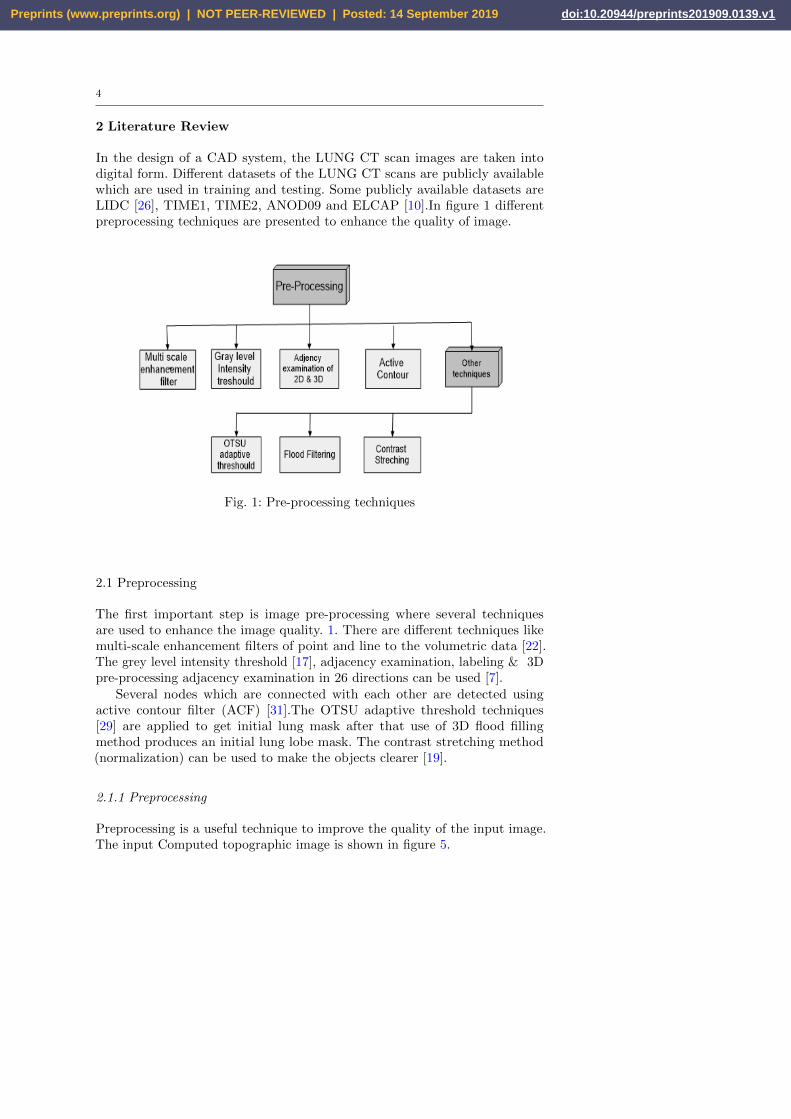
In the design of a CAD system, the LUNG CT scan images are taken intodigital form. Different datasets of the LUNG CT scans are publicly availablewhich are used in training and testing. Some publicly available datasets areLIDC [26], TIME1, TIME2, ANOD09 and ELCAP [10].In figure 1 differentpreprocessing techniques are presented to enhance the quality of image.
Fig. 1: Pre-processing techniques
2.1 Preprocessing
The first important step is image pre-processing where several techniquesare used to enhance the image quality. 1. There are different techniques likemulti-scale enhancement filters of point and line to the volumetric data [22].The grey level intensity threshold [17], adjacency examination, labeling & 3Dpre-processing adjacency examination in 26 directions can be used [7].
Several nodes which are connected with each other are detected usingactive contour filter (ACF) [31].The OTSU adaptive threshold techniques[29] are applied to get initial lung mask after that use of 3D flood fillingmethod produces an initial lung lobe mask. The contrast stretching method(normalization) can be used to make the objects clearer [19].
2.1.1 Preprocessing
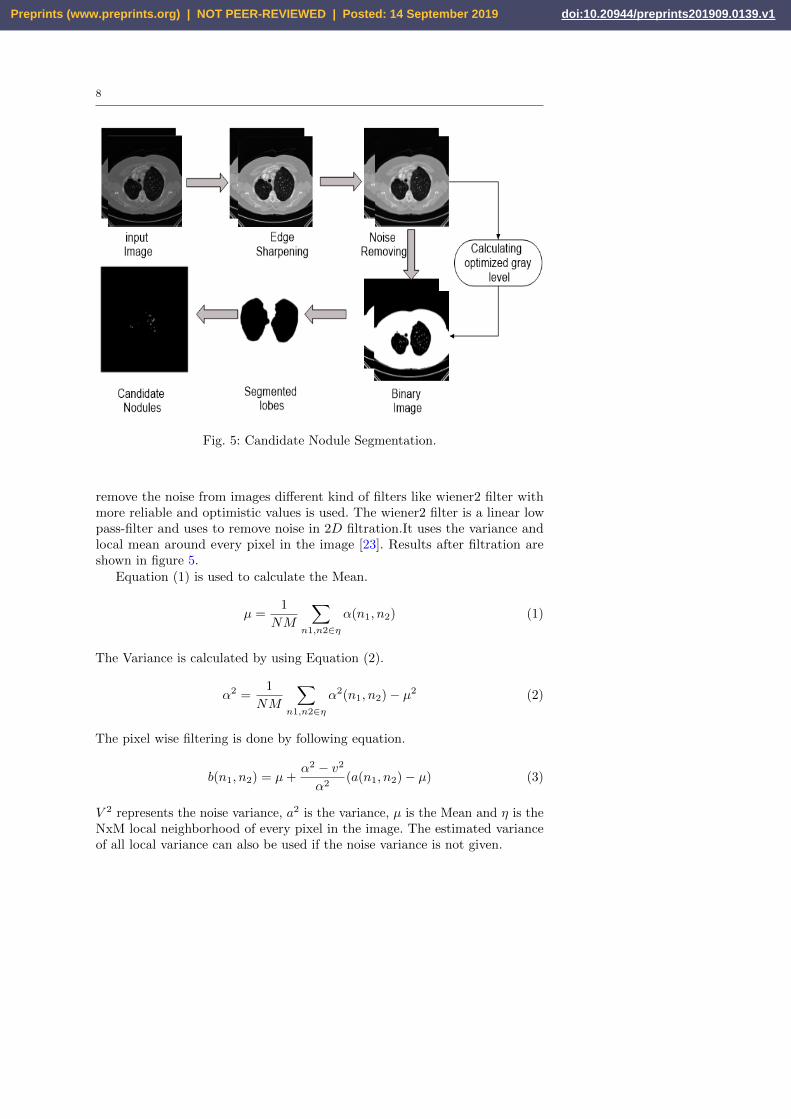
Preprocessing is a useful technique to improve the quality of the input image.The input Computed topographic image is shown in figure 5.
Preprints (www.preprints.org) | NOT PEER-REVIEWED | Posted: 14 September 2019 Preprints (www.preprints.org) | NOT PEER-REVIEWED | Posted: 14 September 2019 doi:10.20944/preprints201909.0139.v1

5
2.2 Segmentation
The segmentation of lung cancer can be done using K-mean clustering, FuzzyC-Mean clustering, Ad-hoc operator, and other clustering methods. K-meangives the same results in a short period of time as compared to other [10, 19].Threshold base technique is used to segment the part of interest in the images.It uses the values of HU Lung CT scan(ranges from -2000 HU to +2000 HU ).The lung in the body is a low-density area. They used an optimum value of HU(-500 HU) to segment the lungs from the other parts of CT scan image [3, 27].The CNN has been used with some configuration of layers to segment the lobesof lungs [15].The location-based category of nodules using hybrid features canbe used [22]. Imaging of standard size was down sampled to get the ROI patchesfor training and testing [21].The intensity threshold has been used for wallattached nodules and active contour refinement was done using morphologicaloperations [19]. The grey level co-occurrence matrix of the image has beenused to get the object of interest [17]. Automatic morphological region-growsegmentation was done for well-circumscribed nodule. Initial mask of lungswas taken and then inverted mask was used to produce the lung lobes. Themorphological operations have been applied to remove the vessel cavities. Then,juxta pleural nodule segmentation was done using edge bridge, fill technique,3D shape, and edge analysis to differentiate malignant nodules from benignnodules [20]. Clusters of highlighted voxels > 3mm was treated as nodulecandidate [16]. Different Segmentation Techniques are shown in Figure 2.
Fig. 2: Segmentation Techniques.
Preprints (www.preprints.org) | NOT PEER-REVIEWED | Posted: 14 September 2019 Preprints (www.preprints.org) | NOT PEER-REVIEWED | Posted: 14 September 2019 doi:10.20944/preprints201909.0139.v1

6
2.3 Features Extraction
The different features of lung nodules like geometric, morphological, statistical,texture, histogram have been extracted as shown in 3. The 2D features includesgeometric features (area, diameter, perimeter, circulatory), 2D intensity basedstatistical features (minimum value inside, mean inside, mean outside, varianceinside, skewness inside, kurtosis inside, Elgen values), 3D geometric features(volume, compactness, bounding box dimension, principal axis lengths, elonga-tion),and 3D intensity based statistical features(minimum values inside, meaninside, mean outside, variance inside, skewness inside, kurtosis inside) havebeen extracted[3].The morphological features (volume, minimum axis length,maximum axis length, MinA/MaxA, Equivalent radius, Sphericity, compact-ness) Outer Surface Statistical and Histogram Features (Mean, Maximum PixelValue, Minimum Pixel Value, Most Frequent Pixel Value, Variance, StandardDeviation, Skewness, Kurtosis) Outer Surface Texture Surface (Contrast, En-ergy, Entropy, Homogeneity, Moment) can be calculated to extract the propertyof the Candidate Nodule [7]. Three features were used to select the critical pointpairs that are boundary segment concave degree, relative boundary distance,and relative position information [29]. The circularity, extent, eccentricity,mean intensity, maximum intensity, area difference, entropy, weighted centroiddifference, mean intensity difference, Sphericity, contrast, standard deviation,skewness can be used for proper detection of Nodules [17, 19, 20].The log edgedetection in ribs CT scan images can also be used [6].In figure 3 differentfeatures are categorized.
2.4 Classification Algorithms
There are many algorithms like SVM [3, 5, 7, 13, 19, 27, 34], CNN [15, 21, 31]PSO [7], ANN [17], 2D and 3D CNN that are used to classify the cancerous andnon-cancerous nodules [16]. For best classification the combined classifiers of
Fig. 3: Feature Extraction Types.
Preprints (www.preprints.org) | NOT PEER-REVIEWED | Posted: 14 September 2019 Preprints (www.preprints.org) | NOT PEER-REVIEWED | Posted: 14 September 2019 doi:10.20944/preprints201909.0139.v1

7
Property Description
Format Digital Imaging and Communications in Medicine
Size the resolution of the images is 512 x 512
Dataset Lung Image Database Consortium (LIDC)
Gray Level 16-bit Gray Scale Level
No of images Dataset contains 110 images
Image type Computed Tomography (CT) Scan
Table 2: Dataset Properties
linear, quadratic, Parzen and ANN has been used [11]. Fisher linear discriminant[FLD], K-means and GA like algorithms can also be used [10]. In the figuredifferent types of classifiers are presented 4.
Fig. 4: Different types of classifiers.
3 Methodology
In the proposed methodology, publically available LIDC dataset is used. Theproperties of dataset are presented in table 2. LIDC dataset contains DICOMformat reports of patients. By exploring DICOM format a new dataset isprepared according to associated ground truth values. Our new dataset consistsof 110 CT scan images, containing 131 candidate nodules. We use two differentmethods of segmentation CNN and OTSU with comparative analysis.
rp, in order to get more enhanced computed topographic images,differentpreprocessing techniques are applied. The resultant image were too noisy, to
Preprints (www.preprints.org) | NOT PEER-REVIEWED | Posted: 14 September 2019 Preprints (www.preprints.org) | NOT PEER-REVIEWED | Posted: 14 September 2019 doi:10.20944/preprints201909.0139.v1
8
Fig. 5: Candidate Nodule Segmentation.
remove the noise from images different kind of filters like wiener2 filter withmore reliable and optimistic values is used. The wiener2 filter is a linear lowpass-filter and uses to remove noise in 2D filtration.It uses the variance andlocal mean around every pixel in the image [23]. Results after filtration areshown in figure 5.
Equation (1) is used to calculate the Mean.
µ =1
NM
∑n1,n2∈η
α(n1, n2) (1)
The Variance is calculated by using Equation (2).
α2 =1
NM
∑n1,n2∈η
α2(n1, n2)− µ2 (2)
The pixel wise filtering is done by following equation.
b(n1, n2) = µ+α2 − v2
α2(a(n1, n2)− µ) (3)
V 2 represents the noise variance, a2 is the variance, µ is the Mean and η is theNxM local neighborhood of every pixel in the image. The estimated varianceof all local variance can also be used if the noise variance is not given.
Preprints (www.preprints.org) | NOT PEER-REVIEWED | Posted: 14 September 2019 Preprints (www.preprints.org) | NOT PEER-REVIEWED | Posted: 14 September 2019 doi:10.20944/preprints201909.0139.v1

9
Fig. 6: Block Diagram of OTSU segmentation
3.0.1 Segmentation using OTSU
In the next phase, Otsu’s thresholding method is used for the segmentation. Itis a non-linear method that converts the gray level image into the logical image.In this methodology, the gray threshold base function is used, which calculatesthe global threshold of the image. It also converts the multi-gray level imageinto a binary image. The binary image after gray-threshold is shown in figure5. The image also contains an unnecessary part. To remove unnecessary parts,big blobs are removed from the image and the area of interest is segmented.Later on, the candidate nodules from the binary image are extracted. All thesteps with a sequence are shown in figure 5. The block diagram of the OTSUpreprocessing and segmentation is shown in figure 6
3.1 Segmentation using CNN
At present, there are a number of successful models exist, that are pre-trainedwith millions of images for the recognition of different objects in 2D images[16]. There are many CNN architectures ,which can be used such as CifarNet,GoogLeNet and AlexNet [15]. Each model has a specific training parameters.These models are very successful for the recognition of different objects in 2D
Preprints (www.preprints.org) | NOT PEER-REVIEWED | Posted: 14 September 2019 Preprints (www.preprints.org) | NOT PEER-REVIEWED | Posted: 14 September 2019 doi:10.20944/preprints201909.0139.v1
10
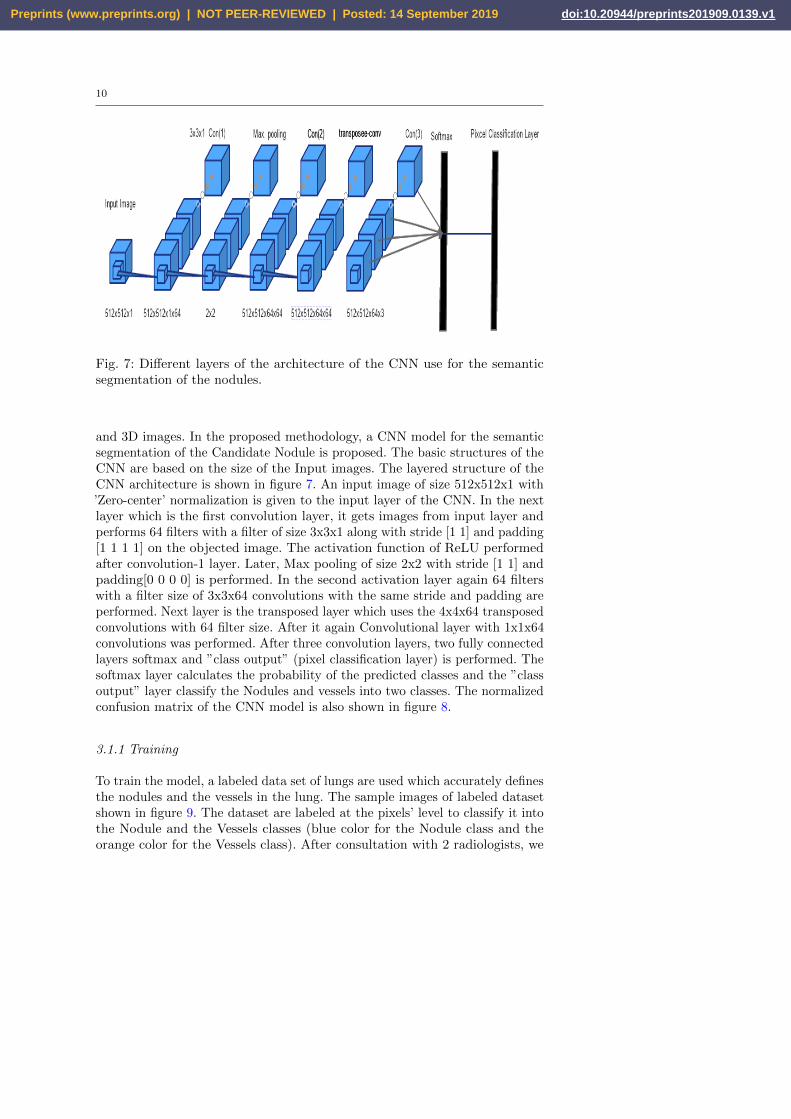
Fig. 7: Different layers of the architecture of the CNN use for the semanticsegmentation of the nodules.
and 3D images. In the proposed methodology, a CNN model for the semanticsegmentation of the Candidate Nodule is proposed. The basic structures of theCNN are based on the size of the Input images. The layered structure of theCNN architecture is shown in figure 7. An input image of size 512x512x1 with’Zero-center’ normalization is given to the input layer of the CNN. In the nextlayer which is the first convolution layer, it gets images from input layer andperforms 64 filters with a filter of size 3x3x1 along with stride [1 1] and padding[1 1 1 1] on the objected image. The activation function of ReLU performedafter convolution-1 layer. Later, Max pooling of size 2x2 with stride [1 1] andpadding[0 0 0 0] is performed. In the second activation layer again 64 filterswith a filter size of 3x3x64 convolutions with the same stride and padding areperformed. Next layer is the transposed layer which uses the 4x4x64 transposedconvolutions with 64 filter size. After it again Convolutional layer with 1x1x64convolutions was performed. After three convolution layers, two fully connectedlayers softmax and ”class output” (pixel classification layer) is performed. Thesoftmax layer calculates the probability of the predicted classes and the ”classoutput” layer classify the Nodules and vessels into two classes. The normalizedconfusion matrix of the CNN model is also shown in figure 8.
3.1.1 Training
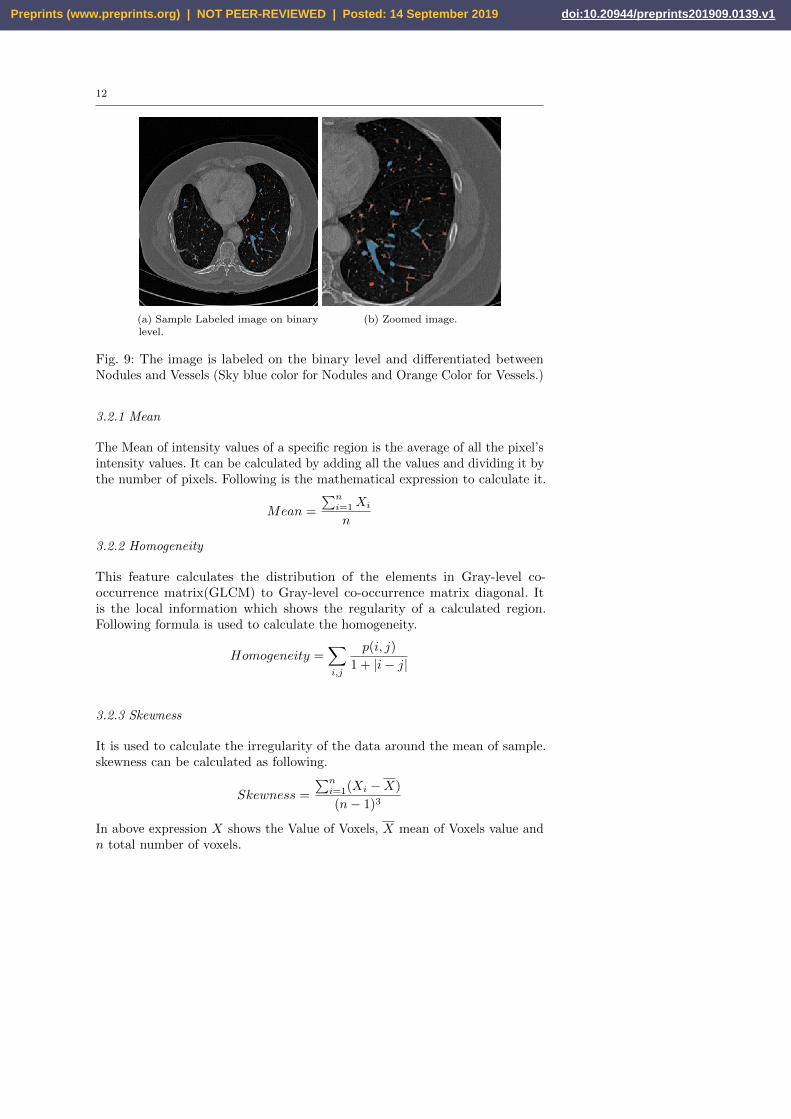
To train the model, a labeled data set of lungs are used which accurately definesthe nodules and the vessels in the lung. The sample images of labeled datasetshown in figure 9. The dataset are labeled at the pixels’ level to classify it intothe Nodule and the Vessels classes (blue color for the Nodule class and theorange color for the Vessels class). After consultation with 2 radiologists, we
Preprints (www.preprints.org) | NOT PEER-REVIEWED | Posted: 14 September 2019 Preprints (www.preprints.org) | NOT PEER-REVIEWED | Posted: 14 September 2019 doi:10.20944/preprints201909.0139.v1
11
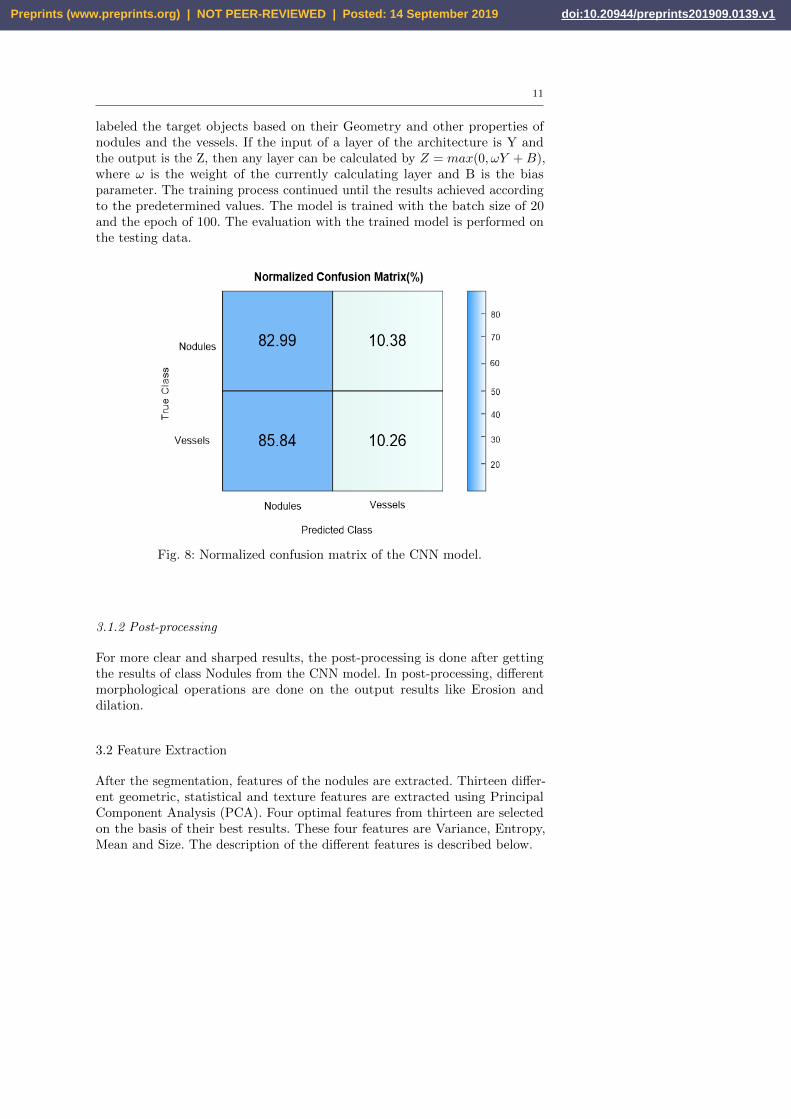
labeled the target objects based on their Geometry and other properties ofnodules and the vessels. If the input of a layer of the architecture is Y andthe output is the Z, then any layer can be calculated by Z = max(0, ωY +B),where ω is the weight of the currently calculating layer and B is the biasparameter. The training process continued until the results achieved accordingto the predetermined values. The model is trained with the batch size of 20and the epoch of 100. The evaluation with the trained model is performed onthe testing data.
Fig. 8: Normalized confusion matrix of the CNN model.
3.1.2 Post-processing
For more clear and sharped results, the post-processing is done after gettingthe results of class Nodules from the CNN model. In post-processing, differentmorphological operations are done on the output results like Erosion anddilation.
3.2 Feature Extraction
After the segmentation, features of the nodules are extracted. Thirteen differ-ent geometric, statistical and texture features are extracted using PrincipalComponent Analysis (PCA). Four optimal features from thirteen are selectedon the basis of their best results. These four features are Variance, Entropy,Mean and Size. The description of the different features is described below.
Preprints (www.preprints.org) | NOT PEER-REVIEWED | Posted: 14 September 2019 Preprints (www.preprints.org) | NOT PEER-REVIEWED | Posted: 14 September 2019 doi:10.20944/preprints201909.0139.v1
12
(a) Sample Labeled image on binarylevel.
(b) Zoomed image.
Fig. 9: The image is labeled on the binary level and differentiated betweenNodules and Vessels (Sky blue color for Nodules and Orange Color for Vessels.)
3.2.1 Mean
The Mean of intensity values of a specific region is the average of all the pixel’sintensity values. It can be calculated by adding all the values and dividing it bythe number of pixels. Following is the mathematical expression to calculate it.
Mean =
∑ni=1Xi
n
3.2.2 Homogeneity
This feature calculates the distribution of the elements in Gray-level co-occurrence matrix(GLCM) to Gray-level co-occurrence matrix diagonal. Itis the local information which shows the regularity of a calculated region.Following formula is used to calculate the homogeneity.
Homogeneity =∑i,j
p(i, j)
1 + |i− j|
3.2.3 Skewness
It is used to calculate the irregularity of the data around the mean of sample.skewness can be calculated as following.
Skewness =
∑ni=1(Xi −X)
(n− 1)3
In above expression X shows the Value of Voxels, X mean of Voxels value andn total number of voxels.
Preprints (www.preprints.org) | NOT PEER-REVIEWED | Posted: 14 September 2019 Preprints (www.preprints.org) | NOT PEER-REVIEWED | Posted: 14 September 2019 doi:10.20944/preprints201909.0139.v1
13
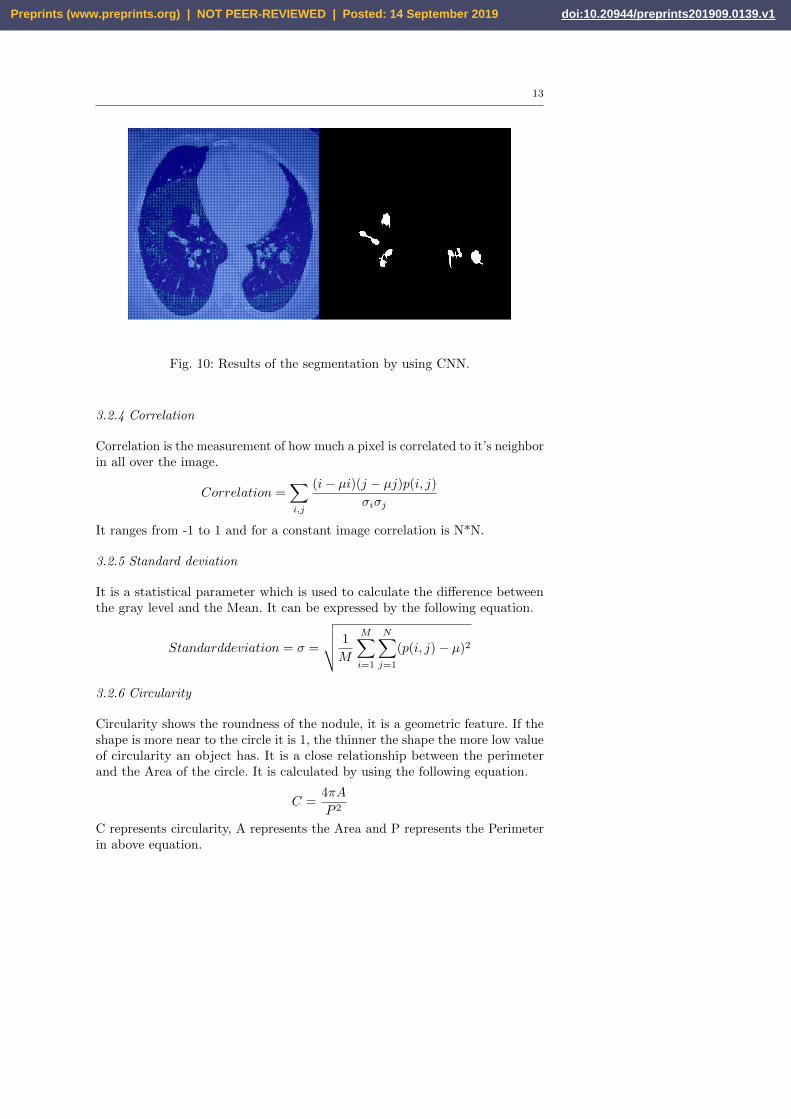
Fig. 10: Results of the segmentation by using CNN.
3.2.4 Correlation
Correlation is the measurement of how much a pixel is correlated to it’s neighborin all over the image.
Correlation =∑i,j
(i− µi)(j − µj)p(i, j)σiσj
It ranges from -1 to 1 and for a constant image correlation is N*N.
3.2.5 Standard deviation
It is a statistical parameter which is used to calculate the difference betweenthe gray level and the Mean. It can be expressed by the following equation.
Standarddeviation = σ =
√√√√ 1
M
M∑i=1
N∑j=1
(p(i, j)− µ)2
3.2.6 Circularity
Circularity shows the roundness of the nodule, it is a geometric feature. If theshape is more near to the circle it is 1, the thinner the shape the more low valueof circularity an object has. It is a close relationship between the perimeterand the Area of the circle. It is calculated by using the following equation.
C =4πA
P 2
C represents circularity, A represents the Area and P represents the Perimeterin above equation.
Preprints (www.preprints.org) | NOT PEER-REVIEWED | Posted: 14 September 2019 Preprints (www.preprints.org) | NOT PEER-REVIEWED | Posted: 14 September 2019 doi:10.20944/preprints201909.0139.v1
14
3.2.7 Energy
Energy feature is used to calculate the uniformity in the image. This is alsoknown as Uniformity of the image or the angular second moment. It rangesfrom 0 to 1. where 1 stands for the constant energy of an image.
Energy =∑i,j
p(i, j)2
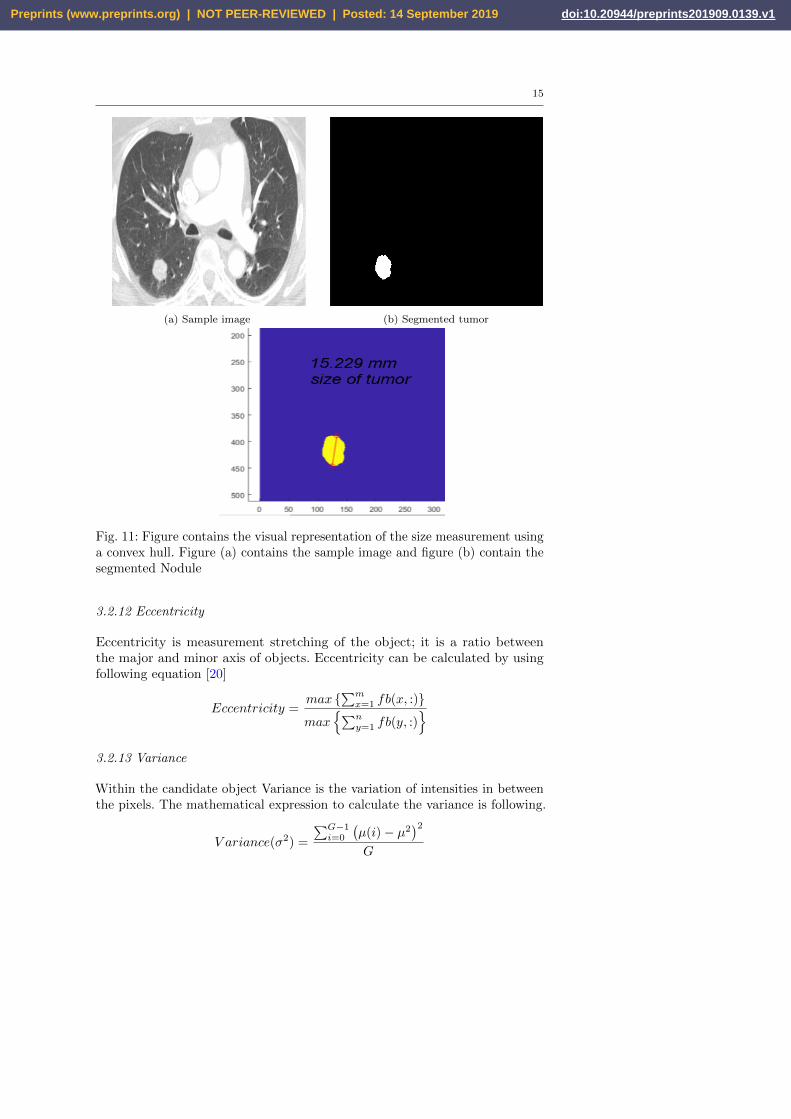
3.2.8 Size
Size is a very basic and important feature of the nodule, more important is tomeasure the size accurately. In the proposed methodology, the diameter of thetumor is measured by using the convex hull as shown in figure 11. It calculatesthe diameter of Nodules from every perspective and calculates the maximumdiameter precisely [4].
3.2.9 Inertia
It is a 3D texture feature of the image. It calculates values of intensity contrastwith the neighbor in a candidate. It can be calculated by using the followingequation.
Inertia =
G−1∑I=0
G−1∑j=0
(i− j)2p(i.j)
3.2.10 Extent
The extent feature is used to calculate how much a nodule is branched.It isalso a geometric feature and it is the ratio of the Area of the object and thearea of the bounding box. The bounding box shows the area of a possible smallrectangle which can enclose the object completely. It’s mathematical expressionis following.
E =Area of object
Area of enclosing Box
3.2.11 Entropy
It describes the randomness and it can be used to show the texture of theimage. Entropy shows the randomness in the Voxels in candidate Nodule. Itcan be calculated as follows.
Entropy(H) = −G−1∑I=0
G−1∑j=0
p(i, j)log2p[(i)]
Preprints (www.preprints.org) | NOT PEER-REVIEWED | Posted: 14 September 2019 Preprints (www.preprints.org) | NOT PEER-REVIEWED | Posted: 14 September 2019 doi:10.20944/preprints201909.0139.v1
15
(a) Sample image (b) Segmented tumor
Fig. 11: Figure contains the visual representation of the size measurement usinga convex hull. Figure (a) contains the sample image and figure (b) contain thesegmented Nodule
3.2.12 Eccentricity
Eccentricity is measurement stretching of the object; it is a ratio betweenthe major and minor axis of objects. Eccentricity can be calculated by usingfollowing equation [20]
Eccentricity =max {
∑mx=1 fb(x, :)}
max{∑n
y=1 fb(y, :)}
3.2.13 Variance
Within the candidate object Variance is the variation of intensities in betweenthe pixels. The mathematical expression to calculate the variance is following.
V ariance(σ2) =
∑G−1i=0
(µ(i)− µ2
)2G
Preprints (www.preprints.org) | NOT PEER-REVIEWED | Posted: 14 September 2019 Preprints (www.preprints.org) | NOT PEER-REVIEWED | Posted: 14 September 2019 doi:10.20944/preprints201909.0139.v1
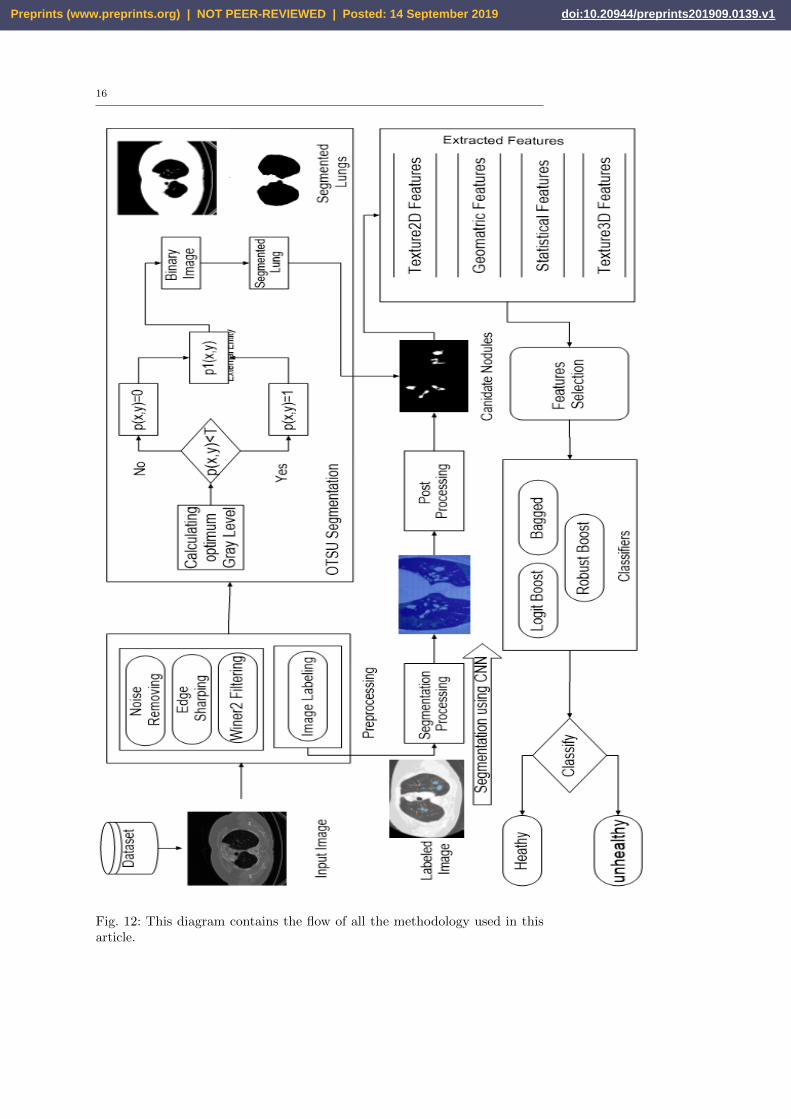
16
Fig. 12: This diagram contains the flow of all the methodology used in thisarticle.
Preprints (www.preprints.org) | NOT PEER-REVIEWED | Posted: 14 September 2019 Preprints (www.preprints.org) | NOT PEER-REVIEWED | Posted: 14 September 2019 doi:10.20944/preprints201909.0139.v1

17
3D Texture Features 2D Texture Features Geometric Statistical
Correlation Mean Size in mm Homogeneity
Inertia Skewness Circularity Standard Deviation
Entropy Variance Eccentricity Energy
Extent
Table 3: Table contain different category of features
Fig. 13: Figure contain different extracted and selected features and the namesof classifier which used to classify the candidate objects.
3.3 Feature Selection
By using Principal Component Analysis (PCA), 13 different features wereextracted in the feature extraction phase. However, we choose four featuressuch as Variance, Entropy, Mean and the Size in mm. Size is one of the keyfeatures which is precisely measured using the Convex hull.
3.4 Classification
In the classification stages, we used 9 different classifiers such as Logist Boost,Bagged and Support Vector Machine (SVM). Detail is shown in figure.13. Byusing different selected features all classifiers are trained and then tested onthe same dataset. The dataset partitioned as 70:30, in which 70% is used forthe training and the 30% is used for the testing purpose. In the proposedmethodology, the 10-fold Cross-validation technique is used, this technique is
Preprints (www.preprints.org) | NOT PEER-REVIEWED | Posted: 14 September 2019 Preprints (www.preprints.org) | NOT PEER-REVIEWED | Posted: 14 September 2019 doi:10.20944/preprints201909.0139.v1

18
10-Cross fold 70% Training and 30% Testing on Dataset
Classifiers Accuracy %Loss %Accuracy %Miss-
Classification RateRecall
False
Positive Rate
True
Negative Rate
Logit Boost 99.23 0.77 97.5 2.5 96.875 0 100
Bagged 99.23 0.77 97.5 2.5 96.875 0 100
Robust Boost 99.23 0.77 97.5 2.5 96.875 0 100
SVM(Binary) 98.47 1.53 95 5 93.125 11.11 88.99
Gentle Boost 97.70 2.3 97.5 2.5 96.875 0 100
Fine KNN 97.70 2.3 92.5 7.5 93.75 12.5 87.5
SVM(Gaussian Kernel)96.64 3.36 92.5 7.5 93.75 12.5 87.5
Medium KNN 96.18 3.82 87.5 12.5 93.75 16.67 83.3
Subspace 91.60 8.4 85 15 87.87 28.57 71.4
Table 4: Nine different classifiers with their result details.
Work YearAccuracySensitivitySpecificityClassifier
[2] 201596.6 96.7 96.3 SVM
[9] 201770.5 77.7 69.5 Simple Rule Based Classifier
[14] 201788.0 84.6 NA Non-linear
[18] 201898.9 98.4 98.7 Random Forest
[32] 201997.2 96.0 97.3 LdcNet-FL
[28] 201993.25 93.12 91.37 RGBPCANet
Proposed Framework201999.23 96.88 100 Logit-Boost
Table 5: The comparison of different Classifier’s results.
used for the validation of the predictive models. In Ten-fold cross-validationtechnique, the dataset is divided into ten subsets in which each subset containboth cancerous and non-cancerous nodules. Multiple classifiers are used for theclassification purpose, every classifier has its own optimized way of work, theSVM classifier is most popular classifier. It is used for 2D classification andcan also be used for multi-dimensional classification with the help of KernelCustomization, Like Gaussian kernel and Polynomial kernel [12].
Bagging and boosting methods are widely used for classification, bootstrap-ping is used in bagging whereas the Boosting is based on sample re-weightingmethod. Boosting technique is originally designed for the classification prob-lems, by using this technique a more robust ensemble is produced by combiningthe outputs of many weak classifiers. Logitboost uses booting algorithms inwhich binomial deviance is minimized, it provides best average accuracy evenfor poor separable classes[25]. Boosting is defined by Freund and Schapire(1997)as a “general problem of creating a very accurate prediction rule by combiningrough and moderately inaccurate rules of thumb”[24].
Adaboost family of algorithms and bootstrap aggregation are 2 most com-mon techniques for constructing ensembles. Both methods take a learningalgorithm and recall it multi times with changing training sets whereas in
Preprints (www.preprints.org) | NOT PEER-REVIEWED | Posted: 14 September 2019 Preprints (www.preprints.org) | NOT PEER-REVIEWED | Posted: 14 September 2019 doi:10.20944/preprints201909.0139.v1
19
(a) Confusion Matrix of decision treeusing Robust Boost ensemble. (b) Confusion Matrix of Bagged.
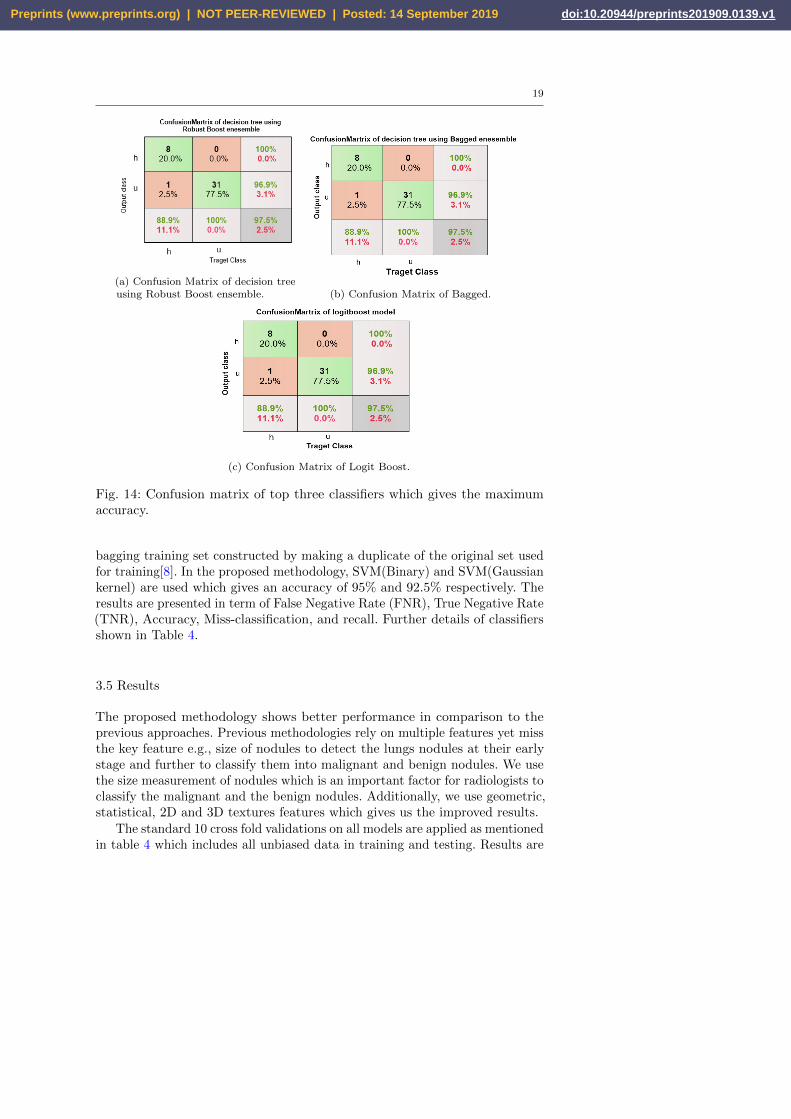
(c) Confusion Matrix of Logit Boost.
Fig. 14: Confusion matrix of top three classifiers which gives the maximumaccuracy.
bagging training set constructed by making a duplicate of the original set usedfor training[8]. In the proposed methodology, SVM(Binary) and SVM(Gaussiankernel) are used which gives an accuracy of 95% and 92.5% respectively. Theresults are presented in term of False Negative Rate (FNR), True Negative Rate(TNR), Accuracy, Miss-classification, and recall. Further details of classifiersshown in Table 4.
3.5 Results
The proposed methodology shows better performance in comparison to theprevious approaches. Previous methodologies rely on multiple features yet missthe key feature e.g., size of nodules to detect the lungs nodules at their earlystage and further to classify them into malignant and benign nodules. We usethe size measurement of nodules which is an important factor for radiologists toclassify the malignant and the benign nodules. Additionally, we use geometric,statistical, 2D and 3D textures features which gives us the improved results.
The standard 10 cross fold validations on all models are applied as mentionedin table 4 which includes all unbiased data in training and testing. Results are
Preprints (www.preprints.org) | NOT PEER-REVIEWED | Posted: 14 September 2019 Preprints (www.preprints.org) | NOT PEER-REVIEWED | Posted: 14 September 2019 doi:10.20944/preprints201909.0139.v1
20
displayed in 3. All classifiers have a range of accuracies from 90.11% to 99.23%.The maximum accuracy using (70% as training and 30% as testing) is 97.5%with a true negative rate of 100% and the false positive rate is 0, its confusionmatrix is shown in figure 14c. The accuracy of 10-fold Cross-validation is99.23% with a loss of 0.77% using Logit Boost. Classification with decisiontree with bagged ensemble also gives a good result which is 99.90% in terms ofaccuracy using 10-cross fold. The same classifier provides 97.5% using 70% ofdataset as training and 30% as testing, its confusion matrix is shown in figure14b.
From experiments, we have achieved 99.23% accuracy which is significantlybetter than the previously reported score as 96.6% [2],70.5%[9],88.0%[14],98.9%[18],97.2%[32],93.25% [28]. The resultant sensitivity rate is 96.875% of differentclassifiers which is also dominant in terms of sensitivity because the sensitivityis much better than others.In previous methodologies sensitivity rate is lessthen our results. Whereas the sensitivity of other methodologies are 96.6% [2],77.7% [9], 84.6% [14], 98.4% [18], 96.0% [32], 93.12% [28].
4 Conclusion
In this study, an efficient approach is proposed to detect the malignant andthe benign nodules. We use semantic segmentation based upon convolutionalneural network for the identification of vessels and candidate nodules fromthe lungs region. Our approach has shown better performance by comparingwith the previous approaches mentioned in the background section and resultssection with the reduction of false positives. Our methodology provides 99.23%accuracy score using 10 fold cross-validation with a loss of 0.77%. The proposedmethod would potentially be helpful to radiologists in the classification ofmalignant and benign nodules.
Compliance with Ethical Standards
Conflict of Interest The authors declare that they have no conflict of interest.
Ethical approval This article does not contain any studies with humanparticipants or animals performed by any of the authors.
Informed consent Informed consent was obtained from all individual partici-pants included in the study.
References
1. (2019) World health organization (2019, 9/4/2019), cancer fact sheetavailable:. URL https://www.who.int/en/news-room/fact-sheets/
detail/cancer’
Preprints (www.preprints.org) | NOT PEER-REVIEWED | Posted: 14 September 2019 Preprints (www.preprints.org) | NOT PEER-REVIEWED | Posted: 14 September 2019 doi:10.20944/preprints201909.0139.v1

21
2. Akram S, Javed MY, Qamar U, Khanum A, Hassan A (2015) Artificial neu-ral network based classification of lungs nodule using hybrid features fromcomputerized tomographic images. Applied Mathematics & InformationSciences 9(1):183
3. Akram S, Javed MY, Akram MU, Qamar U, Hassan A (2016) Pulmonarynodules detection and classification using hybrid features from computerizedtomographic images. Journal of Medical Imaging and Health Informatics6(1):252–259
4. Bankier AA, MacMahon H, Goo JM, Rubin GD, Schaefer-Prokop CM,Naidich DP (2017) Recommendations for measuring pulmonary nodules atct: a statement from the fleischner society. Radiology 285(2):584–600
5. de Carvalho Filho AO, Silva AC, de Paiva AC, Nunes RA, Gattass M(2017) Lung-nodule classification based on computed tomography usingtaxonomic diversity indexes and an svm. Journal of Signal ProcessingSystems 87(2):179–196
6. Chen S, Yao L, Chen B (2016) A parameterized logarithmic image process-ing method with laplacian of gaussian filtering for lung nodule enhance-ment in chest radiographs. Medical & biological engineering & computing54(11):1793–1806
7. Demir O, Yılmaz Camurcu A (2015) Computer-aided detection of lungnodules using outer surface features. Bio-medical materials and engineering26(s1):S1213–S1222
8. Dietterich TG (2000) An experimental comparison of three methods for con-structing ensembles of decision trees: Bagging, boosting, and randomization.Machine learning 40(2):139–157
9. El-Regaily SA, Salem MAM, Aziz MHA, Roushdy MI (2017) Lung nodulesegmentation and detection in computed tomography. In: 2017 Eighth In-ternational Conference on Intelligent Computing and Information Systems(ICICIS), IEEE, pp 72–78
10. El-Regaily SA, Salem MA, Abdel Aziz MH, Roushdy MI (2018) Survey ofcomputer aided detection systems for lung cancer in computed tomography.Current Medical Imaging Reviews 14(1):3–18
11. Elsayed O, Mahar K, Kholief M, Khater HA (2015) Automatic detectionof the pulmonary nodules from ct images. In: SAI Intelligent SystemsConference (IntelliSys), 2015, IEEE, pp 742–746
12. Foody GM, Mathur A (2004) A relative evaluation of multiclass imageclassification by support vector machines. IEEE Transactions on geoscienceand remote sensing 42(6):1335–1343
13. Froz BR, de Carvalho Filho AO, Silva AC, de Paiva AC, Nunes RA, GattassM (2017) Lung nodule classification using artificial crawlers, directionaltexture and support vector machine. Expert Systems with Applications69:176–188
14. Hancock MC, Magnan JF (2017) Predictive capabilities of statistical learn-ing methods for lung nodule malignancy classification using diagnosticimage features: An investigation using the lung image database consortiumdataset. In: Medical Imaging 2017: Computer-Aided Diagnosis, Interna-
Preprints (www.preprints.org) | NOT PEER-REVIEWED | Posted: 14 September 2019 Preprints (www.preprints.org) | NOT PEER-REVIEWED | Posted: 14 September 2019 doi:10.20944/preprints201909.0139.v1

22
tional Society for Optics and Photonics, vol 10134, p 101342515. Hoo-Chang S, Roth HR, Gao M, Lu L, Xu Z, Nogues I, Yao J, Mollura
D, Summers RM (2016) Deep convolutional neural networks for computer-aided detection: Cnn architectures, dataset characteristics and transferlearning. IEEE transactions on medical imaging 35(5):1285
16. Huang X, Shan J, Vaidya V (2017) Lung nodule detection in ct using 3dconvolutional neural networks. In: Biomedical Imaging (ISBI 2017), 2017IEEE 14th International Symposium on, IEEE, pp 379–383
17. Hussain MA, Ansari TM, Gawas PS, Chowdhury NN (2015) Lung cancerdetection using artificial neural network & fuzzy clustering. InternationalJournal of Advanced Research in Computer and Communication Engineer-ing 4(3)
18. Jaffar MA, Zia MS, Hussain M, Siddiqui AB, Akram S, Jamil U (2018)An ensemble shape gradient features descriptor based nodule detectionparadigm: a novel model to augment complex diagnostic decisions assistance.Multimedia Tools and Applications pp 1–27
19. Javaid M, Javid M, Rehman MZU, Shah SIA (2016) A novel approachto cad system for the detection of lung nodules in ct images. Computermethods and programs in biomedicine 135:125–139
20. Krishnamurthy S, Narasimhan G, Rengasamy U (2016) Three-dimensionallung nodule segmentation and shape variance analysis to detect lung cancerwith reduced false positives. Proceedings of the Institution of MechanicalEngineers, Part H: Journal of Engineering in Medicine 230(1):58–70
21. Li W, Cao P, Zhao D, Wang J (2016) Pulmonary nodule classificationwith deep convolutional neural networks on computed tomography images.Computational and mathematical methods in medicine 2016
22. Lu L, Tan Y, Schwartz LH, Zhao B (2015) Hybrid detection of lung noduleson ct scan images. Medical physics 42(9):5042–5054
23. Mathew ST, Nachamai M (2016) Methodical in methodical investigation offiltering algorithms for human brain mri. International Journal of ControlTheory and Applications
24. Parvin H, MirnabiBaboli M, Alinejad-Rokny H (2015) Proposing a clas-sifier ensemble framework based on classifier selection and decision tree.Engineering Applications of Artificial Intelligence 37:34–42
25. Ramırez J, Gorriz JM, Ortiz A, Padilla P, Martınez-Murcia FJ, InitiativeADN, et al. (2016) Ensemble tree learning techniques for magnetic res-onance image analysis. In: Innovation in Medicine and Healthcare 2015,Springer, pp 395–404
26. Setio AA, Jacobs C, Gelderblom J, Ginneken B (2015) Automatic detectionof large pulmonary solid nodules in thoracic ct images. Medical physics42(10):5642–5653
27. Shaukat F, Raja G, Gooya A, Frangi AF (2017) Fully automatic detectionof lung nodules in ct images using a hybrid feature set. Medical physics44(7):3615–3629
28. Shaukat F, Raja G, Ashraf R, Khalid S, Ahmad M, Ali A (2019) Artificialneural network based classification of lung nodules in ct images using
Preprints (www.preprints.org) | NOT PEER-REVIEWED | Posted: 14 September 2019 Preprints (www.preprints.org) | NOT PEER-REVIEWED | Posted: 14 September 2019 doi:10.20944/preprints201909.0139.v1

23
intensity, shape and texture features. Journal of Ambient Intelligence andHumanized Computing pp 1–15
29. Shen S, Bui AA, Cong J, Hsu W (2015) An automated lung segmentationapproach using bidirectional chain codes to improve nodule detectionaccuracy. Computers in biology and medicine 57:139–149
30. Siegel RL, Miller KD, Jemal A (2019) Cancer statistics, 2019. CA: a cancerjournal for clinicians 69(1):7–34
31. Teramoto A, Fujita H, Yamamuro O, Tamaki T (2016) Automated de-tection of pulmonary nodules in pet/ct images: Ensemble false-positivereduction using a convolutional neural network technique. Medical physics43(6Part1):2821–2827
32. Tran GS, Nghiem TP, Nguyen VT, Luong CM, Burie JC (2019) Improvingaccuracy of lung nodule classification using deep learning with focal loss.Journal of Healthcare Engineering 2019
33. Valente IRS, Cortez PC, Neto EC, Soares JM, de Albuquerque VHC,Tavares JMR (2016) Automatic 3d pulmonary nodule detection in ctimages: a survey. Computer methods and programs in biomedicine 124:91–107
34. Yuan J, Liu X, Hou F, Qin H, Hao A (2018) Hybrid-feature-guided lungnodule type classification on ct images. Computers & Graphics 70:288–299
Preprints (www.preprints.org) | NOT PEER-REVIEWED | Posted: 14 September 2019 Preprints (www.preprints.org) | NOT PEER-REVIEWED | Posted: 14 September 2019 doi:10.20944/preprints201909.0139.v1