plasmodium vivax readiness to transmit - bmc systems biology
TRANSCRIPT
RESEARCH ARTICLE Open Access
Plasmodium vivax readiness to transmit:implication for malaria eradicationSwamy Rakesh Adapa1†, Rachel A. Taylor2†, Chengqi Wang1, Richard Thomson-Luque1, Leah R. Johnson2 andRays H. Y. Jiang1*
Abstract
Background: The lack of a continuous long-term in vitro culture system for Plasmodium vivax severely limits ourknowledge of pathophysiology of the most widespread malaria parasite. To gain direct understanding of P. vivaxhuman infections, we used Next Generation Sequencing data mining to unravel parasite in vivo expression profilesfor P. vivax, and P. falciparum as comparison.
Results: We performed cloud and local computing to extract parasite transcriptomes from publicly available rawdata of human blood samples. We developed a Poisson Modelling (PM) method to confidently identify parasitederived transcripts in mixed RNAseq signals of infected host tissues. We successfully retrieved and reconstructedparasite transcriptomes from infected patient blood as early as the first blood stage cycle; and the same methodologydid not recover any significant signal from controls. Surprisingly, these first generation blood parasites already showstrong signature of transmission, which indicates the commitment from asexual-to-sexual stages. Further, we place theresults within the context of P. vivax’s complex life cycle, by developing mathematical models for P. vivax and P.falciparum and using sensitivity analysis assess the relative epidemiological impact of possible early stagetransmission.
Conclusion: The study uncovers the earliest onset of P. vivax blood pathogenesis and highlights the challenges of P.vivax eradication programs.
Keywords: Malaria, RNAseq, Mathematical modelling, Disease transmission, Plasmodium vivax
BackgroundPlasmodium vivax (P. vivax) infection has the mostwidespread distribution across different continents ofany malaria parasite, with up to 2.6 billion people esti-mated to be at risk [1]. It can lead to severe disease anddeath but, despite the high disease burden [2], there is alack of in-depth understanding of the distinct pathogen-esis of P. vivax. This has resulted in a lack of targetedcontrol measures. Thus, as malaria cases decline over-all, the proportion of cases attributable to P. vivax ison the rise [3].Human malaria infection starts with the inoculation of
sporozoites into the skin dermis through the proboscis
of female Anopheles mosquitoes; the sporozoites arehosted in her salivary glands. Some part of the inoculumenters the bloodstream and within a few minutes theyinvade hepatocytes in the liver [4, 5]. During the nextfive to 8 days (depending on the Plasmodium spp), theparasite transforms into a large exoerythrocytic form,packed with thousands of merozoites inside a parasito-phorous vacuolar membrane (PVM). As the parasite ma-tures the membrane breaks down into small packets ofvesicles filled with merozoites. These are released intothe bloodstream, leading to erythrocytic invasion [6]. Inthe next 48 h (depending on species) the parasite under-goes mitotic division and cytoplasmic growth inside theerythrocyte. They may develop either directly into aschizont (asexual) or gametocyte (sexual) [7]. For P. fal-ciparum the sexual stages are not found in the peripheryuntil after multiple blood stage cycles because gameto-genesis, which requires bone marrow sequestration,takes 10 to 12 days, to achieve the fully transmissible
* Correspondence: [email protected]†Swamy Rakesh Adapa and Rachel A. Taylor contributed equally to this work.1Department of Global Health (GH) & Center for Drug Discovery andInnovation (CDDI), College of Public Health, University of South Florida,Tampa, FL 33612, USAFull list of author information is available at the end of the article
© The Author(s). 2019 Open Access This article is distributed under the terms of the Creative Commons Attribution 4.0International License (http://creativecommons.org/licenses/by/4.0/), which permits unrestricted use, distribution, andreproduction in any medium, provided you give appropriate credit to the original author(s) and the source, provide a link tothe Creative Commons license, and indicate if changes were made. The Creative Commons Public Domain Dedication waiver(http://creativecommons.org/publicdomain/zero/1.0/) applies to the data made available in this article, unless otherwise stated.
Adapa et al. BMC Systems Biology (2019) 13:5 https://doi.org/10.1186/s12918-018-0669-4
stage V gametocyte [8]. In contrast, the appearance of P.vivax sexual stages is believed to be much earlier [7].However, whether sexual commitment in P. vivax occursearly still needs to be determined.P. vivax has a complex transmission cycle with distinct
biological features compared to other malaria parasites,most notably: the high prevalence of asymptomatic car-riers and the potential for disease relapses [7, 9] and ga-metocytes in circulation at the very beginning ofinfections [10]. In contrast to the better studied Plasmo-dium falciparum, P. vivax has the unique ability to re-main as dormant hypnozoites in a hepatocyte in theliver and, in the future, to reactivate a blood stage infec-tion leading to what is termed a clinical relapse [7, 11].Unlike P. falciparum, there are currently no establishedlaboratory methods to perform continuous long-termculture of P. vivax in vitro [12]. Furthermore, in P.vivax, the merozoites from both exo-erythrocytic andintra-erythrocytic schizogony have strong preferences ofinfecting reticulocytes [12], which typically compriseabout 1 % of red blood cells. This leads to low parasit-emia rates in peripheral circulation. The host require-ment of human reticulocytes and many other technicalchallenges hampers studies of this parasite. Theseunique P. vivax life cycle characteristics pose major chal-lenges for the understanding of P. vivax pathogenesisand hence the elimination of malaria worldwide [7].We propose that better understanding of these complex
characteristics of P. vivax can be achieved by employing avariety of new and established computational and mathem-atical methods. We utilise cloud computing to achieve this,as we believe that the cloud has the potential to transformfuture analyses of sequencing data. These tools can uncovertraits of P. vivax that cannot be found experimentally aswell as teasing apart the different roles of these traits intransmission of P. vivax at the population level.In this study (Fig. 1), we examined patient blood se-
quencing data using data mining techniques to recoverP. vivax transcripts in the earliest time point possibleduring the blood stage, i.e. immediately after sporozoiteinvasion and the liver stage parasite ruptures into theblood stream. We discovered a very early gametogenesisexpression signature, indicating the possibility of veryearly sexual commitment and possible transmission. Toevaluate the epidemiological impact of this possible earlytransmission, we constructed a novel mathematicalmodel of P. vivax transmission, which quantifies the ef-fect of relapses, asymptomatic carriers and early trans-mission. We used sensitivity analysis to compare all ofthese characteristics of the P. vivax life cycle on thespread of the disease at a population level. Combiningall of these methods allows us to explain why P. vivaxtransmits so successfully and hence why it may be themost difficult malaria to eradicate.
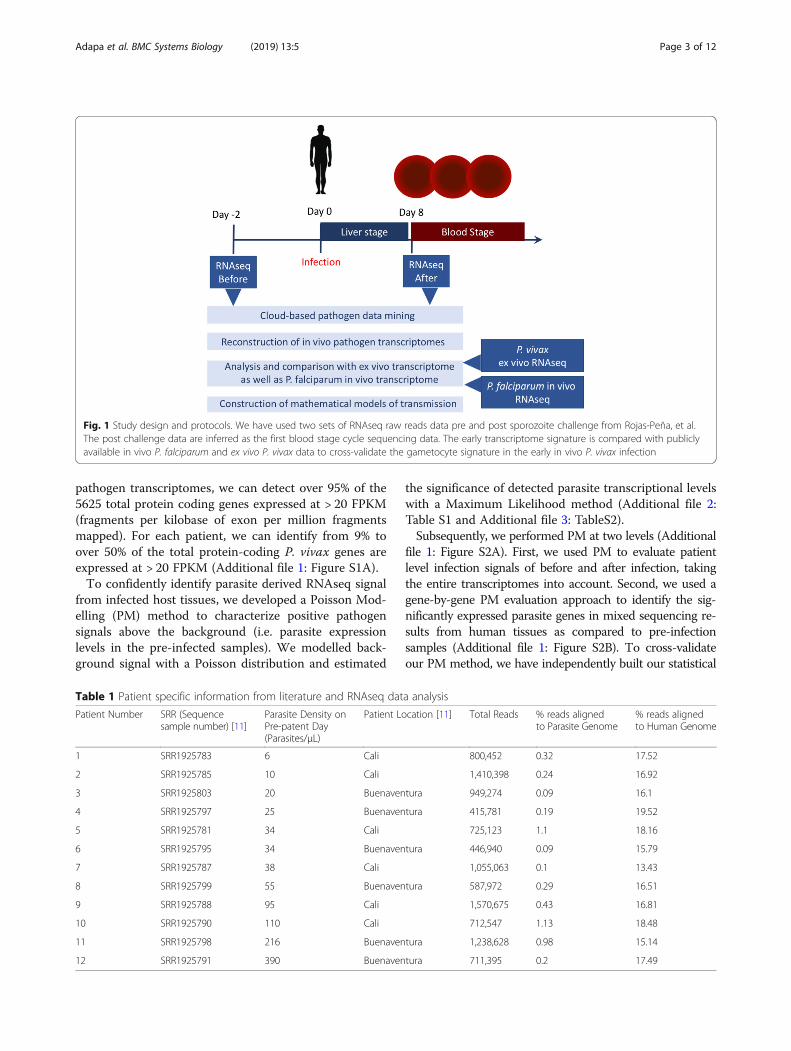
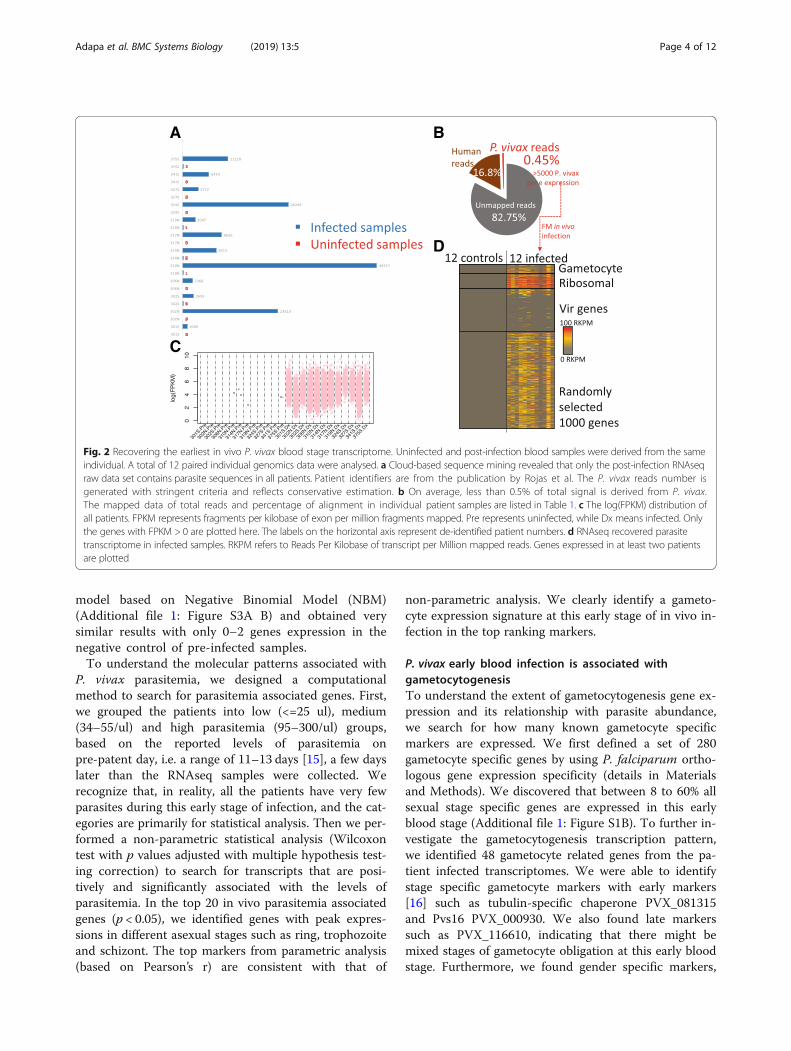
ResultsUsing cloud-based computational pipelines to mineparasite derived transcriptTo understand P. vivax in vivo pathogenesis, we firstutilized a set of publicly available NGS (Next GenerationSequencing) raw data from Rojas-Pina et al. [13] that ex-amined human immune responses against malaria. Weperformed computational analysis to extract the lowlevels of parasite signals from the raw sequencing data,by using pre-infection data as negative controls (Fig. 1).The study by Rojas-Pina et al. performed sporozoitechallenge on 12 volunteers with a single source of P.vivax, and generated whole blood RNAseq before andafter the challenge. The post-infection RNAseq was pro-duced around day 9 (diagnosis day), i.e., the first bloodstage cycle after the liver stage infection which usuallylasts for about 6–7 days [4, 5]. Due to the very low levelsof parasitemia at this time point, we first used acloud-based data mining pipeline to obtain pathogen se-quences (P. vivax) in order to investigate the feasibilityof our project. We deployed the program PathoScope2.0 in the Amazon Elastic Compute Cloud (AmazonEC2: aws.amazon.com/ec2), due to the computationalscalability that can be achieved within a few minutes.We mapped the entire set of raw sequencing reads tothe NCBI NR(Non-Redundant) reference sequences andset P. vivax reference (Sal I) as targets. We have alsoused other pathogens such as viruses and bacteria asnon-targets to increase the search specificity. From atotal of 12 pairs of pre and post infection RNAseq rawsequencing reads data sets, we successfully detected P.vivax sequences from 1000 to almost 50,000 reads inpost-infection samples (Table 1) (Fig. 2a). In contrast,none of the pre-infection samples gave a significantamount of reads (> 10).
Reconstruction of P. vivax in vivo transcriptome from veryearly blood stage infectionNext, we used the Tuxedo RNAseq pipeline [14] to re-construct transcriptomes from the 12 post-infectionsamples, which is deployed in USF research computingcluster. We aligned the entire sequence data to P. vivaxSal 1 and Human (GHRc37) reference genome and esti-mated the transcript abundances. The majority of theraw reads cannot be assigned to any references, primar-ily due to reads quality and possibly a small amount be-longing to unknown genomes and the Phix179 controlgenome generally used during sequencing library con-struction. Reads originating from Phix were filtered priorto implementation of the Tuxedo RNAseq pipeline. Anaverage of 16.8% of the reads can be mapped to humangenome reference GRCh37. On average only 0.45% totalreads on average mapped to the P. vivax reference gen-ome (Fig. 2b). From the 12 post-infection RNAseq
Adapa et al. BMC Systems Biology (2019) 13:5 Page 2 of 12
pathogen transcriptomes, we can detect over 95% of the5625 total protein coding genes expressed at > 20 FPKM(fragments per kilobase of exon per million fragmentsmapped). For each patient, we can identify from 9% toover 50% of the total protein-coding P. vivax genes areexpressed at > 20 FPKM (Additional file 1: Figure S1A).To confidently identify parasite derived RNAseq signal
from infected host tissues, we developed a Poisson Mod-elling (PM) method to characterize positive pathogensignals above the background (i.e. parasite expressionlevels in the pre-infected samples). We modelled back-ground signal with a Poisson distribution and estimated
the significance of detected parasite transcriptional levelswith a Maximum Likelihood method (Additional file 2:Table S1 and Additional file 3: TableS2).Subsequently, we performed PM at two levels (Additional
file 1: Figure S2A). First, we used PM to evaluate patientlevel infection signals of before and after infection, takingthe entire transcriptomes into account. Second, we used agene-by-gene PM evaluation approach to identify the sig-nificantly expressed parasite genes in mixed sequencing re-sults from human tissues as compared to pre-infectionsamples (Additional file 1: Figure S2B). To cross-validateour PM method, we have independently built our statistical
Table 1 Patient specific information from literature and RNAseq data analysis
Patient Number SRR (Sequencesample number) [11]
Parasite Density onPre-patent Day(Parasites/μL)
Patient Location [11] Total Reads % reads alignedto Parasite Genome
% reads alignedto Human Genome
1 SRR1925783 6 Cali 800,452 0.32 17.52
2 SRR1925785 10 Cali 1,410,398 0.24 16.92
3 SRR1925803 20 Buenaventura 949,274 0.09 16.1
4 SRR1925797 25 Buenaventura 415,781 0.19 19.52
5 SRR1925781 34 Cali 725,123 1.1 18.16
6 SRR1925795 34 Buenaventura 446,940 0.09 15.79
7 SRR1925787 38 Cali 1,055,063 0.1 13.43
8 SRR1925799 55 Buenaventura 587,972 0.29 16.51
9 SRR1925788 95 Cali 1,570,675 0.43 16.81
10 SRR1925790 110 Cali 712,547 1.13 18.48
11 SRR1925798 216 Buenaventura 1,238,628 0.98 15.14
12 SRR1925791 390 Buenaventura 711,395 0.2 17.49
Fig. 1 Study design and protocols. We have used two sets of RNAseq raw reads data pre and post sporozoite challenge from Rojas-Peña, et al.The post challenge data are inferred as the first blood stage cycle sequencing data. The early transcriptome signature is compared with publiclyavailable in vivo P. falciparum and ex vivo P. vivax data to cross-validate the gametocyte signature in the early in vivo P. vivax infection
Adapa et al. BMC Systems Biology (2019) 13:5 Page 3 of 12
model based on Negative Binomial Model (NBM)(Additional file 1: Figure S3A B) and obtained verysimilar results with only 0–2 genes expression in thenegative control of pre-infected samples.To understand the molecular patterns associated with
P. vivax parasitemia, we designed a computationalmethod to search for parasitemia associated genes. First,we grouped the patients into low (<=25 ul), medium(34–55/ul) and high parasitemia (95–300/ul) groups,based on the reported levels of parasitemia onpre-patent day, i.e. a range of 11–13 days [15], a few dayslater than the RNAseq samples were collected. Werecognize that, in reality, all the patients have very fewparasites during this early stage of infection, and the cat-egories are primarily for statistical analysis. Then we per-formed a non-parametric statistical analysis (Wilcoxontest with p values adjusted with multiple hypothesis test-ing correction) to search for transcripts that are posi-tively and significantly associated with the levels ofparasitemia. In the top 20 in vivo parasitemia associatedgenes (p < 0.05), we identified genes with peak expres-sions in different asexual stages such as ring, trophozoiteand schizont. The top markers from parametric analysis(based on Pearson’s r) are consistent with that of
non-parametric analysis. We clearly identify a gameto-cyte expression signature at this early stage of in vivo in-fection in the top ranking markers.
P. vivax early blood infection is associated withgametocytogenesisTo understand the extent of gametocytogenesis gene ex-pression and its relationship with parasite abundance,we search for how many known gametocyte specificmarkers are expressed. We first defined a set of 280gametocyte specific genes by using P. falciparum ortho-logous gene expression specificity (details in Materialsand Methods). We discovered that between 8 to 60% allsexual stage specific genes are expressed in this earlyblood stage (Additional file 1: Figure S1B). To further in-vestigate the gametocytogenesis transcription pattern,we identified 48 gametocyte related genes from the pa-tient infected transcriptomes. We were able to identifystage specific gametocyte markers with early markers[16] such as tubulin-specific chaperone PVX_081315and Pvs16 PVX_000930. We also found late markerssuch as PVX_116610, indicating that there might bemixed stages of gametocyte obligation at this early bloodstage. Furthermore, we found gender specific markers,
A B
D
C
Fig. 2 Recovering the earliest in vivo P. vivax blood stage transcriptome. Uninfected and post-infection blood samples were derived from the sameindividual. A total of 12 paired individual genomics data were analysed. a Cloud-based sequence mining revealed that only the post-infection RNAseqraw data set contains parasite sequences in all patients. Patient identifiers are from the publication by Rojas et al. The P. vivax reads number isgenerated with stringent criteria and reflects conservative estimation. b On average, less than 0.5% of total signal is derived from P. vivax.The mapped data of total reads and percentage of alignment in individual patient samples are listed in Table 1. c The log(FPKM) distribution ofall patients. FPKM represents fragments per kilobase of exon per million fragments mapped. Pre represents uninfected, while Dx means infected. Onlythe genes with FPKM > 0 are plotted here. The labels on the horizontal axis represent de-identified patient numbers. d RNAseq recovered parasitetranscriptome in infected samples. RKPM refers to Reads Per Kilobase of transcript per Million mapped reads. Genes expressed in at least two patientsare plotted
Adapa et al. BMC Systems Biology (2019) 13:5 Page 4 of 12
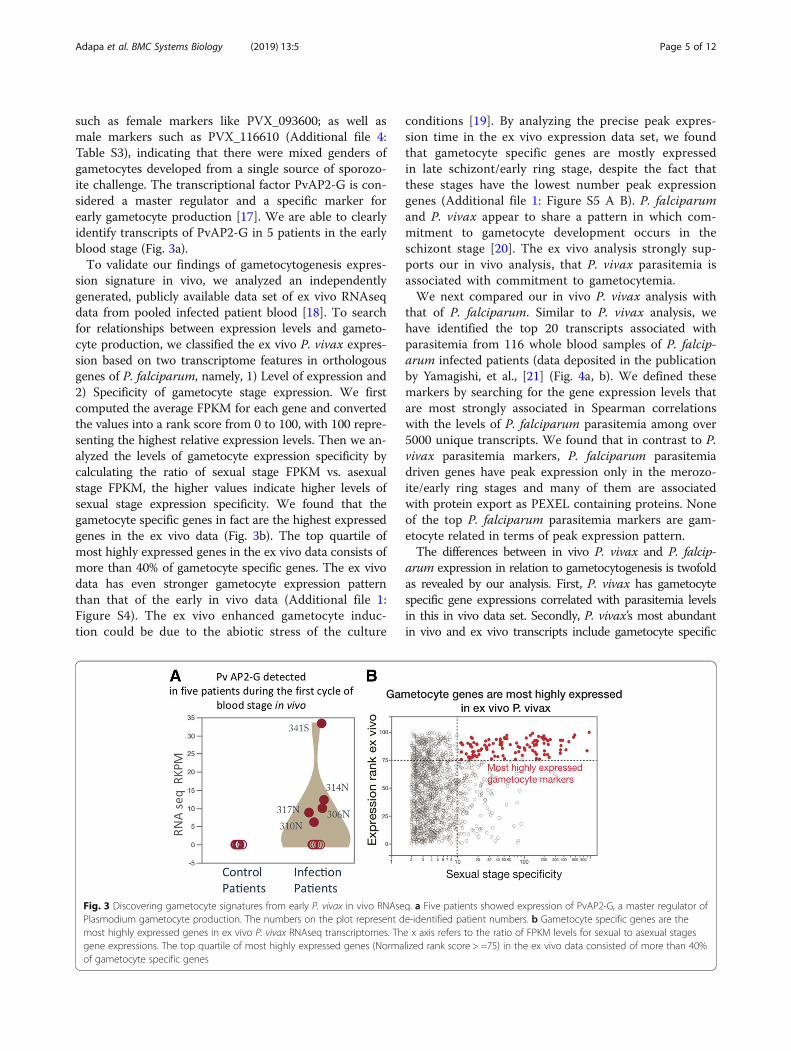
such as female markers like PVX_093600; as well asmale markers such as PVX_116610 (Additional file 4:Table S3), indicating that there were mixed genders ofgametocytes developed from a single source of sporozo-ite challenge. The transcriptional factor PvAP2-G is con-sidered a master regulator and a specific marker forearly gametocyte production [17]. We are able to clearlyidentify transcripts of PvAP2-G in 5 patients in the earlyblood stage (Fig. 3a).To validate our findings of gametocytogenesis expres-
sion signature in vivo, we analyzed an independentlygenerated, publicly available data set of ex vivo RNAseqdata from pooled infected patient blood [18]. To searchfor relationships between expression levels and gameto-cyte production, we classified the ex vivo P. vivax expres-sion based on two transcriptome features in orthologousgenes of P. falciparum, namely, 1) Level of expression and2) Specificity of gametocyte stage expression. We firstcomputed the average FPKM for each gene and convertedthe values into a rank score from 0 to 100, with 100 repre-senting the highest relative expression levels. Then we an-alyzed the levels of gametocyte expression specificity bycalculating the ratio of sexual stage FPKM vs. asexualstage FPKM, the higher values indicate higher levels ofsexual stage expression specificity. We found that thegametocyte specific genes in fact are the highest expressedgenes in the ex vivo data (Fig. 3b). The top quartile ofmost highly expressed genes in the ex vivo data consists ofmore than 40% of gametocyte specific genes. The ex vivodata has even stronger gametocyte expression patternthan that of the early in vivo data (Additional file 1:Figure S4). The ex vivo enhanced gametocyte induc-tion could be due to the abiotic stress of the culture
conditions [19]. By analyzing the precise peak expres-sion time in the ex vivo expression data set, we foundthat gametocyte specific genes are mostly expressedin late schizont/early ring stage, despite the fact thatthese stages have the lowest number peak expressiongenes (Additional file 1: Figure S5 A B). P. falciparumand P. vivax appear to share a pattern in which com-mitment to gametocyte development occurs in theschizont stage [20]. The ex vivo analysis strongly sup-ports our in vivo analysis, that P. vivax parasitemia isassociated with commitment to gametocytemia.We next compared our in vivo P. vivax analysis with
that of P. falciparum. Similar to P. vivax analysis, wehave identified the top 20 transcripts associated withparasitemia from 116 whole blood samples of P. falcip-arum infected patients (data deposited in the publicationby Yamagishi, et al., [21] (Fig. 4a, b). We defined thesemarkers by searching for the gene expression levels thatare most strongly associated in Spearman correlationswith the levels of P. falciparum parasitemia among over5000 unique transcripts. We found that in contrast to P.vivax parasitemia markers, P. falciparum parasitemiadriven genes have peak expression only in the merozo-ite/early ring stages and many of them are associatedwith protein export as PEXEL containing proteins. Noneof the top P. falciparum parasitemia markers are gam-etocyte related in terms of peak expression pattern.The differences between in vivo P. vivax and P. falcip-
arum expression in relation to gametocytogenesis is twofoldas revealed by our analysis. First, P. vivax has gametocytespecific gene expressions correlated with parasitemia levelsin this in vivo data set. Secondly, P. vivax’s most abundantin vivo and ex vivo transcripts include gametocyte specific
Fig. 3 Discovering gametocyte signatures from early P. vivax in vivo RNAseq. a Five patients showed expression of PvAP2-G, a master regulator ofPlasmodium gametocyte production. The numbers on the plot represent de-identified patient numbers. b Gametocyte specific genes are themost highly expressed genes in ex vivo P. vivax RNAseq transcriptomes. The x axis refers to the ratio of FPKM levels for sexual to asexual stagesgene expressions. The top quartile of most highly expressed genes (Normalized rank score > =75) in the ex vivo data consisted of more than 40%of gametocyte specific genes
Adapa et al. BMC Systems Biology (2019) 13:5 Page 5 of 12
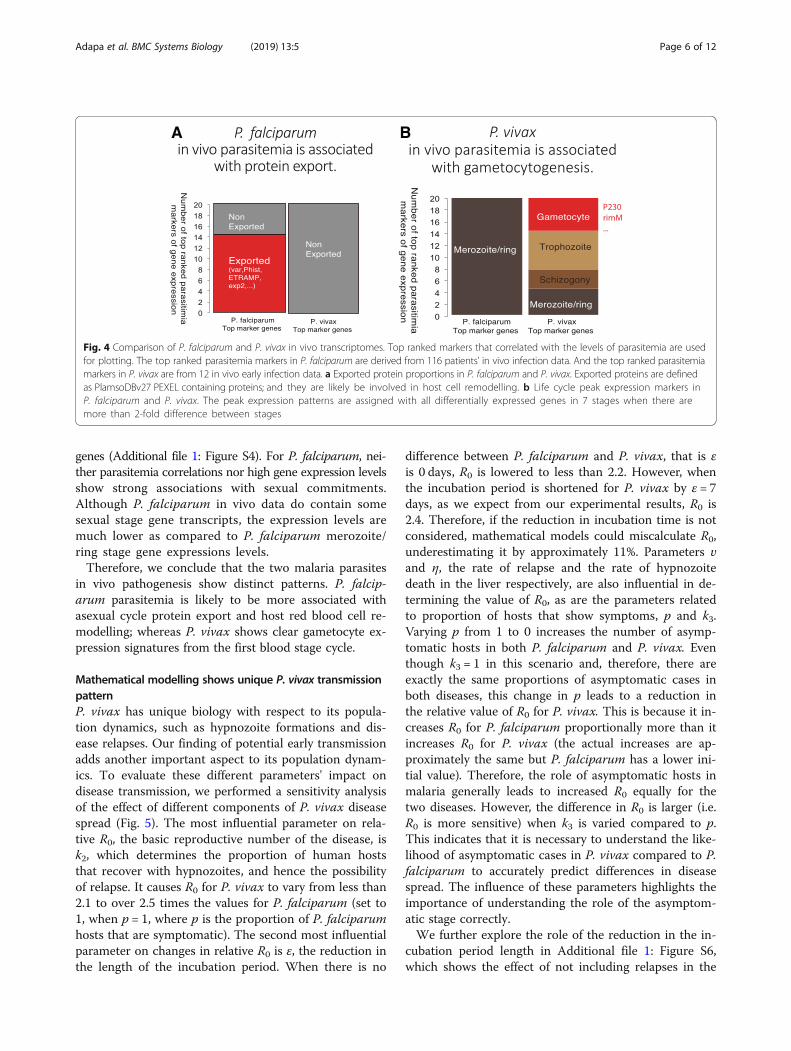
genes (Additional file 1: Figure S4). For P. falciparum, nei-ther parasitemia correlations nor high gene expression levelsshow strong associations with sexual commitments.Although P. falciparum in vivo data do contain somesexual stage gene transcripts, the expression levels aremuch lower as compared to P. falciparum merozoite/ring stage gene expressions levels.Therefore, we conclude that the two malaria parasites
in vivo pathogenesis show distinct patterns. P. falcip-arum parasitemia is likely to be more associated withasexual cycle protein export and host red blood cell re-modelling; whereas P. vivax shows clear gametocyte ex-pression signatures from the first blood stage cycle.
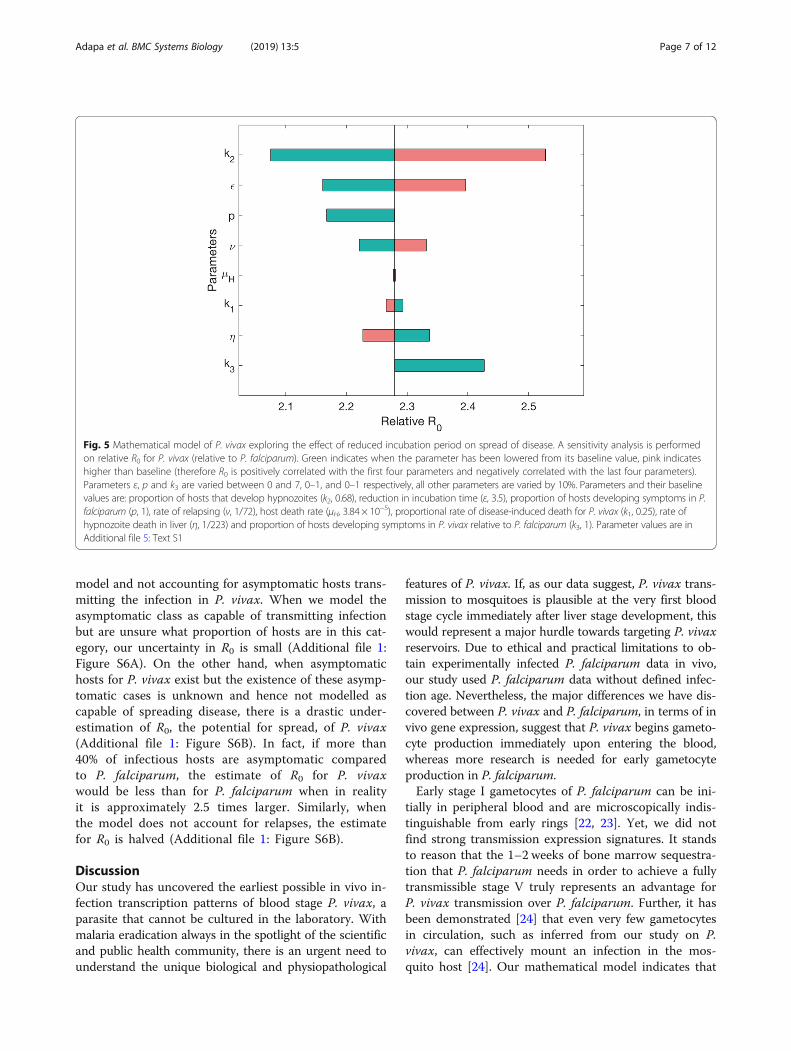
Mathematical modelling shows unique P. vivax transmissionpatternP. vivax has unique biology with respect to its popula-tion dynamics, such as hypnozoite formations and dis-ease relapses. Our finding of potential early transmissionadds another important aspect to its population dynam-ics. To evaluate these different parameters' impact ondisease transmission, we performed a sensitivity analysisof the effect of different components of P. vivax diseasespread (Fig. 5). The most influential parameter on rela-tive R0, the basic reproductive number of the disease, isk2, which determines the proportion of human hoststhat recover with hypnozoites, and hence the possibilityof relapse. It causes R0 for P. vivax to vary from less than2.1 to over 2.5 times the values for P. falciparum (set to1, when p = 1, where p is the proportion of P. falciparumhosts that are symptomatic). The second most influentialparameter on changes in relative R0 is ε, the reduction inthe length of the incubation period. When there is no
difference between P. falciparum and P. vivax, that is εis 0 days, R0 is lowered to less than 2.2. However, whenthe incubation period is shortened for P. vivax by ε = 7days, as we expect from our experimental results, R0 is2.4. Therefore, if the reduction in incubation time is notconsidered, mathematical models could miscalculate R0,underestimating it by approximately 11%. Parameters υand η, the rate of relapse and the rate of hypnozoitedeath in the liver respectively, are also influential in de-termining the value of R0, as are the parameters relatedto proportion of hosts that show symptoms, p and k3.Varying p from 1 to 0 increases the number of asymp-tomatic hosts in both P. falciparum and P. vivax. Eventhough k3 = 1 in this scenario and, therefore, there areexactly the same proportions of asymptomatic cases inboth diseases, this change in p leads to a reduction inthe relative value of R0 for P. vivax. This is because it in-creases R0 for P. falciparum proportionally more than itincreases R0 for P. vivax (the actual increases are ap-proximately the same but P. falciparum has a lower ini-tial value). Therefore, the role of asymptomatic hosts inmalaria generally leads to increased R0 equally for thetwo diseases. However, the difference in R0 is larger (i.e.R0 is more sensitive) when k3 is varied compared to p.This indicates that it is necessary to understand the like-lihood of asymptomatic cases in P. vivax compared to P.falciparum to accurately predict differences in diseasespread. The influence of these parameters highlights theimportance of understanding the role of the asymptom-atic stage correctly.We further explore the role of the reduction in the in-
cubation period length in Additional file 1: Figure S6,which shows the effect of not including relapses in the
A B
Fig. 4 Comparison of P. falciparum and P. vivax in vivo transcriptomes. Top ranked markers that correlated with the levels of parasitemia are usedfor plotting. The top ranked parasitemia markers in P. falciparum are derived from 116 patients’ in vivo infection data. And the top ranked parasitemiamarkers in P. vivax are from 12 in vivo early infection data. a Exported protein proportions in P. falciparum and P. vivax. Exported proteins are definedas PlamsoDBv27 PEXEL containing proteins; and they are likely be involved in host cell remodelling. b Life cycle peak expression markers inP. falciparum and P. vivax. The peak expression patterns are assigned with all differentially expressed genes in 7 stages when there aremore than 2-fold difference between stages
Adapa et al. BMC Systems Biology (2019) 13:5 Page 6 of 12
model and not accounting for asymptomatic hosts trans-mitting the infection in P. vivax. When we model theasymptomatic class as capable of transmitting infectionbut are unsure what proportion of hosts are in this cat-egory, our uncertainty in R0 is small (Additional file 1:Figure S6A). On the other hand, when asymptomatichosts for P. vivax exist but the existence of these asymp-tomatic cases is unknown and hence not modelled ascapable of spreading disease, there is a drastic under-estimation of R0, the potential for spread, of P. vivax(Additional file 1: Figure S6B). In fact, if more than40% of infectious hosts are asymptomatic comparedto P. falciparum, the estimate of R0 for P. vivaxwould be less than for P. falciparum when in realityit is approximately 2.5 times larger. Similarly, whenthe model does not account for relapses, the estimatefor R0 is halved (Additional file 1: Figure S6B).
DiscussionOur study has uncovered the earliest possible in vivo in-fection transcription patterns of blood stage P. vivax, aparasite that cannot be cultured in the laboratory. Withmalaria eradication always in the spotlight of the scientificand public health community, there is an urgent need tounderstand the unique biological and physiopathological
features of P. vivax. If, as our data suggest, P. vivax trans-mission to mosquitoes is plausible at the very first bloodstage cycle immediately after liver stage development, thiswould represent a major hurdle towards targeting P. vivaxreservoirs. Due to ethical and practical limitations to ob-tain experimentally infected P. falciparum data in vivo,our study used P. falciparum data without defined infec-tion age. Nevertheless, the major differences we have dis-covered between P. vivax and P. falciparum, in terms of invivo gene expression, suggest that P. vivax begins gameto-cyte production immediately upon entering the blood,whereas more research is needed for early gametocyteproduction in P. falciparum.Early stage I gametocytes of P. falciparum can be ini-
tially in peripheral blood and are microscopically indis-tinguishable from early rings [22, 23]. Yet, we did notfind strong transmission expression signatures. It standsto reason that the 1–2 weeks of bone marrow sequestra-tion that P. falciparum needs in order to achieve a fullytransmissible stage V truly represents an advantage forP. vivax transmission over P. falciparum. Further, it hasbeen demonstrated [24] that even very few gametocytesin circulation, such as inferred from our study on P.vivax, can effectively mount an infection in the mos-quito host [24]. Our mathematical model indicates that
Fig. 5 Mathematical model of P. vivax exploring the effect of reduced incubation period on spread of disease. A sensitivity analysis is performedon relative R0 for P. vivax (relative to P. falciparum). Green indicates when the parameter has been lowered from its baseline value, pink indicateshigher than baseline (therefore R0 is positively correlated with the first four parameters and negatively correlated with the last four parameters).Parameters ε, p and k3 are varied between 0 and 7, 0–1, and 0–1 respectively, all other parameters are varied by 10%. Parameters and their baselinevalues are: proportion of hosts that develop hypnozoites (k2, 0.68), reduction in incubation time (ε, 3.5), proportion of hosts developing symptoms in P.falciparum (p, 1), rate of relapsing (ν, 1/72), host death rate (μH, 3.84 × 10⁻⁵), proportional rate of disease-induced death for P. vivax (k1, 0.25), rate ofhypnozoite death in liver (η, 1/223) and proportion of hosts developing symptoms in P. vivax relative to P. falciparum (k3, 1). Parameter values are inAdditional file 5: Text S1
Adapa et al. BMC Systems Biology (2019) 13:5 Page 7 of 12
this advantage in early transmission for P. vivax leads toa higher reproductive number relative to P. falciparum,signifying a greater ability to spread quickly throughoutpopulations. Hence, without including shorter incuba-tion periods, models may underestimate the work re-quired to reduce transmission of P. vivax within apopulation.A study in native Amazonian populations [25] found
that the proportion of symptomatic and asymptomaticclinical forms was roughly similar for both P. falciparumand P. vivax. However, others have reported that therelative proportion of submicroscopic P. vivax is signifi-cantly higher than that of P. falciparum [26, 27]. Takinginto account that over 89% of P. vivax submicroscopicinfections are said to be asymptomatic [28], the balancein terms of better asymptomatic transmissibility falls onthe side of P. vivax. Altogether, this evidence suggeststhat the differences we have discovered between P. vivaxand P. falciparum, in terms of in vivo gene expression,suggests that P. vivax has the ability to spread quickly tomultiple hosts before the onset of symptomatic pheno-types. Our mathematical model found that the propor-tion of hosts that are asymptomatic in P. vivaxinfections has a greater impact on population spread ofthe disease than the proportion in P. falciparum. Fur-ther, the model highlights the importance of includingthe asymptomatic stage within models, even if the exactproportion of hosts that will not show symptoms is un-known (Additional file 1: Figure S6). A further factor toconsider is that symptomatic cases of P. vivax are muchmore likely to seek treatment than asymptomatic cases[29]. We assumed the recovery rate was the same acrosssymptomatic and asymptomatic cases. However, if therecovery rate for symptomatic cases is higher, the role ofasymptomatic cases in increasing disease transmissionwill be even more significant.Thus, the results fromacross the computational methods we use confirm theidea, held widely, that P. vivax will be the last parasitestanding before the goal of malaria eradication is to beachieved [3].Our mathematical model highlights the important role
of relapses and asymptomatic cases, similar to previousmathematical models of P. vivax [30, 31] and epidemio-logical studies [32, 33]. However, the sensitivity analysiswe perform allows a quantitative comparison of each ofthese traits, including the reduction in incubation time,on the reproductive ratio, relative to P. falciparum. It as-serts that relapses are the most influential factor on in-creases in disease spread. And yet, relapses are poorlyunderstood with no consensus on what causes them tooccur or on their frequency. Our model can be used forfurther exploration of P. vivax dynamics and can also beadapted to account for the potential evolutionary conse-quences of reducing the length of the incubation period.
A shorter incubation period could indicate lower pro-duction of efficient gametocytes, therefore the probabil-ity of successful transmission from an infected human tomosquito could be reduced [34]. This could be achievedby introducing a trade-off function between these twoparameters in the model. However, the form of thistrade-off function is not clear and would need to be in-vestigated experimentally. The potential reduction in in-cubation period, and hence early transmission, has asubstantial impact on disease spread, dependent on thisevolutionary trade-off. Other potential differences be-tween P. falciparum and P. vivax such as a reduced de-velopment time in the mosquito or the length of waningimmunity, could have an effect on the relative R0 be-tween the diseases, but we have not included these inour model. This may limit our ability to understand thetransmission properties of the two malaria strains. Nordid we include superinfection of multiple diseases withinone host. Further studies are required to determine, forexample, the interaction of different diseases within asingle host. P. falciparum may mask the symptoms of P.vivax which essentially increases the proportion ofasymptomatic P. vivax cases [35].Our model focuses in-stead on some of the differences between P. falciparumand P. vivax and assesses which are of most importancein determining changes in relative R0. The fact that ourmodel is relatively simple compared to previous P. vivaxmodels [30, 31, 36] allows us to more clearly determinehow each parameter affects R0.We used a cloud-based mining method as part of our
study which we employed at a pricing of $0.13/h. All thecomputational storage was synced with Amazon SimpleStorage Service (Amazon S3), which automatically scalesaccording to the current usage requirements. This facil-ity gave us a cost effective ($0.03 per GB) advantage overthe fixed storage on the local computing cluster. Further,this approach does not require local High PerformanceComputing (HPC) facilities and can accommodate highvolumes of data analysis within short time frames. Aspublicly available genomic data grow in complexity andvolume every day, more efficient and more precise ana-lytical tools are needed for future studies. Our study isan example for infectious disease researchers on how touse large raw sequencing data to investigate previouslyintractable pathogenesis-related features. Infectious diseasescientists could use similar approaches in resource-limitedresearch settings.We use a wide variety of computational tools to un-
cover the transmission potential of P. vivax, such ascloud computing, data mining, mathematical modelsand cross-platform genomics data comparisons. In ourstudy, we used a more robust method (non-parametricanalysis) to give a conservative estimate for P. vivax in-fection data because the P. vivax data set is smaller than
Adapa et al. BMC Systems Biology (2019) 13:5 Page 8 of 12
that of P. falciparum. The results of non-parametric andparametric analysis of P. vivax parasitemia associatedgene expressions are mostly consistent (Pearson’s r =0.784). Overall, the unique transmission of P. vivax leadsto a much higher likelihood of disease spread comparedto P. falciparum in similar settings. Although futuretransmission studies need to be conducted to furtherverify the transmission window of these malaria para-sites, our work highlights the challenge of P. vivax eradi-cation and provides evidence for the need for morethorough and earlier transmission intervention mea-sures. Controlled transcriptomic studies comparing P.falciparum and P. vivax gametocyte gene expression inoocysts and sporozoites are needed in order to under-stand how soon sexual commitment is decided in the P.vivax complex life cycle. Since P. vivax commits togametocytogenesis early in the blood stage, rationally de-signing a treatment or vaccine targeting the early bloodstage will reduce transmission rates. However, targetingtreatment at such an early stage is difficult to achieveand once again re-enforces the idea that P. vivax may bethe most difficult malaria to eliminate.
ConclusionIn this study, we used cloud and local computation withPoisson modelling to reconstruct the earliest in vivoblood stage transcriptome of P. vivax infection. Wefound that hundreds of sexual stage specific genes arealready expressed in the first blood stage cycle. Further-more, our novel mathematical modelling quantifies theepidemiological impact of the complex life cycle of P.vivax; and highlights the important challenges for P.vivax control.
MethodsMining parasite data from infected human tissuesWe used the blood transcriptome data sets deposited inGene Expression Omnibus (GEO) under accession num-bers GSE67184, GSE61252 associated with the in vivo P.vivax sporozoite challenge [13] and ex vivo P. vivaxasexual stage culture [18] respectively. We also use thein vivo P. falciparum infection genomic reads [21] de-posited in DNA Data Bank of Japan (DDBJ) under acces-sion number DRA000949 to compare the transcriptabundances with the above datasets.PathoScope 2.0 [37] framework is used to quantify
proportions of reads from individual species present insequencing data from samples from environmental orclinical sources. A spot Elastic Computing Cloud (EC2)instance r3.4xlarge (Virtual CPUs – 16, Memory (GB) –122, Storage (SSD GB) – 320)) was employed. We usedthe Patholib module along with National Centre for Bio-technology Information (NCBI) vast nucleotide databaseto create filter genomes containing host (human),
microbes (virus, bacteria), artificially added sequence(PhiX Control v3, Illumina) and target genome librarycontaining P. vivax Sal-1 sequences using their respect-ive taxonomic identifiers. PathoMap module is used toalign the reads to target library using the Bowtie2 algo-rithm [38] and then filters reads that aligned to the fil-tered genomes. PathoReport was used to annotate thesequences.The Tuxedo suite [14] of programs (Bowtie2, TopHat2,
and Cufflinks) were used to process and analyze thedata. Reference genomes of Human (GHRc37) fromEnsembl human genome database and P. vivax Sal-1from PlasmoDB—a Plasmodium genome resource.Bowtie2 [38] was used to build indexes of the referencegenomes. RNASeq reads from each sample were alignedto the P. vivax Sal-1 genome using TopHat2 (v. 1.4.1)[39]. A maximum of one mismatch per read wasallowed. The mapped reads from TopHat were used toassemble known transcripts from the reference, andtheir abundance FPKM (fragments per kilobase of exonper million fragments mapped) values were calculatedfor all genes using Cufflinks.
Gene expression level estimation with Poisson modelling(PM)Poisson distribution has been widely used to estimatethe background level of gene expression [40–42]. In thiswork, we used Poisson distribution to model the back-ground expression level (x) for each patient.
x � Pois λð Þ ð1Þ
p xjλð Þ ¼ e−λλx
x!ð2Þ
It is well known that the unbiased estimator of λ is themean value of x, which can be calculated from max-imum likelihood estimation.
λ̂ ¼P
xn
ð3Þ
where ∑x is the sum of gene expression level of specificpatient or gene; n is the number of genes considered.Finally, we can compare the expression levels betweendifferent patients or genes by using the mean value ofestimated distribution.Negative Binomial (NB) distribution has been widely
used to estimate the background level of gene expression[43–45]. In this study, we also used NB distribution asan additional method to model the background expres-sion level (x) for each patient. The NB distribution alsoarises as a continuous mixture of Poisson distributionswhere the mixing distribution of the Poisson rate is agamma distribution.
Adapa et al. BMC Systems Biology (2019) 13:5 Page 9 of 12

x � Poisson λð Þ ð1Þ
λ � gamma γ;1−pp
� �ð2Þ
By using bayes rule
P xð Þ ¼Z
P xjλð ÞP λð Þ dλ ¼ Γ γ þ xð Þx!Γ γð Þ px 1−pð Þγ ð3Þ
The parameters can be estimated by maximum likeli-hood. Finally, we compared the expression levels be-tween different patients (samples) or genes by using theexpectation value of estimated distribution. The methodsbased on NBM and PM gave very similar results.
Analysis of RNAseq dataThe sexual stage specific genes are defined by using the7 stages RNAseq data [16]. The stage specific RNAseqdataset is from Illumina-based sequencing of P. falcip-arum 3D7 mRNA from gametocyte stage II and gameto-cyte stage V), and ookinete. The dataset has also fourtime points of asexual stages representing ring, earlytrophozoite, late trophozoite, and schizont. The ortho-logs of P. vivax and P. falciparum were mapped withOrthoMCL data [46]. Sexual stage specific genes are re-quired to have 20 or more fold expression level FPKMdifferences in the sexual stage (gametocytes, ookinete) vsthe time points in the blood stages. The expression dif-ferences between asexual and sexual stages were ana-lyzed with Fisher’s Exact tests, and the P values (< 0.001)were adjusted by multiple hypothesis correction withBenjamini-Hochberg method.
Mathematical modelling of P. vivax transmissionWe created two mathematical models to represent thepopulation-level spread of disease among humans andmosquitoes for P. falciparum and P. vivax malaria. Wedo this to allow comparisons between the two malariadiseases, in order to assess which differences betweenthe two have the most influence in producing thecurrent epidemiological profile of the two diseases. Thiscan inform us whether our genomics research results arean important aspect of P. vivax spread within popula-tions. Similar to many models of vector-borne diseaseswhich were developed for malaria, we categorize humansand mosquitoes into compartments based on their infec-tion status, such as Susceptible, Exposed, Asymptomaticand Infected, [47–49] see Additional file 5: Text S1). Inboth models, we include a time delay in human acquisi-tion of disease, the possibility of asymptomatic hosts,waning immunity, disease-induced death for symptom-atic hosts, natural death and frequency-dependent trans-mission between mosquitoes and hosts. The majorstructural difference between the two models is the
inclusion of hosts with hypnozoites in the P. vivaxmodel; other differences are implemented throughchanges in parameter values. Specifically, the parametersthat alter are the proportion of hosts with symptoms,the disease-induced death rate (lower for P. vivax), thelength of the incubation period and the recovery rate.Accounting for relapses of P. vivax has been achieved inmodels usually by many additional compartments torepresent all the various transitions that can occur (e.g.see [30, 31, 36]). Our model is novel for the simple buteffective way it introduces relapses in P. vivax, byincluding a single compartment for humans with hepa-tocytes in which transition into and out of this compart-ment is parameterised by the average number of relapseseach human is expected to have [50, 51]. For both the P.vivax and P. falciparum model we calculate R0, the basicreproductive number of the disease. This is a commonlyused, fundamental metric of disease transmission poten-tial defined as the number of people one infected personis able to infect in a susceptible population. If R0 > 1then the disease is likely to take off and spread widelythroughout the population. As the models for P. vivaxand P. falciparum contain many similar components, weassess the relative R0 for the diseases, i.e. we divide allvalues of R0 for P. vivax by the value of R0 for P. falcip-arum. The model structure and resultant calculation ofrelative R0 allows us to easily make comparisons be-tween the two diseases as well as ignore potential errorin parameter values for those parameters which areshared between the two models.In order to assess the impact of early transmission in
humans on disease spread compared to other differencesbetween P. falciparum and P. vivax, we perform a sensi-tivity analysis of R0 for P. vivax. For each parameter, wevary its value and calculate the new value of R0 to deter-mine the effect of each parameter. We introduce param-eter ε to represent the reduction in the length of theincubation period for P. vivax in comparison to P. fal-ciparum; thus ε varies from 0 to 7 days to indicate a re-duction from 14 to 7 days in the incubation period. Thatis, the larger ε is, the bigger a difference between P. fal-ciparum and P. vivax, indicating earlier transmission forthe latter disease. The parameter p represents the pro-portion of humans that are symptomatic in the P. falcip-arum model, and thus p varies from 0 to 1. Incomparison, k3p indicates the proportion of symptom-atic hosts in the P. vivax model, therefore, by focusingon k3 between 0 and 1, there are less symptomatic casesfor P. vivax than for P. falciparum. Thus, this ensuresthat there are more asymptomatic cases for P. vivax. Allother parameters are varied by 10% to create a rangefrom 90 to 110% of the baseline value of each parameter.The more R0 changes when a parameter is varied, themore influence that parameter has on R0. In this way we
Adapa et al. BMC Systems Biology (2019) 13:5 Page 10 of 12
can compare how much effect reducing the length ofthe intrinsic incubation period has on disease spreadversus the role of other differences between P. vivaxand P. falciparum.Full details of the models created and the parameter
values chosen as base values are presented in Additionalfile 5: Text S1.
Additional files
Additional file 1: Supplemental figures. Figure S1-S6. (PPTX 2002 kb)
Additional file 2: Supplemental table s1. Table S1. (PDF 1742 kb)
Additional file 3: Supplemental table s2. Table S2. (PDF 753 kb)
Additional file 4: Supplemental table s3. Table S3. (PDF 35 kb)
Additional file 5: Supplemental methods. Text S1. Full details of themathematical models of P. falciparum and P. vivax and the calculation ofR0. (PDF 365 kb)
AbbreviationsAmazon S3: Amazon Simple Storage Service; DDBJ: DNA Data Bank of Japan;EC2: Elastic Computing Cloud; FPKM: Fragments per kilobase of exon permillion fragments mapped; GEO: Gene Expression Omnibus; HPC: HighPerformance Computing; NBM: Negative Binomial Model; NCBI: NationalCentre for Biotechnology Information; NGS: Next Generation Sequencing;P. falciparum: Plasmodium falciparum; P. vivax: Plasmodium vivax;PM: Poisson Modelling; PVM: Parasitophorous Vacuolar Membrane; RNAseq: RNAsequencing; USF: University of South Florida
AcknowledgementsWe would like to thank Justin Gibbons, Alison Roth and John H Adams forconstructive discussions. The authors would like to acknowledge the use ofthe services provided by Research Computing at the University of South Florida.
FundingThis work was supported by the National Institutes of Health [R01AI117017,R35CA197731]; Bill and Melinda Gates Foundation OPP1023601 and Universityof South Florida - USF New Investigator Funding to Rays HY Jiang. The fundershad no role in study design, data collection and analysis, decision to publish, orpreparation of the manuscript.
Availability of data and materialsAll data generated or analysed during this study are included in this publishedarticle and its additional files.
Authors’ contributionsSRA, RAT, LRJ, and RHY designed the project; SRA and CW performed thedata analysis; RAT, LRJ performed mathematical modelling; SRA, RAT, RTL,and RHY wrote the manuscript. All authors read and approved the finalmanuscript.
Ethics approval and consent to participateNot applicable
Consent for publicationNot applicable
Competing interestsThe authors declare that they have no competing interests.
Publisher’s NoteSpringer Nature remains neutral with regard to jurisdictional claims inpublished maps and institutional affiliations.
Author details1Department of Global Health (GH) & Center for Drug Discovery andInnovation (CDDI), College of Public Health, University of South Florida,Tampa, FL 33612, USA. 2Department of Integrative Biology, University ofSouth Florida, Tampa, FL, USA.
Received: 16 August 2017 Accepted: 4 December 2018
References1. World Health O: World malaria report 2015: World Health Organization; 2016.2. Battle KE, Gething PW, Elyazar IR, Moyes CL, Sinka ME, Howes RE, Guerra CA,
Price RN, Baird JK, Hay SI: The global public health significance of Plasmodiumvivax. 2012.
3. Vogel G. The forgotten malaria. Science. 2013;342(6159):684–7.4. Sauerwein RW, Roestenberg M, Moorthy VS. Experimental human challenge
infections can accelerate clinical malaria vaccine development. Nat RevImmunol. 2011;11(1):57–64.
5. Hermsen CC, Telgt DSC, Linders EHP, van de Locht LATF, Eling WMC,Mensink EJBM, Sauerwein RW. Detection of Plasmodium falciparummalaria parasites in vivo by real-time quantitative PCR. Mol BiochemParasitol. 2001;118(2):247–51.
6. Mikolajczak SA, Vaughan AM, Kangwanrangsan N, Roobsoong W,Fishbaugher M, Yimamnuaychok N, Rezakhani N, Lakshmanan V, Singh N,Kaushansky A. Plasmodium vivax liver stage development and hypnozoitepersistence in human liver-chimeric mice. Cell Host Microbe. 2015;17(4):526–35.
7. Mueller I, Galinski MR, Baird JK, Carlton JM, Kochar DK, Alonso PL, del PortilloHA. Key gaps in the knowledge of Plasmodium vivax, a neglected humanmalaria parasite. The Lancet infectious diseases. 2009;9(9):555–66.
8. Lensen A, Bril A, Van De Vegte M, Van Gemert GJ, Eling W, Sauerwein R.Plasmodium falciparum: infectivity of cultured, synchronized gametocytes tomosquitoes. Experimental parasitology. 1999;91(1):101–3.
9. Carlton JM, Sina BJ, Adams JH. Why is Plasmodium vivax a neglected tropicaldisease? PLoS Negl Trop Dis. 2011;5(6):e1160.
10. Bassat Q, Velarde M, Mueller I, Lin J, Leslie T, Wongsrichanalai C, Baird JK.Key knowledge gaps for Plasmodium vivax control and elimination. Am. J.Trop. Med. Hyg. 2016;95(6_Suppl):62–71.
11. White NJ, Imwong M. Relapse. Adv Parasitol. 2012;80:113–50.12. Noulin F, Borlon C, Van Den Abbeele J, D’Alessandro U, Erhart A. 1912–2012:
a century of research on Plasmodium vivax in vitro culture. Trends Parasitol.2013;29(6):286–94.
13. Rojas-Peña ML, Vallejo A, Herrera S, Gibson G, Arévalo-Herrera M. Transcriptionprofiling of malaria-naive and semi-immune Colombian volunteers in aPlasmodium vivax sporozoite challenge. PLoS Negl Trop Dis. 2015;9(8):e0003978.
14. Trapnell C, Roberts A, Goff L, Pertea G, Kim D, Kelley DR, Pimentel H,Salzberg SL, Rinn JL, Pachter L. Differential gene and transcript expressionanalysis of RNA-seq experiments with TopHat and cufflinks. Nat Protoc. 2012;7(3):562–78.
15. Arévalo-Herrera M, Forero-Peña DA, Rubiano K, Gómez-Hincapie J, Martínez NL,Lopez-Perez M, Castellanos A, Céspedes N, Palacios R, Oñate JM. Plasmodiumvivax sporozoite challenge in malaria-naive and semi-immune Colombianvolunteers. PLoS One. 2014;9(6):e99754.
16. López-Barragán MJ, Lemieux J, Quiñones M, Williamson KC, Molina-Cruz A,Cui K, Barillas-Mury C, Zhao K, Su X-Z. Directional gene expression andantisense transcripts in sexual and asexual stages of Plasmodium falciparum.BMC Genomics. 2011;12(1):587.
17. Kafsack BFC, Rovira-Graells N, Clark TG, Bancells C, Crowley VM, Campino SG,Williams AE, Drought LG, Kwiatkowski DP, Baker DA. A transcriptional switchunderlies commitment to sexual development in malaria parasites. Nature.2014;507(7491):248–52.
18. Zhu L, Mok S, Imwong M, Jaidee A, Russell B, Nosten F, Day NP, White NJ,Preiser PR, Bozdech Z. New insights into the Plasmodium vivaxtranscriptome using RNA-Seq. Sci Rep. 2016;6(20498):srep20498.
19. Meibalan E, Marti M. Biology of malaria transmission. Cold Spring Harb.Perspect. Med. 2017;7(3):a025452.
20. Bruce MC, Alano P, Duthie S, Carter R. Commitment of the malaria parasitePlasmodium falciparum to sexual and asexual development. Parasitology.1990;100(02):191–200.
21. Yamagishi J, Natori A, Tolba MEM, Mongan AE, Sugimoto C, Katayama T,Kawashima S, Makalowski W, Maeda R, Eshita Y. Interactive transcriptome
Adapa et al. BMC Systems Biology (2019) 13:5 Page 11 of 12

analysis of malaria patients and infecting Plasmodium falciparum. GenomeRes. 2014;24(9):1433–44.
22. Sinden RE. Gametocytogenesis of Plasmodium falciparum in vitro: anelectron microscopic study. Parasitology. 1982;84(1):1–11.
23. Tibúrcio M, Silvestrini F, Bertuccini L, Sander AF, Turner L, Lavstsen T, Alano P.Early gametocytes of the malaria parasite Plasmodium falciparum specificallyremodel the adhesive properties of infected erythrocyte surface. Cell Microbiol.2013;15(4):647–59.
24. Bousema T, Drakeley C. Epidemiology and infectivity of Plasmodiumfalciparum and Plasmodium vivax gametocytes in relation to malariacontrol and elimination. Clin Microbiol Rev. 2011;24(2):377–410.
25. Alves FP, Durlacher RR, Menezes MJ, Krieger H, Silva LHP, Camargo EP. Highprevalence of asymptomatic Plasmodium vivax and Plasmodium falciparuminfections in native Amazonian populations. Am. J. Trop. Med. Hyg. 2002;66(6):641–8.
26. Cheng Q, Cunningham J, Gatton ML. Systematic review of sub-microscopicP. vivax infections: prevalence and determining factors. PLoS Negl Trop Dis.2015;9(1):e3413.
27. Adams JH, Mueller I. The Biology of Plasmodium vivax. Cold Spring HarbPerspect Med. 2017;7(9):a025585.
28. Howes RE, Battle KE, Mendis KN, Smith DL, Cibulskis RE, Baird JK, Hay SI.Global epidemiology of Plasmodium vivax. Am. J. Trop. Med. Hyg. 2016;95(6Suppl):15–34.
29. Karyana M, Devine A, Kenangalem E, Burdarm L, Poespoprodjo JR, Vemuri R,Anstey NM, Tjitra E, Price RN, Yeung S. Treatment-seeking behaviour andassociated costs for malaria in Papua, Indonesia. Malaria journal. 2016;15(1):536.
30. Ishikawa H, Ishii A, Nagai N, Ohmae H, Harada M, Suguri S, Leafasia J. Amathematical model for the transmission of Plasmodium vivax malaria.Parasitol Int. 2003;52(1):81–93.
31. White MT, Shirreff G, Karl S, Ghani AC, Mueller I. Variation in relapse frequencyand the transmission potential of Plasmodium vivax malaria. Proc R Soc B.2016;283(1827):20160048.
32. Barbosa S, Gozze AB, Lima NF, Batista CL, da Silva Bastos M, Nicolete VC,Fontoura PS, Gonçalves RM, Viana SAS, Menezes MJ. Epidemiology ofdisappearing Plasmodium vivax malaria: a case study in rural Amazonia.PLoS Negl Trop Dis. 2014;8(8):e3109.
33. Olliaro PL, Barnwell JW, Barry A, Mendis K, Mueller I, Reeder JC, Shanks GD,Snounou G, Wongsrichanalai C. Implications of Plasmodium vivax biologyfor control, elimination, and research. Am. J. Trop. Med. Hyg. 2016;95(6_Suppl):4–14.
34. Koella JC, Antia R. Optimal pattern of replication and transmission forparasites with two stages in their life cycle. Theor Popul Biol. 1995;47(3):277–91.
35. Mayxay M, Pukrittayakamee S, Newton PN, White NJ. Mixed-species malariainfections in humans. Trends Parasitol. 2004;20(5):233–40.
36. De Zoysa A, Mendis C, Gamage-Mendis A, Weerasinghe S, Herath P, MendisKN. A mathematical model for Plasmodium vivax malaria transmission:estimation of the impact of transmission-blocking immunity in an endemicarea. Bull World Health Organ. 1991;69(6):725.
37. Hong C, Manimaran S, Shen Y, Perez-Rogers JF, Byrd AL, Castro-Nallar E,Crandall KA, Johnson WE. PathoScope 2.0: a complete computationalframework for strain identification in environmental or clinical sequencingsamples. Microbiome. 2014;2(1):33.
38. Langmead B, Salzberg SL. Fast gapped-read alignment with bowtie 2. NatMethods. 2012;9(4):357–9.
39. Kim D, Pertea G, Trapnell C, Pimentel H, Kelley R, Salzberg SL. TopHat2:accurate alignment of transcriptomes in the presence of insertions,deletions and gene fusions. Genome Biol. 2013;14(4):R36.
40. Anjum A, Jaggi S, Varghese E, Lall S, Bhowmik A, Rai A. Identification ofdifferentially expressed genes in RNA-seq data of Arabidopsis thaliana: acompound distribution approach. J Comput Biol. 2016;23(4):239–47.
41. Hebenstreit D, Fang M, Gu M, Charoensawan V, van Oudenaarden A,Teichmann SA. RNA sequencing reveals two major classes of geneexpression levels in metazoan cells. Mol Syst Biol. 2011;7(1):497.
42. Soneson C, Delorenzi M. A comparison of methods for differential expressionanalysis of RNA-seq data. BMC bioinformatics. 2013;14(1):91.
43. Anders S, Huber W. Differential expression analysis for sequence count data.Genome Biol. 2010;11(10):R106.
44. Cumbie JS, Kimbrel JA, Di Y, Schafer DW, Wilhelm LJ, Fox SE, Sullivan CM,Curzon AD, Carrington JC, Mockler TC. GENE-counter: a computational
pipeline for the analysis of RNA-Seq data for gene expression differences.PLoS One. 2011;6(10):e25279.
45. Zhang ZH, Jhaveri DJ, Marshall VM, Bauer DC, Edson J, Narayanan RK,Robinson GJ, Lundberg AE, Bartlett PF, Wray NR. A comparative studyof techniques for differential expression analysis on RNA-Seq data. PLoSOne. 2014;9(8):e103207.
46. Chen F, Mackey AJ, Stoeckert CJ, Roos DS. OrthoMCL-DB: querying acomprehensive multi-species collection of ortholog groups. NucleicAcids Res. 2006;34(suppl 1):D363–8.
47. Macdonald G. The analysis of equilibrium in malaria. Tropical diseases bulletin.1952;49(9):813.
48. Macdonald G. Epidemiologic models in studies of vetor-borne diseases: there dyer lecture. Public Health Rep. 1961;76(9):753.
49. Ross R. The prevention of malaria. London: John Murray; 1911.50. White MT, Karl S, Battle KE, Hay SI, Mueller I, Ghani AC. Modelling the
contribution of the hypnozoite reservoir to Plasmodium vivax transmission.Elife. 2014;3:e04692.
51. White NJ. Determinants of relapse periodicity in Plasmodium vivax malaria.Malar J. 2011;10(1):297.
Adapa et al. BMC Systems Biology (2019) 13:5 Page 12 of 12