bmc evolutionary biology
TRANSCRIPT

BioMed CentralBMC Evolutionary Biology
ss
Open AcceResearch articleAncient intron insertion sites and palindromic genomic duplication evolutionally shapes an elementally functioning membrane protein familyMotoko Tanaka-Kunishima*, Yoshihiro Ishida, Kunitaro Takahashi, Motoo Honda and Takashi OonumaAddress: Department of Medical Physiology, Meiji Pharmaceutical University, Noshio 2-522-1, Kiyose, Tokyo, MZC204-8588, Japan
Email: Motoko Tanaka-Kunishima* - [email protected]; Yoshihiro Ishida - [email protected]; Kunitaro Takahashi - [email protected]; Motoo Honda - [email protected]; Takashi Oonuma - [email protected]
* Corresponding author
AbstractBackground: In spite of the recent accumulation of genomic data, the evolutionary pathway in theindividual genes of present-day living taxa is still elusive for most genes. Among ion channels, inwardK+ rectifier (IRK) channels are the fundamental and well-defined protein group. We analyzed thegenomic structures of this group and compared them among a phylogenetically wide range withour sequenced Halocynthia roretzi, a tunicate, IRK genomic genes.
Results: A total of 131 IRK genomic genes were analyzed. The phylogenic trees of amino acidsequences revealed a clear diversification of deuterostomic IRKs from protostomic IRKs andsuggested that the tunicate IRKs are possibly representatives of the descendants of ancestor formsof three major groups of IRKs in the vertebrate. However, the exon-intron structures of thetunicate IRK genomes showed considerable similarities to those of Caenorhabditis. In the vertebrateclade, the members in each major group increased at least four times those in the tunicate byvarious types of global gene duplication. The generation of some major groups was inferred to bedue to anti-tandem (palindromic) duplication in early history. The intron insertion points greatlydecreased during the evolution of the vertebrates, remaining as a unique conservation of an introninsertion site in the portion of protein-protein interaction within the coding regions of allvertebrate G-protein-activated IRK genes.
Conclusion: From the genomic survey of a family of IRK genes, it was suggested that the ancientintron insertion sites and the unique palindromic genomic duplication evolutionally shaped thismembrane protein family.
BackgroundAlthough a vast amount of data on the genomic structuresof genes of major phyla in animal, plant, and microbialkingdoms has been accumulated as a result of many
recent successful projects of whole genome shotgun DNAsequencing of biologically and medically important taxa[1-7], the evolutional pathway and physiological signifi-cance of individual genome gene structures, such as the
Published: 20 August 2007
BMC Evolutionary Biology 2007, 7:143 doi:10.1186/1471-2148-7-143
Received: 30 November 2006Accepted: 20 August 2007
This article is available from: http://www.biomedcentral.com/1471-2148/7/143
© 2007 Tanaka-Kunishima et al; licensee BioMed Central Ltd. This is an Open Access article distributed under the terms of the Creative Commons Attribution License (http://creativecommons.org/licenses/by/2.0), which permits unrestricted use, distribution, and reproduction in any medium, provided the original work is properly cited.
Page 1 of 30(page number not for citation purposes)

BMC Evolutionary Biology 2007, 7:143 http://www.biomedcentral.com/1471-2148/7/143
conservation of intron insertions, duplication of genes,and development of gene regulatory sequences of thepresent-day living taxa are still elusive and unclear formost genes. Recent large population studies derived fromthe established genome databases have promoted ourunderstanding of intron significance, favoring the exontheory or the intron early theory, though many pointsremain to be discussed and clarified [8-12]. Similarly, weknow that gene duplication by the tandem repeat or chro-mosomal duplication must be the major evolutionalpower to drive simple to complex living systems at least inthe vertebrate clade [13-17]. However, for individualgenes the exact evidence is still in short availabilitybecause of the gene divergence of the whole genome chro-mosomes in the present-day organisms on the evolution-ary pathway from the ancestor organisms, though therecent excellent whole genome studies on the Saccharo-mycetes have greatly advanced our understanding aboutthese matters [18-20]. Further, although the eukaryoticgenomic complexity may be initiated by the non-adaptivefixation of genetic drift resulting from a reduction of theeffective population size [21], at least in the secondarydevelopment, it is plausible to correlate the evolution ofthe genomic structure to the adaptation of organisms tonew environmental niches, such as, the functional evolu-tion of the proteins as the gene products [22]. However,little is known regarding the mechanisms except the pro-posal that the borders of domains in the protein are rep-resented by the exon boundaries, thus being a proposal ofphysiological support for the exon theory [23-25].
Ion channels are one of the major and important proteingroups functioning for regulating the intra- and extracel-lular ionic environments and for the signal transductionof intracellular and intercellular systems [26]. Among ionchannels, the inward K+ rectifier (IRK) channels comprisethe most fundamental and simple protein group, havingtwo transmembrane segments and one pore-formingregion [27,28]. The physiological functions are well stud-ied in both protostomia and deuterostomia, and almostall members of genes have been sequenced at least in themammals, such as human, mouse, and rat, by cDNA clon-ing or by genome projects [26,28].
Recently, we have sequenced three Halocynthia roretzi IRKgenomic clones, of which cDNA clones have been known[29,30], being TuIRKA, TuGIRKAa, and TuGIRKB clones.Furthermore, the urochordate, Ciona intestinalis, genomeprojects [4] have allowed a genomic survey of tunicate IRKchannel genes for molecular evolutionary analysis incomparison with the genes of both deuterostomal andprotostomal clades. This has occurred because the uro-chordate genes have been known to locate at the branch-ing point for the early vertebrate divergence within thedeuterostomal clades, as shown in the recent exhaustive
comparative study of ion channel genes viewed from theannotation of the Ciona unochordate genes [31].
In the present study, we attempted to analyze the genomicstructures of a group of proteins, which are definitelydefined functionally, and to compare them among a phy-logenetically wide range, including protostomal to deuter-ostomal clades. We also aimed to elucidate the functionaland evolutional significance of intronic insertion, intronicpreservation, gene duplication on the chromosomes, andthe relationship between the genome structure and theexpressed protein structure or physiological function ofthe organism.
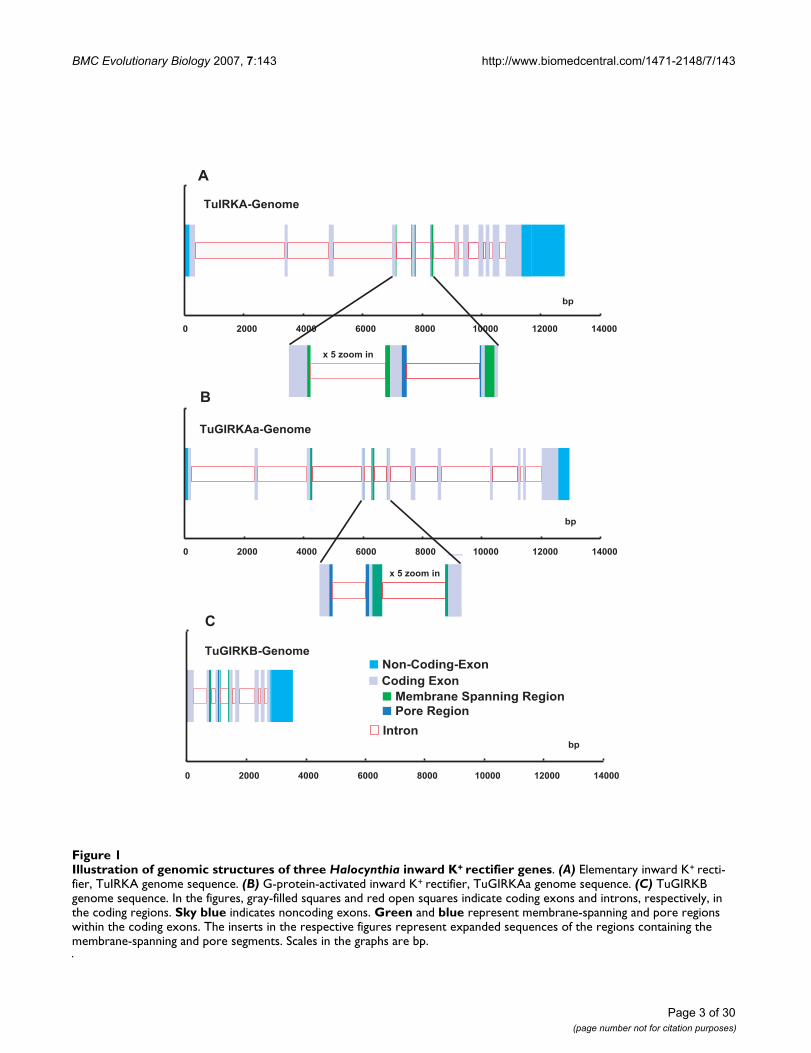
ResultsGenomic sequences of tunicate inward K+ rectifier genesWe determined genomic sequences of three inward K+ rec-tifier genes, TuIRKA, TuGIRKAa, and TuGIRKB, clonedfrom a genomic library of a tunicate, Halocynthia roretzi[see Additional file 1]. With previously reported respectivecDNA sequences [29,30] [see Additional file 2], theirexons and introns in their coding regions were preciselydetermined [see Additional files 1 and 2]. These sequencescovered entire coding regions, including all introns, 5'upper stream regions, and most of the 3' lower streamregions (Fig. 1 and [see Additional file 3]). All intron exonjunctions, which existed in the coding regions, revealedthe mammalian-conserved splicing characteristicsequences, such as the GT of splice donor sites at the ini-tiation of introns and the AG of splice acceptor sites at the3' terminal of respective introns (Fig. 2 and [see Addi-tional file 4]). The average exon length was about 100 bpand was considerably short in comparison with thosefound in mammalian Kcnj genes. The average intronlength was about 500 bp; thus these genomic sequencesrevealed considerably large numbers of intron insertions,from 8 to 11, within a rather short whole coding length ofabout 1000 bp of IRK genes [see Additional file 1].Although the insertions were apparently evenly distrib-uted among the coding regions, all three IRK genomesrevealed characteristic intron insertions in the function-ally important and thereby the strongly conservedsequence portions of the membrane-spanning regionsand the ion pore regions or limes of those regions (Fig. 1).
The phylogenetic tree and a comparison of Halocynthia IRK AA sequences with those of other animal IRK genesThanks to many recent whole genome projects, there aremany numbers of IRK genomic sequences, which aredetermined over their whole genome regions. Amongthem, as the first step, the genomic sequences of the sametunicate Ciona IRK genes, human IRK genes, Caenorhabdi-tis elegans IRK genes, Drosophila melanogaster, and Anophe-les gambiae genes were compared with the sequences ofHalocynthia roretzi IRK genes. With the amino acid (AA)
Page 2 of 30(page number not for citation purposes)
BMC Evolutionary Biology 2007, 7:143 http://www.biomedcentral.com/1471-2148/7/143
Page 3 of 30(page number not for citation purposes)
Illustration of genomic structures of three Halocynthia inward K+ rectifier genesFigure 1Illustration of genomic structures of three Halocynthia inward K+ rectifier genes. (A) Elementary inward K+ recti-fier, TuIRKA genome sequence. (B) G-protein-activated inward K+ rectifier, TuGIRKAa genome sequence. (C) TuGIRKB genome sequence. In the figures, gray-filled squares and red open squares indicate coding exons and introns, respectively, in the coding regions. Sky blue indicates noncoding exons. Green and blue represent membrane-spanning and pore regions within the coding exons. The inserts in the respective figures represent expanded sequences of the regions containing the membrane-spanning and pore segments. Scales in the graphs are bp.
TuGIRKAa-Genome
TuGIRKB-Genome
0 2000 4000 6000 8000 10000 12000 14000
Non-Coding-Exon
Coding Exon
Intron
Membrane Spanning Region
Pore Region
x 5 zoom in
bp
TuIRKA-Genome
0 2000 4000 6000 8000 10000 12000 14000
0 2000 4000 6000 8000 10000 12000 14000
x 5 zoom in
bp
bp
A
B
C

BMC Evolutionary Biology 2007, 7:143 http://www.biomedcentral.com/1471-2148/7/143
Page 4 of 30(page number not for citation purposes)
Intron-Exon junctions in Halocynthia roretzi Inward K+ rectifier genomesFigure 2Intron-Exon junctions in Halocynthia roretzi Inward K+ rectifier genomes. (A) Elementary IRK, TuIRKA genome. (B) G-protein activated IRK, TuGIRKAa genome. Black and red characters indicate the nucleotides in coding regions and the ones in the intronic regions, respectively. Gray triplet characters represented amino acid (AA) codes, which were not inserted with introns. The phase 0 introns were found between those AA pairs. Green and sky blue triplet characters rep-resented AA codes, which were inserted by phase 1 introns between the first and second nucleotides in the codons, and by phase 2 introns between the second and third nucleotides in the codons, respectively. Numbers at both sides of the nucle-otide sequences are those assigned in the reported cDNAs. For another G-protein activated IRK, TuGIRKB genome, the intron-exon junctions are illustrated in an additional file [see Additional file 4].
A TuIRKA Intron-Exon Junctions Donor Intron Accepter
#366 GTC AGT AAC AGgtgagaaatc Val Ser Asn Arg
------ ctttcaacagA ATA CCC ATC 388----------- Ile Pro Ile
465 ATG AGT AAC AGgtgatgagaaMet Ser Asn Arg
------ ttgttacaagA TCA TCA AAC 487----------- Ser Ser Asn
627 AAG AAC TGC AGgtaagtcaat Lys Asn Cys Arg
------ atcatttcagA TTC ATC AAG 649----------- Phe Ile Lys
774 TTT ATA CTC AGgtaataaaat Phe Ile Leu Ser
------ gttttaacagC TGG CTT TTT 796----------- Trp Leu Phe
930 ACG ACA ATT Ggtgagaaatt Thr Thr Ile Gly
------ cgtataacagGT TAT GGA TCG 952------------ Tyr Gly Ser
1053 AAG ATA TCG AGgtaccgaatg Lys Ile Ser Arg
------ ttacgttcagG CCA AAG AAG 1075----------- Pro Lys Lys
1182 GCA ACA ATC AGgtaagctcaa Ala Thr Ile Arg
------ atttttacagA ATG CAA TAT 1204----------- Met Gln Tyr
1377 GCA AAT TTT GAGgtgagcttgg Ala Asn Phe Glu
------ gccctttcag GTC ATT GTA 1398---------- Val Ile Val
1539 AAG TTC GAT AGGgtataaaaac Lys Phe Asp Arg
------ atttcaacag TCA TAC GAA 1560---------- Ser Tyr Glu
1662 AAG AAT ACA TCgtaagttttg Lys Asn Thr Ser
------ cttgtcacagT AAA GAC GCT 1684----------- Lys Asp Ala
1890 AGT ACA AAC ATGgtaaatattc Ser Thr Asn Met
------ ttaattccag GAT AAA TGT 1910---------- Asp Lys Cys
B TuGIRKAa Intron-Exon Junctions Donor Intron Accepter
#222 AAA GCA AGG GAgtgagtaaaa Lys Ala Arg Asp
------ tattttccagC ACG CTC TTT 244----------- Thr Leu Phe
342 CGA CAG ACG AGgtaaagattgArg Gln Thr Arg
------ cattgaacagG TTT GTT ACG 364----------- Phe Val Thr
531 TCA TTT TGC AGgtaggaacat Ser Phe Cys Arg
------ gttgttccagG AAC GAC CTG 553----------- Asn Asp Leu
624 ATA GAA ACT CAGgtgagtaaca Ile Glu Thr Gln
------ ctacttttag GTC ACT ATC G 647---------- Val Thr Ile Gly
729 GAC GCA TTC ATGgtaatgattc ASp Ala Phe Met
------ cttattacag GTT GGA TGC ATG 754---------- Val Gly Cys Met
843 CTA ATG TTC AGgtatatatcc Leu Met Phe Arg
------ ttttgcacagG GTC GGT GAT 865----------- Val Gly Asp
993 CGA CTC TTT CTAgtgagttcat Arg Leu Phe Leu
------ attattcaag GTG ACT CCT C 1106---------- Val Thr Pro Leu
1122 GAA GCT ACA Ggtaagttgac Glu Ala Thr Gly
------ ttaatcccagGA ATG ACC TG 1143------------ Met Thr Cys
1220 G TAC TTT GAGgtaagtgatt Gly Tyr Phe Glu
------ ttatttgtag GTG AAC TAT A 1241---------- Val Asn Tyr Asn
1304 G AGA ATA AAGgtagtatata Glu Arg Ile Lys
------ ttttttacag CAA CGT TTG A 1325---------- Gln Arg Leu Asn
1399 CG AGT TTG AGgtaagaagtt Ala Ser Leu Ser
------ ataattacagC TCG TCG TTC 1420----------- Ser Ser Phe

BMC Evolutionary Biology 2007, 7:143 http://www.biomedcentral.com/1471-2148/7/143
sequences inferred from the JGI Ciona genome database,from the NCBI GenBank and Genome database, or fromthe Ensembl database, the AA sequences of all IRK pro-teins from the seven taxa were aligned by using theClustalX1.83 program, and their phylogenetic tree wasmade by the Neighbor Joining Method in the Mega3 v3.1program (Fig. 3). As the outgroup, the seven bacterial IRK-like proteins were chosen, including KirBAC1.1, of whichthe molecular structure was recently determined by X-rays[32]. Although some branches were not significantaccording to Bootstrap values, i.e., less than 50%, the treerevealed the following three points. First, the three IRKproteins in Halocynthia roretzi revealed correspondingclose homologues in Ciona intestinalis, respectively. More-over, one other IRK gene existed in the tunicates. Second,the three types of tunicate IRK, elementary IRK, GIRK, andpossibly ATP-regulated IRK, were representatives of threemajor groups of the human IRK proteins. All protostomicIRKs were grouped differently from Halocynthia IRKs,though they may show some similarity to a putative CionaATP-regulated type IRK. Prokaryotic IRKs are all evolu-tionally different from those eukaryotic ones. To illustratethe major phylogenetic evolution of IRK genes more sim-ply and clearly, we aligned the AA sequences of tunicate,Caenorhabditis, and bacterial IRK proteins, and the treewas made, as shown in Fig. 4. All internal branches in thetree were verified by a Bootstrap test, suggesting that theelementary IRK group and G-protein-activated groupdiversified from the putative ATP-regulated type in thetunicate clade later than the deuterostomic and protos-tomic diversification in the ancestor IRKs, possibly one ofthe putative ATP-regulated types. The results further con-firmed that the IRKs of protostomic clade were differentfrom those of the deuterostomic clade, but they evolvedafter the eukaryotic diversification from prokaryotic evo-lution.
Comparison of intron exon structures of IRK genes between protostomic and deuterostomic cladesAs described above, 6 to 11 introns were inserted in thecoding regions of the Halocynthia IRK genes. However,108 IRK genes of the vertebrate clade, which are extractedfrom recently established genomic databases listed inAdditional file 5 [see Additional file 5], revealed relativelyfew or no introns in their coding regions. Figure 5 illus-trates frequency histograms of intron numbers in all IRKgenes examined. Figure 5A, 5B, and 5C represents the his-tograms for the three major groups of IRKs of the verte-brates, that is, ATP-regulated, elementary, and G-protein-activated IRKs, respectively. The results indicate that theintron numbers were significantly larger in the tunicateIRKs, but they were rather few either in the amniotic oranamniotic vertebrates, though the anamniotic verte-brates might show some larger numbers, especially in thecase of ATP-regulated IRKs. For the protostomic clade, the
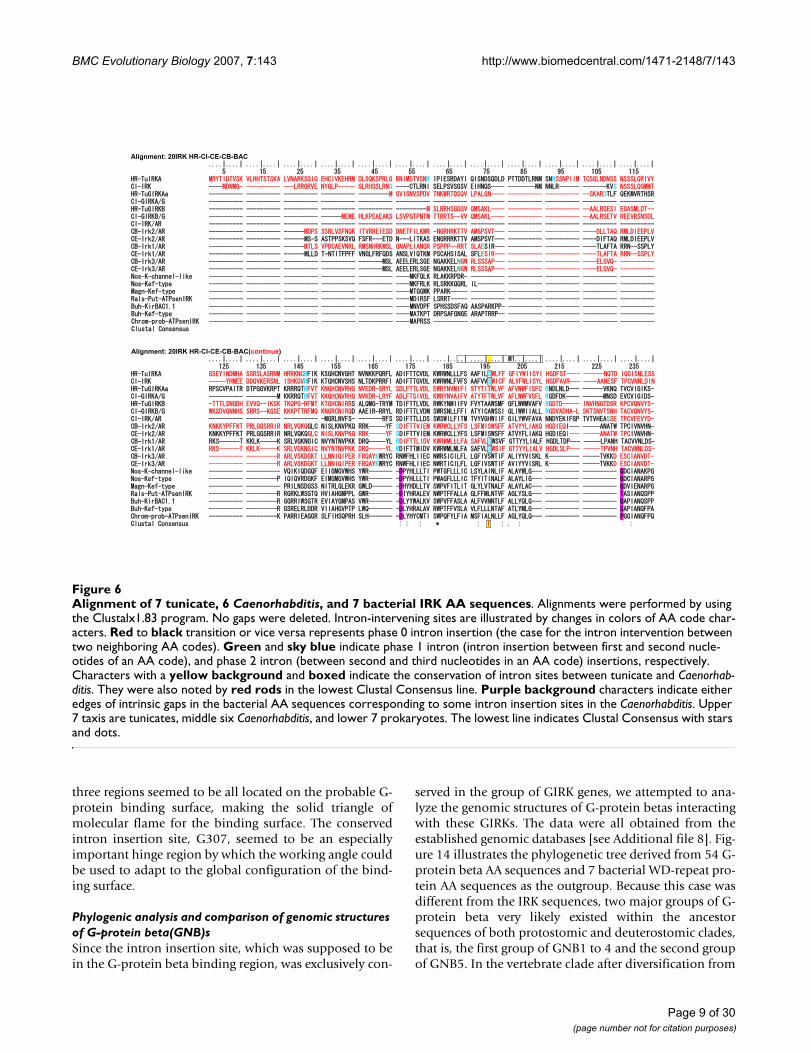
Caenorhabditis definitely revealed the large number of 9,but the Drosophila and Anopheles revealed relatively smallnumbers of less than 4, as shown in Fig. 5D. In Figure 6and 7, 7 tunicate, 6 Caenorhabditis, and 7 bacterial IRK AAsequences were aligned, and the portions of intron inser-tion are illustrated [see Additional file 6]. In either tuni-cates or Caenorhabditis, the sites for insertions were strictlyconserved between the orthologous protein pairs, at leastin the major feature regions of IRK genes. As in the case oftunicates, the Caenorhabditis IRK genes revealed insertionsites at the physiologically important membrane regionsand the ion pore regions. The further three common inser-tion sites were found between the tunicates and theCaenorhabditis (Fig. 6 and 7, yellow background andboxed characters). Thus in terms of the AA sequences, theCaenorhabditis and the tunicate IRKs were separatelygrouped and evolved differently, but the macroscopicgenomic structures seemed to keep commonality betweenthem.
Naturally bacterial IRK protein AA sequences show nointron insertion, but in alignment with eukaryotic IRK AAsequences, they revealed six intrinsic gaps in their con-served and feature regions as the IRK sequences, showingthat no eukaryotic equivalent sequences existed in themodern prokaryotes. However, it should be noted thateither edge of the respective gap seemed to correspond atleast to some of the intron insertion sites in theCaenorhabditis genomes in the five cases out of these sixgaps (Fig. 6 and 7; purple background characters in thebacterial AA sequences).
Comparison of AA sequences and genomic structures among 7 tunicate IRK genes and 108 vertebrate IRK genesIn Figure 8, the phylogenetic tree obtained from the align-ment of a total of 115 IRK AA sequences of tunicates andvertebrates is illustrated. As shown above in the tree com-posed of human and tunicate sequences, the 3 majorfunctional groups of IRK proteins are exactly representedin the major branches of the tree composed from 115 IRKsequences. And it was concluded that the 2 representativeIRKs of tunicate GIRKs, TuGIRKAa and B, and the elemen-tary IRK, TuIRKA, must be descendants of the ancestorforms of vertebrate GIRK and IRK, respectively. Althoughgrouping the putative Ciona ATP-regulated IRK as adescendant of the ancestor sequence for ATP-regulatedIRKs, including ROMKs, was not supported by a Bootstraptest, there were suggestive data to assign the commonancestor for all vertebrate IRKs to one of the relatives ofthe ATP-regulated types. From the survey of the genomicdatabases, a novel evolutional correlation was foundbetween ATP-regulated IRK genes and G-protein-activatedIRK genes, revealing the antitandem or palindromicduplication (Table 1).
Page 5 of 30(page number not for citation purposes)

BMC Evolutionary Biology 2007, 7:143 http://www.biomedcentral.com/1471-2148/7/143
Page 6 of 30(page number not for citation purposes)
Phylogenetic tree derived from 44 IRK AA sequencesFigure 3Phylogenetic tree derived from 44 IRK AA sequences. Forty-four sequences included 3 Halocynthia roretzi IRKs, 4 Ciona IRKs, 15 human IRKs, 3 Caenorhabditis elegans IRKs, 3 Caenorhabditis briggsae IRKs, 4 Drosophila melanogaster IRKs, and 5 Anoph-eles gambiae IRKs. These amino acid (AA) sequences were referred from JGI Ciona genome database, from NCBI GenBank and Genome database, or from Ensembl database. The obtained AA sequences from the seven taxa were aligned using ClustalX1.83 program. The gaps within nonpreserved regions were carefully deleted manually by the BioEdit program. Then the phylogenetic tree derived from the aligned data was made by the Neighbor Joining Method in the Mega3 v3.1 program, using the Amino Poisson correction model with Gamma-distributed Rates among sites (Gamma parameter 2.0) and Bootstrap as the test of inferred branches (Repetition 500), including 295 sites with a pair-wise deletion of Gap/Missing Data. As an out-group, the seven bacterial IRK-like proteins were chosen, including KirBAC1.1, of which the molecular structure was recently determined by X-ray [32]. Those bacterial AA sequences were also referred from an NCBI microbial genome database. The scale for tree-branch length is 0.2 mutation per AA site and is illustrated at the lowermost part of the figure. Abbreviations: IRK, elementary IRK; IRK/G, G-protein-activated IRK; IRK/AR, ATP-regulated IRK; IRK/AS, ATP-sensitive IRK like SU-recep-tor-coupled IRK. Nossp, Nostoc sp.; Nospc, Nostoc punctiforme; Magn, Magnetospirillum magnetotacticum; Chrom, Chromobacte-rium violaceum; Buhpd, Burkholderia pseudomallei; Buhfg, Burkholderia fungorum; Rals, Ralstonia solanacearum. Kef-type K+
transport system. Prob-ATPsenIRK, Probable ATP-sensitive IRK. Put-ATPsenIRK, Putative ATP-sensitive IRK. The scale and abbreviations are applied in this and the following figures.
CB-Irk3/AR
CE-Irk3/AR
DM-Irk3/AR
AN-Irk3/AR
AN-Irk3.1/AR
CB-Irk1/AR
CE-Irk1/AR
CB-Irk2/AR
CE-Irk2/AR
DM-Ir/AS
AN-Ir/AS
AN-Irk2/AS
AN-Irk2.1/AS
DM-Irk2A/AS
DM-Irk2B/AS
CI-IRK/AR
HS-Kcnj1b/AR
HS-Kcnj13/AR
HS-Kcnj15/AR
HS-Kcnj10/AR
CI-GIRKA/G
HR-TuGIRKAa
HS-Kcnj3/G
CI-GIRKB/G
HR-TuGIRKB
HS-Kcnj9/G
HS-Kcnj5/G
HS-Kcnj6/G
HS-Kcnj8/AS
HS-Kcnj11/AS
CI-IRK
HR-TuIRKA
HS-Kcnj16
HS-Kcnj2
HS-Kcnj14
HS-Kcnj12
HS-Kcnj4
Nos-K-channel-like
Nos-Kef-type
Magn-Kef-type
Chrom-prob-ATPsenIRK
Rals-Put-ATPsenIRK
Buh-KirBAC1.1
Buh-Kef-type38
89
100
100
61
100
100
100
100
100
100
100
100
98
100
81
100
99
94
99
100
100
100
92
31
42
100
57
55
99
86
98
51
41
56
47
49
47
37
38
29
0.2

BMC Evolutionary Biology 2007, 7:143 http://www.biomedcentral.com/1471-2148/7/143
On the tree derived from the AA sequences, the GIRK sub-branch was distantly located from the subbranch of ATP-regulated IRKs. However, as illustrated in Table 1, thegenome structures of respective IRKs in the one subbranchhad their partners in the other subbranch, and each pairwas located very closely together on the same chromo-some in an antitandem or a palindromic way. For exam-ple, the 5' terminals of Kcnj 1 or ROMK1 genomes ofhuman, mouse, rat, and chick were only 20 to 80 Kbpapart from the 5' terminals of Kcnj5 or GIRK2 genomes ofrespective species, and their 5' to 3' directions were just
opposite to each other (green characters enclosed by inter-rupted lines in Fig. 8). There were two other similarlypaired subbranches of Kcnj10 and Kcnj9 (orange charac-ters) and of Kcnj15 and Kcnj6 (dark blue characters). Theseparation distances on the respective chromosomes were10 to 20 Kbp for the former pairs and 260 to 450 Kbp forthe latter. This type of pairing could be expected to applyalso to the remaining subbranches of Kcnj 3 and Kcnj13.The genomes of the Kcnj 3 subbranch were all located onthe equivalent chromosomes, where HoxDs were locatedin human, mouse, rat, and chick genomes, but onlyhuman Kcnj13 gene was located on the same chromo-some as that of HoxD, with a relatively large separationdistance from the human Kcnj3 genome.
These results suggested that both ancestors of GIRK andATP-regulated IRK genes were antitandemly or palindro-mically aligned duplicates of each other possibly on thechromosome of ancestor chordates. After the event, tworound duplications of chromosome numbers in theancestor vertebrates [16] made approximately 4 times themembers of genes in each major branch in the vertebrateclade, as suggested in the case of HOX genes [14]. As alsosuggested in the case of HOX genes, there may be someextra chromosome duplications in teleost fish or amphib-ians [17], because we could find some extra members ofthe IRK genes of puffer fish, zebra fish, and Xenopus in therespective subbranches. A recently reported Cionagenomic database from Ensembl suggested that the CionaATP-regulated IRK gene (Protein,ENSCINP00000010507; gene, ENSCING00000005094)is located at Chromosome 4q-373, but there was no infor-mation yet on the location of the Ciona G-protein-acti-vated IRK gene (JGI; ci0100138554). The functionalsignificance for the preservation of the proximity of pairedIRK genomes on the vertebrate chromosomes will be dis-cussed later.
There was also evidence of genuine tandem duplicationwithin the branch of the elementary IRK gene group, asshown in the paired Kcnj2 and Kcnj16 subbranches (Fig.8; Table 1). In this case, the directions from the 5' terminalto the 3' terminal were the same within respective pairs.This tandem duplication in the mouse IRK genome wasnoted previously [33], and this pairing was considered tobe of an origin different from the above antitandem pair-ings. No other evidence of pairing was found in the ele-mentary IRK gene group, except that a possible weaklinkage between Kcnj12 and Kcnj2 subbranches wasfound as listed chromosomal location in Additional file 5[see Additional file 5].
Phylogenetic tree derived from selected 20 IRK AA sequencesFigure 4Phylogenetic tree derived from selected 20 IRK AA sequences. To show the major phylogenetic evolution of IRK genes more visually, the 20 sequences were selected from the 44 IRK data used for the previous Fig. 3, that is, three Halocynthia roretzi IRKs, four Ciona IRKs, three Caenorhabditis elegans IRKs, and three Caenorhabditis briggsae IRKs. The seven bacterial IRK-like proteins were taken as the outgroup, which was the same as in Fig. 3. The position of KirBAC1.1 was underlined. Alignment, phylogenetic tree building, and Bootstrap for the internal branch test were the same as in Fig. 3. The gaps within nonpreserved regions were carefully deleted manually by the BioEdit program. Then the phylogenetic tree derived from the aligned data was made by the Neighbor Joining Method in the Mega3 v3.1 program, including 269 sites with pairwise deletion of Gap/Missing Data. In Additional file 5, Excel data of intron insertion in various IRK genomes, intron numbers, sizes, and loca-tions for 123 IRK genes used for the analysis of the present study were listed. The identification numbers in GenBank or Ensembl for the genes and their locations in the chromo-somes were also included. [see Additional file 5]
CB-Irk3/AR
CE-Irk3/AR
CB-Irk2/AR
CE-Irk2/AR
CB-Irk1/AR
CE-Irk1/AR
CI-IRK/AR
HR-TuGIRKAa
CI-GIRKA/G
HR-TuGIRKB
CI-GIRKB/G
HR-TuIRKA
CI-IRK
Nos-K-channel-like
Nos-Kef-type
Magn-Kef-type
Chrom-prob-ATPsenIRK
Buh-Kef-type
Rals-Put-ATPsenIRK
Buh-KirBAC1.167
75
100
100
74
100
100
100
100
100
100
100
100
89
94
69
50
0.2
Page 7 of 30(page number not for citation purposes)

BMC Evolutionary Biology 2007, 7:143 http://www.biomedcentral.com/1471-2148/7/143
A uniquely conserved intron insertion site among the vertebrate GIRK gene group and tunicate GIRK genesAs described above, intron insertions in the vertebrate IRKcoding regions are very few in comparison with those ofthe tunicate IRKs. Thus the intron and exon structures ofthe vertebrate IRK genes were quite different from those ofthe tunicates, though the AA sequences are phylogeneti-cally closely related to their tunicate orthologs, as shownin the tree in Fig. 8. However, in the group of GIRK genesthere is only one uniquely conserved intron insertion siteamong all vertebrate GIRKs and tunicate GIRKs in Fig. 9and Fig. 10 [see Additional file 7]. As shown Fig. 11, thissite was between the first and second nucleotide in the gly-cine codon and was preserved exclusively in the group ofvertebrate and tunicate GIRKs. The site corresponded toG307 residue in the mouse GIRK1 or Kcnj3 and waslocated at the loop region near the hydrogen bonded turn
a304–306 and between two beta strands a294–303 anda309. The site was suggested to be in the hinge region inthe cytoplasmic C-terminal domain, which could beimportant for open-close transition by G-protein beta andgamma binding, and the residue seemed to be exposed tothe cytoplasmic surface, as inferred from the mouseGIRK1 cytoplasmic crystal structure reported by Nishidaand MacKinnon[34]. It is also noted that two exclusivelyconserved AA sequence regions in the C-terminal domainof the GIRK were located in the upper stream and down-stream within 75 and 25 AA residue distances, respec-tively, from this intron insertion site and. The former,a234–237, were included in the beta-strand region a223–237 and seemed to be located on the cytoplasmic sur-face(Fig. 12). The latter, L333, was previously suggested tobe the most effective activation site by G-protein beta andgamma (Fig. 13) [35]. The above-described conserved
Frequency histograms of intron numbers in all 108 IRK genes examinedFigure 5Frequency histograms of intron numbers in all 108 IRK genes examined. Figure A, B, and C represent the histo-grams for three major groups of vertebrate IRKs, that is, ATP-regulated, elementary, and G-protein-activated IRK groups, respectively. Anamniotic vertebrates mean fish and amphibians, and amniotic birds and mammals. Abscissa, Intron numbers. Ordinate, Number of genes, which showed numbers of intron insertions in the coding regions as indicated on the abscissa. Fig-ure D is the similar histogram for IRK genes of protostomic clade, that is, Caenorhabditis elegans and brigssae, and Drosophila melanogaster and Anofeles gambiae.
0
2
4
6
8
10
12
14
16
18
1 2 3 4 5 6 7 8 9 10 110
IRK-CE, CB
IRK-DM, AN
IRK-HR, CI
IRK-anamniotic Vertebrates
IRK-amniotic Vertebrates
1 2 3 4 5 6 7 8 9 10 110
0
2
4
6
8
10
12
14
16
18
1 2 3 4 5 6 7 8 9 10 110
0
2
4
6
8
10
12
14
16
18
GIRK-HR, CI
GIRK-anamniotic Vertebrates
GIRK-amniotic Vertebrates
1 2 3 4 5 6 7 8 9 10 110
0
2
4
6
8
10
12
14
16
18
IRK/AR-HR, CI
IRK/AR-anamniotic Vertebrates
IRK/AR-amniotic Vertebrates
Intron Num.
freq. freq.
freq.freq.
Intron Num.
Intron Num.
Intron Num.
A
DC
B
Page 8 of 30(page number not for citation purposes)
BMC Evolutionary Biology 2007, 7:143 http://www.biomedcentral.com/1471-2148/7/143
three regions seemed to be all located on the probable G-protein binding surface, making the solid triangle ofmolecular flame for the binding surface. The conservedintron insertion site, G307, seemed to be an especiallyimportant hinge region by which the working angle couldbe used to adapt to the global configuration of the bind-ing surface.
Phylogenic analysis and comparison of genomic structures of G-protein beta(GNB)sSince the intron insertion site, which was supposed to bein the G-protein beta binding region, was exclusively con-
served in the group of GIRK genes, we attempted to ana-lyze the genomic structures of G-protein betas interactingwith these GIRKs. The data were all obtained from theestablished genomic databases [see Additional file 8]. Fig-ure 14 illustrates the phylogenetic tree derived from 54 G-protein beta AA sequences and 7 bacterial WD-repeat pro-tein AA sequences as the outgroup. Because this case wasdifferent from the IRK sequences, two major groups of G-protein beta very likely existed within the ancestorsequences of both protostomic and deuterostomic clades,that is, the first group of GNB1 to 4 and the second groupof GNB5. In the vertebrate clade after diversification from
Alignment of 7 tunicate, 6 Caenorhabditis, and 7 bacterial IRK AA sequencesFigure 6Alignment of 7 tunicate, 6 Caenorhabditis, and 7 bacterial IRK AA sequences. Alignments were performed by using the Clustalx1.83 program. No gaps were deleted. Intron-intervening sites are illustrated by changes in colors of AA code char-acters. Red to black transition or vice versa represents phase 0 intron insertion (the case for the intron intervention between two neighboring AA codes). Green and sky blue indicate phase 1 intron (intron insertion between first and second nucle-otides of an AA code), and phase 2 intron (between second and third nucleotides in an AA code) insertions, respectively. Characters with a yellow background and boxed indicate the conservation of intron sites between tunicate and Caenorhab-ditis. They were also noted by red rods in the lowest Clustal Consensus line. Purple background characters indicate either edges of intrinsic gaps in the bacterial AA sequences corresponding to some intron insertion sites in the Caenorhabditis. Upper 7 taxis are tunicates, middle six Caenorhabditis, and lower 7 prokaryotes. The lowest line indicates Clustal Consensus with stars and dots.
Alignment: 20IRK HR-CI-CE-CB-BAC
Alignment: 20IRK HR-CI-CE-CB-BAC(continue)
Page 9 of 30(page number not for citation purposes)

BMC Evolutionary Biology 2007, 7:143 http://www.biomedcentral.com/1471-2148/7/143
the ancestor chordate, the first group produced 4 mem-bers, and the number seemed to remain throughout thevertebrate evolution, except for some extra production inthe teleost fish. Also in fly and mosquito, two majorgroups remained.
In terms of intron-exon structures, the frequency histo-grams in Fig. 15 demonstrated that the 7 to 11 introninsertions in the coding region were rather constantamong all vertebrate GNBs and Ciona GNBs. Two groupsof GNBs in Caenorhabditis revealed 8 and 7 intron inser-tions, similar to those in Ciona, respectively. However, theGNBs in fly and mosquito revealed a much lower numberof intron insertions than Caenorhabditis did. An alignmentof GNB1 protein sequences illustrated not only strictamino acid residue conservation, but also strict introninsertion site preservation among human, mouse, rat,fish, Ciona, and Caenorhabditis GNB1 proteins (Fig. 16 and
17). However, fly and mosquito GNBs did not conservethe intron insertion sites. The alignment of GNB5 proteinAA sequences illustrated similar results [see Additional file9]. The physiological significance of intron insertion siteconservation will be discussed later.
DiscussionSummary of resultsWe sequenced three Halocynthia IRK genomic genes anddetermined their genomic structures. Furthermore, a totalof 131 IRK genomic genes were inferred from the estab-lished genomic databases. The phylogenic trees derivedfrom the known or inferred AA sequences revealed theclear diversification of deuterostomic IRK from protos-tomic IRK, and the tunicate IRKs were possibly represent-atives of ancestor forms of three major groups of IRKs inthe vertebrate. However, the genomic structures, includ-ing intron-exon connections of the tunicate IRKs, showed
Alignment of 7 tunicate, 6 Caenorhabditis, and 7 bacterial IRK AA sequences (continued from Figure 6Figure 7Alignment of 7 tunicate, 6 Caenorhabditis, and 7 bacterial IRK AA sequences (continued from Figure 6.) The alignments for the rest parts of AA sequences, which are not included in Fig. 6 and 7, are illustrated in an additional file [see Additional file 6].
Alignment: 20IRK HR-CI-CE-CB-BAC(continue)
Alignment: 20IRK HR-CI-CE-CB-BAC(continue)
Page 10 of 30(page number not for citation purposes)

BMC Evolutionary Biology 2007, 7:143 http://www.biomedcentral.com/1471-2148/7/143
Page 11 of 30(page number not for citation purposes)
The phylogenetic tree obtained from the alignment of a total of 7 and 108 IRK AA sequences of tunicates (underlined) and ver-tebrates, respectivelyFigure 8The phylogenetic tree obtained from the alignment of a total of 7 and 108 IRK AA sequences of tunicates (underlined) and vertebrates, respectively. (A) illustrates the upper part of the tree and (B) does the lower part. a and a , b and b', c and c', and d and d' indicate the continuation of branches from the upper part to the lower. The outgroup were seven bacterial IRK genes. Except for Halocynthia data, AA sequences are inferred from the established genome data bases, JGI, NCBI and GenBank, and Ensembl. Alignment was carried out by the ClustalX1.83 program. The gaps within nonpreserved regions were carefully deleted manually by the BioEdit program. The phylogenetic tree derived from the aligned data was then made by the Neighbor Joining Method in the Mega3 v3.1 program, using the Amino Poisson correction model with Gamma-distributed Rates among sites (Gamma parameter 2.0) and Bootstrap as the test of inferred branches (Repetition 500), includ-ing 270 sites with a pairwise deletion of Gaps/Missing Data. The character of the same color indicates the proximity of the chromosomal location of gene pairs between two subbranches. The closure by an interrupted line indicated that the chromo-somal location between paired genes was very close in the order of 10 to 200 Kbp. The closure by dotted line indicates that linkage is weak. The Hox name in the parentheses indicates the equivalence of the chromosomal locations among different taxa by the presence of the specific Hox gene group. See also Additional file 5, chromosomal locations of genes. [see Additional file 5]
HS-Kcnj1a/AR
HS-Kcnj1c/AR
HS-Kcnj1b/AR
MM-Kcnj1/AR
RN-Kcnj1/AR
GG-Kcnj1/AR
DR-Kcnj1.2/AR
DR-Kcnj1.1/AR
MM-Kcnj13/AR
RN-Kcnj13/AR
HS-Kcnj13/AR
GG-Kcnj13/AR
XT-Kcnj13/AR
DR-Kcnj13/AR
FR-Kcnj13/AR
MM-Kcnj15/AR
RN-Kcnj15/AR
HS-Kcnj15/AR
GG-Kcnj15/AR
XT-Kcnj15/AR
FR-Kcnj10.1/AR
FR-Kcnj10.2/AR
XT-Kcnj10/AS
RN-Kcnj10/AR
HS-Kcnj10/AR
MM-Kcnj10/AR
CI-IRK/AR
MM-Kcnj3/G
RN-Kcnj3/G
HS-Kcnj3/G
FR-Kcnj3/G
GG-Kcnj3/G
DR-Kcnj3/G
XT-Kcnj3/G
GG-Kcnj3A/G
FR-Kcnj3A2/G
DR-Kcnj3A/G
FR-Kcnj3A1/G
CI-GIRKA/G
HR-TuGIRKAa
CI-GIRKB/G
HR-TuGIRKB
RN-Kcnj9/G
HS-Kcnj9/G
MM-Kcvnj9/G
FR-Kcnj9/G
HS-Kcnj6/G
RN-Kcnj6/G
MM-Kcnj6/G
GG-Kcnj6/G
FR-Kcnj6/G
FR-Kcnj5/G
XT-Kcnj5/G
XT-Kcnj6/G
GG-Kcnj5/G
HS-Kcnj5/G
MM-Kcnj5/G
87
99
98
99
95
100
65
100
100
100
96
100
100
86
99
99
100
100
86
100
100
99
56
62
100
72
71
34
46
69
25
98
93
98
100
100
100
96
99
87
99
98
37
23
34
96
97
90
24
44
65
95
58
(HOXD)
(HOXD)
GG-KcnjEx/G
XT-KcnjEXB/G
XT-KcnjEXA/G
DR-KcnjEX/G
FR-Kcnj11A/AS
XT-Kcnj11A/AS
MM-Kcnj11/AS
RN-Kcnj11/AS
HS-Kcnj11/AS
DR-Kcnj11/AS
FR-Kcnj11/AS
FR-Kcnj8/AS
GG-Kcnj8/AS
XT-Kcnj8/AS
HS-Kcnj8/AS
MM-Kcnj8/AS
RN-Kcnj8/AS
CI-IRK
HR-TuIRKA
MM-Kcnj16
RN-Kcnj16
HS-Kcnj16
GG-Kcnj16
MM-Kcnj12
RN-Kcnj12
HS-Kcnj12
GG-Kcnj12
XT-Kcnj12
DR-Kcnj12.1
DR-Kcnj12.2
FR-Kcnj12A
XT-Kcnj4
GG-Kcnj4
MM-Kcnj4
HS-Kcnj4
RN-Kcnj4
MM-Kcnj14.2
MM-Kcnj14.1
MM-Kcnj14
RN-Kcnj14
HS-Kcnj14
XT-Kcnj14
FR-Kcnj14
DR-Kcnj2.1
FR-Kcnj2
DR-Kcnj2
XT-Kcnj2
GG-Kcnj2
RN-Kcnj2
MM-Kcnj2
HS-Kcnj2
Nos-K-channel-like
Nos-Kef-type
Magn-Kef-type
Chrom-prob-ATPsenIRK
Rals-Put-ATPsenIRK
Buh-KirBAC1.1
Buh-Kef-type55
95
100
100
63
100
93
99
100
91
100
82
95
99
52
87
90
77
79
45
100
97
55
100
98
43
52
100
100
51
81
74
99
95
71
100
76
100
87
99
88
81
82
73
78
50
92
66
76
65 80
98
96
61
100
0.2
(HOXC)
(HOXA)
(HOXB)
(HOXB)
(HOXB)
(HOXC)
A B
dcba
d’c’b’a’

BMC Evolutionary Biology 2007, 7:143 http://www.biomedcentral.com/1471-2148/7/143
Table 1: The palindromic duplication of the gene pair between ATP-regulated IRK and G-protein-activated IRK genes on a chromosome.
Properties Pair Homolog Summary of Expression
Hox-location Chromosome
Chrom-location and direction
Distance between the
pair in bp
Genes in branches with green color figures in Fig. 5palindromic GG-Kcnj1/AR Kir1.1/ROM-K/
ATP-regulatedGG-chromosome-24
1.06 Mb-reverse
31795
GG-Kcnj5/G GIRK4/Kir3.4/KATP-1
PKNOX2-24-0.14bM
GG-chromosome-24
1.09 Mb-forward
palindromic HS-Kcnj1/AR Kir1.1/ROM-K/ATP-regulated
Kcnj1-Kidney epithelium
HS-chromosome-11
128.2 Mb-reverse
24045
HS-Kcnj5/G GIRK4/Kir3.4/KATP-1
Kcnj5-Heart muscle cell
HS-chromosome-11
128.3 Mb-forward
palindromic MM-Kcnj1.1/AR
Kir1.1/ROM-K/ATP-regulated
MM-chromosome-9
32.4 Mb-forward
80347
MM-Kcnj5/G GIRK4/Kir3.4/KATP-1
MM-chromosome-9
32.3 Mb-reverse
palindromic RN-Kcnj1/AR Kir1.1/ROM-K/ATP-regulated
RN-chromosome-8
32.2 Mb-forward
22000
RN-Kcnj5/G GIRK4/Kir3.4/KATP-1
an annotated genomic sequence(NW_047799) using the gene prediction method: GNOMON*1
RN-chromosome-8
32.1Mb-reverse
Genes in branches with orange color figures in Fig. 5palindromic HS-Kcnj10/AR Kir4.1/Kir1.2/
ATP-regulatedKcnj10-glia HS-
chromosome-1157.2 Mb-reverse
11322
HS-Kcnj9/G GIRK3/Kir3.3 Kcnj9-neuronal cell
HS-chromosome-1
157.3 Mb-forward
palindromic MM-Kcnj10/AR Kir4.1/ATP-regulated
MM-chromosome-1
172.4 Mb-forward
12138
MM-Kcnj9/G GIRK3/Kir3.3 MM-chromosome-1
172.4 Mb-reverse
palindromic RN-Kcnj10/AR KIR4.1/Kir1.2/ATP-regulated
RN-chromosome-13
88.5 Mb-forward
24712
RN-Kcnj9/G GIRK3/Kir3.3/Kir3.1
RN-chromosome-13
88.5 Mb-reverse
Genes in branches with blue color figures in Fig. 5palindromic GG-Kcnj15/AR Kir4.2/Kir1.3 HOXC8-1-
87Mb(stand alone)
GG-chromosome-1
101.25 Mb-forward
275125
GG-Kcnj6/G GIRK2/Kir3.2/KATP-2
HOXC8-1-87Mb
GG-chromosome-1
100.9 Mb-reverse
palindromic HS-Kcnj15/AR Kir4.2/Kir1.3 Kcnj15-kidney, epithelium, glia
HS-chromosome-21
38.5 Mb-forward
339968
HS-Kcnj6/G GIRK2/Kir3.2/KATP-2
Kcnj6-Neuronal cell
HS-chromosome-21
37.9 Mb-reverse
palindromic MM-Kcnj15/AR Kir4.2/Kir1.3 MM-chromosome-16
95.9803Mb-forward
260226
Page 12 of 30(page number not for citation purposes)

BMC Evolutionary Biology 2007, 7:143 http://www.biomedcentral.com/1471-2148/7/143
MM-Kcnj6/G GIRK2/Kir3.2/KATP-2
MM-chromosome-16
95.5 Mb-reverse
palindromic RN-Kcnj15/AR Kir4.2/Kir1.3 RN-chromosome-11
35.6 Mb-forward
460583
RN-Kcnj6/G GIRK2/Kir3.2/KATP-2
RN-chromosome-11
35.1 Mb-reverse
Genes in branches with purple color figures in Fig. 5disperse GG-Kcnj3/G GIRK1/KIR3.1 HOXD(13)-7-
17.1Mb-rGG-chromosome-7
36.4 Mb-forward
Palindromic? HS-Kcnj13/AR Kir7.1/ATP-related
Kcnj13-choroid plexus/thyroid/intestine
HOXD-2q31.1-176.8Mb-f
HS-chromosome-2
233.8 Mb-reverse
78000000
HS-kcnj3/G GIRK1/Kir3.1 Kcnj3-neuronal cell (heteromer with Kcnj6, 9)
HOXD-2q31.1-176.8Mb-f
HS-chromosome-2
155.8 Mb-forward
possibly paired with Kcnj13
Kcnj3-heart muscle cell (heteromer with Kcnj5)
disperse MM-Kcnj3/G GIRK1/Kir3.1 HOXD-2-45.0 cM-74.56Mb-f
MM-chromosome-2
55.4 Mb-forward
disperse RN-Kcnj3/G GIRK1/KIR3.1 HOXD-3-57.3Mb-f
RN-chromosome-3
37.0 Mb-forward
Genes in branches with red color figures in Fig. 5tandem GG-Kcnj16 Kir5.1 GG-
chromosome-18
7.95 Mb-Forward
14689
GG-Kcnj2 Kir2.1 GG-chromosome-18
7.97 Mb-Forward
tandem HS-Kcnj16 Kir5.1 colocalize with Kcnj2 in brain and in kidney
HOXB-17q21-q22-44.06Mb-r
HS-chromosome-17
68.7 Mb-Forward
33932
HS-Kcnj2 Kir2.1 Heart (Andersen Syndrome), Vas. Smooth muscle
HOXB-17q21-q22-44.06Mb-r
HS-chromosome-17
68.8 Mb-Forward
tandem MM-Kcnj16 Kir5.1 HOXB-11-56.08cM-95.87Mb-f
MM-chromosome-11
110.7 Mb-Forward
39324
MM-Kcnj2 Kir2.1 HOXB-11-56.08cM-95.87Mb-f
MM-chromosome-11
110.7 Mb-Forward
tandem RN-Kcnj16 KIR5.1 HOXB-10-84.95Mb-f
RN-chromosome-10
100.5 Mb-Forward
59504
RN-Kcnj2 Kir2.1/Kir2.2 HOXB-10-84.95Mb-f
RN-chromosome-10
100.6 Mb-Forward
DR-Kcnj2.1 Kir1.1/Kir3.1 Zebra-HOXB DR-chromosome-3
2.0 Mb
*1 Noted in NCBI genome project Rat. Predicted protein amino acid sequence was devoid of the major part of C-terminal distal to the feature sequence of Kcnjs. Therefore the AA sequence was not included in the construction of the phylogenetic tree in Fig. 5.From the survey of the established genome databases, all gene pairs within IRK genes as far as thoroughly looked for are illustrated. In addition, the lower four pairs illustrate the tandem duplications of IRK genes in the elementary IRK group. Some of these tandem duplications in the human genome were reported previously [33]. Respective groups of genes which corresponded to the character colors in Fig. 8 are indicated.
Table 1: The palindromic duplication of the gene pair between ATP-regulated IRK and G-protein-activated IRK genes on a chromosome. (Continued)
Page 13 of 30(page number not for citation purposes)

BMC Evolutionary Biology 2007, 7:143 http://www.biomedcentral.com/1471-2148/7/143
considerable similarities to those of Caenorhabditis.Although the major groups of tunicate IRK proteinsincluded only one or two members, in the vertebrate cladethe members in one major group increased at least fourtimes. The generation of paralogues can be achieved byvarious types of gene duplication, such as tandem and/orchromosomal. However, the generation of the majorgroups in the tunicates and vertebrates may be of moreancient origin, and some of the mechanism may bederived from the unique palindromic duplication. Finallythe strong conservation of intron insertion sites in thecoding regions of vertebrate GIRK group indicated theclose functional correlation between the genome struc-tures and the protein structures.
Intron early theoryThe significance of intron insertion has been considerablynotified by the claim of exon theory [8]. The exon theorypersisted that the ancestral eukaryotic genes are generatedfrom numerous short exons connected with ancient
introns, and exon shuffling introduced new functions intothe gene product proteins [23]. Provocative evidence forthe theory is provided by the high-frequency insertion ofintrons between codon sequences, phase 0 intron, and theconservation of intron insertion sites in the codingregions of orthologous proteins from a phylogeneticallywide range of taxis [23]. However, because of massiveintron loss during the evolutionary process and the signif-icant production of new intron insertion in the highlyevolved taxis, such as human and Drosophila, the ancientintron insertion sites may be vastly lost in the genomes ofpresent-day organisms [9]. Those situations have facili-tated several types of late intron theory or synthetic theoryof intron evolution [10-12].
In the present study, we purposefully limited observationand discussion to within the gene group of definitely func-tionally defined proteins, that is, IRK channels. Resultsindicated that both the tunicate IRK genes and theCaenorhabditis IRK genes conserved large numbers of
The selected AA sequences from the alignment of 115 AA sequences to illustrate an exclusively conserved intron intervening site among the tunicate and vertebrate GIRK groupFigure 9The selected AA sequences from the alignment of 115 AA sequences to illustrate an exclusively conserved intron intervening site among the tunicate and vertebrate GIRK group. The yellow background and boxed regions illustrate exclusively conserved AA sites among the tunicate and vertebrate GIRK group and the suggested interaction sites with G-protein beta and gamma[35]. Intron-intervening sites are illustrated by changes in the colors of AA code charac-ters. A red to black transition or vice versa represents phase 0 intron insertion. Green and sky blue indicate phase 1 intron and phase 2 intron insertions, respectively.
Alignment: GIRK
Alignment: HS-IRK
Alignment: HS-IRK/AR
Page 14 of 30(page number not for citation purposes)

BMC Evolutionary Biology 2007, 7:143 http://www.biomedcentral.com/1471-2148/7/143
intron insertion sites in the functionally important trans-membrane and pore regions. Further, three insertion siteswere commonly conserved in terms of AA sequencesbetween the tunicates and the Caenorhabditis, indicatingthat some of the cornerstones of early evolutional historyremained.
Although there is an intriguing hypothesis that the exoncorresponds to protein domains [23,36], the conservedinsertion sites seemed not always to exist at the borders ofdomains. Instead, they were at the structurally criticalpoints, such as the membrane spanning region or insidethe pore regions in the present study. This point will befurther discussed below.
In both chordates and protostomal clades, when therespective members increased within functionally differ-
ent major groups of IRK genes, the number of introninsertions abruptly decreased. In the tunicates or theCaenorhabditis, the members remained small in numberpossibly because of the size constraint of whole genomes,and the intron insertion sites were conserved. Our obser-vation could suggest no points about intron insertions inbacterial genes; however, we were inclined to considerthat the intron appearance is closely related to the earlyappearance of eukaryotic organisms, because some resid-ual gaps of IRK amino acid sequences were left in themodern bacteria, roughly corresponding to the conservedintron insertion sites of the ancestral eukaryotes reflectedin the Caenorhabditis or tunicate genomes. This suggestedthat the intron insertion mechanism newly appeared atleast at the time of diversification between the eukaryoticand prokaryotic ancestors, or that the introns in theprokaryotic and eukaryotic common ancestor, the prog-
The selected AA sequences from the alignment of 115 AA sequences to illustrate an exclusively conserved intron intervening site among the tunicate and vertebrate GIRK group (continued from Figure 9)Figure 10The selected AA sequences from the alignment of 115 AA sequences to illustrate an exclusively conserved intron intervening site among the tunicate and vertebrate GIRK group (continued from Figure 9). The yellow background and boxed regions illustrate exclusively conserved AA sites among the tunicate and vertebrate GIRK group. Especially glycine colored by green indicates the existence of phase 1 intron. In the other group, the intron intervening site was not conserved in spite of the conserved amino acid residue in some genes. The alignments for the rest parts of AA sequences, which are not included in Fig. 9 and 10, are illustrated in an additional file [see Additional file 7].
Alignment: GIRK(continue)
Alignment: HS-IRK(continue)
Alignment: HS-IRK/AR(continue)
Page 15 of 30(page number not for citation purposes)

BMC Evolutionary Biology 2007, 7:143 http://www.biomedcentral.com/1471-2148/7/143
Page 16 of 30(page number not for citation purposes)
The short region of the alignment of 115 AA sequences illustrates an exclusively conserved intron insertion site among the tunicate and vertebrate GIRK groupFigure 11The short region of the alignment of 115 AA sequences illustrates an exclusively conserved intron insertion site among the tunicate and vertebrate GIRK group. Alignment: HR-115IRK-GMVEATGM The region corresponded to 21 amino acids from V303 and M323 in the C-terminal domain of human Kcnj5 (GIRK4). Glycine colored by green indicates the intron insertion site between the first and second nucleotides in the codon (phase 1 intron). In other group, the insertion site was not conserved in spite of the conserved amino acid residue in some genes.

BMC Evolutionary Biology 2007, 7:143 http://www.biomedcentral.com/1471-2148/7/143
Page 17 of 30(page number not for citation purposes)
The short region of the alignment of 115 AA sequences to illustrate exclusively conserved AA sites among the tunicate and vertebrate GIRK groupFigure 12The short region of the alignment of 115 AA sequences to illustrate exclusively conserved AA sites among the tunicate and vertebrate GIRK group. Alignment: HR-115IRK-KSRQ. The region corresponded to 20 amino acid residues from S233 and L252 in the C-terminal domain of human Kcnj5 (GIRK4). Red-colored characters indicate strict and exclusive conservation, and the pink ones less strict.

BMC Evolutionary Biology 2007, 7:143 http://www.biomedcentral.com/1471-2148/7/143
Page 18 of 30(page number not for citation purposes)
The short region of the alignment of 115 AA sequences to illustrate exclusively conserved AA sites among the tunicate and vertebrate GIRK groupFigure 13The short region of the alignment of 115 AA sequences to illustrate exclusively conserved AA sites among the tunicate and vertebrate GIRK group. Alignment: HR-115IRK-LXXG. The region corresponded to 24 amino acid residues from W329 and H352 in the C-terminal domain of human Kcnj5 (GIRK4). Purple-colored characters, L339 in human Kcnj5, indicate strict and exclusive conservation, except tunicate GIRKBs. The Leucine residue in mouse Kcnj6 (GIRK2) has been sug-gested to be the most effective previous activation sites by G-protein beta and gamma [35].

BMC Evolutionary Biology 2007, 7:143 http://www.biomedcentral.com/1471-2148/7/143
enote, genomes disappeared in the prokaryotes, as sug-gested previously [23]. This consideration supported theexon theory in the evolution of the IRK gene family.
There remains the possibility that the common introninsertion between tunicates and Caenorhabditis could bederived from convergent evolution during later historyway after eukaryotic diversification from prokaryotes.However, it was totally unclear what kinds of adaptive
merits produced by the multiple intron insertion com-monly existed in their phylogenetically different ances-tors, although convergent evolution of the AA sequencesmight be derived from the functional similarity of IRKproteins [37].
Gene duplicationIn the vertebrate it has been proposed that gene diversifi-cation has been attained by various kinds of gene duplica-
The phylogenetic tree derived from 54 G-protein beta AA sequencesFigure 14The phylogenetic tree derived from 54 G-protein beta AA sequences. (A) illustrates the upper part of the tree and (B) does the lower part. a and a , and b and b' indicate the continuation of branches from the upper part to the lower. A total of 54 AA sequences of eukaryotic G-protein beta and two beta-like AA sequences were analyzed [see Additional file 8]. The outgroup was 7 bacterial WD-repeat protein AA sequences. Tunicate GNBs were underlined. AA sequences are inferred from the established genome data bases, JGI, NCBI genomes, and Ensembl. Alignment was carried out by the ClustalX 1.83 program. The gaps within nonpreserved regions were carefully deleted manually by the BioEdit program. The phylogenetic tree derived from the aligned data was then made by the Neighbor Joining Method in the Mega3 v3.1 program, using the Amino Poisson correction model with Gamma-distributed Rates among sites (Gamma parameter 2.0) and Bootstrap as the test of inferred branches (Repetition 500), including 471 sites with a pairwise deletion of Gaps/Missing Data. Drosophila and Anopheles Gbeta76C genes may be differently grouped from the vertebrate-type GNBs according to this phylogenetic tree. Those bacte-rial AA sequences of WD-repeat proteins were also referred from the NCBI microbial genome database. Abbreviations: GNB, G-protein beta. Rosfsp, Roseiflexus sp.; Anavar, Anabaena variabilis; Nossp, Nostoc sp.; Nospc, Nostoc punctiforme; Glovio, Gloeo-bacter violaceus.
DR-gnb2/A
DR-gnb2/B
FR-GNB2
HS-GNB2
MM-GNB2
RN-GNB2
DR-gnb4
FR-GNB4
GG-GNB4
HS-GNB4
MM-GNB4
RN-GNB4-like
DR-gnb1
FR-GNB1/A
FR-GNB1/B
GG-GNB1
HS-GNB1
MM-GNB1
RN-GNB1
CE-gpb1
CB-CBG03131
AN-DMGbeta13F/A
AN-DMGbeta13F/B
DM-Gbeta13F/A1
DM-Gbeta13F/A2
CI-GNB1
GG-GNB3
HS-GNB3
MM-GNB3
RN-GNB3
DR-gnb3/A
FR-GNB3/A
DR-gnb3/B
FR-GNB3/B100
62100
66
96
100
100
9999
100
100
100
100
89
100
100
100
92
88
100
91
42
57
41
70
40
85
100
54
42
45
100
AN-GNB/DM-Gbeta76C
DM-Gbeta76C
CE-EAT-11
CB-CBG11904
CI-GNB5
AN-DMGbeta5/A1
AN-DMGbeta5/A2
DM-Gbeta5
GG-GNB5/A3
FR-GNB5/B
DR-gnb5/B
DR-zgc73196/GNB5
DR-gnb5/A
FR-GNB5/A
GG-GNB5/A2
GG-GNB5/A1
HS-GNB5L
MM-GNB5/A2
MM-GNB5/A1
RN-GNB5/A2
RN-GNB5/A1
RN-GNB5/A3
Rosfsp-ctg149-WD-40/ZP_01359362.1
Rosfsp-ctg158-WD-40/ZP_01358743.1
Anavar-WD-40/YP_322074.1
Nospun-COG2319/ZP 00110163.1
Glovio-WD-repeat/NP 924911.1
Nossp-WD-40/NP_484073.1
Nospun-COG2319/ZP 00110089.179
95
55
70
65
100
100
100
100
90
100
92
51
42
83
99
59
59
62
46
25
57
98
64
38
94
0.2
A B
ba
b’a’
Page 19 of 30(page number not for citation purposes)

BMC Evolutionary Biology 2007, 7:143 http://www.biomedcentral.com/1471-2148/7/143
tion [15,16,19,38]. There are many examples of tandemduplication, which could produce the paralogues of genes[39]. It could be inferred that one of the duplicated pairbecame free from the functional constraining andacquired the new function or degenerated as nonfunc-tional by the accumulation of mutations. It is generallyunderstood that the duplication by random insertioncould be derived from the genomic insertion of reversetranscript of the original gene by various transposon-likemechanisms and that the exact duplication of gene regu-latory sequence, such as promoters and enhancers, arerather difficult. Thus block duplication or chromosomalduplication of the concerned gene groups should be aneasier way to produce new functional paralogues. Thefamous two-round duplication of the chromosome sethas been proposed by Ohno in the ancestor vertebrate
[13], and the theory has strong support by the existence offour sets of tandemly aligned Hox gene groups in theamniotic vertebrate genomes and the recent analysis onthe whole genome sequences derived from a wide-rangeof vertebrate taxa including both anamniotes and amni-otes [14-16]. The presence of extra sets of Hox gene groupsin fish has been explained by the extra duplication ofchromosomal sets in the teleosts[17].
In the present study, two major gene groups, ATP-regu-lated IRK and G-protein-activated IRK, of which genebranches were placed quite distantly on the phylogenetictree derived from the IRK AA sequences, were found to bephysically correlated closely and franked anti-tandemly aspairs on the individual chromosomes. This is so-calledpalindromic duplication, which has recently attracted
Frequency histograms of intron numbers in all 52 GNB genes examinedFigure 15Frequency histograms of intron numbers in all 52 GNB genes examined. After we identified the G-protein beta AA sequences and obtaining the trees, we retrieved all respective genomic sequences from the databases. And the exon intron junctions, the length of introns, and the numbers of intron insertions within coding regions were inferred, and listed in Addi-tional file 8 [see Additional file 8]. Figure A and B represents the histograms of intron insertion numbers within coding regions for two major groups of vertebrate GNBs, that is, GNB 1 to 4 and GNB 5 groups, respectively. Anamniotic vertebrates mean fish and amphibian, and amniotic birds and mammals. Abscissa, Intron numbers. Ordinate, and Number of genes, which showed the numbers of intron insertions in the coding regions as indicated on the abscissa. Figure C and D is the similar histogram for two major groups of GNBs genes of the protostomic clades, that is, Caenorhabditis elegans and brigssae, and Drosophila mela-nogaster and Anopheles gambiae. Extra means Gbeta76C genes of Drosophila and Anopheles.
0
2
4
6
8
10
12
14
1 2 3 4 5 6 7 8 9 10 110
GNB1-4-CI
GNB1-4-anamniotic Vertebrates
GNB1-4-amniotic Vertebrates
GNB5-CI
GNB5-anamniotic Vertebrates
GNB5-amniotic Vertebrates
1 2 3 4 5 6 7 8 9 10 1100
2
4
6
8
10
12
14
GNB1-4-CE, CB
GNB1-4-DM, AN
1 2 3 4 5 6 7 8 9 10 110
0
2
4
6
8
10
12
14GNB5-CE, CB
GNB5-DM, AN
Extra-DM, AN
0
2
4
6
8
10
12
14
1 2 3 4 5 6 7 8 9 10 110
A
DC
B
Page 20 of 30(page number not for citation purposes)

BMC Evolutionary Biology 2007, 7:143 http://www.biomedcentral.com/1471-2148/7/143
much attention in the adaptive gene expansion of carci-noma stem cell or fungi, Saccharomyces, genomes [18-20,38]. The unique palindromic duplication during evo-lutional time found in the present study would forciblymake the gene pair share the gene regulatory regions.Although the promoters may be separately placed, thecoincidental transcriptional activity should be difficultbetween the gene pair. The expression must be mutuallyexclusive. Actually, G-protein-activated IRKs are exclu-sively expressed in the neuronal cells of the nervous tis-sues and heart cells [40], and the paired ATP-regulatedIRKs are expressed in the epithelial cells and the glia of thenervous tissue [41-45].
This rather unique type of palindromic duplication musthave been originated before the subbranching in respec-
tive major groups of genes, that is, at the time of the ances-tors common to the tunicate and the vertebrates. Then theparallel but independent functional evolution duringlong archeological history could occur in the gene pairsderiving, respectively, two major distinct gene groups as aresult of mutual and physical constraining in the gene reg-ulatory regions. Therefore the palindromic duplicationwas highly expected to exist also in the modern tunicategenome. However, no evidence of this type duplication ofIRK genes has remained in the genome though the physi-cal maps of the tunicate chromosomes have not yet beencompleted as described in the Results section. In theAscidia, the tandem arrangement of Hox genes was dis-persed, as previously reported [46,47]. Similarly, it waspossible that the evolutional evidence of the antitandemor palindromic duplication of the IRK genes may disap-
Alignment of a tunicate, two Caenorhabditis and Anopheles, a Drosophila, and six vertebrate GNB1 AA sequencesFigure 16Alignment of a tunicate, two Caenorhabditis and Anopheles, a Drosophila, and six vertebrate GNB1 AA sequences. The portions of intron insertion sites are illustrated by changes in colors of AA code characters. Red to black transition or vise versa is the case for the intron insertion that occurred between two neighboring AA codes (phase 0 intron). Green and sky blue indicate phase 1 intron and phase 2 intron, respectively. The upper 7 taxis are deuterostomes, and the lower 4 are protostomes. Alignments were performed by the ClustalX 1.83 program. The lowest line indicates Clustal Con-sensus with stars and dots.
Alignment: GNB1-Intron-insertion
Alignment: GNB1-Intron-insertion (continue)
Page 21 of 30(page number not for citation purposes)

BMC Evolutionary Biology 2007, 7:143 http://www.biomedcentral.com/1471-2148/7/143
pear because of the gene dispersion in the Ascidia duringthe evolutionary time. As Ferrier and Holland [47] havesuggested, the dispersion of the Hox gene groups may bededuced from the inference that the temporal colinearityas well as constraint on the cluster organization mighthave been removed from animals that undergo rapidembryogenesis with a low cell number and predomi-nantly mosaic development. However, it may also beplausible that the dispersion in the genome itself couldlead the rapid embryogenesis with a low cell number andpredominantly mosaic development, resulting from theremoval of the spatial and temporal colinearity in thegenomic structure and regulation, without which the ani-mals had to become adaptable.
Two rather marginal but important points could be dis-cussed in relation to the palindromic duplication. First,according to the constructed phylogenetic tree the G-pro-tein-activated IRK gene may be diverged from the ATP-reg-ulated IRK gene. After the palindromic duplication ofancestoral ATP-regulated IRK genes, the G-protein bind-ing segment on the duplicated genes could be forced toevolve in parallel with G-protein beta and gamma genes.On the other hand, the coupled evolution between G-pro-tein-activated and ATP-regulated IRKs as a result of thepossible joint ownership of the gene regulatory regionsmust be related to apparently independent but actuallyinterdependent functions of the epithelial system derivedfrom mesenchymal or endodermal sheet and the tubularnervous system from ectodermal sheet in the commonancestor of the tunicates and vertebrates. Ionic balance,especially potassium, resulting from the IRK function inthe epithelial transport systems and neural excitable epi-thelium must have been important adaptive factors to
coordinate the regulations of K ion transport activities ofkidney and neurons in the freshwater or landed vertebrateevolution to balance their effects on the internal milieuand membrane excitability. For example, the high activityof ROMK in the kidney, one of the members of ATP-regu-lated IRK, will produce low K+ concentration in the inter-nal milieu, and, if occurring simultaneously, the highactivity of GIRKs in neurons or heart cells will beextremely inhibitory for membrane excitability. In theabove respect, it was interesting that the seawater livingtunicates have a dispersed location between the ATP-regu-lated and G-protein activated IRK genes, where the ionicinternal milieu is balanced mainly by the seawater com-position. In this discussion, it was important to noticethat the ATP-sensitive or SUR-coupled IRKs, such as Kcnj8and Kcnj11, were evolutionally different from ATP-regu-lated IRKs, such as ROMK (see Fig. 5), and that ATP-sensi-tive IRK genes were not paired with G-protein-activatedIRK genes. Actually ATP-sensitive IRK did coexist withGIRKs in the heart cells and neurons.
Second, by closely looking at the phylogenetic tree, we seethat the branching in the respective subbranches was notexactly parallel between the two paired major IRK genebranches, as shown in Fig. 8. The exchange of partnersresulting from one round of homologous recombinationbetween the two members of gene pairs within four mem-bers during the two-round chromosomal duplicationsnicely explained the slight difference of the subbranchingpattern between two major branches of ATP-regulated andG-protein-activated IRK groups.
Alignment of a tunicate, two Caenorhabditis and Anopheles, a Drosophila, and six vertebrate GNB1 AA sequences (continued from Figure 16)Figure 17Alignment of a tunicate, two Caenorhabditis and Anopheles, a Drosophila, and six vertebrate GNB1 AA sequences (continued from Figure 16). The alignments for the rest parts of AA sequences, which are not included in Fig. 16 and 17, are illustrated in an additional file [see Additional file 9]. Another alignment of a tunicate, two Caenorhabditis, two Anopheles, a Drosophila, and seven vertebrate GNB5 AA sequences is also included in the additional file [see Additional file 9].
Alignment: GNB1-Intron-insertion (continue)
Page 22 of 30(page number not for citation purposes)

BMC Evolutionary Biology 2007, 7:143 http://www.biomedcentral.com/1471-2148/7/143
Page 23 of 30(page number not for citation purposes)
Two separate phylogenetic trees for the IRK N terminal plus membrane-spanning region and for the IRK C terminal regionFigure 18Two separate phylogenetic trees for the IRK N terminal plus membrane-spanning region and for the IRK C terminal region. This figure illustrates only the upper halves of the trees and the following figure 19 does the lower halves. a, b, c and d , and m, n, o and p indicate the continuation of branches from the upper halves in this figure to the lower halves in the following figure. Two sets of AA sequence alignments are obtained from two sets of AA sequences divided at the 3' termi-nal of respective M2 regions in a total of 7 (underlined) and 108 IRK AA sequences of tunicates and vertebrates, inferred from the established genome databases, JGI, GenBank, and Ensembl, except Halocynthia data, the same data as in Fig. 5. In this figure the 270 sites used in the tree of Fig. 5 were divided into 123 sites from the membrane and pore regions and into 147 sites from the C-terminal region. This region was defined as from the 3' end of the M2 region to the end. Both trees for these two regions were made by the Mega3 v3.1 program, as described in the legend of Fig. 5, that is, phylogenetic trees being con-structed by the Neighbor-joining methods of Mega 3 v3.1 with the Bootstrap test (500 repetition) and with the Gamma dis-tance model of alpha parameter 2.0. The outgroups were two sets of seven bacterial IRK genes similarly divided at the 3' terminal of respective M2 regions. It was concluded that the C-terminal region of the G-protein-activated IRK group (a total 147 AA sites) revealed a rather slower evolutionary rate or lower mutational rate than that of the ATP-regulated IRK group, except for the Kcnj1 subgroup, and the N-terminal and membrane-spanning region (123 AA sites) of the ATP-regulated IRKs revealed slower evolutionary rates than the same region of the G-protein-activated IRK group.
DR-Kcnj13/AR
FR-Kcnj13/AR
XT-Kcnj13/AR
MM-Kcnj13/AR
RN-Kcnj13/AR
HS-Kcnj13/AR
GG-Kcnj13/AR
HS-Kcnj1a/AR
HS-Kcnj1c/AR
HS-Kcnj1b/AR
MM-Kcnj1/AR
RN-Kcnj1/AR
GG-Kcnj1/AR
DR-Kcnj1.2/AR
DR-Kcnj1.1/AR
MM-Kcnj15/AR
RN-Kcnj15/AR
HS-Kcnj15/AR
GG-Kcnj15/AR
XT-Kcnj15/AR
FR-Kcnj10.1/AR
FR-Kcnj10.2/AR
XT-Kcnj10/AS
MM-Kcnj10/AR
HS-Kcnj10/AR
RN-Kcnj10/AR
CI-IRK/AR
MM-Kcnj3/G
HS-Kcnj3/G
RN-Kcnj3/G
XT-Kcnj3/G
GG-Kcnj3/G
FR-Kcnj3/G
DR-Kcnj3/G
DR-Kcnj3A/G
FR-Kcnj3A1/G
GG-Kcnj3A/G
FR-Kcnj3A2/G
CI-GIRKB/G
HR-TuGIRKB
CI-GIRKA/G
HR-TuGIRKAa
MM-Kcvnj9/G
HS-Kcnj9/G
RN-Kcnj9/G
FR-Kcnj9/G
HS-Kcnj6/G
MM-Kcnj6/G
RN-Kcnj6/G
GG-Kcnj6/G
FR-Kcnj6/G
XT-Kcnj6/G
XT-Kcnj5/G
FR-Kcnj5/G
GG-Kcnj5/G
HS-Kcnj5/G
MM-Kcnj5/G
DR-KcnjEX/G
XT-KcnjEXA/G
GG-KcnjEx/G
XT-KcnjEXB/G
97
79
89
82
46
96
88
68
99
100
99
95
80
99
96
99
77
93
88
100
98
100
93
65
36
82
55
45
97
94
100
62
95
79
32
80
72
16
42
58
43
97
38
29
62
52
79
79
24
15
25
60
65
94
82
HS-Kcnj1a/AR
HS-Kcnj1c/AR
HS-Kcnj1b/AR
MM-Kcnj1/AR
RN-Kcnj1/AR
GG-Kcnj1/AR
DR-Kcnj1.2/AR
DR-Kcnj1.1/AR
MM-Kcnj13/AR
RN-Kcnj13/AR
HS-Kcnj13/AR
GG-Kcnj13/AR
XT-Kcnj13/AR
DR-Kcnj13/AR
FR-Kcnj13/AR
MM-Kcnj15/AR
HS-Kcnj15/AR
RN-Kcnj15/AR
GG-Kcnj15/AR
XT-Kcnj15/AR
FR-Kcnj10.1/AR
FR-Kcnj10.2/AR
XT-Kcnj10/AS
RN-Kcnj10/AR
HS-Kcnj10/AR
MM-Kcnj10/AR
CI-IRK/AR
DR-Kcnj3/G
FR-Kcnj3/G
GG-Kcnj3/G
MM-Kcnj3/G
RN-Kcnj3/G
HS-Kcnj3/G
XT-Kcnj3/G
GG-Kcnj3A/G
FR-Kcnj3A1/G
DR-Kcnj3A/G
FR-Kcnj3A2/G
GG-KcnjEx/G
XT-KcnjEXB/G
XT-KcnjEXA/G
DR-KcnjEX/G
CI-GIRKB/G
HR-TuGIRKB
MM-Kcvnj9/G
RN-Kcnj9/G
HS-Kcnj9/G
FR-Kcnj9/G
CI-GIRKA/G
HR-TuGIRKAa
HS-Kcnj6/G
RN-Kcnj6/G
MM-Kcnj6/G
GG-Kcnj6/G
FR-Kcnj6/G
XT-Kcnj6/G
XT-Kcnj5/G
FR-Kcnj5/G
GG-Kcnj5/G
HS-Kcnj5/G
MM-Kcnj5/G
64
100
96
96
95
40
98
100
96
100
100
96
99
50
70
99
98
98
93
52
96
96
55
84
100
91
86
31
59
33
17
19
99
61
87
100
96
24
100
100
100
90
98
92
82
99
51
75
45
69
61
72
36
35
24
78
25
IRK-N-terminal-Membrane-Pore-Tree IRK-C-terminal Tree
ATP-regurated IRKATP-regurated IRK
GIRK GIRK
a bc d m n po

BMC Evolutionary Biology 2007, 7:143 http://www.biomedcentral.com/1471-2148/7/143
Page 24 of 30(page number not for citation purposes)
Two separate phylogenetic trees for the IRK N terminal plus membrane-spanning region and for the IRK C terminal regionFigure 19Two separate phylogenetic trees for the IRK N terminal plus membrane-spanning region and for the IRK C terminal region. This figure illustrates only the lower halves of the trees and the preceding figure 18 does the upper halves. a', b', c' and d' , and m', n', o' and p' indicate the continuation of branches from the upper halves in the preceding figure 18 to the lower halves in this figure.
MM-Kcnj8/AS
RN-Kcnj8/AS
HS-Kcnj8/AS
XT-Kcnj8/AS
GG-Kcnj8/AS
FR-Kcnj8/AS
FR-Kcnj11A/AS
XT-Kcnj11A/AS
DR-Kcnj11/AS
FR-Kcnj11/AS
HS-Kcnj11/AS
MM-Kcnj11/AS
RN-Kcnj11/AS
CI-IRK
HR-TuIRKA
MM-Kcnj16
RN-Kcnj16
HS-Kcnj16
GG-Kcnj16
MM-Kcnj12
RN-Kcnj12
HS-Kcnj12
GG-Kcnj12
XT-Kcnj12
DR-Kcnj12.2
DR-Kcnj12.1
FR-Kcnj12A
XT-Kcnj4
GG-Kcnj4
MM-Kcnj4
HS-Kcnj4
RN-Kcnj4
MM-Kcnj14
RN-Kcnj14
MM-Kcnj14.2
MM-Kcnj14.1
HS-Kcnj14
XT-Kcnj14
FR-Kcnj14
DR-Kcnj2.1
FR-Kcnj2
DR-Kcnj2
GG-Kcnj2
XT-Kcnj2
RN-Kcnj2
MM-Kcnj2
HS-Kcnj2
Nos-K-channel-like
Nos-Kef-type
Magn-Kef-type
Chrom-prob-ATPsenIRK
Buh-KirBAC1.1
Rals-Put-ATPsenIRK
Buh-Kef-type84
97
97
97
62
100
98
56
67
100
63
77
92
98
94
36
58
78
85
35
38
91
89
87
100
75
95
93
75
100
94
59
98
99
81
70
55
86
73
53
93
76
25
46
78
51
55
99
81
61
16
XT-Kcnj11A/AS
FR-Kcnj11A/AS
MM-Kcnj11/AS
RN-Kcnj11/AS
HS-Kcnj11/AS
DR-Kcnj11/AS
FR-Kcnj11/AS
FR-Kcnj8/AS
GG-Kcnj8/AS
XT-Kcnj8/AS
HS-Kcnj8/AS
MM-Kcnj8/AS
RN-Kcnj8/AS
CI-IRK
HR-TuIRKA
FR-Kcnj12A
HS-Kcnj4
MM-Kcnj4
RN-Kcnj4
GG-Kcnj4
XT-Kcnj4
MM-Kcnj12
HS-Kcnj12
RN-Kcnj12
GG-Kcnj12
DR-Kcnj12.1
DR-Kcnj12.2
XT-Kcnj12
MM-Kcnj14
HS-Kcnj14
MM-Kcnj14.2
MM-Kcnj14.1
RN-Kcnj14
XT-Kcnj14
FR-Kcnj14
DR-Kcnj2
DR-Kcnj2.1
FR-Kcnj2
XT-Kcnj2
GG-Kcnj2
RN-Kcnj2
MM-Kcnj2
HS-Kcnj2
GG-Kcnj16
MM-Kcnj16
RN-Kcnj16
HS-Kcnj16
Nos-K-channel-like
Nos-Kef-type
Magn-Kef-type
Chrom-prob-ATPsenIRK
Rals-Put-ATPsenIRK
Buh-KirBAC1.1
Buh-Kef-type49
74
100
99
55
100
51
98
100
73
100
56
99
96
60
68
72
34
51
41
96
100
71
52
70
100
52
17
38
98
84
99
80
99
87
37
71
28
8063
81
36
45
7969
78
80
88
91
74
0.2 0.2
IRK-N-terminal-Membrane-Pore-Tree(continue) IRK-C-terminal Tree(continue)
a’ b’c’d’ m’ n’ p’o’
BMC Evolutionary Biology 2007, 7:143 http://www.biomedcentral.com/1471-2148/7/143
Functional significance of intron insertionMost introns in the IRK genomes disappeared in the ver-tebrate genomes after gene diversification. However,unique intron insertion sites remained precisely con-served in respect to both AA code and intracodon inser-tion sites exclusively in the G-protein-activated IRK genegroup, including the tunicate ones. As AA sequences, theconservation of the site was partially conceived in thegenes of other major groups. The site is the hinge regionthat is important for the opening-closing of the IRK chan-nel correlated with G-protein beta and gamma binding, asdescribed in the Results. The exclusively conserved Gly-cine, which was also the conserved intron insertion site,composed the hinge region that must bend or rotate as thepivotal role in adjusting against the G-protein beta andgamma binding and accordingly to change the open orclosed state of channels. Thus the strongest evolutionaryconservative pressure must be applied to the hinge site.Here it could be inferred that the conservation of introninsertion with phase 1 but not phase 0 or 2, which has aredundancy at the 5' or 3' side of introns, was probablythe most plausible mechanism to result in an all-or-noneor alternative mutation, that is, conservation or fetal. Thisis because any addition, deletion, or point mutation in theneighborhood of the insertion site would produce mostlya disruption of intron insertions, or even in rare cases adysfunctional change in an amino acid residue, even if theintron insertions were kept. Thus it could be easily imag-ined that both sides of the conserved phase 1 intron inser-tion site could be confronted by the high evolutionalconservative pressure or strict parallel evolution to beadaptable for binding to the partner proteins.
In the above, it was interesting that our survey on thegenome structures of G-protein betas (GNBs), of whichGNB1 is especially the well-known partner of GIRKs andalso other many G-protein activated proteins [48-50],revealed the extremely conserved intron insertion sitesfrom the tunicate genes to the human genes in the verte-brate clade. Among the GNB genes, the vertebrate evolu-tion seemed to introduce the functional diversification ofonly marginal activity by the member increase because ofwhole genome duplication in the specialized groups onthe phylogenic tree. It was suggested instead that becauseof the multi-interactive nature of the protein, the highconservative pressure on the pivotal sites in their molecu-lar structure made their intron insertion sites, includingAA codes, constant during the evolutional time. Actually,the conserved sites of phase 1 intron insertion are placedon the hinge regions between two beta sheets or helixstructures, as inferred from rat GNB1 crystal structuresreported [51,52]. Thus it could be inferred that the siteconservation of intron insertion, especially phase 1intron, is one of the representatives of the genome struc-tures constrained by the protein structures for the adapta-
tion to the protein-protein interaction. On the otherhand, it has been well discussed that phase 0 or phase 2introns have a significant role in exon shuffling or domainexchange for protein structural evolution [23].
Structure and evolutionary rateIt has been hotly debated that protein structural con-straints because of protein-protein interaction couldintroduce a slow evolutionary rate in AA sequences of thecontacting regions of both proteins, because of the neces-sity of the preservation of functionally significant struc-tures and of the parallel evolution between the pairedinteracting regions [53-55]. This inference was also rea-sonably conceived in the C-terminal regions of the IRKs incomparison with the N-terminal and membrane region ofthe IRKs. As shown in Fig. 18 and 19, two separate phylo-genetic trees for the IRK N terminal and membrane-span-ning region and for the IRK C terminal region illustratethat the C-terminal region of G-protein activated IRKgroup revealed rather slower evolutionary rates or lowermutational rates than those of ATP-regulated IRK groupexcept the Kcnj1 subgroup. The N-terminal and mem-brane-spanning regions of the ATP-regulated IRKsrevealed slower evolutionary rates than those of the GIRK.This may be derived from the protein-protein or protein-ligand interactions occurring in the intramolecularly dif-ferent regions between the GIRKs and the ATP-regulatedIRKs. The exceptional Kcnj1 subgroup, which revealed aslower rate in the C-terminal region, has been known tohave the ATP/PIP2-binding site in a 39-amino-acid regionof the C-terminal [56]. Thus it was suggested that thestructural constraints of the proteins limit the evolution-ary rates of the particular protein regions. The conserva-tion of intron-insertion sites at the functionally significantregions described above could be one of the importantmechanisms to facilitate this general tendency.
ConclusionIn the present study, we attempted to analyze the genomicstructures of a group of proteins, which are functionallywell defined, and to compare them among a phylogenet-ically wide range from protostomal to deuterostomalclades. We aimed to elucidate the functional significancein evolutional changes in the genome structure, such asintron insertion and gene duplication, and the interactiverelation between the expressed protein structure and thegenomic structural changes. The results follow. First, thegeneral inron-exon structures may be derived from theearly time of eukaryotic evolution, when the protein fam-ily revealed the first and elemental function with theirunique molecular structures. Second, the various types ofgene duplication could contribute to the gene diversifica-tion resulting in the functional evolution, but some con-straints in the genomic structures because the uniquemolecular mechanisms of the duplication, such as palin-
Page 25 of 30(page number not for citation purposes)
BMC Evolutionary Biology 2007, 7:143 http://www.biomedcentral.com/1471-2148/7/143
dromic duplication, may produce the adaptive parallel orcoordinate evolution among the protein family membersbetween organs or tissues that were functioning differ-ently. Third, the conserved intron insertion site, especiallyin the case of phase 1 intron, could be correlated withamino acid residues that were structurally pivotal roles inthe protein-protein interaction. Thus it was suggested thatthe ancient intron insertion sites, which are intrinsicallyrelated to the functionally key region of the proteins, inthe eukaryotic genome, or possibly in the prokaryotic andeukaryotic common ancestor, and the unique palindro-mic genomic duplication in the genomes of vertebrateclade shaped an elementally functioning membrane pro-tein family during evolution.
MethodsHalocynthia roretzi (HR) IRK cDNAThe cDNAs, TuIRKA, TuGIRKAa, and TuGIRKB were giftsfrom Dr. Y. Kubo in the Division of Biophysics and Neu-robiology, Department of Molecular Physiology, NationalInstitute for Physiological Sciences, and were subclonedinto pBluescript II SK2 (Stratagene, San Diego, CA) inaccordance with the manufacturer's protocol andsequenced [see Additional file 2].
Genomic library screeningA Halocynthia roretzi genomic library constructed inλEMBL3/BamH I Vector (Stratagene) was a gift from Dr.H. Okado of the Department of Molecular Physiology,Function Research Division, Tokyo Metropolitan Institutefor Neurosciences. This library was screened using specificEcoRI fragments of respective HR IRK cDNAs as probes.Filters were prehybridized in a solution containing 50%formamide, 53 SSC, 53 Denhardt's solution, and 0.1%SDS for 1 h at 42°C, then hybridized overnight at 42°C inthe same solution containing Digoxigenin-labeledprobes. The DNA probes were random primed, labeledwith Digoxigenin-11-dUTP using DIG-High Prime, a 5 ×concentrated labeling mixture of random hexamers, dNTPmix containing alkali-labile Digoxigenin-11-dUTP, andlabeling grade Klenow enzyme, and optimized accordingto the manufacturer's manual (Roche; DIG-High PrimeDNA Labeling and Detection Starter Kit II). The filterswere washed twice in 23 SSC and 0.05% SDS at room tem-perature for 20 min and once in 13 SSC and 0.1% SDS at55°C for 2 h. They were then treated with chemilumines-cence reaction buffer (Roche; DIG-High Prime DNA Labe-ling and Detection Starter Kit II). Positive clones weredetected by exposing the luminescence to X-ray films con-tacted with the filters. The λEmble3 clones containingthese positive inserts were amplified and used for thegenomic sequencing. The obtained clones were 2 for theTuIRKA gene, the TuIRKA11 clone, and the TuIRKA14clone, 2 for the TuGIRKAa gene, the TuGIRKAa3 clone,and the TuGIRKAa9 clone, and 1 for the TuGIRKB gene
and the TuGIRKB2 clone, showing the possible coverageof all ORFs, 5' UTRs, and 3' UTRs with restriction maps[see Additional file 3]. And later the coverage was all con-firmed with the sequencing. These 5 clones correspondingto respective cDNAs were digested with Xho I and Sal I,and the digests were subcloned into pBluescript II SK2using an Xho I or Sal I restriction site, respectively. For theTuIRKA gene, the obtained subclones were 17 from thefirst λEMBLE3 clone and the TuIRKA11 clone and 3 fromthe second λEMBLE3 clone and the TuIRKA14 clone. Forthe TuGIRKAa gene, 7 subclones from the TuGIRKAa3clone and 3 from the TuGIRKAa9 clone were obtained.For TuGIRKB, the subclone was recloned into pBluescriptII SK2 from the TuGIRKB2 clone itself. All subclones weresequenced with appropriate primer combinations at leastin both directions, and in some cases a third sequencingwas carried out. In the case of the TuGIRKA gene, PCRclonings of the two gap regions between subclones wereperformed on the original λEMBLE3 clones, using part ofthe decided flanking sequences as primers, and also sub-cloned into pBluescript II SK2 and sequenced. All sus-pected boundaries between the neighboring subcloneswere subjected to perform PCR on the original λEMBLE3clones, using appropriate primers for the tagged sequencederived from the sequenced regions placed at both ends ofthe boundaries. And the continuation beyond the bound-aries of subcloned fragments were all confirmed.
DNA sequencingDNA was sequenced by the Dye Terminator method,using an automated laser fluorescent DNA sequencer (ABIPRISM model 3100, Applied Biosystems, Foster city CA,USA) and a BigDye Terminator Cycle Sequencing Kit(Applied Biosystems, Foster city CA, USA). DNAsequences were analyzed by using the computer programDNASIS3.2-MAC (Hitachi Software, Tokyo, Japan). Exon-intron boundaries were identified by comparing thegenomic and cDNA sequences. All obtained genomic andcDNA sequences necessary for the present experimentalconclusions are listed in Additional files 1, 2, 3 and 4 [seeAdditional files 1, 2, 3 and 4].
Retrieving sequences from the C. intestinalis genome and a cDNA/EST databaseThe C. intestinalis IRK channel protein sequences weretBLASTn searched against the draft or completed genomesequence (Ref.: [4], and Ensembl and DOE Joint GenomeInstitute [JGI] Ciona intestinalis v2.0 [JGI site for the com-plete C. intestinalis genome sequence and gene annota-tions]: [57]) and a cDNA/EST database (Ref.: [7], andGhost Database: [58]) using human and HR IRK channelprotein AA sequences [29,30]. IRK channel proteins wereidentified by using the following basic method. Briefly,when the corresponding cDNA sequence covering thediagnostic sequences for an IRK channel molecule, such as
Page 26 of 30(page number not for citation purposes)

BMC Evolutionary Biology 2007, 7:143 http://www.biomedcentral.com/1471-2148/7/143
a channel pore region and two franking transmembraneregions, and available by InterPro search [59], thededuced protein sequence was used for the analyses.When the cDNA sequence was not available and grail EXPor genewise confidently predicted the gene encompassingthe entire channel region, the peptide sequence deducedfrom the gene model was used. When the predicted genemodel was not perfect, but the ESTs covered either theentire region or the region lacking the gene model, thepeptide sequence was deduced from the assembledsequence obtained by using either a set of ESTs (5' and 3'EST pair), multiple sets of ESTs, or both an EST and thegene model. After the protein AA sequence was identified,the respective genomic sequences were retrieved fromdatabases. All analyzed Ciona IRK genomic genes andother genes are listed in Additional file 5 [see Additionalfile 5].
Molecular phylogenetic analysisThe identified or predicted IRK channel protein sequencesfrom human (database version: NCBI Build 36.2), mouse(database version: NCBI Build 36.1), Takifugu rubripes(database version: IMCB/JGI FUGU 4.0), zebra fish(Danio rerio, database version: Ensembl Zv 6), rat (Rattusnorvegicus, database version: RGSC v3.4), chicken (Gallusgallus, database version: WASHUC 1), and frog (Xenopustropicalis, database version: JGI 4.1) were retrieved fromNCBI Genomes [60] and/or Ensembl [61]. Diagnosticsequences for each retrieved IRK channel molecule, suchas a channel pore region and two franking transmem-brane regions, were identified by InterPro search [59]. Todelineate vertebrate gene families, a similarity search wasperformed (tBLASTn, [62]; E-value cutoff E-10) with allIRK channel proteins from the organisms listed in Addi-tional file 5 [see Additional file 5], that is, the proteins ofHR and Ciona intestinalis (database version JGI2.0), Dro-sophila melanogaster (database version BDGP 4),Caenorhabditis elegans (database version WS 150), Anophe-les gambiae (database version AgamP3), and sevenprokaryotic IRK channel proteins that were added as theoutgroup species (NCBI Genomes Prokaryotic Projects).The prokaryotic sequence was used to root the phyloge-netic tree. Redundancy between the families was removed.The sequences were aligned by using the ClustalX 1.83program [63,64]. Alignments in nonconserved regions ofchannel proteins were carefully checked by eye, andregions with ambiguous alignments, in particular at theless-conserved cytoplasmic region and extracellularregion, were eliminated. Thus verified alignments wereused to construct phylogenetic trees. Neighboring joiningtrees (with 500 bootstrap replicates) were constructedusing MEGA3 [65,66] by using a substitution model ofAmino: Poisson correction with Gamma DistributedRates among sites (Gamma Parameter 2.0) and includingsites with a pairwise deletion of Gaps/Missing data. For
the analyses shown in Figs. 3, 4, 8, 18 and 19 when the NJtrees were constructed, branch points were considered sig-nificant only when the bootstrap tests gave a significantvalue >50%. The sequences used are designated in succes-sion by the abbreviation of the species and the gene name.Abbreviations of the species are as follows: HR for Halo-cynthia roretzi, CI for Ciona intestinalis, HS for human, MMfor M. musculus, RN for Rattus norvegicus, GG for Gallus gal-lus, DR for Danio rerio, FR for Takifugu rubripes, XT forXenopus tropicalis, DM for D. melanogaster, AG for Anophe-les gambiae, CE for C. elegans, and CB for C. briggsae. Afterthe protein AA sequences were identified and the treesobtained, all respective genomic sequences were retrievedfrom the databases. And the inferred sites of exon intronjunctions and the length of respective introns were usedfor a comparison of genomic structures among the organ-isms examined.
Relative dating of duplication eventsThe presence of various palindromic gene duplicationevents was systematically analyzed on the Phylogenetictrees with standard distance metrics obtained above.Duplication events were evaluated by relative dating andthus were based on the relative position of the duplicatedgenes compared to speciation events in the phylogenetictree.
Retrieving G-protein beta (GNB) AA sequences and their genome structures from the genome databasesA total of 54 AA sequences of eukaryotic G-protein betaand two beta-like AA sequences were inferred fromgenome databases, NCBI genome projects, and Ensembl.To delineate GNB gene families, a similarity search wasperformed by using human G-protein beta1 and beta5 AAsequences (tBLASTn, [62]; E-value cutoff E-10), and allGNB AA sequences retrieved from both protostomal anddeuterostomal clades were listed in Additional file 8 [seeAdditional file 8]. Moreover, seven bacterial WD-repeatprotein AA sequences were retrieved from the NCBIprokaryotic genome data projects and were used as theoutgroup for the construction of GNB trees. After the G-protein beta AA sequences were identified and the treesobtained, all respective genomic sequences were alsoretrieved from the databases. And the exon intron junc-tions, length of introns, and numbers of intron insertionswithin coding regions were inferred, as listed in Addi-tional file 8 [see Additional file 8]. Tunicate GNB datawere obtained from the JGI database, Ciona intestinalisv2.0. Alignment was carried out by the ClustalX 1.83 pro-gram [see Additional file 9]. The phylogenetic tree derivedfrom the aligned data was made by the Neighbor JoiningMethod in the Mega3 v3.1 program, using the AminoPoisson correction model with Gamma-distributed ratesamong sites.
Page 27 of 30(page number not for citation purposes)

BMC Evolutionary Biology 2007, 7:143 http://www.biomedcentral.com/1471-2148/7/143
Additional material
AcknowledgementsThis work was supported in part by a grant for the promotion of the advancement of education and research in graduate schools from the Min-istry of Education, Culture, Sports and Technology of Japan, and partly by a grant-in-aid for scientific research from the same Ministry to M. Tanaka-Kunishima. In addition, we appreciate the Misaki Marine Biological Station, Graduate School of Science, University of Tokyo, lending us (M. Tanaka-Kunishima and K. Takahashi) their seashore laboratory for marine biologi-cal experiments.
References1. Benson DA, Karsch-Mizrachi I, Lipman DJ, Ostell J, Wheeler DL:
GenBank. Nucleic acids research 2006, 34(Databaseissue):D16-20.
2. Birney E, Andrews D, Caccamo M, Chen Y, Clarke L, Coates G, CoxT, Cunningham F, Curwen V, Cutts T, Down T, Durbin R, Fernandez-Suarez XM, Flicek P, Graf S, Hammond M, Herrero J, Howe K, Iyer V,Jekosch K, Kahari A, Kasprzyk A, Keefe D, Kokocinski F, Kulesha E,London D, Longden I, Melsopp C, Meidl P, Overduin B, Parker A,Proctor G, Prlic A, Rae M, Rios D, Redmond S, Schuster M, Sealy I,Searle S, Severin J, Slater G, Smedley D, Smith J, Stabenau A, StalkerJ, Trevanion S, Ureta-Vidal A, Vogel J, White S, Woodwark C, Hub-bard TJ: Ensembl 2006. Nucleic acids research 2006, 34(Databaseissue):D556-61.
3. Okubo K, Sugawara H, Gojobori T, Tateno Y: DDBJ in preparationfor overview of research activities behind data submissions.Nucleic acids research 2006, 34(Database issue):D6-9.
4. Dehal P, Satou Y, Campbell RK, Chapman J, Degnan B, De Tomaso A,Davidson B, Di Gregorio A, Gelpke M, Goodstein DM, Harafuji N,Hastings KE, Ho I, Hotta K, Huang W, Kawashima T, Lemaire P, Mar-tinez D, Meinertzhagen IA, Necula S, Nonaka M, Putnam N, Rash S,Saiga H, Satake M, Terry A, Yamada L, Wang HG, Awazu S, Azumi K,Boore J, Branno M, Chin-Bow S, DeSantis R, Doyle S, Francino P,Keys DN, Haga S, Hayashi H, Hino K, Imai KS, Inaba K, Kano S, Koba-yashi K, Kobayashi M, Lee BI, Makabe KW, Manohar C, Matassi G,Medina M, Mochizuki Y, Mount S, Morishita T, Miura S, Nakayama A,Nishizaka S, Nomoto H, Ohta F, Oishi K, Rigoutsos I, Sano M, SasakiA, Sasakura Y, Shoguchi E, Shin-i T, Spagnuolo A, Stainier D, SuzukiMM, Tassy O, Takatori N, Tokuoka M, Yagi K, Yoshizaki F, Wada S,Zhang C, Hyatt PD, Larimer F, Detter C, Doggett N, Glavina T,Hawkins T, Richardson P, Lucas S, Kohara Y, Levine M, Satoh N,Rokhsar DS: The draft genome of Ciona intestinalis: insightsinto chordate and vertebrate origins. Science (New York, NY2002, 298(5601):2157-2167.
Additional file 1TuIRKA, TuGIRKAa and TuGIRKB genomic sequences. The data pro-vided represent the determined IRK gene genomic sequences.Click here for file[http://www.biomedcentral.com/content/supplementary/1471-2148-7-143-S1.doc]
Additional file 2TuIRKA, TuGIRKAa and TuGIRKB cDNA sequences. The data pro-vided represent the IRK cDNA sequences inserted in the vectors used in the present experiment.Click here for file[http://www.biomedcentral.com/content/supplementary/1471-2148-7-143-S2.doc]
Additional file 3Scematic illustration of TuIRKA, TuGIRKAa and TuGIRKB genomic sequences. The data provided the schematic illustration of the intron-exon structures of Halocynthia IRK gene genomic sequences. And the obtained genomic clones used for sequencing.Click here for file[http://www.biomedcentral.com/content/supplementary/1471-2148-7-143-S3.doc]
Additional file 4Halocynthia IRK genome Intron-Exon Junctions. (A) Elementary IRK, TuIRKA genome. (B) G-protein activated IRK, TuGIRKAa genome. (C) G-protein activated IRK, TuGIRKB genome. For the explanation of colored characters, see the legend of Fig. 2 in the original paper.Click here for file[http://www.biomedcentral.com/content/supplementary/1471-2148-7-143-S4.pdf]
Additional file 5Comprehensive listing of IRK genomic genes. Comprehensive listing of IRK genomic genes retrieved from established genomic data bases. Gene names, intron-exon junctions and chromosomal locations are all listed.Click here for file[http://www.biomedcentral.com/content/supplementary/1471-2148-7-143-S5.xls]
Additional file 6Alignment of IRK AA sequences. Alignment of 7 tunicate, 6 Caenorhabditis, and 7 bacterial IRK AA sequences. For the explanation of colored characters, see the legend of Fig. 6 in the original paper.Click here for file[http://www.biomedcentral.com/content/supplementary/1471-2148-7-143-S6.pdf]
Additional file 7Consrved sequences in alignment of IRK AA sequences. The selected AA sequences from the alignment of 115 AA sequences to illustrate an exclu-sively conserved intron intervening site among the tunicate and vertebrate GIRK group. For the explanation of colored characters, see the legend of Fig. 9 in the original paper.Click here for file[http://www.biomedcentral.com/content/supplementary/1471-2148-7-143-S7.pdf]
Additional file 8Comprehensive listing of G-proten beta genomic genes. Comprehensive listing of G-protein beta genomic genes retrieved from established genomic data bases. Gene names, intron-exon junctions and chromosomal loca-tions are all listed.Click here for file[http://www.biomedcentral.com/content/supplementary/1471-2148-7-143-S8.xls]
Additional file 9Alignment of G-protein beta AA sequences. Alignment of a tunicate, two Caenorhabditis and Anopheles, a Drosophila, and six vertebrate GNB1 AA sequences. Another alignment of a tunicate, two Caenorhabdi-tis, two Anopheles, a Drosophila, and seven vertebrate GNB5 AA sequences is also included. For the explanation of colored characters, see the legend of Fig. 16 in the original paper.Click here for file[http://www.biomedcentral.com/content/supplementary/1471-2148-7-143-S9.pdf]
Page 28 of 30(page number not for citation purposes)

BMC Evolutionary Biology 2007, 7:143 http://www.biomedcentral.com/1471-2148/7/143
5. Cochrane G, Aldebert P, Althorpe N, Andersson M, Baker W, Bald-win A, Bates K, Bhattacharyya S, Browne P, van den Broek A, CastroM, Duggan K, Eberhardt R, Faruque N, Gamble J, Kanz C, Kulikova T,Lee C, Leinonen R, Lin Q, Lombard V, Lopez R, McHale M, McWilliamH, Mukherjee G, Nardone F, Pastor MP, Sobhany S, Stoehr P, Tzou-vara K, Vaughan R, Wu D, Zhu W, Apweiler R: EMBL NucleotideSequence Database: developments in 2005. Nucleic acidsresearch 2006, 34(Database issue):D10-5.
6. Wheeler DL, Barrett T, Benson DA, Bryant SH, Canese K,Chetvernin V, Church DM, DiCuccio M, Edgar R, Federhen S, GeerLY, Helmberg W, Kapustin Y, Kenton DL, Khovayko O, Lipman DJ,Madden TL, Maglott DR, Ostell J, Pruitt KD, Schuler GD, Schriml LM,Sequeira E, Sherry ST, Sirotkin K, Souvorov A, Starchenko G, SuzekTO, Tatusov R, Tatusova TA, Wagner L, Yaschenko E: Databaseresources of the National Center for Biotechnology Infor-mation. Nucleic acids research 2006, 34(Database issue):D173-80.
7. Satou Y, Takatori N, Fujiwara S, Nishikata T, Saiga H, Kusakabe T,Shin-i T, Kohara Y, Satoh N: Ciona intestinalis cDNA projects:expressed sequence tag analyses and gene expression pro-files during embryogenesis. Gene 2002, 287(1-2):83-96.
8. Roy SW, Gilbert W: Complex early genes. Proceedings of theNational Academy of Sciences of the United States of America 2005,102(6):1986-1991.
9. Roy SW, Gilbert W: The pattern of intron loss. Proceedings of theNational Academy of Sciences of the United States of America 2005,102(3):713-718.
10. Rzhetsky A, Ayala FJ, Hsu LC, Chang C, Yoshida A: Exon/intronstructure of aldehyde dehydrogenase genes supports the"introns-late" theory. Proceedings of the National Academy of Sci-ences of the United States of America 1997, 94(13):6820-6825.
11. Venkatesh B, Ning Y, Brenner S: Late changes in spliceosomalintrons define clades in vertebrate evolution. Proceedings of theNational Academy of Sciences of the United States of America 1999,96(18):10267-10271.
12. Yoshihama M, Nakao A, Nguyen HD, Kenmochi N: Analysis ofribosomal protein gene structures: implications for intronevolution. PLoS genetics 2006, 2(3):e25.
13. Ohno S: Evolution by Gene Duplication. New York , Springer-Verlag; 1970.
14. Ferrier DE, Holland PW: Ancient origin of the Hox gene cluster.Nature reviews 2001, 2(1):33-38.
15. Blomme T, Vandepoele K, De Bodt S, Simillion C, Maere S, Van dePeer Y: The gain and loss of genes during 600 million years ofvertebrate evolution. Genome biology 2006, 7(5):R43.
16. Dehal P, Boore JL: Two rounds of whole genome duplication inthe ancestral vertebrate. PLoS biology 2005, 3(10):e314.
17. Jaillon O, Aury JM, Brunet F, Petit JL, Stange-Thomann N, Mauceli E,Bouneau L, Fischer C, Ozouf-Costaz C, Bernot A, Nicaud S, Jaffe D,Fisher S, Lutfalla G, Dossat C, Segurens B, Dasilva C, Salanoubat M,Levy M, Boudet N, Castellano S, Anthouard V, Jubin C, Castelli V,Katinka M, Vacherie B, Biemont C, Skalli Z, Cattolico L, Poulain J, DeBerardinis V, Cruaud C, Duprat S, Brottier P, Coutanceau JP, GouzyJ, Parra G, Lardier G, Chapple C, McKernan KJ, McEwan P, Bosak S,Kellis M, Volff JN, Guigo R, Zody MC, Mesirov J, Lindblad-Toh K, Bir-ren B, Nusbaum C, Kahn D, Robinson-Rechavi M, Laudet V, SchachterV, Quetier F, Saurin W, Scarpelli C, Wincker P, Lander ES, Weissen-bach J, Roest Crollius H: Genome duplication in the teleost fishTetraodon nigroviridis reveals the early vertebrate proto-karyotype. Nature 2004, 431(7011):946-957.
18. Liti G, Louis EJ: Yeast evolution and comparative genomics.Annual review of microbiology 2005, 59:135-153.
19. Haber JE, Debatisse M: Gene amplification: yeast takes a turn.Cell 2006, 125(7):1237-1240.
20. Narayanan V, Mieczkowski PA, Kim HM, Petes TD, Lobachev KS:The pattern of gene amplification is determined by the chro-mosomal location of hairpin-capped breaks. Cell 2006,125(7):1283-1296.
21. Lynch M, Conery JS: The origins of genome complexity. Science(New York, NY 2003, 302(5649):1401-1404.
22. Pal C, Papp B, Lercher MJ: An integrated view of protein evolu-tion. Nature reviews 2006, 7(5):337-348.
23. Gilbert W, de Souza SJ, Long M: Origin of genes. Proceedings of theNational Academy of Sciences of the United States of America 1997,94(15):7698-7703.
24. Liu M, Grigoriev A: Protein domains correlate strongly withexons in multiple eukaryotic genomes--evidence of exonshuffling? Trends Genet 2004, 20(9):399-403.
25. Liu M, Walch H, Wu S, Grigoriev A: Significant expansion ofexon-bordering protein domains during animal proteomeevolution. Nucleic acids research 2005, 33(1):95-105.
26. Hille B: Ion Channels of Excitable Membranes. 3rd ed. edition.Sunderland, MA , Sinauer; 2001.
27. Miller C: An overview of the potassium channel family.Genome biology 2000, 1(4):REVIEWS0004.
28. Bichet D, Haass FA, Jan LY: Merging functional studies withstructures of inward-rectifier K(+) channels. Nature reviews2003, 4(12):957-967.
29. Murata Y, Okado H, Katsuyama Y, Okamura Y, Kubo Y: Primarystructure, developmental expression and functional proper-ties of an inward rectifier K+ channel of the tunicate. Recep-tors & channels 2001, 7(5):387-399.
30. Murata Y, Okado H, Kubo Y: Characterization of heteromul-timeric G protein-coupled inwardly rectifying potassiumchannels of the tunicate tadpole with a unique pore prop-erty. The Journal of biological chemistry 2001, 276(21):18529-18539.
31. Okamura Y, Nishino A, Murata Y, Nakajo K, Iwasaki H, Ohtsuka Y,Tanaka-Kunishima M, Takahashi N, Hara Y, Yoshida T, Nishida M,Okado H, Watari H, Meinertzhagen IA, Satoh N, Takahashi K, SatouY, Okada Y, Mori Y: Comprehensive analysis of the ascidiangenome reveals novel insights into the molecular evolutionof ion channel genes. Physiological genomics 2005, 22(3):269-282.
32. Kuo A, Gulbis JM, Antcliff JF, Rahman T, Lowe ED, Zimmer J, Cuth-bertson J, Ashcroft FM, Ezaki T, Doyle DA: Crystal structure ofthe potassium channel KirBac1.1 in the closed state. Science(New York, NY 2003, 300(5627):1922-1926.
33. Derst C, Karschin C, Wischmeyer E, Hirsch JR, Preisig-Muller R,Rajan S, Engel H, Grzeschik K, Daut J, Karschin A: Genetic andfunctional linkage of Kir5.1 and Kir2.1 channel subunits. FEBSletters 2001, 491(3):305-311.
34. Nishida M, MacKinnon R: Structural basis of inward rectifica-tion: cytoplasmic pore of the G protein-gated inward recti-fier GIRK1 at 1.8 A resolution. Cell 2002, 111(7):957-965.
35. Finley M, Arrabit C, Fowler C, Suen KF, Slesinger PA: betaL-betaMloop in the C-terminal domain of G protein-activatedinwardly rectifying K(+) channels is important for G(betag-amma) subunit activation. The Journal of physiology 2004, 555(Pt3):643-657.
36. Vibranovski MD, Sakabe NJ, de Oliveira RS, de Souza SJ: Signs ofancient and modern exon-shuffling are correlated to the dis-tribution of ancient and modern domains along proteins.Journal of molecular evolution 2005, 61(3):341-350.
37. Doolittle RF: Convergent evolution: the need to be explicit.Trends in biochemical sciences 1994, 19(1):15-18.
38. Pipiras E, Coquelle A, Bieth A, Debatisse M: Interstitial deletionsand intrachromosomal amplification initiated from a dou-ble-strand break targeted to a mammalian chromosome.The EMBO journal 1998, 17(1):325-333.
39. Eichler EE, Sankoff D: Structural dynamics of eukaryotic chro-mosome evolution. Science (New York, NY 2003,301(5634):793-797.
40. Mark MD, Herlitze S: G-protein mediated gating of inward-rec-tifier K+ channels. European journal of biochemistry / FEBS 2000,267(19):5830-5836.
41. Connors NC, Adams ME, Froehner SC, Kofuji P: The potassiumchannel Kir4.1 associates with the dystrophin-glycoproteincomplex via alpha-syntrophin in glia. The Journal of biologicalchemistry 2004, 279(27):28387-28392.
42. Doring F, Derst C, Wischmeyer E, Karschin C, Schneggenburger R,Daut J, Karschin A: The epithelial inward rectifier channelKir7.1 displays unusual K+ permeation properties. J Neurosci1998, 18(21):8625-8636.
43. Hebert SC, Desir G, Giebisch G, Wang W: Molecular diversityand regulation of renal potassium channels. Physiological reviews2005, 85(1):319-371.
44. Ishii M, Horio Y, Tada Y, Hibino H, Inanobe A, Ito M, Yamada M,Gotow T, Uchiyama Y, Kurachi Y: Expression and clustered dis-tribution of an inwardly rectifying potassium channel, KAB-2/Kir4.1, on mammalian retinal Muller cell membrane: theirregulation by insulin and laminin signals. J Neurosci 1997,17(20):7725-7735.
Page 29 of 30(page number not for citation purposes)

BMC Evolutionary Biology 2007, 7:143 http://www.biomedcentral.com/1471-2148/7/143
Publish with BioMed Central and every scientist can read your work free of charge
"BioMed Central will be the most significant development for disseminating the results of biomedical research in our lifetime."
Sir Paul Nurse, Cancer Research UK
Your research papers will be:
available free of charge to the entire biomedical community
peer reviewed and published immediately upon acceptance
cited in PubMed and archived on PubMed Central
yours — you keep the copyright
Submit your manuscript here:http://www.biomedcentral.com/info/publishing_adv.asp
BioMedcentral
45. Poopalasundaram S, Knott C, Shamotienko OG, Foran PG, Dolly JO,Ghiani CA, Gallo V, Wilkin GP: Glial heterogeneity in expressionof the inwardly rectifying K(+) channel, Kir4.1, in adult ratCNS. Glia 2000, 30(4):362-372.
46. Ikuta T, Yoshida N, Satoh N, Saiga H: Ciona intestinalis Hox genecluster: Its dispersed structure and residual colinear expres-sion in development. Proceedings of the National Academy of Sci-ences of the United States of America 2004, 101(42):15118-15123.
47. Ferrier DE, Holland PW: Ciona intestinalis ParaHox genes: evo-lution of Hox/ParaHox cluster integrity, developmentalmode, and temporal colinearity. Molecular phylogenetics and evo-lution 2002, 24(3):412-417.
48. Ford CE, Skiba NP, Bae H, Daaka Y, Reuveny E, Shekter LR, Rosal R,Weng G, Yang CS, Iyengar R, Miller RJ, Jan LY, Lefkowitz RJ, HammHE: Molecular basis for interactions of G protein betagammasubunits with effectors. Science (New York, NY 1998,280(5367):1271-1274.
49. Albsoul-Younes AM, Sternweis PM, Zhao P, Nakata H, Nakajima S,Nakajima Y, Kozasa T: Interaction sites of the G protein betasubunit with brain G protein-coupled inward rectifier K+channel. The Journal of biological chemistry 2001,276(16):12712-12717.
50. Mirshahi T, Mittal V, Zhang H, Linder ME, Logothetis DE: Distinctsites on G protein beta gamma subunits regulate differenteffector functions. The Journal of biological chemistry 2002,277(39):36345-36350.
51. Wall MA, Coleman DE, Lee E, Iniguez-Lluhi JA, Posner BA, GilmanAG, Sprang SR: The structure of the G protein heterotrimerGi alpha 1 beta 1 gamma 2. Cell 1995, 83(6):1047-1058.
52. Sondek J, Bohm A, Lambright DG, Hamm HE, Sigler PB: Crystalstructure of a G-protein beta gamma dimer at 2.1A resolu-tion. Nature 1996, 379(6563):369-374.
53. Pagel P, Mewes HW, Frishman D: Conservation of protein-pro-tein interactions - lessons from ascomycota. Trends Genet2004, 20(2):72-76.
54. Fraser HB, Hirsh AE: Evolutionary rate depends on number ofprotein-protein interactions independently of gene expres-sion level. BMC evolutionary biology 2004, 4:13.
55. Saeed R, Deane CM: Protein protein interactions, evolutionaryrate, abundance and age. BMC bioinformatics 2006, 7:128.
56. Dong K, Tang L, MacGregor GG, Hebert SC: Localization of theATP/phosphatidylinositol 4,5 diphosphate-binding site to a39-amino acid region of the carboxyl terminus of the ATP-regulated K+ channel Kir1.1. The Journal of biological chemistry2002, 277(51):49366-49373.
57. JGI-Ciona genome [http://genome.jgi-psf.org/ciona4/ciona4.home.html]
58. Ciona-EST [http://ghost.zool.kyoto-u.ac.jp/indexr1.html]59. InterProScan [http://www.ebi.ac.uk/InterProScan/]60. NCBI-genome [http://www.ncbi.nlm.nih.gov/Genomes/]61. Emsembl [http://www.ensembl.org/index.html]62. NCBI-blast [http://www.ncbi.nlm.nih.gov/blast]63. Thompson JD, Gibson TJ, Plewniak F, Jeanmougin F, Higgins DG: The
CLUSTAL_X windows interface: flexible strategies for mul-tiple sequence alignment aided by quality analysis tools.Nucleic acids research 1997, 25(24):4876-4882.
64. ClustalX [http://www-igbmc.u-strasbg.fr/BioInfo/]65. Kumar S, Tamura K, Nei M: MEGA3: Integrated software for
Molecular Evolutionary Genetics Analysis and sequencealignment. Briefings in bioinformatics 2004, 5(2):150-163.
66. Mega3 [http://www.megasoftware.net]
Page 30 of 30(page number not for citation purposes)