photosystem ii thermostability in situ: environmentally induced acclimation and genotype-specific...
TRANSCRIPT
at SciVerse ScienceDirect
Plant Physiology and Biochemistry 57 (2012) 93e105
Contents lists available
Plant Physiology and Biochemistry
journal homepage: www.elsevier .com/locate/plaphy
Research article
Photosystem II thermostability in situ: Environmentally induced acclimationand genotype-specific reactions in Triticum aestivum L
Marian Brestic a, Marek Zivcak a, Hazem M. Kalaji b, Robert Carpentier c, Suleyman I. Allakhverdiev d,e,*
aDepartment of Plant Physiology, Slovak University of Agriculture in Nitra, Tr. A. Hlinku 2, 949 76 Nitra, SlovakiabDepartment of Plant Physiology, Warsaw University of Life Sciences SGGW, Nowoursynowska 159, 02-776 Warsaw, PolandcDepartment de Chimie-Biologie, Université du Quebec à Trois Rivières, 3351, Boulevard des Forges, C.P. 500, Quebec, G9A 5H7, Canadad Institute of Plant Physiology, Russian Academy of Sciences, Botanicheskaya Street 35, Moscow 127276, Russiae Institute of Basic Biological Problems, Russian Academy of Sciences, Pushchino, Moscow Region 142290, Russia
a r t i c l e i n f o
Article history:Received 2 April 2012Accepted 14 May 2012Available online 21 May 2012
Keywords:PSII thermostabilityHeatChlorophyll fluorescenceAcclimationWheat (Triticum aestivum)
Abbreviations: PSII, photosystem II; PSI, photosyscomplex; RC, reaction center; Chl., chlorophyll; ABS,trapping flux; QA, primary PSII quinone acceptor;acceptor; PQ, plastoquinone; cytb6/f, cytochrome b6rescence induction transient defined by the nameslevel, fluorescence level at 50 ms; J-level, fluorescencfluorescence plateau at w30 ms; P-level, the maximu* Corresponding author. Institute of Plant Physi
Sciences, Botanicheskaya Street 35, Moscow 127276,E-mail address: [email protected]
0981-9428/$ e see front matter � 2012 Elsevier Masdoi:10.1016/j.plaphy.2012.05.012
a b s t r a c t
Photosystem II (PSII) thermostability and acclimation effects on PSII photochemical efficiency wereanalyzed in thirty field grown winter wheat (Triticum aestivum L.) genotypes using prompt chlorophylla fluorescence kinetics before and after dark heat treatment. A gradual increase in temperature causedthe appearance of K-bands at 300 ms on the chlorophyll fluorescence induction curve, indicating theimpairment of the PSII donor side (even by heat treatment at 38 �C). An increase in basal fluorescence,commonly used as a criterion of PSII thermostability, was observed beyond a temperature threshold of44 �C. Moreover, an acclimation shift (increase of critical temperature) was observed at the 3.5 �Cidentified for K-band appearance, but only by 1.1 �C for a steep increase in F0. The single temperatureapproach with regular weekly observations completed within two months using dark heat treatment at40 �C demonstrated that the acclimation effect is not gradual, but occurs immediately and is associatedwith an increase of daily temperature maxima over 30 �C. The acclimated heat treated samples had lesseffect on the donor side of PSII, the higher fraction of active QA
� reducing reaction centers and causinga much lower decrease of connectivity among PSII units compared to non-acclimated samples. In thenon-treated plants the reduction of antennae size, increase of PSII connectivity and changes in theacceptor side occurred as a result of heat acclimation. The enhancement of PSII thermostability persistedover several weeks regardless of weather conditions. The genotype comparison identified three groupsthat differed either in initial PSII thermostability or in acclimation capacity; these groupings were clearlyassociated with the origin of the genotypes.
� 2012 Elsevier Masson SAS. All rights reserved.
1. Introduction
Photosynthesis is a very heat-sensitive process that can bepartially or even completely inhibited by high temperature beforeother symptoms of the stress are detected [1]. Exposure of plants toheat stress typically induces inactivation of photosynthesisregardless of whether the stress is applied to whole plants, intact
tem I; OEC, oxygen evolvingabsorption flux; TR, electronQB, secondary PSII quinone/f; OeJeIeP, transient, fluo-of its intermediate steps; O-e plateau at w2 ms; I-level,m fluorescence.ology, Russian Academy ofRussia.
(S.I. Allakhverdiev).
son SAS. All rights reserved.
tissues or isolated organelles [2]. The primary targets of hightemperature effects in plants are the photosystem II (PSII), carbonfixation by Rubisco and the ATP-generating system [3e5]. Moder-ately high temperature inhibits the repair of PSII damaged byphotoinhibition and activity of reactive oxygen species [5].However, the specific effects of high temperatures on photosyn-thesis depends strongly on plant species [2], the age of leaf or planttissue [6], physiological status of plant as well as on the level ofacclimation [7e9]. Furthermore, the magnitude of the effectdepends not only on the temperature level, but also on the timespent at the higher temperature [10].
Photosynthetic acclimation to high temperatures represents anadjustment in photosynthetic processes and structures at eachlevel, leading to a shift in the optimum temperature toward thenew conditions [11]. This process is usually accompanied by anincrease in the upper limit of the maximum physiologically toler-able temperature. Improvement of thermotolerance through
M. Brestic et al. / Plant Physiology and Biochemistry 57 (2012) 93e10594
acclimation has been observed in many plant species [12,13].Different stress factors can also induce an increase of heat toler-ance. For example, an increase of high temperature tolerance of PSIIwas observed as a result of drought stress [14,15] and salinity[16,17]. There are various published explanations for such anincrease including the accumulation of glycine betaine [18e20],zeaxanthin [21,22], synthesis of isoprene [23,24], or heat shockproteins [25]. Moreover, an important role has been attributed toa wide range of other stress-related proteins and the complex anti-oxidative system has also been implicated in this process [26].
The assessment of heat stress effects on photosynthetic appa-ratus, particularly on PSII status and linear electron transport rate,has been frequently performed through chlorophyll (Chl) a fluo-rescence measurements [27]. Specifically, analysis based on hightime-resolution measurements of the Chl a fluorescence transientrepresents a particularly quick method for gaining detailed infor-mation about PSII photochemical activity, electron transport eventsand the different regulatory processes [28]. Fast Chl a fluorescencekinetics data are derived from the time dependent increase influorescence intensity achieved upon application of continuousbright light to a previously dark adapted sample; the result is calledthe Kautsky curve or Chl a fluorescence transient [29]. The group offluorescence parameters called JIP-test that quantify the stepwiseflow of energy through PSII, using input data from the fluorescencetransient, was formulated with a simplified model of the energyfluxes incorporating the parameters that define each type of flux[29,30]. The energy fluxes consist of an absorbed flux (ABS), trap-ping flux (TR), electron transport flux (ET) and the flux defining thedissipation of non-trapped energy as heat (DI) [29] - a flux quan-tifying the reduction of PSI end acceptor (RE) was later introduced[31]. The method is widely used for screening the stress effects inplants, especially the impacts of high temperature [32,33], lowtemperature [34,35], drought [36,37], salinity [38e40], andsubmergence [41].
In this study we investigated the in situ acclimation of thephotosynthetic apparatus of wheat (Triticum aestivum L.) leavesduring the growth season, leading to enhanced PSII thermosta-bility. An increase of PSII thermostability at the end of vegetationperiod is typically observed, but it is not clear whether thisphenomenon is associated with the plant maturing or whether it isan environmentally induced effect. In order to distinguish betweenthese hypotheses we conducted weekly measurements over twomonths to assess heat thermostability using Chl a fluorescencemeasurements. Wheat has the longest history of cultivation andbreeding of any plant and therefore has an enormous diversity ofgermplasm worldwide e in most of cases well adapted to the localconditions. In this work, we use a relatively large collection ofwheat genotypes of different origin in order to identify anygenotype-specific reactions. Such a large number of measurementsover a relatively short time period were only feasible because of theapplication of fast fluorescence kinetics. In addition to providing anoverview of environmentally induced acclimation and heat effectsat the level of PSII photochemistry in wheat plant, we also discussthe feasibility of the screening within the crop germplasm forimproved heat tolerance as a potential practical use of the chloro-phyll fluorescence method.
2. Material and methods
2.1. Plant material
Winter wheat plants (T. aestivum L.) were cultivated for twoyears in small-plot field trials within Genebank of Research Insti-tute of Plant Production in Piestany, Slovak Republic (N 48� 380, E17� 490); annual average temperature 9.2 �C, in vegetation period
15.5 �C; annual precipitation 593 mm, soil type the luvi-haplicchernozem, pH 6.5 to 7.2. The crop was sown in September andcultivated according to standard agronomic practices.
Within the experiment, 30 genotypes of different geographicorigins were used: Astella, Malvina, Venistar, Torysa, Vanda,Kosutska, Viglasska Cervenoklasa, Samorinska, Vrakunska, Rado-sinska Norma (Slovakia); Komfort (Austria); Tamaro (Switzerland);Biscay (Germany); Griffen (G. Britain); GK Forras (Hungary); Mewa,Gedania (Poland); Echo (Russia); Mottin, Verna (Italy),Steklovidnaja-24 (Kazakhstan); Bbyo-17, Dagdas-94, Pehlivan(Turkey); Shaan 8007-7, Cha-bej (China); Hokushin, Nanbu Komugi(Japan); Piopio-4, Shark-4 (Mexico).
The measurements were performed on detached leaves takenfrom plants in April, May and June; young andmature, healthy, sun-exposed leaves from the main stems of plants inside the canopywere used. Collected leaves were protected from direct sunlight inthe field, then kept in low light and fully hydrated under laboratoryconditions.
2.2. Heat treatment
The heat treatment was performed in darkness. Tissue samplesof approximately 50 mm length were cut from the middle part ofthe leaf and placed into glass tubes with a small amount of water toensure leaf hydration. The tubes were closed and completelysubmersed in a water bath with precisely controlled watertemperature for 30 min. The time of exposure was known to besufficient on the basis of previous analyses using different exposuretimes. The temperature within some tubes was measured,demonstrating that the temperature at the level of leaf surfacereached the water bath level within 1e2 min. After 30 min ofexposure, the tube was removed from the bath (in the dark) and,after cooling, transferred to laboratory temperature (5e10 min) forfurther measurements.
In the experiments with graduated temperature levels,temperatures of 38, 40, 42, 44 and 46 �C were used; a new leafsample was always used for each temperature. In single tempera-ture experiments, a temperature level of 40 �C was used.
2.3. Chlorophyll fluorescence measurements
Chl a fluorescence measurements were performed using theHandy-PEA Continuous Excitation Plant Efficiency Analyser (Han-satech Instruments Ltd, UK). The leaf samples were illuminatedwith continuous red light (wavelength in peak 650 nm; spectralline half-width 22 nm). The light was provided by array of 3 light-emitting diodes. The light pulse intensity used was3500 mmol m�2 s�1 and the duration of the light pulse was 1 s. Thefluorescence signal was recorded with a maximum frequency of105 points s�1 (each 10 ms) within 0e0.3 ms, after which thefrequency of recording gradually decreased collecting a total of 118points within 1 s.
Leaf segment measurements were performed in the middle partof a leaf blade, away from the main leaf vein, after 30 min of darkadaptation, using leaf clips.
Chl a fluorescence transient data were used to calculate basicparameters and the parameters needed for the JIP-test (Table 1)[30,42,43]. The F0 level was measured as the fluorescence at50 ms (F50ms).
2.4. Statistical analysis
The majority of reported data represent the weighted mean� standard error. Statistical analysis was performed using analysis
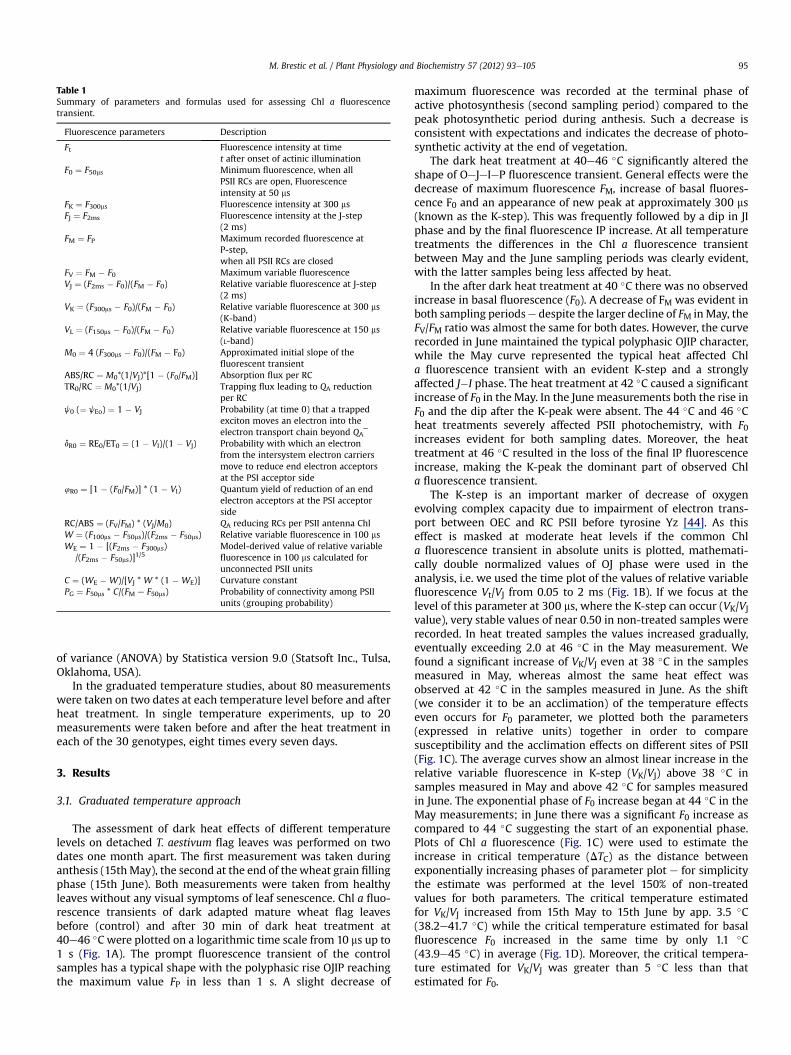
Table 1Summary of parameters and formulas used for assessing Chl a fluorescencetransient.
Fluorescence parameters Description
Ft Fluorescence intensity at timet after onset of actinic illumination
F0 ¼ F50ms Minimum fluorescence, when allPSII RCs are open, Fluorescenceintensity at 50 ms
FK ¼ F300ms Fluorescence intensity at 300 msFJ ¼ F2ms Fluorescence intensity at the J-step
(2 ms)FM ¼ FP Maximum recorded fluorescence at
P-step,when all PSII RCs are closed
FV ¼ FM � F0 Maximum variable fluorescenceVJ ¼ (F2ms � F0)/(FM � F0) Relative variable fluorescence at J-step
(2 ms)VK ¼ (F300ms � F0)/(FM � F0) Relative variable fluorescence at 300 ms
(K-band)VL ¼ (F150ms � F0)/(FM � F0) Relative variable fluorescence at 150 ms
(L-band)M0 ¼ 4 (F300ms � F0)/(FM � F0) Approximated initial slope of the
fluorescent transientABS/RC ¼ M0*(1/VJ)*[1 � (F0/FM)] Absorption flux per RCTR0/RC ¼ M0*(1/VJ) Trapping flux leading to QA reduction
per RCj0 (¼ jEo) ¼ 1 � VJ Probability (at time 0) that a trapped
exciton moves an electron into theelectron transport chain beyond QA‾
dR0 ¼ RE0/ET0 ¼ (1 � VI)/(1 � VJ) Probability with which an electronfrom the intersystem electron carriersmove to reduce end electron acceptorsat the PSI acceptor side
4R0 ¼ [1 � (F0/FM)] * (1 � VI) Quantum yield of reduction of an endelectron acceptors at the PSI acceptorside
RC/ABS ¼ (FV/FM) * (VJ/M0) QA reducing RCs per PSII antenna ChlW ¼ (F100ms � F50ms)/(F2ms � F50ms) Relative variable fluorescence in 100 msWE ¼ 1 � [(F2ms � F300ms)
/(F2ms � F50ms)]1/5Model-derived value of relative variablefluorescence in 100 ms calculated forunconnected PSII units
C ¼ (WE � W)/[VJ * W * (1 � WE)] Curvature constantPG ¼ F50ms * C/(FM e F50ms) Probability of connectivity among PSII
units (grouping probability)
M. Brestic et al. / Plant Physiology and Biochemistry 57 (2012) 93e105 95
of variance (ANOVA) by Statistica version 9.0 (Statsoft Inc., Tulsa,Oklahoma, USA).
In the graduated temperature studies, about 80 measurementswere taken on two dates at each temperature level before and afterheat treatment. In single temperature experiments, up to 20measurements were taken before and after the heat treatment ineach of the 30 genotypes, eight times every seven days.
3. Results
3.1. Graduated temperature approach
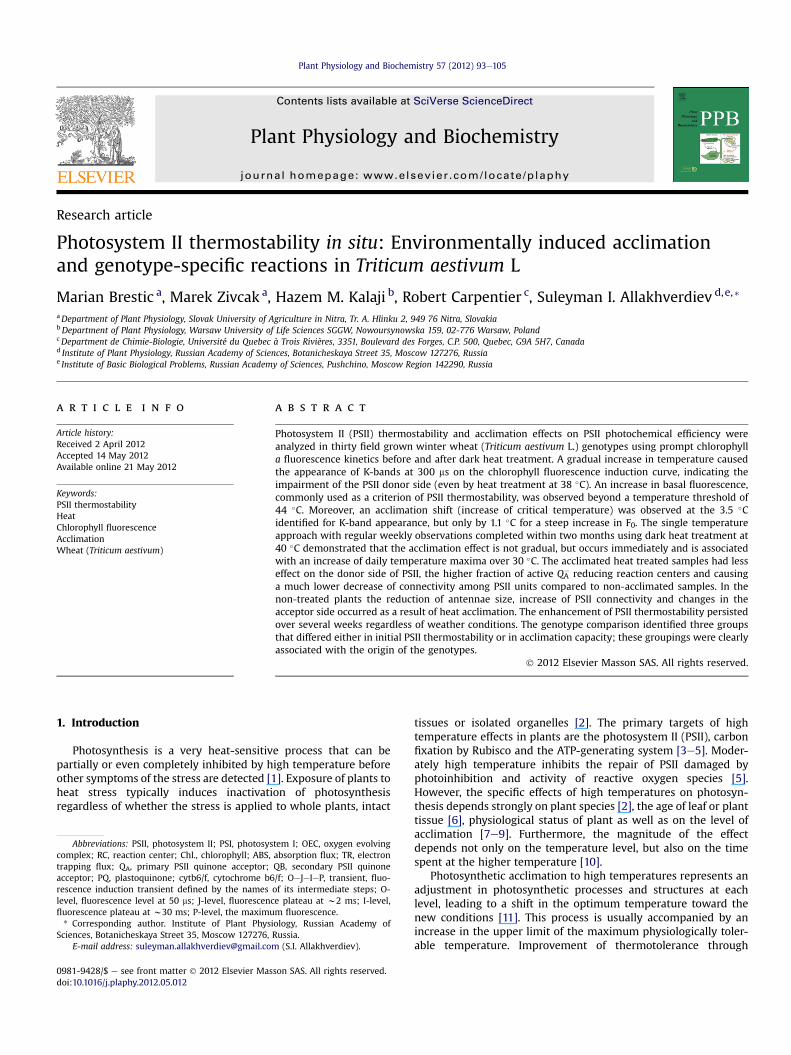
The assessment of dark heat effects of different temperaturelevels on detached T. aestivum flag leaves was performed on twodates one month apart. The first measurement was taken duringanthesis (15th May), the second at the end of the wheat grain fillingphase (15th June). Both measurements were taken from healthyleaves without any visual symptoms of leaf senescence. Chl a fluo-rescence transients of dark adapted mature wheat flag leavesbefore (control) and after 30 min of dark heat treatment at40e46 �C were plotted on a logarithmic time scale from 10 ms up to1 s (Fig. 1A). The prompt fluorescence transient of the controlsamples has a typical shape with the polyphasic rise OJIP reachingthe maximum value FP in less than 1 s. A slight decrease of
maximum fluorescence was recorded at the terminal phase ofactive photosynthesis (second sampling period) compared to thepeak photosynthetic period during anthesis. Such a decrease isconsistent with expectations and indicates the decrease of photo-synthetic activity at the end of vegetation.
The dark heat treatment at 40e46 �C significantly altered theshape of OeJeIeP fluorescence transient. General effects were thedecrease of maximum fluorescence FM, increase of basal fluores-cence F0 and an appearance of new peak at approximately 300 ms(known as the K-step). This was frequently followed by a dip in JIphase and by the final fluorescence IP increase. At all temperaturetreatments the differences in the Chl a fluorescence transientbetween May and the June sampling periods was clearly evident,with the latter samples being less affected by heat.
In the after dark heat treatment at 40 �C there was no observedincrease in basal fluorescence (F0). A decrease of FM was evident inboth sampling periodse despite the larger decline of FM inMay, theFV/FM ratio was almost the same for both dates. However, the curverecorded in June maintained the typical polyphasic OJIP character,while the May curve represented the typical heat affected Chla fluorescence transient with an evident K-step and a stronglyaffected J�I phase. The heat treatment at 42 �C caused a significantincrease of F0 in the May. In the June measurements both the rise inF0 and the dip after the K-peak were absent. The 44 �C and 46 �Cheat treatments severely affected PSII photochemistry, with F0increases evident for both sampling dates. Moreover, the heattreatment at 46 �C resulted in the loss of the final IP fluorescenceincrease, making the K-peak the dominant part of observed Chla fluorescence transient.
The K-step is an important marker of decrease of oxygenevolving complex capacity due to impairment of electron trans-port between OEC and RC PSII before tyrosine Yz [44]. As thiseffect is masked at moderate heat levels if the common Chla fluorescence transient in absolute units is plotted, mathemati-cally double normalized values of OJ phase were used in theanalysis, i.e. we used the time plot of the values of relative variablefluorescence Vt/VJ from 0.05 to 2 ms (Fig. 1B). If we focus at thelevel of this parameter at 300 ms, where the K-step can occur (VK/VJvalue), very stable values of near 0.50 in non-treated samples wererecorded. In heat treated samples the values increased gradually,eventually exceeding 2.0 at 46 �C in the May measurement. Wefound a significant increase of VK/VJ even at 38 �C in the samplesmeasured in May, whereas almost the same heat effect wasobserved at 42 �C in the samples measured in June. As the shift(we consider it to be an acclimation) of the temperature effectseven occurs for F0 parameter, we plotted both the parameters(expressed in relative units) together in order to comparesusceptibility and the acclimation effects on different sites of PSII(Fig. 1C). The average curves show an almost linear increase in therelative variable fluorescence in K-step (VK/VJ) above 38 �C insamples measured in May and above 42 �C for samples measuredin June. The exponential phase of F0 increase began at 44 �C in theMay measurements; in June there was a significant F0 increase ascompared to 44 �C suggesting the start of an exponential phase.Plots of Chl a fluorescence (Fig. 1C) were used to estimate theincrease in critical temperature (DTC) as the distance betweenexponentially increasing phases of parameter plot e for simplicitythe estimate was performed at the level 150% of non-treatedvalues for both parameters. The critical temperature estimatedfor VK/VJ increased from 15th May to 15th June by app. 3.5 �C(38.2e41.7 �C) while the critical temperature estimated for basalfluorescence F0 increased in the same time by only 1.1 �C(43.9e45 �C) in average (Fig. 1D). Moreover, the critical tempera-ture estimated for VK/VJ was greater than 5 �C less than thatestimated for F0.
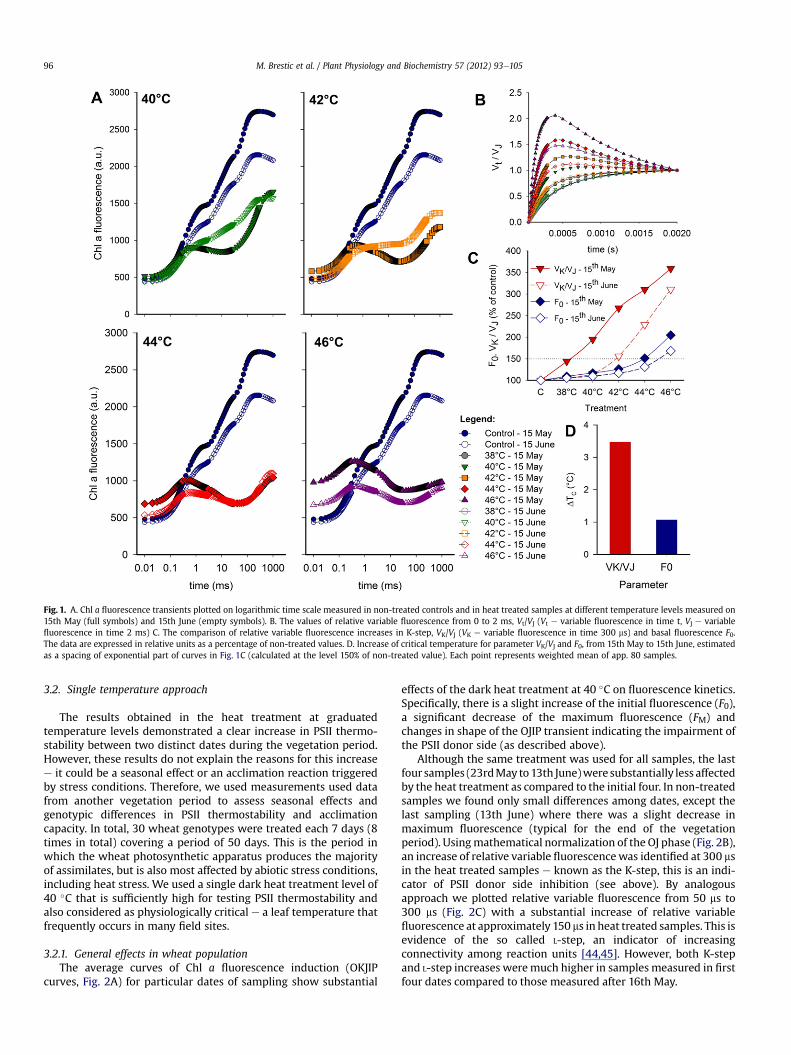
Fig. 1. A. Chl a fluorescence transients plotted on logarithmic time scale measured in non-treated controls and in heat treated samples at different temperature levels measured on15th May (full symbols) and 15th June (empty symbols). B. The values of relative variable fluorescence from 0 to 2 ms, Vt/VJ (Vt e variable fluorescence in time t, VJ e variablefluorescence in time 2 ms) C. The comparison of relative variable fluorescence increases in K-step, VK/VJ (VK e variable fluorescence in time 300 ms) and basal fluorescence F0.The data are expressed in relative units as a percentage of non-treated values. D. Increase of critical temperature for parameter VK/VJ and F0, from 15th May to 15th June, estimatedas a spacing of exponential part of curves in Fig. 1C (calculated at the level 150% of non-treated value). Each point represents weighted mean of app. 80 samples.
M. Brestic et al. / Plant Physiology and Biochemistry 57 (2012) 93e10596
3.2. Single temperature approach
The results obtained in the heat treatment at graduatedtemperature levels demonstrated a clear increase in PSII thermo-stability between two distinct dates during the vegetation period.However, these results do not explain the reasons for this increasee it could be a seasonal effect or an acclimation reaction triggeredby stress conditions. Therefore, we used measurements used datafrom another vegetation period to assess seasonal effects andgenotypic differences in PSII thermostability and acclimationcapacity. In total, 30 wheat genotypes were treated each 7 days (8times in total) covering a period of 50 days. This is the period inwhich the wheat photosynthetic apparatus produces the majorityof assimilates, but is also most affected by abiotic stress conditions,including heat stress. We used a single dark heat treatment level of40 �C that is sufficiently high for testing PSII thermostability andalso considered as physiologically critical e a leaf temperature thatfrequently occurs in many field sites.
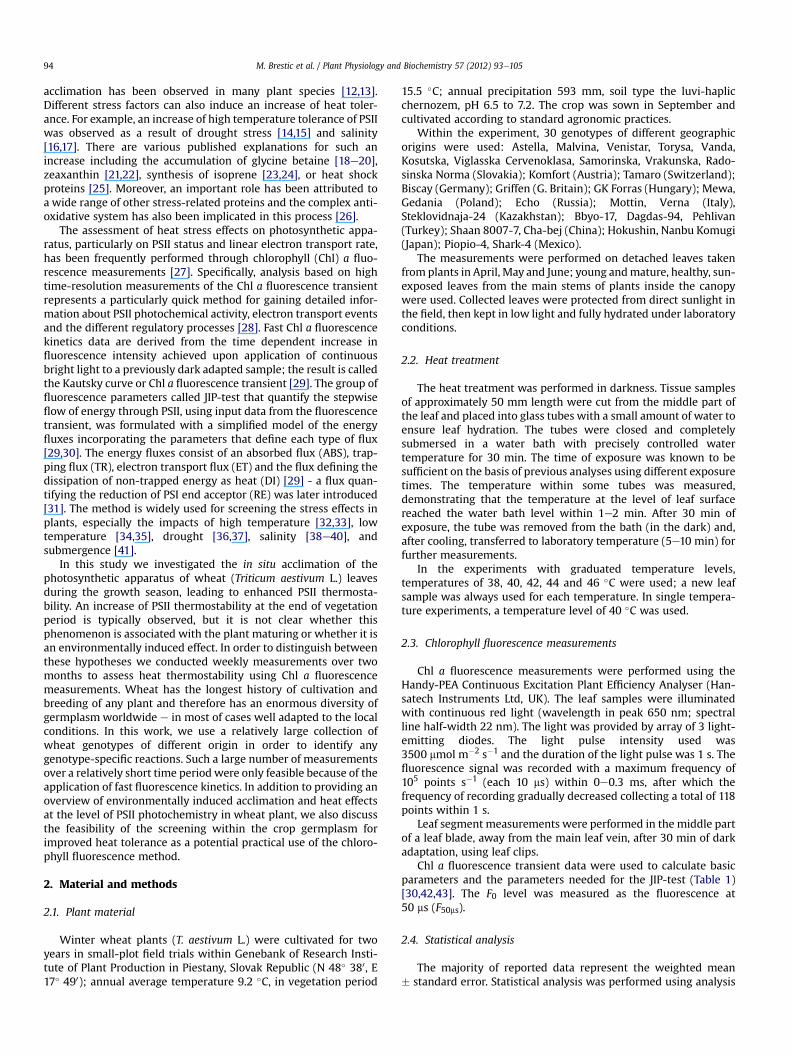
3.2.1. General effects in wheat populationThe average curves of Chl a fluorescence induction (OKJIP
curves, Fig. 2A) for particular dates of sampling show substantial
effects of the dark heat treatment at 40 �C on fluorescence kinetics.Specifically, there is a slight increase of the initial fluorescence (F0),a significant decrease of the maximum fluorescence (FM) andchanges in shape of the OJIP transient indicating the impairment ofthe PSII donor side (as described above).
Although the same treatment was used for all samples, the lastfour samples (23rdMay to13th June)weresubstantially less affectedby the heat treatment as compared to the initial four. In non-treatedsamples we found only small differences among dates, except thelast sampling (13th June) where there was a slight decrease inmaximum fluorescence (typical for the end of the vegetationperiod). Usingmathematical normalization of the OJ phase (Fig. 2B),an increase of relative variable fluorescencewas identified at 300 msin the heat treated samples e known as the K-step, this is an indi-cator of PSII donor side inhibition (see above). By analogousapproach we plotted relative variable fluorescence from 50 ms to300 ms (Fig. 2C) with a substantial increase of relative variablefluorescence at approximately 150 ms in heat treated samples. This isevidence of the so called L-step, an indicator of increasingconnectivity among reaction units [44,45]. However, both K-stepand L-step increases weremuch higher in samples measured in firstfour dates compared to those measured after 16th May.
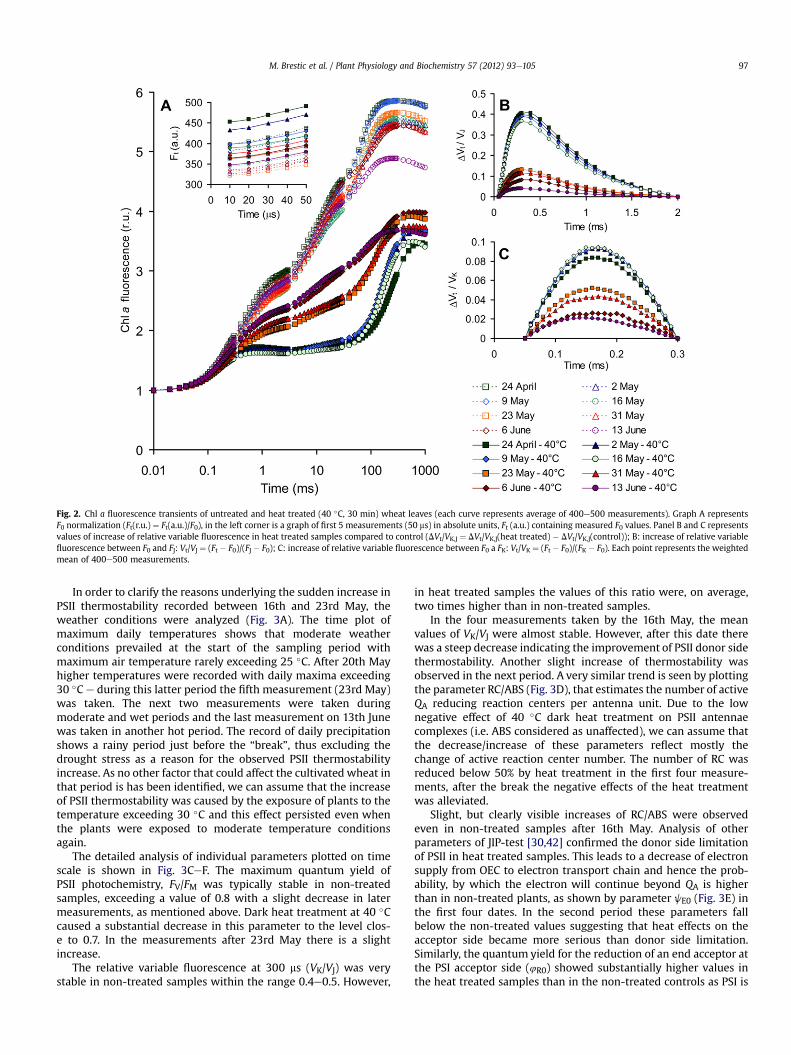
Fig. 2. Chl a fluorescence transients of untreated and heat treated (40 �C, 30 min) wheat leaves (each curve represents average of 400e500 measurements). Graph A representsF0 normalization (Ft(r.u.) ¼ Ft(a.u.)/F0), in the left corner is a graph of first 5 measurements (50 ms) in absolute units, Ft (a.u.) containing measured F0 values. Panel B and C representsvalues of increase of relative variable fluorescence in heat treated samples compared to control (DVt/VK,J ¼ DVt/VK,J(heat treated) � DVt/VK,J(control)); B: increase of relative variablefluorescence between F0 and FJ: Vt/VJ ¼ (Ft � F0)/(FJ � F0); C: increase of relative variable fluorescence between F0 a FK: Vt/VK ¼ (Ft � F0)/(FK � F0). Each point represents the weightedmean of 400e500 measurements.
M. Brestic et al. / Plant Physiology and Biochemistry 57 (2012) 93e105 97
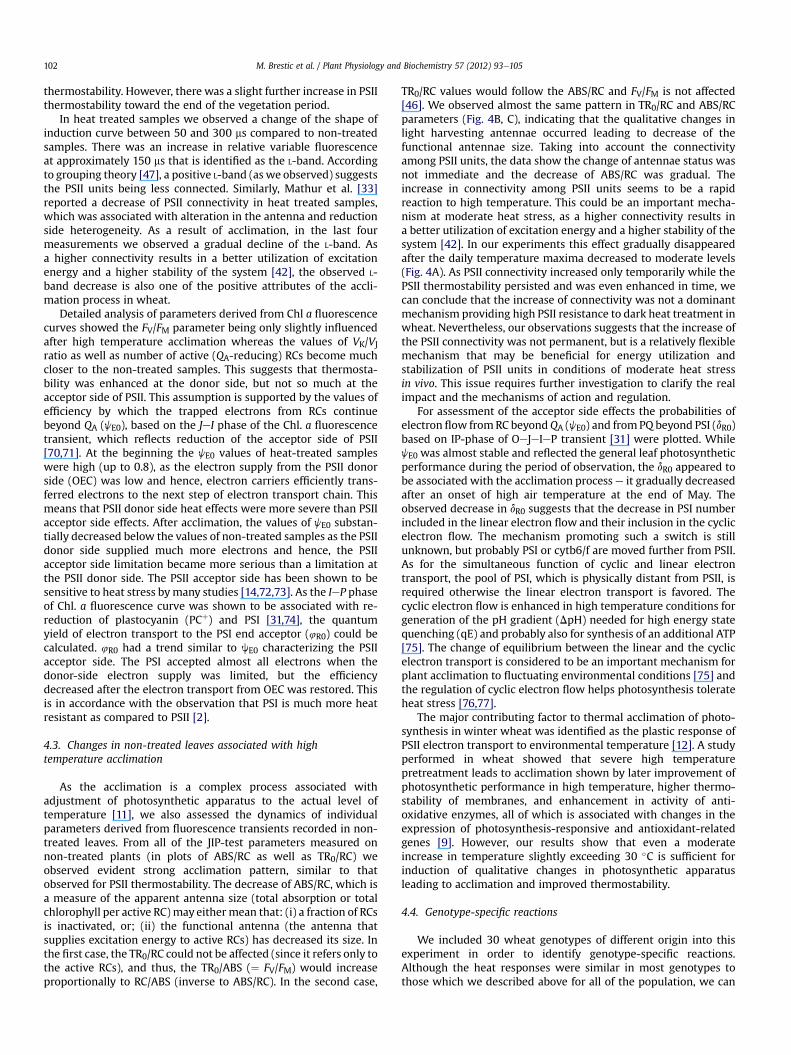
In order to clarify the reasons underlying the sudden increase inPSII thermostability recorded between 16th and 23rd May, theweather conditions were analyzed (Fig. 3A). The time plot ofmaximum daily temperatures shows that moderate weatherconditions prevailed at the start of the sampling period withmaximum air temperature rarely exceeding 25 �C. After 20th Mayhigher temperatures were recorded with daily maxima exceeding30 �C e during this latter period the fifth measurement (23rd May)was taken. The next two measurements were taken duringmoderate and wet periods and the last measurement on 13th Junewas taken in another hot period. The record of daily precipitationshows a rainy period just before the “break”, thus excluding thedrought stress as a reason for the observed PSII thermostabilityincrease. As no other factor that could affect the cultivated wheat inthat period is has been identified, we can assume that the increaseof PSII thermostability was caused by the exposure of plants to thetemperature exceeding 30 �C and this effect persisted even whenthe plants were exposed to moderate temperature conditionsagain.
The detailed analysis of individual parameters plotted on timescale is shown in Fig. 3CeF. The maximum quantum yield ofPSII photochemistry, FV/FM was typically stable in non-treatedsamples, exceeding a value of 0.8 with a slight decrease in latermeasurements, as mentioned above. Dark heat treatment at 40 �Ccaused a substantial decrease in this parameter to the level clos-e to 0.7. In the measurements after 23rd May there is a slightincrease.
The relative variable fluorescence at 300 ms (VK/VJ) was verystable in non-treated samples within the range 0.4e0.5. However,
in heat treated samples the values of this ratio were, on average,two times higher than in non-treated samples.
In the four measurements taken by the 16th May, the meanvalues of VK/VJ were almost stable. However, after this date therewas a steep decrease indicating the improvement of PSII donor sidethermostability. Another slight increase of thermostability wasobserved in the next period. A very similar trend is seen by plottingthe parameter RC/ABS (Fig. 3D), that estimates the number of activeQA reducing reaction centers per antenna unit. Due to the lownegative effect of 40 �C dark heat treatment on PSII antennaecomplexes (i.e. ABS considered as unaffected), we can assume thatthe decrease/increase of these parameters reflect mostly thechange of active reaction center number. The number of RC wasreduced below 50% by heat treatment in the first four measure-ments, after the break the negative effects of the heat treatmentwas alleviated.
Slight, but clearly visible increases of RC/ABS were observedeven in non-treated samples after 16th May. Analysis of otherparameters of JIP-test [30,42] confirmed the donor side limitationof PSII in heat treated samples. This leads to a decrease of electronsupply from OEC to electron transport chain and hence the prob-ability, by which the electron will continue beyond QA is higherthan in non-treated plants, as shown by parameter jE0 (Fig. 3E) inthe first four dates. In the second period these parameters fallbelow the non-treated values suggesting that heat effects on theacceptor side became more serious than donor side limitation.Similarly, the quantum yield for the reduction of an end acceptor atthe PSI acceptor side (4R0) showed substantially higher values inthe heat treated samples than in the non-treated controls as PSI is
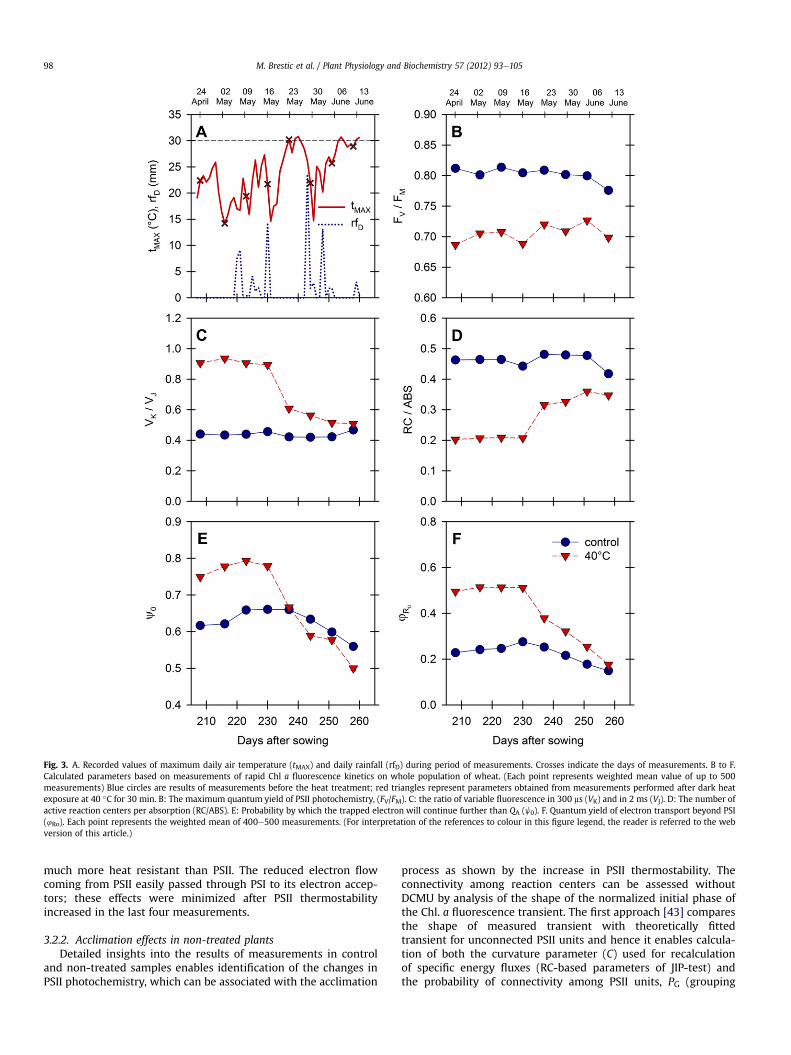
Fig. 3. A. Recorded values of maximum daily air temperature (tMAX) and daily rainfall (rfD) during period of measurements. Crosses indicate the days of measurements. B to F.Calculated parameters based on measurements of rapid Chl a fluorescence kinetics on whole population of wheat. (Each point represents weighted mean value of up to 500measurements) Blue circles are results of measurements before the heat treatment; red triangles represent parameters obtained from measurements performed after dark heatexposure at 40 �C for 30 min. B: The maximum quantum yield of PSII photochemistry, (FV/FM). C: the ratio of variable fluorescence in 300 ms (VK) and in 2 ms (VJ). D: The number ofactive reaction centers per absorption (RC/ABS). E: Probability by which the trapped electron will continue further than QA (j0). F. Quantum yield of electron transport beyond PSI(4Ro). Each point represents the weighted mean of 400e500 measurements. (For interpretation of the references to colour in this figure legend, the reader is referred to the webversion of this article.)
M. Brestic et al. / Plant Physiology and Biochemistry 57 (2012) 93e10598
much more heat resistant than PSII. The reduced electron flowcoming from PSII easily passed through PSI to its electron accep-tors; these effects were minimized after PSII thermostabilityincreased in the last four measurements.
3.2.2. Acclimation effects in non-treated plantsDetailed insights into the results of measurements in control
and non-treated samples enables identification of the changes inPSII photochemistry, which can be associated with the acclimation
process as shown by the increase in PSII thermostability. Theconnectivity among reaction centers can be assessed withoutDCMU by analysis of the shape of the normalized initial phase ofthe Chl. a fluorescence transient. The first approach [43] comparesthe shape of measured transient with theoretically fittedtransient for unconnected PSII units and hence it enables calcula-tion of both the curvature parameter (C) used for recalculationof specific energy fluxes (RC-based parameters of JIP-test) andthe probability of connectivity among PSII units, PG (grouping
M. Brestic et al. / Plant Physiology and Biochemistry 57 (2012) 93e105 99
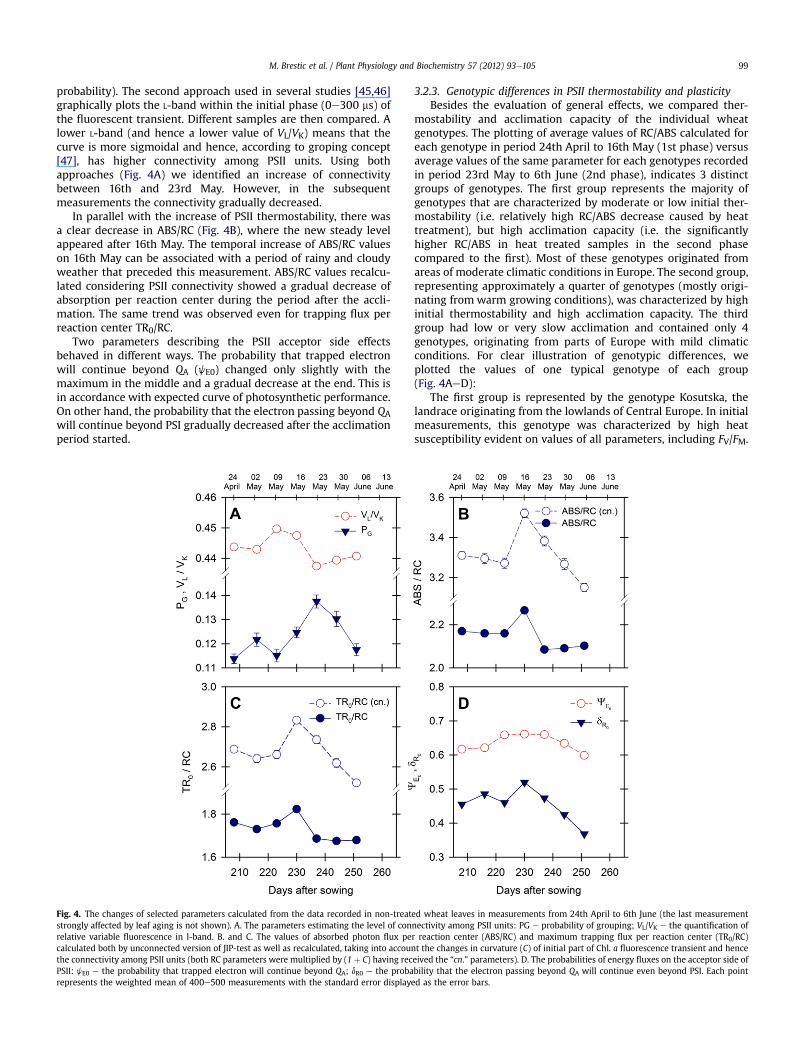
probability). The second approach used in several studies [45,46]graphically plots the L-band within the initial phase (0e300 ms) ofthe fluorescent transient. Different samples are then compared. Alower L-band (and hence a lower value of VL/VK) means that thecurve is more sigmoidal and hence, according to groping concept[47], has higher connectivity among PSII units. Using bothapproaches (Fig. 4A) we identified an increase of connectivitybetween 16th and 23rd May. However, in the subsequentmeasurements the connectivity gradually decreased.
In parallel with the increase of PSII thermostability, there wasa clear decrease in ABS/RC (Fig. 4B), where the new steady levelappeared after 16th May. The temporal increase of ABS/RC valueson 16th May can be associated with a period of rainy and cloudyweather that preceded this measurement. ABS/RC values recalcu-lated considering PSII connectivity showed a gradual decrease ofabsorption per reaction center during the period after the accli-mation. The same trend was observed even for trapping flux perreaction center TR0/RC.
Two parameters describing the PSII acceptor side effectsbehaved in different ways. The probability that trapped electronwill continue beyond QA (jE0) changed only slightly with themaximum in the middle and a gradual decrease at the end. This isin accordance with expected curve of photosynthetic performance.On other hand, the probability that the electron passing beyond QAwill continue beyond PSI gradually decreased after the acclimationperiod started.
Fig. 4. The changes of selected parameters calculated from the data recorded in non-treatstrongly affected by leaf aging is not shown). A. The parameters estimating the level of conrelative variable fluorescence in l-band. B. and C. The values of absorbed photon flux pecalculated both by unconnected version of JIP-test as well as recalculated, taking into accounthe connectivity among PSII units (both RC parameters were multiplied by (1 þ C) having recPSII: jE0 e the probability that trapped electron will continue beyond QA; dR0 e the probarepresents the weighted mean of 400e500 measurements with the standard error displaye
3.2.3. Genotypic differences in PSII thermostability and plasticityBesides the evaluation of general effects, we compared ther-
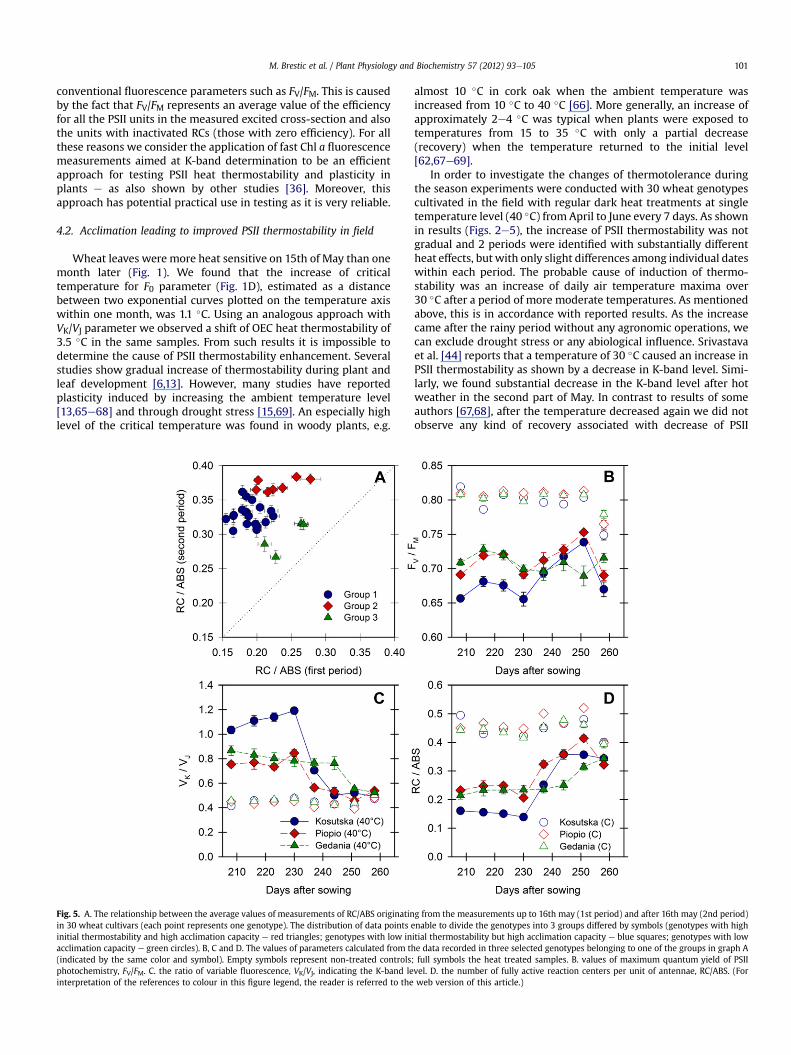
mostability and acclimation capacity of the individual wheatgenotypes. The plotting of average values of RC/ABS calculated foreach genotype in period 24th April to 16th May (1st phase) versusaverage values of the same parameter for each genotypes recordedin period 23rd May to 6th June (2nd phase), indicates 3 distinctgroups of genotypes. The first group represents the majority ofgenotypes that are characterized by moderate or low initial ther-mostability (i.e. relatively high RC/ABS decrease caused by heattreatment), but high acclimation capacity (i.e. the significantlyhigher RC/ABS in heat treated samples in the second phasecompared to the first). Most of these genotypes originated fromareas of moderate climatic conditions in Europe. The second group,representing approximately a quarter of genotypes (mostly origi-nating from warm growing conditions), was characterized by highinitial thermostability and high acclimation capacity. The thirdgroup had low or very slow acclimation and contained only 4genotypes, originating from parts of Europe with mild climaticconditions. For clear illustration of genotypic differences, weplotted the values of one typical genotype of each group(Fig. 4AeD):
The first group is represented by the genotype Kosutska, thelandrace originating from the lowlands of Central Europe. In initialmeasurements, this genotype was characterized by high heatsusceptibility evident on values of all parameters, including FV/FM.
ed wheat leaves in measurements from 24th April to 6th June (the last measurementnectivity among PSII units: PG e probability of grouping; VL/VK e the quantification ofr reaction center (ABS/RC) and maximum trapping flux per reaction center (TR0/RC)t the changes in curvature (C) of initial part of Chl. a fluorescence transient and henceeived the “cn.” parameters). D. The probabilities of energy fluxes on the acceptor side ofbility that the electron passing beyond QA will continue even beyond PSI. Each pointd as the error bars.
M. Brestic et al. / Plant Physiology and Biochemistry 57 (2012) 93e105100
By the hotter period after 20th May the thermostability graduallyincreased.
The second group is represented the genotype Piopio origi-nating from Mexico (Central America). Initial measurements showsignificantly higher PSII thermostability as compared to Kosutska.Moreover, hot weather in third decade of May induced a rapidincrease of thermostability, where the K-step was almost sup-pressed immediately after exposure to the higher temperatures.
The third group is represented by the cultivar Gedania origi-nating from maritime lowlands of Poland. Our measurementsshowed moderate or good initial PSII thermostability, higher thanin Kosutska. However, this genotype did not react to high temper-ature by increasing thermostabilty at the end of May. However, inthe June measurements we observed (even in geneotypes of thisgroup) an increase of heat tolerance. At the end of the vegetationperiod, the heat responses were almost identical in all three groupsof genotypes.
4. Discussion
4.1. Assessment of PSII thermostability
Records of fast Chl a fluorescence transient in dark adaptedsamples represent an efficient tool for assessment of many externalor intrinsic adverse effects on PSII photochemistry [42]. As illus-trated in Fig. 1A, the typical polyphasic transient is very sensitive tohigh temperature and the additional K-band was described withinthe OJ phase approximately 300 ms after illumination [47,48]; the K-band is clearly evident as an early peak in dark heated samples,becoming dominant at 46 �C. As the K-band is hidden at a moderatetemperature level, the plot of relative variable fluorescence at 2 ms(Vt/VJ) was used (Fig. 1B). The increase of variable fluorescence at300 ms can be attributed to a decrease in electron transportbetween the oxygen evolving complex (OEC) and the RC PSII [44] asa result of loss of manganese cluster [49,50] associated withdissociation of a manganese (Mn)-stabilizing protein of 33 kDabound to the donor side of the RC PSII complex followed by therelease of Mn atoms [49e51]. This is the most heat susceptible sitewithin the PSII photochemistry [3e5,9,12,14,26,52]. Besides thisphenomenon, three other main effects of dark heat treatment wereclearly evident: first, a decrease of maximum fluorescence FM.Second, an increase of minimum fluorescence F0; both these effectsresulted to the decrease of variable fluorescence FV and hence intolow FV/FM ratio representing the maximum quantum yield of PSIIphotochemistry. Finally, a change in the typical polyphasic shape ofthe Chl a fluorescence transient (when plotted on a logarithmictime axis).
A significant F0 increase occurred in our measurements beyond42 �C. There are several possible interpretations of such an increase.First, the F0 is an indicator of the heat effects on the PSII acceptorside, as it corresponds to a shift in QA/QB
‾ equilibrium towardQA‾ [53]
with enhanced back electron transfer from QB to QA [52,53]. Analternative explanation of the exponential F0 increase is thedeconnection of PSII light harvesting antennae from the PSII corecomplex [54], heat-induced monomerization of LHC2 trimers [55],or, generally, a complex loss of functional and structural integrity ofPSII [56]. The FM decrease reflects increasing the number of QA non-reducing reaction centers that dissipate the energy of absorbedphotons into the heat. The FV/FM ratio represents the fraction ofabsorbed photon flux that is trapped to reduce primary PSIIacceptor QA. The FV/FM decrease is caused both by the F0 increaseand FM decrease after exposure to high temperatures.
The PSII thermostability, as a part of the overall leaf heat toler-ance, has been determined frequently by the dependence of basalfluorescence and temperature (F0eT curve)e first demonstrated by
Schreiber and Berry [57]. The method is based on a continuousincrease of sample temperature and the permanent record of F0value. The critical temperature TC is the temperature at which the F0starts to steeply increase. The measurements of critical tempera-ture were performed in different species with the range of criticaltemperature from 42 �C up to more than 50 �C [13]. In the first partof our experiment we used the method analogous to the contin-uous F0 measurements: the exposure of leaf samples to severaltemperature levels (graduated temperature approach) with a freshsample used at each level. Such measurements give more complexinformation about the heat effects on PSII photochemistry and alsoenable the estimation of the critical temperature for F0 parameter(or any other measured parameter). The results show a slightincrease of F0 at moderate temperatures, which indicates that theprimary PSII acceptor, QA, is not fully oxidized e this can be a resultof chlororespiration [58] or other processes causing partial re-reduction of fully oxidized QA during dark heat treatment.However, at a temperature 42 �C and more we observed the start ofexponential F0 increase. This observation is consistent with criticaltemperatures published for annual species grown at moderatetemperatures up to 25 �C [13,59,60]. In moderate temperature-grown woody species as well as in tropical and desert species,the critical temperature ranged from 44 to 49 �C [61,62]. Byimproving the thermal stability of the thylakoid membranes, it hasbeen shown that the photosynthetic apparatus will be able topreserve its functional potential at high leaf temperatures therebyminimizing the after-effects of heat stress [63].
The heat stress effects on PSII photochemistry and heat toler-ance at the PSII level have been frequently assessed e even if onlyby the F0, FM and FV/FM parameters. F0 and FM values are stronglydependent on the properties of the sample, mainly on chlorophyllcontent. Hence, high standard deviations are typical, even in non-treated samples. The use of the FV/FM ratio solved this problem.However, it is based on the assumption that F0 is measured inopen RCs (QA fully oxidized) and FM in closed RCs (QA fullyreduced). In heated samples, the F0 can slightly increase as thehigh temperature enhances the process of chlororespirationleading to partial reduction of QA in dark [58]. At heat stressedsamples with highly impaired OEC, the electron transport leadingto QA reduction is low and hence it takes longer to reach the timeof maximum fluorescence. In some cases, the time of saturationflash can be insufficient to reach the FM value (the maximumfluorescence is not reached without DCMU) and hence themeasured FM does not refer to fully reduced QA state (underesti-mation of FM) [45,64]. Both the overestimation of F0 and under-estimation of FM lead to incorrectly determined FV/FM. None ofthese problems are valid for estimation of critical temperatureusing F0 steep increase, as it ignores slight increases in F0. Criticaltemperature represents the temperature at which serious disor-ganization of structure and loss of main functions occurs. Hence, itis a temperature typically in excess of that experienced undernatural ambient conditions, as in most cases leaves in a field arenot heated up to 50 �C. Nevertheless, we found occurrence of theK-step even at temperatures 4e5 �C lower than a steep F0 increase.Moreover, in non-treated plants we observed very stable values ofrelative variable fluorescence in K-step (VK/VJ) (Fig. 2C), neverexceeding the range of 0.43e0.53 in all wheat genotypes regard-less of real QA oxidation state in dark. An increase in VK/VJ causedby heat was clearly evident. We also observed a higher capacity toincrease thermostability on K-band level than in measurements ofF0. Moreover, the physiological significance of the K-band increaseprobably represents the first irreversible heat effect (and hencea key effect) inactivating the PSII reaction centers.
Some studies [6,28e30,41,44] has shown that the parametersderived from JIP-test show a greater sensitivity to heat than
M. Brestic et al. / Plant Physiology and Biochemistry 57 (2012) 93e105 101
conventional fluorescence parameters such as FV/FM. This is causedby the fact that FV/FM represents an average value of the efficiencyfor all the PSII units in the measured excited cross-section and alsothe units with inactivated RCs (those with zero efficiency). For allthese reasons we consider the application of fast Chl a fluorescencemeasurements aimed at K-band determination to be an efficientapproach for testing PSII heat thermostability and plasticity inplants e as also shown by other studies [36]. Moreover, thisapproach has potential practical use in testing as it is very reliable.
4.2. Acclimation leading to improved PSII thermostability in field
Wheat leaves were more heat sensitive on 15th of May than onemonth later (Fig. 1). We found that the increase of criticaltemperature for F0 parameter (Fig. 1D), estimated as a distancebetween two exponential curves plotted on the temperature axiswithin one month, was 1.1 �C. Using an analogous approach withVK/VJ parameter we observed a shift of OEC heat thermostability of3.5 �C in the same samples. From such results it is impossible todetermine the cause of PSII thermostability enhancement. Severalstudies show gradual increase of thermostability during plant andleaf development [6,13]. However, many studies have reportedplasticity induced by increasing the ambient temperature level[13,65e68] and through drought stress [15,69]. An especially highlevel of the critical temperature was found in woody plants, e.g.
Fig. 5. A. The relationship between the average values of measurements of RC/ABS originatinin 30 wheat cultivars (each point represents one genotype). The distribution of data points einitial thermostability and high acclimation capacity e red triangles; genotypes with low inacclimation capacity e green circles). B, C and D. The values of parameters calculated from th(indicated by the same color and symbol). Empty symbols represent non-treated controlsphotochemistry, FV/FM. C. the ratio of variable fluorescence, VK/VJ, indicating the K-band leinterpretation of the references to colour in this figure legend, the reader is referred to the
almost 10 �C in cork oak when the ambient temperature wasincreased from 10 �C to 40 �C [66]. More generally, an increase ofapproximately 2e4 �C was typical when plants were exposed totemperatures from 15 to 35 �C with only a partial decrease(recovery) when the temperature returned to the initial level[62,67e69].
In order to investigate the changes of thermotolerance duringthe season experiments were conducted with 30 wheat genotypescultivated in the field with regular dark heat treatments at singletemperature level (40 �C) from April to June every 7 days. As shownin results (Figs. 2e5), the increase of PSII thermostability was notgradual and 2 periods were identified with substantially differentheat effects, but with only slight differences among individual dateswithin each period. The probable cause of induction of thermo-stability was an increase of daily air temperature maxima over30 �C after a period of more moderate temperatures. As mentionedabove, this is in accordance with reported results. As the increasecame after the rainy period without any agronomic operations, wecan exclude drought stress or any abiological influence. Srivastavaet al. [44] reports that a temperature of 30 �C caused an increase inPSII thermostability as shown by a decrease in K-band level. Simi-larly, we found substantial decrease in the K-band level after hotweather in the second part of May. In contrast to results of someauthors [67,68], after the temperature decreased again we did notobserve any kind of recovery associated with decrease of PSII
g from the measurements up to 16th may (1st period) and after 16th may (2nd period)nable to divide the genotypes into 3 groups differed by symbols (genotypes with highitial thermostability but high acclimation capacity e blue squares; genotypes with lowe data recorded in three selected genotypes belonging to one of the groups in graph A
; full symbols the heat treated samples. B. values of maximum quantum yield of PSIIvel. D. the number of fully active reaction centers per unit of antennae, RC/ABS. (Forweb version of this article.)
M. Brestic et al. / Plant Physiology and Biochemistry 57 (2012) 93e105102
thermostability. However, there was a slight further increase in PSIIthermostability toward the end of the vegetation period.
In heat treated samples we observed a change of the shape ofinduction curve between 50 and 300 ms compared to non-treatedsamples. There was an increase in relative variable fluorescenceat approximately 150 ms that is identified as the L-band. Accordingto grouping theory [47], a positive L-band (as we observed) suggeststhe PSII units being less connected. Similarly, Mathur et al. [33]reported a decrease of PSII connectivity in heat treated samples,which was associated with alteration in the antenna and reductionside heterogeneity. As a result of acclimation, in the last fourmeasurements we observed a gradual decline of the L-band. Asa higher connectivity results in a better utilization of excitationenergy and a higher stability of the system [42], the observed L-band decrease is also one of the positive attributes of the accli-mation process in wheat.
Detailed analysis of parameters derived from Chl a fluorescencecurves showed the FV/FM parameter being only slightly influencedafter high temperature acclimation whereas the values of VK/VJratio as well as number of active (QA-reducing) RCs become muchcloser to the non-treated samples. This suggests that thermosta-bility was enhanced at the donor side, but not so much at theacceptor side of PSII. This assumption is supported by the values ofefficiency by which the trapped electrons from RCs continuebeyond QA (jE0), based on the JeI phase of the Chl. a fluorescencetransient, which reflects reduction of the acceptor side of PSII[70,71]. At the beginning the jE0 values of heat-treated sampleswere high (up to 0.8), as the electron supply from the PSII donorside (OEC) was low and hence, electron carriers efficiently trans-ferred electrons to the next step of electron transport chain. Thismeans that PSII donor side heat effects were more severe than PSIIacceptor side effects. After acclimation, the values of jE0 substan-tially decreased below the values of non-treated samples as the PSIIdonor side supplied much more electrons and hence, the PSIIacceptor side limitation became more serious than a limitation atthe PSII donor side. The PSII acceptor side has been shown to besensitive to heat stress bymany studies [14,72,73]. As the IeP phaseof Chl. a fluorescence curve was shown to be associated with re-reduction of plastocyanin (PCþ) and PSI [31,74], the quantumyield of electron transport to the PSI end acceptor (4R0) could becalculated. 4R0 had a trend similar to jE0 characterizing the PSIIacceptor side. The PSI accepted almost all electrons when thedonor-side electron supply was limited, but the efficiencydecreased after the electron transport from OEC was restored. Thisis in accordance with the observation that PSI is much more heatresistant as compared to PSII [2].
4.3. Changes in non-treated leaves associated with hightemperature acclimation
As the acclimation is a complex process associated withadjustment of photosynthetic apparatus to the actual level oftemperature [11], we also assessed the dynamics of individualparameters derived from fluorescence transients recorded in non-treated leaves. From all of the JIP-test parameters measured onnon-treated plants (in plots of ABS/RC as well as TR0/RC) weobserved evident strong acclimation pattern, similar to thatobserved for PSII thermostability. The decrease of ABS/RC, which isa measure of the apparent antenna size (total absorption or totalchlorophyll per active RC)may either mean that: (i) a fraction of RCsis inactivated, or; (ii) the functional antenna (the antenna thatsupplies excitation energy to active RCs) has decreased its size. Inthe first case, the TR0/RC could not be affected (since it refers only tothe active RCs), and thus, the TR0/ABS (¼ FV/FM) would increaseproportionally to RC/ABS (inverse to ABS/RC). In the second case,
TR0/RC values would follow the ABS/RC and FV/FM is not affected[46]. We observed almost the same pattern in TR0/RC and ABS/RCparameters (Fig. 4B, C), indicating that the qualitative changes inlight harvesting antennae occurred leading to decrease of thefunctional antennae size. Taking into account the connectivityamong PSII units, the data show the change of antennae status wasnot immediate and the decrease of ABS/RC was gradual. Theincrease in connectivity among PSII units seems to be a rapidreaction to high temperature. This could be an important mecha-nism at moderate heat stress, as a higher connectivity results ina better utilization of excitation energy and a higher stability of thesystem [42]. In our experiments this effect gradually disappearedafter the daily temperature maxima decreased to moderate levels(Fig. 4A). As PSII connectivity increased only temporarily while thePSII thermostability persisted and was even enhanced in time, wecan conclude that the increase of connectivity was not a dominantmechanism providing high PSII resistance to dark heat treatment inwheat. Nevertheless, our observations suggests that the increase ofthe PSII connectivity was not permanent, but is a relatively flexiblemechanism that may be beneficial for energy utilization andstabilization of PSII units in conditions of moderate heat stressin vivo. This issue requires further investigation to clarify the realimpact and the mechanisms of action and regulation.
For assessment of the acceptor side effects the probabilities ofelectron flow fromRC beyondQA (jE0) and fromPQ beyond PSI (dR0)based on IP-phase of OeJeIeP transient [31] were plotted. WhilejE0 was almost stable and reflected the general leaf photosyntheticperformance during the period of observation, the dR0 appeared tobe associated with the acclimation process e it gradually decreasedafter an onset of high air temperature at the end of May. Theobserved decrease in dR0 suggests that the decrease in PSI numberincluded in the linear electron flow and their inclusion in the cyclicelectron flow. The mechanism promoting such a switch is stillunknown, but probably PSI or cytb6/f are moved further from PSII.As for the simultaneous function of cyclic and linear electrontransport, the pool of PSI, which is physically distant from PSII, isrequired otherwise the linear electron transport is favored. Thecyclic electron flow is enhanced in high temperature conditions forgeneration of the pH gradient (DpH) needed for high energy statequenching (qE) and probably also for synthesis of an additional ATP[75]. The change of equilibrium between the linear and the cyclicelectron transport is considered to be an important mechanism forplant acclimation to fluctuating environmental conditions [75] andthe regulation of cyclic electron flow helps photosynthesis tolerateheat stress [76,77].
The major contributing factor to thermal acclimation of photo-synthesis in winter wheat was identified as the plastic response ofPSII electron transport to environmental temperature [12]. A studyperformed in wheat showed that severe high temperaturepretreatment leads to acclimation shown by later improvement ofphotosynthetic performance in high temperature, higher thermo-stability of membranes, and enhancement in activity of anti-oxidative enzymes, all of which is associated with changes in theexpression of photosynthesis-responsive and antioxidant-relatedgenes [9]. However, our results show that even a moderateincrease in temperature slightly exceeding 30 �C is sufficient forinduction of qualitative changes in photosynthetic apparatusleading to acclimation and improved thermostability.
4.4. Genotype-specific reactions
We included 30 wheat genotypes of different origin into thisexperiment in order to identify genotype-specific reactions.Although the heat responses were similar in most genotypes tothose which we described above for all of the population, we can
M. Brestic et al. / Plant Physiology and Biochemistry 57 (2012) 93e105 103
identify three different patterns of reactions. The first and mostabundant group was characterized by low initial thermostability,but with a steep increase of thermostability after the stimulusoccurred. The second group, containing 7 genotypes, was charac-terized by high initial thermostability which quickly increased tothe final level. The third group, containing 3 genotypes was char-acterized by intermediate or high initial thermostability, but wascharacterized by only a limited increase in thermostability oracclimated very slowly. This redistribution was clearly associatedwith the origin of genotypes, with the second group (high initialtolerance) consisting of genotypes mainly originating from warmcountries (Mexico, China, Japan, Turkey, and Italy). The first grouprepresented mainly genotypes from Central and Eastern Europeand in the third group were genotypes from countries with mildmaritime climate.
There are many possible reasons for different PSII thermosta-bility and acclimation capacity in plants. The composition of lipidsin thylakoid membranes seems to be important for heat thermo-stability. For example, soybean mutants with unusually highcontent of saturated and low content of unsaturated fatty acids had13 �C higher temperature for 50% inactivation of OEC activity thanin wild type [78]. Arabidopsis mutants deficient in DGDG were alsoshown to be more sensitive to thermal stress [79,80]. The aggre-gation of LHCII seems to represent a protective mechanism to helpdissipate excess excitation energy due to significant inhibition ofCO2 fixation under heat stress [81]. A role for LHCII in the stabili-zation of PSII against heat [82] as well as calcium [83] has also beendescribed. The rate of cyclic electron flow around PSI also seem toinfluence thermostability of PSII as shown from the thermotol-erance level in Arabidopsis mutants affected in either NAD(P)Hdehydrogenase- or FQR-dependent pathways [84]. The heat-shockproteins are often thought to be the main factor providing stabili-zation of membrane complex in heat [25]. However, the heat shockproteins (HSP) do not explain the increase of thermostabilitycaused by drought and other stresses which cause a substantialincrease of PSII thermostability, but doesn’t induce the productionof HSPs [69]. Similarly, the accumulation of osmoprotectants asa result of drought, salinity or heat stress decrease during recovery.However, the increased level of PSII heat thermostability persistslong time after, or shows a partial decrease only. We can hypoth-esize that there are other effects in addition to those mentionedabove that contribute to PSII heat thermostability. However, someof them represent an early reaction with rapid onset and earlyrecovery (an early acclimation), whereas other changes, such asstructural changes at the cell or thylakoid membrane level, developmore slowly but persist for a long time (long-term acclimation).
Most studies show different levels of PSII heat thermostabilityamong species or altered thermostability in mutants or in plantswith modified particular genes, in comparison with wild types.Such a biological material with high thermostability is usually notuseful in crop improvement (e.g. because of pleiotropic effects).However, our results suggest that we can identify significant vari-ability in heat thermostability within high-producing crop geno-types. The application of fast Chl a fluorescence kinetics can help toidentify remarkably heat resistant or susceptible lines withinnumerous collections of genotypes. These can serve either forfurther studies or as a source of high temperature tolerance for cropbreeding.
Acknowledgments
We want to thank the Research Institute of Plant Production inPiestany, Slovakia for providing the field trials as well as for possi-bility to realize the statistical analyses. Moreover, we want to thankMs. Jana Pivkova for a hugework she did during themeasurements.
This work was supported by the grant APVV-0197-10. S.I.A. wouldlike to thank the Russian Foundation for Basic Research (Nos. 11-04-01389a, 11-04-92690a and 12-04-92101a), the Russian Ministryof Science and Education (No. 16.740.11.0176), and the Molecularand Cell Biology Programs of the Russian Academy of Sciences forsupport grants. This work was also supported by a grant fromNatural Sciences and Engineering Research Council of Canada to RC.
References
[1] M.H. Kalaji, T. qoboda, Photosystem II of barley seedlings under cadmium andlead stress, Plant Soil Environ. 53 (2007) 511e516.
[2] J. Berry, O. Björkman, Photosynthetic response and adaptation to temperaturein higher plants, Annu. Rev. Plant Physiol. 31 (1980) 491e543.
[3] M.H. Kalaji, K. Bosa, J. Ko�scielniak, Z. Hossain, Chlorophyll a fluorescence e
a useful tool for the early detection of temperature stress in spring barley(Hordeum vulgare L.), OMICS A J. Integr. Biol. 15 (2011) 925e934.
[4] M.E. Salvucci, S.J. Crafts-Brandner, Inhibition of photosynthesis by heat stress:the activation state of Rubisco as a limiting factor in photosynthesis, Physiol.Plant 120 (2004) 179e186.
[5] S.I. Allakhverdiev, V.D. Kreslavski, V.V. Klimov, D.A. Los, R. Carpentier,P. Mohanty, Heat stress: an overview of molecular responses in photosyn-thesis, Photosynth. Res. 98 (2008) 541e550.
[6] C.D. Jiang, G.M. Jiang, X. Wang, L.H. Li, D.K. Biswas, Y.G. Li, Increased photo-synthetic activities and thermostability of photosystem II with leaf develop-ment of elm seedlings (Ulmus pumila) probed by the fast fluorescence riseOJIP, Environ. Exp. Bot. 58 (2006) 261e268.
[7] F. Valladares, W. Pearcy, Interactions between water stress, sun-shade accli-mation, heat tolerance and photoinhibition in the sclerophyll Heteromelesarbutifolia, Plant Cell Environ. 20 (1997) 25e36.
[8] W. Larcher, Temperature stress and survival ability of Mediterranean scle-rophyllous plants, Plant Biosyst. 134 (2000) 279e295.
[9] X. Wang, J. Cai, D. Jiang, F. Liu, T. Dai, W. Cao, Pre-anthesis high-temperatureacclimation alleviates damage to the flag leaf caused by post-anthesis heatstress in wheat, J. Plant Physiol. 168 (2011) 585e593.
[10] K. Hüve, I. Bichele, B. Rasulov, Ü. Niinemets, When is too hot for photosyn-thesis: heat-induced instability of photosynthesis in relation to respiratoryburst, cell permeability changes and H2O2 formation, Plant Cell Environ. 34(2011) 113e126.
[11] O.K. Atkin, I. Scheurwater, T.L. Pons, High thermal acclimation potential ofboth photosynthesis and respiration in two lowland Plantago species incontrast to an alpine congeneric, Glob. Change Biol. 12 (2006) 500e515.
[12] T. Yamasaki, T. Yamakawa, Y. Yamane, H. Koike, K. Satoh, S. Katoh, Temper-ature acclimation of photosynthesis and related changes in photosystem IIelectron transport in winter wheat, Plant Physiol. 128 (2002) 1097e1102.
[13] F. Froux, M. Ducrey, D. Epron, E. Dreyer, Seasonal variations and acclimationpotential of the thermostability of photochemistry in four Mediterraneanconifers, Ann. For. Sci. 61 (2004) 235e241.
[14] C.M. Lu, J.H. Zhang, Effects of water stress on Photosystem II photochemistryand its thermostability in wheat plants, J. Exp. Bot. 50 (1999) 1199e1206.
[15] D. Epron, Effects of drought on photosynthesis and on the thermotolerance ofphotosystem II in seedlings of cedar (Cedrus atlantica and C. libani), J. Exp. Bot.48 (1997) 1835e1841.
[16] H.X. Chen, W.-J. Li, S.-Z. An, H.-Y. Gao, Characterization of PSII photochemistryand thermostability in salt-treated Rumex leaves, J. Plant Physiol. 161 (2004)257e264.
[17] X. Wen, N. Qiu, Q. Lu, C. Lu, Enhanced thermotolerance of photosystem II insalt-adapted plants of the halophyte Artemisia anethifolia, Planta 200 (2005)486e497.
[18] S.I. Allakhverdiev, Y.M. Feyziev, A. Ahmed, H. Hayashi, J.A. Aliev, V.V. Klimov,et al., Stabilization of oxygen evolution and primary electron transport reac-tions in photosystem II against heat stress with glycinebetaine and sucrose,J. Photochem. Photobiol. 34 (1996) 149e157.
[19] G.C. Papageorgiou, N. Murata, The unusually strong stabilizing effects ofglycine betaine on the structure and function of the oxygen-evolving Photo-system II complex, Photosynth. Res. 43 (1995) 243e252.
[20] S.I. Allakhverdiev, et al., Glycinebetaine alleviates the inhibitory effect ofmoderate heat stress on the repair of photosystem II during photoinhibition,Biochim. Biophys. Acta 1767 (2007) 1363e1371.
[21] B. Demmig, K. Winter, A. Kruger, F.C. Czygan, Zeaxanthin and the heat dissi-pation of excess light energy in Nerium oleander exposed to a combination ofhigh light and water stress, Plant Physiol. 87 (1988) 17e24.
[22] M. Havaux, Carotenoids as membrane stabilizers in chloroplasts, Trends PlantSci. 3 (1998) 147e151.
[23] E.L. Singsaas, M. Lerdau, K. Winter, T.D. Sharkey, Isoprene increases thermo-tolerance of isoprene-emitting species, Plant Physiol. 115 (1997) 1413e1420.
[24] M.E. Siwko, S.J. Marrink, A.H. de Vries, A. Kozubek, A.J.M.S. Uiterkamp,A.E. Mark, Does isoprene protect plant membranes from thermal shock? Amolecular dynamics study, Biochim. Biophys. Acta 1768 (2007) 198e206.
[25] S.A. Heckathorn, C.A. Downs, T.D. Sharkey, J.S. Coleman, The smallmethionine-rich chloroplast heat-shock protein protects photosystem IIelectron transport during heat stress, Plant Physiol. 116 (1998) 439e444.
M. Brestic et al. / Plant Physiology and Biochemistry 57 (2012) 93e105104
[26] S. Wahid, Gelani M. Ashraf, M.R. Foolad, Heat tolerance in plants: an overview,Environ. Exp. Bot. 61 (2007) 199e223.
[27] G.H. Krause, E. Weis, Chlorophyll fluorescence and photosynthesis: the basics,Annu. Rev. Plant Physiol, Plant Mol. Biol. 42 (1991) 313e349.
[28] A. Stirbet, Govindjee, On the relation between the Kautsky effect(chlorophyll a fluorescence induction) and photosystem II: basics andapplications of the OJIP fluorescence transient, J. Photochem. Photobiol. B104 (2011) 236e257.
[29] L. Force, C. Critchley, J.J.S. van Rensen, New fluorescence parameters formonitoring photosynthesis in plants: 1. The effect of illumination on thefluorescence parameters of the JIP test, Photosynth. Res. 78 (2003) 17e33.
[30] B.J. Strasser, R.J. Strasser, Measuring fast fluorescence transients to addressenvironmental questions: the JIP test, in: P. Mathis (Ed.), Photosynthesis:From Light to Biosphere: Proceedings of the Xth International PhotosynthesisCongress, Montpellier- France 1995, vol. V, Kluwer Academic Publishers, TheNetherlands, 1995, pp. 977e980.
[31] G. Schansker, S.Z. Tóth, R.J. Strasser, Methylviologen and dibromothymoqui-none treatments of pea leaves reveal the role of photosystem I in the Chla fluorescence rise OJIP, Biochim. Biophys. Acta 1706 (2005) 250e261.
[32] M. Zivcak, M. Brestic, K. Olsovska, Application of photosynthetic parameters inthe screening of wheat (Triticum aestivum L.) genotypes for improved droughtand high temperature tolerance, in: J.F. Allen, E. Gantt, J.H. Golbeck,B. Osmond (Eds.), Photosynthesis. Energy from the Sun: 14th InternationalCongress on Photosynthesis, Springer, Dordrecht, the Netherlands, 2008, pp.1247e1250.
[33] S. Mathur, S.I. Allakhverdiev, A. Jajoo, Analysis of high temperature stress onthe dynamics of antenna size and reducing side heterogeneity of PhotosystemII in wheat leaves (Triticum aestivum), Biochim. Biophys. Acta 1807 (2011)22e29.
[34] P.D.R. van Heerden, G.H.J. Krüger, R.J. Strasser, Dark chilling effects on soybeangenotypes during vegetative development: parallel studies of CO2assimilation, chlorophyll a fluorescence kinetics OeJeIeP and nitrogen fixa-tion, Physiol. Plant 117 (2003) 476e491.
[35] A.J. Strauss, G.H.J. Krüger, R.J. Strasser, P.D.R. Van Heerden, The role of low soiltemperatures in the inhibition of growth and PSII function during darkchilling in soybean genotypes of contrasting tolerance, Physiol. Plant 131(2007) 89e105.
[36] G. Oukarroum, Schansker, R.J. Strasser, Drought stress effects on photosystemI content and photosystem II thermotolerance analyzed using Chl a fluores-cence kinetics in barley varieties differing in their drought tolerance, Physiol.Plant 137 (2009) 188e199.
[37] M. Zivcak, M. Brestic, K. Olsovska, P. Slamka, Performance index as a sensitiveindicator of water stress in Triticum aestivum L, Plant Soil Environ. 54 (2008)133e139.
[38] M.H. Kalaji, Govindjee, K. Bosa, J. Ko�scielniak, K. _Zuk-Go1aszewska, Effects ofsalt stress on photosystem II efficiency and CO2 assimilation of two Syrianbarley landraces, Environ. Exper. Bot. 73 (2011b) 64e72.
[39] K. Kocheva, P. Lambrev, G. Georgiev, V. Goltsev, M. Karabaliev, Evaluation ofchlorophyll fluorescence and membrane injury in the leaves of barley culti-vars under osmotic stress, Bioelectrochemistry 63 (2004) 121e124.
[40] P. Mehta, S.I. Allakhverdiev, A. Jajoo, Characterization of photosystem IIheterogeneity in response to high salt stress in wheat leaves (Triticum aesti-vum), Photosynth. Res. 105 (2010) 249e255.
[41] R.K. Sarkar, D. Panda, Distinction and characterisation of submergencetolerant and sensitive rice cultivars, probed by the fluorescence OJIP risekinetics, Func. Plant Biol. 36 (2009) 1e12.
[42] R.J. Strasser, A. Srivastava, M. Tsimilli-Michael, Analysis of the chlorophylla fluorescence transient, advances in photosynthesis and respiration, in:G. Papageorgiou, Govindjee (Eds.), Chlorophyll Fluorescence: a Signature ofPhotosynthesis, vol. 19, Kluwer Academic Publishers, The Netherlands, 2004,pp. 321e362.
[43] R.J. Strasser, A.D. Stirbet, Estimation of the energetic connectivity of PS IIcenters in plants using the fluorescence rise OeJeIeP: fitting of experimentaldata to three different PS II models, Math. Comp. Simulat 56 (2001) 451e461.
[44] B. Srivastava, H. Guisse, Greppin, R.J. Strasser, Regulation of antenna structureand electron transport in photosystem II of Pisum sativum under elevatedtemperature probed by the fast polyphasic chlorophyll a fluorescence tran-sient: OKJIP, Biochim. Biophys. Acta 1320 (1997) 95e106.
[45] L.S. Chen, L. Cheng, Photosystem 2 is more tolerant to high temperature inapple (Malus domestica Borkh) leaves than in fruit peel, Photosynthetica 47(2009) 112e120.
[46] M.A. Yusuf, D. Kumar, R. Rajwanshi, R.J. Strasser, M. Tsimili-Michael,Govindjee, N.B. Sarin, Overexpression of g-tocopherol methyl transferasegene in transgenic Brassica juncea plants alleviates abiotic stress: physiolog-ical and chlorophyll a fluorescence measurements, Biochim. Biophys. Acta1797 (2010) 1428e1438.
[47] R.J. Strasser, A.D. Stirbet, Heterogenity of photosystem II probed by thenumerically simulated chlorophyll a fluorescence rise (OeJeIeP), Math.Comp. Simulat 48 (1998) 3e9.
[48] B. Guissé, A. Srivastava, R.J. Strasser, The polyphasic rise of the chlorophylla fluorescence (OeKeJeIeP) in heat stressed leaves, Arch. Sci. Genève 48(1995) 147e160.
[49] D. Nash, M. Miyao, N. Murata, Heat inactivation of oxygen evolution inphotosystem II particles and its acceleration by chloride depletion andexogenous manganese, Biochim. Biophys. Acta 807 (1985) 127e133.
[50] I. Enami, M. Kitamura, T. Tomo, Y. Isokawa, H. Ohta, S. Katoh, Is the primarycause of thermal inactivation of oxygen evolution in spinach PseIimembranes release of the extrinsic 33 kDa protein or of Mn, Biochim. Biophys.Acta 1186 (1994) 52e58.
[51] Y. Yamane, Y. Kashino, H. Koike, K. Satoh, Effects of high temperatures on thephotosynthetic systems in spinach: oxygen-evolving activities, fluorescencecharacteristics and the denaturation process, Photosynth. Res. 57 (1998)51e59.
[52] J.M. Ducruet, Relation between the heat-induced increase of F-0 fluorescenceand a shift in the electronic equilibrium at the acceptor side of photosystem 2,Photosynthetica 37 (1999) 335e338.
[53] R. Kou�ril, D. Lazár, P. Ilík, J. Skotnica, P. Krch�nák, J. Nau�s, High temperature-induced chlorophyll fluorescence rise in plants at 40e50�C: experimentaland theoretical approach, Photosynth. Res. 81 (2004) 49e66.
[54] Y. Yamane, Y. Kashino, H. Koike, K. Satoh, Increases in the fluorescence F0level and reversible inhibition of photosystem II reaction center by hightemperature treatment in higher plants, Photosynth. Res. 52 (1997) 57e64.
[55] G. Garab, Z. Cseh, L. Kovács, S. Rajagopal, Z. Várkonyi, M. Wentworth,L. Mustárdy, A. Dér, A.V. Ruban, E. Papp, A. Holzenburg, P. Horton, Light-induced trimer to monomer transition in the main light-harvesting antennacomplex of plants: thermo-optic mechanism, Biochemistry 41 (2002)15121e15129.
[56] M. �Cajánek, M. �Stroch, I. Lachetová, J. Kalina, V. �Spunda, Characterization ofthe photosystem II inactivation of heat-stressed barley leaves as monitored bythe various parameters of chlorophyll a fluorescence and delayed fluores-cence, J. Photochem. Photobiol. B: Biol. 47 (1998) 39e45.
[57] U. Schreiber, J.A. Berry, Heat-induced changes in chlorophyll fluorescence inintact leaves correlated with damage of the photosynthetic apparatus, Planta136 (1977) 233e238.
[58] L.A. Sazanov, P.A. Burrows, P.J. Nixon, The chloroplast Ndh complex mediatesthe dark reduction of the plastoquinone pool in response to heat stress intobacco leaves, FEBS Lett. 429 (1998) 115e118.
[59] C. Pastenes, P. Horton, Resistance of photosynthesis to high temperature intwo bean varieties, Photosynth. Res. 62 (1999) 197e203.
[60] M. Havaux, R.J. Strasser, H. Greppin, In vivo photoregulation of photochemicaland non-photochemical deactivation of photosystem II in intact plant leaves,Plant Physiol. Biochem. 28 (1990) 735e746.
[61] E. Dreyer, X. Le Roux, P. Montpied, F.A. Daudet, F. Masson, Temperatureresponse of leaf photosynthetic capacity in seedlings from seven temperatetree species, Tree Physiol. 21 (2001) 223e232.
[62] P. Robakowski, P. Montpied, E. Dreyer, Temperature response of photosyn-thesis of silver fir (Abies albaMill.) seedlings, Ann. For. Sci. 59 (2002) 159e166.
[63] P. Haldimann, U. Feller, Growth at moderately elevated temperature alters thephysiological response of the photosynthetic apparatus to heat stress in pea(Pisum sativum L.) leaves, Plant Cell Environ. 28 (2005) 302e317.
[64] S.Z. Tóth, G. Schansker, G. Garab, R.J. Strasser, Photosynthetic electron trans-port activity in heat-treated barley leaves: the role of internal alternativeelectron donors to photosystem II, Biochim. Biophys. Acta 1767 (2007)295e305.
[65] M. Havaux, Stress tolerance of photosystem II in vivo: antagonistic effects ofwater, heat, and photoinhibition stresses, Plant Physiol. 100 (1992) 424e432.
[66] H. Ghouil, P. Montpied, D. Epron, M. Ksontini, B. Hanchi, E. Dreyer, Thermaloptima of photosynthetic functions and thermostability of photochemistry incork oak seedlings, Tree Physiol. 23 (2003) 1031e1039.
[67] Ch. Daas, P. Montpied, B. Hanchi, E. Dreyer, Responses of photosynthesis tohigh temperatures in oak saplings assessed by chlorophyll-a fluorescence:inter-specific diversity and temperature-induced plasticity, Ann. For. Sci. 65(2008) 1e7.
[68] L. Volkova, M. Tausz, L.T. Bennet, E. Dreyer, Interactive effects of high irradi-ance and moderate heat on photosynthesis, pigments, and tocopherol in thetree-fern Dicksonia Antarctica, Funct. Plant Biol. 36 (2009) 1046e1056.
[69] M. Ladjal, D. Epron, M. Ducrey, Effects of drought preconditioning on ther-motolerance of photosystem II and susceptibility of photosynthesis to heatstress in cedar seedlings, Tree Physiol. 20 (2000) 1235e1241.
[70] P. Joliot, A. Joliot, Cyclic electron transport in plant leaf, Proc. Natl. Acad. Sci.USA 99 (2002) 10209e10214.
[71] S.Z. Toth, G. Schansker, R.J. Strasser, A non-invasive assay of the plastoquinonepool redox state based on the OJIP-transient, Photosynth. Res. 93 (2007)193e203.
[72] M.K. Joshi, T.S. Desai, P. Mohanty, Temperature dependent alterations in thepattern of photochemical and non-photochemical quenching and associatedchanges in photosystem II conditions of the leaves, Plant Cell Physiol. 36(1995) 1221e1227.
[73] P. Pospí�sil, E. Tyystjärvi, Molecular mechanism of high-temperature-inducedinhibition of acceptor side of photosystem II, Photosynth. Res. 62 (1999)55e66.
[74] U. Schreiber, C. Neubauer, C. Klughammer, Devices and methods for room-temperature fluorescence analysis, Philos. Trans. R. Soc. Lond. B 323 (1989)241e251.
[75] G.N. Johnson, Physiology of PSI cyclic electron transport in higher plants,Biochim. Biophys. Acta 1807 (2011) 384e389.
[76] T.D. Sharkey, Effects of moderate heat stress on photosynthesis: importance ofthylakoid reactions, rubisco deactivation, reactive oxygen species, andthermotolerance provided by isoprene, Plant Cell Environ. 28 (2005)269e277.

M. Brestic et al. / Plant Physiology and Biochemistry 57 (2012) 93e105 105
[77] R. Zhang, T.D. Sharkey, Photosynthetic electron transport and proton fluxunder moderate heat stress, Photosynth. Res. 100 (2009) 29e43.
[78] M. Alfonso, I. Yruela, S. Almárcegui, E. Torrado, M.A. Pérez, R. Picorel, Unusualtolerance to high temperatures in a new herbicide-resistant D1 mutant fromGlycine max (L.) Merr. cell cultures deficient in fatty acid desaturation, Planta212 (2001) 573e582.
[79] J. Essemine, S. Govindachary, S. Ammar, S. Bouzid, R. Carpentier, Enhancedsensitivity of the photosynthetic apparatus to heat stress in digalactosyl-diacylglycerol deficient Arabidopsis, Exp. Env. Bot. 80 (2012) 16e26.
[80] J. Essemine, S. Govindachary, S. Ammar, S. Bouzid, R. Carpentier, Functionalaspects of the photosynthetic light reactions in heat stressed Arabidopsis defi-cient in digalactosyl-diacylglycerol, J. Plant Physiol. 168 (2011) 1526e1533.
[81] Y. Tang, X. Wen, Q. Lu, Z. Yang, Z. Cheng, C. Lu, Heat stress induces anaggregation of the light-harvesting complex of photosystem II in spinachplants, Plant Physiol. 143 (2007) 629e638.
[82] M. Havaux, F. Tardy, Thermostability and photostability of photosystem II inleaves of the Chlorina-f2 barley mutant deficient in light-harvesting chloro-phyll a/b protein complexes, Plant Physiol. 113 (1997) 913e923.
[83] W. Tan, Q.V. Meng, M. Brestic, K. Olsovska, X. Yang, Photosynthesis isimproved by exogenous calcium in heat-stressed tobacco, J. Plant Physiol. 168(2011) 2063e2071.
[84] J. Essemine, S. Govindachary, S. Ammar, S. Bouzid, R. Carpentier, Abolition ofphotosystem I cyclic electron flow in Arabidopsis thaliana following thermal-stress, Plant Physiol. Biochem. 49 (2011) 235e243.