weed flora survey of tabriz wheat (triticum aestivum l.) fields
TRANSCRIPT
RESEARCH PAPER OPEN ACCESS
Weed flora survey of Tabriz wheat (Triticum aestivum L.)
fields
Sirous Hassannejad*, Soheila Porheidar Ghafarbi
Department of Plant Eco-Physiology, University of Tabriz, Iran
Article published on September 20, 2013
Key words: Disturbing weeds, Dominant plant families, Wheat, Relative dominance, Weed vegetation.
Abstract
In order to recognize, identify and determine the relative dominance of weed species distributed in wheat fields of
Tabriz county-Iran, a total 118 weed species belonging to 24 plant family were observed. Ermopyrum bonaepartis
(Spreng.) Nevski, Acroptilon repens (L.) DC., Cardria Draba (L.) Desv., Chenopodium album L., Polygonum
aviculare L., and Convolvulus arvensis L. with relative dominance (RD) index equal 30, 20.2, 19.1, 18.1, 17.5, and
17.5 respectively were dominant weed species. Poaceae, Brassicaceae and Asteraceae with Family Dominance
Index (FDI) equal 63.08, 45.54, and 45.46 were dominant plant families observed in wheat fields. A. repens (L.)
DC., C. Draba (L.) Desv., C. album L., P. aviculare L., and C. arvensis L. with frequency level 82.2, 75.6, 62.2, 64.4
and 64.4 respectively were the main disturbing weeds prior to harvesting wheat in Tabriz county. Eighty-nine
percent of weeds were below average, because they founded below thirty percent of wheat fields. However, nearly
four percent of weeds were assertive and distributed in more than sixty percent of wheat fields. So, the revised
management procedure about these weeds in different districts of this county is very important.
*Corresponding Author: Sirous Hassannejad [email protected]
Journal of Biodiversity and Environmental Sciences (JBES) ISSN: 2220-6663 (Print) 2222-3045 (Online)
Vol. 3, No. 6, p. 118-132, 2013
http://www.innspub.net
118 | Hassannejad and Ghafarbi
Introduction
Weeds due to their distribution, fast growing ability
and the high level of reproduction are the important
barriers in control of this natural enemy in the wheat
fields. These unwanted plants in our fields cause
reduction in quality and quantity of crops. The
damage caused by weeds through the loss of nutrients
and water is a major cause of interest to the growers
(Memon, 2004). Weeds expended three to four times
more than nitrogen, potassium and magnesium than
crop (Schwerzel and Thomas, 1971).
The ability of weeds to compete successfully with
crops for light, water, and nutrients depends timing of
weed emergence in relation to crop emergence, the
growth form of the weed, and the density of weed
present in the crop (Memon, 2004). According to
Khalaghani (2007) report, average damages coming
from the pretense of weeds in wheat fields in Iran,
was about 23 percent.
Weed flora assessing is useful for determining relative
importance of weed species in farmlands (Thomas,
1985; Frick and Thomas, 1992; McCully et al., 1991).
Various studies have been done about weed flora in
annual crops in many countries like Iran (Minbashi et
al,. 2008; Hassannejad 2011; Hassannejad and
Porheidar Ghafarbi, 2012 and 2013; Nazer Kakhki et
al., 2013), Bulgaria (Milanova et al., 2009), Denmark
(Andreasen and Stryhn, 2008; Andreasen and
Skovgaard, 2009), France (Fried et al. 2008),
Hungray (Novak et al., 2010), the UK (Potts et al.,
2010) and the US (Conn et al., 2011). Tastan and
Erics (1994), investigated weed distribution and
density in wheat fields of four provinces of central
Anatolia. Sinzar (1996), reported weed communities
of wheat in Kosmaj region- Yugoslavia. Abusteit et al.
(1998) surveyed the composition and relative
abundance of the weed flora of wheat in northern
Egypt. Salonen et al. (2001) determined weed species
in grown spring cereals including wheat of southern
and central Finland.
In order to diminish weed species damage, we have to
learn more about their physiology and ecology. The
basic step is correct determination of weed species
and knowledge about their composition in the
cropping systems. So, identifying and distinguish of
these uninvited guests is useful for reduce their
distribution and dominance in our fields. There is a
little information available about weed flora and
relative dominance weed species distributed in Tabriz
county wheat fields. Thus the aim of this study was to
weed flora survey and determine the relative
dominance of weeds in natural conditions in wheat
fields at Tabriz County (northwest of Iran).
Materials and methods
Survey of area
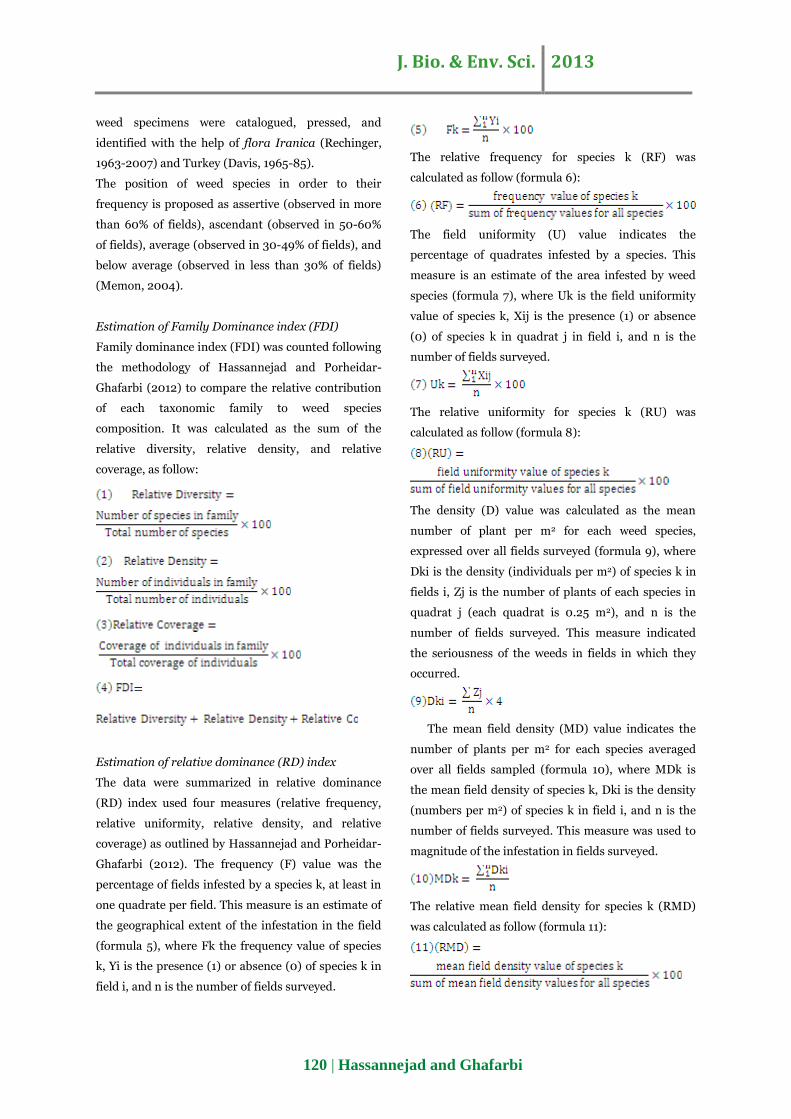
Tabriz county is located between 35o 7´ latitude and
46 o 26´ longitudes. This county has cold semi-aried
climates, with average annual rainfall equal 289 mm,
mean temperature 12.5o, average annual sunshine
hours 2794.3 (Fig. 1.).
Fig. 1. Tabriz county in northwest of Iran.
Data sampling
Weed samplings were performed from 42 wheat fields
in 14 districts of Tabriz County in 2012. Time of
sampling was started by beginning of stem elongation
until the end of heading stages of wheat (Minbashi et
al., 2008). Longitude, latitude, and elevation
information of each field was recorded using the GPS.
Weed sampling method in each field was according to
the methodology defined by Thomas (1985), so that
20 quadrates (0.25 m2) were randomly placed along a
"W" pattern (5 quadrates in each line of this pattern).
All weed species in each quadrat were coded and
recorded (density and cover percentage) for
subsequent data entry and analysis. The collected
119 | Hassannejad and Ghafarbi
J. Bio. & Env. Sci. 2013
weed specimens were catalogued, pressed, and
identified with the help of flora Iranica (Rechinger,
1963-2007) and Turkey (Davis, 1965-85).
The position of weed species in order to their
frequency is proposed as assertive (observed in more
than 60% of fields), ascendant (observed in 50-60%
of fields), average (observed in 30-49% of fields), and
below average (observed in less than 30% of fields)
(Memon, 2004).
Estimation of Family Dominance index (FDI)
Family dominance index (FDI) was counted following
the methodology of Hassannejad and Porheidar-
Ghafarbi (2012) to compare the relative contribution
of each taxonomic family to weed species
composition. It was calculated as the sum of the
relative diversity, relative density, and relative
coverage, as follow:
=
Estimation of relative dominance (RD) index
The data were summarized in relative dominance
(RD) index used four measures (relative frequency,
relative uniformity, relative density, and relative
coverage) as outlined by Hassannejad and Porheidar-
Ghafarbi (2012). The frequency (F) value was the
percentage of fields infested by a species k, at least in
one quadrate per field. This measure is an estimate of
the geographical extent of the infestation in the field
(formula 5), where Fk the frequency value of species
k, Yi is the presence (1) or absence (0) of species k in
field i, and n is the number of fields surveyed.
The relative frequency for species k (RF) was
calculated as follow (formula 6):
The field uniformity (U) value indicates the
percentage of quadrates infested by a species. This
measure is an estimate of the area infested by weed
species (formula 7), where Uk is the field uniformity
value of species k, Xij is the presence (1) or absence
(0) of species k in quadrat j in field i, and n is the
number of fields surveyed.
The relative uniformity for species k (RU) was
calculated as follow (formula 8):
The density (D) value was calculated as the mean
number of plant per m2 for each weed species,
expressed over all fields surveyed (formula 9), where
Dki is the density (individuals per m2) of species k in
fields i, Zj is the number of plants of each species in
quadrat j (each quadrat is 0.25 m2), and n is the
number of fields surveyed. This measure indicated
the seriousness of the weeds in fields in which they
occurred.
The mean field density (MD) value indicates the
number of plants per m2 for each species averaged
over all fields sampled (formula 10), where MDk is
the mean field density of species k, Dki is the density
(numbers per m2) of species k in field i, and n is the
number of fields surveyed. This measure was used to
magnitude of the infestation in fields surveyed.
The relative mean field density for species k (RMD)
was calculated as follow (formula 11):
120 | Hassannejad and Ghafarbi
J. Bio. & Env. Sci. 2013
The coverage (Cki) value indicates the vertical
projection on the ground, based on visual estimates
(formula 12), where Cki is the coverage of species k in
field i, Zj is the coverage of species k in quadrate j,
and n is the number of fields surveyed. For visual
estimates, some count "empty space" within a clump
and others do not.
The mean coverage (MCki) value indicates the
coverage of plants per m2 for each species averaged
over fields sampled (formula 13), where MCki is the
mean field coverage of weed species k, Cki is the
coverage of species k in field i, and n is the number of
fields surveyed.
The relative mean field coverage for species k (RC)
was calculated as follow (formula 14):
In order to summarize the relative dominance (RD) of
a species as the final quantitative measures, relative
form of four of the above measures were combined
into relative dominance (RD) index (formula 15):
Results and discussion
Weed flora of alfalfa fields
A total 118 weed species belonging to 25 plant
families were recorded in wheat fields of Tabriz
county (Tab. 1). Regarding their plant form, 77.12% of
weed species were dicotyledonous, and 22.88% of
them were monocotyledonous. According to Hyvonen
et al. (2003), low-input cultivations were expected to
favor the species numbers and abundance of
dicotyledonous. Regarding weed species life cycle,
78.81, 18.64, and 2.54% were annual, perennial, and
biennial respectively. According to Gomma (2012),
the high contribution of annual weeds can be due to
their short life cycle and high allocation of resources
to the reproductive organs that enables them to resist
the instability of the agro-ecosystem. Radosvich and
Holt (1984) reported that frequently soil disturbance
can be dominance of annual weeds in the fields.
Between 118 weed species, 4.24, 0, 6.78, and 89% of
weeds were found assertive (founded over 60% of
fields), ascendant (frequency 50-60%), average
(frequency 30-49%), and below average (founded in
less than 30% of fields). A. repens (L.) DC., C. draba
(L.) Desv.,P. aviculare L., C. arvensis L., and C.
album L. with frequency level 82.22, 75.56, 64.44,
64.44, and 62.22 percent, respectively were founded
frequently in Tabriz wheat fields (Tab. 2). These weed
species were the most important disturbing weeds
prior to harvesting in this county wheat fields like
Khodabandeh, Tarom and some other counties of
Zanjan province that reported in Nazer Kakhki et al
(2013) research. We need an especial attention to
management of these assertive and disturbing species
prior or after harvesting to reduce their densities for
next years. These weeds were distributed in different
districts of Tabriz county and were adopted to
farmers management methods. High frequency
percentage of some weeds suggests the wider
presence of such species in terms of areas (Memon
2004).
Main plant families according to family dominance
index (FDI)
Dominant plant families were Poaceae, Brassicaceae,
and Asteraceae with 63.08, 45.54, and 45.46 FDI,
respectively (Tab.1). The maximum richness, relative
diversity and relative coverage were found in
Asteraceae family (Tab. 1). However, Poaceae with
highest mean density was located in top order by FDI.
Although Brassicaceae compare to Asteraceae had
minimum richness and relative diversity, but due to
had a high density and vegetation coverage, was 2th
important family infested in Tabriz wheat fields (Tab.
1). Convolvulaceae family with minimum richness
(only with one species; C. arvensis L.), was located
between ten dominant families in wheat fields
according to FDI score. Presence of C. arvensis L. as a
noxious weed species in Convolvulaceae family
caused that this get top order in ranking compared
with Polygonaceae, Papaveraceae, Euphorbiaceae,
121 | Hassannejad and Ghafarbi
J. Bio. & Env. Sci. 2013
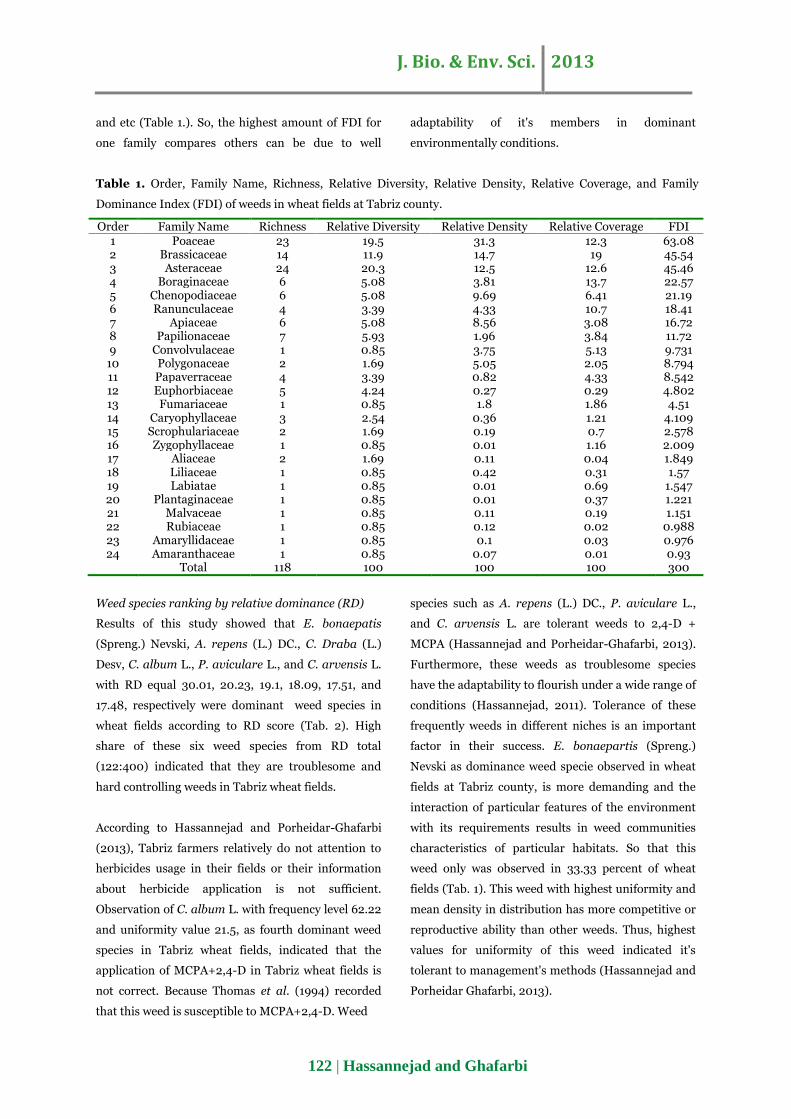
and etc (Table 1.). So, the highest amount of FDI for
one family compares others can be due to well
adaptability of it's members in dominant
environmentally conditions.
Table 1. Order, Family Name, Richness, Relative Diversity, Relative Density, Relative Coverage, and Family
Dominance Index (FDI) of weeds in wheat fields at Tabriz county.
Order Family Name Richness Relative Diversity Relative Density Relative Coverage FDI 1 Poaceae 23 19.5 31.3 12.3 63.08 2 Brassicaceae 14 11.9 14.7 19 45.54 3 Asteraceae 24 20.3 12.5 12.6 45.46 4 Boraginaceae 6 5.08 3.81 13.7 22.57 5 Chenopodiaceae 6 5.08 9.69 6.41 21.19 6 Ranunculaceae 4 3.39 4.33 10.7 18.41 7 Apiaceae 6 5.08 8.56 3.08 16.72 8 Papilionaceae 7 5.93 1.96 3.84 11.72 9 Convolvulaceae 1 0.85 3.75 5.13 9.731 10 Polygonaceae 2 1.69 5.05 2.05 8.794 11 Papaverraceae 4 3.39 0.82 4.33 8.542 12 Euphorbiaceae 5 4.24 0.27 0.29 4.802 13 Fumariaceae 1 0.85 1.8 1.86 4.51 14 Caryophyllaceae 3 2.54 0.36 1.21 4.109 15 Scrophulariaceae 2 1.69 0.19 0.7 2.578 16 Zygophyllaceae 1 0.85 0.01 1.16 2.009 17 Aliaceae 2 1.69 0.11 0.04 1.849 18 Liliaceae 1 0.85 0.42 0.31 1.57 19 Labiatae 1 0.85 0.01 0.69 1.547 20 Plantaginaceae 1 0.85 0.01 0.37 1.221 21 Malvaceae 1 0.85 0.11 0.19 1.151 22 Rubiaceae 1 0.85 0.12 0.02 0.988 23 Amaryllidaceae 1 0.85 0.1 0.03 0.976 24 Amaranthaceae 1 0.85 0.07 0.01 0.93
Total 118 100 100 100 300
Weed species ranking by relative dominance (RD)
Results of this study showed that E. bonaepatis
(Spreng.) Nevski, A. repens (L.) DC., C. Draba (L.)
Desv, C. album L., P. aviculare L., and C. arvensis L.
with RD equal 30.01, 20.23, 19.1, 18.09, 17.51, and
17.48, respectively were dominant weed species in
wheat fields according to RD score (Tab. 2). High
share of these six weed species from RD total
(122:400) indicated that they are troublesome and
hard controlling weeds in Tabriz wheat fields.
According to Hassannejad and Porheidar-Ghafarbi
(2013), Tabriz farmers relatively do not attention to
herbicides usage in their fields or their information
about herbicide application is not sufficient.
Observation of C. album L. with frequency level 62.22
and uniformity value 21.5, as fourth dominant weed
species in Tabriz wheat fields, indicated that the
application of MCPA+2,4-D in Tabriz wheat fields is
not correct. Because Thomas et al. (1994) recorded
that this weed is susceptible to MCPA+2,4-D. Weed
species such as A. repens (L.) DC., P. aviculare L.,
and C. arvensis L. are tolerant weeds to 2,4-D +
MCPA (Hassannejad and Porheidar-Ghafarbi, 2013).
Furthermore, these weeds as troublesome species
have the adaptability to flourish under a wide range of
conditions (Hassannejad, 2011). Tolerance of these
frequently weeds in different niches is an important
factor in their success. E. bonaepartis (Spreng.)
Nevski as dominance weed specie observed in wheat
fields at Tabriz county, is more demanding and the
interaction of particular features of the environment
with its requirements results in weed communities
characteristics of particular habitats. So that this
weed only was observed in 33.33 percent of wheat
fields (Tab. 1). This weed with highest uniformity and
mean density in distribution has more competitive or
reproductive ability than other weeds. Thus, highest
values for uniformity of this weed indicated it's
tolerant to management's methods (Hassannejad and
Porheidar Ghafarbi, 2013).
122 | Hassannejad and Ghafarbi
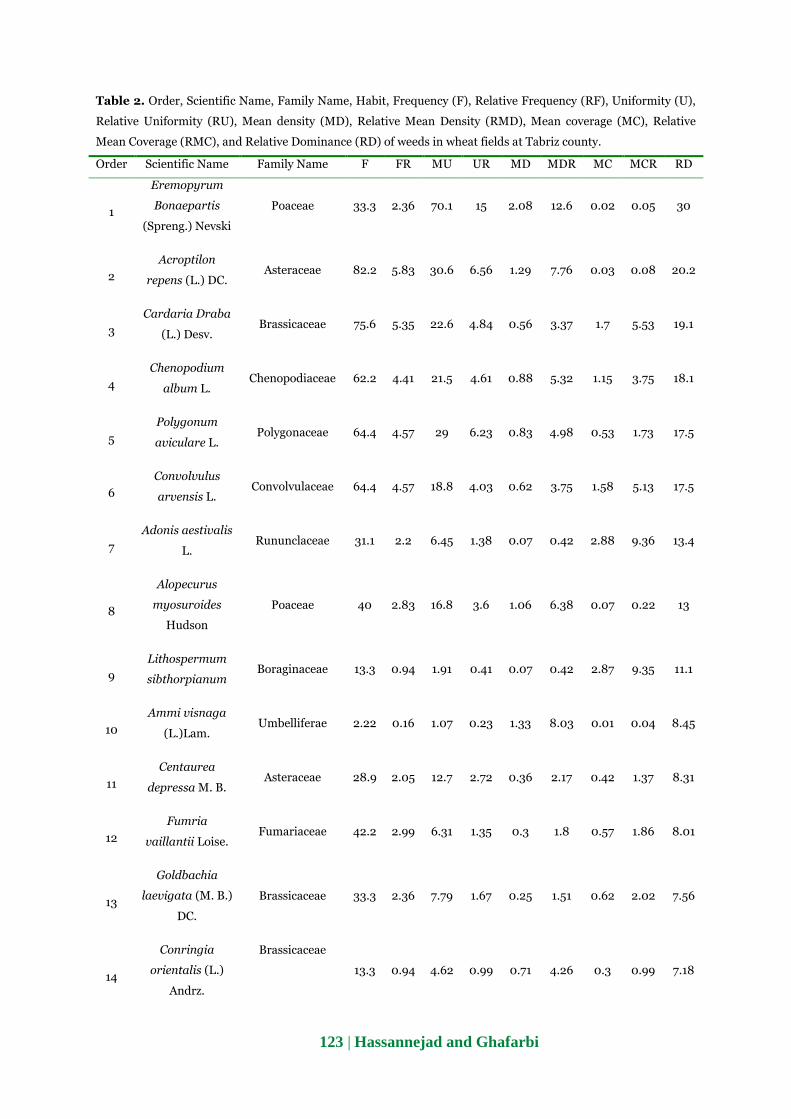
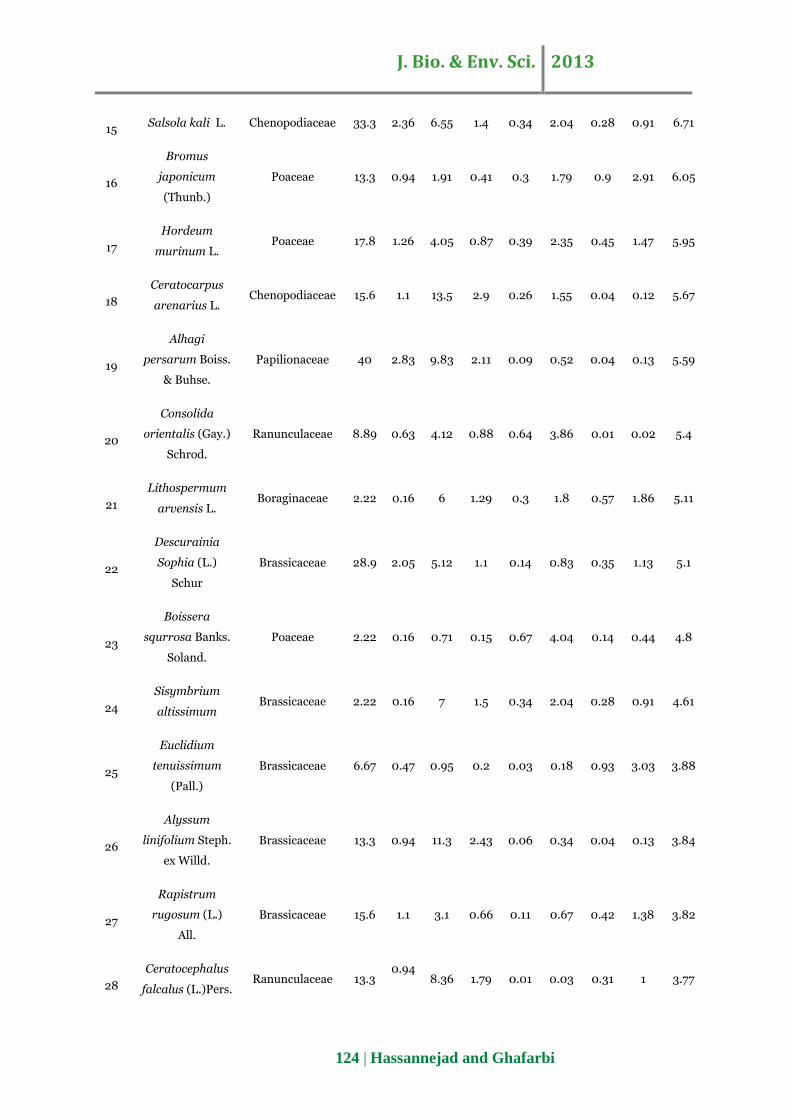
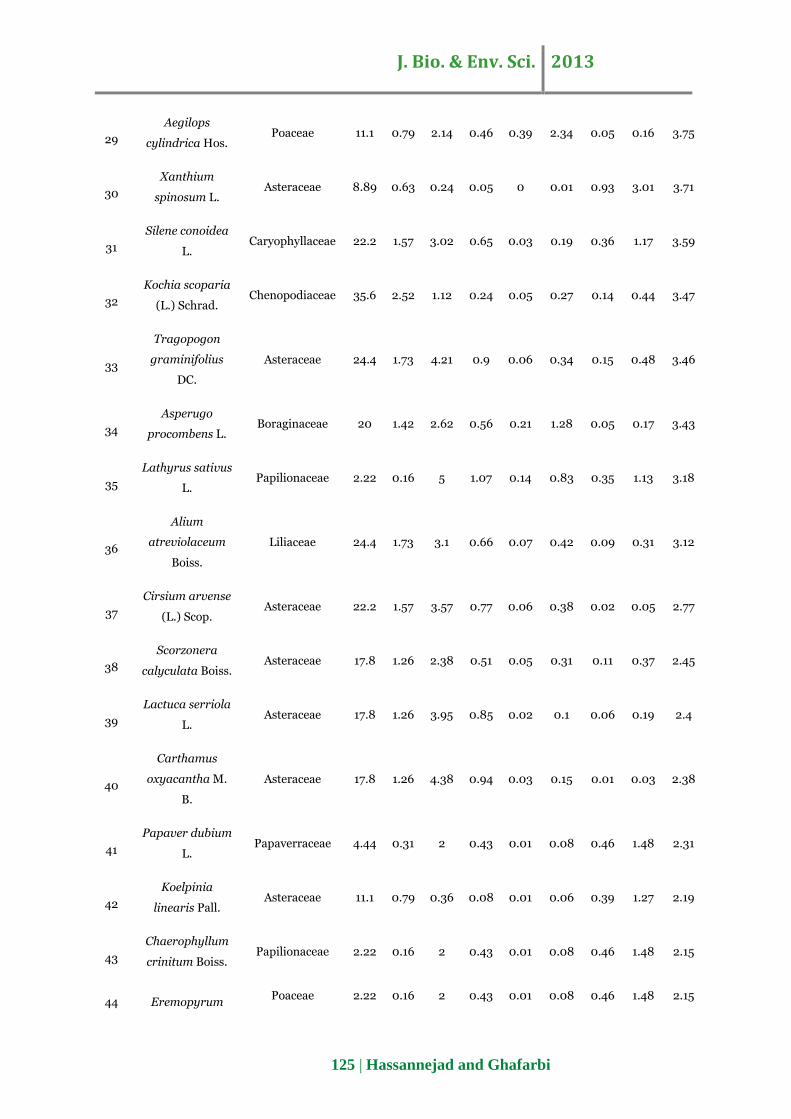
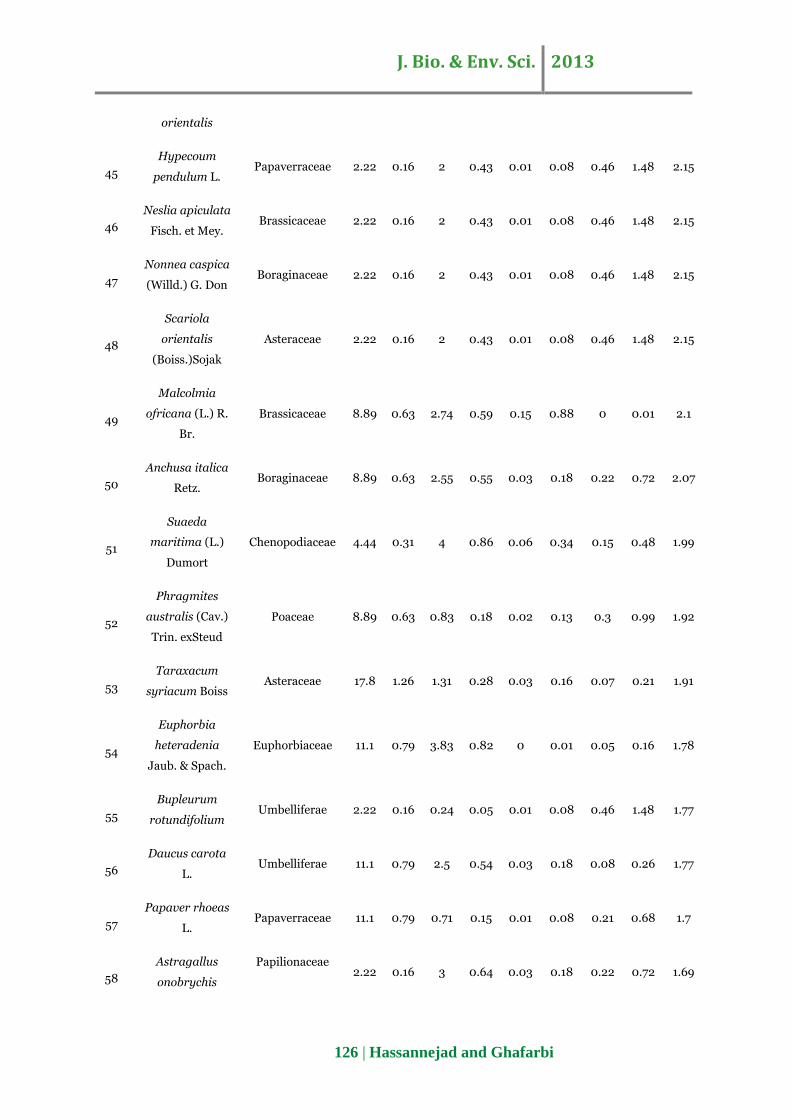
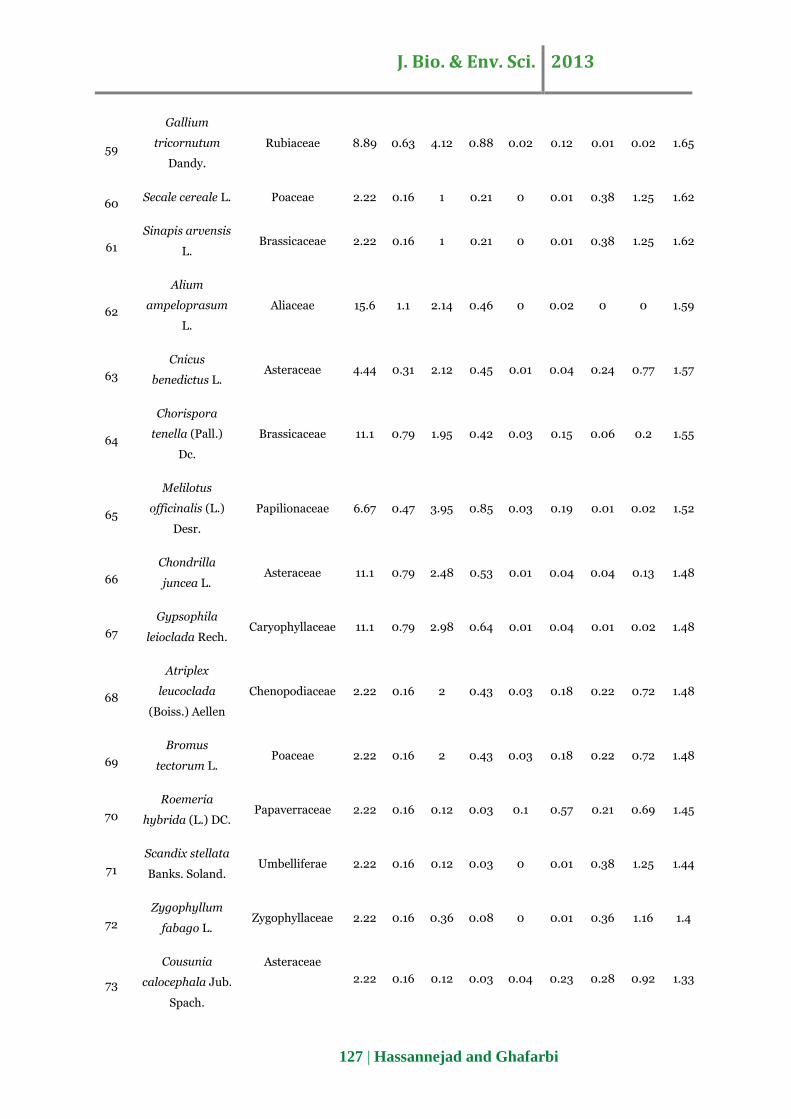
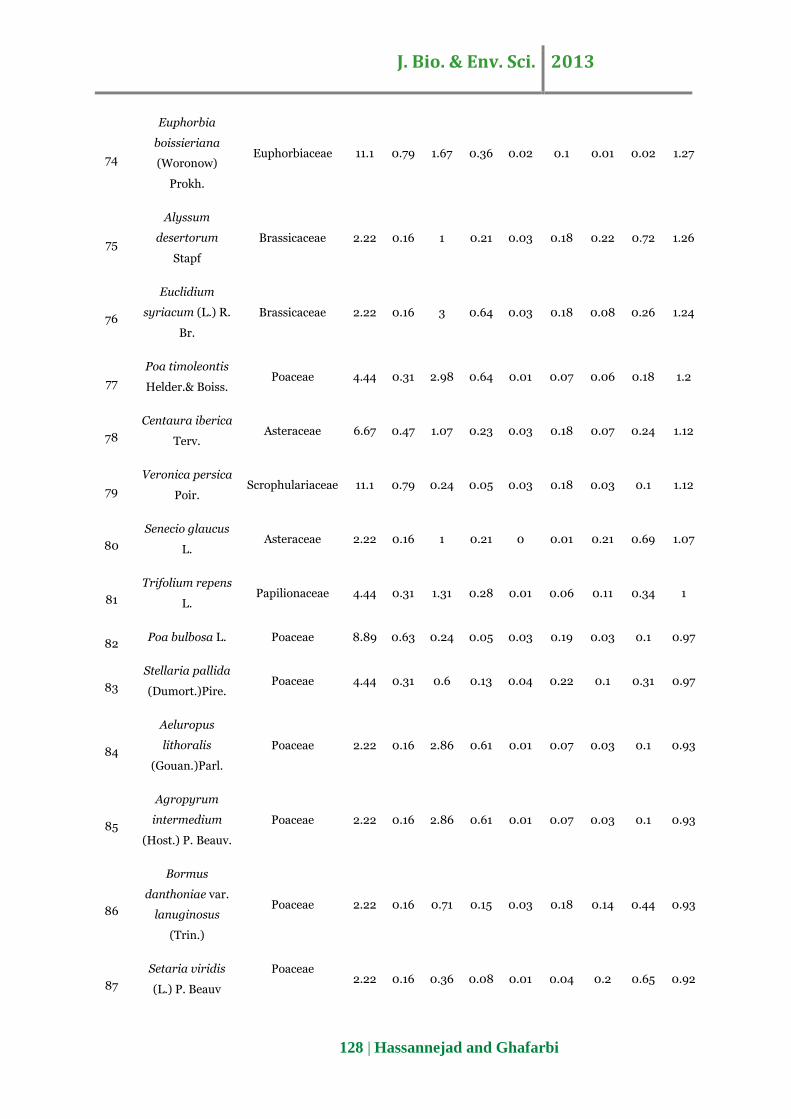
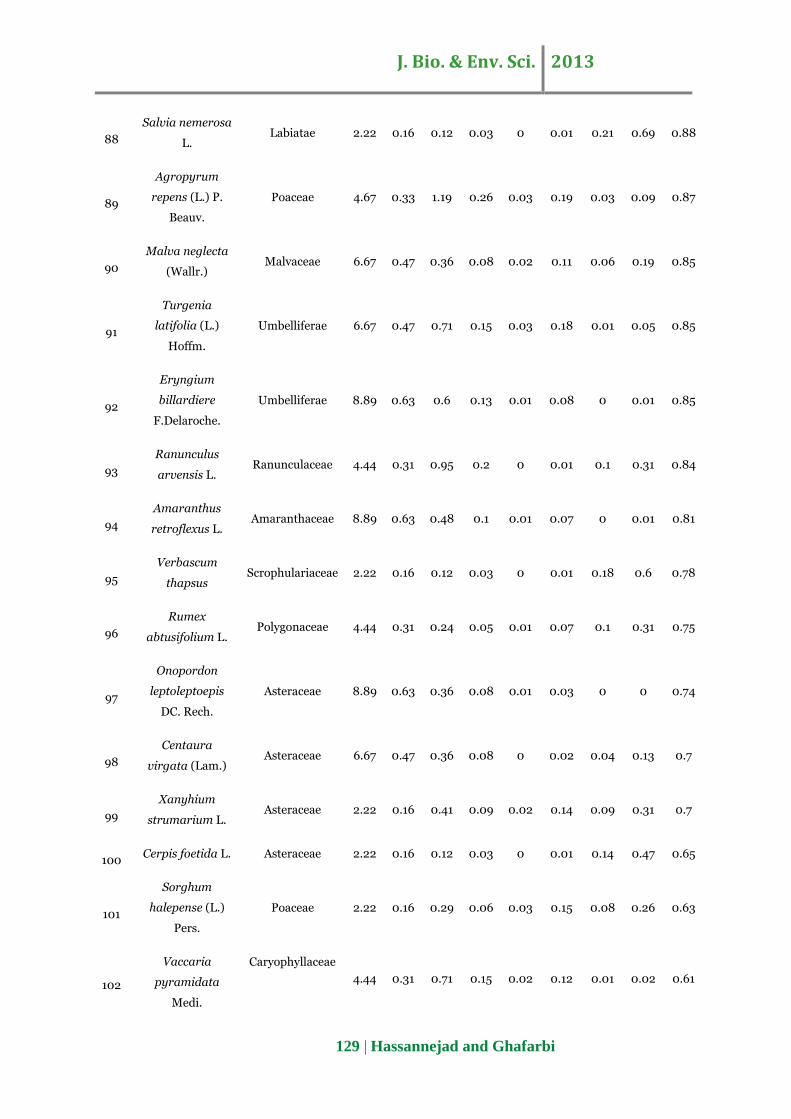
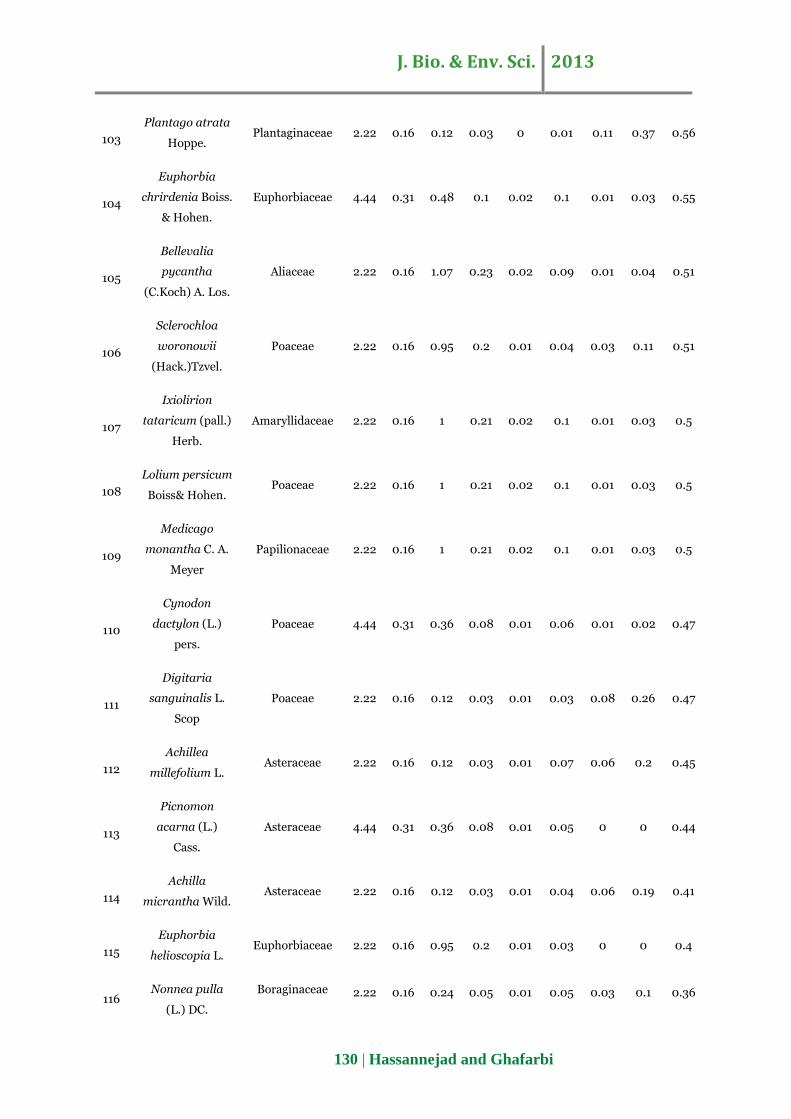
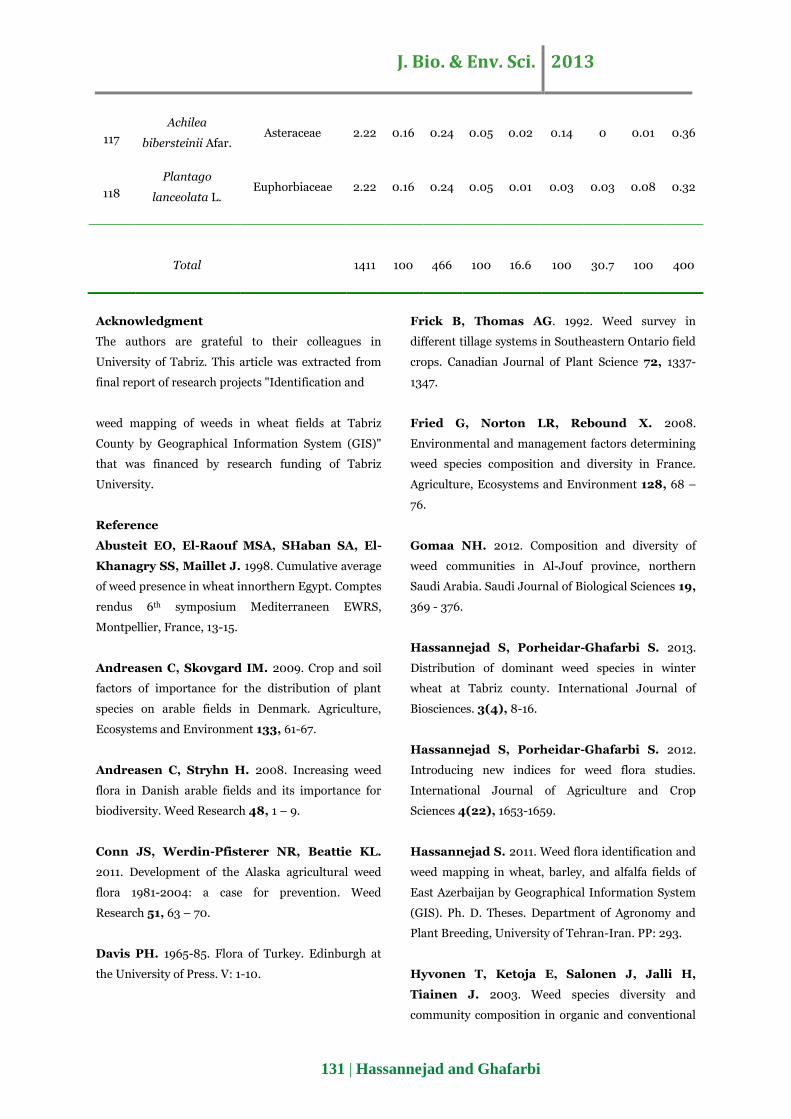
Table 2. Order, Scientific Name, Family Name, Habit, Frequency (F), Relative Frequency (RF), Uniformity (U),
Relative Uniformity (RU), Mean density (MD), Relative Mean Density (RMD), Mean coverage (MC), Relative
Mean Coverage (RMC), and Relative Dominance (RD) of weeds in wheat fields at Tabriz county.
Order Scientific Name Family Name F FR MU UR MD MDR MC MCR RD
1
Eremopyrum
Bonaepartis
(Spreng.) Nevski
Poaceae 33.3 2.36 70.1 15 2.08 12.6 0.02 0.05 30
2
Acroptilon
repens (L.) DC. Asteraceae 82.2 5.83 30.6 6.56 1.29 7.76 0.03 0.08 20.2
3
Cardaria Draba
(L.) Desv. Brassicaceae 75.6 5.35 22.6 4.84 0.56 3.37 1.7 5.53 19.1
4
Chenopodium
album L. Chenopodiaceae 62.2 4.41 21.5 4.61 0.88 5.32 1.15 3.75 18.1
5
Polygonum
aviculare L. Polygonaceae 64.4 4.57 29 6.23 0.83 4.98 0.53 1.73 17.5
6
Convolvulus
arvensis L. Convolvulaceae 64.4 4.57 18.8 4.03 0.62 3.75 1.58 5.13 17.5
7
Adonis aestivalis
L. Rununclaceae 31.1 2.2 6.45 1.38 0.07 0.42 2.88 9.36 13.4
8
Alopecurus
myosuroides
Hudson
Poaceae 40 2.83 16.8 3.6 1.06 6.38 0.07 0.22 13
9
Lithospermum
sibthorpianum Boraginaceae 13.3 0.94 1.91 0.41 0.07 0.42 2.87 9.35 11.1
10
Ammi visnaga
(L.)Lam. Umbelliferae 2.22 0.16 1.07 0.23 1.33 8.03 0.01 0.04 8.45
11
Centaurea
depressa M. B. Asteraceae 28.9 2.05 12.7 2.72 0.36 2.17 0.42 1.37 8.31
12
Fumria
vaillantii Loise. Fumariaceae 42.2 2.99 6.31 1.35 0.3 1.8 0.57 1.86 8.01
13
Goldbachia
laevigata (M. B.)
DC.
Brassicaceae 33.3 2.36 7.79 1.67 0.25 1.51 0.62 2.02 7.56
14
Conringia
orientalis (L.)
Andrz.
Brassicaceae
13.3 0.94 4.62 0.99 0.71 4.26 0.3 0.99 7.18
123 | Hassannejad and Ghafarbi
J. Bio. & Env. Sci. 2013
15 Salsola kali L. Chenopodiaceae 33.3 2.36 6.55 1.4 0.34 2.04 0.28 0.91 6.71
16
Bromus
japonicum
(Thunb.)
Poaceae 13.3 0.94 1.91 0.41 0.3 1.79 0.9 2.91 6.05
17
Hordeum
murinum L. Poaceae 17.8 1.26 4.05 0.87 0.39 2.35 0.45 1.47 5.95
18
Ceratocarpus
arenarius L. Chenopodiaceae 15.6 1.1 13.5 2.9 0.26 1.55 0.04 0.12 5.67
19
Alhagi
persarum Boiss.
& Buhse.
Papilionaceae 40 2.83 9.83 2.11 0.09 0.52 0.04 0.13 5.59
20
Consolida
orientalis (Gay.)
Schrod.
Ranunculaceae 8.89 0.63 4.12 0.88 0.64 3.86 0.01 0.02 5.4
21
Lithospermum
arvensis L. Boraginaceae 2.22 0.16 6 1.29 0.3 1.8 0.57 1.86 5.11
22
Descurainia
Sophia (L.)
Schur
Brassicaceae 28.9 2.05 5.12 1.1 0.14 0.83 0.35 1.13 5.1
23
Boissera
squrrosa Banks.
Soland.
Poaceae 2.22 0.16 0.71 0.15 0.67 4.04 0.14 0.44 4.8
24
Sisymbrium
altissimum Brassicaceae 2.22 0.16 7 1.5 0.34 2.04 0.28 0.91 4.61
25
Euclidium
tenuissimum
(Pall.)
Brassicaceae 6.67 0.47 0.95 0.2 0.03 0.18 0.93 3.03 3.88
26
Alyssum
linifolium Steph.
ex Willd.
Brassicaceae 13.3 0.94 11.3 2.43 0.06 0.34 0.04 0.13 3.84
27
Rapistrum
rugosum (L.)
All.
Brassicaceae 15.6 1.1 3.1 0.66 0.11 0.67 0.42 1.38 3.82
28
Ceratocephalus
falcalus (L.)Pers. Ranunculaceae 13.3
0.94 8.36 1.79 0.01 0.03 0.31 1 3.77
124 | Hassannejad and Ghafarbi
J. Bio. & Env. Sci. 2013
29
Aegilops
cylindrica Hos. Poaceae 11.1 0.79 2.14 0.46 0.39 2.34 0.05 0.16 3.75
30
Xanthium
spinosum L. Asteraceae 8.89 0.63 0.24 0.05 0 0.01 0.93 3.01 3.71
31
Silene conoidea
L. Caryophyllaceae 22.2 1.57 3.02 0.65 0.03 0.19 0.36 1.17 3.59
32
Kochia scoparia
(L.) Schrad. Chenopodiaceae 35.6 2.52 1.12 0.24 0.05 0.27 0.14 0.44 3.47
33
Tragopogon
graminifolius
DC.
Asteraceae 24.4 1.73 4.21 0.9 0.06 0.34 0.15 0.48 3.46
34
Asperugo
procombens L. Boraginaceae 20 1.42 2.62 0.56 0.21 1.28 0.05 0.17 3.43
35
Lathyrus sativus
L. Papilionaceae 2.22 0.16 5 1.07 0.14 0.83 0.35 1.13 3.18
36
Alium
atreviolaceum
Boiss.
Liliaceae 24.4 1.73 3.1 0.66 0.07 0.42 0.09 0.31 3.12
37
Cirsium arvense
(L.) Scop. Asteraceae 22.2 1.57 3.57 0.77 0.06 0.38 0.02 0.05 2.77
38
Scorzonera
calyculata Boiss. Asteraceae 17.8 1.26 2.38 0.51 0.05 0.31 0.11 0.37 2.45
39
Lactuca serriola
L. Asteraceae 17.8 1.26 3.95 0.85 0.02 0.1 0.06 0.19 2.4
40
Carthamus
oxyacantha M.
B.
Asteraceae 17.8 1.26 4.38 0.94 0.03 0.15 0.01 0.03 2.38
41
Papaver dubium
L. Papaverraceae 4.44 0.31 2 0.43 0.01 0.08 0.46 1.48 2.31
42
Koelpinia
linearis Pall. Asteraceae 11.1 0.79 0.36 0.08 0.01 0.06 0.39 1.27 2.19
43
Chaerophyllum
crinitum Boiss. Papilionaceae 2.22 0.16 2 0.43 0.01 0.08 0.46 1.48 2.15
44 Eremopyrum Poaceae 2.22 0.16 2 0.43 0.01 0.08 0.46 1.48 2.15
125 | Hassannejad and Ghafarbi
J. Bio. & Env. Sci. 2013
orientalis
45
Hypecoum
pendulum L. Papaverraceae 2.22 0.16 2 0.43 0.01 0.08 0.46 1.48 2.15
46
Neslia apiculata
Fisch. et Mey. Brassicaceae 2.22 0.16 2 0.43 0.01 0.08 0.46 1.48 2.15
47
Nonnea caspica
(Willd.) G. Don Boraginaceae 2.22 0.16 2 0.43 0.01 0.08 0.46 1.48 2.15
48
Scariola
orientalis
(Boiss.)Sojak
Asteraceae 2.22 0.16 2 0.43 0.01 0.08 0.46 1.48 2.15
49
Malcolmia
ofricana (L.) R.
Br.
Brassicaceae 8.89 0.63 2.74 0.59 0.15 0.88 0 0.01 2.1
50
Anchusa italica
Retz. Boraginaceae 8.89 0.63 2.55 0.55 0.03 0.18 0.22 0.72 2.07
51
Suaeda
maritima (L.)
Dumort
Chenopodiaceae 4.44 0.31 4 0.86 0.06 0.34 0.15 0.48 1.99
52
Phragmites
australis (Cav.)
Trin. exSteud
Poaceae 8.89 0.63 0.83 0.18 0.02 0.13 0.3 0.99 1.92
53
Taraxacum
syriacum Boiss Asteraceae 17.8 1.26 1.31 0.28 0.03 0.16 0.07 0.21 1.91
54
Euphorbia
heteradenia
Jaub. & Spach.
Euphorbiaceae 11.1 0.79 3.83 0.82 0 0.01 0.05 0.16 1.78
55
Bupleurum
rotundifolium Umbelliferae 2.22 0.16 0.24 0.05 0.01 0.08 0.46 1.48 1.77
56
Daucus carota
L. Umbelliferae 11.1 0.79 2.5 0.54 0.03 0.18 0.08 0.26 1.77
57
Papaver rhoeas
L. Papaverraceae 11.1 0.79 0.71 0.15 0.01 0.08 0.21 0.68 1.7
58
Astragallus
onobrychis
Papilionaceae 2.22 0.16 3 0.64 0.03 0.18 0.22 0.72 1.69
126 | Hassannejad and Ghafarbi
J. Bio. & Env. Sci. 2013
59
Gallium
tricornutum
Dandy.
Rubiaceae 8.89 0.63 4.12 0.88 0.02 0.12 0.01 0.02 1.65
60 Secale cereale L. Poaceae 2.22 0.16 1 0.21 0 0.01 0.38 1.25 1.62
61
Sinapis arvensis
L. Brassicaceae 2.22 0.16 1 0.21 0 0.01 0.38 1.25 1.62
62
Alium
ampeloprasum
L.
Aliaceae 15.6 1.1 2.14 0.46 0 0.02 0 0 1.59
63
Cnicus
benedictus L. Asteraceae 4.44 0.31 2.12 0.45 0.01 0.04 0.24 0.77 1.57
64
Chorispora
tenella (Pall.)
Dc.
Brassicaceae 11.1 0.79 1.95 0.42 0.03 0.15 0.06 0.2 1.55
65
Melilotus
officinalis (L.)
Desr.
Papilionaceae 6.67 0.47 3.95 0.85 0.03 0.19 0.01 0.02 1.52
66
Chondrilla
juncea L. Asteraceae 11.1 0.79 2.48 0.53 0.01 0.04 0.04 0.13 1.48
67
Gypsophila
leioclada Rech. Caryophyllaceae 11.1 0.79 2.98 0.64 0.01 0.04 0.01 0.02 1.48
68
Atriplex
leucoclada
(Boiss.) Aellen
Chenopodiaceae 2.22 0.16 2 0.43 0.03 0.18 0.22 0.72 1.48
69
Bromus
tectorum L. Poaceae 2.22 0.16 2 0.43 0.03 0.18 0.22 0.72 1.48
70
Roemeria
hybrida (L.) DC. Papaverraceae 2.22 0.16 0.12 0.03 0.1 0.57 0.21 0.69 1.45
71
Scandix stellata
Banks. Soland. Umbelliferae 2.22 0.16 0.12 0.03 0 0.01 0.38 1.25 1.44
72
Zygophyllum
fabago L. Zygophyllaceae 2.22 0.16 0.36 0.08 0 0.01 0.36 1.16 1.4
73
Cousunia
calocephala Jub.
Spach.
Asteraceae
2.22 0.16 0.12 0.03 0.04 0.23 0.28 0.92 1.33
127 | Hassannejad and Ghafarbi
J. Bio. & Env. Sci. 2013
74
Euphorbia
boissieriana
(Woronow)
Prokh.
Euphorbiaceae 11.1 0.79 1.67 0.36 0.02 0.1 0.01 0.02 1.27
75
Alyssum
desertorum
Stapf
Brassicaceae 2.22 0.16 1 0.21 0.03 0.18 0.22 0.72 1.26
76
Euclidium
syriacum (L.) R.
Br.
Brassicaceae 2.22 0.16 3 0.64 0.03 0.18 0.08 0.26 1.24
77
Poa timoleontis
Helder.& Boiss. Poaceae 4.44 0.31 2.98 0.64 0.01 0.07 0.06 0.18 1.2
78
Centaura iberica
Terv. Asteraceae 6.67 0.47 1.07 0.23 0.03 0.18 0.07 0.24 1.12
79
Veronica persica
Poir. Scrophulariaceae 11.1 0.79 0.24 0.05 0.03 0.18 0.03 0.1 1.12
80
Senecio glaucus
L. Asteraceae 2.22 0.16 1 0.21 0 0.01 0.21 0.69 1.07
81
Trifolium repens
L. Papilionaceae 4.44 0.31 1.31 0.28 0.01 0.06 0.11 0.34 1
82 Poa bulbosa L. Poaceae 8.89 0.63 0.24 0.05 0.03 0.19 0.03 0.1 0.97
83
Stellaria pallida
(Dumort.)Pire. Poaceae 4.44 0.31 0.6 0.13 0.04 0.22 0.1 0.31 0.97
84
Aeluropus
lithoralis
(Gouan.)Parl.
Poaceae 2.22 0.16 2.86 0.61 0.01 0.07 0.03 0.1 0.93
85
Agropyrum
intermedium
(Host.) P. Beauv.
Poaceae 2.22 0.16 2.86 0.61 0.01 0.07 0.03 0.1 0.93
86
Bormus
danthoniae var.
lanuginosus
(Trin.)
Poaceae 2.22 0.16 0.71 0.15 0.03 0.18 0.14 0.44 0.93
87
Setaria viridis
(L.) P. Beauv
Poaceae 2.22 0.16 0.36 0.08 0.01 0.04 0.2 0.65 0.92
128 | Hassannejad and Ghafarbi
J. Bio. & Env. Sci. 2013
88
Salvia nemerosa
L. Labiatae 2.22 0.16 0.12 0.03 0 0.01 0.21 0.69 0.88
89
Agropyrum
repens (L.) P.
Beauv.
Poaceae 4.67 0.33 1.19 0.26 0.03 0.19 0.03 0.09 0.87
90
Malva neglecta
(Wallr.) Malvaceae 6.67 0.47 0.36 0.08 0.02 0.11 0.06 0.19 0.85
91
Turgenia
latifolia (L.)
Hoffm.
Umbelliferae 6.67 0.47 0.71 0.15 0.03 0.18 0.01 0.05 0.85
92
Eryngium
billardiere
F.Delaroche.
Umbelliferae 8.89 0.63 0.6 0.13 0.01 0.08 0 0.01 0.85
93
Ranunculus
arvensis L. Ranunculaceae 4.44 0.31 0.95 0.2 0 0.01 0.1 0.31 0.84
94
Amaranthus
retroflexus L. Amaranthaceae 8.89 0.63 0.48 0.1 0.01 0.07 0 0.01 0.81
95
Verbascum
thapsus Scrophulariaceae 2.22 0.16 0.12 0.03 0 0.01 0.18 0.6 0.78
96
Rumex
abtusifolium L. Polygonaceae 4.44 0.31 0.24 0.05 0.01 0.07 0.1 0.31 0.75
97
Onopordon
leptoleptoepis
DC. Rech.
Asteraceae 8.89 0.63 0.36 0.08 0.01 0.03 0 0 0.74
98
Centaura
virgata (Lam.) Asteraceae 6.67 0.47 0.36 0.08 0 0.02 0.04 0.13 0.7
99
Xanyhium
strumarium L. Asteraceae 2.22 0.16 0.41 0.09 0.02 0.14 0.09 0.31 0.7
100 Cerpis foetida L. Asteraceae 2.22 0.16 0.12 0.03 0 0.01 0.14 0.47 0.65
101
Sorghum
halepense (L.)
Pers.
Poaceae 2.22 0.16 0.29 0.06 0.03 0.15 0.08 0.26 0.63
102
Vaccaria
pyramidata
Medi.
Caryophyllaceae
4.44 0.31 0.71 0.15 0.02 0.12 0.01 0.02 0.61
129 | Hassannejad and Ghafarbi
J. Bio. & Env. Sci. 2013
103
Plantago atrata
Hoppe. Plantaginaceae 2.22 0.16 0.12 0.03 0 0.01 0.11 0.37 0.56
104
Euphorbia
chrirdenia Boiss.
& Hohen.
Euphorbiaceae 4.44 0.31 0.48 0.1 0.02 0.1 0.01 0.03 0.55
105
Bellevalia
pycantha
(C.Koch) A. Los.
Aliaceae 2.22 0.16 1.07 0.23 0.02 0.09 0.01 0.04 0.51
106
Sclerochloa
woronowii
(Hack.)Tzvel.
Poaceae 2.22 0.16 0.95 0.2 0.01 0.04 0.03 0.11 0.51
107
Ixiolirion
tataricum (pall.)
Herb.
Amaryllidaceae 2.22 0.16 1 0.21 0.02 0.1 0.01 0.03 0.5
108
Lolium persicum
Boiss& Hohen. Poaceae 2.22 0.16 1 0.21 0.02 0.1 0.01 0.03 0.5
109
Medicago
monantha C. A.
Meyer
Papilionaceae 2.22 0.16 1 0.21 0.02 0.1 0.01 0.03 0.5
110
Cynodon
dactylon (L.)
pers.
Poaceae 4.44 0.31 0.36 0.08 0.01 0.06 0.01 0.02 0.47
111
Digitaria
sanguinalis L.
Scop
Poaceae 2.22 0.16 0.12 0.03 0.01 0.03 0.08 0.26 0.47
112
Achillea
millefolium L. Asteraceae 2.22 0.16 0.12 0.03 0.01 0.07 0.06 0.2 0.45
113
Picnomon
acarna (L.)
Cass.
Asteraceae 4.44 0.31 0.36 0.08 0.01 0.05 0 0 0.44
114
Achilla
micrantha Wild. Asteraceae 2.22 0.16 0.12 0.03 0.01 0.04 0.06 0.19 0.41
115
Euphorbia
helioscopia L. Euphorbiaceae 2.22 0.16 0.95 0.2 0.01 0.03 0 0 0.4
116 Nonnea pulla
(L.) DC.
Boraginaceae 2.22 0.16 0.24 0.05 0.01 0.05 0.03 0.1 0.36
130 | Hassannejad and Ghafarbi
J. Bio. & Env. Sci. 2013
117
Achilea
bibersteinii Afar. Asteraceae 2.22 0.16 0.24 0.05 0.02 0.14 0 0.01 0.36
118
Plantago
lanceolata L. Euphorbiaceae 2.22 0.16 0.24 0.05 0.01 0.03 0.03 0.08 0.32
Total 1411 100 466 100 16.6 100 30.7 100 400
Acknowledgment
The authors are grateful to their colleagues in
University of Tabriz. This article was extracted from
final report of research projects "Identification and
weed mapping of weeds in wheat fields at Tabriz
County by Geographical Information System (GIS)"
that was financed by research funding of Tabriz
University.
Reference
Abusteit EO, El-Raouf MSA, SHaban SA, El-
Khanagry SS, Maillet J. 1998. Cumulative average
of weed presence in wheat innorthern Egypt. Comptes
rendus 6th symposium Mediterraneen EWRS,
Montpellier, France, 13-15.
Andreasen C, Skovgard IM. 2009. Crop and soil
factors of importance for the distribution of plant
species on arable fields in Denmark. Agriculture,
Ecosystems and Environment 133, 61-67.
Andreasen C, Stryhn H. 2008. Increasing weed
flora in Danish arable fields and its importance for
biodiversity. Weed Research 48, 1 – 9.
Conn JS, Werdin-Pfisterer NR, Beattie KL.
2011. Development of the Alaska agricultural weed
flora 1981-2004: a case for prevention. Weed
Research 51, 63 – 70.
Davis PH. 1965-85. Flora of Turkey. Edinburgh at
the University of Press. V: 1-10.
Frick B, Thomas AG. 1992. Weed survey in
different tillage systems in Southeastern Ontario field
crops. Canadian Journal of Plant Science 72, 1337-
1347.
Fried G, Norton LR, Rebound X. 2008.
Environmental and management factors determining
weed species composition and diversity in France.
Agriculture, Ecosystems and Environment 128, 68 –
76.
Gomaa NH. 2012. Composition and diversity of
weed communities in Al-Jouf province, northern
Saudi Arabia. Saudi Journal of Biological Sciences 19,
369 - 376.
Hassannejad S, Porheidar-Ghafarbi S. 2013.
Distribution of dominant weed species in winter
wheat at Tabriz county. International Journal of
Biosciences. 3(4), 8-16.
Hassannejad S, Porheidar-Ghafarbi S. 2012.
Introducing new indices for weed flora studies.
International Journal of Agriculture and Crop
Sciences 4(22), 1653-1659.
Hassannejad S. 2011. Weed flora identification and
weed mapping in wheat, barley, and alfalfa fields of
East Azerbaijan by Geographical Information System
(GIS). Ph. D. Theses. Department of Agronomy and
Plant Breeding, University of Tehran-Iran. PP: 293.
Hyvonen T, Ketoja E, Salonen J, Jalli H,
Tiainen J. 2003. Weed species diversity and
community composition in organic and conventional
131 | Hassannejad and Ghafarbi
J. Bio. & Env. Sci. 2013
cropping of spring cereals. Agriculture, Ecosystems &
Environment 97, 131–149.
Khalaghani J. 2007. Weed loss assessment in
wheat fields. Final report. Iranian Research Institute
of Plant Protection. pp: 47.
McCully KV, Sampson MG, Watson AK. 1991.
Weed survey of Nova Scotia, Lowbush blueberry
(Vaccinium angustifoliumm) fields. Weed Science
39, 180-185.
Memon RA. 2004. Weed flora composition of wheat
and cotton crops in district Khairpus, Sindh. A thesis
submitted in fulfillment of the requirement for the
degree of doctor of philosophy in botany. Shah Abdul
Latif University Khairpur, Sindh. P. 256
Milanova S, Dimitrova T, Valkova M, Tachkov
J, Atanasova L, Llieva L, Christov C. 2009.
Weed infestation of winter wheat in Pleven region,
Bulgria. Herbologia 10, 1 – 11.
Minbashi M, Baghestanii MA, Rahimian H.
2008. Introducing abundance index for assessing
weed flora in survey studies. Weed Biology and
Management 8, 172 – 180.
Nazer Kakhki SH, Minbash MM, Hassannejad
S, Jafary H, Aleefard M. 2013. Weed population
indices in irrigated wheat fields of Zanjan province of
Iran. Pakistan Journal of Weed Science Research, 19
(2), 123- 156.
Novak R, Dancza I, Szentey L, Karaman J,
Beres I, Kazinczi G and Golya G. 2010. Arable
weeds of Hungary. The fifth national weed survey
(2007-2008). Proceedings of the 15 thEWRS
Symposium, Kaposvar, Hungary. p. 8 – 9.
Potts GR, Ewald JA, Aebischer NJ. 2010. Long –
term changes in the flora of the cereal ecosystem on
the Sussex Downs, England, focusing on the years
1968-2005. Journal of Applied Ecology 47, 215 –
226.
Radosvich SR, Holt JS. 1984. Weed Ecology:
Implications for vegetation management. Johnwiley
and Son. New York.
Rechinger KH. 1963 - 2007. Flora Iranica.
Akademische Durck-U. Verlagsanstalt Graz-Austria.
V: 1-178.
Salonen J, Hyvonen T, Jalli H. 2001. Weed flora
in organically grown spring cereals in Finaland.
Agricultural and Food Science in Finland, 10 (3):
231- 242.
Schwezel PJ, Thomas PEL. 1971. Weed
competition in Cotton PANS. 17 (1), 30-34.
Sinzar B. 1996. Winter wheat weed community in
the Kosmaj region. Zastita Bilja, 47 (4), 313- 321.
Tastan B, Ercis A. 1994. Research on the
distribution and density of weeds in wheat fields in
cereal Anatolia. Bitki Koruma Bulteni, 31 (1-4), 39-
60.
132 | Hassannejad and Ghafarbi