zinc and iron concentration qtl mapped in a triticum spelta × t. aestivum cross
TRANSCRIPT

1 23
Theoretical and Applied GeneticsInternational Journal of Plant BreedingResearch ISSN 0040-5752Volume 127Number 7 Theor Appl Genet (2014) 127:1643-1651DOI 10.1007/s00122-014-2327-6
Zinc and iron concentration QTL mappedin a Triticum spelta × T. aestivum cross
Jayasudha Srinivasa, BalasubramaniamArun, Vinod Kumar Mishra, GyanendraPratap Singh, Govindan Velu, RamanBabu, Neeraj Kumar Vasistha, et al.

1 23
Your article is protected by copyright and
all rights are held exclusively by Springer-
Verlag Berlin Heidelberg. This e-offprint is
for personal use only and shall not be self-
archived in electronic repositories. If you wish
to self-archive your article, please use the
accepted manuscript version for posting on
your own website. You may further deposit
the accepted manuscript version in any
repository, provided it is only made publicly
available 12 months after official publication
or later and provided acknowledgement is
given to the original source of publication
and a link is inserted to the published article
on Springer's website. The link must be
accompanied by the following text: "The final
publication is available at link.springer.com”.

1 3
Theor Appl Genet (2014) 127:1643–1651DOI 10.1007/s00122-014-2327-6
OrIGInAl PAPer
Zinc and iron concentration QTL mapped in a Triticum spelta × T. aestivum cross
Jayasudha Srinivasa · Balasubramaniam Arun · Vinod Kumar Mishra · Gyanendra Pratap Singh · Govindan Velu · Raman Babu · Neeraj Kumar Vasistha · Arun Kumar Joshi
received: 2 December 2013 / Accepted: 5 May 2014 / Published online: 28 May 2014 © Springer-Verlag Berlin Heidelberg 2014
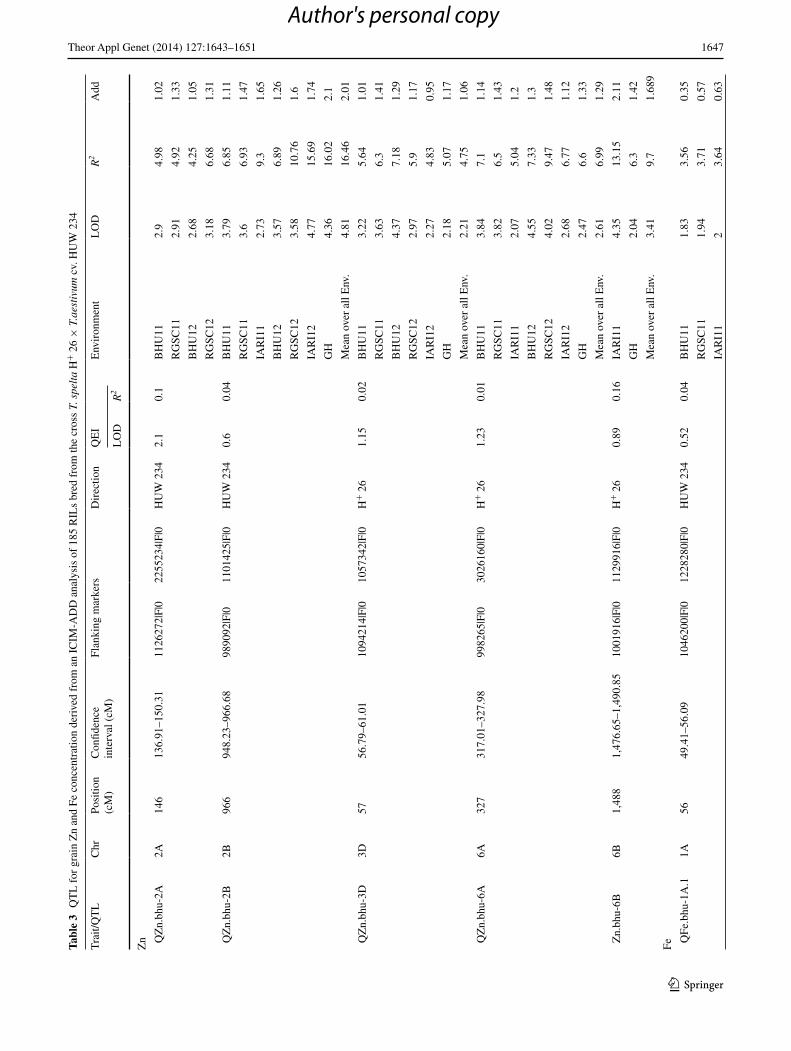
from a greenhouse trial. The range in Zn and Fe concentra-tion across the rIls was, respectively, 18.8–73.5 and 25.3–59.5 ppm, and the concentrations of the two elements were positively correlated with one another (rp =+0.79). Ten QTl (five each for Zn and Fe accumulation) were detected, mapping to seven different chromosomes. The chromo-some 2B and 6A grain Zn QTl were consistently expressed across environments. The proportion of the phenotype explained (PVe) by QZn.bhu-2B was >16 %, and the locus was closely linked to the SnP marker 1101425|F|0, while QZn.bhu-6A (7.0 % PVe) was closely linked to DArT marker 3026160|F|0. Of the five Fe QTl detected, three, all mapping to chromosome 1A were detected in all seven environments. The PVe for QFe.bhu-3B was 26.0 %.
Introduction
A healthy human diet requires a minimal intake of energy, protein and minerals, and this cannot be fully met by a wholly cereal-based diet (Welch and Graham 2004). It has been estimated that at least 40 % of the world’s popula-tion, with a heavy representation of women and children in developing countries, suffers from a dietary deficiency in zinc (Zn) and iron (Fe) (liu et al. 2006; Welch and Graham 2004). Wheat is globally the world’s second most impor-tant cereal, representing ca. 44 % (estimated 2012/13) of global cereal consumption (FAO 2013), therefore its bio-fortification with respect to Zn and Fe could have a measur-able impact on levels of malnutrition.
Breeding for a higher accumulation of minerals, as for any heritable trait, requires the availability of relevant genetic variation. The genetic basis of quantitative traits of this nature can be most easily obtained by linkage mapping, taking advantage of increasingly informative molecular
Abstract Key message Ten QTL underlying the accumulation of Zn and Fe in the grain were mapped in a set of RILs bred from the cross Triticum spelta × T. aestivum. Five of these loci (two for Zn and three for Fe) were consist-ently detected across seven environments.Abstract The genetic basis of accumulation in the grain of Zn and Fe was investigated via QTl mapping in a recom-binant inbred line (rIl) population bred from a cross between Triticum spelta and T. aestivum. The concentration of the two elements was measured from grain produced in three locations over two consecutive cropping seasons and
Communicated by Yunbi Xu.
Electronic supplementary material The online version of this article (doi:10.1007/s00122-014-2327-6) contains supplementary material, which is available to authorized users.
J. Srinivasa · B. Arun · V. K. Mishra · n. K. Vasistha · A. K. Joshi (*) Department of Genetics and Plant Breeding, Institute of Agricultural Sciences, Banaras Hindu University, Varanasi, Indiae-mail: [email protected]
G. P. Singh Division of Genetics, Indian Agricultural research Institute, Pusa, new Delhi, India
G. Velu International Maize and Wheat Improvement Center (CIMMYT), Apdo. Postal 6-641, 06600 Mexico, D.F., Mexico
r. Babu CIMMYT, India C/O ICrISAT, Patancheru, Hyderabad, India
A. K. Joshi CIMMYT, South Asia regional Office, Kathmandu, nepal
Author's personal copy

1644 Theor Appl Genet (2014) 127:1643–1651
1 3
marker platforms. The successful identification of quantita-tive trait loci (QTl) underlying grain Zn and Fe concentra-tion has the potential to accelerate crop improvement via the deployment of marker-assisted selection, and beyond this to the isolation of the gene(s) responsible for the QTl (Salvi and Tuberosa 2005).
Although variation of grain Fe and Zn concentration has been established to have a firm genetic basis (Gregorio 2002). The trait is also highly environmentally dependent, and is particularly sensitive to the concentration of these elements in the soil (Fiel et al. 2005). As a result, efforts to map the genes involved have frequently highlighted the genotype × environment interactions (Trethowan 2007; Trethowan et al. 2005; Joshi et al. 2010). Across the east-ern Gangetic Plains, the major wheat growing area of India, soil analyses have shown that the quantity of available Fe is generally less variable than that of Zn (Joshi et al. 2010). The quantitative inheritance of grain Fe and Zn in wheat, alongside the low heritability of the trait and the large envi-ronment and genotype × environment interactions asso-ciated with them, have slowed the progress in achieving genetic gain. Here, we report the mapping of several grain Zn and Fe concentration QTl, using a set of recombinant inbred lines (rIls) bred from a cross between a Zn and Fe accumulator (Triticum spelta) and a Zn and Fe poor T. aes-tivum cultivar. The material was tested across three loca-tions and over two consecutive cropping seasons, as well as in a controlled greenhouse trial.
Materials and methods
Parental lines, mapping population and grain analysis
A mapping population comprising 185 rIls was developed from the cross T. spelta accession H+ 26 (PI348449) × T. aestivum cv. HUW 234. The latter has been a popular cul-tivar in the north-eastern Plains Zone of India over the last two decades; its grain accumulates only low levels of both Zn and Fe, unlike those of H+ 26. The T. spelta par-ent H+26 was identified from the collection of >300 spelt accessions in CIMMYT gene bank. All T. spelta lines were not good Zn and Fe accumulators. There was huge genetic diversity within spelt gene pool, and H+26 was one of the best Zn and Fe accumulator. The rIls were developed fol-lowing methods set out by Singh and rajaram (1991) and Joshi et al. (2004). The population was field grown in three locations, namely, Banaras Hindu University (BHU), Vara-nasi (25.25°n, 82.99°e), rajiv Gandhi South Campus (rGSC), Mirzapur (25.13°n, 82.56°e) (rGSC) and Indian Agriculture research Institute (IArI), new Delhi (28.64°n, 77.16°e) over two consecutive cropping seasons (2010–2011 and 2011–2012). A further trial was conducted under
greenhouse (GH) conditions in 2011. Planting of the rIls, along with the two parents, was carried out in the first week of December in a randomized complete block design with two replications. each plot comprised three 2-m rows, with an inter-row spacing of 20 cm. The plants were provided with adequate n, P and K fertilizer (120 kg n, 60 kg P2O5 and 40 kg K2O per ha), along with an application of 25 kg per ha Zn. The K2O and P2O5 fertilizer were provided at sow-ing, but the n application was split between 60 kg at sowing, 30 kg 21 days after sowing and 30 kg 45 days after sowing. The GH experiment soil was fertilized at a rate equivalent to 120 kg n, 80 kg P2O5, 60 kg K2O and 20 kg Zn per ha. At harvest, 20 intact spikes were recovered from each rIl and parent plot, and hand threshed. The grain was subjected to Zn and Fe analysis using X-ray fluorescence (eDXrF spec-trometer X-Supreme8000) (Paltridge et al. 2012).
Statistical analysis of phenotypic data
Analyses of variance (AnOVA) for grain Zn and Fe concentration in each of the seven environments were performed using the PrOC GlM procedure included within the SAS v9.2 package (SAS Institute Inc.). esti-mates of the broad-sense heritability, both within and across the environments, were obtained from the AnOVA using the formulae h
2= σ 2
g /(σ 2G + σ 2
e /r), and h
2= σ 2
G/(σ 2G + σ 2
GE/E + σ 2e 8rE), respectively, (Hallauer
and Miranda Filho 1981). Here, σ 2G, σ 2
GE and σ 2e represent,
respectively, the genotypic variance, the genotype × envi-ronment interaction and the error variance, while E and r represent, respectively, the number of environments and the number of replications. Phenotypic and genotypic cor-relations between traits were calculated following Messmer et al. (2011), and Pearson correlation coefficients between grain Zn and Fe concentration were calculated using the PrOC COrr procedure included within the SAS package.
Genotyping, linkage mapping and QTl analysis
Genomic DnA was extracted from 18-day-old seedlings using the Diversity Arrays Technology protocol described online at http://www.diversityarrays.com/sites/default/files/pub/DArT_DnA_isolation.pdf. The resulting DnAs were used for genotyping by 13,460 single nucleotide polymor-phism (SnP) and 14,791 DArT loci at DArT Pty. ltd. (Can-berra, Australia). The linkage map was assembled from the genotypic data using QTl IciMapping v3.2 software (http://www.isbreeding.net), applying a lOD threshold of 3.0 between adjacent markers (li et al. 2007). QTl were identified with the inclusive composite interval mapping (ICIM) algorithm for additive gene effects implemented in QTl IciMapping v.3.2 software. The QTl expressed in each environment separately were defined, as also was the
Author's personal copy

1645Theor Appl Genet (2014) 127:1643–1651
1 3
set of QTl which were stable across all the environments. For both procedures, the walking step was set to 1 cM and a relaxed lOD threshold of 2.5 was applied to call sig-nificance (ribaut et al. 1997; Tuberosa et al. 2002). Sta-bility was inferred when the lOD of the QTl × environ-ment interaction (lODQeI) was <2.5. QTl nomenclature was standard (http://wheat.pw.usda.gov/ggpages/wgc/98/Intro.htm). QTl × QTl interaction was also investigated.
Results
Performance across environments
The grain of the T. spelta parent H+ 26 accumulated sig-nificantly more Zn (62.4 ppm) and Fe (54.9 ppm) than that of the T. aestivum parent cv. HUW 234 (respectively, 30.5 and 35.2 ppm) (Table 1). The range in grain Zn concentra-tion among the rIls was 8.8 ppm (BHU2011) to 73.5 ppm (GH), and in Fe concentration from 25.3 ppm (BHU2011) to 59.5 ppm (GH) (Table 1). Zn and Fe accumulation was gen-erally higher in GH than in any of the field experiments. The broad-sense heritability for Zn accumulation ranged, across the environments, from 0.34 to 0.86, and that for Fe from 0.46 to 0.73. Averaged over the full set of environments, the two heritabilities were, respectively, 0.80 and 0.66. The Zn and Fe concentrations were positively correlated with one another, both at the phenotypic (rp) and the genotypic (rg) level at six of the seven environments (the exception was BHU2012) (Table 1). The distribution of grain Zn and Fe concentration across the rIls was continuous (Fig. 1). A Shapiro–Wilk test with respect to both Zn (W = 0.97, P = 0.08) and Fe (W = 0.99, P = 0.76) revealed that the distributions were normal, and that the range lay between the parental values (Table 1; Fig. 1). The AnOVA showed that both the genotypic and the genotype × environment interac-tion components of the variance were significant (Table 2).
Genetic map
The linkage map was constructed using 5,812 informative markers (3,122 DArT and 2,690 SnP). A total of 2,383 loci mapped to A genome chromosomes, 3,019 to B genome chromosomes and 410 to D genome chromosomes. Chro-mosome 5D was completely unmarked, and chromosome 2D harbored only one marker. The full map covered a genetic length of 20,446 cM with a mean inter-marker dis-tance of 3.5 cM.
Variation in Zn and Fe concentration across environments
An analysis based on the Pearson correlation coefficient (r) revealed that grain Zn concentrations were quite consistent Ta
ble
1 r
ange
, mea
n, b
road
-sen
se h
erita
bilit
y an
d ph
enot
ypic
and
gen
otyp
ic c
orre
latio
ns b
etw
een
grai
n Z
n an
d Fe
con
cent
ratio
n m
easu
red
acro
ss s
even
env
iron
men
ts in
a r
Il p
opul
atio
n br
ed
from
the
cros
s T.
spe
lta
H+
26
× T
. aes
tivu
m c
v. H
UW
234
Sign
ifica
nt a
t * P
< 0
.05
and
** P
< 0
.01
prob
abili
ty le
vels
env
Zn
(ppm
)Fe
(pp
m)
Cor
rela
tions
H+
26
HU
W 2
34r
Ils
H+
26
HU
W 2
34r
Ils
Mea
n ±
SD
Mea
n ±
SD
ran
geM
ean
± S
Dh2
CV
Mea
n ±
SD
Mea
n ±
SD
ran
geM
ean
± S
Dh2
CV
r Pr g
BH
U11
48.6
± 0
.49
21.7
± 0
.71
18.8
–48.
731
.5 ±
5.1
10.
866.
040
.7 ±
0.1
428
.9 ±
1.7
025
.3–3
9.7
29.6
± 2
.12
0.46
5.3
0.33
**0.
22**
BH
U12
51.2
± 0
.78
23.8
± 0
.85
22.8
–51.
334
.4 ±
5.3
60.
708.
551
.0 ±
0.4
232
.6 ±
0.5
730
.1–4
8.1
37.0
± 3
.49
0.70
5.1
0.12
*0.
01 ns
rG
SC11
63.7
± 7
.78
26.8
± 0
.78
24.2
–56.
838
.4 ±
6.2
60.
649.
553
.3 ±
1.2
031
.8 ±
1.2
029
.8–5
3.7
38.1
± 3
.32
0.60
5.5
0.71
**0.
79**
rG
SC12
70.4
± 1
.62
38.9
± 2
.26
30.6
–70.
050
.5 ±
5.5
50.
567.
258
.9 ±
1.8
334
.0 ±
1.6
933
.1–5
7.5
44.1
± 4
.25
0.73
5.0
0.25
**0.
23*
IAr
I11
58.0
± 3
.75
22.7
± 1
.56
20.9
–60.
235
.6 ±
5.8
80.
689.
355
.1 ±
0.5
332
.1 ±
1.4
830
.6–5
3.9
39.5
± 3
.50
0.57
5.7
0.60
**0.
54**
IAr
I12
70.3
± 1
.48
40.8
± 0
.28
38.9
–70.
151
.5 ±
5.1
70.
348.
161
.5 ±
1.1
345
.8 ±
0.3
541
.7–5
8.9
50.2
± 3
.20
0.55
4.3
0.18
*0.
22*
GH
74.8
± 0
.42
38.9
± 1
.56
36.9
–73.
553
.5 ±
5.8
00.
487.
864
.2 ±
0.6
341
.7 ±
0.5
038
.1–5
9.5
49.2
± 4
.26
0.61
5.4
0.51
**0.
49**
Ove
r e
nv.
62.4
± 9
.70
30.5
± 8
.02
18.8
–73.
542
.2 ±
10.
260.
808.
554
.9 ±
7.2
535
.2 ±
5.7
025
.3–5
9.5
41.1
± 7
.61
0.66
5.3
0.79
**0.
92**
Author's personal copy

1646 Theor Appl Genet (2014) 127:1643–1651
1 3
across the seven environments, with r ranging from 0.26 to 0.67 (Fig. 2). Similarly, Fe concentrations were consistent across the environments (r ranging from 0.09 to 0.35). The grain Zn and Fe concentrations were significantly and posi-tively correlated with one another (rp = 0.79) (Fig. 2), sug-gesting that the accumulation of these minerals operates via a common genetic mechanism.
QTl analysis of grain Zn concentration
Five QTl for grain Zn content were identified in all, asso-ciated with a PVe (Phenotypic variance explained) of between 4.3 and 16.5 % (Table 3). QZn.bhu-2B was the most stably expressed QTl (Supplementary fig. 1.1), fol-lowed by QZn.bhu-6A (Supplementary fig. 1.2). Both of these QTl were detectable in each of the seven environ-ments, and also when performance was averaged across the seven environments. The PVe for QZn.bhu-2B was 16.5 % across all environments, while the overall PVe
for QZn.bhu-6A was 7.0 %. A QTl mapping to chromo-some 3D (flanked by the DArT markers 1094214|F|0 and 1057342|F|0) was detected in six of the seven environ-ments and when performance was averaged across the seven environments; its overall PVe was 4.8 % (Table 3). Another QTl mapping to chromosome 2A (flanked by SnP marker 1126272|F|0 and DArT marker 2255234|F|0) was detected in four of the environments (PVe = 6.68 % at rGSC12). Finally, a chromosome 6B QTl was detected in only one environment, but was nevertheless signifi-cant based on line mean performance over environments (PVe = 9.7 %). QZn.bhu-2B was tightly linked (0.68 cM)
Fig. 1 Distribution of grain Zn and Fe concentration: mean performance over seven environments of the 185 rIls bred from the cross T. spelta H+ 26 × T. aestivum cv. HUW 234. Bars indicate the standard error (n = 7)
Table 2 Analysis of variance for grain Zn and Fe concentration measured across seven environments in a rIl population bred from the cross T. spelta H+ 26 × T. aestivum cv. HUW 234
Significant at ** P < 0.01
Source df Zn Fe
environment 6 31,912.29** 19,645.44**
replication 1 219.44** 137.42**
Genotype 184 199.42** 46.33**
Genotype × environment 1,104 25.01** 15.58**
error 1,294 12.79 4.68
Fig. 2 Phenotypic correlation (r) between grain Zn and Fe concen-tration in the rIl population tested across seven environments
Author's personal copy
1647Theor Appl Genet (2014) 127:1643–1651
1 3
Tabl
e 3
QT
l f
or g
rain
Zn
and
Fe c
once
ntra
tion
deri
ved
from
an
ICIM
-AD
D a
naly
sis
of 1
85 r
Ils
bred
fro
m th
e cr
oss
T. s
pelt
a H
+ 2
6 ×
T.a
esti
vum
cv.
HU
W 2
34
Tra
it/Q
Tl
Chr
Posi
tion
(cM
)C
onfid
ence
in
terv
al (
cM)
Flan
king
mar
kers
Dir
ectio
nQ
eI
env
iron
men
tl
OD
R2
Add
lO
DR
2
Zn Q
Zn.
bhu-
2A2A
146
136.
91–1
50.3
111
2627
2|F|
022
5523
4|F|
0H
UW
234
2.1
0.1
BH
U11
2.9
4.98
1.02
rG
SC11
2.91
4.92
1.33
BH
U12
2.68
4.25
1.05
rG
SC12
3.18
6.68
1.31
QZ
n.bh
u-2B
2B96
694
8.23
–966
.68
9890
92|F
|011
0142
5|F|
0H
UW
234
0.6
0.04
BH
U11
3.79
6.85
1.11
rG
SC11
3.6
6.93
1.47
IAr
I11
2.73
9.3
1.65
BH
U12
3.57
6.89
1.26
rG
SC12
3.58
10.7
61.
6
IAr
I12
4.77
15.6
91.
74
GH
4.36
16.0
22.
1
Mea
n ov
er a
ll e
nv.
4.81
16.4
62.
01
QZ
n.bh
u-3D
3D57
56.7
9–61
.01
1094
214|
F|0
1057
342|
F|0
H+
26
1.15
0.02
BH
U11
3.22
5.64
1.01
rG
SC11
3.63
6.3
1.41
BH
U12
4.37
7.18
1.29
rG
SC12
2.97
5.9
1.17
IAr
I12
2.27
4.83
0.95
GH
2.18
5.07
1.17
Mea
n ov
er a
ll e
nv.
2.21
4.75
1.06
QZ
n.bh
u-6A
6A32
731
7.01
–327
.98
9982
65|F
|030
2616
0|F|
0H
+ 2
61.
230.
01B
HU
113.
847.
11.
14
rG
SC11
3.82
6.5
1.43
IAr
I11
2.07
5.04
1.2
BH
U12
4.55
7.33
1.3
rG
SC12
4.02
9.47
1.48
IAr
I12
2.68
6.77
1.12
GH
2.47
6.6
1.33
Mea
n ov
er a
ll e
nv.
2.61
6.99
1.29
Zn.
bhu-
6B6B
1,48
81,
476.
65–1
,490
.85
1001
916|
F|0
1129
916|
F|0
H+
26
0.89
0.16
IAr
I11
4.35
13.1
52.
11
GH
2.04
6.3
1.42
Mea
n ov
er a
ll e
nv.
3.41
9.7
1.68
9
Fe QFe
.bhu
-1A
.11A
5649
.41–
56.0
910
4620
0|F|
012
2828
0|F|
0H
UW
234
0.52
0.04
BH
U11
1.83
3.56
0.35
rG
SC11
1.94
3.71
0.57
IAr
I11
23.
640.
63
Author's personal copy

1648 Theor Appl Genet (2014) 127:1643–1651
1 3
LO
D l
ikel
ihoo
d of
odd
s ra
tio f
or g
enet
ic e
ffec
ts,
R2 t
otal
per
cent
age
of p
heno
typi
c va
riat
ion
expl
aine
d by
eac
h Q
Tl
, Add
the
add
itive
eff
ect,
LO
DQ
EI
lO
D s
core
of
the
QT
l ×
env
iron
men
t in
tera
ctio
n ac
ross
env
iron
men
ts, R
2 QE
I ph
enot
ypic
var
iatio
n ex
plai
ned
by m
ain
effe
cts
of Q
Tl
× e
nvir
onm
ent i
nter
actio
n ac
ross
env
iron
men
ts
Tabl
e 3
con
tinue
d
Tra
it/Q
Tl
Chr
Posi
tion
(cM
)C
onfid
ence
in
terv
al (
cM)
Flan
king
mar
kers
Dir
ectio
nQ
eI
env
iron
men
tl
OD
R2
Add
lO
DR
2
BH
U12
2.97
5.67
0.79
rG
SC12
3.4
5.63
0.96
IAr
I12
3.41
5.67
0.69
GH
3.71
6.12
0.97
Mea
n ov
er a
ll e
nv.
3.32
5.56
0.74
QFe
.bhu
-1A
.21A
227
218.
84–2
27.1
122
8969
5|F|
012
1855
5|F|
0H
UW
234
0.93
0.03
BH
U11
3.47
7.23
0.49
rG
SC11
3.91
8.05
0.84
IAr
I11
2.98
5.8
0.74
BH
U12
4.06
7.84
0.9
rG
SC12
4.59
7.71
1.09
IAr
I12
4.56
7.69
0.78
GH
4.37
7.26
1.03
Mea
n ov
er a
ll e
nv.
4.4
7.48
0.84
QFe
.bhu
-1A
.31A
346
345.
76–3
55.0
217
0801
4|F|
010
0000
8|F|
0H
+ 2
62.
080.
1B
HU
116.
6814
.56
0.75
rG
SC11
6.98
15.0
71.
24
IAr
I11
5.69
11.5
61.
13
BH
U12
9.53
19.9
41.
55
rG
SC12
9.44
17.0
31.
76
IAr
I12
9.37
16.9
91.
26
GH
9.72
17.5
11.
73
Mea
n ov
er a
ll e
nv.
9.09
16.5
51.
35
QFe
.bhu
-2A
2A16
216
1.6–
188.
4910
8148
5|F|
012
1662
1|F|
0H
UW
234
0.52
0.03
IAr
I11
2.66
5.26
0.72
BH
U12
2.33
4.25
0.68
rG
SC12
3.26
5.51
0.95
IAr
I12
3.18
5.39
0.67
GH
3.42
5.75
0.94
Mea
n ov
er a
ll e
nv.
3.27
5.6
0.74
QFe
.bhu
-3B
3B1,
022
1,01
5.23
–1,0
22.2
830
2295
4|F|
011
0232
4|F|
0H
UW
234
8.61
0.5
IAr
I11
3.45
6.97
0.85
BH
U12
2.61
5.06
0.75
rG
SC12
13.9
627
.12.
14
IAr
I12
13.8
226
.87
1.53
GH
13.9
826
.76
2.07
Mea
n ov
er a
ll e
nv.
13.3
25.9
51.
63
Author's personal copy

1649Theor Appl Genet (2014) 127:1643–1651
1 3
to the SnP marker 1101425|F|0, QZn.bhu-6A was sepa-rated by 0.98 cM from DArT marker 3026160|F|0, and DArT marker 1094214|F|0 mapped within 0.21 cM of QZn.bhu-3D. The positive alleles at both QZn.bhu-2A and QZn.bhu-2B were contributed by the low Zn parent cv. HUW 234, while they were inherited from H+ 26 at the other three QTl. The significant QTl × environment inter-actions (QeIs) included the two consistent and stable loci QZn.bhu-2B and QZn.bhu-6A, although the PVe associ-ated with both was very low (respectively, 0.04 and 0.01 %; Table 3).
QTl analysis of grain Fe concentration
Five QTl were also detected underlying grain Fe con-tent. Their PVes ranged from 1.8 to 27.1 % (Table 3). QFe.bhu-1A.2 (overall PVe = 7.5 %) and QFe.bhu-1A.3 (PVe = 16.6 %) were the most consistent and stable, followed by QFe.bhu-1A.1 (PVe = 5.6 %). All three of the QTl mapping to chromosome 1A (Supplementary fig. 1.3) were detected in each environment as well as when performance was averaged over the environments. QFe.bhu-3B was associated with the highest PVe (27.1 %, at rGSC2012), but also had a major effect at IArI2012 (26.9 %), in the GH trial (26.8 %) and across all environ-ments (26.0 %). QFe.bhu-2A was associated with an overall
PVe of 5.6 %. The positive allele was inherited from H+ 26 at QFe.bhu-1A.3, but from cv. HUW 234 at each of the other four loci. The nearest markers to the five loci lay, respectively, at a distance of 0.90, 0.24, 0.40, 0.11 and 0.28 (Table 3). For both traits, no QTl × QTl interaction was observed.
Discussion
Grain Zn and Fe concentration are both quantitatively inherited traits, as shown by their continuous distribution across the rIl population. However, the rIls also showed some transgression in both directions suggesting that both parents carried a few different genes with alleles contrib-uting to increased Zn and Fe concentrations (Ozkan et al. 2007; Xu et al. 2012). Grain Zn concentration was rather more variable than grain Fe concentration. Other varietal contrasts have also shown substantial variation for the con-tent of both minerals (Cakmak et al. 2004; Tiwari et al. 2009; Xu et al. 2012). Greenhouse-raised plants accumu-lated more Zn and Fe in the grain than did the field-grown ones, as similarly observed by Welch et al. (2005). The estimated broad-sense heritability for both grain Zn and Fe concentration varied from medium to high across the seven environments, in accordance with the observations made by
Fig. 3 Partial linkage map derived from the T. spelta H+ 26 × T. aestivum cv. HUW 234 rIl population, indicating the location of QTl for grain Zn and Fe concentration
Author's personal copy

1650 Theor Appl Genet (2014) 127:1643–1651
1 3
Velu et al. (2012). nevertheless, both grain Zn and Fe con-centrations were quite consistent across the environments.
The accumulation of Zn was positively correlated (rp = 0.79**) with that of Fe, suggesting a shared genetic basis for the two traits. Comparing the derived QTl did reveal that the Zn locus on chromosome 2A co-localized with an Fe one (Fig. 3), which offers an opportunity to jointly improve both traits (Welch and Graham 2004). The existence of a positive correlation between grain Zn and Fe accumulation has been reported repeatedly in both bread wheat (Pomeranz and Dikeman 1983; Peterson et al. 1986; raboy et al. 1991; Graham et al. 1999; rengel et al. 1999; Balint et al. 2007; Peleg et al. 2009; Genc et al. 2009, Zhao et al. 2009; Xu et al. 2012), wild emmer (Cakmak et al. 2004; Morgonuov et al. 2007; Peleg et al. 2008), domes-ticated emmer (Gregorio 2002) and triticale (Feil and Fos-sati 1995). However, to date, the co-localization of grain Zn and Fe QTl has only been observed in tetraploid wheat (Peleg et al. 2009).
Although grain of the T. spelta parent H+ 26 accumu-lated much more Zn than that of cv. HUW 234, positive alleles at two of the five grain Zn QTl identified were inherited from the T. aestivum parent. Similar locations for four of the QTl specifically, QZn.bhu-2A (Cakmak et al. 2004; Peleg et al. 2009), QZn.bhu-3D (Xu et al. 2012), QZn.bhu-6A (Cakmak et al. 2004) and QZn.bhu-6B: (Cak-mak et al. 2004; Distelfeld et al. 2007; Genc et al. 2009; Peleg et al. 2009) have been previously identified in other populations. The wild emmer allele of the grain protein locus Gpc-B1 has been shown to also enhance grain Zn and Fe content, and maps to a position consistent with that of QZn.bhu-6A (Uauy et al. 2006). With respect to grain Fe concentration, the positive allele at only one of the five QTl was inherited from H+ 26. The location of two of the QFe-bhu loci coincides with previously mapped ones, namely, QFe-bhu-2A (Cakmak et al. 2004; Xu et al. 2012; Peleg et al. 2009; Tiwari et al. 2009) and QFe-bhu-3B (Peleg et al. 2009); Both H+ 26 and HUW 234 alleles contributed an additive effect on grain Zn and Fe concen-tration, showing that the positive alleles were dispersed across the two parents; as a result, transgressive segregation occurred.
Biofortification of wheat can be achieved through plant breeding without affecting the yield or quality (Velu et al. 2012). It is also a more sustainable and cost-effective solu-tion (White and Broadley 2005). Significant knowledge has been gained on the molecular mechanisms affecting the accumulation of Fe (Bauer et al. 2004; Cakmak 2002) and Zn (Hacisalihoglu and Kochian 2003) in plants. In future, these researches could be applied to develop crops with enhanced mineral concentration through functional (DnA sequence) markers in conventional breeding or molecular targets for genetic engineering (Hacisalihoglu and Kochian
2003). In this study, five QTl for grain Zn were identified, each mapping to a different chromosome, while the five Fe QTl mapped to just three chromosomes. Multi-environ-mental experiments in wheat have led to the recognition of a number of QTl underlying grain micronutrient concen-trations, which are effective across a range of environments (Peleg et al. 2009; Tiwari et al. 2009). Such loci would rep-resent the prime target of any marker-aided selection effort aimed at enhancing grain Fe and/or Zn content, avoiding loci associated with large QeIs (Jansen et al. 1995). The difficulty of using conventional breeding to improve grain mineral content means that marker-aided selection would be an attractive proposition, provided that robust QTl can be identified (Gupta et al. 2010).
Acknowledgments The authors are grateful for constructive sug-gestions made by Wolfgang Pfeifer (HarvestPlus) and ravi P. Singh and Hans J. Braun (CIMMYT, Mexico) in the course of this study. Support rendered by Uttam Kumar, CIMMYT in molecular analysis is also gratefully acknowledged.
Conflict of interest The authors declare that they have no conflict of interest.
Ethical standard All experiments complied with the current laws of the India, the country in which they were performed.
References
Balint AF, roder MS, Hell r, Galiba G, Borner A (2007) Map-ping of QTls affecting copper tolerance and the Cu, Fe, Mn and Zn contents in the shoots of wheat seedlings. Biol Plant 51:129–134
Bauer P, Thiel T, Klatte M, Bereczky Z, Brumbarova T, Hell r, Grosse I (2004) Analysis of sequence, map position, and gene expression reveals conserved essential genes for iron uptake in Arabidopsis and tomato. Plant Physiol 136:4169–4183
Cakmak I (2002) Plant nutrition research: priorities to meet human needs for food in sustainable ways. Plant Soil 247:3–24
Cakmak I, Torun A, Millet e, Feldman M, Fahima T, Korol AB, nevo e, Braun HJ, Ozkan H (2004) Triticum dicoccoides: an impor-tant genetic resource for increasing zinc and iron concentration in modern cultivated wheat. Soil Sci Plant nutr 50:1047–1054
Distelfeld A, Cakmak I, Peleg Z, Ozturk l, Yazici AM, Budak H, Saranga Y, Fahima T (2007) Multiple QTl-effects of wheat Gpc-B1 locus on grain protein and micronutrient concentrations. Physiol Plant 129:635–643
FAO (2013) Food outlook. november 2013. Biannual report on global food markets. FAO trade and markets division. FAO, rome. http://www.fao.org/docrep/019/i3473e/i3473e.pdf
Feil B, Fossati D (1995) Mineral composition of triticale grains as related to grain yield and grain protein. Crop Sci 35:1426–1431
Fiel B, Moser S, Jampatong S, Stamp P (2005) Mineral composi-tion of the grains of tropical maize varieties as affected by pre-anthesis drought and rate of nitrogen fertilization. Crop Sci 45:516–523
Genc Y, Verbyla A, Torun A, Cakmak I, Willsmore K, Wallwork H, McDonald G (2009) Quantitative trait loci analysis of zinc effi-ciency and grain zinc concentration in wheat using whole genome average interval mapping. Plant Soil 314:49–66
Author's personal copy
1651Theor Appl Genet (2014) 127:1643–1651
1 3
Graham rD, Senadhira SB, Iglesias C, Monasterio I (1999) Breeding for micronutrient density in edible portions of staple food crops: conventional approaches. Field Crops res 60:57–80
Gregorio GB (2002) Progress in breeding for trace minerals in staple crops. J nutr 132:500S–502S
Gupta PK, langridge P, Mir rr (2010) Marker-assisted wheat breed-ing: present status and future possibilities. Mol Breed 26:145–161
Hacisalihoglu G, Kochian lV (2003) How do some plants tolerate low levels of soil zinc? Mechanisms of zinc efficiency in crop plants. new Phytol 159:341–350
Hallauer Ar, Miranda Filho JB (1981) Quantitative genetics in maize breeding. Iowa State University Press, Ames
Jansen rC, Van Ooijen JM, Stam P, lister C, Dean C (1995) Geno-type by environment interaction in genetic mapping of multiple quantitative trait loci. Theor Appl Genet 91:33–37
Joshi AK, Kumar S, Ferrara O, Chand r (2004) Inheritance of resist-ance to spot blotch caused by Bipolaris sorokiniana in spring wheat. Plant Breed 123:213–219
Joshi AK, Crossa I, Arun B, Chand r, Trethowan r, Vargas M, Ortiz-Monasterio I (2010) Genotype × environment interaction for zinc and iron concentration of wheat grain in eastern Gangetic plains of India. Field Crops res 116:268–277
li H, Ye G, Wang J (2007) A modified algorithm for the improvement of composite interval mapping. Genetics 175:361–374
liu ZH, Wang HY, Wang Xe, Zhang GP, Chen PD, liu DJ (2006) Genotypic and spike positional difference in grain phytase activ-ity, phytate, inorganic phosphorus, iron, and zinc contents in wheat (Triticum aestivum l.). J Cereal Sci 44:212–219
Messmer r, Fracheboud Y, Banziger M, Stamp P, ribaut JM (2011) Drought stress and tropical maize: QTl for leaf greenness, plant senescence, and root capacitance. Field Crops res 124:93–103
Morgonuov A, Gómez-Becerra HF, Abugalieva A, Dzhunusova M, Yessimbekova M, Muminjanov H, Zelenskiy Y, Ozturk l, Cak-mak I (2007) Iron and zinc grain density in common wheat grown in Central Asia. euphytica 155:193–203
Ozkan H, Brandolini A, Torun A, Altintas S, eker S, Kilian B, Braun HJ, Salamini F, Cakmak I (2007) natural variation and iden-tification of microelements content in seeds of einkorn wheat (Triticum monococcum). In: Buck HT, nisi Je, Salomon n (eds) Wheat production in stressed environments. Springer, Berlin, pp 455–462
Paltridge nG, Palmer lJ, Milham PJ, Guild Ge, Stangoulis JCr (2012) energy-dispersive X-ray fluorescence analysis of zinc and iron concentration in rice and pearl millet grains. Plant Soil 361:251–260
Peleg Z, Saranga Y, Yazici MA, Fahima T, Ozturk l, Cakmak I (2008) Grain zinc, iron and protein concentrations and zinc-efficiency in wild emmer wheat under contrasting irrigation regimes. Plant Soil 306:57–67
Peleg Z, Cakmak I, Ozturk l, Yazici A, Jun Y, Budak H, Korol AB, Fahima T, Saranga Y (2009) Quantitative trait loci conferring grain mineral nutrient concentrations in durum wheat × wild emmer wheat rIl population. Theor Appl Genet 119:353–369
Peterson CJ, Johnson VA, Mattern PJ (1986) Influence of cultivar and environment on mineral and protein concentrations of wheat flour, bran, and grain. Cereal Chem 63:118–186
Pomeranz Y, Dikeman e (1983) Minerals and protein contents in hard red winter wheat flours. Cereal Chem 60:80–82
raboy V, noaman MH, Taylor GA, Pickett SG (1991) Grain phytic acid and protein are highly correlated in winter wheat. Crop Sci 31:631–635
rengel Z, Batten GD, Crowley De (1999) Agronomic approaches for improving the micronutrient density in edible portions of field crops. Field Crops res 60:27–40
ribaut JM, Jiang C, Gonzalez-de-leon D, edmeades GO, Hoisington DA (1997) Identification of quantitative trait loci under drought conditions in tropical maize 1 Yield components and marker assisted selection strategies. Theor Appl Genet 94:887–896
Salvi S, Tuberosa r (2005) To clone or not to clone plant QTls: pre-sent and future challenge Trends. Plant Sci 10:297–304
Singh rP, rajaram S (1991) Genetics of adult-plant resistance of leaf rust in ‘Frontana’ and three CIMMYT wheats. Genome 35:24–31
Tiwari VK, rawat n, Chhuneja P, neelam K, Aggarwal r, randhawa GS, Dhaliwal HS, Keller B, Singh K (2009) Mapping of quantita-tive trait loci for grain iron and zinc concentration in diploid A genome wheat. J Hered 100:771–776
Trethowan rM (2007) Breeding wheat for high iron and zinc at CIM-MYT: state of the art, challenges and future prospects In: Pro-ceedings of the seventh international wheat conference Mar del Plata, Argentina
Trethowan rM, reynolds M, Sayre KD, Ortiz-Monasterio I (2005) Adapting wheat cultivars to resource conserving farming prac-tices and human nutritional needs. Ann Appl Bio 146:405–413
Tuberosa r, Sanguineti MC, landi P, Giuliani MM, Salvi S, Conti S (2002) Identification of QTl for root characteristics in maize grown in hydroponics and analysis of their overlap with QTl for grain yield in the field at two water regimes. Plant Mol Biol 48:697–712
Uauy C, Distelfeld A, Fahima T, Blechl A, Dubcovsky J (2006) A nAC gene regulating senescence improves grain protein, zinc, and iron content in wheat. Science 314:1298–1301
Velu G, Singh rP, Huerta-espino J, Peña-Bautista rJ, Arun B, Mahendru-Singh A, Yaqub Mujahid M, Sohu VS, Mavi GS, Crossa J, Alvarado G, Joshi AK, Pfeiffer WH (2012) Performance of biofortified spring wheat genotypes in target environments for grain zinc and iron concentrations. Field Crops res 137:261–267
Welch rM, Graham rD (2004) Breeding for micronutrients in sta-ble food crops from a human nutrition perspective. J exp Bot 55:353–364
Welch rM, House WA, Ortiz-Monasterio I, Cheng Z (2005) Potential for improving bioavailable zinc in wheat grain (Triticum species) through plant breeding. J Agric Food Chem 53:2176–2180
White PJ, Broadley Mr (2005) Biofortifying crops with essential mineral elements. Trends Plant Sci 10:586–593
Xu YF, An DG, liu DC, Zhang AM, Xu HX, li B (2012) Molecular mapping of QTls for grain zinc, iron and protein concentration of wheat across two environments. Field Crops res 138:57–62
Zhao FJ, Su YH, Dunham SJ, rakszegi M, Bedo Z, McGrath SP, Shewry Pr (2009) Variation in mineral micronutrient concen-trations in grain of wheat lines of diverse origin. J Cereal Sci 49:290–295
Author's personal copy