hydraulic acclimation to shading in boreal conifers of varying shade tolerance
TRANSCRIPT

Hydraulic acclimation to shading in boreal conifers ofvarying shade tolerancepce_2088 382..393
AMANDA L. SCHOONMAKER1, UWE G. HACKE1, SIMON M. LANDHÄUSSER1, VICTOR J. LIEFFERS1 &MELVIN T. TYREE1,2
1Department of Renewable Resources, University of Alberta, Edmonton, AB, Canada, T6G 2H1 and 2Northern ExperimentStation, US Forest Service, 709 Spear St, S. Burlington, VT 05403, USA
ABSTRACT
The purpose of this study was to determine how shadingaffects the hydraulic and wood-anatomical characteristicsof four boreal conifers (Pinus banksiana, Pinus contorta,Picea glauca and Picea mariana) that differ in shade tol-erance. Plants were grown in an open field and under adeciduous-dominated overstory for 6 years. Sapwood- andleaf-area specific conductivity, vulnerability curves, andanatomical measurements (light and scanning electronmicroscopy) were made on leading shoots from six to ninetrees of each treatment combination. There was no differ-ence in sapwood-area specific conductivity between open-grown and understory conifers, although two of four specieshad larger tracheid diameters in the open. Shaded conifersappeared to compensate for small diameter tracheids bychanges in pit membrane structure. Scanning electronmicroscopy revealed that understory conifers had thinnermargo strands, greater maximum pore size in the margo,and more torus extensions. All of these trends may contrib-ute to inadequate sealing of the torus. This is supported bythe fact that all species showed increased vulnerability tocavitation when grown in the understory. Although evapo-rative demand in an understory environment is low, a rapidchange into fully exposed conditions could be detrimentalfor shaded conifers.
Key-words: cavitation; conductivity; pine; spruce; waterrelations; wood anatomy.
INTRODUCTION
Shade-tolerant trees have adopted a suite of strategies toprolong their survival in shade (Walters & Reich 1999).These include changing the spatial arrangement and mor-phology of leaves, increasing the allocation of C towardsleaf production in order to maximize light capture (Givnish1988; Pearcy 2007), reducing allocation of C to the rootsystem (Callaway 1992; Landhäusser & Lieffers 2001; Ren-ninger, Gartner & Meinzer 2006; Pearcy 2007) and loweringrespiration rates and photosynthetic compensation pointsof foliage (Callaway 1992).The sheltered environment of an
understory also has reduced potential evaporative demandsand wind speeds (Bladon et al. 2006). Given these changes,one also would expect the hydraulic architecture to bealtered by the sheltered understory environment. To date,however, little research has actually tested this idea in afield experiment.
Angiosperm seedlings grown under artificial shade orlow light have demonstrated reduced leaf-specific conduc-tivity (Schultz & Matthews 1993; Shumway, Steiner & Kolb1993; Brodribb, Holbrook & Hill 2005) whereas suppressed(reduction in height growth because of shading and compe-tition by surrounding overstory trees) conifers have previ-ously shown no reduction (Renninger, Meinzer & Gartner2007). Shading has been associated with reduced sapwood-area specific conductivity in lower branches relative toupper sun-exposed branches of Pinus contorta (Protz, Silins& Lieffers 2000). Suppression reduced sapwood-area spe-cific conductivity in Pseudotsuga menziesii, Tsuga hetero-phylla and Picea abies compared with released (previouslysuppressed trees where the overstory had been rem-oved) (Renninger et al. 2006) or sun-exposed (Sellin 1993)individuals.
The xylem pressure causing 50% loss in hydraulic con-ductivity (P50), a proxy of cavitation resistance, was lessnegative in four artificially shaded European deciduousangiosperm seedlings (Barigah et al. 2006) as well as inshaded versus sun-lit branches of Fagus sylvatica (Cochard,Lemoine & Dreyer 1999; Lemoine, Cochard & Granier2002). The relative magnitude of the decline in cavitationresistance, however, did not appear to be related to theinherent shade tolerance of the individual angiospermsmeasured (Barigah et al. 2006). It is unclear whether thesefindings are more widely applicable to conifers and espe-cially under field conditions.
The mechanism driving cavitation resistance in conifersis not completely understood. Most recently, Cochardet al. (2009) have suggested capillary failure as a possiblecandidate and further speculated that incomplete contactbetween the torus and pit chamber or pores within the toruscould allow air entry. Across a variety of northern hemi-sphere conifer species, resistance to cavitation and pitresistance have been positively correlated (Pittermann et al.2006a). Higher wood density and smaller diameter tracheidshave also been correlated with increased cavitation
Correspondence: A. L. Schoonmaker. Fax: +(780) 492 1767; e-mail:[email protected]
Plant, Cell and Environment (2010) 33, 382–393 doi: 10.1111/j.1365-3040.2009.02088.x
© 2010 Blackwell Publishing Ltd382
resistance (Hacke et al. 2001; Pittermann et al. 2006b; Hacke& Jansen 2009).As tracheid diameter tends to be narrower inshaded branches or suppressed individuals (Protz et al. 2000;Renninger et al. 2006), it could be inferred that shadingshould increase resistance to cavitation; however, this rela-tionship was not detected in shaded angiosperms (Cochardet al. 1999; Lemoine et al. 2002; Barigah et al. 2006). Thereappears to be a correlation between increased cavitationresistance and declining pit aperture diameter with heightin both Pseudotsuga menziesii and Sequoia sempervirens(Burgess,Pittermann & Dawson 2006;Domec,Lachenbruch& Meinzer 2006; Domec et al. 2008). Similarly, Mayr,Wolfschwenger & Bauer (2002) found that the ratio of pitaperture : pit diameter declined with increased elevationand cavitation resistance in Picea abies. There is little infor-mation, however, on how these characteristics change inunderstory conifers and how these are affected by the shadetolerance of the species. Given the uncertainties regardingcavitation resistance and how this relates to the tracheidanatomy of conifers, further investigation is warranted.
The objective of this study was to assess how understoryshading influences the hydraulic architecture and tracheidanatomy of boreal conifers of varying shade tolerance,grown in either full light or under a deciduous-dominatedcanopy.We studied two shade intolerant pines (Pinus bank-siana and Pinus contorta) and two shade tolerant spruces(Picea mariana and Picea glauca). In the boreal forests ofwestern Canada, both pines are early-successional speciesthat typically establish after stand-replacing disturbances.Picea glauca commonly regenerates underneath an over-story of aspen (Populus tremuloides) and will eventuallyovertop the aspen and become a dominant tree. In contrast,Picea mariana is a common inhabitant of low-lying areasthat are often poorly drained. However, it is also oftenfound regenerating in high densities underneath a canopydominated by Pinus contorta and sparsely in the understoryof aspen-dominated stands. We are hypothesizing thatunderstory grown conifers will have: (1) increased vulner-ability to embolism compared with open-grown conifers;(2) lower sapwood-area specific conductivity driven bysmaller tracheid diameters; and (3) lower leaf-area specificconductivity and soil-to-plant hydraulic conductancecompared with open-grown conifers. Given that Piceaglauca has shown greater morphological plasticity (relativeto Pinus contorta) when grown in this type of shade(Landhäusser & Lieffers 2001) we are expecting that thedifferences between open and understory conifers will belarger in the shade-tolerant spruces than the shade-intolerant pines.
METHODS
Study location and experimental design
One-year-old Pinus banksiana Lamb, Pinus contorta Dougl.Ex Loud., Picea mariana (Mill) B.S.P. and Picea glauca(Moench) Voss seedlings (nursery-grown container stockgrown from local seed sources) were planted in the spring
of 2000 at the University of Alberta Farm (Ellerslie),Edmonton, Alberta (53°N 113°W). Forty seedlings of eachspecies were planted in an open field at 1.0 m spacing.Another set of seedlings (50 of each species) were plantedin a nearby aspen-dominated forest. Average leaf areaindex (LAI) in the stand was 1.82 � 0.24 (mean � standarddeviation) (LAI-2000, Licor, Lincoln, NE, USA) with anaverage light transmission of 21.5 � 5.5%. Seedlings werearranged at 0.5 m spacing in 10 separate plots (five seed-lings of each species) to account for the variability in lightconditions in the understory environment. After the firstestablishment year, two seedlings of each species in eachunderstory plot and 10 seedlings of each species in the openarea were caged to prevent browsing over the followingyears. Seedlings were grown for a total of 6 years through-out which they were kept weed free. For the first 3 years allseedlings were watered during periods of summer drought(June–August) and fertilized with a slow release fertilizer(Osmocote 14-14-14 N-P-K, Scotts Miracle-Gro, Marysville,OH, USA) in order to ensure establishment.After the thirdyear, no additional watering or fertilization took place.
Growth measurements
Six trees of each species growing in the open field anddeciduous understory were harvested in August 2007. Totalheight and diameter at the root base were measured tothe nearest 0.5 mm. To determine whole tree leaf area (Al),projected leaf area was determined on a sub-sample offresh needles collected from each tree using Winfolia(Regent Instruments Inc., Quebec City, Canada) imageanalysis software. Measured needles were oven-driedand weighed. The remaining needles on each tree wereremoved, oven-dried and weighed. The relationshipbetween needle dry weight and projected leaf area from thesub-samples was used to calculate Al for each tree.
Soil-to-plant hydraulic conductance
To determine soil-to-plant hydraulic conductance (Ks-p), 12trees of each species growing in the open field and decidu-ous understory were selected. Measurements were con-ducted over 4 d (August 1, 2, 15 and 16, 2007) and six pineand spruce trees from the understory and open were mea-sured each day (Saliendra, Sperry & Comstock 1995;Andrade et al. 1998; Sellin 2001). A summary of ambientconditions during the 4 d period (Environment Canada2009) is given in Table 1. The afternoon prior to the mea-surement day, a current year branch from upper crownposition was covered with foil and a plastic bag to reducecuticular transpiration. Pre-dawn (3:00–6:00) and midday(11:30–15:00) water potential (Yplant) measurements weremade on current year shoots using a Scholander pressurechamber (PMS Instruments, Corvallis, OR, USA). Middaymeasurements of transpiration (E) were taken with asteady-state porometer (Li-cor 1600, Lincoln, NE, USA)concurrently with the Yplant measurements. Using thesemeasurements, Ks-p was determined as:
Hydraulic acclimation to shading in conifers 383
© 2010 Blackwell Publishing Ltd, Plant, Cell and Environment, 33, 382–393

KEP
s p− =Δ
(1)
where DP = ymidday - ypredawn.
Hydraulic conductivity and vulnerability curves
Hydraulic conductivity (kh) was measured on 2-year-oldapical stem segments from late September to mid-October2007. For the open-grown pines, however, 2-year-old seg-ments were too large for the apparatus so 1-year-old stemsegments were used. In order to ensure that one and 2-year-old stems of open-grown pines gave comparable results wemeasured conductivity and vulnerability curves on smallerPinus contorta saplings that were growing adjacent to theopen-grown individuals in this study. Vulnerability curvesconstructed from 1- and 2-year-old stems of these smallertrees were not significantly different from one another(data not shown). We followed a similar measurement pro-cedure as in Pittermann et al. (2006a) and Hacke & Jansen(2009) where a 14.2 cm segment was sealed to hoses on bothends and a small pressure head of filtered (0.2 mm) 20 mmKCl + 1 mm CaCl2 solution was applied with outflow beingmeasured every 10 s on a balance (CP225D, Sartorius,Göttingen, Germany). When outflow stabilized (within2–5 min), we used the average outflow over the previous40 s in order to calculate hydraulic conductivity asexpressed in:
khWater flow segment length
Pressure head= ×
(2)
Hydraulic conductivity was measured both before and afterflushing the stems with the same solution for 20 min at apressure of 10 kPa in order to remove any native embolism.Overall, there was little or no change between pre- andpost-flushing measurements; thus the maximum conductiv-ity was taken as the larger of the two values obtained.Cross-sectional sapwood area (Aleader) was measured with astereomicroscope (MS5, Leica, Wetzlar, Germany) andimage-analysis software (ImagePro Plus 6.1, Media Cyber-netics, Silver Spring, MD, USA). All needles distal to themeasured segment were collected and distal leaf area(Adistal leaf) was determined similarly as in whole-plantleaf area measurement. Thus, sapwood-area specific con-ductivity (ks) and leaf-area specific conductivity (kl) wereexpressed as:
kk
As
h
leader
= (3)
kk
Al
h
distal leaf
= (4)
Vulnerability to cavitation was determined by centrifug-ing a 14.2 cm stem segment to a known negative pressure for10 min and then measuring the resulting conductivity. Eachsegment was repeatedly measured through a series of pres-sures (5–9 pressures depending on the species ¥ treatment;for more details see Pittermann et al. 2006a; Hacke & Jansen2009). The relationship between loss of conductivity andxylem pressure was fitted to two functions commonly usedfor this type of data. The first was a sigmoidal-exponentialfunction (Pammenter & Vander Willigen 1998):
PLCe
=+ −( )
1001 a x b
(5)
where x is the xylem pressure (MPa) at a correspondingPLC and a and b are coefficients that describe the slope andxylem pressure at 50% loss of conductivity (P50).The secondwas a Weibull function (Li et al. 2008):
PLC e= −⎡
⎣⎢
⎤
⎦⎥
− −( )100 1x
b
c
(6)
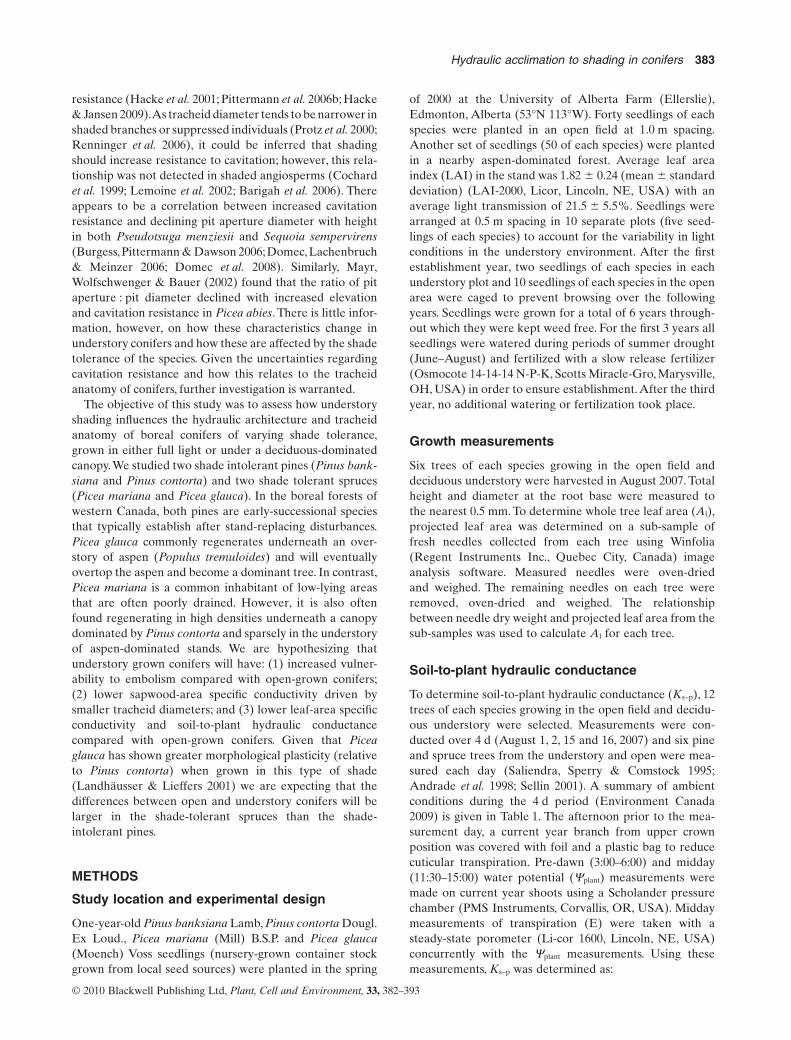
where b determines the xylem pressure at 63.2% loss ofhydraulic conductivity and c the steepness of the slope at b.Of the two fitted functions, we chose the one resulting in thebest fit for each curve. The vulnerability curves fitting thedata for each species (Fig. 1) were determined based onthe best fit for all of the data for all stems measured. Addi-tionally, individual curves for each measured stem werefitted in order to estimate individual P50 measures thatwere averaged between species and growing environment(Fig. 2a).
Xylem anatomical measurements:light microscopy
The anatomical measurements and parameters derivedfrom these measurements follow the methodology andmodeling in Pittermann et al. (2006a,b) and Sperry et al.(2007). The same apical stem segments used in ks and vul-nerability measurements were also used for the anatomicalmeasurements. Tracheid diameters (Dm) were measuredon three radial files (two to three cells wide) on thincross-sections of the entire stem with a Leica DM3000microscope at 200¥ magnification and analyzed with imageanalysis software (ImagePro). This generated between500–1100 individual diameter measurements per stemthat included early and latewood tracheids. Average lumenresistivity (RL) and the average lumen diameter (D) corre-sponding to RL for each stem were expressed as:
Table 1. Average air temperature (Temp), photosyntheticallyactive radiation (PAR) and vapor pressure deficit (VPD) duringthe period 11:00–15:00
Date Temp (°C) PAR (mmol s-1 m-2) VPD (kPa)
August 1 2007 21.3 1634.2 1.14August 2 2007 25.3 1306.5 1.74August 15 2007 18.6 745.7 0.96August 16 2007 21.6 1264.2 1.35
PAR was measured in open conditions.
384 A. L. Schoonmaker et al.
© 2010 Blackwell Publishing Ltd, Plant, Cell and Environment, 33, 382–393
RD
Lm4
=∑128η
π(7)
DR
= 1284
ηπ L
(8)
where h is the viscosity of water at 20 °C and Dm is themeasured diameters of individual tracheids. Additionally,all of the tracheids measured in a species ¥ treatment com-bination were pooled and summarized in a frequency his-togram (Supporting Information Appendix S2)
Using the same cross-sections as earlier, tracheid densitywas also estimated by counting the number of tracheids ineach radial profile (which contained no rays) and multiply-ing it by the fraction of tracheid-occupied sapwood. Trac-heid length (L) and pit measurements were determined bydigesting wood sections in a 1:1 mixture of glacial aceticacid (80%) and hydrogen peroxide (30%) for 48 h at 60 °C(Chaffey 2002). Macerated tissues were mounted on slidesand average tracheid length determined by measuring aminimum of 50 tracheids using a light microscope at 25¥magnification with image analysis software. One-sided tra-cheid surface area and the total number and area of inter-tracheid pits were measured on five tracheids per stem.Given that inter-tracheid pits will occupy only the radialwalls of a tracheids we divided the total area occupied bypits on one radial wall by two times the area of a single
tracheid wall in order to obtain the fraction of tracheidsurface area (Fp) occupied by inter-tracheid pits:
FpTotal area occupied by pits2 one-sided tracheid area
=×
(9)
If it is assumed that a tracheid may approximate a rectanglethen the total inter-tracheid pit area per tracheid (Ap) canby given as:
A DLFP P= 4 (10)
Tracheid resistivity (Rc) is given as:
R R R Rc L w xatracheid density= + = × (11)
where Rw is the end wall resistivity and Rxa is the inverse ofks. Pit-area resistance (rp) is given as:
rR L A
pw P= ′
2(12)
where L′ is the distance between tracheid end walls, aparameter that is assumed to approximate half the tracheidlength (L), because tracheids will overlap by half onaverage (Lancashire & Ennos 2002; Pittermann et al.2006a).
Figure 1. Vulnerability curves of (a)Piba (Pinus banksiana), (b) Pico (Pinuscontorta), (c) Pima (Picea mariana) and(d) Pigl (Picea glauca) grown in an openfield (open) or in an aspen-dominatedunderstory (understory). Error bars are 1standard error of the mean. (n = 6–9).
(c) Pima
Xylem pressure (MPa)
Lo
ss in
con
du
ctivity (
%)
0
20
40
60
80
100(d) Pigl
−8 −6 −4 −2 0 −8 −6 −4 −2 0
(b) Pico(a) Piba
Lo
ss in
co
nd
uctivity (
%)
0
20
40
60
80
100
Understory
Open
Xylem pressure (MPa)
Hydraulic acclimation to shading in conifers 385
© 2010 Blackwell Publishing Ltd, Plant, Cell and Environment, 33, 382–393

Xylem anatomical measurements: scanningelectron microscopy (SEM)
Because of the labor-intensive nature of SEM measure-ments, we focused on describing two species (Pinus contortaand Picea mariana). We measured pit anatomical param-eters on the same plant material used in hydraulic andvulnerability curve measurements (n = 6). Samples wereprepared for SEM measurements following a modified pro-cedure from Jansen, Pletsers & Sano (2008). Specifically,1-cm-long frozen wood sections were split in half andthawed in distilled water for 5 d. After soaking, they weresubjected to an ethanol dehydration series (30, 50, 70 and
90% for 0.5 h in each concentration), immersed for 12 h in100% ethanol and finally air-dried for at least 24 h. Wefound this procedure was very effective in minimizingaspiration of bordered pits. Dried samples were split again,mounted on aluminum stubs with silver paint (Ted PellaInc., Redding, CA, USA) and a thin layer of chromium(1–2 nm) was applied with a sputter coater for 1 min. Pho-tographs were taken with a JEOL 6301F field-emissionscanning electron microscope (JEOL Ltd., Tokyo, Japan)at an accelerating voltage of 2.5 kV. Only earlywood pitswere used for measurements. In the further discussion wedescribe the measurement procedure for a single stemsegment (24 stem segments in total were measured fromeach species ¥ light treatment). For measurement of pit,aperture and torus area and diameter, photographs weretaken at 1000¥ magnification, resulting in the use of 6–20pits per image. Approximately 25–60 pits were measuredand averaged for each individual stem. For measurement ofthe margo parameters (strand length, width, pore size, porefraction and extended torus) 17–21 individual pits werephotographed at 5000–11000¥ magnification. For each pit,we randomly measured the length of 4–8 margo strands and8–12 strand widths and obtained an average for each pit.Weselected a representative section of intact margo (approxi-mately one-fourth to one-half of the entire margo area) andmeasured the area of each pore and determined the meanand maximum pore area for each pit. The pore fractionrepresents the area taken up by pores relative to the wholemargo (strands and pores). The presence of an extendedtorus was defined as a bridge of amorphous material thatcontinuously connects the central torus with the pit border(Sano, Kawakami & Ohtani 1999). Individual pit-level mea-surements were averaged for each stem segment analysed.Image analysis software (ImagePro) was used in the mea-surement of all pit structures.
Wood density
Wood density (r) was measured by water displacement.Specifically, the bark and pith was removed with tweezersand a razor blade from a 2.5-cm-long stem section that wassubsequently inserted with a pin into a beaker of water ona balance to determine the fresh volume of wood. Stemswere then oven-dried at 80 °C for 48 h. Wood density wasexpressed as the dry mass divided by the fresh volume.
Statistical analysis
R (R Development Core Team 2006) statistical environ-ment for statistical computing and graphics was used forall statistical analyses performed. The non-linear regres-sion function nls was used to estimate parameters of thesigmoidal-exponential and Weibull functions used to fitthe loss of conductivity versus xylem pressure data for eachspecies ¥ environment and individual stem segments. Plotsof predicted-y versus residuals and calculated r2 valueswere compared in order to determine which function bestfit the data. T-tests (function t.test) were performedwithin species (not between) in order to separate means of
(b)
Piba Pico Pima Pigl
ks (
mm
2 k
Pa
−1 s
−1)
0.0
0.2
0.4
0.6
0.8
(a)
P50 (
MP
a)
−5
−4
−3
−2
−1
0
Open
Understory
Species
* *
**
Figure 2. Average (a) xylem pressure causing a 50% loss ofconductivity (P50) and (b) sapwood-area specific conductivity (ks)for Piba (Pinus banksiana), Pico (Pinus contorta), Pima (Piceamariana) and Pigl (Picea glauca) grown in an open field (open)or under an aspen-dominated understory (understory). Errorbars are 1 standard error of the mean (n = 6). * indicates themeans of within species comparison are significant at a � 0.05.
386 A. L. Schoonmaker et al.
© 2010 Blackwell Publishing Ltd, Plant, Cell and Environment, 33, 382–393

open-grown and understory saplings within each species.Means were considered significantly different at a � 0.05.Assumptions of normality and homogeneity of vari-ances were assessed with diagnostic plots, normalitytests (function ad.test, cvm.test, lillie.test,pearson.test, sf.test) and an F-test (functionvar.test). Where variances were unequal, we used Welch’stwo sample t-test to account for unequal variances.Results of within species t-tests (p-values and degreesof freedom) are presented in supplemental materials(Supporting Information Appendix S3).
RESULTS
Xylem pressure corresponding to a 50% loss in conductivity(P50) was consistently less negative (more vulnerable) in allspecies grown in the understory (Figs 1 & 2a). However, thegreatest shift was observed in understory Picea marianawhere the average P50 was 50% of open-grown saplings(Fig. 2a). No statistical difference was detected in theaverage sapwood-area specific conductivity (ks) betweenopen-grown and understory conifers (Fig. 2b). Leaf areaspecific conductivity (kl) was significantly lower in all under-story conifers compared with their open-grown counter-parts (Fig. 3a). Soil-to-plant hydraulic conductance (Ks-p)increased in open-grown Pinus contorta and Picea glaucacompared with understory saplings whereas no change wasobserved between open and understory Pinus banksianaand Picea mariana (Fig. 3b).
Wood density (r) was significantly higher in all under-story saplings compared with open-grown conifers (Fig. 4a).There was no difference in tracheid length between openand understory conifers (Fig. 4b). Average lumen diameter(D) was significantly larger in open-grown Pinus contortaand Picea glauca relative to their understory counterparts(Fig. 4c). Corresponding with trends in r and D, tracheiddensity was also higher in understory Pinus contorta, Piceamariana and Picea glauca saplings relative to open-grownsaplings (Fig. 4d).
On average, the width of margo strands was significantlyreduced, whereas the maximum pore area was significantlylarger in understory Pinus contorta and Picea mariana
compared with open-grown individuals (Figs 5 & 6a,c).There was no difference in margo strand length betweenopen and understory conifers (Table 2). Mean pore area,fraction of area occupied by pores (pore fraction), extendedtorus area and the occurrence of torus extensions weresignificantly higher in Picea mariana grown in the under-story compared with the open (Fig. 6b,d–f). No differencewas detected in these parameters between understory andopen-grown Pinus contorta (Fig. 6b,d–f). Open-grownPinus contorta had significantly larger tori and pit aperturediameters compared with understory saplings (Table 2).Tori and overall pit diameters were also significantly largerin open-grown Picea mariana (Table 2). The ratio of torus-: pit area was also larger in open-grown individuals of
Pinus contorta, whereas the torus : aperture area ratio wassignificantly larger in open-grown Picea mariana comparedwith understory saplings (Table 2).
Tracheid resistivity (Rc) showed no consistent trendbetween open and understory saplings (Table 3). Corre-sponding with larger values of D,open-grown Pinus contortaand Picea glauca had lower lumen resistivities (RL)(Table 3). The importance of Rw is clearly seen in the wallfraction, as the end wall component comprised upwards of75% of total resistivity across all open-grown conifers butwas 72% in shaded conditions for both pines and 61–62% inthe spruces (Table 3). Pit resistance (rp) was higher in open-grown individuals of Pinus contorta compared with those inthe understory (Table 3). The number of pits per tracheidwas higher in open-grown Picea mariana compared withunderstory but remained unchanged in all other conifers(Table 3).
Average height, root collar diameter and total leaf area onleading shoots were significantly larger in all open-grownconifers compared with understory conifers (Table 4).Leader leaf area to xylem area (LA : SA) was consistentlyhigher in shaded conditions. When LA : SA was expressedon a whole plant basis, however, the same trend observed inleading shoots was only expressed in Picea mariana. Pinuscontorta showed the opposite pattern (significantly higherLA : SA in open compared with understory) and no differ-ence was observed between open and understory grownPinus banksiana or Picea glauca (Table 4).
Figure 3. Average (a) leaf area specificconductivity (kl) and (b) soil-to-planthydraulic conductance (Ks-p) for Piba(Pinus banksiana), Pico (Pinus contorta),Pima (Picea mariana) and Pigl (Piceaglauca) grown in an open field (open) orunder an aspen-dominated understory(understory). Error bars are 1 standarderror of the mean (n = 6 or 12).* indicates the means of within speciescomparison are significant at a � 0.05.
(a)
Species
Kl (
x1
0−4
mm
2 s
−1 k
Pa
−1)
0
2
4
6
8
10
12
14
OpenUnderstory
(b)
Piba Pico Pima PiglSpecies
Piba Pico Pima Pigl
Ks-p
(mm
ol m
−2 M
Pa
−1 s
−1)
0.0
0.5
1.0
1.5
2.0
2.5
3.0
* * *
*
**
Hydraulic acclimation to shading in conifers 387
© 2010 Blackwell Publishing Ltd, Plant, Cell and Environment, 33, 382–393

DISCUSSION
All four conifer species demonstrated significantly less nega-tive average P50 values when grown in the shade, indicatingthat they were all more susceptible to drought-induced cavi-tation compared with their open-grown counterparts. Thisresult supports our first hypothesis that understory trees willshow increased vulnerability to embolism and is in line withearlier studies on angiosperms (Cochard et al. 1999; Barigahet al. 2006). Interestingly, the magnitude of this response,both in terms of the average P50 (Fig. 2a) and shifting of theentire vulnerability curve (Fig. 1) was greater in the shade-tolerant spruces, Picea mariana in particular, compared withthe shade-intolerant pines. This indicates that the sprucesappear to have greater plasticity in cavitation resistance thanthe pines. In contrast, Barigah et al. (2006) did not observea change in the magnitude of cavitation resistance inangiosperms of differing shade tolerance.
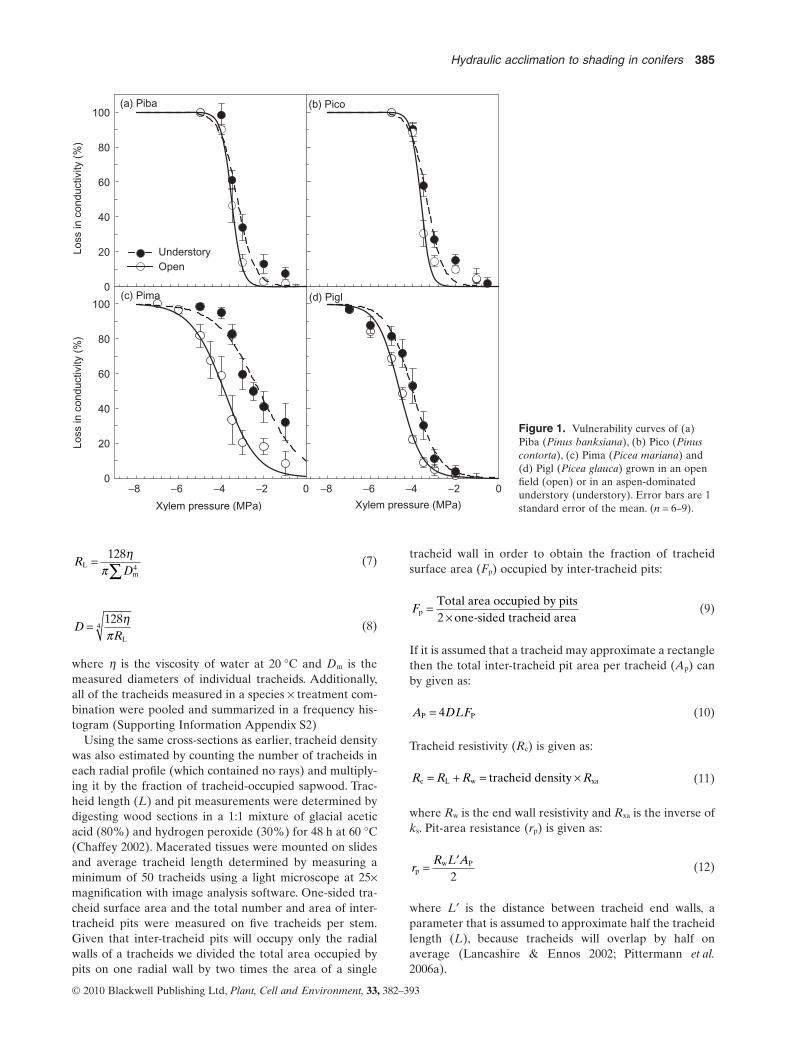
Although understory trees had significantly greater wooddensities and reduced tracheid diameters (D), they also hadmore vulnerable xylem, which contrasts with previous workwhere increased cavitation resistance was positively corre-lated with increasing wood density and decreasing D(Hacke et al. 2001; Hacke & Jansen 2009). Based on ourSEM measurements we suggest three possible mechanisms(that may also operate simultaneously) by which under-story conifers could become more susceptible to cavitation.Mechanism 1: the width of margo strands was significantlysmaller in both understory conifers (Pinus contorta andPicea mariana) measured (Fig. 6a). From this and the factthat there were fewer margo strands in understory conifers,
we could infer that that these strands would be more likelyto tear and prevent the torus from sealing properly.Similarly, Domec et al. (2006) found that margo strandthickness was related to vulnerability in roots, trunkwoodand branches of Pseudotsuga menziesii. Mechanism 2:increased vulnerability could be driven by increased occur-rence and size of torus extensions (Fig. 6e,f). It is possiblethat these extensions are less flexible than the ‘regular’margo strands and may prevent complete sealing of thetorus. Our SEM measurements support this idea as both theoccurrence and the area of extensions were significantlylarger in shaded Picea mariana trees (Fig. 5d). Although wedid not observe a statistical difference in torus extensionsfor Pinus contorta, the average occurrence and size of torusextensions were in the same direction. Also, the differencein vulnerability was much larger between open and under-story Picea mariana than it was in Pinus contorta, thus itwould make sense that the magnitude of the responsewould be less in Pinus contorta. In support of this mecha-nism, Cochard et al. (2009) have suggested that capillaryfailure is a strong candidate driving cavitation resistance inconifers. They further speculated that air could seed inthrough lack of contact between the torus and pit wall.Mechanism 3: the ratio of torus : aperture area was signifi-cantly larger in open-grown Picea mariana compared withunderstory individuals (Table 2). Given that both open andunderstory saplings had similar sized apertures, the smallertori observed in understory Picea mariana would be moreeasily dislodged or not completely cover the pit aperture,allowing air entry to adjacent tracheids. Domec et al. (2008)also found an increased ratio of torus to aperture diameter
Figure 4. Average (a) wood density,(b) tracheid length, (c) lumen diameterand d) tracheid density for Piba (Pinusbanksiana), Pico (Pinus contorta), Pima(Picea mariana) and Pigl (Picea glauca)grown in an open field (open) or underan aspen-dominated understory(understory). Error bars are 1 standarderror of the mean (n = 6). * indicates themeans of within species comparison aresignificant at a � 0.05.
(a)
Wood d
ensity
(g c
m−3
)
0.0
0.1
0.2
0.3
0.4
0.5
0.6
0.7OpenUnderstory
(b)
Tra
cheid
length
(mm
)
0
200
400
600
800
1000
1200
(c)
Species
Lu
me
n d
iam
ete
r (m
m)
0
3
6
9
12
15(d)
Species
Tra
cheid
density
( #
/ m
m2)
0
1000
2000
3000
4000
5000
* *
**
*
*
*
* *
Piba Pico Pima Pigl Piba Pico Pima Pigl
388 A. L. Schoonmaker et al.
© 2010 Blackwell Publishing Ltd, Plant, Cell and Environment, 33, 382–393

in Pseudotsuga menziesii corresponding with increasedheight and cavitation resistance. However, in their case, thisratio appeared to be mainly driven by the pit aperture size.Interestingly, both the average torus diameter and pit aper-ture diameters were significantly larger in open-grownPinus contorta relative to understory individuals suggestingthat Mechanism 3 cannot explain the differences in P50
found in this particular species.We observed no decline in ks as a result of understory
shading (Fig. 2 b). This was an unexpected result asincreased transport capacity typically corresponds withlarger diameter tracheids (Pittermann et al. 2006a,b;Hacke & Jansen 2009). Given these results, how canunderstory conifers with significantly smaller diametertracheids (Pinus contorta and Picea glauca) still havecomparably efficient xylem to open-grown conifers? It ispossible that longer tracheids could offset smaller diam-eter tracheids to some extent. Hacke & Jansen (2009)actually observed a positive relationship between tracheidlength and ks. However, we did not observe a significantdifference in tracheid length between open and under-story conifers (Fig. 4b). A more probable explanationrelates to the reduced proportion of total resistivity attrib-uted to the end wall of the tracheid; the end-wall fraction
tended to be reduced in all understory conifers (signifi-cantly so for Pinus contorta and Picea glauca; Table 3).However, it was not the area or number of pits driving adecrease in end-wall resistivity as there was no statisticaldifference in these parameters between open and under-story conifers (Table 3). We did observe within the margothat the mean pore area in Picea mariana and maximumpore area in Pinus contorta and Picea mariana were sig-nificantly greater in the understory compared with theopen (Figs 5 & 6b,c); larger pores would allow water topass more easily through the bordered pit and woulddecrease end-wall resistivity (Hacke, Sperry & Pittermann2004; Wilson et al. 2008). This agrees with a tendency forhigher pit resistances in open-grown conifers (Table 3).Similarly, Domec et al. (2006) observed a tradeoff betweenpit conductivity and P50 in Pseudotsuga menziesii.
Our results contrast a series of earlier studies whereshading actually resulted in decreased sapwood-area con-ductivity in conifers (Sellin 1993, 2001; Protz et al. 2000;Reid, Silins & Lieffers 2003; Renninger et al. 2007). We aresuggesting three possibilities that could account for thediscrepancy between our study and the previous investi-gations. Firstly, the absolute amount of shade couldhave influenced previous results. All studies had coniferous
Figure 5. Scanning electron microscopyimages showing typical bordered pitstructures of (a) open-grown Pinuscontorta, (b) understory Pinus contorta,(c) open-grown Picea mariana and(d) understory Picea mariana. Close-upview of margo in (e) open-grown Piceamariana and (f) understory Piceamariana. Scale (white bar) represents1 mm.
(a) (b)
(c) (d)
(e) (f)
Hydraulic acclimation to shading in conifers 389
© 2010 Blackwell Publishing Ltd, Plant, Cell and Environment, 33, 382–393

overstories that probably cast deeper and more continuousshade relative to our deciduous stand. Secondly, we exam-ined apical shoots, whereas these studies measured eitherlateral branches or stem sections from lower sections in thecrown; it is possible that competition for resources between
upper and lower branches or even along the primary stemcould have had an impact on ks. Thirdly, genetic differencesbetween suppressed and dominant trees could have influ-enced ks in previous studies (Sellin 1993, 2001; Reid et al.2003) as suppressed trees may simply be genetically inferior
Figure 6. Average (a) margo strandwidth, (b) mean pore area, (c) maximumpore area, (d) pore fraction, (e) extendedtorus area and (f) occurrence of extendedtori for Pinus contorta and Picea marianagrown in an open field (open) or underan aspen-dominated understory(understory). Error bars are 1 standarderror of the mean (n = 6). * indicates themeans of within species comparison aresignificant at a � 0.05.
(a)
Str
an
d w
idth
(mm
)
0.00
0.02
0.04
0.06
0.08OpenUnderstory
(b)
Me
an
po
re a
rea
(mm
2)
0.00
0.02
0.04
0.06
0.08
(c)
Maxim
um
pore
are
a (mm
2)
0.0
0.2
0.4
0.6
0.8(d)
Pore
fra
ction
0.0
0.2
0.4
0.6
(e)
Exte
nded toru
s a
rea (mm
2)
0.0
0.5
1.0
1.5
2.0
2.5(f)
Pico Pima
Occurr
ence e
xte
nded tori (
%)
0
20
40
60
80
* *
*
* *
*
* *
Species
Pico Pima
Species
Table 2. Results from scanning electron microscopy measurements: Mean strand length, torus/pit area, aperture/pit area, torus/aperturearea, torus diameter, pit diameter and aperture diameter for Picea contorta and Picea mariana grown in an open-field (open) or in anaspen-dominated understory (understory)
SpeciesStrandlength (mm)
Torus/pit area
Aperture/pit area
Torus/aperturearea
Torusdiameter (mm)
Pit diameter(mm)
Aperturediameter (mm)
Pinus contortaOpen 2.61 (0.10) 0.29 (0.01) 0.12 (0.01) 2.37 (0.16) 6.37 (0.21) 11.77 (0.34) 4.15 (0.11)Understory 2.59 (0.04) 0.27 (0.00) 0.11 (0.01) 2.42 (0.22) 5.63 (0.22) 10.93 (0.30) 3.66 (0.15)
Picea marianaOpen 2.51 (0.07) 0.23 (0.01) 0.09 (0.00) 2.55 (0.10) 5.21 (0.09) 10.88 (0.15) 3.27 (0.08)Understory 2.40 (0.07) 0.23 (0.00) 0.10 (0.00) 2.14 (0.10) 4.65 (0.11) 9.88 (0.17) 3.19 (0.10)
Values in brackets are 1 standard error of the mean (n = 6). Bold values indicate the means of within species comparison are significant ata � 0.05.
390 A. L. Schoonmaker et al.
© 2010 Blackwell Publishing Ltd, Plant, Cell and Environment, 33, 382–393

and slower growing compared with dominant trees in thesame stand.
The significant decline of leaf area specific conductivity(kl) in all four shade grown conifers and the decline ofsoil-to-plant hydraulic conductance (Ks-p) in shade grownPinus contorta and Picea glauca (Fig. 3) support our final(third) hypothesis. The lack of response in Ks-p in Piceamariana could be the result of a relatively greater sensitivityto drought (in the open-grown environment) inducingreduced transpiration and subsequently lower Ks-p
(Zwiazek & Blake 1989). In the case of Pinus banksiana, wedo not have any direct evidence but this species may besimilarly sensitive to drought as in Picea mariana. The mag-nitude of decrease in kl in the shade ranged from 35–72%for the four conifers measured. This is consistent with
Shumway et al. (1993), Schultz & Matthews (1993) andSellin (2001) who reported reductions in kl in shaded plants.However, Renninger et al. (2007) reported no difference inkl between suppressed and released Pseudotsuga menziesiiand Tsuga heterophylla. The suppressed trees in that par-ticular study also had reduced LA : SA relative to releasedtrees. In our study, the shoots we used to measure kl all hadhigher LA : SA in the shade relative to the open.
Our original hypothesis had suggested that shade toler-ant species (as opposed to shade intolerant species) wouldshow greater differences in hydraulic parameters betweenopen and understory environments. We found this wastrue in terms of cavitation resistance and in various charac-teristics of bordered pit anatomy. However, we saw littledifference between shade tolerant and intolerant species in
Table 3. Results from light microscope measurements: Mean tracheid resistivity (Rc), lumen resistivity (RL), end-wall resistivity (Rw),wall fraction, pit area resistance (rp), number of pits per tracheid and pit fraction (Fp) for Pinus banksiana, P. contorta, Picea mariana andP. glauca grown in an open-field (open) or in an aspen-dominated understory (understory)
SpeciesRc
(MPa s mm-4)RL
(MPa s mm-4)Rw
(MPa s mm-4)Wall fraction(Rw Rc
-1) rp (MPa s m-1)# pits/tracheid Fp
Pinus banksianaOpen 4.47 (0.34) 1.06 (0.11) 3.41 (0.32) 0.76 (0.02) 2.43 (0.31) 18.78 (1.03) 0.06 (0.01)Understory 6.53 (1.51) 1.63 (0.29) 4.89 (1.30) 0.72 (0.03) 2.39 (0.45) 20.18 (1.68) 0.07 (0.01)
Pinus contortaOpen 7.09 (1.45) 0.96 (0.15) 6.14 (1.31) 0.86 (0.01) 4.53 (0.85) 17.58 (1.57) 0.07 (0.00)Understory 7.19 (0.87) 2.02 (0.19) 5.18 (0.65) 0.72 (0.02) 2.84 (0.43) 16.03 (0.93) 0.07 (0.01)
Picea marianaOpen 11.28 (1.96) 2.39 (0.19) 8.89 (1.83) 0.76 (0.03) 2.86 (0.54) 21.03 (1.14) 0.06 (0.00)Understory 9.94 (1.38) 3.58 (0.68) 6.36 (1.49) 0.61 (0.07) 2.31 (0.49) 15.20 (1.72) 0.06 (0.01)
Picea glaucaOpen 6.30 (0.49) 1.32 (0.20) 4.98 (0.52) 0.79 (0.03) 3.15 (0.18) 25.65 (2.11) 0.07 (0.00)Understory 6.96 (1.00) 2.46 (0.17) 4.51 (1.06) 0.62 (0.05) 2.48 (0.41) 22.51 (1.73) 0.06 (0.00)
Values in brackets are 1 standard error of the mean (n = 6). Bold values indicate the means of within species comparison are significant ata � 0.05.
Table 4. Mean height, root collar diameter, total leaf area (Al) and leader LA : SA for Piba (Pinus banksiana), Pico (P. contorta), Pima(Picea mariana) and Pigl (P. glauca) grown in an open-field (open) or under an aspen-dominated understory (understory) in August 2007
Treatment Height (m)Root collardiameter (mm) Al (m2)
Leader LA : SA(cm2 mm-2)a
Whole-plantLA : SA
Pinus banksianaOpen 2.68 (0.15) 41.9 (3.6) 3.1 (0.4) 9.2 (1.4) 2212 (186)Understory 0.78 (0.10) 10.0 (0.5) 0.2 (0.02) 34 (3.4) 1714 (183)
Pinus contortaOpen 2.49 (0.17) 48.4 (4.6) 5.3 (0.9) 8.8 (0.7) 2829 (245)Understory 0.72 (0.07) 10.0 (0.6) 0.1 (0.03) 28 (3.0) 1644 (220)
Picea marianaOpen 1.83 (0.16) 33.8 (2.9) 1.7 (0.3) 5.3 (0.7) 1854 (128)Understory 0.78 (0.06) 9.3 (0.5) 0.2 (0.02) 11 (1.1) 2950 (230)
Picea glaucaOpen 1.82 (0.20) 35.7 (2.9) 2.6 (0.5) 4.6 (1.2) 2432 (226)Understory 0.68 (0.07) 10.0 (0.5) 0.2 (0.04) 11 (0.6) 2713 (236)
Values in brackets are 1 standard error of the mean (n = 6 except Ks-p where n = 12). Bold values indicate the means of within speciescomparison are significant at a � 0.05.aLeader LA : SA was measured from the 1- (open-grown pines) or 2- (all other treatments) year-old shoots used in hydraulic measurements.LA : SA, leaf area to xylem area.
Hydraulic acclimation to shading in conifers 391
© 2010 Blackwell Publishing Ltd, Plant, Cell and Environment, 33, 382–393

terms of water transport efficiency and most other struc-tural anatomical observations (wood density, tracheidlength and diameter, etc.). In fact, it seems more likely thatdifferences in their ecological distributions appeared todictate their plasticity in wood development. Pinus banksi-ana, for example, typically showed the least hydraulic andanatomical responses to understory shading; it is typically adominant tree on dry habitats. On the other hand, Piceamariana, was probably the most variable in its responsesand as such appeared to have the greatest plasticity. Thisspecies inhabits a wide range of habitat types that are likelyto vary enormously in water availability. Thus, a strategythat could presumably reduce the investment of carbon intowood production (i.e. producing wood that is less cavitationresistant when grown in conditions not prone to high poten-tial evapotranspiration) could be adaptive.
CONCLUSIONS
Overall, for plants growing in an understory, both evapo-rative demand and light availability decline. Lower evapo-rative demand results in reduced need for water whereaslow light levels limit the amount of carbon fixation. Thedecline in kl and Ks-p in the understory environment sup-ports the notion of reduced need for water under thesecircumstances. Increased LA : SA in the leading shoots areindicative of a shift in allocation from stem and rootgrowth (hydraulics) to leaf area (light capture) develop-ment in the understory. In terms of the type of xylem pro-duced, our data show that understory trees tended toproduce narrower tracheids. Surprisingly, these tracheidswere still capable of comparable flow with that of open-grown trees with larger diameter tracheids. This was prob-ably driven by changes in pit structure, which is supportedfrom our observations of larger maximum pore sizes inthe margo of shaded Pinus contorta and Picea mariana.Having relatively efficient sapwood water transport meansthat understory conifers could invest less carbon intowood production by producing bordered pits with a moreporous but fragile structure, corresponding with increasedxylem vulnerability. A potential drawback of this strategyis that a rapid change in evaporative demand caused bythe formation of a canopy gap could be detrimental forsome shaded conifers. For an open-grown conifer, the riskof losing the capacity to transport water in order to ‘save’carbon is too large, thus they have employed thestrategy of a more conservative bordered pit design andcompensated for increased pit resistance by larger lumendiameters.
ACKNOWLEDGMENTS
We gratefully acknowledge field and lab assistance fromJennifer Langhorst, Jessica Snedden, Kevin Renkema,Dominique Deshaies, Kelci Mohr, Caroline Lecoutier,Kristine Dahl and Kim Stang. We thank George Braybrookand De-Ann Rollings for assistance with the SEM work.An NSERC PGSM and CGSD and Alberta IngenuityScholarship to ALS, NSERC and Mixedwood Management
Association grants to VJL and support from the CanadaResearch Chair program and the Canada Foundation forInnovation to UGH were all greatly appreciated.
REFERENCES
Andrade J.L., Meinzer F.C., Goldstein G., Holbrook N.M., CavelierJ., Jackson P. & Silvera K. (1998) Regulation of water fluxthrough trunks, branches, and leaves in trees of a lowland tropi-cal forest. Oecologia 115, 463–471.
Barigah T.S., Ibrahim T., Bogard A., Faivre-Vuillin B., LagneauL.A., Montpied P. & Dreyer E. (2006) Irradiance-inducedplasticity in the hydraulic properties of saplings of differenttemperate broad-leaved forest tree species. Tree Physiology 26,1505–1516.
Bladon K.D., Silins U., Landhausser S.M. & Lieffers V.J. (2006)Differential transpiration by three boreal tree speciesin response to increased evaporative demand after variableretention harvesting. Agricultural and Forest Meteorology 138,104–119.
Brodribb T.J., Holbrook N.M. & Hill R.S. (2005) Seedling growthin conifers and angiosperms: impacts of contrasting xylemstructure. Australian Journal of Botany 53, 749–755.
Burgess S.O., Pittermann J. & Dawson T.E. (2006) Hydraulicefficiency and safety of branch xylem increases with height inSequoia sempervirens (D. Don) crowns. Plant, Cell & Environ-ment 29, 229–239.
Callaway R.M. (1992) Morphological and physiological responsesof three California oak species to shade. International Journal ofPlant Science 153, 434–441.
Chaffey N.J. (2002) Wood microscopical techniques. In Wood For-mation in Trees (ed. N.J. Chaffey), pp. 17–40. Taylor & Francis,New York, NY, USA.
Cochard H., Lemoine D. & Dreyer E. (1999) The effects of accli-mation to sunlight on the xylem vulnerability to embolism inFagus sylvatica L. Plant, Cell & Environment 22, 101–108.
Cochard H., Hölttä T., Herbette S., Delzon S. & Mencuccini M.(2009) New insights into the mechanisms of water-stress inducedcavitation in conifers. Plant Physiology 151, 949–954.
Domec J.C., Lachenbruch B. & Meinzer F.C. (2006) Bordered pitstructure and function determine spatial patterns of air-seedingthresholds in xylem of Douglas-fir (Pseudotsuga menziesii;Pinaceae) trees. American Journal of Botany 93, 1588–1600.
Domec J.C., Lachenbruch B., Meinzer F.C., Woodruff D.R., WarrenJ.M. & McCulloh K.A. (2008) Maximum height in a coniferis associated with conflicting requirements for xylem design.Proceedings of the National Academy of Sciences 105, 12069–12074.
Environment Canada (2009) National climate data and informa-tion archive. [WWW document]. URL http://www.climate.weatheroffice.ec.gc.ca/Welcome_e.html [accessed on 7 Decem-ber 2009].
Givnish T.J. (1988) Adaptation to sun and shade: a whole-plant perspective. Australian Journal of Plant Physiology 15,63–92.
Hacke U.G. & Jansen S. (2009) Wood anatomical features associ-ated with hydraulic traits in three boreal conifer species. NewPhytologist 182, 675–686.
Hacke U.G., Sperry J.S., Pockman W.T., Davis S.D. & McCullohK.A. (2001) Trends in wood density and structure are linked toprevention of xylem implosion by negative pressure. Oecologia126, 457–461.
Hacke U.G., Sperry J.S. & Pittermann J. (2004) Anaylsis of circularbordered pit function II. Gymnosperm tracheids with torus-margo pit membranes. American Journal of Botany 91, 386–400.
392 A. L. Schoonmaker et al.
© 2010 Blackwell Publishing Ltd, Plant, Cell and Environment, 33, 382–393

Jansen S., Pletsers A. & Sano Y. (2008) The effect of preparationtechniques on sem-imaging of pit membranes. IAWA Journal 29,161–178.
Lancashire J.R. & Ennos A.R. (2002) Modelling the hydrodynamicresistance of bordered pits. Journal of Experimental Botany 53,1485–1493.
Landhäusser S.M. & Lieffers V.J. (2001) Photosynthesis and carbonallocation of six boreal tree species grown in understory andopen conditions. Tree Physiology 21, 243–250.
Lemoine D., Cochard H. & Granier A. (2002) Within crown varia-tion in hydraulic architecture in beech (Fagus sylvatica L): evi-dence for a stomatal control of xylem embolism. Annals ForestScience 59, 19–27.
Li Y., Sperry J.S., Taneda H., Bush S.E. & Hacke U.G. (2008)Evaluation of centrifugal methods for measuring xylem cavita-tion in conifers, diffuse- and ring-porous angiosperms. NewPhytologist 177, 558–568.
Mayr S., Wolfschwenger M. & Bauer H. (2002) Winter-droughtinduced embolism in Norway spruce (Picea abies) at the Alpinetimberline. Physiologia Plantarum 115, 74–80.
Pammenter N.W. & Vander Willigen C. (1998) A mathematicaland statistical analysis of the curves illustrating vulnerability ofxylem to cavitation. Tree Physiology 18, 589–593.
Pearcy R.W. (2007) Responses of plants to heterogeneous lightenvironments. In Functional Plant Ecology (eds F.I. Pugnaire& F. Valladares), pp. 213–246. CRC Press, Boca Raton, FL,USA.
Pittermann J., Sperry J.S., Hacke U.G., Wheeler J.K. & SikkemaE.H. (2006a) Inter-tracheid pitting and the hydraulic efficiencyof conifer wood: the role of tracheid allometry and cavitationprotection. American Journal of Botany 93, 1265–1273.
Pittermann J., Sperry J.S., Wheeler J.K., Hacke U.G. & SikkemaE.H. (2006b) Mechanical reinforcement of tracheids compro-mises the hydraulic efficiency of conifer xylem. Plant, Cell &Environment 29, 1618–1628.
Protz C.G., Silins U. & Lieffers V.J. (2000) Reduction in branchsapwood hydraulic permeability as a factor limiting survival oflower branches of lodgepole pine. Canadian Journal of ForestResearch 30, 1088–1095.
R Development Core Team (2006) R: A Language and Environ-ment for Statistical Computing. R Foundation for StatisticalComputing, Vienna, Austria. ISBN 3-900051-07-0. [WWW docu-ment]. URL http://www.R-project.org [accessed on 1 January2009].
Reid D.B., Silins U. & Lieffers V.J. (2003) Stem sapwood perme-ability in relation to crown dominance and site quality in self-thinning fire-origin lodgepole pine stands. Tree Physiology 23,833–840.
Renninger H.J., Gartner B.L. & Meinzer F.C. (2006) Effects ofrelease from suppression on wood functional characteristics inyoung Douglas-fir and western hemlock. Canadian Journal ofForest Research 36, 2038–2046.
Renninger H.J., Meinzer F.C. & Gartner B.L. (2007) Hydraulicarchitecture and photosynthetic capacity as constraints onrelease from suppression in Douglas-fir and western hemlock.Tree Physiology 27, 33–42.
Saliendra N.Z., Sperry J.S. & Comstock J.P. (1995) Influence of leafwater status on stomatal response to humidity, hydraulic conduc-tance, and soil drought in Betula occidentalis. Planta 196, 357–366.
Sano Y., Kawakami Y. & Ohtani J. (1999) Variation in the structureof intertracheary pit membranes in Abies sachalinensis, as
observed by field-emission scanning electron microscopy. IAWAJournal 20, 375–388.
Schultz H.R. & Matthews M.A. (1993) Xylem development andhydraulic conductance in sun and shade shoots of grapevine(Vitis vinifera L.): evidence that low light uncouples water trans-port capacity from leaf area. Planta 190, 393–406.
Sellin A. (1993) Resistance to water flow in xylem of Picea abies(L.) Karst. trees grown under contrasting light conditions. Trees7, 220–226.
Sellin A. (2001) Hydraulic and stomatal adjustment of Norwayspruce trees to environmental stress.Tree Physiology 21, 879–888.
Shumway D.L., Steiner K.C. & Kolb T.E. (1993) Variation in seed-ling hydraulic architecture as a function of species and environ-ment. Tree Physiology 12, 41–54.
Sperry J.S., Hacke U.G., Feild T., Sano Y. & Sikkema E.H. (2007)Hydraulic consequences of vessel evolution in angiosperms.International Journal of Plant Science 168, 1127–1139.
Walters M.B. & Reich P.B. (1999) Low-light carbon balance andshade tolerance in the seedlings of woody plants: do winterdeciduous and broad-leaved evergreen species differ? New Phy-tologist 143, 143–154.
Wilson J.P., Knoll A.H., Holbrook N.M. & Marshall C.R. (2008)Modeling fluid flow in Medullosa, an anatomically unusualCarboniferous seed plant. Paleobiology 34, 472–493.
Zwiazek J.J. & Blake T.J. (1989) Effects of preconditioning onsubsequent water relations, stomatal sensitivity, and photosyn-thesis in osmostically stressed black spruce. Canadian Journal ofBotany 67, 2240–2244.
Received 10 August 2009; received in revised form 30 October 2009;accepted for publication 2 November 2004
SUPPORTING INFORMATION
Additional Supporting Information may be found in theonline version of this article:
Appendix S1. Pre-dawn (3:00–6:00) and midday (11:30–15:00) water potential (WP) measurements of Pinusbanksiana, P. contorta, Picea mariana and P. glauca grownin an open field (open) or aspen-dominated understory(understory).Appendix S2. Frequency histograms of tracheids diametersfor Pinus banksiana (a,b), Pinus contorta (c,d), Piceamariana (e,f) and Picea glauca (g,h) grown in an open-field(open) or in an aspen-dominated understory (understory).Appendix S3. P values (degrees of freedom) from withinspecies t-test comparisons (open-grown versus understory)for Pinus banksiana, P. contorta, Picea mariana and P.glauca grown in an open field or in an aspen-dominatedunderstory. Bold values indicate that within species com-parison between open and understory conditions wasstatistically significant at a � 0.05.
Please note: Wiley-Blackwell are not responsible for thecontent or functionality of any supporting materialssupplied by the authors. Any queries (other than missingmaterial) should be directed to the corresponding authorfor the article.
Hydraulic acclimation to shading in conifers 393
© 2010 Blackwell Publishing Ltd, Plant, Cell and Environment, 33, 382–393