partitioning pde computations: methods and performance evaluation
TRANSCRIPT

Purdue UniversityPurdue e-Pubs
Computer Science Technical Reports Department of Computer Science
1986
Partitioning PDE Computations: Methods andPerformance EvaluationCatherine E. Houstis
Elias N. HoustisPurdue University, [email protected]
John R. RicePurdue University, [email protected]
Report Number:86-614
This document has been made available through Purdue e-Pubs, a service of the Purdue University Libraries. Please contact [email protected] foradditional information.
Houstis, Catherine E.; Houstis, Elias N.; and Rice, John R., "Partitioning PDE Computations: Methods and Performance Evaluation"(1986). Computer Science Technical Reports. Paper 532.http://docs.lib.purdue.edu/cstech/532

PARTITIONING PDE COMPUTATIONS:METHODS AND PERFORMANCE EVALUAnON
Catherine E. Houstis*Department of Electrical Engineering
Elias N. Houstis**John R. Rice**
Department of Computer SciencePurdue University
CSD-TR614June 2,1986
ABSTRACT
We consider modeling, predicting and evaluating the perfonnance of methods for solvingPDEs in parallel architectures. We have developed a method for coarse grain partitioning of computations for parallel architectures and we apply it to three PDE applications:(a) Cholesky factorization, (b) spline collocation, and (c) an application complete fromprocessing text input to plotting the PDE solution. OUf partitioning method is oriented tominimizing interprocessor communication and we review some "unifonn" architecturesand models of their communication. We apply this method to the three applicationsimplemented on the FLEX/32 multicomputer. We review the architecture on theFLEX/32 and the results of applying the partitioning method to computation running onthe FLEX/32. We observe that the FLEX/32 does not have any communicationbottleneck and probably will not suffer substantial perfonnance degradation if the processor speeds are increased by a factor of 10. Our partitioning method works reasonablywell even here where communication costs are negligible. The coarse grain structure oftwo of these applications is not highly parallel and we observe speedups of about k/2 fork processors. The other application is highly parallel and we observe optimal speedupsfor any number of processors as the problem size increases.
'loThis research supported in part by NSF grant DMC-8508684.*"'This research supponed in pan by AFOSR granl 84·0385.This paper will appear in the January 1987 issue of Parallel Computing.

-2-
1. MODELING THE PERFORMANCE OF ALGORITHM I ARCHITECTUREPAIRS
We consider a Partial Differential Equation (POE) application A to be a computation with four properties: processing requirements, memory requirements, communication requirements and precedence (or synchronization) between the subcomputations.Visualize the com'putation broken into computational modtdes which are nodes of a precedence graph for the computations. Note the processing and memory requirements ateach node of the graph. Note the communication requirements along each link or edgeor tbe graph. This annotated graph is called G(A). Observe tbat links representingcommunication may need to he added to G(A) even though they are redundant as raras precedence is concerned.
We consider a machine to have three components: processing elements, memoryelements and communication paths (an interconnection network). Similarly, themachine can be represented by an annotated graph G(M). In this paper, we considermachines tha.t have a set of identical processors (which may have local memories), a setof identical common memories, and a queueing delay function which represents thecommunication performance characteristics of the machine. Intuitively, one may con·sider these as machines with a rather uniform architecture, one that scaJes simply withthe number of processors and memories.
Assume that the graph G(A) is given and that an appropriate choice of probJemsize and granularity has been used in partitioning A to create G(A). Assume also thatG(M) is given. In general, we want to map G(A) onto G(M) so the computationalmodules (nodes) of G(A) are associated with processors in G(M) and communicationlinks (edges) or G(A) are associated with data paths in G(M). We assume here that theparallelism or G(A) is no larger than that or G(M). Normally the number or nodes inG(A) is much larger than the number or processors in G(M) and the computation is8cheduled by assigning the computational modules to processors. This produces a newgraph G' (A). The three graphs, G(A), G' (A) and G(M) along with their associatedparameters (e.g. ~peed of processors, amount of arithmetic at a Dede) are a model of thePDE computation A to be carried out on machine M. One key question is how wellthis model predicts the performance of typical algorithm/architecture pairs. A secondkey question is how to map G(A) into G(M) so as to obtain G' (A).
In general, the mapping problem has three somewhat independent steps:1. Reduce the parallelism or the application to that or the machine.2. Schedu~e the computationa.l modules so that the application runs efficiently.3. Given steps I and 2 are done, imhed the application into the machine.The mapping prohlem is known to be NP complete [JENN77] and to find the optimalmapping for any of these three steps is also NP complet.e. We propose to use fast,heuristic algorithms here which are intended to produce good mappings at low cost.

- 3 -
Due to the lack of space, we discuss the parallelism reduction in depth elsewhere[HOUS86], and assume here that this step is not needed. Given that steps 1 and 2 aredone, step 3 is Cairly easy for the class of machines considered here. Thus, this paperconcentrates on the problem of scheduling tbe application so tbat it runs efficiently andon evaluating the performance of these schedules.
Our overall plan for making performance evaluations is as follows. We first devisefast, heuristic algoritbms wbicb carry out steps 1, 2 and 3 above. Note that the orderof steps 1 and 2 is not necessarily fixed, we assume in the discussions that step 1 precedes step 2 so as to simplify the discussion but this is not an essential ingredient toour approach. OUf heuristics use communication delay models for "uniform" architectures in order to simplify the complexity of the mapping problem. Once we have theapplication mapped onto the machine and scheduled to provide good efficiency, we thenrun the program on an actual machine (we use a FLEX/32 multiprocessor) or use asimulation package, (for example, SIM:ONIFUn85]) to llexecute" a "compressed" revision of the program and to estimate its performance.
The performance of a distributed system depends very much on how well thearchitecture and tbe algorithms are matched IKLEIN85]. A methodology for predictingmultiprocessor performance from the systems point of view and the RP3 architecture ispresented in [NORT85J. The problem of mapping has been studied in [BOKH81J and[BERM84,85] for the finite element macbine and CHlP architectures, respectively. In[WILL83J various objective criteria necessary for assigning processes to processors areexamined and tested in a distributed environment. A different approach for modelingcommunications complexity of parallel algoritbms is presented in IGANN84J. Ourapproach to mapping POE compntations onto parallel macbines (i.e. step 2 of the mapping process) is described in IHOUS83j and our approach to compressing the parallelismis described in [HOUS86J.
In tbis paper we give models of three POE applications (Section 2) and discuss howto model communications for various machine architectures (Section 3). We thendescribe the FLEX/32 architecture and its performance (Section 4) and apply our mapping algorithm to the three POE applications (Section 5). The observed performancefor these applications is discussed (Section 6) and compared with predictions Crom themodel. Some conclusions are stated in Section 7.
2. APPLICATION MODELING WITH THREE EXAMPLESFor th~ modeling of an application, we assume an initial partitioning of the com
putation into a numher of communicating compntational modules. If the communication paths among the modules are not known a priori (i.e. real time applications) thenthe partition is modeled by a stochastic AND-EOR directed graph SG(A). In [HOUS84]a stochastic a~alysis is applied to reduce SG(A} into a deterministic graph G(A) which

- 4-
comprises the input to the mapping model.
IC the communication paths among modules are known a priori then we use complexity analysis and/or simulation to obtain values for the parameters of the computation graph G(A). In the case of simulation, we use the data flow language SIMON{FUJI85! and coucurrent C aud FORTRAN languages {FLEX85) to specify the computation modules and their communication and synchronization requirements. In order toexecute SIMON programs we use our non-shared memory multiprocessor simulator{FUJI85). Concurrent C or FORTRAN programs arc run on FLEX/32 multiprocessorsystem. Next, we consider three scientific computations to be used for the evaluationof our methodology.
2.1 Appliclltion I: Cholesky decomposition of symmetric mlltrl••s
We consider the parallelizaUon of Cholesky decomposition of symmetric matrices.Figure 1 presents the computation of each module in the example of a parallel Chale-
sky decomposition algorithm [O'LEA85]. Figure 2 depicts the corresponding graphG(A) and the values of the various workload parameters (node processing time andhlocking time, communication traffic among nodes) ohtained hy setting SIMON'sswitching delay to zero. The bloeking lime or algorithm synchronization delay or amodule is the time that the module must wait ror its inputs before its computation canstart.
K=nWHILE (TRUEI BEGIN
K:=K+l:IF(K=iandK=j)then
BEGINX:=,qrt(X):
1F(j " N) PUT (OUT...EAST.X):IF(; "N) PUT (OUT_SOUTH,X):BREAK:END
ELSE IF (K=j) THENBEGINGET (IN-SOUTH,Y);X=X/YIF Ij " N) PUT (OUT_EAST.X):IF (i "N) PUT (OUT-.SOUTH.Y):BREAK:END
ELSE IF (K=j) THENBEGINGET (IN_EAST,Y):
IF (j " N) PUT (OUT...EAST,Y):IF (i "N) PUT (OUT_SOUTH,X),BREAK;

• 5 -
ELSE BEGINGET (IN_SOUTH,Y);GET (IN_EAST,Z);X=X'Y'Z;IF (i ~ N) PUT (OUT_SOUTH,Y);IF (j ~ N) PUT (OUT_EAST,Z);END
END ·.vHILE
Figure 1. Computation of node (i,j) in SIMON data flow language for a parallelCholesky decomposition algorithm.
A matrix is partitioned into blocks so that the maximum degree or para.llelism isequal to the number or processors. 1£ smaller blocks are used, then the parallelismreduction would be applied but we do not consider tbis case bere. Tbi, application provides an example where the parallelism is mo,Uy less tban maximum and tbus wbere
the speedup should be considerably less than tbe number or processors. See [O'LEA86]for furtber discussions. That paper sbows tbat optimal speedup is acbievable witb aspeedup of N/g for N processors.

- 6-
,"
,
Module processing times
m = (24, 30, 30, 25, 27, 31, 37, 32, 27,34,38, 3g, 21, 28, 35, 45)
Module blocking times
.b. = (a, 4, 14, 24, 15,27,37,48,33,45,61,66,51,64,76,88)
Figure 2. Precedcnce graph G(A) or the parallel Cholcsky decomposition algorithmfor a 4 by 4 block decomposition of a symmet.ric matrix. The assumednumbering of modules is specified in each node. The communication trafficis indicated as a weight on the links of the graph.
2.2 Application II: Spline collocation method. for elliptic PDEs
We consider t.he numerica.l solution of an elliptic PDE problem defined by thesecond order elliptic operator
Lu = au" + 2/1u,y +')1Iyy +6u, +, uy+(U = r,on ncm2 subject to boundary conditions
Bu = 0 on the boundary or n.We use the line collocation method based on cuhic splines studied in lHOUS84!,[VANA85] to discretize the above PDE problem. For simplicity, we consider theHelmhoJtz equation with constant coefficients and an iterative method corresponding toSOR for solving the underlying linear equations. This discretization is defined by theblock equations
Alx = (I-w) Alx-wA2y+wF,
Q2y =(1-w)Qzy+wQIx-wG.where
Al = diag (T,T, ... , T) with T=trid (1,-2,1),
(2.1&)
(2.lb)

- 7 -
Q2 = diag (8,8, ... , 8) with 8=trid (1,4,1),
A2 = P-AI, QI = P-Q2,
P = permutation matrix of the ordering of unknowns,
X = soJut.ion vector in horizontal mesh lines.
y =solution vector in vertical mesh lines.
W = overrelaxation parameter
FIG = consta.nt matrices from the right side r.The discretization (2.1) can be considered as the application of a set of equations
to a data set. For example, the first block 01 equat.ions (2.la) is applied to data associated with the horizontal mesh lines (see Fig. '3a) and the (2.lb) equations are applied todata related to the vertical mesh lines (see Fig. 3b). One partition technique is todivide the data sets (mesh lines) into part:;;, instead of the equations, and assume eachpart is assigned to a single processor. Figure 4 depict.s the parallel spline collocat.ionalgorithm based on the above data set decomposition for a two processor system. Thegeneralization is straight forward. In Section 6 we present the performance of thisparallel algorithm for a. shared memory architecture.
2.3. Application m. Large Bcale PDE computation.
This PDE application is complete from the description of a problem in a very highlevel language through the graphical display 01 the computed solut.ion. Figure 5 showsa schematic diagram with the steps 01 the computation, it has degree 01 parallelism 6.Not shown in Figure 5 are vertical data communication paths between correspondingnodes on the lan-in/lan-out 01 the tree structure in the center. The PDE problemsolved is a general one on a Don-rectangular domain. A multifront method is usedbased on a nested dissection partition of the domain. Gauss elimination is used toeliminate unknowns in the interior of each domain. The numbers shown at each nodeare the "computation units" for a particular instance of this problem corresponding tousing a 20 by 20 mesh, a finite element method with cubic basis functions, and a 40 by40 plotting grid. The domain boundary has 3 pieces and, at the lourth step, all but oneprocessor are working on the interior of the domain. A computational unit here isabout 1000 arithmetic operations plus associated memory and control operations.
Figure 6 show. the same graph with the additional communication paths. Thesepaths transfer LU factorizations of subbJocks of the linear systems from the initial solvephase to the back substitution phrase. The numbers shown are data transfers requiredin units or 1000 words.

- 8-
[ YM+I ]Processor IT YMdata 0
0
0
YM/2YM/2-1
Processor I •0
•data Y,
Yo
(A)
I \IX N/2 xN XN+II
.. . . . .
JXo xI XN/ 2·- ,11 I___t "---..-t-.....
Processor] data - L Processor IT data(B)
Figure 3. Partitions 01 the mesh line data 01 {2.I} into (A) hori20ntal mesh lines and(B) vertical mesh lines. The assigument 01 the lines is shown lor the caseof two processors.

- g -
PROCESSOR IIPROCESSOR I
INITIALIZE X INITIALIZE Y
COMPUTEXAT COMPUTEYAT
BOUNDARY BOUNDARY
FORMF1FORM FD
FORMG1FORM Go
FACTOR T FACTOR S
I -e~
FORMAI~ - FORM AlxD
IFORM A2Yt FORMA2YD...
~FORM RI( FORM RID
SOLVE Alxl=Rll SOLVE Al~=RlD
:r "'l:
FORM Ql~ ~ FORMQ1~
FORM Q211 FORM Q2rn
FORM R2, FORM R2D
SOLVE Q211=~I
II SOLVE Q2YD R2n•n........
I:
Figure 4. Schematic of lhe parallel spline collocation algorithm and iteration (2.1).The decomposition ror two processors is shown based on alterna.tely usingon data. sets the horizontal and vertical mesh lines.

·10·
5.
52
Read Problem Description
Process 3 Boundary Pieces
Merge Boundary Data StructuresIdentiFy All Elements
Process Intericr/BoundaryElements
Create 6 Frontal Are""
Interior Assembly + Elimination
Merger and Eliminationin Neigh boring Areas
Merger and Eliminationin Neighboring Areas
Merger and Eliminationin Neighboring Areas
33
'"
Backsolve For NeighboringUnknowns
!Jacksolve For NeighboringUnknowns
Backsolve for UnknownsTabulate Answer for PlotTabulate Flow Field
Create Plot Dat.a Structure
Compule Contours, Colorsfor 6 Views
Figore 5. 'Annotated graph G(A) Cor Application ill Cor 6 processors. The numbersat the nodes are units of computation to be done.

- 11-
30 28
1.6
38 16
0.2 0.2
38 12
0.3 0.2
37 38
Figure 6. The graph 01 Figure 5 showing additional communication edges and thenumber or units to be communicated along each edge.

- 12 -
3. COMMUNICATION MODELING IN MULTIPROCESSORARCHITECTURES
Our methodology for reducing the initial interconnection graph G(A) is based onminimizing its communication cost. Thus, it is crucial to be able to predict the communication cost or G(A) running on a specific muJtiprocessor system architecture. Weconsider architectures Cor which there is a realistic simple model of the communicationcost at the message passing level. Such performance models of multiprocessor systemsare given in IMAR83), IKRU83!. The performance measure is a delay function whichprovides the expected queueing delay a message suffers in traversing the interconnectionnetwork or the system. Queueing delay is computed as a function of the system's communication interconnection network utilization.
Let
c;j=total traffic (# of messages) between modules mi and mi'
kIP =processors assigned to computational modules,mj,mj
anddk,Q = interprocessor distance in the interconnection network
of the considered architecture,
then the interprocessor communicatr"o7f. cost or queueing delay is given by
D = D(u)
where u = u(Cij, dk,~ I interconnection network characterization) denotes the utilization.When two modules are assigned to different processors their utilization of the interconnection network is computed as follows:
c·· .dkfu = I,l I
C.Twhere C = capacity of interconnection network and T = time rrame during which eachparallel processor is running.
The delay obtained is only approximate because or the various simplifying assumptions involved in the analytical modeling of the performance characteristics (queueing,utilization) of the multiprocessor system. In all or the models we consider, two assumptions are made: (a) every processor accesses the interconnection network at the samerate, and (b} every processor accesses the various common memory modules with thesame probability. These assumptions lead to a queueing model which is mathematically tractable. Intuitively, these assumptions imply that the communication reqnirements of G(A) are nearly uniform. rr G(A) is one of many applications running in thesame system, these assumptions may be realistic even it the algorithm has somewhat

- 13-
non~unirorm communication patterns. A precise investigation on this question is under
way.
We consider the performance analysis of five different multiprocessor parallel architectures: (1) Siogle bus, common memory, (2) Single bus, distributed common memorymodules, (3) Multiple bus, distributed common memory modules, (4) Omega interconnectioD, distributed memory modules, (5) Omega. interconnection processor to processor
rnuJUprocessor system.
3.1 Single bUB common memory architecture
In this architecture, (Figure 7(i)), k processors (Pi) are connected to aD externalcommon memory (eM) via a global bus (GB). Each P; has a local memory (LM;) connected to its own local bus (LB;). The system has been analyzed in 1MAR83) as alImachine repairman" problem. For given bus utilization level, say ull the average
queueing delay per information transfer unit is given by D,(u,) =(k-u.lp,)/u,. Theparameter PI characterizes the communication of the architecture and it is found bysolving the nonlinear algebraic equation.
Pk(p,)-1 k..u, = P ( ) where Pk(p,) =I;p/k!/(k-J)!.
k PI j=O
The workload characterization of the application is given by Pp = pd2 and representsthe ra.tio Ap/ll where Ap is each Pi'S access rate to the bus which in turn depends on thecommunication pattern of G(A) and IIp is the average memory transfer requirementwhich depends on the average message length.
3.2 Single bus distributed memory architecture
This architecture (Figure 7(ii)), is obtained from the previous one hy distributingthe common memory to each processor. The local memory of each Pi is logicallydivided in private memory PMj and common memory CM i and accessed by a double
port.This system has been analyzed in IMAR83]. The average queueing delay per infor
maHon transfer unit as a funelion of the bus utilization is given by
k-u /p pD,(u,) = u: z where p, = ...!:L
Pp+1
k . k'where Pk(p,) = .I;pJ (k-··)I
J=O J .

• 1'1·
3.3 Multiple bus distributed common memory modules architecture
A multiple bus distributed common memory modules architecture is shown in Figure 7(iii). The Pi'S have their own LMj's and communicate via common memory
modules. Multiple global busses are used by the Pi's to access CMi's. Such a. system isreferred to as a kxmxb system where k is the number DC Pi's, m is the number oCeM;'s and b is the number of global busses used. We assume tbat k > m > b.
This system has been analyzed in [MAR821 using several approximate modelsbased on a Markov chain approach..The model we are adopting here provides pl!rCor.mance characteristics which are a lower bound to the characteristics oC the actual sys.tern.
The average queueing delay per inCormation transCer unit is given by
where Pa = Pp
ua =
k k-ik-j ! n rr l
k Ps (i-I)" _I Iwhere Pk(Ps) = I; ---:k-_,l',~~k-!,'::k~,,.-. -
;=1 1+ I;(p}-j-¢ n {3,-')j=O J.9=1
where
and {3p
b-I 9-bI;jPj(9) + bI; [Pb(j + b)Pm_b(O-2b-j + m)]
_ j=1 j=O 0b I 9 b 'L;Pj(O)+ I;(PbO +b)Pm_b(O-2b-j + mJlj= I j=O
>0
Pj(Ol = Pj(H) +Pj_,(O-j) + ... +p,(I-j) +Po(i-j)
wit.h initial condit.ions
Pj(O) = 0 0 < j
PoW) =0 0 > 0
Pj(O) = 1 j > 0
3.4 Omega Interconnection distrIbuted memory modules
In Figure 7(iv), an example oC an Omega interconnected architecture is shownwhere the 9mega network is drawn for k = 8 processors in the system, and 2x2switches.
This system has been analyzed by [KRU83], as t.he interconnection network of theultracomputer {KRU83]. The same analysis applies to a general class of multistage

- 15-
Archlteeture Delay function
(l) Single bus common memory
eM
P,
LM,
P,
LM,
Pp = p/2
D = (k-u/p)/u
(ii) Single bus distributed common memory
- ...J!.....Pp - I-p
D = (k-u/p)/uLM,
P,1-"-+-1 eM,
P,1-4--l eM,
~ 1-_..-_-.__~G~'o~b~'I~b"~'.. , __r
~
(iii) Multiple bus distributed common memory
(lv) Omega Interconnection distributed common memory
CM, CM, CM,
I I•··
I T I
P, P, ... p.
LM, LM, LM.
Globalbusses
Pp = P
D = (k-u/p)/u
Pp = P
INTERCONNECTIONNETWORK
...D = 10 k(t +t m
2(I-i/n}p )+(m-i)t,
go , , 2(i-np)
nMBGA_INTERCONNECTIONNET
P,
LM,•••
P,
LM,
eM,
P,
LM,
Figure 1. The delay function and workload parameter (pp) as a function of ntilization (u) and parameter (p) for Cour shared memory architectures with k
. processors. In case (iii) m = # or common memories, b =#: or commonbusses and k ~ m > b. In case (iv) nxn is the size or the switch, tr =transit time or a switch, tc = cycle time or a. switch, m = #: or packets in a.
msg; p =average # of msgs entered by each P;/eyele time.

int.erconnection networks called Banyan networks [KRU83J. Some or these are theOmega, Delta or indirect cube interconnection networks. In our case, we have considered oxu switches where the capacity of the buffers is infinite. Then the averagedelay per message in traversing the interconnection network is simply its delay perstage times the number or sta.ges (Jognk) in the interconnection.
m2(1 - ~)P'
Dip,) = log"k(t,+t, ( ) ) + (m-I)t,2 1- mp,
and
where k =number of processors in the systemt r = transit. delay of a switchte = cycle Hme of a switrh
n =size of switch (nxn)
m = number of packets per message
P.. =avera.ge number of messages entered by each Pi per cycle time
An exact calculation of D-t(P4) is possible since P4. = u/k and can be directly substitutedinto the delay funct.ion.
3.6 Omega Interconnection PE to PE archItecture
In every architecture considered so Car we have dk" = 1. Figure 8 shows an archi
tecture for which dk,Q ¢. 1. The organization of the processors and memories differs
from that in Figure 7(iv) in that each memory is associated with each processor forming
a single element called the processing element (PE). Thus a PE to PE configuration i.shown in Figure 8. Note that this time the distance between the processors isdk,1 = 1,2. For the average queueing delay per message through tbe omega intercon
nection a formula is given which is the same as in architecture (3.4) but it is stated inmore general terms by INOR85J and is as follows:
u ID =2( ) xmxstx(I--)
l--u u
where u = utilization of the interconnection by a processor per cycle timen:- = Dumber of packets per messagesi = nnmher of network stagesnXD =size or switch
The ahove formula is applicable for the general class of Banyan interconnection

Architecture
PE, I
iNrr., 8~
ER: fK"" 0
N
- 17 -
nMEGA·INTERGONNEGTIONNET
Delay I'nnetloD
U I)D= xmxstx(I--2(I-u) u
Figure 8. The delay function for nonshared memory int.erconnection networks u =utilization of the interconnection by a processor per cycle time, mnumber of packets per message, st = number of network stages, nxn size of switch.

- 18-
net.works, delta, omega, indirect cube.
4. THE FLEX/32 ARCIDTECTURE AND PERFORMANCE
The FLEX/32 is a collection of computers that can each execute independentinstruction streams and can separately access memory. The memory is shared and distributed in several modules as illustrated in Figure g. There are several choices ofboards and they can be mixed.
The shared memory computers communicate by using the common memory. The
intercommunication hardware for FLEX/32 is depicted in Figure 10 and consists of twocommon busses and ten local busses. Common busses are nonmultiplexed, synchronouswith a clock rate of 12 Mhz, and with address width and data width of 32 bils. Thecommunication mechanism is implemented by the Common Control Card (Gee) and
the Common Access Cards (CAG). The GAG· card provides a local bus to commoninterfaces, contains 64 to 512 kbytes of common memory and hardware for interprocess
synchronization. The ecc card also provides a local bus to common bus interface andarbitrates conditional critical region communication. Only one CCC is needed permachine, additional GGG's allow the FLEX/32 to he partitioned into completelyindependent machines.
4.2 The Purdue FLEX/32 configuration
The department or Computer Science at Purdue Unhrersity operates a FLEX/32multiprocessor system with 7 computers based on National Semiconductor N,S 32032processors each supported by floating point unit. Six computers have 1 Mbyte or localmemory and one has 4 Mbytes. The system has 6 CAG cards with 512 Kbytes of common memory each. Each computer can operate in serial mode under UNIX and in muleticomputing or parallel mode under the MMOS operating system IFLEX85!. The system is programmed in Concurrent C and Concurrent FORTRAN 77.
4.2 Purdue FLEX/32 system perf'ormance
Some parameters that have been used to characterize the perrormance or~machines [FOX85) are:
k = number or processors (or computers)tcomm = time to communicate one word between processors
til =time for single precision Doating point calculation
t d1'9 =time for double precision 80ative point calculation
tint. =time for integer calculation
text. = time to read or write one word from external devices
The values of these parameters ror the Purdue FLEX/32 are given in Table 1. Nova.lue is given_ ror tIi because the software does not currently anow one access to single

· 19·
Boards wilhprocessors
andLocal memory
Memoryos
8MI 8M2 8M3 SharedModul
Intercommunication Ha.rdware
-fP3lPI I P5 I
I LMII I LM31 I LMSI
P2 I ~ P6 I
I LM21 I LM4 1 I LM61
-
Inlerraces 10 I/O and Peripherals S
Figure 9. . Schemalic or lhe FLEX/32 archileclure. There may he up to len ,haredmemory modules and twenty processor boards.

- 20-
precision calculations.
The FLEX/32 processors (NS 32032) were compared with VAX 780 single processor computer. It appears that each FLEX/32 computer based on NS 32032 is 1/3 ofVAX 780 Cor double precision floating point calculations and 1/2.65 Cor integer arithmetic. This agrees closely with comparisons to the VAX 780 by other NS32032 basedmachines we have. The LINPACK subroutine DCHDC for Cholesky decomposition forsymmetrie matriees was also used to eompare the performance of the FLEX/32NS32032 processor and the VAX 780. Table 2 gives the performance of LINPACKdouble precision routiDe in C UDder FLEX/32-UNlX and MMOS. The data indicatethat MMOS is slightly faster. Table 2 shows that a Fortran implementation ofDCHDC is slightly more efficient than the C implementation. Table 2 also shows thata single processor on the FLEX/32 runs DCHDC faster thaD expected when comparedto a VAX 780. The ratios or execution times a.verage about 2.1 while the ratios or processor speeds vary Crom 2.6 to 3.3. Once again we see that predicting performance oreven arithmetic dominated applications cannot be done reliably just by using processorspeeds.
Extensive experiments have been performed to measure the communication costthrough the common memory. For the F;;ldue FLEX/32 configuration communicationdelay appears to be eompletely independent of the number of processors that are activeDO matter what they are doing.

·21·
••• C> COMMON BUS *1- .. -" " " """ < < < COMMON BUS *2
" " ... "C>- .. ., -.., .., .., ..,
'" '" '" '"::> ::> ::> ::>Ol Ol Ol Ol
~ ~ ~-'<
" " " "0 0 0 0-' -' -' -'
Figure 10. FLEX/32 intercommunication hardware. The common bus operates at a384 megabit!sec and the local buses have half that capacity.
Parameter FLEX!32 valuepsec
tcomm 6.6
td~ 31.525.13
ti,t 17.0514.66
text 14080
Comments
operands in shared memoryoperands in local memoryoperands in shared memoryoperands in local memoryIIwrite" operationsllread" operat.ions
Table 1. Hardware parameters for the Purdue FLEX!32.

N UNlX-C MMOS-C UNlX/MMOS UNlX-Fi7 FLEX32{VAX78032 0.62 0.58 1.063 0.58 2.3264 3.88 3.52 1.103 3.63 2.1896 12.08 10.74 1.125 11.15 2.18
128 27.18 24.16 1.125 25.33 2.21160 51.83 45.72 1.134 48.18 2.16192 87.92 77.34 1.136 82.56 l.Q9224 137.72 120.94 1.138 125.32 2.05256 204.63 178.4S 1.146 IP~.28 2.08228 285.33 ~51.~e 1.137 ~68.2E 2.15320 390.33 342.96 1.138 367.02 2.16
Table 2. ExecutioL times in seccods on a single processor of tbe LINPACK subrou
ti:.,·:! DeHDe for Cboieskj' ciecompodtio!J of s)'i"..metrk matrices or orderN. Cclum::::~ I, 2 ~~d 3 stJW the effect of running C programs under thetwo operating systems, UNIX a.nd :MMOS. Column 4 shows the time fa. 8
Fortran 77 version and the last column gives the ratio of execution timefor the same program on a VAX 780.
6. MAPPING COMPUTATION MODELS TO ARCHITECTURES
We now consider how to obtain tbe schedule graph G' (A) from the original graphG(A). V:.: use a b~nristj~ algorithm based on the minimization of communication cost.This cost is estimated from the data about communicat.ioD in G(A} aDd the averag-ecommunicaf.ion deia)" mode:h: such as given in Section 2. The details of this algorithmare given in !HOUS83j a.nd we briefly summarize it here for comp!eteness. There arenumerous constraints implicit in the mapping problem which complicate a completemathematical formulation considera.bIy. However, experience shows that this algorithmruns f""t and tOo run t.ime is normally linear in the size of G(A) and the numher of processors. The reduction can be viewed as a clustering process tha.t tries to minimizecommunr"cation Urne for data and computatr"on variable" b)' clust.ering modules together.This clustering must satisry the roHowing constrainl.s:
(i) reaource constraints:
. Every computational module must fit into the memory assigned.- Datablocks must fit into the memory "'<signed.. Com"putations must have enough processor time.

- 23·
(ii) parallelism constraint:. Parallel computational modules can not he clustered, they are assigned ~,o
different processors.
(iii) artificial constraint:
. Processing time on each processor is limited to T (a parameter).
Tbe time frame parameter T is used implicitly to calculate tbe utilization (u) of tbeinterconnection network of the machine M due to inlermodule communication traffic.The reduction of T forces more and more processors to be used.
We give tbe results of applying our metbod to map Applications I and 3 to tbeFLEX/32 architecture. Application 2 is not considered because there is an obviousmapping for it that gives optimal speedup.
6.1 The clustering algorithm
The solution of the reductjoD problem for a specific time frame T is achieved bythe rollowing heuristic clustering strategy:
StartAssign one processor pCT computation moduleAssign data blocks to lclosest' memory
Iteration
1. Select a pair or computation modules ror possible merger into one processorwhich gives maximum reduction in objective runction (communicationcost).
2. Ir no constraint.s are violated, t.hen merges the two modules, otherwiseremove the pair rrom list or eligible pairs.
Experience suggests that this heuristic strategy "solves" the reduction problem inapproximately linear time. Ir the graph G(A) can be scpamt.f>d into disjoints subgraphs by synchronization nodes (nodes with parallelism = I), then the subgraphsare treated separately and the resulting subclusters joined in arbitrary order. Theinput to tbe clustering algorithm is as follows:

·24 -
Algorithm spedfication
the applicatioo graph G(A). Recall that this graph explicitly cootains requir.,.ments tor processing, memory and communication plus the precedence or thecomputation modules. From this information one may easily derive the synchronization delay or blocking times of tbe modules.
Architecture characteristics
communication models (delay (unction)
interconnection network bandwidth
G(M) if diflerent than G(A)
Resource constraint
time Crame parameter T
6.2 Mapping application I to the FLEX/32 architecture
The Cholesky parallel algorithm [O'LEA85j was implcmented in Coocurrent CIFLEX85j for block symmetric matrices. The size of each block is denoted by N' andthe number of blocks is k2 where k represents the number of active processors. Thegraph of the applications is depicted in Figure 2 Cor 4 by 4 b1o.ck matrix. TheFLEX/32 communication delay function is tcomm • k *ci,i where Ci,j is the number oCunits or data transferred between modules i and j. Tahle 3 gives the mappingsobtained versus k. Figure 11 shows the clusters Cor the 5 by S case.
This applicat.ion allows us to test t.he claim t.hat the heurist.ic ma,pping algorithmhas run time proportional to the number or nodes and processors. In this case thenumber or processors is k and the nodes k2. We have ror this algorithm
k
execution time (sec.)100. (execution time)/k'
2
0.688.5
3
1.485.5
4
4.477.0
5
8.S36.8
6
19.819.2

·25 -
k Cluster #1 Cluster #2 Cluster #3 Cluster #4 Cluster #5 Cluster #6
2 1,2 3,4
3 1,2,3 4,7,8,9 5,6
4 1,2,3,4,15,16 5,9,11,12,13 6,7,8 10,14
5 1,2,3,4,5 6,11,16,18,21, 7,8,9,10 12,18,10,20,22 13,14,15
23,24,25
6 1,2,3,4,5, 7,13,19,25,31 8,9,10,11,12 14,20,26,28,32 15,16,17,18 21,27,33
6,22,23,24 20,30 34,35,36
Table 3. The clustering of the nodes of G(A) produced to obtain G' (A) by tbe heuristic algorithm. For k processors the nodes are numbered using the same pattern as in Figure 2 and then assigned to c1ust.ers as indicated in this tabl~.
5.3. Mapping application ill to the FLEX/32 architecture
The application of the heuristic mapping algorithm to the graph G(A) shown inFigures 5 and 6 gives the clusters shown in Figure 12. Each node of G(A) is replacedby the cluster number to which it belongo in G' (A). The interlacing of the clustersmakes the display such as in Figure 11 too complex. The time to con~pute this c1uster~
iog is 5.484 seconds.
5.4 On the beh avior of the mapping algorithm
When the time frame parameter T changes, different clusterings in G(A) can beobtained. Let
TPAR = the shortest time frame Cor which all allocated processors can run theapplication A in parallel,
TMIN = shortest time frame Cor which the application A can run under the
imposed resource utilization constraints.
Our observlltion has been t.hat T MlN -:;f: T pAR when the intermodular communication
cost is very low. For example, in the case of Cholesky decomposition (Figure 2) thereare ten different c1usterings which a.re summarized in Figure 13. Normally,TMIN = TPAR and the mapping algorithm produces a unique solution. If we define asan optimum clnstering for G(A) as the one with minimum elapsed time and minimumcommunication cost then it is easy to verify the Collowing observations.
Lemma: If TMlN ¢ TpAR then the optimum clustering is the one thatcorresponds to time trame T = TPAR or the one with minimum number of clusters.

- 26-
Figure 11. The clusters ohtained hy the mapping ot G(A) into G' (A) tor the 5 by 5Cholesky computation with N=240. The predicted elapsed time is [94seconds to make this computat.ion.

- 27-
I
/5~
5
#3
Figure 12. Partition oC the graph G(A) oC Applications ill into 6 clusters using theheuristic algorithm with T=66.37. The numbers at tbe nodes indicate towhich cluster that node belongs. Clusters 2, 3 and 6 are also indicated bythe heavy lines.

• 28 -
For the different clusterings G' (A) or Figure 13, the elapsed time versus the time frameT are plotted in Figure 14. These results were obtained using simulation on theFLEX/32.
This observation is supported by our experimental results. Table 4 shows the
effeet of using more processors than required for Application I (the 4 by 4, N=240 case).Communication is 50 Cast in the FLEX/32 compared to computation that one sees littleeffect in actuality. We artificially increased the communication requirements by a factor of 100 and those results are shown in column 3 of Table 4. Then the adverse effectoC having too many processors is evident.
The current implementation of the graph reduction pbase is capable, by using aniterative procedure, to identify all possible solutions and the breakpoints as in Figure13. Also, it is possible to estimate the elapsed time provided we are able to predict tbeblocking time of eacb module in G(A) due to the precedence of computations. Theworkload analysis based on SIMON or FLEX/32 provides this inrorrnation. It turnsout that TpAR is a. close upper bound of the elapsed time when the blocking time ofeach module is incorporated as part or the processing time of the modules. We believethat this approach to predicting the elapsed time is reasonable since the blocking timeis solely an attribute of the application algorithm. The importance of the elapsed timeis twofold. (a) For the same application the performance of different multiprocessorsystem architectures can be compared by comparing their elapsed times. The a.dvantage of parallel processing can also be investigated by comparing the elapsed times on aparallel architecture system to a uniprocessor system. (b) Given different initial partitions G(A) of the same application A, their performance can he compared by looking atthe elapsed time of the different partitions running on the same multiprocessor system.
6. PERFORMANCE OF APPLICATION/ARCmTECTURE PAIRSIn this section we present actual performance data for the three applications on
the FLEX/32. We analyze the speedup obtained and correlate this with the computation structure and with the predicted values from our allocation algorithm.
6.1 ApplicatIon I/FLEX32 pair
Consider an N by N matrix and the Cholesky decomposition described in Section2.1 and assume that is to be implemented using k processors. One way is to partitionthe ma.trix into k2 blocks. Then the computational complexity of this algorithm is stleast O(N3/k) and the communication complexity is a.t least O(N2/k). This algorithmwas implemented in concurrent C and ran on the FLEX/32 using different values of Nand k. The mapping was determined by the allocation algorithm assuming a lineardelay model t"rnrnxkxc;,j' Tahle 5 shows the speedup and efficiency obtained. Theentry for k=8 was obtained by partial simulation. Efficiency is the speedup obtained

• 29 - .
10 ~
II I
8 I I~ I
I~
I'" I~
I~= 6 I I0 I ~- I I I0 I I I~ I I'" 4 I'" I I I I IE I I I= I I I I IZ 2 I I I I II I I I I
I I I I I0 I I I I I
0 20 40 60 80 100 120 140 160 200TMIN TpAR
Time Frame Parameter, T
Figure 13 The number of clusters obtained Cor different values of the time frameparameter T lor the Cholesky decomposition application 01 Figure 2 withN=240.
Number 01 Elapsedprocessors time
4 228.685 229.446 230.247
Elapsed time with communicationsrequirements increased by 100.
747.7801.6838.0910.1
Table 4. Effect 01 having more processors than required lor the parallelism 01 an al'"plication in the case of Cholesky decomposition with a 4 by 4 system andN=240 (see Figure 2).

- 30-
divided by k. It is worth noting that the communication complexity is :,,:,,duced withrespect in a factor dose to the speedup.
Number 01 Elapsed Speedup Efficiency
active processors Time
1 4080462 347.10 1.18 .50
3 276.08 1048 040
4 228.67 1.70 .45
5 104.36 2.1 0426 160.54 204 0408 102.38 4.0 040
Table 5. Elapsed time, speedup and efficiency oHained lor Application I on the
FLEX/32.
One should not expect speedup 01 about k (or efficiency almost 1) for thi, application. As ,een in Figure 2, during the computation tbe parallelism of G(A) grow,steadily to its max imum and then decreases steadily back to 1. Thus a course grainedpartitioning such as we use should use, on the average, about balr the processors so weexpect the efficiency to be about 0.5 which corresponds well with the observed results.
In order to study the effect of communication cost on the computation we haveartificially increased it by a factor of 10 and 100. This increases the computationaltime for a 4x4 Cholesky decomposition graph N=240 and 4 active processors as fol
lows:
Communication Elapsed Ratio to
Cost lime normal case
Normal 228.6710 times normal 277.30 1.2
100 times normal 747.67 2.7
One of the objectives 01 our methodology is to predict the perlormance of somealgorithm/architecture pairs. It appears that TpAR caD be used for this purpose. Table6 shows the. predicted elapsed time for various computational graphs of Application I or
FLEX/32 system.

- 31-
Predicted Predicted Measured
k Elapsed time Speedup Speedup
2 316 1.29 1.18
3 243 1.68 1.48
4 162 2.52 1.79
5 159 2.57 2.10
6 140 2.90 2.40
Table 6. Predicted and measured speedup. The predicted time is TPAR trom the allocation a.lgorithm, the measured time from Table 5.
6.2 Application II/FLEX32 pair
A straight forward estimation of the computational complexity DC the spline collocation method indicates that it requires O(N2) arithmetic operations per iteration whereliN is the size or the partition in the x and y directions. Ideally, distributing the workamong k processors reduces the computational complexity in a parallel algorithm toO(N2jk). The performance curve in Figure 14 indicates ideal speedup for large N.Table 7 presents the timings obtained with the FLEX/32 with a single processor andthe VAX 780. These data indicate that the VAX 780 is about twice as fast as aFLEX/32 processor. This agrees with t.he data in Table 2 and supports the conjecturethat the VAX 780 is not as much faster than FLEX/32 processor as the raw speeds ofthe processors would suggest.

- 32-
Speed-up=6
6 -I Speed-up 5
5
~ Speed-up 4
0. 4
r","'"" 3"0.<FJ Speed-up=2
2
/1
, , , I, N
20 40 60 80 100 120 140 160 180 200 220
Number of Lines in One Direction
Figure 14 Measured speedup for Application II OD the FLEX/32. The rough natureor the curve ror 6 processors is due to variations Crom properties or neighboring values of N (e.g. at N=174, 176 and 180).

- ~
N FLEX-UNIX FLEX-MMOS VAX-UNIX FLEX-MMOSIVAX-UNIX
12 0.30 0.24 0.08 3.00
24 1.15 0.82 0.32 2.56
48 4.18 3.18 1.38 2.30
96 15.70 12.52 5.85 2.14
120 23.85 19.54 9.32 2.09
150 38.03 30.52 14.20 2.15
180 52.83 46.61' 20.93 2.23
210 72.2g 58.29' 28.43 2.05
216 78.65 63.43' 29.Q2 2.12
Ii: predi·:ted ,'alues
Table 7. Time to execut.e one iteration on a single processor computer under differentoperating systems. The computation is one itera.tion DC the spline collocation method (see equation 2.1) for an N by N mesh.
We obsene t.hat the computatio"1a! complexity and communication complexity are
hoth O(N'/k) here. For the FLEX/32 the ratio
t"mm/tdW = 6.6/31.5 = 0.21
is quite sma.ll which is necessary to obtain the high efficiency observed here. For theparticular case N =180 we have the following results
k = number of processors
speedup
1 2 3 4 5 6
1 2.00 2.47 3.88 4.77 5.65
The speedup curves as shown in Figure 14 are typical of those seen in other appli
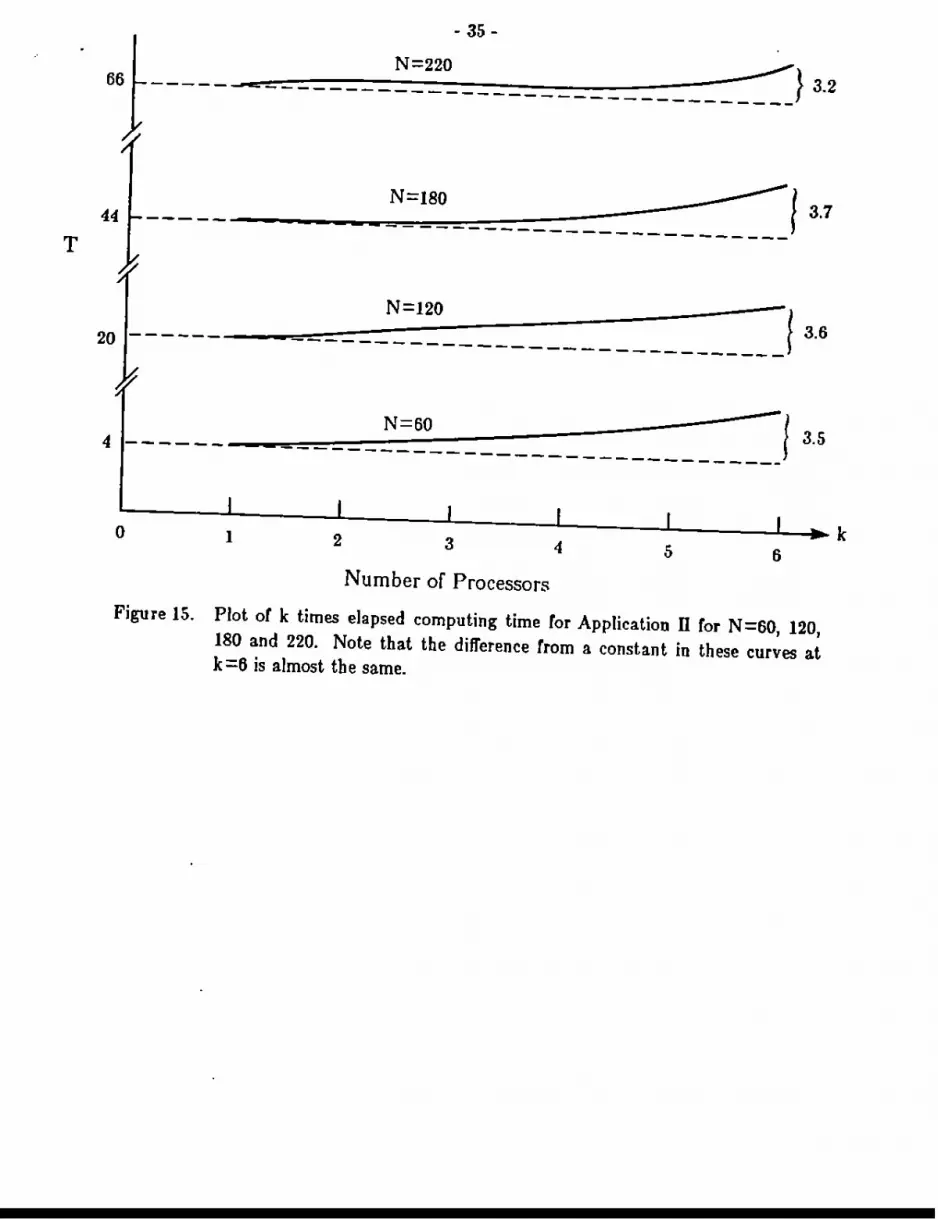
cations and for other machines. This same data is redisplayed in Figure 15, we plot thenumber of processors times the elapsed execution time for one itera.tion or this computation. If we had perfect speedup, then these curves would be constants. We observethat they have a slight rise, almost linear. In particular, each of these has risen about
3.5 at k =6. This suggests that
Elapsed time = C,l'-'"/k + C, = 0.00135 N'/k + 0.75k
which gives.
Speedup = k(l + (k-1)C,/(C,N'))
Thus there is a very plausible fixed overhead or Cz in the elapsed time per processor.The significance of this behavior is that C2 is an overhead independent of N and thus

·34·
one that becomes less significant as the problem size increases.
6.3 Application m/FLEX32 pair
Application m reqnire, 252.86 ,econd, to rnn on a single FLEX/32 processor. Abrier examination or Figure 6 ,ngge,t, that a snbstantial ,peednp i, possible ror 6 processors, but somewhat less than 6 is expected. Tber~ is a drop in parallelism in thecenter or the grap" (where tbe mnltirrontal metbod merges) which involve, substantialcomputation and the "create plot data structure" node is se.quential and sizable. Whenthis application is run with 6 processors on the FLEX/32 using the clustering or Figure12, it takes 72,('.3 seconds. This is a speedup or 3.34.
An analysi, or Figure 5 shows that the maximum possible speedup i, 3.92 ir oneassumes that communication is instant.aneous. Recall that our heuristic algorithm doesnot attempt to minimize elapsed time directly, so the speedup obtained is reasonable.
The time frame parameter T used to achieve the clustering is 66.37. This givesthe predicted speedlip of 252.86/66.37 = 3.81 which is between maximum possible andthe observed value.
7. CONCLUSIONS
We see that the heuristic partitioning algorithm works well even ror a machine likethe FLEX/32 where communication costs are negligible compared to computationalcosts. The applications considered have a high correlation between communication andcomputational costs which is not surprising, this is probably rairly common. The sevenprocessor ii"LEX/32 at Purdue exhibits no communication degradation even with aUprocessors continually accessing shared memory. We expect this situation to continueir the number or processors is increased to the one cabinet limit (20 processors). Our
projection is that the FLEX/32 boards can be npgrade,-: with processor te:: times rasterthan the current ones without adversely impacting most computations. We aresurprised to see on two unrelated, arithmetic dominated applications that the FLEX/32runs haIr as rast as a VAX 780 even though the VAX processors are 3 times raster.
Optimal speedup requires that the degree or paral1elism be maximal most or thetime. Our approach only exploits coarse grain parallelism and two or the applicationscan use both coarse and fine grain parallelism. Even so, we observe good speedup orabout k/2 ror k processors. The third application (spline collocation) naturally has highparallelism and, Cor any number oC processors, we observe optimal speedup as the prof>.lem size increases. In this case the lack of perfect speedup seems to be due to a smallconstant "start up cost" per processor. This small cost has a large apparent effect ontraditional "speedup versus size" graphs.
- 35-
N=220 }66 --- - - -=~_....,.... = ..:.:..-=:- --- 3.2
--------
T
____-.:N~18:0====:_:_::::_:==~---13.7----- =- ------
20 ====-=~N~I~2~0======~~ ~-_-_-_-_-] 3.6
4 ~===~N~60~::_=====_=~==~ -~1 3.5
65432I'-----...I----..I.------L__-L__--L__...L-. ko
Number of Processors
Figure 15. Plot or k times elapsed computing time tor Application IT tor N=60, 120,
180 and 220. Note that the difference trom a constant in these curves atk=6 is almost th e same.

- 36-
8. REFERENCES
[BERMS41
[BERMS5J
[B0KHSIJ
[FLEXS5J
IFOXS5]
[FUJ1S5)
[GANNS4J
[HOUSS4!
[HOUSS3]
[HOUSS6]
IHWANS4]
[JENN77)
IKLEIS5J
[KRUSSS3j
[MARS83)
[MARSS3J
INORTS5)
Berman, F. and Snyder, L., "On mapping parallel algorithms in parallelarchitectures," Prot:. Internal. Con/. Parallel Processing, (lgS4) 307-30Q.Berman, F., Goodrich, M" Koelbel, C., Robinson, ill, \V. J., and Showell,K., Ilprep_p: A mapping preprocessor for chip computers/' Proc. Inter.Cont. Parallel Processing, (IU85) 731-733.
Bokhari, Shamid, H., "On the Mapping Prohlem," IEEE Compute.., C-30,(IUSI) 207-214.Flexible computer corporation, FLEXI9~ Multicomputer system overview,Doc. No. 030-0000-002, Second Edition, June (IU85).Fox, G, The performance of the Caltecb Hypercube in scientific calculations, Caltech Technical Report, April 5 (IU85).Fujimoto, R. M., liThe SIM:ON simulation and development system," Summer Computer Simulation Conference, IgS5 (Univ. of Utah).Gannon, D. and J. Von Rosendale, On the comml:nication complexity ofparallel numerical algorithms, IEEE Trans. Computer, Vol. C-33, No. 12,pp. llSo-llg4, Decemher IgS4.
Houstis, Catherine E., IIAllocation of real time application in distributedsystems," (lgS4) submitted for puhlication.Houstis, C. E., Houstis, E. N., a.nd Rice, J., "Partitioning and Allocation ofPDE Computation to Distributed Systems," PDE Software: Modules Inter/ace. and Sy.!em., Edited by B. Enguist and T. Smedsaas, North Holland,(IU83), 67-S5.Houstis, E. N. and Rice, J. R., Heuristic methods for reducing the par_~l1el
ism in computational graphs, Technical Report, Computer Science, PurdueUniversity, 19S6.Hwang, Kai, and Briggs, Faye, Computer Architecture and Parallel Proce...·ng, McGraw-Hill, tgS4.Jenny, C. J., uProcess partitioning on distributed systems," Digest of paperNationat Telecammunica!io.. Con/erence, (IU77) 31:1-31:10.Kleinrock, Leonard, "Distributed systems," Communications ACM, 28,(IUS5), 1200-1213.Kruskal, C., and Snir, M., liThe performance of multistage interconnectionnets for multiprocessing," IEEE Tra ... Comput"" (lg82), IOgl-IOgS.Marsan, M. A., and Gerla, M., lIMarkov models for multiple bus multiprocessor systems," IEEE Tran•. Compute.., C-32, (IUS3) 2311-248.Marsan, M. A. Balbo, G., and Conte, G., "Comparative performanceanalysis of single bus multiprocessor architectures," IEEE Trans. Comput.ers, C-31, (IU83) 1170-11Ul.
Norton, Alan and G. F. Pfister, "A methodology for prediCting multiprocessor performance," Proc. Internat. Cont. Parallel Processing, (IUS5) 77277S.

[O'LEA86j
IO'LEA86]
[WILL83j
·37·
O'Leary, D. P. and G. W. Stewart, "Data-flow algorithms ror parallelmatr;x computations," Communication ACM, 28, (1085) 84()'853.O'Leary, D. P. and G. W. Stewart, "Assignment and scheduling in parallelmatrix ractorization" LiD. Alg. Appl., (1086), to appear.Williams, E. A. I "Assigning processes to processors in distributed systems,"Pro,. Int,rnat. Conf. Paratld Pro""ing, (1083) 404-406.