particle size ppt
TRANSCRIPT
April 2010
Particle Size Analysis AM Healy
1
Particle Size Analysis
• Why measure particle size of pharmaceuticals???
• Particle size can affect – Final formulation: performance, appearance, stability
– “Processability” of powder (API or excipient)
April 2010
Particle Size Analysis AM Healy
2
Methods for determining particle size
• Microscopy• Sieving• Sedimentation techniques• Optical and electrical sensing zone method• Laser light scattering techniques• (Surface area measurement techniques)
April 2010
Particle Size Analysis AM Healy
3
Choosing a method for particle sizing
• Nature of the material to be sized, e.g.estimated particle size and particle size rangesolubilityease of handlingtoxicityflowabilityintended use
• Cost capitalrunning
• Specification requirements• Time restrictions
April 2010
Particle Size Analysis AM Healy
4
MicroscopyOptical microscopy (1-150µm)Electron microscopy (0.001µ-)
• Being able to examine each particle individually has led to microscopy being considered as an absolute measurement of particle size.
• Can distinguish aggregates from single particles• When coupled to image analysis computers each
field can be examined, and a distribution obtained.
• Number distribution • Most severe limitation of optical microscopy is
the depth of focus being about 10µm at x100 and only 0.5µm at x1000.
• With small particles, diffraction effects increase causing blurring at the edges - determination of particles < 3µm is less and less certain.

April 2010
Particle Size Analysis AM Healy
5
For submicron particles it is necessary to use either
• TEM (Transmission Electron Microscopy) or • SEM (Scanning Electron Microscopy).• TEM and SEM (0.001-5µm)
April 2010
Particle Size Analysis AM Healy
6
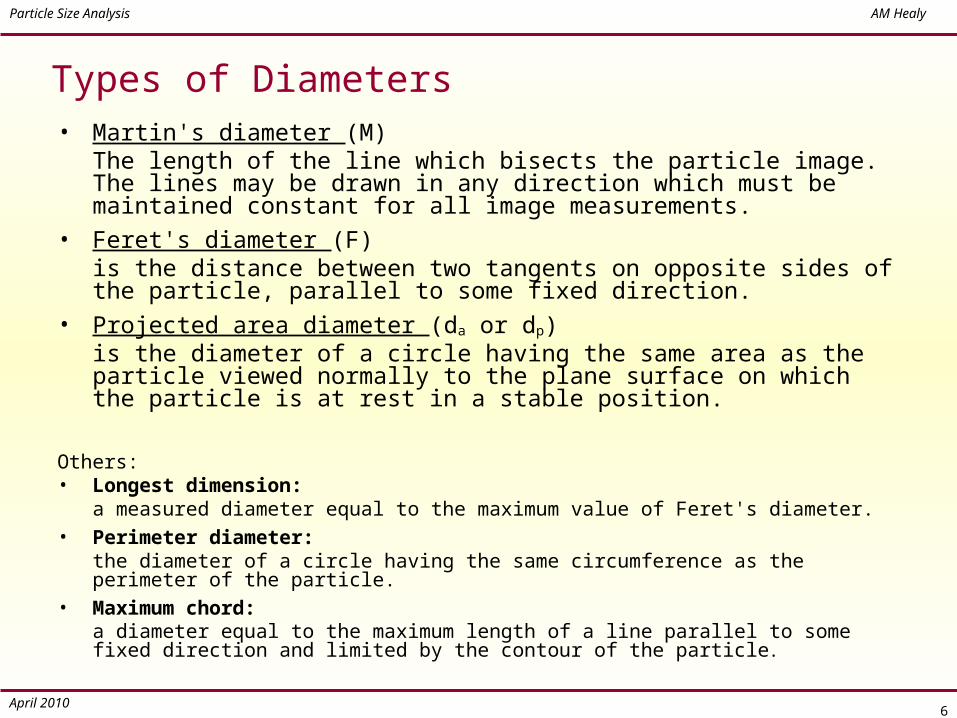
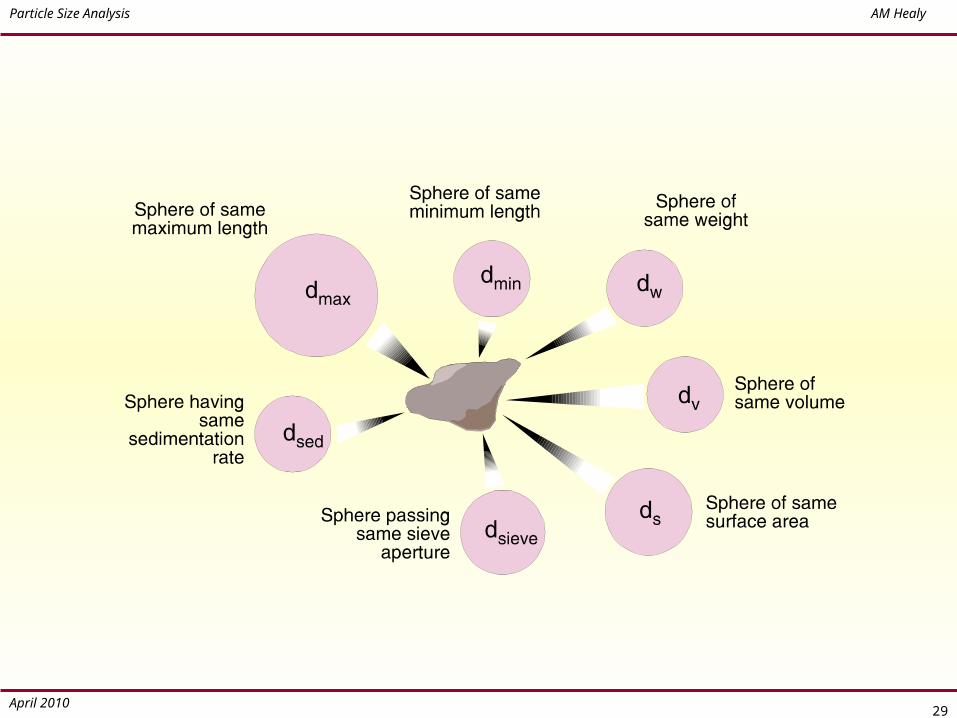
Types of Diameters• Martin's diameter (M)
The length of the line which bisects the particle image. The lines may be drawn in any direction which must be maintained constant for all image measurements.
• Feret's diameter (F)is the distance between two tangents on opposite sides of the particle, parallel to some fixed direction.
• Projected area diameter (da or dp)is the diameter of a circle having the same area as the particle viewed normally to the plane surface on which the particle is at rest in a stable position.
Others:• Longest dimension:
a measured diameter equal to the maximum value of Feret's diameter.• Perimeter diameter:
the diameter of a circle having the same circumference as the perimeter of the particle.
• Maximum chord:a diameter equal to the maximum length of a line parallel to some fixed direction and limited by the contour of the particle.
April 2010
Particle Size Analysis AM Healy
7
Manual Optical Microscopy
Advantages• Relatively inexpensive• Each particle individually examined - detect
aggregates, 2D shape, colour, melting point etc.
• Permanent record - photograph• Small sample sizes required
Disadvantages• Time consuming - high operator fatigue - few
particles examined• Very low throughput• No information on 3D shape• Certain amount of subjectivity associated with
sizing - operator bias
April 2010
Particle Size Analysis AM Healy
8
Transmission and Scanning Electron Microscopy
Advantages• Particles are individually examined• Visual means to see sub-micron specimens• Particle shape can be measured
Disadvantages• Very expensive• Time consuming sample preparation• Materials such as emulsions
difficult/impossible to prepare• Low throughput - Not for routine use
April 2010
Particle Size Analysis AM Healy
9
Automatic and Image Analysis Microscopes
Advantages• Faster and less operator fatigue than manual• No operator bias
Disadvantages• Can be very expensive• No human judgement retained e.g. to separate
out aggregates, select or reject particles etc. (unlike semi-automatic)
April 2010
Particle Size Analysis AM Healy
10
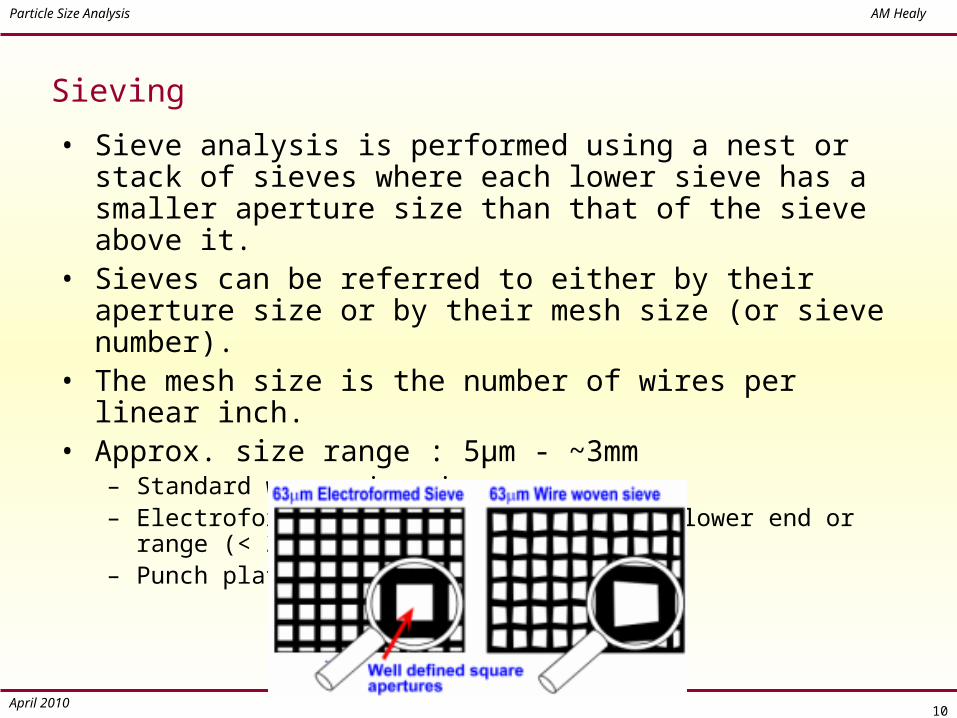
Sieving• Sieve analysis is performed using a nest or
stack of sieves where each lower sieve has a smaller aperture size than that of the sieve above it.
• Sieves can be referred to either by their aperture size or by their mesh size (or sieve number).
• The mesh size is the number of wires per linear inch.
• Approx. size range : 5µm - ~3mm – Standard woven wire sieves– Electroformed micromesh sieves at the lower end or
range (< 20µm)– Punch plate sieves at the upper range.

April 2010
Particle Size Analysis AM Healy
11
• Sieving may be performed wet or dry; by machine or by hand, for a fixed time or until powder passes through the sieve at a constant low rate
• Wet sieving• Air-jet sieving• Weight distribution
April 2010
Particle Size Analysis AM Healy
12
Advantages• Easy to perform• Wide size range• Inexpensive
Disadvantages• Known problems of reproducibility• Wear/damage in use or cleaning• Irregular/agglomerated particles• Rod-like particles : overestimate of under-
size• Labour intensive

April 2010
Particle Size Analysis AM Healy
13
British Pharmacopoeia Volume IV Appendix XVII A. Particle Size of PowdersParticle size classification of powders(Ph. Eur. method 2.9.12, Sieve test)
The degree of fineness of a powder may be expressed by reference to sieves that comply with the specifications for non-analytical sieves (2.1.4).Where the degree of fineness of powders is determined by sieving, it is defined in relation to the sieve number(s) used either by means of the following terms or, where such terms cannot be used, by expressing the fineness of the powder as a percentage m/m passing the sieve(s) used.The following terms are used in the description of powders:Coarse powder: Not less than 95% by mass passes through a number 1400 sieve and not more than 40 % by mass passes through a number 355 sieve.Moderately fine powder: Not less than 95% by mass passes through a number 355 sieve and not more than 40% by mass passes through a number 180 sieve.Fine powder: Not less than 95% by mass passes through a number 180 sieve and not more than 40% by mass passes through a number 125 sieve.
etc., etc….
April 2010
Particle Size Analysis AM Healy
14
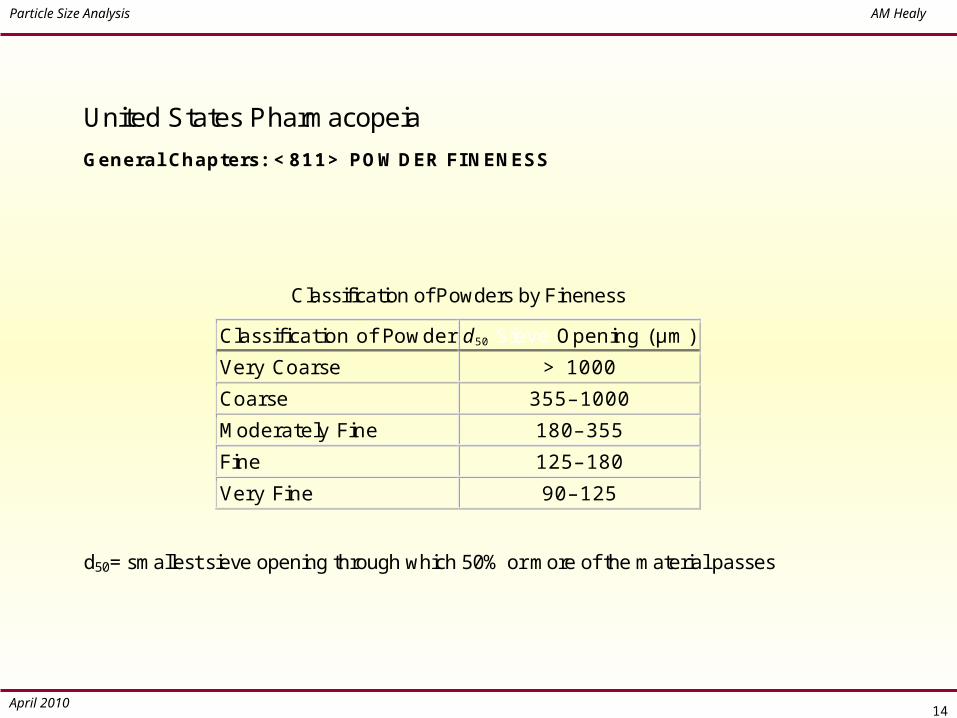
United States Pharm acopeia G eneral Chapters: < 811> PO W D ER FIN EN ESS
Classification of Powders by Fineness
Classification of Pow der d50 Sieve O pening (µm ) Very Coarse > 1000 Coarse 355–1000 M oderately Fine 180–355 Fine 125–180 Very Fine 90–125
d50= sm allest sieve opening through which 50% or m ore of the m aterial passes

April 2010
Particle Size Analysis AM Healy
15
Sedimentation techniques
• Methods depend on the fact that the terminal velocity of a particle in a fluid increases with size.
• Stokes's Law :
• Stokes's diameter (dst) is defined as the diameter of the sphere that would settle at the same rate as the particle
18
2sphfs gd
tx
gd
fssph
18
April 2010
Particle Size Analysis AM Healy
16
• The particle size distribution of fine powder can be determined by examining a sedimenting suspension of the powder.
• 2 categories:(1) Incremental : changes with time in the concentration or density of the suspension at known depths are determined. Can be either fixed time or fixed depth techniques.(2) Cumulative : the rate at which the powder is settling out of suspension is determined. i.e the accumulated particles are measured at a fixed level after all particles between it and the fluid's surface have settled.
• Weight distribution
April 2010
Particle Size Analysis AM Healy
17
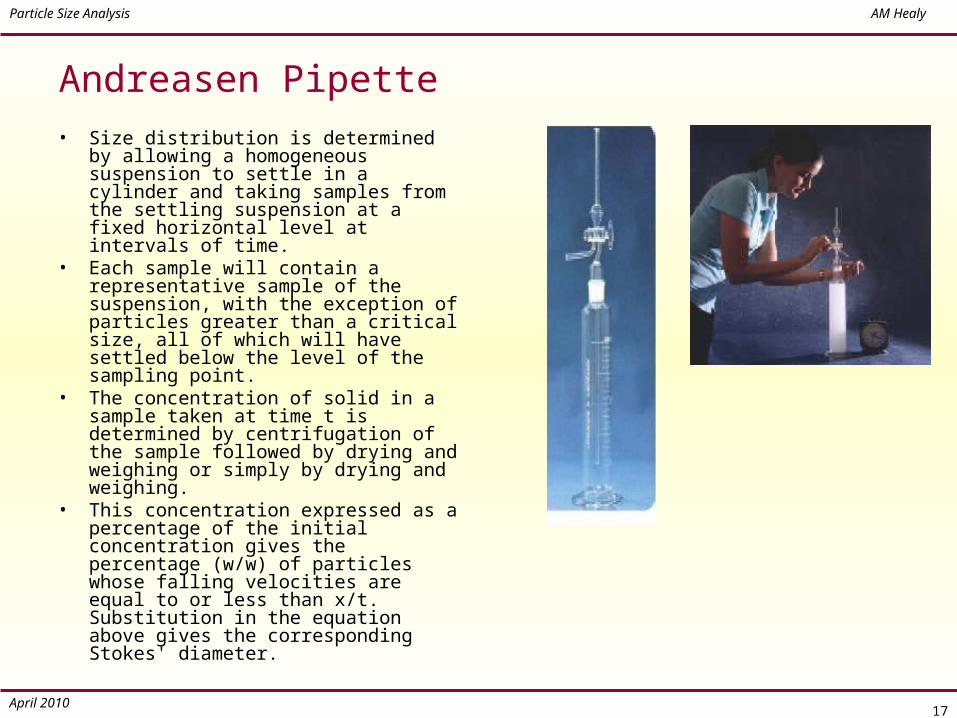
Andreasen Pipette• Size distribution is determined
by allowing a homogeneous suspension to settle in a cylinder and taking samples from the settling suspension at a fixed horizontal level at intervals of time.
• Each sample will contain a representative sample of the suspension, with the exception of particles greater than a critical size, all of which will have settled below the level of the sampling point.
• The concentration of solid in a sample taken at time t is determined by centrifugation of the sample followed by drying and weighing or simply by drying and weighing.
• This concentration expressed as a percentage of the initial concentration gives the percentage (w/w) of particles whose falling velocities are equal to or less than x/t. Substitution in the equation above gives the corresponding Stokes' diameter.
April 2010
Particle Size Analysis AM Healy
18
Advantages• Equipment required can be relatively simple and
inexpensive.• Can measure a wide range of sizes with considerable
accuracy and reproducibility.
Disadvantages• Sedimentation analyses must be carried out at
concentrations which are sufficiently low for interactive effects between particles to be negligible so that their terminal falling velocities can be taken as equal to those of isolated particles.
• Large particles create turbulence, are slowed and are recorded undersize.
• Careful temperature control is necessary to suppress convection currents.
• The lower limit of particle size is set by the increasing importance of Brownian motion for progressively smaller particles.
• Particle re-aggregation during extended measurements.• Particles have to be completely insoluble in the
suspending liquid.
April 2010
Particle Size Analysis AM Healy
19
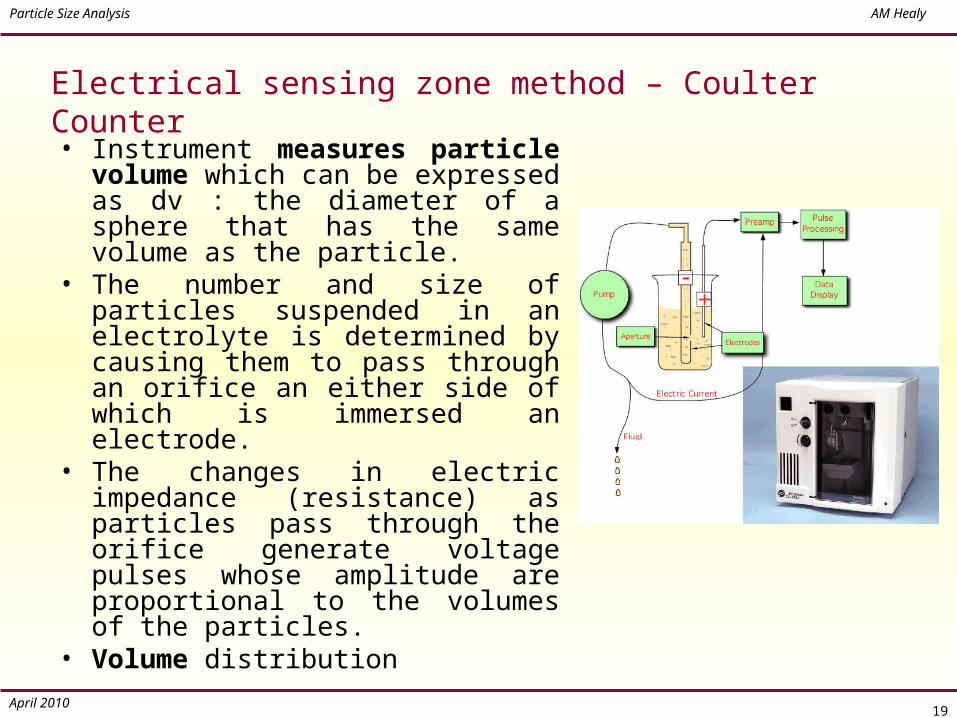
Electrical sensing zone method – Coulter Counter• Instrument measures particle
volume which can be expressed as dv : the diameter of a sphere that has the same volume as the particle.
• The number and size of particles suspended in an electrolyte is determined by causing them to pass through an orifice an either side of which is immersed an electrode.
• The changes in electric impedance (resistance) as particles pass through the orifice generate voltage pulses whose amplitude are proportional to the volumes of the particles.
• Volume distribution
April 2010
Particle Size Analysis AM Healy
20
Optical sensing zone method
• Obscuration of light source relates to particle size (area)
• Advantage of not requiring medium to be an electrolyte
April 2010
Particle Size Analysis AM Healy
21
Laser light scattering techniques
• Laser Diffraction Particle Size Analysis – (Particle size range 0.02-2000µm)
• Photon Correlation Spectroscopy– (Particle size range :1nm to 5µm)
April 2010
Particle Size Analysis AM Healy
22
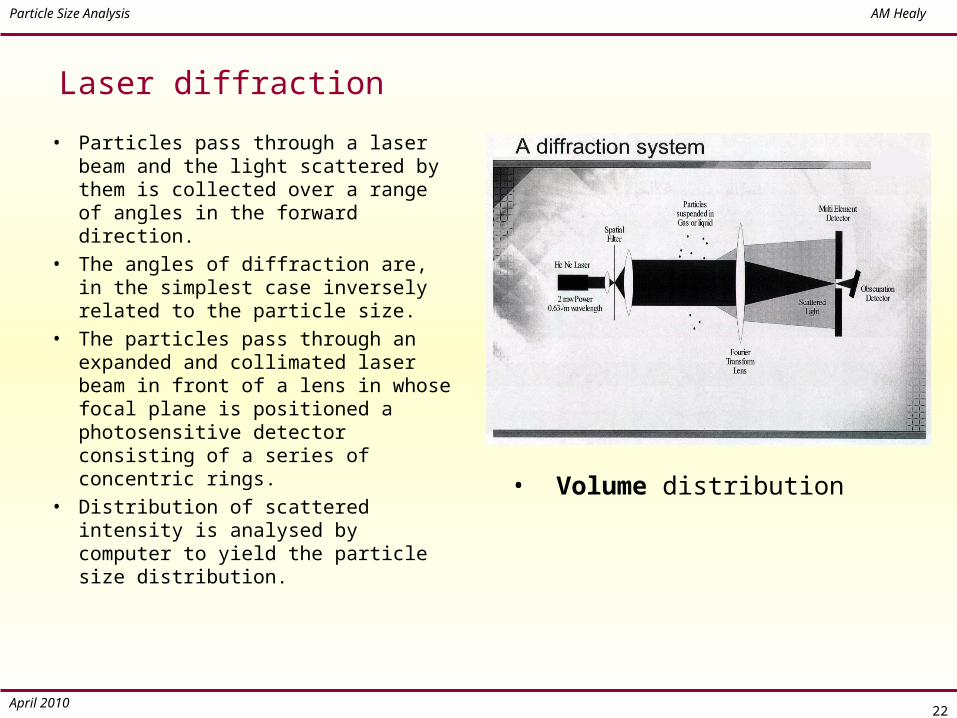
Laser diffraction• Particles pass through a laser
beam and the light scattered by them is collected over a range of angles in the forward direction.
• The angles of diffraction are, in the simplest case inversely related to the particle size.
• The particles pass through an expanded and collimated laser beam in front of a lens in whose focal plane is positioned a photosensitive detector consisting of a series of concentric rings.
• Distribution of scattered intensity is analysed by computer to yield the particle size distribution.
• Volume distribution
April 2010
Particle Size Analysis AM Healy
23
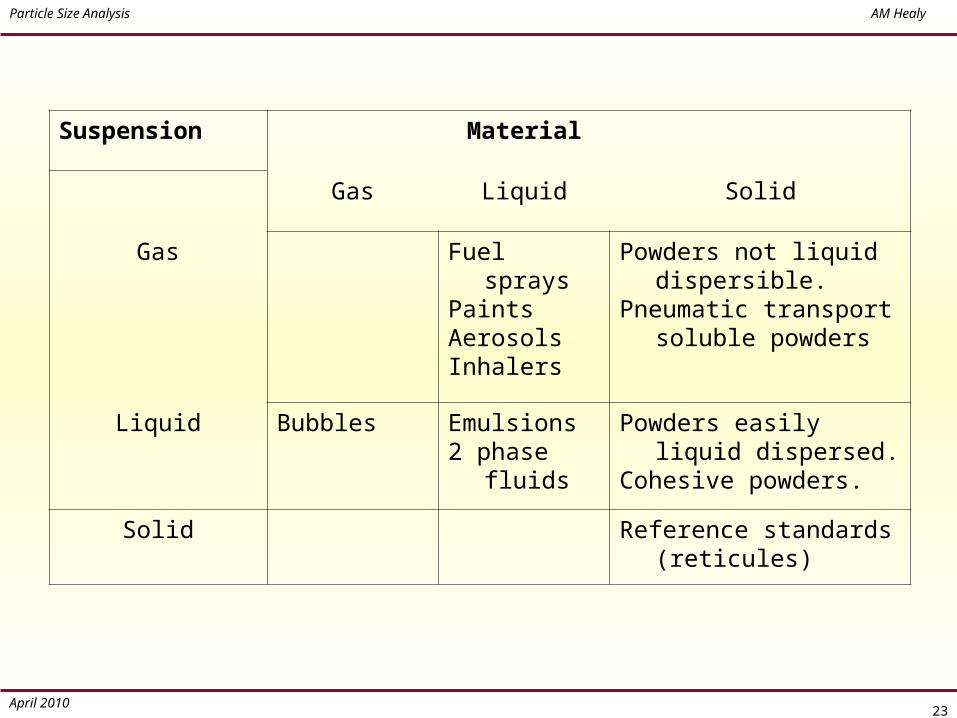
Suspension Material
Gas Liquid Solid
Gas Fuel sprays
PaintsAerosolsInhalers
Powders not liquid dispersible.
Pneumatic transport soluble powders
Liquid Bubbles Emulsions2 phase
fluids
Powders easily liquid dispersed.
Cohesive powders.
Solid Reference standards (reticules)
April 2010
Particle Size Analysis AM Healy
24
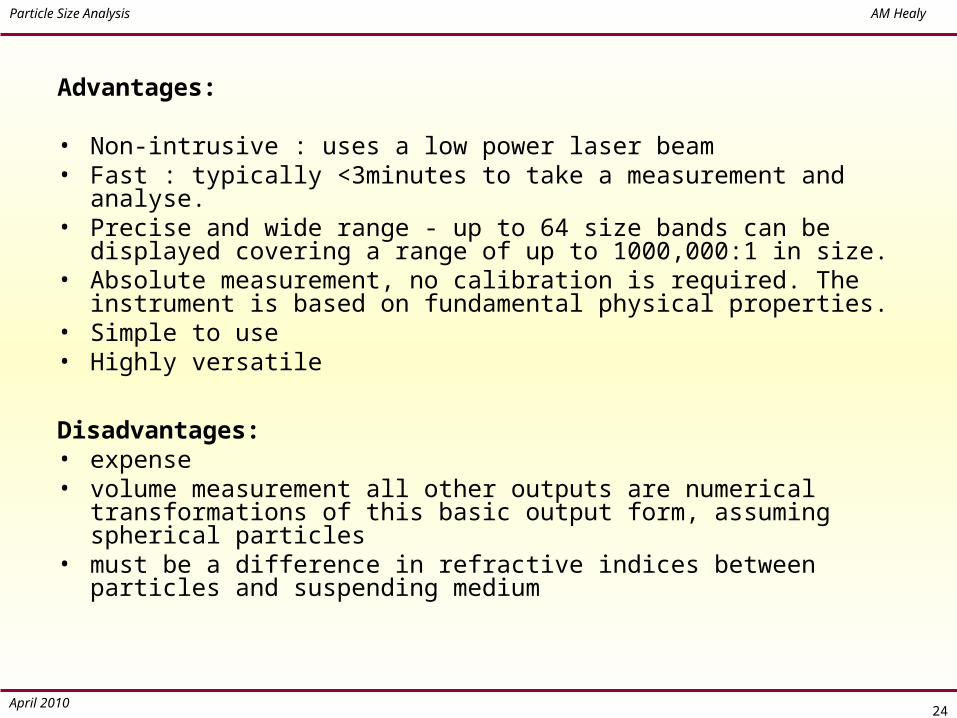
Advantages:
• Non-intrusive : uses a low power laser beam • Fast : typically <3minutes to take a measurement and
analyse. • Precise and wide range - up to 64 size bands can be
displayed covering a range of up to 1000,000:1 in size.• Absolute measurement, no calibration is required. The
instrument is based on fundamental physical properties.• Simple to use• Highly versatile
Disadvantages:• expense• volume measurement all other outputs are numerical
transformations of this basic output form, assuming spherical particles
• must be a difference in refractive indices between particles and suspending medium
April 2010
Particle Size Analysis AM Healy
25
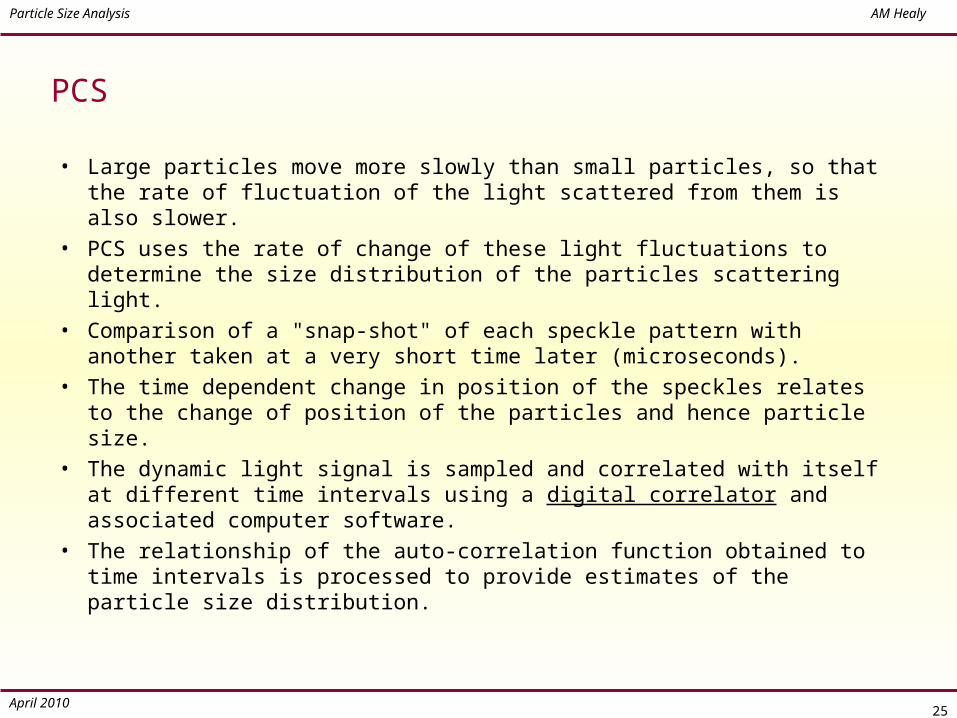
PCS
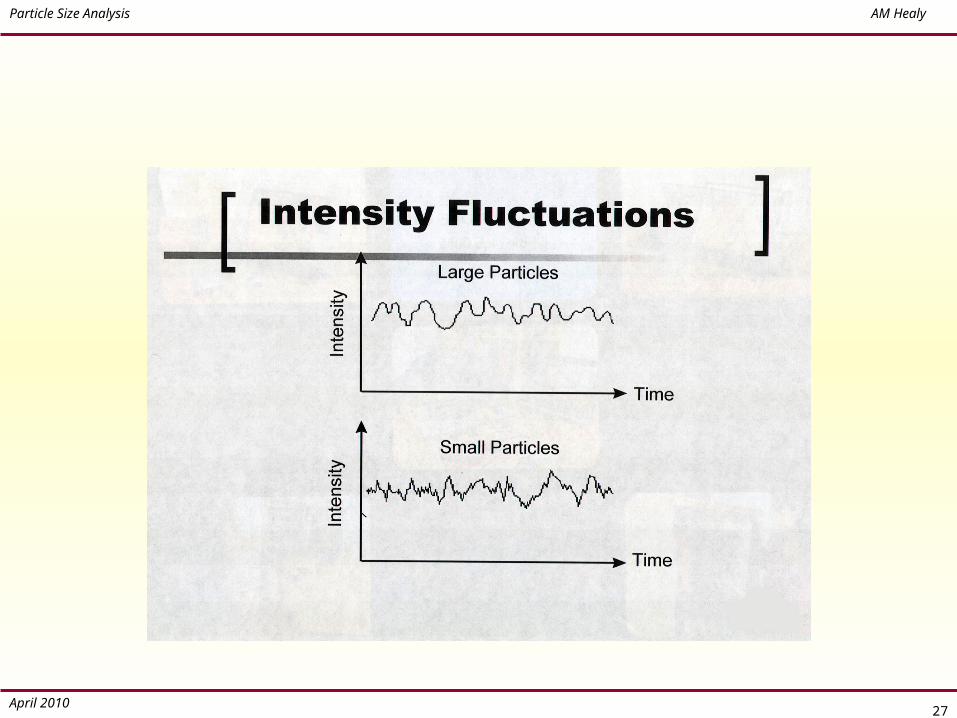
• Large particles move more slowly than small particles, so that the rate of fluctuation of the light scattered from them is also slower.
• PCS uses the rate of change of these light fluctuations to determine the size distribution of the particles scattering light.
• Comparison of a "snap-shot" of each speckle pattern with another taken at a very short time later (microseconds).
• The time dependent change in position of the speckles relates to the change of position of the particles and hence particle size.
• The dynamic light signal is sampled and correlated with itself at different time intervals using a digital correlator and associated computer software.
• The relationship of the auto-correlation function obtained to time intervals is processed to provide estimates of the particle size distribution.
April 2010
Particle Size Analysis AM Healy
26
April 2010
Particle Size Analysis AM Healy
27
April 2010
Particle Size Analysis AM Healy
28
Advantages:• Non-intrusive • Fast • Nanometre size range
Disadvantages:• Sample prep critical• Vibration, temperature fluctuations can
interfere with analysis• Restricted to solid in liquid or liquid in
liquid samples• Expense• Need to know R.I. values and viscosity
April 2010
Particle Size Analysis AM Healy
29
April 2010
Particle Size Analysis AM Healy
30
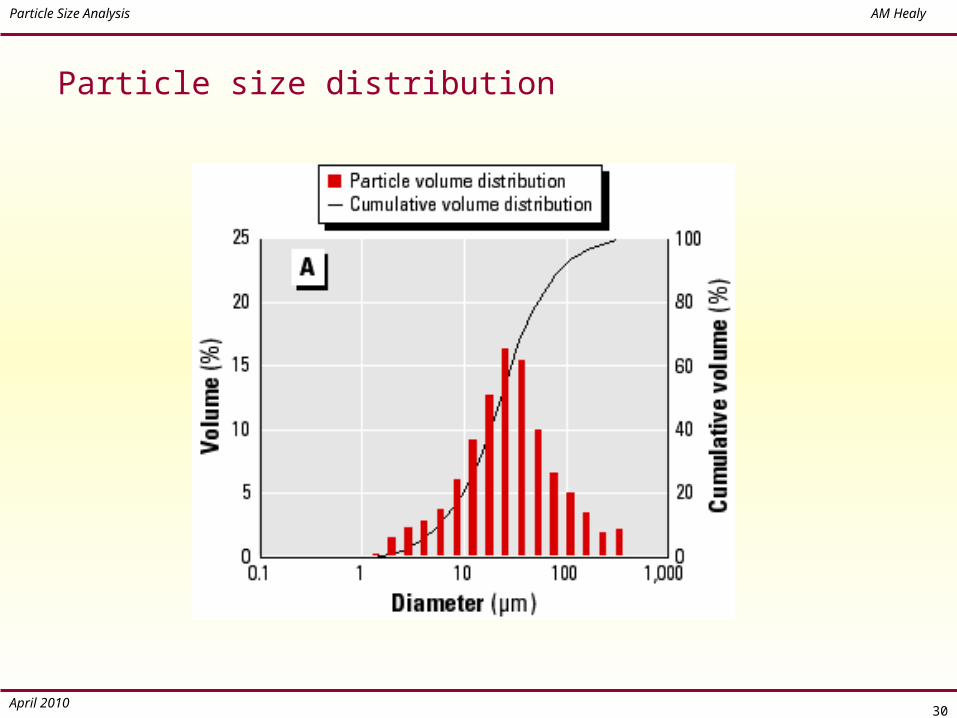
Particle size distribution
April 2010
Particle Size Analysis AM Healy
31