particle size distribution of soils using sieve analysis
TRANSCRIPT
Project No.: Date:Short Title:Sub Sampled By: DS Sieved By:
- BH or TP No.:
C576-35 m Sample No.:KW m Depth From:
Sample Date: m Depth To:
Test Method: AComposite Sieve: No if Yes, Split on: mmMaterial Excluded from Sieve: No Describe:Prior Testing on Sample: No Describe:
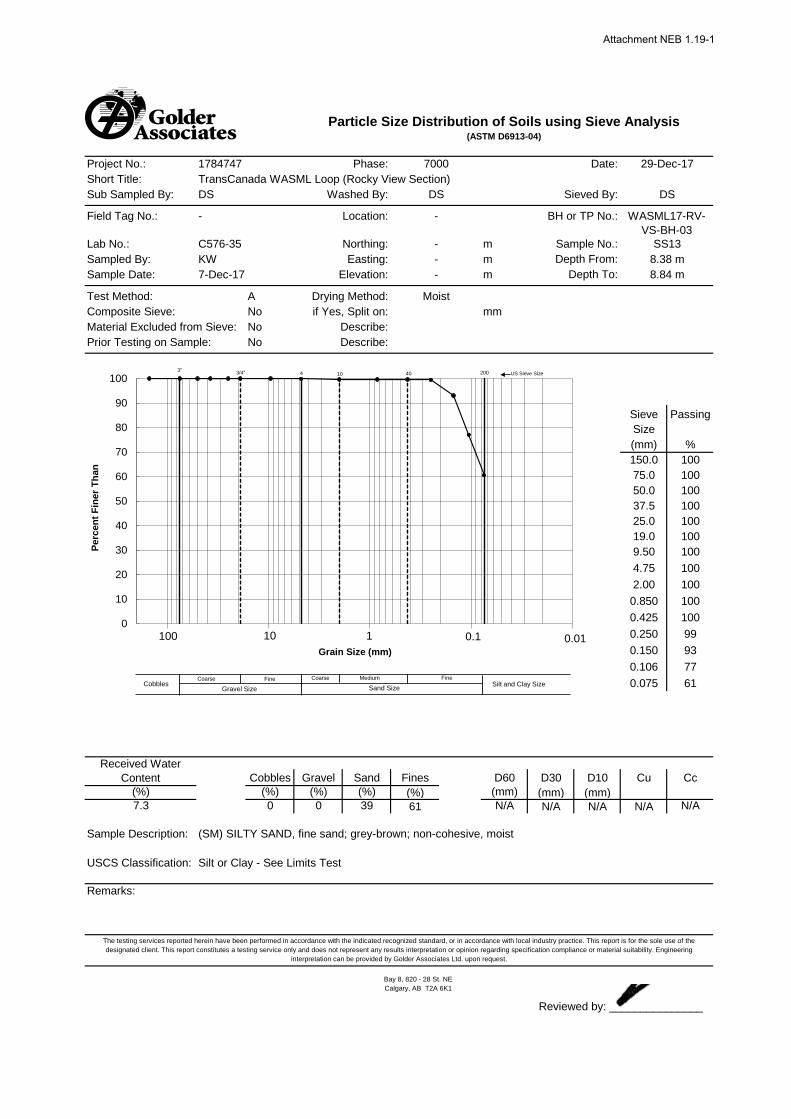
Sieve PassingSize(mm) %150.0 10075.0 10050.0 10037.5 10025.0 10019.0 1009.50 1004.75 1002.00 100
0.850 1000.425 1000.250 990.150 930.106 770.075 61
Cobbles Gravel Sand Fines D60 D30 D10 Cu Cc(%) (%) (%) (%) (mm) (mm) (mm)0 0 39 61 N/A N/A N/A N/A N/A
Sample Description:
USCS Classification:
Remarks:
1784747TransCanada WASML Loop (Rocky View Section)
Washed By:
Location:
Northing:
-
-
Particle Size Distribution of Soils using Sieve Analysis(ASTM D6913-04)
29-Dec-177000Phase:
Received Water Content
DS
--
WASML17-RV-VS-BH-03
SS138.38 m8.84 m
Easting:Elevation:
Drying Method:
Field Tag No.:
Lab No.:Sampled By:
7-Dec-17
7.3
(SM) SILTY SAND, fine sand; grey-brown; non-cohesive, moist
Reviewed by: _______________
(%)
The testing services reported herein have been performed in accordance with the indicated recognized standard, or in accordance with local industry practice. This report is for the sole use of the designated client. This report constitutes a testing service only and does not represent any results interpretation or opinion regarding specification compliance or material suitability. Engineering
interpretation can be provided by Golder Associates Ltd. upon request.
Bay 8, 820 - 28 St. NE Calgary, AB T2A 6K1
Silt or Clay - See Limits Test
DS
Moist
0
10
20
30
40
50
60
70
80
90
100
Perc
ent F
iner
Tha
n
Grain Size (mm)100 10 1 0.1 0.01
CobblesGravel Size Sand Size Silt and Clay Size
3" 3/4" 4 10 20040
Coarse Fine Coarse Medium Fine
US Sieve Size
Attachment NEB 1.19-1
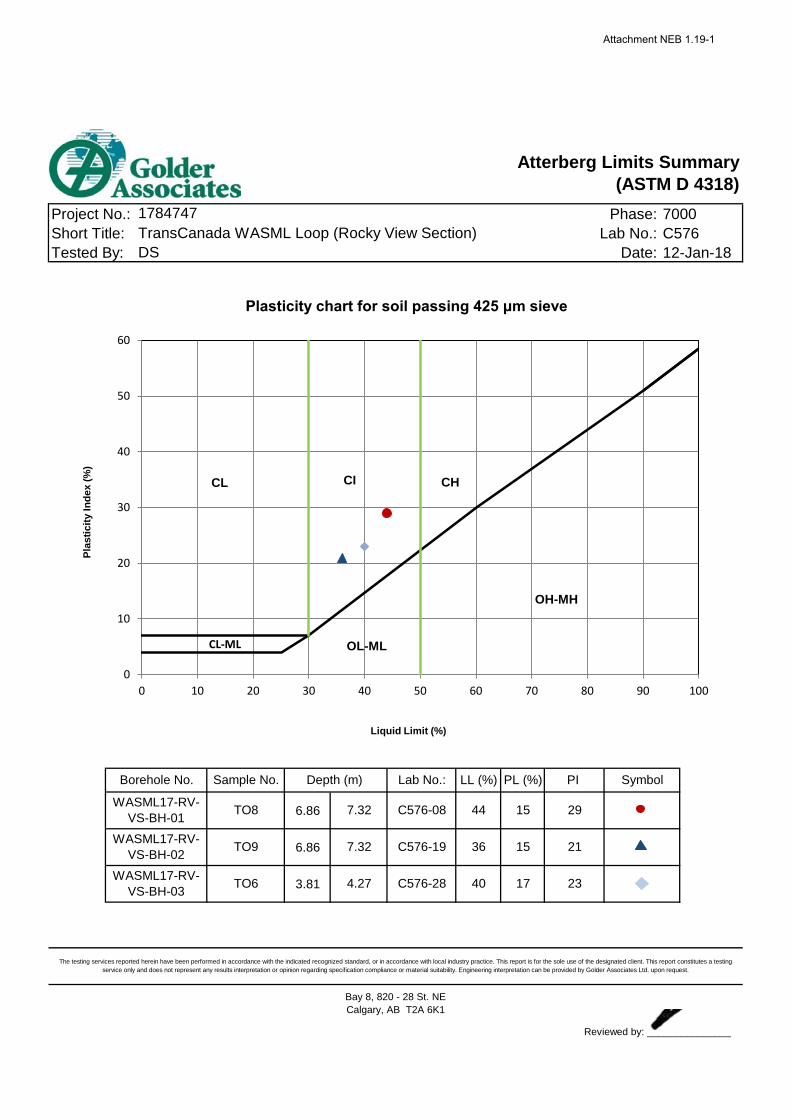
Atterberg Limits Summary(ASTM D 4318)
TransCanada WASML Loop (Rocky View Section)DS
6.86
6.86
3.81
C576-08 29
Project No.:Short Title:Tested By: 12-Jan-18
C5767000
Lab No.:
Phase:
Date:
1784747
LL (%) PL (%) PI
Plasticity chart for soil passing 425 μm sieve
Borehole No.
Reviewed by: _______________
7.32
4.27
C576-19
C576-28
36
40
21
23
15
17
WASML17-RV-VS-BH-01
Sample No.
TO8
TO9
Bay 8, 820 - 28 St. NECalgary, AB T2A 6K1
The testing services reported herein have been performed in accordance with the indicated recognized standard, or in accordance with local industry practice. This report is for the sole use of the designated client. This report constitutes a testing service only and does not represent any results interpretation or opinion regarding specification compliance or material suitability. Engineering interpretation can be provided by Golder Associates Ltd. upon request.
TO6
WASML17-RV-VS-BH-02
WASML17-RV-VS-BH-03
44 15
Depth (m) Lab No.: Symbol
7.32
0
10
20
30
40
50
60
0 10 20 30 40 50 60 70 80 90 100
CI
CL-ML OL-ML
OH-MH
CHCL
Liquid Limit (%)
Plas
ticity
Inde
x (%
)
Attachment NEB 1.19-1
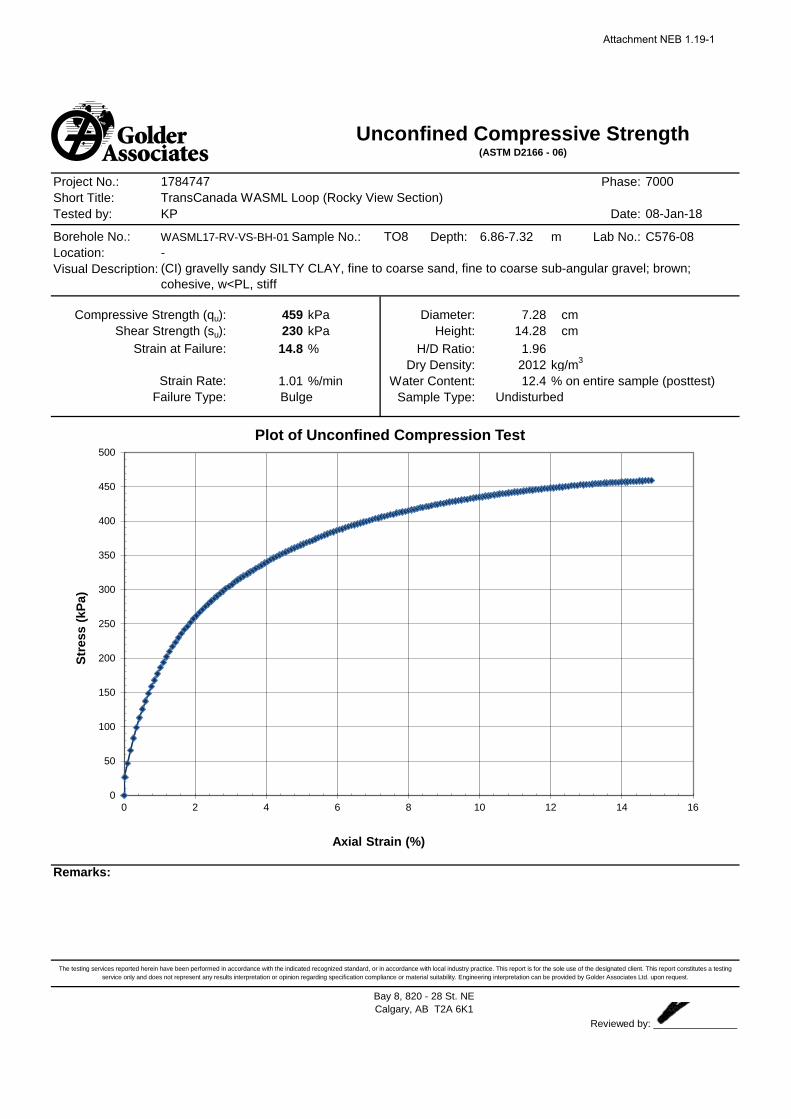
Project No.: Phase:Short Title:Tested by: KP Date:
WASML17-RV-VS-BH-01 Sample No.: Depth: 6.86-7.32 m Lab No.: C576-08
459 kPa Diameter: 7.28 cm230 kPa Height: 14.28 cm
14.8 % H/D Ratio: 1.96 Dry Density: 2012 kg/m3
1.01 %/min Water Content: 12.4 % on entire sample (posttest)Sample Type:
Remarks:
The testing services reported herein have been performed in accordance with the indicated recognized standard, or in accordance with local industry practice. This report is for the sole use of the designated client. This report constitutes a testing service only and does not represent any results interpretation or opinion regarding specification compliance or material suitability. Engineering interpretation can be provided by Golder Associates Ltd. upon request.
Reviewed by: _______________
-
Strain Rate:Undisturbed
Bay 8, 820 - 28 St. NE Calgary, AB T2A 6K1
Compressive Strength (qu):Shear Strength (su):
Strain at Failure:
Location:Visual Description:
Failure Type: Bulge
Unconfined Compressive Strength(ASTM D2166 - 06)
Borehole No.:
7000
08-Jan-18TransCanada WASML Loop (Rocky View Section)
TO8
1784747
(CI) gravelly sandy SILTY CLAY, fine to coarse sand, fine to coarse sub-angular gravel; brown; cohesive, w<PL, stiff
0
50
100
150
200
250
300
350
400
450
500
0 2 4 6 8 10 12 14 16
Stre
ss (k
Pa)
Axial Strain (%)
Plot of Unconfined Compression Test
Attachment NEB 1.19-1
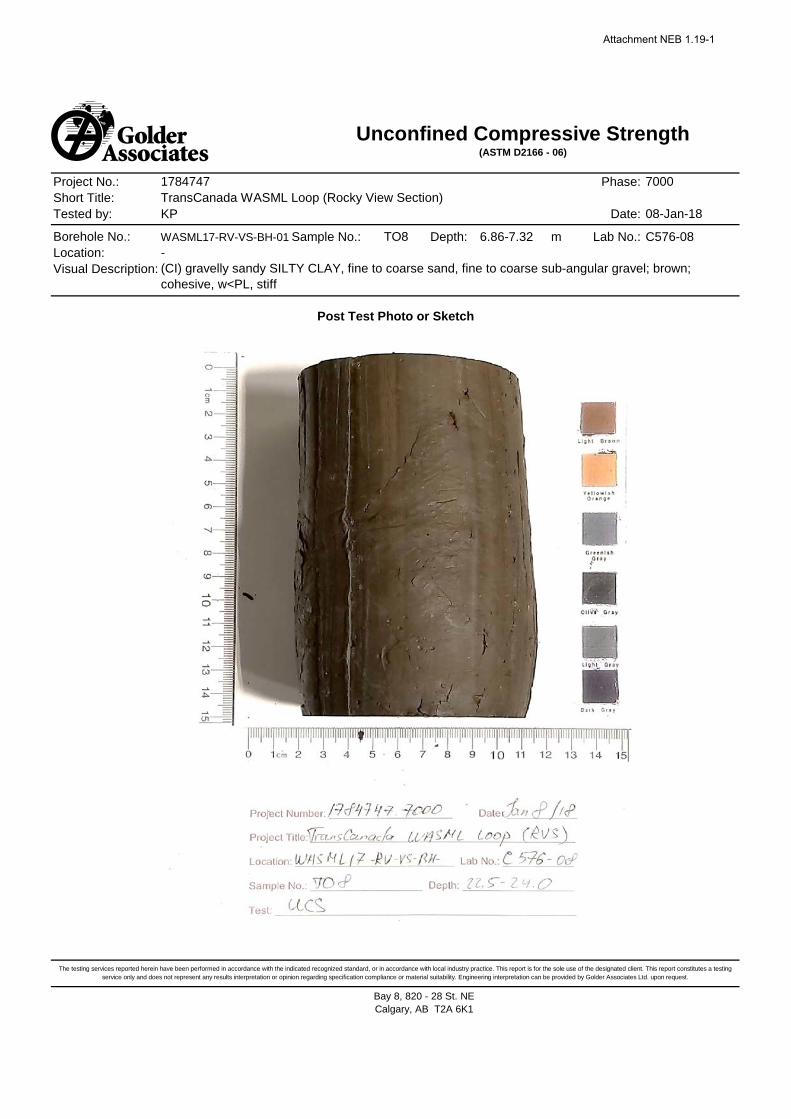
Project No.: Phase:Short Title:Tested by: KP Date:
WASML17-RV-VS-BH-01 Sample No.: Depth: 6.86-7.32 m Lab No.: C576-08
Visual Description:
Unconfined Compressive Strength(ASTM D2166 - 06)
1784747 7000TransCanada WASML Loop (Rocky View Section)
08-Jan-18
Borehole No.: TO8Location: -
(CI) gravelly sandy SILTY CLAY, fine to coarse sand, fine to coarse sub-angular gravel; brown; cohesive, w<PL, stiff
Bay 8, 820 - 28 St. NE Calgary, AB T2A 6K1
Post Test Photo or Sketch
The testing services reported herein have been performed in accordance with the indicated recognized standard, or in accordance with local industry practice. This report is for the sole use of the designated client. This report constitutes a testing service only and does not represent any results interpretation or opinion regarding specification compliance or material suitability. Engineering interpretation can be provided by Golder Associates Ltd. upon request.
Attachment NEB 1.19-1
Project No.: Phase:Short Title:Tested by: KP Date:
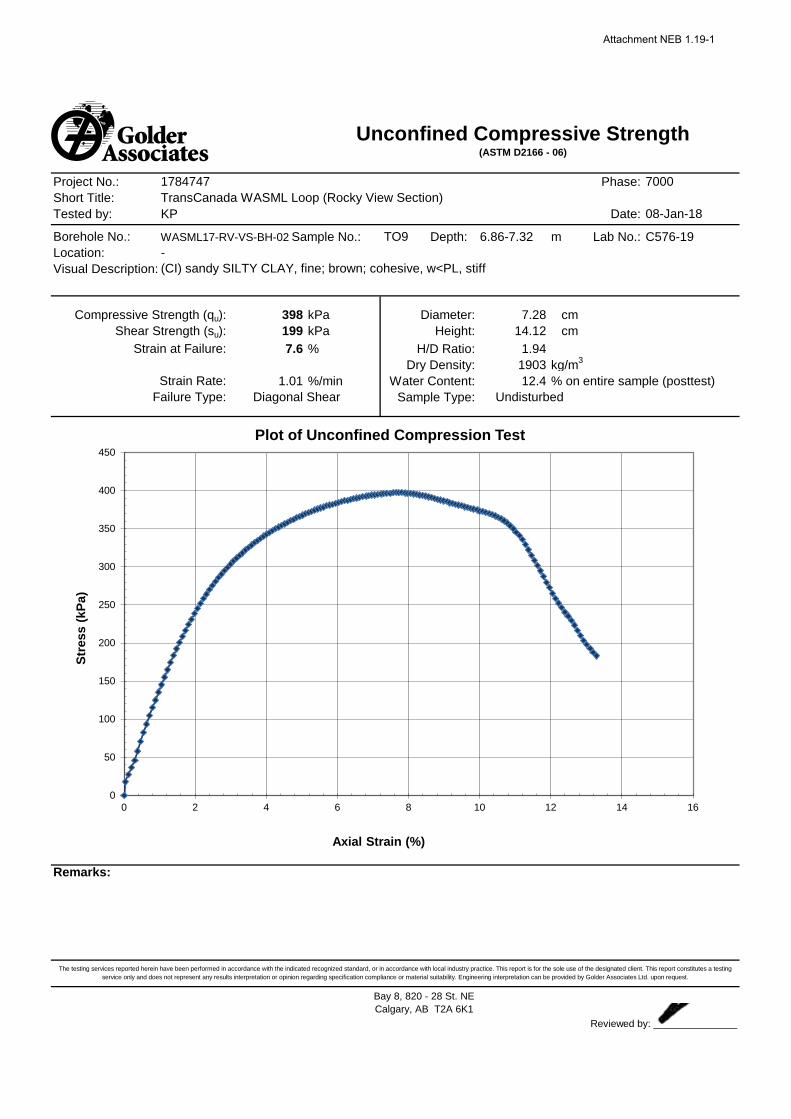
WASML17-RV-VS-BH-02 Sample No.: Depth: 6.86-7.32 m Lab No.: C576-19
398 kPa Diameter: 7.28 cm199 kPa Height: 14.12 cm7.6 % H/D Ratio: 1.94
Dry Density: 1903 kg/m3
1.01 %/min Water Content: 12.4 % on entire sample (posttest)Sample Type:
Remarks:
Unconfined Compressive Strength(ASTM D2166 - 06)
Borehole No.:
7000
08-Jan-18TransCanada WASML Loop (Rocky View Section)
TO9
1784747
(CI) sandy SILTY CLAY, fine; brown; cohesive, w<PL, stiff
The testing services reported herein have been performed in accordance with the indicated recognized standard, or in accordance with local industry practice. This report is for the sole use of the designated client. This report constitutes a testing service only and does not represent any results interpretation or opinion regarding specification compliance or material suitability. Engineering interpretation can be provided by Golder Associates Ltd. upon request.
Reviewed by: _______________
-
Strain Rate:Undisturbed
Bay 8, 820 - 28 St. NE Calgary, AB T2A 6K1
Compressive Strength (qu):Shear Strength (su):
Strain at Failure:
Location:Visual Description:
Failure Type: Diagonal Shear
0
50
100
150
200
250
300
350
400
450
0 2 4 6 8 10 12 14 16
Stre
ss (k
Pa)
Axial Strain (%)
Plot of Unconfined Compression Test
Attachment NEB 1.19-1
Project No.: Phase:Short Title:Tested by: KP Date:
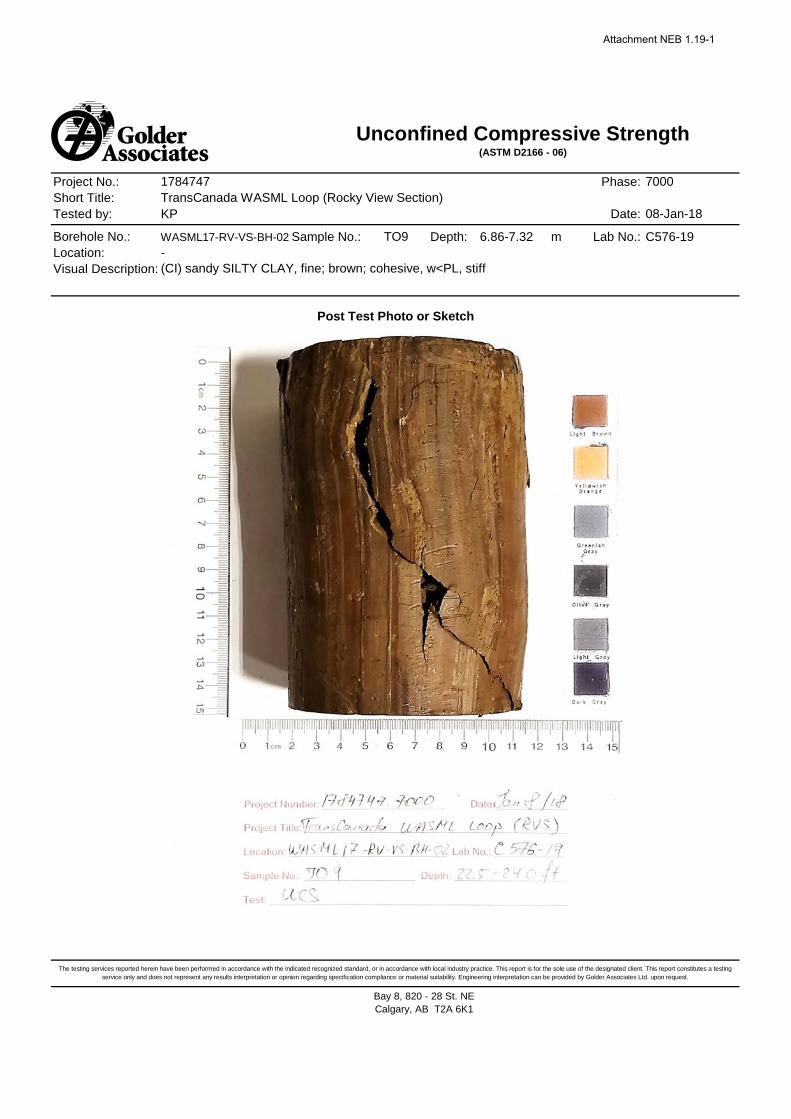
WASML17-RV-VS-BH-02 Sample No.: Depth: 6.86-7.32 m Lab No.: C576-19
Bay 8, 820 - 28 St. NE Calgary, AB T2A 6K1
Post Test Photo or Sketch
The testing services reported herein have been performed in accordance with the indicated recognized standard, or in accordance with local industry practice. This report is for the sole use of the designated client. This report constitutes a testing service only and does not represent any results interpretation or opinion regarding specification compliance or material suitability. Engineering interpretation can be provided by Golder Associates Ltd. upon request.
Visual Description:
Unconfined Compressive Strength(ASTM D2166 - 06)
1784747 7000TransCanada WASML Loop (Rocky View Section)
08-Jan-18
Borehole No.: TO9Location: -
(CI) sandy SILTY CLAY, fine; brown; cohesive, w<PL, stiff
Attachment NEB 1.19-1
[This report shall not be reproduced except in full without the written authority of the Laboratory.]
02-JAN-18
Lab Work Order #: L2040551
Date Received:Golder Associates Ltd.
8, 820-28th Street NECalgary AB T2A 6K1
ATTN: MATTHEW BECKERFINAL 17-JAN-18 12:59 (MT)Report Date:
Version:
Certificate of Analysis
ALS CANADA LTD Part of the ALS Group An ALS Limited Company
____________________________________________
Jessica Spira, Env. Tech. DIPLSenior Account Manager
ADDRESS: 2559 29 Street NE, Calgary, AB T1Y 7B5 Canada | Phone: +1 403 291 9897 | Fax: +1 403 291 0298
Client Phone: 403-248-6386
Job Reference: NOT SUBMITTEDProject P.O. #:
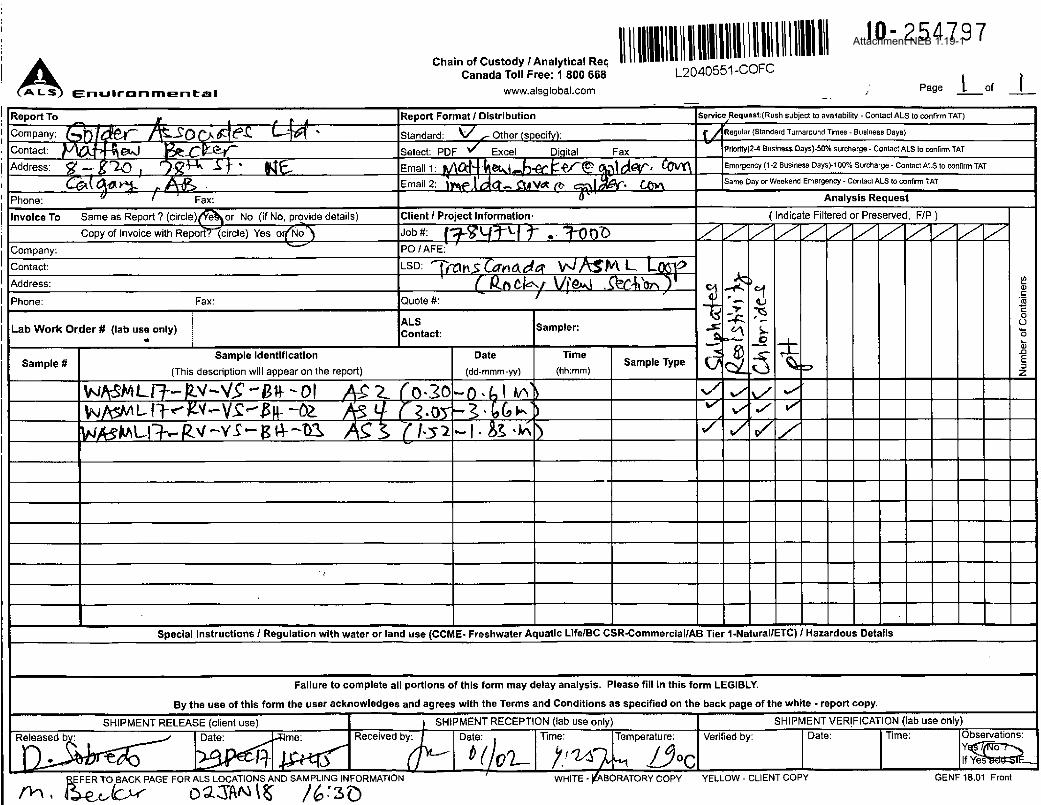
10-254797C of C Numbers:TRANSCANADA WASML LOOP (ROCKY VIEW SECTION)
Legal Site Desc:
Attachment NEB 1.19-1
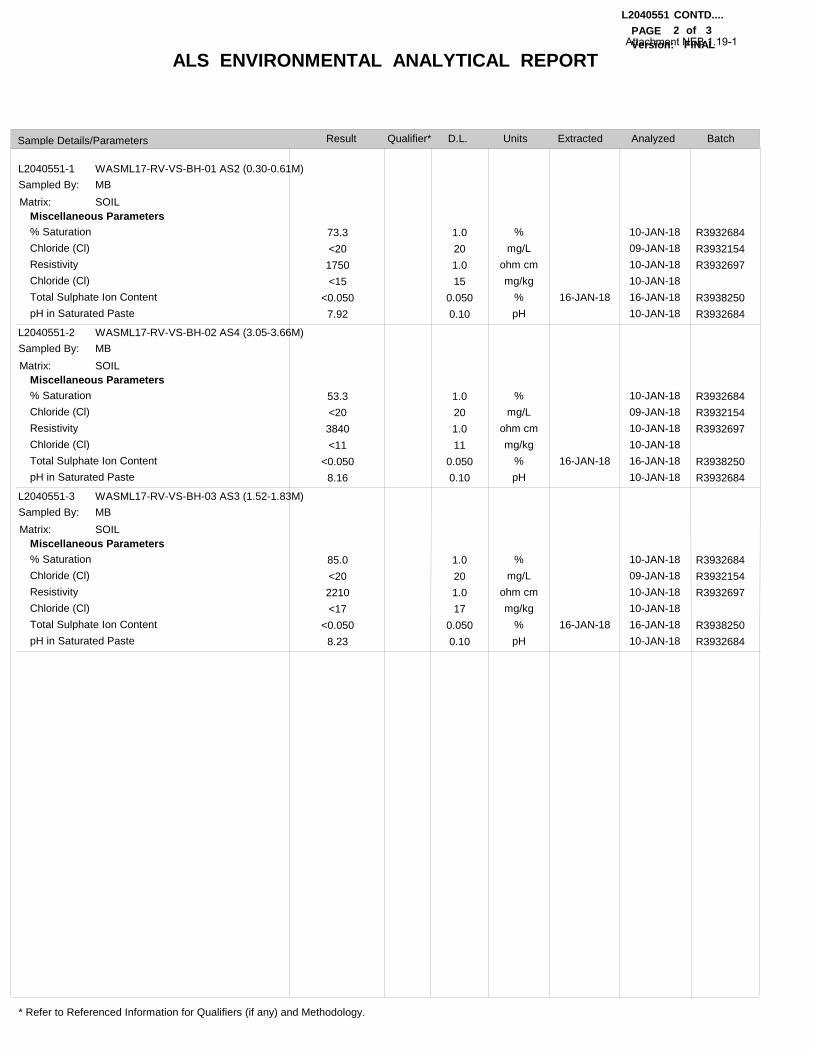
ALS ENVIRONMENTAL ANALYTICAL REPORT
L2040551 CONTD....2PAGE
Result D.L. Units Extracted AnalyzedSample Details/Parameters
of
Qualifier* Batch
* Refer to Referenced Information for Qualifiers (if any) and Methodology.
Version: FINAL 3
L2040551-1
L2040551-2
L2040551-3
WASML17-RV-VS-BH-01 AS2 (0.30-0.61M)
WASML17-RV-VS-BH-02 AS4 (3.05-3.66M)
WASML17-RV-VS-BH-03 AS3 (1.52-1.83M)
MB
MB
MB
Sampled By:
Sampled By:
Sampled By:
SOIL
SOIL
SOIL
Miscellaneous Parameters
Miscellaneous Parameters
Miscellaneous Parameters
% SaturationChloride (Cl)ResistivityChloride (Cl)Total Sulphate Ion ContentpH in Saturated Paste
% SaturationChloride (Cl)ResistivityChloride (Cl)Total Sulphate Ion ContentpH in Saturated Paste
% SaturationChloride (Cl)ResistivityChloride (Cl)Total Sulphate Ion ContentpH in Saturated Paste
%mg/L
ohm cmmg/kg
%pH
%mg/L
ohm cmmg/kg
%pH
%mg/L
ohm cmmg/kg
%pH
16-JAN-18
16-JAN-18
16-JAN-18
10-JAN-1809-JAN-1810-JAN-1810-JAN-1816-JAN-1810-JAN-18
10-JAN-1809-JAN-1810-JAN-1810-JAN-1816-JAN-1810-JAN-18
10-JAN-1809-JAN-1810-JAN-1810-JAN-1816-JAN-1810-JAN-18
73.3<201750<15
<0.0507.92
53.3<203840<11
<0.0508.16
85.0<202210<17
<0.0508.23
1.0201.015
0.0500.10
1.0201.011
0.0500.10
1.0201.017
0.0500.10
Matrix:
Matrix:
Matrix:
R3932684R3932154R3932697
R3938250R3932684
R3932684R3932154R3932697
R3938250R3932684
R3932684R3932154R3932697
R3938250R3932684
Attachment NEB 1.19-1
CL-PASTE-COL-CL
PH-PASTE-CL
RESISTIVITY-PASTE-CL
SAL-MG/KG-CALC-CL
SAT-PCNT-CL
SO4-T-CSA-A23-ED
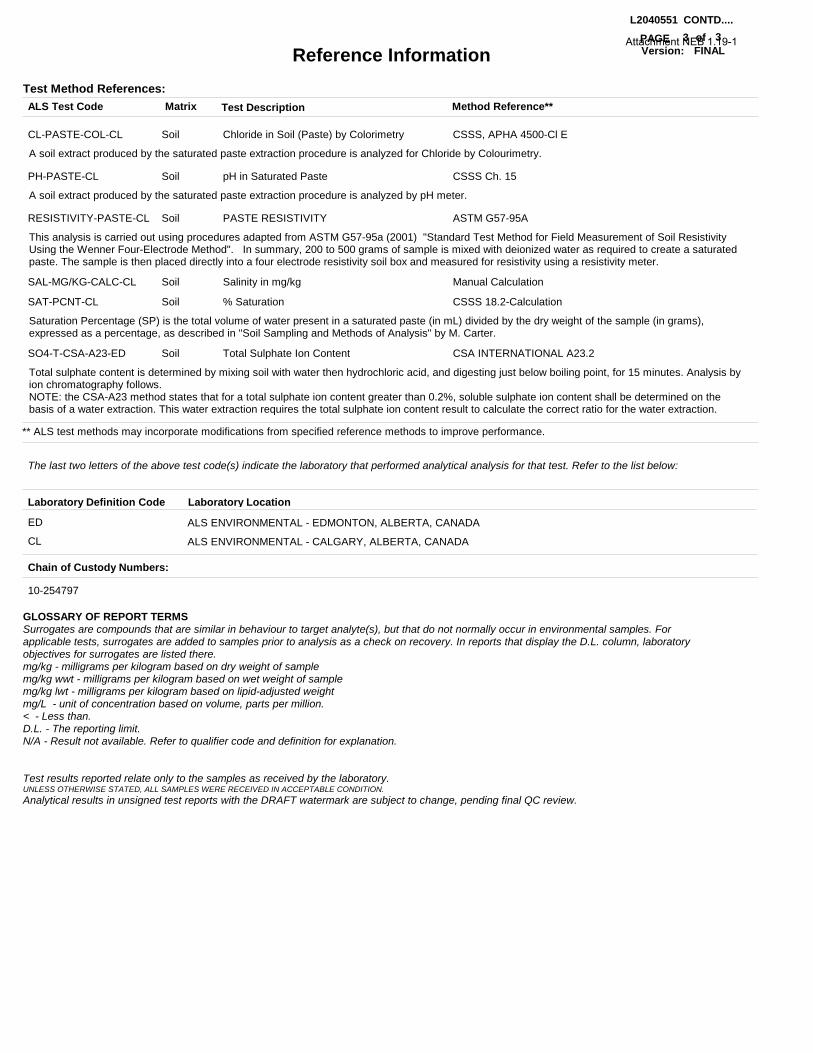
Reference Information
Chloride in Soil (Paste) by Colorimetry
pH in Saturated Paste
PASTE RESISTIVITY
Salinity in mg/kg
% Saturation
Total Sulphate Ion Content
L2040551 CONTD....
3PAGE of
A soil extract produced by the saturated paste extraction procedure is analyzed for Chloride by Colourimetry.
A soil extract produced by the saturated paste extraction procedure is analyzed by pH meter.
This analysis is carried out using procedures adapted from ASTM G57-95a (2001) "Standard Test Method for Field Measurement of Soil Resistivity Using the Wenner Four-Electrode Method". In summary, 200 to 500 grams of sample is mixed with deionized water as required to create a saturated paste. The sample is then placed directly into a four electrode resistivity soil box and measured for resistivity using a resistivity meter.
Saturation Percentage (SP) is the total volume of water present in a saturated paste (in mL) divided by the dry weight of the sample (in grams), expressed as a percentage, as described in "Soil Sampling and Methods of Analysis" by M. Carter.
Total sulphate content is determined by mixing soil with water then hydrochloric acid, and digesting just below boiling point, for 15 minutes. Analysis by ion chromatography follows.NOTE: the CSA-A23 method states that for a total sulphate ion content greater than 0.2%, soluble sulphate ion content shall be determined on the basis of a water extraction. This water extraction requires the total sulphate ion content result to calculate the correct ratio for the water extraction.
ALS Test Code Test Description
Soil
Soil
Soil
Soil
Soil
Soil
CSSS, APHA 4500-Cl E
CSSS Ch. 15
ASTM G57-95A
Manual Calculation
CSSS 18.2-Calculation
CSA INTERNATIONAL A23.2
Method Reference**
** ALS test methods may incorporate modifications from specified reference methods to improve performance.
Matrix
The last two letters of the above test code(s) indicate the laboratory that performed analytical analysis for that test. Refer to the list below:
Laboratory Definition Code Laboratory Location
ED
CL
ALS ENVIRONMENTAL - EDMONTON, ALBERTA, CANADA
ALS ENVIRONMENTAL - CALGARY, ALBERTA, CANADA
Test Method References:
Chain of Custody Numbers:
10-254797
GLOSSARY OF REPORT TERMSSurrogates are compounds that are similar in behaviour to target analyte(s), but that do not normally occur in environmental samples. For applicable tests, surrogates are added to samples prior to analysis as a check on recovery. In reports that display the D.L. column, laboratory objectives for surrogates are listed there.mg/kg - milligrams per kilogram based on dry weight of samplemg/kg wwt - milligrams per kilogram based on wet weight of samplemg/kg lwt - milligrams per kilogram based on lipid-adjusted weight mg/L - unit of concentration based on volume, parts per million.< - Less than.D.L. - The reporting limit.N/A - Result not available. Refer to qualifier code and definition for explanation.
Test results reported relate only to the samples as received by the laboratory.UNLESS OTHERWISE STATED, ALL SAMPLES WERE RECEIVED IN ACCEPTABLE CONDITION.Analytical results in unsigned test reports with the DRAFT watermark are subject to change, pending final QC review.
Version: FINAL 3Attachment NEB 1.19-1
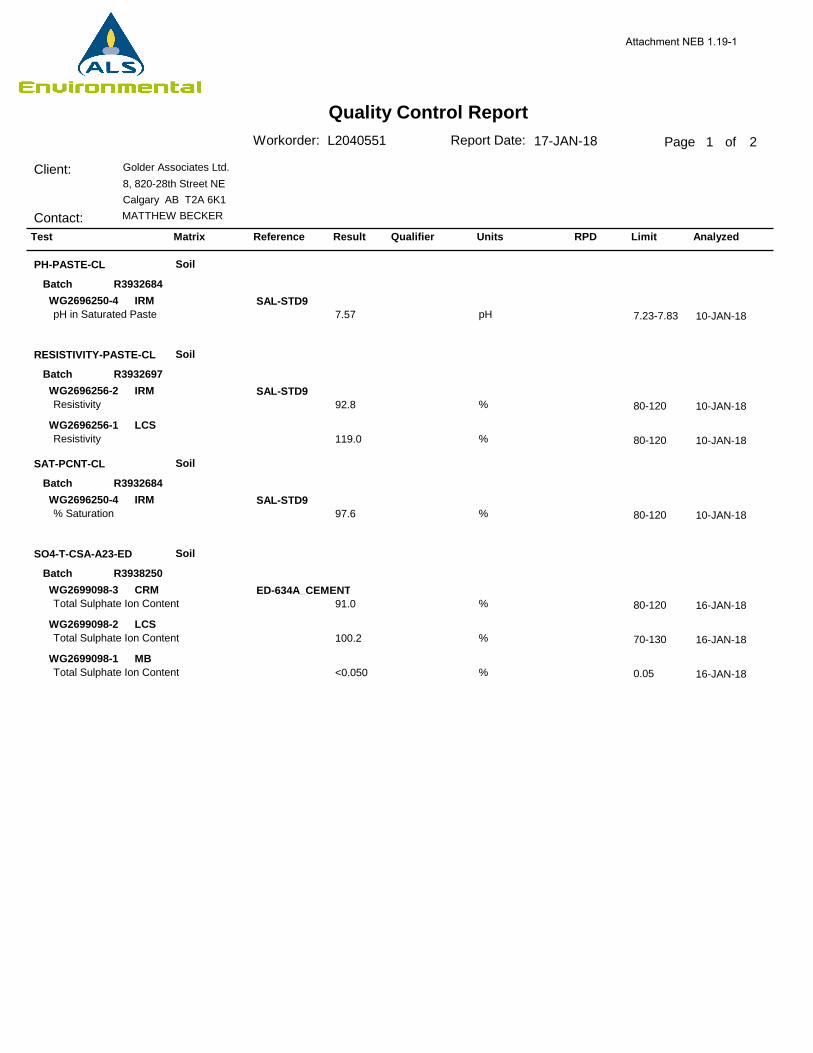
Quality Control ReportPage 1 of
Client:
Contact:
Golder Associates Ltd.8, 820-28th Street NE Calgary AB T2A 6K1MATTHEW BECKER
Report Date: 17-JAN-18Workorder: L2040551
Test Matrix Reference Result Qualifier Units RPD Limit Analyzed
PH-PASTE-CL
RESISTIVITY-PASTE-CL
SAT-PCNT-CL
SO4-T-CSA-A23-ED
Soil
Soil
Soil
Soil
R3932684
R3932697
R3932684
R3938250
Batch
Batch
Batch
Batch
IRM
IRM
LCS
IRM
CRM
LCS
MB
WG2696250-4
WG2696256-2
WG2696256-1
WG2696250-4
WG2699098-3
WG2699098-2
WG2699098-1
SAL-STD9
SAL-STD9
SAL-STD9
ED-634A_CEMENT
pH in Saturated Paste
Resistivity
Resistivity
% Saturation
Total Sulphate Ion Content
Total Sulphate Ion Content
Total Sulphate Ion Content
7.57
92.8
119.0
97.6
91.0
100.2
<0.050
10-JAN-18
10-JAN-18
10-JAN-18
10-JAN-18
16-JAN-18
16-JAN-18
16-JAN-18
7.23-7.83
80-120
80-120
80-120
80-120
70-130
pH
%
%
%
%
%
% 0.05
2
Attachment NEB 1.19-1
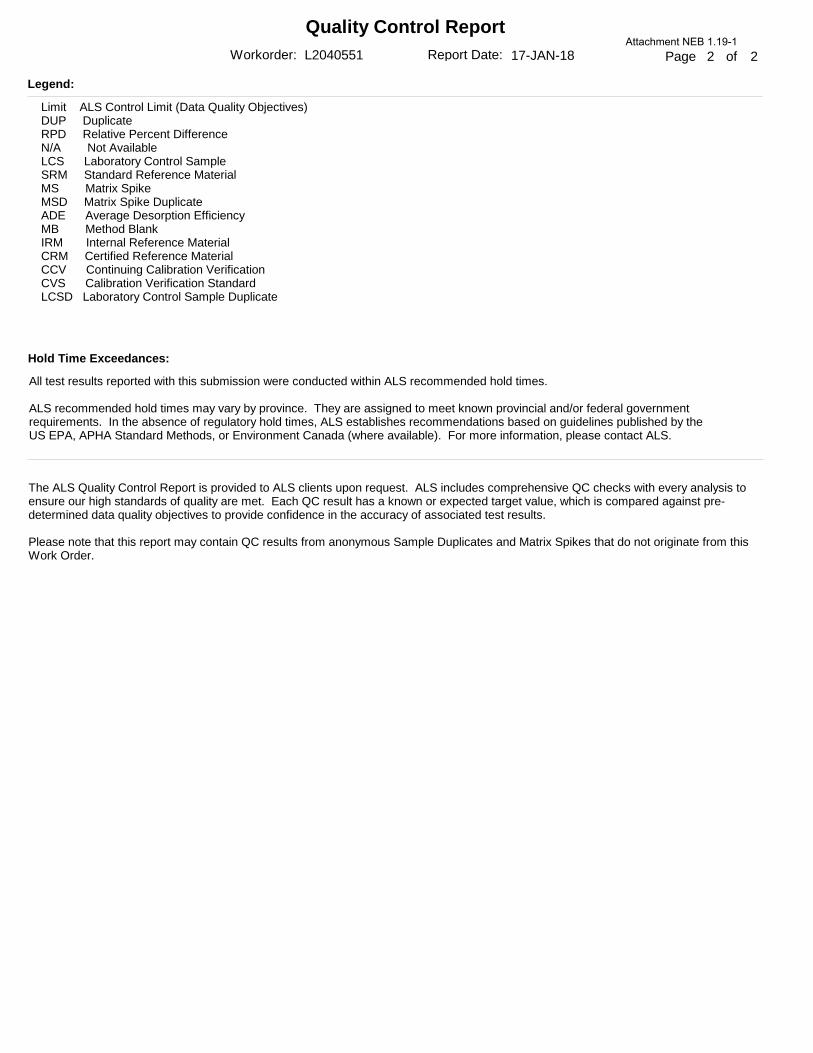
Quality Control ReportPage 2 ofReport Date: 17-JAN-18Workorder: L2040551
Limit ALS Control Limit (Data Quality Objectives)DUP DuplicateRPD Relative Percent DifferenceN/A Not AvailableLCS Laboratory Control SampleSRM Standard Reference MaterialMS Matrix SpikeMSD Matrix Spike DuplicateADE Average Desorption EfficiencyMB Method BlankIRM Internal Reference MaterialCRM Certified Reference MaterialCCV Continuing Calibration VerificationCVS Calibration Verification StandardLCSD Laboratory Control Sample Duplicate
Legend:
The ALS Quality Control Report is provided to ALS clients upon request. ALS includes comprehensive QC checks with every analysis to ensure our high standards of quality are met. Each QC result has a known or expected target value, which is compared against pre-determined data quality objectives to provide confidence in the accuracy of associated test results.
Please note that this report may contain QC results from anonymous Sample Duplicates and Matrix Spikes that do not originate from this Work Order.
Hold Time Exceedances:
All test results reported with this submission were conducted within ALS recommended hold times.
ALS recommended hold times may vary by province. They are assigned to meet known provincial and/or federal government requirements. In the absence of regulatory hold times, ALS establishes recommendations based on guidelines published by the US EPA, APHA Standard Methods, or Environment Canada (where available). For more information, please contact ALS.
2Attachment NEB 1.19-1
Attachment NEB 1.19-1
TRANSCANADA WASML LOOP ROCKY VIEW SECTION
Hand Augers
July 19, 2018 Report No. 00660-GAL-C-RP-0006_1
Attachment NEB 1.19-1
Bay 8, 820 - 28th Street NECalgary, AB
Reviewed By:_________________
Page 1 of 2
General Lab Testing Summary
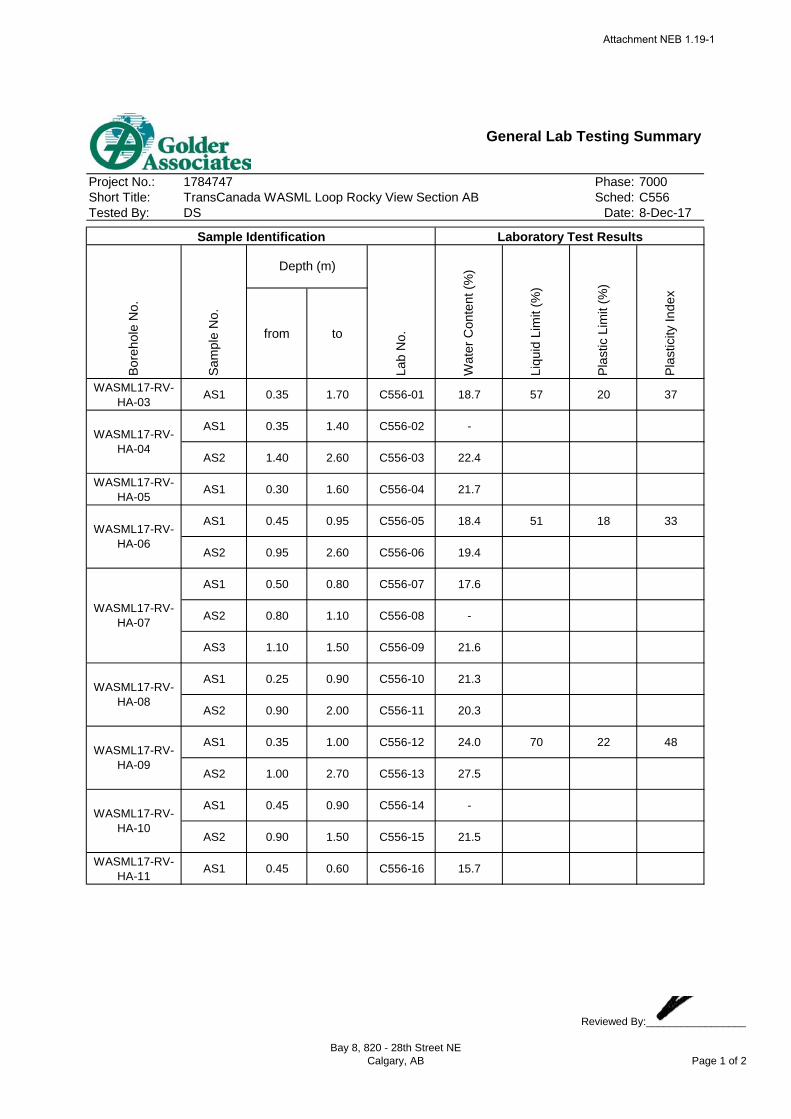
Project No.: 1784747 Phase: 7000Short Title: TransCanada WASML Loop Rocky View Section AB Sched: C556Tested By: DS Date: 8-Dec-17
from to
WASML17-RV-HA-03 AS1 0.35 1.70 C556-01 18.7 57 20 37
AS1 0.35 1.40 C556-02 -
AS2 1.40 2.60 C556-03 22.4
WASML17-RV-HA-05 AS1 0.30 1.60 C556-04 21.7
AS1 0.45 0.95 C556-05 18.4 51 18 33
AS2 0.95 2.60 C556-06 19.4
AS1 0.50 0.80 C556-07 17.6
AS2 0.80 1.10 C556-08 -
AS3 1.10 1.50 C556-09 21.6
AS1 0.25 0.90 C556-10 21.3
AS2 0.90 2.00 C556-11 20.3
AS1 0.35 1.00 C556-12 24.0 70 22 48
AS2 1.00 2.70 C556-13 27.5
AS1 0.45 0.90 C556-14 -
AS2 0.90 1.50 C556-15 21.5
WASML17-RV-HA-11 AS1 0.45 0.60 C556-16 15.7
WASML17-RV-HA-09
WASML17-RV-HA-10
WASML17-RV-HA-04
WASML17-RV-HA-06
WASML17-RV-HA-07
WASML17-RV-HA-08
Laboratory Test ResultsSample Identification
Bore
hole
No.
Sam
ple
No.
Lab
No.
Depth (m)
Wat
er C
onte
nt (%
)
Plas
tic L
imit
(%)
Liqu
id L
imit
(%)
Plas
ticity
Inde
x
Attachment NEB 1.19-1
Bay 8, 820 - 28th Street NECalgary, AB
Reviewed By:_________________
Page 2 of 2
General Lab Testing Summary
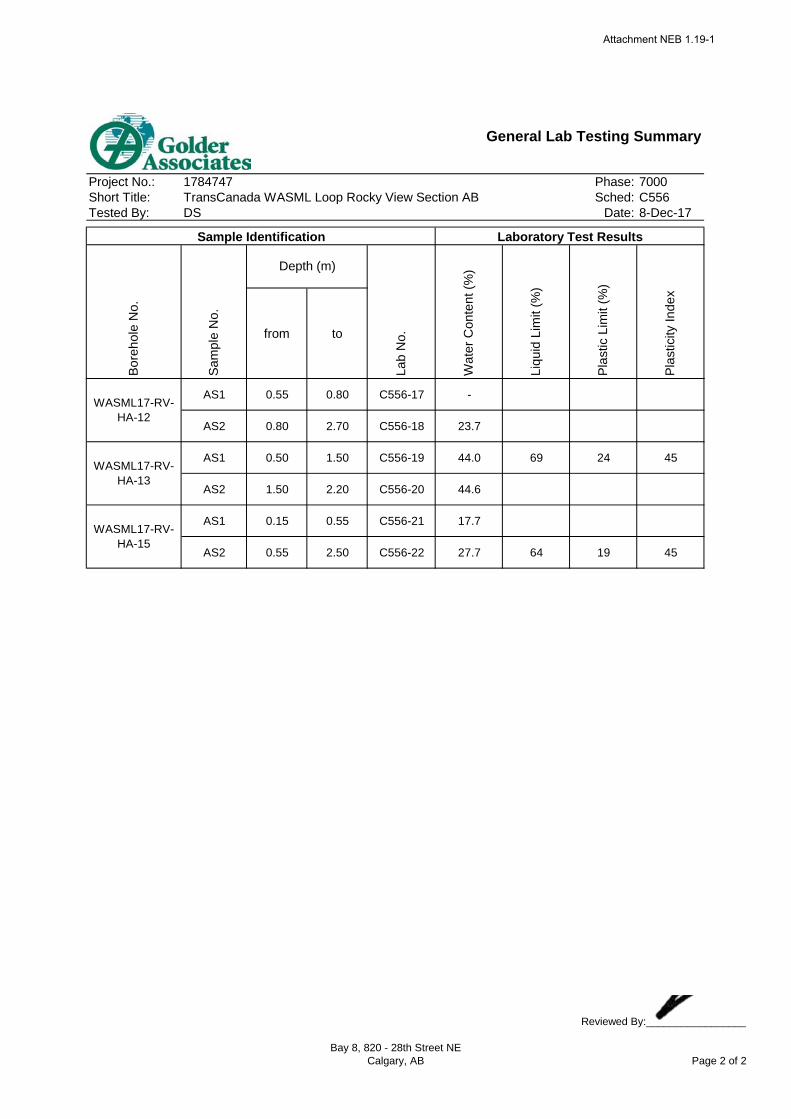
Project No.: 1784747 Phase: 7000Short Title: TransCanada WASML Loop Rocky View Section AB Sched: C556Tested By: DS Date: 8-Dec-17
from to
Laboratory Test ResultsSample Identification
Bore
hole
No.
Sam
ple
No.
Lab
No.
Depth (m)
Wat
er C
onte
nt (%
)
Plas
tic L
imit
(%)
Liqu
id L
imit
(%)
Plas
ticity
Inde
x
AS1 0.55 0.80 C556-17 -
AS2 0.80 2.70 C556-18 23.7
AS1 0.50 1.50 C556-19 44.0 69 24 45
AS2 1.50 2.20 C556-20 44.6
AS1 0.15 0.55 C556-21 17.7
AS2 0.55 2.50 C556-22 27.7 64 19 45
WASML17-RV-HA-12
WASML17-RV-HA-13
WASML17-RV-HA-15
Attachment NEB 1.19-1
C556-01_WASML17-RV-HA-03_AS1_Hydro.xlsx GOLDER ASSOCIATES LTD. Page 1
Project No.: Lab No.:Project Title:
Borehole: Sample No.:Depth:
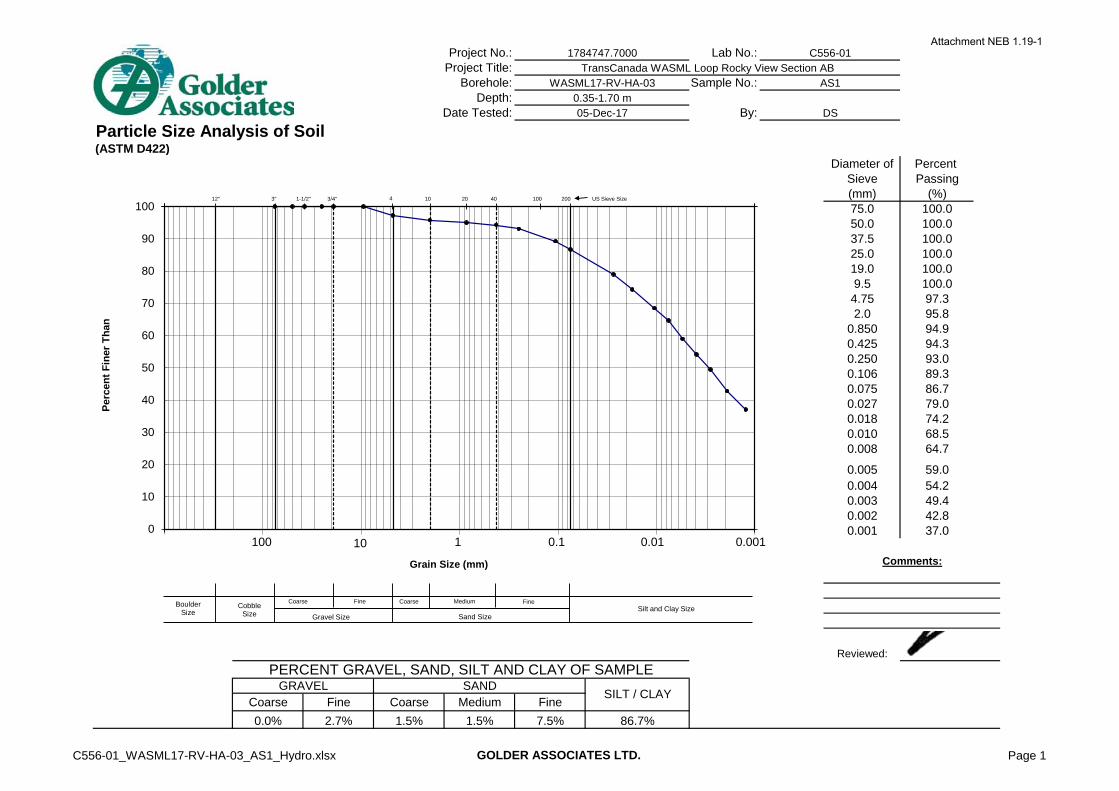
Date Tested: By:Particle Size Analysis of Soil(ASTM D422)
Diameter of Percent Sieve Passing(mm) (%)75.0 100.050.0 100.037.5 100.025.0 100.019.0 100.09.5 100.04.75 97.32.0 95.8
0.850 94.90.425 94.30.250 93.00.106 89.30.075 86.70.027 79.00.018 74.20.010 68.50.008 64.7
0.005 59.00.004 54.20.003 49.40.002 42.80.001 37.0
Reviewed:
Coarse Fine Coarse Medium Fine0.0% 2.7% 1.5% 1.5% 7.5% 86.7%
PERCENT GRAVEL, SAND, SILT AND CLAY OF SAMPLEGRAVEL SAND
SILT / CLAY
Comments:
C556-01TransCanada WASML Loop Rocky View Section AB
1784747.7000
WASML17-RV-HA-030.35-1.70 m05-Dec-17
AS1
DS
0
10
20
30
40
50
60
70
80
90
100
Perc
ent F
iner
Tha
n
Grain Size (mm)
100 10 1 0.1 0.01 0.001
Boulder Size
Cobble Size Gravel Size Sand Size
Silt and Clay Size
3" 1-1/2" 3/4" 4 1012" 20 100 20040
Coarse Fine Coarse Medium Fine
US Sieve Size
Attachment NEB 1.19-1

C556-05_WASML17-RV-HA-06_AS1_Hydro.xlsx GOLDER ASSOCIATES LTD. Page 1
Project No.: Lab No.:Project Title:
Borehole: Sample No.:Depth:
Date Tested: By:Particle Size Analysis of Soil(ASTM D422)
Diameter of Percent Sieve Passing(mm) (%)75.0 100.050.0 100.037.5 100.025.0 100.019.0 100.09.5 100.04.75 98.52.0 98.1
0.850 97.70.425 97.00.250 95.10.106 89.90.075 86.10.028 76.60.018 70.80.011 63.10.008 59.2
0.006 54.40.004 49.50.003 45.70.002 40.80.001 37.0
Reviewed:
Coarse Fine Coarse Medium Fine0.0% 1.5% 0.4% 1.1% 10.8% 86.1%
Comments:
C556-05TransCanada WASML Loop Rocky View Section AB
1784747.7000
WASML17-RV-HA-060.45-0.95 m05-Dec-17
AS1
DS
PERCENT GRAVEL, SAND, SILT AND CLAY OF SAMPLEGRAVEL SAND
SILT / CLAY
0
10
20
30
40
50
60
70
80
90
100
Perc
ent F
iner
Tha
n
Grain Size (mm)
100 10 1 0.1 0.01 0.001
Boulder Size
Cobble Size Gravel Size Sand Size
Silt and Clay Size
3" 1-1/2" 3/4" 4 1012" 20 100 20040
Coarse Fine Coarse Medium Fine
US Sieve Size
Attachment NEB 1.19-1

C556-12_WASML17-RV-HA-09_AS1_Hydro.xlsx GOLDER ASSOCIATES LTD. Page 1
Project No.: Lab No.:Project Title:
Borehole: Sample No.:Depth:
Date Tested: By:Particle Size Analysis of Soil(ASTM D422)
Diameter of Percent Sieve Passing(mm) (%)75.0 100.050.0 100.037.5 100.025.0 100.019.0 100.09.5 100.04.75 100.02.0 99.9
0.850 99.60.425 99.30.250 98.90.106 98.40.075 97.50.027 89.30.017 85.20.010 79.00.007 72.9
0.005 68.70.004 64.60.003 59.50.002 53.30.001 48.2
Reviewed:
Coarse Fine Coarse Medium Fine0.0% 0.0% 0.1% 0.5% 1.8% 97.5%
Comments:
C556-12TransCanada WASML Loop Rocky View Section AB
1784747.7000
WASML17-RV-HA-090.35-1.00 m05-Dec-17
AS1
DS
PERCENT GRAVEL, SAND, SILT AND CLAY OF SAMPLEGRAVEL SAND
SILT / CLAY
0
10
20
30
40
50
60
70
80
90
100
Perc
ent F
iner
Tha
n
Grain Size (mm)
100 10 1 0.1 0.01 0.001
Boulder Size
Cobble Size Gravel Size Sand Size
Silt and Clay Size
3" 1-1/2" 3/4" 4 1012" 20 100 20040
Coarse Fine Coarse Medium Fine
US Sieve Size
Attachment NEB 1.19-1

C556-19_WASML17-RV-HA-13_AS1_Hydro.xlsx GOLDER ASSOCIATES LTD. Page 1
Project No.: Lab No.:Project Title:
Borehole: Sample No.:Depth:
Date Tested: By:Particle Size Analysis of Soil(ASTM D422)
Diameter of Percent Sieve Passing(mm) (%)75.0 100.050.0 100.037.5 100.025.0 100.019.0 100.09.5 100.04.75 100.02.0 100.0
0.850 99.90.425 99.70.250 99.50.106 98.40.075 97.40.028 89.30.018 85.80.011 81.10.008 77.5
0.005 72.80.004 68.10.003 63.40.002 56.30.001 50.4
Reviewed:
Coarse Fine Coarse Medium Fine0.0% 0.0% 0.0% 0.3% 2.3% 97.4%
Comments:
C556-19TransCanada WASML Loop Rocky View Section AB
1784747.7000
WASML17-RV-HA-130.50-1.50 m05-Dec-17
AS1
DS
PERCENT GRAVEL, SAND, SILT AND CLAY OF SAMPLEGRAVEL SAND
SILT / CLAY
0
10
20
30
40
50
60
70
80
90
100
Perc
ent F
iner
Tha
n
Grain Size (mm)
100 10 1 0.1 0.01 0.001
Boulder Size
Cobble Size Gravel Size Sand Size
Silt and Clay Size
3" 1-1/2" 3/4" 4 1012" 20 100 20040
Coarse Fine Coarse Medium Fine
US Sieve Size
Attachment NEB 1.19-1
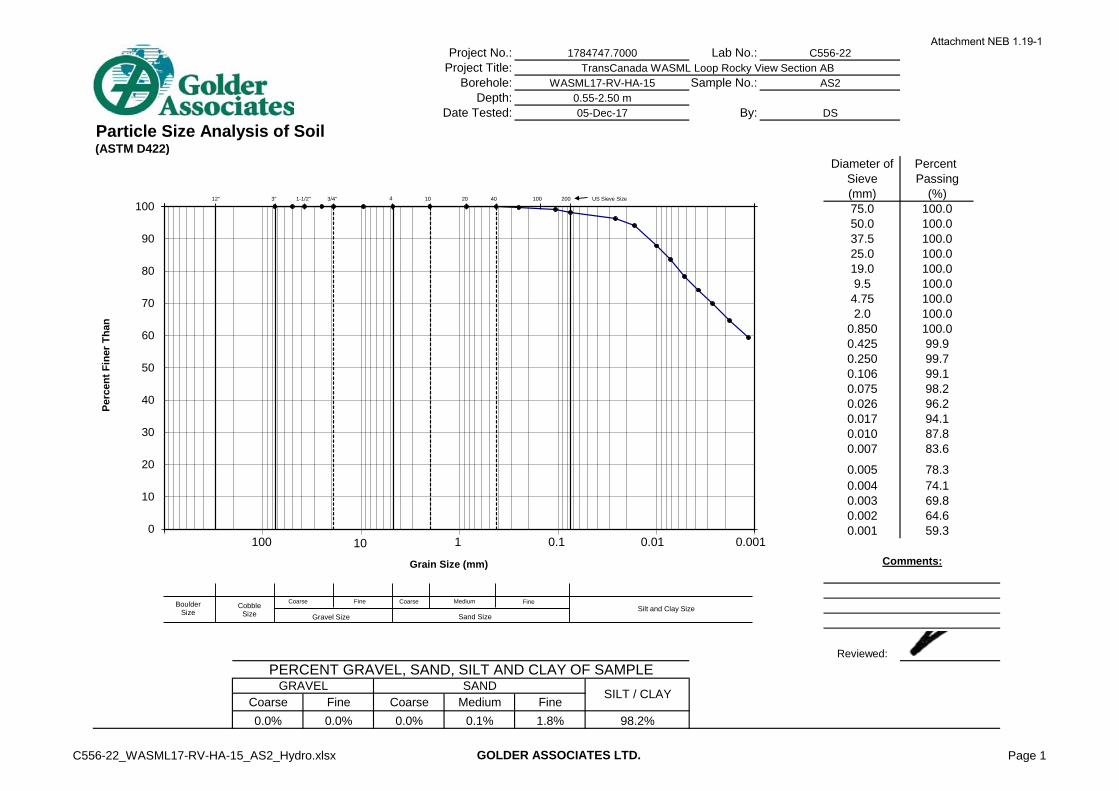
C556-22_WASML17-RV-HA-15_AS2_Hydro.xlsx GOLDER ASSOCIATES LTD. Page 1
Project No.: Lab No.:Project Title:
Borehole: Sample No.:Depth:
Date Tested: By:Particle Size Analysis of Soil(ASTM D422)
Diameter of Percent Sieve Passing(mm) (%)75.0 100.050.0 100.037.5 100.025.0 100.019.0 100.09.5 100.04.75 100.02.0 100.0
0.850 100.00.425 99.90.250 99.70.106 99.10.075 98.20.026 96.20.017 94.10.010 87.80.007 83.6
0.005 78.30.004 74.10.003 69.80.002 64.60.001 59.3
Reviewed:
Coarse Fine Coarse Medium Fine0.0% 0.0% 0.0% 0.1% 1.8% 98.2%
Comments:
C556-22TransCanada WASML Loop Rocky View Section AB
1784747.7000
WASML17-RV-HA-150.55-2.50 m05-Dec-17
AS2
DS
PERCENT GRAVEL, SAND, SILT AND CLAY OF SAMPLEGRAVEL SAND
SILT / CLAY
0
10
20
30
40
50
60
70
80
90
100
Perc
ent F
iner
Tha
n
Grain Size (mm)
100 10 1 0.1 0.01 0.001
Boulder Size
Cobble Size Gravel Size Sand Size
Silt and Clay Size
3" 1-1/2" 3/4" 4 1012" 20 100 20040
Coarse Fine Coarse Medium Fine
US Sieve Size
Attachment NEB 1.19-1
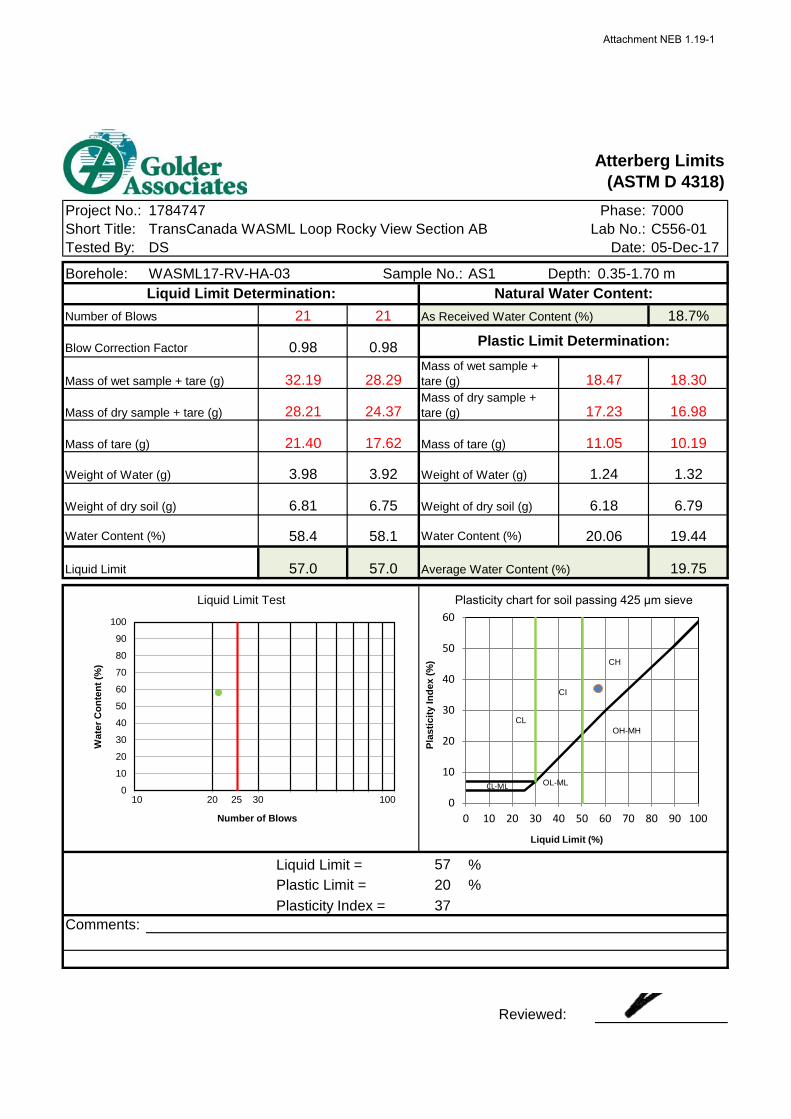
Atterberg Limits(ASTM D 4318)
Depth:
As Received Water Content (%)
Average Water Content (%)
Liquid Limit = %Plastic Limit = %Plasticity Index =
Comments:
Reviewed:
0.98 Plastic Limit Determination:
Mass of tare (g)
Mass of dry sample + tare (g)
Mass of wet sample + tare (g) 18.30
17.23 16.98
10.1911.05
18.47
Project No.:Short Title:Tested By: 05-Dec-17
C556-017000
TransCanada WASML Loop Rocky View Section AB Lab No.:1784747
DS
372057
Plasticity chart for soil passing 425 μm sieve
20.06
Weight of Water (g)
6.75
58.4 58.1
57.0 19.75
Liquid Limit Test
Liquid Limit
18.7%
6.79
19.44
Natural Water Content:21
Phase:
Date:
0.35-1.70 m
6.18
57.0
32.19 28.29
28.21 24.37
21.40 17.62
3.98 3.92 1.24
Water Content (%)
Weight of dry soil (g)
1.32
Water Content (%)
21
0.98
AS1Sample No.:
Weight of dry soil (g) 6.81
Number of Blows
Blow Correction Factor
Mass of wet sample + tare (g)
Borehole: WASML17-RV-HA-03Liquid Limit Determination:
Mass of tare (g)
Weight of Water (g)
Mass of dry sample + tare (g)
0
10
20
30
40
50
60
70
80
90
100
Wat
er C
onte
nt (%
)
Number of Blows
10 20 25 30 100 0
10
20
30
40
50
60
0 10 20 30 40 50 60 70 80 90 100
CI
CL-ML OL-ML
OH-MH
CH
CL
Liquid Limit (%)
Plas
ticity
Inde
x (%
)
Attachment NEB 1.19-1
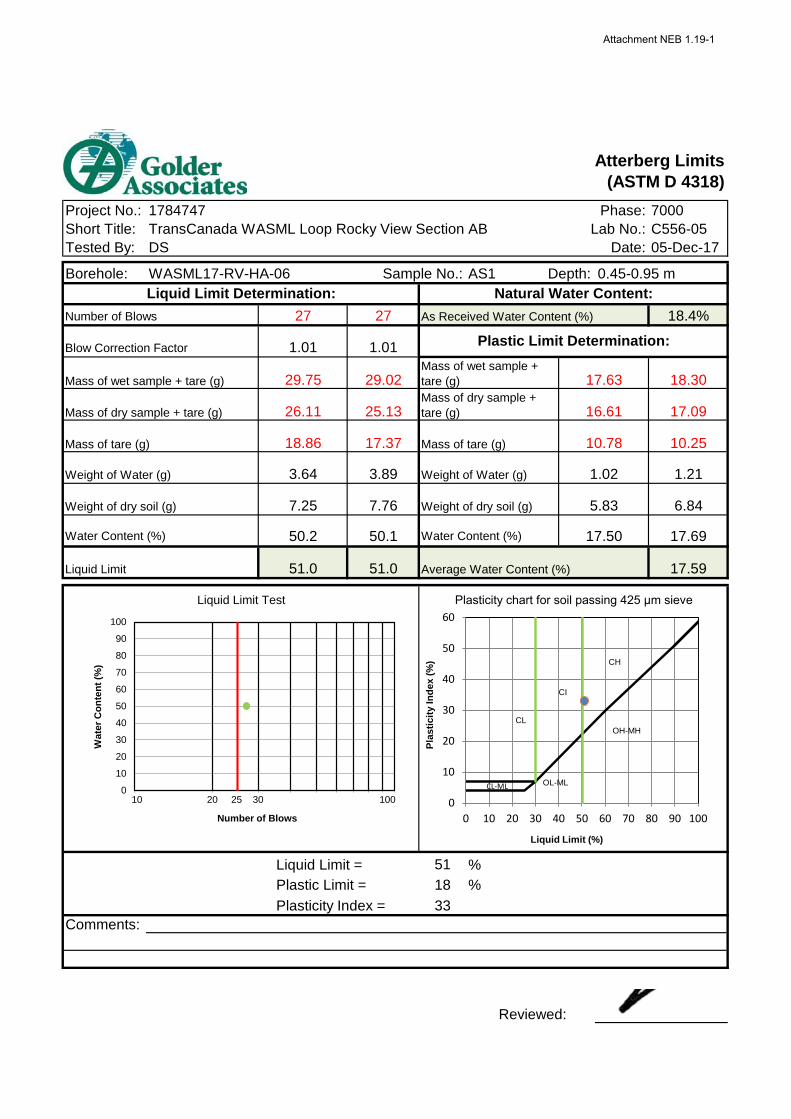
Atterberg Limits(ASTM D 4318)
Depth:
As Received Water Content (%)
Average Water Content (%)
Liquid Limit = %Plastic Limit = %Plasticity Index =
Comments:
Reviewed:
Water Content (%)
27
1.01
AS1Sample No.:
Weight of dry soil (g) 7.25
Number of Blows
Blow Correction Factor
Mass of wet sample + tare (g)
Borehole: WASML17-RV-HA-06Liquid Limit Determination:
Mass of tare (g)
Weight of Water (g)
Mass of dry sample + tare (g)
51.0
29.75 29.02
26.11 25.13
18.86 17.37
3.64 3.89 1.02
Water Content (%)
Weight of dry soil (g)
1.21
18.4%
6.84
17.69
Natural Water Content:27
Phase:
Date:
0.45-0.95 m
5.83
51.0 17.59
Liquid Limit Test
Liquid Limit
17.50
Weight of Water (g)
7.76
50.2 50.1
331851
Plasticity chart for soil passing 425 μm sieve
Project No.:Short Title:Tested By: 05-Dec-17
C556-057000
TransCanada WASML Loop Rocky View Section AB Lab No.:1784747
DS
1.01 Plastic Limit Determination:
Mass of tare (g)
Mass of dry sample + tare (g)
Mass of wet sample + tare (g) 18.30
16.61 17.09
10.2510.78
17.63
0
10
20
30
40
50
60
70
80
90
100
Wat
er C
onte
nt (%
)
Number of Blows
10 20 25 30 100 0
10
20
30
40
50
60
0 10 20 30 40 50 60 70 80 90 100
CI
CL-ML OL-ML
OH-MH
CH
CL
Liquid Limit (%)
Plas
ticity
Inde
x (%
)
Attachment NEB 1.19-1

Atterberg Limits(ASTM D 4318)
Depth:
As Received Water Content (%)
Average Water Content (%)
Liquid Limit = %Plastic Limit = %Plasticity Index =
Comments:
Reviewed:
1.02 Plastic Limit Determination:
Mass of tare (g)
Mass of dry sample + tare (g)
Mass of wet sample + tare (g) 17.09
15.93 15.74
9.7610.52
17.14
Project No.:Short Title:Tested By: 05-Dec-17
C556-127000
TransCanada WASML Loop Rocky View Section AB Lab No.:1784747
DS
482270
Plasticity chart for soil passing 425 μm sieve
22.37
Weight of Water (g)
6.41
68.6 68.3
70.0 22.47
Liquid Limit Test
Liquid Limit
24.0%
5.98
22.58
Natural Water Content:29
Phase:
Date:
0.35-1.00 m
5.41
70.0
29.55 36.28
25.02 31.90
18.42 25.49
4.53 4.38 1.21
Water Content (%)
Weight of dry soil (g)
1.35
Water Content (%)
29
1.02
AS1Sample No.:
Weight of dry soil (g) 6.6
Number of Blows
Blow Correction Factor
Mass of wet sample + tare (g)
Borehole: WASML17-RV-HA-09Liquid Limit Determination:
Mass of tare (g)
Weight of Water (g)
Mass of dry sample + tare (g)
0
10
20
30
40
50
60
70
80
90
100
Wat
er C
onte
nt (%
)
Number of Blows
10 20 25 30 100 0
10
20
30
40
50
60
0 10 20 30 40 50 60 70 80 90 100
CI
CL-ML OL-ML
OH-MH
CH
CL
Liquid Limit (%)
Plas
ticity
Inde
x (%
)
Attachment NEB 1.19-1

Atterberg Limits(ASTM D 4318)
Depth:
As Received Water Content (%)
Average Water Content (%)
Liquid Limit = %Plastic Limit = %Plasticity Index =
Comments:
Reviewed:
Water Content (%)
27
1.01
AS1Sample No.:
Weight of dry soil (g) 6.73
Number of Blows
Blow Correction Factor
Mass of wet sample + tare (g)
Borehole: WASML17-RV-HA-13Liquid Limit Determination:
Mass of tare (g)
Weight of Water (g)
Mass of dry sample + tare (g)
69.0
36.29 36.88
31.66 32.52
24.93 26.18
4.63 4.36 1.60
Water Content (%)
Weight of dry soil (g)
1.61
44.0%
6.62
24.32
Natural Water Content:27
Phase:
Date:
0.50-1.50 m
6.80
69.0 23.92
Liquid Limit Test
Liquid Limit
23.53
Weight of Water (g)
6.34
68.8 68.8
452469
Plasticity chart for soil passing 425 μm sieve
Project No.:Short Title:Tested By: 05-Dec-17
C556-197000
TransCanada WASML Loop Rocky View Section AB Lab No.:1784747
DS
1.01 Plastic Limit Determination:
Mass of tare (g)
Mass of dry sample + tare (g)
Mass of wet sample + tare (g) 18.57
17.00 16.96
10.3410.20
18.60
0
10
20
30
40
50
60
70
80
90
100
Wat
er C
onte
nt (%
)
Number of Blows
10 20 25 30 100 0
10
20
30
40
50
60
0 10 20 30 40 50 60 70 80 90 100
CI
CL-ML OL-ML
OH-MH
CH
CL
Liquid Limit (%)
Plas
ticity
Inde
x (%
)
Attachment NEB 1.19-1

Atterberg Limits(ASTM D 4318)
Depth:
As Received Water Content (%)
Average Water Content (%)
Liquid Limit = %Plastic Limit = %Plasticity Index =
Comments:
Reviewed:
1.02 Plastic Limit Determination:
Mass of tare (g)
Mass of dry sample + tare (g)
Mass of wet sample + tare (g) 18.01
17.27 16.61
9.5410.54
18.54
Project No.:Short Title:Tested By: 05-Dec-17
C556-227000
TransCanada WASML Loop Rocky View Section AB Lab No.:1784747
DS
451964
Plasticity chart for soil passing 425 μm sieve
18.87
Weight of Water (g)
6.25
62.3 62.1
64.0 19.34
Liquid Limit Test
Liquid Limit
27.7%
7.07
19.80
Natural Water Content:30
Phase:
Date:
0.55-2.50 m
6.73
63.0
33.11 31.04
29.27 27.16
23.11 20.91
3.84 3.88 1.27
Water Content (%)
Weight of dry soil (g)
1.40
Water Content (%)
30
1.02
AS2Sample No.:
Weight of dry soil (g) 6.16
Number of Blows
Blow Correction Factor
Mass of wet sample + tare (g)
Borehole: WASML17-RV-HA-15Liquid Limit Determination:
Mass of tare (g)
Weight of Water (g)
Mass of dry sample + tare (g)
0
10
20
30
40
50
60
70
80
90
100
Wat
er C
onte
nt (%
)
Number of Blows
10 20 25 30 100 0
10
20
30
40
50
60
0 10 20 30 40 50 60 70 80 90 100
CI
CL-ML OL-ML
OH-MH
CH
CL
Liquid Limit (%)
Plas
ticity
Inde
x (%
)
Attachment NEB 1.19-1
TRANSCANADA WASML LOOP ROCKY VIEW SECTION
APPENDIX C Terrain Analysis Technical Memorandum Terrain Maps
July 19, 2018 Report No. 00660-GAL-C-RP-0006_1
Attachment NEB 1.19-1
TECHNICAL MEMORANDUM
1.0 TERRAIN ANALYSIS 1.1 BACKGROUND The proposed TransCanada Western Alberta System Mainline (WASML) Loop (Rocky View Section) pipeline is approximately 21.4 km in length. The proposed pipeline will consist of NPS 42 diameter pipe and will be constructed parallel to the existing NGTL NPS 36 WASML and NPS 36 Foothills Pipelines from the existing WAS110 Valve Site (NE-16-026-04-W5M) approximately 150 metres (m) north of the Elbow River to the existing WAS100 Valve Site (NE-10-024-04-W5M) near Cochrane, Alberta.
Between KP 0+000 and approximately KP 16+500, the proposed TransCanada WASML Loop (Rocky View Section) is found within the Okotoks Upland Physiographic District; between approximately KP 16+500 and KP 21+421, the proposed pipeline passes through the Rosebud Plain Physiographic District (Pettapiece1986). The Okotoks Uplands are characterized by till blankets and veneers overlying rolling bedrock, and dissected, undulating till and may also contain lesser amounts of glaciolacustrine materials. The Rosebud Plain is characterized as undulating till materials with significant areas of glaciolacustrine veneers and blankets overlying undulating till, along with lesser amounts of glaciofluvial deposits (Pettapiece 1986).
The study area is underlain by three bedrock formations. From KP 0+000 to approximately KP 1+900 is the Upper Cretaceous Brazeau Formation, from approximately KP 1+900 to KP 5+750 is the Upper Cretaceous and Paleogene Coalspur Formations and from approximately KP 5+750 to KP 21+421 is the Paleogene Paskapoo Formation. All formations consisted of sandstone, siltstone and mudstone (Prior et al. 2013).
Compilation mapping at 1:1,000,000 scale by Fenton et al (2013) suggests that the study area is comprised primarily of glaciolacustrine sediments and till materials, with a lesser amount of fluvial deposits. The glaciolacustrine sediments are located from approximately KP 0+000 to KP 1+900, KP 4+200 to KP 5+800, KP 11+300 to KP 13+800, and KP 19+400 to KP 20+800. The sediments are described as typically fine-grained, distal deposits in or along the margins of glacial lakes. Till deposits are found from approximately KP 1+900 to KP 4+200, KP5+800 to KP 11+300, KP 13+800 to KP 16+500 and KP 20+800 to KP 21+421. The till deposits are described as being deposited directly by glacial ice. Fluvial deposits are confined to the Bow River valley, an area between approximately KP 16+500 to KP 19+400. These fluvial materials are described as being deposited by streams and rivers.
More detailed mapping by Moran (1986) indicates that the study area immediately to the south of the start of the proposed alignment is comprised of silty to gravelly fluvial materials. The first 2.3 km of the proposed alignment is
DATE January 29, 2018 PROJECT No. 1784747
TO David Eremita TransCanada PipeLines Limited
CC Mark Nixon
FROM Dennis O'Leary EMAIL Dennis_O'[email protected]
TRANSCANADA WESTERN ALBERTA SYSTEM MAINLINE (WASML) LOOP (ROCKY VIEW SECTION) - TERRAIN ANALYSIS
Golder Associates Ltd.
102, 2535 - 3rd Avenue S.E., Calgary, Alberta, Canada T2A 7W5 Tel: +1 (403) 299 5600 Fax: +1 (403) 299 5606 www.golder.com
Golder Associates: Operations in Africa, Asia, Australasia, Europe, North America and South America
Golder, Golder Associates and the GA globe design are trademarks of Golder Associates Corporation.
Attachment NEB 1.19-1
17847874 TransCanada PipeLines Limited January 29, 2018
dominated by deep silty and clayey glaciolacustrine sediments, with the next 1.6 km dominated by loamy till material overlying marine bedrock. Starting around KP 3+900 is a band mapped as silty and clayey glaciolacustrine material that continues for about 2.2 km. Following this is a long stretch of mostly loamy till, with small pockets of loamy or silty till that continues to KP 11+250. The till is typically thin and overlies bedrock, with a short segment around KP 8+500 mapped as bedrock. From KP 11+250 to 16+700, the proposed pipeline centerline is mapped as silty and clayey or clayey glaciolacustrine material overlying till deposits. A narrow band within this area, near KP 13+100, is mapped as a till exposure. The next section of the proposed alignment is dominated by variably textured fluvial sediments to KP 19+300. This region is sliced by two narrow bands of deep silty and clayey or silty glaciolacustrine sediments. From KP 19+300 to KP 20+800 the proposed pipeline alignment is mapped as sandy or silty and clayey over sandy glaciolacustrine deposits. The remainder of the proposed pipeline route is mapped as loamy till over bedrock.
MacMillan (1987) mapped Maycroft and Fish Creek soils on glaciolacustrine sediments, Dunvargan soils on till deposits, and Miscellaneous Coarse and Miscellaneous Undifferentiated Mineral soils on undifferentiated material.
The topography is variable with higher slope values typically associated with the Bow River at approximately KP 17+160. Outside of the Bow River valley, slopes typically range from 0% to 10%, although isolated areas with slopes up to 25% are present. The higher slope values are associated with till knolls. The Bow River has slopes up to about 35%. A small creek (Towers Creek) feeding the Bow River has slopes up to 80%.
2.0 METHODS Following a review of available data, including any existing bedrock, surficial geology and soils data, detailed terrain mapping of a 1 km-wide pipeline corridor was completed at scales ranging from 1:5,000 to 1:2,000 using Golder’s softcopy mapping tools. Imagery was acquired from the Alberta government and subsequently merged with the provincial DEM data to produce imagery that could be seen in 3D on a computer monitor with the aid of specialized 3D glasses. 1:20,000 scale black and white aerial photographs dated September 28, 2008 were used for mapping.
Homogenous terrain polygons were delineated on the basis of parent materials/soil types1, surface expression, overburden thickness/depth to bedrock, slope class, drainage and geological modifying processes. Each terrain unit was rated for terrain stability. All mapping adhered to Terrain Classification System for British Columbia, Version 2.0 (Howes and Kenk 1997) and Mapping and Assessing Terrain Stability Guidebook, 2nd Edition (BC Environment 1999).
While initial mapping was completed with the Provincial DEM data, polygon boundaries were subsequently checked against LiDAR data provided by TransCanada following the initial mapping. Adjustments made when LiDAR identified landscape features difficult to quantify using aerial images.
Groundwater well data from a Provincial database (Alberta Environment and Parks 2017) was used to assist in the mapping. These data need to be used with caution as the descriptions of the soil materials is often quite general and not of the same quality as would be obtained from a geotechnical borehole. For example, some water well logs use the term “till”, while most just list textures to a broad scale (e.g., sand, silt, clay, gravels). Terms such as “clay and rocks” is common and were interpreted to mean till or till-like materials. Where the term “clay” was recorded on the surface independent of other information it was interpreted as glaciolacustrine sediments. In addition, borehole and hand auger data from a 2017 Golder geotechnical program were used to confirm materials and add material textures when possible.
1 The term “soil types” is used here from the engineering perspective; they are synonymous with surficial materials and are not intended to imply soils classified from the Canadian System of Soil Classification (1998).
2/11
Attachment NEB 1.19-1
17847874 TransCanada PipeLines Limited January 29, 2018
Table 1 provides the five-class terrain stability classification system (BC Environment 1999) that was used to support this project. It should be noted that no detailed ground truthing of the mapping has occurred to support the application of this classification system.
Table 1: Terrain Stability Classification System Terrain Stability Class Description
I Expected to have a negligible likelihood of landslide initiation following right-of-way forest clearing or access road construction
II Expected to have a very low likelihood of landslide initiation following right-of-way forest clearing or access road construction
III Expected to have a low likelihood of landslide initiation following right-of-way forest clearing or access road construction
IV Expected to contain areas with a moderate likelihood of landslide initiation following right-of-way
V Expected to contain areas with a high likelihood of landslide initiation following right-of-way forest clearing or access road construction.
Notes: 1. Adapted from Mapping and Assessing Terrain Stability Guidebook (Forest Practices Code of BC, 1999); modified from: Land Management Handbook 18 (Chatwin et al. 1994). The classification addresses landslides greater than 0.05 ha in size using conventional forest clearing practices and sidecast road construction. 2. Terrain units classed as I, II and III may contain minor amounts of class IV and V terrain. These areas may not have been delineated due to the mapping scale and scope of work.
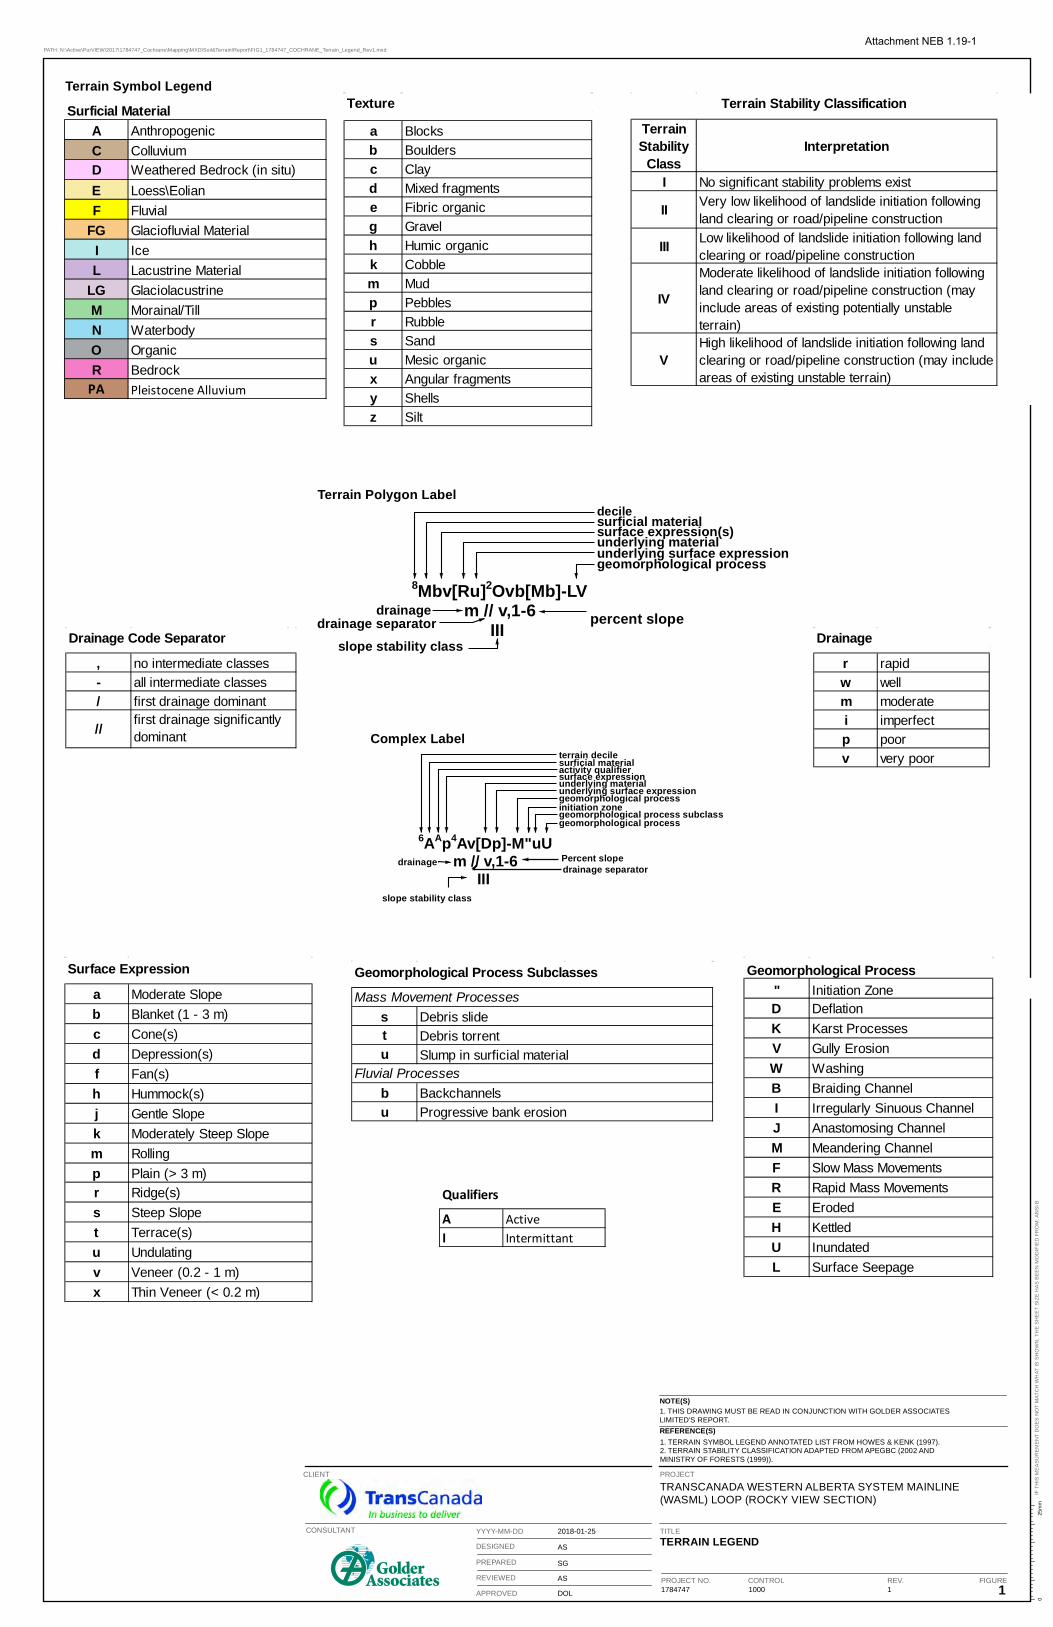
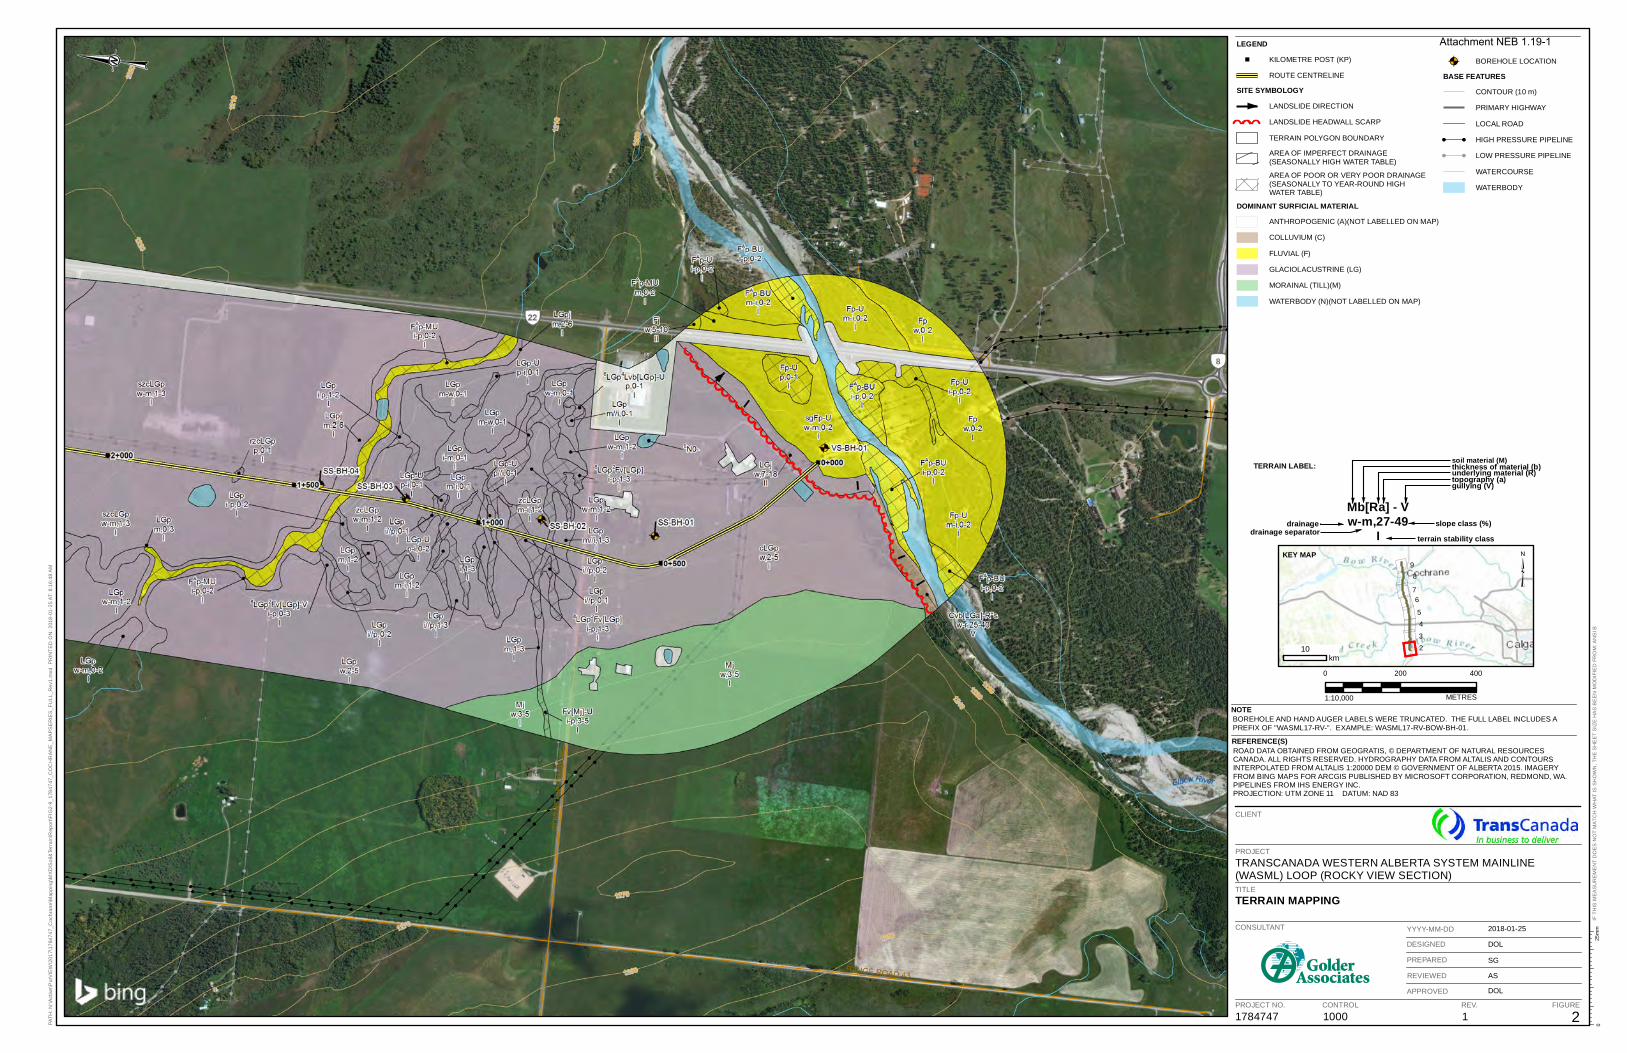
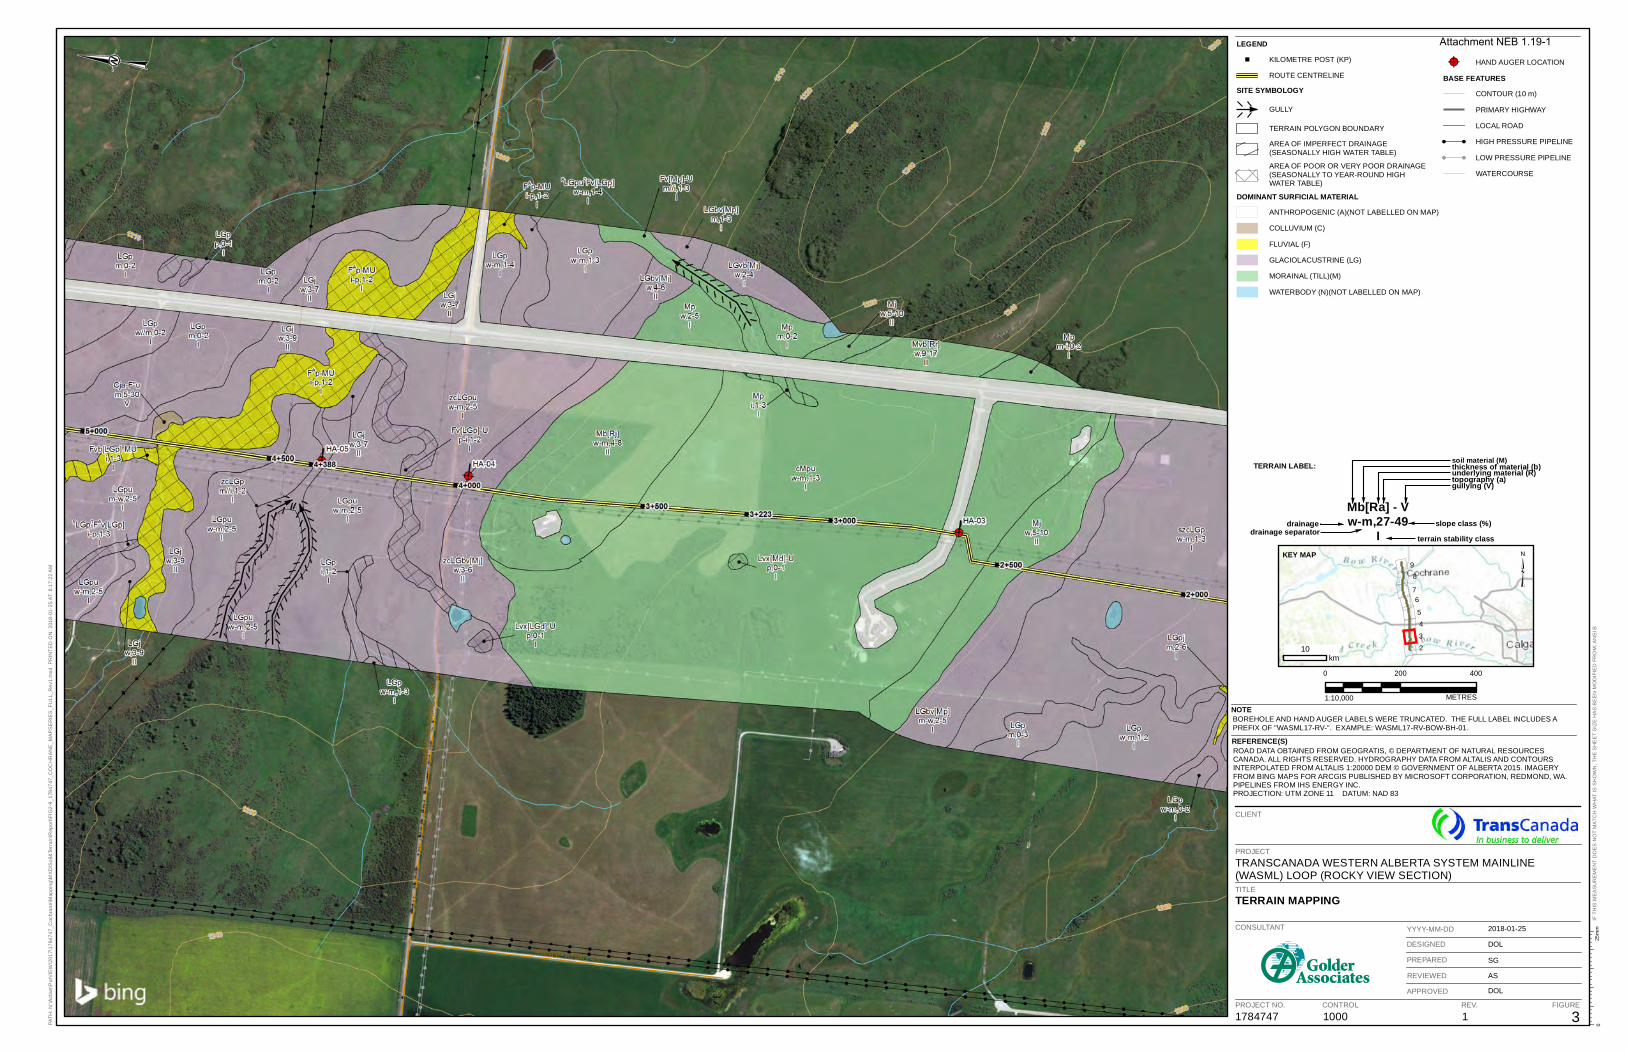
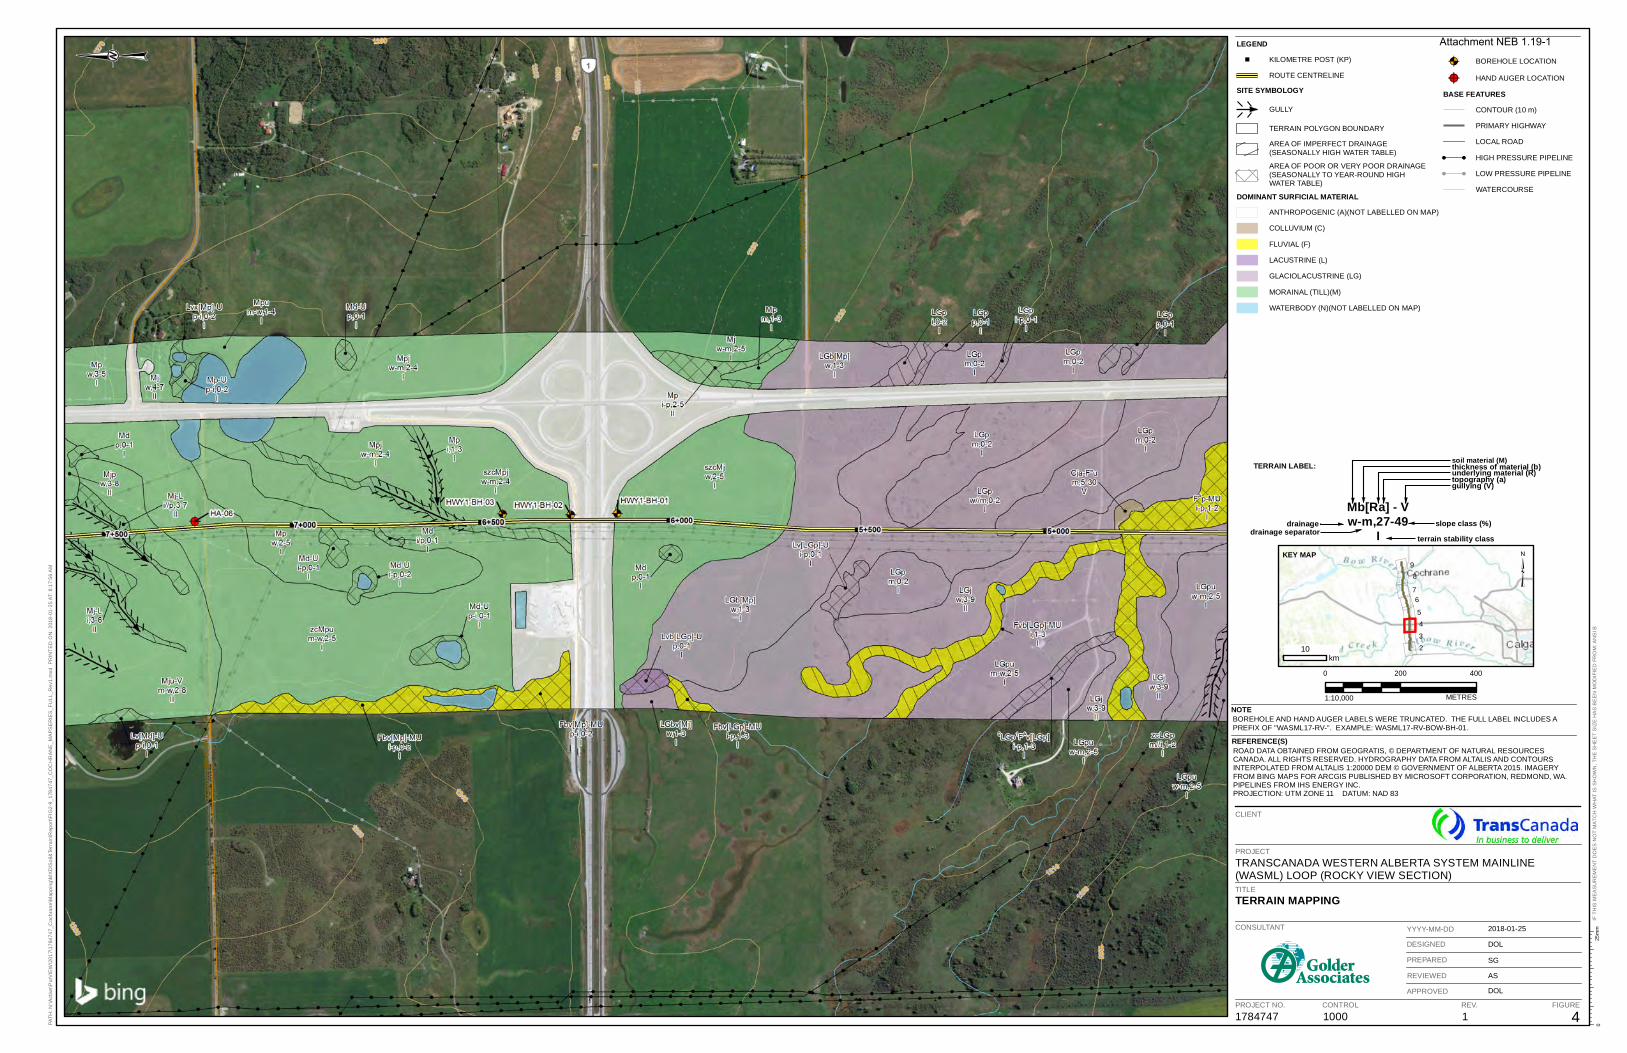
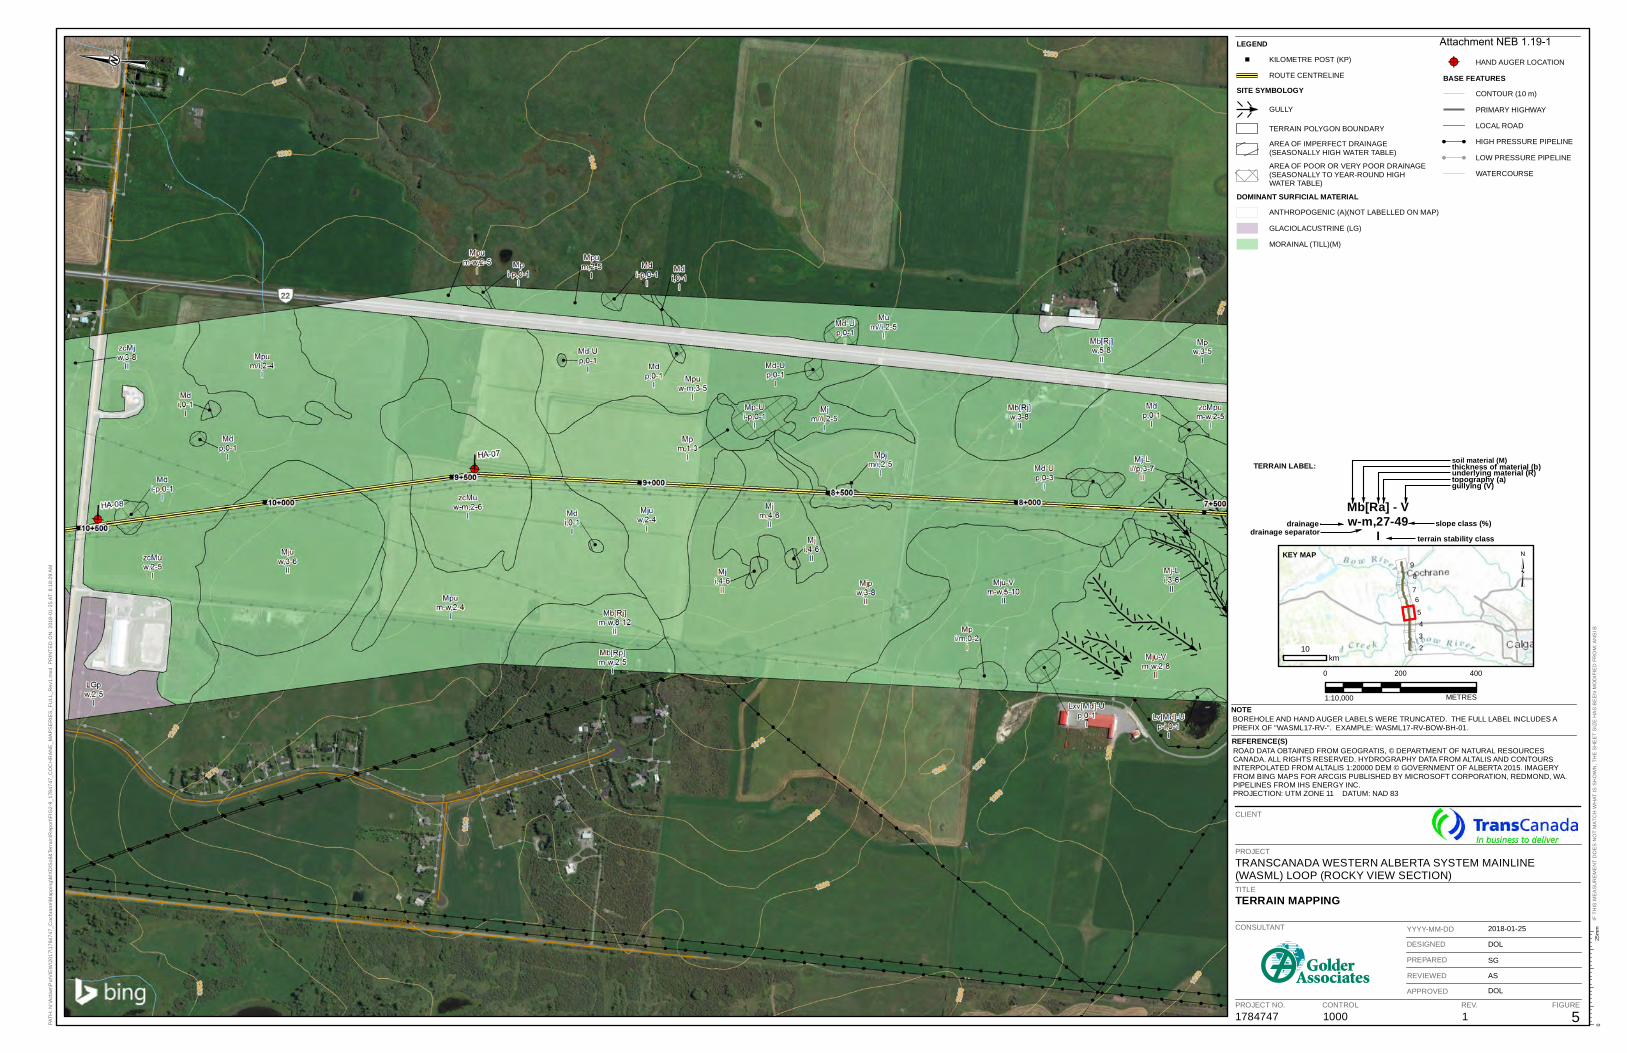
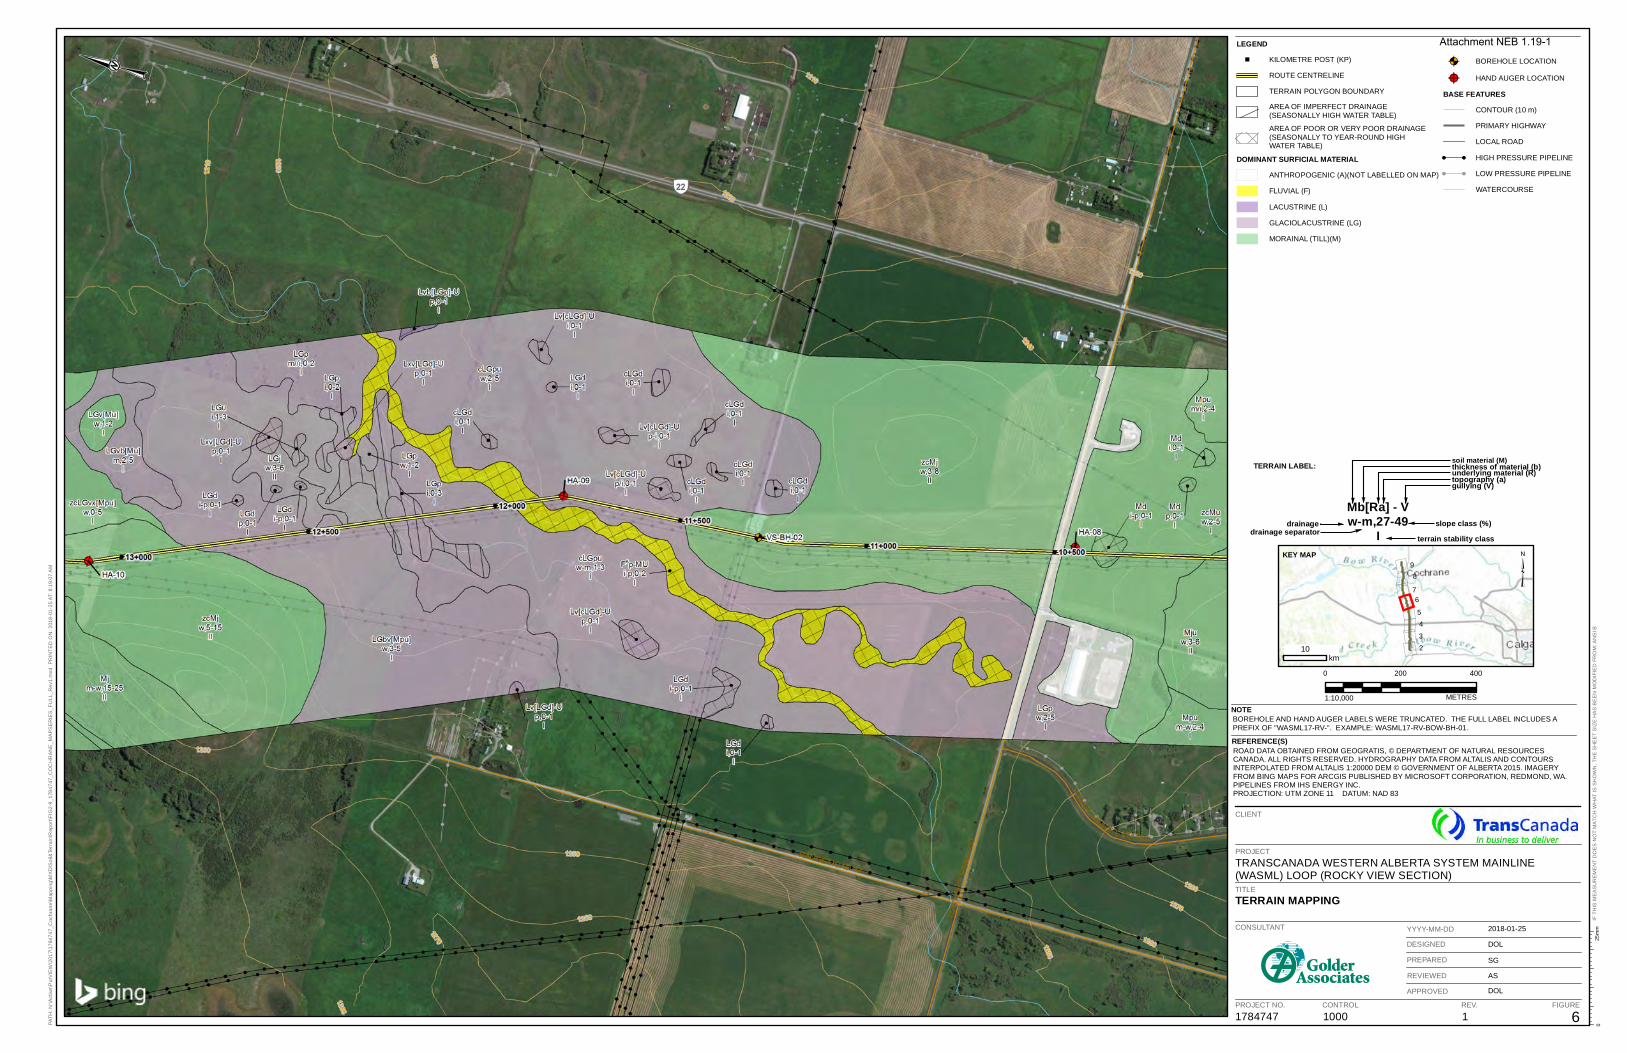
A final set of 1:10,000 scale figures have been produced and are found in Appendix A of the terrain report. Parent materials/soil types have been colour coded based on dominant surficial material as some polygons may contain two types of surficial material. The maps also show the spatial extent of all terrain units, labels for each terrain polygon, the proposed pipeline centerline, KPs and contours. A typical terrain polygon label is as follows:
Cbv[Ra] – R”s w, 25-35
V
Where:
C = dominant parent material type; colluvium bv = surface expression material; blankets (1-3 m) and veneers (<1 m) [R = underlying parent material; bedrock a] = surface expression; moderate slope (27-49%) - R = geomorphic process; rapid mass movement “ = initiation zone of mass movement is within the polygon u = type of mass movement; debris slide w = drainage class; well 25-35 = range of slope percentage; 25-35% V = terrain stability class (Class V - unstable)
3.0 RESULTS A total of 407 terrain units were delineated along the proposed TransCanada WASML Loop (Rocky View Section) pipeline. This results in an average terrain unit of 5.6 ha. The minimum terrain unit was less than 0.1 ha (small water body) while the maximum terrain unit mapped was 195.4 ha, a unit comprised of glaciolacustrine veneers overlying a morainal plain. Of the 407 terrain units, 337 or 83% were senior reviewed to ensure the accuracy of the classification and linework.
3/11
Attachment NEB 1.19-1
17847874 TransCanada PipeLines Limited January 29, 2018
The following sections provide summary statistics for the proposed TransCanada WASML Loop (Rocky View Section) pipeline based upon the detailed desktop mapping. A mapbook at a scale of 1:10,000 is attached to this technical memo.
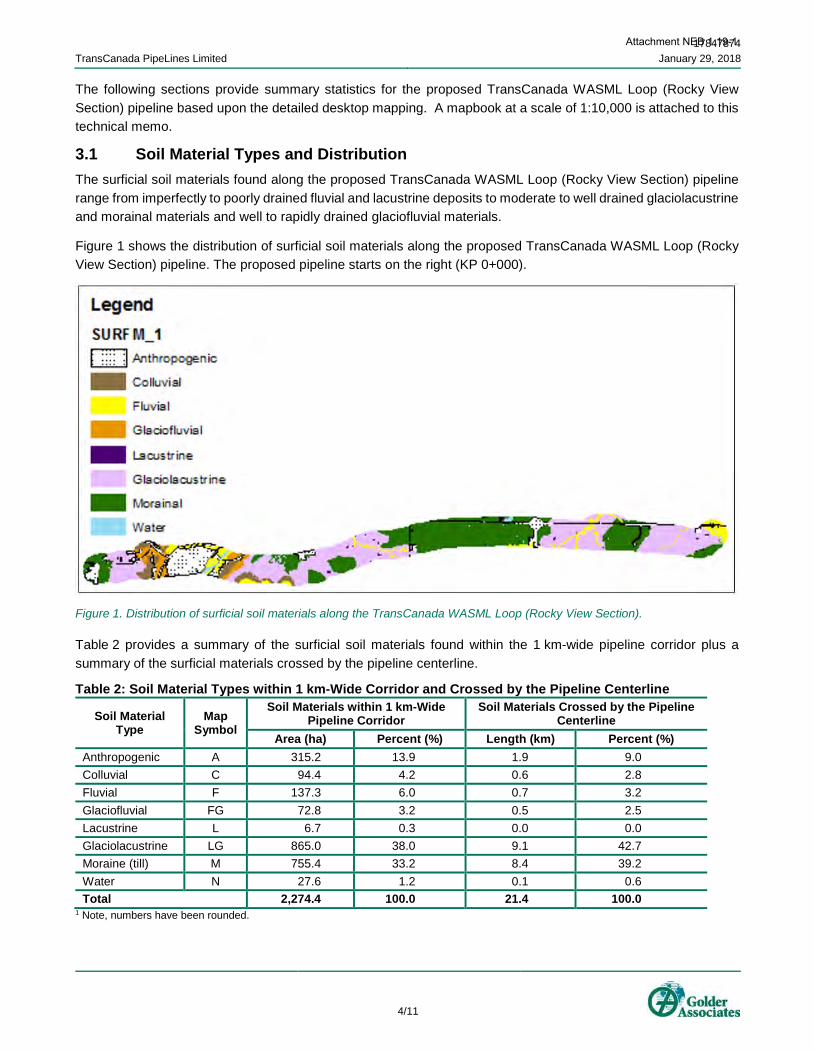
3.1 Soil Material Types and Distribution The surficial soil materials found along the proposed TransCanada WASML Loop (Rocky View Section) pipeline range from imperfectly to poorly drained fluvial and lacustrine deposits to moderate to well drained glaciolacustrine and morainal materials and well to rapidly drained glaciofluvial materials.
Figure 1 shows the distribution of surficial soil materials along the proposed TransCanada WASML Loop (Rocky View Section) pipeline. The proposed pipeline starts on the right (KP 0+000).
Figure 1. Distribution of surficial soil materials along the TransCanada WASML Loop (Rocky View Section).
Table 2 provides a summary of the surficial soil materials found within the 1 km-wide pipeline corridor plus a summary of the surficial materials crossed by the pipeline centerline.
Table 2: Soil Material Types within 1 km-Wide Corridor and Crossed by the Pipeline Centerline
Soil Material Type
Map Symbol
Soil Materials within 1 km-Wide Pipeline Corridor
Soil Materials Crossed by the Pipeline Centerline
Area (ha) Percent (%) Length (km) Percent (%) Anthropogenic A 315.2 13.9 1.9 9.0 Colluvial C 94.4 4.2 0.6 2.8 Fluvial F 137.3 6.0 0.7 3.2 Glaciofluvial FG 72.8 3.2 0.5 2.5 Lacustrine L 6.7 0.3 0.0 0.0 Glaciolacustrine LG 865.0 38.0 9.1 42.7 Moraine (till) M 755.4 33.2 8.4 39.2 Water N 27.6 1.2 0.1 0.6 Total 2,274.4 100.0 21.4 100.0
1 Note, numbers have been rounded.
4/11
Attachment NEB 1.19-1
17847874 TransCanada PipeLines Limited January 29, 2018
Moraine (till) and glaciolacustrine soils are the most common surficial materials mapped within the 1 km-wide pipeline corridor, accounting for over 70 % of surficial materials mapped within the 1 km-wide pipeline corridor and almost 80 % along the project centerline. As can be seen from Table 3, the till and glaciolacustrine sediments are similar in nature with moderately fine to fine textures. The major difference between the two materials is found in percent coarse fragments, with the glaciolacustrine materials having less than 1% coarse fragments while the till has upwards of 15% coarse fragments.
Table 3. Characteristics of the Dominant Soil Series Mapped along the TransCanada WASML Loop (Rocky View Section) Pipeline (MacMillan 1987)
Soil Series2 Soil Material Drainage Particle Size Analysis1
Depth (cm) Texture %
Sand %
Silt %
Clay %Coarse
Fragments Miscellaneous Coarse2 Undifferentiated well 50 to 100 Undifferentiated 60 30 10 30
Fish Creek Glaciolacustrine well 100 to 150 Fine 2 43 55 1 Dunvargan Till well 70 to 100 Moderately fine 32 34 34 15 Miscellaneous Undifferentiated Mineral3
Undifferentiated well 0 to 100 Undifferentiated 40 30 30 5
Maycroft Glaciolacustrine well 90 to 105 Moderately fine 20 50 30 0 1 Particle size analysis from Alberta Soil Information Centre (ASIC) (2015). 2 Soils mapped at 1:50,000 scale (MacMillan 1987). 3 By definition these miscellaneous series are highly variable in texture and coarse fragment content.
Brief descriptions of the dominant parent material types are contained in the following sections.
3.1.1 Glaciolacustrine Glaciolacustrine sediments are crossed by approximately 9.1 km of the proposed pipeline and are concentrated in three main areas along the pipeline corridor: from KP 0+006 to KP 2+423; from KP 3+895 to KP 5+688; and from KP 11+479 to KP 16+620. A smaller area was also mapped north of the Bow River between KP 19+699 and KP 21+030. The glaciolacustrine deposits in the region are described by Moran (1986) as silt and clay offshore sediments, sometimes overlying glacial (till) sediments and sometimes overlying sand. One extensive deposit of glaciolacustrine sediments, centered on KP 15+500, is described by Moran (1986) as clay over pebble-loam till.
3.1.2 Till Approximately 8.4 km of the proposed pipeline crosses till materials; these soils have been mapped extensively along the proposed pipeline corridor. There is a deposit west of KP 0+500, along with a larger deposit that splits the glaciolacustrine materials found in the southern quarter of the pipeline corridor. The largest deposit begins just south of the TransCanada Highway (Hwy 1; KP 5+690) and extends to about KP 12+000. There are a further four smaller pockets distributed along the northern half of the pipeline corridor. The till is described by Moran (1986) as Spy Hill Drift, which varies in texture from pebble-loam to silt and clay over pebble-loam. It typically drapes over Brazeau Formation, although sometimes deposits are thicker. The bedrock is comprised of varying combinations of sandstone, siltstone, shale and mudstone. MacMillan (1987) has mapped the tills in this area as Dunvargan till, a well-drained soil comprised of near equal amounts of sand (32%) silt (34%) and clay (34%) with approximately 15% coarse fragments.
3.1.3 Colluvial Colluvial surficial materials account for 2.8% of the linear distance along the centerline, being crossed only once by the proposed pipeline for a distance of approximately 600 m near KP 4+805. These surficial materials were not mapped by Moran (1986).
5/11
Attachment NEB 1.19-1
17847874 TransCanada PipeLines Limited January 29, 2018
3.1.4 Fluvial Fluvial deposits are mapped along the Bow River and Towers Creek and account for 3.2% or approximately 700 m of the surficial materials crossed by the proposed centerline. These soils are described by Moran (1986) as gravel with minor sand, or sandy gravel overlying glaciolacustrine silt in the Bow River and Tower Creek valley floors. There are also fluvial materials associated with several smaller drainages crossing the proposed pipeline alignment.
3.1.5 Glaciofluvial Glaciofluvial deposits account for only 2.5% or about 525 m of the surficial materials crossed the proposed pipeline. Along the proposed centerline, Glaciofluvial deposit have been mapped between KP 18+969 and KP 19+284 (split by Highway 1A), and KP 19+660 and KP 19+699 on the north side of the Bow River, and in a small area south of the Bow River between KP 16+389 and KP 16+628, within the Bow River valley bottom. Moran (1986) describes most of this material as silt, sand and gravel with minor clay.
Soil map units as encountered along the proposed pipeline alignment centreline according to mapping at 1:50,000 scale by MacMillan (1987) is summarized in Table 4.
While most of the soil mapping shows a high correlation with the terrain mapping, in terms of parent materials, there are some differences. These differences can be attributed to the mapping scales employed by each discipline and to the background data available at the time each was mapped.
Table 4: Description of Soil Units Crossed by the Proposed Pipeline Centerline by Approximate KPs Kilometer Post Soil Map Unit Description
KP 0+000 to KP 0+065 Miscellaneous Coarse
Well drained, sandy soils formed on undifferentiated materials with relatively high coarse fragment content
KP 0+065 to KP 1+730 Fish Creek Well drained, silty clayey soils formed on glaciolacustrine deposits with very low coarse fragment content
KP 1+730 to KP 3+970 Dunvargan Well drained, sandy silty clayey soils formed on till with moderate coarse fragment content
KP 3+970 to KP 6+000 Fish Creek Well drained, silty clayey soils formed on glaciolacustrine deposits with very low coarse fragment content
KP 6+000 to KP 14+005 Dunvargan Well drained, sandy silty clayey soils formed on till with moderate coarse fragment content
KP 14+005 to KP 16+560 Fish Creek Well drained, silty clayey soils formed on glaciolacustrine deposits with very low coarse fragment content
KP 16+560 to KP 17+610 Miscellaneous Coarse
Well drained, sandy soils formed on undifferentiated materials with relatively high coarse fragment content
KP 17+610 to KP 18+820 Miscellaneous Undifferentiated Mineral
Well drained, variably textured soils usually dominated by sands formed on undifferentiated materials with variable coarse fragment contents
KP 18+820 to KP 21+421 Maycroft Well drained, sandy clayey silty soils formed on glaciolacustrine deposits with very low coarse fragment content
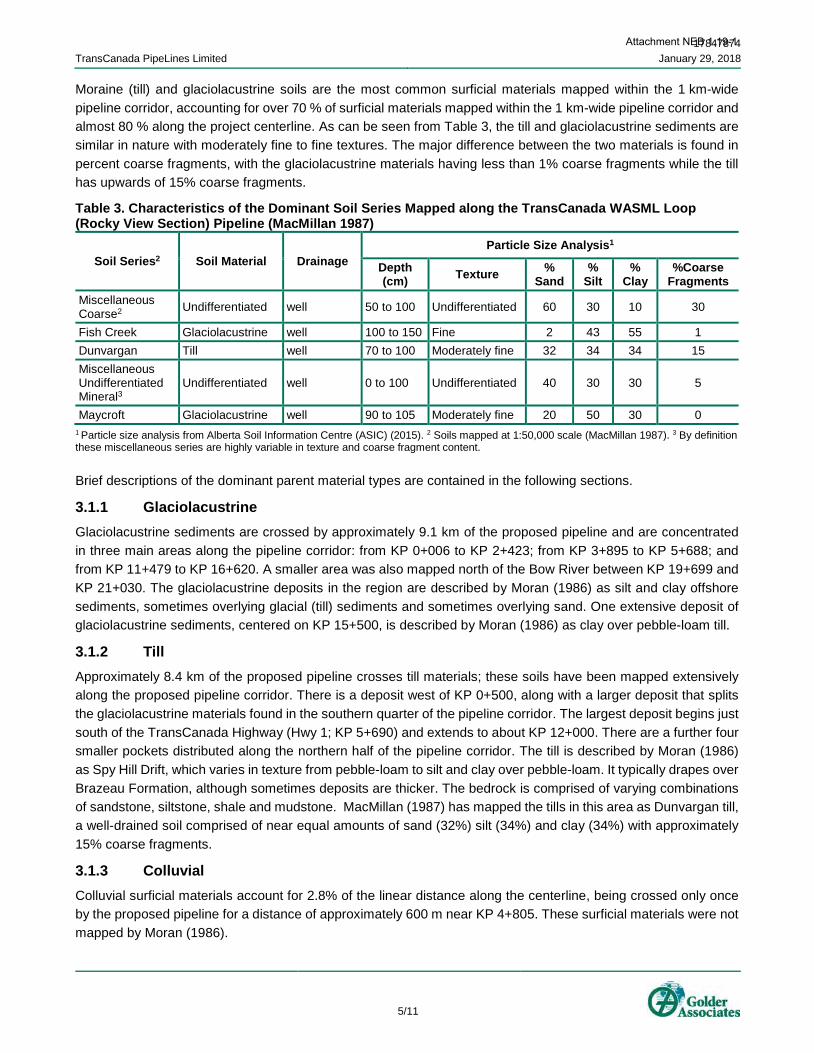
3.2 Drainage Figure 2 shows the distribution of the drainage regimes along the proposed TransCanada WASML Loop (Rocky View Section) pipeline and the colours represent the dominant soil drainage. As can be seen, moderate to well drained conditions are dominant, accounting for 78.9% of all drainage classes found within the 1 km wide pipeline corridor, and 86.2 % of the terrain crossed by the Project centerline (Table 5). Areas with seasonally high fluctuating water tables, imperfect to poorly drained soils, account for only 5.8 % of the area or 4.2 % (900 m) of
6/11
Attachment NEB 1.19-1
17847874 TransCanada PipeLines Limited January 29, 2018
the terrain crossed by the proposed centerline. Of this poorly drained soils are crossed for only 88 m of the proposed pipeline. No very poorly drained organics were mapped within the pipeline corridor (Table 5).
Figure 2. Drainage Conditions within the 1-km wide TransCanada WASML Loop (Rocky View Section) Pipeline Corridor
Table 5: Drainage Classes within 1-km Wide Pipeline Corridor and Crossed by the Pipeline Centerline
Drainage Class
Map Symbol
Drainage Classes within 1-km Wide Pipeline Corridor
Drainage Classes Crossed by the Pipeline Centerline
Area (ha) Percent (%) Length (km) Percent (%) Rapid r 6.0 0.3 0.0 0.0 Well w 1,496.3 65.8 17.0 79.3 Moderate m 297.1 13.1 1.5 7.0 Imperfect i 111.2 4.9 0.8 3.8 Poor p 21.1 0.9 0.1 0.4 Very poor v 0.0 0.0 0.0 0.0 Null1 - 342.6 15.1 2.0 9.6 Total 2,274.4 100.0 21.4 100.0
1 Null includes water (N) and anthropogenic (A). 2 Note, numbers have been rounded.
Table 6 provides the approximate KPs where poorly drained terrain was mapped along the centerline; the centerline does not cross any areas mapped as very poorly drained (Organic).
Table 6: Approximate KPs where the Pipeline Centreline Crosses Poorly and Very Poorly Drained Soils. Pipeline Crossings of:
Poor Drainage (Poorly drained mineral soils) Very Poor Drainage (Organic soils)
KP 1+052 - KP 1+079 (28 m) KP 1+106 - KP 1+110 (5 m) KP 1+641 - KP 1+662 (21 m) KP 4+117 - KP 4+151 (34 m)
none
7/11
Attachment NEB 1.19-1
17847874 TransCanada PipeLines Limited January 29, 2018
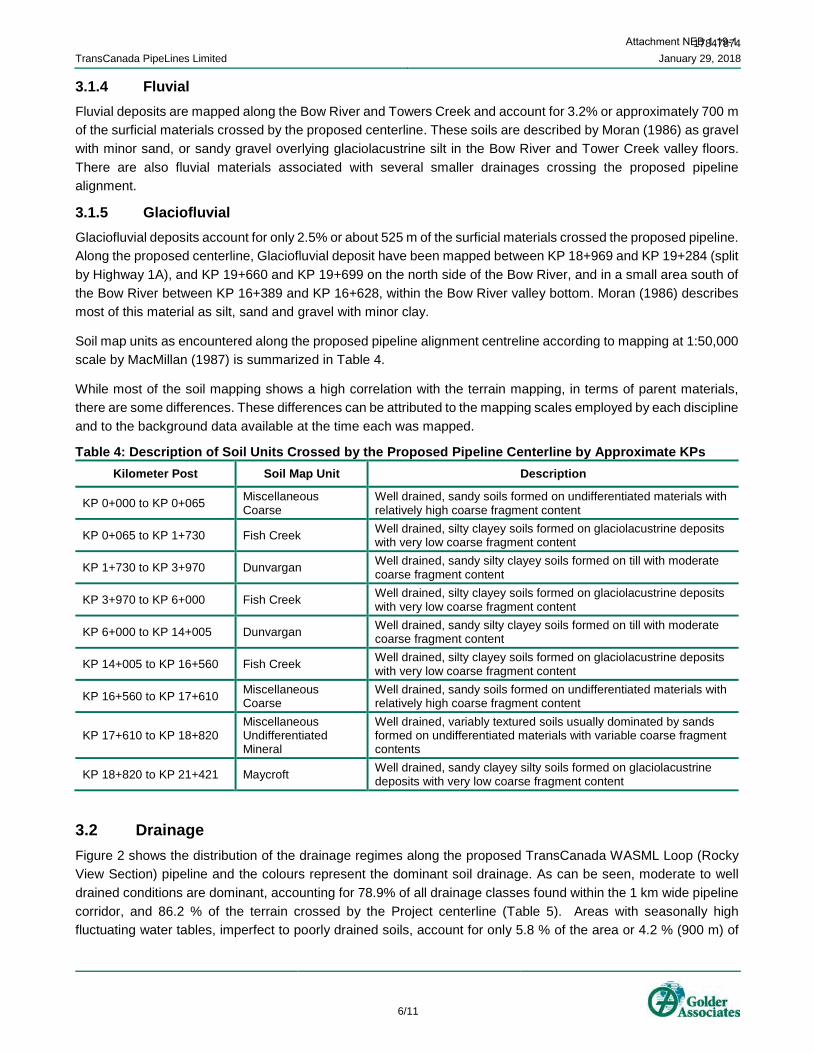
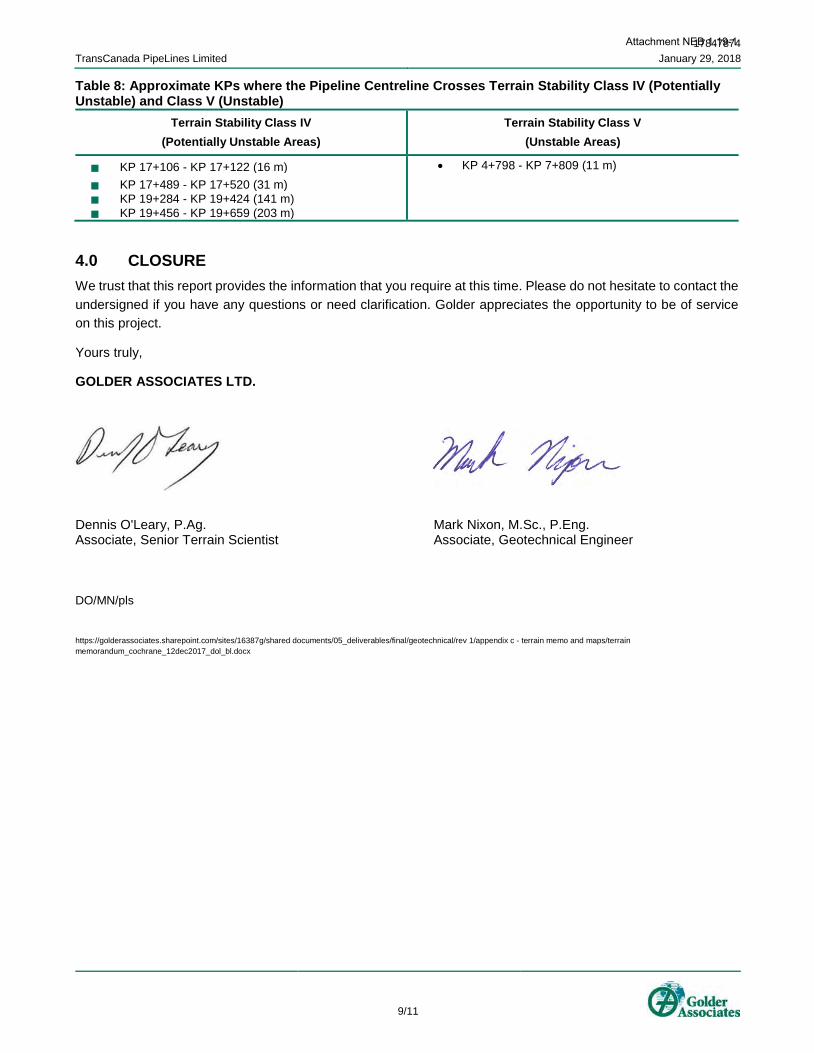
3.3 Terrain Stability Figure 3 shows the distribution of the slope stability classes along the proposed TransCanada WASML Loop (Rocky View Section) pipeline; the colours represent the slope stability class of the polygon. 97.6% or 21 km of the terrain crossed by the proposed pipeline is classified as stable. Only 1.9 % or 600 m of the area crossed by the proposed pipeline has been mapped as potentially unstable (Class IV) or unstable (Class V). Four segments totalling 391 m were assigned Class IV and one segment, 11 m in length was assigned Class V (11m) along the proposed TransCanada WASML Loop (Rocky View Section) (Table 8).
Figure 3. Terrain Stability Class within the 1-km wide TransCanada WASML Loop (Rocky View Section) Pipeline Corridor
Table 7: Terrain Stability Classes within 1-km Wide Pipeline Corridor and Crossed by the Project Centerline
Terrain Stability
Class Map
Symbol
Terrain Stability Classes within 1 km-Wide Pipeline Corridor
Terrain Stability Classes Crossed by the Project Centerline
Area (ha) Percent (%) Length (km) Percent (%) Stable I 1446.6 63.6 14.2 66.2 Generally stable II 382.1 16.8 4.6 21.3
Moderately stable III 47.8 2.1 0.2 1.1
Potentially unstable IV 28.7 1.3 0.4 1.8
Unstable V 26.5 1.2 0.0 0.1 Null1 - 342.6 15.1 2.0 9.6 Total 2274.4 100.0 21.4 100.0
1 Null includes water (N) and anthropogenic (A).
Table 8 provides the approximate KPs where Terrain Stability Class IV (potentially unstable) and Class V (Unstable) was mapped along the centerline.
8/11
Attachment NEB 1.19-1
17847874 TransCanada PipeLines Limited January 29, 2018
Table 8: Approximate KPs where the Pipeline Centreline Crosses Terrain Stability Class IV (Potentially Unstable) and Class V (Unstable)
Terrain Stability Class IV (Potentially Unstable Areas)
Terrain Stability Class V (Unstable Areas)
KP 17+106 - KP 17+122 (16 m)
KP 17+489 - KP 17+520 (31 m) KP 19+284 - KP 19+424 (141 m) KP 19+456 - KP 19+659 (203 m)
• KP 4+798 - KP 7+809 (11 m)
4.0 CLOSURE We trust that this report provides the information that you require at this time. Please do not hesitate to contact the undersigned if you have any questions or need clarification. Golder appreciates the opportunity to be of service on this project.
Yours truly,
GOLDER ASSOCIATES LTD.
Dennis O'Leary, P.Ag. Mark Nixon, M.Sc., P.Eng. Associate, Senior Terrain Scientist Associate, Geotechnical Engineer
DO/MN/pls
https://golderassociates.sharepoint.com/sites/16387g/shared documents/05_deliverables/final/geotechnical/rev 1/appendix c - terrain memo and maps/terrain memorandum_cochrane_12dec2017_dol_bl.docx
9/11
Attachment NEB 1.19-1
Da-Ming Duan 1784787 TransCanada PipeLines Limited January 29, 2018
5.0 REFERENCES Alberta Soil Information Centre (ASIC). 2015. AGRASID 3.0: Agricultural Region of Alberta Soil Inventory
Database (Version 3.0). Agriculture and Agri-Food Canada (AAFC), Alberta Agriculture, Food and Rural Development (AFRD). Available at: http://www1.agric.gov.ab.ca/$department/deptdocs.nsf/all/sag10372
Alberta Environment and Parks. 2017. Alberta Water Well Information Database, Alberta Environment and Parks. Retrieved November 2017 via Alberta Environment and Parks FTP site at: http://aep.alberta.ca/water/reports-data/alberta-water-well-information-database/
B.C. Ministry of Environment. 1999. Mapping and Assessing Terrain Stability Guidebook, 2nd Edition.
Fenton, M. M., E. J. Waters, S. M. Pawley, N. Atkinson, D. J. Utting and K. McKay. 2013. Surficial Geology of Alberta (GIS data, polygon features). Alberta Geological Survey, Map 601. Scale 1:1,000,000. Available at: http://ags.aer.ca/publications/MAP_601.html
Howes, D. E. and E. Kenk. 1997. Terrain Classification System for British Columbia, Version 2. B.C. Ministry of Environment.
MacMillan, R. A. 1987. Soil Survey of the Calgary Urban Perimeter: Alberta Soil Survey Report No. 45. Terrain Sciences Department, Alberta Research Council, Edmonton, Alberta.
Moran, S. 1986. Surficial geology of the Calgary urban area; Alberta Research Council, ARC/AGS Bulletin 53, 57 p., digitized in 2008.
Pettapiece, W. W. 1986. Physiographic subdivisions of Alberta. Land Resource Research Center, Research Branch, Agriculture Canada, Ottawa.
Prior, G. J., Hathaway, B., Glombick, P. M., Pana, D. I., Banks, C. J., Hay, D. C., Schneider, C. L., Grobe, M., Elgr, R., and Weiss, J.A. 2013. Bedrock Geology of Alberta. Alberta Geological Survey, Map 600.
10/10
Attachment NEB 1.19-1
Da-Ming Duan 1784787 TransCanada PipeLines Limited January 29, 2018
ATTACHMENT A Terrain Mapbook
Attachment NEB 1.19-1
a Moderate Slopeb Blanket (1 - 3 m)c Cone(s)d Depression(s)f Fan(s)h Hummock(s)j Gentle Slopek Moderately Steep Slopem Rollingp Plain (> 3 m)r Ridge(s)s Steep Slopet Terrace(s)u Undulatingv Veneer (0.2 - 1 m)x Thin Veneer (< 0.2 m)
Surface Expression
CLIENT
TITLETERRAIN LEGEND
PATH: N:\Active\PurVIEW\2017\1784747_Cochrane\Mapping\MXD\Soil&Terrain\Report\FIG1_1784747_COCHRANE_Terrain_Legend_Rev1.mxd
IF T
HIS
ME
AS
UR
EM
EN
T D
OE
S N
OT
MAT
CH
WH
AT IS
SH
OW
N, T
HE
SH
EE
T S
IZE
HA
S B
EE
N M
OD
IFIE
D F
RO
M: A
NS
I B25
mm
0
1784747 1000 1 1
2018-01-25
AS
SG
AS
DOL
CONSULTANT
PROJECT NO. CONTROL REV. FIGURE
YYYY-MM-DD
DESIGNED
PREPARED
REVIEWED
APPROVED
1. THIS DRAWING MUST BE READ IN CONJUNCTION WITH GOLDER ASSOCIATESLIMITED'S REPORT.
NOTE(S)
Terrain Stability
ClassInterpretation
I No significant stability problems exist
II Very low likelihood of landslide initiation following land clearing or road/pipeline construction
III Low likelihood of landslide initiation following land clearing or road/pipeline construction
IVModerate likelihood of landslide initiation following land clearing or road/pipeline construction (may include areas of existing potentially unstable terrain)
VHigh likelihood of landslide initiation following land clearing or road/pipeline construction (may include areas of existing unstable terrain)
Terrain Stability ClassificationTerrain Symbol Legend
r rapidw wellm moderatei imperfectp poorv very poor
Drainage
Geomorphological Process SubclassesMass Movement Processes
stu
bu Progressive bank erosion
Fluvial Processes
Debris slideDebris torrentSlump in surficial material
Backchannels
" Initiation ZoneD DeflationK Karst ProcessesV Gully ErosionW WashingB Braiding ChannelI Irregularly Sinuous ChannelJ Anastomosing ChannelM Meandering ChannelF Slow Mass MovementsR Rapid Mass MovementsE Eroded H KettledU InundatedL Surface Seepage
Geomorphological Process
Drainage Code Separator,-/// first drainage significantly
dominant
no intermediate classesall intermediate classesfirst drainage dominant
1. TERRAIN SYMBOL LEGEND ANNOTATED LIST FROM HOWES & KENK (1997).2. TERRAIN STABILITY CLASSIFICATION ADAPTED FROM APEGBC (2002 ANDMINISTRY OF FORESTS (1999)).
PROJECT
TRANSCANADA WESTERN ALBERTA SYSTEM MAINLINE(WASML) LOOP (ROCKY VIEW SECTION)
REFERENCE(S)
A AnthropogenicC ColluviumD Weathered Bedrock (in situ)E Loess\EolianF Fluvial
FG Glaciofluvial MaterialI IceL Lacustrine Material
LG GlaciolacustrineM Morainal/TillN WaterbodyO OrganicR Bedrock
PA Pleistocene Alluvium
Surficial Material
Complex Label
6AAp4Av[Dp]-M"uUm // v,1-6
III slope stability class
drainage drainage separator
geomorphological process
activity qualifiersurface expression
geomorphological process subclass
surficial materialterrain decile
underlying materialunderlying surface expressiongeomorphological process initiation zone
A ActiveI Intermittant
Qualifiers
Terrain Polygon Label
percent slope
8Mbv[Ru]2Ovb[Mb]-LVm // v,1-6
III
decilesurficial material
underlying surface expressiongeomorphological process
drainage
surface expression(s)underlying material
drainage separatorslope stability class
Percent slope
a Blocksb Bouldersc Clayd Mixed fragmentse Fibric organic g Gravelh Humic organick Cobblem Mudp Pebblesr Rubbles Sandu Mesic organicx Angular fragmentsy Shellsz Silt
Texture
Attachment NEB 1.19-1
LEGEND; KILOMETRE POST (KP)
ROUTE CENTRELINE
SITE SYMBOLOGYLANDSLIDE DIRECTION
ØØØ LANDSLIDE HEADWALL SCARP
TERRAIN POLYGON BOUNDARY
AREA OF IMPERFECT DRAINAGE(SEASONALLY HIGH WATER TABLE)
AREA OF POOR OR VERY POOR DRAINAGE(SEASONALLY TO YEAR-ROUND HIGHWATER TABLE)
DOMINANT SURFICIAL MATERIALANTHROPOGENIC (A)(NOT LABELLED ON MAP)
COLLUVIUM (C)
FLUVIAL (F)
GLACIOLACUSTRINE (LG)
MORAINAL (TILL)(M)
WATERBODY (N)(NOT LABELLED ON MAP)
PATH
: N:\A
ctiv
e\P
urV
IEW
\201
7\17
8474
7_C
ochr
ane\
Map
ping
\MX
D\S
oil&
Terr
ain\
Rep
ort\F
IG2-
9_17
8474
7_C
OC
HR
AN
E_M
AP
SE
RIE
S_F
ULL
_Rev
1.m
xd P
RIN
TED
ON
: 201
8-01
-25
AT: 8
:16:
48 A
M
IF T
HIS
ME
AS
UR
EM
EN
T D
OE
S N
OT
MAT
CH
WH
AT IS
SH
OW
N, T
HE
SH
EE
T S
IZE
HA
S B
EE
N M
OD
IFIE
D F
RO
M: A
NS
I B25
mm
0
CLIENT
REFERENCE(S)ROAD DATA OBTAINED FROM GEOGRATIS, © DEPARTMENT OF NATURAL RESOURCESCANADA. ALL RIGHTS RESERVED. HYDROGRAPHY DATA FROM ALTALIS AND CONTOURSINTERPOLATED FROM ALTALIS 1:20000 DEM © GOVERNMENT OF ALBERTA 2015. IMAGERYFROM BING MAPS FOR ARCGIS PUBLISHED BY MICROSOFT CORPORATION, REDMOND, WA.PIPELINES FROM IHS ENERGY INC.PROJECTION: UTM ZONE 11 DATUM: NAD 83
PROJECT
TRANSCANADA WESTERN ALBERTA SYSTEM MAINLINE(WASML) LOOP (ROCKY VIEW SECTION)TITLETERRAIN MAPPING
1784747 1000 1 2
2018-01-25
DOL
SG
AS
DOL
CONSULTANT
PROJECT NO. CONTROL REV. FIGURE
YYYY-MM-DD
DESIGNED
PREPARED
REVIEWED
APPROVED
8
6
4
2
9
7
5
3
KEY MAP
10km
³
TERRAIN LABEL: soil material (M)thickness of material (b)
gullying (V)
drainage
underlying material (R)topography (a)
drainage separator
Mb[Ra] - Vw-m,27-49
I terrain stability classslope class (%)
0 200 400
1:10,000 METRES
NOTEBOREHOLE AND HAND AUGER LABELS WERE TRUNCATED. THE FULL LABEL INCLUDES APREFIX OF "WASML17-RV-". EXAMPLE: WASML17-RV-BOW-BH-01.
@A BOREHOLE LOCATION
BASE FEATURESCONTOUR (10 m)
PRIMARY HIGHWAY
LOCAL ROAD
!! !! HIGH PRESSURE PIPELINE
!! !! LOW PRESSURE PIPELINE
WATERCOURSE
WATERBODY
Attachment NEB 1.19-1
LEGEND; KILOMETRE POST (KP)
ROUTE CENTRELINE
SITE SYMBOLOGY
GULLY
TERRAIN POLYGON BOUNDARY
AREA OF IMPERFECT DRAINAGE(SEASONALLY HIGH WATER TABLE)
AREA OF POOR OR VERY POOR DRAINAGE(SEASONALLY TO YEAR-ROUND HIGHWATER TABLE)
DOMINANT SURFICIAL MATERIALANTHROPOGENIC (A)(NOT LABELLED ON MAP)
COLLUVIUM (C)
FLUVIAL (F)
GLACIOLACUSTRINE (LG)
MORAINAL (TILL)(M)
WATERBODY (N)(NOT LABELLED ON MAP)
PATH
: N:\A
ctiv
e\P
urV
IEW
\201
7\17
8474
7_C
ochr
ane\
Map
ping
\MX
D\S
oil&
Terr
ain\
Rep
ort\F
IG2-
9_17
8474
7_C
OC
HR
AN
E_M
AP
SE
RIE
S_F
ULL
_Rev
1.m
xd P
RIN
TED
ON
: 201
8-01
-25
AT: 8
:17:
22 A
M
IF T
HIS
ME
AS
UR
EM
EN
T D
OE
S N
OT
MAT
CH
WH
AT IS
SH
OW
N, T
HE
SH
EE
T S
IZE
HA
S B
EE
N M
OD
IFIE
D F
RO
M: A
NS
I B25
mm
0
CLIENT
REFERENCE(S)ROAD DATA OBTAINED FROM GEOGRATIS, © DEPARTMENT OF NATURAL RESOURCESCANADA. ALL RIGHTS RESERVED. HYDROGRAPHY DATA FROM ALTALIS AND CONTOURSINTERPOLATED FROM ALTALIS 1:20000 DEM © GOVERNMENT OF ALBERTA 2015. IMAGERYFROM BING MAPS FOR ARCGIS PUBLISHED BY MICROSOFT CORPORATION, REDMOND, WA.PIPELINES FROM IHS ENERGY INC.PROJECTION: UTM ZONE 11 DATUM: NAD 83
PROJECT
TRANSCANADA WESTERN ALBERTA SYSTEM MAINLINE(WASML) LOOP (ROCKY VIEW SECTION)TITLETERRAIN MAPPING
1784747 1000 1 3
2018-01-25
DOL
SG
AS
DOL
CONSULTANT
PROJECT NO. CONTROL REV. FIGURE
YYYY-MM-DD
DESIGNED
PREPARED
REVIEWED
APPROVED
8
6
4
2
9
7
5
3
KEY MAP
10km
³
TERRAIN LABEL: soil material (M)thickness of material (b)
gullying (V)
drainage
underlying material (R)topography (a)
drainage separator
Mb[Ra] - Vw-m,27-49
I terrain stability classslope class (%)
0 200 400
1:10,000 METRES
NOTEBOREHOLE AND HAND AUGER LABELS WERE TRUNCATED. THE FULL LABEL INCLUDES APREFIX OF "WASML17-RV-". EXAMPLE: WASML17-RV-BOW-BH-01.
@? HAND AUGER LOCATION
BASE FEATURESCONTOUR (10 m)
PRIMARY HIGHWAY
LOCAL ROAD
!! !! HIGH PRESSURE PIPELINE
!! !! LOW PRESSURE PIPELINE
WATERCOURSE
Attachment NEB 1.19-1
LEGEND; KILOMETRE POST (KP)
ROUTE CENTRELINE
SITE SYMBOLOGY
GULLY
TERRAIN POLYGON BOUNDARY
AREA OF IMPERFECT DRAINAGE(SEASONALLY HIGH WATER TABLE)
AREA OF POOR OR VERY POOR DRAINAGE(SEASONALLY TO YEAR-ROUND HIGHWATER TABLE)
DOMINANT SURFICIAL MATERIALANTHROPOGENIC (A)(NOT LABELLED ON MAP)
COLLUVIUM (C)
FLUVIAL (F)
LACUSTRINE (L)
GLACIOLACUSTRINE (LG)
MORAINAL (TILL)(M)
WATERBODY (N)(NOT LABELLED ON MAP)
PATH
: N:\A
ctiv
e\P
urV
IEW
\201
7\17
8474
7_C
ochr
ane\
Map
ping
\MX
D\S
oil&
Terr
ain\
Rep
ort\F
IG2-
9_17
8474
7_C
OC
HR
AN
E_M
AP
SE
RIE
S_F
ULL
_Rev
1.m
xd P
RIN
TED
ON
: 201
8-01
-25
AT: 8
:17:
56 A
M
IF T
HIS
ME
AS
UR
EM
EN
T D
OE
S N
OT
MAT
CH
WH
AT IS
SH
OW
N, T
HE
SH
EE
T S
IZE
HA
S B
EE
N M
OD
IFIE
D F
RO
M: A
NS
I B25
mm
0
CLIENT
REFERENCE(S)ROAD DATA OBTAINED FROM GEOGRATIS, © DEPARTMENT OF NATURAL RESOURCESCANADA. ALL RIGHTS RESERVED. HYDROGRAPHY DATA FROM ALTALIS AND CONTOURSINTERPOLATED FROM ALTALIS 1:20000 DEM © GOVERNMENT OF ALBERTA 2015. IMAGERYFROM BING MAPS FOR ARCGIS PUBLISHED BY MICROSOFT CORPORATION, REDMOND, WA.PIPELINES FROM IHS ENERGY INC.PROJECTION: UTM ZONE 11 DATUM: NAD 83
PROJECT
TRANSCANADA WESTERN ALBERTA SYSTEM MAINLINE(WASML) LOOP (ROCKY VIEW SECTION)TITLETERRAIN MAPPING
1784747 1000 1 4
2018-01-25
DOL
SG
AS
DOL
CONSULTANT
PROJECT NO. CONTROL REV. FIGURE
YYYY-MM-DD
DESIGNED
PREPARED
REVIEWED
APPROVED
8
6
4
2
9
7
5
3
KEY MAP
10km
³
TERRAIN LABEL: soil material (M)thickness of material (b)
gullying (V)
drainage
underlying material (R)topography (a)
drainage separator
Mb[Ra] - Vw-m,27-49
I terrain stability classslope class (%)
0 200 400
1:10,000 METRES
NOTEBOREHOLE AND HAND AUGER LABELS WERE TRUNCATED. THE FULL LABEL INCLUDES APREFIX OF "WASML17-RV-". EXAMPLE: WASML17-RV-BOW-BH-01.
@A BOREHOLE LOCATION
@? HAND AUGER LOCATION
BASE FEATURESCONTOUR (10 m)
PRIMARY HIGHWAY
LOCAL ROAD
!! !! HIGH PRESSURE PIPELINE
!! !! LOW PRESSURE PIPELINE
WATERCOURSE
Attachment NEB 1.19-1
LEGEND; KILOMETRE POST (KP)
ROUTE CENTRELINE
SITE SYMBOLOGY
GULLY
TERRAIN POLYGON BOUNDARY
AREA OF IMPERFECT DRAINAGE(SEASONALLY HIGH WATER TABLE)
AREA OF POOR OR VERY POOR DRAINAGE(SEASONALLY TO YEAR-ROUND HIGHWATER TABLE)
DOMINANT SURFICIAL MATERIALANTHROPOGENIC (A)(NOT LABELLED ON MAP)
GLACIOLACUSTRINE (LG)
MORAINAL (TILL)(M)
PATH
: N:\A
ctiv
e\P
urV
IEW
\201
7\17
8474
7_C
ochr
ane\
Map
ping
\MX
D\S
oil&
Terr
ain\
Rep
ort\F
IG2-
9_17
8474
7_C
OC
HR
AN
E_M
AP
SE
RIE
S_F
ULL
_Rev
1.m
xd P
RIN
TED
ON
: 201
8-01
-25
AT: 8
:18:
29 A
M
IF T
HIS
ME
AS
UR
EM
EN
T D
OE
S N
OT
MAT
CH
WH
AT IS
SH
OW
N, T
HE
SH
EE
T S
IZE
HA
S B
EE
N M
OD
IFIE
D F
RO
M: A
NS
I B25
mm
0
CLIENT
REFERENCE(S)ROAD DATA OBTAINED FROM GEOGRATIS, © DEPARTMENT OF NATURAL RESOURCESCANADA. ALL RIGHTS RESERVED. HYDROGRAPHY DATA FROM ALTALIS AND CONTOURSINTERPOLATED FROM ALTALIS 1:20000 DEM © GOVERNMENT OF ALBERTA 2015. IMAGERYFROM BING MAPS FOR ARCGIS PUBLISHED BY MICROSOFT CORPORATION, REDMOND, WA.PIPELINES FROM IHS ENERGY INC.PROJECTION: UTM ZONE 11 DATUM: NAD 83
PROJECT
TRANSCANADA WESTERN ALBERTA SYSTEM MAINLINE(WASML) LOOP (ROCKY VIEW SECTION)TITLETERRAIN MAPPING
1784747 1000 1 5
2018-01-25
DOL
SG
AS
DOL
CONSULTANT
PROJECT NO. CONTROL REV. FIGURE
YYYY-MM-DD
DESIGNED
PREPARED
REVIEWED
APPROVED
8
6
4
2
9
7
5
3
KEY MAP
10km
³
TERRAIN LABEL: soil material (M)thickness of material (b)
gullying (V)
drainage
underlying material (R)topography (a)
drainage separator
Mb[Ra] - Vw-m,27-49
I terrain stability classslope class (%)
0 200 400
1:10,000 METRES
NOTEBOREHOLE AND HAND AUGER LABELS WERE TRUNCATED. THE FULL LABEL INCLUDES APREFIX OF "WASML17-RV-". EXAMPLE: WASML17-RV-BOW-BH-01.
@? HAND AUGER LOCATION
BASE FEATURESCONTOUR (10 m)
PRIMARY HIGHWAY
LOCAL ROAD
!! !! HIGH PRESSURE PIPELINE
!! !! LOW PRESSURE PIPELINE
WATERCOURSE
Attachment NEB 1.19-1
LEGEND; KILOMETRE POST (KP)
ROUTE CENTRELINE
TERRAIN POLYGON BOUNDARY
AREA OF IMPERFECT DRAINAGE(SEASONALLY HIGH WATER TABLE)
AREA OF POOR OR VERY POOR DRAINAGE(SEASONALLY TO YEAR-ROUND HIGHWATER TABLE)
DOMINANT SURFICIAL MATERIALANTHROPOGENIC (A)(NOT LABELLED ON MAP)
FLUVIAL (F)
LACUSTRINE (L)
GLACIOLACUSTRINE (LG)
MORAINAL (TILL)(M)
PATH
: N:\A
ctiv
e\P
urV
IEW
\201
7\17
8474
7_C
ochr
ane\
Map
ping
\MX
D\S
oil&
Terr
ain\
Rep
ort\F
IG2-
9_17
8474
7_C
OC
HR
AN
E_M
AP
SE
RIE
S_F
ULL
_Rev
1.m
xd P
RIN
TED
ON
: 201
8-01
-25
AT: 8
:19:
07 A
M
IF T
HIS
ME
AS
UR
EM
EN
T D
OE
S N
OT
MAT
CH
WH
AT IS
SH
OW
N, T
HE
SH
EE
T S
IZE
HA
S B
EE
N M
OD
IFIE
D F
RO
M: A
NS
I B25
mm
0
CLIENT
REFERENCE(S)ROAD DATA OBTAINED FROM GEOGRATIS, © DEPARTMENT OF NATURAL RESOURCESCANADA. ALL RIGHTS RESERVED. HYDROGRAPHY DATA FROM ALTALIS AND CONTOURSINTERPOLATED FROM ALTALIS 1:20000 DEM © GOVERNMENT OF ALBERTA 2015. IMAGERYFROM BING MAPS FOR ARCGIS PUBLISHED BY MICROSOFT CORPORATION, REDMOND, WA.PIPELINES FROM IHS ENERGY INC.PROJECTION: UTM ZONE 11 DATUM: NAD 83
PROJECT
TRANSCANADA WESTERN ALBERTA SYSTEM MAINLINE(WASML) LOOP (ROCKY VIEW SECTION)TITLETERRAIN MAPPING
1784747 1000 1 6
2018-01-25
DOL
SG
AS
DOL
CONSULTANT
PROJECT NO. CONTROL REV. FIGURE
YYYY-MM-DD
DESIGNED
PREPARED
REVIEWED
APPROVED
8
6
4
2
9
7
5
3
KEY MAP
10km
³
TERRAIN LABEL: soil material (M)thickness of material (b)
gullying (V)
drainage
underlying material (R)topography (a)
drainage separator
Mb[Ra] - Vw-m,27-49
I terrain stability classslope class (%)
0 200 400
1:10,000 METRES
NOTEBOREHOLE AND HAND AUGER LABELS WERE TRUNCATED. THE FULL LABEL INCLUDES APREFIX OF "WASML17-RV-". EXAMPLE: WASML17-RV-BOW-BH-01.
@A BOREHOLE LOCATION
@? HAND AUGER LOCATION
BASE FEATURESCONTOUR (10 m)
PRIMARY HIGHWAY
LOCAL ROAD
!! !! HIGH PRESSURE PIPELINE
!! !! LOW PRESSURE PIPELINE
WATERCOURSE
Attachment NEB 1.19-1
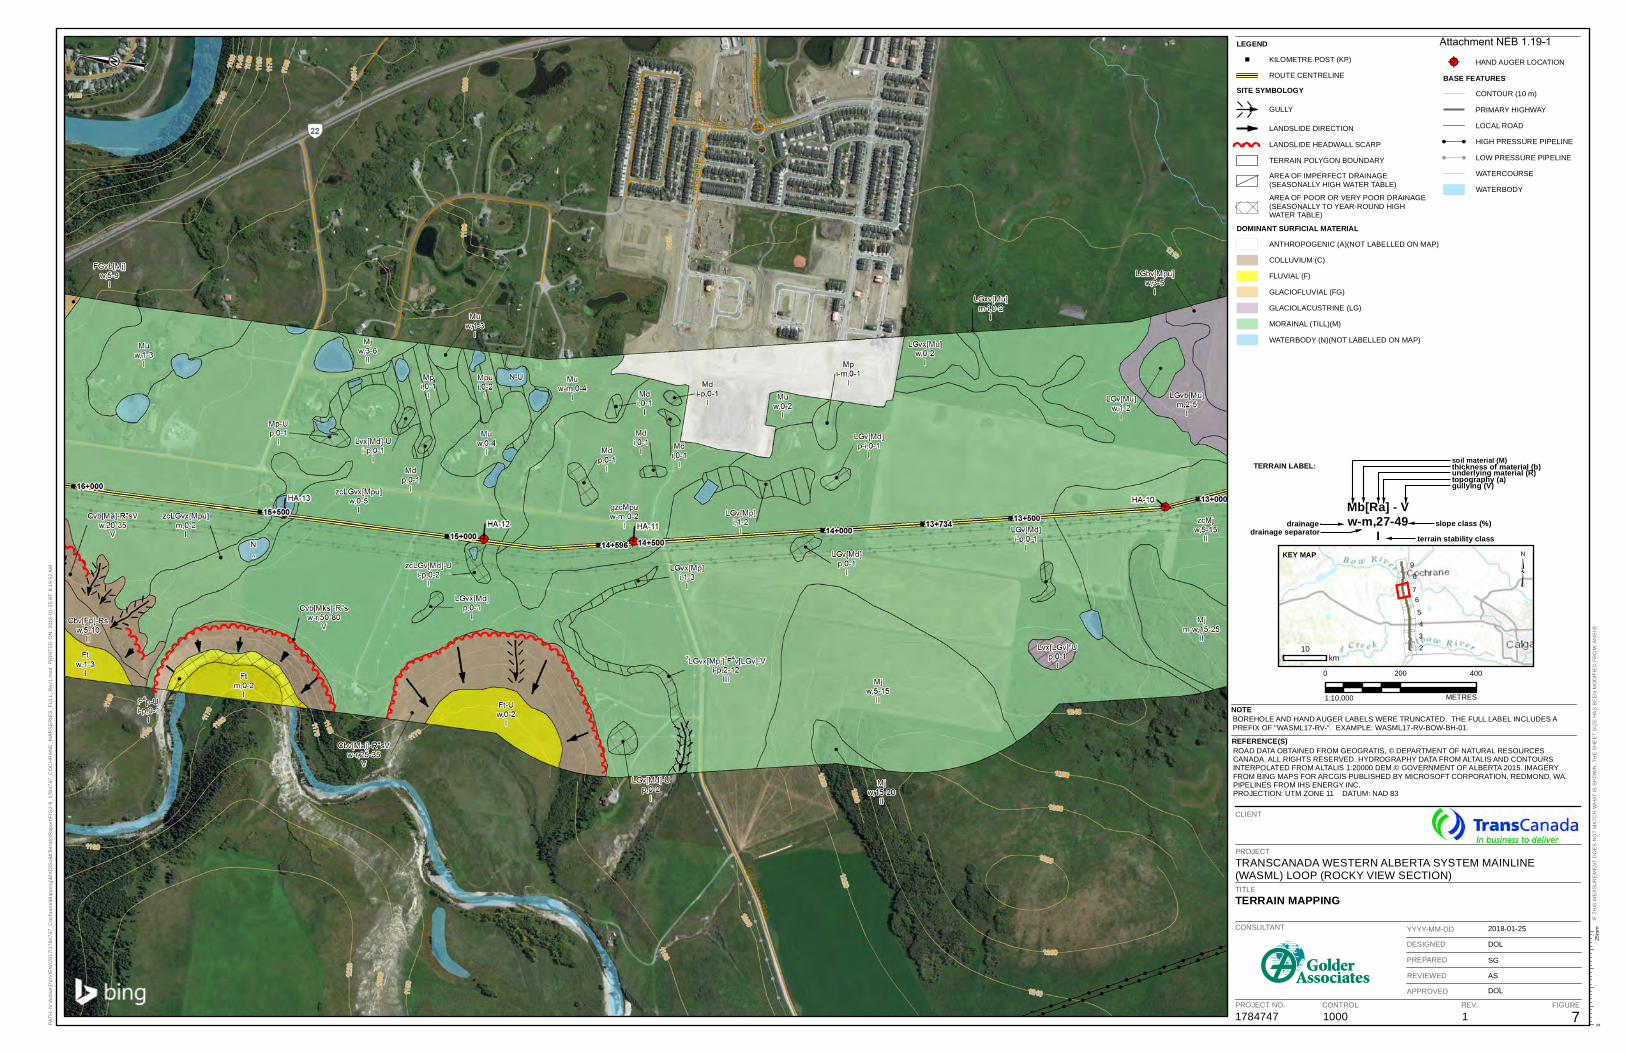
LEGEND; KILOMETRE POST (KP)
ROUTE CENTRELINE
SITE SYMBOLOGY
GULLY
LANDSLIDE DIRECTION
ØØØ LANDSLIDE HEADWALL SCARP
TERRAIN POLYGON BOUNDARY
AREA OF IMPERFECT DRAINAGE(SEASONALLY HIGH WATER TABLE)
AREA OF POOR OR VERY POOR DRAINAGE(SEASONALLY TO YEAR-ROUND HIGHWATER TABLE)
DOMINANT SURFICIAL MATERIALANTHROPOGENIC (A)(NOT LABELLED ON MAP)
COLLUVIUM (C)
FLUVIAL (F)
GLACIOFLUVIAL (FG)
GLACIOLACUSTRINE (LG)
MORAINAL (TILL)(M)
WATERBODY (N)(NOT LABELLED ON MAP)
PATH
: N:\A
ctiv
e\P
urV
IEW
\201
7\17
8474
7_C
ochr
ane\
Map
ping
\MX
D\S
oil&
Terr
ain\
Rep
ort\F
IG2-
9_17
8474
7_C
OC
HR
AN
E_M
AP
SE
RIE
S_F
ULL
_Rev
1.m
xd P
RIN
TED
ON
: 201
8-01
-25
AT: 8
:19:
52 A
M
IF T
HIS
ME
AS
UR
EM
EN
T D
OE
S N
OT
MAT
CH
WH
AT IS
SH
OW
N, T
HE
SH
EE
T S
IZE
HA
S B
EE
N M
OD
IFIE
D F
RO
M: A
NS
I B25
mm
0
CLIENT
REFERENCE(S)ROAD DATA OBTAINED FROM GEOGRATIS, © DEPARTMENT OF NATURAL RESOURCESCANADA. ALL RIGHTS RESERVED. HYDROGRAPHY DATA FROM ALTALIS AND CONTOURSINTERPOLATED FROM ALTALIS 1:20000 DEM © GOVERNMENT OF ALBERTA 2015. IMAGERYFROM BING MAPS FOR ARCGIS PUBLISHED BY MICROSOFT CORPORATION, REDMOND, WA.PIPELINES FROM IHS ENERGY INC.PROJECTION: UTM ZONE 11 DATUM: NAD 83
PROJECT
TRANSCANADA WESTERN ALBERTA SYSTEM MAINLINE(WASML) LOOP (ROCKY VIEW SECTION)TITLETERRAIN MAPPING
1784747 1000 1 7
2018-01-25
DOL
SG
AS
DOL
CONSULTANT
PROJECT NO. CONTROL REV. FIGURE
YYYY-MM-DD
DESIGNED
PREPARED
REVIEWED
APPROVED
8
6
4
2
9
7
5
3
KEY MAP
10km
³
TERRAIN LABEL: soil material (M)thickness of material (b)
gullying (V)
drainage
underlying material (R)topography (a)
drainage separator
Mb[Ra] - Vw-m,27-49
I terrain stability classslope class (%)
0 200 400
1:10,000 METRES
NOTEBOREHOLE AND HAND AUGER LABELS WERE TRUNCATED. THE FULL LABEL INCLUDES APREFIX OF "WASML17-RV-". EXAMPLE: WASML17-RV-BOW-BH-01.
@? HAND AUGER LOCATION
BASE FEATURESCONTOUR (10 m)
PRIMARY HIGHWAY
LOCAL ROAD
!! !! HIGH PRESSURE PIPELINE
!! !! LOW PRESSURE PIPELINE
WATERCOURSE
WATERBODY
Attachment NEB 1.19-1
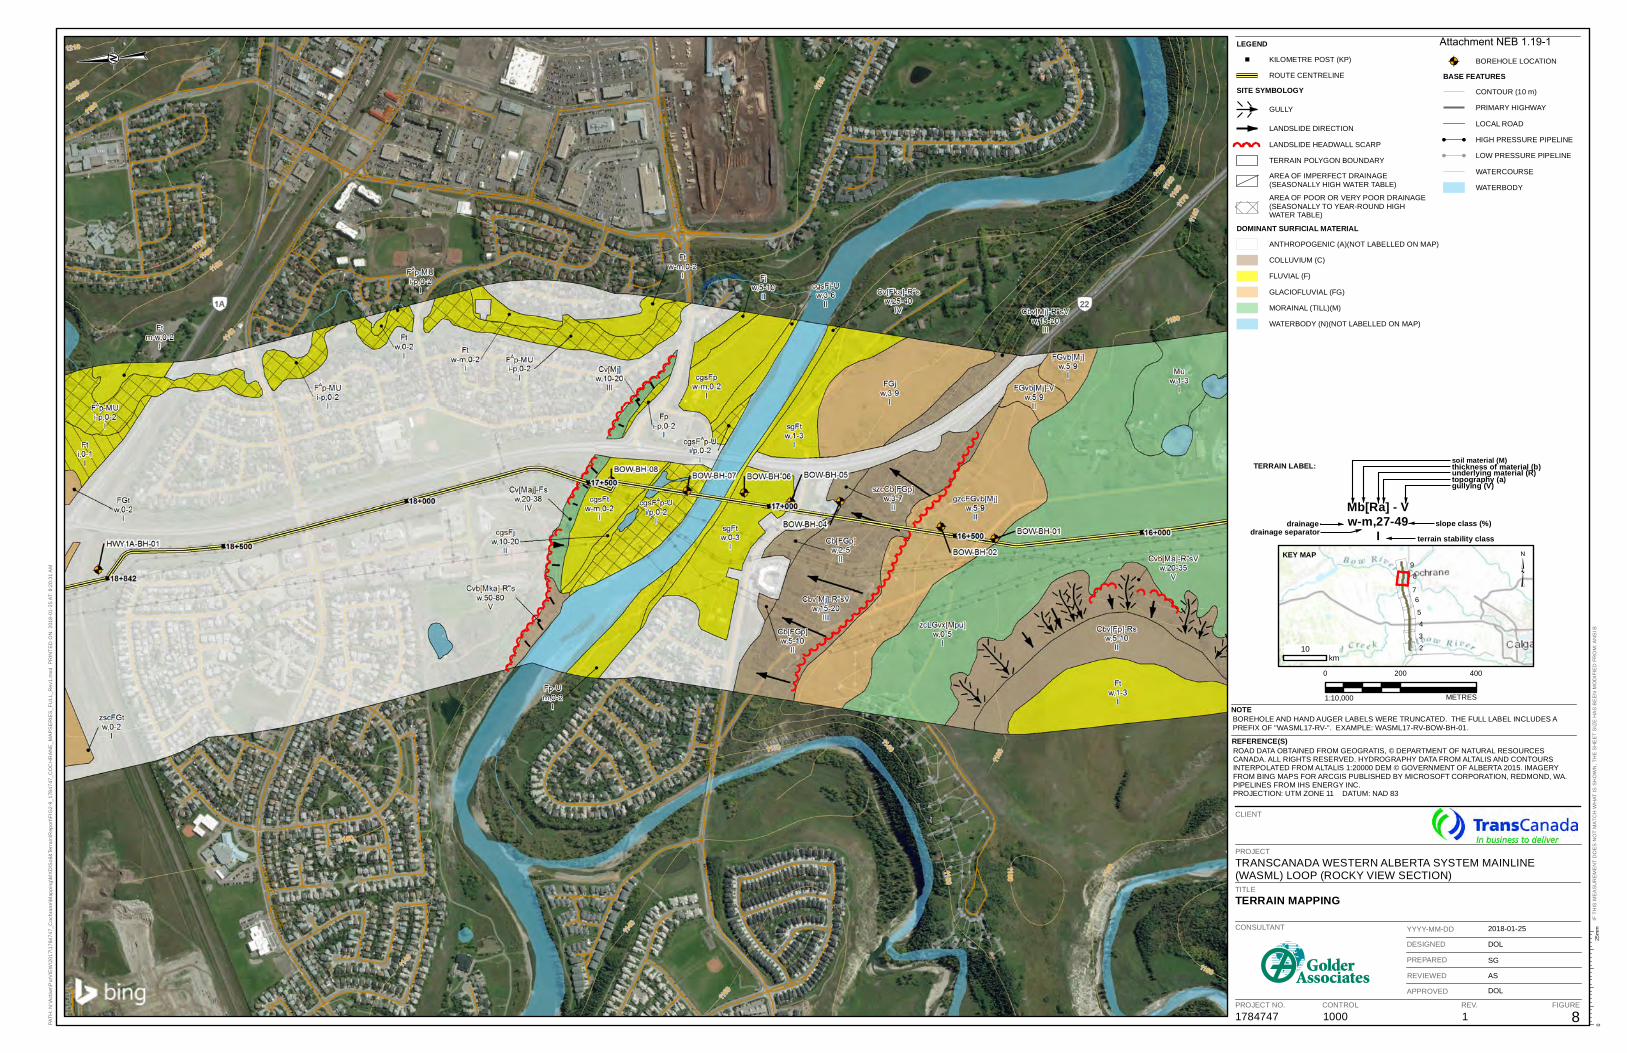
LEGEND; KILOMETRE POST (KP)
ROUTE CENTRELINE
SITE SYMBOLOGY
GULLY
LANDSLIDE DIRECTION
ØØØ LANDSLIDE HEADWALL SCARP
TERRAIN POLYGON BOUNDARY
AREA OF IMPERFECT DRAINAGE(SEASONALLY HIGH WATER TABLE)
AREA OF POOR OR VERY POOR DRAINAGE(SEASONALLY TO YEAR-ROUND HIGHWATER TABLE)
DOMINANT SURFICIAL MATERIALANTHROPOGENIC (A)(NOT LABELLED ON MAP)
COLLUVIUM (C)
FLUVIAL (F)
GLACIOFLUVIAL (FG)
MORAINAL (TILL)(M)
WATERBODY (N)(NOT LABELLED ON MAP)
PATH
: N:\A
ctiv
e\P
urV
IEW
\201
7\17
8474
7_C
ochr
ane\
Map
ping
\MX
D\S
oil&
Terr
ain\
Rep
ort\F
IG2-
9_17
8474
7_C
OC
HR
AN
E_M
AP
SE
RIE
S_F
ULL
_Rev
1.m
xd P
RIN
TED
ON
: 201
8-01
-25
AT: 8
:20:
31 A
M
IF T
HIS
ME
AS
UR
EM
EN
T D
OE
S N
OT
MAT
CH
WH
AT IS
SH
OW
N, T
HE
SH
EE
T S
IZE
HA
S B
EE
N M
OD
IFIE
D F
RO
M: A
NS
I B25
mm
0
CLIENT
REFERENCE(S)ROAD DATA OBTAINED FROM GEOGRATIS, © DEPARTMENT OF NATURAL RESOURCESCANADA. ALL RIGHTS RESERVED. HYDROGRAPHY DATA FROM ALTALIS AND CONTOURSINTERPOLATED FROM ALTALIS 1:20000 DEM © GOVERNMENT OF ALBERTA 2015. IMAGERYFROM BING MAPS FOR ARCGIS PUBLISHED BY MICROSOFT CORPORATION, REDMOND, WA.PIPELINES FROM IHS ENERGY INC.PROJECTION: UTM ZONE 11 DATUM: NAD 83
PROJECT
TRANSCANADA WESTERN ALBERTA SYSTEM MAINLINE(WASML) LOOP (ROCKY VIEW SECTION)TITLETERRAIN MAPPING
1784747 1000 1 8
2018-01-25
DOL
SG
AS
DOL
CONSULTANT
PROJECT NO. CONTROL REV. FIGURE
YYYY-MM-DD
DESIGNED
PREPARED
REVIEWED
APPROVED
8
6
4
2
9
7
5
3
KEY MAP
10km
³
TERRAIN LABEL: soil material (M)thickness of material (b)
gullying (V)
drainage
underlying material (R)topography (a)
drainage separator
Mb[Ra] - Vw-m,27-49
I terrain stability classslope class (%)
0 200 400
1:10,000 METRES
NOTEBOREHOLE AND HAND AUGER LABELS WERE TRUNCATED. THE FULL LABEL INCLUDES APREFIX OF "WASML17-RV-". EXAMPLE: WASML17-RV-BOW-BH-01.
@A BOREHOLE LOCATION
BASE FEATURESCONTOUR (10 m)
PRIMARY HIGHWAY
LOCAL ROAD
!! !! HIGH PRESSURE PIPELINE
!! !! LOW PRESSURE PIPELINE
WATERCOURSE
WATERBODY
Attachment NEB 1.19-1
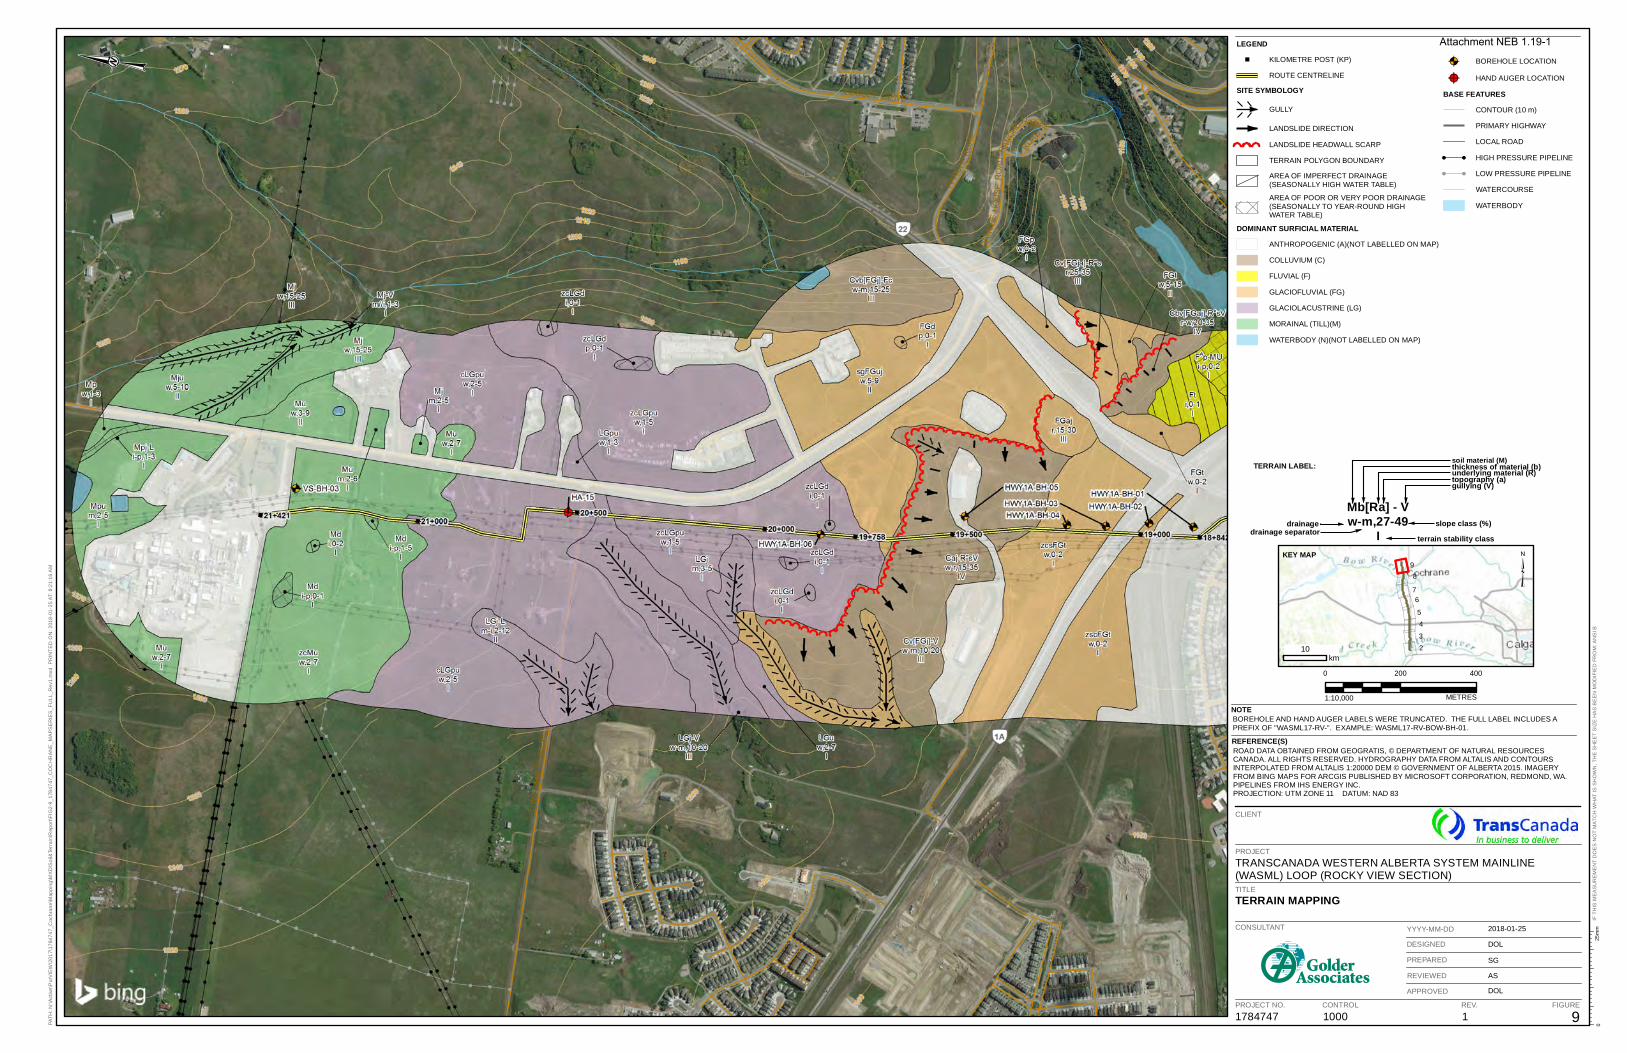
LEGEND; KILOMETRE POST (KP)
ROUTE CENTRELINE
SITE SYMBOLOGY
GULLY
LANDSLIDE DIRECTION
ØØØ LANDSLIDE HEADWALL SCARP
TERRAIN POLYGON BOUNDARY
AREA OF IMPERFECT DRAINAGE(SEASONALLY HIGH WATER TABLE)
AREA OF POOR OR VERY POOR DRAINAGE(SEASONALLY TO YEAR-ROUND HIGHWATER TABLE)
DOMINANT SURFICIAL MATERIALANTHROPOGENIC (A)(NOT LABELLED ON MAP)
COLLUVIUM (C)
FLUVIAL (F)
GLACIOFLUVIAL (FG)
GLACIOLACUSTRINE (LG)
MORAINAL (TILL)(M)
WATERBODY (N)(NOT LABELLED ON MAP)
PATH
: N:\A
ctiv
e\P
urV
IEW
\201
7\17
8474
7_C
ochr
ane\
Map
ping
\MX
D\S
oil&
Terr
ain\
Rep
ort\F
IG2-
9_17
8474
7_C
OC
HR
AN
E_M
AP
SE
RIE
S_F
ULL
_Rev
1.m
xd P
RIN
TED
ON
: 201
8-01
-25
AT: 8
:21:
16 A
M
IF T
HIS
ME
AS
UR
EM
EN
T D
OE
S N
OT
MAT
CH
WH
AT IS
SH
OW
N, T
HE
SH
EE
T S
IZE
HA
S B
EE
N M
OD
IFIE
D F
RO
M: A
NS
I B25
mm
0
CLIENT
REFERENCE(S)ROAD DATA OBTAINED FROM GEOGRATIS, © DEPARTMENT OF NATURAL RESOURCESCANADA. ALL RIGHTS RESERVED. HYDROGRAPHY DATA FROM ALTALIS AND CONTOURSINTERPOLATED FROM ALTALIS 1:20000 DEM © GOVERNMENT OF ALBERTA 2015. IMAGERYFROM BING MAPS FOR ARCGIS PUBLISHED BY MICROSOFT CORPORATION, REDMOND, WA.PIPELINES FROM IHS ENERGY INC.PROJECTION: UTM ZONE 11 DATUM: NAD 83
PROJECT
TRANSCANADA WESTERN ALBERTA SYSTEM MAINLINE(WASML) LOOP (ROCKY VIEW SECTION)TITLETERRAIN MAPPING
1784747 1000 1 9
2018-01-25
DOL
SG
AS
DOL
CONSULTANT
PROJECT NO. CONTROL REV. FIGURE
YYYY-MM-DD
DESIGNED
PREPARED
REVIEWED
APPROVED
8
6
4
2
9
7
5
3
KEY MAP
10km
³
TERRAIN LABEL: soil material (M)thickness of material (b)
gullying (V)
drainage
underlying material (R)topography (a)
drainage separator
Mb[Ra] - Vw-m,27-49
I terrain stability classslope class (%)
0 200 400
1:10,000 METRES
NOTEBOREHOLE AND HAND AUGER LABELS WERE TRUNCATED. THE FULL LABEL INCLUDES APREFIX OF "WASML17-RV-". EXAMPLE: WASML17-RV-BOW-BH-01.
@A BOREHOLE LOCATION
@? HAND AUGER LOCATION
BASE FEATURESCONTOUR (10 m)
PRIMARY HIGHWAY
LOCAL ROAD
!! !! HIGH PRESSURE PIPELINE
!! !! LOW PRESSURE PIPELINE
WATERCOURSE
WATERBODY
Attachment NEB 1.19-1
TRANSCANADA WASML LOOP ROCKY VIEW SECTION
APPENDIX D Terrain Units and Drainage Summary
July 19, 2018 Report No. 00660-GAL-C-RP-0006_1
Attachment NEB 1.19-1
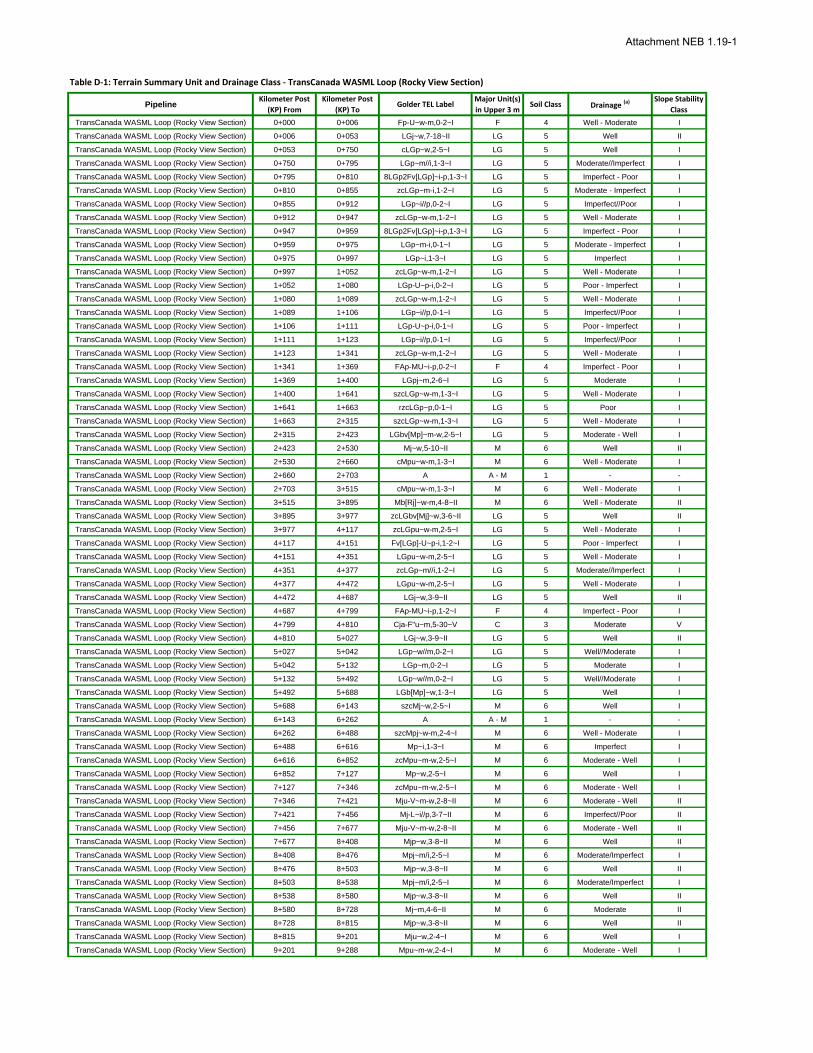
Pipeline Kilometer Post
(KP) From
Kilometer Post
(KP) ToGolder TEL Label
Major Unit(s)
in Upper 3 mSoil Class Drainage
(a) Slope Stability
Class
TransCanada WASML Loop (Rocky View Section) 0+000 0+006 Fp-U~w-m,0-2~I F 4 Well - Moderate I
TransCanada WASML Loop (Rocky View Section) 0+006 0+053 LGj~w,7-18~II LG 5 Well II
TransCanada WASML Loop (Rocky View Section) 0+053 0+750 cLGp~w,2-5~I LG 5 Well I
TransCanada WASML Loop (Rocky View Section) 0+750 0+795 LGp~m//i,1-3~I LG 5 Moderate//Imperfect I
TransCanada WASML Loop (Rocky View Section) 0+795 0+810 8LGp2Fv[LGp]~i-p,1-3~I LG 5 Imperfect - Poor I
TransCanada WASML Loop (Rocky View Section) 0+810 0+855 zcLGp~m-i,1-2~I LG 5 Moderate - Imperfect I
TransCanada WASML Loop (Rocky View Section) 0+855 0+912 LGp~i//p,0-2~I LG 5 Imperfect//Poor I
TransCanada WASML Loop (Rocky View Section) 0+912 0+947 zcLGp~w-m,1-2~I LG 5 Well - Moderate I
TransCanada WASML Loop (Rocky View Section) 0+947 0+959 8LGp2Fv[LGp]~i-p,1-3~I LG 5 Imperfect - Poor I
TransCanada WASML Loop (Rocky View Section) 0+959 0+975 LGp~m-i,0-1~I LG 5 Moderate - Imperfect I
TransCanada WASML Loop (Rocky View Section) 0+975 0+997 LGp~i,1-3~I LG 5 Imperfect I
TransCanada WASML Loop (Rocky View Section) 0+997 1+052 zcLGp~w-m,1-2~I LG 5 Well - Moderate I
TransCanada WASML Loop (Rocky View Section) 1+052 1+080 LGp-U~p-i,0-2~I LG 5 Poor - Imperfect I
TransCanada WASML Loop (Rocky View Section) 1+080 1+089 zcLGp~w-m,1-2~I LG 5 Well - Moderate I
TransCanada WASML Loop (Rocky View Section) 1+089 1+106 LGp~i//p,0-1~I LG 5 Imperfect//Poor I
TransCanada WASML Loop (Rocky View Section) 1+106 1+111 LGp-U~p-i,0-1~I LG 5 Poor - Imperfect I
TransCanada WASML Loop (Rocky View Section) 1+111 1+123 LGp~i//p,0-1~I LG 5 Imperfect//Poor I
TransCanada WASML Loop (Rocky View Section) 1+123 1+341 zcLGp~w-m,1-2~I LG 5 Well - Moderate I
TransCanada WASML Loop (Rocky View Section) 1+341 1+369 FAp-MU~i-p,0-2~I F 4 Imperfect - Poor I
TransCanada WASML Loop (Rocky View Section) 1+369 1+400 LGpj~m,2-6~I LG 5 Moderate I
TransCanada WASML Loop (Rocky View Section) 1+400 1+641 szcLGp~w-m,1-3~I LG 5 Well - Moderate I
TransCanada WASML Loop (Rocky View Section) 1+641 1+663 rzcLGp~p,0-1~I LG 5 Poor I
TransCanada WASML Loop (Rocky View Section) 1+663 2+315 szcLGp~w-m,1-3~I LG 5 Well - Moderate I
TransCanada WASML Loop (Rocky View Section) 2+315 2+423 LGbv[Mp]~m-w,2-5~I LG 5 Moderate - Well I
TransCanada WASML Loop (Rocky View Section) 2+423 2+530 Mj~w,5-10~II M 6 Well II
TransCanada WASML Loop (Rocky View Section) 2+530 2+660 cMpu~w-m,1-3~I M 6 Well - Moderate I
TransCanada WASML Loop (Rocky View Section) 2+660 2+703 A A - M 1 - -
TransCanada WASML Loop (Rocky View Section) 2+703 3+515 cMpu~w-m,1-3~I M 6 Well - Moderate I
TransCanada WASML Loop (Rocky View Section) 3+515 3+895 Mb[Rj]~w-m,4-8~II M 6 Well - Moderate II
TransCanada WASML Loop (Rocky View Section) 3+895 3+977 zcLGbv[Mj]~w,3-6~II LG 5 Well II
TransCanada WASML Loop (Rocky View Section) 3+977 4+117 zcLGpu~w-m,2-5~I LG 5 Well - Moderate I
TransCanada WASML Loop (Rocky View Section) 4+117 4+151 Fv[LGp]-U~p-i,1-2~I LG 5 Poor - Imperfect I
TransCanada WASML Loop (Rocky View Section) 4+151 4+351 LGpu~w-m,2-5~I LG 5 Well - Moderate I
TransCanada WASML Loop (Rocky View Section) 4+351 4+377 zcLGp~m//i,1-2~I LG 5 Moderate//Imperfect I
TransCanada WASML Loop (Rocky View Section) 4+377 4+472 LGpu~w-m,2-5~I LG 5 Well - Moderate I
TransCanada WASML Loop (Rocky View Section) 4+472 4+687 LGj~w,3-9~II LG 5 Well II
TransCanada WASML Loop (Rocky View Section) 4+687 4+799 FAp-MU~i-p,1-2~I F 4 Imperfect - Poor I
TransCanada WASML Loop (Rocky View Section) 4+799 4+810 Cja-F"u~m,5-30~V C 3 Moderate V
TransCanada WASML Loop (Rocky View Section) 4+810 5+027 LGj~w,3-9~II LG 5 Well II
TransCanada WASML Loop (Rocky View Section) 5+027 5+042 LGp~w//m,0-2~I LG 5 Well//Moderate I
TransCanada WASML Loop (Rocky View Section) 5+042 5+132 LGp~m,0-2~I LG 5 Moderate I
TransCanada WASML Loop (Rocky View Section) 5+132 5+492 LGp~w//m,0-2~I LG 5 Well//Moderate I
TransCanada WASML Loop (Rocky View Section) 5+492 5+688 LGb[Mp]~w,1-3~I LG 5 Well I
TransCanada WASML Loop (Rocky View Section) 5+688 6+143 szcMj~w,2-5~I M 6 Well I
TransCanada WASML Loop (Rocky View Section) 6+143 6+262 A A - M 1 - -
TransCanada WASML Loop (Rocky View Section) 6+262 6+488 szcMpj~w-m,2-4~I M 6 Well - Moderate I
TransCanada WASML Loop (Rocky View Section) 6+488 6+616 Mp~i,1-3~I M 6 Imperfect I
TransCanada WASML Loop (Rocky View Section) 6+616 6+852 zcMpu~m-w,2-5~I M 6 Moderate - Well I
TransCanada WASML Loop (Rocky View Section) 6+852 7+127 Mp~w,2-5~I M 6 Well I
TransCanada WASML Loop (Rocky View Section) 7+127 7+346 zcMpu~m-w,2-5~I M 6 Moderate - Well I
TransCanada WASML Loop (Rocky View Section) 7+346 7+421 Mju-V~m-w,2-8~II M 6 Moderate - Well II
TransCanada WASML Loop (Rocky View Section) 7+421 7+456 Mj-L~i//p,3-7~II M 6 Imperfect//Poor II
TransCanada WASML Loop (Rocky View Section) 7+456 7+677 Mju-V~m-w,2-8~II M 6 Moderate - Well II
TransCanada WASML Loop (Rocky View Section) 7+677 8+408 Mjp~w,3-8~II M 6 Well II
TransCanada WASML Loop (Rocky View Section) 8+408 8+476 Mpj~m/i,2-5~I M 6 Moderate/Imperfect I
TransCanada WASML Loop (Rocky View Section) 8+476 8+503 Mjp~w,3-8~II M 6 Well II
TransCanada WASML Loop (Rocky View Section) 8+503 8+538 Mpj~m/i,2-5~I M 6 Moderate/Imperfect I
TransCanada WASML Loop (Rocky View Section) 8+538 8+580 Mjp~w,3-8~II M 6 Well II
TransCanada WASML Loop (Rocky View Section) 8+580 8+728 Mj~m,4-6~II M 6 Moderate II
TransCanada WASML Loop (Rocky View Section) 8+728 8+815 Mjp~w,3-8~II M 6 Well II
TransCanada WASML Loop (Rocky View Section) 8+815 9+201 Mju~w,2-4~I M 6 Well I
TransCanada WASML Loop (Rocky View Section) 9+201 9+288 Mpu~m-w,2-4~I M 6 Moderate - Well I
Table D‐1: Terrain Summary Unit and Drainage Class ‐ TransCanada WASML Loop (Rocky View Section)
Attachment NEB 1.19-1

Pipeline Kilometer Post
(KP) From
Kilometer Post
(KP) ToGolder TEL Label
Major Unit(s)
in Upper 3 mSoil Class Drainage
(a) Slope Stability
Class
Table D‐1: Terrain Summary Unit and Drainage Class ‐ TransCanada WASML Loop (Rocky View Section)
TransCanada WASML Loop (Rocky View Section) 9+288 9+605 zcMu~w-m,2-6~I M 6 Well - Moderate I
TransCanada WASML Loop (Rocky View Section) 9+605 9+754 zcMu~w,2-5~I M 6 Well I
TransCanada WASML Loop (Rocky View Section) 9+754 10+094 Mju~w,3-6~II M 6 Well II
TransCanada WASML Loop (Rocky View Section) 10+094 10+324 zcMu~w,2-5~I M 6 Well I
TransCanada WASML Loop (Rocky View Section) 10+324 10+401 Md~i-p,0-1~I M 6 Imperfect - Poor I
TransCanada WASML Loop (Rocky View Section) 10+401 10+477 zcMu~w,2-5~I M 6 Well I
TransCanada WASML Loop (Rocky View Section) 10+477 10+505 A A - M 1 - -
TransCanada WASML Loop (Rocky View Section) 10+505 11+479 zcMj~w,3-8~II M 6 Well II
TransCanada WASML Loop (Rocky View Section) 11+479 11+877 cLGpu~w,2-5~I LG 5 Well I
TransCanada WASML Loop (Rocky View Section) 11+877 11+957 FAp-MU~i-p,0-2~I F 4 Imperfect - Poor I
TransCanada WASML Loop (Rocky View Section) 11+957 12+192 cLGpu~w-m,1-3~I LG 5 Well - Moderate I
TransCanada WASML Loop (Rocky View Section) 12+192 12+237 LGp~i,0-3~I LG 5 Imperfect I
TransCanada WASML Loop (Rocky View Section) 12+237 12+284 cLGpu~w-m,1-3~I LG 5 Well - Moderate I
TransCanada WASML Loop (Rocky View Section) 12+284 12+298 LGp~i,0-3~I LG 5 Imperfect I
TransCanada WASML Loop (Rocky View Section) 12+298 12+814 LGbv[Mpu]~w,3-5~I LG 5 Well I
TransCanada WASML Loop (Rocky View Section) 12+814 13+387 zcMj~w,5-15~II M 6 Well II
TransCanada WASML Loop (Rocky View Section) 13+387 14+420 zcLGvx[Mpu]~w,0-5~I M 6 Well I
TransCanada WASML Loop (Rocky View Section) 14+420 14+829 gzcMpu~w-m,0-2~I M 6 Well - Moderate I
TransCanada WASML Loop (Rocky View Section) 14+829 14+854 Mu~w-m,0-4~I M 6 Well - Moderate I
TransCanada WASML Loop (Rocky View Section) 14+854 14+888 zcLGvx[Mpu]~w,0-5~I M 6 Well I
TransCanada WASML Loop (Rocky View Section) 14+888 14+920 zcLGv[Md]-U~i-p,0-2~I M 6 Imperfect - Poor I
TransCanada WASML Loop (Rocky View Section) 14+920 15+407 zcLGvx[Mpu]~w,0-5~I M 6 Well I
TransCanada WASML Loop (Rocky View Section) 15+407 15+419 zcLGvx[Mpu]~m,0-2~I M 6 Moderate I
TransCanada WASML Loop (Rocky View Section) 15+419 15+450 N --- - - -
TransCanada WASML Loop (Rocky View Section) 15+450 15+468 zcLGvx[Mpu]~m,0-2~I M 6 Moderate I
TransCanada WASML Loop (Rocky View Section) 15+468 16+389 zcLGvx[Mpu]~w,0-5~I M 6 Well I
TransCanada WASML Loop (Rocky View Section) 16+389 16+628 gzcFGvb[Mj]~w,5-9~II FG 4 Well II
TransCanada WASML Loop (Rocky View Section) 16+628 16+821 Cbv[Mj]-R"sV~w,15-20~III C 3 Well III
TransCanada WASML Loop (Rocky View Section) 16+821 16+835 Cb[FGp]~w,2-5~II C 3 Well II
TransCanada WASML Loop (Rocky View Section) 16+835 16+948 A A - C/F 2 - -
TransCanada WASML Loop (Rocky View Section) 16+948 17+106 sgFt~w,0-3~I F 4 Well I
TransCanada WASML Loop (Rocky View Section) 17+106 17+122 Cv[Fka]-R"s~w,25-40~IV F 4 Well IV
TransCanada WASML Loop (Rocky View Section) 17+122 17+188 N --- - - -
TransCanada WASML Loop (Rocky View Section) 17+188 17+289 cgsFAp-U~i/p,0-2~I F 4 Imperfect/Poor I
TransCanada WASML Loop (Rocky View Section) 17+289 17+318 N --- - - -
TransCanada WASML Loop (Rocky View Section) 17+318 17+324 cgsFj~w,10-20~II F 4 Well II
TransCanada WASML Loop (Rocky View Section) 17+324 17+489 cgsFt~w-m,0-2~I F 4 Well - Moderate I
TransCanada WASML Loop (Rocky View Section) 17+489 17+520 Cv[Maj]-Fs~w,20-38~IV M 6 Well IV
TransCanada WASML Loop (Rocky View Section) 17+520 18+969 A A - C/F 2 - -
TransCanada WASML Loop (Rocky View Section) 18+969 19+012 zscFGt~w,0-2~I FG 4 Well I
TransCanada WASML Loop (Rocky View Section) 19+012 19+080 A A - C/F 2 - -
TransCanada WASML Loop (Rocky View Section) 19+080 19+284 zcsFGt~w,0-2~I FG 4 Well I
TransCanada WASML Loop (Rocky View Section) 19+284 19+425 Caj-R"sV~w-r,15-35~IV C 3 Well - Rapid IV
TransCanada WASML Loop (Rocky View Section) 19+425 19+456 A A - C/F 2 - -
TransCanada WASML Loop (Rocky View Section) 19+456 19+660 Caj-R"sV~w-r,15-35~IV C 3 Well - Rapid IV
TransCanada WASML Loop (Rocky View Section) 19+660 19+699 sgFGpu~w,1-5~I FG 4 Well I
TransCanada WASML Loop (Rocky View Section) 19+699 20+404 zcLGpu~w,1-5~I LG 5 Well I
TransCanada WASML Loop (Rocky View Section) 20+404 20+448 LGj-V~w-m,10-20~III LG 5 Well - Moderate III
TransCanada WASML Loop (Rocky View Section) 20+448 21+030 cLGpu~w,2-5~I LG 5 Well I
TransCanada WASML Loop (Rocky View Section) 21+030 21+115 Mu~w,2-7~I M 6 Well I
TransCanada WASML Loop (Rocky View Section) 21+115 21+140 Md~i-p,1-5~I M 6 Imperfect - Poor I
TransCanada WASML Loop (Rocky View Section) 21+140 21+347 Mu~w,2-7~I M 6 Well I
TransCanada WASML Loop (Rocky View Section) 21+347 21+421 A A - M 1 - -
Soil Class Proportion of Peat
1 Less than 30 cm
2 Less than 30 cm
3 Less than 30 cm
4 Less than 30 cm
5 Less than 30 cm
6 Less than 30 cm
(a) Drainage type based on desktop terrain analysis, no field verification completed.
Moraine
Landforms
Unspecified Fill Material - Moraine
Colluvium
Fluvial/Glaciofluvial
Glaciolacustrine
Unspecified Fill Material - Colluvium/Fluvial
Attachment NEB 1.19-1
TRANSCANADA WASML LOOP ROCKY VIEW SECTION
APPENDIX E Geophysical Report
July 19, 2018 Report No. 00660-GAL-C-RP-0006_1
Attachment NEB 1.19-1
July 2018
GEOPHYSICAL REPORT
TransCanada WASML Loop (Rockyview Section)
REPO
RT
Report Number: 00660-GAL-EN-RP-0002_1
Distribution: 1 E-Copy TransCanada PipeLines Limited 1 E-Copy Golder Associates Ltd.
Submitted to: TransCanada PipeLines Limited 450 - 1st Street SW Calgary, AB T2P 5H1
Attachment NEB 1.19-1
TRANSCANADA WASML LOOP (ROCKYVIEW SECTION) BOW RIVER AND HWY 1A CROSSINGS
Table of Contents
1.0 INTRODUCTION .................................................................................................................................................... 1
2.0 SITE AND PROJECT DESCRIPTION ................................................................................................................... 1
3.0 SCOPE OF WORK ................................................................................................................................................ 2
4.0 METHOD ................................................................................................................................................................ 3
4.1 SEISMIC REFRACTION METHOD .......................................................................................................... 3
4.2 ELECTRICAL RESISTIVITY TOMOGRAPHY METHOD ......................................................................... 4
5.0 FIELD PROGRAM AND DATA ACQUISITION ..................................................................................................... 6
6.0 DATA PROCESSING ............................................................................................................................................ 8
6.1 SEISMIC DATA PROCESSING ................................................................................................................ 8
6.2 ERT DATA PROCESSING ..................................................................................................................... 10
7.0 RESULTS ............................................................................................................................................................ 10
7.1 BOW RIVER RESULTS .......................................................................................................................... 10
7.2 HIGHWAY 1A RESULTS ........................................................................................................................ 11
8.0 SUMMARY AND CONCLUSIONS ...................................................................................................................... 12
9.0 CLOSURE ............................................................................................................................................................ 13
10.0 REFERENCES ..................................................................................................................................................... 14
11.0 LIMITATIONS OF GEOPHYSICAL METHODS .................................................................................................. 15
July 2018 Report No. 00660-GAL-EN-RP-0002_1 i
Attachment NEB 1.19-1
TRANSCANADA WASML LOOP (ROCKYVIEW SECTION) BOW RIVER AND HWY 1A CROSSINGS
TABLES Table 1: Approximate Range of Seismic P-Wave Velocity of Common Geological Materials ......................................... 4
Table 2: Resistivity and Conductivity Ranges of Common Geological Materials ............................................................. 4
Table 3: Summary of On Land Geophysics Survey Lines ............................................................................................... 8
FIGURES Figure 1: Bow River and Hwy 1A Crossings Site Map .................................................................................................... 2
Figure 2: Seismic Refraction Method .............................................................................................................................. 3
Figure 3: ERT Method ..................................................................................................................................................... 5
Figure 4: ERT Survey Configuration ............................................................................................................................... 6
Figure 5: Seismic Impact Source .................................................................................................................................... 7
Figure 6: Seismic Record Example ................................................................................................................................. 9
Figures 7 to 8 (Following the report text)
July 2018 Report No. 00660-GAL-EN-RP-0002_1 ii
Attachment NEB 1.19-1
TRANSCANADA WASML LOOP (ROCKYVIEW SECTION) BOW RIVER AND HWY 1A CROSSINGS
1.0 INTRODUCTION Golder Associates Ltd. (Golder) was retained by TransCanada PipeLines Limited (TransCanada) to conduct a geophysical investigation for TransCanada’s Western Alberta System Mainline (WASML) Loop’s (Rockyview Section) Bow River and Hwy 1A Crossings, located within the town of Cochrane, Alberta. The project consists of a proposed crossing of the Bow River, likely by means of the Horizontal Directional Drilling (HDD) method and a proposed crossing of Hwy 1A. The objective of the geophysical investigation - and the associated geotechnical drilling investigation - was to characterize stratigraphy, including the depth to bedrock, along the proposed HDD paths. Golder was authorized to carry out this work under Master Engineering Service Agreement (MESA) No. 4600007344.
Golder’s scope of work is based on the Geophysical Scope of Work outlined in Golder’s proposal dated July 27, 2017.
Field work for this investigation was conducted in two stages. The first was on September 18 to 21, 2017 and consisted of the collection of Electrical Resistivity Tomography (ERT) data. The second occurred on October 31 to November 4, 2017 and consisted of the collection of Seismic Refraction Tomography (SRT) data. This report summarizes the methods used, conditions and results of the investigation. Use of this report is subject to conditions outlined in the “Limitations of Geophysical Methods” section which follows the main text and forms an integral part of this document.
2.0 SITE AND PROJECT DESCRIPTION It is understood that TransCanada is planning to construct the WASML Loop (Rockyview Section) consisting of approximately 21 km of NPS 42 pipe, located near the town of Cochrane, Alberta. The proposed WASML Loop will parallel the existing NGTL NPS 36 WASML and NPS 36 Foothills Pipeline from the WAS110 Valve Site (NE-16-26-4-W5M) to the WAS100 Valve Site (NE-10-24-4-W5M. It is understood that there are five (5) major crossings, three (3) of which require geophysical investigations, including Hwy 1A, the Bow River and Highway 1 that will be installed using trenchless methods, likely HDD. The crossing of Hwy 1 was deemed unsuitable for geophysical methods. This geophysical investigation focusses on the Bow River and Hwy 1A crossings.
Figure 1 below displays the locations of the geophysical transects and incident geotechnical boreholes projected on an aerial photo of the Bow River and Hwy 1A crossings area.
July 2018 Report No. 00660-GAL-EN-RP-0002_1 1
Attachment NEB 1.19-1
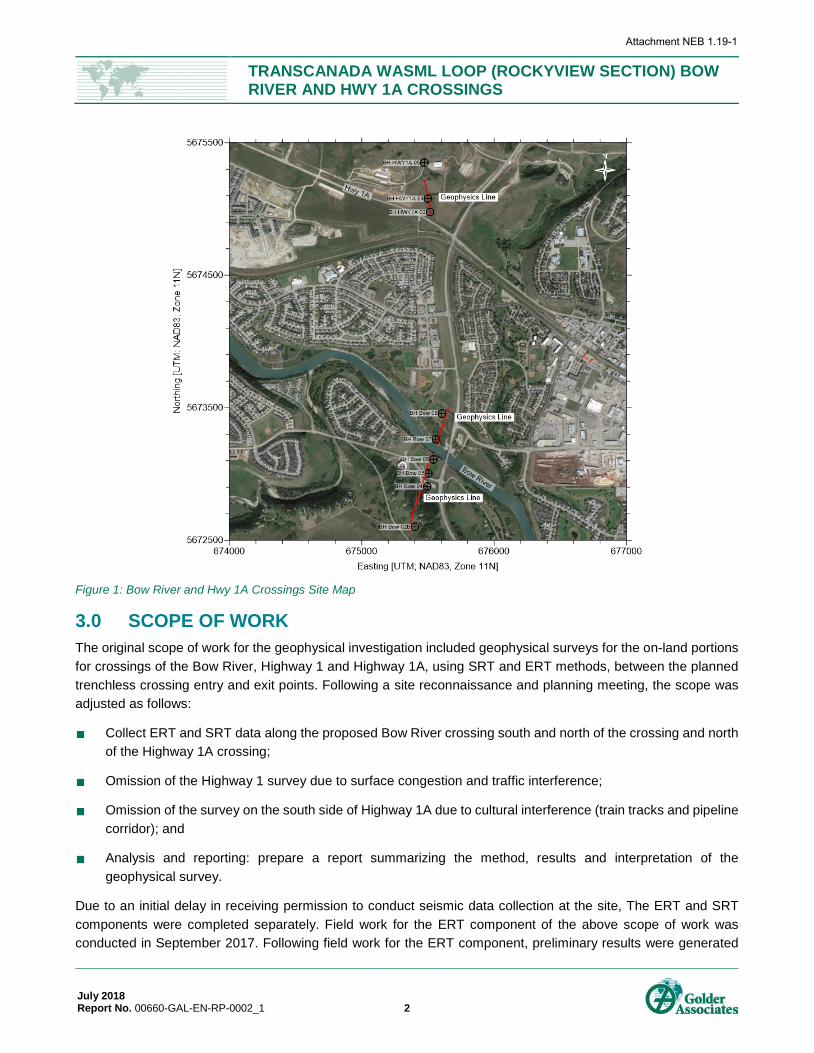
TRANSCANADA WASML LOOP (ROCKYVIEW SECTION) BOW RIVER AND HWY 1A CROSSINGS
Figure 1: Bow River and Hwy 1A Crossings Site Map
3.0 SCOPE OF WORK The original scope of work for the geophysical investigation included geophysical surveys for the on-land portions for crossings of the Bow River, Highway 1 and Highway 1A, using SRT and ERT methods, between the planned trenchless crossing entry and exit points. Following a site reconnaissance and planning meeting, the scope was adjusted as follows:
Collect ERT and SRT data along the proposed Bow River crossing south and north of the crossing and north of the Highway 1A crossing;
Omission of the Highway 1 survey due to surface congestion and traffic interference;
Omission of the survey on the south side of Highway 1A due to cultural interference (train tracks and pipeline corridor); and
Analysis and reporting: prepare a report summarizing the method, results and interpretation of the geophysical survey.
Due to an initial delay in receiving permission to conduct seismic data collection at the site, The ERT and SRT components were completed separately. Field work for the ERT component of the above scope of work was conducted in September 2017. Following field work for the ERT component, preliminary results were generated
July 2018 Report No. 00660-GAL-EN-RP-0002_1 2
Attachment NEB 1.19-1
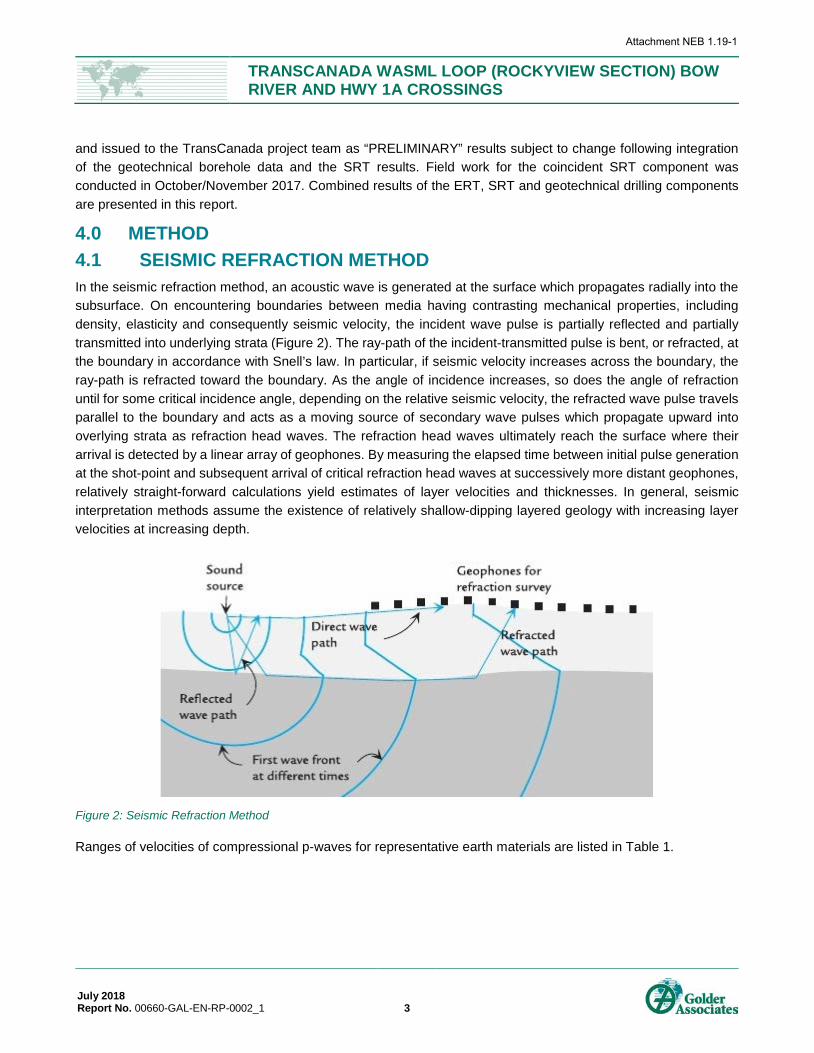
TRANSCANADA WASML LOOP (ROCKYVIEW SECTION) BOW RIVER AND HWY 1A CROSSINGS
and issued to the TransCanada project team as “PRELIMINARY” results subject to change following integration of the geotechnical borehole data and the SRT results. Field work for the coincident SRT component was conducted in October/November 2017. Combined results of the ERT, SRT and geotechnical drilling components are presented in this report.
4.0 METHOD 4.1 SEISMIC REFRACTION METHOD In the seismic refraction method, an acoustic wave is generated at the surface which propagates radially into the subsurface. On encountering boundaries between media having contrasting mechanical properties, including density, elasticity and consequently seismic velocity, the incident wave pulse is partially reflected and partially transmitted into underlying strata (Figure 2). The ray-path of the incident-transmitted pulse is bent, or refracted, at the boundary in accordance with Snell’s law. In particular, if seismic velocity increases across the boundary, the ray-path is refracted toward the boundary. As the angle of incidence increases, so does the angle of refraction until for some critical incidence angle, depending on the relative seismic velocity, the refracted wave pulse travels parallel to the boundary and acts as a moving source of secondary wave pulses which propagate upward into overlying strata as refraction head waves. The refraction head waves ultimately reach the surface where their arrival is detected by a linear array of geophones. By measuring the elapsed time between initial pulse generation at the shot-point and subsequent arrival of critical refraction head waves at successively more distant geophones, relatively straight-forward calculations yield estimates of layer velocities and thicknesses. In general, seismic interpretation methods assume the existence of relatively shallow-dipping layered geology with increasing layer velocities at increasing depth.
Figure 2: Seismic Refraction Method
Ranges of velocities of compressional p-waves for representative earth materials are listed in Table 1.
July 2018 Report No. 00660-GAL-EN-RP-0002_1 3
Attachment NEB 1.19-1
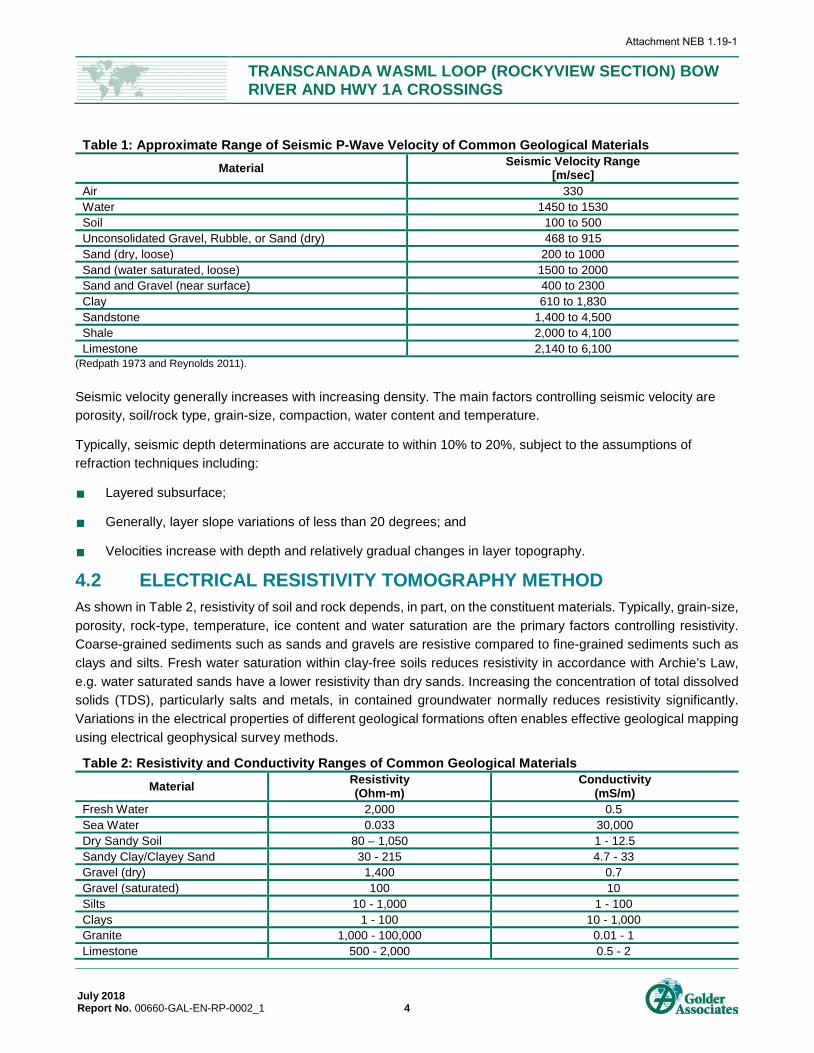
TRANSCANADA WASML LOOP (ROCKYVIEW SECTION) BOW RIVER AND HWY 1A CROSSINGS
Table 1: Approximate Range of Seismic P-Wave Velocity of Common Geological Materials Material Seismic Velocity Range
[m/sec] Air 330 Water 1450 to 1530 Soil 100 to 500 Unconsolidated Gravel, Rubble, or Sand (dry) 468 to 915 Sand (dry, loose) 200 to 1000 Sand (water saturated, loose) 1500 to 2000 Sand and Gravel (near surface) 400 to 2300 Clay 610 to 1,830 Sandstone 1,400 to 4,500 Shale 2,000 to 4,100 Limestone 2,140 to 6,100
(Redpath 1973 and Reynolds 2011).
Seismic velocity generally increases with increasing density. The main factors controlling seismic velocity are porosity, soil/rock type, grain-size, compaction, water content and temperature.
Typically, seismic depth determinations are accurate to within 10% to 20%, subject to the assumptions of refraction techniques including:
Layered subsurface;
Generally, layer slope variations of less than 20 degrees; and
Velocities increase with depth and relatively gradual changes in layer topography.
4.2 ELECTRICAL RESISTIVITY TOMOGRAPHY METHOD As shown in Table 2, resistivity of soil and rock depends, in part, on the constituent materials. Typically, grain-size, porosity, rock-type, temperature, ice content and water saturation are the primary factors controlling resistivity. Coarse-grained sediments such as sands and gravels are resistive compared to fine-grained sediments such as clays and silts. Fresh water saturation within clay-free soils reduces resistivity in accordance with Archie’s Law, e.g. water saturated sands have a lower resistivity than dry sands. Increasing the concentration of total dissolved solids (TDS), particularly salts and metals, in contained groundwater normally reduces resistivity significantly. Variations in the electrical properties of different geological formations often enables effective geological mapping using electrical geophysical survey methods.
Table 2: Resistivity and Conductivity Ranges of Common Geological Materials Material Resistivity
(Ohm-m) Conductivity
(mS/m) Fresh Water 2,000 0.5 Sea Water 0.033 30,000 Dry Sandy Soil 80 – 1,050 1 - 12.5 Sandy Clay/Clayey Sand 30 - 215 4.7 - 33 Gravel (dry) 1,400 0.7 Gravel (saturated) 100 10 Silts 10 - 1,000 1 - 100 Clays 1 - 100 10 - 1,000 Granite 1,000 - 100,000 0.01 - 1 Limestone 500 - 2,000 0.5 - 2
July 2018 Report No. 00660-GAL-EN-RP-0002_1 4
Attachment NEB 1.19-1
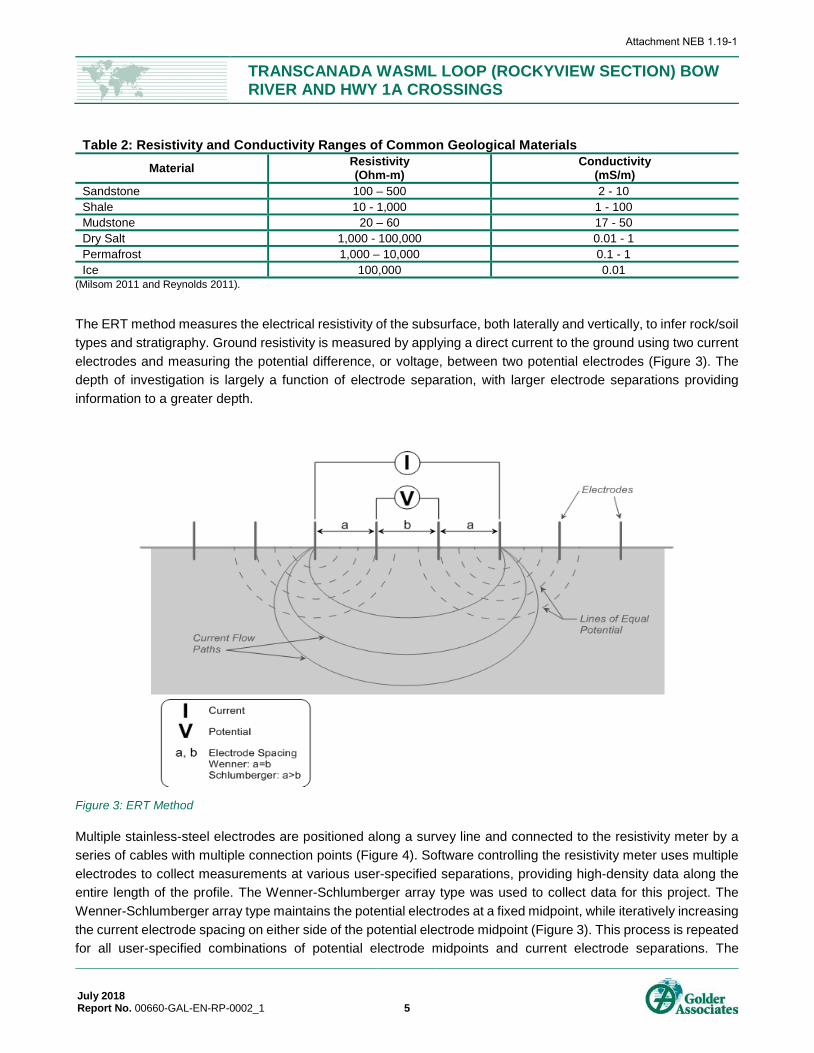
TRANSCANADA WASML LOOP (ROCKYVIEW SECTION) BOW RIVER AND HWY 1A CROSSINGS
Table 2: Resistivity and Conductivity Ranges of Common Geological Materials Material Resistivity
(Ohm-m) Conductivity
(mS/m) Sandstone 100 – 500 2 - 10 Shale 10 - 1,000 1 - 100 Mudstone 20 – 60 17 - 50 Dry Salt 1,000 - 100,000 0.01 - 1 Permafrost 1,000 – 10,000 0.1 - 1 Ice 100,000 0.01
(Milsom 2011 and Reynolds 2011).
The ERT method measures the electrical resistivity of the subsurface, both laterally and vertically, to infer rock/soil types and stratigraphy. Ground resistivity is measured by applying a direct current to the ground using two current electrodes and measuring the potential difference, or voltage, between two potential electrodes (Figure 3). The depth of investigation is largely a function of electrode separation, with larger electrode separations providing information to a greater depth.
Figure 3: ERT Method
Multiple stainless-steel electrodes are positioned along a survey line and connected to the resistivity meter by a series of cables with multiple connection points (Figure 4). Software controlling the resistivity meter uses multiple electrodes to collect measurements at various user-specified separations, providing high-density data along the entire length of the profile. The Wenner-Schlumberger array type was used to collect data for this project. The Wenner-Schlumberger array type maintains the potential electrodes at a fixed midpoint, while iteratively increasing the current electrode spacing on either side of the potential electrode midpoint (Figure 3). This process is repeated for all user-specified combinations of potential electrode midpoints and current electrode separations. The
July 2018 Report No. 00660-GAL-EN-RP-0002_1 5
Attachment NEB 1.19-1
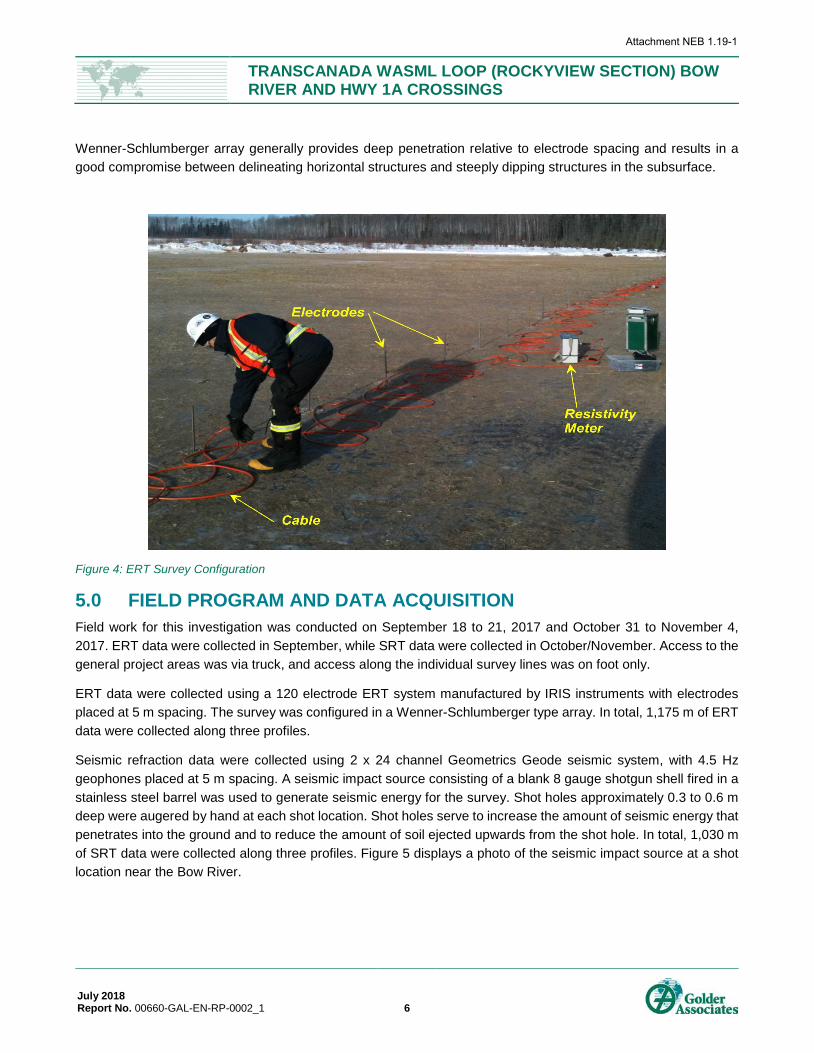
TRANSCANADA WASML LOOP (ROCKYVIEW SECTION) BOW RIVER AND HWY 1A CROSSINGS
Wenner-Schlumberger array generally provides deep penetration relative to electrode spacing and results in a good compromise between delineating horizontal structures and steeply dipping structures in the subsurface.
Figure 4: ERT Survey Configuration
5.0 FIELD PROGRAM AND DATA ACQUISITION Field work for this investigation was conducted on September 18 to 21, 2017 and October 31 to November 4, 2017. ERT data were collected in September, while SRT data were collected in October/November. Access to the general project areas was via truck, and access along the individual survey lines was on foot only.
ERT data were collected using a 120 electrode ERT system manufactured by IRIS instruments with electrodes placed at 5 m spacing. The survey was configured in a Wenner-Schlumberger type array. In total, 1,175 m of ERT data were collected along three profiles.
Seismic refraction data were collected using 2 x 24 channel Geometrics Geode seismic system, with 4.5 Hz geophones placed at 5 m spacing. A seismic impact source consisting of a blank 8 gauge shotgun shell fired in a stainless steel barrel was used to generate seismic energy for the survey. Shot holes approximately 0.3 to 0.6 m deep were augered by hand at each shot location. Shot holes serve to increase the amount of seismic energy that penetrates into the ground and to reduce the amount of soil ejected upwards from the shot hole. In total, 1,030 m of SRT data were collected along three profiles. Figure 5 displays a photo of the seismic impact source at a shot location near the Bow River.
July 2018 Report No. 00660-GAL-EN-RP-0002_1 6
Attachment NEB 1.19-1
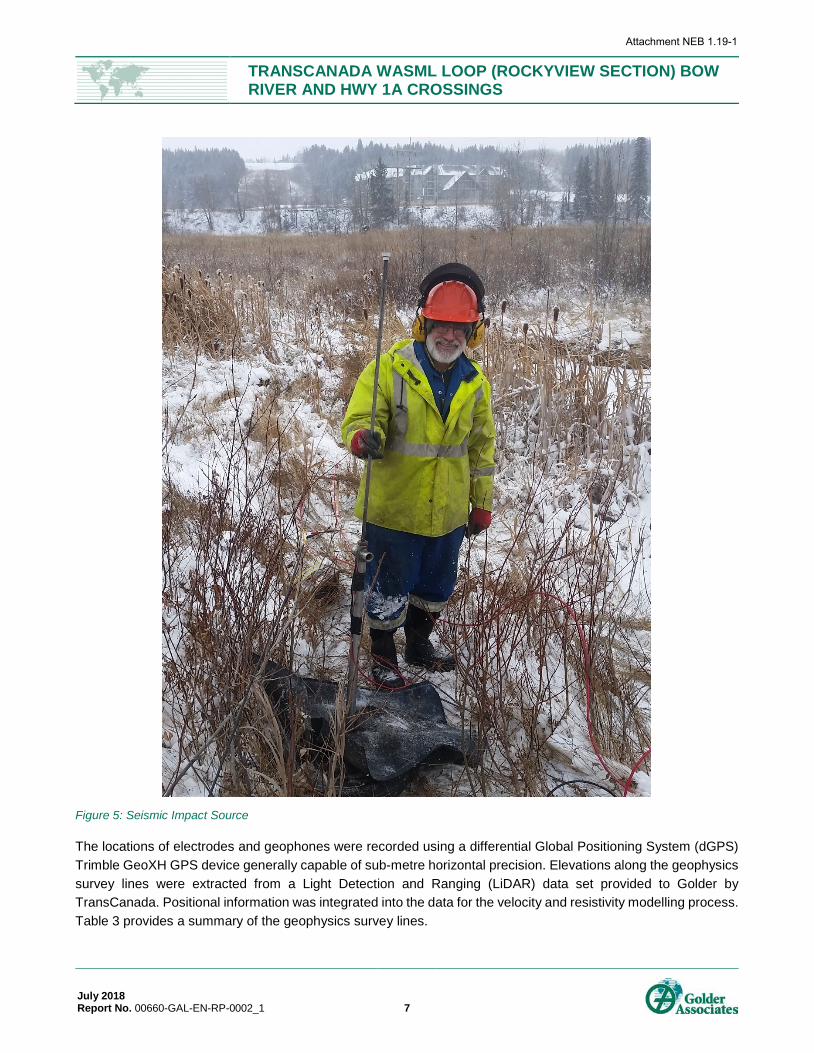
TRANSCANADA WASML LOOP (ROCKYVIEW SECTION) BOW RIVER AND HWY 1A CROSSINGS
Figure 5: Seismic Impact Source
The locations of electrodes and geophones were recorded using a differential Global Positioning System (dGPS) Trimble GeoXH GPS device generally capable of sub-metre horizontal precision. Elevations along the geophysics survey lines were extracted from a Light Detection and Ranging (LiDAR) data set provided to Golder by TransCanada. Positional information was integrated into the data for the velocity and resistivity modelling process. Table 3 provides a summary of the geophysics survey lines.
July 2018 Report No. 00660-GAL-EN-RP-0002_1 7
Attachment NEB 1.19-1
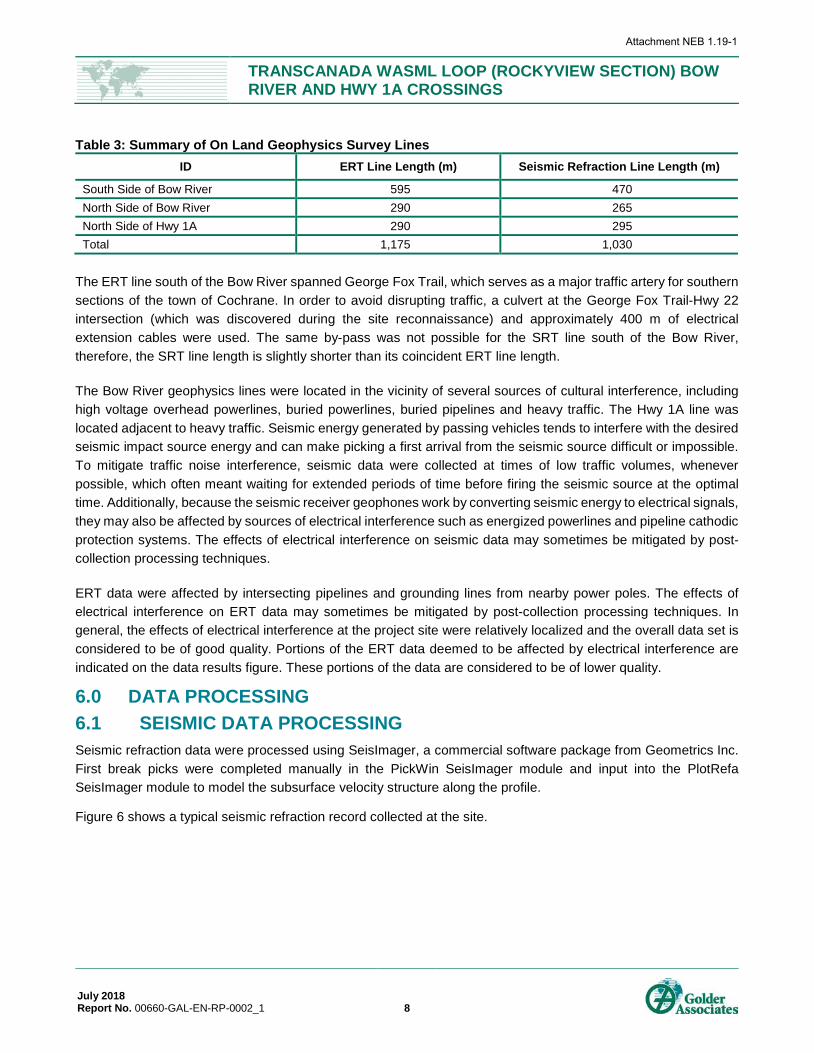
TRANSCANADA WASML LOOP (ROCKYVIEW SECTION) BOW RIVER AND HWY 1A CROSSINGS
Table 3: Summary of On Land Geophysics Survey Lines ID ERT Line Length (m) Seismic Refraction Line Length (m)
South Side of Bow River 595 470 North Side of Bow River 290 265 North Side of Hwy 1A 290 295 Total 1,175 1,030
The ERT line south of the Bow River spanned George Fox Trail, which serves as a major traffic artery for southern sections of the town of Cochrane. In order to avoid disrupting traffic, a culvert at the George Fox Trail-Hwy 22 intersection (which was discovered during the site reconnaissance) and approximately 400 m of electrical extension cables were used. The same by-pass was not possible for the SRT line south of the Bow River, therefore, the SRT line length is slightly shorter than its coincident ERT line length.
The Bow River geophysics lines were located in the vicinity of several sources of cultural interference, including high voltage overhead powerlines, buried powerlines, buried pipelines and heavy traffic. The Hwy 1A line was located adjacent to heavy traffic. Seismic energy generated by passing vehicles tends to interfere with the desired seismic impact source energy and can make picking a first arrival from the seismic source difficult or impossible. To mitigate traffic noise interference, seismic data were collected at times of low traffic volumes, whenever possible, which often meant waiting for extended periods of time before firing the seismic source at the optimal time. Additionally, because the seismic receiver geophones work by converting seismic energy to electrical signals, they may also be affected by sources of electrical interference such as energized powerlines and pipeline cathodic protection systems. The effects of electrical interference on seismic data may sometimes be mitigated by post-collection processing techniques.
ERT data were affected by intersecting pipelines and grounding lines from nearby power poles. The effects of electrical interference on ERT data may sometimes be mitigated by post-collection processing techniques. In general, the effects of electrical interference at the project site were relatively localized and the overall data set is considered to be of good quality. Portions of the ERT data deemed to be affected by electrical interference are indicated on the data results figure. These portions of the data are considered to be of lower quality.
6.0 DATA PROCESSING 6.1 SEISMIC DATA PROCESSING Seismic refraction data were processed using SeisImager, a commercial software package from Geometrics Inc. First break picks were completed manually in the PickWin SeisImager module and input into the PlotRefa SeisImager module to model the subsurface velocity structure along the profile.
Figure 6 shows a typical seismic refraction record collected at the site.
July 2018 Report No. 00660-GAL-EN-RP-0002_1 8
Attachment NEB 1.19-1
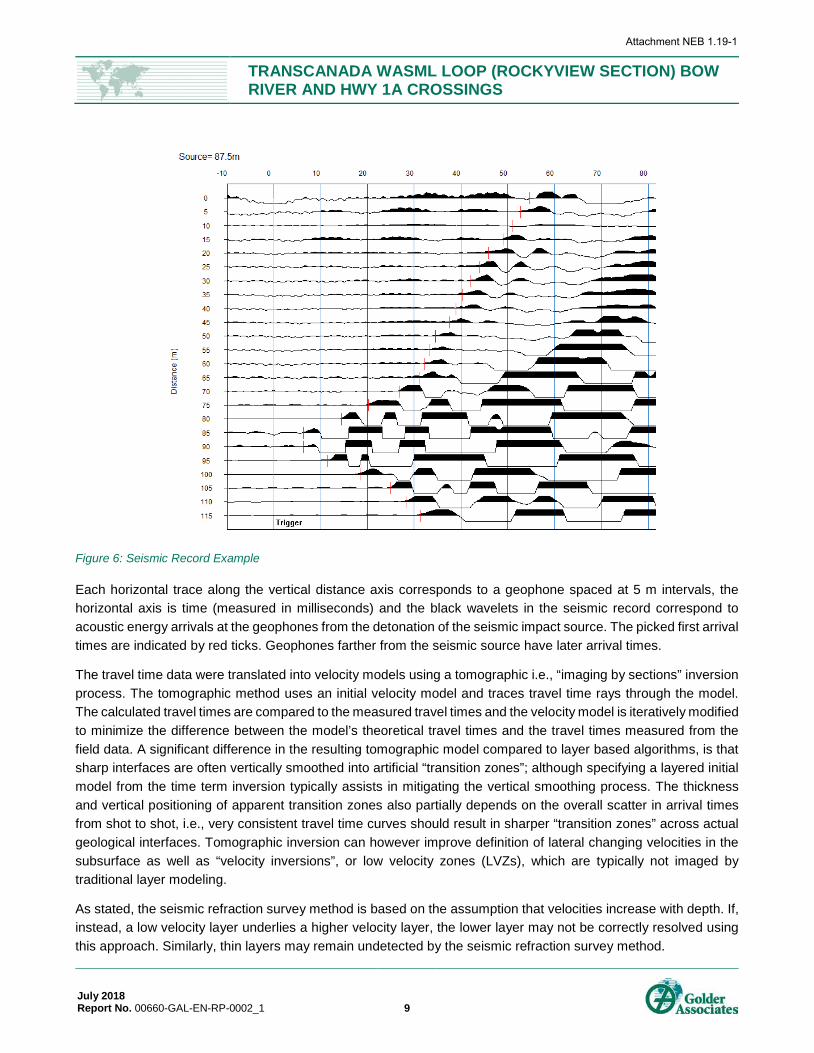
TRANSCANADA WASML LOOP (ROCKYVIEW SECTION) BOW RIVER AND HWY 1A CROSSINGS
Figure 6: Seismic Record Example
Each horizontal trace along the vertical distance axis corresponds to a geophone spaced at 5 m intervals, the horizontal axis is time (measured in milliseconds) and the black wavelets in the seismic record correspond to acoustic energy arrivals at the geophones from the detonation of the seismic impact source. The picked first arrival times are indicated by red ticks. Geophones farther from the seismic source have later arrival times.
The travel time data were translated into velocity models using a tomographic i.e., “imaging by sections” inversion process. The tomographic method uses an initial velocity model and traces travel time rays through the model. The calculated travel times are compared to the measured travel times and the velocity model is iteratively modified to minimize the difference between the model’s theoretical travel times and the travel times measured from the field data. A significant difference in the resulting tomographic model compared to layer based algorithms, is that sharp interfaces are often vertically smoothed into artificial “transition zones”; although specifying a layered initial model from the time term inversion typically assists in mitigating the vertical smoothing process. The thickness and vertical positioning of apparent transition zones also partially depends on the overall scatter in arrival times from shot to shot, i.e., very consistent travel time curves should result in sharper “transition zones” across actual geological interfaces. Tomographic inversion can however improve definition of lateral changing velocities in the subsurface as well as “velocity inversions”, or low velocity zones (LVZs), which are typically not imaged by traditional layer modeling.
As stated, the seismic refraction survey method is based on the assumption that velocities increase with depth. If, instead, a low velocity layer underlies a higher velocity layer, the lower layer may not be correctly resolved using this approach. Similarly, thin layers may remain undetected by the seismic refraction survey method.
July 2018 Report No. 00660-GAL-EN-RP-0002_1 9
Attachment NEB 1.19-1
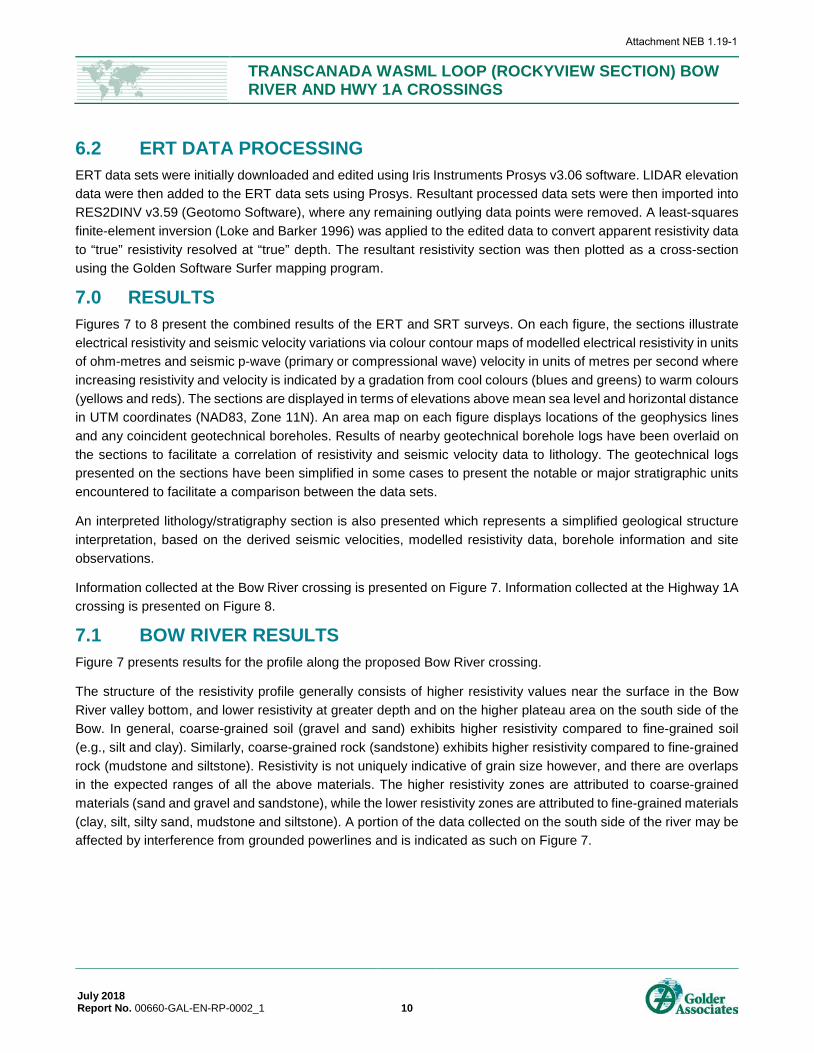
TRANSCANADA WASML LOOP (ROCKYVIEW SECTION) BOW RIVER AND HWY 1A CROSSINGS
6.2 ERT DATA PROCESSING ERT data sets were initially downloaded and edited using Iris Instruments Prosys v3.06 software. LIDAR elevation data were then added to the ERT data sets using Prosys. Resultant processed data sets were then imported into RES2DINV v3.59 (Geotomo Software), where any remaining outlying data points were removed. A least-squares finite-element inversion (Loke and Barker 1996) was applied to the edited data to convert apparent resistivity data to “true” resistivity resolved at “true” depth. The resultant resistivity section was then plotted as a cross-section using the Golden Software Surfer mapping program.
7.0 RESULTS Figures 7 to 8 present the combined results of the ERT and SRT surveys. On each figure, the sections illustrate electrical resistivity and seismic velocity variations via colour contour maps of modelled electrical resistivity in units of ohm-metres and seismic p-wave (primary or compressional wave) velocity in units of metres per second where increasing resistivity and velocity is indicated by a gradation from cool colours (blues and greens) to warm colours (yellows and reds). The sections are displayed in terms of elevations above mean sea level and horizontal distance in UTM coordinates (NAD83, Zone 11N). An area map on each figure displays locations of the geophysics lines and any coincident geotechnical boreholes. Results of nearby geotechnical borehole logs have been overlaid on the sections to facilitate a correlation of resistivity and seismic velocity data to lithology. The geotechnical logs presented on the sections have been simplified in some cases to present the notable or major stratigraphic units encountered to facilitate a comparison between the data sets.
An interpreted lithology/stratigraphy section is also presented which represents a simplified geological structure interpretation, based on the derived seismic velocities, modelled resistivity data, borehole information and site observations.
Information collected at the Bow River crossing is presented on Figure 7. Information collected at the Highway 1A crossing is presented on Figure 8.
7.1 BOW RIVER RESULTS Figure 7 presents results for the profile along the proposed Bow River crossing.
The structure of the resistivity profile generally consists of higher resistivity values near the surface in the Bow River valley bottom, and lower resistivity at greater depth and on the higher plateau area on the south side of the Bow. In general, coarse-grained soil (gravel and sand) exhibits higher resistivity compared to fine-grained soil (e.g., silt and clay). Similarly, coarse-grained rock (sandstone) exhibits higher resistivity compared to fine-grained rock (mudstone and siltstone). Resistivity is not uniquely indicative of grain size however, and there are overlaps in the expected ranges of all the above materials. The higher resistivity zones are attributed to coarse-grained materials (sand and gravel and sandstone), while the lower resistivity zones are attributed to fine-grained materials (clay, silt, silty sand, mudstone and siltstone). A portion of the data collected on the south side of the river may be affected by interference from grounded powerlines and is indicated as such on Figure 7.
July 2018 Report No. 00660-GAL-EN-RP-0002_1 10
Attachment NEB 1.19-1
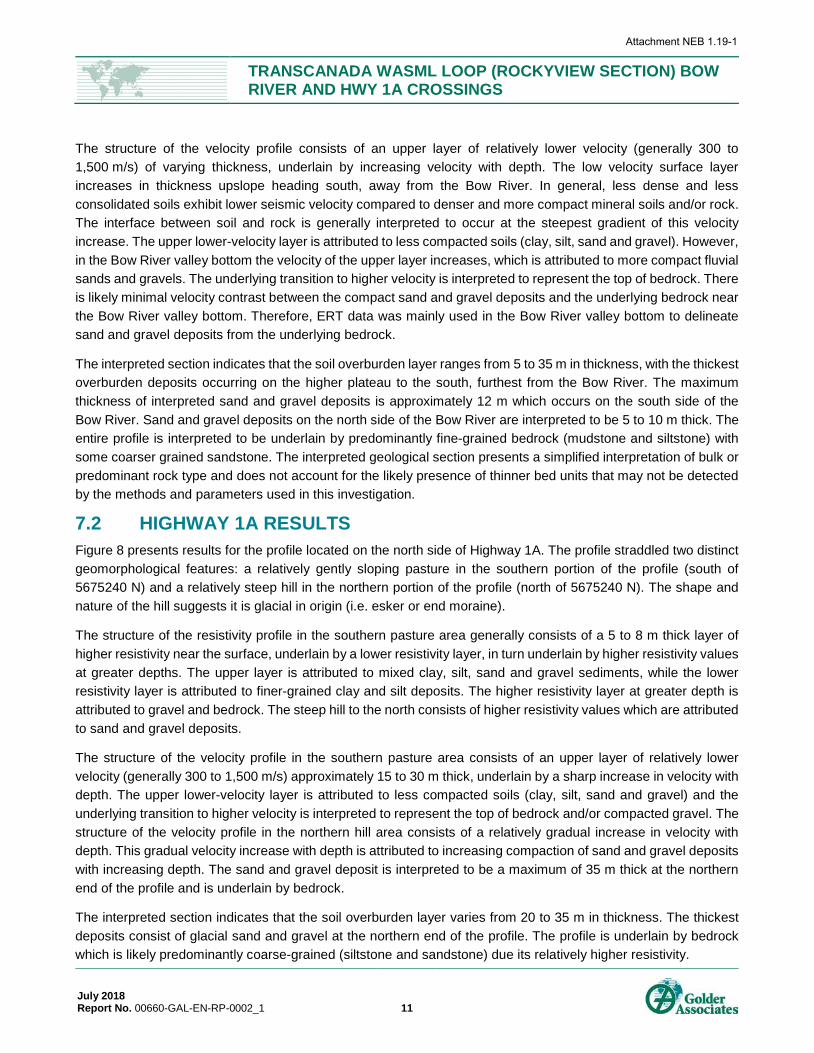
TRANSCANADA WASML LOOP (ROCKYVIEW SECTION) BOW RIVER AND HWY 1A CROSSINGS
The structure of the velocity profile consists of an upper layer of relatively lower velocity (generally 300 to 1,500 m/s) of varying thickness, underlain by increasing velocity with depth. The low velocity surface layer increases in thickness upslope heading south, away from the Bow River. In general, less dense and less consolidated soils exhibit lower seismic velocity compared to denser and more compact mineral soils and/or rock. The interface between soil and rock is generally interpreted to occur at the steepest gradient of this velocity increase. The upper lower-velocity layer is attributed to less compacted soils (clay, silt, sand and gravel). However, in the Bow River valley bottom the velocity of the upper layer increases, which is attributed to more compact fluvial sands and gravels. The underlying transition to higher velocity is interpreted to represent the top of bedrock. There is likely minimal velocity contrast between the compact sand and gravel deposits and the underlying bedrock near the Bow River valley bottom. Therefore, ERT data was mainly used in the Bow River valley bottom to delineate sand and gravel deposits from the underlying bedrock.
The interpreted section indicates that the soil overburden layer ranges from 5 to 35 m in thickness, with the thickest overburden deposits occurring on the higher plateau to the south, furthest from the Bow River. The maximum thickness of interpreted sand and gravel deposits is approximately 12 m which occurs on the south side of the Bow River. Sand and gravel deposits on the north side of the Bow River are interpreted to be 5 to 10 m thick. The entire profile is interpreted to be underlain by predominantly fine-grained bedrock (mudstone and siltstone) with some coarser grained sandstone. The interpreted geological section presents a simplified interpretation of bulk or predominant rock type and does not account for the likely presence of thinner bed units that may not be detected by the methods and parameters used in this investigation.
7.2 HIGHWAY 1A RESULTS Figure 8 presents results for the profile located on the north side of Highway 1A. The profile straddled two distinct geomorphological features: a relatively gently sloping pasture in the southern portion of the profile (south of 5675240 N) and a relatively steep hill in the northern portion of the profile (north of 5675240 N). The shape and nature of the hill suggests it is glacial in origin (i.e. esker or end moraine).
The structure of the resistivity profile in the southern pasture area generally consists of a 5 to 8 m thick layer of higher resistivity near the surface, underlain by a lower resistivity layer, in turn underlain by higher resistivity values at greater depths. The upper layer is attributed to mixed clay, silt, sand and gravel sediments, while the lower resistivity layer is attributed to finer-grained clay and silt deposits. The higher resistivity layer at greater depth is attributed to gravel and bedrock. The steep hill to the north consists of higher resistivity values which are attributed to sand and gravel deposits.
The structure of the velocity profile in the southern pasture area consists of an upper layer of relatively lower velocity (generally 300 to 1,500 m/s) approximately 15 to 30 m thick, underlain by a sharp increase in velocity with depth. The upper lower-velocity layer is attributed to less compacted soils (clay, silt, sand and gravel) and the underlying transition to higher velocity is interpreted to represent the top of bedrock and/or compacted gravel. The structure of the velocity profile in the northern hill area consists of a relatively gradual increase in velocity with depth. This gradual velocity increase with depth is attributed to increasing compaction of sand and gravel deposits with increasing depth. The sand and gravel deposit is interpreted to be a maximum of 35 m thick at the northern end of the profile and is underlain by bedrock.
The interpreted section indicates that the soil overburden layer varies from 20 to 35 m in thickness. The thickest deposits consist of glacial sand and gravel at the northern end of the profile. The profile is underlain by bedrock which is likely predominantly coarse-grained (siltstone and sandstone) due its relatively higher resistivity.
July 2018 Report No. 00660-GAL-EN-RP-0002_1 11
Attachment NEB 1.19-1
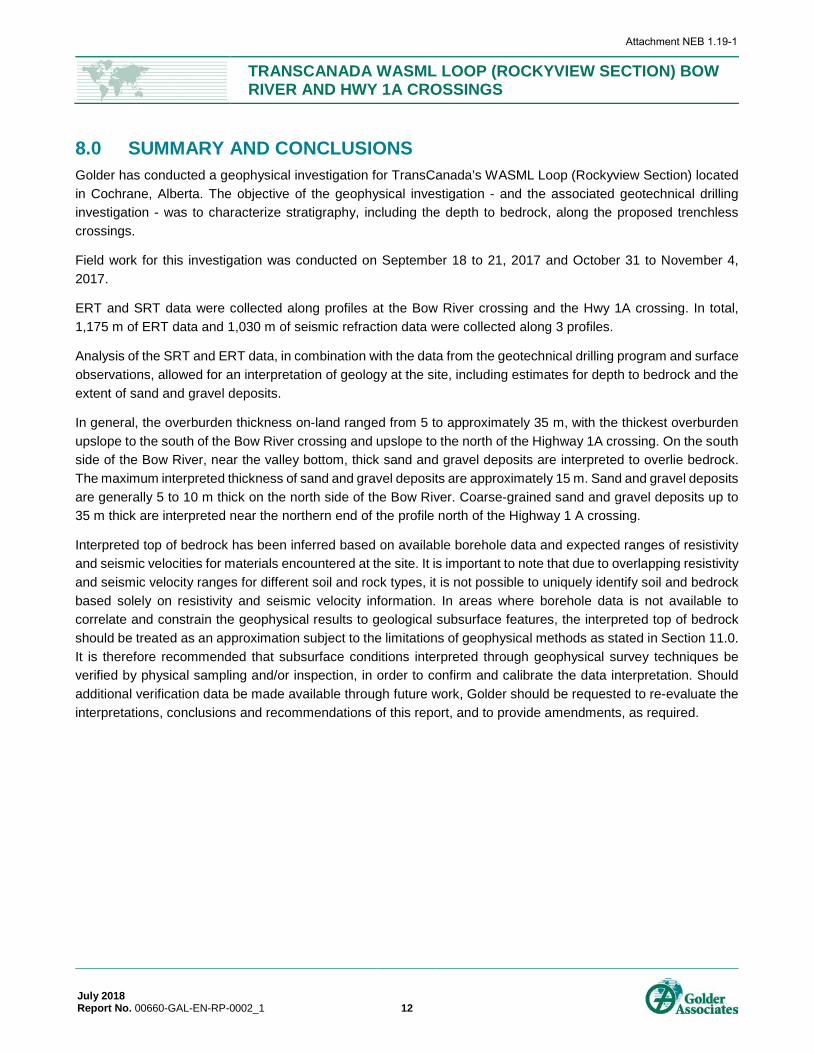
TRANSCANADA WASML LOOP (ROCKYVIEW SECTION) BOW RIVER AND HWY 1A CROSSINGS
8.0 SUMMARY AND CONCLUSIONS Golder has conducted a geophysical investigation for TransCanada’s WASML Loop (Rockyview Section) located in Cochrane, Alberta. The objective of the geophysical investigation - and the associated geotechnical drilling investigation - was to characterize stratigraphy, including the depth to bedrock, along the proposed trenchless crossings.
Field work for this investigation was conducted on September 18 to 21, 2017 and October 31 to November 4, 2017.
ERT and SRT data were collected along profiles at the Bow River crossing and the Hwy 1A crossing. In total, 1,175 m of ERT data and 1,030 m of seismic refraction data were collected along 3 profiles.
Analysis of the SRT and ERT data, in combination with the data from the geotechnical drilling program and surface observations, allowed for an interpretation of geology at the site, including estimates for depth to bedrock and the extent of sand and gravel deposits.
In general, the overburden thickness on-land ranged from 5 to approximately 35 m, with the thickest overburden upslope to the south of the Bow River crossing and upslope to the north of the Highway 1A crossing. On the south side of the Bow River, near the valley bottom, thick sand and gravel deposits are interpreted to overlie bedrock. The maximum interpreted thickness of sand and gravel deposits are approximately 15 m. Sand and gravel deposits are generally 5 to 10 m thick on the north side of the Bow River. Coarse-grained sand and gravel deposits up to 35 m thick are interpreted near the northern end of the profile north of the Highway 1 A crossing.
Interpreted top of bedrock has been inferred based on available borehole data and expected ranges of resistivity and seismic velocities for materials encountered at the site. It is important to note that due to overlapping resistivity and seismic velocity ranges for different soil and rock types, it is not possible to uniquely identify soil and bedrock based solely on resistivity and seismic velocity information. In areas where borehole data is not available to correlate and constrain the geophysical results to geological subsurface features, the interpreted top of bedrock should be treated as an approximation subject to the limitations of geophysical methods as stated in Section 11.0. It is therefore recommended that subsurface conditions interpreted through geophysical survey techniques be verified by physical sampling and/or inspection, in order to confirm and calibrate the data interpretation. Should additional verification data be made available through future work, Golder should be requested to re-evaluate the interpretations, conclusions and recommendations of this report, and to provide amendments, as required.
July 2018 Report No. 00660-GAL-EN-RP-0002_1 12
Attachment NEB 1.19-1
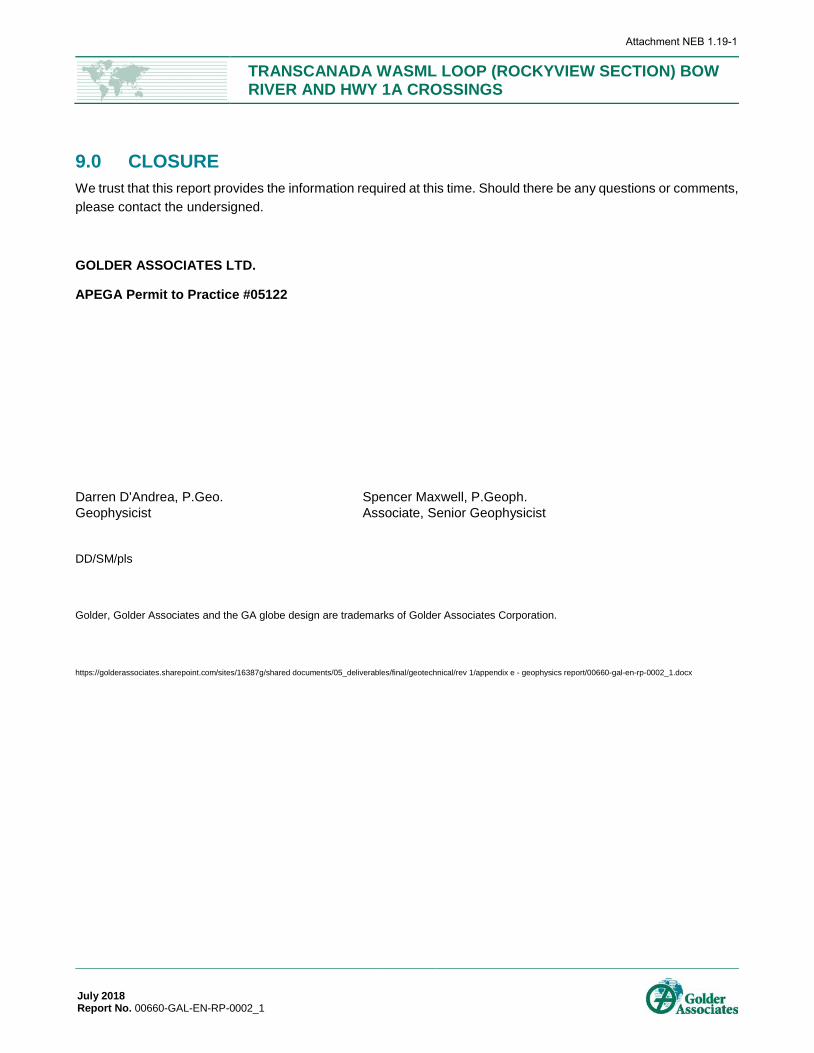
TRANSCANADA WASML LOOP (ROCKYVIEW SECTION) BOW RIVER AND HWY 1A CROSSINGS
9.0 CLOSURE We trust that this report provides the information required at this time. Should there be any questions or comments, please contact the undersigned.
GOLDER ASSOCIATES LTD.
APEGA Permit to Practice #05122
Darren D'Andrea, P.Geo. Spencer Maxwell, P.Geoph. Geophysicist Associate, Senior Geophysicist
DD/SM/pls
Golder, Golder Associates and the GA globe design are trademarks of Golder Associates Corporation.
https://golderassociates.sharepoint.com/sites/16387g/shared documents/05_deliverables/final/geotechnical/rev 1/appendix e - geophysics report/00660-gal-en-rp-0002_1.docx
July 2018 Report No. 00660-GAL-EN-RP-0002_1
Attachment NEB 1.19-1
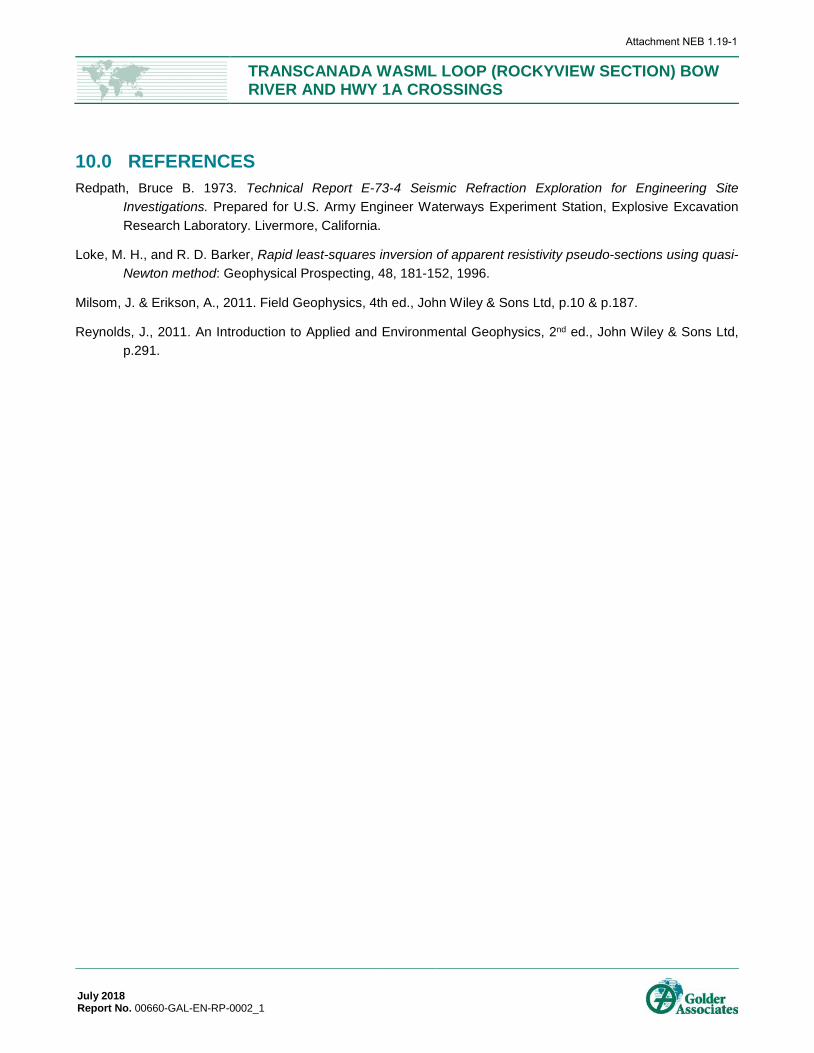
TRANSCANADA WASML LOOP (ROCKYVIEW SECTION) BOW RIVER AND HWY 1A CROSSINGS
10.0 REFERENCES Redpath, Bruce B. 1973. Technical Report E-73-4 Seismic Refraction Exploration for Engineering Site
Investigations. Prepared for U.S. Army Engineer Waterways Experiment Station, Explosive Excavation Research Laboratory. Livermore, California.
Loke, M. H., and R. D. Barker, Rapid least-squares inversion of apparent resistivity pseudo-sections using quasi-Newton method: Geophysical Prospecting, 48, 181-152, 1996.
Milsom, J. & Erikson, A., 2011. Field Geophysics, 4th ed., John Wiley & Sons Ltd, p.10 & p.187.
Reynolds, J., 2011. An Introduction to Applied and Environmental Geophysics, 2nd ed., John Wiley & Sons Ltd, p.291.
July 2018 Report No. 00660-GAL-EN-RP-0002_1
Attachment NEB 1.19-1
TRANSCANADA WASML LOOP (ROCKYVIEW SECTION) BOW RIVER AND HWY 1A CROSSINGS
11.0 LIMITATIONS OF GEOPHYSICAL METHODS Golder has prepared this report in a manner consistent with that level of care and skill ordinarily exercised by members of the engineering and science professions currently practicing in Canada, subject to the time limits and physical constraints applicable to the work described in this report. No other warranty, express or implied, is made. The work completed, as documented in this report, is subject to the Terms and Conditions submitted to the Client.
This report has been prepared for the specific site, objective, development and/or purpose described to Golder by the Client, and is subject to the scope of work, financial and scheduling constraints of the assignment and the agreement entered into with the Client. The factual data, interpretations and recommendations pertain to this specific project, as described in this report, are based on the information obtained during the assessment by Golder on the dates cited in the report, and are not applicable to any other project or site location. The validity of this report is affected by any change of site conditions, purpose, development plans or significant delay from the date of this report to initiating or completing the project. If changes or delays occur, Golder cannot be responsible for the use of this report, or portions thereof, unless Golder is requested to review and, if necessary, revise the report.
The inferences concerning the site conditions contained in this report are based on information obtained during the assessment conducted by Golder personnel, and are based solely on the condition at the time of the assessment, supplemented by historical and/or other information obtained by Golder, as described in this report. The conclusions presented in this report represent the judgment of the assessor, and are based on observations and measurements made, and on site conditions observed on the date(s) cited in this report. Due to the nature of the investigation, and the limited data available, the assessor cannot warrant against undiscovered features that may impact the project, nor variations in subsurface conditions between measuring points.
The information, recommendations and opinions expressed in this report are for the sole benefit of the Client. No other party may use or rely on this report or any portion thereof without Golder’s express, written consent. The report, all plans, data, drawings and other documents, as well as all electronic media prepared by Golder, are considered its professional work product and shall remain the copyright property of Golder.
It is a fundamental assumption for geophysical survey techniques that there will be sufficient physical property contrast between the media being investigated. However, physical properties can vary in the field such that media and subsurface bodies may not be sufficiently in contrast with their surroundings, and result in uncertainty with respect to data interpretation. It is recommended that subsurface conditions interpreted through geophysical survey techniques be verified by physical sampling and/or inspection, in order to confirm and calibrate the data interpretation. Once verification data are available through future work, including excavations, borings, or other studies, Golder Associates Ltd. should be requested to re-evaluate the interpretations, conclusions and recommendations of this report, and to provide amendments, as required.
July 2018 Report No. 00660-GAL-EN-RP-0002_1
Attachment NEB 1.19-1
TRANSCANADA WASML LOOP (ROCKYVIEW SECTION) BOW RIVER AND HWY 1A CROSSINGS
FIGURES
July 2018 Report No. 00660-GAL-EN-RP-0002_1
Attachment NEB 1.19-1
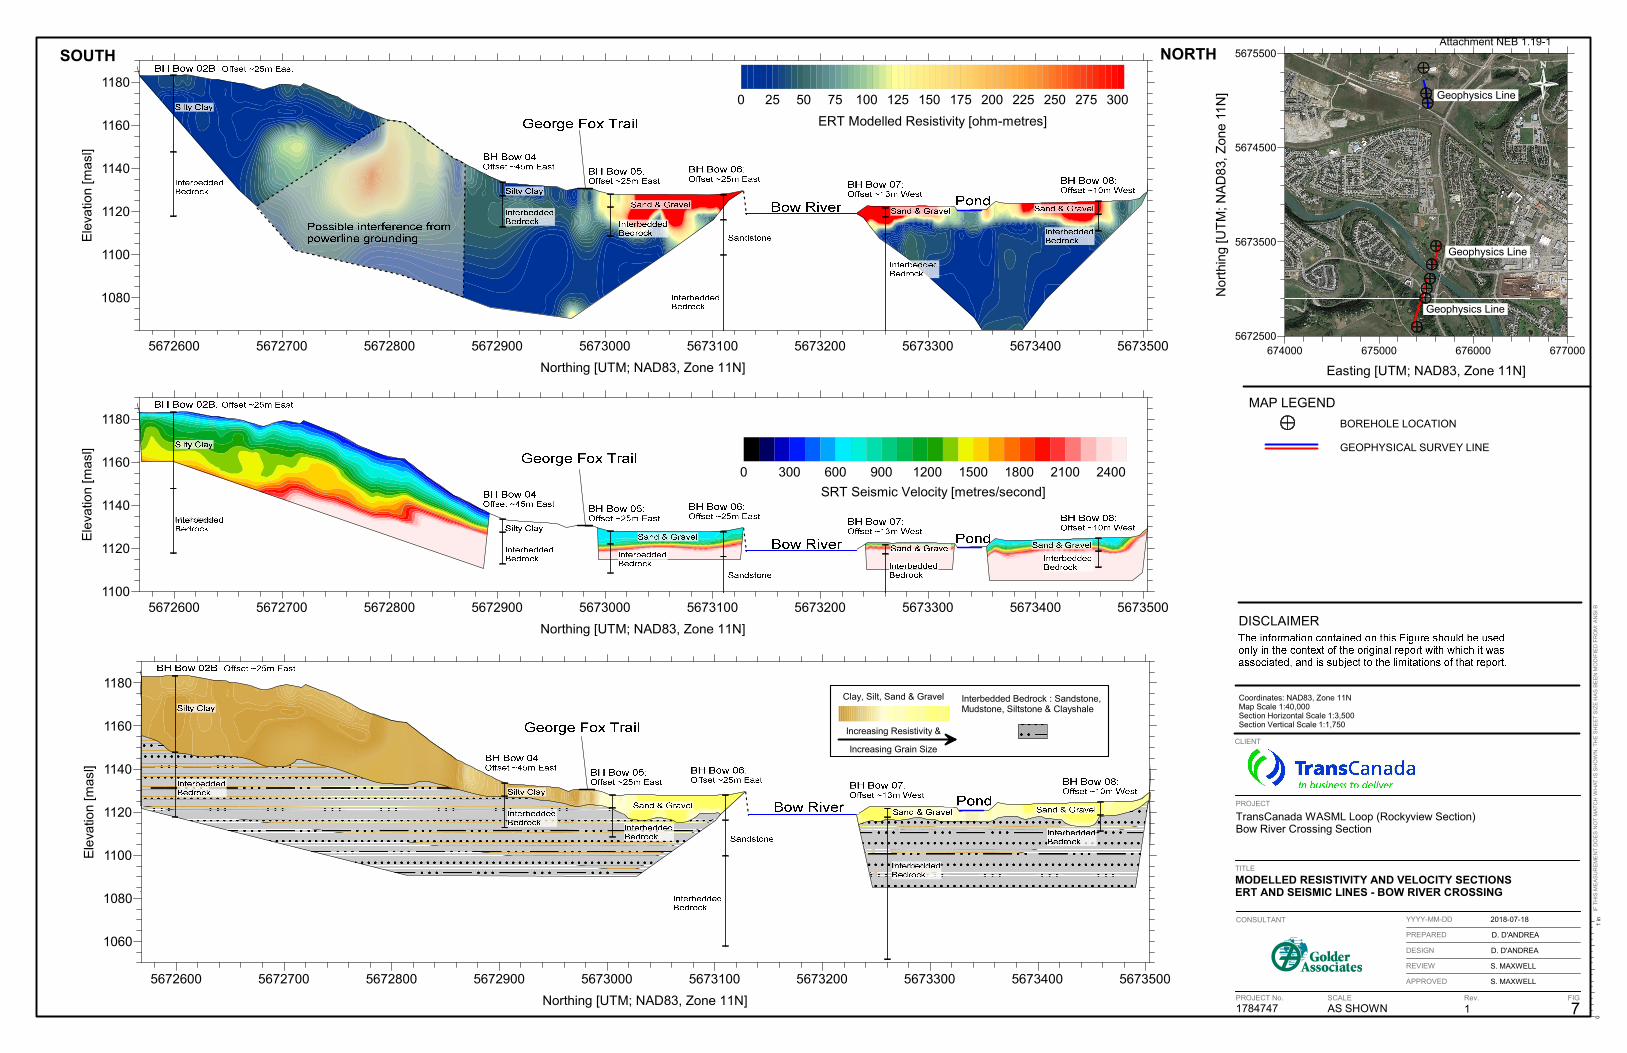
01
inIF
TH
IS M
EA
SU
RE
ME
NT
DO
ES
NO
T M
AT
CH
WH
AT
IS S
HO
WN
, TH
E S
HE
ET
SIZ
E H
AS
BE
EN
MO
DIF
IED
FR
OM
: AN
SI
B
TITLE
PROJECT No. Rev.
PROJECT
CLIENT
CONSULTANT
DESIGN
PREPARED
REVIEW
APPROVED
YYYY-MM-DD
FIGSCALE
7
S. MAXWELL
S. MAXWELL
D. D'ANDREA
D. D'ANDREA
2018-07-18
1AS SHOWN1784747
MODELLED RESISTIVITY AND VELOCITY SECTIONSERT AND SEISMIC LINES - BOW RIVER CROSSING
TransCanada WASML Loop (Rockyview Section)Bow River Crossing Section
Coordinates: NAD83, Zone 11NMap Scale 1:40,000Section Horizontal Scale 1:3,500Section Vertical Scale 1:1,750
MAP LEGEND
BOREHOLE LOCATION
GEOPHYSICAL SURVEY LINE
DISCLAIMER
SOUTH NORTH
Geophysics Line
Geophysics Line
Geophysics Line
674000 675000 676000 677000
Easting [UTM; NAD83, Zone 11N]
5672500
5673500
5674500
5675500
No
rthi
ng [U
TM
; NA
D83
, Z
one
11N
]
5672600 5672700 5672800 5672900 5673000 5673100 5673200 5673300 5673400 5673500
Northing [UTM; NAD83, Zone 11N]
1080
1100
1120
1140
1160
1180E
leva
tion
[ma
sl]
0
5672600 5672700 5672800 5672900 5673000 5673100 5673200 5673300 5673400 5673500
Northing [UTM; NAD83, Zone 11N]
1100
1120
1140
1160
1180
Ele
vatio
n [m
asl
]
5672600 5672700 5672800 5672900 5673000 5673100 5673200 5673300 5673400 5673500
Northing [UTM; NAD83, Zone 11N]
1060
1080
1100
1120
1140
1160
1180
Ele
vatio
n [m
asl
]
Interbedded Bedrock : Sandstone,Mudstone, Siltstone & Clayshale
Clay, Silt, Sand & Gravel
Increasing Resistivity &
Increasing Grain Size
0 300 600 900 1200 1500 1800 2100 2400
SRT Seismic Velocity [metres/second]
0 25 50 75 100 125 150 175 200 225 250 275 300
ERT Modelled Resistivity [ohm-metres]
Attachment NEB 1.19-1
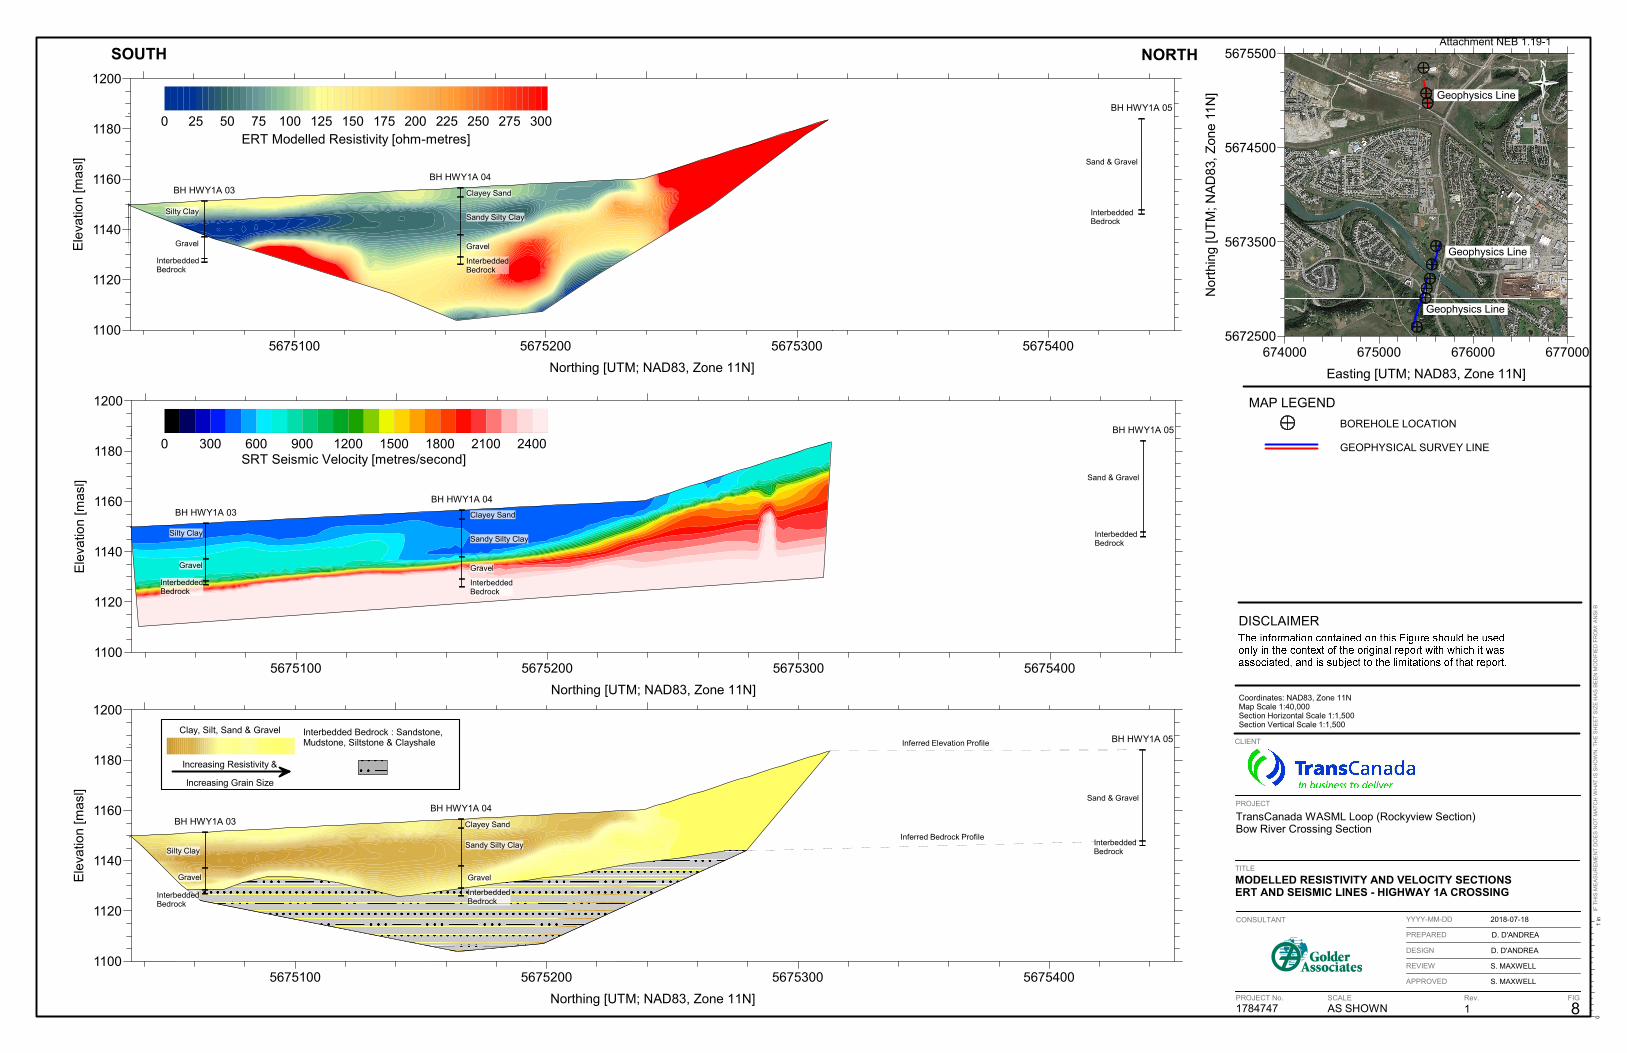
01
inIF
TH
IS M
EA
SU
RE
ME
NT
DO
ES
NO
T M
AT
CH
WH
AT
IS S
HO
WN
, TH
E S
HE
ET
SIZ
E H
AS
BE
EN
MO
DIF
IED
FR
OM
: AN
SI
B
TITLE
PROJECT No. Rev.
PROJECT
CLIENT
CONSULTANT
DESIGN
PREPARED
REVIEW
APPROVED
YYYY-MM-DD
FIGSCALE
8
S. MAXWELL
S. MAXWELL
D. D'ANDREA
D. D'ANDREA
2018-07-18
1AS SHOWN1784747
MODELLED RESISTIVITY AND VELOCITY SECTIONSERT AND SEISMIC LINES - HIGHWAY 1A CROSSING
TransCanada WASML Loop (Rockyview Section)Bow River Crossing Section
Coordinates: NAD83, Zone 11NMap Scale 1:40,000Section Horizontal Scale 1:1,500Section Vertical Scale 1:1,500
MAP LEGEND
BOREHOLE LOCATION
GEOPHYSICAL SURVEY LINE
DISCLAIMER
SOUTH NORTH
Geophysics Line
Geophysics Line
Geophysics Line
674000 675000 676000 677000
Easting [UTM; NAD83, Zone 11N]
5672500
5673500
5674500
5675500
No
rthi
ng [U
TM
; NA
D83
, Z
one
11N
]
Silty Clay
Gravel
InterbeddedBedrock
Clayey Sand
Sandy Silty Clay
Gravel
InterbeddedBedrock
InterbeddedBedrock
Sand & Gravel
BH HWY1A 03
BH HWY1A 04
BH HWY1A 05
5675100 5675200 5675300 5675400
Northing [UTM; NAD83, Zone 11N]
1100
1120
1140
1160
1180
1200E
leva
tion
[ma
sl]
Sand & Gravel
Silty Clay
Gravel
InterbeddedBedrock
Clayey Sand
Sandy Silty Clay
Gravel
InterbeddedBedrock
InterbeddedBedrock
BH HWY1A 03
BH HWY1A 04
BH HWY1A 05
5675100 5675200 5675300 5675400
Northing [UTM; NAD83, Zone 11N]
1100
1120
1140
1160
1180
1200
Ele
vatio
n [m
asl
]
Silty Clay
Gravel
InterbeddedBedrock
Clayey Sand
Sandy Silty Clay
Gravel
InterbeddedBedrock
Sand & Gravel
InterbeddedBedrock
Inferred Bedrock Profile
Inferred Elevation Profile
BH HWY1A 03
BH HWY1A 04
BH HWY1A 05
5675100 5675200 5675300 5675400
Northing [UTM; NAD83, Zone 11N]
1100
1120
1140
1160
1180
1200
Ele
vatio
n [m
asl
]
Interbedded Bedrock : Sandstone,Mudstone, Siltstone & Clayshale
Clay, Silt, Sand & Gravel
Increasing Resistivity &
Increasing Grain Size
0 25 50 75 100 125 150 175 200 225 250 275 300ERT Modelled Resistivity [ohm-metres]
0 300 600 900 1200 1500 1800 2100 2400SRT Seismic Velocity [metres/second]
Attachment NEB 1.19-1
TRANSCANADA WASML LOOP ROCKY VIEW SECTION
APPENDIX F Geologic Hazard Classification Summary
July 19, 2018 Report No. 00660-GAL-C-RP-0006_1
Attachment NEB 1.19-1
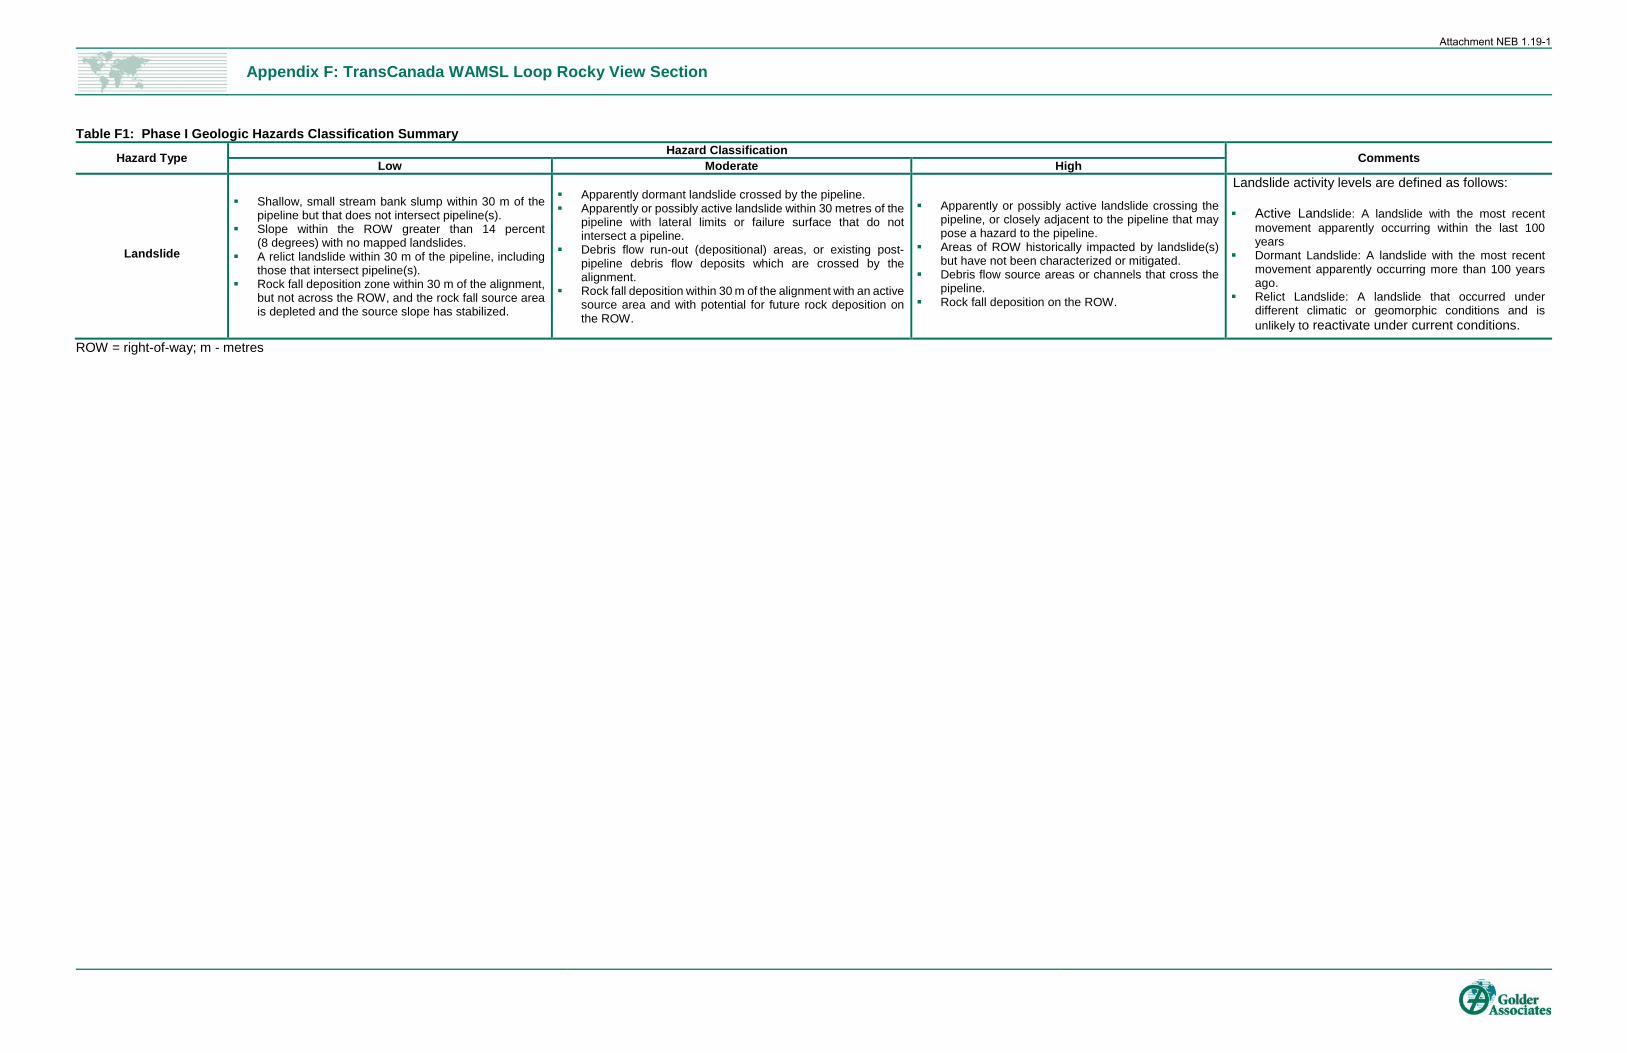
Appendix F: TransCanada WAMSL Loop Rocky View Section
Table F1: Phase I Geologic Hazards Classification Summary
Hazard Type Hazard Classification Comments Low Moderate High
Landslide
Shallow, small stream bank slump within 30 m of the pipeline but that does not intersect pipeline(s).
Slope within the ROW greater than 14 percent (8 degrees) with no mapped landslides.
A relict landslide within 30 m of the pipeline, including those that intersect pipeline(s).
Rock fall deposition zone within 30 m of the alignment, but not across the ROW, and the rock fall source area is depleted and the source slope has stabilized.
Apparently dormant landslide crossed by the pipeline. Apparently or possibly active landslide within 30 metres of the
pipeline with lateral limits or failure surface that do not intersect a pipeline.
Debris flow run-out (depositional) areas, or existing post-pipeline debris flow deposits which are crossed by the alignment.
Rock fall deposition within 30 m of the alignment with an active source area and with potential for future rock deposition on the ROW.
Apparently or possibly active landslide crossing the pipeline, or closely adjacent to the pipeline that may pose a hazard to the pipeline.
Areas of ROW historically impacted by landslide(s) but have not been characterized or mitigated.
Debris flow source areas or channels that cross the pipeline.
Rock fall deposition on the ROW.
Landslide activity levels are defined as follows: Active Landslide: A landslide with the most recent
movement apparently occurring within the last 100 years
Dormant Landslide: A landslide with the most recent movement apparently occurring more than 100 years ago.
Relict Landslide: A landslide that occurred under different climatic or geomorphic conditions and is unlikely to reactivate under current conditions.
ROW = right-of-way; m - metres
Attachment NEB 1.19-1
Golder Associates Ltd. 102, 2535 - 3rd Avenue S.E. Calgary, Alberta, T2A 7W5 Canada T: +1 (403) 299 5600
Attachment NEB 1.19-1