soils and rocks - ser digital
TRANSCRIPT

Executive BoardAlberto Sayão Ian Schumann MartinsPontifical Catholic University of Rio de Janeiro, Brazil Federal University of Rio de Janeiro, Brazil
Jorge Almeida e Sousa João MaranhaUniversity of Coimbra, Portugal LNEC, Portugal
Associate EditorsH. Einstein E. Maranha das Neves Harry G. PoulosMIT, USA Lisbon Technical University, Portugal University of Sidney, Australia
John A. Hudson Nielen van der Merve Niek RengersImperial College, UK University of Pretoria, South Africa ITC, The Netherlands
Kenji Ishihara Paul Marinos Fumio TatsuokaUniversity of Tokyo, Japan NTUA, Greece Tokyo University of Science, Japan
Michele Jamiolkowski James K. Mitchell Luiz González de VallejoStudio Geotecnico Italiano, Italy Virginia Tech., USA UCM, Spain
Willy A. Lacerda Lars Persson Roger FrankCOPPE/UFRJ, Brazil SGU, Sweden ENPC-Cermes, France
Editorial Board MembersRoberto F. Azevedo Orencio Monje Vilar R. Jonathan FanninFederal University of Viçosa, Brazil University of São Paulo at São Carlos, Brazil University of British Columbia, Canada
Milton Kanji Maria Eugenia Boscov Laura CaldeiraUniversity of São Paulo, Brazil University of São Paulo, Brazil LNEC, Portugal
Antonio M.S. Oliveira Vinod Garga António S. CardosoUniversity of Guarulhos, Brazil University of Ottawa, Canada University of Porto, Portugal
Omar Y. Bitar Richard J. Bathurst José D. RodriguesIPT, Brazil Royal Military College of Canada Consultant, Portugal
Lázaro V. Zuquette Robert Mair António G. CoelhoUniversity of São Paulo, Brazil University of Cambridge, UK Consultant, Portugal
Fabio Taioli Serge Leroueil Luís R. SousaUniversity of São Paulo, Brazil University of Laval, Canada University of Porto, Portugal
Tarcisio Celestino Mario Manassero Rui M. CorreiaUniversity of São Paulo-SC, Brazil Politécnico di Torino, Italy LNEC, Portugal
Roberto Q. Coutinho Luis Valenzuela João MarcelinoFederal Univ. of Pernambuco, Brazil Consultant, Chile LNEC, Portugal
Nilo C. Consoli Jorge G. Zornberg António C. MineiroFederal Univ. Rio Grande do Sul, Brazil University of Texas/Austin, USA University of Lisbon, Portugal
Sandro S. Sandroni Andrew Whittle António P. CunhaConsultant, Brazil MIT, USA LNEC, Portugal New
Sérgio A.B. Fontoura Pierre Bérest António G. CorreiaPontifical Catholic University, Brazil LCPC, France University of Minho, Portugal
Ennio M. Palmeira Peter Kaiser Carlos D. GamaUniversity of Brasilia, Brazil Laurentian University, Canada Lisbon Technical University, Portugal
Luciano Décourt He Manchao José V. LemosConsultant, Brazil CUMT, China LNEC, Portugal
Faiçal Massad Teruo Nakai Nuno GrossmannUniversity of São Paulo, Brazil Nagoya Inst. Technology, Japan LNEC, Portugal
Marcus Pacheco Claudio Olalla Luís L. LemosUniversity of the State of Rio de Janeiro, Brazil CEDEX, Spain University of Coimbra, Portugal
Paulo Maia Frederick Baynes Ricardo OliveiraUniversity of Northern Rio de Janeiro, Brazil Baynes Geologic Ltd., Australia COBA, Portugal
Renato Cunha R. Kerry RoweUniversity of Brasília, Brazil Queen’s University, Canada
SOILS and ROCKSAn International Journal of Geotechnical and Geoenvironmental Engineering
Editor Waldemar Coelho Hachich - University of São Paulo, Brazil
Co-editor Manuel Matos Fernandes - University of Porto, Portugal
Special Issue: In Situ Testing for Ground CharacterizationGuest-editors: Roberto Quental Coutinho - Universidade Federal de Pernambuco, Brazil
António Viana da Fonseca - University of Porto, Portugal

Soils and Rocks
1978, 1 (1, 2)1979, 1 (3), 2 (1,2)1980-1983, 3-6 (1, 2, 3)1984, 7 (single number)1985-1987, 8-10 (1, 2, 3)1988-1990, 11-13 (single number)1991-1992, 14-15 (1, 2)1993, 16 (1, 2, 3, 4)1994-2010, 17-33 (1, 2, 3)2011, 34 (1, 2, 3, 4)2012-2013, 35-36 (1, 2, 3)2014, 37 (1, 2, 3)
ISSN 1980-9743 CDU 624.131.1
Soils and Rocks publishes papers in English in the broad fields of Geotechnical Engineering, Engineering Geology and Geo-environmental Engineering. The Journal is published in April, August and December. Subscription price is US$ 90.00 per year. The jour-nal, with the name “Solos e Rochas”, was first published in 1978 by the Graduate School of Engineering, Federal University of Rio deJaneiro (COPPE-UFRJ). In 1980 it became the official magazine of the Brazilian Association for Soil Mechanics and Geotechnical Engi-neering (ABMS), acquiring the national character that had been the intention of its founders. In 1986 it also became the official Journal ofthe Brazilian Association for Engineering Geology and the Environment (ABGE) and in 1999 became the Latin American GeotechnicalJournal, following the support of Latin-American representatives gathered for the Pan-American Conference of Guadalajara (1996). In2007 the journal acquired the status of an international journal under the name of Soils and Rocks, published by the Brazilian Associationfor Soil Mechanics and Geotechnical Engineering (ABMS), Brazilian Association for Engineering Geology and the Environment(ABGE) and Portuguese Geotechnical Society (SPG). In 2010, ABGE decided to publish its own journal and left the partnership.

ARTICLESExamination of the Potential of the Seismic Dilatometer (SDMT) to Estimate In Situ Stiffness
Decay Curves in Various Soil TypesS. Amoroso, P. Monaco, B.M. Lehane, D. Marchetti 177
An Approach to Derive Strength Parameters of Residual Soils from DMT ResultsN. Cruz, C. Rodrigues, A. Viana da Fonseca 195
A View of Pressuremeter Testing in North AmericaJ. Benoît, J.A. Howie 211
Penetration Rate Ef on Cone Resistance: Insights From Calibration Chamber and Field TestingR. Salgado, M. Prezzi 233
Energy Measurement in the Brazilian SPT SystemC.M. Santana, F.A.B. Danziger, B.R. Danziger 243
Geotechnical Characterization of Suape Soft Clays, BrazilR.Q. Coutinho, M.I.M.C.V. Bello 257
On the Characterization and Classification of Bauxite TailingsF. Schnaid, H.P. Nierwinski, J. Bedin, E. Odebrecht 277
ISSN 1980-9743
SOILS and ROCKSAn International Journal of Geotechnical and Geoenvironmental Engineering
Publication ofABMS - Brazilian Association for Soil Mechanics and Geotechnical Engineering
SPG - Portuguese Geotechnical SocietyVolume 37, N. 3, September-December 2014
Table of Contents


Articles
Soils and Rocksv. 37, n. 3


Examination of the Potential of the Seismic Dilatometer(SDMT) to Estimate In Situ Stiffness Decay Curves
in Various Soil TypesS. Amoroso, P. Monaco, B.M. Lehane, D. Marchetti
Abstract. This paper illustrates the use of the seismic dilatometer (SDMT) to assess the decay of in-situ stiffness withstrain level in different soil types. The approach adopted in this study relies on the ability of the SDMT to provide routinelyat each test depth both a small strain stiffness (G0 from VS) and a working strain stiffness (constrained modulus MDMT
derived from the usual DMT interpretation). At various test sites, working strain DMT moduli are compared with referencestiffness decay curves back-figured from (i) the behavior observed under a full-scale test embankment (at Treporti) orfootings (in Texas), (ii) from laboratory tests (at L’Aquila, Fucino plain and Po plain) and (iii) various combinations of in-situ and laboratory testing techniques (Western Australia). Typical ranges of the shear strains �DMT associated with workingstrain DMT moduli are inferred to assist construction of stiffness - strain decay curves for different soil types.Keywords: seismic dilatometer, in situ stiffness decay curves, working strain stiffness, small strain stiffness.
1. Introduction
Methods for deriving stiffness decay curves (G-�curves or similar, G = shear modulus, � = shear strain) fromin situ tests have been proposed by various Authors e.g.Robertson & Ferrera (1993) and Fahey (1998) used the un-load-reload (u-r) cycles from self-boring pressuremetertests; Mayne et al. (1999) and Marchetti et al. (2008) em-ployed the SDMT; Elhakim & Mayne (2003) and Mayne(2003) adopted the seismic cone tests (SCPTs) whileLehane & Fahey (2004) combined the SCPT and DMT.
The seismic dilatometer (SDMT) is the combinationof the flat dilatometer (DMT) with an add-on seismic mod-ule for the measurement of the shear wave velocity VS. Theapproach adopted in this study relies on the ability of theSDMT to provide routinely, at each test depth, both thestiffness at small strains (the small strain shear modulus G0
obtained from the shear wave velocity VS as G0 = � VS
2) andthe stiffness at operative strains (as represented by the con-strained modulus MDMT obtained by the usual DMT interpre-tation). The potential for these two stiffness values toprovide guidance when selecting the G-� curve of a soil ele-ment is examined.
2. Flat Dilatometer Test (DMT)The flat dilatometer, introduced by Marchetti (1980),
consists of a steel blade having a thin, expandable, circularsteel membrane mounted on one face. When at rest, themembrane is flush with the surrounding flat surface of theblade. The blade is connected, by an electro-pneumatic
tube running through the insertion rods, to a control unit onthe surface (Figs. 1a and 1b). The control unit is equippedwith pressure gauges, an audio-visual signal, a valve forregulating gas pressure (provided by a tank) and ventvalves. The blade is advanced into the ground using com-mon field equipment, i.e. penetrometers normally used forthe cone penetration test (CPT) or drill rigs.
The test starts by inserting the dilatometer into theground. When the blade has advanced to the desired testdepth, the penetration is stopped. The operator inflates themembrane and takes, in about 30 sec, two readings: the Apressure, required to just begin to move the membrane(“lift-off” pressure), and the B pressure, required to expandthe membrane center of 1.1 mm against the soil. A thirdreading C (“closing pressure”) can also optionally be takenby slowly deflating the membrane soon after B is reached.The blade is then advanced to the next test depth, with adepth increment of typically 20 cm.
The interpretation proceeds as follows. First the fieldreadings are used to derive the DMT intermediate parame-ters material index ID, horizontal stress index KD, dilato-meter modulus ED. Then ID, KD, ED are used, by means ofcommonly used correlations, to estimate the constrainedmodulus M, the undrained shear strength su, the in situ earthpressure coefficient K0 (clays), the overconsolidation ratioOCR (clays), the friction angle �’ (sands), the bulk unitweight �. Consolidation and permeability coefficients maybe estimated by performing dissipation tests. The
Soils and Rocks, São Paulo, 37(3): 177-194, September-December, 2014. 177
Sara Amoroso, Researcher, Department of Seismology and Tectonophysics, Istituto Nazionale di Geofisica e Vulcanologia, Italy. e-mail: [email protected] Monaco, Assistant Professor, Department of Civil, Architectural and Environmental Engineering, University of L’Aquila, Italy. e-mail: [email protected] M. Lehane, Winthrop Professor, School of Civil, Environmental and Mining Engineering, University of Western Australia, Western Australia. e-mail:[email protected] Marchetti, Engineer, Studio Prof. Marchetti, Italy. e-mail: [email protected] on March 2, 2014; Final Acceptance on December 15, 2014; Discussion open until April 30, 2015.

C-reading, in sand, approximately equals the equilibriumpore pressure.
More detailed information on the DMT equipment,test procedure and all the interpretation formulae may befound in the comprehensive report by ISSMGE TechnicalCommittee TC16 (Marchetti et al., 2001).
3. Seismic Dilatometer Test (SDMT)
The seismic dilatometer (SDMT) is a combination ofthe mechanical flat dilatometer (DMT) with an add-on seis-mic module for measuring the shear wave velocity VS. Firstintroduced by Hepton (1988), the SDMT was subsequentlyimproved at Georgia Tech, Atlanta, USA (Martin &Mayne, 1997, 1998; Mayne et al., 1999). A new SDMTsystem (Figs. 1b and 1c) has been more recently developedin Italy (Marchetti et al., 2008).
The seismic module (Fig. 1b) is a cylindrical elementplaced above the DMT blade, equipped with two receiversspaced at 0.50 m. The shear wave source, located at groundsurface, is an automatic hammer or a pendulum hammer(� 10 kg) which hits horizontally a steel rectangular platepressed vertically against the soil (by the weight of thetruck) and oriented with its long axis parallel to the axis ofthe receivers, so that they can offer the highest sensitivity tothe generated shear wave. When a shear wave is generatedat the surface (Fig. 1c), it reaches first the upper receiver,then, after a delay, the lower receiver. The seismograms ac-quired by the two receivers, amplified and digitized atdepth, are transmitted to a PC at the surface, which deter-mines the delay. VS is obtained as the ratio between the dif-ference in distance between the source and the two receiv-ers (S2 - S1) and the delay of the arrival of the impulse fromthe first to the second receiver (�t).
The determination of the delay from SDMT seis-mograms, normally obtained using a cross-correlation al-gorithm rather than relying on the first arrival time orspecific single points in the seismogram, is generally well
conditioned. The true-interval test configuration with tworeceivers avoids possible inaccuracy in the determinationof the “zero time” at the hammer impact, sometimes ob-served in the pseudo-interval one-receiver configuration.Moreover, the couple of seismograms recorded by the tworeceivers at a given test depth corresponds to the same ham-mer blow and not to different blows in sequence, which arenot necessarily identical. Hence the repeatability of VS mea-surements is considerably improved (observed VS repeat-ability � 1%, i.e. a few m/s). VS measurements are takenevery 0.50 m of depth (while the mechanical DMT readingsare taken every 0.20 m). Validations of VS measurements bySDMT by comparison with VS measured by other in situseismic tests at various research sites are reported by Mar-chetti et al. (2008).
4.Tentative Method for Deriving in situ G-�Decay Curves from SDMT
Marchetti et al. (2008) first proposed the possible useof the SDMT for deriving in situ elemental soil stiffnessvariations with strain level (G-� curves or similar). Suchcurves could be tentatively constructed by fitting “refer-ence typical-shape” laboratory G-� curves through twopoints, both obtained by SDMT: (1) the initial small strainmodulus G0 (obtained as G0 = � VS
2), and (2) a workingstrain modulus GDMT.
To locate the second point on the G-� curve it is nec-essary to know, at least approximately, the elemental shearstrain corresponding to GDMT. Indications by Mayne (2001)locate the DMT moduli at an intermediate level of strain (�� 0.05-0.1%) along the G-� curve. Similarly Ishihara(2001) classified the DMT within the group of methods ofmeasurement of soil deformation characteristics involvingan intermediate level of strain (0.01-1%). The above quali-tative indications are investigated in this paper.
178 Soils and Rocks, São Paulo, 37(3): 177-194, September-December, 2014.
Amoroso et al.
Figure 1 - (a) Schematic layout of the flat dilatometer test. (b) Seismic dilatometer equipment. (c) Schematic layout of the seismicdilatometer test (Marchetti et al., 2001; Marchetti et al., 2008).

As suggested by Marchetti et al. (2008), a workingstrain shear modulus GDMT can be derived from the con-strained modulus MDMT provided by the usual DMT inter-pretation (Marchetti, 1980, Marchetti et al., 2001). As afirst approximation, by referring to linear elasticity:
G MDMT DMT��
�1 2
2 1
( )
(1)
where = Poisson’s ratio. E.g. assuming a typical drained of 0.2 (noting that MDMT is a drained modulus), the workingstrain shear modulus may be obtained from Eq. 1 asGDMT = 0.375 MDMT. It should be noted that correlations be-tween the DMT parameters (ED and KD) and MDMT proposedby Marchetti (1980) are based on the assumption that MDMT
represents a reasonable estimate of the “operative” ordrained working strain modulus (i.e. the modulus that,when introduced into the linear elasticity formulae, pro-vides realistic estimates of the settlement of a shallow foun-dation under working loads). This assumption is supportedby the good agreement observed in a large number of welldocumented comparisons between measured and DMT-predicted settlements or moduli (see Monaco et al., 2006;Marchetti et al., 2008).
The use of the SDMT to assess the in situ decay ofstiffness at various test sites is explored in the followingsections using data obtained in different soil types andwhere both SDMT data and “reference” stiffness decaycurves were available. Such stiffness decay curves were:(a) back-figured from the observed behavior under a full-scale test embankment (Treporti) or footings (Texas), (b)obtained by laboratory tests (L’Aquila, Fucino plain, Poplain), or (c) reconstructed by the combined use of differentin situ/laboratory techniques (Western Australia). The pro-cedure adopted in all cases is as follows, and is shown sche-matically on Fig. 2:1) Using SDMT data obtained at the same depth of each
available reference stiffness decay curve, a workingstrain modulus GDMT (or EDMT) is derived from MDMT and
normalized by its small strain value G0 (or E0) derivedfrom VS.
2) The GDMT/G0 (or EDMT/E0) horizontal ordinate line is super-imposed to the same-depth experimental stiffness de-cay curve, in such a way that the data point ordinatematches the curve;
3) The “intersection” of the GDMT/G0 (or EDMT/E0) horizontalordinate line with the stiffness decay curve provides ashear strain value referred to here as �DMT.
5. Stiffness Decay by SDMT at Various TestSites
5.1. Treporti, Venice (Italy)
A full-scale vertically-walled cylindrical test em-bankment (40 m diameter, 6.7 m height, applied load106 kPa) was constructed at the site of Treporti, Venice (It-aly) where ground conditions are typical of the highly het-erogeneous, predominantly silty deposits of the Venicelagoon. Pore pressures, surface settlements, horizontalmovements and vertical displacements were monitoredcontinuously and at various depths; see Simonini (2006).The Treporti test site was investigated extensively bymeans of piezocone tests (Gottardi & Tonni, 2004), flatdilatometer tests (Marchetti et al., 2004), seismic piezo-cone tests and seismic dilatometer tests (McGillivray &Mayne, 2004), continuous coring boreholes and high qual-ity laboratory tests (Simonini et al., 2006). Significant re-sults of the experimental program at Treporti have alreadybeen published by various research groups.
Figure 3 shows the profiles of the DMT parameters atTreporti, namely the material index ID, the constrainedmodulus MDMT, the undrained shear strength su and the hori-zontal stress index KD from DMT 14 at the centre of the em-bankment, as well as the profiles of VS obtained fromSDMT 14 (McGillivray & Mayne, 2004), before startingthe construction of the embankment (2002).
The Treporti embankment research has provided aunique opportunity to investigate the decay of soil stiffnessin situ (Monaco et al., 2014). Besides the moduli at the endof construction, moduli were also back-calculated in the el-ements on the centerline from local vertical strains v mea-sured during construction, under each load increment (fromsmall to working strains). The stiffness considered in thissection is the Young’s modulus E.
In situ secant Young’s moduli E were back-calculatedat the mid-height of each 1 m soil layer as E = (��v - 2 ��r)/v, assuming vertical and radial stress increments ��v
and ��r according to the theory of elasticity, v obtainedfrom extensometer data at the centre of the embankmentunder each load increment during construction (Marchettiet al., 2006). Figure 4a shows the moduli corresponding tothe first construction step (H = 0.5 m), to half-bank(H = 3.5 m) and to the construction end (H = 6.7 m). In thesame figure, the small strain modulus E0, derived from VS
Examination of the Potential of the Seismic Dilatometer (SDMT) to Estimate In Situ Stiffness Decay Curves in Various Soil Types
Soils and Rocks, São Paulo, 37(3): 177-194, September-December, 2014. 179
Figure 2 - Procedure to derive in situ G-� decay curves fromSDMT.

measured by SDMT, and the modulus EDMT derived fromMDMT are shown for comparative purposes, assuming elas-
ticity theory and a Poisson’s ratio = 0.15 for both cases(hence EDMT = 0.95 MDMT). Figure 4a shows the progressivereduction of the back-calculated moduli E under increasingload. Such reduction should reflect the combined effects ofthe increase in stiffness with stress level and the reductionin stiffness with strain level.
In order to separate the two effects, the dependence ofE on current stress level was taken into account, as a firstapproximation, by use of the Janbu’s relation:
E K ppE a
v
a
n
��
��
�
��
�(2)
where KE = modulus number, pa = reference atmosphericpressure (100 kPa), �’v = current vertical effective stress,and n = exponent, generally varying between 0.5 to 1 andassumed here to equal 0.5, following the observations ofCola & Simonini (2002). The variation of the modulusnumber KE in Eq. 2 corresponding to E back-calculated un-der each load increment is represented in Fig. 4b, whicheven more clearly shows the decay of stiffness, normalizedfor the effect of stress level, with increasing strain.
180 Soils and Rocks, São Paulo, 37(3): 177-194, September-December, 2014.
Amoroso et al.
Figure 3 - Profiles of soil parameters from DMT 14 at the bank center (Marchetti et al., 2004) and VS profiles from SDMT 14(McGillivray & Mayne, 2004) before embankment construction.
Figure 4 - Variation of (a) secant Young’s modulus E, and (b) corresponding modulus number KE (Eq. 2), back-calculated from local v
measured at the center under various embankment loads throughout construction (Monaco et al., 2014, with permission from ASCE).

In situ decay curves of soil stiffness with strain level(Fig. 5) were reconstructed from the back-calculatedmoduli at the mid-height of each 1 m soil layer. To accountfor the effect of varying stress level, such in situ curves areexpressed in terms of variation of the ratio KE/KE0, where KE
and KE0 are respectively the modulus number correspond-ing to E back-calculated for each load increment and to theinitial modulus E0 (KE0 is obtained by Eq. 2 for E = E0 and�’v = �’v0). The two sets of curves in Fig. 5 are representa-tive of two distinct soil layers: (a) the sand layer between 2to 8 m depth, and (b) the low plasticity (plasticity indexPI = 8-12%, Simonini et al., 2006) silt layer between 8 to20 m depth (which contributed most of the observed settle-ment). Note that the initial part of the curves in Fig. 5 atsmall strains is missing, since the extensometers did notprovide reliable measurements of v less than about 0.01-0.5%.
At Treporti test site, using SDMT results obtained atthe depth of each back-figured in situ stiffness decay curvein Fig. 5, Young’s moduli EDMT were derived from MDMT us-
ing elasticity theory and normalized by their small strainvalues E0 derived from VS. The EDMT moduli were derivedfrom the constrained moduli MDMT, using the theory of elas-ticity, by Eq. 3:
EM
DMTDMT�
� �
�
( )( )
( )
1 1 2
1
(3)
assuming = 0.15, hence EDMT = 0.95 MDMT.
The dots in Fig. 5 are the intersection between the insitu decay curve at a given depth and the horizontal linehaving as ordinate the ratio KE/KE0 corresponding to EDMT/E0
at the same depth. Such “intersections” provided the valuesof the associated abscissas, i.e. the vertical strains v in thiscase. The rectangular shaded areas in Figs. 5a and 5b de-note, for each soil layer, the range of values of the ratioKE/KE0 corresponding to EDMT/E0 and the associated range ofvertical strains: v � 0.01 to 0.1% in sand, � 0.3 to 1% in silt(Monaco et al., 2014).
Hence, the ratio GDMT/G0 was calculated by using thetheory of elasticity (Eq. 4), while the corresponding shearstrain �DMT was obtained by Eqs. 5, 6, as introduced byAtkinson (2000):
GE
DMTDMT��2 1( )
(4)
assuming = 0.15, hence GDMT = 0.43 EDMT.
s v� �( )1 (5)
� DMT s�3
2(6)
where s = shear strain for the individual soil elements.
The values of the normalized working strain shearmodulus GDMT/G0 range from 0.18 to 0.24 in sand and 0.02 to0.12 in silt, while the range of values of the shear strain �DMT
are 0.02% to 0.14% in sand, 0.50% to 1.65% in silt.
5.2. Texas A&M University National Geotechnical Ex-perimentation Site (U.S.A.)
In 1994 a Spread Footing Prediction Symposium wasconducted at the Texas A&M University National Geo-technical Experimentation Site, as part of the ASCE Geo-technical Specialty Conference Settlement ’94. Five squarefootings, ranging in size from 1 to 3 m, were constructedand tested to obtain the complete load-settlement curves(Gibbens & Briaud, 1994a). The test site, composed of me-dium dense silty fine sand, was extensively investigated byseveral in situ tests (SPT, CPTU, DMT, borehole pres-suremeter, Cross-Hole, borehole shear test and step bladetest). Laboratory triaxial and resonant column tests wereexecuted on reconstituted samples (Gibbens & Briaud,1994b). Figure 6 plots the DMT profiles (DMT 1, DMT 2),
Examination of the Potential of the Seismic Dilatometer (SDMT) to Estimate In Situ Stiffness Decay Curves in Various Soil Types
Soils and Rocks, São Paulo, 37(3): 177-194, September-December, 2014. 181
Figure 5 - Curves of decay of soil stiffness with vertical strainback-calculated from local v measurements (curves labeled “Insitu curves”) in the sand layer 2 to 8 m depth (box a) and in the siltlayer 8 to 20 m depth (box b). The dots are the intersection be-tween the curve at a given depth and the horizontal line having asordinate the ratio KE/KE0 corresponding to EDMT/E0 at the samedepth. Such “intersections” provided the values of the associatedabscissas v (Monaco et al., 2014, with permission from ASCE).

in terms of the material index ID, the constrained modulusM, the friction angle �’ and the horizontal stress index KD.
Figure 7 shows the in situ stiffness decay curve recon-structed by Berardi (1999) based on the observed perfor-mance of the footings. The Young’s modulus E was back-figured from the observed load-settlement curves by use ofa non linear iterative approach. The influence of currentstress level was considered “implicit” in the E values deter-mined over a limited influence depth, assumed within B and2B (B = footing width). In Fig. 7 the decay of E, normalizedto its initial value E0, is plotted as a function of the relativedisplacement w/B% (footing settlement w/ width B).
From the results of two DMTs executed at the TexasA&M University test site, Young’s moduli EDMT (averagevalues over an influence depth assumed within B and 2B)were derived from MDMT by Eq. 3, assuming = 0.2. The ini-tial values of E0 over the same depth interval were derivedfrom VS measured by Cross-Hole via elasticity theory (for = 0.2). In Fig. 7 the data points corresponding to EDMT/E0
for each footing size (3 m, 2 m, 1.5 m and 1 m) are superim-posed to the E/E0 - w/B curve reconstructed by Berardi(1999). The “intersection” of the DMT data points with the
observed in situ decay curve indicates that the moduli esti-mated from DMT are located in a range of relative displace-ment w/B � 0.25 to 0.45%.
Hence, the ratio GDMT/G0 was calculated by using thetheory of elasticity (Eq. 4), while the corresponding shearstrain �DMT was obtained by Eqs. 6, 7, as introduced byAtkinson (2000):
v
w
B�
3(7)
The values of the normalized working strain shearmodulus GDMT/G0 range from 0.20% to 0.25%, while therange of values of the shear strain �DMT are 0.02 to 0.14% insand, 0.13 to 0.23% in silt.
5.3. L’Aquila (Italy)
Following the destructive April 6, 2009 earthquake(moment magnitude Mw = 6.3), the area of L’Aquila was ex-tensively investigated by a variety of geotechnical and geo-physical testing techniques, involving several workinggroups. Soon after the earthquake site investigations, in-cluding Down-Hole, surface wave tests and SDMT, wereconcentrated at a number of sites selected for the construc-tion of new temporary houses for the homeless people(C.A.S.E. Project). Advanced cyclic/dynamic laboratorytests, including resonant column/torsional shear tests (RC-CTS) and double sample direct simple shear tests(DSDSS), were carried out on undisturbed samples fromseveral C.A.S.E. sites, in medium- to fine-grained soils, bya network of Italian soil dynamics laboratories. Details anddata are reported in Monaco et al. (2012); Santucci deMagistris et al. (2013); Monaco et al. (2013). The availabil-ity of both SDMT and laboratory test results at threeC.A.S.E. sites (Cese di Preturo, Pianola, Roio Piano) per-mitted some calibration of empirical estimates of non-linear parameters from SDMT (Amoroso et al., 2012).
Coupled data from SDMT and resonant column/tor-sional shear tests were also obtained from an extensivegeotechnical investigation performed in the Southern partof the city centre of L’Aquila for the reconstruction of sev-eral damaged buildings (Totani et al., 2012; Amoroso et al.,2015).
182 Soils and Rocks, São Paulo, 37(3): 177-194, September-December, 2014.
Amoroso et al.
Figure 6 - DMT profiles at Texas A&M University National Geotechnical Experimentation Site (after Gibbens & Briaud, 1994b).
Figure 7 - Stiffness decay curve at Texas A&M University Na-tional Geotechnical Experimentation Site (Berardi, 1999) and su-perimposed EDMT/E0 data points (Amoroso et al., 2012).

Table 1 reports the values of the shear wave velocityVS measured by SDMT, the small strain shear modulus G0
in situ obtained from VS, the constrained modulus MDMT ob-tained from the SDMT at the depth of the samples tested inthe laboratory, the working strain shear modulus GDMT cal-
culated using Eq. 1, assuming = 0.2, and the plasticityindex PI. The values of the normalized working strainshear modulus GDMT/G0, also reported in Table 1, result0.10 to 0.23 in silt and clay, 0.37 in silty sand. Figure 8plots the SDMT profiles, in terms of the material index ID,the constrained modulus M, the undrained shear strength
su, the horizontal stress index KD and the shear wave veloc-ity VS at the four mentioned sites. In Fig. 9 each GDMT/G0
data point (grey symbols) is superimposed on the corre-sponding same-depth laboratory G/G0 curve (RC tests byUniversity of Napoli Federico II, DSDSS tests by Univer-sity of Roma La Sapienza). The range of values of the
shear strain �DMT resulting from the “intersection” of theGDMT/G0 data points with the laboratory curves (rectangu-
lar areas in Fig. 9) are �DMT = 0.24 to 0.52% in silt and clay,
�DMT = 0.16% in silty sand; these are also reported inTable 1.
Examination of the Potential of the Seismic Dilatometer (SDMT) to Estimate In Situ Stiffness Decay Curves in Various Soil Types
Soils and Rocks, São Paulo, 37(3): 177-194, September-December, 2014. 183
Figure 8 - SDMT profiles at L’Aquila basin: (a) Cese di Preturo, (b) Pianola, (c) Roio Piano, (d) L’Aquila (after Monaco et al., 2012).

5.4. Fucino plain (Italy)
In 1986 a comprehensive investigation, involvingstatic and dynamic loading effects, was carried out in the na-tional research site of Fucino, Italy (Burghignoli et al.,1991). In situ tests (SPT, CPT, DMT, self-boring pres-sumeter, vane test, Down-Hole, Cross-Hole, Spectral Analy-
sis of Surface Waves) and laboratory tests (static anddynamic) were carried out to investigate the homogeneouslacustrine clay deposit to a depth of 40 m. Resonant col-umn/torsional shear tests (RC-CTS) were executed ontwelve undisturbed samples recovered from depths rangingbetween 3 and 37 m (effective vertical stress between 30 and250 kPa). Although the data points pertain to a wide range ofconsolidation stresses, the results define, within a narrowband, the strong dependence of the stiffness on the strainlevel (Burghignoli et al., 1991). In 2004 the same site in theFucino plain was investigated by seismic dilatometer (Mar-chetti et al., 2008) and the results are illustrated in Fig. 10.
Table 2 reports the values of the shear wave velocityVS measured by SDMT, the small strain shear modulus G0
in situ obtained from VS, the constrained modulus MDMT ob-tained by SDMT at the depth of the samples tested in thelaboratory, the working strain shear modulus GDMT calcu-lated by Eq. 1, assuming = 0.2, and the plasticity index PI.The values of the normalized working strain shear modulusGDMT/G0, also reported in Table 2, result 0.04 to 0.13 in clay.In Fig. 11 each GDMT/G0 data point (grey symbols) is super-imposed on the corresponding same-depth laboratory G/G0
curve (RC tests). The range of values of the shear strain �DMT
resulting from the “intersection” of the GDMT/G0 data pointswith the laboratory curves (rectangular areas in Fig. 11) are�DMT = 1.10 to 1.70% in clay; these are also reported inTable 2.
184 Soils and Rocks, São Paulo, 37(3): 177-194, September-December, 2014.
Amoroso et al.
Table 1 - L’Aquila - Values of GDMT/G0 obtained from SDMT and corresponding shear strain �DMT determined from the intersection withthe G/G0-� laboratory curves (after Amoroso et al., 2012).
Test site Sample Depth(m)
Soil type VS (m/s) G0
(MPa)MDMT
(MPa) GDMT
(MPa)GDMT/G0 �DMT (%) PI (%)
Cese di Preturo S3-C1 4.0-4.8 Silty clay 261 133 67 0.2 25 0.19 0.24 37
Cese di Preturo S3-C3 17.5-18.0 Clayey silt 274 149 39 0.2 15 0.1 0.48 37
Pianola S1-C1 6.0-6.5 Silty sand 303 195 193 0.2 72 0.37 0.16 31
Roio Piano S3-C2 7.0-7.5 Clayey silt 233 105 64 0.2 24 0.23 0.46 19
L’Aquila S1-C1 3.5-4.0 Clayey-sandy silt 344 232 97 0.2 36 0.16 0.52 31
Table 2 - Fucino plain - Values of GDMT/G0 obtained from SDMT and corresponding shear strain �DMT determined from the intersectionwith the G/G0-� laboratory curves.
Test site Sample Depth(m)
Soil type VS (m/s) G0 (MPa) MDMT
(MPa) GDMT
(MPa)GDMT/G0 �DMT (%) PI (%)
Telespazio - 5.0 Clay 70 14.7 1.4 0.2 0.5 0.04 1.70 30-70
Telespazio - 10.0 Clay 101 15.7 1.8 0.2 0.7 0.04 1.70 30-70
Telespazio - 15.0 Clay 98 17.7 2.2 0.2 0.8 0.05 1.60 30-70
Telespazio - 20.0 Clay 124 16.7 4 0.2 1.5 0.09 1.40 30-70
Telespazio - 25.0 Clay 156 16.7 5.6 0.2 2.1 0.13 1.10 30-70
Telespazio - 30.0 Clay 183 17.7 5.9 0.2 2.2 0.13 1.10 30-70
Figure 9 - Laboratory G/G0-� curves and superimposed GDMT/G0
data points at L’Aquila (after Amoroso et al., 2012).

5.5. Po plain (Italy)
The seismic sequence which affected northern Italy inMay 2012, in particular the two main shocks that occurredon May 20, 2012 (Mw = 5.8) and May 29, 2012 (Mw = 5.6),induced several cases of liquefaction and related grounddeformations.
An extensive site investigation program was subse-quently planned by the “Liquefaction Working Group”promoted by the Emilia Romagna regional government andby the national Department of Civil Protection, in additionto the existing soil investigation data base, to characterizethe soils and to define the input data necessary for site seis-mic response analyses and for assessment of liquefactionhazard (Regione Emilia Romagna - Liquefaction WorkingGroup, 2012). The available results of this investigationprogramme, illustrated in various reports and papers (e.g.Facciorusso et al., 2012, Fioravante et al., 2013), includeborehole logs, results of piezocone/seismic piezocone pen-etration tests (CPTU/SCPTU) and laboratory tests on sam-ples, including resonant column/torsional shear tests
(RC-CTS). An additional investigation involving seismicdilatometer (SDMTs), as illustrated in Fig. 12, as well asresonant column tests (RC) was carried out by the WorkingGroup S2-UR4 (2013) and focused only on the area of SanCarlo; see also Romeo et al. (2015). The town of San Carlowas constructed above the abandoned channel of the RenoRiver, and sand is the prevailing lithology in the band nearthis paleo-channel. Part of the town was built on the ancientbanks of the Reno River.
The availability of results from both SDMT and labo-ratory resonant column (RC) tests on undisturbed samplestaken in nearby boreholes in the area of San Carlo permittedsome calibration of empirical estimates of non-linear pa-rameters from SDMT.
Table 3 reports the values of the shear wave velocityVS measured by SDMT, the small strain shear modulus G0
in situ obtained from VS, the constrained modulus MDMT ob-tained from SDMTs performed at the depth of the samplestested in the laboratory, the working strain shear modulusGDMT calculated by Eq. 1, assuming = 0.2, and the plastic-ity index PI. The values of the normalized working strainshear modulus GDMT/G0 range from 0.07 to 0.10 in silt andclay, and 0.06 to 0.32 in silty sand; see Table 3. In Fig. 13each GDMT/G0 data point (black and grey symbols) is super-imposed on the corresponding same-depth laboratory G/G0
curve (RC tests). The range of values of the shear strain �DMT
resulting from the “intersection” of the GDMT/G0 data pointswith the laboratory curves (rectangular areas in Fig. 13) are�DMT = 0.32% to 0.47% in silt and clay, �DMT = 0.07 to 0.30%in silty sand; see Table 3.
5.6. Western Australia
The G/G0-� decay curves presented in this sectionwere obtained at five different test sites in Western Austra-lia (Shenton Park, Ledge Point, Perth CBD, East Perth,Margaret River). Such curves were constructed based onthe results of several in situ tests, including flat/seismicdilatometer tests (DMT/SDMT), seismic cone penetrationtests (SCPT), self-boring pressuremeter tests (SBP) and
Examination of the Potential of the Seismic Dilatometer (SDMT) to Estimate In Situ Stiffness Decay Curves in Various Soil Types
Soils and Rocks, São Paulo, 37(3): 177-194, September-December, 2014. 185
Figure 10 - SDMT profiles at Fucino plain (Marchetti et al., 2008).
Figure 11 - Laboratory G/G0-� curve (Burghignoli et al., 1991)and superimposed GDMT/G0 data points at Fucino plain.

laboratory triaxial tests. Details can be found in Amoroso(2011), Fahey et al. (2003, 2007), Lehane et al. (2007),Lehane (2010), Lehane & Fahey (2004), Schneider et al.(2008), Schneider & Lehane (2010).
Figure 14 shows the SDMT profiles, in terms of thematerial index ID, the constrained modulus MDMT, the in-ferred friction angle �’ or the undrained shear strength su,the horizontal stress index KD and the shear wave velocityVS at the three mentioned sites.
The in situ normalized G/G0-� decay curves shown inFig. 15 (Shenton Park, silica sand), Fig. 16 (Ledge Point,calcareous sand) and Fig. 17 (Perth CBD, alluvial siltyclay) were reconstructed by combining the information re-sulting from SCPT and SBP. In particular:
• the initial part of the curves (� � 0.001%) was character-ized by the small strain shear modulus G0 obtained fromVS measured by SCPT (no SDMT data were available atthese sites);
• the non-linear G/G0-� decay at medium to large shearstrains (� � 0.01%) was estimated based on SBP data, ac-cording to the procedure proposed by Jardine (1992);
• the central part of the curves (0.001% > � > 0.01%) wasdefined by simply connecting the initial part obtainedfrom SCPT (G0) and the final part obtained from SBP.
The working strain shear modulus GDMT was calcu-lated from MDMT obtained by DMT at the same depths of theSCPT and SBP data used to define the G/G0-� curve, by useof Eq. 1, assuming = 0.2 in sand in silty clay. The values
186 Soils and Rocks, São Paulo, 37(3): 177-194, September-December, 2014.
Amoroso et al.
Figure 12 - SDMT profiles at Po plain (Working Group S2-UR4, 2013).
Table 3 - Po plain - Values of GDMT/G0 obtained from SDMT and corresponding shear strain �DMT determined from the intersection withthe G/G0-� laboratory curves (after Working Group S2-UR4, 2013).
Test site Sample Depth (m) Soiltype
VS
(m/s)G0
(MPa)MDMT
(MPa) GDMT
(MPa)GDMT/G0 �DMT
(%)PI(%)
San Carlo S3 CI3 9.5-9.6 Silty sand 181 64 54 0.2 20 0.32 0.07 -
San Carlo S10 CI1 13-13.6 Silty clay 159 46 8 0.2 3 0.07 0.47 49
San Carlo S2 CI2 7.3-7.4 Sandy silt 175 53 14 0.2 5 0.10 0.32 12-17
San Carlo S11 CI1 2.0-2.6 Silty sand 205 75 23 0.2 9 0.11 0.13 -
San Carlo S11 CI2 6.0-6.6 Silty sand 157 42 7 0.2 3 0.06 0.30 -
San Carlo S11 CI3 9.0-9.6 Silty sand 170 53 14 0.2 5 0.10 0.12 -
Figure 13 - Laboratory G/G0-� curves (after Fioravante et al.,2013) and superimposed GDMT/G0 data points at Po plain.

of GDMT/G0 range from 0.10 to 0.20 in silica sand, 0.08 to0.31 in calcareous sand, 0.09 to 0.30 in silty clay; see Table4. The black and grey symbols in Figs. 15, 16 and 17 repre-sent the position of the GDMT/G0 data points on the corre-sponding in situ reference G/G0-� decay curves. The rangeof values of the shear strain �DMT resulting from the “inter-section” with the in situ G/G0-� curves (rectangular shaded
areas in Figs. 15, 16 and 17), also reported in Table 4, are
�DMT = 0.04-0.15% in sand and �DMT = 0.23-1.50% in siltyclay.
The G/G0-� decay curves shown in Fig. 18 (EastPerth, soft clay) and Fig. 19 (Margaret River, silty clay)were reconstructed by combining the information resulting
Examination of the Potential of the Seismic Dilatometer (SDMT) to Estimate In Situ Stiffness Decay Curves in Various Soil Types
Soils and Rocks, São Paulo, 37(3): 177-194, September-December, 2014. 187
Figure 14 - DMT profiles and VS profiles at different sites in Western Australia: (a) Shenton Park, (b) Ledge Point, (c) Perth CBD, (d)East Perth, (e) Margaret River (Amoroso, 2011).

from in situ SDMT and laboratory triaxial tests. In thiscase:• the initial part of the curves (� � 0.001%) was character-
ized by G0 derived from VS measured by SDMT;• the non-linear G/G0-� decay at medium to large shear
strains (� � 0.1% at Margaret River, � � 0.5% at EastPerth) was estimated from triaxial tests according toAtkinson (2000);
• the central part of the curves (0.001% > � > 0.5% at EastPerth, 0.001% > � > 0.1% at Margaret River) was definedby simply connecting the initial part obtained fromSDMT (G0) and the final part obtained from triaxial tests.
The working strain shear modulus GDMT was calcu-lated from MDMT obtained by SDMT at the same depths of
the samples tested in the laboratory by use of Eq. 1, assum-ing = 0.2 at both sites. The values of GDMT/G0 vary from0.04 in soft clay to 0.07 in silty clay; see Table 4. The valuesof the shear strain �DMT resulting from the “intersection” ofthe GDMT/G0 data points with the reconstructed referenceG/G0-� decay curves (dot symbols in Figs. 18 and 19) are5.5% in soft clay and vary from 0.23% to 1.50% in siltyclay; see Table 4.
6. Discussion
6.1. Summary of results at various test sites
Over the past decades, numerous studies have beenconducted regarding the dynamic soil properties and the
188 Soils and Rocks, São Paulo, 37(3): 177-194, September-December, 2014.
Amoroso et al.
Figure 15 - In situ G/G0-� decay curves and superimposed GDMT/G0 data points at Shenton Park (silica sand), Western Australia (Amo-roso et al., 2012).
Figure 16 - In situ G/G0-� decay curves and superimposed GDMT/G0
data points at Ledge Point (calcareous sand), Western Australia(Amoroso et al., 2012).
Figure 17 - In situ G/G0-� decay curves and superimposed GDMT/G0
data points at Perth CBD (silty clay), Western Australia (afterAmoroso et al., 2012).

Examination of the Potential of the Seismic Dilatometer (SDMT) to Estimate In Situ Stiffness Decay Curves in Various Soil Types
Soils and Rocks, São Paulo, 37(3): 177-194, September-December, 2014. 189
Figure 18 - In situ G/G0-� decay curves and superimposed GDMT/G0
data points at East Perth (soft clay), Western Australia (Amorosoet al., 2012).
Figure 19 - In situ G/G0-� decay curves and superimposed GDMT/G0
data points at Margaret River (silty clay), Western Australia(Amoroso et al., 2012).
Table 4 - Western Australia - Values of GDMT/G0 obtained from SDMT (or DMT + SCPT) and corresponding shear strain �DMT determinedfrom the intersection with the G/G0 - � reference curves at five test sites (Amoroso et al., 2012).
Test site Sample Depth(m)
Soil type VS
(m/s)G0
(MPa)MDMT
(MPa) GDMT
(MPa)GDMT/G0 �DMT
(%)PI(%)
Shenton Park BH1A 1.3 Silica sand 252 105 42 0.2 16 0.15 0.09 -
Shenton Park BH2A 1.3 Silica sand 252 105 40 0.2 15 0.14 0.07 -
Shenton Park BH2B 2.3 Silica sand 267 118 35 0.2 13 0.11 0.06 -
Shenton Park BH3A 2.3 Silica sand 267 118 33 0.2 12 0.11 0.04 -
Shenton Park BH2C 3.3 Silica sand 280 129 36 0.2 14 0.11 0.15 -
Shenton Park BH3B 3.3 Silica sand 280 129 36 0.2 13 0.10 0.09 -
Shenton Park BH1B 3.3 Silica sand 280 129 35 0.2 13 0.10 0.05 -
Shenton Park BH2D 3.9 Silica sand 282 132 42 0.2 16 0.12 0.07 -
Shenton Park BH1C 4.3 Silica sand 283 132 63 0.2 23 0.17 0.04 -
Shenton Park BH3C 4.6 Silica sand 283 132 72 0.2 27 0.20 0.05 -
Ledge Point BHB 1.3 Calcareous sand 217 78 16 0.2 6 0.08 0.09 -
Ledge Point BHB 3.3 Calcareous sand 361 215 176 0.2 76 0.31 0.06 -
Perth CBD NML4 9.45 Silty clay 334 212 52 0.2 20 0.09 0.25 20
Perth CBD NML4 10.65 Silty clay 373 264 67 0.2 25 0.10 1.45 20
Perth CBD NML4 12.05 Silty clay 388 286 130 0.2 49 0.17 0.45 20
Perth CBD NML4 13.35 Silty clay 319 193 86 0.2 32 0.17 1.05 20
Perth CBD NML4 15.2 Silty clay 324 199 56 0.2 21 0.11 1.5 20
Perth CBD NML4 16.7 Silty clay 260 128 101 0.2 38 0.30 0.23 20
East Perth BH6 15.8-16.0 Soft clay 87 12 1.8 0.2 0.5 0.04 5.5 45-50
Margaret R. BH3 6.0 Silty clay 174 55 13 0.2 4 0.07 1.75 43
Margaret R. BH5 9.0 Silty clay 362 256 68 0.2 20 0.07 0.36 13

parameters affecting them, such as the mean effective con-fining pressure, the soil type and the plasticity. Various in-vestigators have proposed non linear curves for sands (forexample Darendeli, 2001; Seed et al., 1986; Iwasaki et al.,1978; Kokusho, 1980), clays and silts with different plas-ticity (for example Darendeli 2001; Vucetic & Dobry,1991; Sun et al., 1988). Figure 20 summarizes the upperand lower ranges of these typical curves, obtained for dif-ferent values of the mean effective confining pressure, as-
sumed between 25 and 1600 kPa, and a plasticity index PIranging between 0% and 100%. Figure 20 shows that thecurves proposed by Darendeli (2001) including all the otherreference curves.
Figure 21 depicts the possible use of the SDMT forcalibrating the selection of in situ G/G0-� decay curvesin various soil types. The results obtained at all the testsites previously described were superimposed on theDarendeli (2001) G/G0-� stiffness decay curves. Therectangular shaded areas in Fig. 21 represent the rangeof values of the normalized working strain shear modu-lus GDMT/G0 determined in different soil types (sand, siltand clay) and the corresponding shear strain �DMT deter-mined by the “intersection” procedure. Based on theavailable information, the “typical range” of shearstrain associated to the working strain moduli GDMT canbe approximately assumed as: �DMT � 0.01-0.45% insand, �DMT � 0.1-1.9% in silt and clay. In soft clay thevalues of �DMT > 2% (not shown in Fig. 21) are too high toattempt an interpolation using a reference stiffness de-cay curve.
These observations are in agreement with prelimi-nary literature indications (Mayne, 2001; Ishihara, 2001).Moreover, the calculated values of the ratio GDMT/G0 -which could be regarded as the shear modulus decay fac-tor at working strains - are in line with the trends observedby Marchetti et al. (2008), who investigated the experi-mental interrelationship between small strain and work-ing strain stiffness using SDMT in sand, silt and clay. Inparticular, the diagrams of the ratio GDMT/G0 vs. the DMThorizontal stress index KD (related to OCR) constructed byMarchetti et al. (2008) using the SDMT results at 34 dif-ferent sites, in a variety of soil types, indicated that the Gdecay in sands is more significant at lower strains than insilts and clays, and that the decay curves in silts and claysare very similar.
190 Soils and Rocks, São Paulo, 37(3): 177-194, September-December, 2014.
Amoroso et al.
Figure 20 - Reference G/G0-� decay curves: (a) sands, (b) silts andclays with plasticity index PI = 0-50%, (c) silts and clays withplasticity index PI = 50-100%.
Figure 21 - Possible use of the SDMT for calibrating the selectionof in situ G/G0-� decay curves in various soil types.

6.2. Proposed numerical G-� decay curves from SDMT
Several authors (Hardin & Drnevich, 1972; Bellotti etal., 1989; Byrne et al., 1990; Fahey & Carter, 1993; Fahey,1998) introduced a hyperbolic model to represent thenon-linear stress-strain behaviour of soil in pressuremetertests. In this respect, the SDMT experimental data deter-mined at all the investigated test sites (Fig. 22) were used toassist the construction of a hyperbolic stress-strain equation(Eq. 8):
G
G G
G DMT DMT
0 0
1
1 1
�
� �
���
�
���
�
�
(8)
Thus, the ratio GDMT/G0 obtained from SDMT and theestimated shear strain �DMT were used to plot the correspond-ing hyperbolic curve at each test site. In the examplesshown in Fig. 23a (Shenton Park, sand) and 23b (Roio Pi-ano, clayey silt), the curves obtained from SDMT, usingEq. 8 and the coupled values of GDMT/G0 - �DMT introduced inthe tables (thick black lines in Figs. 23a and b), evidentlyprovide a reasonable fit to the “measured” stiffness decaycurves.
The estimated �DMT values for each case history exam-
ined are plotted on Fig. 23. It is apparent that �DMT values inclays are higher than those in sands; this trend is in keepingwith that seen on Fig. 20. Combined with a measuredGDMT/G0 value from the SDMT, Fig. 23 can be used in com-bination with Eq. 8 to provide a first order estimate of a
given soil’s elemental G vs � curve. It is noted that hyper-
Examination of the Potential of the Seismic Dilatometer (SDMT) to Estimate In Situ Stiffness Decay Curves in Various Soil Types
Soils and Rocks, São Paulo, 37(3): 177-194, September-December, 2014. 191
Figure 23 - Comparison between hyperbolic and “measured” stiffness decay curves at Shenton Park (a) and Roio Piano (b).
Figure 22 - SDMT experimental data used to assist the construc-tion of a hyperbolic equation.

bolic G vs � curves have been seen to be particularly rele-vant for dynamic/cyclic applications.
7. Conclusions
The results presented in this paper support the possi-ble use of the SDMT to assess the decay of in situ stiffnesswith strain level and to address the selection of elementalG-� curves in various soil types. This potential stems fromthe ability of the SDMT to provide routinely, at each testdepth, both a small strain stiffness (G0 from VS) and a work-ing strain stiffness GDMT (derived via standard DMT corre-lations). “Reference typical-shape” laboratory G-� curvesmay be tentatively fitted through these two stiffness values.A significant premise of this approach is that, to locate thesecond point on the G-� curve, it is necessary to know (atleast approximately) the shear strain �DMT corresponding toworking strain modulus GDMT.
Typical ranges of �DMT in different soil types have beeninferred from the “intersection” of the SDMT data pointswith same-depth reference stiffness decay curves - back-figured from the observed field behavior under full-scaleloading, or obtained by cyclic/dynamic laboratory tests orreconstructed by the combined use of different in situ/labo-ratory techniques - at various test sites.
Based on the available information, �DMT is typicallyabout 0.1% in sand, about 0.5 to 1.0% in silt and clay andgreater than 2% in soft clay. The proposed hyperbolic rela-tionship, together with an estimate of �DMT from Fig. 21, canprovide a useful first order estimate of a soil’s G-� degrada-tion curve.
Acknowledgments
Special thanks to Prof. Silvano Marchetti for provid-ing the initial ideas for this study, and for his precious andcontinuous suggestions to support this research. Specialthanks also to Prof. Martin Fahey for offering his knowl-edge and experience to critically approach the presentstudy.
References
Amoroso, S. (2011) G-� decay curves by seismic dilato-meter (SDMT). PhD Dissertation, Department of Struc-tural, Water and Soil Engineering, University ofL’Aquila, L’Aquila, 480 p.
Amoroso, S.; Monaco, P. & Marchetti, D. (2012) Use of theSeismic Dilatometer (SDMT) to estimate in situ G-� de-cay curves in various soil types. Coutinho, R. & Mayne,P.W. (eds) Proc. 4th Int. Conf. on Geotechnical andGeophysical Site Characterization, ISC’4, Porto de Ga-linhas, Brazil, v. 1, p. 489-497.
Amoroso, S.; Totani, F.; Totani, G. & Monaco, P. (2015)Local seismic response in the Southern part of the his-toric centre of L’Aquila. Engineering Geology for Soci-ety and Territory - Urban Geology, Sustainable Plan-
ning and Landscape Exploitation, Springer Interna-tional Publishing, v. 5:XVIII, p. 1097-1100.
Atkinson, J.H. (2000) Non-linear soil stiffness in routinedesign. Géotechnique, v. 50:5, p. 487-508.
Bellotti, R.; Ghionna, V.; Jamiolkowski, M.; Robertson,P.K. & Peterson, R.W. (1989) Interpretation of modulifrom self-boring pressumeter tests in sand. Géotechni-que, v. 39, p. 269-292.
Berardi, R. (1999) Non linear elastic approaches in founda-tion design. Jamiolkowski, M.; Lancellotta R. & LoPresti D.C.F. (eds) Pre-Failure Deformation Character-istics in Geomaterials. Balkema, Rotterdam, p. 733-739.
Burghignoli, A.; Cavalera, L.; Chieppa, V.; Jamiolkowski,M.; Mancuso, C.; Marchetti, S.; Pane, V.; Paoliani, P.;Silvestri, F.; Vinale, F. & Vittori, E. (1991) Geotechni-cal characterization of Fucino clay. Proc. X ECSMFE,Firenze, v. 1, p. 27-40.
Byrne, P.M.; Salgado, F.M. & Howie, J.A. (1990) Rela-tionship between the unload shear modulus from pres-sumeter tests and the maximum shear modulus forsands. Proc. 3rd International Symposium on Pressu-meters, ISP3, Oxford, p. 231-241.
Cola, S. & Simonini, P. (2002) Mechanical behaviour ofsilty soils of the Venice lagoon as a function of theirgrading properties. Can. Geotech. J., v. 39:4, p. 879-893.
Darendeli, M.B. (2001) Development of a New Family ofNormalized Modulus Reduction and Material DampingCurves. PhD Dissertation, University of Texas.
Elhakim, A.F. & Mayne, P.W. (2003) Derived stress-strain-strength of clays from seismic cone tests. Proc.3rd Int. Symp. Deform. Charact. Geomaterials, Lyon,v. 1, p. 81-87.
Facciorusso, J.; Madiai, C. & Vannucchi, G. (2012) Ris-posta sismica locale e pericolosità sismica di liquefa-zione a San Carlo e Mirabello (FE). University of Flor-ence, 3 October 2012 (in Italian),http://ambiente.regione.emilia-romagna.it/geologia/temi/sismica/liquefazione-gruppo-di-lavoro/RAPPORTO_RSL_LIQ_ott_2012_UNIFI.pdf/at_download/file/RAPPORTO_RSL_LIQ_ott_2012_UNIFI.pdf.
Fahey, M. & Carter, J.P. (1993) A finite element study ofthe pressuremeter test in sand using a non-linear elasticplastic model. Can. Geotech. J., v. 30, p. 348-362.
Fahey, M. (1998) Deformation and in situ stress measure-ment. Robertson P.K. & Mayne P.W. (eds) Proc. 1st Int.Conf. on Site Characterization, Atlanta, v. 1, p. 49-68.
Fahey, M.; Lehane, B.M. & Stewart, D. (2003) Soil stiff-ness for shallow foundation design in the Perth CBD.Australian Geomechanics, v. 38:3, p. 61-90.
Fahey M.; Schneider, J.A. & Lehane, B.M. (2007) Self-boring pressuremeter testing in Spearwood dune sands.Australian Geomechanics, v. 42:4, p. 57-71.
192 Soils and Rocks, São Paulo, 37(3): 177-194, September-December, 2014.
Amoroso et al.

Fioravante, V.; Giretti, D.; Abate, G.; Aversa, S.; Boldini,D.; Capilleri, P.P.; Cavallaro, A.; Chamlagain, D.;Crespellani, T.; Dezi, F.; Facciorusso, J.; Ghinelli, A.;Grasso, S.; Lanzo, G.; Madiai, C.; Massimino, M.R.;Maugeri, M.; Pagliaroli, A.; Rainieri, C.; Tropeano, G.;Santucci De Magistris, F.; Sica, S.;Silvestri, F. & Van-nucchi, G. (2013) Earthquake geotechnical engineeringaspects of the 2012 Emilia-Romagna earthquake (Italy).Proc. 7th Int. Conf. on Case Histories in GeotechnicalEngineering, Chicago, Paper No. EQ-5.
Gibbens, R.M. & Briaud, J.L. (1994a) Test and predictionresults for five large spread footings on sand. Geotech-nical Special Publication, ASCE, v. 41, p. 92-128.
Gibbens, R.M. & Briaud, J.L. (1994b) Data and predictionrequest for the spread footing prediction event (at theoccasion of the ASCE Spec. Conf. Settlement ‘94).Geotechnical Special Publication, ASCE, v. 41, p. 11-85.
Gottardi, G. & Tonni, L. (2004) A comparative study ofpiezocone tests on the silty soils of the Venice lagoon(Treporti Test Site). Viana da Fonseca A. & MayneP.W. (eds) Proc. 2nd International Conference on SiteCharacterization, Porto, v. 2, p. 1643-1649.
Hardin, B. O. & Drnevich, V. P. (1972) Shear modulus anddamping in soils: design equations and curves. J. SoilMech. and Found. Div., ASCE, v. 98:SM7, p. 667-692.
Hepton, P. (1988) Shear wave velocity measurements dur-ing penetration testing. Proc. Penetration Testing in theUK, ICE, p. 275-278.
Ishihara, K. (2001) Estimate of relative density from in-situpenetration tests. Rahardjo P.P. & Lunne T. (eds). Proc.Int. Conf. on In Situ Measurement of Soil Properties andCase Histories, Bali, p. 17-26.
Iwasaki, T.; Tatsuoka, F. & Takagi, Y. (1978) Shear moduliof sands under cyclic torsional shear loading. Soils andFoundations, v. 18:1, p. 39-56.
Jardine, R.J. (1992) Non-linear stiffness parameters fromundrained pressuremeter tests. Can. Geotech. J.,v. 29:3, p. 436-447.
Kokusho, T. (1980) Cyclic triaxial test of dynamic soilproperties for wide strain range. Soils and Foundations,v. 20:2, p. 45-60.
Lehane, B.M. & Fahey, M. (2004) Using SCPT and DMTdata for settlement prediction in sand. Viana da FonsecaA. & Mayne P.W. (eds) Proc. 2nd Int. Conf. on SiteCharacterization, Porto, v. 2, p. 1673-1679.
Lehane, B.M.; Mathew, G. & Stewart, D. (2007) A labora-tory investigation of the upper horizons of thePerth/Guildford formation in Perth CBD. AustralianGeomechanics, v. 42:3, p. 87-100.
Lehane, B.M. (2010) Shallow foundation performance in acalcareous sand. Proc 2nd Int. Symposium on Frontiersin Offshore Geotechnics, ISFOG-2, Perth, p. 427-432.
Marchetti, S. (1980) In Situ Tests by Flat Dilatometer. J.Geotech. Engrg. Div., ASCE, v. 106:GT3, p. 299-321.
Marchetti, S.; Monaco, P.; Totani, G. & Calabrese, M.(2001) The Flat Dilatometer Test (DMT) in Soil Inves-tigations - A Report by the ISSMGE Committee TC16.Proc. 2nd Int. Conf. on the Flat Dilatometer, Washing-ton D.C., p. 7-48.
Marchetti, S.; Monaco, P.; Calabrese, M. & Totani, G.(2004) DMT-predicted vs measured settlements under afull-scale instrumented embankment at Treporti (Ven-ice, Italy). Viana da Fonseca A. & Mayne P.W. (eds)Proc. 2nd Int. Conf. on Site Characterization, Porto,v. 2, p. 1511-1518.
Marchetti, S.; Monaco, P.; Calabrese, M. & Totani, G.(2006) Comparison of moduli determined by DMT andbackfigured from local strain measurements under a40 m diameter circular test load in the Venice area.Failmezger R.A. & Anderson J.B. (eds) Proc. 2nd Int.Conf. on the Flat Dilatometer, Washington D.C.,p. 220-230.
Marchetti, S.; Monaco, P.; Totani, G. & Marchetti, D.(2008) In Situ tests by seismic dilatometer (SDMT).Laier, J.E.; Crapps D.K. & Hussein M.H. (eds) FromResearch to Practice in Geotechnical Engineering. Geo-technical Special Publication, ASCE, v. 180, p. 292-311.
Martin, G.K. & Mayne, P.W. (1997) Seismic flat dilato-meter tests in Connecticut Valley Varved clay. Geo-tech. Testing J., ASTM, v. 20:3, p. 357-361.
Martin, G.K. & Mayne, P.W. (1998) Seismic flat dila-tometer in Piedmont residual soils. Robertson P.K. &Mayne P.W. (eds) Proc. 1st Int. Conf. on Site Charac-terization, Atlanta, v. 2, p. 837-843.
Mayne, P.W.; Schneider, J.A. & Martin, G.K. (1999)Small- and large-strain soil properties from seismic flatdilatometer tests. Jamiolkowski, M.; Lancellotta R. &Lo Presti D.C.F. (eds) Pre-failure Deformation Charac-teristics in Geomaterials. Balkema, Rotterdam, p. 419-427.
Mayne, P.W. (2001) Stress-strain-strength-flow parame-ters from enhanced in-situ tests. Rahardjo P.P. & LunneT. (eds), Proc. Int. Conf. on In Situ Measurement of SoilProperties and Case Histories, Bali, p. 27-47.
Mayne, P.W. (2003) Class “A” footing response predictionfrom seismic cone tests. Proc. 3rd Int. Symp. Deform.Charact. Geomaterials, Lyon, v. 1, p. 883-888.
McGillivray, A. & Mayne, P.W. (2004) Seismic piezoconeand seismic flat dilatometer tests at Treporti. Viana daFonseca A. & Mayne P.W. (eds) Proc. 2nd Int. Conf. onSite Characterization, Porto, v. 2, p. 1695-1700.
Monaco, P.; Totani, G. & Calabrese, M. (2006) DMT-predicted vs observed settlements: a review of the avail-able experience. Failmezger R.A. & Anderson J.B.(eds) Proc. 2nd Int. Conf. on the Flat Dilatometer,Washington D.C., p. 244-252.
Monaco, P.; Totani, G.; Barla, G.; Cavallaro, A.; Costanzo,A.; D’Onofrio, A.; Evangelista, L.; Foti, S.; Grasso, S.;
Examination of the Potential of the Seismic Dilatometer (SDMT) to Estimate In Situ Stiffness Decay Curves in Various Soil Types
Soils and Rocks, São Paulo, 37(3): 177-194, September-December, 2014. 193

Lanzo, G.; Madiai, C.; Maraschini, M.; Marchetti, S.;Maugeri, M.; Pagliaroli, A.; Pallara, O.; Penna, A.;Saccenti, A.; Santucci de Magistris, F.; Scasserra, G.;Silvestri, F.; Simonelli, A.L.; Simoni, G.; Tommasi, P.;Vannucchi, G. & Verrucci, L. (2012) Geotechnical as-pects of the L’Aquila earthquake. Sakr M.A. & AnsalA. (eds) Special Topics in Advances in EarthquakeGeotechnical Engineering, Chapter 1. Springer Sci-ence+Business Media B.V.
Monaco, P.; Totani, G.; Amoroso, S.; Totani, F. & Mar-chetti, D. (2013) Site characterization by seismic dila-tometer (SDMT) in the city of L’Aquila. Rivista Ita-liana di Geotecnica, v. XLVII:3, p. 8-22.
Monaco P.; Amoroso S.; Marchetti S.; Marchetti D.; TotaniG.; Cola S. & Simonini P. (2014) Overconsolidationand Stiffness of Venice Lagoon Sands and Silts fromSDMT and CPTU. J. Geotech. Geoenviron. Eng.,ASCE, v. 140:1, p. 215-227.
Regione Emilia Romagna - Liquefaction Working Group(2012) Primo rapporto sugli effetti della liquefazioneosservati a S. Carlo, frazione di S. Agostino (Provinciadi Ferrara). 25 June 2012 (in Italian),http://ambiente.regione.emilia-romagna.it/geologia/temi/sismica/liquefazione-gruppo-di-lavoro/rapporto_sancarlo.pdf/at_download/file/rapporto_sancarlo.pdf.
Robertson, P.K. & Ferrera, R.S. (1993) Seismic and pres-suremeter testing to determine soil modulus. Predictivesoil mechanics, Wroth Memorial Symposium, p. 562-580.
Romeo, R. W.; Amoroso, S.; Facciorusso, J.; Lenti, L.;Madiai, C.; Martino, S.; Monaco, P.; Rinaldis, D. &Totani, F. (2015) Soil liquefaction during the Emilia,2012 seismic sequence: investigation and analysis. En-gineering Geology for Society and Territory - UrbanGeology, Sustainable Planning and Landscape Exploi-tation, Springer International Publishing, v. 5:XVIII,p. 1107-1110.
Santucci de Magistris, F.; d’Onofrio, A.; Evangelista, L.;Foti, S.; Maraschini, M.; Monaco, P.; Amoroso, S.;Totani, G.; Lanzo G.; Pagliaroli, A.; Madiai, C.; Si-moni, G. & Silvestri, F. (2013) Geotechnical character-ization of the Aterno valley for site response analyses.Rivista Italiana di Geotecnica, v. XLVII:3, p. 23-43.
Schneider, J.A.; Fahey, M. & Lehane, B.M. (2008) Charac-terization of an unsaturated sand deposit by in situ test-ing. Proc. 3rd Int. Conf. on Site Characterization,p. 633-638.
Schneider, J.A. & Lehane, B.M. (2010) Evaluation of conepenetration test data from a calcareous sand dune. Proc.2nd Int. Symp. on Penetration Testing, HuntingtonBeach, CA.
Seed, H.B.; Wong, R.T.; Idriss, I.M. & Tokimatsu, K.(1986) Moduli and damping factors for dynamic analy-ses of cohesionless soils. Journal of the Soil Mechanicsand Foundations Division, ASCE, v. 112:SM11,p. 1016-1032.
Simonini, P. (2004) Characterization of the Venice lagoonsilts from in-situ tests and the performance of a test em-bankment. Viana da Fonseca A. & Mayne P.W. (eds)Proc. 2nd Int. Conf. on Site Characterization, Porto,v. 1, p. 187-207.
Simonini, P.; Ricceri, G. & Cola, S. (2006) Geotechnicalcharacterization and properties of the Venice lagoonheterogeneous silts. Proc. 2nd Int Workshop on Charac-terization and Engineering Properties of Natural Soils,Singapore, v. 4, p. 2289-2328.
Sun, J.I.; Golesorkhi, R. & Seed H.B. (1988) DynamicModuli and Damping Ratio for Cohesive Soils. Report,UCB/EERC-88/15, University of California at Berkley,48 p.
Totani, G.; Totani, F.; Monaco, P.; Tallini, M.; Del Mo-naco, F. & Zia, G. (2012) Site investigations and geo-technical problems in the Southern part of the historiccentre of L’Aquila. Maugeri M. & Soccodato C. (eds)Proc. 2nd Int. Conf. on Performance-Based Design inEarthquake Geotechnical Engineering, Taormina, Italy,Paper No. 2.13, p. 315-328 (CD-ROM).
Vucetic, M. & Dobry, R. (1991) Effect of soil plasticityoncyclic response. Journal of Geotechnical Engineering,ASCE, v. 120:7, p. 585-594.
Working Group S2-UR4 (2013) Analysis of the liquefac-tion phenomena in the area of San Carlo by seismicdilatometer (SDMT). Project S2-2012 INGV-DPC, De-liverable D8.1 - Annex 3, Rev. 1.1, Sept. 2013https://docs.google.com/file/d/0B60wsWaPpDL4RVMzb01ETU8zT2s/edit?usp=sharing.
194 Soils and Rocks, São Paulo, 37(3): 177-194, September-December, 2014.
Amoroso et al.

An Approach to Derive Strength Parametersof Residual Soils from DMT Results
N. Cruz, C. Rodrigues, A. Viana da Fonseca
Abstract. Residual soils show a specific mechanical behaviour classified as non-conventional when compared with sedi-mentary transported soils, since the presence of a cemented matrix plays an important role on their strength and stiffness.Moreover, suction is frequent in natural profiles, which in residual soils creates several problems on the interpretation ofin-situ test results. These two factors, cementation and suction, are contributing simultaneously as structuring factors. Cor-relations to deduce strength parameters in Portuguese granitic residual soils by Marchetti Dilatometer were previously es-tablished under a data base obtained in careful triaxial testing programs executed on “undisturbed” samples. However, thereference results were affected by sampling disturbance and space variability, and therefore somehow deviated fromin-situ conditions. To solve these problems, a large calibration box was constructed to work with artificially cemented soilswhere DMT blades could be pre-installed and pushed-in. Water level, suction and seismic velocities were monitored dur-ing the experiment and a triaxial program was established in parallel on the same artificially cemented mixtures. As a re-sult, specific correlations to derive the cohesion intercept value and the angle of shearing resistance in saturated andunsaturated conditions were developed and subsequently tested in a well characterized experimental site. Herein, the re-sults of that experimental framework are presented and discussed.Keywords: residual soils, Portuguese granitic formations, cohesion intercept, angle of shearing resistance, suction, in-situcharacterization, DMT.
1. Introduction
Residual soils strength characterization is not an easytask to estimate from in situ tests, due to its cohesive-frictional nature (Viana da Fonseca & Coutinho, 2008).Having two components - friction and cohesion - a strengthwill have to be evaluated from laboratory triaxial tests overundisturbed samples, since the evaluation of strengththrough in situ tests is usually conveyed under pure fric-tional granular soils, under the bias of angle of shearing re-sistance (frictional and dilatant components) or underTresca type shear strength when geomaterials are analysedin total stresses, as it is the case of undrained shear strengthin clayey soils, or the maximum total shear strength in veryhard soils and soft rocks. This will be approximate to theconcept of “cohesive” soils, where the strength is mostly aproperty explicitly non-frictional.
In the case of residual soils, cohesive strength is re-lated with the inter-particular bonding inherited from theparent rock that provided the cemented structure and withthe contribution of suction, when this is present. On theother hand, the angle of shearing resistance comprises twoportions, as stated above. One is related with the pure fric-tion that is mobilized during the relative movement be-tween the particles. The other concerning the resistance thatis mobilized during this relative movement, required to de-stroy the natural inter-particular cementation and its spatial
organization, that is, its fabric. It should be stressed that dueto the usually low void ratio of these materials typicallythere is an increase in volume (positive dilatancy) duringshear.
The most straightforward way to characterize thistype of strength is through triaxial tests, but the process hasto face the important disadvantage related with samplingdisturbance (Ferreira et al., 2011), where the partial loss ofcementation structure is mostly unavoidable. The referredsampling disturbance and the discontinuous information re-lated to laboratory tests leave an important role to in-situtests on residual soil characterization for routine analysis,especially those that induce small disturbance during in-stallation and allow the direct estimation of stress-strain re-sponse (Viana da Fonseca et al., 2011), such as pressu-remeters (self-boring pressuremeter, SBPT, in a first degreeand, as a fair compromise, Ménard pressuremeter, PMT)and dilatometers (such as Marchetti Flat Dilatometer,DMT). Seismic tests may give relevant interpretation whenassociated to the more simple tools (seismic dilatometerSDMT, seismic piezocone SCPTu), as they give a refer-ence value of the small strain shear modulus (G0 = �.Vs
2).Some important works modelling in-situ tests in residualsoils have been undergoing, such as the new cavity expan-sion model that incorporates the effects of structure and itsdegradation (Mantaras & Schnaid, 2002; Schnaid & Man-
Soils and Rocks, São Paulo, 37(3): 195-209, September-December, 2014. 195
Nuno Bravo de Faria Cruz, PhD, Department of Geology and Geotechnics, MOTA-ENGIL / University of Aveiro, Vila Nova de Gaia, Portugal. e-mail: [email protected] Manuel Gonçalves Rodrigues, PhD, Coordinator Professor, Department of Civil Engineering, Polytechnic Institute of Guarda, Guarda, Portugal. e-mail: [email protected]ónio Joaquim Pereira Viana da Fonseca, PhD, Associate Professor, Department of Civil Engineering, University of Porto, Porto, Portugal. e-mail: [email protected] on March 20, 2014; Final Acceptance on December 15, 2014; Discussion open until April 30, 2015.

taras, 2003), the extension of the cavity expansion theory tounsaturated soils (Schnaid & Coutinho, 2005) and the over-all fitting Self-Boring Pressuremeter pressure-expansioncurve (Fahey & Randolph, 1984; Viana da Fonseca &Coutinho, 2008; Topa Gomes et al., 2008; Topa Gomes,2009). Viana da Fonseca (1996) had also highlighted theutility of plate load tests, by performing series of tests withdifferent plate sizes allowing the determination of strengthparameters (c’ and �’) by multiple optimization of the re-sults, although this procedure is time-consuming and thelimitation of involving very superficial horizons makes itless attractive.
2. DMT Tests in Residual Soils
DMT tests can be seen as a combination of some fea-tures of both CPT/CPTu and PMT tests with some detailsthat really make it a very interesting technique available inmodern geotechnical characterization. The fundamentaladvantages of the test are related with the high level of pre-cision measuring both the pressures and the displacements,the response supported by semi-spherical expansion theo-ries, the quasi-continuous profiles that provide a reasonableamount of data adequate for statistical analysis, the numeri-cal identification of soil type, the deduction of intermediateparameters that represent common geotechnical features(namely deformability and stress history) and its easy com-bination with any type of in-situ and laboratory tests.
In its essence, dilatometer is a stainless steel flat blade(14 mm thick, 95 mm wide and 220 mm length) with a flex-ible steel membrane (60 mm in diameter) on one of itsfaces. The equipment is pushed (or driven) into the ground,by means of a CPT rig or similar, and an expansion of themembrane is conventionally performed every 20 cm depth.At each depth, the penetration is stopped and the membraneis expanded to lift-off the diaphragm (reading A, corre-sponding to a deflection of 0.05 mm), followed by a deflec-tion of 1.10 mm (reading B). After this expansion sequencean additional pressure, designated by “C-reading” (closingpressure), may be taken by slowly deflating the membranesoon after the B position is reached until the membrane co-mes back to the 0.05 mm position (A position). These pres-sures must then be corrected by the values �A and �B,determined by calibration, to take into account the mem-brane stiffness and thus converted into the three basic pres-sures p0, p1 and p2. Four intermediate parameters arededuced from these basic test parameters, namely MaterialIndex (ID), Dilatometer Modulus (ED), Horizontal Stress In-dex (KD) and Pore Pressure Index (UD), having some recog-nizable physical meaning and some engineering usefulness(Marchetti, 1980), as discussed below. Current geotech-nical soil parameters are obtained from these intermediateparameters (and not directly from the basic p0, p1 and p2 pa-rameters), independently or combined together, covering awide range of possibilities.
The ID parameter is one key parameter for DMT inter-pretations, due to its ability to identify soils throughout anumerical value, which can be easily introduced in specificformulae for deriving geotechnical parameters. Although ID
is not a result of a sieve analysis but just a mechanical be-haviour parameter (a kind of rigidity index) from which soilstratigraphy is deduced (Marchetti, 1997), the numerical re-sult representing soil types undoubtedly offers a lot of extrapossibilities to develop constitutive laws to be applied towide ranges of different soils, with particular emphasis toIntermediate Geomaterials (IGM).
The horizontal stress index (Marchetti, 1980) was de-fined to be related to the at rest earth pressure coefficient,K0, and thus its determination is obtained by the effectivelift-off pressure (p0 - u0, where u0 is the equilibrium porepressure) normalized by the in-situ effective vertical stress.The parameter can be regarded as a K0 amplified by pene-tration, with normally consolidated (NC) deposits with noageing and/or cementation structure represented by thevalue KD � 2 (in clays) (Marchetti, 1980). Furthermore, thetypical KD profile is very similar in shape to the OCR profilegiving useful information not only about stress history butalso on the presence of cementation structures (Cruz et al.,2004a; Cruz 2010). In general the evolution of KD profilesfollows some typical trends, (Marchetti, 1980):a) KD profiles tend to follow the classical shape of the OCR
profile;b) Normally-consolidated (NC) soils tend to present values
of KD around 2;c) Over-consolidated (OC) soils show values of KD above 2,
decreasing with depth and converging to NC values;d) Normally consolidated soils affected by cementation or
ageing structures show values of KD higher than 2, re-maining fairly stable with depth.The theory of elasticity is used to derive the dila-
tometer modulus, ED (Marchetti, 1980), by considering thatmembrane expansion into the surrounding soil can be asso-ciated to the loading of a flexible circular area of an elastichalf-space, from which the outward movement of the mem-brane centre under a normal pressure variation, �p = p1 - p0,can be calculated. Considering the characteristics of thetest, the dilatometer modulus is represented by the equa-tion:
EE
pd ��
�1
34 72�
. � (1)
where E represents the Young’s modulus and represents thePoisson’s ratio.
At last, the pore pressure index, UD, (Lutenegger &Kabir, 1988) is related to pore pressure condition, which isquite similar to Bq of CPTu tests.
DMT tests have been mostly used in sedimentarysoils, where the test has shown his remarkable usefulness inestimating stress history, strength and stiffness characteris-tics in soft/loose to medium soils. However, the application
196 Soils and Rocks, São Paulo, 37(3): 195-209, September-December, 2014.
Cruz et al.

of the test to residual soils characterization is still begin-ning, mostly within research programs. In general practice,is rather common to see applying correlations developedfor sedimentary to residual soils characterization, whichfrequently leads to erroneous interpretations. In the case ofPortuguese residual sandy soils, the angle of shearing resis-tance is clearly overestimated because it incorporates thecohesive component of strength due to cementation, whilethis (cohesive) parcel cannot be calculated since is not con-sidered in sedimentary approaches for the test interpreta-tions. Since at least two basic parameters (p0 and p1) areobtained, DMT offers a good via to separate cohesive fromfriction/dilatancy components.
Previous research using DMT alone or combinedwith CPTu tests in residual soil characterization (Cruz,1995; Cruz et al., 1997, 2004a, b; Cruz & Viana da Fon-seca, 2006a, 2006b) has shown that the test could be effi-ciently used to derive strength parameters of residual soilsfrom Porto Granites. Firstly, Cruz et al. (1997) based theirhypotheses on two well documented cases (Cruz, 1995;Viana da Fonseca, 1996) following the proposal from Mar-chetti (1980) from which KD may be a well adapted indexparameter for detecting cementation and quantify its mag-nitude. The results showed that typical profiles were moreor less stable with depth, within 5-7 interval, indicating ce-mentation or ageing according to Marchetti’s (1980) initialstatements. However, the correlation with the values of thecohesive intercept obtained from triaxial testing in undis-turbed samples revealed poor sensitivity of the parameter tobe used with success. This is certainly related to the factthat KD depends only on p0, which is the parameter more af-fected by the blade penetration, so mostly associated to thehorizontal stress state, more than natural interparticle ce-mentation.
A second step was attempted by Cruz et al. (2004b)and Cruz & Viana da Fonseca (2006a), based on the OCRparameter derived from DMT. In fact, OCR correlatesstrongly with the range between p0 and p1 and is an amplifi-cation of KD, thus bringing more sensitivity to small varia-tions of cohesive intercept. Although the concept of over-consolidation does not have a meaning in residual soils andis very questionable in the case of sandy soils, the presenceof a naturally cemented structure gives rise to some aspectsof the mechanical behaviour, similar to those observed inoverconsolidated clays, as it is sustained by Leroueil &Vaughan (1990). In short, the behaviour of a cohesive-frictional soil will show an important variation in thestress-strain behaviour when the cementation bonds start tobreak, which will be very similar to the response of over-consolidated soils, although with quite distinct pattern ofthe relative values of void ratios, namely under the classicalcritical state approaches (Viana da Fonseca et al., 2011). Inthe case of cohesive-frictional materials, the pre-consoli-dation stress as defined in sedimentary clays would be di-rectly associated to the magnitude of the cohesive compo-
nent of strength related mainly to interparticle cementationand/or suction, but also to some contribution to dilatancy.For this reason, the concept is usually designated as “vir-tual”, vOCR (Viana da Fonseca, 1996), or “apparent” over-consolidation, AOCR (Mayne, 2006), since it does not rep-resent a pre-consolidation stress as in the true OCR, butonly the strength arising from structural interparticle ce-mentation. Having in mind that residual soils from PortoGranite are mostly sandy silts to silty sands, OCR derivedfrom DMT in granular sedimentary soils (Marchetti &Crapps, 1981) was selected as reference parameter for cor-relation with the cohesive intercept in Mohr-Coulombstrength criteria. In parallel, the ratio between constrainedmodulus (MDMT) and CPTu corrected tip resistance (qt) wasalso studied as an index parameter, because it is also relatedto overconsolidation ratio in sandy soils (Baldi et al., 1988;Jendeby, 1992) and could work as a control parameter ofOCR derived from DMT. Based on a large quantity ofin-situ information collected in Porto Granite Formation(40 boreholes with regular Standard Penetration Tests SPT,36 DMT, 22 CPTu, 4 PMT, 5 Dynamic Probing Super-Heavy tests DPSH), specific correlations were proposed todeduce the effective cohesion intercept from vOCR andMDMT/qt. The obtained data clearly demonstrated paralleltrends followed by both indexes and a similar good level ofaccuracy of the respective correlations to deduce cohesivecomponent of strength (Cruz et al., 2004a; Cruz & Viana daFonseca, 2006a). Since they are independent evaluations,this convergence seems to confirm the adequacy of the pro-posed approach.
The presence of a cemented structure also creates aserious obstacle to derive angles of shearing resistancefrom in-situ tests (SPT, CPTu, PMT and, of course, DMT)when sedimentary soil correlations are used, because theywere developed on the principle of a (unique) granularstrength (Viana da Fonseca, 1996; Cruz et al., 2004a; Cruz& Viana da Fonseca, 2006a; Viana da Fonseca et al., 2009;Cruz, 2010). Resistance in cemented soils is then “as-sumed” in the same way as in granular materials, that ishigh values of strength associated to higher values of theangle of shearing resistance (peak value) incorporating thefrictional component of a critical state value, plus dila-tancy. In short, cohesive component of strength is “trans-formed” in an “equivalent” additional value on the angle ofshearing resistance and once the cohesive intercept is ob-tained, it is reasonable to expect that it can be used to cor-rect the over-estimation of that angle, derived from sedi-mentary correlations. Considering the low influence thatsampling has on the evaluation of angle of shearing resis-tance (Viana da Fonseca, 2003), the observed differencebetween calculated DMT (which represents the globalstrength) and triaxial (which represents solely the frictionplus dilatants value) should correlate with the magnitude ofcohesion, that is with vOCR (Cruz & Viana da Fonseca,2006a).
Soils and Rocks, São Paulo, 37(3): 195-209, September-December, 2014. 197
An Approach to Derive Strength Parameters of Residual Soils from DMT Results

Although the proposed correlations were establishedwith careful triaxial testing programs, the results of refer-ence cohesion were obviously affected in an unknown ex-tent by sampling disturbance and space variability, andtherefore the reference values used to define these correla-tions would be deviated from “in-situ” real conditions(Cruz et al., 2004a; Cruz, 2010).
3. Experimental Framework
As a consequence of the effects of sampling on thederived correlations referred in the previous section, it be-came fundamental to develop an experimental programmein controlled conditions that could avoid those effects tosettle more definitive correlations. To do so, a special largedimension container with diverse measuring systems(CemSoil Box) was created in order to work with large arti-ficially cemented samples where DMT blades could be in-stalled, remoulded in the same conditions as those thatwould be tested in triaxial apparatus. Moreover, it was alsodecided to pre-install blades, aiming to evaluate the staticpenetration influence in the loss of cementation strength,and the overall effects on stiffness. The whole experience(Cruz, 2010) relied on residual soils from Guarda GraniticFormation, characterized by patterns of behaviour identicalto those observed in Porto Granite Formation (Viana daFonseca, 1996, 2003), where the previous research (Cruz etal., 2004a; Cruz & Viana da Fonseca, 2006a) had been per-formed. The natural spot from where the soil was collectedis located in a very well characterized experimental site(Rodrigues, 2003), investigated by laboratory triaxial tests(within the same ranges of confining stresses and void ra-tios of the present experiment) and in-situ CPTu, PMT andDMT tests.
Four different compositions of soil-cement mixturesand one uncemented were prepared to be tested in CemSoil,followed by an exhaustive laboratory program, includinguniaxial, tensile and triaxial testing at low to medium con-fining stresses, performed on samples prepared in the sameconditions of CemSoil. As a consequence of these disposi-
tions, it was possible to create comparable controlledconditions, namely in curing times, compaction proce-dures, final unit weights and void ratios. Therefore, thesampling problems were avoided and the effects of DMTblade insertion on naturally cemented residual soils couldbe reproduced and studied, aiming to correct the empiricalcorrelations previously proposed by Cruz et al. (2004b). Insummary, the most relevant issues considered in the prepa-ration of the experiment were the following:a) Artificially remoulded samples were used in the present
experiment avoiding problems associated to samplingdamage, by eliminating this dispersion factor;
b) CemSoil and triaxial samples had the same curing times,void ratios (or unit weights) and cementation levelswhen tested, thus space variability and microfabricdifferences were tentatively minimized;
c) Since CemSoil samples were prepared in one time withthe water being introduced only after curing, then ob-served differences in strength above and below waterlevel should be mainly due to suction effects;
d) The testing sequences in Cemsoil box were controlled byusing piezometers, tensiometers and geophones forseismic wave velocities measurements;
e) The experiment was based in DMT measurements bothin pre-installed and pushed-in blades, which allowedto compare the influence of its penetration.
3.1. Laboratory calibration program
As previously referred, four different compositions ofsoil-cement mixtures and one uncemented were prepared tobe tested in CemSoil Box and in an exhaustive laboratoryprogram. This program included uniaxial and diametralcompressive tests performed in saturated and unsaturatedconditions, as well as isotropically consolidated drained(CID) triaxial testing at low to medium confining stresses(25, 50, 75 and 300 kPa), in saturated conditions. On thewhole, the laboratory program included 40 unconfined, di-ametral and triaxial compressive tests. Figure 1 illustratessome details of triaxial testing system.
198 Soils and Rocks, São Paulo, 37(3): 195-209, September-December, 2014.
Cruz et al.
Figure 1 - Triaxial testing: a) Artificially cemented sample; b) LVDT installation; c) Test apparatus.

The mixtures were moulded to represent the geo-technical units existing in Porto and Guarda Granites, cor-responding to identical ranges of uniaxial and tensilestrengths, both of them used as cementation reference in-dexes. This indexation was supported by the extensive datacollected for Porto Geotechnical Map (COBA, 2003) fromwhich a global study on the mechanical degradation withweathering of Porto Granites was made (Cruz, 2010).Guarda Granites geotechnical information (Rodrigues,2003) was compared and fitted within that data base.
Two types of cement have been used, namely SECILCIM I/52.5R (Mixtures 1 and 3, corresponding respectivelyto 1% and 2% of cement) and CIMPOR CIM II/B-L 32.5N(Mixtures 2 and 4 corresponding respectively to 2% and3% of cement). Detailed discussion about this combineduse can be found in Cruz (2010), but it should be mentionedthat the whole research program was based in consideringexactly the same curing time for each pair of samples (labo-ratory and the corresponding CemSoil samples). Compres-sive and tensile strength were used for indexation, insteadthe percentage of cement. Therefore, as far as the accuracyof these index parameters and the similarity of CemSoil andlaboratory samples were ensured, the combination of theboth cement types could be considered acceptable.
3.2. CemSoil box
CemSoil box (Fig. 2) is a container (Large box) with1.5 m height steel box with a square cross section of 1.0 m2,with 3 mm thick steel walls, reinforced by metal bars placedat 1/3 and 2/3 of its height. Each panel was fixed to the adja-cent with a profile of 5 screws (10 mm) with 150 mm of in-fluence radius. Due to the panel-to-panel fixation system,in two of the faces this reinforcement system was in contactwith the wall by a central 7 mm thick H beam (100 x 50mm2) placed vertically. This system aimed to reduce hori-zontal displacements during compaction processes. The in-ner surfaces (vertical walls) and bottom surface of the cell
were covered with a plastic film, in contact with the steelwall, followed by 15 mm Styrofoam plates in order to cre-ate a smooth and flexible transition between the soil and theexternal border.
Figure 3 shows a plan view and a vertical cross-section of CemSoil box with the distribution of installedequipment. CemSoil block samples (1.0 x 1.0 x 1.5 m3)were compacted in homogeneous layers of 70-80 mm, aim-ing to create homogeneous samples, with similar void ra-tios in CemSoil and triaxial testing, thus creating compara-ble conditions. The compaction in CemSoil box washandmade, using a round wood hammer of 40 cm diameter.
Considering the main objectives of the experiment,two DMT blades were positioned during the compactionprocesses, one being placed 20 cm above CemSoil baselevel and the other 25 cm below the surface upper level ofthe soil. Furthermore, since residual soils are commonly af-fected by suction phenomena, which clearly affect theirstrength and stiffness behaviour and mislead the interpreta-tion of in-situ test results, block samples were only partiallysaturated to have the chance of studying the influence ofsuction on DMT results. For this purpose, two open tubePVC piezometers were installed, one located nearby thewater entry in CemSoil and another in the opposite corner,which allowed to control the water level and its stabiliza-tion during the main experiment. To evaluate the generatedsuction profile, six tensiometers were placed at different lo-cations in Cemsoil box. Finally, three pairs of geophones toevaluate compression (Vp) and shear (Vs) wave velocitieswere placed vertically and horizontally (Almeida et al.,2012), respectively for suction and low energy seismic vi-brational wave velocities determinations. Figure 4 illus-trates this monitoring system.
The location and distribution of all these measuringtools within CemSoil box was chosen with reference tosome available published works on the subject, namelythose that studied the influence of DMT dimensions by
Soils and Rocks, São Paulo, 37(3): 195-209, September-December, 2014. 199
An Approach to Derive Strength Parameters of Residual Soils from DMT Results
Figure 2 - CemSoil Box: a) CemSoil sample ready for testing; b) View after testing.

strain path analysis (Huang, 1989; Finno, 1993; Whittle &Aubeny, 1992) or flat cavity expansion analysis (Yu et al.,1993; Smith & Houlsby, 1995). Numerical modelling ofthe penetration phase, using the strain path analysis (Whit-tle & Aubeny, 1992), pointed out some useful indicationsabout the soil volume that may be influenced by the dila-tometer insertion, which were considered in accordance.
The experiment with DMT in CemSoil box includedpre-installed and pushed-in blades to analyse the effects ofpenetration on the final results. However, pushed-in testswere performed only in the destructured non-cementedsample and in Mixture 1 and Mixture 2, since due to its highresistance it was impossible to penetrate the equipment in
the remaining mixtures. In all samples, regular measure-ments of suction pressures and seismic wave velocitieswere obtained during curing periods, before and after thesaturation phase, which was concluded two days beforeeach test. Finally, at each pre-selected testing day, DMT ex-pansion tests of the first (below water level) and second(above water level) installed blades were made. After thesetests, the second testing sequence with the blade beingpushed-in down to the first blade depth was executed (de-tails in Cruz, 2010). The respective results were then com-pared with triaxial test results in terms of strength andstiffness parameters, from where the correlations based inDMT parameters were developed.
200 Soils and Rocks, São Paulo, 37(3): 195-209, September-December, 2014.
Cruz et al.
Figure 3 - Vertical cross section and plan view of Cemsoil instrumentation.
Figure 4 - Testing devices: a) Tensiometers b) Geophones.

4. Discussion of Results
4.1. Laboratory strength evaluation
Table 1 presents a summary of laboratory results ob-tained both in naturally and artificially cemented samples,indexed by the NSPT (SPT blow count) ranges found in Portoand Guarda natural geotechnical units. These ranges weresettled by considering the comparable ranges of uniaxialand tensile strengths found in Porto Geotechnical Map(COBA, 2003).
The reference strength parameters (c’, ’) were ob-tained through CID triaxial testing, following the Mohr-Coulomb strength criterion, assuming the failure as corre-sponding to the maximum of the stress ratio q/p’ (where q isthe deviator stress and p’ is the mean effective stress) mobi-lized during shear. The obtained failure envelopes in the ar-tificially cemented mixtures and destructured uncementedsamples are represented in Fig. 5, which clearly shows thenon-linearity of the envelope, more evident with increasingcementation levels. As so, the envelopes deviate from thetheoretical Mohr-Coulomb model, which assumes linearitybetween normal and shear stresses in the failure plane.
The aforementioned deviation should be understoodas a consequence of complex phenomena that rules theshear strength mobilization in this type of cohesive-fric-tional materials. In fact, in order to allow the relative move-ment of particles, fabric interlocking creates an extra resis-tance during shear that commonly generates a volumeincrease (positive dilatancy), as a result of the usually me-dium to low void ratios of these soils. The higher is the in-terlocking, the higher will be the strength arising from thiseffect. On the other hand, although the ratio between fric-tion forces that are mobilized in the surface of the particlesand the installed normal forces is linear, the required forcesto overcome interlocking vary with the magnitude of nor-mal forces, which aggravates the non-linearity of failureenvelope. Figure 6 gives a closer look of the relationshipsbetween dilatancy (d = �v/�s, where �v is the increment ofvolumetric strain and �s is increment of shear strain) andstress ratio, (� =q/p’) for the conventional drained tests. Inorder to simplify the analysis only some of the obtained re-
sults are plotted, namely the uncemented, the weakest(Mix 1) and the strongest cemented (Mix 4) samples, sub-jected to lower and higher confining stresses (p’0 = 25 kPaand p’0 = 300 kPa, respectively). The results show that forthe uncemented sample the relationship d;q/p’ is essentiallylinear, showing that the mobilized resistance is eminentlyfrictional, while in cemented materials the increment of ef-fective confining stress leads to a decreasing dilatancy andgenerates a higher punctual friction between particles as aresult of the normal stress increase. Figure 6a reveals thatthere is a volume increase in shearing, being the strain lev-els related with maximum stress ratio (q/p’) and maximumdilatancy very close.
Another characteristic highlighted by Fig. 6 is that thecementation structure is increasingly degraded with in-creasing confining stresses. In fact, the stress-dilatancy be-haviour of Mix 4 (25 kPa) reveals a first part with an in-creasing volume reduction up to the coordinates [d = 0.7;q/p’ = 0.9], which might be related with the readjustment tothe initial conditions of the test. From this point on, the evo-lution is almost vertical up to the coordinates [d = 0.82;q/p’ = 2.1], meaning that dilatancy remains fairly constantand corresponds to an elastic response of the soil. This sug-gests that cementation opposes to the volume increase.With the stress evolution, the cemented structure starts to
Soils and Rocks, São Paulo, 37(3): 195-209, September-December, 2014. 201
An Approach to Derive Strength Parameters of Residual Soils from DMT Results
Table 1 - Laboratory test results related with CemSoil samples.
Strength Naturallycemented
Destructurednon-cemented
Mixture 1 Mixture 2 Mixture 3 Mixture 4
Ranges of NSPT (blows/30 cm) 10-30 - 10-30 30-60 > 60 (ISRM W5)
Uniaxial compressive strength, qu (kPa) 81.3 20.8 72.6 124.9 273.0 312.3
Diametral compressive strength, qd (kPa) 12.3 1.5 7.2 15.3 33.2 39.4
Cohesion, c’ (kPa)* 37.1 0.0 23.8 38.4 63.2 107.7
Angle of shearing resistance, ’ (°)* 34.0 35.0 33.0 34.0 30.0 30.0
*Results obtained in triaxial compression tests in saturated samples, cured in the same conditions of the set of tests, both in laboratoryand in CemSoil box.
Figure 5 - Failure envelopes from triaxial tests performed in arti-ficially cemented soils and natural de-structured soils.

break generating a yield (Second yield, according to Coop& Willson, 2003) followed by a rapid evolution towardsmaximum dilatancy (close to peak resistance), when gener-alized failure occurs (Gross yield, according to Coop &Willson, 2003). This means that for the maximum stress ra-tio (assumed as the failure criterion) the strength resultingfrom cementation is already significantly affected. Afterpeak strength, there is a decrease on dilatancy rates of evo-lution that follows the strength decrease towards the criticalstate (constant resistance with null dilatancy). The samesample (Mix 4), when subjected to higher confiningstresses (300 kPa), shows a smoother pattern of variationwith no signs of volume increase, evolving directly to criti-cal state after generalized bond breakage. This may be re-lated with the previous partial bond breakage during conso-lidation phase and also by the higher stress restraining thevolume increase. Therefore, strain levels related to peakstrength increase with effective confining stress, which willprobably generate higher level of destructuration. The be-haviour of the less cemented sample (Mix 1) is locatedwithin the behaviours of uncemented and more cementedsample (Mix 4). In conclusion, as the cementation level de-creases, the stress-dilatancy behaviour approaches linearityrevealing loss of importance of the cement portion.
From the practical point of view, which is at the baseof the present research, this complex behaviour creates seri-ous difficulties to establish a simple way to get mechanicalparameters of these residual soils for design. Firstly, be-cause design of foundations or retaining walls and slopestability analysis usually are based on limit equilibriummodels that depend on the Mohr-Coulomb strength crite-rion, where the dilatancy is not an input parameter. In suchcase, to estimate the Mohr-Coulomb strength parameters(c’, ’) it is necessary to linearize the failure envelope. Forthis purpose, when wide stress fields are considered the de-
viations will certainly be relevant, generating an overesti-mation of cohesive intercept for high mean stresses and theoverestimation of angles of shearing resistance in the oppo-site situation. However, if the stress field in the character-ization programme is somewhere close to those of thegeotechnical problem under study, then the deviations willhave small consequences on the final results.
On the other hand, the strength contributions differ-entiated by cohesion, dilatancy and friction, would be verydifficult to get from DMT tests, as in any other geotechnicaltests used in routine analysis. In such case, triaxial andDMT results could not be easily compared, since cohesionand friction incorporate the dilatancy contributions in thecase of DMT, while in the triaxial case that influence couldbe identified independently (Viana da Fonseca et al., 2014).As a consequence, and for simplicity, it was assumed to se-lect comparable situations in the correlations definition,meaning that triaxial testing results were expressed in termsof a cohesive and a frictional contribution, which incorpo-rate the influence of dilatancy and the effect of bonding thatis still present when the maximum strength is mobilized. Inother words, the strength parameters obtained by DMTtests from the correlations arising from this work can be di-rectly applied in a Mohr-Coulomb based analysis, withoutlosing the distinct contributions of the cohesive and fric-tional/dilatant strength that really will be present in thefield.
4.2. DMT test results
4.2.1. Basic and intermediate parameters
From the basic pressures point of view, the compari-son of pushed-in and pre-installed blades showed that pene-tration generates different disturbance consequences innon-cemented and cemented soils. In fact, in non-cemented
202 Soils and Rocks, São Paulo, 37(3): 195-209, September-December, 2014.
Cruz et al.
Figure 6 - Stress ratio dilation relation for uncemented and cemented samples subject to a confining effective stress of: a) 25 kPa,b) 300 kPa.

soils the basic DMT parameters (p0 and p1) are higher in thecase of pushed-in tests, revealing a somehow expected ef-fect of densification around the blade, especially on themembrane where measurements are made. On the otherhand, in cemented soil mixtures the same insertion proce-dure reduces the values of pressures monitored during thetests by local destructuration or interparticle debonding.Accordingly, under pushed-in conditions, p0 and p1 increasewith cementing level (Fig. 7), confirming the previouslymentioned sensitivity of DMT to cementation (Cruz et al.,2004a). As a consequence of these trends, the intermediateparameters ED and KD increase with cementation, while ID
remains essentially the same (Cruz, 2010).Aiming at an effective control of the experiment with
external reference, DMT tests were also performed in thesame spot of natural residual soils from where the soil wascollected and remoulded. The obtained results revealed thatlocal DMT basic and intermediate parameters were situatedbetween those obtained in Mixtures 1 and 2, which is coher-ent with the results of uniaxial, diametral and triaxial (cohe-sive) strengths previously presented in Table 1.
4.2.2. The influence of suction on DMT parameters
The results obtained in unsaturated conditions re-vealed an increment of the global strength and stiffness,which must be related to the presence of suction. In fact,when unsaturated results are normalized in relation topushed-in saturated values (Fig. 8), here designated by p1*,ED*, ID*, KD*, a decrease of the magnitude of each normal-ized parameter when approaching the water level is ob-served suggesting an adequate sensitivity of DMT to detect
the effect of suction, somehow expected since DMT pres-sures are directly measured.
This conclusion is confirmed also by the non-cemen-ted sample results in unsaturated conditions, consideringthat in this case the results should reflect suction alone.Data also reveal a decay of KD and ED with increasing ce-mentation, apart from suction influence, which is explainedby the clear increase of cohesion intercept, while suction re-mains essentially the same. Therefore, these results clearlyput in evidence the high sensitivity of DMT to both suctionand cementation in the cohesive component of strength.
A different behaviour is followed by ID, revealing tobe mostly independent from saturation levels in cementedsoils, while in non-cemented samples suction influencesnotoriously the magnitude of the parameter. This is in ac-cordance with recent evidences of such behaviour, pub-
Soils and Rocks, São Paulo, 37(3): 195-209, September-December, 2014. 203
An Approach to Derive Strength Parameters of Residual Soils from DMT Results
Figure 7 - Variation of DMT basic parameters with diametralcompressive strength (qd), in pushed-in conditions.
Figure 8 - Normalized (unsaturated/saturated) DMT parameters obtained in pushed-in conditions.

lished in Arroyo et al. (2013). In saturated conditions, theevaluation of soil type was found very accurate when com-pared with elemental soil classifications based on the per-centage of clay, silt and sand, while unit weights obtainedthrough ID and ED (Marchetti & Crapps, 1981) were con-firmed by laboratory determinations on good quality ex-tracted samples. Since the homogeneity in the large proto-type (CemSoil) was carefully assessed, and differencesbetween triaxial and CemSoil samples were minimized bythe careful correspondence in the preparation of both void,moisture and cementation conditions, the above consider-ations strongly suggest that DMT is adequate to infer thecohesion components arising from suction and cementa-tion, even after the blade penetration.
4.2.3. The virtual overconsolidation ratio (vOCR) andglobal cohesion (c’g)
As previously stated by Cruz et al. (2004a) and Cruz& Viana da Fonseca (2006a), the DMT key parameter forevaluating the cohesive strength is the virtual overconsoli-dation ratio (vOCR) that represents the order of magnitudeat which the stress-strain behaviour changes, expressed bythe enlargement of yield locus due to cementation structure.The determination of vOCR follows the same formulationsproposed by Marchetti & Crapps (1981) for sedimentarysoils, as follows:
ID < 1.2 (cohesive soils) OCR = (0.5 KD)1.56 (2)
ID > 2 (sandy soils) OCR = (0.67 KD)1.91 (3)
1.2 < ID < 2 (mixed soils) OCR = (m KD)n (4)
where
m = 0.5 + 0.17 P (5)
n = 1.56 + 0.35 P (6)
with
P = (ID - 1.2) / 0.8 (7)
The considerations presented in the previous sub-chapter revealed that above the water level the magnitudeof the DMT intermediate parameters is clearly influencedby suction, and so will be vOCR. Considering the homoge-neity and similarity of the triaxial and CemSoil samples,triaxial cohesion intercept can be assumed as representativeof the whole sample moulded in CemSoil. Therefore the in-crease in the results obtained above the water level shouldbe interpreted as a consequence of suction. If that is ac-cepted, a global cohesive component (c’g) due to bothinterparticular bonding and suction (when the latter is pres-ent), should be the reference parameter to correlate withDMT results.
The suction measurements taken during the CemSoilexperiment make possible evaluating suction contributionto shear strength, from the third term in the model proposedby Fredlund et al. (1978):
= c’ + (� - ua) tan’ + (ua - uw) tanb (8)
where ua is the atmospheric pressure, uw is the pore waterpressure and b is the “angle” of increase of cohesion withsuction (similar to the concept of angle of shearing resist-ance in its dependence on stress).
The term (ua - uw) corresponds to the suction measuredon tensiometers, while for b, a 14° reference value was ob-tained by Topa Gomes (2009) in Porto highly weatheredgranites (W4 to W5) and in the residual soil of ISC’2-CEFEUP (Arroyo et al., 2013), which was assumed in thisanalysis given the similarity of Guarda and Porto granites,in what concerns to mineralogy, grain size distribution,plasticity and solids unit weight.
Expressing the global cohesion (c’g) results as func-tion of vOCR, a specific correlation to derive the global co-hesive intercept is obtained, as presented in Eq. 9 and inFig. 9. In this figure, the previous correlation presented byCruz et al. (2004a) based on triaxial testing is also repre-sented.
c’g = 7.716 ln (vOCR) + 2.9639 (9)
It is important to note that the previous correlationwas based on a narrower band of vOCR values and it wasdefined as a straight line, while the new data are better rep-resented by a logarithmic function. Considering this newapproach, the former data were incorporated and a newmatch fundamental function was defined. As it would beexpected, the effect of sampling processes usually leads to areduction of cohesion intercept, with an extent that seems tobe dependent on the most appropriate equipment and con-venient procedures. In this case, the differences betweencorrelations lead to a general loss (mainly related to sam-pling) of around one third (1/3). For future interpretations,the previous correlations were based on statically pushed-in 70 mm Shelby tube samples.
Since the parameter b is not usually available, thus ithas to be estimated, it is important to analyse their influenceon the final results. Taking into account the usual values for
204 Soils and Rocks, São Paulo, 37(3): 195-209, September-December, 2014.
Cruz et al.
Figure 9 - Correlations of global cohesion intercept (c’g) as afunction of vOCR.

this parameter in the studies developed in Porto granite re-sidual soils, as those reported in Topa Gomes et al. (2008),and in other international reference works (Futai, 1999), avariation of 5° around the considered value was found to besufficient. Observed deviations resulting from variations ofb within 10° and 20° are insignificant, as shown in Fig. 10.
The evolution of the global cohesion intercept, c’g, inCemSoil and in-situ test results obtained from direct appli-cation of the proposed correlation is presented in Figs. 11aand 11b, respectively. Figure 11a reveals once more thesame trends observed in all other analysed parameters, within-situ values falling between Mixtures 1 and 2, while thein-situ profile (Fig. 11b) shows a general decrease of theoverall cohesion intercept until the water level is reached,remaining fairly constant after that depth with slightlylower values than those obtained in triaxial testing. It is alsoworth to note the convergence with the c’g profile repre-sented in the same figure, obtained by considering a theo-retical linear evolution of suction as a function of thedistance from the water level.
4.2.4. Corrected angle of shear resistance
Angles of shearing resistance in these residual soilscan be derived by the approach proposed by Marchetti(1997) for sedimentary sandy soils, applying a correctionfactor that should be function of the result of cohesion inter-cept or the index DMT parameter used in cohesion correla-tion (vOCR), as proposed by Cruz et al. (2004a) and Cruz& Viana da Fonseca (2006a). The correlation for correctingthe angle of shearing resistance, derived from the availabledata in the course of this framework, is presented in Fig. 12,where dmt represents the angle of shearing resistance ob-tained from the correlations applied to sedimentary soilsand ref is the reference angle of shearing resistance ob-tained by triaxial tests on remoulded conditions. As a con-sequence, the corrected angle of shearing resistance (corr)derived from DMT can be obtained as follows:
corr = dmt - 3.3483 ln (OCR) + 5.4367 (10)
Using this correction, the CemSoil box (pushed-intests) and in-situ test results are compared with the respec-tive triaxial data, revealing a good reproduction of the ex-perimental results. Figure 13 shows that CemSoil saturatedresults converge well with triaxial tests, while in-situ dataslightly decrease with depth due to suction effects.
4.3. Procedure to evaluate strength parameters
As a consequence of this calibration work, it was pos-sible to propose a procedure (Fig. 14), to derive strength pa-rameters of Porto and Guarda granitic residual soils fromDMT data. Its application in other granitic environmentsshould be verified, although the authors believe that thismethod may be generalized in other granitic residual sapro-
Soils and Rocks, São Paulo, 37(3): 195-209, September-December, 2014. 205
An Approach to Derive Strength Parameters of Residual Soils from DMT Results
Figure 10 - Upper and lower expected limits for the cohesive in-tercept (c’g) correlations.
Figure 11 - Global cohesion intercept (c’g) results in: a) Cemsoil;b) In-situ.
Figure 12 - Correction factor for evaluating angle of shearing re-sistance.

litic soils. For applications in other residual geomaterials(as for instance, in lateritic soils) with different genesis ordifferent mineralogical/chemical compositions, specificcorrelations should be calibrated by tentatively using thesame procedure followed in this work.
The procedure to get the parameters from DMT testsstarts with the evaluation of global cohesion through thecorrespondent correlation. If the conditions are saturated,then the result represents both global and true cohesion,since suction is null. In the case of unsaturated conditions,the global cohesion incorporates both contributions and sosuction related parameters (ua - uw, b) are required for re-spective differentiation. An alternative way that may behelpful, when values of these parameters (measured or esti-mated) are not available, is to consider the mean value ofcohesion obtained in the first results below water level(c’(avg below)) as representative of the soil cohesion above waterlevel. Considering this approach, it becomes possible toevaluate suction by subtracting the value of c’(avg below) fromthe value of the global cohesion (c’g). Finally, the correctedangles of shearing resistance (corr) are obtained by subtract-ing the correction factor (Fig. 12, in previous sub-section)to the angles of friction obtained by traditional sedimentaryapproach (DMT).
206 Soils and Rocks, São Paulo, 37(3): 195-209, September-December, 2014.
Cruz et al.
Figure 13 - Triaxial and deduced angles of shearing resistance in:a) Cemsoil; b) In-situ.
Figure 14 - Evaluation of strength parameters in residual soils.

5. Conclusions
In the context of this framework a model to interpretDMT results in residual soils from Portuguese granites waselaborated, followed by an experiment in controlled condi-tions to establish adequate correlations with the geotech-nical strength parameters, namely the global cohesionintercept (arising from the cementation structure and suc-tion) and the angles of shearing resistance corresponding toa linearized Mohr-Coulomb failure envelope. The obtainedcorrelations were then applied to DMT tests performed inthe IPG experimental site (Rodrigues, 2003; Cruz, 2010)and the consequent results showed an excellent conver-gence with the reference parameters, proving to be ade-quate for Porto and Guarda granites.
Previous correlations to obtain strength of the samematerials (Cruz et al., 2004a; Cruz & Viana da Fonseca,2006) were affected by sampling disturbance and spacevariability of the triaxial testing that served as reference anddid not take into account suction effects on cohesive inter-cept. To overcome these uncertainties a dedicated experi-mental facility was planned and realized, consisting of alarge dimension prototype (CemSoil box), where artifi-cially cemented soils were moulded with the purpose of ex-ecuting DMT tests with pre-installed and pushed-in blades.Specimens for triaxial testing were also prepared followingthe same moulding process and state conditions. The ob-tained results confirmed that DMT parameters are influ-enced by both cementation and suction. Using as referenceparameter a concept similar to overconsolidation ratio, des-ignated by “virtual” (vOCR), it was possible to establishcalibrated correlations for deriving a global cohesive inter-cept (c’g) generated by cementation and suction effects.Moreover, when suction parameters (b and ua - uw) areavailable, the cohesion resulting from cementation struc-ture is easily obtained by subtracting the suction contribu-tion, calculated by the third term of Fredlund et al. (1978)strength criterion. In cases where there is no informationabout suction, a novel procedure to separate cementationand suction contributions was also proposed. The experi-ment also proved that angles of shearing resistance could bederived with accuracy by the approach proposed by Mar-chetti (1997) for sedimentary sandy soils, as far as a correc-tion factor based on vOCR is used. DMT tests performed inthe same spot of Guarda Granitic Formation from where theartificial samples of the main experiment were moulded,showed high convergence with triaxial results, confirmingthe adequacy of the correlations developed in this frame-work for deriving the in-situ strength parameters. The pre-sented correlations were tested only in Portuguese granites,and so its extension to other residual soils with differentgenesis or different mineralogic/chemical compositionsshould be confirmed in the first place. The presented workmay represent a path to follow.
Acknowledgments
This research was developed under the activities ofMOTA-ENGIL, namely “Geomechanic Modelling of Re-sidual Soils, RESOIL, financed by European Community(QREN/UE/FEDER), under the activities of CEC (FEUP),PTDC/ECM/099475/2008, financed by the OperationalProgram for Competitive Factors, COMPETE.
References
Almeida, F.; Café. L.; Cruz, N. & Rodrigues, C. (2012)Laboratorial S-wave measurements with buried geo-phones in a large calibration box. Proc. Geotechnicaland Geophysical Site Characterization ISC’4, v. 2,p. 1419-1426.
Arroyo, M.; Amaral, M.F. & Viana da Fonseca, A. (2013)Isotropic yielding of unsaturated cemented silty sand.Canadian Geotechnical Journal, v. 50:8, p. 807-819.
Baldi, G.; Bellotti, R.; Ghionna N. & Jamiolkowski, M.(1988) Stiffness of sands from CPT, SPT and DMT - acritical review. Penetration Testing. Institution of CivilEngineers, British Geotechnical Conference, Birming-ham, paper n. 42, p. 299-305.
COBA (2003) Porto Geotechnical Map. Work performedby COBA with the collaboration of Faculty of Sciencesof University of Porto. Porto City Hall (in Portuguese).
Coop, M.R. & Willson, S.M. (2003) Behavior of hydrocar-bon reservoir sands and sandstones. Journal of Geo-technical and Geoenvironmental Engineering, ASCE,v. 129:11, p. 1010-1019.
Cruz, N. (1995) Evaluation of Geotechnical Parameters byDMT Tests. MSc Thesis, Faculty of Science and Tech-nology, University of Coimbra.
Cruz, N. (2010) Modelling Geomechanics of ResidualSoils by DMT Tests. PhD Thesis, University of Porto,Portugal.
Cruz, N.; Viana da Fonseca, A.; Coelho, P. & Lemos, J.(1997) Evaluation of geotechnical parameters by DMTin Portuguese soils. XIV Int. Conf. on Soil Mechanicsand Foundation Engineering, Hambourg, Germany,v. 1, p. 77-80.
Cruz, N.; Viana da Fonseca, A. & Neves, E. (2004a) Evalu-ation of effective cohesive intercept on residual soils byDMT data. Proc. 2nd Int. Site Characterization - ISC’2,Porto, Portugal, Sept. 2004. Millpress, Rotterdam, v. 2,p. 1275-1278.
Cruz, N.; Figueiredo, S. & Viana da Fonseca, A. (2004b)Deriving geotechnical parameters of residual soils fromgranite by interpreting DMT+CPTU tests. Proc. 2nd Int.Site Characterization - ISC’2, Porto, Portugal, v. 2,p. 1799-1803.
Cruz, N. & Viana da Fonseca, A. (2006a) Portuguese expe-rience in residual soil characterization by DMT tests.Proc. 2nd Int. Flat Dilatometer Conference, WashingtonD.C., v. 1, p. 359-364.
Soils and Rocks, São Paulo, 37(3): 195-209, September-December, 2014. 207
An Approach to Derive Strength Parameters of Residual Soils from DMT Results

Cruz, N. & Viana da Fonseca, A. (2006b) Characterizationof stiff residual soils by dynamically push-in DMT.ASCE Geotechnical Special Publication n. 149,p. 261-268.
Fahey, M. & Randolph, M.F. (1984) Effect of disturbanceon parameters derived from self-boring pressuremetertests in sands. Géotechnique, v. 34:1, p. 81-97.
Ferreira, C.; Viana da Fonseca, A. & Nash, D. (2011) Shearwave velocities for sample quality assessment on a re-sidual soil. Soils and Foundations, v. 51:4, p. 683-692.
Finno, R. J. (1993) Analytical interpretation of dilatometerpenetration trough saturated cohesive soils. Géotechni-que, v. 43:2, p. 241-254.
Fredlund, D.G.; Morgenstern, N.R. & Widger, R.A. (1978)The shear strength of unsaturated soils. Canadian Geo-technical Journal, v. 15:3, p. 313-321.
Futai, M.M. (1999) Theoretical-Experimental Study ofNon-Saturated Tropical Soils: Application to SlopesRavine Processes. PhD Thesis, COPPE-UFRJ, Rio deJaneiro.
Huang, A.B. (1989) Strain path analysis for arbitrarythree-dimensional penetrometers. Journal for Numeri-cal and Analytical Methods in Geomechanics, v. 13:5,p. 551-564.
Jendeby, L. (1992) Deep compaction by vibrowing. NordicGeot. Meeting, v. 1, p. 19-24.
Leroueil, S. & Vaughan, P.R. (1990) The general and con-gruent effects of structure in natural clays and weakrocks. Géotechnique, v. 40:3, p. 467-488.
Lutenegger, A. J. & Kabir, M.G. (1988) “Dilatometer C-reading to help determine stratigraphy”. Proc. ISoPT-1,Orlando, FL, v. 1, p. 549-554.
Mantaras, F.M. & Schnaid, F. (2002) Cylindrical cavity ex-pansion in dilatant cohesive-frictional materials. Géo-technique, v. 52:5, p. 337-348.
Marchetti, S. (1980) In-situ tests by flat dilatometer. J.Geotechnical, Eng. Div. ASCE, v. 106:3, p. 299-321.
Marchetti, S. (1997) The flat dilatometer design applica-tions. III Geotechnical Engineering Conference, CairoUniversity. Keynote Lecture, v. 1, p. 421-448.
Marchetti, S. & Crapps, D.K. (1981) DMT operating man-ual. GPE Inc.Gainsville, Florida.
Mayne, P. W. (2006) Interrelationships of DMT and CPT insoft clays. Proc. 2nd Int. Conf. on Flat Dilatometer,Washington, DC, v. 1, p. 231-236.
Rodrigues, C. (2003) Geotechnical Characterization andGeomechanical Behaviour Analysis of a Saprolite fromGuarda Granites. PhD Thesis, University of Coimbra.(in Portuguese).
Schnaid, F. & Mantaras, F.M. (2003) Cavity expansion incemented materials: structure degradation effects. Géo-technique, v. 53:9, p. 797-807.
Schnaid, F. & Coutinho, R.Q. (2005) Pressuremeter tests inBrazil (National Report). International Symposium 50Years of Pressuremeters, v. 2, p. 305-318.
Smith, M.G. & Houlsby, G.T. (1995) Interpretation ofMarchetti’s dilatometer in clay. Proc. 11th EuropeanConf. on Soil Mechanics and Foundation Engineering.Copenhagen, Denmark. p. 1247-1253.
Topa Gomes, A., Viana da Fonseca, A. & Fahey, M. (2008)Self-boring pressuremeter tests in Porto residual soil:results and numerical modelling. Geotechnical SiteCharacterization. Huang and Mayne (eds). Proc. ISC’3.Taylors & Francis, v. 2, p. 1193-1021 (CD-Rom)
Topa Gomes, A. (2009) Elliptical Shafts by the SequentialExcavation Method. The Example of Metro do Porto.PhD Thesis, University of Porto. (in Portuguese).
Viana da Fonseca, A. (1996) Geomechanics of Porto Re-sidual Soil from Granite. Design Criteria for DirectFoundations. PhD Thesis presented to Porto University.
Viana da Fonseca, A. (2003) Characterising and derivingengineering properties of a saprolitic soil from granite,from Porto. Tan, Phoon, Hight & Leroueil (eds) Char-acterisation and Engineering Properties of NaturalSoils. Swets & Zeltlinger, Lisse, v. 2, p. 1341-1378.
Viana da Fonseca, A. & Coutinho, R. Q. (2008) Character-ization of residual soils. Keynote paper. Proc. 3rd Inter-national Conference on Site Characterization, Taiwan.
Viana da Fonseca, A.; Silva, S. & Cruz, N. (2009) Geo-technical characterization by in-situ and lab tests to theback analysis of a supported excavation in Metro doPorto. Int. Geotechnical and Geological EngineeringJournal, v. 28:3, p.251-264.
Viana da Fonseca, A.; Coop, M.R.; Fahey, M. & Consoli,N. (2011) The interpretation of conventional and non-conventional laboratory tests for challenging geotech-nical problems. Keynote Lecture, 5th Int. Symp. on De-formation Characteristics of Geomaterials. IOS Press,Amsterdam, v. 1, p. 84-119.
Viana da Fonseca, A.; Amaral, M.F.; Panico, F. & Rios, S.(2014) Indexation of dynamic and static geomechanicalproperties of a cemented aggregate for transportationengineering. Journal of Transportation Geotechnics, v.1, p. 1-14.
Whittle, A.J. & Aubeny, C.P. (1992) The effects of installa-tion disturbance on interpretation of in situ tests in clay.Proc. Wroth Memorial Symp., Oxford, July, v. 1,p. 742-767.
Yu, H.S.; Carter, J.P. & Booker, J.R. (1993) Analysis of thedilatometer test in undrained clay. Predictive Soil Me-chanics. Thomas Telford, London, v. 1, p. 783-795.
List of Symbols
c’: cohesive intercept in Mohr-Coulomb criterionc’g: global cohesion due to cementation and suction inMohr-Coulomb criterionCID: triaxial test, isotropically consolidated drainedCPT: cone penetration testCPTu: piezocone test
208 Soils and Rocks, São Paulo, 37(3): 195-209, September-December, 2014.
Cruz et al.

d: rate of dilatancy = �p
v/�p
s, where �p
v is the increment ofvolumetric strain and �p
s is increment of shear strainDMT: Marchettis flat dilatometer testDPSH: dynamic probing super-heavy testED: dilatometer modulus (DMT)ED*: ratio between unsaturated/saturated values of ED
ID: material index (DMT)ID*: ratio between unsaturated/saturated values of ID
KD: horizontal stress index (DMT)KD*: ratio between unsaturated/saturated values of KD
NC: normally consolidated soilNSPT: number of blows to penetrate 30 cm in SPTOC: overconsolidated soilOCR: overconsolidation ratiop’: mean effective stressp0: DMT first pressure reading (lift-off)p1: DMT second pressure reading (membrane expansion)p1*: ratio between unsaturated/saturated values of p1
p2: DMT third pressure reading (closing pressure)pa: atmospheric pressure (101.3 kPa)PMT: Ménard pressuremeter testq: deviator stress
qc: cone tip resistance (CPT/CPTu)qd: diametral compression strengthqt: corrected cone tip resistance (CPTu)qu: uniaxial compression strengthqu*: ratio between unsaturated/saturated values of qu
SCPTu: seismic piezocone testSDMT: seismic dilatometer testSPT: standard penetration testu, uw: pore water pressureu0: at rest pore water pressureua: pore air pressureUD: pore pressure index (DMT)UD*: ratio between unsaturated/saturated values of UD
vOCR/AOCR: virtual OCR/apparent OCRVP: compression wave velocityVS: shear wave velocityz: depth’: effective angle of shearing resistance’DMT: angle of shearing resistance derived from DMT’ref: reference angle of shearing resistanceb: suction angle of shearing resistance�: stress ratio (q/p’).
Soils and Rocks, São Paulo, 37(3): 195-209, September-December, 2014. 209
An Approach to Derive Strength Parameters of Residual Soils from DMT Results


A View of Pressuremeter Testing in North America
J. Benoît, J.A. Howie
Abstract. The pressuremeter was introduced to North America by Ménard in 1957. It consists of a cylindrical probe whichis inserted into the ground in a borehole, by self-boring or by pushing, and is expanded against the soil or rock to obtain apressure-expansion curve. Interpretation methods based on cavity expansion theory applied to realistic models of soilbehavior allow derivation of in situ lateral stress, stiffness, strength and volume change characteristics of the material beingtested. Since its introduction, the pressuremeter test (PMT) has been a popular topic of research but has not gained wideacceptance in geotechnical engineering site characterization practice which, in North America, is still dominated by theStandard Penetration Test (SPT) and more recently by the piezocone (CPTu). Over the same period, the PMT has becomethe dominant tool for site investigation and foundation design in France. There, the PMT is used empirically based on avery large amount of load testing and experience. This paper examines the use of the PMT in North American practice,discusses its strengths and weaknesses, identifies trends in its use for site characterization and geotechnical design andidentifies possible reasons for its lack of adoption by industry. We conclude that the PMT is not competitive with othertechniques such as the CPTu and SPT for general site characterization where such tests are possible but that the PMT offersgreat potential to provide geotechnical design parameters in problematic materials such as hard, very dense or gravellysoils, residual, saprolitic or lateritic soils, soft and fractured rocks, frozen ground and ice. The PMT also has application inall soils where high consequences of failure require very detailed analysis and design. We also emphasize the need forimprovements in the education of geotechnical practitioners on the use of the pressuremeter.
Keywords: Ménard, pressuremeter, self-boring, prebored, pressuremeter design.
1. Introduction
The original concept of the pressuremeter dates backto Kögler in 1933 who developed a device consisting of arubber bladder clamped at both ends and lowered in apre-bored hole. The expansion of the device against thesides of the borehole allowed the determination of thestress-strain characteristics of the soil. Without knowledgeof Kögler’s work, Ménard (1957) developed a much im-proved pressuremeter (PMT), which has been widely usedin engineering practice for more than half a century. In spiteof the simplicity of this concept, there are a number of in-herent problems associated with inserting an instrument ina pre-bored hole. The pre-drilling of a borehole inevitablyinduces disturbance due to the drilling process and also al-lows unloading due to pre-boring the hole. When used inrelatively stiff soils and soft rocks, these problems are eas-ily overcome, but in soft clays and cohesionless soils suchas sands, these problems are more difficult to circumvent.However, under the assumptions that disturbance and stressrelief are minimal when using careful borehole preparationtechniques, the cavity expansion measurements and inter-preted results can be used directly in a set of design rules,derived empirically but based on theory. The results canalso be used indirectly by obtaining soil and rock strengthand deformation parameters which can be used in conven-tional design of geotechnical structures.
Recognizing the effects of pre-boring on the parame-ters obtained and the corresponding necessity of using em-pirical correlations, French and English research groups(Baguelin et al., 1972; Wroth & Hughes, 1972) independ-ently developed a self-boring pressuremeter (SBPM) whichcould be inserted into the ground with minimal disturbance.The SBPM probe is similar in testing concept to the pre-bored pressuremeter except that it is advanced into theground through a balanced process of pushing while cuttingthe soil which enters a sharp cutting shoe located at the bot-tom of the probe. The cuttings are flushed above the probein the annular space inside the probe body. Results fromSBPM tests have been used primarily to obtain soil parame-ters such as strength and deformation properties for use inconventional design or analytical methods such as finite el-ement analysis. Other types of pressuremeters have beenintroduced, mostly in an effort to increase productivity es-pecially offshore. Such techniques include push-in and fulldisplacement devices. These methods also induce a consis-tent and repeatable amount of disturbance and conse-quently are not as operator dependent.
Regardless of the type of probe used or method ofplacement into the ground, once the appropriate depth isreached, a pressuremeter test is conducted as follows. Themembrane is expanded against the sides of the borehole andthe pressure, displacement and, in some cases, porewaterpressures are monitored and recorded. Either stress or strain
Soils and Rocks, São Paulo, 37(3): 211-231, September-December, 2014. 211
Jean Benoît, Ph.D., Professor, Department of Civil Engineering, University of New Hampshire Kingsbury Hall, Durham, New Hampshire, USA. e-mail: [email protected] A. Howie, Ph.D., Associate Professor, Department of Civil Engineering, University of British Columbia, BC, Canada. e-mail: [email protected] on March 28, 2014; Final Acceptance on December 15, 2014; Discussion open until April 30, 2015.

controlled expansion tests may be carried out. Each testmay generally be conducted in 10 to 30 min depending onthe type of material and test procedure.
This paper will review the current use of the pressure-meter as an in situ testing tool in North America, highlightits benefits and discuss why its use has been limited com-pared to other field techniques such as the Standard Pene-tration Test (SPT) and the Cone Penetration Test (CPT).While emphasis will be placed on the prebored pressu-remeter test, other pressuremeter tests will be discussed interms of applicability and acceptability to engineeringpractice.
2. Background
The prebored pressuremeter as we know it today isthe product of the vision and ingenuity of Louis Ménardwhile a student at Ecole Nationale des Ponts et Chausséesin Paris. As part of his final project, Ménard and his twocolleagues (Gauthier et al., 1954) described the pressu-remeter shown in Fig. 1, its use, and a theoretical study gov-erning the interpretation of the test curve. Although themanuscript was only 20 pages, it covered stresses and dis-placements around the expanding cylindrical cavity forcases of cohesive soils, saturated sands and clays, unsatu-rated soils and inelastic soils followed by numerical exam-ples for dry and saturated soil. They concluded that theprincipal advantage of pressuremeter use was to allow thestudy of pressure-deformation characteristics of soils andthat their study was to shed light on the interpretation ofthose results. At that stage of their study, they also assumedthat no remolding of soil occurs as a result of borehole prep-aration. Ménard’s patent application followed and was sub-mitted in Paris on January 19, 1955. The schematic of hisprobe described in his patent application is as previouslyshown in Fig. 1.
Following his studies in Paris, he travelled to the USAto do a Master’s thesis under Dr. Ralph Peck. His thesis en-titled “An Apparatus for Measuring the Strength of Soils inPlace” was completed in 1957 at the University of Illinois.Ménard recognized that his invention, which he coined the“pressiometer” had competition from other field tools suchas the field vane in clays and the standard penetration test insands. However, he recommended his tool because “A the-oretical interpretation of the curve “strain versus stress”gives immediately the values of the cohesion, the frictionangle and the modulus of elasticity.” From his work he con-cluded the following:
a) The pressiometer is a very precise method ofsubsurface exploration;
b) The bearing capacity increases with themodulus of elasticity of the soil.
Part of his research work included testing in varioussoils such as glacial till, fluvial and compacted clays andsand. Figure 2 shows pressuremeter tests done in Chicagoclays at shallow depth in an investigation designed to eval-
uate the remolding due to the driving of H-piles and decom-pression from the excavation for the Island Steel Building.The test labeled 42 was performed 1 m away from the pilewhile test 44 was done at the same depth but only 0.3 maway. The results from the tests indicated a decrease in un-drained strength of about 40% due to the driving of the pilesand unloading from the excavation while the modulus ofelasticity varied from 41 kg/cm2 (4 MPa) for the undis-turbed clay compared to only 6 kg/cm2 (0.6 MPa) for theremolded clay. Through testing at two other sites, Ménardwas able to demonstrate good agreement between his theo-retical derivations and the experimental results.
According to Ladanyi (1995), Ménard recognizedsome limitations in his initial theoretical approach to inter-pretation of the test and began to develop empirical rulesgoverning the use of the pressuremeter results for founda-
212 Soils and Rocks, São Paulo, 37(3): 211-231, September-December, 2014.
Benoît & Howie
Figure 1 - Schematic description of the original pressuremeter(Gauthier et al., 1954).

tion design. The approach was validated initially by com-parison to full-scale load tests and has been improved andextended by research and practice in the years since, partic-ularly in France where it has become the dominant tool forsite investigation and foundation design. Although the orig-inal pressuremeter shown in Fig. 1 required a borehole di-ameter of 140 mm, the second prototype was reduced to50 mm (Cassan, 2005). A series of improvements and mod-ifications in the guard cells’ design and pressurization,volume and pressure measurement systems, membraneprotection, and control unit for conducting and recordingthe test were continuously implemented in an effort tomake the pressuremeter a more reliable and accurate testmethod. These changes also allowed the pressuremeter tobe used at greater depths and higher pressures. Dimensionsof the pressuremeter also evolved to improve on the lengthto diameter ratio. Other groups outside France have alsomodified the details of the pressuremeter and the systemused to measure expansion of the pressuremeter membraneby using various displacement sensors instead of volumemeasurements.
The prebored pressuremeter has been successfullyused in hard soils and soft or weak rocks where other in situtools cannot penetrate these materials or lack the capacityto measure geotechnical parameters in these formations.Special probes with rugged membranes can acquire pres-
sure-expansion curves which can be interpreted to estimatematerial stiffness properties and, in some cases, strengthparameters in carefully prepared boreholes.
Ménard protected his invention from outside influ-ence for 10 years through patent protection but in 1969 be-gan to sell and license its use to others (Ladanyi, 1995).This opened the pressuremeter concept to much research.In an effort to eliminate the disturbance effects of pre-boring, the self-boring pressuremeter was developed by re-search groups in France (Baguelin et al., 1972) andEngland (Wroth & Hughes, 1972). Differences exist be-tween the French system (PAFSOR) and the British system(CamKoMeter) but the objectives are the same. Insertion ofthe probe into the ground occurs using a cutter system lo-cated inside a cutting or driving shoe to minimize distur-bance. As the probe is pushed into the ground, the soilwhich enters the cutting shoe is cut by the rotating cutterand flushed to the ground surface through the annular spaceinside the probe body. Other systems of advance have beensuccessfully used, e.g. jetting (Benoît et al., 1995) and haveproved to often be more time-effective in soils. Once thetesting depth is reached, the membrane is expanded againstthe sides of the borehole and the pressure, displacements(or volume) and, in some cases, porewater pressures, aremeasured continuously and automatically. The SBPM testcan be conducted in a stress or strain controlled manner.Because the SBPM is inserted with minimal disturbance,the cavity expansion measurements can be analyzed usingbasic continuum mechanics of cavity expansion and conse-quently engineers need not rely on empirical correlations toobtain soil parameters for use in foundation design.
Other types of pressuremeter were introduced in aneffort to circumvent the requirements to produce a preparedhole for testing or to use an often time consuming methodof advance in the case of self-boring by using pushing as themethod of insertion. The need for pressuremeter testing off-shore was the major catalyst for these innovations. One ap-proach developed was the Push-in Pressuremeter (Reid etal., 1982) which comprised an expansion unit mountedaround a tube similar to a sample tube. However, Bandis &Lacasse (1986) showed that the insertion of this unit causedconsiderable disturbance and the fact that the probe had tobe withdrawn from the hole between tests did not offer sig-nificant improvement in productivity. Another develop-ment aimed at the offshore market was the Cone Pressu-remeter which was also known as the Full-DisplacementPressuremeter (Hughes & Robertson, 1985; Withers et al.,1986). The Pencel Pressuremeter was an adaptation of thepavement evaluation tool described by Briaud & Shields(1979) which was also pushed into place for testing. Thesetools were based on the concept that it was better to create aconsistent, repeatable degree of disturbance in the soil adja-cent to the expansion unit. An additional advantage of thismethod is an increased production rate.
Soils and Rocks, São Paulo, 37(3): 211-231, September-December, 2014. 213
A View of Pressuremeter Testing in North America
Figure 2 - Pressuremeter tests performed by Ménard in Chicagoclays (Ménard, 1957).

3. Approaches to Analysis and Interpretationof Test Curves
In a report by the ISSMGE Committee TC 16 onpressuremeter testing in onshore ground investigations,Clarke & Gambin (1998) noted that two approaches to in-terpretation and use of pressuremeter results had evolved.One was based on analytical methods used to derive basicsoil properties (strength, stiffness etc.) from the test curvesand the other was based on the development of a set of em-pirical design rules based on measurements made in a verystandard way with a standard instrument. They also hintedat a strong diversity of opinion between proponents of thetwo approaches but regarded such differences as healthy.
Figure 3 from Clayton et al. (1995) shows schematicpressuremeter curves obtained using the three principalmethods of insertion. The differences are readily seen. Forthe prebored test, the wall of the test pocket has been un-loaded by the drilling and will have relaxed inwards. Thepressure increase and deflection required to re-establishcontact between the probe and the cavity wall and to exceedthe in situ lateral stress to begin expansion will depend onthe material type and properties, the relative diameters ofthe borehole and the probe, the quality of the drilling andthe expertise of the pressuremeter test field crew in installa-tion of the probe. This results in an S-shaped expansioncurve. For the full displacement probe, since it is pushedinto the ground, the initial deformation results in the expan-sion curve starting at a higher stress. In principle, for theself-boring advance, the stresses in situ are theoretically un-changed by the probe insertion and thus the beginning ofthe expansion curve should represent the in situ lateralstress.
In reality, no probe can be installed without some dis-turbance of the soil. For example, a 0.5 mm expansion of a76 mm diameter pressuremeter represents 1.3% cavitystrain (�r/ro where ro is the initial cavity radius and �r is thechange in radius). With full scale expansion of a typicalSBPM test being only 10% cavity strain, small movementsinduced during installation can have a large effect on themeasured expansion curve. For most soils, such a deforma-tion would lead to the formation of a zone immediately ad-jacent to the pressuremeter that has reached yield. Forsaturated fine grained soils, this will be a zone exhibitingexcess pore pressure and in free-draining soils, will be azone of volume change. From Fig. 3(b), it can be seen thatthere is the potential for disturbance to cause large stresschanges from the in situ stress even for SBPM testing in rel-atively soft soils. In stiff soils, the potential stress changesare very large. Consequently, “lift-off” pressures are unreli-able measures of in situ stress even in a test conducted afterexpert installation of the probe. Much research effort hasbeen expended in an attempt to clarify the effects of suchdisturbance on subsequent test curves but the fundamentalproblem is that it is not possible to reliably assess from themeasured test curve the degree of disturbance caused by in-stallation of the probe.
The schematic test curves in Fig. 3 all include un-load-reload loops. Palmer (1972) showed that the slope ofthe initial part of an ideal expansion curve is twice the shearmodulus. To avoid the effects of disturbance on the initialpart of the expansion curve, unload-reload loops can be in-terpreted to give the elastic shear modulus of the soil orrock. Such loops are considered to be little affected by dis-turbance as is shown in Fig. 3 where the slopes of the un-load-reload loops are similar in all three cases.
214 Soils and Rocks, São Paulo, 37(3): 211-231, September-December, 2014.
Benoît & Howie
Figure 3 - Schematic differences in stress-strain curves as a result of pressuremeter installation procedures (Clayton et al., 1995).

3.1. Interpretation to derive soil properties
The analysis of pressuremeter test results based ontheory requires the following assumptions:• The probe can be installed without disturbing the soil to
be deformed by the test (or in the case of the conepressuremeter, the degree of disturbance is consistent),
• The assumed soil model is representative of the stress-strain response of the soil being deformed by the pres-suremeter expansion,
• Deformation occurs under plane strain conditions.The analysis is dependent on the type of soil and
whether the cavity expansion is conducted drained or un-drained. If the test is undertaken in a saturated fine-grainedsoil and the test is conducted fast enough to prevent drain-age, then the soil will deform at constant volume and allelements surrounding the probe will have the same stress-strain behavior. However, if the soil is a free draining gran-ular material, the stress-strain curve will no longer beunique with radius but rather a function of the stress level.In other words, near the walls of the cavity the stresses willbe high and hence the shear resistance will be high. Bothstresses and strength will decrease with radial distance.Furthermore, because the volume is allowed to change dur-ing the test, as the sand shears, the material will expand ordilate depending on its initial stress level and initial density.If the material is a rock then the interpretation becomeseven more complex because of the tensile strength of therock, the presence of discontinuities and planes of weak-ness and the determination of a suitable failure criterion.
In general, from a pressuremeter test, it is possible toobtain, empirically, theoretically or analytically, the lateralstress in the ground, the stress-strain behavior, the strengthand in some cases the consolidation characteristics. Severalinterpretation techniques are available to evaluate thesevarious parameters.
The early approaches to pressuremeter interpretationbased on cavity expansion theories used graphical manipu-lations of the test curves to derive soil parameters. Table 1from Yu (2004) gives examples of available methods to in-terpret fundamental soil parameters from in situ testing. Inthe initial attempts at interpretation, parameters weretreated separately. The total lateral stress was taken to bethe stress at first movement of the membrane (“lift-off”pressure), the shear modulus was derived from unload-reload loops or from an inferred stress-strain curve andshear strength was obtained from graphical manipulation ofthe test curve. As noted by Ladanyi (1995), with the adventof the PC-age, the whole pressuremeter curve could be ana-lyzed using computer-aided modeling. Shuttle & Jefferies(1995) refer to the process as Iterative Forward Modeling.The ability to simulate complete pressuremeter curves,both loading and unloading, using realistic soil models hasled to attempts to use comparisons between simulated andmeasured pressuremeter curves to obtain estimates of geo-technical parameters. Both expansion and contractioncurves can be modeled. To use the approach, a group of rel-evant parameters is selected based on the assumed constitu-tive model and is used to predict a theoretical curve. Theparameters are adjusted until good agreement is achievedbetween the measured and calculated curves. Figure 4(a)shows an example of curve fitting for a clay soil fromJefferies (1988) and Fig. 4(b) is an example for sand fromRoy et al. (2002). Both of these examples are based onSBPM data. However, modeling can also be applied toprebored or full-displacement pressuremeter test data, pro-vided the curve-matching focuses on the latter part of theexpansion curve or the unloading curve (e.g. Ferreira &Robertson, 1992). Schnaid et al. (2000) suggested that in alightly structured granite saprolite, the curve fitting tech-nique applied to the loading curve of a SBPM test provided
Soils and Rocks, São Paulo, 37(3): 211-231, September-December, 2014. 215
A View of Pressuremeter Testing in North America
Table 1 - Examples of the capabilities of in situ tests for measuring soil properties (Yu, 2004).
Test Measured Properties Selected References
Cone penetration tests(CPT/CPTU)
Soil profiling; Stress history (OCR); Consolidationcoefficient; In situ state parameter for sand; Un-drained shear strength; Hydrostatic pore pressure
Robertson (1986), Wroth (1984), Mayne(1993), Baligh and Levadoux (1986), Teh(1987), Been et al. (1987), Yu and Mitchell(1998), Lunne et al. (1997)
Self-boring pressuremetertests (SBPMT)
Horizontal in situ stress; Shear modulus; Shearstrength; Stress-strain curve; In situ state parameterfor sand; Consolidation coefficient; Small strainstiffness
Jamiolkowski et al. (1985), Wroth (1982), Gibsonand Anderson (1961), Hughes et al. (1977),Palmer (1972), Manassero (1989), Yu (1994,1996, 2000), Clarke et al. (1979), Byrne et al.(1990), Jardine (1992), Fahey and Carter(1993), Bolton and Whittle (1999)
Cone pressuremeter tests(CPMT)
Horizontal in situ stress; Shear modulus; Shearstrength; In situ state parameter for sand
Houlsby and Withers (1988), Schnaid (1990),Yu (1990), Yu et al. (1996)
Flat dilatometer tests(DMT)
Soil profiling; Horizontal in situ stress; Stress his-tory (OCR); Shear strength; In situ state parameterfor sand
Marchetti (1980), Mayne and Martin (1998),Finno (1993), Huang (1989), Yu (2004)

properties typical of peak shear strength parameters,whereas those obtained from the unloading portion weremore typical of the critical state behavior.
This approach has the advantage that parameters arerelated to each other and can be checked for consistencywith those of soils that are typical of the soil being tested.For example, for a linear elastic, perfectly plastic soil, theparameters assumed would be the total horizontal stress,shear modulus (G) and undrained shear strength (su).Whether the resulting derived soil parameters are typical ofthe soil being tested can be assessed. Similarly, the esti-mated total lateral stress and equilibrium pore pressure canbe used to derive the coefficient of earth pressure at-rest, Ko.This value can be assessed against values typical of soilswith similar geological history. As the soil models increasein complexity, the number of soil parameters that have to beadjusted may become large.
Numerical analysis also allows the influence of de-partures from the ideal case to be assessed. For example,Yeung & Carter (1990), Houlsby & Carter (1993) andJefferies & Shuttle (1995) discuss the effect of the finitelength of the probe on the shear strength and rigidity indexderived from approaches based on assumption of an infi-nitely long cavity and linear elastic, perfectly plastic soilbehavior. These authors show that the effects of the finitelength should be considered in the interpretation of thepressuremeter curves and indicate that such effects could
result in errors in interpreted undrained shear strength of upto 40%.
It is clear that computer aided modeling providesgreat potential for the interpretation of pressuremeter testcurves to determine the characteristic behavior of the soiltested. However, the interpretation must be considered to-gether with other available geotechnical and geological in-formation about the material and requires the application ofengineering judgment based on an appreciation of the fac-tors affecting the results.
3.2. Interpretation by Ménard rules
The alternative to interpreting the curves to obtainfundamental properties and the attendant problems arisingfrom the many uncertainties in both the test curve and theinterpretation is the one followed by Ménard and developedby his collaborators and successors. A prebored pressu-remeter test is conducted using a standard probe, installedaccording to restrictive drilling requirements governing theformation of the test pocket, and expanded according to astandard test procedure. The resulting test curves are ana-lyzed in a prescribed way and specific parameters are de-rived from them.
From a conventional pressuremeter expansion, threebasic parameters are obtained: the creep pressure pf, theMénard modulus EM and the limit pressure pLM. Figure 5shows the analysis procedure from the current interna-tional draft standard, ISO 22476 4, which is used to define
216 Soils and Rocks, São Paulo, 37(3): 211-231, September-December, 2014.
Benoît & Howie
Figure 4 - (a): Example of curve fitting in clay (after Jefferies 1988). (b): Example of curve fitting in sand (Roy et al., 2002).

the three main pressuremeter parameters: pf, EM, and pLM.The quality of the test is evaluated using the number ofdata points available to define each portion of the expand-ing cavity as well as the scatter of the test points. The testcurve shown in Fig. 5 is an ideal test. The first part of thecurve is a recompression zone, followed by a quasi-linearzone which transforms to a non-linear third portion as thecavity volume approaches twice its initial volume. Thetest curve has been corrected for pressure and volumelosses per standard calibration procedures outlined in thestandard.
A test where test points are found in the first twogroups only may indicate that the test hole was too largewhile a test with only the last two groups of points is gener-ally indicative of the hole being too small or the presence ofswelling ground. This approach has been in existence fordecades as previously reported by Kastman (1978) usingPMT tests carried out in the USA. Below the test curve isthe corrected creep curve resulting from the differences involume between the 30 s and 60 s readings from each pres-sure increment. This creep curve is used to define the vari-ous sections of the test. For example, the creep pressure is
Soils and Rocks, São Paulo, 37(3): 211-231, September-December, 2014. 217
A View of Pressuremeter Testing in North America
Figure 5 - Pressuremeter test curve analysis (ISO/FDIS 22476-4:2009 (E)).

located between the values p2i and pfi which are estimatedusing a graphical procedure. It has been shown that thequality of the test is reflected in the closeness of those twovalues.
The limit pressure is also obtained from the test buttypically using an extrapolation technique. The limit pres-sure is defined as the pressure required for doubling the ini-tial borehole cavity. In practice, this pressure is rarelyattained because of the risk of membrane burst at higher ex-pansion. Consequently, the limit pressure is obtained by ex-trapolation using a variety of methods. Often the value isobtained visually using the test curve. However, more re-producible methods should be used such as the reciprocalmethod (1/V from ASTM and ISO 22476-4) or the doublehyperbolic method. Figure 5 illustrates both techniques.
Finally, the pressuremeter modulus, often referred toas the Ménard modulus, is generally defined as the slope ofthe linear portion of the expansion curve prior to the creeppressure. This pseudo-elastic range is defined by points p1i
and p2i in Fig. 5. The modulus obtained using the pressure-meter test is often quoted as being an elastic modulus equalto Young’s modulus since it is obtained from Eq. 1 which isbased on the theory of linear elasticity (Gambin et al.,1996).
E VV V p p
V VM c� � ���
��
�
�
�
�
��
�
�2 1
21 2 2 1
2 1
( )( )
( )� (1)
with Poisson’s ratio � = 0.33, where EM = pressuremetermodulus and Vc = volume of initial cavity.
However, as stated by Gambin et al. (1996), Ménardrecognized that the modulus of the soil was dependent onthe stress path and strain level. It is clear from Gambin et al.(1996) and Briaud (1992) that the slope of the curve used toderive the modulus EM obtained using the pressuremeter is
influenced by the various parameters and conditionsincluding the coefficient of earth pressure at-rest, Ko, thefriction angle, soil stiffness, the length to diameter ratio ofthe pressuremeter probe, the stress path, the disturbance ofthe borehole wall and the test expansion strain rate. Thepressuremeter modulus, EM, is more appropriately referredto as a modulus of deformation. Gambin et al. (1996) con-clude that in analyses of deformation based on linear elas-ticity where a modulus is required, EM should likely bemultiplied by a factor of 5 to 10 if it is going to be used as aYoung’s modulus.
Interpretation of the pressuremeter test is well-detailed in the standard but is still subject to variability.Reiffsteck (2009) reports that pressuremeter test curvesprovided to 9 individuals as part of a pile prediction exer-cise during the International Symposium on Pressuremeters(ISP5) yielded an acceptable range of pressuremeter modu-lus and limit pressure. Figure 6 shows the results in terms oflimit pressure for a total of 42 PMT tests. Reiffsteck statesthat the mean error is in the order of 24% which is consis-tent with errors observed with other in situ tests such as theCPT as reported by Long (2008).
Because these parameters are obtained by a standardprocedure in all materials, their values can be used in a sim-ilar manner to the standard parameters measured in theCPTu (tip, friction and pore pressure), i.e. by comparisonwith data from other similar materials, it is possible to makequalitative assessments of the likely soil characteristics.The parameters can also be used to design foundations byfollowing strict design rules. From the onset, design ruleshave been devised in France using the pressuremeter resultsdirectly in the assessment of bearing capacity of shallowfoundations, deep foundations including lateral loading,settlement evaluation of shallow and deep foundations as
218 Soils and Rocks, São Paulo, 37(3): 211-231, September-December, 2014.
Benoît & Howie
Figure 6 - Limit pressure from 9 participants on 3 boreholes for a total of 42 tests (Reiffsteck, 2009).

well as a panoply of applications to geotechnical structuresand methods. From the pressuremeter deformation modu-lus, it is possible to assess settlement of foundations anddisplacement of laterally loaded piles while with the limitpressure, the bearing capacity can be evaluated for shallowand deep foundations. These rules are based on theory aswell as observations and measurements of numerous in-strumented experiments carried out at well documented testsites located in a variety of geological materials. The rulesare not described in this paper but can be found in numerousdocuments (Briaud, 1992). However, many are in French.Work is ongoing to incorporate these design rules into theEurocode which would make them significantly more ac-cessible.
The majority of design work in France is done usingthe PMT and the well-established design rules. With im-provements in testing techniques, equipment, additionalobservations and advanced numerical modeling, the rulesare constantly revised to provide more versatile, accurateand safe design procedures. Expanding these rules throughthe Eurocode will also lead to improvements.
Some examples are provided herein to illustrate theefforts undertaken by various French research groups to ad-vance the Ménard design rules. For example, Bustamante etal. (2009) in a paper describing pile design using the PMT,states that the current method is based on 561 pile load testson more than 400 piles instrumented to measure skin fric-tion and end bearing. These piles have been installed usingmore than 26 different techniques. They also show that thePMT is often more versatile than other in situ tests such asthe CPT, the SPT and coring for laboratory testing asshown in Table 2. The tests were carried out in various ma-terials including weathered or fragmented rock and ce-mented or very fine cohesionless formations. Their resultsled to improvements in design charts for unit skin friction,qs, and a simplification of tip bearing factors, kp, for 26 piletypes. The work was further simplified as part of the draft-ing of the French standard for deep foundations for imple-mentation in Eurocode 7 (AFNOR, 2012; Reiffsteck &Burlon, 2012). Using results from 159 load tests, a chart as
shown in Fig. 7 was developed for determining the unit skinfriction, qs. Each curve represents a different pile type andinstallation method and was validated using, on average, 30load tests. The values for fsol, equivalent to the normalizedunit frictional resistance, fs, are given in tabular form in thestandard NF P94-262 as a function of soil type. The unitskin friction, qs, is then determined using fsol multiplied by asoil-structure coefficient which is a function of pile typeand installation method as well as soil type. The standardalso provides limiting values for qs for each case. The meth-ods are straightforward, reliable considering the number ofload tests used in their development, and useful especiallyfor cases with similar geological conditions.
4. Pressuremeter Testing in North AmericaBased on a review of North American literature, it
seems that most pressuremeter testing has been of theprebored variety. Early SBPM research was conducted insoils conducive to the installation of the SBPM with mini-mal disturbance which are also the soils that are suited to in-vestigation by other in situ tests such as the SPT, the CPTu,the field vane and the flat plate dilatometer (DMT). In suchsoils, the pressuremeter offers no significant advantages for
Soils and Rocks, São Paulo, 37(3): 211-231, September-December, 2014. 219
A View of Pressuremeter Testing in North America
Table 2 - Comparison of in situ test and coring feasibility at 204 sites (Bustamante et al., 2009).
Type of test Number of sites as a function of test feasibility1
Tests completed2 Insufficient no. of tests3 Tests possible but curtailed Tests inadequate4
PMT (pLM) 155 Sites (76%) 3 Sites (1.5%) 46 Sites (22.5%) 0 Site (0%)
CPT (qc) 60 Sites (29.4%) 79 Sites (38.7%) 23 Sites (11.3%) 42 Sites (20.6%)
SPT (N) 26 Sites (12.7%) 54 Sites (26.5%) 72 Sites (35.3%) 52 Sites (25.5%)
Coring for laboratory(c’ and �’)
21 Sites (10.3%) 67 Sites (32.8%) 69 Sites (33.8%) 47 Sites (23.1%)
1It is assumed that a PMT or an SPT log includes a test every meter. 2Throughout the whole pile depth at least. 3Insufficient No. of tests(PMT), premature refusal (CPT), excessive blow count (SPT) or sample badly recovered. 4Tests deemed inadequate beforehand due ei-ther to soil type or to soil resistance.
Figure 7 - Design chart for evaluating the unit skin friction qs frompressuremeter test limit pressure (in Reiffsteck & Burlon, 2012;AFNOR (2012) Standard NF P94-262).

geotechnical characterization over these other tests and sothe other tools dominate. In the research sphere, the PMThas continued to be of great interest. The PMT has alsofound use in what Ladanyi (1995) termed “non-standard”materials. He was primarily referring to testing in frozensoils, ice and in soft and hard rock but there has also beenconsiderable testing in other hard-to-investigate soils suchas glacial tills, hard clays, residual soils and municipalwastes.
4.1. ASTM standards
The only ASTM standard related to pressuremetertesting in North America is ASTM Standard D4719. Thecurrent version was published in 2007 and is concernedwith prebored pressuremeter testing. The scope of this stan-dard is summarized in the following excerpts from ASTM:
This test method covers pressuremeter testingof soils. A pressuremeter test is an in situ stress-straintest performed on the wall of a borehole using a cylin-drical probe that is expanded radially. To obtain via-ble test results, disturbance to the borehole wall mustbe minimized.
This test method includes the procedure fordrilling the borehole, inserting the probe, and con-ducting pressuremeter tests in both granular and co-hesive soils, but does not include high pressure
testing in rock. Knowledge of the type of soil in whicheach pressuremeter test is to be made is necessary forassessment of (1) the method of boring or probeplacement, or both, (2) the interpretation of the testdata, and (3) the reasonableness of the test results.
It goes on to state that the method does not cover theself-boring pressuremeter and is limited to the pressure-meter which is inserted into predrilled boreholes or, undercertain circumstances, is inserted by driving. There is nocurrent ASTM Standard for versions of the test focused onthe derivation of basic soil parameters.
Elsewhere, pressuremeter testing and test interpreta-tion are provided by the international draft standard ISO22476-4 prepared by the Technical Committee ISO/TC 182(Geotechnics, Subcommittee SC 1, and by Technical Com-mittee CEN/TC 341, Geotechnical investigation and test-ing) which provides a more complete set of procedures. Theinternational standard is not limited to using the PMT insoils only but includes weak rocks. It is interesting to notethat this standard refers to the prebored pressuremeter asthe Ménard Pressuremeter Test (MPT). Figure 8 shows aschematic of the MPT.
The ASTM standard outlines the test procedures aswell as making suggestions on best practices for boreholepreparation based on soil types as shown in Table 3. In Ta-ble 4 are the recommendations from the international stan-
220 Soils and Rocks, São Paulo, 37(3): 211-231, September-December, 2014.
Benoît & Howie
Figure 8 - Schematic of the prebored or Ménard pressuremeter (ISO, 2009).

dard. The international standard also defines the maximumtime allowed between formation of the test pocket and theactual testing as well as the length of opened borehole per-mitted between tests to avoid further disturbance of the soilor rock. Table 5 shows these recommendations.
The ASTM specifications were originally developedusing the French standards as a template. The new interna-tional standard includes contributions from several coun-tries and users with diverse experiences making the docu-ment more useable and consistent. The ASTM standardoften lags behind where updates are required only every 7years and is revised by a smaller pool of users. Using the in-ternational standard as a working document for NorthAmerican practice would help promote exchange of infor-mation and results that could be used in developing im-proved methods of insertion, testing and interpretation.
A difference between ASTM and the ISO 22476-4standards should also be pointed out. The internationalcommittee does not mention the use of unload-reload loopsas part of the Ménard pressuremeter test while ASTM indi-cates that such a loop is acceptable and that the resultingmodulus should be clearly identified as an unload-reloadmodulus. However, D4719 gives little guidance as to howsuch an unload-reload loop should be conducted and inter-preted. In his Ménard lecture, Briaud (2013) states that he“would strongly discourage the use of the reload modulus”in the prebored PMT because it is not a “standard modulus”and “is not precisely defined”.
However, one of the most significant benefits of pres-suremeter testing in soils and rocks is the ability to evaluatea modulus in situ from the resulting stress-strain measure-ment during expansion of the test cavity and unload-reloadcycles. As shown in Table 6 from Clarke (1995), the moduliobtained from pressuremeter tests are quoted several differ-ent ways, making it difficult to arrive at consistent and per-tinent use of the pressuremeter moduli in analyses of defor-mation. It has been shown that the unload-reload modulusappears to be relatively unaffected by the method of inser-tion since this unloading and reloading is essentially elastic.However, it is necessary to perform the unload-reload loopscarefully to ensure that they can be interpreted reliably. Forexample, Wroth (1984) argued that the stress decrement inan unload-reload loop should be limited to twice the un-drained shear strength in undrained PM tests. In sands, thestress decrement should be limited to approximately 40%of the initial effective stress at the start of unloading (Fahey,1991). In addition, the strain increment level associatedwith the modulus needs to be reported since the modulus re-duces with increasing strain increment level (Clarke,1995). In drained expansion, the effect of stress level at thestart of unloading also needs to be considered as stiffnessincreases with stress level.
Soils and Rocks, São Paulo, 37(3): 211-231, September-December, 2014. 221
A View of Pressuremeter Testing in North America
Tab
le3
-G
uide
lines
for
Sele
ctio
nof
Bor
ehol
ePr
epar
atio
nM
etho
dsan
dT
ools
(AST
MD
4719
).
Soil
Typ
eR
otar
yD
rilli
ngw
ithbo
ttom
disc
harg
eof
prep
ared
mud
Push
edth
inw
all
sam
pler
Pilo
thol
edr
ill-
ing
and
subs
e-qu
ents
ampl
erpu
shin
g
Pilo
thol
edr
ill-
ing
and
sim
ulta
-ne
ous
shav
ing
Con
tinuo
usfl
ight
auge
rH
and
auge
rin
the
dry
Han
dau
ger
with
botto
mdi
scha
rge
ofpr
epar
edm
ud
Dri
ven
orvi
bro-
driv
ensa
mpl
er
Cor
eba
rrel
drill
ing
Rot
ary
perc
us-
sion
Dri
ven
vibr
o-dr
iven
orpu
shed
slot
ted
tube
Cla
yey
soils So
ftFi
rmto
stif
fSt
iff
toha
rd
2B 1B 1
2B 1 2
2 2 1
2 2 1
NR 1B 1B
NR 1 NA
1 1 NA
NR
NR
NA
NR
NR 1B
NR
NR 2B
NR
NR
NR
Silty
soils
Abo
veG
WL
C
Und
erG
WL
C
1B 1B
2B
NR
2 NR
2B 2B
1 NR
1 NR
2 12 NR
NR
NR
NR
NR
NR
NR
Sand
yso
ils Loo
sean
dab
ove
GW
LC
Loo
sean
dbe
low
GW
LC
Med
ium
tode
nse
1B 1B 1B
NR
NR
NR
NR
NR
NR
2 2 2
2 NR 1
2 NR 1
1 1 1
2 NR 2
NA
NA
NR
NR
NR 2B
NR
NR
NR
Sand
ygr
avel
orgr
avel
ysa
nds
belo
wG
WL
Loo
seD
ense
2 NR
NA
NA
NA
NA
NA
NA
NA
NR
NA
NA
NA
NA
NR
NR
NA
NA
2 22 1D
Wea
ther
edro
ck1
NA
2BN
A1
NA
NA
12
2N
R
A1
isfi
rstc
hoic
e;2
isse
cond
choi
ce;N
Ris
notr
ecom
men
ded;
and
NA
isno
napp
licab
le.
BM
etho
dis
appl
icab
leon
lyun
der
cert
ain
cond
ition
s(s
eete
xtfo
rde
tails
).C
GW
Lis
grou
ndw
ater
leve
l.D
Pilo
thol
edr
illin
gre
quir
edbe
fore
hand
.

222 Soils and Rocks, São Paulo, 37(3): 211-231, September-December, 2014.
Benoît & Howie
Tab
le4
-G
uide
lines
for
pres
sure
met
erpr
obe
plac
emen
ttec
hniq
ues
(ada
pted
from
ISO
,200
9).
Prob
epl
acin
gw
ithou
tsoi
ldis
plac
emen
tPr
obe
plac
ing
bydi
rect
driv
ing
1<
dt/d
c�1.
15(d
t/dc
�0)
Rot
ary
drill
ing
Rot
ary
perc
ussi
onT
ube
push
ing,
driv
ing
orvi
brod
rivi
ngD
rive
nsl
otte
dtu
be
OH
D*
HA
/HA
M*
CFA
CD
RP
RPM
STD
TM
PTD
TV
DT
DST
Slud
gean
dso
ftcl
ayS°
R°
--$
--$
RT
WT
-A
$
Soft
tofi
rmcl
ayey
soils
R°
R°
S$S$
-A
$°
A°
A$
A-
Stif
fcl
ayey
soils
R°
S$°
RR
°A
$S°
S$°
-A
$-
Silty
soils
:
-ab
ove
wat
erta
ble
S°R
°S
S$°
-A
°S°
A$
AA
-
-be
low
wat
erta
ble
A$
°S$
°-
A$
°-
A°
S5 °-
--
A$
Loo
sesa
ndy
soils
:
-ab
ove
wat
erta
ble
S°R
$°
SA
-A
°A
°-$
--
-
-be
low
wat
erta
ble
A$
°S°
--$
-A
°A
5 °-$
--
A$ +
Med
ium
dens
ean
dde
nse
sand
yso
ilsR
°R
°R
A°
AS°
S5 °-
AA
S$ +
Gra
vels
,cob
bles
S°
-$ °-$
-$A
R°
A$ °
AA
R$ +
Coh
esiv
eno
nho
mog
eneo
usso
ils(e
.g.b
ould
ercl
ay)
S°A
°A
S$°
AR
°A
$°
AA
Loo
seno
nho
mog
eneo
usso
ils,o
ther
soils
nots
peci
fied
abov
e(e
.g.t
ills,
som
eal
luvi
alde
posi
ts,m
anm
ade
soils
,tre
ated
orun
trea
ted
fills
)
S°A
°A
A°
AS°
S$°
-A
AS$ +
Wea
ther
edro
ck,w
eak
rock
R°
S°S
S$°
A$
S°S$
°A
$A
$
RR
ecom
men
ded
OH
DO
pen
hole
drill
ing.
PTPu
shed
tube
SSu
ited
HA
OH
Dpe
rfor
med
with
aha
ndau
ger
TW
TT
hin
wal
ltub
e,pu
shed
AA
ccep
tabl
eH
AM
OH
Dpe
rfor
med
with
aha
ndau
ger
and
mud
DT
Dri
ven
tube
-N
otsu
ited
CFA
Con
tinuo
usfl
ight
auge
rV
DT
Vib
rodr
iven
tube
Not
cove
red
byth
isst
anda
rdC
DC
ore
drill
ing
DST
Dri
ven
slot
ted
tube
dtdr
illin
gto
oldi
amet
erR
PR
otar
ype
rcus
sion
dcpr
obe
outs
ide
diam
eter
RPM
Rot
ary
perc
ussi
onw
ithm
udST
DT
MSl
otte
dtu
bew
ithin
side
disi
nteg
ratin
gto
olan
dm
udci
rcul
atio
n$
Dep
endi
ngon
the
actu
alsi
teco
nditi
ons
and
onth
eev
alua
tion
ofth
eop
erat
or-
*R
otat
ion
spee
dsh
ould
note
xcee
d60
rpm
and
tool
diam
eter
notb
em
ore
than
1.15
dc°
Slur
ryci
rcul
atio
n:pr
essu
resh
ould
note
xcee
d50
0kPa
and
the
flow
rate
15l/m
in.T
hefl
owca
nbe
tem
pora
rily
inte
rrup
ted
ifne
cess
ary
+Pi
loth
ole
with
poss
ible
preb
orin
gte
chni
ques
:DST
,RP
and
RPM

4.2. Examples of pressuremeter testing
Although Ménard carried out his first pressuremetertests in the USA, acceptance and utilization of the test hasbeen overall relatively slow compared to other in situ toolsand techniques such as the cone penetration test. Neverthe-less, several firms make use of the PMT either as soil test-ing services for various clients or directly by geotechnicalconsultants for site characterization and design of founda-tions. The use of the PMT in the USA and Canada appearsto be localized and is highly dependent on historical use andexperience.
One of the early uses of the prebored PMT was in theChicago area as shown in the original work of Ménard andthen later in publications by Kastman (1978), Baker (2005)and Lukas (2010). A paper by Kastman (1978) uses the ra-tio between the Ménard modulus and the net limit pressureEM/pLM as an indicator of test quality (or disturbance) and foridentifying soils. Figure 9 shows results from Kastman(1978) for a variety of soils tested using the PMT in theUSA using the ratio EM/pLM as a function of the logarithm ofthe pressuremeter modulus. The summary of results clearlyshows a strong linear relationship for each soil type. The ra-tio was found to be in the range of 8 to 12 for normally con-solidated soils and 12 to 20 for overconsolidated soils.
Lukas (2010) discusses his experience with the PMTin Chicago clays which are heavily overconsolidated andcannot be penetrated by the CPT or by sampling with thinwalled Shelby tubes. Up to the 1970’s, properties were ob-tained from the SPT where penetration values N were gen-
erally greater than 50 to 100. The use of the pressuremeterwas well-received as it was easily deployed in the field andfar less expensive than full scale load tests. Bearing capac-ity and settlement predictions in 35 years of experiencehave correlated reasonably well. In his paper he discussestwo cases. Settlement of a sixty-one story building foundedon drilled piers in “hardpan” was estimated using pressure-
Soils and Rocks, São Paulo, 37(3): 211-231, September-December, 2014. 223
A View of Pressuremeter Testing in North America
Table 6 - Terms used to define moduli taken from pressuremetertests (Clarke, 1995).
Symbol Definition
Gi Initial secant shear modulus
EM Ménard modulus
Gur Secant shear modulus from an unload/reload cycle
Gu Secant shear modulus from an unloading curve
Gr Secant shear modulus from a reloading curve
Em Secant elastic modulus from an unloading curve
Em* Secant elastic modulus from a reloading curve
Emo Maximum elastic modulus from an unloading curve
Ero Maximum elastic modulus from a reloading curve
Gn Secant shear modulus measured over strain range n%
Go Maximum shear modulus
Gs Equivalent element modulus
Guro Equivalent shear modulus at the in-situ effectivestress
Table 5 - Maximum continuous drilling or driving stage length before testing (adapted from ISO, 2009).
Soil type Maximum continuous drilling or tube driving stage length (m)
Adapted rotarydrillingb
Rotary percussivedrillingb
Tube pushing, drivingand vibrodrivingc
Sludge and soft clay, soft clayey soil 1a - 1a
Firm clayey soils 2 2 3
Stiff clayey soils 5 4 4
Silty soils: above ground water table 4 3 3
Silty soils: below water table 2a 1a -
Loose sandy soils: above ground water table 3 2 -
Loose sandy soils: below water table 1a 1a -
Medium dense and dense sandy soils 5 5 4
Coarse soils: gravels, cobbles 3 5 3
Coarse soils with cohesion 4 5 3
Loose non homogeneous soils, other soils not specifiedabove (e.g. tills, etc.)
2 3 2
Weathered rock, weak rock 4 5 3
a: Or the required interval between two successive tests.b: Refer to Table C.2 for acceptable techniques.c: Not applicable to STDTM technique (see C.2.6.3).

meter data. The estimated movements agreed well with themeasurements in the field when the bearing pressures werebelow the creep pressure and the pressuremeter moduluswas used in settlement calculations. The second case dealtwith bearing capacity of a mat foundation for a high rise tobe founded on the overconsolidated clay. Using the pressu-remeter results, the calculated bearing capacity agreed wellwith that obtained by more conventional approaches to de-sign when using undrained shear strengths derived from thePM test.
Similarly to Lukas (2010), Baker (2005) describes hisexperience with the pressuremeter in the Chicago area soilsas well as in other parts of the world. The PMT has beenused in Chicago since 1969 and has allowed less conserva-tive design of drilled piers and caissons than is obtainedusing parameters derived from SPT and unconfined com-pression tests, increasing allowable pressures by more than50%. From his experiences in highly consolidated glacialtills and medium dense to dense deposits, using the pressu-remeter theory and appropriate PMT results allows reliablepredictions of settlement magnitudes of deep foundationsunder working load. The confidence in reliably predictingsettlements has afforded them to be more innovative intheir designs. Baker suggests that for reliable settlementpredictions, the dead load bearing stress plus the overbur-den pressure should not exceed the average creep pressure.However, there are cases where such an approach is not ap-plicable, e.g. weakly cemented sandstone. Their settlementevaluation is done either using the Ménard rules or elastictheory with an equivalent Young’s modulus derived from
the PMT. Their approach has been based on localexperience and performance monitoring of other similarfoundations in similar soils. This often leads to com-pany-specific empirical relationships.
Pressuremeter testing has also been carried out exten-sively in the Miocene clay in the Richmond, Virginia area(Martin & Drahos, 1986). This clay is highly preconsoli-dated and hard in consistency. This material is also sensi-tive and highly plastic. From their work they developed arelationship between the constrained modulus from the re-load portion of their consolidation tests and the pressu-remeter modulus, EM. The results shown in Fig. 10 werefound to be much different than what was previously pub-lished by Lukas & DeBussy (1976) for Chicago clays. Theyalso developed a correlation between the PMT creep pres-sure and the preconsolidation pressure (pc) and recom-mended a conservative estimate of pc could be obtainedfrom the expression: pc = 0.6 pf.
Based on the technical literature and geotechnical re-ports reviewed by the authors, a number of different ver-sions of the pressuremeter are in use as outlined in Table 7.By far the most common encountered was the Texam pres-suremeter. This is a monocellular version of the preboredPM developed by Briaud and his co-workers (Briaud,1992). There is also a high capacity version of this probe,the Probex, designed for testing in rock. According toBriaud (2005), the Texam was designed:
“to simplify and make safer (no pressurized gasbottle) the operation and the repairing of the Ménard
224 Soils and Rocks, São Paulo, 37(3): 211-231, September-December, 2014.
Benoît & Howie
Figure 9 - Pressuremeter ratio EM/pLM as a function of the pressuremeter modulus EM (Kastman, 1978).

pressuremeter while allowing for more versatility inthe types of possible PMT tests (e.g.: cyclic tests).”
Briaud (1992) stated that comparison testing betweenthe Texam and the triple cell Ménard probes showed thatthe results were comparable provided the length to diame-ter ratio (L/D) of the monocell probe exceeded 6. Sincethen, the Texam probe appears to have become the mostcommon version of the probe in published case histories ofprebored testing. However, the standard GAM model seriesis the preferred tool in Europe and complies with Europeanstandards. The Pencel probe has also been the subject ofconsiderable research, particularly in Florida (Cosentino etal., 2006; Messaoud & Nouaouria, 2010; Messaoud et al.,2011). At 35 mm diameter, it is much smaller than mostother probes. A major focus of this work has been the deri-vation of p-y curves for the design of piles under lateralloads.
Some testing has also been done using a Cambridgestyle monocell probe installed in a prebored hole which isinflated by gas and has strain feeler arms at 120 degree in-tervals at mid-height of the probe. Test curves obtainedwith this probe only expand to 10% to 15% cavity strain
and so cannot be continued to sufficient cavity strain toachieve a doubling of the cavity volume. Consequently,Ménard-type limit pressures also have to be obtained by ex-trapolation for this tool. However, most of the cases involv-ing this approach to pressuremeter testing were based ontest procedures that did not follow ASTM D4719 and wereanalyzed and interpreted using computer aided modelling(CAM) based on simple constitutive models of soil behav-ior. The tests were interpreted to obtain the fundamentalproperties of the materials tested which were then consid-ered in conjunction with other geotechnical and geologicalinformation collected by the site characterization.
Jefferies et al. (1987) used CAM and SBPM testing todetermine a profile of effective stress in Beaufort Sea clays.They argued that the lateral stress profile did not agree withestimates based on overconsolidation ratios obtained fromconsolidation tests and emphasized the importance of fieldtesting. A similar recent example of such an approach ispresented in Hoopes & Hughes (2014) in which pressure-meter test results were used in the estimation of the in situlateral stress profile of glacially over-ridden glaciolacus-trine clay by seeking a pressure during unloading at whichno expansion or contraction occurred.
In a paper on the use of in situ tests for design ofdrilled shafts in coarse granular deposits, Rabab’ah et al.(2012) described an ingenious solution developed by Dur-kee et al. (2007) to the preparation of a test pocket in suchchallenging soil conditions. They drilled an oversized hole(127 mm) using a down-hole air hammer and left a casingin place. They then tremie-grouted the hole with a weakgrout placed through a central tube while withdrawing thecasing. After a curing period of 2 weeks, they drilled a76 mm diameter hole through the grout which left a 20 mmannulus around the wall of the pocket in which the PM wasinstalled. The cement grout was designed to be brittle and tofracture early in the expansion of the pressuremeter. Thetest pocket preparation sequence is illustrated in Fig. 11. Atotal of 45 pressuremeter tests carried out in this way usinga Cambridge-style monocell probe were considered to be ofgood to excellent quality and were interpreted to give geo-technical properties of the soil. The interpretation took ac-
Soils and Rocks, São Paulo, 37(3): 211-231, September-December, 2014. 225
A View of Pressuremeter Testing in North America
Table 7 - Most common pressuremeters encountered in north american document review.
Model Design Method of insertion Method of inflation Method of strainmeasurement
Menard Triple cell Prebored Hydraulic Volume
Texam Monocell Prebored Hydraulic Volume
Probex* Monocell Prebored Hydraulic Volume
Cambridge type Monocell Prebored (some self-boring) Gas 3/6 strain arms
Pencel Monocell Driven or pushed Hydraulic Volume
Oyo elastometer 100 Monocell Prebored Gas 2 feeler arms
*High capacity version of Texam.
Figure 10 - Relationship between Constrained Reload Modulusfrom consolidation tests and Pressuremeter Modulus (after Martin& Drahos, 1986) (Note: 1 TSF = 95.76 kPa).

count of the presence of the grout. Despite the likelihood ofsome disturbance of the soil tested, this procedure allowedsome assessment of soil properties which would have oth-erwise been impossible given the difficulty of drilling andsampling in such soils.
The pressuremeter continues to be of interest to re-searchers. Dafni (2013) presents a study of pressuremetertesting in weak rock using a Cambridge-type monocell in-strument in which he applies CAM based on representativeconstitutive models for rock. A comparison of measureddata and a curve simulated using the Hoek-Brown modelinitiated by Yang and Zou (2011) is shown in Fig. 12.Jacobs (2003) carried out Ménard-style PMTs to study theuse of the pressuremeter for estimating the side shear ca-pacity of drilled shafts in Florida limestone. An example ofhis test results is shown in Fig. 13. The existing approachwas based on laboratory testing of intact rock core and therewas interest in determining whether the PMT would givedata more representative of the rock mass. He found that anempirical design method for side shear capacity by theLaboratoire Central des Ponts et Chaussées (LCPC) per-formed reasonably well and recommended that it be studiedfurther. He observed that the method required further cali-bration by comparison with load testing before design usein Florida.
5. DiscussionPressuremeter testing has not yet attained widespread
acceptance in North American geotechnical engineeringpractice. It tends to be seen as being too expensive for rou-tine practice. A common view of the test is expressed by theNevada Department of Transportation as follows:
The pressuremeter test is a delicate tool, andthe test is very sensitive to borehole disturbance. Thedata may be difficult to interpret for some soils, but itprovides the advantage that due to the large size ofthe pressuremeter cell it is less likely to be adverselyaffected by gravel in the soil. This test requires a highlevel of technical expertise to perform, and is timeconsuming.
The situation is complicated by the fact that a range ofinstruments and test procedures are in use. The shape of thepressuremeter test curve in any soil or rock is affected bythe insertion method, the geometry of the instrument and bydetails of the test procedures. Consequently, tests carriedout with different instruments and procedures will obtaindifferent test curves in a given material, with the magnitudeof the variation being material-dependent. There is evi-dence that engineers continue to interpret their test resultsusing the Ménard rules despite their test data not being ob-tained by instruments and procedures conforming to thoserules.
For conventional foundation engineering in sands andfiner soils which are normally to moderately overconsoli-dated, the pressuremeter offers no advantage over fasterand more robust in situ tests such as the seismic CPTu andDMT except in unusual cases where pressuremeter data canprovide additional insight. However, the prebored PMT isbetter-suited than conventional penetration tests or drillingand sampling to the characterization of the mechanical be-havior of hard or very dense soils, coarse grained soils, re-
226 Soils and Rocks, São Paulo, 37(3): 211-231, September-December, 2014.
Benoît & Howie
Figure 12 - Measured and simulated PMT curves in Weak Rock(Dafni, 2013).
Figure 11 - Schematic of drilling procedure in gravelly soils (Af-ter Durkee et al., 2007).

sidual, saprolitic or lateritic soils, soft and fractured rocks,frozen ground and ice.. The challenge then becomes to drilla suitable test pocket to allow pressuremeter tests to be car-ried out successfully. Briaud (2013) emphasizes that this is“the most important and most difficult step in a qualitypressuremeter test”.
Where pressuremeter testing is carried out, the proce-dures set out in the current version of the ASTM standardon prebored pressuremeter testing are not consistent with
those of the European standard. The major difference is theoption to include an unload-reload loop at some stage of theexpansion. The latter guidelines are based on the decades ofexperience in France of successful use of PMT parametersdirectly for foundation design. This difference compro-mises the ability of engineers in North America to benefitfrom that experience.
One reason for the slow adoption of the PMT in NorthAmerica is the lack of familiarity with the test and its inter-
Soils and Rocks, São Paulo, 37(3): 211-231, September-December, 2014. 227
A View of Pressuremeter Testing in North America
Figure 13 - Example of PMT in Limestone (Jacobs, 2003).

pretation and use. This can in part be traced to the educationsystem. Benoît (2013), using a questionnaire distributed tomembers of the United States Universities Council on Geo-technical Education and Research (USUCGER), discussedthe status of current pressuremeter activities in the UnitedStates of America. A questionnaire was widely distributedto academics to assess the level and type of activities in re-search and teaching. One of the questions asked how muchlecture time was devoted to each in situ test in graduatecourses. The results from this question are shown inFig. 14. For the SPT and CPT, 25% of the programs spendless than 30 min while another 25% dedicate 1-2 h andabout 13% cover the material in greater detail, using over 3h. For the DMT, PMT and geophysical methods, approxi-mately 40% of the programs spend only 10 to 30 min onthese topics while about 15% of them use an hour or more.It was somewhat surprising that as much as 20% of the pro-grams spend less than 10 min on the FVT, DMT, PMT andgeophysical methods.
In this survey, the perception was that certain toolssuch as the pressuremeter are time consuming and too com-plex. However, if future and current geotechnical engineersare not taught the basic use and interpretation of the varioustest methods, opportunities to improve the efficiency andsafety of our designs are likely to continue their slow prog-ress and, of course, more sophisticated tests are unlikely.Proper training and understanding of more sophisticatedtest methods will lead to greater use of field methods suchas the PMT.
6. Conclusions
While the PMT has been available in North Americasince the late 1950’s, it has not achieved wide acceptance ingeotechnical engineering practice. In sandy and finer soilswhich have not been subject to heavy overconsolidation or
other processes of densification, the PM is slower and moreexpensive for routine use and cannot compete with moreconventional tests such as the CPTu, DMT or SPT. It doesfind use in such soils for design problems where the conse-quences of poor geotechnical performance justify more ex-tensive design and analysis. Examples of such uses wouldbe in the derivation of p-y curves for the design of laterallyloaded piles and the estimation of stiffness for detailed as-sessment of differential settlement. Where fundamentalproperties are derived from a Cambridge-style approach toPM testing, input parameters for detailed numerical analy-sis can be derived.
The PMT has been used extensively in areas of theUS and Canada where hard or very dense soils are encoun-tered such as in glacial tills and heavily overconsolidatedclays, dense/hard residual soils, and very coarse granularsoils. It has also been used in soft and fractured rock, frozensoils and ice and as a tool for quality control of ground im-provement. Where the test has found favor, it has generallybeen where conventional approaches to site characteriza-tion yield uncertain or insensitive results (what is the differ-ence in soil parameters between an SPT blow count of 50for 1 inch and 100 for 1 inch?). As the methods of interpre-tation have a basis in theory, it is possible to derive mean-ingful strength and deformation parameters for all materi-als in which a PMT expansion curve can be obtained. It isalso possible to relate the measured parameters to the ex-tensive body of experience gained with the use of the PMfor foundation design in Europe and elsewhere.
In order for the test to gain wider acceptance in engi-neering practice in North America, the following measuresare required:
• the teaching of the theory and principles of PM testing atgraduate schools must be improved. This will increase
228 Soils and Rocks, São Paulo, 37(3): 211-231, September-December, 2014.
Benoît & Howie
Figure 14 - In Situ tests lecture time in us graduate geotechnical courses (based on 40 respondents) (Benoît, 2013).

the likelihood that the PMT will be used appropriatelyand will result in a positive experience.
• equipment and test procedures should be more strictlystandardized so that they produce data that are consistentwith the design methods being employed. If the Ménardrules are to be invoked, then the test should be carried outaccording to the Ménard rules, i.e. no unload-reload cy-cles. If the Cambridge-type approach is to be used, thenthe ASTM D4719 test procedures are inapplicable andalternative equipment and procedures should be fol-lowed.
• it should be recognized that the PMT is most applicablein difficult ground conditions provided a suitable testpocket can be prepared.
• more full scale load testing and monitoring of founda-tions of North American projects are required to verifyand promote the applicability of PM based design meth-ods.
As stated by Casagrande (1966) when dealing withprojects and subsurface conditions in Richmond, Virginia,an effort had to be made to “collect and evaluate systemati-cally information on the subsoil conditions, and on the de-sign and performance of buildings, in Richmond. Thiswould eventually lead to a set of relatively simple and reli-able guide rules for the design of building foundations inthis city.” The Ménard rules have essentially been derivedand improved following this philosophy. The pressure-meter is a tool that has been insufficiently used in NorthAmerica and, at times, has been used inappropriately. A re-vival of the use of the pressuremeter is essential, especiallyas numerical tools require more sophisticated parametersfor analysis.
References
AFNOR (2012) Justification des Ouvrages Géotechniques- Normes d’Application Nationale de l’Eurocode 7 -Fondations Profondes, norme NF P94-262.
ASTM D4719 (2007) Standard Test Methods for PreboredPressuremeter Testing in Soils. Annual Book of ASTMStandards, Section 4, v. 04.08.
Baguelin, F.; Jézéquel, J.-F.; Le Mée, H. & Le Méhaute, A.(1972) Expansions of Cylindrical Probes in Soft Soils.Journal of Soil Mechanics and Foundation Design,ASCE, v. 98:SM11, p. 1129-1142.
Bandis, C. and Lacasse, S. (1986) Interpretation of Self-Boring and Push-In Pressuremeter Tests in HolmenSand. NGI Report No. 40019-21, Oslo.
Baker, C.N. (2005) The use of the Menard Pressuremeter ininnovative foundation design from Chicago to KualaLumpur. Proceedings of the International Symposium50 Years of Pressuremeters, Gambin, Magnan and Mes-tat, Editors, Presses de l’ENPC/LCPC, 22-24 August,Paris, France, v. 2, p. 63-95.
Benoît, J. (2013) Current status of pressuremeter testing ed-ucation in the USA. Parallel International Symposium
on Pressuremeters, 18th International Conference onSoil Mechanics and Geotechnical Engineering, Paris,France.
Benoît, J.; Atwood, M.J.; Findlay, R.C. & Hilliard, B.D.(1995) Evaluation of jetting insertion for the self-boringpressuremeter. Canadian Geotechnical Journal, v. 32,p. 22-39.
Briaud, J.-L. (2013) Ménard Lecture: The pressuremeterTest: Expanding its use. Proceedings of the 18th Interna-tional Conference on Soil Mechanics and GeotechnicalEngineering, Paris, France, p. 107-126.
Briaud, J.-L. (2005) The pre-boring pressuremeter: somecontributions. Proceedings of the International Sympo-sium 50 Years of Pressuremeters, Gambin, Magnan andMestat, Editors, Presses de l’ENPC/LCPC, 22-24 Au-gust, Paris, France, v. 2, p. 103-124.
Briaud, J.-L. (1992) The Pressuremeter. A.A. BalkemaPublications, Rotterdam, 322 p.
Briaud, J.-L. & Shields, D.H. (1979) A special pressu-remeter and pressuremeter test for pavement evaluationand design. Geotechnical Testing Journal, v. 2:3,p. 143-151.
Bustamante, M.; Gambin, M. & Gianeselli, L. (2009) PileDesign at Failure Using the Ménard Pressuremeter: AnUp-Date. French contributions to International Founda-tion Congress & Equipment Expo ‘09 ContemporaryTopics in In Situ Testing, Analysis, and Reliability ofFoundations, ASCE Geotechnical Special PublicationNo. 186, Orlando, Florida, p. 127-134.
Casagrande, L. (1966) Subsoils and Foundation Design inRichmond, VA. Journal of the Soil Mechanics andFoundation Design, SM5, September, p. 109-126.
Cassan, M. (2005) Historique des Pressiomètres. Proceed-ings of the International Symposium 50 Years of Pres-suremeters, Gambin, Magnan and Mestat, Editors,Presses de l’ENPC/LCPC, 22-24 August, 2005, Paris,France, v. 2, p. 125-200.
Clarke, B.G. (1995) Pressuremeters in Geotechnical De-sign. Blackie Academic & Professional, city, 364 p.
Clarke, B. & Gambin, M.P. (1998) Pressuremeter testing inonshore ground investigations. A report by theISSMGE Committee 16, International Conference onSite Characterization, Atlanta.
Clayton, C.R.I.; Matthews, M.C. & Simons, N.E. (1995)Site Investigation. Blackwell Science, city, 584 p.
Cosentino, P.; Kalajian, E.; Stansifer, R.; Anderson, J.B.;Kattamuri, K.; Sundaram, S.; Messaoud, F.; Misilo, T.& Cottingham, M. (2006) Standardizing the pressu-remeter test for determining p-y curves for laterallyloaded piles. FDOT Research Report, Contract BD 658.
Dafni, J. (2013) The Analysis of Weak Rock Using thePressuremeter. M.Sc. Thesis, Department of Civil En-gineering, University of Washington, Seattle.
Drahos, E.G. (2014) Personal communication.
Soils and Rocks, São Paulo, 37(3): 211-231, September-December, 2014. 229
A View of Pressuremeter Testing in North America

Durkee, D.; Ackerman, F.; Smith, D. & Rucker, M. (2007)Borehole preparation technique for pressuremeter test-ing in sand gravel and cobbles. Geotechnical SpecialPublication No. 162, Geo-Denver 2007, February 18-21, 2007, Denver, Colorado.
Fahey, M. (1991) Measuring shear modulus in sand withthe self-boring pressuremeter. deformation of soils anddisplacements of structures. Proc. X Eur. emif. SMFE,Florence,Italy, Balkema, Rotterdam, v. 1, p. 73-76.
Ferreira, R.S. & Robertson, P.K. (1992) Interpretation ofundrained self-boring pressuremeter test results incor-porating unloading. Canadian Geotechnical Journal, v.29:6, p. 918-928.
Gambin, M.; Flavigny, E. & Boulon, M. (1996) Le modulepressiométrique: Historique et modélisation. XI Collo-que Franco-Polonais en Mécanique des Sols et desRoches Appliquée, Gdansk, Poland.
Gauthier, A.; Gonin, H. & Ménard, L. (1954) Travail de find’étude. Ecole Nationale des Ponts et Chaussées, Paris,France.
Hoopes, O. & Hughes, J. (2014) In Situ Lateral Stress Mea-surement in Glaciolacustrine Seattle Clay Using thePressuremeter. Journal of Geotechnical and Geoen-vironmental Engineering, 10.1061/(ASCE)GT.1943-5606.0001077, 04013054.
Houlsby, G.T. & Carter, J.P. (1993) The Effects of Pressu-remeter Geometry on the Results of Tests in Clay.Géotechnique, v. 43, p. 567-576.
Houlsby, G.T. & Withers, N.J. (1988) Analysis of ConePressuremeter Test in Clay. Géotechnique, v. 38:4,p. 575-587.
Hughes, J. M. O. and Robertson, P. K. (1985). Full-Dis-placement Pressuremeter Testing in Sand. CanadianGeotechnical Journal, v. 22, p. 298-307.
ISO/FDIS 22476-4:2009(E) - ISO/TC 182/SC 1 (2009)Geotechnical Investigation and Testing - Field Testing -Part 4: Ménard Pressuremeter Test.
Jacobs, S.A. (2003) Insitu Measurement of Florida Lime-stone Modulus and Strength Properties, M. Eng. Thesis,University of Florida.
Jefferies, M.G. (1988) Determination of Horizontal Geo-static Stress in Clay with Self-Bored Pressuremeter. Ca-nadian Geotechnical Journal, v. 25, p. 559-573.
Jefferies, M.G.; & Shuttle, D.A. (1995) Disturbance doesnot prevent obtaining reliable parameters from sbptests, the pressuremeter and its new avenues. Proceed-ings of the Fourth International Symposium on Pressu-remeters (ISP4), G. Ballivy (ed) Sherbrooke, Québec,Canada, May 17-19, A.A. Balkema, Publisher, p. 177-183.
Jefferies, M.G.; Crooks, J.H.A.; Becker, D.E. & Hill, P.R.(1987) Independence of geostatic stress from overcon-solidation in some beaufort sea clays. Canadian Geo-technical Journal, v. 24:3, p. 342-356.
Kastman, K. (1978) In-Situ testing with the Ménard pres-suremeter. Proceedings of a Symposium on Site Explo-ration in Soft Ground using In Situ Techniques,Alexandria, Virginia, Final Report, p. 206-223.
Ladanyi, B. (1995) A Brief History of Pressuremeter. Pro-ceedings of the 4th International Symposium on thePressuremeter and its New Avenues, Sherbrooke, Qué-bec, Canada. Edited by G. Ballivy, A.A. Balkema, p. 5-23.
Long, M. (2008) Design Parameters from In Situ Tests inSoft Ground - Recent Developments. Proceedings ofthe Third International Conference on Geotechnical andGeophysical Site Characterization ISC-3, Taipei, Tai-wan, p. 89-116.
Lukas, R.G. (2010) Pressuremeter Testing for FoundationDesign. Art of Foundation Engineering Practice, ASCEGeotechnical Special Publication No. 198, Geo-Flo-rida, p. 392-400.
Lukas, R.G. & De Bussy, B.L. (1976) Pressuremeter andLaboratory Test Correlations for Clays. ASCE Journalof Geotechnical Engineering, v. 102:9, p. 945-962.
Martin, R.E. & Drahos, E.G. (1986) Pressuremeter Corre-lations for Preconsolidated Clays. Proceedings of InSitu ‘86, ASCE, June, Blacksburg, Virginia, p. 206-220.
Ménard, L. (1957) An Apparatus for Measuring theStrength of Soils in Place. Thesis submitted in partialfulfillment of the requirements for the degree of Masterof Science in Civil Engineering, University of Illinois,50 p.
Messaoud, M.S.M.F. & Cosentino, P.J. (2011) PENCELpressuremeter test evaluation for developing p-y curvesfor driven piles. ACEE International Journal on Trans-portation and Urban Development, v. 1:2, p. 14-18.
Messaoud, F. & Nouaouria, M.S. (2010) The use of PEN-CEL pressuremeter test for underground structures. In-ternational Journal of Civil Engineering, v. 8:1,p. 33-43.
Palmer, A.C. (1972) Undrained Plane-Strain Expansion ofa Cylindrical Cavity in Clay: a Simple Interpretation ofthe Pressuremeter Test. Geotechnique, September,v. 22:3, p. 451-457.
Rabab’ah, S.R.; Niedzielski, J.C. & Durkee, D.B. (2012)Use of in-situ tests for design of drilled shafts in coarsegranular deposits. GeoCongress 2012, p. 265-274.
Reid, W.M.; St. John, H.D.; Fyffe, S. & Rigden, W.J.(1982) The push-in pressuremeter. Proceedings of theSymposium on the Pressuremeter and its Marine Appli-cations, Paris, France.
Reiffsteck, P. (2009) ISP5 Pile Prediction Revisited.French contributions to International Foundation Con-gress & Equipment Expo ‘09, Contemporary Topics inIn Situ Testing, Analysis, and Reliability of Founda-tions, ASCE Geotechnical Special Publication No. 186,Orlando, Florida, p. 50-57.
230 Soils and Rocks, São Paulo, 37(3): 211-231, September-December, 2014.
Benoît & Howie

Reiffsteck, P. & Burlon, S. (2012) Traitement des Incer-titudes dans le Calcul Géotechnique avec la NouvelleNorme Fondations Profondes NF P 94 262, Tunisia.
Roy, D.; Campanella, R.; Byrne, P.; & Hughes, J. (2002)Undrained Anisotropic Monotonic Behavior of Sandfrom In Situ Tests. Journal of Geotechnical and Geo-environmental Engineering, v. 128:1, p. 85-91.
Schnaid, F.; Ortigao, J.A.R.; Mántaras, F.M.; Cunha, R.P.& MacGregor, I. (2000) Analysis of self-boring pres-suremeter (SBPM) and Marchetti dilatometer (DMT)tests in granite saprolites. Canadian Geotechnical Jour-nal, v. 37:4, p. 796-810,
Shuttle, D.A. & Jefferies, M.G. (1995) A practical Geome-try Correction for Pressuremeter Tests in Clay. Géo-technique, v. 45:3, p. 549-553.
Withers, N.J.; Schaap, K.H.J. & Dalton, J.C.P. (1986) TheDevelopment of a Full Displacement Pressuremeter.Proceeding of the Symposium on Pressuremeter and itsMarine Applications, ASTM STP 950, p. 38-56.
Wroth, C.P. (1984) The Interpretation of In-Situ Soil Tests.24th Rankine Lecture, Géotechnique, v. 34:4, p. 449-489.
Wroth, C.P. & Hughes, J.M.O. (1972) An Instrument forthe In Situ Measurement of the Properties of Soft Clays.Report of the Department of Engineering, University ofCambridge, CUED/C, Soils TR 13.
Yang. X.-L. & Zou, J.-F. (2011) Cavity Expansion Analy-sis with Non-linear Failure Criterion. Proceedings ofthe Institution of Civil Engineers - Geotechnical Engi-neering, v. 164, p. 41-49.
Yeung, S.K. & Carter, J.P. (1990) Interpretation of thePressuremeter Test in Clay Allowing for MembraneEnd Effects and Material Non-homogeneity. Pressure-meters, London, Thomas Telford Limited, p. 199-208.
Yu, H.S. (2004) James K. Mitchell Lecture: In Situ SoilTesting: from Mechanics to Interpretation. ProceedingsISC-2 on Geotechnical and Geophysical Site Character-ization. Millpress, Rotterdam.
Soils and Rocks, São Paulo, 37(3): 211-231, September-December, 2014. 231
A View of Pressuremeter Testing in North America


Penetration Rate Effects on Cone Resistance:Insights From Calibration Chamber and Field Testing
R. Salgado, M. Prezzi
Abstract. Cone penetration in mixed or intermediate soils (soils containing mixtures of sand, silt and clay) is neither fullydrained nor fully undrained at the standard cone penetration rate of 20 mm/s. Considerable research, mainly relying oncentrifuge tests, has been undertaken to quantify the effects of penetration rate (and thus partial drainage) on coneresistance. In this paper, the effects of penetration rate on cone resistance in saturated clayey soils were investigated byperforming field tests and miniature cone penetration tests in a calibration chamber. The field tests were performed at sitesespecially selected to span the range of drainage conditions from fully drained to fully undrained. The calibration chambertests, using both conical and flat-tip penetrometers, were performed at different penetration rates in two specimensprepared by mixing kaolin clay and sand with different mixing ratios and one-dimensionally consolidateding the mixtures.A correlation between cone resistance and drainage conditions is established based on the cone penetration test results. Thetransitions from no drainage to partial drainage and from partial drainage to full drainage are defined as a function ofpenetration rate normalized with respect to the penetrometer diameter and the coefficient of consolidation.Keywords: cone penetration, CPT, penetration rate, mixed soils.
1. Introduction
The cone penetration test (CPT) has become one ofthe preferred methods of site characterization partly due toits simplicity, partly as a result of the development of coneresistance-based correlations for footing design(Schmertmann, 1970; Mayne & Poulos, 1999; Lee &Salgado, 2002; Lee et al., 2005; Foye et al., 2006; Lee etal., 2008; O’Loughlin & Lehane, 2010), pile design (Lee &Salgado, 1999; Lee et al., 2003; Jardine et al., 2005; Kolk etal., 2005; Xu et al., 2008; Seo et al., 2009; Foye et al.,2009; Niazi & Mayne, 2013) and liquefaction resistance es-timation (Seed & De Alba, 1986; Stark & Olson, 1995;Salgado et al., 1997; Robertson & Wride, 1998; Carraro etal., 2003). The apparent simplicity of the CPT, however,hides considerably complex mechanics (Salgado, 2013).One source of complexity is possible partial drainage dur-ing cone penetration.
The standard rate of penetration in a CPT is20 � 5 mm/s according to ISO 22476-1 and ASTM D 5778.This standard penetration rate is specified regardless of soiltype. Cone penetration at the standard rate is fully drainedfor clean sand and fully undrained for pure clay. For soilsconsisting of mixtures of silt, sand and clay, cone penetra-tion may take place under partially drained conditions at thestandard penetration rate, depending on the ratios of thesethree broad particle size groups. This means that use of cor-relations developed for sand (in which tests would bedrained at standard rates of penetration) or clay (in whichtests would be undrained at standard rates of penetration)
will not work for soil in which penetration at the standardrate takes place under partially drained conditions.
Physically, drainage conditions during penetrationare important because, if the penetration rate is sufficientlylow for a given clayey soil, the soil ahead and around theadvancing cone partially consolidates during penetration,thereby developing greater shear strength and stiffness thanit would have under undrained conditions. The closer theconditions are to fully drained during penetration, thehigher the value of qc. Another physical process that is atplay for soils with large clay content for penetration underfully undrained conditions is the effect of the rate of loadingon shear strength due to the “viscosity” (rate dependence ofthe shear strength) of clayey soils. The higher the penetra-tion rate is, the larger the undrained shear strength su (andtherefore qc) is. These two physical processes - drainageand loading rate effects - have opposite effects on qc.
A number of studies (Bemben & Myers, 1974; Cam-panella et al., 1983; Kamp, 1982; Powell & Quarterman,1988; Rocha Filho & Alencar, 1985; Roy et al., 1982; Tani& Craig, 1995) have considered rate effects in CPT testingfor both clays and sands. Results of some field cone pene-tration tests and centrifuge test results indicated that coneresistance increases and excess pore pressure drops as thepenetration rate decreases (Campanella et al., 1983; Houseet al., 2001; Randolph & Hope, 2004; Rocha Filho &Alencar, 1985; Mahmoodzadeh & Randolph, 2014).
The degree of consolidation during penetration de-pends on the cone penetration rate, cone diameter, and con-solidation coefficient of the soil (Finnie & Randolph, 1994;
Soils and Rocks, São Paulo, 37(3): 233-242, September-December, 2014. 233
Rodrigo Salgado, Ph.D., Professor, Lyles School of Civil Engineering, Purdue University, West Lafayette, IN, USA. e-mail: [email protected] Prezzi, Ph.D., Professor, Lyles School of Civil Engineering, Purdue University, West Lafayette, IN, USA. e-mail: [email protected] on May 30, 2014; Final Acceptance on December 15, 2014; Discussion open until April 30, 2015.

House et al., 2001; Randolph & Hope, 2004; Mahmoodza-deh & Randolph, 2014). These factors can be used to obtaina normalized penetration rate V:
Vvd
cc
v
�
where v = cone penetration rate; dc = cone diameter; andcv = coefficient of consolidation that would be obtainedfrom a one-dimensional consolidation test performed on asample with the same fabric orientation as it would have inthe field. As pore pressure is generated during cone pene-tration, the generated hydraulic gradients in the soil aroundthe cone will determine flow direction. Therefore, normal-ization with respect with cv is not necessarily correct. Mostresults reported in the literature were normalized with re-spect to cv, so this normalization will also be used in thepresent paper. Conceptually, penetration resistance wouldvary with rate of penetration, as illustrated in Fig. 1, whichshows that penetration resistance is highest at low penetra-tion rates, when penetration is drained, and then transitionsto its lowest value at sufficiently high rates of penetration.The research questions in connection with this are:1) Is there a single backbone curve if cone resistance is nor-
malized in some manner, for all soil types?2) For increasing penetration rates, what are the values of
normalized penetration rates Vd and Vu at which pene-tration transitions to partially drained and then to fullyundrained penetration?
3) If Vu is seen, alternatively, as the rate at which penetra-tion resistance stabilizes at its lowest value, how doessoil viscosity affect its value?The centrifuge has been the primary tool used to
study these questions. Figure 2 shows results from a fewprevious studies (Oliveira et al., 2011; Randolph & Hope,2004; Schneider et al., 2007; Mahmoodzadeh & Randolph,2014). The soil tested by Randolph & Hope (2004), Schnei-der et al. (2007) and Mahmoodzadeh & Randolph (2014)
was a kaolin clay, while the soil tested by Oliveira et al.(2011) was silty mine tailings. The plot shows the ratio ofnormalized cone resistance (qc,p under drained, partiallydrained or undrained conditions divided by the undrainedvalue of cone resistance qc,u) vs. the normalized rateV = vdc/cv of penetration, discussed earlier. The values ofthis ratio range between roughly 2.7 and 3.7. The limitingnormalized penetration rate for drained penetration variesin a range of roughly 0.01 to 1, but the limiting normalizedpenetration rate for transitioning from partially to fully un-drained penetration varies within a much wider range, fromas little as 1 to over 100.
In this paper, the effect of rate on cone resistance isassessed through a series of CPTs performed using a minia-ture cone in a large calibration chamber and field tests espe-cially designed to investigate rate effects. These experi-ments complement the body of work developed throughcentrifuge testing and shed some additional light on thethree research questions posed earlier.
2. Field TestingKim et al. (2008) investigated the effects of penetra-
tion rate on cone resistance at two field test sites in the stateof Indiana. The advantage of studying rate effects in thefield is that the shortcomings of laboratory testing areavoided. The coefficient of consolidation cv was obtainedfrom consolidation tests performed for two loading stagesclose to the vertical effective stresses of the correspondingCPT test layers considered in the field. The values of thenormalized cone resistance q t v/ �� obtained for the two testsites considered are plotted as a function of log V in Fig. 3.With the normalization, the values of q t v/ �� drop with in-creasing V until V � 4 and then increase only slightly as Vincreases further. The effect of the cone penetration rate onthe excess pore pressure measured is shown in the same fig-ure as a function of log V. The excess pore pressure is nor-
234 Soils and Rocks, São Paulo, 37(3): 233-242, September-December, 2014.
Salgado & Prezzi
Figure 1 - Conceptual backbone curve for cone penetration resis-tance vs. rate of penetration.
Figure 2 - Backbone curve for CPTs performed in centrifuges(modified after Oliveira et al., 2011).

malized with respect to the maximum value of excess porepressure measured in a given soil layer. The transition fromundrained to partially drained penetration occurs at aboutV = 10.
Since the undrained shear strength su (and thus coneresistance measured under undrained conditions) dependson the rate of loading, the value of penetration rate at whichpenetration transitions from undrained to partially drainedpenetration (which should be based on pore pressure obser-vations) does not coincide with the point at which the plotof cone resistance vs. penetration rate transitions from a
range where it is flat to one in which it increases. Accordingto Fig. 3(a) and (b), this transition occurs for V � 10. In therange between the minimum qt in Fig. 3 (observed at V � 4)and V � 10, qt would tend to drop because it approaches un-drained conditions but would tend to increase because load-ing rate effects on the soil shear strength start becomingsignificant. From a practical standpoint, if the goal is to de-termine the value of V at which penetration resistance stopsdropping, then the V � 4 read from the qt plot may be ofgreater interest, but penetration may not be fully undrainedat that value of V.
Soils and Rocks, São Paulo, 37(3): 233-242, September-December, 2014. 235
Penetration Rate Effects on Cone Resistance: Insights From Calibration Chamber and Field Testing
Figure 3 - Field results showing (a) cone penetration resistance vs. normalized rate of penetration and (b) backbone curve for CPTs per-formed in the field.

3. Calibration Chamber Cone PenetrationTests
3.1. Overview
Calibration chamber tests are useful in the develop-ment of empirical correlations between soil properties andin situ test methods such as the CPT. Homogeneous sam-ples can be prepared in the calibration chamber, and thestress state of the soil sample in the chamber can be con-trolled.
Calibration chamber penetration tests with a minia-ture cone were performed at the Korea University Calibra-tion Chamber Laboratory in Seoul, Korea (see Fig. 4). Thechamber has an inside diameter of 1.2 m and a height of1.0 m. The top plate of the chamber has 9 holes to provideaccess for the cone penetrometer. The chamber has a dou-ble-wall system, which permits the simulation of K0 consol-idation.
3.2. Normalization of penetration rate and discussion ofchamber specimens
In order to evaluate CPT rate effects in clayey soils,cone penetration rates in the calibration chamber tests mustcover the whole range of expected drainage conditions(from undrained to fully drained conditions). The normal-ized penetration rate V is useful to accommodate results ob-tained from different test conditions, penetrometer sizes,and samples. Results of CPTs performed in the field dis-cussed earlier indicated that the values of V that correspondto the transition from fully undrained to partially drainedconditions were between 4 and 10 (Kim et al., 2008). Re-garding the other end of the range, centrifuge test resultsdiscussed earlier showed that the value of V corresponding
to the transition from partially to fully drained conditionscould be as low as 0.01.
The range of the penetration rate possible in thechamber tests, based on equipment limitations, was be-tween 20 mm/s and 0.01 mm/s. In planning the experi-ments, the target range for normalized penetration rate Vwas 0.01 < V < 30 in order to fully cover the entire range ofdrainage conditions. Since the miniature cone diameter is11.3 mm and the range of cone velocities is constrained byequipment limitations, the variable left to control was cv.
3.3. Coefficient of consolidation and mixing ratios
A total of 16 flexible-wall permeameter tests wereperformed in general accordance with ASTM D 5084: tentests with mixtures of Ottawa sand (ASTM C778 Graded)and kaolin clay (10%, 14.5%, 15%, 16.6%, 19%, 21%,21.8% 24%, and 29.1% of kaolin clay), and six tests withmixtures of Jumunjin sand and kaolin clay (16%, 17.5%,18.5%, 22%, 22.2%, and 25% of kaolin clay). Figure 5shows the grain size distribution curves of Ottawa sand,Jumunjin sand and kaolin clay.
Figure 6 shows the percentage of clay of the soil mix-tures studied vs. cv in log scale for an isotropic confiningstress of 150 kPa. From this graph, it can be seen that the logcv has an approximately linear relationship with the claycontent of the soil mixtures. Based on the cv values shownin Fig. 6, values of V were calculated for v = 20 mm/s andD = 11.3 mm (the miniature cone diameter). For the targetvalue of 60 for V (twice as high as the upper limit of 30 sug-gested in the literature) required to allow fully undrainedconditions at a penetration rate of 20 mm/s, a soil withcv � 3.8 x 10⁻⁶ m2/s was found to be needed. Based on theflexible-wall test results, a mixing ratio of 25% kaolin clayand 75% Jumunjin sand (cv = 3.45 x 10⁻⁶ m2/s) was selectedfor the first calibration chamber sample. This sample al-
236 Soils and Rocks, São Paulo, 37(3): 233-242, September-December, 2014.
Salgado & Prezzi
Figure 4 - Schematic view of the flexible wall calibration cham-ber (Kim et al., 2006).
Figure 5 - Grain size distribution of Jumunjin sand, Ottawa sand,and kaolin clay (modified after Kim et al., 2006).

lowed tests at V = 0.033 to V = 66 for D = 11.3 mm and v be-tween 0.01 mm/s and 20 mm/s.
As previously discussed, a V as low as 0.01 was be-lieved to be required to allow penetration under fullydrained conditions. In order to achieve that value of V, theother chamber specimen was prepared with a mixing ratioof 18% clay and 82% Jumunjin sand (cv = 6.9 x 10⁻⁵ m2/s).The value of V for this soil mixture was equal to 0.0016 forv = 0.01 mm/s and D = 11.3 mm.
3.4. Cone penetration test program
The miniature piezocone penetrometer used in thecalibration chamber tests has a diameter of 11.3 mm (pro-jected cone area = 100 mm2), a cone apex angle of 60° and anet area ratio of 0.62. The miniature cone, which was bor-rowed from Fugro B.V., Netherlands, is equipped with afriction sleeve and a porous stone to measure pore pressurejust behind the tip. All pore pressure measurements shouldbe considered to be related to where the porous stone is lo-cated, so comparison of results across experiments shouldbe done carefully. A flat tip was manufactured specially forthe minicone and used to investigate the effect of the tipshape on penetration test results.
Minicone penetration tests were performed at ninedifferent penetration rates, ranging from 20 mm/s to0.01 mm/s, in the specimen made with 25% kaolin clay and75% Jumunjin sand by weight (referred to as P1), whichhad a floating fabric (Carraro et al., 2009, Carraro et al.,2003; Salgado et al., 2000). Eight different penetrationrates, ranging from 20 mm/s to 0.05 mm/s, were used in thetests in the specimen made with 18% kaolin clay and 82%Jumunjin sand (referred to as P2), which has a non-floatingfabric. The CPTs were performed down to a depth ofaround 750 mm (out of the 950 mm specimen height). Thispenetration depth was sufficient to obtain stable cone resis-tance values for more than two different penetration stages.
Therefore, the penetration test in each hole was done in twostages with two different penetration rates.
4. Results of Miniature Cone PenetrationTests
4.1. Penetration tests in specimen P1
Results of tests performed with both the conical andflat tips in specimen P1 are presented in Fig. 7. The cone re-sistance qt is the corrected cone resistance for the pore pres-sure acting on the shoulder area behind the cone tip. Figure7(a) shows that qt for v of 20 mm/s and 8 mm/s is almost thesame, around 0.7 MPa, and the corresponding excess porepressures are 295 kPa and 270 kPa, respectively. These re-sults show that, for v of 20 mm/s and 8 mm/s, cone penetra-tion occurred under undrained conditions. The values of qt
started to increase slowly as v decreased from 8 mm/s to0.25 mm/s. The measured average qt values showed an in-crease of 30% (from 0.7 MPa to 0.91 MPa) for a reductionin v from 8 mm/s to 0.25 mm/s, whereas the pore pressuredecreased about 20% for the same change in v. The valuesof qt increased from 0.91 MPa to 3.14 MPa (or about 3.5times) for a change in v from 0.25 mm/s to 0.02 mm/s. Forthe same change in v, the excess pore pressure droppedfrom 222 kPa to 8 kPa. The decrease in excess pore pres-sure to practically zero indicates that the drainage condi-tions changed from partially drained to drained. The valuesof qt and excess pore pressure for v = 0.01 mm/s (for whichconditions are also drained) are almost the same as the val-ues measured for v = 0.02 mm/s.
The miniature penetration tests with a flat tip wereperformed to investigate the impact of the shape of the tipon penetration resistance. The results obtained using both acone tip and a flat tip under the same conditions provide in-sights into the relationship between cone resistance andlimit unit pile base resistance. The average values of flat-tipresistance and pore pressures are also presented in Fig. 7.
Soils and Rocks, São Paulo, 37(3): 233-242, September-December, 2014. 237
Penetration Rate Effects on Cone Resistance: Insights From Calibration Chamber and Field Testing
Figure 6 - Percentage of clay of soil mixtures vs. cv.

The overall flat tip resistances obtained in P1 for the entirepenetration rate range are similar to the corresponding coneresistances. The transition points indicating change indrainage conditions seem to be identical for the two tipshapes.
4.2. Penetration tests in specimen P2
The penetration tests performed in P2 focused onidentifying the transition between partially drained andfully drained conditions. The steady-state values of qt andexcess pore pressure vs. penetration rate for specimen P2are shown in Fig. 8(a) and Fig. 8(b). While the penetrationrate decreased from 20 mm/s to 2 mm/s, the values of qt in-creased from 1.28 MPa to 1.65 MPa, and the excess porepressure decreased by about 40%. This drop in excess porepressure indicates that the penetration was likely not fullyundrained even with the 20 mm/s maximum v, and it cer-
tainly was not so for 2 mm/s. The transition from partiallydrained to fully drained conditions took place for a penetra-tion rate of about 0.1 mm/s. The average qt at fully drainedconditions was approximately 4 MPa.
The shape of the tip influenced the values measuredin the penetration tests performed in P2. For v = 20 mm/s,the resistance of the flat tip was 2.1 MPa, 64% higher thanthe cone resistance measured at the same speed. Over thewhole range of penetration rates, the flat tip resistance val-ues were higher than the corresponding cone resistance val-ues, but this difference reduced as drainage increased.Under fully drained conditions, for v = 0.1 mm/s, the flat tipresistance was 4.4 MPa, and the cone resistance was4.0 MPa, a more modest difference, practically justifyingan assumption often made for sands that qc � qbL, where qbL
is the limit unit base resistance of a pile in sand under the
238 Soils and Rocks, São Paulo, 37(3): 233-242, September-December, 2014.
Salgado & Prezzi
Figure 7 - Effect of penetration rate on (a) qt and (b) pore pressure u for specimen P1.
Figure 8 - Effect of penetration rate on (a) qt and (b) pore pressure u for specimen P2.

same conditions as those under which qc was measured, solong as the ratio of pile to particle size is sufficiently large(a ratio as low as 20 might be sufficient). Only a small dif-ference in the excess pore pressure measurements was ob-served.
4.3. Normalized cone resistance vs. normalized penetra-tion rates
The results of the penetration tests in the two differentspecimens can be plotted in terms of the cone resistancenormalized by vertical effective stress and the normalizedpenetration rate V. The values of cv used for normalizationwere calculated using the data obtained from the calibrationchamber specimen consolidation, which was conducted un-der perfect 1D conditions, without sidewall resistance. Themeasured values of cv are equal to 3.5 x 10⁻⁶ m2/s for P1 and3.1 x 10-5 m2/s for P2.
The normalized results for P1 and P2 are shown inFig. 9 as a function of log V. The plots in Fig. 9 (a) suggestthat the cone resistance increases when V drops below ap-proximately 1, with the transition between partially drainedand fully drained conditions occurring around V � 0.05. Ac-cording to the normalized excess pore pressure shown inFig. 9 (a), the transition from undrained to partially drainedpenetration occurs around V � 10, and the transition frompartially drained to fully drained conditions occurs aroundV � 0.05. The reason for the discrepancy between the pene-
tration rate at which qt stabilizes and that at which theexcess pore pressure stabilizes can be explained by the su-perposition of the two main rate effects. In the penetrationrange between V � 1 and V � 10, qt would tend to drop be-cause it approaches partially drained conditions but wouldtend to increase because loading rate effects due to viscos-ity effects start taking place. From a practical standpoint, ifthe goal is to determine the value of V at which penetrationresistance is stable, then the V � 1 read from the qt plot maybe of greater interest. The backbone curves in Fig. 9 (b)show the effect of fabric on the normalized cone resistancevalues. The maximum ratio of qc,p/qc,u for specimen P1,which has a floating fabric, is about 4.7, while that for spec-imen P2, which has a non-floating fabric, is about 2.5. Thisis likely related to the different distribution of excess porepressure developing ahead of the advancing cone, with thespecimen with floating fabric experiencing greater excesspore generation [see Fig. 7(b) and Fig. 8(b)], and thus offer-ing relatively less resistance to the penetration of the coneunder partially drained conditions. These results highlightthe difficulty in assessing partial drainage effects for in situsoils consisting of mixtures of sand, silt and clay, wherefabric effects can affect the measured cone resistances.
The results presented in this paper may be used to ob-tain the limiting values of cv that clayey soils would have tohave for penetration to take place under drained and un-drained conditions for given values of penetration rate and
Soils and Rocks, São Paulo, 37(3): 233-242, September-December, 2014. 239
Penetration Rate Effects on Cone Resistance: Insights From Calibration Chamber and Field Testing
Figure 9 - Results for specimens P1 and P2: (a) cone resistance normalized with respect to vertical effective stress and excess pore pres-sure normalized with respect to its maximum observed value vs. normalized penetration rate V and (b) backbone curves (in terms of ratioof qc at any rate of penetration to qc under undrained conditions) for specimen P1 and P2.

cone diameter. As discussed previously, the drainage con-ditions change from undrained to partially drained at avalue of V � 10, which corresponds to a cv � 7.1 x 10⁻⁵ m2/sfor the standard cone penetration rate (20 mm/s) and diame-ter (35.7 mm). However, because of the offsetting effect ofrate-dependent shear strength, cone resistance starts to pla-teau for V > 1, which corresponds to a cv � 7.1 x 10⁻⁴ m2/s.Therefore, we can conclude that undrained cone resistanceis expected to be measured in CPTs performed with thestandard cone at the standard rate in soils having cv valuesless than roughly 10-3 to 10-4 m2/s. At the other end of thespectrum, the test results suggest that a value of cv largerthan about 1.4 x 10⁻² m2/s (or roughly 10-2 m2/s) is necessaryfor fully drained conditions to be achieved with a standardCPT.
5. DiscussionTable 1 summarizes what has been learned so far in
connection with the dependence of cone resistance on rateof penetration for soils tested so far (kaolinite, clay, sandyclay, silty mine tailings) in the centrifuge, calibrationchamber and field. Vd is the rate below which penetration isdrained. Vu is the rate above which the cone resistance stabi-lizes at its lowest value. The value approximates, but notnecessarily coincides with, the rate above which penetra-tion is undrained, as discussed previously. It is apparentfrom the table that there are differences in the values ob-served for the limiting rates between centrifuge on the onehand and chamber and field tests on the other. The centri-fuge test results also appear to suggest that these rates couldvary within relative wide ranges.
The relatively wide ranges observed in centrifuge re-sults may be due to fundamental differences in soil behav-ior as well as details of the penetration boundary-valueproblem. The centrifuge tests that led to the backbonecurves in Fig. 2 were performed in a kaolinite sample and asilty soil. A clear difference between clay and silt, both ofwhich have been used in research on this topic, is that claydevelops planes of failure with aligned particles and has aresidual shear strength less than critical, but silt does not.Differences in fabric between test models also would havean effect on the gradients of strength and drainage aroundthe advancing cone. Spatial variation of rates of loading anddegree of consolidation around the advancing cone also
place limits on achievement of a single backbone curve, aswell as on normalization of rates of penetration with respectto cv. The backbone curves are likely to depend not only onthe nature of the soil but also its state (void ratio, effectivestress state, over-consolidation ratio and fabric), and gener-alizations may not be achievable before significant amountof testing is done for soils spanning the whole range of par-ticle sizes and soil state.
The lesson to CPT performance and interpretation inpractice from research done on this topic so far is clear andrelatively straightforward: the use of the standard 20 mm/sshould no longer be the norm. Every effort should be madeto perform CPTs under either fully drained or fully un-drained penetration whenever feasible. The alternative is tointerpret tests performed under partially drained penetra-tion, which is still very challenging. In order to avoid pene-tration under partial drainage and the more challenginginterpretation of such tests, CPTs in sand-controlled soilsshould be performed as slowly as possible to guarantee fulldrainage, while CPTs in clay-controlled soils should beperformed as fast as required to ensure fully undrained pen-etration.
6. Summary and Conclusions
The main focus of the research presented in this paperwas to evaluate and quantify the factors affecting the resultsof cone penetration testing performed at penetration ratesleading to drainage conditions ranging from fully drainedto fully undrained. Rate effects and the effects of drainageconditions around the cone tip during penetration werestudied. Results from a series of penetration tests per-formed in the centrifuge, the calibration chamber and thefield conducted at various penetration rates were presented,and the transition from undrained to partially drained andthen to fully drained penetration was investigated in termsof a normalized penetration rate.
The ratio of cone resistance measured under drainedto that under undrained conditions observed in the calibra-tion chamber tests in clay samples was 2.5 to 4.7. The tran-sition from undrained to partially drained conditionsoccurred for V values approximately equal to 10. For V be-tween approximately 10 and 1, cone resistance was fairlystable because of the offsetting effects on shear strength ofloading rate and drainage rate. The transition from partiallydrained to fully drained conditions occurred at V � 0.05.From these limiting V values, it is possible to obtain limit-ing values of cv required for fully drained and fully un-drained penetration for a given cone and penetration ratefor the test soil. For soils like the soil tested in the calibra-tion chamber tests reported here having cv values less thanabout 7.1 x 10⁻⁵ m2/s (V = 10), standard penetration (v = 20mm/s and D = 35.7 mm) takes place under undrained condi-tions, whereas for cv values greater than about 1.4 x 10⁻² m2/s(V = 0.05), standard penetration takes place under drainedconditions.
240 Soils and Rocks, São Paulo, 37(3): 233-242, September-December, 2014.
Salgado & Prezzi
Table 1 - Approximate values of the rates at which penetrationtransitions from drained to partially drained and partially drainedto drained penetration and ratio of drained to undrained penetra-tion resistance for the field, chamber and centrifuge testing.
Key quantities Field Chamber Centrifuge
Vd < 1 0.05 0.01-1
Vu 10 1 2-100
qc, drained/qc, undrained undefined 2.5-4.7 2.7-3.7

The fact that results from centrifuge tests on clay andsilt are not in agreement and that no agreement can be foundbetween the centrifuge test results and the calibrationchamber test results on clay and a sandy clay tested in thecalibration chamber suggests that a single backbone curvethat would apply to all soils likely does not exist. Signifi-cant further testing with a variety of soils in a variety ofconditions is required to advance understanding of penetra-tion rate and its relationship to drainage rate. In order toavoid the challenges that the limited understanding of thisrelationship presents to interpretation of CPT results, it maybe advantageous to vary the rate of penetration during atest, where possible, to guarantee either full drainage or nodrainage during penetration.
References
ASTM (2013) Standard Specification for Standard Sand -C778-13. ASTM International, West Conshohocken,Pennsylvania, USA
ASTM (2012) Standard Test Method for Electronic Fric-tion Cone and Piezocone Penetration Testing of Soils -D5778-12. ASTM International, West Conshohocken,Pennsylvania, USA
ASTM (2010) Standard Test Methods for Measurement ofHydraulic Conductivity of Saturated Porous MaterialsUsing a Flexible Wall Permeameter, ASTM Interna-tional - D5084-10. West Conshohocken, Pennsylvania,USA
Bemben, S.M.; & Myers, H.J.; (1974) The influence of rateof penetration on static cone resistance in Connecticutriver valley varved clay, in: Proceedings of the Euro-pean Symposium on Penetration Testing, Stockholm,p. 33-34.
Campanella, R.G.; & Robertson, P.K.; Gillespie, D. (1983)Cone penetration testing in deltaic soils. Can. Geotech.J. v. 20, p. 23-35.
Carraro, J.; Bandini, P.; & Salgado, R. (2003) Liquefactionresistance of clean and nonplastic silty sands based oncone penetration resistance. J. Geotech. Geoenviron-mental Eng. v. 129, p. 965-976.
Carraro, J.; Prezzi, & M.; Salgado, R. (2009) Shear strengthand stiffness of sands containing plastic or nonplasticfines. J. Geotech. Geoenvironmental Eng. v. 135,p. 1167-1178.
Carraro, J.A.H.; Bandini, P.; & Salgado, R. (2003) Lique-faction resistance of clean and nonplastic silty sandsbased on cone penetration resistance. J. Geotech.Geoenvironmental Eng. v. 129, p. 965-976.
Finnie, I.M.S.; & Randolph, M.F. (1994) Punch-throughand liquefaction induced failure of shallow foundationson calcareous sediments, in: Proc. 17th Int. Conf. on theBehavior of Offshore Structures. assachusetts Instituteof Technogology, Boston, p. 217-230.
Foye, K.C.; Abou-Jaoude, G.; Prezzi, M.; & Salgado, R.(2009) Resistance factors for use in load and resistance
factor design of driven pipe piles in sands. J. Geotech.Geoenvironmental Eng. v. 135, p. 1-13.
Foye, K.C.; Salgado, R.; & Scott, B. (2006) Resistance fac-tors for use in shallow foundation LRFD. J. Geotech.Geoenvironmental Eng. v. 132, p. 1208-1218.
House, A.R.; Oliveira, J.R.M. ; & Randolph, M.F. (2001)Evaluating the coefficient of consolidation using pene-tration tests. Int. J. Phys. Model. Geotech. v. 1, p. 17-26.
Jardine, F.M.; Chow, F.C.; Overy, R.F.; & Standing, J.R.(2005) ICP design methods for driven piles in sands andclays. Thomas Telford, London, UK.
Kamp, W.G.B. Te (1982) The influence of the rate of pene-tration on the cone resistance “qc” in sand, in: Proceed-ings of the Second European Symposium on Penetra-tion Testing, ESOPT-II, Amsterdam, p. 627-633.
Kim, K., Prezzi, M.; & Salgado, R. (2006) Interpretation ofcone penetration tests in cohesive soils. ReportFHWA/IN/JTRP-2006/22, Joint Transportation Re-search Program.
Kim, K., Prezzi, M.; Salgado, R.; & Lee, W. (2008) Effectof penetration rate on cone penetration resistance in sat-urated clayey soils. J. Geotech. Geoenvironmental Eng.v. 134, p. 1142-1153.
Kolk, H.J.; Baaijens, A.E.; & Senders, M. (2005) Designcriteria for pipe piles in silica sands, in: The 1st Interna-tional Symposium on Frontiers in Offshore Geotech-nics. Taylor & Francis, London, UK, Perth, Australia,p. 711-716.
Lee, J.; Eun, J., Prezzi, M.; & Salgado, R. (2008) Strain in-fluence diagrams for settlement estimation of both iso-lated and multiple footings in sand. J. Geotech.Geoenvironmental Eng. v. 134, p. 417-427.
Lee, J.; & Salgado, R.; (2002) Estimation of footing settle-ment in sand. Int. J. Geomech. v. 2, p. 1-28.
Lee, J.; Salgado, & R.; Kim, S.; (2005) Bearing capacity ofcircular footings under surcharge using state-dependentfinite element analysis. Comput. Geotech. v. 32,p. 445-457.
Lee, J.; Salgado, R.; & Paik, K. (2003) Estimation of loadcapacity of pipe piles in sand based on cone penetrationtest results. J. Geotech. Geoenvironmental Eng. v. 129,p. 391-403.
Lee, J.H.; & Salgado, R. (1999) Determination of pile baseresistance in sands. J. Geotech. Geoenvironmental Eng.v. 125, p. 673-683.
Mayne, P.W.; & Poulos, H.G. (1999) Approximate dis-placement influence factors for elastic shallow founda-tions. J. Geotech. Geoenvironmental Eng. v. 125,p. 453-460.
Niazi, F.S.; & Mayne, P.W. (2013) Cone Penetration TestBased Direct Methods for Evaluating Static Axial Ca-pacity of Single Piles. Geotech. Geol. Eng. v. 31,p. 979-1009.
O’Loughlin, C.D.; & Lehane, B.M.; (2010) Nonlinear conepenetration test-based method for predicting footing
Soils and Rocks, São Paulo, 37(3): 233-242, September-December, 2014. 241
Penetration Rate Effects on Cone Resistance: Insights From Calibration Chamber and Field Testing

settlements on sand. J. Geotech. GeoenvironmentalEng. v. 136, p. 409-416.
Oliveira, J. R. M. S.; Almeida, M.S.S.; Motta, H.P.G.; &Almeida, M.C.F.; (2011) Influence of penetration rateon penetrometer resistance. J. Geotech. Geoenviron-mental Eng. v. 137, p. 695-703.
Powell, J.J.M.; & Quarterman, R.S.T. (1988) The interpre-tation of cone penetration tests in clays, with particularreference to rate effects, in: Proceedings of the Interna-tional Symposium on Penetration Testing, Orlando, p.903-909.
Randolph, M.F.; & Hope, S. (2004) Effect of cone velocityon cone resistance and excess pore pressures, in:Kogisha, Y. (ed) Proc., Int. Symp. On Eng. Practice andPerformance of Soft Deposits. Osaka, p. 147-152.
Robertson, P.K.; & Wride, C. (Fear). (1998) Evaluating cy-clic liquefaction potential using the cone penetrationtest. Can. Geotech. J. v. 35, p. 442-459.
Rocha Filho, P.; & Alencar, J.A. (1985) Piezocone Tests inthe Rio de Janeiro soft clay deposit, in: Proceedings ofthe 11th International Conference on Soil Mechanicsand Foundation Engineering, San Francisco, p. 859-862.
Roy, M.; Tremblay, M.; Tavenas, F.; & Rochelle, P.L.(1982) Development of pore pressure in quasi-staticpenetration tests in sensitive clay. Can. Geotech. J.v. 19, p. 124-138.
Salgado, R.; (2013) The mechanics of cone penetration?:Contributions from experimental and theoretical stud-ies, in: Proceedings of Geotechnical and GeophysicalSite Characterization 4, ISC4. CRC Press (Keynote pa-per), p. 131-153.
Salgado, R.; Bandini, P.; & Karim, A. (2000) Shearstrength and stiffness of silty sand. J. Geotech. Geo-environmental Eng. v. 126, p. 451-462.
Salgado, R.; Boulanger, R.W.; & Mitchell, J.K. (1997) Lat-eral stress effects on CPT liquefaction resistance corre-lations. J. Geotech. Geoenvironmental Eng. v. 123,p. 726-735.
Schmertmann, J.H. (1970) Static cone to compute staticsettlement over sand. J. Soil Mech. Found. Div. v. 96,p. 1011-1043.
Schneider, J.A.; Lehane, B.M.; & Schnaid, F. (2007) Ve-locity Effects on Piezocone Measurements in Normallyand Over Consolidated Clays. Int. J. Phys. Model.Geotech. v. 7, p. 23-34.
Seed, H.B.; & De Alba, P. (1986) Use of SPT and CPT testsfor evaluating the liquefaction resistance of sands, in:Use of in Situ Tests in Geotechnical Engineering,Geotech. Spec. Publ, No.6. ASCE, New York City,N.Y.
Seo, H.; Yildirim, I.Z.; & Prezzi, M. (2009) Assessment ofthe Axial Load Response of an H Pile Driven in Multi-layered Soil. J. Geotech. Geoenvironmental Eng.v. 135, p. 1789-1804.
Stark, T.D.; & Olson, S.M. (1995) Liquefaction resistanceusing CPT and field case histories. J. Geotech. Eng.v. 121, p. 856-869.
Tani, K.; & Craig, W.H., 1995. Bearing capacity of circularfoundations on soft clay of strength increasing withdepth. Soils Found. v. 35, p. 21-35.
Xu, X.; Schneider, J.A.; & Lehane, B.M. (2008) Cone pen-etration test (CPT) methods for end-bearing assessmentof open- and closed-ended driven piles in siliceoussand. Can. Geotech. J. v. 45, p. 1130-1141.
242 Soils and Rocks, São Paulo, 37(3): 233-242, September-December, 2014.
Salgado & Prezzi

Energy Measurement in the Brazilian SPT System
C.M. Santana, F.A.B. Danziger, B.R. Danziger
Abstract. This paper presents results of the instrumentation of 373 blows from two SPT deployments performed in theSarapuí II Test Site, located in Duque de Caxias, Rio de Janeiro. In these blows the hammer drop height, its velocity atimpact, the rate of blows and also the energy transferred to the rod stem have been measured. It is therefore possible toknow the loss of energy for the SPT process (and the corresponding efficiency factors), since the hammer is delivered atzero velocity up to the time the transmitted energy reaches the rod stem.Keywords: SPT, energy, efficiency.
1. IntroductionDespite the existing problems associated with the re-
liability and repeatability of the Standard Penetration Test,Campanella & Sy (1994) emphasize that the SPT continuesto be the most used in situ test for foundation design, evalu-ation of liquefaction potential and compaction control ofsands and sandy silts. Many authors associate the wide-spread use of the test to the simplicity of the test procedure,robustness of the equipment and low operational cost (e.g.,Broms & Flodin, 1988; Décourt, 1989).
Some factors influencing the N value obtained fromSPT have been discussed in several papers (e.g., Fletcher,1965; Ireland et al., 1970; De Mello, 1971; Serota & Low-ther, 1973; Kovacs et al., 1977, 1978; Palacios, 1977;Schmertmann & Palacios, 1979; Kovacs, 1979, 1980,1994; Kovacs & Salomone, 1982; Riggs et al., 1983; Belin-canta, 1985, 1998; Skempton, 1986; Belincanta & Cintra,1998; Décourt et al., 1988; Tokimatsu, 1988; Décourt,1989; Clayton, 1990; Matsumoto et al., 1992; Morgano &Liang, 1992; Teixeira, 1993; Abou-matar & Goble, 1997;Aoki & Cintra, 2000; Fujita & Ohno, 2000; Cavalcante,2002; Odebrecht, 2003; Daniel et al., 2005; Youd et al.,2008; Santana et al., 2012).
One of these papers, by Schmertmann & Palacios(1979), has shown that the number of blows N varies in-versely with the energy delivered to the rod stem, to N equalat least 50. After some discussions concerning the need tostandardize and the choice of the proper energy to be usedas a reference for the N value (e.g., Kovacs & Salomone,1982; Robertson et al., 1983; Seed et al., 1985; Skempton,1986), ISSMFE (1989) has established 60% of the theoreti-cal free fall energy (or nominal potential energy) as the in-ternational reference. Therefore the corresponding N60 isobtained as
N NE
E60
60
� (1)
where N = measured number of blows, E = energy corre-sponding to N and E60 = 60% of the international referenceenergy E*, E* = 474 J.
Décourt (1989) and Kulhawy & Mayne (1990) havesummarized the factors affecting the energy transmissionfrom the hammer to the rods. According to Décourt (1989),the energy entering the rod stem (or enthru energy, Ei) canbe obtained as
E e e e Ei � 1 2 3 * (2)
where e1, e2 and e3 are efficiency (or correction) factors. Theefficiency factor e1 relates the kinetic energy just before theimpact to the free fall energy and is mainly dependent onthe way the hammer is lifted and released. A number ofstudies have been carried out on this subject (e.g., Kovacs etal., 1977, 1978; Kovacs, 1979, 1980; Kovacs & Salomone,1982; Skempton, 1986; Tokimatsu, 1988; Décourt, 1989).The factor e2 is associated to the loss of energy due to thepresence of the anvil (e.g., Skempton, 1986; Décourt,1989). The efficiency factor e3 is related to the rod lengthand e3 values smaller than 1 have been proposed (e.g.,Schmertmann & Palacios, 1979; Skempton, 1986) to takeinto account the separation between hammer and anvil forrod lengths smaller than 10 m, due to the upcoming stresswave. However, recent research (Cavalcante, 2002; Ode-brecht, 2003; Daniel et al., 2005; Odebrecht et al., 2005;Danziger et al., 2006) has shown that a number of impactsmay occur in a single blow, each impact being responsiblefor part of the energy delivered to the rod stem. Thus, e3
should be taken as 1. The e1, e2 and e3 values are discussedbelow together with the corresponding values obtainedherein.
The efficiency factors are related to the theoretical (ornominal) free fall energy, thus they are not the real ones. In-stead, the efficiency factors are influenced by the errors as-sociated with the non-use of the real free fall energy during
Soils and Rocks, São Paulo, 37(3): 243-255, September-December, 2014. 243
Christian Matos de Santana, D.Sc., Civil Engineer, Departamento Nacional de Infraestrutura de Transportes, Aracaju, SE, Brazil. e-mail: [email protected] Artur Brasil Danziger, D.Sc., Full Professor, COPPE e Escola Politécnica, Universidade Federal do Rio de Janeiro, Rio de Janeiro, RJ, Brazil. e-mail:[email protected] Ragoni Danziger, D.Sc., Associate Professor, Escola de Engenharia, Universidade Estadual do Rio de Janeiro, Rio de Janeiro, RJ, Brazil. e-mail:[email protected] on June 27, 2014; Final Acceptance on December 15, 2014; Discussion open until April 30, 2015.

the test. To the authors’ knowledge, very few studies havebeen conducted regarding the potential energy actuallyused in the test (e.g., Riggs et al., 1983; Cavalcante et al.,2011), the latter only relating to the hand lifted pinweighthammer system regularly used in Brazil. However, a veryexperienced crew performed the SPTs in the study carriedout by Cavalcante et al. (2011), and the obtained resultscannot be considered typical but rather a benchmark for thebest results possible to be obtained with this system.
This paper presents research to measure the potentialenergy of the regular Brazilian system in regular opera-tional conditions, i.e. with a crew with regular experience.Also, the impact velocity of the hammer has been evalu-ated. The blow count rate was also measured, provided thatthere are recommendations for the rate to be used in lique-faction analysis (Seed et al., 1985). The energy reaching therod stem has been measured and used to evaluate the effi-ciency factors, which have been therefore evaluated basedboth on the nominal free fall energy and on the measuredenergy.
2. Equipment
2.1. SPT analyzer
The SPT Analyzer measures the energy transmitted tothe rod stem, besides other quantities. It is composed of adata acquisition unit, instrumented rods and connection ca-bles, as can be seen in Fig. 1.
The acquisition data unit has two channels for theforce signal and other two for the acceleration signal. Itsmaximum sample frequency is 20 kHz. The maximumreading interval is 102.4 ms.
Rods 1 m in length have been instrumented, each witha pair of force measuring devices and a pair of accelerome-ters. Electric strain-gauges have been used for monitoringthe force in the instrumented rods, forming a Wheatstonebridge directly fixed to the rods. Piezoelectric accelerome-ters, with 0.02 g resolution and capacity of 5000 g, have
been used to record the rod acceleration. The accelerome-ters can be fixed to the rods in diametrically opposite posi-tions and between the force sensors. The data acquisitionsystem transforms the acceleration records into velocityupon integration with time.
2.2. High speed camera
A Casio EX-FH20 high speed camera, capable of re-cording up to 1000 pictures per second, was used to recordthe hammer drop height and impact velocity.
The images recorded by the camera were digitizedand analyzed picture by picture in order to enable identifi-cation of the maximum height drop during hammer raiseand the moment the hammer hit the anvil. To help deter-mine the hammer position, an Invar ruler is positioned be-side the SPT set. Figure 2 shows the system employed inthe instrumentation of the SPT.
3. Tests Performed
3.1. Test characteristics
Two SPT deployments have been monitored in Sara-puí II Test Site, situated at the margin of the WashingtonLuiz Highway, in the area of the Navy Radio Station in themunicipality of Duque de Caxias/RJ. Geotechnical charac-teristics of the test site have been provided by Jannuzzi(2009, 2013).
According to Jannuzzi (2009) the soil profile in theregion is formed by a very soft clay layer with a typicalthickness of 7.5 m to 8.0 m, followed by minor layers ofclay, sands and silts and clays once more. The water table isat ground level.
The same crew including a chief-operator and threeauxiliary-operators were in charge of the two SPT borings.
An anvil with a mass of 977 g was used (see Fig. 3). Itshould be pointed out that although the Brazilian standardNBR-6484/2001 states that the anvil should have a mass
244 Soils and Rocks, São Paulo, 37(3): 243-255, September-December, 2014.
Santana et al.
Figure 1 - SPT analyzer. Figure 2 - System employed in SPT energy monitoring.

ranging from 3.5 kg to 4.5 kg, anvils with a mass of around1 kg are very often used all over Brazil. Reference must bemade to, for example, Skempton 1986, Décourt 1989,Belincanta 1998 and Belincanta & Cintra 1998 for the in-fluence of the anvil mass on the energy transmitted to therod stem.
A sisal rope was used for lifting and releasing thehammer. The pinweight hammer with a wood cushion isshown in Fig. 4. No measurement was made of the hammermass in the present study. However the SPT company incharge of the tests has informed that the hammer mass isverified periodically and is equal to 65 kg. Measurementsmade in previous research (Cavalcante, 2002) indicate thatthis information may be considered reliable, and errors inthe hammer mass may be generally considered negligible.The hammer drop height has been visually controlled, as in
the usual procedure, with the aid of a mark at the pinweighthammer.
The rods employed in the tests had an external diame-ter of 33 mm, 3.2 kg per meter, as recommended in the Bra-zilian standard NBR-6484/2001.
In the first boring, named Boring 1, 141 blows havebeen monitored. The rod stem length (including the sam-pler) varied from 10.80 to 22.80 m (nominal test depthsvarying from 9 to 21 m).
In the second boring, named Boring 2, 232 blowshave been monitored. The rod stem length (including thesampler) varied from 11.70 to 25.70 m (nominal test depthsvarying from 10 to 23 m).
3.2. Instrumentation results
In order to avoid significant loss of image quality, arate of 210 pictures per second was used, corresponding to amaximum resolution of 480 x 360 pixels. The records ob-tained by the high speed camera have been transferred to acomputer, separated picture by picture, and analyzed byAutoCAD software in a way that it would be possible to de-fine the hammer height during drop by the action of eachblow. An Invar ruler acted as a reference.
The height measured in the picture just before ham-mer release is defined as the hammer drop height. The ham-mer impact velocity has been obtained by the analysis ofthe hammer height picture by picture, since the instant of itsrelease up to the imminence of impact (last picture beforehammer contact with the anvil). Thus it has been possible toadjust a function that describes the relation between theheight drop of the hammer and the time, according to Fig. 5.
The derivation of the hammer drop height in relationto time, when the height drop tends to zero is the impact ve-locity.
Different polynomial functions of two and three de-grees have been tested in various blow counts that producedgood agreement. The difference observed in the velocityduring impact selecting one or other polynomial functionhas been of very low significance. The option has been thento try to adjust a second-degree polynomial function in or-der to simplify the numerical estimation.
Soils and Rocks, São Paulo, 37(3): 243-255, September-December, 2014. 245
Energy Measurement in the Brazilian SPT System
Figure 3 - Anvil employed in Sarapuí II SPTs.
Figure 4 - Equipment employed in the tests in Sarapuí II Experi-mental Test Site.
Figure 5 - Hammer drop height vs. time (obtained during film-ing).

Cavalcante et al. (2011) used polynomial functions offourth degree to describe hammer drop height function withtime.
The hammer acceleration in time is the second deriva-tive of the hammer drop height in time. In this way, the useof a second-degree polynomial function implies the consid-eration of constant hammer acceleration during the hammerrelease.
The hammer acceleration during its release is influ-enced by the gravitational force (which is approximatelyconstant) and by friction forces. In this way, the resultantfrom the friction forces is considered constant during thehammer release.
Considering that the second or third degree polyno-mial functions did not produce significant change in the ad-justments, it is reasonable to consider that the friction vs.time function, in the analyzed cases, is approximately con-stant.
The average values of hammer drop height (hd), ham-mer velocity at impact (vi), potential energy of hammer atrelease (Ep) and kinetic energy at impact (Ek) in each blowsequence of borings 1 and 2 are presented in Tables 1 and 2,respectively. The potential energy and kinetic energy at im-pact have been calculated as:
Ep = m.g.hd (3)
Ek = 0.5.m.vi
2 (4)
where m = hammer mass, considered as 65 kg and g = grav-ity acceleration, considered as 9.81 m/s2.
In the three first blow sequences of Boring 2 no film-ing has been carried out. Furthermore, in a significant num-ber of blows from deployments 1 and 2 (152), it has notbeen possible to determine the impact velocity due to prob-lems with the video. In a smaller number of blows (102)video problems prevented the determination of hammerdrop height in both deployments.
Due to errors in the SPT Analyzer operation, the rodenergy in six blows from sequences 6 and 9 from Boring 2has not been monitored. However, the hammer drop heightand impact velocity of these blows have been measured.
Figures 6 and 7 show the frequency distribution of theSPT hammer drop height in borings 1 and 2, respectively.Figures 8 and 9 illustrate the percentage of blows applied indifferent ranges of hammer drop height in borings 1 and 2,respectively.
Figures 10 and 11 show the hammer drop height blowby blow in each sequence from borings 1 and 2, in all avail-able cases.
Tables 1 and 2 present, for each blow sequence, thefollowing measurements: the number of blow counts for45 cm sampler penetration (N45), the average frequency ofblow count application, the working shift when the blowshave been applied (see definition below), the nominal depthof the test and the length of the rod stem, the hammer dropheight, the impact velocity and the energies measured, aswell as energy ratios.
The average frequency of the blows has been calcu-lated considering the interval from the initial lifting of thehammer, in the first blow of each sequence, up to the finalof the hammer impact for the last blow. Figure 12 shows thehammer drop height vs. the frequency of blows.
In order to evaluate the variation in hammer dropheight during the day, the working period of the boringcrew was divided in four shifts, namely: first shift, from 8and 10 AM; second shift, from 10 to 12 AM; third shift,from 14 to 16 PM and fourth shift, from 16 to 18 PM. Figure13 shows the corresponding variation.
The energy reaching the rod stem (enthru energy) (Ei)has been calculated from Eq. 5. The values of force (F) andvelocity (v) have been obtained through the measurementsfrom the strain-gauges and accelerometers installed on therods. Tables 1 and 2 present the measured values.
E F v dti � � �� (5)
246 Soils and Rocks, São Paulo, 37(3): 243-255, September-December, 2014.
Santana et al.
Figure 6 - Frequency distribution of the hammer drop heightfrom Boring 1.
Figure 7 - Frequency distribution of the hammer drop height fromBoring 2.

Soils and Rocks, São Paulo, 37(3): 243-255, September-December, 2014. 247
Energy Measurement in the Brazilian SPT System
Tab
le1
-M
easu
red
valu
esfo
rB
orin
g1.
Sequ
ence
N45
1Fr
eque
ncy
(Blo
ws/
min
)Sh
ift
Dep
th2
(m)
L3
(m)
h d4(m
)v i7
(m/s
)E
p8(J
)E
k9(J
)E
i10(J
)E
p/E*11
Ek/E
*(e
1)E
i/E*
Ek/E
p
(e1*
)E
i/Ep
Ei/E
k
(e2)
A5
SD6
ASD
ASD
ASD
ASD
15
32.1
49.
0010
.80
0.87
0.07
3.83
0.16
554.
047
.547
8.2
40.5
429.
663
.41.
161.
000.
900.
860.
780.
90
22
31.3
210
.00
11.7
90.
710.
073.
53-
451.
941
.540
5.7
-36
6.7
65.2
0.94
0.85
0.77
0.90
0.81
0.90
38
22.8
211
.00
12.8
00.
770.
063.
610.
0849
2.8
35.9
423.
918
.638
2.1
27.1
1.03
0.89
0.80
0.86
0.78
0.90
415
29.0
312
.00
13.8
00.
870.
064.
020.
1555
3.4
37.8
525.
840
.049
3.5
34.3
1.16
1.10
1.03
0.95
0.89
0.94
53
-3
13.0
014
.81
0.69
0.05
3.41
0.27
437.
432
.838
0.2
60.7
328.
641
.80.
910.
800.
690.
870.
750.
86
64
39.7
315
.00
16.8
30.
670.
033.
380.
0342
9.1
20.0
371.
65.
931
8.1
22.7
0.90
0.78
0.67
0.87
0.74
0.86
718
27.2
219
.00
20.6
80.
690.
033.
670.
0944
1.1
18.4
436.
921
.741
1.4
18.4
0.92
0.91
0.86
0.99
0.93
0.94
819
24.0
320
.00
21.7
60.
830.
063.
750.
1452
9.4
39.0
458.
033
.543
1.5
18.1
1.11
0.96
0.90
0.87
0.82
0.94
926
26.1
421
.00
22.7
70.
860.
083.
930.
1854
7.3
47.9
502.
946
.144
7.1
35.4
1.14
1.05
0.93
0.92
0.82
0.89
1041
19.4
422
.00
23.8
00.
780.
053.
680.
1149
7.8
29.1
441.
325
.540
9.6
22.6
1.04
0.92
0.86
0.89
0.82
0.93
1 N45
=nu
mbe
rof
blow
sfo
r45
cmsa
mpl
erpe
netr
atio
n;2 D
epth
=no
min
alde
pth
ofth
eSP
T(m
);3 L
=le
ngth
ofth
ero
dst
em,i
nclu
ding
the
sam
pler
leng
th(m
);4 h d
=SP
Tha
mm
erdr
ophe
ight
;5 A
=av
erag
eva
lue;
6 SD=
stan
dard
devi
atio
n;7 v i
=SP
Tha
mm
erim
pact
velo
city
;8 E
p=
actu
alpo
tent
iale
nerg
yof
the
SPT
ham
mer
atth
ere
leas
em
omen
t;9 E
k=
kine
ticen
ergy
ofth
eSP
Tha
mm
erat
the
imm
inen
ceof
impa
ct;
10E
i=
ener
gym
easu
red
just
belo
wth
ean
vil;
11E
*=
theo
retic
alpo
tent
iale
nerg
yof
SPT
ham
mer
from
Bra
zilia
nsy
stem
(478
.2J)
.

Figure 14 shows typical force and velocity signalsmeasured just below the anvil. Figure 15 shows typical val-ues of energy vs. time.
Figure 16 illustrates values of Ei normalized by theactual potential energy (Ep), as a function of the rod length,for borings 1 and 2.
3.3. Analysis of the results
The average hammer drop height of sequences fromBoring 1 varied from 67 to 87 cm, with actual potential en-ergy in the range 429.1 - 554.0 J, reaching a difference of29%. The hammer has been lifted higher than 80 cm, orlower than 70 cm (difference higher than 5 cm from thestandard value) in 64% of the blows. The average hammerdrop height of the whole data from Boring 1 is 80 cm, with astandard deviation of 9 cm.
The scatter in hammer drop height values was smallerin Boring 2. The average hammer drop height varied from69 to 87 cm, with potential energies in the range 440.8-553.0 J, reaching a difference of 25%. The hammer has
248 Soils and Rocks, São Paulo, 37(3): 243-255, September-December, 2014.
Santana et al.
Tab
le2
-M
easu
red
valu
esfo
rB
orin
g2.
Sequ
ence
N45
Freq
uenc
y(B
low
s/m
in)
Shif
tD
epth
(m)
L (m)
h d(m
)v i
(m/s
)E
p(J
)E
k(J
)E
i(J
)E
p/E*
Ek/E
*(e
1)E
i/E*
Ek/E
p
(e1*
)E
i/Ep
Ei/E
k
(e2)
ASD
ASD
ASD
ASD
ASD
17
--
10.0
011
.70
--
--
--
--
451.
729
.7-
-0.
94-
--
28
--
11.0
012
.70
--
--
--
--
449.
334
.2-
-0.
94-
--
35
--
12.0
014
.70
--
--
--
--
472.
242
.7-
-0.
99-
--
45
27.1
313
.00
15.7
00.
750.
043.
690.
1247
7.4
28.2
442.
529
.540
8.1
15.1
1.00
0.93
0.85
0.93
0.85
0.92
511
26.6
314
.00
16.7
00.
780.
063.
780.
1649
7.9
41.1
466.
239
.246
3.9
31.2
1.04
0.97
0.97
0.94
0.93
0.99
69
28.6
415
.00
17.7
00.
850.
133.
920.
2754
1.2
80.8
501.
868
.055
1.4
15.0
1.13
1.05
1.15
0.93
--
77
33.3
416
.00
18.7
00.
740.
053.
710.
1247
1.2
32.3
448.
228
.142
7.2
19.6
0.99
0.94
0.89
0.95
0.91
0.95
815
29.8
117
.00
19.7
00.
780.
063.
780.
1649
6.5
39.3
465.
138
.844
5.5
41.7
1.04
0.97
0.93
0.94
0.90
0.96
95
25.7
218
.00
20.7
00.
740.
013.
640.
0847
0.4
8.8
430.
318
.248
1.8
44.9
0.98
0.90
1.01
0.91
--
1016
32.9
219
.00
21.7
00.
800.
063.
860.
1451
2.4
39.3
484.
935
.546
5.9
28.4
1.07
1.01
0.97
0.95
0.91
0.96
1125
28.3
220
.00
22.7
00.
870.
063.
980.
1255
3.0
36.5
516.
232
.148
2.2
35.6
1.16
1.08
1.01
0.93
0.87
0.93
1246
27.6
221
.00
23.7
00.
750.
073.
700.
1847
5.8
41.7
446.
543
.344
5.6
42.2
1.00
0.93
0.93
0.94
0.94
1.00
1351
24.0
322
.00
24.7
00.
720.
043.
670.
1145
7.8
22.7
438.
926
.744
1.0
18.1
0.96
0.92
0.92
0.96
0.96
1.00
1428
20.5
423
.00
25.7
00.
690.
043.
570.
0944
0.8
22.8
414.
321
.440
3.5
26.8
0.92
0.87
0.84
0.94
0.92
0.97
Figure 8 - Percentage of blow counts applied in different rangesof hammer drop height from Boring 1.
Figure 9 - Percentage of blow counts applied in different rangesof hammer drop height from Boring 2.

Soils and Rocks, São Paulo, 37(3): 243-255, September-December, 2014. 249
Energy Measurement in the Brazilian SPT System
Figure 10 - Hammer drop height measured in Boring 1.

250 Soils and Rocks, São Paulo, 37(3): 243-255, September-December, 2014.
Santana et al.
Figure 11a - Hammer drop height measured in Boring 2 (sequences from 4 to 13).

been lifted to heights greater than 80 cm or lower than70 cm in 46% of the blows. The average hammer dropheight is 76 cm, with a standard deviation of 8 cm.
Therefore, in spite of both borings had been per-formed by the same crew, using the same equipment and onthe same site, under the same conditions, a difference on theaverage hammer drop height in Borings 1 and 2 was veri-
fied (80 and 76 cm, respectively). Two other aspects ob-served in the tests: i) a variation in the hammer drop heightin the same blow sequence; ii) a variation in the averagehammer drop height from different sequences.
A tendency to increase the hammer drop height withthe advance of the sequence was observed in both borings.Only in two out of 21 sequences the opposite behavior wasverified. It was hypothesized that the increase in hammerdrop height is caused by the fatigue of the crew, resulting inless care in the procedure, although the opposite shouldseem more probable. The average frequency of the blowswas 19.4 and 39.7 blows per minute, in Borings 1 and 2, re-spectively, which is a significant difference. The smallerfrequencies were observed in the longer sequences, withmore than 25 blows, probably also caused by fatigue of thecrew. The shorter sequences, with five or even fewer blows,presented the higher frequencies. The average frequency ofblows for all sequences (Borings 1 and 2) was27.8 blows/min with a standard deviation of 4.7 blows/min.
Many authors (e.g., Kovacs, 1979; Seed et al., 1985;Skempton, 1986; Décourt, 1989) discuss the influence ofthe frequency of blows on SPT results.
Soils and Rocks, São Paulo, 37(3): 243-255, September-December, 2014. 251
Energy Measurement in the Brazilian SPT System
Figure 12 - Hammer drop height vs. frequency of blows per min-ute.
Figure 11b - Hammer drop height measured in Boring 2 (se-quence 14).
Figure 13 - Hammer drop height vs. shift (first shift, from 8 and10 AM; second shift, from 10 to 12 AM; third shift, from 14 to 16PM and fourth shift, from 16 to 18 PM).
Figure 14 - Typical signals of force and velocity measured justbelow the anvil (Blow 21 of Sequence 9, Boring 1).
Figure 15 - Typical values of energy (just below the anvil) vs.time (Blow 21 of Sequence 9, Boring 1).

In fact, the dynamic condition of SPT may generateexcess pore water pressures that can influence the soil resis-tance to penetration, even in sands. These excess pore waterpressures can be influenced by the driving frequencies.Tests submitted to different frequencies can result in differ-ent N values in the same soil. Seed et al. (1985) showed thatthe N values might be affected by the blow application fre-quency, depending on soil characteristics.
Danziger et al. (2009) and Souza et al. (2012a,2012b) listed different values of the ratio qc/N (where qc iscone resistance) for loose and dense sands. Unlike the CPT,where the test is performed in drained conditions in the caseof sands, SPT may generate positive excess pore pressuresin loose sands and negative excess pore pressures in densesands. This results in lower qc/N values when tests are car-ried out in dense sands, and higher qc/N values when testsare performed in loose sands.
Although not very pronounced, Fig. 12 shows a ten-dency of more scatter on the hammer drop height with theincrease of the frequency of blows, not only above, but alsobelow the standard value.
The work shift does not seem to have influenced thehammer drop height, as indicated by the data presented in
Fig. 13, where a similar scatter was observed for all workshifts.
The average hammer velocity at impact varied from3.38 to 4.02 m/s (kinetic energy of 371.6 and 525.8 J, re-spectively) in the sequences from Boring 1, whereas in thesequences from Boring 2 the average hammer velocity atimpact varied from 3.57 to 3.98 m/s (kinetic energy of414.3 and 516.2 J, respectively), see Tables 1 and 2. Thisvariation is a consequence of the inadequate control in thehammer drop height.
The efficiency factor e1 (Ek/E*), defined by Décourt(1989), varied in Boring 1 from 0.78 to 1.10 and in Boring 2from 0.87 to 1.08. These values are greater than those foundby Cavalcante et al. (2011) and varied in a broader rangethan those presented by Décourt (1989), see Fig. 17. Valuesof e1 greater than 1.00 are explained by the hammer dropheight above the standard value in various sequences.
In order to avoid the influence of the hammer dropheight on the efficiency factors, Santana et al. (2012) pro-posed the use of an efficiency factor e1*, given by Ek/Ep. Thevalues of e1* varied from 0.86 to 0.99 in Boring 1 and from0.91 to 0.96 in Boring 2. These values are greater than thosepresented by Décourt (1989) for the manual system and byCavalcante et al. (2011), see Fig. 18. As expected, e1* val-ues have less scatter than e1 values.
The average energy measured just below the anvil, Ei,varied from 318.1 J (efficiency of 67% in relation to thetheoretical potential energy or nominal energy) to 493.5 J(efficiency of 103%) in Boring 1, whereas in Boring 2 var-ied from 403.5 J (efficiency of 84%) to 551.4 J (efficiencyof 115%). This significant scatter in Ei values is mainly aconsequence of the variation on the hammer drop height,see Tables 1 and 2.
These results indicate that even SPT performed by thesame boring crew, in similar conditions, can result in N val-ues with distinct significance. When the efficiency of theenergy measured just below the anvil is calculated in rela-tion to the actual potential energy, the range in efficiency issignificantly lower, varying from 74% to 93% in Boring 1and from 85% to 96% in Boring 2, see Tables 1 and 2.
252 Soils and Rocks, São Paulo, 37(3): 243-255, September-December, 2014.
Santana et al.
Figure 16 - Rod length vs. energy just below the anvil normalizedby the actual potential energy (Ei/Ep).
Figure 17 - Values of the efficiency factor e1 (adapted fromSkempton, 1986, Décourt, 1989 and Cavalcante et al., 2011).

The efficiency factor e2 (Ei/Ek) varied from 0.86 to0.94 in Boring 1 and from 0.92 to 1.00 in Boring 2. Thesevalues are in the range - average line of Décourt (1989) dataand Cavalcante et al. (2011) data -, considering the anvil of977 g, see Tables 1 and 2 and Fig. 19.
It is possible that high values of factor e2 are associ-ated to the downward movement of the rod stem duringhammer blow, generating an increase in potential energythat is transferred to the rods in subsequent hammer im-pacts of the same blow. This occurrence, described byOdebrecht (2003), is more relevant in low resistance soils.The SPT Analyzer is capable of measuring the whole en-ergy transferred to the rod stem, only if the process occursbefore 102 ms. However, the kinetic energy is calculated inrelation to the first hammer impact with the anvil, so the e2
value can be overestimated should other impacts occur.
The results of Ei/Ep as a function of the rod lengthmeasured in Borings 1 and 2 are presented in Fig. 16. Thisfigure illustrates that the energy transferred to the rod stemis not significantly affected by its length, at least in therange of lengths analyzed, from 10.80 to 25.70 m. This is
corroborated by previous studies (e.g., Cavalcante, 2002;Odebrecht, 2003; Daniel et al., 2005; Danziger et al., 2008)indicating that the energy transmitted to the rod stem doesnot depend on its length and the e3 factor should be consid-ered equal to 1.00.
4. Conclusions
The paper presented the instrumentation results oftwo SPT deployments performed by the same crew, usingthe same procedures and equipment in the Sarapui II Exper-imental Test Site. The main conclusions are summarized asfollows:i) Although both borings had been performed by the same
crew, using the same equipment and on the same site,under the same conditions, a difference was found inthe average hammer drop height in Borings 1 and 2 (80and 76 cm, respectively). Two other aspects observedin the tests: a variation in the hammer drop height in thesame blow sequence; a variation in the average hammerdrop height from different sequences.
ii) A tendency to increase the hammer drop height as the se-quence advances was observed in both borings. Theopposite behavior was verified in only two out of 21sequences. It was hypothesized that the increase inhammer drop height is caused by the fatigue of thecrew, resulting in the careless of the procedure, al-though the opposite should seem more probable.
iii) The average frequency of blows was 19.4 and 39.7blows per minute in Borings 1 and 2, respectively. Thesmaller frequencies were observed in the longer se-quences, with more than 25 blows, probably caused bythe fatigue of the crew. The shorter sequences, withfive or even less blows, presented the higher frequen-cies.
iv) A slight trend of higher scatter on the hammer dropheight was observed when the rate of blows increased.
Soils and Rocks, São Paulo, 37(3): 243-255, September-December, 2014. 253
Energy Measurement in the Brazilian SPT System
Figure 18 - Values of the efficiency factor e1* (adapted fromSkempton, 1986, Décourt, 1989 and Cavalcante et al., 2011).
Figure 19 - Efficiency factor e2 as a function of the anvil mass (adapted from Décourt, 1989 and Cavalcante et al., 2011).

v) The work shift does not seem to have influenced thehammer drop height, since a similar scatter was ob-served for all work shifts.
vi) The efficiency factor e1 (Ek/E*) varied in Boring 1 from0.78 to 1.10 and in Boring 2 from 0.87 to 1.08. Thesevalues are higher than those found by Cavalcante et al.(2011) and varied in a broader range than those pre-sented by Décourt (1989). Values of e1 greater than1.00 are explained by the hammer drop height abovethe standard value in various sequences.
vii) The values of e1* (Ek/Ep) varied in Boring 1 from 0.86 to0.99 and in Boring 2 from 0.91 to 0.96, in a narrowerrange than the e1 values.
viii) The average energy measured just below the anvil, Ei,varied from 318.1 J (efficiency of 67% in relation tothe theoretical potential energy or nominal energy) to493.5 J (efficiency of 103%) in Boring 1, whereas inBoring 2 varied from 403.5 J (efficiency of 84%) to551.4 J (efficiency of 115%). The scatter in Ei values ismainly due to the variation in the hammer drop height.The obtained results indicate that even SPT performedby the same boring crew, in similar conditions, can re-sult in N values with distinct significance.
ix) When the efficiency of the energy measured just belowthe anvil is calculated in relation to the actual potentialenergy, the range in efficiency is significantly lower,varying from 74% to 93% in Boring 1 and from 85%to 96% in Boring 2.
x) The efficiency factor e2 (Ei/Ek) varied in Boring 1 from0.86 to 0.94 and in Boring 2 from 0.92 to 1.00.
xi) The values of Ei/Ep vs. the rod length indicate that the en-ergy transferred to the rod stem is not significantly af-fected by its length, and the efficiency factor e3 shouldbe considered as 1.00.
Acknowledgments
Roberto Marinho and Max Gomes de Souza, for theirhelp in performing instrumented SPTs. Elvyn Marshall,who proofread the paper.
ReferencesABNT (2001) Soil - SPT - Test Method. Brazilian Standard
NBR 6484, Brazilian Technical Standards Association(ABNT), 17 p. (in Portuguese).
Abou-Matar, H. & Goble, G.G. (1997) SPT DynamicsAnalysis and Measurements. Journal of Geotechnicaland Geoenvironmental Engineering, ASCE, v. 123:10,p. 921-928.
Aoki, N. & Cintra, J.C.A. (2000) The Application of En-ergy Conservation Hamilton’s Principle to the Determi-nation of Energy Efficiency in SPT Tests. Proc. 6th Int.Conf. on the Application of the Stress-Wave Theory toPiles, São Paulo, v.1, p. 457-460.
Belincanta, A. (1985) Dynamic Energy in SPT – Resultsfrom a Theoretical-Experimental Investigation. M.Sc.
Thesis, EPUSP, São Paulo State University, São Paulo,217 p. (in Portuguese).
Belincanta, A. (1998) Evaluation of Factors Affecting thePenetration Resistance in SPT. Ph.D. Thesis, EESC,São Paulo State University, São Carlos, 141 p. (in Por-tuguese).
Belincanta, A. & Cintra, J.C.A. (1998) Factors AffectingSPT: the Brazilian Experience. Solos e Rochas, v. 21:3,p. 119-133 (in Portuguese).
Broms, B.B. & Flodin, N. (1988) History of Soil Penetra-tion Testing. Penetration Testing, ISOPT-1. J. De Rui-ter Ed., Orlando, p. 178-186.
Campanella, R.G. & Sy, A. (1994) Recent Developments inEnergy Calibration of Penetration Tests at UBC. Proc.XII Int. Conf. on Soil Mech. Found. Eng., New Delhi,p. 151-156.
Cavalcante, E. H. (2002) Theoretical-Experimental Inves-tigation of SPT. Ph.D. Thesis, COPPE, Federal Univer-sity of Rio de Janeiro, Rio de Janeiro, 430 p. (in Portu-guese).
Cavalcante, E.H.; Danziger, B.R. & Danziger, F.A.B.(2011) Measurement of Drop Height and Impact Veloc-ity in the Brazilian SPT System. Soils and Rocks,v. 34:3, p. 207-218.
Clayton, C.R.I. (1990) SPT Energy Transmission: Theory,Measurement and Significance. Ground Engineering, v.23:10, p. 35-43.
Daniel, C.R.; Howie, J.A.; Jackson, R.S. & Walker, B.(2005) Review of Standard Penetration Test Short RodCorrections. Journal of Geotechnical and Geoenviron-mental Engineering, ASCE, v. 131:4, p. 489-497.
Danziger, B.R.; Souza, J.M.S. & Danziger, F.A.B. (2009)Comparison of Methods to Predict Mobilized LoadsDuring SPT in Sand. Proc. Engenharia de Fundações:Passado Recente e Perspectivas, São Carlos, v. 1,p. 65-73 (in Portuguese).
Danziger, F.A.B.; Danziger, B.R. & Cavalcante, E.H.(2006) Discussion of Review of Standard PenetrationTest Short Rod Corrections, by Chris R. Daniel, John A.Howie, R. Scott Jackson, & Brian Walker. Journal ofGeotechnical and Geoenvironmental Engineering,ASCE, v. 132:12, p. 1634-1637.
Danziger, F.A.B.; Danziger, B.R. & Cavalcante, E.H.(2008) On the SPT Energy and the Meaning of N Valuein Special Cases. Proc. XIV Braz. Conf. on Soil Mech.Geotech. Eng., Búzios, CD-rom, p. 2214-2224 (in Por-tuguese).
Décourt, L. (1989) General report / Discussion Session 2:SPT, CPT, Pressuremeter Testing and Recent Develop-ments in In-Situ Testing – Part 2: The Standard Penetra-tion Test, State-of-the-Art Report. Proc. XII Int. Conf.on Soil Mech. Found. Eng., Rio de Janeiro, v. 4,p. 2405-2416.
Décourt, L.; Muromachi, T.; Nixon, I.K.; Schmertmann,J.H.; Thorburn, S. & Zolkov, E. (1988) Standard Pene-tration Test (SPT): International Reference Test Proce-
254 Soils and Rocks, São Paulo, 37(3): 243-255, September-December, 2014.
Santana et al.

dure. Proc. ISSMFE Technical Committee on Penetra-tion Testing – SPT Working Party, ISOPT-I, Orlando,v.1, p. 3-26.
De Mello, V.F.B. (1971) Standard Penetration Test. Proc.4th Pan-American Conf. on Soil Mech. Found. Eng.,Puerto Rico, v. l, p. 1-86.
Fletcher, G.F.A. (1965) Standard Penetration Test: Its Usesand Abuses. Journal of the Soil Mechanics and Founda-tions Division, ASCE, v. 91:SM4, p. 67-75.
Fujita, K. & Ohno, M. (2000) Stress Wave Application toStandard Penetration Test in Japan. Proc. 6th Int. Conf.on the Application of Stress-Wave Theory to Piles, SãoPaulo, v. 1, p. 469-475.
Ireland, H.O.; Moretto, O. & Vargas, M. (1970) The Dy-namic Penetration Test: A Standard that is not Stan-dardized. Géotechnique, v. 20:2, p. 185-192.
ISSMFE (1989) Report of the ISSMFE – Technical Com-mittee on Penetration Testing of Soils – TC 16 WithReference Test Procedures – CPT – SPT – DP – WST.International Reference Test Procedure for the StandardPenetration Test (SPT), p. 17-19.
Jannuzzi, G.M.F. (2009) The Characterization of Sarapuí IISoft Clay Site by In-Situ Testing. M.Sc. Thesis,COPPE, Federal University of Rio de Janeiro, Rio deJaneiro, 195 p. (in Portuguese).
Jannuzzi, G.M.F. (2013) Innovative, Modern and Tradi-tional Methods to Characterize the Sarapuí II Soft Clay.Ph.D. Thesis, COPPE, Federal University of Rio de Ja-neiro, Rio de Janeiro, 414 p. (in Portuguese).
Kovacs, W.D. (1979) Velocity Measurement of Free-FallSPT Hammer. Journal of the Geotechnical EngineeringDivision, ASCE, v. 105:GT1, p. 1-10.
Kovacs, W. D. (1980) What Constitutes a Turn? Geo-technical Testing Journal, ASTM, v. 3:3, p. 127-130.
Kovacs, W.D. (1994) Effects of SPT Equipment and Proce-dures on the Design of Shallow Foundations on Sand.Proc. Settlement’94, ASCE, New York, v. 1, p. 121-131.
Kovacs, W.D.; Evans, J.C. & Griffith, A.H. (1977) To-wards a More Standardized SPT. Proc. 9th Int. Conf. onSoil Mech. Found. Eng., Tokyo, v. 2, p. 269-276.
Kovacs, W.D.; Griffith, A.W. & Evans, J.C. (1978) An Al-ternative to the Cathead and Rope for the Standard Pen-etration Test. Geotechnical Testing Journal, ASTM,v. 1:2, p. 72-81.
Kovacs, W.D. & Salomone, L.A. (1982) SPT Hammer En-ergy Measurement. Journal of the Soil Mechanics andFoundations Division, ASCE, v. 108:GT4, p. 599-620.
Kulhawy, F.H. & Mayne, P.W. (1990) Manual on Esti-mating Soil Properties for Foundation Design. Preparedby Cornell University for Electric Power Research In-stitute (EPRI), 308 p.
Matsumoto, T.; Sikigushi, H. & Yoshida, H. (1992) Signif-icance of Two Point Strain Measurement in SPT. Soilsand Foundations, v. 32:2, p. 67-82.
Morgano, C.M. & Liang, R. (1992) Energy Transfer in SPT– Rod Length Effect. Proc. 4th Int. Conf. on the Appli-cation of Stress-Wave Theory to Piles, Netherlands,v. 1, p. 121-127.
Odebrecht, E. (2003) SPT Energy Measurement. Ph.D.Thesis, Federal University of Rio Grande do Sul, PortoAlegre, 230 p. (in Portuguese).
Odebrecht, E.; Schnaid, F.; Rocha, M.M. & Bernardes,G.P. (2005) Energy Efficiency for Standard PenetrationTests. Journal of Geotechnical and GeoenvironmentalEngineering, ASCE, v. 131:10, p. 1252-1263.
Palacios, A. (1977) Theory and Measurements of EnergyTransfer During Standard Penetration Test Sampling.Ph.D. Thesis, University of Florida, USA, 391 p.
Riggs, C.O.; Schmidt, O. N. & Rassieur, C.L. (1983) Re-producible SPT Hammer Impact Force with an Auto-matic Free Fall SPT Hammer System. GeotechnicalTesting Journal, ASTM, v. 6:3, p. 201-209.
Robertson, P.K.; Campanella, R.G. & Wightman, A.(1983) SPT-CPT Correlations. Journal of GeotechnicalEngineering, ASCE, v. 109:11, p. 1449-1459.
Santana, C.M.; Danziger, F.A.B. & Danziger, B.R. (2012)The measurement of Energy Reaching the Sampler inSPT. Proc. 4th Int. Conf. on Site Characterization,ISC-4, Porto de Galinhas, v. 1, p. 921-926.
Schmertmann, J.H. & Palacios, A. (1979) Energy Dynam-ics of SPT. Journal of the Geotechnical Engineering Di-vision, ASCE, v. 105:GT8, p. 909-926.
Seed, H.B.; Tokimatsu, K.; Harder, L.F. & Chung, R.M.(1985) Influence of SPT Procedures in Soil LiquefactionResistance Evaluations. Journal of the Geotechnical En-gineering Division, ASCE, v. 111:12, p. 1425-1445.
Serota, S. & Lowther, G. (1973) SPT Practice Meets Criti-cal Review. Ground Engineering, v. 6:1, p. 20-22.
Souza, J.M.S.; Danziger, B.R. & Danziger, F.A.B. (2012a)The Influence of the Relative Density of Sands in SPT andCPT Correlations. Soils and Rocks, v. 35:1, p. 99-113.
Souza, J.M.S.; Danziger, B.R. & Danziger, F.A.B. (2012b)The Influence of Sand Density on SPT x CPT Correla-tions. Proc. 4th Int. Conf. on Site Characterization,ISC-4, Porto de Galinhas, v. 1, p. 859-864.
Skempton, A.W. (1986) Standard Penetration Test Proce-dures and the Effects in Sands of Overburden Pressure,Relative Density, Particle Size, Ageing and Overcon-solidation. Géotechnique, v. 36:3, p. 425-447.
Teixeira, A.H. (1993) An Improvement of the SPT. In Soilsfrom São Paulo, ABMS-NRSP, chapter 4, p. 75-93 (inPortuguese).
Tokimatsu, K. (1988) Penetration Tests for Dynamic Prob-lems. ISOPT-1, J. De Ruiter Ed., Orlando, p. 117-136.
Youd, T.L.; Bartholomew, H.W. & Steidl, J.H. (2008) SPTHammer Energy Ratio vs. Drop Height. Journal of Geo-technical and Geoenvironmental Engineering, ASCE,v. 134:3, p. 397-400.
Soils and Rocks, São Paulo, 37(3): 243-255, September-December, 2014. 255
Energy Measurement in the Brazilian SPT System


Geotechnical Characterization of Suape Soft Clays, Brazil
R.Q. Coutinho, M.I.M.C.V. Bello
Abstract. Comprehensive research has been carried out by the Geotechnical Group (GEGEP) of the Federal University ofPernambuco in the soft clay deposits in Northeastern Brazil near the city of Recife. This paper presents the results ofimportant geotechnical investigations of soft clays in two areas within the Suape Port and Industrial Complex. Thegeotechnical parameters were obtained from laboratory (classification, compressibility and strength) and in situ (SPT,vane and CPTU) tests, and were compared with regional empirical correlations and proposals presented in literature. Thevane tests were performed to obtain undrained strength and overconsolidation ratio parameters. The classifications for soilbehavior, together with flow characteristics, strength and overconsolidation ratio parameters, were determined bypiezocone tests. The results are compared with results from reference tests, and discussed with results from the literature,including the results of Recife and other Brazilian clays. This study confirms that parameters can be obtained by means ofin situ tests with correlations suited to the local/regional experience and the importance of having a joint laboratory and insitu test program. This prediction is fundamental for a proper geotechnical site characterization in studies and engineeringprojects.Keywords: geotechnical parameters, soft clays, laboratory and in situ testing.
1. Introduction
The Suape Port and Industrial Complex is a verycomplete and important industrial center in Northeast Bra-zil. The geographical location of Pernambuco State givesSuape Port an international status since it is located on themain international shipping routes. Large companies, ashipyard, refinery and other industries already exist or theirfacilities are under construction in this area.
The use of field tests to evaluate geotechnical param-eters of soils has been increasing in recent years. Coutinho(2008) (see also Coutinho et al., 2008) published a studyabout the geotechnical parameters obtained from in situ in-vestigations for practical projects. The ability to obtain pa-rameters by means of in situ tests with correlations suited tothe local/regional experiment is fundamental for propergeotechnical site characterization in studies and engineer-ing projects. Soil stratigraphy, compressibility and rate ofconsolidation parameters, undrained shear strength (Su)and the overconsolidation ratio (OCR) of soft clays can beestimated based on an investigation program including insitu and laboratory testing (Schnaid, 2009; Mayne, 2007;Lunne et al., 1997).
This paper presents the results of important geo-technical investigations of soft clays carried out in two ar-eas within the Suape Port and Industrial Complex. Thegeotechnical parameters were obtained from laboratory(classification, compressibility and strength) and in situ(SPT, water content measurement, vane and CPTU) tests,and then compared with regional and proposed correlationspresented in literature. The vane tests were used for obtain-
ing undrained strength and overconsolidation ratioparameters. The classifications concerning soil behavior, inaddition to flow characteristics, strength andoverconsolidation ratio parameters were determined bypiezocone tests. The results were discussed after comparingthe laboratory tests and regional and literature results. Thisstudy is part of a research program of the Geotechnical Re-search Group (GEGEP) of the Federal University ofPernambuco (UFPE).
2. Characteristics of the Study Area
The AE-1 and AE-2 study areas are within the SuapeIndustrial and Port Complex, in the town of Ipojuca, Per-nambuco State, Brazil (Fig. 1). The coastal location is char-acterized by a complex geology, including low-lyingplains, with soils featuring reduced load capacities, verysoft organic clays, with the presence of peat, roots, shellsand fine layers of sand and silt. This soft soil generally has ahigh water and organic content with very low penetrationtest values (NSPT). Projects included construction of em-bankments of varying heights (some 17 m) on the subsoil ofclays and peat material.
The AE-1 study area is part of an access route where atemporary embankment around 2.0 m in height, has beenbuilt. The AE-2 study area, which includes an importantproject, was divided into five (5) subdivisions, where 20boreholes and 34 undisturbed Shelby samples were taken.Geotechnical site characterization included laboratory(characterization, oedometer and triaxial) and field (SPT,vane and CPTU) tests. Figures 2 and 3 illustrate typical soilparameter profiles for SUB-AREA A and C, respectively
Soils and Rocks, São Paulo, 37(3): 257-276, September-December, 2014. 257
Roberto Quental Coutinho, D.Sc., Professor, Departamento de Engenharia Civil, Universidade Federal de Pernambuco, Recife, PE, Brazil. e-mail: [email protected] Isabela Marques da Cunha V. Bello, D.Sc., Lecturer, Departamento de Engenharia Civil, Universidade Federal de Pernambuco, Caruaru, PE, Brazil. e-mail:[email protected] on April 30, 2014; Final Acceptance on December 15, 2014; Discussion open until April 30, 2015.

(AE-2 study area). Figure 4 presents a plasticity chart withlaboratory test results on Suape soft soils, including organicsoils. Results from two other Brazilian soft deposits are alsopresented (Recife-PE and Juturnaíba-RJ). Proposed rangesfor inorganic and organic clays and peats are included. Fur-ther information about the geological and geotechnicalcharacterization, together with parameters of the Suapestudy areas, can be found in Coutinho (2010) and Bello(2011).
3. Soil Classification ChartsRobertson & Campanella (1983), Robertson et al.
(1986) and Sully et al. (1988) were the first to presentcharts based on piezocone tests that include measurementsfor cone resistance (qt) corrected for pore pressure (Eq. 1).
258 Soils and Rocks, São Paulo, 37(3): 257-276, September-December, 2014.
Coutinho & Bello
Figure 1 - Location of study areas: Suape, Ipojuca (Coutinho,2010; Bello, 2011).
Figure 2 - Geotechnical profile of E106 (AE - 2 study area, SUB-AREA A), Suape (Coutinho, 2010; Bello, 2011).
Figure 3 - Geotechnical profile of E121 (AE-2 study area, SUB-AREA C), Suape (Coutinho, 2010; Bello, 2011).

Robertson et al. (1986) profiled a chart introducing the porepressure ratio, Bq (Eq. 2). This chart indicates 12 possiblezones, or soil categories, obtained by plotting log qt vs. Fr
paired with sets of log qt vs. Bq. Mayne (2007) shows 25 dif-ferent CPT methods for soil classification, including thewell-known methods from Begemann (1965), Schmer-tmann et al. (1978), and Robertson (1990).
q q u at c� � �2 1( ) (1)
where u2 = pore pressure measured at the cone shoulder;a = the ratio between the shoulder area unaffected by thepore water pressure and the total shoulder area.
Bu u
v
��
�2 0
1 �(2)
where Bq = pore pressure ratio; u0 = in-situ pore pressure;�v = total vertical overburden stress at the depth z corre-sponding to the readings.
Robertson (1990) proposed a refinement of the Rob-ertson et al. (1986) profiling chart, plotting “normalizedcone resistance”, Qt, against “normalized friction ratio”, Fr
against pore pressure ratio Bq, and presented a nine-zonechart (Eqs. 3 and 4 respectively), (Fig. 5). Normalizationwas proposed to compensate for qc dependency on the over-burden stress, and when analyzing deep CPTU soundings(deeper than 30 m). Profiling charts developed for shal-lower soundings are not suitable for deeper sites.
tt v
v
����
�0
0
(3)
Ff
qr
s
t v
��
�� 0
100 (4)
where fs = sleeve friction.
Robertson (2010) suggested updating the charts sup-plied by Robertson et al. (1986), and Robertson (1990). Theupdated charts, which are dimensionless and color codedfor improved presentation, define nine (9) SBT zones thatare consistent.
Schneider et al. (2008) developed general soil classi-fication charts using parametric studies (Fig. 6). The “zo-nes” in the three charts are exactly the same, but the plotsare shown in different formats: (1) coordinates log Q - log�u2/�’vo; (2) coordinates Q - �u2/�’vo; (3) coordinates semi-log Q - �u2/�’vo. These formats are best used in cases of: (1)clays, clayey silts, silts, sandy silts, and sands without nega-tive penetration pore pressures; (2) sands and transitionalsoils with small negative excess penetration pore pressures,and (3) clay soils with large negative excess penetrationpore pressure.
Long (2008) (see also Mollé, 2005; Coutinho, 2008)in a special study concluded that the Robertson et al. (1986)and Robertson (1990) charts for soil classification usingCPTU data seem to work well in clays, clayey silts, siltysands and sands. They may have difficulties in using thesecharts in organic soils and peat, and in cases of complexstratigraphy.
Two proposals for soil classification from CPTUwere utilized in Suape AE-2 study areas:(a) Robertson (1990) charts:
(a.1) Coordinates log Q - Bq
(a.2) Coordinates log Q - Fr
(b) Schneider et al. (2008) charts:
(b.1) Case 1: Coordinates log Q - log �u2/�’vo
(b.2) Case 3: Coordinates semi log Q - �u2/�’vo
Eleven verticals were analyzed (six verticals in AE-2SUB-AREA A, and five verticals in AE-2 SUB-AREA C).Figures 7 and 8 show results of CPTU classification fromboreholes E104 (SUB-AREA A) and E121 (SUB-AREAC), respectively. For each borehole, classification of grain-
Soils and Rocks, São Paulo, 37(3): 257-276, September-December, 2014. 259
Geotechnical Characterization of Suape Soft Clays, Brazil
Figure 4 - Plasticity chart-soft soil results: (a) Suape (Bello, 2011); (b) Recife and Juturnaíba (Coutinho et al., 1998).

size distribution and NSPT values were compared with theCPTU classification.
3.1. Robertson (1990) charts results
In the Robertson (1990) chart (log Q - Bq), it was ob-served that the points tend to rise when the overconso-lidation ratio (OCR) value increases (Figs. 7 and 8). Thesepoints are relative to the surface layer, and the layer belowthe clay layer, where silty and sandy material (bands 5, 6and 7) can be found. These results were concordant with
OCR and sensitivity (St) values obtained from oedometerand vane field tests, respectively. The points indicating claysoils are situated in bands 3 and 4.
In the Robertson (1990) chart (log Q - Fr), the pointsare situated in bands 3 and 4 (clay and silty clay). The Fr
values were greater than 1.0.The Robertson (1990) charts predict soil behavior,
and are not directly related to soil classification criteria, us-ing geological descriptions based on grain-size distribu-tion. It has been verified that the greatest difference
260 Soils and Rocks, São Paulo, 37(3): 257-276, September-December, 2014.
Coutinho & Bello
Figure 5 - Type of soil behavior (Robertson, 1990).
Figure 6 - Proposals for soils classification using CPTU testing for several forms of plotting (Schneider et al., 2008).

between the results of classification from grain-size distri-bution and CPTU tests occurs in the mixed soil regions andin the transition zones between layers of the profile.
3.2. Schneider et al. (2008) charts results
The Schneider et al. (2008) chart - Case 1 (Coordi-nates log Q - log �u2/�’vo) features coordinates identical tothe Robertson (1990) chart, allowing direct comparison ofthe results (Figs. 7 and 8). In general, soil classification ofthe study area by the Schneider et al. (2008) chart - Case 1was in agreement with the classification from Robertson(1990).
In the Schneider et al. (2008) chart - Case 3 (Coordi-nates semi log Q - �u2/�’vo), the plotted results only tookinto consideration material with positive pore pressure val-ues, since the horizontal coordinate is a semi-log scale.
Therefore, this chart does not show materials with negativevalue of pore-pressure.
It is important to emphasize the care needed whenidentifying the points relating to SPT tests. Classification oflayers indicating grain-size distribution can demonstratedifferences in the values for NSPT and water content, makingit necessary to divide classification into sub-layers to beplotted into separate charts.
Another major concern is the presence of transitionalsoils. These soils are characterized as mixtures of differentmaterials. In the Schneider et al. (2008) charts, these soilscan be clearly observed inside the determined boundaries(Figs. 7 and 8). In general, results from the Schneider et al.(2008) charts were also satisfactory for the Suape soft soils,consistent with classification using grain-size distributionand NSPT values.
Soils and Rocks, São Paulo, 37(3): 257-276, September-December, 2014. 261
Geotechnical Characterization of Suape Soft Clays, Brazil
Figure 7 - Comparison between soil classification from grain-size, and piezocone tests - E104 (SUB-AREA A) (Bello, 2011; Bello &Coutinho, 2012).

4. Compressibility Parameters
Laboratory incremental oedometer tests were per-formed on soil specimens with a diameter of 87 mm andheight of 20 mm, using Bishop apparatus, with doubledrainage. Loads were doubled for each stage, beginning at5-10 kPa until 640-1280 kPa and then decreased to 10 kPa.Each stage usually took 24 h.
Typical curves of void ratio vs. effective stress ob-tained from oedometer tests are shown in Fig. 9 for the tworesearch sites. It can be seen that the “virgin” portion is notlinear. This is consistent with findings in many other inves-tigations (Coutinho, 1976; Coutinho & Lacerda, 1987;Mesri & Choi, 1985). In this study, the virgin portion curve
was simplified by two linear parts to obtain the compres-sion index Cc (Cc1 and Cc2).
The quality of samples was evaluated using the pro-posal presented in Coutinho (2007), which represents theBrazilian experiment, based on the proposal of Lunne et al.(1997). This criterion uses the ratio �e/e0 corresponding tothe initial effective vertical stress (�’vo), and can be de-scribed as: OCR = 1-2.5; �e/e0 < 0.05; - Very Good to Ex-cellent; �e/e0 = 0.05-0.08 - Good to Fair; �e/e0 = 0.08-0.14 -Poor; and �e/e0 > 0.14 - Very Poor. Some samples in thisstudy showed results with considerable disturbance. In thestudy, these curves e (v) vs. log p or the compressibilityparameters were corrected to obtain results equivalent to
262 Soils and Rocks, São Paulo, 37(3): 257-276, September-December, 2014.
Coutinho & Bello
Figure 8 - Comparison between soil classification from grain-size, and piezocone tests - E121 (SUB-AREA C) (Bello, 2011; Bello &Coutinho, 2012).

samples of very good to excellent quality. Methodologyproposed by Oliveira (2002), Schmertmann (1955), Cou-tinho (2007) and Futai (2010) was used and are briefly pre-sented in Coutinho & Bello (2012a). In this paper, theresults are in general those effectively corrected or initiallyof very good quality.
Figures 2 and 3 show results of the overconsolidationratio (OCR = �’vm/�’vo) and the compressibility parameters:compression index Cc (first part) and swell index Cs for twosites studied. It can be observed that the deposits have ahigher void ratio and very high compressibility.
Statistical correlations (Cc vs. eo and Cc vs. w (%)) forSuape soft clays have been developed using all data fromthe corrected laboratory test database. The results of Cc vs.w are shown in Fig. 10). Results of Juturnaíba organic soils(Coutinho, 1986; Coutinho & Lacerda, 1987) are alsoshown, as are the results from Recife soft clays (Coutinho etal., 1998); Coutinho (2007); and Juturnaiba organic soils
(Coutinho, 1986; Coutinho & Lacerda, 1987). The watercontent w (%), obtained from the SPT testing can be used tohave the first estimate of Cc.
The Cc vs. w (%) correlations (Figs. 10a and b) arequite similar for the deposit, particularly for clay soils. TheSuape clays presenting a smaller inclination: Recife SoftClay Cc 0.0126w (%) and Suape Soft Clay Cc = 0.0097w(%) Cc 0.01w (%). In general, correlations for clay havehigher correlation coefficients (r2) and lower standard error(lower dispersion) than those for organic soil/peat. Proba-bly for the more difficulty do obtain sample of very goodquality.
The organic soft Juturnaíba research site has highercorrelation coefficients than Recife and Suape deposits(less dispersion), due to better quality samples. The behav-ior of these clay deposits under one-dimensional consolida-tion is strongly affected by sampling disturbance. The gen-eral equation between Cc and w (%) for Recife and Suape
Soils and Rocks, São Paulo, 37(3): 257-276, September-December, 2014. 263
Geotechnical Characterization of Suape Soft Clays, Brazil
Figure 9 - Experimental curve and curve drawn by the proposed corrections on a good-quality sample E109: (a) proposal by Oliveira(2002); (b) proposal by Schmertmann (1955) (Bello, 2011).
Figure 10 - Statistical correlations for organic soils and soft/medium clays: (a) Recife and Juturnaíba (Coutinho et al., 1998); (b) Suape(Bello, 2011).

clays is very similar to the equation presented by Bowles(1979) for organic silts and clays (Cc = 0.0115w), and is alsovery similar to those presented by Djoenaidi (1985) (seeKulhawy & Mayne, 1990). Almeida et al. (2008) plotted Cc
vs. w values (%) of seven clays from Rio de Janeiro(Cc = 0.013w), including Juturnaíba-RJ clays from Couti-nho (1986). Koppula (1981) obtained a similar correlation(Cc = 0.010w) for the normally densified clays with lowsensitivity (St < 1.5). In general, it has been found that softclays and soft organic soils Cc = 0.010 to 0.015w (%)(Coutinho, 2007).
5. Coefficient of Consolidation
The coefficient of consolidation measurement is oneof the soil properties major challenges for geotechnical en-gineering. Parameters for the consolidation rate may be as-sessed using oedometer (laboratory) and piezocone in situtests by measuring the dissipation or decay of pore pressurethrough time after penetration ceases (Lunne et al., 1997).
Field stress and pore-pressures around the piezoconecan be calculated using the strain path method, according toformulas provided by Baligh & Lavadoux (1986), andHoulsby & Teh (1988).
Baligh & Lavadoux (1986) concluded that dissipationis predominantly in a horizontal direction. The dissipationprocess can be expressed by a one-dimensional factor oftime, as in Eq. 5:
Tc
R Ic
T R I
th
hr*
*
;� �2
2
(5)
where R: piezocone radius; T*: dissipation time; Ir: rigidityindex (G/Su); G: shear modulus.
Houlsby & Teh (1988) presented the following proce-dure to determine ch: (a) calculate the difference betweenpore pressure at the beginning of dissipation, ui, and the hy-drostatic pore pressure, uo; (b) calculate the percentage ofdissipation u50% = (ui - uo)/2, and use the experimental curveto determine the actual time taken for 50% of the dissipa-tion to occur, t50%; (c) obtain the T* value in Table 1, and cal-culate ch by using Eq. 5.
Robertson et al. (1992) propose a direct estimate of ch
from the t50 value using an abacus. This calculation is validfor Ir values varying between 50 and 500, and for cone areasof 10-15 cm2. Values for ch obtained from these procedurescorrespond to soil properties in the preconsolidation band,due to the fact that during penetration, material surroundingthe cone undergoes increased levels of deformation, and inthis state behaves as soil in recompression (Baligh, 1986;Baligh & Levadoux, 1986). Jamiolkowski et al. (1985) pro-posed estimating ch in the normal compression band (N.C.)using Eq. 6. The authors presented experimental values forCs/Cc that varied in the 0.13-0.15 range.
The coefficient of consolidation in the vertical direc-tion can be estimated using permeability in the horizontaland vertical planes from Eq. 7 (Lunne et al., 1997).
c N CC
Cc CPTUh
s
ch( . ) ( )� (6)
c N Ck
hc N Cv
v
h
h( . ) ( . )� (7)
where kh and kv represent horizontal and vertical permeabil-ity, respectively.
In the study area, ch calculations were carried out ac-cording to a formula proposed by Houlsby & Teh (1988). Ineach CPTU vertical, ch values were calculated in relation tothe depths of the dissipation tests in both study areas, con-sidering Ir = 50. Figure 11 shows an example of results ofpore pressure of dissipation tests, including the procedureto determine t50%, for the CPTU 120, Sub Area C - AE - 2.Values of ch were also determined from laboratory troughradial oedometer tests.
Figure 12a shows value variation relating to thedepths from the radial oedometer and piezocone tests forthe AE-1 study area. In this figure, ch values are also ob-tained from piezocone tests in the N.C. band estimated
264 Soils and Rocks, São Paulo, 37(3): 257-276, September-December, 2014.
Coutinho & Bello
Table 1 - Time factor in function of percentage of pore pressuredissipation (Houlsby & Teh, 1988).
U (%) Time factor (T*) in relation to the position of the porepressure transducer
Face of the cone (u1) Base of the cone (u2)
20 0.014 0.038
30 0.032 0.078
40 0.063 0.142
50 0.118 0.245
60 0.226 0.439
70 0.463 0.804
80 1.040 1.600
Figure 11 - Results of pore pressure of dissipation tests, including theprocedure to determine t50%, for the CPTU 120, Sub Area C - AE - 2.

from in the Jamiolkowski et al. (1985) proposal. The aver-age ch value from piezocone tests in the O.C. band was4.40 x 10-6 m2/s.
In general, the average ch values varied in the same or-der of magnitude in both the oedometer (1.15 x 10⁻⁷ m2/s)and piezocone tests (6.16 x 10⁻⁷ m2/s), considering ch resultsin the N.C. band. The overall average chnc value was3.65 x 10-7 m2/s.
The variation of ch values relating to the depths of theoedometer and piezocone tests, for the AE-2 study area isshown in Fig. 12b. The average ch value from piezoconetests in the O.C. band was 4.03 x 10⁻⁷ m2/s. The cv values ob-tained in vertical oedometer tests were converted into ch
values according to Eq. 7 (ch = 1.5cv). The average ch valuesvaried from 4.94 x 10⁻⁸ m2/s in the oedometer tests to 4.03 x10⁻⁷ m2/s in the piezocone tests. The overall average ch value
was 1.34 x 10⁻⁷ m2/s. In this study, a wide band of ch valueswas measured from oedometer and piezocone tests.
Leroueil & Hight (2003) evaluated the coefficient ofconsolidation determined by piezocone testing, in additionto other methods (Fig. 13). The in situ ch values within thenormal consolidation range are typically 10 times higherthan the values deduced from oedometer test results (usingthe Casagrande method). The in situ ch values in the normalconsolidation range are also around two orders of magni-tude less than values in the over-consolidated range, de-duced from in situ observations. The piezocone dissipationtests appear to be somewhere between the field values ob-tained for the over-consolidated and the normally consoli-dated ranges (cv and ch). This figure also shows the rangedetermined for the laboratory and piezocone ch values ofSuape clays. The ranges is situated in the limits shown byLeroueil & Hight (2003).
Soils and Rocks, São Paulo, 37(3): 257-276, September-December, 2014. 265
Geotechnical Characterization of Suape Soft Clays, Brazil
Figure 12 - Coefficient of consolidation values,oedometer and piezocone tests, Suape (Coutinho, 2010; Bello, 2011).

Figure 14 shows results for cv and ch values obtainedfrom oedometer and piezocone tests in the O. C. and N. C.ranges. The ch (OC range) was much higher (three times asmuch) in the piezocone test in Recife and Suape clays.Recife soft clays have slightly higher values.
The coefficient of consolidation values obtained fromoedometer and piezocone tests are complementary. Theoedometer tests are essential for obtaining appropriatecompressibility parameters. Results concerning the coeffi-cients of consolidation obtained in the study areas are satis-
factory and consistent with results obtained in Braziliansoft soils, and with experience reported in international lit-erature.
6. Undrained and Effective Shear Strength
No single undrained shear strength exists. The in situundrained shear strength depends on the failure mode, soilanisotropy, strain rate and stress history (Lunne et al.,1997).
The triaxial compression, triaxial extension and sim-ple shear laboratory tests with consolidation in the isotropicor anisotropic condition for effective field stress conditionshave been used to obtain undrained strength values ingeotechnical engineering studies and projects.
Undrained strength can be determined in the field bymeans of vane and piezocone tests. In order to use in a pro-ject, the strength obtained in a vane test must be correctedby Bjerrum’s correction factor (1973). In the piezoconetest, empirical correlations appropriate for the area understudy based on field and laboratory tests should be used.
In the field vane test, undrained strength (Su) can bedetermined from maximum torque obtained with the vanerotation (Eq. 8).
ST
Du �
0863
. max
�(8)
where: Tmax is the maximum torque measured during thetest; D is the vane diameter.
To estimate the value of Su through the piezocone test,three cone factors are normally used: Nkt, Nke and N�u, loadcapacity, effective tip resistance and pore pressure, respec-tively (Lunne et al., 1997). Undrained shear strength is then
266 Soils and Rocks, São Paulo, 37(3): 257-276, September-December, 2014.
Coutinho & Bello
Figure 13 - Coefficients of consolidation (from Leroueil & High, 2003) and Suape clays results.
Figure 14 - Values for the cv, ch and ch/cv relation vs. log �’vc -Recife and Suape (from Coutinho & Bello, 2008).

defined by Eq. 9. The qt, qe and �u values are determinedfrom the piezocone tests results. The Nkt, Nke and N�u, factorsare based on theoretical work or, more often, on empiricalexperimental correlations using laboratory or in situ tests(Lune et al., 1997).
Sq
N
q u
N
u u
Nu
t v
kt
t
ke u
��
��
���
0 2 2 0
�
(9)
where qt is cone resistance corrected for pore pressure ef-fects; qe is the effective cone resistance; �u is excess porepressure; �vo is total vertical pressure.
6.1. Laboratory - Triaxial UU-C2
The undrained strength profiles obtained in labora-tory triaxial UU-C tests for the studied verticals in SUB-AREAS A and C are presented in Figs. 15 and 16. Themean values of Su obtained in the triaxial tests in SUB-AREA A were 10.8 � 5.4 kPa for the first 2.0 m of depth,followed by around 7.4 � 5.0 kPa to 7.0 m in depth. InSUB-AREA C the mean Su values were 7.8 � 0.6 kPathroughout the profile. Some of the results obtained in thetriaxial UU tests may be influenced by the disturbance ofthe sample (see Coutinho & Bellom, 2012a), so it is impor-tant to compare the results of the triaxial with field vanetests.
Soils and Rocks, São Paulo, 37(3): 257-276, September-December, 2014. 267
Geotechnical Characterization of Suape Soft Clays, Brazil
Figure 15 - Results of triaxial and field vane test - SUB-AREA A, study area AE-2 - Suape (Coutinho & Bello, 2012b).
Figure 16 - Results of triaxial and field vane test - SUB-AREA C, study area AE-2 - Suape (Coutinho & Bello, 2012b).

6.2. Vane tests
The undrained strength profiles obtained in the fieldvane tests for the studied verticals are presented in Figs. 15and 16. The Suvane results in the verticals of the SUB-AREAA showed a similar trend in behavior, with a mean Suvane
value of 7.5 � 1.5 kPa to a depth of 2.0 m, and with meanvalues 11.8 � 1.1 kPa at a depth of 7.0 m. The E110 verticalpresented a high Suvane value at a depth of 4.0 m, possibly dueto the presence of roots in the soil. Sensitivity had meanvalues of around 5. The Su results determined in SUB-AREA C presented mean Su values of 15.8 � 3.6 kPa up to2.5 m in depth, starting from this point, the Suvane values in-crease linearly reaching 21.0 kPa at 7.0 m. In general the St
presented mean values in the 5-10 range.The mean Su values obtained from the field vane test
were generally greater than the Su laboratory values. Theseresults are similar to those obtained in Recife soft clays(Coutinho, 2007), but in the Suape study the laboratory re-sults are more influenced by the sample quality.
The values of the ratio Suvane/�’vo vs. PI for soils in theareas AE-1 and AE-2 (SUB-AREAS A and C) are pre-sented in Fig. 17. The area AE-1 was divided in twostretches of mangrove deposits.
The two deposits of AE-2 (SUB-AREAS A and C) re-vealed layers with a similar value range as Suvane/�’vo, situ-ated above the curve proposed by Bjerrum (1973) foryoung clays and around the curve of old clays. The range ofthe mean Suvane/�’vo values found in the AE-2 study area was0.45-0.68, much greater than the Recife values (Coutinho etal., 2000). The PI values obtained in the area under studywere also much greater than the PI values obtained inRecife.
The mangrove 1 deposit (AE-1) presented values ofSuvane/�’vo situated above the curve proposed by Bjerrum(1973) for young clays, while the mangrove 2 deposit
(AE-1) had values of Suvane/�’vo slightly below the curve foryoung clays.
Figure 18 shows the ratio Suvane/�’vm vs. PI proposed byMesri (1975), Coutinho et al. (2000) modified fromSkempton (1957), Larsson (1980) and Mayne & Mitchell(1988), together with the mean values of various Brazilianclays, including Recife and Suape AE-2 (SUB-AREAS Aand C). For Recife and Suape clays, the points fall betweenthe Larsson (1980) and Mesri (1975) correlations, formingupper and lower limits, respectively. The proposal fromCoutinho et al. (2000) represents satisfactorily clays fromRecife, Juturnaíba-RJ, Sarapuí, RJ and for Suape, PE in-cluding organic clay from Recife-PE. The �’vm value of thepoor quality samples was corrected (see Coutinho & Bello,2012b; Bello, 2011).
In order to draw up embankment projects it is neces-sary to use a correction factor according to Bjerrum’s pro-posal (1973). Considering that the plasticity index results inSuape clays were generally high (values up to 150%), thecorrection factor soils have a value of about 0.6.
6.3. Piezocone tests
To estimate Su values using the piezocone test, threeexperimental parameters were adopted, Nku, Nke and N�u. Thevalue of the experimental parameters was determined bythe Su values from field vane tests.
Figure 19 shows the Nkt variation of SUB-AREAS Aand C. In general, it is observed that Nkt varied between 6and 14 in SUB-AREA A, with a mean value of 10. InSUB-AREA C, Nkt varied between 5 and 16, with a meanvalue of 9. These results show that the two sub-areas havesimilar Nkt variation ranges with a mean value between 9and 10. Figure 20 presents the mean value of Nkt (12 �1.0)obtained from Suvane for the Recife research sites. From theseresults, Su for Recife soft clay can be estimated with reason-able confidence for practical purposes (Coutinho et al.,
268 Soils and Rocks, São Paulo, 37(3): 257-276, September-December, 2014.
Coutinho & Bello
Figure 17 - Resistance ratio-Suape, study areas AE-1 and AE-2 - Suvanea/�’vo and PI (Bello, 2011).

2000). These mean values are about 20-25% greater thanthe Nkt results obtained in Suape.
Almeida et al. (2010) found a wide range of Nkt meanvalues (3-20) for deposits of very soft soils in Rio de Ja-neiro. Schnaid (2009) found Nkt values representative ofsoft clay deposits in Porto Alegre varying between 8 and16, with a mean value of 11. In general, it can be observedthat mean values of Brazilian clays vary around 9 to 12(Coutinho & Schnaid 2010).
According to Lunne et al. (1997) Nkt values tend to in-crease with an increase in plasticity, decrease with an in-crease in sensitivity and decrease as Bq increases. Brazilianclay results confirm that it is recommended to evaluate ineach deposit or at least local experience to obtain represen-tative Nkt values.
The variation range of N�u values obtained in theSuape studies areas was between 6.5 and 10.0, with mean
Soils and Rocks, São Paulo, 37(3): 257-276, September-December, 2014. 269
Geotechnical Characterization of Suape Soft Clays, Brazil
Figure 18 - Resistance ratio-Suape, study area AE-2 - (b) Suvane/�’vm and IP (Bello, 2011).
Figure 19 - Nkt values obtained from field vane test: Suape claysstudy area AE-2 (SUB-AREA A and C).
Figure 20 - Nkt values - field vane test (a) International Club; (b) SESI-Ibura (Oliveira, 2000; Coutinho, et al., 2000).

values around 8.0. In general, N�u increases linearly withdepth (Bello, 2011; Bello & Coutinho, 2012). In Recife andSuape clays, N�u values varied between 7.5 and 11.0 withmean values around 9.5 (Coutinho, 2007, 2008; Coutinho& Schnaid, 2010). La Rochelle et al. (1988) obtained forthree Canadian clays N�u values between 7 and 9, using asreference Su values from field vane tests, where the over-consolidation ratio values varied between 1.2 and 50. Thevariation range of the Nke factor values obtained in theSuape study areas was between 4.0 and 9.0 with mean val-ues around 5.0. In general, Nke increases linearly with depth(Bello, 2011; Bello & Coutinho, 2012).
Figures 21a and b show the undrained strength pro-files of the verticals E102 (SUB-AREA A) and E128(SUB-AREA C), obtained through the piezocone usingmean valves of the experimental parameters and field vanetests. The Su values derived from Nkt showed agreementswith Su values obtained from the vane tests. The Su valuesderived from N�u showed a greater difference in relation toSu vane values, because of the difficulty of an accurate �umeasurement, including pore pressure negative values. TheSu values deriving from Nke, showed the highest degree ofdispersion, which can be explained by the small effectivetip resistance value, qe, that was the basis for calculating Nke.
6.4. Effective shear strength
The effective shear strength envelope is usually deter-mined by laboratory testing, such as, for example, the
triaxial drained compression or excursion test (or un-drained with pore pressure measurements). The effectivefriction angle ( ’) can be estimated by in situ testing, suchas the piezocone, or by statistical correlation with plasticityindex (PI) proposed by Bjerrum & Simons (1960). Figure22a shows this statistical correlation with results from fiveBrazilian clays, including Recife soft clays. Figure 22bgives the results of ’ from Suape clays (AE-1 and AE-2)obtained by triaxial CIU-C test. There is dispersion in theresults but it is possible to see that the Bjerrum & Simons(1960) proposal is also satisfactory for a preliminary esti-mation of ’ for Suape soft clays. A specific Suape clay sta-tistical correlation is also shown in Fig. 22b.
7. Overconsolidation Ratio
The stress history of the soil can be indicated for theprofiles of effective field stress (�’vo), preconsolidationstress (�’vm) and the overconsolidation ratio (OCR). It con-stitutes an indispensable factor for the analysis of behaviorof clay deposits. Traditionally obtained in oedometer tests,OCR can be estimated from field vane (Chandler, 1988)and piezocone tests (Lunne et al., 1997).
Critical-state soil mechanics, as well as theSHANSEP method showed that normalized undrainedstrength (Su/�’vo) increases with an increase in OCR(Eq. 10).
270 Soils and Rocks, São Paulo, 37(3): 257-276, September-December, 2014.
Coutinho & Bello
Figure 21 - Suape clays: Su profile - piezocone and field vane tests. (a) E102 (SUB-AREA A); (b) E128 (SUB-AREA C).

S Su
v
u
v
m
�
�
���
�
��� �
�
�
���
�
���� �0 0O. C. N. C.
OCR( ) (10)
where N.C. and O.C. is the normally consolidated andoverconsolidated range, respectively.
Chandler (1988) collected data from vane tests of 19clay deposits, enclosed normally consolidated and over-consolidated clays with OCR up to 7.5, obtaining m valueequal to 0.95 (Eq. 11).
OCR O. C.
N. C.
��
�
���
�
���
�
�
���
�
���
�
�
�����
�
�
�S
S
u
v
u
v
�
�
0
0
����
1
0 95.
(11)
Tavenas & Leroueil (1987) gathered the data used forAAS et al. (1986) and Chandler (1988) and plotted them us-ing Bjerrum’s curve (1973) as reference. The authors foundthe m value equal to 1 (with small dispersions) (Eq. 12).
OCR O. C.
O. C.
��
�
���
�
���
�
�
���
�
���
S
S
uvane
v
u
v
�
�
0
0
(12)
Mayne & Mitchell (1988) developed a database withresults of field vane and oedometer tests including indexproperties of 96 different clays, in order to define a generalcorrelation that could be used to estimate OCR values fromfield vane tests (Eq. 13). The deposits showed: 1 < OCR <40; 3% < PI < 300%; 1.6 kPa < Suvane < 380 kPa and sensi-tivity varying from 2 up to high values.
OCR ��
�
���
�
���
�22 0 48
0
( ) .IPS uvane
v�(13)
Lunne et al. (1997) stated that methods to derive OCRfrom piezocone tests data fall into three main categories: (a)methods based on undrained shear strength; (b) methodsbased on the shape of the CPTU profile; and (c) methodsbased directly on piezocone tests data.
OCR values can be obtained from CPTU resultsthrough correlations in functions of Qt, where Qt = (qT - �vo)/�’vo and �u/�’vo (Eqs. 14 to 17).
OCR (Lunne ., 1989)� f Q et alt( ) (14)
OCR (Kulhawy & Mayneunne, 1990)� 032. ( )Qt (15)
OCR (Sully ., 1988)� ��
0 49 15 1 2
0
. .u u
uet al (16)
OCR (Lunne ., 1989)��
�
���
�
���f
uet al
v
� 1
0�(17)
7.1. Oedometer tests
Figure 23 shows the OCR profiles of SUB-AREAS Aand C obtained from conventional oedometer tests. In gen-eral, OCRoed. values were greater than 1.0 up to 2.0 m indepth and a tendency towards the unit value with depth isobserved. Poor quality samples had their OCRoed values cor-rected (see Coutinho & Bello, 2012b; Bello, 2011).
7.2. Vane tests
To estimate the OCR value using the field vane testsperformed in the two study areas (AE-1 and AE-2), Chan-dler (1988), Tavenas & Leroueil (1987) and Mayne &Mitchell (1988) proposals were used. Figure 23a presentsthe results obtained for the OCR profile of SUB-AREA A,including oedometer tests. The OCR results well differenti-
Soils and Rocks, São Paulo, 37(3): 257-276, September-December, 2014. 271
Geotechnical Characterization of Suape Soft Clays, Brazil
Figure 22 - Relation ’ vs. PI: (a) Brazilian Clays; (b) Area AE-1 (Bello, 2011).

ated along the depths but with similar trends in behavior areobserved.
Figure 24 shows OCR results determined through thethree proposals compared to OCR results obtained in con-ventional oedometer tests. Mayne & Mitchell (1988) pro-posal is the one that comes closest to the laboratory OCRvalues for the Suape study areas, always presenting greatervalues, as was the case with Recife clays (Coutinho et al.,2000; Coutinho, 2008). Mayne & Mitchell (1988) proposalis being adapted for Suape clays (Eq. 11), considering bothSub-Areas A and C.
OCR OCRlab vane� 065. (18)
Figure 24b shows the OCR profile obtained in a labo-ratory and OCR estimated by the Mayne & Mitchell (1988)proposal adapted for Suape clays (Eq. 11). A good correla-tion can be seen between OCRvane and OCRlab values in good
quality samples. These correlations can be useful when nogood quality samples are available and to provide comple-mentary results in an investigation.
7.3. Piezocone tests
The OCR values were estimated through the CPTUtest using proposals from: Lunne et al. (1989) and Kulhawy& Mayne (1990). Results of Recife soft clays are also pre-sented (Coutinho, 2007). Figure 25a shows OCR profilesobtained by the three proposals, together with the OCR re-sults obtained through the oedometer test for SUB-AREASA and C. It can be seen that the correlations of Lunne et al.(1989) and Kulhawy & Mayne (1990) show higherOCRCPTU values than the OCRlab but with similar behaviortrends.
Coutinho (2007, 2008) showed OCR profile resultsfrom Recife soft clays obtained using oedometer tests and
272 Soils and Rocks, São Paulo, 37(3): 257-276, September-December, 2014.
Coutinho & Bello
Figure 23 - (a) OCRoed. vs. OCRvane; (b) OCRoed. vs. OCR from Mayne and Mitchell proposal (1988) for Suape.
Figure 24 - Comparison between OCRlab vs. OCRvane, AE-2: (a) SUB-AREA A; (b) SUB-AREA C.
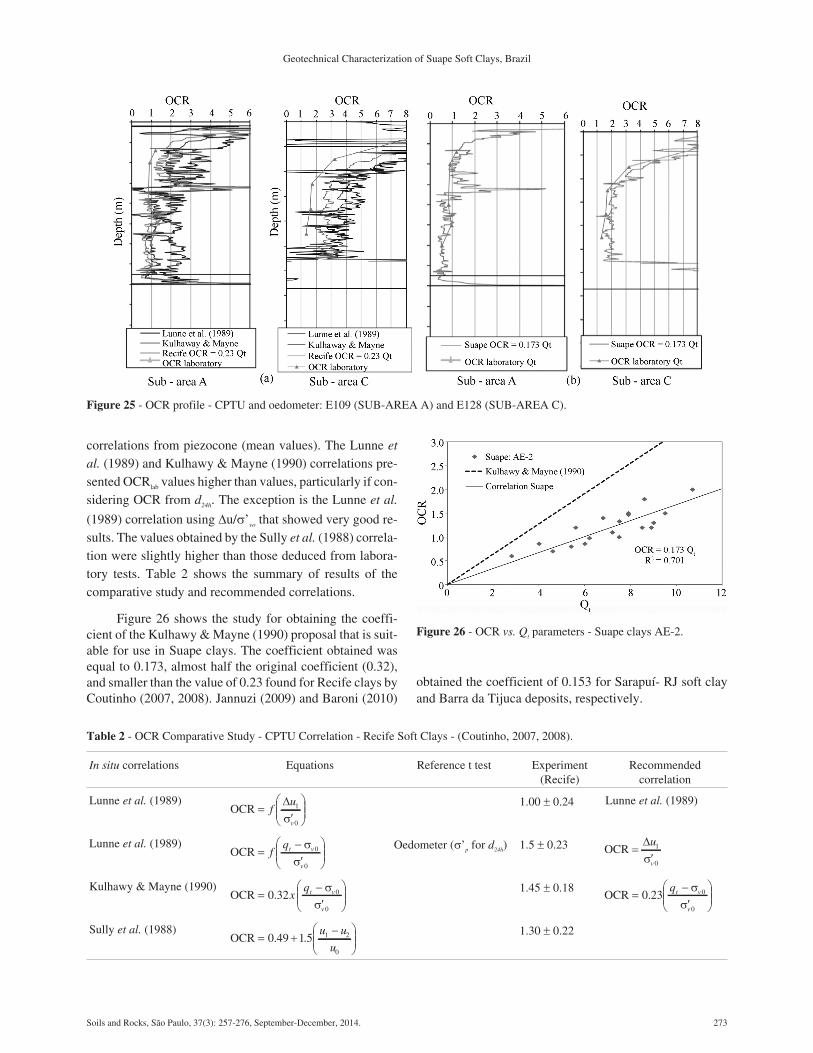
correlations from piezocone (mean values). The Lunne etal. (1989) and Kulhawy & Mayne (1990) correlations pre-sented OCRlab values higher than values, particularly if con-sidering OCR from d24h. The exception is the Lunne et al.
(1989) correlation using �u/�’vo that showed very good re-sults. The values obtained by the Sully et al. (1988) correla-tion were slightly higher than those deduced from labora-tory tests. Table 2 shows the summary of results of thecomparative study and recommended correlations.
Figure 26 shows the study for obtaining the coeffi-cient of the Kulhawy & Mayne (1990) proposal that is suit-able for use in Suape clays. The coefficient obtained wasequal to 0.173, almost half the original coefficient (0.32),and smaller than the value of 0.23 found for Recife clays byCoutinho (2007, 2008). Jannuzi (2009) and Baroni (2010)
obtained the coefficient of 0.153 for Sarapuí- RJ soft clayand Barra da Tijuca deposits, respectively.
Soils and Rocks, São Paulo, 37(3): 257-276, September-December, 2014. 273
Geotechnical Characterization of Suape Soft Clays, Brazil
Figure 25 - OCR profile - CPTU and oedometer: E109 (SUB-AREA A) and E128 (SUB-AREA C).
Table 2 - OCR Comparative Study - CPTU Correlation - Recife Soft Clays - (Coutinho, 2007, 2008).
In situ correlations Equations Reference t test Experiment(Recife)
Recommendedcorrelation
Lunne et al. (1989)OCR �
�
�
���
�
���f
u
v
� 1
0�1.00 � 0.24 Lunne et al. (1989)
Lunne et al. (1989)OCR �
��
�
���
�
���f
qt v
v
�
�0
0
Oedometer (�’p for d24h) 1.5 � 0.23 OCR ��
�u
v
1
0�
Kulhawy & Mayne (1990)OCR �
��
�
���
�
���0 32 0
0
. xqt v
v
�
�1.45 � 0.18
OCR ���
�
���
�
���0 23 0
0
.qt v
v
�
�
Sully et al. (1988)OCR � �
��
���
�
���0 49 1 5 1 2
0
. .u u
u
1.30 � 0.22
Figure 26 - OCR vs. Qt parameters - Suape clays AE-2.

Figure 25b shows the OCR profile obtained in thelaboratory and OCR estimated from the Kulhawy & Mayne(1990) proposal adapted for Suape clays (OCR = 0.173Qt).A good correlation between OCRCPTU values and OCRlab val-ues in good quality samples is observed for Suape Clays.This correlation can be useful when there are no good qual-ity samples available, and for further research.
8. ConclusionsThis paper has provided results of a geotechnical site
characterization from laboratory and in situ tests performedin an important investigation of soft clays in two areaswithin the Suape Port and Industrial Complex, Brazil.
Soil classification results from the Robertson (1990)and Schneider et al. (2008) charts generally agreed with thegrain-size distribution and NSPT values. Considering theBrazilian experiment and results obtained from the studyareas, the Robertson (1990) proposal confirmed its effi-ciency for soil classification from piezocone tests. TheSchneider et al. (2008) proposal was adequate for use inSuape soils; however, it would seem appropriate to carryout further studies elsewhere in Brazil.
Compressibility parameters are discussed, includingthe development of a statistical correlation Cc = 0.0097 vs.w (%) - approximately Cc 0.01 w (%). It is also very im-portant to determine the water content in each SPT test.
The horizontal coefficient of consolidation valueswith depths from the oedometer and piezocone tests for thestudy areas revealed a wide range of variations consideringthe O.C. and N.C. ranges. The ch values in the N.C. rangeobtained from piezocone tests were higher (around 10 ti-mes more) than the ch values obtained from oedometertests. These results are in agreement with results fromRecife soft clays, along with other soils reported in the liter-ature.
This study confirmed the potential of piezocone testsfor use in obtaining adequate predictions for geotechnicalclassification/consolidation parameters in soft soil depos-its.
The values of the ratio Suvane/�’vo vs. PI for Suape claysin general fell between the curves for young and old claysproposed by Bjerrum (1973). For Recife and Suape clays,and other Brazilians clays, the points of the ratio Suvane/�’vm
vs. PI fall between the correlations of Larsson (1980) andMesri (1975), with satisfactory prediction by Coutinho(2007) proposal Su/�’vm = 0.11 + 0.0037 PI (modified fromSkempton, 1957). It is possible to make a satisfactory pre-diction of Su from CPTU using proposals in the literature(Nkt, N�u and Nke). In Suape, satisfactory Su results were ob-tained considering Nkt of 9-10, in general, with Brazilianclays in the range (9-12), including Recife.
The Mayne & Mitchell (1988) proposal for obtainOCRvane adapted for Suape clays (OCRlab = 0.65.OCRvane)presented values with a good correlation with the OCRlab
values in good quality samples. Kulhawy & Mayne’s
(1990) proposal to obtain OCR from CPTU adapted toSuape clays (OCR= 0.173Qt) provided OCRCPTU values witha good correlation with OCRlab values. The corrected coeffi-cient (0.173) was almost half the original coefficient (0.32),and it was smaller than the value found for Recife clays(0.23) and similar for Rio de Janeiro clay (0.153).
This study confirms that parameters can be obtainedthrough in situ tests with correlations suited to local/re-gional experiment; and it is also important to have a jointlaboratory and in situ test program. This prediction is fun-damental for a proper geotechnical site characterization inresearch and engineering projects.
Acknowledgments
The authors acknowledge support from specific re-search projects PRONEX (CNPq/FACEPE); and INCT-REAGEO (CNPq); CNPq for the financial support (fellow-ship) in research involving the authors; and Gusmão Engi-neers Associated for the partnership.
References
Aas, G.; Lacasse, S.; Lunne T. & Hoeg, K. (1986) Use of insitu tests for foundation design on clay. 6th Conf. on Useof In Situ Tests in Geotechnical Engineering, ASCESpecial Publication, p. 1-30.
Almeida. M.S.S., M.E.S. Marques. & M. Baroni (2010)Geotechnical parameters of very soft clays obtainedwith CPTU compared with other site investigationtools. CPT’10 Conference Proceedings, California,USA.
Almeida, M.S.S., Marques, M.E.S. & Miranda, T.C., Nas-cimento, C.M.C. (2008) Lowland reclamation in urbanareas, Proc. TC 41 International Workshop on UrbanInfrastructure, Búzios, Brazil.
Baligh, M.M. (1986) Undrained deep penetration II: Porepressure. Geotechnique, v. 36:4, p. 486-501.
Baligh, M.M. & Lavadoux, J.N. (1986) Consolidation afterundrained piezocone penetration II: Interpretation.Journal of Geotechnical Engineering, ASCE, v. 112:7,p. 727-45.
Baroni, M. (2010) Investigação Geotécnica em ArgilasOrgânicas Muito Compressíveis em Depósitos da Barrada Tijuca. Master’s Dissertation, COPPE, Federal Uni-versity of Rio de Janeiro, 270 p.
Begemann, H.K.S. (1965) The friction jacket cone as an aidin determining the soil profile. Proc.6th InternationalConference on Soil Mechanics and Foundation Engi-neering, ICSMFE, Montreal, v. 2, p. 17-20.
Bello, M.I.M.C.V. & Coutinho, R.Q. (2012) Piezoconetesting for use in the classification of soil behavior andflow characteristics: An experiment carried out in Sua-pe, Pernambuco. Coutinho & Mayne (eds) The 4th Inter-national Conference on Site Characterization ISC’4,ISSMGE, Recife. Brazil, v. 1. p. 405-413.
274 Soils and Rocks, São Paulo, 37(3): 257-276, September-December, 2014.
Coutinho & Bello

Bello, M.I.M.C.V. (2011) Parâmetros Geotécnicos e Bancode Dados de Argilas Moles: o Caso de Suape. D.Sc.Thesis. Federal University of Pernambuco, 320 p.
Bjerrum, L. (1973) Problems of soil mechanics and con-struction of soft clays and structurally unstable soils.Proceedings of the 8th International Conference on SoilMechanics and Foundation Engineering, Moscow, v. 2,p. 111-159.
Bjerrum, L. & Simons, N.E. (1960) Comparison of shearstrength characteristics of normally consolidated clays.ASCE, Conference on Shear Strength of CohesiveSoils, Boulder, Colorado, p. 711-726.
Chandler R.J. (1988) The In Situ Measurements of the Un-drained Shear Strength of Clays Using the Field Vane.ASTM, STP, Nº 1014, p. 13-44.
Coutinho, R.Q. (2010) Investigação Geotécnica área Refi-naria Petrobrás - Suape-PE. Technical Report,GEGEP/UFPE Agreement, Petrobras Refinery Consor-tium, Pernambuco.
Coutinho, R.Q. (2008) Investigação Geotécnica de Campoe Avanços para a Prática. Proc. XIV Congresso Brasi-leiro de Mecânica de Solos e Engenharia Geotécnica,COBRAMSEG’2008, Búzios., v. 1. p. 201-230.
Coutinho, R.Q. (2007) Characterization and EngineeringProperties of Recife Soft Clays - Brazil. Tan, Phoon,Hight and Leroueil (eds) The Second InternationalWorkshop on Characterization e Engineering Prop-erties of Natural Soils, Singapore, p. 2049-2100.
Coutinho, R.Q. (1980) Estudo de Características Geotéc-nicas das Argilas Moles do Recife. Relatório TécnicoProjeto Pesquisador CNPq - DECivil/UFPE, período1978-1980.
Coutinho, R.Q. (1976) Características de Adensamentocom Drenagem Vertical e Radial em Argila Mole naBaixada Fluminense, M.Sc. dissertation,COPPE/UFRJ, 206 p.
Coutinho, R.Q. & Bello, M.I.M.C.V. (2012a) Evaluation ofSample Quality and Correction of Compressibility Pa-rameters Results to account for the Effects of SampleDisturbance - Experiment at Suape in Pernambuco.Coutinho & Mayne (eds) The 4º International Conf. onSite Characterization, ISC’4, ISSMGE, Recife, Brazil,v. 2, p. 1621-1629.
Coutinho, R.Q. & Bello, M.I.M.C.V. (2012b) Undrainedstrength and overconsolidation ratio parameters ofsuape soft clays, Pernambuco. Coutinho & Mayne (eds)The 4th International Conference on Site Characteriza-tion, ISC’4, ISSMGE, Recife, Brazil, v. 2. p. 1631-1639.
Coutinho, R.Q. & Schnaid, F. (2010) CPT - Regional Re-port for South America. CPT10 Conf. Proc., California,USA. v. 1, p. 313-333.
Coutinho, R.Q.; Bello, M.I.M.C.V. & Soares, F.L. (2008)Geotechnical investigation of the Recife soft clays bypiezocone test. Proc. ISC’3, Taipei, v. 1.p. 311-319.
Coutinho, R.Q. & Bello, M.I.M.C.V. (2008) Caracteriza-ção geotécnica do solo mole do acesso à Ilha de Tatuoca- Porto de Suape/PE. Proc. XIV COBRAMSEG’2008,ABMS, Búzios, Brazil, v. 2, p. 265-269.
Coutinho, R.Q., Oliveira, A.T.J. & Oliveira, J.T.R. (2000)Conferência Palheta: Experiência, Tradição e Inovação.Seminar on Special Foundation Engineering and Geo-technics. SEFE IV, São Paulo, Brazil, v. 3, p. 53-79.
Coutinho. R.Q.; Oliveira, J.T.R. & Oliveira, A.T.J. (1998)Estudo quantitativo da qualidade de amostras de argilasmoles brasileiras - Recife e Rio de Janeiro. Proc. XIBrazilian Congresso on Soil Mechanics and Geotech-nical Engineering, COBRAMSEG, ABMS, Brasília,v. 2. p. 927-936.
Coutinho, R.Q., Oliveira, J.T.R & Danziger, F.A.B. (1993)Geotechnical characterization of a Recife soft clay.Soils and Rocks, v. 16:4, p. 255-266.
Coutinho, R.Q. & Lacerda, W.A. (1987) Characterization -consolidation of Juturnaíba organic clays. Proc. Inter-national Symposium on Geotechnical Engineering ofSoft Soils, v. 1, p. 17-24, Mexico. Published also inSoils and Rocks, v. 17:2, p. 145-154 (1994).
Djoenaidi, W.J. (1985) A Compendium of Soils Propertiesand Correlations. Master’s Thesis, University of Syd-ney, Australia.
Fellenius, B.H. & Eslami, A. (2000) Soil Profile Interpretedfrom CPTu Data. Year 2000 Geotechnics. GeotechnicalEngineering Conference, Asian Institute of Technol-ogy, Bangkok, Thailand, 18 p.
Ferreira, S.R.M. (1982) Compressibilidade de uma ArgilaOrgânica Mole do Recife. Dissertação de M.Sc., Enge-nharia Civil, COPPE/UFRJ, Rio de Janeiro.
Futai, M.M (2010) Theoretical and Practical Concepts onBehavior Analysis of some Rio de Janeiro Clays. D.Sc.Seminar, COPPE/UFRJ, Rio de Janeiro, 133 p.
Houlsby, G.T. & Teh, C.I. (1988) Analysis of the piezo-cone in clay. Proc. International Symposium on Pene-tration Testing, ISOPT-1, Orlando, USA, p. 777-783.
Jannuzi, G.M.F. (2009) Characterization of the Sarapuí IISoft Soil Deposit Through Field Tests. Master’s Disser-tation, COPPE/UFPE, Rio de Janeiro, Brazil.
Jamiolkowski M., Ladd, C., Germaine & J. T., Lancellota,R. (1985) New developments in field and laboratorytesting of soils. Proc. 11th ICSMFE, San Francisco,USA, v. 1, p. 57-153.
Jefferies, M.G. & Davies, M.P. (1993) Use of CPTu to esti-mate equivalent SPT N60. American Society for Tes-ting and Materials, ASTM, Geotechnical TestingJournal, v. 16:4, p. 458-468.
Koppula, S.D. (1981) Statistical estimation of compressionindex. Geotechnical Testing Journal, v. 4:2, p. 68-73.
Kulhawy, F.H., Mayne & P.W. (1990) Manual on estimat-ing soil properties for foundation design. Electric Po-wer Research Institute, EPRI, August, 1990.
Soils and Rocks, São Paulo, 37(3): 257-276, September-December, 2014. 275
Geotechnical Characterization of Suape Soft Clays, Brazil

La Rochelle, P.; Tavena, F. & Leroueil, S. (1988) Clays ofEastern Canada and their contribution to understandingclay behaviour. Canadian Geotechnical Journal,v. 25:3, p. 413-427.
Larsson R. (1980) Undrained shear strength in stability cal-culation of embankments and foundations on soft clays.Canadian Geotechnical Journal, v. 17:4, p. 591-602.
Leroueil, S. & Hight, D.W. (2003) Characterization of soilsfor engineering. Characterization and engineering prop-erties of natural soils. Tan, T.S.; Phon, K.K.; Hight,D.W. & Leroueil, S. (eds) Singapore, v. 1, p. 255-236.
Long, M. (2008) Design parameters from in situ tests in softground - recent developments. Proc. 3rd InternationalConference on Geotechnical and Geophysical SiteCharacterization, ISC’3, Taipei, v.1, p. 89-116.
Lunne, T., Robertson, P.K. & Powell, J.J.M. (1997) ConePenetration Testing in Geotechnical Practice. BlackieAcademic & Professional, 312 p.
Lunne, T., Lacasse, S & Rad, N.S. (1989) Pressuremetertesting and recent developments - Part I: All tests exceptSPT. General Report, 12 ICSMGE, v. 4, p. 2339-2403.
Mayne, P.W. (2007) Synthesis 368 on Cone PenetrationTesting: State-of-Practice, NCHRP Project 20-05; Task37-14, Transportation Research Board, National Acad-emies Press, Washington, D.C., 118 p.
Mayne, P.W. & Mitchell, J.K (1988) Profiling of over-consolidation ratio in clays by field vane. CanadianGeotechnical Journal, v. 25, p. 150-157.
Mesri G. (1975) New design procedure for stability of softclays. Discussion. Journal of Geotechnical EngineeringDivision, ASCE, v. 101:GT4, p. 409-412.
Mesri, G. & Choi, Y.K. (1985) Settlement analysis of em-bankment on soft clays. Journal of Geotechnical Engi-neering Division, ASCE, JUDGE, v. 111:4, p. 441-464.
Mollé, J. (2005) The accuracy of the interpretation ofCPT-based soil classification methods for soft soils.MSc Thesis. Section for Engineering Geology, Depart-ment of Applied Earth Sciences, Delft University ofTechnology. Memoirs of the Centre of Engineering Ge-ology in the Netherlands, No. 242. Report AES/IG/05-25.
Oliveira J.T.R. (2002) Influência da Qualidade da Amos-tragem no Comportamento Tensão-Deformação-Tem-po das Argilas Moles. Doctorate Thesis, COPPE/UFRJ- DEC-UFPE .
Ramsey, N. (2002) A calibrated model for the interpreta-tion of cone penetration tests (CPTs) in North Sea Qua-ternary Soils. Offshore Site Investigation andGeotechnics - Diversity and Sustainability, Society forUnderwater Technology, London, p. 341-356.
Robertson, P.K. (2010) Evaluation of flow liquefaction andliquefied strength using the Cone Penetration Test.American Society of Civil Engineers, ASCE, Journal ofGeotechnical & Geoenvironmental Engineering,v. 136:6, p. 842-853.
Robertson, P.K. (1990) Soil Classification by the cone pen-etration test: Replay. Canadian Geotechnical Journal,v. 27:1, p. 151-158.
Robertson, P.K., Campanella, R.G., Gillespie, D. & Grieg,J. (1986) Use of piezometer cone data. Proc. AmericanSociety of Civil Engineers, ASCE, In-Situ 86 SpecialtyConference. Geotechnical Special Publication GSP No.6, p. 1263-1280.
Robertson, P.K. & Campanella, R.G. (1983) Interpretationof cone penetrometer tests, Part I sand. Canadian Geo-technical Journal, v. 20:4, p. 718-733.
Robertson, P.K., Sully, J.P., Woelle, D.J., Lunne, T., Po-well, J.J.M. & Gillespie, D.G. (1992) Estimating coeffi-cient on consolidation from piezocone tests. CanadianGeotechnical Journal, v. 29, p. 539-550.
Schmertmann, J.H. (1955) The undisturbed consolidationbehavior of clay. Transactions, ASCE, v. 120, p. 1201-1233.
Schmertmann, J.H., Hartmann, J.P. & Brown, P.R. (1978)Improved strain influence factor diagrams. ASCE Jour-nal of the Geotechnical Engineering Division,v. 104:GT8, p. 1131-1135.
Schnaid, F. (2009) In situ Testing in Geomechanics. Taylorand Francis, Oxon.
Schnaid, F. (2000) Ensaios de Campo e suas Aplicações àEngenharia de Fundações. 1st ed. Oficina de Textos,São Paulo, 189 p.
Schneider, J.A., Randolph, M.F., Mayne, P.W. & Ramsey,N.R (2008) Analysis of factors influencing soil classifi-cation using normalized piezocone tip resistance andpore pressure parameters. Journal of Geotechnical andGeoenvironmental Engineering, ASCE, v.134:11,p. 1569-1586.
Skempton, A.W. (1957) Discussion: The Planning and De-sign of the New Hong Kong Airport, by K. Grace andJ.K.M. Henry. Institution of Civil Engineers, v. 7,p. 305-307.
Sully, J.P.; Campanella, R.G. & Robertson, P.K. (1988) In-terpretation of penetration pore pressure to evaluatestress history in clays. Proc. ISOPOT-1, Florida, v. 2,p. 993-999.
Tavenas, F. & Leroueil, S. (1987) State-of-the-Art report:Laboratory and in situ stress strain-time behaviour ofsoft clays. International Symposium on GeotechnicalEngineering of Soft Soils, Mexico City, v. 2, p. 3-48.
276 Soils and Rocks, São Paulo, 37(3): 257-276, September-December, 2014.
Coutinho & Bello

On the Characterization and Classification of Bauxite Tailings
F. Schnaid, H.P. Nierwinski, J. Bedin, E. Odebrecht
Abstract. Large-scale mining operations generate vast quantities of tailings that are deposited in hydraulic-fill tailingdams in the form of slurries. Stability of these impoundments require investigation of water table configuration, aquiferboundaries, site characterization and determination of short and long term properties of tailings. These aspects areevaluated in this paper from a comprehensive site investigation that comprises both laboratory and field tests from abauxite tailing deposit in northern Brazil. The purpose is to enhance the understanding on the mechanical properties ofbauxite tailings in order to select or develop appropriate constitutive models for predicting the behavior of tailingsimpoundments. Attention is given to the characterization and classification of silt tailings from the combination ofmeasurements from independent tests expressed on the basis of the ratio of the elastic stiffness to penetration tip resistance.Keywords: bauxite tailings, critical state, piezocone, liquefaction.
1. Introduction
Many countries with large mining industry operationsare active in implementing effective environmental legisla-tion to ensure sustainable development with minimum eco-system degradation. Tailing storage facilities is one subjectof major concern, given the potential environmental impactin discharge areas. The most popular type of embankmentfor tailings dams is the upstream construction where newparts of the embankment are built on top of the slurries im-pounded during the previous stage (i.e. the dam crest moves“upstream” during construction). Although this is a lowcost process, the upstream embankment type is a high riskoperation, particularly because (a) upstream dams are par-ticularly susceptible to liquefaction under seismic groundmotion and (b) dam stability is endangered if the raisingrate of the dam is high due to excess pore pressure builtwithin the deposit during construction. Since tailings havedifferent properties compared to natural materials and theway of testing tailings material need to be calibrated forthese differences, there is a need for field and laboratorystudies of physico-mechanical characteristics of tailingdam deposits.
Recent research projects in Brazil comprise compre-hensive in situ (CPTU, DMT, Vane) and laboratory charac-terization (triaxial and oedometer) in active iron ore, gold,bauxite and zinc residue storages. This includes a decade ofconsecutive site investigation research all over Brazil, pro-viding an opportunity to examine the state of tailings fromthe beginning of operations to closure (e.g. Schnaid, 2005;Bedin et al., 2008; 2012; Schnaid et al., 2013). This paperexplores some features of this study with focus on funda-
mental aspects of behavior, as well as the characterizationand classification of bauxite tailings in storage facilities.
2. Laboratory Testing Program
An extensive laboratory testing program has beencarried out to study the geotechnical properties and behav-ior of gold, bauxite and zinc (e.g. Bedin et al., 2012;Schnaid et al., 2013). Some characteristic features are com-mon to all silty tailings and are highlighted here from testscarried out on bauxite. Characterization comprises identifi-cation of minerals, grain size distribution and microscopy(Table 1). The material disposed in ponds is predominantlylow to non-plastic, silty clay (typically 80% silt, 15% clayand 5% sand) with an average unit weight of 16 kN/m3 andhigh specific gravity (2.70 < G < 3.00) reflecting the highiron content of the tailings. Microscopy reveals well-rounded as well as angular grains, forming loosely arrangedstructure that due to angularity may result in relatively highdrained shear strength.
Undisturbed samples in silts are typically too difficultor costly to obtain and, for this reason, reconstituted sam-ples need to be prepared for laboratory testing. Disturbedsamples were retrieved using a bucket type of samplerwhich allows samples to be extracted without losing water.The moist tamping method has been used to reconstitutespecimens at their average in situ density. Samples wereprepared by mixing the soil with small amount of water andcompacting the mixture in a mold, in layers prepared ofequal volume lifts to produce homogeneous mixtures (e.g.Lade, 1978). The mixture is partially saturated when placedand the inter-particle suction is utilized to allow high voidsratio to be achieved.
Soils and Rocks, São Paulo, 37(3): 277-284, September-December, 2014. 277
F. Schnaid, Ph.D., Full Professor, Departamento de Engenharia Civil, Universidade Federal do Rio Grande do Sul, Porto Alegre, RS, Brazil. e-mail: [email protected]. Nierwinski, MSc. Student, Programa de Pós Graduação em Engenharia Civil, Universidade Federal do Rio Grande do Sul, Porto Alegre, RS, Brazil. e-mail:[email protected]. Bedin, D.Sc. Student, Programa de Pós Graduação em Engenharia Civil, Universidade Federal do Rio Grande do Sul, Porto Alegre, RS, Brazil. e-mail:[email protected]. Odebrecht, D.Sc., Associate Professor, Departamento de Engenharia Civil, Universidade do Estado de Santa Catarina, Joinville, SC, Brazil. e-mail:[email protected] on June 19, 2014; Final Acceptance on December 15, 2014; Discussion open until April 30, 2015.

One dimensional compression and hydraulic conduc-tivity tests have been carried out in specimens reconstitutedat different void ratios, ranging from 2.6 to 1.4, which cov-ers the maximum and minimum determined in situ values.The vertical effective stress-void ratio relationship pre-sented in Fig. 1 gives a description of the soil compressibil-ity. The vertical stresses were not sufficiently high to iden-tify the normal compression line (NCL), and an attempt tofit a straight line to points measured at high stresses give aslope � equal to 0.093 to an initial void ratio of 1.7. The hy-draulic conductivity has been determined by constant headtests carried out in the oedometer cells at different verticalstresses. An average value of 2 x 10⁻⁸ m/s was taken as rep-resentative.
Undrained triaxial tests were performed to evaluatethe stress-strain-pore pressure response of bauxite tailings.Saturation of soil specimens was accomplished by applica-tion of a back pressure of around 500 kPa to produce B val-
ues higher than 95%. All reported test specimens wereisotropically consolidated from a single initial void ratio totheir desired consolidation pressure before shearing at0.1 mm/min under undrained conditions. Results on satu-rated samples are presented in Fig. 2, in which deviatoricstress (�1 - �3) and pore pressures are plotted against axialstrains. Tests generate considerable excess pore pressureand gentle strain softening. Fifteen percent maximum axialstrain was sufficient to establish critical state conditions inthese undrained tests, as shown in Fig. 2 using the Cam-bridge (p‘ - q) and (e - ln p‘) planes. The isotropic andoedometric compression lines are presented in the same di-agram for reference. Results show the idealized behavior ofa unique critical state line (CSL) described by parallel ICLand CSL (despite the fact that NCL and ICL do not producea match) The shear strength properties were zero cohesionand effective angle of internal friction angle typically of36°, and the state parameter of the order of 0.08.
3. Field characterization
Field tests are the preferable alternative to assess tail-ing properties and hydrogeologic conditions within the im-poundment. In situ water content, unit weight and specificgravity in this bauxite tailings are shown in Fig. 3. Typicalprofiles from a series of SCPTU are shown in Fig. 4. Mea-sured cone resistance qt, sleeve friction fs and pore pressureu2 are plotted against depth revealing a relatively homoge-neous profile down to about 16 m. Although the piezoconetests were conducted about 10 m away from each other, twoprofiles revealed lenses of granular materials that are nottaken into consideration in the forgoing analysis. Shear
278 Soils and Rocks, São Paulo, 37(3): 277-284, September-December, 2014.
Schnaid et al.
Table 1 - Bauxite tailings composition.
Element % by weight
Na 14.33
Al 16.85
Si 12.58
Ca 2.86
Ti 6.70
Fe 46.65
Total 99.96
Figure 1 - Results from oedometer tests.

Soils and Rocks, São Paulo, 37(3): 277-284, September-December, 2014. 279
On the Characterization and Classification of Bauxite Tailings
Figure 2 - Bauxite critical state conditions.
Figure 3 - In situ water content, unit weight and specific gravity in the bauxite tailing dam.

wave velocity measurements show monotonic increasewith depth and yield shear modulus in the range of 20 to50 MPa.
Values of the pore pressure parameter Bq range from0.5 to 0.8 indicating undrained paths during cone penetra-tion. High Bq is consistent with the measured hydraulic con-ductivity values and the contractive response in shear.
In these site investigations, close attention has beengiven to a precise determination of the position of the watertable at the time of the investigation programme, whichchanges with time in these recently deposited, under con-solidation slurries placed over a pervious free drained de-posit foundation. This is achieved by a close inspection of aseries of dissipation tests obtained by recording the valuesof the pore water pressure with time during a pause in push-ing and whilst the cone penetrometer is held stationary. Al-though dissipation tests are often held for the time that takesfor 50% consolidation, t50, in tailings a special recommen-dation is made to held the penetrometer stationary for lon-ger periods corresponding to a time interval between t90 tot100.
Values of ch and cv can be also estimated from thesedissipation tests following the analysis proposed byHoulsby & Teh (1988). A summary of values obtained inthe alumina STF is summarized in Fig. 5. Although valuesof ch range between 2 x 10⁻⁶ and 8 x 10⁻⁵ cm2/s, there is nodistinct variation trend with depth. An average ch value ofabout 8 x 10⁻⁶ is representative of this alumina tailing de-posit.
4. Classification
Several attempts have been made to combine thepiezocone measurements in order to produce classification
charts designed to describe soil type for engineering appli-cations (Douglas & Olsen, 1981; Senneset & Janbu, 1985;Robertson et al., 1986; Robertson, 1990; Jefferies & Da-vies, 1991). Published CPTU soil classification charts aretypically constructed from dimensionless ratios such asQt (=(qt - �vo)/�‘vo), Bq (=(u - uo)/(qt - �vo)) and Fr (=(fs/qt -�vo)x 100%). The original chart by Robertson (1990) pro-duces very scattered data with soil ranging from sandy-siltto clay (Fig. 6).
The normalized soil behavior index Ic proposed byRobertson (1990) is shown in the Fig. 7 and indicates/char-acterizes silty-sand and sandy-silt soils (1.90 < Ic < 2.82).
An alternative relationship uses the ratio of the elasticstiffness to penetration tip resistance (Go/qc), following theconcept that a material that is stiffer in deformation may bestronger in strength. An approach developed by Robertson(2010) correlating Go/qc and Qt is shown in Fig. 8. In addi-tion CPT data can be expressed in the unified plot proposedby Shuttle & Cunning (2007) using the Q(1 - Bq)+1 vs. Fspace (Fig. 9), where strain softening is a predominantly re-sponse.
A similar plot has been suggested by Schnaid et al.(2004) and Schnaid (2005) in which the the Go/qc ratio is re-lated to the normalized dimensionless parameter qc1, de-fined as:
p
pc
c
a
a
v1 �
�
��
�
��(1)
where pa is the atmospheric pressure. Results shown inFig. 10 define a specific region in the Go/qc vs. qc1 space thatfalls outside, above and to the left of the region establishedfor sand. Independent sets of data from gold and zinc high
280 Soils and Rocks, São Paulo, 37(3): 277-284, September-December, 2014.
Schnaid et al.
Figure 4 - Typical CPTU profiles.

Soils and Rocks, São Paulo, 37(3): 277-284, September-December, 2014. 281
On the Characterization and Classification of Bauxite Tailings
Figure 5 - Values of coefficient of consolidation.
Figure 6 - Classification of bauxite tailings on the chart proposed by Robertson (1990).

plasticity slurries have been added to the same plot, fallingon the very same region established for bauxite tailings.The classification method was then considered to providean adequate representation of the fines influence bygrouping all materials in a single area that appears to be
representative of compressible materials that may exhibitstrong strain softening (e.g. Schnaid et al., 2013). Thisevidence is in accordance to laboratory observations.
5. Conclusion
The purpose of this paper is to study the mechanicalproperties of bauxite tailings and to evaluate how the cur-rent site investigation practice is able to identify factorsrelated to tailing response and to stability problems of im-poundments. The hydraulic conductivity of tailings variesfrom point to point in a deposit and, for the present study, alocation representative of fine, non-plastic, silt tailings hasbeen selected. Laboratory tests were carried out on recon-stituted samples leading to measured coefficient of hydrau-lic conductivity of the order of 2 x 10⁻⁸ m/s, zero cohesion,friction angle of 36° and state parameter of 0.08. Drainedshear strength is often higher than that for similar naturalsoils due to high particle angularity.
The piezocone test is the most popular technique usedto characterize tailing impoundments and it successfullydelineated the stratigraphy of bauxite. Predominantly un-drained penetration enabled strength and stiffness to be as-sessed with reasonable accuracy. The coefficient ofconsolidation of bauxite slurries is in the range shown by
282 Soils and Rocks, São Paulo, 37(3): 277-284, September-December, 2014.
Schnaid et al.
Figure 7 - Normalized soil behavior index Ic of bauxite tailingsproposed by Robertson (1990).
Figure 8 - Classification of bauxite tailings on the chart proposedby Robertson and Fear (1995).
Figure 9 - Unified classification chart (Shuttle & Cunning (2007& 2008)).

natural clays. Undrained strength of these slurries is impor-tant in evaluation of liquefaction behaviour.
Finally the usefulness of the Go/qc ratio in tailingsclassification is highlighted, because combination of elasticstiffness to ultimate strength provides direct means to iden-tify deposits that are highly compressible and may be sus-ceptible to liquefaction.
AcknowledgmentsThe work described in this paper was carried out with
the support from ALUMAR. The authors are particulargrateful to the engineers Leandro Moura Costa Filho for hisfruitful contribution and collaboration.
ReferencesBedin, J.; Schnaid, F. & Costa Filho, L.M. (2008) Study of
geotechnical properties of gold tailing mining. Proc. IVLuso Brazilian Congress of Geotechnics, IV GEO2008, Coimbra, Portugal, v. 1, p. 25-32.
Bedin, J.; Schnaid, F.; Fonseca, A.J.P.V. & Costa Filho,L.M. (2012) Gold tailings liquefaction under criticalstate soil mechanics. Geotechnique, v. 62, p. 263-267.
Douglas, B.J. & Olsen, R.S. (1981) Soil classification usingelectric cone penetrometer. Proc. ASCE National Con-vention, St. Louis, p. 209-227.
Houlsby, G.T. & Teh, C.I. (1988) Analysis of the piezo-cone in clay. Proc. International Symposium on Pene-tration Test, Rotterdam, Netherlands, v. 1, p. 777-783.
Jefferies, M.G. & Davies, M.O. (1991) Soil classificationby the cone penetration test: Discussion. CanadianGeotechnical Journal, v. 281, p. 177-176.
Lade, R.S. (1978) Preparing test specimens using under-compaction. Geotechnical Testing Journal, Philadel-phia, v. 1:1, p. 16-23.
Robertson. P.K., Campanella, R.G., Gillespie, D. & Greig,J. (1986) Use of piezometer cone data. Proc. ASCESpecialty Conference, In-Situ’86: Use of In-situ testingin Geotechnical Engineering, Blacksburg, p. 1263-1280.
Robertson, P.K. (1990) Soil classification using the conepenetration test. Canadian Geotechnical Journal,v. 27:1, p. 151-158.
Robertson, P.K. & Fear, C.E. (1995) Liquefaction of sandsand its evaluation. Proc. First International Conferenceon Earthquake Geotechnical Engineering, keynote lec-ture, Tokyo, Japan.
Robertson, P.K. (2010) Evaluation of flow liquefaction andliquefied strength using the cone penetration test. Jour-nal of Geotechnical Geoenvironmental Engineering,ASCE, v. 136:6, p. 842:853.
Schnaid, F. (2005) Geo-characterization and properties ofnatural soils by in situ tests. Proc. 16th ICSMGE, Osaka,Millpress, Rotterdam, v. 1, p. 3-45.
Schnaid, F.; Lehane, B.M. & Fahey. M. (2004) In situ testcharacterization of unusual geomateriais. Proc. 2nd ISC,keynote lecture, Porto, Millpress, Rotterdam, v. 1,p. 49-74.
Schnaid, F.; Bedin, J.; Viana da Fonseca, A.J.P. & CostaFilho, L.M. (2013) Stiffness and strenght governing thestatic liquefaction of tailings. Journal GeotechnicalGeoenvironmental Engineerimg, v. 139:12, p. 2136-2144.
Soils and Rocks, São Paulo, 37(3): 277-284, September-December, 2014. 283
On the Characterization and Classification of Bauxite Tailings
Figure 10 - Classification of bauxite tailings represented in the Go/qc vs. qc1 space.

Senneset, K. & Janbu, N. (1985) Shear strength parametersobtained from static cone penetration tests. Proc. Symp.Shear Strength of Marine Sediments, ASTM SpecialTechnical Publication, STP. 883, p. 41-54.
Shuttle, D.A. & Cunning, J. (2007) Liquefaction potentialof silts from CPTU. Canadian Geotechnical Journal,v. 44:1, p. 1-19.
Shuttle, D.A. & Cunning, J. (2008) Discussion: Liquefac-tion Potential of Silts from CPTu. Canadian Geo-technical Journal, v. 45, p. 142-145.
284 Soils and Rocks, São Paulo, 37(3): 277-284, September-December, 2014.
Schnaid et al.

SOILS and ROCKSAn International Journal of Geotechnical and Geoenvironmental Engineering
Publication ofABMS - Brazilian Association for Soil Mechanics and Geotechnical Engineering
SPG - Portuguese Geotechnical SocietyVolume 37, N. 3, September-December 2014
Author index
Albuquerque, P.J.R. 171Alonso, Eduardo E. 3Amoroso, S. 177Aoki, N. 61Arêde, A. 133Bacellar, L.A.P. 51Barreto, G.W. 61Bastos, R.K.X. 161Bedin, J. 277Bello, M.I.M.C.V. 257Benoît, J. 211Betim, L.S. 161Borgatto, A.V.A. 133Boscov, M.E.G. 85Camarini, G. 171Carvalho, D. 171Cintra, J.C.A. 61Costa, A. 133Coutinho, R.Q. 257Cruz, N. 195Danziger, B.R. 243Danziger, F.A.B. 243Dias, D. 39Feng, J.L. 73Ferreira, Q.C.G. 51Fineza, A.G. 161Guedes, J. 133He, M.C. 73
Howie, J.A. 211Janin, J.P. 39Karam, K. 133Laister, E. 171Lehane, B.M. 177Mahler, C.F. 133Mañas, L.M.S. 85Marchetti, D. 177Marques, E.A.G. 161Massad, Faiçal 113Menezes, J.E.Q. 133Mitchell, J.K. 99Monaco, P. 177Münnich, K. 133Nierwinski, H.P. 277Odebrecht, E. 277Paupério, E. 133Prezzi, M. 233Ribeiro e Sousa, L. 133Rodrigues, C. 195Salgado, R. 233Santana, C.M. 243Schnaid, F. 277Sousa, L.R. 73van Elk, A.G.P. 85Viana da Fonseca, A. 133, 195Wang, C.G. 73Webler, A.D. 133

Instructions for Submission of ManuscriptsCategory of the Papers
Soils and Rocks is the international scientific journal editedby the Brazilian Association for Soil Mechanics and Geotech-nical Engineering (ABMS) and the Portuguese Geotechnical So-ciety (SPG). The aim of the journal is to publish (in English)original research and technical works on all geotechnical bran-ches.
According to its content the accepted paper is classified in oneof the following categories: Article paper, Technical Note, CaseStudy or Discussion. An article paper is an extensive and conclu-sive dissertation about a geotechnical topic. A paper is consideredas a technical note if it gives a short description of ongoing stud-ies, comprising partial results and/or particular aspects of the in-vestigation. A case study is a report of unusual problems foundduring the design, construction or the performance of geotech-nical projects. A case study is also considered as the report of anunusual solution given to an ordinary problem. The discussionsabout published papers, case studies and technical notes are madein the Discussions Section.
When submitting a manuscript for review, the authors shouldindicate the category of the manuscript, and is also understoodthat they:
a) assume full responsibility for the contents and accuracy ofthe information in the paper;
b) assure that the paper has not been previously published, andis not being submitted to any other periodical for publication.
Manuscript Instructions
Manuscripts must be written in English. The text is to be typedin a word processor (preferably MS Word), single column, usingISO A4 page size, left, right, top, and bottom margins of 25 mm,Times New Roman 12 font, and line spacing of 1.5. All lines andpages should be numbered. The text should be written in the thirdperson.
The first page of the manuscript must include the title of thepaper followed by the names of the authors with the abbreviationof the most relevant academic title. The affiliation, address ande-mail must appear below each author´s name. An abstract of 200words follows after the author´s names. A list with up to sixkeywords at the end of the abstract is required.
Although variations on the sequence and title of each sectionare possible, it is suggested that the text contains the followingsections: Introduction, Material and Methods, Results, Discus-sions, Conclusions, Acknowledgements, References and List ofSymbols. A brief description of each section is given next.
Introduction: This section should indicate the state of the artof the problem under evaluation, a description of the problem andthe methods undertaken. The objective of the work should beclearly presented at the end of the section.
Materials and Methods: This section should include all in-formation needed to the reproduction of the presented work byother researchers.
Results: In this section the data of the investigation should bepresented in a clear and concise way. Figures and tables shouldnot repeat the same information.
Discussion: The analyses of the results should be described inthis section.
Conclusions: The content of this section should be based onthe data and on the discussions presented.
Acknowledgenments: If necessary, concise acknowledge-ments should be presented in this section.
References: References to other published sources must bemade in the text by the last name(s) of the author(s), followed bythe year of publication, similarly to one of the two possibilitiesbelow:
…while Silva and Pereira (1987) observed that resistance de-pended on soil density… or It was observed that resistance de-pended on soil density (Silva and Pereira, 1987).
In the case of three or more authors, the reduced format mustbe used, e.g.: Silva et al. (1982) or (Silva et al., 1982). Two ormore citations belonging to the same author(s) and published inthe same year are to be distinguished with small letters, e.g.:(Silva, 1975a, b, c.). Standards must be cited in the text by the ini-tials of the entity and the year of publication, e.g.: ABNT (1996),ASTM (2003).
Full references shall be listed alphabetically at the end of thetext by the first author´s last name. Several references belongingto the same author shall be cited chronologically. Some examplesare listed next:Papers: Bishop, A.W. & Blight, G.E. (1963). Some aspects of ef-
fective stress in saturated and unsaturated soils. Geotechni-que, 13(2): 177-197.
Books: Lambe, T.W & Whitman, R.V. (1979). Soil Mechanics,SI Version. John Wiley & Sons, New York, 553 p.
Book with editors: Sharma, H.D.; Dukes, M.T. & Olsen, D.M.(1990). Field measurements of dynamic moduli and Poisson’sratios of refuse and underlying soils at a landfill site. Landva,A. & Knowles, G.D. (eds), Geotechnics of Waste Fills - The-ory and Practice, American Society for Testing and Materials- STP 1070, Philadelphia, pp. 57-70.
Proceedings (printed matter or CD-ROM): Jamiolkowski, M.;Ladd, C.C.; Germaine, J.T & Lancellotta, R. (1985). New de-velopments in field and laboratory testing of soils. Proc. 11thInt. Conf. on Soil Mech. and Found. Engn., ISSMFE, SanFrancisco, v. 1, pp. 57-153.(specify if CD ROM).
Thesis and dissertations: Lee, K.L. (1965). Triaxial CompressiveStrength of Saturated Sands Under Seismic Loading Condi-tions. PhD Dissertation, Department of Civil Engineering,University of California, Berkeley, 521 p.
Standards: ASTM (2003). Standard Test Method for Particle SizeAnalysis of Soils - D 422-63. ASTM International, WestConshohocken, Pennsylvania, USA, 8 p.
Internet references: Soi ls and Rocks avai lable athttp://www.abms.com.br and downloaded on August 6th2003.
On line first publications must also bring the digital object identi-fier (DOI) at the end.Figures shall be either computer generated or drawn with In-
dia ink on tracing paper. Computer generated figures must be ac-companied by the corresponding digital file (.tif, .jpg, .pcx, etc.).All figures (graphs, line drawings, photographs, etc.) shall benumbered consecutively and have a caption consisting of the fig-ure number and a brief title or description of the figure. This num-ber should be used when referring to the figure in text. Photo-graphs should be black and white, sharp, high contrasted andprinted on glossy paper.
Tables shall be numbered consecutively in Arabic and have acaption consisting of the table number and a brief title. This num-ber should be used when referring to the table in the text. Unitsshould be indicated in the first line of the table, below the title ofeach column. Acronyms should be avoided. When applicable, theunits should come right below the corresponding column head-ing. Additional comments can be placed as footnotes.

Equations shall appear isolated in a single line of the text.Numbers identifying equations must be flushed with the rightmargin. International System (SI) units must be used. The defini-tions of the symbols used in the equations must appear in the Listof Symbols. It is recommended that the symbols used are in ac-cordance with Lexicon in 8 Languages, ISSMFE (1981) and theISRM List of Symbols.
The text of the submitted manuscript (including figures, tablesand references) intended to be published as an article paper or acase history should not contain more than 30 pages, formatted ac-cording to the instructions mentioned above. Technical notes anddiscussions should have no more than 15 and 8 pages, respec-tively. Longer manuscripts may be exceptionally accepted if theauthors provide proper explanation for the need of the requiredextra space in a cover letter.
Discussion
Discussions must be written in English. The first page of a dis-cussion should contain:
The title of the paper under discussion;Name of the author(s) of the discussion, followed by their po-
sition, affiliation, address and e-mail. The author(s) of the discus-sion should refer to himself (herself/themselves) as the reader(s)and to the author(s) of the paper as the author(s).
Figures, tables and equations should be numbered followingthe same sequence of the original paper. All instructions previ-
ously mentioned for the preparation of article papers, case studiesand technical notes also apply to the preparation of discussions.
Editorial Review
Each paper will be evaluated by reviewers selected by the edi-tors according to the subject of the paper. The authors will be in-formed about the results of the review process. If the paper isaccepted, the authors will be required to submit a version of therevised manuscript with the suggested modifications. If themanuscript is rejected for publication, the authors will be in-formed about the reasons for rejection. In any situation compris-ing modification of the original text, classification of themanuscript in a category different from that proposed by the au-thors, or rejection, the authors can reply presenting their reasonsfor disagreeing with the reviewer comments.
Submission
The author(s) must upload a digital file of the manuscript tothe Soils and Rocks website.
Follow Up
The online management system will provide a password to thecorresponding author, which will enable him/her to follow the re-viewing process of the submitted manuscript at the Soils andRocks website.