an imaging sensor of particle size spectra and plankton, for
TRANSCRIPT
HAL Id: hal-03508179https://hal.sorbonne-universite.fr/hal-03508179
Submitted on 3 Jan 2022
HAL is a multi-disciplinary open accessarchive for the deposit and dissemination of sci-entific research documents, whether they are pub-lished or not. The documents may come fromteaching and research institutions in France orabroad, or from public or private research centers.
L’archive ouverte pluridisciplinaire HAL, estdestinée au dépôt et à la diffusion de documentsscientifiques de niveau recherche, publiés ou non,émanant des établissements d’enseignement et derecherche français ou étrangers, des laboratoirespublics ou privés.
The Underwater Vision Profiler 6: an imaging sensor ofparticle size spectra and plankton, for autonomous and
cabled platformsMarc Picheral, Camille Catalano, Denis Brousseau, Hervé Claustre, Laurent
Coppola, Edouard Leymarie, Jérôme Coindat, Fabio Dias, Sylvain Fevre,Lionel Guidi, et al.
To cite this version:Marc Picheral, Camille Catalano, Denis Brousseau, Hervé Claustre, Laurent Coppola, et al.. The Un-derwater Vision Profiler 6: an imaging sensor of particle size spectra and plankton, for autonomous andcabled platforms. Limnology and Oceanography: Methods, Association for the Sciences of Limnologyand Oceanography, 2021, �10.1002/lom3.10475�. �hal-03508179�
Limnol. Oceanogr.: Methods 2021© 2021 The Authors. Limnology and Oceanography: Methods published by
Wiley Periodicals LLC on behalf of Association for the Sciences ofLimnology and Oceanography.
doi: 10.1002/lom3.10475
The Underwater Vision Profiler 6: an imaging sensor of particle sizespectra and plankton, for autonomous and cabled platforms
Marc Picheral ,1* Camille Catalano,1 Denis Brousseau,2 Hervé Claustre ,1 Laurent Coppola ,1
Edouard Leymarie ,1 Jérôme Coindat ,3 Fabio Dias,4 Sylvain Fevre ,3 Lionel Guidi ,1
Jean Olivier Irisson ,1 Louis Legendre ,1 Fabien Lombard,1 Laurent Mortier,5 Christophe Penkerch,1
Andreas Rogge ,6,7 Catherine Schmechtig,1 Simon Thibault ,2 Thierry Tixier,4 Anya Waite ,8
Lars Stemmann 1
1Sorbonne Université, Centre National de la Recherche Scientifique, Laboratoire d’Océanographie de Villefranche (LOV),Villefranche-sur-Mer, France
2Centre d’Optique, Phototonique et Laser, Université Laval, Quebec City, Quebec, Canada3Hydroptic, L’Isle-Jourdain, France4WISIP, Clermont-Ferrand, France5Ecole Nationale Supérieure de Techniques Avancées (ENSTA), Unité de Mécanique (UME), Palaiseau, France6Institute for Ecosystem Research, Christian-Albrechts-Universität zu Kiel, Kiel, Germany7Polar Biological Oceanography Section, Alfred Wegener Institute, Helmholtz Centre for Polar and Marine Research,Bremerhaven, Germany
8Department of Oceanography and Ocean Frontier Institute, Dalhousie University, Halifax, Nova Scotia, Canada
AbstractAutonomous and cabled platforms are revolutionizing our understanding of ocean systems by providing 4D
monitoring of the water column, thus going beyond the reach of ship-based surveys and increasing the depth ofremotely sensed observations. However, very few commercially available sensors for such platforms are capable ofmonitoring large particulate matter (100–2000 μm) and plankton despite their important roles in the biologicalcarbon pump and as trophic links from phytoplankton to fish. Here, we provide details of a new, commerciallyavailable scientific camera-based particle counter, specifically designed to be deployed on autonomous and cabledplatforms: the Underwater Vision Profiler 6 (UVP6). Indeed, the UVP6 camera-and-lighting and processing system,while small in size and requiring low power, provides data of quality comparable to that of previous much largerUVPs deployed from ships. We detail the UVP6 camera settings, its performance when acquiring data on aquaticparticles and plankton, their quality control, analysis of its recordings, and streaming from in situ acquisition tousers. In addition, we explain how the UVP6 has already been integrated into platforms such as BGC-Argo floats,gliders and long-term mooring systems (autonomous platforms). Finally, we use results from actual deploymentsto illustrate how UVP6 data can contribute to addressing longstanding questions in marine science, and also sug-gest new avenues that can be explored using UVP6-equipped autonomous platforms.
Marine particles (mostly aggregates of organic and inorganicdetritus and bacteria) and plankton are ubiquitous in the oceanand play important roles in biogeochemical cycles and trophicwebs (Stemmann and Boss 2012; Turner 2015). In particular, sev-eral ecological services depend on biological processes largelymediated by marine particles and plankton (Ducklow et al. 2001;
Travers et al. 2007; Rose et al. 2010). As a consequence, bothparti-cles and plankton have been recognized as biological EssentialOceanographic Variables (EOVs) for the Global Ocean ObservingSystem (Miloslavich et al. 2018; Muller-Karger et al. 2018). Obser-vations of particles and phytoplankton rely, on the one hand, onparticle-collecting devices such as sediment traps that have beenused for decades to assess the quantity and quality of settlingmarine snow in the ocean, but these can only resolve coarse spa-tial and temporal variations. On the other hand, in situ camerasdeployed from ships have been used since the early 1990s todetect, measure, and identify marine particles and plankton inthe size range of 100–2000 μm at high spatiotemporal resolution(Honjo et al. 1984; Lampitt et al. 1993; Ratmeyer and
*Correspondence: [email protected]
This is an open access article under the terms of the Creative CommonsAttribution-NonCommercial License, which permits use, distribution andreproduction in any medium, provided the original work is properly citedand is not used for commercial purposes.
1
Wefer 1996). The imaging devices hold the promise of operation-ality and global consistency (Stemmann et al. 2012b; Lombardet al. 2019). An extensive review published by Lombardet al. (2019) has accordingly presented the different camera-basedsystems available on the shelf, in which Underwater Vision Pro-filer (UVP) sensors were described along with other instruments,and their respective key characteristics were compared.
The UVP is unique in that it is the only intercalibratedcamera-based sensor that targets marine particles > 100 μm(in this paper, large particulate matter [LPM] corresponds tothe 100–2000 μm range). The 5th model (UVP5), resultingfrom three decades of developments since the 1980s (Gorskyet al. 2000; Picheral et al. 2010), was small enough to bemounted inside most Conductivity, Temperature, Depth(CTD) Sensors frames (Picheral et al. 2010), enabling great pro-gress to be made in understanding the sinking of organic par-ticles and carbon sequestration, following the UVP5’sdeployment during oceanographic cruises at ocean mesoscales(Gorsky et al. 2002; Guidi et al. 2007; Waite et al. 2016),regional scales (Ramondenc et al. 2016), and the global scale(Guidi et al. 2015). In this way, the UVP led to the descriptionof different types of aggregates, which were found to be linkedwith surface primary production (Roullier et al. 2014;Trudnowska et al. 2021). While not specifically developed toobserve plankton, which are sometimes too rare or too smallto be efficiently observed by it, this UVP nonetheless gave riseto major discoveries through in situ observations of rareand fragile plankton such as rhizarians (Biard et al. 2016;Stemmann et al. 2008a,b), planktonic polychaetes(Christiansen et al. 2018), Trichodesmium colonies (Guidi et al.2012; Sandel et al. 2015), Arctic copepod communities(Vilgrain et al. 2021), and plankton communities more gener-ally (Stemmann et al. 2008c; Forest et al. 2012). Yet despiteextensive use of the UVP5 in the last decade (about 1000 castsper year since 2008), its more widespread use is limited by thedifficulty of acquiring data in rough sea conditions and ice-covered high latitudes where ship operations are difficult.
In parallel, the last decades have seen the emergence ofautonomous platforms which are now used to remotely recordtemperature, salinity (Roemmich et al. 2009), and many otherEOVs (Claustre et al. 2020). These platforms include autono-mous underwater vehicles (AUVs), profiling floats (simplycalled “floats” hereinafter) and underwater gliders (simplycalled “gliders” hereinafter). The idea of deploying imagingsensors on autonomous platforms to provide global monitor-ing of particles and plankton was proposed a decade ago(Stemmann et al. 2012a), but technological constraints havehindered their implementation. While Ohman et al. (2019)have described a camera-based zooplankton sensor for gliders,it has yet to be scaled up for general use. Specifically, the tech-nical challenges of designing a camera-based sensor that canbe mounted on autonomous platforms are: miniaturization,low energy requirement to optimize the lifetime of the plat-form, and direct broadcast of data from the platform to the
online repository. We therefore addressed the challenge ofdeveloping a camera-based sensor mountable on gliders andfloats, and simple enough to be produced commercially at arelatively low cost, bearing in mind that floats and their sen-sors are lost at the end of their useful lives. The targeted sizerange of particles varied from a few tens of micrometers to afew centimeters, encompassing marine snow and meso- andmacro-zooplankton. This way, our new imaging sensor couldprovide data for key EOVs on autonomous platforms.
In this paper, we provide details of the new, miniaturizedUVP6s designed to meet our identified criteria and existing intwo versions: the UVP6-LP (low power) and the UVP6-HF(high frequency). On the one hand, the UVP6-LP is an off-the-shelf quantitative scientific imaging sensor specificallydesigned to be deployed on modern marine autonomous orcabled platforms, the latter including seabed observatories andremotely operated vehicles (ROVs). Its sensor is especiallysuited for platforms with low power and/or that are relativelysmall-sized. While the UVP6-HF uses the same optical systemas the UVP6-LP, it on the other hand images at a faster rateand thus requires more power, and is designed to be deployedon CTD rosettes and cruising AUVs.
Here, we provide information on the integration of theUVP6-LP into gliders, floats, and long-term mooring lines. Weassess the quality of the resulting data by intercomparing theresults of different UVP6s, and comparing them with thoseobtained with the UVP5 reference. Finally, we provide threeexamples from field deployments of UVP6s to demonstratethe relevance of their results to ocean ecosystem studies.
Materials and proceduresMaterials
The UVP5 and UVP6In all UVP models including versions 5 and 6, the objects
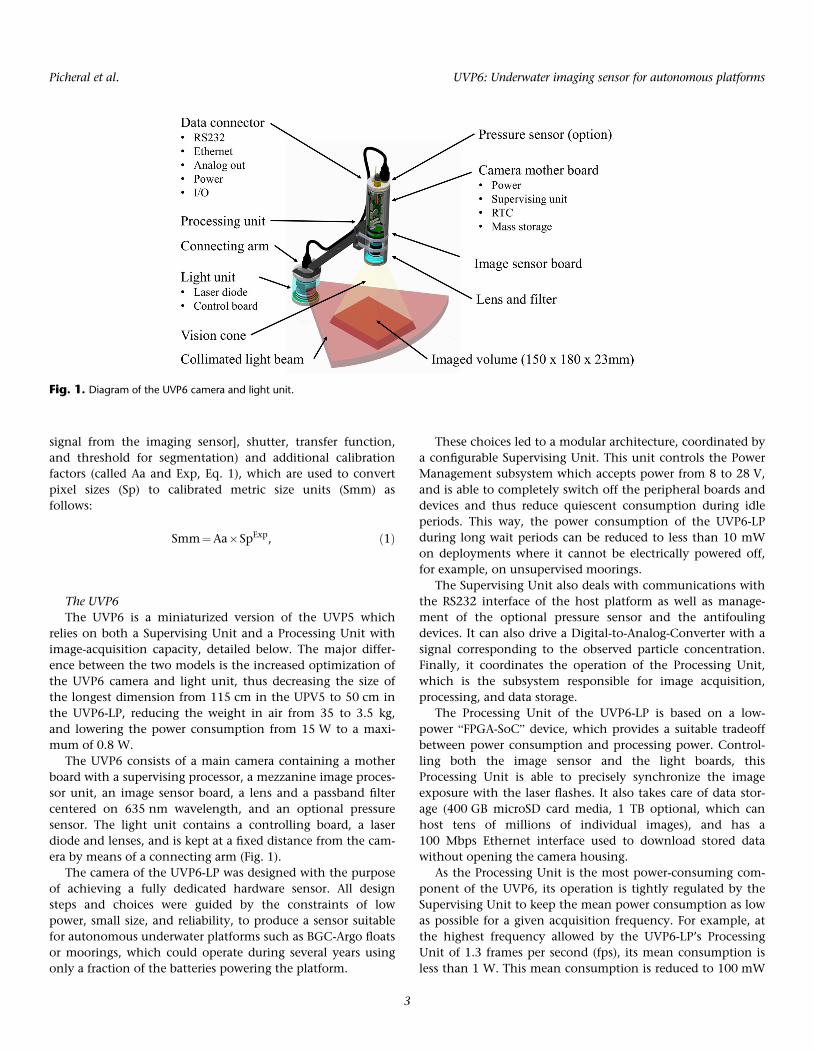
imaged by the camera are illuminated by a lateral collimatedlight beam created in front of the lens (Fig. 1). All objectswithin this thin coherent sheet of light are imaged on a blackbackground, which allows the UVP to easily detect and sizethem using a fixed threshold of pixel light intensity on the8-bit gray scale (called “threshold” in this manuscript) forimage segmentation (i.e., the process by which a digital imageis partitioned into various subgroups of pixels called imageobjects). Furthermore, all imaged particles within a fixed vol-ume are in focus and at the same distance from the camera,thus enabling reliable size measurements as well as accuratedeterminations of particle and plankton concentrations.
Because the intensity of the light reflected by the particlescan be high enough to activate pixels around the objects andbecause the light is also scattered and diffused in the path tothe camera, a size compensation is applied when convertingfrom pixels to metric units (Picheral et al. 2010). Results fromthe UVP thus depend on its optical tuning, fixed settings(black level, correction matrix, gain [amplification of the
2
Picheral et al. UVP6: Underwater imaging sensor for autonomous platforms
signal from the imaging sensor], shutter, transfer function,and threshold for segmentation) and additional calibrationfactors (called Aa and Exp, Eq. 1), which are used to convertpixel sizes (Sp) to calibrated metric size units (Smm) asfollows:
Smm¼Aa�SpExp, ð1Þ
The UVP6The UVP6 is a miniaturized version of the UVP5 which
relies on both a Supervising Unit and a Processing Unit withimage-acquisition capacity, detailed below. The major differ-ence between the two models is the increased optimization ofthe UVP6 camera and light unit, thus decreasing the size ofthe longest dimension from 115 cm in the UPV5 to 50 cm inthe UVP6-LP, reducing the weight in air from 35 to 3.5 kg,and lowering the power consumption from 15 W to a maxi-mum of 0.8 W.
The UVP6 consists of a main camera containing a motherboard with a supervising processor, a mezzanine image proces-sor unit, an image sensor board, a lens and a passband filtercentered on 635 nm wavelength, and an optional pressuresensor. The light unit contains a controlling board, a laserdiode and lenses, and is kept at a fixed distance from the cam-era by means of a connecting arm (Fig. 1).
The camera of the UVP6-LP was designed with the purposeof achieving a fully dedicated hardware sensor. All designsteps and choices were guided by the constraints of lowpower, small size, and reliability, to produce a sensor suitablefor autonomous underwater platforms such as BGC-Argo floatsor moorings, which could operate during several years usingonly a fraction of the batteries powering the platform.
These choices led to a modular architecture, coordinated bya configurable Supervising Unit. This unit controls the PowerManagement subsystem which accepts power from 8 to 28 V,and is able to completely switch off the peripheral boards anddevices and thus reduce quiescent consumption during idleperiods. This way, the power consumption of the UVP6-LPduring long wait periods can be reduced to less than 10 mWon deployments where it cannot be electrically powered off,for example, on unsupervised moorings.
The Supervising Unit also deals with communications withthe RS232 interface of the host platform as well as manage-ment of the optional pressure sensor and the antifoulingdevices. It can also drive a Digital-to-Analog-Converter with asignal corresponding to the observed particle concentration.Finally, it coordinates the operation of the Processing Unit,which is the subsystem responsible for image acquisition,processing, and data storage.
The Processing Unit of the UVP6-LP is based on a low-power “FPGA-SoC” device, which provides a suitable tradeoffbetween power consumption and processing power. Control-ling both the image sensor and the light boards, thisProcessing Unit is able to precisely synchronize the imageexposure with the laser flashes. It also takes care of data stor-age (400 GB microSD card media, 1 TB optional, which canhost tens of millions of individual images), and has a100 Mbps Ethernet interface used to download stored datawithout opening the camera housing.
As the Processing Unit is the most power-consuming com-ponent of the UVP6, its operation is tightly regulated by theSupervising Unit to keep the mean power consumption as lowas possible for a given acquisition frequency. For example, atthe highest frequency allowed by the UVP6-LP’s ProcessingUnit of 1.3 frames per second (fps), its mean consumption isless than 1 W. This mean consumption is reduced to 100 mW
Fig. 1. Diagram of the UVP6 camera and light unit.
3
Picheral et al. UVP6: Underwater imaging sensor for autonomous platforms
when the UVP6-LP is configured to process one image every10 s (i.e., 0.1 fps).
The image sensor board of the UVP6 carries a 5 MpixelsCMOS monochrome image sensor (Sony IMX264) — a choicemotivated by a tradeoff among several criteria that includedresolution, pixel size, component size, light sensitivity, sensornoise, and power consumption. This choice also represents anupgrade in relation to the UVP5, currently existing in two ver-sions: one with a 1.2 Mpixels CCD imager and the other witha 4 Mpixels CMOS imager.
The light board is synchronized with the image sensor’sglobal electronic shutter which acquires all pixels at the sametime. The light board also drives a laser diode emittingconstant-power red laser flashes (635 nm). Constant opticalpower is an extremely important feature that ensures thehomogeneity of UVP6 data at different depths and water/sensor temperatures. The UVP6 light board thus has a temper-ature compensation circuit and can produce constant opticalpower flashes from 0�C to 35�C.
Finally, the UVP6 has a power back-up system that makes itsuitable for eventual functioning with a simple on/off control-ler. In this case, even if the input power were abruptly switchedoff, the camera has a power reserve to shut down gradually andthus avoid data losses and file system corruption.
The UVP6 firmwareSoftware development for the UVP6 followed the same
objective as that for designing the hardware architecture, thatis, achieving the best performance/power ratio withoutcompromising data quality. A 2nd important feature was toprovide a highly configurable and flexible UVP6, suitable fordifferent types of deployments.
The Supervising Unit software implements a smart anddynamic resource-managing algorithm, intended to optimizepower consumption in real time according to the UVP6’sworkload. Furthermore, the high degree of configurabilitymakes the UVP6 very versatile, that is, it can be used for casesranging from the simplest power on/off to intricate autono-mous acquisition schedules (AUTO and TIME main setup),including host (platform) controlled profiles that can be trig-gered on demand and in real time (SUPERVISED mode).
The Processing Unit software includes image- and data-processing algorithms. It consists of three main processingsteps: (1) light correction using a zone-specific gain correction,(2) image segmentation, and (3) object/particle counting andcharacterization.
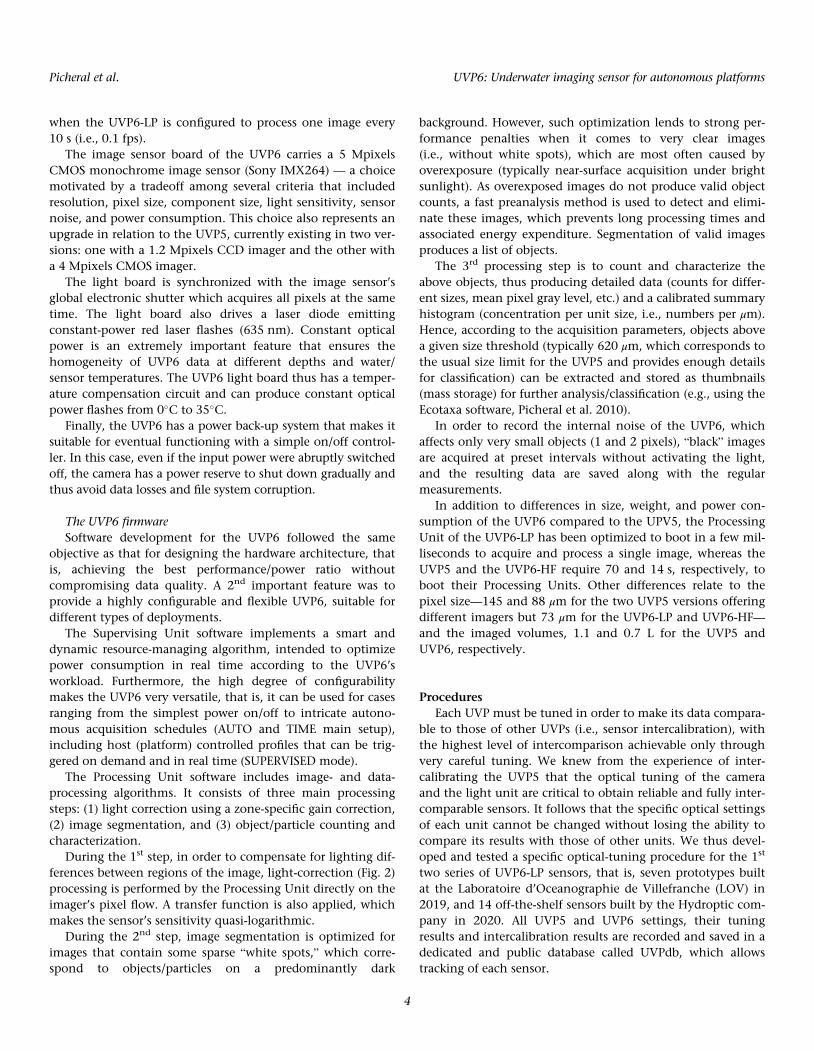
During the 1st step, in order to compensate for lighting dif-ferences between regions of the image, light-correction (Fig. 2)processing is performed by the Processing Unit directly on theimager’s pixel flow. A transfer function is also applied, whichmakes the sensor’s sensitivity quasi-logarithmic.
During the 2nd step, image segmentation is optimized forimages that contain some sparse “white spots,” which corre-spond to objects/particles on a predominantly dark
background. However, such optimization lends to strong per-formance penalties when it comes to very clear images(i.e., without white spots), which are most often caused byoverexposure (typically near-surface acquisition under brightsunlight). As overexposed images do not produce valid objectcounts, a fast preanalysis method is used to detect and elimi-nate these images, which prevents long processing times andassociated energy expenditure. Segmentation of valid imagesproduces a list of objects.
The 3rd processing step is to count and characterize theabove objects, thus producing detailed data (counts for differ-ent sizes, mean pixel gray level, etc.) and a calibrated summaryhistogram (concentration per unit size, i.e., numbers per μm).Hence, according to the acquisition parameters, objects abovea given size threshold (typically 620 μm, which corresponds tothe usual size limit for the UVP5 and provides enough detailsfor classification) can be extracted and stored as thumbnails(mass storage) for further analysis/classification (e.g., using theEcotaxa software, Picheral et al. 2010).
In order to record the internal noise of the UVP6, whichaffects only very small objects (1 and 2 pixels), “black” imagesare acquired at preset intervals without activating the light,and the resulting data are saved along with the regularmeasurements.
In addition to differences in size, weight, and power con-sumption of the UVP6 compared to the UPV5, the ProcessingUnit of the UVP6-LP has been optimized to boot in a few mil-liseconds to acquire and process a single image, whereas theUVP5 and the UVP6-HF require 70 and 14 s, respectively, toboot their Processing Units. Other differences relate to thepixel size—145 and 88 μm for the two UVP5 versions offeringdifferent imagers but 73 μm for the UVP6-LP and UVP6-HF—and the imaged volumes, 1.1 and 0.7 L for the UVP5 andUVP6, respectively.
ProceduresEach UVP must be tuned in order to make its data compara-
ble to those of other UVPs (i.e., sensor intercalibration), withthe highest level of intercomparison achievable only throughvery careful tuning. We knew from the experience of inter-calibrating the UVP5 that the optical tuning of the cameraand the light unit are critical to obtain reliable and fully inter-comparable sensors. It follows that the specific optical settingsof each unit cannot be changed without losing the ability tocompare its results with those of other units. We thus devel-oped and tested a specific optical-tuning procedure for the 1st
two series of UVP6-LP sensors, that is, seven prototypes builtat the Laboratoire d’Oceanographie de Villefranche (LOV) in2019, and 14 off-the-shelf sensors built by the Hydroptic com-pany in 2020. All UVP5 and UVP6 settings, their tuningresults and intercalibration results are recorded and saved in adedicated and public database called UVPdb, which allowstracking of each sensor.
4
Picheral et al. UVP6: Underwater imaging sensor for autonomous platforms
UVP6 light and camera tuningThe UVP6 camera tuning includes five steps:
(1) optical centering of the sensor board using a specific target,(2) measurement of the imaging sensor’s raw sensitivity,(3) tuning of the lens aperture to a defined sensitivity valueequivalent to F4 when the best optical resolution is obtained,(4) tuning of the focusing of the imaging sensor, and (5) sensi-tivity tests after the UVP6 is finally assembled.
The UVP6 light tuning is performed on a calibration benchto compensate for the different lighting patterns created byheterogeneity among laser diodes. After the camera and lightare assembled with a connecting arm, the rotation and center-ing of the camera relative to the light source are checked foreach individual camera-and-light combination.
The UVP6 sensor is immersed in an aquarium filled withfreshwater with the camera facing a white target placed at 45�
in the light beam to measure the light beam’s intensity andthickness. The resulting values are used to calculate the vol-ume of the image captured by the camera, which correspondsto the intersection of the vision cone of the camera and thelight beam (Fig. 1). The intensity of the light measured by thecamera is used to adjust the flash and corresponding shutterduration of each UVP6 to compensate for differences amongsensors and provide a fixed and common segmentationsetting.
UVP6 optical compensationThe collimated light beam in front of the UVP6 camera is
created from a single source (Fig. 1). As a consequence, despitethe specific design of the lighting lens, the collimated lightbeam is still subject to significant radial divergence (Fig. 1). Inaddition, vignetting due to the camera lens is observed in thelight intensity received by the UVP6 (i.e., lower intensity atthe corners than in the center). Correction of this lighting het-erogeneity cannot be achieved by theoretical modelingbecause of the complex properties of seawater and the verydiverse types of objects (i.e., particles) imaged by the UVP6.For this reason, a method based on zonal correction of theimage (Fig. 2) was developed to compensate for the UPV6’soptical and lighting heterogeneity, with an empirical zone-specific gain correction applied to the original images duringthe initial processing steps. This correction is designed toobtain identical size spectra (abundance of particles per sizeclass) in each zone of the image for a given population of par-ticles. To reach this goal, the image is divided into 120 zones(250 � 250 pixels) for which the local gain is selected afteroptimization (root mean square error [RMSE] minimization)and then interpolated over the whole image.
The efficiency of the gain zonal correction matrix is testedfor each UVP6 during the intercalibration process by recordingand analyzing the full raw images.
Fig. 2. Examples of data from UVP6 000007LP showing the effect of zonal correction on the size spectra of particles: (a) image of the gain correctionmatrix to be applied to the raw image; (b) example of UVP6 data obtained without application of the correction matrix, presented here for illustrativepurposes only; (c) real UVP6 data obtained after application of the correction matrix, with (1) position of selected particles, (2) size spectra in the120 zones of the image, and (3) spectral differences in the 120 zones. The result of the application of the gain correction matrix is evaluated by thehomogeneity among spectra in the 120 zones of the image (c2 and c3).
5
Picheral et al. UVP6: Underwater imaging sensor for autonomous platforms
UVP6 intercalibration and comparison with UVP5Intercalibration of reference UVP6s with reference UVP5With the UVP6 being the successor of the UVP5, we
wanted the two generations of UVPs to be highly comparablefor the full range of particle sizes. We thus tuned the settingsof the UVP6 on those of the UVP5, and created for this pur-pose three reference UVP6s to be used for all laterintercalibrations.
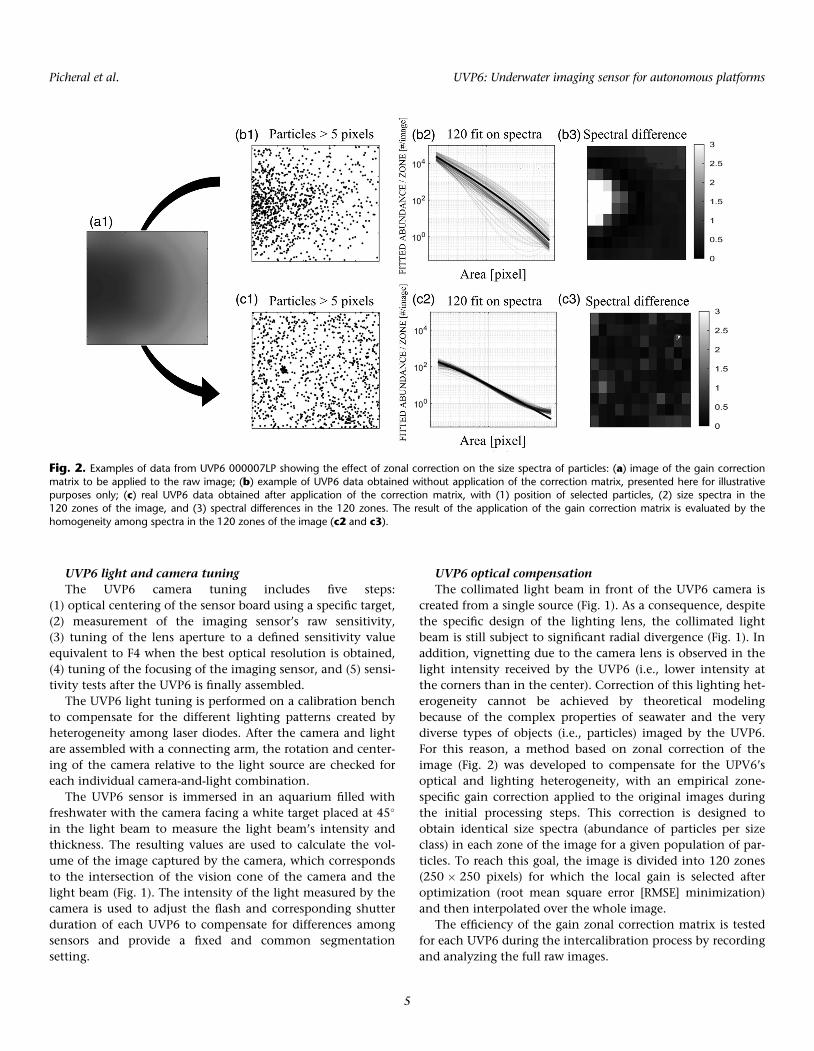
Given that preliminary intercalibration experimentsshowed that three UVP6s built at LOV (i.e., sn000005lp,000008lp, and 000010lp) provided very similar size spectra,we adjusted these three UVP6 to make them our references forfuture intercalibrations of all other UPV6 units (Fig. 3). Thethree UVP6s were attached to the same frame with a referenceUVP5, which itself had been monitored over a number ofyears for its stability by comparisons with other UVP5. Welowered these four UVPs off Nice (Mediterranean Sea, France)at the speed of 0.5 m s�1 down to 250 or 500 m during sixdives over a period of 3 weeks. The total volumes imaged bythe three UVP6 ranged between 763 and 1232 L. After averag-ing the raw size spectra of all vertical profiles of each of thethree UVP6s, we compared the resulting three sets of spectrawith the averaged raw size spectra of the reference UVP5.Because the reference UVP5 had larger pixels than the UVP6s,we limited the size range of the intercalibration analysis toparticles above 9 pixels for UVP5 and 24 pixels for UVP6, for
which the abundance of objects began to be very similar, andwe limited the upper sizes to classes in which a minimum of30 objects were counted.
We then determined the optimal threshold for each UVP6as being the gray level for segmentation for which the RMSEbetween the raw particle size spectra of the UVP6 and the ref-erence UVP5 was minimum. The final value of the optimumthreshold was 20 on the 0–255 8-bit gray scale for each of thethree UVP6s.
We then computed the tuning parameters Aa and Exp(Eq. 1) of each UVP6 by minimizing the RMSE distancebetween the particle size spectra of UVP5 and UVP6. The smallranges of Aa (2271–2387) and Exp (1.130–1.143) show thatthe three UVP6 references produced almost identical results.
Intercalibration of the 1st two UVP6 seriesNext, we used the same method to intercalibrate the 1st
18 UVP6s (4 others from LOV and 14 from Hydroptic), exceptthat we averaged the size spectra of the three reference UVP6sinstead of using the measurements from a single UVP5. Inaddition, given that all UVP6s had the same resolution, weextended the size range down to 3-pixel objects. We did notcount the 1- and 2-pixel objects, which could have beenimpacted by sensor noise. As previously, we limited the uppersize to those classes in which a minimum of 30 objects werecounted.
Each UVP6 was lowered three times at sea, using a differentshutter value each time (i.e., optimum, 15% lower, and 15%higher). For each shutter value, the optimum threshold forimage segmentation was determined by minimizing theRMSE. The best shutter value was the one providing the clos-est optimum threshold above 20 (i.e., the optimum thresholdof the three reference UVP6s) on the 8-bit gray scale (0–255).This method ensured similar and limited noise for each UVP6.The Aa and Exp parameters (Eq. 1) were then adjusted for finertuning.
The mean resulting threshold on the 8-bit gray scale (0–255) for all the intercalibrated UVP6s was 20.6 (20–22), veryclose to the threshold for the three reference UVP6. This resultindicated that the shutter correction and range were efficientat adjusting the different UVP6s, and that the UVP6s fromLOV and Hydroptic did not differ.
We also compared the inter-UVP6 distribution of RMSEbetween size spectra (particle abundance as a function of sizeexpressed in Equivalent Spherical Diameter) for two differentcases: (1) with the threshold tuning and using the mean Aaand Exp values of the reference UVP6s, and (2) with thethreshold tuning and using and individually optimized Aaand Exp values for each UVP6. Optimizing the Aa and Expparameters for each UVP6 led to a smaller RMSE, as expected.We noticed, however, that, in both cases, the RMSE was betterthan the RMSE of the three reference UVP6s. The optimizationof Aa and Exp for each UVP6 was therefore not relevant, andwe consequently favored a hardware calibration of the shutter
Fig. 3. Example of results from an in situ intercalibration experiment.The particle spectra of three UVP6s (gray crosses, after adjustment duringthe in situ intercalibration experiments) are compared to those of thethree UVP6 references (red circles).
6
Picheral et al. UVP6: Underwater imaging sensor for autonomous platforms
and its corresponding threshold to obtain coherent resultsamong UVP6s. Hence, the same averaged Aa and Exp parame-ters (i.e., 2300 and 1.1359, respectively) are used for all UVP6s.These parameters provide a lower detection size of 55 and81 μm ESD for 1- and 2-pixel targets, respectively.
Conclusion from the UVP6 intercalibrationThe tuning of a UVP6 includes measurement of the light
power and selection of the best shutter value and threshold ofthe 8-bit gray scale close to 20 to fit the performance of thereference UVP6s. Even if the tuning procedure of the thresh-old values was limited to particle sizes up to 1 mm in the tri-als, these values could be extended by increasing the sampledwater volume via deeper and/or repeated deployments. Thematching of size spectra indicates that the detection of parti-cles was identical for all UVP6s (Fig. 3).
The intercalibration statistics from 18 UVP6s indicate that themean shutter was 318 ms at gain 6, the threshold was 20.6 (8-bitgray 0–255 scale), and the RMSE for the reference size spectrumwas 0.0028. The standard deviations for the shutter, the gain andthe RMSE were 53 ms, 0.6 and 0.0019, respectively.
UVP6 integration setup for in situ deploymentThe UVP6 has been designed to be easily integrated into
different autonomous or cabled platforms, that is, in addition
to its small size and low power consumption, it can start auto-matically after powering. It can also be fully piloted by theplatform, to which it will generally be attached via the con-necting arm between the camera and the light unit. Thanks toits RS232 and Ethernet interfaces, communication and down-loading of data without opening the camera housing are possi-ble and easy.
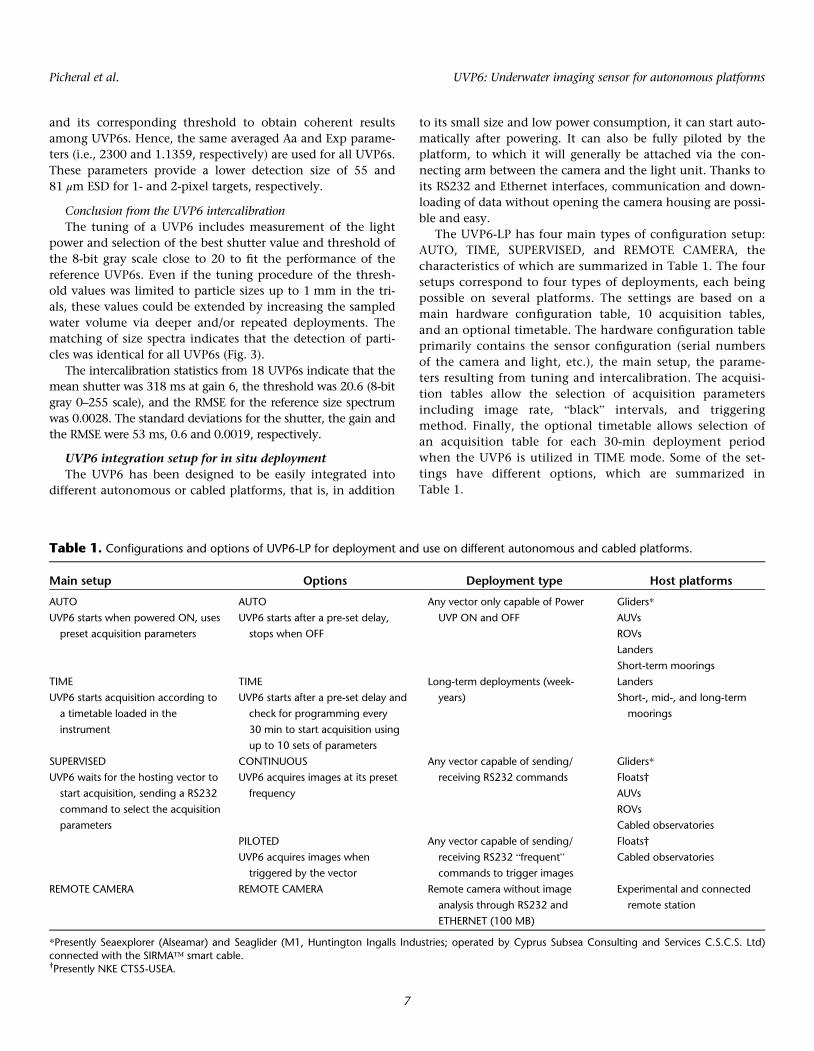
The UVP6-LP has four main types of configuration setup:AUTO, TIME, SUPERVISED, and REMOTE CAMERA, thecharacteristics of which are summarized in Table 1. The foursetups correspond to four types of deployments, each beingpossible on several platforms. The settings are based on amain hardware configuration table, 10 acquisition tables,and an optional timetable. The hardware configuration tableprimarily contains the sensor configuration (serial numbersof the camera and light, etc.), the main setup, the parame-ters resulting from tuning and intercalibration. The acquisi-tion tables allow the selection of acquisition parametersincluding image rate, “black” intervals, and triggeringmethod. Finally, the optional timetable allows selection ofan acquisition table for each 30-min deployment periodwhen the UVP6 is utilized in TIME mode. Some of the set-tings have different options, which are summarized inTable 1.
Table 1. Configurations and options of UVP6-LP for deployment and use on different autonomous and cabled platforms.
Main setup Options Deployment type Host platforms
AUTO
UVP6 starts when powered ON, uses
preset acquisition parameters
AUTO
UVP6 starts after a pre-set delay,
stops when OFF
Any vector only capable of Power
UVP ON and OFF
Gliders*
AUVs
ROVs
Landers
Short-term moorings
TIME
UVP6 starts acquisition according to
a timetable loaded in the
instrument
TIME
UVP6 starts after a pre-set delay and
check for programming every
30 min to start acquisition using
up to 10 sets of parameters
Long-term deployments (week-
years)
Landers
Short-, mid-, and long-term
moorings
SUPERVISED
UVP6 waits for the hosting vector to
start acquisition, sending a RS232
command to select the acquisition
parameters
CONTINUOUS
UVP6 acquires images at its preset
frequency
Any vector capable of sending/
receiving RS232 commands
Gliders*
Floats†
AUVs
ROVs
Cabled observatories
PILOTED
UVP6 acquires images when
triggered by the vector
Any vector capable of sending/
receiving RS232 “frequent”commands to trigger images
Floats†
Cabled observatories
REMOTE CAMERA REMOTE CAMERA Remote camera without image
analysis through RS232 and
ETHERNET (100 MB)
Experimental and connected
remote station
*Presently Seaexplorer (Alseamar) and Seaglider (M1, Huntington Ingalls Industries; operated by Cyprus Subsea Consulting and Services C.S.C.S. Ltd)connected with the SIRMA™ smart cable.†Presently NKE CTS5-USEA.
7
Picheral et al. UVP6: Underwater imaging sensor for autonomous platforms
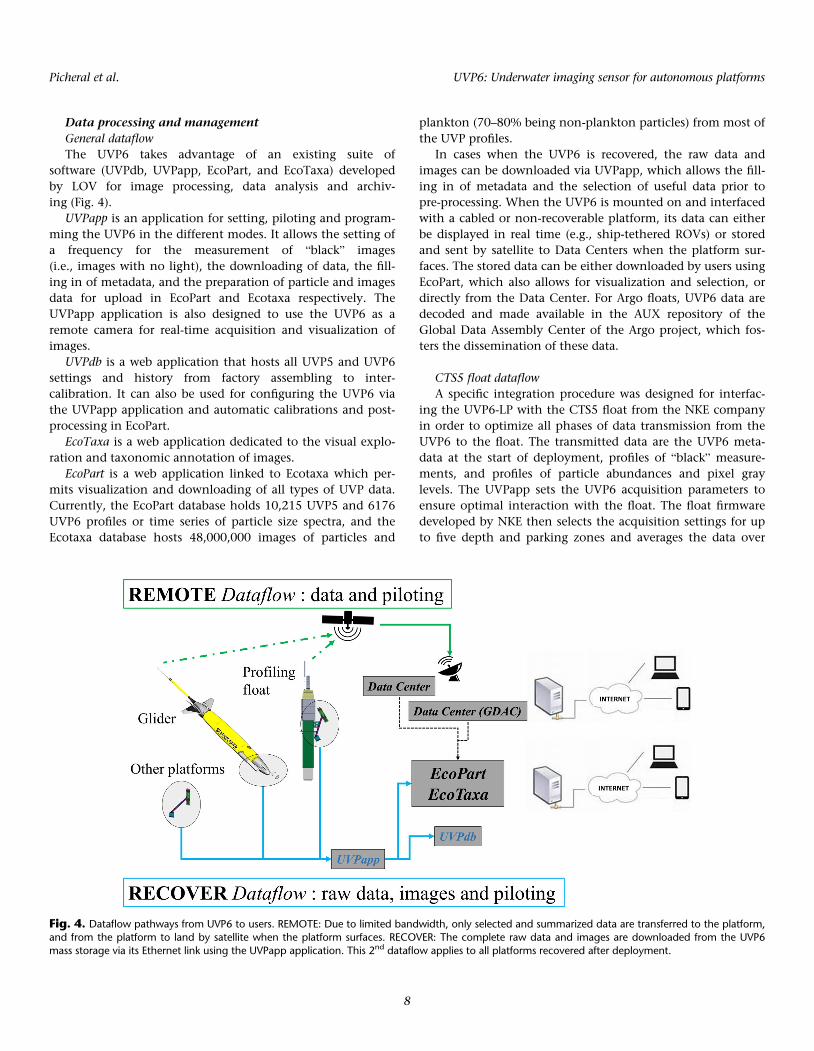
Data processing and managementGeneral dataflowThe UVP6 takes advantage of an existing suite of
software (UVPdb, UVPapp, EcoPart, and EcoTaxa) developedby LOV for image processing, data analysis and archiv-ing (Fig. 4).
UVPapp is an application for setting, piloting and program-ming the UVP6 in the different modes. It allows the setting ofa frequency for the measurement of “black” images(i.e., images with no light), the downloading of data, the fill-ing in of metadata, and the preparation of particle and imagesdata for upload in EcoPart and Ecotaxa respectively. TheUVPapp application is also designed to use the UVP6 as aremote camera for real-time acquisition and visualization ofimages.
UVPdb is a web application that hosts all UVP5 and UVP6settings and history from factory assembling to inter-calibration. It can also be used for configuring the UVP6 viathe UVPapp application and automatic calibrations and post-processing in EcoPart.
EcoTaxa is a web application dedicated to the visual explo-ration and taxonomic annotation of images.
EcoPart is a web application linked to Ecotaxa which per-mits visualization and downloading of all types of UVP data.Currently, the EcoPart database holds 10,215 UVP5 and 6176UVP6 profiles or time series of particle size spectra, and theEcotaxa database hosts 48,000,000 images of particles and
plankton (70–80% being non-plankton particles) from most ofthe UVP profiles.
In cases when the UVP6 is recovered, the raw data andimages can be downloaded via UVPapp, which allows the fill-ing in of metadata and the selection of useful data prior topre-processing. When the UVP6 is mounted on and interfacedwith a cabled or non-recoverable platform, its data can eitherbe displayed in real time (e.g., ship-tethered ROVs) or storedand sent by satellite to Data Centers when the platform sur-faces. The stored data can be either downloaded by users usingEcoPart, which also allows for visualization and selection, ordirectly from the Data Center. For Argo floats, UVP6 data aredecoded and made available in the AUX repository of theGlobal Data Assembly Center of the Argo project, which fos-ters the dissemination of these data.
CTS5 float dataflowA specific integration procedure was designed for interfac-
ing the UVP6-LP with the CTS5 float from the NKE companyin order to optimize all phases of data transmission from theUVP6 to the float. The transmitted data are the UVP6 meta-data at the start of deployment, profiles of “black” measure-ments, and profiles of particle abundances and pixel graylevels. The UVPapp sets the UVP6 acquisition parameters toensure optimal interaction with the float. The float firmwaredeveloped by NKE then selects the acquisition settings for upto five depth and parking zones and averages the data over
Fig. 4. Dataflow pathways from UVP6 to users. REMOTE: Due to limited bandwidth, only selected and summarized data are transferred to the platform,and from the platform to land by satellite when the platform surfaces. RECOVER: The complete raw data and images are downloaded from the UVP6mass storage via its Ethernet link using the UVPapp application. This 2nd dataflow applies to all platforms recovered after deployment.
8
Picheral et al. UVP6: Underwater imaging sensor for autonomous platforms
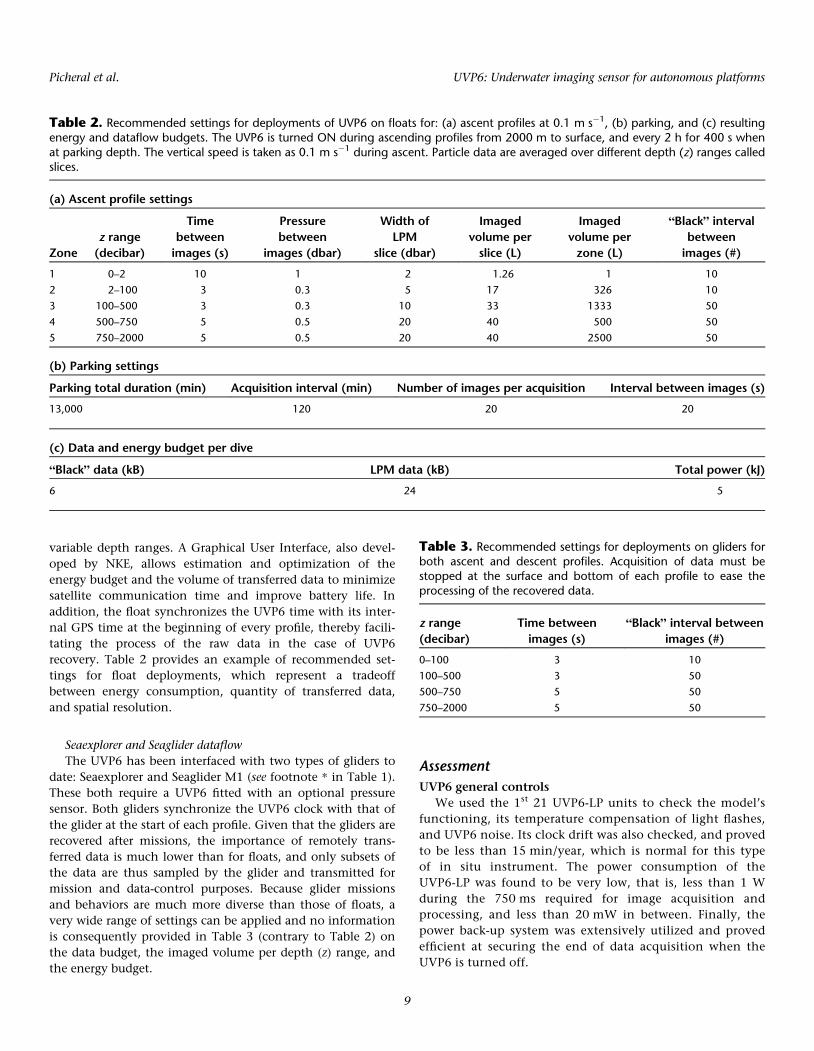
variable depth ranges. A Graphical User Interface, also devel-oped by NKE, allows estimation and optimization of theenergy budget and the volume of transferred data to minimizesatellite communication time and improve battery life. Inaddition, the float synchronizes the UVP6 time with its inter-nal GPS time at the beginning of every profile, thereby facili-tating the process of the raw data in the case of UVP6recovery. Table 2 provides an example of recommended set-tings for float deployments, which represent a tradeoffbetween energy consumption, quantity of transferred data,and spatial resolution.
Seaexplorer and Seaglider dataflowThe UVP6 has been interfaced with two types of gliders to
date: Seaexplorer and Seaglider M1 (see footnote * in Table 1).These both require a UVP6 fitted with an optional pressuresensor. Both gliders synchronize the UVP6 clock with that ofthe glider at the start of each profile. Given that the gliders arerecovered after missions, the importance of remotely trans-ferred data is much lower than for floats, and only subsets ofthe data are thus sampled by the glider and transmitted formission and data-control purposes. Because glider missionsand behaviors are much more diverse than those of floats, avery wide range of settings can be applied and no informationis consequently provided in Table 3 (contrary to Table 2) onthe data budget, the imaged volume per depth (z) range, andthe energy budget.
AssessmentUVP6 general controls
We used the 1st 21 UVP6-LP units to check the model’sfunctioning, its temperature compensation of light flashes,and UVP6 noise. Its clock drift was also checked, and provedto be less than 15 min/year, which is normal for this typeof in situ instrument. The power consumption of theUVP6-LP was found to be very low, that is, less than 1 Wduring the 750 ms required for image acquisition andprocessing, and less than 20 mW in between. Finally, thepower back-up system was extensively utilized and provedefficient at securing the end of data acquisition when theUVP6 is turned off.
Table 2. Recommended settings for deployments of UVP6 on floats for: (a) ascent profiles at 0.1 m s�1, (b) parking, and (c) resultingenergy and dataflow budgets. The UVP6 is turned ON during ascending profiles from 2000 m to surface, and every 2 h for 400 s whenat parking depth. The vertical speed is taken as 0.1 m s�1 during ascent. Particle data are averaged over different depth (z) ranges calledslices.
(a) Ascent profile settings
Zonez range(decibar)
Timebetweenimages (s)
Pressurebetween
images (dbar)
Width ofLPM
slice (dbar)
Imagedvolume perslice (L)
Imagedvolume perzone (L)
“Black” intervalbetweenimages (#)
1 0–2 10 1 2 1.26 1 10
2 2–100 3 0.3 5 17 326 10
3 100–500 3 0.3 10 33 1333 50
4 500–750 5 0.5 20 40 500 50
5 750–2000 5 0.5 20 40 2500 50
(b) Parking settings
Parking total duration (min) Acquisition interval (min) Number of images per acquisition Interval between images (s)
13,000 120 20 20
(c) Data and energy budget per dive
“Black” data (kB) LPM data (kB) Total power (kJ)
6 24 5
Table 3. Recommended settings for deployments on gliders forboth ascent and descent profiles. Acquisition of data must bestopped at the surface and bottom of each profile to ease theprocessing of the recovered data.
z range(decibar)
Time betweenimages (s)
“Black” interval betweenimages (#)
0–100 3 10
100–500 3 50
500–750 5 50
750–2000 5 50
9
Picheral et al. UVP6: Underwater imaging sensor for autonomous platforms
UVP6 orientation on floatsFor deployments on floats, we compared the vertical orien-
tation of the sensors by mounting two UVP6s on the samefloat for three descent and three ascent profiles (down to850, 650, and 470 decibars, respectively). The analysis of theresults confirmed that down-looking and up-looking profilesprovided the same information during both descent(0.03 m s�1) and typical float ascent (0.1 m/s), which wascoherent with the fact that the float’s very low speed preventsany wake effect. This result led to the decision to mount theUVP6 on floats looking downwards, as this orientation reducesthe effect of direct sunlight on the images, and also preventssinking particles from settling on the instrument’s porthole.
Three case studiesWe deployed UVP6 prototypes on different platforms.
Here, we present examples of selected data from deployments
on NKE CTS5 floats, a Seaexplorer glider in the MediterraneanSea, and a mooring in the Arctic Ocean near Svalbard,Norway. All data were processed using UVPapp and importedin EcoPart and Ecotaxa after recovery, and also in quasi realtime via satellite telemetry for the float and glider deploy-ments. The data used for Figs. 5–9 were exported with EcoPart.The purpose here is not to analyze data in detail, but to pro-vide examples of the possibilities provided by the UVP6mounted on autonomous platforms. We also provide imagesof different particles and plankton recorded by the UVP6 toillustrate its imaging capability. The original data are availableon the EcoPart and Ecotaxa websites.
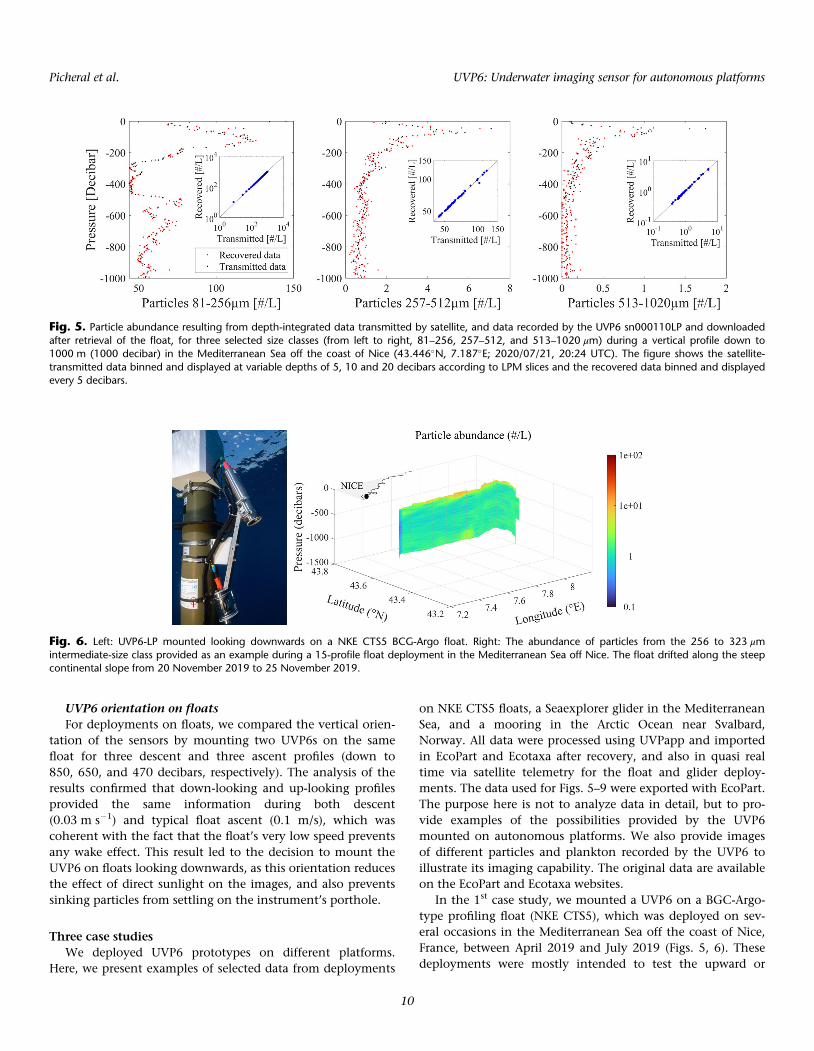
In the 1st case study, we mounted a UVP6 on a BGC-Argo-type profiling float (NKE CTS5), which was deployed on sev-eral occasions in the Mediterranean Sea off the coast of Nice,France, between April 2019 and July 2019 (Figs. 5, 6). Thesedeployments were mostly intended to test the upward or
Fig. 5. Particle abundance resulting from depth-integrated data transmitted by satellite, and data recorded by the UVP6 sn000110LP and downloadedafter retrieval of the float, for three selected size classes (from left to right, 81–256, 257–512, and 513–1020 μm) during a vertical profile down to1000 m (1000 decibar) in the Mediterranean Sea off the coast of Nice (43.446�N, 7.187�E; 2020/07/21, 20:24 UTC). The figure shows the satellite-transmitted data binned and displayed at variable depths of 5, 10 and 20 decibars according to LPM slices and the recovered data binned and displayedevery 5 decibars.
Fig. 6. Left: UVP6-LP mounted looking downwards on a NKE CTS5 BCG-Argo float. Right: The abundance of particles from the 256 to 323 μmintermediate-size class provided as an example during a 15-profile float deployment in the Mediterranean Sea off Nice. The float drifted along the steepcontinental slope from 20 November 2019 to 25 November 2019.
10
Picheral et al. UVP6: Underwater imaging sensor for autonomous platforms
downward orientation of the UVP6, the transfer of databetween the UVP6 and the float, the satellite data transmis-sion, and the coherence between the transmitted data andthose downloaded after recovering the instrument. Maximumdeployment duration was 30 d, with one vertical profile oneach day. A maximum of 30 profiles was acquired during eachdeployment, corresponding to a virtual 10-month deploymentfor a classic BGC-Argo float profiling once every 10 d. Datatransmitted by satellite, although averaged onboard the UVP6over depth intervals, were not different from those down-loaded after the float deployment (Fig. 5).
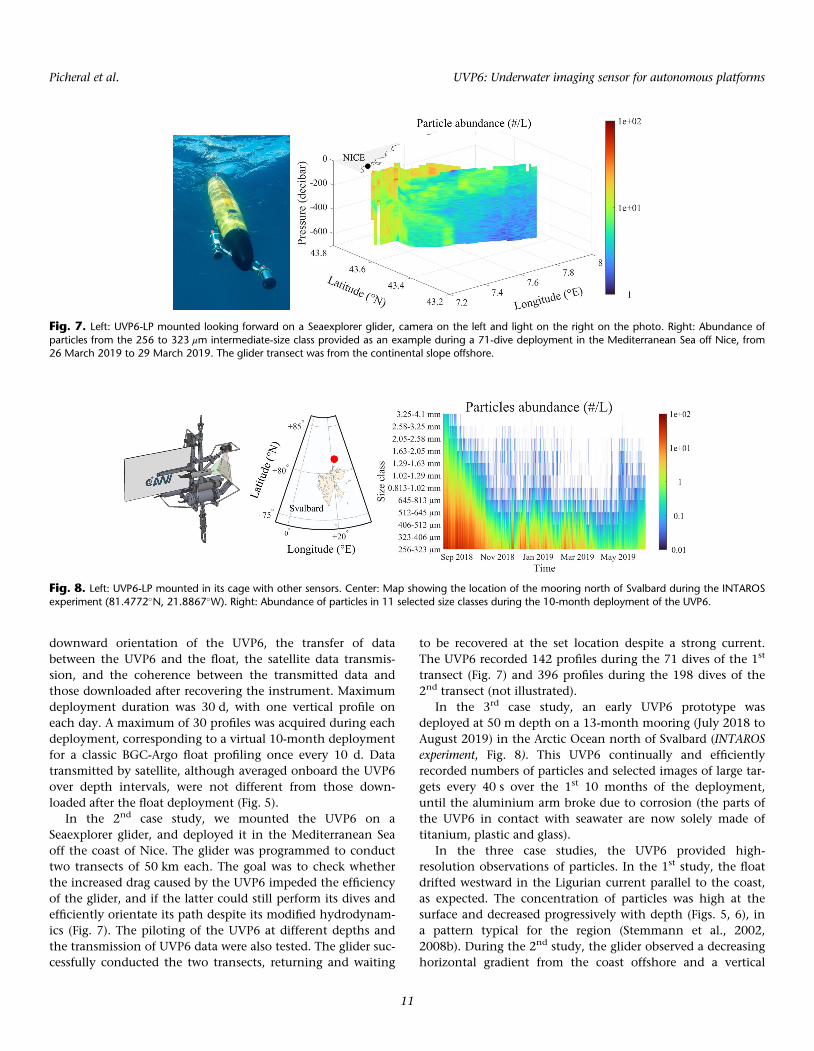
In the 2nd case study, we mounted the UVP6 on aSeaexplorer glider, and deployed it in the Mediterranean Seaoff the coast of Nice. The glider was programmed to conducttwo transects of 50 km each. The goal was to check whetherthe increased drag caused by the UVP6 impeded the efficiencyof the glider, and if the latter could still perform its dives andefficiently orientate its path despite its modified hydrodynam-ics (Fig. 7). The piloting of the UVP6 at different depths andthe transmission of UVP6 data were also tested. The glider suc-cessfully conducted the two transects, returning and waiting
to be recovered at the set location despite a strong current.The UVP6 recorded 142 profiles during the 71 dives of the 1st
transect (Fig. 7) and 396 profiles during the 198 dives of the2nd transect (not illustrated).
In the 3rd case study, an early UVP6 prototype wasdeployed at 50 m depth on a 13-month mooring (July 2018 toAugust 2019) in the Arctic Ocean north of Svalbard (INTAROSexperiment, Fig. 8). This UVP6 continually and efficientlyrecorded numbers of particles and selected images of large tar-gets every 40 s over the 1st 10 months of the deployment,until the aluminium arm broke due to corrosion (the parts ofthe UVP6 in contact with seawater are now solely made oftitanium, plastic and glass).
In the three case studies, the UVP6 provided high-resolution observations of particles. In the 1st study, the floatdrifted westward in the Ligurian current parallel to the coast,as expected. The concentration of particles was high at thesurface and decreased progressively with depth (Figs. 5, 6), ina pattern typical for the region (Stemmann et al., 2002,2008b). During the 2nd study, the glider observed a decreasinghorizontal gradient from the coast offshore and a vertical
Fig. 7. Left: UVP6-LP mounted looking forward on a Seaexplorer glider, camera on the left and light on the right on the photo. Right: Abundance ofparticles from the 256 to 323 μm intermediate-size class provided as an example during a 71-dive deployment in the Mediterranean Sea off Nice, from26 March 2019 to 29 March 2019. The glider transect was from the continental slope offshore.
Fig. 8. Left: UVP6-LP mounted in its cage with other sensors. Center: Map showing the location of the mooring north of Svalbard during the INTAROSexperiment (81.4772�N, 21.8867�W). Right: Abundance of particles in 11 selected size classes during the 10-month deployment of the UVP6.
11
Picheral et al. UVP6: Underwater imaging sensor for autonomous platforms
gradient from the surface to 1000 m depth (Fig. 7), consistentwith an earlier observation (Stemmann et al. 2008b). TheUVP6 mounted on a float provided daily vertical variations ofparticles during 1 month, which have only been observedonce in the past because of the ship time required (Stemmannet al. 2000). The UVP6 mounted on a glider provided detailsof the sharp boundary in the distribution of particles acrossthe Ligurian Current, an area subject to complex horizontaland vertical hydrodynamics (Stemmann et al. 2008b). For the3rd study in the Arctic Ocean, there were no previous data onparticles acquired at such a frequency in the selected area. Theresults (Fig. 8) show a three-step seasonal dynamic, with aninitial decrease in particle concentration at the onset of win-ter, episodic particle bursts during winter which could corre-spond to sea-ice dynamics, and the beginning of a particle risein June possibly resulting from the settling of particles pro-duced during the spring bloom.
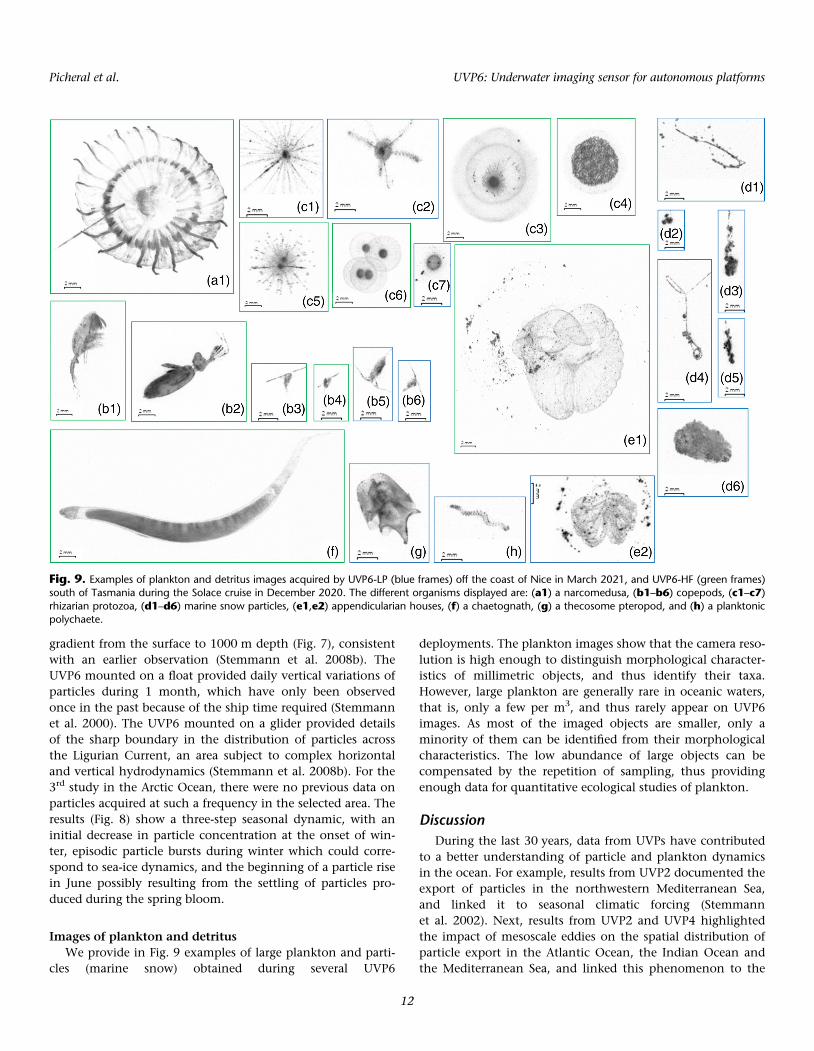
Images of plankton and detritusWe provide in Fig. 9 examples of large plankton and parti-
cles (marine snow) obtained during several UVP6
deployments. The plankton images show that the camera reso-lution is high enough to distinguish morphological character-istics of millimetric objects, and thus identify their taxa.However, large plankton are generally rare in oceanic waters,that is, only a few per m3, and thus rarely appear on UVP6images. As most of the imaged objects are smaller, only aminority of them can be identified from their morphologicalcharacteristics. The low abundance of large objects can becompensated by the repetition of sampling, thus providingenough data for quantitative ecological studies of plankton.
DiscussionDuring the last 30 years, data from UVPs have contributed
to a better understanding of particle and plankton dynamicsin the ocean. For example, results from UVP2 documented theexport of particles in the northwestern Mediterranean Sea,and linked it to seasonal climatic forcing (Stemmannet al. 2002). Next, results from UVP2 and UVP4 highlightedthe impact of mesoscale eddies on the spatial distribution ofparticle export in the Atlantic Ocean, the Indian Ocean andthe Mediterranean Sea, and linked this phenomenon to the
Fig. 9. Examples of plankton and detritus images acquired by UVP6-LP (blue frames) off the coast of Nice in March 2021, and UVP6-HF (green frames)south of Tasmania during the Solace cruise in December 2020. The different organisms displayed are: (a1) a narcomedusa, (b1–b6) copepods, (c1–c7)rhizarian protozoa, (d1–d6) marine snow particles, (e1,e2) appendicularian houses, (f) a chaetognath, (g) a thecosome pteropod, and (h) a planktonicpolychaete.
12
Picheral et al. UVP6: Underwater imaging sensor for autonomous platforms
surface distribution of phytoplankton blooms (Stemmannet al. 2002; Guidi et al. 2007; Waite et al., 2016). Later,improvements to the imaging sensor and lighting system ofthe UVP4 enabled simultaneous estimation of vertical distri-butions of particles and zooplankton, and led to the 1st publi-shed comparison of mesopelagic macrozooplanktonassemblages in a mesoscale context and across oceanic regions(Stemmann et al. 2008a,c). In addition, a global analysis ofthe complete database generated by the different UVPsshowed that the size distribution of particles in the mesope-lagic layer is closely related to the size distribution of phyto-plankton in the euphotic zone (Guidi et al. 2009).
As of 2008, the UVP5 could be installed on CTD-rosetteframes and deployed together with other oceanographic sen-sors, that is, it no longer required stand-alone deployments ordedicated ship time. Since then, the UVP5 has been deployedon average 1000 times per year, resulting in community pro-gress in the study of key processes related to global andregional biological carbon pumps (Guidi et al. 2015; Ram-ondenc et al. 2016), macroplankton diversity in the upperkilometer of the ocean (Forest et al. 2012; Sandel et al. 2015;Biard et al. 2016; Christiansen et al. 2018), and fluxes of parti-cles across coastal regions (Forest et al. 2013), in oxygen mini-mum zone areas (Roullier et al. 2014) and in the deepequatorial Pacific Ocean (Kiko et al. 2017). Other majorimprovements include software developments for both thestreaming of data from UVPs to databases, and the automaticrecognition of all types of objects (particles and plankton) onUVP images.
The “quantum leap” from UVP5 to UVP6 represents amajor step forward in our ability to observe particles andplankton in the ocean. This is because the UVP6 can bemounted on floats, gliders and other autonomous or tetheredplatforms, thus allowing investigation of spatial and temporalparticle and plankton dynamics at a high resolution that hasbeen out of reach until now. The UVP6 has already beendeployed down to 4500 m on Kiel6000 ROV, landers, bottomstations, sediment traps, and drifting arrays. Presently (2nd
half of 2021), six UVP6 are profiling on CTS5 (BGC-)Argofloats in the Indian, Atlantic, and Pacific Oceans, and threeunits are deployed on long-term moorings in the EquatorialAtlantic and in the Wedel Sea.
Examples of what is now made possible by the UVP6include deployments on moorings to capture the effects ofrapid temporal events such as storms, periods of stratification,and destratification, or temporary intrusions of water masseson particles and plankton. Meanwhile, UV6s mounted ongliders can potentially survey the distributions of particles andplankton in and across physical features such as eddies, fronts,mesoscale filaments, or microlayers, which were difficult tocapture with previous UVPs because of the required ship time.Otherwise, UVP6 mounted on BCG-Argo floats together withother BGC sensors could provide long-term information(up to 4 years if used in a classic BGC-Argo float framework of
about 350 cycles from 1000 m depth to the surface, or200 cycles from 2000 m to the surface every 10 d), thus gener-ating new understanding about seasonal and multi-annualvariations of biological activity in surface and intermediatewaters and deep particle export. These examples representonly a fraction of what is achievable with the UVP6, as it mayalso be integrated into cabled benthic observatories, deployedin rivers, lakes, canals, industrial waters, used to monitor bal-last water, as well as other applications not yet foreseen.
Comments and recommendationsThe UVP6 is an optical sensor, and as such its optical sur-
faces need to remain clean and should be regularly checked toavoid biofouling and ensure data consistency when deployedin shallow water. Biofouling is limited on floats because theirdeep parking depth (≥ 1000 m) prevents colonization by bio-films. Our 1st observations show that the results from fielddeployments on the Svalbard mooring, floats and gliders (seeabove) were not impacted by any biofouling. In conditionswhere biofouling could occur, cleaning or protection devicesfor lenses or lighting could be interfaced using the input/out-put channel already present on the UVP6.
The present state of the UVP6 sensor leaves daytime verti-cal profiles open to impact by sunlight in the upper water col-umn (e.g., down to 50 m in oceanic waters and at times ofhigh sun elevation). This impact is nevertheless minimized bymounting the UVP facing down on floats as recommendedabove, which in addition prevents sinking particles from set-tling on the UVP’s porthole. It is also recommended that theUVP6 be set to record “black” images at regular image-acquisition intervals, that is, every 10 images above 100 mand every 50 deeper (default option in the acquisition tables;see above). The resulting information can be used to monitorthe UVP6 noise for 1- and 2-pixel particles, and possibly sub-tract it from the data afterward. The “black” measurements(i.e., acquired without activating the light) are also useful fordetecting times when sunlight increases the noise levels onsmaller particles (remnant overexposure), thus enabling defini-tion of the useful depth for each profile below which the dataare free from this bias.
When it is possible to recover the UVP6 after deployment(i.e., generally not the case when the UVP is mounted on afloat), researchers can download the recorded images, whichcan generally not be transmitted by satellite. The downloadeddata allow post-calibration, and detailed identification of theobjects on images. In addition, they give access to finer verti-cal resolution, which is voluntarily degraded to limit theamount of data transmitted by satellite and the duration ofdata transmission (the two dataflow pathways in Fig. 5).
The UVP6-LP was developed for integration on autono-mous vectors, hence our strategy of energy thriftiness. Resultsof the UVP6 are comparable to those of the UVP5 in terms ofthe abundance of small particles, but due to a lower
13
Picheral et al. UVP6: Underwater imaging sensor for autonomous platforms
acquisition rate and smaller imaged volume, larger objectsincluding zooplankton could be rarer in UVP6-LP data sets, asobserved during our intercalibration experiments. TheUVP6-LP’s slow acquisition rate resulting from energy limita-tion precludes its use on fast-speed vectors such as AUVs andCTDs, for which we designed the UVP6-HF. The latter sensoris now undergoing extensive tests on different cruises in thePacific, Indian, Atlantic, and Arctic Oceans.
ReferencesBiard, T., and others. 2016. In situ imaging reveals the biomass
of giant protists in the global ocean. Nature 532: 504. doi:10.1038/nature17652
Christiansen, S., and others. 2018. Particulate matter fluxinterception in oceanic mesoscale eddies by the polychaetePoeobius sp. Limnol. Oceanogr. 63: 2093–2109. doi:10.1002/lno.10926
Claustre, H., K. S. Johnson, and Y. Takeshita. 2020. Observingthe global ocean with biogeochemical-Argo. Ann. Rev. Mar.Sci. 12: 23–48. doi:10.1146/annurev-marine-010419-010956
Ducklow, H. W., D. K. Steinberg, and K. O. Buesseler. 2001.Upper ocean carbon export and the biological pump.Oceanogr. Wash. DC Oceanogr. Soc. 14: 50–58. doi:10.5670/oceanog.2001.06
Forest, A., L. Stemmann, M. Picheral, L. Burdorf, D. Robert, L.Fortier, and M. Babin. 2012. Size distribution of particlesand zooplankton across the shelf-basin system in southeastBeaufort Sea: Combined results from an Underwater VisionProfiler and vertical net tows. Biogeosciences 9: 1301–1320.doi:10.5194/Bg-9-1301-2012
Forest, A., and others. 2013. Ecosystem function and particleflux dynamics across the Mackenzie Shelf (Beaufort Sea,Arctic Ocean): An integrative analysis of spatial variabilityand biophysical forcings. Biogeosciences 10: 2833–2866.doi:10.5194/bg-10-2833-2013
Gorsky, G., M. Picheral, and L. Stemmann. 2000. Use of theUnderwater Video Profiler for the study of aggregatedynamics in the North Mediterranean. Estuar. Coast. ShelfSci. 50: 121–128. doi:10.1006/ecss.1999.0539
Gorsky, G., L. Prieur, I. Taupier-Letage, L. Stemmann, and M.Picheral. 2002. Large particulate matter in the WesternMediterranean: I. LPM distribution related to mesoscalehydrodynamics. Journal of Marine Systems 33: 289–311.doi:10.1016/S0924-7963(02)00063-5
Guidi, L., L. Stemmann, L. Legendre, M. Picheral, L. Prieur, andG. Gorsky. 2007. Vertical distribution of aggregates (> 110μm) and mesoscale activity in the northeastern Atlantic:Effects on the deep vertical export of surface carbon. Limnol.Oceanogr. 52: 7–18. doi:10.4319/lo.2007.52.1.0007
Guidi, L., L. Stemmann, G. A. Jackson, F. Ibanez, H. Claustre,L. Legendre, M. Picheral, and G. Gorsky. 2009. Effects ofphytoplankton community on production, size and export
of large aggregates: A world-ocean analysis. Limnol. Ocean-ogr. 54: 1951–1963. doi:10.4319/lo.2009.54.6.1951
Guidi, L., P. H. Calil, S. Duhamel, K. M. Björkman, S. C.Doney, G. A. Jackson, B. Li, M. J. Church, S. Tozzi, Z. S.Kolber, and K. J. Richards. 2012. Does eddy-eddy interactioncontrol surface phytoplankton distribution and carbonexport in the North Pacific Subtropical Gyre? J. Geophys.Res. Biogeosci. 117: G02024. doi:10.1029/2012JG001984
Guidi, L., L. Legendre, G. Reygondeau, J. Uitz, L. Stemmann,and S. A. Henson. 2015. A new look at ocean carbonremineralization for estimating deepwater sequestration.Global Biogeochem. Cycles 29: 1044–1059. doi:10.1002/2014gb005063
Honjo, S., K. W. Doherty, Y. C. Agrawal, and V. L. Asper. 1984.Direct optical assessment of large amorphous aggregates(marine snow) in the Deep Ocean. Deep Sea Res. Part Ocean-ogr. Res. Pap. 31: 67–76. doi:10.1016/0198-0149(84)90073-6
Kiko, R., and others. 2017. Biological and physical influenceson marine snowfall at the equator. Nat. Geosci. 10: 852.doi:10.1038/ngeo3042
Lampitt, R. S., W. R. Hillier, and P. G. Challenor. 1993. Sea-sonal and diel variation in the open ocean concentration ofmarine snow aggregates. Nature 362: 737–739. doi:10.1038/362737a0
Lombard, F., and others. 2019. Globally consistent quantita-tive observations of planktonic ecosystems. Front. Mar. Sci.6: 196. doi:10.3119/fmars.2019.00196
Miloslavich, P., and others. 2018. Essential ocean variables forglobal sustained observations of biodiversity and ecosystemchanges. Glob. Change Biol. 24: 2416–2433. doi:10.1111/gcb.14108
Muller-Karger, F. E., and others. 2018. Advancing marine bio-logical observations and data requirements of the comple-mentary essential ocean variables (EOVs) and essentialbiodiversity variables (EBVs) frameworks. Front. Mar. Sci.5: 211.
Ohman, M. D., R. E. Davis, J. T. Sherman, K. R. Grindley,B. M. Whitmore, C. F. Nickels, and J. S. Ellen. 2019. Zoo-glider: An autonomous vehicle for optical and acousticsensing of zooplankton. Limnol. Oceanogr. Methods 17:69–86. doi:10.1002/lom3.10301
Picheral, M., L. Guidi, L. Stemmann, D. M. Karl, G. Iddaoud,and G. Gorsky. 2010. The Underwater Vision Profiler 5: Anadvanced instrument for high spatial resolution studies ofparticle size spectra and zooplankton. Limnol. Oceanogr.Methods 8: 462–473. doi:10.4319/lom.2010.8.462
Ramondenc, S., F. MadeleineGoutx, C. Lombard, L. Santinelli,G. G. Stemmann, and L. Guidi. 2016. An initial carbonexport assessment in the Mediterranean Sea based ondrifting sediment traps and the Underwater Vision Profilerdata sets. Deep-Sea Res. Part Oceanogr. Res. Pap. 117: 107–119. doi:10.1016/j.dsr.2016.08.015
Ratmeyer, V., and G. Wefer. 1996. A high resolution camera sys-tem (ParCa) for imaging particles in the ocean: System design
14
Picheral et al. UVP6: Underwater imaging sensor for autonomous platforms
and results from profiles and a three-month deployment.J. Mar. Res. 54: 589–603. doi:10.1357/0022240963213565
Roemmich, D., G. C. Johnson, S. Riser, R. Davis, J. Gilson,W. B. Owens, S. L. Garzoli, C. Schmid, and M. Ignaszewski.2009. The Argo program observing the Global Ocean withprofiling floats. Oceanography 22: 34–43. doi:10.5670/oceanog.2009.36
Rose, K. A., and others. 2010. End-to-end models for the anal-ysis of marine ecosystems: Challenges, issues, and nextsteps. Mar. Coast. Fish. 2: 115–130. doi:10.1577/C09-059.1
Roullier, F., L. Berline, L. Guidi, X. D. De Madron, M. Picheral,A. Sciandra, S. Pesant, and L. Stemmann. 2014. Particle sizedistribution and estimated carbon flux across the ArabianSea oxygen minimum zone. Biogeosciences 11: 4541–4557.doi:10.5194/bg-11-4541-2014
Sandel, V., R. Kiko, P. Brandt, M. Dengler, L. Stemmann, P.Vandromme, U. Sommer, and H. Hauss. 2015. NitrogenFuelling of the Pelagic Food Web of the Tropical Atlantic.PLoS One 10: e0131258. doi:10.1371/journal.pone.0131258
Stemmann, L., M. Picheral, and G. Gorsky. 2000. Diel varia-tion in the vertical distribution of particulate matter(> 0.15 mm) in the NW Mediterranean Sea investigatedwith the Underwater Video Profiler. Deep-Sea Res. Part IOceanogr. Res. Pap. 47: 505–531. doi:10.1016/S0967-0637(99)00100-4
Stemmann, L., G. Gorsky, J. C. Marty, M. Picheral, and J. C.Miquel. 2002. Four-year study of large-particle vertical dis-tribution (0–1000 m) in the NW Mediterranean in relationto hydrology, phytoplankton, and vertical flux. Deep-SeaRes. Part II Top. Stud. Oceanogr. 49: 2143–2162. doi:10.1016/S0967-0645(02)00032-2
Stemmann, L., A. Hosia, M. J. Youngbluth, H. Soiland, M.Picheral, and G. Gorsky. 2008a. Vertical distribution (0–1000 m) of macrozooplankton, estimated using the Under-water Video Profiler, in different hydrographic regimesalong the northern portion of the Mid-Atlantic Ridge.Deep-Sea Res. Part II Top. Stud. Oceanogr. 55: 94–105. doi:10.1016/j.dsr2.2007.09.019
Stemmann, L., L. Prieur, L. Legendre, I. Taupier-Letage, M.Picheral, L. Guidi, and G. Gorsky. 2008b. Effects of frontalprocesses on marine aggregate dynamics and fluxes: Aninterannual study in a permanent geostrophic front(NW Mediterranean). J. Mar. Syst. 70: 1–20.
Stemmann, L., and others. 2008. Global zoogeography of frag-ile macrozooplankton in the upper 100-1000 m inferredfrom the underwater video profiler. Ices J. Mar. Sci. 65:433–442. doi:10.1093/icesjms/fsn010
Stemmann, L., and E. Boss. 2012. Plankton and particle sizeand packaging: From determining optical properties to driv-ing the biological pump. Ann. Rev. Mar. Sci. 4: 263–290.doi:10.1146/Annurev-Marine-120710-100853
Stemmann, L., H. Claustre, and F. D’ortenzio. 2012a.Integrated observation system for pelagic ecosystems and
biogeochemical cycles in the oceans. Sens. Ecol. Integr.Knowl. Ecosyst. 1: 261–278.
Stemmann, L., M. Picheral, L. Guidi, F. Lombard, F. Prejger, H.Claustre, and G. Gorsky. 2012b. Assessing the spatial andtemporal distributions of zooplankton and marine particlesusing the Underwater Vision Profiler. Sens. Ecol. 119:119–137.
Travers, M., Y.-J. Shin, S. Jennings, and P. Cury. 2007. Towardsend-to-end models for investigating the effects of climateand fishing in marine ecosystems. Prog. Oceanogr. 75:751–770. doi:10.1016/j.pocean.2007.08.001
Trudnowska, E., and others. 2021. Marine snow morphologyilluminates the evolution of phytoplankton blooms anddetermines their subsequent vertical export. Nat. Commun.12: 2816. doi:10.1038/s41467-021-22994-4
Turner, J. T. 2015. Zooplankton fecal pellets, marine snow,phytodetritus and the ocean’s biological pump. Prog.Oceanogr. 130: 205–248. doi:10.1016/j.pocean.2014.08.005
Vilgrain, L., F. Maps, M. Picheral, M. Babin, C. Aubry, J.Irisson, and S. Ayata. 2021. Trait-based approach using insitu copepod images reveals contrasting ecological patternsacross an Arctic ice melt zone. Limnol. Oceanogr. 66(4):1155–1167. doi:10.1002/lno.11672
Waite, A. M., L. Stemmann, L. Guidi, P. H. R. Calil, A. M. C.Hogg, M. Feng, P. A. Thompson, M. Picheral, and G.Gorsky. 2016. The wineglass effect shapes particle export tothe deep ocean in mesoscale eddies. Geophys. Res. Lett. 43:9791–9800. doi:10.1002/2015gl066463
AcknowledgmentsWe acknowledge Prof. Gaby Gorsky who initiated the development of
the UVP. We gratefully thank Ehsan Abdi, Emna Abidi, Florent Besson, JeanYves Carval, Emilie Diamond, Laura Picheral, Louis Petiteau, Antoine Poteauand Christophe Schaeffer, for their assistance in the many technicalexperiments required for qualification of the UVP6. The development of theUVP6 was mainly funded by the European Union’s Horizon 2020 researchand innovation program under grant agreement no. 635359, projectBRIDGES (Bringing together Research and Industry for the Development ofGlider Environmental Services), and the GOPPI project of the “ProgrammeChallenge Numérique” of the French Banque Publique d’Investissementand the Pôle Mer Méditerranée. LS was supported in the initial phase of thedevelopment by the CNRS/Sorbonne University Chair VISION. Theintegration of the UVP6 on the NKE CTS5 float was partly funded by theERC REFINE (European Research Council, grant agreement 834177). Weacknowledge funding by the H2020 project INTAROS (Integrated Arcticobservation system; grant no. 727890) and the PACES (Polar Regions andCoasts in a Changing Earth System) Program of the Helmholtz Association.
Submitted 03 June 2021
Revised 05 October 2021
Accepted 30 November 2021
Associate editor: Ivona Cetinic
15
Picheral et al. UVP6: Underwater imaging sensor for autonomous platforms