measurements of the secondary particle energy spectra in the space shuttle
TRANSCRIPT
Pergamon Radiorim Measuremenrs, Vol. 24, No. 2. pp. I29- 138, I995
13504487(94)ooo94-8 Copyright c 1995 Elsevier Science Ltd
Printed in Great Britain. All rights reserved
1350-4487/95 $9.50 + .oo
MEASUREMENTS OF THE SECONDARY PARTICLE ENERGY SPECTRA IN THE SPACE SHUTTLE
GAUTAM D. BADHWAR, JAGDISH U. PATEL, FRANCIS A. CUCINOTTA* and JOHN W. WILSON*
NASA Johnson Space Center, Houston, TX 77058-3696, U.S.A.; and *NASA Langley Research Center, Hampton, VA 23681-0001, U.S.A.
(Received 6 September 1994)
Abstract-Measurements of the energy spectra of secondary particles produced by galactic cosmic rays and trapped protons due to the nuclear interactions of these particles with the Shuttle shielding provide a powerful tool for validating radiation transport codes. A code validated in this way can be used to better estimate the dose and dose equivalent to body organs, measurements that cannot be made directly. The principal cause of single event upsets in electronic devices in the region of the South Atlantic Anomaly is secondary particles, and even in the region of galactic cosmic radiation a significant fraction is produced by secondary particles. In this paper, we describe the first direct measurements of the energy spectra of secondary protons, deuterons, tritons, 3He and 4He produced by galactic cosmic rays inside the Space Shuttle using a charged particle spectrometer. A comparison of these spectra with radiation transport code HZETRN showed reasonably good agreement for secondary protons. However, the code seriously underestimated the flux of all other light ions. The code has been modified to include pick-up and knock-on processes. The modified code leads to good agreement for deuterons and ‘He but not for other light ions. This revised code leads to about 10% higher dose equivalent than the original code under moderate shielding, if we assume that higher charge ion fluxes are correctly predicted by the model.
INTRODUCTION
The radiation environment in space is quite complex and cannot be duplicated using ground-based acceler- ators. The galactic cosmic radiation (GCR) contains nuclei from hydrogen to uranium with energies of a few MeV to hundreds of TeV. The free space radi- ation environment is modified by the Earth’s mag- netic field and its intensity is reduced by the Earth’s shadow. This modified energy spectrum of galactic particles impinges on the Space Shuttle and is further modified by nuclear interactions with the spacecraft material (mostly aluminum). It is this modified spec- trum that is needed for estimating radiation risk to crew members and electronic devices, such as the Shuttle General Purpose Computers (GPCs). There are a large number of studies dealing with the charge and energy spectra of ions in free space or at balloon altitudes. Secondary particles produced by GCR par- ticles in the atmosphere have been studied, because this background has to be subtracted from balloon measurements to obtain the spectra above the Earth’s atmosphere (Papini et al., 1993).
Studies of interactions of GCR particles with nu- clear emulsion targets (Powell ef al., 1959) have demonstrated the prolific production of deuterium and tritium. Low energy deuterium and ‘He, in particular, have received considerable attention be- cause of their fundamental importance in cosmic ray
propagation models. However, since it has not been experimentally possible to separate the primary par- ticles from atmospheric secondary particles, the fluxes of secondary ions have been calculated. However, the radiation transport codes necessary for these calcu- lations need independent verification. This can be accomplished using data from accelerators and space flights. The Space Shuttle offers a unique platform for the study of these secondary particles, particularly for light ions (defined as protons, deuterium, tritium, 3 He and 4He) because of reasonably high production cross-sections and the short duration of these flights. In the absence of a solar particle event, a spec- trometer will see both the trapped particles from the South Atlantic Anomaly (SAA) and charged particles from GCR. For spacecraft observations in low earth orbit, the SAA particles are easily separated from the GCR particles because: (1) there are only about 7 orbital passes lasting about 20 min each through the SAA of a total of about 18 passes a day lasting about 90min each; and (2) the SAA is geographically confined to a relatively small area of the South Atlantic. The GCR particles are observed over the full latitude and longitude range of the Shuttle orbit. Thus, for an instrument with time-resolved infor- mation, the SAA and GCR data can be separated. Even more relevant, if ions are observed in the region outside the SAA with energies below the minimum
129
130 G. D. BADHWAR et al.
geomagnetic cut-off, then these particles must be of secondary origin. Thus, a clean separation of secon- daries generated by the interaction of GCR particles with the Shuttle shielding can be made.
This paper presents the first results of secondary, light ion energy spectra produced by GCR particles in two relatively high altitude Space Shuttle flights but with markedly different geomagnetic cut-offs. The energy region measured by the detector, below about 450 MeV for protons and about 80 MeV/n for other light ions, combined with the geomagnetic cut-offs for these missions, make the comparisons an excellent test of target fragmentation effects from high energy projectile nuclei. These reactions are dominated by primary protons, and secondary pro- ton and neutron induced ones because of their much higher fluxes in the spacecraft shielding. These results are compared with model calculations using the HZETRN radiation transport code (Wilson et al., 1991; Cucinotta et al., 1994). This represents the first detailed attempt to validate the code for space appli- cation.
INSTRUMENTATION AND DATA ANALYSIS
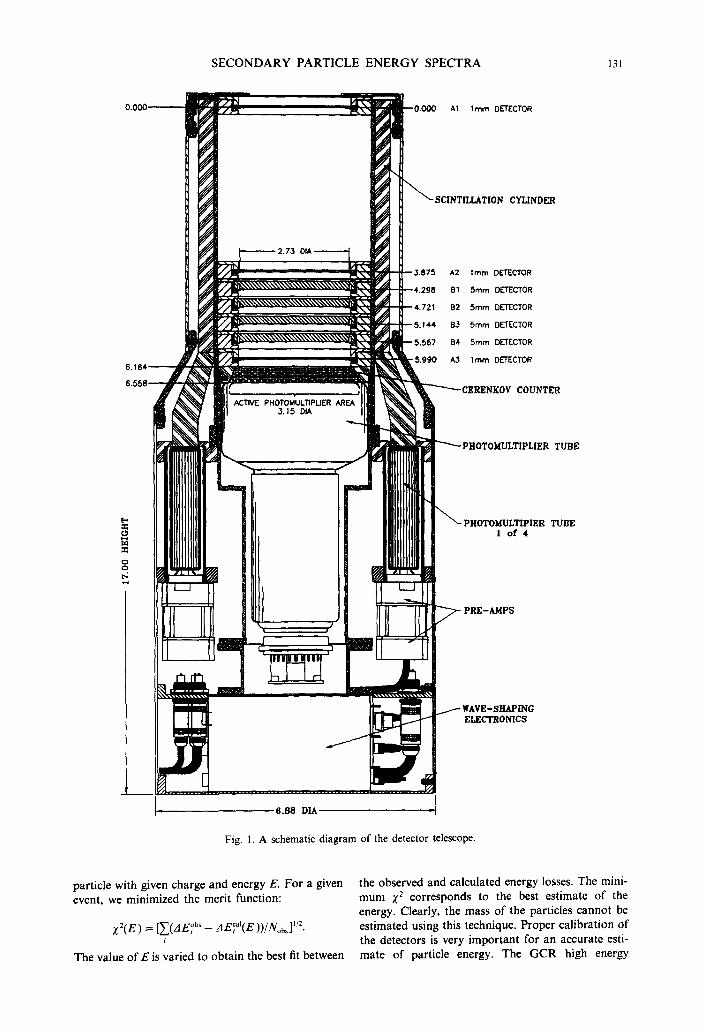
The measurements were made using a solid state detector telescope. Figure 1 is a schematic of the telescope geometry. It consists of two 1 mm thick lithium-drifted silicon detectors Al and A2 that define the geometry of the telescope to be 35” opening angle. These two detectors are followed by four 5 mm thick lithium-drifted silicon detectors (Bl to B4), a 1 mm thick lithium-drifted silicon detector A3 and a sapphire Cerenkov detector, C, which is viewed di- rectly by a photomultiplier tube. The whole telescope is surrounded by a plastic scintillator mantle, 6, that is viewed by four photomultiplier tubes. The output of two opposite tubes is summed and thus there are two independent measurements Dl and D2 from this detector. Figure 2 is a block diagram of the elec- tronics. The basic trigger of this telescope is AlA2. If this trigger is satisfied, then each of the detectors A 1, A2, Bl . B4, A3, C, Dl and D2 are pulse-height analyzed into a 4096 channel analog to digital con- verter (ADC). In addition, counting rates in each of these detectors is monitored every 10 s, as are the coincidence rates. The linearity and calibration of detector electronics is checked every 4 h using a precision pulse generator. The flight data set was recorded on two 20 MB hard disks. The telescope was mounted in the mid-deck of the Shuttle in a storage locker with the telescope axis parallel to the Shuttle body axis. The telescope opening viewed the Shuttle nose cone. The shielding mass-vs-solid angle distri- bution for isotropic incidence flux for the telescope was very close to that for an omni-directional detec- tor at the location of the instrument. Figure 3 is a plot of the Al A26 coincidence rate. The spikes show passes of the Shuttle through the SAA. The back- ground is from galactic cosmic radiation. The SAA
component is easily distinguished from the GCR particles. Moreover, in the GCR region, if ions are observed with energies below the minimum geomag- netic cut-off of the Shuttle orbit, then such particles must be of secondary origin only. This permits a clean separation of secondaries generated by the interactions of galactic particles in the Shuttle shield- ing.
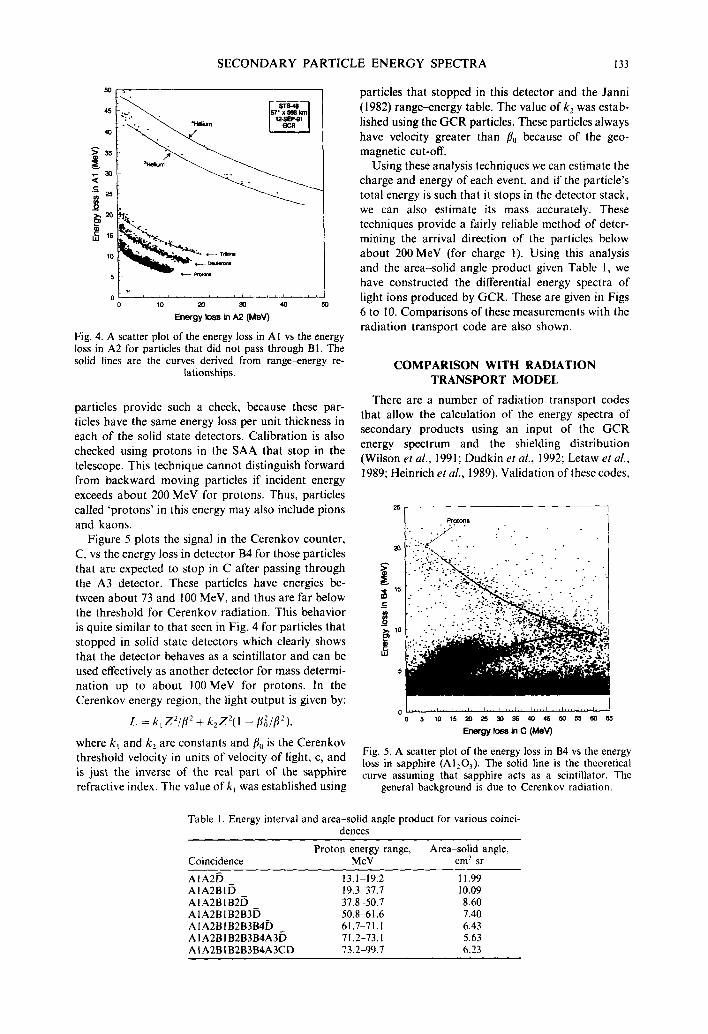
Figure 4 is a scatter plot of the measured energy loss in Al and A2 detectors for those particles that did not pass through Bl. The solid lines are the theoretical curves based on the range-energy tables of Janni (1982). The spread of data around the solid line is due to the path length variation caused by the finite opening angle of the telescope. This was confirmed by a Monte Carlo calculation. There is a very clear separation between various light ions from hydrogen to 4He. There are inadequate statistics to determine the spectra of ions with charge greater than 2. The expected hyperbolic shape of the curves allows one to calculate the mass of a particle that stops anywhere in the detector stack. If AE is the energy loss in a detector of a particle that deposits energy E in a subsequent detector and stops, then the product
AE x EccM”-‘Z’,
where M is the particle mass in proton mass units and Z is its charge. The power index n is the best fit by a power law to the proton rangeenergy relation: R, = kE” when E is expressed in MeV and range R, is expressed in g cme2 of silicon. Thus, the charge, mass and energy of each stopping particle can be calculated. Table 1 gives the area-solid angle product for particles that stop in various detectors. The given product is taken into account in calculating the differential energy spectra for various particles.
This technique for determining the charge and mass of particles can separate forward (incident first on Al) from backward (incident last on Al) moving particles. However, the forward moving particles have a detection threshold of 13 MeV compared to about 90 MeV for backward moving particles. Thus, there is very strong bias in favor of forward moving particles.
Charged particles that pass through all of the solid state detectors have to be treated separately. The data can be divided into two categories depending upon the signal in the Cerenkov counter. The sapphire detector nominally has a threshold of about 200 MeV/n; however, as we discuss below, this par- ticular piece of synthetic sapphire scintillates and thus for much of this analysis was used as a scintillator and not as a Cerenkov detector. Thus, this detector also provides a measure of energy loss, dE/dx, par- ticularly for particles below the Cerenkov threshold. Particles that go through all of the detectors from Al to C produce eight measurements of energy loss. For these particles the charge and energy can be estimated by comparing the measured energy loss as a function of detector depth to calculated energy loss for a
SECONDARY PARTICLE ENERGY SPECTRA 131
6.164
6.558
-0.000 Al lmm DETECTOR
\ SCINTIUATION CYLINDER
3.075 A2 imm DETECTOR
4.296 61 5mm OUECTOR
4.721 62 5mm DEIECTOR
5.144 83 5mm DETECTOR
5.567 84 5mm DETECTOR
5.990 AS lmm DETECTOR
ACTIVE PHOTOMULTIPLIER AREA
b PHOTOMULTIPLIER TUBE
-CERENKOV COUNTER
- PHOTOMULTIPIER 1 of 4
- PRE-AMPS
-WAVE-SHAPING ELECTRONICS
Fig. 1. A schematic diagram of the detector telescope.
TUBE
particle with given charge and energy E. For a given the observed and calculated energy losses. The mini- event, we minimized the merit function: mum x2 corresponds to the best estimate of the
energy. Clearly, the mass of the particles cannot be x2(E) = [~(LLT;~’ - dEr”‘(E))/Nob,]“2. estimated using this technique. Proper calibration of
, the detectors is very important for an accurate esti- The value of E is varied to obtain the best fit between mate of particle energy. The GCR high energy

132 G. D. BADHWAR et al.
PHIDE FUNCTIONAL DIAGRAM
Pm- W$’ swng Peak Am Ampliliers fd%%on Coincidence An@fbm Stmtchem Converters
11 CPU
Fig. 2. An electronic block diagram of the detector telescope.
500
0
0 STS-48
0 lam ZcIKI 3ooo 4oM) 5cao 6oao 7ooa
MISSION ELAPSED TIME (minutes)
Fig. 3. AlA2D coincidence rate per minute as a function of the mission elapsed time for STS-48. The spikes are the SAA passes. The large variation in counting rate during the SAA passes is due to pitch
angle distribution.
SECONDARY PARTICLE ENERGY SPECTRA 133
I.
0 ,,/‘(,,1’,,,1’1’,/‘/1’,, 0 10 20 30 40 50
Energy loaa in AZ (MN)
Fig. 4. A scatter plot of the energy loss in Al vs the energy loss in A2 for particles that did not pass through BI. The solid lines are the curves derived from range-nergy re-
lationships.
particles provide such a check, because these par- ticles have the same energy loss per unit thickness in each of the solid state detectors. Calibration is also checked using protons in the SAA that stop in the telescope. This technique cannot distinguish forward from backward moving particles if incident energy exceeds about 200 MeV for protons. Thus, particles called ‘protons’ in this energy may also include pions and kaons.
Figure 5 plots the signal in the Cerenkov counter, C, vs the energy loss in detector B4 for those particles that are expected to stop in C after passing through the A3 detector. These particles have energies be- tween about 73 and 100 MeV, and thus are far below the threshold for Cerenkov radiation. This behavior is quite similar to that seen in Fig. 4 for particles that stopped in solid state detectors which clearly shows that the detector behaves as a scintillator and can be used effectively as another detector for mass determi- nation up to about 100MeV for protons. In the Cerenkov energy region, the light output is given by:
L = k,Z’/fi* + k,Z’(l -,&;/B’),
where k, and k, are constants and f10 is the Cerenkov threshold velocity in units of velocity of light, c, and is just the inverse of the real part of the sapphire refractive index. The value of k, was established using
particles that stopped in this detector and the Janni (1982) range-energy table. The value of k, was estab- lished using the GCR particles. These particles always have velocity greater than @,, because of the geo- magnetic cut-off.
Using these analysis techniques we can estimate the charge and energy of each event, and if the particle’s total energy is such that it stops in the detector stack, we can also estimate its mass accurately. These techniques provide a fairly reliable method of deter- mining the arrival direction of the particles below about 200MeV (for charge 1). Using this analysis and the area-solid angle product given Table 1, we have constructed the differential energy spectra of light ions produced by GCR. These are given in Figs 6 to 10. Comparisons of these measurements with the radiation transport code are also shown.
COMPARISON WITH RADIATION TRANSPORT MODEL
There are a number of radiation transport codes that allow the calculation of the energy spectra of secondary products using an input of the GCR energy spectrum and the shielding distribution (Wilson et al., 1991; Dudkin et al., 1992; Letaw et al.,
1989; Heinrich et al., 1989). Validation of these codes.
Fig. 5. A scatter plot of the energy loss in B4 vs the energy loss in sapphire (AllO,). The solid line is the theoretical curve assuming that sapphire acts as a scintillator. The
general background is due to Cerenkov radiation.
Table I. Energy interval and area-solid angle product for various coinci- dences
Coincidence Proton energy range, Area-solid angle,
MeV cm? sr
AlA 13.1-19.2 II.99 AIA2BlB 19.3-37.7 10.09 AIA2BIB21j 37.8-50.7 8.60 AIA2BlB2B3fi 50.8dl.6 7.40 AIA2BlB2B3B4D 61.7-71.1 6.43 AIA2BlB2B3B4A3fi 71.2-73.1 5.63 AlA2BIB28384A3CD 73.2-99.7 6.23
G. D. BADHWAR et al.
50 100 150 200 250 300 360 4ol450
Kinetii Energy (MN/n)
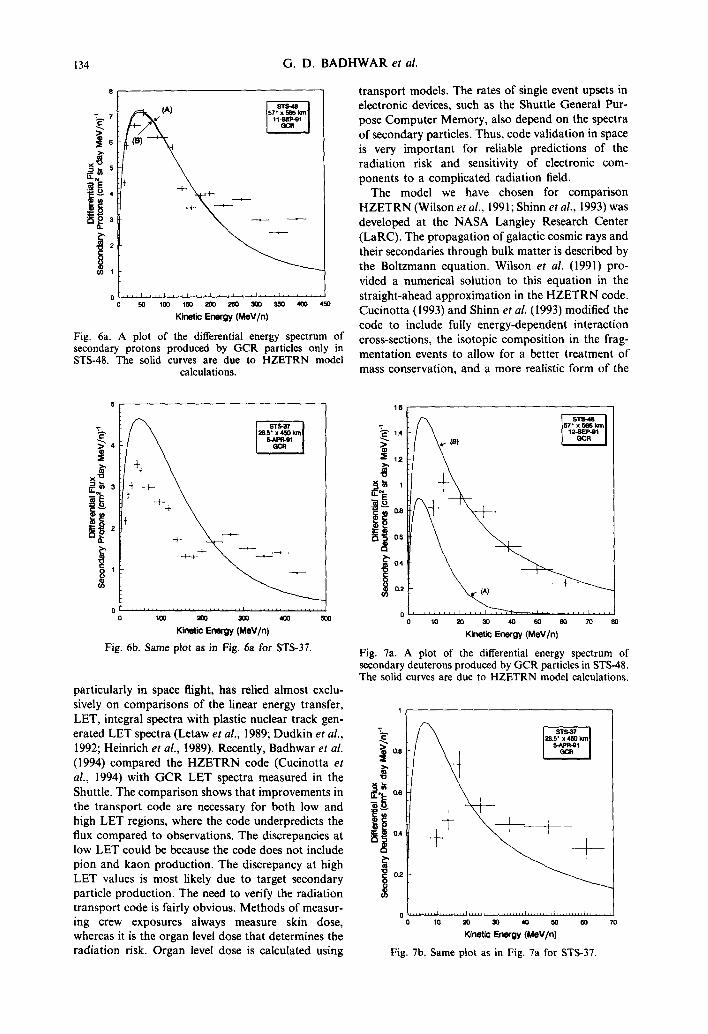
Fig. 6a. A plot of the differential energy spectrum of secondary protons produced by GCR particles only in STS-48. The solid curves are due to HZETRN model
calculations.
0 IO0 am 3x al 5m
Kinetic Energy (MeV/n)
Fig. 6b. Same plot as in Fig. 6a for STS-37.
particularly in space flight, has relied almost exclu- sively on comparisons of the linear energy transfer, LET, integral spectra with plastic nuclear track gen- erated LET spectra (Letaw et al., 1989; Dudkin et al., 1992; Heinrich et al., 1989). Recently, Badhwar et al. (1994) compared the HZETRN code (Cucinotta et al., 1994) with GCR LET spectra measured in the Shuttle. The comparison shows that improvements in the transport code are necessary for both low and high LET regions, where the code underpredicts the flux compared to observations. The discrepancies at low LET could be because the code does not include pion and kaon production. The discrepancy at high LET values is most likely due to target secondary particle production. The need to verify the radiation transport code is fairly obvious. Methods of measur- ing crew exposures always measure skin dose, whereas it is the organ level dose that determines the radiation risk. Organ level dose is calculated using
transport models. The rates of single event upsets in electronic devices, such as the Shuttle General Pur- pose Computer Memory, also depend on the spectra of secondary particles. Thus, code validation in space is very important for reliable predictions of the radiation risk and sensitivity of electronic com- ponents to a complicated radiation field.
The model we have chosen for comparison HZETRN (Wilson et al., 1991; Shinn et al., 1993) was developed at the NASA Langley Research Center (LaRC). The propagation of galactic cosmic rays and their secondaries through bulk matter is described by the Boltzmann equation. Wilson et al. (1991) pro- vided a numerical solution to this equation in the straight-ahead approximation in the HZETRN code. Cucinotta (1993) and Shinn et al. (1993) modified the code to include fully energy-dependent interaction cross-sections, the isotopic composition in the frag- mentation events to allow for a better treatment of mass conservation, and a more realistic form of the
0 10 al 30 40 so 80 70
Kinetic Energy (MN/n)
Fig. 7a. A plot of the differential energy spectrum of secondary deuterons produced by GCR particles in STS-48. The solid curves are due to HZETRN model calculations.
,.J
0 10 20 30 40 50 M 70
Kinetic Energy (MeV/n)
Fig. 7b. Same plot as in Fig. 7a for STS-37.

SECONDARY PARTICLE ENERGY SPECTRA 135
L,,,,,.,.,/,,,,,,,,/
0 10 20 33 40 50
Kinetic Energy (WV/n)
Fig. 8a. A plot of the differential energy spectrum of secondary tritons produced by GCR particles in STS-48. The solid curves are due to HZETRN model calculations.
OL. 0 10 P a0 40 50 80 70
Kinetic Energy (MN/n)
Fig. 8b. Same plot as in Fig. 8a for STS-37.
energy spectrum of target fragmentation. This modified version of the HZETRN code has been used to calculate the energy spectra of secondary light ions produced in the Shuttle shielding. There are several mechanisms for the production of proton and light ion secondaries. These ions are produced through projectile fragmentation, largely of “He primaries, which are produced with energies close to that corre- sponding to the primary particle velocity. Due to geomagnetic cut-offs and the energy range of this detector, secondaries from projectile fragmentation are largely unobserved in the present measurements.
The dominant source of secondaries in the energy range of this detector is through target fragmentation in the Shuttle shielding. The target fragmentation events are dominated by proton and neutron induced reactions because of their higher fluxes. Evaporation particles from target fragmentation events produce a large fraction of the dose or dose equivalent because of their production at low energies and hence high
LET values. The production cross-section of evapor- ation particles is estimated in HZETRN code (Wilson et al., 1991) based on the results of Bertini et al. (1992). There is also a fast component of proton, neutron and light ion secondaries produced in target fragmentation events. These fast components from direct knock-out and cascade processes for proton and neutron secondaries have been included in HZETRN as described by Wilson et al. (1991). However, the fast component of other light ion secondaries produced mostly from direct knock-out reactions and pick-up reactions had been neglected in HZETRN and is shown to be important in the comparisons to these measurements. The input GCR spectrum was calculated using the model of Badhwar and O’Neill (1993). The value of the deceleration potential, @(MV), required as input to this model, was derived from the measured Climax, Colarado neutron monitor rate during the periods rel- evant to these two Shuttle flights. This model
0.08
0.08
0.M
0.02
0 4 0 10 20 30 40 50
Kinetic Energy (t&V/n)
Fig. 9a. A plot of the differential energy spectrum of secondary ‘He produced by GCR particles in STS-48. The
solid curves are due to HZETRN model calculations.
0 0 10 22 30 40 50 80 70
Kinetic Energy (MN/n)
Fig. 9b. Same plot as in Fig. 9a for STS-37.
136 G. D. BADHWAR et al.
0 ~,,~~~1~‘1~1’,“~,~‘,~,,~‘~~,‘~,~,,,,,~’,~,,””’ 0 10 20 al 40 50
Klrmtlc Energy (h&V/n)
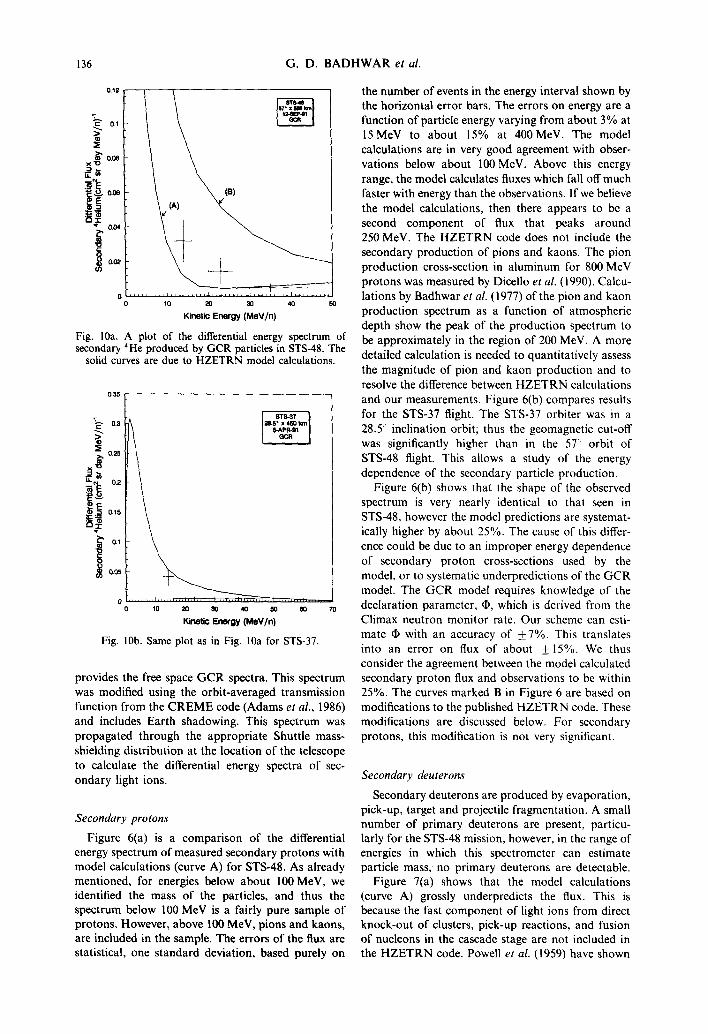
Fig. 10a. A plot of the differential energy spectrum of secondary “He produced by GCR particles in STS-48. The
solid curves are due to HZETRN model calculations.
1
/_I zesgi&m
d 10 20 90 40 so 00 70
Kinetic Energy (MeV/n)
Fig. lob. Same plot as in Fig. 10a for STS-37.
provides the free space GCR spectra. This spectrum was modified using the orbit-averaged transmission function from the CREME code (Adams et al., 1986) and includes Earth shadowing. This spectrum was propagated through the appropriate Shuttle mass- shielding distribution at the location of the telescope to calculate the differential energy spectra of sec- ondary light ions.
Secondary protons
Figure 6(a) is a comparison of the differential energy spectrum of measured secondary protons with model calculations (curve A) for STS-48. As already mentioned, for energies below about 100 MeV, we identified the mass of the particles, and thus the spectrum below 100 MeV is a fairly pure sample of protons. However, above 100 MeV, pions and kaons, are included in the sample. The errors of the flux are statistical, one standard deviation, based purely on
the number of events in the energy interval shown by the horizontal error bars. The errors on energy are a function of particle energy varying from about 3% at 15 MeV to about 15% at 400 MeV. The model calculations are in very good agreement with obser- vations below about 100 MeV. Above this energy range, the model calculates fluxes which fall off much faster with energy than the observations. If we believe the model calculations, then there appears to be a second component of flux that peaks around 250 MeV. The HZETRN code does not include the secondary production of pions and kaons. The pion production cross-section in aluminum for 800 MeV protons was measured by Dice110 et al. (1990). Calcu- lations by Badhwar et al. (1977) of the pion and kaon production spectrum as a function of atmospheric depth show the peak of the production spectrum to be approximately in the region of 200 MeV. A more detailed calculation is needed to quantitatively assess the magnitude of pion and kaon production and to resolve the difference between HZETRN calculations and our measurements. Figure 6(b) compares results for the STS-37 flight. The STS-37 orbiter was in a 28.5” inclination orbit; thus the geomagnetic cut-off was significantly higher than in the 57’ orbit of STS-48 flight. This allows a study of the energy dependence of the secondary particle production.
Figure 6(b) shows that the shape of the observed spectrum is very nearly identical to that seen in STS-48, however the model predictions are systemat- ically higher by about 25%. The cause of this differ- ence could be due to an improper energy dependence of secondary proton cross-sections used by the model, or to systematic underpredictions of the GCR model. The GCR model requires knowledge of the declaration parameter, 0, which is derived from the Climax neutron monitor rate. Our scheme can esti- mate @ with an accuracy of f7%. This translates into an error on flux of about + 15%. We thus consider the agreement between the model calculated secondary proton flux and observations to be within 25%. The curves marked B in Figure 6 are based on modifications to the published HZETRN code. These modifications are discussed below. For secondary protons, this modification is not very significant.
Secondary deuterons
Secondary deuterons are produced by evaporation, pick-up, target and projectile fragmentation. A small number of primary deuterons are present, particu- larly for the STS-48 mission, however, in the range of energies in which this spectrometer can estimate particle mass; no primary deuterons are detectable.
Figure 7(a) shows that the model calculations (curve A) grossly underpredicts the flux. This is because the fast component of light ions from direct knock-out of clusters, pick-up reactions, and fusion of nucleons in the cascade stage are not included in the HZETRN code. Powell er al. (1959) have shown

SECONDARY PARTICLE ENERGY SPECTRA 137
that there is significant production of deuterons and tritons in the collision of GCR particles in nuclear emulsions. Indeed, they determined the angular dis- tribution and spectrum of these secondary particles (see also Papini et al., 1993). The code was then modified to include the fast component. The pro- duction cross-section from knock-out and pick-up was estimated by subtracting the evaporation cross- section estimated by Bertini er al. (1992) from the experimental data (Betrand and Peele, 1973; Wu et al.. 1979; Alard et al., 1975; Beck and Powell, 1976). The neutron induced knock-out was assumed to be the same as for protons at higher energies. The shape of the secondary spectrum was assumed to be an exponential. exp (-E,/E,,); the slope parameter E, was estimated from experimental data. Alard et al. (1975) measured light ion production cross-sections in proton-nucleus interactions at 600 MeV. If we estimate the value of slope parameter E,, from these data, the modified HZETRN code leads to much higher fluxes of ions heavier than protons. A more appropriate value of E,, can be derived from the data of Bertrand and Peele (I 973) Wu et al. (1979) Alard et a/. (1975) and Beck and Powell (1976) for an incident proton energy range from 62 to 600 MeV. The curve marked B is based on this modification (Cucinotta et (II., 1994). The effect of this change on the secondary proton spectrum is minimal; however, there is good agreement between the measured and calculated deuteron spectrum above about 20 MeV/n. The model produces higher fluxes at energies below 20 MeV/n. Figure 7(b) is a comparison of the model calculation with observation for the STS-37 flight, where the mean energy of incident GCR particles is considerably higher than in STS-48. Here the agree- ment is not as good, although the shape of the calculated spectrum above 20 MeV/n is the same as the observed spectrum. There is no a priori reason for assuming that the energy dependence of the pro- duction cross-sections is exponential. The data for secondary production suggests that the high energy part of the spectrum can be represented by an exponential form, however there is little data in the literature to estimate the value of the parameter E, for proton energies above 600 MeV. Experiments on the fast component of light ion clusters produced at higher proton energies are clearly needed. Models of direct cluster knock-out (Cucinotta and Dubey. 1994) using a pre-equilibrium formalism are being pursued to improve the representation of these secondary distributions.
Secondary tritons
Figure 8(a) compares the models (A and B) and measured (STS-48) differential energy spectrum of tritons. Model results do not agree well either in shape or magnitude. Since we are able to resolve triton from deuterons or ‘He very well, these results show the need for a decrease in the production
cross-section over that included in the model. The comparison for STS-37 is shown in Fig. 8(b) and again shows that the model B overestimates the flux by about a factor of three.
Secondary 3 He
Figure 9(a) shows a comparison of the STS-48 measured spectrum with model calculations. Clearly model B agrees with observations better. Figure 9(b) shows the same comparison with data from STS-37. Overall agreement with model B appears to be satis- factory.
Secondary 4 He
Figure IO(a) and (b) shows a comparison of the secondary 4He differential spectrum with model cal- culations for STS-48 and -37, respectively. The agree- ment is poor in both cases (A and B) The model B significantly overpredicts the flux at all energies.
The comparison described above suggests that even with the additions to HZETRN for the production of deuterons, tritons, ‘He and 4He from fast knock-out processes some important discrepancies remain in the comparison to the observations. The agreement for protons, deuterons and ‘He ions are quite encourag- ing considering the many factors involved in the comparison process including the GCR environment model, geomagnetic cut-off model, shielding model, as well as the radiation transport model. The radi- ation transport code predicted the absorbed dose and dose equivalent, under moderate shielding, to within + 15% (Badhwar et al., 1994). However, compari- sons of measured lineal energy spectrum to calculated LET spectrum showed important differences at low and high values of LET. It is expected that implemen- tation of theoretical models for the shape of light cluster production spectrum and better represen- tation of the detector response, including accounting for the detector geometry and the local production of secondaries in the detector, will improve the compari- sons made here.
CONCLUSIONS
A charged particle spectrometer that measures the energy and mass spectra of energetic particles was flown twice in the mid-deck of the Space Shuttle during the period around solar maximum. The two fairly high altitude flights were in 28.5 and 57 inclination orbits. thus significantly different mean energy of incident GCR particles were encountered. The combination of the geomagnetic cut-off and detector capabilities have provided, for the first time, a unique ability to study the energy spectrum of purely secondary particles produced by the GCR particles with the Shuttle shielding. The differential energy spectra of protons below 450 MeV, and of deuterons, tritons. ‘He and 4He ions below about

138 G. D. BADHWAR ef al.
80 MeV/n were measured. Although fragments with charge >2 have been observed, the count-rate stat- istics are too poor (because of short flight times) to construct energy spectra for these particles. Compari- son of the observed spectra with spectra calculated using HZETRN showed shortcomings for all light ions except protons, where the need for adding pion and kaon production to the code was identified. The HZETRN code was modified to include knock-out and pick-up processes. This led to a reasonable description of secondary proton, deuteron, and ‘He spectrum but not of tritons and 4He. The present measurements are thus a strong test of secondary particle production which is dominated by proton and neutron induced reactions due to their large flux. These results suggest that the need for additional measurements on cluster knock-out, pick-up and stripping at high energies. There is also a clear need to add the secondary pion and kaon production to the transport code.
Acknowledgements-The origin of this experiment followed discussions that Gautam Badhwar and Robert Richmond (JSC) had with John Mitchell and Kenneth Hardy of the Brooks Air Force Base, San Antonio, Texas. The US. Air Force provided the seed money to initiate this project, We are grateful to Bob Richmond for initiatine this discussion and for early design decisions. Subsequent support was provided by the Orbiter Project Office. Frank Littleton and Pat O’Neill were instrumental in pushing this project for- ward. Most of the support for flight and analysis came from the Space Station Crew Health System. We would like to thank Dr Dane Russo and T. A. White for this support. Mr Sudhir Giri and Mark Bowman, Krug Life Sciences Inc., provided support for flight integration in the Shuttle. A number of people helped in engineering this instrument, We would like to thank Drs Les Braby and Thomas Conroy, and Mr David Elergy of Battelle Pacific Northwest Labora- tory, for the design and fabrication of the electronics, Mr Frank Gibbons and Tu Nguyen, Lockheed, provided elec- tronic engineering support. Mr Robert Dunn provided all of the mechanical engineering work. The programming sup- port of Mr Omar Baltaii and Fadi Riman. Lockheed. in oost Aight data analysis is greatly appreciated. Finahy, L the support of Dr Donald Robbins, Acting Director, Space and Life Sciences, Johnson Space Center, Houston, has been instrumental in carrying out this experiment. We owe a debt to all of these individuals.
REFERENCES Adams Jr J. H., Silberberg R. and Tsao C. H. (1986) Cosmic
Ray Effects on Micro-Electronics. Part IV. Naval Research Laboratory Memorandum Report 5901.
Alard J. P., Baldit A., Brun R., Costilhes J. P., Dilmain J., Farcoix J., Fraysse L.. Pellet J., Roche G., Tamain J. C., Cordaillat and Pasinetti A. (1975) Light- fragment production in p-nucleus interactions at 600 MeV, astrophysical applications. Nuouo Cimento 30, 320-344.
Badhwar G. D. and O’Neill P. M. (1993) Time lag of twenty two year solar modulation. In Proc. 23rd Int. Cosmic Ray Conf. 3, pp. 535-539.
Badhwar G. D., Cucinotta F. A., Braby L. A. and Konradi A. (1994) Measurements on the Shuttle of the LET spectra of galactic cosmic radiation and comparison with radiation transport model. Radiat. Res. 139, 344350.
Badhwar G. D., Stephens S. A. and Golden R. L. (1977) An analytic representation of the proton-proton and pro- ton-nucleus cross-sections and its application to the sea-level spectrum and charge ratio of muons. Phys. Rev. 15, 820-831.
Beck S. M. and Powell C. A. (1976) Proton and Deuteron Double Differential Cross-sections at Angles from 10 to 60 from Be, C, Al, Fe, Cu, Ge, W, and Pb. NASA Technical Note D-81 19.
Bertini H. W., Guthrie M. P. and Culowski A. H. (1992) Nonelastic Interactions of Nucleus and n-mesons with Complex Nuclei at Energies below 3 GeV. ORNL Technical Memoradum 3148, U.S. Atomic Energy Commission, 28 March 1992.
Betrand F. E. and Peele R. W. (1973) Complete hydrogen and helium particle spectrum from 30 to 60 MeV proton bombardment of nuclei with A = 12 to 209 and comparison with intranuclear cascade model. Phys. Rev. C 8, 104551064.
Cucinotta F. A. (1993) Calculations of Cosmic Ray Helium Transport in Shielding Materials. NASA Technical Publication 3354, Washington, D.C.
Cucinotta F. A., Townsend L. W., Wilson J. W., Shinn J. L.. Badhwar G. D. and Dubev R. R. (1994) Lieht ion component of the galactic cosmic rays: nuclea; inter- actions and transport theory. COSPAR Meeting, Hamburg, Germany.
Cucinotta F. A. and Dubey R. R. (1994) Alpha cluster description of excitation energies in “C(‘zC, 3 alpha)X at 2.1-A GeV. Phys. Rev. C-SO, 752-758. .
Dicello J. F.. Paciotti M. and Schillaci M. E. (1990) Cross sections for pion, proton, and heavy-ion production from 800 MeV protons incident upon aluminum and silicon. Nucl. Instrum. Meth. Phys Res. B45, 135-138.
Dudkin V. E., Karpov 0. N., Potapov Yu. V., Akopova A. B., Magradze N. V., Moissenko A. A., Benton E. V., Frank A. L. and Watts J. W. (1992) Experimental and calculated LET distributions in Cosmos 2044 biosatel- lites. Nucl. Tracks Radial. Meas. 20, 427430.
Heinrich W., Weigel B., Ohrndorf T., Bucker H. Reitz G. and Schott J. U. (1989) LET spectra of cosmic-ray nuclei for near Earth orbits. Radiat. Res, 118, 63-82.
Janni J. (1982) Proton Range-Energy Tables, I keV- IO Gev, Part I and II. Atomic Data and Data Tables, 27, nos 4 and 5.
Letaw J. R., Silberberg R., Tsao C. H. and Benton E. V. (1989) Model analysis of space shuttle dosimetry data. Adr?. Space. Res. 12, 2-5.
Papini P., Grimani C. and Stephens S. A. (1993) Secondary deuterium produced by cosmic rays in the atmosphere. In Proc. 23rd Inr. Cosmic Ray Corzf. 1, pp. 503-506.
Powell C. F., Fowler P. H. and Perkins D. H. (1959) The Study of Elementary Particles by the Photographic Method, pp. 424461. Pergamon Press, New York.
Shinn J. L., Hohn S., Tripathi R. K., Wilson J. W., Townsend L. W. and Norbury J. W. (1993) Fully Energy Dependent HZETRN (A Galactic Cosmic-Rav Transport Code). TP-3242. NASA, Washington, D.C.
Wilson J. W.. Townsend L. W.. Schimmerline W.. Khandel- wal G. S., Kahn F.. Nealy J. E., C¬ta F. A., Simonsen L. C., Shinn J. L. and Norbury J. W. (1991) Transport Methods and Interactions for Space Radi- ations. RP 1257, NASA Washington, D.C.
Wu J. R.. Chang C. C. and Holmgren (1979) Charged particle spectra; 90 MeV protons on “Al, 5XNi. YOZn and ‘“‘Bi. Phy.s. Rev. C 19, 698-713.