always on - active secondary part 1 - readable secondary
TRANSCRIPT
AlwaysOn: Active Secondary Part 1 - Readable Secondary Sunil Agarwal, Principal Program Manager
SUNIL AGARWAL: Hello, and welcome to this series of talks on AlwaysOn technologies delivered to you as part of Microsoft Virtual Academy. My name is Sunil Agarwal, I'm a principal program manager with SQL Server team and it is my pleasure today to talk to you about active secondaries. Active implies the ability to do some meaningful work on your secondary replica besides just keeping up with the primary. If you look at a secondary replica in a typical database mirroring kind of a configuration, secondary replica is only using less than 5 percent of CPU cycles and less than 25 percent of IO cycles. You have 95 percent CPU and 75 percent IO cycles that are just going waste. And what active secondary is providing is the capability to use those cycles to do some more meaningful work. This presentation, we have divided into two parts. In the part one, that is this presentation, I will describe how you can use your secondary replica to offload your reporting workload. In the part two, Kevin Farley (ph.), he will describe how you can use your secondary replica to offload your database and transaction log backup.
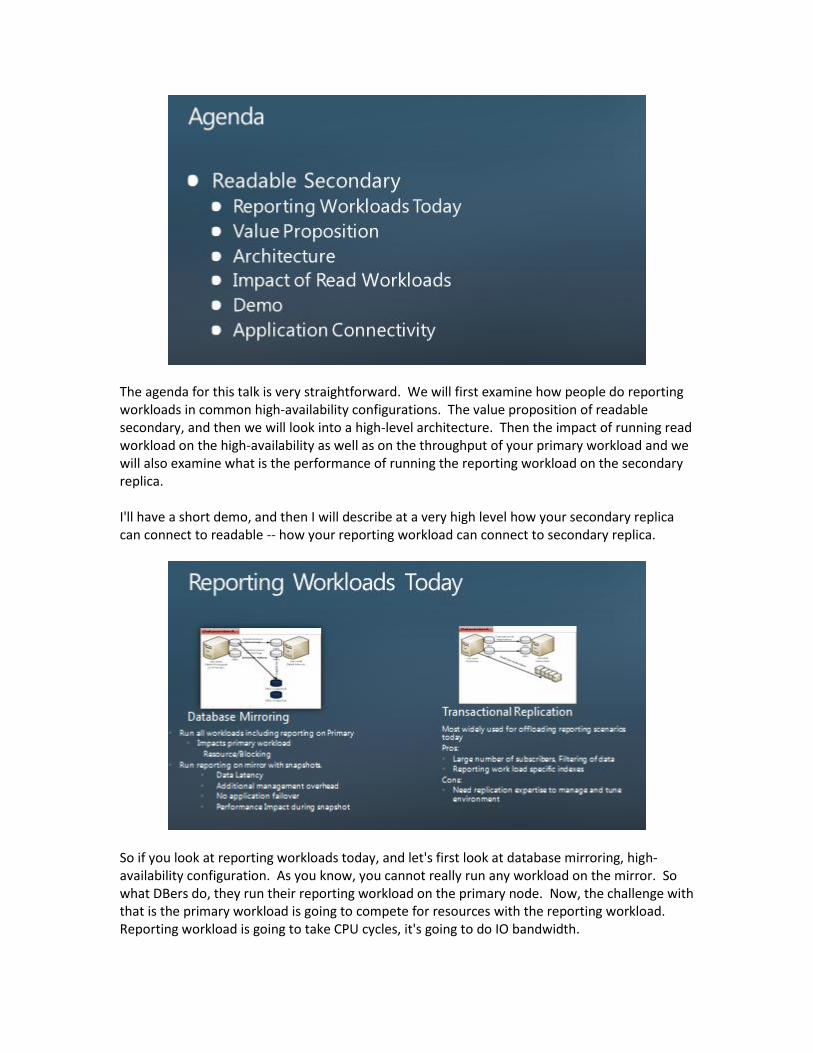
The agenda for this talk is very straightforward. We will first examine how people do reporting workloads in common high-availability configurations. The value proposition of readable secondary, and then we will look into a high-level architecture. Then the impact of running read workload on the high-availability as well as on the throughput of your primary workload and we will also examine what is the performance of running the reporting workload on the secondary replica. I'll have a short demo, and then I will describe at a very high level how your secondary replica can connect to readable -- how your reporting workload can connect to secondary replica.
So if you look at reporting workloads today, and let's first look at database mirroring, high-availability configuration. As you know, you cannot really run any workload on the mirror. So what DBers do, they run their reporting workload on the primary node. Now, the challenge with that is the primary workload is going to compete for resources with the reporting workload. Reporting workload is going to take CPU cycles, it's going to do IO bandwidth.
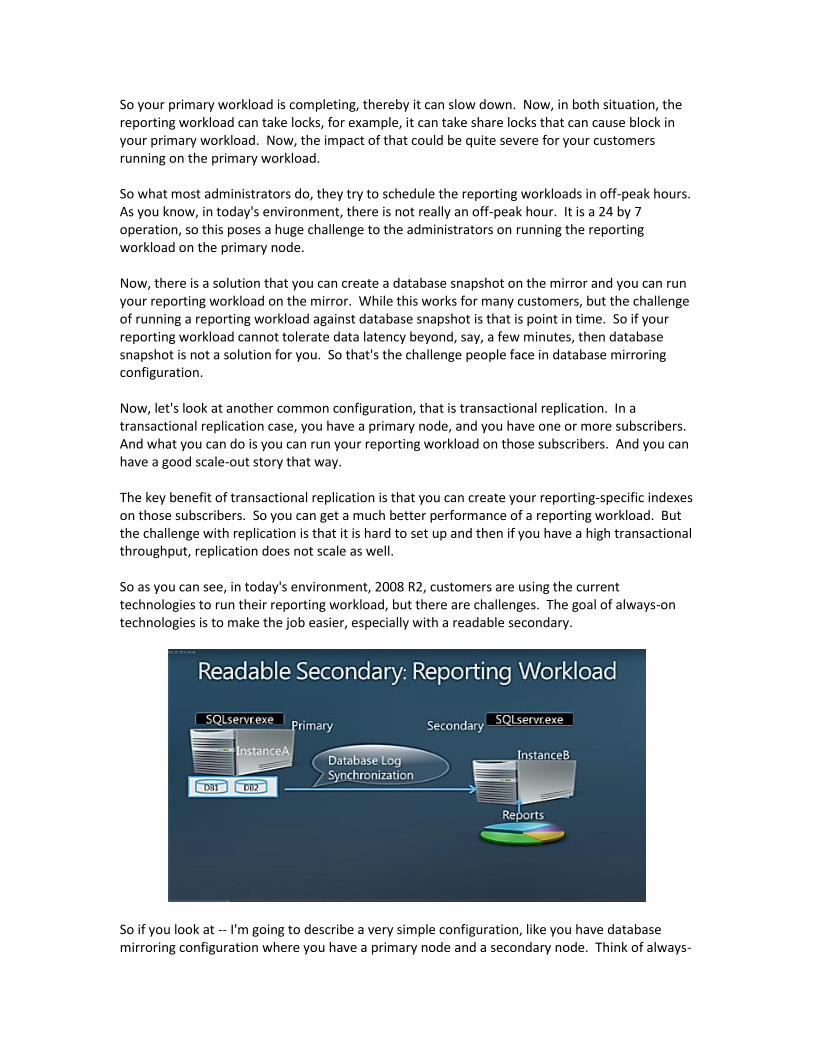
So your primary workload is completing, thereby it can slow down. Now, in both situation, the reporting workload can take locks, for example, it can take share locks that can cause block in your primary workload. Now, the impact of that could be quite severe for your customers running on the primary workload. So what most administrators do, they try to schedule the reporting workloads in off-peak hours. As you know, in today's environment, there is not really an off-peak hour. It is a 24 by 7 operation, so this poses a huge challenge to the administrators on running the reporting workload on the primary node. Now, there is a solution that you can create a database snapshot on the mirror and you can run your reporting workload on the mirror. While this works for many customers, but the challenge of running a reporting workload against database snapshot is that is point in time. So if your reporting workload cannot tolerate data latency beyond, say, a few minutes, then database snapshot is not a solution for you. So that's the challenge people face in database mirroring configuration. Now, let's look at another common configuration, that is transactional replication. In a transactional replication case, you have a primary node, and you have one or more subscribers. And what you can do is you can run your reporting workload on those subscribers. And you can have a good scale-out story that way. The key benefit of transactional replication is that you can create your reporting-specific indexes on those subscribers. So you can get a much better performance of a reporting workload. But the challenge with replication is that it is hard to set up and then if you have a high transactional throughput, replication does not scale as well. So as you can see, in today's environment, 2008 R2, customers are using the current technologies to run their reporting workload, but there are challenges. The goal of always-on technologies is to make the job easier, especially with a readable secondary.
So if you look at -- I'm going to describe a very simple configuration, like you have database mirroring configuration where you have a primary node and a secondary node. Think of always-
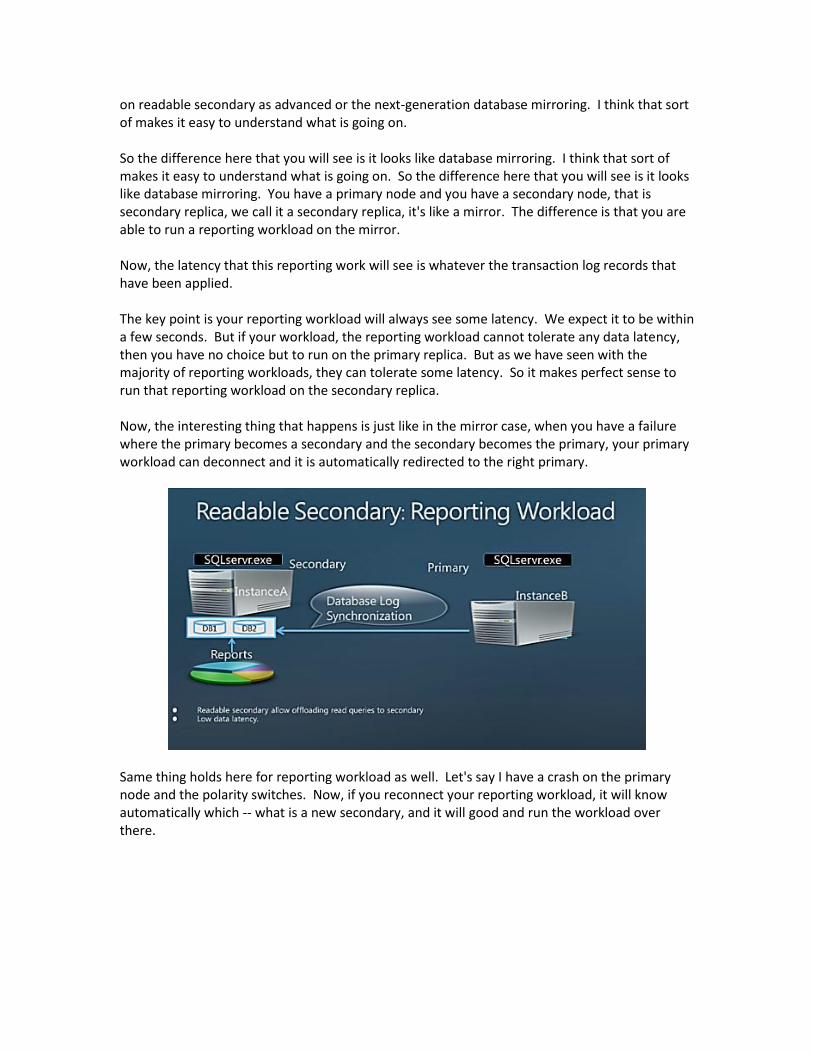
on readable secondary as advanced or the next-generation database mirroring. I think that sort of makes it easy to understand what is going on. So the difference here that you will see is it looks like database mirroring. I think that sort of makes it easy to understand what is going on. So the difference here that you will see is it looks like database mirroring. You have a primary node and you have a secondary node, that is secondary replica, we call it a secondary replica, it's like a mirror. The difference is that you are able to run a reporting workload on the mirror. Now, the latency that this reporting work will see is whatever the transaction log records that have been applied. The key point is your reporting workload will always see some latency. We expect it to be within a few seconds. But if your workload, the reporting workload cannot tolerate any data latency, then you have no choice but to run on the primary replica. But as we have seen with the majority of reporting workloads, they can tolerate some latency. So it makes perfect sense to run that reporting workload on the secondary replica. Now, the interesting thing that happens is just like in the mirror case, when you have a failure where the primary becomes a secondary and the secondary becomes the primary, your primary workload can deconnect and it is automatically redirected to the right primary.
Same thing holds here for reporting workload as well. Let's say I have a crash on the primary node and the polarity switches. Now, if you reconnect your reporting workload, it will know automatically which -- what is a new secondary, and it will good and run the workload over there.
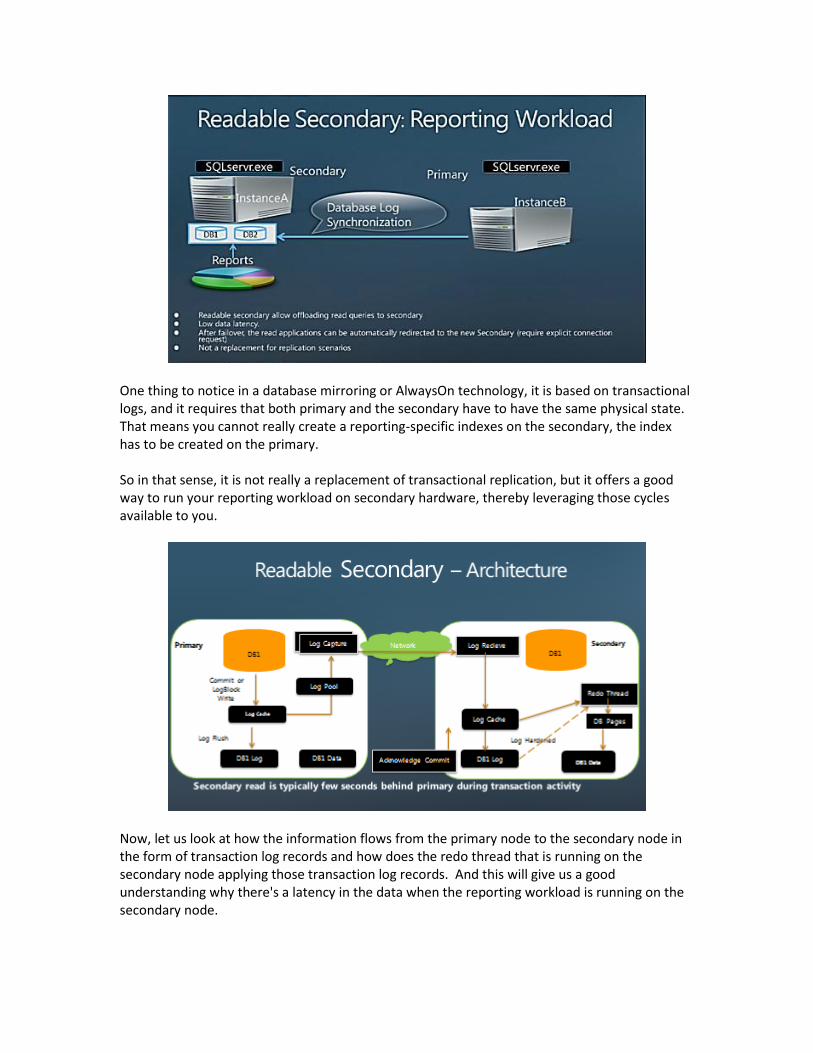
One thing to notice in a database mirroring or AlwaysOn technology, it is based on transactional logs, and it requires that both primary and the secondary have to have the same physical state. That means you cannot really create a reporting-specific indexes on the secondary, the index has to be created on the primary. So in that sense, it is not really a replacement of transactional replication, but it offers a good way to run your reporting workload on secondary hardware, thereby leveraging those cycles available to you.
Now, let us look at how the information flows from the primary node to the secondary node in the form of transaction log records and how does the redo thread that is running on the secondary node applying those transaction log records. And this will give us a good understanding why there's a latency in the data when the reporting workload is running on the secondary node.

So primary workload is generating transaction log records on the left side, and it is filling the log cache with those log records. Now, when the log cache becomes full or the primary node issues a commit operation, at that time the transaction log records from the log buffer are flushed to the log desk to make it persistent. Now, since we are running in an AlwaysOn configuration, we have a second component, which is log pool. In that case, what happens is when the log cache is being flushed to the log desk on the primary node, those log records also get copied to log pool. The log records in the log pool are read by a thread called log capture and its job is to read the log records from log pool and send to this secondary replica. If there are multiple secondary replicas, there is one log capture thread for each of those replicas, and this is good because you want to send the log records across multiple replicas in parallel, not sequential. Now, let us look at what happens on the secondary replica. So there's a thread, log receive, that is running on the secondary replica. It receives the log records from the network and it starts writing to the log cache. While the log records are being written to the log cache, there's a redo thread that is always running on the secondary replica. It is reading those log records and applying those changes to the data pages and the index pages in the database on the secondary to bring it up to date with whatever has happened on the primary. As you can imagine, the redo thread needs to read pages and apply the change, but there is some extra work the redo thread has to do to make those changes available on those data pages. Now, when the log cache on the secondary replica becomes full, or it receives a commit log record, it hardens the content of log cache onto the log disk on the secondary replica. Now, if the secondary replica was configured to run in synch mode, it will send an acknowledgement on the commit to the primary node indicating that it has hardened the transaction, and so it is safe to tell the user that the transaction is committed. And because we have hardened the logs on the secondary, there is a guarantee that in case there is a failover, there's no data loss because we have all the logs. Now, while this is going on, the redo thread is applying those transaction log records. And it is running independently of how log records are being generated on the secondary or being copied and persisted. So, in general, what we have seen is the redo thread is running a few seconds behind. If, for example, it can become behind a few minutes, in that case, those log records are not available in the log cache. In that case, it will pick up those log records from the log disk, and that is what is shown in the dotted line on the right side of the slide. So far, what we have seen is that you can run your reporting workload in AlwaysOn on the secondary replica. There is some latency, and it provides automatic failover in case the primary node changes the polarity.
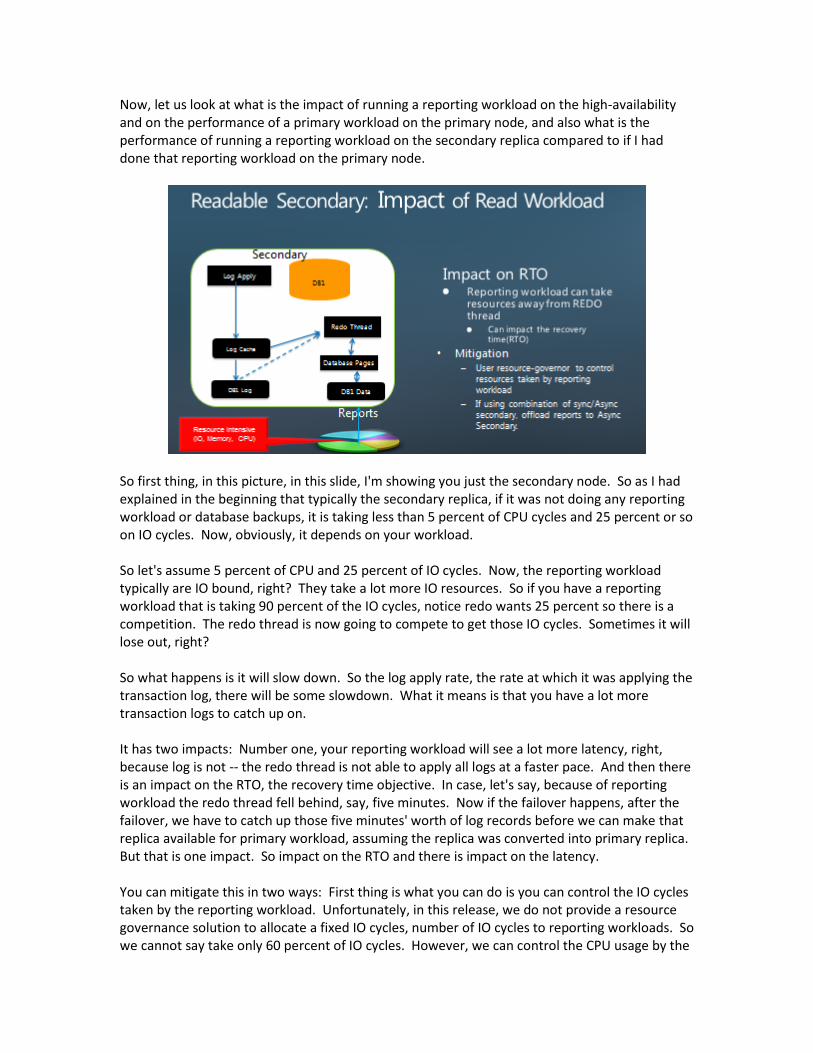
Now, let us look at what is the impact of running a reporting workload on the high-availability and on the performance of a primary workload on the primary node, and also what is the performance of running a reporting workload on the secondary replica compared to if I had done that reporting workload on the primary node.
So first thing, in this picture, in this slide, I'm showing you just the secondary node. So as I had explained in the beginning that typically the secondary replica, if it was not doing any reporting workload or database backups, it is taking less than 5 percent of CPU cycles and 25 percent or so on IO cycles. Now, obviously, it depends on your workload. So let's assume 5 percent of CPU and 25 percent of IO cycles. Now, the reporting workload typically are IO bound, right? They take a lot more IO resources. So if you have a reporting workload that is taking 90 percent of the IO cycles, notice redo wants 25 percent so there is a competition. The redo thread is now going to compete to get those IO cycles. Sometimes it will lose out, right? So what happens is it will slow down. So the log apply rate, the rate at which it was applying the transaction log, there will be some slowdown. What it means is that you have a lot more transaction logs to catch up on. It has two impacts: Number one, your reporting workload will see a lot more latency, right, because log is not -- the redo thread is not able to apply all logs at a faster pace. And then there is an impact on the RTO, the recovery time objective. In case, let's say, because of reporting workload the redo thread fell behind, say, five minutes. Now if the failover happens, after the failover, we have to catch up those five minutes' worth of log records before we can make that replica available for primary workload, assuming the replica was converted into primary replica. But that is one impact. So impact on the RTO and there is impact on the latency. You can mitigate this in two ways: First thing is what you can do is you can control the IO cycles taken by the reporting workload. Unfortunately, in this release, we do not provide a resource governance solution to allocate a fixed IO cycles, number of IO cycles to reporting workloads. So we cannot say take only 60 percent of IO cycles. However, we can control the CPU usage by the
supporting workload. So by giving less CPU to the suspecting workload, you can indirectly control how much IO cycles it will consume. So it's an indirect way, not the perfect solution, but it is there. Other solution that some of our customers have done is if they have two replicas, one is a sync replica and one is an async replica. What they do is they can do the reporting on the async replica and the sync replica is running without additional overhead. So in that case, the are able to guarantee the high-availability, no compromise on the RTO while still able to offload the reporting workload on the async replica. Now, obviously, this needs three nodes, a bit more expensive. So those are the choices you have. So that is one aspect of running a reporting workload and the impact on the high availability, namely in terms of RTO.
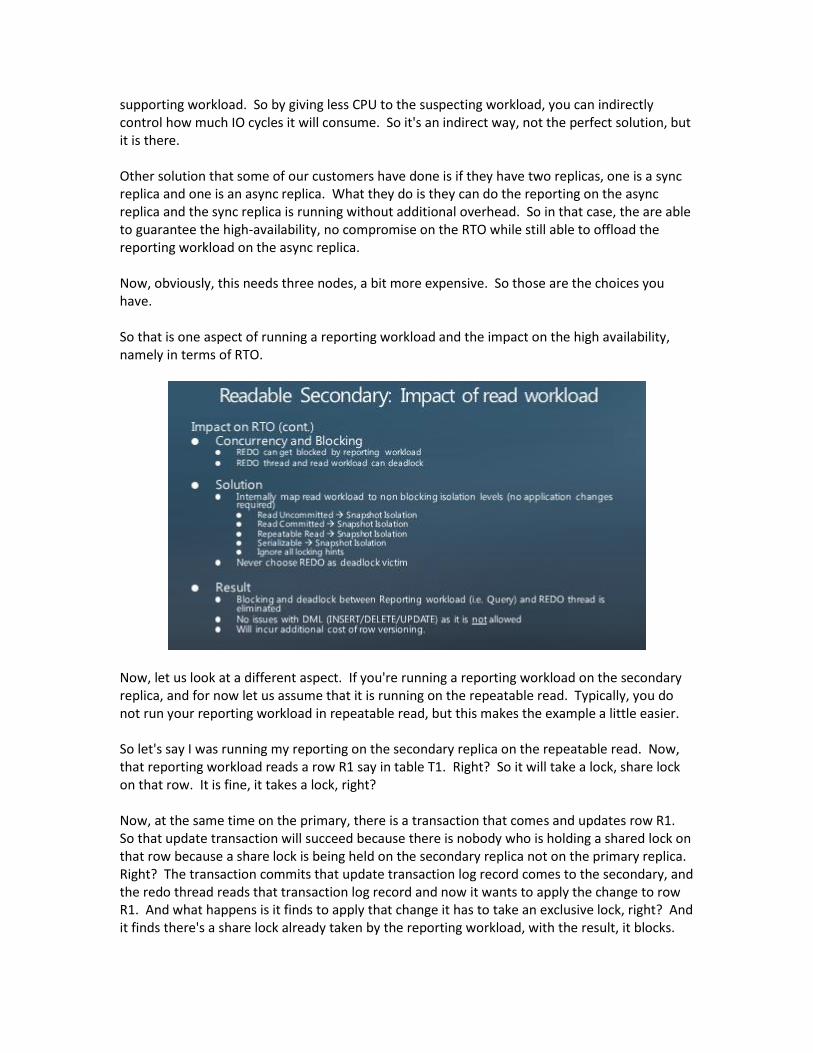
Now, let us look at a different aspect. If you're running a reporting workload on the secondary replica, and for now let us assume that it is running on the repeatable read. Typically, you do not run your reporting workload in repeatable read, but this makes the example a little easier. So let's say I was running my reporting on the secondary replica on the repeatable read. Now, that reporting workload reads a row R1 say in table T1. Right? So it will take a lock, share lock on that row. It is fine, it takes a lock, right? Now, at the same time on the primary, there is a transaction that comes and updates row R1. So that update transaction will succeed because there is nobody who is holding a shared lock on that row because a share lock is being held on the secondary replica not on the primary replica. Right? The transaction commits that update transaction log record comes to the secondary, and the redo thread reads that transaction log record and now it wants to apply the change to row R1. And what happens is it finds to apply that change it has to take an exclusive lock, right? And it finds there's a share lock already taken by the reporting workload, with the result, it blocks.
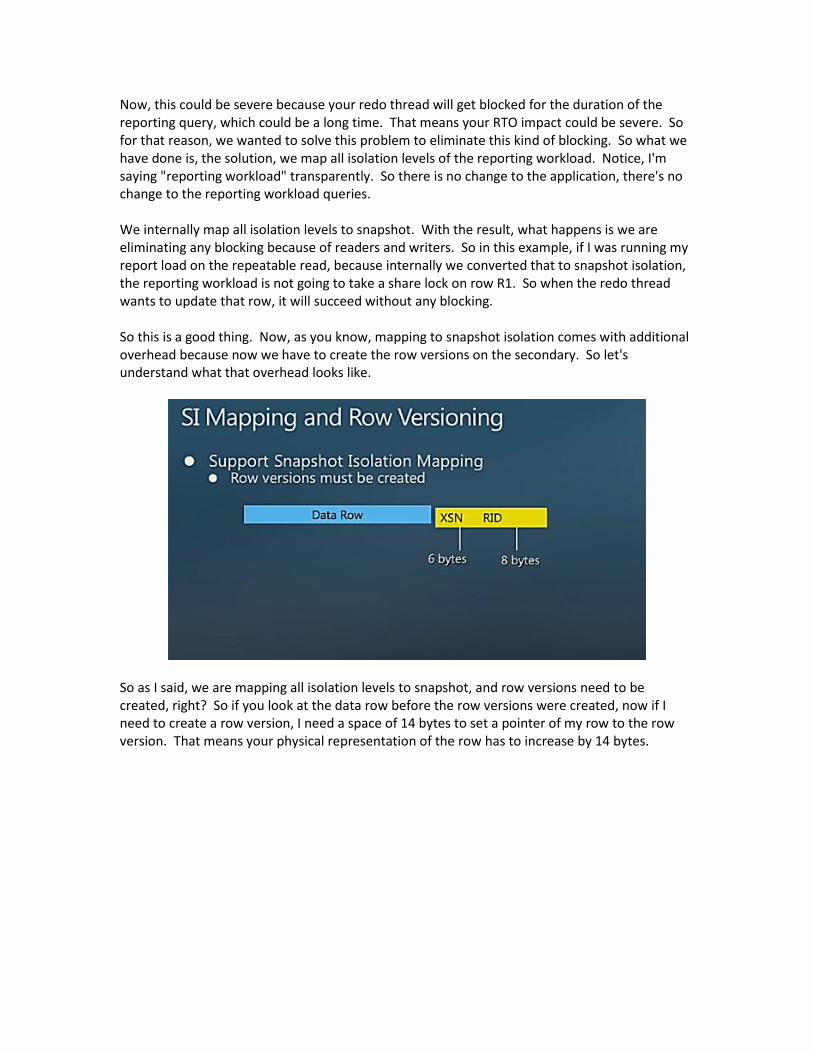
Now, this could be severe because your redo thread will get blocked for the duration of the reporting query, which could be a long time. That means your RTO impact could be severe. So for that reason, we wanted to solve this problem to eliminate this kind of blocking. So what we have done is, the solution, we map all isolation levels of the reporting workload. Notice, I'm saying "reporting workload" transparently. So there is no change to the application, there's no change to the reporting workload queries. We internally map all isolation levels to snapshot. With the result, what happens is we are eliminating any blocking because of readers and writers. So in this example, if I was running my report load on the repeatable read, because internally we converted that to snapshot isolation, the reporting workload is not going to take a share lock on row R1. So when the redo thread wants to update that row, it will succeed without any blocking. So this is a good thing. Now, as you know, mapping to snapshot isolation comes with additional overhead because now we have to create the row versions on the secondary. So let's understand what that overhead looks like.
So as I said, we are mapping all isolation levels to snapshot, and row versions need to be created, right? So if you look at the data row before the row versions were created, now if I need to create a row version, I need a space of 14 bytes to set a pointer of my row to the row version. That means your physical representation of the row has to increase by 14 bytes.
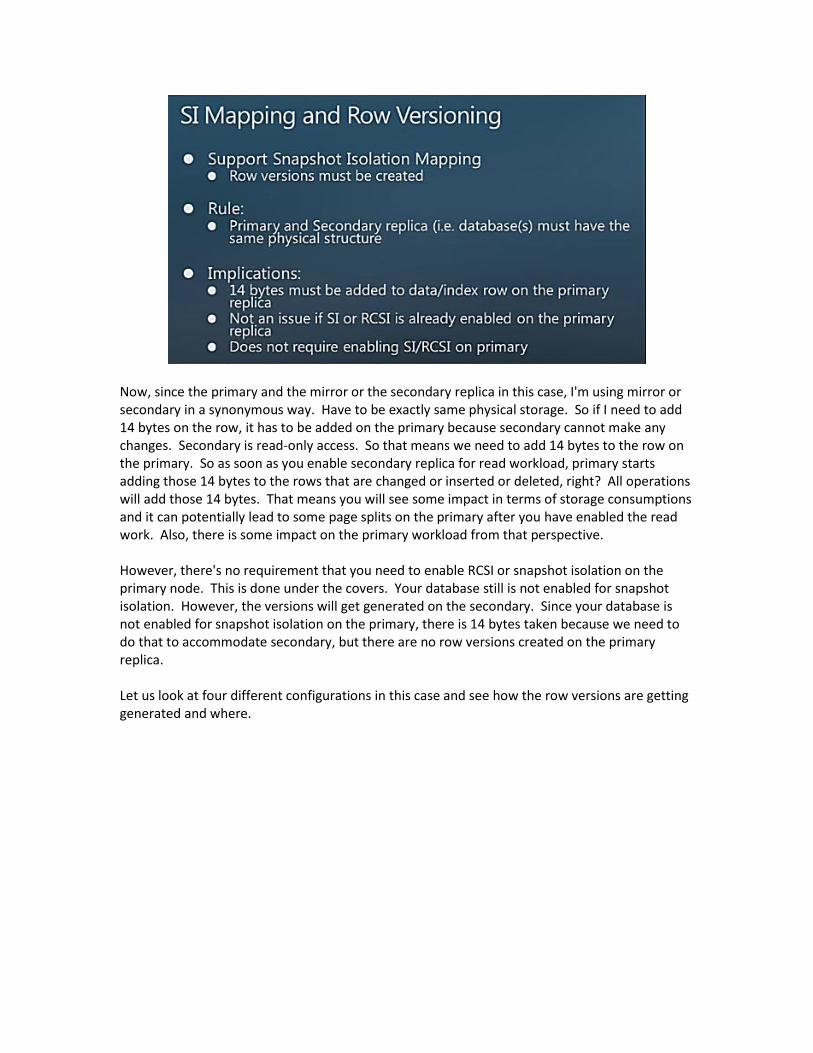
Now, since the primary and the mirror or the secondary replica in this case, I'm using mirror or secondary in a synonymous way. Have to be exactly same physical storage. So if I need to add 14 bytes on the row, it has to be added on the primary because secondary cannot make any changes. Secondary is read-only access. So that means we need to add 14 bytes to the row on the primary. So as soon as you enable secondary replica for read workload, primary starts adding those 14 bytes to the rows that are changed or inserted or deleted, right? All operations will add those 14 bytes. That means you will see some impact in terms of storage consumptions and it can potentially lead to some page splits on the primary after you have enabled the read work. Also, there is some impact on the primary workload from that perspective. However, there's no requirement that you need to enable RCSI or snapshot isolation on the primary node. This is done under the covers. Your database still is not enabled for snapshot isolation. However, the versions will get generated on the secondary. Since your database is not enabled for snapshot isolation on the primary, there is 14 bytes taken because we need to do that to accommodate secondary, but there are no row versions created on the primary replica. Let us look at four different configurations in this case and see how the row versions are getting generated and where.
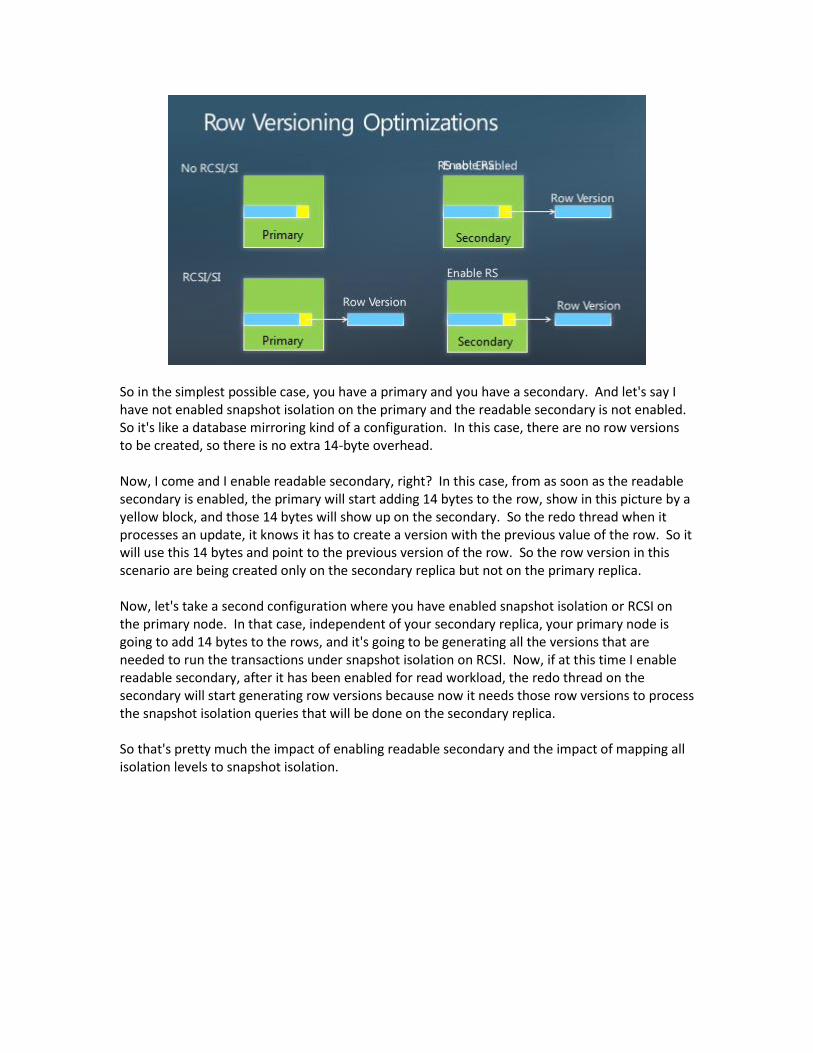
So in the simplest possible case, you have a primary and you have a secondary. And let's say I have not enabled snapshot isolation on the primary and the readable secondary is not enabled. So it's like a database mirroring kind of a configuration. In this case, there are no row versions to be created, so there is no extra 14-byte overhead. Now, I come and I enable readable secondary, right? In this case, from as soon as the readable secondary is enabled, the primary will start adding 14 bytes to the row, show in this picture by a yellow block, and those 14 bytes will show up on the secondary. So the redo thread when it processes an update, it knows it has to create a version with the previous value of the row. So it will use this 14 bytes and point to the previous version of the row. So the row version in this scenario are being created only on the secondary replica but not on the primary replica. Now, let's take a second configuration where you have enabled snapshot isolation or RCSI on the primary node. In that case, independent of your secondary replica, your primary node is going to add 14 bytes to the rows, and it's going to be generating all the versions that are needed to run the transactions under snapshot isolation on RCSI. Now, if at this time I enable readable secondary, after it has been enabled for read workload, the redo thread on the secondary will start generating row versions because now it needs those row versions to process the snapshot isolation queries that will be done on the secondary replica. So that's pretty much the impact of enabling readable secondary and the impact of mapping all isolation levels to snapshot isolation.
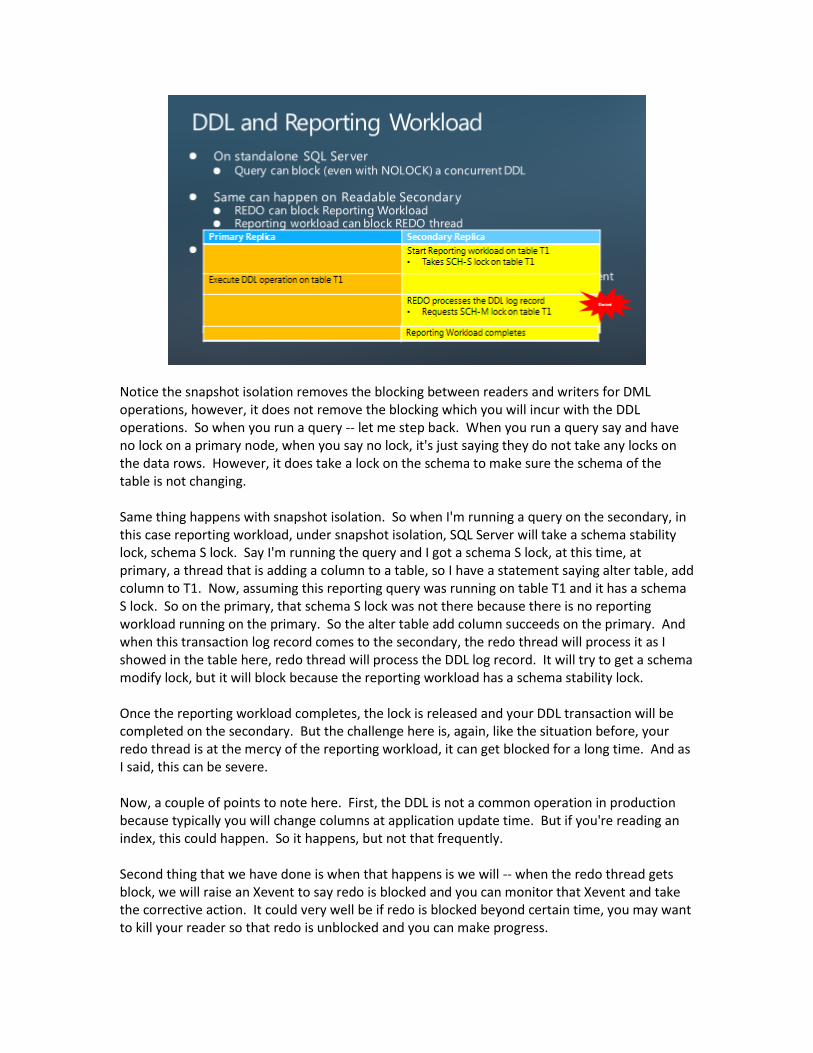
Notice the snapshot isolation removes the blocking between readers and writers for DML operations, however, it does not remove the blocking which you will incur with the DDL operations. So when you run a query -- let me step back. When you run a query say and have no lock on a primary node, when you say no lock, it's just saying they do not take any locks on the data rows. However, it does take a lock on the schema to make sure the schema of the table is not changing. Same thing happens with snapshot isolation. So when I'm running a query on the secondary, in this case reporting workload, under snapshot isolation, SQL Server will take a schema stability lock, schema S lock. Say I'm running the query and I got a schema S lock, at this time, at primary, a thread that is adding a column to a table, so I have a statement saying alter table, add column to T1. Now, assuming this reporting query was running on table T1 and it has a schema S lock. So on the primary, that schema S lock was not there because there is no reporting workload running on the primary. So the alter table add column succeeds on the primary. And when this transaction log record comes to the secondary, the redo thread will process it as I showed in the table here, redo thread will process the DDL log record. It will try to get a schema modify lock, but it will block because the reporting workload has a schema stability lock. Once the reporting workload completes, the lock is released and your DDL transaction will be completed on the secondary. But the challenge here is, again, like the situation before, your redo thread is at the mercy of the reporting workload, it can get blocked for a long time. And as I said, this can be severe. Now, a couple of points to note here. First, the DDL is not a common operation in production because typically you will change columns at application update time. But if you're reading an index, this could happen. So it happens, but not that frequently. Second thing that we have done is when that happens is we will -- when the redo thread gets block, we will raise an Xevent to say redo is blocked and you can monitor that Xevent and take the corrective action. It could very well be if redo is blocked beyond certain time, you may want to kill your reader so that redo is unblocked and you can make progress.
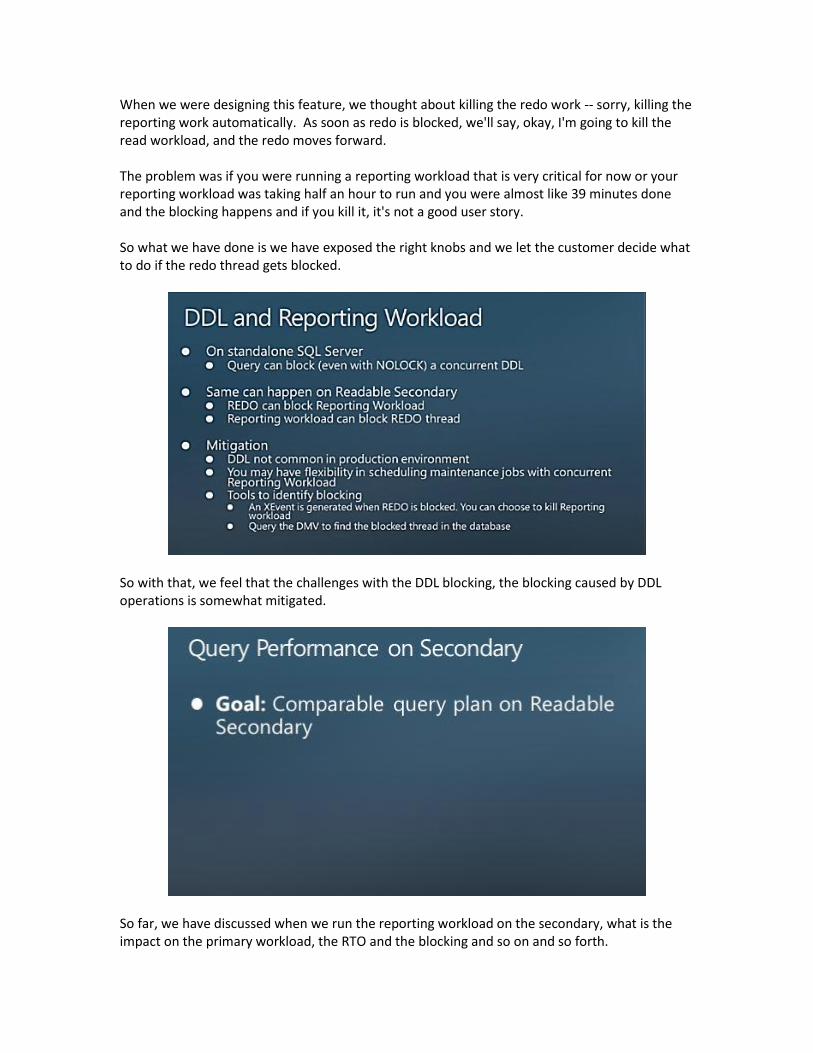
When we were designing this feature, we thought about killing the redo work -- sorry, killing the reporting work automatically. As soon as redo is blocked, we'll say, okay, I'm going to kill the read workload, and the redo moves forward. The problem was if you were running a reporting workload that is very critical for now or your reporting workload was taking half an hour to run and you were almost like 39 minutes done and the blocking happens and if you kill it, it's not a good user story. So what we have done is we have exposed the right knobs and we let the customer decide what to do if the redo thread gets blocked.
So with that, we feel that the challenges with the DDL blocking, the blocking caused by DDL operations is somewhat mitigated.
So far, we have discussed when we run the reporting workload on the secondary, what is the impact on the primary workload, the RTO and the blocking and so on and so forth.

Now, let's look at the performance of reporting workload on the secondary. Ideally, what you want is that if I was running the reporting workload secondary, I should have a comparable query plan, same play or similar plan if I had on the same reporting query on the primary node. Now, to explain this point a little better, let me take a simple example. In this case, I'm going to show you a case with a read-only database. So here I have a database called Fu. So I'm going to first drop this database. I drop this database. And I'm going to create this database. And what I'm going to do is I'm going to create a table, T1. And on this table, I'm going to create an index on column C1, non-clustered index. Now, I'm going to insert a row into this table. I insert a row, and I'm going to do a query on this table. Okay? I do a query on select style from this table, T1, where the C1 is between 1 and 20. So if you look at the query plan, I look at the query plan. It says it is a table scan. Now, this is an interesting point. Even though there is an index available on column C1, SQL Server chose to do table scan. And the reason is obvious because if there is only one row, there's no reason to traverse the non-clustered index. So it will be more efficient for me to go directly and do the full table scan because I have only one row, right? Does that make sense? So now what I'm going to do is I'm going to insert 10,000 rows into this table. Okay? 10,000 rows have been inserted. And what I'm going to do is I'm going to make this database as read only. And you will see why I'm doing that, and it has sort of an implication on the challenges that we have on the readable secondary. So I'm going to go to the test database, I'm going to look at the properties. I go to the options, and I mark this database as -- it's a read-write database, I'm going to mark it as read-only database. I do, and it has been updated. Now the database is read-only. You can see on the explorer that it says that it is read-only database, right? Now, let me use the database test. Five because connection was disconnected. Now if I do the query again, okay, now notice that I have 10,001 rows in this database, in this table, because I inserted 10,000 rows. So when I look at the query, execution plan, it still says it is a table scan. And the reason is because the database was made read only, the optimizer, when it was compiling the program, this query, it realized the stats on this query are out of date because the stats are based on one row, but now there are 10,000 rows. I'm going to show you what the stat looks like. So two things. There's only one row. And from its perspective, it makes sense to do the table scan, right? So it does a table scan. If I show you the statistics on the table, it just shows there's only one row. So this is what the optimizer is seeing, it's saying, hey, there's only one row, it makes sense for me to do the table scan. So the key point is when the database is marked read only, you do not get updates of the statistics, okay? Now, what I should do -- let me just mark this database as read-write. So I'm going to go back to the properties and I'm going to mark this database as read-write, okay? I do that. Now if the database was read-write and I go back and reuse this database and I do a query and if I look at the plan, notice it is choosing the index plan. So in this case, what happened was optimizer
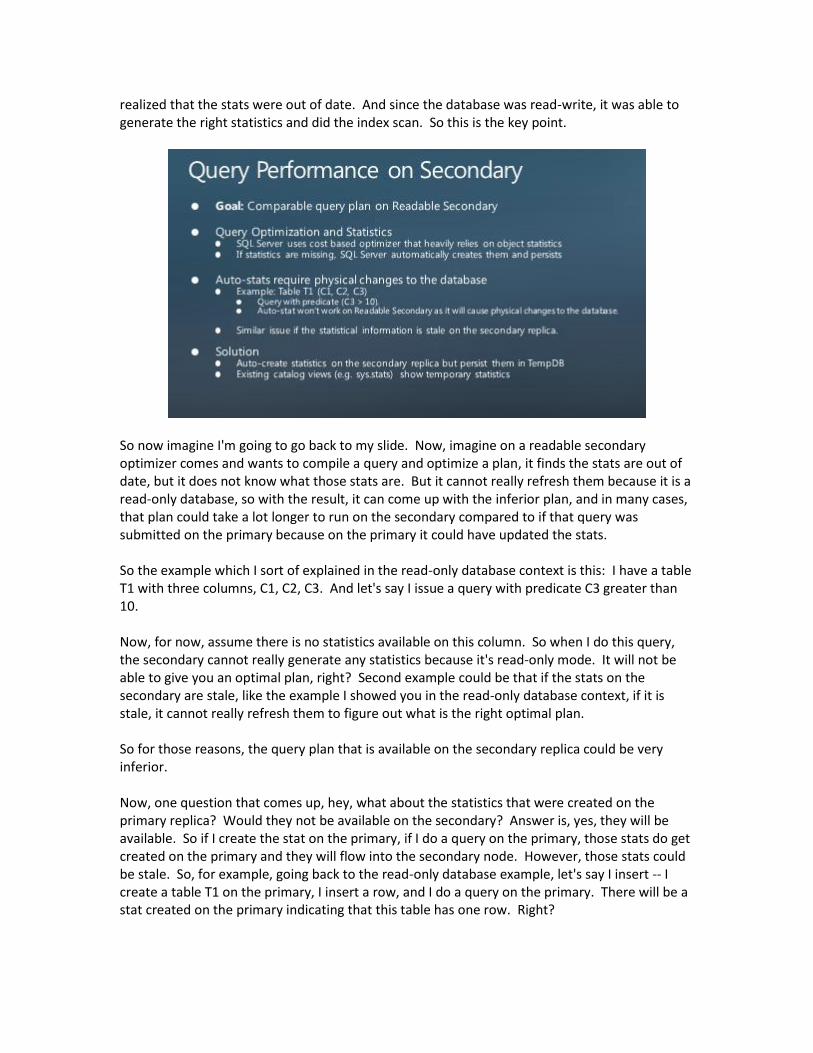
realized that the stats were out of date. And since the database was read-write, it was able to generate the right statistics and did the index scan. So this is the key point.
So now imagine I'm going to go back to my slide. Now, imagine on a readable secondary optimizer comes and wants to compile a query and optimize a plan, it finds the stats are out of date, but it does not know what those stats are. But it cannot really refresh them because it is a read-only database, so with the result, it can come up with the inferior plan, and in many cases, that plan could take a lot longer to run on the secondary compared to if that query was submitted on the primary because on the primary it could have updated the stats. So the example which I sort of explained in the read-only database context is this: I have a table T1 with three columns, C1, C2, C3. And let's say I issue a query with predicate C3 greater than 10. Now, for now, assume there is no statistics available on this column. So when I do this query, the secondary cannot really generate any statistics because it's read-only mode. It will not be able to give you an optimal plan, right? Second example could be that if the stats on the secondary are stale, like the example I showed you in the read-only database context, if it is stale, it cannot really refresh them to figure out what is the right optimal plan. So for those reasons, the query plan that is available on the secondary replica could be very inferior. Now, one question that comes up, hey, what about the statistics that were created on the primary replica? Would they not be available on the secondary? Answer is, yes, they will be available. So if I create the stat on the primary, if I do a query on the primary, those stats do get created on the primary and they will flow into the secondary node. However, those stats could be stale. So, for example, going back to the read-only database example, let's say I insert -- I create a table T1 on the primary, I insert a row, and I do a query on the primary. There will be a stat created on the primary indicating that this table has one row. Right?
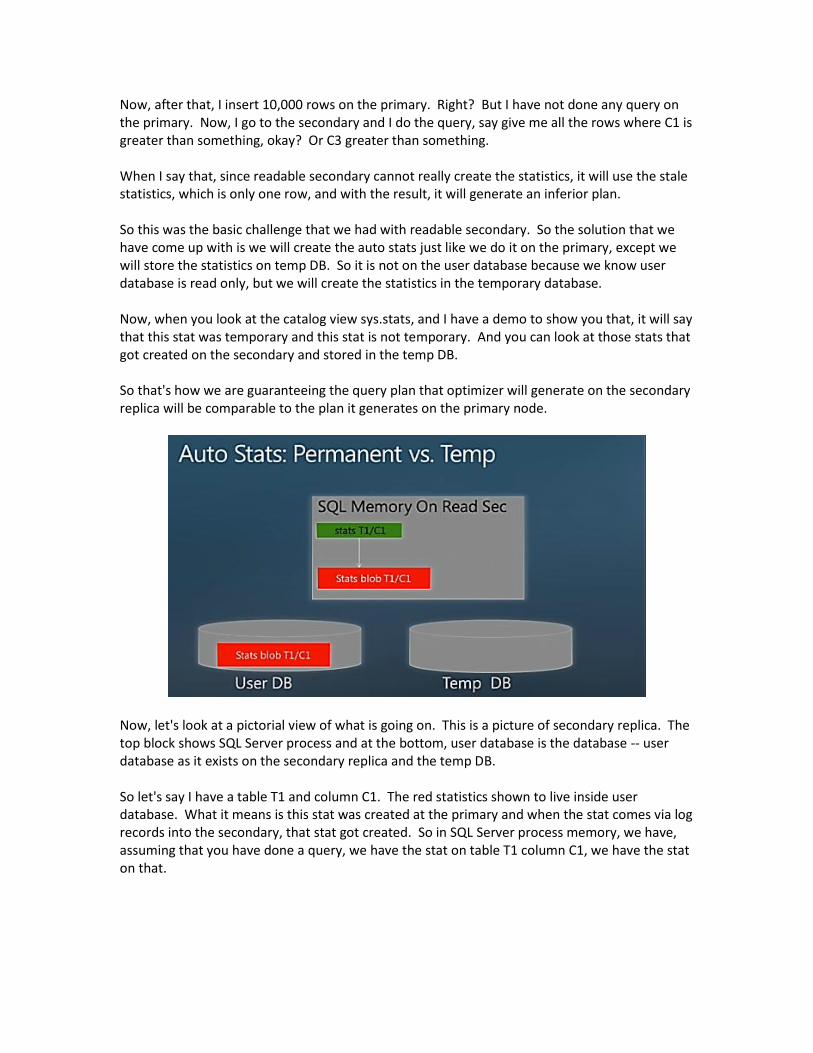
Now, after that, I insert 10,000 rows on the primary. Right? But I have not done any query on the primary. Now, I go to the secondary and I do the query, say give me all the rows where C1 is greater than something, okay? Or C3 greater than something. When I say that, since readable secondary cannot really create the statistics, it will use the stale statistics, which is only one row, and with the result, it will generate an inferior plan. So this was the basic challenge that we had with readable secondary. So the solution that we have come up with is we will create the auto stats just like we do it on the primary, except we will store the statistics on temp DB. So it is not on the user database because we know user database is read only, but we will create the statistics in the temporary database. Now, when you look at the catalog view sys.stats, and I have a demo to show you that, it will say that this stat was temporary and this stat is not temporary. And you can look at those stats that got created on the secondary and stored in the temp DB. So that's how we are guaranteeing the query plan that optimizer will generate on the secondary replica will be comparable to the plan it generates on the primary node.
Now, let's look at a pictorial view of what is going on. This is a picture of secondary replica. The top block shows SQL Server process and at the bottom, user database is the database -- user database as it exists on the secondary replica and the temp DB. So let's say I have a table T1 and column C1. The red statistics shown to live inside user database. What it means is this stat was created at the primary and when the stat comes via log records into the secondary, that stat got created. So in SQL Server process memory, we have, assuming that you have done a query, we have the stat on table T1 column C1, we have the stat on that.
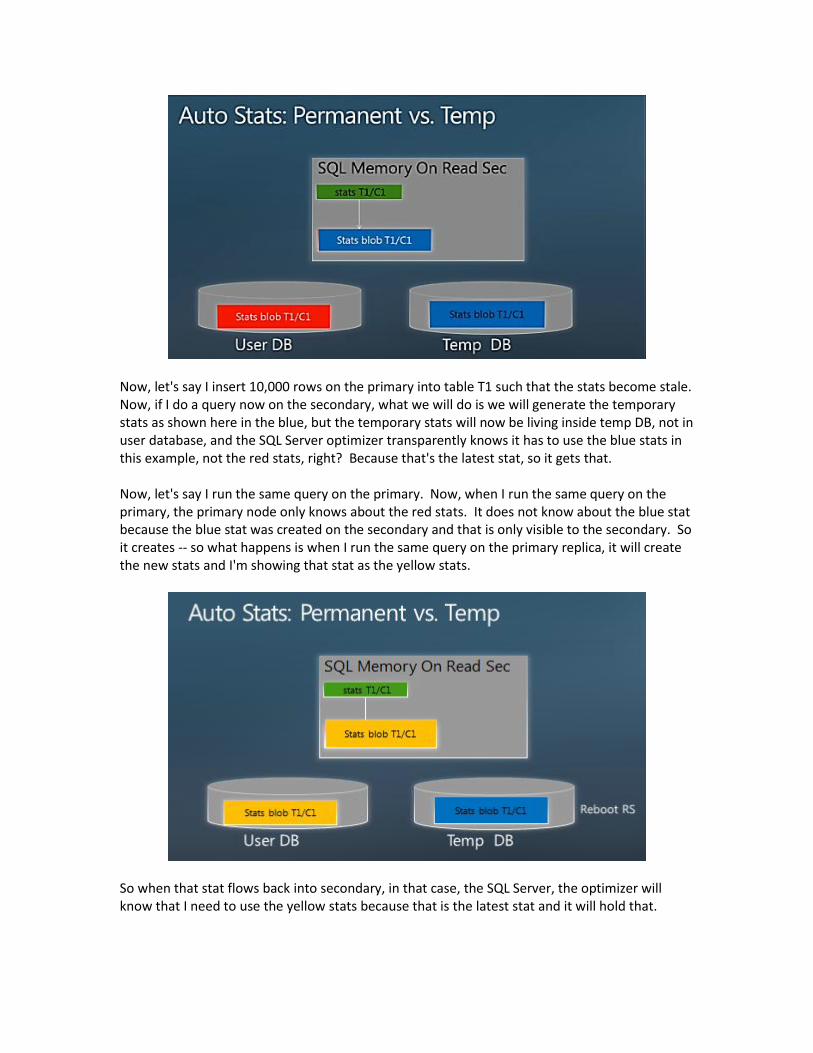
Now, let's say I insert 10,000 rows on the primary into table T1 such that the stats become stale. Now, if I do a query now on the secondary, what we will do is we will generate the temporary stats as shown here in the blue, but the temporary stats will now be living inside temp DB, not in user database, and the SQL Server optimizer transparently knows it has to use the blue stats in this example, not the red stats, right? Because that's the latest stat, so it gets that. Now, let's say I run the same query on the primary. Now, when I run the same query on the primary, the primary node only knows about the red stats. It does not know about the blue stat because the blue stat was created on the secondary and that is only visible to the secondary. So it creates -- so what happens is when I run the same query on the primary replica, it will create the new stats and I'm showing that stat as the yellow stats.
So when that stat flows back into secondary, in that case, the SQL Server, the optimizer will know that I need to use the yellow stats because that is the latest stat and it will hold that.

Now, what happens with the blue stat? I mean, as you can see, the blue stat is not really needed. We don't automatically drop it, but we provide you -- you can use drop statistics command in T-SQL to drop it if you want, right? Other thing to note is if, for example, your secondary replica is restarted, all the stats that you have in the temp DB gets lost. It's not a big deal because the auto stats are generated based on sampling. It's not really expensive to create, so when you restart your secondary and you start submitting queries, any stats that it finds missing or stale it will automatically generate them.
Now, let us look at a demo on how these statistics are working. So I go back to my demo and what I'm going to show you is a primary database and on the Explorer here on the left side, let me just show you that the database -- the instance 6PLHSI is a primary replica, right? So this is my primary replica. Okay? So what I'm going to do is I'm going to use my database that has been part of availability group. I drop the table T1 and then what I'm going to do is I'm going to insert a row into this table. And let us look at the stats at this time in table T1. You will find that there is no stats. The reason is just because I inserted a row, SQL Server will not automatically create the statistics, it will only create the statistics when you do a query. So I go and let's add in a query. I do a query and now if I look at my stats, it shows there's a stat on column C1. And notice the name of the stats. This shows that this was an internally generated name, so this is an automatically generated statistics, okay? Now, what I'm going to do is I'm going to do an insert. I'm going to insert 10,000 rows into this table. I insert 10,000 rows. By inserting those 10,000 rows, obviously, the stats have become stale. If I do a query, it will sort of create the new stats, but I'm not going to do that here, okay? Now I'm going to go to my secondary. Okay?

Secondary is on instance -- let me just show you on the Explorer. It will show you that this is a secondary replica. So it is a secondary replica, okay? So I go there. And let me do this. I go here. I use a database and before I do anything else, let me try to create a database -- or table. It fails because the secondary database or secondary replica you cannot really make any changes to the database. That's to show that this is read only. Now, if I look at the stats here, okay, when I look at the stats, notice the stat that I had created on the primary still shows up here, right? Which is true, because anything that you make changes on the primary via log records, it will come to the secondary, okay? Now, if I do a query on column C2. Now, I have not done a query on column C2 on the primary, so that means those stats are missing. So then I do this query, and now if I look at the stats, you will see that a new stat has been created on the secondary. This stat does not exist on the primary. I can go back to primary and I look at the stats. This is the primary, okay? And I'm going to show you the stat on the primary. It still has one stat, right? Going back to secondary now, it shows two stats. Now, the interesting thing is I'm looking at sys.stats catalog view. If you go here, it says there's a new column, it's temporary, it says the first stat is not temporary and the second stat is temporary. So, to me, it means that this is a temporary stat. And what we have done is we generate a special name for the stats that are temporary. We sort of append read only database statistics to all auto-generated statistics that are stored on the secondary, right? Now, let me do another query. I'm going to do a query on C1, okay? Now, this query on C1 will find out that the stale existing statistics that were created on the primary is now stale, right? When I do this query, and if I go and look at my stats. I look at my stats. You will notice even that has become temporary. Why? Because when I ran this query on the secondary, it knew that the stats that I have are stale, so it recomputes the statistics to make it up to date. This is like the example I was showing you the red stat became the blue stat. So this is the stat that got created on the secondary, this is updated. Now, if I want to drop some stats, right. So in this case, I know this is my temporary stat. And let's say I want to drop it. Okay, I copy it. I go to a command to say I'm going to drop it. Okay, so I go here. And it's dropped. And if I look at my sys.stats on the secondary, on the table T1, let me just do that. You will notice I have dropped one of my temporary stats. Okay. So this has been dropped. So this is how you can see how the stats are being managed on the secondary replica. Now, the space taken by stats on the temporary database is not a whole lot because each stat typically takes one space, so it's 8K. So we have, say, 1,000 statistics or 5,000 statistics, at most, you are taking 40 megabytes of temp DB. So what you need to do is you have to configure your system to accommodate the space needed for storing the temporary stats.

So that's all I wanted to say about this demo. Now, let me talk about the connectivity.
So when you have a secondary replica, you can choose to say that no read workload is allowed. This is a database building configuration, right? You can say in secondary role for this replica, I will not allow any read workload. So when you know this is a default. There are two other options. You can say I will allow read-only workload, or I will allow all workload. And let's look into why we have these two options. So it is clear that you can only run a read-only workload on the secondary, you cannot really run a read-write workload. So if you have set up your readable secondary to say that I only allow read-only workload, the connection that the reporting workload has to give should have a property -- is a new property on the connection called read-only intent. So you need to say that this connection is read-only intent. So then when it comes to the secondary replica and secondary replica is configured to accept only read-only connections, it will accept that connection and that connection will be successful. Now, the benefit of that one is if you were by mistake, right, connected a non-read-only workload to the secondary replica, and for that you did not set the intent to read only, it comes, it will deny that. What happens is this makes the customer story a little better in the sense there is no surprise. It's not like I was able to connect my workload to a node in AlwaysOn topology and after a few minutes or after some time I find out, oops, I connected to the readable secondary, I should have connected to the primary node. So you can use that connection property to avoid surprises. There's another benefit of that. Notice there is another option called primary role. In the primary role that is in a replica that you have could be two roles. It could be a secondary, right, or it could be a primary. So when the replica is a primary node, I can say allow connections read-write, allow all connections, right?
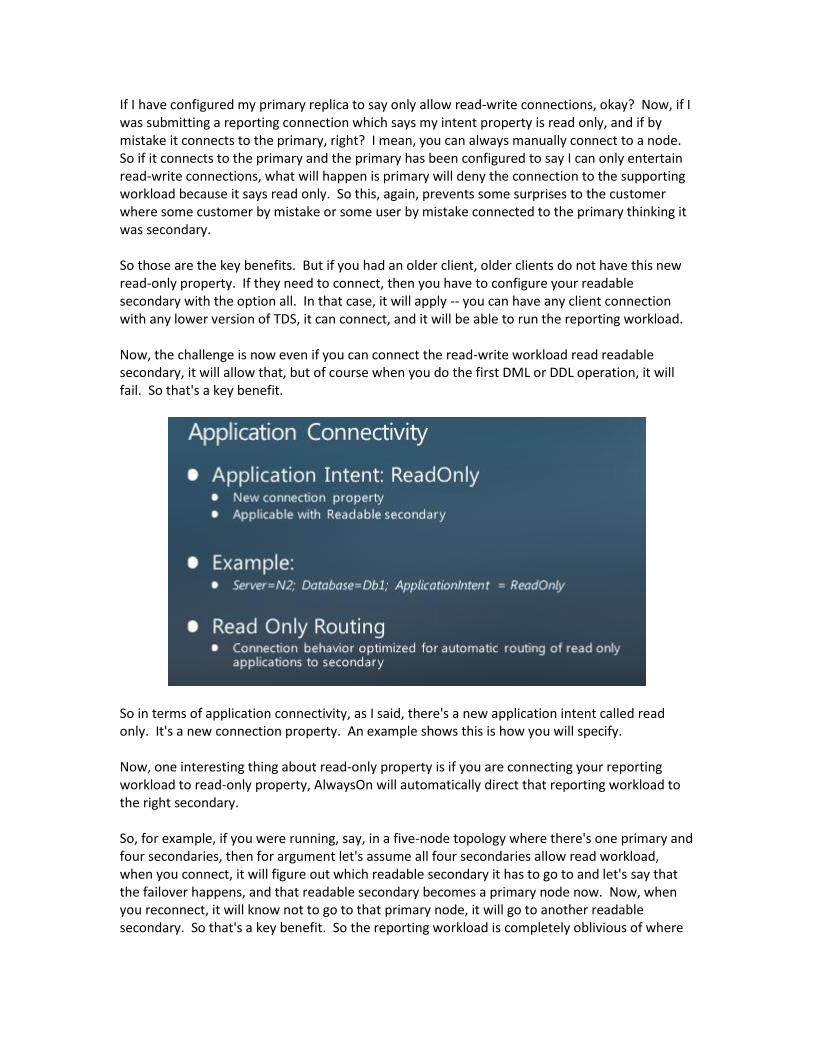
If I have configured my primary replica to say only allow read-write connections, okay? Now, if I was submitting a reporting connection which says my intent property is read only, and if by mistake it connects to the primary, right? I mean, you can always manually connect to a node. So if it connects to the primary and the primary has been configured to say I can only entertain read-write connections, what will happen is primary will deny the connection to the supporting workload because it says read only. So this, again, prevents some surprises to the customer where some customer by mistake or some user by mistake connected to the primary thinking it was secondary. So those are the key benefits. But if you had an older client, older clients do not have this new read-only property. If they need to connect, then you have to configure your readable secondary with the option all. In that case, it will apply -- you can have any client connection with any lower version of TDS, it can connect, and it will be able to run the reporting workload. Now, the challenge is now even if you can connect the read-write workload read readable secondary, it will allow that, but of course when you do the first DML or DDL operation, it will fail. So that's a key benefit.
So in terms of application connectivity, as I said, there's a new application intent called read only. It's a new connection property. An example shows this is how you will specify. Now, one interesting thing about read-only property is if you are connecting your reporting workload to read-only property, AlwaysOn will automatically direct that reporting workload to the right secondary. So, for example, if you were running, say, in a five-node topology where there's one primary and four secondaries, then for argument let's assume all four secondaries allow read workload, when you connect, it will figure out which readable secondary it has to go to and let's say that the failover happens, and that readable secondary becomes a primary node now. Now, when you reconnect, it will know not to go to that primary node, it will go to another readable secondary. So that's a key benefit. So the reporting workload is completely oblivious of where
the readable secondary is. The system, the read-only routing will take care of the fact of knowing where the secondary is and will direct your connection to that.
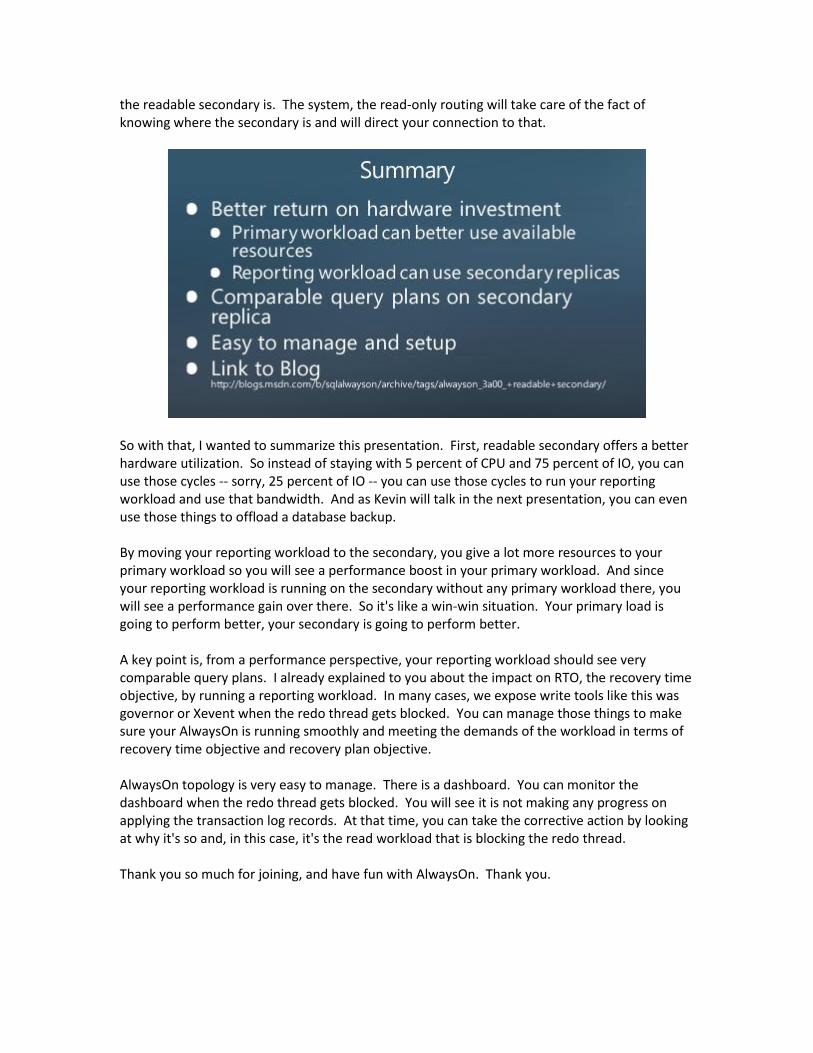
So with that, I wanted to summarize this presentation. First, readable secondary offers a better hardware utilization. So instead of staying with 5 percent of CPU and 75 percent of IO, you can use those cycles -- sorry, 25 percent of IO -- you can use those cycles to run your reporting workload and use that bandwidth. And as Kevin will talk in the next presentation, you can even use those things to offload a database backup. By moving your reporting workload to the secondary, you give a lot more resources to your primary workload so you will see a performance boost in your primary workload. And since your reporting workload is running on the secondary without any primary workload there, you will see a performance gain over there. So it's like a win-win situation. Your primary load is going to perform better, your secondary is going to perform better. A key point is, from a performance perspective, your reporting workload should see very comparable query plans. I already explained to you about the impact on RTO, the recovery time objective, by running a reporting workload. In many cases, we expose write tools like this was governor or Xevent when the redo thread gets blocked. You can manage those things to make sure your AlwaysOn is running smoothly and meeting the demands of the workload in terms of recovery time objective and recovery plan objective. AlwaysOn topology is very easy to manage. There is a dashboard. You can monitor the dashboard when the redo thread gets blocked. You will see it is not making any progress on applying the transaction log records. At that time, you can take the corrective action by looking at why it's so and, in this case, it's the read workload that is blocking the redo thread. Thank you so much for joining, and have fun with AlwaysOn. Thank you.
END