paper for entrepreneurship journal - the university of texas at dallas
TRANSCRIPT
Will MP3 downloads Annihilate the Record Industry?
The Evidence so Far
Stan Liebowitz
School of Management
University of Texas at Dallas*
June, 2003
* I would like to thank Mukesh Chugh for research assistance.
After Napster exploded into the public’s consciousness in 1999, concerns with MP3 downloads,
their impact on the recording industry, and the industry’s attempt to thwart such downloads, have been
in the news almost continuously. The Napster case was only the most public front in a wide ranging
battle between the entertainment industries (movies and records) and the millions of individuals who
were using the Internet to download, without authorization, copyrighted works, but who otherwise
were thought to be the putative customers of these industries.
This fight has spilled over into the political arena. The manifestations were seen in a bill
proposed by Representative Howard Berman from California in 2002 that would have allowed
copyright owners to engage with impunity in otherwise illegal activities “disabling, interfering with,
blocking, diverting, or otherwise impairing” the “unauthorized” distribution of copyrighted items.1 The
bill did attempt to restrict these otherwise illegal activities to those that do not “alter, delete, or
otherwise impair the integrity of any computer file or data residing on the computer of a file trader” but
it still amounted to authorizing ‘hacking’ behavior that is disallowed in other venues.
This is only a small part in a flurry of activities taken by the copyright-based industries to protect
themselves against what they see as online pilfering of their products.
At the center of the current controversy is the fear by the recording industry that great damage,
perhaps even mortal damage, will be done to them if they do not stop online ‘trading’ of music files, a
fear I refer to as the “annihilation hypothesis”. The movie industry is taking a backseat to the record
industry for the moment because the size of the files needed to view movies make online movie trading
prohibitively time consuming at current connection speeds and because most users do not yet have the
equipment to write DVDs.
Central to any discussion of the annihilation hypothesis should be empirical examinations of the
industry. Yet there have been few studies attempting to examine the impact of MP3 downloads. In the
Napster case the recording industry presented evidence purporting to demonstrate that MP3 downloads
were harmful to record sales and Napster presented evidence purporting to demonstrate that online file-
sharing was beneficial to the record companies.2
1 The text of the bill along with its justification can be found at: http://www.house.gov/berman/pr072502.htm. 2 Napster and its experts claimed that file-sharing merely allowed the customers of record companies to ‘sample’ or ‘try out’ songs in advance of purchase. With the better information provided by such sampling, customers would be more likely, according to Napster’s experts, to purchase the songs that they knew they liked. The recording industry and its experts, on the other hand, claimed that file sharing substituted for the purchase of a record and that the downloading of MP3s would and had decreased the purchase of records.
2
As I have explained elsewhere, the evidence provided by the recording industry in the Napster
case, in my opinion, failed to support any claim of harm, to say nothing of supporting the annihilation
hypothesis, although the judge nevertheless ruled against Napster.3 I also argued that although there
was not yet good evidence to support such harm, there were good economic reasons to believe that
online file sharing would be harmful to the industry.4 At that time there was little evidence of any
decline in record sales and I provided rationales as to why the evidence to support this claim had not
yet surfaced.5
Peer-to-peer file sharing, although anathema to the recording industry, is providing a wonderful
natural experiment to economists or anyone else who might be interested in the impacts of
unauthorized copying. The longer it goes on, the more evidence that can be accumulated on the impact
of the copying on the market for authorized works. The fact that there appear to be actual
measurements on the number of files downloaded provides a metric on the size of the copying activity
that had never existed with any prior copying technologies.6 The natural experiment is still ongoing
and results are still coming in. With all the energy and heat being generated on these topics, however,
this seems like a good time to take stock and examine what we currently know about the impact of
MP3 downloading on record sales.
My conclusions, in a nutshell, are that MP3 downloading does appear to be causing harm. No
other explanations that have been put forward seem to be able to explain the decline in sales that have
occurred since 1999. Still, it is not clear that the harm will be fatal.
3 See Chapter 7 in my book “Rethinking the Network Economy” Amacom, 2002 or my article “Back to the Future: Can Copyright Owners Appropriate Revenues in the Face of New Copying Technologies?” in The Economics of Copyright: Recent Developments and Analysis, edited by Wendy Gordon and Richard Watt, Edward Elgar Publishing, 2003. 4 There are certain theoretical conditions (e.g., indirect appropriability) under which unauthorized copying might in fact enhance, or at least leave undiminished, the revenues to the copyright owner. See SJ Liebowitz ‘The Impact Of Reprography On The Copyright System,’ Copyright Revision Studies, Bureau Of Corporate Affairs, Ottawa, 1981 but the term ‘indirect appropriability’ was coined in my 1985 paper ‘Copying And Indirect Appropriability: Photocopying Of Journals,’ Journal Of Political Economy, October, 1985, pp. 945-957. Indirect appropriability can only work under certain non-general conditions, although Michele Boldrin and David Levine (American Economic Review, May 2002) have recently put forward a similar idea without apparently noticing the real-world limitations to the idea (See the critique by Benjamin Klein, Andres V. Lerner, Kevin M. Murphy in “Intellectual Property: Do We Need It? The Economics of Copyright ‘Fair Use’ in a Networked World,” American Economic Review, 206-208. 5 At that time, I was quoted in various interviews as suggesting that our theories might be missing some important elements since I thought that we should have begun to see harm and yet we were not seeing any. Since then the statistics from the recording industry, as I discuss below, have provided the evidence to support the supposition that MP3 downloading would be harmful to the industry. 6 Although it is not clear just how accurate these estimates are. See Footnote 47 for details on some of these post-Napster estimates. These estimates indicated that at Napster’s peak downloads were the equivalent of 250 million CDs per month (worldwide). According to RIAA numbers, US national sales ran approximately 80 million CDs per month. So the potential impact of MP3 downloads on sales should have been large. See ‘Music Downloads Soar,’ Reuters, September 6, 2001, available at: http://news.cnet.com/news/0–1005–200–7080479.html.
3
I. Background
Records are just a particular category of consumer goods, and not a terribly large one in terms of
revenues. Even so, listening to music is one of the major daily activities for many Americans.
Estimates indicate that the average American spends 45 minutes a day listening to recorded music and
almost three hours listening to the radio—where music is the major programming ingredient.7 Thus
even if its share of GDP is small, its share of the collective consciousness and behavior of consumers is
very large. It is also possible that its value to consumers might be much larger than that indicated by
market revenues, just as air or water provide enormous values but very little, if any, market revenues.8
As is the case with most economic goods, we expect the demand in the market to be impacted
by economic factors such as changes in taste, income, prices of substitutes and complements,
demographics, and changes in the nature of the product. Many of these factors are discussed in Section
II.A. The factor that is of particular relevance in this market is the impact of copying.
The analysis will consist, therefore, of simply examining the sales of albums and trying to
determine the factors responsible for changes in sales. We can then focus on sales in the last few years,
since that is the period in which MP3 downloading began, and see whether sales decline in an
otherwise unexplained manner, or whether they fail to increase as we might have expected them to.
II. The Current Numbers
Data on quantities of records sold in the United States on a yearly basis are available from the
Recording Industry Association of America (RIAA), as are data on revenues. The data on revenues are
estimates based on the list price of recordings—actual transaction prices are not available.9 Although
these numbers are for just the United States market, we can presume that any negative impacts of MP3
downloading would be at least as likely to show up in the US market as any other, due to the large
number of computers, Internet connections, and CD burners and also to the fact that most of the
population can afford to purchase CDs legitimately.
7 See Table No.909 “Media Usage and Consumer Spending: 1993 to 2003” in the 2000 US Statistical Abstract. 8 I felt the need to remind readers of the diamond water paradox because of a statement by Paul Romer who, in an otherwise thoughtful paper, appears to have forgotten it . He states: “The stakes in the battle over the music business are small enough to get lost in rounding error for world GDP of about $30 trillion. However, this battle creates a “teachable moment” that could help frame policy in more important areas.” See “When Should We Use Intellectual Property Rights?” American Economic Review, May, 2002, 213-216. 9 Data on quantities were reported beginning in 1973. For prior years only the industry revenues were reported.
4
The data reported by the RIAA include the number of units of recorded music sold in various
recording mediums (e.g., CDs, audio cassettes and vinyl records) as well as the revenues generated by
each of these mediums. It also contains a breakdown of sales by playing time—singles or albums.
Naturally, the RIAA tend to use these numbers in a way that is most consistent with the picture
they wish to portray about the conditions of the industry. At the present time the condition they wish to
portray is one where the industry is reeling from the impact of MP3 downloads.10
Before a more complete analysis of the data is undertaken, it is useful to examine the evidence at
its most basic level. This, however, requires some decisions about how the ‘output’ of the industry is
measured. Various measures of ‘sales’ can lead to somewhat different views of the industry
environment as is seen in Figure 1.
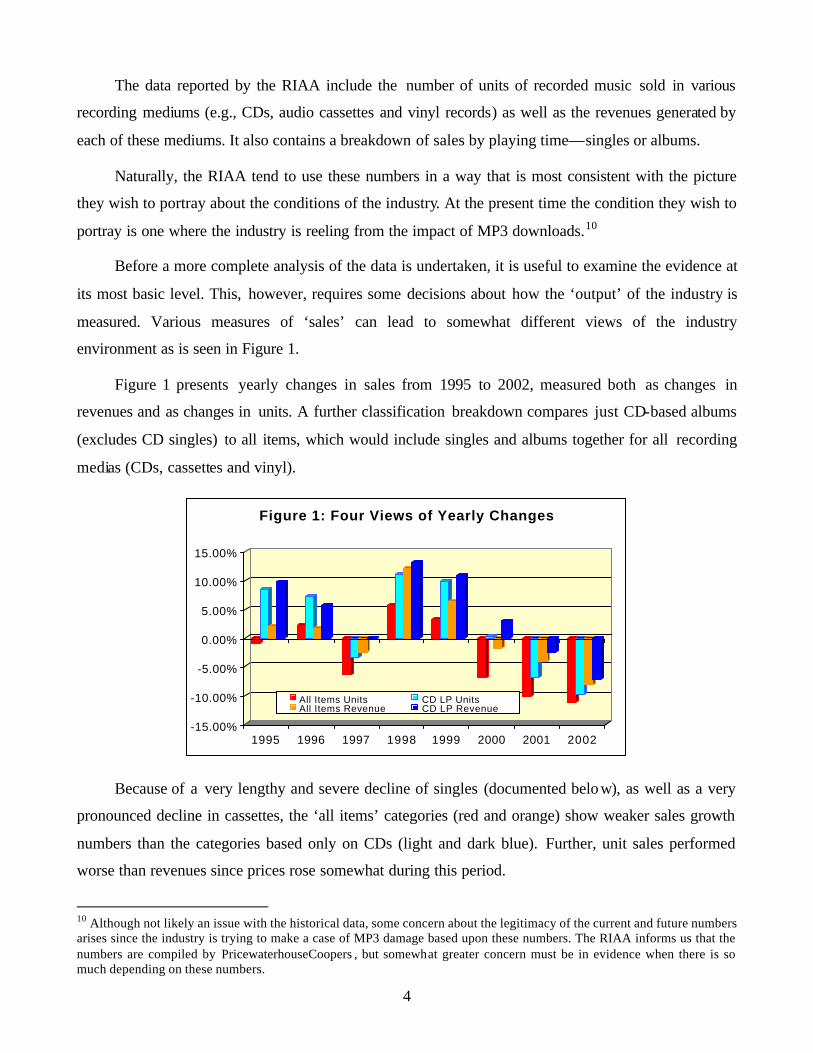
Figure 1 presents yearly changes in sales from 1995 to 2002, measured both as changes in
revenues and as changes in units. A further classification breakdown compares just CD-based albums
(excludes CD singles) to all items, which would include singles and albums together for all recording
medias (CDs, cassettes and vinyl).
-15.00%
-10.00%
-5.00%
0.00%
5.00%
10.00%
15.00%
1995 1996 1997 1998 1999 2000 2001 2002
Figure 1: Four Views of Yearly Changes
All Items Units CD LP UnitsAll Items Revenue CD LP Revenue
Because of a very lengthy and severe decline of singles (documented below), as well as a very
pronounced decline in cassettes, the ‘all items’ categories (red and orange) show weaker sales growth
numbers than the categories based only on CDs (light and dark blue). Further, unit sales performed
worse than revenues since prices rose somewhat during this period.
10 Although not likely an issue with the historical data, some concern about the legitimacy of the current and future numbers arises since the industry is trying to make a case of MP3 damage based upon these numbers. The RIAA informs us that the numbers are compiled by PricewaterhouseCoopers , but somewhat greater concern must be in evidence when there is so much depending on these numbers.
5
In 2001, for example, sales fell by 2%, 4%, 7%, or 10%, depending on which classification one
chooses as the basis for comparisons. CD revenues fell the least, total units fell the most. It is not
surprising that the RIAA chose total units as the measurement trumpeted in its headlines, experiencing
about a ten percent drop in sales that year, since that is a far more impressive a drop than the two
percent fall in CD revenues. The fact that the RIAA choose this particular number, however, does not
necessarily make it wrong or even misleading.
Determining the proper unit of measure is not straightforward. Although the total industry might
seem to be best represented by the ‘all items’ category, that overall focus can be misleading when there
is a change taking place in the individual sectors. For example, sales should be artificially inflated
during a period when a new media is rolling out and consumers are replenishing their music collections
in the new media. Alternatively, when singles are being eliminated from the market the ‘all items’
category will show a smaller growth rate than the non-single categories, as was the case above.
The decline in singles appears in the data beginning in the 1970s although the decline was not
monotonic. Clearly, most of this decline has nothing to do with MP3 downloads; thus I will treat the
decline in singles as an exogenous event and remove it from the analysis.11
A. Economic Factors Possibly Influencing Record Sales
There are many possible influences on the quantity of records sold. The prime textbook
candidates for factors likely to alter the quantity of records sold would normally be changes in tastes,
record prices, incomes, population, the prices of substitutes and complements, and any other factors
that might be deemed important. There are several major factors in this market that could be examined:
i. The price and quantity of records: Actual transaction prices for record sales are not, to my knowledge, available. Instead, one must rely on RIAA estimates of list prices and also for estimates on the number of units sold.12 I am not aware of any good data on yearly production costs.
ii. For most products, income changes are expected to be related to consumption since as income goes up consumption is likely to rise.13
11 Even if MP3 file trading exacerbated the decline in the single, we should still be able to get an unbiased impact of MP3 downloads by limiting our attention to full length recordings. 12 There is an ‘alternative’ market for music that operates outside of normal distribution channels and often doesn’t use barcodes on CDs. It this alternative market were to grow to become a significant source of CDs, than the official statistics on CD sales would be understated. Unfortunately, I am not aware of any estimates on the size of this market. 13 In other words, ‘normal’ goods, in the rhapsodic lingo of economists.
6
iii. Changes in recording formats – RIAA provides data the number of units in different formats (i.e., tapes, vinyl disks, CDs) sold in each year and one can try to incorporate this into the analysis.
iv. Changes in the ‘quality’ of music or in musical ‘taste’ would be difficult to ascertain but clearly would have an impact on the market. It is often stated, although usually in a form that is not testable, that some years are better than others in terms of musical innovation. 14 I try to control for this variable by including information on concert sales as a measure of interest in music. This is found in Section IV.E below.
v. Changes in the size and distribution of the population potential users – estimates in the distribution of album purchasers are available from the RIAA and these will play a role in the analysis, in Section IV.F.
vi. A change in media portability can change the nature of the demand, opening up or closing markets. When LP records became the dominant form of recorded music there was no portable form of recorded music. LP records were the domain of the home stereo since they were too bulky to be played in automobiles or other mobile venues.15 With the advent of 8-track tape, a new market opened up to record producers who were then able to sell tapes for the automobile as well as vinyl records for the home. Prerecorded audio cassettes were another new market, one that allowed listening to music while exercising or just walking around, as well as expanding the automobile market. This important factor is discussed in Section IV.C.
vii. Changes in the price of complements/substitutes, such as television, movies, radio, videogames and so forth. 16 I am not aware of any ‘major’ change in these categories over the period of analysis. The less substantial changes that did occur are examined in Section IV.D.
viii. Finally, sales might be influenced by the nature of the distribution channels. As authorized digital downloads play an increasing share of this market, the sales of ‘albums’ would be likely to change, particularly if pricing is no longer ‘per unit’ but instead more of the ‘per month’ variety. On a more prosaic level, if distribution shifts from record stores to major discount chains, such as Wal-Mart and Best Buy, as seems to have been the case in the last decade, unit sales might increase because retail margins lower the effective price to consumers. If these large retail chains are
14 There is an article in Slate by Mark Jenkins that makes this claim. See “Hit Charade: The music industry's self-inflicted wounds.” Tuesday, August 20, 2002 available at http://slate.msn.com/?id=2069732. He also claims, however, that CD prices have outpaced inflation, a statement inconsistent with my analysis. 15 Some small number of automobiles actually did have record players (so I learned in doing this research) but they never achieved any substantial level of penetration. 16 In this regard it is interesting to note that a large decline in record sales occurred as radio gained popularity in the early 1920s. Record sales fell by about half from 1920 to 1925. This tends to refute the common misconception that payola—record companies paying to get airplay—reveals the positive impact of radio to record sales. Instead payola should be thought of as indicative of competition between companies within the record industry. Imagine, for example, that there was no radio. The only way to listen to music in automobiles would be to lis ten to prerecorded music, which would certainly increase record sales along the lines suggested later in the paper. See “Off the Record” by David Morton, Rutgers University Press, 2000, for additional evidence on the impact of radio. For a history of Payola See Ronald Coase “Payola in Radio and Television Broadcasting,” Journal of Law and Economics, October 1979, 269-328.
7
able to negotiate lower wholesale prices than record stores were able to, the revenue growth using list prices would overstate the actual health of the recording industry.17
III. Some Underlying Trends
The record industry, as is the case with most industries, is fairly complex, with many factors
changing at once. Choices need to be made to make the analysis tractable. At the most basic level we
have seen that sales in the recording industry have dropped during 2001 and 2002, although they had
risen during 1999, Napster’s first year of existence, and gave mixed results for 2000, depending on
how record sales were measured. I try now to perform a somewhat more exacting analysis. To do this I
will limit the market to full- length albums, regardless of the media on which an album is housed. First,
however, we will examine the market for singles to see what might be left out of an analysis that
focuses on albums.
A. The Market for Singles
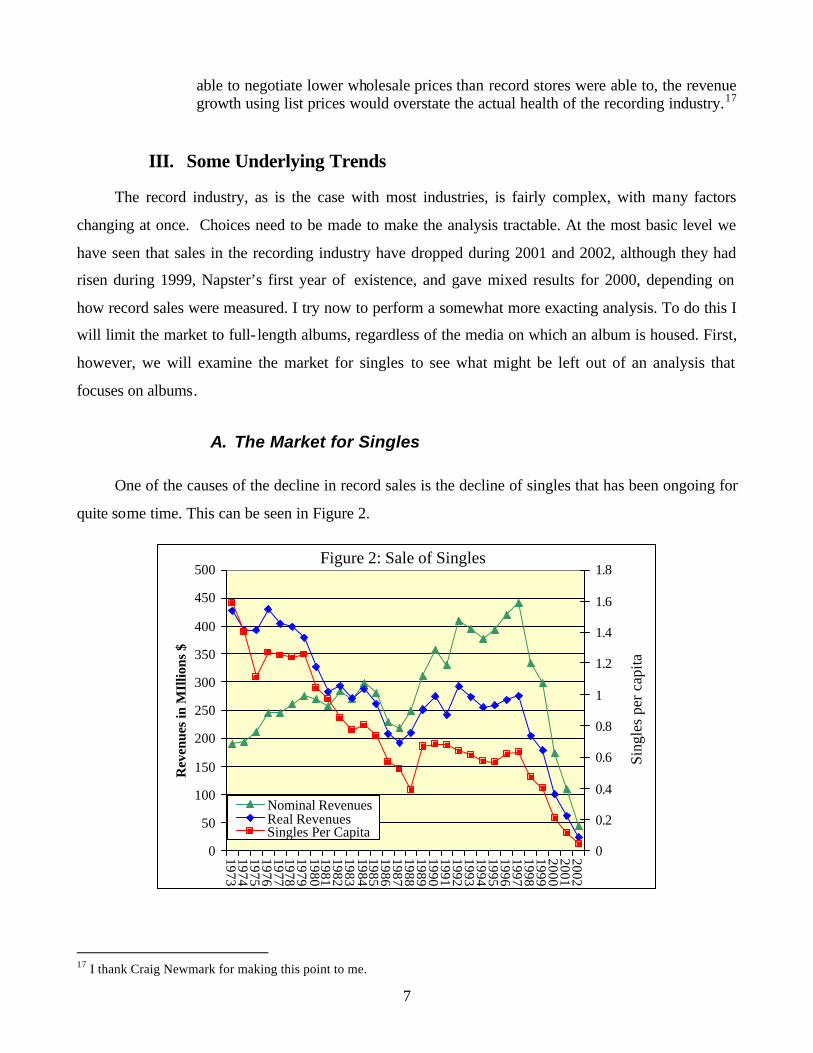
One of the causes of the decline in record sales is the decline of singles that has been ongoing for
quite some time. This can be seen in Figure 2.
Figure 2: Sale of Singles
0
50
100
150
200
250
300
350
400
450
500197319741975197619771978197919801981198219831984198519861987198819891990199119921993199419951996199719981999200020012002
Rev
enue
s in
MIl
lions
$
0
0.2
0.4
0.6
0.8
1
1.2
1.4
1.6
1.8
Sing
les
per c
apita
Nominal RevenuesReal RevenuesSingles Per Capita
17 I thank Craig Newmark for making this point to me.
8
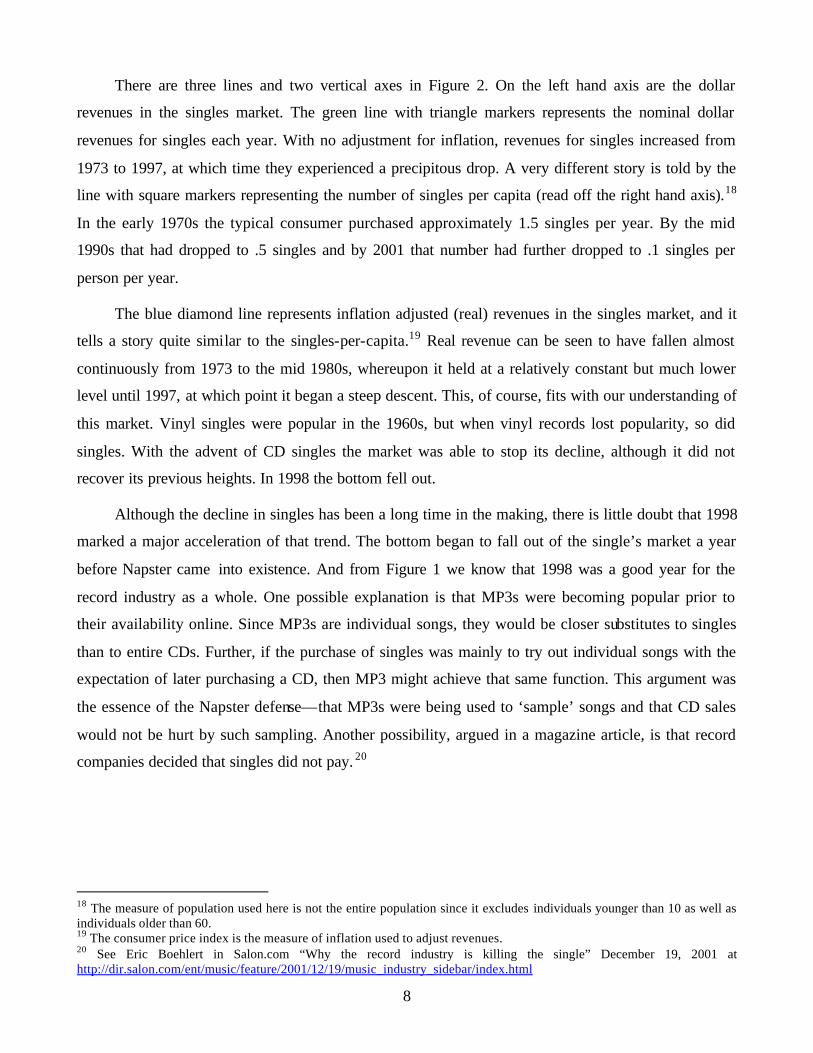
There are three lines and two vertical axes in Figure 2. On the left hand axis are the dollar
revenues in the singles market. The green line with triangle markers represents the nominal dollar
revenues for singles each year. With no adjustment for inflation, revenues for singles increased from
1973 to 1997, at which time they experienced a precipitous drop. A very different story is told by the
line with square markers representing the number of singles per capita (read off the right hand axis).18
In the early 1970s the typical consumer purchased approximately 1.5 singles per year. By the mid
1990s that had dropped to .5 singles and by 2001 that number had further dropped to .1 singles per
person per year.
The blue diamond line represents inflation adjusted (real) revenues in the singles market, and it
tells a story quite similar to the singles-per-capita.19 Real revenue can be seen to have fallen almost
continuously from 1973 to the mid 1980s, whereupon it held at a relatively constant but much lower
level until 1997, at which point it began a steep descent. This, of course, fits with our understanding of
this market. Vinyl singles were popular in the 1960s, but when vinyl records lost popularity, so did
singles. With the advent of CD singles the market was able to stop its decline, although it did not
recover its previous heights. In 1998 the bottom fell out.
Although the decline in singles has been a long time in the making, there is little doubt that 1998
marked a major acceleration of that trend. The bottom began to fall out of the single’s market a year
before Napster came into existence. And from Figure 1 we know that 1998 was a good year for the
record industry as a whole. One possible explanation is that MP3s were becoming popular prior to
their availability online. Since MP3s are individual songs, they would be closer substitutes to singles
than to entire CDs. Further, if the purchase of singles was mainly to try out individual songs with the
expectation of later purchasing a CD, then MP3 might achieve that same function. This argument was
the essence of the Napster defense—that MP3s were being used to ‘sample’ songs and that CD sales
would not be hurt by such sampling. Another possibility, argued in a magazine article, is that record
companies decided that singles did not pay. 20
18 The measure of population used here is not the entire population since it excludes individuals younger than 10 as well as individuals older than 60. 19 The consumer price index is the measure of inflation used to adjust revenues. 20 See Eric Boehlert in Salon.com “Why the record industry is killing the single” December 19, 2001 at http://dir.salon.com/ent/music/feature/2001/12/19/music_industry_sidebar/index.html
9
For all intents and purposes, singles are now practically nonexistent.21 It seems possible that
MP3s are responsible for killing off the singles market, even if what was left of the market was very
small (in 1997 singles accounted for merely 3.6% of record revenues). Nevertheless, the downloading
of MP3s was clearly not the primary factor in the fall of singles, although it might have been the final
nail in the coffin.
From this point on I will focus attention on ‘albums’ which include long playing vinyl records,
long playing cassettes, eight track tapes, and full length CDs. Since the market for singles has been
undergoing a lengthy decline, its exclusion is likely to provide results less severe than would be found
with statistics for all forms of records as typically reported by the RIAA.
B. Some History of Album Sales in this Market
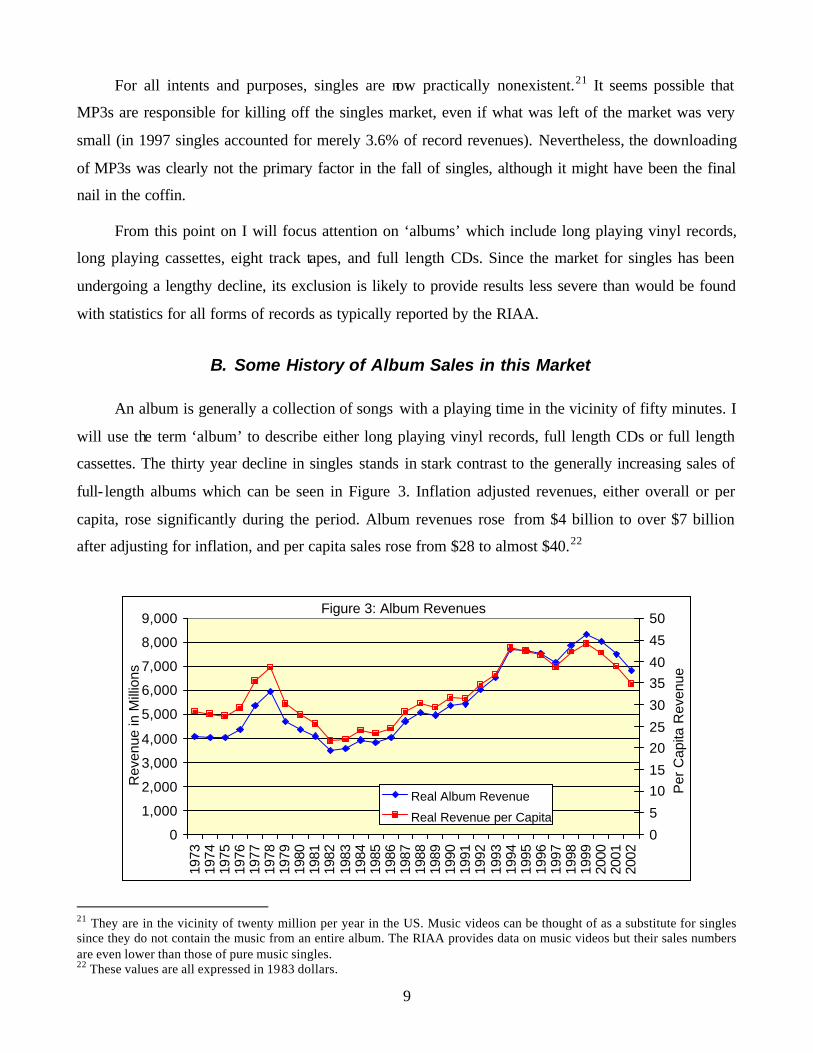
An album is generally a collection of songs with a playing time in the vicinity of fifty minutes. I
will use the term ‘album’ to describe either long playing vinyl records, full length CDs or full length
cassettes. The thirty year decline in singles stands in stark contrast to the generally increasing sales of
full- length albums which can be seen in Figure 3. Inflation adjusted revenues, either overall or per
capita, rose significantly during the period. Album revenues rose from $4 billion to over $7 billion
after adjusting for inflation, and per capita sales rose from $28 to almost $40.22
Figure 3: Album Revenues
0
1,000
2,000
3,000
4,000
5,000
6,000
7,000
8,000
9,000
1973
1974
1975
1976
1977
1978
1979
1980
1981
1982
1983
1984
1985
1986
1987
1988
1989
1990
1991
1992
1993
1994
1995
1996
1997
1998
1999
2000
2001
2002
Rev
enue
in M
illio
ns
0
5
1015
2025
30
3540
45
50
Per
Cap
ita R
even
ue
Real Album Revenue
Real Revenue per Capita
21 They are in the vicinity of twenty million per year in the US. Music videos can be thought of as a substitute for singles since they do not contain the music from an entire album. The RIAA provides data on music videos but their sales numbers are even lower than those of pure music singles. 22 These values are all expressed in 1983 dollars.
10
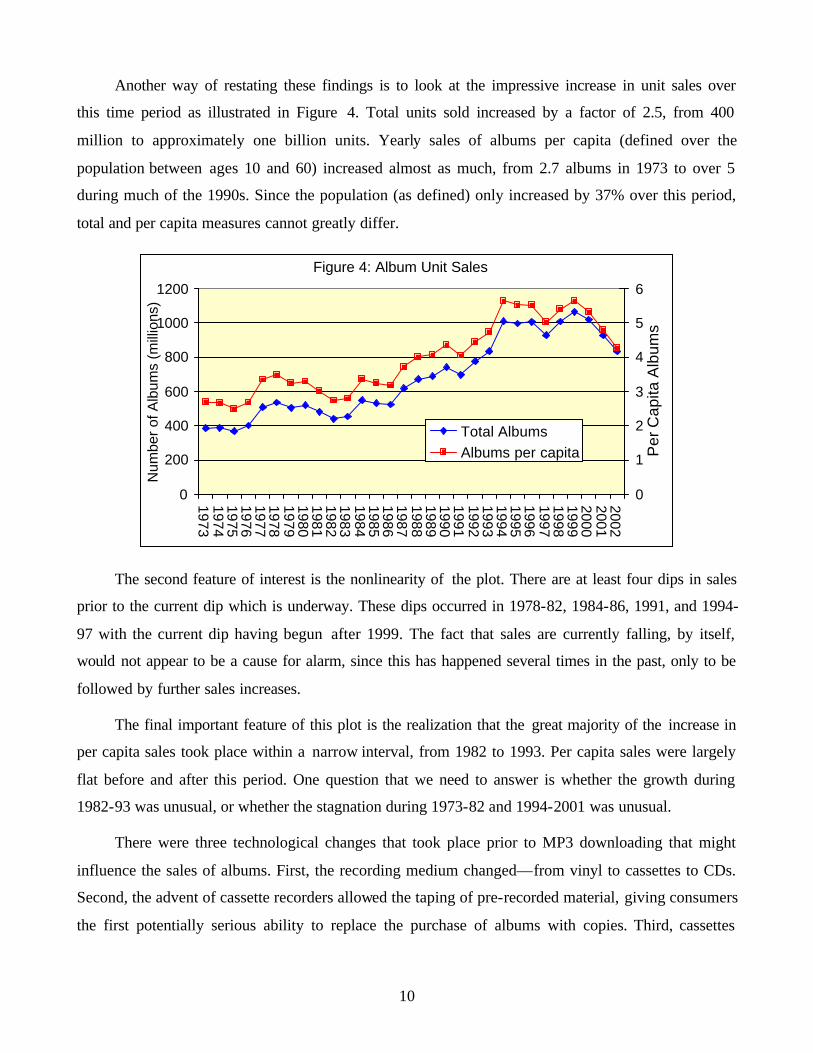
Another way of restating these findings is to look at the impressive increase in unit sales over
this time period as illustrated in Figure 4. Total units sold increased by a factor of 2.5, from 400
million to approximately one billion units. Yearly sales of albums per capita (defined over the
population between ages 10 and 60) increased almost as much, from 2.7 albums in 1973 to over 5
during much of the 1990s. Since the population (as defined) only increased by 37% over this period,
total and per capita measures cannot greatly differ.
Figure 4: Album Unit Sales
0
200
400
600
800
1000
1200
197319741975197619771978197919801981198219831984198519861987198819891990199119921993199419951996199719981999200020012002
Num
ber
of A
lbum
s (m
illio
ns)
0
1
2
3
4
5
6
Per
Cap
ita A
lbum
s
Total AlbumsAlbums per capita
The second feature of interest is the nonlinearity of the plot. There are at least four dips in sales
prior to the current dip which is underway. These dips occurred in 1978-82, 1984-86, 1991, and 1994-
97 with the current dip having begun after 1999. The fact that sales are currently falling, by itself,
would not appear to be a cause for alarm, since this has happened several times in the past, only to be
followed by further sales increases.
The final important feature of this plot is the realization that the great majority of the increase in
per capita sales took place within a narrow interval, from 1982 to 1993. Per capita sales were largely
flat before and after this period. One question that we need to answer is whether the growth during
1982-93 was unusual, or whether the stagnation during 1973-82 and 1994-2001 was unusual.
There were three technological changes that took place prior to MP3 downloading that might
influence the sales of albums. First, the recording medium changed—from vinyl to cassettes to CDs.
Second, the advent of cassette recorders allowed the taping of pre-recorded material, giving consumers
the first potentially serious ability to replace the purchase of albums with copies. Third, cassettes
11
players (and shortly after CD players) allowed the first portable use of prerecorded media since there
were no truly portable LP devices.
An examination of the shifts in recording media will complete this section on the background of
the industry.
C. The Shift in Recorded Media
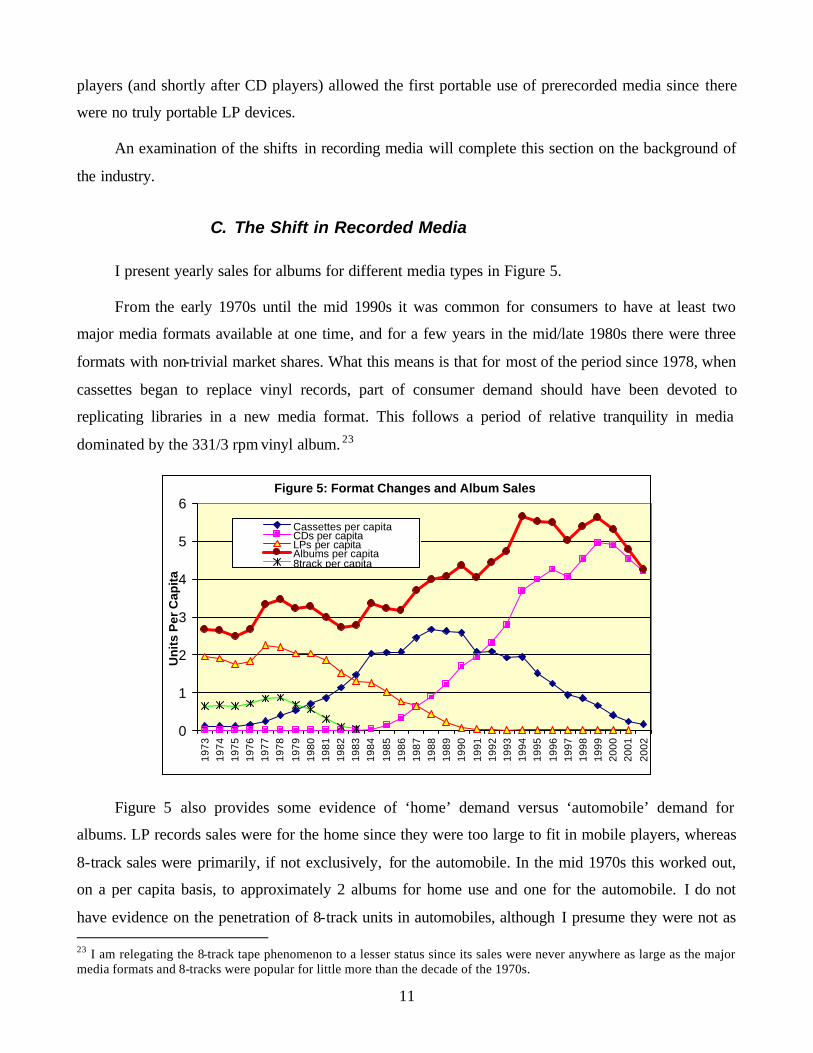
I present yearly sales for albums for different media types in Figure 5.
From the early 1970s until the mid 1990s it was common for consumers to have at least two
major media formats available at one time, and for a few years in the mid/late 1980s there were three
formats with non-trivial market shares. What this means is that for most of the period since 1978, when
cassettes began to replace vinyl records, part of consumer demand should have been devoted to
replicating libraries in a new media format. This follows a period of relative tranquility in media
dominated by the 331/3 rpm vinyl album. 23
Figure 5: Format Changes and Album Sales
0
1
2
3
4
5
6
1973
1974
1975
1976
1977
1978
1979
1980
1981
1982
1983
1984
1985
1986
1987
1988
1989
1990
1991
1992
1993
1994
1995
1996
1997
1998
1999
2000
2001
2002
Un
its
Per
Cap
ita
Cassettes per capitaCDs per capitaLPs per capitaAlbums per capita8track per capita
Figure 5 also provides some evidence of ‘home’ demand versus ‘automobile’ demand for
albums. LP records sales were for the home since they were too large to fit in mobile players, whereas
8-track sales were primarily, if not exclusively, for the automobile. In the mid 1970s this worked out,
on a per capita basis, to approximately 2 albums for home use and one for the automobile. I do not
have evidence on the penetration of 8-track units in automobiles, although I presume they were not as 23 I am relegating the 8-track tape phenomenon to a lesser status since its sales were never anywhere as large as the major media formats and 8-tracks were popular for little more than the decade of the 1970s.
12
ubiquitous in automobiles as cassettes and CD players are now. Thus the full demand for music in
automobiles may be understated by these values.
Changes in media might be thought to lead to changes in demand due to a ‘librarying’ motive
that would consist of individuals wishing to update some of their favorite recordings to the new
medium, particularly if the new medium has either sonic or other utilitarian advantages. The strength
of this librarying motive is an empirical question, however.
The empirical support for the librarying hypothesis is mixed, however. When cassettes first
started to appear in significant numbers, from 1977 onward, LP (and 8-track) sales fell by about as
much as prerecorded cassette sales grew, precluding a temporary upward blip. This may be partly due
to the impact of copying, discussed below. It wasn’t until the last half of the 1980s, when CDs began
to be sold in large numbers, that overall sales of albums began their fairly dramatic rise, from 3.2 in
1986 to 5.6 in 1994.
But even in this decade, the support for the librarying hypothesis is mixed. According to Ebrain
market research, a branch of the Consumer Electronics Association, the rapid growth in penetration of
CD players ended after 1995, yet record sales did not begin to fall in a serious manner until after
1999.24
If the typical consumer replenishing his library for the new format took 5 years or more to
achieve this goal, then the current downturn in sales might be attributed to the librarying motive. One
might test this by examining whether a higher percentage of CD purchases were of relatively old
recordings after 2000 than was the case before. This would be a particularly sharp test since it is
claimed that a larger number of ‘old’ songs are available for download than can be found in the typical
record store, indicating that if MP3 downloads were responsible that there would be fewer old records
being purchased after 2000.
Although I have not performed such a test, I suspect that librarying is not the key factor at work
because there is little evidence that the switch from LPs to cassettes caused much of an increase in
sales. Still, the impact of unauthorized copying possible with cassettes might have clouded that finding
as well.
24 The growth in market penetration, beginning with 1984 is: 0.30%, 1.10%, 2.70%, 3.90%, 4.40%, 5.20%, 6.00%, 6.60%, 8.80%, 9.00%, 8.00%, 8.00%, 3.10%, 1.90%, 2.00%, 1.00%, 2.00%.
13
Although the peak of cassette sales was only slightly higher than the peak of LP sales, the peak
of CD sales was much higher than either of the older formats. Why did CD sales peak at a level so
much higher than the previous recording formats? I will return to this question in section IV.C.
IV. Other Factors Affecting Sales
A. The Role of Price and Income
As reported, the data provided by the RIAA do not list actual prices but only a derived list price.
It is unclear how serious a problem the use of list, as opposed to transaction prices, would be in this
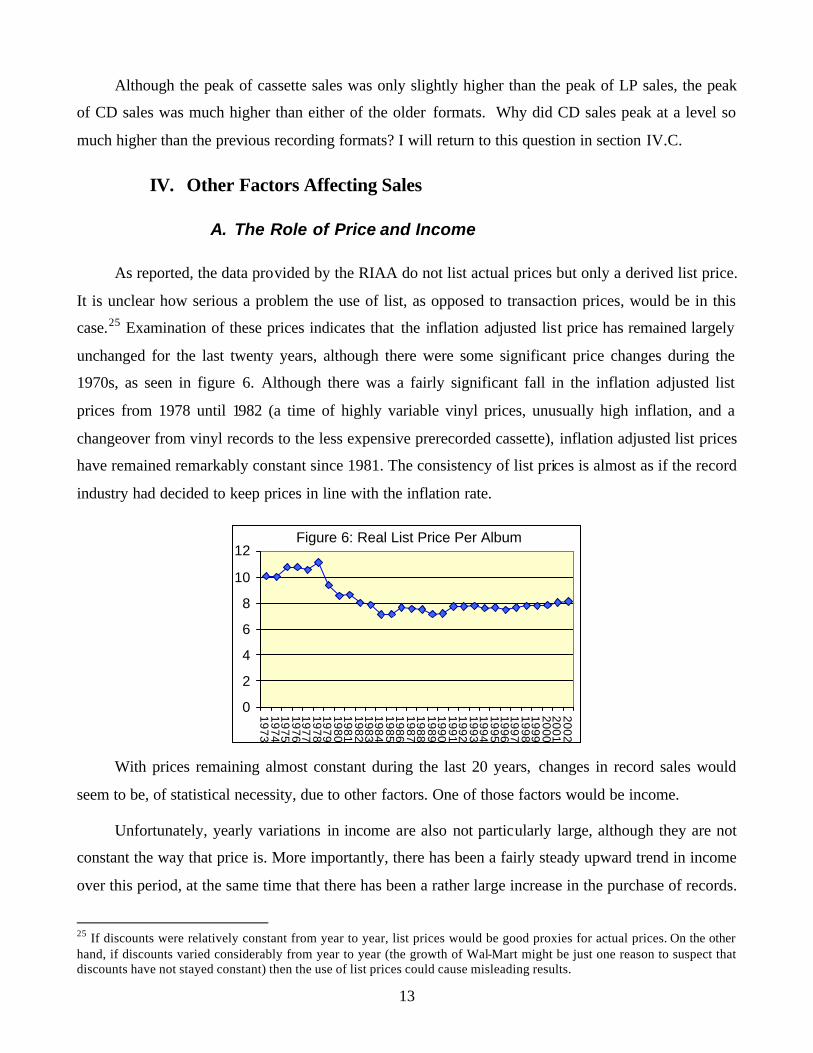
case.25 Examination of these prices indicates that the inflation adjusted list price has remained largely
unchanged for the last twenty years, although there were some significant price changes during the
1970s, as seen in figure 6. Although there was a fairly significant fall in the inflation adjusted list
prices from 1978 until 1982 (a time of highly variable vinyl prices, unusually high inflation, and a
changeover from vinyl records to the less expensive prerecorded cassette), inflation adjusted list prices
have remained remarkably constant since 1981. The consistency of list prices is almost as if the record
industry had decided to keep prices in line with the inflation rate.
Figure 6: Real List Price Per Album
0
2
4
6
8
10
12197319741975197619771978197919801981198219831984198519861987198819891990199119921993199419951996199719981999200020012002
With prices remaining almost constant during the last 20 years, changes in record sales would
seem to be, of statistical necessity, due to other factors. One of those factors would be income.
Unfortunately, yearly variations in income are also not particularly large, although they are not
constant the way that price is. More importantly, there has been a fairly steady upward trend in income
over this period, at the same time that there has been a rather large increase in the purchase of records.
25 If discounts were relatively constant from year to year, list prices would be good proxies for actual prices. On the other hand, if discounts varied considerably from year to year (the growth of Wal-Mart might be just one reason to suspect that discounts have not stayed constant) then the use of list prices could cause misleading results.
14
This means that the common trend in the two series would make it misleading to run a regression
comparing income with record purchases and price.
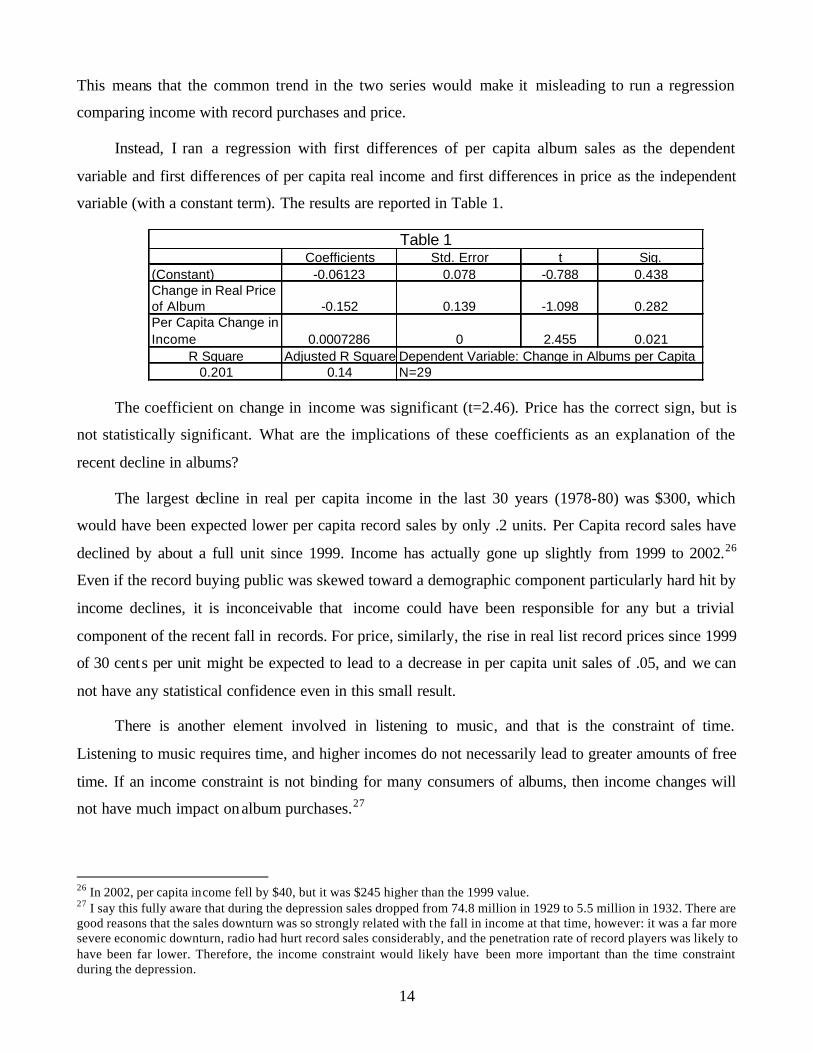
Instead, I ran a regression with first differences of per capita album sales as the dependent
variable and first differences of per capita real income and first differences in price as the independent
variable (with a constant term). The results are reported in Table 1.
Coefficients Std. Error t Sig.(Constant) -0.06123 0.078 -0.788 0.438Change in Real Price of Album -0.152 0.139 -1.098 0.282Per Capita Change in Income 0.0007286 0 2.455 0.021
R Square Adjusted R Square Dependent Variable: Change in Albums per Capita0.201 0.14
Table 1
N=29
The coefficient on change in income was significant (t=2.46). Price has the correct sign, but is
not statistically significant. What are the implications of these coefficients as an explanation of the
recent decline in albums?
The largest decline in real per capita income in the last 30 years (1978-80) was $300, which
would have been expected lower per capita record sales by only .2 units. Per Capita record sales have
declined by about a full unit since 1999. Income has actually gone up slightly from 1999 to 2002.26
Even if the record buying public was skewed toward a demographic component particularly hard hit by
income declines, it is inconceivable that income could have been responsible for any but a trivial
component of the recent fall in records. For price, similarly, the rise in real list record prices since 1999
of 30 cents per unit might be expected to lead to a decrease in per capita unit sales of .05, and we can
not have any statistical confidence even in this small result.
There is another element involved in listening to music, and that is the constraint of time.
Listening to music requires time, and higher incomes do not necessarily lead to greater amounts of free
time. If an income constraint is not binding for many consumers of albums, then income changes will
not have much impact on album purchases.27
26 In 2002, per capita income fell by $40, but it was $245 higher than the 1999 value. 27 I say this fully aware that during the depression sales dropped from 74.8 million in 1929 to 5.5 million in 1932. There are good reasons that the sales downturn was so strongly related with the fall in income at that time, however: it was a far more severe economic downturn, radio had hurt record sales considerably, and the penetration rate of record players was likely to have been far lower. Therefore, the income constraint would likely have been more important than the time constraint during the depression.
15
B. Copying Using Cassettes
The issue of home copying using cassette recorders was a precursor to the current controversy
about MP3 downloading. Both would have been expected to lower sales if they were substitutes for the
purchase of additional prerecorded material. It might be argued that home copying of audiotapes was a
better substitute for an original purchase than is an MP3 download since cassettes could be played on
the main home stereo system, whereas MP3s are typically not playable on the main stereo system
unless converted back to the original format found on CDs.28 At the time, dire predictions were made
about the health of the recording industry by no less than Alan Greenspan. 29
What does hindsight tell us about the impact of audiotaping?
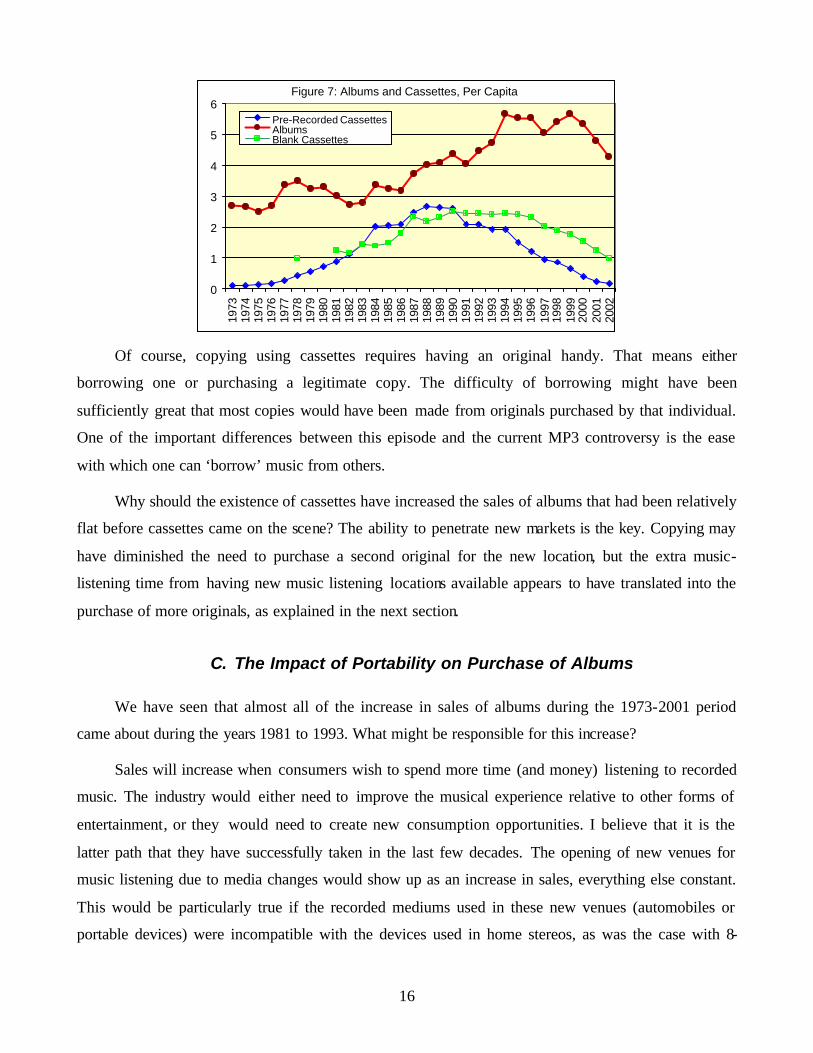
Figure 7 repeats earlier information on albums and prerecorded cassettes, but adds in the number
of blank cassettes, all per capita.30 I have only been able to get sales numbers for blank cassettes
starting in 1978, although sales obviously occurred prior to that. Cassette recorders allowed consumers
to use taped copies to replace the purchase of originals. During the period of growth of cassettes,
however, there was also a large increase in the sales of prerecorded albums. Clearly, the existence of
cassette recorder/players seems to have had a positive overall impact on record producers, although we
can not say that the growth might not have been more robust had the recording (copying) potential of
cassettes been removed.
28 Some CD and DVD players have recently allowed the playing of MP3 files on CDs, but I do not know the penetration of these machines and suspect it is not yet that large. Similarly, portable MP3 players are reported to have extremely small market shares, in the single digits. 29 “At present…severe economic damage [is being done] to the property rights of owners of copyrights in sound recordings and musical compositions…under present and emerging conditions, the industry simply has no out…Unless something meaningful is done to respond to the…problem, the industry itself is at risk.” From Greenspan’s testimony in 1983 on the Home Recording Act. Hearings before the Subcommittee on Patents, Copyrights and Trademarks, October 25, 1983. 30 Information on the number of blank cassettes (beginning with 1981), as well as information below on the penetration rates of portable technologies all come from Ebrain Market Research, which is a service of the Consumer Electronics Association. The blank cassette value for 1978 comes from the text of the 1990 Edition of “Entertainment Industry Economics” [Harold Vogel, Cambridge University Press] states that in 1978 approximately 150 million blank tapes were sold.
16
Figure 7: Albums and Cassettes, Per Capita
0
1
2
3
4
5
6
1973
1974
1975
1976
1977
1978
1979
1980
1981
1982
1983
1984
1985
1986
1987
1988
1989
1990
1991
1992
1993
1994
1995
1996
1997
1998
1999
2000
2001
2002
Pre-Recorded CassettesAlbumsBlank Cassettes
Of course, copying using cassettes requires having an original handy. That means either
borrowing one or purchasing a legitimate copy. The difficulty of borrowing might have been
sufficiently great that most copies would have been made from originals purchased by that individual.
One of the important differences between this episode and the current MP3 controversy is the ease
with which one can ‘borrow’ music from others.
Why should the existence of cassettes have increased the sales of albums that had been relatively
flat before cassettes came on the scene? The ability to penetrate new markets is the key. Copying may
have diminished the need to purchase a second original for the new location, but the extra music-
listening time from having new music listening locations available appears to have translated into the
purchase of more originals, as explained in the next section.
C. The Impact of Portability on Purchase of Albums
We have seen that almost all of the increase in sales of albums during the 1973-2001 period
came about during the years 1981 to 1993. What might be responsible for this increase?
Sales will increase when consumers wish to spend more time (and money) listening to recorded
music. The industry would either need to improve the musical experience relative to other forms of
entertainment, or they would need to create new consumption opportunities. I believe that it is the
latter path that they have successfully taken in the last few decades. The opening of new venues for
music listening due to media changes would show up as an increase in sales, everything else constant.
This would be particularly true if the recorded mediums used in these new venues (automobiles or
portable devices) were incompatible with the devices used in home stereos, as was the case with 8-
17
track tapes, since then it would not possible to purchase a single pre-recorded item that could be used
in both the home and car.31
In particular, music listeners, during the 1980s, were able, in increasing numbers, to listen to
their favorite albums in automobiles, or while walking or exercising. It was the 8-track cassette that
first opened up the auto market to prerecorded music.
Cassettes, unlike 8-tracks, were used in more than automobiles, however. They were also used in
the home as well as in portable devices. Some increase in sales due to a more complete penetration of
automobiles undoubtedly occurred, although I do not have detailed information on cassette penetration
in automobiles.
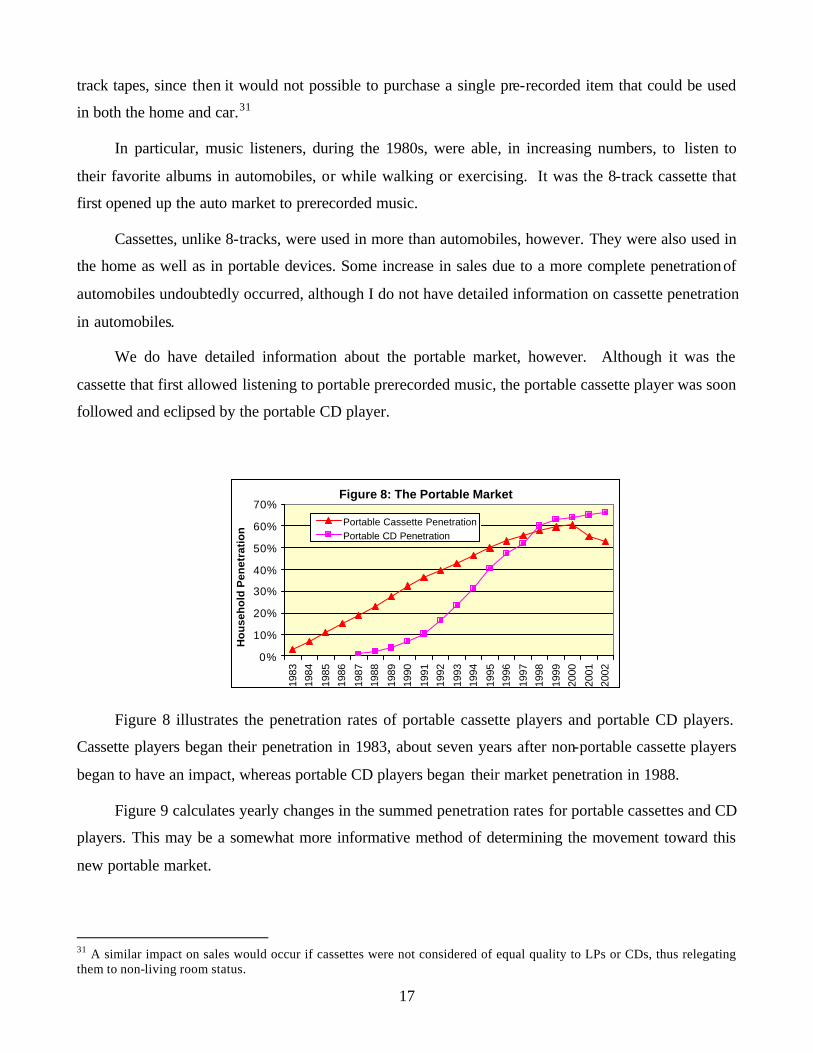
We do have detailed information about the portable market, however. Although it was the
cassette that first allowed listening to portable prerecorded music, the portable cassette player was soon
followed and eclipsed by the portable CD player.
Figure 8: The Portable Market
0%
10%
20%
30%
40%
50%
60%
70%
1983
1984
1985
1986
1987
1988
1989
1990
1991
1992
1993
1994
1995
1996
1997
1998
1999
2000
2001
2002
Ho
use
ho
ld P
enet
rati
on
Portable Cassette PenetrationPortable CD Penetration
Figure 8 illustrates the penetration rates of portable cassette players and portable CD players.
Cassette players began their penetration in 1983, about seven years after non-portable cassette players
began to have an impact, whereas portable CD players began their market penetration in 1988.
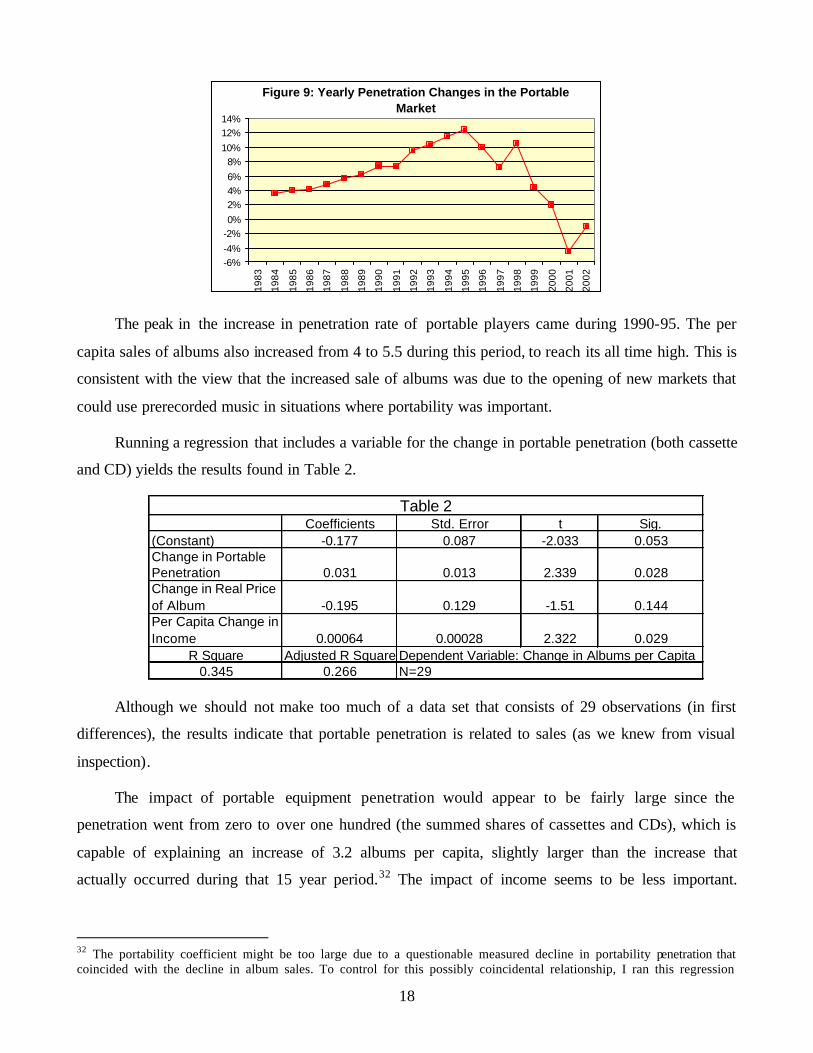
Figure 9 calculates yearly changes in the summed penetration rates for portable cassettes and CD
players. This may be a somewhat more informative method of determining the movement toward this
new portable market.
31 A similar impact on sales would occur if cassettes were not considered of equal quality to LPs or CDs, thus relegating them to non-living room status.
18
Figure 9: Yearly Penetration Changes in the Portable Market
-6%-4%-2%0%2%4%6%8%
10%12%14%
1983
1984
1985
1986
1987
1988
1989
1990
1991
1992
1993
1994
1995
1996
1997
1998
1999
2000
2001
2002
The peak in the increase in penetration rate of portable players came during 1990-95. The per
capita sales of albums also increased from 4 to 5.5 during this period, to reach its all time high. This is
consistent with the view that the increased sale of albums was due to the opening of new markets that
could use prerecorded music in situations where portability was important.
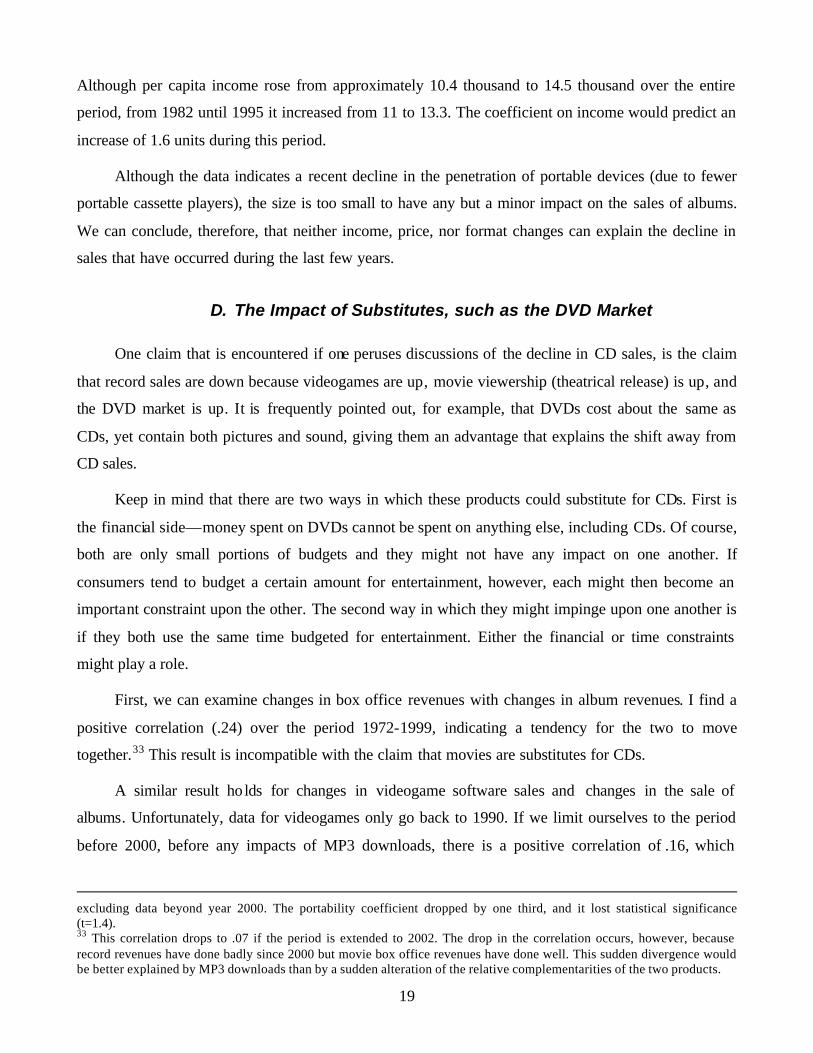
Running a regression that includes a variable for the change in portable penetration (both cassette
and CD) yields the results found in Table 2.
Coefficients Std. Error t Sig.(Constant) -0.177 0.087 -2.033 0.053Change in Portable Penetration 0.031 0.013 2.339 0.028Change in Real Price of Album -0.195 0.129 -1.51 0.144Per Capita Change in Income 0.00064 0.00028 2.322 0.029
R Square Adjusted R Square Dependent Variable: Change in Albums per Capita0.345 0.266
Table 2
N=29
Although we should not make too much of a data set that consists of 29 observations (in first
differences), the results indicate that portable penetration is related to sales (as we knew from visual
inspection).
The impact of portable equipment penetration would appear to be fairly large since the
penetration went from zero to over one hundred (the summed shares of cassettes and CDs), which is
capable of explaining an increase of 3.2 albums per capita, slightly larger than the increase that
actually occurred during that 15 year period.32 The impact of income seems to be less important.
32 The portability coefficient might be too large due to a questionable measured decline in portability penetration that coincided with the decline in album sales. To control for this possibly coincidental relationship, I ran this regression
19
Although per capita income rose from approximately 10.4 thousand to 14.5 thousand over the entire
period, from 1982 until 1995 it increased from 11 to 13.3. The coefficient on income would predict an
increase of 1.6 units during this period.
Although the data indicates a recent decline in the penetration of portable devices (due to fewer
portable cassette players), the size is too small to have any but a minor impact on the sales of albums.
We can conclude, therefore, that neither income, price, nor format changes can explain the decline in
sales that have occurred during the last few years.
D. The Impact of Substitutes, such as the DVD Market
One claim that is encountered if one peruses discussions of the decline in CD sales, is the claim
that record sales are down because videogames are up, movie viewership (theatrical release) is up, and
the DVD market is up. It is frequently pointed out, for example, that DVDs cost about the same as
CDs, yet contain both pictures and sound, giving them an advantage that explains the shift away from
CD sales.
Keep in mind that there are two ways in which these products could substitute for CDs. First is
the financial side—money spent on DVDs cannot be spent on anything else, including CDs. Of course,
both are only small portions of budgets and they might not have any impact on one another. If
consumers tend to budget a certain amount for entertainment, however, each might then become an
important constraint upon the other. The second way in which they might impinge upon one another is
if they both use the same time budgeted for entertainment. Either the financial or time constraints
might play a role.
First, we can examine changes in box office revenues with changes in album revenues. I find a
positive correlation (.24) over the period 1972-1999, indicating a tendency for the two to move
together.33 This result is incompatible with the claim that movies are substitutes for CDs.
A similar result ho lds for changes in videogame software sales and changes in the sale of
albums. Unfortunately, data for videogames only go back to 1990. If we limit ourselves to the period
before 2000, before any impacts of MP3 downloads, there is a positive correlation of .16, which
excluding data beyond year 2000. The portability coefficient dropped by one third, and it lost statistical significance (t=1.4). 33 This correlation drops to .07 if the period is extended to 2002. The drop in the correlation occurs, however, because record revenues have done badly since 2000 but movie box office revenues have done well. This sudden divergence would be better explained by MP3 downloads than by a sudden alteration of the relative complementarities of the two products.
20
indicates that the two move together and not separately. This relationship also fails to support the claim
that videogames are particularly close substitutes for CDs.34
Finally, the same story holds for prerecorded movies (VHS). From 1990 to 1999 there is a slight
positive correlation between yearly changes in per capita unit purchases in the two markets (.12).35
Again, there is little evidence that VHS tapes and CDs were substitutes, and thus there is little reason
to believe that DVDs and CDs are substitutes.
Admittedly, there is presumably some common factor at work causing sales of CDs, prerecorded
movies, box office receipts, and videogames to all tend to change in the same direction. 36 But it does
not appear to be overly strong.
The second constraint in engaging in any of these activities is one of time. Published estimates
indicate that listening to recorded music took approximately 45 minutes of a person’s time per day,
whereas going to movies took 2 minutes, watching prerecorded movies took 9 minutes, and playing
videogames took 7 minutes.37 I do not believe it would be reasonable to argue, at the low time- levels of
usage for these non-music activities, that changes in movie attendance, DVD usage, or videogames
usage, for the population as a whole, could be responsible for more than a small portion of the changes
in album sales discussed below.
Although there are reasons to suspect the veracity of these time-use numbers, I am not aware of
any other estimates that could be used in their place.38
34 Since 2000, videogame sales have continued to increase whereas CD revenues have fallen. The correlation for the entire period is negative (-.16). 35 When the years 2000-2002 are included, the correlation becomes negative (-.38). These last 3 years recorded particularly large increases in DVD growth and also negative changes in CD sales. But the recent large increases in prerecorded movies were not so large as to be entirely unprecedented. 36 It wouldn’t appear to be income. The correlation of income changes and other variables is .20 for box office changes, .24 for videogame revenue changes, and -.20 for prerecorded movies. 37 Table 909 in the US statistical abstract. Original source is Veronis, Suhler & Associates 38 While examining the numbers for time spent listening to recorded music, I was struck by the very close association between these estimates and the sales of albums. In particular, the time spent listening to music fell in the last few years at the same time that album sales have fallen. If this had been true, then the annihilation hypothesis would clearly be false since MP3 downloading is an act that should tend to lead to increased listening of recorded music at the same time that album sales were falling. If listening to music was falling, then the decline in albums could be attributed to this decline in listening and MP3 could be exonerated. Alas, when I investigated I found the two series tracked one another so closely that it appeared that record sales might have been virtually the only ingredient used in estimating time spent listening to music. When I contacted Veronis, Suhler, they confirmed that these estimates of time spent were not taken from surveys of use, but instead were based on a formula using other statistics that they agreed probably included record sales to an important extent.
21
E. Has the Music Changed?
When the record industry has a decline, critics of the industry will often claim that sales fell
because the music was not interesting. Thus, it is not surprising that this has emerged as an answer to
the question: “if MP3s are not hurting the industry, what is?”
Clearly, this hypothesis could be true. It would not be surprising if there were peaks and valleys
in the creative output of the record business. The problem with the hypothesis, however, is determining
a way to test it.
The clearest market measure of the vibrancy of the industry is sales of records. But since that
statistic is now tarnished by the possibility of MP3 downloading, and we wish to test the hypothesis
that MP3 downloads hurt sales, some other measure market valuation of the music is needed.
One source of data that I have been able to access is the financial success of concerts. Pollstar
Magazine provides data on concert tour revenues. Concert tours suffer from one important defect—
many of the acts are well past their recording prime although they still draw very well in concert
venues (e.g., the Rolling Stones). Nevertheless, there is a positive correlation between concert revenues
changes and changes in record sales (.37 from 1991-1999) although it is not as high as would be
preferred.
Interestingly, the years 2000 and 2001 had the largest real increases in concert revenues—the
same time the record industry was experiencing unusually large decreases in revenues. Although this is
not sufficiently strong to say that interest in music increased after 2000, it is certainly inconsistent with
the claim that interest in music fell after 1999.
A second potential source of data would be time spent listening to radio. Of course, radio
consists of non-music activities and listening to radio is a function of other activities such as time spent
in automobiles. Nevertheless, data available from Arbitron allow us to focus on the use of radio in the
home, where competition from alternative sources of entertainment would be most pronounced.
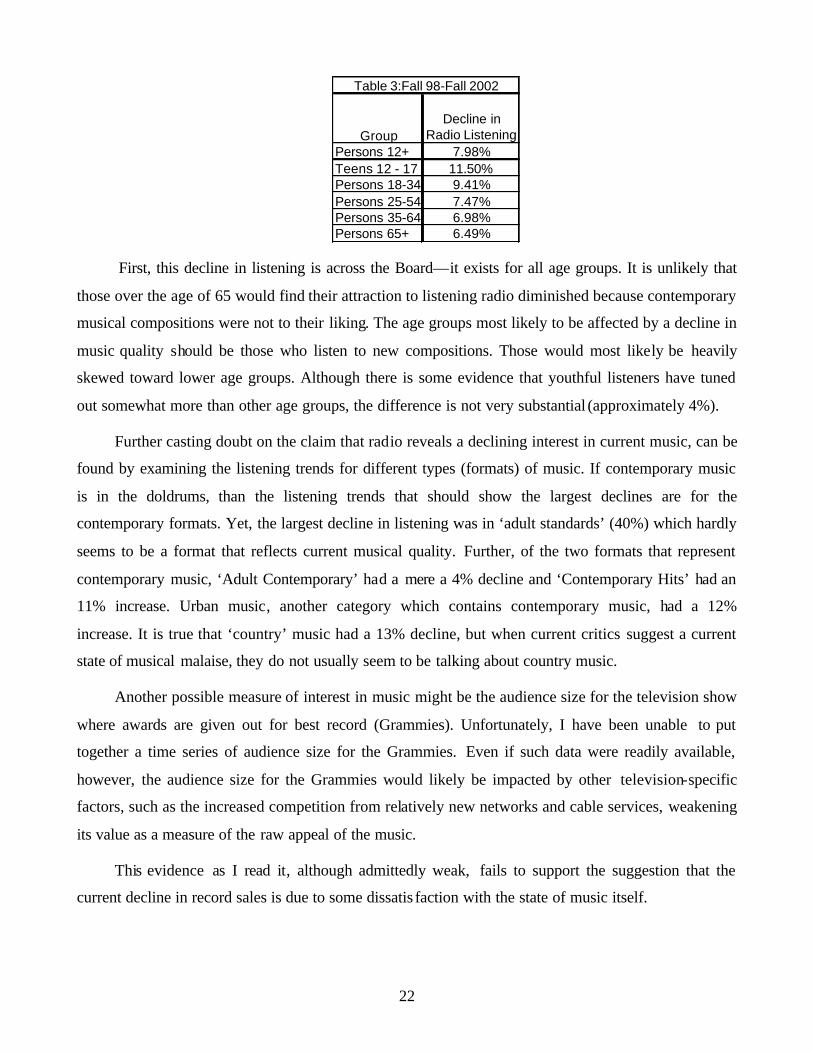
Data from the last 5 years reveals a fairly serious decline in listening—8%. Do we finally have
some support here for the claim that music has lost its inherent interest? Digging somewhat deeper, we
find little support for this claim in Table 3.
22
GroupDecline in
Radio ListeningPersons 12+ 7.98%Teens 12 - 17 11.50%Persons 18-34 9.41%Persons 25-54 7.47%Persons 35-64 6.98%Persons 65+ 6.49%
Table 3:Fall 98-Fall 2002
First, this decline in listening is across the Board—it exists for all age groups. It is unlikely that
those over the age of 65 would find their attraction to listening radio diminished because contemporary
musical compositions were not to their liking. The age groups most likely to be affected by a decline in
music quality should be those who listen to new compositions. Those would most likely be heavily
skewed toward lower age groups. Although there is some evidence that youthful listeners have tuned
out somewhat more than other age groups, the difference is not very substantial (approximately 4%).
Further casting doubt on the claim that radio reveals a declining interest in current music, can be
found by examining the listening trends for different types (formats) of music. If contemporary music
is in the doldrums, than the listening trends that should show the largest declines are for the
contemporary formats. Yet, the largest decline in listening was in ‘adult standards’ (40%) which hardly
seems to be a format that reflects current musical quality. Further, of the two formats that represent
contemporary music, ‘Adult Contemporary’ had a mere a 4% decline and ‘Contemporary Hits’ had an
11% increase. Urban music, another category which contains contemporary music, had a 12%
increase. It is true that ‘country’ music had a 13% decline, but when current critics suggest a current
state of musical malaise, they do not usually seem to be talking about country music.
Another possible measure of interest in music might be the audience size for the television show
where awards are given out for best record (Grammies). Unfortunately, I have been unable to put
together a time series of audience size for the Grammies. Even if such data were readily available,
however, the audience size for the Grammies would likely be impacted by other television-specific
factors, such as the increased competition from relatively new networks and cable services, weakening
its value as a measure of the raw appeal of the music.
This evidence as I read it, although admittedly weak, fails to support the suggestion that the
current decline in record sales is due to some dissatis faction with the state of music itself.
23
F. Changes in the Audience
There has been a flattening of the distribution of purchasers during the last few decades. The
broadening comes from the wider age distribution of record purchasers, as reported in surveys.39 This
broadening of the consumer market might be the result of a generation that grew up with LP records
(the baby boomers) and which continued to purchase albums as they aged, whereas previous middle-
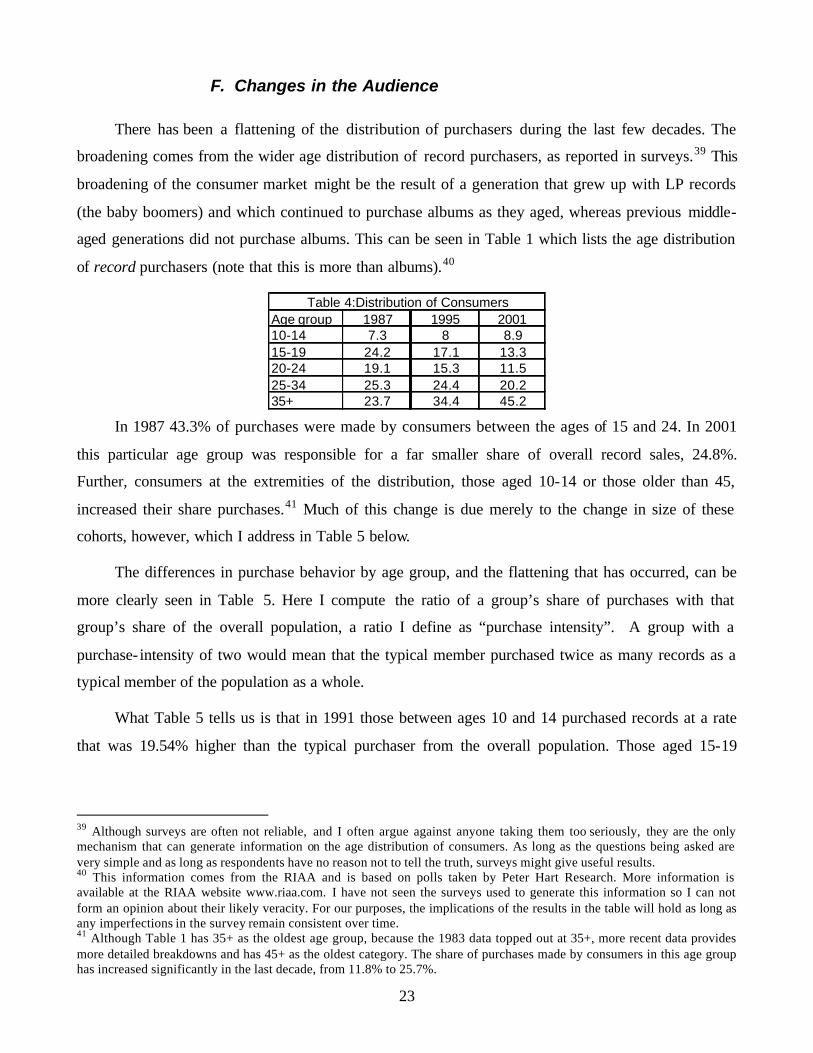
aged generations did not purchase albums. This can be seen in Table 1 which lists the age distribution
of record purchasers (note that this is more than albums).40
Age group 1987 1995 200110-14 7.3 8 8.915-19 24.2 17.1 13.320-24 19.1 15.3 11.525-34 25.3 24.4 20.235+ 23.7 34.4 45.2
Table 4:Distribution of Consumers
In 1987 43.3% of purchases were made by consumers between the ages of 15 and 24. In 2001
this particular age group was responsible for a far smaller share of overall record sales, 24.8%.
Further, consumers at the extremities of the distribution, those aged 10-14 or those older than 45,
increased their share purchases.41 Much of this change is due merely to the change in size of these
cohorts, however, which I address in Table 5 below.
The differences in purchase behavior by age group, and the flattening that has occurred, can be
more clearly seen in Table 5. Here I compute the ratio of a group’s share of purchases with that
group’s share of the overall population, a ratio I define as “purchase intensity”. A group with a
purchase- intensity of two would mean that the typical member purchased twice as many records as a
typical member of the population as a whole.
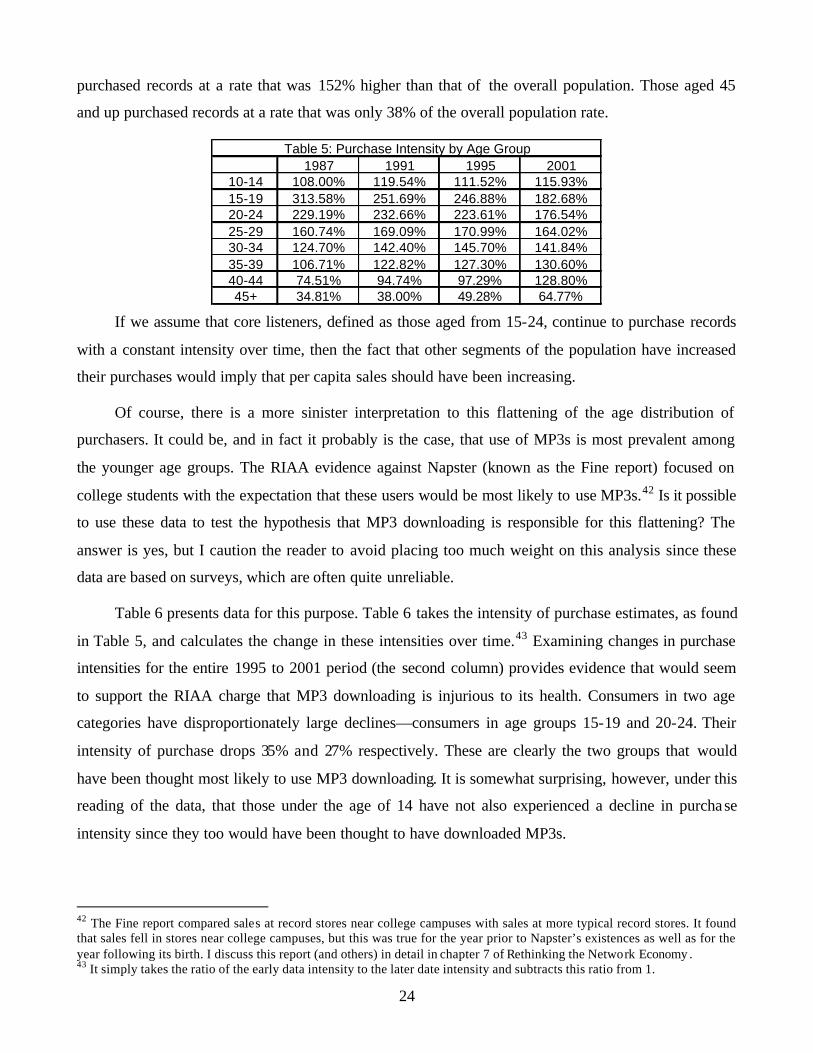
What Table 5 tells us is that in 1991 those between ages 10 and 14 purchased records at a rate
that was 19.54% higher than the typical purchaser from the overall population. Those aged 15-19
39 Although surveys are often not reliable, and I often argue against anyone taking them too seriously, they are the only mechanism that can generate information on the age distribution of consumers. As long as the questions being asked are very simple and as long as respondents have no reason not to tell the truth, surveys might give useful results. 40 This information comes from the RIAA and is based on polls taken by Peter Hart Research. More information is available at the RIAA website www.riaa.com. I have not seen the surveys used to generate this information so I can not form an opinion about their likely veracity. For our purposes, the implications of the results in the table will hold as long as any imperfections in the survey remain consistent over time. 41 Although Table 1 has 35+ as the oldest age group, because the 1983 data topped out at 35+, more recent data provides more detailed breakdowns and has 45+ as the oldest category. The share of purchases made by consumers in this age group has increased significantly in the last decade, from 11.8% to 25.7%.
24
purchased records at a rate that was 152% higher than that of the overall population. Those aged 45
and up purchased records at a rate that was only 38% of the overall population rate.
1987 1991 1995 200110-14 108.00% 119.54% 111.52% 115.93%15-19 313.58% 251.69% 246.88% 182.68%20-24 229.19% 232.66% 223.61% 176.54%25-29 160.74% 169.09% 170.99% 164.02%30-34 124.70% 142.40% 145.70% 141.84%35-39 106.71% 122.82% 127.30% 130.60%40-44 74.51% 94.74% 97.29% 128.80%45+ 34.81% 38.00% 49.28% 64.77%
Table 5: Purchase Intensity by Age Group
If we assume that core listeners, defined as those aged from 15-24, continue to purchase records
with a constant intensity over time, then the fact that other segments of the population have increased
their purchases would imply that per capita sales should have been increasing.
Of course, there is a more sinister interpretation to this flattening of the age distribution of
purchasers. It could be, and in fact it probably is the case, that use of MP3s is most prevalent among
the younger age groups. The RIAA evidence against Napster (known as the Fine report) focused on
college students with the expectation that these users would be most likely to use MP3s.42 Is it possible
to use these data to test the hypothesis that MP3 downloading is responsible for this flattening? The
answer is yes, but I caution the reader to avoid placing too much weight on this analysis since these
data are based on surveys, which are often quite unreliable.
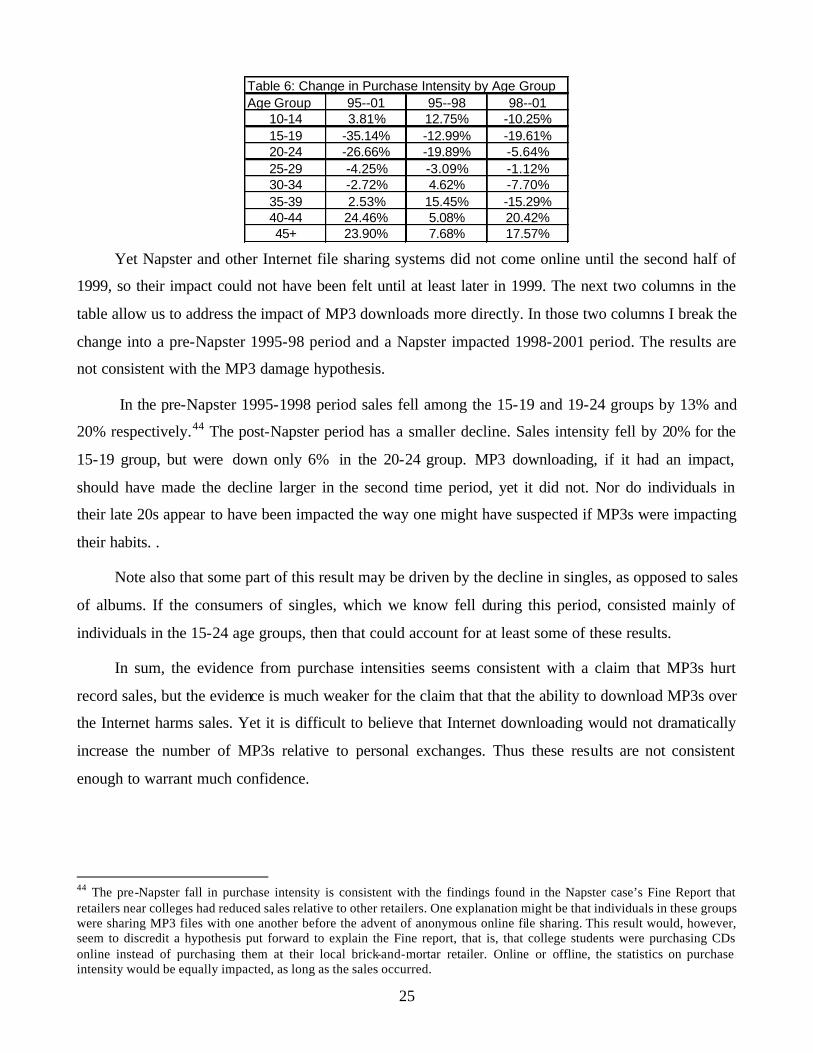
Table 6 presents data for this purpose. Table 6 takes the intensity of purchase estimates, as found
in Table 5, and calculates the change in these intensities over time.43 Examining changes in purchase
intensities for the entire 1995 to 2001 period (the second column) provides evidence that would seem
to support the RIAA charge that MP3 downloading is injurious to its health. Consumers in two age
categories have disproportionately large declines—consumers in age groups 15-19 and 20-24. Their
intensity of purchase drops 35% and 27% respectively. These are clearly the two groups that would
have been thought most likely to use MP3 downloading. It is somewhat surprising, however, under this
reading of the data, that those under the age of 14 have not also experienced a decline in purchase
intensity since they too would have been thought to have downloaded MP3s.
42 The Fine report compared sales at record stores near college campuses with sales at more typical record stores. It found that sales fell in stores near college campuses, but this was true for the year prior to Napster’s existences as well as for the year following its birth. I discuss this report (and others) in detail in chapter 7 of Rethinking the Network Economy . 43 It simply takes the ratio of the early data intensity to the later date intensity and subtracts this ratio from 1.
25
Age Group 95--01 95--98 98--0110-14 3.81% 12.75% -10.25%15-19 -35.14% -12.99% -19.61%20-24 -26.66% -19.89% -5.64%25-29 -4.25% -3.09% -1.12%30-34 -2.72% 4.62% -7.70%35-39 2.53% 15.45% -15.29%40-44 24.46% 5.08% 20.42%45+ 23.90% 7.68% 17.57%
Table 6: Change in Purchase Intensity by Age Group
Yet Napster and other Internet file sharing systems did not come online until the second half of
1999, so their impact could not have been felt until at least later in 1999. The next two columns in the
table allow us to address the impact of MP3 downloads more directly. In those two columns I break the
change into a pre-Napster 1995-98 period and a Napster impacted 1998-2001 period. The results are
not consistent with the MP3 damage hypothesis.
In the pre-Napster 1995-1998 period sales fell among the 15-19 and 19-24 groups by 13% and
20% respectively.44 The post-Napster period has a smaller decline. Sales intensity fell by 20% for the
15-19 group, but were down only 6% in the 20-24 group. MP3 downloading, if it had an impact,
should have made the decline larger in the second time period, yet it did not. Nor do individuals in
their late 20s appear to have been impacted the way one might have suspected if MP3s were impacting
their habits. .
Note also that some part of this result may be driven by the decline in singles, as opposed to sales
of albums. If the consumers of singles, which we know fell during this period, consisted mainly of
individuals in the 15-24 age groups, then that could account for at least some of these results.
In sum, the evidence from purchase intensities seems consistent with a claim that MP3s hurt
record sales, but the evidence is much weaker for the claim that that the ability to download MP3s over
the Internet harms sales. Yet it is difficult to believe that Internet downloading would not dramatically
increase the number of MP3s relative to personal exchanges. Thus these results are not consistent
enough to warrant much confidence.
44 The pre-Napster fall in purchase intensity is consistent with the findings found in the Napster case’s Fine Report that retailers near colleges had reduced sales relative to other retailers. One explanation might be that individuals in these groups were sharing MP3 files with one another before the advent of anonymous online file sharing. This result would, however, seem to discredit a hypothesis put forward to explain the Fine report, that is, that college students were purchasing CDs online instead of purchasing them at their local brick-and-mortar retailer. Online or offline, the statistics on purchase intensity would be equally impacted, as long as the sales occurred.
26
V. The Current Situation
This brings us up to the current moment. Without a doubt sales have fallen from 1999 to 2002, as
we have seen. Yet the 2002 value of 4.33 albums is still relatively high by historical terms. The
questions that I think we would need to be able to answer, if we are to provide useful guidance to
public policy, include the following:
A) Is the current decline in record sales due to MP3 downloads, MP3 use, or neither?
B) If the current decline is due to MP3s, should we measure the impact as the decline from 1999
levels or from higher levels that might have been expected to occur if not for MP3
downloads?
C) Is the current decline just the tip of the iceberg?
D) If the current decline were due to MP3s, could we generate a metric indicating the number of
‘lost sales’ for each MP3 album equivalent?
What I believe the lengthy examination of the industry that I have just imposed upon the reader
can accomplish, however, is to allow us to make some educated guesses about how the recording
industry would have evolved without MP3s, and thus to better gauge the impact of MP3 downloads
from that information.
What would have been the prognostications for albums sales if MP3 didn’t exist? I believe that
the movement in the market to but a single recording format, and the maturation of the portable and
automobile markets imply that sales would at least have leveled off, with or without MP3s. Whether
they would have fallen is less clear, but since purchases of dual recording formats would no longer
have been necessary, there is some possibility of a decline in sales.
What, then, is the impact of MP3 downloading? Given the enormity of the whole MP3 download
enterprise it should be easy to recognize its impact on album sales if its impact is large. What do I
mean by ‘large’? If each MP3 song substituted for a purchased song, as has often been claimed by the
record industry in the case of blank tapes, we would clearly have a large impact.45 If each two MP3s
substituted for one purchased song, that would be large. Even if each four MP3s substituted for one
purchased song, that too should probably be considered a impact large. If, on the other hand, each
hundred MP3s substituted for one purchased song, that would not, in my opinion, qualify as a ‘large’
45 When the recording industry made estimates of the harm from copying, each blank audio cassette sold tended to be counted as a lost sale of an album, clearly leading to an overestimate of harm.
27
impact and it would be most difficult to measure, given all the factors influencing the sales of albums.
There is, of course, a vague ‘in-between’ range that is neither large nor small.
It is useful to recall that the emergence of Napster occurred in the fall of 1999. The decline in
albums sales beginning in 2000 would seem to fit the timing of Napster’s birth quite well. The growth
in sales from 1997 to 1999 would seem to argue against a claim that MP3 use, independent of Internet
downloads, damaged record sales. This is contrary to the findings in the material in and around Table 6
on the alteration of the distribution of users, where an independent impact of MP3 downloading as
opposed to MP3 use, was not discernable. Still, the evidence, in my opinion, currently supports a claim
of damage, although the case is far from airtight.
The decline in albums from 1999 to 2002 is the largest decline that has occurred over the last 30
years. But we need to expose these results to somewhat greater scrutiny.
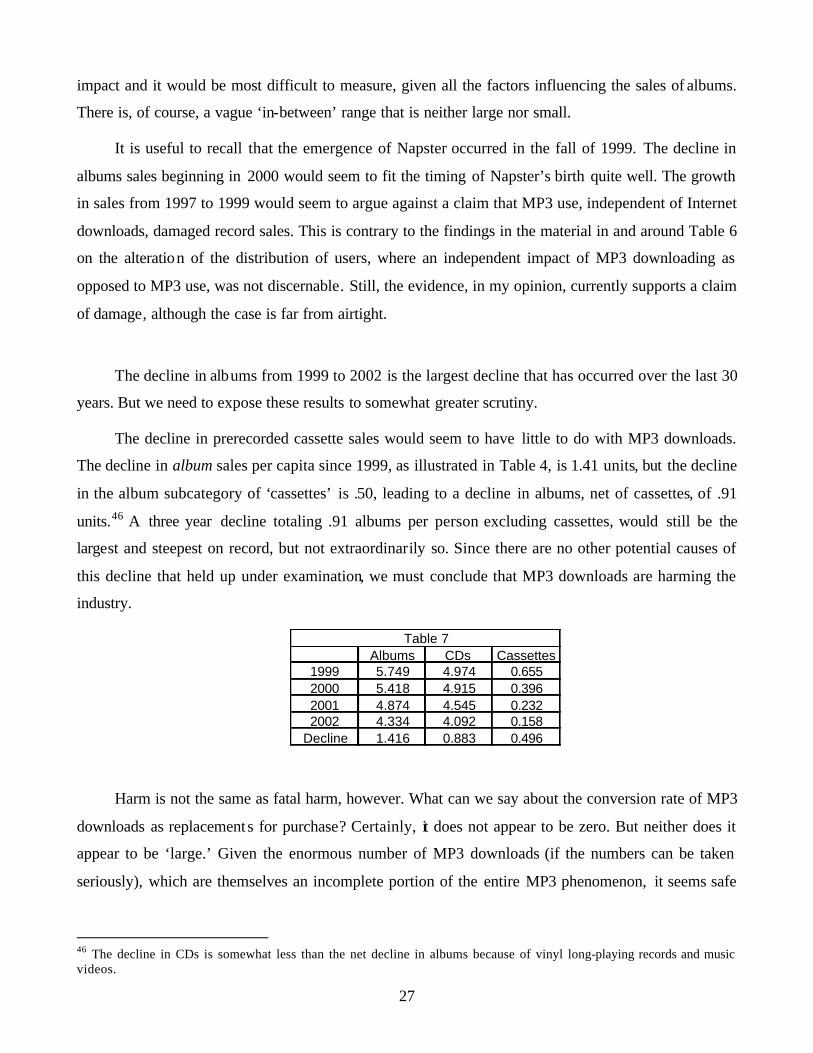
The decline in prerecorded cassette sales would seem to have little to do with MP3 downloads.
The decline in album sales per capita since 1999, as illustrated in Table 4, is 1.41 units, but the decline
in the album subcategory of ‘cassettes’ is .50, leading to a decline in albums, net of cassettes, of .91
units.46 A three year decline totaling .91 albums per person excluding cassettes, would still be the
largest and steepest on record, but not extraordinarily so. Since there are no other potential causes of
this decline that held up under examination, we must conclude that MP3 downloads are harming the
industry.
Albums CDs Cassettes1999 5.749 4.974 0.6552000 5.418 4.915 0.3962001 4.874 4.545 0.2322002 4.334 4.092 0.158
Decline 1.416 0.883 0.496
Table 7
Harm is not the same as fatal harm, however. What can we say about the conversion rate of MP3
downloads as replacement s for purchase? Certainly, it does not appear to be zero. But neither does it
appear to be ‘large.’ Given the enormous number of MP3 downloads (if the numbers can be taken
seriously), which are themselves an incomplete portion of the entire MP3 phenomenon, it seems safe
46 The decline in CDs is somewhat less than the net decline in albums because of vinyl long-playing records and music videos.
28
to say that the CD equivalent of MP3 downloads is at least equal to the entire sales market for CDs.47
If MP3s downloads replaced sales at a 1 to 1 ratio, there would be no CD market to speak of. In that
case we would be talking about a drop in CDs of 5 units, not .89 units. If MP3 downloads converted at
4:1 the album market would have dropped by 25%. Removing the impact of the decline in cassettes,
which seems appropriate, it would appear that the conversion rate at the moment is on the order of 5:1
or 6:1. Not large but not small.
The more important question is whether the decline is sales will continue.
One possibility is that MP3 downloads will continue to increase. If this is the case, even if the
conversion rate remains constant, at 6:1 say, the damage to the industry will continue to increase.
Obviously, the degree to which individuals engage in MP3 downloading depends, among other things,
on potential deterrent effects of legal penalties and perhaps more importantly, on any social
opprobrium associated with this activity. It is difficult to judge whether or how these factors will
change in the next few years, although these are the dimensions where the RIAA has focused its
proscriptive activities.48 A second reason MP3 downloading might grow more is the possibility of
greater broadband access, making the downloading of large files less burdensome.
Even if the activity of MP3 downloading remained constant, however, there is an additional
reason that the impact of MP3 downloads might have become increasingly severe over the last few
years. This reason is the spread in CD burners. Without burning a CD, MP3s can not substitute for the
purchase of CDs in the many devices that were made to use CDs, such as automobiles, home stereos,
and portable devices.49 If MP3s are only used on computers they are not likely to replace the sale of
CDs. To the extent that the steady state share of CD burners has not yet been reached, however, the
measured conversion rate will be understated.
47 At its peak, Napster downloads were estimated to be in the vicinity of 2.8 billion files per month. It was also claimed that the four largest Napster replacements, FastTrack, Audiogalaxy, iMesh and Gnutella, were responsible for 3.05 billion downloaded files a month in August of 2001, although not all of these were songs. The data come from Webnoize, a company that tracks Internet usage as reported by Scarlet Pruitt, IDG News Service\Boston Bureau, September 07, 2001 in “Study: Look out labels: file swapping growing.” See http://www.idg.net/idgns/2001/09/07/StudyLookOutLabelsFileSwapping.shtml Assuming ten songs per CD, this would imply 300 million CDs per month worth of songs. According to RIAA numbers, US national sales ran approximately 80 million CDs per month, less than one third the CD equivalent number of downloads. Thus the potential impact of downloading should have been large. According to the IFPI, total sales of CDs worldwide are less than two and a half billion, which is less than the CD equivalent of MP3 downloads. 48 The RIAA has sent out large numbers of letters threatening legal action if, for example, schools and businesses do not try to restrict the downloading of songs through their networks. They have threatened individuals who have made available large numbers of songs to peer-to-peer networks. They have run advertisements equating peer-to-peer downloading with theft. 49 Note that treating MP3s as a new format is possible, but that it has, at least through 2001, a trivial impact in the portable market, with fewer than three million units in use.
29
A survey by the RIAA in August of 2000 suggested that 30% of music consumers under the age
of 54 had CD burners.50 As I am writing this paper, in the late spring of 2003, it seems reasonable that
the penetration of CD burners must be quite large since they have been quite inexpensive and standard
on most new computers for several years now. Although the number of households with computers is
usually put at about 60%, this number is presumably higher for music users under the age of 54,
meaning that between 30% and 50% of music users with computers possessed CD burners in 2000. As
a guess, by 2002, with approximately two years having passed since this survey, it would seem
reasonable to believe that the share of music users with CD burning capability could easily have been
at 75% or more of its short-term potential maximum.51 Further, since we might expect that this option
would have been used first by those most interested in burning CDs, the additional impact from
providing CD burning capability to that computer owners who did not yet have it would be smaller
than the share of such owners.
The decline in sales due to the inc reased penetration of CD burners would be largely complete, if
this reasoning were correct. If the decline in albums continues unabated in 2003, meaning another
decline in the vicinity of .4 albums per capita, this hypothesis will be largely discredited. On the other
hand, if the decline drops to below .25 albums, we can presume the decline in sales is largely over.
VI. Conclusions
If the analysis in this paper is correct, MP3 downloads are causing significant harm to the record
industry. It is not clear, however, whe ther such downloading in our current legal environment will
cause a mortal blow to the industry. I suspect that the worst damage to the industry is behind us, but we
will know soon enough as new data are made available. It is important to understand the impact of
MP3 downloads if we, as a society, are to determine appropriate responses to allow the record
companies to take in defending their economic position from the encroachments brought about by MP3
downloads.
It is also understandable that the record companies may not be willing participants in this
laboratory for economic analysis. Why should they risk their revenues in an experiment that may end
50 It was this or a similar statistic, reported in USA Today in 2002 but not dated or attributed to the RIAA, that made me suspect that perhaps MP3 downloading might not cause great harm to the record industry. After all, the RIAA numbers for 2001 were not yet out and the decline in 2000 was quite small given the well publicized extent of MP3 usage. I had thought that the lack of CD burners was a logical explanation for why harm had not yet shown up at a scale similar to the MP3 phenomenon, but the report of 30% CD ownership seemed to weaken that explanation. Shortly after this , when the 2001 numbers came out, the decline in CD sales became far more apparent. See my interview in Salon Magazine at http://www.salon.com/tech/feature/2002/06/13/liebowitz/index.html?x 51 Not every mu sic user has a computer, so the maximum penetration is less than 100%.
30
badly for them? How many of us would volunteer to undergo surgery without anesthesia to test a
theory that claimed it wasn’t really necessary? I think it is important to understand that a decline of 20-
25% is a considerable number.52
Nevertheless, how far should we be willing to go to protect the record industry from a 20-25%
decline in business? Are recent proposals, such as the Berman bill going too far? My own view is that
such proposals are going too far. Should we switch to a non-market alternative as suggested by Lessig,
Natenal, and Romer?53 I believe that switching to a non-market alternative should be an absolutely
last-resort policy, for reasons I enunciate in my 2003 paper.54 Allowing record companies to protect
their wares using digital right management technology seems to be a far more reasonable alternative.55
If, on the other hand, future evidence indicates that in fact the record industry would not survive mp3s,
we might need to rethink the answers to these questions.
This paper has not taken a particular position on these issues. The goal of this paper was to
provide some empirical analysis to replace what has often been little more than emotional wrangling
and haranguing on both sides. Answers to difficult policy questions are not likely to be well informed
without such an understanding of the empirical backdrop to the issues.
52 The recording industry is likely to complain that if revenues fall by 20%, that profits will have to fall far more. While there is some truth to this in the ‘short run’, the recording industry appears to be quite scalable, with no minimum efficient scale that would require giant producers in order to be able to sustain a market. Therefore, a new equilibrium should eventually be achieved with normal profits but with revenues 20% lower. 53 Lawrence Lessig, “Just Compensation: Congress should help artists get paid without delivering the Internet into the hands of the big labels.” The Standard, Apr 06 2001; Neil Weinstock Netanel “Impose a Noncommercial Use Levy to Allow Free P2P File -Swapping and Remixing” Working Paper; Romer in footnote 8. 54 Stan J Liebowitz, “The Production of Music in the face of peer-to-peer downloading: Does there exist something better than the market?”, working paper. 55 I discuss this at length in my Cato policy analysis and in my book “Rethinking the Network Economy”