annual budget - city of dallas
TRANSCRIPT
— CITY OF DALLAS —
ANNUAL BUDGET For Fiscal Year 2013-2014
October 1, 2013 – September 30, 2014
As Approved on September 18, 2013 by
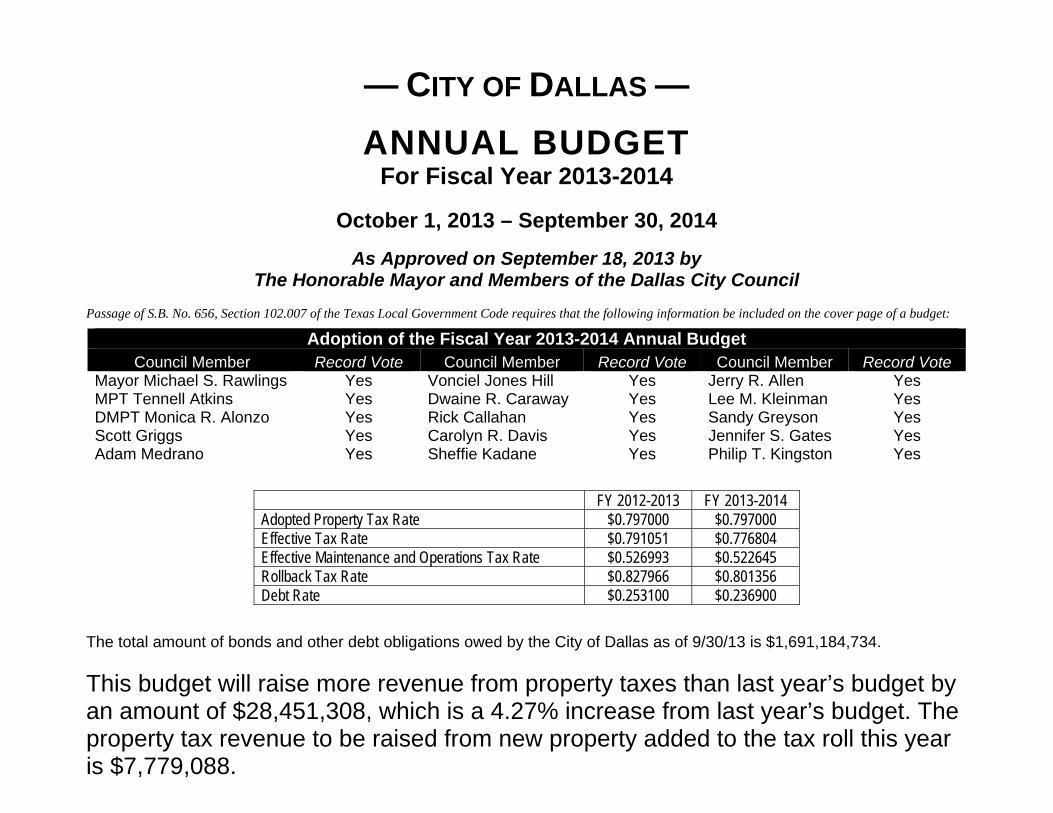
The Honorable Mayor and Members of the Dallas City Council Passage of S.B. No. 656, Section 102.007 of the Texas Local Government Code requires that the following information be included on the cover page of a budget:
Adoption of the Fiscal Year 2013-2014 Annual Budget Council Member Record Vote Council Member Record Vote Council Member Record Vote
Mayor Michael S. Rawlings Yes Vonciel Jones Hill Yes Jerry R. Allen Yes MPT Tennell Atkins Yes Dwaine R. Caraway Yes Lee M. Kleinman Yes DMPT Monica R. Alonzo Yes Rick Callahan Yes Sandy Greyson Yes Scott Griggs Yes Carolyn R. Davis Yes Jennifer S. Gates Yes Adam Medrano Yes Sheffie Kadane Yes Philip T. Kingston Yes
FY 2012-2013 FY 2013-2014 Adopted Property Tax Rate $0.797000 $0.797000 Effective Tax Rate $0.791051 $0.776804 Effective Maintenance and Operations Tax Rate $0.526993 $0.522645 Rollback Tax Rate $0.827966 $0.801356 Debt Rate $0.253100 $0.236900
The total amount of bonds and other debt obligations owed by the City of Dallas as of 9/30/13 is $1,691,184,734. This budget will raise more revenue from property taxes than last year’s budget by an amount of $28,451,308, which is a 4.27% increase from last year’s budget. The property tax revenue to be raised from new property added to the tax roll this year is $7,779,088.

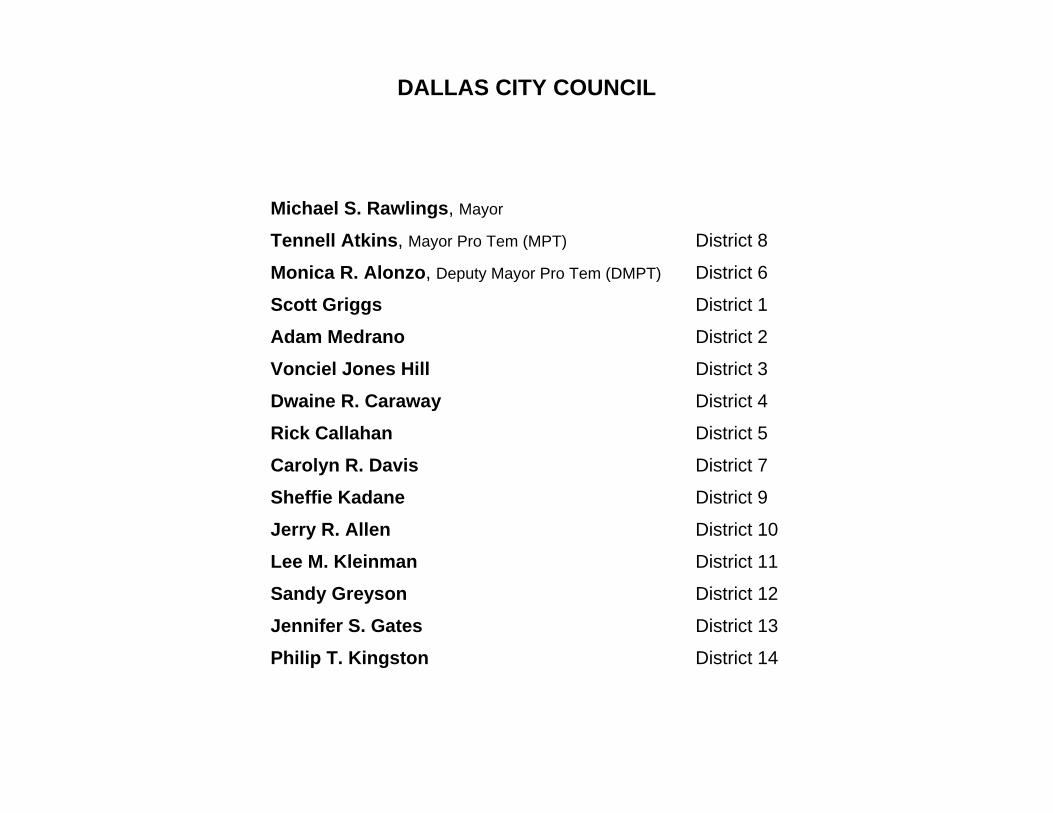
DALLAS CITY COUNCIL
Michael S. Rawlings, Mayor
Tennell Atkins, Mayor Pro Tem (MPT) District 8
Monica R. Alonzo, Deputy Mayor Pro Tem (DMPT) District 6
Scott Griggs District 1
Adam Medrano District 2
Vonciel Jones Hill District 3
Dwaine R. Caraway District 4
Rick Callahan District 5
Carolyn R. Davis District 7
Sheffie Kadane District 9
Jerry R. Allen District 10
Lee M. Kleinman District 11
Sandy Greyson District 12
Jennifer S. Gates District 13
Philip T. Kingston District 14


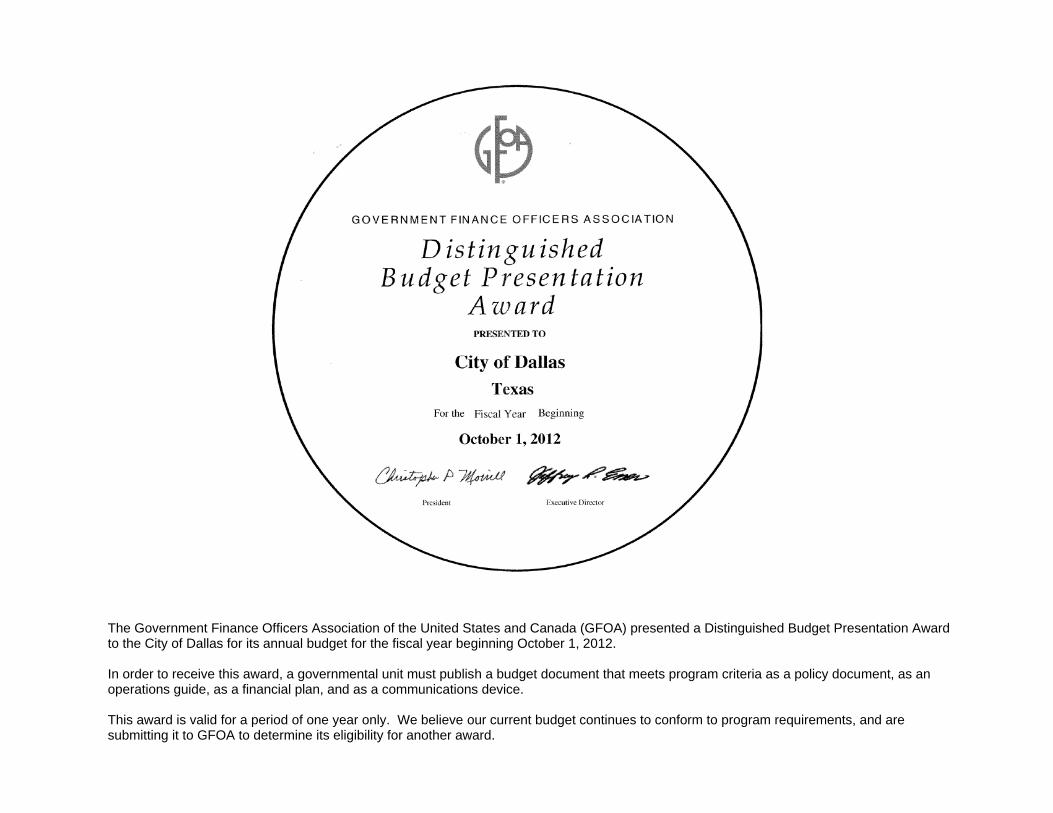
The Government Finance Officers Association of the United States and Canada (GFOA) presented a Distinguished Budget Presentation Award to the City of Dallas for its annual budget for the fiscal year beginning October 1, 2012. In order to receive this award, a governmental unit must publish a budget document that meets program criteria as a policy document, as an operations guide, as a financial plan, and as a communications device. This award is valid for a period of one year only. We believe our current budget continues to conform to program requirements, and are submitting it to GFOA to determine its eligibility for another award.

To: The Honorable Mayor and Members of the Dallas City Council
Executive SummaryAt a time when national headlines include news of municipal bank-ruptcies and continued financial hardship, Dallas has carefully navi-gated through this difficult period. Our healthy position today is the result of tough financial sacrifices. Council, staff and community partnerships have enabled us to leverage resources; thus reducing the negative impact of cuts while heightening the impact of continued investment in public safety, economic development and infrastruc-ture. Moving forward, this budget seeks to strengthen safety, restore services and grow business.
Economic Outlook:
While the Texas economy churns on a path of expansion, Dallas con-tinues its post-recession stabilization and is experiencing areas of measured economic growth. The Dallas unemployment rate of 6.3% is below the national average (7.6%) and existing home sales and housing starts are increasing. Although this period of growth is expected to continue, the City maintains a cautionary approach realizing that a world event could slow or moderate expansion in the Dallas economy during the next 12 months.
The Mayor, City Council, and City management have worked diligently over the past five years to offset the economic effects of the global recession by operating within the City’s resources; establish-ing priorities; focusing on core services; finding operational efficien-cies; and positioning the City for recovery.
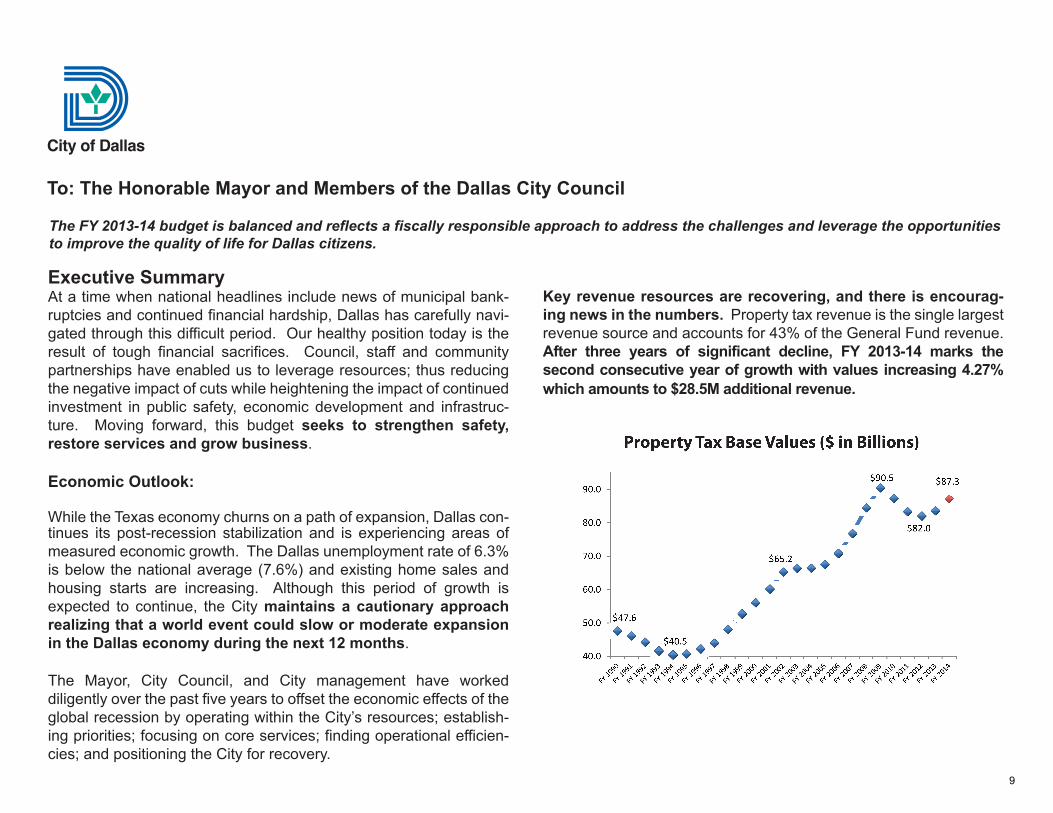
Key revenue resources are recovering, and there is encourag-ing news in the numbers. Property tax revenue is the single largest revenue source and accounts for 43% of the General Fund revenue. After three years of significant decline, FY 2013-14 marks the second consecutive year of growth with values increasing 4.27% which amounts to $28.5M additional revenue.
The FY 2013-14 budget is balanced and reflects a fiscally responsible approach to address the challenges and leverage the opportunities to improve the quality of life for Dallas citizens.
9
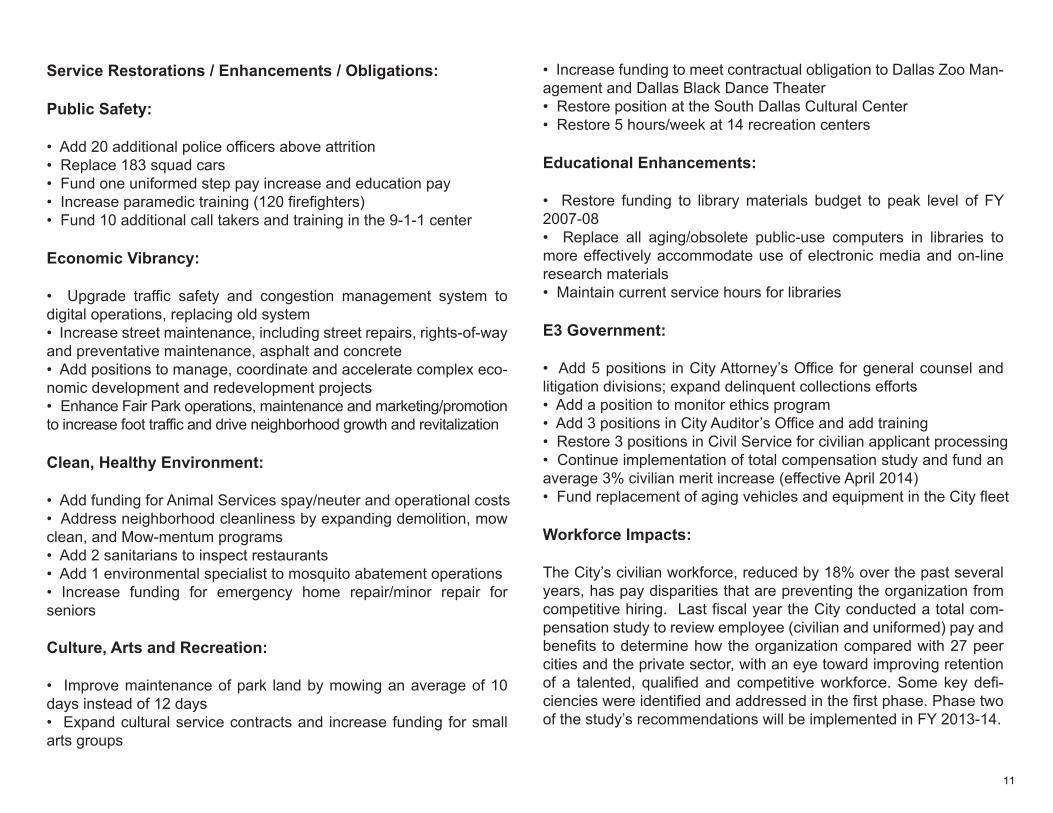
New construction appraised values are increasing but still signifi-cantly below the 2008 peak.
No new taxes. The tax rate will remain at the same level. There-fore, guiding principles and development goals of the FY 2013-14 City of Dallas budget is as follows:
Guiding Principles:
• Maintain current year service levels and restore some discontinued services• Fund on-going obligations• Address most critical needs
Development Goals:
• Continue to focus on crime reduction by adding 20 officers above attrition to begin to address population growth; add cameras to deter criminal behavior; fund one step pay increase and full-year fund edu-cation pay for uniform police and fire personnel to retain younger officers; and fund 10 additional call takers and additional training in 9-1-1 operations center. • Continue strategic restoration of services and strategic service increases such as street maintenance to slow the rate of required replacement. • Continue to invest in key economic development opportunities to encourage private development and continue to grow the tax base.• Continue development efforts in Southern Dallas and attract more visitors to Fair Park by restoring amenities and promoting park events and assets, and work to improve neighborhoods surrounding Fair Park.
We will continue to strengthen the City’s financial condition through strategic planning, effective and efficient management and by expanding the City’s economic tax base through aggressive and creative economic development activities. Therefore, the FY 2013-14 City of Dallas budget allows the City to continue to operate within its resources; reflects the City’s established priorities; and supports the City’s ability to recover and thrive. All key service levels are maintained with some service restorations, enhancements, and some increased obligations. 10
Service Restorations / Enhancements / Obligations: Public Safety: • Add 20 additional police officers above attrition • Replace 183 squad cars • Fund one uniformed step pay increase and education pay• Increase paramedic training (120 firefighters)• Fund 10 additional call takers and training in the 9-1-1 center
Economic Vibrancy:
• Upgrade traffic safety and congestion management system to digital operations, replacing old system• Increase street maintenance, including street repairs, rights-of-way and preventative maintenance, asphalt and concrete • Add positions to manage, coordinate and accelerate complex eco-nomic development and redevelopment projects • Enhance Fair Park operations, maintenance and marketing/promotion to increase foot traffic and drive neighborhood growth and revitalization
Clean, Healthy Environment:
• Add funding for Animal Services spay/neuter and operational costs• Address neighborhood cleanliness by expanding demolition, mow clean, and Mow-mentum programs• Add 2 sanitarians to inspect restaurants • Add 1 environmental specialist to mosquito abatement operations• Increase funding for emergency home repair/minor repair for seniors
Culture, Arts and Recreation:
• Improve maintenance of park land by mowing an average of 10 days instead of 12 days• Expand cultural service contracts and increase funding for small arts groups
• Increase funding to meet contractual obligation to Dallas Zoo Man-agement and Dallas Black Dance Theater • Restore position at the South Dallas Cultural Center• Restore 5 hours/week at 14 recreation centers
Educational Enhancements:
• Restore funding to library materials budget to peak level of FY 2007-08• Replace all aging/obsolete public-use computers in libraries to more effectively accommodate use of electronic media and on-line research materials• Maintain current service hours for libraries
E3 Government:
• Add 5 positions in City Attorney’s Office for general counsel and litigation divisions; expand delinquent collections efforts• Add a position to monitor ethics program • Add 3 positions in City Auditor’s Office and add training • Restore 3 positions in Civil Service for civilian applicant processing• Continue implementation of total compensation study and fund an average 3% civilian merit increase (effective April 2014) • Fund replacement of aging vehicles and equipment in the City fleet
Workforce Impacts:
The City’s civilian workforce, reduced by 18% over the past several years, has pay disparities that are preventing the organization from competitive hiring. Last fiscal year the City conducted a total com-pensation study to review employee (civilian and uniformed) pay and benefits to determine how the organization compared with 27 peer cities and the private sector, with an eye toward improving retention of a talented, qualified and competitive workforce. Some key defi-ciencies were identified and addressed in the first phase. Phase two of the study’s recommendations will be implemented in FY 2013-14.
11
Service Charges:
Water:
With the state still facing drought and water challenges, it is important that the City continue to focus on maintaining infrastructure, conserv-ing resources and providing for future needs through: rehabilitation and/or replacement of 54 miles of aging water and wastewater mains; water treatment plant improvements to enhance reliability and water quality and increase capacity; and continued water conserva-tion efforts. To achieve these goals, the typical residential monthly bill will increase by 3.6%.
Sanitation:
Residential collection fees of $20.25 per month will be adjusted by $0.39 per month in order to maintain full cost recovery for increasing costs of temporary labor contracts, sanitation workers compensation brought to market, and fleet maintenance expenses.
Stormwater Drainage Management:
There is no rate change in FY 2013-14.
Looking Forward:
Our focus is to Strengthen, Restore and Grow: Strengthen our safety programs, restore community services, and grow our economy.
The city offers hundreds of programs and services, and is involved with millions of transactions every year. This demands we have systems and processes in place. We understand that sometimes working through those processes can be frustrating for citizens, but we have been making significant progress in simplifying our systems to improve customer service. We are implementing new technology to make it easier for citizens to access services, and deploying new communication tools to better engage and inform the public.
Our initiatives are having a positive impact. In the 2013 Community Survey, 73% of respondents rated the overall quality of life in Dallas as excellent or good. Other major findings reveal that while there are some differences for specific services, overall satisfaction with City services is generally the same throughout the City; the City of Dallas is setting the standard for service delivery; and the City continues to maintain high overall satisfaction ratings even though the results for most other large U.S. cities have decreased.
We intend to build on those successes, further simplify processes and promote an environment of enthusiasm, so that citizens, busi-ness owners and developers know when they walk into a city facility for help, they will be working with partners for their success.
Several exciting projects are underway with more to come online during the next fiscal year. The Love Field Modernization Project is on schedule and on budget. It will be completed upon full repeal of the Wright Amendment in fall 2014. The renovation of 2014 Main Street is nearly complete and will significantly upgrade judicial operations and welcome the planned addition of the UNT Dallas College of Law. Downtown continues to attract urban residents with an estimated 40,000 people now living in the expanded downtown areas. The Farmers Market, now operated privately, will soon be enhanced by retail and residential development. Construction of new retail devel-opment at the Dallas Omni Convention Center Hotel will begin during the next fiscal year. Both projects will strengthen economic develop-ment in the southern part of the Central Business District.
Trinity River Corridor planning and implementation of new projects are gaining momentum. The Continental Avenue Bridge will be trans-formed into a unique outdoor space. The Great Trinity River Gateway and Horse Trails and the Pavilion and Amphitheater Entryway on 8th Street connecting Moore Park and the Santa Fe Trestle Trail will soon be joined by the Texas Horse Park, the Trinity Forest Golf Course and additional bike trails in the Trinity floodway. The course will host The PGA Byron Nelson Golf Championship as well as First Tee of Greater Dallas junior golf program and the Southern Methodist University golf program. In 2014, construction of the new Sylvan Avenue Bridge will be completed, the upgraded Baker Pump Station will go on-line, and work will begin on the Able Pump Station; all projects addressing
12
13

14
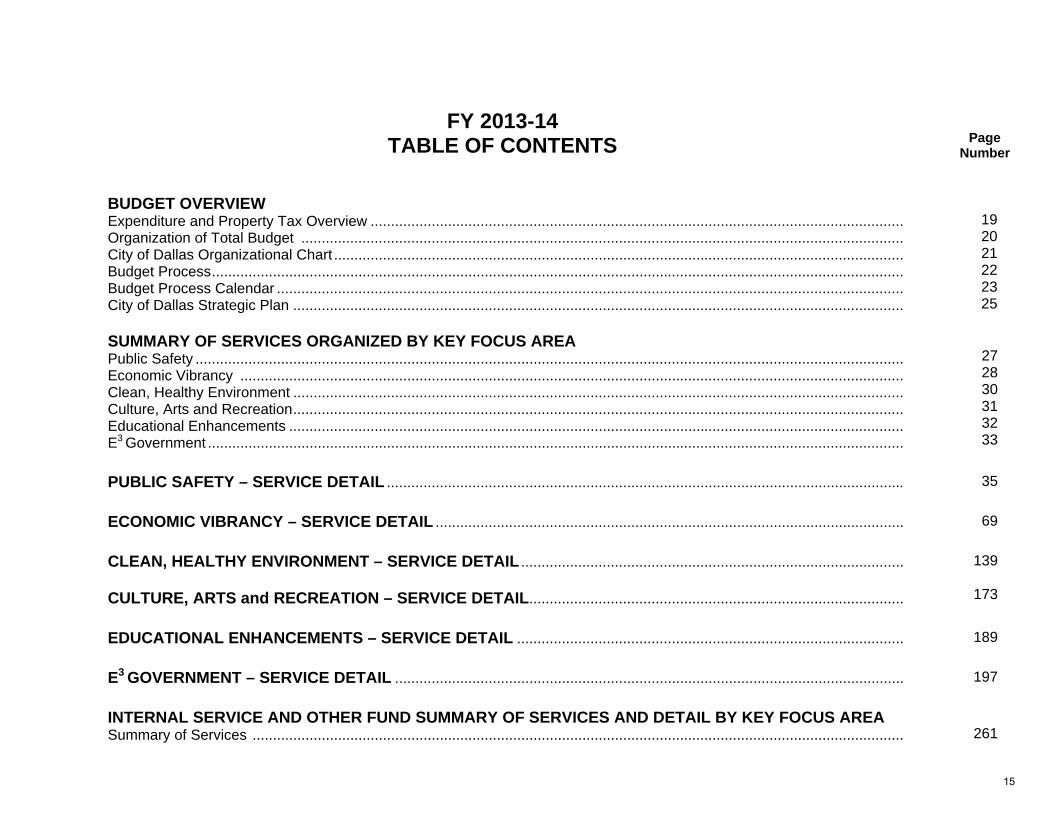
FY 2013-14 TABLE OF CONTENTS
Page Number
BUDGET OVERVIEW Expenditure and Property Tax Overview ...................................................................................................................................Organization of Total Budget ....................................................................................................................................................City of Dallas Organizational Chart ............................................................................................................................................Budget Process ..........................................................................................................................................................................Budget Process Calendar ..........................................................................................................................................................City of Dallas Strategic Plan ......................................................................................................................................................
19 20 21 22 23 25
SUMMARY OF SERVICES ORGANIZED BY KEY FOCUS AREA Public Safety ..............................................................................................................................................................................Economic Vibrancy ...................................................................................................................................................................Clean, Healthy Environment ......................................................................................................................................................Culture, Arts and Recreation ......................................................................................................................................................Educational Enhancements .......................................................................................................................................................E3 Government ...........................................................................................................................................................................
27 28 30 31 32
33
PUBLIC SAFETY – SERVICE DETAIL ...............................................................................................................................
35
ECONOMIC VIBRANCY – SERVICE DETAIL ...................................................................................................................
69
CLEAN, HEALTHY ENVIRONMENT – SERVICE DETAIL .............................................................................................. CULTURE, ARTS and RECREATION – SERVICE DETAIL ............................................................................................
139
173
EDUCATIONAL ENHANCEMENTS – SERVICE DETAIL ...............................................................................................
189
E3 GOVERNMENT – SERVICE DETAIL .............................................................................................................................
197
INTERNAL SERVICE AND OTHER FUND SUMMARY OF SERVICES AND DETAIL BY KEY FOCUS AREA Summary of Services ................................................................................................................................................................
261
15
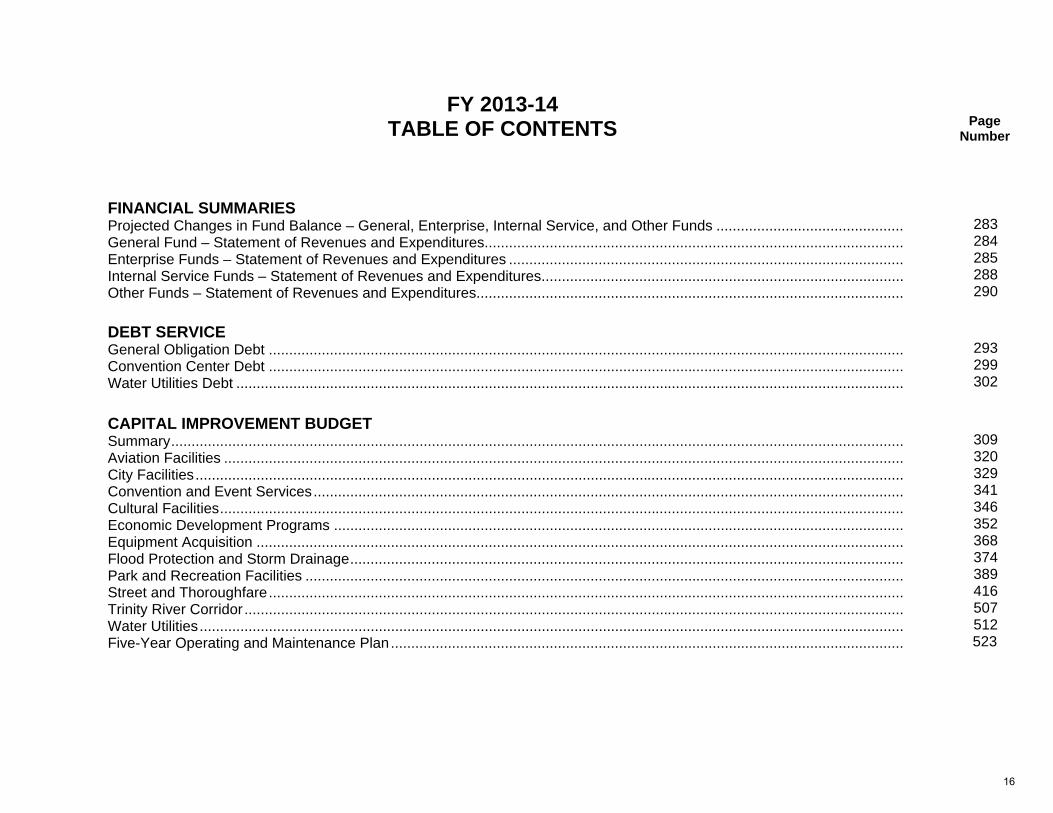
FY 2013-14
TABLE OF CONTENTS
Page Number
FINANCIAL SUMMARIES Projected Changes in Fund Balance – General, Enterprise, Internal Service, and Other Funds ..............................................General Fund – Statement of Revenues and Expenditures.......................................................................................................Enterprise Funds – Statement of Revenues and Expenditures .................................................................................................Internal Service Funds – Statement of Revenues and Expenditures .........................................................................................Other Funds – Statement of Revenues and Expenditures.........................................................................................................
283 284 285 288 290
DEBT SERVICE General Obligation Debt ............................................................................................................................................................Convention Center Debt ............................................................................................................................................................Water Utilities Debt ....................................................................................................................................................................
293 299 302
CAPITAL IMPROVEMENT BUDGET Summary ....................................................................................................................................................................................Aviation Facilities .......................................................................................................................................................................City Facilities ..............................................................................................................................................................................Convention and Event Services .................................................................................................................................................Cultural Facilities ........................................................................................................................................................................Economic Development Programs ............................................................................................................................................Equipment Acquisition ...............................................................................................................................................................Flood Protection and Storm Drainage ........................................................................................................................................Park and Recreation Facilities ...................................................................................................................................................Street and Thoroughfare ............................................................................................................................................................Trinity River Corridor ..................................................................................................................................................................Water Utilities .............................................................................................................................................................................Five-Year Operating and Maintenance Plan ..............................................................................................................................
309 320 329 341 346 352 368 374 389 416 507 512
523
16
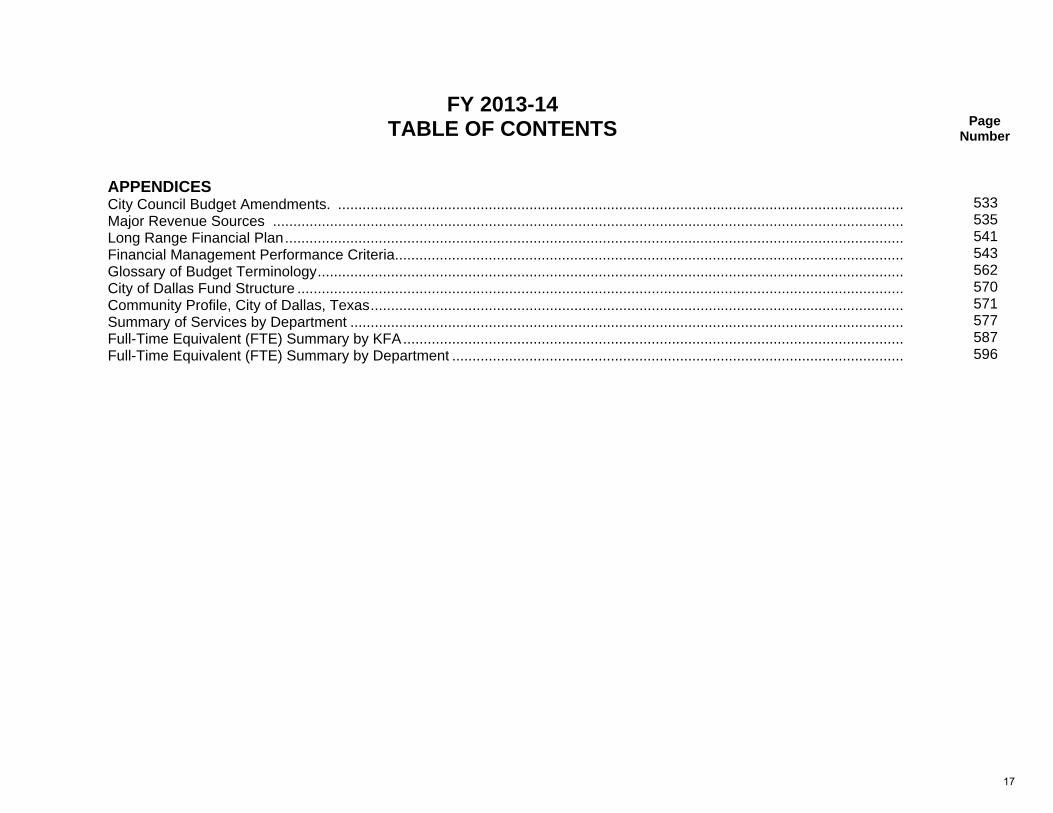
FY 2013-14
TABLE OF CONTENTS
Page Number
APPENDICES City Council Budget Amendments. ...........................................................................................................................................Major Revenue Sources ...........................................................................................................................................................Long Range Financial Plan ........................................................................................................................................................Financial Management Performance Criteria.............................................................................................................................Glossary of Budget Terminology ................................................................................................................................................City of Dallas Fund Structure .....................................................................................................................................................Community Profile, City of Dallas, Texas ...................................................................................................................................Summary of Services by Department ........................................................................................................................................Full-Time Equivalent (FTE) Summary by KFA ...........................................................................................................................Full-Time Equivalent (FTE) Summary by Department ...............................................................................................................
533 535 541 543 562 570 571 577 587 596
17
HOW TO USE THIS DOCUMENT
This page is included to provide an overview on how this document is organized. The hierarchy of organization is Key Focus Areas supported by individual Services: Key Focus Areas The FY 2013-14 Budget is presented by six (6) City Council established Key Focus Areas as the City’s top priorities. The six Key Focus Areas are:
1. Public Safety Improvements and Crime Reduction 2. Economic Vibrancy 3. A Cleaner, Healthier City Environment 4. Better Cultural, Arts and Recreational Amenities 5. Educational Enhancements 6. Make Government Services More Efficient, Effective and Economical
Services are functional activities that are not dependent on other Services and were identified by City Departments. Summary of Services (See Tab)
This section includes a summary of all Services by Key Focus Area. A numbering system (1.1, 1.2, 1.3, etc.) is used to identify the Service. The first digit represents the Key Focus Area number (See
above). The second digit represents the Service. The summary includes the responsible Department, Total Proposed Dollars (all funding sources), General Fund Proposed Dollars
and General Fund FTEs. Service Detail Pages by Key Focus Area (See Tabs listed by Key Focus Name)
Each Service is organized by Key Focus Area. Use the 2 digit identifying number to find a specific Service from the Summary page.
The Services include both General Fund and Enterprise Fund Services and are sorted alphabetically by Service name. Each detail page includes a Description, Funding Chart, Efficiency Measure, and Service Target FY 2013-14
o Funding Chart includes operating budgets (shown as either General Fund or Enterprise Funds). Additional Resources reflect, for example, reimbursement from the Capital Budget, Storm Water or Other funds as well as Grants and Donations.
o Measures provide additional information and are tied to the Performance Management system.
18
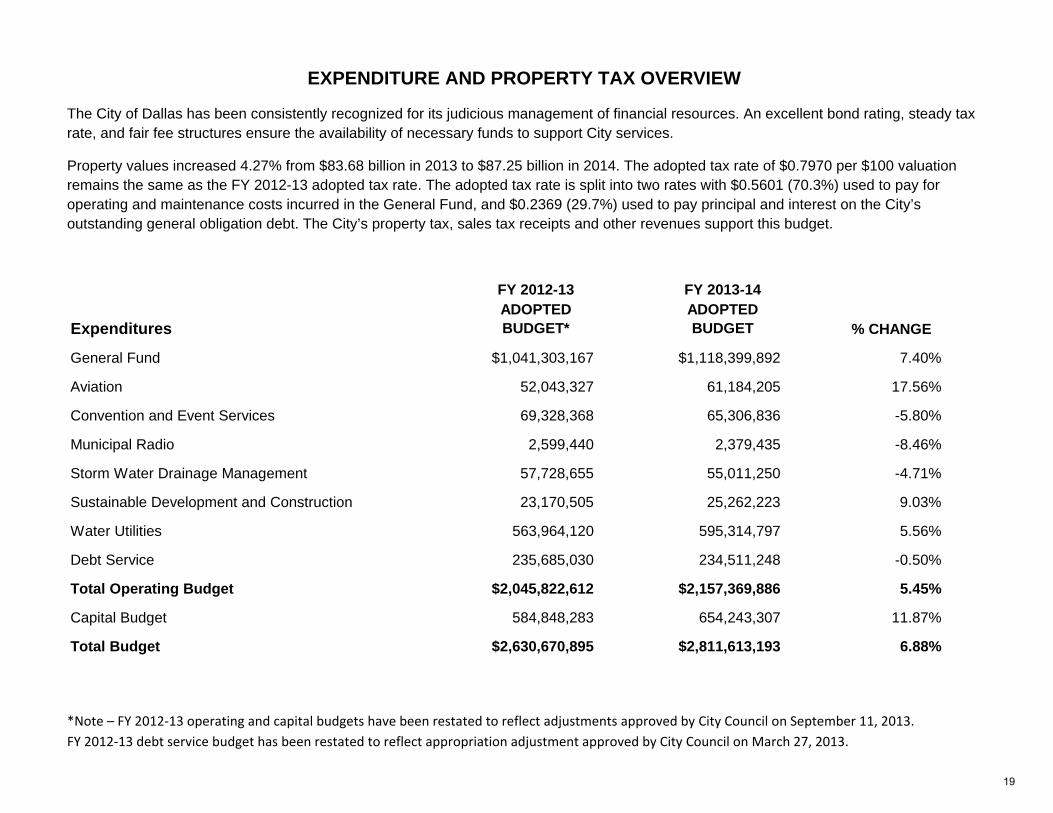
*Note – FY 2012‐13 operating and capital budgets have been restated to reflect adjustments approved by City Council on September 11, 2013. FY 2012‐13 debt service budget has been restated to reflect appropriation adjustment approved by City Council on March 27, 2013.
EXPENDITURE AND PROPERTY TAX OVERVIEW
The City of Dallas has been consistently recognized for its judicious management of financial resources. An excellent bond rating, steady tax rate, and fair fee structures ensure the availability of necessary funds to support City services.
Property values increased 4.27% from $83.68 billion in 2013 to $87.25 billion in 2014. The adopted tax rate of $0.7970 per $100 valuation remains the same as the FY 2012-13 adopted tax rate. The adopted tax rate is split into two rates with $0.5601 (70.3%) used to pay for operating and maintenance costs incurred in the General Fund, and $0.2369 (29.7%) used to pay principal and interest on the City’s outstanding general obligation debt. The City’s property tax, sales tax receipts and other revenues support this budget.
FY 2012-13 FY 2013-14
ExpendituresADOPTEDBUDGET*
ADOPTEDBUDGET % CHANGE
General Fund $1,041,303,167 $1,118,399,892 7.40%
Aviation 52,043,327 61,184,205 17.56%
Convention and Event Services 69,328,368 65,306,836 -5.80%
Municipal Radio 2,599,440 2,379,435 -8.46%
Storm Water Drainage Management 57,728,655 55,011,250 -4.71%
Sustainable Development and Construction 23,170,505 25,262,223 9.03%
Water Utilities 563,964,120 595,314,797 5.56%
Debt Service 235,685,030 234,511,248 -0.50%
Total Operating Budget $2,045,822,612 $2,157,369,886 5.45%
Capital Budget 584,848,283 654,243,307 11.87%
Total Budget $2,630,670,895 $2,811,613,193 6.88%
19
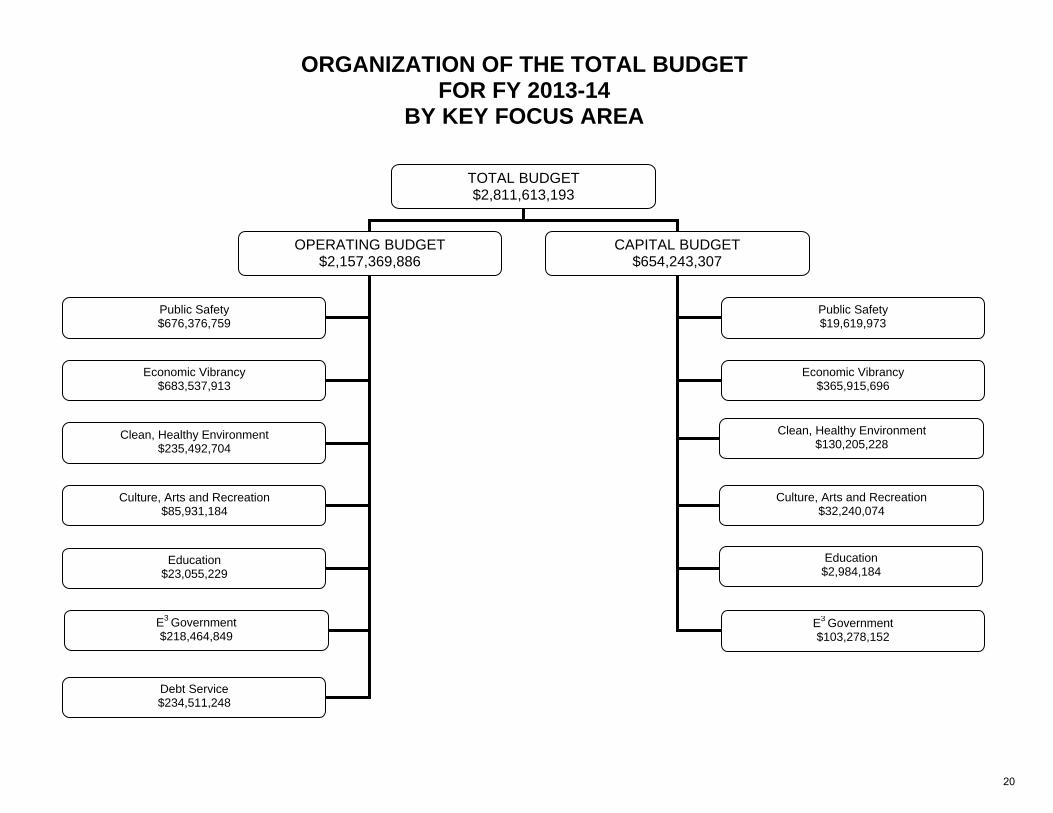
ORGANIZATION OF THE TOTAL BUDGET FOR FY 2013-14
BY KEY FOCUS AREA TOTAL BUDGET
$2,811,613,193
OPERATING BUDGET $2,157,369,886
CAPITAL BUDGET $654,243,307
Public Safety $676,376,759
Economic Vibrancy $683,537,913
Clean, Healthy Environment $235,492,704
Culture, Arts and Recreation $85,931,184
Education $23,055,229
Public Safety $19,619,973
Economic Vibrancy $365,915,696
Clean, Healthy Environment $130,205,228
E3 Government $218,464,849
Debt Service $234,511,248
E3 Government $103,278,152
Education $2,984,184
Culture, Arts and Recreation $32,240,074
20
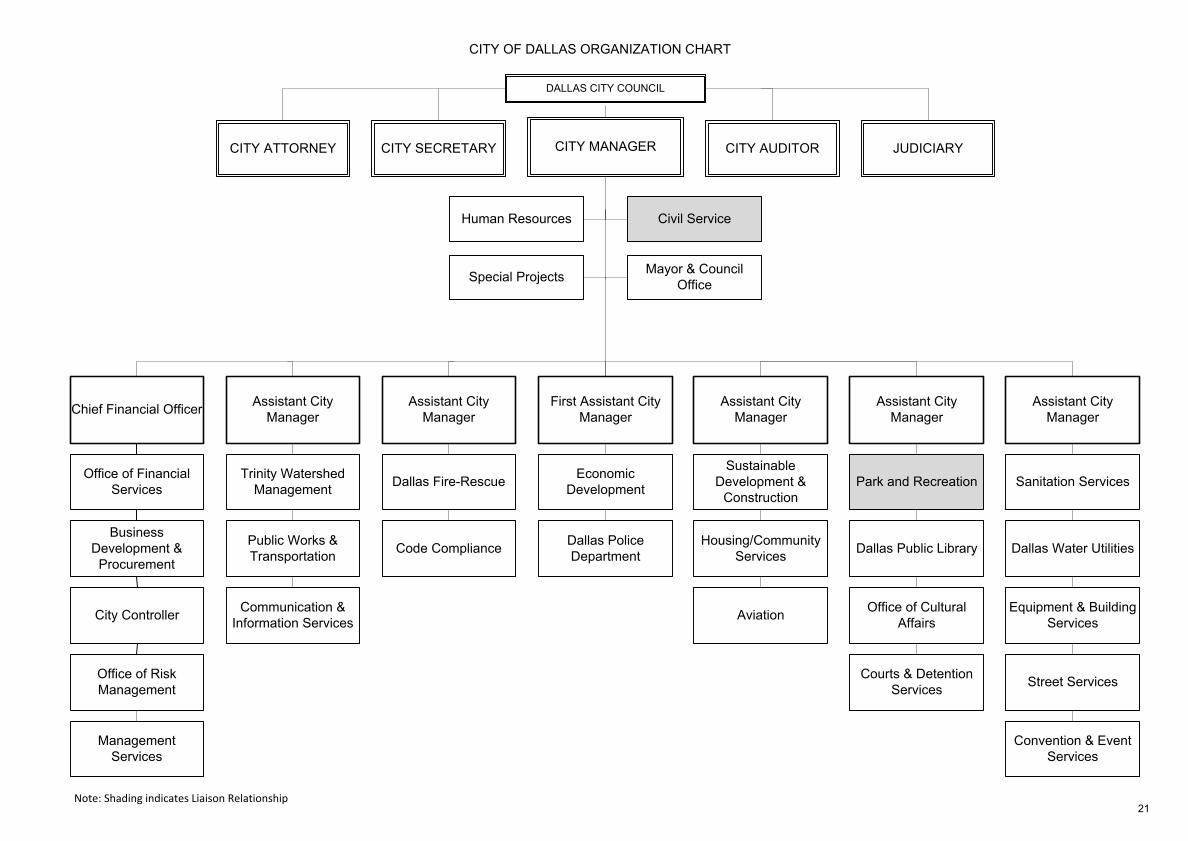
DALLAS CITY COUNCIL
Assistant City Manager
Trinity Watershed Management
CITY MANAGER CITY AUDITORCITY SECRETARY
Civil Service
Mayor & Council Office
Human Resources
Communication & Information Services
CITY ATTORNEY
Public Works & Transportation
Special Projects
JUDICIARY
CITY OF DALLAS ORGANIZATION CHART
Note: Shading indicates Liaison Relationship
Chief Financial Officer
Office of Financial Services
Business Development & Procurement
City Controller
Office of Risk Management
Management Services
Assistant City Manager
Park and Recreation
Dallas Public Library
Office of Cultural Affairs
Courts & Detention Services
Assistant City Manager
Sustainable Development &
Construction
Housing/Community Services
Aviation
Assistant City Manager
Dallas Fire-Rescue
Code Compliance
Equipment & Building Services
Street Services
Assistant City Manager
Dallas Water Utilities
Sanitation Services
Convention & Event Services
First Assistant City Manager
Economic Development
Dallas Police Department
21
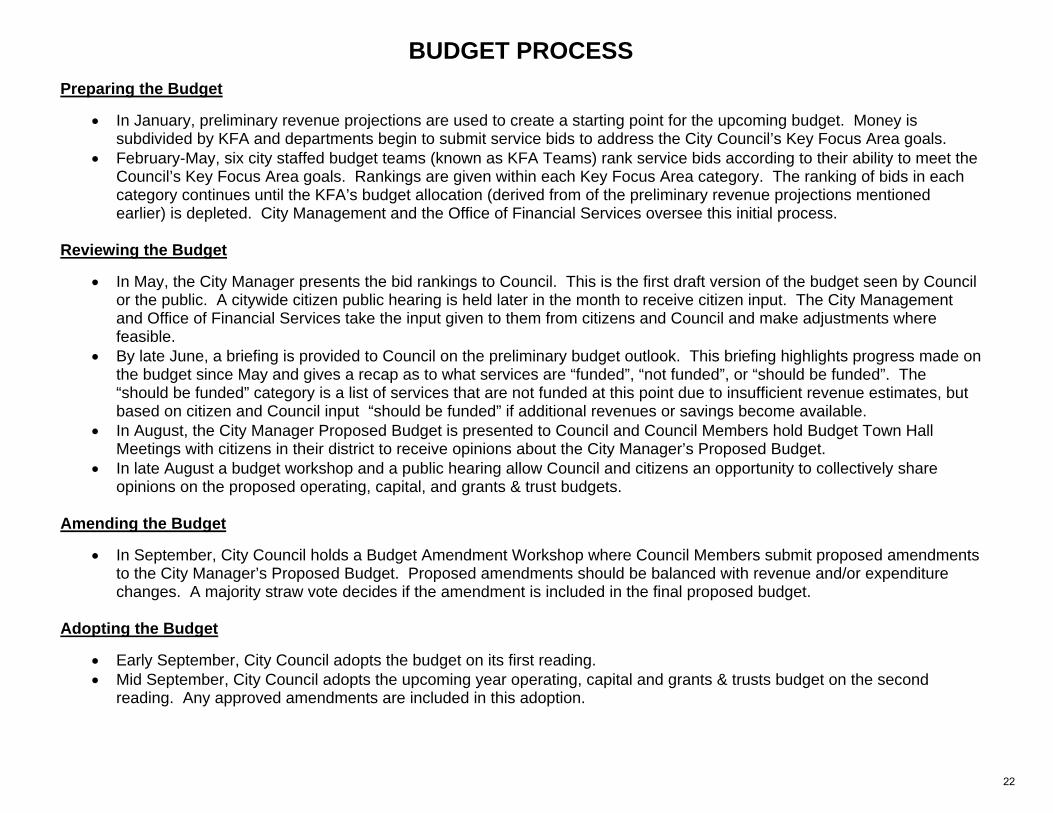
BUDGET PROCESS Preparing the Budget
In January, preliminary revenue projections are used to create a starting point for the upcoming budget. Money is subdivided by KFA and departments begin to submit service bids to address the City Council’s Key Focus Area goals.
February-May, six city staffed budget teams (known as KFA Teams) rank service bids according to their ability to meet the Council’s Key Focus Area goals. Rankings are given within each Key Focus Area category. The ranking of bids in each category continues until the KFA’s budget allocation (derived from of the preliminary revenue projections mentioned earlier) is depleted. City Management and the Office of Financial Services oversee this initial process.
Reviewing the Budget
In May, the City Manager presents the bid rankings to Council. This is the first draft version of the budget seen by Council or the public. A citywide citizen public hearing is held later in the month to receive citizen input. The City Management and Office of Financial Services take the input given to them from citizens and Council and make adjustments where feasible.
By late June, a briefing is provided to Council on the preliminary budget outlook. This briefing highlights progress made on the budget since May and gives a recap as to what services are “funded”, “not funded”, or “should be funded”. The “should be funded” category is a list of services that are not funded at this point due to insufficient revenue estimates, but based on citizen and Council input “should be funded” if additional revenues or savings become available.
In August, the City Manager Proposed Budget is presented to Council and Council Members hold Budget Town Hall Meetings with citizens in their district to receive opinions about the City Manager’s Proposed Budget.
In late August a budget workshop and a public hearing allow Council and citizens an opportunity to collectively share opinions on the proposed operating, capital, and grants & trust budgets.
Amending the Budget
In September, City Council holds a Budget Amendment Workshop where Council Members submit proposed amendments to the City Manager’s Proposed Budget. Proposed amendments should be balanced with revenue and/or expenditure changes. A majority straw vote decides if the amendment is included in the final proposed budget.
Adopting the Budget
Early September, City Council adopts the budget on its first reading. Mid September, City Council adopts the upcoming year operating, capital and grants & trusts budget on the second
reading. Any approved amendments are included in this adoption.
22
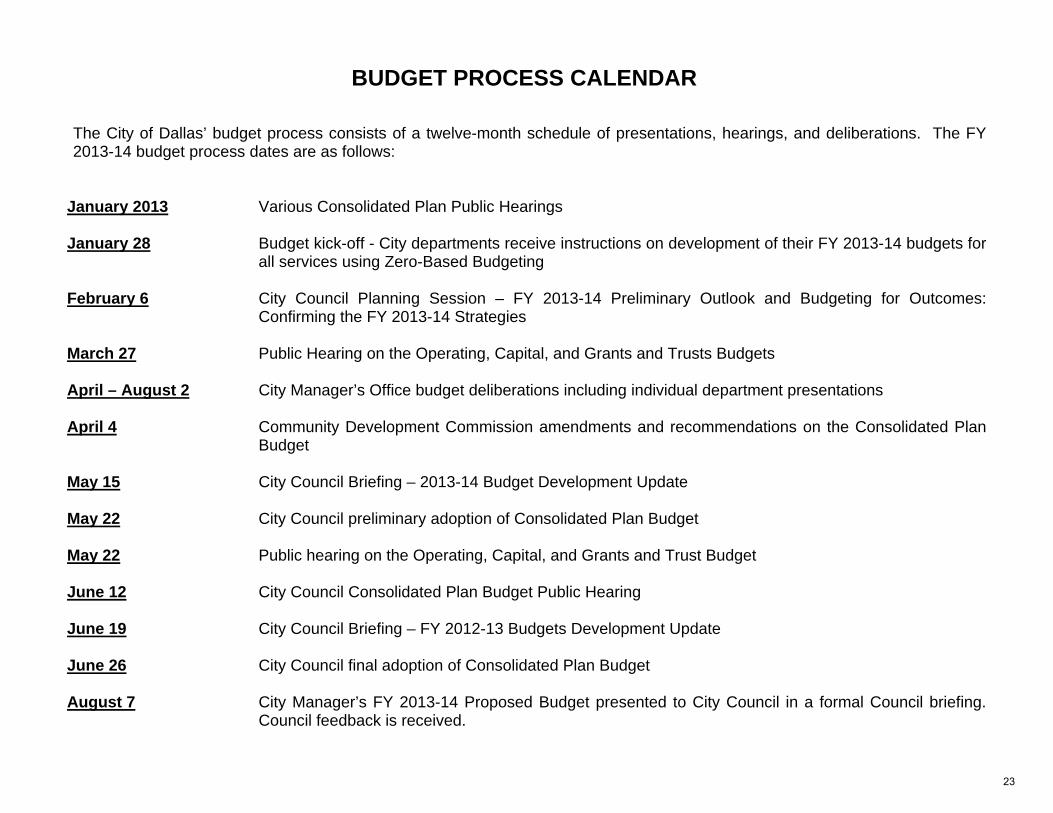
BUDGET PROCESS CALENDAR The City of Dallas’ budget process consists of a twelve-month schedule of presentations, hearings, and deliberations. The FY 2013-14 budget process dates are as follows:
January 2013 Various Consolidated Plan Public Hearings January 28 Budget kick-off - City departments receive instructions on development of their FY 2013-14 budgets for
all services using Zero-Based Budgeting February 6 City Council Planning Session – FY 2013-14 Preliminary Outlook and Budgeting for Outcomes:
Confirming the FY 2013-14 Strategies March 27 Public Hearing on the Operating, Capital, and Grants and Trusts Budgets April – August 2 City Manager’s Office budget deliberations including individual department presentations April 4 Community Development Commission amendments and recommendations on the Consolidated Plan
Budget May 15 City Council Briefing – 2013-14 Budget Development Update May 22 City Council preliminary adoption of Consolidated Plan Budget May 22 Public hearing on the Operating, Capital, and Grants and Trust Budget June 12 City Council Consolidated Plan Budget Public Hearing June 19 City Council Briefing – FY 2012-13 Budgets Development Update June 26 City Council final adoption of Consolidated Plan Budget August 7 City Manager’s FY 2013-14 Proposed Budget presented to City Council in a formal Council briefing.
Council feedback is received.
23
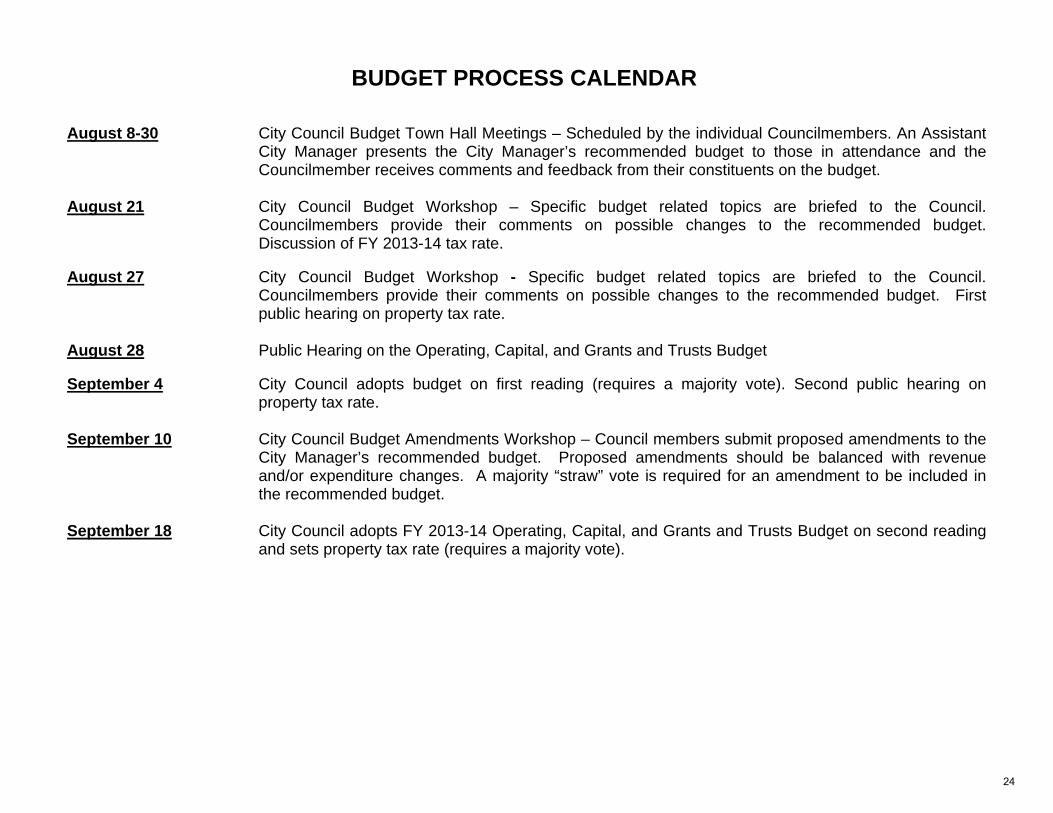
BUDGET PROCESS CALENDAR August 8-30 City Council Budget Town Hall Meetings – Scheduled by the individual Councilmembers. An Assistant
City Manager presents the City Manager’s recommended budget to those in attendance and the Councilmember receives comments and feedback from their constituents on the budget.
August 21 City Council Budget Workshop – Specific budget related topics are briefed to the Council.
Councilmembers provide their comments on possible changes to the recommended budget. Discussion of FY 2013-14 tax rate.
August 27 City Council Budget Workshop - Specific budget related topics are briefed to the Council.
Councilmembers provide their comments on possible changes to the recommended budget. First public hearing on property tax rate.
August 28 Public Hearing on the Operating, Capital, and Grants and Trusts Budget September 4 City Council adopts budget on first reading (requires a majority vote). Second public hearing on
property tax rate. September 10 City Council Budget Amendments Workshop – Council members submit proposed amendments to the
City Manager’s recommended budget. Proposed amendments should be balanced with revenue and/or expenditure changes. A majority “straw” vote is required for an amendment to be included in the recommended budget.
September 18 City Council adopts FY 2013-14 Operating, Capital, and Grants and Trusts Budget on second reading
and sets property tax rate (requires a majority vote).
24
City of Dallas Strategic Plan
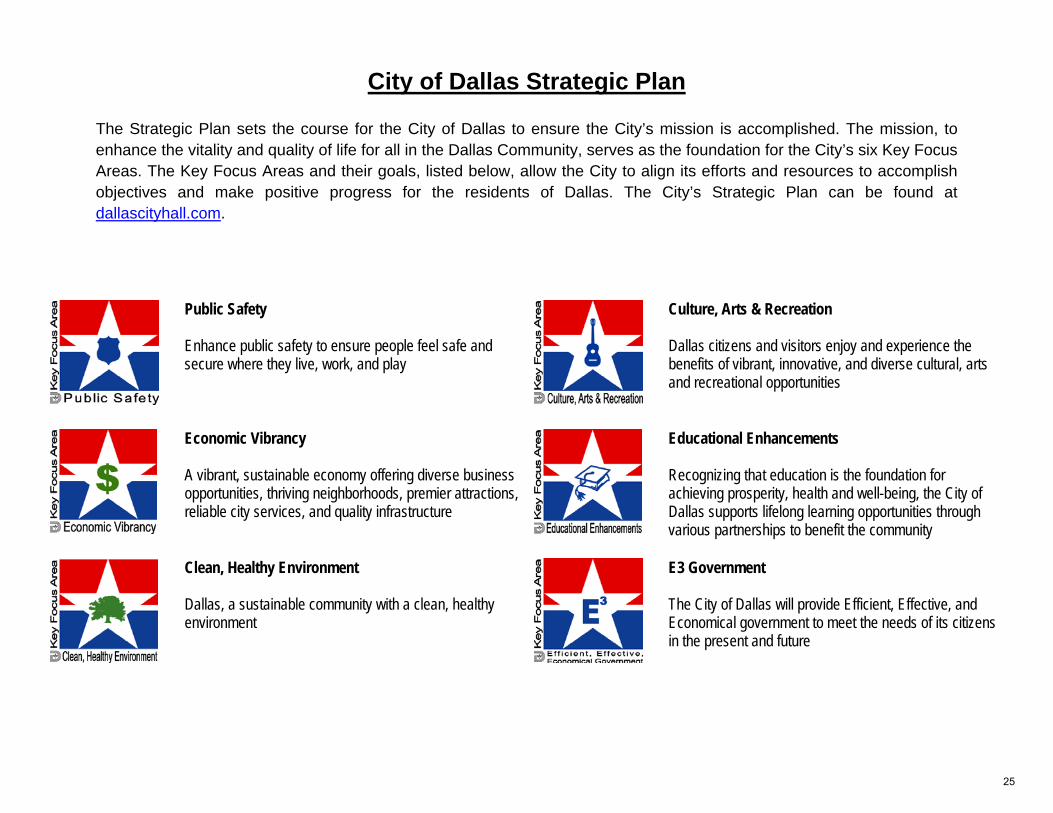
The Strategic Plan sets the course for the City of Dallas to ensure the City’s mission is accomplished. The mission, to enhance the vitality and quality of life for all in the Dallas Community, serves as the foundation for the City’s six Key Focus Areas. The Key Focus Areas and their goals, listed below, allow the City to align its efforts and resources to accomplish objectives and make positive progress for the residents of Dallas. The City’s Strategic Plan can be found at dallascityhall.com.
Public Safety Enhance public safety to ensure people feel safe and secure where they live, work, and play
Culture, Arts & Recreation Dallas citizens and visitors enjoy and experience the benefits of vibrant, innovative, and diverse cultural, arts and recreational opportunities
Economic Vibrancy A vibrant, sustainable economy offering diverse business opportunities, thriving neighborhoods, premier attractions, reliable city services, and quality infrastructure
Educational Enhancements Recognizing that education is the foundation for achieving prosperity, health and well-being, the City of Dallas supports lifelong learning opportunities through various partnerships to benefit the community
Clean, Healthy Environment Dallas, a sustainable community with a clean, healthy environment
E3 Government The City of Dallas will provide Efficient, Effective, and Economical government to meet the needs of its citizens in the present and future
25

26
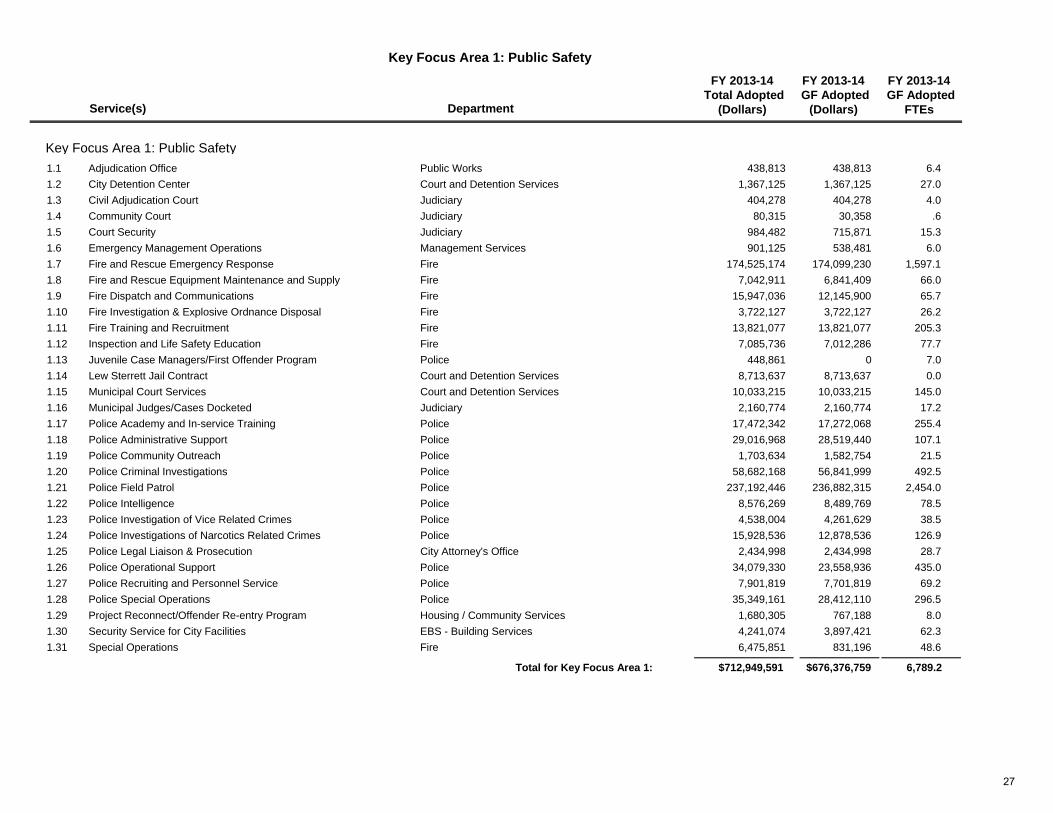
Key Focus Area 1: Public Safety
Service(s) Department
FY 2013-14 Total Adopted
(Dollars)
FY 2013-14 GF Adopted
(Dollars)
FY 2013-14 GF Adopted
FTEs
Key Focus Area 1: Public Safety438,813 438,813 6.4Adjudication Office1.1 Public Works
1,367,125 1,367,125 27.0City Detention Center1.2 Court and Detention Services404,278 404,278 4.0Civil Adjudication Court1.3 Judiciary
80,315 30,358 .6Community Court1.4 Judiciary984,482 715,871 15.3Court Security1.5 Judiciary901,125 538,481 6.0Emergency Management Operations1.6 Management Services
174,525,174 174,099,230 1,597.1Fire and Rescue Emergency Response1.7 Fire7,042,911 6,841,409 66.0Fire and Rescue Equipment Maintenance and Supply1.8 Fire
15,947,036 12,145,900 65.7Fire Dispatch and Communications1.9 Fire3,722,127 3,722,127 26.2Fire Investigation & Explosive Ordnance Disposal 1.10 Fire
13,821,077 13,821,077 205.3Fire Training and Recruitment1.11 Fire7,085,736 7,012,286 77.7Inspection and Life Safety Education1.12 Fire
448,861 0 7.0Juvenile Case Managers/First Offender Program1.13 Police8,713,637 8,713,637 0.0Lew Sterrett Jail Contract1.14 Court and Detention Services
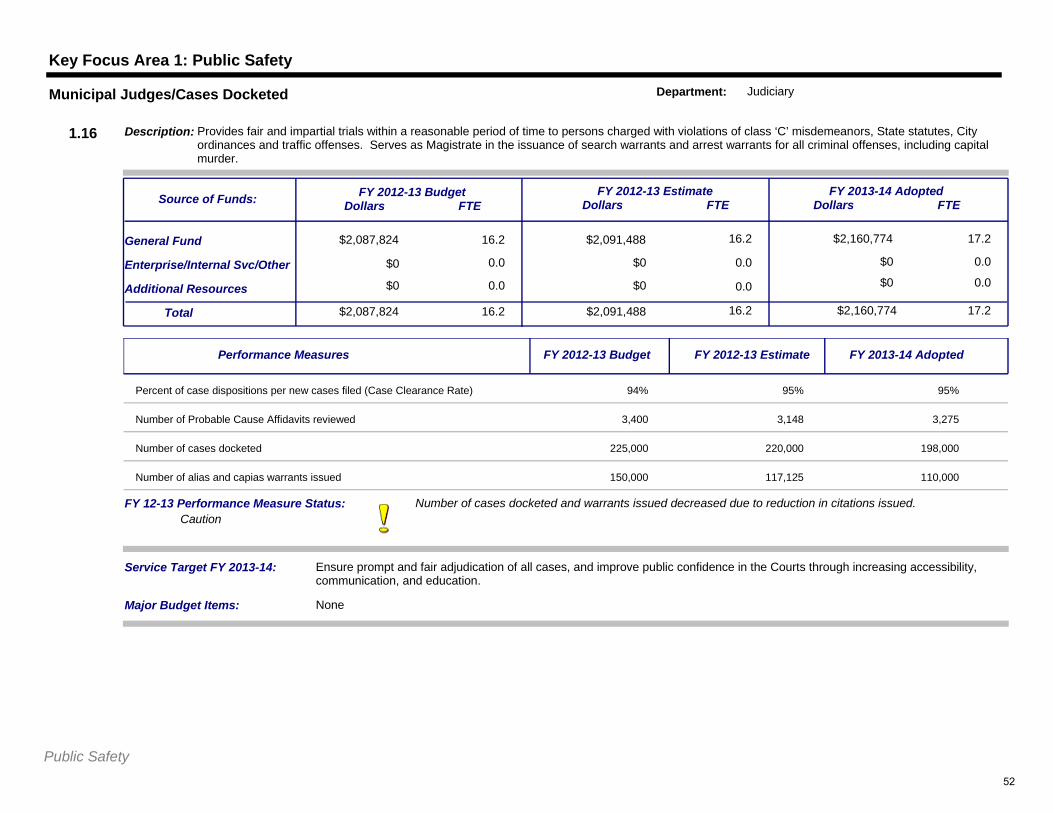
10,033,215 10,033,215 145.0Municipal Court Services1.15 Court and Detention Services2,160,774 2,160,774 17.2Municipal Judges/Cases Docketed1.16 Judiciary
17,472,342 17,272,068 255.4Police Academy and In-service Training1.17 Police29,016,968 28,519,440 107.1Police Administrative Support 1.18 Police1,703,634 1,582,754 21.5Police Community Outreach1.19 Police
58,682,168 56,841,999 492.5Police Criminal Investigations1.20 Police237,192,446 236,882,315 2,454.0Police Field Patrol1.21 Police
8,576,269 8,489,769 78.5Police Intelligence1.22 Police4,538,004 4,261,629 38.5Police Investigation of Vice Related Crimes1.23 Police
15,928,536 12,878,536 126.9Police Investigations of Narcotics Related Crimes1.24 Police2,434,998 2,434,998 28.7Police Legal Liaison & Prosecution1.25 City Attorney's Office
34,079,330 23,558,936 435.0Police Operational Support1.26 Police7,901,819 7,701,819 69.2Police Recruiting and Personnel Service1.27 Police
35,349,161 28,412,110 296.5Police Special Operations1.28 Police1,680,305 767,188 8.0Project Reconnect/Offender Re-entry Program1.29 Housing / Community Services4,241,074 3,897,421 62.3Security Service for City Facilities1.30 EBS - Building Services6,475,851 831,196 48.6Special Operations1.31 Fire
$676,376,759 6,789.2$712,949,591Total for Key Focus Area 1:
27
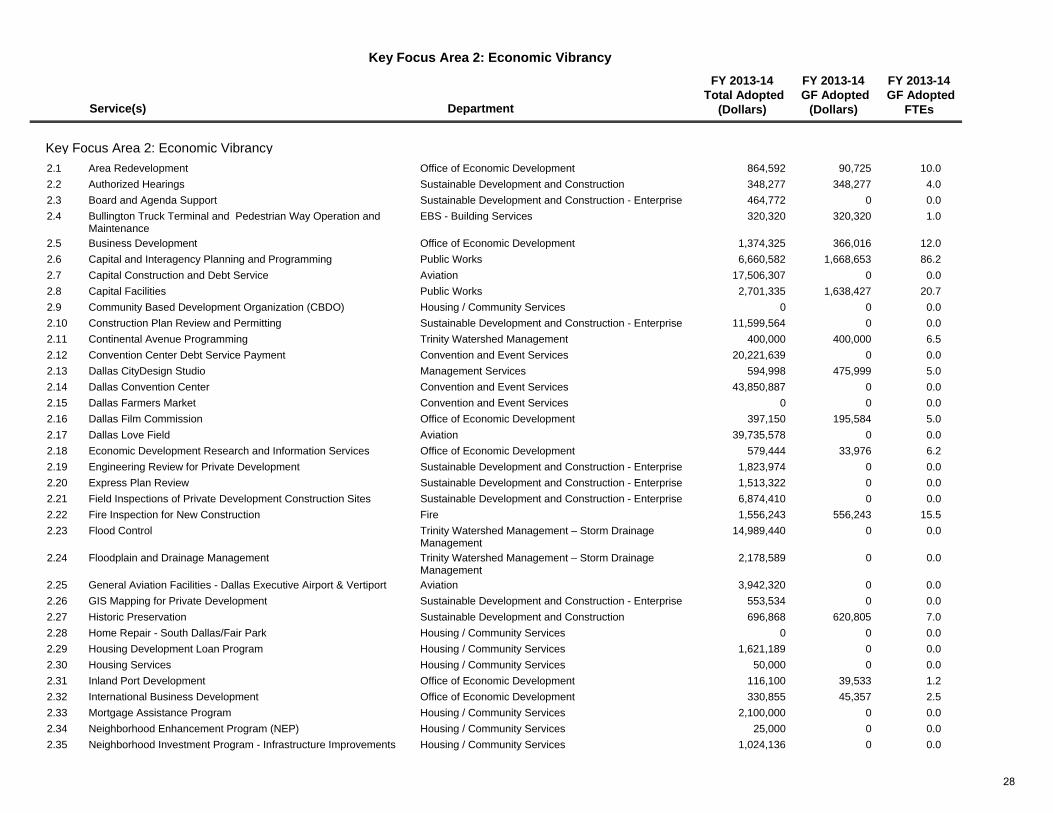
Key Focus Area 2: Economic Vibrancy
Service(s) Department
FY 2013-14 Total Adopted
(Dollars)
FY 2013-14 GF Adopted
(Dollars)
FY 2013-14 GF Adopted
FTEs
Key Focus Area 2: Economic Vibrancy864,592 90,725 10.0Area Redevelopment2.1 Office of Economic Development348,277 348,277 4.0Authorized Hearings2.2 Sustainable Development and Construction464,772 0 0.0Board and Agenda Support2.3 Sustainable Development and Construction - Enterprise320,320 320,320 1.0Bullington Truck Terminal and Pedestrian Way Operation and
Maintenance2.4 EBS - Building Services
1,374,325 366,016 12.0Business Development2.5 Office of Economic Development6,660,582 1,668,653 86.2Capital and Interagency Planning and Programming2.6 Public Works
17,506,307 0 0.0Capital Construction and Debt Service2.7 Aviation 2,701,335 1,638,427 20.7Capital Facilities2.8 Public Works
0 0 0.0Community Based Development Organization (CBDO)2.9 Housing / Community Services11,599,564 0 0.0Construction Plan Review and Permitting2.10 Sustainable Development and Construction - Enterprise
400,000 400,000 6.5Continental Avenue Programming2.11 Trinity Watershed Management20,221,639 0 0.0Convention Center Debt Service Payment2.12 Convention and Event Services
594,998 475,999 5.0Dallas CityDesign Studio2.13 Management Services43,850,887 0 0.0Dallas Convention Center2.14 Convention and Event Services
0 0 0.0Dallas Farmers Market2.15 Convention and Event Services397,150 195,584 5.0Dallas Film Commission2.16 Office of Economic Development
39,735,578 0 0.0Dallas Love Field 2.17 Aviation 579,444 33,976 6.2Economic Development Research and Information Services2.18 Office of Economic Development
1,823,974 0 0.0Engineering Review for Private Development2.19 Sustainable Development and Construction - Enterprise1,513,322 0 0.0Express Plan Review2.20 Sustainable Development and Construction - Enterprise6,874,410 0 0.0Field Inspections of Private Development Construction Sites2.21 Sustainable Development and Construction - Enterprise1,556,243 556,243 15.5Fire Inspection for New Construction2.22 Fire
14,989,440 0 0.0Flood Control2.23 Trinity Watershed Management – Storm Drainage Management
2,178,589 0 0.0Floodplain and Drainage Management2.24 Trinity Watershed Management – Storm Drainage Management
3,942,320 0 0.0General Aviation Facilities - Dallas Executive Airport & Vertiport2.25 Aviation 553,534 0 0.0GIS Mapping for Private Development2.26 Sustainable Development and Construction - Enterprise696,868 620,805 7.0Historic Preservation2.27 Sustainable Development and Construction
0 0 0.0Home Repair - South Dallas/Fair Park2.28 Housing / Community Services1,621,189 0 0.0Housing Development Loan Program2.29 Housing / Community Services
50,000 0 0.0Housing Services2.30 Housing / Community Services116,100 39,533 1.2Inland Port Development2.31 Office of Economic Development330,855 45,357 2.5International Business Development2.32 Office of Economic Development
2,100,000 0 0.0Mortgage Assistance Program2.33 Housing / Community Services25,000 0 0.0Neighborhood Enhancement Program (NEP)2.34 Housing / Community Services
1,024,136 0 0.0Neighborhood Investment Program - Infrastructure Improvements2.35 Housing / Community Services
28
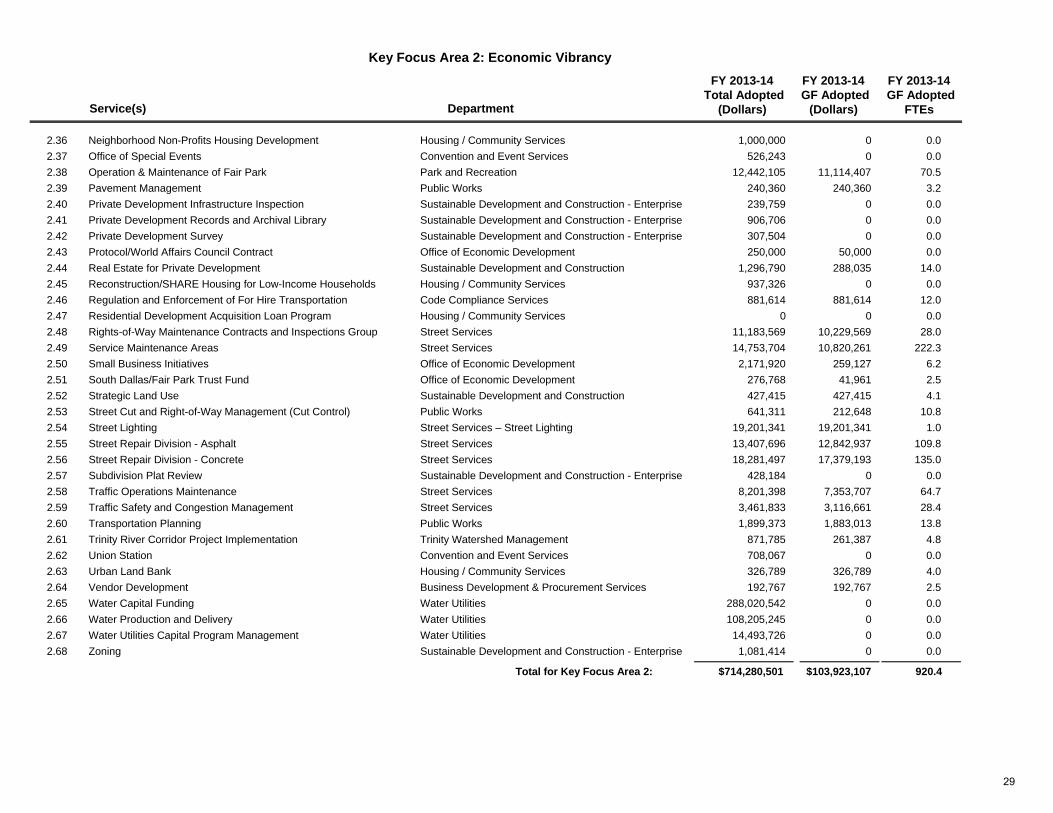
Key Focus Area 2: Economic Vibrancy
Service(s) Department
FY 2013-14 Total Adopted
(Dollars)
FY 2013-14 GF Adopted
(Dollars)
FY 2013-14 GF Adopted
FTEs
1,000,000 0 0.0Neighborhood Non-Profits Housing Development2.36 Housing / Community Services526,243 0 0.0Office of Special Events2.37 Convention and Event Services
12,442,105 11,114,407 70.5Operation & Maintenance of Fair Park2.38 Park and Recreation240,360 240,360 3.2Pavement Management2.39 Public Works239,759 0 0.0Private Development Infrastructure Inspection2.40 Sustainable Development and Construction - Enterprise906,706 0 0.0Private Development Records and Archival Library2.41 Sustainable Development and Construction - Enterprise307,504 0 0.0Private Development Survey2.42 Sustainable Development and Construction - Enterprise250,000 50,000 0.0Protocol/World Affairs Council Contract2.43 Office of Economic Development
1,296,790 288,035 14.0Real Estate for Private Development2.44 Sustainable Development and Construction937,326 0 0.0Reconstruction/SHARE Housing for Low-Income Households2.45 Housing / Community Services881,614 881,614 12.0Regulation and Enforcement of For Hire Transportation2.46 Code Compliance Services
0 0 0.0Residential Development Acquisition Loan Program2.47 Housing / Community Services11,183,569 10,229,569 28.0Rights-of-Way Maintenance Contracts and Inspections Group2.48 Street Services14,753,704 10,820,261 222.3Service Maintenance Areas2.49 Street Services2,171,920 259,127 6.2Small Business Initiatives2.50 Office of Economic Development
276,768 41,961 2.5South Dallas/Fair Park Trust Fund2.51 Office of Economic Development427,415 427,415 4.1Strategic Land Use 2.52 Sustainable Development and Construction641,311 212,648 10.8Street Cut and Right-of-Way Management (Cut Control)2.53 Public Works
19,201,341 19,201,341 1.0Street Lighting2.54 Street Services – Street Lighting13,407,696 12,842,937 109.8Street Repair Division - Asphalt2.55 Street Services18,281,497 17,379,193 135.0Street Repair Division - Concrete2.56 Street Services
428,184 0 0.0Subdivision Plat Review2.57 Sustainable Development and Construction - Enterprise8,201,398 7,353,707 64.7Traffic Operations Maintenance2.58 Street Services3,461,833 3,116,661 28.4Traffic Safety and Congestion Management2.59 Street Services1,899,373 1,883,013 13.8Transportation Planning2.60 Public Works
871,785 261,387 4.8Trinity River Corridor Project Implementation 2.61 Trinity Watershed Management708,067 0 0.0Union Station2.62 Convention and Event Services326,789 326,789 4.0Urban Land Bank2.63 Housing / Community Services192,767 192,767 2.5Vendor Development2.64 Business Development & Procurement Services
288,020,542 0 0.0Water Capital Funding2.65 Water Utilities108,205,245 0 0.0Water Production and Delivery2.66 Water Utilities
14,493,726 0 0.0Water Utilities Capital Program Management2.67 Water Utilities1,081,414 0 0.0Zoning 2.68 Sustainable Development and Construction - Enterprise
$103,923,107 920.4$714,280,501Total for Key Focus Area 2:
29
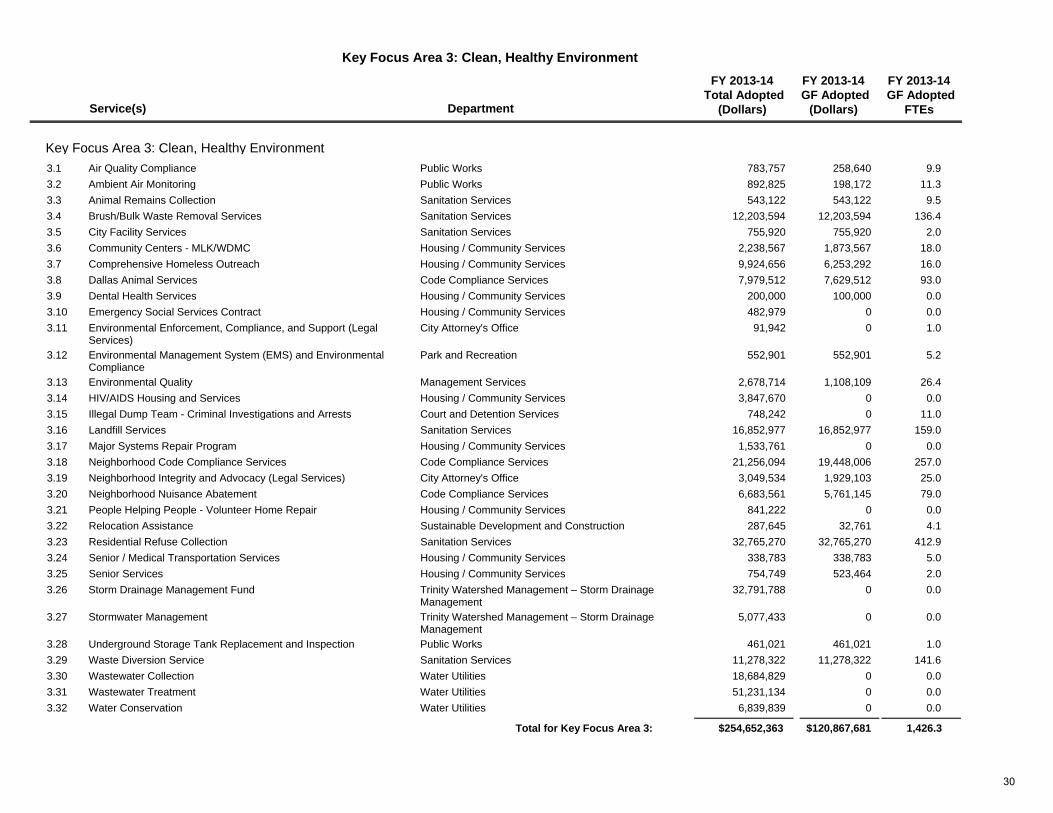
Key Focus Area 3: Clean, Healthy Environment
Service(s) Department
FY 2013-14 Total Adopted
(Dollars)
FY 2013-14 GF Adopted
(Dollars)
FY 2013-14 GF Adopted
FTEs
Key Focus Area 3: Clean, Healthy Environment783,757 258,640 9.9Air Quality Compliance3.1 Public Works892,825 198,172 11.3Ambient Air Monitoring 3.2 Public Works543,122 543,122 9.5Animal Remains Collection3.3 Sanitation Services
12,203,594 12,203,594 136.4Brush/Bulk Waste Removal Services3.4 Sanitation Services 755,920 755,920 2.0City Facility Services3.5 Sanitation Services
2,238,567 1,873,567 18.0Community Centers - MLK/WDMC3.6 Housing / Community Services9,924,656 6,253,292 16.0Comprehensive Homeless Outreach3.7 Housing / Community Services7,979,512 7,629,512 93.0Dallas Animal Services 3.8 Code Compliance Services
200,000 100,000 0.0Dental Health Services3.9 Housing / Community Services482,979 0 0.0Emergency Social Services Contract3.10 Housing / Community Services
91,942 0 1.0Environmental Enforcement, Compliance, and Support (Legal Services)
3.11 City Attorney's Office
552,901 552,901 5.2Environmental Management System (EMS) and Environmental Compliance
3.12 Park and Recreation
2,678,714 1,108,109 26.4Environmental Quality3.13 Management Services3,847,670 0 0.0HIV/AIDS Housing and Services3.14 Housing / Community Services
748,242 0 11.0Illegal Dump Team - Criminal Investigations and Arrests3.15 Court and Detention Services16,852,977 16,852,977 159.0Landfill Services3.16 Sanitation Services 1,533,761 0 0.0Major Systems Repair Program3.17 Housing / Community Services
21,256,094 19,448,006 257.0Neighborhood Code Compliance Services3.18 Code Compliance Services3,049,534 1,929,103 25.0Neighborhood Integrity and Advocacy (Legal Services)3.19 City Attorney's Office6,683,561 5,761,145 79.0Neighborhood Nuisance Abatement3.20 Code Compliance Services
841,222 0 0.0People Helping People - Volunteer Home Repair3.21 Housing / Community Services287,645 32,761 4.1Relocation Assistance3.22 Sustainable Development and Construction
32,765,270 32,765,270 412.9Residential Refuse Collection3.23 Sanitation Services 338,783 338,783 5.0Senior / Medical Transportation Services3.24 Housing / Community Services754,749 523,464 2.0Senior Services3.25 Housing / Community Services
32,791,788 0 0.0Storm Drainage Management Fund3.26 Trinity Watershed Management – Storm Drainage Management
5,077,433 0 0.0Stormwater Management3.27 Trinity Watershed Management – Storm Drainage Management
461,021 461,021 1.0Underground Storage Tank Replacement and Inspection3.28 Public Works11,278,322 11,278,322 141.6Waste Diversion Service3.29 Sanitation Services 18,684,829 0 0.0Wastewater Collection3.30 Water Utilities51,231,134 0 0.0Wastewater Treatment3.31 Water Utilities6,839,839 0 0.0Water Conservation3.32 Water Utilities
$120,867,681 1,426.3$254,652,363Total for Key Focus Area 3:
30
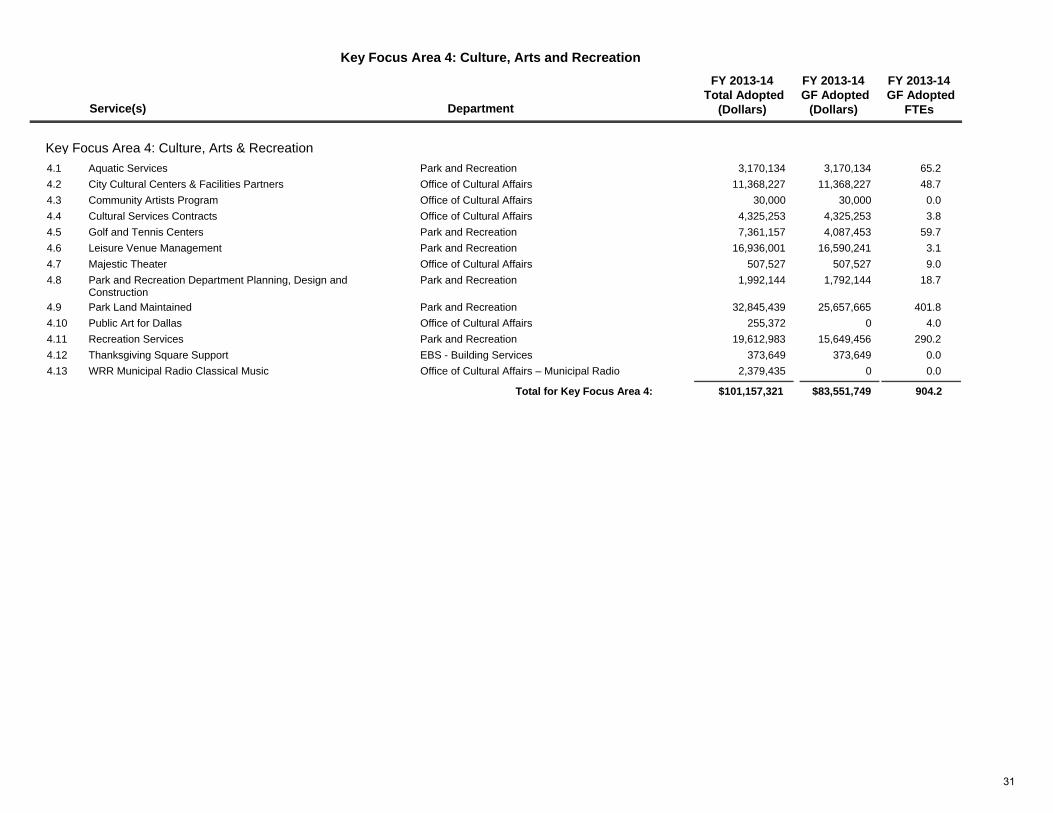
Key Focus Area 4: Culture, Arts and Recreation
Service(s) Department
FY 2013-14 Total Adopted
(Dollars)
FY 2013-14 GF Adopted
(Dollars)
FY 2013-14 GF Adopted
FTEs
Key Focus Area 4: Culture, Arts & Recreation3,170,134 3,170,134 65.2Aquatic Services4.1 Park and Recreation
11,368,227 11,368,227 48.7City Cultural Centers & Facilities Partners4.2 Office of Cultural Affairs30,000 30,000 0.0Community Artists Program4.3 Office of Cultural Affairs
4,325,253 4,325,253 3.8Cultural Services Contracts4.4 Office of Cultural Affairs7,361,157 4,087,453 59.7Golf and Tennis Centers4.5 Park and Recreation
16,936,001 16,590,241 3.1Leisure Venue Management4.6 Park and Recreation507,527 507,527 9.0Majestic Theater4.7 Office of Cultural Affairs
1,992,144 1,792,144 18.7Park and Recreation Department Planning, Design and Construction
4.8 Park and Recreation
32,845,439 25,657,665 401.8Park Land Maintained4.9 Park and Recreation255,372 0 4.0Public Art for Dallas4.10 Office of Cultural Affairs
19,612,983 15,649,456 290.2Recreation Services4.11 Park and Recreation373,649 373,649 0.0Thanksgiving Square Support4.12 EBS - Building Services
2,379,435 0 0.0WRR Municipal Radio Classical Music4.13 Office of Cultural Affairs – Municipal Radio
$83,551,749 904.2$101,157,321Total for Key Focus Area 4:
31
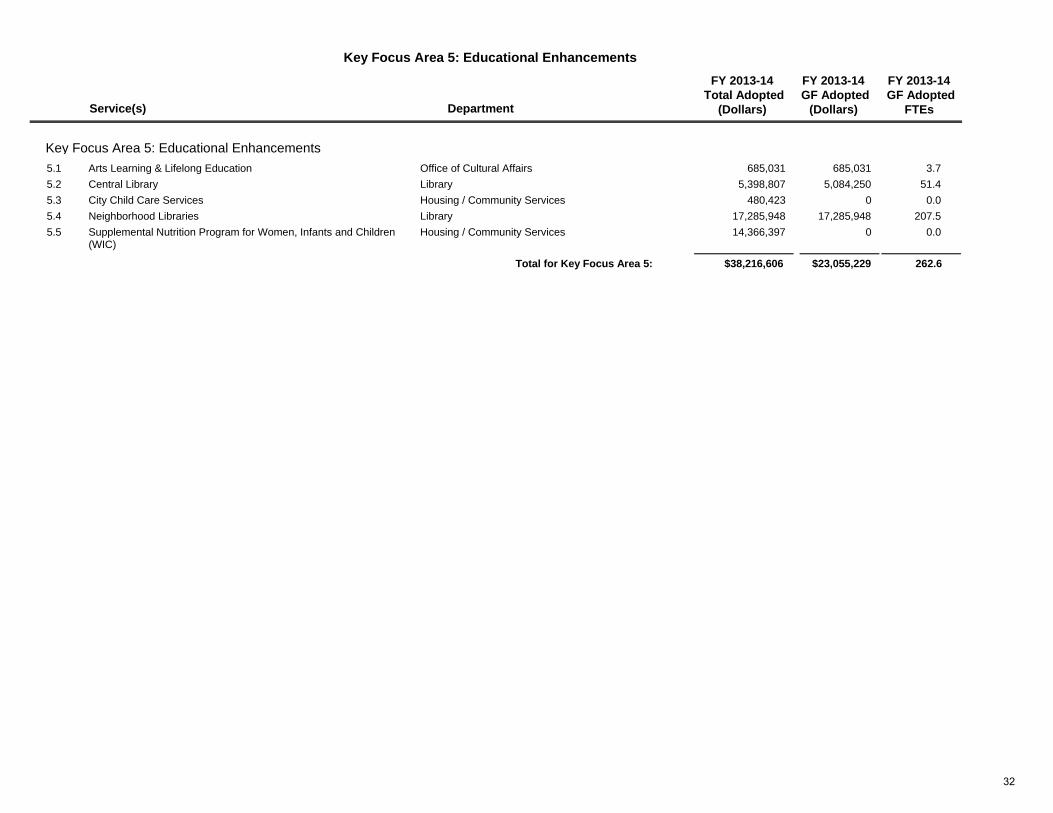
Key Focus Area 5: Educational Enhancements
Service(s) Department
FY 2013-14 Total Adopted
(Dollars)
FY 2013-14 GF Adopted
(Dollars)
FY 2013-14 GF Adopted
FTEs
Key Focus Area 5: Educational Enhancements685,031 685,031 3.7Arts Learning & Lifelong Education 5.1 Office of Cultural Affairs
5,398,807 5,084,250 51.4Central Library5.2 Library480,423 0 0.0City Child Care Services5.3 Housing / Community Services
17,285,948 17,285,948 207.5Neighborhood Libraries5.4 Library14,366,397 0 0.0Supplemental Nutrition Program for Women, Infants and Children
(WIC)5.5 Housing / Community Services
$23,055,229 262.6$38,216,606Total for Key Focus Area 5:
32
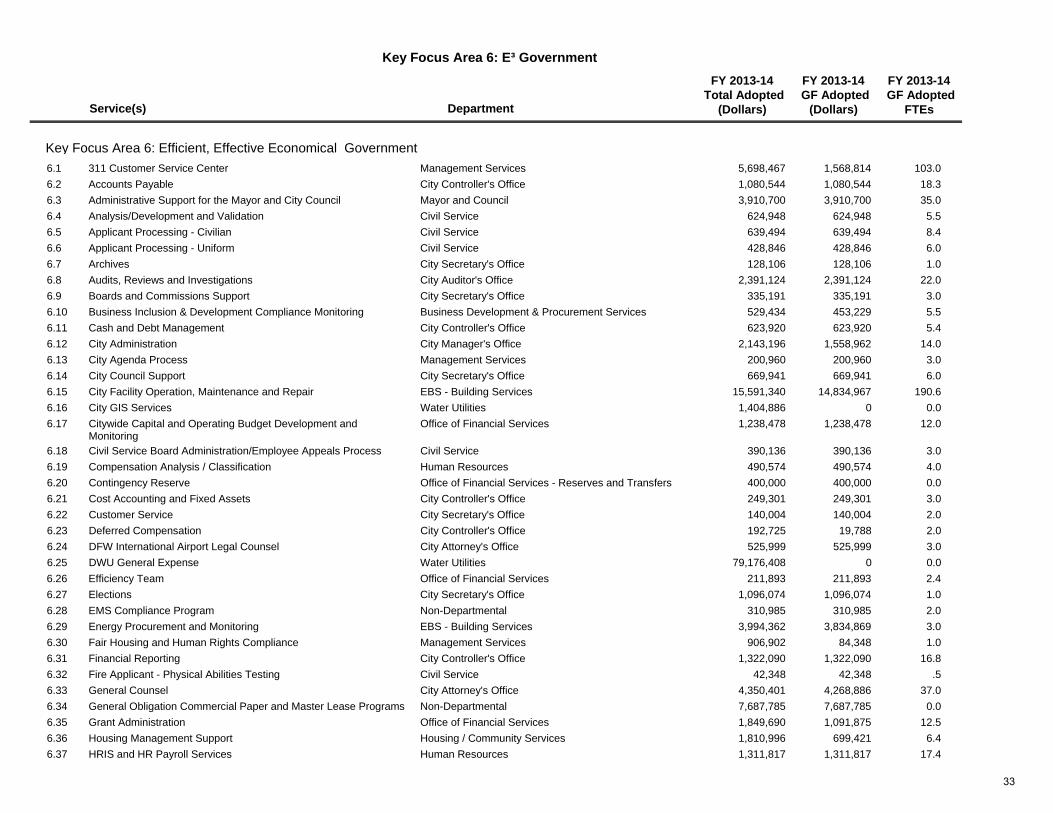
Key Focus Area 6: E³ Government
Service(s) Department
FY 2013-14 Total Adopted
(Dollars)
FY 2013-14 GF Adopted
(Dollars)
FY 2013-14 GF Adopted
FTEs
Key Focus Area 6: Efficient, Effective Economical Government5,698,467 1,568,814 103.0311 Customer Service Center6.1 Management Services1,080,544 1,080,544 18.3Accounts Payable6.2 City Controller's Office3,910,700 3,910,700 35.0Administrative Support for the Mayor and City Council6.3 Mayor and Council
624,948 624,948 5.5Analysis/Development and Validation6.4 Civil Service 639,494 639,494 8.4Applicant Processing - Civilian6.5 Civil Service 428,846 428,846 6.0Applicant Processing - Uniform6.6 Civil Service 128,106 128,106 1.0Archives6.7 City Secretary's Office
2,391,124 2,391,124 22.0Audits, Reviews and Investigations6.8 City Auditor's Office335,191 335,191 3.0Boards and Commissions Support6.9 City Secretary's Office529,434 453,229 5.5Business Inclusion & Development Compliance Monitoring6.10 Business Development & Procurement Services623,920 623,920 5.4Cash and Debt Management6.11 City Controller's Office
2,143,196 1,558,962 14.0City Administration6.12 City Manager's Office 200,960 200,960 3.0City Agenda Process6.13 Management Services669,941 669,941 6.0City Council Support6.14 City Secretary's Office
15,591,340 14,834,967 190.6City Facility Operation, Maintenance and Repair6.15 EBS - Building Services1,404,886 0 0.0City GIS Services6.16 Water Utilities1,238,478 1,238,478 12.0Citywide Capital and Operating Budget Development and
Monitoring6.17 Office of Financial Services
390,136 390,136 3.0Civil Service Board Administration/Employee Appeals Process6.18 Civil Service 490,574 490,574 4.0Compensation Analysis / Classification6.19 Human Resources 400,000 400,000 0.0Contingency Reserve6.20 Office of Financial Services - Reserves and Transfers249,301 249,301 3.0Cost Accounting and Fixed Assets6.21 City Controller's Office140,004 140,004 2.0Customer Service6.22 City Secretary's Office192,725 19,788 2.0Deferred Compensation6.23 City Controller's Office525,999 525,999 3.0DFW International Airport Legal Counsel6.24 City Attorney's Office
79,176,408 0 0.0DWU General Expense6.25 Water Utilities211,893 211,893 2.4Efficiency Team6.26 Office of Financial Services
1,096,074 1,096,074 1.0Elections6.27 City Secretary's Office310,985 310,985 2.0EMS Compliance Program6.28 Non-Departmental
3,994,362 3,834,869 3.0Energy Procurement and Monitoring 6.29 EBS - Building Services906,902 84,348 1.0Fair Housing and Human Rights Compliance6.30 Management Services
1,322,090 1,322,090 16.8Financial Reporting6.31 City Controller's Office42,348 42,348 .5Fire Applicant - Physical Abilities Testing6.32 Civil Service
4,350,401 4,268,886 37.0General Counsel6.33 City Attorney's Office7,687,785 7,687,785 0.0General Obligation Commercial Paper and Master Lease Programs6.34 Non-Departmental1,849,690 1,091,875 12.5Grant Administration6.35 Office of Financial Services1,810,996 699,421 6.4Housing Management Support6.36 Housing / Community Services1,311,817 1,311,817 17.4HRIS and HR Payroll Services6.37 Human Resources
33
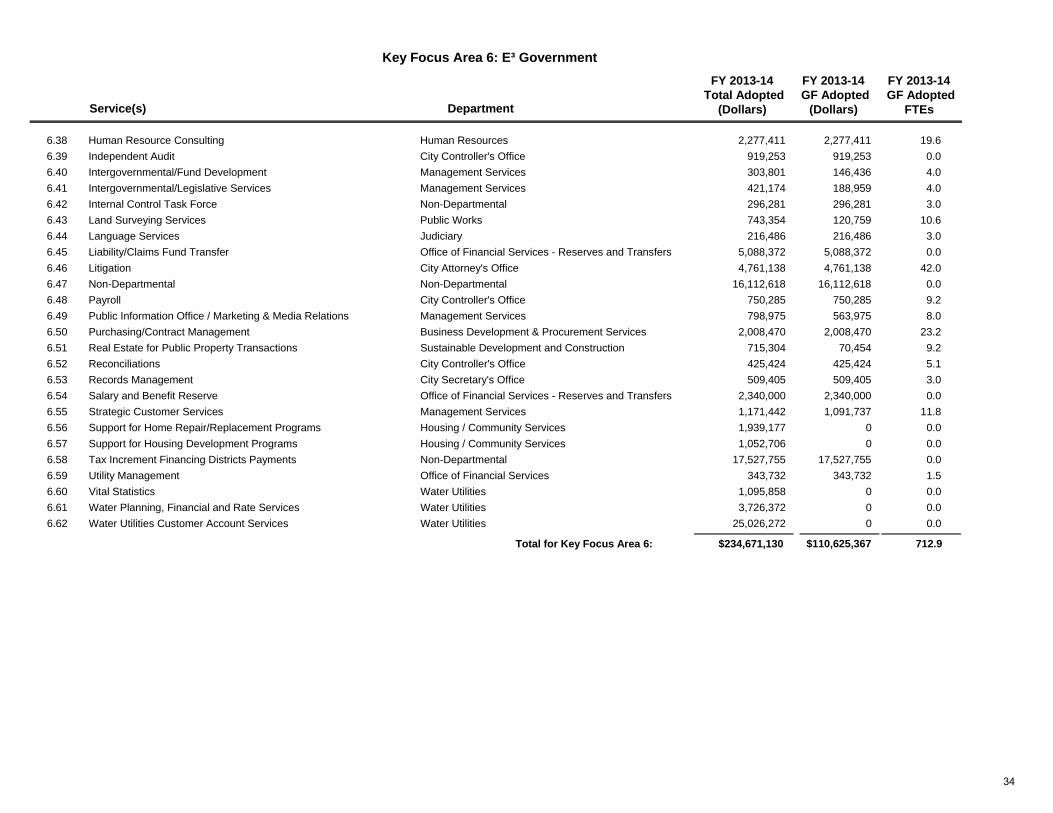
Key Focus Area 6: E³ Government
Service(s) Department
FY 2013-14 Total Adopted
(Dollars)
FY 2013-14 GF Adopted
(Dollars)
FY 2013-14 GF Adopted
FTEs
2,277,411 2,277,411 19.6Human Resource Consulting6.38 Human Resources 919,253 919,253 0.0Independent Audit6.39 City Controller's Office303,801 146,436 4.0Intergovernmental/Fund Development6.40 Management Services421,174 188,959 4.0Intergovernmental/Legislative Services6.41 Management Services296,281 296,281 3.0Internal Control Task Force6.42 Non-Departmental743,354 120,759 10.6Land Surveying Services6.43 Public Works216,486 216,486 3.0Language Services6.44 Judiciary
5,088,372 5,088,372 0.0Liability/Claims Fund Transfer6.45 Office of Financial Services - Reserves and Transfers4,761,138 4,761,138 42.0Litigation6.46 City Attorney's Office
16,112,618 16,112,618 0.0Non-Departmental6.47 Non-Departmental750,285 750,285 9.2Payroll6.48 City Controller's Office798,975 563,975 8.0Public Information Office / Marketing & Media Relations 6.49 Management Services
2,008,470 2,008,470 23.2Purchasing/Contract Management6.50 Business Development & Procurement Services715,304 70,454 9.2Real Estate for Public Property Transactions6.51 Sustainable Development and Construction425,424 425,424 5.1Reconciliations6.52 City Controller's Office509,405 509,405 3.0Records Management6.53 City Secretary's Office
2,340,000 2,340,000 0.0Salary and Benefit Reserve6.54 Office of Financial Services - Reserves and Transfers1,171,442 1,091,737 11.8Strategic Customer Services6.55 Management Services1,939,177 0 0.0Support for Home Repair/Replacement Programs6.56 Housing / Community Services1,052,706 0 0.0Support for Housing Development Programs6.57 Housing / Community Services
17,527,755 17,527,755 0.0Tax Increment Financing Districts Payments6.58 Non-Departmental343,732 343,732 1.5Utility Management6.59 Office of Financial Services
1,095,858 0 0.0Vital Statistics6.60 Water Utilities3,726,372 0 0.0Water Planning, Financial and Rate Services6.61 Water Utilities
25,026,272 0 0.0Water Utilities Customer Account Services6.62 Water Utilities
$110,625,367 712.9$234,671,130Total for Key Focus Area 6:
34
Public SafetyEnhance public safety to ensure people feel safe and
secure where they live, work, and play
2013-2014
35

36
Key Focus Area 1: Public Safety
$410,576 6.4
0.0
$356,026 5.6
$0 0.0
$438,813
$0 0.0
6.4General Fund
Additional Resources
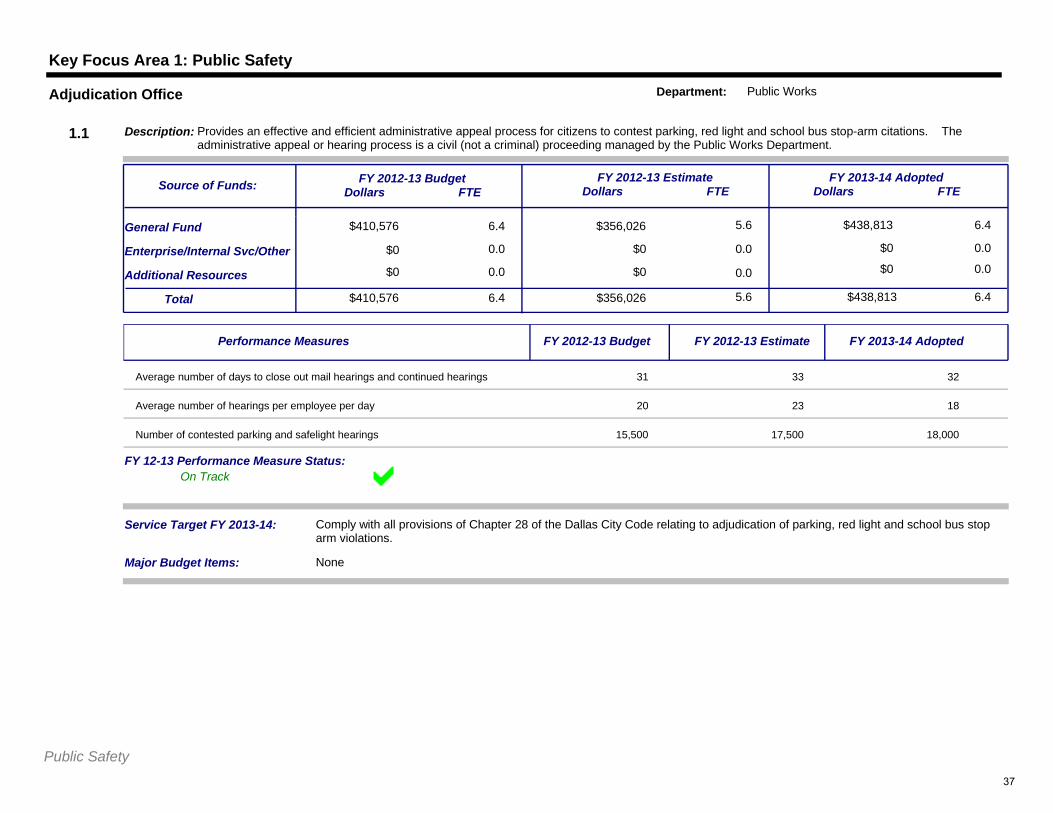
Service Target FY 2013-14: Comply with all provisions of Chapter 28 of the Dallas City Code relating to adjudication of parking, red light and school bus stop arm violations.
$410,576Total 6.4 $356,026 5.6 $438,813 6.4
Enterprise/Internal Svc/Other
$0 0.0 $0 0.0 $0 0.0
FY 2012-13 BudgetDollars FTE
FY 2012-13 EstimateDollars FTE
FY 2013-14 AdoptedDollars FTE
Description: Provides an effective and efficient administrative appeal process for citizens to contest parking, red light and school bus stop-arm citations. The administrative appeal or hearing process is a civil (not a criminal) proceeding managed by the Public Works Department.
Source of Funds:
1.1
Adjudication Office Department: Public Works
$0
Major Budget Items: None
On TrackFY 12-13 Performance Measure Status:
Performance Measures FY 2012-13 Budget FY 2012-13 Estimate FY 2013-14 Adopted
Average number of days to close out mail hearings and continued hearings 31 33 32
Average number of hearings per employee per day 20 23 18
Number of contested parking and safelight hearings 15,500 17,500 18,000
Public Safety37
Key Focus Area 1: Public Safety
$1,298,736 27.0
0.0
$1,376,965 27.8
$0 0.0
$1,367,125
$0 0.0
27.0General Fund
Additional Resources
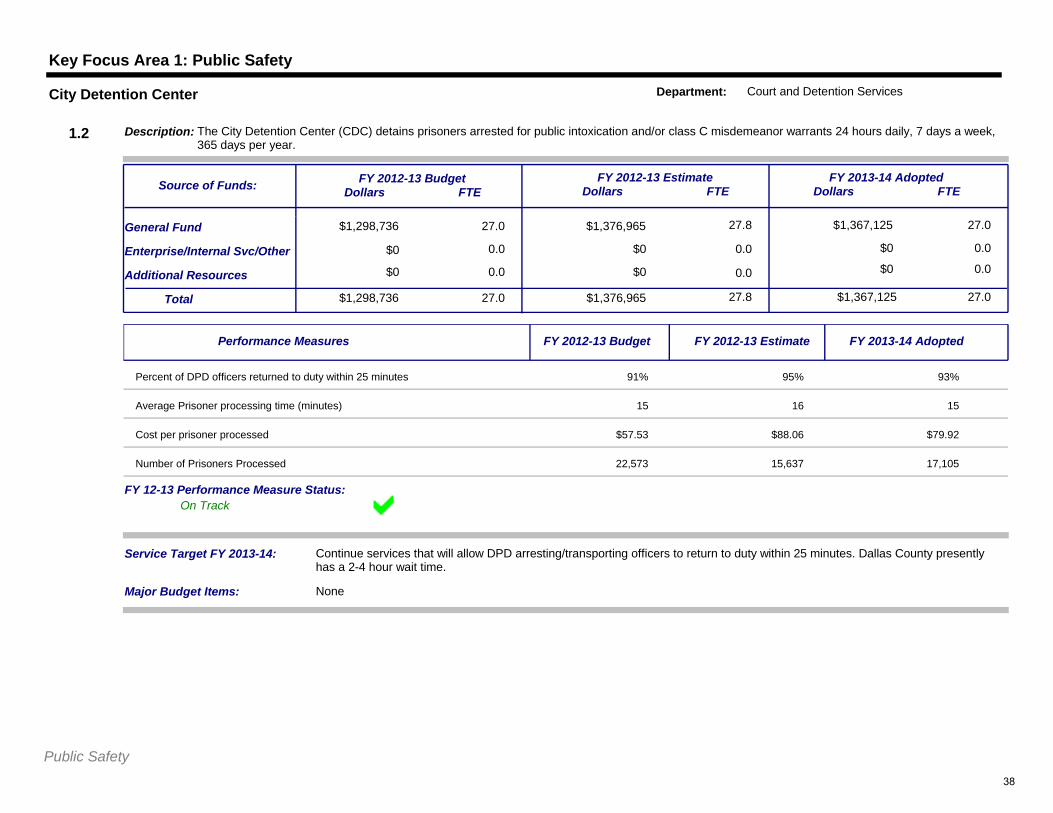
Service Target FY 2013-14: Continue services that will allow DPD arresting/transporting officers to return to duty within 25 minutes. Dallas County presently has a 2-4 hour wait time.
$1,298,736Total 27.0 $1,376,965 27.8 $1,367,125 27.0
Enterprise/Internal Svc/Other
$0 0.0 $0 0.0 $0 0.0
FY 2012-13 BudgetDollars FTE
FY 2012-13 EstimateDollars FTE
FY 2013-14 AdoptedDollars FTE
Description: The City Detention Center (CDC) detains prisoners arrested for public intoxication and/or class C misdemeanor warrants 24 hours daily, 7 days a week, 365 days per year.
Source of Funds:
1.2
City Detention Center Department: Court and Detention Services
$0
Major Budget Items: None
On TrackFY 12-13 Performance Measure Status:
Performance Measures FY 2012-13 Budget FY 2012-13 Estimate FY 2013-14 Adopted
Percent of DPD officers returned to duty within 25 minutes 91% 95% 93%
Average Prisoner processing time (minutes) 15 16 15
Cost per prisoner processed $57.53 $88.06 $79.92
Number of Prisoners Processed 22,573 15,637 17,105
Public Safety38
Key Focus Area 1: Public Safety
$388,498 4.0
0.0
$350,755 4.0
$0 0.0
$404,278
$0 0.0
4.0General Fund
Additional Resources
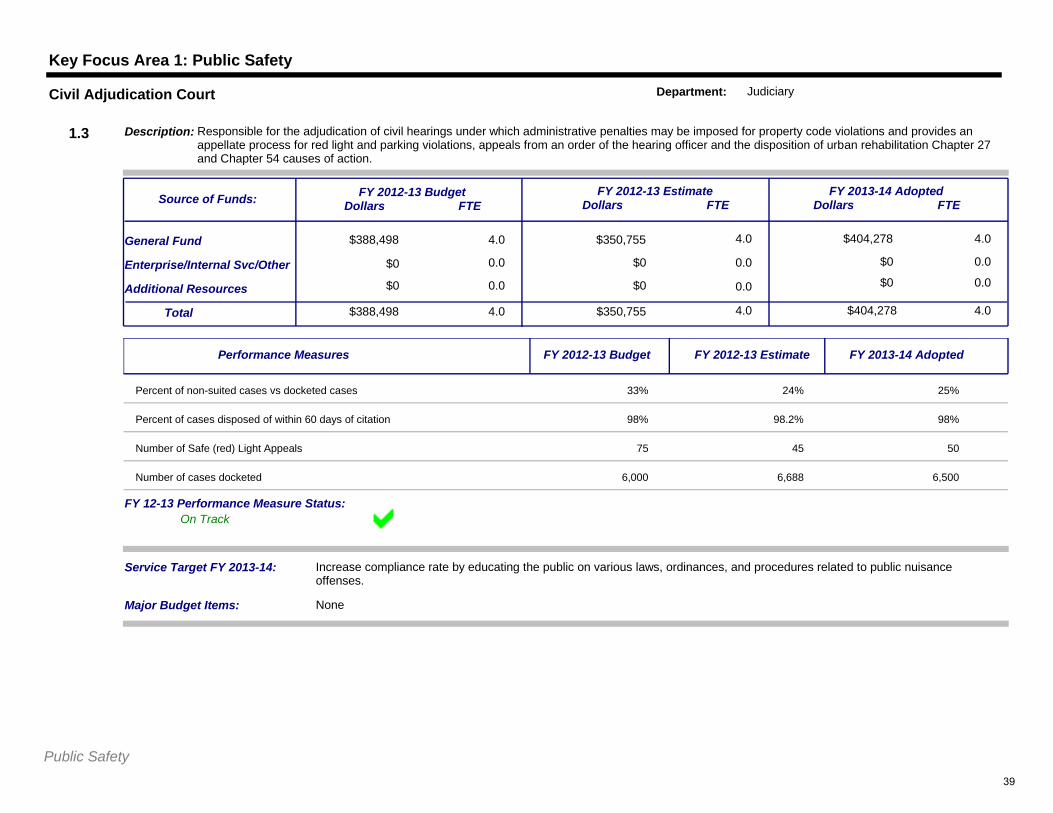
Service Target FY 2013-14: Increase compliance rate by educating the public on various laws, ordinances, and procedures related to public nuisance offenses.
$388,498Total 4.0 $350,755 4.0 $404,278 4.0
Enterprise/Internal Svc/Other
$0 0.0 $0 0.0 $0 0.0
FY 2012-13 BudgetDollars FTE
FY 2012-13 EstimateDollars FTE
FY 2013-14 AdoptedDollars FTE
Description: Responsible for the adjudication of civil hearings under which administrative penalties may be imposed for property code violations and provides an appellate process for red light and parking violations, appeals from an order of the hearing officer and the disposition of urban rehabilitation Chapter 27 and Chapter 54 causes of action.
Source of Funds:
1.3
Civil Adjudication Court Department: Judiciary
$0
Major Budget Items: None
On TrackFY 12-13 Performance Measure Status:
Performance Measures FY 2012-13 Budget FY 2012-13 Estimate FY 2013-14 Adopted
Percent of non-suited cases vs docketed cases 33% 24% 25%
Percent of cases disposed of within 60 days of citation 98% 98.2% 98%
Number of Safe (red) Light Appeals 75 45 50
Number of cases docketed 6,000 6,688 6,500
Public Safety39
Key Focus Area 1: Public Safety
$0 0.6
0.0
$0 0.6
$0 0.0
$30,358
$0 0.0
0.6General Fund
Additional Resources
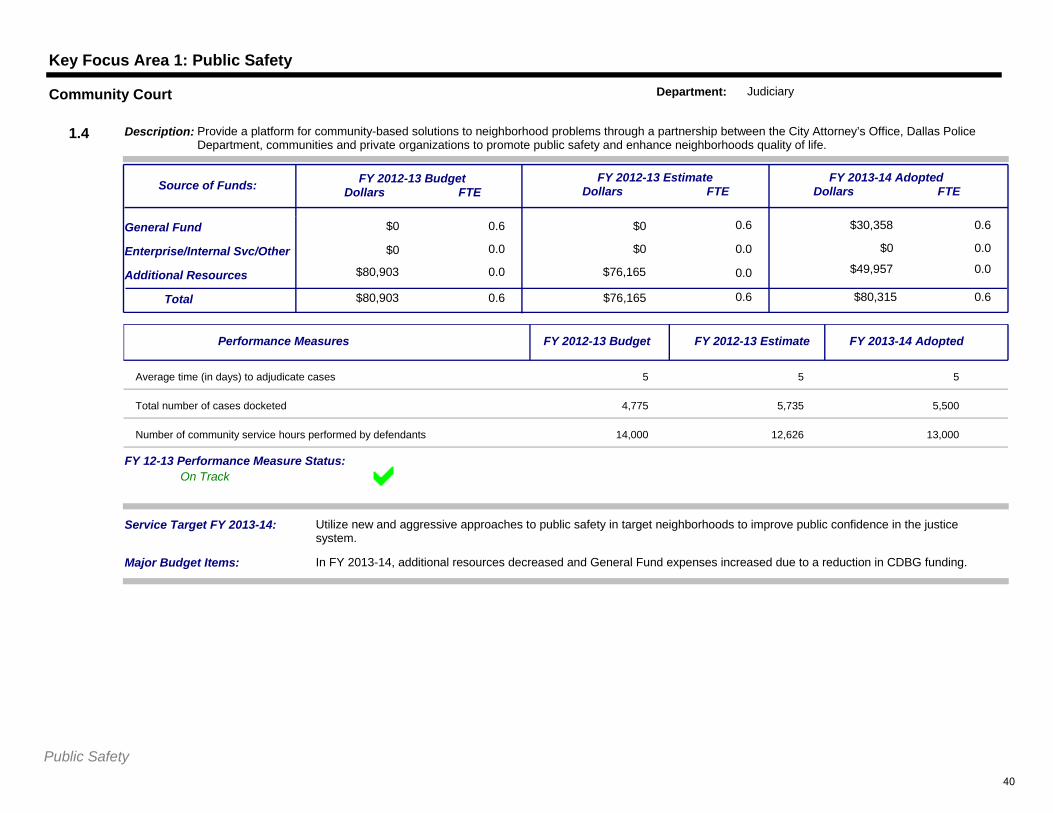
Service Target FY 2013-14: Utilize new and aggressive approaches to public safety in target neighborhoods to improve public confidence in the justice system.
$80,903Total 0.6 $76,165 0.6 $80,315 0.6
Enterprise/Internal Svc/Other
$80,903 0.0 $76,165 0.0 $49,957 0.0
FY 2012-13 BudgetDollars FTE
FY 2012-13 EstimateDollars FTE
FY 2013-14 AdoptedDollars FTE
Description: Provide a platform for community-based solutions to neighborhood problems through a partnership between the City Attorney’s Office, Dallas Police Department, communities and private organizations to promote public safety and enhance neighborhoods quality of life.
Source of Funds:
1.4
Community Court Department: Judiciary
$0
Major Budget Items: In FY 2013-14, additional resources decreased and General Fund expenses increased due to a reduction in CDBG funding.
On TrackFY 12-13 Performance Measure Status:
Performance Measures FY 2012-13 Budget FY 2012-13 Estimate FY 2013-14 Adopted
Average time (in days) to adjudicate cases 5 5 5
Total number of cases docketed 4,775 5,735 5,500
Number of community service hours performed by defendants 14,000 12,626 13,000
Public Safety40
Key Focus Area 1: Public Safety
$664,941 15.3
0.0
$665,817 15.3
$0 0.0
$715,871
$0 0.0
15.3General Fund
Additional Resources
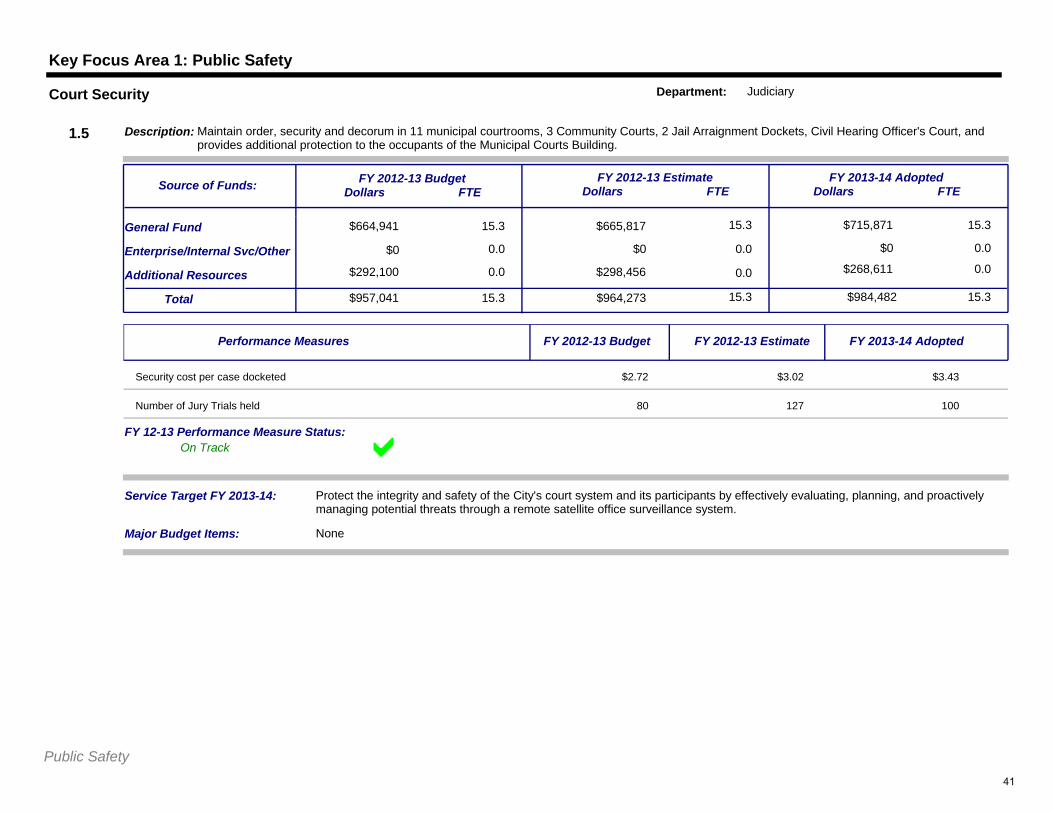
Service Target FY 2013-14: Protect the integrity and safety of the City's court system and its participants by effectively evaluating, planning, and proactively managing potential threats through a remote satellite office surveillance system.
$957,041Total 15.3 $964,273 15.3 $984,482 15.3
Enterprise/Internal Svc/Other
$292,100 0.0 $298,456 0.0 $268,611 0.0
FY 2012-13 BudgetDollars FTE
FY 2012-13 EstimateDollars FTE
FY 2013-14 AdoptedDollars FTE
Description: Maintain order, security and decorum in 11 municipal courtrooms, 3 Community Courts, 2 Jail Arraignment Dockets, Civil Hearing Officer's Court, and provides additional protection to the occupants of the Municipal Courts Building.
Source of Funds:
1.5
Court Security Department: Judiciary
$0
Major Budget Items: None
On TrackFY 12-13 Performance Measure Status:
Performance Measures FY 2012-13 Budget FY 2012-13 Estimate FY 2013-14 Adopted
Security cost per case docketed $2.72 $3.02 $3.43
Number of Jury Trials held 80 127 100
Public Safety41
Key Focus Area 1: Public Safety
$445,511 5.0
0.0
$536,487 5.0
$0 0.0
$538,481
$0 0.0
6.0General Fund
Additional Resources
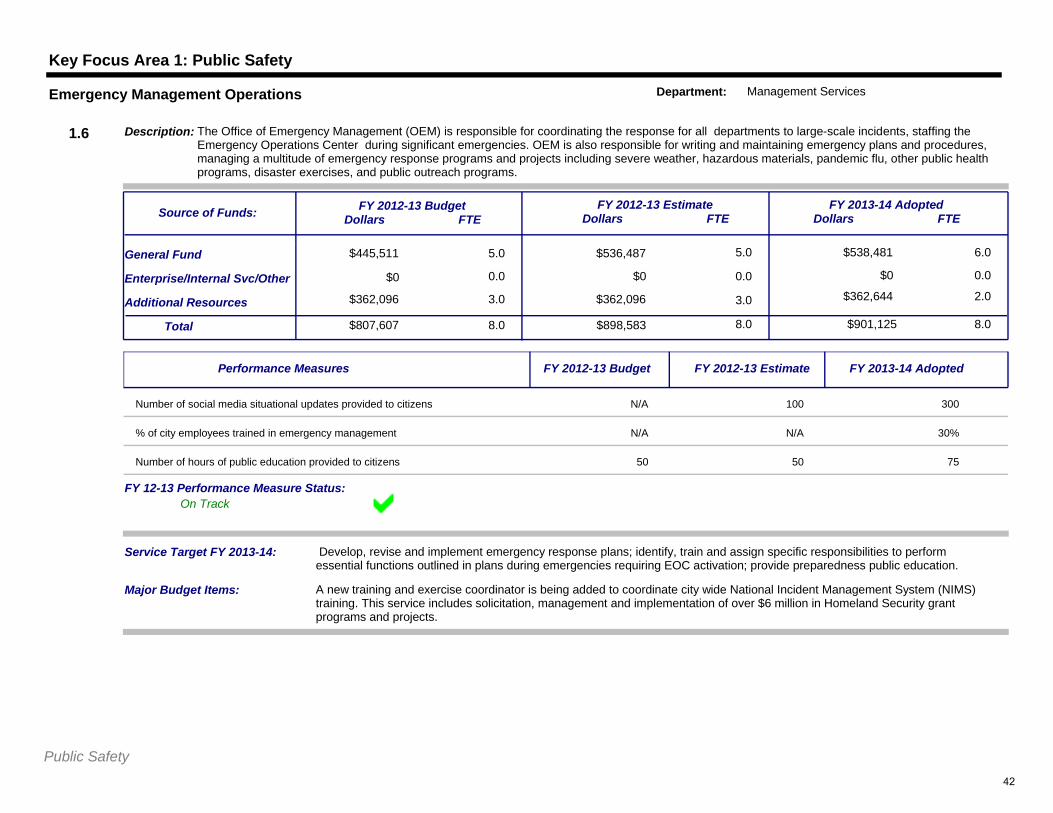
Service Target FY 2013-14: Develop, revise and implement emergency response plans; identify, train and assign specific responsibilities to perform essential functions outlined in plans during emergencies requiring EOC activation; provide preparedness public education.
$807,607Total 8.0 $898,583 8.0 $901,125 8.0
Enterprise/Internal Svc/Other
$362,096 3.0 $362,096 3.0 $362,644 2.0
FY 2012-13 BudgetDollars FTE
FY 2012-13 EstimateDollars FTE
FY 2013-14 AdoptedDollars FTE
Description: The Office of Emergency Management (OEM) is responsible for coordinating the response for all departments to large-scale incidents, staffing the Emergency Operations Center during significant emergencies. OEM is also responsible for writing and maintaining emergency plans and procedures, managing a multitude of emergency response programs and projects including severe weather, hazardous materials, pandemic flu, other public health programs, disaster exercises, and public outreach programs.
Source of Funds:
1.6
Emergency Management Operations Department: Management Services
$0
Major Budget Items: A new training and exercise coordinator is being added to coordinate city wide National Incident Management System (NIMS) training. This service includes solicitation, management and implementation of over $6 million in Homeland Security grant programs and projects.
On TrackFY 12-13 Performance Measure Status:
Performance Measures FY 2012-13 Budget FY 2012-13 Estimate FY 2013-14 Adopted
Number of social media situational updates provided to citizens N/A 100 300
% of city employees trained in emergency management N/A N/A 30%
Number of hours of public education provided to citizens 50 50 75
Public Safety42
Key Focus Area 1: Public Safety
$163,754,526 1,638.0
0.0
$166,642,443 1,654.4
$0 0.0
$174,099,230
$0 0.0
1,597.1General Fund
Additional Resources
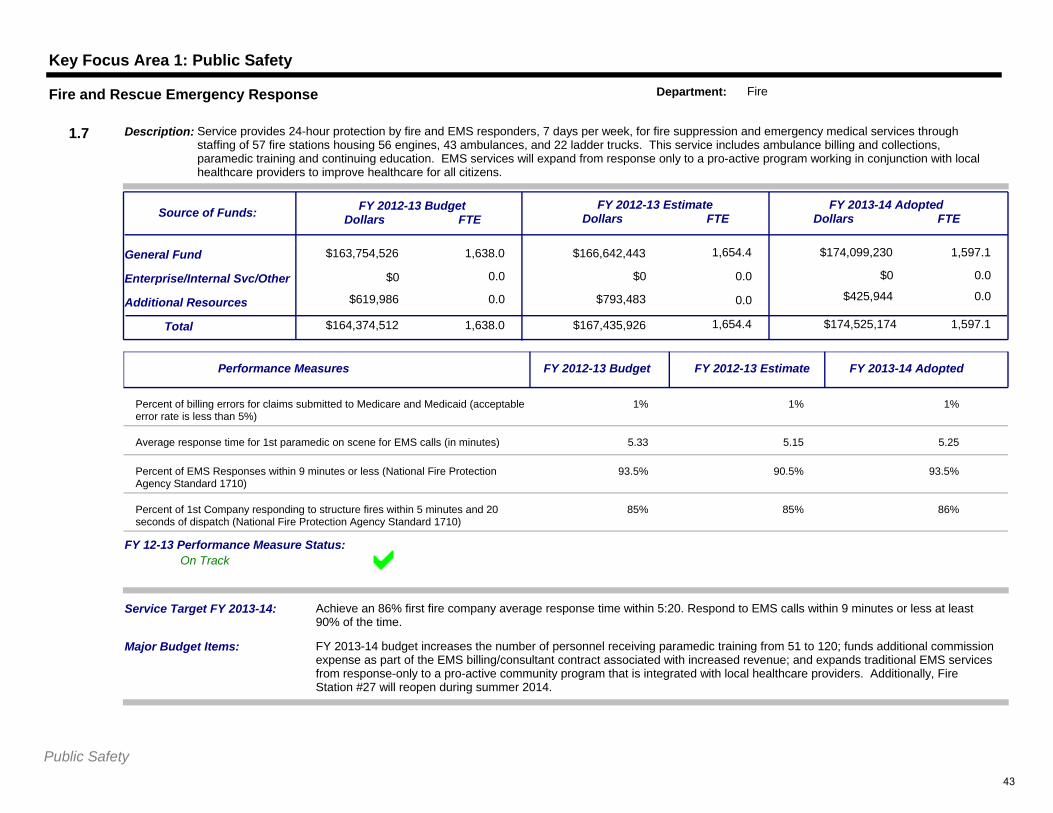
Service Target FY 2013-14: Achieve an 86% first fire company average response time within 5:20. Respond to EMS calls within 9 minutes or less at least 90% of the time.
$164,374,512Total 1,638.0 $167,435,926 1,654.4 $174,525,174 1,597.1
Enterprise/Internal Svc/Other
$619,986 0.0 $793,483 0.0 $425,944 0.0
FY 2012-13 BudgetDollars FTE
FY 2012-13 EstimateDollars FTE
FY 2013-14 AdoptedDollars FTE
Description: Service provides 24-hour protection by fire and EMS responders, 7 days per week, for fire suppression and emergency medical services through staffing of 57 fire stations housing 56 engines, 43 ambulances, and 22 ladder trucks. This service includes ambulance billing and collections, paramedic training and continuing education. EMS services will expand from response only to a pro-active program working in conjunction with local healthcare providers to improve healthcare for all citizens.
Source of Funds:
1.7
Fire and Rescue Emergency Response Department: Fire
$0
Major Budget Items: FY 2013-14 budget increases the number of personnel receiving paramedic training from 51 to 120; funds additional commission expense as part of the EMS billing/consultant contract associated with increased revenue; and expands traditional EMS services from response-only to a pro-active community program that is integrated with local healthcare providers. Additionally, Fire Station #27 will reopen during summer 2014.
On TrackFY 12-13 Performance Measure Status:
Performance Measures FY 2012-13 Budget FY 2012-13 Estimate FY 2013-14 Adopted
Percent of billing errors for claims submitted to Medicare and Medicaid (acceptable error rate is less than 5%)
1% 1% 1%
Average response time for 1st paramedic on scene for EMS calls (in minutes) 5.33 5.15 5.25
Percent of EMS Responses within 9 minutes or less (National Fire Protection Agency Standard 1710)
93.5% 90.5% 93.5%
Percent of 1st Company responding to structure fires within 5 minutes and 20 seconds of dispatch (National Fire Protection Agency Standard 1710)
85% 85% 86%
Public Safety43
Key Focus Area 1: Public Safety
$9,055,577 65.6
0.0
$6,122,613 62.5
$0 0.0
$6,841,409
$0 0.0
66.0General Fund
Additional Resources
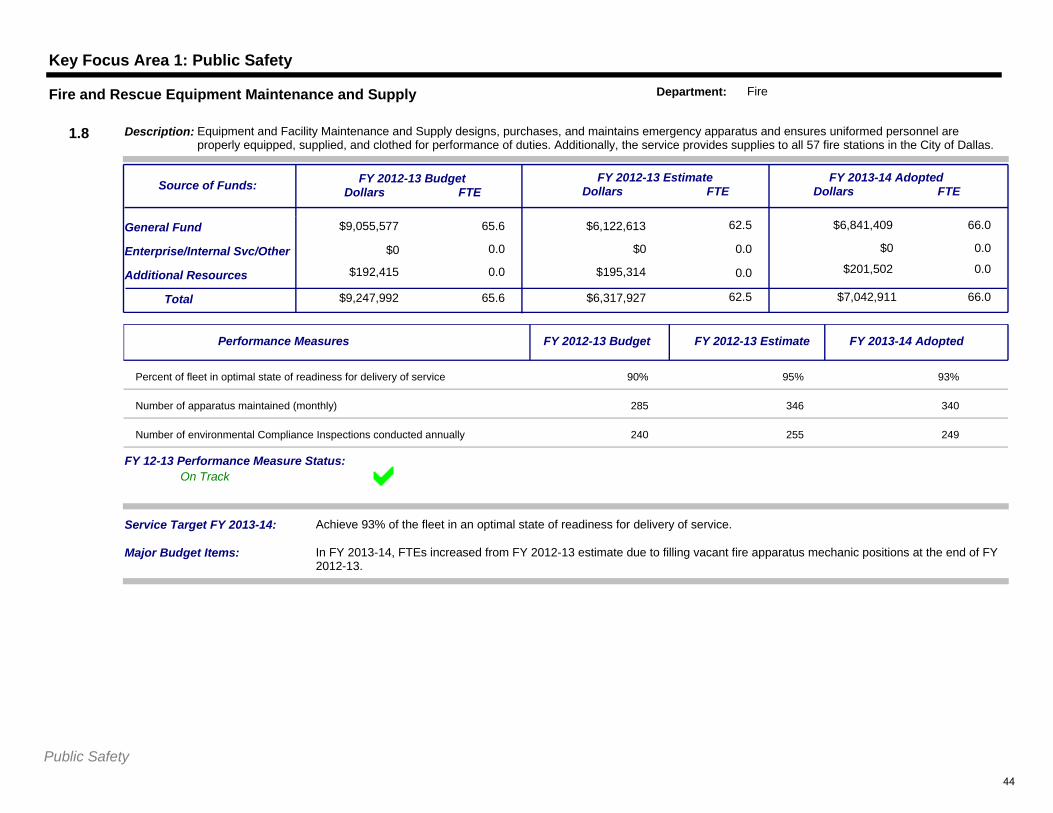
Service Target FY 2013-14: Achieve 93% of the fleet in an optimal state of readiness for delivery of service.
$9,247,992Total 65.6 $6,317,927 62.5 $7,042,911 66.0
Enterprise/Internal Svc/Other
$192,415 0.0 $195,314 0.0 $201,502 0.0
FY 2012-13 BudgetDollars FTE
FY 2012-13 EstimateDollars FTE
FY 2013-14 AdoptedDollars FTE
Description: Equipment and Facility Maintenance and Supply designs, purchases, and maintains emergency apparatus and ensures uniformed personnel are properly equipped, supplied, and clothed for performance of duties. Additionally, the service provides supplies to all 57 fire stations in the City of Dallas.
Source of Funds:
1.8
Fire and Rescue Equipment Maintenance and Supply Department: Fire
$0
Major Budget Items: In FY 2013-14, FTEs increased from FY 2012-13 estimate due to filling vacant fire apparatus mechanic positions at the end of FY 2012-13.
On TrackFY 12-13 Performance Measure Status:
Performance Measures FY 2012-13 Budget FY 2012-13 Estimate FY 2013-14 Adopted
Percent of fleet in optimal state of readiness for delivery of service 90% 95% 93%
Number of apparatus maintained (monthly) 285 346 340
Number of environmental Compliance Inspections conducted annually 240 255 249
Public Safety44
Key Focus Area 1: Public Safety
$8,580,562 65.6
0.0
$8,533,437 62.5
$0 0.0
$12,145,900
$0 0.0
65.7General Fund
Additional Resources
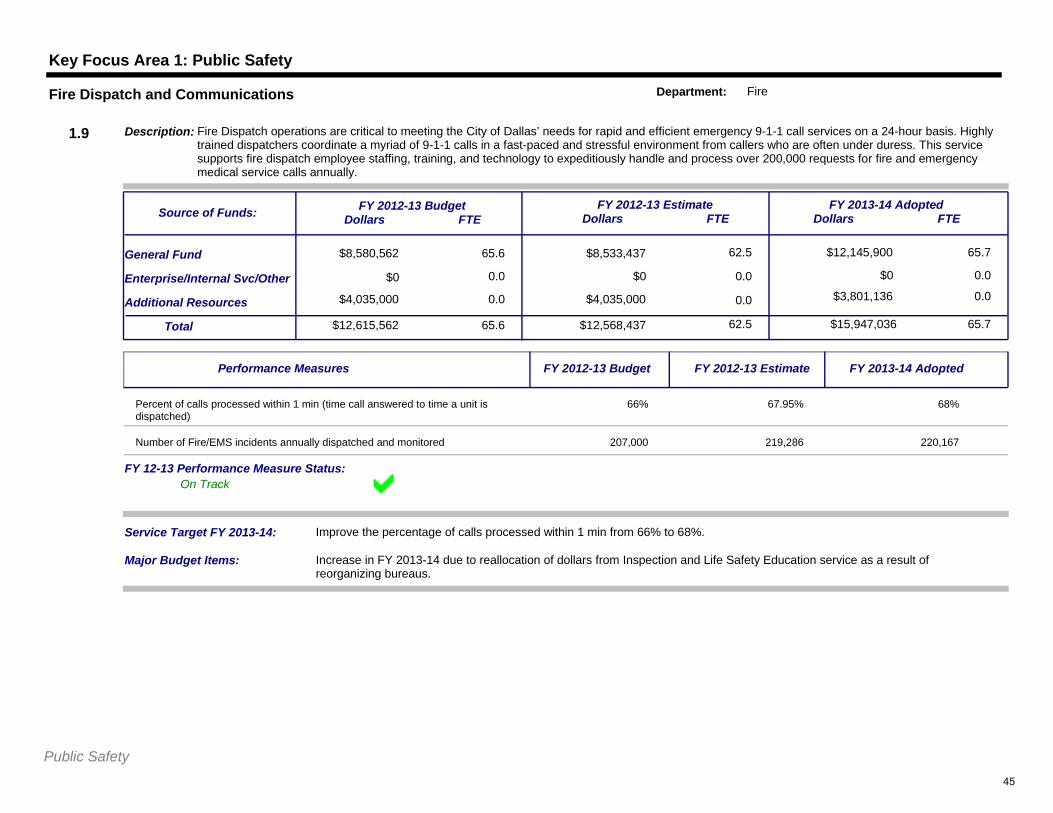
Service Target FY 2013-14: Improve the percentage of calls processed within 1 min from 66% to 68%.
$12,615,562Total 65.6 $12,568,437 62.5 $15,947,036 65.7
Enterprise/Internal Svc/Other
$4,035,000 0.0 $4,035,000 0.0 $3,801,136 0.0
FY 2012-13 BudgetDollars FTE
FY 2012-13 EstimateDollars FTE
FY 2013-14 AdoptedDollars FTE
Description: Fire Dispatch operations are critical to meeting the City of Dallas’ needs for rapid and efficient emergency 9-1-1 call services on a 24-hour basis. Highly trained dispatchers coordinate a myriad of 9-1-1 calls in a fast-paced and stressful environment from callers who are often under duress. This service supports fire dispatch employee staffing, training, and technology to expeditiously handle and process over 200,000 requests for fire and emergency medical service calls annually.
Source of Funds:
1.9
Fire Dispatch and Communications Department: Fire
$0
Major Budget Items: Increase in FY 2013-14 due to reallocation of dollars from Inspection and Life Safety Education service as a result of reorganizing bureaus.
On TrackFY 12-13 Performance Measure Status:
Performance Measures FY 2012-13 Budget FY 2012-13 Estimate FY 2013-14 Adopted
Percent of calls processed within 1 min (time call answered to time a unit is dispatched)
66% 67.95% 68%
Number of Fire/EMS incidents annually dispatched and monitored 207,000 219,286 220,167
Public Safety45
Key Focus Area 1: Public Safety
$3,891,013 25.4
0.0
$3,796,742 24.3
$0 0.0
$3,722,127
$0 0.0
26.2General Fund
Additional Resources
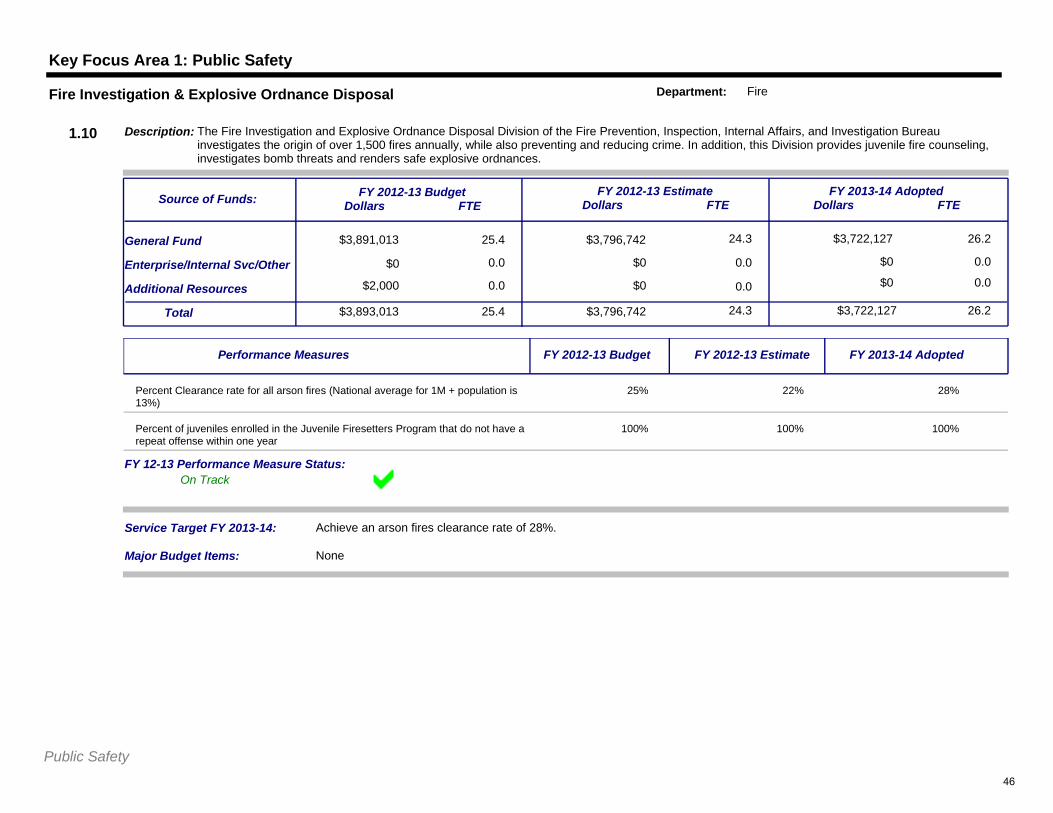
Service Target FY 2013-14: Achieve an arson fires clearance rate of 28%.
$3,893,013Total 25.4 $3,796,742 24.3 $3,722,127 26.2
Enterprise/Internal Svc/Other
$2,000 0.0 $0 0.0 $0 0.0
FY 2012-13 BudgetDollars FTE
FY 2012-13 EstimateDollars FTE
FY 2013-14 AdoptedDollars FTE
Description: The Fire Investigation and Explosive Ordnance Disposal Division of the Fire Prevention, Inspection, Internal Affairs, and Investigation Bureau investigates the origin of over 1,500 fires annually, while also preventing and reducing crime. In addition, this Division provides juvenile fire counseling, investigates bomb threats and renders safe explosive ordnances.
Source of Funds:
1.10
Fire Investigation & Explosive Ordnance Disposal Department: Fire
$0
Major Budget Items: None
On TrackFY 12-13 Performance Measure Status:
Performance Measures FY 2012-13 Budget FY 2012-13 Estimate FY 2013-14 Adopted
Percent Clearance rate for all arson fires (National average for 1M + population is 13%)
25% 22% 28%
Percent of juveniles enrolled in the Juvenile Firesetters Program that do not have a repeat offense within one year
100% 100% 100%
Public Safety46
Key Focus Area 1: Public Safety
$9,489,394 119.4
0.0
$8,312,403 98.5
$0 0.0
$13,821,077
$0 0.0
205.3General Fund
Additional Resources
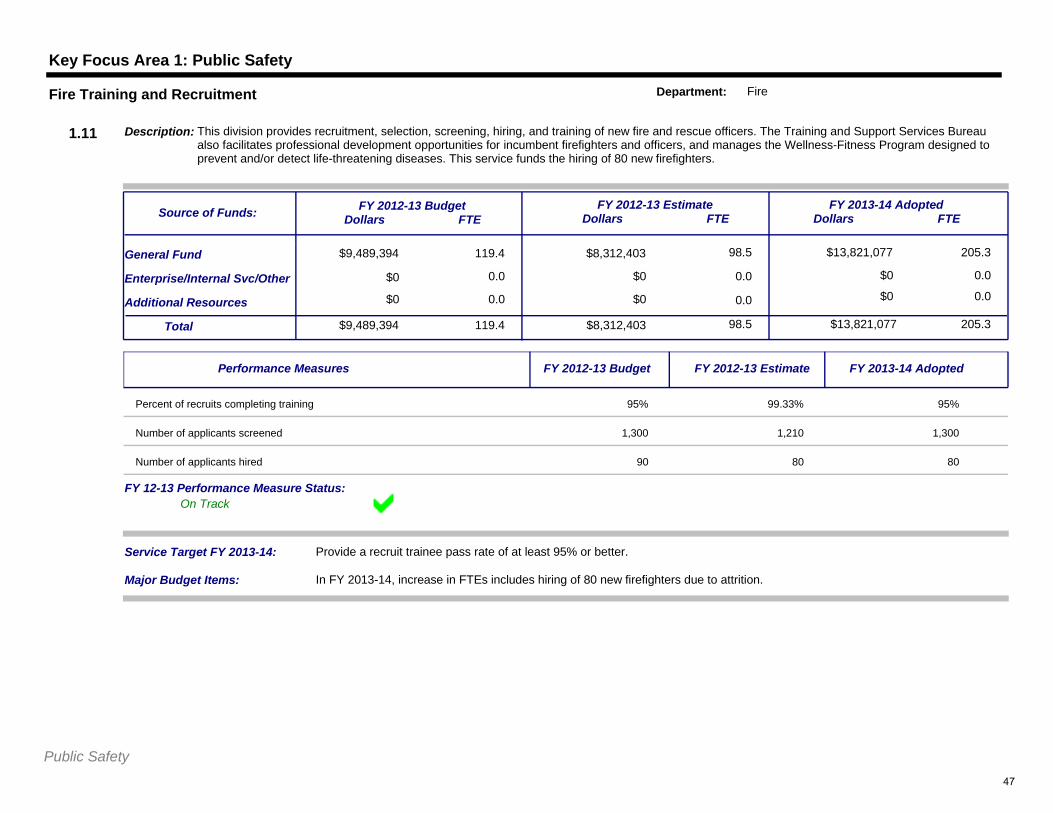
Service Target FY 2013-14: Provide a recruit trainee pass rate of at least 95% or better.
$9,489,394Total 119.4 $8,312,403 98.5 $13,821,077 205.3
Enterprise/Internal Svc/Other
$0 0.0 $0 0.0 $0 0.0
FY 2012-13 BudgetDollars FTE
FY 2012-13 EstimateDollars FTE
FY 2013-14 AdoptedDollars FTE
Description: This division provides recruitment, selection, screening, hiring, and training of new fire and rescue officers. The Training and Support Services Bureau also facilitates professional development opportunities for incumbent firefighters and officers, and manages the Wellness-Fitness Program designed to prevent and/or detect life-threatening diseases. This service funds the hiring of 80 new firefighters.
Source of Funds:
1.11
Fire Training and Recruitment Department: Fire
$0
Major Budget Items: In FY 2013-14, increase in FTEs includes hiring of 80 new firefighters due to attrition.
On TrackFY 12-13 Performance Measure Status:
Performance Measures FY 2012-13 Budget FY 2012-13 Estimate FY 2013-14 Adopted
Percent of recruits completing training 95% 99.33% 95%
Number of applicants screened 1,300 1,210 1,300
Number of applicants hired 90 80 80
Public Safety47
Key Focus Area 1: Public Safety
$10,361,840 85.6
0.0
$10,943,001 92.8
$0 0.0
$7,012,286
$0 0.0
77.7General Fund
Additional Resources
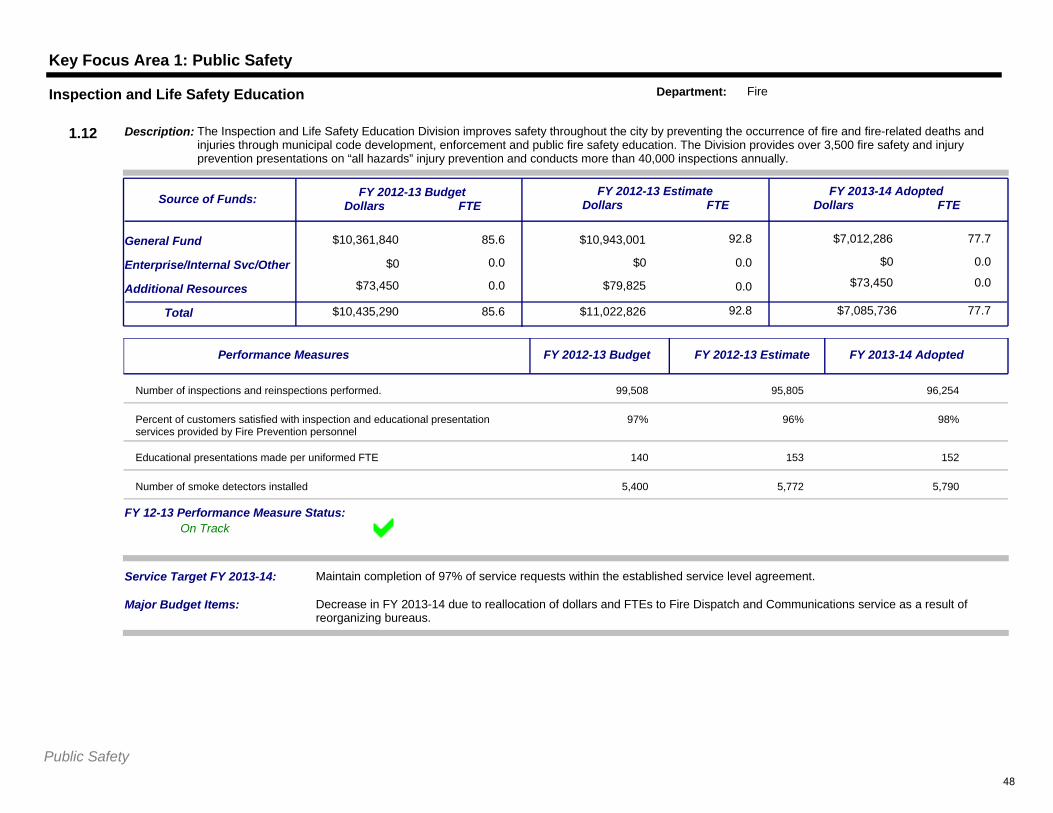
Service Target FY 2013-14: Maintain completion of 97% of service requests within the established service level agreement.
$10,435,290Total 85.6 $11,022,826 92.8 $7,085,736 77.7
Enterprise/Internal Svc/Other
$73,450 0.0 $79,825 0.0 $73,450 0.0
FY 2012-13 BudgetDollars FTE
FY 2012-13 EstimateDollars FTE
FY 2013-14 AdoptedDollars FTE
Description: The Inspection and Life Safety Education Division improves safety throughout the city by preventing the occurrence of fire and fire-related deaths and injuries through municipal code development, enforcement and public fire safety education. The Division provides over 3,500 fire safety and injury prevention presentations on “all hazards” injury prevention and conducts more than 40,000 inspections annually.
Source of Funds:
1.12
Inspection and Life Safety Education Department: Fire
$0
Major Budget Items: Decrease in FY 2013-14 due to reallocation of dollars and FTEs to Fire Dispatch and Communications service as a result of reorganizing bureaus.
On TrackFY 12-13 Performance Measure Status:
Performance Measures FY 2012-13 Budget FY 2012-13 Estimate FY 2013-14 Adopted
Number of inspections and reinspections performed. 99,508 95,805 96,254
Percent of customers satisfied with inspection and educational presentation services provided by Fire Prevention personnel
97% 96% 98%
Educational presentations made per uniformed FTE 140 153 152
Number of smoke detectors installed 5,400 5,772 5,790
Public Safety48
Key Focus Area 1: Public Safety
$0 7.0
0.0
$0 6.6
$0 0.0
$0
$0 0.0
7.0General Fund
Additional Resources
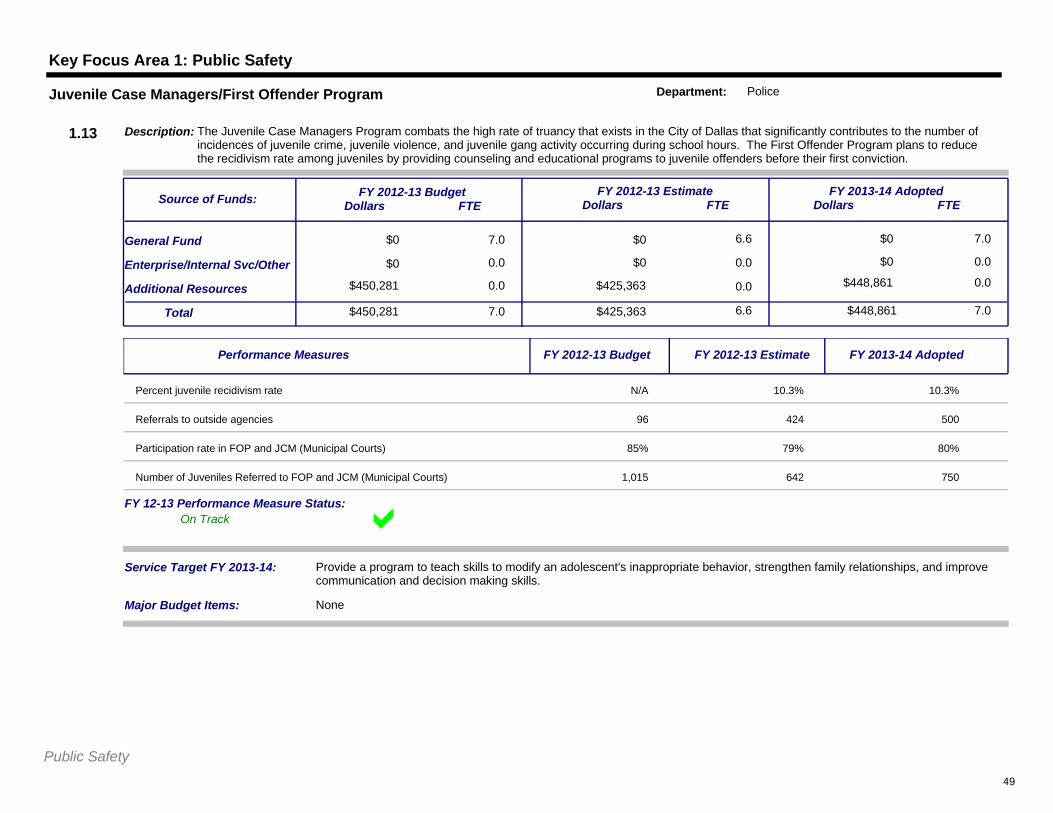
Service Target FY 2013-14: Provide a program to teach skills to modify an adolescent's inappropriate behavior, strengthen family relationships, and improve communication and decision making skills.
$450,281Total 7.0 $425,363 6.6 $448,861 7.0
Enterprise/Internal Svc/Other
$450,281 0.0 $425,363 0.0 $448,861 0.0
FY 2012-13 BudgetDollars FTE
FY 2012-13 EstimateDollars FTE
FY 2013-14 AdoptedDollars FTE
Description: The Juvenile Case Managers Program combats the high rate of truancy that exists in the City of Dallas that significantly contributes to the number of incidences of juvenile crime, juvenile violence, and juvenile gang activity occurring during school hours. The First Offender Program plans to reduce the recidivism rate among juveniles by providing counseling and educational programs to juvenile offenders before their first conviction.
Source of Funds:
1.13
Juvenile Case Managers/First Offender Program Department: Police
$0
Major Budget Items: None
On TrackFY 12-13 Performance Measure Status:
Performance Measures FY 2012-13 Budget FY 2012-13 Estimate FY 2013-14 Adopted
Percent juvenile recidivism rate N/A 10.3% 10.3%
Referrals to outside agencies 96 424 500
Participation rate in FOP and JCM (Municipal Courts) 85% 79% 80%
Number of Juveniles Referred to FOP and JCM (Municipal Courts) 1,015 642 750
Public Safety49
Key Focus Area 1: Public Safety
$8,228,943 0.0
0.0
$8,228,943 0.0
$0 0.0
$8,713,637
$0 0.0
0.0General Fund
Additional Resources
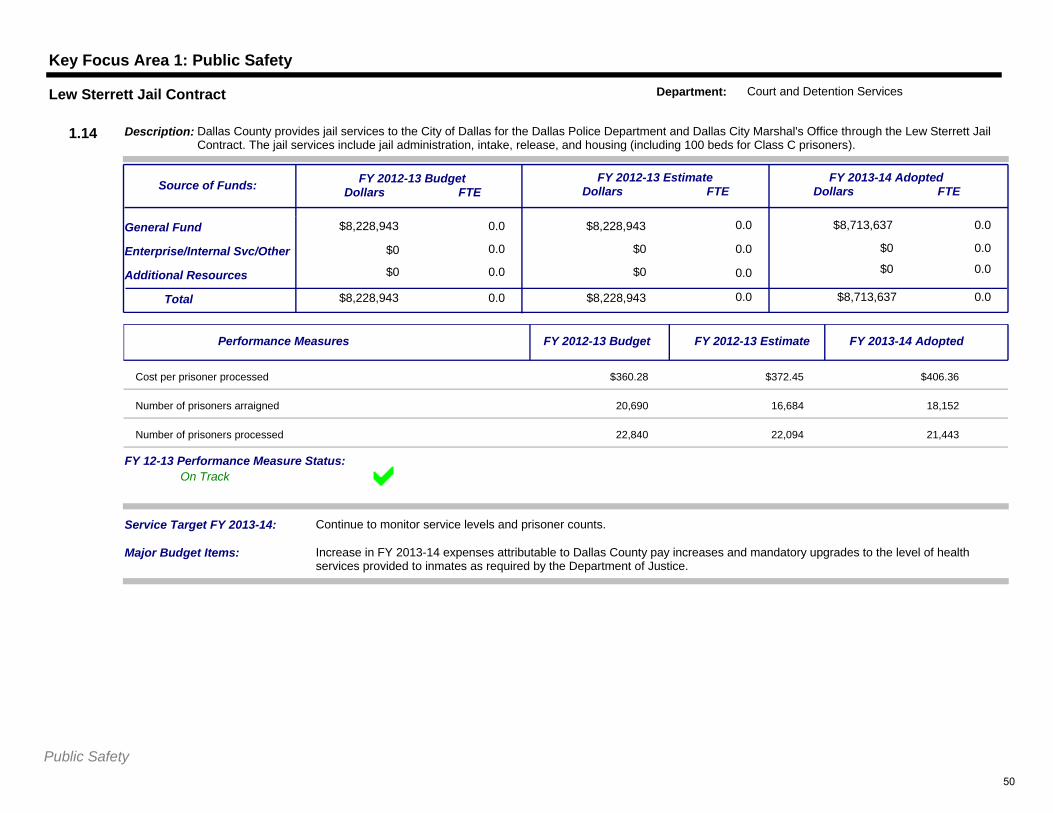
Service Target FY 2013-14: Continue to monitor service levels and prisoner counts.
$8,228,943Total 0.0 $8,228,943 0.0 $8,713,637 0.0
Enterprise/Internal Svc/Other
$0 0.0 $0 0.0 $0 0.0
FY 2012-13 BudgetDollars FTE
FY 2012-13 EstimateDollars FTE
FY 2013-14 AdoptedDollars FTE
Description: Dallas County provides jail services to the City of Dallas for the Dallas Police Department and Dallas City Marshal's Office through the Lew Sterrett Jail Contract. The jail services include jail administration, intake, release, and housing (including 100 beds for Class C prisoners).
Source of Funds:
1.14
Lew Sterrett Jail Contract Department: Court and Detention Services
$0
Major Budget Items: Increase in FY 2013-14 expenses attributable to Dallas County pay increases and mandatory upgrades to the level of health services provided to inmates as required by the Department of Justice.
On TrackFY 12-13 Performance Measure Status:
Performance Measures FY 2012-13 Budget FY 2012-13 Estimate FY 2013-14 Adopted
Cost per prisoner processed $360.28 $372.45 $406.36
Number of prisoners arraigned 20,690 16,684 18,152
Number of prisoners processed 22,840 22,094 21,443
Public Safety50
Key Focus Area 1: Public Safety
$9,554,962 156.0
0.0
$9,156,226 141.8
$0 0.0
$10,033,215
$0 0.0
145.0General Fund
Additional Resources
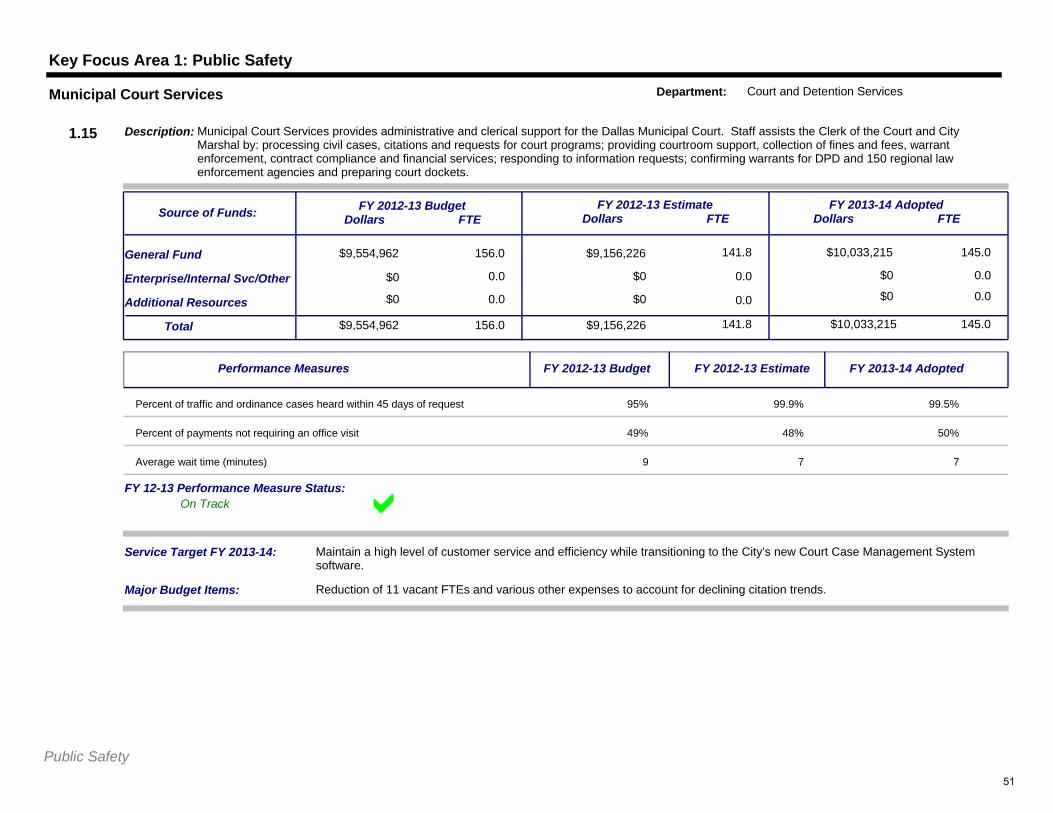
Service Target FY 2013-14: Maintain a high level of customer service and efficiency while transitioning to the City’s new Court Case Management System software.
$9,554,962Total 156.0 $9,156,226 141.8 $10,033,215 145.0
Enterprise/Internal Svc/Other
$0 0.0 $0 0.0 $0 0.0
FY 2012-13 BudgetDollars FTE
FY 2012-13 EstimateDollars FTE
FY 2013-14 AdoptedDollars FTE
Description: Municipal Court Services provides administrative and clerical support for the Dallas Municipal Court. Staff assists the Clerk of the Court and City Marshal by: processing civil cases, citations and requests for court programs; providing courtroom support, collection of fines and fees, warrant enforcement, contract compliance and financial services; responding to information requests; confirming warrants for DPD and 150 regional law enforcement agencies and preparing court dockets.
Source of Funds:
1.15
Municipal Court Services Department: Court and Detention Services
$0
Major Budget Items: Reduction of 11 vacant FTEs and various other expenses to account for declining citation trends.
On TrackFY 12-13 Performance Measure Status:
Performance Measures FY 2012-13 Budget FY 2012-13 Estimate FY 2013-14 Adopted
Percent of traffic and ordinance cases heard within 45 days of request 95% 99.9% 99.5%
Percent of payments not requiring an office visit 49% 48% 50%
Average wait time (minutes) 9 7 7
Public Safety51
Key Focus Area 1: Public Safety
$2,087,824 16.2
0.0
$2,091,488 16.2
$0 0.0
$2,160,774
$0 0.0
17.2General Fund
Additional Resources
Service Target FY 2013-14: Ensure prompt and fair adjudication of all cases, and improve public confidence in the Courts through increasing accessibility, communication, and education.
$2,087,824Total 16.2 $2,091,488 16.2 $2,160,774 17.2
Enterprise/Internal Svc/Other
$0 0.0 $0 0.0 $0 0.0
FY 2012-13 BudgetDollars FTE
FY 2012-13 EstimateDollars FTE
FY 2013-14 AdoptedDollars FTE
Description: Provides fair and impartial trials within a reasonable period of time to persons charged with violations of class ‘C’ misdemeanors, State statutes, City ordinances and traffic offenses. Serves as Magistrate in the issuance of search warrants and arrest warrants for all criminal offenses, including capital murder.
Source of Funds:
1.16
Municipal Judges/Cases Docketed Department: Judiciary
$0
Major Budget Items: None
Number of cases docketed and warrants issued decreased due to reduction in citations issued.Caution
FY 12-13 Performance Measure Status:
Performance Measures FY 2012-13 Budget FY 2012-13 Estimate FY 2013-14 Adopted
Percent of case dispositions per new cases filed (Case Clearance Rate) 94% 95% 95%
Number of Probable Cause Affidavits reviewed 3,400 3,148 3,275
Number of cases docketed 225,000 220,000 198,000
Number of alias and capias warrants issued 150,000 117,125 110,000
Public Safety52
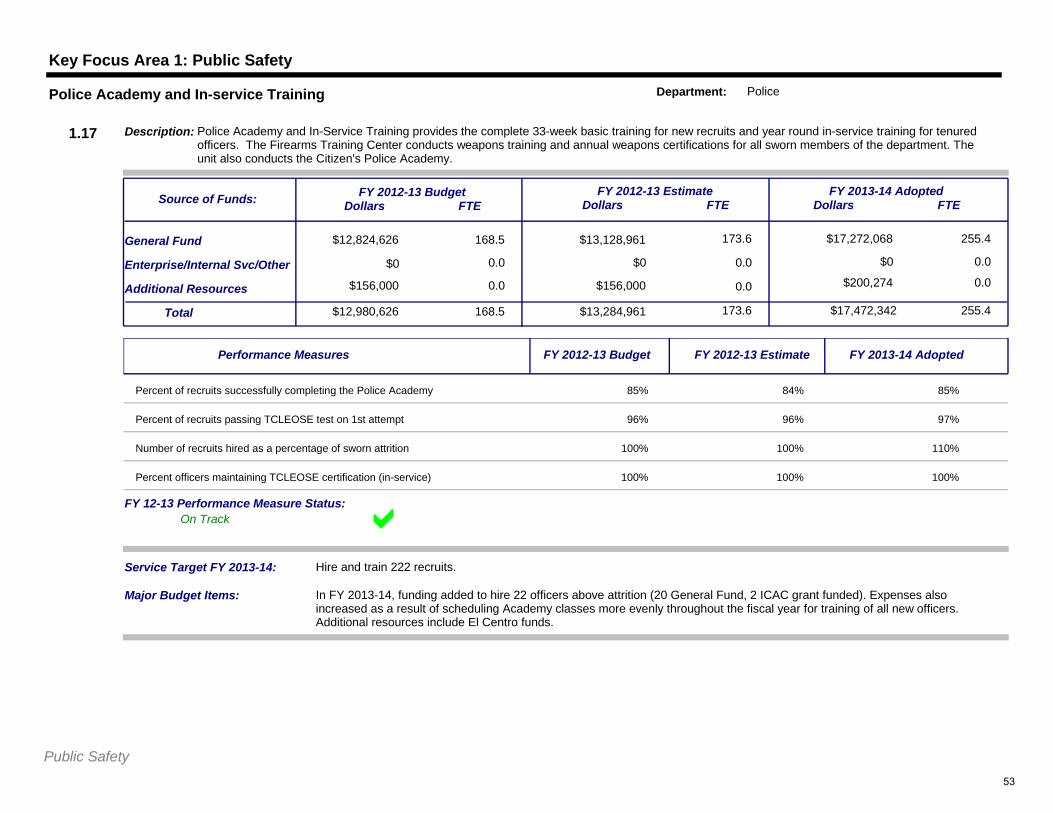
Key Focus Area 1: Public Safety
$12,824,626 168.5
0.0
$13,128,961 173.6
$0 0.0
$17,272,068
$0 0.0
255.4General Fund
Additional Resources
Service Target FY 2013-14: Hire and train 222 recruits.
$12,980,626Total 168.5 $13,284,961 173.6 $17,472,342 255.4
Enterprise/Internal Svc/Other
$156,000 0.0 $156,000 0.0 $200,274 0.0
FY 2012-13 BudgetDollars FTE
FY 2012-13 EstimateDollars FTE
FY 2013-14 AdoptedDollars FTE
Description: Police Academy and In-Service Training provides the complete 33-week basic training for new recruits and year round in-service training for tenured officers. The Firearms Training Center conducts weapons training and annual weapons certifications for all sworn members of the department. The unit also conducts the Citizen's Police Academy.
Source of Funds:
1.17
Police Academy and In-service Training Department: Police
$0
Major Budget Items: In FY 2013-14, funding added to hire 22 officers above attrition (20 General Fund, 2 ICAC grant funded). Expenses also increased as a result of scheduling Academy classes more evenly throughout the fiscal year for training of all new officers. Additional resources include El Centro funds.
On TrackFY 12-13 Performance Measure Status:
Performance Measures FY 2012-13 Budget FY 2012-13 Estimate FY 2013-14 Adopted
Percent of recruits successfully completing the Police Academy 85% 84% 85%
Percent of recruits passing TCLEOSE test on 1st attempt 96% 96% 97%
Number of recruits hired as a percentage of sworn attrition 100% 100% 110%
Percent officers maintaining TCLEOSE certification (in-service) 100% 100% 100%
Public Safety53
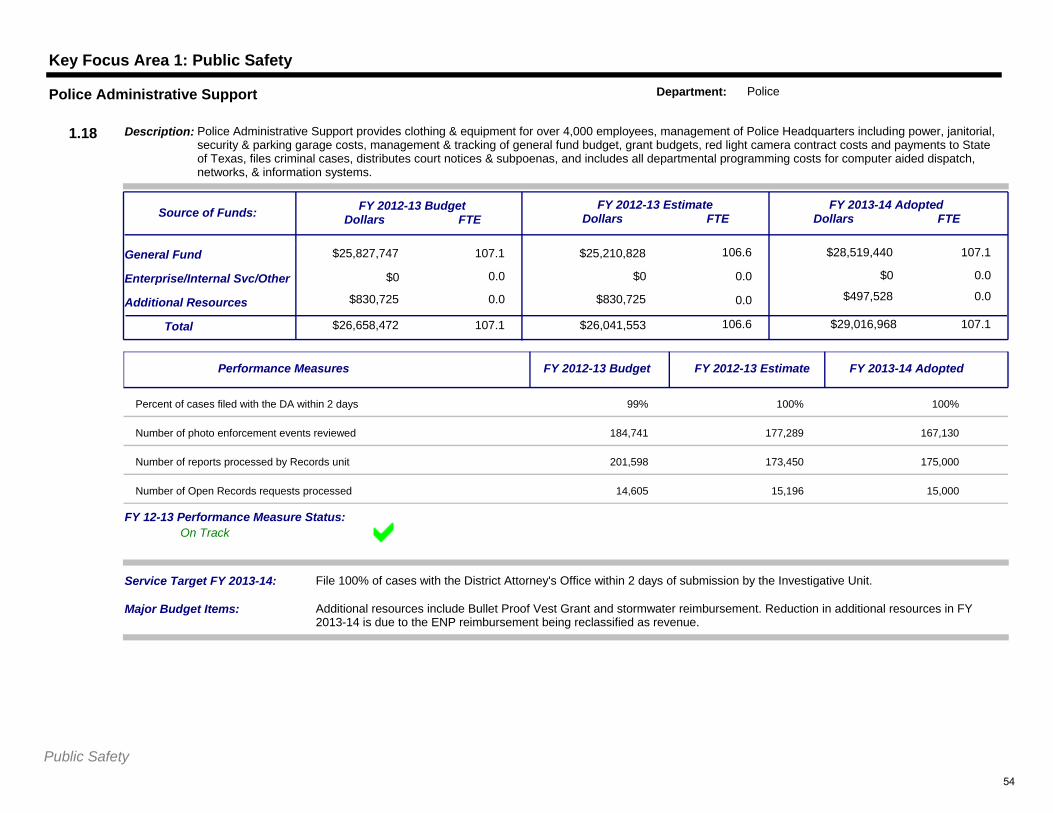
Key Focus Area 1: Public Safety
$25,827,747 107.1
0.0
$25,210,828 106.6
$0 0.0
$28,519,440
$0 0.0
107.1General Fund
Additional Resources
Service Target FY 2013-14: File 100% of cases with the District Attorney's Office within 2 days of submission by the Investigative Unit.
$26,658,472Total 107.1 $26,041,553 106.6 $29,016,968 107.1
Enterprise/Internal Svc/Other
$830,725 0.0 $830,725 0.0 $497,528 0.0
FY 2012-13 BudgetDollars FTE
FY 2012-13 EstimateDollars FTE
FY 2013-14 AdoptedDollars FTE
Description: Police Administrative Support provides clothing & equipment for over 4,000 employees, management of Police Headquarters including power, janitorial, security & parking garage costs, management & tracking of general fund budget, grant budgets, red light camera contract costs and payments to State of Texas, files criminal cases, distributes court notices & subpoenas, and includes all departmental programming costs for computer aided dispatch, networks, & information systems.
Source of Funds:
1.18
Police Administrative Support Department: Police
$0
Major Budget Items: Additional resources include Bullet Proof Vest Grant and stormwater reimbursement. Reduction in additional resources in FY 2013-14 is due to the ENP reimbursement being reclassified as revenue.
On TrackFY 12-13 Performance Measure Status:
Performance Measures FY 2012-13 Budget FY 2012-13 Estimate FY 2013-14 Adopted
Percent of cases filed with the DA within 2 days 99% 100% 100%
Number of photo enforcement events reviewed 184,741 177,289 167,130
Number of reports processed by Records unit 201,598 173,450 175,000
Number of Open Records requests processed 14,605 15,196 15,000
Public Safety54
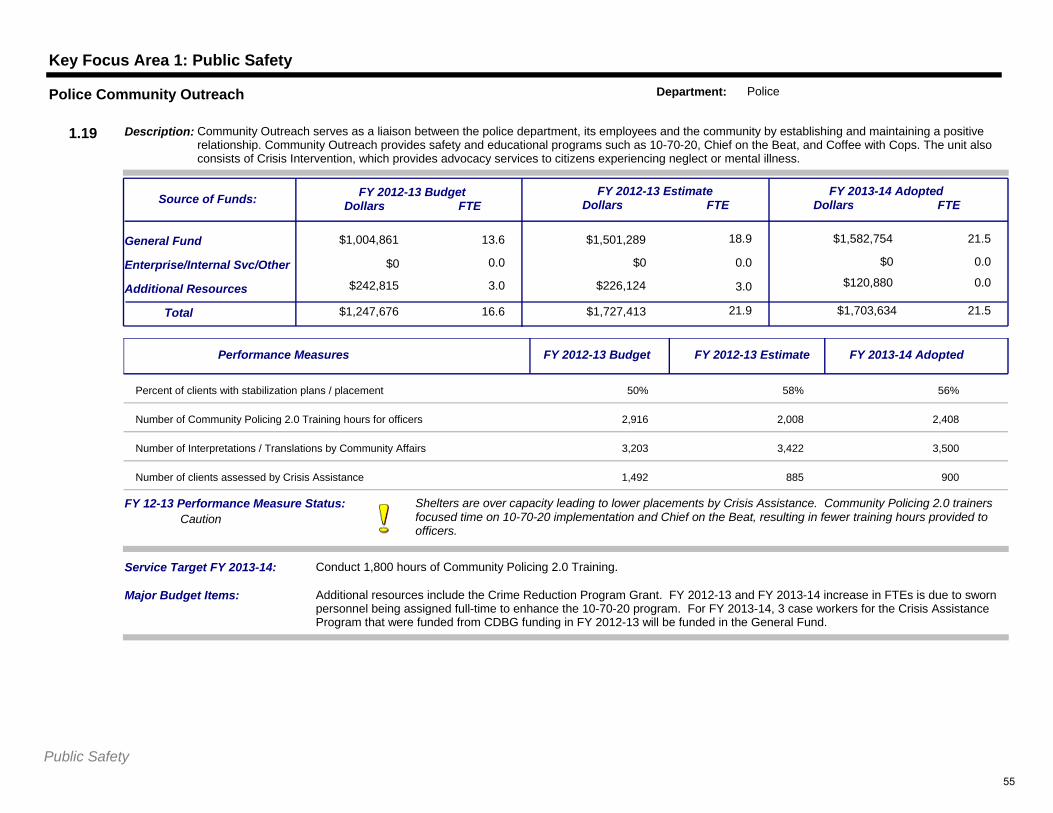
Key Focus Area 1: Public Safety
$1,004,861 13.6
0.0
$1,501,289 18.9
$0 0.0
$1,582,754
$0 0.0
21.5General Fund
Additional Resources
Service Target FY 2013-14: Conduct 1,800 hours of Community Policing 2.0 Training.
$1,247,676Total 16.6 $1,727,413 21.9 $1,703,634 21.5
Enterprise/Internal Svc/Other
$242,815 3.0 $226,124 3.0 $120,880 0.0
FY 2012-13 BudgetDollars FTE
FY 2012-13 EstimateDollars FTE
FY 2013-14 AdoptedDollars FTE
Description: Community Outreach serves as a liaison between the police department, its employees and the community by establishing and maintaining a positive relationship. Community Outreach provides safety and educational programs such as 10-70-20, Chief on the Beat, and Coffee with Cops. The unit also consists of Crisis Intervention, which provides advocacy services to citizens experiencing neglect or mental illness.
Source of Funds:
1.19
Police Community Outreach Department: Police
$0
Major Budget Items: Additional resources include the Crime Reduction Program Grant. FY 2012-13 and FY 2013-14 increase in FTEs is due to sworn personnel being assigned full-time to enhance the 10-70-20 program. For FY 2013-14, 3 case workers for the Crisis Assistance Program that were funded from CDBG funding in FY 2012-13 will be funded in the General Fund.
Shelters are over capacity leading to lower placements by Crisis Assistance. Community Policing 2.0 trainers focused time on 10-70-20 implementation and Chief on the Beat, resulting in fewer training hours provided to officers.
CautionFY 12-13 Performance Measure Status:
Performance Measures FY 2012-13 Budget FY 2012-13 Estimate FY 2013-14 Adopted
Percent of clients with stabilization plans / placement 50% 58% 56%
Number of Community Policing 2.0 Training hours for officers 2,916 2,008 2,408
Number of Interpretations / Translations by Community Affairs 3,203 3,422 3,500
Number of clients assessed by Crisis Assistance 1,492 885 900
Public Safety55
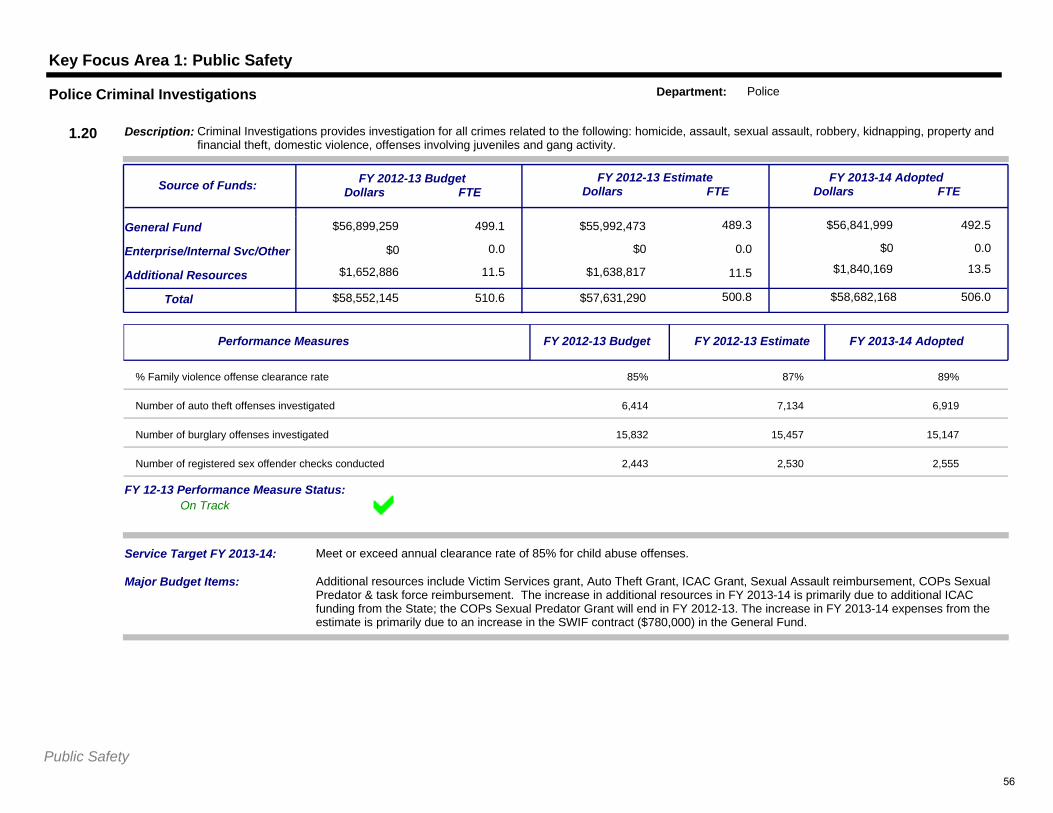
Key Focus Area 1: Public Safety
$56,899,259 499.1
0.0
$55,992,473 489.3
$0 0.0
$56,841,999
$0 0.0
492.5General Fund
Additional Resources
Service Target FY 2013-14: Meet or exceed annual clearance rate of 85% for child abuse offenses.
$58,552,145Total 510.6 $57,631,290 500.8 $58,682,168 506.0
Enterprise/Internal Svc/Other
$1,652,886 11.5 $1,638,817 11.5 $1,840,169 13.5
FY 2012-13 BudgetDollars FTE
FY 2012-13 EstimateDollars FTE
FY 2013-14 AdoptedDollars FTE
Description: Criminal Investigations provides investigation for all crimes related to the following: homicide, assault, sexual assault, robbery, kidnapping, property and financial theft, domestic violence, offenses involving juveniles and gang activity.
Source of Funds:
1.20
Police Criminal Investigations Department: Police
$0
Major Budget Items: Additional resources include Victim Services grant, Auto Theft Grant, ICAC Grant, Sexual Assault reimbursement, COPs Sexual Predator & task force reimbursement. The increase in additional resources in FY 2013-14 is primarily due to additional ICAC funding from the State; the COPs Sexual Predator Grant will end in FY 2012-13. The increase in FY 2013-14 expenses from the estimate is primarily due to an increase in the SWIF contract ($780,000) in the General Fund.
On TrackFY 12-13 Performance Measure Status:
Performance Measures FY 2012-13 Budget FY 2012-13 Estimate FY 2013-14 Adopted
% Family violence offense clearance rate 85% 87% 89%
Number of auto theft offenses investigated 6,414 7,134 6,919
Number of burglary offenses investigated 15,832 15,457 15,147
Number of registered sex offender checks conducted 2,443 2,530 2,555
Public Safety56
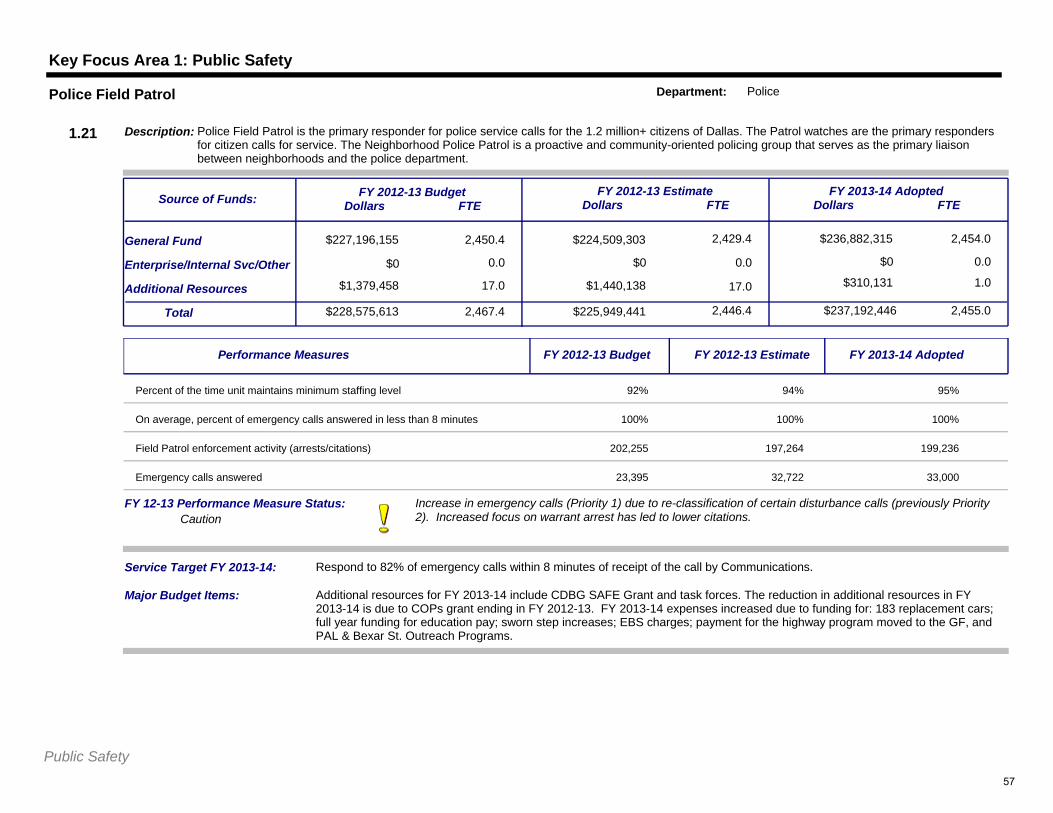
Key Focus Area 1: Public Safety
$227,196,155 2,450.4
0.0
$224,509,303 2,429.4
$0 0.0
$236,882,315
$0 0.0
2,454.0General Fund
Additional Resources
Service Target FY 2013-14: Respond to 82% of emergency calls within 8 minutes of receipt of the call by Communications.
$228,575,613Total 2,467.4 $225,949,441 2,446.4 $237,192,446 2,455.0
Enterprise/Internal Svc/Other
$1,379,458 17.0 $1,440,138 17.0 $310,131 1.0
FY 2012-13 BudgetDollars FTE
FY 2012-13 EstimateDollars FTE
FY 2013-14 AdoptedDollars FTE
Description: Police Field Patrol is the primary responder for police service calls for the 1.2 million+ citizens of Dallas. The Patrol watches are the primary responders for citizen calls for service. The Neighborhood Police Patrol is a proactive and community-oriented policing group that serves as the primary liaison between neighborhoods and the police department.
Source of Funds:
1.21
Police Field Patrol Department: Police
$0
Major Budget Items: Additional resources for FY 2013-14 include CDBG SAFE Grant and task forces. The reduction in additional resources in FY 2013-14 is due to COPs grant ending in FY 2012-13. FY 2013-14 expenses increased due to funding for: 183 replacement cars; full year funding for education pay; sworn step increases; EBS charges; payment for the highway program moved to the GF, and PAL & Bexar St. Outreach Programs.
Increase in emergency calls (Priority 1) due to re-classification of certain disturbance calls (previously Priority 2). Increased focus on warrant arrest has led to lower citations. Caution
FY 12-13 Performance Measure Status:
Performance Measures FY 2012-13 Budget FY 2012-13 Estimate FY 2013-14 Adopted
Percent of the time unit maintains minimum staffing level 92% 94% 95%
On average, percent of emergency calls answered in less than 8 minutes 100% 100% 100%
Field Patrol enforcement activity (arrests/citations) 202,255 197,264 199,236
Emergency calls answered 23,395 32,722 33,000
Public Safety57
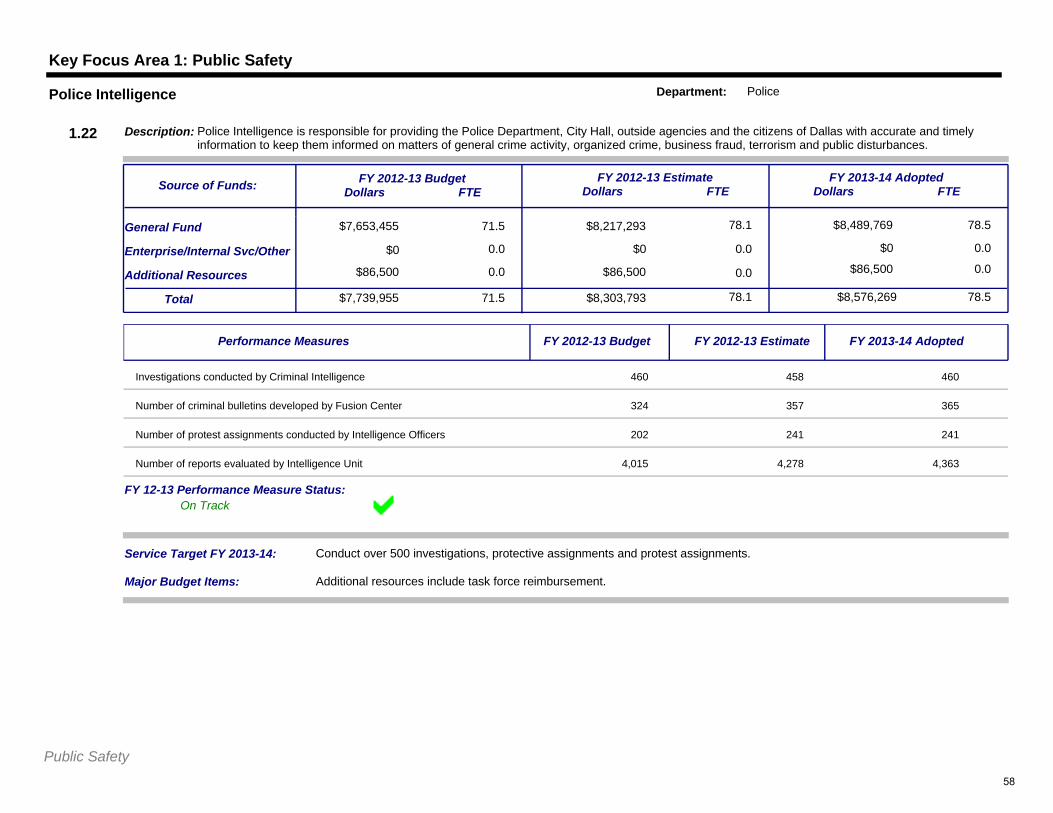
Key Focus Area 1: Public Safety
$7,653,455 71.5
0.0
$8,217,293 78.1
$0 0.0
$8,489,769
$0 0.0
78.5General Fund
Additional Resources
Service Target FY 2013-14: Conduct over 500 investigations, protective assignments and protest assignments.
$7,739,955Total 71.5 $8,303,793 78.1 $8,576,269 78.5
Enterprise/Internal Svc/Other
$86,500 0.0 $86,500 0.0 $86,500 0.0
FY 2012-13 BudgetDollars FTE
FY 2012-13 EstimateDollars FTE
FY 2013-14 AdoptedDollars FTE
Description: Police Intelligence is responsible for providing the Police Department, City Hall, outside agencies and the citizens of Dallas with accurate and timely information to keep them informed on matters of general crime activity, organized crime, business fraud, terrorism and public disturbances.
Source of Funds:
1.22
Police Intelligence Department: Police
$0
Major Budget Items: Additional resources include task force reimbursement.
On TrackFY 12-13 Performance Measure Status:
Performance Measures FY 2012-13 Budget FY 2012-13 Estimate FY 2013-14 Adopted
Investigations conducted by Criminal Intelligence 460 458 460
Number of criminal bulletins developed by Fusion Center 324 357 365
Number of protest assignments conducted by Intelligence Officers 202 241 241
Number of reports evaluated by Intelligence Unit 4,015 4,278 4,363
Public Safety58
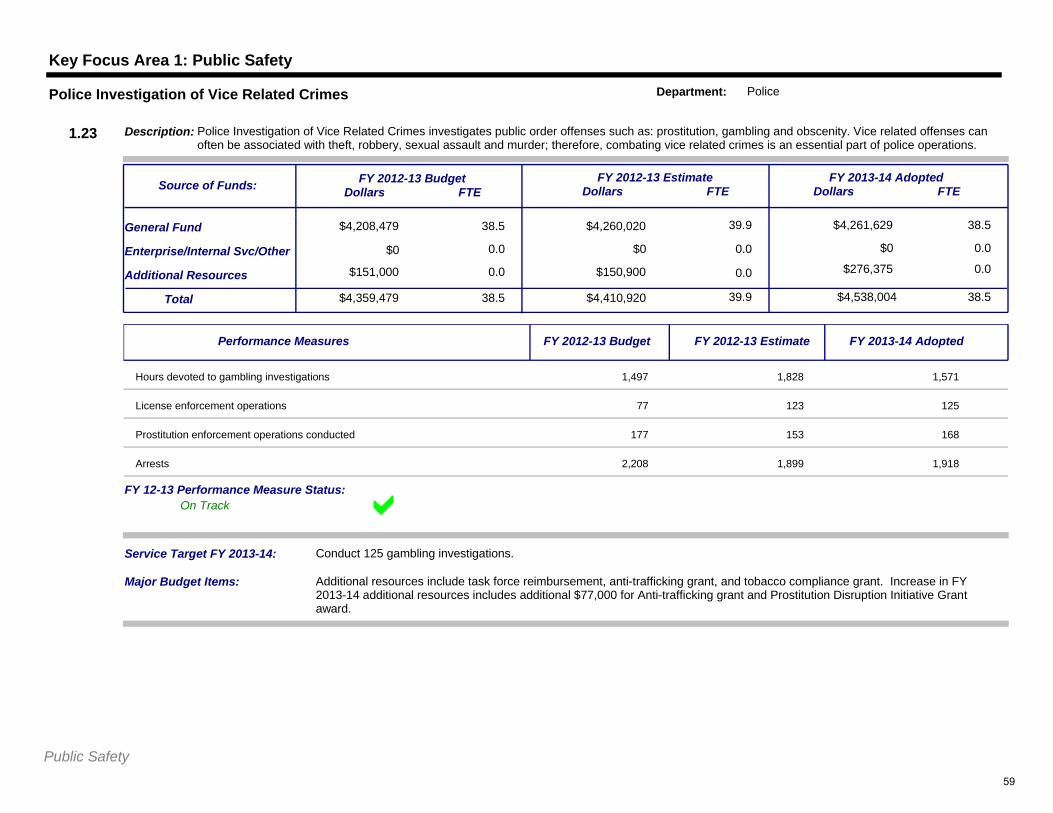
Key Focus Area 1: Public Safety
$4,208,479 38.5
0.0
$4,260,020 39.9
$0 0.0
$4,261,629
$0 0.0
38.5General Fund
Additional Resources
Service Target FY 2013-14: Conduct 125 gambling investigations.
$4,359,479Total 38.5 $4,410,920 39.9 $4,538,004 38.5
Enterprise/Internal Svc/Other
$151,000 0.0 $150,900 0.0 $276,375 0.0
FY 2012-13 BudgetDollars FTE
FY 2012-13 EstimateDollars FTE
FY 2013-14 AdoptedDollars FTE
Description: Police Investigation of Vice Related Crimes investigates public order offenses such as: prostitution, gambling and obscenity. Vice related offenses can often be associated with theft, robbery, sexual assault and murder; therefore, combating vice related crimes is an essential part of police operations.
Source of Funds:
1.23
Police Investigation of Vice Related Crimes Department: Police
$0
Major Budget Items: Additional resources include task force reimbursement, anti-trafficking grant, and tobacco compliance grant. Increase in FY 2013-14 additional resources includes additional $77,000 for Anti-trafficking grant and Prostitution Disruption Initiative Grant award.
On TrackFY 12-13 Performance Measure Status:
Performance Measures FY 2012-13 Budget FY 2012-13 Estimate FY 2013-14 Adopted
Hours devoted to gambling investigations 1,497 1,828 1,571
License enforcement operations 77 123 125
Prostitution enforcement operations conducted 177 153 168
Arrests 2,208 1,899 1,918
Public Safety59
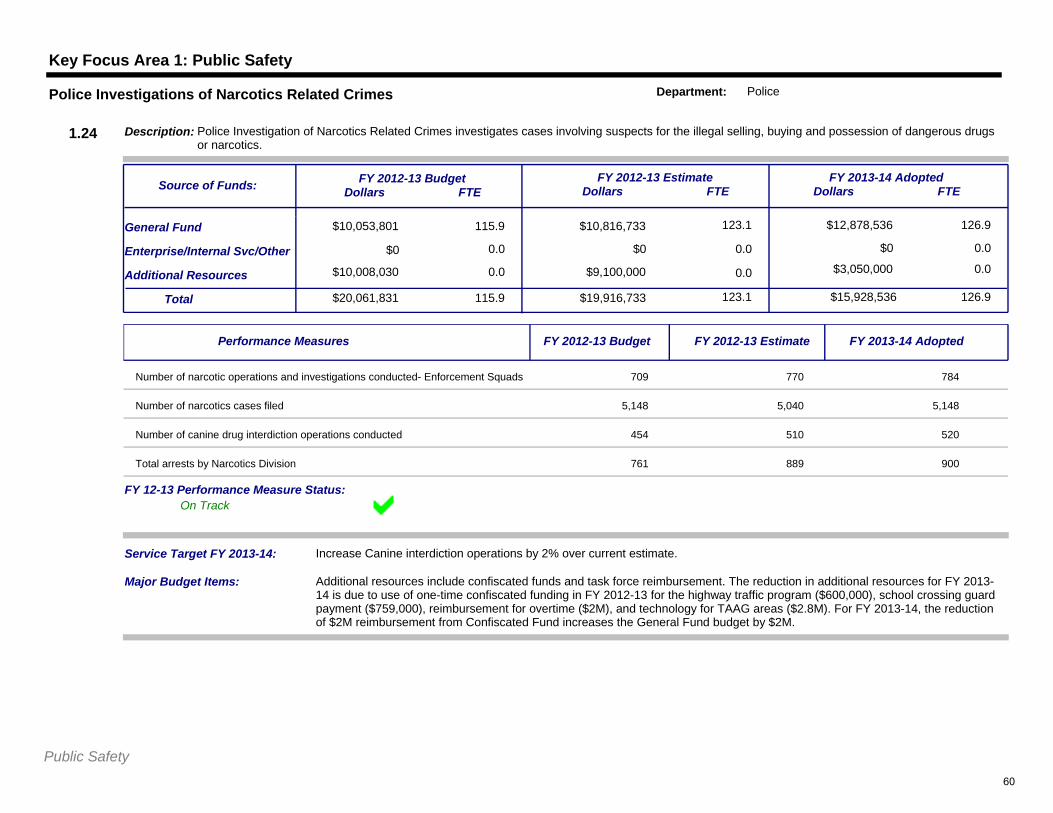
Key Focus Area 1: Public Safety
$10,053,801 115.9
0.0
$10,816,733 123.1
$0 0.0
$12,878,536
$0 0.0
126.9General Fund
Additional Resources
Service Target FY 2013-14: Increase Canine interdiction operations by 2% over current estimate.
$20,061,831Total 115.9 $19,916,733 123.1 $15,928,536 126.9
Enterprise/Internal Svc/Other
$10,008,030 0.0 $9,100,000 0.0 $3,050,000 0.0
FY 2012-13 BudgetDollars FTE
FY 2012-13 EstimateDollars FTE
FY 2013-14 AdoptedDollars FTE
Description: Police Investigation of Narcotics Related Crimes investigates cases involving suspects for the illegal selling, buying and possession of dangerous drugs or narcotics.
Source of Funds:
1.24
Police Investigations of Narcotics Related Crimes Department: Police
$0
Major Budget Items: Additional resources include confiscated funds and task force reimbursement. The reduction in additional resources for FY 2013-14 is due to use of one-time confiscated funding in FY 2012-13 for the highway traffic program ($600,000), school crossing guard payment ($759,000), reimbursement for overtime ($2M), and technology for TAAG areas ($2.8M). For FY 2013-14, the reduction of $2M reimbursement from Confiscated Fund increases the General Fund budget by $2M.
On TrackFY 12-13 Performance Measure Status:
Performance Measures FY 2012-13 Budget FY 2012-13 Estimate FY 2013-14 Adopted
Number of narcotic operations and investigations conducted- Enforcement Squads 709 770 784
Number of narcotics cases filed 5,148 5,040 5,148
Number of canine drug interdiction operations conducted 454 510 520
Total arrests by Narcotics Division 761 889 900
Public Safety60
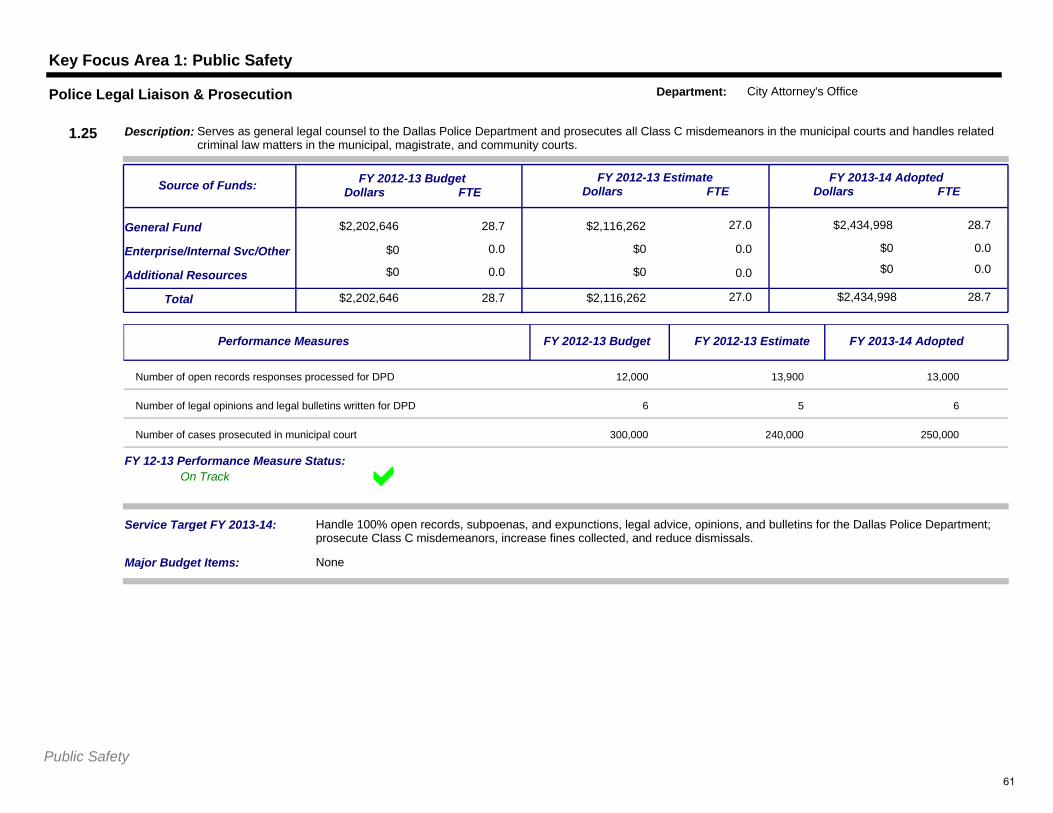
Key Focus Area 1: Public Safety
$2,202,646 28.7
0.0
$2,116,262 27.0
$0 0.0
$2,434,998
$0 0.0
28.7General Fund
Additional Resources
Service Target FY 2013-14: Handle 100% open records, subpoenas, and expunctions, legal advice, opinions, and bulletins for the Dallas Police Department; prosecute Class C misdemeanors, increase fines collected, and reduce dismissals.
$2,202,646Total 28.7 $2,116,262 27.0 $2,434,998 28.7
Enterprise/Internal Svc/Other
$0 0.0 $0 0.0 $0 0.0
FY 2012-13 BudgetDollars FTE
FY 2012-13 EstimateDollars FTE
FY 2013-14 AdoptedDollars FTE
Description: Serves as general legal counsel to the Dallas Police Department and prosecutes all Class C misdemeanors in the municipal courts and handles related criminal law matters in the municipal, magistrate, and community courts.
Source of Funds:
1.25
Police Legal Liaison & Prosecution Department: City Attorney's Office
$0
Major Budget Items: None
On TrackFY 12-13 Performance Measure Status:
Performance Measures FY 2012-13 Budget FY 2012-13 Estimate FY 2013-14 Adopted
Number of open records responses processed for DPD 12,000 13,900 13,000
Number of legal opinions and legal bulletins written for DPD 6 5 6
Number of cases prosecuted in municipal court 300,000 240,000 250,000
Public Safety61
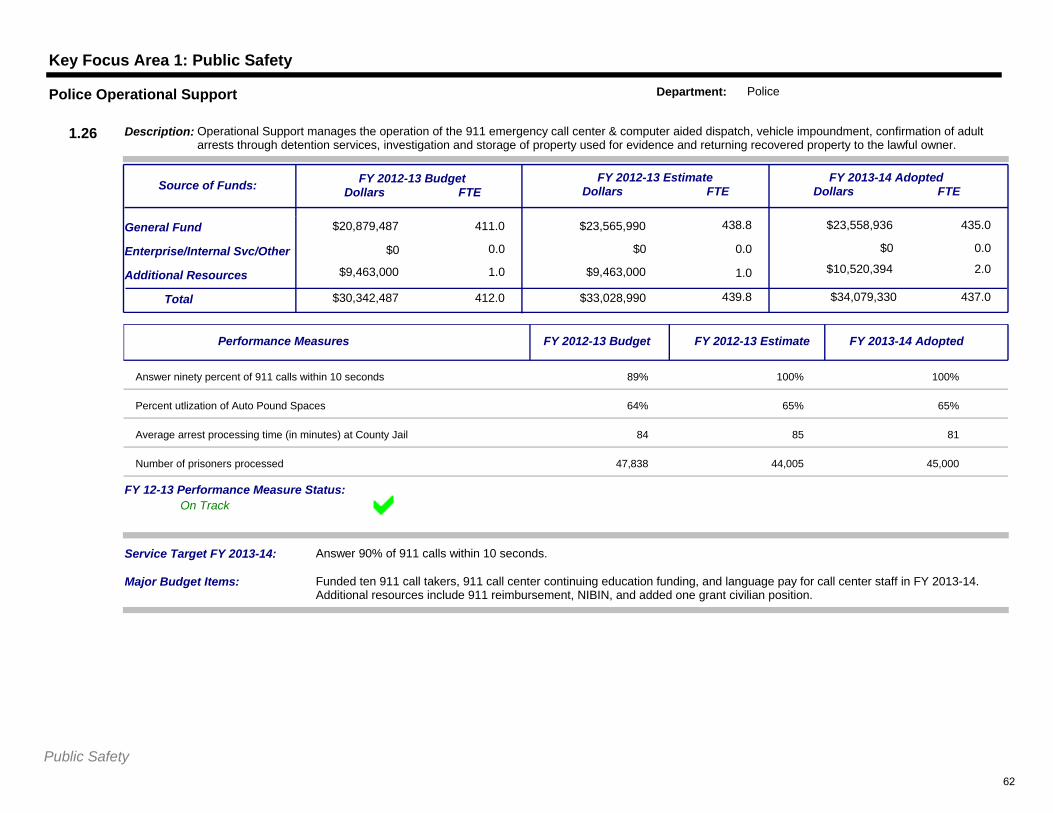
Key Focus Area 1: Public Safety
$20,879,487 411.0
0.0
$23,565,990 438.8
$0 0.0
$23,558,936
$0 0.0
435.0General Fund
Additional Resources
Service Target FY 2013-14: Answer 90% of 911 calls within 10 seconds.
$30,342,487Total 412.0 $33,028,990 439.8 $34,079,330 437.0
Enterprise/Internal Svc/Other
$9,463,000 1.0 $9,463,000 1.0 $10,520,394 2.0
FY 2012-13 BudgetDollars FTE
FY 2012-13 EstimateDollars FTE
FY 2013-14 AdoptedDollars FTE
Description: Operational Support manages the operation of the 911 emergency call center & computer aided dispatch, vehicle impoundment, confirmation of adult arrests through detention services, investigation and storage of property used for evidence and returning recovered property to the lawful owner.
Source of Funds:
1.26
Police Operational Support Department: Police
$0
Major Budget Items: Funded ten 911 call takers, 911 call center continuing education funding, and language pay for call center staff in FY 2013-14. Additional resources include 911 reimbursement, NIBIN, and added one grant civilian position.
On TrackFY 12-13 Performance Measure Status:
Performance Measures FY 2012-13 Budget FY 2012-13 Estimate FY 2013-14 Adopted
Answer ninety percent of 911 calls within 10 seconds 89% 100% 100%
Percent utlization of Auto Pound Spaces 64% 65% 65%
Average arrest processing time (in minutes) at County Jail 84 85 81
Number of prisoners processed 47,838 44,005 45,000
Public Safety62
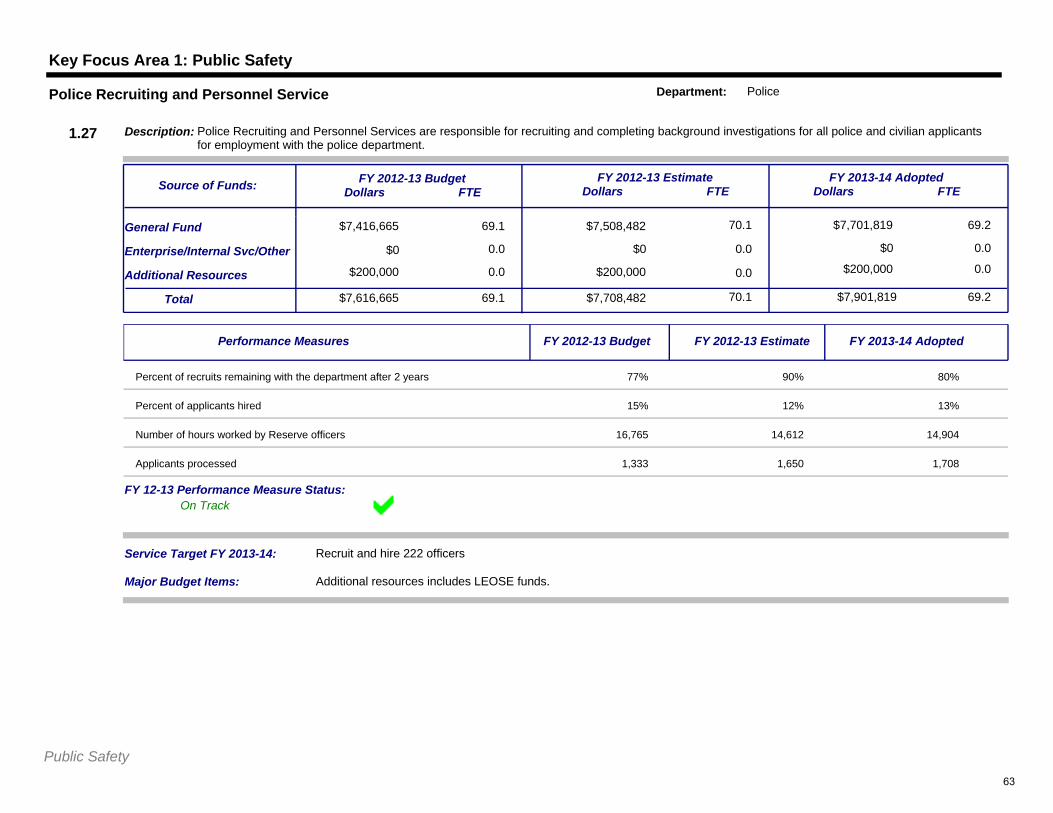
Key Focus Area 1: Public Safety
$7,416,665 69.1
0.0
$7,508,482 70.1
$0 0.0
$7,701,819
$0 0.0
69.2General Fund
Additional Resources
Service Target FY 2013-14: Recruit and hire 222 officers
$7,616,665Total 69.1 $7,708,482 70.1 $7,901,819 69.2
Enterprise/Internal Svc/Other
$200,000 0.0 $200,000 0.0 $200,000 0.0
FY 2012-13 BudgetDollars FTE
FY 2012-13 EstimateDollars FTE
FY 2013-14 AdoptedDollars FTE
Description: Police Recruiting and Personnel Services are responsible for recruiting and completing background investigations for all police and civilian applicants for employment with the police department.
Source of Funds:
1.27
Police Recruiting and Personnel Service Department: Police
$0
Major Budget Items: Additional resources includes LEOSE funds.
On TrackFY 12-13 Performance Measure Status:
Performance Measures FY 2012-13 Budget FY 2012-13 Estimate FY 2013-14 Adopted
Percent of recruits remaining with the department after 2 years 77% 90% 80%
Percent of applicants hired 15% 12% 13%
Number of hours worked by Reserve officers 16,765 14,612 14,904
Applicants processed 1,333 1,650 1,708
Public Safety63
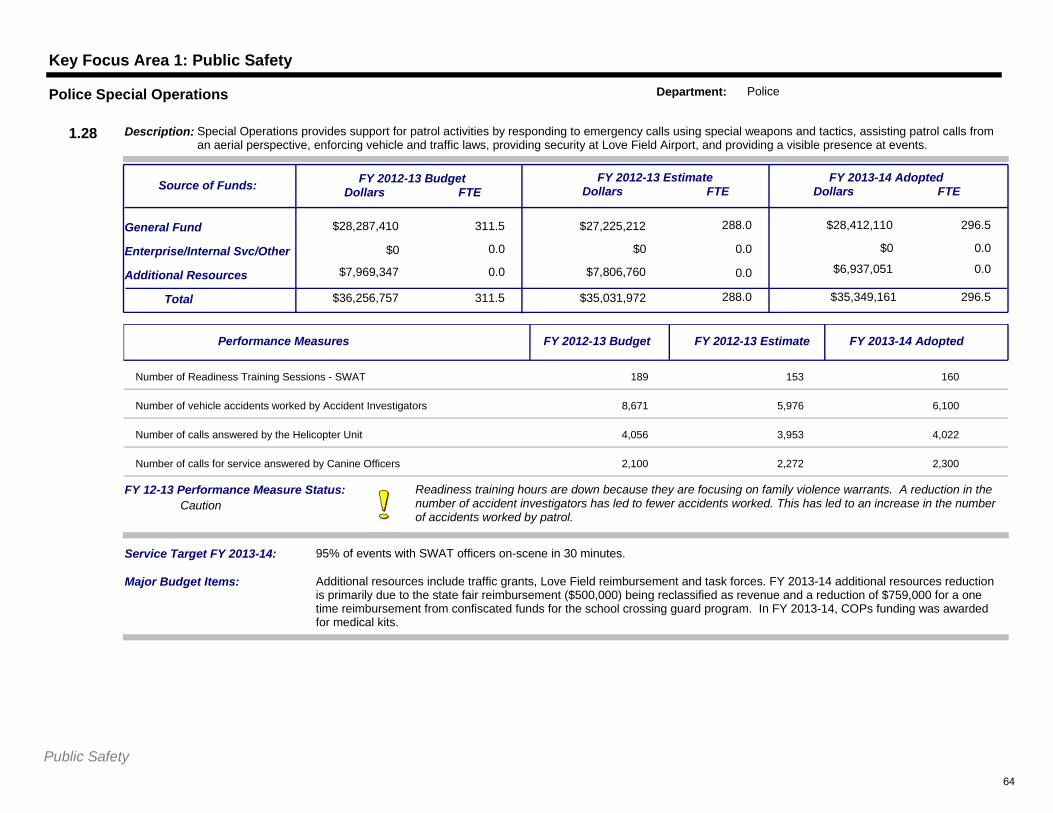
Key Focus Area 1: Public Safety
$28,287,410 311.5
0.0
$27,225,212 288.0
$0 0.0
$28,412,110
$0 0.0
296.5General Fund
Additional Resources
Service Target FY 2013-14: 95% of events with SWAT officers on-scene in 30 minutes.
$36,256,757Total 311.5 $35,031,972 288.0 $35,349,161 296.5
Enterprise/Internal Svc/Other
$7,969,347 0.0 $7,806,760 0.0 $6,937,051 0.0
FY 2012-13 BudgetDollars FTE
FY 2012-13 EstimateDollars FTE
FY 2013-14 AdoptedDollars FTE
Description: Special Operations provides support for patrol activities by responding to emergency calls using special weapons and tactics, assisting patrol calls from an aerial perspective, enforcing vehicle and traffic laws, providing security at Love Field Airport, and providing a visible presence at events.
Source of Funds:
1.28
Police Special Operations Department: Police
$0
Major Budget Items: Additional resources include traffic grants, Love Field reimbursement and task forces. FY 2013-14 additional resources reduction is primarily due to the state fair reimbursement ($500,000) being reclassified as revenue and a reduction of $759,000 for a one time reimbursement from confiscated funds for the school crossing guard program. In FY 2013-14, COPs funding was awarded for medical kits.
Readiness training hours are down because they are focusing on family violence warrants. A reduction in the number of accident investigators has led to fewer accidents worked. This has led to an increase in the number of accidents worked by patrol.
CautionFY 12-13 Performance Measure Status:
Performance Measures FY 2012-13 Budget FY 2012-13 Estimate FY 2013-14 Adopted
Number of Readiness Training Sessions - SWAT 189 153 160
Number of vehicle accidents worked by Accident Investigators 8,671 5,976 6,100
Number of calls answered by the Helicopter Unit 4,056 3,953 4,022
Number of calls for service answered by Canine Officers 2,100 2,272 2,300
Public Safety64
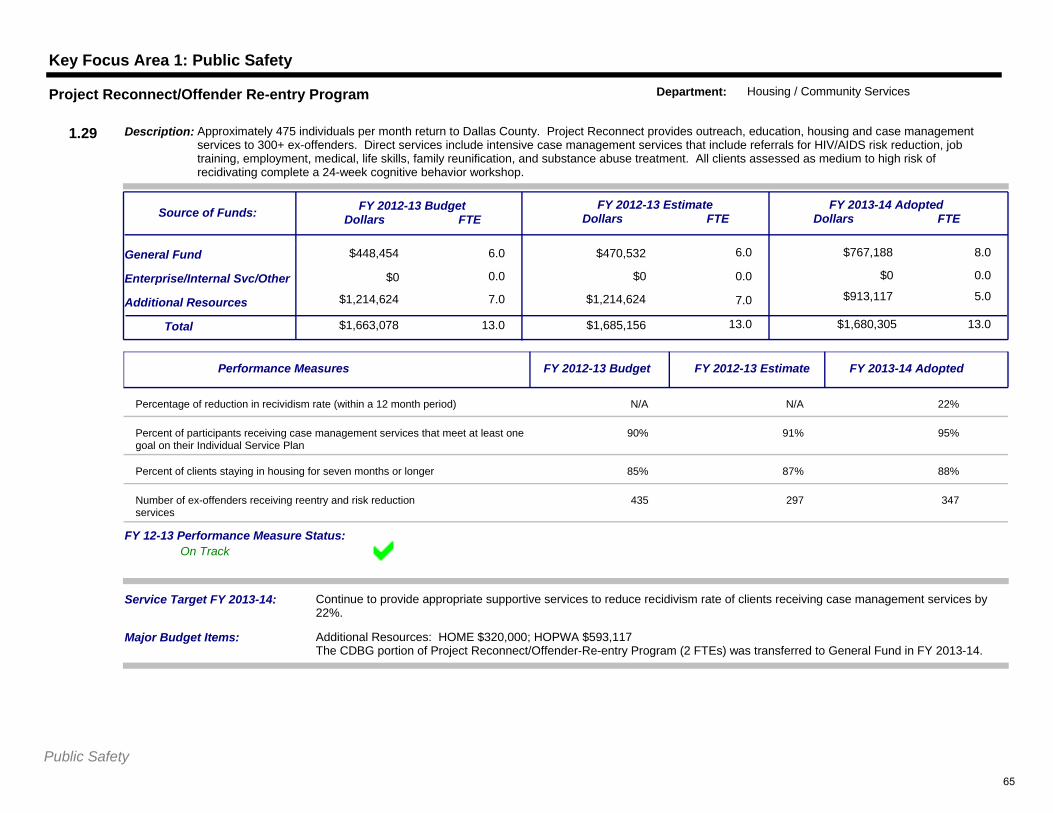
Key Focus Area 1: Public Safety
$448,454 6.0
0.0
$470,532 6.0
$0 0.0
$767,188
$0 0.0
8.0General Fund
Additional Resources
Service Target FY 2013-14: Continue to provide appropriate supportive services to reduce recidivism rate of clients receiving case management services by 22%.
$1,663,078Total 13.0 $1,685,156 13.0 $1,680,305 13.0
Enterprise/Internal Svc/Other
$1,214,624 7.0 $1,214,624 7.0 $913,117 5.0
FY 2012-13 BudgetDollars FTE
FY 2012-13 EstimateDollars FTE
FY 2013-14 AdoptedDollars FTE
Description: Approximately 475 individuals per month return to Dallas County. Project Reconnect provides outreach, education, housing and case management services to 300+ ex-offenders. Direct services include intensive case management services that include referrals for HIV/AIDS risk reduction, job training, employment, medical, life skills, family reunification, and substance abuse treatment. All clients assessed as medium to high risk of recidivating complete a 24-week cognitive behavior workshop.
Source of Funds:
1.29
Project Reconnect/Offender Re-entry Program Department: Housing / Community Services
$0
Major Budget Items: Additional Resources: HOME $320,000; HOPWA $593,117The CDBG portion of Project Reconnect/Offender-Re-entry Program (2 FTEs) was transferred to General Fund in FY 2013-14.
On TrackFY 12-13 Performance Measure Status:
Performance Measures FY 2012-13 Budget FY 2012-13 Estimate FY 2013-14 Adopted
Percentage of reduction in recividism rate (within a 12 month period) N/A N/A 22%
Percent of participants receiving case management services that meet at least one goal on their Individual Service Plan
90% 91% 95%
Percent of clients staying in housing for seven months or longer 85% 87% 88%
Number of ex-offenders receiving reentry and risk reduction services
435 297 347
Public Safety65
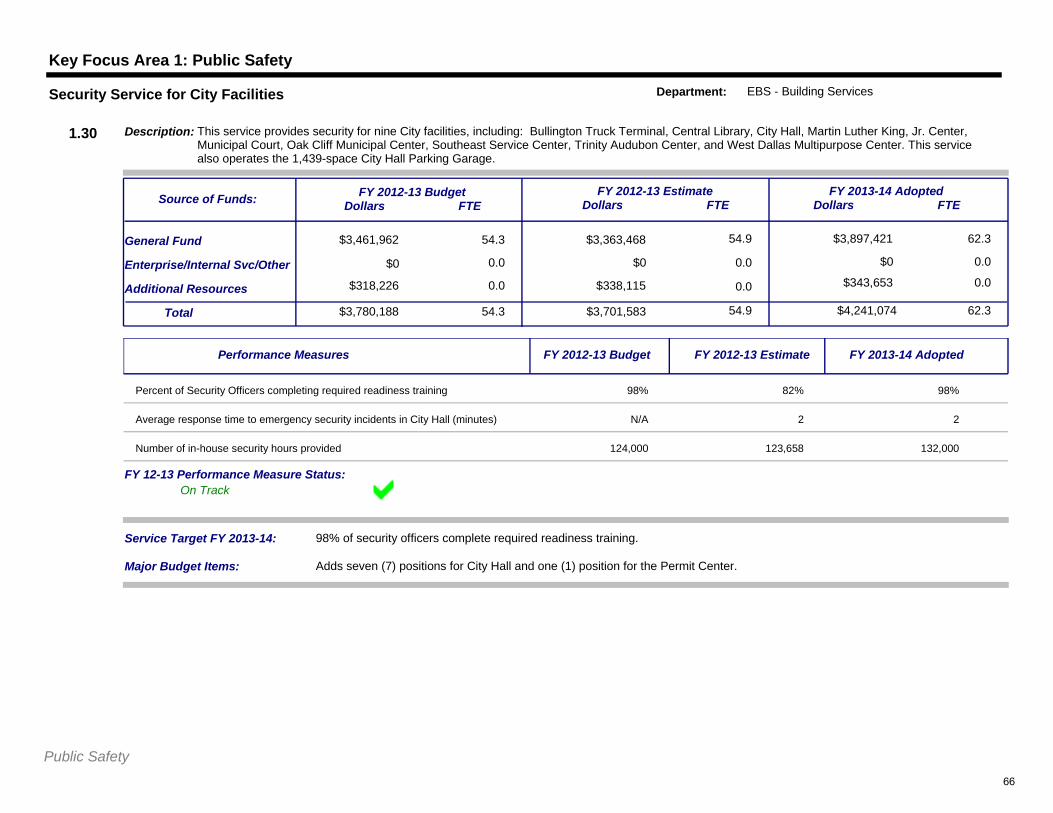
Key Focus Area 1: Public Safety
$3,461,962 54.3
0.0
$3,363,468 54.9
$0 0.0
$3,897,421
$0 0.0
62.3General Fund
Additional Resources
Service Target FY 2013-14: 98% of security officers complete required readiness training.
$3,780,188Total 54.3 $3,701,583 54.9 $4,241,074 62.3
Enterprise/Internal Svc/Other
$318,226 0.0 $338,115 0.0 $343,653 0.0
FY 2012-13 BudgetDollars FTE
FY 2012-13 EstimateDollars FTE
FY 2013-14 AdoptedDollars FTE
Description: This service provides security for nine City facilities, including: Bullington Truck Terminal, Central Library, City Hall, Martin Luther King, Jr. Center, Municipal Court, Oak Cliff Municipal Center, Southeast Service Center, Trinity Audubon Center, and West Dallas Multipurpose Center. This service also operates the 1,439-space City Hall Parking Garage.
Source of Funds:
1.30
Security Service for City Facilities Department: EBS - Building Services
$0
Major Budget Items: Adds seven (7) positions for City Hall and one (1) position for the Permit Center.
On TrackFY 12-13 Performance Measure Status:
Performance Measures FY 2012-13 Budget FY 2012-13 Estimate FY 2013-14 Adopted
Percent of Security Officers completing required readiness training 98% 82% 98%
Average response time to emergency security incidents in City Hall (minutes) N/A 2 2
Number of in-house security hours provided 124,000 123,658 132,000
Public Safety66
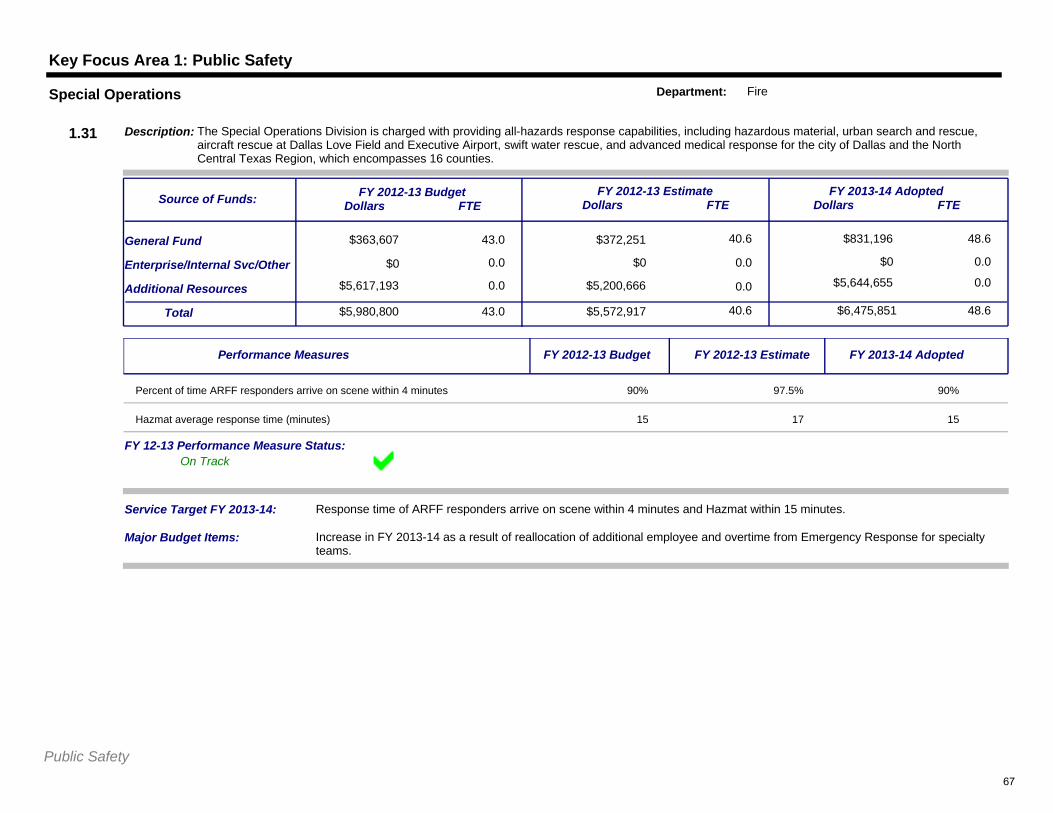
Key Focus Area 1: Public Safety
$363,607 43.0
0.0
$372,251 40.6
$0 0.0
$831,196
$0 0.0
48.6General Fund
Additional Resources
Service Target FY 2013-14: Response time of ARFF responders arrive on scene within 4 minutes and Hazmat within 15 minutes.
$5,980,800Total 43.0 $5,572,917 40.6 $6,475,851 48.6
Enterprise/Internal Svc/Other
$5,617,193 0.0 $5,200,666 0.0 $5,644,655 0.0
FY 2012-13 BudgetDollars FTE
FY 2012-13 EstimateDollars FTE
FY 2013-14 AdoptedDollars FTE
Description: The Special Operations Division is charged with providing all-hazards response capabilities, including hazardous material, urban search and rescue, aircraft rescue at Dallas Love Field and Executive Airport, swift water rescue, and advanced medical response for the city of Dallas and the North Central Texas Region, which encompasses 16 counties.
Source of Funds:
1.31
Special Operations Department: Fire
$0
Major Budget Items: Increase in FY 2013-14 as a result of reallocation of additional employee and overtime from Emergency Response for specialty teams.
On TrackFY 12-13 Performance Measure Status:
Performance Measures FY 2012-13 Budget FY 2012-13 Estimate FY 2013-14 Adopted
Percent of time ARFF responders arrive on scene within 4 minutes 90% 97.5% 90%
Hazmat average response time (minutes) 15 17 15
Public Safety67

68
Economic Vibrancy A vibrant, sustainable economy offering diverse business opportunities, thriving neighborhoods, premier attractions, reliable
city services, and quality infrastructure
2013-2014
69

70
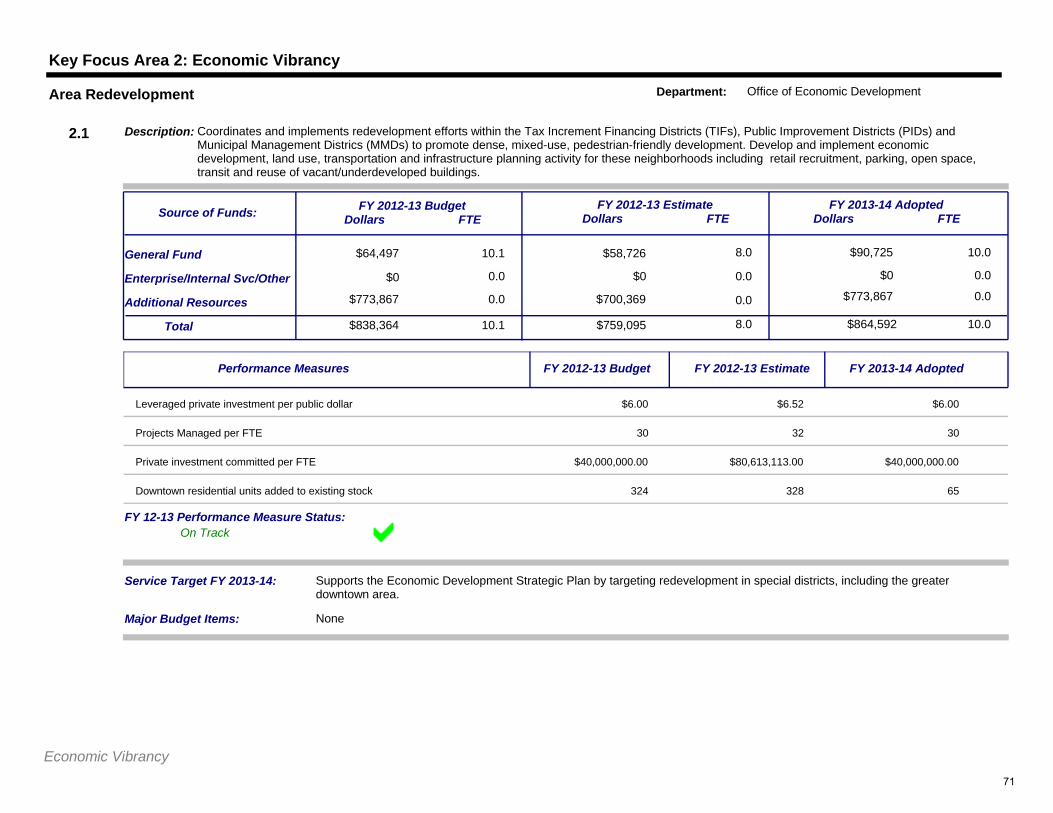
Key Focus Area 2: Economic Vibrancy
$64,497 10.1
0.0
$58,726 8.0
$0 0.0
$90,725
$0 0.0
10.0General Fund
Additional Resources
Service Target FY 2013-14: Supports the Economic Development Strategic Plan by targeting redevelopment in special districts, including the greater downtown area.
$838,364Total 10.1 $759,095 8.0 $864,592 10.0
Enterprise/Internal Svc/Other
$773,867 0.0 $700,369 0.0 $773,867 0.0
FY 2012-13 BudgetDollars FTE
FY 2012-13 EstimateDollars FTE
FY 2013-14 AdoptedDollars FTE
Description: Coordinates and implements redevelopment efforts within the Tax Increment Financing Districts (TIFs), Public Improvement Districts (PIDs) and Municipal Management Districs (MMDs) to promote dense, mixed-use, pedestrian-friendly development. Develop and implement economic development, land use, transportation and infrastructure planning activity for these neighborhoods including retail recruitment, parking, open space, transit and reuse of vacant/underdeveloped buildings.
Source of Funds:
2.1
Area Redevelopment Department: Office of Economic Development
$0
Major Budget Items: None
On TrackFY 12-13 Performance Measure Status:
Performance Measures FY 2012-13 Budget FY 2012-13 Estimate FY 2013-14 Adopted
Leveraged private investment per public dollar $6.00 $6.52 $6.00
Projects Managed per FTE 30 32 30
Private investment committed per FTE $40,000,000.00 $80,613,113.00 $40,000,000.00
Downtown residential units added to existing stock 324 328 65
Economic Vibrancy71
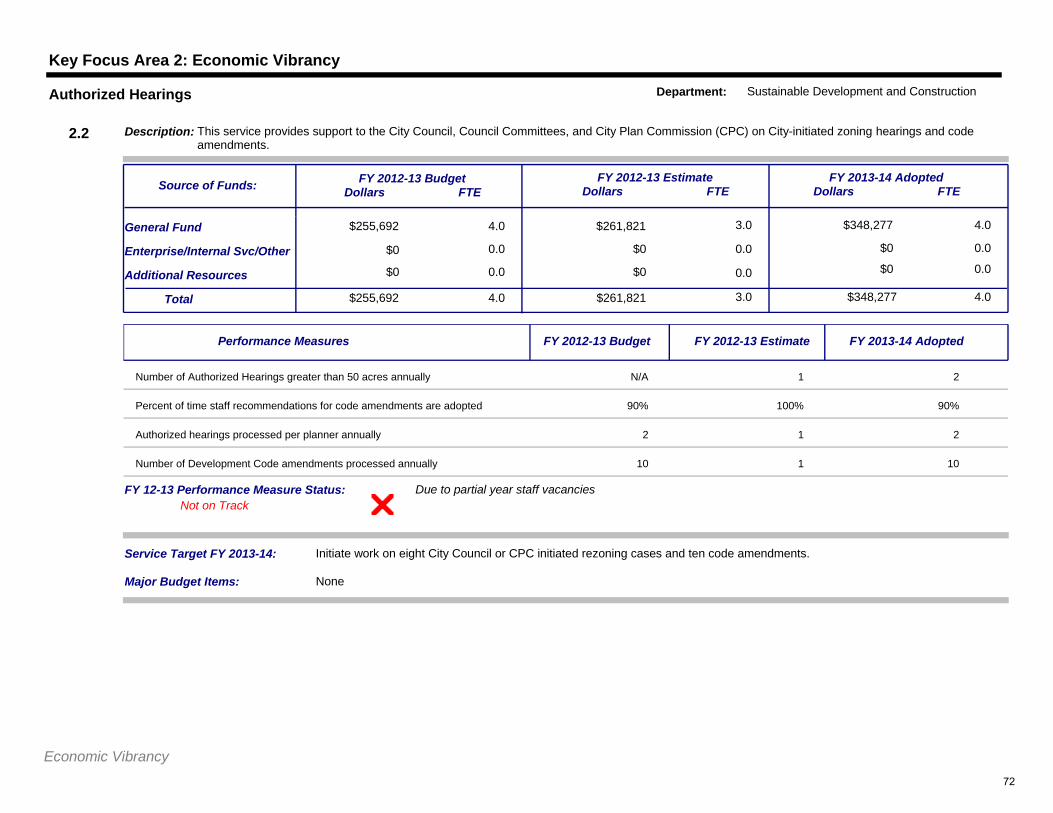
Key Focus Area 2: Economic Vibrancy
$255,692 4.0
0.0
$261,821 3.0
$0 0.0
$348,277
$0 0.0
4.0General Fund
Additional Resources
Service Target FY 2013-14: Initiate work on eight City Council or CPC initiated rezoning cases and ten code amendments.
$255,692Total 4.0 $261,821 3.0 $348,277 4.0
Enterprise/Internal Svc/Other
$0 0.0 $0 0.0 $0 0.0
FY 2012-13 BudgetDollars FTE
FY 2012-13 EstimateDollars FTE
FY 2013-14 AdoptedDollars FTE
Description: This service provides support to the City Council, Council Committees, and City Plan Commission (CPC) on City-initiated zoning hearings and code amendments.
Source of Funds:
2.2
Authorized Hearings Department: Sustainable Development and Construction
$0
Major Budget Items: None
Due to partial year staff vacanciesNot on Track
FY 12-13 Performance Measure Status:
Performance Measures FY 2012-13 Budget FY 2012-13 Estimate FY 2013-14 Adopted
Number of Authorized Hearings greater than 50 acres annually N/A 1 2
Percent of time staff recommendations for code amendments are adopted 90% 100% 90%
Authorized hearings processed per planner annually 2 1 2
Number of Development Code amendments processed annually 10 1 10
Economic Vibrancy72
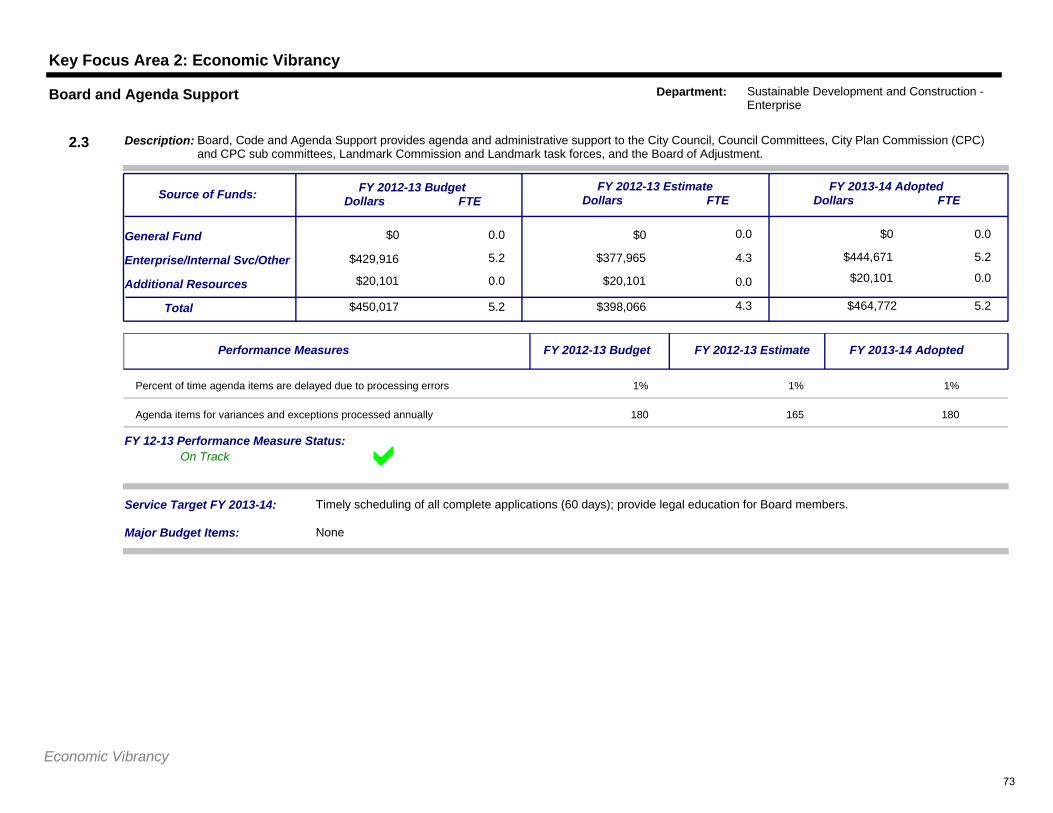
Key Focus Area 2: Economic Vibrancy
$0 0.0
5.2
$0 0.0
$377,965 4.3
$0
$444,671 5.2
0.0General Fund
Additional Resources
Service Target FY 2013-14: Timely scheduling of all complete applications (60 days); provide legal education for Board members.
$450,017Total 5.2 $398,066 4.3 $464,772 5.2
Enterprise/Internal Svc/Other
$20,101 0.0 $20,101 0.0 $20,101 0.0
FY 2012-13 BudgetDollars FTE
FY 2012-13 EstimateDollars FTE
FY 2013-14 AdoptedDollars FTE
Description: Board, Code and Agenda Support provides agenda and administrative support to the City Council, Council Committees, City Plan Commission (CPC) and CPC sub committees, Landmark Commission and Landmark task forces, and the Board of Adjustment.
Source of Funds:
2.3
Board and Agenda Support Department: Sustainable Development and Construction - Enterprise
$429,916
Major Budget Items: None
On TrackFY 12-13 Performance Measure Status:
Performance Measures FY 2012-13 Budget FY 2012-13 Estimate FY 2013-14 Adopted
Percent of time agenda items are delayed due to processing errors 1% 1% 1%
Agenda items for variances and exceptions processed annually 180 165 180
Economic Vibrancy73
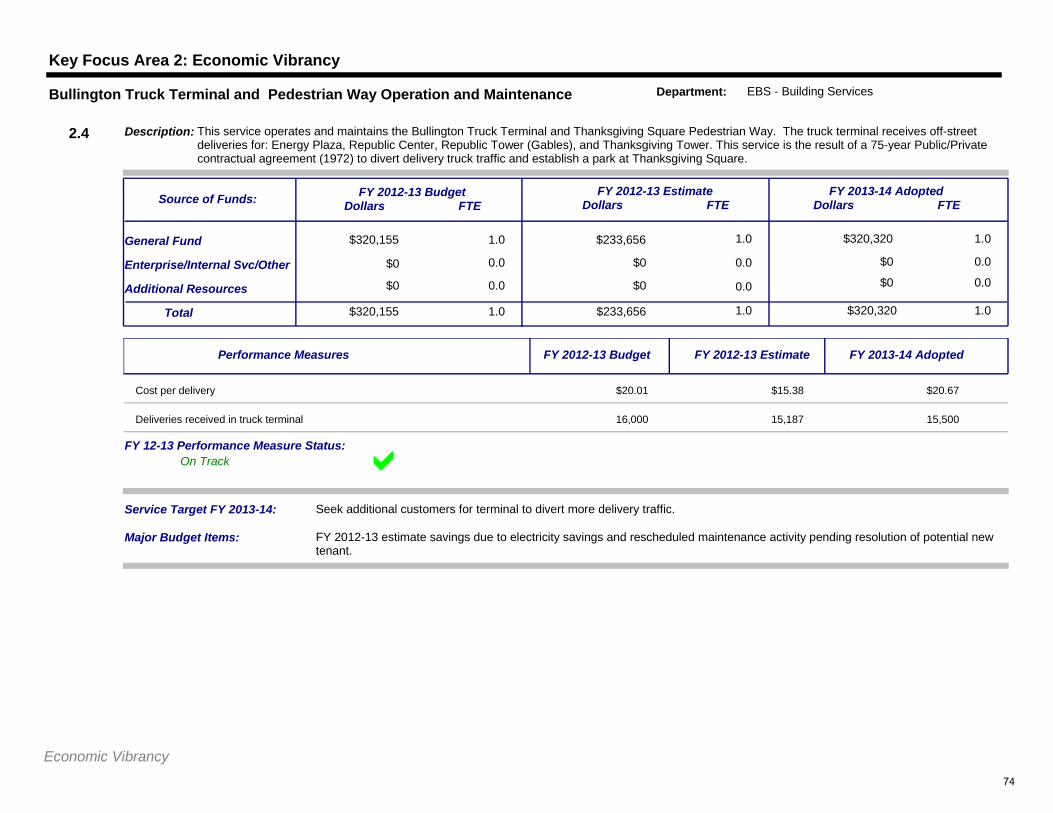
Key Focus Area 2: Economic Vibrancy
$320,155 1.0
0.0
$233,656 1.0
$0 0.0
$320,320
$0 0.0
1.0General Fund
Additional Resources
Service Target FY 2013-14: Seek additional customers for terminal to divert more delivery traffic.
$320,155Total 1.0 $233,656 1.0 $320,320 1.0
Enterprise/Internal Svc/Other
$0 0.0 $0 0.0 $0 0.0
FY 2012-13 BudgetDollars FTE
FY 2012-13 EstimateDollars FTE
FY 2013-14 AdoptedDollars FTE
Description: This service operates and maintains the Bullington Truck Terminal and Thanksgiving Square Pedestrian Way. The truck terminal receives off-street deliveries for: Energy Plaza, Republic Center, Republic Tower (Gables), and Thanksgiving Tower. This service is the result of a 75-year Public/Private contractual agreement (1972) to divert delivery truck traffic and establish a park at Thanksgiving Square.
Source of Funds:
2.4
Bullington Truck Terminal and Pedestrian Way Operation and Maintenance Department: EBS - Building Services
$0
Major Budget Items: FY 2012-13 estimate savings due to electricity savings and rescheduled maintenance activity pending resolution of potential new tenant.
On TrackFY 12-13 Performance Measure Status:
Performance Measures FY 2012-13 Budget FY 2012-13 Estimate FY 2013-14 Adopted
Cost per delivery $20.01 $15.38 $20.67
Deliveries received in truck terminal 16,000 15,187 15,500
Economic Vibrancy74
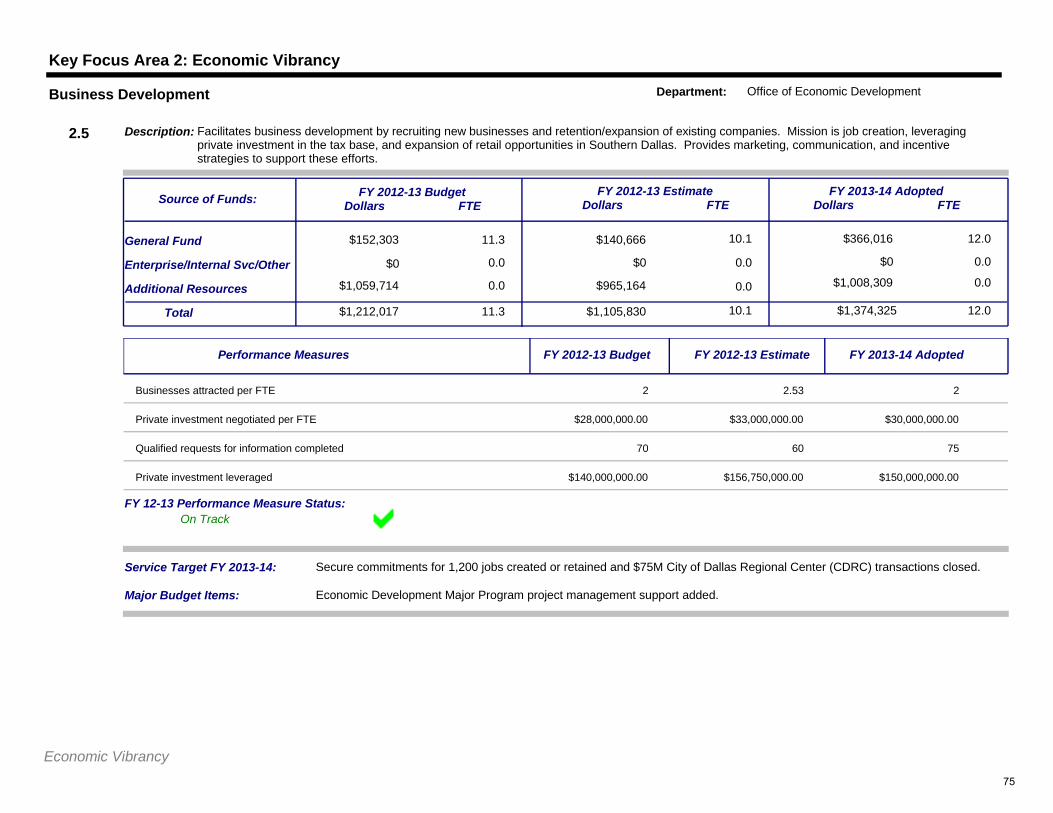
Key Focus Area 2: Economic Vibrancy
$152,303 11.3
0.0
$140,666 10.1
$0 0.0
$366,016
$0 0.0
12.0General Fund
Additional Resources
Service Target FY 2013-14: Secure commitments for 1,200 jobs created or retained and $75M City of Dallas Regional Center (CDRC) transactions closed.
$1,212,017Total 11.3 $1,105,830 10.1 $1,374,325 12.0
Enterprise/Internal Svc/Other
$1,059,714 0.0 $965,164 0.0 $1,008,309 0.0
FY 2012-13 BudgetDollars FTE
FY 2012-13 EstimateDollars FTE
FY 2013-14 AdoptedDollars FTE
Description: Facilitates business development by recruiting new businesses and retention/expansion of existing companies. Mission is job creation, leveraging private investment in the tax base, and expansion of retail opportunities in Southern Dallas. Provides marketing, communication, and incentive strategies to support these efforts.
Source of Funds:
2.5
Business Development Department: Office of Economic Development
$0
Major Budget Items: Economic Development Major Program project management support added.
On TrackFY 12-13 Performance Measure Status:
Performance Measures FY 2012-13 Budget FY 2012-13 Estimate FY 2013-14 Adopted
Businesses attracted per FTE 2 2.53 2
Private investment negotiated per FTE $28,000,000.00 $33,000,000.00 $30,000,000.00
Qualified requests for information completed 70 60 75
Private investment leveraged $140,000,000.00 $156,750,000.00 $150,000,000.00
Economic Vibrancy75
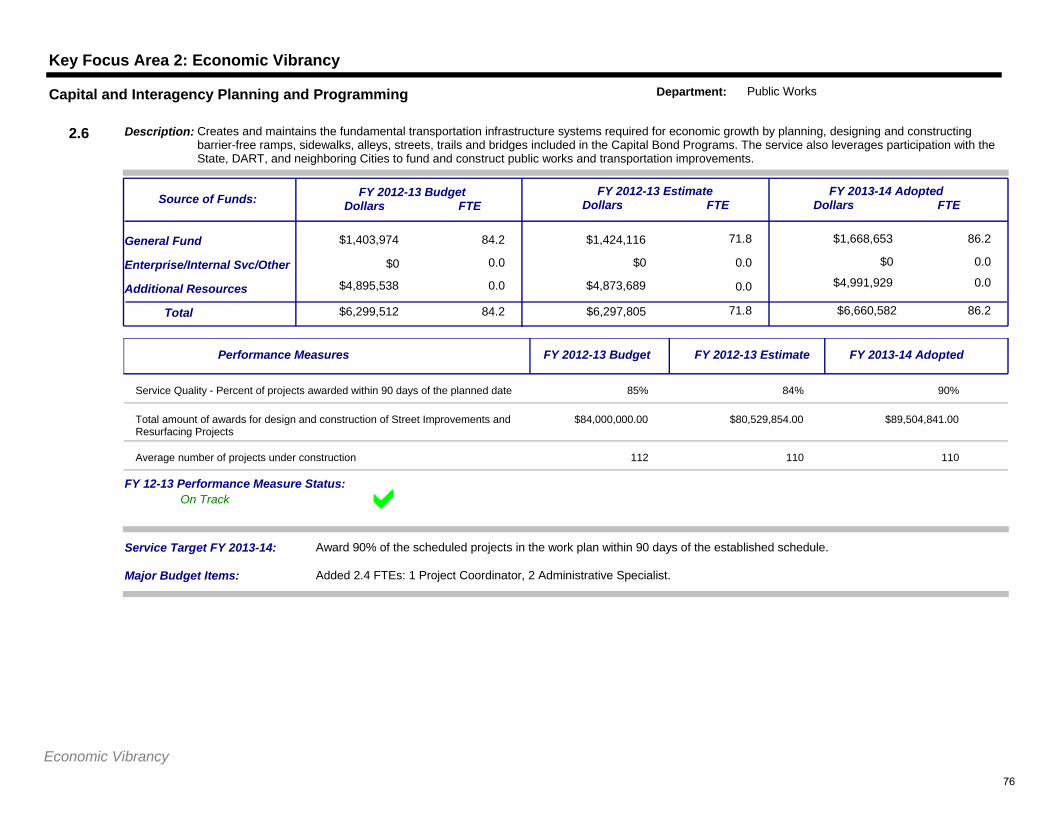
Key Focus Area 2: Economic Vibrancy
$1,403,974 84.2
0.0
$1,424,116 71.8
$0 0.0
$1,668,653
$0 0.0
86.2General Fund
Additional Resources
Service Target FY 2013-14: Award 90% of the scheduled projects in the work plan within 90 days of the established schedule.
$6,299,512Total 84.2 $6,297,805 71.8 $6,660,582 86.2
Enterprise/Internal Svc/Other
$4,895,538 0.0 $4,873,689 0.0 $4,991,929 0.0
FY 2012-13 BudgetDollars FTE
FY 2012-13 EstimateDollars FTE
FY 2013-14 AdoptedDollars FTE
Description: Creates and maintains the fundamental transportation infrastructure systems required for economic growth by planning, designing and constructing barrier-free ramps, sidewalks, alleys, streets, trails and bridges included in the Capital Bond Programs. The service also leverages participation with the State, DART, and neighboring Cities to fund and construct public works and transportation improvements.
Source of Funds:
2.6
Capital and Interagency Planning and Programming Department: Public Works
$0
Major Budget Items: Added 2.4 FTEs: 1 Project Coordinator, 2 Administrative Specialist.
On TrackFY 12-13 Performance Measure Status:
Performance Measures FY 2012-13 Budget FY 2012-13 Estimate FY 2013-14 Adopted
Service Quality - Percent of projects awarded within 90 days of the planned date 85% 84% 90%
Total amount of awards for design and construction of Street Improvements and Resurfacing Projects
$84,000,000.00 $80,529,854.00 $89,504,841.00
Average number of projects under construction 112 110 110
Economic Vibrancy76
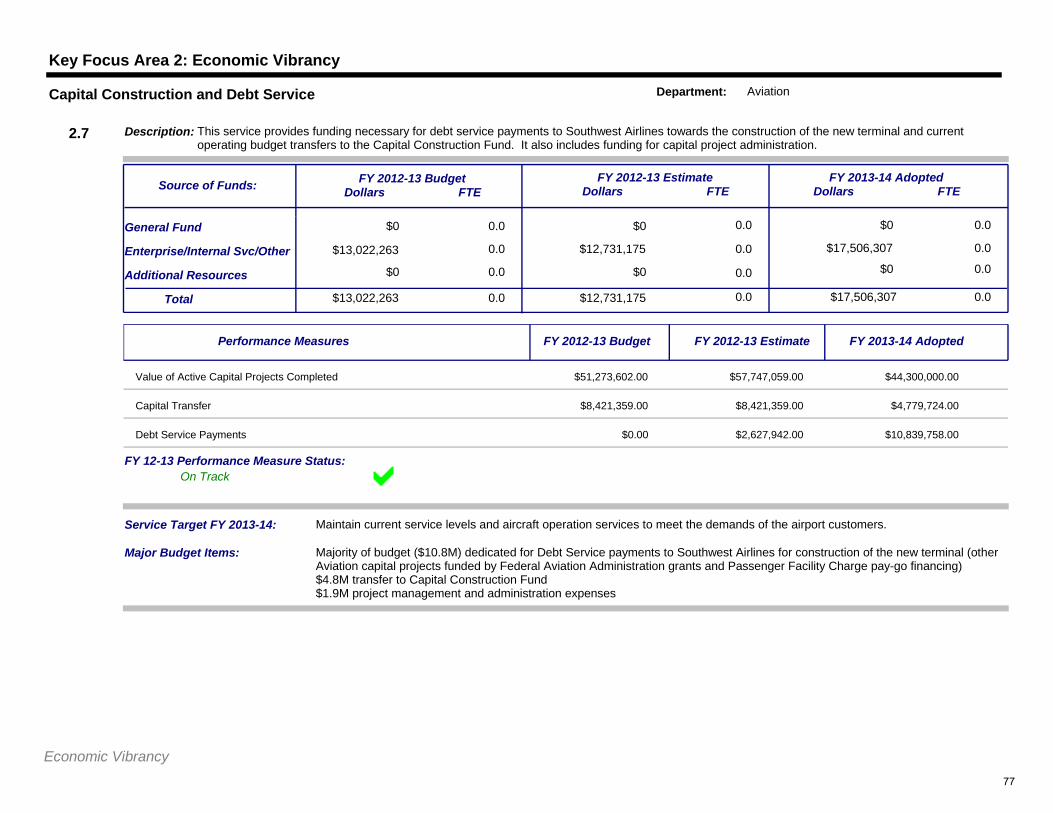
Key Focus Area 2: Economic Vibrancy
$0 0.0
0.0
$0 0.0
$12,731,175 0.0
$0
$17,506,307 0.0
0.0General Fund
Additional Resources
Service Target FY 2013-14: Maintain current service levels and aircraft operation services to meet the demands of the airport customers.
$13,022,263Total 0.0 $12,731,175 0.0 $17,506,307 0.0
Enterprise/Internal Svc/Other
$0 0.0 $0 0.0 $0 0.0
FY 2012-13 BudgetDollars FTE
FY 2012-13 EstimateDollars FTE
FY 2013-14 AdoptedDollars FTE
Description: This service provides funding necessary for debt service payments to Southwest Airlines towards the construction of the new terminal and current operating budget transfers to the Capital Construction Fund. It also includes funding for capital project administration.
Source of Funds:
2.7
Capital Construction and Debt Service Department: Aviation
$13,022,263
Major Budget Items: Majority of budget ($10.8M) dedicated for Debt Service payments to Southwest Airlines for construction of the new terminal (other Aviation capital projects funded by Federal Aviation Administration grants and Passenger Facility Charge pay-go financing)$4.8M transfer to Capital Construction Fund$1.9M project management and administration expenses
On TrackFY 12-13 Performance Measure Status:
Performance Measures FY 2012-13 Budget FY 2012-13 Estimate FY 2013-14 Adopted
Value of Active Capital Projects Completed $51,273,602.00 $57,747,059.00 $44,300,000.00
Capital Transfer $8,421,359.00 $8,421,359.00 $4,779,724.00
Debt Service Payments $0.00 $2,627,942.00 $10,839,758.00
Economic Vibrancy77
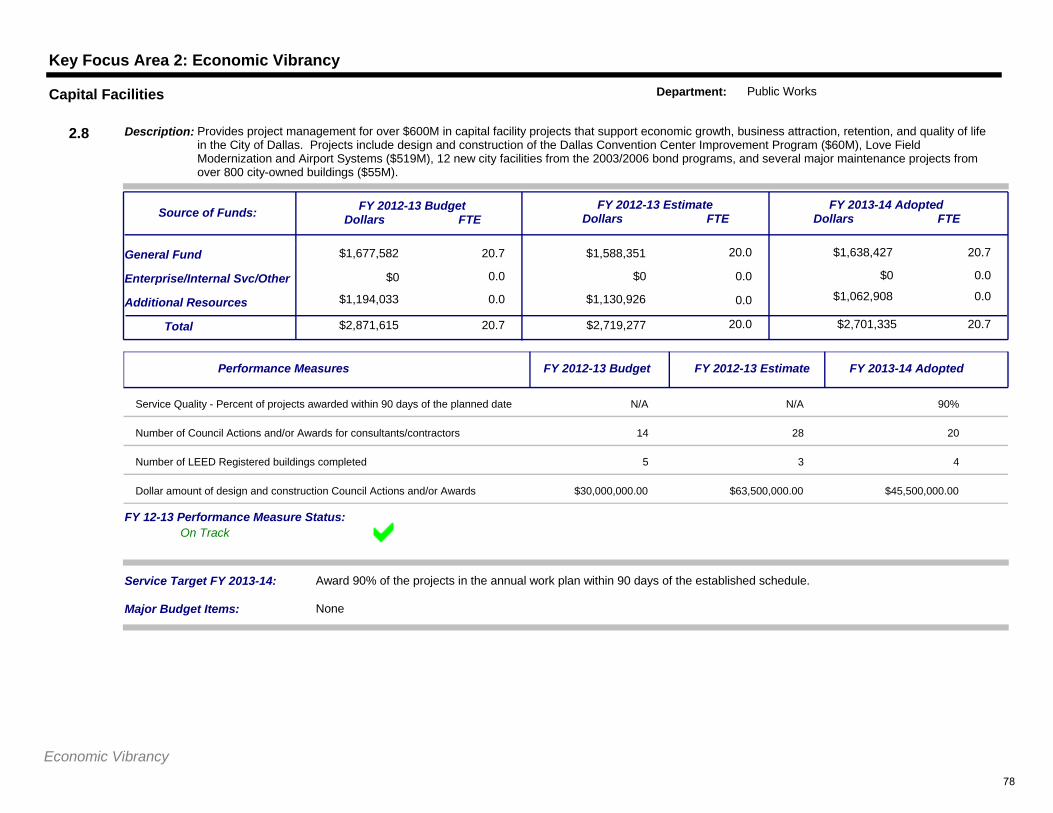
Key Focus Area 2: Economic Vibrancy
$1,677,582 20.7
0.0
$1,588,351 20.0
$0 0.0
$1,638,427
$0 0.0
20.7General Fund
Additional Resources
Service Target FY 2013-14: Award 90% of the projects in the annual work plan within 90 days of the established schedule.
$2,871,615Total 20.7 $2,719,277 20.0 $2,701,335 20.7
Enterprise/Internal Svc/Other
$1,194,033 0.0 $1,130,926 0.0 $1,062,908 0.0
FY 2012-13 BudgetDollars FTE
FY 2012-13 EstimateDollars FTE
FY 2013-14 AdoptedDollars FTE
Description: Provides project management for over $600M in capital facility projects that support economic growth, business attraction, retention, and quality of life in the City of Dallas. Projects include design and construction of the Dallas Convention Center Improvement Program ($60M), Love Field Modernization and Airport Systems ($519M), 12 new city facilities from the 2003/2006 bond programs, and several major maintenance projects from over 800 city-owned buildings ($55M).
Source of Funds:
2.8
Capital Facilities Department: Public Works
$0
Major Budget Items: None
On TrackFY 12-13 Performance Measure Status:
Performance Measures FY 2012-13 Budget FY 2012-13 Estimate FY 2013-14 Adopted
Service Quality - Percent of projects awarded within 90 days of the planned date N/A N/A 90%
Number of Council Actions and/or Awards for consultants/contractors 14 28 20
Number of LEED Registered buildings completed 5 3 4
Dollar amount of design and construction Council Actions and/or Awards $30,000,000.00 $63,500,000.00 $45,500,000.00
Economic Vibrancy78
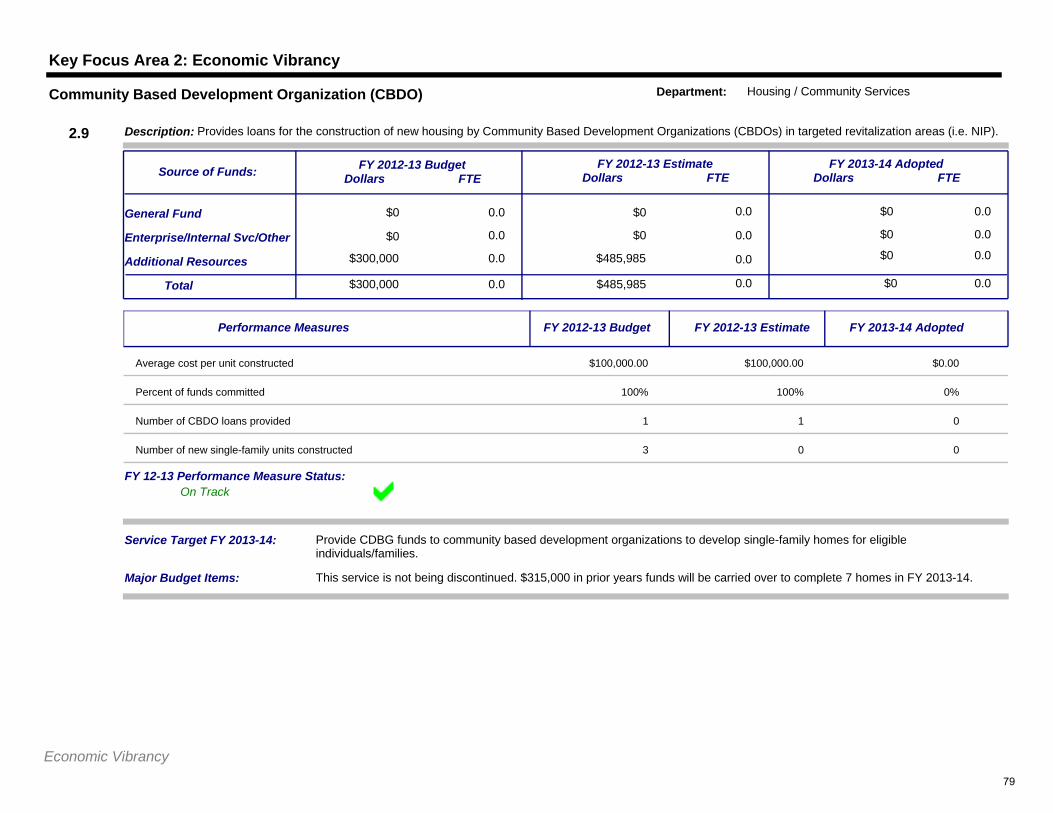
Key Focus Area 2: Economic Vibrancy
$0 0.0
0.0
$0 0.0
$0 0.0
$0
$0 0.0
0.0General Fund
Additional Resources
Service Target FY 2013-14: Provide CDBG funds to community based development organizations to develop single-family homes for eligible individuals/families.
$300,000Total 0.0 $485,985 0.0 $0 0.0
Enterprise/Internal Svc/Other
$300,000 0.0 $485,985 0.0 $0 0.0
FY 2012-13 BudgetDollars FTE
FY 2012-13 EstimateDollars FTE
FY 2013-14 AdoptedDollars FTE
Description: Provides loans for the construction of new housing by Community Based Development Organizations (CBDOs) in targeted revitalization areas (i.e. NIP).
Source of Funds:
2.9
Community Based Development Organization (CBDO) Department: Housing / Community Services
$0
Major Budget Items: This service is not being discontinued. $315,000 in prior years funds will be carried over to complete 7 homes in FY 2013-14.
On TrackFY 12-13 Performance Measure Status:
Performance Measures FY 2012-13 Budget FY 2012-13 Estimate FY 2013-14 Adopted
Average cost per unit constructed $100,000.00 $100,000.00 $0.00
Percent of funds committed 100% 100% 0%
Number of CBDO loans provided 1 1 0
Number of new single-family units constructed 3 0 0
Economic Vibrancy79
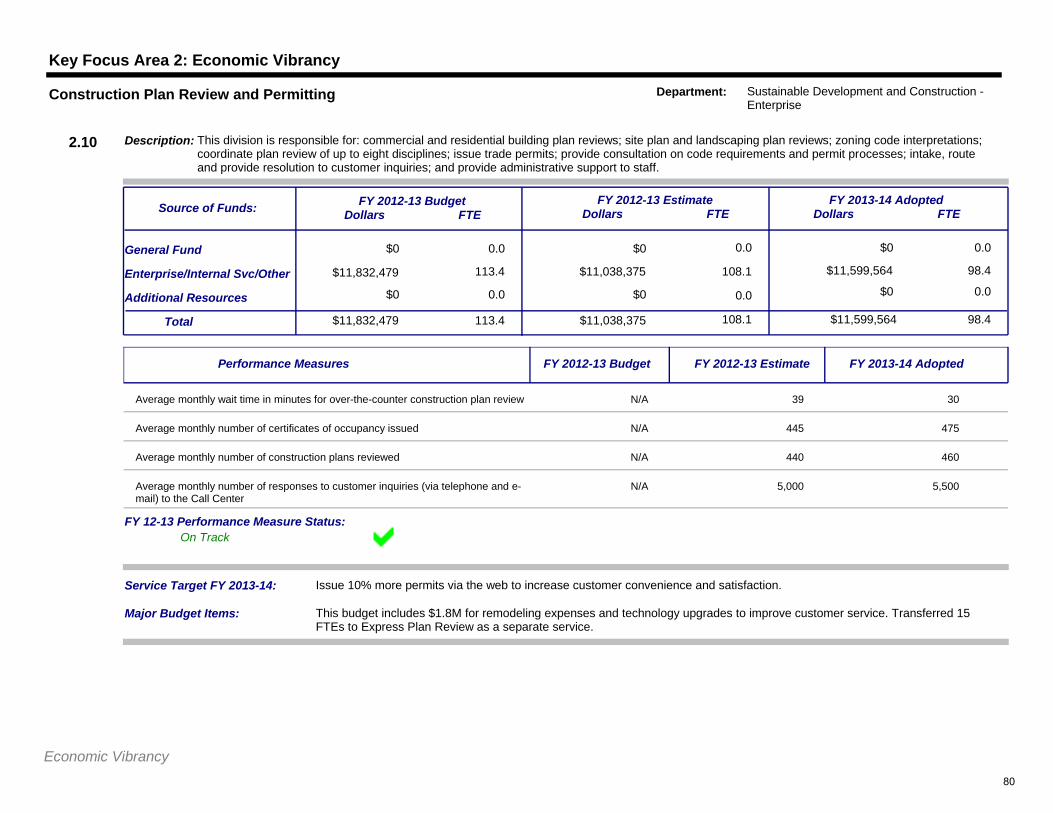
Key Focus Area 2: Economic Vibrancy
$0 0.0
113.4
$0 0.0
$11,038,375 108.1
$0
$11,599,564 98.4
0.0General Fund
Additional Resources
Service Target FY 2013-14: Issue 10% more permits via the web to increase customer convenience and satisfaction.
$11,832,479Total 113.4 $11,038,375 108.1 $11,599,564 98.4
Enterprise/Internal Svc/Other
$0 0.0 $0 0.0 $0 0.0
FY 2012-13 BudgetDollars FTE
FY 2012-13 EstimateDollars FTE
FY 2013-14 AdoptedDollars FTE
Description: This division is responsible for: commercial and residential building plan reviews; site plan and landscaping plan reviews; zoning code interpretations; coordinate plan review of up to eight disciplines; issue trade permits; provide consultation on code requirements and permit processes; intake, route and provide resolution to customer inquiries; and provide administrative support to staff.
Source of Funds:
2.10
Construction Plan Review and Permitting Department: Sustainable Development and Construction - Enterprise
$11,832,479
Major Budget Items: This budget includes $1.8M for remodeling expenses and technology upgrades to improve customer service. Transferred 15 FTEs to Express Plan Review as a separate service.
On TrackFY 12-13 Performance Measure Status:
Performance Measures FY 2012-13 Budget FY 2012-13 Estimate FY 2013-14 Adopted
Average monthly wait time in minutes for over-the-counter construction plan review N/A 39 30
Average monthly number of certificates of occupancy issued N/A 445 475
Average monthly number of construction plans reviewed N/A 440 460
Average monthly number of responses to customer inquiries (via telephone and e-mail) to the Call Center
N/A 5,000 5,500
Economic Vibrancy80
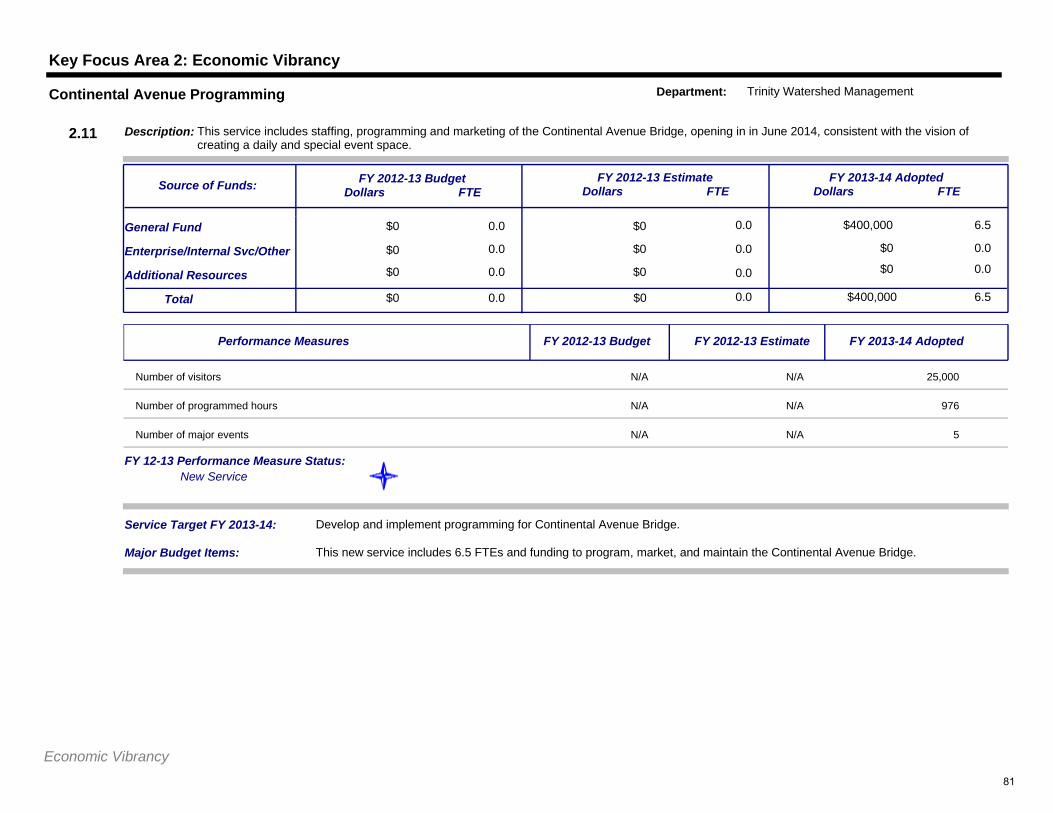
Key Focus Area 2: Economic Vibrancy
$0 0.0
0.0
$0 0.0
$0 0.0
$400,000
$0 0.0
6.5General Fund
Additional Resources
Service Target FY 2013-14: Develop and implement programming for Continental Avenue Bridge.
$0Total 0.0 $0 0.0 $400,000 6.5
Enterprise/Internal Svc/Other
$0 0.0 $0 0.0 $0 0.0
FY 2012-13 BudgetDollars FTE
FY 2012-13 EstimateDollars FTE
FY 2013-14 AdoptedDollars FTE
Description: This service includes staffing, programming and marketing of the Continental Avenue Bridge, opening in in June 2014, consistent with the vision of creating a daily and special event space.
Source of Funds:
2.11
Continental Avenue Programming Department: Trinity Watershed Management
$0
Major Budget Items: This new service includes 6.5 FTEs and funding to program, market, and maintain the Continental Avenue Bridge.
New ServiceFY 12-13 Performance Measure Status:
Performance Measures FY 2012-13 Budget FY 2012-13 Estimate FY 2013-14 Adopted
Number of visitors N/A N/A 25,000
Number of programmed hours N/A N/A 976
Number of major events N/A N/A 5
Economic Vibrancy81
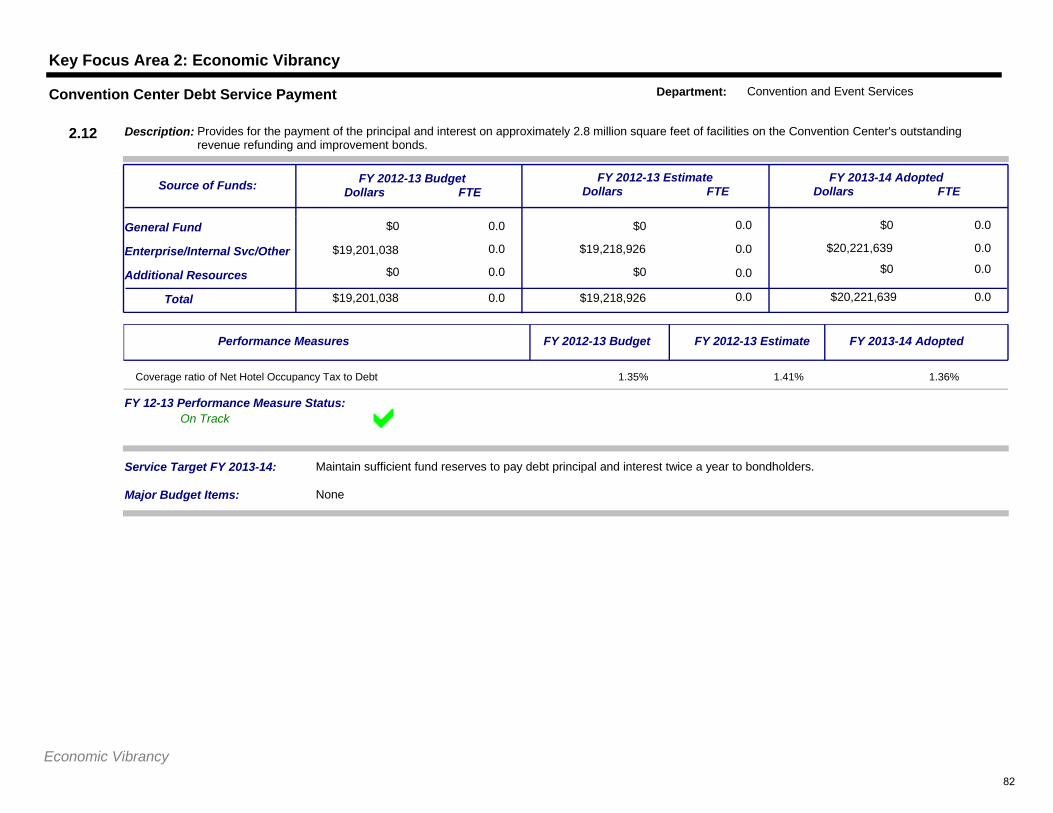
Key Focus Area 2: Economic Vibrancy
$0 0.0
0.0
$0 0.0
$19,218,926 0.0
$0
$20,221,639 0.0
0.0General Fund
Additional Resources
Service Target FY 2013-14: Maintain sufficient fund reserves to pay debt principal and interest twice a year to bondholders.
$19,201,038Total 0.0 $19,218,926 0.0 $20,221,639 0.0
Enterprise/Internal Svc/Other
$0 0.0 $0 0.0 $0 0.0
FY 2012-13 BudgetDollars FTE
FY 2012-13 EstimateDollars FTE
FY 2013-14 AdoptedDollars FTE
Description: Provides for the payment of the principal and interest on approximately 2.8 million square feet of facilities on the Convention Center's outstanding revenue refunding and improvement bonds.
Source of Funds:
2.12
Convention Center Debt Service Payment Department: Convention and Event Services
$19,201,038
Major Budget Items: None
On TrackFY 12-13 Performance Measure Status:
Performance Measures FY 2012-13 Budget FY 2012-13 Estimate FY 2013-14 Adopted
Coverage ratio of Net Hotel Occupancy Tax to Debt 1.35% 1.41% 1.36%
Economic Vibrancy82
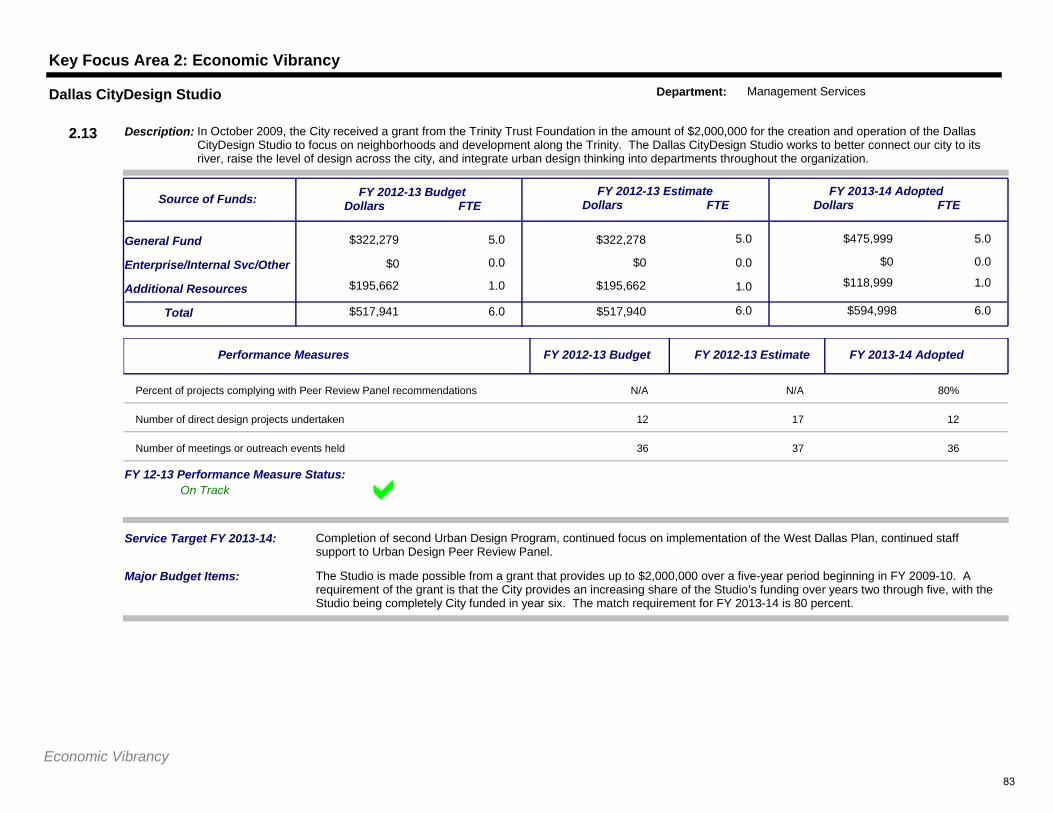
Key Focus Area 2: Economic Vibrancy
$322,279 5.0
0.0
$322,278 5.0
$0 0.0
$475,999
$0 0.0
5.0General Fund
Additional Resources
Service Target FY 2013-14: Completion of second Urban Design Program, continued focus on implementation of the West Dallas Plan, continued staff support to Urban Design Peer Review Panel.
$517,941Total 6.0 $517,940 6.0 $594,998 6.0
Enterprise/Internal Svc/Other
$195,662 1.0 $195,662 1.0 $118,999 1.0
FY 2012-13 BudgetDollars FTE
FY 2012-13 EstimateDollars FTE
FY 2013-14 AdoptedDollars FTE
Description: In October 2009, the City received a grant from the Trinity Trust Foundation in the amount of $2,000,000 for the creation and operation of the Dallas CityDesign Studio to focus on neighborhoods and development along the Trinity. The Dallas CityDesign Studio works to better connect our city to its river, raise the level of design across the city, and integrate urban design thinking into departments throughout the organization.
Source of Funds:
2.13
Dallas CityDesign Studio Department: Management Services
$0
Major Budget Items: The Studio is made possible from a grant that provides up to $2,000,000 over a five-year period beginning in FY 2009-10. A requirement of the grant is that the City provides an increasing share of the Studio’s funding over years two through five, with the Studio being completely City funded in year six. The match requirement for FY 2013-14 is 80 percent.
On TrackFY 12-13 Performance Measure Status:
Performance Measures FY 2012-13 Budget FY 2012-13 Estimate FY 2013-14 Adopted
Percent of projects complying with Peer Review Panel recommendations N/A N/A 80%
Number of direct design projects undertaken 12 17 12
Number of meetings or outreach events held 36 37 36
Economic Vibrancy83
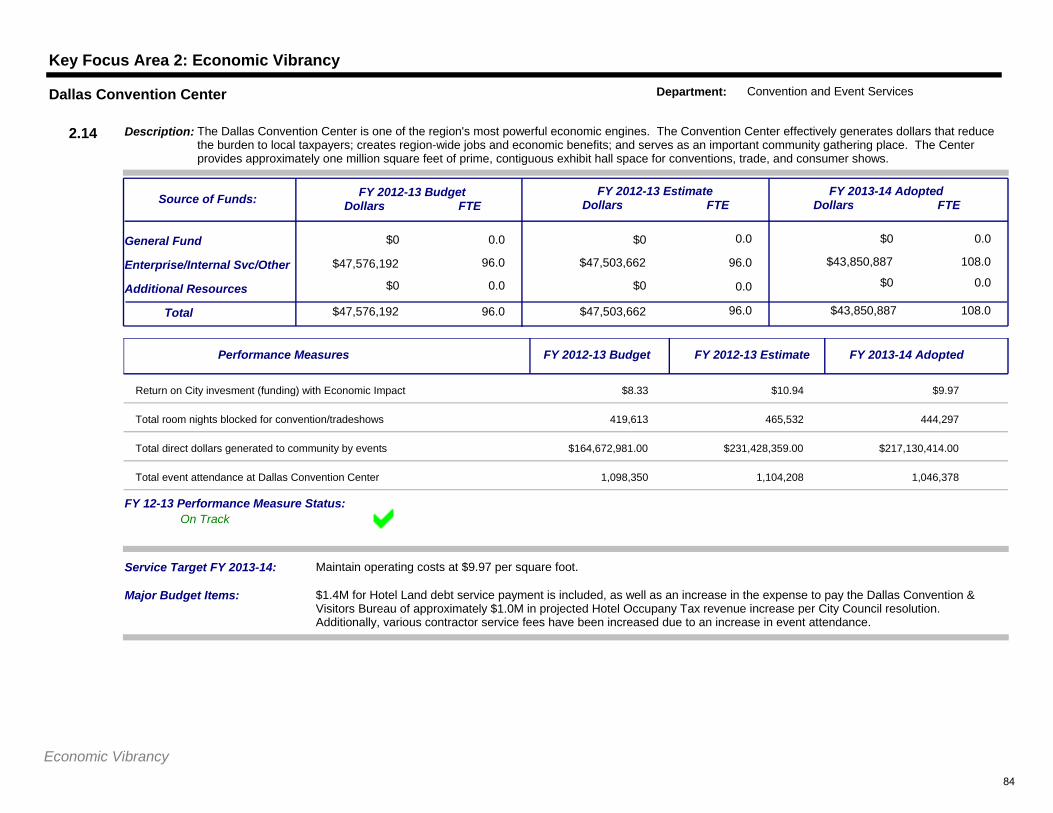
Key Focus Area 2: Economic Vibrancy
$0 0.0
96.0
$0 0.0
$47,503,662 96.0
$0
$43,850,887 108.0
0.0General Fund
Additional Resources
Service Target FY 2013-14: Maintain operating costs at $9.97 per square foot.
$47,576,192Total 96.0 $47,503,662 96.0 $43,850,887 108.0
Enterprise/Internal Svc/Other
$0 0.0 $0 0.0 $0 0.0
FY 2012-13 BudgetDollars FTE
FY 2012-13 EstimateDollars FTE
FY 2013-14 AdoptedDollars FTE
Description: The Dallas Convention Center is one of the region's most powerful economic engines. The Convention Center effectively generates dollars that reduce the burden to local taxpayers; creates region-wide jobs and economic benefits; and serves as an important community gathering place. The Center provides approximately one million square feet of prime, contiguous exhibit hall space for conventions, trade, and consumer shows.
Source of Funds:
2.14
Dallas Convention Center Department: Convention and Event Services
$47,576,192
Major Budget Items: $1.4M for Hotel Land debt service payment is included, as well as an increase in the expense to pay the Dallas Convention & Visitors Bureau of approximately $1.0M in projected Hotel Occupany Tax revenue increase per City Council resolution. Additionally, various contractor service fees have been increased due to an increase in event attendance.
On TrackFY 12-13 Performance Measure Status:
Performance Measures FY 2012-13 Budget FY 2012-13 Estimate FY 2013-14 Adopted
Return on City invesment (funding) with Economic Impact $8.33 $10.94 $9.97
Total room nights blocked for convention/tradeshows 419,613 465,532 444,297
Total direct dollars generated to community by events $164,672,981.00 $231,428,359.00 $217,130,414.00
Total event attendance at Dallas Convention Center 1,098,350 1,104,208 1,046,378
Economic Vibrancy84
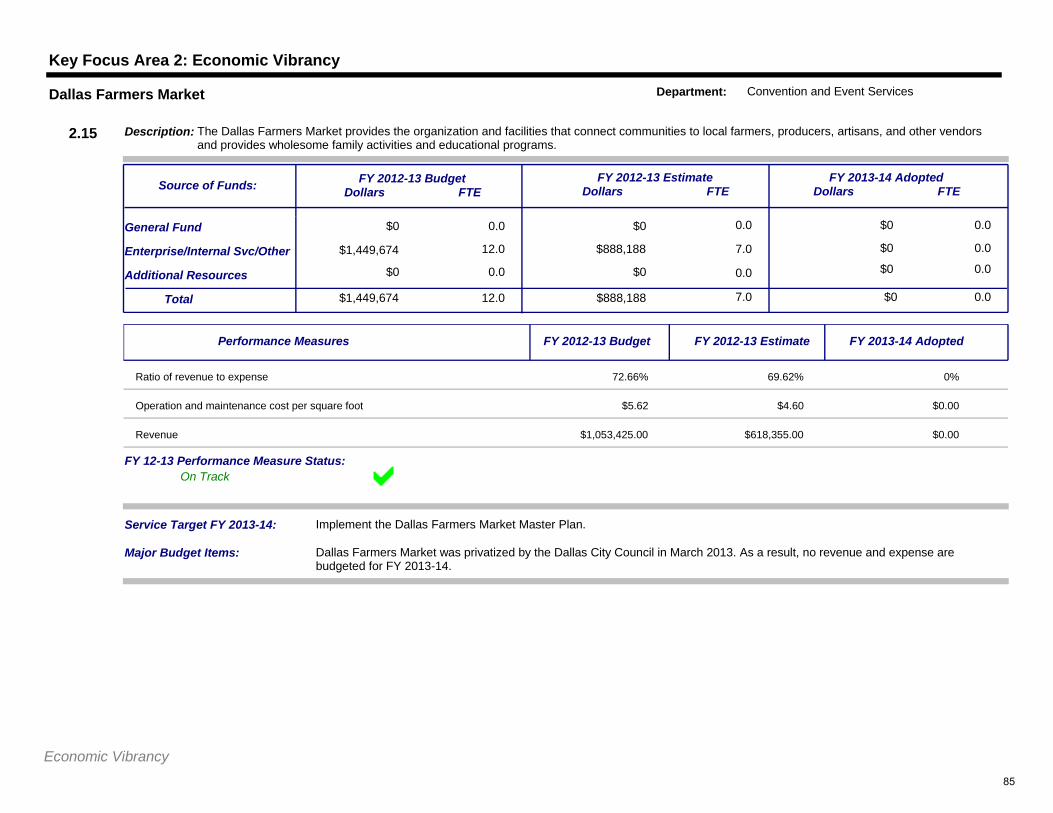
Key Focus Area 2: Economic Vibrancy
$0 0.0
12.0
$0 0.0
$888,188 7.0
$0
$0 0.0
0.0General Fund
Additional Resources
Service Target FY 2013-14: Implement the Dallas Farmers Market Master Plan.
$1,449,674Total 12.0 $888,188 7.0 $0 0.0
Enterprise/Internal Svc/Other
$0 0.0 $0 0.0 $0 0.0
FY 2012-13 BudgetDollars FTE
FY 2012-13 EstimateDollars FTE
FY 2013-14 AdoptedDollars FTE
Description: The Dallas Farmers Market provides the organization and facilities that connect communities to local farmers, producers, artisans, and other vendors and provides wholesome family activities and educational programs.
Source of Funds:
2.15
Dallas Farmers Market Department: Convention and Event Services
$1,449,674
Major Budget Items: Dallas Farmers Market was privatized by the Dallas City Council in March 2013. As a result, no revenue and expense are budgeted for FY 2013-14.
On TrackFY 12-13 Performance Measure Status:
Performance Measures FY 2012-13 Budget FY 2012-13 Estimate FY 2013-14 Adopted
Ratio of revenue to expense 72.66% 69.62% 0%
Operation and maintenance cost per square foot $5.62 $4.60 $0.00
Revenue $1,053,425.00 $618,355.00 $0.00
Economic Vibrancy85
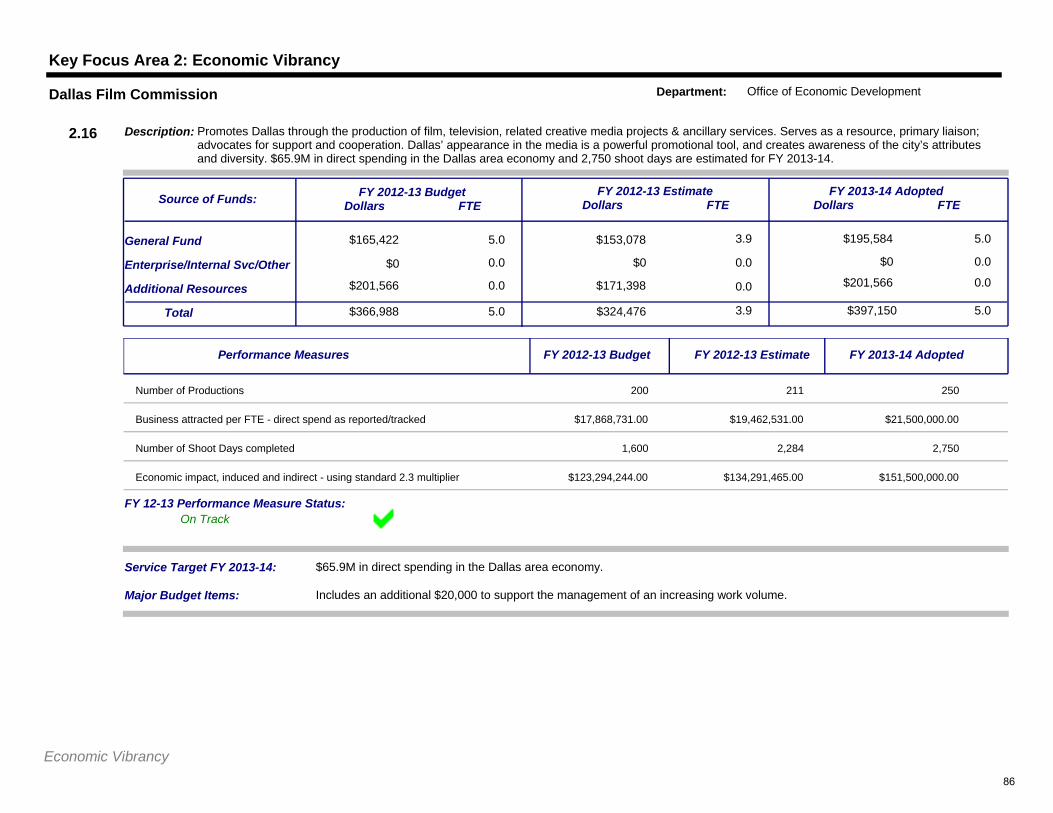
Key Focus Area 2: Economic Vibrancy
$165,422 5.0
0.0
$153,078 3.9
$0 0.0
$195,584
$0 0.0
5.0General Fund
Additional Resources
Service Target FY 2013-14: $65.9M in direct spending in the Dallas area economy.
$366,988Total 5.0 $324,476 3.9 $397,150 5.0
Enterprise/Internal Svc/Other
$201,566 0.0 $171,398 0.0 $201,566 0.0
FY 2012-13 BudgetDollars FTE
FY 2012-13 EstimateDollars FTE
FY 2013-14 AdoptedDollars FTE
Description: Promotes Dallas through the production of film, television, related creative media projects & ancillary services. Serves as a resource, primary liaison; advocates for support and cooperation. Dallas’ appearance in the media is a powerful promotional tool, and creates awareness of the city’s attributes and diversity. $65.9M in direct spending in the Dallas area economy and 2,750 shoot days are estimated for FY 2013-14.
Source of Funds:
2.16
Dallas Film Commission Department: Office of Economic Development
$0
Major Budget Items: Includes an additional $20,000 to support the management of an increasing work volume.
On TrackFY 12-13 Performance Measure Status:
Performance Measures FY 2012-13 Budget FY 2012-13 Estimate FY 2013-14 Adopted
Number of Productions 200 211 250
Business attracted per FTE - direct spend as reported/tracked $17,868,731.00 $19,462,531.00 $21,500,000.00
Number of Shoot Days completed 1,600 2,284 2,750
Economic impact, induced and indirect - using standard 2.3 multiplier $123,294,244.00 $134,291,465.00 $151,500,000.00
Economic Vibrancy86
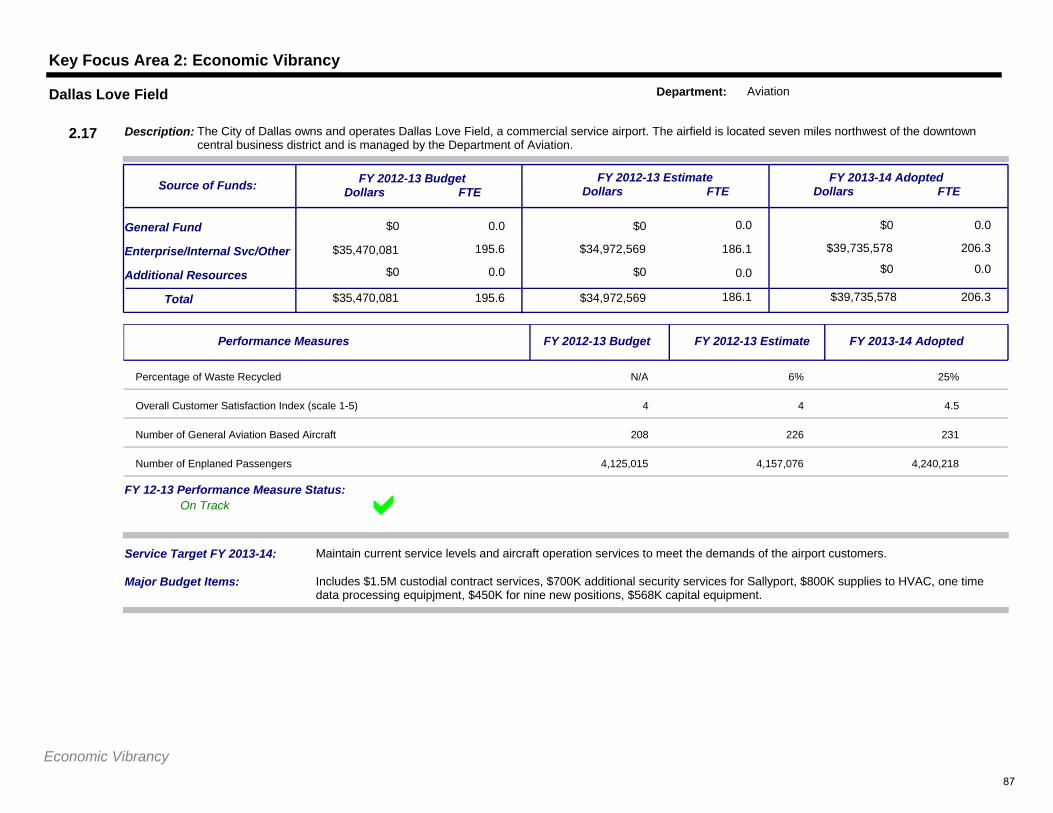
Key Focus Area 2: Economic Vibrancy
$0 0.0
195.6
$0 0.0
$34,972,569 186.1
$0
$39,735,578 206.3
0.0General Fund
Additional Resources
Service Target FY 2013-14: Maintain current service levels and aircraft operation services to meet the demands of the airport customers.
$35,470,081Total 195.6 $34,972,569 186.1 $39,735,578 206.3
Enterprise/Internal Svc/Other
$0 0.0 $0 0.0 $0 0.0
FY 2012-13 BudgetDollars FTE
FY 2012-13 EstimateDollars FTE
FY 2013-14 AdoptedDollars FTE
Description: The City of Dallas owns and operates Dallas Love Field, a commercial service airport. The airfield is located seven miles northwest of the downtown central business district and is managed by the Department of Aviation.
Source of Funds:
2.17
Dallas Love Field Department: Aviation
$35,470,081
Major Budget Items: Includes $1.5M custodial contract services, $700K additional security services for Sallyport, $800K supplies to HVAC, one time data processing equipjment, $450K for nine new positions, $568K capital equipment.
On TrackFY 12-13 Performance Measure Status:
Performance Measures FY 2012-13 Budget FY 2012-13 Estimate FY 2013-14 Adopted
Percentage of Waste Recycled N/A 6% 25%
Overall Customer Satisfaction Index (scale 1-5) 4 4 4.5
Number of General Aviation Based Aircraft 208 226 231
Number of Enplaned Passengers 4,125,015 4,157,076 4,240,218
Economic Vibrancy87
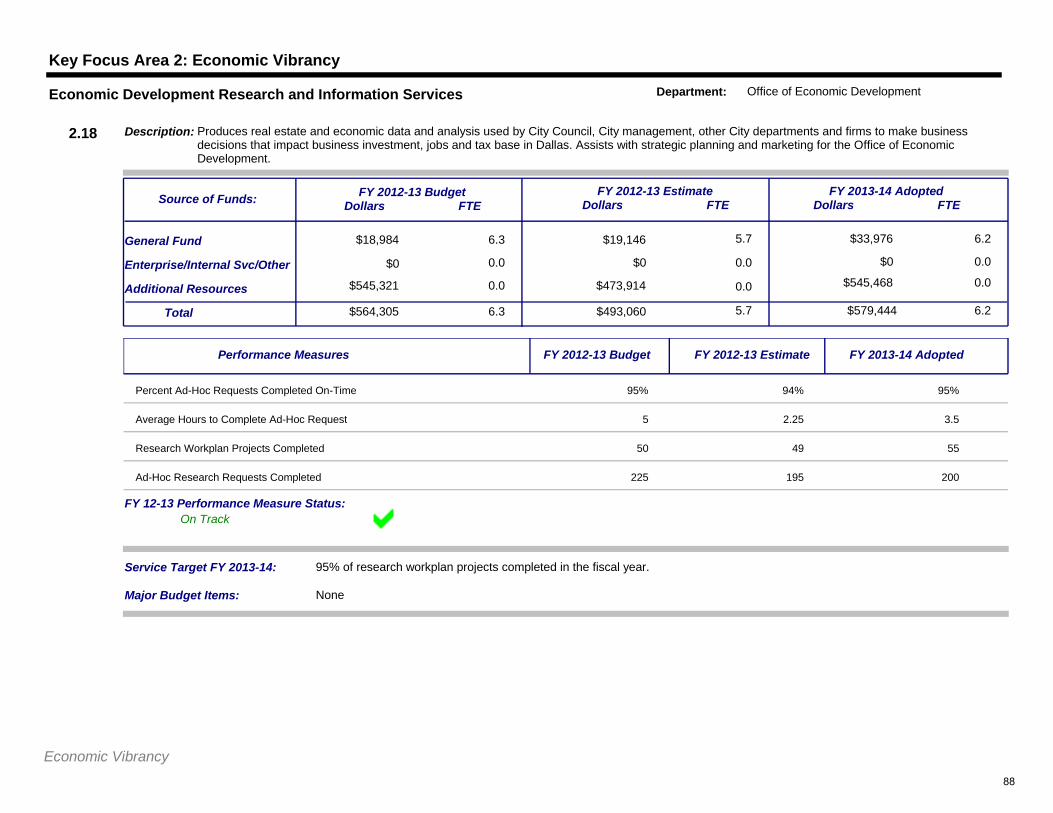
Key Focus Area 2: Economic Vibrancy
$18,984 6.3
0.0
$19,146 5.7
$0 0.0
$33,976
$0 0.0
6.2General Fund
Additional Resources
Service Target FY 2013-14: 95% of research workplan projects completed in the fiscal year.
$564,305Total 6.3 $493,060 5.7 $579,444 6.2
Enterprise/Internal Svc/Other
$545,321 0.0 $473,914 0.0 $545,468 0.0
FY 2012-13 BudgetDollars FTE
FY 2012-13 EstimateDollars FTE
FY 2013-14 AdoptedDollars FTE
Description: Produces real estate and economic data and analysis used by City Council, City management, other City departments and firms to make business decisions that impact business investment, jobs and tax base in Dallas. Assists with strategic planning and marketing for the Office of Economic Development.
Source of Funds:
2.18
Economic Development Research and Information Services Department: Office of Economic Development
$0
Major Budget Items: None
On TrackFY 12-13 Performance Measure Status:
Performance Measures FY 2012-13 Budget FY 2012-13 Estimate FY 2013-14 Adopted
Percent Ad-Hoc Requests Completed On-Time 95% 94% 95%
Average Hours to Complete Ad-Hoc Request 5 2.25 3.5
Research Workplan Projects Completed 50 49 55
Ad-Hoc Research Requests Completed 225 195 200
Economic Vibrancy88
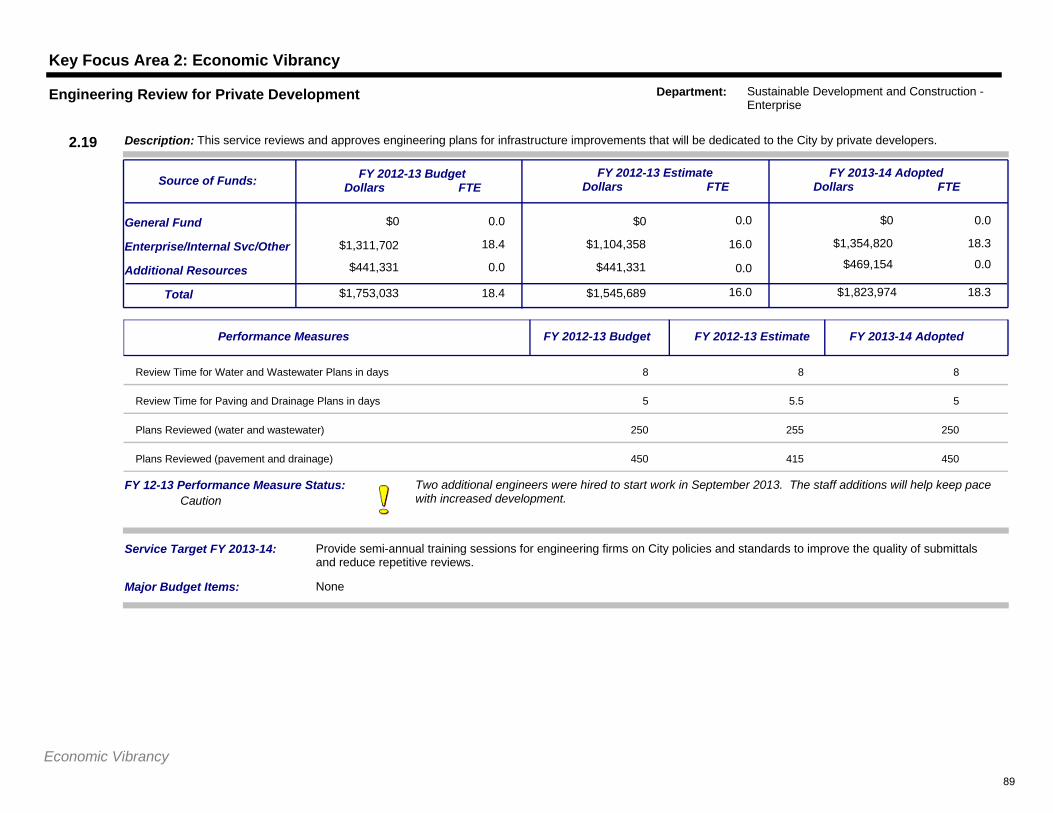
Key Focus Area 2: Economic Vibrancy
$0 0.0
18.4
$0 0.0
$1,104,358 16.0
$0
$1,354,820 18.3
0.0General Fund
Additional Resources
Service Target FY 2013-14: Provide semi-annual training sessions for engineering firms on City policies and standards to improve the quality of submittals and reduce repetitive reviews.
$1,753,033Total 18.4 $1,545,689 16.0 $1,823,974 18.3
Enterprise/Internal Svc/Other
$441,331 0.0 $441,331 0.0 $469,154 0.0
FY 2012-13 BudgetDollars FTE
FY 2012-13 EstimateDollars FTE
FY 2013-14 AdoptedDollars FTE
Description: This service reviews and approves engineering plans for infrastructure improvements that will be dedicated to the City by private developers.
Source of Funds:
2.19
Engineering Review for Private Development Department: Sustainable Development and Construction - Enterprise
$1,311,702
Major Budget Items: None
Two additional engineers were hired to start work in September 2013. The staff additions will help keep pace with increased development.Caution
FY 12-13 Performance Measure Status:
Performance Measures FY 2012-13 Budget FY 2012-13 Estimate FY 2013-14 Adopted
Review Time for Water and Wastewater Plans in days 8 8 8
Review Time for Paving and Drainage Plans in days 5 5.5 5
Plans Reviewed (water and wastewater) 250 255 250
Plans Reviewed (pavement and drainage) 450 415 450
Economic Vibrancy89
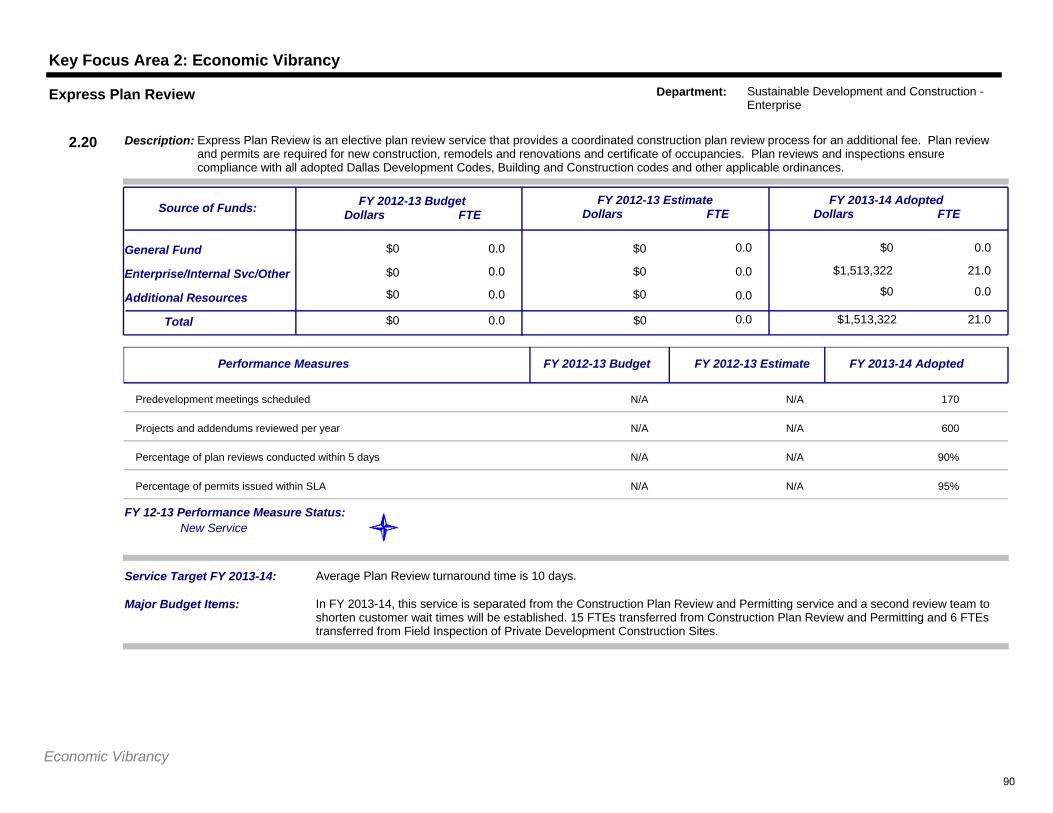
Key Focus Area 2: Economic Vibrancy
$0 0.0
0.0
$0 0.0
$0 0.0
$0
$1,513,322 21.0
0.0General Fund
Additional Resources
Service Target FY 2013-14: Average Plan Review turnaround time is 10 days.
$0Total 0.0 $0 0.0 $1,513,322 21.0
Enterprise/Internal Svc/Other
$0 0.0 $0 0.0 $0 0.0
FY 2012-13 BudgetDollars FTE
FY 2012-13 EstimateDollars FTE
FY 2013-14 AdoptedDollars FTE
Description: Express Plan Review is an elective plan review service that provides a coordinated construction plan review process for an additional fee. Plan review and permits are required for new construction, remodels and renovations and certificate of occupancies. Plan reviews and inspections ensure compliance with all adopted Dallas Development Codes, Building and Construction codes and other applicable ordinances.
Source of Funds:
2.20
Express Plan Review Department: Sustainable Development and Construction - Enterprise
$0
Major Budget Items: In FY 2013-14, this service is separated from the Construction Plan Review and Permitting service and a second review team to shorten customer wait times will be established. 15 FTEs transferred from Construction Plan Review and Permitting and 6 FTEs transferred from Field Inspection of Private Development Construction Sites.
New ServiceFY 12-13 Performance Measure Status:
Performance Measures FY 2012-13 Budget FY 2012-13 Estimate FY 2013-14 Adopted
Predevelopment meetings scheduled N/A N/A 170
Projects and addendums reviewed per year N/A N/A 600
Percentage of plan reviews conducted within 5 days N/A N/A 90%
Percentage of permits issued within SLA N/A N/A 95%
Economic Vibrancy90
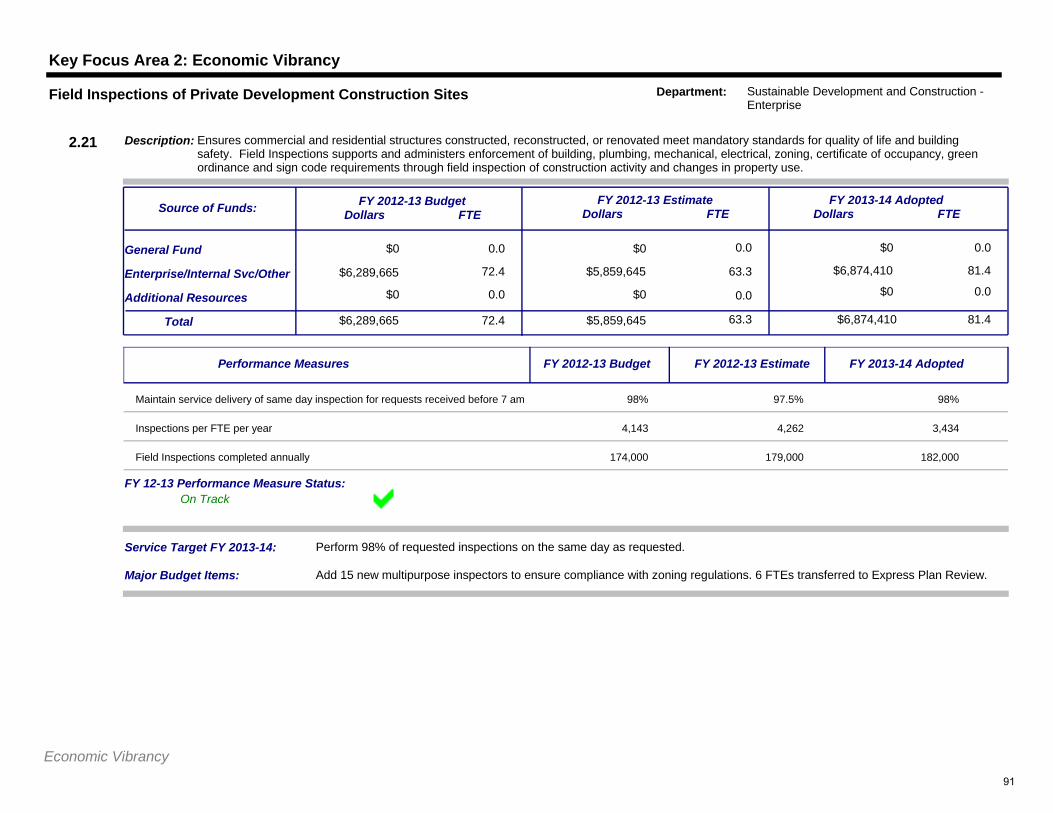
Key Focus Area 2: Economic Vibrancy
$0 0.0
72.4
$0 0.0
$5,859,645 63.3
$0
$6,874,410 81.4
0.0General Fund
Additional Resources
Service Target FY 2013-14: Perform 98% of requested inspections on the same day as requested.
$6,289,665Total 72.4 $5,859,645 63.3 $6,874,410 81.4
Enterprise/Internal Svc/Other
$0 0.0 $0 0.0 $0 0.0
FY 2012-13 BudgetDollars FTE
FY 2012-13 EstimateDollars FTE
FY 2013-14 AdoptedDollars FTE
Description: Ensures commercial and residential structures constructed, reconstructed, or renovated meet mandatory standards for quality of life and building safety. Field Inspections supports and administers enforcement of building, plumbing, mechanical, electrical, zoning, certificate of occupancy, green ordinance and sign code requirements through field inspection of construction activity and changes in property use.
Source of Funds:
2.21
Field Inspections of Private Development Construction Sites Department: Sustainable Development and Construction - Enterprise
$6,289,665
Major Budget Items: Add 15 new multipurpose inspectors to ensure compliance with zoning regulations. 6 FTEs transferred to Express Plan Review.
On TrackFY 12-13 Performance Measure Status:
Performance Measures FY 2012-13 Budget FY 2012-13 Estimate FY 2013-14 Adopted
Maintain service delivery of same day inspection for requests received before 7 am 98% 97.5% 98%
Inspections per FTE per year 4,143 4,262 3,434
Field Inspections completed annually 174,000 179,000 182,000
Economic Vibrancy91
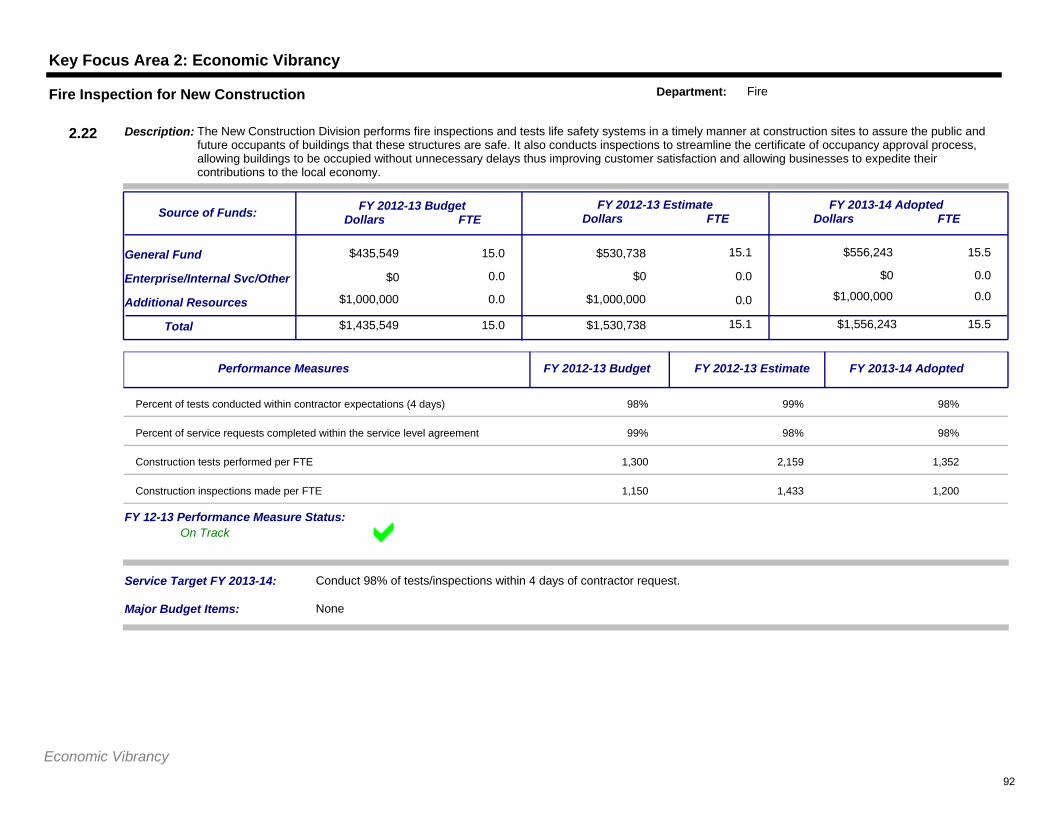
Key Focus Area 2: Economic Vibrancy
$435,549 15.0
0.0
$530,738 15.1
$0 0.0
$556,243
$0 0.0
15.5General Fund
Additional Resources
Service Target FY 2013-14: Conduct 98% of tests/inspections within 4 days of contractor request.
$1,435,549Total 15.0 $1,530,738 15.1 $1,556,243 15.5
Enterprise/Internal Svc/Other
$1,000,000 0.0 $1,000,000 0.0 $1,000,000 0.0
FY 2012-13 BudgetDollars FTE
FY 2012-13 EstimateDollars FTE
FY 2013-14 AdoptedDollars FTE
Description: The New Construction Division performs fire inspections and tests life safety systems in a timely manner at construction sites to assure the public and future occupants of buildings that these structures are safe. It also conducts inspections to streamline the certificate of occupancy approval process, allowing buildings to be occupied without unnecessary delays thus improving customer satisfaction and allowing businesses to expedite their contributions to the local economy.
Source of Funds:
2.22
Fire Inspection for New Construction Department: Fire
$0
Major Budget Items: None
On TrackFY 12-13 Performance Measure Status:
Performance Measures FY 2012-13 Budget FY 2012-13 Estimate FY 2013-14 Adopted
Percent of tests conducted within contractor expectations (4 days) 98% 99% 98%
Percent of service requests completed within the service level agreement 99% 98% 98%
Construction tests performed per FTE 1,300 2,159 1,352
Construction inspections made per FTE 1,150 1,433 1,200
Economic Vibrancy92
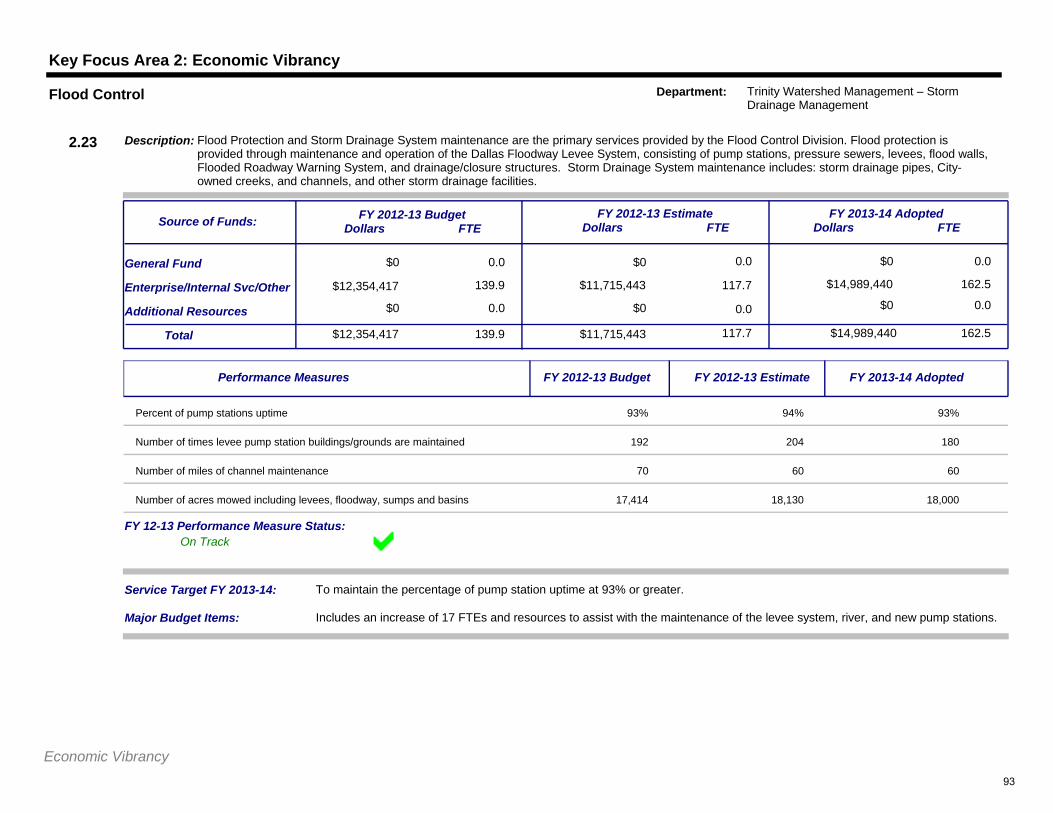
Key Focus Area 2: Economic Vibrancy
$0 0.0
139.9
$0 0.0
$11,715,443 117.7
$0
$14,989,440 162.5
0.0General Fund
Additional Resources
Service Target FY 2013-14: To maintain the percentage of pump station uptime at 93% or greater.
$12,354,417Total 139.9 $11,715,443 117.7 $14,989,440 162.5
Enterprise/Internal Svc/Other$0 0.0 $0 0.0 $0 0.0
FY 2012-13 BudgetDollars FTE
FY 2012-13 EstimateDollars FTE
FY 2013-14 AdoptedDollars FTE
Description: Flood Protection and Storm Drainage System maintenance are the primary services provided by the Flood Control Division. Flood protection is provided through maintenance and operation of the Dallas Floodway Levee System, consisting of pump stations, pressure sewers, levees, flood walls, Flooded Roadway Warning System, and drainage/closure structures. Storm Drainage System maintenance includes: storm drainage pipes, City-owned creeks, and channels, and other storm drainage facilities.
Source of Funds:
2.23
Flood Control Department: Trinity Watershed Management – Storm Drainage Management
$12,354,417
Major Budget Items: Includes an increase of 17 FTEs and resources to assist with the maintenance of the levee system, river, and new pump stations.
On TrackFY 12-13 Performance Measure Status:
Performance Measures FY 2012-13 Budget FY 2012-13 Estimate FY 2013-14 Adopted
Percent of pump stations uptime 93% 94% 93%
Number of times levee pump station buildings/grounds are maintained 192 204 180
Number of miles of channel maintenance 70 60 60
Number of acres mowed including levees, floodway, sumps and basins 17,414 18,130 18,000
Economic Vibrancy93
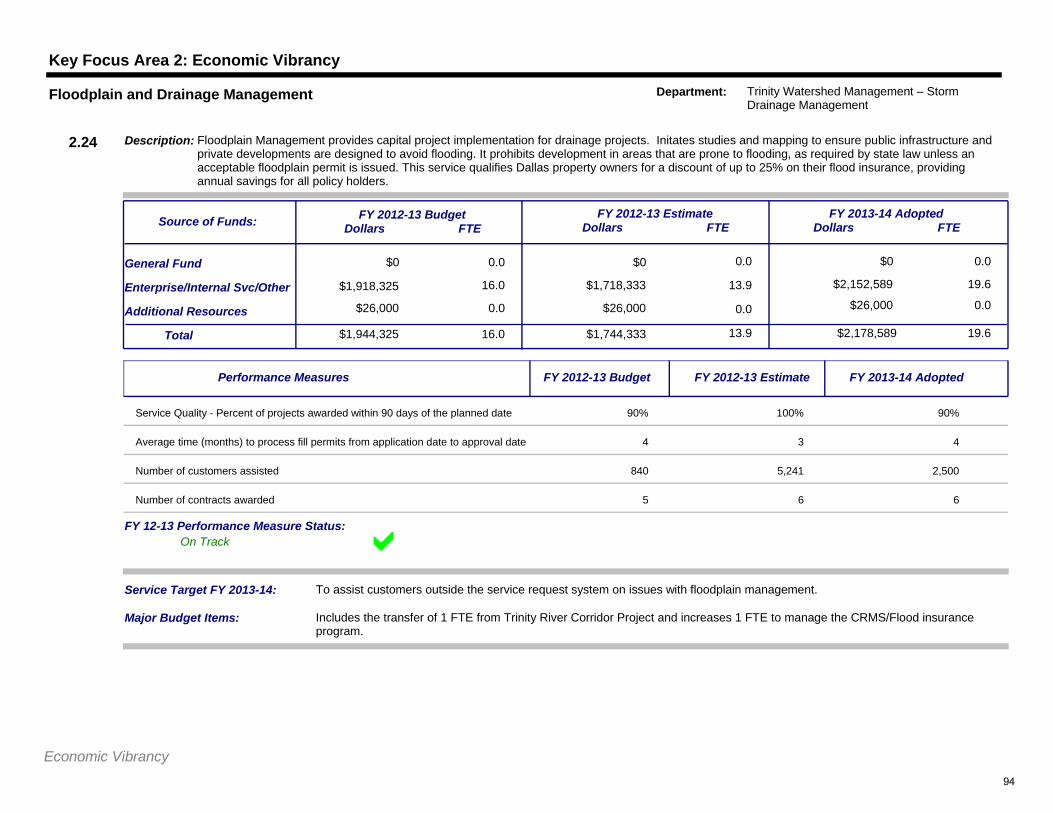
Key Focus Area 2: Economic Vibrancy
$0 0.0
16.0
$0 0.0
$1,718,333 13.9
$0
$2,152,589 19.6
0.0General Fund
Additional Resources
Service Target FY 2013-14: To assist customers outside the service request system on issues with floodplain management.
$1,944,325Total 16.0 $1,744,333 13.9 $2,178,589 19.6
Enterprise/Internal Svc/Other$26,000 0.0 $26,000 0.0 $26,000 0.0
FY 2012-13 BudgetDollars FTE
FY 2012-13 EstimateDollars FTE
FY 2013-14 AdoptedDollars FTE
Description: Floodplain Management provides capital project implementation for drainage projects. Initates studies and mapping to ensure public infrastructure and private developments are designed to avoid flooding. It prohibits development in areas that are prone to flooding, as required by state law unless an acceptable floodplain permit is issued. This service qualifies Dallas property owners for a discount of up to 25% on their flood insurance, providing annual savings for all policy holders.
Source of Funds:
2.24
Floodplain and Drainage Management Department: Trinity Watershed Management – Storm Drainage Management
$1,918,325
Major Budget Items: Includes the transfer of 1 FTE from Trinity River Corridor Project and increases 1 FTE to manage the CRMS/Flood insurance program.
On TrackFY 12-13 Performance Measure Status:
Performance Measures FY 2012-13 Budget FY 2012-13 Estimate FY 2013-14 Adopted
Service Quality - Percent of projects awarded within 90 days of the planned date 90% 100% 90%
Average time (months) to process fill permits from application date to approval date 4 3 4
Number of customers assisted 840 5,241 2,500
Number of contracts awarded 5 6 6
Economic Vibrancy94
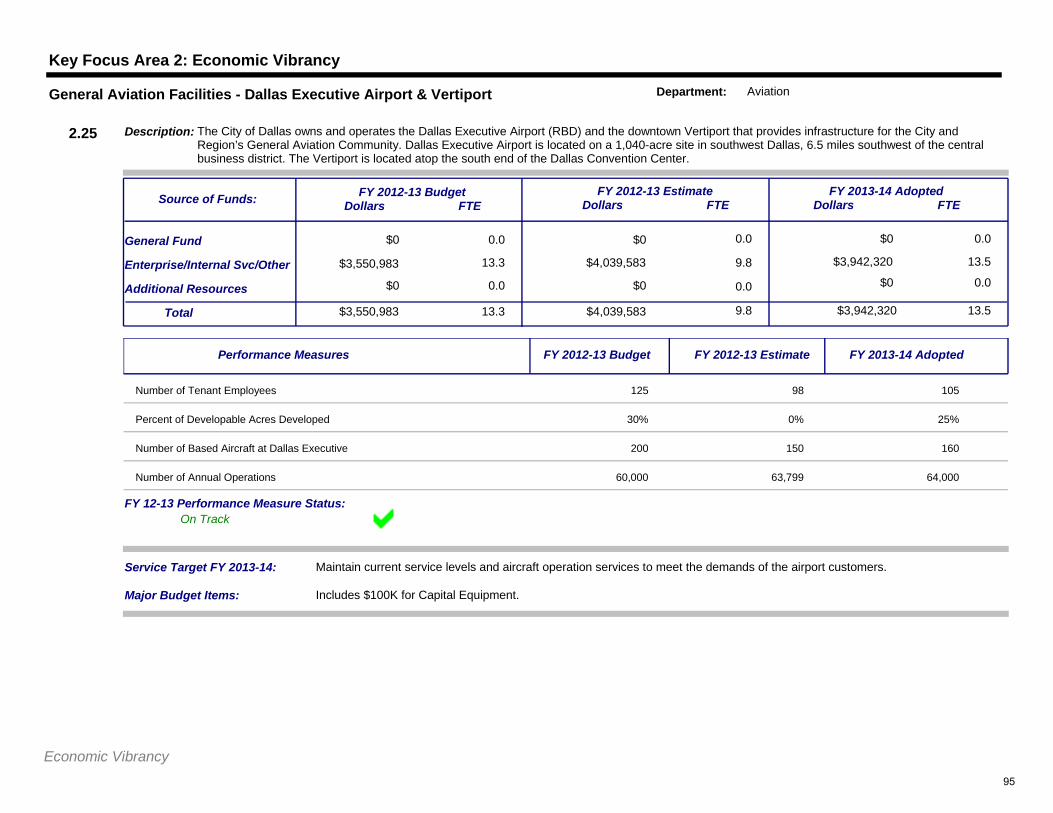
Key Focus Area 2: Economic Vibrancy
$0 0.0
13.3
$0 0.0
$4,039,583 9.8
$0
$3,942,320 13.5
0.0General Fund
Additional Resources
Service Target FY 2013-14: Maintain current service levels and aircraft operation services to meet the demands of the airport customers.
$3,550,983Total 13.3 $4,039,583 9.8 $3,942,320 13.5
Enterprise/Internal Svc/Other
$0 0.0 $0 0.0 $0 0.0
FY 2012-13 BudgetDollars FTE
FY 2012-13 EstimateDollars FTE
FY 2013-14 AdoptedDollars FTE
Description: The City of Dallas owns and operates the Dallas Executive Airport (RBD) and the downtown Vertiport that provides infrastructure for the City and Region’s General Aviation Community. Dallas Executive Airport is located on a 1,040-acre site in southwest Dallas, 6.5 miles southwest of the central business district. The Vertiport is located atop the south end of the Dallas Convention Center.
Source of Funds:
2.25
General Aviation Facilities - Dallas Executive Airport & Vertiport Department: Aviation
$3,550,983
Major Budget Items: Includes $100K for Capital Equipment.
On TrackFY 12-13 Performance Measure Status:
Performance Measures FY 2012-13 Budget FY 2012-13 Estimate FY 2013-14 Adopted
Number of Tenant Employees 125 98 105
Percent of Developable Acres Developed 30% 0% 25%
Number of Based Aircraft at Dallas Executive 200 150 160
Number of Annual Operations 60,000 63,799 64,000
Economic Vibrancy95
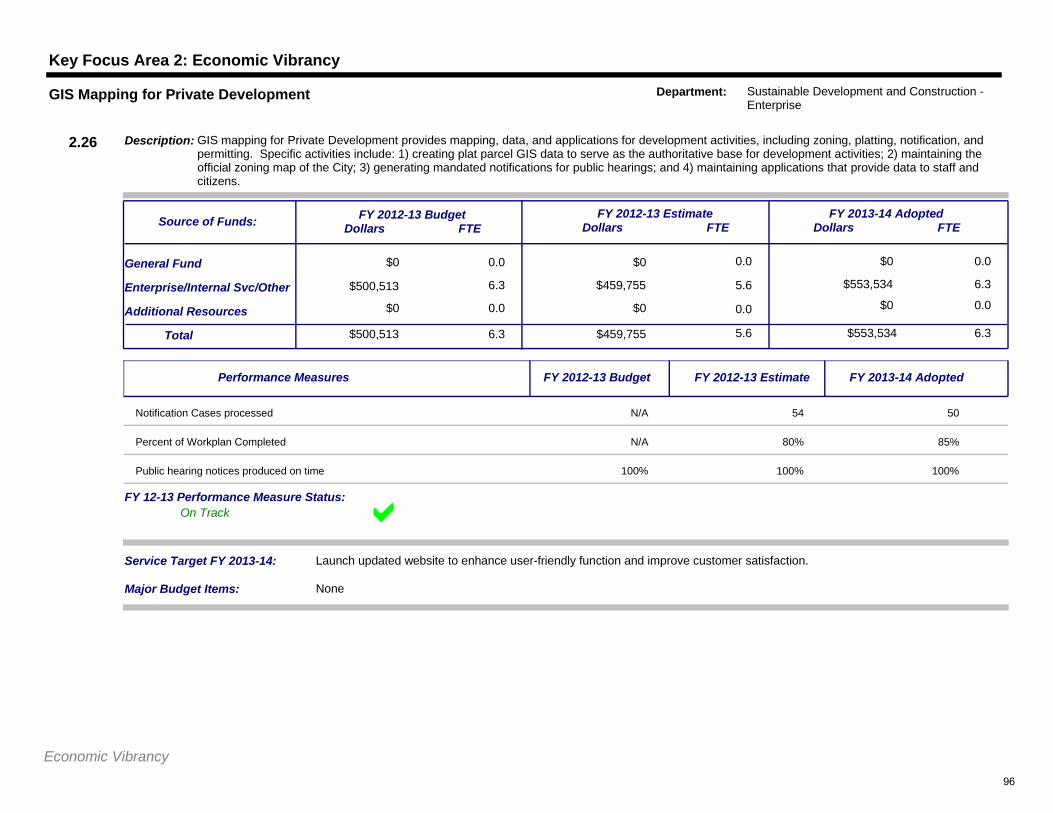
Key Focus Area 2: Economic Vibrancy
$0 0.0
6.3
$0 0.0
$459,755 5.6
$0
$553,534 6.3
0.0General Fund
Additional Resources
Service Target FY 2013-14: Launch updated website to enhance user-friendly function and improve customer satisfaction.
$500,513Total 6.3 $459,755 5.6 $553,534 6.3
Enterprise/Internal Svc/Other$0 0.0 $0 0.0 $0 0.0
FY 2012-13 BudgetDollars FTE
FY 2012-13 EstimateDollars FTE
FY 2013-14 AdoptedDollars FTE
Description: GIS mapping for Private Development provides mapping, data, and applications for development activities, including zoning, platting, notification, and permitting. Specific activities include: 1) creating plat parcel GIS data to serve as the authoritative base for development activities; 2) maintaining the official zoning map of the City; 3) generating mandated notifications for public hearings; and 4) maintaining applications that provide data to staff and citizens.
Source of Funds:
2.26
GIS Mapping for Private Development Department: Sustainable Development and Construction - Enterprise
$500,513
Major Budget Items: None
On TrackFY 12-13 Performance Measure Status:
Performance Measures FY 2012-13 Budget FY 2012-13 Estimate FY 2013-14 Adopted
Notification Cases processed N/A 54 50
Percent of Workplan Completed N/A 80% 85%
Public hearing notices produced on time 100% 100% 100%
Economic Vibrancy96
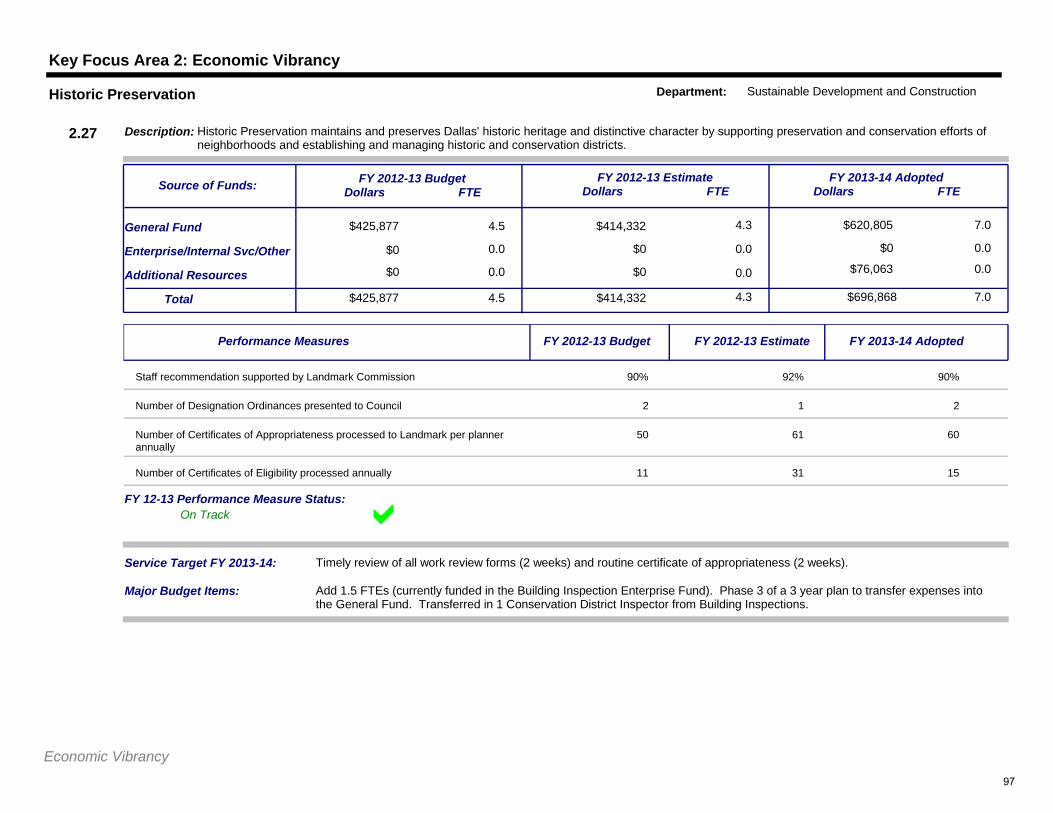
Key Focus Area 2: Economic Vibrancy
$425,877 4.5
0.0
$414,332 4.3
$0 0.0
$620,805
$0 0.0
7.0General Fund
Additional Resources
Service Target FY 2013-14: Timely review of all work review forms (2 weeks) and routine certificate of appropriateness (2 weeks).
$425,877Total 4.5 $414,332 4.3 $696,868 7.0
Enterprise/Internal Svc/Other
$0 0.0 $0 0.0 $76,063 0.0
FY 2012-13 BudgetDollars FTE
FY 2012-13 EstimateDollars FTE
FY 2013-14 AdoptedDollars FTE
Description: Historic Preservation maintains and preserves Dallas' historic heritage and distinctive character by supporting preservation and conservation efforts of neighborhoods and establishing and managing historic and conservation districts.
Source of Funds:
2.27
Historic Preservation Department: Sustainable Development and Construction
$0
Major Budget Items: Add 1.5 FTEs (currently funded in the Building Inspection Enterprise Fund). Phase 3 of a 3 year plan to transfer expenses into the General Fund. Transferred in 1 Conservation District Inspector from Building Inspections.
On TrackFY 12-13 Performance Measure Status:
Performance Measures FY 2012-13 Budget FY 2012-13 Estimate FY 2013-14 Adopted
Staff recommendation supported by Landmark Commission 90% 92% 90%
Number of Designation Ordinances presented to Council 2 1 2
Number of Certificates of Appropriateness processed to Landmark per planner annually
50 61 60
Number of Certificates of Eligibility processed annually 11 31 15
Economic Vibrancy97
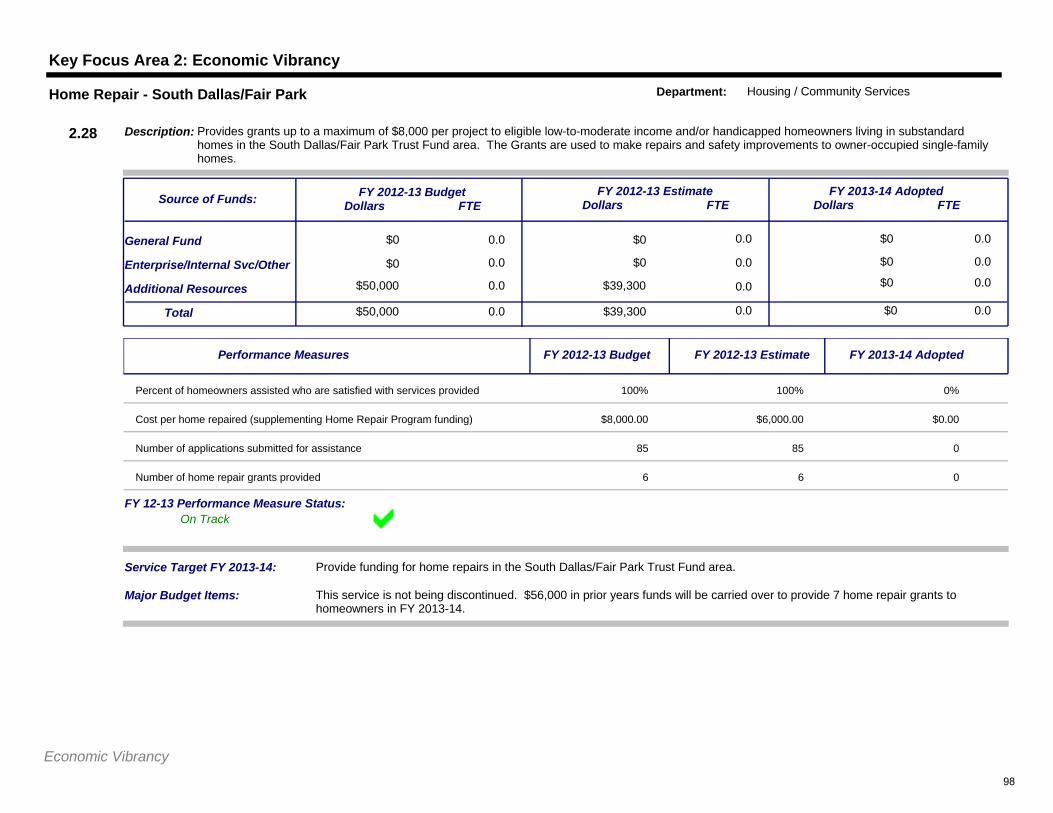
Key Focus Area 2: Economic Vibrancy
$0 0.0
0.0
$0 0.0
$0 0.0
$0
$0 0.0
0.0General Fund
Additional Resources
Service Target FY 2013-14: Provide funding for home repairs in the South Dallas/Fair Park Trust Fund area.
$50,000Total 0.0 $39,300 0.0 $0 0.0
Enterprise/Internal Svc/Other
$50,000 0.0 $39,300 0.0 $0 0.0
FY 2012-13 BudgetDollars FTE
FY 2012-13 EstimateDollars FTE
FY 2013-14 AdoptedDollars FTE
Description: Provides grants up to a maximum of $8,000 per project to eligible low-to-moderate income and/or handicapped homeowners living in substandard homes in the South Dallas/Fair Park Trust Fund area. The Grants are used to make repairs and safety improvements to owner-occupied single-family homes.
Source of Funds:
2.28
Home Repair - South Dallas/Fair Park Department: Housing / Community Services
$0
Major Budget Items: This service is not being discontinued. $56,000 in prior years funds will be carried over to provide 7 home repair grants to homeowners in FY 2013-14.
On TrackFY 12-13 Performance Measure Status:
Performance Measures FY 2012-13 Budget FY 2012-13 Estimate FY 2013-14 Adopted
Percent of homeowners assisted who are satisfied with services provided 100% 100% 0%
Cost per home repaired (supplementing Home Repair Program funding) $8,000.00 $6,000.00 $0.00
Number of applications submitted for assistance 85 85 0
Number of home repair grants provided 6 6 0
Economic Vibrancy98
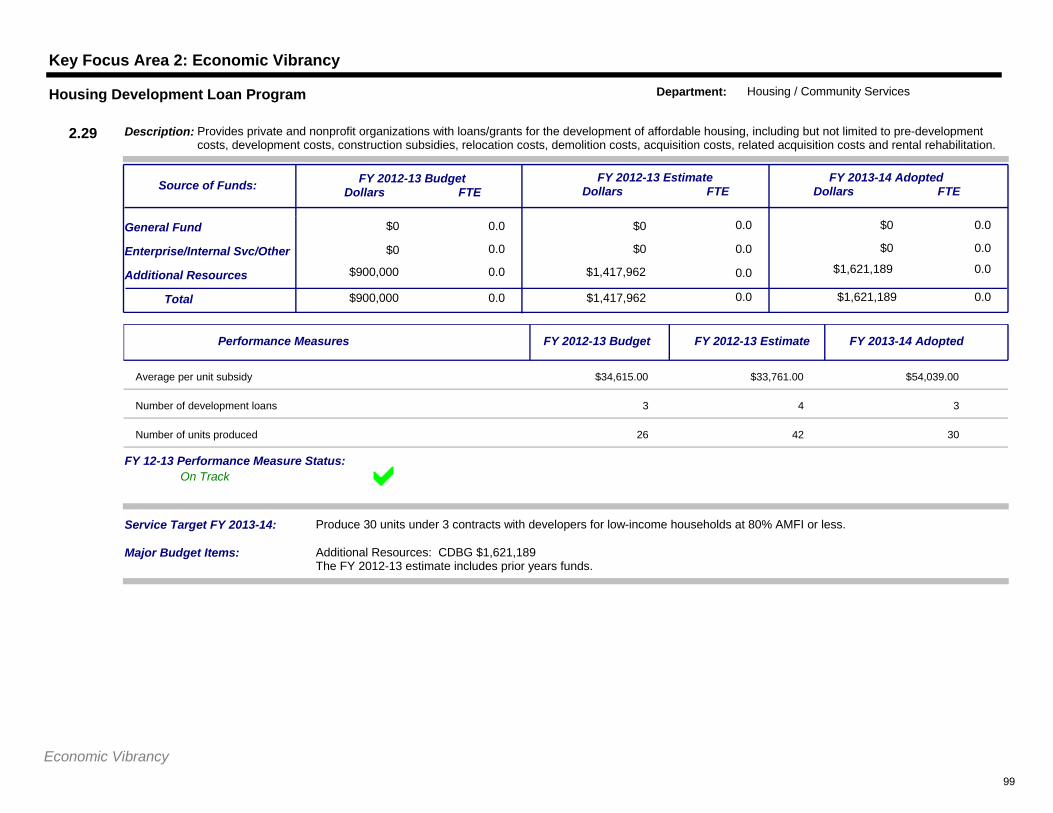
Key Focus Area 2: Economic Vibrancy
$0 0.0
0.0
$0 0.0
$0 0.0
$0
$0 0.0
0.0General Fund
Additional Resources
Service Target FY 2013-14: Produce 30 units under 3 contracts with developers for low-income households at 80% AMFI or less.
$900,000Total 0.0 $1,417,962 0.0 $1,621,189 0.0
Enterprise/Internal Svc/Other
$900,000 0.0 $1,417,962 0.0 $1,621,189 0.0
FY 2012-13 BudgetDollars FTE
FY 2012-13 EstimateDollars FTE
FY 2013-14 AdoptedDollars FTE
Description: Provides private and nonprofit organizations with loans/grants for the development of affordable housing, including but not limited to pre-development costs, development costs, construction subsidies, relocation costs, demolition costs, acquisition costs, related acquisition costs and rental rehabilitation.
Source of Funds:
2.29
Housing Development Loan Program Department: Housing / Community Services
$0
Major Budget Items: Additional Resources: CDBG $1,621,189The FY 2012-13 estimate includes prior years funds.
On TrackFY 12-13 Performance Measure Status:
Performance Measures FY 2012-13 Budget FY 2012-13 Estimate FY 2013-14 Adopted
Average per unit subsidy $34,615.00 $33,761.00 $54,039.00
Number of development loans 3 4 3
Number of units produced 26 42 30
Economic Vibrancy99
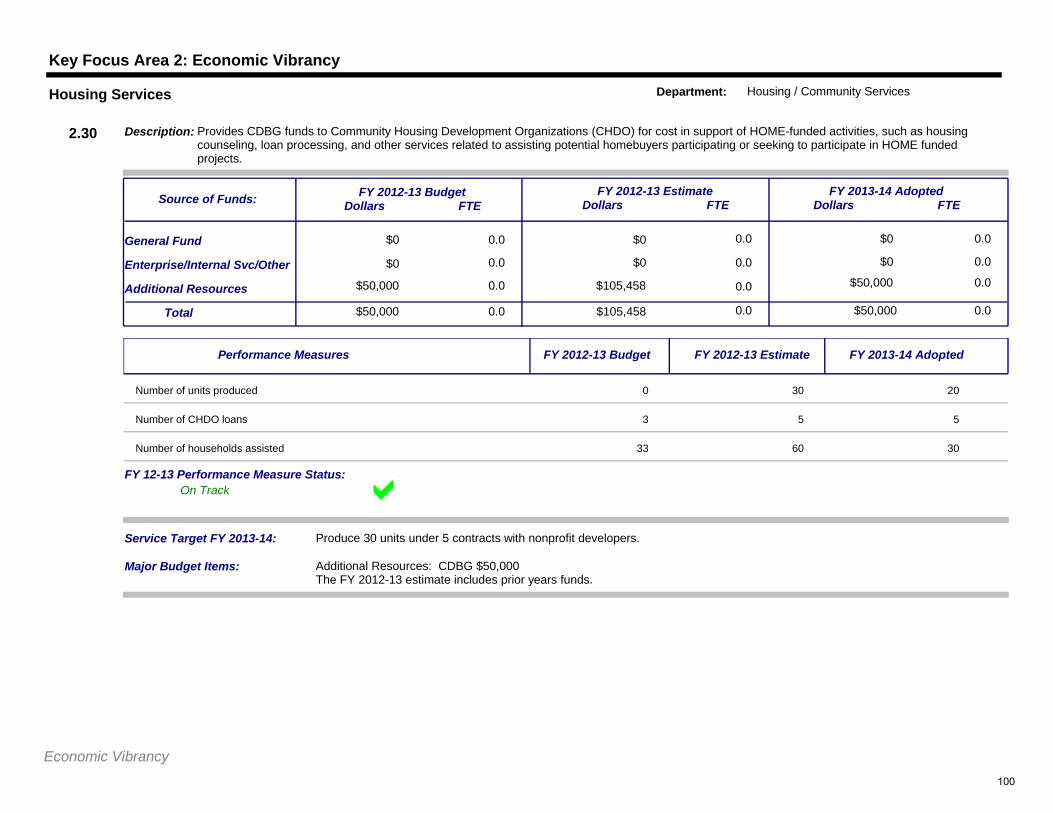
Key Focus Area 2: Economic Vibrancy
$0 0.0
0.0
$0 0.0
$0 0.0
$0
$0 0.0
0.0General Fund
Additional Resources
Service Target FY 2013-14: Produce 30 units under 5 contracts with nonprofit developers.
$50,000Total 0.0 $105,458 0.0 $50,000 0.0
Enterprise/Internal Svc/Other
$50,000 0.0 $105,458 0.0 $50,000 0.0
FY 2012-13 BudgetDollars FTE
FY 2012-13 EstimateDollars FTE
FY 2013-14 AdoptedDollars FTE
Description: Provides CDBG funds to Community Housing Development Organizations (CHDO) for cost in support of HOME-funded activities, such as housing counseling, loan processing, and other services related to assisting potential homebuyers participating or seeking to participate in HOME funded projects.
Source of Funds:
2.30
Housing Services Department: Housing / Community Services
$0
Major Budget Items: Additional Resources: CDBG $50,000The FY 2012-13 estimate includes prior years funds.
On TrackFY 12-13 Performance Measure Status:
Performance Measures FY 2012-13 Budget FY 2012-13 Estimate FY 2013-14 Adopted
Number of units produced 0 30 20
Number of CHDO loans 3 5 5
Number of households assisted 33 60 30
Economic Vibrancy100
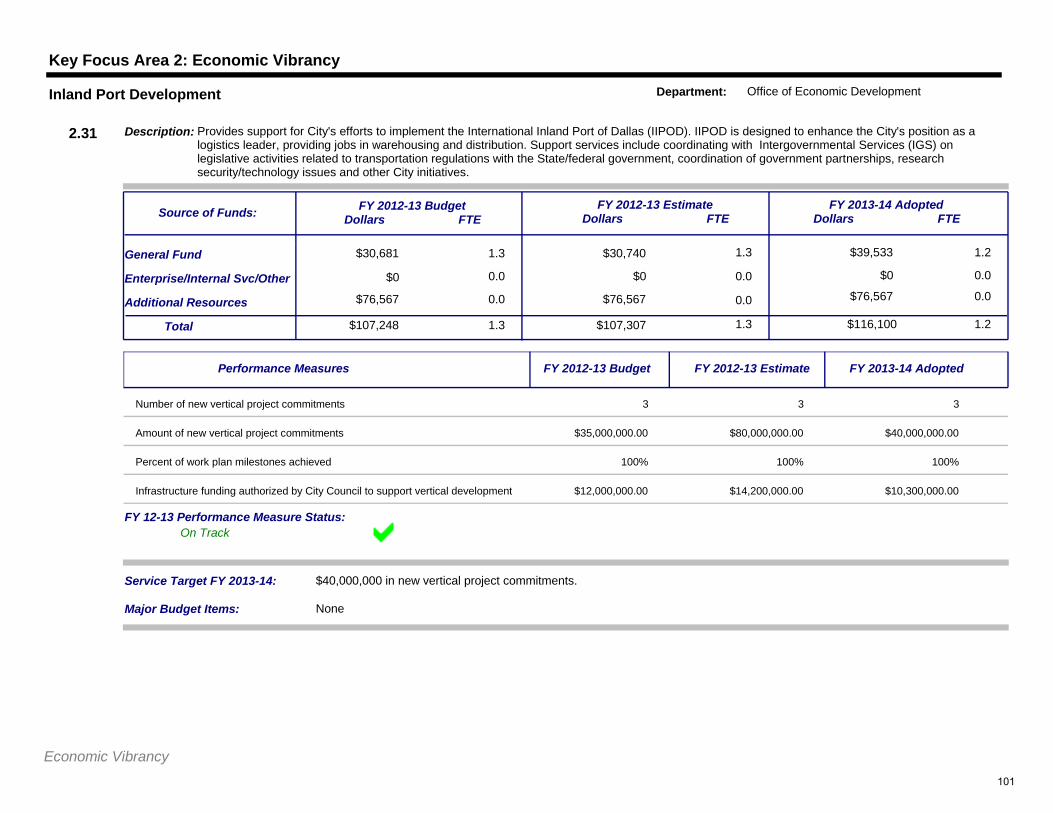
Key Focus Area 2: Economic Vibrancy
$30,681 1.3
0.0
$30,740 1.3
$0 0.0
$39,533
$0 0.0
1.2General Fund
Additional Resources
Service Target FY 2013-14: $40,000,000 in new vertical project commitments.
$107,248Total 1.3 $107,307 1.3 $116,100 1.2
Enterprise/Internal Svc/Other
$76,567 0.0 $76,567 0.0 $76,567 0.0
FY 2012-13 BudgetDollars FTE
FY 2012-13 EstimateDollars FTE
FY 2013-14 AdoptedDollars FTE
Description: Provides support for City's efforts to implement the International Inland Port of Dallas (IIPOD). IIPOD is designed to enhance the City's position as a logistics leader, providing jobs in warehousing and distribution. Support services include coordinating with Intergovernmental Services (IGS) on legislative activities related to transportation regulations with the State/federal government, coordination of government partnerships, research security/technology issues and other City initiatives.
Source of Funds:
2.31
Inland Port Development Department: Office of Economic Development
$0
Major Budget Items: None
On TrackFY 12-13 Performance Measure Status:
Performance Measures FY 2012-13 Budget FY 2012-13 Estimate FY 2013-14 Adopted
Number of new vertical project commitments 3 3 3
Amount of new vertical project commitments $35,000,000.00 $80,000,000.00 $40,000,000.00
Percent of work plan milestones achieved 100% 100% 100%
Infrastructure funding authorized by City Council to support vertical development $12,000,000.00 $14,200,000.00 $10,300,000.00
Economic Vibrancy101
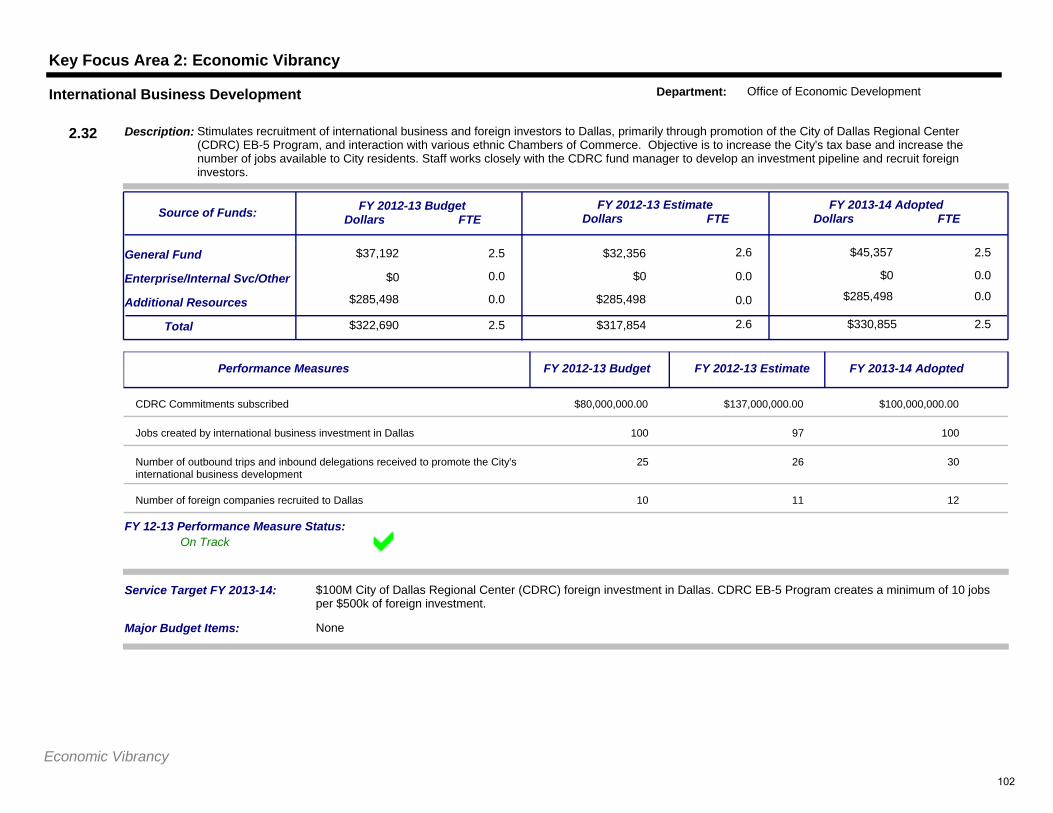
Key Focus Area 2: Economic Vibrancy
$37,192 2.5
0.0
$32,356 2.6
$0 0.0
$45,357
$0 0.0
2.5General Fund
Additional Resources
Service Target FY 2013-14: $100M City of Dallas Regional Center (CDRC) foreign investment in Dallas. CDRC EB-5 Program creates a minimum of 10 jobs per $500k of foreign investment.
$322,690Total 2.5 $317,854 2.6 $330,855 2.5
Enterprise/Internal Svc/Other
$285,498 0.0 $285,498 0.0 $285,498 0.0
FY 2012-13 BudgetDollars FTE
FY 2012-13 EstimateDollars FTE
FY 2013-14 AdoptedDollars FTE
Description: Stimulates recruitment of international business and foreign investors to Dallas, primarily through promotion of the City of Dallas Regional Center (CDRC) EB-5 Program, and interaction with various ethnic Chambers of Commerce. Objective is to increase the City's tax base and increase the number of jobs available to City residents. Staff works closely with the CDRC fund manager to develop an investment pipeline and recruit foreign investors.
Source of Funds:
2.32
International Business Development Department: Office of Economic Development
$0
Major Budget Items: None
On TrackFY 12-13 Performance Measure Status:
Performance Measures FY 2012-13 Budget FY 2012-13 Estimate FY 2013-14 Adopted
CDRC Commitments subscribed $80,000,000.00 $137,000,000.00 $100,000,000.00
Jobs created by international business investment in Dallas 100 97 100
Number of outbound trips and inbound delegations received to promote the City's international business development
25 26 30
Number of foreign companies recruited to Dallas 10 11 12
Economic Vibrancy102
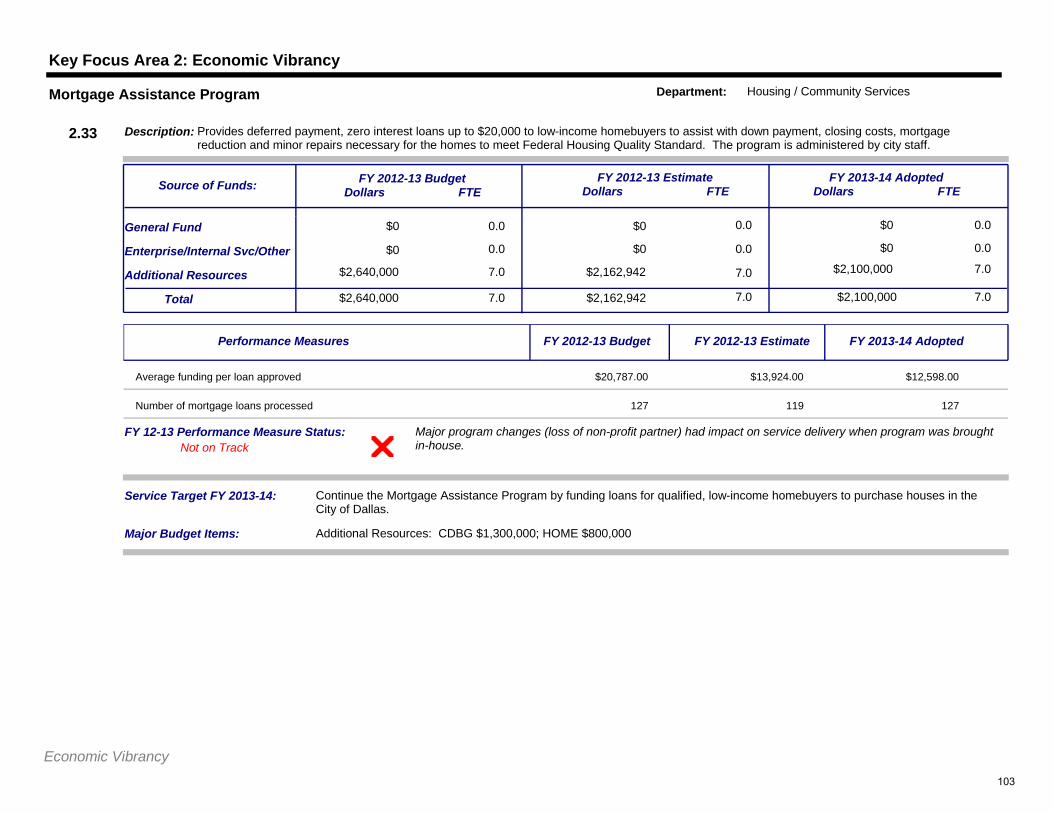
Key Focus Area 2: Economic Vibrancy
$0 0.0
0.0
$0 0.0
$0 0.0
$0
$0 0.0
0.0General Fund
Additional Resources
Service Target FY 2013-14: Continue the Mortgage Assistance Program by funding loans for qualified, low-income homebuyers to purchase houses in the City of Dallas.
$2,640,000Total 7.0 $2,162,942 7.0 $2,100,000 7.0
Enterprise/Internal Svc/Other
$2,640,000 7.0 $2,162,942 7.0 $2,100,000 7.0
FY 2012-13 BudgetDollars FTE
FY 2012-13 EstimateDollars FTE
FY 2013-14 AdoptedDollars FTE
Description: Provides deferred payment, zero interest loans up to $20,000 to low-income homebuyers to assist with down payment, closing costs, mortgage reduction and minor repairs necessary for the homes to meet Federal Housing Quality Standard. The program is administered by city staff.
Source of Funds:
2.33
Mortgage Assistance Program Department: Housing / Community Services
$0
Major Budget Items: Additional Resources: CDBG $1,300,000; HOME $800,000
Major program changes (loss of non-profit partner) had impact on service delivery when program was brought in-house.Not on Track
FY 12-13 Performance Measure Status:
Performance Measures FY 2012-13 Budget FY 2012-13 Estimate FY 2013-14 Adopted
Average funding per loan approved $20,787.00 $13,924.00 $12,598.00
Number of mortgage loans processed 127 119 127
Economic Vibrancy103
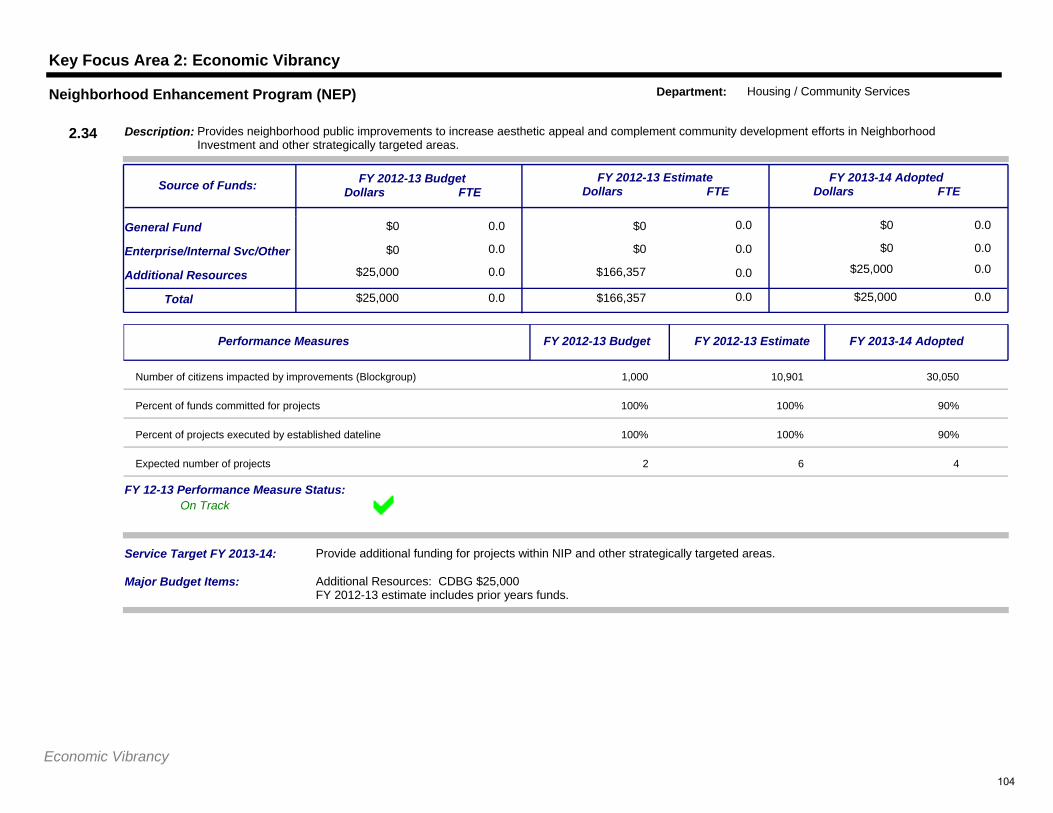
Key Focus Area 2: Economic Vibrancy
$0 0.0
0.0
$0 0.0
$0 0.0
$0
$0 0.0
0.0General Fund
Additional Resources
Service Target FY 2013-14: Provide additional funding for projects within NIP and other strategically targeted areas.
$25,000Total 0.0 $166,357 0.0 $25,000 0.0
Enterprise/Internal Svc/Other
$25,000 0.0 $166,357 0.0 $25,000 0.0
FY 2012-13 BudgetDollars FTE
FY 2012-13 EstimateDollars FTE
FY 2013-14 AdoptedDollars FTE
Description: Provides neighborhood public improvements to increase aesthetic appeal and complement community development efforts in Neighborhood Investment and other strategically targeted areas.
Source of Funds:
2.34
Neighborhood Enhancement Program (NEP) Department: Housing / Community Services
$0
Major Budget Items: Additional Resources: CDBG $25,000FY 2012-13 estimate includes prior years funds.
On TrackFY 12-13 Performance Measure Status:
Performance Measures FY 2012-13 Budget FY 2012-13 Estimate FY 2013-14 Adopted
Number of citizens impacted by improvements (Blockgroup) 1,000 10,901 30,050
Percent of funds committed for projects 100% 100% 90%
Percent of projects executed by established dateline 100% 100% 90%
Expected number of projects 2 6 4
Economic Vibrancy104
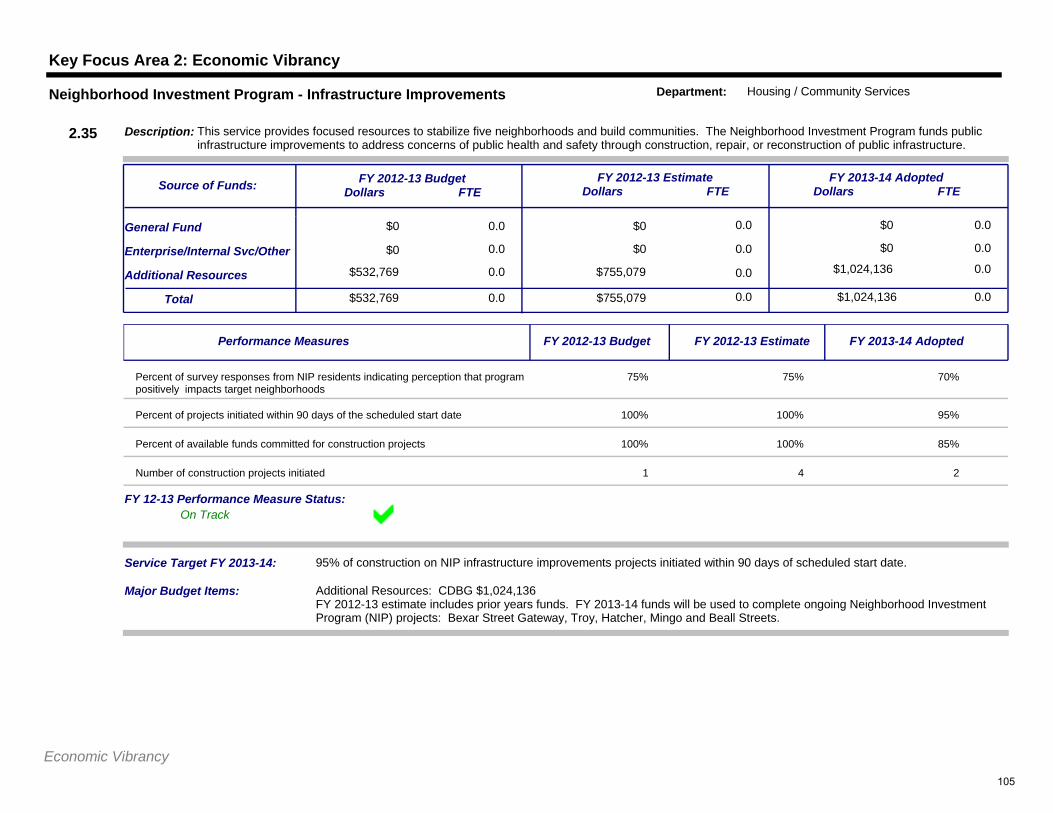
Key Focus Area 2: Economic Vibrancy
$0 0.0
0.0
$0 0.0
$0 0.0
$0
$0 0.0
0.0General Fund
Additional Resources
Service Target FY 2013-14: 95% of construction on NIP infrastructure improvements projects initiated within 90 days of scheduled start date.
$532,769Total 0.0 $755,079 0.0 $1,024,136 0.0
Enterprise/Internal Svc/Other
$532,769 0.0 $755,079 0.0 $1,024,136 0.0
FY 2012-13 BudgetDollars FTE
FY 2012-13 EstimateDollars FTE
FY 2013-14 AdoptedDollars FTE
Description: This service provides focused resources to stabilize five neighborhoods and build communities. The Neighborhood Investment Program funds public infrastructure improvements to address concerns of public health and safety through construction, repair, or reconstruction of public infrastructure.
Source of Funds:
2.35
Neighborhood Investment Program - Infrastructure Improvements Department: Housing / Community Services
$0
Major Budget Items: Additional Resources: CDBG $1,024,136FY 2012-13 estimate includes prior years funds. FY 2013-14 funds will be used to complete ongoing Neighborhood Investment Program (NIP) projects: Bexar Street Gateway, Troy, Hatcher, Mingo and Beall Streets.
On TrackFY 12-13 Performance Measure Status:
Performance Measures FY 2012-13 Budget FY 2012-13 Estimate FY 2013-14 Adopted
Percent of survey responses from NIP residents indicating perception that program positively impacts target neighborhoods
75% 75% 70%
Percent of projects initiated within 90 days of the scheduled start date 100% 100% 95%
Percent of available funds committed for construction projects 100% 100% 85%
Number of construction projects initiated 1 4 2
Economic Vibrancy105
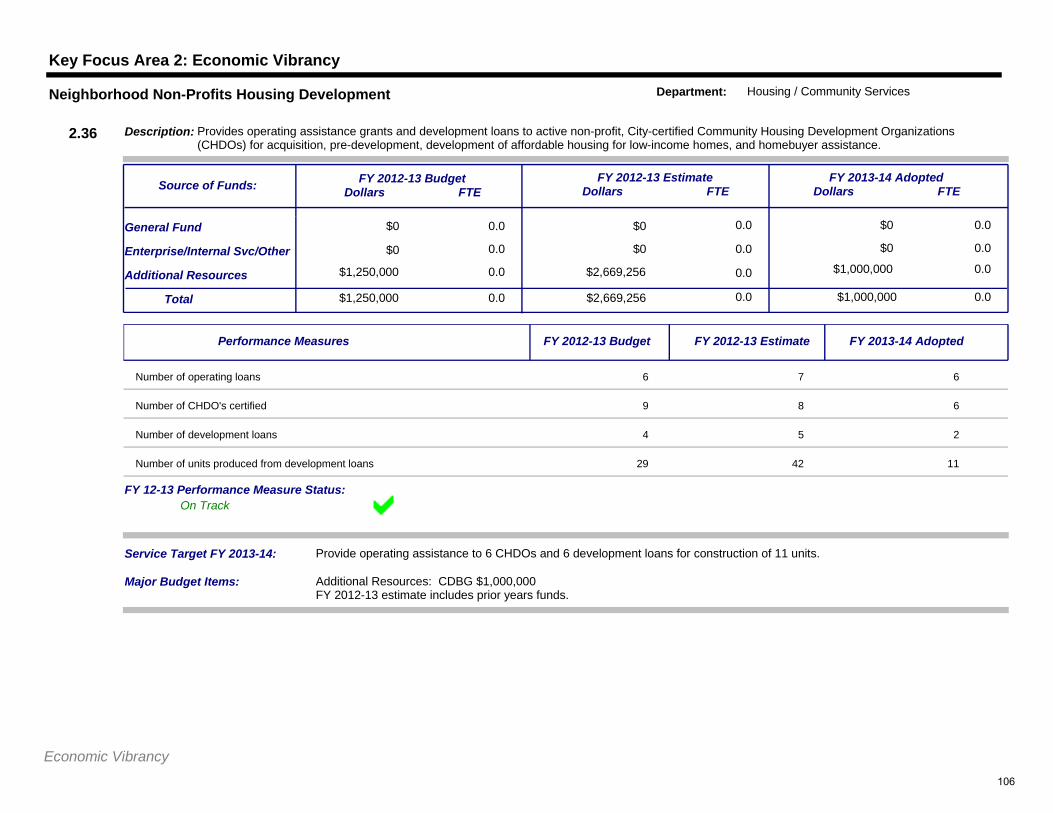
Key Focus Area 2: Economic Vibrancy
$0 0.0
0.0
$0 0.0
$0 0.0
$0
$0 0.0
0.0General Fund
Additional Resources
Service Target FY 2013-14: Provide operating assistance to 6 CHDOs and 6 development loans for construction of 11 units.
$1,250,000Total 0.0 $2,669,256 0.0 $1,000,000 0.0
Enterprise/Internal Svc/Other
$1,250,000 0.0 $2,669,256 0.0 $1,000,000 0.0
FY 2012-13 BudgetDollars FTE
FY 2012-13 EstimateDollars FTE
FY 2013-14 AdoptedDollars FTE
Description: Provides operating assistance grants and development loans to active non-profit, City-certified Community Housing Development Organizations (CHDOs) for acquisition, pre-development, development of affordable housing for low-income homes, and homebuyer assistance.
Source of Funds:
2.36
Neighborhood Non-Profits Housing Development Department: Housing / Community Services
$0
Major Budget Items: Additional Resources: CDBG $1,000,000FY 2012-13 estimate includes prior years funds.
On TrackFY 12-13 Performance Measure Status:
Performance Measures FY 2012-13 Budget FY 2012-13 Estimate FY 2013-14 Adopted
Number of operating loans 6 7 6
Number of CHDO's certified 9 8 6
Number of development loans 4 5 2
Number of units produced from development loans 29 42 11
Economic Vibrancy106
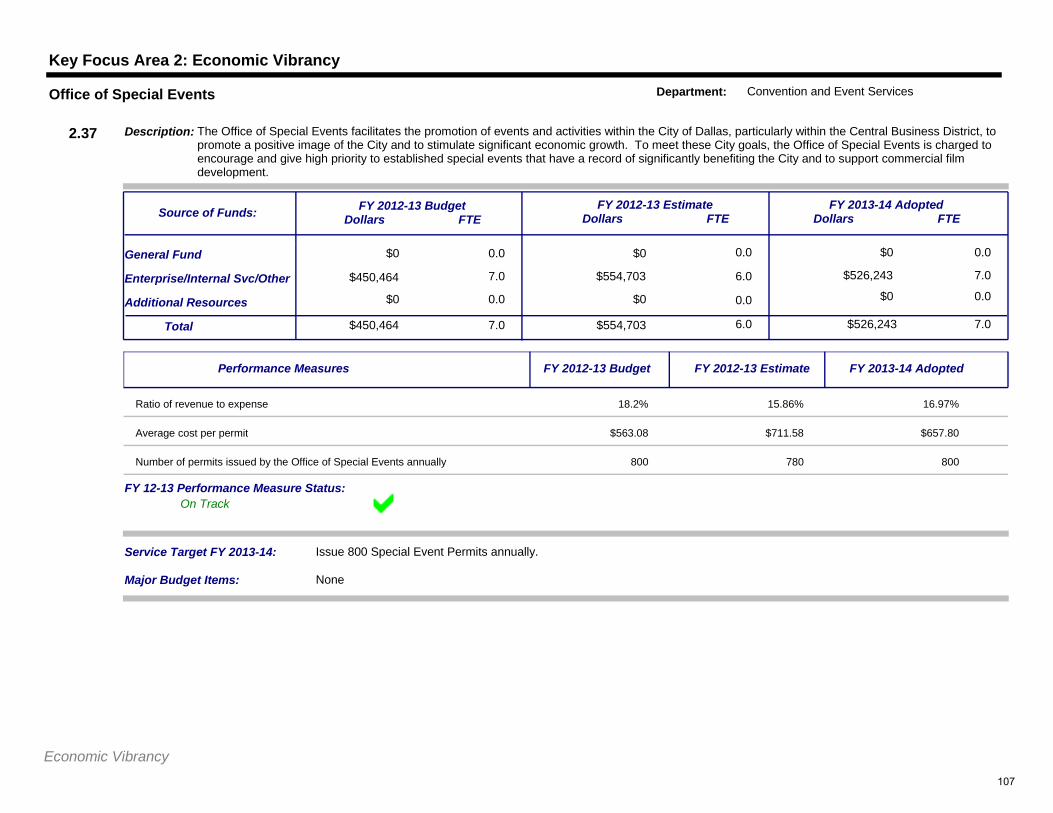
Key Focus Area 2: Economic Vibrancy
$0 0.0
7.0
$0 0.0
$554,703 6.0
$0
$526,243 7.0
0.0General Fund
Additional Resources
Service Target FY 2013-14: Issue 800 Special Event Permits annually.
$450,464Total 7.0 $554,703 6.0 $526,243 7.0
Enterprise/Internal Svc/Other
$0 0.0 $0 0.0 $0 0.0
FY 2012-13 BudgetDollars FTE
FY 2012-13 EstimateDollars FTE
FY 2013-14 AdoptedDollars FTE
Description: The Office of Special Events facilitates the promotion of events and activities within the City of Dallas, particularly within the Central Business District, to promote a positive image of the City and to stimulate significant economic growth. To meet these City goals, the Office of Special Events is charged to encourage and give high priority to established special events that have a record of significantly benefiting the City and to support commercial film development.
Source of Funds:
2.37
Office of Special Events Department: Convention and Event Services
$450,464
Major Budget Items: None
On TrackFY 12-13 Performance Measure Status:
Performance Measures FY 2012-13 Budget FY 2012-13 Estimate FY 2013-14 Adopted
Ratio of revenue to expense 18.2% 15.86% 16.97%
Average cost per permit $563.08 $711.58 $657.80
Number of permits issued by the Office of Special Events annually 800 780 800
Economic Vibrancy107
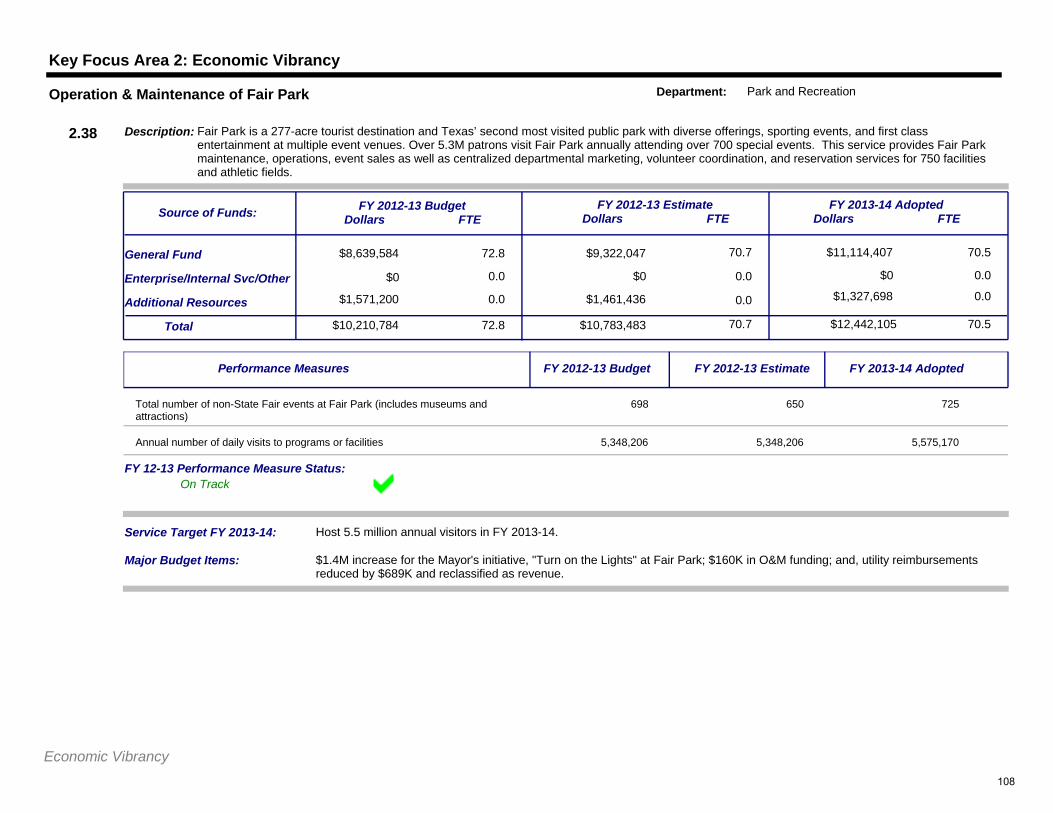
Key Focus Area 2: Economic Vibrancy
$8,639,584 72.8
0.0
$9,322,047 70.7
$0 0.0
$11,114,407
$0 0.0
70.5General Fund
Additional Resources
Service Target FY 2013-14: Host 5.5 million annual visitors in FY 2013-14.
$10,210,784Total 72.8 $10,783,483 70.7 $12,442,105 70.5
Enterprise/Internal Svc/Other
$1,571,200 0.0 $1,461,436 0.0 $1,327,698 0.0
FY 2012-13 BudgetDollars FTE
FY 2012-13 EstimateDollars FTE
FY 2013-14 AdoptedDollars FTE
Description: Fair Park is a 277-acre tourist destination and Texas’ second most visited public park with diverse offerings, sporting events, and first class entertainment at multiple event venues. Over 5.3M patrons visit Fair Park annually attending over 700 special events. This service provides Fair Park maintenance, operations, event sales as well as centralized departmental marketing, volunteer coordination, and reservation services for 750 facilities and athletic fields.
Source of Funds:
2.38
Operation & Maintenance of Fair Park Department: Park and Recreation
$0
Major Budget Items: $1.4M increase for the Mayor's initiative, "Turn on the Lights" at Fair Park; $160K in O&M funding; and, utility reimbursements reduced by $689K and reclassified as revenue.
On TrackFY 12-13 Performance Measure Status:
Performance Measures FY 2012-13 Budget FY 2012-13 Estimate FY 2013-14 Adopted
Total number of non-State Fair events at Fair Park (includes museums and attractions)
698 650 725
Annual number of daily visits to programs or facilities 5,348,206 5,348,206 5,575,170
Economic Vibrancy108
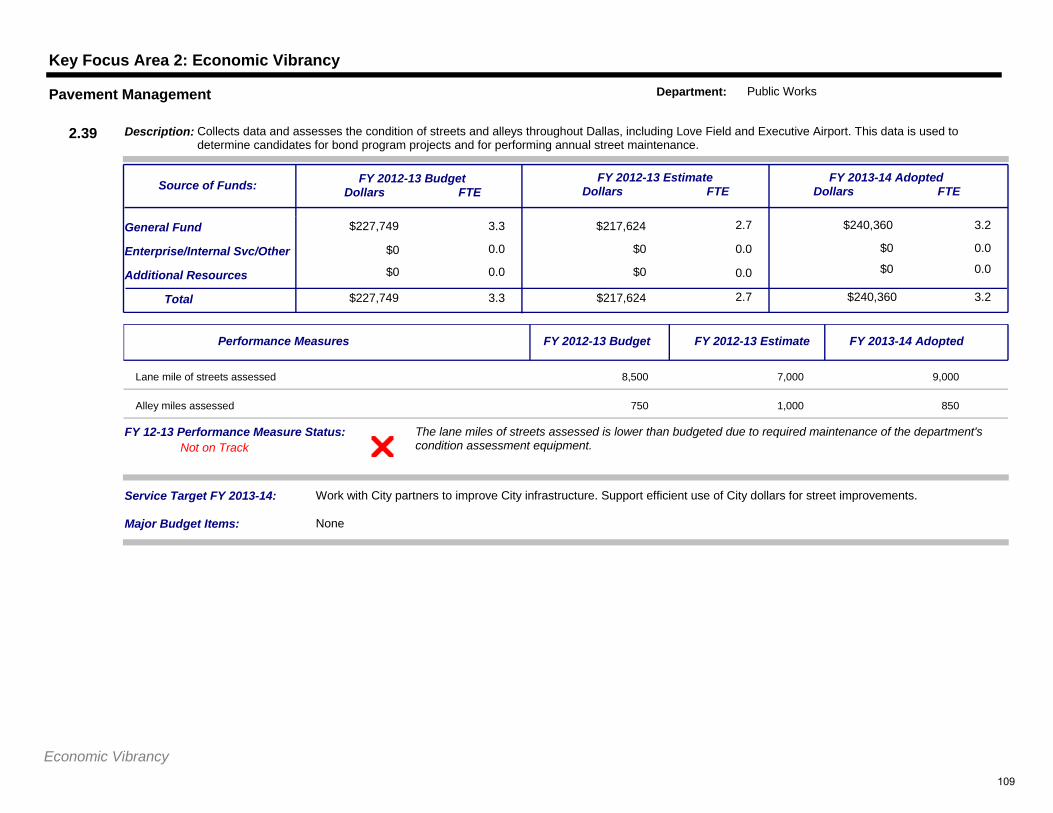
Key Focus Area 2: Economic Vibrancy
$227,749 3.3
0.0
$217,624 2.7
$0 0.0
$240,360
$0 0.0
3.2General Fund
Additional Resources
Service Target FY 2013-14: Work with City partners to improve City infrastructure. Support efficient use of City dollars for street improvements.
$227,749Total 3.3 $217,624 2.7 $240,360 3.2
Enterprise/Internal Svc/Other
$0 0.0 $0 0.0 $0 0.0
FY 2012-13 BudgetDollars FTE
FY 2012-13 EstimateDollars FTE
FY 2013-14 AdoptedDollars FTE
Description: Collects data and assesses the condition of streets and alleys throughout Dallas, including Love Field and Executive Airport. This data is used to determine candidates for bond program projects and for performing annual street maintenance.
Source of Funds:
2.39
Pavement Management Department: Public Works
$0
Major Budget Items: None
The lane miles of streets assessed is lower than budgeted due to required maintenance of the department's condition assessment equipment.Not on Track
FY 12-13 Performance Measure Status:
Performance Measures FY 2012-13 Budget FY 2012-13 Estimate FY 2013-14 Adopted
Lane mile of streets assessed 8,500 7,000 9,000
Alley miles assessed 750 1,000 850
Economic Vibrancy109
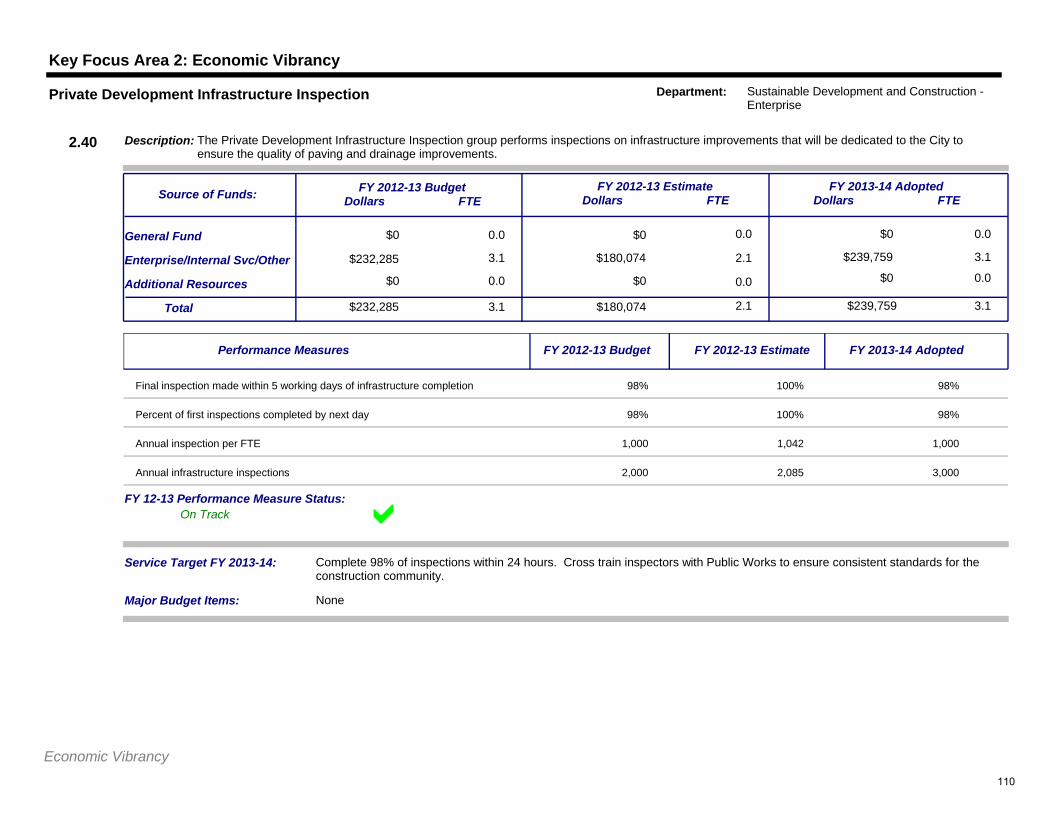
Key Focus Area 2: Economic Vibrancy
$0 0.0
3.1
$0 0.0
$180,074 2.1
$0
$239,759 3.1
0.0General Fund
Additional Resources
Service Target FY 2013-14: Complete 98% of inspections within 24 hours. Cross train inspectors with Public Works to ensure consistent standards for the construction community.
$232,285Total 3.1 $180,074 2.1 $239,759 3.1
Enterprise/Internal Svc/Other
$0 0.0 $0 0.0 $0 0.0
FY 2012-13 BudgetDollars FTE
FY 2012-13 EstimateDollars FTE
FY 2013-14 AdoptedDollars FTE
Description: The Private Development Infrastructure Inspection group performs inspections on infrastructure improvements that will be dedicated to the City to ensure the quality of paving and drainage improvements.
Source of Funds:
2.40
Private Development Infrastructure Inspection Department: Sustainable Development and Construction - Enterprise
$232,285
Major Budget Items: None
On TrackFY 12-13 Performance Measure Status:
Performance Measures FY 2012-13 Budget FY 2012-13 Estimate FY 2013-14 Adopted
Final inspection made within 5 working days of infrastructure completion 98% 100% 98%
Percent of first inspections completed by next day 98% 100% 98%
Annual inspection per FTE 1,000 1,042 1,000
Annual infrastructure inspections 2,000 2,085 3,000
Economic Vibrancy110
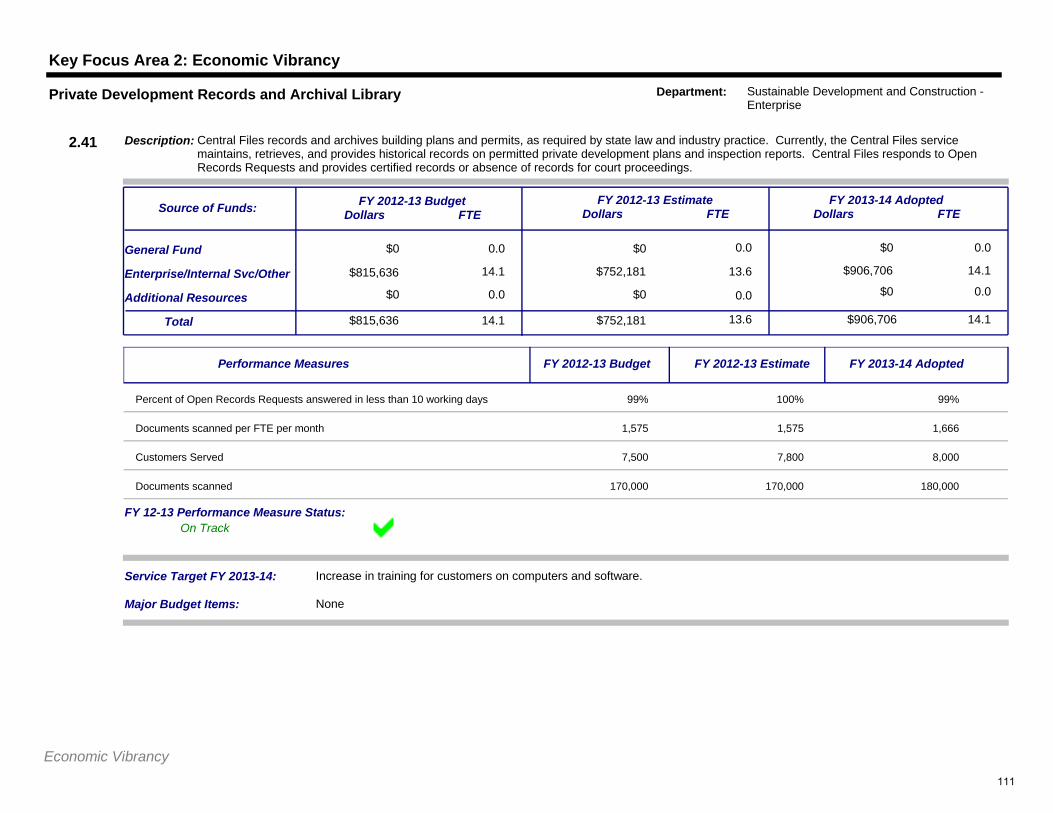
Key Focus Area 2: Economic Vibrancy
$0 0.0
14.1
$0 0.0
$752,181 13.6
$0
$906,706 14.1
0.0General Fund
Additional Resources
Service Target FY 2013-14: Increase in training for customers on computers and software.
$815,636Total 14.1 $752,181 13.6 $906,706 14.1
Enterprise/Internal Svc/Other
$0 0.0 $0 0.0 $0 0.0
FY 2012-13 BudgetDollars FTE
FY 2012-13 EstimateDollars FTE
FY 2013-14 AdoptedDollars FTE
Description: Central Files records and archives building plans and permits, as required by state law and industry practice. Currently, the Central Files service maintains, retrieves, and provides historical records on permitted private development plans and inspection reports. Central Files responds to Open Records Requests and provides certified records or absence of records for court proceedings.
Source of Funds:
2.41
Private Development Records and Archival Library Department: Sustainable Development and Construction - Enterprise
$815,636
Major Budget Items: None
On TrackFY 12-13 Performance Measure Status:
Performance Measures FY 2012-13 Budget FY 2012-13 Estimate FY 2013-14 Adopted
Percent of Open Records Requests answered in less than 10 working days 99% 100% 99%
Documents scanned per FTE per month 1,575 1,575 1,666
Customers Served 7,500 7,800 8,000
Documents scanned 170,000 170,000 180,000
Economic Vibrancy111
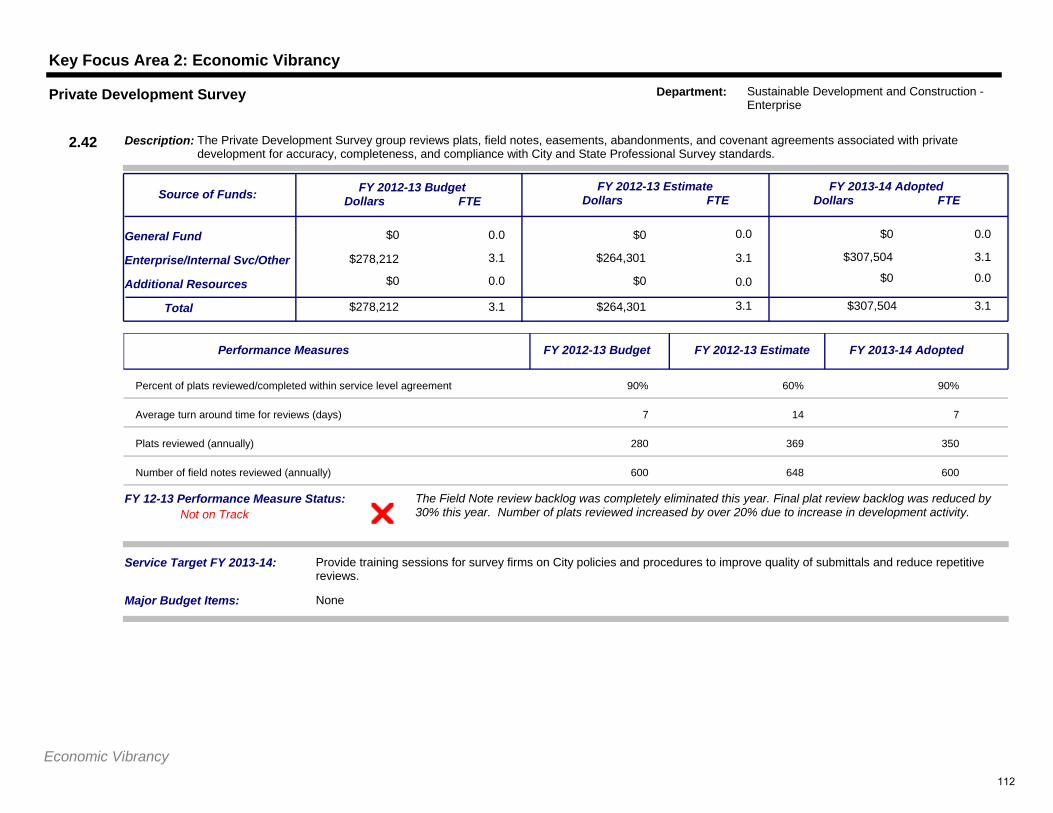
Key Focus Area 2: Economic Vibrancy
$0 0.0
3.1
$0 0.0
$264,301 3.1
$0
$307,504 3.1
0.0General Fund
Additional Resources
Service Target FY 2013-14: Provide training sessions for survey firms on City policies and procedures to improve quality of submittals and reduce repetitive reviews.
$278,212Total 3.1 $264,301 3.1 $307,504 3.1
Enterprise/Internal Svc/Other
$0 0.0 $0 0.0 $0 0.0
FY 2012-13 BudgetDollars FTE
FY 2012-13 EstimateDollars FTE
FY 2013-14 AdoptedDollars FTE
Description: The Private Development Survey group reviews plats, field notes, easements, abandonments, and covenant agreements associated with private development for accuracy, completeness, and compliance with City and State Professional Survey standards.
Source of Funds:
2.42
Private Development Survey Department: Sustainable Development and Construction - Enterprise
$278,212
Major Budget Items: None
The Field Note review backlog was completely eliminated this year. Final plat review backlog was reduced by 30% this year. Number of plats reviewed increased by over 20% due to increase in development activity.Not on Track
FY 12-13 Performance Measure Status:
Performance Measures FY 2012-13 Budget FY 2012-13 Estimate FY 2013-14 Adopted
Percent of plats reviewed/completed within service level agreement 90% 60% 90%
Average turn around time for reviews (days) 7 14 7
Plats reviewed (annually) 280 369 350
Number of field notes reviewed (annually) 600 648 600
Economic Vibrancy112
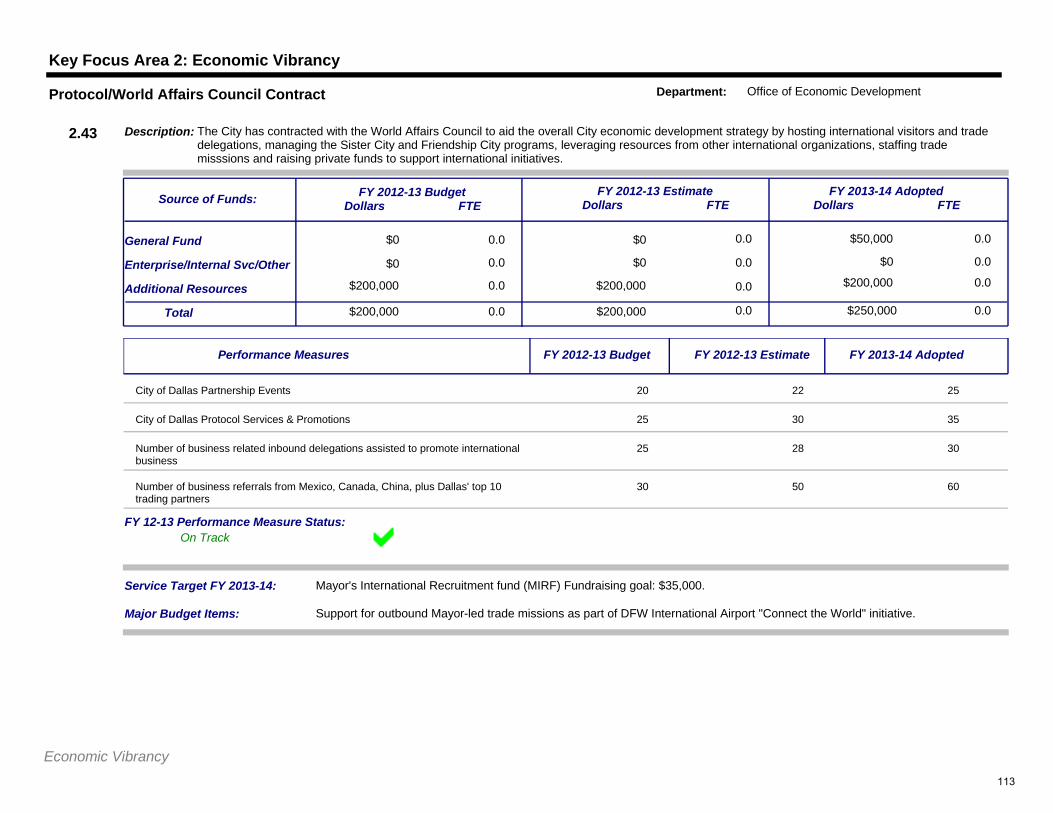
Key Focus Area 2: Economic Vibrancy
$0 0.0
0.0
$0 0.0
$0 0.0
$50,000
$0 0.0
0.0General Fund
Additional Resources
Service Target FY 2013-14: Mayor's International Recruitment fund (MIRF) Fundraising goal: $35,000.
$200,000Total 0.0 $200,000 0.0 $250,000 0.0
Enterprise/Internal Svc/Other
$200,000 0.0 $200,000 0.0 $200,000 0.0
FY 2012-13 BudgetDollars FTE
FY 2012-13 EstimateDollars FTE
FY 2013-14 AdoptedDollars FTE
Description: The City has contracted with the World Affairs Council to aid the overall City economic development strategy by hosting international visitors and trade delegations, managing the Sister City and Friendship City programs, leveraging resources from other international organizations, staffing trade misssions and raising private funds to support international initiatives.
Source of Funds:
2.43
Protocol/World Affairs Council Contract Department: Office of Economic Development
$0
Major Budget Items: Support for outbound Mayor-led trade missions as part of DFW International Airport "Connect the World" initiative.
On TrackFY 12-13 Performance Measure Status:
Performance Measures FY 2012-13 Budget FY 2012-13 Estimate FY 2013-14 Adopted
City of Dallas Partnership Events 20 22 25
City of Dallas Protocol Services & Promotions 25 30 35
Number of business related inbound delegations assisted to promote international business
25 28 30
Number of business referrals from Mexico, Canada, China, plus Dallas' top 10 trading partners
30 50 60
Economic Vibrancy113
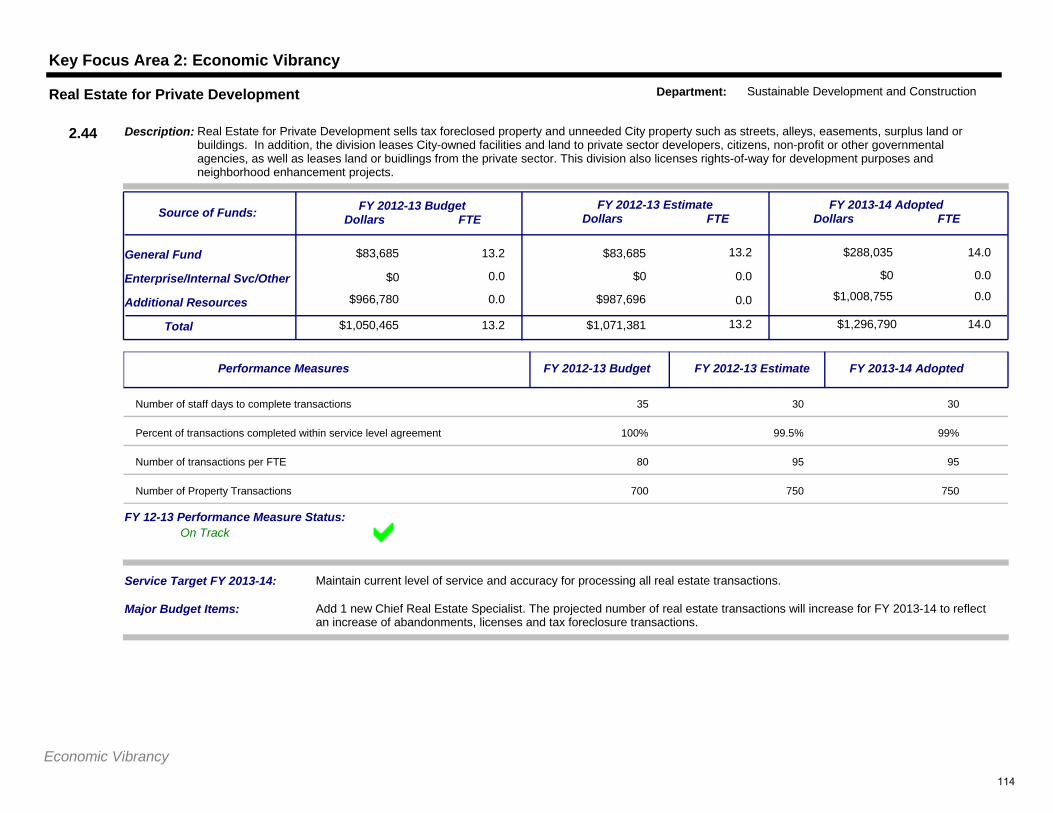
Key Focus Area 2: Economic Vibrancy
$83,685 13.2
0.0
$83,685 13.2
$0 0.0
$288,035
$0 0.0
14.0General Fund
Additional Resources
Service Target FY 2013-14: Maintain current level of service and accuracy for processing all real estate transactions.
$1,050,465Total 13.2 $1,071,381 13.2 $1,296,790 14.0
Enterprise/Internal Svc/Other
$966,780 0.0 $987,696 0.0 $1,008,755 0.0
FY 2012-13 BudgetDollars FTE
FY 2012-13 EstimateDollars FTE
FY 2013-14 AdoptedDollars FTE
Description: Real Estate for Private Development sells tax foreclosed property and unneeded City property such as streets, alleys, easements, surplus land or buildings. In addition, the division leases City-owned facilities and land to private sector developers, citizens, non-profit or other governmental agencies, as well as leases land or buidlings from the private sector. This division also licenses rights-of-way for development purposes and neighborhood enhancement projects.
Source of Funds:
2.44
Real Estate for Private Development Department: Sustainable Development and Construction
$0
Major Budget Items: Add 1 new Chief Real Estate Specialist. The projected number of real estate transactions will increase for FY 2013-14 to reflect an increase of abandonments, licenses and tax foreclosure transactions.
On TrackFY 12-13 Performance Measure Status:
Performance Measures FY 2012-13 Budget FY 2012-13 Estimate FY 2013-14 Adopted
Number of staff days to complete transactions 35 30 30
Percent of transactions completed within service level agreement 100% 99.5% 99%
Number of transactions per FTE 80 95 95
Number of Property Transactions 700 750 750
Economic Vibrancy114
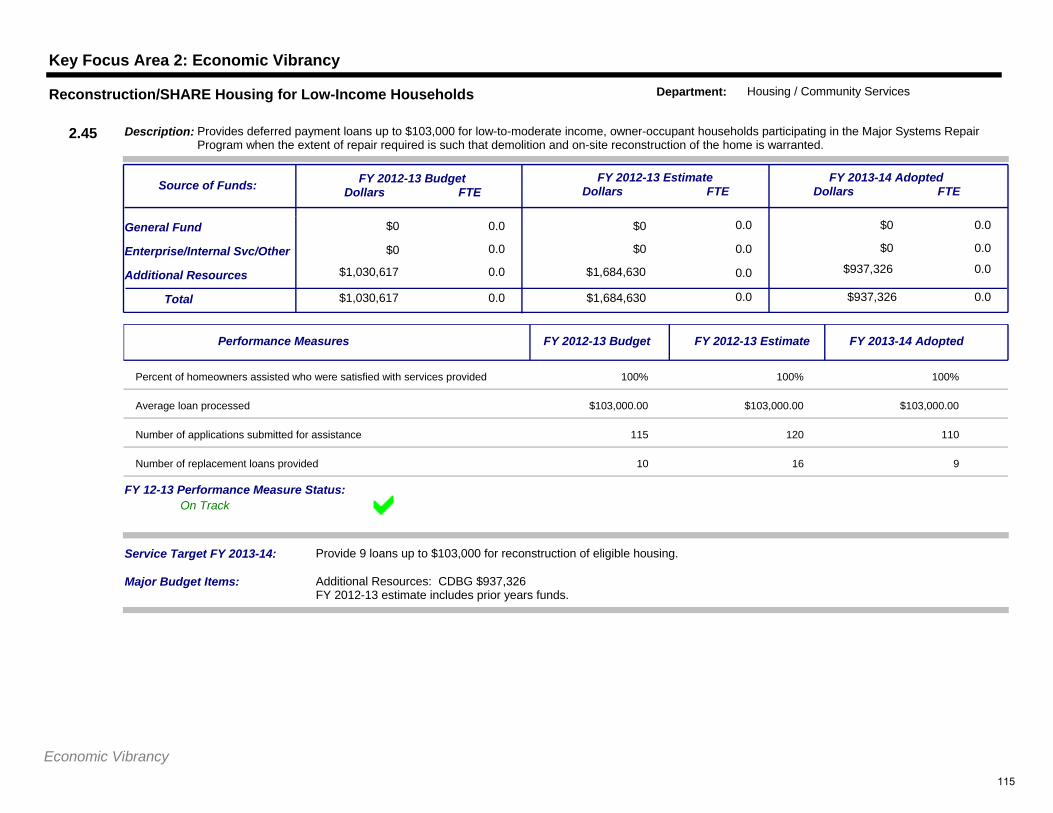
Key Focus Area 2: Economic Vibrancy
$0 0.0
0.0
$0 0.0
$0 0.0
$0
$0 0.0
0.0General Fund
Additional Resources
Service Target FY 2013-14: Provide 9 loans up to $103,000 for reconstruction of eligible housing.
$1,030,617Total 0.0 $1,684,630 0.0 $937,326 0.0
Enterprise/Internal Svc/Other
$1,030,617 0.0 $1,684,630 0.0 $937,326 0.0
FY 2012-13 BudgetDollars FTE
FY 2012-13 EstimateDollars FTE
FY 2013-14 AdoptedDollars FTE
Description: Provides deferred payment loans up to $103,000 for low-to-moderate income, owner-occupant households participating in the Major Systems Repair Program when the extent of repair required is such that demolition and on-site reconstruction of the home is warranted.
Source of Funds:
2.45
Reconstruction/SHARE Housing for Low-Income Households Department: Housing / Community Services
$0
Major Budget Items: Additional Resources: CDBG $937,326FY 2012-13 estimate includes prior years funds.
On TrackFY 12-13 Performance Measure Status:
Performance Measures FY 2012-13 Budget FY 2012-13 Estimate FY 2013-14 Adopted
Percent of homeowners assisted who were satisfied with services provided 100% 100% 100%
Average loan processed $103,000.00 $103,000.00 $103,000.00
Number of applications submitted for assistance 115 120 110
Number of replacement loans provided 10 16 9
Economic Vibrancy115
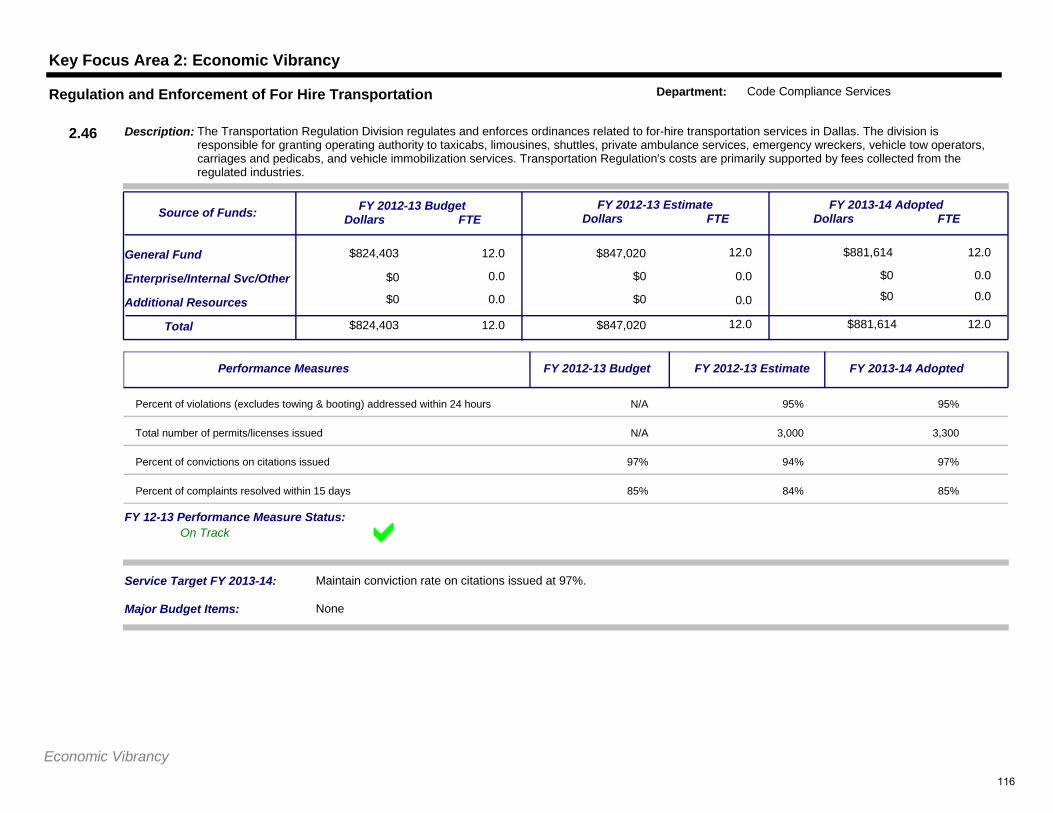
Key Focus Area 2: Economic Vibrancy
$824,403 12.0
0.0
$847,020 12.0
$0 0.0
$881,614
$0 0.0
12.0General Fund
Additional Resources
Service Target FY 2013-14: Maintain conviction rate on citations issued at 97%.
$824,403Total 12.0 $847,020 12.0 $881,614 12.0
Enterprise/Internal Svc/Other
$0 0.0 $0 0.0 $0 0.0
FY 2012-13 BudgetDollars FTE
FY 2012-13 EstimateDollars FTE
FY 2013-14 AdoptedDollars FTE
Description: The Transportation Regulation Division regulates and enforces ordinances related to for-hire transportation services in Dallas. The division is responsible for granting operating authority to taxicabs, limousines, shuttles, private ambulance services, emergency wreckers, vehicle tow operators, carriages and pedicabs, and vehicle immobilization services. Transportation Regulation's costs are primarily supported by fees collected from the regulated industries.
Source of Funds:
2.46
Regulation and Enforcement of For Hire Transportation Department: Code Compliance Services
$0
Major Budget Items: None
On TrackFY 12-13 Performance Measure Status:
Performance Measures FY 2012-13 Budget FY 2012-13 Estimate FY 2013-14 Adopted
Percent of violations (excludes towing & booting) addressed within 24 hours N/A 95% 95%
Total number of permits/licenses issued N/A 3,000 3,300
Percent of convictions on citations issued 97% 94% 97%
Percent of complaints resolved within 15 days 85% 84% 85%
Economic Vibrancy116
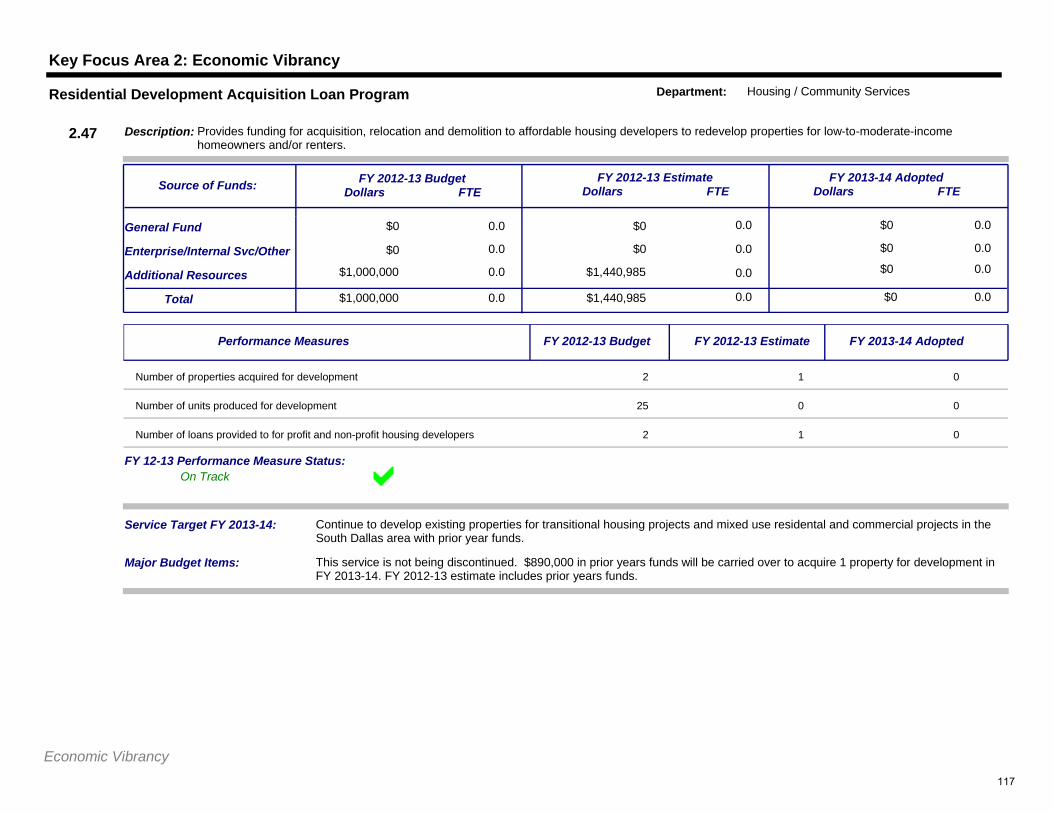
Key Focus Area 2: Economic Vibrancy
$0 0.0
0.0
$0 0.0
$0 0.0
$0
$0 0.0
0.0General Fund
Additional Resources
Service Target FY 2013-14: Continue to develop existing properties for transitional housing projects and mixed use residental and commercial projects in the South Dallas area with prior year funds.
$1,000,000Total 0.0 $1,440,985 0.0 $0 0.0
Enterprise/Internal Svc/Other
$1,000,000 0.0 $1,440,985 0.0 $0 0.0
FY 2012-13 BudgetDollars FTE
FY 2012-13 EstimateDollars FTE
FY 2013-14 AdoptedDollars FTE
Description: Provides funding for acquisition, relocation and demolition to affordable housing developers to redevelop properties for low-to-moderate-income homeowners and/or renters.
Source of Funds:
2.47
Residential Development Acquisition Loan Program Department: Housing / Community Services
$0
Major Budget Items: This service is not being discontinued. $890,000 in prior years funds will be carried over to acquire 1 property for development in FY 2013-14. FY 2012-13 estimate includes prior years funds.
On TrackFY 12-13 Performance Measure Status:
Performance Measures FY 2012-13 Budget FY 2012-13 Estimate FY 2013-14 Adopted
Number of properties acquired for development 2 1 0
Number of units produced for development 25 0 0
Number of loans provided to for profit and non-profit housing developers 2 1 0
Economic Vibrancy117
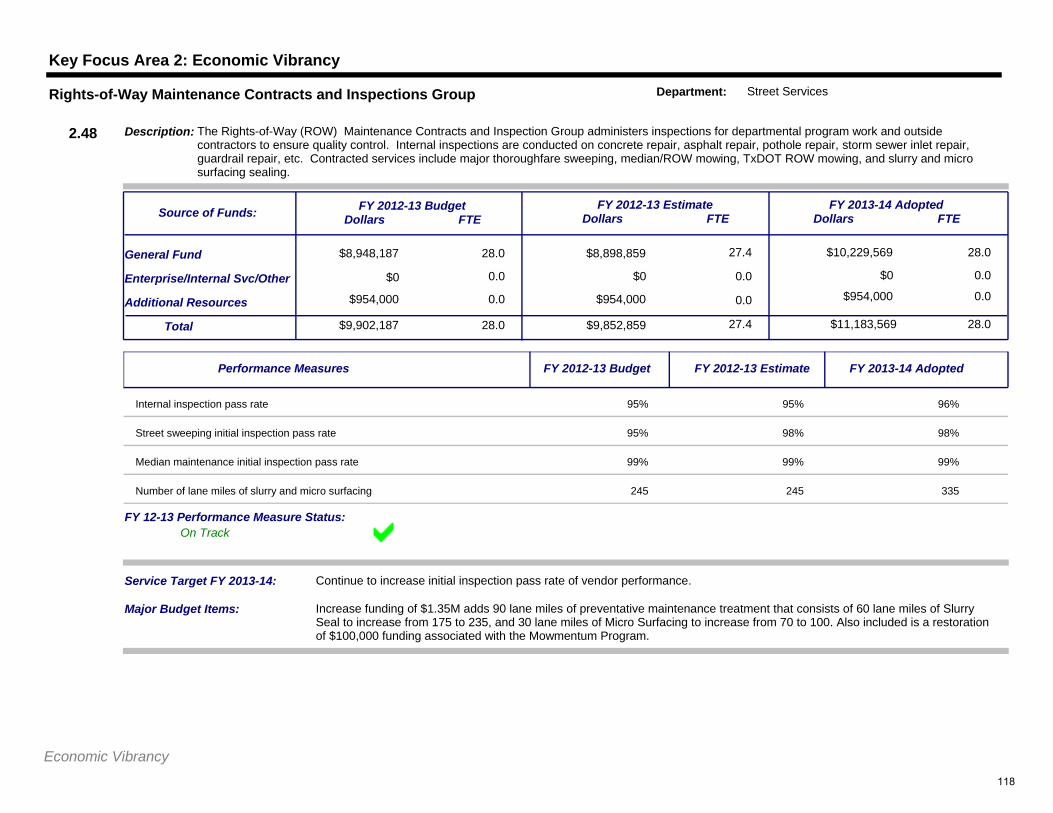
Key Focus Area 2: Economic Vibrancy
$8,948,187 28.0
0.0
$8,898,859 27.4
$0 0.0
$10,229,569
$0 0.0
28.0General Fund
Additional Resources
Service Target FY 2013-14: Continue to increase initial inspection pass rate of vendor performance.
$9,902,187Total 28.0 $9,852,859 27.4 $11,183,569 28.0
Enterprise/Internal Svc/Other
$954,000 0.0 $954,000 0.0 $954,000 0.0
FY 2012-13 BudgetDollars FTE
FY 2012-13 EstimateDollars FTE
FY 2013-14 AdoptedDollars FTE
Description: The Rights-of-Way (ROW) Maintenance Contracts and Inspection Group administers inspections for departmental program work and outside contractors to ensure quality control. Internal inspections are conducted on concrete repair, asphalt repair, pothole repair, storm sewer inlet repair, guardrail repair, etc. Contracted services include major thoroughfare sweeping, median/ROW mowing, TxDOT ROW mowing, and slurry and micro surfacing sealing.
Source of Funds:
2.48
Rights-of-Way Maintenance Contracts and Inspections Group Department: Street Services
$0
Major Budget Items: Increase funding of $1.35M adds 90 lane miles of preventative maintenance treatment that consists of 60 lane miles of Slurry Seal to increase from 175 to 235, and 30 lane miles of Micro Surfacing to increase from 70 to 100. Also included is a restoration of $100,000 funding associated with the Mowmentum Program.
On TrackFY 12-13 Performance Measure Status:
Performance Measures FY 2012-13 Budget FY 2012-13 Estimate FY 2013-14 Adopted
Internal inspection pass rate 95% 95% 96%
Street sweeping initial inspection pass rate 95% 98% 98%
Median maintenance initial inspection pass rate 99% 99% 99%
Number of lane miles of slurry and micro surfacing 245 245 335
Economic Vibrancy118
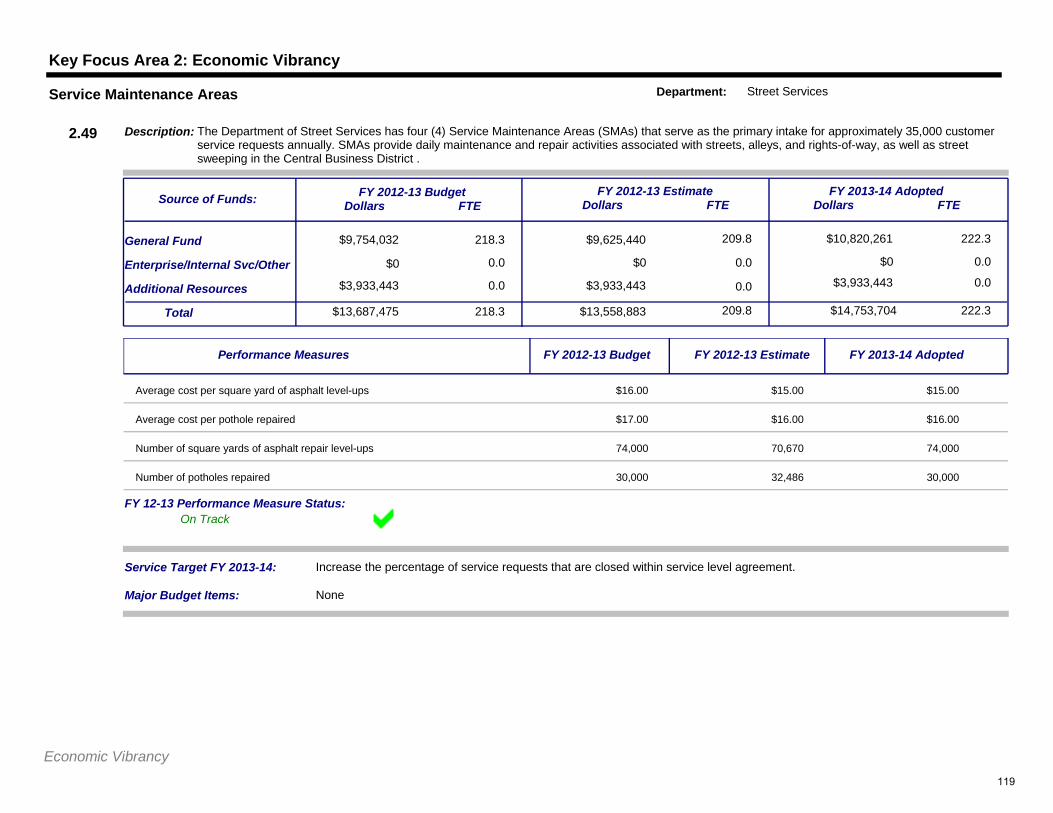
Key Focus Area 2: Economic Vibrancy
$9,754,032 218.3
0.0
$9,625,440 209.8
$0 0.0
$10,820,261
$0 0.0
222.3General Fund
Additional Resources
Service Target FY 2013-14: Increase the percentage of service requests that are closed within service level agreement.
$13,687,475Total 218.3 $13,558,883 209.8 $14,753,704 222.3
Enterprise/Internal Svc/Other
$3,933,443 0.0 $3,933,443 0.0 $3,933,443 0.0
FY 2012-13 BudgetDollars FTE
FY 2012-13 EstimateDollars FTE
FY 2013-14 AdoptedDollars FTE
Description: The Department of Street Services has four (4) Service Maintenance Areas (SMAs) that serve as the primary intake for approximately 35,000 customer service requests annually. SMAs provide daily maintenance and repair activities associated with streets, alleys, and rights-of-way, as well as street sweeping in the Central Business District .
Source of Funds:
2.49
Service Maintenance Areas Department: Street Services
$0
Major Budget Items: None
On TrackFY 12-13 Performance Measure Status:
Performance Measures FY 2012-13 Budget FY 2012-13 Estimate FY 2013-14 Adopted
Average cost per square yard of asphalt level-ups $16.00 $15.00 $15.00
Average cost per pothole repaired $17.00 $16.00 $16.00
Number of square yards of asphalt repair level-ups 74,000 70,670 74,000
Number of potholes repaired 30,000 32,486 30,000
Economic Vibrancy119
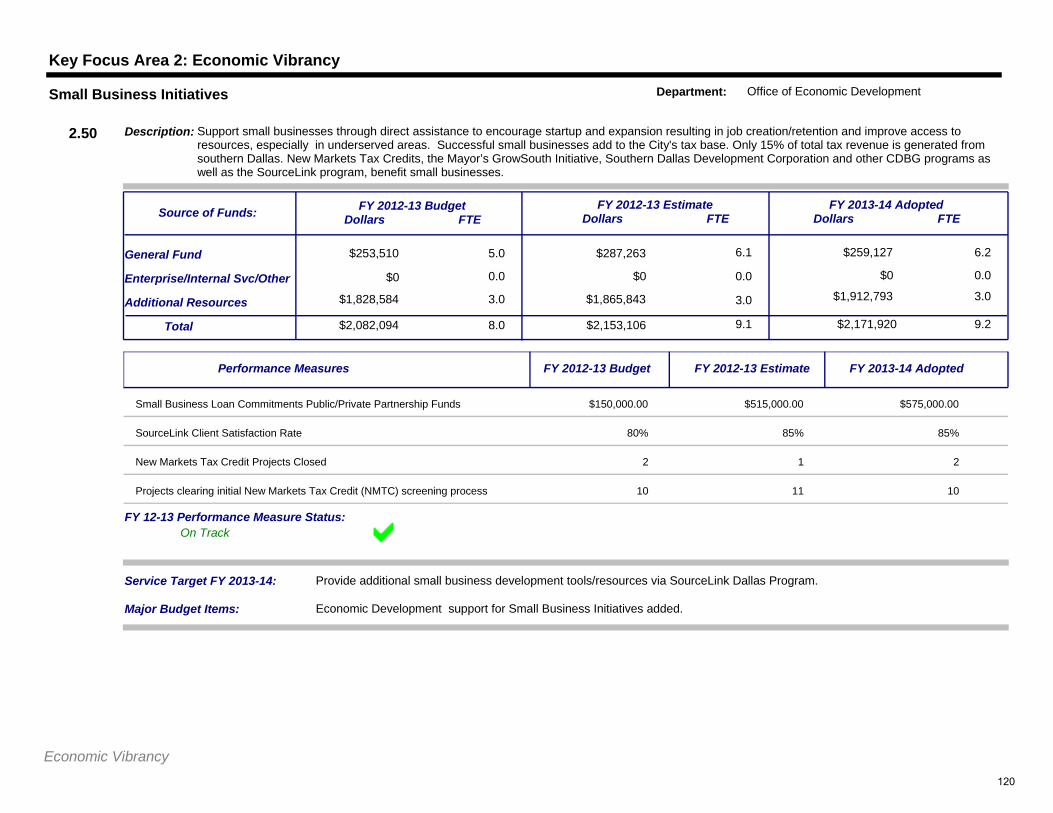
Key Focus Area 2: Economic Vibrancy
$253,510 5.0
0.0
$287,263 6.1
$0 0.0
$259,127
$0 0.0
6.2General Fund
Additional Resources
Service Target FY 2013-14: Provide additional small business development tools/resources via SourceLink Dallas Program.
$2,082,094Total 8.0 $2,153,106 9.1 $2,171,920 9.2
Enterprise/Internal Svc/Other
$1,828,584 3.0 $1,865,843 3.0 $1,912,793 3.0
FY 2012-13 BudgetDollars FTE
FY 2012-13 EstimateDollars FTE
FY 2013-14 AdoptedDollars FTE
Description: Support small businesses through direct assistance to encourage startup and expansion resulting in job creation/retention and improve access to resources, especially in underserved areas. Successful small businesses add to the City's tax base. Only 15% of total tax revenue is generated from southern Dallas. New Markets Tax Credits, the Mayor’s GrowSouth Initiative, Southern Dallas Development Corporation and other CDBG programs as well as the SourceLink program, benefit small businesses.
Source of Funds:
2.50
Small Business Initiatives Department: Office of Economic Development
$0
Major Budget Items: Economic Development support for Small Business Initiatives added.
On TrackFY 12-13 Performance Measure Status:
Performance Measures FY 2012-13 Budget FY 2012-13 Estimate FY 2013-14 Adopted
Small Business Loan Commitments Public/Private Partnership Funds $150,000.00 $515,000.00 $575,000.00
SourceLink Client Satisfaction Rate 80% 85% 85%
New Markets Tax Credit Projects Closed 2 1 2
Projects clearing initial New Markets Tax Credit (NMTC) screening process 10 11 10
Economic Vibrancy120
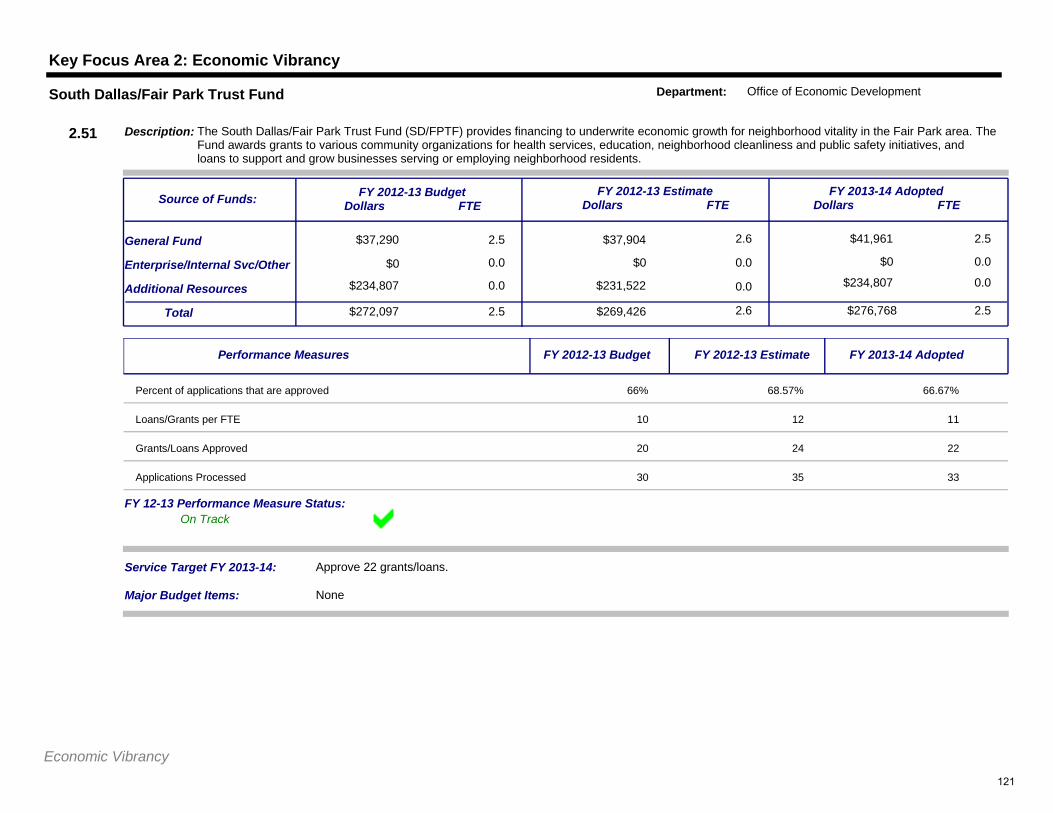
Key Focus Area 2: Economic Vibrancy
$37,290 2.5
0.0
$37,904 2.6
$0 0.0
$41,961
$0 0.0
2.5General Fund
Additional Resources
Service Target FY 2013-14: Approve 22 grants/loans.
$272,097Total 2.5 $269,426 2.6 $276,768 2.5
Enterprise/Internal Svc/Other
$234,807 0.0 $231,522 0.0 $234,807 0.0
FY 2012-13 BudgetDollars FTE
FY 2012-13 EstimateDollars FTE
FY 2013-14 AdoptedDollars FTE
Description: The South Dallas/Fair Park Trust Fund (SD/FPTF) provides financing to underwrite economic growth for neighborhood vitality in the Fair Park area. The Fund awards grants to various community organizations for health services, education, neighborhood cleanliness and public safety initiatives, and loans to support and grow businesses serving or employing neighborhood residents.
Source of Funds:
2.51
South Dallas/Fair Park Trust Fund Department: Office of Economic Development
$0
Major Budget Items: None
On TrackFY 12-13 Performance Measure Status:
Performance Measures FY 2012-13 Budget FY 2012-13 Estimate FY 2013-14 Adopted
Percent of applications that are approved 66% 68.57% 66.67%
Loans/Grants per FTE 10 12 11
Grants/Loans Approved 20 24 22
Applications Processed 30 35 33
Economic Vibrancy121
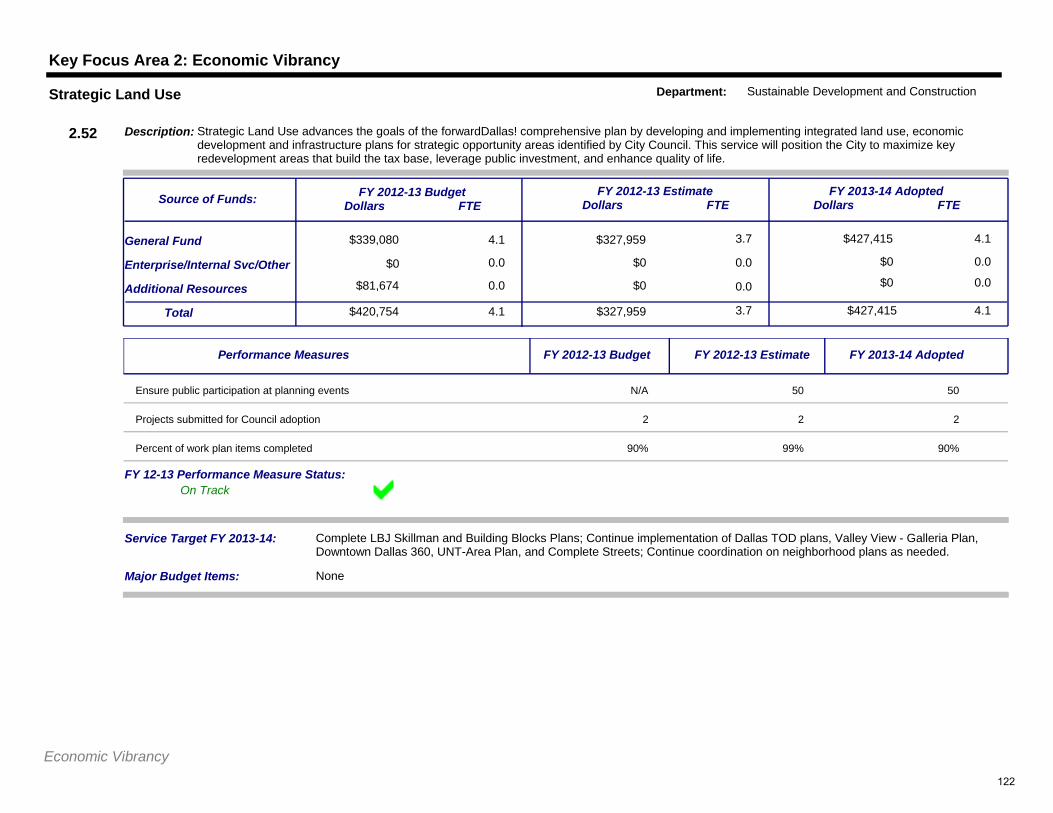
Key Focus Area 2: Economic Vibrancy
$339,080 4.1
0.0
$327,959 3.7
$0 0.0
$427,415
$0 0.0
4.1General Fund
Additional Resources
Service Target FY 2013-14: Complete LBJ Skillman and Building Blocks Plans; Continue implementation of Dallas TOD plans, Valley View - Galleria Plan, Downtown Dallas 360, UNT-Area Plan, and Complete Streets; Continue coordination on neighborhood plans as needed.
$420,754Total 4.1 $327,959 3.7 $427,415 4.1
Enterprise/Internal Svc/Other
$81,674 0.0 $0 0.0 $0 0.0
FY 2012-13 BudgetDollars FTE
FY 2012-13 EstimateDollars FTE
FY 2013-14 AdoptedDollars FTE
Description: Strategic Land Use advances the goals of the forwardDallas! comprehensive plan by developing and implementing integrated land use, economic development and infrastructure plans for strategic opportunity areas identified by City Council. This service will position the City to maximize key redevelopment areas that build the tax base, leverage public investment, and enhance quality of life.
Source of Funds:
2.52
Strategic Land Use Department: Sustainable Development and Construction
$0
Major Budget Items: None
On TrackFY 12-13 Performance Measure Status:
Performance Measures FY 2012-13 Budget FY 2012-13 Estimate FY 2013-14 Adopted
Ensure public participation at planning events N/A 50 50
Projects submitted for Council adoption 2 2 2
Percent of work plan items completed 90% 99% 90%
Economic Vibrancy122
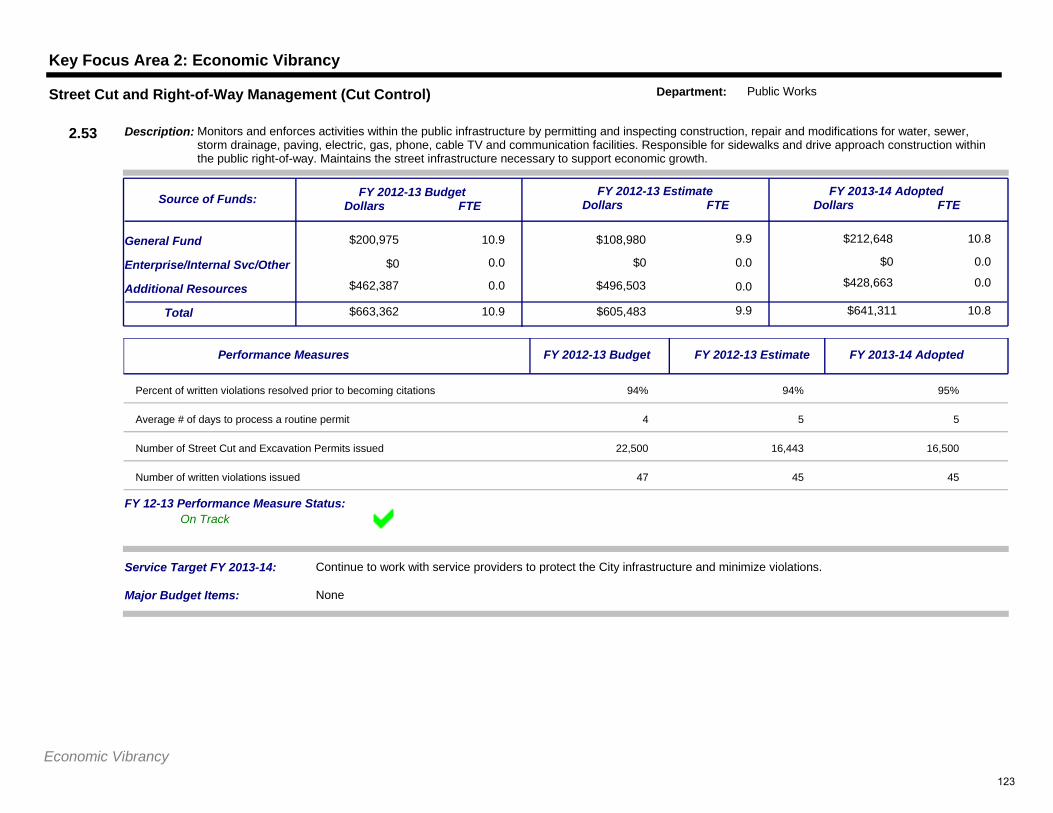
Key Focus Area 2: Economic Vibrancy
$200,975 10.9
0.0
$108,980 9.9
$0 0.0
$212,648
$0 0.0
10.8General Fund
Additional Resources
Service Target FY 2013-14: Continue to work with service providers to protect the City infrastructure and minimize violations.
$663,362Total 10.9 $605,483 9.9 $641,311 10.8
Enterprise/Internal Svc/Other
$462,387 0.0 $496,503 0.0 $428,663 0.0
FY 2012-13 BudgetDollars FTE
FY 2012-13 EstimateDollars FTE
FY 2013-14 AdoptedDollars FTE
Description: Monitors and enforces activities within the public infrastructure by permitting and inspecting construction, repair and modifications for water, sewer, storm drainage, paving, electric, gas, phone, cable TV and communication facilities. Responsible for sidewalks and drive approach construction within the public right-of-way. Maintains the street infrastructure necessary to support economic growth.
Source of Funds:
2.53
Street Cut and Right-of-Way Management (Cut Control) Department: Public Works
$0
Major Budget Items: None
On TrackFY 12-13 Performance Measure Status:
Performance Measures FY 2012-13 Budget FY 2012-13 Estimate FY 2013-14 Adopted
Percent of written violations resolved prior to becoming citations 94% 94% 95%
Average # of days to process a routine permit 4 5 5
Number of Street Cut and Excavation Permits issued 22,500 16,443 16,500
Number of written violations issued 47 45 45
Economic Vibrancy123
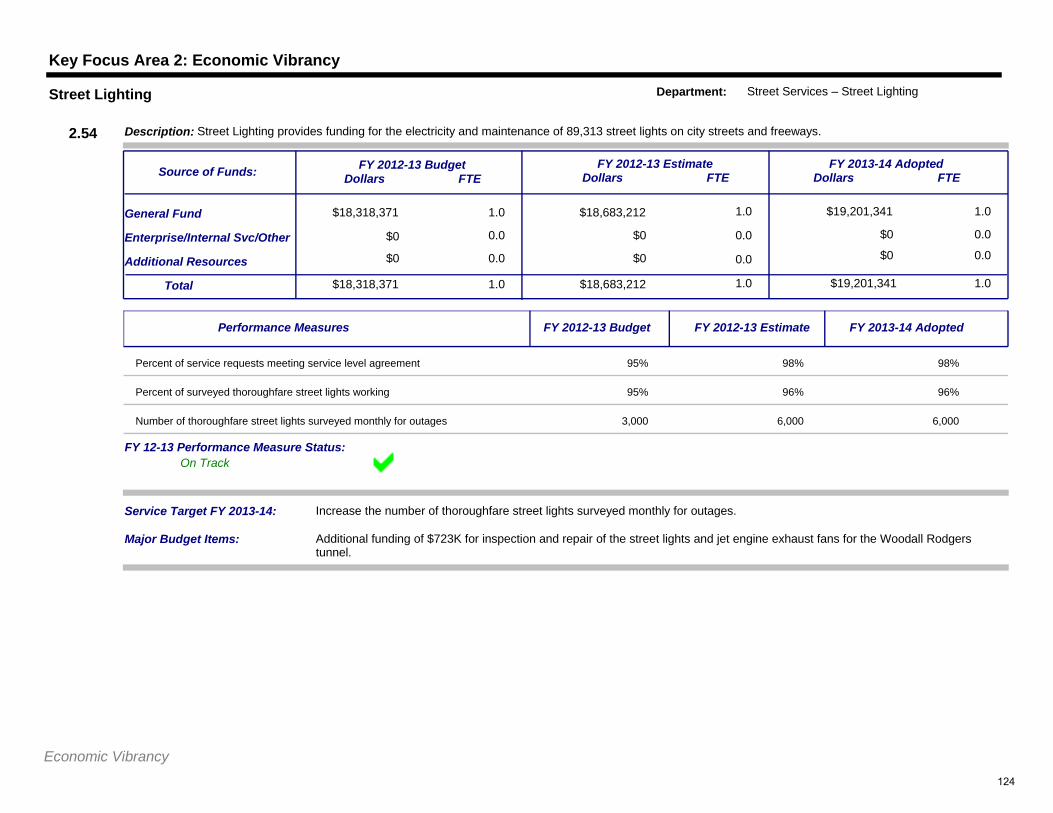
Key Focus Area 2: Economic Vibrancy
$18,318,371 1.0
0.0
$18,683,212 1.0
$0 0.0
$19,201,341
$0 0.0
1.0General Fund
Additional Resources
Service Target FY 2013-14: Increase the number of thoroughfare street lights surveyed monthly for outages.
$18,318,371Total 1.0 $18,683,212 1.0 $19,201,341 1.0
Enterprise/Internal Svc/Other
$0 0.0 $0 0.0 $0 0.0
FY 2012-13 BudgetDollars FTE
FY 2012-13 EstimateDollars FTE
FY 2013-14 AdoptedDollars FTE
Description: Street Lighting provides funding for the electricity and maintenance of 89,313 street lights on city streets and freeways.
Source of Funds:
2.54
Street Lighting Department: Street Services – Street Lighting
$0
Major Budget Items: Additional funding of $723K for inspection and repair of the street lights and jet engine exhaust fans for the Woodall Rodgers tunnel.
On TrackFY 12-13 Performance Measure Status:
Performance Measures FY 2012-13 Budget FY 2012-13 Estimate FY 2013-14 Adopted
Percent of service requests meeting service level agreement 95% 98% 98%
Percent of surveyed thoroughfare street lights working 95% 96% 96%
Number of thoroughfare street lights surveyed monthly for outages 3,000 6,000 6,000
Economic Vibrancy124
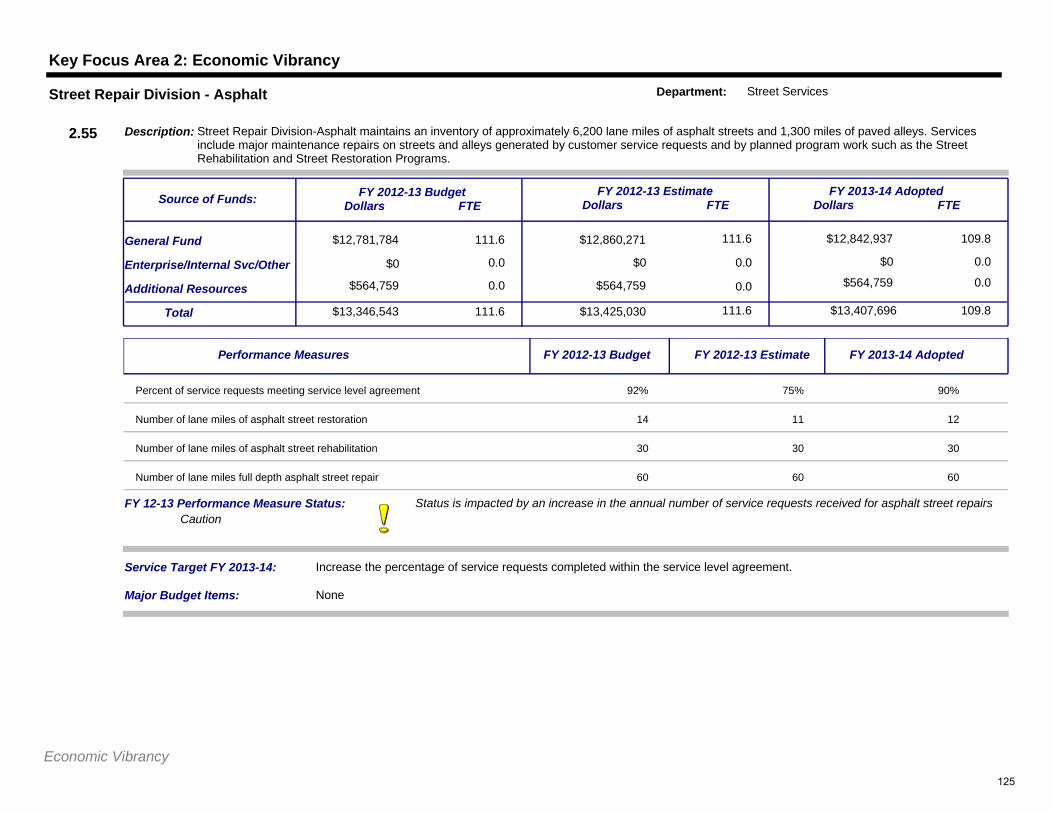
Key Focus Area 2: Economic Vibrancy
$12,781,784 111.6
0.0
$12,860,271 111.6
$0 0.0
$12,842,937
$0 0.0
109.8General Fund
Additional Resources
Service Target FY 2013-14: Increase the percentage of service requests completed within the service level agreement.
$13,346,543Total 111.6 $13,425,030 111.6 $13,407,696 109.8
Enterprise/Internal Svc/Other
$564,759 0.0 $564,759 0.0 $564,759 0.0
FY 2012-13 BudgetDollars FTE
FY 2012-13 EstimateDollars FTE
FY 2013-14 AdoptedDollars FTE
Description: Street Repair Division-Asphalt maintains an inventory of approximately 6,200 lane miles of asphalt streets and 1,300 miles of paved alleys. Services include major maintenance repairs on streets and alleys generated by customer service requests and by planned program work such as the Street Rehabilitation and Street Restoration Programs.
Source of Funds:
2.55
Street Repair Division - Asphalt Department: Street Services
$0
Major Budget Items: None
Status is impacted by an increase in the annual number of service requests received for asphalt street repairs Caution
FY 12-13 Performance Measure Status:
Performance Measures FY 2012-13 Budget FY 2012-13 Estimate FY 2013-14 Adopted
Percent of service requests meeting service level agreement 92% 75% 90%
Number of lane miles of asphalt street restoration 14 11 12
Number of lane miles of asphalt street rehabilitation 30 30 30
Number of lane miles full depth asphalt street repair 60 60 60
Economic Vibrancy125
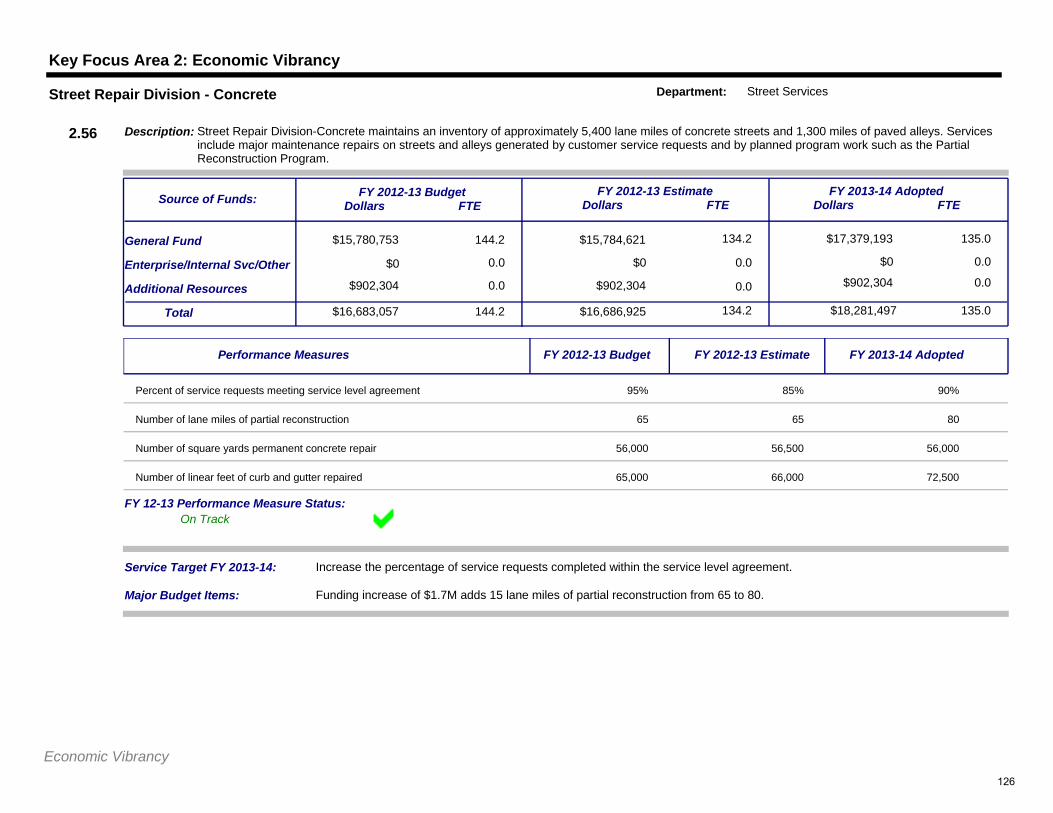
Key Focus Area 2: Economic Vibrancy
$15,780,753 144.2
0.0
$15,784,621 134.2
$0 0.0
$17,379,193
$0 0.0
135.0General Fund
Additional Resources
Service Target FY 2013-14: Increase the percentage of service requests completed within the service level agreement.
$16,683,057Total 144.2 $16,686,925 134.2 $18,281,497 135.0
Enterprise/Internal Svc/Other
$902,304 0.0 $902,304 0.0 $902,304 0.0
FY 2012-13 BudgetDollars FTE
FY 2012-13 EstimateDollars FTE
FY 2013-14 AdoptedDollars FTE
Description: Street Repair Division-Concrete maintains an inventory of approximately 5,400 lane miles of concrete streets and 1,300 miles of paved alleys. Services include major maintenance repairs on streets and alleys generated by customer service requests and by planned program work such as the Partial Reconstruction Program.
Source of Funds:
2.56
Street Repair Division - Concrete Department: Street Services
$0
Major Budget Items: Funding increase of $1.7M adds 15 lane miles of partial reconstruction from 65 to 80.
On TrackFY 12-13 Performance Measure Status:
Performance Measures FY 2012-13 Budget FY 2012-13 Estimate FY 2013-14 Adopted
Percent of service requests meeting service level agreement 95% 85% 90%
Number of lane miles of partial reconstruction 65 65 80
Number of square yards permanent concrete repair 56,000 56,500 56,000
Number of linear feet of curb and gutter repaired 65,000 66,000 72,500
Economic Vibrancy126
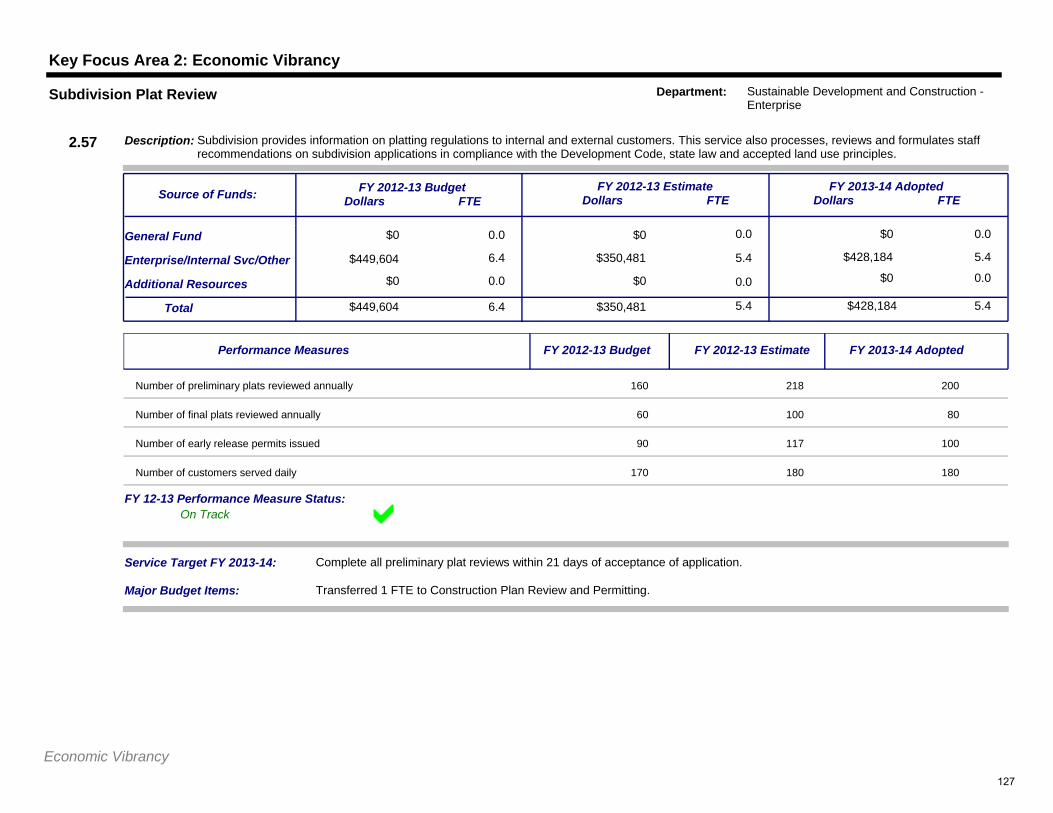
Key Focus Area 2: Economic Vibrancy
$0 0.0
6.4
$0 0.0
$350,481 5.4
$0
$428,184 5.4
0.0General Fund
Additional Resources
Service Target FY 2013-14: Complete all preliminary plat reviews within 21 days of acceptance of application.
$449,604Total 6.4 $350,481 5.4 $428,184 5.4
Enterprise/Internal Svc/Other
$0 0.0 $0 0.0 $0 0.0
FY 2012-13 BudgetDollars FTE
FY 2012-13 EstimateDollars FTE
FY 2013-14 AdoptedDollars FTE
Description: Subdivision provides information on platting regulations to internal and external customers. This service also processes, reviews and formulates staff recommendations on subdivision applications in compliance with the Development Code, state law and accepted land use principles.
Source of Funds:
2.57
Subdivision Plat Review Department: Sustainable Development and Construction - Enterprise
$449,604
Major Budget Items: Transferred 1 FTE to Construction Plan Review and Permitting.
On TrackFY 12-13 Performance Measure Status:
Performance Measures FY 2012-13 Budget FY 2012-13 Estimate FY 2013-14 Adopted
Number of preliminary plats reviewed annually 160 218 200
Number of final plats reviewed annually 60 100 80
Number of early release permits issued 90 117 100
Number of customers served daily 170 180 180
Economic Vibrancy127
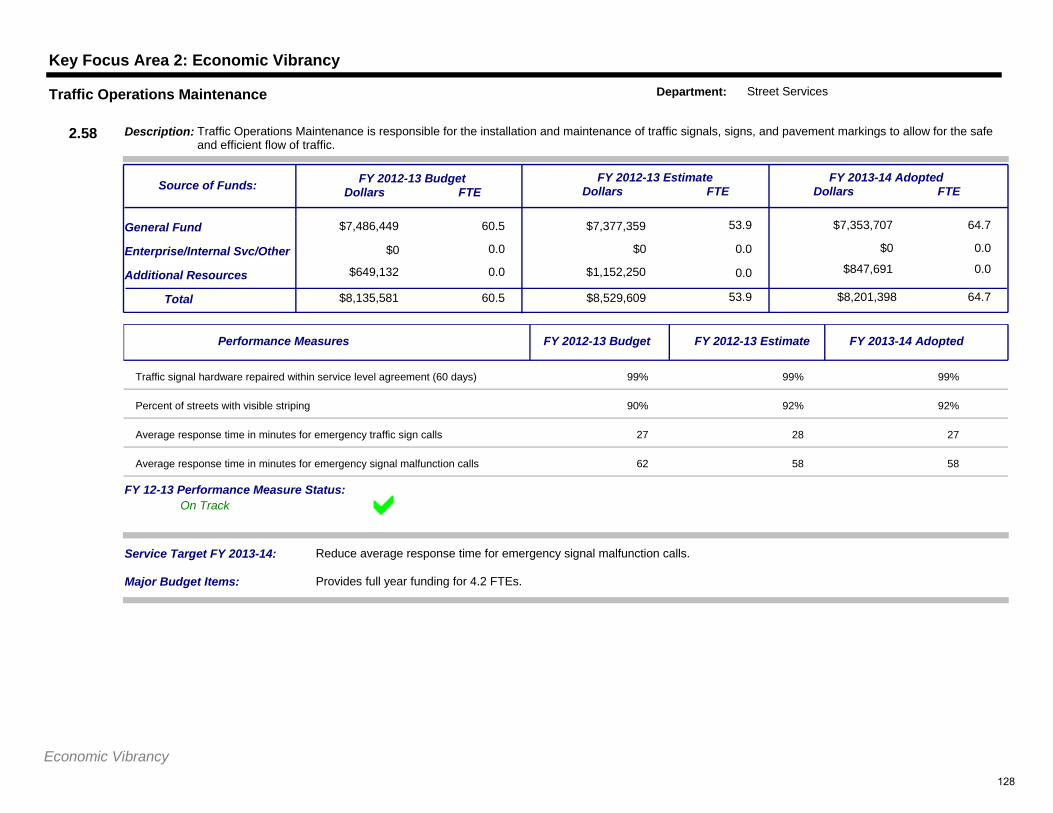
Key Focus Area 2: Economic Vibrancy
$7,486,449 60.5
0.0
$7,377,359 53.9
$0 0.0
$7,353,707
$0 0.0
64.7General Fund
Additional Resources
Service Target FY 2013-14: Reduce average response time for emergency signal malfunction calls.
$8,135,581Total 60.5 $8,529,609 53.9 $8,201,398 64.7
Enterprise/Internal Svc/Other
$649,132 0.0 $1,152,250 0.0 $847,691 0.0
FY 2012-13 BudgetDollars FTE
FY 2012-13 EstimateDollars FTE
FY 2013-14 AdoptedDollars FTE
Description: Traffic Operations Maintenance is responsible for the installation and maintenance of traffic signals, signs, and pavement markings to allow for the safe and efficient flow of traffic.
Source of Funds:
2.58
Traffic Operations Maintenance Department: Street Services
$0
Major Budget Items: Provides full year funding for 4.2 FTEs.
On TrackFY 12-13 Performance Measure Status:
Performance Measures FY 2012-13 Budget FY 2012-13 Estimate FY 2013-14 Adopted
Traffic signal hardware repaired within service level agreement (60 days) 99% 99% 99%
Percent of streets with visible striping 90% 92% 92%
Average response time in minutes for emergency traffic sign calls 27 28 27
Average response time in minutes for emergency signal malfunction calls 62 58 58
Economic Vibrancy128
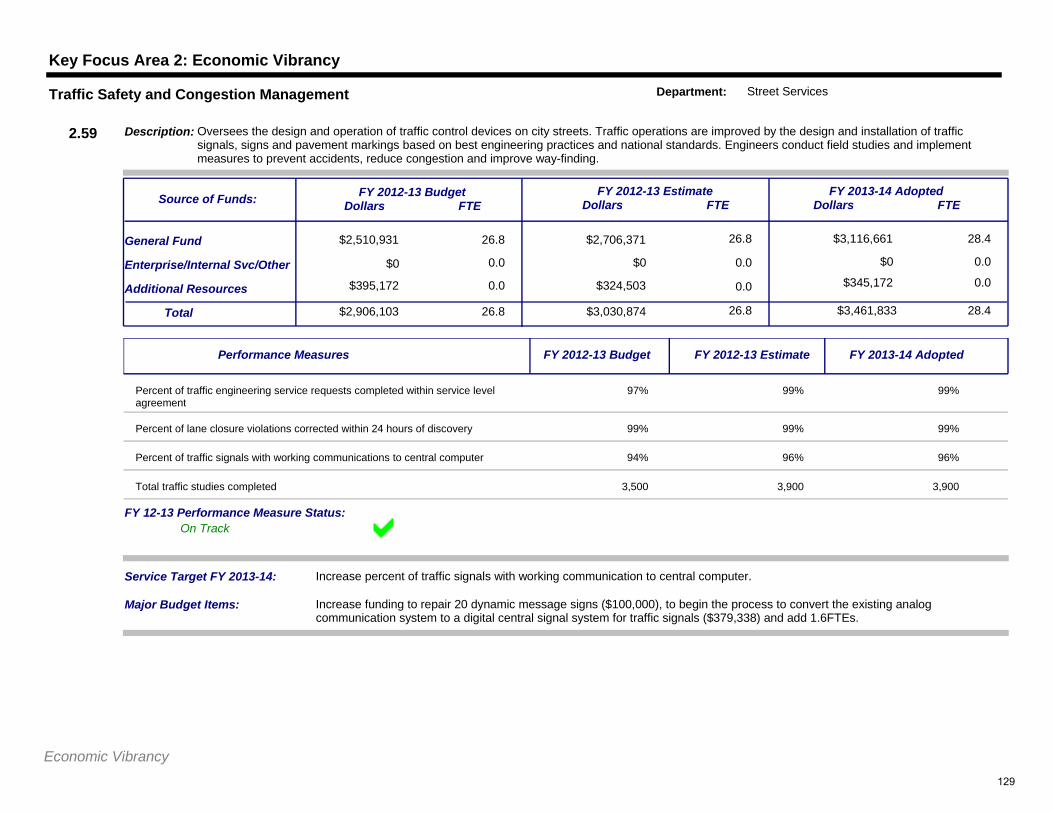
Key Focus Area 2: Economic Vibrancy
$2,510,931 26.8
0.0
$2,706,371 26.8
$0 0.0
$3,116,661
$0 0.0
28.4General Fund
Additional Resources
Service Target FY 2013-14: Increase percent of traffic signals with working communication to central computer.
$2,906,103Total 26.8 $3,030,874 26.8 $3,461,833 28.4
Enterprise/Internal Svc/Other
$395,172 0.0 $324,503 0.0 $345,172 0.0
FY 2012-13 BudgetDollars FTE
FY 2012-13 EstimateDollars FTE
FY 2013-14 AdoptedDollars FTE
Description: Oversees the design and operation of traffic control devices on city streets. Traffic operations are improved by the design and installation of traffic signals, signs and pavement markings based on best engineering practices and national standards. Engineers conduct field studies and implement measures to prevent accidents, reduce congestion and improve way-finding.
Source of Funds:
2.59
Traffic Safety and Congestion Management Department: Street Services
$0
Major Budget Items: Increase funding to repair 20 dynamic message signs ($100,000), to begin the process to convert the existing analog communication system to a digital central signal system for traffic signals ($379,338) and add 1.6FTEs.
On TrackFY 12-13 Performance Measure Status:
Performance Measures FY 2012-13 Budget FY 2012-13 Estimate FY 2013-14 Adopted
Percent of traffic engineering service requests completed within service level agreement
97% 99% 99%
Percent of lane closure violations corrected within 24 hours of discovery 99% 99% 99%
Percent of traffic signals with working communications to central computer 94% 96% 96%
Total traffic studies completed 3,500 3,900 3,900
Economic Vibrancy129
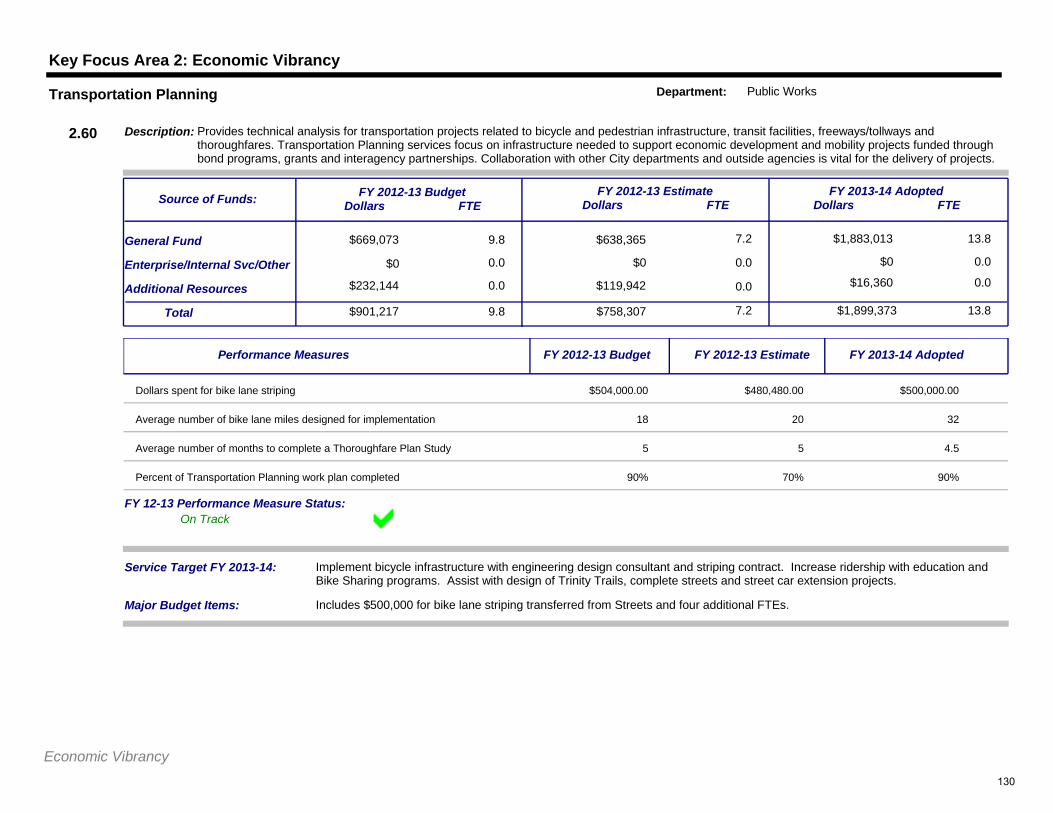
Key Focus Area 2: Economic Vibrancy
$669,073 9.8
0.0
$638,365 7.2
$0 0.0
$1,883,013
$0 0.0
13.8General Fund
Additional Resources
Service Target FY 2013-14: Implement bicycle infrastructure with engineering design consultant and striping contract. Increase ridership with education and Bike Sharing programs. Assist with design of Trinity Trails, complete streets and street car extension projects.
$901,217Total 9.8 $758,307 7.2 $1,899,373 13.8
Enterprise/Internal Svc/Other
$232,144 0.0 $119,942 0.0 $16,360 0.0
FY 2012-13 BudgetDollars FTE
FY 2012-13 EstimateDollars FTE
FY 2013-14 AdoptedDollars FTE
Description: Provides technical analysis for transportation projects related to bicycle and pedestrian infrastructure, transit facilities, freeways/tollways and thoroughfares. Transportation Planning services focus on infrastructure needed to support economic development and mobility projects funded through bond programs, grants and interagency partnerships. Collaboration with other City departments and outside agencies is vital for the delivery of projects.
Source of Funds:
2.60
Transportation Planning Department: Public Works
$0
Major Budget Items: Includes $500,000 for bike lane striping transferred from Streets and four additional FTEs.
On TrackFY 12-13 Performance Measure Status:
Performance Measures FY 2012-13 Budget FY 2012-13 Estimate FY 2013-14 Adopted
Dollars spent for bike lane striping $504,000.00 $480,480.00 $500,000.00
Average number of bike lane miles designed for implementation 18 20 32
Average number of months to complete a Thoroughfare Plan Study 5 5 4.5
Percent of Transportation Planning work plan completed 90% 70% 90%
Economic Vibrancy130
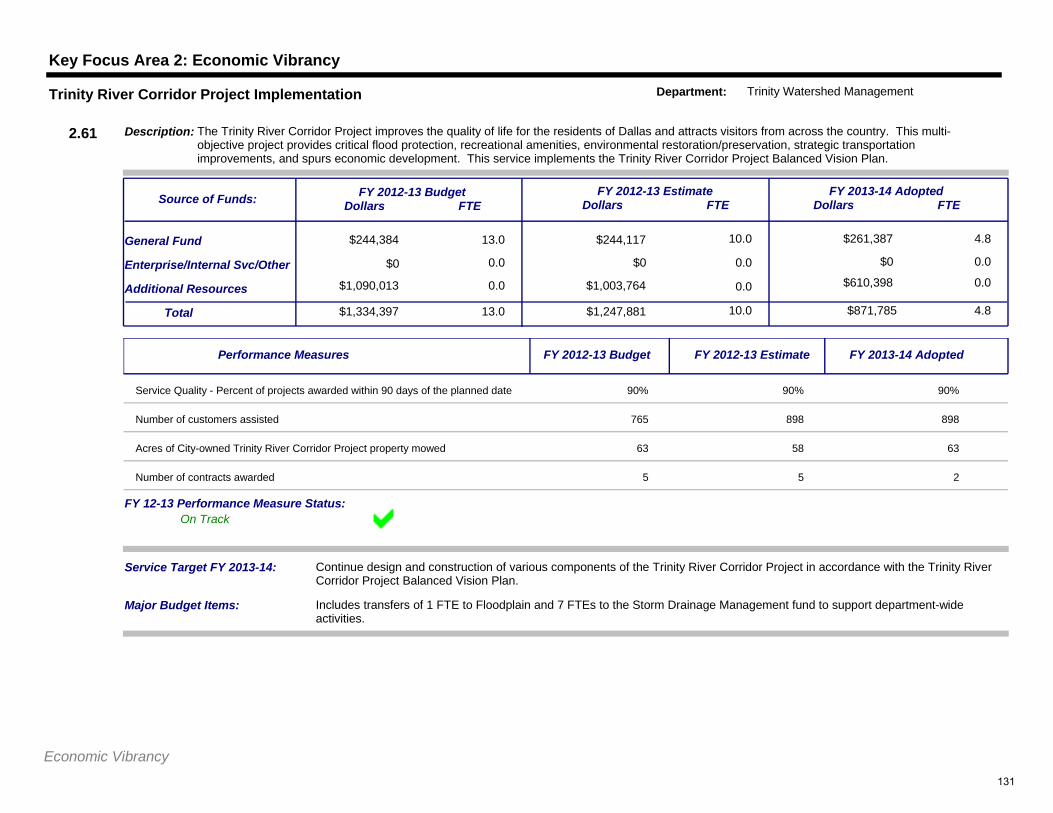
Key Focus Area 2: Economic Vibrancy
$244,384 13.0
0.0
$244,117 10.0
$0 0.0
$261,387
$0 0.0
4.8General Fund
Additional Resources
Service Target FY 2013-14: Continue design and construction of various components of the Trinity River Corridor Project in accordance with the Trinity River Corridor Project Balanced Vision Plan.
$1,334,397Total 13.0 $1,247,881 10.0 $871,785 4.8
Enterprise/Internal Svc/Other
$1,090,013 0.0 $1,003,764 0.0 $610,398 0.0
FY 2012-13 BudgetDollars FTE
FY 2012-13 EstimateDollars FTE
FY 2013-14 AdoptedDollars FTE
Description: The Trinity River Corridor Project improves the quality of life for the residents of Dallas and attracts visitors from across the country. This multi-objective project provides critical flood protection, recreational amenities, environmental restoration/preservation, strategic transportation improvements, and spurs economic development. This service implements the Trinity River Corridor Project Balanced Vision Plan.
Source of Funds:
2.61
Trinity River Corridor Project Implementation Department: Trinity Watershed Management
$0
Major Budget Items: Includes transfers of 1 FTE to Floodplain and 7 FTEs to the Storm Drainage Management fund to support department-wide activities.
On TrackFY 12-13 Performance Measure Status:
Performance Measures FY 2012-13 Budget FY 2012-13 Estimate FY 2013-14 Adopted
Service Quality - Percent of projects awarded within 90 days of the planned date 90% 90% 90%
Number of customers assisted 765 898 898
Acres of City-owned Trinity River Corridor Project property mowed 63 58 63
Number of contracts awarded 5 5 2
Economic Vibrancy131
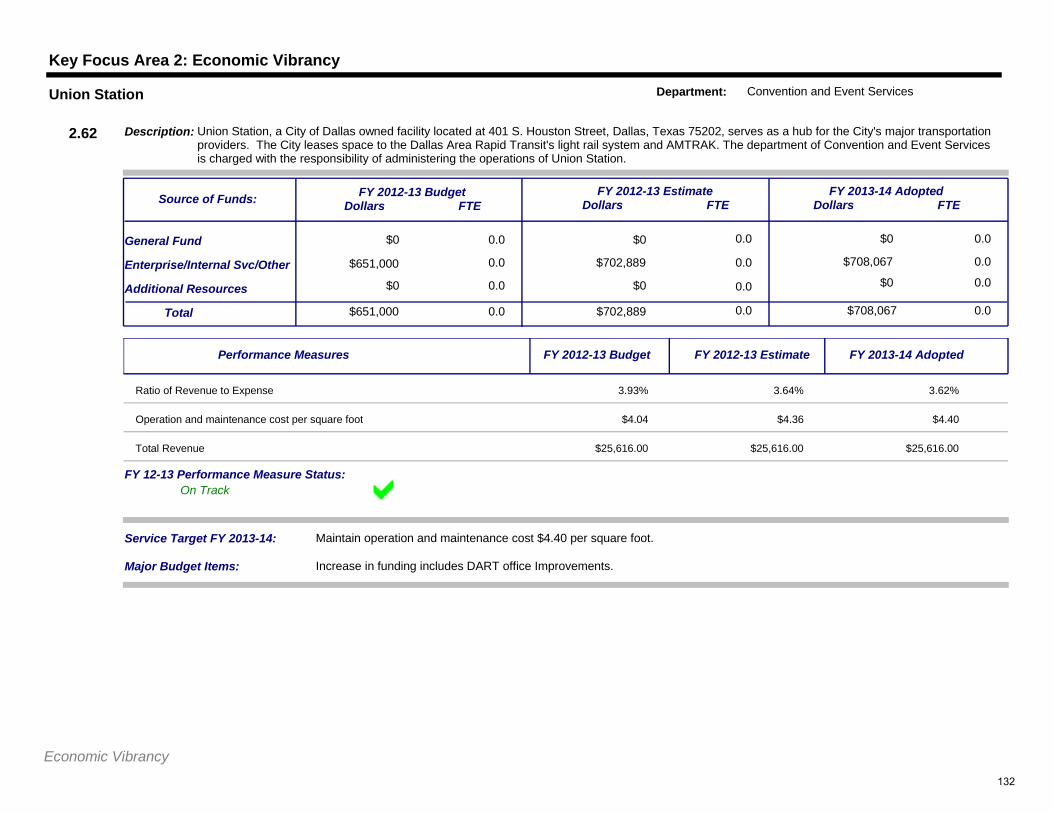
Key Focus Area 2: Economic Vibrancy
$0 0.0
0.0
$0 0.0
$702,889 0.0
$0
$708,067 0.0
0.0General Fund
Additional Resources
Service Target FY 2013-14: Maintain operation and maintenance cost $4.40 per square foot.
$651,000Total 0.0 $702,889 0.0 $708,067 0.0
Enterprise/Internal Svc/Other
$0 0.0 $0 0.0 $0 0.0
FY 2012-13 BudgetDollars FTE
FY 2012-13 EstimateDollars FTE
FY 2013-14 AdoptedDollars FTE
Description: Union Station, a City of Dallas owned facility located at 401 S. Houston Street, Dallas, Texas 75202, serves as a hub for the City's major transportation providers. The City leases space to the Dallas Area Rapid Transit's light rail system and AMTRAK. The department of Convention and Event Services is charged with the responsibility of administering the operations of Union Station.
Source of Funds:
2.62
Union Station Department: Convention and Event Services
$651,000
Major Budget Items: Increase in funding includes DART office Improvements.
On TrackFY 12-13 Performance Measure Status:
Performance Measures FY 2012-13 Budget FY 2012-13 Estimate FY 2013-14 Adopted
Ratio of Revenue to Expense 3.93% 3.64% 3.62%
Operation and maintenance cost per square foot $4.04 $4.36 $4.40
Total Revenue $25,616.00 $25,616.00 $25,616.00
Economic Vibrancy132
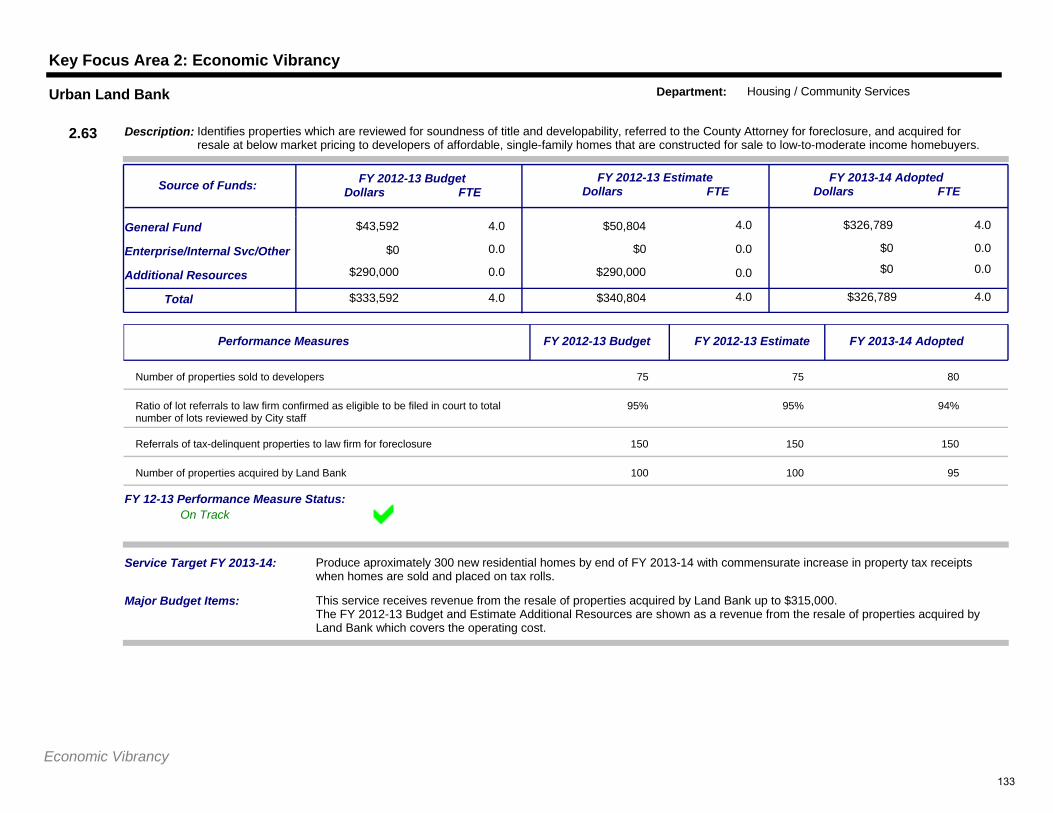
Key Focus Area 2: Economic Vibrancy
$43,592 4.0
0.0
$50,804 4.0
$0 0.0
$326,789
$0 0.0
4.0General Fund
Additional Resources
Service Target FY 2013-14: Produce aproximately 300 new residential homes by end of FY 2013-14 with commensurate increase in property tax receipts when homes are sold and placed on tax rolls.
$333,592Total 4.0 $340,804 4.0 $326,789 4.0
Enterprise/Internal Svc/Other
$290,000 0.0 $290,000 0.0 $0 0.0
FY 2012-13 BudgetDollars FTE
FY 2012-13 EstimateDollars FTE
FY 2013-14 AdoptedDollars FTE
Description: Identifies properties which are reviewed for soundness of title and developability, referred to the County Attorney for foreclosure, and acquired for resale at below market pricing to developers of affordable, single-family homes that are constructed for sale to low-to-moderate income homebuyers.
Source of Funds:
2.63
Urban Land Bank Department: Housing / Community Services
$0
Major Budget Items: This service receives revenue from the resale of properties acquired by Land Bank up to $315,000.The FY 2012-13 Budget and Estimate Additional Resources are shown as a revenue from the resale of properties acquired by Land Bank which covers the operating cost.
On TrackFY 12-13 Performance Measure Status:
Performance Measures FY 2012-13 Budget FY 2012-13 Estimate FY 2013-14 Adopted
Number of properties sold to developers 75 75 80
Ratio of lot referrals to law firm confirmed as eligible to be filed in court to total number of lots reviewed by City staff
95% 95% 94%
Referrals of tax-delinquent properties to law firm for foreclosure 150 150 150
Number of properties acquired by Land Bank 100 100 95
Economic Vibrancy133
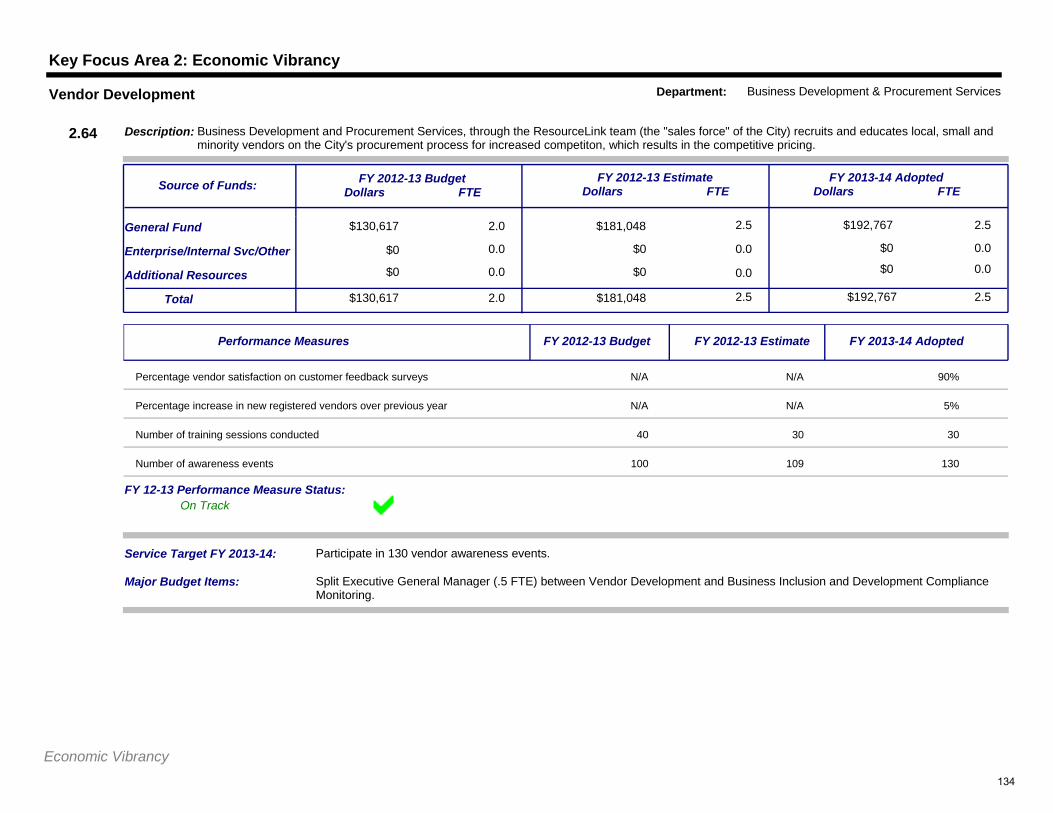
Key Focus Area 2: Economic Vibrancy
$130,617 2.0
0.0
$181,048 2.5
$0 0.0
$192,767
$0 0.0
2.5General Fund
Additional Resources
Service Target FY 2013-14: Participate in 130 vendor awareness events.
$130,617Total 2.0 $181,048 2.5 $192,767 2.5
Enterprise/Internal Svc/Other
$0 0.0 $0 0.0 $0 0.0
FY 2012-13 BudgetDollars FTE
FY 2012-13 EstimateDollars FTE
FY 2013-14 AdoptedDollars FTE
Description: Business Development and Procurement Services, through the ResourceLink team (the "sales force" of the City) recruits and educates local, small and minority vendors on the City's procurement process for increased competiton, which results in the competitive pricing.
Source of Funds:
2.64
Vendor Development Department: Business Development & Procurement Services
$0
Major Budget Items: Split Executive General Manager (.5 FTE) between Vendor Development and Business Inclusion and Development Compliance Monitoring.
On TrackFY 12-13 Performance Measure Status:
Performance Measures FY 2012-13 Budget FY 2012-13 Estimate FY 2013-14 Adopted
Percentage vendor satisfaction on customer feedback surveys N/A N/A 90%
Percentage increase in new registered vendors over previous year N/A N/A 5%
Number of training sessions conducted 40 30 30
Number of awareness events 100 109 130
Economic Vibrancy134
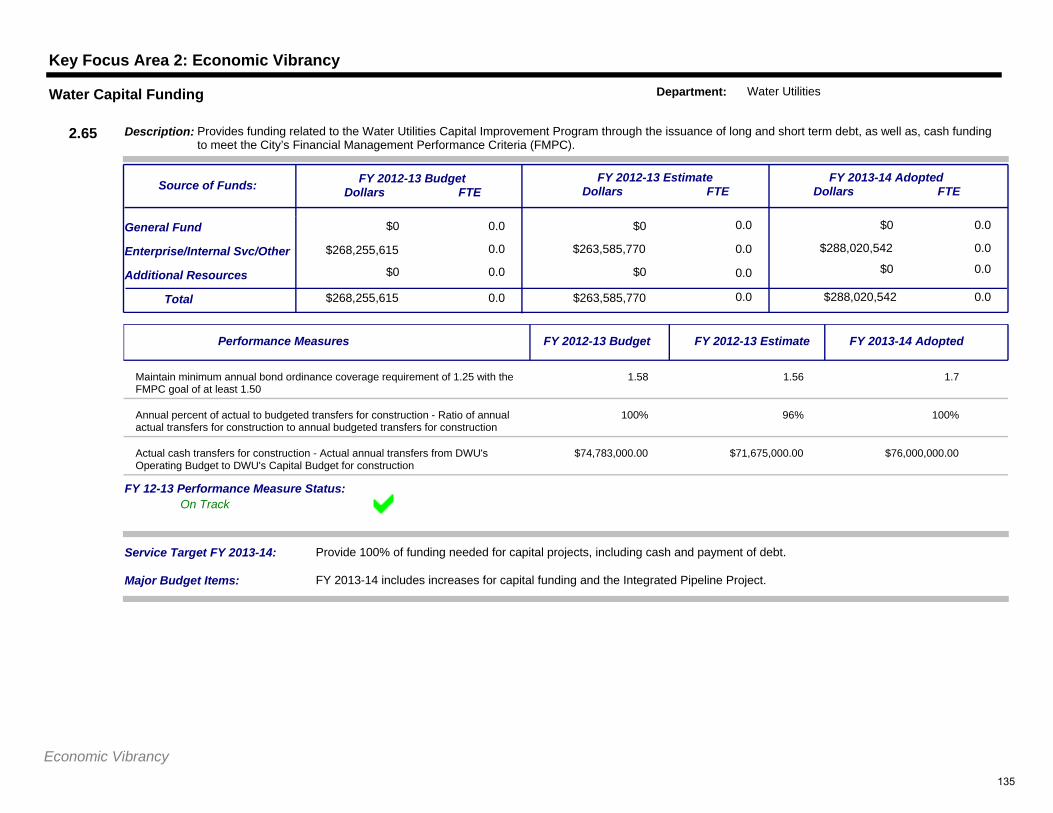
Key Focus Area 2: Economic Vibrancy
$0 0.0
0.0
$0 0.0
$263,585,770 0.0
$0
$288,020,542 0.0
0.0General Fund
Additional Resources
Service Target FY 2013-14: Provide 100% of funding needed for capital projects, including cash and payment of debt.
$268,255,615Total 0.0 $263,585,770 0.0 $288,020,542 0.0
Enterprise/Internal Svc/Other
$0 0.0 $0 0.0 $0 0.0
FY 2012-13 BudgetDollars FTE
FY 2012-13 EstimateDollars FTE
FY 2013-14 AdoptedDollars FTE
Description: Provides funding related to the Water Utilities Capital Improvement Program through the issuance of long and short term debt, as well as, cash funding to meet the City’s Financial Management Performance Criteria (FMPC).
Source of Funds:
2.65
Water Capital Funding Department: Water Utilities
$268,255,615
Major Budget Items: FY 2013-14 includes increases for capital funding and the Integrated Pipeline Project.
On TrackFY 12-13 Performance Measure Status:
Performance Measures FY 2012-13 Budget FY 2012-13 Estimate FY 2013-14 Adopted
Maintain minimum annual bond ordinance coverage requirement of 1.25 with the FMPC goal of at least 1.50
1.58 1.56 1.7
Annual percent of actual to budgeted transfers for construction - Ratio of annual actual transfers for construction to annual budgeted transfers for construction
100% 96% 100%
Actual cash transfers for construction - Actual annual transfers from DWU's Operating Budget to DWU's Capital Budget for construction
$74,783,000.00 $71,675,000.00 $76,000,000.00
Economic Vibrancy135
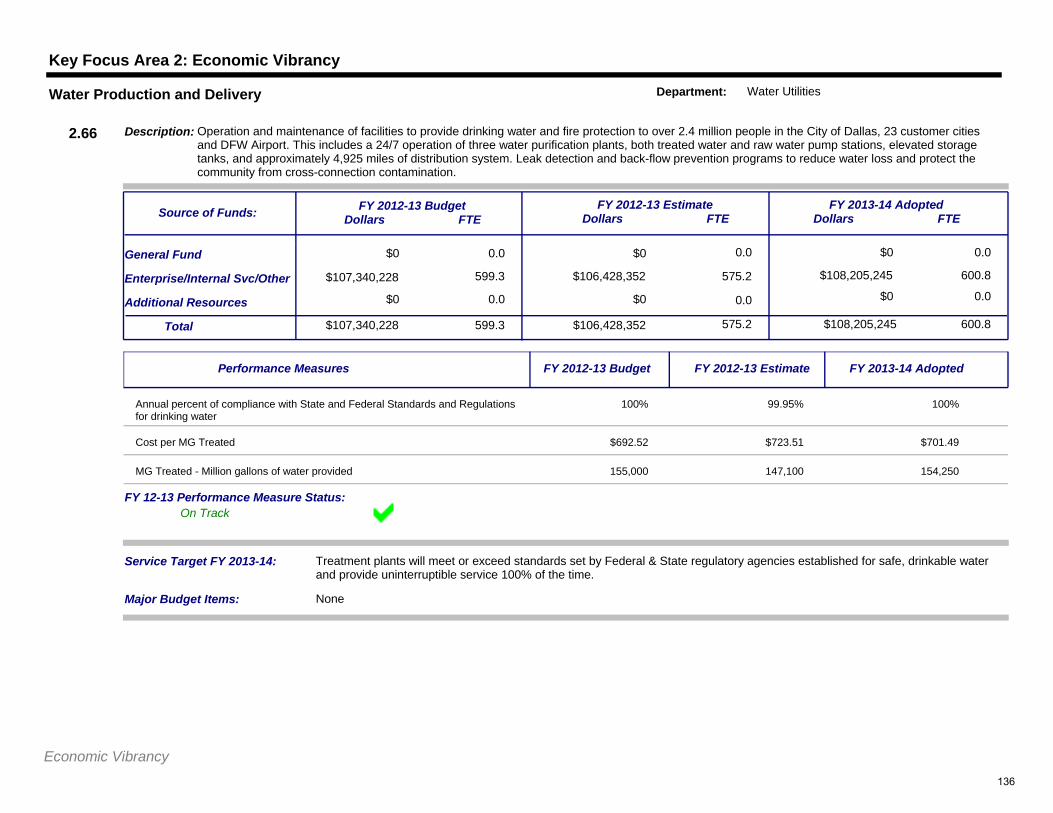
Key Focus Area 2: Economic Vibrancy
$0 0.0
599.3
$0 0.0
$106,428,352 575.2
$0
$108,205,245 600.8
0.0General Fund
Additional Resources
Service Target FY 2013-14: Treatment plants will meet or exceed standards set by Federal & State regulatory agencies established for safe, drinkable water and provide uninterruptible service 100% of the time.
$107,340,228Total 599.3 $106,428,352 575.2 $108,205,245 600.8
Enterprise/Internal Svc/Other
$0 0.0 $0 0.0 $0 0.0
FY 2012-13 BudgetDollars FTE
FY 2012-13 EstimateDollars FTE
FY 2013-14 AdoptedDollars FTE
Description: Operation and maintenance of facilities to provide drinking water and fire protection to over 2.4 million people in the City of Dallas, 23 customer cities and DFW Airport. This includes a 24/7 operation of three water purification plants, both treated water and raw water pump stations, elevated storage tanks, and approximately 4,925 miles of distribution system. Leak detection and back-flow prevention programs to reduce water loss and protect the community from cross-connection contamination.
Source of Funds:
2.66
Water Production and Delivery Department: Water Utilities
$107,340,228
Major Budget Items: None
On TrackFY 12-13 Performance Measure Status:
Performance Measures FY 2012-13 Budget FY 2012-13 Estimate FY 2013-14 Adopted
Annual percent of compliance with State and Federal Standards and Regulations for drinking water
100% 99.95% 100%
Cost per MG Treated $692.52 $723.51 $701.49
MG Treated - Million gallons of water provided 155,000 147,100 154,250
Economic Vibrancy136
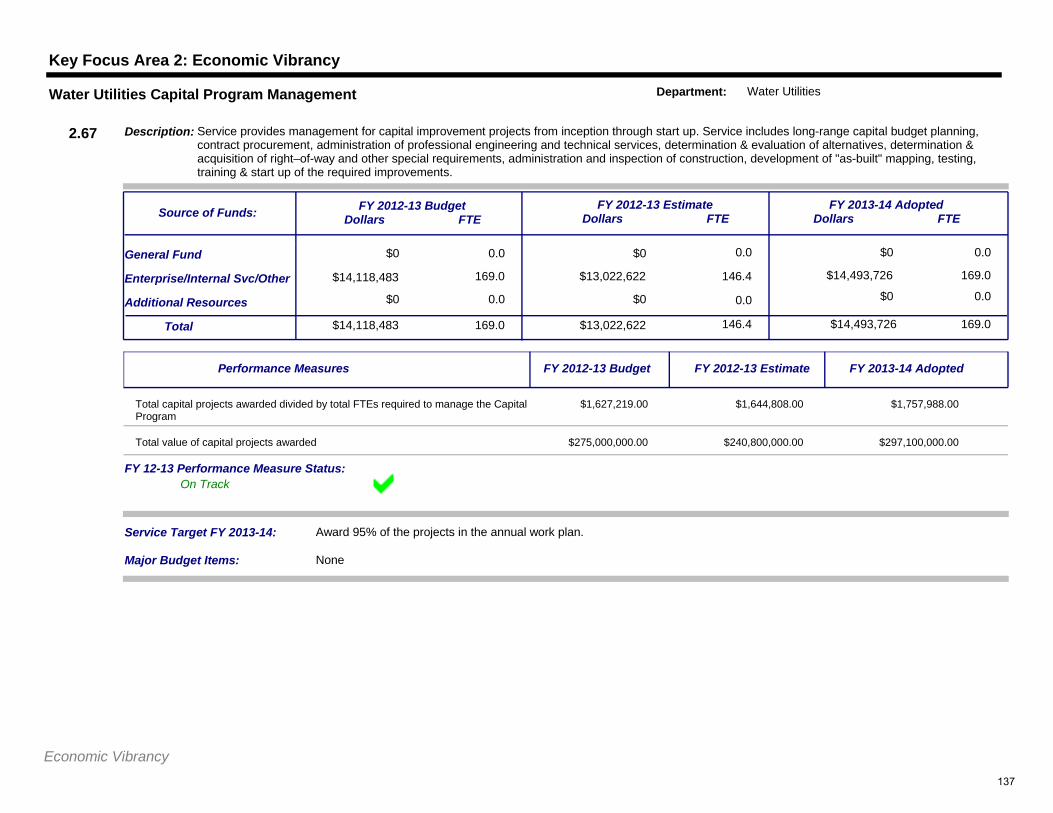
Key Focus Area 2: Economic Vibrancy
$0 0.0
169.0
$0 0.0
$13,022,622 146.4
$0
$14,493,726 169.0
0.0General Fund
Additional Resources
Service Target FY 2013-14: Award 95% of the projects in the annual work plan.
$14,118,483Total 169.0 $13,022,622 146.4 $14,493,726 169.0
Enterprise/Internal Svc/Other
$0 0.0 $0 0.0 $0 0.0
FY 2012-13 BudgetDollars FTE
FY 2012-13 EstimateDollars FTE
FY 2013-14 AdoptedDollars FTE
Description: Service provides management for capital improvement projects from inception through start up. Service includes long-range capital budget planning, contract procurement, administration of professional engineering and technical services, determination & evaluation of alternatives, determination & acquisition of right–of-way and other special requirements, administration and inspection of construction, development of "as-built" mapping, testing, training & start up of the required improvements.
Source of Funds:
2.67
Water Utilities Capital Program Management Department: Water Utilities
$14,118,483
Major Budget Items: None
On TrackFY 12-13 Performance Measure Status:
Performance Measures FY 2012-13 Budget FY 2012-13 Estimate FY 2013-14 Adopted
Total capital projects awarded divided by total FTEs required to manage the Capital Program
$1,627,219.00 $1,644,808.00 $1,757,988.00
Total value of capital projects awarded $275,000,000.00 $240,800,000.00 $297,100,000.00
Economic Vibrancy137
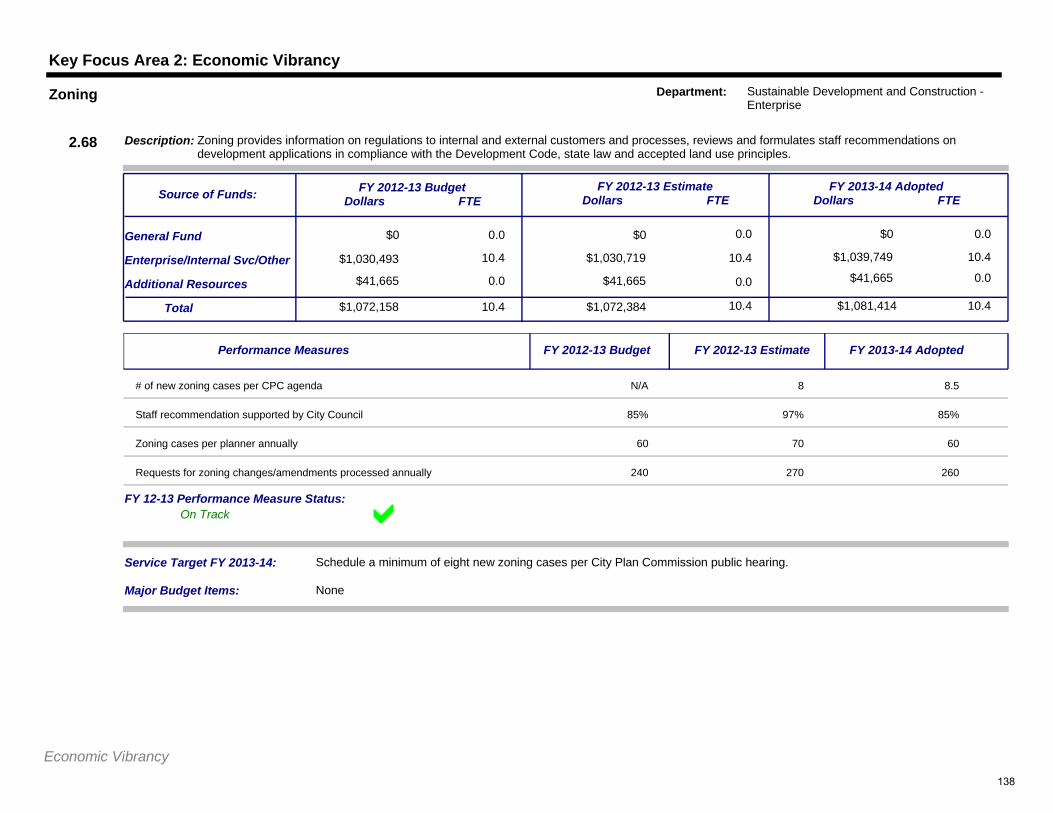
Key Focus Area 2: Economic Vibrancy
$0 0.0
10.4
$0 0.0
$1,030,719 10.4
$0
$1,039,749 10.4
0.0General Fund
Additional Resources
Service Target FY 2013-14: Schedule a minimum of eight new zoning cases per City Plan Commission public hearing.
$1,072,158Total 10.4 $1,072,384 10.4 $1,081,414 10.4
Enterprise/Internal Svc/Other
$41,665 0.0 $41,665 0.0 $41,665 0.0
FY 2012-13 BudgetDollars FTE
FY 2012-13 EstimateDollars FTE
FY 2013-14 AdoptedDollars FTE
Description: Zoning provides information on regulations to internal and external customers and processes, reviews and formulates staff recommendations on development applications in compliance with the Development Code, state law and accepted land use principles.
Source of Funds:
2.68
Zoning Department: Sustainable Development and Construction - Enterprise
$1,030,493
Major Budget Items: None
On TrackFY 12-13 Performance Measure Status:
Performance Measures FY 2012-13 Budget FY 2012-13 Estimate FY 2013-14 Adopted
# of new zoning cases per CPC agenda N/A 8 8.5
Staff recommendation supported by City Council 85% 97% 85%
Zoning cases per planner annually 60 70 60
Requests for zoning changes/amendments processed annually 240 270 260
Economic Vibrancy138
Clean, Healthy EnvironmentDallas, a sustainable community with a
clean, healthy environment
2013-2014
139

140
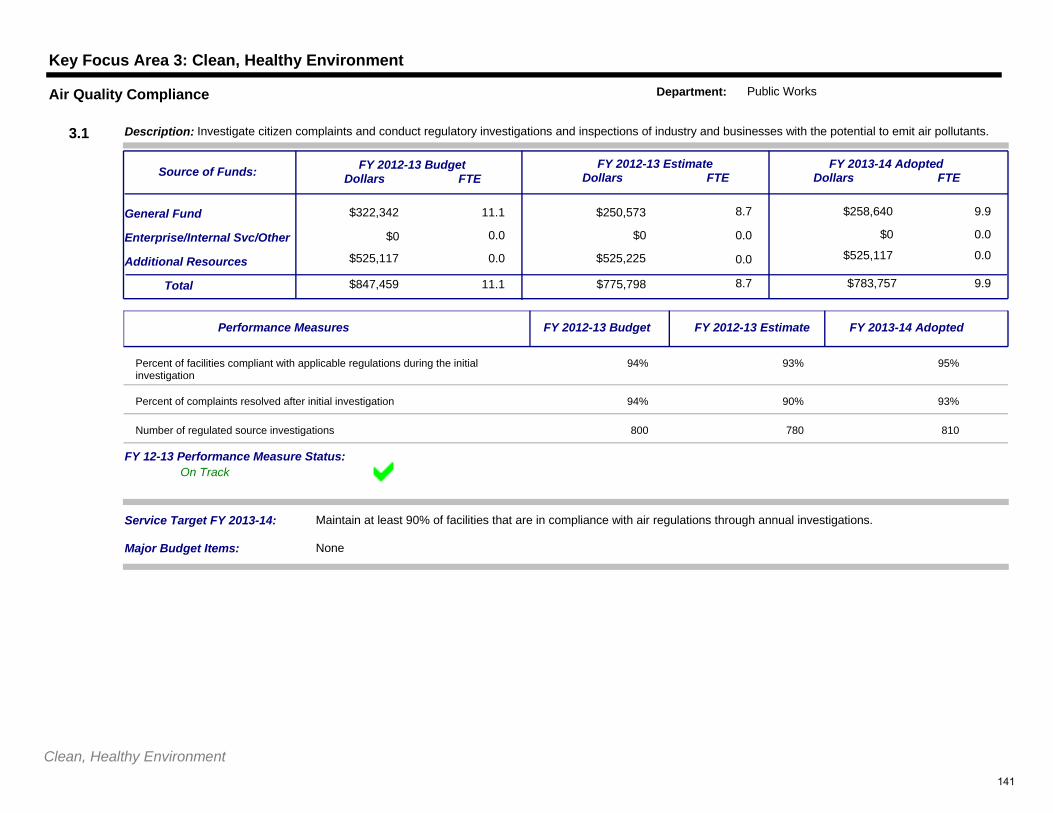
Key Focus Area 3: Clean, Healthy Environment
$322,342 11.1
0.0
$250,573 8.7
$0 0.0
$258,640
$0 0.0
9.9General Fund
Additional Resources
Service Target FY 2013-14: Maintain at least 90% of facilities that are in compliance with air regulations through annual investigations.
$847,459Total 11.1 $775,798 8.7 $783,757 9.9
Enterprise/Internal Svc/Other
$525,117 0.0 $525,225 0.0 $525,117 0.0
FY 2012-13 BudgetDollars FTE
FY 2012-13 EstimateDollars FTE
FY 2013-14 AdoptedDollars FTE
Description: Investigate citizen complaints and conduct regulatory investigations and inspections of industry and businesses with the potential to emit air pollutants.
Source of Funds:
3.1
Air Quality Compliance Department: Public Works
$0
Major Budget Items: None
On TrackFY 12-13 Performance Measure Status:
Performance Measures FY 2012-13 Budget FY 2012-13 Estimate FY 2013-14 Adopted
Percent of facilities compliant with applicable regulations during the initial investigation
94% 93% 95%
Percent of complaints resolved after initial investigation 94% 90% 93%
Number of regulated source investigations 800 780 810
Clean, Healthy Environment141
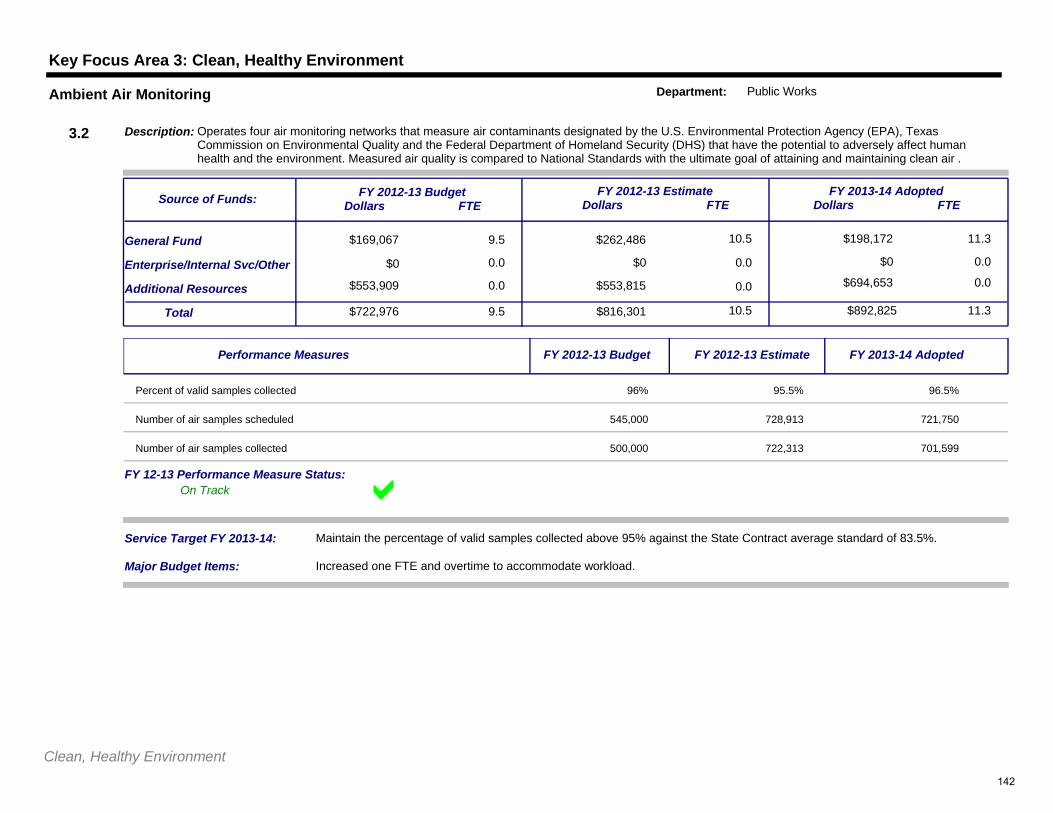
Key Focus Area 3: Clean, Healthy Environment
$169,067 9.5
0.0
$262,486 10.5
$0 0.0
$198,172
$0 0.0
11.3General Fund
Additional Resources
Service Target FY 2013-14: Maintain the percentage of valid samples collected above 95% against the State Contract average standard of 83.5%.
$722,976Total 9.5 $816,301 10.5 $892,825 11.3
Enterprise/Internal Svc/Other
$553,909 0.0 $553,815 0.0 $694,653 0.0
FY 2012-13 BudgetDollars FTE
FY 2012-13 EstimateDollars FTE
FY 2013-14 AdoptedDollars FTE
Description: Operates four air monitoring networks that measure air contaminants designated by the U.S. Environmental Protection Agency (EPA), Texas Commission on Environmental Quality and the Federal Department of Homeland Security (DHS) that have the potential to adversely affect human health and the environment. Measured air quality is compared to National Standards with the ultimate goal of attaining and maintaining clean air .
Source of Funds:
3.2
Ambient Air Monitoring Department: Public Works
$0
Major Budget Items: Increased one FTE and overtime to accommodate workload.
On TrackFY 12-13 Performance Measure Status:
Performance Measures FY 2012-13 Budget FY 2012-13 Estimate FY 2013-14 Adopted
Percent of valid samples collected 96% 95.5% 96.5%
Number of air samples scheduled 545,000 728,913 721,750
Number of air samples collected 500,000 722,313 701,599
Clean, Healthy Environment142
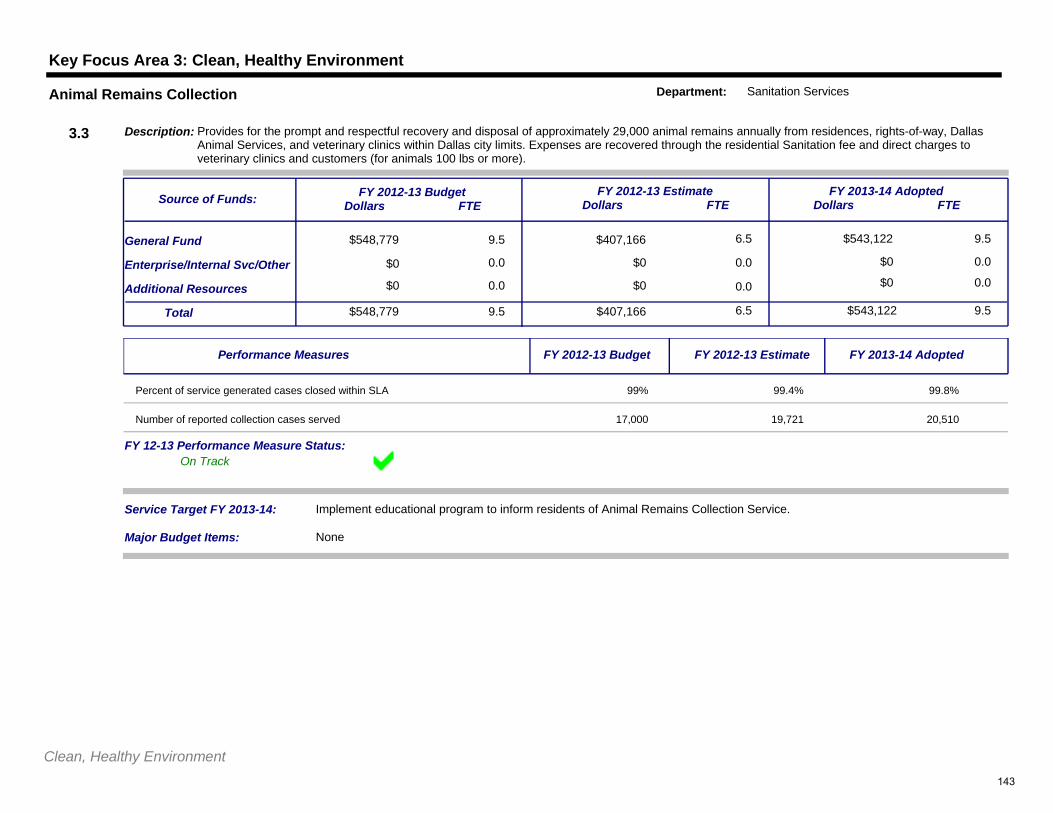
Key Focus Area 3: Clean, Healthy Environment
$548,779 9.5
0.0
$407,166 6.5
$0 0.0
$543,122
$0 0.0
9.5General Fund
Additional Resources
Service Target FY 2013-14: Implement educational program to inform residents of Animal Remains Collection Service.
$548,779Total 9.5 $407,166 6.5 $543,122 9.5
Enterprise/Internal Svc/Other
$0 0.0 $0 0.0 $0 0.0
FY 2012-13 BudgetDollars FTE
FY 2012-13 EstimateDollars FTE
FY 2013-14 AdoptedDollars FTE
Description: Provides for the prompt and respectful recovery and disposal of approximately 29,000 animal remains annually from residences, rights-of-way, Dallas Animal Services, and veterinary clinics within Dallas city limits. Expenses are recovered through the residential Sanitation fee and direct charges to veterinary clinics and customers (for animals 100 lbs or more).
Source of Funds:
3.3
Animal Remains Collection Department: Sanitation Services
$0
Major Budget Items: None
On TrackFY 12-13 Performance Measure Status:
Performance Measures FY 2012-13 Budget FY 2012-13 Estimate FY 2013-14 Adopted
Percent of service generated cases closed within SLA 99% 99.4% 99.8%
Number of reported collection cases served 17,000 19,721 20,510
Clean, Healthy Environment143
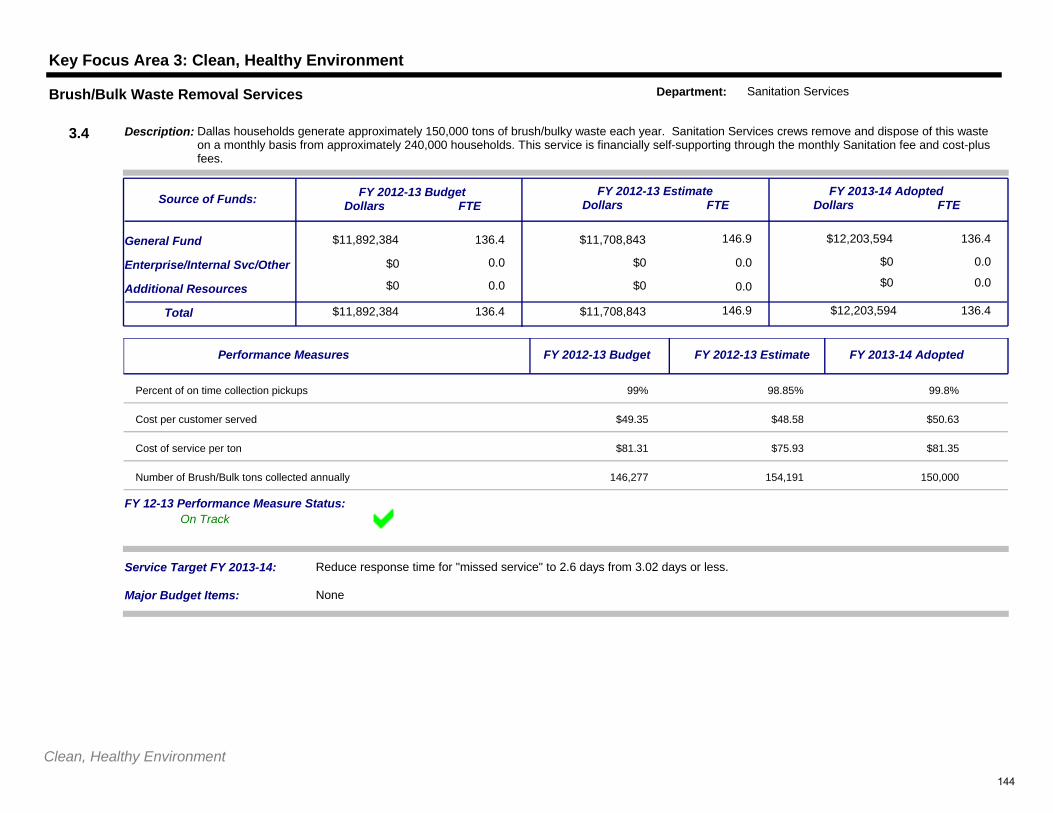
Key Focus Area 3: Clean, Healthy Environment
$11,892,384 136.4
0.0
$11,708,843 146.9
$0 0.0
$12,203,594
$0 0.0
136.4General Fund
Additional Resources
Service Target FY 2013-14: Reduce response time for "missed service" to 2.6 days from 3.02 days or less.
$11,892,384Total 136.4 $11,708,843 146.9 $12,203,594 136.4
Enterprise/Internal Svc/Other
$0 0.0 $0 0.0 $0 0.0
FY 2012-13 BudgetDollars FTE
FY 2012-13 EstimateDollars FTE
FY 2013-14 AdoptedDollars FTE
Description: Dallas households generate approximately 150,000 tons of brush/bulky waste each year. Sanitation Services crews remove and dispose of this waste on a monthly basis from approximately 240,000 households. This service is financially self-supporting through the monthly Sanitation fee and cost-plus fees.
Source of Funds:
3.4
Brush/Bulk Waste Removal Services Department: Sanitation Services
$0
Major Budget Items: None
On TrackFY 12-13 Performance Measure Status:
Performance Measures FY 2012-13 Budget FY 2012-13 Estimate FY 2013-14 Adopted
Percent of on time collection pickups 99% 98.85% 99.8%
Cost per customer served $49.35 $48.58 $50.63
Cost of service per ton $81.31 $75.93 $81.35
Number of Brush/Bulk tons collected annually 146,277 154,191 150,000
Clean, Healthy Environment144
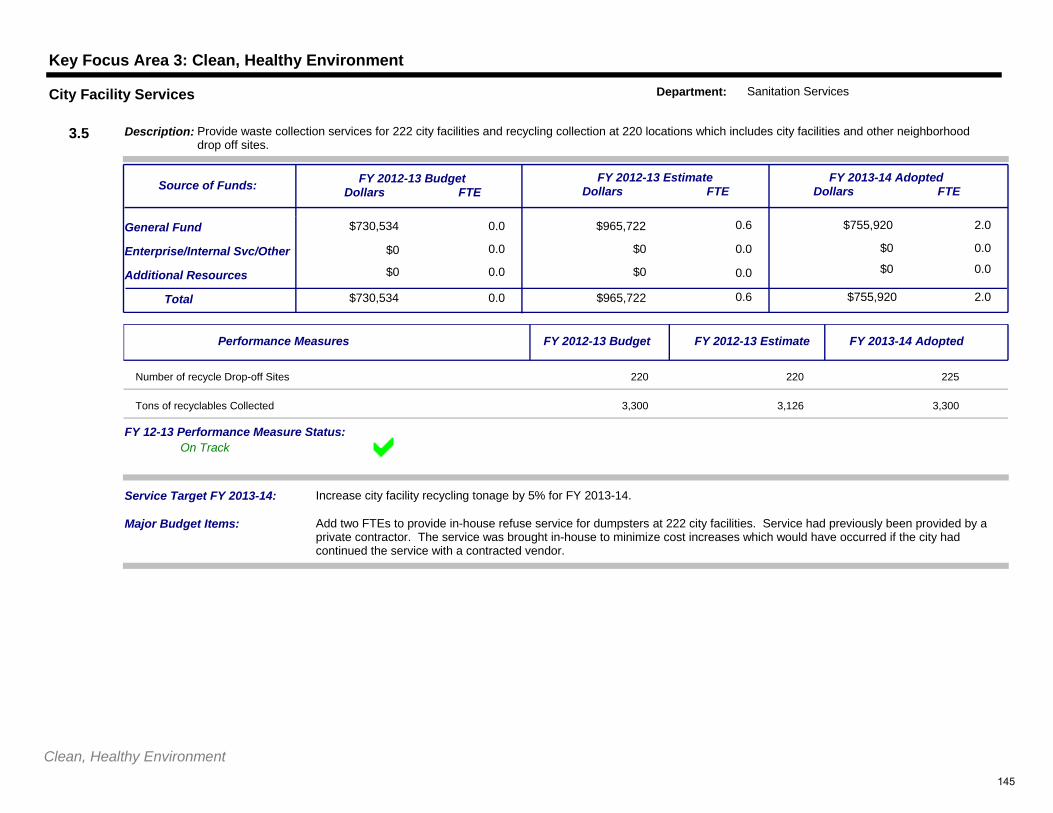
Key Focus Area 3: Clean, Healthy Environment
$730,534 0.0
0.0
$965,722 0.6
$0 0.0
$755,920
$0 0.0
2.0General Fund
Additional Resources
Service Target FY 2013-14: Increase city facility recycling tonage by 5% for FY 2013-14.
$730,534Total 0.0 $965,722 0.6 $755,920 2.0
Enterprise/Internal Svc/Other
$0 0.0 $0 0.0 $0 0.0
FY 2012-13 BudgetDollars FTE
FY 2012-13 EstimateDollars FTE
FY 2013-14 AdoptedDollars FTE
Description: Provide waste collection services for 222 city facilities and recycling collection at 220 locations which includes city facilities and other neighborhood drop off sites.
Source of Funds:
3.5
City Facility Services Department: Sanitation Services
$0
Major Budget Items: Add two FTEs to provide in-house refuse service for dumpsters at 222 city facilities. Service had previously been provided by a private contractor. The service was brought in-house to minimize cost increases which would have occurred if the city had continued the service with a contracted vendor.
On TrackFY 12-13 Performance Measure Status:
Performance Measures FY 2012-13 Budget FY 2012-13 Estimate FY 2013-14 Adopted
Number of recycle Drop-off Sites 220 220 225
Tons of recyclables Collected 3,300 3,126 3,300
Clean, Healthy Environment145
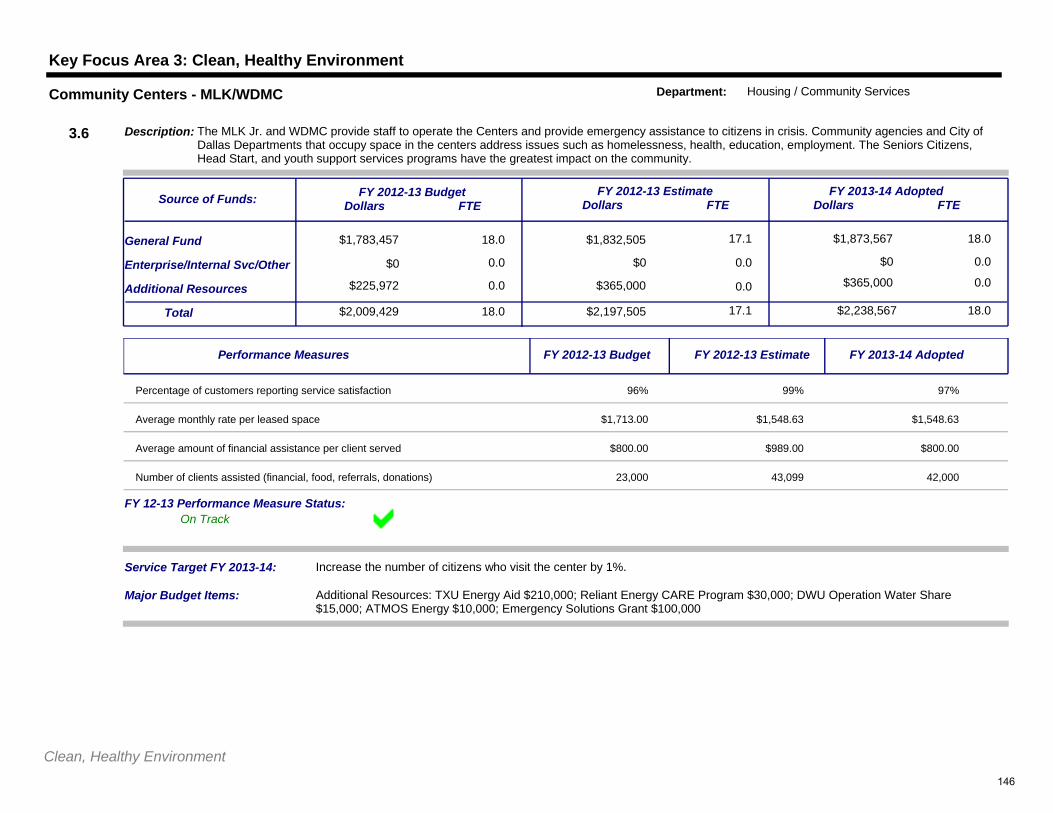
Key Focus Area 3: Clean, Healthy Environment
$1,783,457 18.0
0.0
$1,832,505 17.1
$0 0.0
$1,873,567
$0 0.0
18.0General Fund
Additional Resources
Service Target FY 2013-14: Increase the number of citizens who visit the center by 1%.
$2,009,429Total 18.0 $2,197,505 17.1 $2,238,567 18.0
Enterprise/Internal Svc/Other
$225,972 0.0 $365,000 0.0 $365,000 0.0
FY 2012-13 BudgetDollars FTE
FY 2012-13 EstimateDollars FTE
FY 2013-14 AdoptedDollars FTE
Description: The MLK Jr. and WDMC provide staff to operate the Centers and provide emergency assistance to citizens in crisis. Community agencies and City of Dallas Departments that occupy space in the centers address issues such as homelessness, health, education, employment. The Seniors Citizens, Head Start, and youth support services programs have the greatest impact on the community.
Source of Funds:
3.6
Community Centers - MLK/WDMC Department: Housing / Community Services
$0
Major Budget Items: Additional Resources: TXU Energy Aid $210,000; Reliant Energy CARE Program $30,000; DWU Operation Water Share $15,000; ATMOS Energy $10,000; Emergency Solutions Grant $100,000
On TrackFY 12-13 Performance Measure Status:
Performance Measures FY 2012-13 Budget FY 2012-13 Estimate FY 2013-14 Adopted
Percentage of customers reporting service satisfaction 96% 99% 97%
Average monthly rate per leased space $1,713.00 $1,548.63 $1,548.63
Average amount of financial assistance per client served $800.00 $989.00 $800.00
Number of clients assisted (financial, food, referrals, donations) 23,000 43,099 42,000
Clean, Healthy Environment146
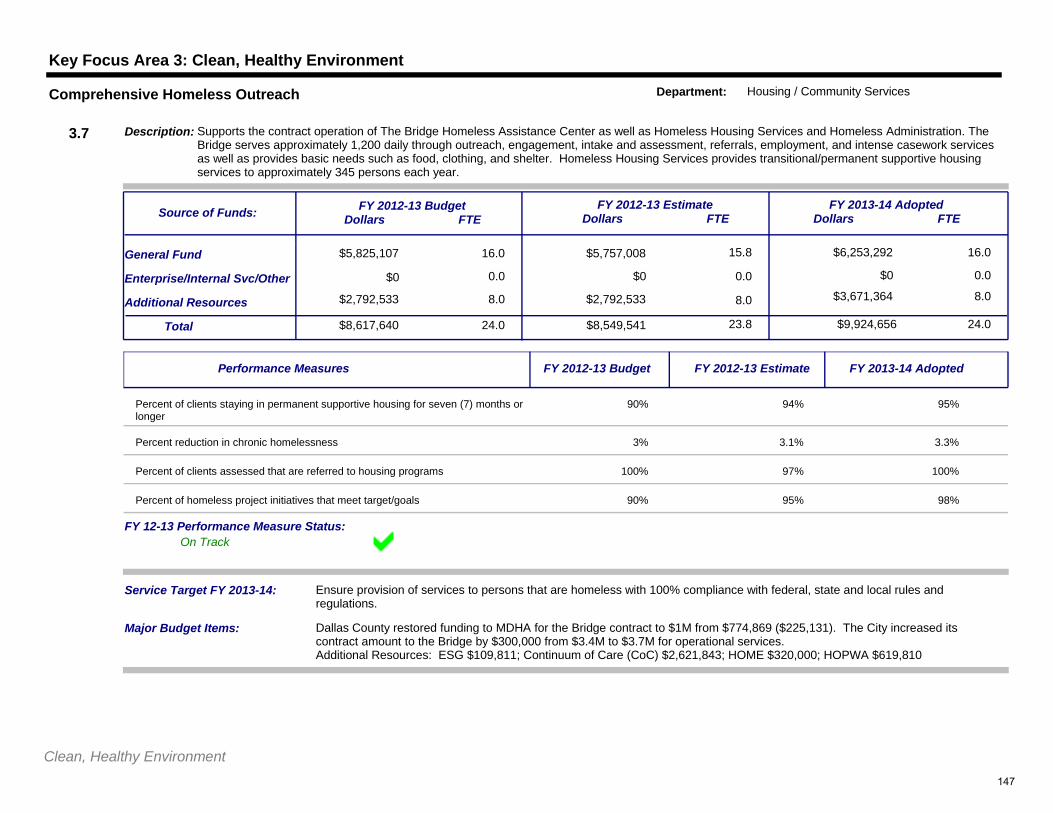
Key Focus Area 3: Clean, Healthy Environment
$5,825,107 16.0
0.0
$5,757,008 15.8
$0 0.0
$6,253,292
$0 0.0
16.0General Fund
Additional Resources
Service Target FY 2013-14: Ensure provision of services to persons that are homeless with 100% compliance with federal, state and local rules and regulations.
$8,617,640Total 24.0 $8,549,541 23.8 $9,924,656 24.0
Enterprise/Internal Svc/Other
$2,792,533 8.0 $2,792,533 8.0 $3,671,364 8.0
FY 2012-13 BudgetDollars FTE
FY 2012-13 EstimateDollars FTE
FY 2013-14 AdoptedDollars FTE
Description: Supports the contract operation of The Bridge Homeless Assistance Center as well as Homeless Housing Services and Homeless Administration. The Bridge serves approximately 1,200 daily through outreach, engagement, intake and assessment, referrals, employment, and intense casework services as well as provides basic needs such as food, clothing, and shelter. Homeless Housing Services provides transitional/permanent supportive housing services to approximately 345 persons each year.
Source of Funds:
3.7
Comprehensive Homeless Outreach Department: Housing / Community Services
$0
Major Budget Items: Dallas County restored funding to MDHA for the Bridge contract to $1M from $774,869 ($225,131). The City increased its contract amount to the Bridge by $300,000 from $3.4M to $3.7M for operational services.Additional Resources: ESG $109,811; Continuum of Care (CoC) $2,621,843; HOME $320,000; HOPWA $619,810
On TrackFY 12-13 Performance Measure Status:
Performance Measures FY 2012-13 Budget FY 2012-13 Estimate FY 2013-14 Adopted
Percent of clients staying in permanent supportive housing for seven (7) months or longer
90% 94% 95%
Percent reduction in chronic homelessness 3% 3.1% 3.3%
Percent of clients assessed that are referred to housing programs 100% 97% 100%
Percent of homeless project initiatives that meet target/goals 90% 95% 98%
Clean, Healthy Environment147
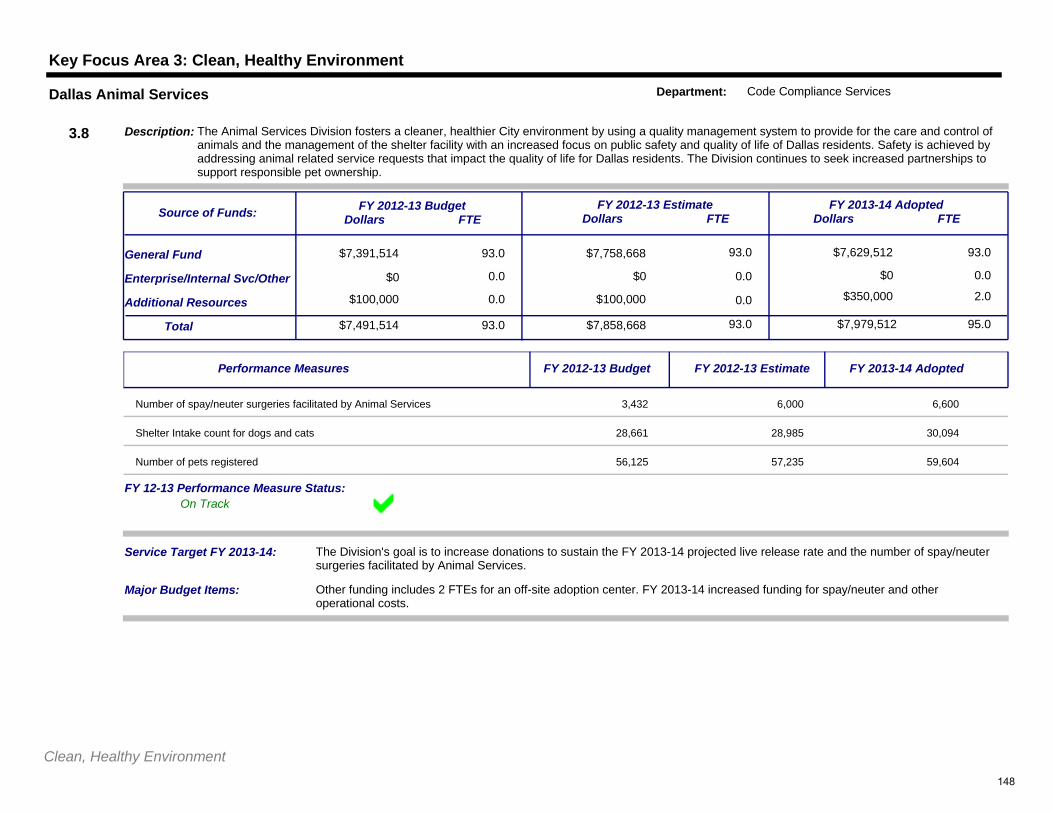
Key Focus Area 3: Clean, Healthy Environment
$7,391,514 93.0
0.0
$7,758,668 93.0
$0 0.0
$7,629,512
$0 0.0
93.0General Fund
Additional Resources
Service Target FY 2013-14: The Division's goal is to increase donations to sustain the FY 2013-14 projected live release rate and the number of spay/neuter surgeries facilitated by Animal Services.
$7,491,514Total 93.0 $7,858,668 93.0 $7,979,512 95.0
Enterprise/Internal Svc/Other
$100,000 0.0 $100,000 0.0 $350,000 2.0
FY 2012-13 BudgetDollars FTE
FY 2012-13 EstimateDollars FTE
FY 2013-14 AdoptedDollars FTE
Description: The Animal Services Division fosters a cleaner, healthier City environment by using a quality management system to provide for the care and control of animals and the management of the shelter facility with an increased focus on public safety and quality of life of Dallas residents. Safety is achieved by addressing animal related service requests that impact the quality of life for Dallas residents. The Division continues to seek increased partnerships to support responsible pet ownership.
Source of Funds:
3.8
Dallas Animal Services Department: Code Compliance Services
$0
Major Budget Items: Other funding includes 2 FTEs for an off-site adoption center. FY 2013-14 increased funding for spay/neuter and other operational costs.
On TrackFY 12-13 Performance Measure Status:
Performance Measures FY 2012-13 Budget FY 2012-13 Estimate FY 2013-14 Adopted
Number of spay/neuter surgeries facilitated by Animal Services 3,432 6,000 6,600
Shelter Intake count for dogs and cats 28,661 28,985 30,094
Number of pets registered 56,125 57,235 59,604
Clean, Healthy Environment148
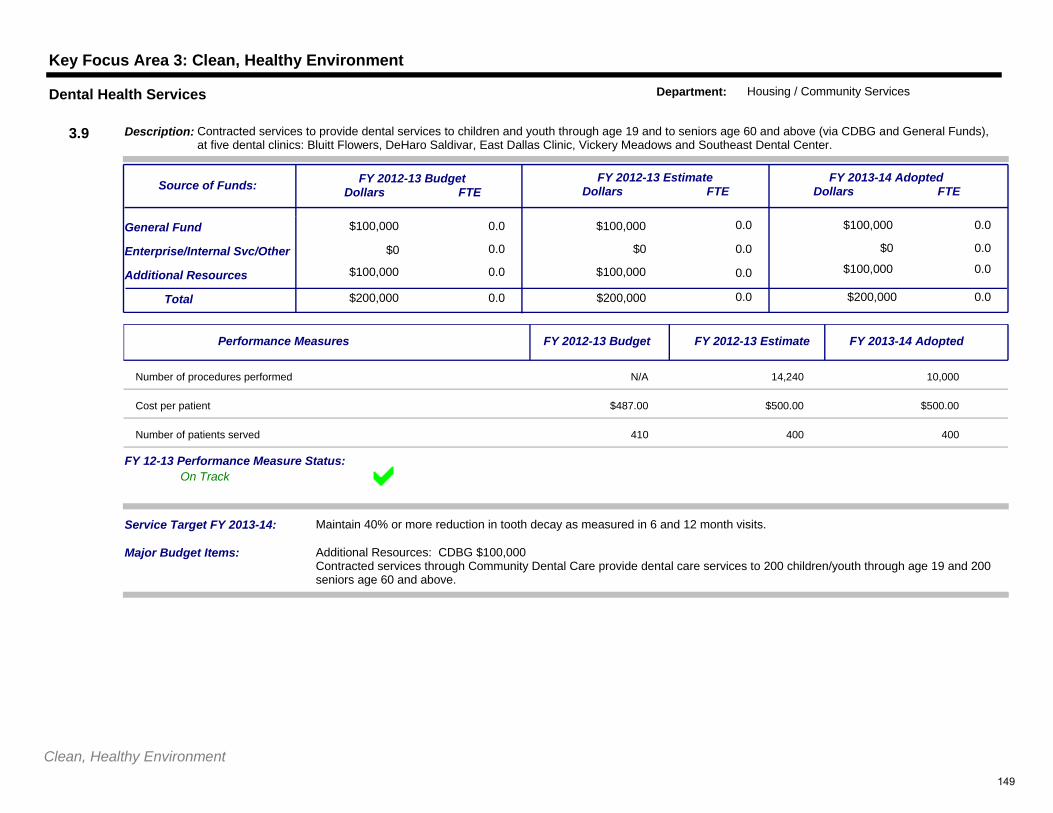
Key Focus Area 3: Clean, Healthy Environment
$100,000 0.0
0.0
$100,000 0.0
$0 0.0
$100,000
$0 0.0
0.0General Fund
Additional Resources
Service Target FY 2013-14: Maintain 40% or more reduction in tooth decay as measured in 6 and 12 month visits.
$200,000Total 0.0 $200,000 0.0 $200,000 0.0
Enterprise/Internal Svc/Other
$100,000 0.0 $100,000 0.0 $100,000 0.0
FY 2012-13 BudgetDollars FTE
FY 2012-13 EstimateDollars FTE
FY 2013-14 AdoptedDollars FTE
Description: Contracted services to provide dental services to children and youth through age 19 and to seniors age 60 and above (via CDBG and General Funds), at five dental clinics: Bluitt Flowers, DeHaro Saldivar, East Dallas Clinic, Vickery Meadows and Southeast Dental Center.
Source of Funds:
3.9
Dental Health Services Department: Housing / Community Services
$0
Major Budget Items: Additional Resources: CDBG $100,000Contracted services through Community Dental Care provide dental care services to 200 children/youth through age 19 and 200 seniors age 60 and above.
On TrackFY 12-13 Performance Measure Status:
Performance Measures FY 2012-13 Budget FY 2012-13 Estimate FY 2013-14 Adopted
Number of procedures performed N/A 14,240 10,000
Cost per patient $487.00 $500.00 $500.00
Number of patients served 410 400 400
Clean, Healthy Environment149
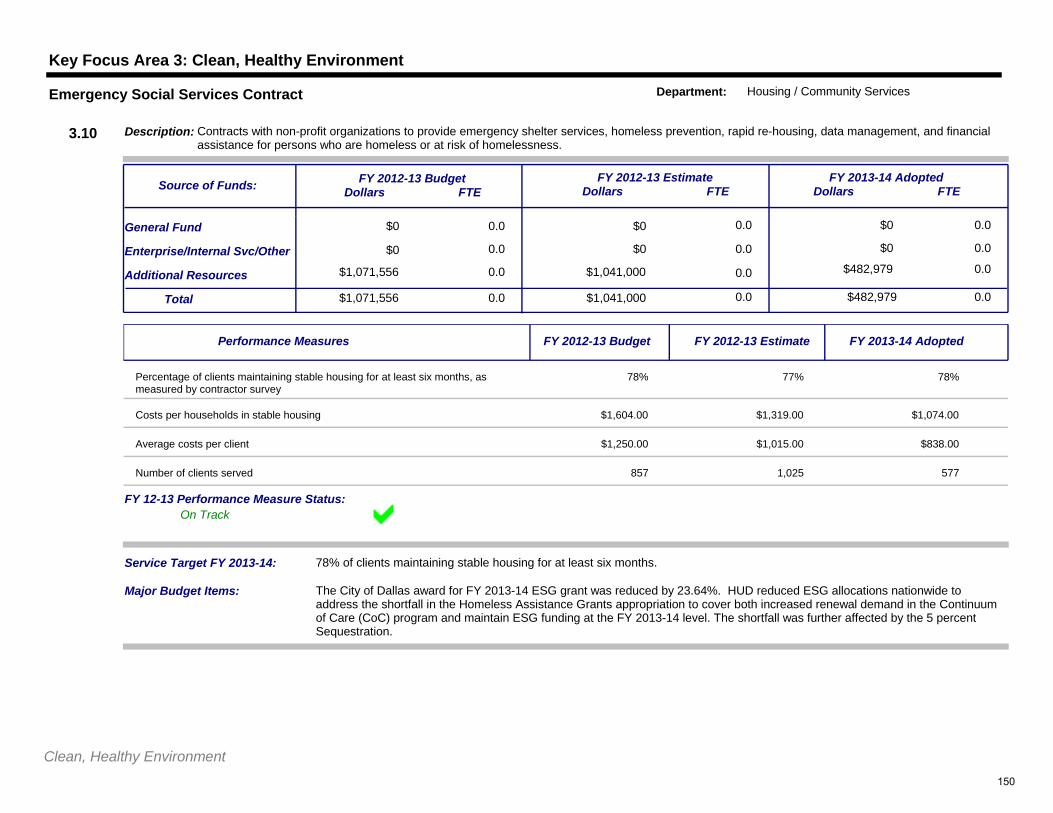
Key Focus Area 3: Clean, Healthy Environment
$0 0.0
0.0
$0 0.0
$0 0.0
$0
$0 0.0
0.0General Fund
Additional Resources
Service Target FY 2013-14: 78% of clients maintaining stable housing for at least six months.
$1,071,556Total 0.0 $1,041,000 0.0 $482,979 0.0
Enterprise/Internal Svc/Other
$1,071,556 0.0 $1,041,000 0.0 $482,979 0.0
FY 2012-13 BudgetDollars FTE
FY 2012-13 EstimateDollars FTE
FY 2013-14 AdoptedDollars FTE
Description: Contracts with non-profit organizations to provide emergency shelter services, homeless prevention, rapid re-housing, data management, and financial assistance for persons who are homeless or at risk of homelessness.
Source of Funds:
3.10
Emergency Social Services Contract Department: Housing / Community Services
$0
Major Budget Items: The City of Dallas award for FY 2013-14 ESG grant was reduced by 23.64%. HUD reduced ESG allocations nationwide to address the shortfall in the Homeless Assistance Grants appropriation to cover both increased renewal demand in the Continuum of Care (CoC) program and maintain ESG funding at the FY 2013-14 level. The shortfall was further affected by the 5 percent Sequestration.
On TrackFY 12-13 Performance Measure Status:
Performance Measures FY 2012-13 Budget FY 2012-13 Estimate FY 2013-14 Adopted
Percentage of clients maintaining stable housing for at least six months, as measured by contractor survey
78% 77% 78%
Costs per households in stable housing $1,604.00 $1,319.00 $1,074.00
Average costs per client $1,250.00 $1,015.00 $838.00
Number of clients served 857 1,025 577
Clean, Healthy Environment150
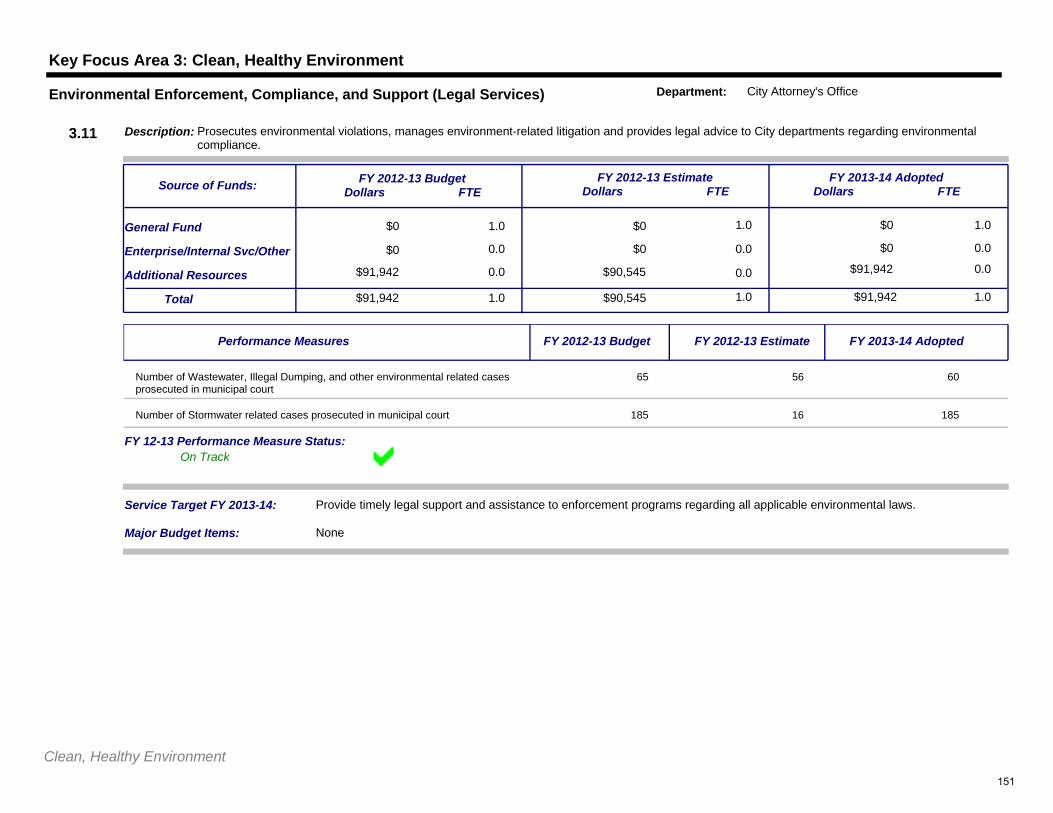
Key Focus Area 3: Clean, Healthy Environment
$0 1.0
0.0
$0 1.0
$0 0.0
$0
$0 0.0
1.0General Fund
Additional Resources
Service Target FY 2013-14: Provide timely legal support and assistance to enforcement programs regarding all applicable environmental laws.
$91,942Total 1.0 $90,545 1.0 $91,942 1.0
Enterprise/Internal Svc/Other
$91,942 0.0 $90,545 0.0 $91,942 0.0
FY 2012-13 BudgetDollars FTE
FY 2012-13 EstimateDollars FTE
FY 2013-14 AdoptedDollars FTE
Description: Prosecutes environmental violations, manages environment-related litigation and provides legal advice to City departments regarding environmental compliance.
Source of Funds:
3.11
Environmental Enforcement, Compliance, and Support (Legal Services) Department: City Attorney's Office
$0
Major Budget Items: None
On TrackFY 12-13 Performance Measure Status:
Performance Measures FY 2012-13 Budget FY 2012-13 Estimate FY 2013-14 Adopted
Number of Wastewater, Illegal Dumping, and other environmental related cases prosecuted in municipal court
65 56 60
Number of Stormwater related cases prosecuted in municipal court 185 16 185
Clean, Healthy Environment151
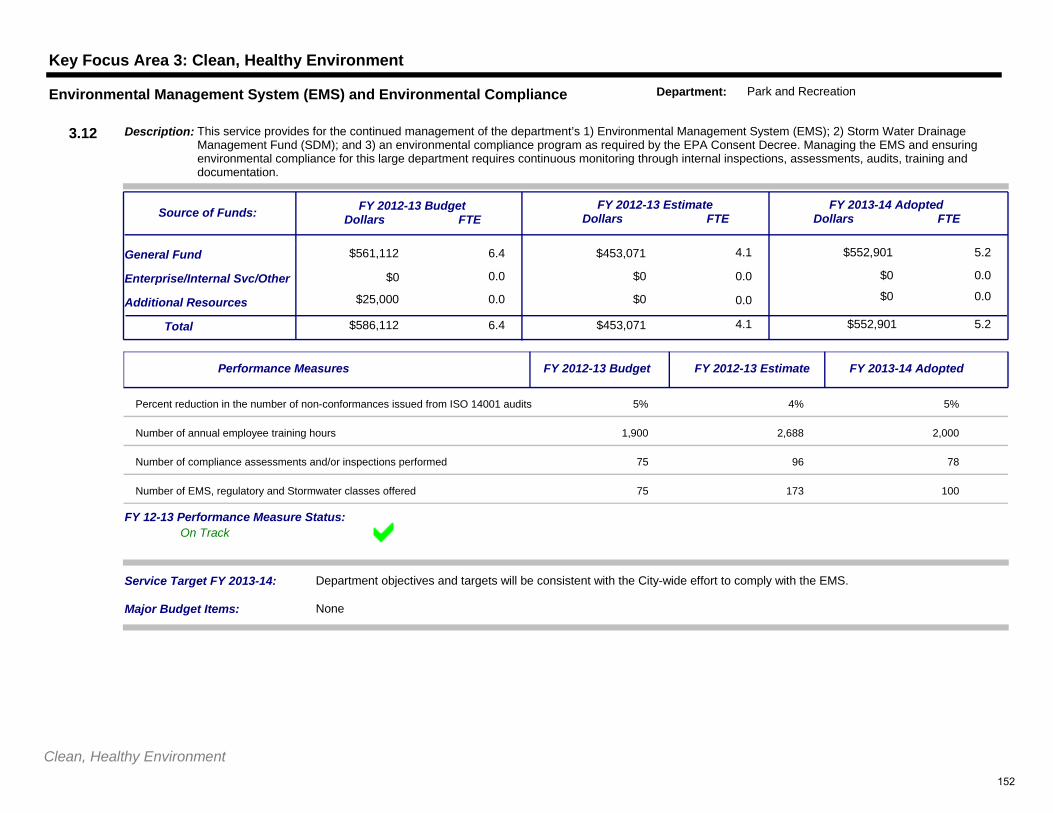
Key Focus Area 3: Clean, Healthy Environment
$561,112 6.4
0.0
$453,071 4.1
$0 0.0
$552,901
$0 0.0
5.2General Fund
Additional Resources
Service Target FY 2013-14: Department objectives and targets will be consistent with the City-wide effort to comply with the EMS.
$586,112Total 6.4 $453,071 4.1 $552,901 5.2
Enterprise/Internal Svc/Other
$25,000 0.0 $0 0.0 $0 0.0
FY 2012-13 BudgetDollars FTE
FY 2012-13 EstimateDollars FTE
FY 2013-14 AdoptedDollars FTE
Description: This service provides for the continued management of the department’s 1) Environmental Management System (EMS); 2) Storm Water Drainage Management Fund (SDM); and 3) an environmental compliance program as required by the EPA Consent Decree. Managing the EMS and ensuring environmental compliance for this large department requires continuous monitoring through internal inspections, assessments, audits, training and documentation.
Source of Funds:
3.12
Environmental Management System (EMS) and Environmental Compliance Department: Park and Recreation
$0
Major Budget Items: None
On TrackFY 12-13 Performance Measure Status:
Performance Measures FY 2012-13 Budget FY 2012-13 Estimate FY 2013-14 Adopted
Percent reduction in the number of non-conformances issued from ISO 14001 audits 5% 4% 5%
Number of annual employee training hours 1,900 2,688 2,000
Number of compliance assessments and/or inspections performed 75 96 78
Number of EMS, regulatory and Stormwater classes offered 75 173 100
Clean, Healthy Environment152
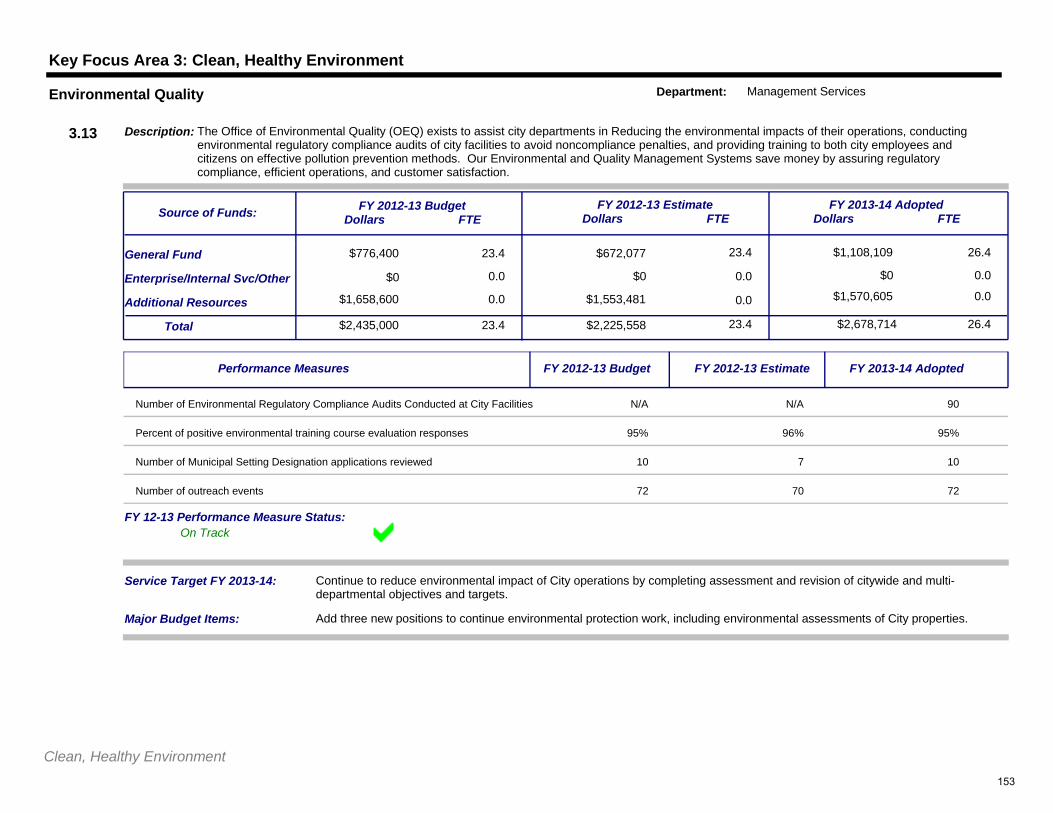
Key Focus Area 3: Clean, Healthy Environment
$776,400 23.4
0.0
$672,077 23.4
$0 0.0
$1,108,109
$0 0.0
26.4General Fund
Additional Resources
Service Target FY 2013-14: Continue to reduce environmental impact of City operations by completing assessment and revision of citywide and multi-departmental objectives and targets.
$2,435,000Total 23.4 $2,225,558 23.4 $2,678,714 26.4
Enterprise/Internal Svc/Other
$1,658,600 0.0 $1,553,481 0.0 $1,570,605 0.0
FY 2012-13 BudgetDollars FTE
FY 2012-13 EstimateDollars FTE
FY 2013-14 AdoptedDollars FTE
Description: The Office of Environmental Quality (OEQ) exists to assist city departments in Reducing the environmental impacts of their operations, conducting environmental regulatory compliance audits of city facilities to avoid noncompliance penalties, and providing training to both city employees and citizens on effective pollution prevention methods. Our Environmental and Quality Management Systems save money by assuring regulatory compliance, efficient operations, and customer satisfaction.
Source of Funds:
3.13
Environmental Quality Department: Management Services
$0
Major Budget Items: Add three new positions to continue environmental protection work, including environmental assessments of City properties.
On TrackFY 12-13 Performance Measure Status:
Performance Measures FY 2012-13 Budget FY 2012-13 Estimate FY 2013-14 Adopted
Number of Environmental Regulatory Compliance Audits Conducted at City Facilities N/A N/A 90
Percent of positive environmental training course evaluation responses 95% 96% 95%
Number of Municipal Setting Designation applications reviewed 10 7 10
Number of outreach events 72 70 72
Clean, Healthy Environment153
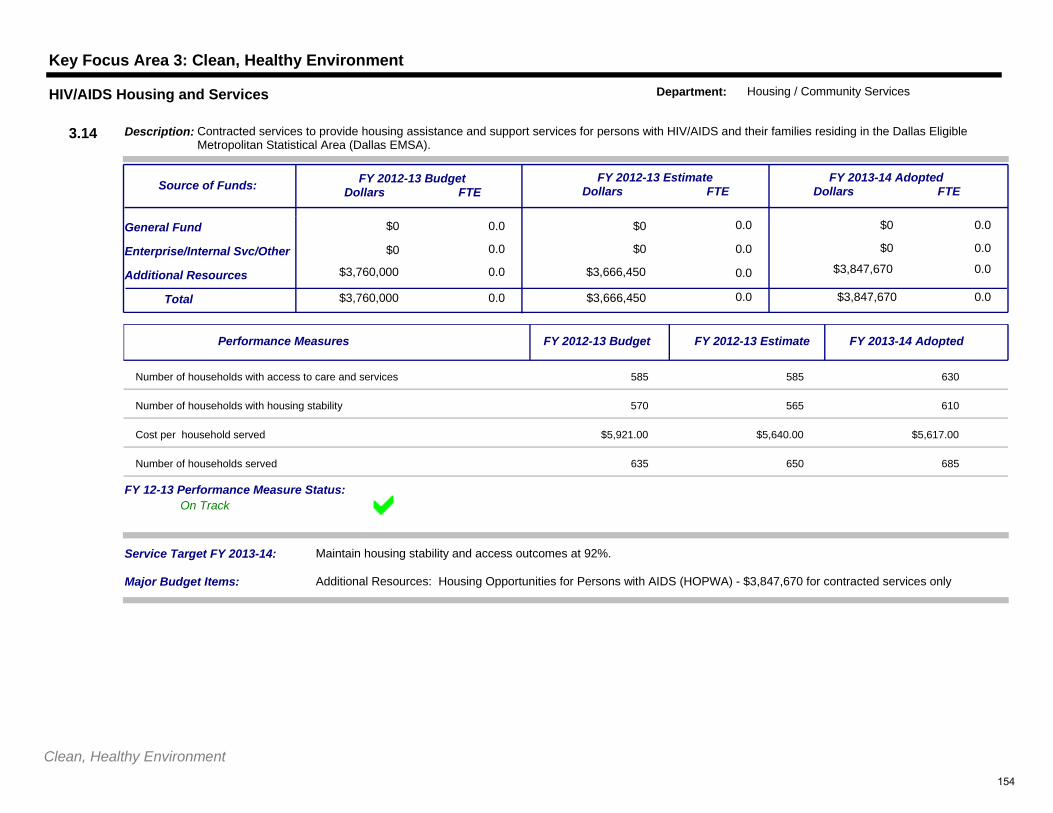
Key Focus Area 3: Clean, Healthy Environment
$0 0.0
0.0
$0 0.0
$0 0.0
$0
$0 0.0
0.0General Fund
Additional Resources
Service Target FY 2013-14: Maintain housing stability and access outcomes at 92%.
$3,760,000Total 0.0 $3,666,450 0.0 $3,847,670 0.0
Enterprise/Internal Svc/Other
$3,760,000 0.0 $3,666,450 0.0 $3,847,670 0.0
FY 2012-13 BudgetDollars FTE
FY 2012-13 EstimateDollars FTE
FY 2013-14 AdoptedDollars FTE
Description: Contracted services to provide housing assistance and support services for persons with HIV/AIDS and their families residing in the Dallas Eligible Metropolitan Statistical Area (Dallas EMSA).
Source of Funds:
3.14
HIV/AIDS Housing and Services Department: Housing / Community Services
$0
Major Budget Items: Additional Resources: Housing Opportunities for Persons with AIDS (HOPWA) - $3,847,670 for contracted services only
On TrackFY 12-13 Performance Measure Status:
Performance Measures FY 2012-13 Budget FY 2012-13 Estimate FY 2013-14 Adopted
Number of households with access to care and services 585 585 630
Number of households with housing stability 570 565 610
Cost per household served $5,921.00 $5,640.00 $5,617.00
Number of households served 635 650 685
Clean, Healthy Environment154
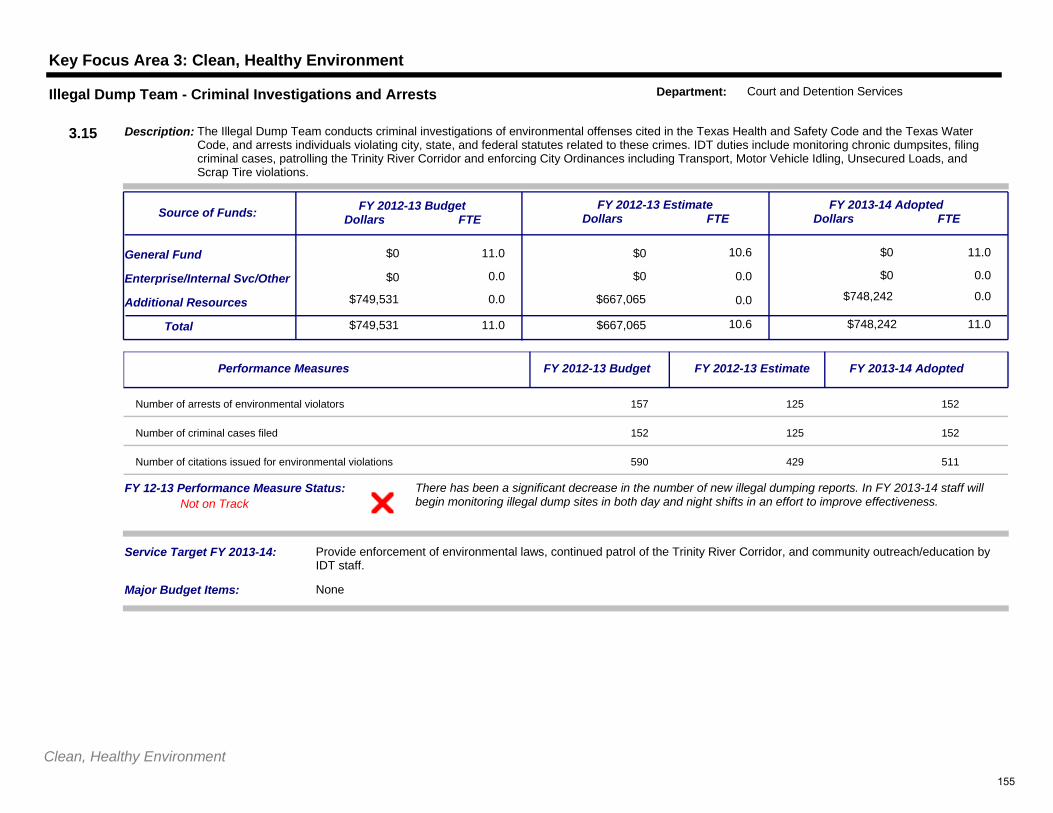
Key Focus Area 3: Clean, Healthy Environment
$0 11.0
0.0
$0 10.6
$0 0.0
$0
$0 0.0
11.0General Fund
Additional Resources
Service Target FY 2013-14: Provide enforcement of environmental laws, continued patrol of the Trinity River Corridor, and community outreach/education by IDT staff.
$749,531Total 11.0 $667,065 10.6 $748,242 11.0
Enterprise/Internal Svc/Other
$749,531 0.0 $667,065 0.0 $748,242 0.0
FY 2012-13 BudgetDollars FTE
FY 2012-13 EstimateDollars FTE
FY 2013-14 AdoptedDollars FTE
Description: The Illegal Dump Team conducts criminal investigations of environmental offenses cited in the Texas Health and Safety Code and the Texas Water Code, and arrests individuals violating city, state, and federal statutes related to these crimes. IDT duties include monitoring chronic dumpsites, filing criminal cases, patrolling the Trinity River Corridor and enforcing City Ordinances including Transport, Motor Vehicle Idling, Unsecured Loads, and Scrap Tire violations.
Source of Funds:
3.15
Illegal Dump Team - Criminal Investigations and Arrests Department: Court and Detention Services
$0
Major Budget Items: None
There has been a significant decrease in the number of new illegal dumping reports. In FY 2013-14 staff will begin monitoring illegal dump sites in both day and night shifts in an effort to improve effectiveness.Not on Track
FY 12-13 Performance Measure Status:
Performance Measures FY 2012-13 Budget FY 2012-13 Estimate FY 2013-14 Adopted
Number of arrests of environmental violators 157 125 152
Number of criminal cases filed 152 125 152
Number of citations issued for environmental violations 590 429 511
Clean, Healthy Environment155
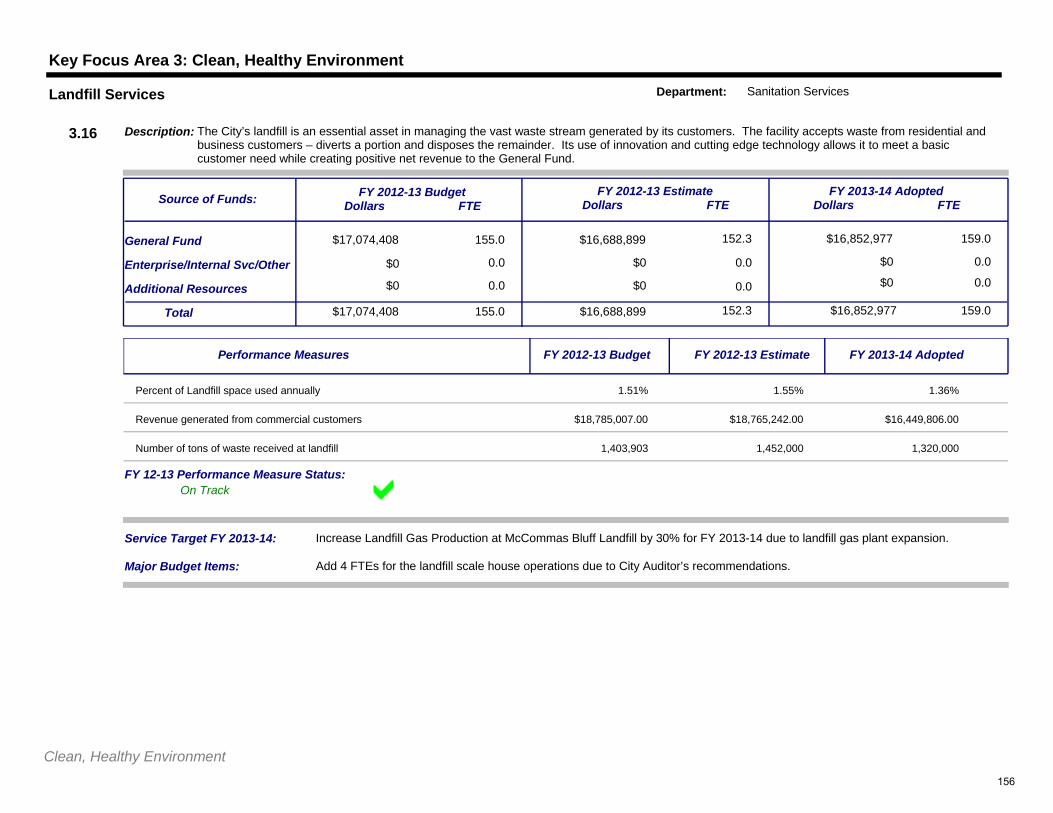
Key Focus Area 3: Clean, Healthy Environment
$17,074,408 155.0
0.0
$16,688,899 152.3
$0 0.0
$16,852,977
$0 0.0
159.0General Fund
Additional Resources
Service Target FY 2013-14: Increase Landfill Gas Production at McCommas Bluff Landfill by 30% for FY 2013-14 due to landfill gas plant expansion.
$17,074,408Total 155.0 $16,688,899 152.3 $16,852,977 159.0
Enterprise/Internal Svc/Other
$0 0.0 $0 0.0 $0 0.0
FY 2012-13 BudgetDollars FTE
FY 2012-13 EstimateDollars FTE
FY 2013-14 AdoptedDollars FTE
Description: The City’s landfill is an essential asset in managing the vast waste stream generated by its customers. The facility accepts waste from residential and business customers – diverts a portion and disposes the remainder. Its use of innovation and cutting edge technology allows it to meet a basic customer need while creating positive net revenue to the General Fund.
Source of Funds:
3.16
Landfill Services Department: Sanitation Services
$0
Major Budget Items: Add 4 FTEs for the landfill scale house operations due to City Auditor’s recommendations.
On TrackFY 12-13 Performance Measure Status:
Performance Measures FY 2012-13 Budget FY 2012-13 Estimate FY 2013-14 Adopted
Percent of Landfill space used annually 1.51% 1.55% 1.36%
Revenue generated from commercial customers $18,785,007.00 $18,765,242.00 $16,449,806.00
Number of tons of waste received at landfill 1,403,903 1,452,000 1,320,000
Clean, Healthy Environment156
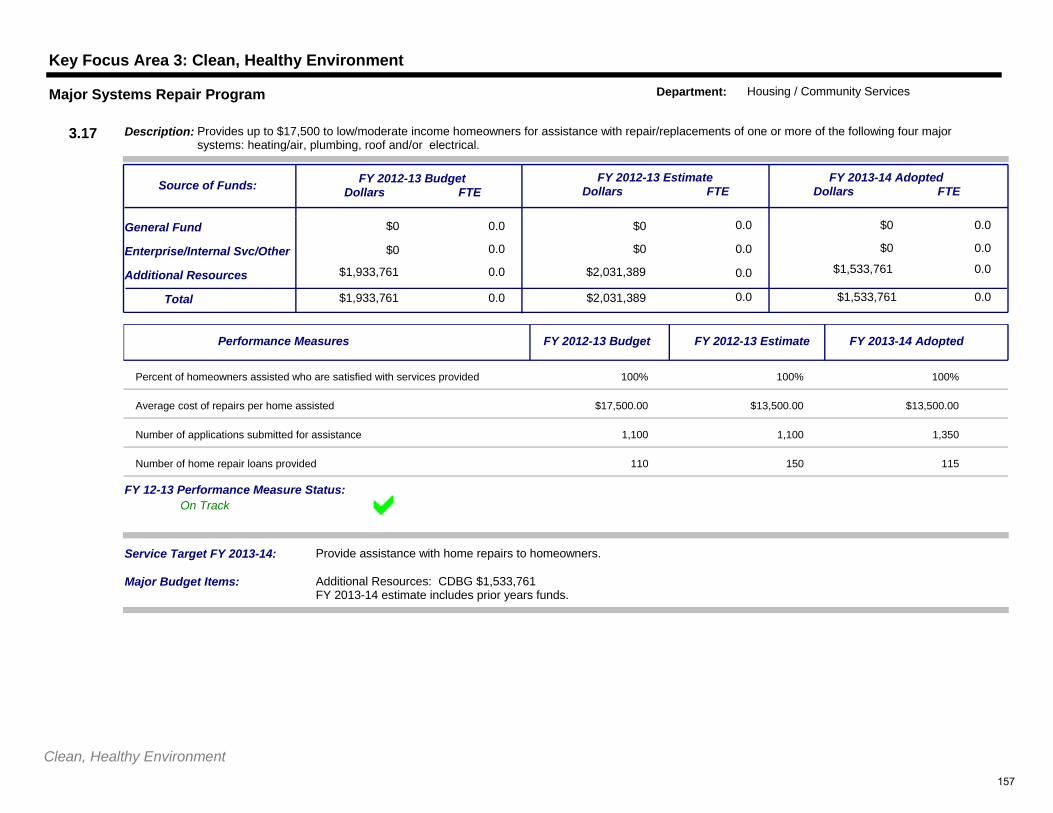
Key Focus Area 3: Clean, Healthy Environment
$0 0.0
0.0
$0 0.0
$0 0.0
$0
$0 0.0
0.0General Fund
Additional Resources
Service Target FY 2013-14: Provide assistance with home repairs to homeowners.
$1,933,761Total 0.0 $2,031,389 0.0 $1,533,761 0.0
Enterprise/Internal Svc/Other
$1,933,761 0.0 $2,031,389 0.0 $1,533,761 0.0
FY 2012-13 BudgetDollars FTE
FY 2012-13 EstimateDollars FTE
FY 2013-14 AdoptedDollars FTE
Description: Provides up to $17,500 to low/moderate income homeowners for assistance with repair/replacements of one or more of the following four major systems: heating/air, plumbing, roof and/or electrical.
Source of Funds:
3.17
Major Systems Repair Program Department: Housing / Community Services
$0
Major Budget Items: Additional Resources: CDBG $1,533,761FY 2013-14 estimate includes prior years funds.
On TrackFY 12-13 Performance Measure Status:
Performance Measures FY 2012-13 Budget FY 2012-13 Estimate FY 2013-14 Adopted
Percent of homeowners assisted who are satisfied with services provided 100% 100% 100%
Average cost of repairs per home assisted $17,500.00 $13,500.00 $13,500.00
Number of applications submitted for assistance 1,100 1,100 1,350
Number of home repair loans provided 110 150 115
Clean, Healthy Environment157
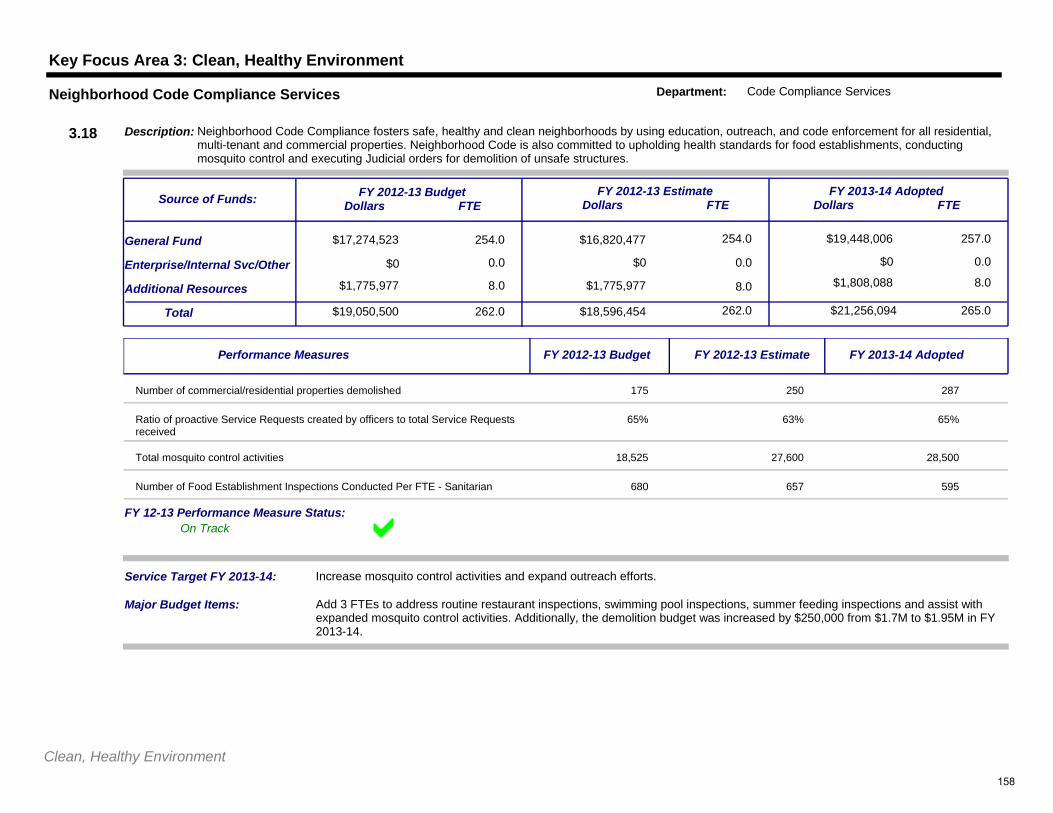
Key Focus Area 3: Clean, Healthy Environment
$17,274,523 254.0
0.0
$16,820,477 254.0
$0 0.0
$19,448,006
$0 0.0
257.0General Fund
Additional Resources
Service Target FY 2013-14: Increase mosquito control activities and expand outreach efforts.
$19,050,500Total 262.0 $18,596,454 262.0 $21,256,094 265.0
Enterprise/Internal Svc/Other
$1,775,977 8.0 $1,775,977 8.0 $1,808,088 8.0
FY 2012-13 BudgetDollars FTE
FY 2012-13 EstimateDollars FTE
FY 2013-14 AdoptedDollars FTE
Description: Neighborhood Code Compliance fosters safe, healthy and clean neighborhoods by using education, outreach, and code enforcement for all residential, multi-tenant and commercial properties. Neighborhood Code is also committed to upholding health standards for food establishments, conducting mosquito control and executing Judicial orders for demolition of unsafe structures.
Source of Funds:
3.18
Neighborhood Code Compliance Services Department: Code Compliance Services
$0
Major Budget Items: Add 3 FTEs to address routine restaurant inspections, swimming pool inspections, summer feeding inspections and assist with expanded mosquito control activities. Additionally, the demolition budget was increased by $250,000 from $1.7M to $1.95M in FY 2013-14.
On TrackFY 12-13 Performance Measure Status:
Performance Measures FY 2012-13 Budget FY 2012-13 Estimate FY 2013-14 Adopted
Number of commercial/residential properties demolished 175 250 287
Ratio of proactive Service Requests created by officers to total Service Requests received
65% 63% 65%
Total mosquito control activities 18,525 27,600 28,500
Number of Food Establishment Inspections Conducted Per FTE - Sanitarian 680 657 595
Clean, Healthy Environment158
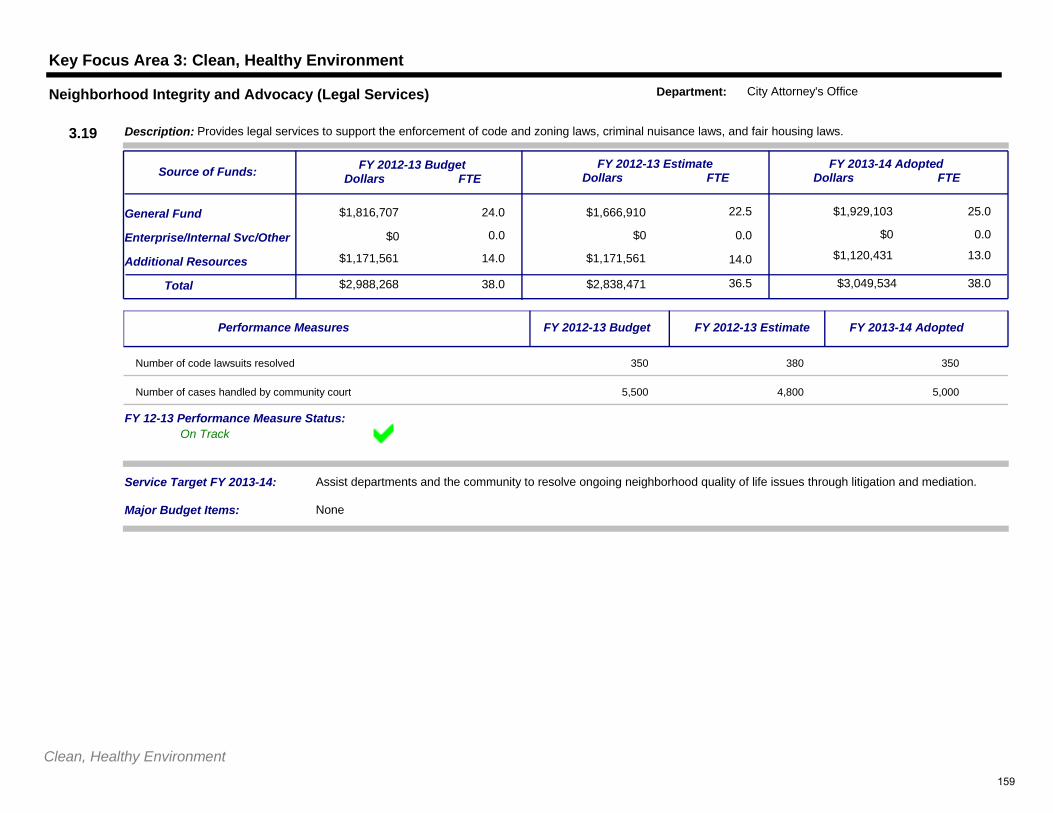
Key Focus Area 3: Clean, Healthy Environment
$1,816,707 24.0
0.0
$1,666,910 22.5
$0 0.0
$1,929,103
$0 0.0
25.0General Fund
Additional Resources
Service Target FY 2013-14: Assist departments and the community to resolve ongoing neighborhood quality of life issues through litigation and mediation.
$2,988,268Total 38.0 $2,838,471 36.5 $3,049,534 38.0
Enterprise/Internal Svc/Other
$1,171,561 14.0 $1,171,561 14.0 $1,120,431 13.0
FY 2012-13 BudgetDollars FTE
FY 2012-13 EstimateDollars FTE
FY 2013-14 AdoptedDollars FTE
Description: Provides legal services to support the enforcement of code and zoning laws, criminal nuisance laws, and fair housing laws.
Source of Funds:
3.19
Neighborhood Integrity and Advocacy (Legal Services) Department: City Attorney's Office
$0
Major Budget Items: None
On TrackFY 12-13 Performance Measure Status:
Performance Measures FY 2012-13 Budget FY 2012-13 Estimate FY 2013-14 Adopted
Number of code lawsuits resolved 350 380 350
Number of cases handled by community court 5,500 4,800 5,000
Clean, Healthy Environment159
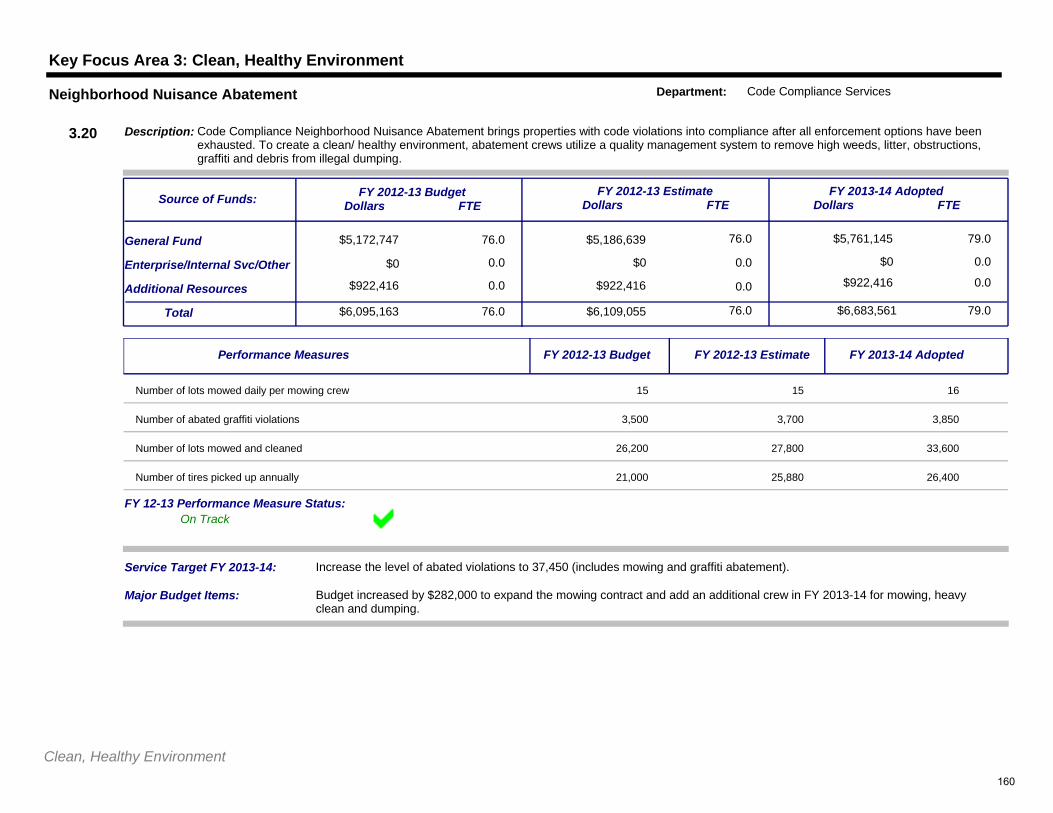
Key Focus Area 3: Clean, Healthy Environment
$5,172,747 76.0
0.0
$5,186,639 76.0
$0 0.0
$5,761,145
$0 0.0
79.0General Fund
Additional Resources
Service Target FY 2013-14: Increase the level of abated violations to 37,450 (includes mowing and graffiti abatement).
$6,095,163Total 76.0 $6,109,055 76.0 $6,683,561 79.0
Enterprise/Internal Svc/Other
$922,416 0.0 $922,416 0.0 $922,416 0.0
FY 2012-13 BudgetDollars FTE
FY 2012-13 EstimateDollars FTE
FY 2013-14 AdoptedDollars FTE
Description: Code Compliance Neighborhood Nuisance Abatement brings properties with code violations into compliance after all enforcement options have been exhausted. To create a clean/ healthy environment, abatement crews utilize a quality management system to remove high weeds, litter, obstructions, graffiti and debris from illegal dumping.
Source of Funds:
3.20
Neighborhood Nuisance Abatement Department: Code Compliance Services
$0
Major Budget Items: Budget increased by $282,000 to expand the mowing contract and add an additional crew in FY 2013-14 for mowing, heavy clean and dumping.
On TrackFY 12-13 Performance Measure Status:
Performance Measures FY 2012-13 Budget FY 2012-13 Estimate FY 2013-14 Adopted
Number of lots mowed daily per mowing crew 15 15 16
Number of abated graffiti violations 3,500 3,700 3,850
Number of lots mowed and cleaned 26,200 27,800 33,600
Number of tires picked up annually 21,000 25,880 26,400
Clean, Healthy Environment160
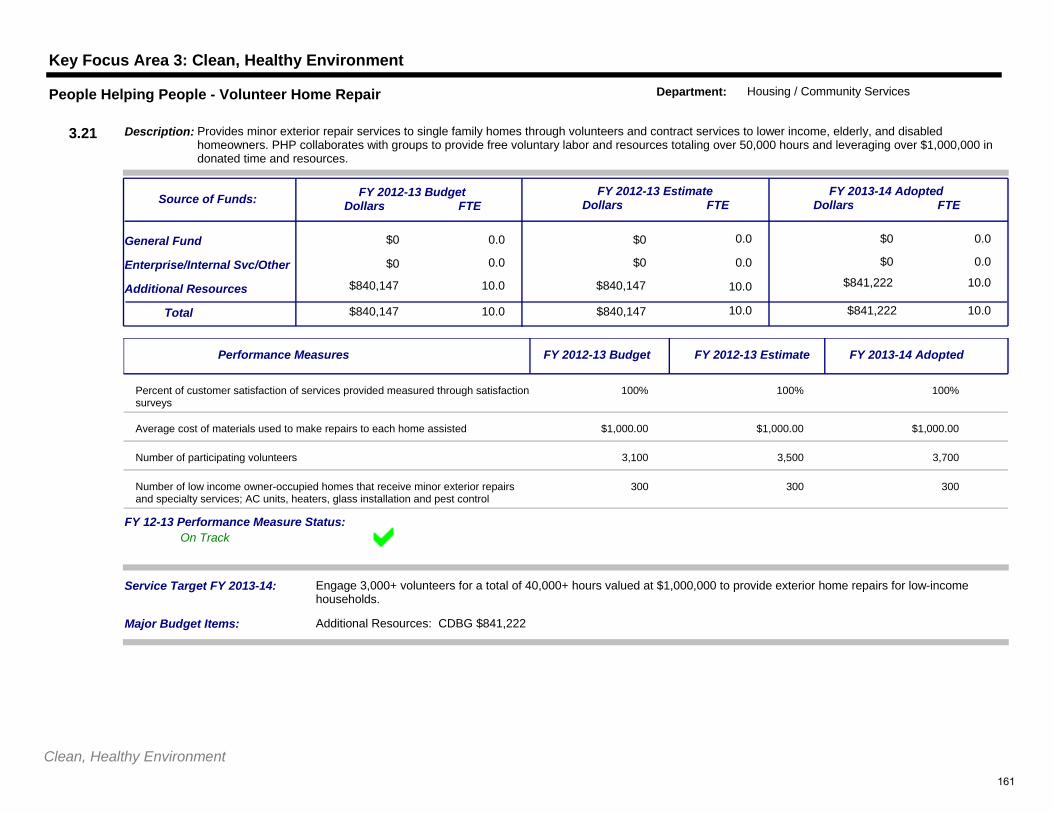
Key Focus Area 3: Clean, Healthy Environment
$0 0.0
0.0
$0 0.0
$0 0.0
$0
$0 0.0
0.0General Fund
Additional Resources
Service Target FY 2013-14: Engage 3,000+ volunteers for a total of 40,000+ hours valued at $1,000,000 to provide exterior home repairs for low-income households.
$840,147Total 10.0 $840,147 10.0 $841,222 10.0
Enterprise/Internal Svc/Other
$840,147 10.0 $840,147 10.0 $841,222 10.0
FY 2012-13 BudgetDollars FTE
FY 2012-13 EstimateDollars FTE
FY 2013-14 AdoptedDollars FTE
Description: Provides minor exterior repair services to single family homes through volunteers and contract services to lower income, elderly, and disabled homeowners. PHP collaborates with groups to provide free voluntary labor and resources totaling over 50,000 hours and leveraging over $1,000,000 in donated time and resources.
Source of Funds:
3.21
People Helping People - Volunteer Home Repair Department: Housing / Community Services
$0
Major Budget Items: Additional Resources: CDBG $841,222
On TrackFY 12-13 Performance Measure Status:
Performance Measures FY 2012-13 Budget FY 2012-13 Estimate FY 2013-14 Adopted
Percent of customer satisfaction of services provided measured through satisfaction surveys
100% 100% 100%
Average cost of materials used to make repairs to each home assisted $1,000.00 $1,000.00 $1,000.00
Number of participating volunteers 3,100 3,500 3,700
Number of low income owner-occupied homes that receive minor exterior repairs and specialty services; AC units, heaters, glass installation and pest control
300 300 300
Clean, Healthy Environment161
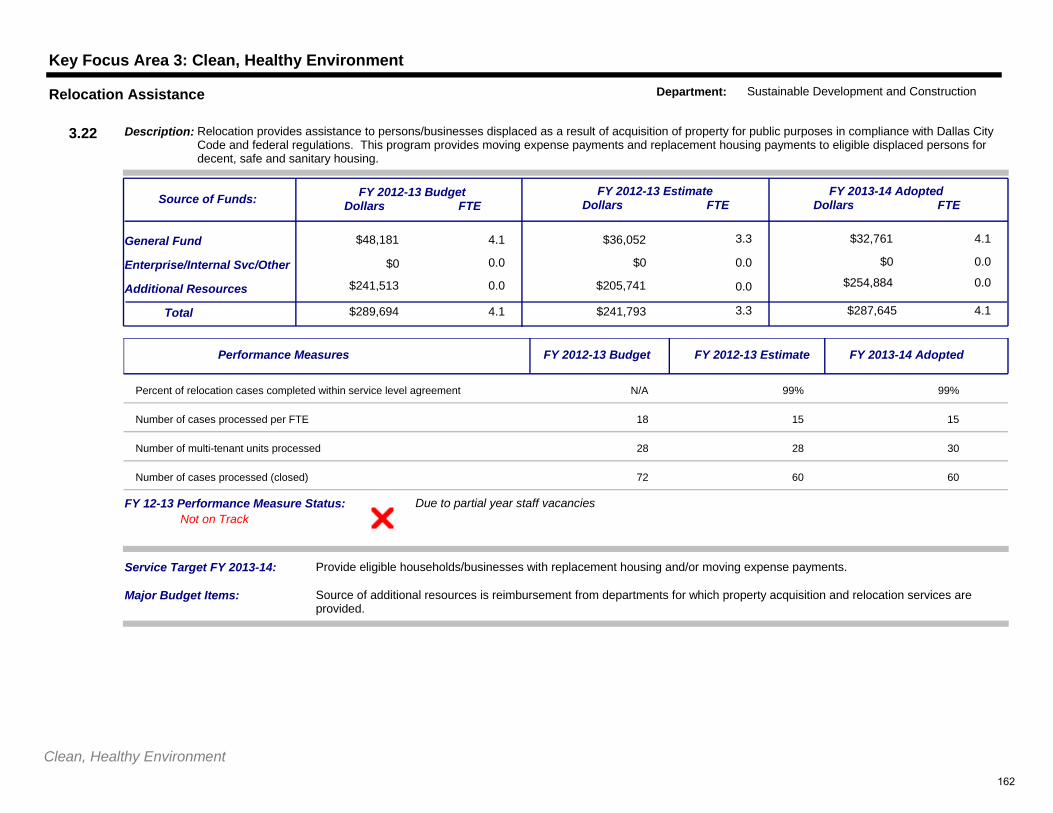
Key Focus Area 3: Clean, Healthy Environment
$48,181 4.1
0.0
$36,052 3.3
$0 0.0
$32,761
$0 0.0
4.1General Fund
Additional Resources
Service Target FY 2013-14: Provide eligible households/businesses with replacement housing and/or moving expense payments.
$289,694Total 4.1 $241,793 3.3 $287,645 4.1
Enterprise/Internal Svc/Other
$241,513 0.0 $205,741 0.0 $254,884 0.0
FY 2012-13 BudgetDollars FTE
FY 2012-13 EstimateDollars FTE
FY 2013-14 AdoptedDollars FTE
Description: Relocation provides assistance to persons/businesses displaced as a result of acquisition of property for public purposes in compliance with Dallas City Code and federal regulations. This program provides moving expense payments and replacement housing payments to eligible displaced persons for decent, safe and sanitary housing.
Source of Funds:
3.22
Relocation Assistance Department: Sustainable Development and Construction
$0
Major Budget Items: Source of additional resources is reimbursement from departments for which property acquisition and relocation services are provided.
Due to partial year staff vacanciesNot on Track
FY 12-13 Performance Measure Status:
Performance Measures FY 2012-13 Budget FY 2012-13 Estimate FY 2013-14 Adopted
Percent of relocation cases completed within service level agreement N/A 99% 99%
Number of cases processed per FTE 18 15 15
Number of multi-tenant units processed 28 28 30
Number of cases processed (closed) 72 60 60
Clean, Healthy Environment162
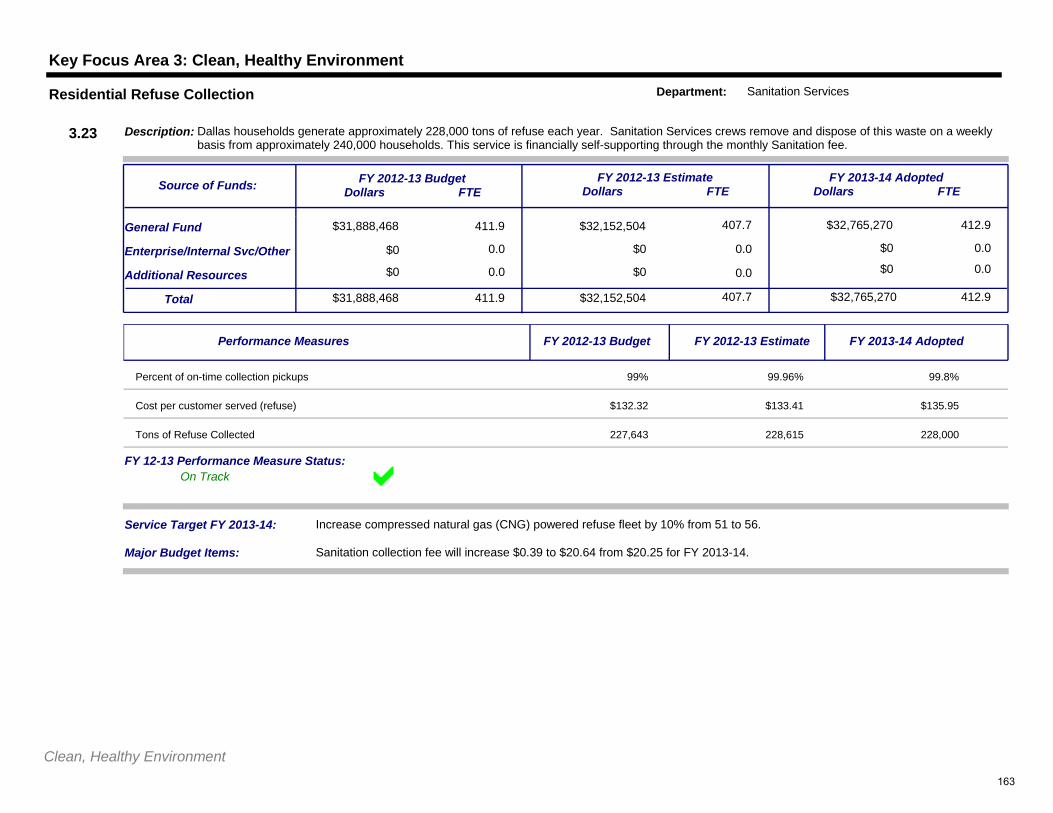
Key Focus Area 3: Clean, Healthy Environment
$31,888,468 411.9
0.0
$32,152,504 407.7
$0 0.0
$32,765,270
$0 0.0
412.9General Fund
Additional Resources
Service Target FY 2013-14: Increase compressed natural gas (CNG) powered refuse fleet by 10% from 51 to 56.
$31,888,468Total 411.9 $32,152,504 407.7 $32,765,270 412.9
Enterprise/Internal Svc/Other
$0 0.0 $0 0.0 $0 0.0
FY 2012-13 BudgetDollars FTE
FY 2012-13 EstimateDollars FTE
FY 2013-14 AdoptedDollars FTE
Description: Dallas households generate approximately 228,000 tons of refuse each year. Sanitation Services crews remove and dispose of this waste on a weekly basis from approximately 240,000 households. This service is financially self-supporting through the monthly Sanitation fee.
Source of Funds:
3.23
Residential Refuse Collection Department: Sanitation Services
$0
Major Budget Items: Sanitation collection fee will increase $0.39 to $20.64 from $20.25 for FY 2013-14.
On TrackFY 12-13 Performance Measure Status:
Performance Measures FY 2012-13 Budget FY 2012-13 Estimate FY 2013-14 Adopted
Percent of on-time collection pickups 99% 99.96% 99.8%
Cost per customer served (refuse) $132.32 $133.41 $135.95
Tons of Refuse Collected 227,643 228,615 228,000
Clean, Healthy Environment163
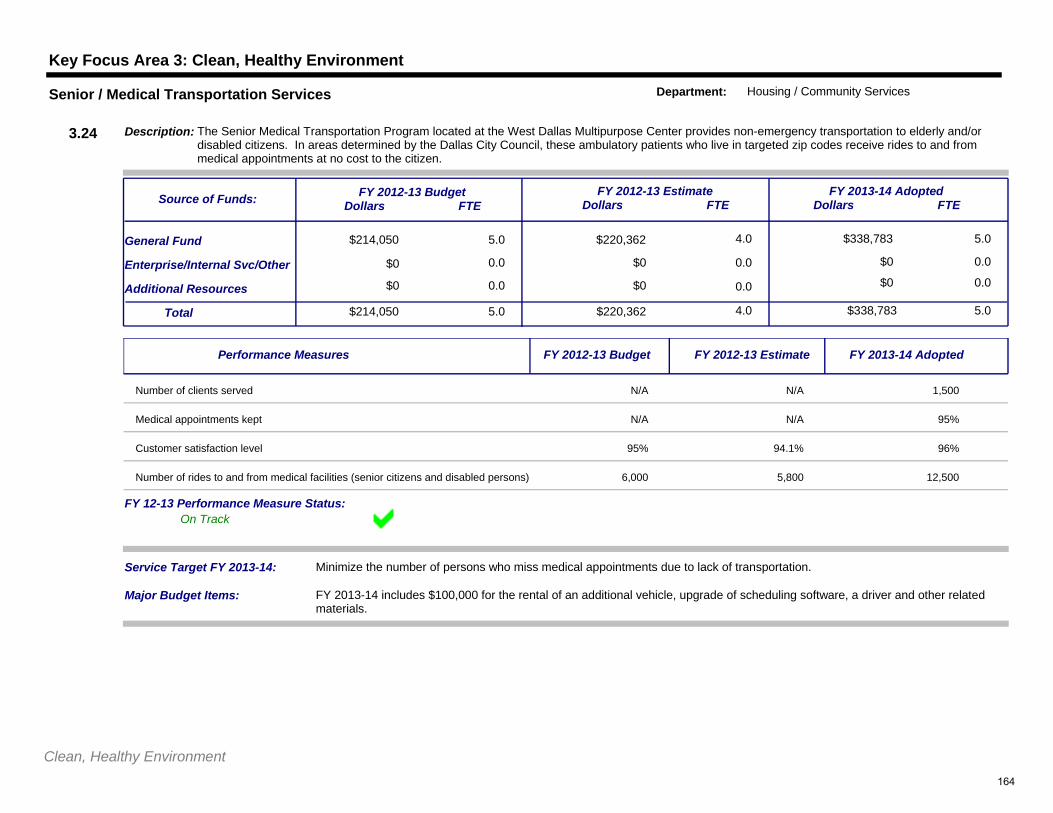
Key Focus Area 3: Clean, Healthy Environment
$214,050 5.0
0.0
$220,362 4.0
$0 0.0
$338,783
$0 0.0
5.0General Fund
Additional Resources
Service Target FY 2013-14: Minimize the number of persons who miss medical appointments due to lack of transportation.
$214,050Total 5.0 $220,362 4.0 $338,783 5.0
Enterprise/Internal Svc/Other
$0 0.0 $0 0.0 $0 0.0
FY 2012-13 BudgetDollars FTE
FY 2012-13 EstimateDollars FTE
FY 2013-14 AdoptedDollars FTE
Description: The Senior Medical Transportation Program located at the West Dallas Multipurpose Center provides non-emergency transportation to elderly and/or disabled citizens. In areas determined by the Dallas City Council, these ambulatory patients who live in targeted zip codes receive rides to and from medical appointments at no cost to the citizen.
Source of Funds:
3.24
Senior / Medical Transportation Services Department: Housing / Community Services
$0
Major Budget Items: FY 2013-14 includes $100,000 for the rental of an additional vehicle, upgrade of scheduling software, a driver and other related materials.
On TrackFY 12-13 Performance Measure Status:
Performance Measures FY 2012-13 Budget FY 2012-13 Estimate FY 2013-14 Adopted
Number of clients served N/A N/A 1,500
Medical appointments kept N/A N/A 95%
Customer satisfaction level 95% 94.1% 96%
Number of rides to and from medical facilities (senior citizens and disabled persons) 6,000 5,800 12,500
Clean, Healthy Environment164
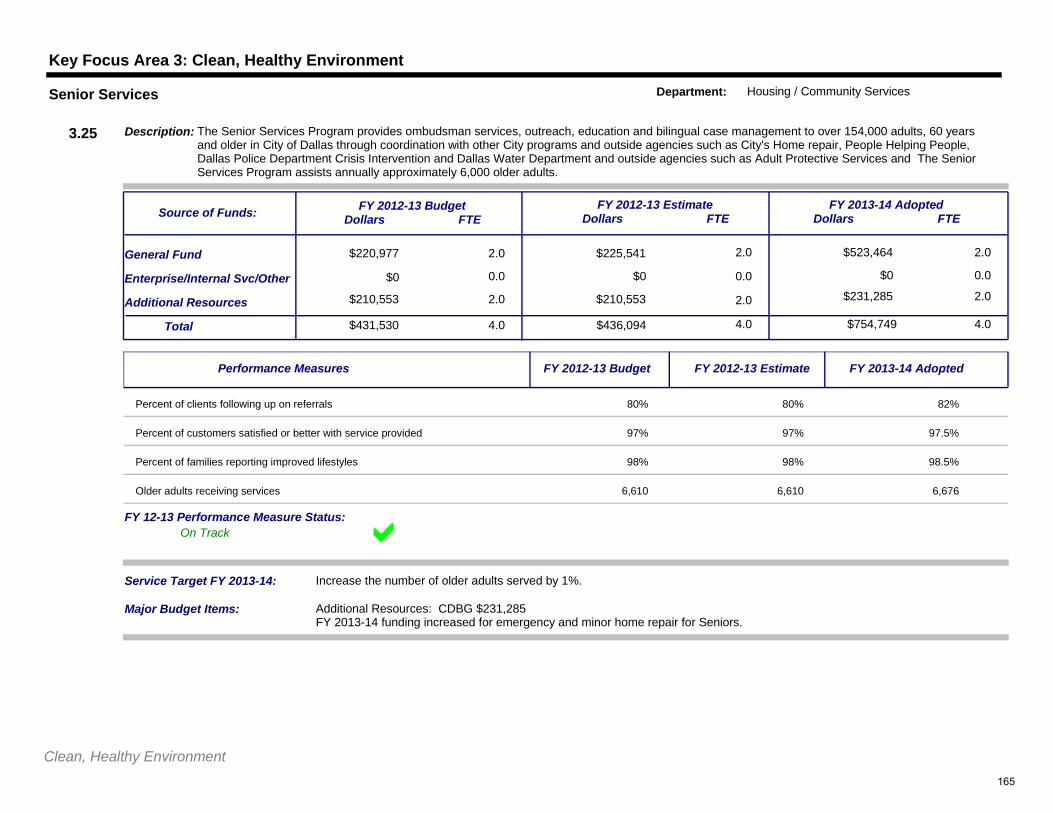
Key Focus Area 3: Clean, Healthy Environment
$220,977 2.0
0.0
$225,541 2.0
$0 0.0
$523,464
$0 0.0
2.0General Fund
Additional Resources
Service Target FY 2013-14: Increase the number of older adults served by 1%.
$431,530Total 4.0 $436,094 4.0 $754,749 4.0
Enterprise/Internal Svc/Other
$210,553 2.0 $210,553 2.0 $231,285 2.0
FY 2012-13 BudgetDollars FTE
FY 2012-13 EstimateDollars FTE
FY 2013-14 AdoptedDollars FTE
Description: The Senior Services Program provides ombudsman services, outreach, education and bilingual case management to over 154,000 adults, 60 years and older in City of Dallas through coordination with other City programs and outside agencies such as City's Home repair, People Helping People, Dallas Police Department Crisis Intervention and Dallas Water Department and outside agencies such as Adult Protective Services and The Senior Services Program assists annually approximately 6,000 older adults.
Source of Funds:
3.25
Senior Services Department: Housing / Community Services
$0
Major Budget Items: Additional Resources: CDBG $231,285FY 2013-14 funding increased for emergency and minor home repair for Seniors.
On TrackFY 12-13 Performance Measure Status:
Performance Measures FY 2012-13 Budget FY 2012-13 Estimate FY 2013-14 Adopted
Percent of clients following up on referrals 80% 80% 82%
Percent of customers satisfied or better with service provided 97% 97% 97.5%
Percent of families reporting improved lifestyles 98% 98% 98.5%
Older adults receiving services 6,610 6,610 6,676
Clean, Healthy Environment165
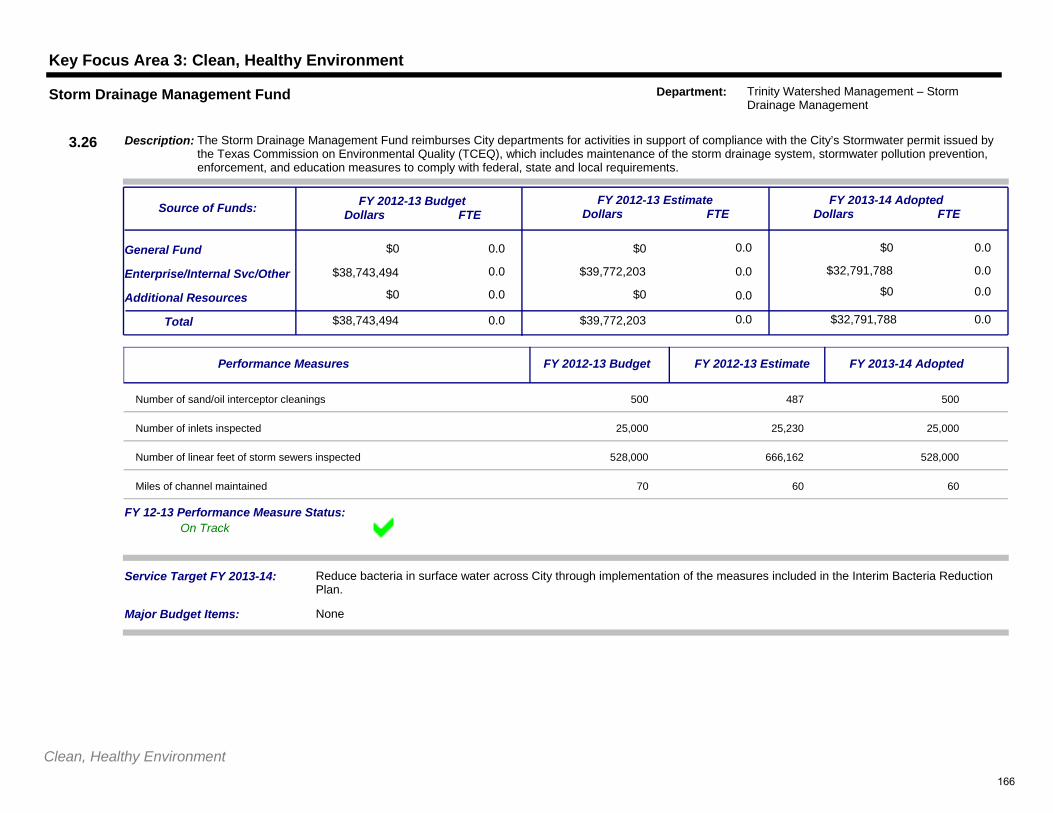
Key Focus Area 3: Clean, Healthy Environment
$0 0.0
0.0
$0 0.0
$39,772,203 0.0
$0
$32,791,788 0.0
0.0General Fund
Additional Resources
Service Target FY 2013-14: Reduce bacteria in surface water across City through implementation of the measures included in the Interim Bacteria Reduction Plan.
$38,743,494Total 0.0 $39,772,203 0.0 $32,791,788 0.0
Enterprise/Internal Svc/Other
$0 0.0 $0 0.0 $0 0.0
FY 2012-13 BudgetDollars FTE
FY 2012-13 EstimateDollars FTE
FY 2013-14 AdoptedDollars FTE
Description: The Storm Drainage Management Fund reimburses City departments for activities in support of compliance with the City’s Stormwater permit issued by the Texas Commission on Environmental Quality (TCEQ), which includes maintenance of the storm drainage system, stormwater pollution prevention, enforcement, and education measures to comply with federal, state and local requirements.
Source of Funds:
3.26
Storm Drainage Management Fund Department: Trinity Watershed Management – Storm Drainage Management
$38,743,494
Major Budget Items: None
On TrackFY 12-13 Performance Measure Status:
Performance Measures FY 2012-13 Budget FY 2012-13 Estimate FY 2013-14 Adopted
Number of sand/oil interceptor cleanings 500 487 500
Number of inlets inspected 25,000 25,230 25,000
Number of linear feet of storm sewers inspected 528,000 666,162 528,000
Miles of channel maintained 70 60 60
Clean, Healthy Environment166
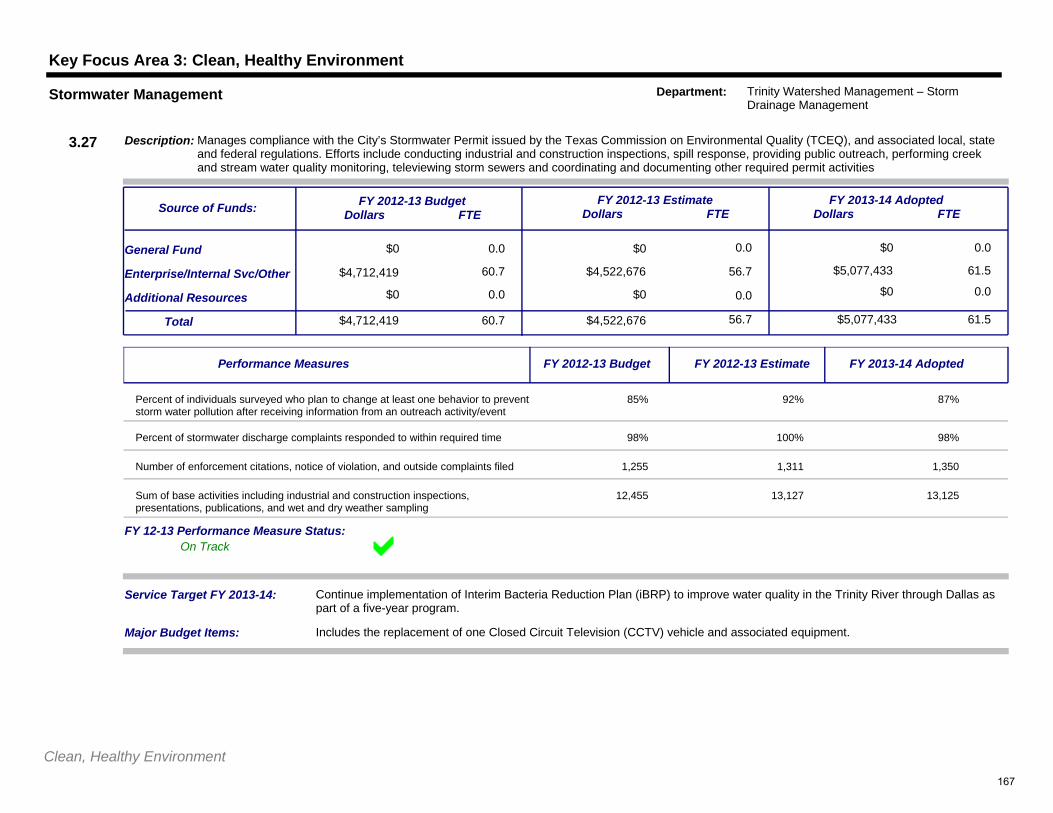
Key Focus Area 3: Clean, Healthy Environment
$0 0.0
60.7
$0 0.0
$4,522,676 56.7
$0
$5,077,433 61.5
0.0General Fund
Additional Resources
Service Target FY 2013-14: Continue implementation of Interim Bacteria Reduction Plan (iBRP) to improve water quality in the Trinity River through Dallas as part of a five-year program.
$4,712,419Total 60.7 $4,522,676 56.7 $5,077,433 61.5
Enterprise/Internal Svc/Other
$0 0.0 $0 0.0 $0 0.0
FY 2012-13 BudgetDollars FTE
FY 2012-13 EstimateDollars FTE
FY 2013-14 AdoptedDollars FTE
Description: Manages compliance with the City’s Stormwater Permit issued by the Texas Commission on Environmental Quality (TCEQ), and associated local, state and federal regulations. Efforts include conducting industrial and construction inspections, spill response, providing public outreach, performing creek and stream water quality monitoring, televiewing storm sewers and coordinating and documenting other required permit activities
Source of Funds:
3.27
Stormwater Management Department: Trinity Watershed Management – Storm Drainage Management
$4,712,419
Major Budget Items: Includes the replacement of one Closed Circuit Television (CCTV) vehicle and associated equipment.
On TrackFY 12-13 Performance Measure Status:
Performance Measures FY 2012-13 Budget FY 2012-13 Estimate FY 2013-14 Adopted
Percent of individuals surveyed who plan to change at least one behavior to prevent storm water pollution after receiving information from an outreach activity/event
85% 92% 87%
Percent of stormwater discharge complaints responded to within required time 98% 100% 98%
Number of enforcement citations, notice of violation, and outside complaints filed 1,255 1,311 1,350
Sum of base activities including industrial and construction inspections, presentations, publications, and wet and dry weather sampling
12,455 13,127 13,125
Clean, Healthy Environment167
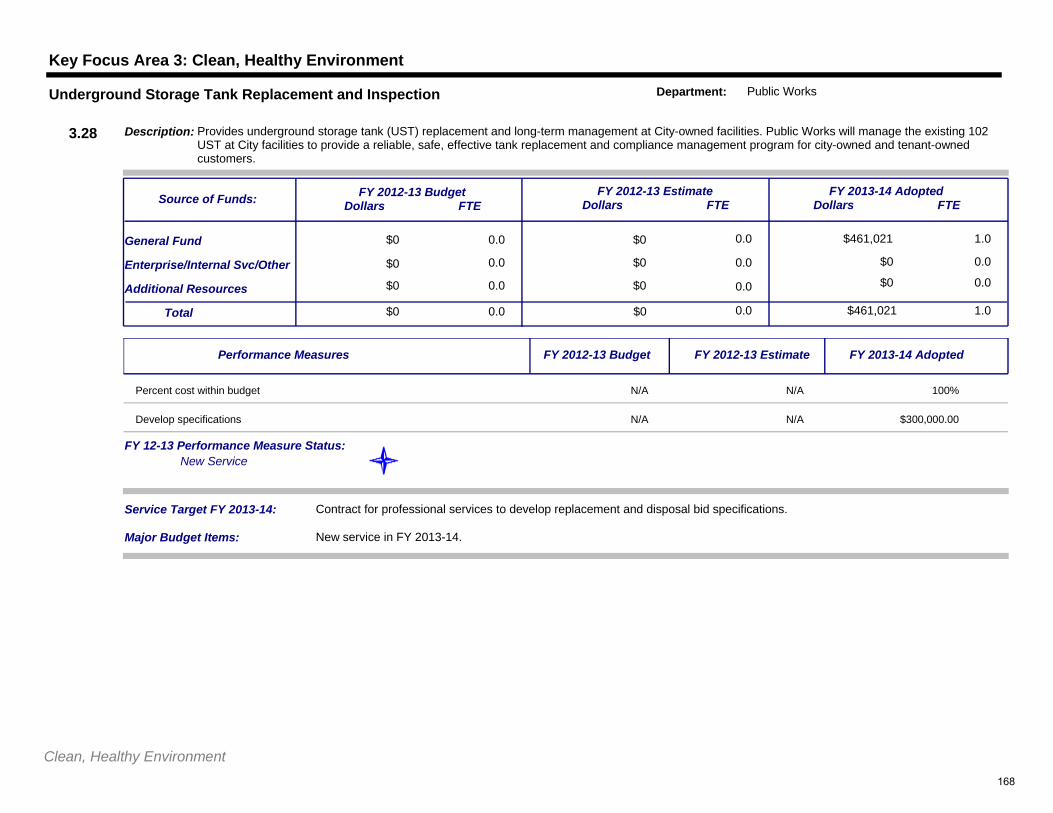
Key Focus Area 3: Clean, Healthy Environment
$0 0.0
0.0
$0 0.0
$0 0.0
$461,021
$0 0.0
1.0General Fund
Additional Resources
Service Target FY 2013-14: Contract for professional services to develop replacement and disposal bid specifications.
$0Total 0.0 $0 0.0 $461,021 1.0
Enterprise/Internal Svc/Other
$0 0.0 $0 0.0 $0 0.0
FY 2012-13 BudgetDollars FTE
FY 2012-13 EstimateDollars FTE
FY 2013-14 AdoptedDollars FTE
Description: Provides underground storage tank (UST) replacement and long-term management at City-owned facilities. Public Works will manage the existing 102 UST at City facilities to provide a reliable, safe, effective tank replacement and compliance management program for city-owned and tenant-owned customers.
Source of Funds:
3.28
Underground Storage Tank Replacement and Inspection Department: Public Works
$0
Major Budget Items: New service in FY 2013-14.
New ServiceFY 12-13 Performance Measure Status:
Performance Measures FY 2012-13 Budget FY 2012-13 Estimate FY 2013-14 Adopted
Percent cost within budget N/A N/A 100%
Develop specifications N/A N/A $300,000.00
Clean, Healthy Environment168
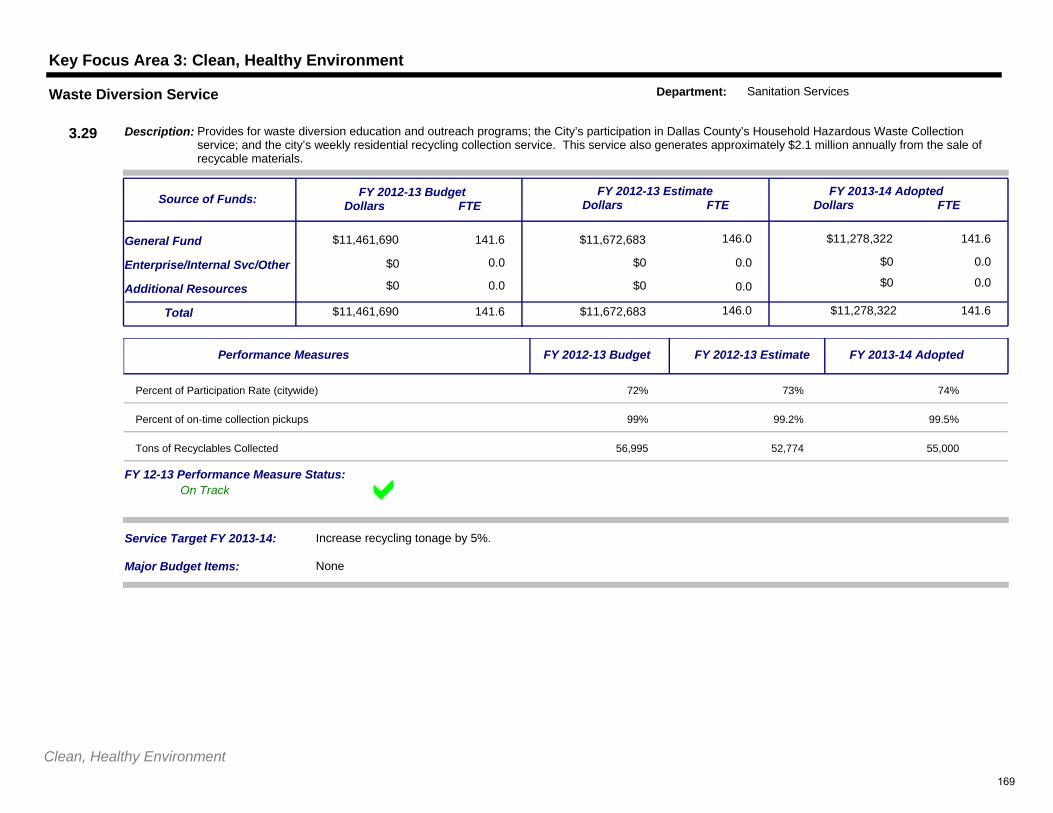
Key Focus Area 3: Clean, Healthy Environment
$11,461,690 141.6
0.0
$11,672,683 146.0
$0 0.0
$11,278,322
$0 0.0
141.6General Fund
Additional Resources
Service Target FY 2013-14: Increase recycling tonage by 5%.
$11,461,690Total 141.6 $11,672,683 146.0 $11,278,322 141.6
Enterprise/Internal Svc/Other
$0 0.0 $0 0.0 $0 0.0
FY 2012-13 BudgetDollars FTE
FY 2012-13 EstimateDollars FTE
FY 2013-14 AdoptedDollars FTE
Description: Provides for waste diversion education and outreach programs; the City’s participation in Dallas County’s Household Hazardous Waste Collection service; and the city’s weekly residential recycling collection service. This service also generates approximately $2.1 million annually from the sale of recycable materials.
Source of Funds:
3.29
Waste Diversion Service Department: Sanitation Services
$0
Major Budget Items: None
On TrackFY 12-13 Performance Measure Status:
Performance Measures FY 2012-13 Budget FY 2012-13 Estimate FY 2013-14 Adopted
Percent of Participation Rate (citywide) 72% 73% 74%
Percent of on-time collection pickups 99% 99.2% 99.5%
Tons of Recyclables Collected 56,995 52,774 55,000
Clean, Healthy Environment169
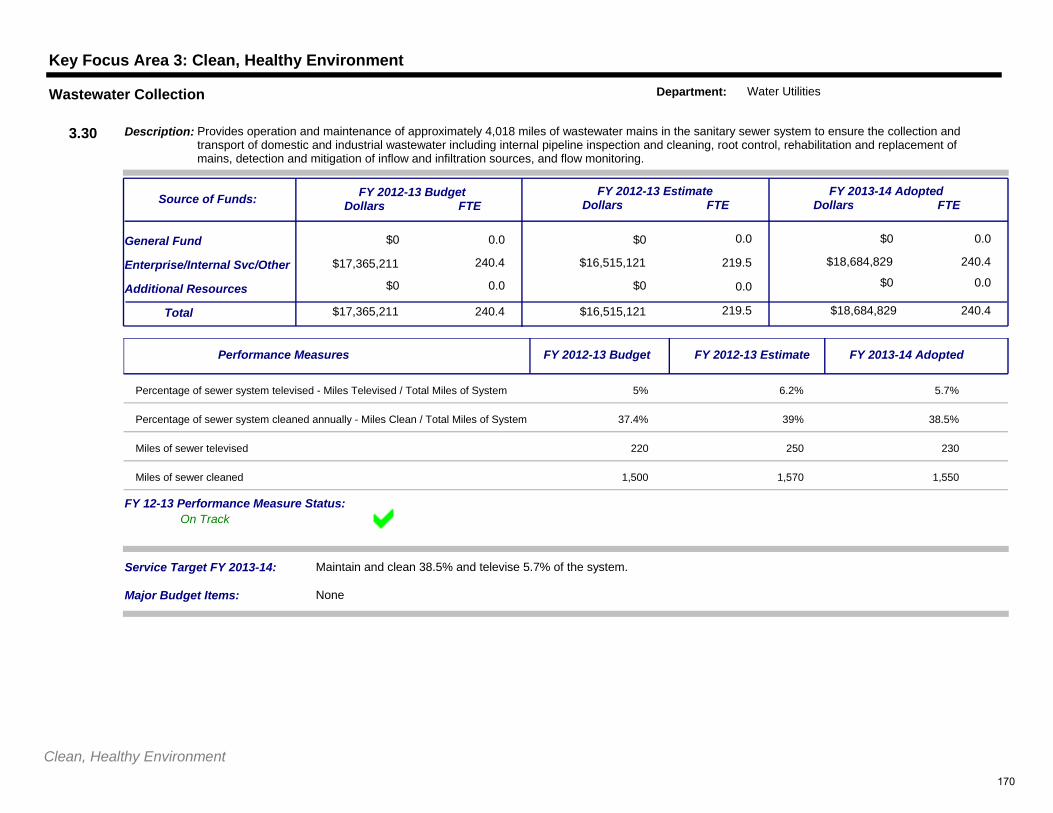
Key Focus Area 3: Clean, Healthy Environment
$0 0.0
240.4
$0 0.0
$16,515,121 219.5
$0
$18,684,829 240.4
0.0General Fund
Additional Resources
Service Target FY 2013-14: Maintain and clean 38.5% and televise 5.7% of the system.
$17,365,211Total 240.4 $16,515,121 219.5 $18,684,829 240.4
Enterprise/Internal Svc/Other
$0 0.0 $0 0.0 $0 0.0
FY 2012-13 BudgetDollars FTE
FY 2012-13 EstimateDollars FTE
FY 2013-14 AdoptedDollars FTE
Description: Provides operation and maintenance of approximately 4,018 miles of wastewater mains in the sanitary sewer system to ensure the collection and transport of domestic and industrial wastewater including internal pipeline inspection and cleaning, root control, rehabilitation and replacement of mains, detection and mitigation of inflow and infiltration sources, and flow monitoring.
Source of Funds:
3.30
Wastewater Collection Department: Water Utilities
$17,365,211
Major Budget Items: None
On TrackFY 12-13 Performance Measure Status:
Performance Measures FY 2012-13 Budget FY 2012-13 Estimate FY 2013-14 Adopted
Percentage of sewer system televised - Miles Televised / Total Miles of System 5% 6.2% 5.7%
Percentage of sewer system cleaned annually - Miles Clean / Total Miles of System 37.4% 39% 38.5%
Miles of sewer televised 220 250 230
Miles of sewer cleaned 1,500 1,570 1,550
Clean, Healthy Environment170
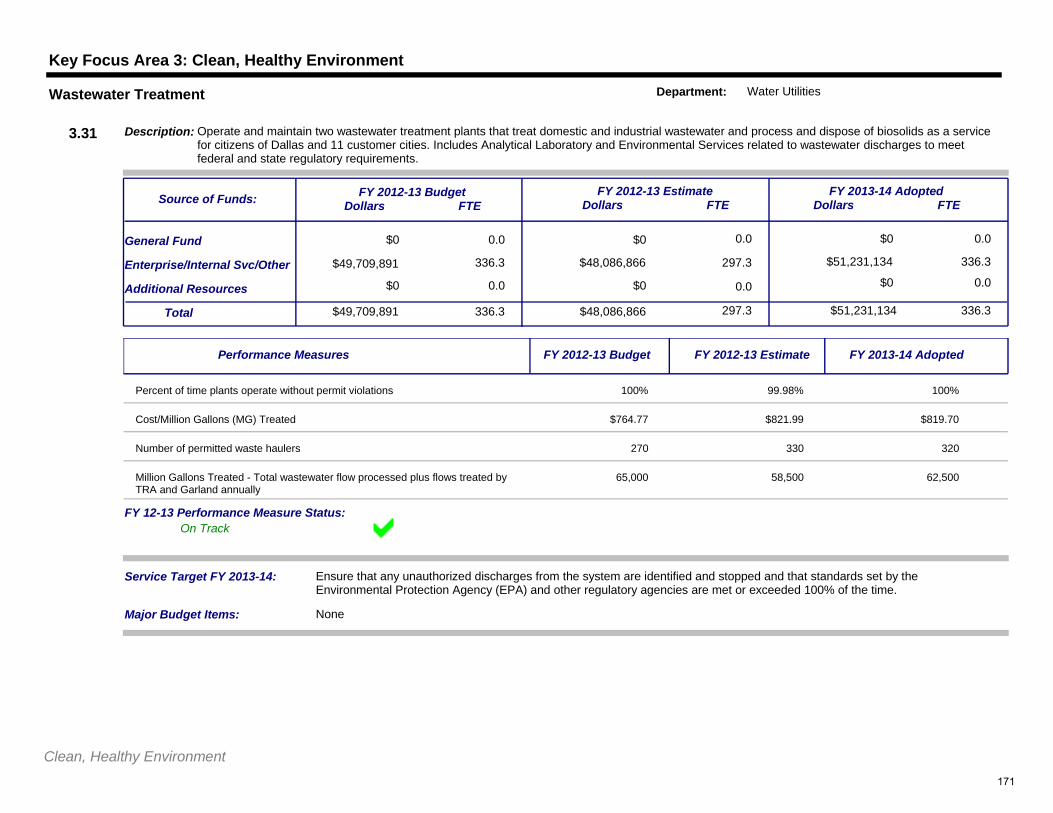
Key Focus Area 3: Clean, Healthy Environment
$0 0.0
336.3
$0 0.0
$48,086,866 297.3
$0
$51,231,134 336.3
0.0General Fund
Additional Resources
Service Target FY 2013-14: Ensure that any unauthorized discharges from the system are identified and stopped and that standards set by the Environmental Protection Agency (EPA) and other regulatory agencies are met or exceeded 100% of the time.
$49,709,891Total 336.3 $48,086,866 297.3 $51,231,134 336.3
Enterprise/Internal Svc/Other
$0 0.0 $0 0.0 $0 0.0
FY 2012-13 BudgetDollars FTE
FY 2012-13 EstimateDollars FTE
FY 2013-14 AdoptedDollars FTE
Description: Operate and maintain two wastewater treatment plants that treat domestic and industrial wastewater and process and dispose of biosolids as a service for citizens of Dallas and 11 customer cities. Includes Analytical Laboratory and Environmental Services related to wastewater discharges to meet federal and state regulatory requirements.
Source of Funds:
3.31
Wastewater Treatment Department: Water Utilities
$49,709,891
Major Budget Items: None
On TrackFY 12-13 Performance Measure Status:
Performance Measures FY 2012-13 Budget FY 2012-13 Estimate FY 2013-14 Adopted
Percent of time plants operate without permit violations 100% 99.98% 100%
Cost/Million Gallons (MG) Treated $764.77 $821.99 $819.70
Number of permitted waste haulers 270 330 320
Million Gallons Treated - Total wastewater flow processed plus flows treated by TRA and Garland annually
65,000 58,500 62,500
Clean, Healthy Environment171
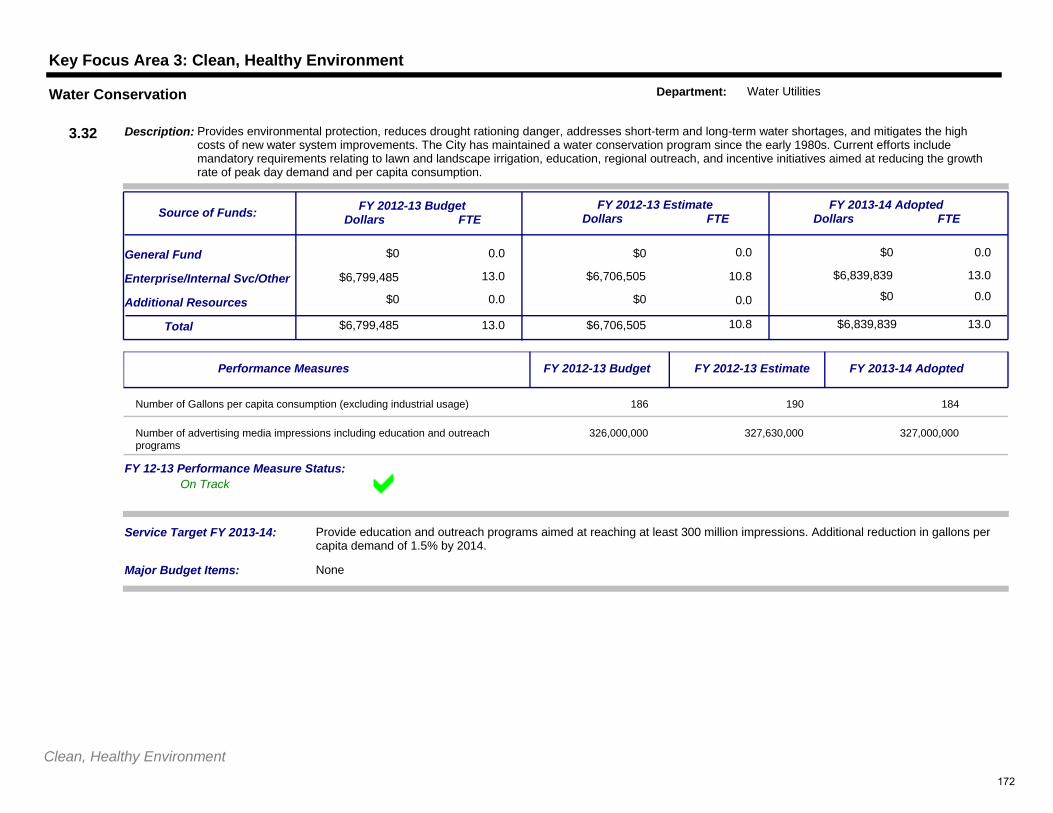
Key Focus Area 3: Clean, Healthy Environment
$0 0.0
13.0
$0 0.0
$6,706,505 10.8
$0
$6,839,839 13.0
0.0General Fund
Additional Resources
Service Target FY 2013-14: Provide education and outreach programs aimed at reaching at least 300 million impressions. Additional reduction in gallons per capita demand of 1.5% by 2014.
$6,799,485Total 13.0 $6,706,505 10.8 $6,839,839 13.0
Enterprise/Internal Svc/Other
$0 0.0 $0 0.0 $0 0.0
FY 2012-13 BudgetDollars FTE
FY 2012-13 EstimateDollars FTE
FY 2013-14 AdoptedDollars FTE
Description: Provides environmental protection, reduces drought rationing danger, addresses short-term and long-term water shortages, and mitigates the high costs of new water system improvements. The City has maintained a water conservation program since the early 1980s. Current efforts include mandatory requirements relating to lawn and landscape irrigation, education, regional outreach, and incentive initiatives aimed at reducing the growth rate of peak day demand and per capita consumption.
Source of Funds:
3.32
Water Conservation Department: Water Utilities
$6,799,485
Major Budget Items: None
On TrackFY 12-13 Performance Measure Status:
Performance Measures FY 2012-13 Budget FY 2012-13 Estimate FY 2013-14 Adopted
Number of Gallons per capita consumption (excluding industrial usage) 186 190 184
Number of advertising media impressions including education and outreach programs
326,000,000 327,630,000 327,000,000
Clean, Healthy Environment172
Culture, Arts & RecreationDallas citizens and visitors enjoy and experiencethe benefits of vibrant, innovative, and diverse cultural, arts and recreational opportunities
2013-2014
173

174
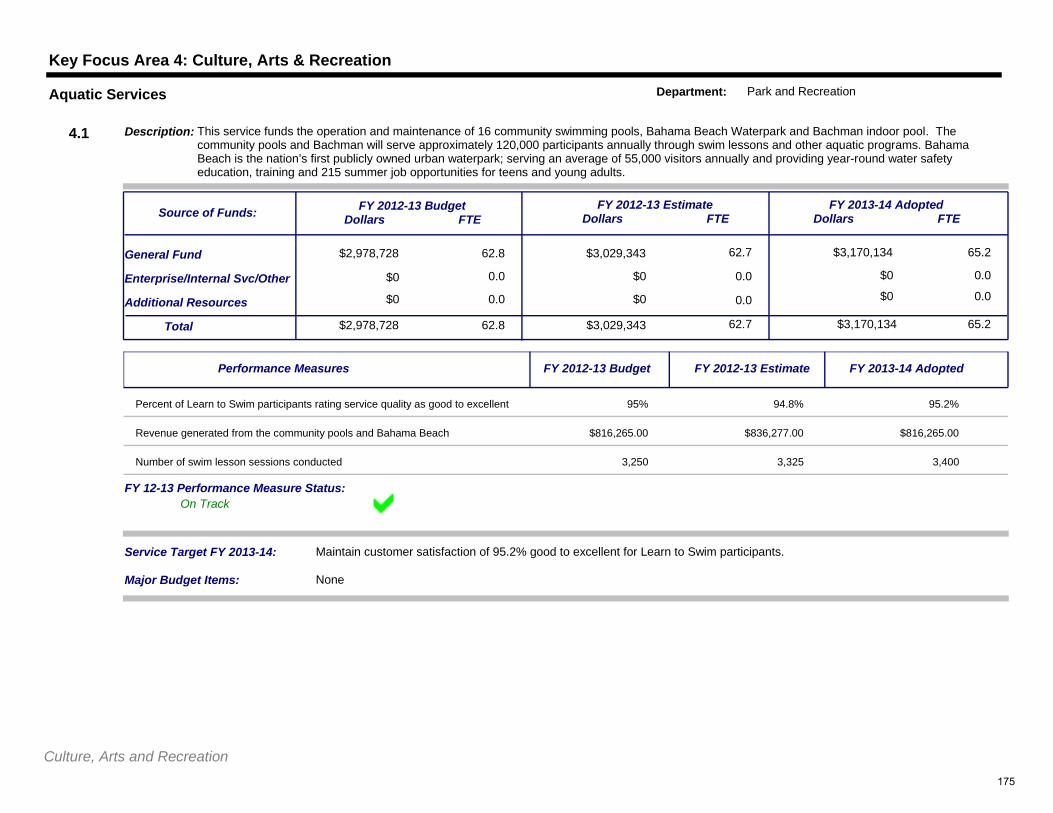
Key Focus Area 4: Culture, Arts & Recreation
$2,978,728 62.8
0.0
$3,029,343 62.7
$0 0.0
$3,170,134
$0 0.0
65.2General Fund
Additional Resources
Service Target FY 2013-14: Maintain customer satisfaction of 95.2% good to excellent for Learn to Swim participants.
$2,978,728Total 62.8 $3,029,343 62.7 $3,170,134 65.2
Enterprise/Internal Svc/Other
$0 0.0 $0 0.0 $0 0.0
FY 2012-13 BudgetDollars FTE
FY 2012-13 EstimateDollars FTE
FY 2013-14 AdoptedDollars FTE
Description: This service funds the operation and maintenance of 16 community swimming pools, Bahama Beach Waterpark and Bachman indoor pool. The community pools and Bachman will serve approximately 120,000 participants annually through swim lessons and other aquatic programs. Bahama Beach is the nation’s first publicly owned urban waterpark; serving an average of 55,000 visitors annually and providing year-round water safety education, training and 215 summer job opportunities for teens and young adults.
Source of Funds:
4.1
Aquatic Services Department: Park and Recreation
$0
Major Budget Items: None
On TrackFY 12-13 Performance Measure Status:
Performance Measures FY 2012-13 Budget FY 2012-13 Estimate FY 2013-14 Adopted
Percent of Learn to Swim participants rating service quality as good to excellent 95% 94.8% 95.2%
Revenue generated from the community pools and Bahama Beach $816,265.00 $836,277.00 $816,265.00
Number of swim lesson sessions conducted 3,250 3,325 3,400
Culture, Arts and Recreation175
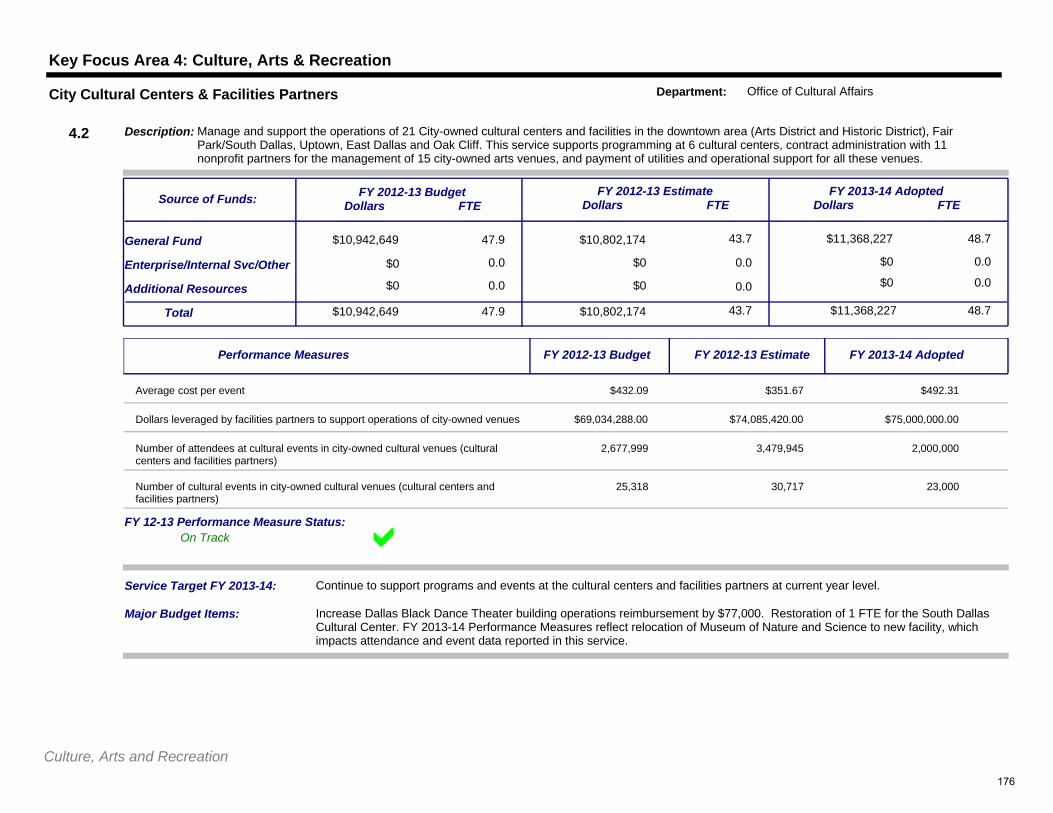
Key Focus Area 4: Culture, Arts & Recreation
$10,942,649 47.9
0.0
$10,802,174 43.7
$0 0.0
$11,368,227
$0 0.0
48.7General Fund
Additional Resources
Service Target FY 2013-14: Continue to support programs and events at the cultural centers and facilities partners at current year level.
$10,942,649Total 47.9 $10,802,174 43.7 $11,368,227 48.7
Enterprise/Internal Svc/Other
$0 0.0 $0 0.0 $0 0.0
FY 2012-13 BudgetDollars FTE
FY 2012-13 EstimateDollars FTE
FY 2013-14 AdoptedDollars FTE
Description: Manage and support the operations of 21 City-owned cultural centers and facilities in the downtown area (Arts District and Historic District), Fair Park/South Dallas, Uptown, East Dallas and Oak Cliff. This service supports programming at 6 cultural centers, contract administration with 11 nonprofit partners for the management of 15 city-owned arts venues, and payment of utilities and operational support for all these venues.
Source of Funds:
4.2
City Cultural Centers & Facilities Partners Department: Office of Cultural Affairs
$0
Major Budget Items: Increase Dallas Black Dance Theater building operations reimbursement by $77,000. Restoration of 1 FTE for the South Dallas Cultural Center. FY 2013-14 Performance Measures reflect relocation of Museum of Nature and Science to new facility, which impacts attendance and event data reported in this service.
On TrackFY 12-13 Performance Measure Status:
Performance Measures FY 2012-13 Budget FY 2012-13 Estimate FY 2013-14 Adopted
Average cost per event $432.09 $351.67 $492.31
Dollars leveraged by facilities partners to support operations of city-owned venues $69,034,288.00 $74,085,420.00 $75,000,000.00
Number of attendees at cultural events in city-owned cultural venues (cultural centers and facilities partners)
2,677,999 3,479,945 2,000,000
Number of cultural events in city-owned cultural venues (cultural centers and facilities partners)
25,318 30,717 23,000
Culture, Arts and Recreation176
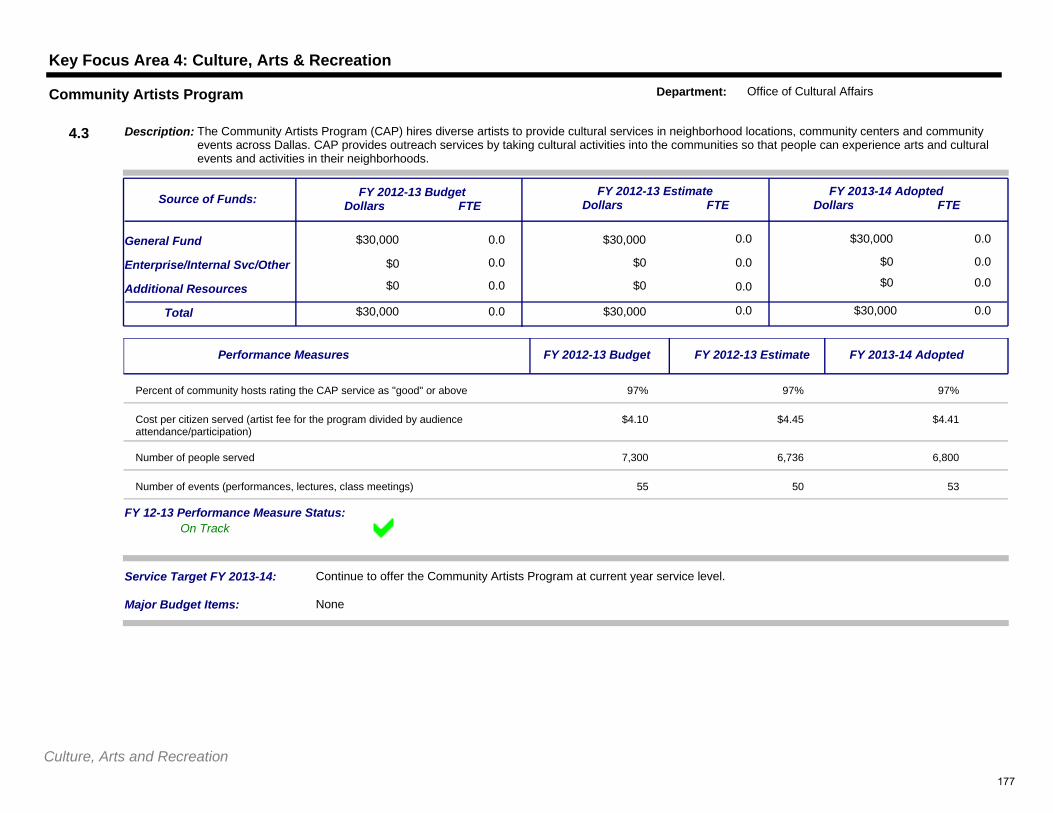
Key Focus Area 4: Culture, Arts & Recreation
$30,000 0.0
0.0
$30,000 0.0
$0 0.0
$30,000
$0 0.0
0.0General Fund
Additional Resources
Service Target FY 2013-14: Continue to offer the Community Artists Program at current year service level.
$30,000Total 0.0 $30,000 0.0 $30,000 0.0
Enterprise/Internal Svc/Other
$0 0.0 $0 0.0 $0 0.0
FY 2012-13 BudgetDollars FTE
FY 2012-13 EstimateDollars FTE
FY 2013-14 AdoptedDollars FTE
Description: The Community Artists Program (CAP) hires diverse artists to provide cultural services in neighborhood locations, community centers and community events across Dallas. CAP provides outreach services by taking cultural activities into the communities so that people can experience arts and cultural events and activities in their neighborhoods.
Source of Funds:
4.3
Community Artists Program Department: Office of Cultural Affairs
$0
Major Budget Items: None
On TrackFY 12-13 Performance Measure Status:
Performance Measures FY 2012-13 Budget FY 2012-13 Estimate FY 2013-14 Adopted
Percent of community hosts rating the CAP service as "good" or above 97% 97% 97%
Cost per citizen served (artist fee for the program divided by audience attendance/participation)
$4.10 $4.45 $4.41
Number of people served 7,300 6,736 6,800
Number of events (performances, lectures, class meetings) 55 50 53
Culture, Arts and Recreation177
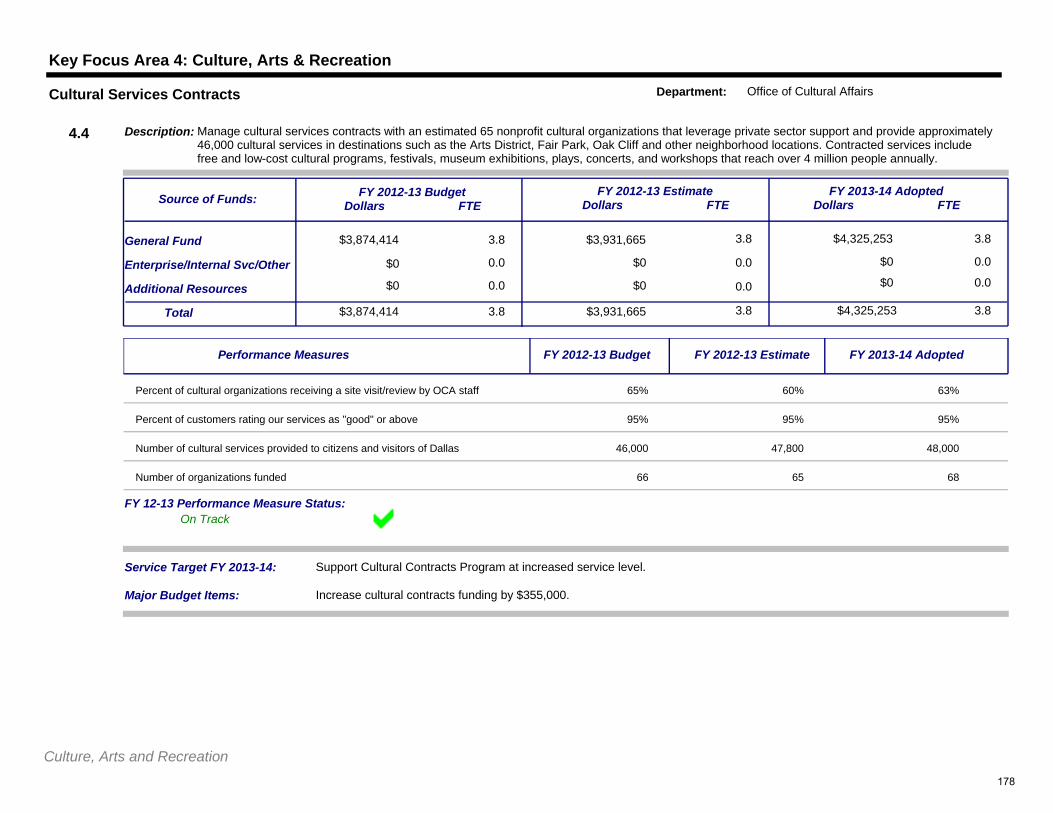
Key Focus Area 4: Culture, Arts & Recreation
$3,874,414 3.8
0.0
$3,931,665 3.8
$0 0.0
$4,325,253
$0 0.0
3.8General Fund
Additional Resources
Service Target FY 2013-14: Support Cultural Contracts Program at increased service level.
$3,874,414Total 3.8 $3,931,665 3.8 $4,325,253 3.8
Enterprise/Internal Svc/Other
$0 0.0 $0 0.0 $0 0.0
FY 2012-13 BudgetDollars FTE
FY 2012-13 EstimateDollars FTE
FY 2013-14 AdoptedDollars FTE
Description: Manage cultural services contracts with an estimated 65 nonprofit cultural organizations that leverage private sector support and provide approximately 46,000 cultural services in destinations such as the Arts District, Fair Park, Oak Cliff and other neighborhood locations. Contracted services include free and low-cost cultural programs, festivals, museum exhibitions, plays, concerts, and workshops that reach over 4 million people annually.
Source of Funds:
4.4
Cultural Services Contracts Department: Office of Cultural Affairs
$0
Major Budget Items: Increase cultural contracts funding by $355,000.
On TrackFY 12-13 Performance Measure Status:
Performance Measures FY 2012-13 Budget FY 2012-13 Estimate FY 2013-14 Adopted
Percent of cultural organizations receiving a site visit/review by OCA staff 65% 60% 63%
Percent of customers rating our services as "good" or above 95% 95% 95%
Number of cultural services provided to citizens and visitors of Dallas 46,000 47,800 48,000
Number of organizations funded 66 65 68
Culture, Arts and Recreation178
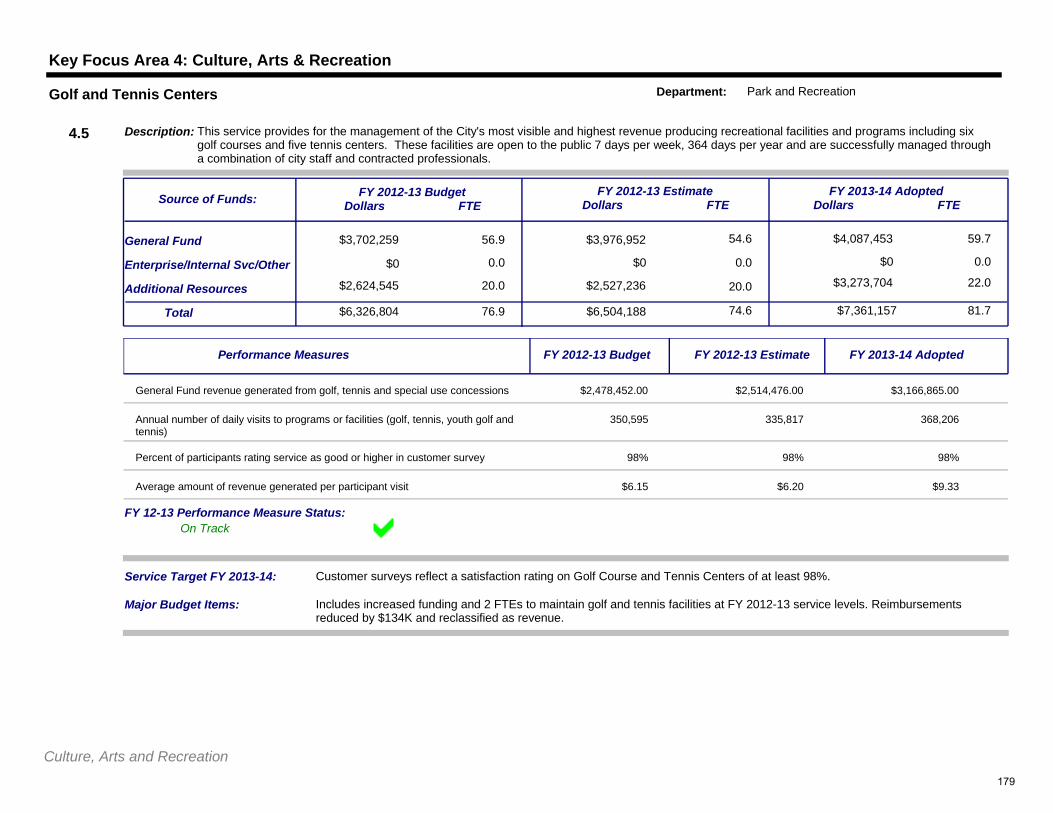
Key Focus Area 4: Culture, Arts & Recreation
$3,702,259 56.9
0.0
$3,976,952 54.6
$0 0.0
$4,087,453
$0 0.0
59.7General Fund
Additional Resources
Service Target FY 2013-14: Customer surveys reflect a satisfaction rating on Golf Course and Tennis Centers of at least 98%.
$6,326,804Total 76.9 $6,504,188 74.6 $7,361,157 81.7
Enterprise/Internal Svc/Other
$2,624,545 20.0 $2,527,236 20.0 $3,273,704 22.0
FY 2012-13 BudgetDollars FTE
FY 2012-13 EstimateDollars FTE
FY 2013-14 AdoptedDollars FTE
Description: This service provides for the management of the City's most visible and highest revenue producing recreational facilities and programs including six golf courses and five tennis centers. These facilities are open to the public 7 days per week, 364 days per year and are successfully managed through a combination of city staff and contracted professionals.
Source of Funds:
4.5
Golf and Tennis Centers Department: Park and Recreation
$0
Major Budget Items: Includes increased funding and 2 FTEs to maintain golf and tennis facilities at FY 2012-13 service levels. Reimbursements reduced by $134K and reclassified as revenue.
On TrackFY 12-13 Performance Measure Status:
Performance Measures FY 2012-13 Budget FY 2012-13 Estimate FY 2013-14 Adopted
General Fund revenue generated from golf, tennis and special use concessions $2,478,452.00 $2,514,476.00 $3,166,865.00
Annual number of daily visits to programs or facilities (golf, tennis, youth golf and tennis)
350,595 335,817 368,206
Percent of participants rating service as good or higher in customer survey 98% 98% 98%
Average amount of revenue generated per participant visit $6.15 $6.20 $9.33
Culture, Arts and Recreation179
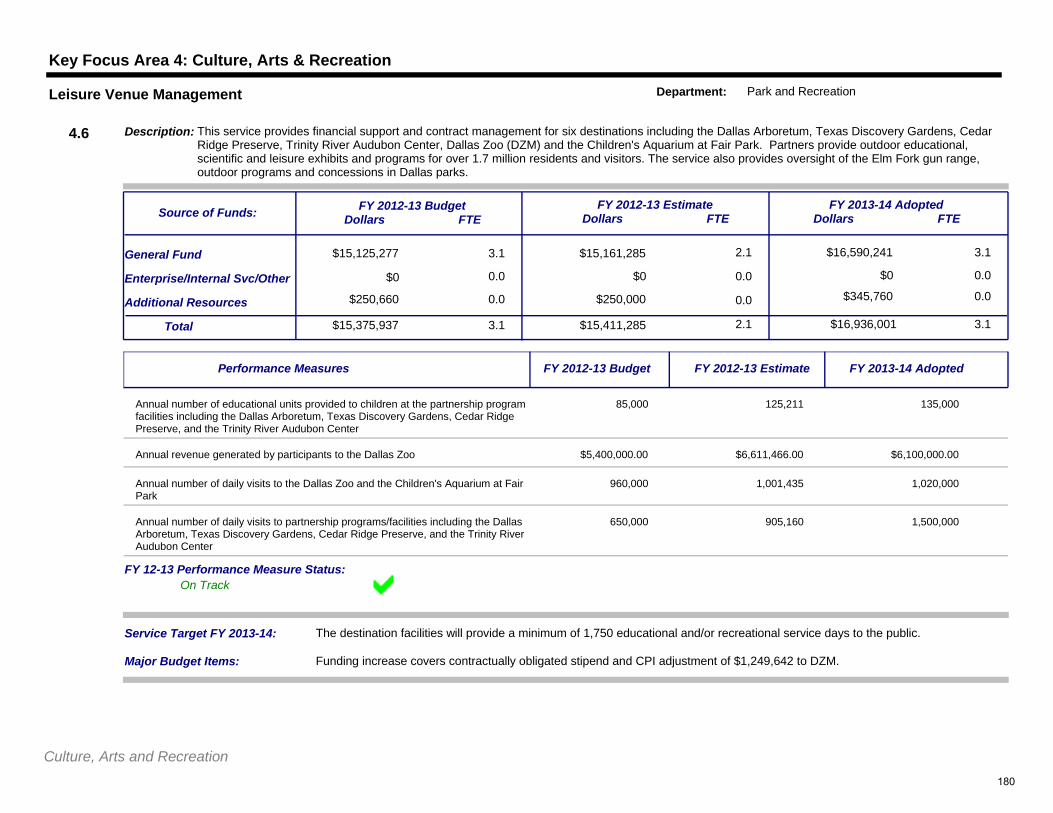
Key Focus Area 4: Culture, Arts & Recreation
$15,125,277 3.1
0.0
$15,161,285 2.1
$0 0.0
$16,590,241
$0 0.0
3.1General Fund
Additional Resources
Service Target FY 2013-14: The destination facilities will provide a minimum of 1,750 educational and/or recreational service days to the public.
$15,375,937Total 3.1 $15,411,285 2.1 $16,936,001 3.1
Enterprise/Internal Svc/Other
$250,660 0.0 $250,000 0.0 $345,760 0.0
FY 2012-13 BudgetDollars FTE
FY 2012-13 EstimateDollars FTE
FY 2013-14 AdoptedDollars FTE
Description: This service provides financial support and contract management for six destinations including the Dallas Arboretum, Texas Discovery Gardens, Cedar Ridge Preserve, Trinity River Audubon Center, Dallas Zoo (DZM) and the Children's Aquarium at Fair Park. Partners provide outdoor educational, scientific and leisure exhibits and programs for over 1.7 million residents and visitors. The service also provides oversight of the Elm Fork gun range, outdoor programs and concessions in Dallas parks.
Source of Funds:
4.6
Leisure Venue Management Department: Park and Recreation
$0
Major Budget Items: Funding increase covers contractually obligated stipend and CPI adjustment of $1,249,642 to DZM.
On TrackFY 12-13 Performance Measure Status:
Performance Measures FY 2012-13 Budget FY 2012-13 Estimate FY 2013-14 Adopted
Annual number of educational units provided to children at the partnership program facilities including the Dallas Arboretum, Texas Discovery Gardens, Cedar Ridge Preserve, and the Trinity River Audubon Center
85,000 125,211 135,000
Annual revenue generated by participants to the Dallas Zoo $5,400,000.00 $6,611,466.00 $6,100,000.00
Annual number of daily visits to the Dallas Zoo and the Children's Aquarium at Fair Park
960,000 1,001,435 1,020,000
Annual number of daily visits to partnership programs/facilities including the Dallas Arboretum, Texas Discovery Gardens, Cedar Ridge Preserve, and the Trinity River Audubon Center
650,000 905,160 1,500,000
Culture, Arts and Recreation180
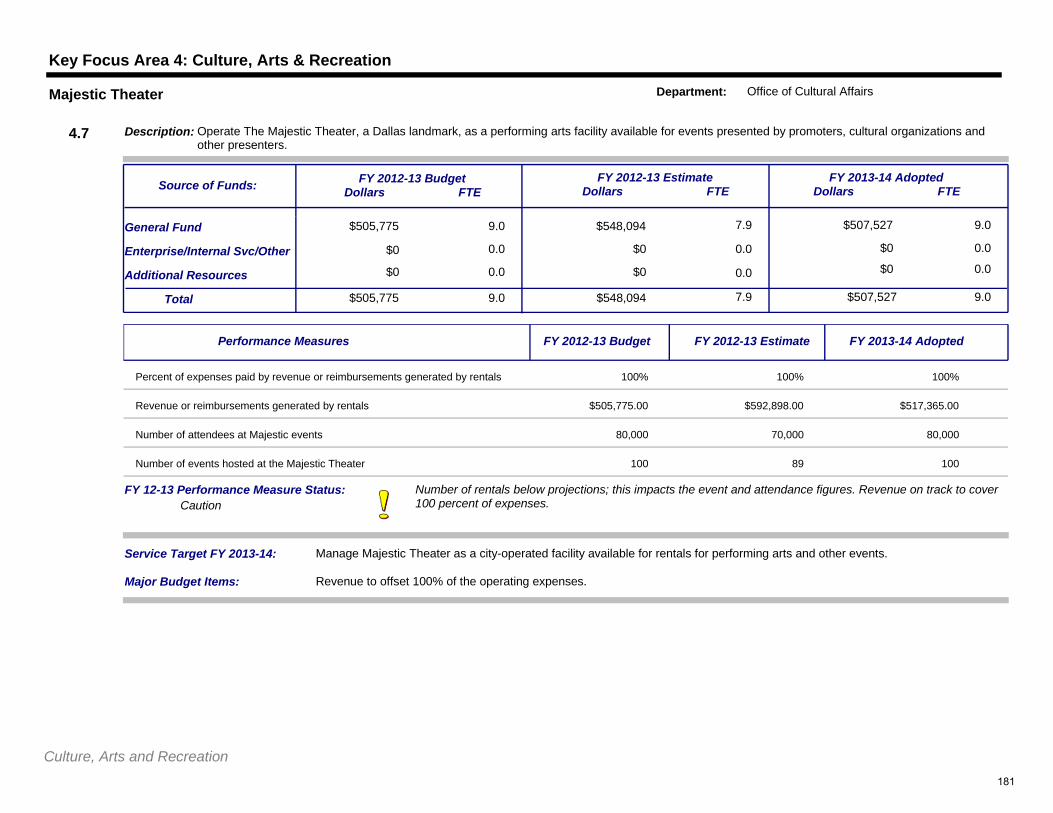
Key Focus Area 4: Culture, Arts & Recreation
$505,775 9.0
0.0
$548,094 7.9
$0 0.0
$507,527
$0 0.0
9.0General Fund
Additional Resources
Service Target FY 2013-14: Manage Majestic Theater as a city-operated facility available for rentals for performing arts and other events.
$505,775Total 9.0 $548,094 7.9 $507,527 9.0
Enterprise/Internal Svc/Other
$0 0.0 $0 0.0 $0 0.0
FY 2012-13 BudgetDollars FTE
FY 2012-13 EstimateDollars FTE
FY 2013-14 AdoptedDollars FTE
Description: Operate The Majestic Theater, a Dallas landmark, as a performing arts facility available for events presented by promoters, cultural organizations and other presenters.
Source of Funds:
4.7
Majestic Theater Department: Office of Cultural Affairs
$0
Major Budget Items: Revenue to offset 100% of the operating expenses.
Number of rentals below projections; this impacts the event and attendance figures. Revenue on track to cover 100 percent of expenses. Caution
FY 12-13 Performance Measure Status:
Performance Measures FY 2012-13 Budget FY 2012-13 Estimate FY 2013-14 Adopted
Percent of expenses paid by revenue or reimbursements generated by rentals 100% 100% 100%
Revenue or reimbursements generated by rentals $505,775.00 $592,898.00 $517,365.00
Number of attendees at Majestic events 80,000 70,000 80,000
Number of events hosted at the Majestic Theater 100 89 100
Culture, Arts and Recreation181
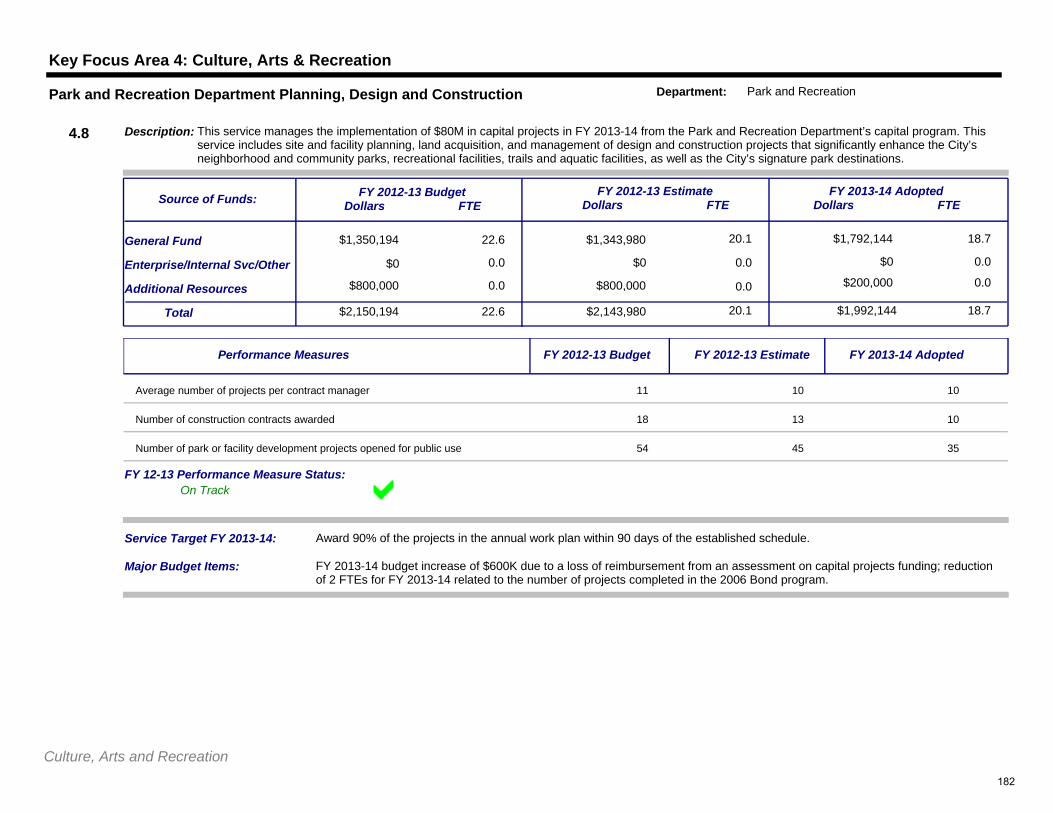
Key Focus Area 4: Culture, Arts & Recreation
$1,350,194 22.6
0.0
$1,343,980 20.1
$0 0.0
$1,792,144
$0 0.0
18.7General Fund
Additional Resources
Service Target FY 2013-14: Award 90% of the projects in the annual work plan within 90 days of the established schedule.
$2,150,194Total 22.6 $2,143,980 20.1 $1,992,144 18.7
Enterprise/Internal Svc/Other
$800,000 0.0 $800,000 0.0 $200,000 0.0
FY 2012-13 BudgetDollars FTE
FY 2012-13 EstimateDollars FTE
FY 2013-14 AdoptedDollars FTE
Description: This service manages the implementation of $80M in capital projects in FY 2013-14 from the Park and Recreation Department’s capital program. This service includes site and facility planning, land acquisition, and management of design and construction projects that significantly enhance the City’s neighborhood and community parks, recreational facilities, trails and aquatic facilities, as well as the City’s signature park destinations.
Source of Funds:
4.8
Park and Recreation Department Planning, Design and Construction Department: Park and Recreation
$0
Major Budget Items: FY 2013-14 budget increase of $600K due to a loss of reimbursement from an assessment on capital projects funding; reduction of 2 FTEs for FY 2013-14 related to the number of projects completed in the 2006 Bond program.
On TrackFY 12-13 Performance Measure Status:
Performance Measures FY 2012-13 Budget FY 2012-13 Estimate FY 2013-14 Adopted
Average number of projects per contract manager 11 10 10
Number of construction contracts awarded 18 13 10
Number of park or facility development projects opened for public use 54 45 35
Culture, Arts and Recreation182
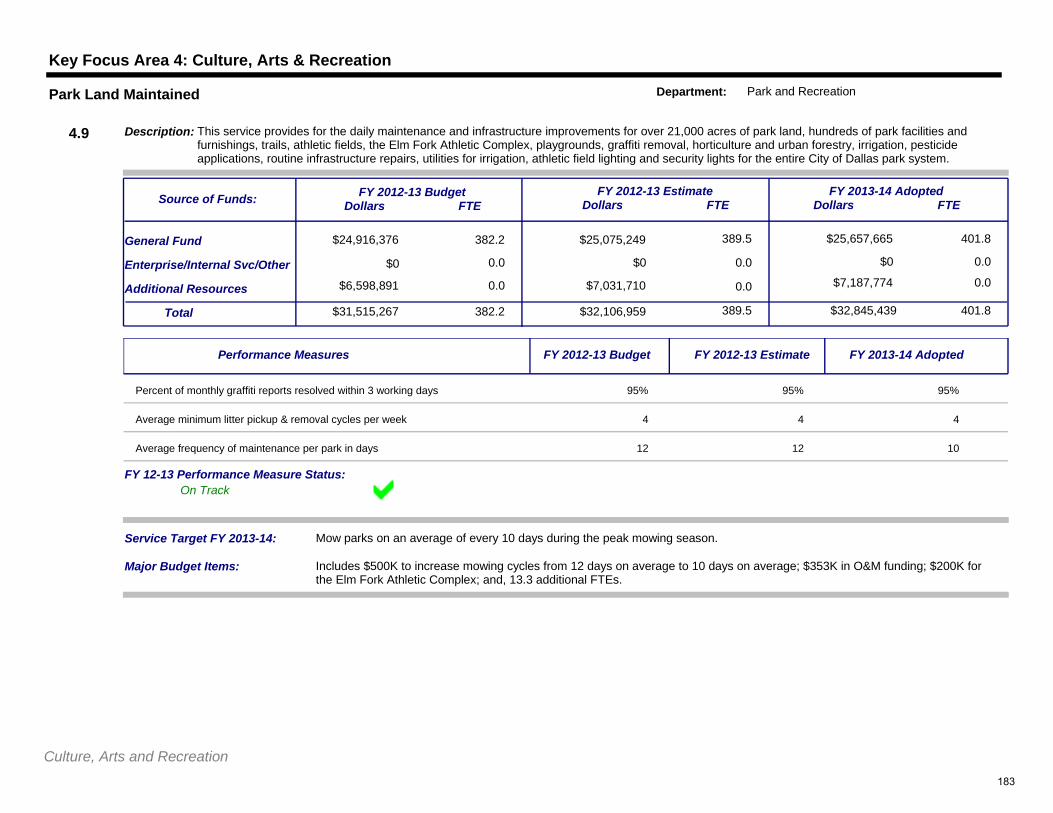
Key Focus Area 4: Culture, Arts & Recreation
$24,916,376 382.2
0.0
$25,075,249 389.5
$0 0.0
$25,657,665
$0 0.0
401.8General Fund
Additional Resources
Service Target FY 2013-14: Mow parks on an average of every 10 days during the peak mowing season.
$31,515,267Total 382.2 $32,106,959 389.5 $32,845,439 401.8
Enterprise/Internal Svc/Other
$6,598,891 0.0 $7,031,710 0.0 $7,187,774 0.0
FY 2012-13 BudgetDollars FTE
FY 2012-13 EstimateDollars FTE
FY 2013-14 AdoptedDollars FTE
Description: This service provides for the daily maintenance and infrastructure improvements for over 21,000 acres of park land, hundreds of park facilities and furnishings, trails, athletic fields, the Elm Fork Athletic Complex, playgrounds, graffiti removal, horticulture and urban forestry, irrigation, pesticide applications, routine infrastructure repairs, utilities for irrigation, athletic field lighting and security lights for the entire City of Dallas park system.
Source of Funds:
4.9
Park Land Maintained Department: Park and Recreation
$0
Major Budget Items: Includes $500K to increase mowing cycles from 12 days on average to 10 days on average; $353K in O&M funding; $200K for the Elm Fork Athletic Complex; and, 13.3 additional FTEs.
On TrackFY 12-13 Performance Measure Status:
Performance Measures FY 2012-13 Budget FY 2012-13 Estimate FY 2013-14 Adopted
Percent of monthly graffiti reports resolved within 3 working days 95% 95% 95%
Average minimum litter pickup & removal cycles per week 4 4 4
Average frequency of maintenance per park in days 12 12 10
Culture, Arts and Recreation183
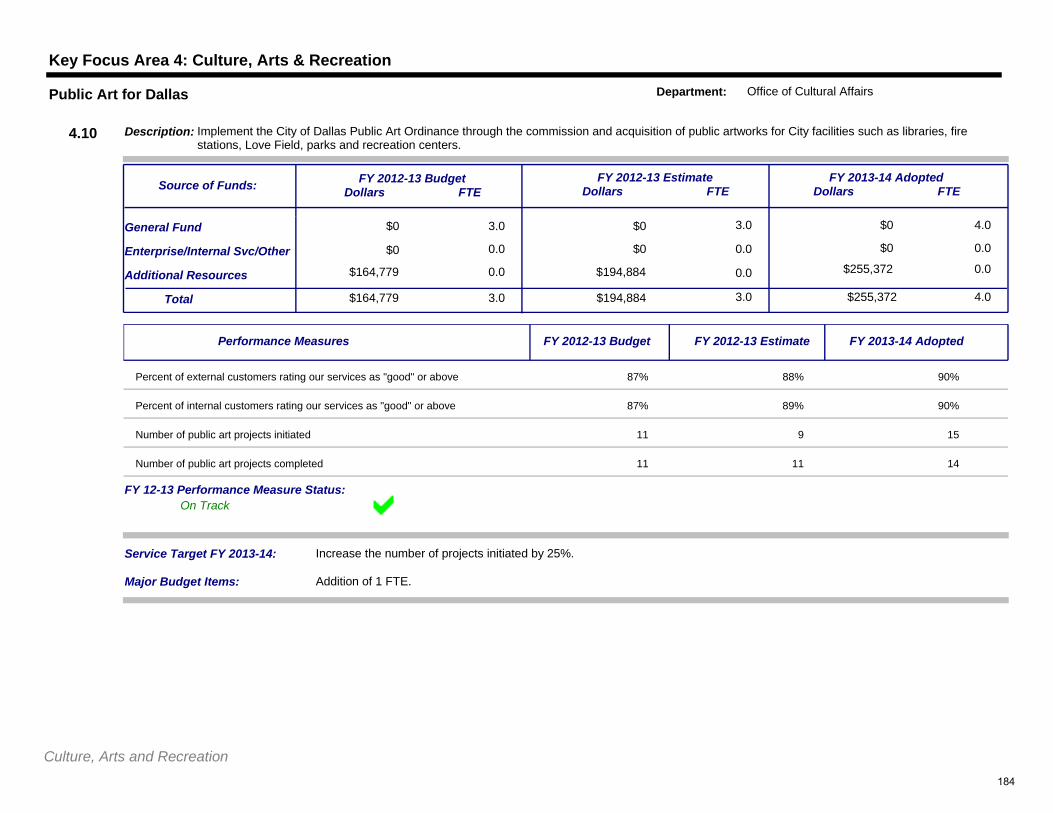
Key Focus Area 4: Culture, Arts & Recreation
$0 3.0
0.0
$0 3.0
$0 0.0
$0
$0 0.0
4.0General Fund
Additional Resources
Service Target FY 2013-14: Increase the number of projects initiated by 25%.
$164,779Total 3.0 $194,884 3.0 $255,372 4.0
Enterprise/Internal Svc/Other
$164,779 0.0 $194,884 0.0 $255,372 0.0
FY 2012-13 BudgetDollars FTE
FY 2012-13 EstimateDollars FTE
FY 2013-14 AdoptedDollars FTE
Description: Implement the City of Dallas Public Art Ordinance through the commission and acquisition of public artworks for City facilities such as libraries, fire stations, Love Field, parks and recreation centers.
Source of Funds:
4.10
Public Art for Dallas Department: Office of Cultural Affairs
$0
Major Budget Items: Addition of 1 FTE.
On TrackFY 12-13 Performance Measure Status:
Performance Measures FY 2012-13 Budget FY 2012-13 Estimate FY 2013-14 Adopted
Percent of external customers rating our services as "good" or above 87% 88% 90%
Percent of internal customers rating our services as "good" or above 87% 89% 90%
Number of public art projects initiated 11 9 15
Number of public art projects completed 11 11 14
Culture, Arts and Recreation184
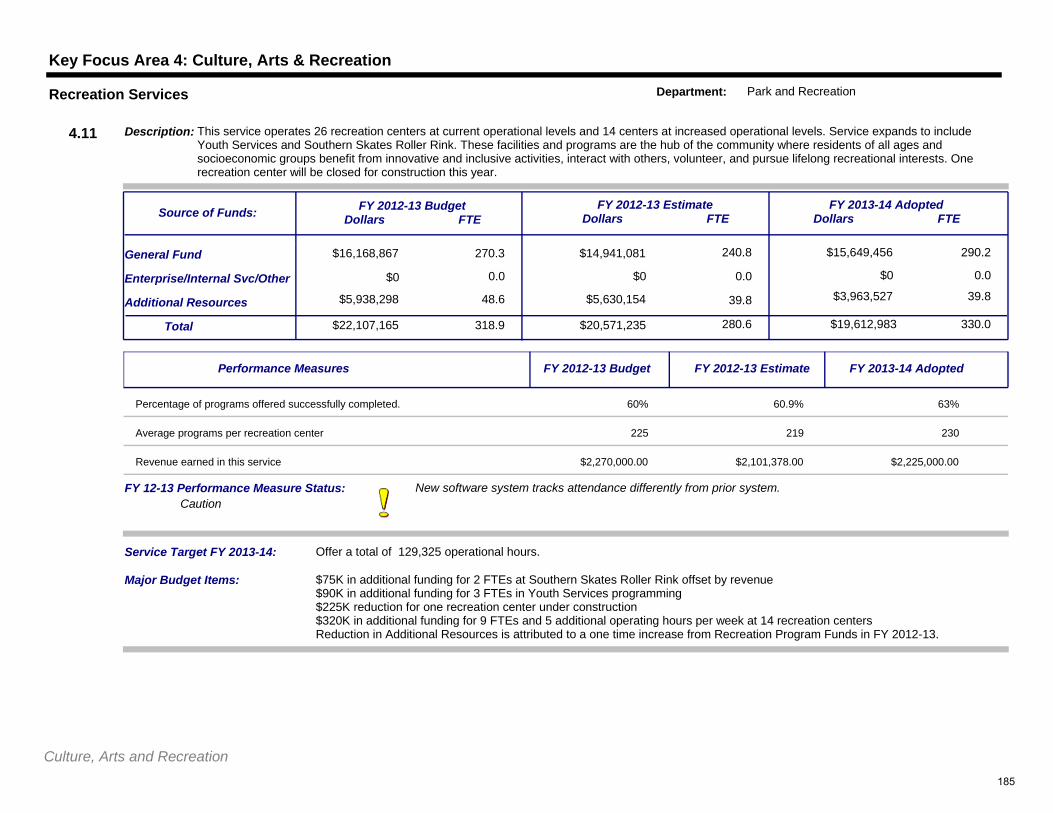
Key Focus Area 4: Culture, Arts & Recreation
$16,168,867 270.3
0.0
$14,941,081 240.8
$0 0.0
$15,649,456
$0 0.0
290.2General Fund
Additional Resources
Service Target FY 2013-14: Offer a total of 129,325 operational hours.
$22,107,165Total 318.9 $20,571,235 280.6 $19,612,983 330.0
Enterprise/Internal Svc/Other
$5,938,298 48.6 $5,630,154 39.8 $3,963,527 39.8
FY 2012-13 BudgetDollars FTE
FY 2012-13 EstimateDollars FTE
FY 2013-14 AdoptedDollars FTE
Description: This service operates 26 recreation centers at current operational levels and 14 centers at increased operational levels. Service expands to include Youth Services and Southern Skates Roller Rink. These facilities and programs are the hub of the community where residents of all ages and socioeconomic groups benefit from innovative and inclusive activities, interact with others, volunteer, and pursue lifelong recreational interests. One recreation center will be closed for construction this year.
Source of Funds:
4.11
Recreation Services Department: Park and Recreation
$0
Major Budget Items: $75K in additional funding for 2 FTEs at Southern Skates Roller Rink offset by revenue$90K in additional funding for 3 FTEs in Youth Services programming$225K reduction for one recreation center under construction$320K in additional funding for 9 FTEs and 5 additional operating hours per week at 14 recreation centersReduction in Additional Resources is attributed to a one time increase from Recreation Program Funds in FY 2012-13.
New software system tracks attendance differently from prior system.Caution
FY 12-13 Performance Measure Status:
Performance Measures FY 2012-13 Budget FY 2012-13 Estimate FY 2013-14 Adopted
Percentage of programs offered successfully completed. 60% 60.9% 63%
Average programs per recreation center 225 219 230
Revenue earned in this service $2,270,000.00 $2,101,378.00 $2,225,000.00
Culture, Arts and Recreation185
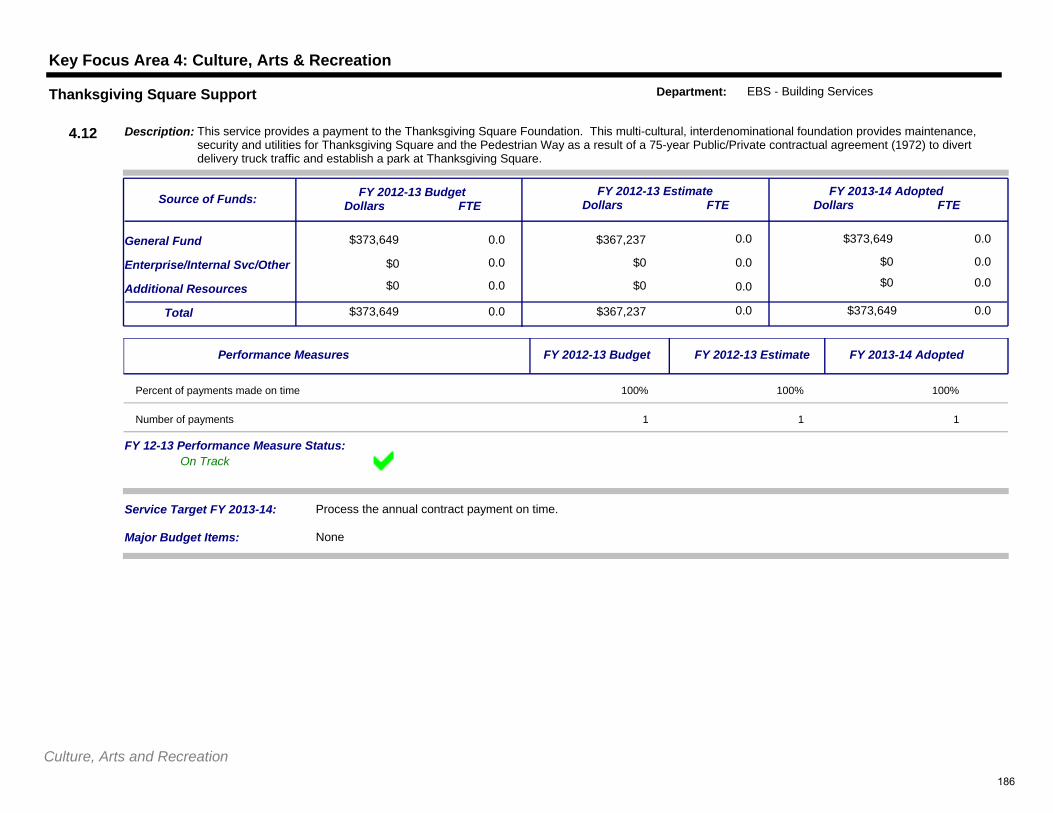
Key Focus Area 4: Culture, Arts & Recreation
$373,649 0.0
0.0
$367,237 0.0
$0 0.0
$373,649
$0 0.0
0.0General Fund
Additional Resources
Service Target FY 2013-14: Process the annual contract payment on time.
$373,649Total 0.0 $367,237 0.0 $373,649 0.0
Enterprise/Internal Svc/Other
$0 0.0 $0 0.0 $0 0.0
FY 2012-13 BudgetDollars FTE
FY 2012-13 EstimateDollars FTE
FY 2013-14 AdoptedDollars FTE
Description: This service provides a payment to the Thanksgiving Square Foundation. This multi-cultural, interdenominational foundation provides maintenance, security and utilities for Thanksgiving Square and the Pedestrian Way as a result of a 75-year Public/Private contractual agreement (1972) to divert delivery truck traffic and establish a park at Thanksgiving Square.
Source of Funds:
4.12
Thanksgiving Square Support Department: EBS - Building Services
$0
Major Budget Items: None
On TrackFY 12-13 Performance Measure Status:
Performance Measures FY 2012-13 Budget FY 2012-13 Estimate FY 2013-14 Adopted
Percent of payments made on time 100% 100% 100%
Number of payments 1 1 1
Culture, Arts and Recreation186
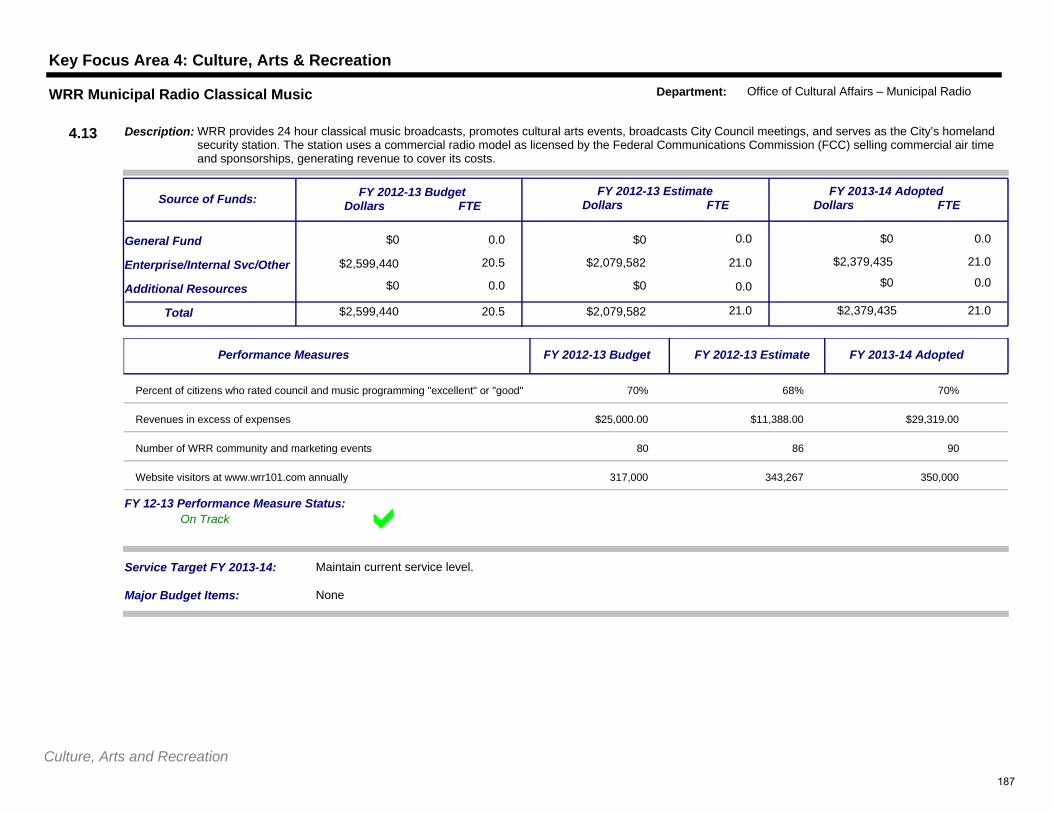
Key Focus Area 4: Culture, Arts & Recreation
$0 0.0
20.5
$0 0.0
$2,079,582 21.0
$0
$2,379,435 21.0
0.0General Fund
Additional Resources
Service Target FY 2013-14: Maintain current service level.
$2,599,440Total 20.5 $2,079,582 21.0 $2,379,435 21.0
Enterprise/Internal Svc/Other
$0 0.0 $0 0.0 $0 0.0
FY 2012-13 BudgetDollars FTE
FY 2012-13 EstimateDollars FTE
FY 2013-14 AdoptedDollars FTE
Description: WRR provides 24 hour classical music broadcasts, promotes cultural arts events, broadcasts City Council meetings, and serves as the City’s homeland security station. The station uses a commercial radio model as licensed by the Federal Communications Commission (FCC) selling commercial air time and sponsorships, generating revenue to cover its costs.
Source of Funds:
4.13
WRR Municipal Radio Classical Music Department: Office of Cultural Affairs – Municipal Radio
$2,599,440
Major Budget Items: None
On TrackFY 12-13 Performance Measure Status:
Performance Measures FY 2012-13 Budget FY 2012-13 Estimate FY 2013-14 Adopted
Percent of citizens who rated council and music programming "excellent" or "good" 70% 68% 70%
Revenues in excess of expenses $25,000.00 $11,388.00 $29,319.00
Number of WRR community and marketing events 80 86 90
Website visitors at www.wrr101.com annually 317,000 343,267 350,000
Culture, Arts and Recreation187

188
Educational EnhancementsRecognizing that education is the foundation for achieving
prosperity, health and well-being, the City of Dallas supportslifelong learning opportunities through various partnerships to benefit the community
2013-2014
189

190
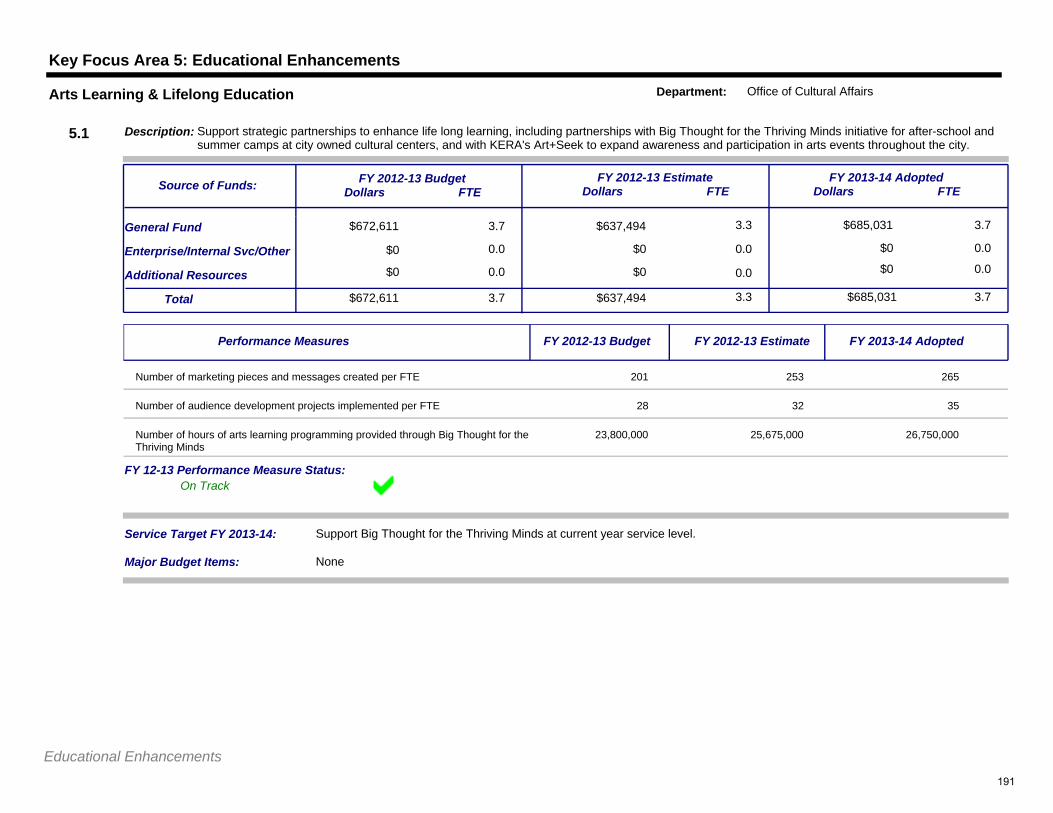
Key Focus Area 5: Educational Enhancements
$672,611 3.7
0.0
$637,494 3.3
$0 0.0
$685,031
$0 0.0
3.7General Fund
Additional Resources
Service Target FY 2013-14: Support Big Thought for the Thriving Minds at current year service level.
$672,611Total 3.7 $637,494 3.3 $685,031 3.7
Enterprise/Internal Svc/Other
$0 0.0 $0 0.0 $0 0.0
FY 2012-13 BudgetDollars FTE
FY 2012-13 EstimateDollars FTE
FY 2013-14 AdoptedDollars FTE
Description: Support strategic partnerships to enhance life long learning, including partnerships with Big Thought for the Thriving Minds initiative for after-school and summer camps at city owned cultural centers, and with KERA's Art+Seek to expand awareness and participation in arts events throughout the city.
Source of Funds:
5.1
Arts Learning & Lifelong Education Department: Office of Cultural Affairs
$0
Major Budget Items: None
On TrackFY 12-13 Performance Measure Status:
Performance Measures FY 2012-13 Budget FY 2012-13 Estimate FY 2013-14 Adopted
Number of marketing pieces and messages created per FTE 201 253 265
Number of audience development projects implemented per FTE 28 32 35
Number of hours of arts learning programming provided through Big Thought for the Thriving Minds
23,800,000 25,675,000 26,750,000
Educational Enhancements191
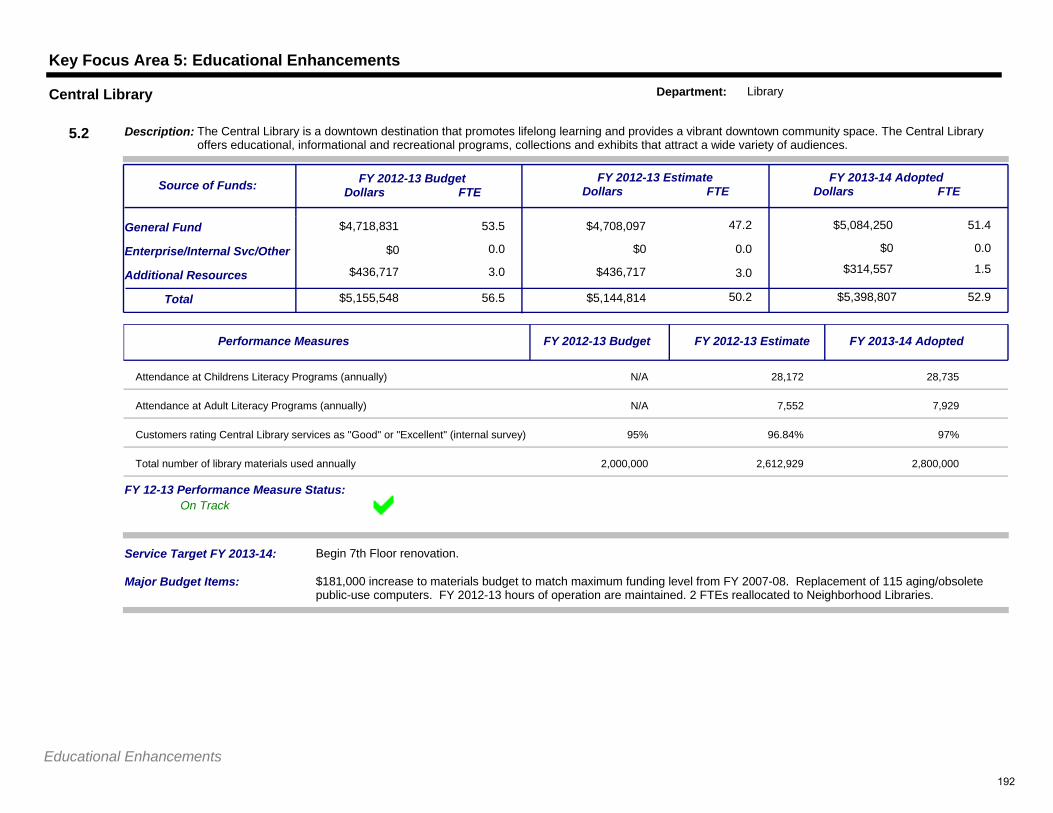
Key Focus Area 5: Educational Enhancements
$4,718,831 53.5
0.0
$4,708,097 47.2
$0 0.0
$5,084,250
$0 0.0
51.4General Fund
Additional Resources
Service Target FY 2013-14: Begin 7th Floor renovation.
$5,155,548Total 56.5 $5,144,814 50.2 $5,398,807 52.9
Enterprise/Internal Svc/Other
$436,717 3.0 $436,717 3.0 $314,557 1.5
FY 2012-13 BudgetDollars FTE
FY 2012-13 EstimateDollars FTE
FY 2013-14 AdoptedDollars FTE
Description: The Central Library is a downtown destination that promotes lifelong learning and provides a vibrant downtown community space. The Central Library offers educational, informational and recreational programs, collections and exhibits that attract a wide variety of audiences.
Source of Funds:
5.2
Central Library Department: Library
$0
Major Budget Items: $181,000 increase to materials budget to match maximum funding level from FY 2007-08. Replacement of 115 aging/obsolete public-use computers. FY 2012-13 hours of operation are maintained. 2 FTEs reallocated to Neighborhood Libraries.
On TrackFY 12-13 Performance Measure Status:
Performance Measures FY 2012-13 Budget FY 2012-13 Estimate FY 2013-14 Adopted
Attendance at Childrens Literacy Programs (annually) N/A 28,172 28,735
Attendance at Adult Literacy Programs (annually) N/A 7,552 7,929
Customers rating Central Library services as "Good" or "Excellent" (internal survey) 95% 96.84% 97%
Total number of library materials used annually 2,000,000 2,612,929 2,800,000
Educational Enhancements192
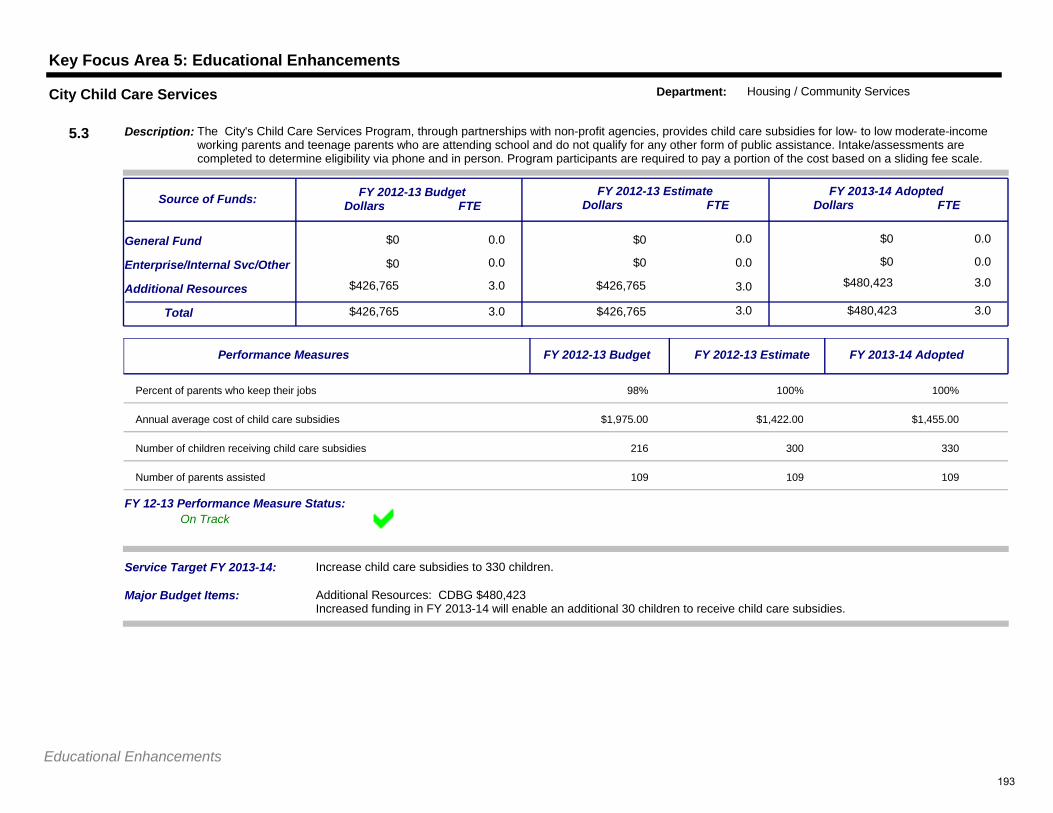
Key Focus Area 5: Educational Enhancements
$0 0.0
0.0
$0 0.0
$0 0.0
$0
$0 0.0
0.0General Fund
Additional Resources
Service Target FY 2013-14: Increase child care subsidies to 330 children.
$426,765Total 3.0 $426,765 3.0 $480,423 3.0
Enterprise/Internal Svc/Other
$426,765 3.0 $426,765 3.0 $480,423 3.0
FY 2012-13 BudgetDollars FTE
FY 2012-13 EstimateDollars FTE
FY 2013-14 AdoptedDollars FTE
Description: The City's Child Care Services Program, through partnerships with non-profit agencies, provides child care subsidies for low- to low moderate-income working parents and teenage parents who are attending school and do not qualify for any other form of public assistance. Intake/assessments are completed to determine eligibility via phone and in person. Program participants are required to pay a portion of the cost based on a sliding fee scale.
Source of Funds:
5.3
City Child Care Services Department: Housing / Community Services
$0
Major Budget Items: Additional Resources: CDBG $480,423Increased funding in FY 2013-14 will enable an additional 30 children to receive child care subsidies.
On TrackFY 12-13 Performance Measure Status:
Performance Measures FY 2012-13 Budget FY 2012-13 Estimate FY 2013-14 Adopted
Percent of parents who keep their jobs 98% 100% 100%
Annual average cost of child care subsidies $1,975.00 $1,422.00 $1,455.00
Number of children receiving child care subsidies 216 300 330
Number of parents assisted 109 109 109
Educational Enhancements193
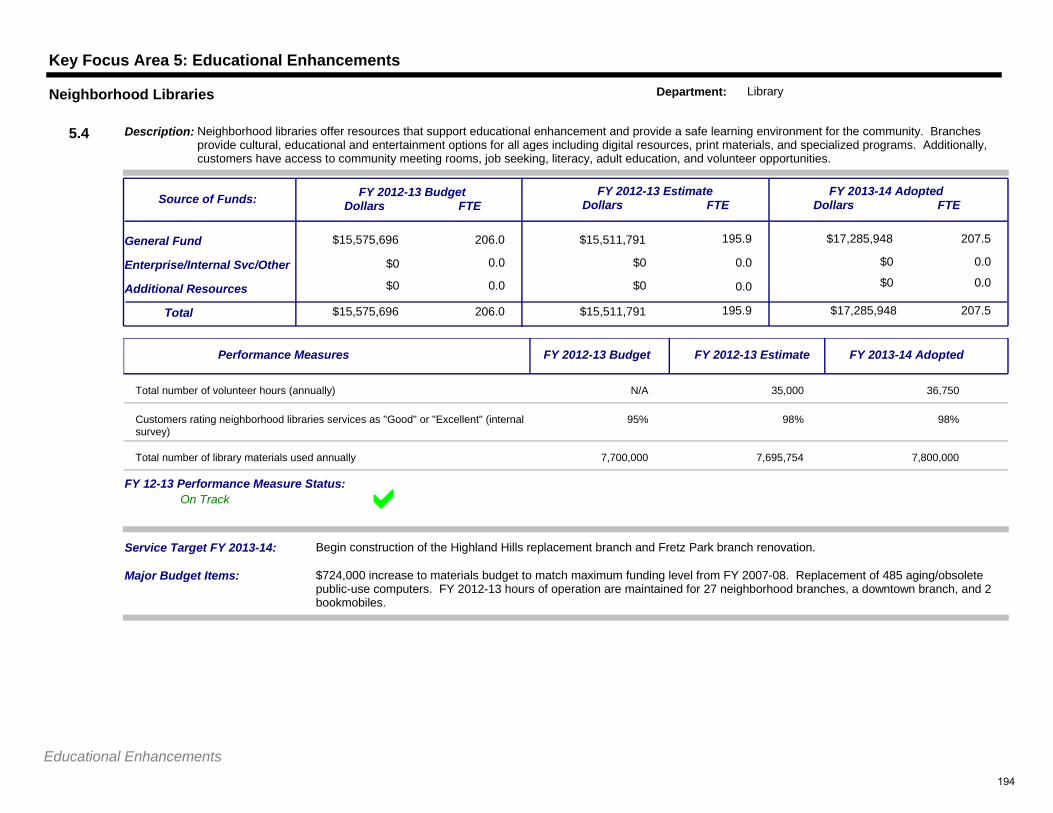
Key Focus Area 5: Educational Enhancements
$15,575,696 206.0
0.0
$15,511,791 195.9
$0 0.0
$17,285,948
$0 0.0
207.5General Fund
Additional Resources
Service Target FY 2013-14: Begin construction of the Highland Hills replacement branch and Fretz Park branch renovation.
$15,575,696Total 206.0 $15,511,791 195.9 $17,285,948 207.5
Enterprise/Internal Svc/Other
$0 0.0 $0 0.0 $0 0.0
FY 2012-13 BudgetDollars FTE
FY 2012-13 EstimateDollars FTE
FY 2013-14 AdoptedDollars FTE
Description: Neighborhood libraries offer resources that support educational enhancement and provide a safe learning environment for the community. Branches provide cultural, educational and entertainment options for all ages including digital resources, print materials, and specialized programs. Additionally, customers have access to community meeting rooms, job seeking, literacy, adult education, and volunteer opportunities.
Source of Funds:
5.4
Neighborhood Libraries Department: Library
$0
Major Budget Items: $724,000 increase to materials budget to match maximum funding level from FY 2007-08. Replacement of 485 aging/obsolete public-use computers. FY 2012-13 hours of operation are maintained for 27 neighborhood branches, a downtown branch, and 2 bookmobiles.
On TrackFY 12-13 Performance Measure Status:
Performance Measures FY 2012-13 Budget FY 2012-13 Estimate FY 2013-14 Adopted
Total number of volunteer hours (annually) N/A 35,000 36,750
Customers rating neighborhood libraries services as "Good" or "Excellent" (internal survey)
95% 98% 98%
Total number of library materials used annually 7,700,000 7,695,754 7,800,000
Educational Enhancements194
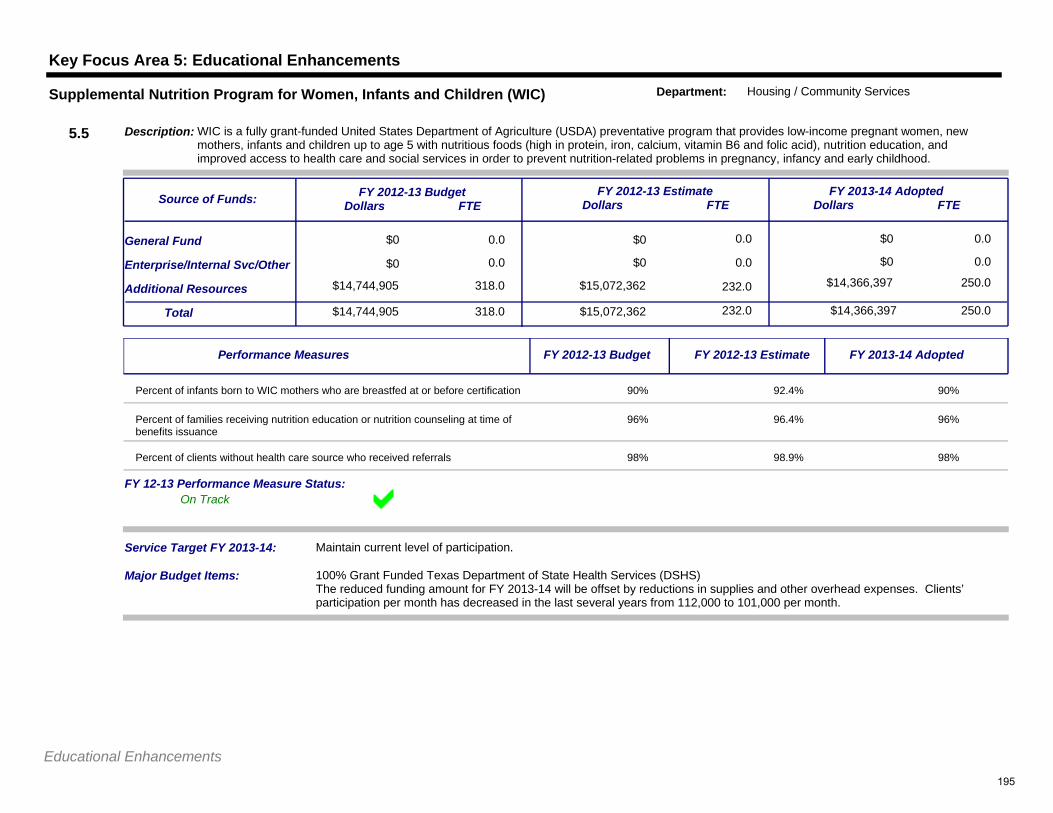
Key Focus Area 5: Educational Enhancements
$0 0.0
0.0
$0 0.0
$0 0.0
$0
$0 0.0
0.0General Fund
Additional Resources
Service Target FY 2013-14: Maintain current level of participation.
$14,744,905Total 318.0 $15,072,362 232.0 $14,366,397 250.0
Enterprise/Internal Svc/Other
$14,744,905 318.0 $15,072,362 232.0 $14,366,397 250.0
FY 2012-13 BudgetDollars FTE
FY 2012-13 EstimateDollars FTE
FY 2013-14 AdoptedDollars FTE
Description: WIC is a fully grant-funded United States Department of Agriculture (USDA) preventative program that provides low-income pregnant women, new mothers, infants and children up to age 5 with nutritious foods (high in protein, iron, calcium, vitamin B6 and folic acid), nutrition education, and improved access to health care and social services in order to prevent nutrition-related problems in pregnancy, infancy and early childhood.
Source of Funds:
5.5
Supplemental Nutrition Program for Women, Infants and Children (WIC) Department: Housing / Community Services
$0
Major Budget Items: 100% Grant Funded Texas Department of State Health Services (DSHS)The reduced funding amount for FY 2013-14 will be offset by reductions in supplies and other overhead expenses. Clients’ participation per month has decreased in the last several years from 112,000 to 101,000 per month.
On TrackFY 12-13 Performance Measure Status:
Performance Measures FY 2012-13 Budget FY 2012-13 Estimate FY 2013-14 Adopted
Percent of infants born to WIC mothers who are breastfed at or before certification 90% 92.4% 90%
Percent of families receiving nutrition education or nutrition counseling at time of benefits issuance
96% 96.4% 96%
Percent of clients without health care source who received referrals 98% 98.9% 98%
Educational Enhancements195

196
Efficient, Effective Economical(E3) Government
The City of Dallas will provide Efficient, Effective, andEconomical government to meet the needs of its citizens
in the present and future
2013-2014
197

198
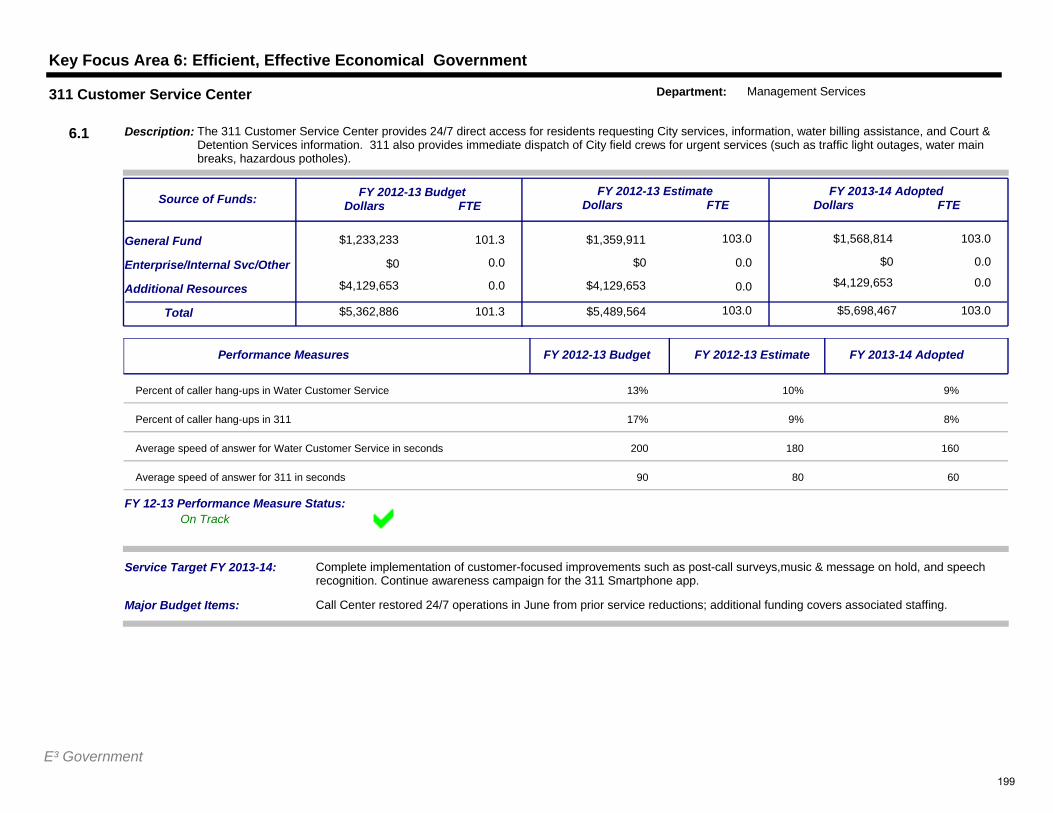
Key Focus Area 6: Efficient, Effective Economical Government
$1,233,233 101.3
0.0
$1,359,911 103.0
$0 0.0
$1,568,814
$0 0.0
103.0General Fund
Additional Resources
Service Target FY 2013-14: Complete implementation of customer-focused improvements such as post-call surveys,music & message on hold, and speech recognition. Continue awareness campaign for the 311 Smartphone app.
$5,362,886Total 101.3 $5,489,564 103.0 $5,698,467 103.0
Enterprise/Internal Svc/Other
$4,129,653 0.0 $4,129,653 0.0 $4,129,653 0.0
FY 2012-13 BudgetDollars FTE
FY 2012-13 EstimateDollars FTE
FY 2013-14 AdoptedDollars FTE
Description: The 311 Customer Service Center provides 24/7 direct access for residents requesting City services, information, water billing assistance, and Court & Detention Services information. 311 also provides immediate dispatch of City field crews for urgent services (such as traffic light outages, water main breaks, hazardous potholes).
Source of Funds:
6.1
311 Customer Service Center Department: Management Services
$0
Major Budget Items: Call Center restored 24/7 operations in June from prior service reductions; additional funding covers associated staffing.
On TrackFY 12-13 Performance Measure Status:
Performance Measures FY 2012-13 Budget FY 2012-13 Estimate FY 2013-14 Adopted
Percent of caller hang-ups in Water Customer Service 13% 10% 9%
Percent of caller hang-ups in 311 17% 9% 8%
Average speed of answer for Water Customer Service in seconds 200 180 160
Average speed of answer for 311 in seconds 90 80 60
E³ Government199
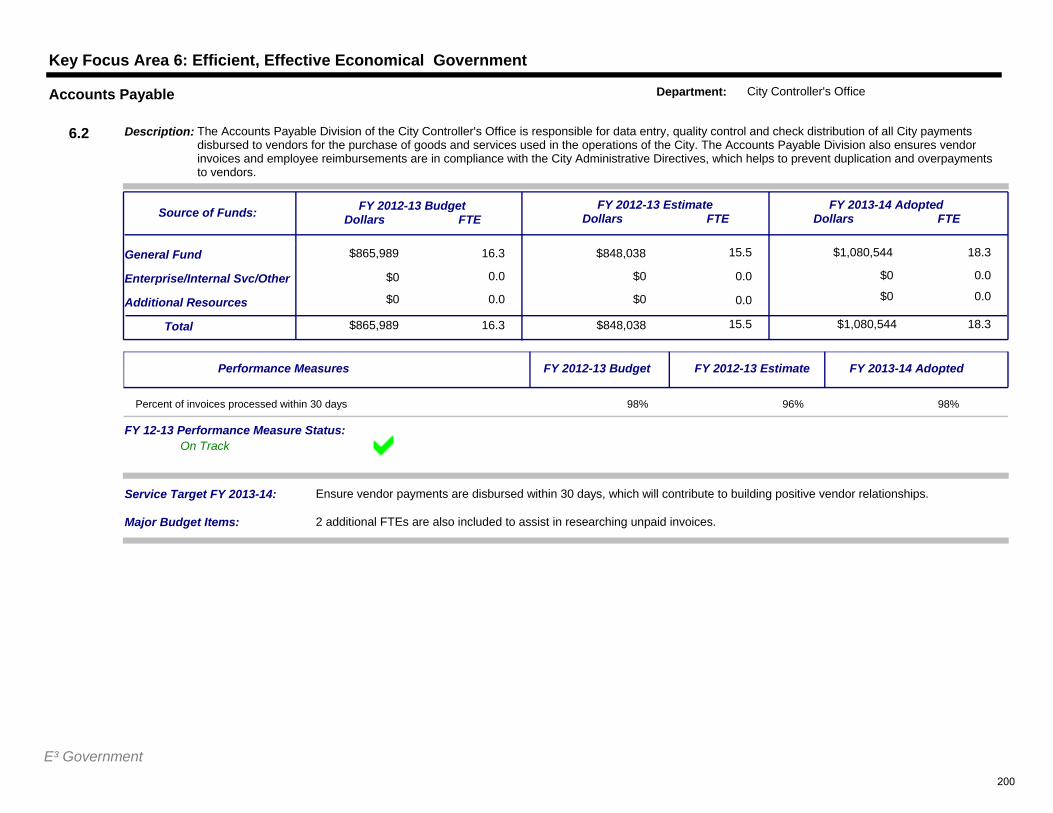
Key Focus Area 6: Efficient, Effective Economical Government
$865,989 16.3
0.0
$848,038 15.5
$0 0.0
$1,080,544
$0 0.0
18.3General Fund
Additional Resources
Service Target FY 2013-14: Ensure vendor payments are disbursed within 30 days, which will contribute to building positive vendor relationships.
$865,989Total 16.3 $848,038 15.5 $1,080,544 18.3
Enterprise/Internal Svc/Other
$0 0.0 $0 0.0 $0 0.0
FY 2012-13 BudgetDollars FTE
FY 2012-13 EstimateDollars FTE
FY 2013-14 AdoptedDollars FTE
Description: The Accounts Payable Division of the City Controller's Office is responsible for data entry, quality control and check distribution of all City payments disbursed to vendors for the purchase of goods and services used in the operations of the City. The Accounts Payable Division also ensures vendor invoices and employee reimbursements are in compliance with the City Administrative Directives, which helps to prevent duplication and overpayments to vendors.
Source of Funds:
6.2
Accounts Payable Department: City Controller's Office
$0
Major Budget Items: 2 additional FTEs are also included to assist in researching unpaid invoices.
On TrackFY 12-13 Performance Measure Status:
Performance Measures FY 2012-13 Budget FY 2012-13 Estimate FY 2013-14 Adopted
Percent of invoices processed within 30 days 98% 96% 98%
E³ Government200
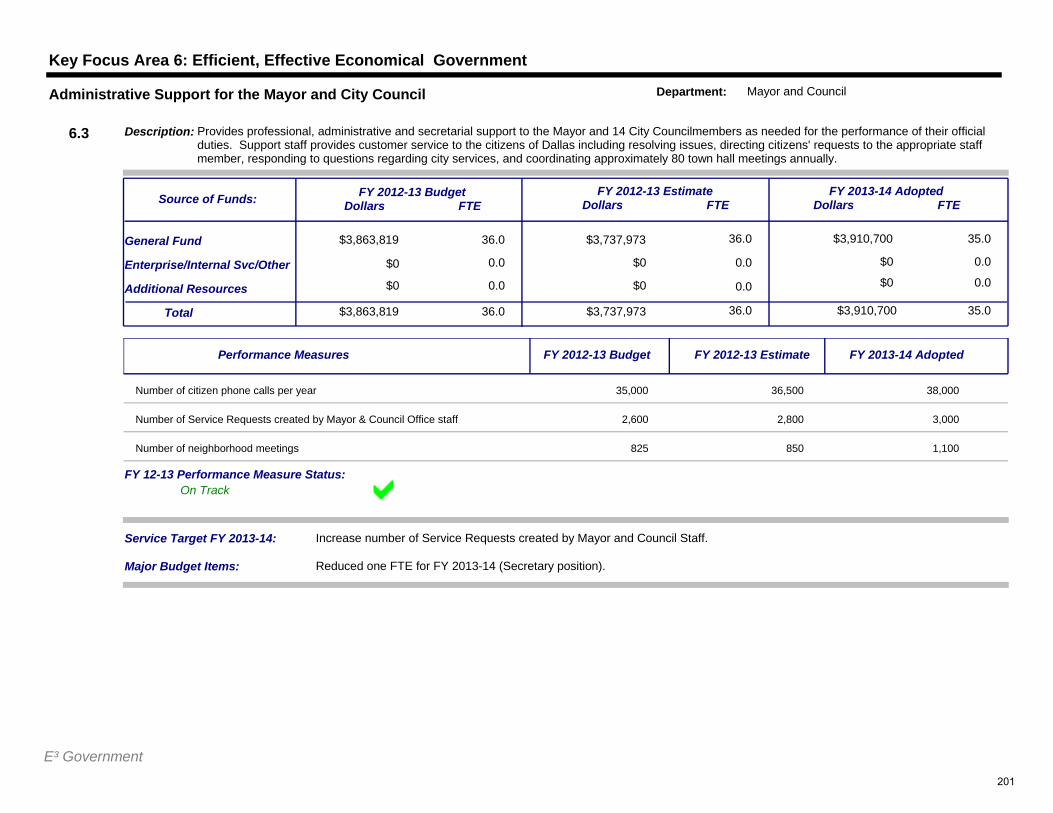
Key Focus Area 6: Efficient, Effective Economical Government
$3,863,819 36.0
0.0
$3,737,973 36.0
$0 0.0
$3,910,700
$0 0.0
35.0General Fund
Additional Resources
Service Target FY 2013-14: Increase number of Service Requests created by Mayor and Council Staff.
$3,863,819Total 36.0 $3,737,973 36.0 $3,910,700 35.0
Enterprise/Internal Svc/Other
$0 0.0 $0 0.0 $0 0.0
FY 2012-13 BudgetDollars FTE
FY 2012-13 EstimateDollars FTE
FY 2013-14 AdoptedDollars FTE
Description: Provides professional, administrative and secretarial support to the Mayor and 14 City Councilmembers as needed for the performance of their official duties. Support staff provides customer service to the citizens of Dallas including resolving issues, directing citizens' requests to the appropriate staff member, responding to questions regarding city services, and coordinating approximately 80 town hall meetings annually.
Source of Funds:
6.3
Administrative Support for the Mayor and City Council Department: Mayor and Council
$0
Major Budget Items: Reduced one FTE for FY 2013-14 (Secretary position).
On TrackFY 12-13 Performance Measure Status:
Performance Measures FY 2012-13 Budget FY 2012-13 Estimate FY 2013-14 Adopted
Number of citizen phone calls per year 35,000 36,500 38,000
Number of Service Requests created by Mayor & Council Office staff 2,600 2,800 3,000
Number of neighborhood meetings 825 850 1,100
E³ Government201
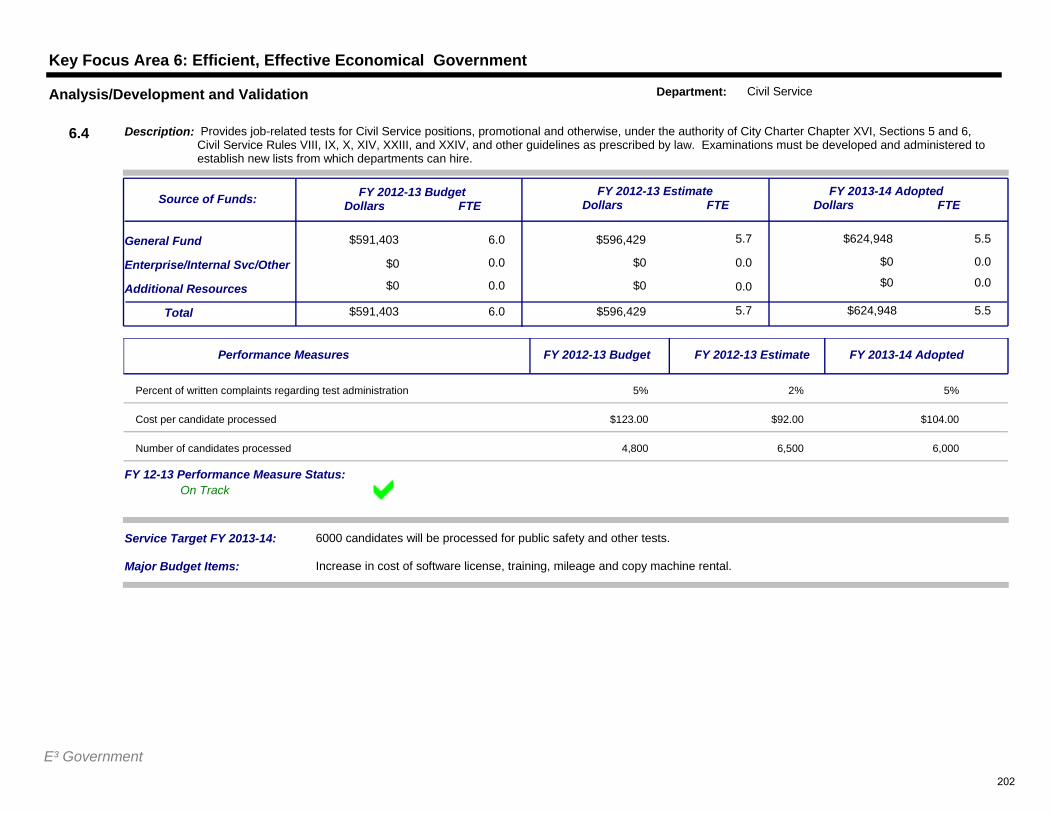
Key Focus Area 6: Efficient, Effective Economical Government
$591,403 6.0
0.0
$596,429 5.7
$0 0.0
$624,948
$0 0.0
5.5General Fund
Additional Resources
Service Target FY 2013-14: 6000 candidates will be processed for public safety and other tests.
$591,403Total 6.0 $596,429 5.7 $624,948 5.5
Enterprise/Internal Svc/Other
$0 0.0 $0 0.0 $0 0.0
FY 2012-13 BudgetDollars FTE
FY 2012-13 EstimateDollars FTE
FY 2013-14 AdoptedDollars FTE
Description: Provides job-related tests for Civil Service positions, promotional and otherwise, under the authority of City Charter Chapter XVI, Sections 5 and 6, Civil Service Rules VIII, IX, X, XIV, XXIII, and XXIV, and other guidelines as prescribed by law. Examinations must be developed and administered to establish new lists from which departments can hire.
Source of Funds:
6.4
Analysis/Development and Validation Department: Civil Service
$0
Major Budget Items: Increase in cost of software license, training, mileage and copy machine rental.
On TrackFY 12-13 Performance Measure Status:
Performance Measures FY 2012-13 Budget FY 2012-13 Estimate FY 2013-14 Adopted
Percent of written complaints regarding test administration 5% 2% 5%
Cost per candidate processed $123.00 $92.00 $104.00
Number of candidates processed 4,800 6,500 6,000
E³ Government202
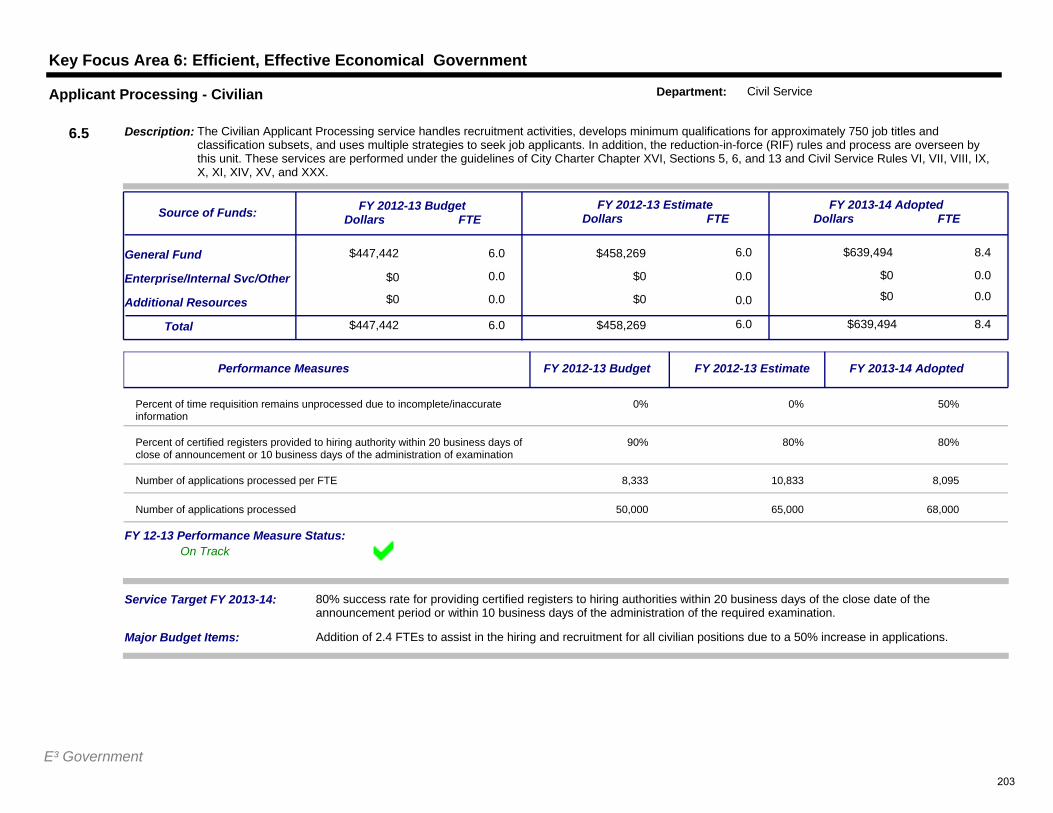
Key Focus Area 6: Efficient, Effective Economical Government
$447,442 6.0
0.0
$458,269 6.0
$0 0.0
$639,494
$0 0.0
8.4General Fund
Additional Resources
Service Target FY 2013-14: 80% success rate for providing certified registers to hiring authorities within 20 business days of the close date of the announcement period or within 10 business days of the administration of the required examination.
$447,442Total 6.0 $458,269 6.0 $639,494 8.4
Enterprise/Internal Svc/Other
$0 0.0 $0 0.0 $0 0.0
FY 2012-13 BudgetDollars FTE
FY 2012-13 EstimateDollars FTE
FY 2013-14 AdoptedDollars FTE
Description: The Civilian Applicant Processing service handles recruitment activities, develops minimum qualifications for approximately 750 job titles and classification subsets, and uses multiple strategies to seek job applicants. In addition, the reduction-in-force (RIF) rules and process are overseen by this unit. These services are performed under the guidelines of City Charter Chapter XVI, Sections 5, 6, and 13 and Civil Service Rules VI, VII, VIII, IX, X, XI, XIV, XV, and XXX.
Source of Funds:
6.5
Applicant Processing - Civilian Department: Civil Service
$0
Major Budget Items: Addition of 2.4 FTEs to assist in the hiring and recruitment for all civilian positions due to a 50% increase in applications.
On TrackFY 12-13 Performance Measure Status:
Performance Measures FY 2012-13 Budget FY 2012-13 Estimate FY 2013-14 Adopted
Percent of time requisition remains unprocessed due to incomplete/inaccurate information
0% 0% 50%
Percent of certified registers provided to hiring authority within 20 business days of close of announcement or 10 business days of the administration of examination
90% 80% 80%
Number of applications processed per FTE 8,333 10,833 8,095
Number of applications processed 50,000 65,000 68,000
E³ Government203
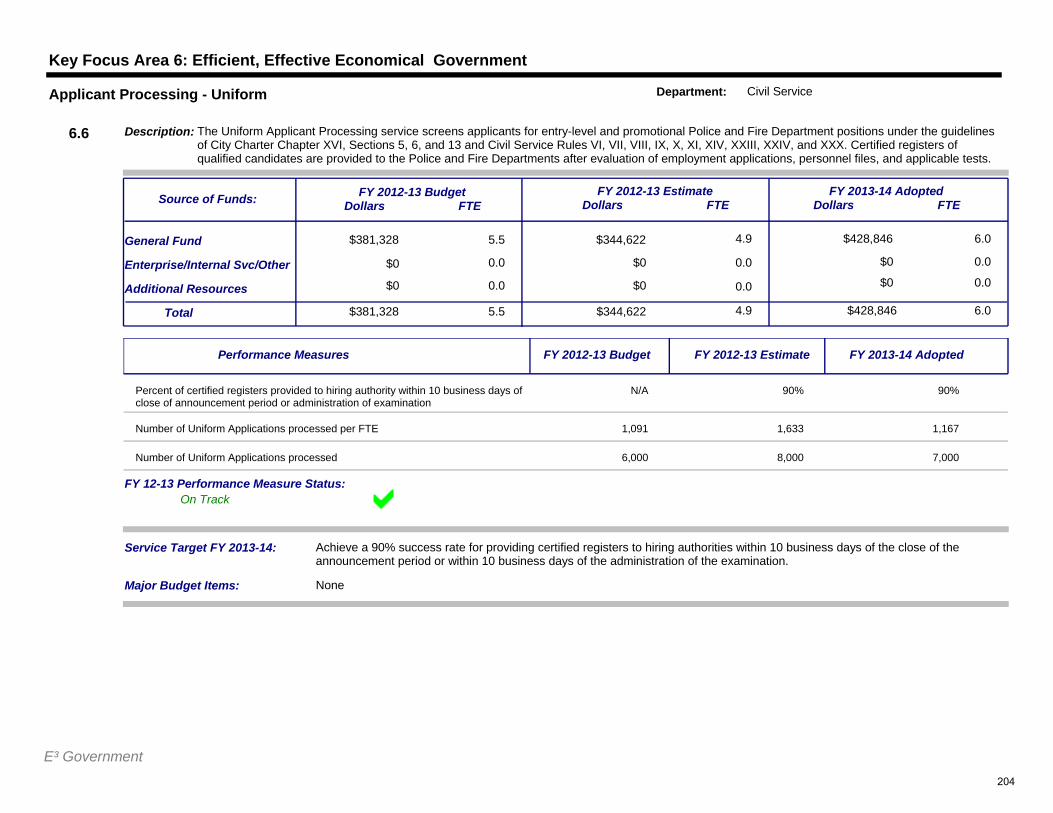
Key Focus Area 6: Efficient, Effective Economical Government
$381,328 5.5
0.0
$344,622 4.9
$0 0.0
$428,846
$0 0.0
6.0General Fund
Additional Resources
Service Target FY 2013-14: Achieve a 90% success rate for providing certified registers to hiring authorities within 10 business days of the close of the announcement period or within 10 business days of the administration of the examination.
$381,328Total 5.5 $344,622 4.9 $428,846 6.0
Enterprise/Internal Svc/Other
$0 0.0 $0 0.0 $0 0.0
FY 2012-13 BudgetDollars FTE
FY 2012-13 EstimateDollars FTE
FY 2013-14 AdoptedDollars FTE
Description: The Uniform Applicant Processing service screens applicants for entry-level and promotional Police and Fire Department positions under the guidelines of City Charter Chapter XVI, Sections 5, 6, and 13 and Civil Service Rules VI, VII, VIII, IX, X, XI, XIV, XXIII, XXIV, and XXX. Certified registers of qualified candidates are provided to the Police and Fire Departments after evaluation of employment applications, personnel files, and applicable tests.
Source of Funds:
6.6
Applicant Processing - Uniform Department: Civil Service
$0
Major Budget Items: None
On TrackFY 12-13 Performance Measure Status:
Performance Measures FY 2012-13 Budget FY 2012-13 Estimate FY 2013-14 Adopted
Percent of certified registers provided to hiring authority within 10 business days of close of announcement period or administration of examination
N/A 90% 90%
Number of Uniform Applications processed per FTE 1,091 1,633 1,167
Number of Uniform Applications processed 6,000 8,000 7,000
E³ Government204
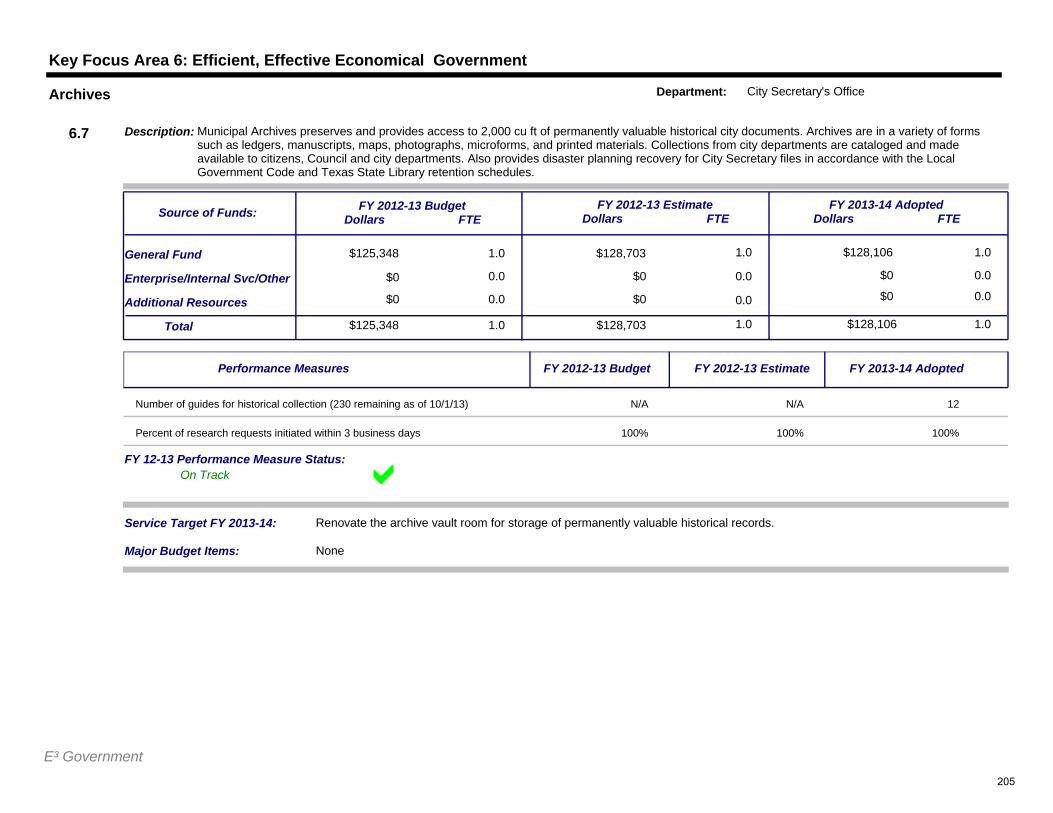
Key Focus Area 6: Efficient, Effective Economical Government
$125,348 1.0
0.0
$128,703 1.0
$0 0.0
$128,106
$0 0.0
1.0General Fund
Additional Resources
Service Target FY 2013-14: Renovate the archive vault room for storage of permanently valuable historical records.
$125,348Total 1.0 $128,703 1.0 $128,106 1.0
Enterprise/Internal Svc/Other
$0 0.0 $0 0.0 $0 0.0
FY 2012-13 BudgetDollars FTE
FY 2012-13 EstimateDollars FTE
FY 2013-14 AdoptedDollars FTE
Description: Municipal Archives preserves and provides access to 2,000 cu ft of permanently valuable historical city documents. Archives are in a variety of forms such as ledgers, manuscripts, maps, photographs, microforms, and printed materials. Collections from city departments are cataloged and made available to citizens, Council and city departments. Also provides disaster planning recovery for City Secretary files in accordance with the Local Government Code and Texas State Library retention schedules.
Source of Funds:
6.7
Archives Department: City Secretary's Office
$0
Major Budget Items: None
On TrackFY 12-13 Performance Measure Status:
Performance Measures FY 2012-13 Budget FY 2012-13 Estimate FY 2013-14 Adopted
Number of guides for historical collection (230 remaining as of 10/1/13) N/A N/A 12
Percent of research requests initiated within 3 business days 100% 100% 100%
E³ Government205
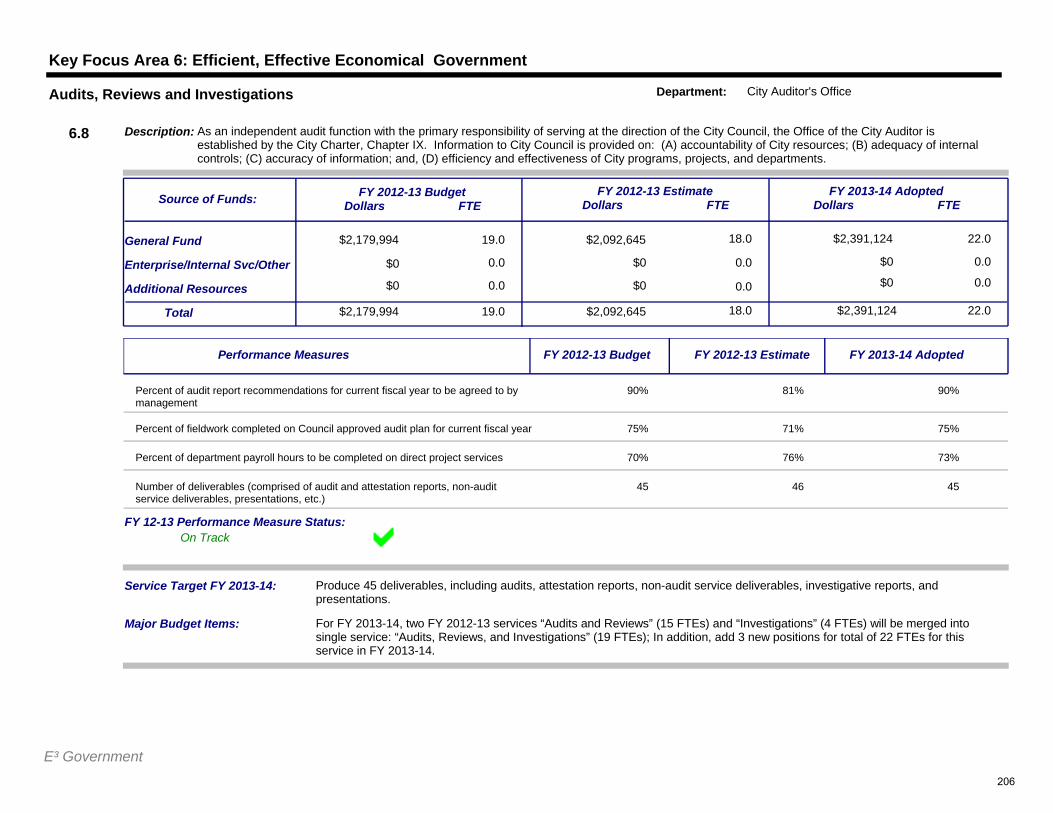
Key Focus Area 6: Efficient, Effective Economical Government
$2,179,994 19.0
0.0
$2,092,645 18.0
$0 0.0
$2,391,124
$0 0.0
22.0General Fund
Additional Resources
Service Target FY 2013-14: Produce 45 deliverables, including audits, attestation reports, non-audit service deliverables, investigative reports, and presentations.
$2,179,994Total 19.0 $2,092,645 18.0 $2,391,124 22.0
Enterprise/Internal Svc/Other
$0 0.0 $0 0.0 $0 0.0
FY 2012-13 BudgetDollars FTE
FY 2012-13 EstimateDollars FTE
FY 2013-14 AdoptedDollars FTE
Description: As an independent audit function with the primary responsibility of serving at the direction of the City Council, the Office of the City Auditor is established by the City Charter, Chapter IX. Information to City Council is provided on: (A) accountability of City resources; (B) adequacy of internal controls; (C) accuracy of information; and, (D) efficiency and effectiveness of City programs, projects, and departments.
Source of Funds:
6.8
Audits, Reviews and Investigations Department: City Auditor's Office
$0
Major Budget Items: For FY 2013-14, two FY 2012-13 services “Audits and Reviews” (15 FTEs) and “Investigations” (4 FTEs) will be merged into single service: “Audits, Reviews, and Investigations” (19 FTEs); In addition, add 3 new positions for total of 22 FTEs for this service in FY 2013-14.
On TrackFY 12-13 Performance Measure Status:
Performance Measures FY 2012-13 Budget FY 2012-13 Estimate FY 2013-14 Adopted
Percent of audit report recommendations for current fiscal year to be agreed to by management
90% 81% 90%
Percent of fieldwork completed on Council approved audit plan for current fiscal year 75% 71% 75%
Percent of department payroll hours to be completed on direct project services 70% 76% 73%
Number of deliverables (comprised of audit and attestation reports, non-audit service deliverables, presentations, etc.)
45 46 45
E³ Government206
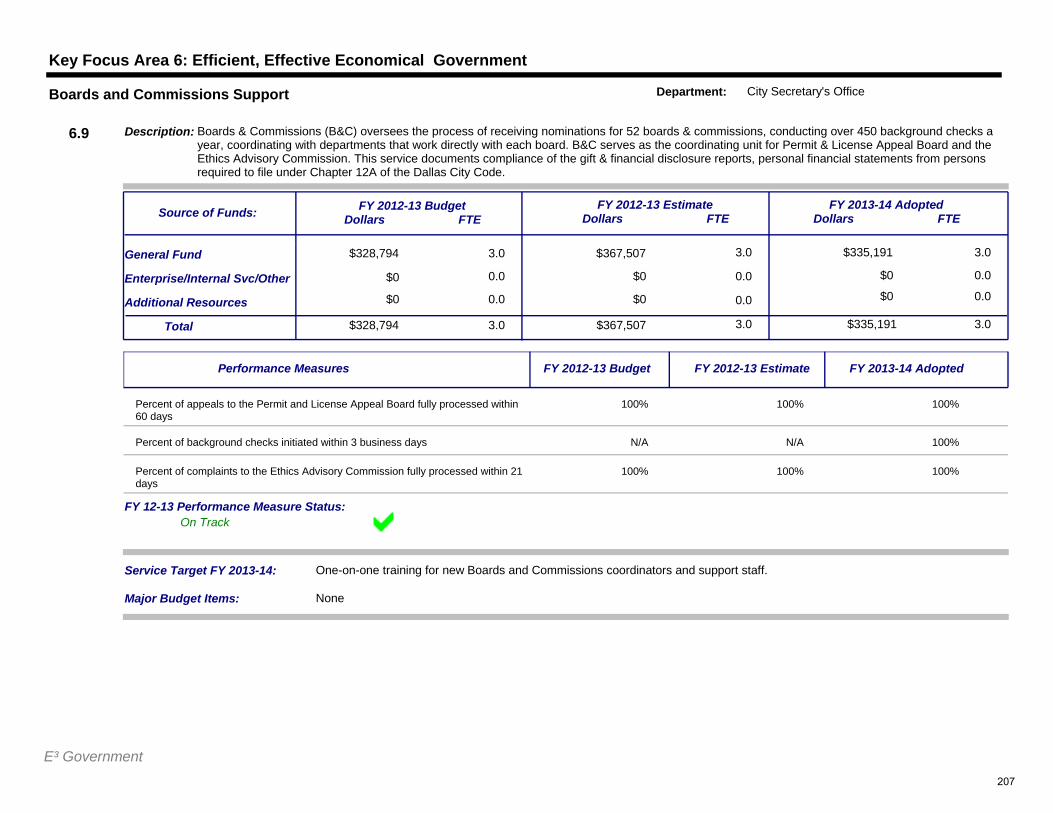
Key Focus Area 6: Efficient, Effective Economical Government
$328,794 3.0
0.0
$367,507 3.0
$0 0.0
$335,191
$0 0.0
3.0General Fund
Additional Resources
Service Target FY 2013-14: One-on-one training for new Boards and Commissions coordinators and support staff.
$328,794Total 3.0 $367,507 3.0 $335,191 3.0
Enterprise/Internal Svc/Other
$0 0.0 $0 0.0 $0 0.0
FY 2012-13 BudgetDollars FTE
FY 2012-13 EstimateDollars FTE
FY 2013-14 AdoptedDollars FTE
Description: Boards & Commissions (B&C) oversees the process of receiving nominations for 52 boards & commissions, conducting over 450 background checks a year, coordinating with departments that work directly with each board. B&C serves as the coordinating unit for Permit & License Appeal Board and the Ethics Advisory Commission. This service documents compliance of the gift & financial disclosure reports, personal financial statements from persons required to file under Chapter 12A of the Dallas City Code.
Source of Funds:
6.9
Boards and Commissions Support Department: City Secretary's Office
$0
Major Budget Items: None
On TrackFY 12-13 Performance Measure Status:
Performance Measures FY 2012-13 Budget FY 2012-13 Estimate FY 2013-14 Adopted
Percent of appeals to the Permit and License Appeal Board fully processed within 60 days
100% 100% 100%
Percent of background checks initiated within 3 business days N/A N/A 100%
Percent of complaints to the Ethics Advisory Commission fully processed within 21 days
100% 100% 100%
E³ Government207
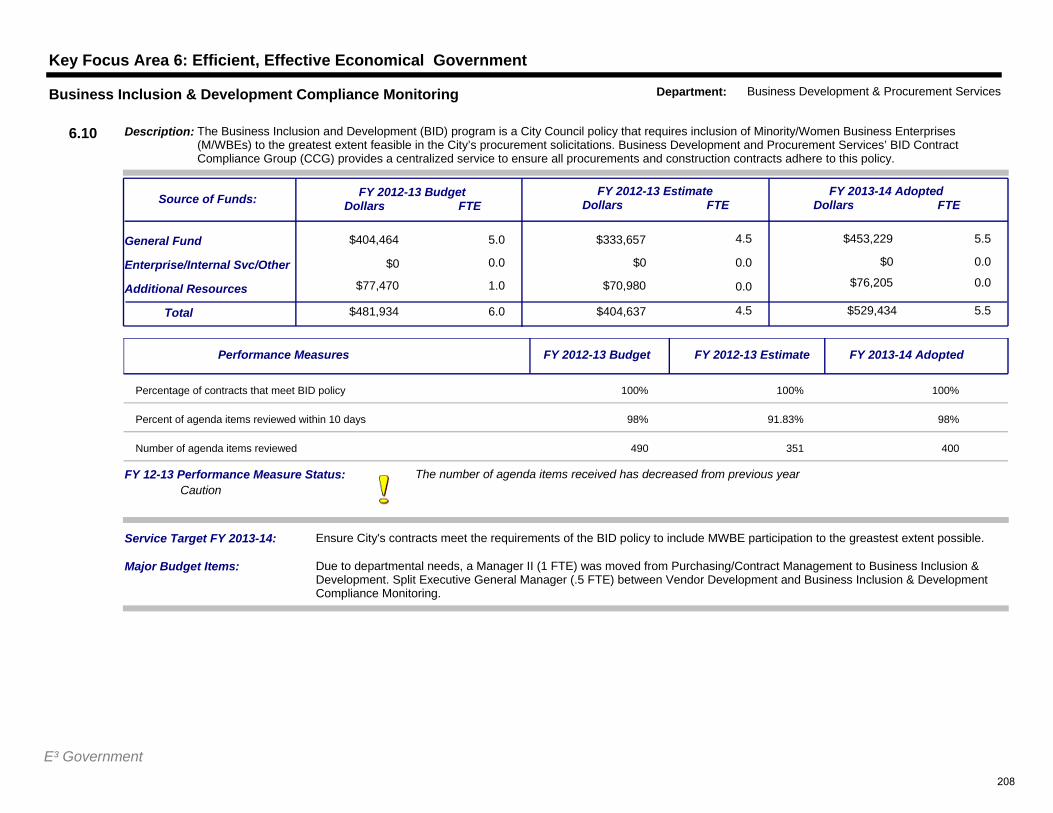
Key Focus Area 6: Efficient, Effective Economical Government
$404,464 5.0
0.0
$333,657 4.5
$0 0.0
$453,229
$0 0.0
5.5General Fund
Additional Resources
Service Target FY 2013-14: Ensure City's contracts meet the requirements of the BID policy to include MWBE participation to the greastest extent possible.
$481,934Total 6.0 $404,637 4.5 $529,434 5.5
Enterprise/Internal Svc/Other
$77,470 1.0 $70,980 0.0 $76,205 0.0
FY 2012-13 BudgetDollars FTE
FY 2012-13 EstimateDollars FTE
FY 2013-14 AdoptedDollars FTE
Description: The Business Inclusion and Development (BID) program is a City Council policy that requires inclusion of Minority/Women Business Enterprises (M/WBEs) to the greatest extent feasible in the City’s procurement solicitations. Business Development and Procurement Services’ BID Contract Compliance Group (CCG) provides a centralized service to ensure all procurements and construction contracts adhere to this policy.
Source of Funds:
6.10
Business Inclusion & Development Compliance Monitoring Department: Business Development & Procurement Services
$0
Major Budget Items: Due to departmental needs, a Manager II (1 FTE) was moved from Purchasing/Contract Management to Business Inclusion & Development. Split Executive General Manager (.5 FTE) between Vendor Development and Business Inclusion & Development Compliance Monitoring.
The number of agenda items received has decreased from previous yearCaution
FY 12-13 Performance Measure Status:
Performance Measures FY 2012-13 Budget FY 2012-13 Estimate FY 2013-14 Adopted
Percentage of contracts that meet BID policy 100% 100% 100%
Percent of agenda items reviewed within 10 days 98% 91.83% 98%
Number of agenda items reviewed 490 351 400
E³ Government208
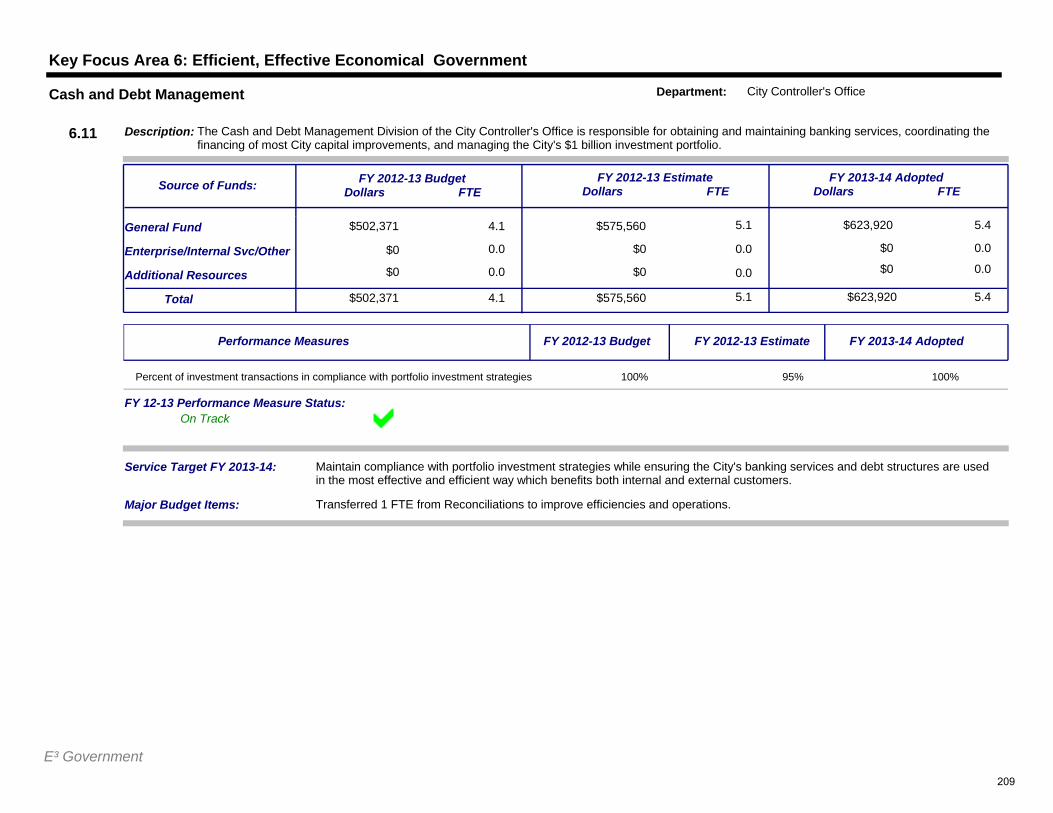
Key Focus Area 6: Efficient, Effective Economical Government
$502,371 4.1
0.0
$575,560 5.1
$0 0.0
$623,920
$0 0.0
5.4General Fund
Additional Resources
Service Target FY 2013-14: Maintain compliance with portfolio investment strategies while ensuring the City's banking services and debt structures are used in the most effective and efficient way which benefits both internal and external customers.
$502,371Total 4.1 $575,560 5.1 $623,920 5.4
Enterprise/Internal Svc/Other
$0 0.0 $0 0.0 $0 0.0
FY 2012-13 BudgetDollars FTE
FY 2012-13 EstimateDollars FTE
FY 2013-14 AdoptedDollars FTE
Description: The Cash and Debt Management Division of the City Controller's Office is responsible for obtaining and maintaining banking services, coordinating the financing of most City capital improvements, and managing the City's $1 billion investment portfolio.
Source of Funds:
6.11
Cash and Debt Management Department: City Controller's Office
$0
Major Budget Items: Transferred 1 FTE from Reconciliations to improve efficiencies and operations.
On TrackFY 12-13 Performance Measure Status:
Performance Measures FY 2012-13 Budget FY 2012-13 Estimate FY 2013-14 Adopted
Percent of investment transactions in compliance with portfolio investment strategies 100% 95% 100%
E³ Government209
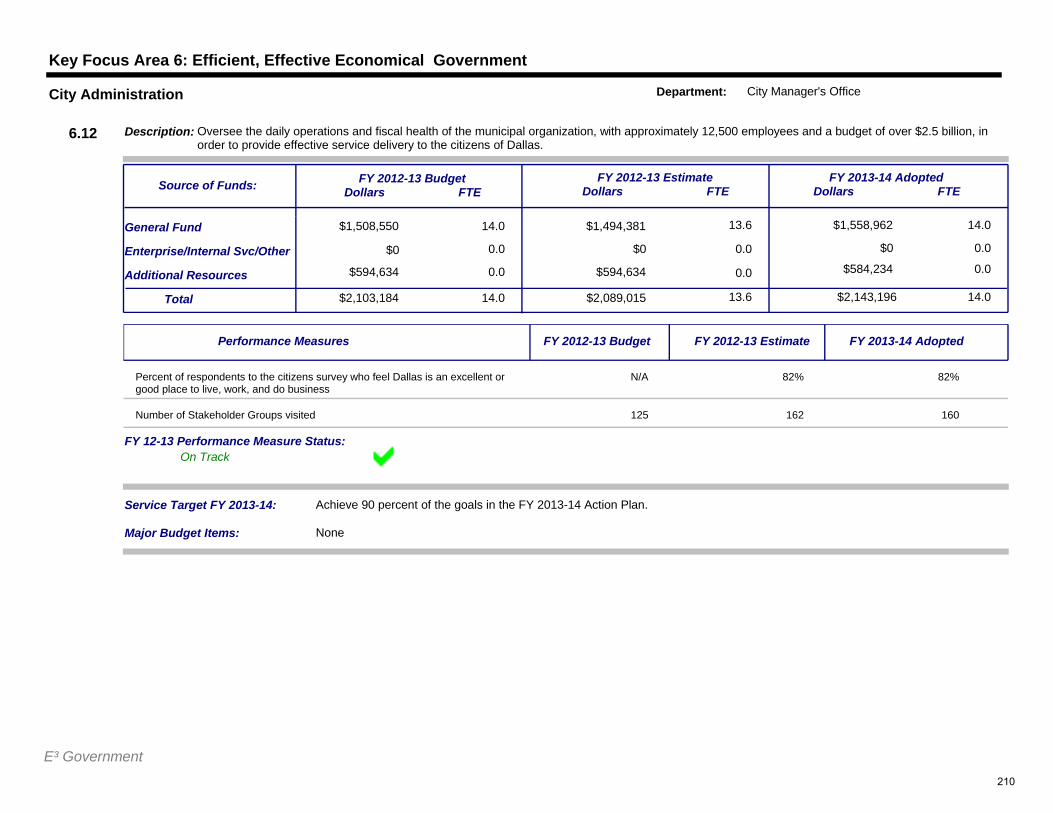
Key Focus Area 6: Efficient, Effective Economical Government
$1,508,550 14.0
0.0
$1,494,381 13.6
$0 0.0
$1,558,962
$0 0.0
14.0General Fund
Additional Resources
Service Target FY 2013-14: Achieve 90 percent of the goals in the FY 2013-14 Action Plan.
$2,103,184Total 14.0 $2,089,015 13.6 $2,143,196 14.0
Enterprise/Internal Svc/Other
$594,634 0.0 $594,634 0.0 $584,234 0.0
FY 2012-13 BudgetDollars FTE
FY 2012-13 EstimateDollars FTE
FY 2013-14 AdoptedDollars FTE
Description: Oversee the daily operations and fiscal health of the municipal organization, with approximately 12,500 employees and a budget of over $2.5 billion, in order to provide effective service delivery to the citizens of Dallas.
Source of Funds:
6.12
City Administration Department: City Manager's Office
$0
Major Budget Items: None
On TrackFY 12-13 Performance Measure Status:
Performance Measures FY 2012-13 Budget FY 2012-13 Estimate FY 2013-14 Adopted
Percent of respondents to the citizens survey who feel Dallas is an excellent or good place to live, work, and do business
N/A 82% 82%
Number of Stakeholder Groups visited 125 162 160
E³ Government210
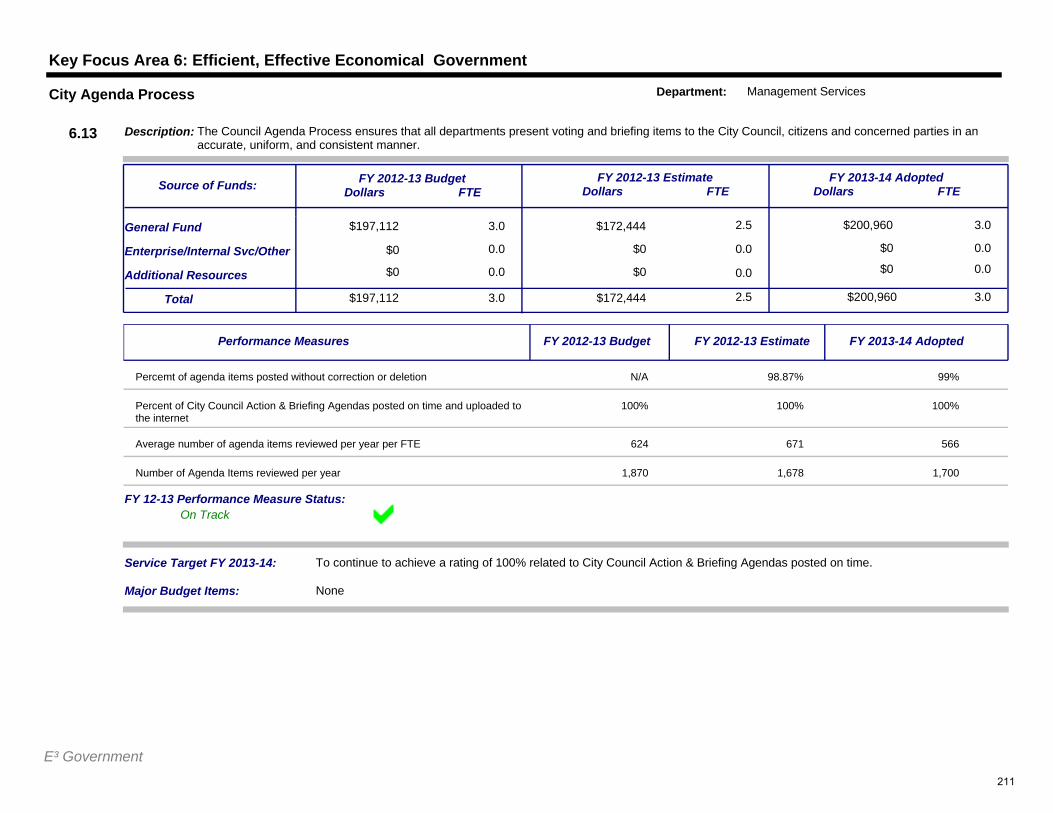
Key Focus Area 6: Efficient, Effective Economical Government
$197,112 3.0
0.0
$172,444 2.5
$0 0.0
$200,960
$0 0.0
3.0General Fund
Additional Resources
Service Target FY 2013-14: To continue to achieve a rating of 100% related to City Council Action & Briefing Agendas posted on time.
$197,112Total 3.0 $172,444 2.5 $200,960 3.0
Enterprise/Internal Svc/Other
$0 0.0 $0 0.0 $0 0.0
FY 2012-13 BudgetDollars FTE
FY 2012-13 EstimateDollars FTE
FY 2013-14 AdoptedDollars FTE
Description: The Council Agenda Process ensures that all departments present voting and briefing items to the City Council, citizens and concerned parties in an accurate, uniform, and consistent manner.
Source of Funds:
6.13
City Agenda Process Department: Management Services
$0
Major Budget Items: None
On TrackFY 12-13 Performance Measure Status:
Performance Measures FY 2012-13 Budget FY 2012-13 Estimate FY 2013-14 Adopted
Percemt of agenda items posted without correction or deletion N/A 98.87% 99%
Percent of City Council Action & Briefing Agendas posted on time and uploaded to the internet
100% 100% 100%
Average number of agenda items reviewed per year per FTE 624 671 566
Number of Agenda Items reviewed per year 1,870 1,678 1,700
E³ Government211
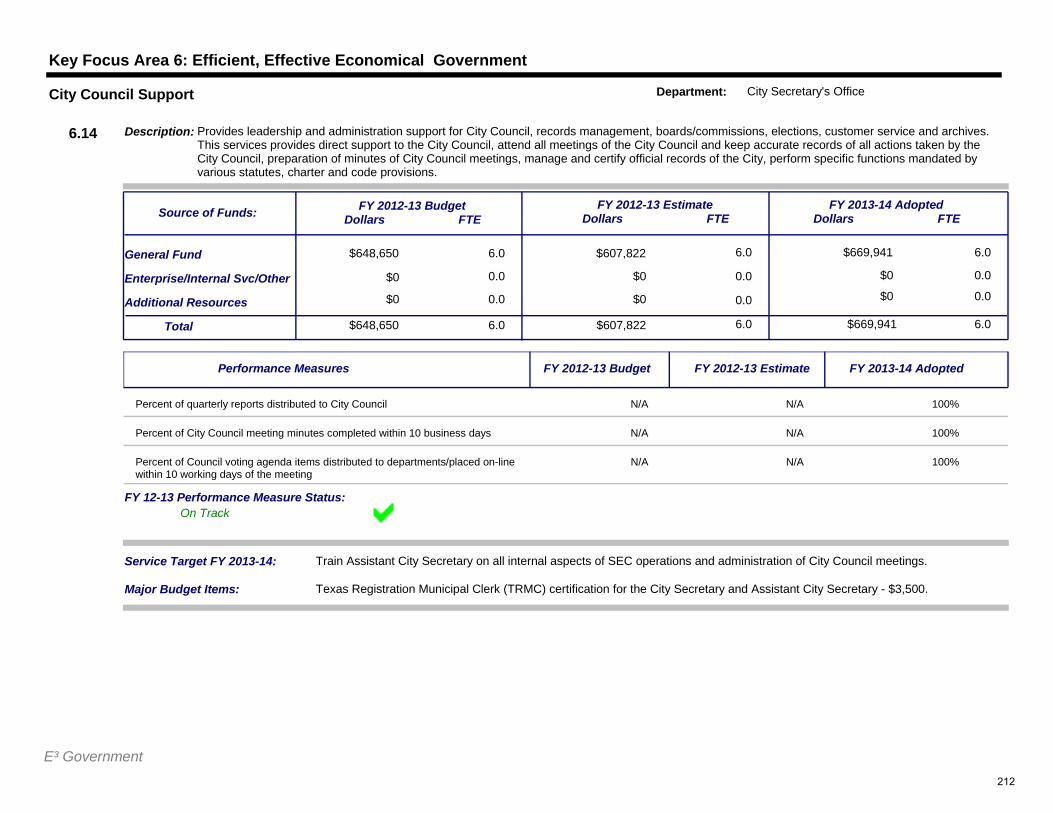
Key Focus Area 6: Efficient, Effective Economical Government
$648,650 6.0
0.0
$607,822 6.0
$0 0.0
$669,941
$0 0.0
6.0General Fund
Additional Resources
Service Target FY 2013-14: Train Assistant City Secretary on all internal aspects of SEC operations and administration of City Council meetings.
$648,650Total 6.0 $607,822 6.0 $669,941 6.0
Enterprise/Internal Svc/Other
$0 0.0 $0 0.0 $0 0.0
FY 2012-13 BudgetDollars FTE
FY 2012-13 EstimateDollars FTE
FY 2013-14 AdoptedDollars FTE
Description: Provides leadership and administration support for City Council, records management, boards/commissions, elections, customer service and archives. This services provides direct support to the City Council, attend all meetings of the City Council and keep accurate records of all actions taken by the City Council, preparation of minutes of City Council meetings, manage and certify official records of the City, perform specific functions mandated by various statutes, charter and code provisions.
Source of Funds:
6.14
City Council Support Department: City Secretary's Office
$0
Major Budget Items: Texas Registration Municipal Clerk (TRMC) certification for the City Secretary and Assistant City Secretary - $3,500.
On TrackFY 12-13 Performance Measure Status:
Performance Measures FY 2012-13 Budget FY 2012-13 Estimate FY 2013-14 Adopted
Percent of quarterly reports distributed to City Council N/A N/A 100%
Percent of City Council meeting minutes completed within 10 business days N/A N/A 100%
Percent of Council voting agenda items distributed to departments/placed on-line within 10 working days of the meeting
N/A N/A 100%
E³ Government212
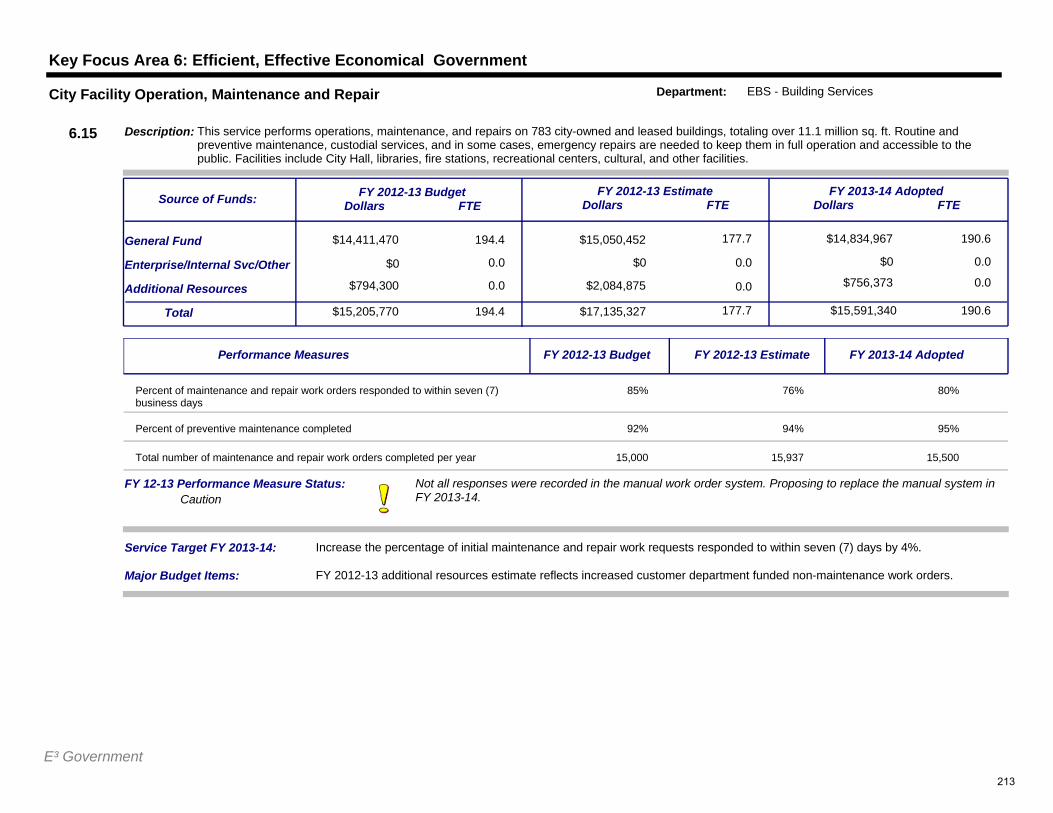
Key Focus Area 6: Efficient, Effective Economical Government
$14,411,470 194.4
0.0
$15,050,452 177.7
$0 0.0
$14,834,967
$0 0.0
190.6General Fund
Additional Resources
Service Target FY 2013-14: Increase the percentage of initial maintenance and repair work requests responded to within seven (7) days by 4%.
$15,205,770Total 194.4 $17,135,327 177.7 $15,591,340 190.6
Enterprise/Internal Svc/Other
$794,300 0.0 $2,084,875 0.0 $756,373 0.0
FY 2012-13 BudgetDollars FTE
FY 2012-13 EstimateDollars FTE
FY 2013-14 AdoptedDollars FTE
Description: This service performs operations, maintenance, and repairs on 783 city-owned and leased buildings, totaling over 11.1 million sq. ft. Routine and preventive maintenance, custodial services, and in some cases, emergency repairs are needed to keep them in full operation and accessible to the public. Facilities include City Hall, libraries, fire stations, recreational centers, cultural, and other facilities.
Source of Funds:
6.15
City Facility Operation, Maintenance and Repair Department: EBS - Building Services
$0
Major Budget Items: FY 2012-13 additional resources estimate reflects increased customer department funded non-maintenance work orders.
Not all responses were recorded in the manual work order system. Proposing to replace the manual system in FY 2013-14. Caution
FY 12-13 Performance Measure Status:
Performance Measures FY 2012-13 Budget FY 2012-13 Estimate FY 2013-14 Adopted
Percent of maintenance and repair work orders responded to within seven (7) business days
85% 76% 80%
Percent of preventive maintenance completed 92% 94% 95%
Total number of maintenance and repair work orders completed per year 15,000 15,937 15,500
E³ Government213
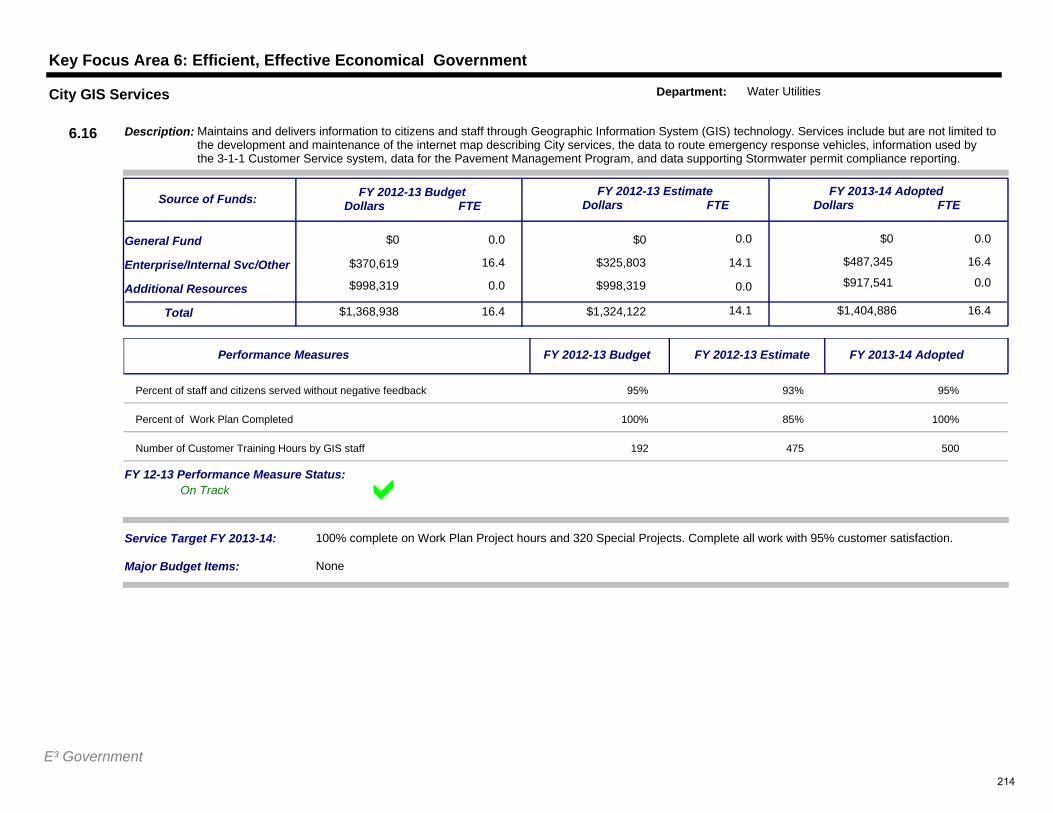
Key Focus Area 6: Efficient, Effective Economical Government
$0 0.0
16.4
$0 0.0
$325,803 14.1
$0
$487,345 16.4
0.0General Fund
Additional Resources
Service Target FY 2013-14: 100% complete on Work Plan Project hours and 320 Special Projects. Complete all work with 95% customer satisfaction.
$1,368,938Total 16.4 $1,324,122 14.1 $1,404,886 16.4
Enterprise/Internal Svc/Other
$998,319 0.0 $998,319 0.0 $917,541 0.0
FY 2012-13 BudgetDollars FTE
FY 2012-13 EstimateDollars FTE
FY 2013-14 AdoptedDollars FTE
Description: Maintains and delivers information to citizens and staff through Geographic Information System (GIS) technology. Services include but are not limited to the development and maintenance of the internet map describing City services, the data to route emergency response vehicles, information used by the 3-1-1 Customer Service system, data for the Pavement Management Program, and data supporting Stormwater permit compliance reporting.
Source of Funds:
6.16
City GIS Services Department: Water Utilities
$370,619
Major Budget Items: None
On TrackFY 12-13 Performance Measure Status:
Performance Measures FY 2012-13 Budget FY 2012-13 Estimate FY 2013-14 Adopted
Percent of staff and citizens served without negative feedback 95% 93% 95%
Percent of Work Plan Completed 100% 85% 100%
Number of Customer Training Hours by GIS staff 192 475 500
E³ Government214
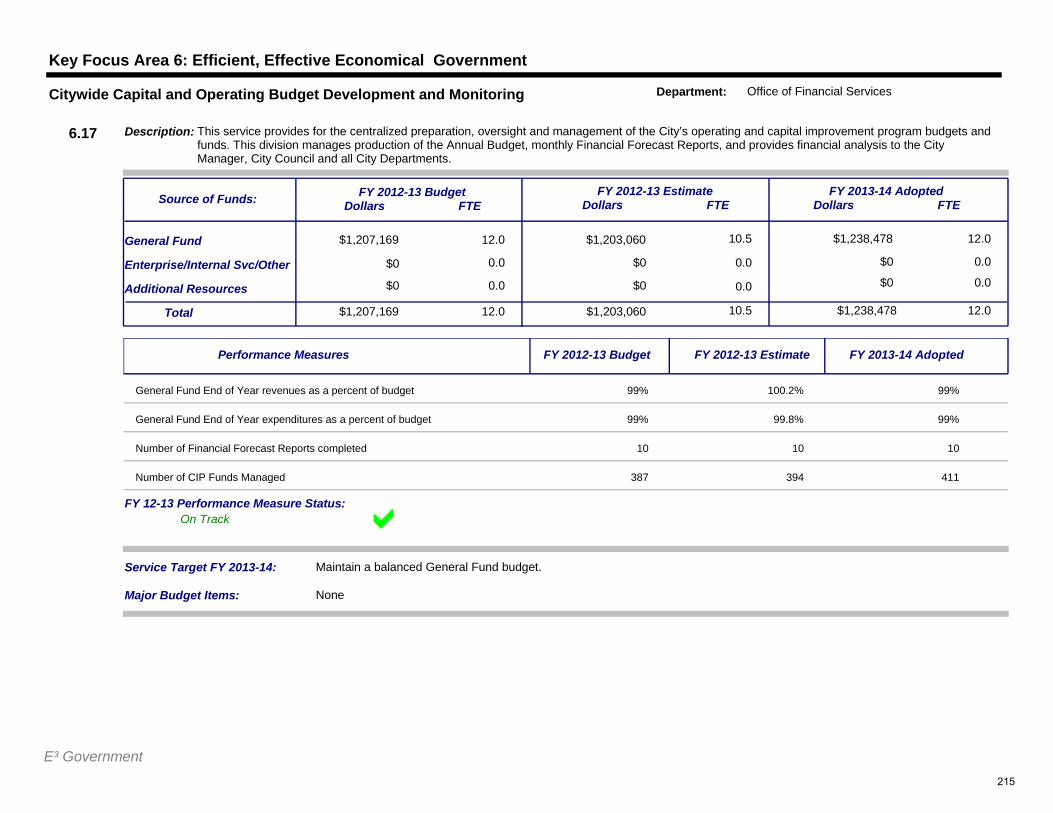
Key Focus Area 6: Efficient, Effective Economical Government
$1,207,169 12.0
0.0
$1,203,060 10.5
$0 0.0
$1,238,478
$0 0.0
12.0General Fund
Additional Resources
Service Target FY 2013-14: Maintain a balanced General Fund budget.
$1,207,169Total 12.0 $1,203,060 10.5 $1,238,478 12.0
Enterprise/Internal Svc/Other
$0 0.0 $0 0.0 $0 0.0
FY 2012-13 BudgetDollars FTE
FY 2012-13 EstimateDollars FTE
FY 2013-14 AdoptedDollars FTE
Description: This service provides for the centralized preparation, oversight and management of the City’s operating and capital improvement program budgets and funds. This division manages production of the Annual Budget, monthly Financial Forecast Reports, and provides financial analysis to the City Manager, City Council and all City Departments.
Source of Funds:
6.17
Citywide Capital and Operating Budget Development and Monitoring Department: Office of Financial Services
$0
Major Budget Items: None
On TrackFY 12-13 Performance Measure Status:
Performance Measures FY 2012-13 Budget FY 2012-13 Estimate FY 2013-14 Adopted
General Fund End of Year revenues as a percent of budget 99% 100.2% 99%
General Fund End of Year expenditures as a percent of budget 99% 99.8% 99%
Number of Financial Forecast Reports completed 10 10 10
Number of CIP Funds Managed 387 394 411
E³ Government215
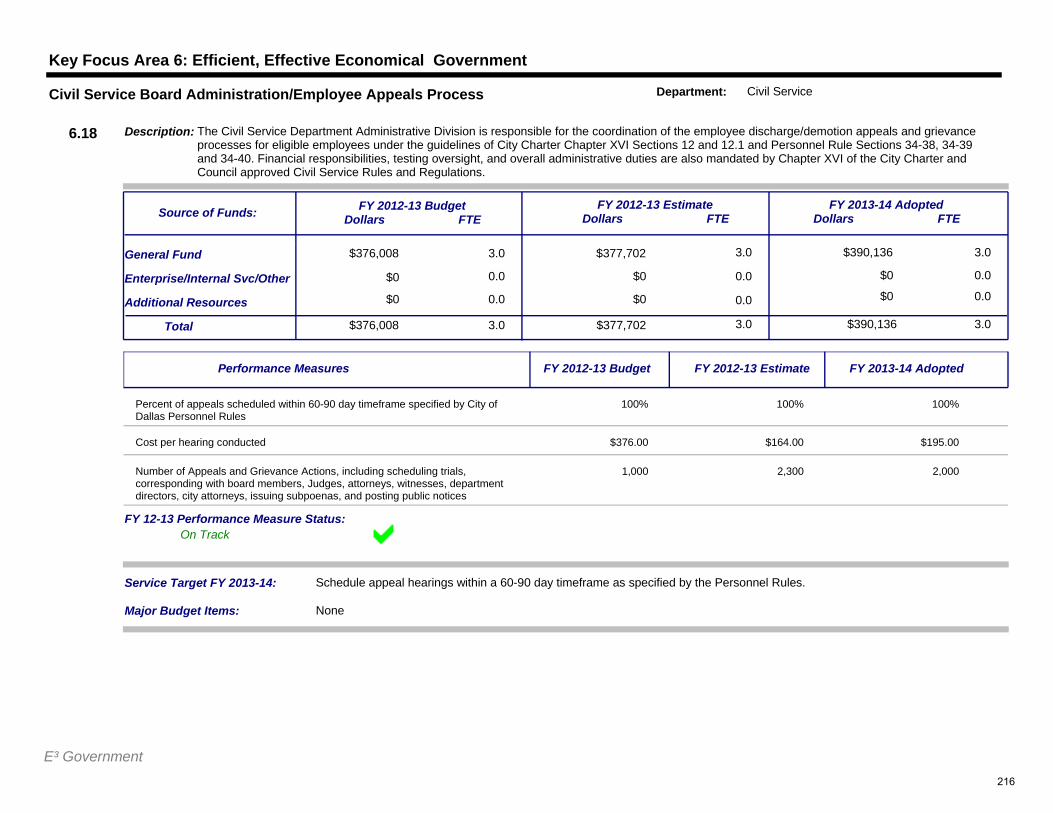
Key Focus Area 6: Efficient, Effective Economical Government
$376,008 3.0
0.0
$377,702 3.0
$0 0.0
$390,136
$0 0.0
3.0General Fund
Additional Resources
Service Target FY 2013-14: Schedule appeal hearings within a 60-90 day timeframe as specified by the Personnel Rules.
$376,008Total 3.0 $377,702 3.0 $390,136 3.0
Enterprise/Internal Svc/Other
$0 0.0 $0 0.0 $0 0.0
FY 2012-13 BudgetDollars FTE
FY 2012-13 EstimateDollars FTE
FY 2013-14 AdoptedDollars FTE
Description: The Civil Service Department Administrative Division is responsible for the coordination of the employee discharge/demotion appeals and grievance processes for eligible employees under the guidelines of City Charter Chapter XVI Sections 12 and 12.1 and Personnel Rule Sections 34-38, 34-39 and 34-40. Financial responsibilities, testing oversight, and overall administrative duties are also mandated by Chapter XVI of the City Charter and Council approved Civil Service Rules and Regulations.
Source of Funds:
6.18
Civil Service Board Administration/Employee Appeals Process Department: Civil Service
$0
Major Budget Items: None
On TrackFY 12-13 Performance Measure Status:
Performance Measures FY 2012-13 Budget FY 2012-13 Estimate FY 2013-14 Adopted
Percent of appeals scheduled within 60-90 day timeframe specified by City of Dallas Personnel Rules
100% 100% 100%
Cost per hearing conducted $376.00 $164.00 $195.00
Number of Appeals and Grievance Actions, including scheduling trials, corresponding with board members, Judges, attorneys, witnesses, department directors, city attorneys, issuing subpoenas, and posting public notices
1,000 2,300 2,000
E³ Government216
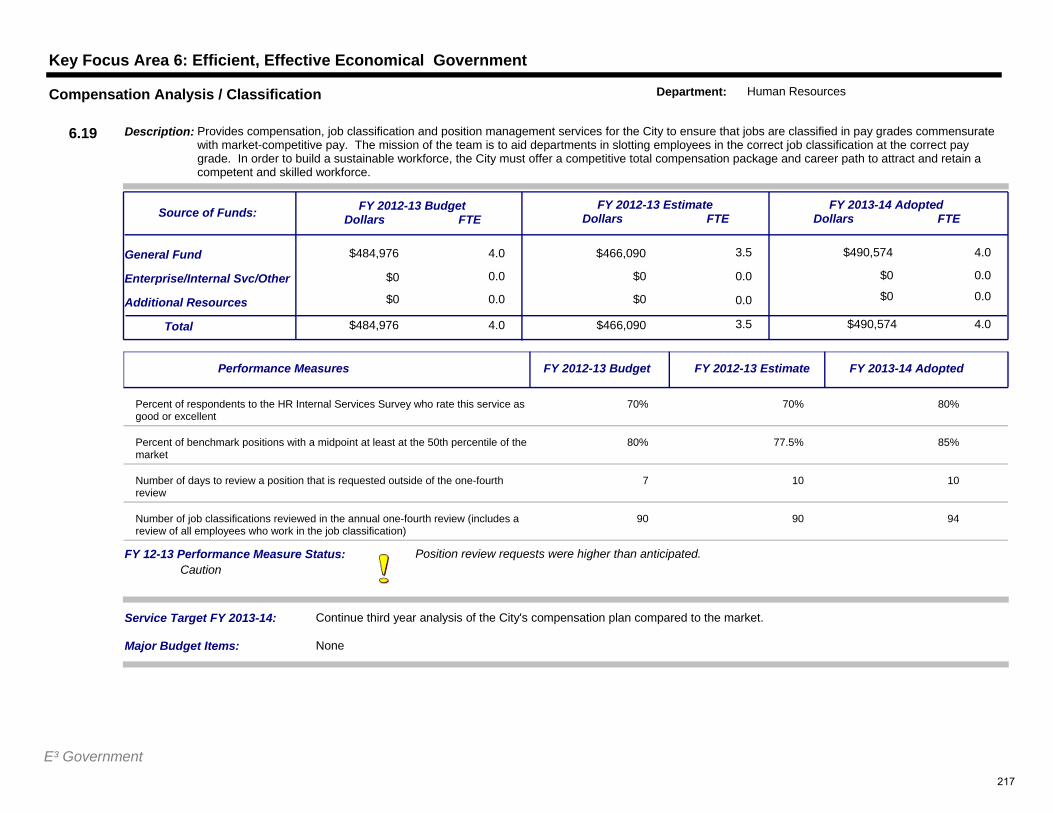
Key Focus Area 6: Efficient, Effective Economical Government
$484,976 4.0
0.0
$466,090 3.5
$0 0.0
$490,574
$0 0.0
4.0General Fund
Additional Resources
Service Target FY 2013-14: Continue third year analysis of the City's compensation plan compared to the market.
$484,976Total 4.0 $466,090 3.5 $490,574 4.0
Enterprise/Internal Svc/Other
$0 0.0 $0 0.0 $0 0.0
FY 2012-13 BudgetDollars FTE
FY 2012-13 EstimateDollars FTE
FY 2013-14 AdoptedDollars FTE
Description: Provides compensation, job classification and position management services for the City to ensure that jobs are classified in pay grades commensurate with market-competitive pay. The mission of the team is to aid departments in slotting employees in the correct job classification at the correct pay grade. In order to build a sustainable workforce, the City must offer a competitive total compensation package and career path to attract and retain a competent and skilled workforce.
Source of Funds:
6.19
Compensation Analysis / Classification Department: Human Resources
$0
Major Budget Items: None
Position review requests were higher than anticipated.Caution
FY 12-13 Performance Measure Status:
Performance Measures FY 2012-13 Budget FY 2012-13 Estimate FY 2013-14 Adopted
Percent of respondents to the HR Internal Services Survey who rate this service as good or excellent
70% 70% 80%
Percent of benchmark positions with a midpoint at least at the 50th percentile of the market
80% 77.5% 85%
Number of days to review a position that is requested outside of the one-fourth review
7 10 10
Number of job classifications reviewed in the annual one-fourth review (includes a review of all employees who work in the job classification)
90 90 94
E³ Government217
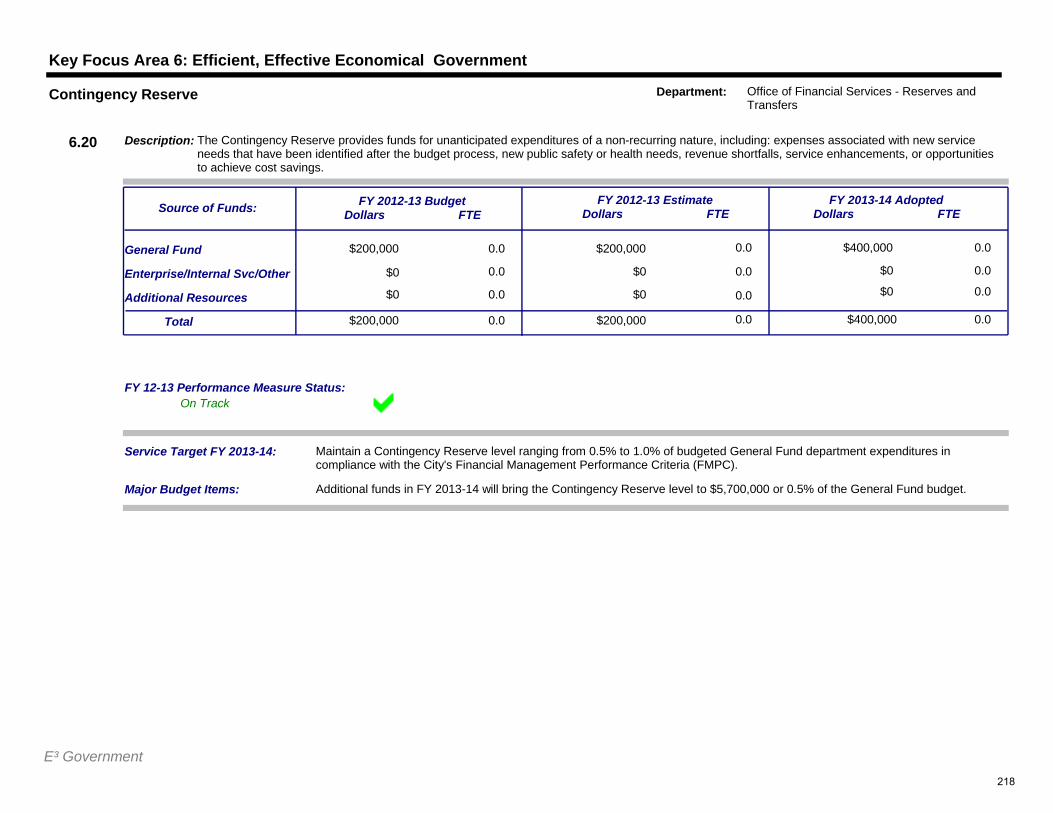
Key Focus Area 6: Efficient, Effective Economical Government
$200,000 0.0
0.0
$200,000 0.0
$0 0.0
$400,000
$0 0.0
0.0General Fund
Additional Resources
Service Target FY 2013-14: Maintain a Contingency Reserve level ranging from 0.5% to 1.0% of budgeted General Fund department expenditures in compliance with the City's Financial Management Performance Criteria (FMPC).
$200,000Total 0.0 $200,000 0.0 $400,000 0.0
Enterprise/Internal Svc/Other
$0 0.0 $0 0.0 $0 0.0
FY 2012-13 BudgetDollars FTE
FY 2012-13 EstimateDollars FTE
FY 2013-14 AdoptedDollars FTE
Description: The Contingency Reserve provides funds for unanticipated expenditures of a non-recurring nature, including: expenses associated with new service needs that have been identified after the budget process, new public safety or health needs, revenue shortfalls, service enhancements, or opportunities to achieve cost savings.
Source of Funds:
6.20
Contingency Reserve Department: Office of Financial Services - Reserves and Transfers
$0
Major Budget Items: Additional funds in FY 2013-14 will bring the Contingency Reserve level to $5,700,000 or 0.5% of the General Fund budget.
On TrackFY 12-13 Performance Measure Status:
E³ Government218
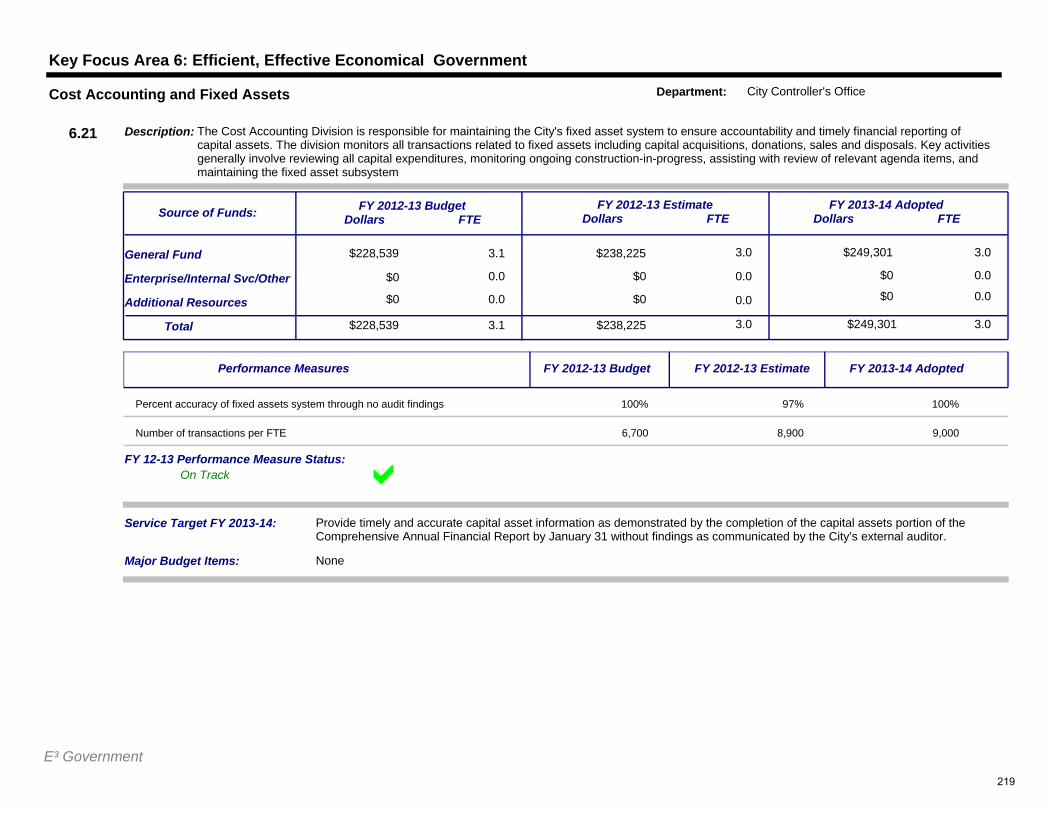
Key Focus Area 6: Efficient, Effective Economical Government
$228,539 3.1
0.0
$238,225 3.0
$0 0.0
$249,301
$0 0.0
3.0General Fund
Additional Resources
Service Target FY 2013-14: Provide timely and accurate capital asset information as demonstrated by the completion of the capital assets portion of the Comprehensive Annual Financial Report by January 31 without findings as communicated by the City’s external auditor.
$228,539Total 3.1 $238,225 3.0 $249,301 3.0
Enterprise/Internal Svc/Other
$0 0.0 $0 0.0 $0 0.0
FY 2012-13 BudgetDollars FTE
FY 2012-13 EstimateDollars FTE
FY 2013-14 AdoptedDollars FTE
Description: The Cost Accounting Division is responsible for maintaining the City's fixed asset system to ensure accountability and timely financial reporting of capital assets. The division monitors all transactions related to fixed assets including capital acquisitions, donations, sales and disposals. Key activities generally involve reviewing all capital expenditures, monitoring ongoing construction-in-progress, assisting with review of relevant agenda items, and maintaining the fixed asset subsystem
Source of Funds:
6.21
Cost Accounting and Fixed Assets Department: City Controller's Office
$0
Major Budget Items: None
On TrackFY 12-13 Performance Measure Status:
Performance Measures FY 2012-13 Budget FY 2012-13 Estimate FY 2013-14 Adopted
Percent accuracy of fixed assets system through no audit findings 100% 97% 100%
Number of transactions per FTE 6,700 8,900 9,000
E³ Government219
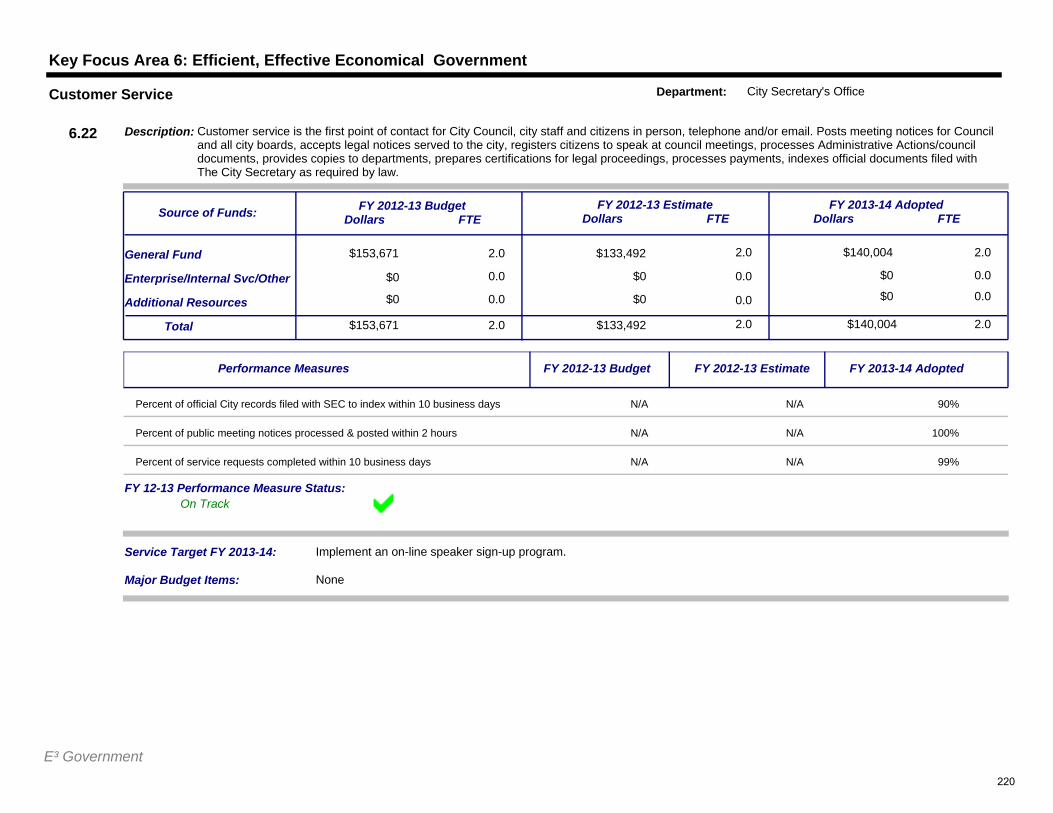
Key Focus Area 6: Efficient, Effective Economical Government
$153,671 2.0
0.0
$133,492 2.0
$0 0.0
$140,004
$0 0.0
2.0General Fund
Additional Resources
Service Target FY 2013-14: Implement an on-line speaker sign-up program.
$153,671Total 2.0 $133,492 2.0 $140,004 2.0
Enterprise/Internal Svc/Other
$0 0.0 $0 0.0 $0 0.0
FY 2012-13 BudgetDollars FTE
FY 2012-13 EstimateDollars FTE
FY 2013-14 AdoptedDollars FTE
Description: Customer service is the first point of contact for City Council, city staff and citizens in person, telephone and/or email. Posts meeting notices for Council and all city boards, accepts legal notices served to the city, registers citizens to speak at council meetings, processes Administrative Actions/council documents, provides copies to departments, prepares certifications for legal proceedings, processes payments, indexes official documents filed with The City Secretary as required by law.
Source of Funds:
6.22
Customer Service Department: City Secretary's Office
$0
Major Budget Items: None
On TrackFY 12-13 Performance Measure Status:
Performance Measures FY 2012-13 Budget FY 2012-13 Estimate FY 2013-14 Adopted
Percent of official City records filed with SEC to index within 10 business days N/A N/A 90%
Percent of public meeting notices processed & posted within 2 hours N/A N/A 100%
Percent of service requests completed within 10 business days N/A N/A 99%
E³ Government220
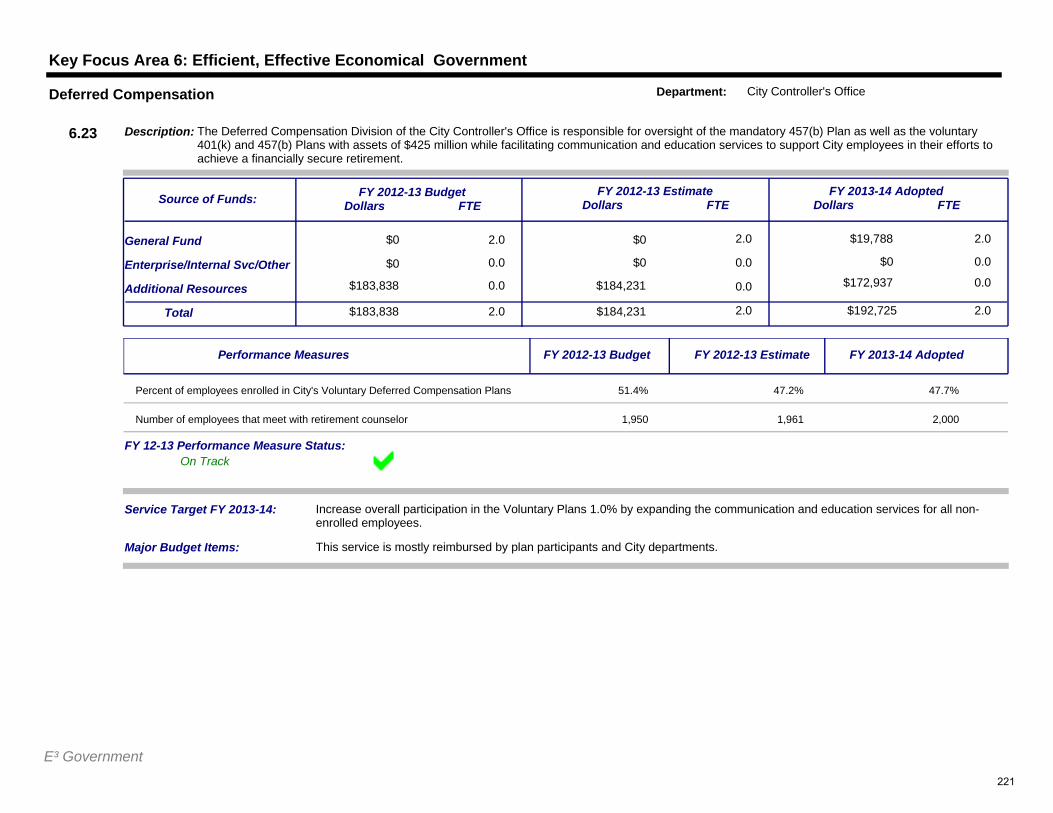
Key Focus Area 6: Efficient, Effective Economical Government
$0 2.0
0.0
$0 2.0
$0 0.0
$19,788
$0 0.0
2.0General Fund
Additional Resources
Service Target FY 2013-14: Increase overall participation in the Voluntary Plans 1.0% by expanding the communication and education services for all non-enrolled employees.
$183,838Total 2.0 $184,231 2.0 $192,725 2.0
Enterprise/Internal Svc/Other
$183,838 0.0 $184,231 0.0 $172,937 0.0
FY 2012-13 BudgetDollars FTE
FY 2012-13 EstimateDollars FTE
FY 2013-14 AdoptedDollars FTE
Description: The Deferred Compensation Division of the City Controller's Office is responsible for oversight of the mandatory 457(b) Plan as well as the voluntary 401(k) and 457(b) Plans with assets of $425 million while facilitating communication and education services to support City employees in their efforts to achieve a financially secure retirement.
Source of Funds:
6.23
Deferred Compensation Department: City Controller's Office
$0
Major Budget Items: This service is mostly reimbursed by plan participants and City departments.
On TrackFY 12-13 Performance Measure Status:
Performance Measures FY 2012-13 Budget FY 2012-13 Estimate FY 2013-14 Adopted
Percent of employees enrolled in City's Voluntary Deferred Compensation Plans 51.4% 47.2% 47.7%
Number of employees that meet with retirement counselor 1,950 1,961 2,000
E³ Government221
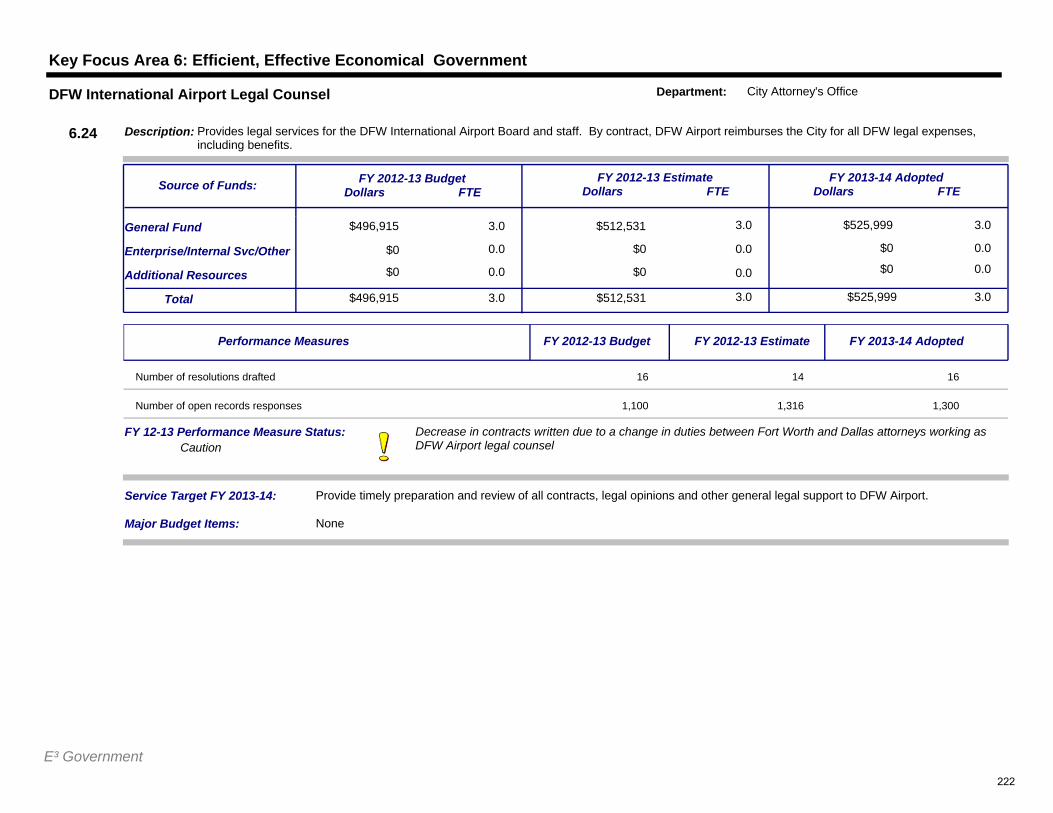
Key Focus Area 6: Efficient, Effective Economical Government
$496,915 3.0
0.0
$512,531 3.0
$0 0.0
$525,999
$0 0.0
3.0General Fund
Additional Resources
Service Target FY 2013-14: Provide timely preparation and review of all contracts, legal opinions and other general legal support to DFW Airport.
$496,915Total 3.0 $512,531 3.0 $525,999 3.0
Enterprise/Internal Svc/Other
$0 0.0 $0 0.0 $0 0.0
FY 2012-13 BudgetDollars FTE
FY 2012-13 EstimateDollars FTE
FY 2013-14 AdoptedDollars FTE
Description: Provides legal services for the DFW International Airport Board and staff. By contract, DFW Airport reimburses the City for all DFW legal expenses, including benefits.
Source of Funds:
6.24
DFW International Airport Legal Counsel Department: City Attorney's Office
$0
Major Budget Items: None
Decrease in contracts written due to a change in duties between Fort Worth and Dallas attorneys working as DFW Airport legal counselCaution
FY 12-13 Performance Measure Status:
Performance Measures FY 2012-13 Budget FY 2012-13 Estimate FY 2013-14 Adopted
Number of resolutions drafted 16 14 16
Number of open records responses 1,100 1,316 1,300
E³ Government222
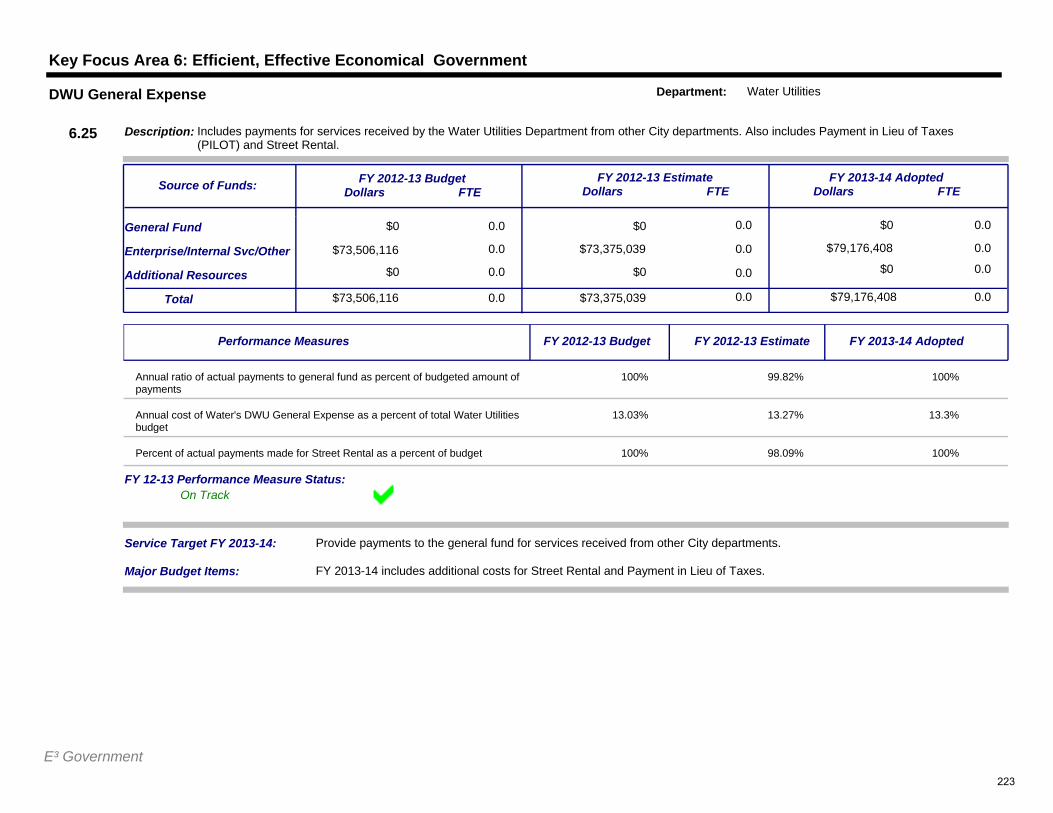
Key Focus Area 6: Efficient, Effective Economical Government
$0 0.0
0.0
$0 0.0
$73,375,039 0.0
$0
$79,176,408 0.0
0.0General Fund
Additional Resources
Service Target FY 2013-14: Provide payments to the general fund for services received from other City departments.
$73,506,116Total 0.0 $73,375,039 0.0 $79,176,408 0.0
Enterprise/Internal Svc/Other
$0 0.0 $0 0.0 $0 0.0
FY 2012-13 BudgetDollars FTE
FY 2012-13 EstimateDollars FTE
FY 2013-14 AdoptedDollars FTE
Description: Includes payments for services received by the Water Utilities Department from other City departments. Also includes Payment in Lieu of Taxes (PILOT) and Street Rental.
Source of Funds:
6.25
DWU General Expense Department: Water Utilities
$73,506,116
Major Budget Items: FY 2013-14 includes additional costs for Street Rental and Payment in Lieu of Taxes.
On TrackFY 12-13 Performance Measure Status:
Performance Measures FY 2012-13 Budget FY 2012-13 Estimate FY 2013-14 Adopted
Annual ratio of actual payments to general fund as percent of budgeted amount of payments
100% 99.82% 100%
Annual cost of Water's DWU General Expense as a percent of total Water Utilities budget
13.03% 13.27% 13.3%
Percent of actual payments made for Street Rental as a percent of budget 100% 98.09% 100%
E³ Government223
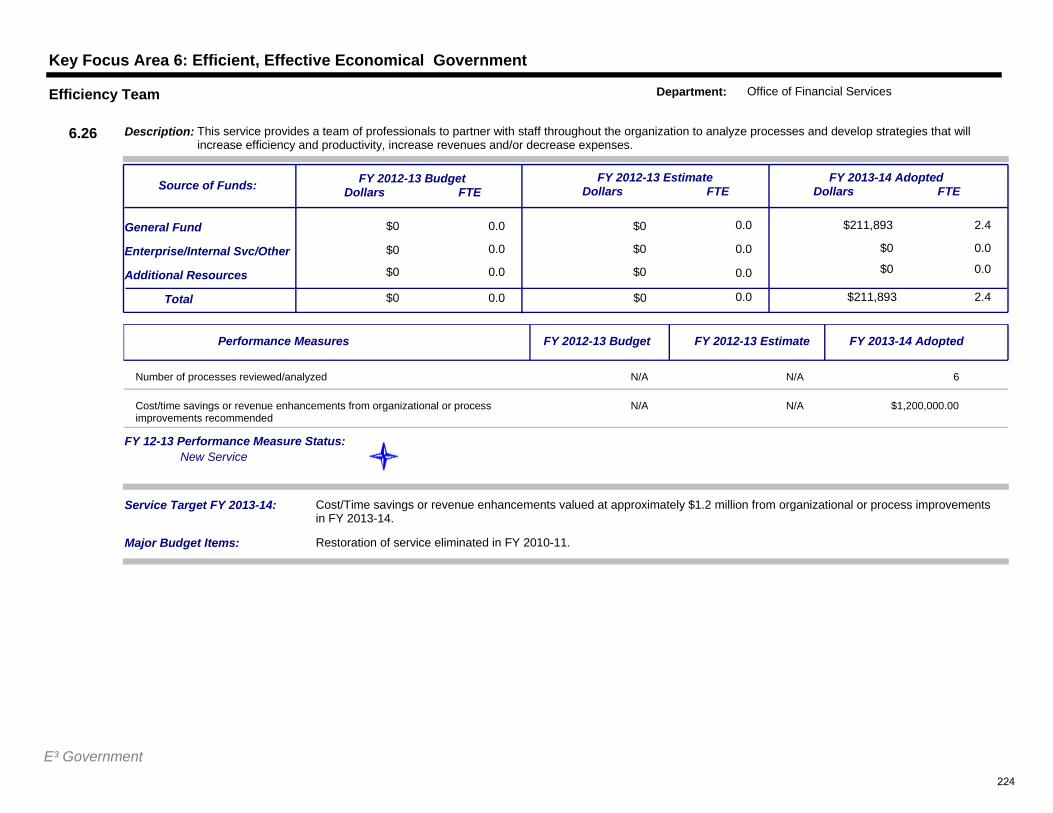
Key Focus Area 6: Efficient, Effective Economical Government
$0 0.0
0.0
$0 0.0
$0 0.0
$211,893
$0 0.0
2.4General Fund
Additional Resources
Service Target FY 2013-14: Cost/Time savings or revenue enhancements valued at approximately $1.2 million from organizational or process improvements in FY 2013-14.
$0Total 0.0 $0 0.0 $211,893 2.4
Enterprise/Internal Svc/Other
$0 0.0 $0 0.0 $0 0.0
FY 2012-13 BudgetDollars FTE
FY 2012-13 EstimateDollars FTE
FY 2013-14 AdoptedDollars FTE
Description: This service provides a team of professionals to partner with staff throughout the organization to analyze processes and develop strategies that will increase efficiency and productivity, increase revenues and/or decrease expenses.
Source of Funds:
6.26
Efficiency Team Department: Office of Financial Services
$0
Major Budget Items: Restoration of service eliminated in FY 2010-11.
New ServiceFY 12-13 Performance Measure Status:
Performance Measures FY 2012-13 Budget FY 2012-13 Estimate FY 2013-14 Adopted
Number of processes reviewed/analyzed N/A N/A 6
Cost/time savings or revenue enhancements from organizational or process improvements recommended
N/A N/A $1,200,000.00
E³ Government224
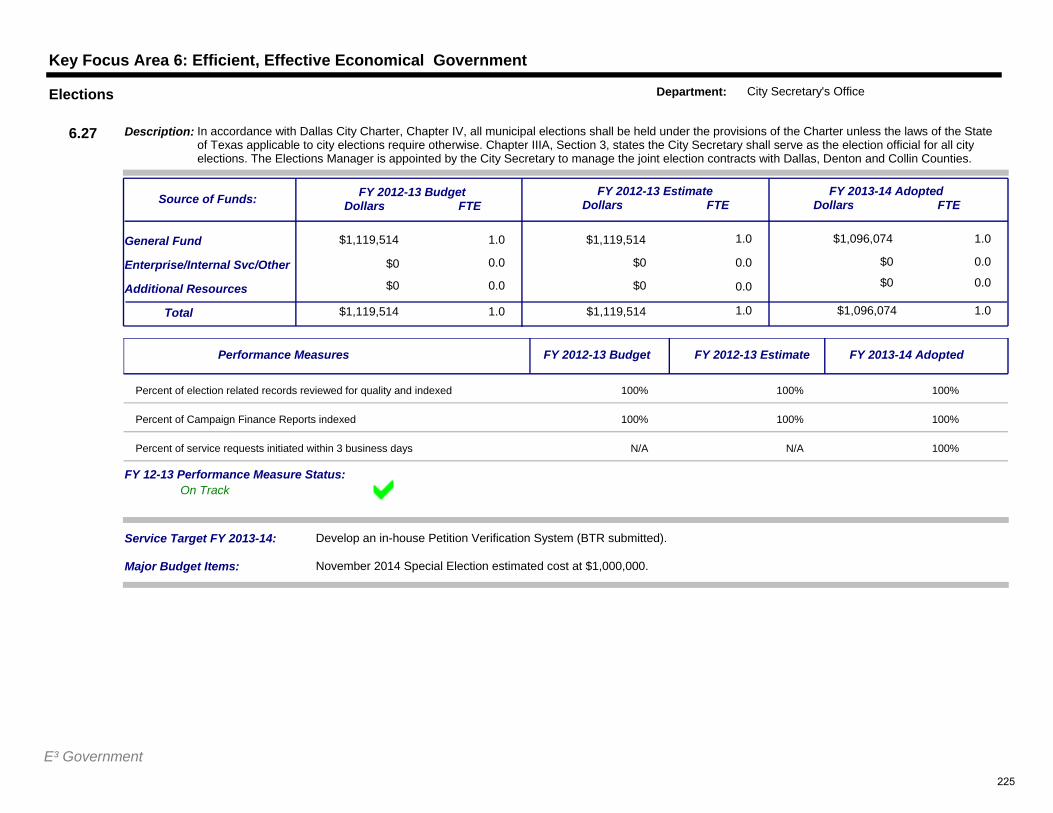
Key Focus Area 6: Efficient, Effective Economical Government
$1,119,514 1.0
0.0
$1,119,514 1.0
$0 0.0
$1,096,074
$0 0.0
1.0General Fund
Additional Resources
Service Target FY 2013-14: Develop an in-house Petition Verification System (BTR submitted).
$1,119,514Total 1.0 $1,119,514 1.0 $1,096,074 1.0
Enterprise/Internal Svc/Other
$0 0.0 $0 0.0 $0 0.0
FY 2012-13 BudgetDollars FTE
FY 2012-13 EstimateDollars FTE
FY 2013-14 AdoptedDollars FTE
Description: In accordance with Dallas City Charter, Chapter IV, all municipal elections shall be held under the provisions of the Charter unless the laws of the State of Texas applicable to city elections require otherwise. Chapter IIIA, Section 3, states the City Secretary shall serve as the election official for all city elections. The Elections Manager is appointed by the City Secretary to manage the joint election contracts with Dallas, Denton and Collin Counties.
Source of Funds:
6.27
Elections Department: City Secretary's Office
$0
Major Budget Items: November 2014 Special Election estimated cost at $1,000,000.
On TrackFY 12-13 Performance Measure Status:
Performance Measures FY 2012-13 Budget FY 2012-13 Estimate FY 2013-14 Adopted
Percent of election related records reviewed for quality and indexed 100% 100% 100%
Percent of Campaign Finance Reports indexed 100% 100% 100%
Percent of service requests initiated within 3 business days N/A N/A 100%
E³ Government225
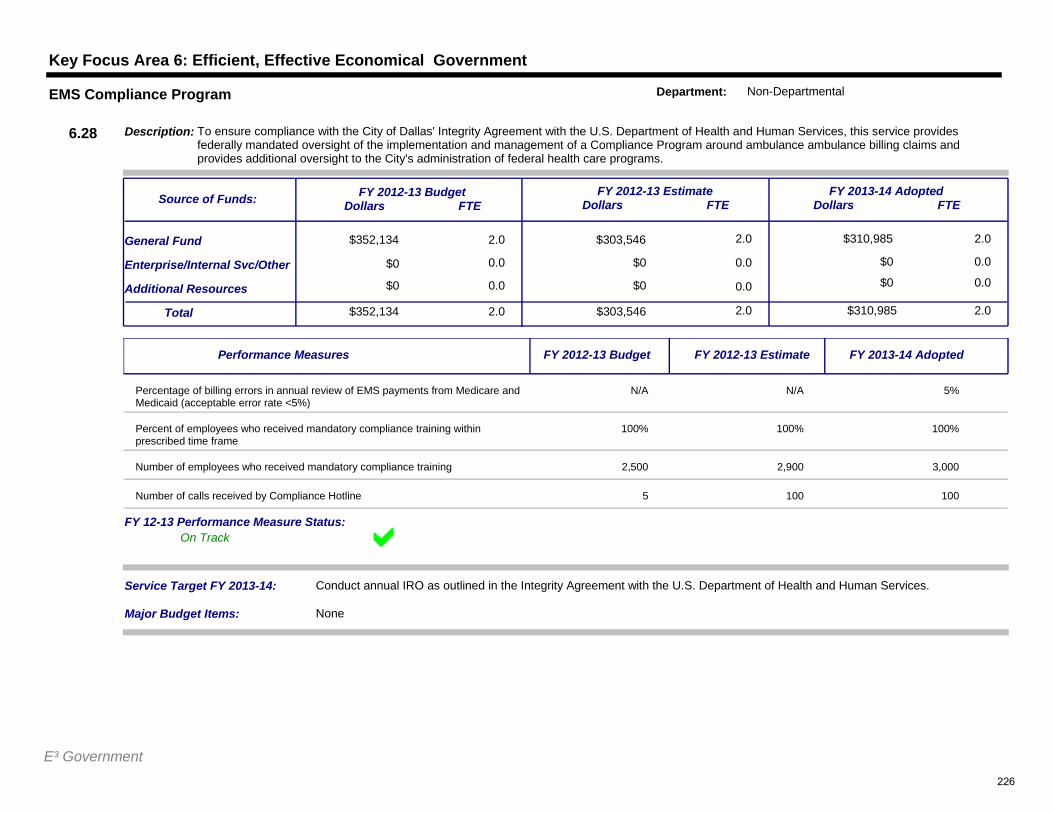
Key Focus Area 6: Efficient, Effective Economical Government
$352,134 2.0
0.0
$303,546 2.0
$0 0.0
$310,985
$0 0.0
2.0General Fund
Additional Resources
Service Target FY 2013-14: Conduct annual IRO as outlined in the Integrity Agreement with the U.S. Department of Health and Human Services.
$352,134Total 2.0 $303,546 2.0 $310,985 2.0
Enterprise/Internal Svc/Other
$0 0.0 $0 0.0 $0 0.0
FY 2012-13 BudgetDollars FTE
FY 2012-13 EstimateDollars FTE
FY 2013-14 AdoptedDollars FTE
Description: To ensure compliance with the City of Dallas' Integrity Agreement with the U.S. Department of Health and Human Services, this service provides federally mandated oversight of the implementation and management of a Compliance Program around ambulance ambulance billing claims and provides additional oversight to the City's administration of federal health care programs.
Source of Funds:
6.28
EMS Compliance Program Department: Non-Departmental
$0
Major Budget Items: None
On TrackFY 12-13 Performance Measure Status:
Performance Measures FY 2012-13 Budget FY 2012-13 Estimate FY 2013-14 Adopted
Percentage of billing errors in annual review of EMS payments from Medicare and Medicaid (acceptable error rate <5%)
N/A N/A 5%
Percent of employees who received mandatory compliance training within prescribed time frame
100% 100% 100%
Number of employees who received mandatory compliance training 2,500 2,900 3,000
Number of calls received by Compliance Hotline 5 100 100
E³ Government226
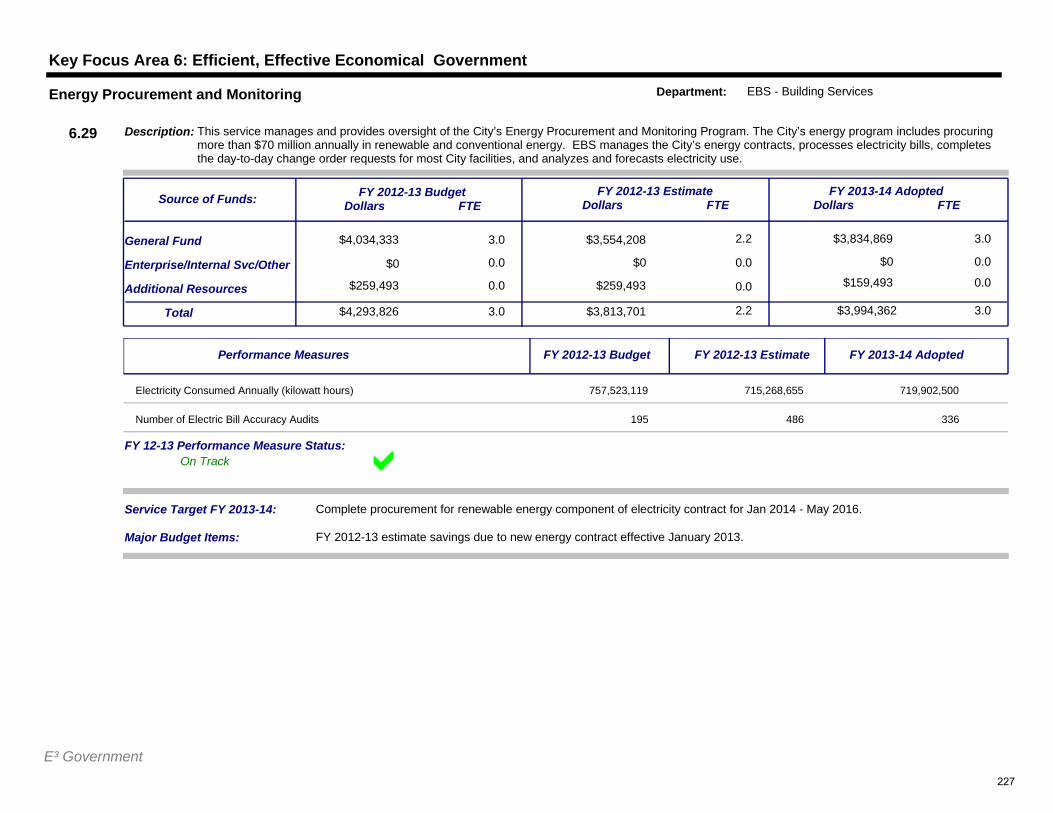
Key Focus Area 6: Efficient, Effective Economical Government
$4,034,333 3.0
0.0
$3,554,208 2.2
$0 0.0
$3,834,869
$0 0.0
3.0General Fund
Additional Resources
Service Target FY 2013-14: Complete procurement for renewable energy component of electricity contract for Jan 2014 - May 2016.
$4,293,826Total 3.0 $3,813,701 2.2 $3,994,362 3.0
Enterprise/Internal Svc/Other
$259,493 0.0 $259,493 0.0 $159,493 0.0
FY 2012-13 BudgetDollars FTE
FY 2012-13 EstimateDollars FTE
FY 2013-14 AdoptedDollars FTE
Description: This service manages and provides oversight of the City’s Energy Procurement and Monitoring Program. The City’s energy program includes procuring more than $70 million annually in renewable and conventional energy. EBS manages the City’s energy contracts, processes electricity bills, completes the day-to-day change order requests for most City facilities, and analyzes and forecasts electricity use.
Source of Funds:
6.29
Energy Procurement and Monitoring Department: EBS - Building Services
$0
Major Budget Items: FY 2012-13 estimate savings due to new energy contract effective January 2013.
On TrackFY 12-13 Performance Measure Status:
Performance Measures FY 2012-13 Budget FY 2012-13 Estimate FY 2013-14 Adopted
Electricity Consumed Annually (kilowatt hours) 757,523,119 715,268,655 719,902,500
Number of Electric Bill Accuracy Audits 195 486 336
E³ Government227
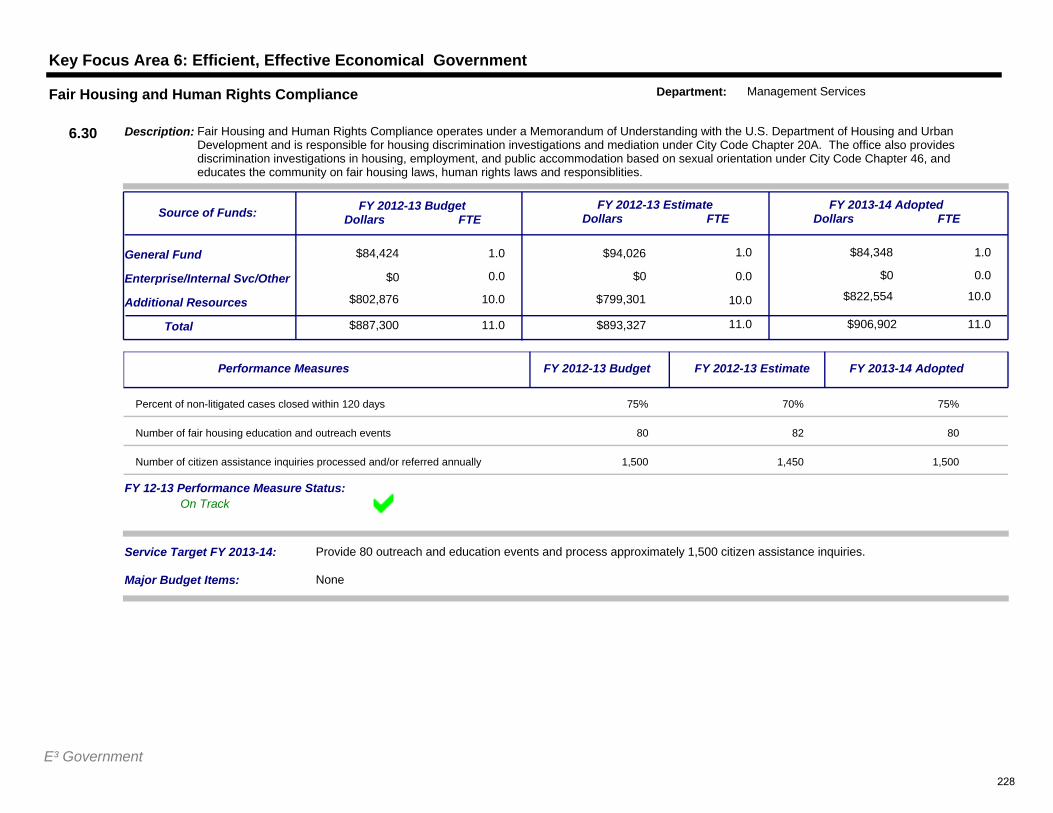
Key Focus Area 6: Efficient, Effective Economical Government
$84,424 1.0
0.0
$94,026 1.0
$0 0.0
$84,348
$0 0.0
1.0General Fund
Additional Resources
Service Target FY 2013-14: Provide 80 outreach and education events and process approximately 1,500 citizen assistance inquiries.
$887,300Total 11.0 $893,327 11.0 $906,902 11.0
Enterprise/Internal Svc/Other
$802,876 10.0 $799,301 10.0 $822,554 10.0
FY 2012-13 BudgetDollars FTE
FY 2012-13 EstimateDollars FTE
FY 2013-14 AdoptedDollars FTE
Description: Fair Housing and Human Rights Compliance operates under a Memorandum of Understanding with the U.S. Department of Housing and Urban Development and is responsible for housing discrimination investigations and mediation under City Code Chapter 20A. The office also provides discrimination investigations in housing, employment, and public accommodation based on sexual orientation under City Code Chapter 46, and educates the community on fair housing laws, human rights laws and responsiblities.
Source of Funds:
6.30
Fair Housing and Human Rights Compliance Department: Management Services
$0
Major Budget Items: None
On TrackFY 12-13 Performance Measure Status:
Performance Measures FY 2012-13 Budget FY 2012-13 Estimate FY 2013-14 Adopted
Percent of non-litigated cases closed within 120 days 75% 70% 75%
Number of fair housing education and outreach events 80 82 80
Number of citizen assistance inquiries processed and/or referred annually 1,500 1,450 1,500
E³ Government228
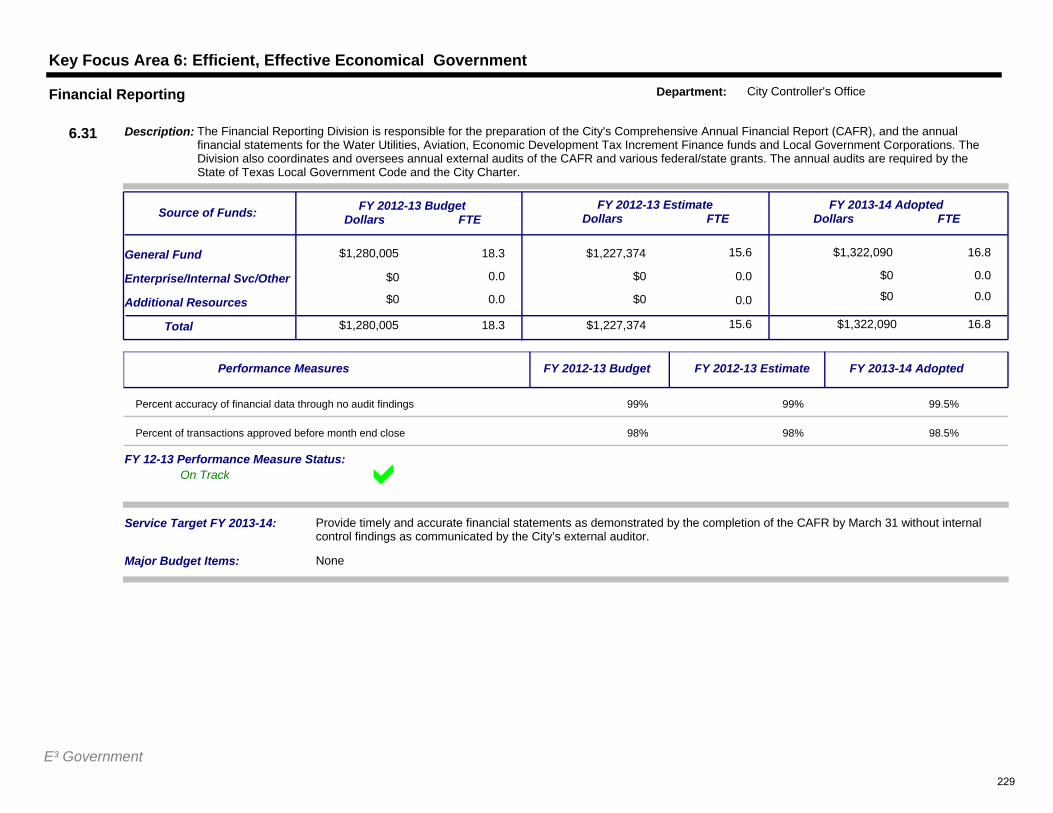
Key Focus Area 6: Efficient, Effective Economical Government
$1,280,005 18.3
0.0
$1,227,374 15.6
$0 0.0
$1,322,090
$0 0.0
16.8General Fund
Additional Resources
Service Target FY 2013-14: Provide timely and accurate financial statements as demonstrated by the completion of the CAFR by March 31 without internal control findings as communicated by the City’s external auditor.
$1,280,005Total 18.3 $1,227,374 15.6 $1,322,090 16.8
Enterprise/Internal Svc/Other
$0 0.0 $0 0.0 $0 0.0
FY 2012-13 BudgetDollars FTE
FY 2012-13 EstimateDollars FTE
FY 2013-14 AdoptedDollars FTE
Description: The Financial Reporting Division is responsible for the preparation of the City's Comprehensive Annual Financial Report (CAFR), and the annual financial statements for the Water Utilities, Aviation, Economic Development Tax Increment Finance funds and Local Government Corporations. The Division also coordinates and oversees annual external audits of the CAFR and various federal/state grants. The annual audits are required by the State of Texas Local Government Code and the City Charter.
Source of Funds:
6.31
Financial Reporting Department: City Controller's Office
$0
Major Budget Items: None
On TrackFY 12-13 Performance Measure Status:
Performance Measures FY 2012-13 Budget FY 2012-13 Estimate FY 2013-14 Adopted
Percent accuracy of financial data through no audit findings 99% 99% 99.5%
Percent of transactions approved before month end close 98% 98% 98.5%
E³ Government229
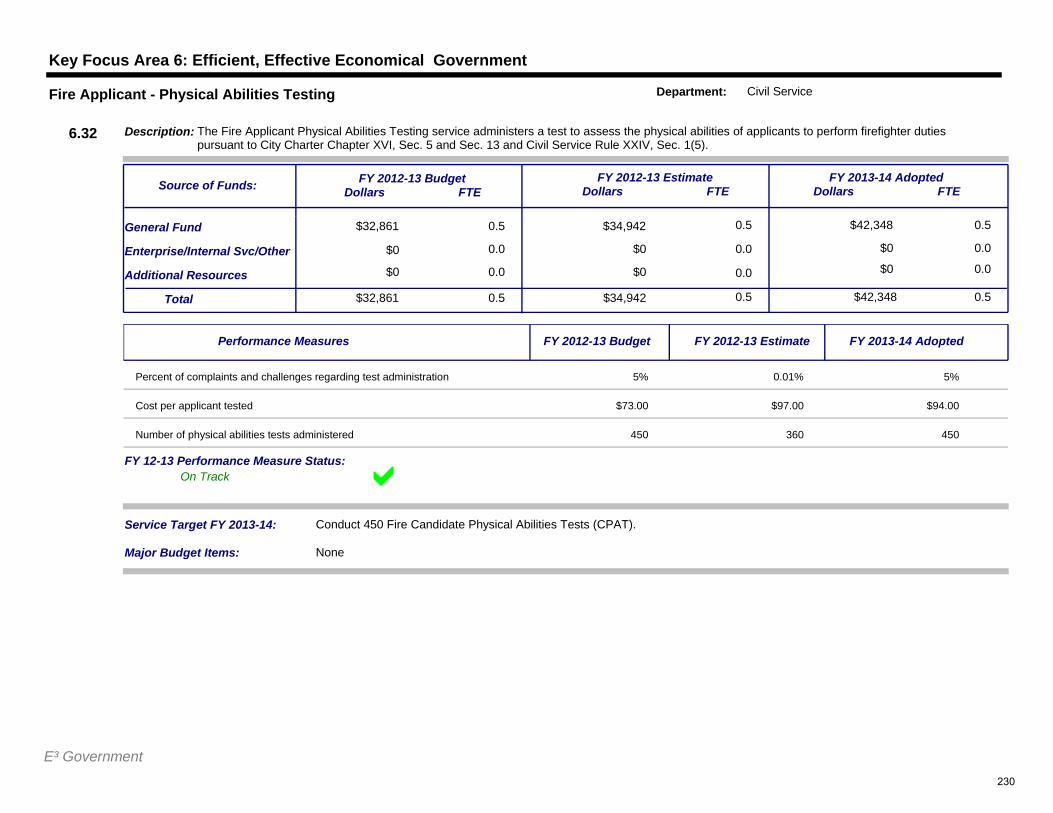
Key Focus Area 6: Efficient, Effective Economical Government
$32,861 0.5
0.0
$34,942 0.5
$0 0.0
$42,348
$0 0.0
0.5General Fund
Additional Resources
Service Target FY 2013-14: Conduct 450 Fire Candidate Physical Abilities Tests (CPAT).
$32,861Total 0.5 $34,942 0.5 $42,348 0.5
Enterprise/Internal Svc/Other
$0 0.0 $0 0.0 $0 0.0
FY 2012-13 BudgetDollars FTE
FY 2012-13 EstimateDollars FTE
FY 2013-14 AdoptedDollars FTE
Description: The Fire Applicant Physical Abilities Testing service administers a test to assess the physical abilities of applicants to perform firefighter duties pursuant to City Charter Chapter XVI, Sec. 5 and Sec. 13 and Civil Service Rule XXIV, Sec. 1(5).
Source of Funds:
6.32
Fire Applicant - Physical Abilities Testing Department: Civil Service
$0
Major Budget Items: None
On TrackFY 12-13 Performance Measure Status:
Performance Measures FY 2012-13 Budget FY 2012-13 Estimate FY 2013-14 Adopted
Percent of complaints and challenges regarding test administration 5% 0.01% 5%
Cost per applicant tested $73.00 $97.00 $94.00
Number of physical abilities tests administered 450 360 450
E³ Government230
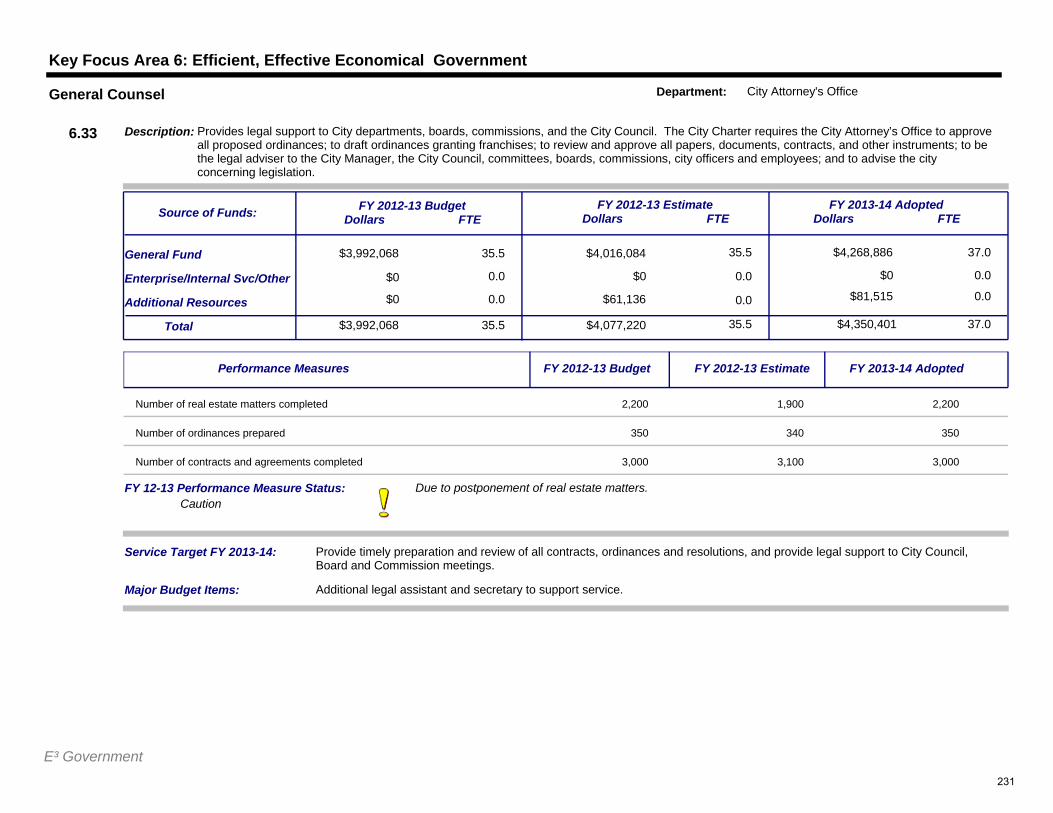
Key Focus Area 6: Efficient, Effective Economical Government
$3,992,068 35.5
0.0
$4,016,084 35.5
$0 0.0
$4,268,886
$0 0.0
37.0General Fund
Additional Resources
Service Target FY 2013-14: Provide timely preparation and review of all contracts, ordinances and resolutions, and provide legal support to City Council, Board and Commission meetings.
$3,992,068Total 35.5 $4,077,220 35.5 $4,350,401 37.0
Enterprise/Internal Svc/Other
$0 0.0 $61,136 0.0 $81,515 0.0
FY 2012-13 BudgetDollars FTE
FY 2012-13 EstimateDollars FTE
FY 2013-14 AdoptedDollars FTE
Description: Provides legal support to City departments, boards, commissions, and the City Council. The City Charter requires the City Attorney’s Office to approve all proposed ordinances; to draft ordinances granting franchises; to review and approve all papers, documents, contracts, and other instruments; to be the legal adviser to the City Manager, the City Council, committees, boards, commissions, city officers and employees; and to advise the city concerning legislation.
Source of Funds:
6.33
General Counsel Department: City Attorney's Office
$0
Major Budget Items: Additional legal assistant and secretary to support service.
Due to postponement of real estate matters.Caution
FY 12-13 Performance Measure Status:
Performance Measures FY 2012-13 Budget FY 2012-13 Estimate FY 2013-14 Adopted
Number of real estate matters completed 2,200 1,900 2,200
Number of ordinances prepared 350 340 350
Number of contracts and agreements completed 3,000 3,100 3,000
E³ Government231
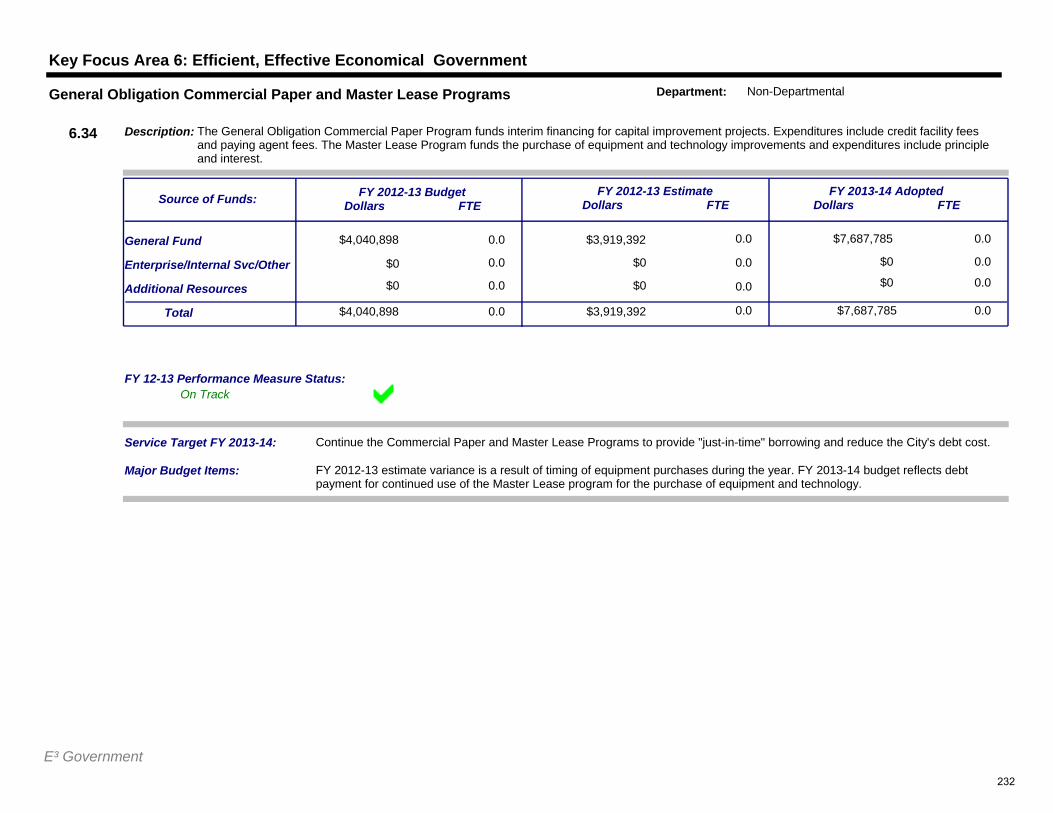
Key Focus Area 6: Efficient, Effective Economical Government
$4,040,898 0.0
0.0
$3,919,392 0.0
$0 0.0
$7,687,785
$0 0.0
0.0General Fund
Additional Resources
Service Target FY 2013-14: Continue the Commercial Paper and Master Lease Programs to provide "just-in-time" borrowing and reduce the City's debt cost.
$4,040,898Total 0.0 $3,919,392 0.0 $7,687,785 0.0
Enterprise/Internal Svc/Other
$0 0.0 $0 0.0 $0 0.0
FY 2012-13 BudgetDollars FTE
FY 2012-13 EstimateDollars FTE
FY 2013-14 AdoptedDollars FTE
Description: The General Obligation Commercial Paper Program funds interim financing for capital improvement projects. Expenditures include credit facility fees and paying agent fees. The Master Lease Program funds the purchase of equipment and technology improvements and expenditures include principle and interest.
Source of Funds:
6.34
General Obligation Commercial Paper and Master Lease Programs Department: Non-Departmental
$0
Major Budget Items: FY 2012-13 estimate variance is a result of timing of equipment purchases during the year. FY 2013-14 budget reflects debt payment for continued use of the Master Lease program for the purchase of equipment and technology.
On TrackFY 12-13 Performance Measure Status:
E³ Government232
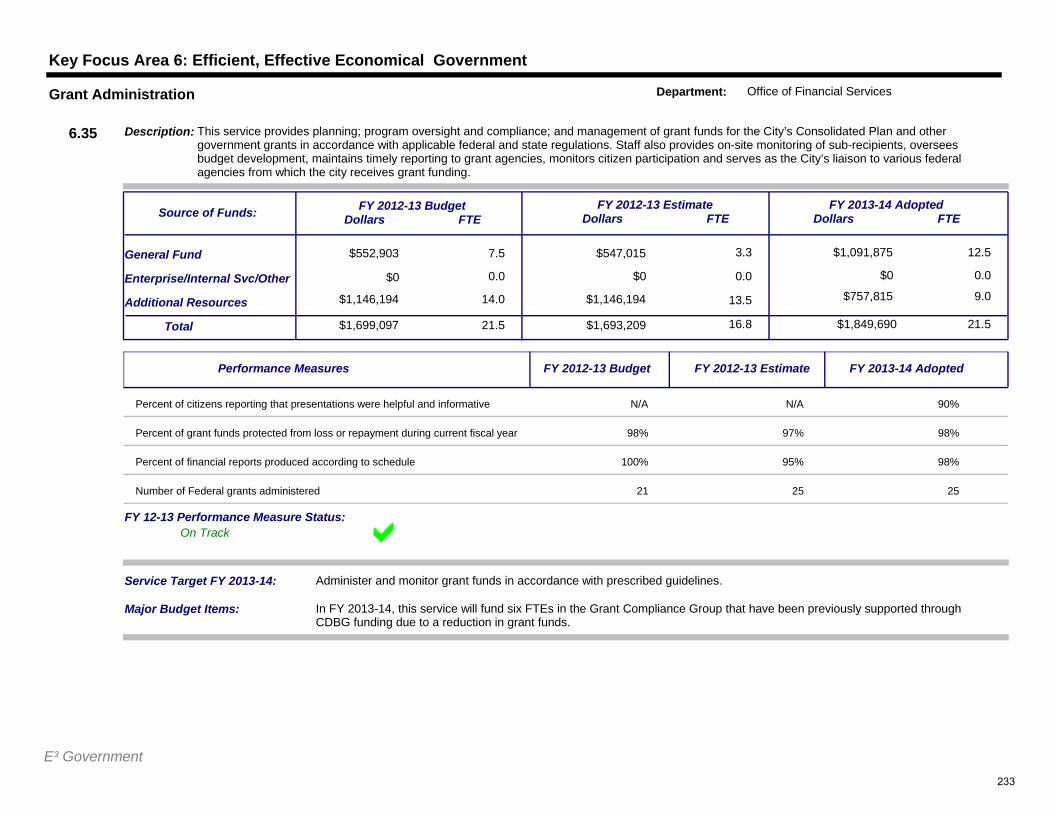
Key Focus Area 6: Efficient, Effective Economical Government
$552,903 7.5
0.0
$547,015 3.3
$0 0.0
$1,091,875
$0 0.0
12.5General Fund
Additional Resources
Service Target FY 2013-14: Administer and monitor grant funds in accordance with prescribed guidelines.
$1,699,097Total 21.5 $1,693,209 16.8 $1,849,690 21.5
Enterprise/Internal Svc/Other
$1,146,194 14.0 $1,146,194 13.5 $757,815 9.0
FY 2012-13 BudgetDollars FTE
FY 2012-13 EstimateDollars FTE
FY 2013-14 AdoptedDollars FTE
Description: This service provides planning; program oversight and compliance; and management of grant funds for the City’s Consolidated Plan and other government grants in accordance with applicable federal and state regulations. Staff also provides on-site monitoring of sub-recipients, oversees budget development, maintains timely reporting to grant agencies, monitors citizen participation and serves as the City’s liaison to various federal agencies from which the city receives grant funding.
Source of Funds:
6.35
Grant Administration Department: Office of Financial Services
$0
Major Budget Items: In FY 2013-14, this service will fund six FTEs in the Grant Compliance Group that have been previously supported through CDBG funding due to a reduction in grant funds.
On TrackFY 12-13 Performance Measure Status:
Performance Measures FY 2012-13 Budget FY 2012-13 Estimate FY 2013-14 Adopted
Percent of citizens reporting that presentations were helpful and informative N/A N/A 90%
Percent of grant funds protected from loss or repayment during current fiscal year 98% 97% 98%
Percent of financial reports produced according to schedule 100% 95% 98%
Number of Federal grants administered 21 25 25
E³ Government233
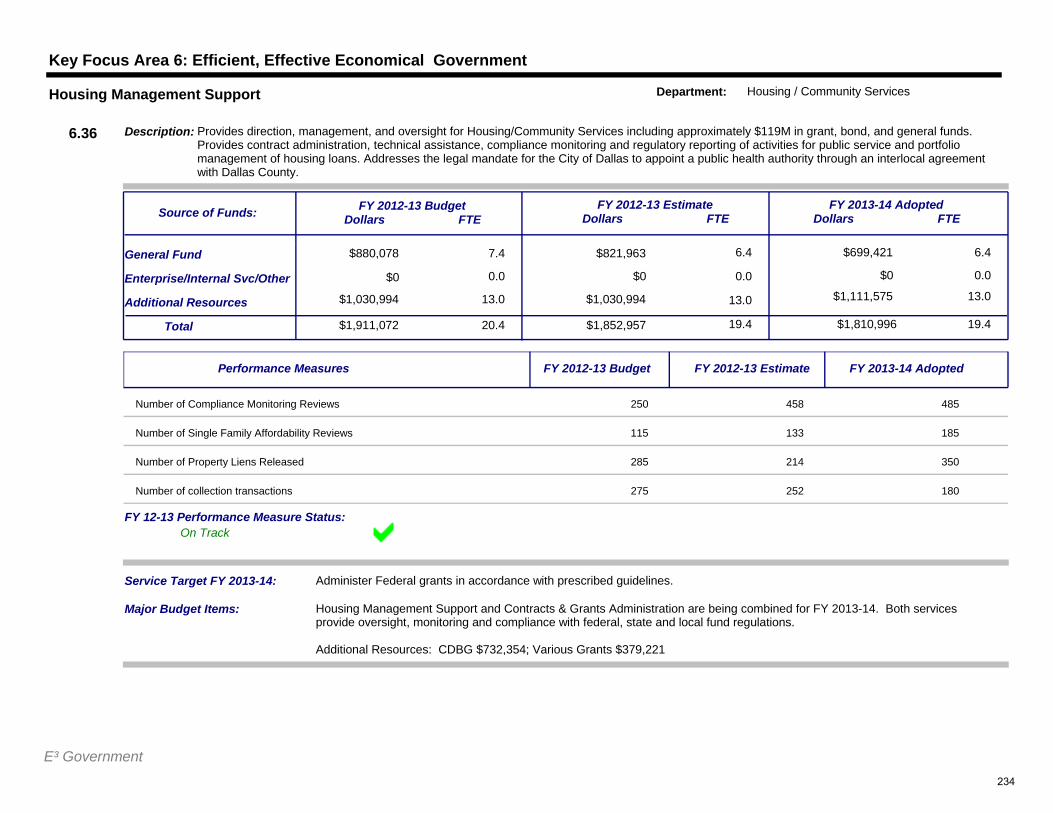
Key Focus Area 6: Efficient, Effective Economical Government
$880,078 7.4
0.0
$821,963 6.4
$0 0.0
$699,421
$0 0.0
6.4General Fund
Additional Resources
Service Target FY 2013-14: Administer Federal grants in accordance with prescribed guidelines.
$1,911,072Total 20.4 $1,852,957 19.4 $1,810,996 19.4
Enterprise/Internal Svc/Other
$1,030,994 13.0 $1,030,994 13.0 $1,111,575 13.0
FY 2012-13 BudgetDollars FTE
FY 2012-13 EstimateDollars FTE
FY 2013-14 AdoptedDollars FTE
Description: Provides direction, management, and oversight for Housing/Community Services including approximately $119M in grant, bond, and general funds. Provides contract administration, technical assistance, compliance monitoring and regulatory reporting of activities for public service and portfolio management of housing loans. Addresses the legal mandate for the City of Dallas to appoint a public health authority through an interlocal agreement with Dallas County.
Source of Funds:
6.36
Housing Management Support Department: Housing / Community Services
$0
Major Budget Items: Housing Management Support and Contracts & Grants Administration are being combined for FY 2013-14. Both services provide oversight, monitoring and compliance with federal, state and local fund regulations.
Additional Resources: CDBG $732,354; Various Grants $379,221
On TrackFY 12-13 Performance Measure Status:
Performance Measures FY 2012-13 Budget FY 2012-13 Estimate FY 2013-14 Adopted
Number of Compliance Monitoring Reviews 250 458 485
Number of Single Family Affordability Reviews 115 133 185
Number of Property Liens Released 285 214 350
Number of collection transactions 275 252 180
E³ Government234
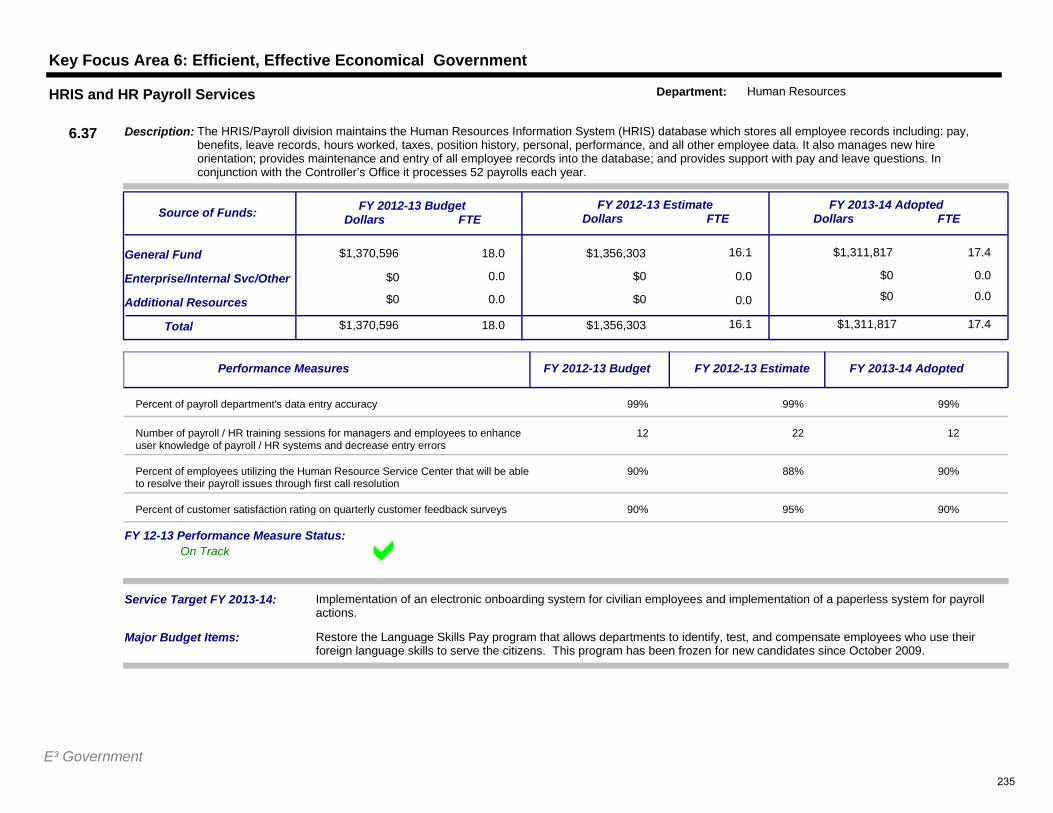
Key Focus Area 6: Efficient, Effective Economical Government
$1,370,596 18.0
0.0
$1,356,303 16.1
$0 0.0
$1,311,817
$0 0.0
17.4General Fund
Additional Resources
Service Target FY 2013-14: Implementation of an electronic onboarding system for civilian employees and implementation of a paperless system for payroll actions.
$1,370,596Total 18.0 $1,356,303 16.1 $1,311,817 17.4
Enterprise/Internal Svc/Other
$0 0.0 $0 0.0 $0 0.0
FY 2012-13 BudgetDollars FTE
FY 2012-13 EstimateDollars FTE
FY 2013-14 AdoptedDollars FTE
Description: The HRIS/Payroll division maintains the Human Resources Information System (HRIS) database which stores all employee records including: pay, benefits, leave records, hours worked, taxes, position history, personal, performance, and all other employee data. It also manages new hire orientation; provides maintenance and entry of all employee records into the database; and provides support with pay and leave questions. In conjunction with the Controller’s Office it processes 52 payrolls each year.
Source of Funds:
6.37
HRIS and HR Payroll Services Department: Human Resources
$0
Major Budget Items: Restore the Language Skills Pay program that allows departments to identify, test, and compensate employees who use their foreign language skills to serve the citizens. This program has been frozen for new candidates since October 2009.
On TrackFY 12-13 Performance Measure Status:
Performance Measures FY 2012-13 Budget FY 2012-13 Estimate FY 2013-14 Adopted
Percent of payroll department's data entry accuracy 99% 99% 99%
Number of payroll / HR training sessions for managers and employees to enhance user knowledge of payroll / HR systems and decrease entry errors
12 22 12
Percent of employees utilizing the Human Resource Service Center that will be able to resolve their payroll issues through first call resolution
90% 88% 90%
Percent of customer satisfaction rating on quarterly customer feedback surveys 90% 95% 90%
E³ Government235
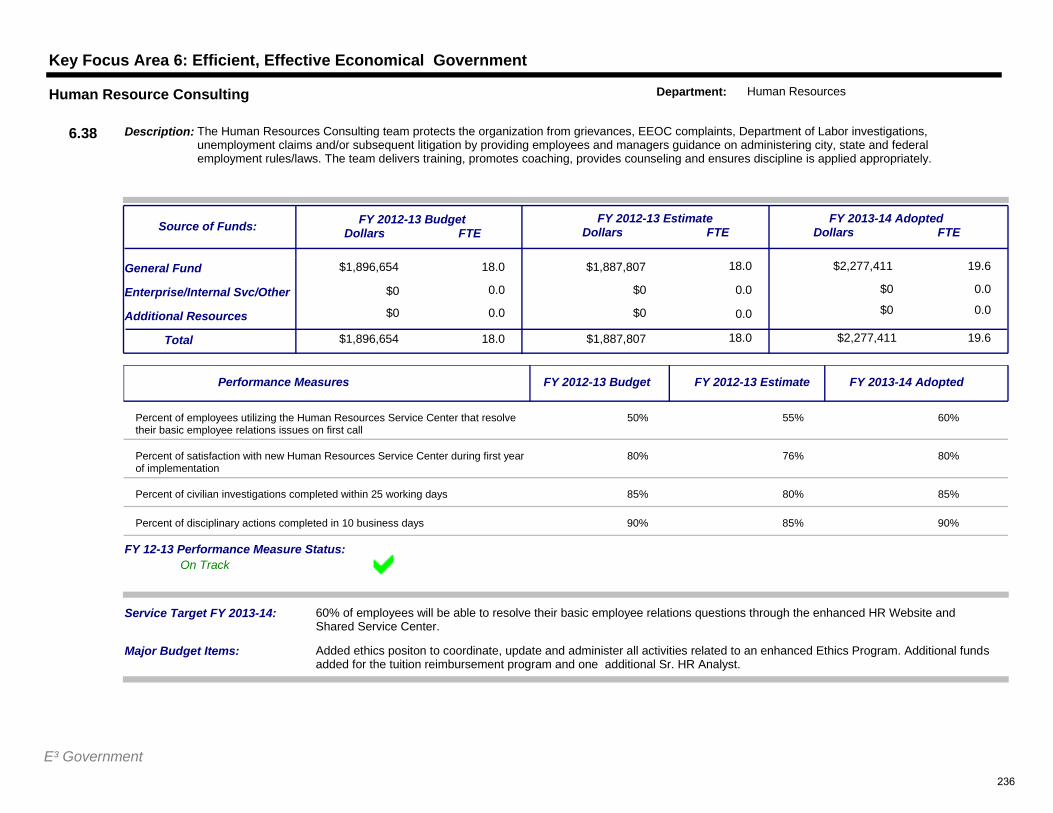
Key Focus Area 6: Efficient, Effective Economical Government
$1,896,654 18.0
0.0
$1,887,807 18.0
$0 0.0
$2,277,411
$0 0.0
19.6General Fund
Additional Resources
Service Target FY 2013-14: 60% of employees will be able to resolve their basic employee relations questions through the enhanced HR Website and Shared Service Center.
$1,896,654Total 18.0 $1,887,807 18.0 $2,277,411 19.6
Enterprise/Internal Svc/Other
$0 0.0 $0 0.0 $0 0.0
FY 2012-13 BudgetDollars FTE
FY 2012-13 EstimateDollars FTE
FY 2013-14 AdoptedDollars FTE
Description: The Human Resources Consulting team protects the organization from grievances, EEOC complaints, Department of Labor investigations, unemployment claims and/or subsequent litigation by providing employees and managers guidance on administering city, state and federal employment rules/laws. The team delivers training, promotes coaching, provides counseling and ensures discipline is applied appropriately.
Source of Funds:
6.38
Human Resource Consulting Department: Human Resources
$0
Major Budget Items: Added ethics positon to coordinate, update and administer all activities related to an enhanced Ethics Program. Additional funds added for the tuition reimbursement program and one additional Sr. HR Analyst.
On TrackFY 12-13 Performance Measure Status:
Performance Measures FY 2012-13 Budget FY 2012-13 Estimate FY 2013-14 Adopted
Percent of employees utilizing the Human Resources Service Center that resolve their basic employee relations issues on first call
50% 55% 60%
Percent of satisfaction with new Human Resources Service Center during first year of implementation
80% 76% 80%
Percent of civilian investigations completed within 25 working days 85% 80% 85%
Percent of disciplinary actions completed in 10 business days 90% 85% 90%
E³ Government236
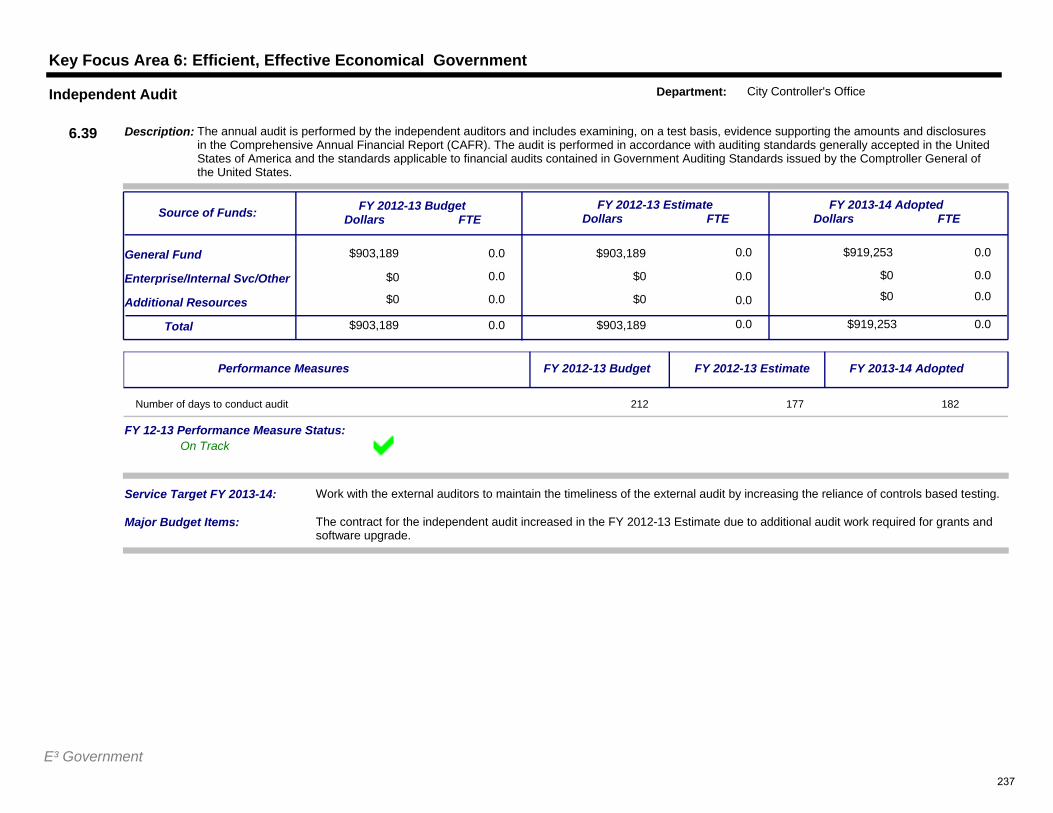
Key Focus Area 6: Efficient, Effective Economical Government
$903,189 0.0
0.0
$903,189 0.0
$0 0.0
$919,253
$0 0.0
0.0General Fund
Additional Resources
Service Target FY 2013-14: Work with the external auditors to maintain the timeliness of the external audit by increasing the reliance of controls based testing.
$903,189Total 0.0 $903,189 0.0 $919,253 0.0
Enterprise/Internal Svc/Other
$0 0.0 $0 0.0 $0 0.0
FY 2012-13 BudgetDollars FTE
FY 2012-13 EstimateDollars FTE
FY 2013-14 AdoptedDollars FTE
Description: The annual audit is performed by the independent auditors and includes examining, on a test basis, evidence supporting the amounts and disclosures in the Comprehensive Annual Financial Report (CAFR). The audit is performed in accordance with auditing standards generally accepted in the United States of America and the standards applicable to financial audits contained in Government Auditing Standards issued by the Comptroller General of the United States.
Source of Funds:
6.39
Independent Audit Department: City Controller's Office
$0
Major Budget Items: The contract for the independent audit increased in the FY 2012-13 Estimate due to additional audit work required for grants and software upgrade.
On TrackFY 12-13 Performance Measure Status:
Performance Measures FY 2012-13 Budget FY 2012-13 Estimate FY 2013-14 Adopted
Number of days to conduct audit 212 177 182
E³ Government237
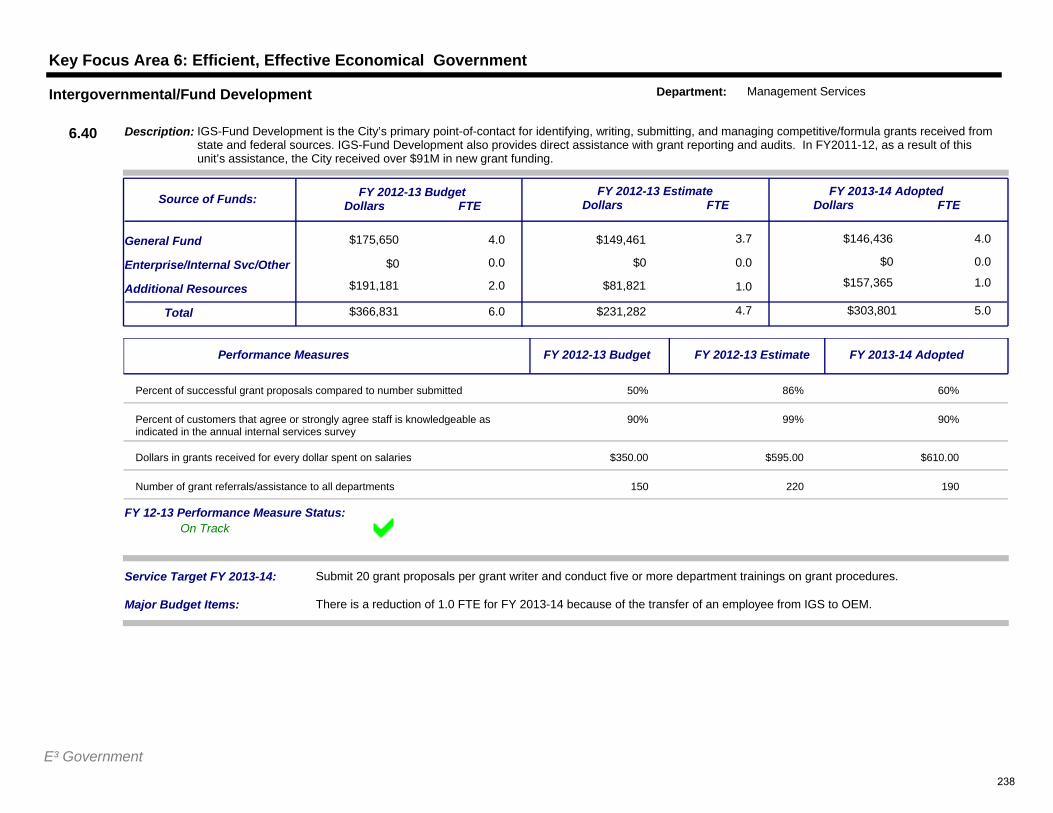
Key Focus Area 6: Efficient, Effective Economical Government
$175,650 4.0
0.0
$149,461 3.7
$0 0.0
$146,436
$0 0.0
4.0General Fund
Additional Resources
Service Target FY 2013-14: Submit 20 grant proposals per grant writer and conduct five or more department trainings on grant procedures.
$366,831Total 6.0 $231,282 4.7 $303,801 5.0
Enterprise/Internal Svc/Other
$191,181 2.0 $81,821 1.0 $157,365 1.0
FY 2012-13 BudgetDollars FTE
FY 2012-13 EstimateDollars FTE
FY 2013-14 AdoptedDollars FTE
Description: IGS-Fund Development is the City’s primary point-of-contact for identifying, writing, submitting, and managing competitive/formula grants received from state and federal sources. IGS-Fund Development also provides direct assistance with grant reporting and audits. In FY2011-12, as a result of this unit’s assistance, the City received over $91M in new grant funding.
Source of Funds:
6.40
Intergovernmental/Fund Development Department: Management Services
$0
Major Budget Items: There is a reduction of 1.0 FTE for FY 2013-14 because of the transfer of an employee from IGS to OEM.
On TrackFY 12-13 Performance Measure Status:
Performance Measures FY 2012-13 Budget FY 2012-13 Estimate FY 2013-14 Adopted
Percent of successful grant proposals compared to number submitted 50% 86% 60%
Percent of customers that agree or strongly agree staff is knowledgeable as indicated in the annual internal services survey
90% 99% 90%
Dollars in grants received for every dollar spent on salaries $350.00 $595.00 $610.00
Number of grant referrals/assistance to all departments 150 220 190
E³ Government238
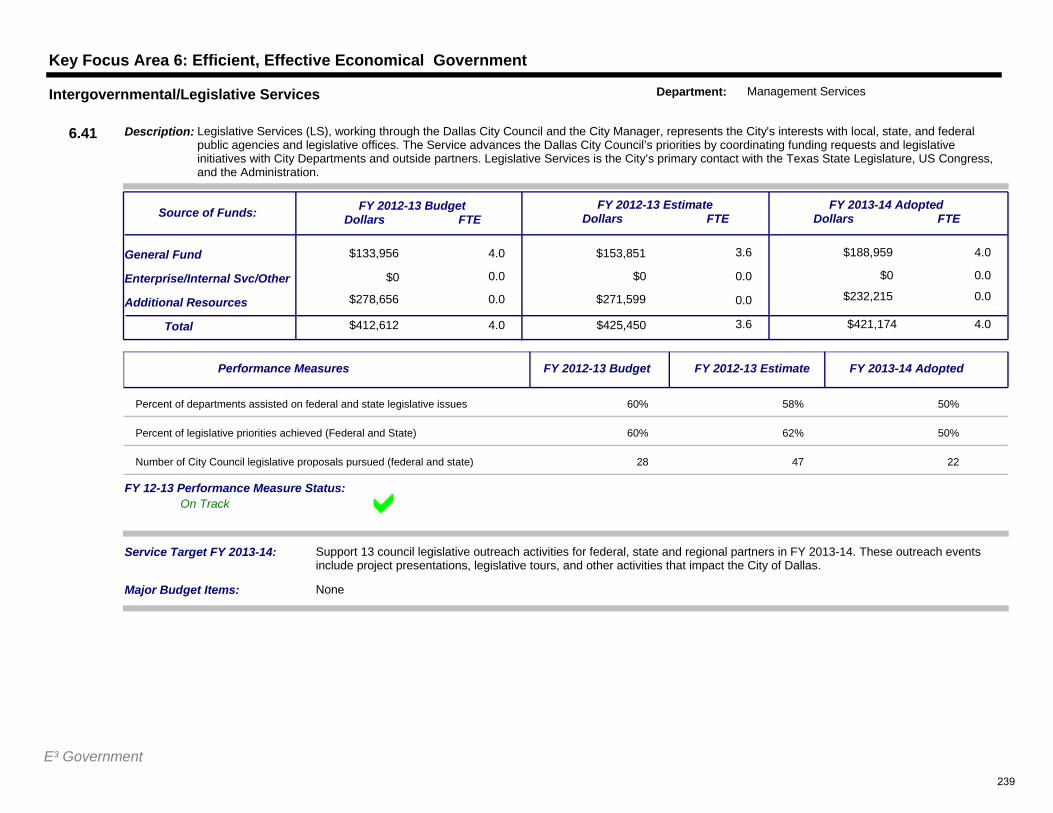
Key Focus Area 6: Efficient, Effective Economical Government
$133,956 4.0
0.0
$153,851 3.6
$0 0.0
$188,959
$0 0.0
4.0General Fund
Additional Resources
Service Target FY 2013-14: Support 13 council legislative outreach activities for federal, state and regional partners in FY 2013-14. These outreach events include project presentations, legislative tours, and other activities that impact the City of Dallas.
$412,612Total 4.0 $425,450 3.6 $421,174 4.0
Enterprise/Internal Svc/Other
$278,656 0.0 $271,599 0.0 $232,215 0.0
FY 2012-13 BudgetDollars FTE
FY 2012-13 EstimateDollars FTE
FY 2013-14 AdoptedDollars FTE
Description: Legislative Services (LS), working through the Dallas City Council and the City Manager, represents the City's interests with local, state, and federal public agencies and legislative offices. The Service advances the Dallas City Council’s priorities by coordinating funding requests and legislative initiatives with City Departments and outside partners. Legislative Services is the City’s primary contact with the Texas State Legislature, US Congress, and the Administration.
Source of Funds:
6.41
Intergovernmental/Legislative Services Department: Management Services
$0
Major Budget Items: None
On TrackFY 12-13 Performance Measure Status:
Performance Measures FY 2012-13 Budget FY 2012-13 Estimate FY 2013-14 Adopted
Percent of departments assisted on federal and state legislative issues 60% 58% 50%
Percent of legislative priorities achieved (Federal and State) 60% 62% 50%
Number of City Council legislative proposals pursued (federal and state) 28 47 22
E³ Government239
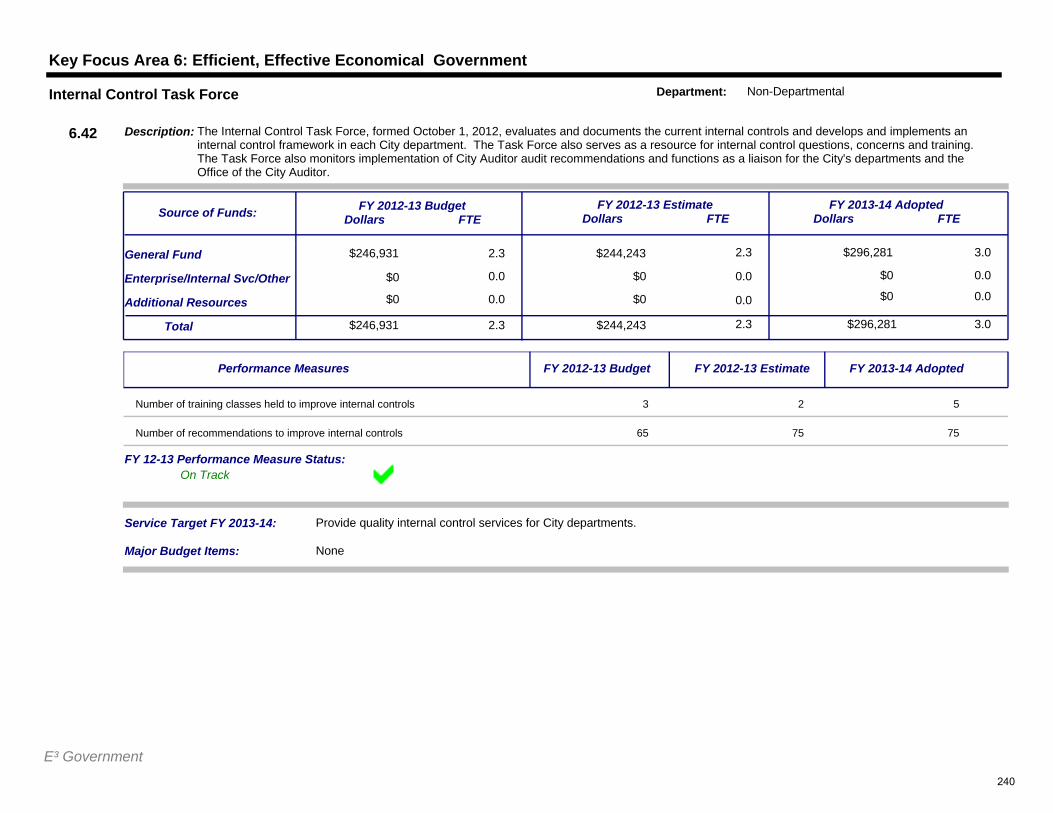
Key Focus Area 6: Efficient, Effective Economical Government
$246,931 2.3
0.0
$244,243 2.3
$0 0.0
$296,281
$0 0.0
3.0General Fund
Additional Resources
Service Target FY 2013-14: Provide quality internal control services for City departments.
$246,931Total 2.3 $244,243 2.3 $296,281 3.0
Enterprise/Internal Svc/Other
$0 0.0 $0 0.0 $0 0.0
FY 2012-13 BudgetDollars FTE
FY 2012-13 EstimateDollars FTE
FY 2013-14 AdoptedDollars FTE
Description: The Internal Control Task Force, formed October 1, 2012, evaluates and documents the current internal controls and develops and implements an internal control framework in each City department. The Task Force also serves as a resource for internal control questions, concerns and training. The Task Force also monitors implementation of City Auditor audit recommendations and functions as a liaison for the City's departments and the Office of the City Auditor.
Source of Funds:
6.42
Internal Control Task Force Department: Non-Departmental
$0
Major Budget Items: None
On TrackFY 12-13 Performance Measure Status:
Performance Measures FY 2012-13 Budget FY 2012-13 Estimate FY 2013-14 Adopted
Number of training classes held to improve internal controls 3 2 5
Number of recommendations to improve internal controls 65 75 75
E³ Government240
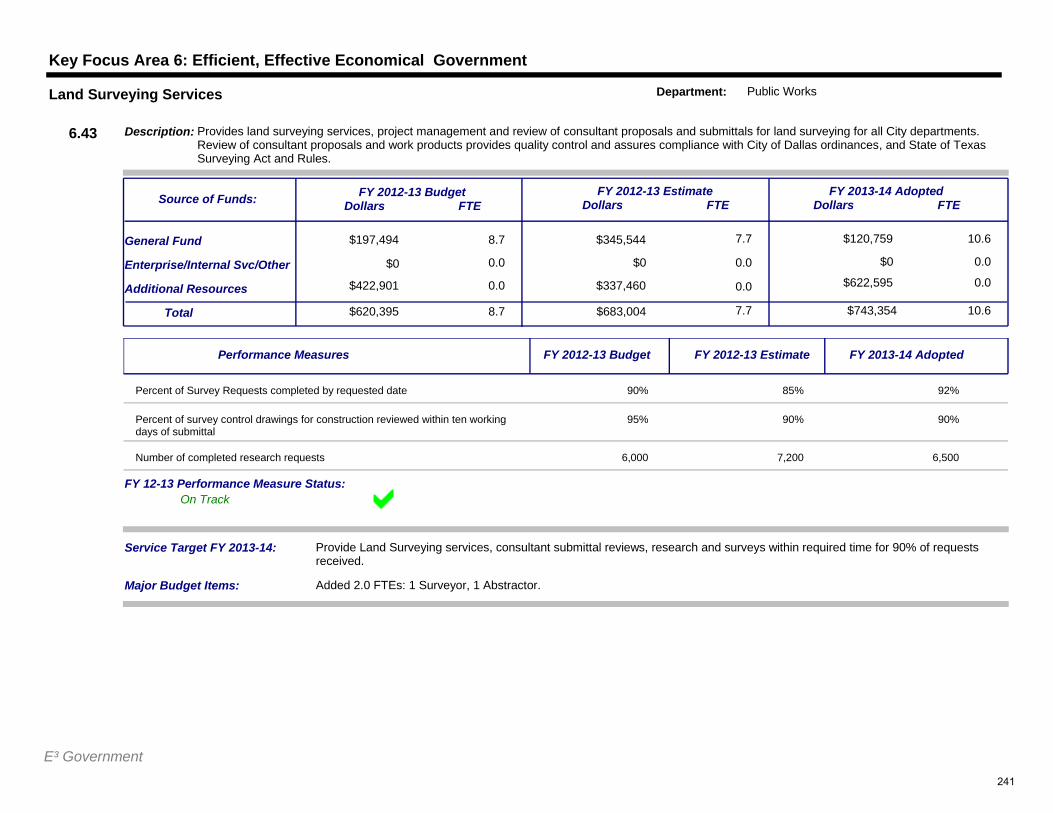
Key Focus Area 6: Efficient, Effective Economical Government
$197,494 8.7
0.0
$345,544 7.7
$0 0.0
$120,759
$0 0.0
10.6General Fund
Additional Resources
Service Target FY 2013-14: Provide Land Surveying services, consultant submittal reviews, research and surveys within required time for 90% of requests received.
$620,395Total 8.7 $683,004 7.7 $743,354 10.6
Enterprise/Internal Svc/Other
$422,901 0.0 $337,460 0.0 $622,595 0.0
FY 2012-13 BudgetDollars FTE
FY 2012-13 EstimateDollars FTE
FY 2013-14 AdoptedDollars FTE
Description: Provides land surveying services, project management and review of consultant proposals and submittals for land surveying for all City departments. Review of consultant proposals and work products provides quality control and assures compliance with City of Dallas ordinances, and State of Texas Surveying Act and Rules.
Source of Funds:
6.43
Land Surveying Services Department: Public Works
$0
Major Budget Items: Added 2.0 FTEs: 1 Surveyor, 1 Abstractor.
On TrackFY 12-13 Performance Measure Status:
Performance Measures FY 2012-13 Budget FY 2012-13 Estimate FY 2013-14 Adopted
Percent of Survey Requests completed by requested date 90% 85% 92%
Percent of survey control drawings for construction reviewed within ten working days of submittal
95% 90% 90%
Number of completed research requests 6,000 7,200 6,500
E³ Government241
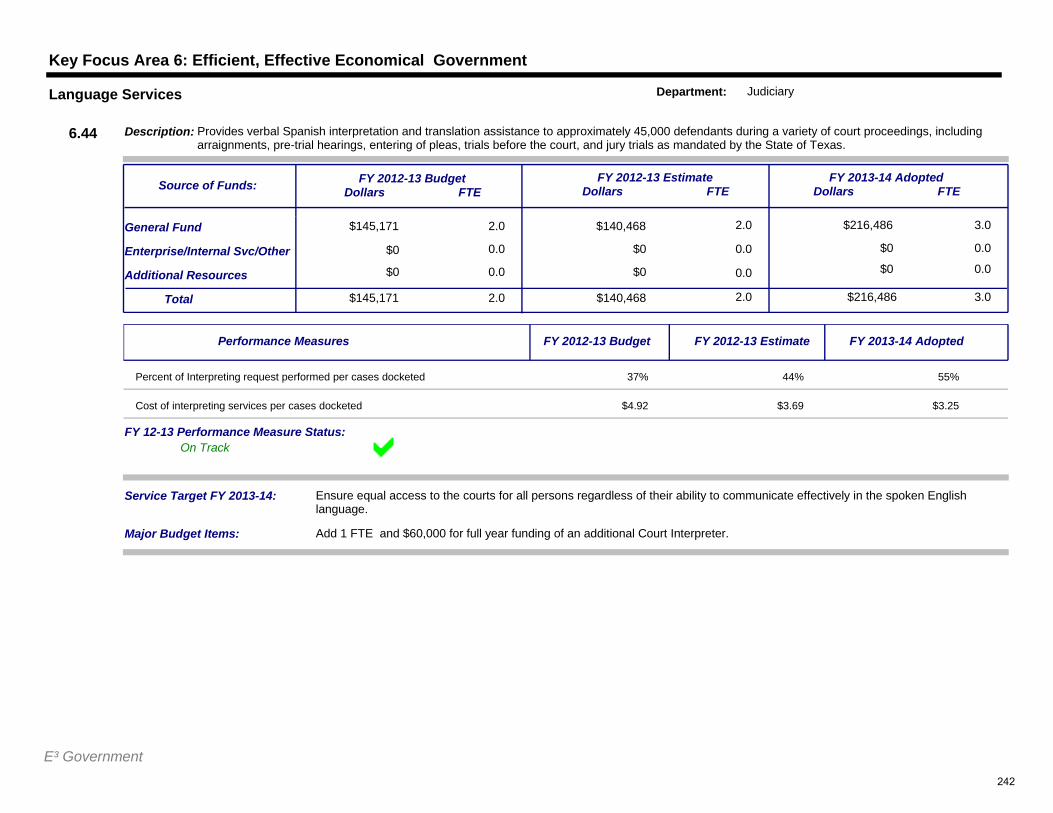
Key Focus Area 6: Efficient, Effective Economical Government
$145,171 2.0
0.0
$140,468 2.0
$0 0.0
$216,486
$0 0.0
3.0General Fund
Additional Resources
Service Target FY 2013-14: Ensure equal access to the courts for all persons regardless of their ability to communicate effectively in the spoken English language.
$145,171Total 2.0 $140,468 2.0 $216,486 3.0
Enterprise/Internal Svc/Other
$0 0.0 $0 0.0 $0 0.0
FY 2012-13 BudgetDollars FTE
FY 2012-13 EstimateDollars FTE
FY 2013-14 AdoptedDollars FTE
Description: Provides verbal Spanish interpretation and translation assistance to approximately 45,000 defendants during a variety of court proceedings, including arraignments, pre-trial hearings, entering of pleas, trials before the court, and jury trials as mandated by the State of Texas.
Source of Funds:
6.44
Language Services Department: Judiciary
$0
Major Budget Items: Add 1 FTE and $60,000 for full year funding of an additional Court Interpreter.
On TrackFY 12-13 Performance Measure Status:
Performance Measures FY 2012-13 Budget FY 2012-13 Estimate FY 2013-14 Adopted
Percent of Interpreting request performed per cases docketed 37% 44% 55%
Cost of interpreting services per cases docketed $4.92 $3.69 $3.25
E³ Government242
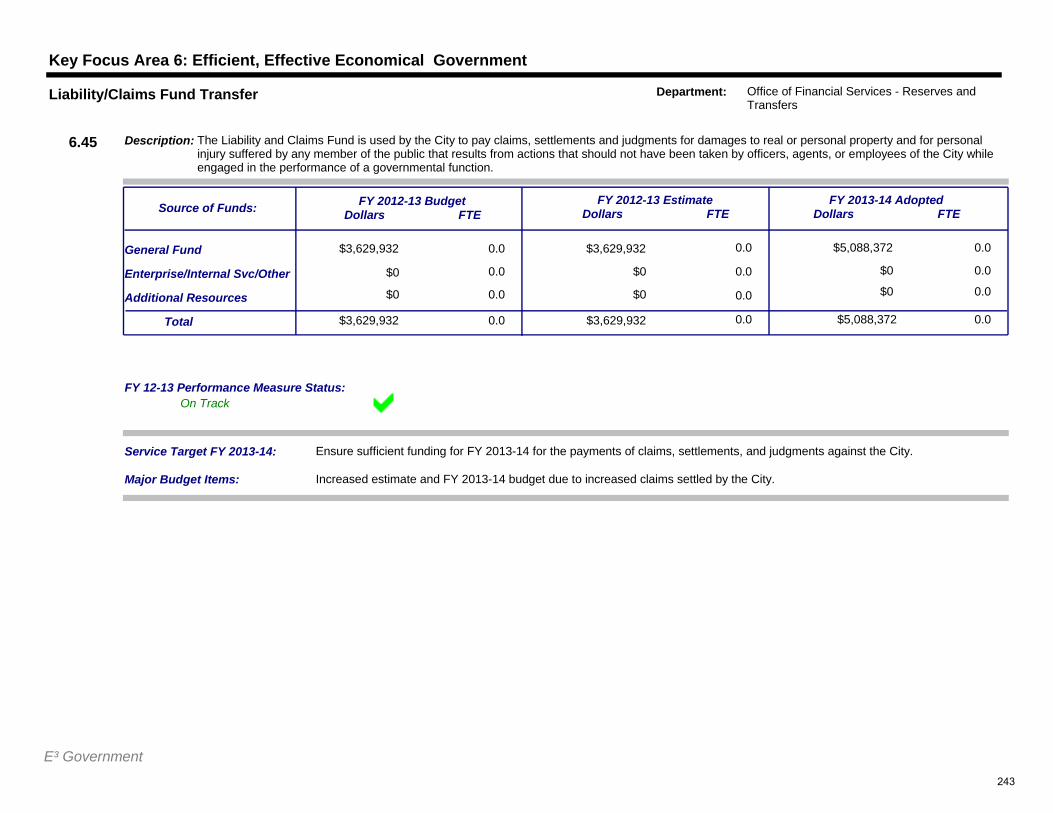
Key Focus Area 6: Efficient, Effective Economical Government
$3,629,932 0.0
0.0
$3,629,932 0.0
$0 0.0
$5,088,372
$0 0.0
0.0General Fund
Additional Resources
Service Target FY 2013-14: Ensure sufficient funding for FY 2013-14 for the payments of claims, settlements, and judgments against the City.
$3,629,932Total 0.0 $3,629,932 0.0 $5,088,372 0.0
Enterprise/Internal Svc/Other
$0 0.0 $0 0.0 $0 0.0
FY 2012-13 BudgetDollars FTE
FY 2012-13 EstimateDollars FTE
FY 2013-14 AdoptedDollars FTE
Description: The Liability and Claims Fund is used by the City to pay claims, settlements and judgments for damages to real or personal property and for personal injury suffered by any member of the public that results from actions that should not have been taken by officers, agents, or employees of the City while engaged in the performance of a governmental function.
Source of Funds:
6.45
Liability/Claims Fund Transfer Department: Office of Financial Services - Reserves and Transfers
$0
Major Budget Items: Increased estimate and FY 2013-14 budget due to increased claims settled by the City.
On TrackFY 12-13 Performance Measure Status:
E³ Government243
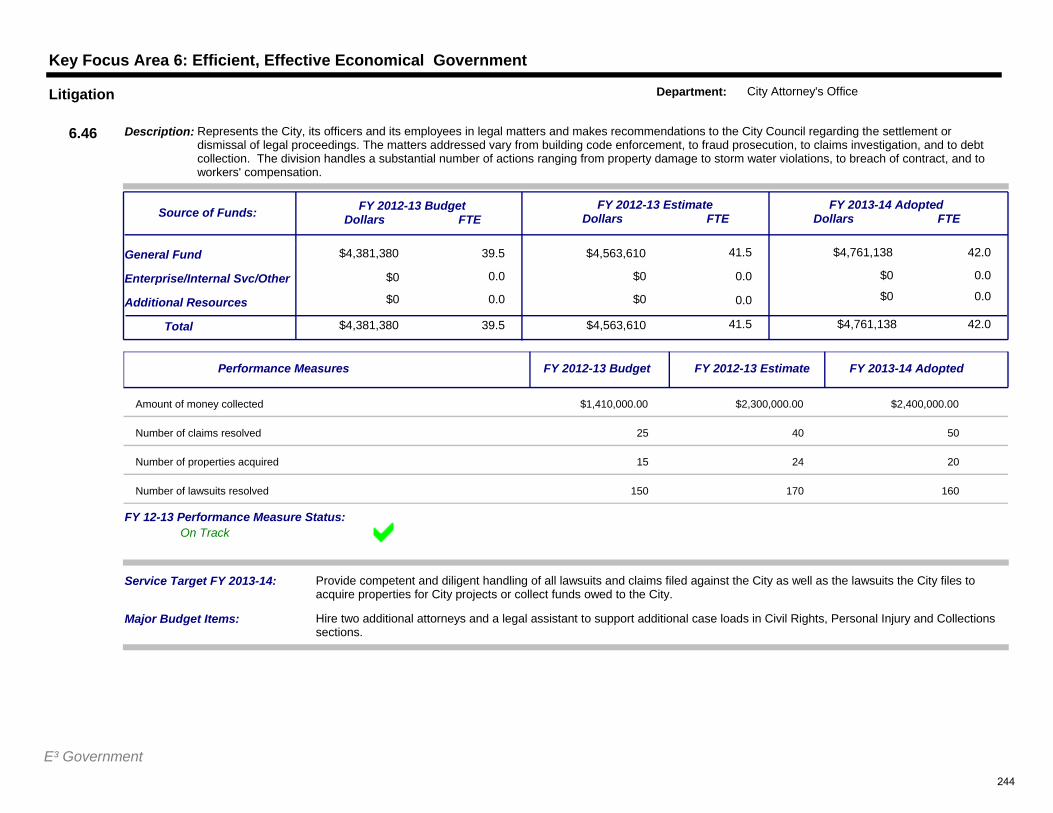
Key Focus Area 6: Efficient, Effective Economical Government
$4,381,380 39.5
0.0
$4,563,610 41.5
$0 0.0
$4,761,138
$0 0.0
42.0General Fund
Additional Resources
Service Target FY 2013-14: Provide competent and diligent handling of all lawsuits and claims filed against the City as well as the lawsuits the City files to acquire properties for City projects or collect funds owed to the City.
$4,381,380Total 39.5 $4,563,610 41.5 $4,761,138 42.0
Enterprise/Internal Svc/Other
$0 0.0 $0 0.0 $0 0.0
FY 2012-13 BudgetDollars FTE
FY 2012-13 EstimateDollars FTE
FY 2013-14 AdoptedDollars FTE
Description: Represents the City, its officers and its employees in legal matters and makes recommendations to the City Council regarding the settlement or dismissal of legal proceedings. The matters addressed vary from building code enforcement, to fraud prosecution, to claims investigation, and to debt collection. The division handles a substantial number of actions ranging from property damage to storm water violations, to breach of contract, and to workers' compensation.
Source of Funds:
6.46
Litigation Department: City Attorney's Office
$0
Major Budget Items: Hire two additional attorneys and a legal assistant to support additional case loads in Civil Rights, Personal Injury and Collections sections.
On TrackFY 12-13 Performance Measure Status:
Performance Measures FY 2012-13 Budget FY 2012-13 Estimate FY 2013-14 Adopted
Amount of money collected $1,410,000.00 $2,300,000.00 $2,400,000.00
Number of claims resolved 25 40 50
Number of properties acquired 15 24 20
Number of lawsuits resolved 150 170 160
E³ Government244
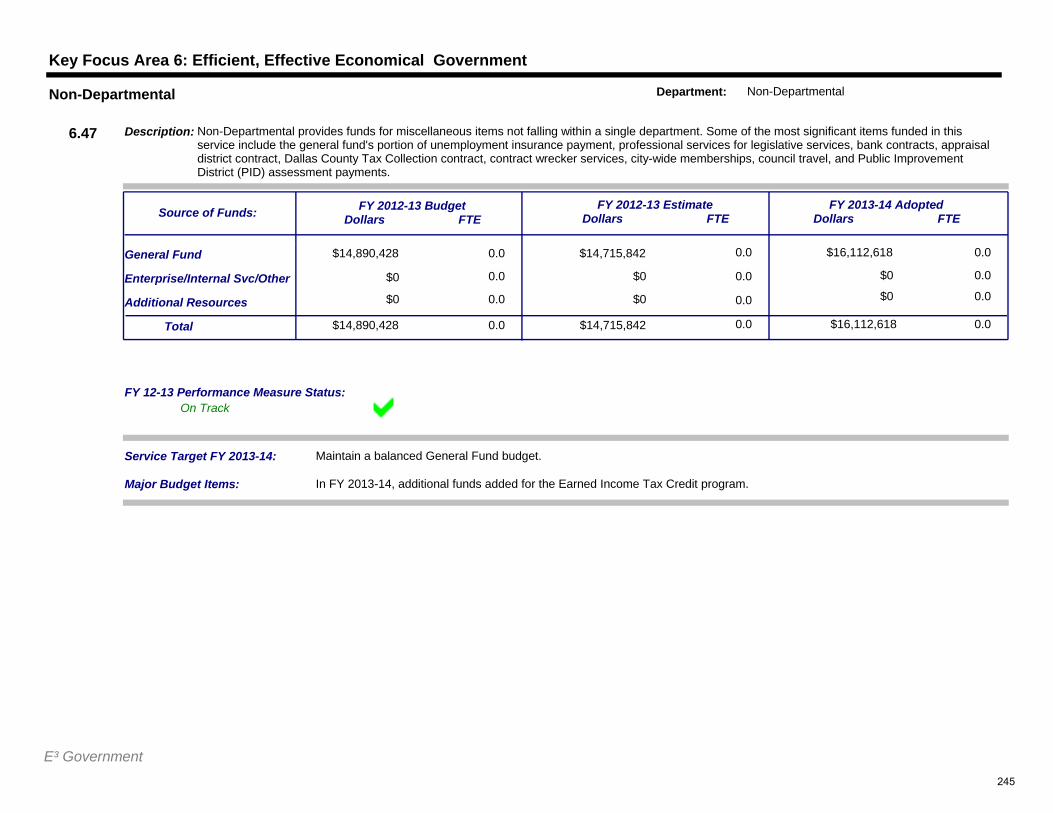
Key Focus Area 6: Efficient, Effective Economical Government
$14,890,428 0.0
0.0
$14,715,842 0.0
$0 0.0
$16,112,618
$0 0.0
0.0General Fund
Additional Resources
Service Target FY 2013-14: Maintain a balanced General Fund budget.
$14,890,428Total 0.0 $14,715,842 0.0 $16,112,618 0.0
Enterprise/Internal Svc/Other
$0 0.0 $0 0.0 $0 0.0
FY 2012-13 BudgetDollars FTE
FY 2012-13 EstimateDollars FTE
FY 2013-14 AdoptedDollars FTE
Description: Non-Departmental provides funds for miscellaneous items not falling within a single department. Some of the most significant items funded in this service include the general fund's portion of unemployment insurance payment, professional services for legislative services, bank contracts, appraisal district contract, Dallas County Tax Collection contract, contract wrecker services, city-wide memberships, council travel, and Public Improvement District (PID) assessment payments.
Source of Funds:
6.47
Non-Departmental Department: Non-Departmental
$0
Major Budget Items: In FY 2013-14, additional funds added for the Earned Income Tax Credit program.
On TrackFY 12-13 Performance Measure Status:
E³ Government245
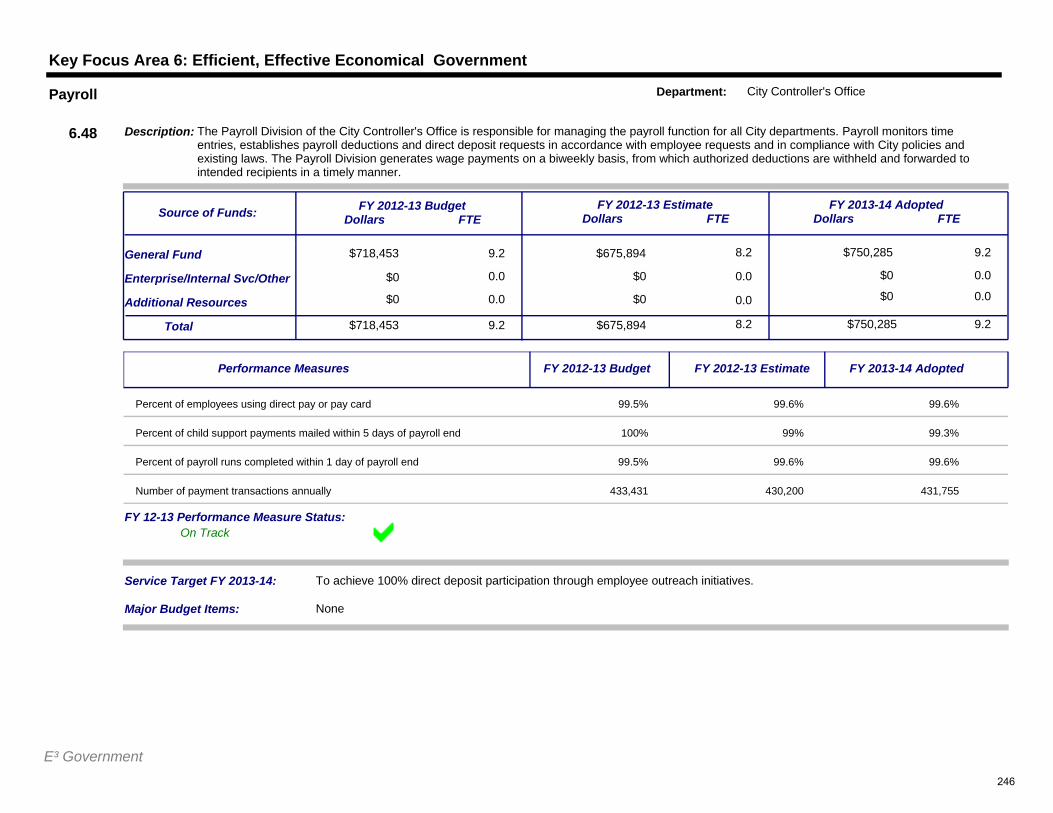
Key Focus Area 6: Efficient, Effective Economical Government
$718,453 9.2
0.0
$675,894 8.2
$0 0.0
$750,285
$0 0.0
9.2General Fund
Additional Resources
Service Target FY 2013-14: To achieve 100% direct deposit participation through employee outreach initiatives.
$718,453Total 9.2 $675,894 8.2 $750,285 9.2
Enterprise/Internal Svc/Other
$0 0.0 $0 0.0 $0 0.0
FY 2012-13 BudgetDollars FTE
FY 2012-13 EstimateDollars FTE
FY 2013-14 AdoptedDollars FTE
Description: The Payroll Division of the City Controller's Office is responsible for managing the payroll function for all City departments. Payroll monitors time entries, establishes payroll deductions and direct deposit requests in accordance with employee requests and in compliance with City policies and existing laws. The Payroll Division generates wage payments on a biweekly basis, from which authorized deductions are withheld and forwarded to intended recipients in a timely manner.
Source of Funds:
6.48
Payroll Department: City Controller's Office
$0
Major Budget Items: None
On TrackFY 12-13 Performance Measure Status:
Performance Measures FY 2012-13 Budget FY 2012-13 Estimate FY 2013-14 Adopted
Percent of employees using direct pay or pay card 99.5% 99.6% 99.6%
Percent of child support payments mailed within 5 days of payroll end 100% 99% 99.3%
Percent of payroll runs completed within 1 day of payroll end 99.5% 99.6% 99.6%
Number of payment transactions annually 433,431 430,200 431,755
E³ Government246
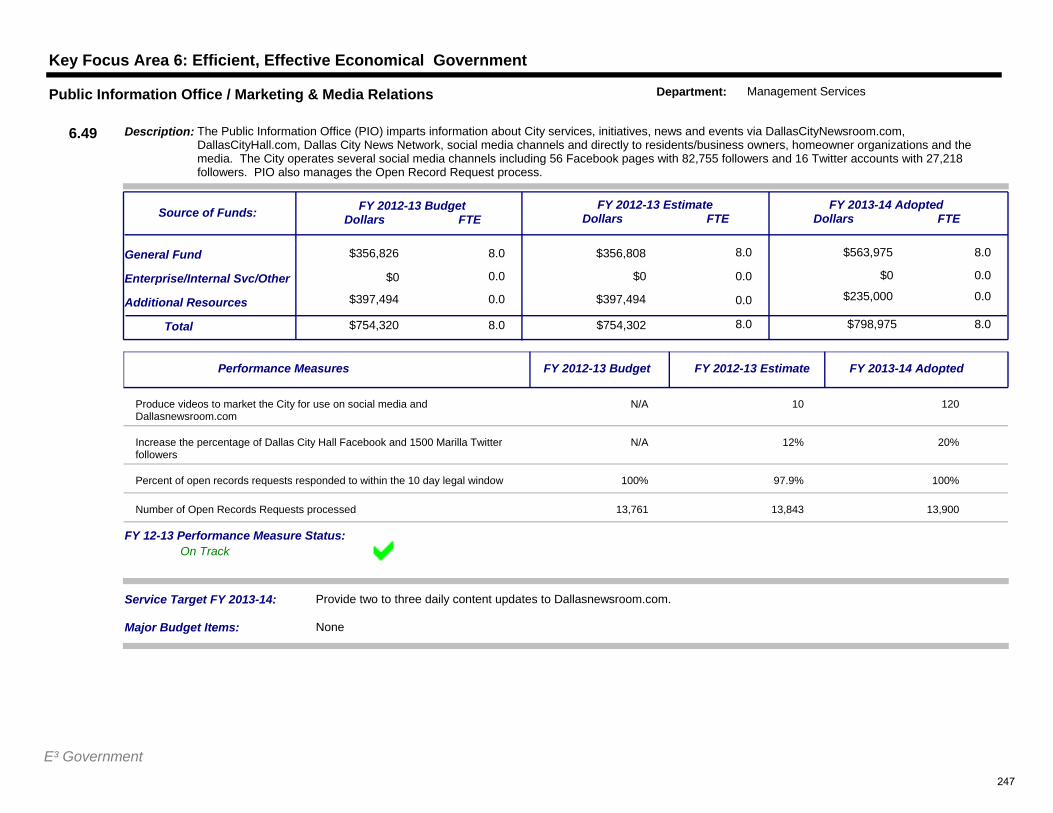
Key Focus Area 6: Efficient, Effective Economical Government
$356,826 8.0
0.0
$356,808 8.0
$0 0.0
$563,975
$0 0.0
8.0General Fund
Additional Resources
Service Target FY 2013-14: Provide two to three daily content updates to Dallasnewsroom.com.
$754,320Total 8.0 $754,302 8.0 $798,975 8.0
Enterprise/Internal Svc/Other
$397,494 0.0 $397,494 0.0 $235,000 0.0
FY 2012-13 BudgetDollars FTE
FY 2012-13 EstimateDollars FTE
FY 2013-14 AdoptedDollars FTE
Description: The Public Information Office (PIO) imparts information about City services, initiatives, news and events via DallasCityNewsroom.com, DallasCityHall.com, Dallas City News Network, social media channels and directly to residents/business owners, homeowner organizations and the media. The City operates several social media channels including 56 Facebook pages with 82,755 followers and 16 Twitter accounts with 27,218 followers. PIO also manages the Open Record Request process.
Source of Funds:
6.49
Public Information Office / Marketing & Media Relations Department: Management Services
$0
Major Budget Items: None
On TrackFY 12-13 Performance Measure Status:
Performance Measures FY 2012-13 Budget FY 2012-13 Estimate FY 2013-14 Adopted
Produce videos to market the City for use on social media and Dallasnewsroom.com
N/A 10 120
Increase the percentage of Dallas City Hall Facebook and 1500 Marilla Twitter followers
N/A 12% 20%
Percent of open records requests responded to within the 10 day legal window 100% 97.9% 100%
Number of Open Records Requests processed 13,761 13,843 13,900
E³ Government247
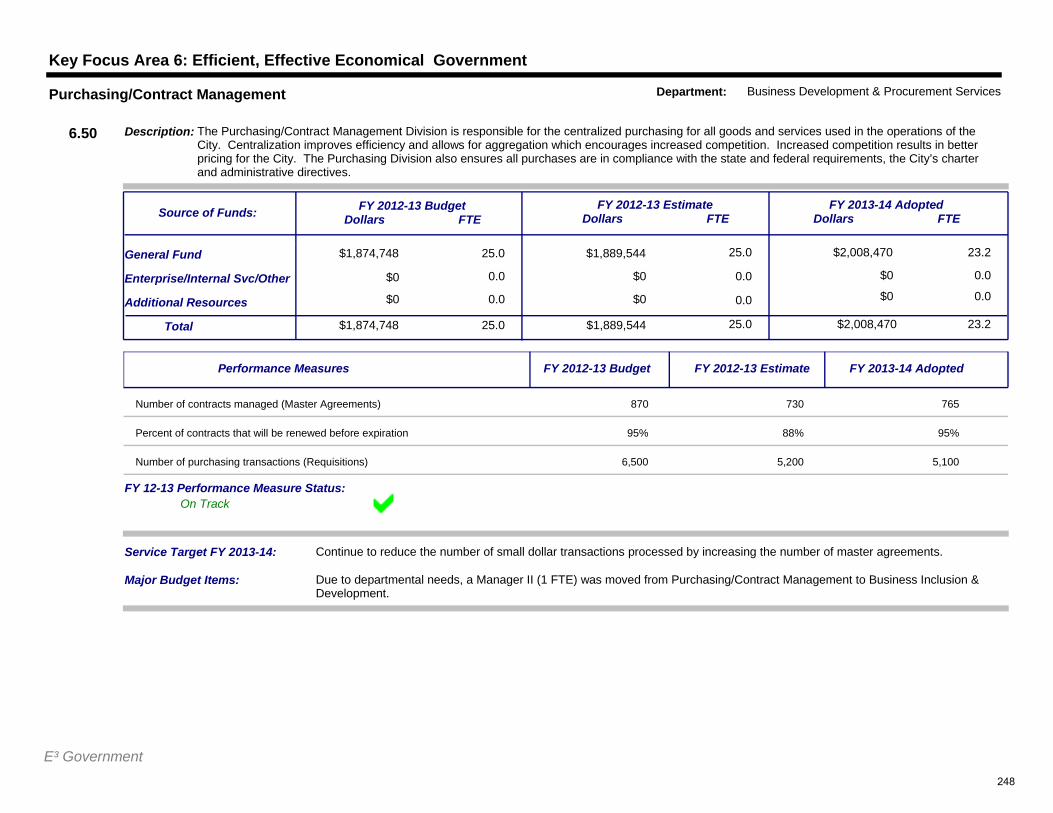
Key Focus Area 6: Efficient, Effective Economical Government
$1,874,748 25.0
0.0
$1,889,544 25.0
$0 0.0
$2,008,470
$0 0.0
23.2General Fund
Additional Resources
Service Target FY 2013-14: Continue to reduce the number of small dollar transactions processed by increasing the number of master agreements.
$1,874,748Total 25.0 $1,889,544 25.0 $2,008,470 23.2
Enterprise/Internal Svc/Other
$0 0.0 $0 0.0 $0 0.0
FY 2012-13 BudgetDollars FTE
FY 2012-13 EstimateDollars FTE
FY 2013-14 AdoptedDollars FTE
Description: The Purchasing/Contract Management Division is responsible for the centralized purchasing for all goods and services used in the operations of the City. Centralization improves efficiency and allows for aggregation which encourages increased competition. Increased competition results in better pricing for the City. The Purchasing Division also ensures all purchases are in compliance with the state and federal requirements, the City’s charter and administrative directives.
Source of Funds:
6.50
Purchasing/Contract Management Department: Business Development & Procurement Services
$0
Major Budget Items: Due to departmental needs, a Manager II (1 FTE) was moved from Purchasing/Contract Management to Business Inclusion & Development.
On TrackFY 12-13 Performance Measure Status:
Performance Measures FY 2012-13 Budget FY 2012-13 Estimate FY 2013-14 Adopted
Number of contracts managed (Master Agreements) 870 730 765
Percent of contracts that will be renewed before expiration 95% 88% 95%
Number of purchasing transactions (Requisitions) 6,500 5,200 5,100
E³ Government248
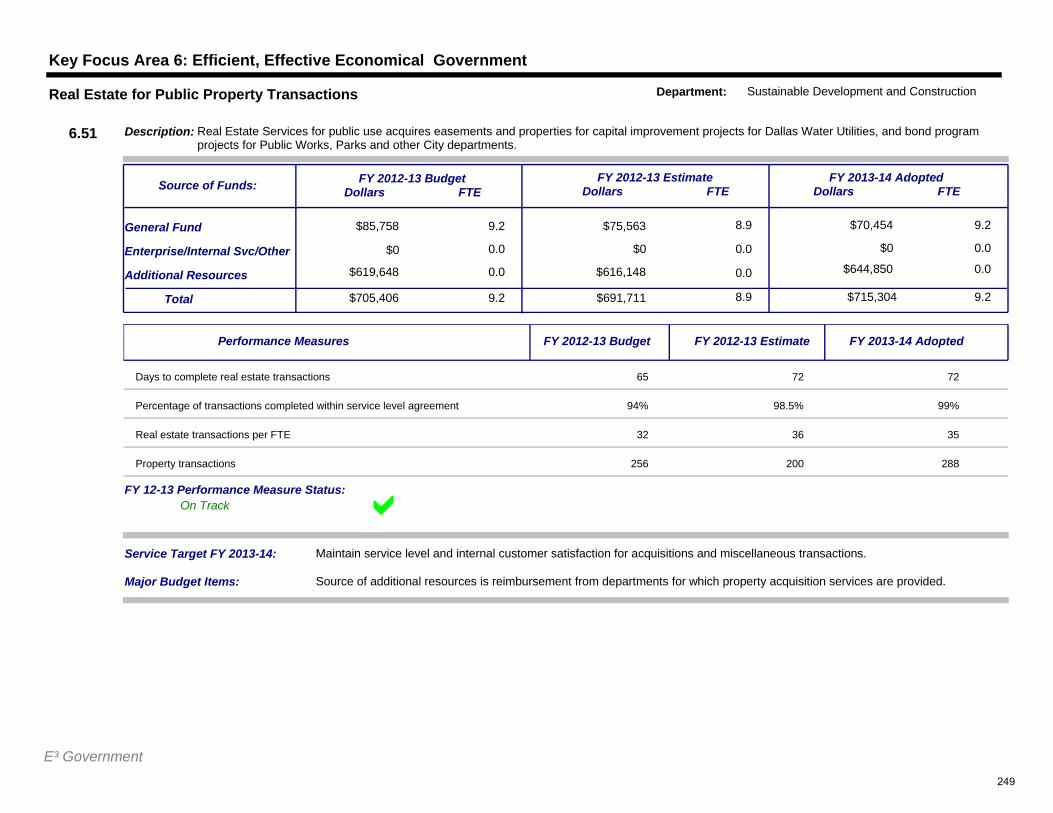
Key Focus Area 6: Efficient, Effective Economical Government
$85,758 9.2
0.0
$75,563 8.9
$0 0.0
$70,454
$0 0.0
9.2General Fund
Additional Resources
Service Target FY 2013-14: Maintain service level and internal customer satisfaction for acquisitions and miscellaneous transactions.
$705,406Total 9.2 $691,711 8.9 $715,304 9.2
Enterprise/Internal Svc/Other
$619,648 0.0 $616,148 0.0 $644,850 0.0
FY 2012-13 BudgetDollars FTE
FY 2012-13 EstimateDollars FTE
FY 2013-14 AdoptedDollars FTE
Description: Real Estate Services for public use acquires easements and properties for capital improvement projects for Dallas Water Utilities, and bond program projects for Public Works, Parks and other City departments.
Source of Funds:
6.51
Real Estate for Public Property Transactions Department: Sustainable Development and Construction
$0
Major Budget Items: Source of additional resources is reimbursement from departments for which property acquisition services are provided.
On TrackFY 12-13 Performance Measure Status:
Performance Measures FY 2012-13 Budget FY 2012-13 Estimate FY 2013-14 Adopted
Days to complete real estate transactions 65 72 72
Percentage of transactions completed within service level agreement 94% 98.5% 99%
Real estate transactions per FTE 32 36 35
Property transactions 256 200 288
E³ Government249
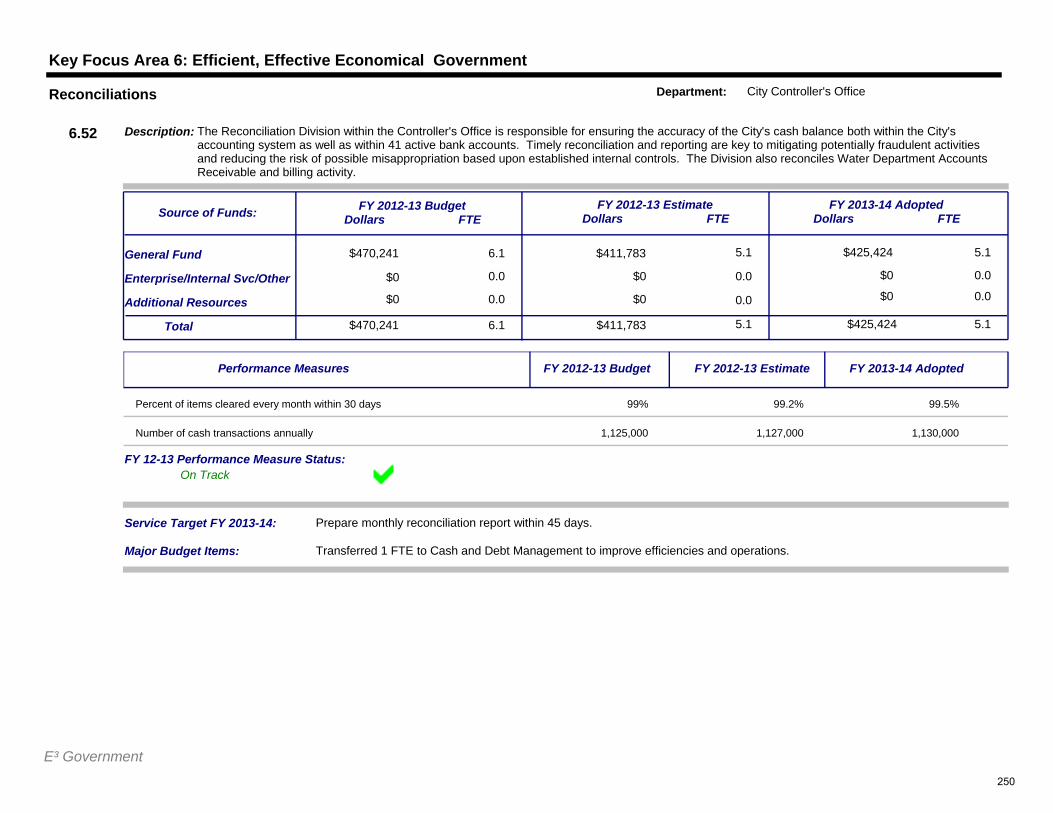
Key Focus Area 6: Efficient, Effective Economical Government
$470,241 6.1
0.0
$411,783 5.1
$0 0.0
$425,424
$0 0.0
5.1General Fund
Additional Resources
Service Target FY 2013-14: Prepare monthly reconciliation report within 45 days.
$470,241Total 6.1 $411,783 5.1 $425,424 5.1
Enterprise/Internal Svc/Other
$0 0.0 $0 0.0 $0 0.0
FY 2012-13 BudgetDollars FTE
FY 2012-13 EstimateDollars FTE
FY 2013-14 AdoptedDollars FTE
Description: The Reconciliation Division within the Controller's Office is responsible for ensuring the accuracy of the City's cash balance both within the City's accounting system as well as within 41 active bank accounts. Timely reconciliation and reporting are key to mitigating potentially fraudulent activities and reducing the risk of possible misappropriation based upon established internal controls. The Division also reconciles Water Department Accounts Receivable and billing activity.
Source of Funds:
6.52
Reconciliations Department: City Controller's Office
$0
Major Budget Items: Transferred 1 FTE to Cash and Debt Management to improve efficiencies and operations.
On TrackFY 12-13 Performance Measure Status:
Performance Measures FY 2012-13 Budget FY 2012-13 Estimate FY 2013-14 Adopted
Percent of items cleared every month within 30 days 99% 99.2% 99.5%
Number of cash transactions annually 1,125,000 1,127,000 1,130,000
E³ Government250
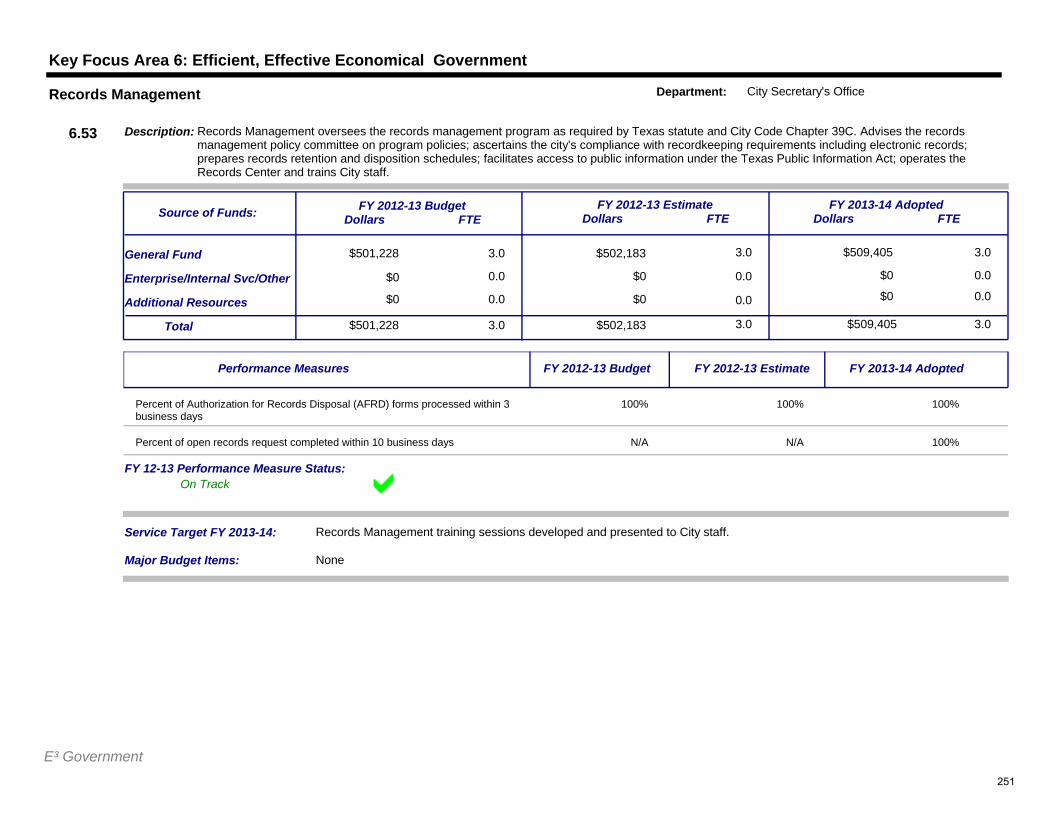
Key Focus Area 6: Efficient, Effective Economical Government
$501,228 3.0
0.0
$502,183 3.0
$0 0.0
$509,405
$0 0.0
3.0General Fund
Additional Resources
Service Target FY 2013-14: Records Management training sessions developed and presented to City staff.
$501,228Total 3.0 $502,183 3.0 $509,405 3.0
Enterprise/Internal Svc/Other
$0 0.0 $0 0.0 $0 0.0
FY 2012-13 BudgetDollars FTE
FY 2012-13 EstimateDollars FTE
FY 2013-14 AdoptedDollars FTE
Description: Records Management oversees the records management program as required by Texas statute and City Code Chapter 39C. Advises the records management policy committee on program policies; ascertains the city's compliance with recordkeeping requirements including electronic records; prepares records retention and disposition schedules; facilitates access to public information under the Texas Public Information Act; operates the Records Center and trains City staff.
Source of Funds:
6.53
Records Management Department: City Secretary's Office
$0
Major Budget Items: None
On TrackFY 12-13 Performance Measure Status:
Performance Measures FY 2012-13 Budget FY 2012-13 Estimate FY 2013-14 Adopted
Percent of Authorization for Records Disposal (AFRD) forms processed within 3 business days
100% 100% 100%
Percent of open records request completed within 10 business days N/A N/A 100%
E³ Government251
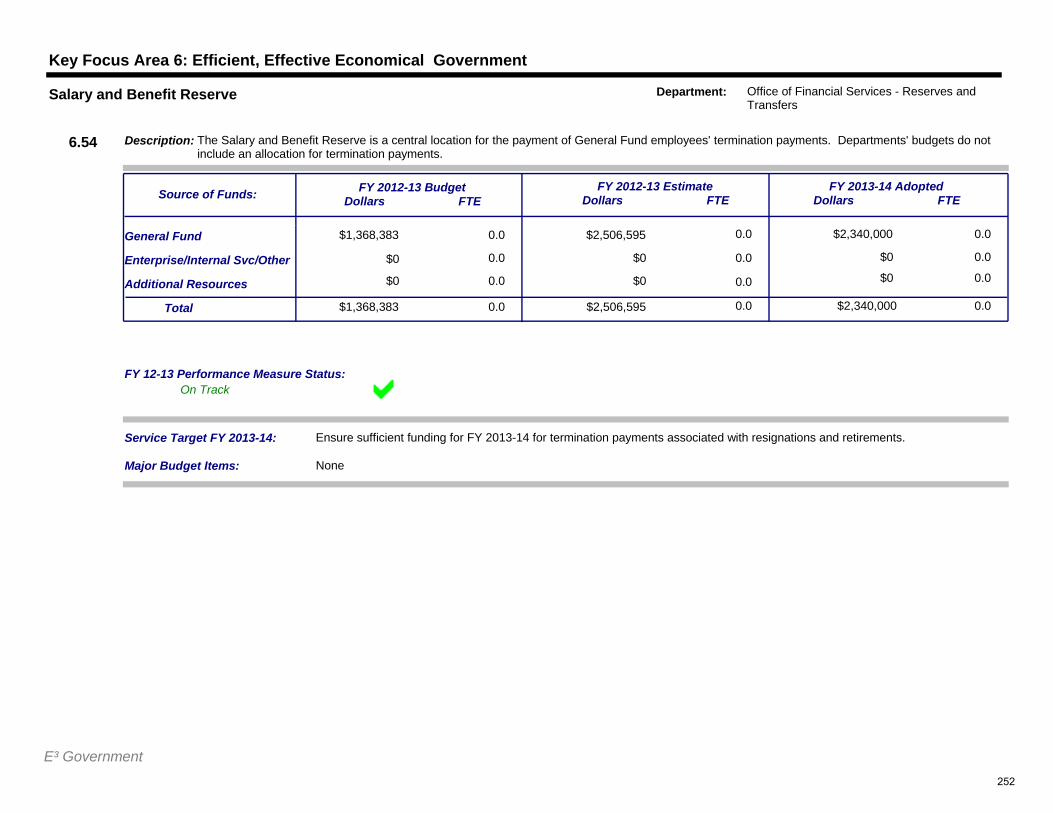
Key Focus Area 6: Efficient, Effective Economical Government
$1,368,383 0.0
0.0
$2,506,595 0.0
$0 0.0
$2,340,000
$0 0.0
0.0General Fund
Additional Resources
Service Target FY 2013-14: Ensure sufficient funding for FY 2013-14 for termination payments associated with resignations and retirements.
$1,368,383Total 0.0 $2,506,595 0.0 $2,340,000 0.0
Enterprise/Internal Svc/Other
$0 0.0 $0 0.0 $0 0.0
FY 2012-13 BudgetDollars FTE
FY 2012-13 EstimateDollars FTE
FY 2013-14 AdoptedDollars FTE
Description: The Salary and Benefit Reserve is a central location for the payment of General Fund employees' termination payments. Departments' budgets do not include an allocation for termination payments.
Source of Funds:
6.54
Salary and Benefit Reserve Department: Office of Financial Services - Reserves and Transfers
$0
Major Budget Items: None
On TrackFY 12-13 Performance Measure Status:
E³ Government252
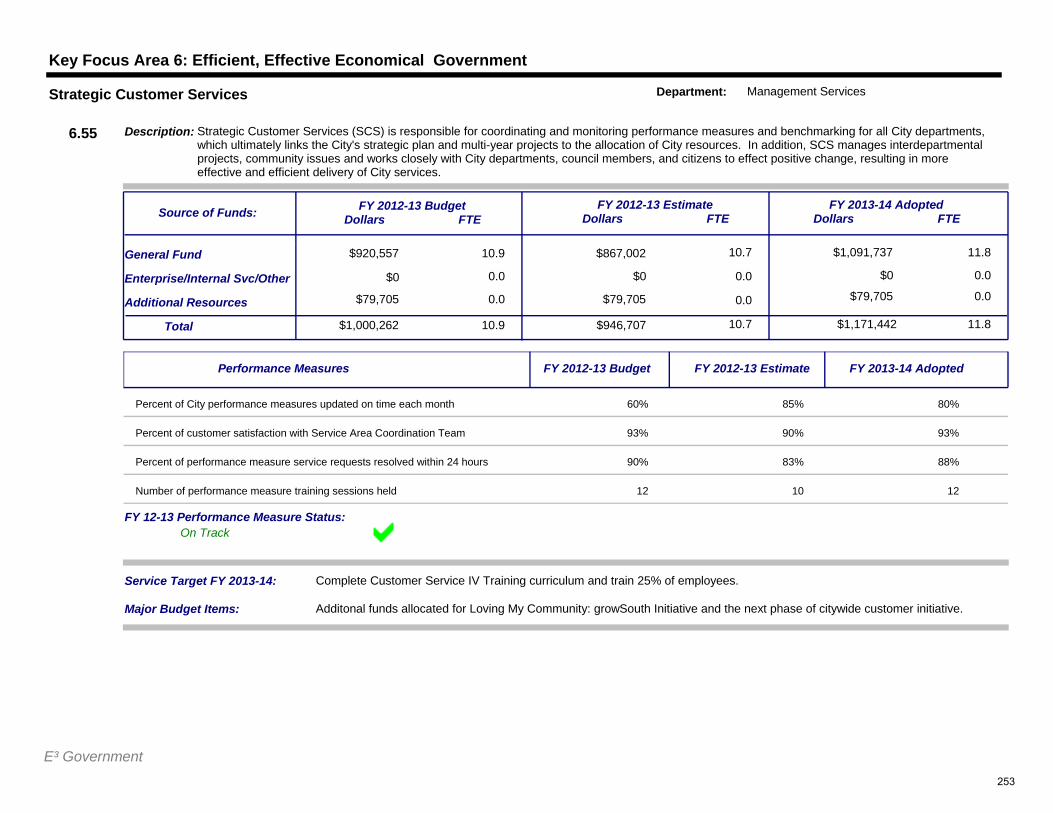
Key Focus Area 6: Efficient, Effective Economical Government
$920,557 10.9
0.0
$867,002 10.7
$0 0.0
$1,091,737
$0 0.0
11.8General Fund
Additional Resources
Service Target FY 2013-14: Complete Customer Service IV Training curriculum and train 25% of employees.
$1,000,262Total 10.9 $946,707 10.7 $1,171,442 11.8
Enterprise/Internal Svc/Other
$79,705 0.0 $79,705 0.0 $79,705 0.0
FY 2012-13 BudgetDollars FTE
FY 2012-13 EstimateDollars FTE
FY 2013-14 AdoptedDollars FTE
Description: Strategic Customer Services (SCS) is responsible for coordinating and monitoring performance measures and benchmarking for all City departments, which ultimately links the City's strategic plan and multi-year projects to the allocation of City resources. In addition, SCS manages interdepartmental projects, community issues and works closely with City departments, council members, and citizens to effect positive change, resulting in more effective and efficient delivery of City services.
Source of Funds:
6.55
Strategic Customer Services Department: Management Services
$0
Major Budget Items: Additonal funds allocated for Loving My Community: growSouth Initiative and the next phase of citywide customer initiative.
On TrackFY 12-13 Performance Measure Status:
Performance Measures FY 2012-13 Budget FY 2012-13 Estimate FY 2013-14 Adopted
Percent of City performance measures updated on time each month 60% 85% 80%
Percent of customer satisfaction with Service Area Coordination Team 93% 90% 93%
Percent of performance measure service requests resolved within 24 hours 90% 83% 88%
Number of performance measure training sessions held 12 10 12
E³ Government253
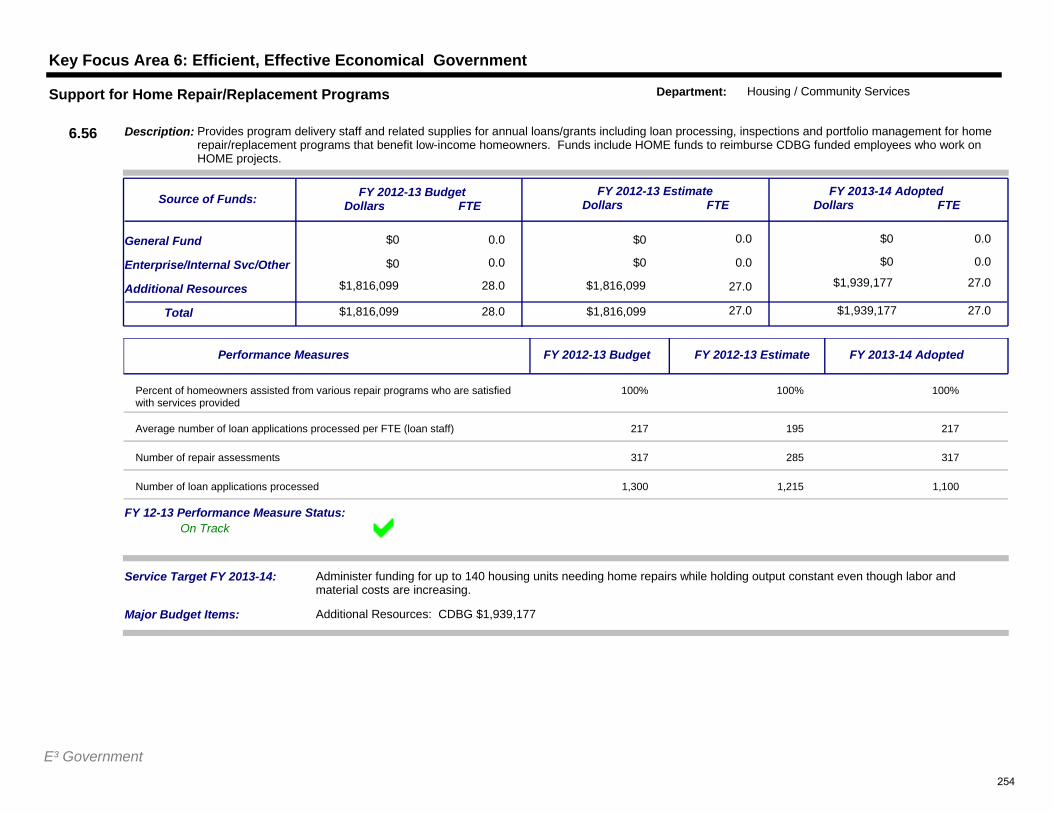
Key Focus Area 6: Efficient, Effective Economical Government
$0 0.0
0.0
$0 0.0
$0 0.0
$0
$0 0.0
0.0General Fund
Additional Resources
Service Target FY 2013-14: Administer funding for up to 140 housing units needing home repairs while holding output constant even though labor and material costs are increasing.
$1,816,099Total 28.0 $1,816,099 27.0 $1,939,177 27.0
Enterprise/Internal Svc/Other
$1,816,099 28.0 $1,816,099 27.0 $1,939,177 27.0
FY 2012-13 BudgetDollars FTE
FY 2012-13 EstimateDollars FTE
FY 2013-14 AdoptedDollars FTE
Description: Provides program delivery staff and related supplies for annual loans/grants including loan processing, inspections and portfolio management for home repair/replacement programs that benefit low-income homeowners. Funds include HOME funds to reimburse CDBG funded employees who work on HOME projects.
Source of Funds:
6.56
Support for Home Repair/Replacement Programs Department: Housing / Community Services
$0
Major Budget Items: Additional Resources: CDBG $1,939,177
On TrackFY 12-13 Performance Measure Status:
Performance Measures FY 2012-13 Budget FY 2012-13 Estimate FY 2013-14 Adopted
Percent of homeowners assisted from various repair programs who are satisfied with services provided
100% 100% 100%
Average number of loan applications processed per FTE (loan staff) 217 195 217
Number of repair assessments 317 285 317
Number of loan applications processed 1,300 1,215 1,100
E³ Government254
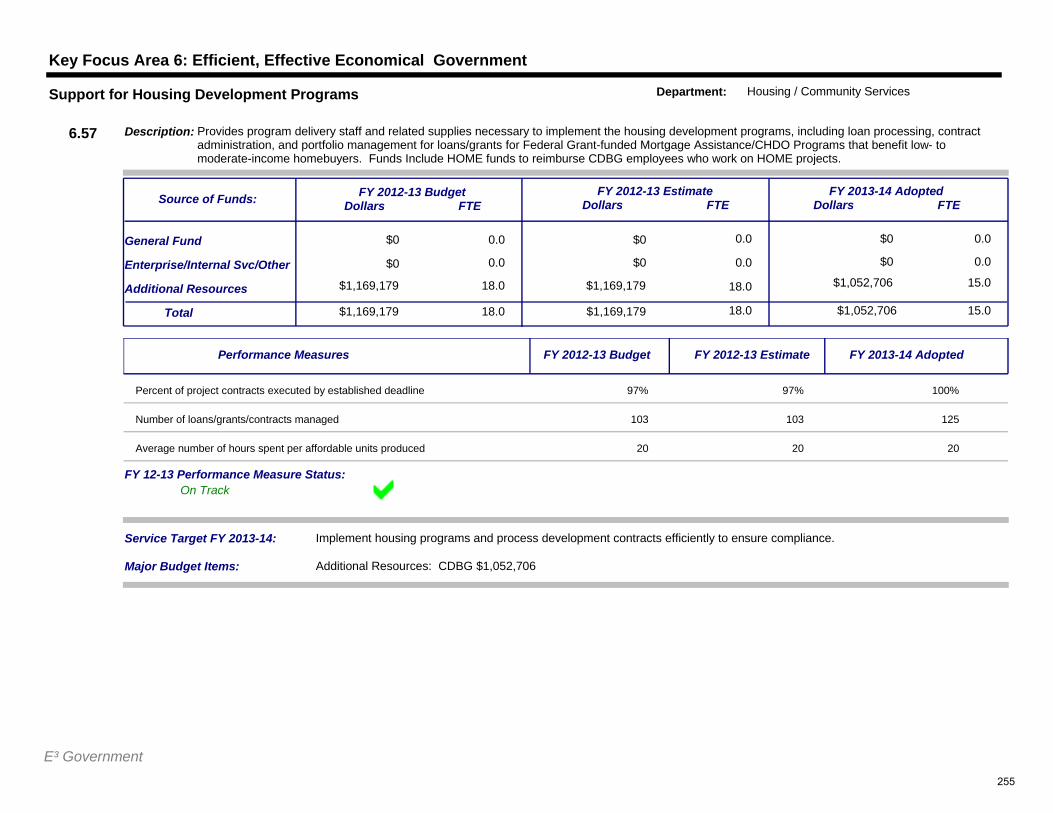
Key Focus Area 6: Efficient, Effective Economical Government
$0 0.0
0.0
$0 0.0
$0 0.0
$0
$0 0.0
0.0General Fund
Additional Resources
Service Target FY 2013-14: Implement housing programs and process development contracts efficiently to ensure compliance.
$1,169,179Total 18.0 $1,169,179 18.0 $1,052,706 15.0
Enterprise/Internal Svc/Other
$1,169,179 18.0 $1,169,179 18.0 $1,052,706 15.0
FY 2012-13 BudgetDollars FTE
FY 2012-13 EstimateDollars FTE
FY 2013-14 AdoptedDollars FTE
Description: Provides program delivery staff and related supplies necessary to implement the housing development programs, including loan processing, contract administration, and portfolio management for loans/grants for Federal Grant-funded Mortgage Assistance/CHDO Programs that benefit low- to moderate-income homebuyers. Funds Include HOME funds to reimburse CDBG employees who work on HOME projects.
Source of Funds:
6.57
Support for Housing Development Programs Department: Housing / Community Services
$0
Major Budget Items: Additional Resources: CDBG $1,052,706
On TrackFY 12-13 Performance Measure Status:
Performance Measures FY 2012-13 Budget FY 2012-13 Estimate FY 2013-14 Adopted
Percent of project contracts executed by established deadline 97% 97% 100%
Number of loans/grants/contracts managed 103 103 125
Average number of hours spent per affordable units produced 20 20 20
E³ Government255
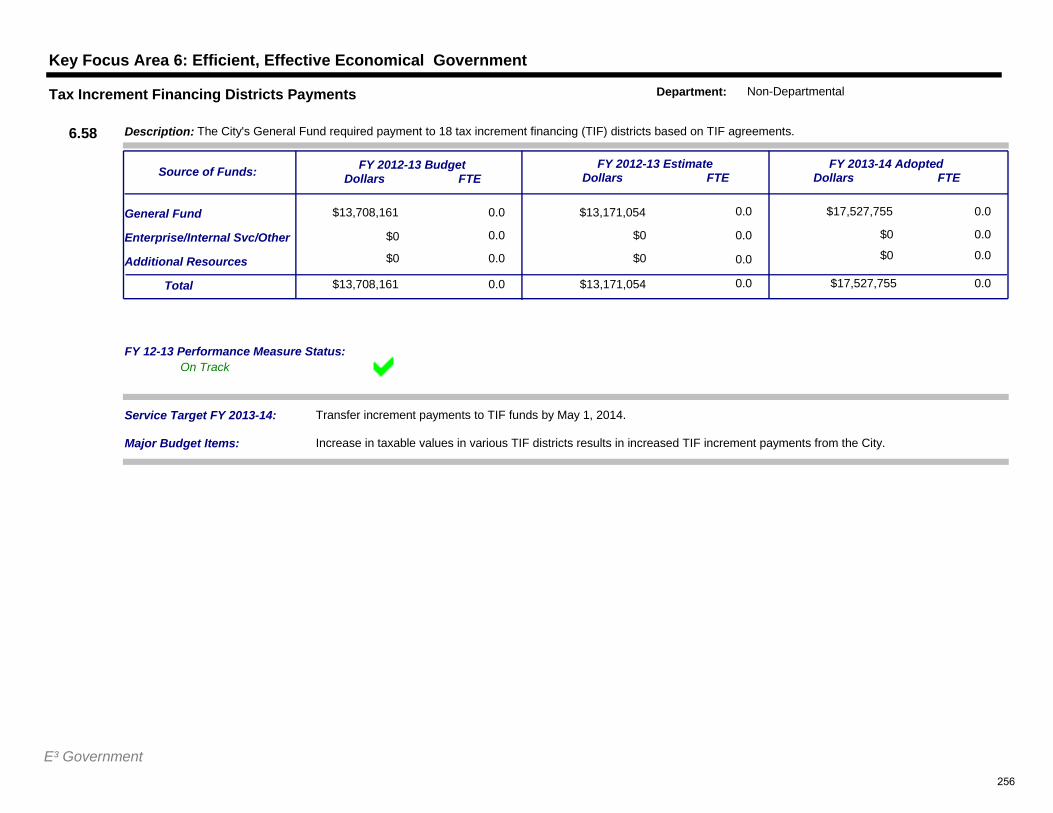
Key Focus Area 6: Efficient, Effective Economical Government
$13,708,161 0.0
0.0
$13,171,054 0.0
$0 0.0
$17,527,755
$0 0.0
0.0General Fund
Additional Resources
Service Target FY 2013-14: Transfer increment payments to TIF funds by May 1, 2014.
$13,708,161Total 0.0 $13,171,054 0.0 $17,527,755 0.0
Enterprise/Internal Svc/Other
$0 0.0 $0 0.0 $0 0.0
FY 2012-13 BudgetDollars FTE
FY 2012-13 EstimateDollars FTE
FY 2013-14 AdoptedDollars FTE
Description: The City's General Fund required payment to 18 tax increment financing (TIF) districts based on TIF agreements.
Source of Funds:
6.58
Tax Increment Financing Districts Payments Department: Non-Departmental
$0
Major Budget Items: Increase in taxable values in various TIF districts results in increased TIF increment payments from the City.
On TrackFY 12-13 Performance Measure Status:
E³ Government256
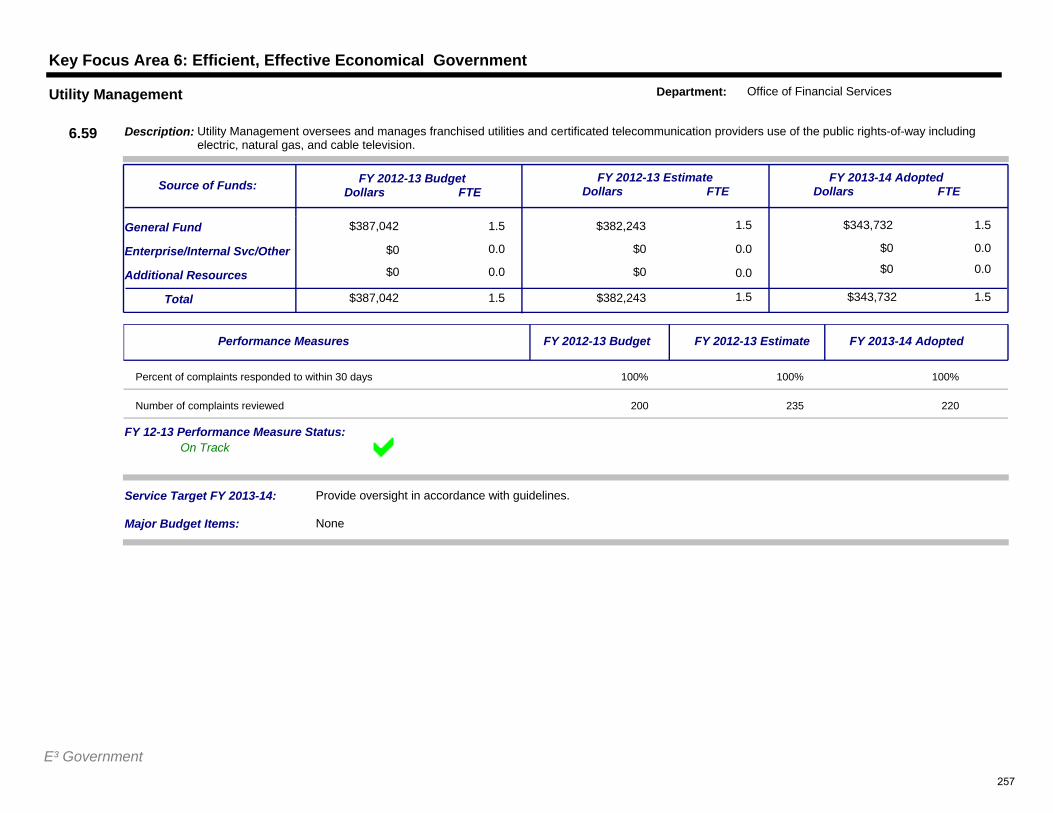
Key Focus Area 6: Efficient, Effective Economical Government
$387,042 1.5
0.0
$382,243 1.5
$0 0.0
$343,732
$0 0.0
1.5General Fund
Additional Resources
Service Target FY 2013-14: Provide oversight in accordance with guidelines.
$387,042Total 1.5 $382,243 1.5 $343,732 1.5
Enterprise/Internal Svc/Other
$0 0.0 $0 0.0 $0 0.0
FY 2012-13 BudgetDollars FTE
FY 2012-13 EstimateDollars FTE
FY 2013-14 AdoptedDollars FTE
Description: Utility Management oversees and manages franchised utilities and certificated telecommunication providers use of the public rights-of-way including electric, natural gas, and cable television.
Source of Funds:
6.59
Utility Management Department: Office of Financial Services
$0
Major Budget Items: None
On TrackFY 12-13 Performance Measure Status:
Performance Measures FY 2012-13 Budget FY 2012-13 Estimate FY 2013-14 Adopted
Percent of complaints responded to within 30 days 100% 100% 100%
Number of complaints reviewed 200 235 220
E³ Government257
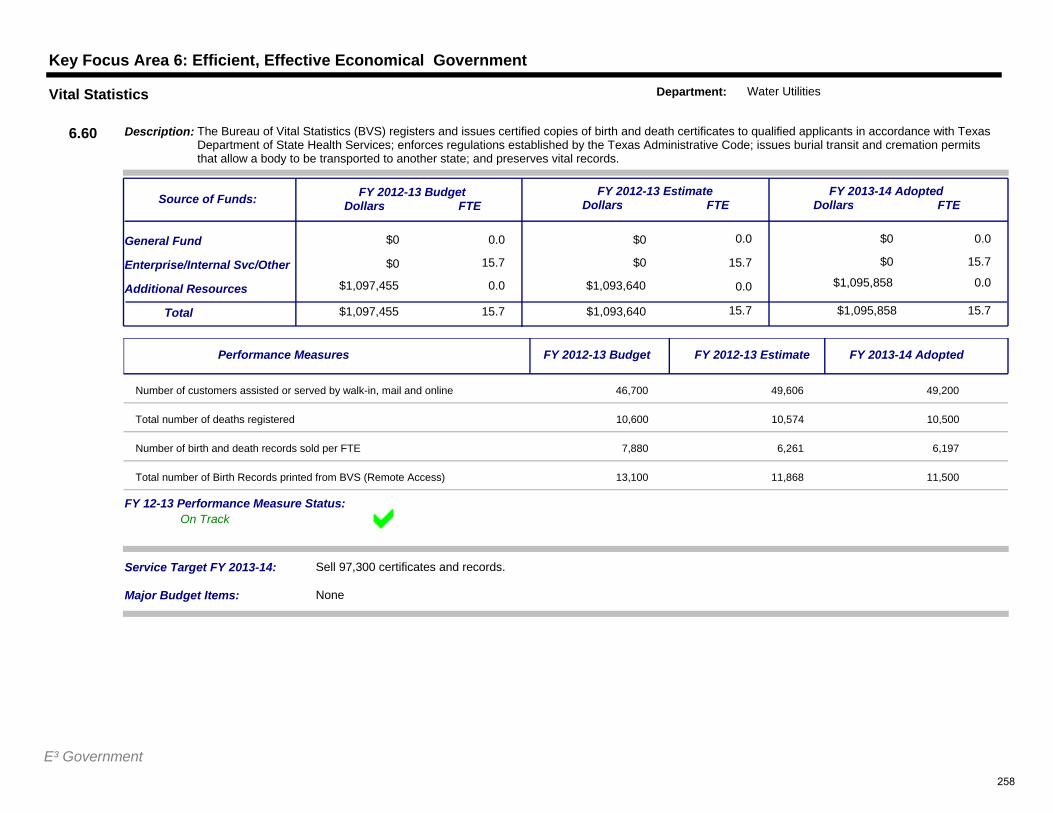
Key Focus Area 6: Efficient, Effective Economical Government
$0 0.0
15.7
$0 0.0
$0 15.7
$0
$0 15.7
0.0General Fund
Additional Resources
Service Target FY 2013-14: Sell 97,300 certificates and records.
$1,097,455Total 15.7 $1,093,640 15.7 $1,095,858 15.7
Enterprise/Internal Svc/Other
$1,097,455 0.0 $1,093,640 0.0 $1,095,858 0.0
FY 2012-13 BudgetDollars FTE
FY 2012-13 EstimateDollars FTE
FY 2013-14 AdoptedDollars FTE
Description: The Bureau of Vital Statistics (BVS) registers and issues certified copies of birth and death certificates to qualified applicants in accordance with Texas Department of State Health Services; enforces regulations established by the Texas Administrative Code; issues burial transit and cremation permits that allow a body to be transported to another state; and preserves vital records.
Source of Funds:
6.60
Vital Statistics Department: Water Utilities
$0
Major Budget Items: None
On TrackFY 12-13 Performance Measure Status:
Performance Measures FY 2012-13 Budget FY 2012-13 Estimate FY 2013-14 Adopted
Number of customers assisted or served by walk-in, mail and online 46,700 49,606 49,200
Total number of deaths registered 10,600 10,574 10,500
Number of birth and death records sold per FTE 7,880 6,261 6,197
Total number of Birth Records printed from BVS (Remote Access) 13,100 11,868 11,500
E³ Government258
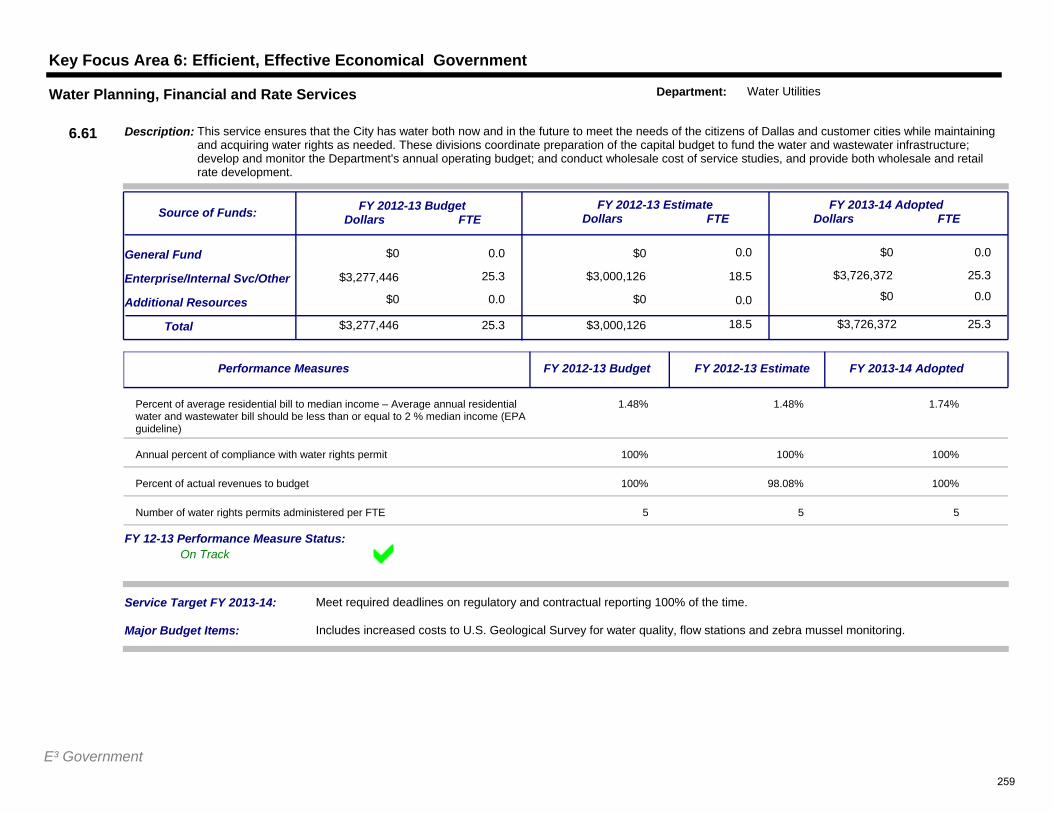
Key Focus Area 6: Efficient, Effective Economical Government
$0 0.0
25.3
$0 0.0
$3,000,126 18.5
$0
$3,726,372 25.3
0.0General Fund
Additional Resources
Service Target FY 2013-14: Meet required deadlines on regulatory and contractual reporting 100% of the time.
$3,277,446Total 25.3 $3,000,126 18.5 $3,726,372 25.3
Enterprise/Internal Svc/Other
$0 0.0 $0 0.0 $0 0.0
FY 2012-13 BudgetDollars FTE
FY 2012-13 EstimateDollars FTE
FY 2013-14 AdoptedDollars FTE
Description: This service ensures that the City has water both now and in the future to meet the needs of the citizens of Dallas and customer cities while maintaining and acquiring water rights as needed. These divisions coordinate preparation of the capital budget to fund the water and wastewater infrastructure; develop and monitor the Department's annual operating budget; and conduct wholesale cost of service studies, and provide both wholesale and retail rate development.
Source of Funds:
6.61
Water Planning, Financial and Rate Services Department: Water Utilities
$3,277,446
Major Budget Items: Includes increased costs to U.S. Geological Survey for water quality, flow stations and zebra mussel monitoring.
On TrackFY 12-13 Performance Measure Status:
Performance Measures FY 2012-13 Budget FY 2012-13 Estimate FY 2013-14 Adopted
Percent of average residential bill to median income – Average annual residential water and wastewater bill should be less than or equal to 2 % median income (EPA guideline)
1.48% 1.48% 1.74%
Annual percent of compliance with water rights permit 100% 100% 100%
Percent of actual revenues to budget 100% 98.08% 100%
Number of water rights permits administered per FTE 5 5 5
E³ Government259
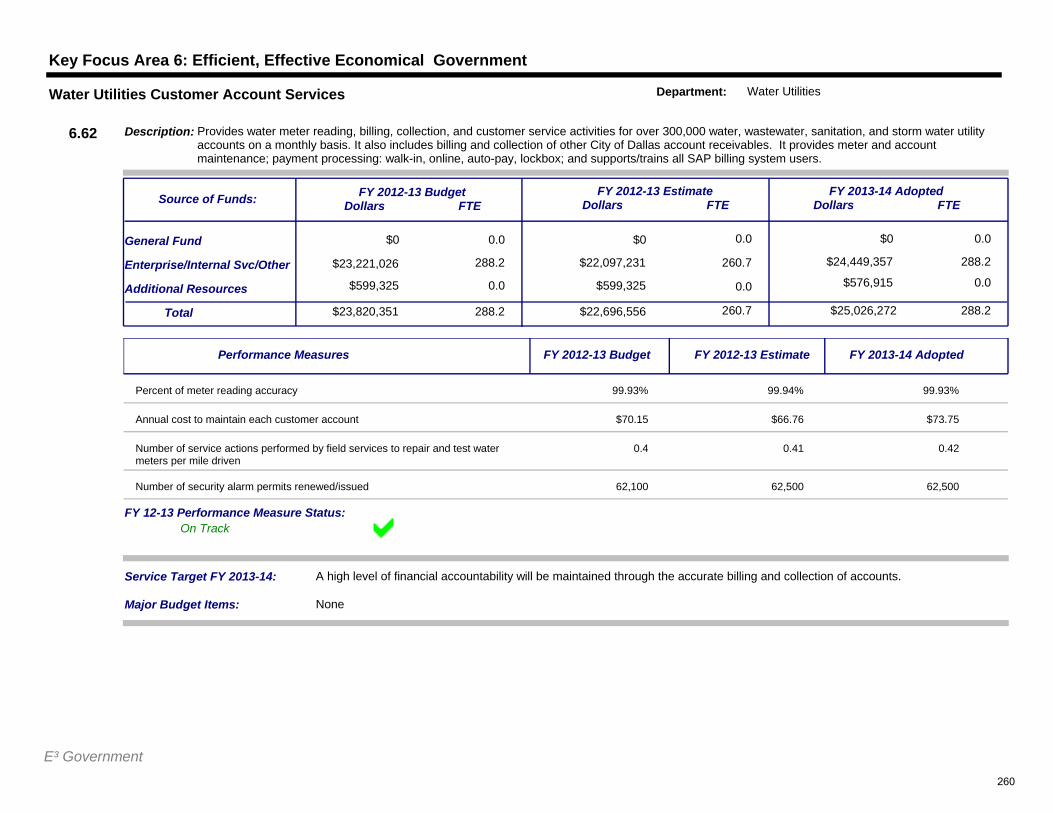
Key Focus Area 6: Efficient, Effective Economical Government
$0 0.0
288.2
$0 0.0
$22,097,231 260.7
$0
$24,449,357 288.2
0.0General Fund
Additional Resources
Service Target FY 2013-14: A high level of financial accountability will be maintained through the accurate billing and collection of accounts.
$23,820,351Total 288.2 $22,696,556 260.7 $25,026,272 288.2
Enterprise/Internal Svc/Other
$599,325 0.0 $599,325 0.0 $576,915 0.0
FY 2012-13 BudgetDollars FTE
FY 2012-13 EstimateDollars FTE
FY 2013-14 AdoptedDollars FTE
Description: Provides water meter reading, billing, collection, and customer service activities for over 300,000 water, wastewater, sanitation, and storm water utility accounts on a monthly basis. It also includes billing and collection of other City of Dallas account receivables. It provides meter and account maintenance; payment processing: walk-in, online, auto-pay, lockbox; and supports/trains all SAP billing system users.
Source of Funds:
6.62
Water Utilities Customer Account Services Department: Water Utilities
$23,221,026
Major Budget Items: None
On TrackFY 12-13 Performance Measure Status:
Performance Measures FY 2012-13 Budget FY 2012-13 Estimate FY 2013-14 Adopted
Percent of meter reading accuracy 99.93% 99.94% 99.93%
Annual cost to maintain each customer account $70.15 $66.76 $73.75
Number of service actions performed by field services to repair and test water meters per mile driven
0.4 0.41 0.42
Number of security alarm permits renewed/issued 62,100 62,500 62,500
E³ Government260
INTERNAL SERVICES AND OTHER FUNDS
The following information is reported separately from prior Key Focus Areas because the costs are already captured in those Services. Services included in this section are reported by Key Focus Area. The following funds are included:
9-1-1 System Operations Communication and Information Services Employee Benefits (Administration) Equipment and Building Services – Equipment Services Express Business Center Risk Management (Administration)
261

262
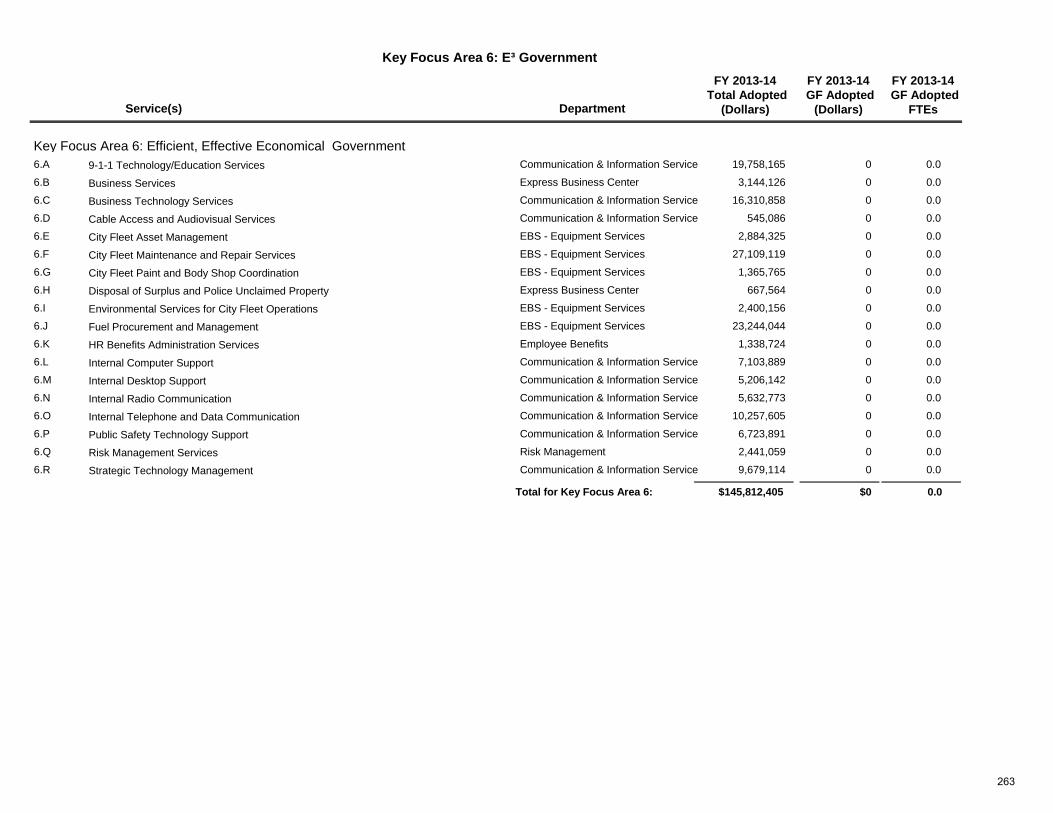
Key Focus Area 6: E³ Government
Service(s) Department
FY 2013-14 Total Adopted
(Dollars)
FY 2013-14 GF Adopted
(Dollars)
FY 2013-14 GF Adopted
FTEs
Key Focus Area 6: Efficient, Effective Economical GovernmentCommunication & Information Service 19,758,165 0 0.09-1-1 Technology/Education Services6.A
Express Business Center 3,144,126 0 0.0Business Services6.B
Communication & Information Service 16,310,858 0 0.0Business Technology Services6.C
Communication & Information Service 545,086 0 0.0Cable Access and Audiovisual Services6.D
EBS - Equipment Services 2,884,325 0 0.0City Fleet Asset Management6.E
EBS - Equipment Services 27,109,119 0 0.0City Fleet Maintenance and Repair Services6.F
EBS - Equipment Services 1,365,765 0 0.0City Fleet Paint and Body Shop Coordination6.G
Express Business Center 667,564 0 0.0Disposal of Surplus and Police Unclaimed Property6.H
EBS - Equipment Services 2,400,156 0 0.0Environmental Services for City Fleet Operations6.I
EBS - Equipment Services 23,244,044 0 0.0Fuel Procurement and Management6.J
Employee Benefits 1,338,724 0 0.0HR Benefits Administration Services6.K
Communication & Information Service 7,103,889 0 0.0Internal Computer Support6.L
Communication & Information Service 5,206,142 0 0.0Internal Desktop Support6.M
Communication & Information Service 5,632,773 0 0.0Internal Radio Communication6.N
Communication & Information Service 10,257,605 0 0.0Internal Telephone and Data Communication6.O
Communication & Information Service 6,723,891 0 0.0Public Safety Technology Support6.P
Risk Management 2,441,059 0 0.0Risk Management Services6.Q
Communication & Information Service 9,679,114 0 0.0Strategic Technology Management6.R
$0 0.0$145,812,405Total for Key Focus Area 6:
263

264
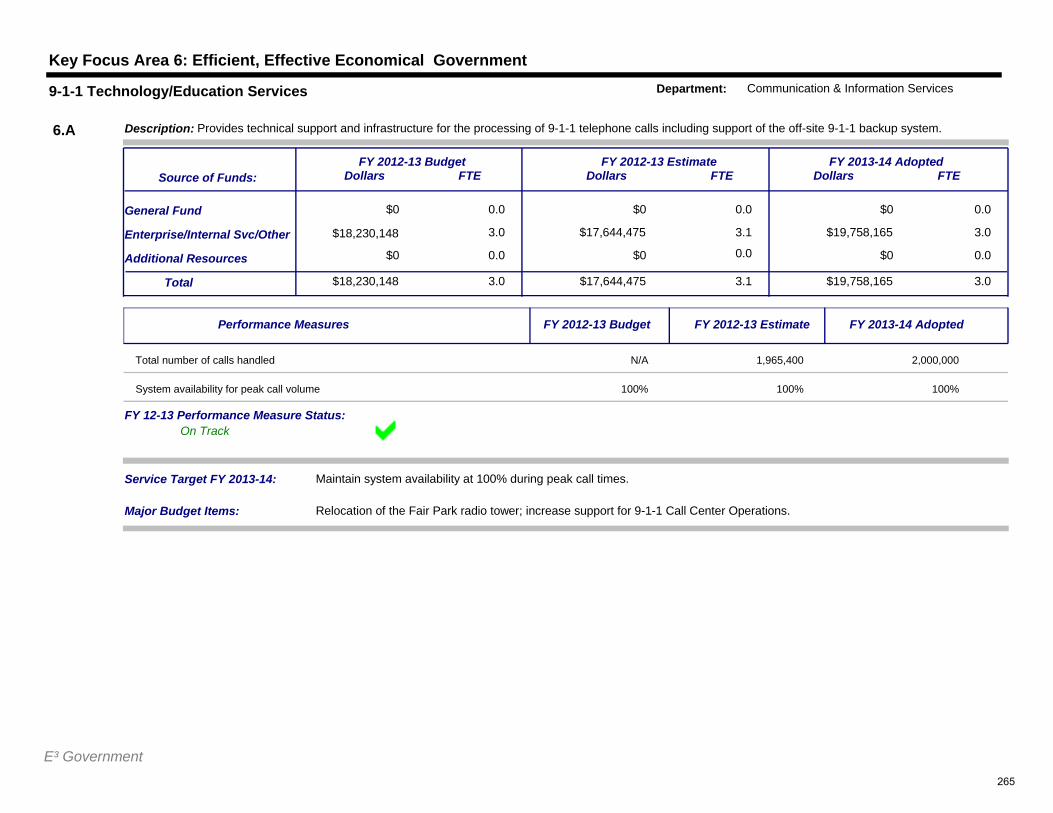
Key Focus Area 6: Efficient, Effective Economical Government
$0 0.0
3.0
$0 0.0
$17,644,475 3.1
$0
$19,758,165 3.0
0.0General Fund
Additional Resources
Service Target FY 2013-14: Maintain system availability at 100% during peak call times.
$18,230,148Total 3.0 $17,644,475 3.1 $19,758,165 3.0
Enterprise/Internal Svc/Other
$0 0.0 $0 0.0 $0 0.0
FY 2012-13 BudgetDollars FTE
FY 2012-13 EstimateDollars FTE
FY 2013-14 AdoptedDollars FTE
Description: Provides technical support and infrastructure for the processing of 9-1-1 telephone calls including support of the off-site 9-1-1 backup system.
Source of Funds:
6.A
9-1-1 Technology/Education Services Department: Communication & Information Services
$18,230,148
Major Budget Items: Relocation of the Fair Park radio tower; increase support for 9-1-1 Call Center Operations.
On TrackFY 12-13 Performance Measure Status:
Performance Measures FY 2012-13 Budget FY 2012-13 Estimate FY 2013-14 Adopted
Total number of calls handled N/A 1,965,400 2,000,000
System availability for peak call volume 100% 100% 100%
E³ Government265
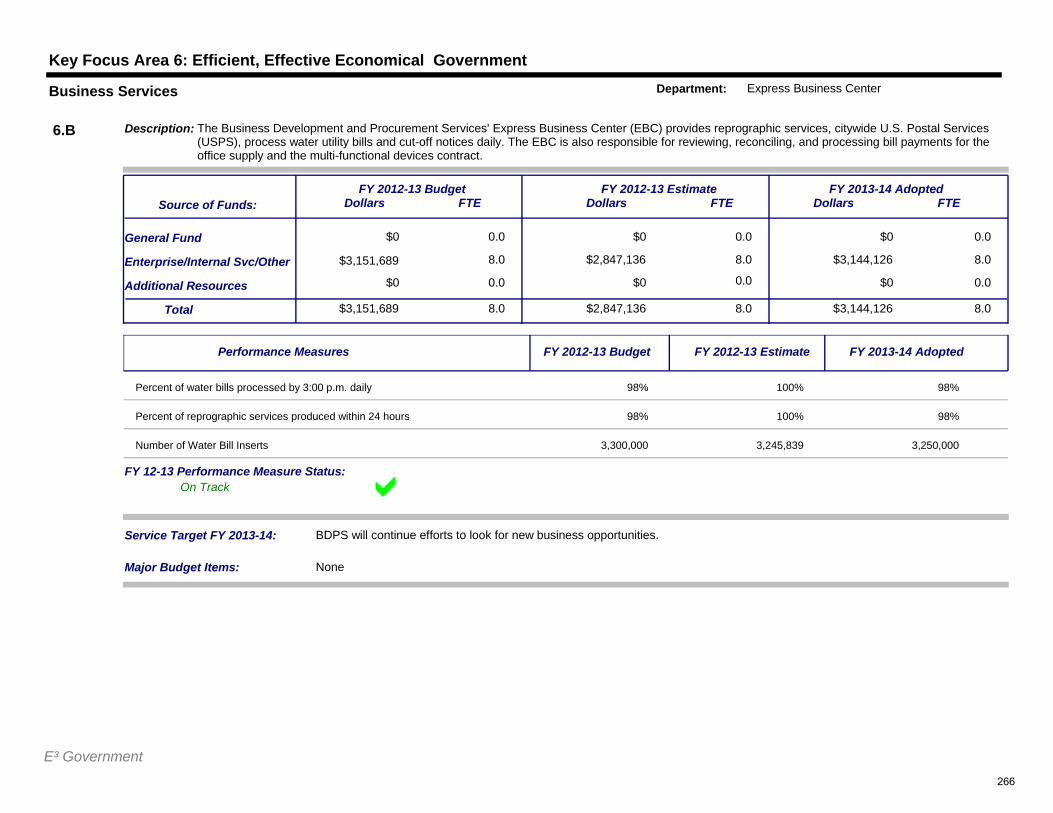
Key Focus Area 6: Efficient, Effective Economical Government
$0 0.0
8.0
$0 0.0
$2,847,136 8.0
$0
$3,144,126 8.0
0.0General Fund
Additional Resources
Service Target FY 2013-14: BDPS will continue efforts to look for new business opportunities.
$3,151,689Total 8.0 $2,847,136 8.0 $3,144,126 8.0
Enterprise/Internal Svc/Other
$0 0.0 $0 0.0 $0 0.0
FY 2012-13 BudgetDollars FTE
FY 2012-13 EstimateDollars FTE
FY 2013-14 AdoptedDollars FTE
Description: The Business Development and Procurement Services' Express Business Center (EBC) provides reprographic services, citywide U.S. Postal Services (USPS), process water utility bills and cut-off notices daily. The EBC is also responsible for reviewing, reconciling, and processing bill payments for the office supply and the multi-functional devices contract.
Source of Funds:
6.B
Business Services Department: Express Business Center
$3,151,689
Major Budget Items: None
On TrackFY 12-13 Performance Measure Status:
Performance Measures FY 2012-13 Budget FY 2012-13 Estimate FY 2013-14 Adopted
Percent of water bills processed by 3:00 p.m. daily 98% 100% 98%
Percent of reprographic services produced within 24 hours 98% 100% 98%
Number of Water Bill Inserts 3,300,000 3,245,839 3,250,000
E³ Government266
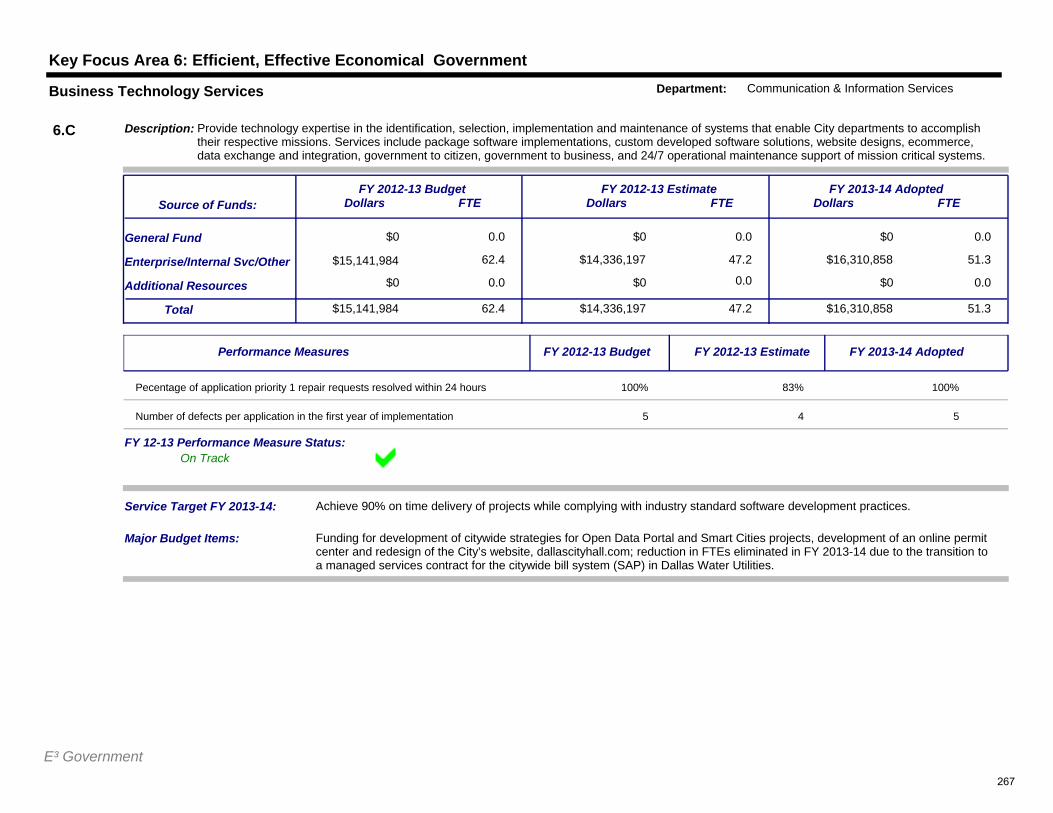
Key Focus Area 6: Efficient, Effective Economical Government
$0 0.0
62.4
$0 0.0
$14,336,197 47.2
$0
$16,310,858 51.3
0.0General Fund
Additional Resources
Service Target FY 2013-14: Achieve 90% on time delivery of projects while complying with industry standard software development practices.
$15,141,984Total 62.4 $14,336,197 47.2 $16,310,858 51.3
Enterprise/Internal Svc/Other
$0 0.0 $0 0.0 $0 0.0
FY 2012-13 BudgetDollars FTE
FY 2012-13 EstimateDollars FTE
FY 2013-14 AdoptedDollars FTE
Description: Provide technology expertise in the identification, selection, implementation and maintenance of systems that enable City departments to accomplish their respective missions. Services include package software implementations, custom developed software solutions, website designs, ecommerce, data exchange and integration, government to citizen, government to business, and 24/7 operational maintenance support of mission critical systems.
Source of Funds:
6.C
Business Technology Services Department: Communication & Information Services
$15,141,984
Major Budget Items: Funding for development of citywide strategies for Open Data Portal and Smart Cities projects, development of an online permit center and redesign of the City’s website, dallascityhall.com; reduction in FTEs eliminated in FY 2013-14 due to the transition to a managed services contract for the citywide bill system (SAP) in Dallas Water Utilities.
On TrackFY 12-13 Performance Measure Status:
Performance Measures FY 2012-13 Budget FY 2012-13 Estimate FY 2013-14 Adopted
Pecentage of application priority 1 repair requests resolved within 24 hours 100% 83% 100%
Number of defects per application in the first year of implementation 5 4 5
E³ Government267
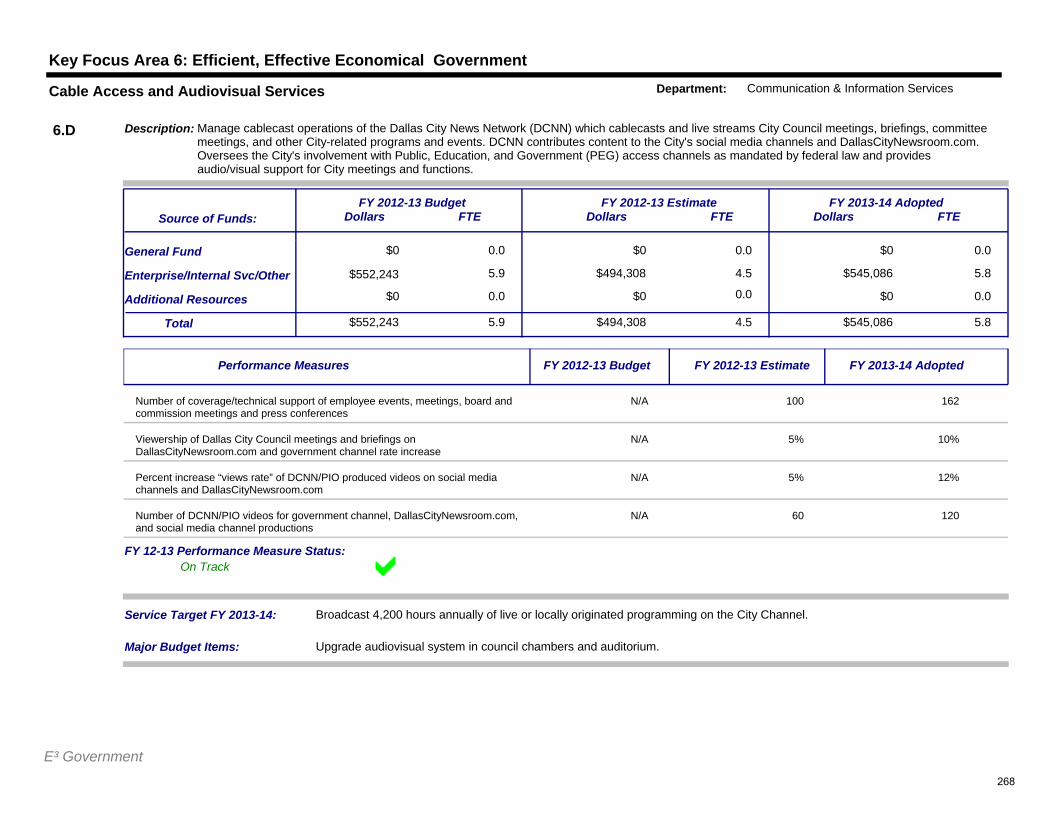
Key Focus Area 6: Efficient, Effective Economical Government
$0 0.0
5.9
$0 0.0
$494,308 4.5
$0
$545,086 5.8
0.0General Fund
Additional Resources
Service Target FY 2013-14: Broadcast 4,200 hours annually of live or locally originated programming on the City Channel.
$552,243Total 5.9 $494,308 4.5 $545,086 5.8
Enterprise/Internal Svc/Other
$0 0.0 $0 0.0 $0 0.0
FY 2012-13 BudgetDollars FTE
FY 2012-13 EstimateDollars FTE
FY 2013-14 AdoptedDollars FTE
Description: Manage cablecast operations of the Dallas City News Network (DCNN) which cablecasts and live streams City Council meetings, briefings, committee meetings, and other City-related programs and events. DCNN contributes content to the City's social media channels and DallasCityNewsroom.com. Oversees the City's involvement with Public, Education, and Government (PEG) access channels as mandated by federal law and provides audio/visual support for City meetings and functions.
Source of Funds:
6.D
Cable Access and Audiovisual Services Department: Communication & Information Services
$552,243
Major Budget Items: Upgrade audiovisual system in council chambers and auditorium.
On TrackFY 12-13 Performance Measure Status:
Performance Measures FY 2012-13 Budget FY 2012-13 Estimate FY 2013-14 Adopted
Number of coverage/technical support of employee events, meetings, board and commission meetings and press conferences
N/A 100 162
Viewership of Dallas City Council meetings and briefings on DallasCityNewsroom.com and government channel rate increase
N/A 5% 10%
Percent increase “views rate” of DCNN/PIO produced videos on social media channels and DallasCityNewsroom.com
N/A 5% 12%
Number of DCNN/PIO videos for government channel, DallasCityNewsroom.com, and social media channel productions
N/A 60 120
E³ Government268
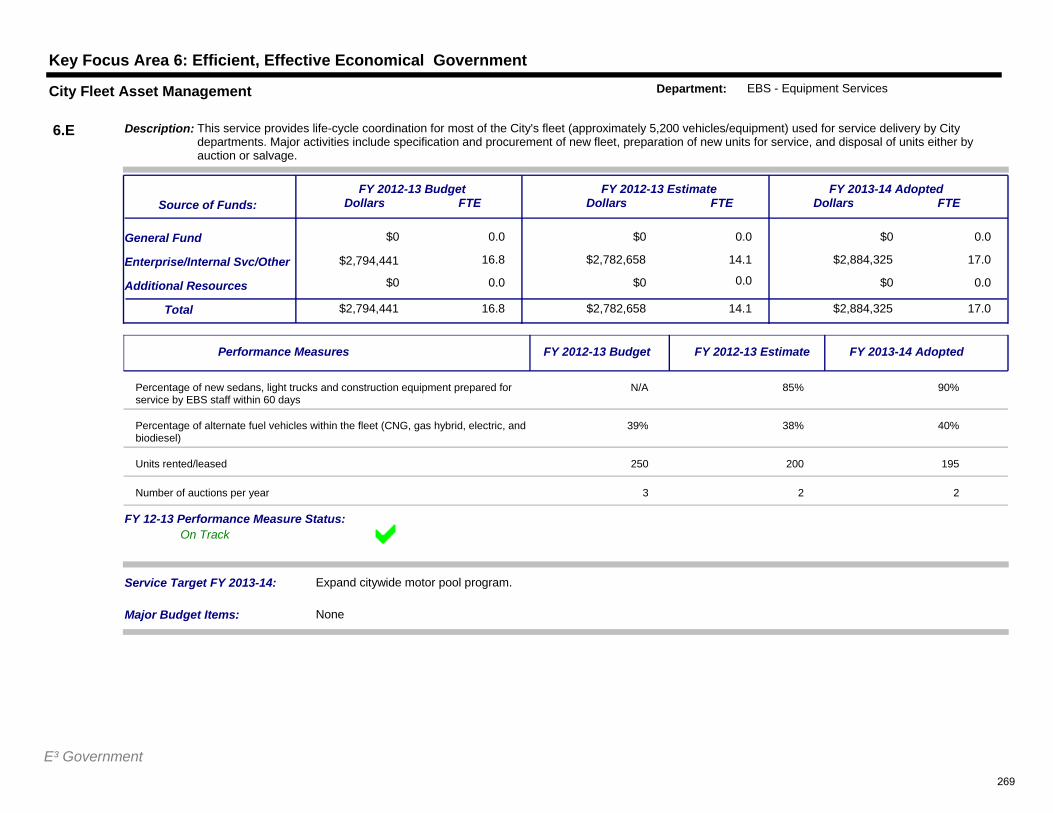
Key Focus Area 6: Efficient, Effective Economical Government
$0 0.0
16.8
$0 0.0
$2,782,658 14.1
$0
$2,884,325 17.0
0.0General Fund
Additional Resources
Service Target FY 2013-14: Expand citywide motor pool program.
$2,794,441Total 16.8 $2,782,658 14.1 $2,884,325 17.0
Enterprise/Internal Svc/Other
$0 0.0 $0 0.0 $0 0.0
FY 2012-13 BudgetDollars FTE
FY 2012-13 EstimateDollars FTE
FY 2013-14 AdoptedDollars FTE
Description: This service provides life-cycle coordination for most of the City's fleet (approximately 5,200 vehicles/equipment) used for service delivery by City departments. Major activities include specification and procurement of new fleet, preparation of new units for service, and disposal of units either by auction or salvage.
Source of Funds:
6.E
City Fleet Asset Management Department: EBS - Equipment Services
$2,794,441
Major Budget Items: None
On TrackFY 12-13 Performance Measure Status:
Performance Measures FY 2012-13 Budget FY 2012-13 Estimate FY 2013-14 Adopted
Percentage of new sedans, light trucks and construction equipment prepared for service by EBS staff within 60 days
N/A 85% 90%
Percentage of alternate fuel vehicles within the fleet (CNG, gas hybrid, electric, and biodiesel)
39% 38% 40%
Units rented/leased 250 200 195
Number of auctions per year 3 2 2
E³ Government269
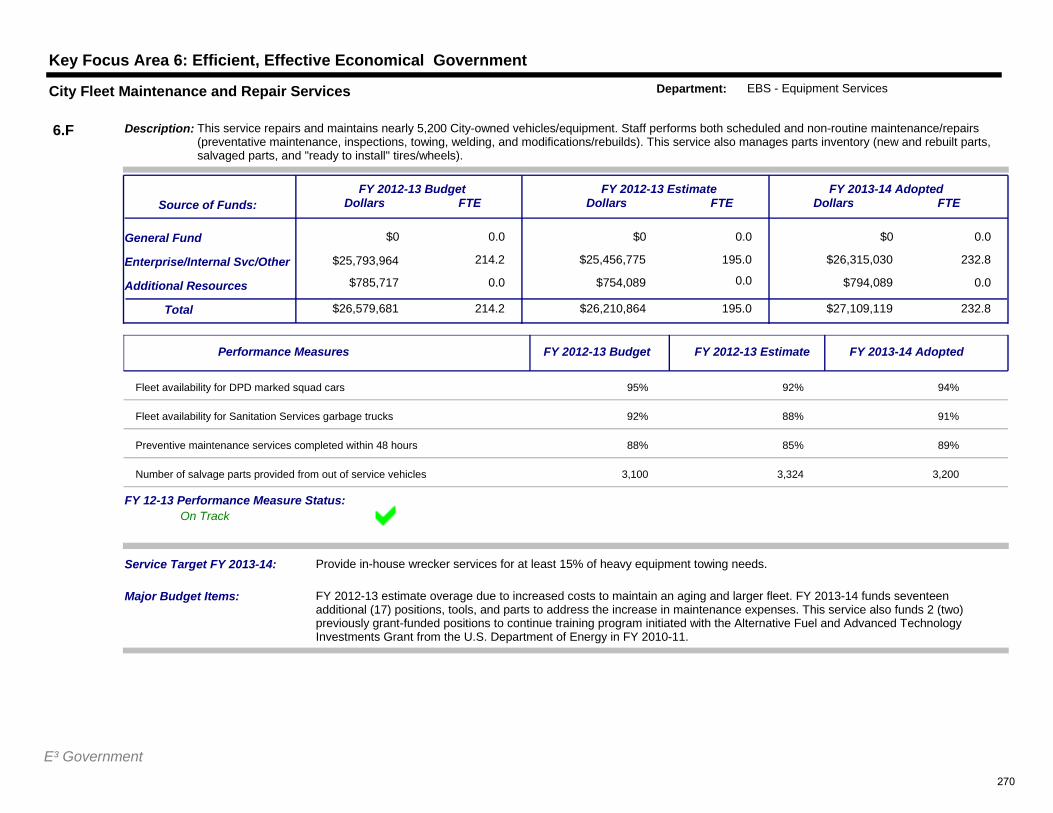
Key Focus Area 6: Efficient, Effective Economical Government
$0 0.0
214.2
$0 0.0
$25,456,775 195.0
$0
$26,315,030 232.8
0.0General Fund
Additional Resources
Service Target FY 2013-14: Provide in-house wrecker services for at least 15% of heavy equipment towing needs.
$26,579,681Total 214.2 $26,210,864 195.0 $27,109,119 232.8
Enterprise/Internal Svc/Other
$785,717 0.0 $754,089 0.0 $794,089 0.0
FY 2012-13 BudgetDollars FTE
FY 2012-13 EstimateDollars FTE
FY 2013-14 AdoptedDollars FTE
Description: This service repairs and maintains nearly 5,200 City-owned vehicles/equipment. Staff performs both scheduled and non-routine maintenance/repairs (preventative maintenance, inspections, towing, welding, and modifications/rebuilds). This service also manages parts inventory (new and rebuilt parts, salvaged parts, and "ready to install" tires/wheels).
Source of Funds:
6.F
City Fleet Maintenance and Repair Services Department: EBS - Equipment Services
$25,793,964
Major Budget Items: FY 2012-13 estimate overage due to increased costs to maintain an aging and larger fleet. FY 2013-14 funds seventeen additional (17) positions, tools, and parts to address the increase in maintenance expenses. This service also funds 2 (two) previously grant-funded positions to continue training program initiated with the Alternative Fuel and Advanced Technology Investments Grant from the U.S. Department of Energy in FY 2010-11.
On TrackFY 12-13 Performance Measure Status:
Performance Measures FY 2012-13 Budget FY 2012-13 Estimate FY 2013-14 Adopted
Fleet availability for DPD marked squad cars 95% 92% 94%
Fleet availability for Sanitation Services garbage trucks 92% 88% 91%
Preventive maintenance services completed within 48 hours 88% 85% 89%
Number of salvage parts provided from out of service vehicles 3,100 3,324 3,200
E³ Government270
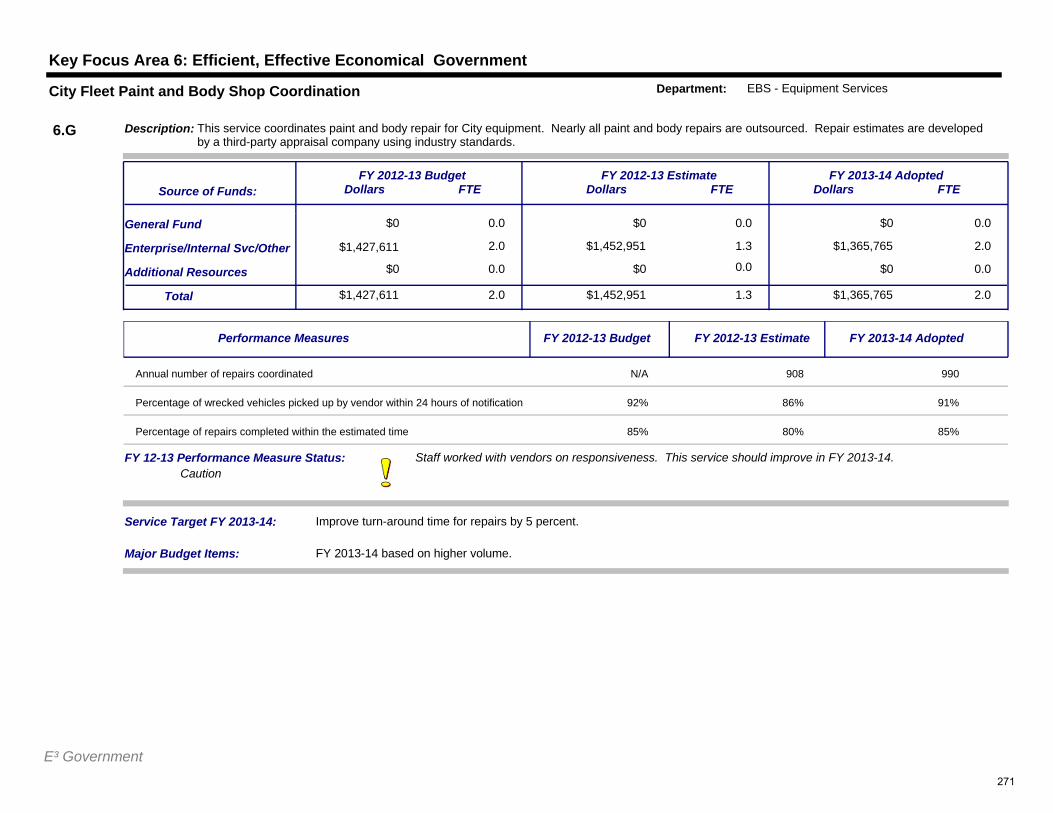
Key Focus Area 6: Efficient, Effective Economical Government
$0 0.0
2.0
$0 0.0
$1,452,951 1.3
$0
$1,365,765 2.0
0.0General Fund
Additional Resources
Service Target FY 2013-14: Improve turn-around time for repairs by 5 percent.
$1,427,611Total 2.0 $1,452,951 1.3 $1,365,765 2.0
Enterprise/Internal Svc/Other
$0 0.0 $0 0.0 $0 0.0
FY 2012-13 BudgetDollars FTE
FY 2012-13 EstimateDollars FTE
FY 2013-14 AdoptedDollars FTE
Description: This service coordinates paint and body repair for City equipment. Nearly all paint and body repairs are outsourced. Repair estimates are developed by a third-party appraisal company using industry standards.
Source of Funds:
6.G
City Fleet Paint and Body Shop Coordination Department: EBS - Equipment Services
$1,427,611
Major Budget Items: FY 2013-14 based on higher volume.
Staff worked with vendors on responsiveness. This service should improve in FY 2013-14.Caution
FY 12-13 Performance Measure Status:
Performance Measures FY 2012-13 Budget FY 2012-13 Estimate FY 2013-14 Adopted
Annual number of repairs coordinated N/A 908 990
Percentage of wrecked vehicles picked up by vendor within 24 hours of notification 92% 86% 91%
Percentage of repairs completed within the estimated time 85% 80% 85%
E³ Government271
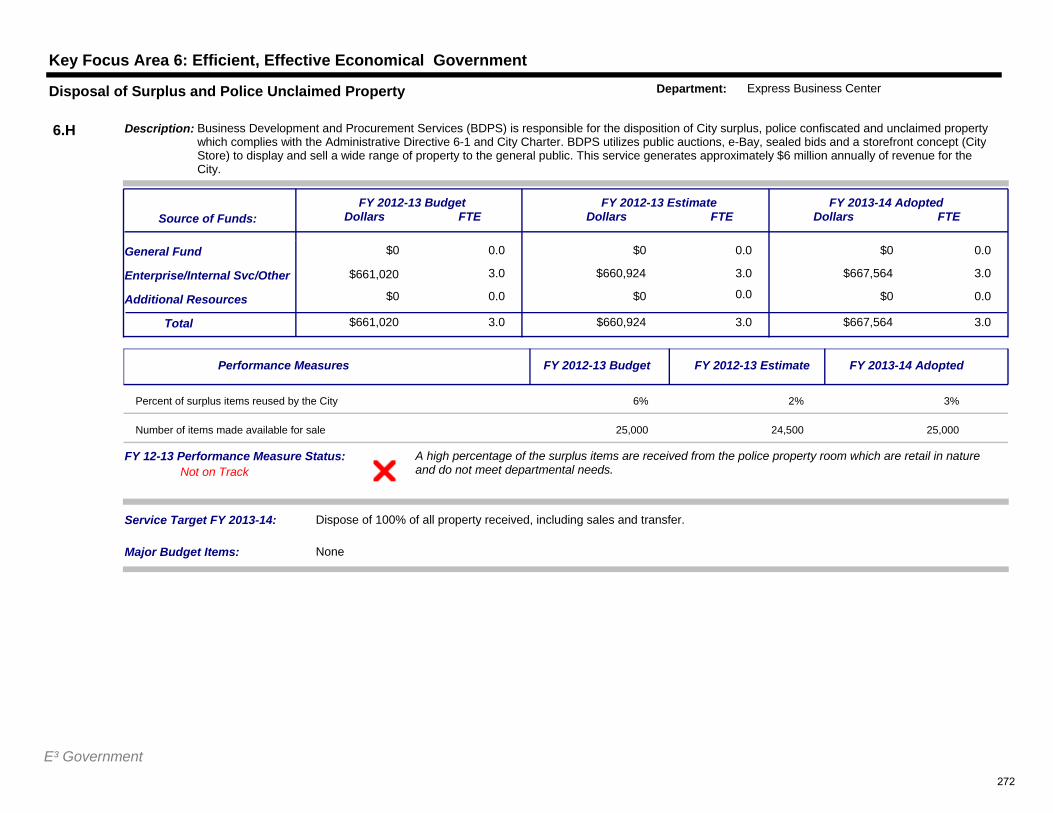
Key Focus Area 6: Efficient, Effective Economical Government
$0 0.0
3.0
$0 0.0
$660,924 3.0
$0
$667,564 3.0
0.0General Fund
Additional Resources
Service Target FY 2013-14: Dispose of 100% of all property received, including sales and transfer.
$661,020Total 3.0 $660,924 3.0 $667,564 3.0
Enterprise/Internal Svc/Other
$0 0.0 $0 0.0 $0 0.0
FY 2012-13 BudgetDollars FTE
FY 2012-13 EstimateDollars FTE
FY 2013-14 AdoptedDollars FTE
Description: Business Development and Procurement Services (BDPS) is responsible for the disposition of City surplus, police confiscated and unclaimed property which complies with the Administrative Directive 6-1 and City Charter. BDPS utilizes public auctions, e-Bay, sealed bids and a storefront concept (City Store) to display and sell a wide range of property to the general public. This service generates approximately $6 million annually of revenue for the City.
Source of Funds:
6.H
Disposal of Surplus and Police Unclaimed Property Department: Express Business Center
$661,020
Major Budget Items: None
A high percentage of the surplus items are received from the police property room which are retail in nature and do not meet departmental needs.Not on Track
FY 12-13 Performance Measure Status:
Performance Measures FY 2012-13 Budget FY 2012-13 Estimate FY 2013-14 Adopted
Percent of surplus items reused by the City 6% 2% 3%
Number of items made available for sale 25,000 24,500 25,000
E³ Government272
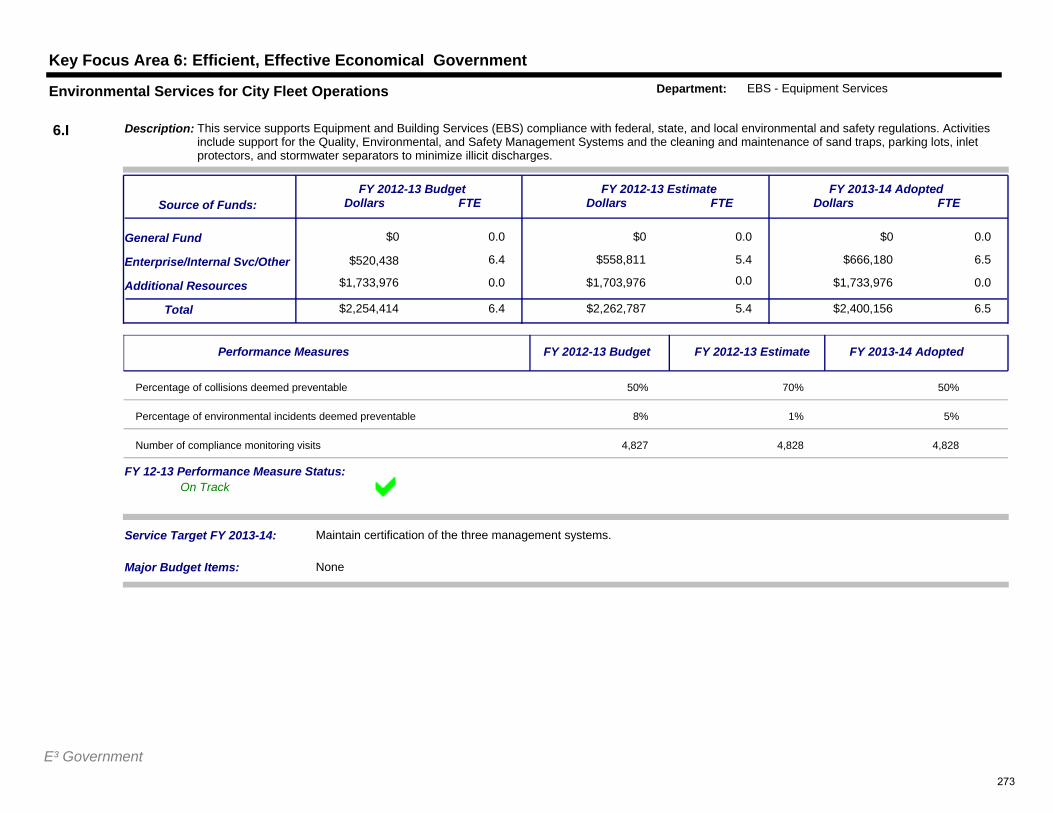
Key Focus Area 6: Efficient, Effective Economical Government
$0 0.0
6.4
$0 0.0
$558,811 5.4
$0
$666,180 6.5
0.0General Fund
Additional Resources
Service Target FY 2013-14: Maintain certification of the three management systems.
$2,254,414Total 6.4 $2,262,787 5.4 $2,400,156 6.5
Enterprise/Internal Svc/Other
$1,733,976 0.0 $1,703,976 0.0 $1,733,976 0.0
FY 2012-13 BudgetDollars FTE
FY 2012-13 EstimateDollars FTE
FY 2013-14 AdoptedDollars FTE
Description: This service supports Equipment and Building Services (EBS) compliance with federal, state, and local environmental and safety regulations. Activities include support for the Quality, Environmental, and Safety Management Systems and the cleaning and maintenance of sand traps, parking lots, inlet protectors, and stormwater separators to minimize illicit discharges.
Source of Funds:
6.I
Environmental Services for City Fleet Operations Department: EBS - Equipment Services
$520,438
Major Budget Items: None
On TrackFY 12-13 Performance Measure Status:
Performance Measures FY 2012-13 Budget FY 2012-13 Estimate FY 2013-14 Adopted
Percentage of collisions deemed preventable 50% 70% 50%
Percentage of environmental incidents deemed preventable 8% 1% 5%
Number of compliance monitoring visits 4,827 4,828 4,828
E³ Government273
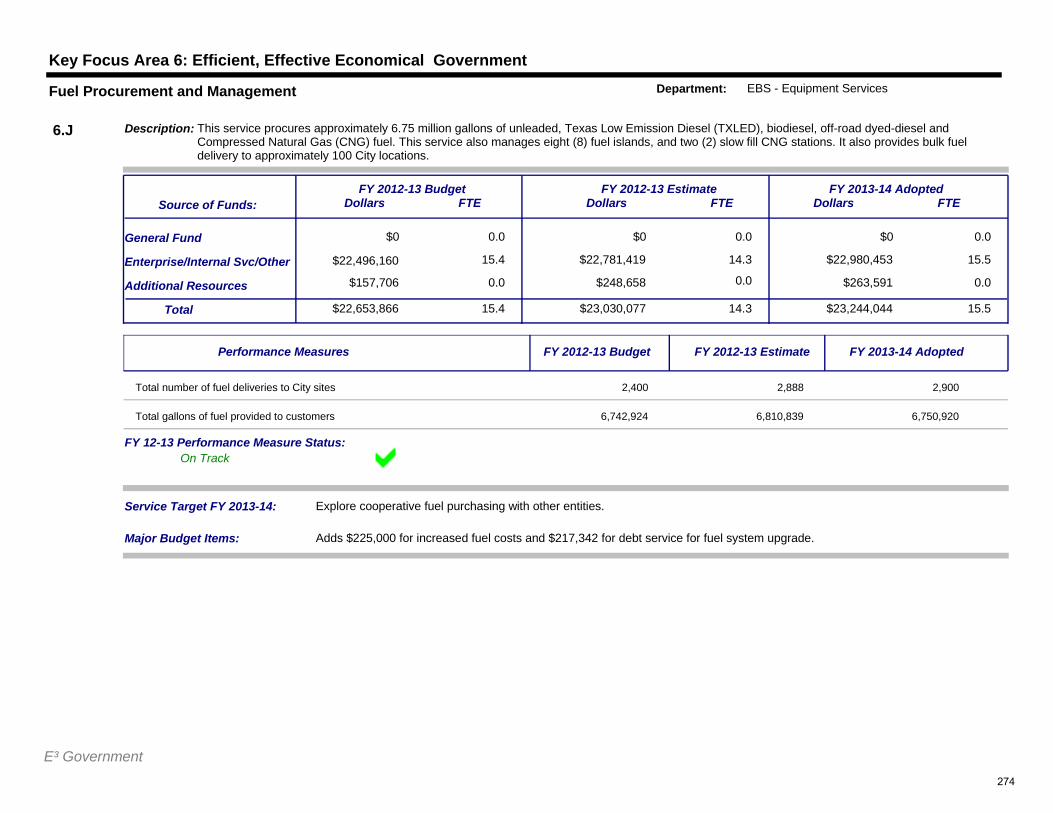
Key Focus Area 6: Efficient, Effective Economical Government
$0 0.0
15.4
$0 0.0
$22,781,419 14.3
$0
$22,980,453 15.5
0.0General Fund
Additional Resources
Service Target FY 2013-14: Explore cooperative fuel purchasing with other entities.
$22,653,866Total 15.4 $23,030,077 14.3 $23,244,044 15.5
Enterprise/Internal Svc/Other
$157,706 0.0 $248,658 0.0 $263,591 0.0
FY 2012-13 BudgetDollars FTE
FY 2012-13 EstimateDollars FTE
FY 2013-14 AdoptedDollars FTE
Description: This service procures approximately 6.75 million gallons of unleaded, Texas Low Emission Diesel (TXLED), biodiesel, off-road dyed-diesel and Compressed Natural Gas (CNG) fuel. This service also manages eight (8) fuel islands, and two (2) slow fill CNG stations. It also provides bulk fuel delivery to approximately 100 City locations.
Source of Funds:
6.J
Fuel Procurement and Management Department: EBS - Equipment Services
$22,496,160
Major Budget Items: Adds $225,000 for increased fuel costs and $217,342 for debt service for fuel system upgrade.
On TrackFY 12-13 Performance Measure Status:
Performance Measures FY 2012-13 Budget FY 2012-13 Estimate FY 2013-14 Adopted
Total number of fuel deliveries to City sites 2,400 2,888 2,900
Total gallons of fuel provided to customers 6,742,924 6,810,839 6,750,920
E³ Government274
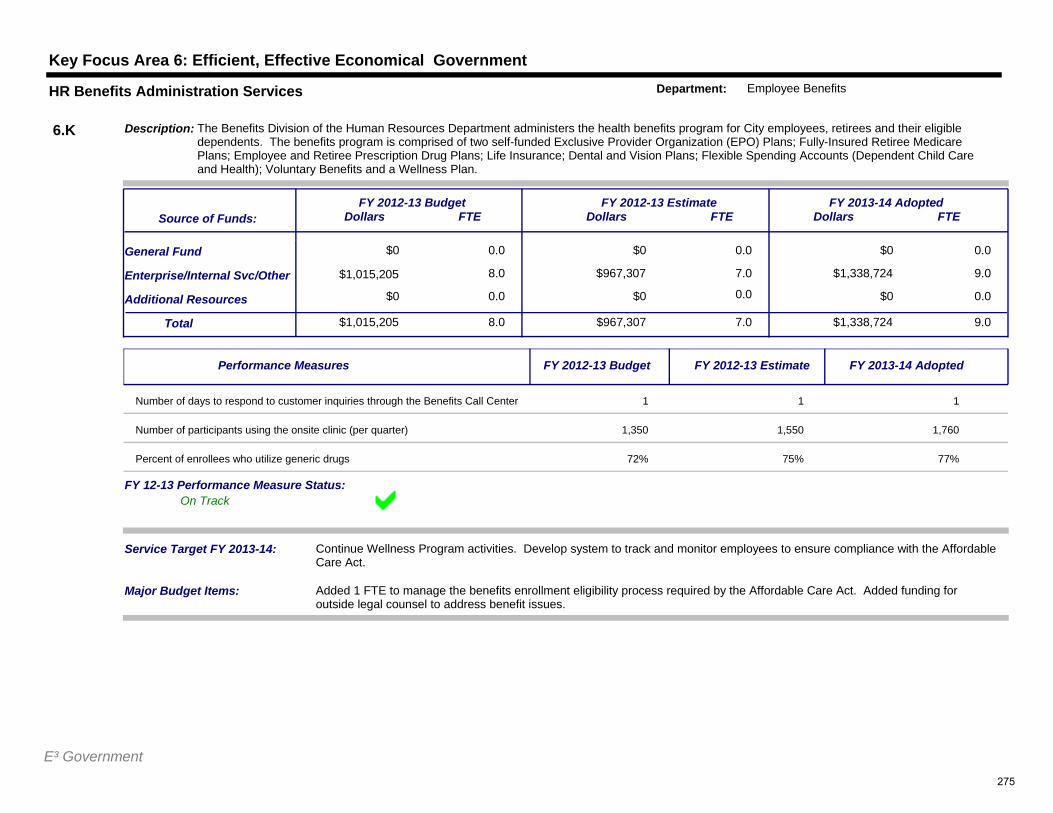
Key Focus Area 6: Efficient, Effective Economical Government
$0 0.0
8.0
$0 0.0
$967,307 7.0
$0
$1,338,724 9.0
0.0General Fund
Additional Resources
Service Target FY 2013-14: Continue Wellness Program activities. Develop system to track and monitor employees to ensure compliance with the Affordable Care Act.
$1,015,205Total 8.0 $967,307 7.0 $1,338,724 9.0
Enterprise/Internal Svc/Other
$0 0.0 $0 0.0 $0 0.0
FY 2012-13 BudgetDollars FTE
FY 2012-13 EstimateDollars FTE
FY 2013-14 AdoptedDollars FTE
Description: The Benefits Division of the Human Resources Department administers the health benefits program for City employees, retirees and their eligible dependents. The benefits program is comprised of two self-funded Exclusive Provider Organization (EPO) Plans; Fully-Insured Retiree Medicare Plans; Employee and Retiree Prescription Drug Plans; Life Insurance; Dental and Vision Plans; Flexible Spending Accounts (Dependent Child Care and Health); Voluntary Benefits and a Wellness Plan.
Source of Funds:
6.K
HR Benefits Administration Services Department: Employee Benefits
$1,015,205
Major Budget Items: Added 1 FTE to manage the benefits enrollment eligibility process required by the Affordable Care Act. Added funding for outside legal counsel to address benefit issues.
On TrackFY 12-13 Performance Measure Status:
Performance Measures FY 2012-13 Budget FY 2012-13 Estimate FY 2013-14 Adopted
Number of days to respond to customer inquiries through the Benefits Call Center 1 1 1
Number of participants using the onsite clinic (per quarter) 1,350 1,550 1,760
Percent of enrollees who utilize generic drugs 72% 75% 77%
E³ Government275
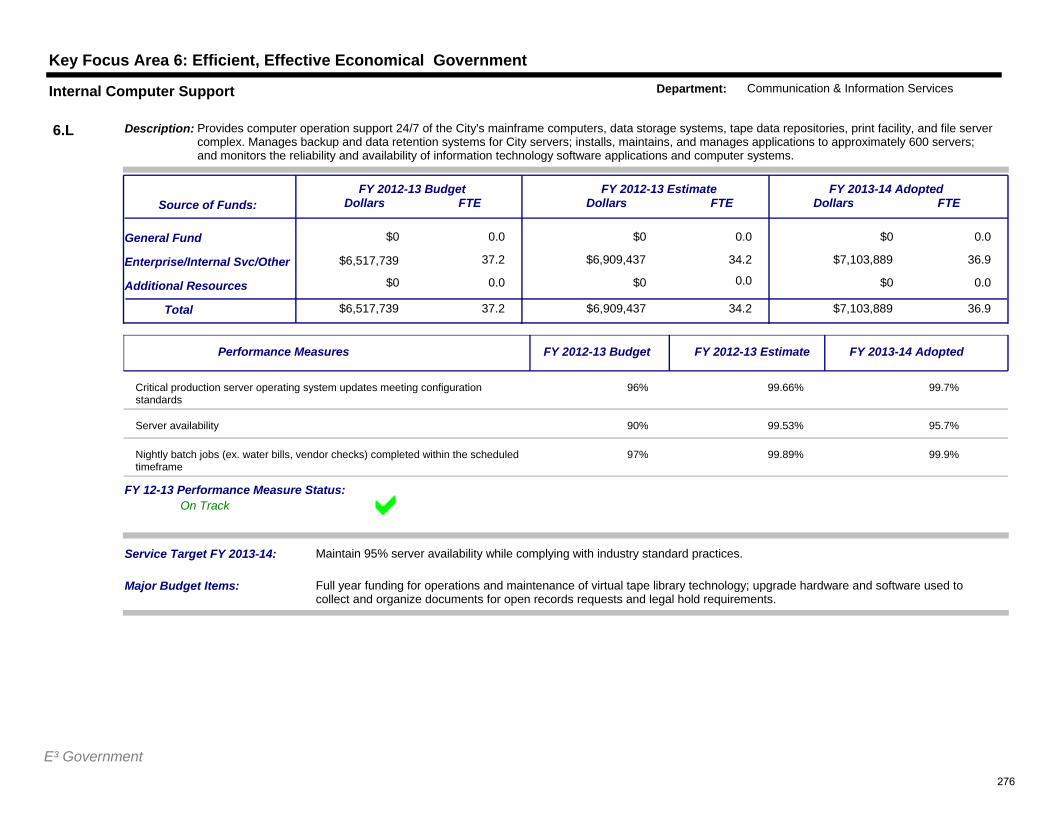
Key Focus Area 6: Efficient, Effective Economical Government
$0 0.0
37.2
$0 0.0
$6,909,437 34.2
$0
$7,103,889 36.9
0.0General Fund
Additional Resources
Service Target FY 2013-14: Maintain 95% server availability while complying with industry standard practices.
$6,517,739Total 37.2 $6,909,437 34.2 $7,103,889 36.9
Enterprise/Internal Svc/Other
$0 0.0 $0 0.0 $0 0.0
FY 2012-13 BudgetDollars FTE
FY 2012-13 EstimateDollars FTE
FY 2013-14 AdoptedDollars FTE
Description: Provides computer operation support 24/7 of the City's mainframe computers, data storage systems, tape data repositories, print facility, and file server complex. Manages backup and data retention systems for City servers; installs, maintains, and manages applications to approximately 600 servers; and monitors the reliability and availability of information technology software applications and computer systems.
Source of Funds:
6.L
Internal Computer Support Department: Communication & Information Services
$6,517,739
Major Budget Items: Full year funding for operations and maintenance of virtual tape library technology; upgrade hardware and software used to collect and organize documents for open records requests and legal hold requirements.
On TrackFY 12-13 Performance Measure Status:
Performance Measures FY 2012-13 Budget FY 2012-13 Estimate FY 2013-14 Adopted
Critical production server operating system updates meeting configuration standards
96% 99.66% 99.7%
Server availability 90% 99.53% 95.7%
Nightly batch jobs (ex. water bills, vendor checks) completed within the scheduled timeframe
97% 99.89% 99.9%
E³ Government276
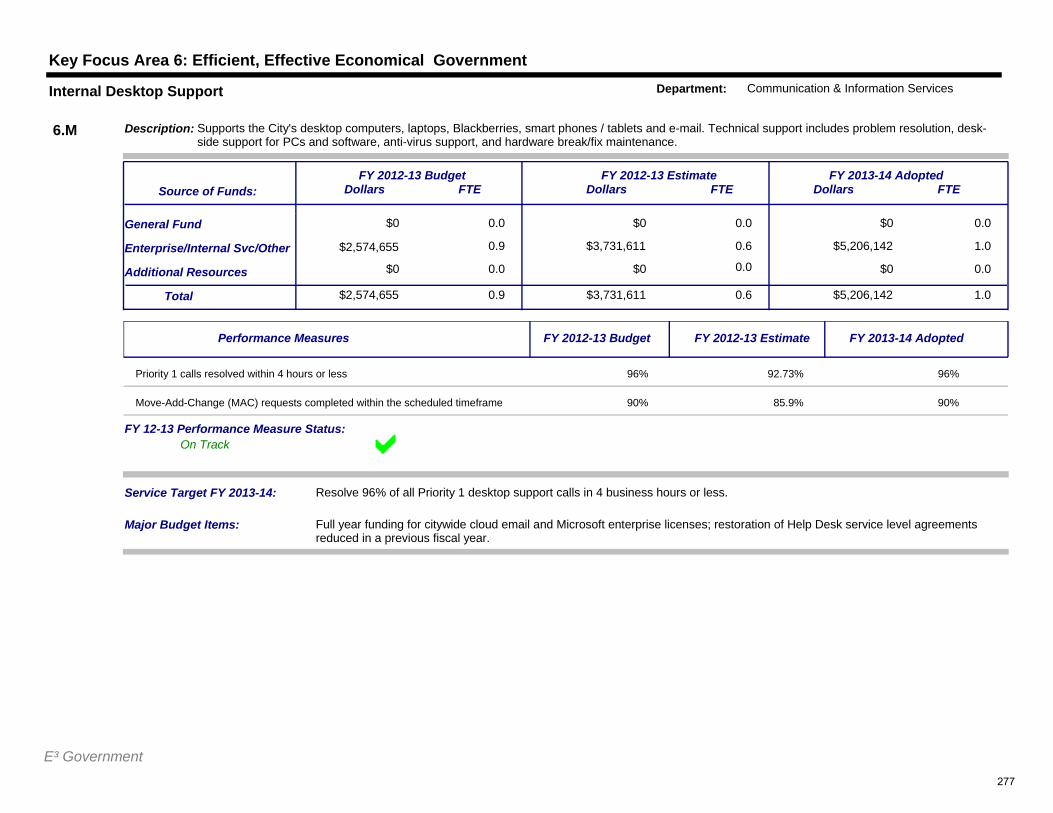
Key Focus Area 6: Efficient, Effective Economical Government
$0 0.0
0.9
$0 0.0
$3,731,611 0.6
$0
$5,206,142 1.0
0.0General Fund
Additional Resources
Service Target FY 2013-14: Resolve 96% of all Priority 1 desktop support calls in 4 business hours or less.
$2,574,655Total 0.9 $3,731,611 0.6 $5,206,142 1.0
Enterprise/Internal Svc/Other
$0 0.0 $0 0.0 $0 0.0
FY 2012-13 BudgetDollars FTE
FY 2012-13 EstimateDollars FTE
FY 2013-14 AdoptedDollars FTE
Description: Supports the City's desktop computers, laptops, Blackberries, smart phones / tablets and e-mail. Technical support includes problem resolution, desk-side support for PCs and software, anti-virus support, and hardware break/fix maintenance.
Source of Funds:
6.M
Internal Desktop Support Department: Communication & Information Services
$2,574,655
Major Budget Items: Full year funding for citywide cloud email and Microsoft enterprise licenses; restoration of Help Desk service level agreements reduced in a previous fiscal year.
On TrackFY 12-13 Performance Measure Status:
Performance Measures FY 2012-13 Budget FY 2012-13 Estimate FY 2013-14 Adopted
Priority 1 calls resolved within 4 hours or less 96% 92.73% 96%
Move-Add-Change (MAC) requests completed within the scheduled timeframe 90% 85.9% 90%
E³ Government277
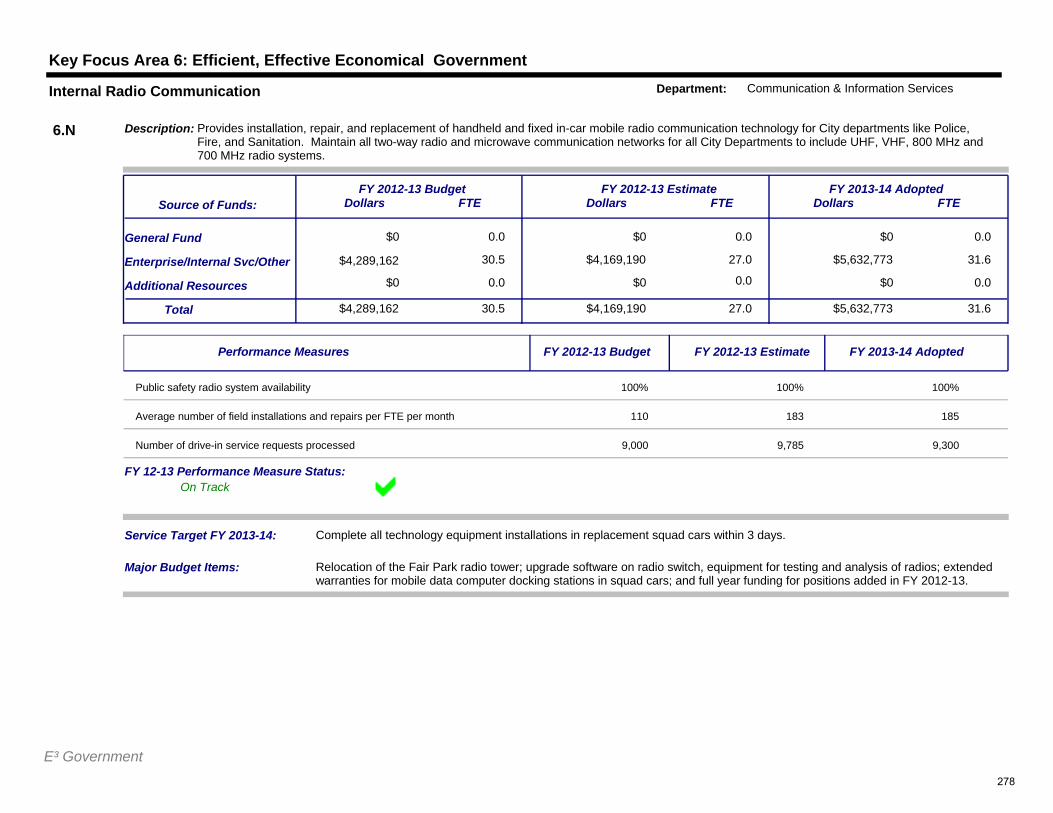
Key Focus Area 6: Efficient, Effective Economical Government
$0 0.0
30.5
$0 0.0
$4,169,190 27.0
$0
$5,632,773 31.6
0.0General Fund
Additional Resources
Service Target FY 2013-14: Complete all technology equipment installations in replacement squad cars within 3 days.
$4,289,162Total 30.5 $4,169,190 27.0 $5,632,773 31.6
Enterprise/Internal Svc/Other
$0 0.0 $0 0.0 $0 0.0
FY 2012-13 BudgetDollars FTE
FY 2012-13 EstimateDollars FTE
FY 2013-14 AdoptedDollars FTE
Description: Provides installation, repair, and replacement of handheld and fixed in-car mobile radio communication technology for City departments like Police, Fire, and Sanitation. Maintain all two-way radio and microwave communication networks for all City Departments to include UHF, VHF, 800 MHz and 700 MHz radio systems.
Source of Funds:
6.N
Internal Radio Communication Department: Communication & Information Services
$4,289,162
Major Budget Items: Relocation of the Fair Park radio tower; upgrade software on radio switch, equipment for testing and analysis of radios; extended warranties for mobile data computer docking stations in squad cars; and full year funding for positions added in FY 2012-13.
On TrackFY 12-13 Performance Measure Status:
Performance Measures FY 2012-13 Budget FY 2012-13 Estimate FY 2013-14 Adopted
Public safety radio system availability 100% 100% 100%
Average number of field installations and repairs per FTE per month 110 183 185
Number of drive-in service requests processed 9,000 9,785 9,300
E³ Government278
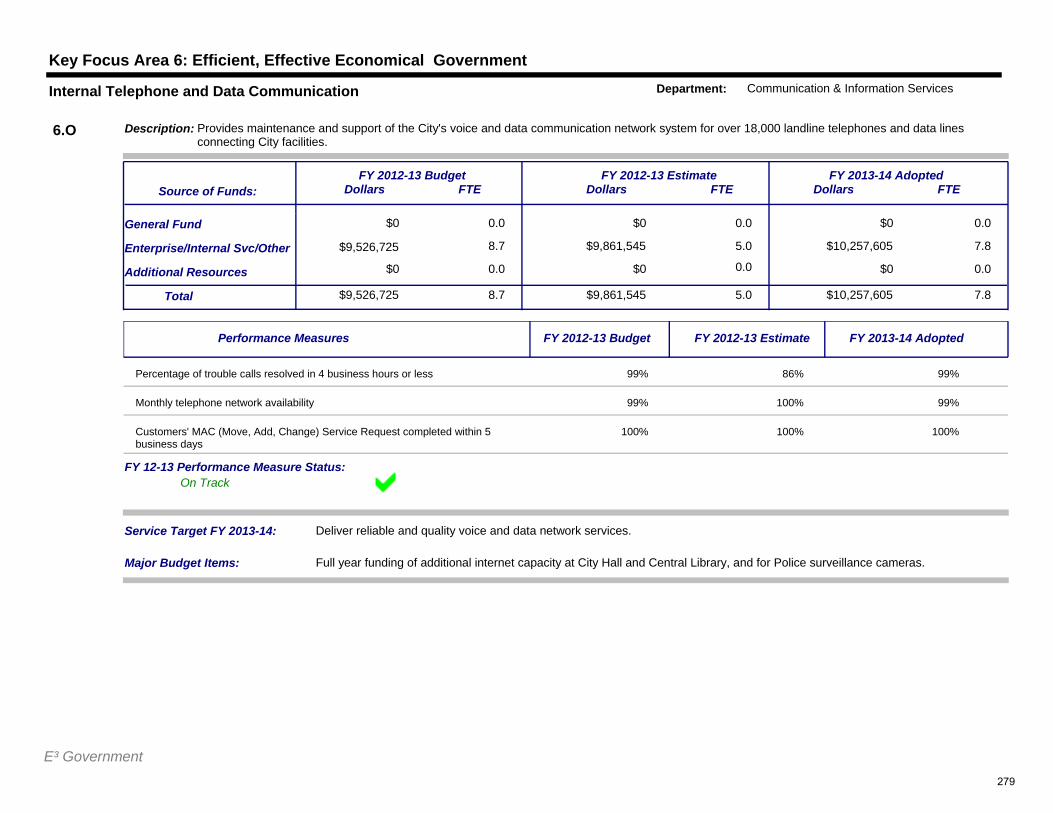
Key Focus Area 6: Efficient, Effective Economical Government
$0 0.0
8.7
$0 0.0
$9,861,545 5.0
$0
$10,257,605 7.8
0.0General Fund
Additional Resources
Service Target FY 2013-14: Deliver reliable and quality voice and data network services.
$9,526,725Total 8.7 $9,861,545 5.0 $10,257,605 7.8
Enterprise/Internal Svc/Other
$0 0.0 $0 0.0 $0 0.0
FY 2012-13 BudgetDollars FTE
FY 2012-13 EstimateDollars FTE
FY 2013-14 AdoptedDollars FTE
Description: Provides maintenance and support of the City's voice and data communication network system for over 18,000 landline telephones and data lines connecting City facilities.
Source of Funds:
6.O
Internal Telephone and Data Communication Department: Communication & Information Services
$9,526,725
Major Budget Items: Full year funding of additional internet capacity at City Hall and Central Library, and for Police surveillance cameras.
On TrackFY 12-13 Performance Measure Status:
Performance Measures FY 2012-13 Budget FY 2012-13 Estimate FY 2013-14 Adopted
Percentage of trouble calls resolved in 4 business hours or less 99% 86% 99%
Monthly telephone network availability 99% 100% 99%
Customers' MAC (Move, Add, Change) Service Request completed within 5 business days
100% 100% 100%
E³ Government279
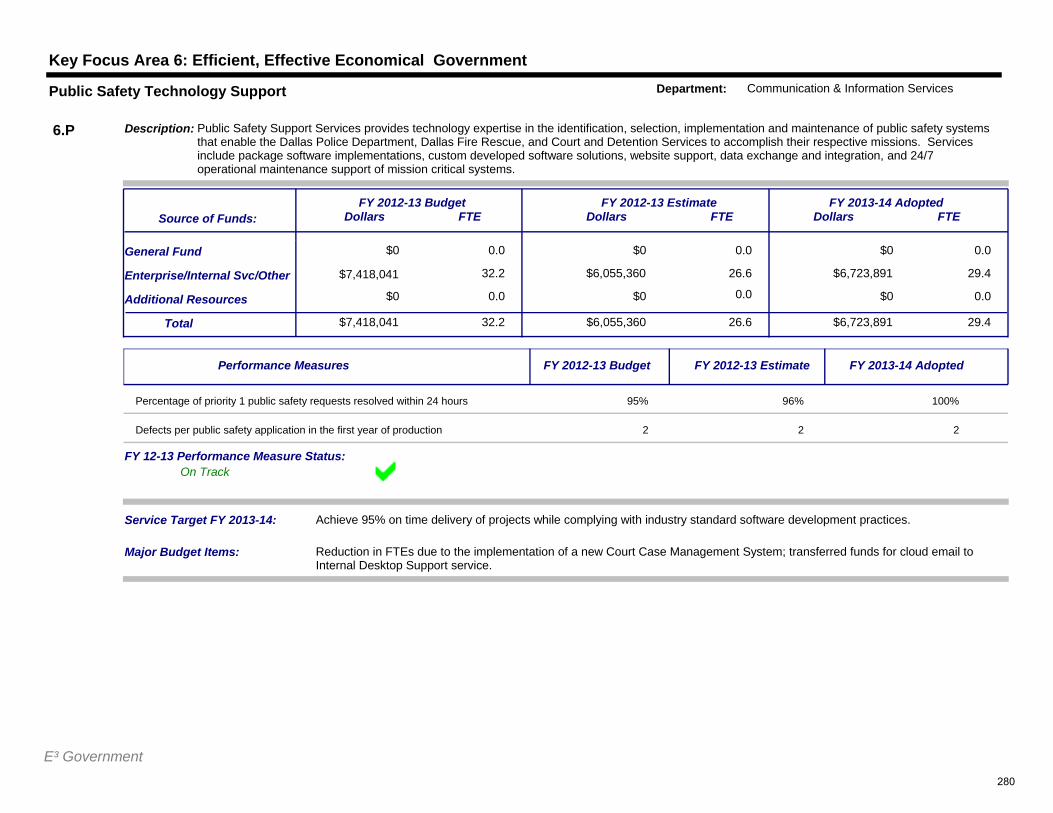
Key Focus Area 6: Efficient, Effective Economical Government
$0 0.0
32.2
$0 0.0
$6,055,360 26.6
$0
$6,723,891 29.4
0.0General Fund
Additional Resources
Service Target FY 2013-14: Achieve 95% on time delivery of projects while complying with industry standard software development practices.
$7,418,041Total 32.2 $6,055,360 26.6 $6,723,891 29.4
Enterprise/Internal Svc/Other
$0 0.0 $0 0.0 $0 0.0
FY 2012-13 BudgetDollars FTE
FY 2012-13 EstimateDollars FTE
FY 2013-14 AdoptedDollars FTE
Description: Public Safety Support Services provides technology expertise in the identification, selection, implementation and maintenance of public safety systems that enable the Dallas Police Department, Dallas Fire Rescue, and Court and Detention Services to accomplish their respective missions. Services include package software implementations, custom developed software solutions, website support, data exchange and integration, and 24/7 operational maintenance support of mission critical systems.
Source of Funds:
6.P
Public Safety Technology Support Department: Communication & Information Services
$7,418,041
Major Budget Items: Reduction in FTEs due to the implementation of a new Court Case Management System; transferred funds for cloud email to Internal Desktop Support service.
On TrackFY 12-13 Performance Measure Status:
Performance Measures FY 2012-13 Budget FY 2012-13 Estimate FY 2013-14 Adopted
Percentage of priority 1 public safety requests resolved within 24 hours 95% 96% 100%
Defects per public safety application in the first year of production 2 2 2
E³ Government280
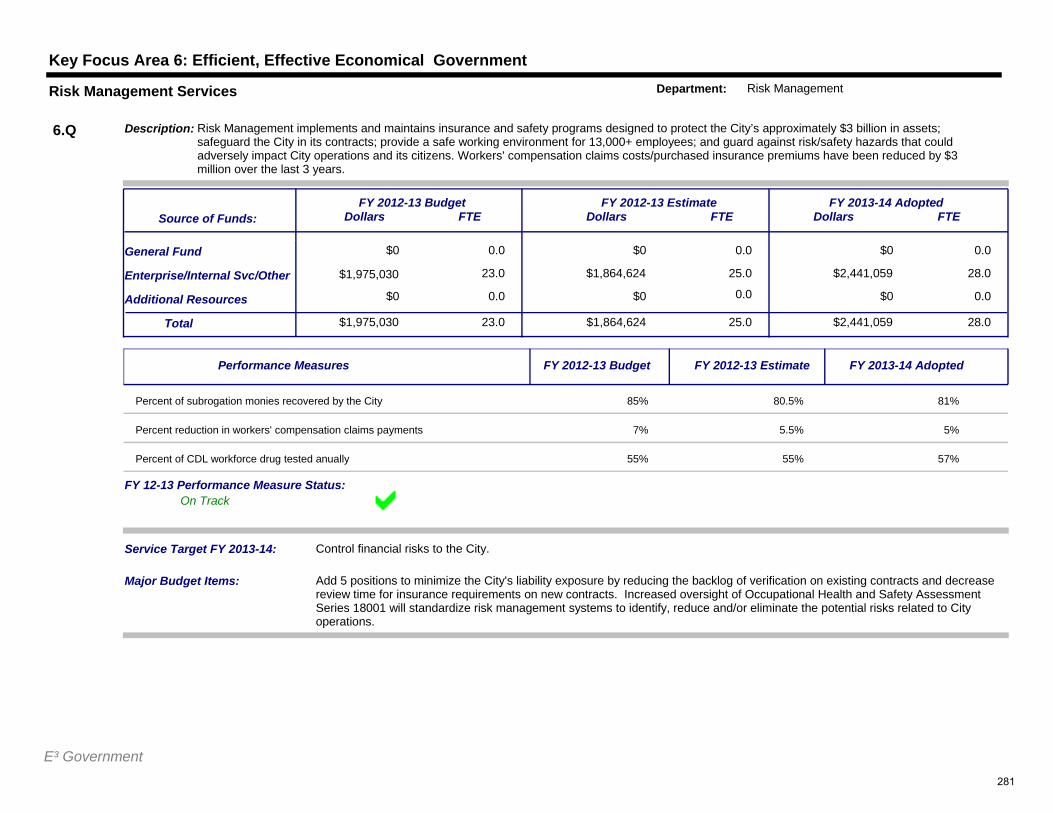
Key Focus Area 6: Efficient, Effective Economical Government
$0 0.0
23.0
$0 0.0
$1,864,624 25.0
$0
$2,441,059 28.0
0.0General Fund
Additional Resources
Service Target FY 2013-14: Control financial risks to the City.
$1,975,030Total 23.0 $1,864,624 25.0 $2,441,059 28.0
Enterprise/Internal Svc/Other
$0 0.0 $0 0.0 $0 0.0
FY 2012-13 BudgetDollars FTE
FY 2012-13 EstimateDollars FTE
FY 2013-14 AdoptedDollars FTE
Description: Risk Management implements and maintains insurance and safety programs designed to protect the City’s approximately $3 billion in assets; safeguard the City in its contracts; provide a safe working environment for 13,000+ employees; and guard against risk/safety hazards that could adversely impact City operations and its citizens. Workers' compensation claims costs/purchased insurance premiums have been reduced by $3 million over the last 3 years.
Source of Funds:
6.Q
Risk Management Services Department: Risk Management
$1,975,030
Major Budget Items: Add 5 positions to minimize the City's liability exposure by reducing the backlog of verification on existing contracts and decrease review time for insurance requirements on new contracts. Increased oversight of Occupational Health and Safety Assessment Series 18001 will standardize risk management systems to identify, reduce and/or eliminate the potential risks related to City operations.
On TrackFY 12-13 Performance Measure Status:
Performance Measures FY 2012-13 Budget FY 2012-13 Estimate FY 2013-14 Adopted
Percent of subrogation monies recovered by the City 85% 80.5% 81%
Percent reduction in workers' compensation claims payments 7% 5.5% 5%
Percent of CDL workforce drug tested anually 55% 55% 57%
E³ Government281
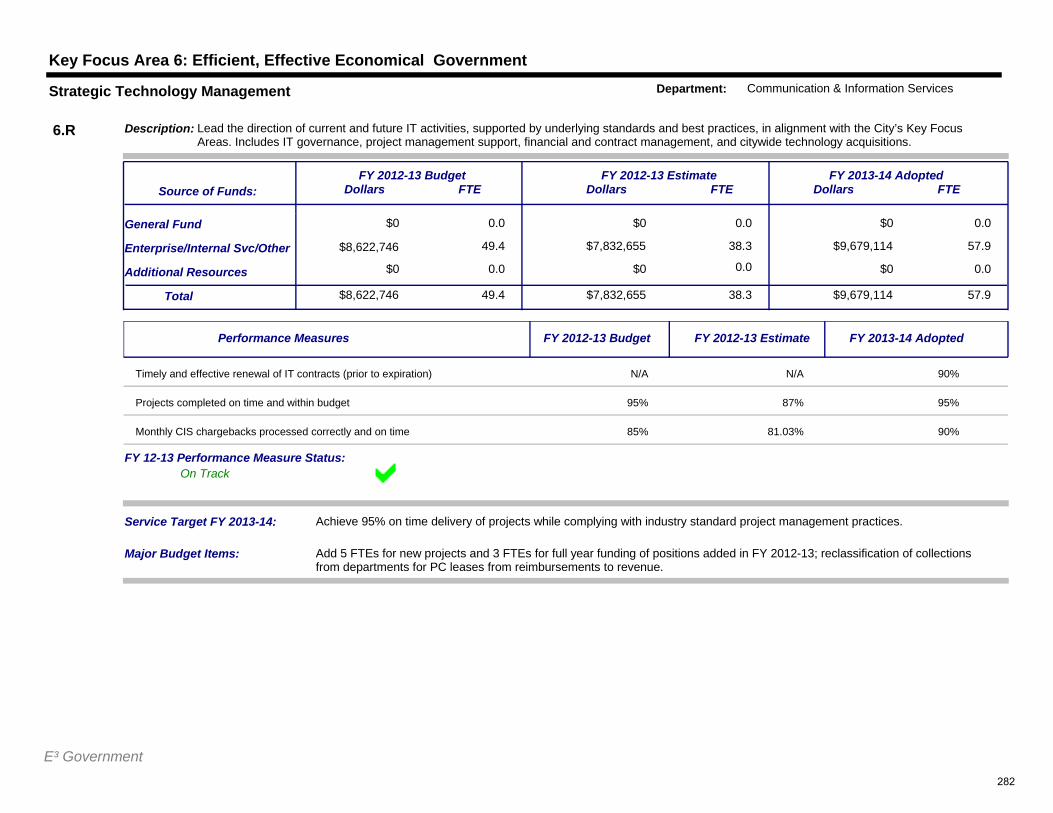
Key Focus Area 6: Efficient, Effective Economical Government
$0 0.0
49.4
$0 0.0
$7,832,655 38.3
$0
$9,679,114 57.9
0.0General Fund
Additional Resources
Service Target FY 2013-14: Achieve 95% on time delivery of projects while complying with industry standard project management practices.
$8,622,746Total 49.4 $7,832,655 38.3 $9,679,114 57.9
Enterprise/Internal Svc/Other
$0 0.0 $0 0.0 $0 0.0
FY 2012-13 BudgetDollars FTE
FY 2012-13 EstimateDollars FTE
FY 2013-14 AdoptedDollars FTE
Description: Lead the direction of current and future IT activities, supported by underlying standards and best practices, in alignment with the City’s Key Focus Areas. Includes IT governance, project management support, financial and contract management, and citywide technology acquisitions.
Source of Funds:
6.R
Strategic Technology Management Department: Communication & Information Services
$8,622,746
Major Budget Items: Add 5 FTEs for new projects and 3 FTEs for full year funding of positions added in FY 2012-13; reclassification of collections from departments for PC leases from reimbursements to revenue.
On TrackFY 12-13 Performance Measure Status:
Performance Measures FY 2012-13 Budget FY 2012-13 Estimate FY 2013-14 Adopted
Timely and effective renewal of IT contracts (prior to expiration) N/A N/A 90%
Projects completed on time and within budget 95% 87% 95%
Monthly CIS chargebacks processed correctly and on time 85% 81.03% 90%
E³ Government282
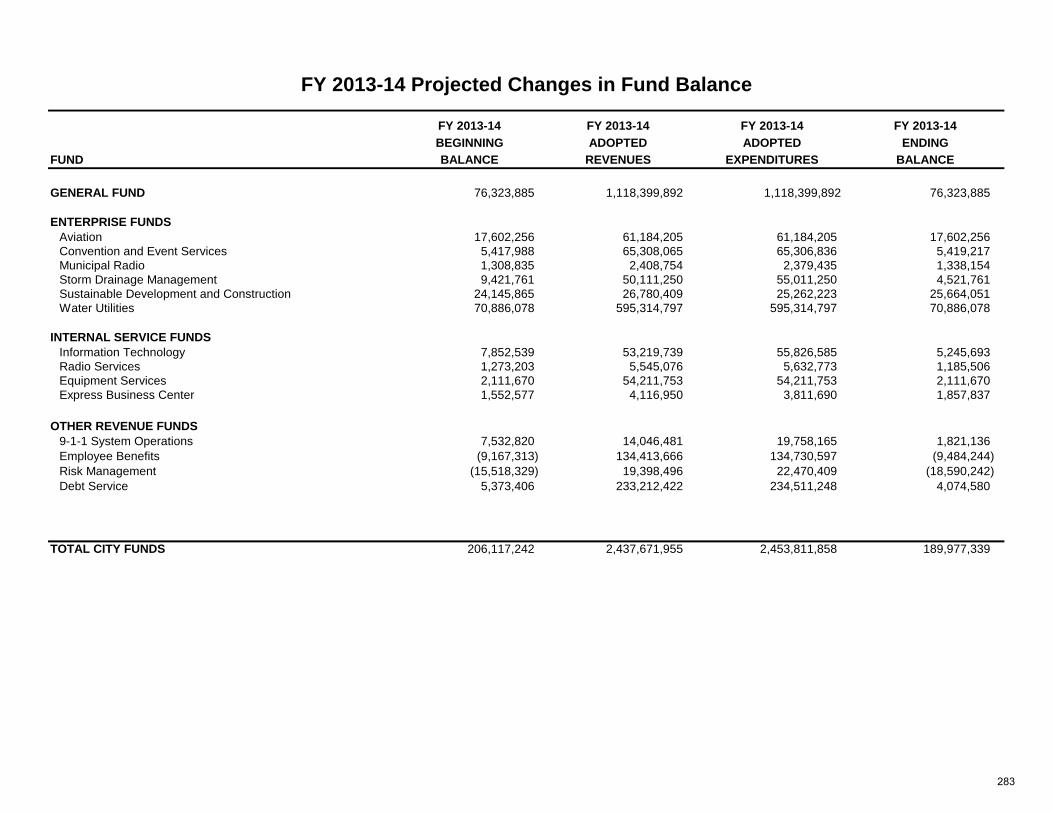
FY 2013-14 FY 2013-14 FY 2013-14 FY 2013-14BEGINNING ADOPTED ADOPTED ENDING
FUND BALANCE REVENUES EXPENDITURES BALANCE
GENERAL FUND 76,323,885 1,118,399,892 1,118,399,892 76,323,885
ENTERPRISE FUNDSAviation 17,602,256 61,184,205 61,184,205 17,602,256Convention and Event Services 5,417,988 65,308,065 65,306,836 5,419,217Municipal Radio 1,308,835 2,408,754 2,379,435 1,338,154Storm Drainage Management 9,421,761 50,111,250 55,011,250 4,521,761Sustainable Development and Construction 24,145,865 26,780,409 25,262,223 25,664,051Water Utilities 70,886,078 595,314,797 595,314,797 70,886,078
INTERNAL SERVICE FUNDSInformation Technology 7,852,539 53,219,739 55,826,585 5,245,693Radio Services 1,273,203 5,545,076 5,632,773 1,185,506Equipment Services 2,111,670 54,211,753 54,211,753 2,111,670Express Business Center 1,552,577 4,116,950 3,811,690 1,857,837
OTHER REVENUE FUNDS9 1 1 S t O ti 7 532 820 14 046 481 19 758 165 1 821 136
FY 2013-14 Projected Changes in Fund Balance
9-1-1 System Operations 7,532,820 14,046,481 19,758,165 1,821,136Employee Benefits (9,167,313) 134,413,666 134,730,597 (9,484,244)Risk Management (15,518,329) 19,398,496 22,470,409 (18,590,242)Debt Service 5,373,406 233,212,422 234,511,248 4,074,580
TOTAL CITY FUNDS 206,117,242 2,437,671,955 2,453,811,858 189,977,339
283
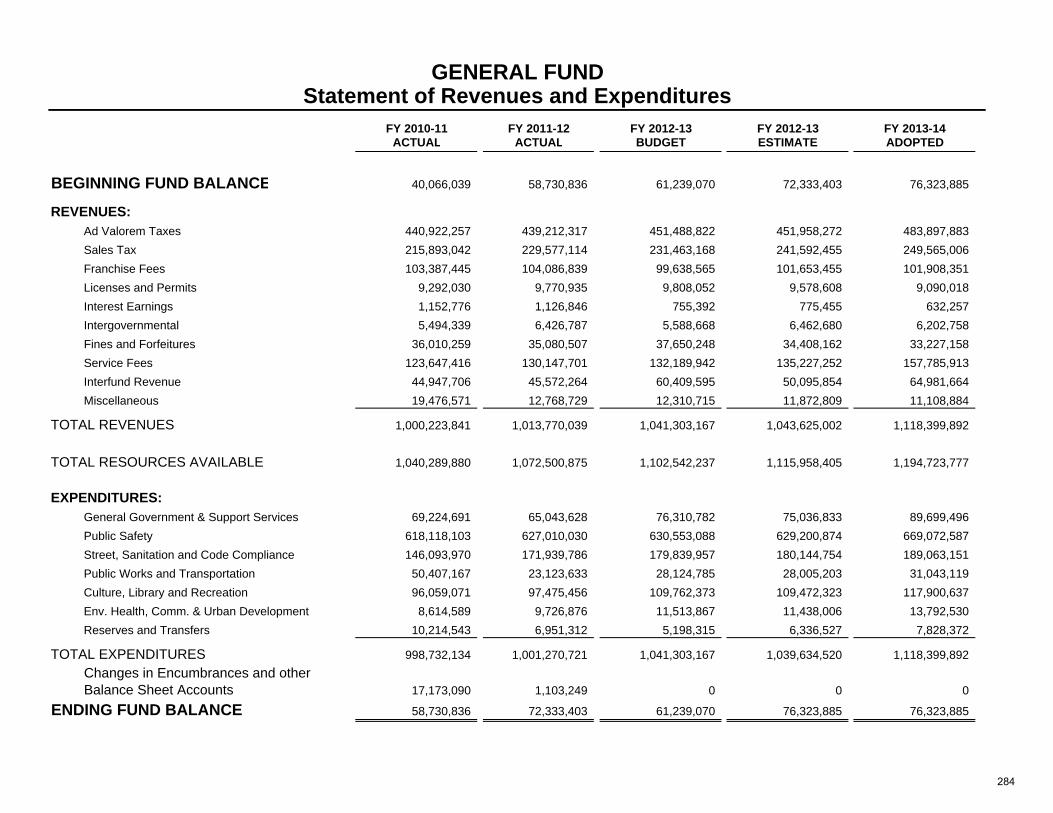
FY 2010-11 FY 2011-12 FY 2012-13 FY 2012-13 FY 2013-14ACTUAL ACTUAL BUDGET ESTIMATE ADOPTED
BEGINNING FUND BALANCE 40,066,039 58,730,836 61,239,070 72,333,403 76,323,885
REVENUES:Ad Valorem Taxes 440,922,257 439,212,317 451,488,822 451,958,272 483,897,883Sales Tax 215,893,042 229,577,114 231,463,168 241,592,455 249,565,006Franchise Fees 103,387,445 104,086,839 99,638,565 101,653,455 101,908,351Licenses and Permits 9,292,030 9,770,935 9,808,052 9,578,608 9,090,018Interest Earnings 1,152,776 1,126,846 755,392 775,455 632,257Intergovernmental 5,494,339 6,426,787 5,588,668 6,462,680 6,202,758Fines and Forfeitures 36,010,259 35,080,507 37,650,248 34,408,162 33,227,158Service Fees 123,647,416 130,147,701 132,189,942 135,227,252 157,785,913Interfund Revenue 44,947,706 45,572,264 60,409,595 50,095,854 64,981,664Miscellaneous 19,476,571 12,768,729 12,310,715 11,872,809 11,108,884
TOTAL REVENUES 1,000,223,841 1,013,770,039 1,041,303,167 1,043,625,002 1,118,399,892
GENERAL FUNDStatement of Revenues and Expenditures
TOTAL RESOURCES AVAILABLE 1,040,289,880 1,072,500,875 1,102,542,237 1,115,958,405 1,194,723,777
EXPENDITURES:General Government & Support Services 69,224,691 65,043,628 76,310,782 75,036,833 89,699,496Public Safety 618,118,103 627,010,030 630,553,088 629,200,874 669,072,587Street, Sanitation and Code Compliance 146,093,970 171,939,786 179,839,957 180,144,754 189,063,151Public Works and Transportation 50,407,167 23,123,633 28,124,785 28,005,203 31,043,119Culture, Library and Recreation 96,059,071 97,475,456 109,762,373 109,472,323 117,900,637Env. Health, Comm. & Urban Development 8,614,589 9,726,876 11,513,867 11,438,006 13,792,530Reserves and Transfers 10,214,543 6,951,312 5,198,315 6,336,527 7,828,372
TOTAL EXPENDITURES 998,732,134 1,001,270,721 1,041,303,167 1,039,634,520 1,118,399,892Changes in Encumbrances and otherBalance Sheet Accounts 17,173,090 1,103,249 0 0 0
ENDING FUND BALANCE 58,730,836 72,333,403 61,239,070 76,323,885 76,323,885
284
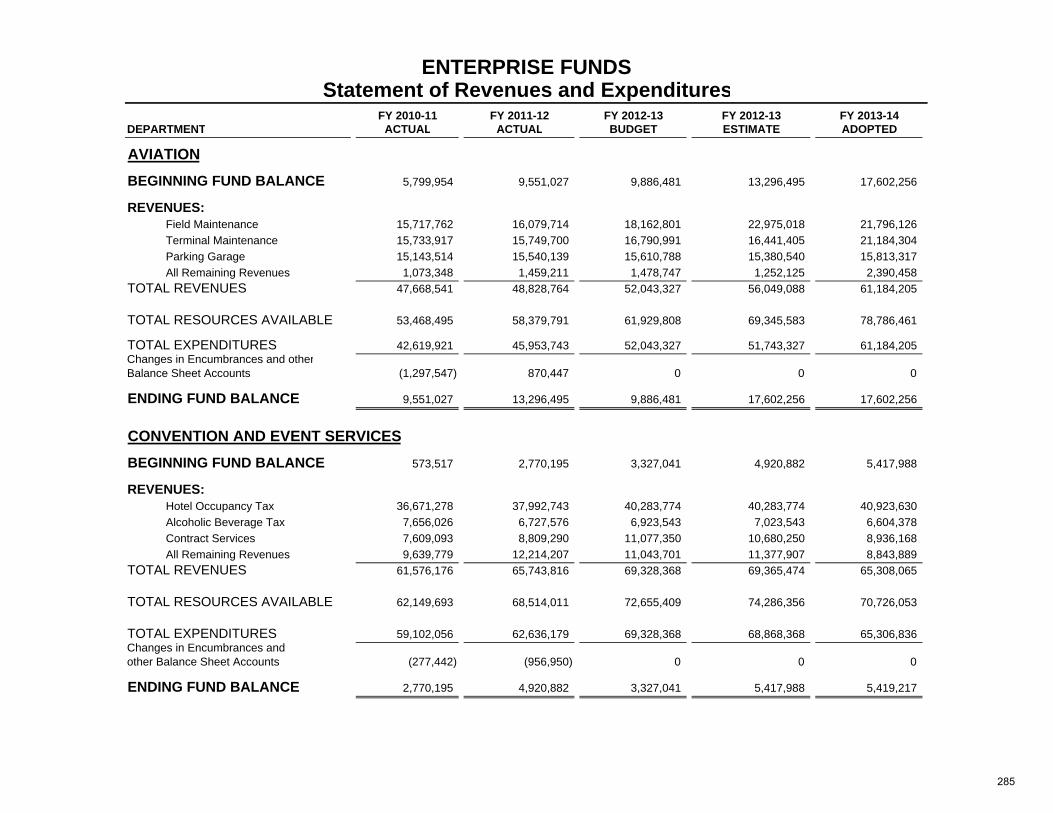
ENTERPRISE FUNDSStatement of Revenues and Expenditures
FY 2010-11 FY 2011-12 FY 2012-13 FY 2012-13 FY 2013-14DEPARTMENT ACTUAL ACTUAL BUDGET ESTIMATE ADOPTED
AVIATION
BEGINNING FUND BALANCE 5,799,954 9,551,027 9,886,481 13,296,495 17,602,256
REVENUES:Field Maintenance 15,717,762 16,079,714 18,162,801 22,975,018 21,796,126Terminal Maintenance 15,733,917 15,749,700 16,790,991 16,441,405 21,184,304Parking Garage 15,143,514 15,540,139 15,610,788 15,380,540 15,813,317All Remaining Revenues 1,073,348 1,459,211 1,478,747 1,252,125 2,390,458
TOTAL REVENUES 47,668,541 48,828,764 52,043,327 56,049,088 61,184,205
TOTAL RESOURCES AVAILABLE 53,468,495 58,379,791 61,929,808 69,345,583 78,786,461
TOTAL EXPENDITURES 42,619,921 45,953,743 52,043,327 51,743,327 61,184,205Changes in Encumbrances and otherBalance Sheet Accounts (1,297,547) 870,447 0 0 0
ENDING FUND BALANCE 9,551,027 13,296,495 9,886,481 17,602,256 17,602,256
CONVENTION AND EVENT SERVICES
BEGINNING FUND BALANCE 573,517 2,770,195 3,327,041 4,920,882 5,417,988
REVENUES: Hotel Occupancy Tax 36,671,278 37,992,743 40,283,774 40,283,774 40,923,630Alcoholic Beverage Tax 7,656,026 6,727,576 6,923,543 7,023,543 6,604,378Contract Services 7,609,093 8,809,290 11,077,350 10,680,250 8,936,168All Remaining Revenues 9,639,779 12,214,207 11,043,701 11,377,907 8,843,889
TOTAL REVENUES 61,576,176 65,743,816 69,328,368 69,365,474 65,308,065
TOTAL RESOURCES AVAILABLE 62,149,693 68,514,011 72,655,409 74,286,356 70,726,053
TOTAL EXPENDITURES 59,102,056 62,636,179 69,328,368 68,868,368 65,306,836Changes in Encumbrances and other Balance Sheet Accounts (277,442) (956,950) 0 0 0
ENDING FUND BALANCE 2,770,195 4,920,882 3,327,041 5,417,988 5,419,217
285
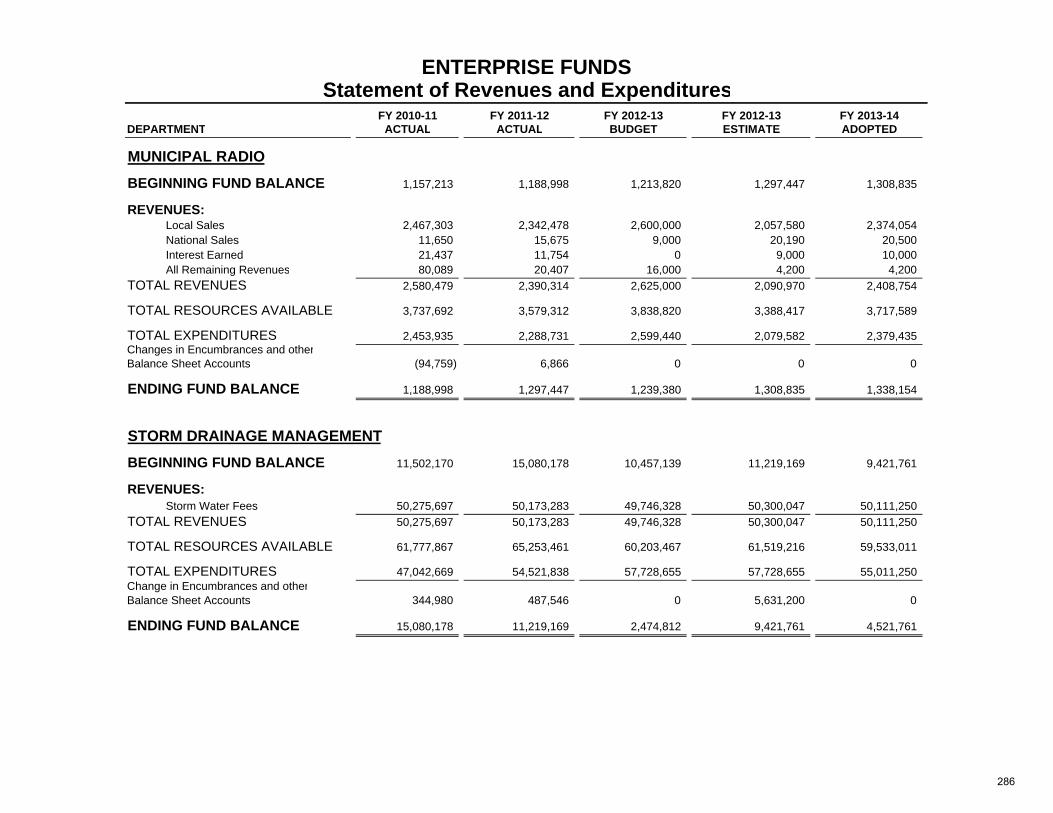
ENTERPRISE FUNDSStatement of Revenues and Expenditures
FY 2010-11 FY 2011-12 FY 2012-13 FY 2012-13 FY 2013-14DEPARTMENT ACTUAL ACTUAL BUDGET ESTIMATE ADOPTED
MUNICIPAL RADIO
BEGINNING FUND BALANCE 1,157,213 1,188,998 1,213,820 1,297,447 1,308,835
REVENUES:Local Sales 2,467,303 2,342,478 2,600,000 2,057,580 2,374,054National Sales 11,650 15,675 9,000 20,190 20,500Interest Earned 21,437 11,754 0 9,000 10,000All Remaining Revenues 80,089 20,407 16,000 4,200 4,200
TOTAL REVENUES 2,580,479 2,390,314 2,625,000 2,090,970 2,408,754
TOTAL RESOURCES AVAILABLE 3,737,692 3,579,312 3,838,820 3,388,417 3,717,589
TOTAL EXPENDITURES 2,453,935 2,288,731 2,599,440 2,079,582 2,379,435Changes in Encumbrances and otherBalance Sheet Accounts (94,759) 6,866 0 0 0
ENDING FUND BALANCE 1,188,998 1,297,447 1,239,380 1,308,835 1,338,154
STORM DRAINAGE MANAGEMENT
BEGINNING FUND BALANCE 11,502,170 15,080,178 10,457,139 11,219,169 9,421,761
REVENUES:Storm Water Fees 50,275,697 50,173,283 49,746,328 50,300,047 50,111,250
TOTAL REVENUES 50,275,697 50,173,283 49,746,328 50,300,047 50,111,250
TOTAL RESOURCES AVAILABLE 61,777,867 65,253,461 60,203,467 61,519,216 59,533,011
TOTAL EXPENDITURES 47,042,669 54,521,838 57,728,655 57,728,655 55,011,250Change in Encumbrances and otherBalance Sheet Accounts 344,980 487,546 0 5,631,200 0
ENDING FUND BALANCE 15,080,178 11,219,169 2,474,812 9,421,761 4,521,761
286
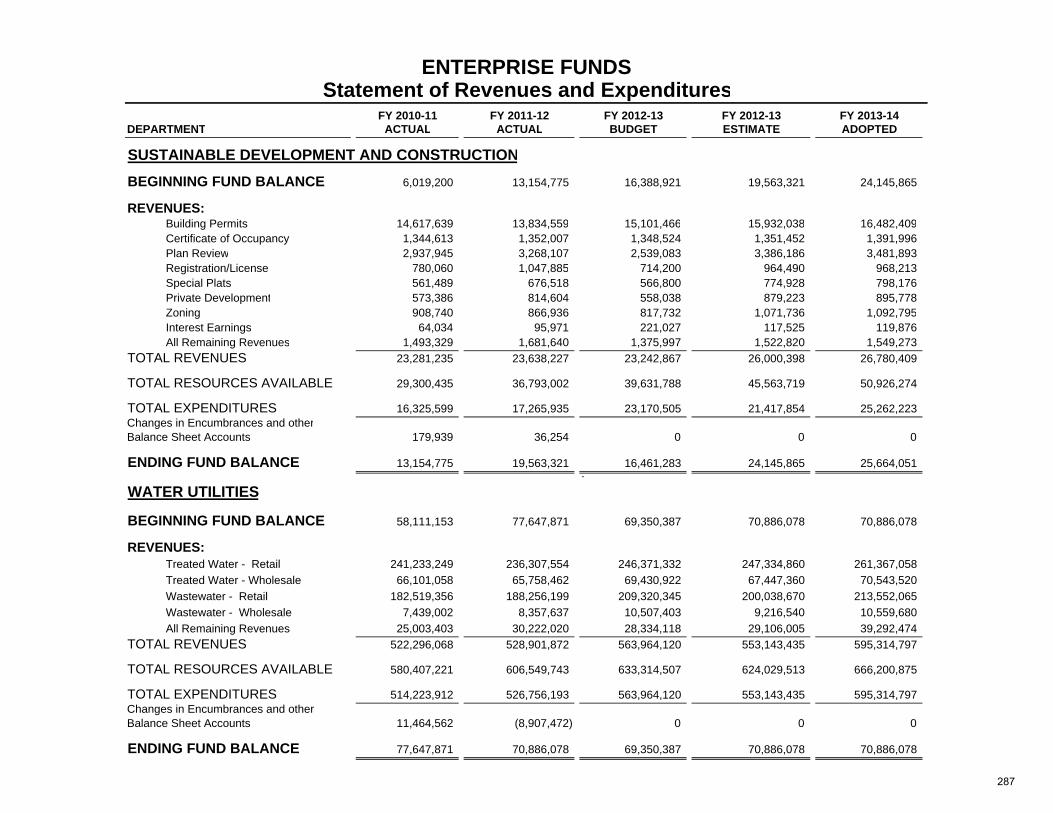
ENTERPRISE FUNDSStatement of Revenues and Expenditures
FY 2010-11 FY 2011-12 FY 2012-13 FY 2012-13 FY 2013-14DEPARTMENT ACTUAL ACTUAL BUDGET ESTIMATE ADOPTED
SUSTAINABLE DEVELOPMENT AND CONSTRUCTION
BEGINNING FUND BALANCE 6,019,200 13,154,775 16,388,921 19,563,321 24,145,865
REVENUES:Building Permits 14,617,639 13,834,559 15,101,466 15,932,038 16,482,409Certificate of Occupancy 1,344,613 1,352,007 1,348,524 1,351,452 1,391,996Plan Review 2,937,945 3,268,107 2,539,083 3,386,186 3,481,893Registration/License 780,060 1,047,885 714,200 964,490 968,213Special Plats 561,489 676,518 566,800 774,928 798,176Private Development 573,386 814,604 558,038 879,223 895,778Zoning 908,740 866,936 817,732 1,071,736 1,092,795Interest Earnings 64,034 95,971 221,027 117,525 119,876All Remaining Revenues 1,493,329 1,681,640 1,375,997 1,522,820 1,549,273
TOTAL REVENUES 23,281,235 23,638,227 23,242,867 26,000,398 26,780,409
TOTAL RESOURCES AVAILABLE 29,300,435 36,793,002 39,631,788 45,563,719 50,926,274
TOTAL EXPENDITURES 16,325,599 17,265,935 23,170,505 21,417,854 25,262,223Changes in Encumbrances and otherBalance Sheet Accounts 179,939 36,254 0 0 0
ENDING FUND BALANCE 13,154,775 19,563,321 16,461,283 24,145,865 25,664,051.
WATER UTILITIES
BEGINNING FUND BALANCE 58,111,153 77,647,871 69,350,387 70,886,078 70,886,078
REVENUES:Treated Water - Retail 241,233,249 236,307,554 246,371,332 247,334,860 261,367,058Treated Water - Wholesale 66,101,058 65,758,462 69,430,922 67,447,360 70,543,520Wastewater - Retail 182,519,356 188,256,199 209,320,345 200,038,670 213,552,065Wastewater - Wholesale 7,439,002 8,357,637 10,507,403 9,216,540 10,559,680All Remaining Revenues 25,003,403 30,222,020 28,334,118 29,106,005 39,292,474
TOTAL REVENUES 522,296,068 528,901,872 563,964,120 553,143,435 595,314,797
TOTAL RESOURCES AVAILABLE 580,407,221 606,549,743 633,314,507 624,029,513 666,200,875
TOTAL EXPENDITURES 514,223,912 526,756,193 563,964,120 553,143,435 595,314,797Changes in Encumbrances and other Balance Sheet Accounts 11,464,562 (8,907,472) 0 0 0
ENDING FUND BALANCE 77,647,871 70,886,078 69,350,387 70,886,078 70,886,078
287
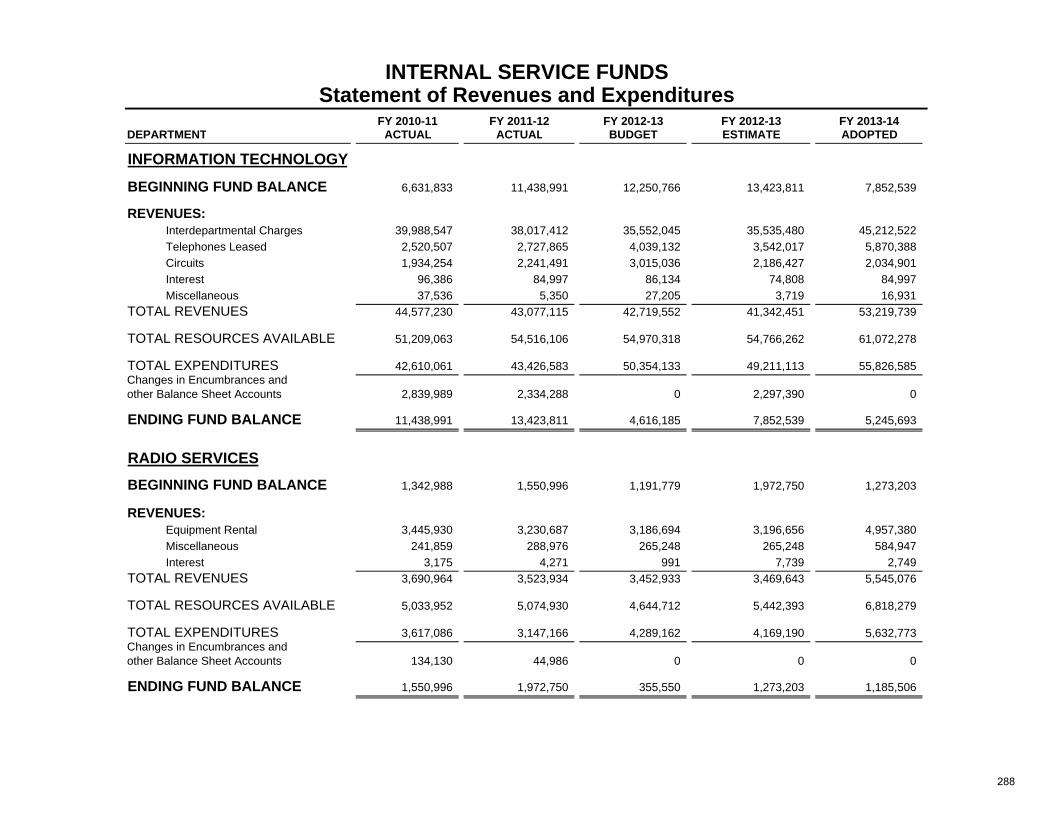
INTERNAL SERVICE FUNDSStatement of Revenues and Expenditures
FY 2010-11 FY 2011-12 FY 2012-13 FY 2012-13 FY 2013-14DEPARTMENT ACTUAL ACTUAL BUDGET ESTIMATE ADOPTED
INFORMATION TECHNOLOGY
BEGINNING FUND BALANCE 6,631,833 11,438,991 12,250,766 13,423,811 7,852,539
REVENUES:Interdepartmental Charges 39,988,547 38,017,412 35,552,045 35,535,480 45,212,522Telephones Leased 2,520,507 2,727,865 4,039,132 3,542,017 5,870,388Circuits 1,934,254 2,241,491 3,015,036 2,186,427 2,034,901Interest 96,386 84,997 86,134 74,808 84,997Miscellaneous 37,536 5,350 27,205 3,719 16,931
TOTAL REVENUES 44,577,230 43,077,115 42,719,552 41,342,451 53,219,739
TOTAL RESOURCES AVAILABLE 51,209,063 54,516,106 54,970,318 54,766,262 61,072,278
TOTAL EXPENDITURES 42,610,061 43,426,583 50,354,133 49,211,113 55,826,585Changes in Encumbrances andother Balance Sheet Accounts 2,839,989 2,334,288 0 2,297,390 0
ENDING FUND BALANCE 11,438,991 13,423,811 4,616,185 7,852,539 5,245,693
RADIO SERVICESBEGINNING FUND BALANCE 1,342,988 1,550,996 1,191,779 1,972,750 1,273,203
REVENUES:Equipment Rental 3,445,930 3,230,687 3,186,694 3,196,656 4,957,380Miscellaneous 241,859 288,976 265,248 265,248 584,947Interest 3,175 4,271 991 7,739 2,749
TOTAL REVENUES 3,690,964 3,523,934 3,452,933 3,469,643 5,545,076
TOTAL RESOURCES AVAILABLE 5,033,952 5,074,930 4,644,712 5,442,393 6,818,279
TOTAL EXPENDITURES 3,617,086 3,147,166 4,289,162 4,169,190 5,632,773Changes in Encumbrances andother Balance Sheet Accounts 134,130 44,986 0 0 0
ENDING FUND BALANCE 1,550,996 1,972,750 355,550 1,273,203 1,185,506
288
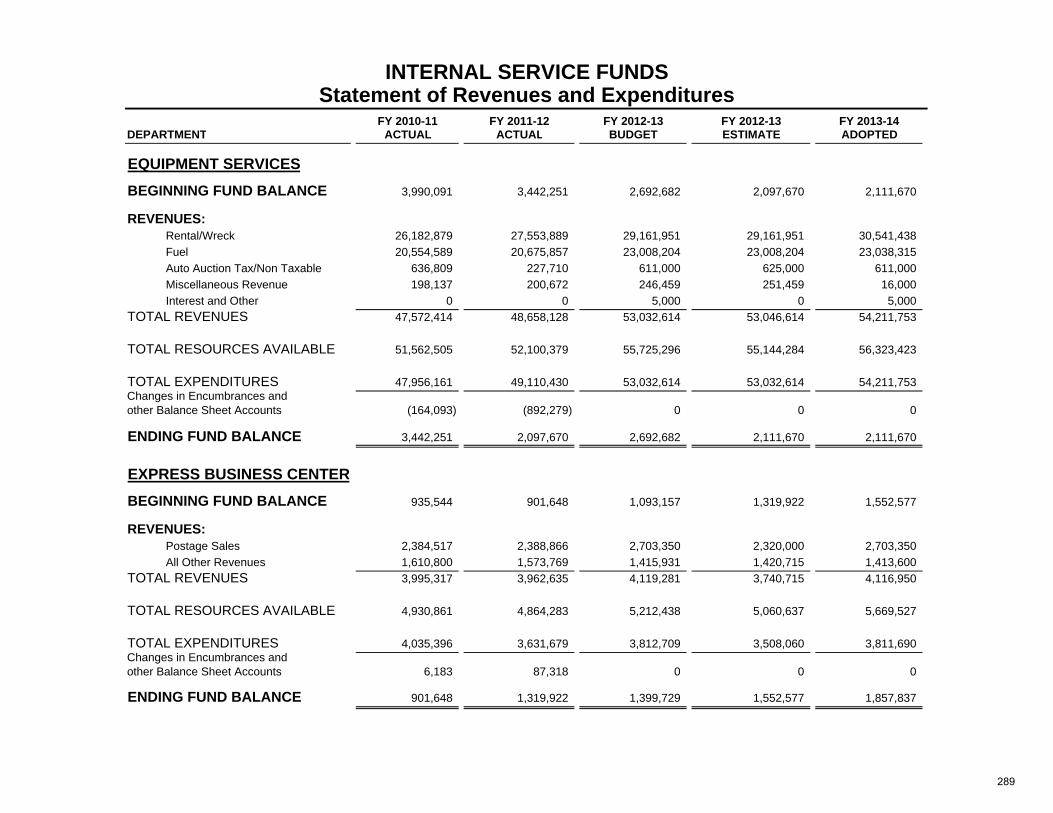
INTERNAL SERVICE FUNDSStatement of Revenues and Expenditures
FY 2010-11 FY 2011-12 FY 2012-13 FY 2012-13 FY 2013-14DEPARTMENT ACTUAL ACTUAL BUDGET ESTIMATE ADOPTED
EQUIPMENT SERVICESBEGINNING FUND BALANCE 3,990,091 3,442,251 2,692,682 2,097,670 2,111,670
REVENUES:Rental/Wreck 26,182,879 27,553,889 29,161,951 29,161,951 30,541,438Fuel 20,554,589 20,675,857 23,008,204 23,008,204 23,038,315Auto Auction Tax/Non Taxable 636,809 227,710 611,000 625,000 611,000Miscellaneous Revenue 198,137 200,672 246,459 251,459 16,000Interest and Other 0 0 5,000 0 5,000
TOTAL REVENUES 47,572,414 48,658,128 53,032,614 53,046,614 54,211,753
TOTAL RESOURCES AVAILABLE 51,562,505 52,100,379 55,725,296 55,144,284 56,323,423
TOTAL EXPENDITURES 47,956,161 49,110,430 53,032,614 53,032,614 54,211,753Changes in Encumbrances and other Balance Sheet Accounts (164,093) (892,279) 0 0 0
ENDING FUND BALANCE 3,442,251 2,097,670 2,692,682 2,111,670 2,111,670
EXPRESS BUSINESS CENTERBEGINNING FUND BALANCE 935,544 901,648 1,093,157 1,319,922 1,552,577
REVENUES:Postage Sales 2,384,517 2,388,866 2,703,350 2,320,000 2,703,350All Other Revenues 1,610,800 1,573,769 1,415,931 1,420,715 1,413,600
TOTAL REVENUES 3,995,317 3,962,635 4,119,281 3,740,715 4,116,950
TOTAL RESOURCES AVAILABLE 4,930,861 4,864,283 5,212,438 5,060,637 5,669,527
TOTAL EXPENDITURES 4,035,396 3,631,679 3,812,709 3,508,060 3,811,690Changes in Encumbrances andother Balance Sheet Accounts 6,183 87,318 0 0 0
ENDING FUND BALANCE 901,648 1,319,922 1,399,729 1,552,577 1,857,837
289
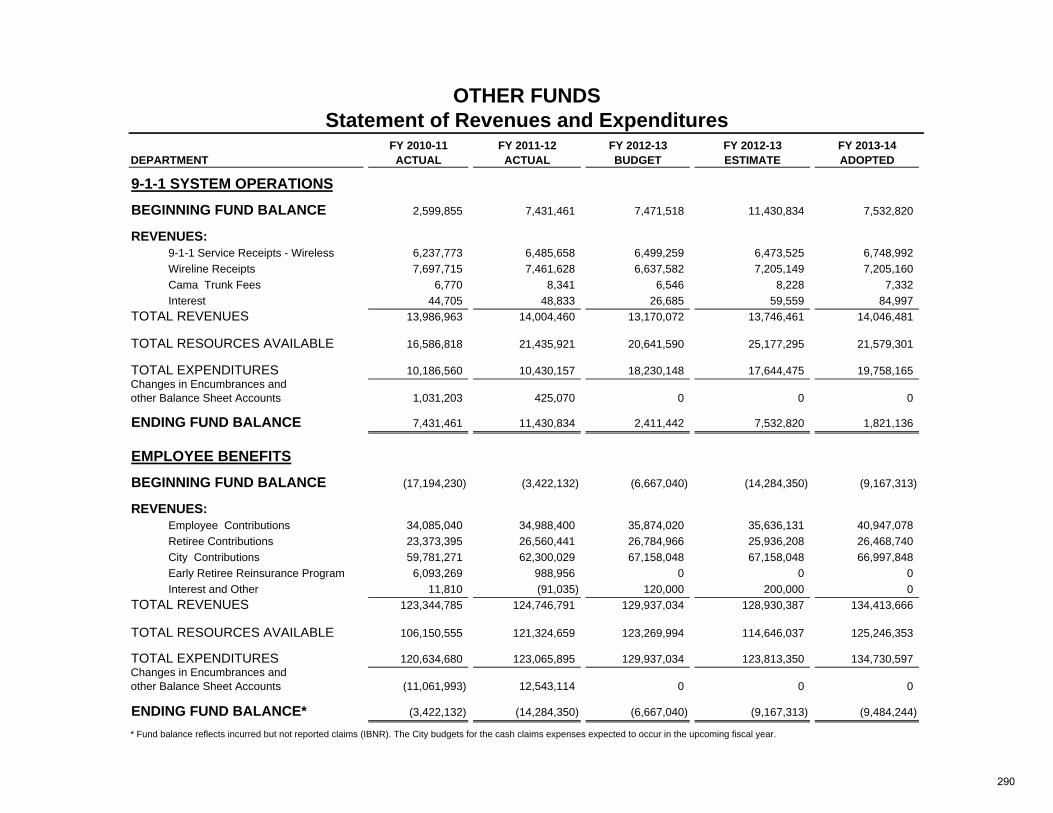
OTHER FUNDSStatement of Revenues and Expenditures
FY 2010-11 FY 2011-12 FY 2012-13 FY 2012-13 FY 2013-14DEPARTMENT ACTUAL ACTUAL BUDGET ESTIMATE ADOPTED
9-1-1 SYSTEM OPERATIONS
BEGINNING FUND BALANCE 2,599,855 7,431,461 7,471,518 11,430,834 7,532,820
REVENUES:9-1-1 Service Receipts - Wireless 6,237,773 6,485,658 6,499,259 6,473,525 6,748,992Wireline Receipts 7,697,715 7,461,628 6,637,582 7,205,149 7,205,160Cama Trunk Fees 6,770 8,341 6,546 8,228 7,332Interest 44,705 48,833 26,685 59,559 84,997
TOTAL REVENUES 13,986,963 14,004,460 13,170,072 13,746,461 14,046,481
TOTAL RESOURCES AVAILABLE 16,586,818 21,435,921 20,641,590 25,177,295 21,579,301
TOTAL EXPENDITURES 10,186,560 10,430,157 18,230,148 17,644,475 19,758,165Changes in Encumbrances andother Balance Sheet Accounts 1,031,203 425,070 0 0 0
ENDING FUND BALANCE 7,431,461 11,430,834 2,411,442 7,532,820 1,821,136
EMPLOYEE BENEFITS
BEGINNING FUND BALANCE (17,194,230) (3,422,132) (6,667,040) (14,284,350) (9,167,313)
REVENUES:Employee Contributions 34,085,040 34,988,400 35,874,020 35,636,131 40,947,078Retiree Contributions 23,373,395 26,560,441 26,784,966 25,936,208 26,468,740City Contributions 59,781,271 62,300,029 67,158,048 67,158,048 66,997,848Early Retiree Reinsurance Program 6,093,269 988,956 0 0 0Interest and Other 11,810 (91,035) 120,000 200,000 0
TOTAL REVENUES 123,344,785 124,746,791 129,937,034 128,930,387 134,413,666
TOTAL RESOURCES AVAILABLE 106,150,555 121,324,659 123,269,994 114,646,037 125,246,353
TOTAL EXPENDITURES 120,634,680 123,065,895 129,937,034 123,813,350 134,730,597Changes in Encumbrances andother Balance Sheet Accounts (11,061,993) 12,543,114 0 0 0
ENDING FUND BALANCE* (3,422,132) (14,284,350) (6,667,040) (9,167,313) (9,484,244)
* Fund balance reflects incurred but not reported claims (IBNR). The City budgets for the cash claims expenses expected to occur in the upcoming fiscal year.
290
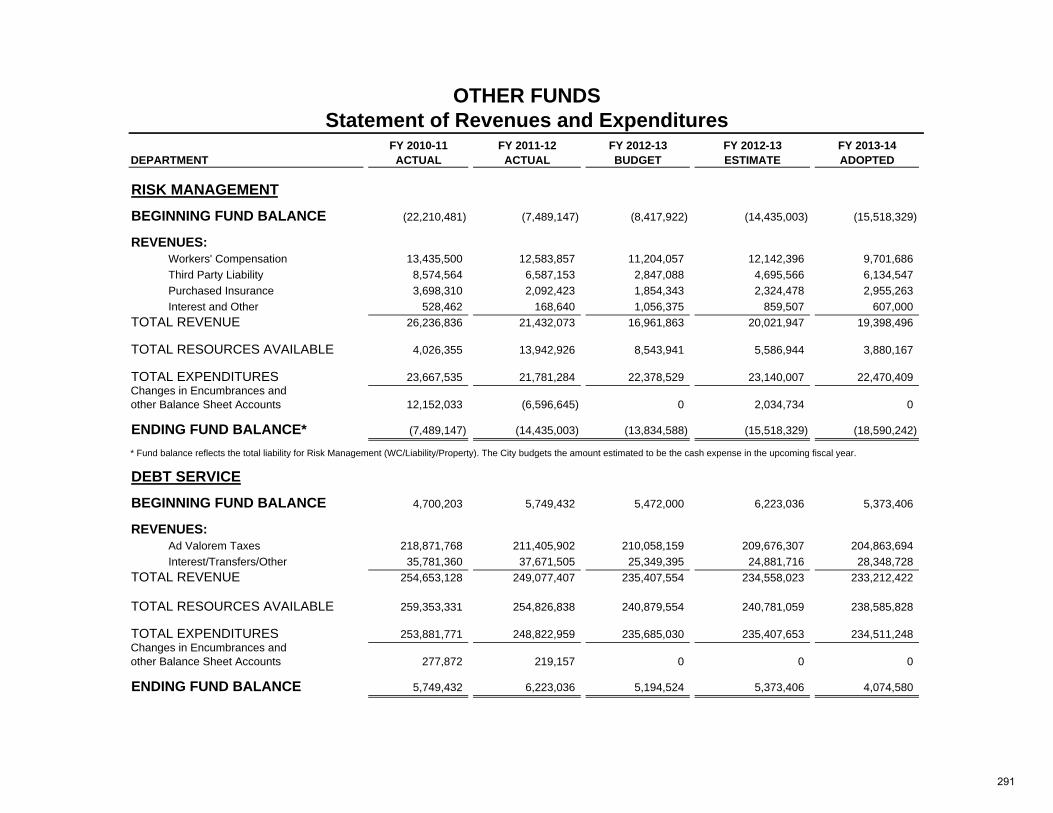
OTHER FUNDSStatement of Revenues and Expenditures
FY 2010-11 FY 2011-12 FY 2012-13 FY 2012-13 FY 2013-14DEPARTMENT ACTUAL ACTUAL BUDGET ESTIMATE ADOPTED
RISK MANAGEMENT
BEGINNING FUND BALANCE (22,210,481) (7,489,147) (8,417,922) (14,435,003) (15,518,329)
REVENUES:Workers' Compensation 13,435,500 12,583,857 11,204,057 12,142,396 9,701,686Third Party Liability 8,574,564 6,587,153 2,847,088 4,695,566 6,134,547Purchased Insurance 3,698,310 2,092,423 1,854,343 2,324,478 2,955,263Interest and Other 528,462 168,640 1,056,375 859,507 607,000
TOTAL REVENUE 26,236,836 21,432,073 16,961,863 20,021,947 19,398,496
TOTAL RESOURCES AVAILABLE 4,026,355 13,942,926 8,543,941 5,586,944 3,880,167
TOTAL EXPENDITURES 23,667,535 21,781,284 22,378,529 23,140,007 22,470,409Changes in Encumbrances andother Balance Sheet Accounts 12,152,033 (6,596,645) 0 2,034,734 0
ENDING FUND BALANCE* (7,489,147) (14,435,003) (13,834,588) (15,518,329) (18,590,242)
* Fund balance reflects the total liability for Risk Management (WC/Liability/Property). The City budgets the amount estimated to be the cash expense in the upcoming fiscal year.
DEBT SERVICE
BEGINNING FUND BALANCE 4,700,203 5,749,432 5,472,000 6,223,036 5,373,406
REVENUES:Ad Valorem Taxes 218,871,768 211,405,902 210,058,159 209,676,307 204,863,694Interest/Transfers/Other 35,781,360 37,671,505 25,349,395 24,881,716 28,348,728
TOTAL REVENUE 254,653,128 249,077,407 235,407,554 234,558,023 233,212,422
TOTAL RESOURCES AVAILABLE 259,353,331 254,826,838 240,879,554 240,781,059 238,585,828
TOTAL EXPENDITURES 253,881,771 248,822,959 235,685,030 235,407,653 234,511,248Changes in Encumbrances andother Balance Sheet Accounts 277,872 219,157 0 0 0
ENDING FUND BALANCE 5,749,432 6,223,036 5,194,524 5,373,406 4,074,580
291

292
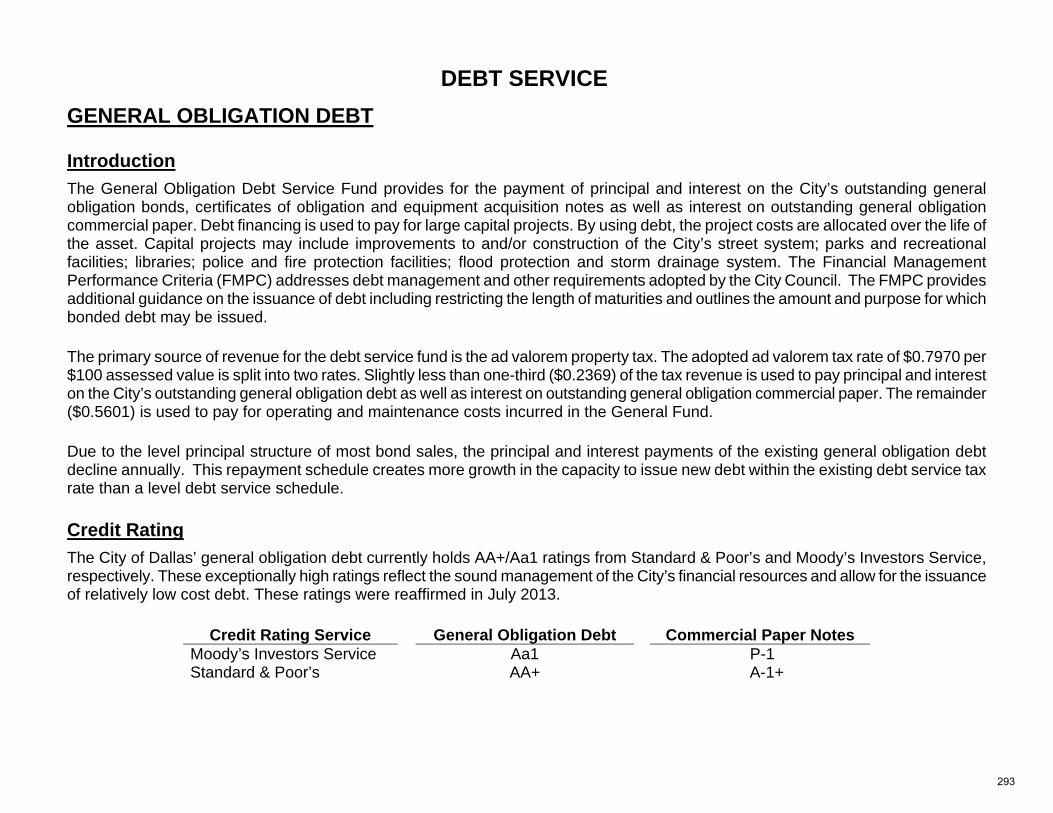
DEBT SERVICE
GENERAL OBLIGATION DEBT Introduction The General Obligation Debt Service Fund provides for the payment of principal and interest on the City’s outstanding general obligation bonds, certificates of obligation and equipment acquisition notes as well as interest on outstanding general obligation commercial paper. Debt financing is used to pay for large capital projects. By using debt, the project costs are allocated over the life of the asset. Capital projects may include improvements to and/or construction of the City’s street system; parks and recreational facilities; libraries; police and fire protection facilities; flood protection and storm drainage system. The Financial Management Performance Criteria (FMPC) addresses debt management and other requirements adopted by the City Council. The FMPC provides additional guidance on the issuance of debt including restricting the length of maturities and outlines the amount and purpose for which bonded debt may be issued. The primary source of revenue for the debt service fund is the ad valorem property tax. The adopted ad valorem tax rate of $0.7970 per $100 assessed value is split into two rates. Slightly less than one-third ($0.2369) of the tax revenue is used to pay principal and interest on the City’s outstanding general obligation debt as well as interest on outstanding general obligation commercial paper. The remainder ($0.5601) is used to pay for operating and maintenance costs incurred in the General Fund. Due to the level principal structure of most bond sales, the principal and interest payments of the existing general obligation debt decline annually. This repayment schedule creates more growth in the capacity to issue new debt within the existing debt service tax rate than a level debt service schedule. Credit Rating The City of Dallas’ general obligation debt currently holds AA+/Aa1 ratings from Standard & Poor’s and Moody’s Investors Service, respectively. These exceptionally high ratings reflect the sound management of the City’s financial resources and allow for the issuance of relatively low cost debt. These ratings were reaffirmed in July 2013.
Credit Rating Service General Obligation Debt Commercial Paper Notes Moody’s Investors Service Aa1 P-1 Standard & Poor’s AA+ A-1+
293
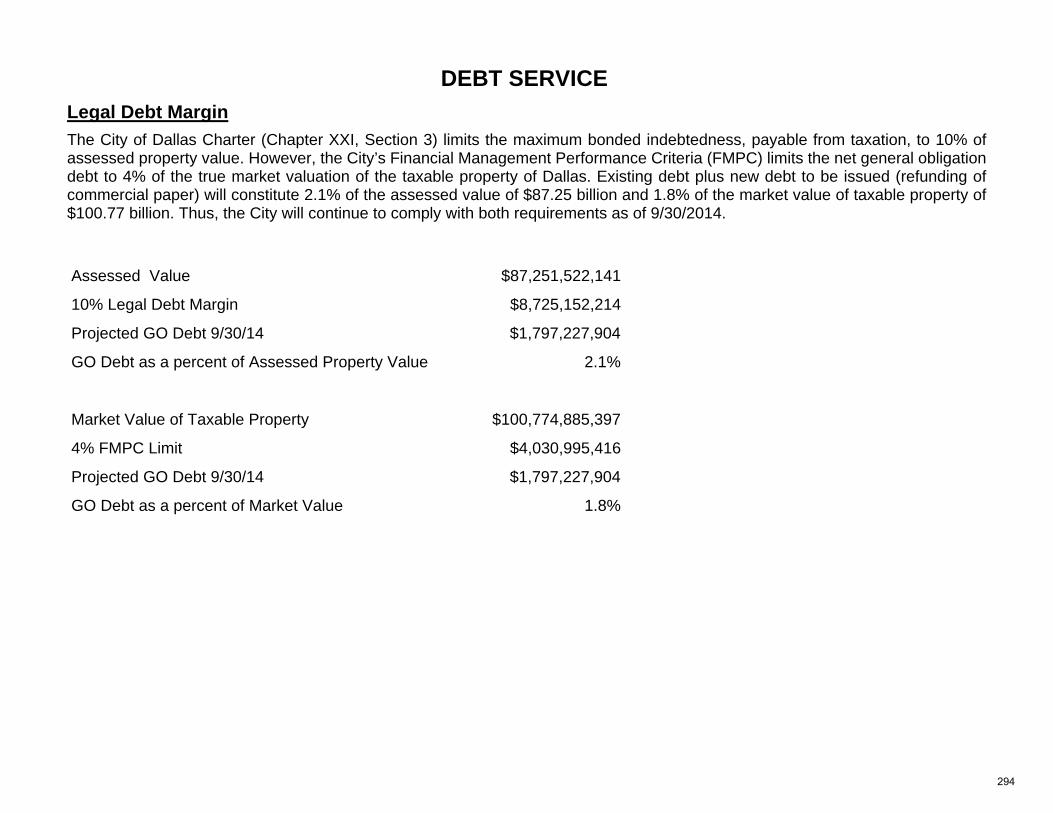
DEBT SERVICE
Legal Debt Margin The City of Dallas Charter (Chapter XXI, Section 3) limits the maximum bonded indebtedness, payable from taxation, to 10% of assessed property value. However, the City’s Financial Management Performance Criteria (FMPC) limits the net general obligation debt to 4% of the true market valuation of the taxable property of Dallas. Existing debt plus new debt to be issued (refunding of commercial paper) will constitute 2.1% of the assessed value of $87.25 billion and 1.8% of the market value of taxable property of $100.77 billion. Thus, the City will continue to comply with both requirements as of 9/30/2014.
Assessed Value $87,251,522,141
10% Legal Debt Margin $8,725,152,214
Projected GO Debt 9/30/14 $1,797,227,904
GO Debt as a percent of Assessed Property Value 2.1%
Market Value of Taxable Property $100,774,885,397
4% FMPC Limit $4,030,995,416
Projected GO Debt 9/30/14 $1,797,227,904
GO Debt as a percent of Market Value 1.8%
294
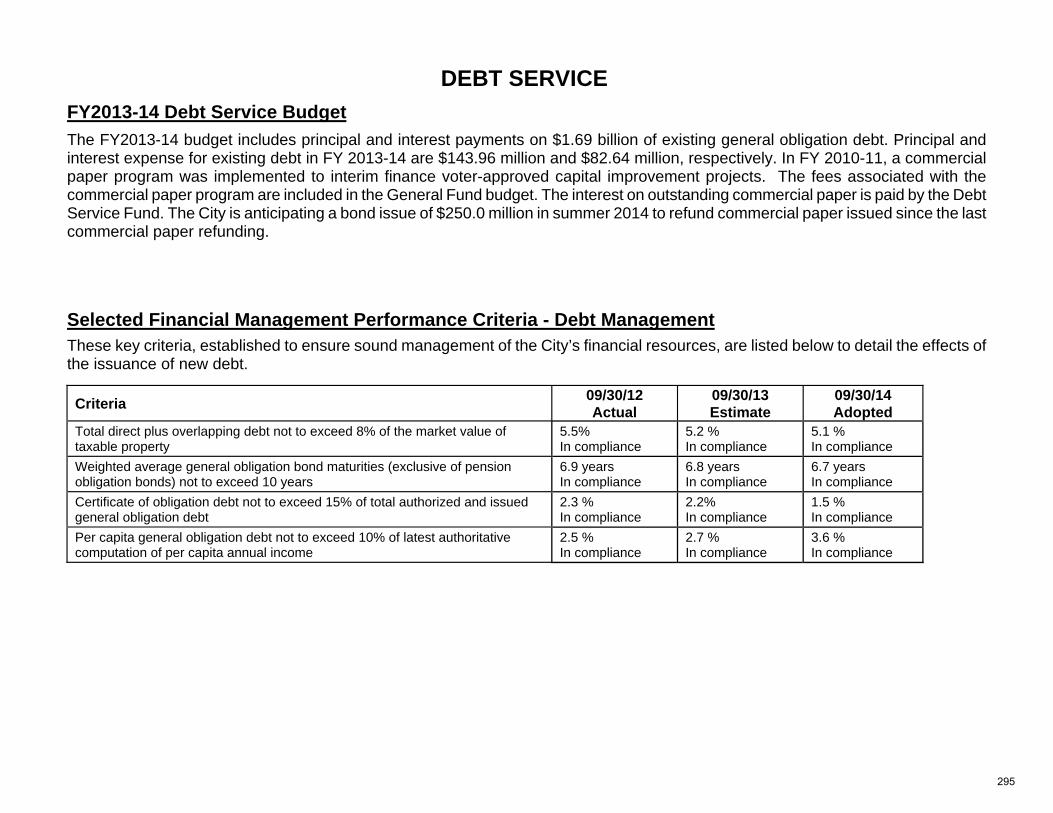
DEBT SERVICE
FY2013-14 Debt Service Budget The FY2013-14 budget includes principal and interest payments on $1.69 billion of existing general obligation debt. Principal and interest expense for existing debt in FY 2013-14 are $143.96 million and $82.64 million, respectively. In FY 2010-11, a commercial paper program was implemented to interim finance voter-approved capital improvement projects. The fees associated with the commercial paper program are included in the General Fund budget. The interest on outstanding commercial paper is paid by the Debt Service Fund. The City is anticipating a bond issue of $250.0 million in summer 2014 to refund commercial paper issued since the last commercial paper refunding.
Selected Financial Management Performance Criteria - Debt Management
These key criteria, established to ensure sound management of the City’s financial resources, are listed below to detail the effects of the issuance of new debt.
Criteria 09/30/12 Actual
09/30/13 Estimate
09/30/14 Adopted
Total direct plus overlapping debt not to exceed 8% of the market value of taxable property
5.5% In compliance
5.2 % In compliance
5.1 % In compliance
Weighted average general obligation bond maturities (exclusive of pension obligation bonds) not to exceed 10 years
6.9 years In compliance
6.8 years In compliance
6.7 years In compliance
Certificate of obligation debt not to exceed 15% of total authorized and issued general obligation debt
2.3 % In compliance
2.2% In compliance
1.5 % In compliance
Per capita general obligation debt not to exceed 10% of latest authoritative computation of per capita annual income
2.5 % In compliance
2.7 % In compliance
3.6 % In compliance
295
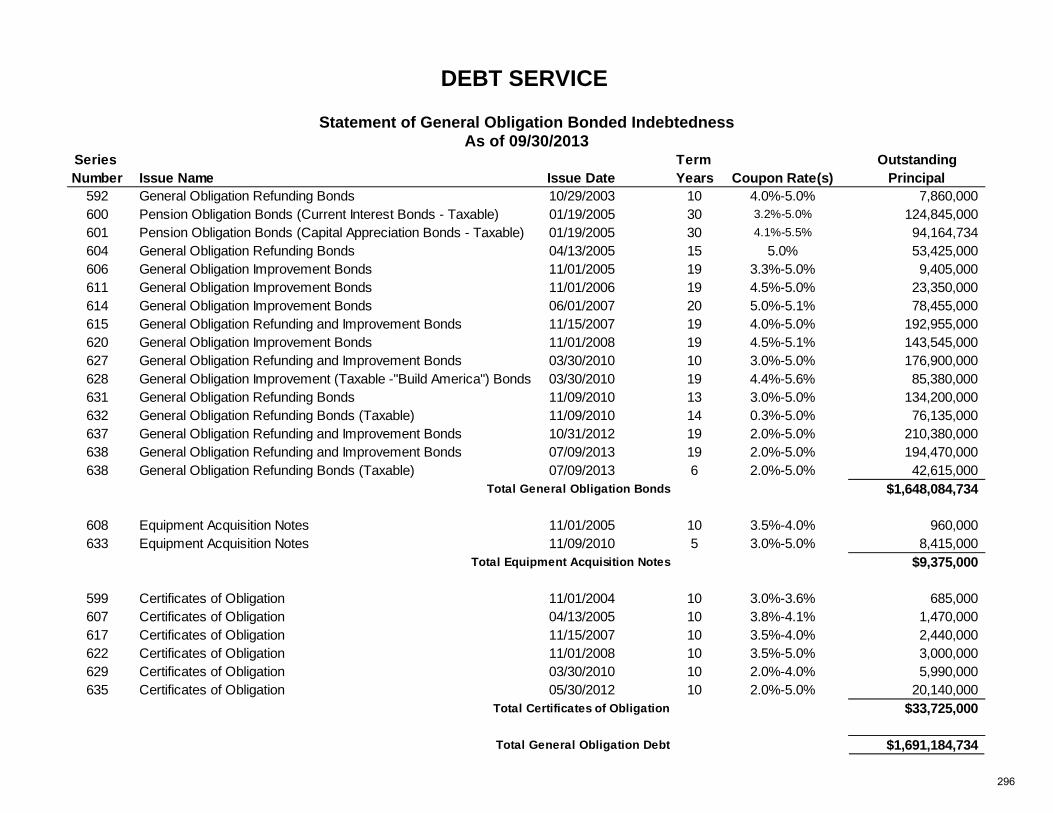
DEBT SERVICE
Statement of General Obligation Bonded Indebtedness
As of 09/30/2013 Series Term OutstandingNumber Issue Name Issue Date Years Coupon Rate(s) Principal
592 General Obligation Refunding Bonds 10/29/2003 10 4.0%-5.0% 7,860,000 600 Pension Obligation Bonds (Current Interest Bonds - Taxable) 01/19/2005 30 3.2%-5.0% 124,845,000 601 Pension Obligation Bonds (Capital Appreciation Bonds - Taxable) 01/19/2005 30 4.1%-5.5% 94,164,734 604 General Obligation Refunding Bonds 04/13/2005 15 5.0% 53,425,000 606 General Obligation Improvement Bonds 11/01/2005 19 3.3%-5.0% 9,405,000 611 General Obligation Improvement Bonds 11/01/2006 19 4.5%-5.0% 23,350,000 614 General Obligation Improvement Bonds 06/01/2007 20 5.0%-5.1% 78,455,000 615 General Obligation Refunding and Improvement Bonds 11/15/2007 19 4.0%-5.0% 192,955,000 620 General Obligation Improvement Bonds 11/01/2008 19 4.5%-5.1% 143,545,000 627 General Obligation Refunding and Improvement Bonds 03/30/2010 10 3.0%-5.0% 176,900,000 628 General Obligation Improvement (Taxable -"Build America") Bonds 03/30/2010 19 4.4%-5.6% 85,380,000 631 General Obligation Refunding Bonds 11/09/2010 13 3.0%-5.0% 134,200,000 632 General Obligation Refunding Bonds (Taxable) 11/09/2010 14 0.3%-5.0% 76,135,000 637 General Obligation Refunding and Improvement Bonds 10/31/2012 19 2.0%-5.0% 210,380,000 638 General Obligation Refunding and Improvement Bonds 07/09/2013 19 2.0%-5.0% 194,470,000 638 General Obligation Refunding Bonds (Taxable) 07/09/2013 6 2.0%-5.0% 42,615,000
Total General Obligation Bonds $1,648,084,734
608 Equipment Acquisition Notes 11/01/2005 10 3.5%-4.0% 960,000 633 Equipment Acquisition Notes 11/09/2010 5 3.0%-5.0% 8,415,000
Total Equipment Acquisition Notes $9,375,000
599 Certificates of Obligation 11/01/2004 10 3.0%-3.6% 685,000 607 Certificates of Obligation 04/13/2005 10 3.8%-4.1% 1,470,000 617 Certificates of Obligation 11/15/2007 10 3.5%-4.0% 2,440,000 622 Certificates of Obligation 11/01/2008 10 3.5%-5.0% 3,000,000 629 Certificates of Obligation 03/30/2010 10 2.0%-4.0% 5,990,000 635 Certificates of Obligation 05/30/2012 10 2.0%-5.0% 20,140,000
Total Certificates of Obligation $33,725,000
Total General Obligation Debt $1,691,184,734
296
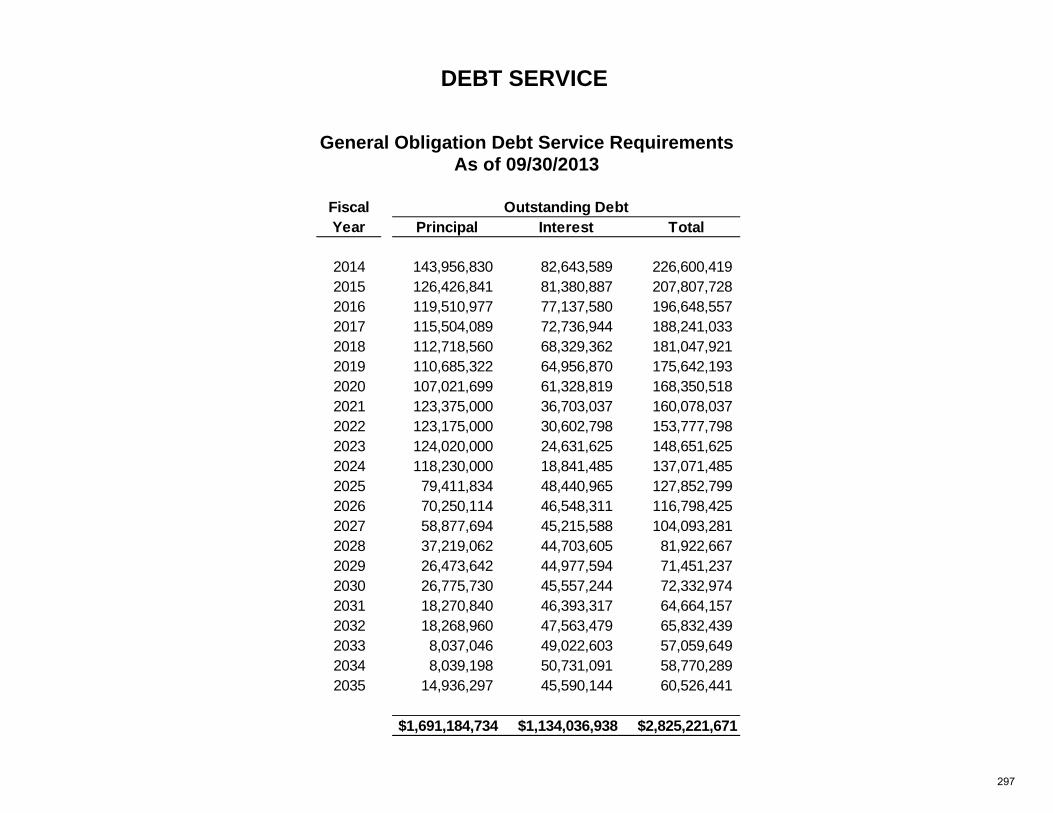
DEBT SERVICE
General Obligation Debt Service Requirements As of 09/30/2013
Principal Interest Total
2014 143,956,830 82,643,589 226,600,419 2015 126,426,841 81,380,887 207,807,728 2016 119,510,977 77,137,580 196,648,557 2017 115,504,089 72,736,944 188,241,033 2018 112,718,560 68,329,362 181,047,921 2019 110,685,322 64,956,870 175,642,193 2020 107,021,699 61,328,819 168,350,518 2021 123,375,000 36,703,037 160,078,037 2022 123,175,000 30,602,798 153,777,798 2023 124,020,000 24,631,625 148,651,625 2024 118,230,000 18,841,485 137,071,485 2025 79,411,834 48,440,965 127,852,799 2026 70,250,114 46,548,311 116,798,425 2027 58,877,694 45,215,588 104,093,281 2028 37,219,062 44,703,605 81,922,667 2029 26,473,642 44,977,594 71,451,237 2030 26,775,730 45,557,244 72,332,974 2031 18,270,840 46,393,317 64,664,157 2032 18,268,960 47,563,479 65,832,439 2033 8,037,046 49,022,603 57,059,649 2034 8,039,198 50,731,091 58,770,289 2035 14,936,297 45,590,144 60,526,441
$1,691,184,734 $1,134,036,938 $2,825,221,671
Fiscal Year
Outstanding Debt
297
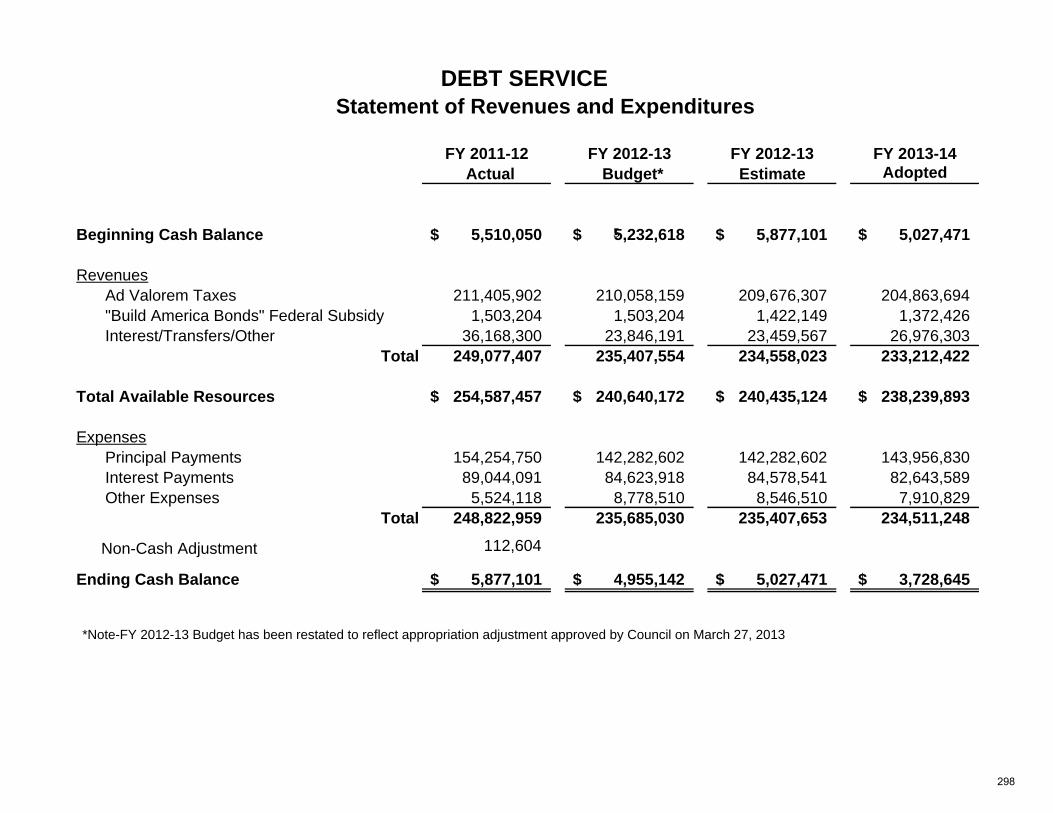
DEBT SERVICE
Statement of Revenues and Expenditures
FY 2011-12 FY 2012-13 FY 2012-13 FY 2013-14 Actual Budget* Estimate Adopted
Beginning Cash Balance 5,510,050$
5,232,618$
5 5,877,101$
5,027,471$
RevenuesAd Valorem Taxes 211,405,902 210,058,159 209,676,307 204,863,694"Build America Bonds" Federal Subsidy 1,503,204 1,503,204 1,422,149 1,372,426Interest/Transfers/Other 36,168,300 23,846,191 23,459,567 26,976,303
Total 249,077,407 235,407,554 234,558,023 233,212,422
Total Available Resources 254,587,457$
240,640,172$
240,435,124$
238,239,893$
ExpensesPrincipal Payments 154,254,750 142,282,602 142,282,602 143,956,830Interest Payments 89,044,091 84,623,918 84,578,541 82,643,589Other Expenses 5,524,118 8,778,510 8,546,510 7,910,829
Total 248,822,959 235,685,030 235,407,653 234,511,248
Ending Cash Balance 5,877,101$
4,955,142$
5,027,471$
3,728,645$
*Note-FY 2012-13 Budget has been restated to reflect appropriation adjustment approved by Council on March 27, 2013
Non-Cash Adjustment 112,604
298
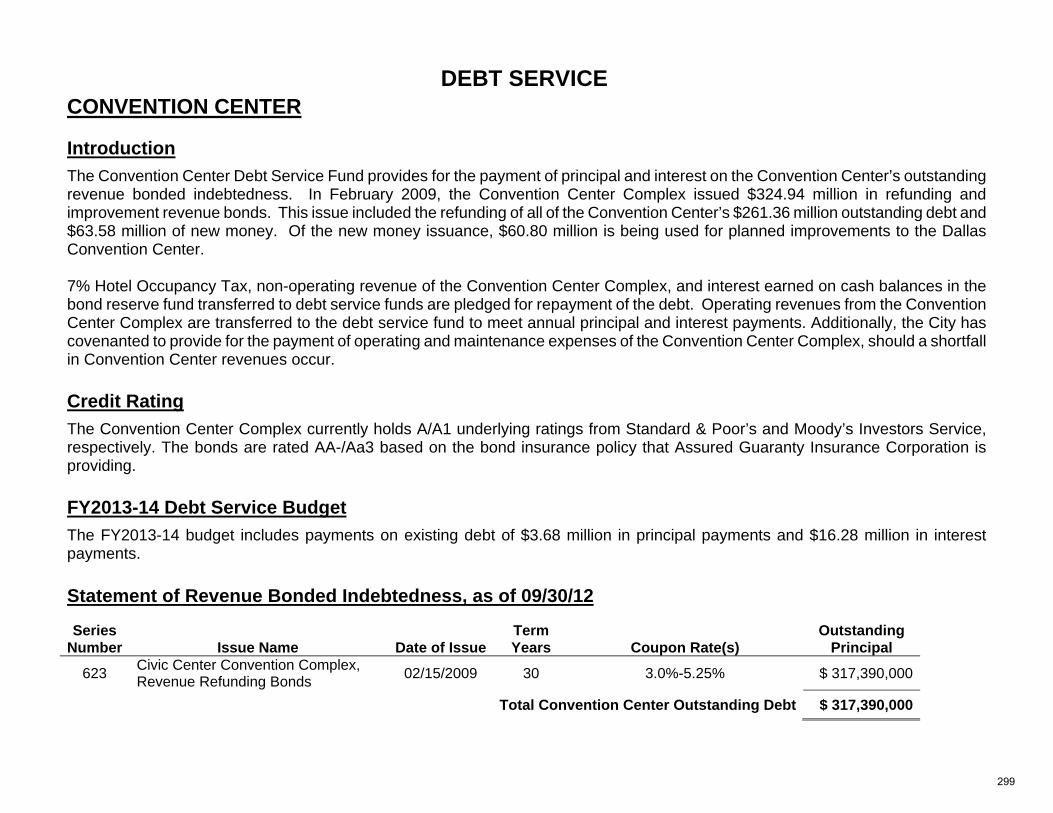
DEBT SERVICE
CONVENTION CENTER Introduction The Convention Center Debt Service Fund provides for the payment of principal and interest on the Convention Center’s outstanding revenue bonded indebtedness. In February 2009, the Convention Center Complex issued $324.94 million in refunding and improvement revenue bonds. This issue included the refunding of all of the Convention Center’s $261.36 million outstanding debt and $63.58 million of new money. Of the new money issuance, $60.80 million is being used for planned improvements to the Dallas Convention Center. 7% Hotel Occupancy Tax, non-operating revenue of the Convention Center Complex, and interest earned on cash balances in the bond reserve fund transferred to debt service funds are pledged for repayment of the debt. Operating revenues from the Convention Center Complex are transferred to the debt service fund to meet annual principal and interest payments. Additionally, the City has covenanted to provide for the payment of operating and maintenance expenses of the Convention Center Complex, should a shortfall in Convention Center revenues occur. Credit Rating The Convention Center Complex currently holds A/A1 underlying ratings from Standard & Poor’s and Moody’s Investors Service, respectively. The bonds are rated AA-/Aa3 based on the bond insurance policy that Assured Guaranty Insurance Corporation is providing. FY2013-14 Debt Service Budget The FY2013-14 budget includes payments on existing debt of $3.68 million in principal payments and $16.28 million in interest payments. Statement of Revenue Bonded Indebtedness, as of 09/30/12
Series
Number Issue Name Date of Issue Term Years Coupon Rate(s)
Outstanding Principal
623 Civic Center Convention Complex, Revenue Refunding Bonds 02/15/2009 30 3.0%-5.25% $ 317,390,000
Total Convention Center Outstanding Debt $ 317,390,000
299
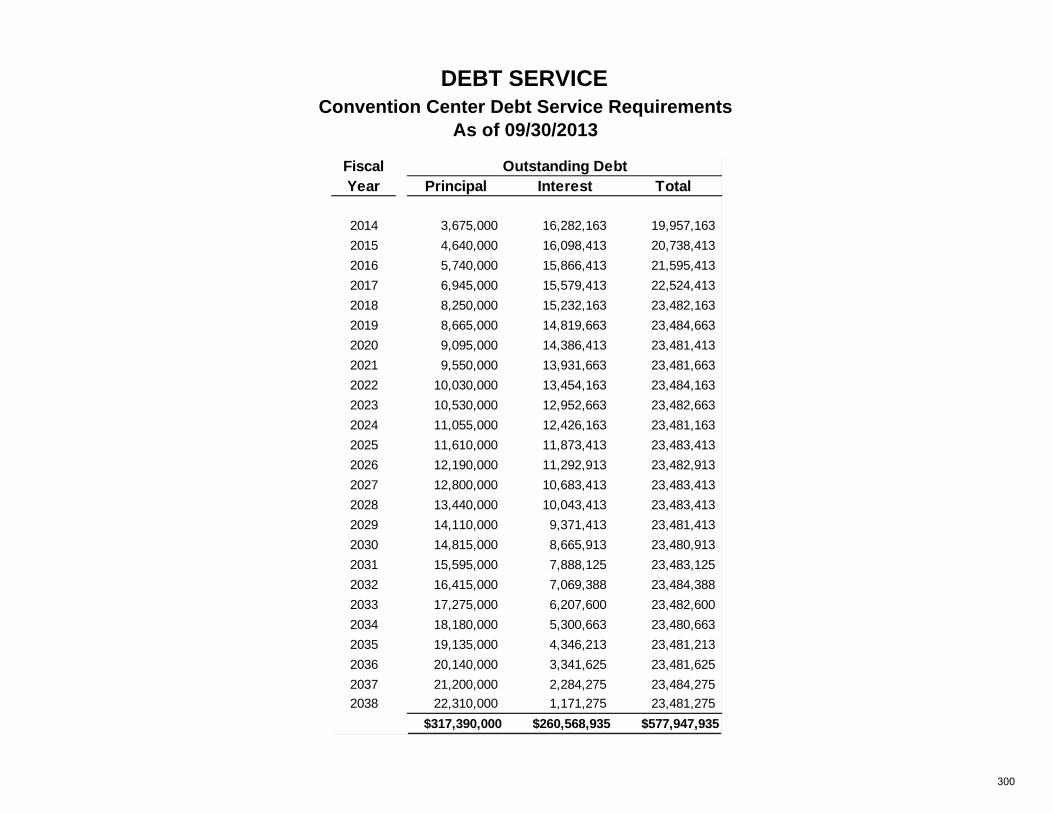
DEBT SERVICE
Convention Center Debt Service Requirements As of 09/30/2013
Principal Interest Total
2014 3,675,000 16,282,163 19,957,163 2015 4,640,000 16,098,413 20,738,413 2016 5,740,000 15,866,413 21,595,413 2017 6,945,000 15,579,413 22,524,413 2018 8,250,000 15,232,163 23,482,163 2019 8,665,000 14,819,663 23,484,663 2020 9,095,000 14,386,413 23,481,413 2021 9,550,000 13,931,663 23,481,663 2022 10,030,000 13,454,163 23,484,163 2023 10,530,000 12,952,663 23,482,663 2024 11,055,000 12,426,163 23,481,163 2025 11,610,000 11,873,413 23,483,413 2026 12,190,000 11,292,913 23,482,913 2027 12,800,000 10,683,413 23,483,413 2028 13,440,000 10,043,413 23,483,413 2029 14,110,000 9,371,413 23,481,413 2030 14,815,000 8,665,913 23,480,913 2031 15,595,000 7,888,125 23,483,125 2032 16,415,000 7,069,388 23,484,388 2033 17,275,000 6,207,600 23,482,600 2034 18,180,000 5,300,663 23,480,663 2035 19,135,000 4,346,213 23,481,213 2036 20,140,000 3,341,625 23,481,625 2037 21,200,000 2,284,275 23,484,275 2038 22,310,000 1,171,275 23,481,275
$317,390,000 $260,568,935 $577,947,935
Fiscal Year
Outstanding Debt
300
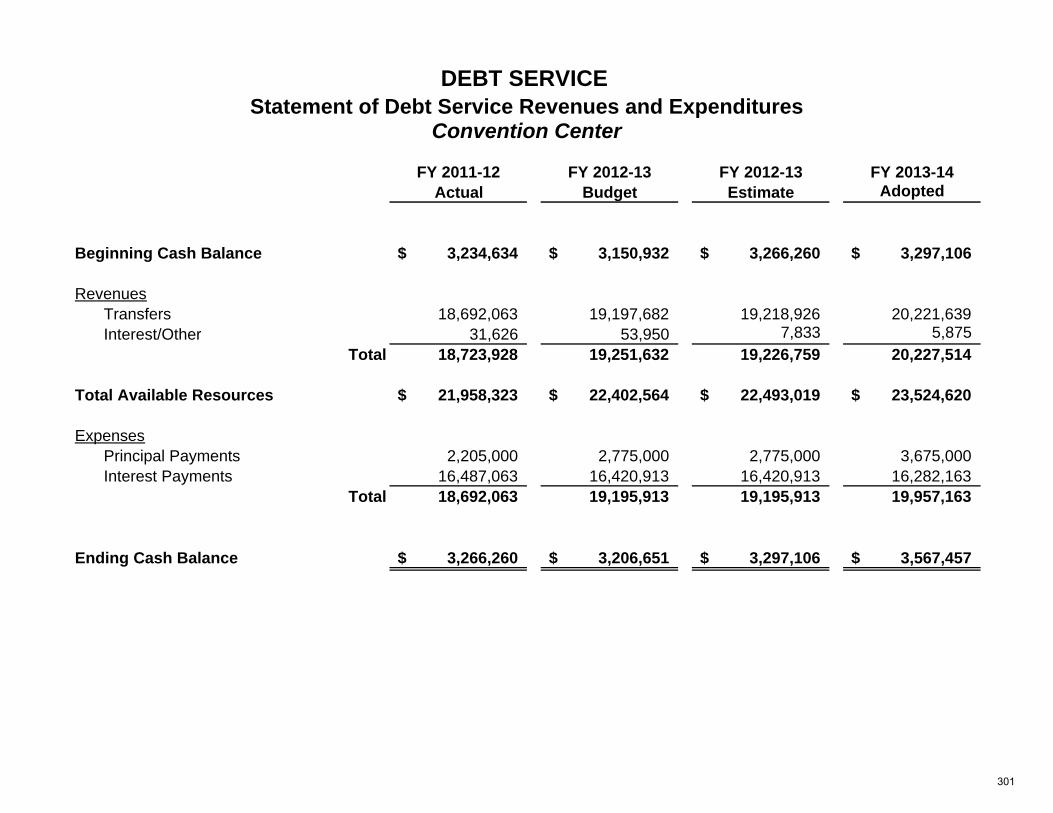
DEBT SERVICE
Statement of Debt Service Revenues and Expenditures Convention Center
FY 2011-12 FY 2012-13 FY 2012-13 FY 2013-14Actual Budget Estimate Adopted
Beginning Cash Balance 3,234,634$
3,150,932$
3,266,260$
3,297,106$
RevenuesTransfers 18,692,063 19,197,682 19,218,926 20,221,639Interest/Other 31,626 53,950 7,833 5,875
Total 18,723,928 19,251,632 19,226,759 20,227,514
Total Available Resources 21,958,323$
22,402,564$
22,493,019$
23,524,620$
ExpensesPrincipal Payments 2,205,000 2,775,000 2,775,000 3,675,000Interest Payments 16,487,063 16,420,913 16,420,913 16,282,163
Total 18,692,063 19,195,913 19,195,913 19,957,163
Ending Cash Balance 3,266,260$
3,206,651$
3,297,106$
3,567,457$
301
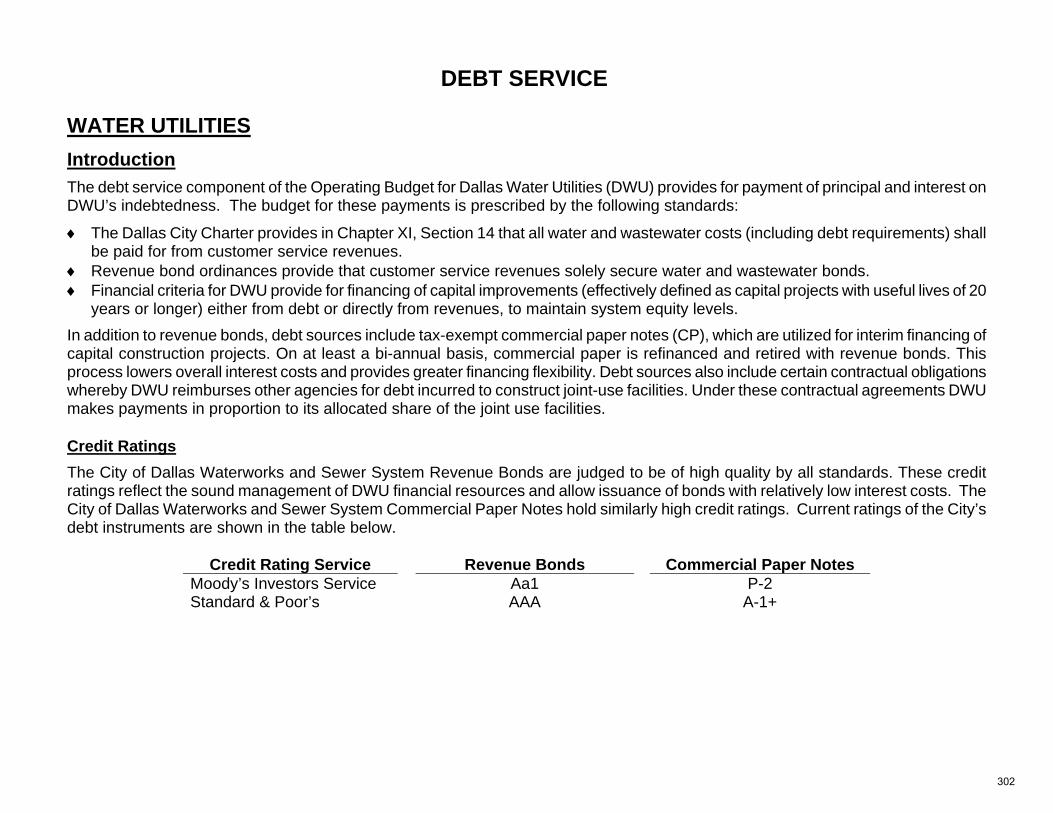
DEBT SERVICE
WATER UTILITIES
Introduction The debt service component of the Operating Budget for Dallas Water Utilities (DWU) provides for payment of principal and interest on DWU’s indebtedness. The budget for these payments is prescribed by the following standards:
The Dallas City Charter provides in Chapter XI, Section 14 that all water and wastewater costs (including debt requirements) shall be paid for from customer service revenues.
Revenue bond ordinances provide that customer service revenues solely secure water and wastewater bonds. Financial criteria for DWU provide for financing of capital improvements (effectively defined as capital projects with useful lives of 20
years or longer) either from debt or directly from revenues, to maintain system equity levels. In addition to revenue bonds, debt sources include tax-exempt commercial paper notes (CP), which are utilized for interim financing of capital construction projects. On at least a bi-annual basis, commercial paper is refinanced and retired with revenue bonds. This process lowers overall interest costs and provides greater financing flexibility. Debt sources also include certain contractual obligations whereby DWU reimburses other agencies for debt incurred to construct joint-use facilities. Under these contractual agreements DWU makes payments in proportion to its allocated share of the joint use facilities. Credit Ratings The City of Dallas Waterworks and Sewer System Revenue Bonds are judged to be of high quality by all standards. These credit ratings reflect the sound management of DWU financial resources and allow issuance of bonds with relatively low interest costs. The City of Dallas Waterworks and Sewer System Commercial Paper Notes hold similarly high credit ratings. Current ratings of the City’s debt instruments are shown in the table below.
Credit Rating Service Revenue Bonds Commercial Paper Notes Moody’s Investors Service Aa1 P-2 Standard & Poor’s AAA A-1+
302
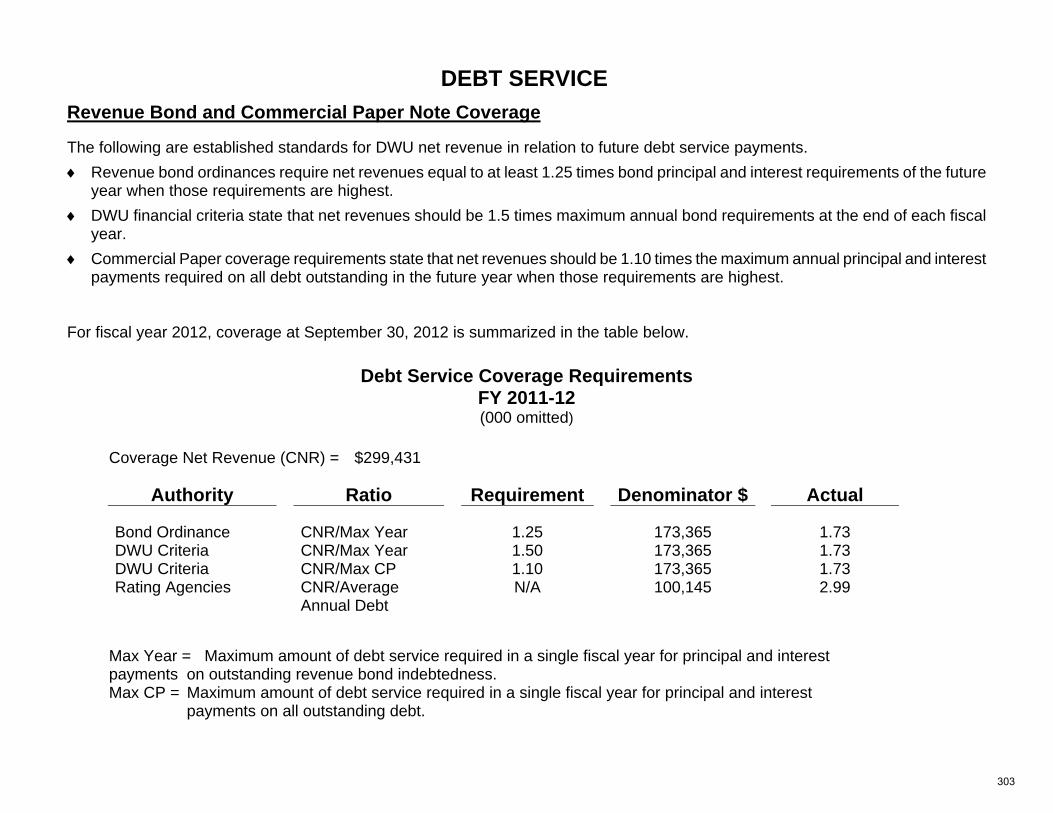
DEBT SERVICE
Revenue Bond and Commercial Paper Note Coverage The following are established standards for DWU net revenue in relation to future debt service payments. Revenue bond ordinances require net revenues equal to at least 1.25 times bond principal and interest requirements of the future
year when those requirements are highest. DWU financial criteria state that net revenues should be 1.5 times maximum annual bond requirements at the end of each fiscal
year. Commercial Paper coverage requirements state that net revenues should be 1.10 times the maximum annual principal and interest
payments required on all debt outstanding in the future year when those requirements are highest. For fiscal year 2012, coverage at September 30, 2012 is summarized in the table below.
Debt Service Coverage Requirements FY 2011-12 (000 omitted)
Coverage Net Revenue (CNR) = $299,431
Authority Ratio Requirement Denominator $ Actual Bond Ordinance CNR/Max Year 1.25 173,365 1.73 DWU Criteria CNR/Max Year 1.50 173,365 1.73 DWU Criteria CNR/Max CP 1.10 173,365 1.73 Rating Agencies CNR/Average
Annual Debt N/A 100,145 2.99
Max Year = Maximum amount of debt service required in a single fiscal year for principal and interest payments on outstanding revenue bond indebtedness. Max CP = Maximum amount of debt service required in a single fiscal year for principal and interest payments on all outstanding debt.
303
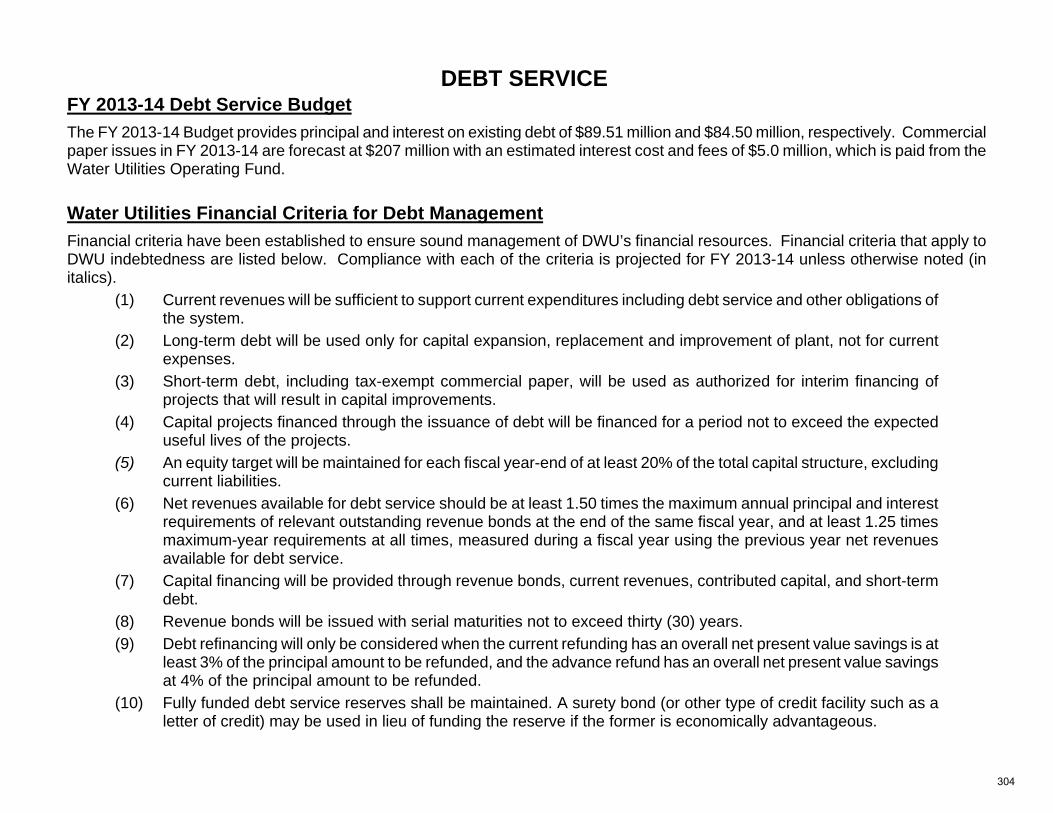
DEBT SERVICE
FY 2013-14 Debt Service Budget The FY 2013-14 Budget provides principal and interest on existing debt of $89.51 million and $84.50 million, respectively. Commercial paper issues in FY 2013-14 are forecast at $207 million with an estimated interest cost and fees of $5.0 million, which is paid from the Water Utilities Operating Fund.
Water Utilities Financial Criteria for Debt Management Financial criteria have been established to ensure sound management of DWU’s financial resources. Financial criteria that apply to DWU indebtedness are listed below. Compliance with each of the criteria is projected for FY 2013-14 unless otherwise noted (in italics).
(1) Current revenues will be sufficient to support current expenditures including debt service and other obligations of the system.
(2) Long-term debt will be used only for capital expansion, replacement and improvement of plant, not for current expenses.
(3) Short-term debt, including tax-exempt commercial paper, will be used as authorized for interim financing of projects that will result in capital improvements.
(4) Capital projects financed through the issuance of debt will be financed for a period not to exceed the expected useful lives of the projects.
(5) An equity target will be maintained for each fiscal year-end of at least 20% of the total capital structure, excluding current liabilities.
(6) Net revenues available for debt service should be at least 1.50 times the maximum annual principal and interest requirements of relevant outstanding revenue bonds at the end of the same fiscal year, and at least 1.25 times maximum-year requirements at all times, measured during a fiscal year using the previous year net revenues available for debt service.
(7) Capital financing will be provided through revenue bonds, current revenues, contributed capital, and short-term debt.
(8) Revenue bonds will be issued with serial maturities not to exceed thirty (30) years. (9) Debt refinancing will only be considered when the current refunding has an overall net present value savings is at
least 3% of the principal amount to be refunded, and the advance refund has an overall net present value savings at 4% of the principal amount to be refunded.
(10) Fully funded debt service reserves shall be maintained. A surety bond (or other type of credit facility such as a letter of credit) may be used in lieu of funding the reserve if the former is economically advantageous.
304
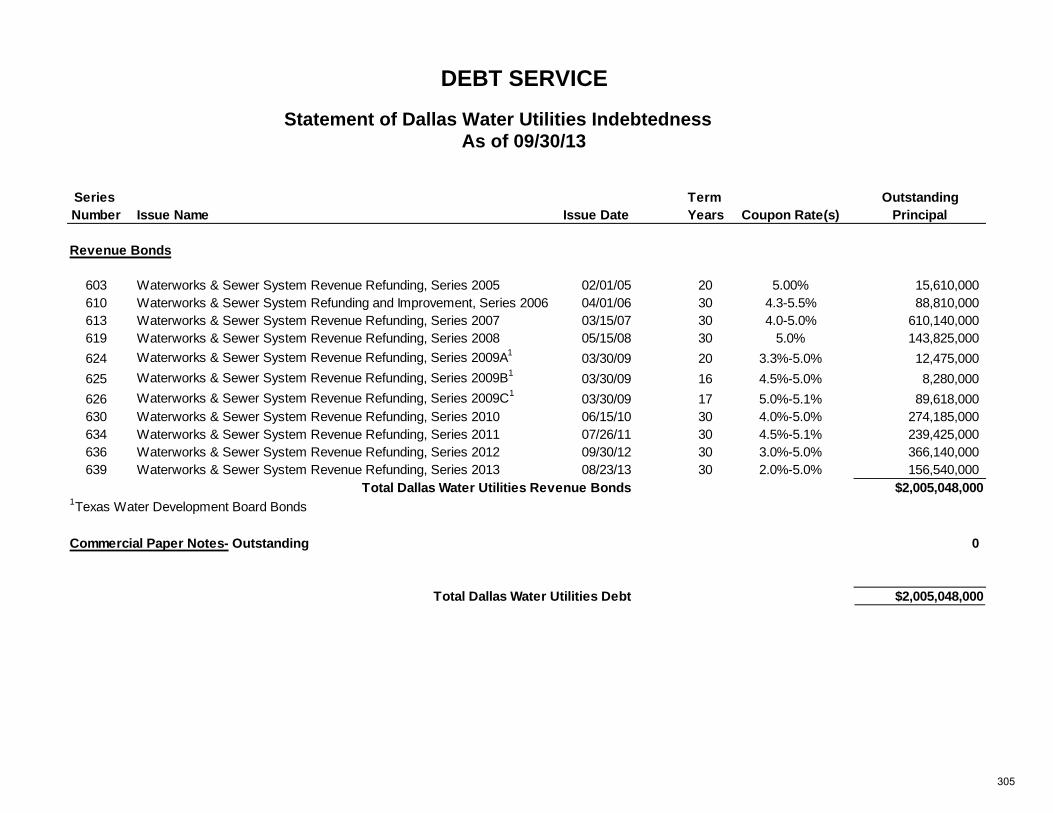
DEBT SERVICE
Statement of Dallas Water Utilities Indebtedness
As of 09/30/13 Series Term OutstandingNumber Issue Name Issue Date Years Coupon Rate(s) Principal
Revenue Bonds
603 Waterworks & Sewer System Revenue Refunding, Series 2005 02/01/05 20 5.00% 15,610,000 610 Waterworks & Sewer System Refunding and Improvement, Series 2006 04/01/06 30 4.3-5.5% 88,810,000 613 Waterworks & Sewer System Revenue Refunding, Series 2007 03/15/07 30 4.0-5.0% 610,140,000 619 Waterworks & Sewer System Revenue Refunding, Series 2008 05/15/08 30 5.0% 143,825,000 624 Waterworks & Sewer System Revenue Refunding, Series 2009A1 03/30/09 20 3.3%-5.0% 12,475,000 625 Waterworks & Sewer System Revenue Refunding, Series 2009B1 03/30/09 16 4.5%-5.0% 8,280,000 626 Waterworks & Sewer System Revenue Refunding, Series 2009C1 03/30/09 17 5.0%-5.1% 89,618,000 630 Waterworks & Sewer System Revenue Refunding, Series 2010 06/15/10 30 4.0%-5.0% 274,185,000 634 Waterworks & Sewer System Revenue Refunding, Series 2011 07/26/11 30 4.5%-5.1% 239,425,000 636 Waterworks & Sewer System Revenue Refunding, Series 2012 09/30/12 30 3.0%-5.0% 366,140,000 639 Waterworks & Sewer System Revenue Refunding, Series 2013 08/23/13 30 2.0%-5.0% 156,540,000
Total Dallas Water Utilities Revenue Bonds $2,005,048,0001Texas Water Development Board Bonds
Commercial Paper Notes- Outstanding 0
Total Dallas Water Utilities Debt $2,005,048,000
305
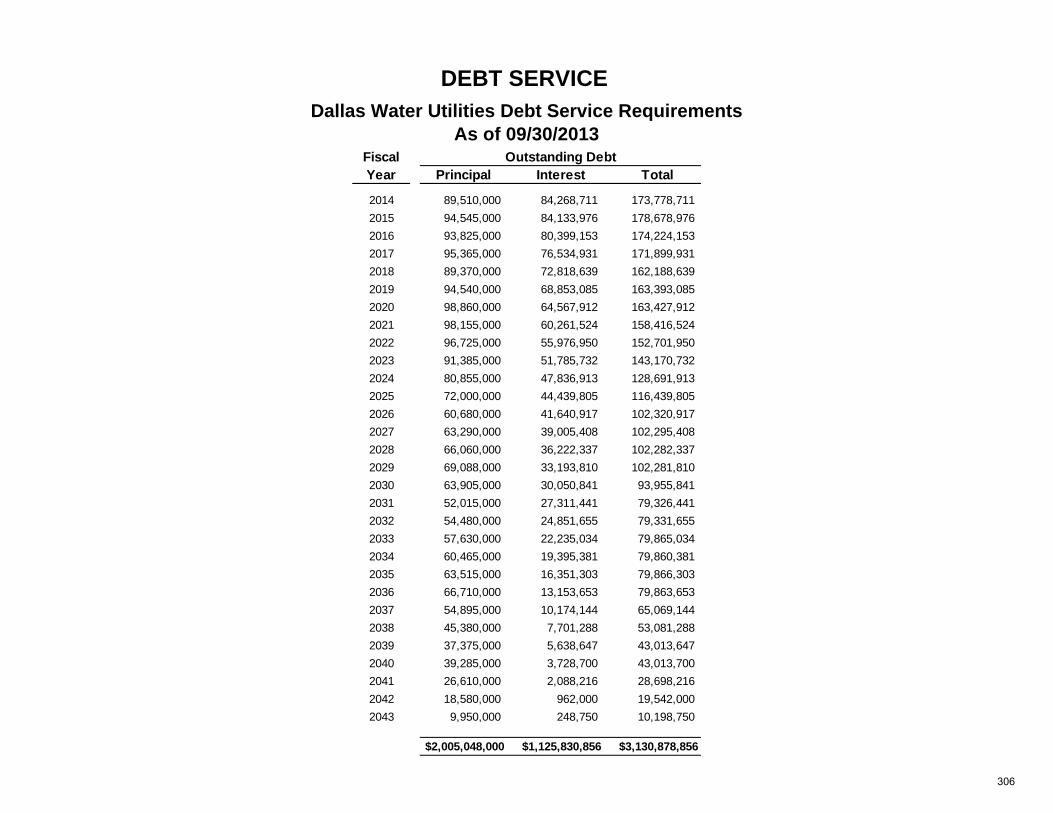
DEBT SERVICE
Dallas Water Utilities Debt Service Requirements
As of 09/30/2013
Principal Interest Total
2014 89,510,000 84,268,711 173,778,711 2015 94,545,000 84,133,976 178,678,976 2016 93,825,000 80,399,153 174,224,153 2017 95,365,000 76,534,931 171,899,931 2018 89,370,000 72,818,639 162,188,639 2019 94,540,000 68,853,085 163,393,085 2020 98,860,000 64,567,912 163,427,912 2021 98,155,000 60,261,524 158,416,524 2022 96,725,000 55,976,950 152,701,950 2023 91,385,000 51,785,732 143,170,732 2024 80,855,000 47,836,913 128,691,913 2025 72,000,000 44,439,805 116,439,805 2026 60,680,000 41,640,917 102,320,917 2027 63,290,000 39,005,408 102,295,408 2028 66,060,000 36,222,337 102,282,337 2029 69,088,000 33,193,810 102,281,810 2030 63,905,000 30,050,841 93,955,841 2031 52,015,000 27,311,441 79,326,441 2032 54,480,000 24,851,655 79,331,655 2033 57,630,000 22,235,034 79,865,034 2034 60,465,000 19,395,381 79,860,381 2035 63,515,000 16,351,303 79,866,303 2036 66,710,000 13,153,653 79,863,653 2037 54,895,000 10,174,144 65,069,144 2038 45,380,000 7,701,288 53,081,288 2039 37,375,000 5,638,647 43,013,647 2040 39,285,000 3,728,700 43,013,700 2041 26,610,000 2,088,216 28,698,216 2042 18,580,000 962,000 19,542,000 2043 9,950,000 248,750 10,198,750
$2,005,048,000 $1,125,830,856 $3,130,878,856
Fiscal Year
Outstanding Debt
306
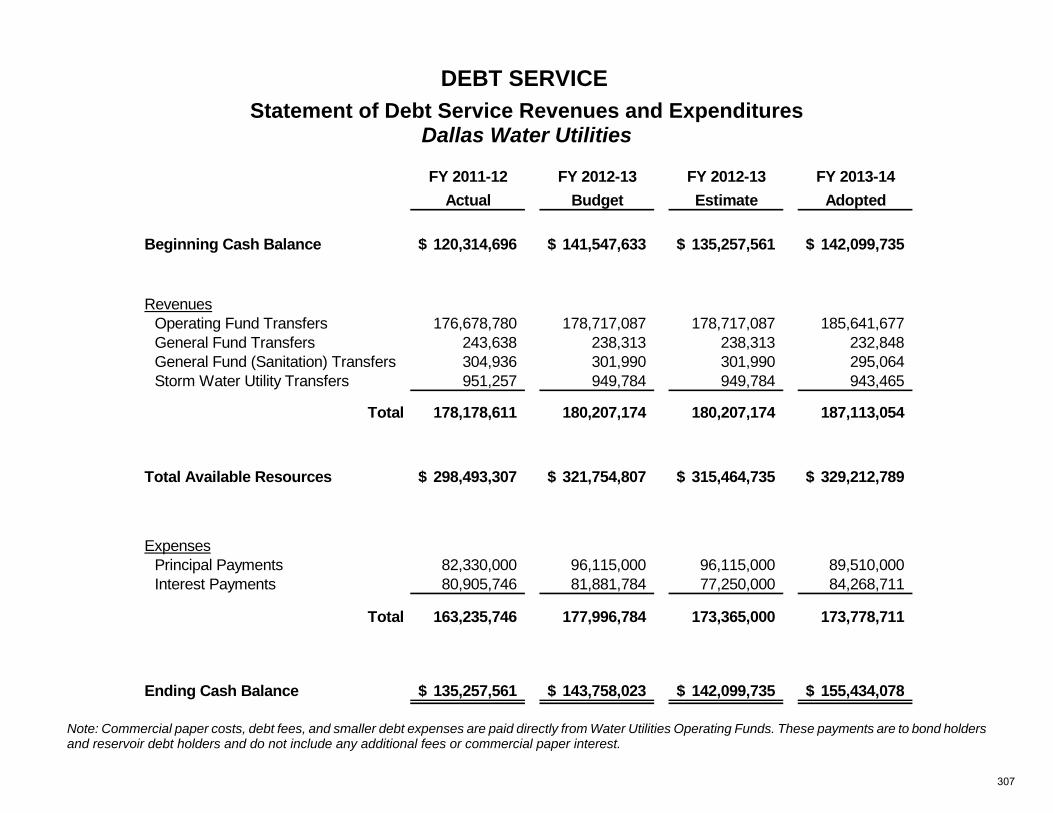
DEBT SERVICE
Statement of Debt Service Revenues and Expenditures
Dallas Water Utilities
Note: Commercial paper costs, debt fees, and smaller debt expenses are paid directly from Water Utilities Operating Funds. These payments are to bond holders and reservoir debt holders and do not include any additional fees or commercial paper interest.
FY 2011-12 FY 2012-13 FY 2012-13 FY 2013-14Actual Budget Estimate Adopted
Beginning Cash Balance 120,314,696$ 141,547,633$ 135,257,561$ 142,099,735$
RevenuesOperating Fund Transfers 176,678,780 178,717,087 178,717,087 185,641,677General Fund Transfers 243,638 238,313 238,313 232,848General Fund (Sanitation) Transfers 304,936 301,990 301,990 295,064Storm Water Utility Transfers 951,257 949,784 949,784 943,465
Total 178,178,611 180,207,174 180,207,174 187,113,054
Total Available Resources 298,493,307$ 321,754,807$ 315,464,735$ 329,212,789$
ExpensesPrincipal Payments 82,330,000 96,115,000 96,115,000 89,510,000Interest Payments 80,905,746 81,881,784 77,250,000 84,268,711
Total 163,235,746 177,996,784 173,365,000 173,778,711
Ending Cash Balance 135,257,561$ 143,758,023$ 142,099,735$ 155,434,078$
307

308
FY 2013-14 ADOPTED CAPITAL IMPROVEMENT BUDGET
The Adopted FY 2013-14 Capital Improvement Program budget is $654.24 million consisting of $340.98 million for General Purpose Capital Improvements and $313.26 million for Enterprise Fund Capital Improvements. This compares to the amended FY 2012-13 Budget of $543.20 million that consisted of $244.28 million for General Purpose projects and $298.92 million for Enterprise Fund projects.
General Purpose Capital Improvement Program The General Purpose Capital Improvement Program provides for improvements to and/or construction of the City’s street system; parks and recreational facilities; libraries; police and fire protection facilities; cultural art facilities; the flood protection and storm drainage system; other City-owned facilities, and economic initiatives. General obligation bonds are the primary financing mechanism for these capital improvements. On November 6, 2012 the citizens of Dallas overwhelmingly approved a $642.00 million Capital Bond program. Beginning in FY 2010-11, commercial paper is utilized to interim finance capital improvement projects. The commercial paper will be refinanced and retired with general obligation bonds approved by voters in 1998, 2006 and 2012. Enterprise Fund Capital Improvement Program The Capital Improvement Program for the enterprise departments consists of improvements to and/or construction of water and wastewater systems, venues for convention activities, and air transportation facilities. These projects are funded primarily by the transfer of enterprise revenues and the issuance of debt such as commercial paper and/or revenue bonds. Capital Budget Process The FY 2013-14 Capital Improvement Program budget was developed according to the same schedule as the City’s operating funds. The foundation of the annual General Purpose Capital Improvement Program budget is the 2006 and 2012 General Obligation Bond Programs. The development of these bond programs included the update of a citywide needs inventory; citizen input meetings; analysis of financial and implementation capacity; City Council workshops and amendments; and, public hearings.
How to Read the Capital Budget The Capital Improvement Budget portion of this document is comprised of the following sections: Summaries – Includes tables and charts highlighting the City’s priorities for project funding in the upcoming fiscal year. Projects are identified by the City Council’s Key Focus Area, funding source, and capital improvement program. Bond Issue Schedules – Provides annual funded amounts, by proposition, for the 1998, 2003, 2006 and 2012 Bond Programs. Capital Program Sections – Provides information by capital program, service and project. Capital program information includes narrative for program mission, current year major accomplishments, and upcoming budget year objectives. Expenditures by funding source and service are summarized by capital program. A detailed project listing, in alphabetical order, follows the program summaries. Active projects budgeted in prior fiscal years are also included. Projects funded in prior years that were finalized as of April 30, 2013, have been excluded. Included in the project detail for each project is the service category, corresponding Council priority Key Focus Area, council district, funding source, the total project budget over the life of the project, remaining appropriations, and new appropriations for the upcoming budget year. Estimated costs for future phases of current projects beyond FY 2013-14 have been indicated when known. Identification of future cost is not a commitment of future funding. The project costs used in developing the City’s bond programs are estimated at the mid-point of the bond program timeframe. By doing this, projects completed earlier in the bond program will generally cost less than originally projected. These cost savings are accumulated in a project contingency reserve and then used to offset overruns for projects scheduled to be completed later in the bond program’s life. The current appropriations for the contingency reserves are included in the detailed project listing by proposition. These appropriations are transferred to projects when needed to fully fund a bond program project.
309
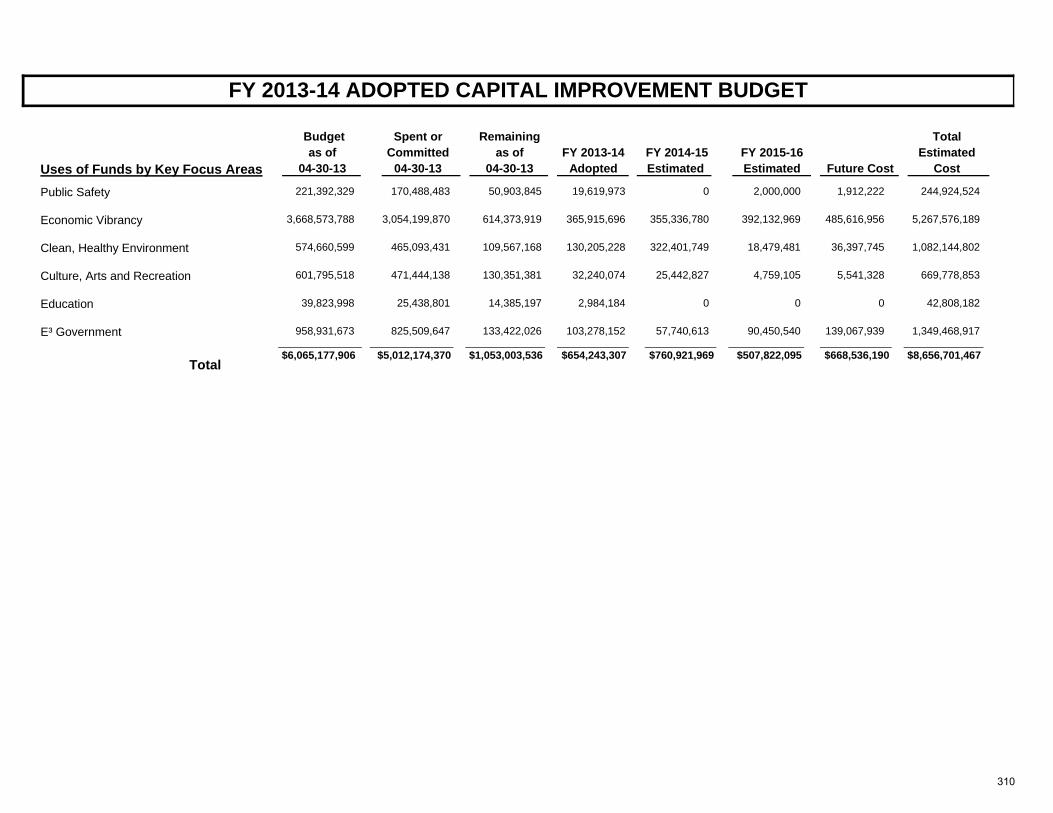
Uses of Funds by Key Focus Areas
Budget
FY 2013-14 ADOPTED CAPITAL IMPROVEMENT BUDGET
TotalEstimated
CostFuture Cost FY 2015-16 Estimated
as of04-30-13
Spent orCommitted
04-30-13
Remainingas of
04-30-13FY 2013-14
AdoptedFY 2014-15Estimated
Public Safety 2,000,000 244,924,52450,903,845170,488,483221,392,329 1,912,22219,619,973 0
Economic Vibrancy 392,132,969 5,267,576,189614,373,9193,054,199,8703,668,573,788 485,616,956365,915,696 355,336,780
Clean, Healthy Environment 18,479,481 1,082,144,802109,567,168465,093,431574,660,599 36,397,745130,205,228 322,401,749
Culture, Arts and Recreation 4,759,105 669,778,853130,351,381471,444,138601,795,518 5,541,32832,240,074 25,442,827
Education 0 42,808,18214,385,19725,438,80139,823,998 02,984,184 0
E³ Government 90,450,540 1,349,468,917133,422,026825,509,647958,931,673 139,067,939103,278,152 57,740,613
$507,822,095 $8,656,701,467Total
$1,053,003,536$5,012,174,370$6,065,177,906 $668,536,190$654,243,307 $760,921,969
310
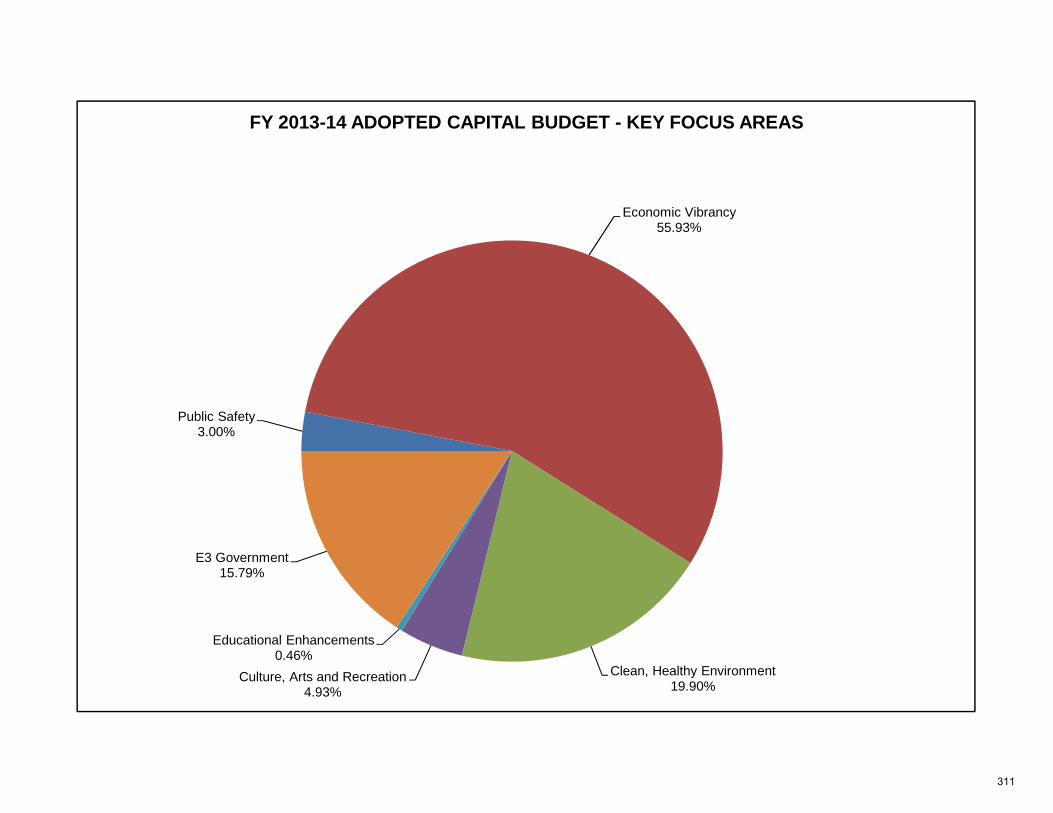
Public Safety3.00%
Economic Vibrancy55.93%
Clean, Healthy Environment19.90%
Culture, Arts and Recreation4.93%
Educational Enhancements0.46%
E3 Government15.79%
FY 2013-14 ADOPTED CAPITAL BUDGET - KEY FOCUS AREAS
311
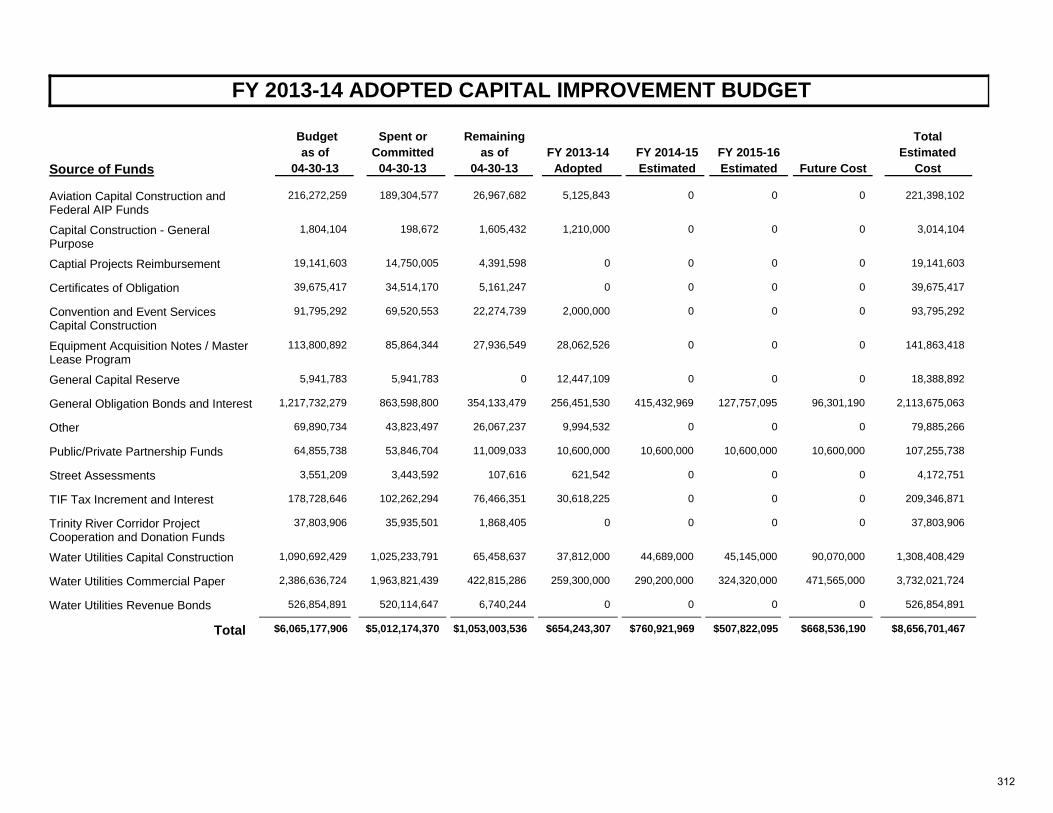
Source of Funds
Budget
FY 2013-14 ADOPTED CAPITAL IMPROVEMENT BUDGET
TotalEstimated
CostFuture CostFY 2014-15Estimated
as of04-30-13
Spent orCommitted
04-30-13
Remainingas of
04-30-13FY 2015-16Estimated
FY 2013-14Adopted
Aviation Capital Construction and Federal AIP Funds
0 221,398,10226,967,682189,304,577216,272,259 005,125,843
Capital Construction - General Purpose
0 3,014,1041,605,432198,6721,804,104 001,210,000
Captial Projects Reimbursement 0 19,141,6034,391,59814,750,00519,141,603 000
Certificates of Obligation 0 39,675,4175,161,24734,514,17039,675,417 000
Convention and Event Services Capital Construction
0 93,795,29222,274,73969,520,55391,795,292 002,000,000
Equipment Acquisition Notes / Master Lease Program
0 141,863,41827,936,54985,864,344113,800,892 0028,062,526
General Capital Reserve 0 18,388,89205,941,7835,941,783 0012,447,109
General Obligation Bonds and Interest 415,432,969 2,113,675,063354,133,479863,598,8001,217,732,279 96,301,190127,757,095256,451,530
Other 0 79,885,26626,067,23743,823,49769,890,734 009,994,532
Public/Private Partnership Funds 10,600,000 107,255,73811,009,03353,846,70464,855,738 10,600,00010,600,00010,600,000
Street Assessments 0 4,172,751107,6163,443,5923,551,209 00621,542
TIF Tax Increment and Interest 0 209,346,87176,466,351102,262,294178,728,646 0030,618,225
Trinity River Corridor Project Cooperation and Donation Funds
0 37,803,9061,868,40535,935,50137,803,906 000
Water Utilities Capital Construction 44,689,000 1,308,408,42965,458,6371,025,233,7911,090,692,429 90,070,00045,145,00037,812,000
Water Utilities Commercial Paper 290,200,000 3,732,021,724422,815,2861,963,821,4392,386,636,724 471,565,000324,320,000259,300,000
Water Utilities Revenue Bonds 0 526,854,8916,740,244520,114,647526,854,891 000
$760,921,969Total $1,053,003,536$5,012,174,370$6,065,177,906 $668,536,190 $8,656,701,467$507,822,095$654,243,307
312

Aviation Revenue Bonds0.00%
Other2.66%
Certificates of Obligation0.00%
Water Utilities Commercial Paper
39.76%
Enterprise Capital Construction
7.97%
Federal Airport Improvement Funds0.00%
Equipment Acquisition Notes / Master Lease Program
4.30%General Obligation Bonds
and Interest39.32%
General Capital Reserve1.30%
TIF Tax Increment4.69%
FY 2013-14 ADOPTED CAPITAL BUDGET - SOURCES OF FUNDS
313
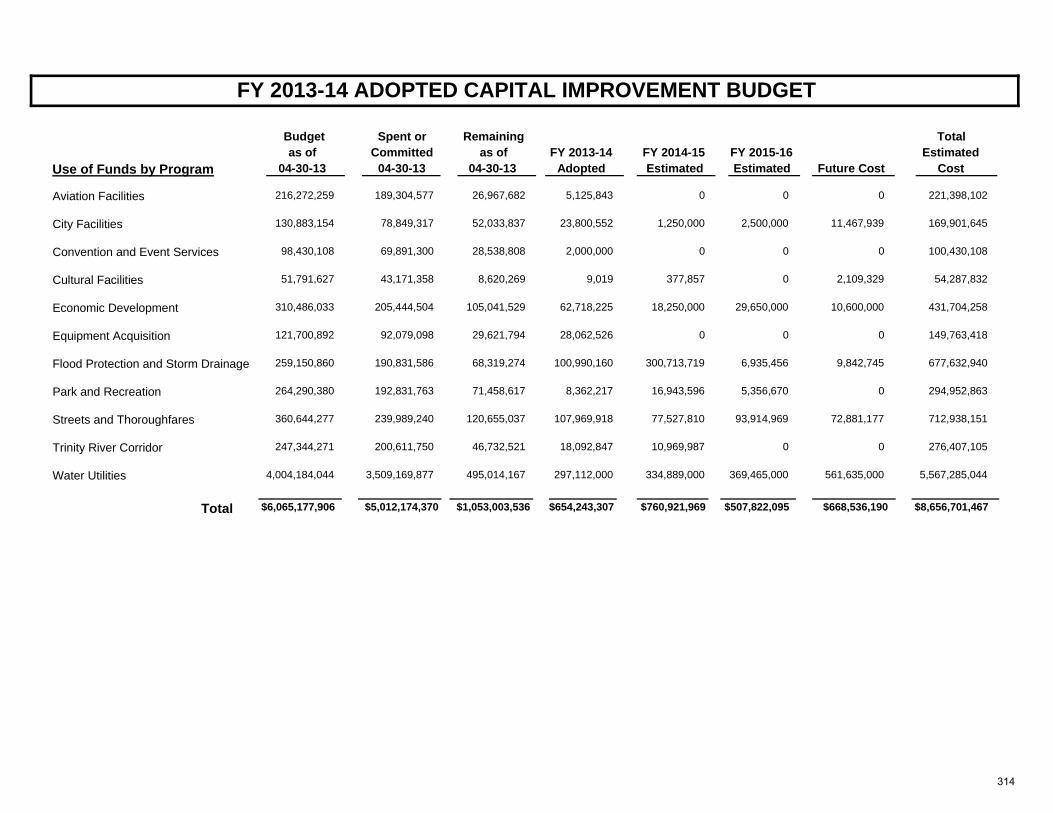
Use of Funds by Program
Budget
FY 2013-14 ADOPTED CAPITAL IMPROVEMENT BUDGET
TotalEstimated
CostFuture CostFY 2015-16Estimated
as of04-30-13
Spent orCommitted
04-30-13
Remainingas of
04-30-13FY 2013-14
AdoptedFY 2014-15Estimated
Aviation Facilities 221,398,10226,967,682189,304,577216,272,259 005,125,843 0
City Facilities 169,901,64552,033,83778,849,317130,883,154 11,467,9392,500,00023,800,552 1,250,000
Convention and Event Services 100,430,10828,538,80869,891,30098,430,108 002,000,000 0
Cultural Facilities 54,287,8328,620,26943,171,35851,791,627 2,109,32909,019 377,857
Economic Development 431,704,258105,041,529205,444,504310,486,033 10,600,00029,650,00062,718,225 18,250,000
Equipment Acquisition 149,763,41829,621,79492,079,098121,700,892 0028,062,526 0
Flood Protection and Storm Drainage 677,632,94068,319,274190,831,586259,150,860 9,842,7456,935,456100,990,160 300,713,719
Park and Recreation 294,952,86371,458,617192,831,763264,290,380 05,356,6708,362,217 16,943,596
Streets and Thoroughfares 712,938,151120,655,037239,989,240360,644,277 72,881,17793,914,969107,969,918 77,527,810
Trinity River Corridor 276,407,10546,732,521200,611,750247,344,271 0018,092,847 10,969,987
Water Utilities 5,567,285,044495,014,1673,509,169,8774,004,184,044 561,635,000369,465,000297,112,000 334,889,000
$507,822,095 $8,656,701,467Total $1,053,003,536$5,012,174,370$6,065,177,906 $668,536,190$654,243,307 $760,921,969
314
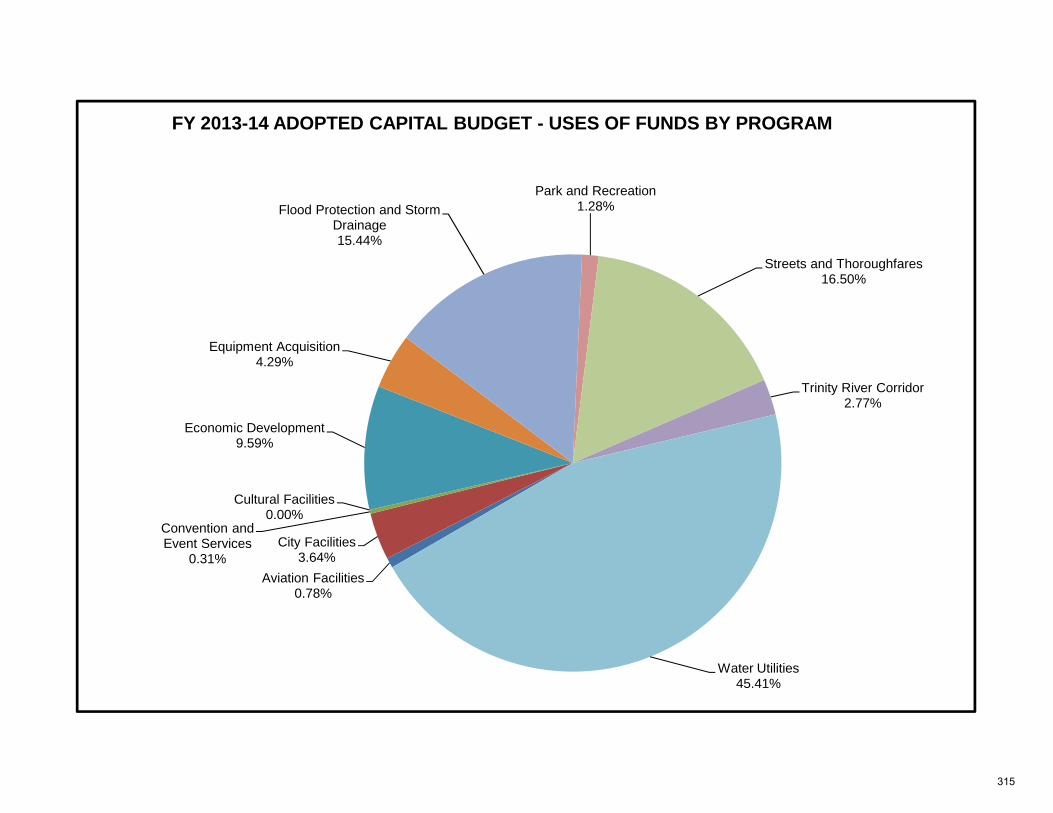
Aviation Facilities0.78%
City Facilities3.64%
Convention and Event Services
0.31%
Cultural Facilities0.00%
Economic Development 9.59%
Equipment Acquisition 4.29%
Flood Protection and Storm Drainage15.44%
Park and Recreation1.28%
Streets and Thoroughfares16.50%
Trinity River Corridor2.77%
Water Utilities45.41%
FY 2013-14 ADOPTED CAPITAL BUDGET - USES OF FUNDS BY PROGRAM
315
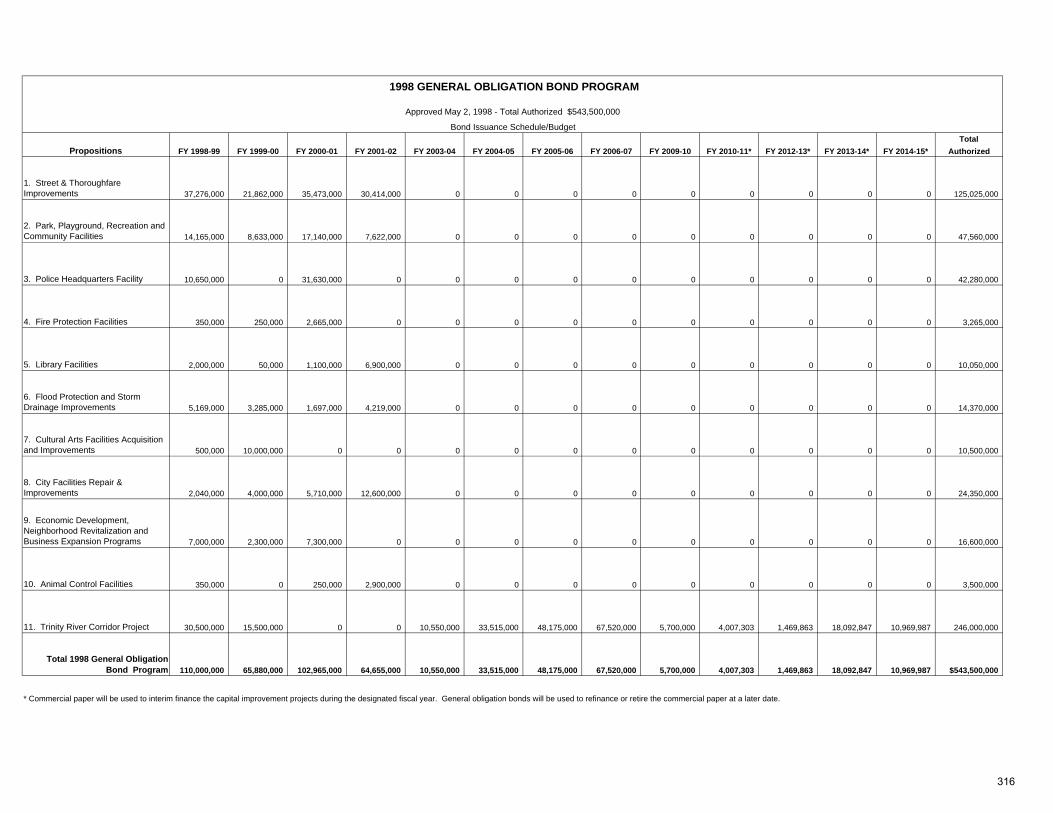
TotalPropositions FY 1998-99 FY 1999-00 FY 2000-01 FY 2001-02 FY 2003-04 FY 2004-05 FY 2005-06 FY 2006-07 FY 2009-10 FY 2010-11* FY 2012-13* FY 2013-14* FY 2014-15* Authorized
1. Street & Thoroughfare Improvements 37,276,000 21,862,000 35,473,000 30,414,000 0 0 0 0 0 0 0 0 0 125,025,000
2. Park, Playground, Recreation and Community Facilities 14,165,000 8,633,000 17,140,000 7,622,000 0 0 0 0 0 0 0 0 0 47,560,000
3. Police Headquarters Facility 10,650,000 0 31,630,000 0 0 0 0 0 0 0 0 0 0 42,280,000
4. Fire Protection Facilities 350,000 250,000 2,665,000 0 0 0 0 0 0 0 0 0 0 3,265,000
5. Library Facilities 2,000,000 50,000 1,100,000 6,900,000 0 0 0 0 0 0 0 0 0 10,050,000
6. Flood Protection and Storm Drainage Improvements 5,169,000 3,285,000 1,697,000 4,219,000 0 0 0 0 0 0 0 0 0 14,370,000
7. Cultural Arts Facilities Acquisition and Improvements 500,000 10,000,000 0 0 0 0 0 0 0 0 0 0 0 10,500,000
8. City Facilities Repair & Improvements 2,040,000 4,000,000 5,710,000 12,600,000 0 0 0 0 0 0 0 0 0 24,350,000
9. Economic Development, Neighborhood Revitalization and Business Expansion Programs 7,000,000 2,300,000 7,300,000 0 0 0 0 0 0 0 0 0 0 16,600,000
10. Animal Control Facilities 350,000 0 250,000 2,900,000 0 0 0 0 0 0 0 0 0 3,500,000
11. Trinity River Corridor Project 30,500,000 15,500,000 0 0 10,550,000 33,515,000 48,175,000 67,520,000 5,700,000 4,007,303 1,469,863 18,092,847 10,969,987 246,000,000
Total 1998 General Obligation Bond Program 110,000,000 65,880,000 102,965,000 64,655,000 10,550,000 33,515,000 48,175,000 67,520,000 5,700,000 4,007,303 1,469,863 18,092,847 10,969,987 $543,500,000
* Commercial paper will be used to interim finance the capital improvement projects during the designated fiscal year. General obligation bonds will be used to refinance or retire the commercial paper at a later date.
1998 GENERAL OBLIGATION BOND PROGRAM
Approved May 2, 1998 - Total Authorized $543,500,000
Bond Issuance Schedule/Budget
316
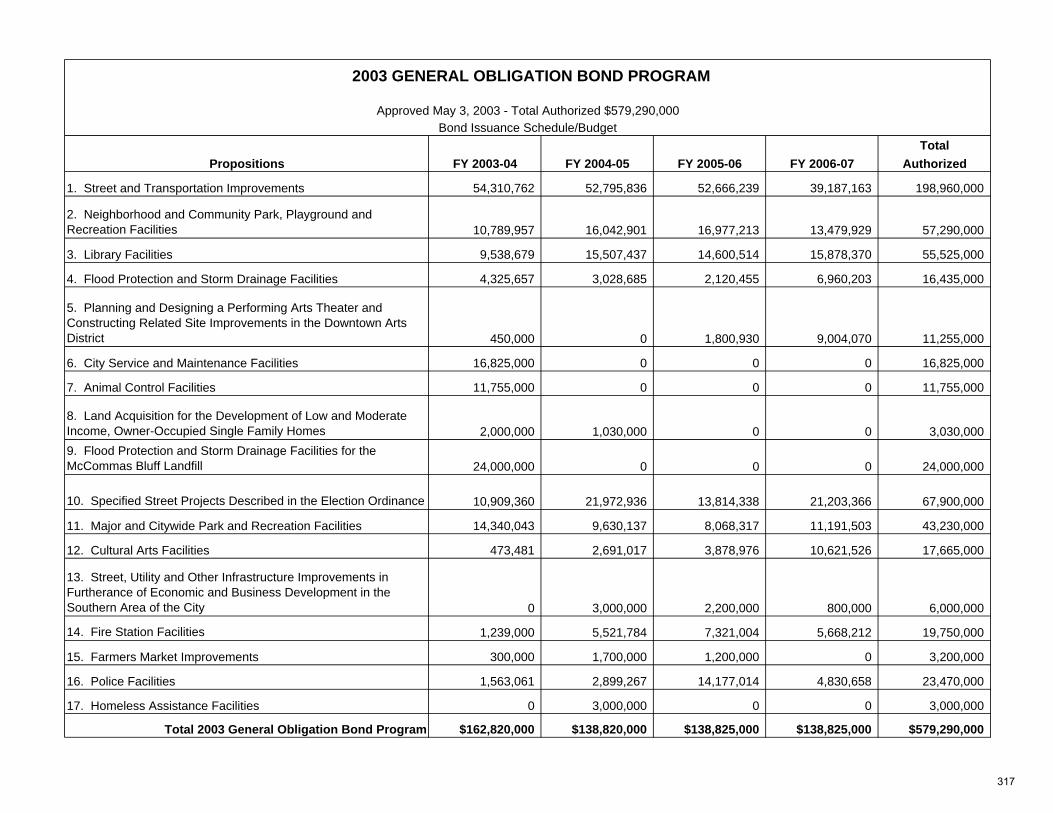
TotalPropositions FY 2003-04 FY 2004-05 FY 2005-06 FY 2006-07 Authorized
1. Street and Transportation Improvements 54,310,762 52,795,836 52,666,239 39,187,163 198,960,000
2. Neighborhood and Community Park, Playground and Recreation Facilities 10,789,957 16,042,901 16,977,213 13,479,929 57,290,000
3. Library Facilities 9,538,679 15,507,437 14,600,514 15,878,370 55,525,000
4. Flood Protection and Storm Drainage Facilities 4,325,657 3,028,685 2,120,455 6,960,203 16,435,000
5. Planning and Designing a Performing Arts Theater and Constructing Related Site Improvements in the Downtown Arts District 450,000 0 1,800,930 9,004,070 11,255,000
6. City Service and Maintenance Facilities 16,825,000 0 0 0 16,825,000
7. Animal Control Facilities 11,755,000 0 0 0 11,755,000
8. Land Acquisition for the Development of Low and Moderate Income, Owner-Occupied Single Family Homes 2,000,000 1,030,000 0 0 3,030,0009. Flood Protection and Storm Drainage Facilities for the McCommas Bluff Landfill 24,000,000 0 0 0 24,000,000
10. Specified Street Projects Described in the Election Ordinance 10,909,360 21,972,936 13,814,338 21,203,366 67,900,000
11. Major and Citywide Park and Recreation Facilities 14,340,043 9,630,137 8,068,317 11,191,503 43,230,000
12. Cultural Arts Facilities 473,481 2,691,017 3,878,976 10,621,526 17,665,000
13. Street, Utility and Other Infrastructure Improvements in Furtherance of Economic and Business Development in the Southern Area of the City 0 3,000,000 2,200,000 800,000 6,000,000
14. Fire Station Facilities 1,239,000 5,521,784 7,321,004 5,668,212 19,750,000
15. Farmers Market Improvements 300,000 1,700,000 1,200,000 0 3,200,000
16. Police Facilities 1,563,061 2,899,267 14,177,014 4,830,658 23,470,000
17. Homeless Assistance Facilities 0 3,000,000 0 0 3,000,000
Total 2003 General Obligation Bond Program $162,820,000 $138,820,000 $138,825,000 $138,825,000 $579,290,000
2003 GENERAL OBLIGATION BOND PROGRAM
Approved May 3, 2003 - Total Authorized $579,290,000Bond Issuance Schedule/Budget
317
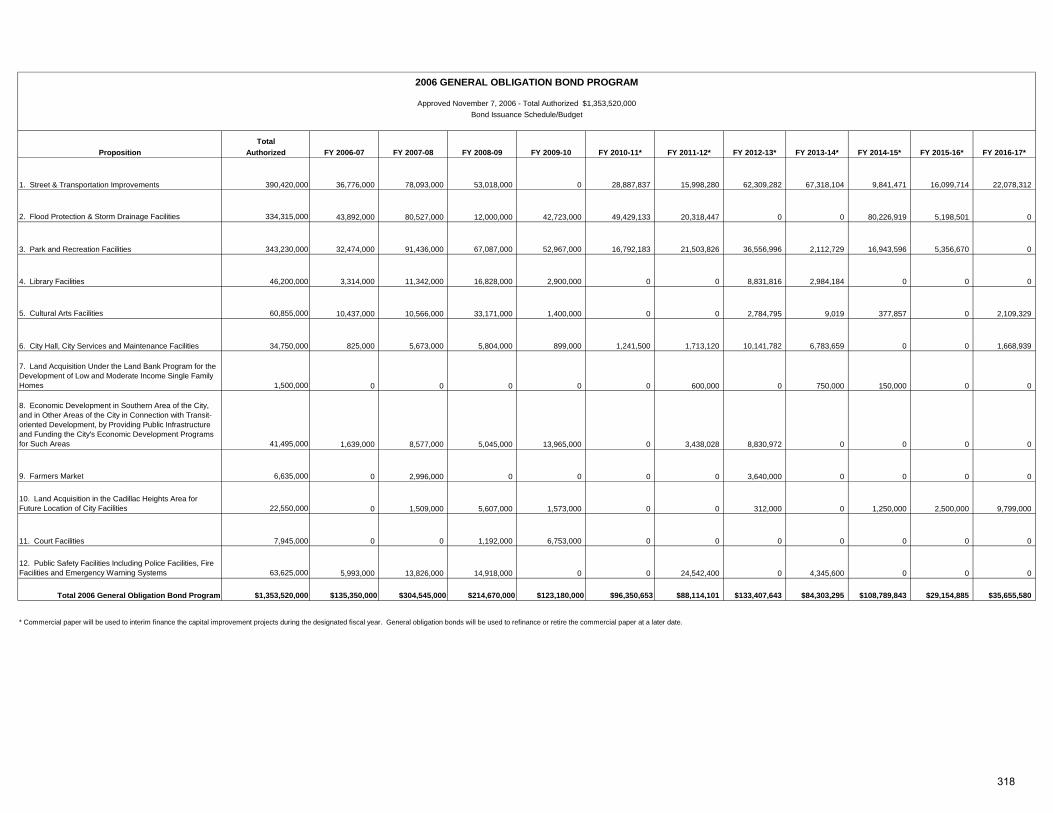
TotalProposition Authorized FY 2006-07 FY 2007-08 FY 2008-09 FY 2009-10 FY 2010-11* FY 2011-12* FY 2012-13* FY 2013-14* FY 2014-15* FY 2015-16* FY 2016-17*
1. Street & Transportation Improvements 390,420,000 36,776,000 78,093,000 53,018,000 0 28,887,837 15,998,280 62,309,282 67,318,104 9,841,471 16,099,714 22,078,312
2. Flood Protection & Storm Drainage Facilities 334,315,000 43,892,000 80,527,000 12,000,000 42,723,000 49,429,133 20,318,447 0 0 80,226,919 5,198,501 0
3. Park and Recreation Facilities 343,230,000 32,474,000 91,436,000 67,087,000 52,967,000 16,792,183 21,503,826 36,556,996 2,112,729 16,943,596 5,356,670 0
4. Library Facilities 46,200,000 3,314,000 11,342,000 16,828,000 2,900,000 0 0 8,831,816 2,984,184 0 0 0
5. Cultural Arts Facilities 60,855,000 10,437,000 10,566,000 33,171,000 1,400,000 0 0 2,784,795 9,019 377,857 0 2,109,329
6. City Hall, City Services and Maintenance Facilities 34,750,000 825,000 5,673,000 5,804,000 899,000 1,241,500 1,713,120 10,141,782 6,783,659 0 0 1,668,939
7. Land Acquisition Under the Land Bank Program for the Development of Low and Moderate Income Single Family Homes 1,500,000 0 0 0 0 0 600,000 0 750,000 150,000 0 0
8. Economic Development in Southern Area of the City, and in Other Areas of the City in Connection with Transit-oriented Development, by Providing Public Infrastructure and Funding the City's Economic Development Programs for Such Areas 41,495,000 1,639,000 8,577,000 5,045,000 13,965,000 0 3,438,028 8,830,972 0 0 0 0
9. Farmers Market 6,635,000 0 2,996,000 0 0 0 0 3,640,000 0 0 0 0
10. Land Acquisition in the Cadillac Heights Area for Future Location of City Facilities 22,550,000 0 1,509,000 5,607,000 1,573,000 0 0 312,000 0 1,250,000 2,500,000 9,799,000
11. Court Facilities 7,945,000 0 0 1,192,000 6,753,000 0 0 0 0 0 0 0
12. Public Safety Facilities Including Police Facilities, Fire Facilities and Emergency Warning Systems 63,625,000 5,993,000 13,826,000 14,918,000 0 0 24,542,400 0 4,345,600 0 0 0
Total 2006 General Obligation Bond Program $1,353,520,000 $135,350,000 $304,545,000 $214,670,000 $123,180,000 $96,350,653 $88,114,101 $133,407,643 $84,303,295 $108,789,843 $29,154,885 $35,655,580
* Commercial paper will be used to interim finance the capital improvement projects during the designated fiscal year. General obligation bonds will be used to refinance or retire the commercial paper at a later date.
Bond Issuance Schedule/Budget
2006 GENERAL OBLIGATION BOND PROGRAM
Approved November 7, 2006 - Total Authorized $1,353,520,000
318
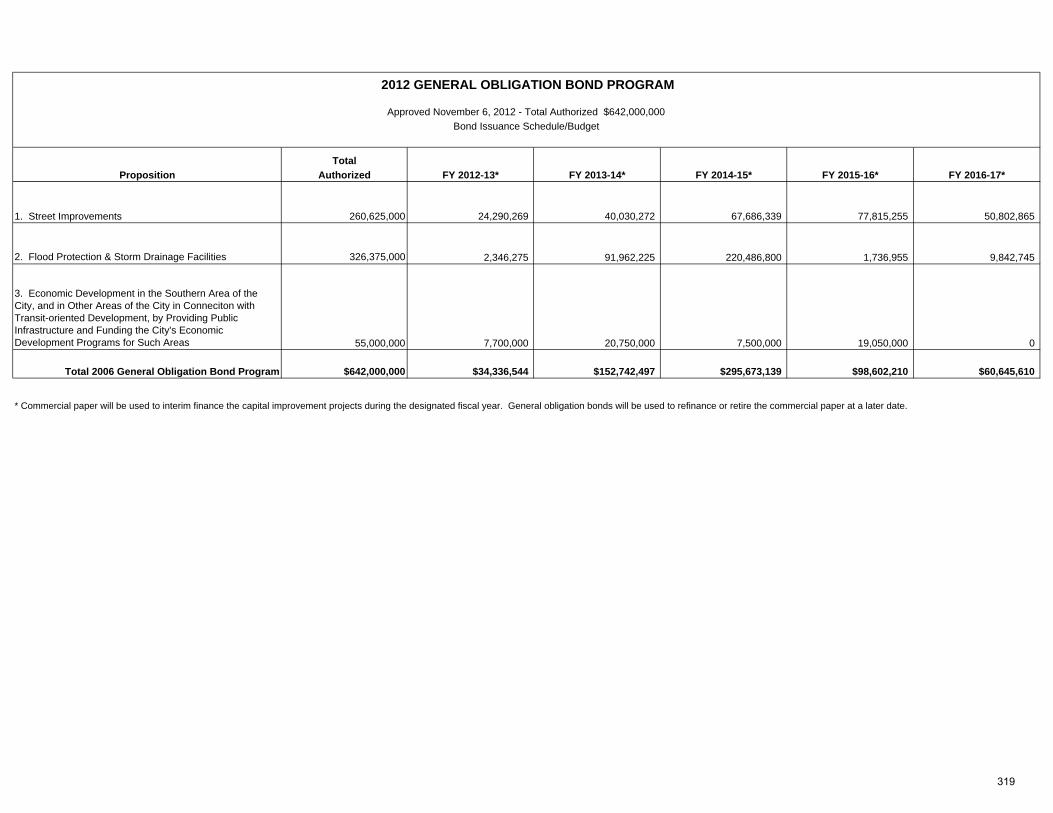
TotalProposition Authorized FY 2012-13* FY 2013-14* FY 2014-15* FY 2015-16* FY 2016-17*
1. Street Improvements 260,625,000 24,290,269 40,030,272 67,686,339 77,815,255 50,802,865
2. Flood Protection & Storm Drainage Facilities 326,375,000 2,346,275 91,962,225 220,486,800 1,736,955 9,842,745
3. Economic Development in the Southern Area of the City, and in Other Areas of the City in Conneciton with Transit-oriented Development, by Providing Public Infrastructure and Funding the City's Economic Development Programs for Such Areas 55,000,000 7,700,000 20,750,000 7,500,000 19,050,000 0
Total 2006 General Obligation Bond Program $642,000,000 $34,336,544 $152,742,497 $295,673,139 $98,602,210 $60,645,610
* Commercial paper will be used to interim finance the capital improvement projects during the designated fiscal year. General obligation bonds will be used to refinance or retire the commercial paper at a later date.
2012 GENERAL OBLIGATION BOND PROGRAM
Approved November 6, 2012 - Total Authorized $642,000,000Bond Issuance Schedule/Budget
319
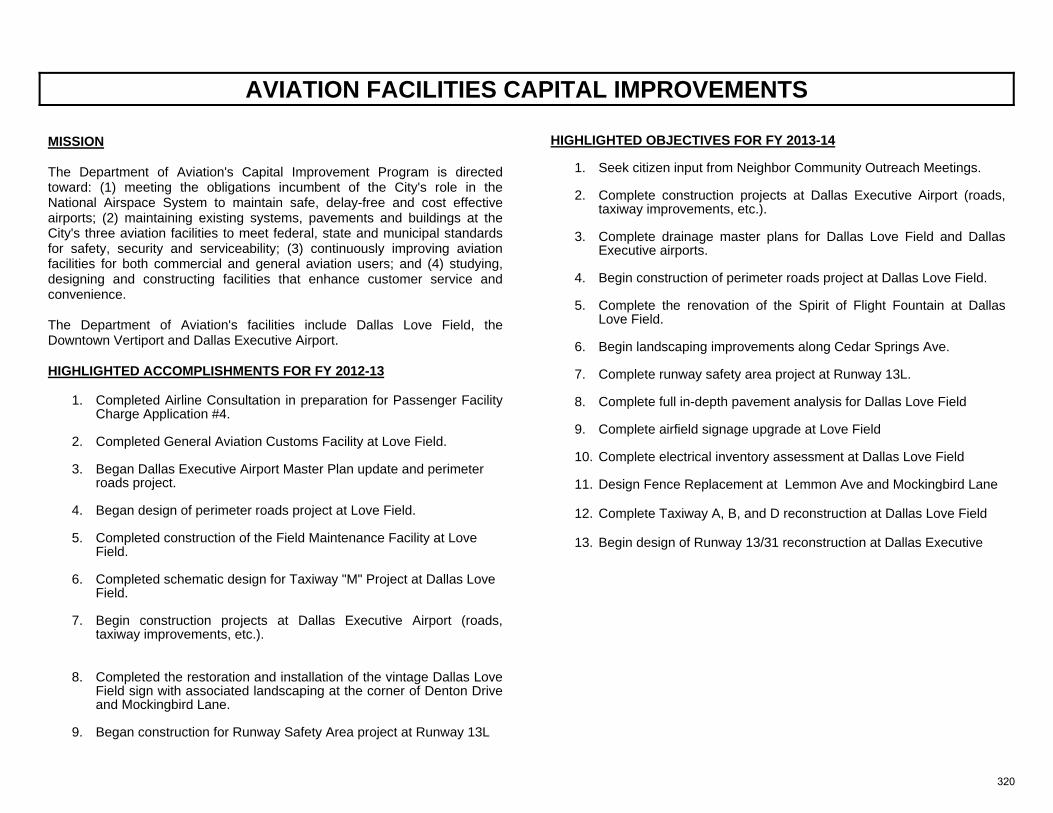
AVIATION FACILITIES CAPITAL IMPROVEMENTS
MISSION The Department of Aviation's Capital Improvement Program is directed toward: (1) meeting the obligations incumbent of the City's role in the National Airspace System to maintain safe, delay-free and cost effective airports; (2) maintaining existing systems, pavements and buildings at the City's three aviation facilities to meet federal, state and municipal standards for safety, security and serviceability; (3) continuously improving aviation facilities for both commercial and general aviation users; and (4) studying, designing and constructing facilities that enhance customer service and convenience. The Department of Aviation's facilities include Dallas Love Field, the Downtown Vertiport and Dallas Executive Airport. HIGHLIGHTED ACCOMPLISHMENTS FOR FY 2012-13
1. Completed Airline Consultation in preparation for Passenger Facility Charge Application #4.
2. Completed General Aviation Customs Facility at Love Field.
3. Began Dallas Executive Airport Master Plan update and perimeter
roads project.
4. Began design of perimeter roads project at Love Field.
5. Completed construction of the Field Maintenance Facility at Love Field.
6. Completed schematic design for Taxiway "M" Project at Dallas Love
Field.
7. Begin construction projects at Dallas Executive Airport (roads, taxiway improvements, etc.).
8. Completed the restoration and installation of the vintage Dallas Love
Field sign with associated landscaping at the corner of Denton Drive and Mockingbird Lane.
9. Began construction for Runway Safety Area project at Runway 13L
HIGHLIGHTED OBJECTIVES FOR FY 2013-14
1. Seek citizen input from Neighbor Community Outreach Meetings.
2. Complete construction projects at Dallas Executive Airport (roads, taxiway improvements, etc.).
3. Complete drainage master plans for Dallas Love Field and Dallas Executive airports.
4. Begin construction of perimeter roads project at Dallas Love Field.
5. Complete the renovation of the Spirit of Flight Fountain at Dallas Love Field.
6. Begin landscaping improvements along Cedar Springs Ave.
7. Complete runway safety area project at Runway 13L.
8. Complete full in-depth pavement analysis for Dallas Love Field
9. Complete airfield signage upgrade at Love Field
10. Complete electrical inventory assessment at Dallas Love Field
11. Design Fence Replacement at Lemmon Ave and Mockingbird Lane
12. Complete Taxiway A, B, and D reconstruction at Dallas Love Field
13. Begin design of Runway 13/31 reconstruction at Dallas Executive
320
AVIATION FACILITIES CAPITAL IMPROVEMENTS
SERVICE DESCRIPTIONS Airfield Electrical Federal Aviation Regulations establish very detailed requirements for the installation and operation of electrical lighting systems within the Airport Operating Area (AOA). These systems include runway and taxiway lighting, guidance signs, navigational aids and obstruction and apron lighting. Reconstruction and new installation projects are scheduled based on inspection findings and changes in federal regulations. Aviation Land Acquisition Paragraph 5.4 of the Dallas Love Field Policies directs the Department of Aviation to acquire privately owned parcels within the area bounded by Mockingbird Lane, Lemmon Avenue, Denton Drive and Shorecrest Drive for transportation, aviation or other appropriate uses when such land becomes available for purchase and when City funding is available for such acquisition. Environmental Federal and State regulations administered by the Environmental Protection Agency (EPA), the Texas Commission on Environmental Quality (TCEQ), and Municipal Codes administered by the City’s Environmental and Health Services Department (EHS), direct the environmental projects undertaken by the Department of Aviation. Landscaping Both Dallas Love Field and Dallas Executive Airport are located within the Dallas city limits and are surrounded by or in close proximity to residential housing and retail businesses. The airports strive to maintain a "good neighbor” status and make every possible effort to be aesthetically pleasing. Parking A Parking Garage Feasibility Study concluded that existing parking facilities at Love Field were inadequate to meet current and projected demands. To remedy this shortage, a new parking garage was constructed to add 4,000 spaces to the existing on-airport parking capacity. A second sky bridge with integral people movers was also added to connect the new parking garage with the terminal building. Pavement Maintenance/Construction Federal Aviation Regulations establish very detailed requirements for maintenance and construction of pavement areas within the Airport Operating Area (AOA). Dallas Love Field and Dallas Executive Airport maintain a massive amount of concrete and asphalt pavement areas. These areas require daily inspections. Repair, reconstruction and new construction projects are scheduled based on
inspection findings. Safety/Security Federal Aviation Regulations (FAR) Part 139 and Transportation Security Administration (TSA) Part 1540 and associated Advisory Circulars establish very detailed requirements for safety and security at air carrier airports such as Love Field. FAR Part 139 addresses safety issues related to preventing inadvertent entry by unauthorized personnel or animals into operational areas of the airport; aircraft rescue and firefighting (ARFF); and ensuring the safety of personnel and aircraft within the confines of the airport's AOA. TSA Part 1540 focuses on securing the airport from intentional entry into the restricted areas of the airport by unauthorized personnel and protecting personnel and property from weapons and explosive devices. Terminal Since the airports are the first impression many visitors have of the City of Dallas, it is necessary that the airport terminal facilities be maintained in a manner that presents a clean and attractive appearance while providing high levels of customer convenience. Last year over 8 million passengers passed through the Love Field terminal either arriving in Dallas or traveling to other destinations. This usage level places a great strain on existing facilities, requiring aggressive programs for updating, renovating and maintenance to maintain the traveling public's favorable impression of Love Field and the City of Dallas. Similar challenges exist at Dallas Executive; however, in accordance with the Master Plan Study, a new replacement terminal building has been constructed to meet projected special and service needs. Vertiport The Vertiport is a public use aviation related facility located in the Central Business District on the south end of the Dallas Convention Center; the flight deck covers approximately 169,000 square feet, or about four acres, and is 65 feet above ground. It houses two lighted landing take-off pads which can be converted to a rollway for future tilt-rotor operations. In addition there are five 60x60 parking/tie down areas for corporate size helicopters. The FAA established dedicated approach and departure corridors which are assets to the complex airspace model for the metroplex. The Vertiport has a dedicated and secured parking area allowing for 26 vehicles at street level, and easy access to the flight deck from street level and the loading dock levels via a vehicular ramp. The Heliport also hosts a full service lobby with ground access, passenger waiting area, small conference room, pilot’s lounge, flight planning area and an operational area for staff.
321
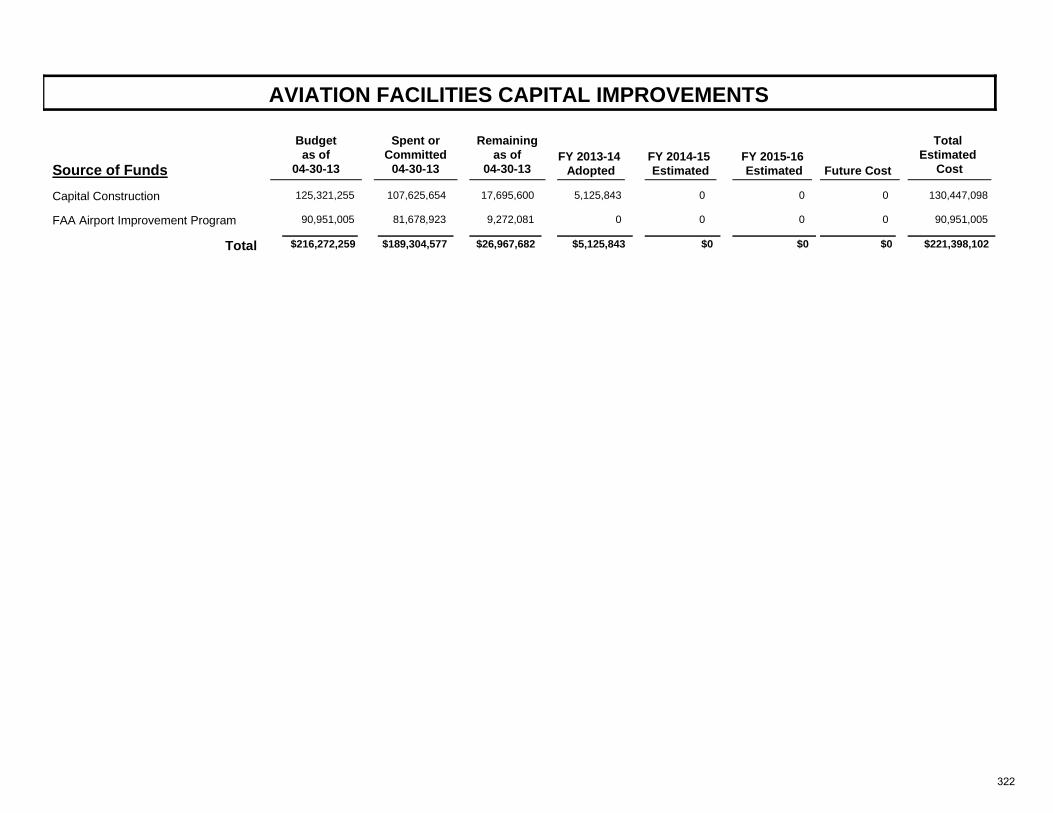
AVIATION FACILITIES CAPITAL IMPROVEMENTS
Source of FundsFY 2013-14
Adopted
Total Estimated
CostFY 2014-15 Estimated
FY 2015-16 Estimated
Future Cost
Remainingas of
04-30-13
Spent orCommitted
04-30-13
Budgetas of
04-30-13
Capital Construction 125,321,255 107,625,654 5,125,84317,695,600 130,447,0980 0 0
FAA Airport Improvement Program 90,951,005 81,678,923 09,272,081 90,951,0050 0 0
$189,304,577 $5,125,843Total $216,272,259 $26,967,682 $0 $221,398,102$0 $0
322
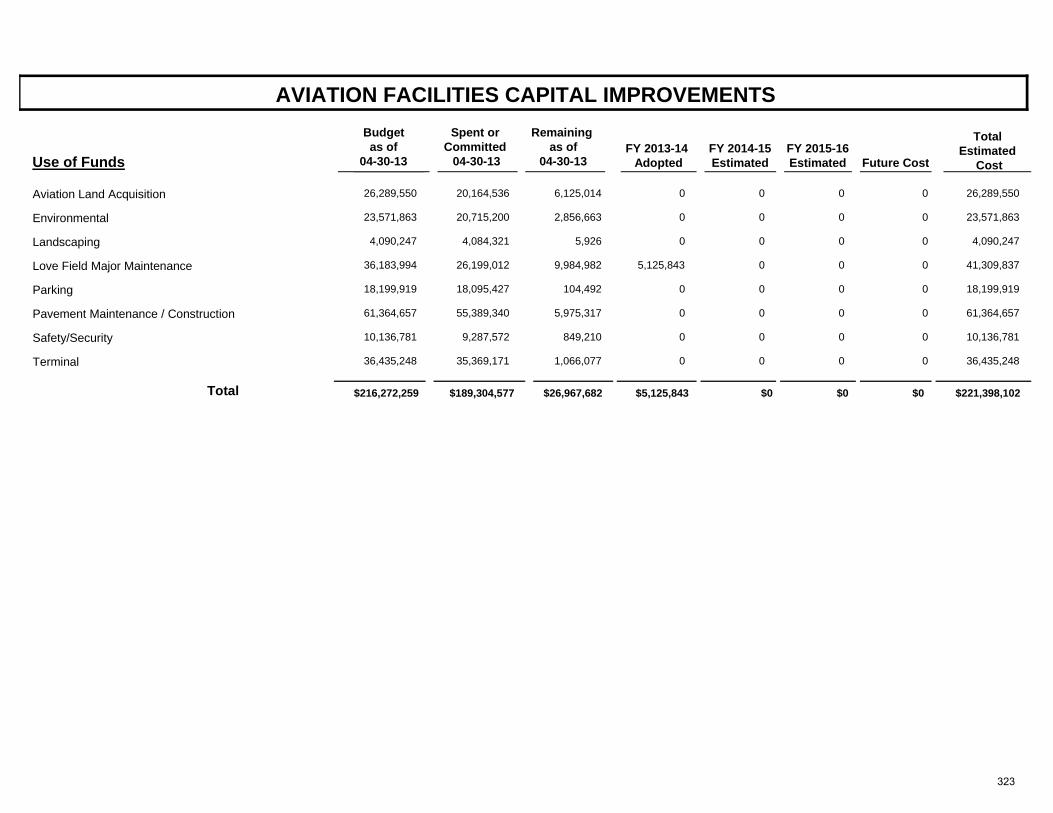
AVIATION FACILITIES CAPITAL IMPROVEMENTS
Use of FundsFY 2013-14
Adopted
Total Estimated
Cost FY 2014-15 Estimated
FY 2015-16 Estimated
Future Cost
Spent or Committed
04-30-13
Remaining as of
04-30-13
Budget as of
04-30-13
Aviation Land Acquisition 26,289,550 20,164,536 06,125,014 26,289,5500 0 0
Environmental 23,571,863 20,715,200 02,856,663 23,571,8630 0 0
Landscaping 4,090,247 4,084,321 05,926 4,090,2470 0 0
Love Field Major Maintenance 36,183,994 26,199,012 5,125,8439,984,982 41,309,8370 0 0
Parking 18,199,919 18,095,427 0104,492 18,199,9190 0 0
Pavement Maintenance / Construction 61,364,657 55,389,340 05,975,317 61,364,6570 0 0
Safety/Security 10,136,781 9,287,572 0849,210 10,136,7810 0 0
Terminal 36,435,248 35,369,171 01,066,077 36,435,2480 0 0
$189,304,577 $5,125,843Total $216,272,259 $26,967,682 $0 $221,398,102$0 $0
323
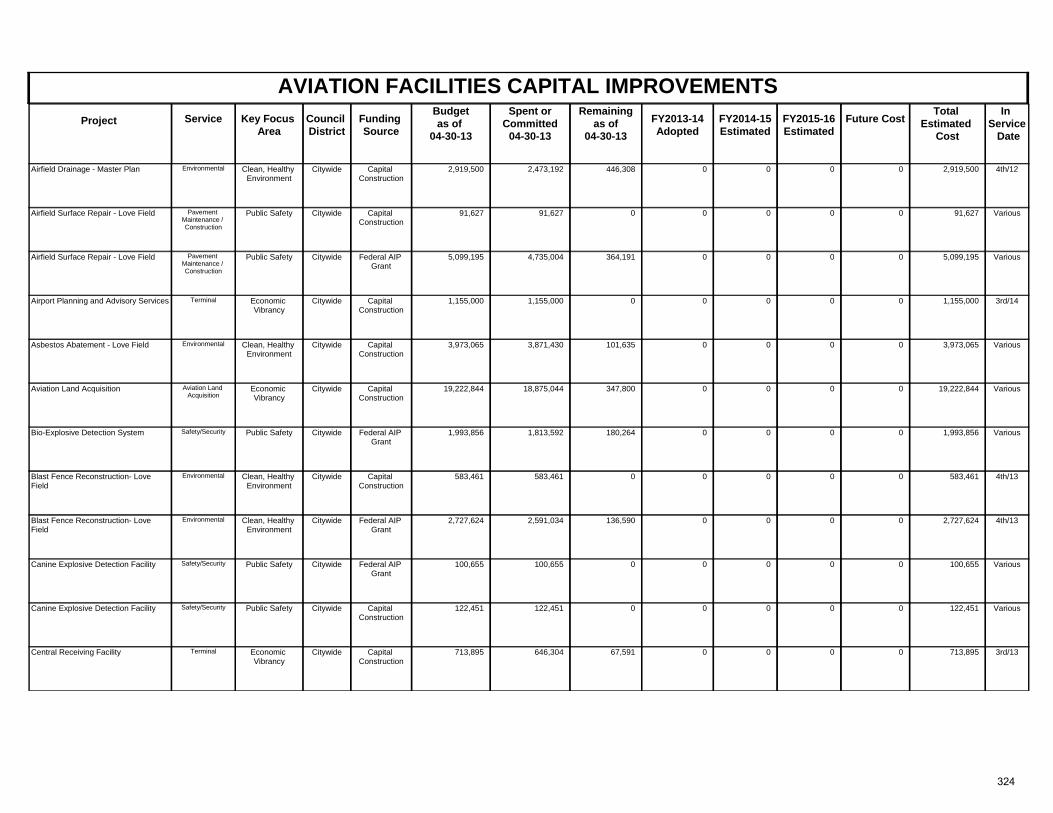
AVIATION FACILITIES CAPITAL IMPROVEMENTSProject Key Focus
AreaCouncil District
Spent orCommitted
04-30-13
Total Estimated
Cost
In Service Date
Funding Source
Remainingas of
04-30-13 FY2013-14
AdoptedFuture CostService FY2014-15
Estimated FY2015-16 Estimated
Budgetas of
04-30-13
Clean, Healthy Environment
Citywide 4th/12Capital Construction
2,919,500 2,473,192 446,308 2,919,500Airfield Drainage - Master Plan 0 0Environmental 00
Public Safety Citywide VariousCapital Construction
91,627 91,627 0 91,627Airfield Surface Repair - Love Field 0 0Pavement Maintenance / Construction
00
Public Safety Citywide VariousFederal AIP Grant
5,099,195 4,735,004 364,191 5,099,195Airfield Surface Repair - Love Field 0 0Pavement Maintenance / Construction
00
Economic Vibrancy
Citywide 3rd/14Capital Construction
1,155,000 1,155,000 0 1,155,000Airport Planning and Advisory Services 0 0Terminal 00
Clean, Healthy Environment
Citywide VariousCapital Construction
3,973,065 3,871,430 101,635 3,973,065Asbestos Abatement - Love Field 0 0Environmental 00
Economic Vibrancy
Citywide VariousCapital Construction
19,222,844 18,875,044 347,800 19,222,844Aviation Land Acquisition 0 0Aviation Land Acquisition
00
Public Safety Citywide VariousFederal AIP Grant
1,993,856 1,813,592 180,264 1,993,856Bio-Explosive Detection System 0 0Safety/Security 00
Clean, Healthy Environment
Citywide 4th/13Capital Construction
583,461 583,461 0 583,461Blast Fence Reconstruction- Love Field
0 0Environmental 00
Clean, Healthy Environment
Citywide 4th/13Federal AIP Grant
2,727,624 2,591,034 136,590 2,727,624Blast Fence Reconstruction- Love Field
0 0Environmental 00
Public Safety Citywide VariousFederal AIP Grant
100,655 100,655 0 100,655Canine Explosive Detection Facility 0 0Safety/Security 00
Public Safety Citywide VariousCapital Construction
122,451 122,451 0 122,451Canine Explosive Detection Facility 0 0Safety/Security 00
Economic Vibrancy
Citywide 3rd/13Capital Construction
713,895 646,304 67,591 713,895Central Receiving Facility 0 0Terminal 00
324
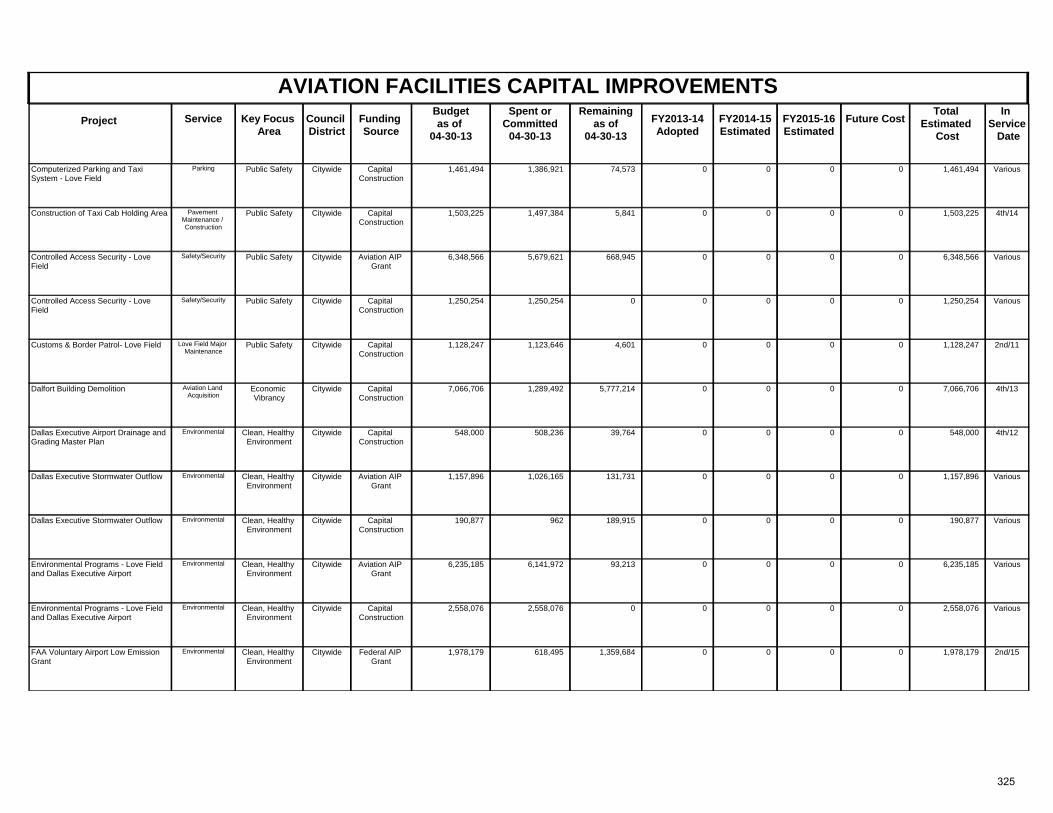
AVIATION FACILITIES CAPITAL IMPROVEMENTSProject Key Focus
AreaCouncil District
Spent orCommitted
04-30-13
Total Estimated
Cost
In Service Date
Funding Source
Remainingas of
04-30-13 FY2013-14
AdoptedFuture CostService FY2014-15
Estimated FY2015-16 Estimated
Budgetas of
04-30-13
Public Safety Citywide VariousCapital Construction
1,461,494 1,386,921 74,573 1,461,494Computerized Parking and Taxi System - Love Field
0 0Parking 00
Public Safety Citywide 4th/14Capital Construction
1,503,225 1,497,384 5,841 1,503,225Construction of Taxi Cab Holding Area 0 0Pavement Maintenance / Construction
00
Public Safety Citywide VariousAviation AIP Grant
6,348,566 5,679,621 668,945 6,348,566Controlled Access Security - Love Field
0 0Safety/Security 00
Public Safety Citywide VariousCapital Construction
1,250,254 1,250,254 0 1,250,254Controlled Access Security - Love Field
0 0Safety/Security 00
Public Safety Citywide 2nd/11Capital Construction
1,128,247 1,123,646 4,601 1,128,247Customs & Border Patrol- Love Field 0 0Love Field Major Maintenance
00
Economic Vibrancy
Citywide 4th/13Capital Construction
7,066,706 1,289,492 5,777,214 7,066,706Dalfort Building Demolition 0 0Aviation Land Acquisition
00
Clean, Healthy Environment
Citywide 4th/12Capital Construction
548,000 508,236 39,764 548,000Dallas Executive Airport Drainage and Grading Master Plan
0 0Environmental 00
Clean, Healthy Environment
Citywide VariousAviation AIP Grant
1,157,896 1,026,165 131,731 1,157,896Dallas Executive Stormwater Outflow 0 0Environmental 00
Clean, Healthy Environment
Citywide VariousCapital Construction
190,877 962 189,915 190,877Dallas Executive Stormwater Outflow 0 0Environmental 00
Clean, Healthy Environment
Citywide VariousAviation AIP Grant
6,235,185 6,141,972 93,213 6,235,185Environmental Programs - Love Field and Dallas Executive Airport
0 0Environmental 00
Clean, Healthy Environment
Citywide VariousCapital Construction
2,558,076 2,558,076 0 2,558,076Environmental Programs - Love Field and Dallas Executive Airport
0 0Environmental 00
Clean, Healthy Environment
Citywide 2nd/15Federal AIP Grant
1,978,179 618,495 1,359,684 1,978,179FAA Voluntary Airport Low Emission Grant
0 0Environmental 00
325
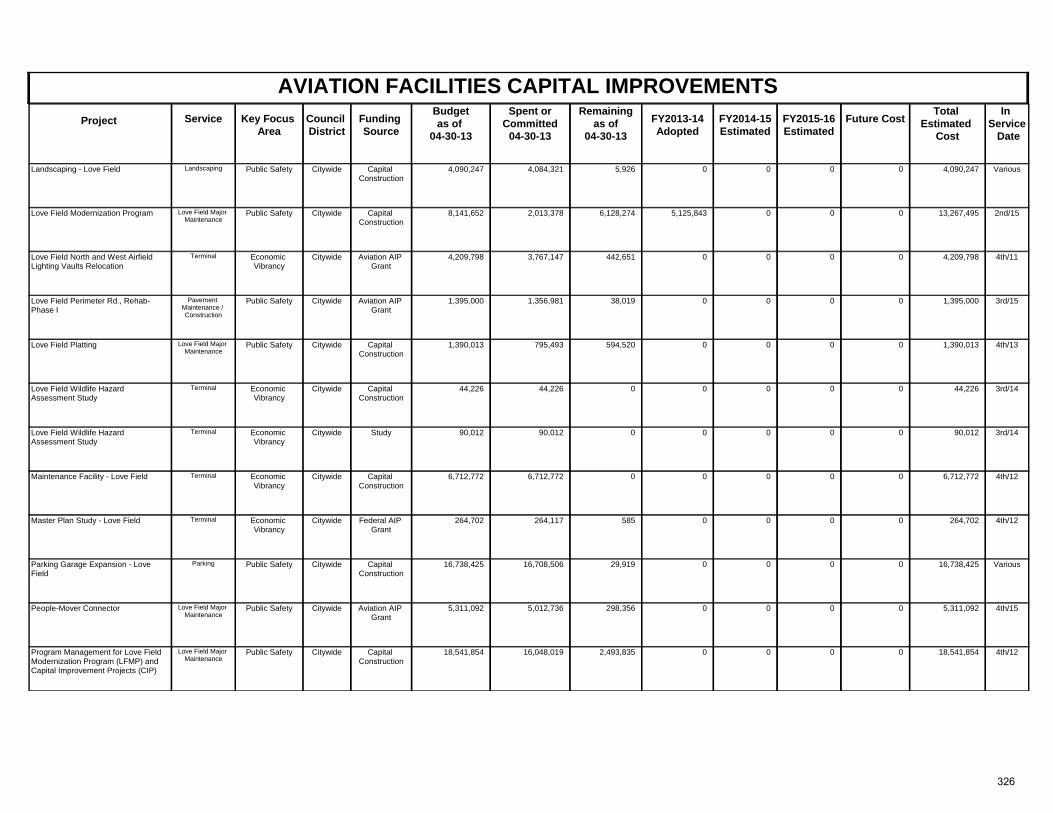
AVIATION FACILITIES CAPITAL IMPROVEMENTSProject Key Focus
AreaCouncil District
Spent orCommitted
04-30-13
Total Estimated
Cost
In Service Date
Funding Source
Remainingas of
04-30-13 FY2013-14
AdoptedFuture CostService FY2014-15
Estimated FY2015-16 Estimated
Budgetas of
04-30-13
Public Safety Citywide VariousCapital Construction
4,090,247 4,084,321 5,926 4,090,247Landscaping - Love Field 0 0Landscaping 00
Public Safety Citywide 2nd/15Capital Construction
8,141,652 2,013,378 6,128,274 13,267,495Love Field Modernization Program 5,125,843 0Love Field Major Maintenance
00
Economic Vibrancy
Citywide 4th/11Aviation AIP Grant
4,209,798 3,767,147 442,651 4,209,798Love Field North and West Airfield Lighting Vaults Relocation
0 0Terminal 00
Public Safety Citywide 3rd/15Aviation AIP Grant
1,395,000 1,356,981 38,019 1,395,000Love Field Perimeter Rd., Rehab-Phase I
0 0Pavement Maintenance / Construction
00
Public Safety Citywide 4th/13Capital Construction
1,390,013 795,493 594,520 1,390,013Love Field Platting 0 0Love Field Major Maintenance
00
Economic Vibrancy
Citywide 3rd/14Capital Construction
44,226 44,226 0 44,226Love Field Wildlife Hazard Assessment Study
0 0Terminal 00
Economic Vibrancy
Citywide 3rd/14Study 90,012 90,012 0 90,012Love Field Wildlife Hazard Assessment Study
0 0Terminal 00
Economic Vibrancy
Citywide 4th/12Capital Construction
6,712,772 6,712,772 0 6,712,772Maintenance Facility - Love Field 0 0Terminal 00
Economic Vibrancy
Citywide 4th/12Federal AIP Grant
264,702 264,117 585 264,702Master Plan Study - Love Field 0 0Terminal 00
Public Safety Citywide VariousCapital Construction
16,738,425 16,708,506 29,919 16,738,425Parking Garage Expansion - Love Field
0 0Parking 00
Public Safety Citywide 4th/15Aviation AIP Grant
5,311,092 5,012,736 298,356 5,311,092People-Mover Connector 0 0Love Field Major Maintenance
00
Public Safety Citywide 4th/12Capital Construction
18,541,854 16,048,019 2,493,835 18,541,854Program Management for Love Field Modernization Program (LFMP) and Capital Improvement Projects (CIP)
0 0Love Field Major Maintenance
00
326
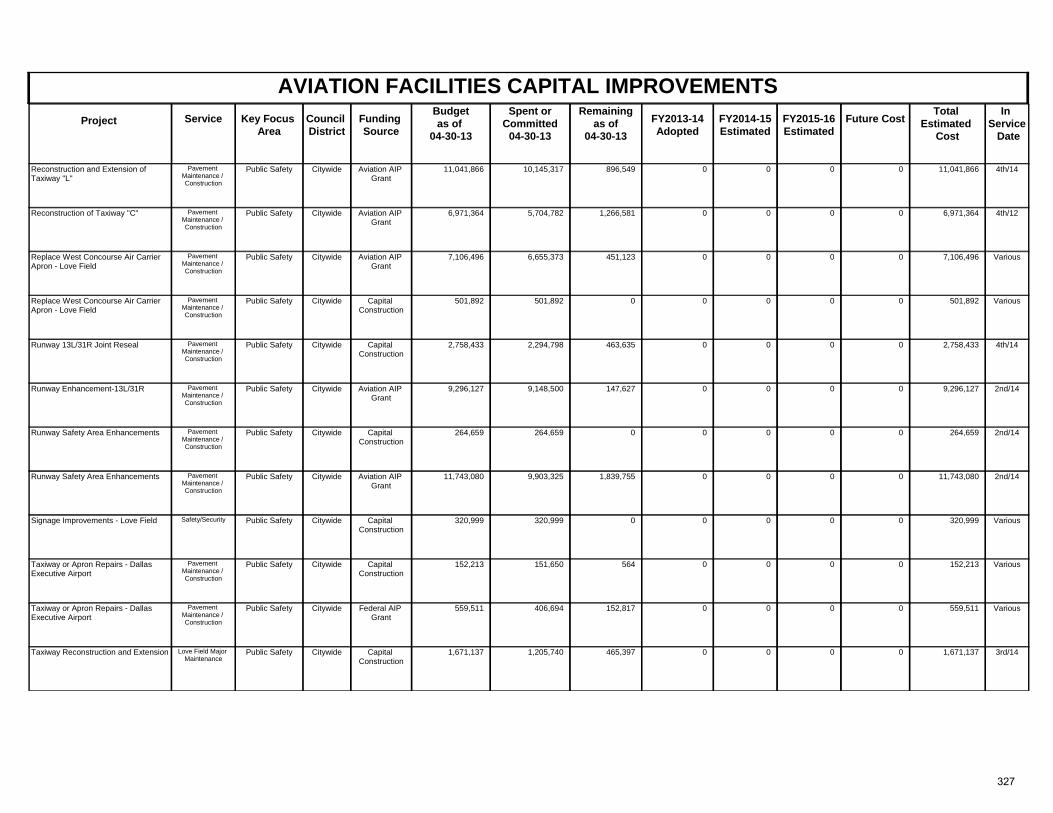
AVIATION FACILITIES CAPITAL IMPROVEMENTSProject Key Focus
AreaCouncil District
Spent orCommitted
04-30-13
Total Estimated
Cost
In Service Date
Funding Source
Remainingas of
04-30-13 FY2013-14
AdoptedFuture CostService FY2014-15
Estimated FY2015-16 Estimated
Budgetas of
04-30-13
Public Safety Citywide 4th/14Aviation AIP Grant
11,041,866 10,145,317 896,549 11,041,866Reconstruction and Extension of Taxiway "L"
0 0Pavement Maintenance / Construction
00
Public Safety Citywide 4th/12Aviation AIP Grant
6,971,364 5,704,782 1,266,581 6,971,364Reconstruction of Taxiway "C" 0 0Pavement Maintenance / Construction
00
Public Safety Citywide VariousAviation AIP Grant
7,106,496 6,655,373 451,123 7,106,496Replace West Concourse Air Carrier Apron - Love Field
0 0Pavement Maintenance / Construction
00
Public Safety Citywide VariousCapital Construction
501,892 501,892 0 501,892Replace West Concourse Air Carrier Apron - Love Field
0 0Pavement Maintenance / Construction
00
Public Safety Citywide 4th/14Capital Construction
2,758,433 2,294,798 463,635 2,758,433Runway 13L/31R Joint Reseal 0 0Pavement Maintenance / Construction
00
Public Safety Citywide 2nd/14Aviation AIP Grant
9,296,127 9,148,500 147,627 9,296,127Runway Enhancement-13L/31R 0 0Pavement Maintenance / Construction
00
Public Safety Citywide 2nd/14Capital Construction
264,659 264,659 0 264,659Runway Safety Area Enhancements 0 0Pavement Maintenance / Construction
00
Public Safety Citywide 2nd/14Aviation AIP Grant
11,743,080 9,903,325 1,839,755 11,743,080Runway Safety Area Enhancements 0 0Pavement Maintenance / Construction
00
Public Safety Citywide VariousCapital Construction
320,999 320,999 0 320,999Signage Improvements - Love Field 0 0Safety/Security 00
Public Safety Citywide VariousCapital Construction
152,213 151,650 564 152,213Taxiway or Apron Repairs - Dallas Executive Airport
0 0Pavement Maintenance / Construction
00
Public Safety Citywide VariousFederal AIP Grant
559,511 406,694 152,817 559,511Taxiway or Apron Repairs - Dallas Executive Airport
0 0Pavement Maintenance / Construction
00
Public Safety Citywide 3rd/14Capital Construction
1,671,137 1,205,740 465,397 1,671,137Taxiway Reconstruction and Extension 0 0Love Field Major Maintenance
00
327
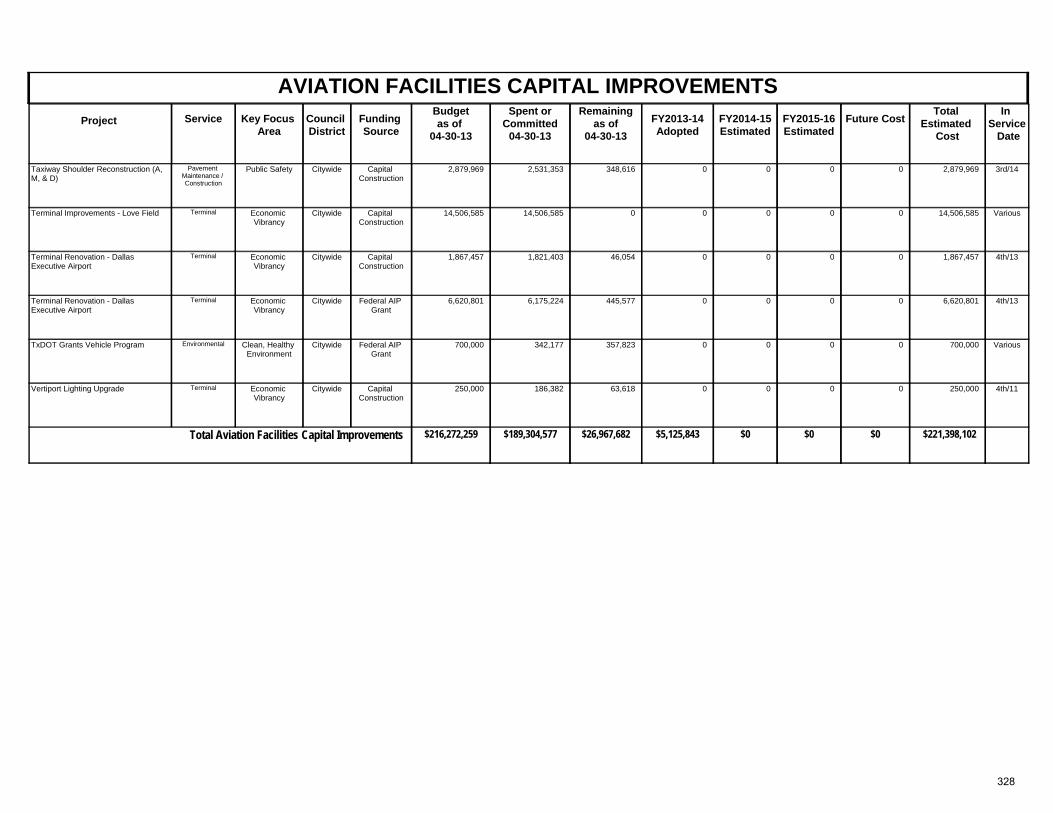
AVIATION FACILITIES CAPITAL IMPROVEMENTSProject Key Focus
AreaCouncil District
Spent orCommitted
04-30-13
Total Estimated
Cost
In Service Date
Funding Source
Remainingas of
04-30-13 FY2013-14
AdoptedFuture CostService FY2014-15
Estimated FY2015-16 Estimated
Budgetas of
04-30-13
Public Safety Citywide 3rd/14Capital Construction
2,879,969 2,531,353 348,616 2,879,969Taxiway Shoulder Reconstruction (A, M, & D)
0 0Pavement Maintenance / Construction
00
Economic Vibrancy
Citywide VariousCapital Construction
14,506,585 14,506,585 0 14,506,585Terminal Improvements - Love Field 0 0Terminal 00
Economic Vibrancy
Citywide 4th/13Capital Construction
1,867,457 1,821,403 46,054 1,867,457Terminal Renovation - Dallas Executive Airport
0 0Terminal 00
Economic Vibrancy
Citywide 4th/13Federal AIP Grant
6,620,801 6,175,224 445,577 6,620,801Terminal Renovation - Dallas Executive Airport
0 0Terminal 00
Clean, Healthy Environment
Citywide VariousFederal AIP Grant
700,000 342,177 357,823 700,000TxDOT Grants Vehicle Program 0 0Environmental 00
Economic Vibrancy
Citywide 4th/11Capital Construction
250,000 186,382 63,618 250,000Vertiport Lighting Upgrade 0 0Terminal 00
$216,272,259 $26,967,682Total Aviation Facilities Capital Improvements $189,304,577 $221,398,102$5,125,843 $0$0$0
328
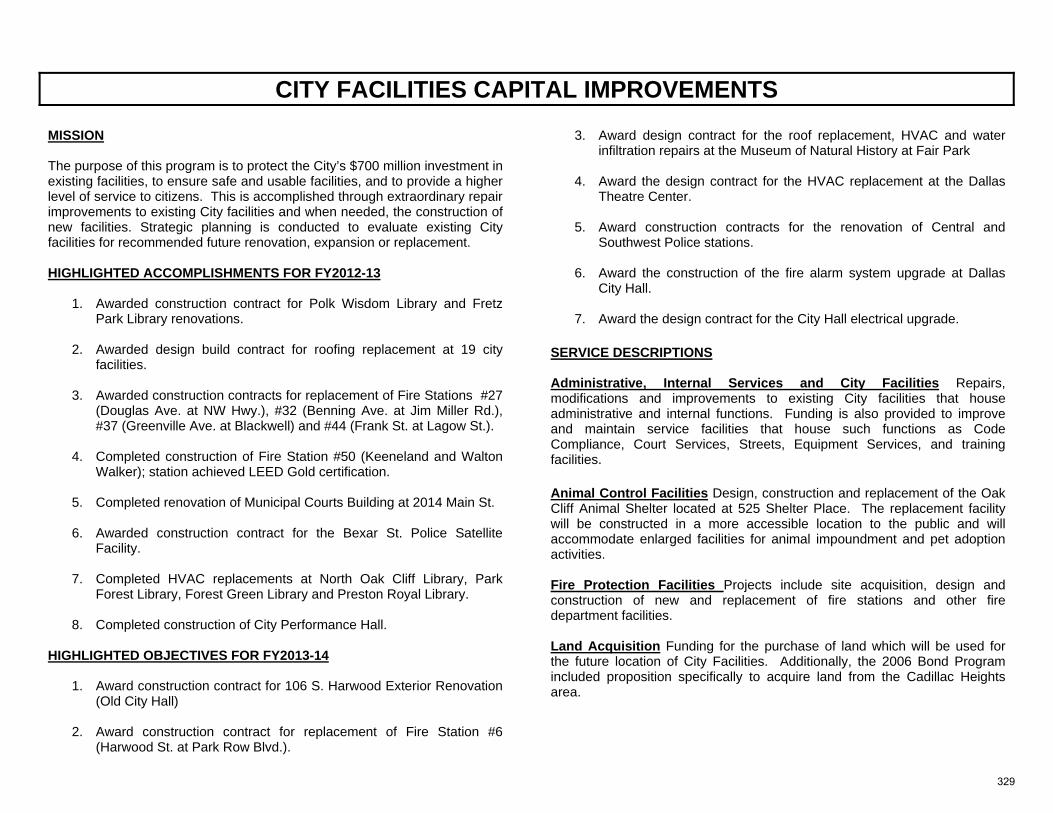
CITY FACILITIES CAPITAL IMPROVEMENTS
MISSION The purpose of this program is to protect the City’s $700 million investment in existing facilities, to ensure safe and usable facilities, and to provide a higher level of service to citizens. This is accomplished through extraordinary repair improvements to existing City facilities and when needed, the construction of new facilities. Strategic planning is conducted to evaluate existing City facilities for recommended future renovation, expansion or replacement. HIGHLIGHTED ACCOMPLISHMENTS FOR FY2012-13
1. Awarded construction contract for Polk Wisdom Library and Fretz Park Library renovations.
2. Awarded design build contract for roofing replacement at 19 city facilities.
3. Awarded construction contracts for replacement of Fire Stations #27
(Douglas Ave. at NW Hwy.), #32 (Benning Ave. at Jim Miller Rd.), #37 (Greenville Ave. at Blackwell) and #44 (Frank St. at Lagow St.).
4. Completed construction of Fire Station #50 (Keeneland and Walton Walker); station achieved LEED Gold certification.
5. Completed renovation of Municipal Courts Building at 2014 Main St.
6. Awarded construction contract for the Bexar St. Police Satellite
Facility.
7. Completed HVAC replacements at North Oak Cliff Library, Park Forest Library, Forest Green Library and Preston Royal Library.
8. Completed construction of City Performance Hall. HIGHLIGHTED OBJECTIVES FOR FY2013-14
1. Award construction contract for 106 S. Harwood Exterior Renovation (Old City Hall)
2. Award construction contract for replacement of Fire Station #6 (Harwood St. at Park Row Blvd.).
3. Award design contract for the roof replacement, HVAC and water infiltration repairs at the Museum of Natural History at Fair Park
4. Award the design contract for the HVAC replacement at the Dallas
Theatre Center.
5. Award construction contracts for the renovation of Central and Southwest Police stations.
6. Award the construction of the fire alarm system upgrade at Dallas
City Hall.
7. Award the design contract for the City Hall electrical upgrade.
SERVICE DESCRIPTIONS Administrative, Internal Services and City Facilities Repairs, modifications and improvements to existing City facilities that house administrative and internal functions. Funding is also provided to improve and maintain service facilities that house such functions as Code Compliance, Court Services, Streets, Equipment Services, and training facilities. Animal Control Facilities Design, construction and replacement of the Oak Cliff Animal Shelter located at 525 Shelter Place. The replacement facility will be constructed in a more accessible location to the public and will accommodate enlarged facilities for animal impoundment and pet adoption activities. Fire Protection Facilities Projects include site acquisition, design and construction of new and replacement of fire stations and other fire department facilities. Land Acquisition Funding for the purchase of land which will be used for the future location of City Facilities. Additionally, the 2006 Bond Program included proposition specifically to acquire land from the Cadillac Heights area.
329
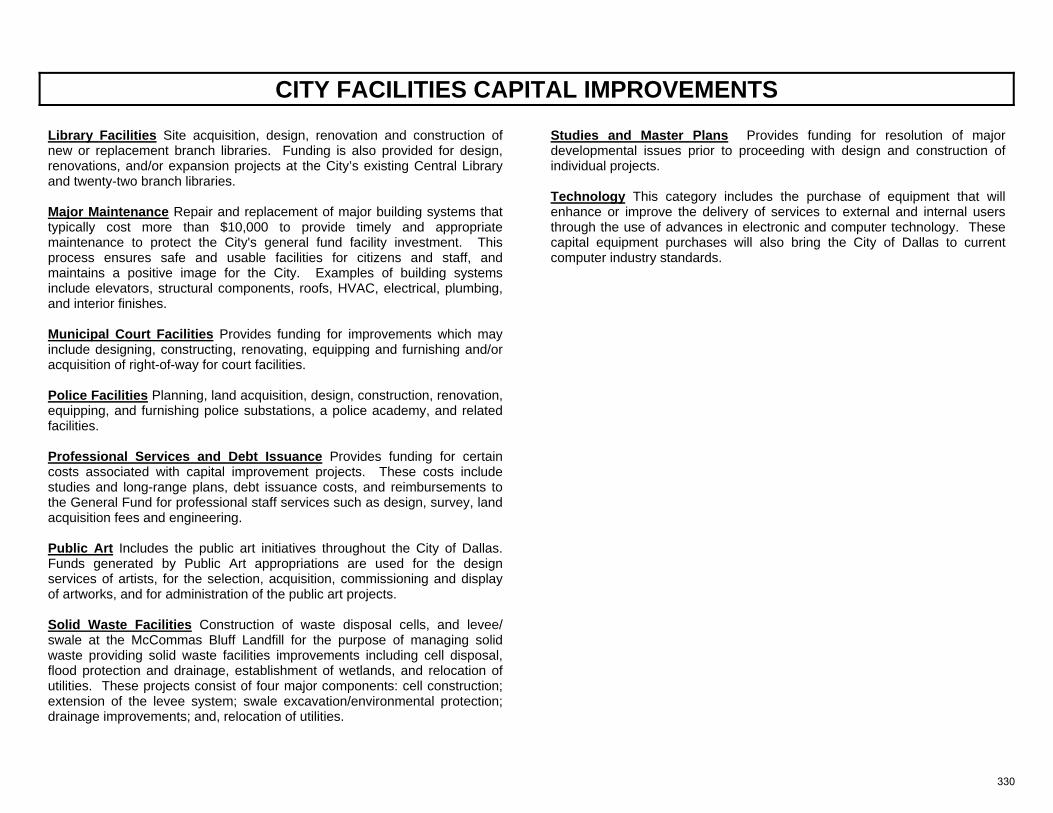
CITY FACILITIES CAPITAL IMPROVEMENTS
Library Facilities Site acquisition, design, renovation and construction of new or replacement branch libraries. Funding is also provided for design, renovations, and/or expansion projects at the City’s existing Central Library and twenty-two branch libraries. Major Maintenance Repair and replacement of major building systems that typically cost more than $10,000 to provide timely and appropriate maintenance to protect the City's general fund facility investment. This process ensures safe and usable facilities for citizens and staff, and maintains a positive image for the City. Examples of building systems include elevators, structural components, roofs, HVAC, electrical, plumbing, and interior finishes. Municipal Court Facilities Provides funding for improvements which may include designing, constructing, renovating, equipping and furnishing and/or acquisition of right-of-way for court facilities. Police Facilities Planning, land acquisition, design, construction, renovation, equipping, and furnishing police substations, a police academy, and related facilities. Professional Services and Debt Issuance Provides funding for certain costs associated with capital improvement projects. These costs include studies and long-range plans, debt issuance costs, and reimbursements to the General Fund for professional staff services such as design, survey, land acquisition fees and engineering. Public Art Includes the public art initiatives throughout the City of Dallas. Funds generated by Public Art appropriations are used for the design services of artists, for the selection, acquisition, commissioning and display of artworks, and for administration of the public art projects. Solid Waste Facilities Construction of waste disposal cells, and levee/ swale at the McCommas Bluff Landfill for the purpose of managing solid waste providing solid waste facilities improvements including cell disposal, flood protection and drainage, establishment of wetlands, and relocation of utilities. These projects consist of four major components: cell construction; extension of the levee system; swale excavation/environmental protection; drainage improvements; and, relocation of utilities.
Studies and Master Plans Provides funding for resolution of major developmental issues prior to proceeding with design and construction of individual projects. Technology This category includes the purchase of equipment that will enhance or improve the delivery of services to external and internal users through the use of advances in electronic and computer technology. These capital equipment purchases will also bring the City of Dallas to current computer industry standards.
330
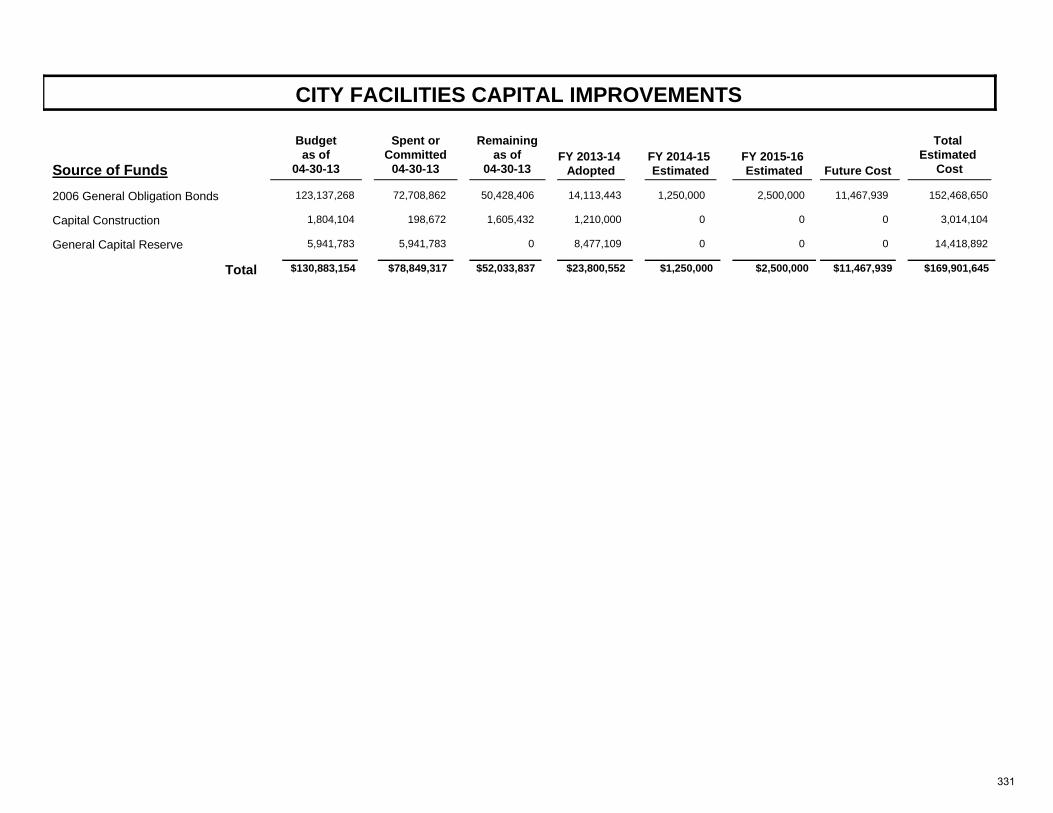
CITY FACILITIES CAPITAL IMPROVEMENTS
Source of FundsFY 2013-14
Adopted
Total Estimated
CostFY 2014-15 Estimated
FY 2015-16 Estimated
Future Cost
Remainingas of
04-30-13
Spent orCommitted
04-30-13
Budgetas of
04-30-13
2006 General Obligation Bonds 123,137,268 72,708,862 14,113,44350,428,406 152,468,6501,250,000 2,500,000 11,467,939
Capital Construction 1,804,104 198,672 1,210,0001,605,432 3,014,1040 0 0
General Capital Reserve 5,941,783 5,941,783 8,477,1090 14,418,8920 0 0
$78,849,317 $23,800,552Total $130,883,154 $52,033,837 $1,250,000 $169,901,645$2,500,000 $11,467,939
331
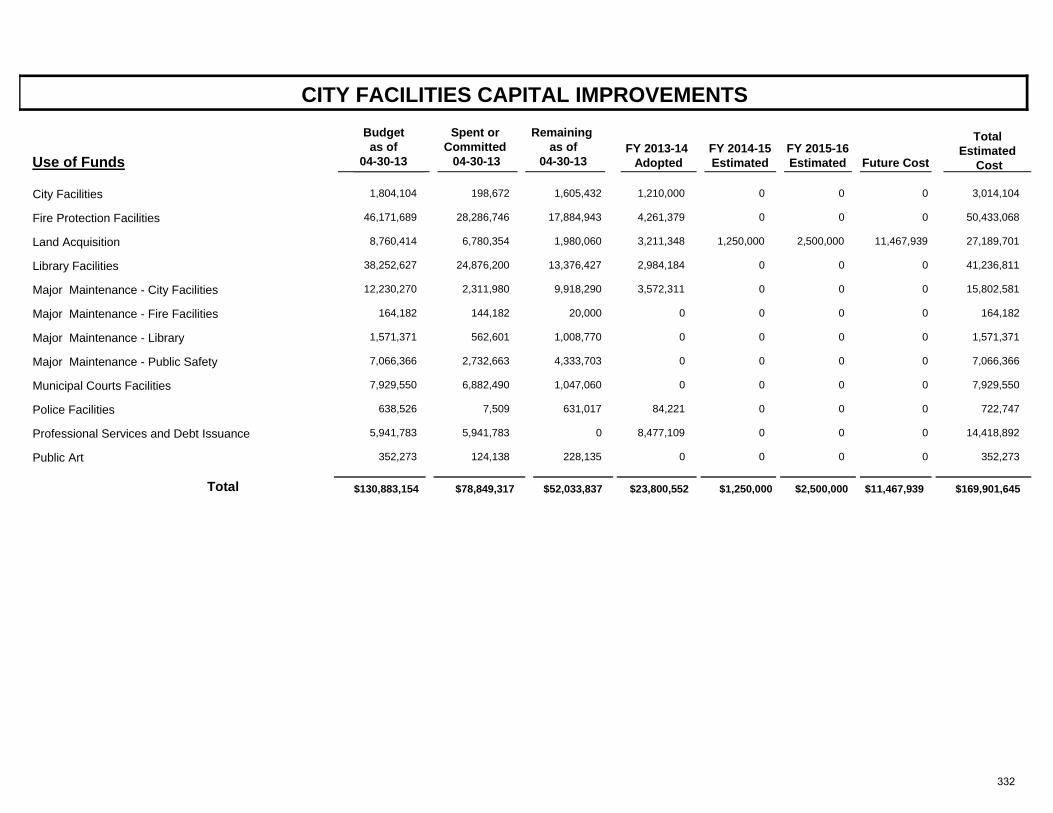
CITY FACILITIES CAPITAL IMPROVEMENTS
Use of FundsFY 2013-14
Adopted
Total Estimated
Cost FY 2014-15 Estimated
FY 2015-16 Estimated
Future Cost
Spent or Committed
04-30-13
Remaining as of
04-30-13
Budget as of
04-30-13
City Facilities 1,804,104 198,672 1,210,0001,605,432 3,014,1040 0 0
Fire Protection Facilities 46,171,689 28,286,746 4,261,37917,884,943 50,433,0680 0 0
Land Acquisition 8,760,414 6,780,354 3,211,3481,980,060 27,189,7011,250,000 2,500,000 11,467,939
Library Facilities 38,252,627 24,876,200 2,984,18413,376,427 41,236,8110 0 0
Major Maintenance - City Facilities 12,230,270 2,311,980 3,572,3119,918,290 15,802,5810 0 0
Major Maintenance - Fire Facilities 164,182 144,182 020,000 164,1820 0 0
Major Maintenance - Library 1,571,371 562,601 01,008,770 1,571,3710 0 0
Major Maintenance - Public Safety 7,066,366 2,732,663 04,333,703 7,066,3660 0 0
Municipal Courts Facilities 7,929,550 6,882,490 01,047,060 7,929,5500 0 0
Police Facilities 638,526 7,509 84,221631,017 722,7470 0 0
Professional Services and Debt Issuance 5,941,783 5,941,783 8,477,1090 14,418,8920 0 0
Public Art 352,273 124,138 0228,135 352,2730 0 0
$78,849,317 $23,800,552Total $130,883,154 $52,033,837 $1,250,000 $169,901,645$2,500,000 $11,467,939
332
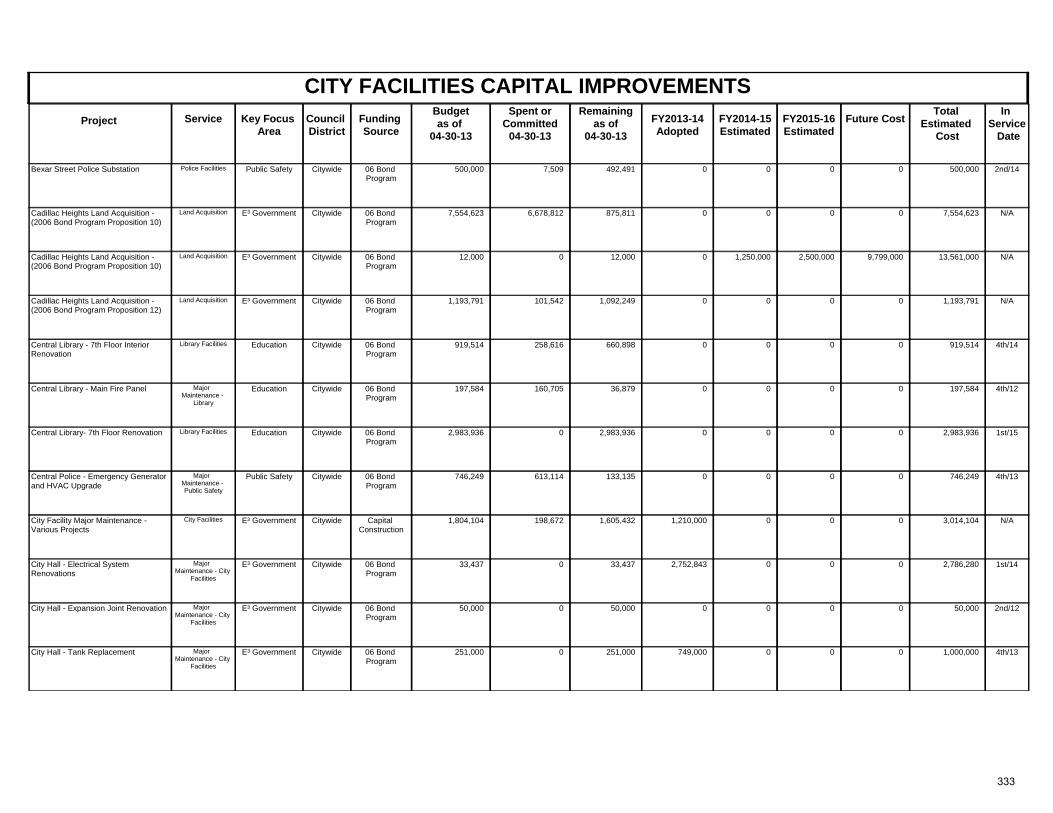
CITY FACILITIES CAPITAL IMPROVEMENTSProject Key Focus
AreaCouncil District
Spent orCommitted
04-30-13
Total Estimated
Cost
In Service Date
Funding Source
Remainingas of
04-30-13 FY2013-14
AdoptedFuture CostService FY2014-15
Estimated FY2015-16 Estimated
Budgetas of
04-30-13
Public Safety Citywide 2nd/1406 Bond Program
500,000 7,509 492,491 500,000Bexar Street Police Substation 0 0Police Facilities 00
E³ Government Citywide N/A06 Bond Program
7,554,623 6,678,812 875,811 7,554,623Cadillac Heights Land Acquisition - (2006 Bond Program Proposition 10)
0 0Land Acquisition 00
E³ Government Citywide N/A06 Bond Program
12,000 0 12,000 13,561,000Cadillac Heights Land Acquisition - (2006 Bond Program Proposition 10)
0 9,799,000Land Acquisition 2,500,0001,250,000
E³ Government Citywide N/A06 Bond Program
1,193,791 101,542 1,092,249 1,193,791Cadillac Heights Land Acquisition - (2006 Bond Program Proposition 12)
0 0Land Acquisition 00
Education Citywide 4th/1406 Bond Program
919,514 258,616 660,898 919,514Central Library - 7th Floor Interior Renovation
0 0Library Facilities 00
Education Citywide 4th/1206 Bond Program
197,584 160,705 36,879 197,584Central Library - Main Fire Panel 0 0Major Maintenance -
Library
00
Education Citywide 1st/1506 Bond Program
2,983,936 0 2,983,936 2,983,936Central Library- 7th Floor Renovation 0 0Library Facilities 00
Public Safety Citywide 4th/1306 Bond Program
746,249 613,114 133,135 746,249Central Police - Emergency Generator and HVAC Upgrade
0 0Major Maintenance - Public Safety
00
E³ Government Citywide N/ACapital Construction
1,804,104 198,672 1,605,432 3,014,104City Facility Major Maintenance - Various Projects
1,210,000 0City Facilities 00
E³ Government Citywide 1st/1406 Bond Program
33,437 0 33,437 2,786,280City Hall - Electrical System Renovations
2,752,843 0Major Maintenance - City
Facilities
00
E³ Government Citywide 2nd/1206 Bond Program
50,000 0 50,000 50,000City Hall - Expansion Joint Renovation 0 0Major Maintenance - City
Facilities
00
E³ Government Citywide 4th/1306 Bond Program
251,000 0 251,000 1,000,000City Hall - Tank Replacement 749,000 0Major Maintenance - City
Facilities
00
333
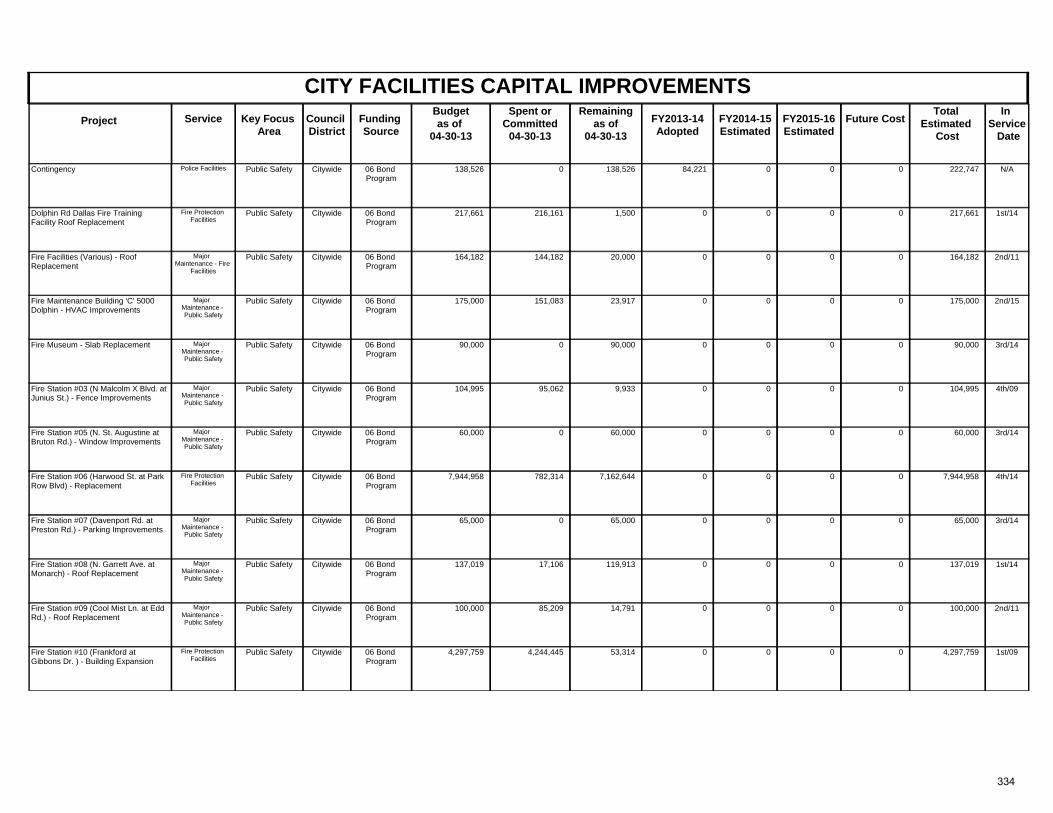
CITY FACILITIES CAPITAL IMPROVEMENTSProject Key Focus
AreaCouncil District
Spent orCommitted
04-30-13
Total Estimated
Cost
In Service Date
Funding Source
Remainingas of
04-30-13 FY2013-14
AdoptedFuture CostService FY2014-15
Estimated FY2015-16 Estimated
Budgetas of
04-30-13
Public Safety Citywide N/A06 Bond Program
138,526 0 138,526 222,747Contingency 84,221 0Police Facilities 00
Public Safety Citywide 1st/1406 Bond Program
217,661 216,161 1,500 217,661Dolphin Rd Dallas Fire Training Facility Roof Replacement
0 0Fire Protection Facilities
00
Public Safety Citywide 2nd/1106 Bond Program
164,182 144,182 20,000 164,182Fire Facilities (Various) - Roof Replacement
0 0Major Maintenance - Fire
Facilities
00
Public Safety Citywide 2nd/1506 Bond Program
175,000 151,083 23,917 175,000Fire Maintenance Building 'C' 5000 Dolphin - HVAC Improvements
0 0Major Maintenance - Public Safety
00
Public Safety Citywide 3rd/1406 Bond Program
90,000 0 90,000 90,000Fire Museum - Slab Replacement 0 0Major Maintenance - Public Safety
00
Public Safety Citywide 4th/0906 Bond Program
104,995 95,062 9,933 104,995Fire Station #03 (N Malcolm X Blvd. at Junius St.) - Fence Improvements
0 0Major Maintenance - Public Safety
00
Public Safety Citywide 3rd/1406 Bond Program
60,000 0 60,000 60,000Fire Station #05 (N. St. Augustine at Bruton Rd.) - Window Improvements
0 0Major Maintenance - Public Safety
00
Public Safety Citywide 4th/1406 Bond Program
7,944,958 782,314 7,162,644 7,944,958Fire Station #06 (Harwood St. at Park Row Blvd) - Replacement
0 0Fire Protection Facilities
00
Public Safety Citywide 3rd/1406 Bond Program
65,000 0 65,000 65,000Fire Station #07 (Davenport Rd. at Preston Rd.) - Parking Improvements
0 0Major Maintenance - Public Safety
00
Public Safety Citywide 1st/1406 Bond Program
137,019 17,106 119,913 137,019Fire Station #08 (N. Garrett Ave. at Monarch) - Roof Replacement
0 0Major Maintenance - Public Safety
00
Public Safety Citywide 2nd/1106 Bond Program
100,000 85,209 14,791 100,000Fire Station #09 (Cool Mist Ln. at Edd Rd.) - Roof Replacement
0 0Major Maintenance - Public Safety
00
Public Safety Citywide 1st/0906 Bond Program
4,297,759 4,244,445 53,314 4,297,759Fire Station #10 (Frankford at Gibbons Dr. ) - Building Expansion
0 0Fire Protection Facilities
00
334
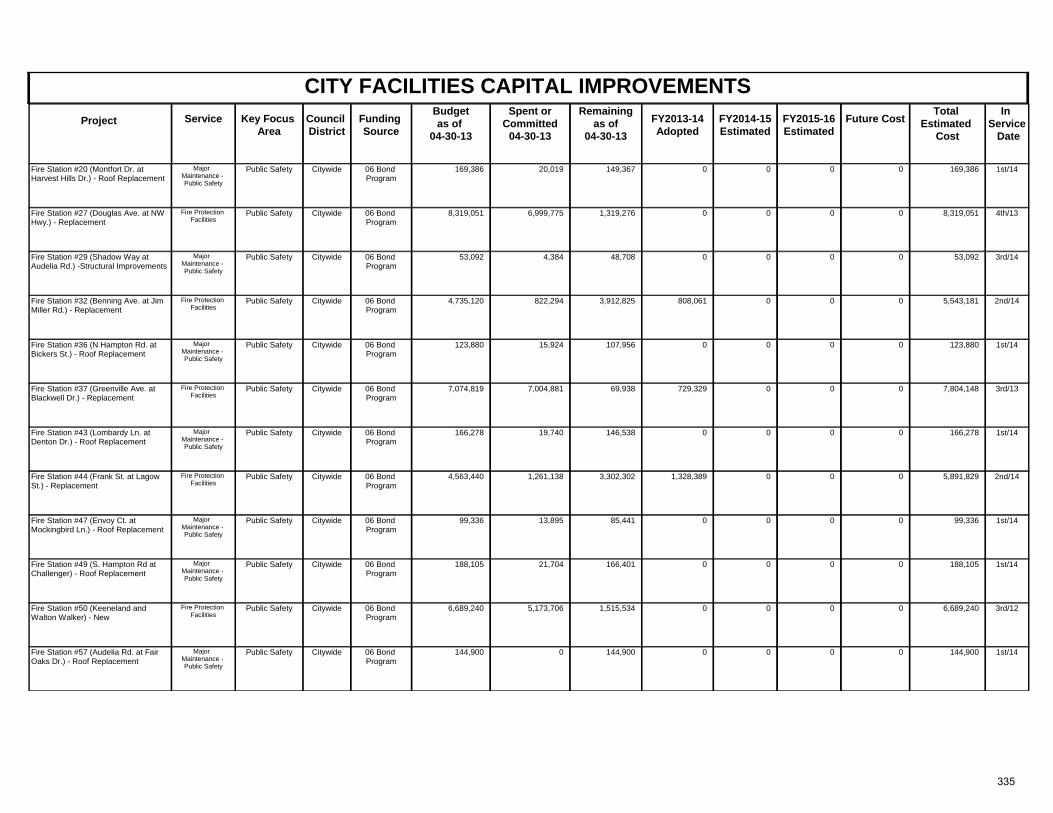
CITY FACILITIES CAPITAL IMPROVEMENTSProject Key Focus
AreaCouncil District
Spent orCommitted
04-30-13
Total Estimated
Cost
In Service Date
Funding Source
Remainingas of
04-30-13 FY2013-14
AdoptedFuture CostService FY2014-15
Estimated FY2015-16 Estimated
Budgetas of
04-30-13
Public Safety Citywide 1st/1406 Bond Program
169,386 20,019 149,367 169,386Fire Station #20 (Montfort Dr. at Harvest Hills Dr.) - Roof Replacement
0 0Major Maintenance - Public Safety
00
Public Safety Citywide 4th/1306 Bond Program
8,319,051 6,999,775 1,319,276 8,319,051Fire Station #27 (Douglas Ave. at NW Hwy.) - Replacement
0 0Fire Protection Facilities
00
Public Safety Citywide 3rd/1406 Bond Program
53,092 4,384 48,708 53,092Fire Station #29 (Shadow Way at Audelia Rd.) -Structural Improvements
0 0Major Maintenance - Public Safety
00
Public Safety Citywide 2nd/1406 Bond Program
4,735,120 822,294 3,912,825 5,543,181Fire Station #32 (Benning Ave. at Jim Miller Rd.) - Replacement
808,061 0Fire Protection Facilities
00
Public Safety Citywide 1st/1406 Bond Program
123,880 15,924 107,956 123,880Fire Station #36 (N Hampton Rd. at Bickers St.) - Roof Replacement
0 0Major Maintenance - Public Safety
00
Public Safety Citywide 3rd/1306 Bond Program
7,074,819 7,004,881 69,938 7,804,148Fire Station #37 (Greenville Ave. at Blackwell Dr.) - Replacement
729,329 0Fire Protection Facilities
00
Public Safety Citywide 1st/1406 Bond Program
166,278 19,740 146,538 166,278Fire Station #43 (Lombardy Ln. at Denton Dr.) - Roof Replacement
0 0Major Maintenance - Public Safety
00
Public Safety Citywide 2nd/1406 Bond Program
4,563,440 1,261,138 3,302,302 5,891,829Fire Station #44 (Frank St. at Lagow St.) - Replacement
1,328,389 0Fire Protection Facilities
00
Public Safety Citywide 1st/1406 Bond Program
99,336 13,895 85,441 99,336Fire Station #47 (Envoy Ct. at Mockingbird Ln.) - Roof Replacement
0 0Major Maintenance - Public Safety
00
Public Safety Citywide 1st/1406 Bond Program
188,105 21,704 166,401 188,105Fire Station #49 (S. Hampton Rd at Challenger) - Roof Replacement
0 0Major Maintenance - Public Safety
00
Public Safety Citywide 3rd/1206 Bond Program
6,689,240 5,173,706 1,515,534 6,689,240Fire Station #50 (Keeneland and Walton Walker) - New
0 0Fire Protection Facilities
00
Public Safety Citywide 1st/1406 Bond Program
144,900 0 144,900 144,900Fire Station #57 (Audelia Rd. at Fair Oaks Dr.) - Roof Replacement
0 0Major Maintenance - Public Safety
00
335
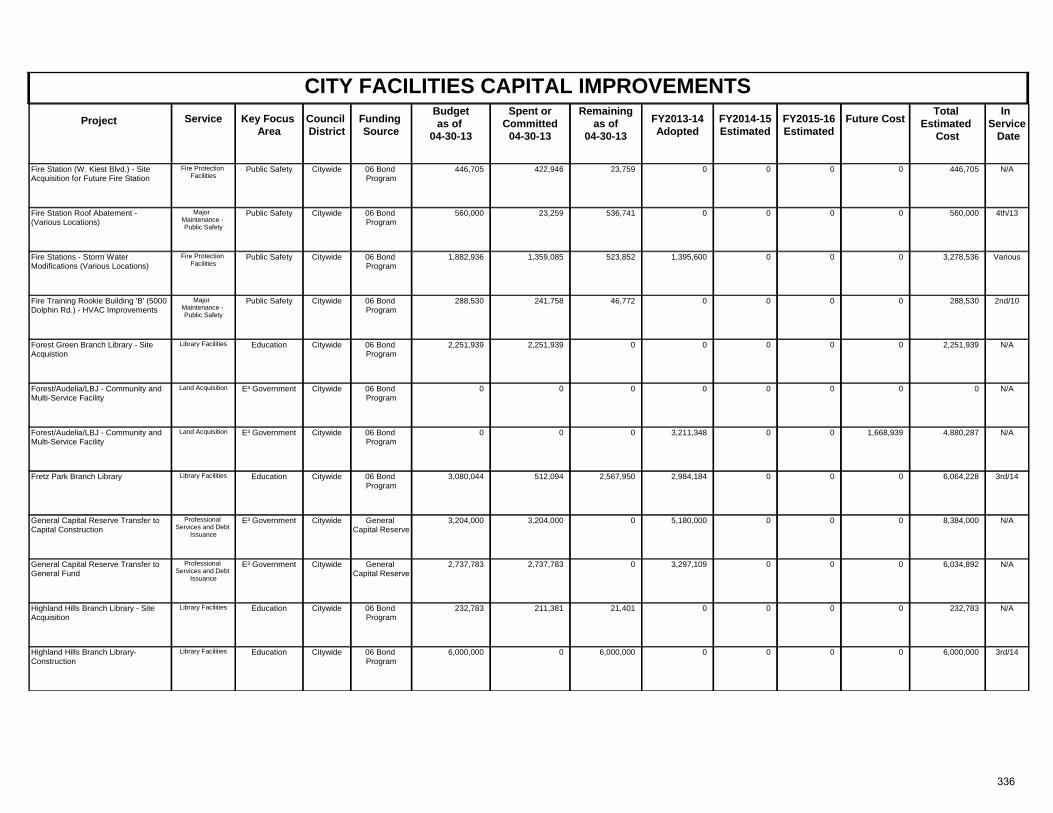
CITY FACILITIES CAPITAL IMPROVEMENTSProject Key Focus
AreaCouncil District
Spent orCommitted
04-30-13
Total Estimated
Cost
In Service Date
Funding Source
Remainingas of
04-30-13 FY2013-14
AdoptedFuture CostService FY2014-15
Estimated FY2015-16 Estimated
Budgetas of
04-30-13
Public Safety Citywide N/A06 Bond Program
446,705 422,946 23,759 446,705Fire Station (W. Kiest Blvd.) - Site Acquisition for Future Fire Station
0 0Fire Protection Facilities
00
Public Safety Citywide 4th/1306 Bond Program
560,000 23,259 536,741 560,000Fire Station Roof Abatement - (Various Locations)
0 0Major Maintenance - Public Safety
00
Public Safety Citywide Various06 Bond Program
1,882,936 1,359,085 523,852 3,278,536Fire Stations - Storm Water Modifications (Various Locations)
1,395,600 0Fire Protection Facilities
00
Public Safety Citywide 2nd/1006 Bond Program
288,530 241,758 46,772 288,530Fire Training Rookie Building 'B' (5000 Dolphin Rd.) - HVAC Improvements
0 0Major Maintenance - Public Safety
00
Education Citywide N/A06 Bond Program
2,251,939 2,251,939 0 2,251,939Forest Green Branch Library - Site Acquistion
0 0Library Facilities 00
E³ Government Citywide N/A06 Bond Program
0 0 0 0Forest/Audelia/LBJ - Community and Multi-Service Facility
0 0Land Acquisition 00
E³ Government Citywide N/A06 Bond Program
0 0 0 4,880,287Forest/Audelia/LBJ - Community and Multi-Service Facility
3,211,348 1,668,939Land Acquisition 00
Education Citywide 3rd/1406 Bond Program
3,080,044 512,094 2,567,950 6,064,228Fretz Park Branch Library 2,984,184 0Library Facilities 00
E³ Government Citywide N/AGeneral Capital Reserve
3,204,000 3,204,000 0 8,384,000General Capital Reserve Transfer to Capital Construction
5,180,000 0Professional Services and Debt
Issuance
00
E³ Government Citywide N/AGeneral Capital Reserve
2,737,783 2,737,783 0 6,034,892General Capital Reserve Transfer to General Fund
3,297,109 0Professional Services and Debt
Issuance
00
Education Citywide N/A06 Bond Program
232,783 211,381 21,401 232,783Highland Hills Branch Library - Site Acquisition
0 0Library Facilities 00
Education Citywide 3rd/1406 Bond Program
6,000,000 0 6,000,000 6,000,000Highland Hills Branch Library- Construction
0 0Library Facilities 00
336
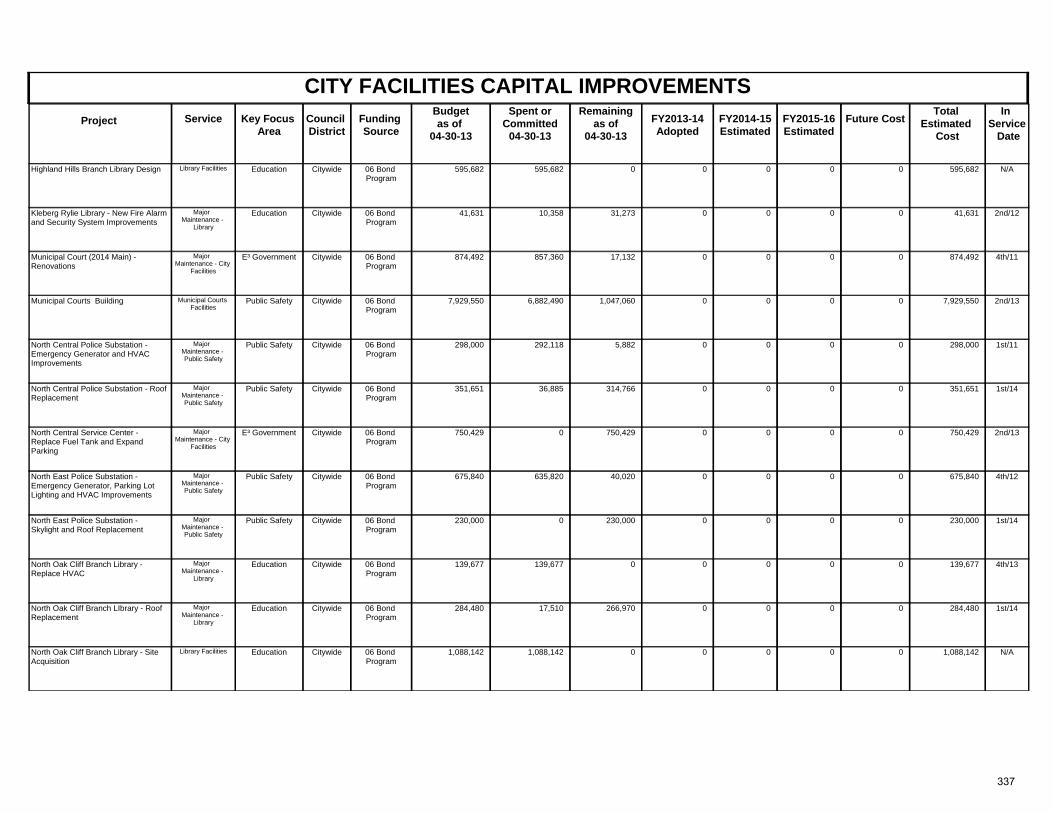
CITY FACILITIES CAPITAL IMPROVEMENTSProject Key Focus
AreaCouncil District
Spent orCommitted
04-30-13
Total Estimated
Cost
In Service Date
Funding Source
Remainingas of
04-30-13 FY2013-14
AdoptedFuture CostService FY2014-15
Estimated FY2015-16 Estimated
Budgetas of
04-30-13
Education Citywide N/A06 Bond Program
595,682 595,682 0 595,682Highland Hills Branch Library Design 0 0Library Facilities 00
Education Citywide 2nd/1206 Bond Program
41,631 10,358 31,273 41,631Kleberg Rylie Library - New Fire Alarm and Security System Improvements
0 0Major Maintenance -
Library
00
E³ Government Citywide 4th/1106 Bond Program
874,492 857,360 17,132 874,492Municipal Court (2014 Main) - Renovations
0 0Major Maintenance - City
Facilities
00
Public Safety Citywide 2nd/1306 Bond Program
7,929,550 6,882,490 1,047,060 7,929,550Municipal Courts Building 0 0Municipal Courts Facilities
00
Public Safety Citywide 1st/1106 Bond Program
298,000 292,118 5,882 298,000North Central Police Substation - Emergency Generator and HVAC Improvements
0 0Major Maintenance - Public Safety
00
Public Safety Citywide 1st/1406 Bond Program
351,651 36,885 314,766 351,651North Central Police Substation - Roof Replacement
0 0Major Maintenance - Public Safety
00
E³ Government Citywide 2nd/1306 Bond Program
750,429 0 750,429 750,429North Central Service Center - Replace Fuel Tank and Expand Parking
0 0Major Maintenance - City
Facilities
00
Public Safety Citywide 4th/1206 Bond Program
675,840 635,820 40,020 675,840North East Police Substation - Emergency Generator, Parking Lot Lighting and HVAC Improvements
0 0Major Maintenance - Public Safety
00
Public Safety Citywide 1st/1406 Bond Program
230,000 0 230,000 230,000North East Police Substation - Skylight and Roof Replacement
0 0Major Maintenance - Public Safety
00
Education Citywide 4th/1306 Bond Program
139,677 139,677 0 139,677North Oak Cliff Branch Library - Replace HVAC
0 0Major Maintenance -
Library
00
Education Citywide 1st/1406 Bond Program
284,480 17,510 266,970 284,480North Oak Cliff Branch LIbrary - Roof Replacement
0 0Major Maintenance -
Library
00
Education Citywide N/A06 Bond Program
1,088,142 1,088,142 0 1,088,142North Oak Cliff Branch Library - Site Acquisition
0 0Library Facilities 00
337
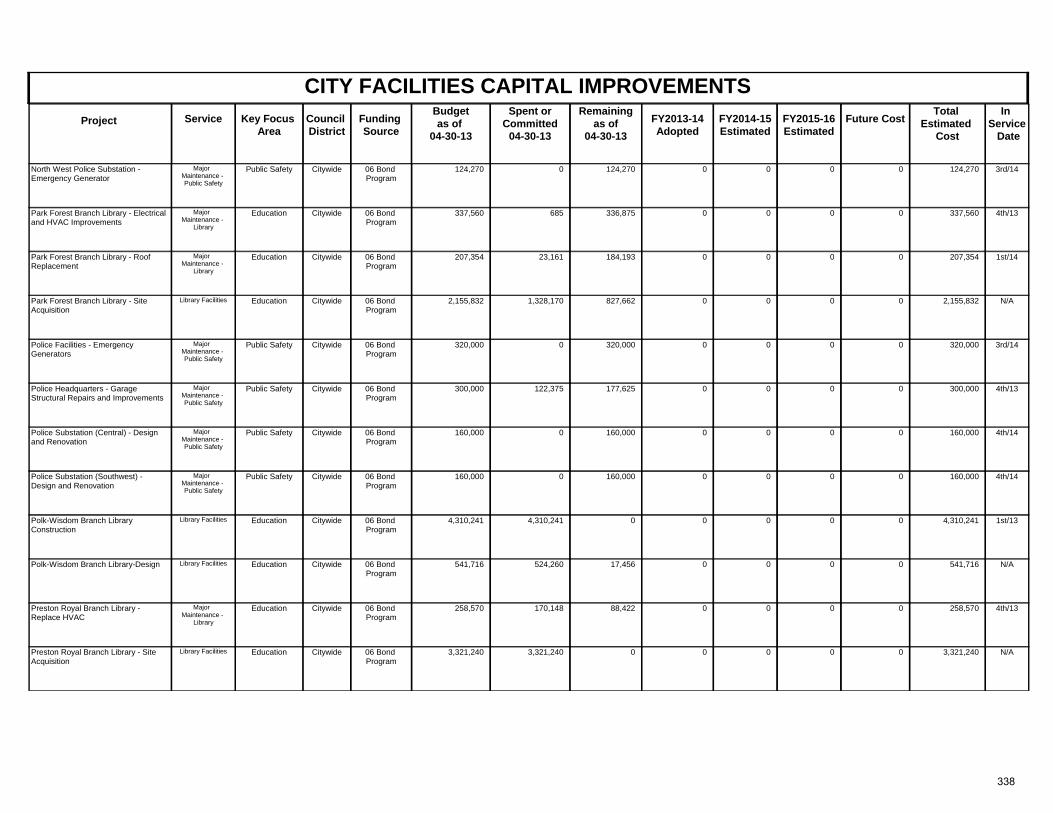
CITY FACILITIES CAPITAL IMPROVEMENTSProject Key Focus
AreaCouncil District
Spent orCommitted
04-30-13
Total Estimated
Cost
In Service Date
Funding Source
Remainingas of
04-30-13 FY2013-14
AdoptedFuture CostService FY2014-15
Estimated FY2015-16 Estimated
Budgetas of
04-30-13
Public Safety Citywide 3rd/1406 Bond Program
124,270 0 124,270 124,270North West Police Substation - Emergency Generator
0 0Major Maintenance - Public Safety
00
Education Citywide 4th/1306 Bond Program
337,560 685 336,875 337,560Park Forest Branch Library - Electrical and HVAC Improvements
0 0Major Maintenance -
Library
00
Education Citywide 1st/1406 Bond Program
207,354 23,161 184,193 207,354Park Forest Branch Library - Roof Replacement
0 0Major Maintenance -
Library
00
Education Citywide N/A06 Bond Program
2,155,832 1,328,170 827,662 2,155,832Park Forest Branch Library - Site Acquisition
0 0Library Facilities 00
Public Safety Citywide 3rd/1406 Bond Program
320,000 0 320,000 320,000Police Facilities - Emergency Generators
0 0Major Maintenance - Public Safety
00
Public Safety Citywide 4th/1306 Bond Program
300,000 122,375 177,625 300,000Police Headquarters - Garage Structural Repairs and Improvements
0 0Major Maintenance - Public Safety
00
Public Safety Citywide 4th/1406 Bond Program
160,000 0 160,000 160,000Police Substation (Central) - Design and Renovation
0 0Major Maintenance - Public Safety
00
Public Safety Citywide 4th/1406 Bond Program
160,000 0 160,000 160,000Police Substation (Southwest) - Design and Renovation
0 0Major Maintenance - Public Safety
00
Education Citywide 1st/1306 Bond Program
4,310,241 4,310,241 0 4,310,241Polk-Wisdom Branch Library Construction
0 0Library Facilities 00
Education Citywide N/A06 Bond Program
541,716 524,260 17,456 541,716Polk-Wisdom Branch Library-Design 0 0Library Facilities 00
Education Citywide 4th/1306 Bond Program
258,570 170,148 88,422 258,570Preston Royal Branch Library - Replace HVAC
0 0Major Maintenance -
Library
00
Education Citywide N/A06 Bond Program
3,321,240 3,321,240 0 3,321,240Preston Royal Branch Library - Site Acquisition
0 0Library Facilities 00
338
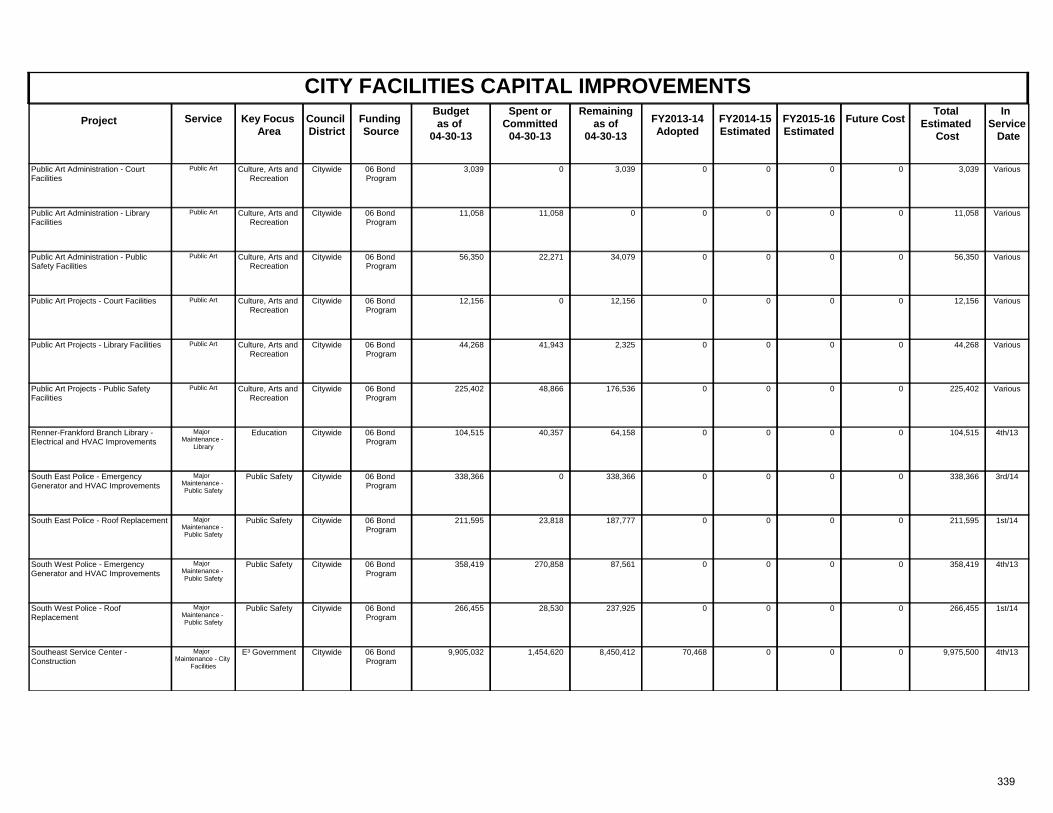
CITY FACILITIES CAPITAL IMPROVEMENTSProject Key Focus
AreaCouncil District
Spent orCommitted
04-30-13
Total Estimated
Cost
In Service Date
Funding Source
Remainingas of
04-30-13 FY2013-14
AdoptedFuture CostService FY2014-15
Estimated FY2015-16 Estimated
Budgetas of
04-30-13
Culture, Arts and Recreation
Citywide Various06 Bond Program
3,039 0 3,039 3,039Public Art Administration - Court Facilities
0 0Public Art 00
Culture, Arts and Recreation
Citywide Various06 Bond Program
11,058 11,058 0 11,058Public Art Administration - Library Facilities
0 0Public Art 00
Culture, Arts and Recreation
Citywide Various06 Bond Program
56,350 22,271 34,079 56,350Public Art Administration - Public Safety Facilities
0 0Public Art 00
Culture, Arts and Recreation
Citywide Various06 Bond Program
12,156 0 12,156 12,156Public Art Projects - Court Facilities 0 0Public Art 00
Culture, Arts and Recreation
Citywide Various06 Bond Program
44,268 41,943 2,325 44,268Public Art Projects - Library Facilities 0 0Public Art 00
Culture, Arts and Recreation
Citywide Various06 Bond Program
225,402 48,866 176,536 225,402Public Art Projects - Public Safety Facilities
0 0Public Art 00
Education Citywide 4th/1306 Bond Program
104,515 40,357 64,158 104,515Renner-Frankford Branch Library - Electrical and HVAC Improvements
0 0Major Maintenance -
Library
00
Public Safety Citywide 3rd/1406 Bond Program
338,366 0 338,366 338,366South East Police - Emergency Generator and HVAC Improvements
0 0Major Maintenance - Public Safety
00
Public Safety Citywide 1st/1406 Bond Program
211,595 23,818 187,777 211,595South East Police - Roof Replacement 0 0Major Maintenance - Public Safety
00
Public Safety Citywide 4th/1306 Bond Program
358,419 270,858 87,561 358,419South West Police - Emergency Generator and HVAC Improvements
0 0Major Maintenance - Public Safety
00
Public Safety Citywide 1st/1406 Bond Program
266,455 28,530 237,925 266,455South West Police - Roof Replacement
0 0Major Maintenance - Public Safety
00
E³ Government Citywide 4th/1306 Bond Program
9,905,032 1,454,620 8,450,412 9,975,500Southeast Service Center - Construction
70,468 0Major Maintenance - City
Facilities
00
339
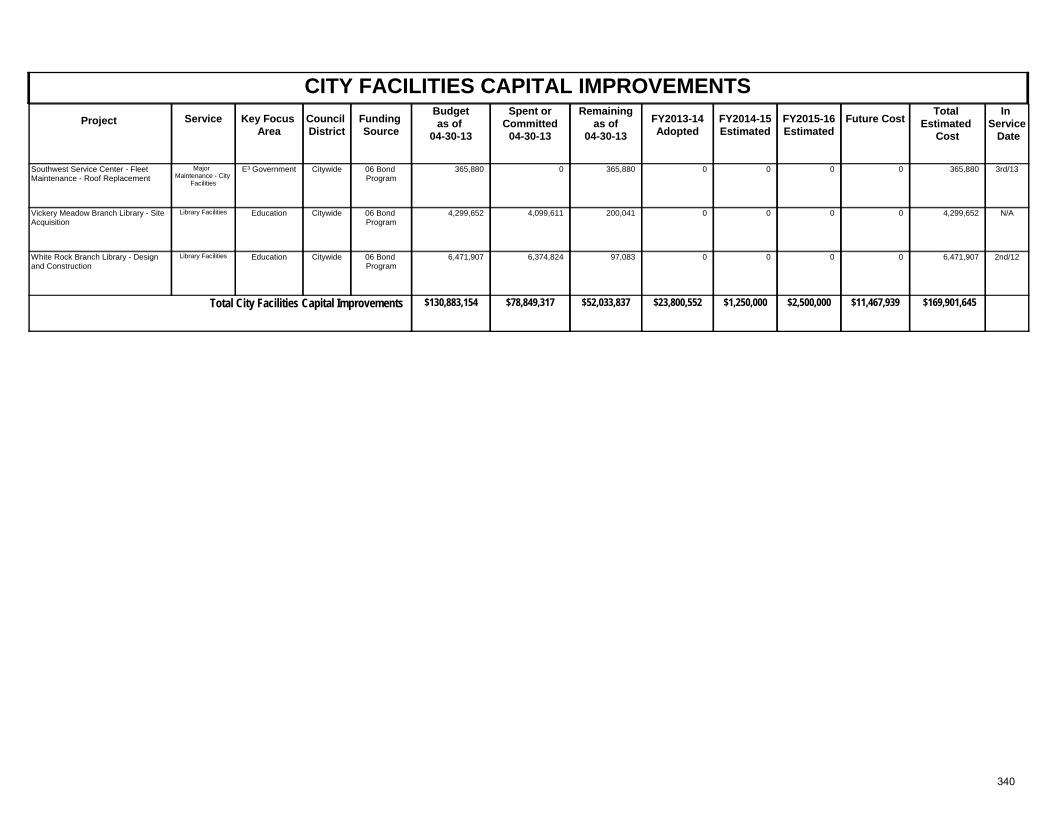
CITY FACILITIES CAPITAL IMPROVEMENTSProject Key Focus
AreaCouncil District
Spent orCommitted
04-30-13
Total Estimated
Cost
In Service Date
Funding Source
Remainingas of
04-30-13 FY2013-14
AdoptedFuture CostService FY2014-15
Estimated FY2015-16 Estimated
Budgetas of
04-30-13
E³ Government Citywide 3rd/1306 Bond Program
365,880 0 365,880 365,880Southwest Service Center - Fleet Maintenance - Roof Replacement
0 0Major Maintenance - City
Facilities
00
Education Citywide N/A06 Bond Program
4,299,652 4,099,611 200,041 4,299,652Vickery Meadow Branch Library - Site Acquisition
0 0Library Facilities 00
Education Citywide 2nd/1206 Bond Program
6,471,907 6,374,824 97,083 6,471,907White Rock Branch Library - Design and Construction
0 0Library Facilities 00
$130,883,154 $52,033,837Total City Facilities Capital Improvements $78,849,317 $169,901,645$23,800,552 $11,467,939$2,500,000$1,250,000
340
CONVENTION AND EVENT SERVICES FACILITIES IMPROVEMENTS
MISSION The Department of Convention and Event Services is directed towards: (1) renovating, maintaining, and preserving existing facilities, (2) replacing equipment to enhance operational efficiency and occupant safety, and (3) expanding Convention Center facilities to ensure adequate space necessary to attract new clients, visitors and citizens to the facility. A variety of convention and event facilities are available to clients, citizens and visitors to Dallas, including the Dallas Convention Center, Dallas Farmers Market, and Union Station Transportation Hub. HIGHLIGHTED ACCOMPLISHMENTS FOR FY 2012-13
1. Completed construction contract for upper D meeting spaces proposed in the capital improvement program of the Dallas Convention Center.
2. Completed construction of the Dallas Convention Center Hotel
integration.
3. Completed phase II study for proposed capital improvement program of existing facility, meeting/ballroom spaces, restrooms and mechanical, electrical, plumbing (MEP) renovations at the DCC.
4. Transitioned Dallas Farmers Market to private
ownership/operations. The plan was executed on June 17, 2013.
5. Awarded the contract and began construction of phase 1 of the roof replacement, the Fire Alarm and emergency lighting improvements and the water proofing of A,B and C Buildings.
6. Awarded the contract for Phase 2 of the roof replacement.
7. Awarded the contract and replaced the cooling towers at Union
Station
HIGHLIGHTED OBJECTIVES FOR FY 2013-14
1. Complete both reroofing projects, waterproofing and the improvement of the fire alarm and emergency lighting system.
2. Finalize the planning and design and award the construction
contract of restrooms and meeting rooms.
3. Complete waterproofing at Union Station. SERVICE DESCRIPTIONS Convention Center Improvements The Dallas Convention Center has identified a list of needs that has formed the basis for the capital improvement program that will be implemented in two phases. Phase I finished out the D area meeting space and hotel connector integration into the Dallas Convention Center as well as HVAC improvements. Phase II will cover life safety improvements and a waterproofing package that includes new roofing and interior improvements. Farmers Market Improvements City Council approved the development agreement for privatization of Dallas Farmers Market on February 27, 2013 and the sale and lease of real property at the Market on March 27, 2013. City ownership, management and operations of the Market ceased on June 17, 2013. Union Station Renovations These projects included the masonry wall cleaning and repairs, granite cleaning and repairs, plaster repairs, terra cotta cleaning and repairs, steel window restoration (excludes abatement), north canopy restoration, terrace/loggia waterproofing, roof replacement, and improvement and upgrading HVAC system, electrical and plumbing systems at Union Station.
341
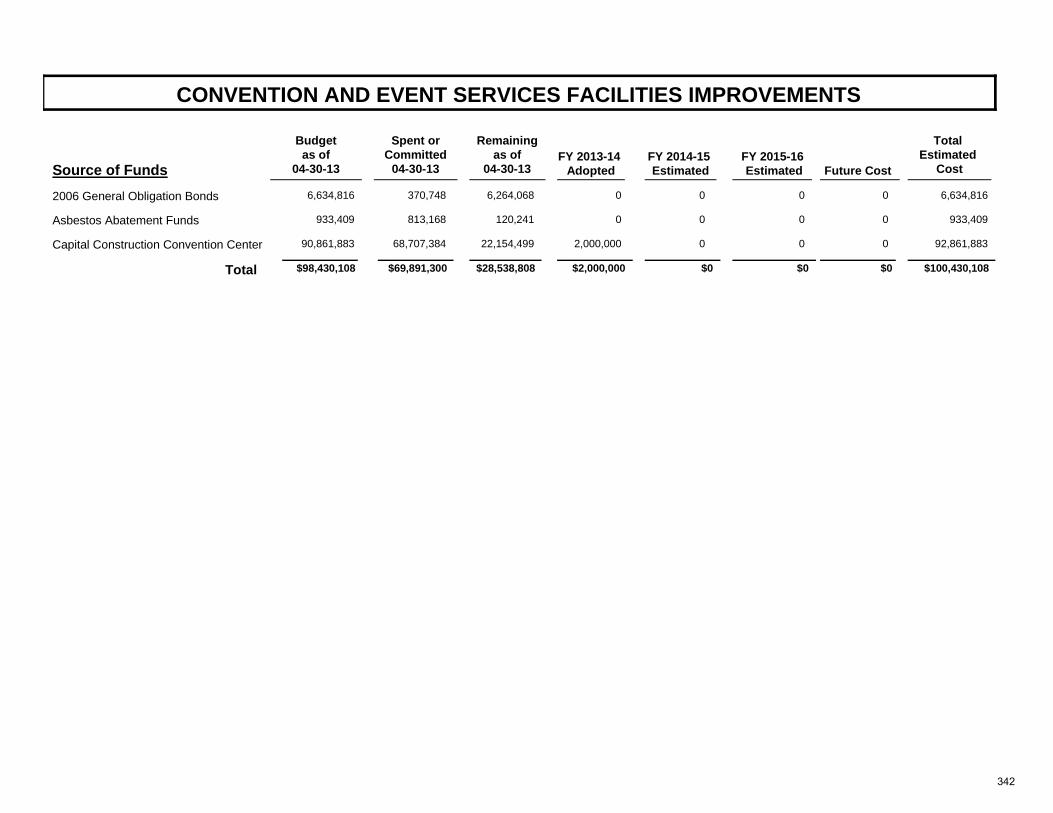
CONVENTION AND EVENT SERVICES FACILITIES IMPROVEMENTS
Source of FundsFY 2013-14
Adopted
Total Estimated
CostFY 2014-15 Estimated
FY 2015-16 Estimated
Future Cost
Remainingas of
04-30-13
Spent orCommitted
04-30-13
Budgetas of
04-30-13
2006 General Obligation Bonds 6,634,816 370,748 06,264,068 6,634,8160 0 0
Asbestos Abatement Funds 933,409 813,168 0120,241 933,4090 0 0
Capital Construction Convention Center 90,861,883 68,707,384 2,000,00022,154,499 92,861,8830 0 0
$69,891,300 $2,000,000Total $98,430,108 $28,538,808 $0 $100,430,108$0 $0
342
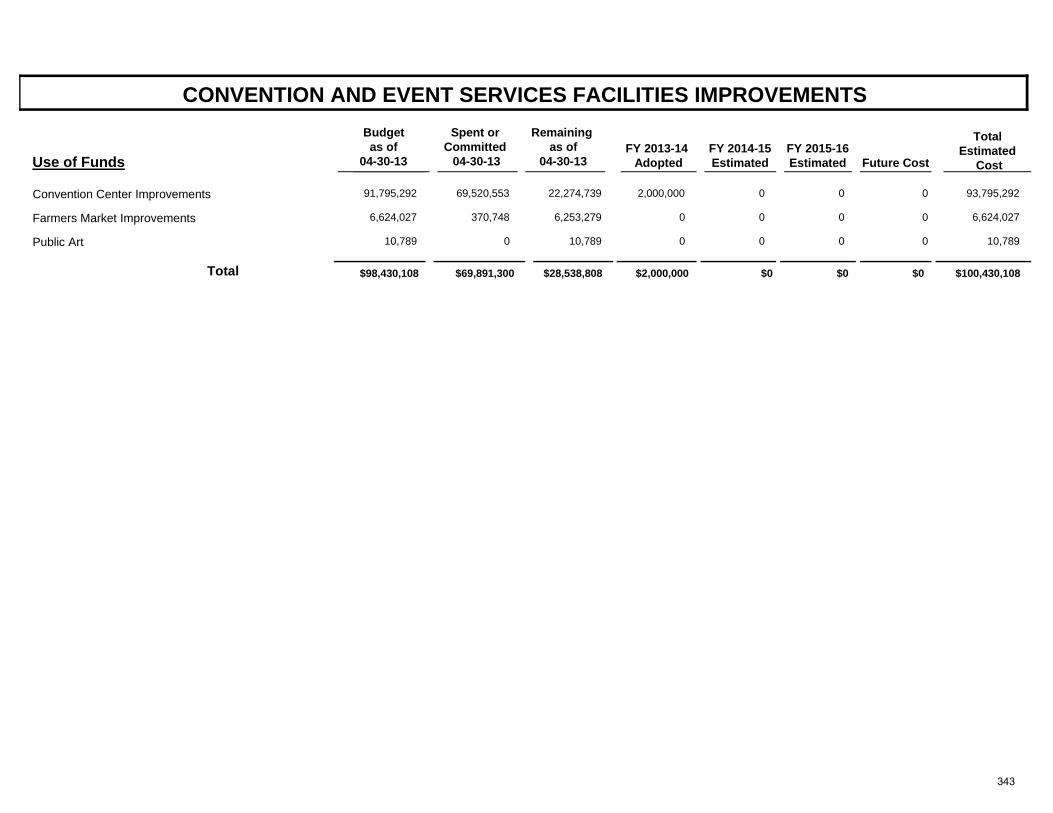
CONVENTION AND EVENT SERVICES FACILITIES IMPROVEMENTS
Use of FundsFY 2013-14
Adopted
Total Estimated
Cost FY 2014-15 Estimated
FY 2015-16 Estimated
Future Cost
Spent or Committed
04-30-13
Remaining as of
04-30-13
Budget as of
04-30-13
Convention Center Improvements 91,795,292 69,520,553 2,000,00022,274,739 93,795,2920 0 0
Farmers Market Improvements 6,624,027 370,748 06,253,279 6,624,0270 0 0
Public Art 10,789 0 010,789 10,7890 0 0
$69,891,300 $2,000,000Total $98,430,108 $28,538,808 $0 $100,430,108$0 $0
343
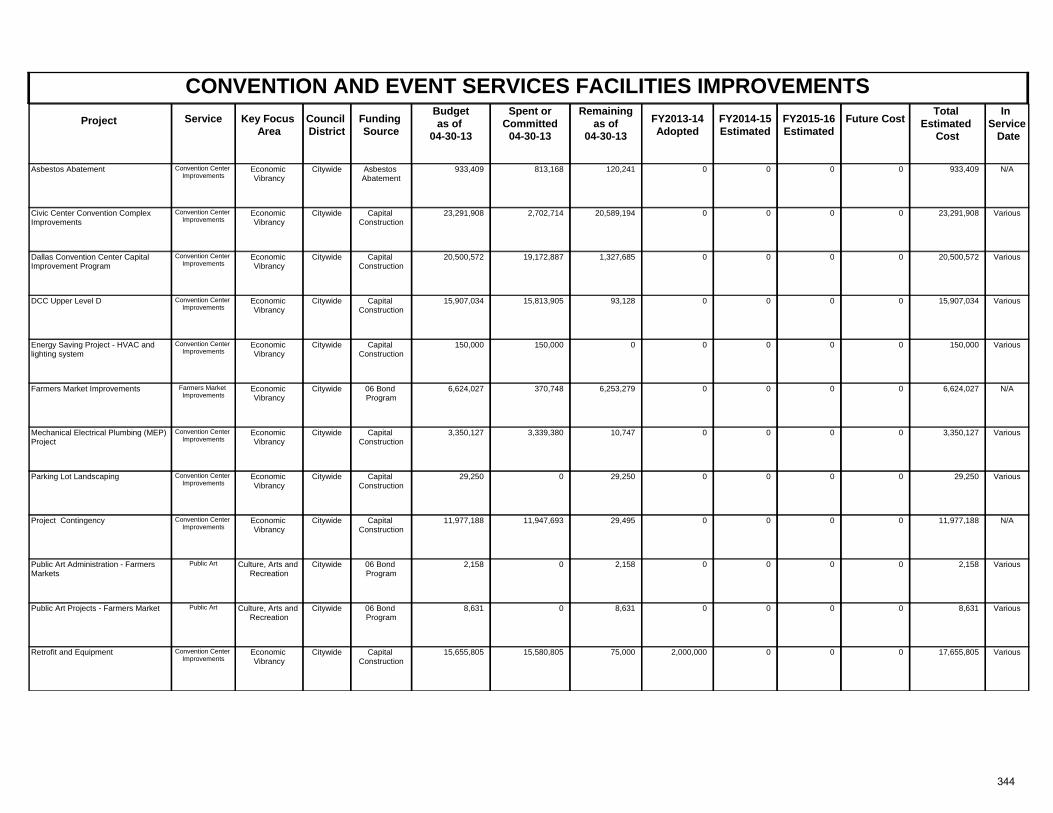
CONVENTION AND EVENT SERVICES FACILITIES IMPROVEMENTSProject Key Focus
AreaCouncil District
Spent orCommitted
04-30-13
Total Estimated
Cost
In Service Date
Funding Source
Remainingas of
04-30-13 FY2013-14
AdoptedFuture CostService FY2014-15
Estimated FY2015-16 Estimated
Budgetas of
04-30-13
Economic Vibrancy
Citywide N/AAsbestos Abatement
933,409 813,168 120,241 933,409Asbestos Abatement 0 0Convention Center Improvements
00
Economic Vibrancy
Citywide VariousCapital Construction
23,291,908 2,702,714 20,589,194 23,291,908Civic Center Convention Complex Improvements
0 0Convention Center Improvements
00
Economic Vibrancy
Citywide VariousCapital Construction
20,500,572 19,172,887 1,327,685 20,500,572Dallas Convention Center Capital Improvement Program
0 0Convention Center Improvements
00
Economic Vibrancy
Citywide VariousCapital Construction
15,907,034 15,813,905 93,128 15,907,034DCC Upper Level D 0 0Convention Center Improvements
00
Economic Vibrancy
Citywide VariousCapital Construction
150,000 150,000 0 150,000Energy Saving Project - HVAC and lighting system
0 0Convention Center Improvements
00
Economic Vibrancy
Citywide N/A06 Bond Program
6,624,027 370,748 6,253,279 6,624,027Farmers Market Improvements 0 0Farmers Market Improvements
00
Economic Vibrancy
Citywide VariousCapital Construction
3,350,127 3,339,380 10,747 3,350,127Mechanical Electrical Plumbing (MEP) Project
0 0Convention Center Improvements
00
Economic Vibrancy
Citywide VariousCapital Construction
29,250 0 29,250 29,250Parking Lot Landscaping 0 0Convention Center Improvements
00
Economic Vibrancy
Citywide N/ACapital Construction
11,977,188 11,947,693 29,495 11,977,188Project Contingency 0 0Convention Center Improvements
00
Culture, Arts and Recreation
Citywide Various06 Bond Program
2,158 0 2,158 2,158Public Art Administration - Farmers Markets
0 0Public Art 00
Culture, Arts and Recreation
Citywide Various06 Bond Program
8,631 0 8,631 8,631Public Art Projects - Farmers Market 0 0Public Art 00
Economic Vibrancy
Citywide VariousCapital Construction
15,655,805 15,580,805 75,000 17,655,805Retrofit and Equipment 2,000,000 0Convention Center Improvements
00
344
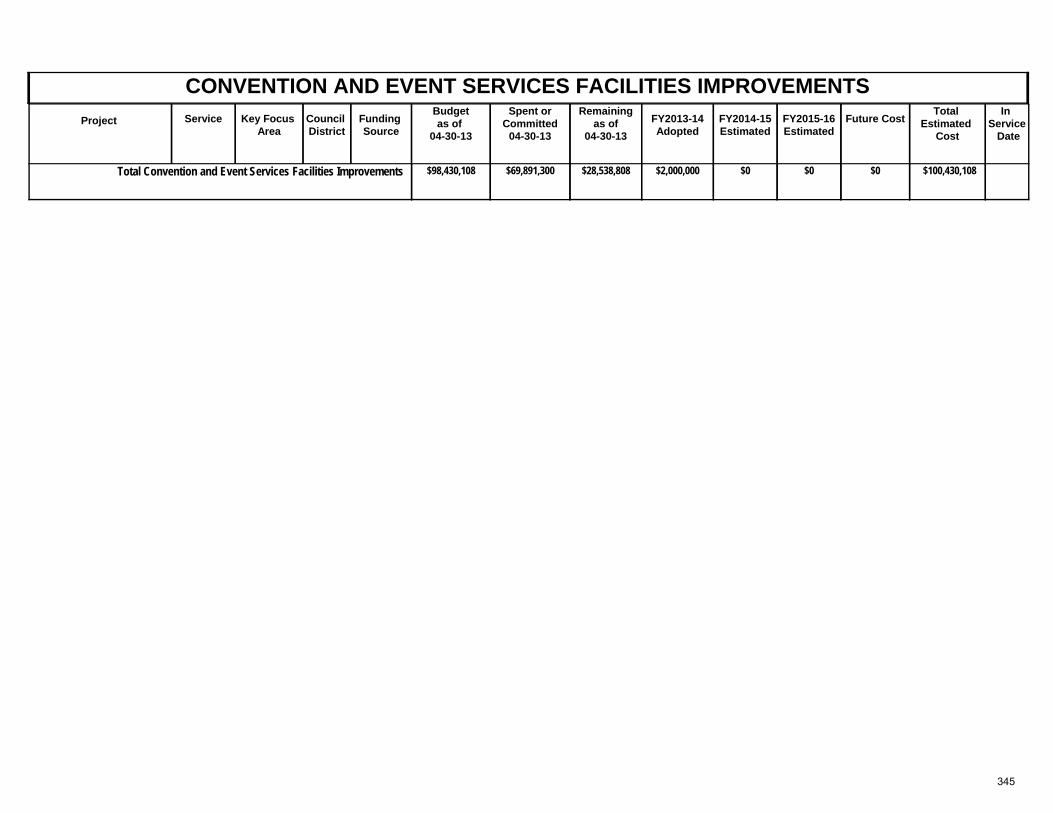
CONVENTION AND EVENT SERVICES FACILITIES IMPROVEMENTSProject Key Focus
AreaCouncil District
Spent orCommitted
04-30-13
Total Estimated
Cost
In Service Date
Funding Source
Remainingas of
04-30-13 FY2013-14
AdoptedFuture CostService FY2014-15
Estimated FY2015-16 Estimated
Budgetas of
04-30-13
$98,430,108 $28,538,808Total Convention and Event Services Facilities Improvements $69,891,300 $100,430,108$2,000,000 $0$0$0
345
CULTURAL FACILITIES CAPITAL IMPROVEMENTS
MISSION This program provides funding for site acquisition, design, construction and/or renovation of the City's cultural facilities including the Meyerson Symphony Center, Dallas Museum of Art, Bath House Cultural Center, City Performance Hall, Latino Cultural Center, Majestic Theatre, Oak Cliff Cultural Center, South Dallas Cultural Center, and WRR 101.1FM. The program includes the strategic Cultural Facilities Master Plan to provide effective and efficient utilization of existing facilities, develop a plan for investment in the existing facilities and funding for any new facilities, as well as Public Art. Private funding participation consistent with the City of Dallas Cultural Policy is required for this program. HIGHLIGHTED ACCOMPLISHMENTS FOR FY2012-13
1. Opened the City Performance Hall. 2. Completed roof and HVAC replacement at the Majestic Theater.
3. Upgraded dimmer system at the Majestic Theater.
4. Completed twelve public art projects: Dallas Love Field (8) – (Moss
Lee Love Garden, East Tunnel to Ticketing Hall, Ramp to Parking Garage, Concourse exit glass wall, Lobby Focal Wall, Concourse Diamond area, Entrance Garden, Entrance Ramp); White Rock Hill Library; Fire Station #50; Oak Cliff Mural; Cotton Bowl.
HIGHLIGHTED OBJECTIVES FOR FY2013-14
1. Initiate 9 new public art works: Samuel Grand Park; Fretz Park; South Dallas Distribution Center; Dallas Zoo; Water Theater Re-Design; Jaycee-Zaragoza Park; Kleberg-Rylie Park; Fretz Park Branch Library; Polk Wisdom Branch Library; Beckley-Commerce Street.
2. Complete 13 works of public art projects: Fire Station #32; Arboretum; Fire Station #27; Texas Horse Park; Fire Station #44; Highland Hills Library; Elm Fork Soccer Complex; Samuel Grand Park; Fretz Park; Love Field (2) – (Baggage Claim and West Tunnel.
3. Upgrade HVAC controls of Balcony and 5th floor units at the Majestic Theater.
4. Complete upgrade of the Fire Alarm System at Majestic Theater.
SERVICE DESCRIPTIONS Cultural Facilities Site acquisition, design, construction and/or renovation of the City’s cultural facilities. Major Maintenance Repair and replacement of major building systems that typically cost more than $10,000 and provide timely and appropriate maintenance to protect the City's general fund facility investment. This process ensures safe and usable facilities for citizens and staff, and maintains a positive image for the City. Examples of building systems include elevators, structural components, roofs, HVAC, electrical, plumbing, and interior finishes. Municipal Radio Improvements Projects include the upgrading and expanding of digital broadcast equipment to ensure high quality broadcast, uninterrupted service, and compliance withFederal Communications Commission requirements for a 100,000 Kw FM radio transmitter, and the construction of a new broadcast facility or renovation of existing broadcast facility, including building security and production studio improvements. City Performance Hall Completes the planning, design and construction of a performing arts theater and constructing the related site improvements within the Downtown Arts District, including the acquisition of land, relocation of utilities, and infrastructure improvements. Professional Services and Debt Issuance Provides funding for certain costs associated with capital improvement projects. These costs include studies and long-range plans, debt issuance costs, and reimbursements to the General Fund for professional staff services such as design, survey, land acquisition fees and engineering. Debt issuance and CIP engineering costs are paid from the interest earned on bond proceeds. These costs may also include transfers to the General Fund and/or the Debt Service Fund. Public Art Includes the public art initiatives throughout the City of Dallas. Funds generated by Public Art appropriations are used for the design services of artists, for the selection, acquisition, commissioning and display of artworks and for administration of the public art projects.
346
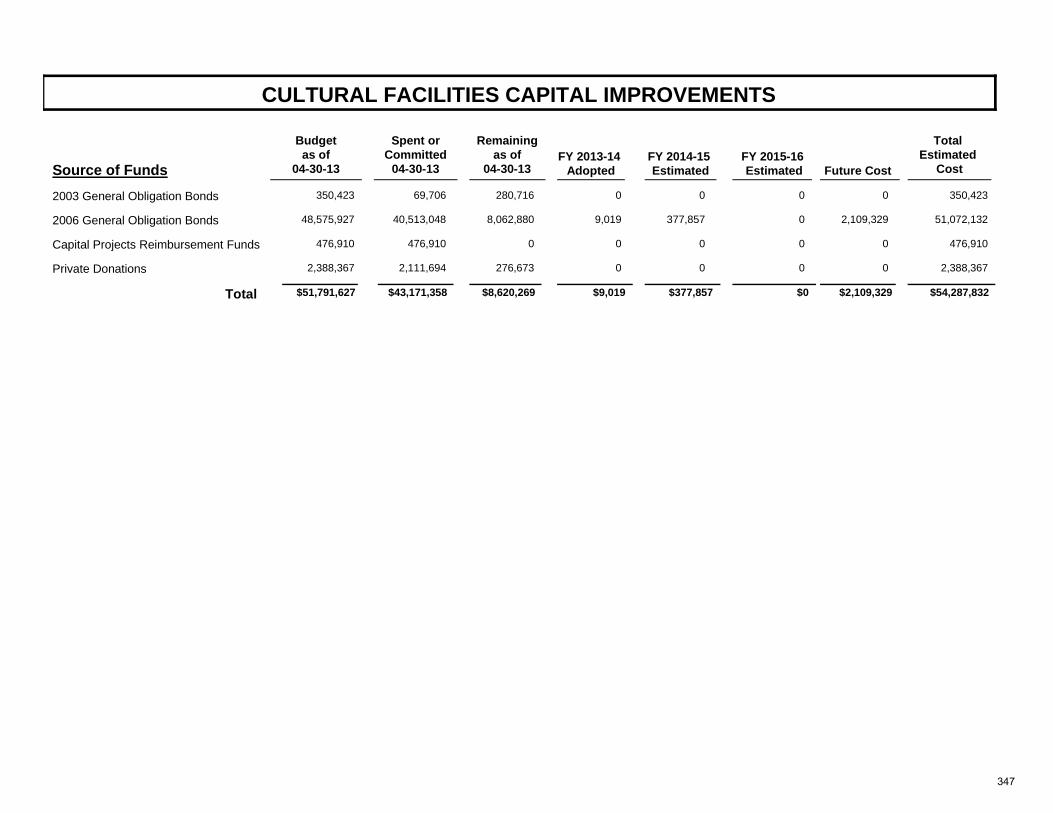
CULTURAL FACILITIES CAPITAL IMPROVEMENTS
Source of FundsFY 2013-14
Adopted
Total Estimated
CostFY 2014-15 Estimated
FY 2015-16 Estimated
Future Cost
Remainingas of
04-30-13
Spent orCommitted
04-30-13
Budgetas of
04-30-13
2003 General Obligation Bonds 350,423 69,706 0280,716 350,4230 0 0
2006 General Obligation Bonds 48,575,927 40,513,048 9,0198,062,880 51,072,132377,857 0 2,109,329
Capital Projects Reimbursement Funds 476,910 476,910 00 476,9100 0 0
Private Donations 2,388,367 2,111,694 0276,673 2,388,3670 0 0
$43,171,358 $9,019Total $51,791,627 $8,620,269 $377,857 $54,287,832$0 $2,109,329
347
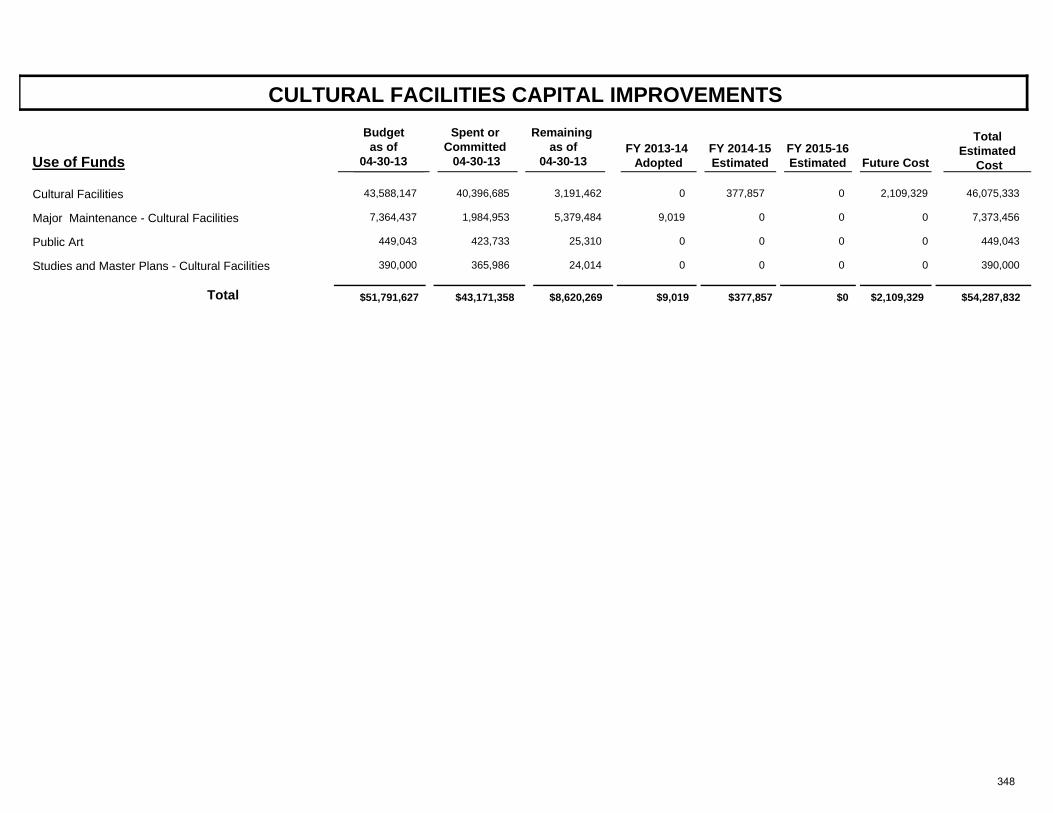
CULTURAL FACILITIES CAPITAL IMPROVEMENTS
Use of FundsFY 2013-14
Adopted
Total Estimated
Cost FY 2014-15 Estimated
FY 2015-16 Estimated
Future Cost
Spent or Committed
04-30-13
Remaining as of
04-30-13
Budget as of
04-30-13
Cultural Facilities 43,588,147 40,396,685 03,191,462 46,075,333377,857 0 2,109,329
Major Maintenance - Cultural Facilities 7,364,437 1,984,953 9,0195,379,484 7,373,4560 0 0
Public Art 449,043 423,733 025,310 449,0430 0 0
Studies and Master Plans - Cultural Facilities 390,000 365,986 024,014 390,0000 0 0
$43,171,358 $9,019Total $51,791,627 $8,620,269 $377,857 $54,287,832$0 $2,109,329
348
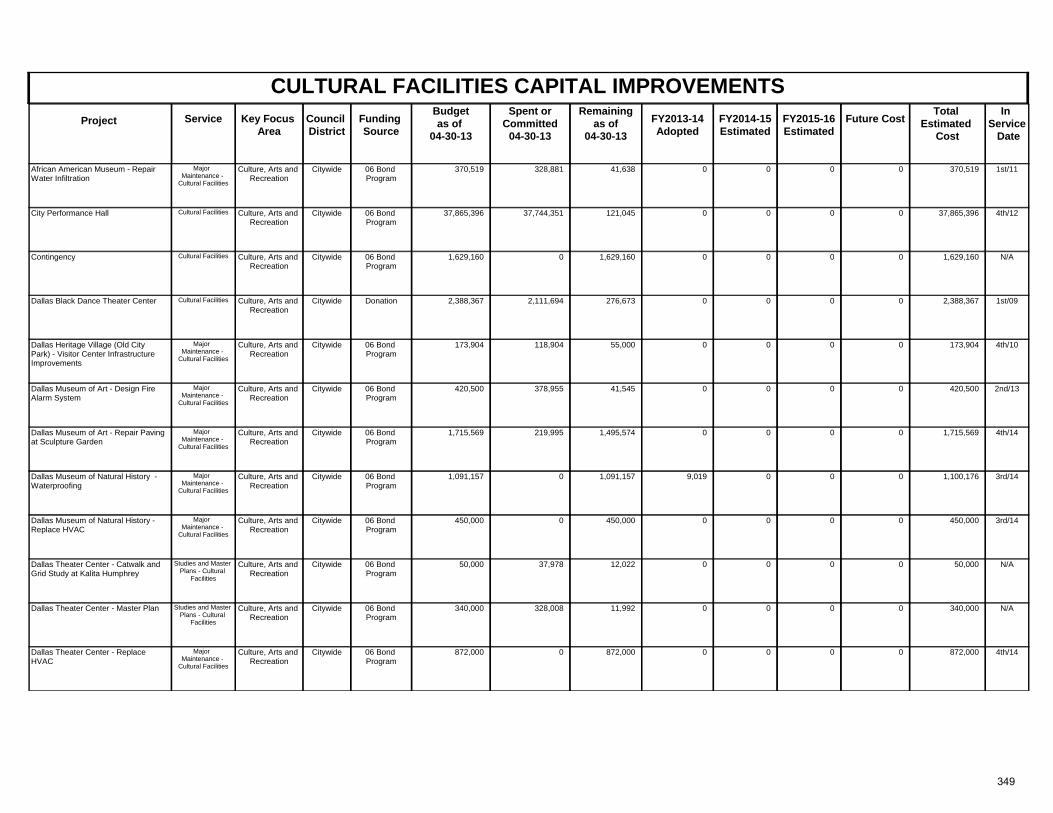
CULTURAL FACILITIES CAPITAL IMPROVEMENTSProject Key Focus
AreaCouncil District
Spent orCommitted
04-30-13
Total Estimated
Cost
In Service Date
Funding Source
Remainingas of
04-30-13 FY2013-14
AdoptedFuture CostService FY2014-15
Estimated FY2015-16 Estimated
Budgetas of
04-30-13
Culture, Arts and Recreation
Citywide 1st/1106 Bond Program
370,519 328,881 41,638 370,519African American Museum - Repair Water Infiltration
0 0Major Maintenance -
Cultural Facilities
00
Culture, Arts and Recreation
Citywide 4th/1206 Bond Program
37,865,396 37,744,351 121,045 37,865,396City Performance Hall 0 0Cultural Facilities 00
Culture, Arts and Recreation
Citywide N/A06 Bond Program
1,629,160 0 1,629,160 1,629,160Contingency 0 0Cultural Facilities 00
Culture, Arts and Recreation
Citywide 1st/09Donation 2,388,367 2,111,694 276,673 2,388,367Dallas Black Dance Theater Center 0 0Cultural Facilities 00
Culture, Arts and Recreation
Citywide 4th/1006 Bond Program
173,904 118,904 55,000 173,904Dallas Heritage Village (Old City Park) - Visitor Center Infrastructure Improvements
0 0Major Maintenance -
Cultural Facilities
00
Culture, Arts and Recreation
Citywide 2nd/1306 Bond Program
420,500 378,955 41,545 420,500Dallas Museum of Art - Design Fire Alarm System
0 0Major Maintenance -
Cultural Facilities
00
Culture, Arts and Recreation
Citywide 4th/1406 Bond Program
1,715,569 219,995 1,495,574 1,715,569Dallas Museum of Art - Repair Paving at Sculpture Garden
0 0Major Maintenance -
Cultural Facilities
00
Culture, Arts and Recreation
Citywide 3rd/1406 Bond Program
1,091,157 0 1,091,157 1,100,176Dallas Museum of Natural History - Waterproofing
9,019 0Major Maintenance -
Cultural Facilities
00
Culture, Arts and Recreation
Citywide 3rd/1406 Bond Program
450,000 0 450,000 450,000Dallas Museum of Natural History - Replace HVAC
0 0Major Maintenance -
Cultural Facilities
00
Culture, Arts and Recreation
Citywide N/A06 Bond Program
50,000 37,978 12,022 50,000Dallas Theater Center - Catwalk and Grid Study at Kalita Humphrey
0 0Studies and Master Plans - Cultural
Facilities
00
Culture, Arts and Recreation
Citywide N/A06 Bond Program
340,000 328,008 11,992 340,000Dallas Theater Center - Master Plan 0 0Studies and Master Plans - Cultural
Facilities
00
Culture, Arts and Recreation
Citywide 4th/1406 Bond Program
872,000 0 872,000 872,000Dallas Theater Center - Replace HVAC
0 0Major Maintenance -
Cultural Facilities
00
349
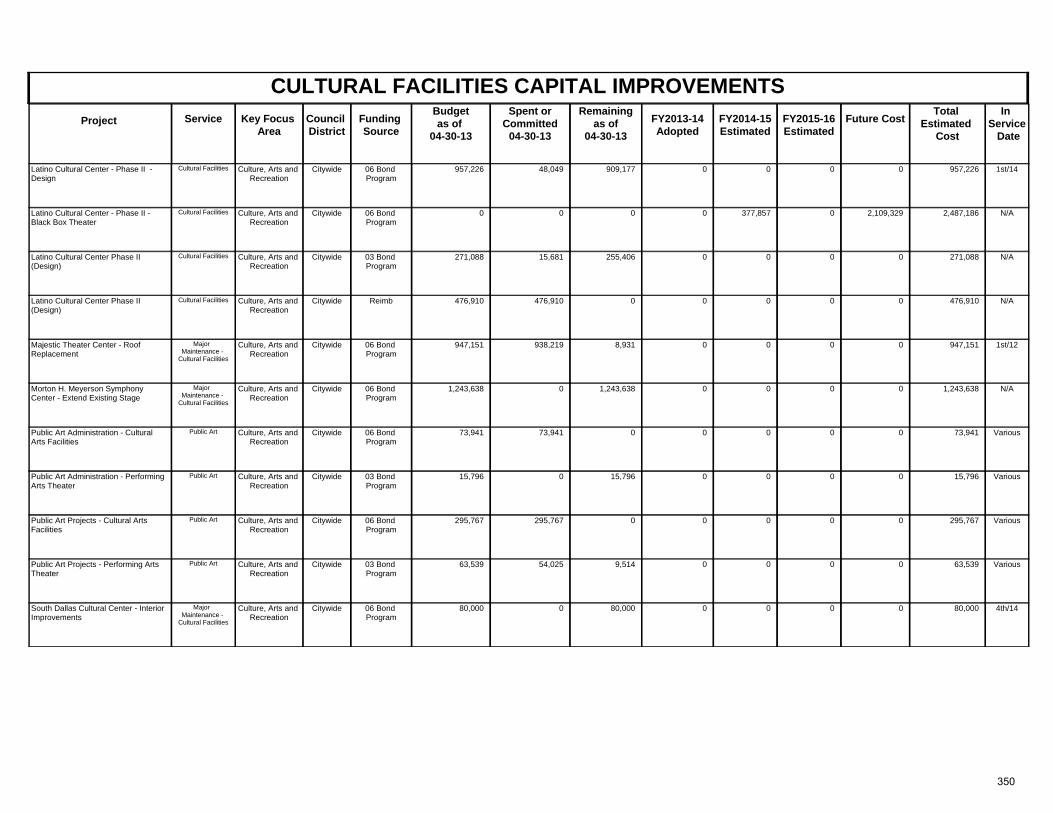
CULTURAL FACILITIES CAPITAL IMPROVEMENTSProject Key Focus
AreaCouncil District
Spent orCommitted
04-30-13
Total Estimated
Cost
In Service Date
Funding Source
Remainingas of
04-30-13 FY2013-14
AdoptedFuture CostService FY2014-15
Estimated FY2015-16 Estimated
Budgetas of
04-30-13
Culture, Arts and Recreation
Citywide 1st/1406 Bond Program
957,226 48,049 909,177 957,226Latino Cultural Center - Phase II - Design
0 0Cultural Facilities 00
Culture, Arts and Recreation
Citywide N/A06 Bond Program
0 0 0 2,487,186Latino Cultural Center - Phase II -Black Box Theater
0 2,109,329Cultural Facilities 0377,857
Culture, Arts and Recreation
Citywide N/A03 Bond Program
271,088 15,681 255,406 271,088Latino Cultural Center Phase II (Design)
0 0Cultural Facilities 00
Culture, Arts and Recreation
Citywide N/AReimb 476,910 476,910 0 476,910Latino Cultural Center Phase II (Design)
0 0Cultural Facilities 00
Culture, Arts and Recreation
Citywide 1st/1206 Bond Program
947,151 938,219 8,931 947,151Majestic Theater Center - Roof Replacement
0 0Major Maintenance -
Cultural Facilities
00
Culture, Arts and Recreation
Citywide N/A06 Bond Program
1,243,638 0 1,243,638 1,243,638Morton H. Meyerson Symphony Center - Extend Existing Stage
0 0Major Maintenance -
Cultural Facilities
00
Culture, Arts and Recreation
Citywide Various06 Bond Program
73,941 73,941 0 73,941Public Art Administration - Cultural Arts Facilities
0 0Public Art 00
Culture, Arts and Recreation
Citywide Various03 Bond Program
15,796 0 15,796 15,796Public Art Administration - Performing Arts Theater
0 0Public Art 00
Culture, Arts and Recreation
Citywide Various06 Bond Program
295,767 295,767 0 295,767Public Art Projects - Cultural Arts Facilities
0 0Public Art 00
Culture, Arts and Recreation
Citywide Various03 Bond Program
63,539 54,025 9,514 63,539Public Art Projects - Performing Arts Theater
0 0Public Art 00
Culture, Arts and Recreation
Citywide 4th/1406 Bond Program
80,000 0 80,000 80,000South Dallas Cultural Center - Interior Improvements
0 0Major Maintenance -
Cultural Facilities
00
350
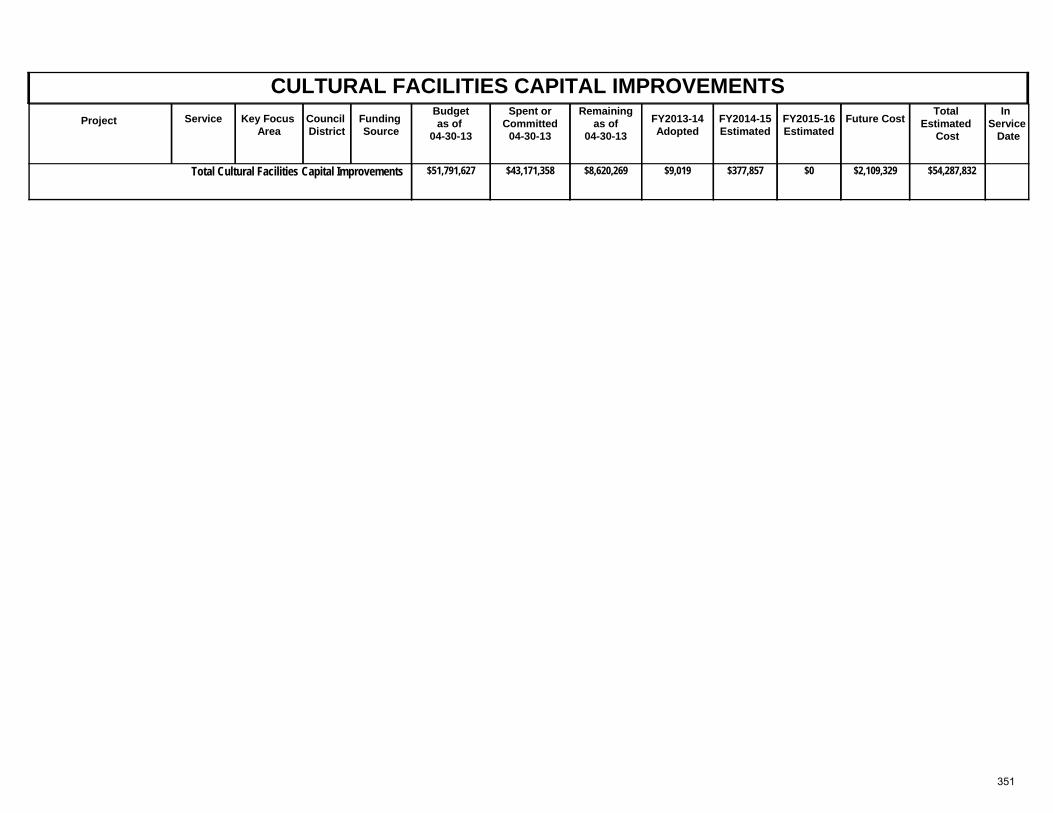
CULTURAL FACILITIES CAPITAL IMPROVEMENTSProject Key Focus
AreaCouncil District
Spent orCommitted
04-30-13
Total Estimated
Cost
In Service Date
Funding Source
Remainingas of
04-30-13 FY2013-14
AdoptedFuture CostService FY2014-15
Estimated FY2015-16 Estimated
Budgetas of
04-30-13
$51,791,627 $8,620,269Total Cultural Facilities Capital Improvements $43,171,358 $54,287,832$9,019 $2,109,329$0$377,857
351
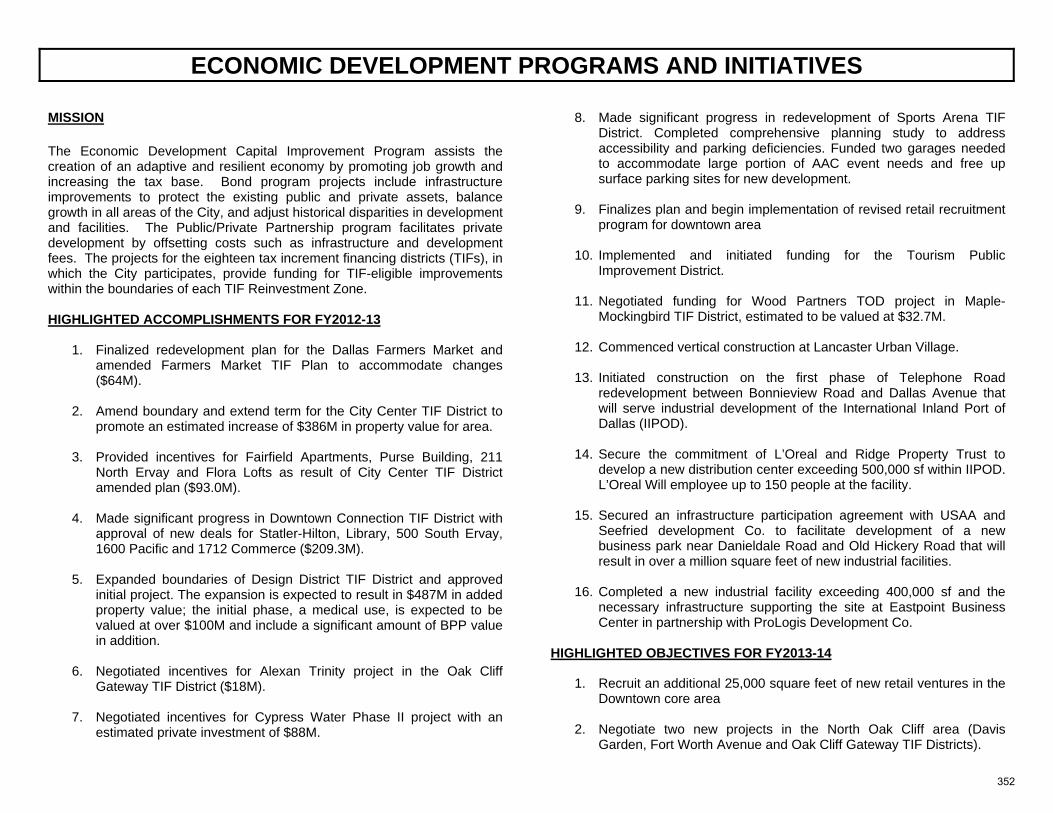
ECONOMIC DEVELOPMENT PROGRAMS AND INITIATIVES
MISSION The Economic Development Capital Improvement Program assists the creation of an adaptive and resilient economy by promoting job growth and increasing the tax base. Bond program projects include infrastructure improvements to protect the existing public and private assets, balance growth in all areas of the City, and adjust historical disparities in development and facilities. The Public/Private Partnership program facilitates private development by offsetting costs such as infrastructure and development fees. The projects for the eighteen tax increment financing districts (TIFs), in which the City participates, provide funding for TIF-eligible improvements within the boundaries of each TIF Reinvestment Zone. HIGHLIGHTED ACCOMPLISHMENTS FOR FY2012-13
1. Finalized redevelopment plan for the Dallas Farmers Market and amended Farmers Market TIF Plan to accommodate changes ($64M).
2. Amend boundary and extend term for the City Center TIF District to promote an estimated increase of $386M in property value for area.
3. Provided incentives for Fairfield Apartments, Purse Building, 211 North Ervay and Flora Lofts as result of City Center TIF District amended plan ($93.0M).
4. Made significant progress in Downtown Connection TIF District with approval of new deals for Statler-Hilton, Library, 500 South Ervay, 1600 Pacific and 1712 Commerce ($209.3M).
5. Expanded boundaries of Design District TIF District and approved initial project. The expansion is expected to result in $487M in added property value; the initial phase, a medical use, is expected to be valued at over $100M and include a significant amount of BPP value in addition.
6. Negotiated incentives for Alexan Trinity project in the Oak Cliff Gateway TIF District ($18M).
7. Negotiated incentives for Cypress Water Phase II project with an estimated private investment of $88M.
8. Made significant progress in redevelopment of Sports Arena TIF District. Completed comprehensive planning study to address accessibility and parking deficiencies. Funded two garages needed to accommodate large portion of AAC event needs and free up surface parking sites for new development.
9. Finalizes plan and begin implementation of revised retail recruitment program for downtown area
10. Implemented and initiated funding for the Tourism Public Improvement District.
11. Negotiated funding for Wood Partners TOD project in Maple-Mockingbird TIF District, estimated to be valued at $32.7M.
12. Commenced vertical construction at Lancaster Urban Village.
13. Initiated construction on the first phase of Telephone Road
redevelopment between Bonnieview Road and Dallas Avenue that will serve industrial development of the International Inland Port of Dallas (IIPOD).
14. Secure the commitment of L’Oreal and Ridge Property Trust to develop a new distribution center exceeding 500,000 sf within IIPOD. L’Oreal Will employee up to 150 people at the facility.
15. Secured an infrastructure participation agreement with USAA and
Seefried development Co. to facilitate development of a new business park near Danieldale Road and Old Hickery Road that will result in over a million square feet of new industrial facilities.
16. Completed a new industrial facility exceeding 400,000 sf and the necessary infrastructure supporting the site at Eastpoint Business Center in partnership with ProLogis Development Co.
HIGHLIGHTED OBJECTIVES FOR FY2013-14
1. Recruit an additional 25,000 square feet of new retail ventures in the Downtown core area
2. Negotiate two new projects in the North Oak Cliff area (Davis Garden, Fort Worth Avenue and Oak Cliff Gateway TIF Districts).
352
ECONOMIC DEVELOPMENT PROGRAMS AND INITIATIVES
3. Negotiate one additional project in Transient-Oriented Development (TOD) TIF District.
4. Negotiate one additional project in Parkland area (Southwestern Medical and Maple-Mockingbird TIF Districts).
5. Finalize redevelopment plans for Bishop Arts Village and consider
creation of a new TIF District or termination of agreement.
6. Complete Area planning for 5 TOD project areas funded by HUD Sustainable Community Challenge Planning Grant.
7. Pursue redevelopment of Highland Park Apartments in Southeast Oak Cliff.
8. Secure commitments for the development of over one (1) million sf of new industrial facilities within IIPOD.
9. Initiate construction of Cleveland Road improvements to facilitate the development of over 100 acres of undeveloped property for a new commercial operation.
SERVICE DESCRIPTIONS Acquisition & Demolition Economic development in the Southern area of the city, as well as other areas of the city in connection with transit oriented development, through planning, designing, constructing, improving, extending and expanding public street, utility and other infrastructure facilities, including the acquisition of land therefore, and through funding the city’s programs for economic development including the acquisition of improved and unimproved properties, the demolition of existing structures, making loans and grants of bond proceeds and otherwise providing assistance for private commercial, industrial retail, residential and mixed-use development. Affordable Housing Land acquisition for the development of low and moderate-income, owner-occupied, single-family homes. These are housing related services and are provided by The Housing Department. Cedars Tax Increment Financing District Initiated in 1992, the Cedars Tax Increment Financing District provides infrastructure improvements in the Cedars area. The TIF will expire in 2022.
City Center Tax Increment Financing District Initiated in 1996, the City Center Tax Increment Financing District provides a long-term program to replace and upgrade the area’s infrastructure and create a vibrant downtown core district. The intent of the program is to improve the economics for developing residential property in the downtown core and creating a destination retail district that serves downtown residents and visitors and supporting the office market. The TIF will expire in 2012. Cityplace Area Tax Increment Financing District Initiated in 1992, the Cityplace Area Tax Increment Financing District consists of a program of public improvements intended to stimulate new private investment in the Cityplace neighborhood over a 20-year period. The TIF expired in 2012. Davis Garden Tax Increment Financing District Initiated in 2007, the Davis Garden Tax Increment Financing District provides a long-term program to replace and upgrade the area’s infrastructure, support redevelopment of structurally obsolete apartment and commercial development in the North Oak Cliff area and create a vibrant mixed-use district in the area southwest of the intersection of Westmoreland Road and I-30. The TIF will expire in 2039. Deep Ellum Tax Increment Financing District Initiated in 2005, the Deep Ellum Tax Increment Financing District provides funding for environmental Remediation and infrastructure improvements in the Deep Ellum area. The TIF will expire in 2028. Design District Tax Increment Financing District Initiated in 2005, the Design District Tax Increment Financing District provides funding for environmental remediation and infrastructure improvements in the Design District area. The TIF will expire in 2028. Downtown Connection Tax Increment Financing District Initiated in 2005, the Downtown Connection Tax Increment Financing District provides a long-term program to replace and upgrade the area’s infrastructure, fund catalyst projects and create a vibrant downtown core district. The intent of the program is to improve the economics for developing residential property in the downtown core and creating a destination retail district that serves downtown residents and visitors and supporting the office market. The TIF will expire in 2036.
353
ECONOMIC DEVELOPMENT PROGRAMS AND INITIATIVES
Farmers Market Tax Increment Financing District Initiated in 1998, the Farmers Market Tax Increment Financing District has been instrumental in stimulating private investment and leasing demand in the Farmers Market area. The TIF will expire in 2013. Fort Worth Avenue Tax Increment Financing District Initiated in 2007, the Fort Worth Avenue Tax Increment Financing District provides a long-term program to replace and upgrade the area’s infrastructure, support redevelopment of structurally obsolete commercial development in the North Oak Cliff area in order to foster the redevelopment of the Fort Worth Avenue corridor between the Trinity River and west of Hampton Road. The TIF will expire in 2029. Grand Park South Tax Increment Financing District Initiated in 2005, the Grand Park South Tax Increment Financing District provides funding for environmental remediation, historic preservation and infrastructure improvements in the area west of Fair Park and north of Martin Luther King, Jr. Boulevard. The TIF will expire in 2036. Infrastructure Support Provides funding for infrastructure support of economic development and Neighborhood Investment Program projects in Southern Dallas. It also provides funding for infrastructure support for transit-oriented development. Maple-Mockingbird Tax Increment Financing District Initiated in 2008, the Maple-Mockingbird Tax Increment Financing District provides funding for environmental remediation and infrastructure improvements in the area between Dallas Love Field Airport and the Southwestern Medical District. The TIF will expire in 2033. Neighborhood Revitalization Initiatives Funding for developer fee rebates and housing construction cost participation. Oak Cliff Gateway Tax Increment Financing District Initiated in 1992, the Oak Cliff Gateway Tax Increment Financing District promotes the redevelopment, stabilization, and growth of the Oak Cliff Gateway TIF District area. The TIF will expire in 2022. Cypress Waters Tax Increment Financing District Initiated in 2011, the Cypress Waters Tax Increment Financing District promotes the redevelopment, stabilization, and growth of the Cypress Waters TIF District area. The TIF will expire in 2040.
Professional Services and Debt Issuance Provides funding for certain costs associated with capital improvement projects. These costs include studies and long-range plans, debt issuance costs, and reimbursements to the General Fund for professional staff services such as design, survey, land acquisition fees and engineering. Debt issuance and CIP Engineering costs are paid from the interest earned on bond proceeds. Public Art Includes the public art initiatives throughout the City of Dallas. Funds generated by Public Art appropriations are used for the design services of artists, for the selection, acquisition, commissioning and display of artworks and for administration of the public art projects. Public Private Partnership This program provides a funding source for qualified business related projects to facilitate private investment and job creation and real estate development in the City of Dallas. Funds are primarily targeted for business and other development projects occurring in Southern Dallas, the City’s Enterprise Zones, targeted industries and transit oriented development. Eligible expenditures include economic development grants to offset infrastructure costs, development fees and other associated development costs for certain qualifying projects through special programmatic provisions. Skillman Corridor Tax Increment Financing District Initiated in 2005, the Skillman Corridor Tax Increment Financing District provides a long-term program to replace and upgrade the area’s infrastructure, fund environmental remediation in order to support redevelopment of structurally obsolete apartments and commercial development in the Skillman Corridor area between Caruth Haven and LBJ Freeway. The TIF will expire in 2036. Southwestern Medical Tax Increment Financing District Initiated in 2005, the Southwest Medical Tax Increment Financing District provides funding for environmental remediation and infrastructure improvements in the Southwestern Medical area. The TIF will expire in 2028. Sports Arena Tax Increment Financing District Initiated in 1998, the Sports Arena Tax Increment Financing District is expected to stimulate development and redevelopment that would not otherwise occur solely through private investment in the area of Dallas. The TIF will expire in 2019.
354
ECONOMIC DEVELOPMENT PROGRAMS AND INITIATIVES
State-Thomas Tax Increment Financing District Initiated in 1989, the State-Thomas Tax Increment Financing District was the first to be created. The district has been successful at utilizing TIF funded public infrastructure improvements to attract and enable private sector development. Development, which has occurred in the State-Thomas TIF District, has resulted in a substantial impact on the surrounding community. The TIF expired in 2008. Final infrastructure improvements for the district are currently nearing completion. TOD Tax Increment Financing District Initiated in 2008, the TOD Tax Increment Financing District provides funding for environmental remediation infrastructure improvements in three areas along the DART line: the Lancaster-Corridor/8th& Corinth area; the Cedars West area; and the Mockingbird/Lovers Lane area. The TIF will expire in 2038. Vickery Meadow Tax Increment Financing District Initiated in 2005, the Vickery Meadow Tax Increment Financing District provides funding for grants, environmental remediation and infrastructure improvements in the Vickery Meadow area. The TIF will expire in 2028.
355
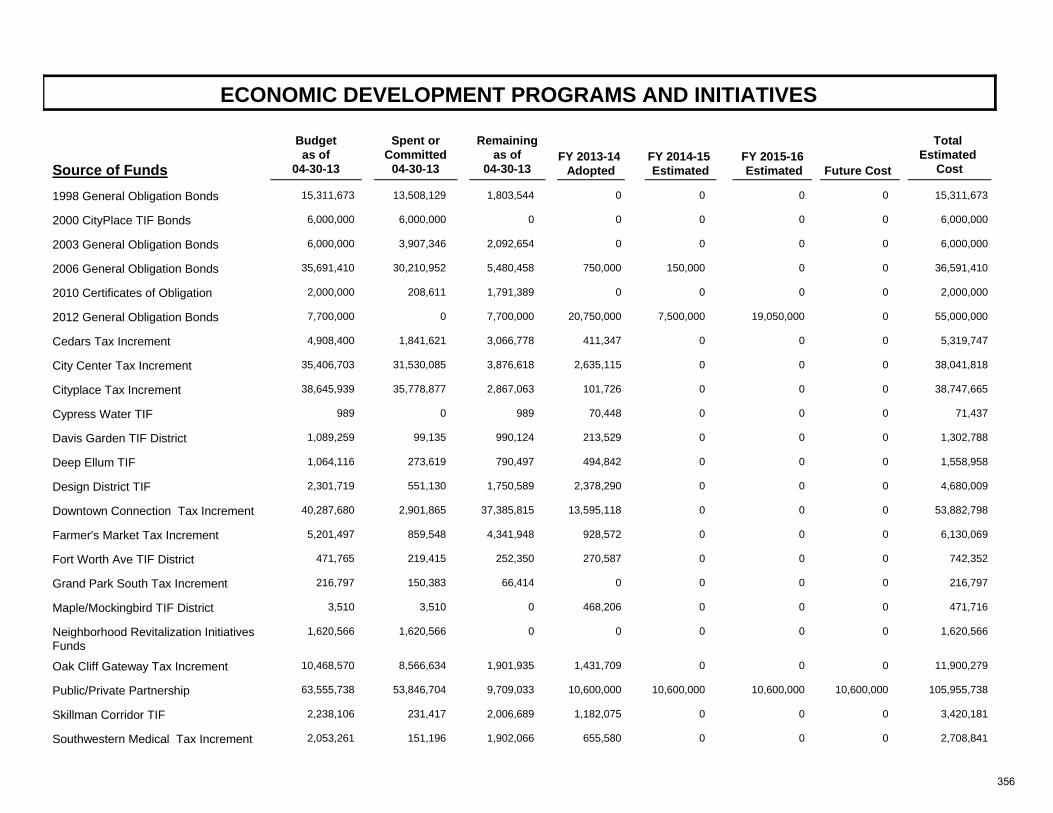
ECONOMIC DEVELOPMENT PROGRAMS AND INITIATIVES
Source of FundsFY 2013-14
Adopted
Total Estimated
CostFY 2014-15 Estimated
FY 2015-16 Estimated
Future Cost
Remainingas of
04-30-13
Spent orCommitted
04-30-13
Budgetas of
04-30-13
1998 General Obligation Bonds 15,311,673 13,508,129 01,803,544 15,311,6730 0 0
2000 CityPlace TIF Bonds 6,000,000 6,000,000 00 6,000,0000 0 0
2003 General Obligation Bonds 6,000,000 3,907,346 02,092,654 6,000,0000 0 0
2006 General Obligation Bonds 35,691,410 30,210,952 750,0005,480,458 36,591,410150,000 0 0
2010 Certificates of Obligation 2,000,000 208,611 01,791,389 2,000,0000 0 0
2012 General Obligation Bonds 7,700,000 0 20,750,0007,700,000 55,000,0007,500,000 19,050,000 0
Cedars Tax Increment 4,908,400 1,841,621 411,3473,066,778 5,319,7470 0 0
City Center Tax Increment 35,406,703 31,530,085 2,635,1153,876,618 38,041,8180 0 0
Cityplace Tax Increment 38,645,939 35,778,877 101,7262,867,063 38,747,6650 0 0
Cypress Water TIF 989 0 70,448989 71,4370 0 0
Davis Garden TIF District 1,089,259 99,135 213,529990,124 1,302,7880 0 0
Deep Ellum TIF 1,064,116 273,619 494,842790,497 1,558,9580 0 0
Design District TIF 2,301,719 551,130 2,378,2901,750,589 4,680,0090 0 0
Downtown Connection Tax Increment 40,287,680 2,901,865 13,595,11837,385,815 53,882,7980 0 0
Farmer's Market Tax Increment 5,201,497 859,548 928,5724,341,948 6,130,0690 0 0
Fort Worth Ave TIF District 471,765 219,415 270,587252,350 742,3520 0 0
Grand Park South Tax Increment 216,797 150,383 066,414 216,7970 0 0
Maple/Mockingbird TIF District 3,510 3,510 468,2060 471,7160 0 0
Neighborhood Revitalization Initiatives Funds
1,620,566 1,620,566 00 1,620,5660 0 0
Oak Cliff Gateway Tax Increment 10,468,570 8,566,634 1,431,7091,901,935 11,900,2790 0 0
Public/Private Partnership 63,555,738 53,846,704 10,600,0009,709,033 105,955,73810,600,000 10,600,000 10,600,000
Skillman Corridor TIF 2,238,106 231,417 1,182,0752,006,689 3,420,1810 0 0
Southwestern Medical Tax Increment 2,053,261 151,196 655,5801,902,066 2,708,8410 0 0
356
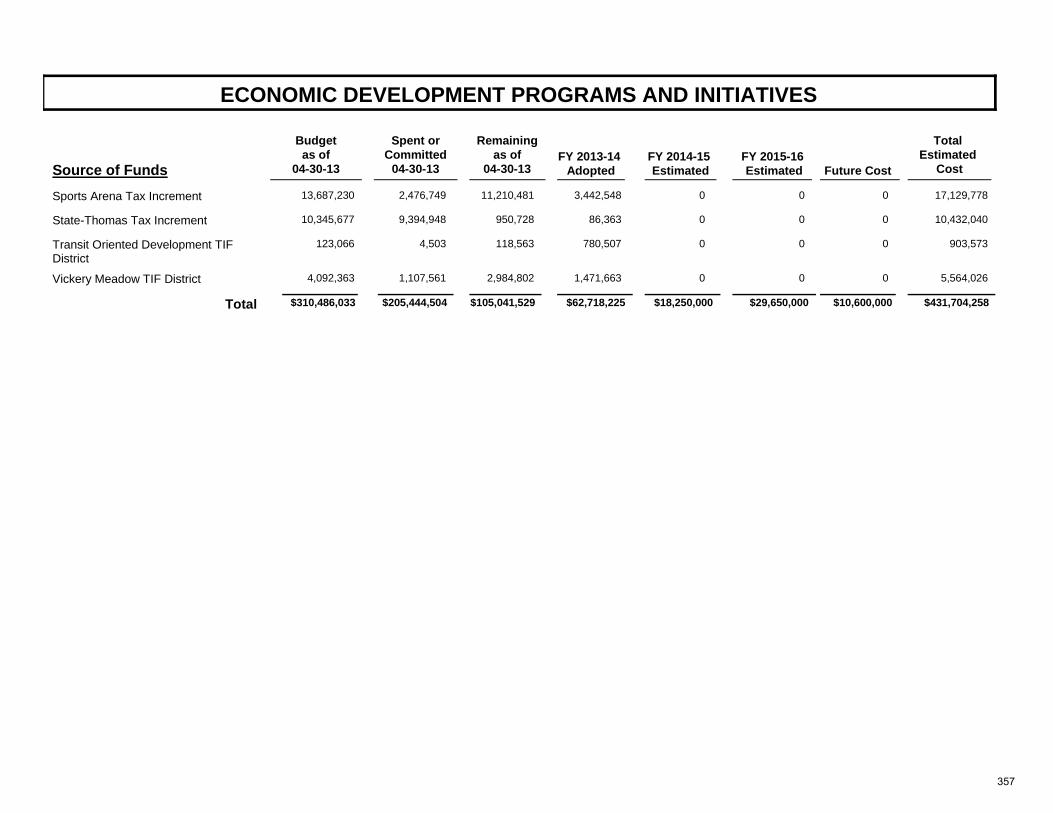
ECONOMIC DEVELOPMENT PROGRAMS AND INITIATIVES
Source of FundsFY 2013-14
Adopted
Total Estimated
CostFY 2014-15 Estimated
FY 2015-16 Estimated
Future Cost
Remainingas of
04-30-13
Spent orCommitted
04-30-13
Budgetas of
04-30-13
Sports Arena Tax Increment 13,687,230 2,476,749 3,442,54811,210,481 17,129,7780 0 0
State-Thomas Tax Increment 10,345,677 9,394,948 86,363950,728 10,432,0400 0 0
Transit Oriented Development TIF District
123,066 4,503 780,507118,563 903,5730 0 0
Vickery Meadow TIF District 4,092,363 1,107,561 1,471,6632,984,802 5,564,0260 0 0
$205,444,504 $62,718,225Total $310,486,033 $105,041,529 $18,250,000 $431,704,258$29,650,000 $10,600,000
357
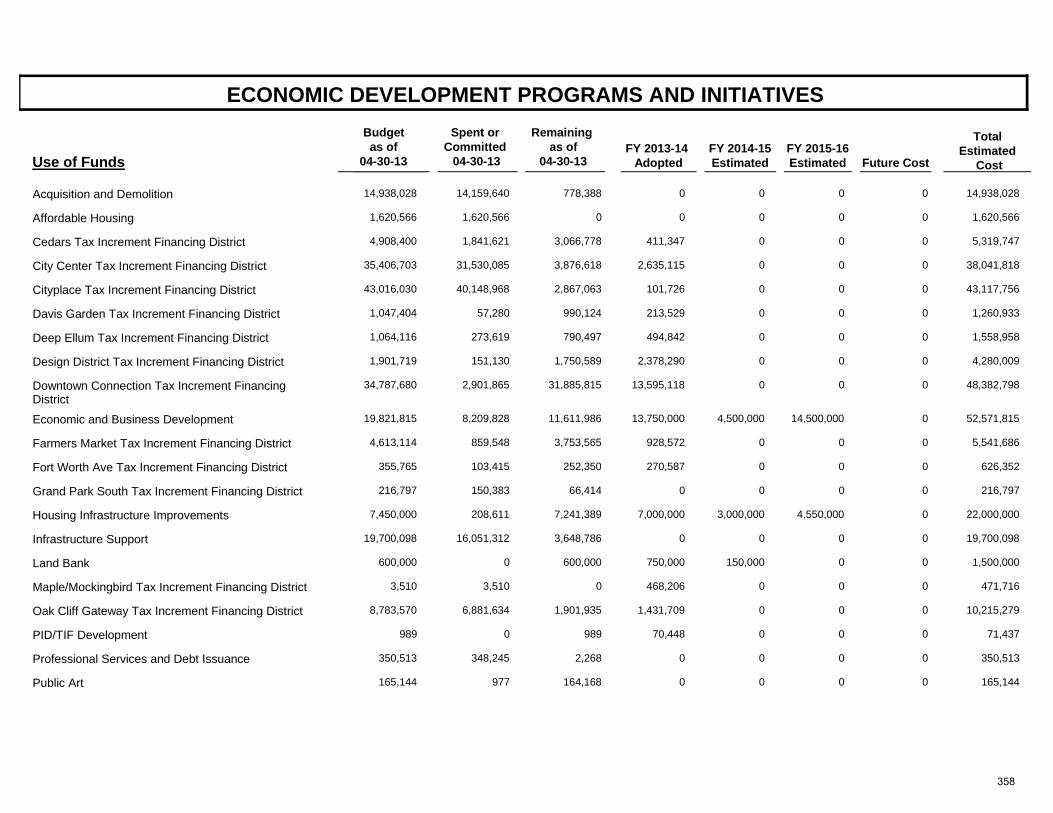
ECONOMIC DEVELOPMENT PROGRAMS AND INITIATIVES
Use of FundsFY 2013-14
Adopted
Total Estimated
Cost FY 2014-15 Estimated
FY 2015-16 Estimated
Future Cost
Spent or Committed
04-30-13
Remaining as of
04-30-13
Budget as of
04-30-13
Acquisition and Demolition 14,938,028 14,159,640 0778,388 14,938,0280 0 0
Affordable Housing 1,620,566 1,620,566 00 1,620,5660 0 0
Cedars Tax Increment Financing District 4,908,400 1,841,621 411,3473,066,778 5,319,7470 0 0
City Center Tax Increment Financing District 35,406,703 31,530,085 2,635,1153,876,618 38,041,8180 0 0
Cityplace Tax Increment Financing District 43,016,030 40,148,968 101,7262,867,063 43,117,7560 0 0
Davis Garden Tax Increment Financing District 1,047,404 57,280 213,529990,124 1,260,9330 0 0
Deep Ellum Tax Increment Financing District 1,064,116 273,619 494,842790,497 1,558,9580 0 0
Design District Tax Increment Financing District 1,901,719 151,130 2,378,2901,750,589 4,280,0090 0 0
Downtown Connection Tax Increment Financing District
34,787,680 2,901,865 13,595,11831,885,815 48,382,7980 0 0
Economic and Business Development 19,821,815 8,209,828 13,750,00011,611,986 52,571,8154,500,000 14,500,000 0
Farmers Market Tax Increment Financing District 4,613,114 859,548 928,5723,753,565 5,541,6860 0 0
Fort Worth Ave Tax Increment Financing District 355,765 103,415 270,587252,350 626,3520 0 0
Grand Park South Tax Increment Financing District 216,797 150,383 066,414 216,7970 0 0
Housing Infrastructure Improvements 7,450,000 208,611 7,000,0007,241,389 22,000,0003,000,000 4,550,000 0
Infrastructure Support 19,700,098 16,051,312 03,648,786 19,700,0980 0 0
Land Bank 600,000 0 750,000600,000 1,500,000150,000 0 0
Maple/Mockingbird Tax Increment Financing District 3,510 3,510 468,2060 471,7160 0 0
Oak Cliff Gateway Tax Increment Financing District 8,783,570 6,881,634 1,431,7091,901,935 10,215,2790 0 0
PID/TIF Development 989 0 70,448989 71,4370 0 0
Professional Services and Debt Issuance 350,513 348,245 02,268 350,5130 0 0
Public Art 165,144 977 0164,168 165,1440 0 0
358
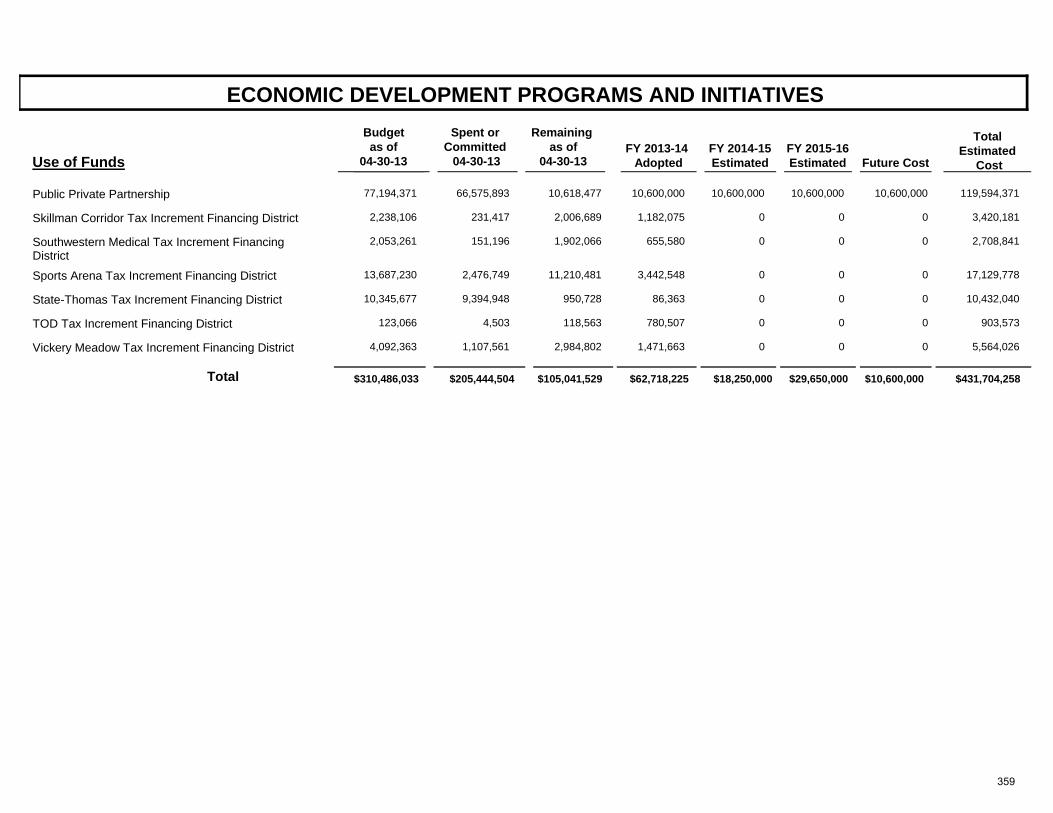
ECONOMIC DEVELOPMENT PROGRAMS AND INITIATIVES
Use of FundsFY 2013-14
Adopted
Total Estimated
Cost FY 2014-15 Estimated
FY 2015-16 Estimated
Future Cost
Spent or Committed
04-30-13
Remaining as of
04-30-13
Budget as of
04-30-13
Public Private Partnership 77,194,371 66,575,893 10,600,00010,618,477 119,594,37110,600,000 10,600,000 10,600,000
Skillman Corridor Tax Increment Financing District 2,238,106 231,417 1,182,0752,006,689 3,420,1810 0 0
Southwestern Medical Tax Increment Financing District
2,053,261 151,196 655,5801,902,066 2,708,8410 0 0
Sports Arena Tax Increment Financing District 13,687,230 2,476,749 3,442,54811,210,481 17,129,7780 0 0
State-Thomas Tax Increment Financing District 10,345,677 9,394,948 86,363950,728 10,432,0400 0 0
TOD Tax Increment Financing District 123,066 4,503 780,507118,563 903,5730 0 0
Vickery Meadow Tax Increment Financing District 4,092,363 1,107,561 1,471,6632,984,802 5,564,0260 0 0
$205,444,504 $62,718,225Total $310,486,033 $105,041,529 $18,250,000 $431,704,258$29,650,000 $10,600,000
359
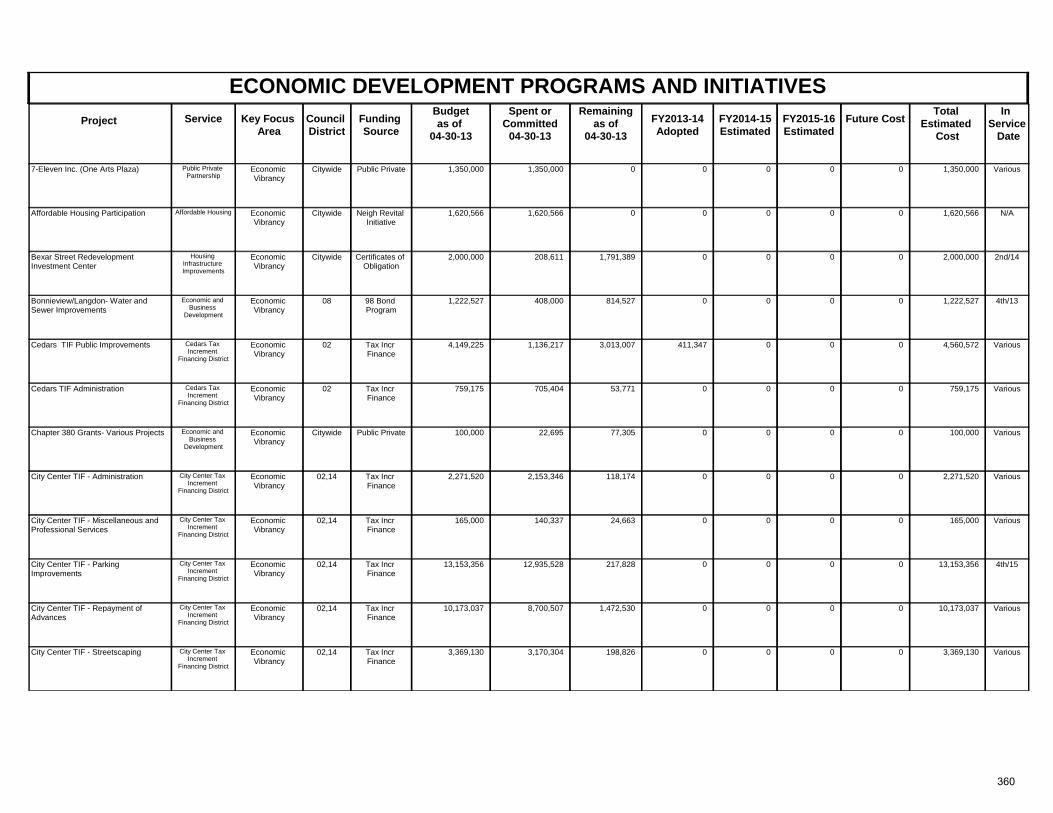
ECONOMIC DEVELOPMENT PROGRAMS AND INITIATIVESProject Key Focus
AreaCouncil District
Spent orCommitted
04-30-13
Total Estimated
Cost
In Service Date
Funding Source
Remainingas of
04-30-13 FY2013-14
AdoptedFuture CostService FY2014-15
Estimated FY2015-16 Estimated
Budgetas of
04-30-13
Economic Vibrancy
Citywide VariousPublic Private 1,350,000 1,350,000 0 1,350,0007-Eleven Inc. (One Arts Plaza) 0 0Public Private Partnership
00
Economic Vibrancy
Citywide N/ANeigh Revital Initiative
1,620,566 1,620,566 0 1,620,566Affordable Housing Participation 0 0Affordable Housing 00
Economic Vibrancy
Citywide 2nd/14Certificates of Obligation
2,000,000 208,611 1,791,389 2,000,000Bexar Street Redevelopment Investment Center
0 0Housing Infrastructure Improvements
00
Economic Vibrancy
08 4th/1398 Bond Program
1,222,527 408,000 814,527 1,222,527Bonnieview/Langdon- Water and Sewer Improvements
0 0Economic and Business
Development
00
Economic Vibrancy
02 VariousTax Incr Finance
4,149,225 1,136,217 3,013,007 4,560,572Cedars TIF Public Improvements 411,347 0Cedars Tax Increment
Financing District
00
Economic Vibrancy
02 VariousTax Incr Finance
759,175 705,404 53,771 759,175Cedars TIF Administration 0 0Cedars Tax Increment
Financing District
00
Economic Vibrancy
Citywide VariousPublic Private 100,000 22,695 77,305 100,000Chapter 380 Grants- Various Projects 0 0Economic and Business
Development
00
Economic Vibrancy
02,14 VariousTax Incr Finance
2,271,520 2,153,346 118,174 2,271,520City Center TIF - Administration 0 0City Center Tax Increment
Financing District
00
Economic Vibrancy
02,14 VariousTax Incr Finance
165,000 140,337 24,663 165,000City Center TIF - Miscellaneous and Professional Services
0 0City Center Tax Increment
Financing District
00
Economic Vibrancy
02,14 4th/15Tax Incr Finance
13,153,356 12,935,528 217,828 13,153,356City Center TIF - Parking Improvements
0 0City Center Tax Increment
Financing District
00
Economic Vibrancy
02,14 VariousTax Incr Finance
10,173,037 8,700,507 1,472,530 10,173,037City Center TIF - Repayment of Advances
0 0City Center Tax Increment
Financing District
00
Economic Vibrancy
02,14 VariousTax Incr Finance
3,369,130 3,170,304 198,826 3,369,130City Center TIF - Streetscaping 0 0City Center Tax Increment
Financing District
00
360
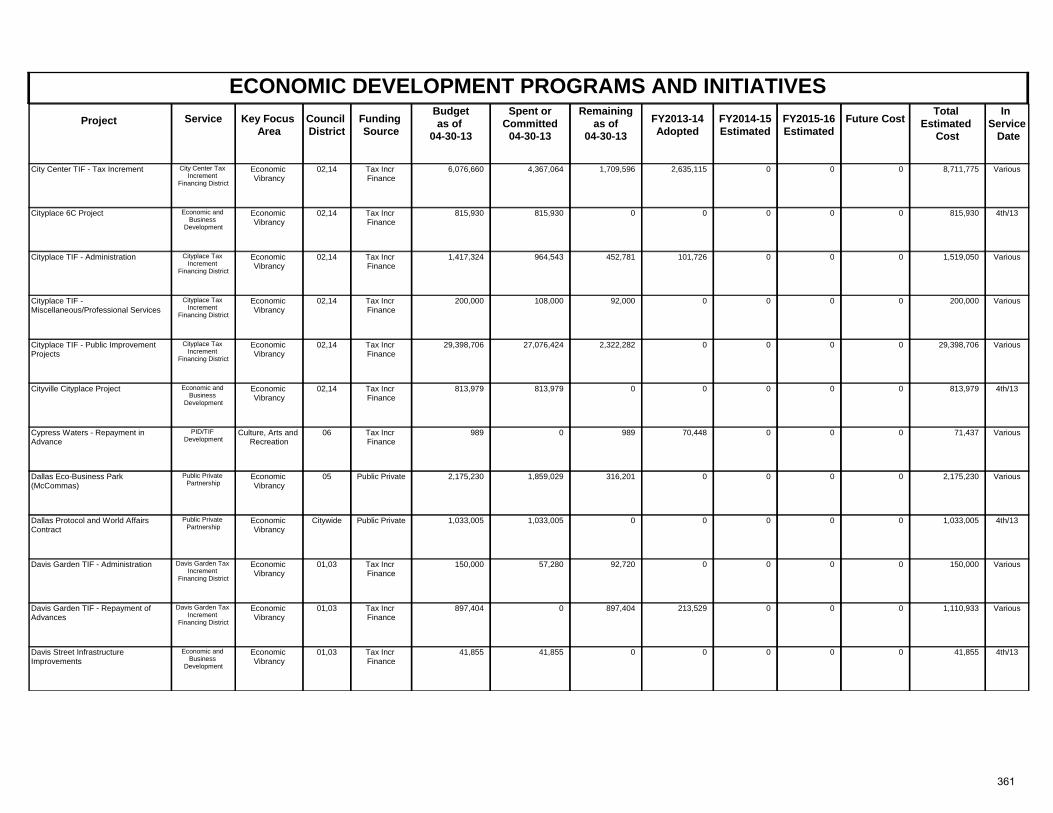
ECONOMIC DEVELOPMENT PROGRAMS AND INITIATIVESProject Key Focus
AreaCouncil District
Spent orCommitted
04-30-13
Total Estimated
Cost
In Service Date
Funding Source
Remainingas of
04-30-13 FY2013-14
AdoptedFuture CostService FY2014-15
Estimated FY2015-16 Estimated
Budgetas of
04-30-13
Economic Vibrancy
02,14 VariousTax Incr Finance
6,076,660 4,367,064 1,709,596 8,711,775City Center TIF - Tax Increment 2,635,115 0City Center Tax Increment
Financing District
00
Economic Vibrancy
02,14 4th/13Tax Incr Finance
815,930 815,930 0 815,930Cityplace 6C Project 0 0Economic and Business
Development
00
Economic Vibrancy
02,14 VariousTax Incr Finance
1,417,324 964,543 452,781 1,519,050Cityplace TIF - Administration 101,726 0Cityplace Tax Increment
Financing District
00
Economic Vibrancy
02,14 VariousTax Incr Finance
200,000 108,000 92,000 200,000Cityplace TIF - Miscellaneous/Professional Services
0 0Cityplace Tax Increment
Financing District
00
Economic Vibrancy
02,14 VariousTax Incr Finance
29,398,706 27,076,424 2,322,282 29,398,706Cityplace TIF - Public Improvement Projects
0 0Cityplace Tax Increment
Financing District
00
Economic Vibrancy
02,14 4th/13Tax Incr Finance
813,979 813,979 0 813,979Cityville Cityplace Project 0 0Economic and Business
Development
00
Culture, Arts and Recreation
06 VariousTax Incr Finance
989 0 989 71,437Cypress Waters - Repayment in Advance
70,448 0PID/TIF Development
00
Economic Vibrancy
05 VariousPublic Private 2,175,230 1,859,029 316,201 2,175,230Dallas Eco-Business Park (McCommas)
0 0Public Private Partnership
00
Economic Vibrancy
Citywide 4th/13Public Private 1,033,005 1,033,005 0 1,033,005Dallas Protocol and World Affairs Contract
0 0Public Private Partnership
00
Economic Vibrancy
01,03 VariousTax Incr Finance
150,000 57,280 92,720 150,000Davis Garden TIF - Administration 0 0Davis Garden Tax Increment
Financing District
00
Economic Vibrancy
01,03 VariousTax Incr Finance
897,404 0 897,404 1,110,933Davis Garden TIF - Repayment of Advances
213,529 0Davis Garden Tax Increment
Financing District
00
Economic Vibrancy
01,03 4th/13Tax Incr Finance
41,855 41,855 0 41,855Davis Street Infrastructure Improvements
0 0Economic and Business
Development
00
361
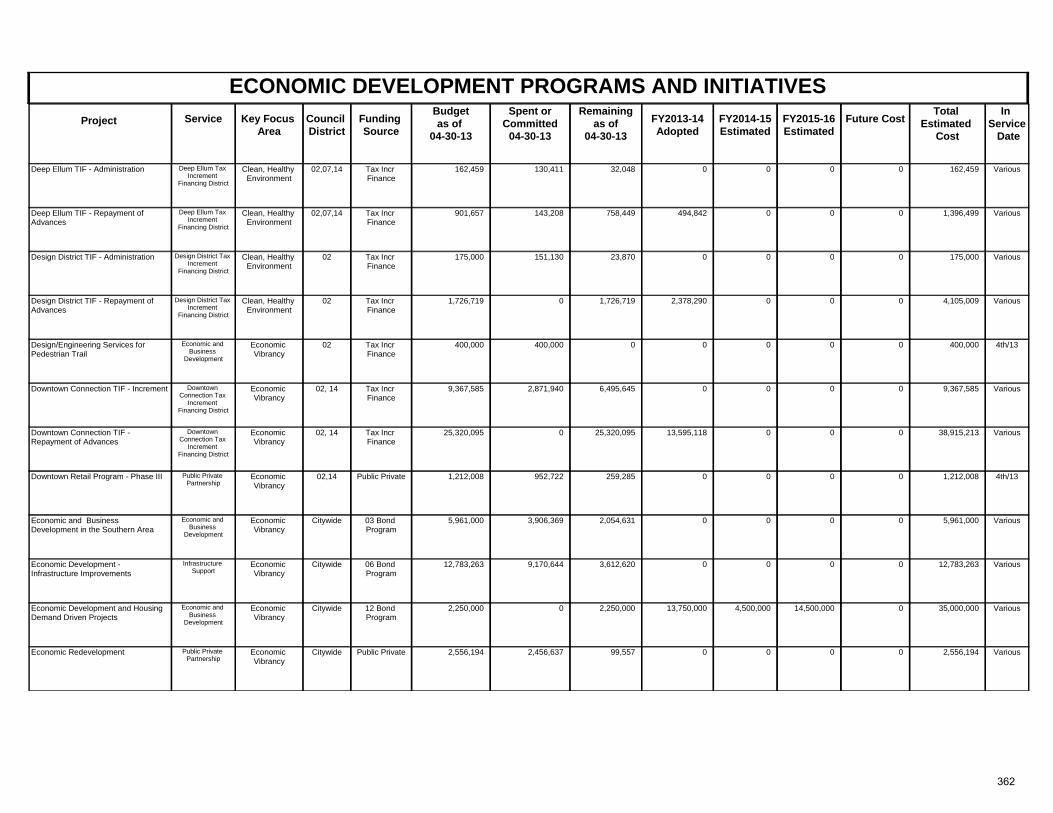
ECONOMIC DEVELOPMENT PROGRAMS AND INITIATIVESProject Key Focus
AreaCouncil District
Spent orCommitted
04-30-13
Total Estimated
Cost
In Service Date
Funding Source
Remainingas of
04-30-13 FY2013-14
AdoptedFuture CostService FY2014-15
Estimated FY2015-16 Estimated
Budgetas of
04-30-13
Clean, Healthy Environment
02,07,14 VariousTax Incr Finance
162,459 130,411 32,048 162,459Deep Ellum TIF - Administration 0 0Deep Ellum Tax Increment
Financing District
00
Clean, Healthy Environment
02,07,14 VariousTax Incr Finance
901,657 143,208 758,449 1,396,499Deep Ellum TIF - Repayment of Advances
494,842 0Deep Ellum Tax Increment
Financing District
00
Clean, Healthy Environment
02 VariousTax Incr Finance
175,000 151,130 23,870 175,000Design District TIF - Administration 0 0Design District Tax Increment
Financing District
00
Clean, Healthy Environment
02 VariousTax Incr Finance
1,726,719 0 1,726,719 4,105,009Design District TIF - Repayment of Advances
2,378,290 0Design District Tax Increment
Financing District
00
Economic Vibrancy
02 4th/13Tax Incr Finance
400,000 400,000 0 400,000Design/Engineering Services for Pedestrian Trail
0 0Economic and Business
Development
00
Economic Vibrancy
02, 14 VariousTax Incr Finance
9,367,585 2,871,940 6,495,645 9,367,585Downtown Connection TIF - Increment 0 0Downtown Connection Tax
Increment Financing District
00
Economic Vibrancy
02, 14 VariousTax Incr Finance
25,320,095 0 25,320,095 38,915,213Downtown Connection TIF - Repayment of Advances
13,595,118 0Downtown Connection Tax
Increment Financing District
00
Economic Vibrancy
02,14 4th/13Public Private 1,212,008 952,722 259,285 1,212,008Downtown Retail Program - Phase III 0 0Public Private Partnership
00
Economic Vibrancy
Citywide Various03 Bond Program
5,961,000 3,906,369 2,054,631 5,961,000Economic and Business Development in the Southern Area
0 0Economic and Business
Development
00
Economic Vibrancy
Citywide Various06 Bond Program
12,783,263 9,170,644 3,612,620 12,783,263Economic Development - Infrastructure Improvements
0 0Infrastructure Support
00
Economic Vibrancy
Citywide Various12 Bond Program
2,250,000 0 2,250,000 35,000,000Economic Development and Housing Demand Driven Projects
13,750,000 0Economic and Business
Development
14,500,0004,500,000
Economic Vibrancy
Citywide VariousPublic Private 2,556,194 2,456,637 99,557 2,556,194Economic Redevelopment 0 0Public Private Partnership
00
362
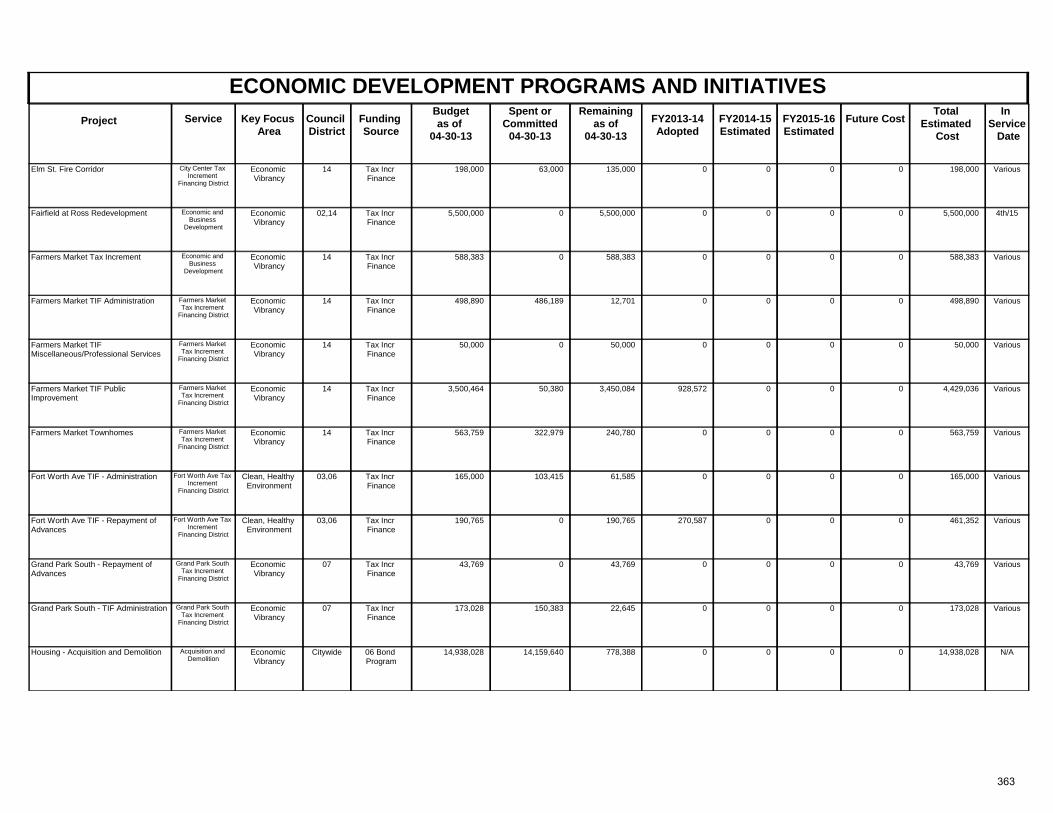
ECONOMIC DEVELOPMENT PROGRAMS AND INITIATIVESProject Key Focus
AreaCouncil District
Spent orCommitted
04-30-13
Total Estimated
Cost
In Service Date
Funding Source
Remainingas of
04-30-13 FY2013-14
AdoptedFuture CostService FY2014-15
Estimated FY2015-16 Estimated
Budgetas of
04-30-13
Economic Vibrancy
14 VariousTax Incr Finance
198,000 63,000 135,000 198,000Elm St. Fire Corridor 0 0City Center Tax Increment
Financing District
00
Economic Vibrancy
02,14 4th/15Tax Incr Finance
5,500,000 0 5,500,000 5,500,000Fairfield at Ross Redevelopment 0 0Economic and Business
Development
00
Economic Vibrancy
14 VariousTax Incr Finance
588,383 0 588,383 588,383Farmers Market Tax Increment 0 0Economic and Business
Development
00
Economic Vibrancy
14 VariousTax Incr Finance
498,890 486,189 12,701 498,890Farmers Market TIF Administration 0 0Farmers Market Tax Increment
Financing District
00
Economic Vibrancy
14 VariousTax Incr Finance
50,000 0 50,000 50,000Farmers Market TIF Miscellaneous/Professional Services
0 0Farmers Market Tax Increment
Financing District
00
Economic Vibrancy
14 VariousTax Incr Finance
3,500,464 50,380 3,450,084 4,429,036Farmers Market TIF Public Improvement
928,572 0Farmers Market Tax Increment
Financing District
00
Economic Vibrancy
14 VariousTax Incr Finance
563,759 322,979 240,780 563,759Farmers Market Townhomes 0 0Farmers Market Tax Increment
Financing District
00
Clean, Healthy Environment
03,06 VariousTax Incr Finance
165,000 103,415 61,585 165,000Fort Worth Ave TIF - Administration 0 0Fort Worth Ave Tax Increment
Financing District
00
Clean, Healthy Environment
03,06 VariousTax Incr Finance
190,765 0 190,765 461,352Fort Worth Ave TIF - Repayment of Advances
270,587 0Fort Worth Ave Tax Increment
Financing District
00
Economic Vibrancy
07 VariousTax Incr Finance
43,769 0 43,769 43,769Grand Park South - Repayment of Advances
0 0Grand Park South Tax Increment
Financing District
00
Economic Vibrancy
07 VariousTax Incr Finance
173,028 150,383 22,645 173,028Grand Park South - TIF Administration 0 0Grand Park South Tax Increment
Financing District
00
Economic Vibrancy
Citywide N/A06 Bond Program
14,938,028 14,159,640 778,388 14,938,028Housing - Acquisition and Demolition 0 0Acquisition and Demolition
00
363
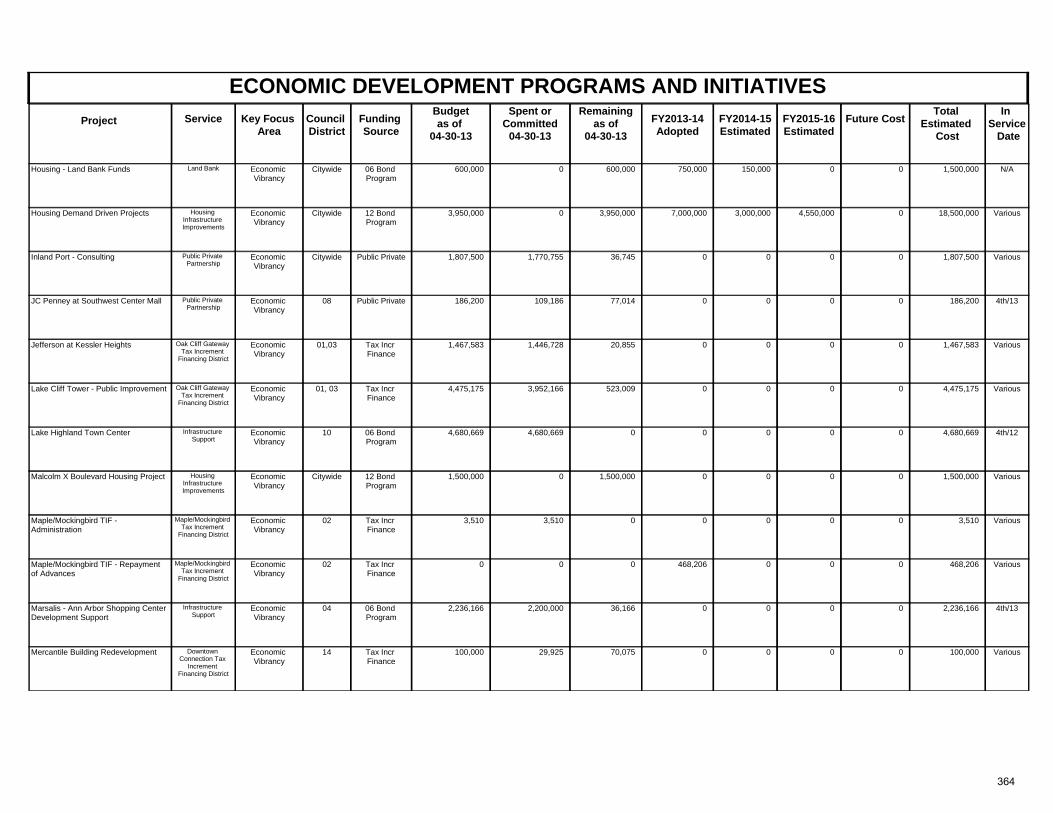
ECONOMIC DEVELOPMENT PROGRAMS AND INITIATIVESProject Key Focus
AreaCouncil District
Spent orCommitted
04-30-13
Total Estimated
Cost
In Service Date
Funding Source
Remainingas of
04-30-13 FY2013-14
AdoptedFuture CostService FY2014-15
Estimated FY2015-16 Estimated
Budgetas of
04-30-13
Economic Vibrancy
Citywide N/A06 Bond Program
600,000 0 600,000 1,500,000Housing - Land Bank Funds 750,000 0Land Bank 0150,000
Economic Vibrancy
Citywide Various12 Bond Program
3,950,000 0 3,950,000 18,500,000Housing Demand Driven Projects 7,000,000 0Housing Infrastructure Improvements
4,550,0003,000,000
Economic Vibrancy
Citywide VariousPublic Private 1,807,500 1,770,755 36,745 1,807,500Inland Port - Consulting 0 0Public Private Partnership
00
Economic Vibrancy
08 4th/13Public Private 186,200 109,186 77,014 186,200JC Penney at Southwest Center Mall 0 0Public Private Partnership
00
Economic Vibrancy
01,03 VariousTax Incr Finance
1,467,583 1,446,728 20,855 1,467,583Jefferson at Kessler Heights 0 0Oak Cliff Gateway Tax Increment
Financing District
00
Economic Vibrancy
01, 03 VariousTax Incr Finance
4,475,175 3,952,166 523,009 4,475,175Lake Cliff Tower - Public Improvement 0 0Oak Cliff Gateway Tax Increment
Financing District
00
Economic Vibrancy
10 4th/1206 Bond Program
4,680,669 4,680,669 0 4,680,669Lake Highland Town Center 0 0Infrastructure Support
00
Economic Vibrancy
Citywide Various12 Bond Program
1,500,000 0 1,500,000 1,500,000Malcolm X Boulevard Housing Project 0 0Housing Infrastructure Improvements
00
Economic Vibrancy
02 VariousTax Incr Finance
3,510 3,510 0 3,510Maple/Mockingbird TIF - Administration
0 0Maple/Mockingbird Tax Increment
Financing District
00
Economic Vibrancy
02 VariousTax Incr Finance
0 0 0 468,206Maple/Mockingbird TIF - Repayment of Advances
468,206 0Maple/Mockingbird Tax Increment
Financing District
00
Economic Vibrancy
04 4th/1306 Bond Program
2,236,166 2,200,000 36,166 2,236,166Marsalis - Ann Arbor Shopping Center Development Support
0 0Infrastructure Support
00
Economic Vibrancy
14 VariousTax Incr Finance
100,000 29,925 70,075 100,000Mercantile Building Redevelopment 0 0Downtown Connection Tax
Increment Financing District
00
364
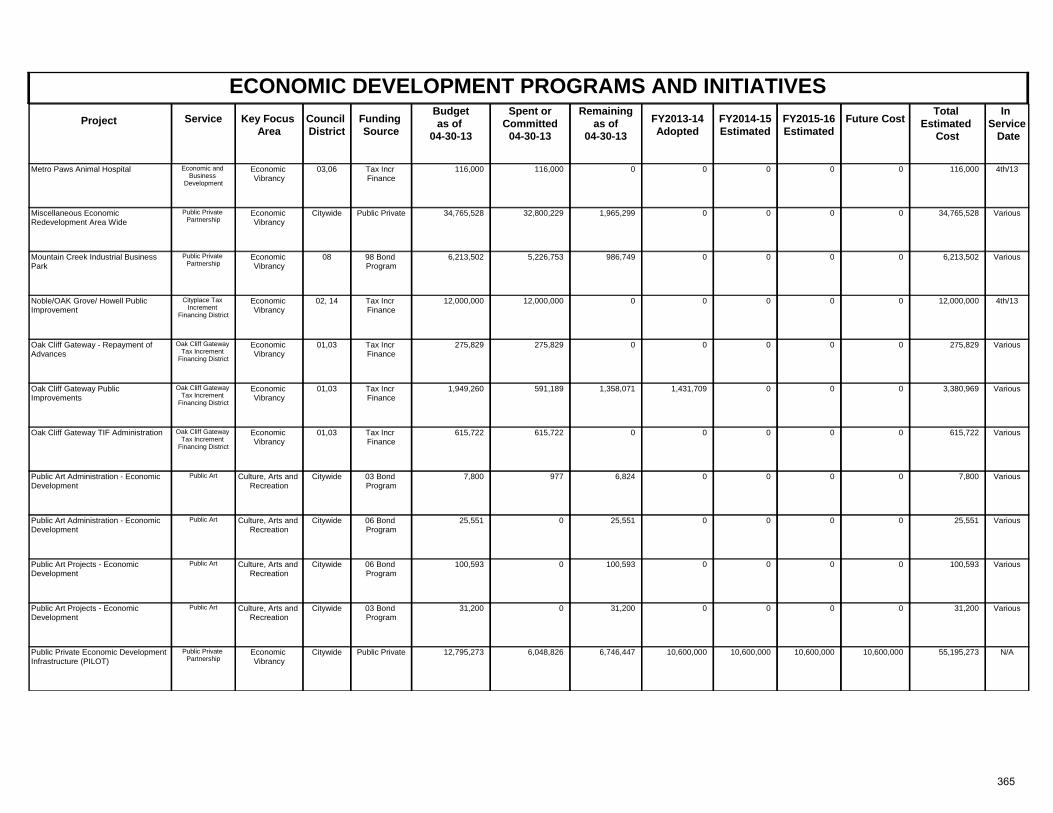
ECONOMIC DEVELOPMENT PROGRAMS AND INITIATIVESProject Key Focus
AreaCouncil District
Spent orCommitted
04-30-13
Total Estimated
Cost
In Service Date
Funding Source
Remainingas of
04-30-13 FY2013-14
AdoptedFuture CostService FY2014-15
Estimated FY2015-16 Estimated
Budgetas of
04-30-13
Economic Vibrancy
03,06 4th/13Tax Incr Finance
116,000 116,000 0 116,000Metro Paws Animal Hospital 0 0Economic and Business
Development
00
Economic Vibrancy
Citywide VariousPublic Private 34,765,528 32,800,229 1,965,299 34,765,528Miscellaneous Economic Redevelopment Area Wide
0 0Public Private Partnership
00
Economic Vibrancy
08 Various98 Bond Program
6,213,502 5,226,753 986,749 6,213,502Mountain Creek Industrial Business Park
0 0Public Private Partnership
00
Economic Vibrancy
02, 14 4th/13Tax Incr Finance
12,000,000 12,000,000 0 12,000,000Noble/OAK Grove/ Howell Public Improvement
0 0Cityplace Tax Increment
Financing District
00
Economic Vibrancy
01,03 VariousTax Incr Finance
275,829 275,829 0 275,829Oak Cliff Gateway - Repayment of Advances
0 0Oak Cliff Gateway Tax Increment
Financing District
00
Economic Vibrancy
01,03 VariousTax Incr Finance
1,949,260 591,189 1,358,071 3,380,969Oak Cliff Gateway Public Improvements
1,431,709 0Oak Cliff Gateway Tax Increment
Financing District
00
Economic Vibrancy
01,03 VariousTax Incr Finance
615,722 615,722 0 615,722Oak Cliff Gateway TIF Administration 0 0Oak Cliff Gateway Tax Increment
Financing District
00
Culture, Arts and Recreation
Citywide Various03 Bond Program
7,800 977 6,824 7,800Public Art Administration - Economic Development
0 0Public Art 00
Culture, Arts and Recreation
Citywide Various06 Bond Program
25,551 0 25,551 25,551Public Art Administration - Economic Development
0 0Public Art 00
Culture, Arts and Recreation
Citywide Various06 Bond Program
100,593 0 100,593 100,593Public Art Projects - Economic Development
0 0Public Art 00
Culture, Arts and Recreation
Citywide Various03 Bond Program
31,200 0 31,200 31,200Public Art Projects - Economic Development
0 0Public Art 00
Economic Vibrancy
Citywide N/APublic Private 12,795,273 6,048,826 6,746,447 55,195,273Public Private Economic Development Infrastructure (PILOT)
10,600,000 10,600,000Public Private Partnership
10,600,00010,600,000
365
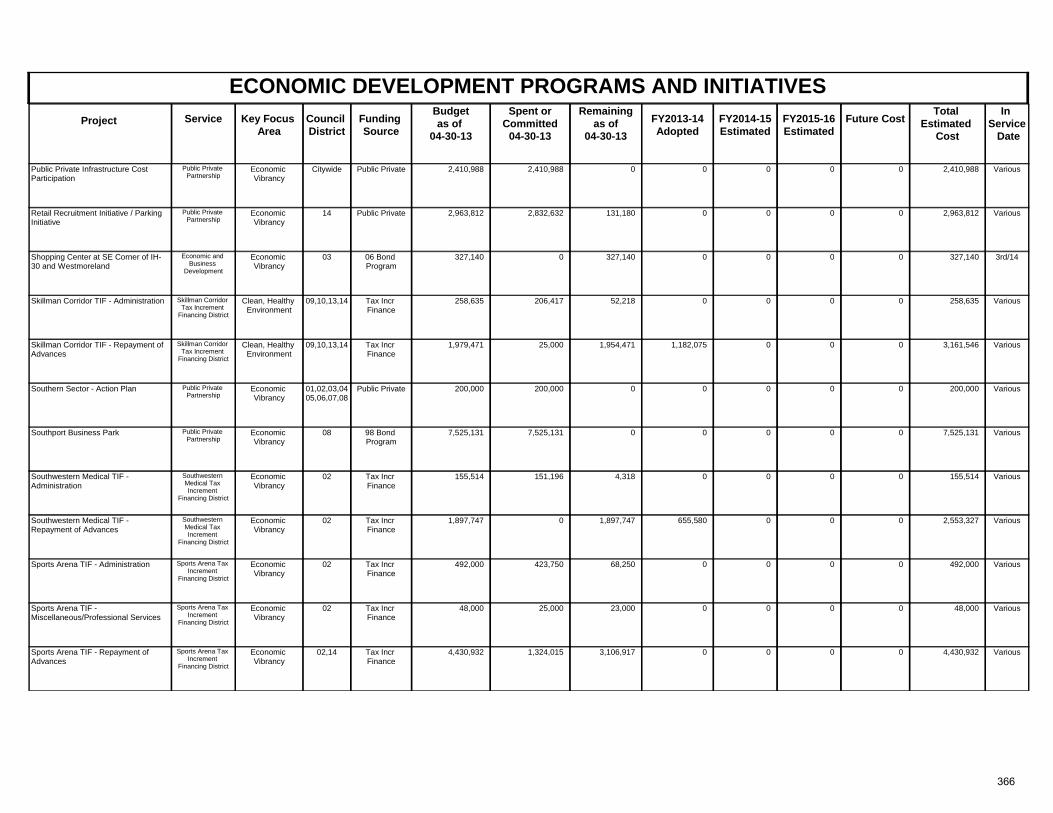
ECONOMIC DEVELOPMENT PROGRAMS AND INITIATIVESProject Key Focus
AreaCouncil District
Spent orCommitted
04-30-13
Total Estimated
Cost
In Service Date
Funding Source
Remainingas of
04-30-13 FY2013-14
AdoptedFuture CostService FY2014-15
Estimated FY2015-16 Estimated
Budgetas of
04-30-13
Economic Vibrancy
Citywide VariousPublic Private 2,410,988 2,410,988 0 2,410,988Public Private Infrastructure Cost Participation
0 0Public Private Partnership
00
Economic Vibrancy
14 VariousPublic Private 2,963,812 2,832,632 131,180 2,963,812Retail Recruitment Initiative / Parking Initiative
0 0Public Private Partnership
00
Economic Vibrancy
03 3rd/1406 Bond Program
327,140 0 327,140 327,140Shopping Center at SE Corner of IH-30 and Westmoreland
0 0Economic and Business
Development
00
Clean, Healthy Environment
09,10,13,14 VariousTax Incr Finance
258,635 206,417 52,218 258,635Skillman Corridor TIF - Administration 0 0Skillman Corridor Tax Increment
Financing District
00
Clean, Healthy Environment
09,10,13,14 VariousTax Incr Finance
1,979,471 25,000 1,954,471 3,161,546Skillman Corridor TIF - Repayment of Advances
1,182,075 0Skillman Corridor Tax Increment
Financing District
00
Economic Vibrancy
01,02,03,0405,06,07,08
VariousPublic Private 200,000 200,000 0 200,000Southern Sector - Action Plan 0 0Public Private Partnership
00
Economic Vibrancy
08 Various98 Bond Program
7,525,131 7,525,131 0 7,525,131Southport Business Park 0 0Public Private Partnership
00
Economic Vibrancy
02 VariousTax Incr Finance
155,514 151,196 4,318 155,514Southwestern Medical TIF - Administration
0 0Southwestern Medical Tax Increment
Financing District
00
Economic Vibrancy
02 VariousTax Incr Finance
1,897,747 0 1,897,747 2,553,327Southwestern Medical TIF - Repayment of Advances
655,580 0Southwestern Medical Tax Increment
Financing District
00
Economic Vibrancy
02 VariousTax Incr Finance
492,000 423,750 68,250 492,000Sports Arena TIF - Administration 0 0Sports Arena Tax Increment
Financing District
00
Economic Vibrancy
02 VariousTax Incr Finance
48,000 25,000 23,000 48,000Sports Arena TIF - Miscellaneous/Professional Services
0 0Sports Arena Tax Increment
Financing District
00
Economic Vibrancy
02,14 VariousTax Incr Finance
4,430,932 1,324,015 3,106,917 4,430,932Sports Arena TIF - Repayment of Advances
0 0Sports Arena Tax Increment
Financing District
00
366
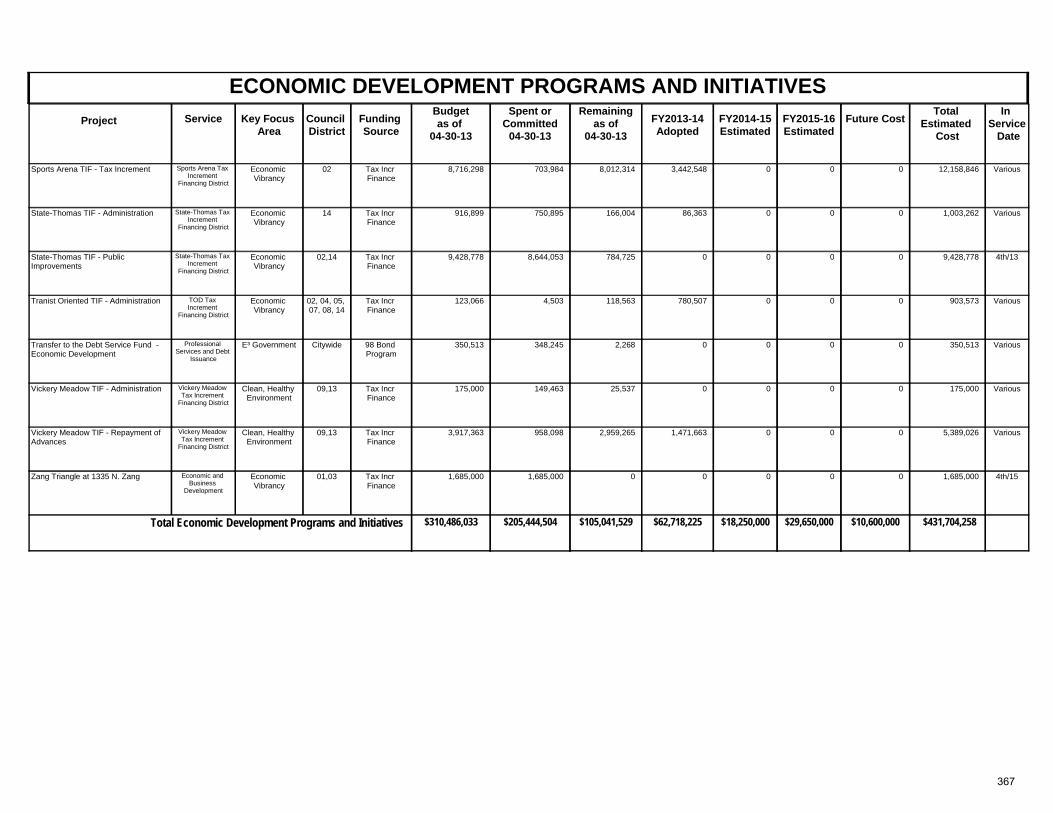
ECONOMIC DEVELOPMENT PROGRAMS AND INITIATIVESProject Key Focus
AreaCouncil District
Spent orCommitted
04-30-13
Total Estimated
Cost
In Service Date
Funding Source
Remainingas of
04-30-13 FY2013-14
AdoptedFuture CostService FY2014-15
Estimated FY2015-16 Estimated
Budgetas of
04-30-13
Economic Vibrancy
02 VariousTax Incr Finance
8,716,298 703,984 8,012,314 12,158,846Sports Arena TIF - Tax Increment 3,442,548 0Sports Arena Tax Increment
Financing District
00
Economic Vibrancy
14 VariousTax Incr Finance
916,899 750,895 166,004 1,003,262State-Thomas TIF - Administration 86,363 0State-Thomas Tax Increment
Financing District
00
Economic Vibrancy
02,14 4th/13Tax Incr Finance
9,428,778 8,644,053 784,725 9,428,778State-Thomas TIF - Public Improvements
0 0State-Thomas Tax Increment
Financing District
00
Economic Vibrancy
02, 04, 05, 07, 08, 14
VariousTax Incr Finance
123,066 4,503 118,563 903,573Tranist Oriented TIF - Administration 780,507 0TOD Tax Increment
Financing District
00
E³ Government Citywide Various98 Bond Program
350,513 348,245 2,268 350,513Transfer to the Debt Service Fund - Economic Development
0 0Professional Services and Debt
Issuance
00
Clean, Healthy Environment
09,13 VariousTax Incr Finance
175,000 149,463 25,537 175,000Vickery Meadow TIF - Administration 0 0Vickery Meadow Tax Increment
Financing District
00
Clean, Healthy Environment
09,13 VariousTax Incr Finance
3,917,363 958,098 2,959,265 5,389,026Vickery Meadow TIF - Repayment of Advances
1,471,663 0Vickery Meadow Tax Increment
Financing District
00
Economic Vibrancy
01,03 4th/15Tax Incr Finance
1,685,000 1,685,000 0 1,685,000Zang Triangle at 1335 N. Zang 0 0Economic and Business
Development
00
$310,486,033 $105,041,529Total Economic Development Programs and Initiatives $205,444,504 $431,704,258$62,718,225 $10,600,000$29,650,000$18,250,000
367
EQUIPMENT ACQUISITION
MISSION This program provides funding for the purchase of capital equipment used in the day-to-day operations of the City. HIGHLIGHTED ACCOMPLISHMENTS FOR FY2012-13
1. Completed upgrades to the Computer Aided Dispatch system for the remaining in-car mobile installations.
2. Purchased 10 replacement fire engines and 3 replacement aerial
ladder trucks.
3. Purchased 1 replacement hazardous material response apparatus.
4. Purchased 149 pieces of replacement fleet equipment, including sedans, light and heavy trucks and off road equipment.
5. Purchased 101 Compressed Natural Gas (CNG) sedans and light
and heavy trucks
6. Purchased 25 pieces of sanitation collection and 10 pieces of disposal equipment for a total of 35 pieces.
HIGHLIGHTED OBJECTIVES FOR FY2013-14
1. Continue location infrastructure and regional warrant updates.
2. Finalize implementation of the citywide network refresh project for key infrastructure equipment updates for remote locations throughout the City.
3. Continue implementation of secondary phases of the electronic
citation program.
4. Purchase 236 pieces of fleet replacement equipment (including prisoner transport vans, road repair patch trucks and off road equipment) which have reached the end of their useful life cycle.
5. Purchase 200 police squad cars.
6. Purchase 24 pieces of sanitation collection equipment. SERVICE DESCRIPTIONS Fleet Replacement This category includes purchases of fleet such as trucks, sedans, vans, dump trucks, backhoes, motorcycle; landfill equipment such as compactors, rotobooms, loaders and bulldozers; and fire emergency apparatus such as pumpers and trucks. Professional Services and Debt Issuance Provides funding for certain costs associated with capital improvement projects. These costs include studies and long-range plans, debt issuance costs, and reimbursements to the General Fund for professional staff services such as design, survey, land acquisition fees and engineering. Debt issuance and CIP engineering costs are paid from the interest earned on bond proceeds. These costs may also include transfers to the General Fund and/or the Debt Service Fund. Technology This category includes the purchase of equipment that will enhance or improve the delivery of services to external and internal users through the use of advances in electronic and computer technology. These capital equipment purchases will also bring the City of Dallas to current computer industry standards. Operational Equipment Provides for the purchases of new and/or replacement equipment used to deliver services to the public on a daily basis. Equipment purchases in this category include, but are not limited to, mowers, sanders, concrete saws, street striping machines, tractors, flood warning systems, and paving breakers.
368
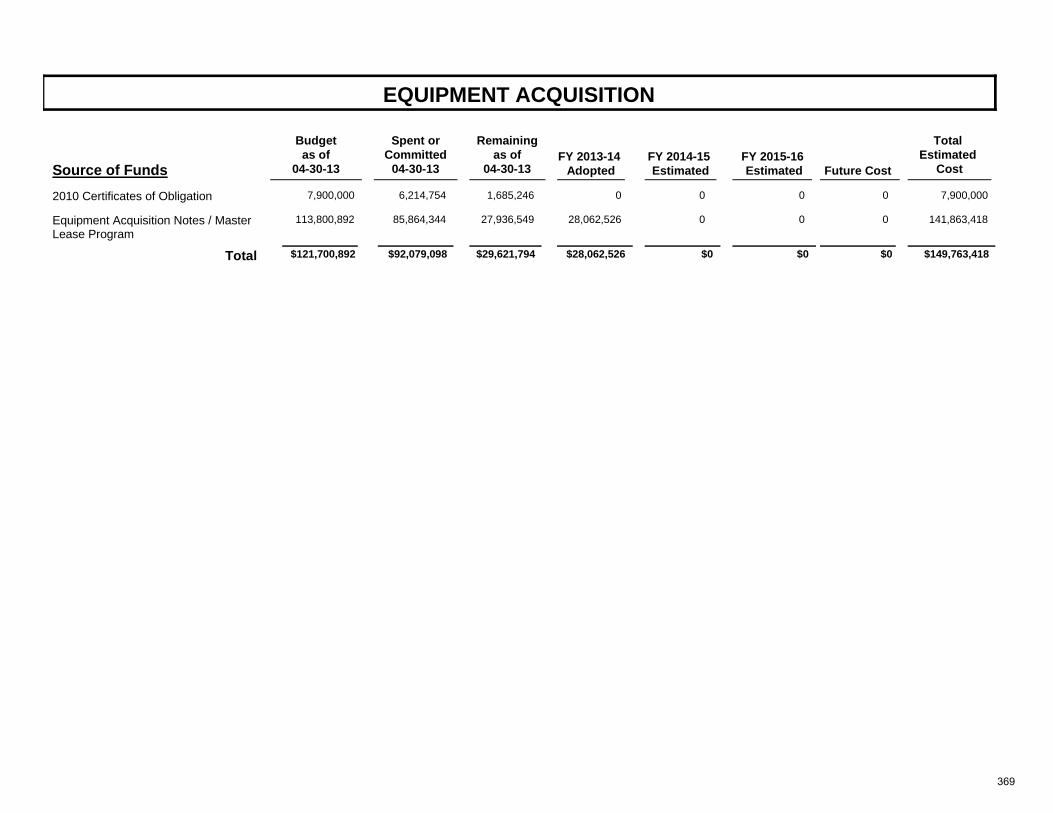
EQUIPMENT ACQUISITION
Source of FundsFY 2013-14
Adopted
Total Estimated
CostFY 2014-15 Estimated
FY 2015-16 Estimated
Future Cost
Remainingas of
04-30-13
Spent orCommitted
04-30-13
Budgetas of
04-30-13
2010 Certificates of Obligation 7,900,000 6,214,754 01,685,246 7,900,0000 0 0
Equipment Acquisition Notes / Master Lease Program
113,800,892 85,864,344 28,062,52627,936,549 141,863,4180 0 0
$92,079,098 $28,062,526Total $121,700,892 $29,621,794 $0 $149,763,418$0 $0
369
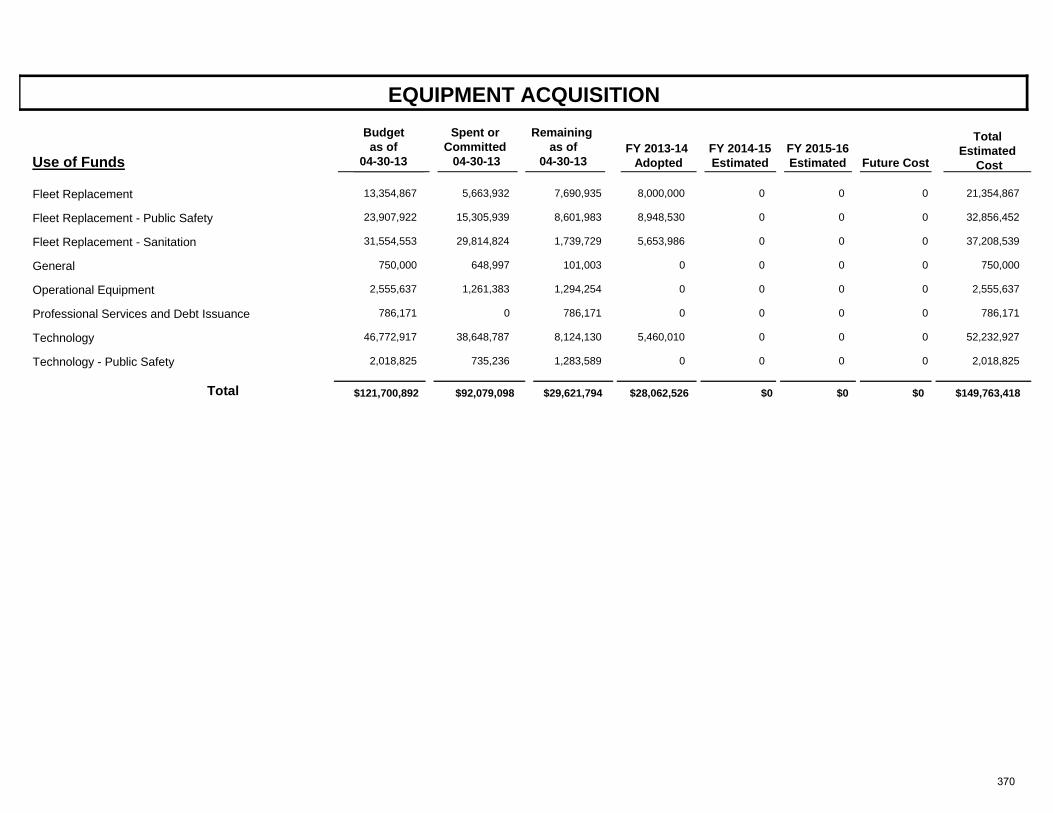
EQUIPMENT ACQUISITION
Use of FundsFY 2013-14
Adopted
Total Estimated
Cost FY 2014-15 Estimated
FY 2015-16 Estimated
Future Cost
Spent or Committed
04-30-13
Remaining as of
04-30-13
Budget as of
04-30-13
Fleet Replacement 13,354,867 5,663,932 8,000,0007,690,935 21,354,8670 0 0
Fleet Replacement - Public Safety 23,907,922 15,305,939 8,948,5308,601,983 32,856,4520 0 0
Fleet Replacement - Sanitation 31,554,553 29,814,824 5,653,9861,739,729 37,208,5390 0 0
General 750,000 648,997 0101,003 750,0000 0 0
Operational Equipment 2,555,637 1,261,383 01,294,254 2,555,6370 0 0
Professional Services and Debt Issuance 786,171 0 0786,171 786,1710 0 0
Technology 46,772,917 38,648,787 5,460,0108,124,130 52,232,9270 0 0
Technology - Public Safety 2,018,825 735,236 01,283,589 2,018,8250 0 0
$92,079,098 $28,062,526Total $121,700,892 $29,621,794 $0 $149,763,418$0 $0
370
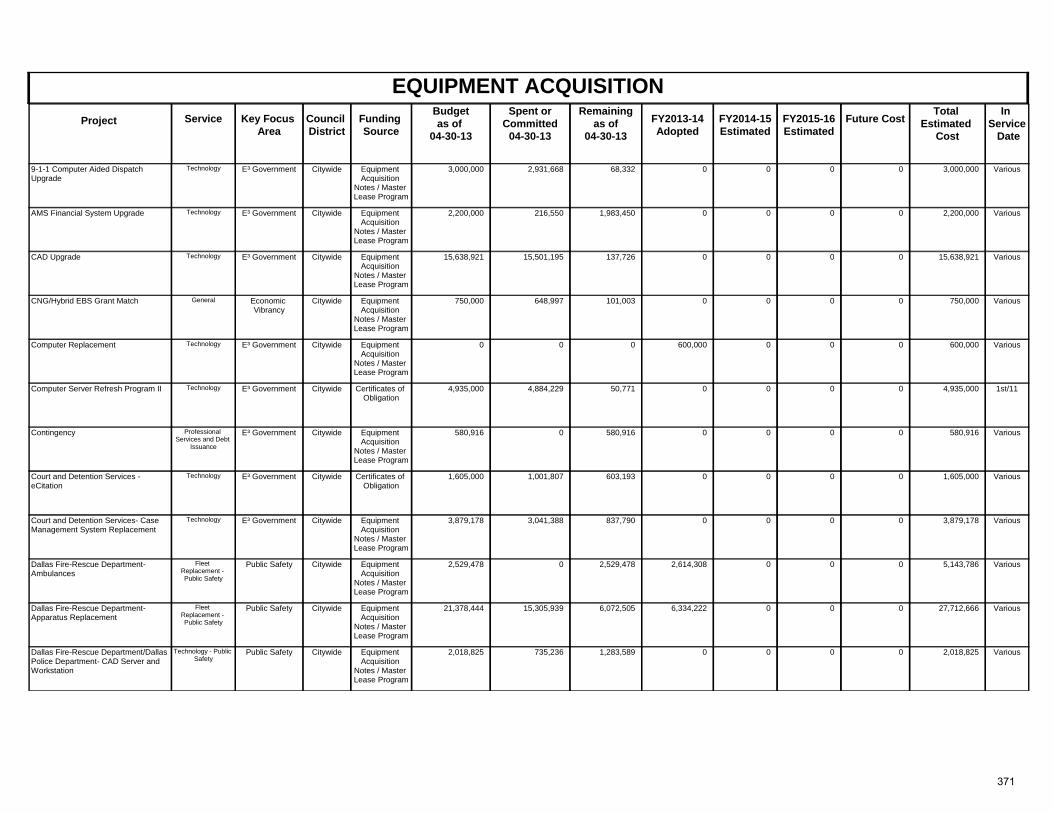
EQUIPMENT ACQUISITIONProject Key Focus
AreaCouncil District
Spent orCommitted
04-30-13
Total Estimated
Cost
In Service Date
Funding Source
Remainingas of
04-30-13 FY2013-14
AdoptedFuture CostService FY2014-15
Estimated FY2015-16 Estimated
Budgetas of
04-30-13
E³ Government Citywide VariousEquipment Acquisition
Notes / Master Lease Program
3,000,000 2,931,668 68,332 3,000,0009-1-1 Computer Aided Dispatch Upgrade
0 0Technology 00
E³ Government Citywide VariousEquipment Acquisition
Notes / Master Lease Program
2,200,000 216,550 1,983,450 2,200,000AMS Financial System Upgrade 0 0Technology 00
E³ Government Citywide VariousEquipment Acquisition
Notes / Master Lease Program
15,638,921 15,501,195 137,726 15,638,921CAD Upgrade 0 0Technology 00
Economic Vibrancy
Citywide VariousEquipment Acquisition
Notes / Master Lease Program
750,000 648,997 101,003 750,000CNG/Hybrid EBS Grant Match 0 0General 00
E³ Government Citywide VariousEquipment Acquisition
Notes / Master Lease Program
0 0 0 600,000Computer Replacement 600,000 0Technology 00
E³ Government Citywide 1st/11Certificates of Obligation
4,935,000 4,884,229 50,771 4,935,000Computer Server Refresh Program II 0 0Technology 00
E³ Government Citywide VariousEquipment Acquisition
Notes / Master Lease Program
580,916 0 580,916 580,916Contingency 0 0Professional Services and Debt
Issuance
00
E³ Government Citywide VariousCertificates of Obligation
1,605,000 1,001,807 603,193 1,605,000Court and Detention Services - eCitation
0 0Technology 00
E³ Government Citywide VariousEquipment Acquisition
Notes / Master Lease Program
3,879,178 3,041,388 837,790 3,879,178Court and Detention Services- Case Management System Replacement
0 0Technology 00
Public Safety Citywide VariousEquipment Acquisition
Notes / Master Lease Program
2,529,478 0 2,529,478 5,143,786Dallas Fire-Rescue Department- Ambulances
2,614,308 0Fleet Replacement - Public Safety
00
Public Safety Citywide VariousEquipment Acquisition
Notes / Master Lease Program
21,378,444 15,305,939 6,072,505 27,712,666Dallas Fire-Rescue Department- Apparatus Replacement
6,334,222 0Fleet Replacement - Public Safety
00
Public Safety Citywide VariousEquipment Acquisition
Notes / Master Lease Program
2,018,825 735,236 1,283,589 2,018,825Dallas Fire-Rescue Department/Dallas Police Department- CAD Server and Workstation
0 0Technology - Public Safety
00
371
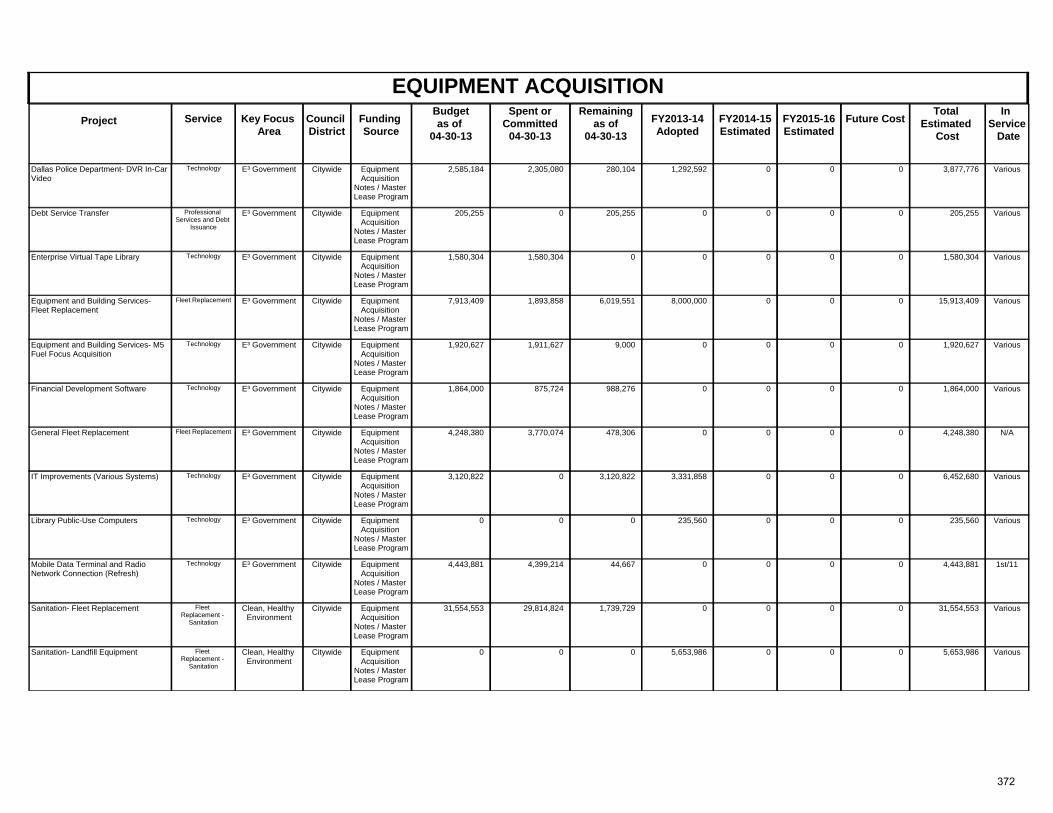
EQUIPMENT ACQUISITIONProject Key Focus
AreaCouncil District
Spent orCommitted
04-30-13
Total Estimated
Cost
In Service Date
Funding Source
Remainingas of
04-30-13 FY2013-14
AdoptedFuture CostService FY2014-15
Estimated FY2015-16 Estimated
Budgetas of
04-30-13
E³ Government Citywide VariousEquipment Acquisition
Notes / Master Lease Program
2,585,184 2,305,080 280,104 3,877,776Dallas Police Department- DVR In-Car Video
1,292,592 0Technology 00
E³ Government Citywide VariousEquipment Acquisition
Notes / Master Lease Program
205,255 0 205,255 205,255Debt Service Transfer 0 0Professional Services and Debt
Issuance
00
E³ Government Citywide VariousEquipment Acquisition
Notes / Master Lease Program
1,580,304 1,580,304 0 1,580,304Enterprise Virtual Tape Library 0 0Technology 00
E³ Government Citywide VariousEquipment Acquisition
Notes / Master Lease Program
7,913,409 1,893,858 6,019,551 15,913,409Equipment and Building Services- Fleet Replacement
8,000,000 0Fleet Replacement 00
E³ Government Citywide VariousEquipment Acquisition
Notes / Master Lease Program
1,920,627 1,911,627 9,000 1,920,627Equipment and Building Services- M5 Fuel Focus Acquisition
0 0Technology 00
E³ Government Citywide VariousEquipment Acquisition
Notes / Master Lease Program
1,864,000 875,724 988,276 1,864,000Financial Development Software 0 0Technology 00
E³ Government Citywide N/AEquipment Acquisition
Notes / Master Lease Program
4,248,380 3,770,074 478,306 4,248,380General Fleet Replacement 0 0Fleet Replacement 00
E³ Government Citywide VariousEquipment Acquisition
Notes / Master Lease Program
3,120,822 0 3,120,822 6,452,680IT Improvements (Various Systems) 3,331,858 0Technology 00
E³ Government Citywide VariousEquipment Acquisition
Notes / Master Lease Program
0 0 0 235,560Library Public-Use Computers 235,560 0Technology 00
E³ Government Citywide 1st/11Equipment Acquisition
Notes / Master Lease Program
4,443,881 4,399,214 44,667 4,443,881Mobile Data Terminal and Radio Network Connection (Refresh)
0 0Technology 00
Clean, Healthy Environment
Citywide VariousEquipment Acquisition
Notes / Master Lease Program
31,554,553 29,814,824 1,739,729 31,554,553Sanitation- Fleet Replacement 0 0Fleet Replacement -
Sanitation
00
Clean, Healthy Environment
Citywide VariousEquipment Acquisition
Notes / Master Lease Program
0 0 0 5,653,986Sanitation- Landfill Equipment 5,653,986 0Fleet Replacement -
Sanitation
00
372
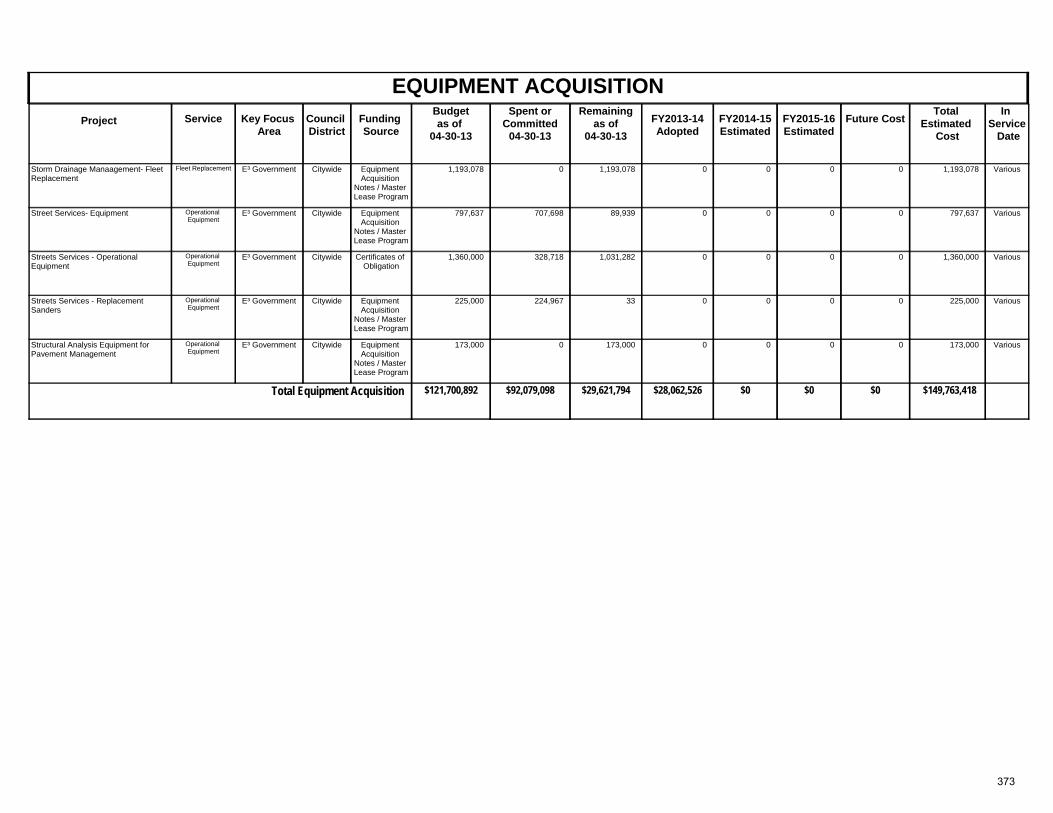
EQUIPMENT ACQUISITIONProject Key Focus
AreaCouncil District
Spent orCommitted
04-30-13
Total Estimated
Cost
In Service Date
Funding Source
Remainingas of
04-30-13 FY2013-14
AdoptedFuture CostService FY2014-15
Estimated FY2015-16 Estimated
Budgetas of
04-30-13
E³ Government Citywide VariousEquipment Acquisition
Notes / Master Lease Program
1,193,078 0 1,193,078 1,193,078Storm Drainage Manaagement- Fleet Replacement
0 0Fleet Replacement 00
E³ Government Citywide VariousEquipment Acquisition
Notes / Master Lease Program
797,637 707,698 89,939 797,637Street Services- Equipment 0 0Operational Equipment
00
E³ Government Citywide VariousCertificates of Obligation
1,360,000 328,718 1,031,282 1,360,000Streets Services - Operational Equipment
0 0Operational Equipment
00
E³ Government Citywide VariousEquipment Acquisition
Notes / Master Lease Program
225,000 224,967 33 225,000Streets Services - Replacement Sanders
0 0Operational Equipment
00
E³ Government Citywide VariousEquipment Acquisition
Notes / Master Lease Program
173,000 0 173,000 173,000Structural Analysis Equipment for Pavement Management
0 0Operational Equipment
00
$121,700,892 $29,621,794Total Equipment Acquisition $92,079,098 $149,763,418$28,062,526 $0$0$0
373
FLOOD PROTECTION AND STORM DRAINAGE CAPITAL IMPROVEMENTS
MISSION This program provides for the preparation of plans, specifications, and construction to improve storm drainage and reduce the loss of property due to flooding and erosion. These projects include construction and replacement of storm drainage systems, inadequate bridges and culverts, erosion control structures, and the implementation of flood plain management plans to improve the flood protection system. HIGHLIGHTED ACCOMPLISHMENTS FOR FY 2012-13
1. Completed the design of the Able Pump Station. 2. Completed construction for 11 erosion control projects including
8022 Claremont Drive, 2118-2132 Clarksdale Drive, 8220 Coolgreene Drive, 2631-2635 Deep Hill Circle, 4518 Dove Creek Way, 2102-2103 Healey, 3417, 3429, 3509, 3529 Holliday, and 8165-8171 Hunnicut Road.
3. Completed construction of Pavaho Pump Station. 4. Completed construction of Ricketts Branch detention basin project.
5. Continued construction of the Rush Creek diversion system. 6. Continued construction of Baker (Hampton-Oak Lawn) Pump
Station. HIGHLIGHTED OBJECTIVES FOR FY 2013-14
1. Begin construction on Able Sump Station improvements.
2. Continue design of Mill Creek, Middle Peaks Branch, and State Thomas flood protection and storm drainage improvements.
3. Complete construction of Rush Creek relief/diversion system.
4. Complete construction of Baker (Hampton-Oak Lawn) pump station.
5. Complete construction on State Thomas-Antique District and State Thomas-McKinney Avenue storm drainage relief systems.
SERVICE DESCRIPTIONS Erosion Control Erosion control projects are recommended for structures threatened by creek or channel bank erosion. Typical structures include streets, culverts, bridges, alleys and homes. Erosion occurring in areas not associated with creek banks or man-made channels is not included in this category. This category would provide armoring of natural creek banks to protect soil against further erosion loss. Flood Management Comprised of projects recommended in Flood Plain Management Studies of creeks and tributaries. The emphasis is on reduction of severe flood impact on bridges and neighborhoods bordering flood plain areas. Typical projects in this category are bridge and culvert replacement, creek channelization, detention basins and construction of flood protection levees. Storm Drainage Relief System Provides funds for the construction of storm drainage system improvements. Many areas within the City of Dallas are served by storm drainage systems that are inadequate because of continued development and the fact that many of the older systems were designed to a lesser standard than is used today. In many cases, because of the high cost of retrofitting improvements in fully developed areas, these projects are proposed for design and construction by phases. Professional Services and Debt Issuance Provides funding for certain costs associated with capital improvement projects. These costs include studies and long-range plans, debt issuance costs, and reimbursements to the General Fund for professional staff services such as design, survey, land acquisition fees and engineering. Debt issuance and CIP Engineering costs are paid from the interest earned on bond proceeds. Public Art Includes the public art initiatives throughout the City of Dallas. Funds generated by Public Art appropriations are used for the design services of artists, for the selection, acquisition, commissioning and display of artworks and for administration of the public art projects.
374
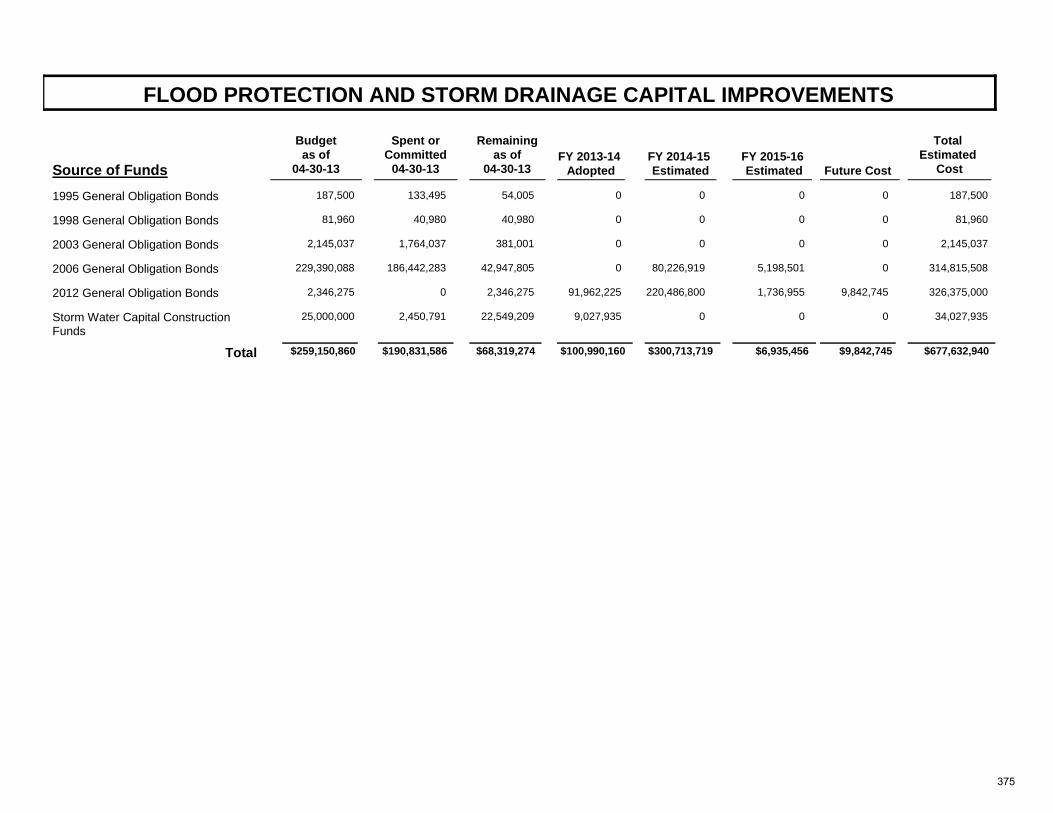
FLOOD PROTECTION AND STORM DRAINAGE CAPITAL IMPROVEMENTS
Source of FundsFY 2013-14
Adopted
Total Estimated
CostFY 2014-15 Estimated
FY 2015-16 Estimated
Future Cost
Remainingas of
04-30-13
Spent orCommitted
04-30-13
Budgetas of
04-30-13
1995 General Obligation Bonds 187,500 133,495 054,005 187,5000 0 0
1998 General Obligation Bonds 81,960 40,980 040,980 81,9600 0 0
2003 General Obligation Bonds 2,145,037 1,764,037 0381,001 2,145,0370 0 0
2006 General Obligation Bonds 229,390,088 186,442,283 042,947,805 314,815,50880,226,919 5,198,501 0
2012 General Obligation Bonds 2,346,275 0 91,962,2252,346,275 326,375,000220,486,800 1,736,955 9,842,745
Storm Water Capital Construction Funds
25,000,000 2,450,791 9,027,93522,549,209 34,027,9350 0 0
$190,831,586 $100,990,160Total $259,150,860 $68,319,274 $300,713,719 $677,632,940$6,935,456 $9,842,745
375
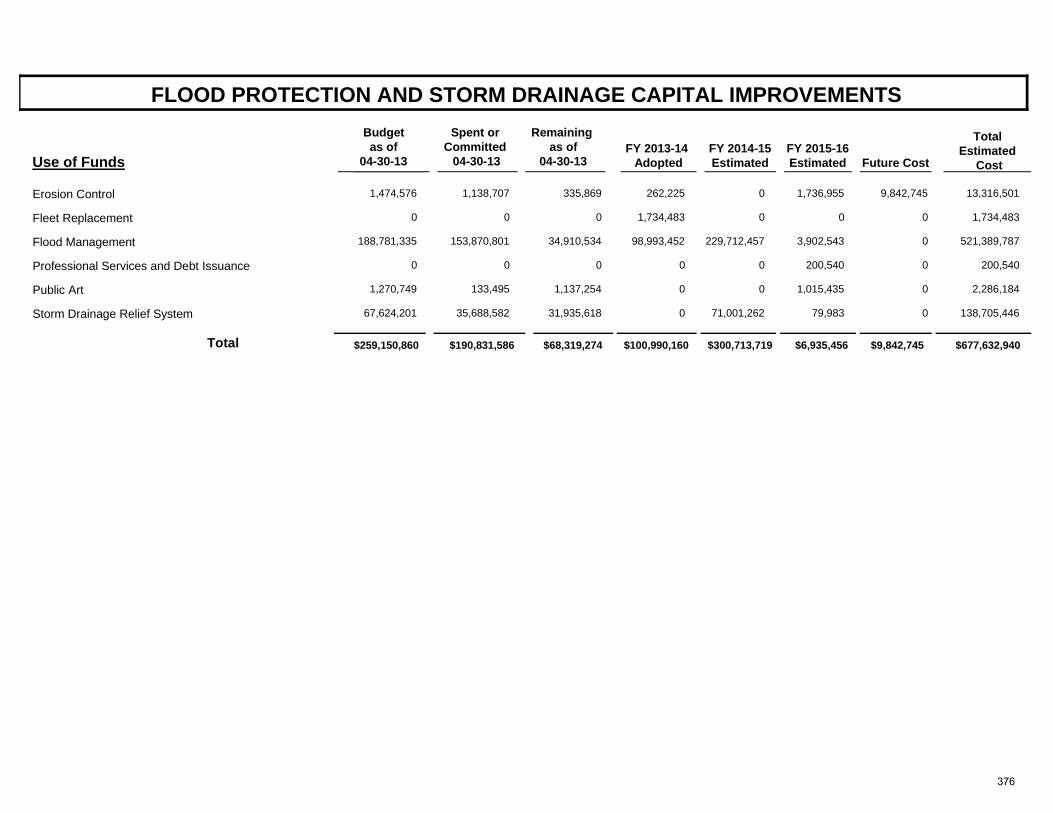
FLOOD PROTECTION AND STORM DRAINAGE CAPITAL IMPROVEMENTS
Use of FundsFY 2013-14
Adopted
Total Estimated
Cost FY 2014-15 Estimated
FY 2015-16 Estimated
Future Cost
Spent or Committed
04-30-13
Remaining as of
04-30-13
Budget as of
04-30-13
Erosion Control 1,474,576 1,138,707 262,225335,869 13,316,5010 1,736,955 9,842,745
Fleet Replacement 0 0 1,734,4830 1,734,4830 0 0
Flood Management 188,781,335 153,870,801 98,993,45234,910,534 521,389,787229,712,457 3,902,543 0
Professional Services and Debt Issuance 0 0 00 200,5400 200,540 0
Public Art 1,270,749 133,495 01,137,254 2,286,1840 1,015,435 0
Storm Drainage Relief System 67,624,201 35,688,582 031,935,618 138,705,44671,001,262 79,983 0
$190,831,586 $100,990,160Total $259,150,860 $68,319,274 $300,713,719 $677,632,940$6,935,456 $9,842,745
376
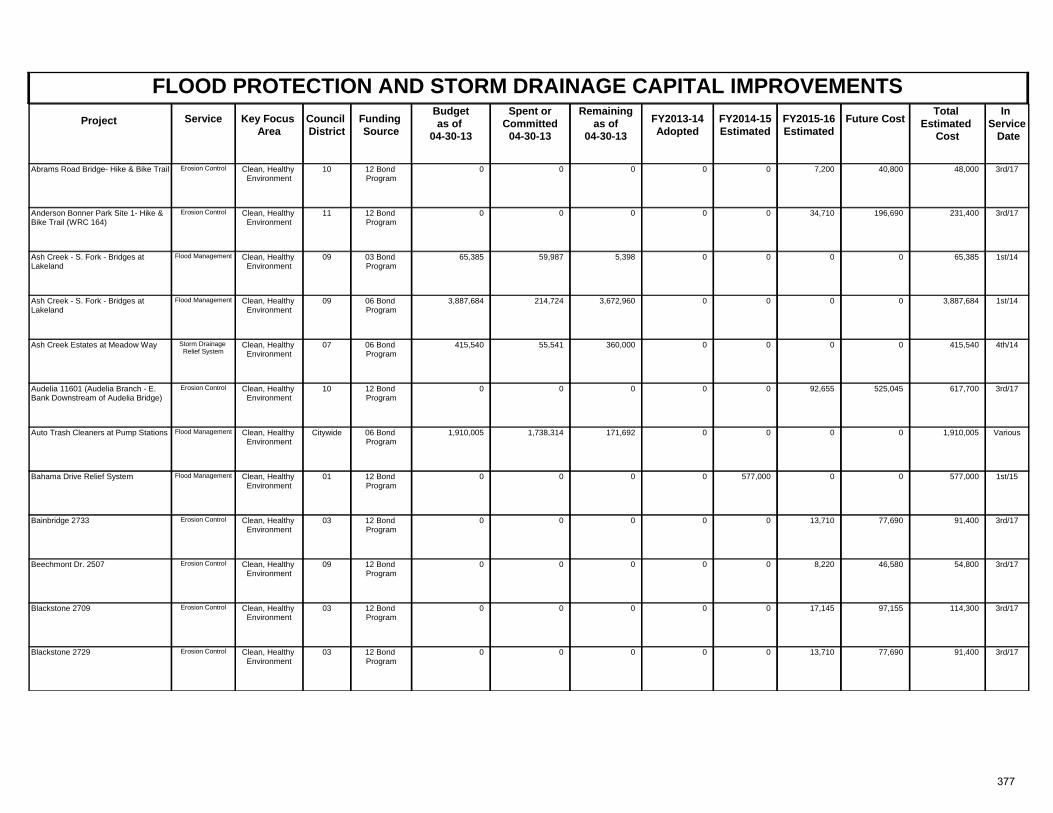
FLOOD PROTECTION AND STORM DRAINAGE CAPITAL IMPROVEMENTSProject Key Focus
AreaCouncil District
Spent orCommitted
04-30-13
Total Estimated
Cost
In Service Date
Funding Source
Remainingas of
04-30-13 FY2013-14
AdoptedFuture CostService FY2014-15
Estimated FY2015-16 Estimated
Budgetas of
04-30-13
Clean, Healthy Environment
10 3rd/1712 Bond Program
0 0 0 48,000Abrams Road Bridge- Hike & Bike Trail 0 40,800Erosion Control 7,2000
Clean, Healthy Environment
11 3rd/1712 Bond Program
0 0 0 231,400Anderson Bonner Park Site 1- Hike & Bike Trail (WRC 164)
0 196,690Erosion Control 34,7100
Clean, Healthy Environment
09 1st/1403 Bond Program
65,385 59,987 5,398 65,385Ash Creek - S. Fork - Bridges at Lakeland
0 0Flood Management 00
Clean, Healthy Environment
09 1st/1406 Bond Program
3,887,684 214,724 3,672,960 3,887,684Ash Creek - S. Fork - Bridges at Lakeland
0 0Flood Management 00
Clean, Healthy Environment
07 4th/1406 Bond Program
415,540 55,541 360,000 415,540Ash Creek Estates at Meadow Way 0 0Storm Drainage Relief System
00
Clean, Healthy Environment
10 3rd/1712 Bond Program
0 0 0 617,700Audelia 11601 (Audelia Branch - E. Bank Downstream of Audelia Bridge)
0 525,045Erosion Control 92,6550
Clean, Healthy Environment
Citywide Various06 Bond Program
1,910,005 1,738,314 171,692 1,910,005Auto Trash Cleaners at Pump Stations 0 0Flood Management 00
Clean, Healthy Environment
01 1st/1512 Bond Program
0 0 0 577,000Bahama Drive Relief System 0 0Flood Management 0577,000
Clean, Healthy Environment
03 3rd/1712 Bond Program
0 0 0 91,400Bainbridge 2733 0 77,690Erosion Control 13,7100
Clean, Healthy Environment
09 3rd/1712 Bond Program
0 0 0 54,800Beechmont Dr. 2507 0 46,580Erosion Control 8,2200
Clean, Healthy Environment
03 3rd/1712 Bond Program
0 0 0 114,300Blackstone 2709 0 97,155Erosion Control 17,1450
Clean, Healthy Environment
03 3rd/1712 Bond Program
0 0 0 91,400Blackstone 2729 0 77,690Erosion Control 13,7100
377
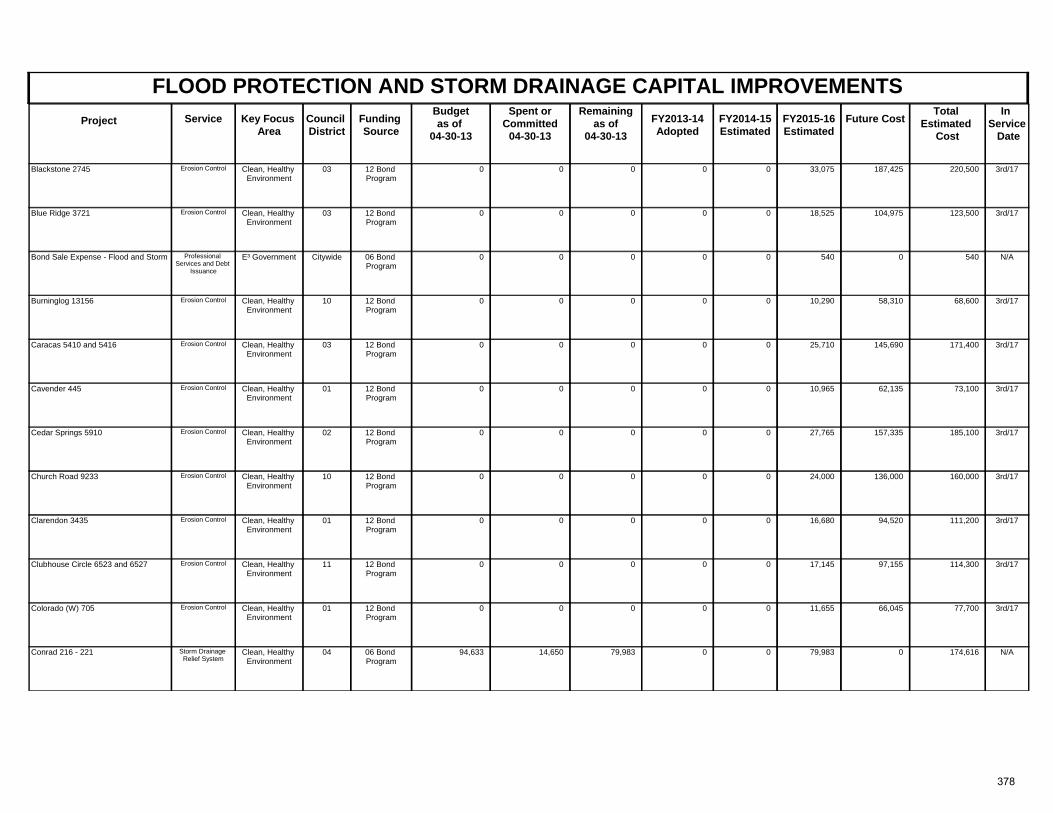
FLOOD PROTECTION AND STORM DRAINAGE CAPITAL IMPROVEMENTSProject Key Focus
AreaCouncil District
Spent orCommitted
04-30-13
Total Estimated
Cost
In Service Date
Funding Source
Remainingas of
04-30-13 FY2013-14
AdoptedFuture CostService FY2014-15
Estimated FY2015-16 Estimated
Budgetas of
04-30-13
Clean, Healthy Environment
03 3rd/1712 Bond Program
0 0 0 220,500Blackstone 2745 0 187,425Erosion Control 33,0750
Clean, Healthy Environment
03 3rd/1712 Bond Program
0 0 0 123,500Blue Ridge 3721 0 104,975Erosion Control 18,5250
E³ Government Citywide N/A06 Bond Program
0 0 0 540Bond Sale Expense - Flood and Storm 0 0Professional Services and Debt
Issuance
5400
Clean, Healthy Environment
10 3rd/1712 Bond Program
0 0 0 68,600Burninglog 13156 0 58,310Erosion Control 10,2900
Clean, Healthy Environment
03 3rd/1712 Bond Program
0 0 0 171,400Caracas 5410 and 5416 0 145,690Erosion Control 25,7100
Clean, Healthy Environment
01 3rd/1712 Bond Program
0 0 0 73,100Cavender 445 0 62,135Erosion Control 10,9650
Clean, Healthy Environment
02 3rd/1712 Bond Program
0 0 0 185,100Cedar Springs 5910 0 157,335Erosion Control 27,7650
Clean, Healthy Environment
10 3rd/1712 Bond Program
0 0 0 160,000Church Road 9233 0 136,000Erosion Control 24,0000
Clean, Healthy Environment
01 3rd/1712 Bond Program
0 0 0 111,200Clarendon 3435 0 94,520Erosion Control 16,6800
Clean, Healthy Environment
11 3rd/1712 Bond Program
0 0 0 114,300Clubhouse Circle 6523 and 6527 0 97,155Erosion Control 17,1450
Clean, Healthy Environment
01 3rd/1712 Bond Program
0 0 0 77,700Colorado (W) 705 0 66,045Erosion Control 11,6550
Clean, Healthy Environment
04 N/A06 Bond Program
94,633 14,650 79,983 174,616Conrad 216 - 221 0 0Storm Drainage Relief System
79,9830
378
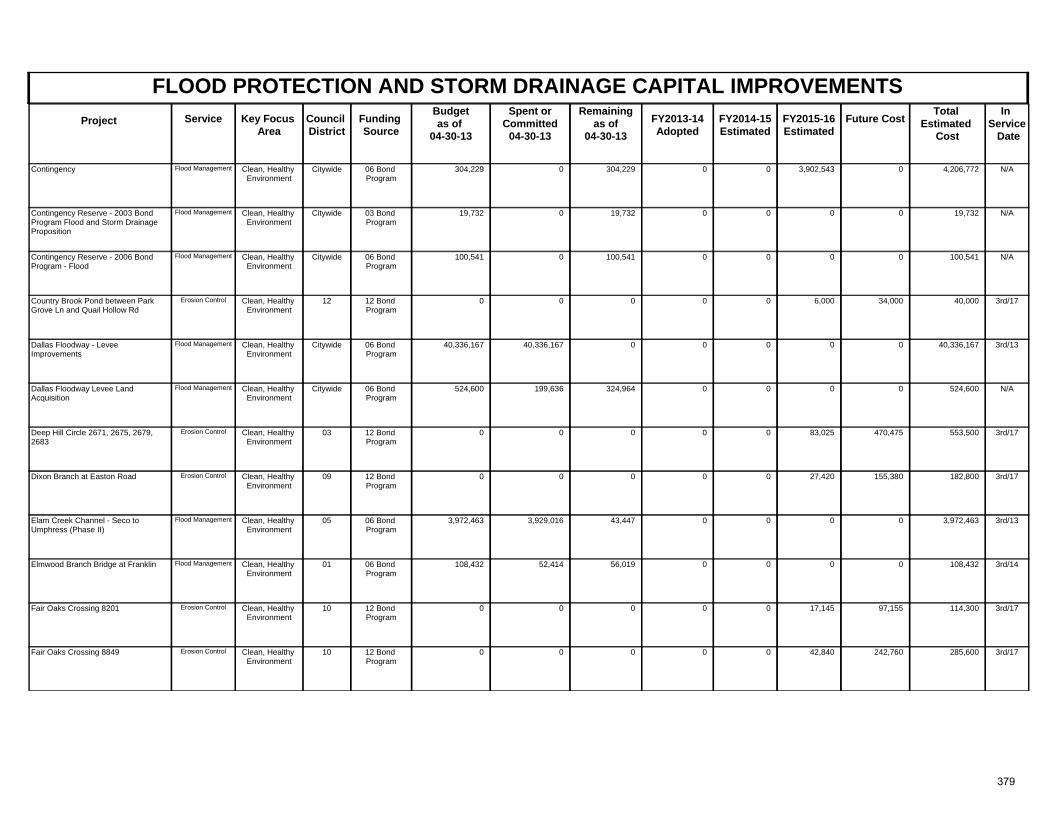
FLOOD PROTECTION AND STORM DRAINAGE CAPITAL IMPROVEMENTSProject Key Focus
AreaCouncil District
Spent orCommitted
04-30-13
Total Estimated
Cost
In Service Date
Funding Source
Remainingas of
04-30-13 FY2013-14
AdoptedFuture CostService FY2014-15
Estimated FY2015-16 Estimated
Budgetas of
04-30-13
Clean, Healthy Environment
Citywide N/A06 Bond Program
304,229 0 304,229 4,206,772Contingency 0 0Flood Management 3,902,5430
Clean, Healthy Environment
Citywide N/A03 Bond Program
19,732 0 19,732 19,732Contingency Reserve - 2003 Bond Program Flood and Storm Drainage Proposition
0 0Flood Management 00
Clean, Healthy Environment
Citywide N/A06 Bond Program
100,541 0 100,541 100,541Contingency Reserve - 2006 Bond Program - Flood
0 0Flood Management 00
Clean, Healthy Environment
12 3rd/1712 Bond Program
0 0 0 40,000Country Brook Pond between Park Grove Ln and Quail Hollow Rd
0 34,000Erosion Control 6,0000
Clean, Healthy Environment
Citywide 3rd/1306 Bond Program
40,336,167 40,336,167 0 40,336,167Dallas Floodway - Levee Improvements
0 0Flood Management 00
Clean, Healthy Environment
Citywide N/A06 Bond Program
524,600 199,636 324,964 524,600Dallas Floodway Levee Land Acquisition
0 0Flood Management 00
Clean, Healthy Environment
03 3rd/1712 Bond Program
0 0 0 553,500Deep Hill Circle 2671, 2675, 2679, 2683
0 470,475Erosion Control 83,0250
Clean, Healthy Environment
09 3rd/1712 Bond Program
0 0 0 182,800Dixon Branch at Easton Road 0 155,380Erosion Control 27,4200
Clean, Healthy Environment
05 3rd/1306 Bond Program
3,972,463 3,929,016 43,447 3,972,463Elam Creek Channel - Seco to Umphress (Phase II)
0 0Flood Management 00
Clean, Healthy Environment
01 3rd/1406 Bond Program
108,432 52,414 56,019 108,432Elmwood Branch Bridge at Franklin 0 0Flood Management 00
Clean, Healthy Environment
10 3rd/1712 Bond Program
0 0 0 114,300Fair Oaks Crossing 8201 0 97,155Erosion Control 17,1450
Clean, Healthy Environment
10 3rd/1712 Bond Program
0 0 0 285,600Fair Oaks Crossing 8849 0 242,760Erosion Control 42,8400
379
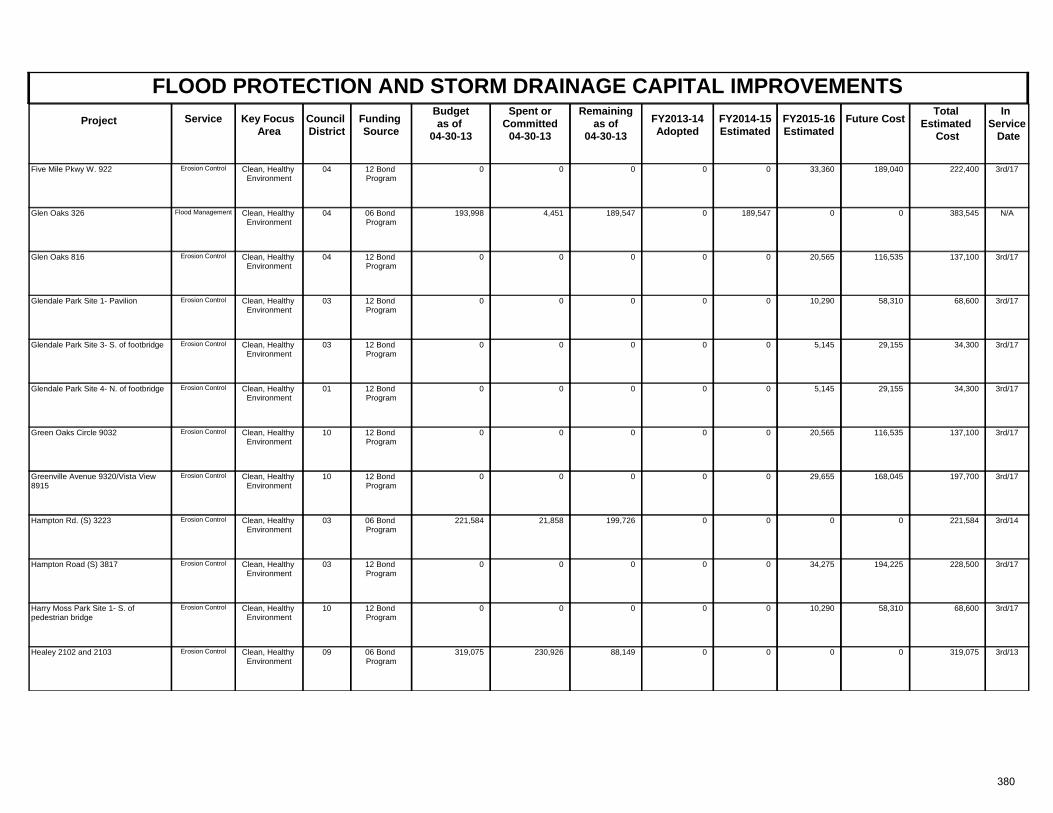
FLOOD PROTECTION AND STORM DRAINAGE CAPITAL IMPROVEMENTSProject Key Focus
AreaCouncil District
Spent orCommitted
04-30-13
Total Estimated
Cost
In Service Date
Funding Source
Remainingas of
04-30-13 FY2013-14
AdoptedFuture CostService FY2014-15
Estimated FY2015-16 Estimated
Budgetas of
04-30-13
Clean, Healthy Environment
04 3rd/1712 Bond Program
0 0 0 222,400Five Mile Pkwy W. 922 0 189,040Erosion Control 33,3600
Clean, Healthy Environment
04 N/A06 Bond Program
193,998 4,451 189,547 383,545Glen Oaks 326 0 0Flood Management 0189,547
Clean, Healthy Environment
04 3rd/1712 Bond Program
0 0 0 137,100Glen Oaks 816 0 116,535Erosion Control 20,5650
Clean, Healthy Environment
03 3rd/1712 Bond Program
0 0 0 68,600Glendale Park Site 1- Pavilion 0 58,310Erosion Control 10,2900
Clean, Healthy Environment
03 3rd/1712 Bond Program
0 0 0 34,300Glendale Park Site 3- S. of footbridge 0 29,155Erosion Control 5,1450
Clean, Healthy Environment
01 3rd/1712 Bond Program
0 0 0 34,300Glendale Park Site 4- N. of footbridge 0 29,155Erosion Control 5,1450
Clean, Healthy Environment
10 3rd/1712 Bond Program
0 0 0 137,100Green Oaks Circle 9032 0 116,535Erosion Control 20,5650
Clean, Healthy Environment
10 3rd/1712 Bond Program
0 0 0 197,700Greenville Avenue 9320/Vista View 8915
0 168,045Erosion Control 29,6550
Clean, Healthy Environment
03 3rd/1406 Bond Program
221,584 21,858 199,726 221,584Hampton Rd. (S) 3223 0 0Erosion Control 00
Clean, Healthy Environment
03 3rd/1712 Bond Program
0 0 0 228,500Hampton Road (S) 3817 0 194,225Erosion Control 34,2750
Clean, Healthy Environment
10 3rd/1712 Bond Program
0 0 0 68,600Harry Moss Park Site 1- S. of pedestrian bridge
0 58,310Erosion Control 10,2900
Clean, Healthy Environment
09 3rd/1306 Bond Program
319,075 230,926 88,149 319,075Healey 2102 and 2103 0 0Erosion Control 00
380
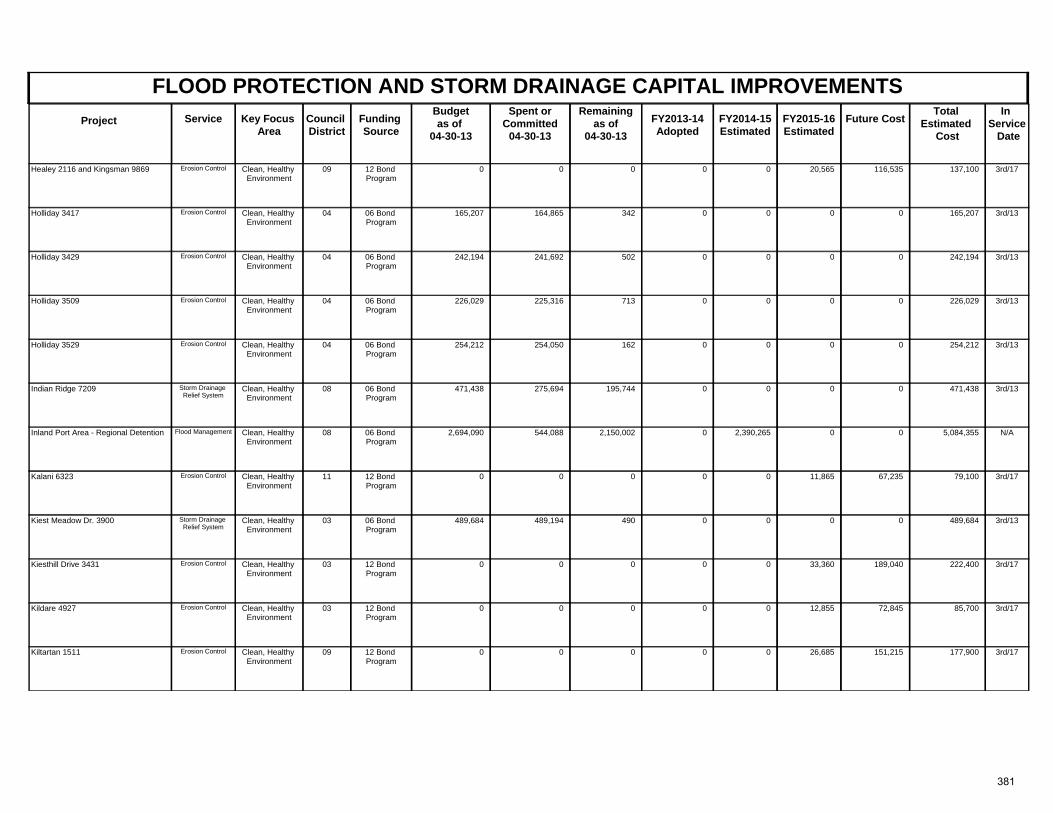
FLOOD PROTECTION AND STORM DRAINAGE CAPITAL IMPROVEMENTSProject Key Focus
AreaCouncil District
Spent orCommitted
04-30-13
Total Estimated
Cost
In Service Date
Funding Source
Remainingas of
04-30-13 FY2013-14
AdoptedFuture CostService FY2014-15
Estimated FY2015-16 Estimated
Budgetas of
04-30-13
Clean, Healthy Environment
09 3rd/1712 Bond Program
0 0 0 137,100Healey 2116 and Kingsman 9869 0 116,535Erosion Control 20,5650
Clean, Healthy Environment
04 3rd/1306 Bond Program
165,207 164,865 342 165,207Holliday 3417 0 0Erosion Control 00
Clean, Healthy Environment
04 3rd/1306 Bond Program
242,194 241,692 502 242,194Holliday 3429 0 0Erosion Control 00
Clean, Healthy Environment
04 3rd/1306 Bond Program
226,029 225,316 713 226,029Holliday 3509 0 0Erosion Control 00
Clean, Healthy Environment
04 3rd/1306 Bond Program
254,212 254,050 162 254,212Holliday 3529 0 0Erosion Control 00
Clean, Healthy Environment
08 3rd/1306 Bond Program
471,438 275,694 195,744 471,438Indian Ridge 7209 0 0Storm Drainage Relief System
00
Clean, Healthy Environment
08 N/A06 Bond Program
2,694,090 544,088 2,150,002 5,084,355Inland Port Area - Regional Detention 0 0Flood Management 02,390,265
Clean, Healthy Environment
11 3rd/1712 Bond Program
0 0 0 79,100Kalani 6323 0 67,235Erosion Control 11,8650
Clean, Healthy Environment
03 3rd/1306 Bond Program
489,684 489,194 490 489,684Kiest Meadow Dr. 3900 0 0Storm Drainage Relief System
00
Clean, Healthy Environment
03 3rd/1712 Bond Program
0 0 0 222,400Kiesthill Drive 3431 0 189,040Erosion Control 33,3600
Clean, Healthy Environment
03 3rd/1712 Bond Program
0 0 0 85,700Kildare 4927 0 72,845Erosion Control 12,8550
Clean, Healthy Environment
09 3rd/1712 Bond Program
0 0 0 177,900Kiltartan 1511 0 151,215Erosion Control 26,6850
381
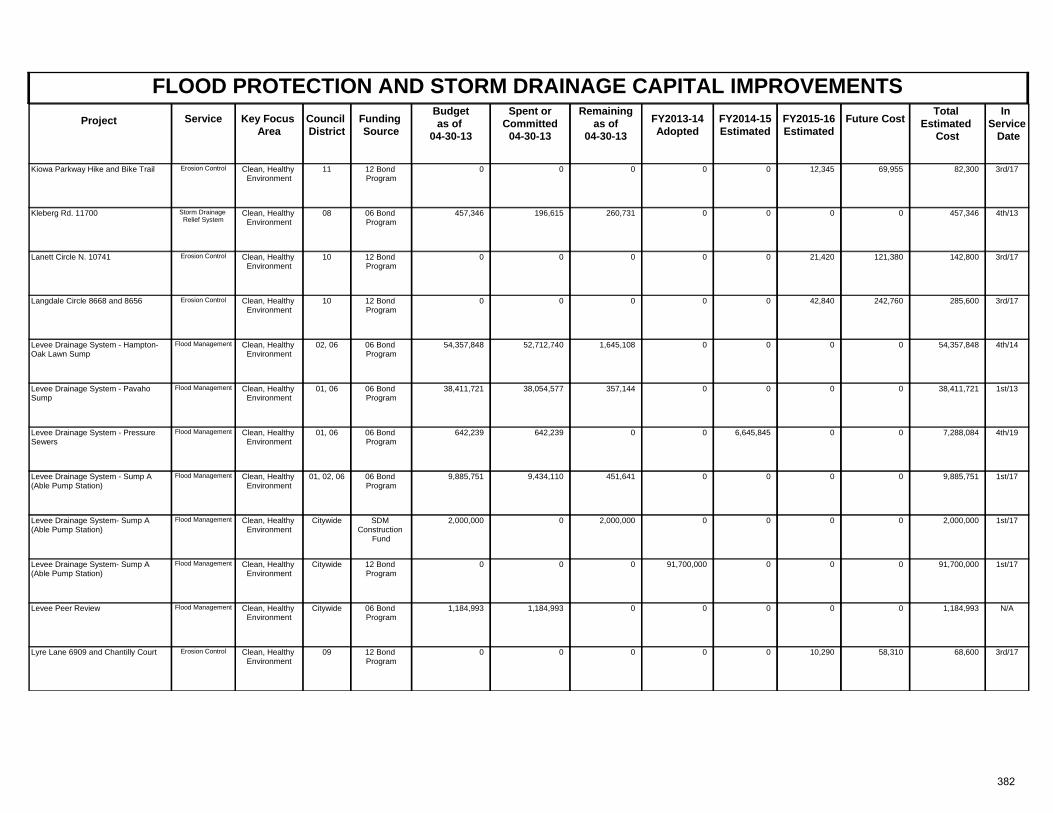
FLOOD PROTECTION AND STORM DRAINAGE CAPITAL IMPROVEMENTSProject Key Focus
AreaCouncil District
Spent orCommitted
04-30-13
Total Estimated
Cost
In Service Date
Funding Source
Remainingas of
04-30-13 FY2013-14
AdoptedFuture CostService FY2014-15
Estimated FY2015-16 Estimated
Budgetas of
04-30-13
Clean, Healthy Environment
11 3rd/1712 Bond Program
0 0 0 82,300Kiowa Parkway Hike and Bike Trail 0 69,955Erosion Control 12,3450
Clean, Healthy Environment
08 4th/1306 Bond Program
457,346 196,615 260,731 457,346Kleberg Rd. 11700 0 0Storm Drainage Relief System
00
Clean, Healthy Environment
10 3rd/1712 Bond Program
0 0 0 142,800Lanett Circle N. 10741 0 121,380Erosion Control 21,4200
Clean, Healthy Environment
10 3rd/1712 Bond Program
0 0 0 285,600Langdale Circle 8668 and 8656 0 242,760Erosion Control 42,8400
Clean, Healthy Environment
02, 06 4th/1406 Bond Program
54,357,848 52,712,740 1,645,108 54,357,848Levee Drainage System - Hampton-Oak Lawn Sump
0 0Flood Management 00
Clean, Healthy Environment
01, 06 1st/1306 Bond Program
38,411,721 38,054,577 357,144 38,411,721Levee Drainage System - Pavaho Sump
0 0Flood Management 00
Clean, Healthy Environment
01, 06 4th/1906 Bond Program
642,239 642,239 0 7,288,084Levee Drainage System - Pressure Sewers
0 0Flood Management 06,645,845
Clean, Healthy Environment
01, 02, 06 1st/1706 Bond Program
9,885,751 9,434,110 451,641 9,885,751Levee Drainage System - Sump A (Able Pump Station)
0 0Flood Management 00
Clean, Healthy Environment
Citywide 1st/17SDM Construction
Fund
2,000,000 0 2,000,000 2,000,000Levee Drainage System- Sump A (Able Pump Station)
0 0Flood Management 00
Clean, Healthy Environment
Citywide 1st/1712 Bond Program
0 0 0 91,700,000Levee Drainage System- Sump A (Able Pump Station)
91,700,000 0Flood Management 00
Clean, Healthy Environment
Citywide N/A06 Bond Program
1,184,993 1,184,993 0 1,184,993Levee Peer Review 0 0Flood Management 00
Clean, Healthy Environment
09 3rd/1712 Bond Program
0 0 0 68,600Lyre Lane 6909 and Chantilly Court 0 58,310Erosion Control 10,2900
382
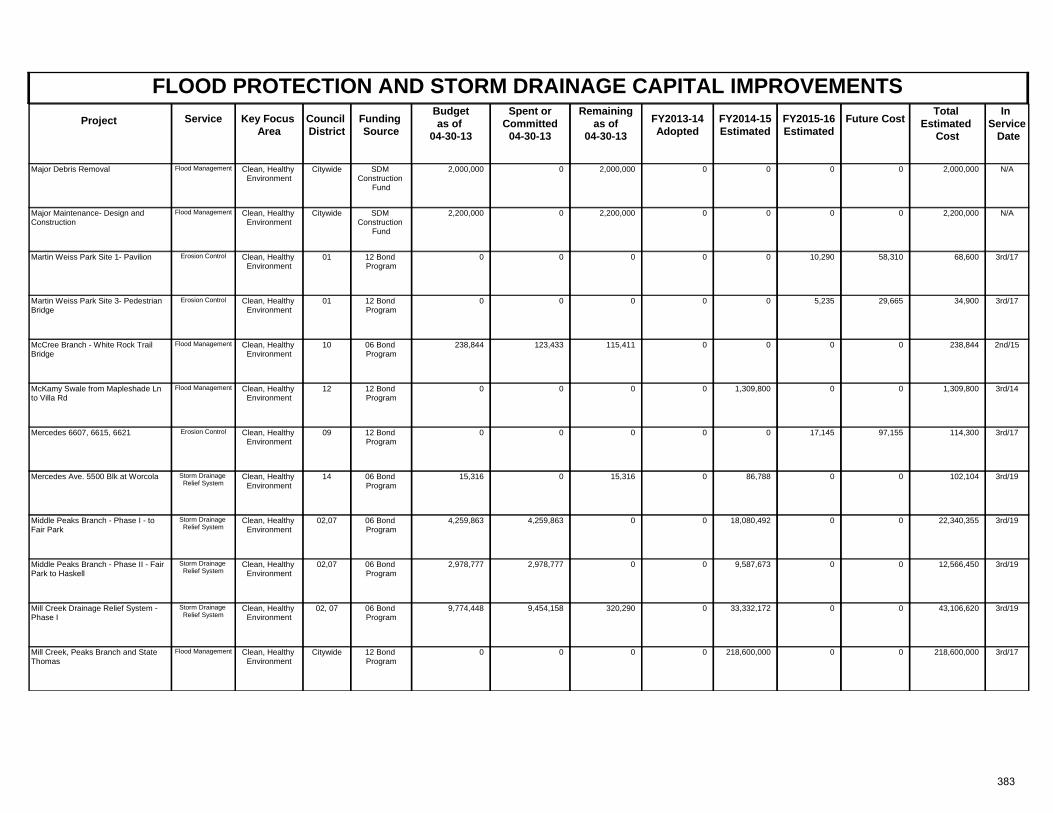
FLOOD PROTECTION AND STORM DRAINAGE CAPITAL IMPROVEMENTSProject Key Focus
AreaCouncil District
Spent orCommitted
04-30-13
Total Estimated
Cost
In Service Date
Funding Source
Remainingas of
04-30-13 FY2013-14
AdoptedFuture CostService FY2014-15
Estimated FY2015-16 Estimated
Budgetas of
04-30-13
Clean, Healthy Environment
Citywide N/ASDM Construction
Fund
2,000,000 0 2,000,000 2,000,000Major Debris Removal 0 0Flood Management 00
Clean, Healthy Environment
Citywide N/ASDM Construction
Fund
2,200,000 0 2,200,000 2,200,000Major Maintenance- Design and Construction
0 0Flood Management 00
Clean, Healthy Environment
01 3rd/1712 Bond Program
0 0 0 68,600Martin Weiss Park Site 1- Pavilion 0 58,310Erosion Control 10,2900
Clean, Healthy Environment
01 3rd/1712 Bond Program
0 0 0 34,900Martin Weiss Park Site 3- Pedestrian Bridge
0 29,665Erosion Control 5,2350
Clean, Healthy Environment
10 2nd/1506 Bond Program
238,844 123,433 115,411 238,844McCree Branch - White Rock Trail Bridge
0 0Flood Management 00
Clean, Healthy Environment
12 3rd/1412 Bond Program
0 0 0 1,309,800McKamy Swale from Mapleshade Ln to Villa Rd
0 0Flood Management 01,309,800
Clean, Healthy Environment
09 3rd/1712 Bond Program
0 0 0 114,300Mercedes 6607, 6615, 6621 0 97,155Erosion Control 17,1450
Clean, Healthy Environment
14 3rd/1906 Bond Program
15,316 0 15,316 102,104Mercedes Ave. 5500 Blk at Worcola 0 0Storm Drainage Relief System
086,788
Clean, Healthy Environment
02,07 3rd/1906 Bond Program
4,259,863 4,259,863 0 22,340,355Middle Peaks Branch - Phase I - to Fair Park
0 0Storm Drainage Relief System
018,080,492
Clean, Healthy Environment
02,07 3rd/1906 Bond Program
2,978,777 2,978,777 0 12,566,450Middle Peaks Branch - Phase II - Fair Park to Haskell
0 0Storm Drainage Relief System
09,587,673
Clean, Healthy Environment
02, 07 3rd/1906 Bond Program
9,774,448 9,454,158 320,290 43,106,620Mill Creek Drainage Relief System - Phase I
0 0Storm Drainage Relief System
033,332,172
Clean, Healthy Environment
Citywide 3rd/1712 Bond Program
0 0 0 218,600,000Mill Creek, Peaks Branch and State Thomas
0 0Flood Management 0218,600,000
383
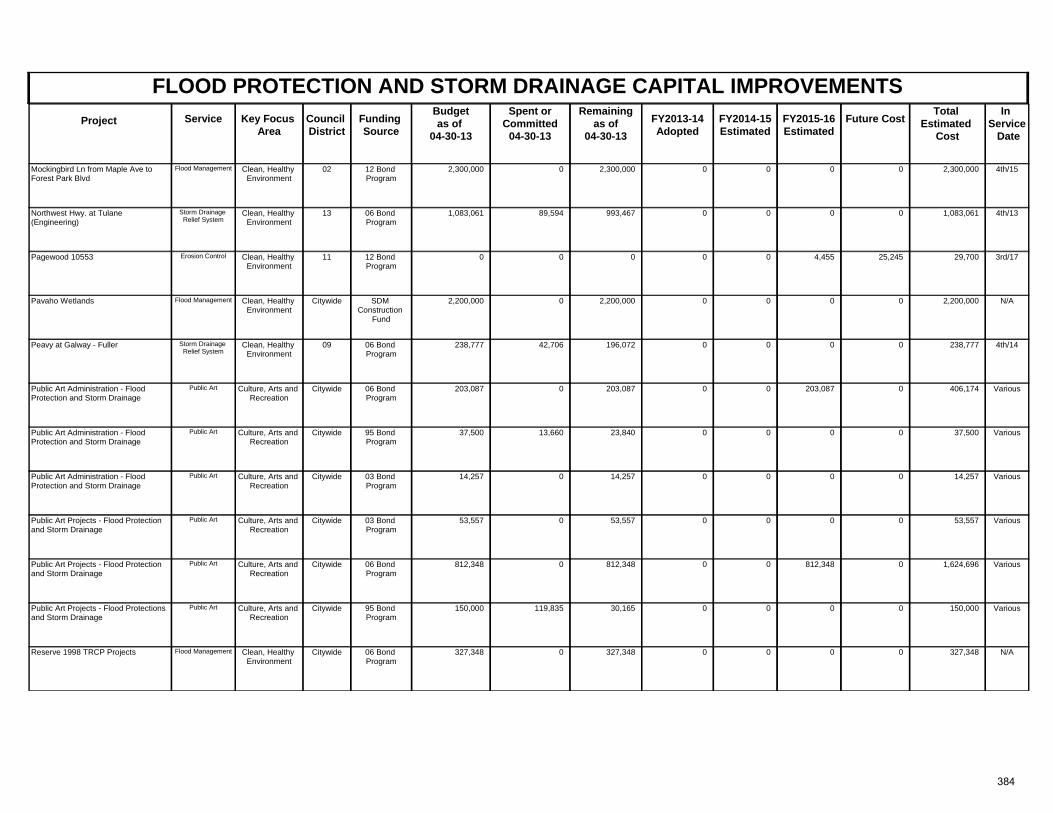
FLOOD PROTECTION AND STORM DRAINAGE CAPITAL IMPROVEMENTSProject Key Focus
AreaCouncil District
Spent orCommitted
04-30-13
Total Estimated
Cost
In Service Date
Funding Source
Remainingas of
04-30-13 FY2013-14
AdoptedFuture CostService FY2014-15
Estimated FY2015-16 Estimated
Budgetas of
04-30-13
Clean, Healthy Environment
02 4th/1512 Bond Program
2,300,000 0 2,300,000 2,300,000Mockingbird Ln from Maple Ave to Forest Park Blvd
0 0Flood Management 00
Clean, Healthy Environment
13 4th/1306 Bond Program
1,083,061 89,594 993,467 1,083,061Northwest Hwy. at Tulane (Engineering)
0 0Storm Drainage Relief System
00
Clean, Healthy Environment
11 3rd/1712 Bond Program
0 0 0 29,700Pagewood 10553 0 25,245Erosion Control 4,4550
Clean, Healthy Environment
Citywide N/ASDM Construction
Fund
2,200,000 0 2,200,000 2,200,000Pavaho Wetlands 0 0Flood Management 00
Clean, Healthy Environment
09 4th/1406 Bond Program
238,777 42,706 196,072 238,777Peavy at Galway - Fuller 0 0Storm Drainage Relief System
00
Culture, Arts and Recreation
Citywide Various06 Bond Program
203,087 0 203,087 406,174Public Art Administration - Flood Protection and Storm Drainage
0 0Public Art 203,0870
Culture, Arts and Recreation
Citywide Various95 Bond Program
37,500 13,660 23,840 37,500Public Art Administration - Flood Protection and Storm Drainage
0 0Public Art 00
Culture, Arts and Recreation
Citywide Various03 Bond Program
14,257 0 14,257 14,257Public Art Administration - Flood Protection and Storm Drainage
0 0Public Art 00
Culture, Arts and Recreation
Citywide Various03 Bond Program
53,557 0 53,557 53,557Public Art Projects - Flood Protection and Storm Drainage
0 0Public Art 00
Culture, Arts and Recreation
Citywide Various06 Bond Program
812,348 0 812,348 1,624,696Public Art Projects - Flood Protection and Storm Drainage
0 0Public Art 812,3480
Culture, Arts and Recreation
Citywide Various95 Bond Program
150,000 119,835 30,165 150,000Public Art Projects - Flood Protections and Storm Drainage
0 0Public Art 00
Clean, Healthy Environment
Citywide N/A06 Bond Program
327,348 0 327,348 327,348Reserve 1998 TRCP Projects 0 0Flood Management 00
384
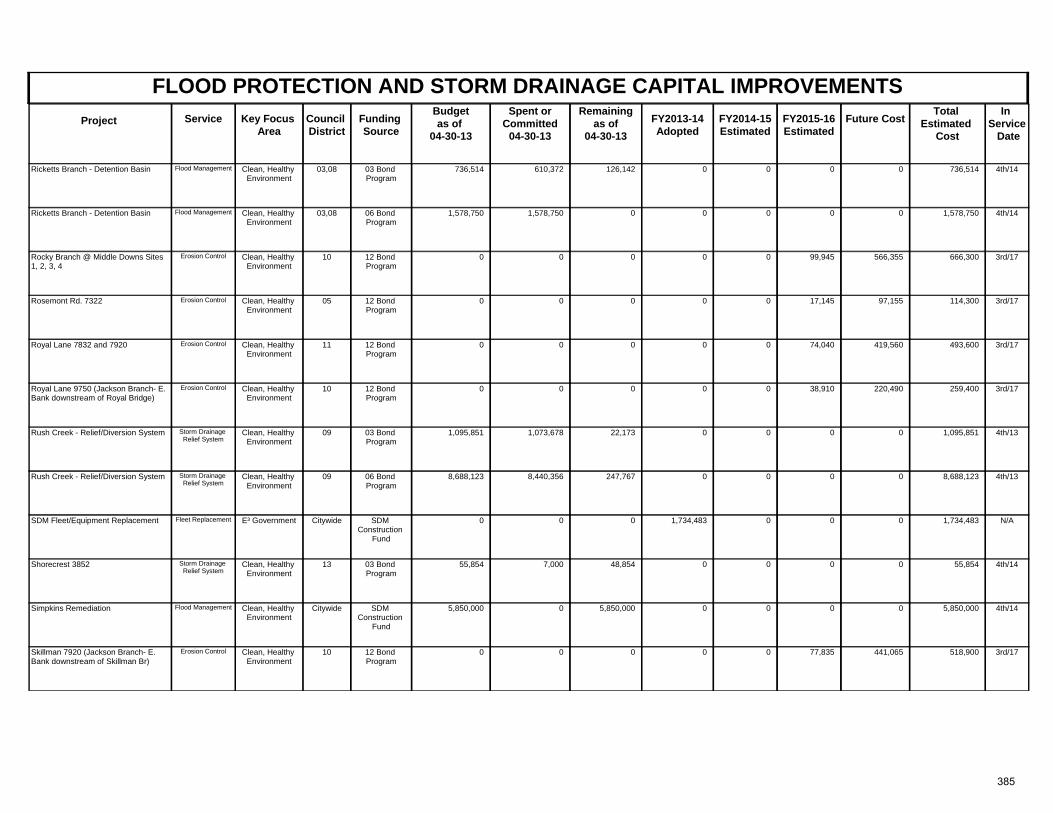
FLOOD PROTECTION AND STORM DRAINAGE CAPITAL IMPROVEMENTSProject Key Focus
AreaCouncil District
Spent orCommitted
04-30-13
Total Estimated
Cost
In Service Date
Funding Source
Remainingas of
04-30-13 FY2013-14
AdoptedFuture CostService FY2014-15
Estimated FY2015-16 Estimated
Budgetas of
04-30-13
Clean, Healthy Environment
03,08 4th/1403 Bond Program
736,514 610,372 126,142 736,514Ricketts Branch - Detention Basin 0 0Flood Management 00
Clean, Healthy Environment
03,08 4th/1406 Bond Program
1,578,750 1,578,750 0 1,578,750Ricketts Branch - Detention Basin 0 0Flood Management 00
Clean, Healthy Environment
10 3rd/1712 Bond Program
0 0 0 666,300Rocky Branch @ Middle Downs Sites 1, 2, 3, 4
0 566,355Erosion Control 99,9450
Clean, Healthy Environment
05 3rd/1712 Bond Program
0 0 0 114,300Rosemont Rd. 7322 0 97,155Erosion Control 17,1450
Clean, Healthy Environment
11 3rd/1712 Bond Program
0 0 0 493,600Royal Lane 7832 and 7920 0 419,560Erosion Control 74,0400
Clean, Healthy Environment
10 3rd/1712 Bond Program
0 0 0 259,400Royal Lane 9750 (Jackson Branch- E. Bank downstream of Royal Bridge)
0 220,490Erosion Control 38,9100
Clean, Healthy Environment
09 4th/1303 Bond Program
1,095,851 1,073,678 22,173 1,095,851Rush Creek - Relief/Diversion System 0 0Storm Drainage Relief System
00
Clean, Healthy Environment
09 4th/1306 Bond Program
8,688,123 8,440,356 247,767 8,688,123Rush Creek - Relief/Diversion System 0 0Storm Drainage Relief System
00
E³ Government Citywide N/ASDM Construction
Fund
0 0 0 1,734,483SDM Fleet/Equipment Replacement 1,734,483 0Fleet Replacement 00
Clean, Healthy Environment
13 4th/1403 Bond Program
55,854 7,000 48,854 55,854Shorecrest 3852 0 0Storm Drainage Relief System
00
Clean, Healthy Environment
Citywide 4th/14SDM Construction
Fund
5,850,000 0 5,850,000 5,850,000Simpkins Remediation 0 0Flood Management 00
Clean, Healthy Environment
10 3rd/1712 Bond Program
0 0 0 518,900Skillman 7920 (Jackson Branch- E. Bank downstream of Skillman Br)
0 441,065Erosion Control 77,8350
385
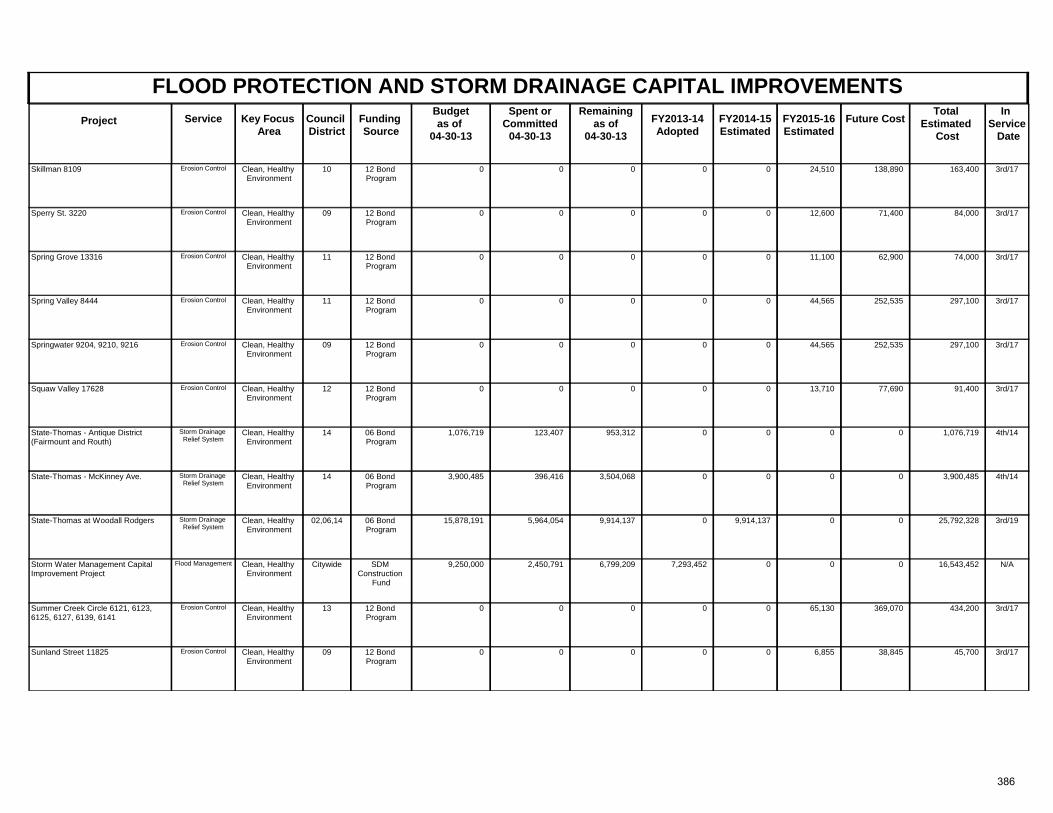
FLOOD PROTECTION AND STORM DRAINAGE CAPITAL IMPROVEMENTSProject Key Focus
AreaCouncil District
Spent orCommitted
04-30-13
Total Estimated
Cost
In Service Date
Funding Source
Remainingas of
04-30-13 FY2013-14
AdoptedFuture CostService FY2014-15
Estimated FY2015-16 Estimated
Budgetas of
04-30-13
Clean, Healthy Environment
10 3rd/1712 Bond Program
0 0 0 163,400Skillman 8109 0 138,890Erosion Control 24,5100
Clean, Healthy Environment
09 3rd/1712 Bond Program
0 0 0 84,000Sperry St. 3220 0 71,400Erosion Control 12,6000
Clean, Healthy Environment
11 3rd/1712 Bond Program
0 0 0 74,000Spring Grove 13316 0 62,900Erosion Control 11,1000
Clean, Healthy Environment
11 3rd/1712 Bond Program
0 0 0 297,100Spring Valley 8444 0 252,535Erosion Control 44,5650
Clean, Healthy Environment
09 3rd/1712 Bond Program
0 0 0 297,100Springwater 9204, 9210, 9216 0 252,535Erosion Control 44,5650
Clean, Healthy Environment
12 3rd/1712 Bond Program
0 0 0 91,400Squaw Valley 17628 0 77,690Erosion Control 13,7100
Clean, Healthy Environment
14 4th/1406 Bond Program
1,076,719 123,407 953,312 1,076,719State-Thomas - Antique District (Fairmount and Routh)
0 0Storm Drainage Relief System
00
Clean, Healthy Environment
14 4th/1406 Bond Program
3,900,485 396,416 3,504,068 3,900,485State-Thomas - McKinney Ave. 0 0Storm Drainage Relief System
00
Clean, Healthy Environment
02,06,14 3rd/1906 Bond Program
15,878,191 5,964,054 9,914,137 25,792,328State-Thomas at Woodall Rodgers 0 0Storm Drainage Relief System
09,914,137
Clean, Healthy Environment
Citywide N/ASDM Construction
Fund
9,250,000 2,450,791 6,799,209 16,543,452Storm Water Management Capital Improvement Project
7,293,452 0Flood Management 00
Clean, Healthy Environment
13 3rd/1712 Bond Program
0 0 0 434,200Summer Creek Circle 6121, 6123, 6125, 6127, 6139, 6141
0 369,070Erosion Control 65,1300
Clean, Healthy Environment
09 3rd/1712 Bond Program
0 0 0 45,700Sunland Street 11825 0 38,845Erosion Control 6,8550
386
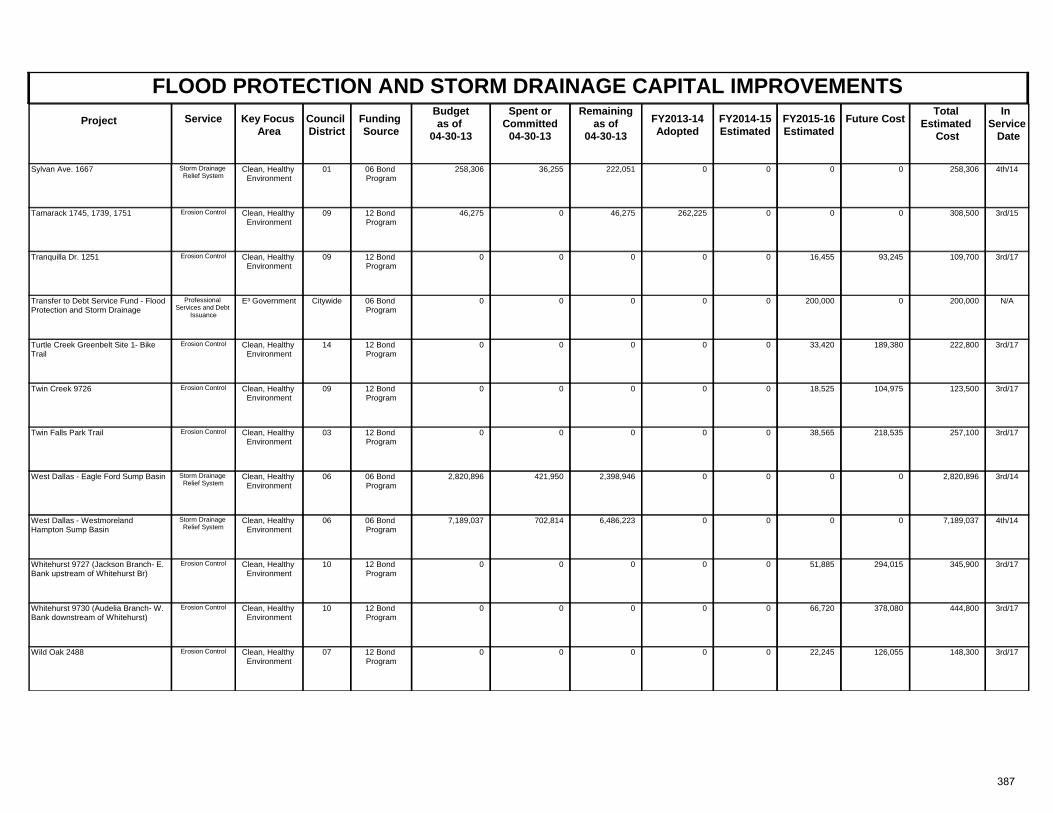
FLOOD PROTECTION AND STORM DRAINAGE CAPITAL IMPROVEMENTSProject Key Focus
AreaCouncil District
Spent orCommitted
04-30-13
Total Estimated
Cost
In Service Date
Funding Source
Remainingas of
04-30-13 FY2013-14
AdoptedFuture CostService FY2014-15
Estimated FY2015-16 Estimated
Budgetas of
04-30-13
Clean, Healthy Environment
01 4th/1406 Bond Program
258,306 36,255 222,051 258,306Sylvan Ave. 1667 0 0Storm Drainage Relief System
00
Clean, Healthy Environment
09 3rd/1512 Bond Program
46,275 0 46,275 308,500Tamarack 1745, 1739, 1751 262,225 0Erosion Control 00
Clean, Healthy Environment
09 3rd/1712 Bond Program
0 0 0 109,700Tranquilla Dr. 1251 0 93,245Erosion Control 16,4550
E³ Government Citywide N/A06 Bond Program
0 0 0 200,000Transfer to Debt Service Fund - Flood Protection and Storm Drainage
0 0Professional Services and Debt
Issuance
200,0000
Clean, Healthy Environment
14 3rd/1712 Bond Program
0 0 0 222,800Turtle Creek Greenbelt Site 1- Bike Trail
0 189,380Erosion Control 33,4200
Clean, Healthy Environment
09 3rd/1712 Bond Program
0 0 0 123,500Twin Creek 9726 0 104,975Erosion Control 18,5250
Clean, Healthy Environment
03 3rd/1712 Bond Program
0 0 0 257,100Twin Falls Park Trail 0 218,535Erosion Control 38,5650
Clean, Healthy Environment
06 3rd/1406 Bond Program
2,820,896 421,950 2,398,946 2,820,896West Dallas - Eagle Ford Sump Basin 0 0Storm Drainage Relief System
00
Clean, Healthy Environment
06 4th/1406 Bond Program
7,189,037 702,814 6,486,223 7,189,037West Dallas - Westmoreland Hampton Sump Basin
0 0Storm Drainage Relief System
00
Clean, Healthy Environment
10 3rd/1712 Bond Program
0 0 0 345,900Whitehurst 9727 (Jackson Branch- E. Bank upstream of Whitehurst Br)
0 294,015Erosion Control 51,8850
Clean, Healthy Environment
10 3rd/1712 Bond Program
0 0 0 444,800Whitehurst 9730 (Audelia Branch- W. Bank downstream of Whitehurst)
0 378,080Erosion Control 66,7200
Clean, Healthy Environment
07 3rd/1712 Bond Program
0 0 0 148,300Wild Oak 2488 0 126,055Erosion Control 22,2450
387
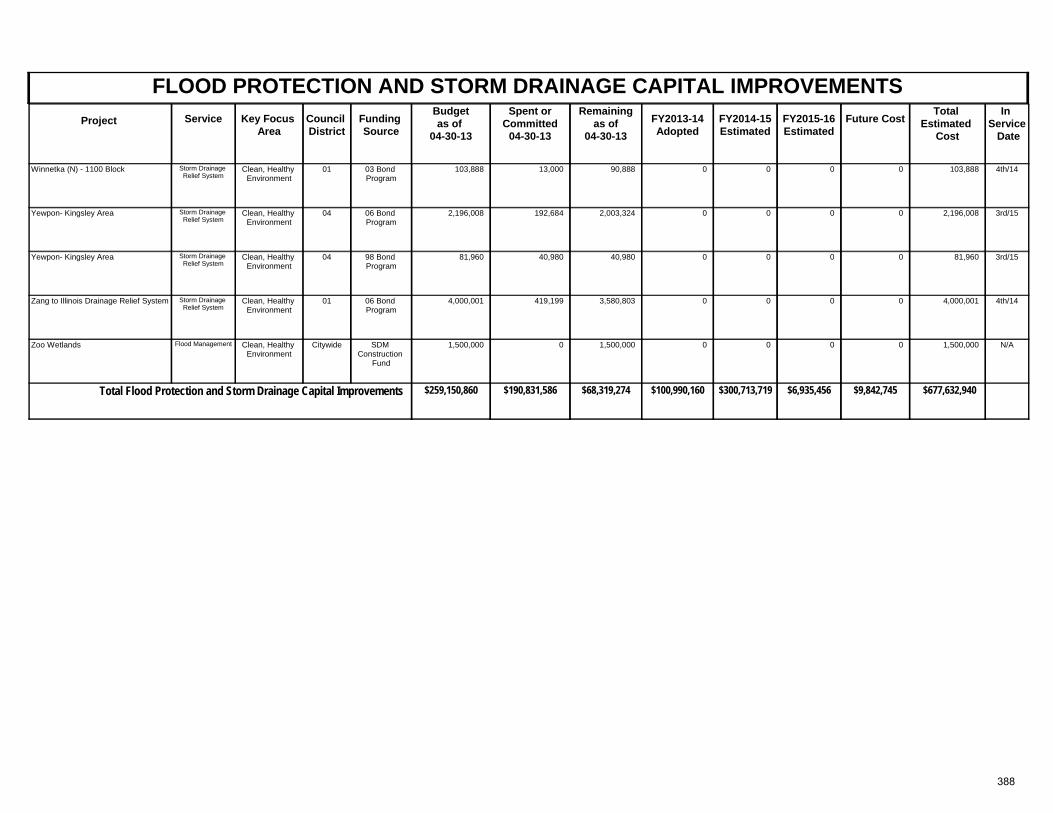
FLOOD PROTECTION AND STORM DRAINAGE CAPITAL IMPROVEMENTSProject Key Focus
AreaCouncil District
Spent orCommitted
04-30-13
Total Estimated
Cost
In Service Date
Funding Source
Remainingas of
04-30-13 FY2013-14
AdoptedFuture CostService FY2014-15
Estimated FY2015-16 Estimated
Budgetas of
04-30-13
Clean, Healthy Environment
01 4th/1403 Bond Program
103,888 13,000 90,888 103,888Winnetka (N) - 1100 Block 0 0Storm Drainage Relief System
00
Clean, Healthy Environment
04 3rd/1506 Bond Program
2,196,008 192,684 2,003,324 2,196,008Yewpon- Kingsley Area 0 0Storm Drainage Relief System
00
Clean, Healthy Environment
04 3rd/1598 Bond Program
81,960 40,980 40,980 81,960Yewpon- Kingsley Area 0 0Storm Drainage Relief System
00
Clean, Healthy Environment
01 4th/1406 Bond Program
4,000,001 419,199 3,580,803 4,000,001Zang to Illinois Drainage Relief System 0 0Storm Drainage Relief System
00
Clean, Healthy Environment
Citywide N/ASDM Construction
Fund
1,500,000 0 1,500,000 1,500,000Zoo Wetlands 0 0Flood Management 00
$259,150,860 $68,319,274Total Flood Protection and Storm Drainage Capital Improvements $190,831,586 $677,632,940$100,990,160 $9,842,745$6,935,456$300,713,719
388
PARK AND RECREATION CAPITAL IMPROVEMENTS
MISSION The mission of the Park and Recreation Capital Improvement Program is to:
Recover the quality and prestige of the Dallas park system Regain the confidence and enthusiasm of our citizens Reposition the Dallas Park and Recreation Department as a
recognized state and national leader “A Renaissance Plan for Dallas Parks and Recreation in the 21st Century” This program provides for the design, construction and maintenance of Park and Recreation facilities including: playgrounds, major parks, public facilities, athletic facilities, aquatic facilities, erosion control, site development, historic preservation, and service facilities. HIGHLIGHTED ACCOMPLISHMENTS FOR FY2012-13
1. Completion of Woodall Rogers Deck Park (Klyde Warren Park), the Elm Fork Athletic Complex, and Luna Vista Golf Course renovation.
2. Completion of playground replacements at Friendship, Glencoe, JJ Lemmon, Fruitdale, Ricketts Branch, College, Casa Linda, Holcomb and JP Hawn parks.
3. Completion of recreation center renovations and expansions at Harry Stone, Samuell-Grand and Beckley Saner recreation centers.
4. Completion of pavilions at College and Miller Family parks.
5. Completion of Pike Park Plaza, Seaton Park Loop Trail, Five Mile Creek Trail design, White Rock Creek Trail renovation from Forest Lane to Royal Lane, Reverchon Park improvements and Turtle Creek erosion control.
6. Completion of spraygrounds at Willie Mae Butler and Beckley Saner parks.
7. Begin construction of the Texas Horse Park.
HIGHLIGHTED OBJECTIVES FOR FY2013-14
1. Complete improvements to Cotton Bowl at Fair Park, White Rock Lake Dog Park renovation, restorations at Lee Park (including Roque Courts) and Dealey Plaza Phase 2.
2. Complete trail improvements at: Trinity Strand Trail, Kiest Trail, Five Mile Creek Trail from Glendale Park to College Park, White Rock Lake E. Lawther Trail from Mockingbird Point to Big Thicket, White Rock Creek Trail from Valley View Park to Hillcrest Park, and Lake Highlands Trail Phase 3. Complete amenities package at Kiestwood Trail.
3. Complete recreation center renovations at Cummings, Anita Martinez, and Walnut Hill recreation centers.
4. Complete improvements at Luna Vista Golf Course Service Center, Lakeland Hills pavilion and parking improvements at Park in the Woods
5. Complete playground improvements at Cedar Run, and Big Thicket (White Rock Lake) parks; soccer fields and parking improvements at Timberglen Park; and site development at Griggs Park.
SERVICE DESCRIPTIONS Administrative and Internal Service Facilities Provides for service facilities required to effectively and efficiently deliver services in an expanding park system. Aquatic Facilities These improvements provide for new neighborhood spraygrounds, family aquatic centers and infrastructure improvements to Park and Recreation public swimming pools. The improvements may include new filtration systems, new piping and chlorination systems, re-plastering of pool walls, new perimeter fencing, new decking and improvements to the restroom and changing facilities. Citywide Parks Projects have a broader benefit to the citizens. Included within these projects are storm water quality improvements, park accessibility improvements and land acquisition.
389
PARK AND RECREATION CAPITAL IMPROVEMENTS
Code Compliance, Safety and Security Provides a mechanism to address major critical needs throughout the city. Community Parks These parks are larger than Neighborhood Parks and usually comprise 15 to 100 acres and serve a 2-mile radius. These parks may include areas for intense recreation activity such as competitive sports, swimming, tennis, playgrounds, volleyball etc. There may also be passive recreation opportunities such as walking, viewing, sitting and picnicking. Dallas Arboretum Provides for the development at Dallas Arboretum in partnership with the Dallas Arboretum and Botanical Society. Dallas Zoo This category provides for development within the park and is often accomplished in partnership with the Dallas Zoological Society. Downtown Parks Provides for the development of parks within the Central Business District. Environmental Provides funding to address improvements directly affecting the health and well-being of the citizens of Dallas. Erosion Control These projects employ a variety of engineering techniques to control erosion around creek, channel or lake banks. Erosion problems, if left unchecked, will cause damage to existing structures in the park and may create hazardous conditions. Fair Park Provides for the development of projects within Fair Park. These projects often are completed in partnership with the State Fair of Texas, Inc. or other institutions who have a stake in the development of the park. Hike and Bike Trails All-weather trail projects that encourage walking, bicycling, and other modes of transportation as an alternative to the automobile. These trails offer sufficient width to accommodate bicyclists, pedestrians, and skaters, and are recommended under the North Central Texas Council of Government's (COG) Mobility 2025 Plan and the Texas Natural Resources Conservation Commission's (TNRCC) Emission Reduction Plan for the region. Historic Restoration These improvements provide for the restoration and stabilization of historically significant park facilities, particularly those constructed during the 1930s Works Progress Administration era.
Linear/Linkage These areas are built connections or natural corridors that link parks together. Typically, the linear park is developed for one or more modes of recreational travel such as walking, jogging, skating etc. Major Maintenance Provides repair and replacement of major building systems that typically cost more than $10,000 and provide timely and appropriate maintenance to protect the City's general fund facility investment. This process ensures safe and usable facilities for citizens and staff, and maintains a positive image for the City. Examples of building systems include elevators, structural components, roofs, HVAC, electrical, plumbing, and interior finishes. Major Park Facilities These improvements provide for the development of new park facilities or renovation of existing facilities at regional parks that provide citywide or regional services. Included are projects at Fair Park, Dallas Zoo, Dallas Nature Center, Katy Trail, Golf Courses, and the Arboretum. Metropolitan Park These parks are large facilities that service several communities. The parks range in size from 100-500 acres which serve the entire City and are natural areas or developed for a variety of outdoor recreation activities. Mini Park These parks are used to address limited, isolated or unique recreation needs of concentrated populations; usually 1 acre or less in size with less than ¼ mile service radius. Neighborhood Park Facilities These facilities provide for new recreation centers and additions to and renovations of existing recreation centers. The standard recreation center has program space and a full gymnasium. An addition typically consists of a large multi-purpose room. Reservation facilities are available to the public for rental for special events and functions. These parks are from 1 to 15 acres in size and service a ½ mile radius. Park Land Acquisition Provides funding for the acquisition of land for future park development. Playground Improvement Includes new playgrounds or replacement of outdated playground equipment. These projects may also include replacement or installation of new groundcover material to ensure playground safety.
390
PARK AND RECREATION CAPITAL IMPROVEMENTS
Professional Services and Debt Issuance Provides funding for certain costs associated with capital improvement projects. These costs include studies and long-range plans, debt issuance costs, and reimbursements to the General Fund for professional staff services such as design, survey, land acquisition fees and engineering. These costs also include transfers to General Fund. Public Art Includes the public art initiatives throughout the City of Dallas. Funds generated by Public Art appropriations are used for the design services of artists, for the selection, acquisition, commissioning and display of artworks and for administration of the public art projects. Public Private Partnership Provides a funding source for leveraging potential participation and private funding to support park development and programming. Recreation Centers These facilities provide for new recreation centers and additions to and renovations of existing recreation centers. The standard recreation center has program space and a full gymnasium. An addition typically consists of a large multi-purpose room. Reservation facilities are available to the public for rental for special events and functions. Regional Parks These parks are very large multi-use parks that serve several communities within a particular region. They encompass 500+ acres and serve those within a one-hour driving distance. The regional park will provide a wide array of active and passive recreation activities for all age groups. Site Development Includes the development and implementation of Park master plans. These projects may include installing some or all of the components as outlined in the Plan. Typical components may include: pavilions, sidewalks, barrier free ramps, hiking and biking trails, drainage, landscaping and irrigation, fencing, lighting, signage, and other improvements. Special Use Areas These areas are for specialized or single purpose recreation activities. There are no specific standards for size or acreage. Included in these areas are: historic areas, nature centers, marinas, golf courses, zoos, arboretums, amphitheaters, plazas and community squares.
Studies and Master Plans Provides funding for resolution of major developmental issues prior to proceeding with design and construction of individual projects. Trail Development Provides funding for trails identified within the citywide trails master plan.
391
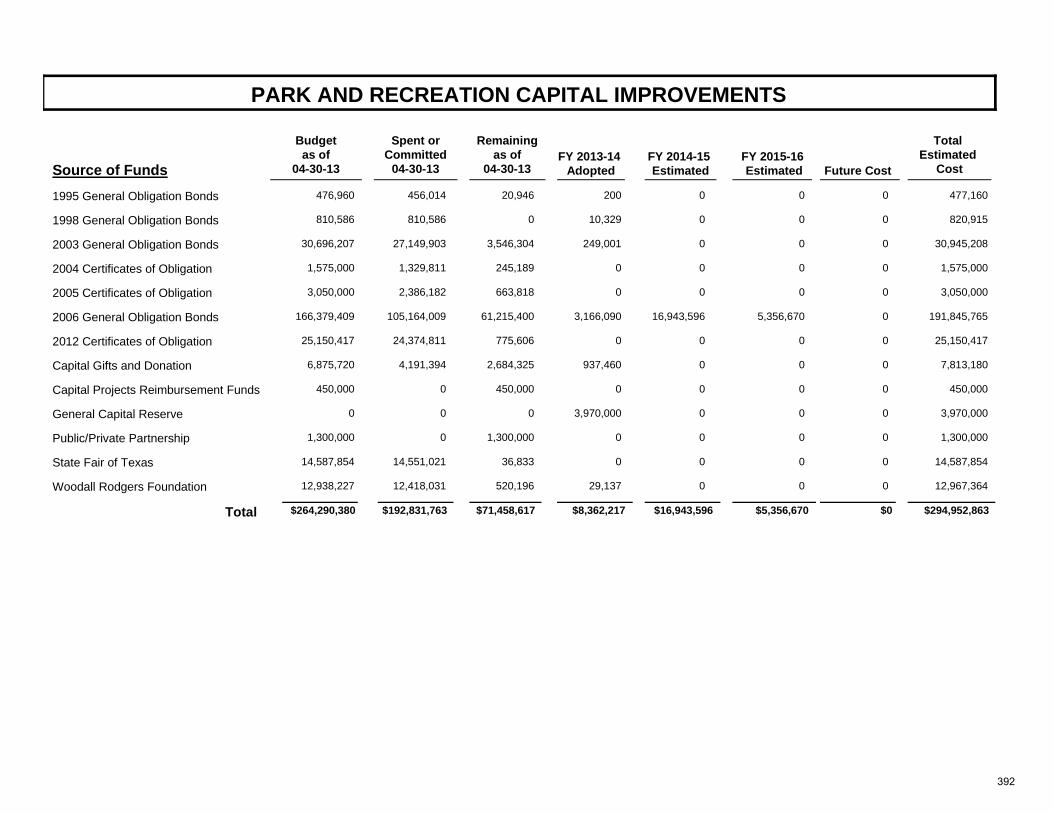
PARK AND RECREATION CAPITAL IMPROVEMENTS
Source of FundsFY 2013-14
Adopted
Total Estimated
CostFY 2014-15 Estimated
FY 2015-16 Estimated
Future Cost
Remainingas of
04-30-13
Spent orCommitted
04-30-13
Budgetas of
04-30-13
1995 General Obligation Bonds 476,960 456,014 20020,946 477,1600 0 0
1998 General Obligation Bonds 810,586 810,586 10,3290 820,9150 0 0
2003 General Obligation Bonds 30,696,207 27,149,903 249,0013,546,304 30,945,2080 0 0
2004 Certificates of Obligation 1,575,000 1,329,811 0245,189 1,575,0000 0 0
2005 Certificates of Obligation 3,050,000 2,386,182 0663,818 3,050,0000 0 0
2006 General Obligation Bonds 166,379,409 105,164,009 3,166,09061,215,400 191,845,76516,943,596 5,356,670 0
2012 Certificates of Obligation 25,150,417 24,374,811 0775,606 25,150,4170 0 0
Capital Gifts and Donation 6,875,720 4,191,394 937,4602,684,325 7,813,1800 0 0
Capital Projects Reimbursement Funds 450,000 0 0450,000 450,0000 0 0
General Capital Reserve 0 0 3,970,0000 3,970,0000 0 0
Public/Private Partnership 1,300,000 0 01,300,000 1,300,0000 0 0
State Fair of Texas 14,587,854 14,551,021 036,833 14,587,8540 0 0
Woodall Rodgers Foundation 12,938,227 12,418,031 29,137520,196 12,967,3640 0 0
$192,831,763 $8,362,217Total $264,290,380 $71,458,617 $16,943,596 $294,952,863$5,356,670 $0
392
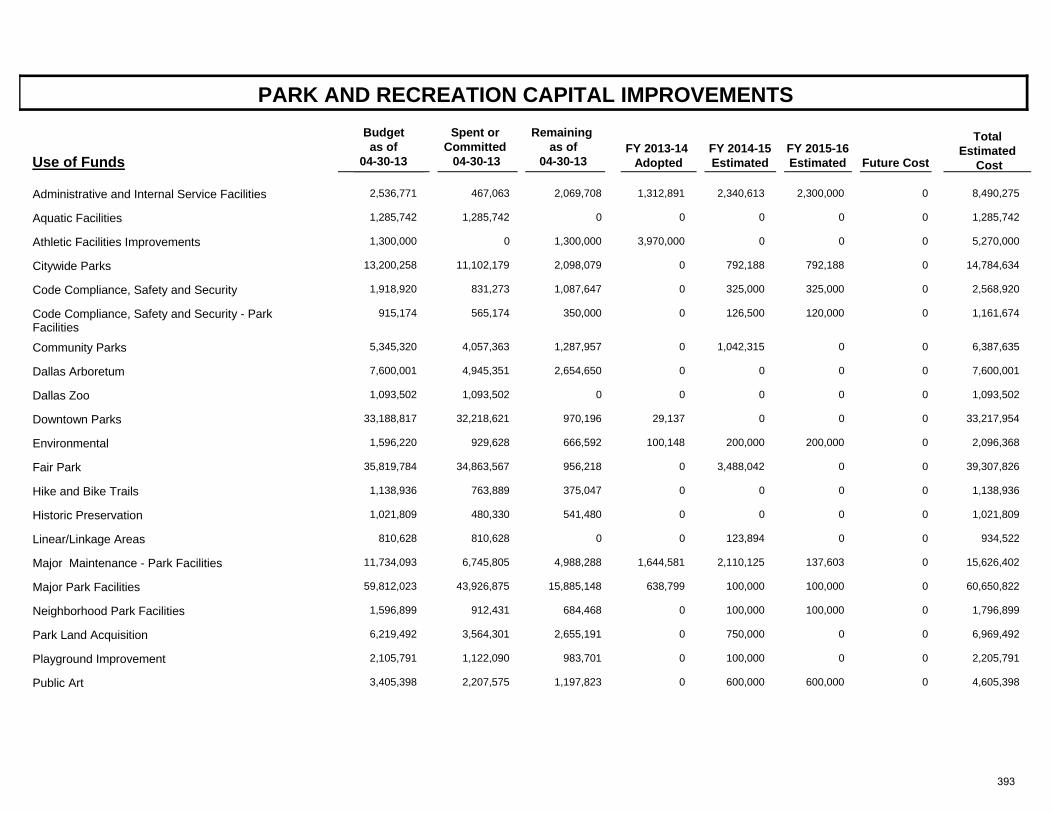
PARK AND RECREATION CAPITAL IMPROVEMENTS
Use of FundsFY 2013-14
Adopted
Total Estimated
Cost FY 2014-15 Estimated
FY 2015-16 Estimated
Future Cost
Spent or Committed
04-30-13
Remaining as of
04-30-13
Budget as of
04-30-13
Administrative and Internal Service Facilities 2,536,771 467,063 1,312,8912,069,708 8,490,2752,340,613 2,300,000 0
Aquatic Facilities 1,285,742 1,285,742 00 1,285,7420 0 0
Athletic Facilities Improvements 1,300,000 0 3,970,0001,300,000 5,270,0000 0 0
Citywide Parks 13,200,258 11,102,179 02,098,079 14,784,634792,188 792,188 0
Code Compliance, Safety and Security 1,918,920 831,273 01,087,647 2,568,920325,000 325,000 0
Code Compliance, Safety and Security - Park Facilities
915,174 565,174 0350,000 1,161,674126,500 120,000 0
Community Parks 5,345,320 4,057,363 01,287,957 6,387,6351,042,315 0 0
Dallas Arboretum 7,600,001 4,945,351 02,654,650 7,600,0010 0 0
Dallas Zoo 1,093,502 1,093,502 00 1,093,5020 0 0
Downtown Parks 33,188,817 32,218,621 29,137970,196 33,217,9540 0 0
Environmental 1,596,220 929,628 100,148666,592 2,096,368200,000 200,000 0
Fair Park 35,819,784 34,863,567 0956,218 39,307,8263,488,042 0 0
Hike and Bike Trails 1,138,936 763,889 0375,047 1,138,9360 0 0
Historic Preservation 1,021,809 480,330 0541,480 1,021,8090 0 0
Linear/Linkage Areas 810,628 810,628 00 934,522123,894 0 0
Major Maintenance - Park Facilities 11,734,093 6,745,805 1,644,5814,988,288 15,626,4022,110,125 137,603 0
Major Park Facilities 59,812,023 43,926,875 638,79915,885,148 60,650,822100,000 100,000 0
Neighborhood Park Facilities 1,596,899 912,431 0684,468 1,796,899100,000 100,000 0
Park Land Acquisition 6,219,492 3,564,301 02,655,191 6,969,492750,000 0 0
Playground Improvement 2,105,791 1,122,090 0983,701 2,205,791100,000 0 0
Public Art 3,405,398 2,207,575 01,197,823 4,605,398600,000 600,000 0
393
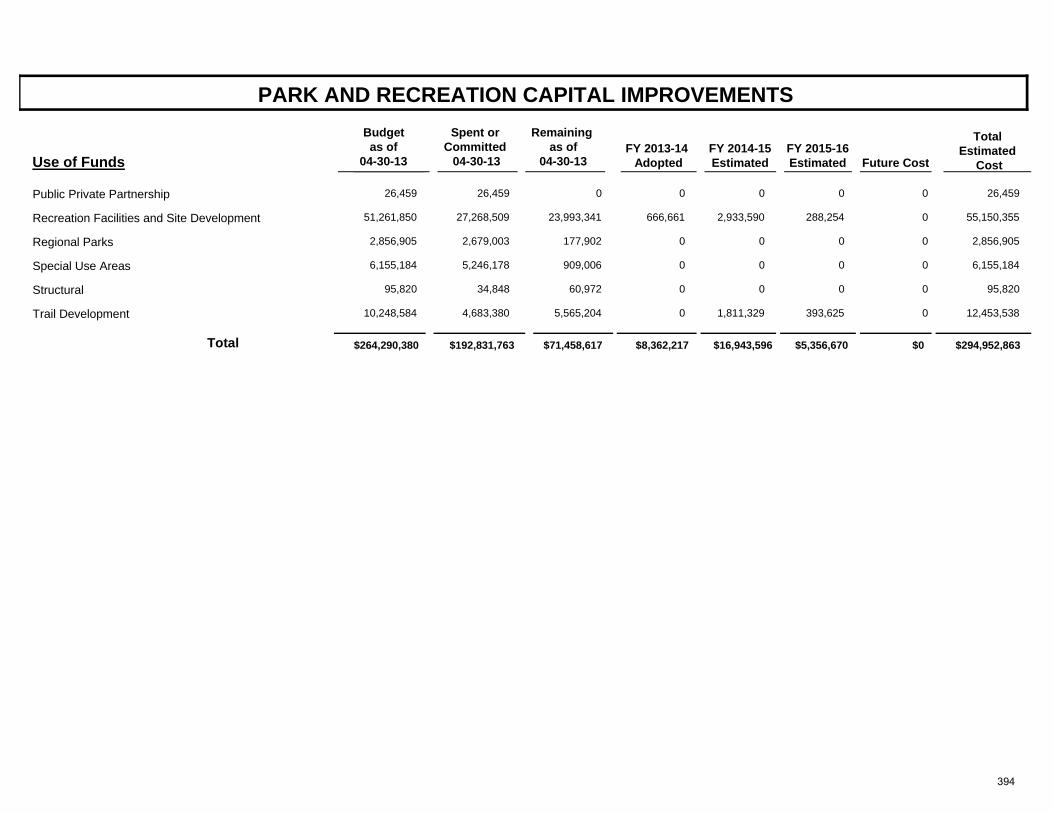
PARK AND RECREATION CAPITAL IMPROVEMENTS
Use of FundsFY 2013-14
Adopted
Total Estimated
Cost FY 2014-15 Estimated
FY 2015-16 Estimated
Future Cost
Spent or Committed
04-30-13
Remaining as of
04-30-13
Budget as of
04-30-13
Public Private Partnership 26,459 26,459 00 26,4590 0 0
Recreation Facilities and Site Development 51,261,850 27,268,509 666,66123,993,341 55,150,3552,933,590 288,254 0
Regional Parks 2,856,905 2,679,003 0177,902 2,856,9050 0 0
Special Use Areas 6,155,184 5,246,178 0909,006 6,155,1840 0 0
Structural 95,820 34,848 060,972 95,8200 0 0
Trail Development 10,248,584 4,683,380 05,565,204 12,453,5381,811,329 393,625 0
$192,831,763 $8,362,217Total $264,290,380 $71,458,617 $16,943,596 $294,952,863$5,356,670 $0
394
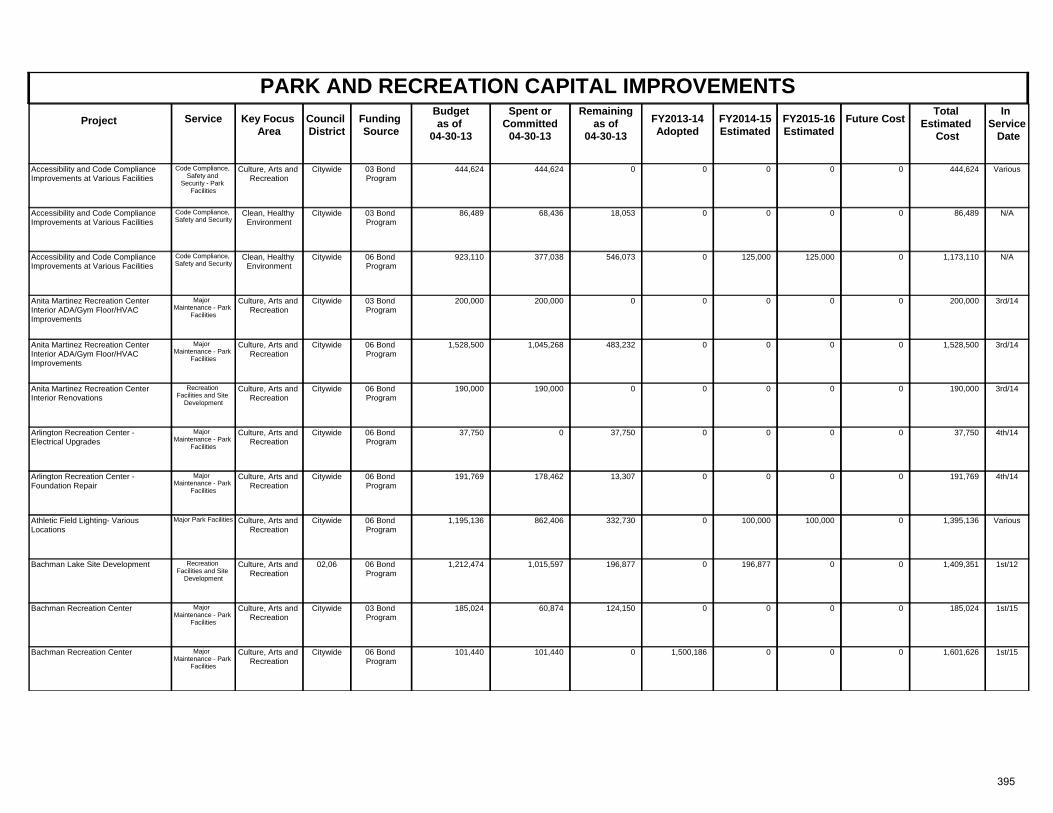
PARK AND RECREATION CAPITAL IMPROVEMENTSProject Key Focus
AreaCouncil District
Spent orCommitted
04-30-13
Total Estimated
Cost
In Service Date
Funding Source
Remainingas of
04-30-13 FY2013-14
AdoptedFuture CostService FY2014-15
Estimated FY2015-16 Estimated
Budgetas of
04-30-13
Culture, Arts and Recreation
Citywide Various03 Bond Program
444,624 444,624 0 444,624Accessibility and Code Compliance Improvements at Various Facilities
0 0Code Compliance, Safety and
Security - Park Facilities
00
Clean, Healthy Environment
Citywide N/A03 Bond Program
86,489 68,436 18,053 86,489Accessibility and Code Compliance Improvements at Various Facilities
0 0Code Compliance, Safety and Security
00
Clean, Healthy Environment
Citywide N/A06 Bond Program
923,110 377,038 546,073 1,173,110Accessibility and Code Compliance Improvements at Various Facilities
0 0Code Compliance, Safety and Security
125,000125,000
Culture, Arts and Recreation
Citywide 3rd/1403 Bond Program
200,000 200,000 0 200,000Anita Martinez Recreation Center Interior ADA/Gym Floor/HVAC Improvements
0 0Major Maintenance - Park
Facilities
00
Culture, Arts and Recreation
Citywide 3rd/1406 Bond Program
1,528,500 1,045,268 483,232 1,528,500Anita Martinez Recreation Center Interior ADA/Gym Floor/HVAC Improvements
0 0Major Maintenance - Park
Facilities
00
Culture, Arts and Recreation
Citywide 3rd/1406 Bond Program
190,000 190,000 0 190,000Anita Martinez Recreation Center Interior Renovations
0 0Recreation Facilities and Site
Development
00
Culture, Arts and Recreation
Citywide 4th/1406 Bond Program
37,750 0 37,750 37,750Arlington Recreation Center - Electrical Upgrades
0 0Major Maintenance - Park
Facilities
00
Culture, Arts and Recreation
Citywide 4th/1406 Bond Program
191,769 178,462 13,307 191,769Arlington Recreation Center - Foundation Repair
0 0Major Maintenance - Park
Facilities
00
Culture, Arts and Recreation
Citywide Various06 Bond Program
1,195,136 862,406 332,730 1,395,136Athletic Field Lighting- Various Locations
0 0Major Park Facilities 100,000100,000
Culture, Arts and Recreation
02,06 1st/1206 Bond Program
1,212,474 1,015,597 196,877 1,409,351Bachman Lake Site Development 0 0Recreation Facilities and Site
Development
0196,877
Culture, Arts and Recreation
Citywide 1st/1503 Bond Program
185,024 60,874 124,150 185,024Bachman Recreation Center 0 0Major Maintenance - Park
Facilities
00
Culture, Arts and Recreation
Citywide 1st/1506 Bond Program
101,440 101,440 0 1,601,626Bachman Recreation Center 1,500,186 0Major Maintenance - Park
Facilities
00
395
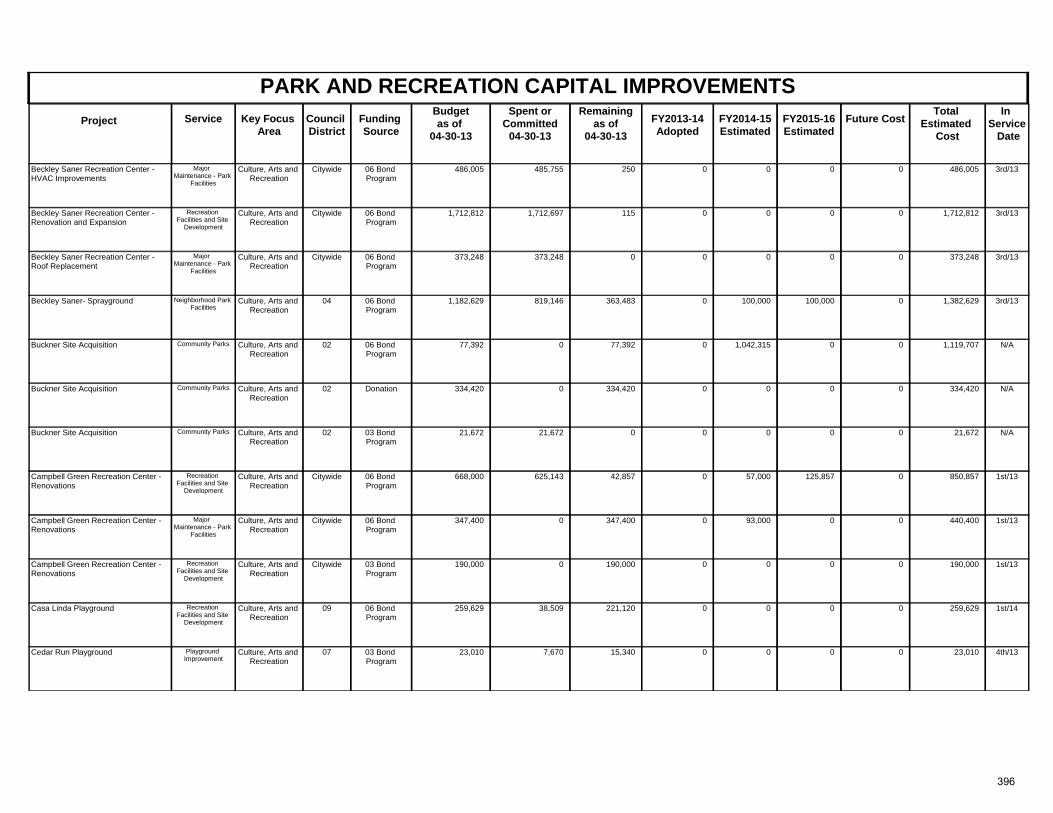
PARK AND RECREATION CAPITAL IMPROVEMENTSProject Key Focus
AreaCouncil District
Spent orCommitted
04-30-13
Total Estimated
Cost
In Service Date
Funding Source
Remainingas of
04-30-13 FY2013-14
AdoptedFuture CostService FY2014-15
Estimated FY2015-16 Estimated
Budgetas of
04-30-13
Culture, Arts and Recreation
Citywide 3rd/1306 Bond Program
486,005 485,755 250 486,005Beckley Saner Recreation Center - HVAC Improvements
0 0Major Maintenance - Park
Facilities
00
Culture, Arts and Recreation
Citywide 3rd/1306 Bond Program
1,712,812 1,712,697 115 1,712,812Beckley Saner Recreation Center - Renovation and Expansion
0 0Recreation Facilities and Site
Development
00
Culture, Arts and Recreation
Citywide 3rd/1306 Bond Program
373,248 373,248 0 373,248Beckley Saner Recreation Center - Roof Replacement
0 0Major Maintenance - Park
Facilities
00
Culture, Arts and Recreation
04 3rd/1306 Bond Program
1,182,629 819,146 363,483 1,382,629Beckley Saner- Sprayground 0 0Neighborhood Park Facilities
100,000100,000
Culture, Arts and Recreation
02 N/A06 Bond Program
77,392 0 77,392 1,119,707Buckner Site Acquisition 0 0Community Parks 01,042,315
Culture, Arts and Recreation
02 N/ADonation 334,420 0 334,420 334,420Buckner Site Acquisition 0 0Community Parks 00
Culture, Arts and Recreation
02 N/A03 Bond Program
21,672 21,672 0 21,672Buckner Site Acquisition 0 0Community Parks 00
Culture, Arts and Recreation
Citywide 1st/1306 Bond Program
668,000 625,143 42,857 850,857Campbell Green Recreation Center - Renovations
0 0Recreation Facilities and Site
Development
125,85757,000
Culture, Arts and Recreation
Citywide 1st/1306 Bond Program
347,400 0 347,400 440,400Campbell Green Recreation Center - Renovations
0 0Major Maintenance - Park
Facilities
093,000
Culture, Arts and Recreation
Citywide 1st/1303 Bond Program
190,000 0 190,000 190,000Campbell Green Recreation Center - Renovations
0 0Recreation Facilities and Site
Development
00
Culture, Arts and Recreation
09 1st/1406 Bond Program
259,629 38,509 221,120 259,629Casa Linda Playground 0 0Recreation Facilities and Site
Development
00
Culture, Arts and Recreation
07 4th/1303 Bond Program
23,010 7,670 15,340 23,010Cedar Run Playground 0 0Playground Improvement
00
396
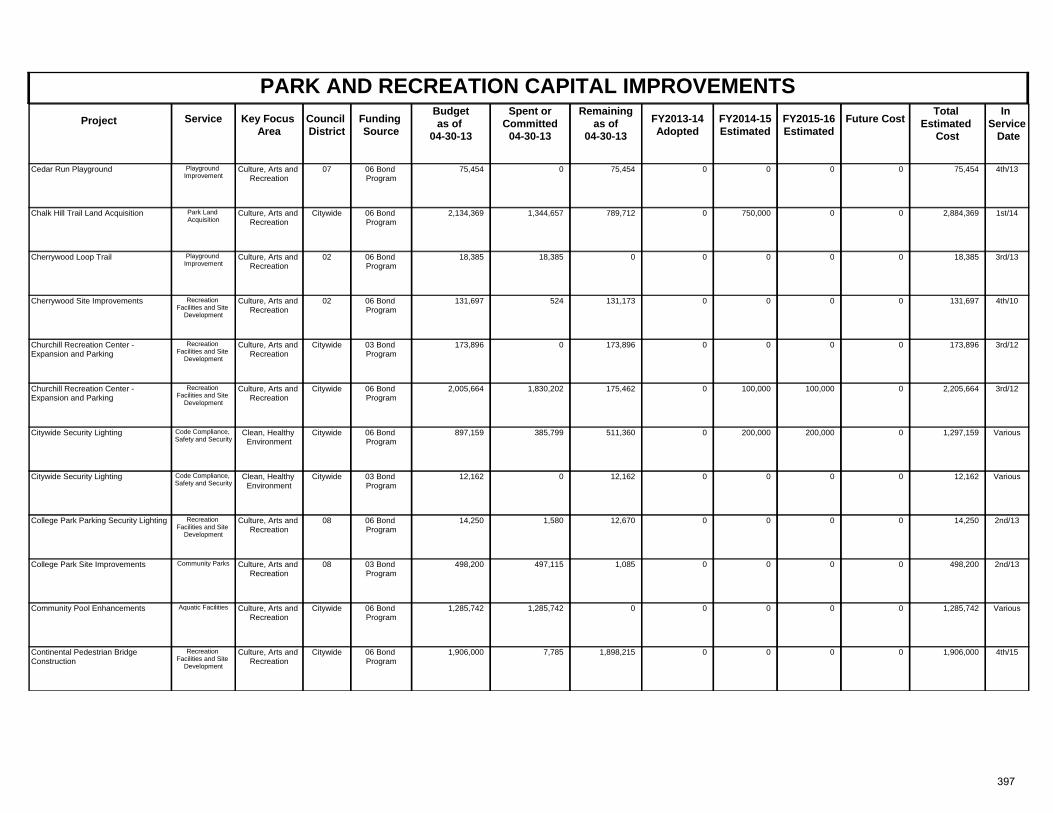
PARK AND RECREATION CAPITAL IMPROVEMENTSProject Key Focus
AreaCouncil District
Spent orCommitted
04-30-13
Total Estimated
Cost
In Service Date
Funding Source
Remainingas of
04-30-13 FY2013-14
AdoptedFuture CostService FY2014-15
Estimated FY2015-16 Estimated
Budgetas of
04-30-13
Culture, Arts and Recreation
07 4th/1306 Bond Program
75,454 0 75,454 75,454Cedar Run Playground 0 0Playground Improvement
00
Culture, Arts and Recreation
Citywide 1st/1406 Bond Program
2,134,369 1,344,657 789,712 2,884,369Chalk Hill Trail Land Acquisition 0 0Park Land Acquisition
0750,000
Culture, Arts and Recreation
02 3rd/1306 Bond Program
18,385 18,385 0 18,385Cherrywood Loop Trail 0 0Playground Improvement
00
Culture, Arts and Recreation
02 4th/1006 Bond Program
131,697 524 131,173 131,697Cherrywood Site Improvements 0 0Recreation Facilities and Site
Development
00
Culture, Arts and Recreation
Citywide 3rd/1203 Bond Program
173,896 0 173,896 173,896Churchill Recreation Center - Expansion and Parking
0 0Recreation Facilities and Site
Development
00
Culture, Arts and Recreation
Citywide 3rd/1206 Bond Program
2,005,664 1,830,202 175,462 2,205,664Churchill Recreation Center - Expansion and Parking
0 0Recreation Facilities and Site
Development
100,000100,000
Clean, Healthy Environment
Citywide Various06 Bond Program
897,159 385,799 511,360 1,297,159Citywide Security Lighting 0 0Code Compliance, Safety and Security
200,000200,000
Clean, Healthy Environment
Citywide Various03 Bond Program
12,162 0 12,162 12,162Citywide Security Lighting 0 0Code Compliance, Safety and Security
00
Culture, Arts and Recreation
08 2nd/1306 Bond Program
14,250 1,580 12,670 14,250College Park Parking Security Lighting 0 0Recreation Facilities and Site
Development
00
Culture, Arts and Recreation
08 2nd/1303 Bond Program
498,200 497,115 1,085 498,200College Park Site Improvements 0 0Community Parks 00
Culture, Arts and Recreation
Citywide Various06 Bond Program
1,285,742 1,285,742 0 1,285,742Community Pool Enhancements 0 0Aquatic Facilities 00
Culture, Arts and Recreation
Citywide 4th/1506 Bond Program
1,906,000 7,785 1,898,215 1,906,000Continental Pedestrian Bridge Construction
0 0Recreation Facilities and Site
Development
00
397
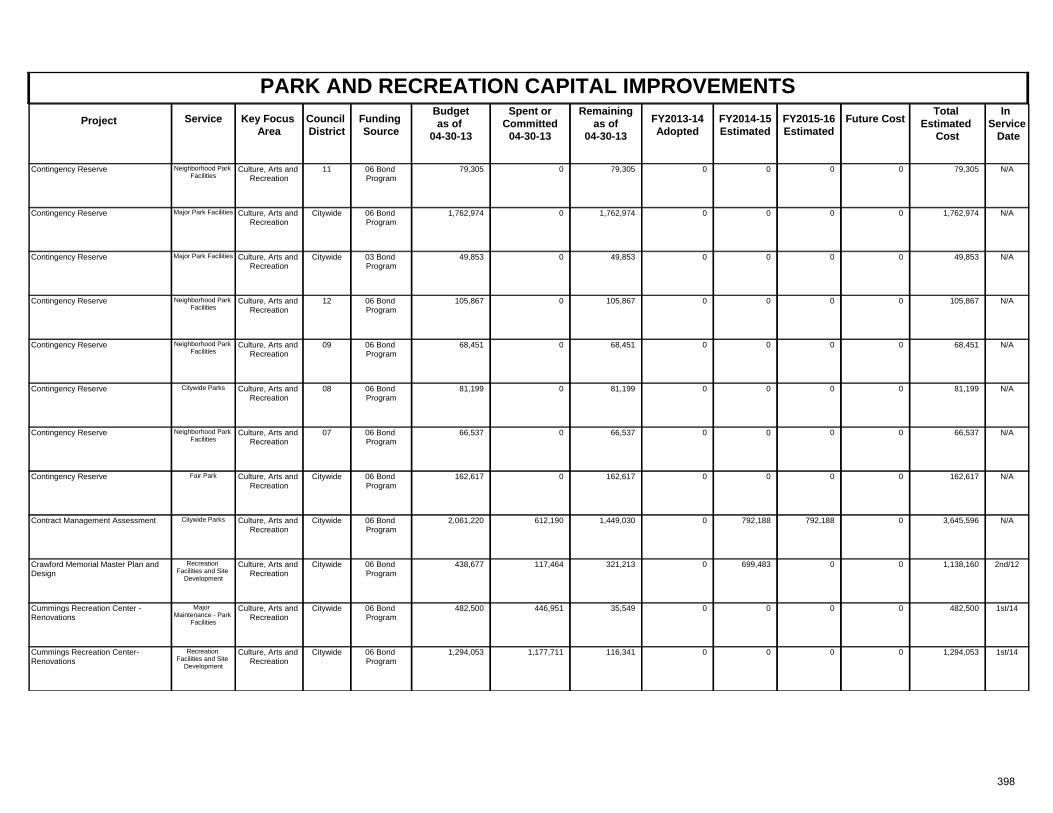
PARK AND RECREATION CAPITAL IMPROVEMENTSProject Key Focus
AreaCouncil District
Spent orCommitted
04-30-13
Total Estimated
Cost
In Service Date
Funding Source
Remainingas of
04-30-13 FY2013-14
AdoptedFuture CostService FY2014-15
Estimated FY2015-16 Estimated
Budgetas of
04-30-13
Culture, Arts and Recreation
11 N/A06 Bond Program
79,305 0 79,305 79,305Contingency Reserve 0 0Neighborhood Park Facilities
00
Culture, Arts and Recreation
Citywide N/A06 Bond Program
1,762,974 0 1,762,974 1,762,974Contingency Reserve 0 0Major Park Facilities 00
Culture, Arts and Recreation
Citywide N/A03 Bond Program
49,853 0 49,853 49,853Contingency Reserve 0 0Major Park Facilities 00
Culture, Arts and Recreation
12 N/A06 Bond Program
105,867 0 105,867 105,867Contingency Reserve 0 0Neighborhood Park Facilities
00
Culture, Arts and Recreation
09 N/A06 Bond Program
68,451 0 68,451 68,451Contingency Reserve 0 0Neighborhood Park Facilities
00
Culture, Arts and Recreation
08 N/A06 Bond Program
81,199 0 81,199 81,199Contingency Reserve 0 0Citywide Parks 00
Culture, Arts and Recreation
07 N/A06 Bond Program
66,537 0 66,537 66,537Contingency Reserve 0 0Neighborhood Park Facilities
00
Culture, Arts and Recreation
Citywide N/A06 Bond Program
162,617 0 162,617 162,617Contingency Reserve 0 0Fair Park 00
Culture, Arts and Recreation
Citywide N/A06 Bond Program
2,061,220 612,190 1,449,030 3,645,596Contract Management Assessment 0 0Citywide Parks 792,188792,188
Culture, Arts and Recreation
Citywide 2nd/1206 Bond Program
438,677 117,464 321,213 1,138,160Crawford Memorial Master Plan and Design
0 0Recreation Facilities and Site
Development
0699,483
Culture, Arts and Recreation
Citywide 1st/1406 Bond Program
482,500 446,951 35,549 482,500Cummings Recreation Center - Renovations
0 0Major Maintenance - Park
Facilities
00
Culture, Arts and Recreation
Citywide 1st/1406 Bond Program
1,294,053 1,177,711 116,341 1,294,053Cummings Recreation Center- Renovations
0 0Recreation Facilities and Site
Development
00
398
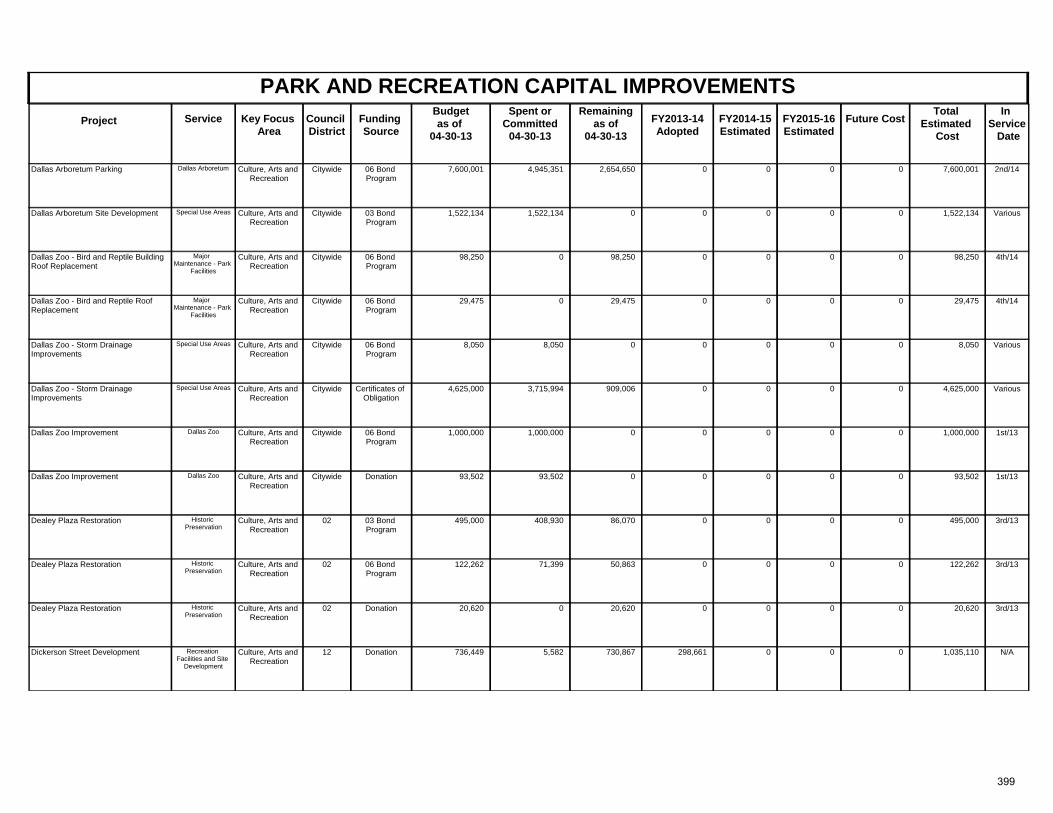
PARK AND RECREATION CAPITAL IMPROVEMENTSProject Key Focus
AreaCouncil District
Spent orCommitted
04-30-13
Total Estimated
Cost
In Service Date
Funding Source
Remainingas of
04-30-13 FY2013-14
AdoptedFuture CostService FY2014-15
Estimated FY2015-16 Estimated
Budgetas of
04-30-13
Culture, Arts and Recreation
Citywide 2nd/1406 Bond Program
7,600,001 4,945,351 2,654,650 7,600,001Dallas Arboretum Parking 0 0Dallas Arboretum 00
Culture, Arts and Recreation
Citywide Various03 Bond Program
1,522,134 1,522,134 0 1,522,134Dallas Arboretum Site Development 0 0Special Use Areas 00
Culture, Arts and Recreation
Citywide 4th/1406 Bond Program
98,250 0 98,250 98,250Dallas Zoo - Bird and Reptile Building Roof Replacement
0 0Major Maintenance - Park
Facilities
00
Culture, Arts and Recreation
Citywide 4th/1406 Bond Program
29,475 0 29,475 29,475Dallas Zoo - Bird and Reptile Roof Replacement
0 0Major Maintenance - Park
Facilities
00
Culture, Arts and Recreation
Citywide Various06 Bond Program
8,050 8,050 0 8,050Dallas Zoo - Storm Drainage Improvements
0 0Special Use Areas 00
Culture, Arts and Recreation
Citywide VariousCertificates of Obligation
4,625,000 3,715,994 909,006 4,625,000Dallas Zoo - Storm Drainage Improvements
0 0Special Use Areas 00
Culture, Arts and Recreation
Citywide 1st/1306 Bond Program
1,000,000 1,000,000 0 1,000,000Dallas Zoo Improvement 0 0Dallas Zoo 00
Culture, Arts and Recreation
Citywide 1st/13Donation 93,502 93,502 0 93,502Dallas Zoo Improvement 0 0Dallas Zoo 00
Culture, Arts and Recreation
02 3rd/1303 Bond Program
495,000 408,930 86,070 495,000Dealey Plaza Restoration 0 0Historic Preservation
00
Culture, Arts and Recreation
02 3rd/1306 Bond Program
122,262 71,399 50,863 122,262Dealey Plaza Restoration 0 0Historic Preservation
00
Culture, Arts and Recreation
02 3rd/13Donation 20,620 0 20,620 20,620Dealey Plaza Restoration 0 0Historic Preservation
00
Culture, Arts and Recreation
12 N/ADonation 736,449 5,582 730,867 1,035,110Dickerson Street Development 298,661 0Recreation Facilities and Site
Development
00
399
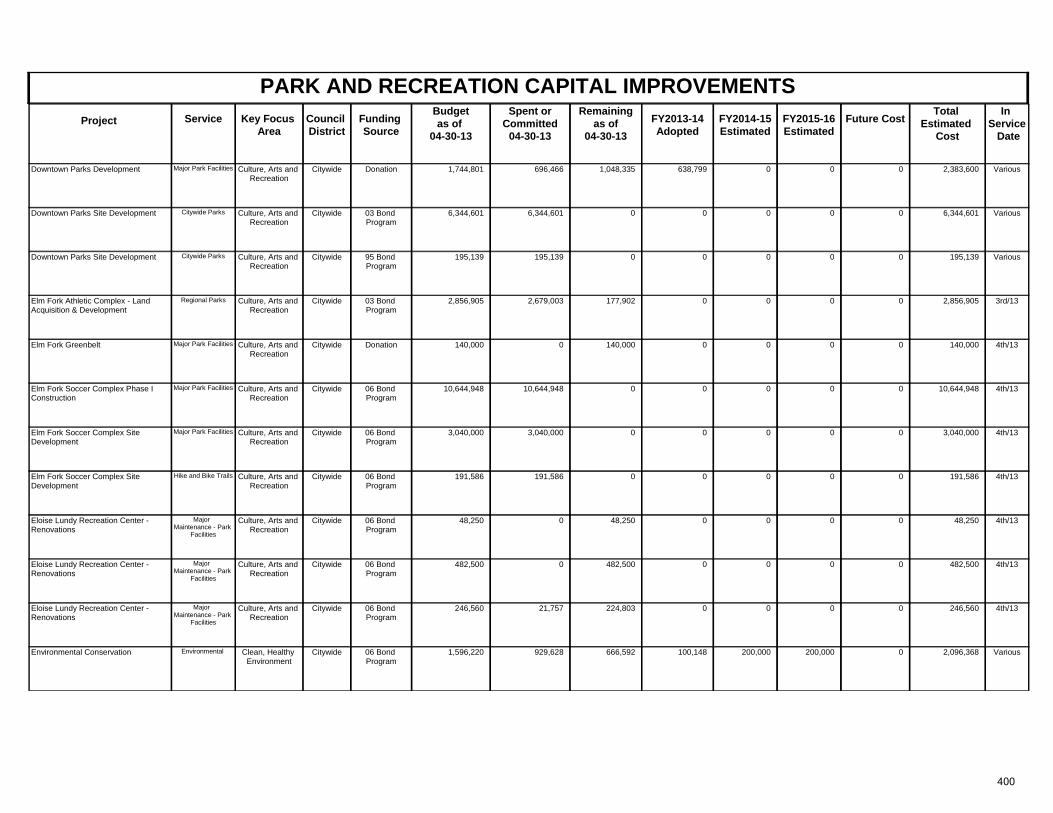
PARK AND RECREATION CAPITAL IMPROVEMENTSProject Key Focus
AreaCouncil District
Spent orCommitted
04-30-13
Total Estimated
Cost
In Service Date
Funding Source
Remainingas of
04-30-13 FY2013-14
AdoptedFuture CostService FY2014-15
Estimated FY2015-16 Estimated
Budgetas of
04-30-13
Culture, Arts and Recreation
Citywide VariousDonation 1,744,801 696,466 1,048,335 2,383,600Downtown Parks Development 638,799 0Major Park Facilities 00
Culture, Arts and Recreation
Citywide Various03 Bond Program
6,344,601 6,344,601 0 6,344,601Downtown Parks Site Development 0 0Citywide Parks 00
Culture, Arts and Recreation
Citywide Various95 Bond Program
195,139 195,139 0 195,139Downtown Parks Site Development 0 0Citywide Parks 00
Culture, Arts and Recreation
Citywide 3rd/1303 Bond Program
2,856,905 2,679,003 177,902 2,856,905Elm Fork Athletic Complex - Land Acquisition & Development
0 0Regional Parks 00
Culture, Arts and Recreation
Citywide 4th/13Donation 140,000 0 140,000 140,000Elm Fork Greenbelt 0 0Major Park Facilities 00
Culture, Arts and Recreation
Citywide 4th/1306 Bond Program
10,644,948 10,644,948 0 10,644,948Elm Fork Soccer Complex Phase I Construction
0 0Major Park Facilities 00
Culture, Arts and Recreation
Citywide 4th/1306 Bond Program
3,040,000 3,040,000 0 3,040,000Elm Fork Soccer Complex Site Development
0 0Major Park Facilities 00
Culture, Arts and Recreation
Citywide 4th/1306 Bond Program
191,586 191,586 0 191,586Elm Fork Soccer Complex Site Development
0 0Hike and Bike Trails 00
Culture, Arts and Recreation
Citywide 4th/1306 Bond Program
48,250 0 48,250 48,250Eloise Lundy Recreation Center - Renovations
0 0Major Maintenance - Park
Facilities
00
Culture, Arts and Recreation
Citywide 4th/1306 Bond Program
482,500 0 482,500 482,500Eloise Lundy Recreation Center - Renovations
0 0Major Maintenance - Park
Facilities
00
Culture, Arts and Recreation
Citywide 4th/1306 Bond Program
246,560 21,757 224,803 246,560Eloise Lundy Recreation Center - Renovations
0 0Major Maintenance - Park
Facilities
00
Clean, Healthy Environment
Citywide Various06 Bond Program
1,596,220 929,628 666,592 2,096,368Environmental Conservation 100,148 0Environmental 200,000200,000
400
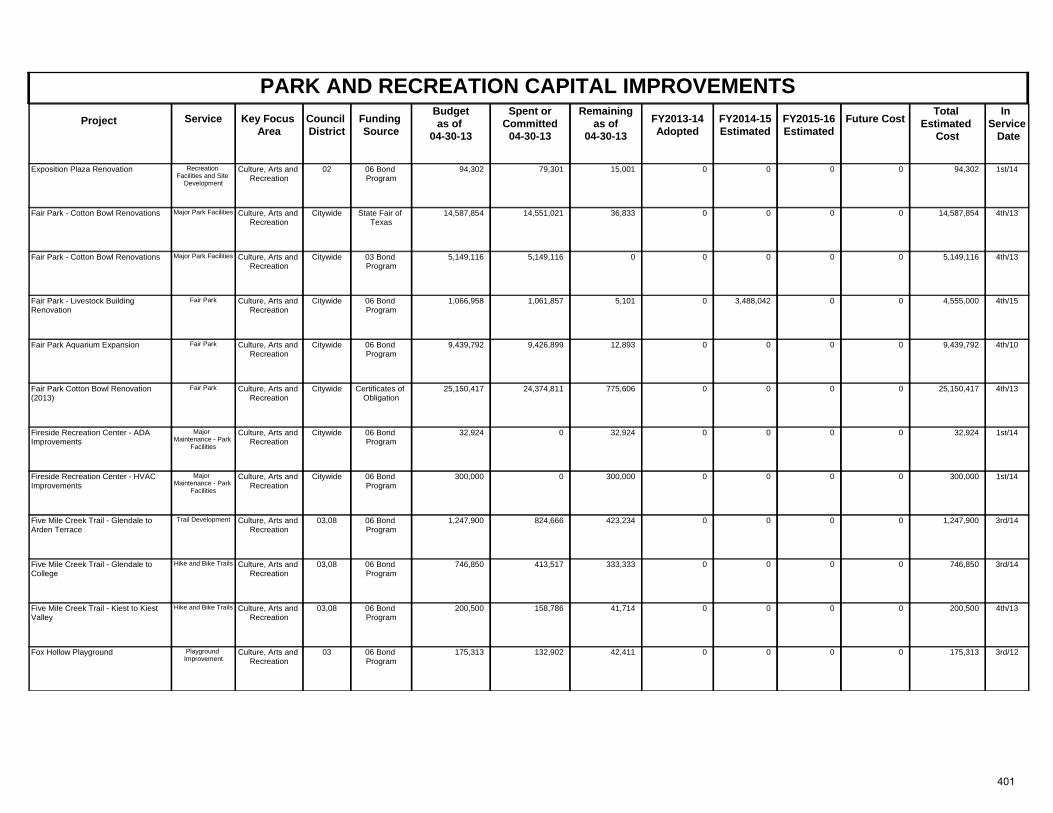
PARK AND RECREATION CAPITAL IMPROVEMENTSProject Key Focus
AreaCouncil District
Spent orCommitted
04-30-13
Total Estimated
Cost
In Service Date
Funding Source
Remainingas of
04-30-13 FY2013-14
AdoptedFuture CostService FY2014-15
Estimated FY2015-16 Estimated
Budgetas of
04-30-13
Culture, Arts and Recreation
02 1st/1406 Bond Program
94,302 79,301 15,001 94,302Exposition Plaza Renovation 0 0Recreation Facilities and Site
Development
00
Culture, Arts and Recreation
Citywide 4th/13State Fair of Texas
14,587,854 14,551,021 36,833 14,587,854Fair Park - Cotton Bowl Renovations 0 0Major Park Facilities 00
Culture, Arts and Recreation
Citywide 4th/1303 Bond Program
5,149,116 5,149,116 0 5,149,116Fair Park - Cotton Bowl Renovations 0 0Major Park Facilities 00
Culture, Arts and Recreation
Citywide 4th/1506 Bond Program
1,066,958 1,061,857 5,101 4,555,000Fair Park - Livestock Building Renovation
0 0Fair Park 03,488,042
Culture, Arts and Recreation
Citywide 4th/1006 Bond Program
9,439,792 9,426,899 12,893 9,439,792Fair Park Aquarium Expansion 0 0Fair Park 00
Culture, Arts and Recreation
Citywide 4th/13Certificates of Obligation
25,150,417 24,374,811 775,606 25,150,417Fair Park Cotton Bowl Renovation (2013)
0 0Fair Park 00
Culture, Arts and Recreation
Citywide 1st/1406 Bond Program
32,924 0 32,924 32,924Fireside Recreation Center - ADA Improvements
0 0Major Maintenance - Park
Facilities
00
Culture, Arts and Recreation
Citywide 1st/1406 Bond Program
300,000 0 300,000 300,000Fireside Recreation Center - HVAC Improvements
0 0Major Maintenance - Park
Facilities
00
Culture, Arts and Recreation
03,08 3rd/1406 Bond Program
1,247,900 824,666 423,234 1,247,900Five Mile Creek Trail - Glendale to Arden Terrace
0 0Trail Development 00
Culture, Arts and Recreation
03,08 3rd/1406 Bond Program
746,850 413,517 333,333 746,850Five Mile Creek Trail - Glendale to College
0 0Hike and Bike Trails 00
Culture, Arts and Recreation
03,08 4th/1306 Bond Program
200,500 158,786 41,714 200,500Five Mile Creek Trail - Kiest to Kiest Valley
0 0Hike and Bike Trails 00
Culture, Arts and Recreation
03 3rd/1206 Bond Program
175,313 132,902 42,411 175,313Fox Hollow Playground 0 0Playground Improvement
00
401
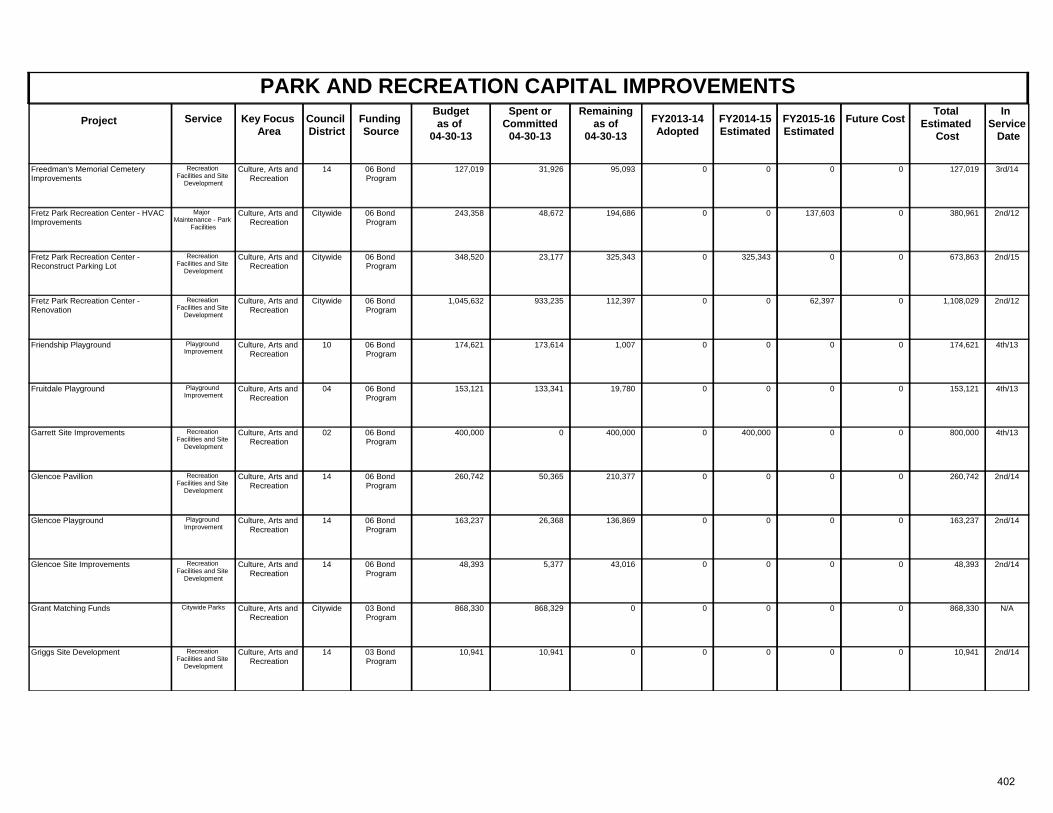
PARK AND RECREATION CAPITAL IMPROVEMENTSProject Key Focus
AreaCouncil District
Spent orCommitted
04-30-13
Total Estimated
Cost
In Service Date
Funding Source
Remainingas of
04-30-13 FY2013-14
AdoptedFuture CostService FY2014-15
Estimated FY2015-16 Estimated
Budgetas of
04-30-13
Culture, Arts and Recreation
14 3rd/1406 Bond Program
127,019 31,926 95,093 127,019Freedman's Memorial Cemetery Improvements
0 0Recreation Facilities and Site
Development
00
Culture, Arts and Recreation
Citywide 2nd/1206 Bond Program
243,358 48,672 194,686 380,961Fretz Park Recreation Center - HVAC Improvements
0 0Major Maintenance - Park
Facilities
137,6030
Culture, Arts and Recreation
Citywide 2nd/1506 Bond Program
348,520 23,177 325,343 673,863Fretz Park Recreation Center - Reconstruct Parking Lot
0 0Recreation Facilities and Site
Development
0325,343
Culture, Arts and Recreation
Citywide 2nd/1206 Bond Program
1,045,632 933,235 112,397 1,108,029Fretz Park Recreation Center - Renovation
0 0Recreation Facilities and Site
Development
62,3970
Culture, Arts and Recreation
10 4th/1306 Bond Program
174,621 173,614 1,007 174,621Friendship Playground 0 0Playground Improvement
00
Culture, Arts and Recreation
04 4th/1306 Bond Program
153,121 133,341 19,780 153,121Fruitdale Playground 0 0Playground Improvement
00
Culture, Arts and Recreation
02 4th/1306 Bond Program
400,000 0 400,000 800,000Garrett Site Improvements 0 0Recreation Facilities and Site
Development
0400,000
Culture, Arts and Recreation
14 2nd/1406 Bond Program
260,742 50,365 210,377 260,742Glencoe Pavillion 0 0Recreation Facilities and Site
Development
00
Culture, Arts and Recreation
14 2nd/1406 Bond Program
163,237 26,368 136,869 163,237Glencoe Playground 0 0Playground Improvement
00
Culture, Arts and Recreation
14 2nd/1406 Bond Program
48,393 5,377 43,016 48,393Glencoe Site Improvements 0 0Recreation Facilities and Site
Development
00
Culture, Arts and Recreation
Citywide N/A03 Bond Program
868,330 868,329 0 868,330Grant Matching Funds 0 0Citywide Parks 00
Culture, Arts and Recreation
14 2nd/1403 Bond Program
10,941 10,941 0 10,941Griggs Site Development 0 0Recreation Facilities and Site
Development
00
402
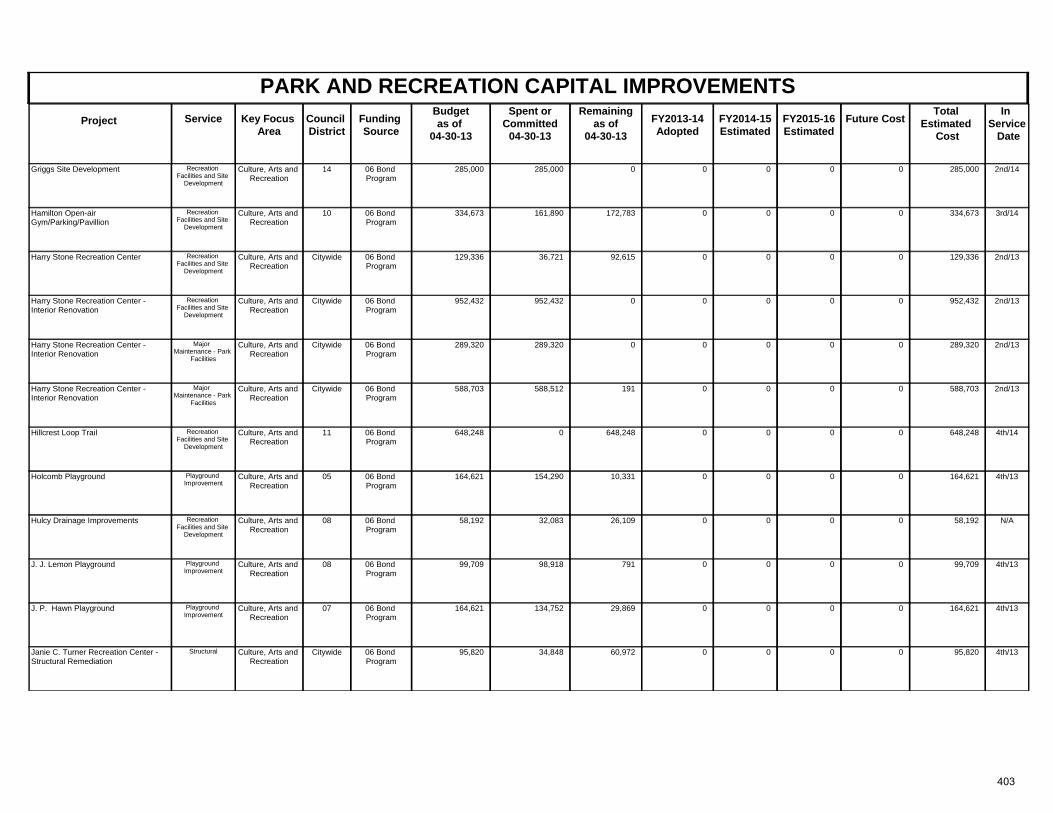
PARK AND RECREATION CAPITAL IMPROVEMENTSProject Key Focus
AreaCouncil District
Spent orCommitted
04-30-13
Total Estimated
Cost
In Service Date
Funding Source
Remainingas of
04-30-13 FY2013-14
AdoptedFuture CostService FY2014-15
Estimated FY2015-16 Estimated
Budgetas of
04-30-13
Culture, Arts and Recreation
14 2nd/1406 Bond Program
285,000 285,000 0 285,000Griggs Site Development 0 0Recreation Facilities and Site
Development
00
Culture, Arts and Recreation
10 3rd/1406 Bond Program
334,673 161,890 172,783 334,673Hamilton Open-air Gym/Parking/Pavillion
0 0Recreation Facilities and Site
Development
00
Culture, Arts and Recreation
Citywide 2nd/1306 Bond Program
129,336 36,721 92,615 129,336Harry Stone Recreation Center 0 0Recreation Facilities and Site
Development
00
Culture, Arts and Recreation
Citywide 2nd/1306 Bond Program
952,432 952,432 0 952,432Harry Stone Recreation Center - Interior Renovation
0 0Recreation Facilities and Site
Development
00
Culture, Arts and Recreation
Citywide 2nd/1306 Bond Program
289,320 289,320 0 289,320Harry Stone Recreation Center - Interior Renovation
0 0Major Maintenance - Park
Facilities
00
Culture, Arts and Recreation
Citywide 2nd/1306 Bond Program
588,703 588,512 191 588,703Harry Stone Recreation Center - Interior Renovation
0 0Major Maintenance - Park
Facilities
00
Culture, Arts and Recreation
11 4th/1406 Bond Program
648,248 0 648,248 648,248Hillcrest Loop Trail 0 0Recreation Facilities and Site
Development
00
Culture, Arts and Recreation
05 4th/1306 Bond Program
164,621 154,290 10,331 164,621Holcomb Playground 0 0Playground Improvement
00
Culture, Arts and Recreation
08 N/A06 Bond Program
58,192 32,083 26,109 58,192Hulcy Drainage Improvements 0 0Recreation Facilities and Site
Development
00
Culture, Arts and Recreation
08 4th/1306 Bond Program
99,709 98,918 791 99,709J. J. Lemon Playground 0 0Playground Improvement
00
Culture, Arts and Recreation
07 4th/1306 Bond Program
164,621 134,752 29,869 164,621J. P. Hawn Playground 0 0Playground Improvement
00
Culture, Arts and Recreation
Citywide 4th/1306 Bond Program
95,820 34,848 60,972 95,820Janie C. Turner Recreation Center - Structural Remediation
0 0Structural 00
403
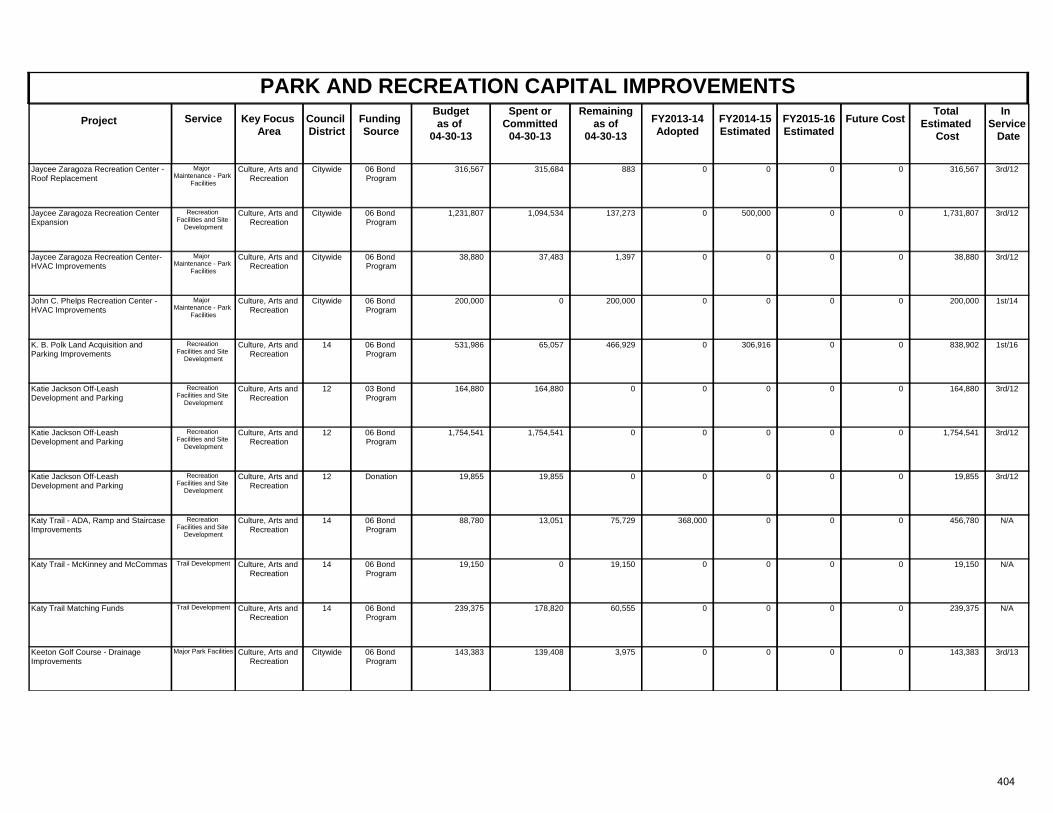
PARK AND RECREATION CAPITAL IMPROVEMENTSProject Key Focus
AreaCouncil District
Spent orCommitted
04-30-13
Total Estimated
Cost
In Service Date
Funding Source
Remainingas of
04-30-13 FY2013-14
AdoptedFuture CostService FY2014-15
Estimated FY2015-16 Estimated
Budgetas of
04-30-13
Culture, Arts and Recreation
Citywide 3rd/1206 Bond Program
316,567 315,684 883 316,567Jaycee Zaragoza Recreation Center - Roof Replacement
0 0Major Maintenance - Park
Facilities
00
Culture, Arts and Recreation
Citywide 3rd/1206 Bond Program
1,231,807 1,094,534 137,273 1,731,807Jaycee Zaragoza Recreation Center Expansion
0 0Recreation Facilities and Site
Development
0500,000
Culture, Arts and Recreation
Citywide 3rd/1206 Bond Program
38,880 37,483 1,397 38,880Jaycee Zaragoza Recreation Center- HVAC Improvements
0 0Major Maintenance - Park
Facilities
00
Culture, Arts and Recreation
Citywide 1st/1406 Bond Program
200,000 0 200,000 200,000John C. Phelps Recreation Center - HVAC Improvements
0 0Major Maintenance - Park
Facilities
00
Culture, Arts and Recreation
14 1st/1606 Bond Program
531,986 65,057 466,929 838,902K. B. Polk Land Acquisition and Parking Improvements
0 0Recreation Facilities and Site
Development
0306,916
Culture, Arts and Recreation
12 3rd/1203 Bond Program
164,880 164,880 0 164,880Katie Jackson Off-Leash Development and Parking
0 0Recreation Facilities and Site
Development
00
Culture, Arts and Recreation
12 3rd/1206 Bond Program
1,754,541 1,754,541 0 1,754,541Katie Jackson Off-Leash Development and Parking
0 0Recreation Facilities and Site
Development
00
Culture, Arts and Recreation
12 3rd/12Donation 19,855 19,855 0 19,855Katie Jackson Off-Leash Development and Parking
0 0Recreation Facilities and Site
Development
00
Culture, Arts and Recreation
14 N/A06 Bond Program
88,780 13,051 75,729 456,780Katy Trail - ADA, Ramp and Staircase Improvements
368,000 0Recreation Facilities and Site
Development
00
Culture, Arts and Recreation
14 N/A06 Bond Program
19,150 0 19,150 19,150Katy Trail - McKinney and McCommas 0 0Trail Development 00
Culture, Arts and Recreation
14 N/A06 Bond Program
239,375 178,820 60,555 239,375Katy Trail Matching Funds 0 0Trail Development 00
Culture, Arts and Recreation
Citywide 3rd/1306 Bond Program
143,383 139,408 3,975 143,383Keeton Golf Course - Drainage Improvements
0 0Major Park Facilities 00
404
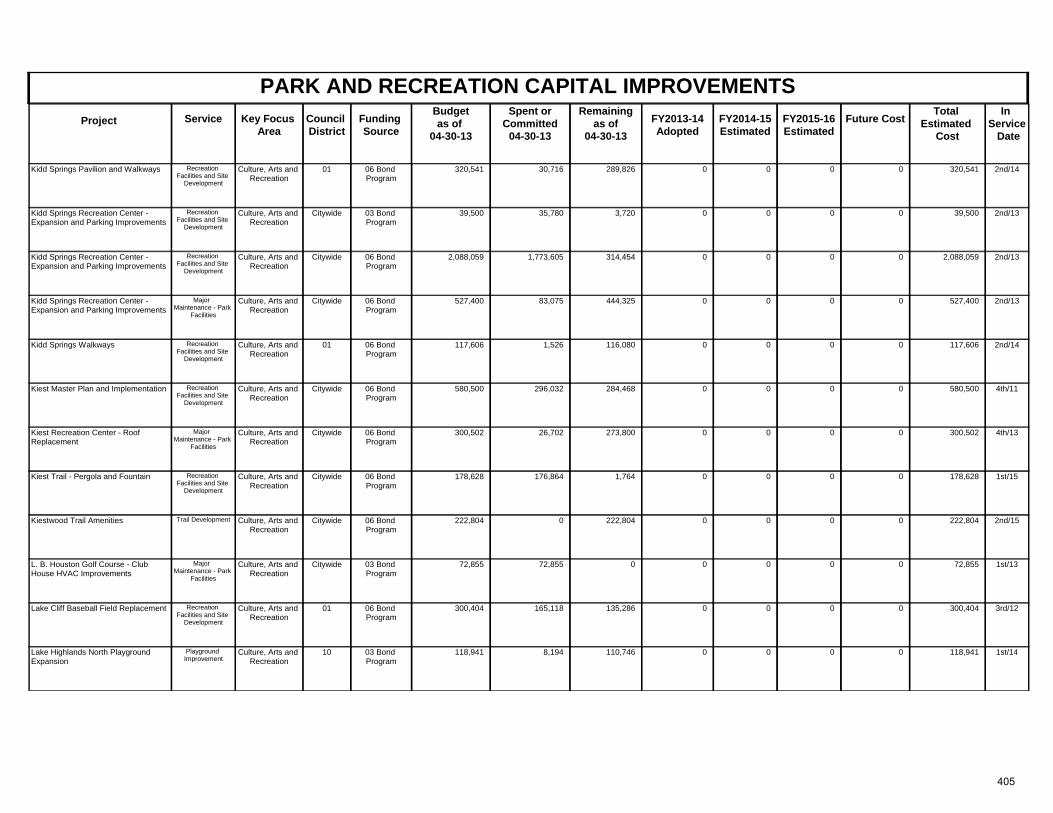
PARK AND RECREATION CAPITAL IMPROVEMENTSProject Key Focus
AreaCouncil District
Spent orCommitted
04-30-13
Total Estimated
Cost
In Service Date
Funding Source
Remainingas of
04-30-13 FY2013-14
AdoptedFuture CostService FY2014-15
Estimated FY2015-16 Estimated
Budgetas of
04-30-13
Culture, Arts and Recreation
01 2nd/1406 Bond Program
320,541 30,716 289,826 320,541Kidd Springs Pavilion and Walkways 0 0Recreation Facilities and Site
Development
00
Culture, Arts and Recreation
Citywide 2nd/1303 Bond Program
39,500 35,780 3,720 39,500Kidd Springs Recreation Center - Expansion and Parking Improvements
0 0Recreation Facilities and Site
Development
00
Culture, Arts and Recreation
Citywide 2nd/1306 Bond Program
2,088,059 1,773,605 314,454 2,088,059Kidd Springs Recreation Center - Expansion and Parking Improvements
0 0Recreation Facilities and Site
Development
00
Culture, Arts and Recreation
Citywide 2nd/1306 Bond Program
527,400 83,075 444,325 527,400Kidd Springs Recreation Center - Expansion and Parking Improvements
0 0Major Maintenance - Park
Facilities
00
Culture, Arts and Recreation
01 2nd/1406 Bond Program
117,606 1,526 116,080 117,606Kidd Springs Walkways 0 0Recreation Facilities and Site
Development
00
Culture, Arts and Recreation
Citywide 4th/1106 Bond Program
580,500 296,032 284,468 580,500Kiest Master Plan and Implementation 0 0Recreation Facilities and Site
Development
00
Culture, Arts and Recreation
Citywide 4th/1306 Bond Program
300,502 26,702 273,800 300,502Kiest Recreation Center - Roof Replacement
0 0Major Maintenance - Park
Facilities
00
Culture, Arts and Recreation
Citywide 1st/1506 Bond Program
178,628 176,864 1,764 178,628Kiest Trail - Pergola and Fountain 0 0Recreation Facilities and Site
Development
00
Culture, Arts and Recreation
Citywide 2nd/1506 Bond Program
222,804 0 222,804 222,804Kiestwood Trail Amenities 0 0Trail Development 00
Culture, Arts and Recreation
Citywide 1st/1303 Bond Program
72,855 72,855 0 72,855L. B. Houston Golf Course - Club House HVAC Improvements
0 0Major Maintenance - Park
Facilities
00
Culture, Arts and Recreation
01 3rd/1206 Bond Program
300,404 165,118 135,286 300,404Lake Cliff Baseball Field Replacement 0 0Recreation Facilities and Site
Development
00
Culture, Arts and Recreation
10 1st/1403 Bond Program
118,941 8,194 110,746 118,941Lake Highlands North Playground Expansion
0 0Playground Improvement
00
405
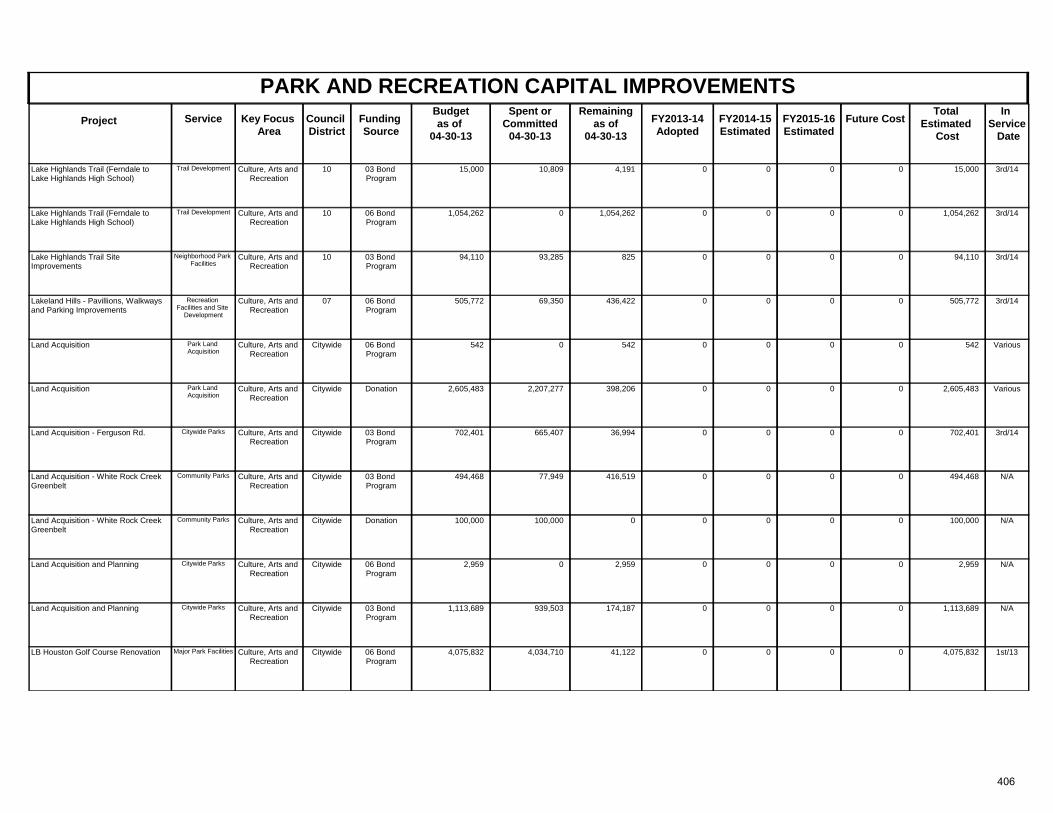
PARK AND RECREATION CAPITAL IMPROVEMENTSProject Key Focus
AreaCouncil District
Spent orCommitted
04-30-13
Total Estimated
Cost
In Service Date
Funding Source
Remainingas of
04-30-13 FY2013-14
AdoptedFuture CostService FY2014-15
Estimated FY2015-16 Estimated
Budgetas of
04-30-13
Culture, Arts and Recreation
10 3rd/1403 Bond Program
15,000 10,809 4,191 15,000Lake Highlands Trail (Ferndale to Lake Highlands High School)
0 0Trail Development 00
Culture, Arts and Recreation
10 3rd/1406 Bond Program
1,054,262 0 1,054,262 1,054,262Lake Highlands Trail (Ferndale to Lake Highlands High School)
0 0Trail Development 00
Culture, Arts and Recreation
10 3rd/1403 Bond Program
94,110 93,285 825 94,110Lake Highlands Trail Site Improvements
0 0Neighborhood Park Facilities
00
Culture, Arts and Recreation
07 3rd/1406 Bond Program
505,772 69,350 436,422 505,772Lakeland Hills - Pavillions, Walkways and Parking Improvements
0 0Recreation Facilities and Site
Development
00
Culture, Arts and Recreation
Citywide Various06 Bond Program
542 0 542 542Land Acquisition 0 0Park Land Acquisition
00
Culture, Arts and Recreation
Citywide VariousDonation 2,605,483 2,207,277 398,206 2,605,483Land Acquisition 0 0Park Land Acquisition
00
Culture, Arts and Recreation
Citywide 3rd/1403 Bond Program
702,401 665,407 36,994 702,401Land Acquisition - Ferguson Rd. 0 0Citywide Parks 00
Culture, Arts and Recreation
Citywide N/A03 Bond Program
494,468 77,949 416,519 494,468Land Acquisition - White Rock Creek Greenbelt
0 0Community Parks 00
Culture, Arts and Recreation
Citywide N/ADonation 100,000 100,000 0 100,000Land Acquisition - White Rock Creek Greenbelt
0 0Community Parks 00
Culture, Arts and Recreation
Citywide N/A06 Bond Program
2,959 0 2,959 2,959Land Acquisition and Planning 0 0Citywide Parks 00
Culture, Arts and Recreation
Citywide N/A03 Bond Program
1,113,689 939,503 174,187 1,113,689Land Acquisition and Planning 0 0Citywide Parks 00
Culture, Arts and Recreation
Citywide 1st/1306 Bond Program
4,075,832 4,034,710 41,122 4,075,832LB Houston Golf Course Renovation 0 0Major Park Facilities 00
406
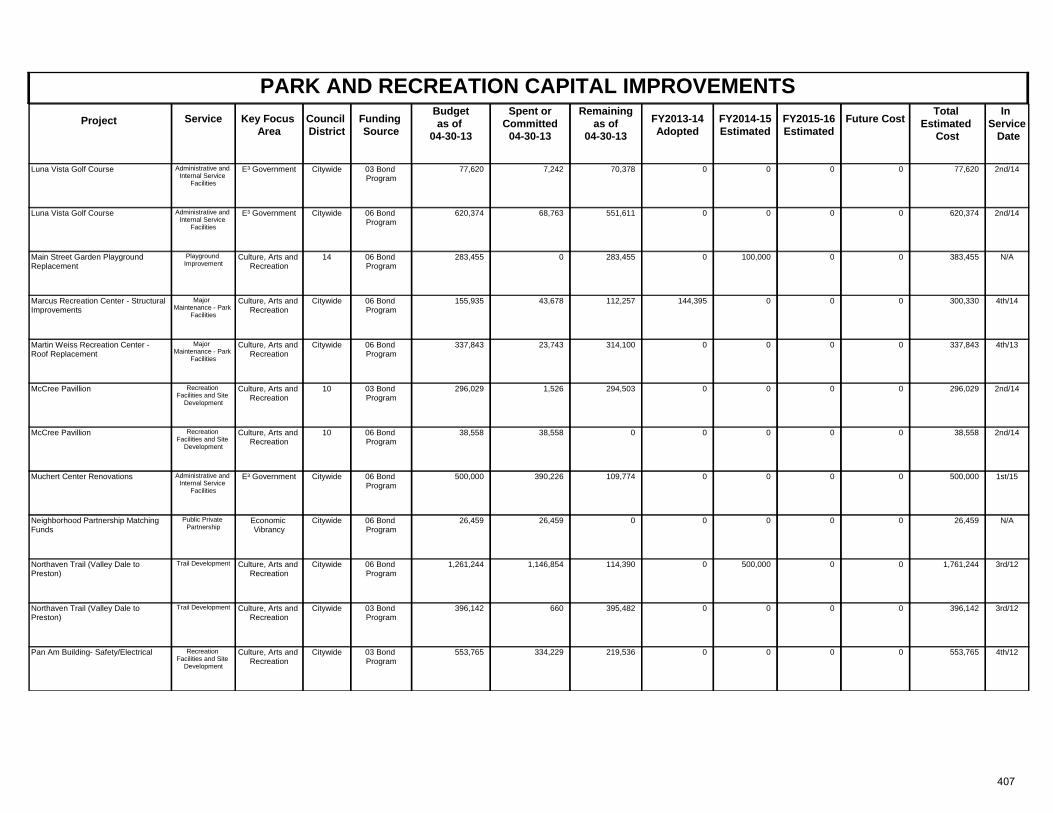
PARK AND RECREATION CAPITAL IMPROVEMENTSProject Key Focus
AreaCouncil District
Spent orCommitted
04-30-13
Total Estimated
Cost
In Service Date
Funding Source
Remainingas of
04-30-13 FY2013-14
AdoptedFuture CostService FY2014-15
Estimated FY2015-16 Estimated
Budgetas of
04-30-13
E³ Government Citywide 2nd/1403 Bond Program
77,620 7,242 70,378 77,620Luna Vista Golf Course 0 0Administrative and Internal Service
Facilities
00
E³ Government Citywide 2nd/1406 Bond Program
620,374 68,763 551,611 620,374Luna Vista Golf Course 0 0Administrative and Internal Service
Facilities
00
Culture, Arts and Recreation
14 N/A06 Bond Program
283,455 0 283,455 383,455Main Street Garden Playground Replacement
0 0Playground Improvement
0100,000
Culture, Arts and Recreation
Citywide 4th/1406 Bond Program
155,935 43,678 112,257 300,330Marcus Recreation Center - Structural Improvements
144,395 0Major Maintenance - Park
Facilities
00
Culture, Arts and Recreation
Citywide 4th/1306 Bond Program
337,843 23,743 314,100 337,843Martin Weiss Recreation Center - Roof Replacement
0 0Major Maintenance - Park
Facilities
00
Culture, Arts and Recreation
10 2nd/1403 Bond Program
296,029 1,526 294,503 296,029McCree Pavillion 0 0Recreation Facilities and Site
Development
00
Culture, Arts and Recreation
10 2nd/1406 Bond Program
38,558 38,558 0 38,558McCree Pavillion 0 0Recreation Facilities and Site
Development
00
E³ Government Citywide 1st/1506 Bond Program
500,000 390,226 109,774 500,000Muchert Center Renovations 0 0Administrative and Internal Service
Facilities
00
Economic Vibrancy
Citywide N/A06 Bond Program
26,459 26,459 0 26,459Neighborhood Partnership Matching Funds
0 0Public Private Partnership
00
Culture, Arts and Recreation
Citywide 3rd/1206 Bond Program
1,261,244 1,146,854 114,390 1,761,244Northaven Trail (Valley Dale to Preston)
0 0Trail Development 0500,000
Culture, Arts and Recreation
Citywide 3rd/1203 Bond Program
396,142 660 395,482 396,142Northaven Trail (Valley Dale to Preston)
0 0Trail Development 00
Culture, Arts and Recreation
Citywide 4th/1203 Bond Program
553,765 334,229 219,536 553,765Pan Am Building- Safety/Electrical 0 0Recreation Facilities and Site
Development
00
407
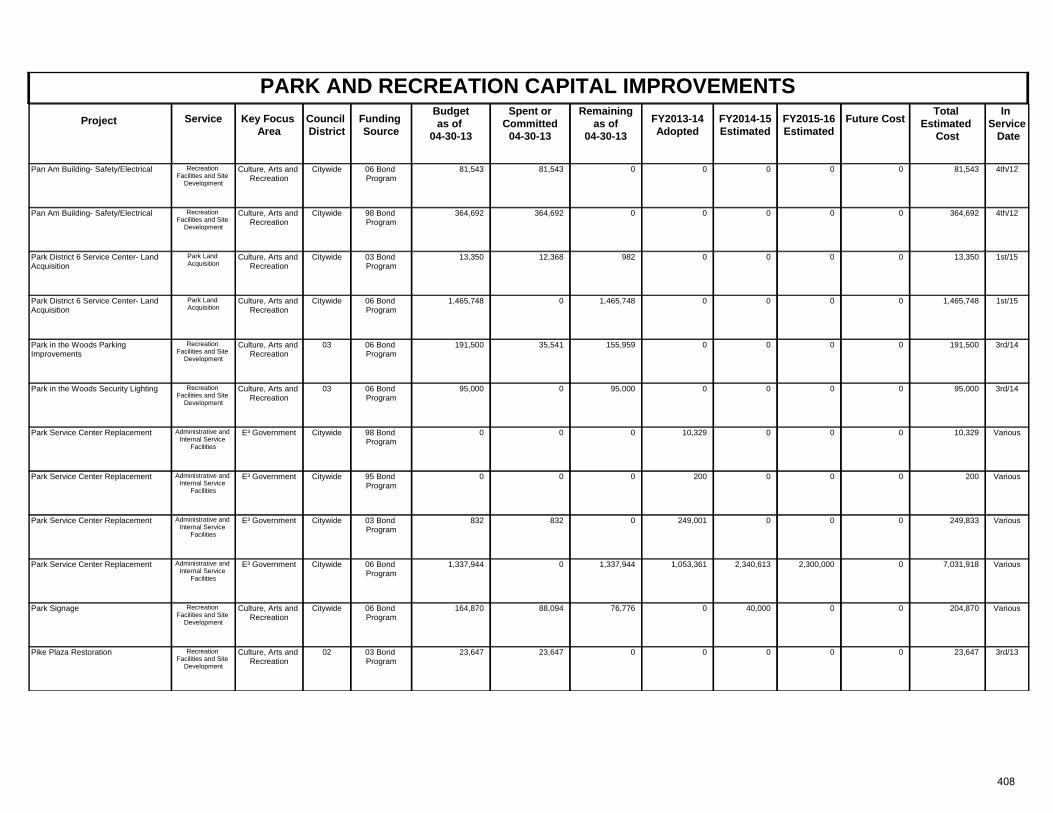
PARK AND RECREATION CAPITAL IMPROVEMENTSProject Key Focus
AreaCouncil District
Spent orCommitted
04-30-13
Total Estimated
Cost
In Service Date
Funding Source
Remainingas of
04-30-13 FY2013-14
AdoptedFuture CostService FY2014-15
Estimated FY2015-16 Estimated
Budgetas of
04-30-13
Culture, Arts and Recreation
Citywide 4th/1206 Bond Program
81,543 81,543 0 81,543Pan Am Building- Safety/Electrical 0 0Recreation Facilities and Site
Development
00
Culture, Arts and Recreation
Citywide 4th/1298 Bond Program
364,692 364,692 0 364,692Pan Am Building- Safety/Electrical 0 0Recreation Facilities and Site
Development
00
Culture, Arts and Recreation
Citywide 1st/1503 Bond Program
13,350 12,368 982 13,350Park District 6 Service Center- Land Acquisition
0 0Park Land Acquisition
00
Culture, Arts and Recreation
Citywide 1st/1506 Bond Program
1,465,748 0 1,465,748 1,465,748Park District 6 Service Center- Land Acquisition
0 0Park Land Acquisition
00
Culture, Arts and Recreation
03 3rd/1406 Bond Program
191,500 35,541 155,959 191,500Park in the Woods Parking Improvements
0 0Recreation Facilities and Site
Development
00
Culture, Arts and Recreation
03 3rd/1406 Bond Program
95,000 0 95,000 95,000Park in the Woods Security Lighting 0 0Recreation Facilities and Site
Development
00
E³ Government Citywide Various98 Bond Program
0 0 0 10,329Park Service Center Replacement 10,329 0Administrative and Internal Service
Facilities
00
E³ Government Citywide Various95 Bond Program
0 0 0 200Park Service Center Replacement 200 0Administrative and Internal Service
Facilities
00
E³ Government Citywide Various03 Bond Program
832 832 0 249,833Park Service Center Replacement 249,001 0Administrative and Internal Service
Facilities
00
E³ Government Citywide Various06 Bond Program
1,337,944 0 1,337,944 7,031,918Park Service Center Replacement 1,053,361 0Administrative and Internal Service
Facilities
2,300,0002,340,613
Culture, Arts and Recreation
Citywide Various06 Bond Program
164,870 88,094 76,776 204,870Park Signage 0 0Recreation Facilities and Site
Development
040,000
Culture, Arts and Recreation
02 3rd/1303 Bond Program
23,647 23,647 0 23,647Pike Plaza Restoration 0 0Recreation Facilities and Site
Development
00
408
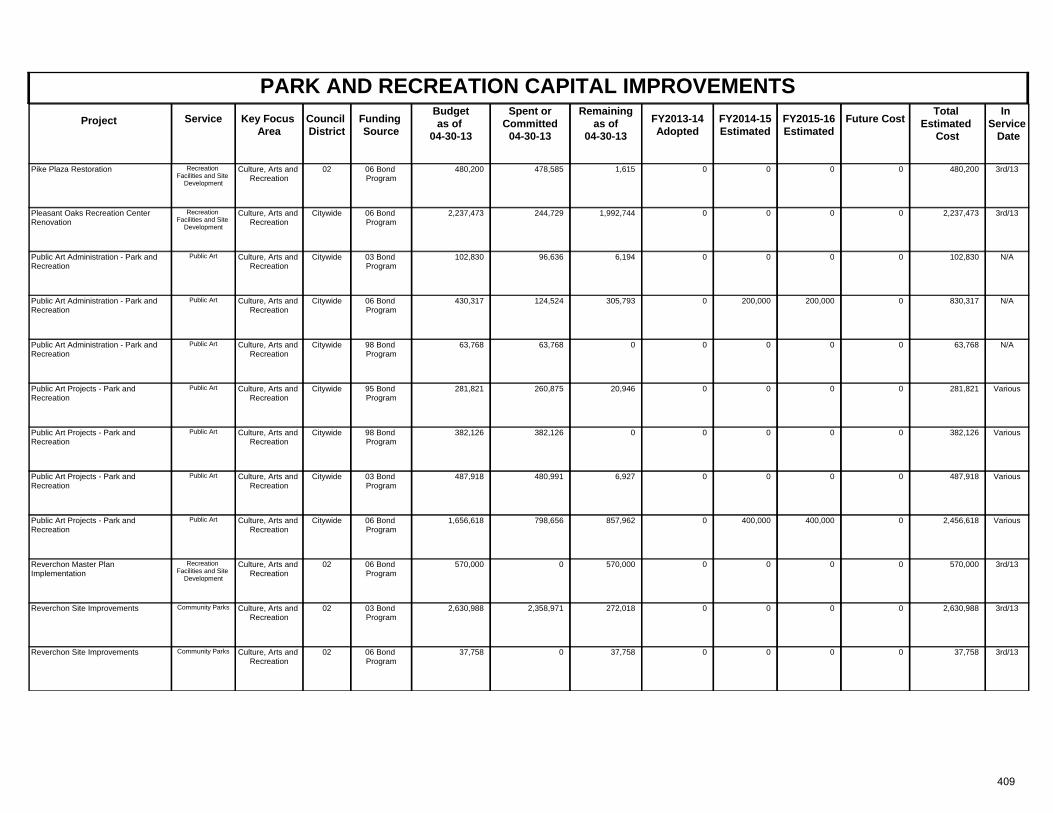
PARK AND RECREATION CAPITAL IMPROVEMENTSProject Key Focus
AreaCouncil District
Spent orCommitted
04-30-13
Total Estimated
Cost
In Service Date
Funding Source
Remainingas of
04-30-13 FY2013-14
AdoptedFuture CostService FY2014-15
Estimated FY2015-16 Estimated
Budgetas of
04-30-13
Culture, Arts and Recreation
02 3rd/1306 Bond Program
480,200 478,585 1,615 480,200Pike Plaza Restoration 0 0Recreation Facilities and Site
Development
00
Culture, Arts and Recreation
Citywide 3rd/1306 Bond Program
2,237,473 244,729 1,992,744 2,237,473Pleasant Oaks Recreation Center Renovation
0 0Recreation Facilities and Site
Development
00
Culture, Arts and Recreation
Citywide N/A03 Bond Program
102,830 96,636 6,194 102,830Public Art Administration - Park and Recreation
0 0Public Art 00
Culture, Arts and Recreation
Citywide N/A06 Bond Program
430,317 124,524 305,793 830,317Public Art Administration - Park and Recreation
0 0Public Art 200,000200,000
Culture, Arts and Recreation
Citywide N/A98 Bond Program
63,768 63,768 0 63,768Public Art Administration - Park and Recreation
0 0Public Art 00
Culture, Arts and Recreation
Citywide Various95 Bond Program
281,821 260,875 20,946 281,821Public Art Projects - Park and Recreation
0 0Public Art 00
Culture, Arts and Recreation
Citywide Various98 Bond Program
382,126 382,126 0 382,126Public Art Projects - Park and Recreation
0 0Public Art 00
Culture, Arts and Recreation
Citywide Various03 Bond Program
487,918 480,991 6,927 487,918Public Art Projects - Park and Recreation
0 0Public Art 00
Culture, Arts and Recreation
Citywide Various06 Bond Program
1,656,618 798,656 857,962 2,456,618Public Art Projects - Park and Recreation
0 0Public Art 400,000400,000
Culture, Arts and Recreation
02 3rd/1306 Bond Program
570,000 0 570,000 570,000Reverchon Master Plan Implementation
0 0Recreation Facilities and Site
Development
00
Culture, Arts and Recreation
02 3rd/1303 Bond Program
2,630,988 2,358,971 272,018 2,630,988Reverchon Site Improvements 0 0Community Parks 00
Culture, Arts and Recreation
02 3rd/1306 Bond Program
37,758 0 37,758 37,758Reverchon Site Improvements 0 0Community Parks 00
409
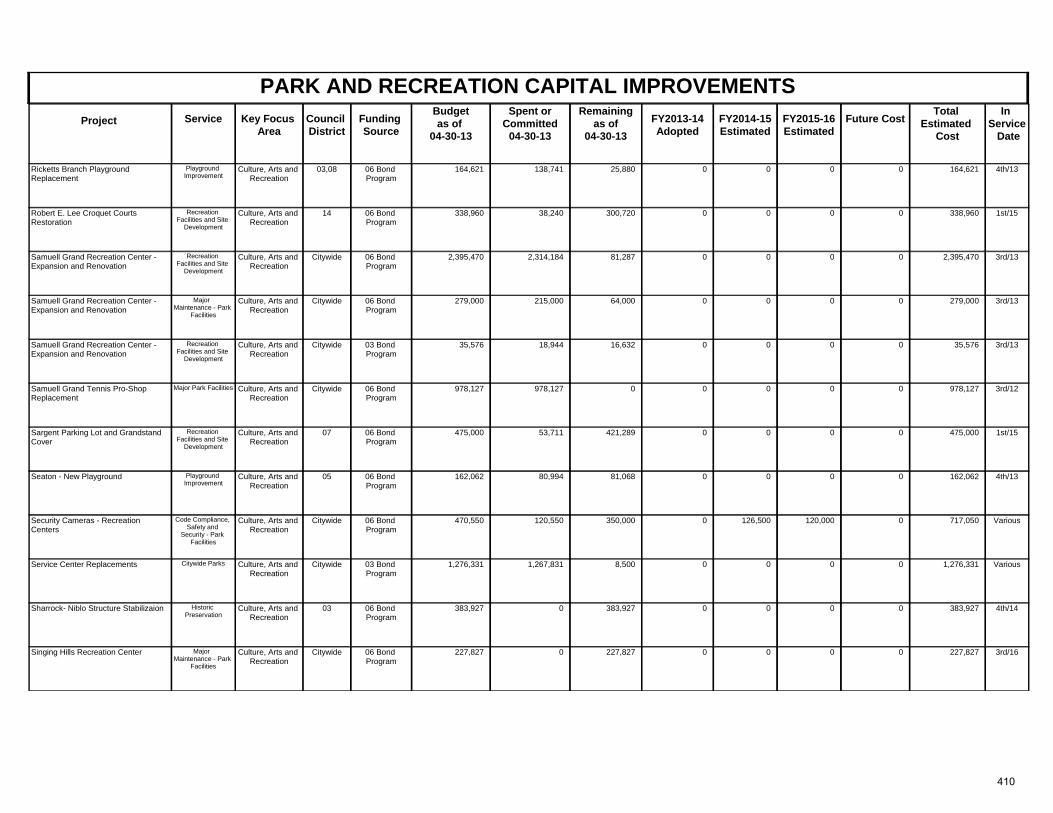
PARK AND RECREATION CAPITAL IMPROVEMENTSProject Key Focus
AreaCouncil District
Spent orCommitted
04-30-13
Total Estimated
Cost
In Service Date
Funding Source
Remainingas of
04-30-13 FY2013-14
AdoptedFuture CostService FY2014-15
Estimated FY2015-16 Estimated
Budgetas of
04-30-13
Culture, Arts and Recreation
03,08 4th/1306 Bond Program
164,621 138,741 25,880 164,621Ricketts Branch Playground Replacement
0 0Playground Improvement
00
Culture, Arts and Recreation
14 1st/1506 Bond Program
338,960 38,240 300,720 338,960Robert E. Lee Croquet Courts Restoration
0 0Recreation Facilities and Site
Development
00
Culture, Arts and Recreation
Citywide 3rd/1306 Bond Program
2,395,470 2,314,184 81,287 2,395,470Samuell Grand Recreation Center - Expansion and Renovation
0 0Recreation Facilities and Site
Development
00
Culture, Arts and Recreation
Citywide 3rd/1306 Bond Program
279,000 215,000 64,000 279,000Samuell Grand Recreation Center - Expansion and Renovation
0 0Major Maintenance - Park
Facilities
00
Culture, Arts and Recreation
Citywide 3rd/1303 Bond Program
35,576 18,944 16,632 35,576Samuell Grand Recreation Center - Expansion and Renovation
0 0Recreation Facilities and Site
Development
00
Culture, Arts and Recreation
Citywide 3rd/1206 Bond Program
978,127 978,127 0 978,127Samuell Grand Tennis Pro-Shop Replacement
0 0Major Park Facilities 00
Culture, Arts and Recreation
07 1st/1506 Bond Program
475,000 53,711 421,289 475,000Sargent Parking Lot and Grandstand Cover
0 0Recreation Facilities and Site
Development
00
Culture, Arts and Recreation
05 4th/1306 Bond Program
162,062 80,994 81,068 162,062Seaton - New Playground 0 0Playground Improvement
00
Culture, Arts and Recreation
Citywide Various06 Bond Program
470,550 120,550 350,000 717,050Security Cameras - Recreation Centers
0 0Code Compliance, Safety and
Security - Park Facilities
120,000126,500
Culture, Arts and Recreation
Citywide Various03 Bond Program
1,276,331 1,267,831 8,500 1,276,331Service Center Replacements 0 0Citywide Parks 00
Culture, Arts and Recreation
03 4th/1406 Bond Program
383,927 0 383,927 383,927Sharrock- Niblo Structure Stabilizaion 0 0Historic Preservation
00
Culture, Arts and Recreation
Citywide 3rd/1606 Bond Program
227,827 0 227,827 227,827Singing Hills Recreation Center 0 0Major Maintenance - Park
Facilities
00
410
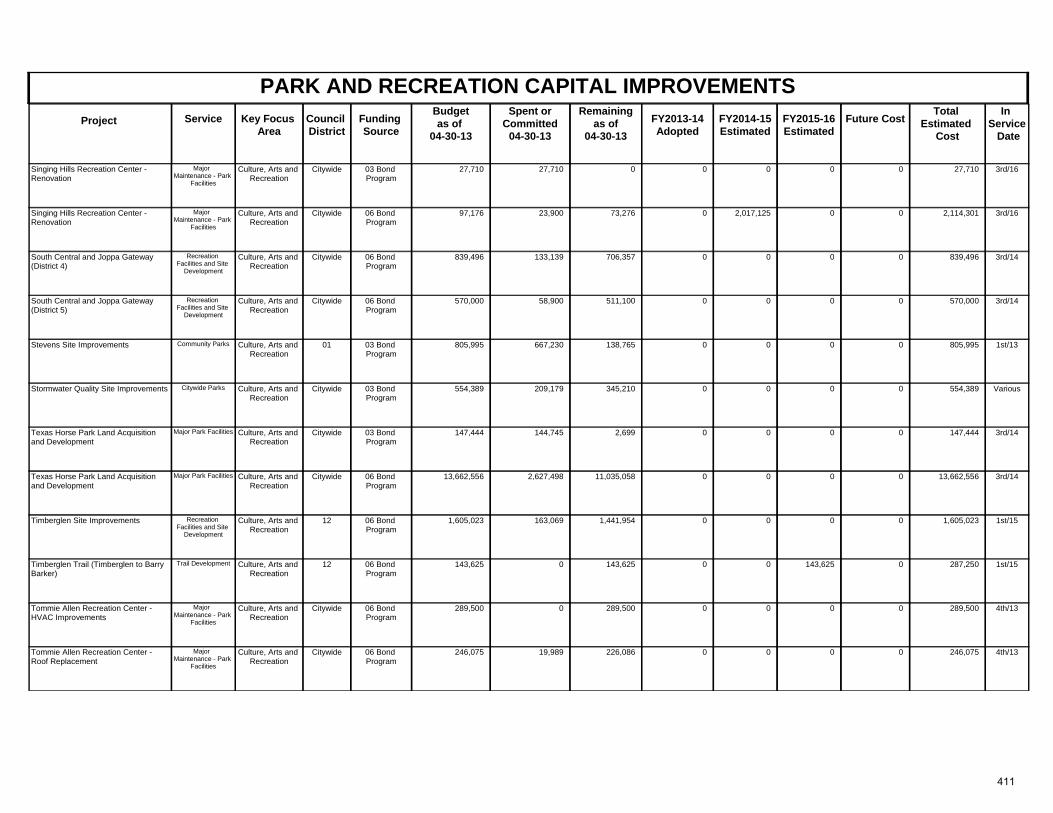
PARK AND RECREATION CAPITAL IMPROVEMENTSProject Key Focus
AreaCouncil District
Spent orCommitted
04-30-13
Total Estimated
Cost
In Service Date
Funding Source
Remainingas of
04-30-13 FY2013-14
AdoptedFuture CostService FY2014-15
Estimated FY2015-16 Estimated
Budgetas of
04-30-13
Culture, Arts and Recreation
Citywide 3rd/1603 Bond Program
27,710 27,710 0 27,710Singing Hills Recreation Center - Renovation
0 0Major Maintenance - Park
Facilities
00
Culture, Arts and Recreation
Citywide 3rd/1606 Bond Program
97,176 23,900 73,276 2,114,301Singing Hills Recreation Center - Renovation
0 0Major Maintenance - Park
Facilities
02,017,125
Culture, Arts and Recreation
Citywide 3rd/1406 Bond Program
839,496 133,139 706,357 839,496South Central and Joppa Gateway (District 4)
0 0Recreation Facilities and Site
Development
00
Culture, Arts and Recreation
Citywide 3rd/1406 Bond Program
570,000 58,900 511,100 570,000South Central and Joppa Gateway (District 5)
0 0Recreation Facilities and Site
Development
00
Culture, Arts and Recreation
01 1st/1303 Bond Program
805,995 667,230 138,765 805,995Stevens Site Improvements 0 0Community Parks 00
Culture, Arts and Recreation
Citywide Various03 Bond Program
554,389 209,179 345,210 554,389Stormwater Quality Site Improvements 0 0Citywide Parks 00
Culture, Arts and Recreation
Citywide 3rd/1403 Bond Program
147,444 144,745 2,699 147,444Texas Horse Park Land Acquisition and Development
0 0Major Park Facilities 00
Culture, Arts and Recreation
Citywide 3rd/1406 Bond Program
13,662,556 2,627,498 11,035,058 13,662,556Texas Horse Park Land Acquisition and Development
0 0Major Park Facilities 00
Culture, Arts and Recreation
12 1st/1506 Bond Program
1,605,023 163,069 1,441,954 1,605,023Timberglen Site Improvements 0 0Recreation Facilities and Site
Development
00
Culture, Arts and Recreation
12 1st/1506 Bond Program
143,625 0 143,625 287,250Timberglen Trail (Timberglen to Barry Barker)
0 0Trail Development 143,6250
Culture, Arts and Recreation
Citywide 4th/1306 Bond Program
289,500 0 289,500 289,500Tommie Allen Recreation Center - HVAC Improvements
0 0Major Maintenance - Park
Facilities
00
Culture, Arts and Recreation
Citywide 4th/1306 Bond Program
246,075 19,989 226,086 246,075Tommie Allen Recreation Center - Roof Replacement
0 0Major Maintenance - Park
Facilities
00
411
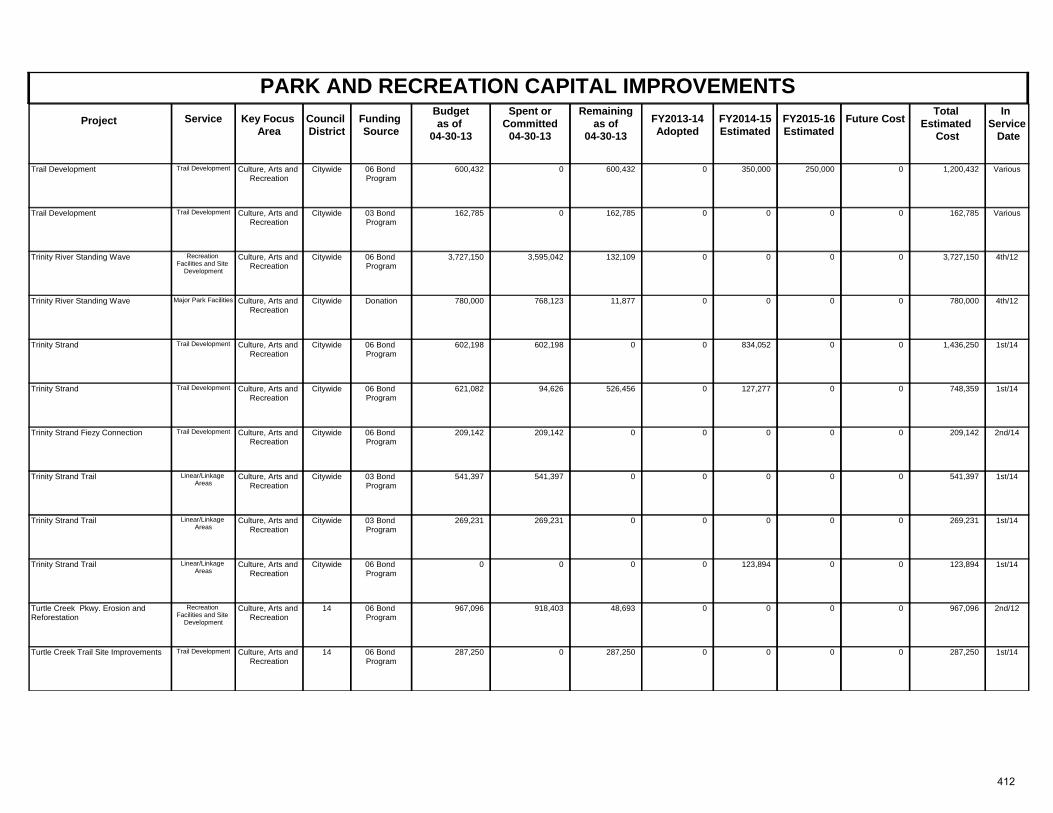
PARK AND RECREATION CAPITAL IMPROVEMENTSProject Key Focus
AreaCouncil District
Spent orCommitted
04-30-13
Total Estimated
Cost
In Service Date
Funding Source
Remainingas of
04-30-13 FY2013-14
AdoptedFuture CostService FY2014-15
Estimated FY2015-16 Estimated
Budgetas of
04-30-13
Culture, Arts and Recreation
Citywide Various06 Bond Program
600,432 0 600,432 1,200,432Trail Development 0 0Trail Development 250,000350,000
Culture, Arts and Recreation
Citywide Various03 Bond Program
162,785 0 162,785 162,785Trail Development 0 0Trail Development 00
Culture, Arts and Recreation
Citywide 4th/1206 Bond Program
3,727,150 3,595,042 132,109 3,727,150Trinity River Standing Wave 0 0Recreation Facilities and Site
Development
00
Culture, Arts and Recreation
Citywide 4th/12Donation 780,000 768,123 11,877 780,000Trinity River Standing Wave 0 0Major Park Facilities 00
Culture, Arts and Recreation
Citywide 1st/1406 Bond Program
602,198 602,198 0 1,436,250Trinity Strand 0 0Trail Development 0834,052
Culture, Arts and Recreation
Citywide 1st/1406 Bond Program
621,082 94,626 526,456 748,359Trinity Strand 0 0Trail Development 0127,277
Culture, Arts and Recreation
Citywide 2nd/1406 Bond Program
209,142 209,142 0 209,142Trinity Strand Fiezy Connection 0 0Trail Development 00
Culture, Arts and Recreation
Citywide 1st/1403 Bond Program
541,397 541,397 0 541,397Trinity Strand Trail 0 0Linear/Linkage Areas
00
Culture, Arts and Recreation
Citywide 1st/1403 Bond Program
269,231 269,231 0 269,231Trinity Strand Trail 0 0Linear/Linkage Areas
00
Culture, Arts and Recreation
Citywide 1st/1406 Bond Program
0 0 0 123,894Trinity Strand Trail 0 0Linear/Linkage Areas
0123,894
Culture, Arts and Recreation
14 2nd/1206 Bond Program
967,096 918,403 48,693 967,096Turtle Creek Pkwy. Erosion and Reforestation
0 0Recreation Facilities and Site
Development
00
Culture, Arts and Recreation
14 1st/1406 Bond Program
287,250 0 287,250 287,250Turtle Creek Trail Site Improvements 0 0Trail Development 00
412
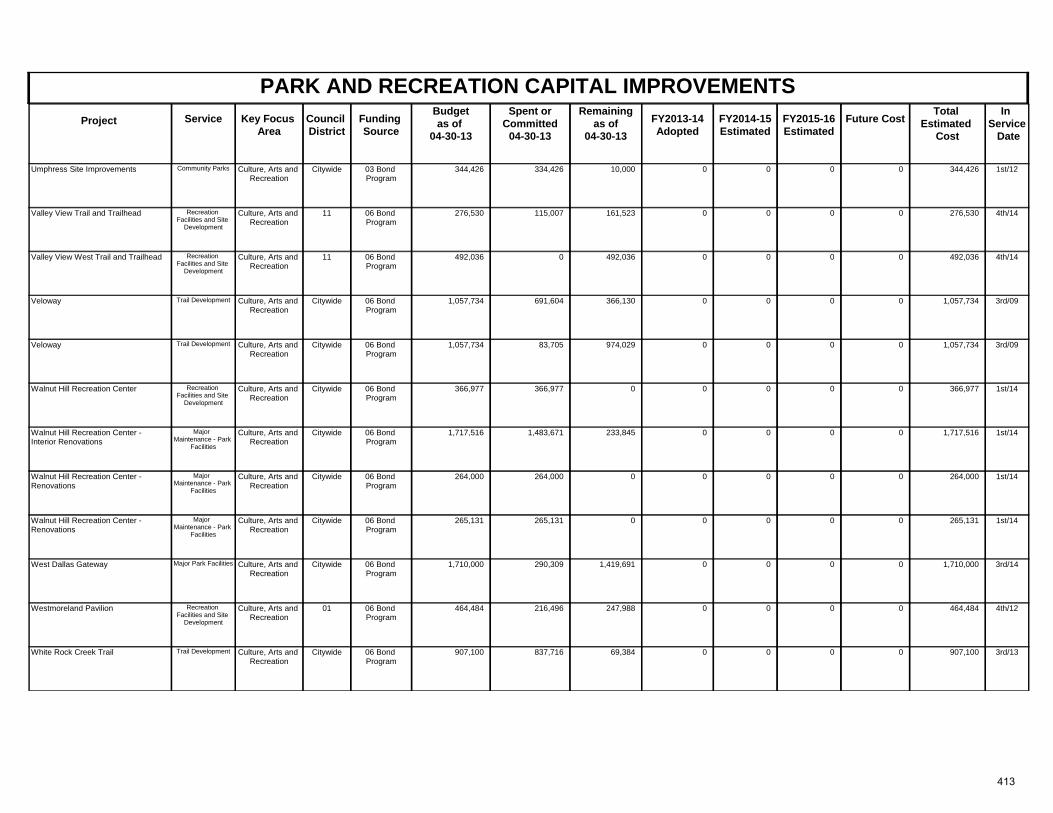
PARK AND RECREATION CAPITAL IMPROVEMENTSProject Key Focus
AreaCouncil District
Spent orCommitted
04-30-13
Total Estimated
Cost
In Service Date
Funding Source
Remainingas of
04-30-13 FY2013-14
AdoptedFuture CostService FY2014-15
Estimated FY2015-16 Estimated
Budgetas of
04-30-13
Culture, Arts and Recreation
Citywide 1st/1203 Bond Program
344,426 334,426 10,000 344,426Umphress Site Improvements 0 0Community Parks 00
Culture, Arts and Recreation
11 4th/1406 Bond Program
276,530 115,007 161,523 276,530Valley View Trail and Trailhead 0 0Recreation Facilities and Site
Development
00
Culture, Arts and Recreation
11 4th/1406 Bond Program
492,036 0 492,036 492,036Valley View West Trail and Trailhead 0 0Recreation Facilities and Site
Development
00
Culture, Arts and Recreation
Citywide 3rd/0906 Bond Program
1,057,734 691,604 366,130 1,057,734Veloway 0 0Trail Development 00
Culture, Arts and Recreation
Citywide 3rd/0906 Bond Program
1,057,734 83,705 974,029 1,057,734Veloway 0 0Trail Development 00
Culture, Arts and Recreation
Citywide 1st/1406 Bond Program
366,977 366,977 0 366,977Walnut Hill Recreation Center 0 0Recreation Facilities and Site
Development
00
Culture, Arts and Recreation
Citywide 1st/1406 Bond Program
1,717,516 1,483,671 233,845 1,717,516Walnut Hill Recreation Center - Interior Renovations
0 0Major Maintenance - Park
Facilities
00
Culture, Arts and Recreation
Citywide 1st/1406 Bond Program
264,000 264,000 0 264,000Walnut Hill Recreation Center - Renovations
0 0Major Maintenance - Park
Facilities
00
Culture, Arts and Recreation
Citywide 1st/1406 Bond Program
265,131 265,131 0 265,131Walnut Hill Recreation Center - Renovations
0 0Major Maintenance - Park
Facilities
00
Culture, Arts and Recreation
Citywide 3rd/1406 Bond Program
1,710,000 290,309 1,419,691 1,710,000West Dallas Gateway 0 0Major Park Facilities 00
Culture, Arts and Recreation
01 4th/1206 Bond Program
464,484 216,496 247,988 464,484Westmoreland Pavilion 0 0Recreation Facilities and Site
Development
00
Culture, Arts and Recreation
Citywide 3rd/1306 Bond Program
907,100 837,716 69,384 907,100White Rock Creek Trail 0 0Trail Development 00
413

PARK AND RECREATION CAPITAL IMPROVEMENTSProject Key Focus
AreaCouncil District
Spent orCommitted
04-30-13
Total Estimated
Cost
In Service Date
Funding Source
Remainingas of
04-30-13 FY2013-14
AdoptedFuture CostService FY2014-15
Estimated FY2015-16 Estimated
Budgetas of
04-30-13
Culture, Arts and Recreation
Citywide N/A06 Bond Program
4,750,000 0 4,750,000 4,750,000White Rock Hills Recreation Center - Land Acquisition
0 0Recreation Facilities and Site
Development
00
Culture, Arts and Recreation
Citywide 1st/1506 Bond Program
1,660,535 401,347 1,259,188 1,660,535White Rock Lake East Lawther Trail Replacement
0 0Recreation Facilities and Site
Development
00
Culture, Arts and Recreation
Citywide 4th/1406 Bond Program
971,000 223,946 747,054 971,000White Rock Lake Mockingbird Point Improvements
0 0Recreation Facilities and Site
Development
00
Culture, Arts and Recreation
Citywide 1st/1406 Bond Program
164,621 13,920 150,701 164,621White Rock Lake Park (Nautical Area) Playground Replacement (Big Thicket No. 2)
0 0Playground Improvement
00
Culture, Arts and Recreation
Citywide 1st/1506 Bond Program
474,799 63,915 410,884 474,799White Rock Lake Security Lights 0 0Recreation Facilities and Site
Development
00
Culture, Arts and Recreation
Citywide 4th/1406 Bond Program
143,625 2,580 141,045 143,625White Rock Trail Extension 0 0Trail Development 00
Culture, Arts and Recreation
Citywide 3rd/1206 Bond Program
77,200 2,924 74,276 77,200Willie B Johnson Recreation Center - HVAC Improvements
0 0Major Maintenance - Park
Facilities
00
Culture, Arts and Recreation
Citywide 3rd/1206 Bond Program
1,117,719 1,084,929 32,790 1,117,719Willie B Johnson Recreation Center - Interior Renovation
0 0Recreation Facilities and Site
Development
00
Culture, Arts and Recreation
07 3rd/1306 Bond Program
1,036,831 824,963 211,868 1,344,802Willie Mae Butler Park- Sprayground 0 0Recreation Facilities and Site
Development
0307,971
Culture, Arts and Recreation
Citywide 1st/13Donation 300,590 300,590 0 300,590Woodall Rodgers Deck Plaza Development
0 0Downtown Parks 00
Culture, Arts and Recreation
Citywide 1st/13Reimb 450,000 0 450,000 450,000Woodall Rodgers Deck Plaza Development
0 0Downtown Parks 00
Culture, Arts and Recreation
Citywide 1st/1306 Bond Program
19,500,000 19,500,000 0 19,500,000Woodall Rodgers Deck Plaza Development
0 0Downtown Parks 00
414
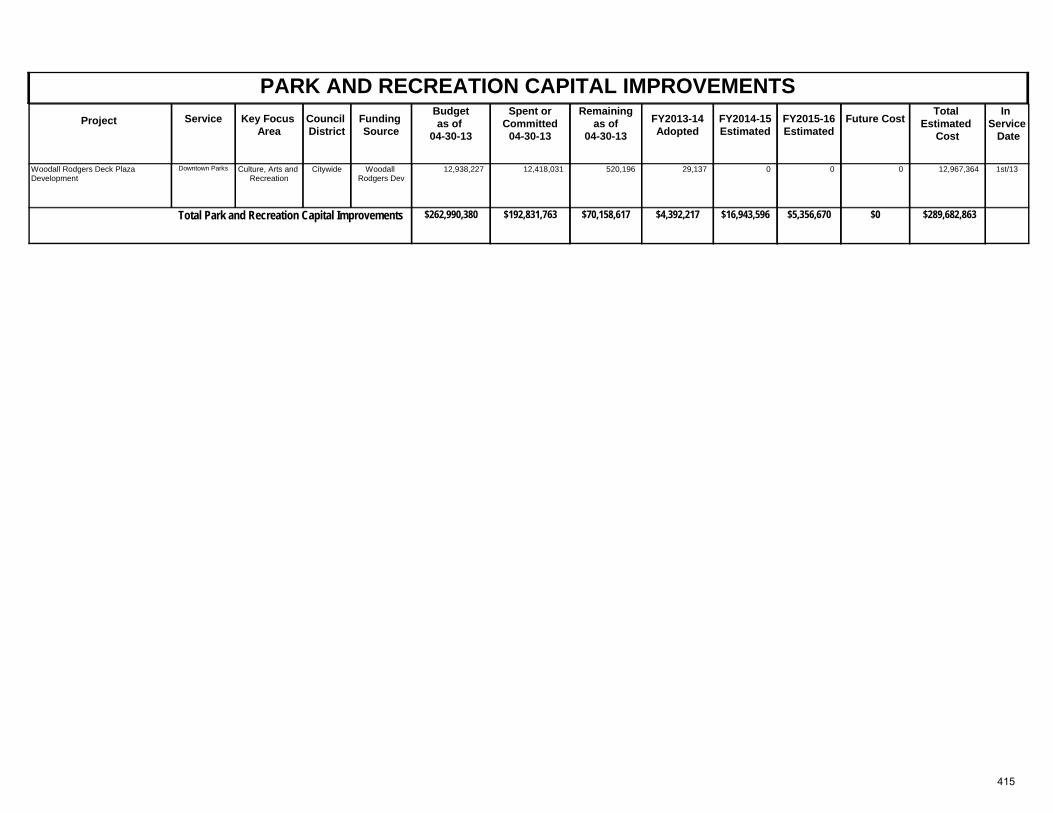
PARK AND RECREATION CAPITAL IMPROVEMENTSProject Key Focus
AreaCouncil District
Spent orCommitted
04-30-13
Total Estimated
Cost
In Service Date
Funding Source
Remainingas of
04-30-13 FY2013-14
AdoptedFuture CostService FY2014-15
Estimated FY2015-16 Estimated
Budgetas of
04-30-13
Culture, Arts and Recreation
Citywide 1st/13Woodall Rodgers Dev
12,938,227 12,418,031 520,196 12,967,364Woodall Rodgers Deck Plaza Development
29,137 0Downtown Parks 00
$262,990,380 $70,158,617Total Park and Recreation Capital Improvements $192,831,763 $289,682,863$4,392,217 $0$5,356,670$16,943,596
415
STREET AND THOROUGHFARE CAPITAL IMPROVEMENTS
MISSION Street and Thoroughfare capital improvements seek to enhance the overall transportation system in the City of Dallas to provide safe and efficient movement of people, goods and services throughout the City. These projects include transportation systems management, participation with other agencies for improvements to intersections, thoroughfares and alternative modes of transportation, as well as street resurfacing, street petitions, street reconstruction, local collectors, sidewalks, thoroughfare improvements, alley petitions and reconstruction, and bridge repair and modification. HIGHLIGHTED ACCOMPLISHMENTS FOR FY 2012-13
1. Completed construction of 8 Alley Reconstruction projects including alley Carry Back Cir. & TU ROW - Pensive to T-alley, Catamore (3144) & Woodwind - Dundee including "T", Chattington (7606) & Rolling Acres - Tophill to Carriage, Cromwell(11001) - Royal to Cromwell, Paldao Dr (7311 - 7429) Spring Valley - Meandering to Carillon, Tahoe & Brush Creek-Brush Creek to Roaring Springs, Talisman Dr & Wildflower from Wildflower to Caraway, Whitehall & Jubilee Trail - Shans to Cromwell .
2. Completed 3 Bridge Repair and Modification projects including Lake June Rd. over Prairie Creek, Mockingbird Bridge over Fisher Road, Simpson Stuart Rd. over Five Mile Creek.
3. Completed 4 Sidewalk projects including Community from Webb
Chapel Ext. to NW Hwy, Herbert Street, from Toronto Street to Canada Drive, McCallum from Hillcrest to Coit, Martin Weiss elementary and D. A. Hulcy Middle.
4. Completed 2 Street Petitions projects including Laneri Ave -
Merrimac Ave to Mercedes Ave, Oldgate Ln. - Garland Rd to Diceman Dr.
5. Completed 142 barrier-free ramps and 164 slope downs.
6. Completed 5 Street Reconstruction projects including Congo St. from
S. Carroll Ave. to Bank St., Campbell Rd at DART crossing, Fitchburg St - Chalk Hill Rd to Weir St, Irving Blvd (N Serv Rd) - Mockingbird Lane to Woodall St.
7. Completed 559 Resident Cost-Share Sidewalk Replacement projects.
8. Completed 30 Fast-Fix Sidewalk Replacement projects.
9. Completed 30 segments of street resurfacing for a total of 39 lane
miles.
10. Completed 2 Streetscape/Urban Design projects including Bexar St.-CF Hawn (US 175) Svc. Rd. to Brigham Ln., Buckner Blvd (Phase II) - Bruton to Scyene.
11. Completed 5 Intergovernmental Partnership Projects including Katy
Trail Phase III, Gaston & Washington, Northwest Highway from West Lawther to Buckner, CBD Signage and Wayfinding Phase II, and Frankford from Coit to the East City Limits.
HIGHLIGHTED OBJECTIVES FOR FY2013-14
1. Complete 3 Alley Petitions projects.
2. Complete 17 Alley Reconstruction projects such as 9th St & 10th St - Zang to Madison, Aberdeen Ave & Mimosa Ln - Tibbs to Edgemere, and Marsalis & Lancaster - 11th to Jefferson.
3. Complete 2 Bridge Repair and modification projects including the Fair Oaks Crossing bridge.
4. Complete 13 Intergovernmental Partnership Projects such as Gaston at Washington, Katy Trail 3 and 4, Montfort from Peterson to Alpha, McKinney Ave Trolley Olive Street Ext, and Sylvan Bridge.
5. Complete 1 Street Modification and Bottlenecks project at Montfort and Peterson.
6. Complete 13 Street Petitions projects such as Bainbridge Dr - Camp Wisdom to Cliffwood Dr, Missouri Av (E) - Fowler St to Illinois Ave (E), and Woodway Dr - Fountaindale Dr to Dead-End.
416
STREET AND THOROUGHFARE CAPITAL IMPROVEMENTS
7. Complete 12 Street Reconstruction projects such as Forsythe Dr - Gayglen Dr to Komatty Dr, Southwell Rd - Ables Ln to Shady Tr, Titan Dr - Empress Row to Governors Row, and Fordham Rd - Bonnie View Rd to Hale St.
8. Complete 9 Streetscape/Urban Design projects such as Akard from
Commerce to Elm, Bexar Street Corridor- US 175 to Rochester, and Spring Avenue Redevelopment Project.
9. Complete 2 Target Neighborhood projects including Polk St (S) - Ferndale Av to Clarendon Av.
10. Complete 13 Thoroughfares projects such as Akard - Commerce to
Elm, Central Boulevard - Commerce to Live Oak, and Routh St - Ross to San Jacinto.
11. Complete 100 slopedowns and 150 barrier-free ramps. 12. Complete 250 Resident Cost-Share Sidewalk Replacement projects. 13. Complete 50 Fast-Fix Sidewalk Replacement projects. 14. Complete 25 segments of street resurfacing for a total of 51 lane
miles such as Alpha from Peyton to Coit and Sunnyvale from Ann Arbor to Kiest. This begins the 2012 Bond Program Resurfacing.
SERVICE DESCRIPTIONS Alley Petitions Engineering and construction of alley paving through petitions from the Property Owners Cost Participation Program (POCPP). Petitions must represent a two-thirds majority of the abutting property owners and/or residents adjacent to unimproved alleys for a valid paving petition. Property owners are assessed for a portion of the cost. Alley Reconstruction Engineering and construction of alleys that have exceeded their structural life expectancy.
Alternate Mode Transportation Trails All weather trail projects that encourage walking, bicycling and other modes of transportation as an alternative to the automobile. These facilities offer sufficient width to accommodate bicyclists, pedestrians and skaters, and are recommended under the North Central Texas Council of Government's (COG) Mobility 2025 Plan and the Texas Natural Resources Conservation Commission's (TNRCC) Emission Reduction Plan for the region. Barrier Free Ramps The general public requests barrier-free-ramp projects. Priority is given to walkways serving government offices and facilities, health care facilities (hospitals, clinics, retirement facilities, etc.), bus stops and transportation centers (DART), commercial districts (private businesses offering goods and services to the public), schools, followed by walkways serving residential areas. Bridge Repair and Modification Provide for repair and modification of bridges due to structural deficiencies identified in the bi-annual Bridge Inspection and Appraisal Program (BRINSAP) performed by Texas Department of Transportation. Complete Streets The new complete streets vision is to build streets that are safe and comfortable for everyone: young and old, motorists and bicyclists, walkers and wheelchair users, and bus and train riders alike. Economic and Business Development Street, utility and other infrastructure improvements in furtherance of economic and business development in the Southern area of the City and other target project sites. Gateway (West Dallas Gateway) Provides for railroad coordination, temporary track relocation, bridges, retaining walls, street paving including storm drainage, water and wastewater utilities, and other related infrastructure improvements consistent with the City Design Studio West Dallas redevelopment plan. Housing Infrastructure Improvements Street, alley and drainage infrastructure improvements for low to moderate-income housing. Property owners may be assessed for a portion of the cost.
417
STREET AND THOROUGHFARE CAPITAL IMPROVEMENTS
Intelligent Transportation Systems Projects include changeable turn-lane signs, adaptive signal timing, and Roadside cameras. Changeable turn lane signs will display various turning movement messages throughout the day to help reduce traffic congestion. The adaptive signal timing system will measure traffic flow and automatically download optimized traffic signal timings for freeway ramps and arterials frequently affected by traffic diverting from freeways. Roadside cameras monitor traffic conditions at critical intersections from the City Hall Traffic Management Center and allow remote traffic signal timing changes to be made more efficiently. Intergovernmental Partnership Projects Transportation projects where the City is leveraging funding from other federal, state and local sources. These projects typically include building a Roadway to the standard identified in the Thoroughfare Plan, adding turn lanes at intersections, signal and other ITS upgrades, and trail projects. Local Collector Improvements to substandard or over-burdened local collector streets to bring them into compliance with current City standards including safety, lane width, and pavement thickness. Participation With Other Government Agencies - Alternate Modes Improvements to alternate modes of transportation such as separate bike routes, signage, or parking facilities with matching funds from other agencies. Participation With Other Government Agencies - Intersections Improvements for turning movements, addition of auxiliary turn lanes, and increasing storage capacity at designated intersections using matching funds from other agencies. Participation With Other Government Agencies - Thoroughfares Provides for improvement of substandard or overburdened City thoroughfares to bring them into compliance with current City standards including safety, lane width and pavement thickness by using matching funds from other agencies.
PID/TIF Development Public Improvement Districts (PIDs) and Tax Increment Financing (TIF) districts are special districts used to finance planned economic development activities in specific target areas of the City. Capital improvement projects provide for the engineering and construction of street, drainage, landscaping and streetscaping improvements at the beginning of the redevelopment process to encourage private investments in PIDs and TIFs. Professional Services and Debt Issuance Provides funding for certain costs associated with capital improvement projects. These costs include studies and long-range plans, debt issuance costs, and reimbursements to the General Fund for professional staff services such as design, survey, land acquisition fees and engineering. Debt issuance and CIP Engineering costs are paid from the interest earned on bond proceeds. Public Art Includes the public art initiatives throughout the City of Dallas. Funds generated by Public Art appropriations are used for the design services of artists, for the selection, acquisition, commissioning and display of artworks and for administration of the public art projects. Public/Private Partnerships Provides cost participation for street infrastructure improvements related to Public/Private Development. School Flasher Upgrades Replace existing flasher assemblies. This will eliminate hard-wired electrical connections and electricity costs by using stand-alone solar-powered assemblies. Control equipment will also be upgraded to allow flexible flasher activation schedules. Sidewalk Improvements Sidewalk replacement cost sharing program between the City and the citizens. This program was created to assist property owners with the cost of replacing sidewalks. Under this program, the City pays 50% and the property owners pay 50% of the cost to replace the sidewalk. Sidewalk Petitions Provides for a new sidewalk that is petitioned by citizens. Sidewalk petition projects are validated by meeting the following requirements:
Signatures of 2/3 majority of the abutting property owners and ½ of the property frontage, or
Signatures of ½ of the abutting property owners and 2/3rds of the property frontage.
418
STREET AND THOROUGHFARE CAPITAL IMPROVEMENTS
Sidewalk Safety Provides for new sidewalks in high pedestrian areas. These projects are requested by parents, teachers, school administrators and general public and are submitted to the Citizen Safety Advisory Committee for review. Adjacent property owners are assessed for a portion of the cost. Street Improvements Funding for engineering and construction. Street Lighting Projects include completion of the 1981 CBD Roadway Lighting Master Plan and installation of historic-style street lights in lieu of conventional street lights in 5 designated historic districts. In the Central Business District, approximately 600 shoe box-style 1000-watt metal halide street lights will be installed. St. Modifications and Bottleneck Removal Transportation projects that provide a mobility improvement at a location where the capacity is currently constrained. Street Petitions Engineering and construction of street paving petition improvements requested by property owners through the Property Owners Cost Participation Program (POCPP). Petitions must represent a two-thirds majority of the abutting property owners and/or residents adjacent to unimproved street for a valid paving petition. Property owners are assessed for a portion of the cost. Street Reconstruction Engineering and construction of street that have exceeded their structural life expectancy. Street Resurfacing Street Resurfacing Design and construction for streets that need resurfacing. Resurfacing consists of removal of previous asphalt overlays or milling of existing concrete, repairs to base pavement, curb, gutter, and sidewalks, where required for the resurfacing project and placement of new or recycled asphalt overlays or concrete repairs and traffic markings, as necessary. Streetscape/Urban Design Design and installation of sidewalks, barrier-free ramps, brick pavers, trees and planting materials, irrigation systems, street lighting, and pedestrian lighting. Target Neighborhood Improvement of substandard residential streets to current City standards without requiring street petition. Property owners will be assessed for a portion of the cost.
Thoroughfares Roadway projects that improve the capacity of a segment of Roadway by constructing it to the standard identified on the Thoroughfare Plan or CBD Streets and Vehicular Circulation Plan. Traffic Devices - Illuminated Crosswalks Installation of mid-block pedestrian crosswalks with illuminated pavement markers for increased pedestrian safety. Traffic Signal Control Equipment Upgrades Replace traffic control equipment citywide (signal controllers and conflict monitors) that have exceeded their design life. As electronic equipment ages, the number of failures increases. Equipment reliability effects traffic safety and congestion. Traffic Signal Upgrades Replacement of traffic signal hardware that is structurally deficient, prone to being damaged by vehicles, and/or requires operational improvement such as the addition of left turn signals or pedestrian signals. In the Central Business District, signal poles will be replaced by a streetscape-style hardware that have higher signal display mounting heights providing better visibility. Transportation Systems Management Installation of new traffic signals and school flashers where warranted, replacement of structurally deficient traffic signal hardware and installation of Intelligent Transportation System devices to improve traffic flow. Trinity River Transportation Related Projects Engineering studies, design, initial right-of-way acquisition and construction of transportation related improvements in the Trinity River Corridor. Warranted Signals, School Flashers and Whistle-Banned Railroad Crossings Construction of traffic signals at approximately 12 un-signalized intersections per year that meet the criteria (warrants) for traffic signal installations. In addition, funds would be used for the installation of approximately 10 to 15 new school zones with flashers per year. This category also provides for the installation of supplemental safety measures required to implement a whistle ban.
419
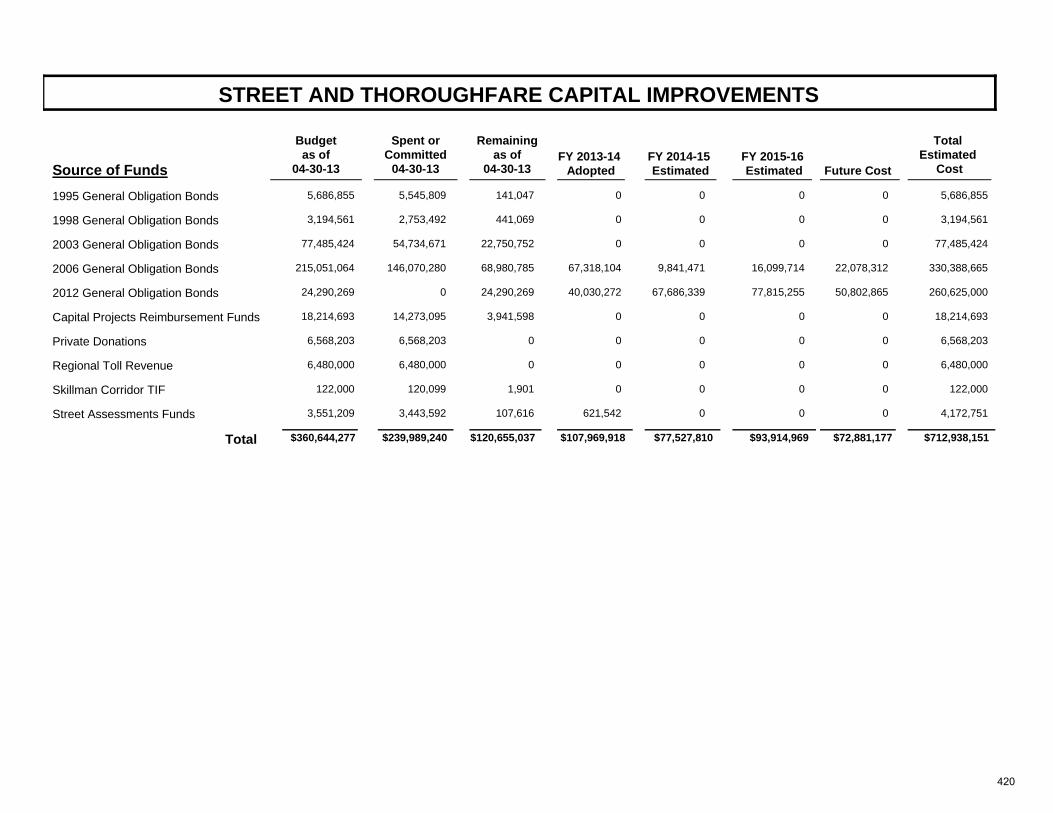
STREET AND THOROUGHFARE CAPITAL IMPROVEMENTS
Source of FundsFY 2013-14
Adopted
Total Estimated
CostFY 2014-15 Estimated
FY 2015-16 Estimated
Future Cost
Remainingas of
04-30-13
Spent orCommitted
04-30-13
Budgetas of
04-30-13
1995 General Obligation Bonds 5,686,855 5,545,809 0141,047 5,686,8550 0 0
1998 General Obligation Bonds 3,194,561 2,753,492 0441,069 3,194,5610 0 0
2003 General Obligation Bonds 77,485,424 54,734,671 022,750,752 77,485,4240 0 0
2006 General Obligation Bonds 215,051,064 146,070,280 67,318,10468,980,785 330,388,6659,841,471 16,099,714 22,078,312
2012 General Obligation Bonds 24,290,269 0 40,030,27224,290,269 260,625,00067,686,339 77,815,255 50,802,865
Capital Projects Reimbursement Funds 18,214,693 14,273,095 03,941,598 18,214,6930 0 0
Private Donations 6,568,203 6,568,203 00 6,568,2030 0 0
Regional Toll Revenue 6,480,000 6,480,000 00 6,480,0000 0 0
Skillman Corridor TIF 122,000 120,099 01,901 122,0000 0 0
Street Assessments Funds 3,551,209 3,443,592 621,542107,616 4,172,7510 0 0
$239,989,240 $107,969,918Total $360,644,277 $120,655,037 $77,527,810 $712,938,151$93,914,969 $72,881,177
420
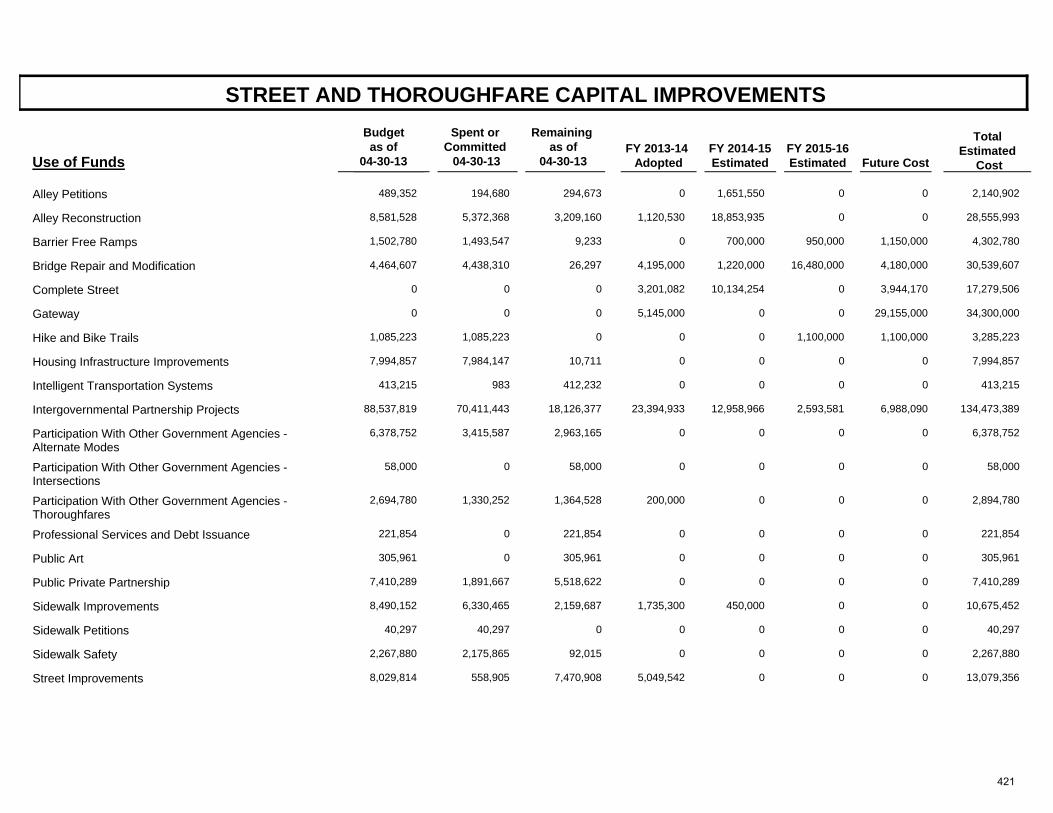
STREET AND THOROUGHFARE CAPITAL IMPROVEMENTS
Use of FundsFY 2013-14
Adopted
Total Estimated
Cost FY 2014-15 Estimated
FY 2015-16 Estimated
Future Cost
Spent or Committed
04-30-13
Remaining as of
04-30-13
Budget as of
04-30-13
Alley Petitions 489,352 194,680 0294,673 2,140,9021,651,550 0 0
Alley Reconstruction 8,581,528 5,372,368 1,120,5303,209,160 28,555,99318,853,935 0 0
Barrier Free Ramps 1,502,780 1,493,547 09,233 4,302,780700,000 950,000 1,150,000
Bridge Repair and Modification 4,464,607 4,438,310 4,195,00026,297 30,539,6071,220,000 16,480,000 4,180,000
Complete Street 0 0 3,201,0820 17,279,50610,134,254 0 3,944,170
Gateway 0 0 5,145,0000 34,300,0000 0 29,155,000
Hike and Bike Trails 1,085,223 1,085,223 00 3,285,2230 1,100,000 1,100,000
Housing Infrastructure Improvements 7,994,857 7,984,147 010,711 7,994,8570 0 0
Intelligent Transportation Systems 413,215 983 0412,232 413,2150 0 0
Intergovernmental Partnership Projects 88,537,819 70,411,443 23,394,93318,126,377 134,473,38912,958,966 2,593,581 6,988,090
Participation With Other Government Agencies - Alternate Modes
6,378,752 3,415,587 02,963,165 6,378,7520 0 0
Participation With Other Government Agencies - Intersections
58,000 0 058,000 58,0000 0 0
Participation With Other Government Agencies - Thoroughfares
2,694,780 1,330,252 200,0001,364,528 2,894,7800 0 0
Professional Services and Debt Issuance 221,854 0 0221,854 221,8540 0 0
Public Art 305,961 0 0305,961 305,9610 0 0
Public Private Partnership 7,410,289 1,891,667 05,518,622 7,410,2890 0 0
Sidewalk Improvements 8,490,152 6,330,465 1,735,3002,159,687 10,675,452450,000 0 0
Sidewalk Petitions 40,297 40,297 00 40,2970 0 0
Sidewalk Safety 2,267,880 2,175,865 092,015 2,267,8800 0 0
Street Improvements 8,029,814 558,905 5,049,5427,470,908 13,079,3560 0 0
421
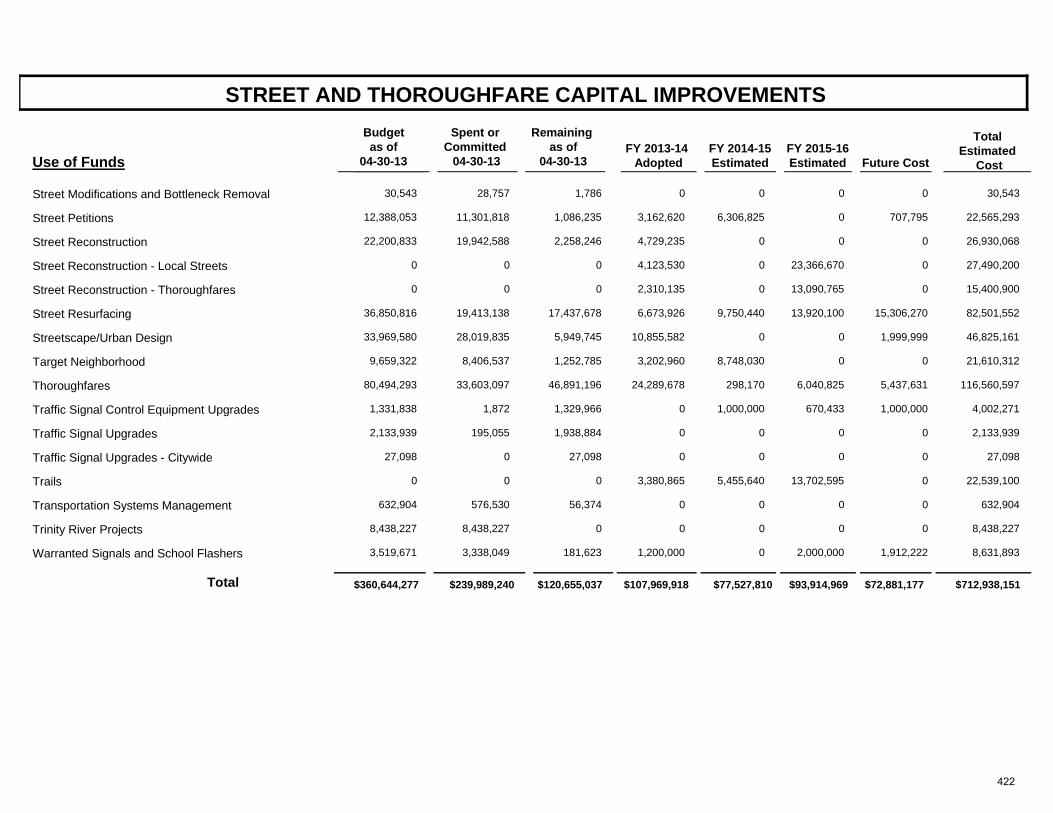
STREET AND THOROUGHFARE CAPITAL IMPROVEMENTS
Use of FundsFY 2013-14
Adopted
Total Estimated
Cost FY 2014-15 Estimated
FY 2015-16 Estimated
Future Cost
Spent or Committed
04-30-13
Remaining as of
04-30-13
Budget as of
04-30-13
Street Modifications and Bottleneck Removal 30,543 28,757 01,786 30,5430 0 0
Street Petitions 12,388,053 11,301,818 3,162,6201,086,235 22,565,2936,306,825 0 707,795
Street Reconstruction 22,200,833 19,942,588 4,729,2352,258,246 26,930,0680 0 0
Street Reconstruction - Local Streets 0 0 4,123,5300 27,490,2000 23,366,670 0
Street Reconstruction - Thoroughfares 0 0 2,310,1350 15,400,9000 13,090,765 0
Street Resurfacing 36,850,816 19,413,138 6,673,92617,437,678 82,501,5529,750,440 13,920,100 15,306,270
Streetscape/Urban Design 33,969,580 28,019,835 10,855,5825,949,745 46,825,1610 0 1,999,999
Target Neighborhood 9,659,322 8,406,537 3,202,9601,252,785 21,610,3128,748,030 0 0
Thoroughfares 80,494,293 33,603,097 24,289,67846,891,196 116,560,597298,170 6,040,825 5,437,631
Traffic Signal Control Equipment Upgrades 1,331,838 1,872 01,329,966 4,002,2711,000,000 670,433 1,000,000
Traffic Signal Upgrades 2,133,939 195,055 01,938,884 2,133,9390 0 0
Traffic Signal Upgrades - Citywide 27,098 0 027,098 27,0980 0 0
Trails 0 0 3,380,8650 22,539,1005,455,640 13,702,595 0
Transportation Systems Management 632,904 576,530 056,374 632,9040 0 0
Trinity River Projects 8,438,227 8,438,227 00 8,438,2270 0 0
Warranted Signals and School Flashers 3,519,671 3,338,049 1,200,000181,623 8,631,8930 2,000,000 1,912,222
$239,989,240 $107,969,918Total $360,644,277 $120,655,037 $77,527,810 $712,938,151$93,914,969 $72,881,177
422
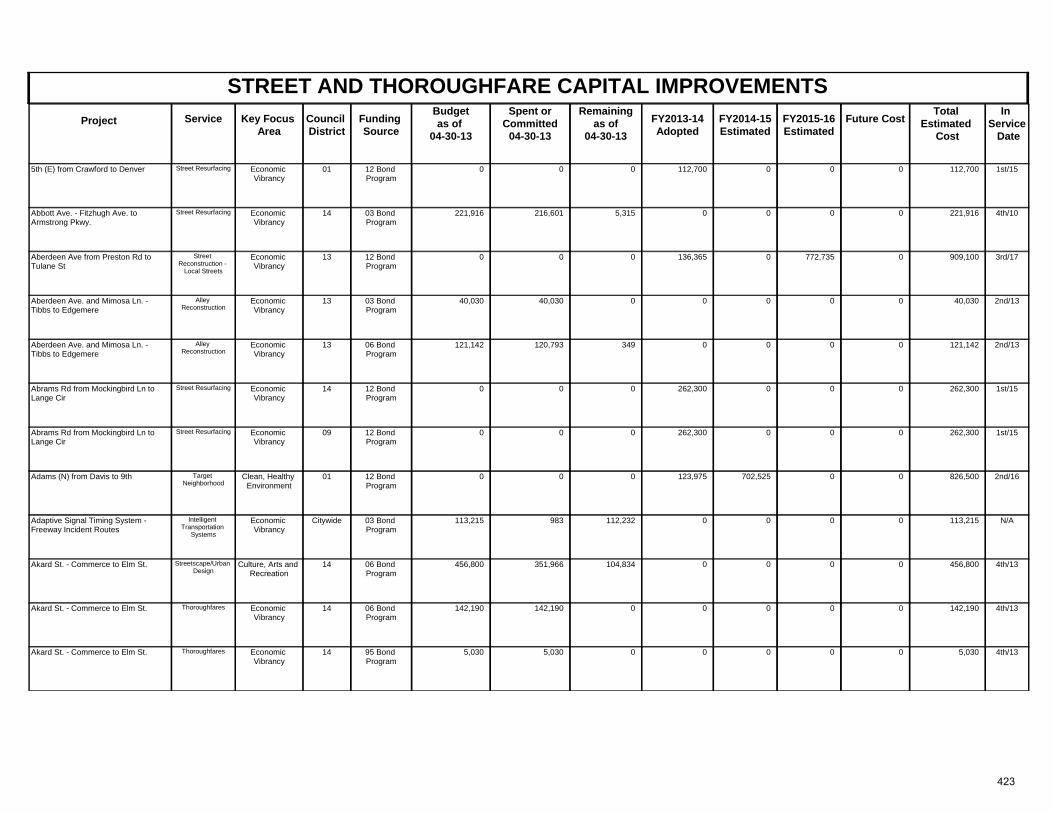
STREET AND THOROUGHFARE CAPITAL IMPROVEMENTSProject Key Focus
AreaCouncil District
Spent orCommitted
04-30-13
Total Estimated
Cost
In Service Date
Funding Source
Remainingas of
04-30-13 FY2013-14
AdoptedFuture CostService FY2014-15
Estimated FY2015-16 Estimated
Budgetas of
04-30-13
Economic Vibrancy
01 1st/1512 Bond Program
0 0 0 112,7005th (E) from Crawford to Denver 112,700 0Street Resurfacing 00
Economic Vibrancy
14 4th/1003 Bond Program
221,916 216,601 5,315 221,916Abbott Ave. - Fitzhugh Ave. to Armstrong Pkwy.
0 0Street Resurfacing 00
Economic Vibrancy
13 3rd/1712 Bond Program
0 0 0 909,100Aberdeen Ave from Preston Rd to Tulane St
136,365 0Street Reconstruction -
Local Streets
772,7350
Economic Vibrancy
13 2nd/1303 Bond Program
40,030 40,030 0 40,030Aberdeen Ave. and Mimosa Ln. - Tibbs to Edgemere
0 0Alley Reconstruction
00
Economic Vibrancy
13 2nd/1306 Bond Program
121,142 120,793 349 121,142Aberdeen Ave. and Mimosa Ln. - Tibbs to Edgemere
0 0Alley Reconstruction
00
Economic Vibrancy
14 1st/1512 Bond Program
0 0 0 262,300Abrams Rd from Mockingbird Ln to Lange Cir
262,300 0Street Resurfacing 00
Economic Vibrancy
09 1st/1512 Bond Program
0 0 0 262,300Abrams Rd from Mockingbird Ln to Lange Cir
262,300 0Street Resurfacing 00
Clean, Healthy Environment
01 2nd/1612 Bond Program
0 0 0 826,500Adams (N) from Davis to 9th 123,975 0Target Neighborhood
0702,525
Economic Vibrancy
Citywide N/A03 Bond Program
113,215 983 112,232 113,215Adaptive Signal Timing System - Freeway Incident Routes
0 0Intelligent Transportation
Systems
00
Culture, Arts and Recreation
14 4th/1306 Bond Program
456,800 351,966 104,834 456,800Akard St. - Commerce to Elm St. 0 0Streetscape/Urban Design
00
Economic Vibrancy
14 4th/1306 Bond Program
142,190 142,190 0 142,190Akard St. - Commerce to Elm St. 0 0Thoroughfares 00
Economic Vibrancy
14 4th/1395 Bond Program
5,030 5,030 0 5,030Akard St. - Commerce to Elm St. 0 0Thoroughfares 00
423
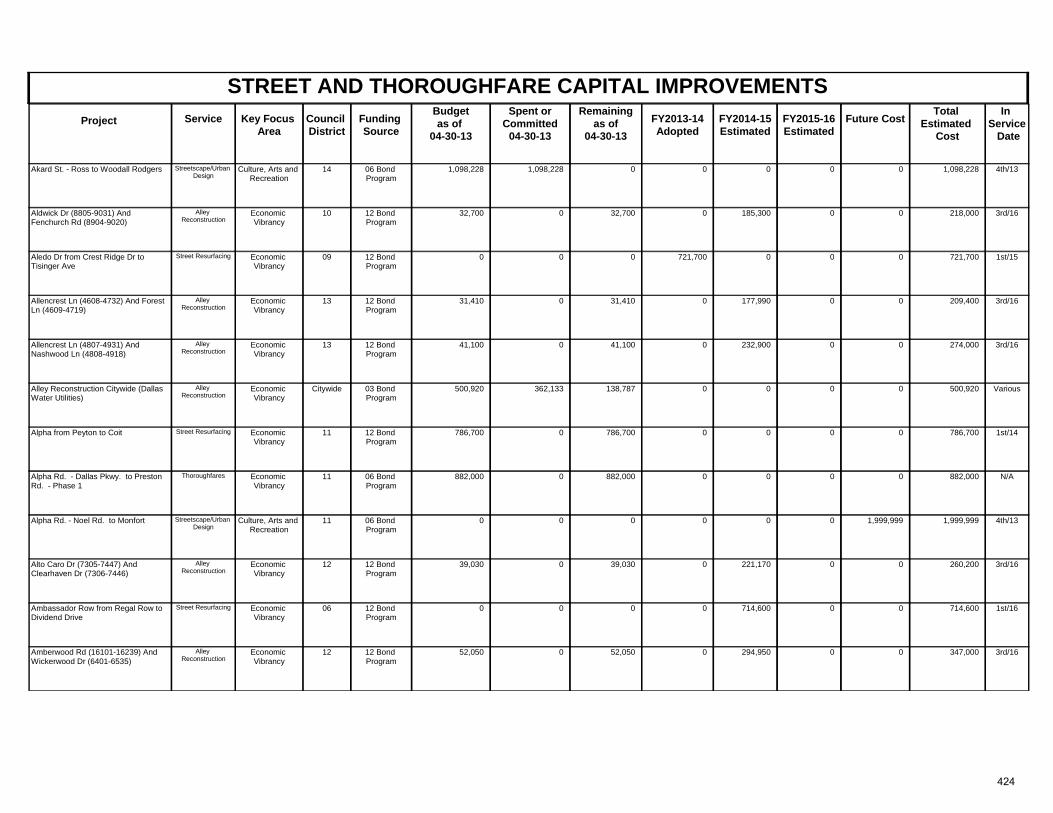
STREET AND THOROUGHFARE CAPITAL IMPROVEMENTSProject Key Focus
AreaCouncil District
Spent orCommitted
04-30-13
Total Estimated
Cost
In Service Date
Funding Source
Remainingas of
04-30-13 FY2013-14
AdoptedFuture CostService FY2014-15
Estimated FY2015-16 Estimated
Budgetas of
04-30-13
Culture, Arts and Recreation
14 4th/1306 Bond Program
1,098,228 1,098,228 0 1,098,228Akard St. - Ross to Woodall Rodgers 0 0Streetscape/Urban Design
00
Economic Vibrancy
10 3rd/1612 Bond Program
32,700 0 32,700 218,000Aldwick Dr (8805-9031) And Fenchurch Rd (8904-9020)
0 0Alley Reconstruction
0185,300
Economic Vibrancy
09 1st/1512 Bond Program
0 0 0 721,700Aledo Dr from Crest Ridge Dr to Tisinger Ave
721,700 0Street Resurfacing 00
Economic Vibrancy
13 3rd/1612 Bond Program
31,410 0 31,410 209,400Allencrest Ln (4608-4732) And Forest Ln (4609-4719)
0 0Alley Reconstruction
0177,990
Economic Vibrancy
13 3rd/1612 Bond Program
41,100 0 41,100 274,000Allencrest Ln (4807-4931) And Nashwood Ln (4808-4918)
0 0Alley Reconstruction
0232,900
Economic Vibrancy
Citywide Various03 Bond Program
500,920 362,133 138,787 500,920Alley Reconstruction Citywide (Dallas Water Utilities)
0 0Alley Reconstruction
00
Economic Vibrancy
11 1st/1412 Bond Program
786,700 0 786,700 786,700Alpha from Peyton to Coit 0 0Street Resurfacing 00
Economic Vibrancy
11 N/A06 Bond Program
882,000 0 882,000 882,000Alpha Rd. - Dallas Pkwy. to Preston Rd. - Phase 1
0 0Thoroughfares 00
Culture, Arts and Recreation
11 4th/1306 Bond Program
0 0 0 1,999,999Alpha Rd. - Noel Rd. to Monfort 0 1,999,999Streetscape/Urban Design
00
Economic Vibrancy
12 3rd/1612 Bond Program
39,030 0 39,030 260,200Alto Caro Dr (7305-7447) And Clearhaven Dr (7306-7446)
0 0Alley Reconstruction
0221,170
Economic Vibrancy
06 1st/1612 Bond Program
0 0 0 714,600Ambassador Row from Regal Row to Dividend Drive
0 0Street Resurfacing 0714,600
Economic Vibrancy
12 3rd/1612 Bond Program
52,050 0 52,050 347,000Amberwood Rd (16101-16239) And Wickerwood Dr (6401-6535)
0 0Alley Reconstruction
0294,950
424
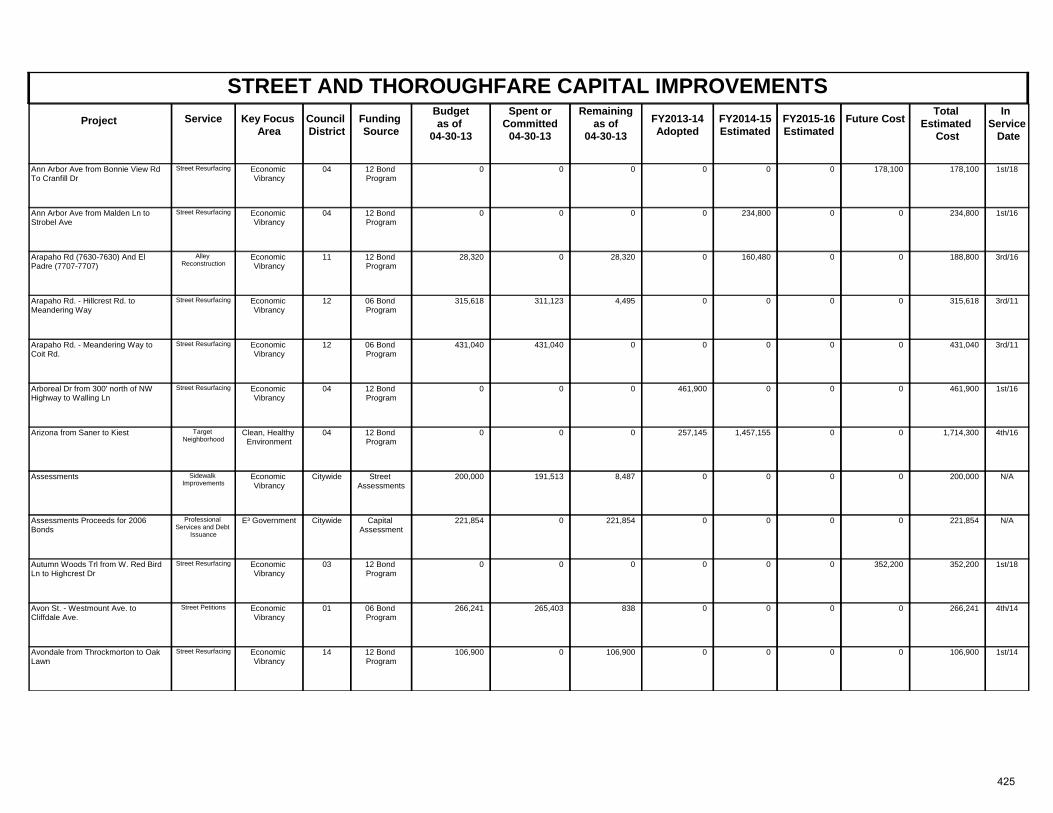
STREET AND THOROUGHFARE CAPITAL IMPROVEMENTSProject Key Focus
AreaCouncil District
Spent orCommitted
04-30-13
Total Estimated
Cost
In Service Date
Funding Source
Remainingas of
04-30-13 FY2013-14
AdoptedFuture CostService FY2014-15
Estimated FY2015-16 Estimated
Budgetas of
04-30-13
Economic Vibrancy
04 1st/1812 Bond Program
0 0 0 178,100Ann Arbor Ave from Bonnie View Rd To Cranfill Dr
0 178,100Street Resurfacing 00
Economic Vibrancy
04 1st/1612 Bond Program
0 0 0 234,800Ann Arbor Ave from Malden Ln to Strobel Ave
0 0Street Resurfacing 0234,800
Economic Vibrancy
11 3rd/1612 Bond Program
28,320 0 28,320 188,800Arapaho Rd (7630-7630) And El Padre (7707-7707)
0 0Alley Reconstruction
0160,480
Economic Vibrancy
12 3rd/1106 Bond Program
315,618 311,123 4,495 315,618Arapaho Rd. - Hillcrest Rd. to Meandering Way
0 0Street Resurfacing 00
Economic Vibrancy
12 3rd/1106 Bond Program
431,040 431,040 0 431,040Arapaho Rd. - Meandering Way to Coit Rd.
0 0Street Resurfacing 00
Economic Vibrancy
04 1st/1612 Bond Program
0 0 0 461,900Arboreal Dr from 300' north of NW Highway to Walling Ln
461,900 0Street Resurfacing 00
Clean, Healthy Environment
04 4th/1612 Bond Program
0 0 0 1,714,300Arizona from Saner to Kiest 257,145 0Target Neighborhood
01,457,155
Economic Vibrancy
Citywide N/AStreet Assessments
200,000 191,513 8,487 200,000Assessments 0 0Sidewalk Improvements
00
E³ Government Citywide N/ACapital Assessment
221,854 0 221,854 221,854Assessments Proceeds for 2006 Bonds
0 0Professional Services and Debt
Issuance
00
Economic Vibrancy
03 1st/1812 Bond Program
0 0 0 352,200Autumn Woods Trl from W. Red Bird Ln to Highcrest Dr
0 352,200Street Resurfacing 00
Economic Vibrancy
01 4th/1406 Bond Program
266,241 265,403 838 266,241Avon St. - Westmount Ave. to Cliffdale Ave.
0 0Street Petitions 00
Economic Vibrancy
14 1st/1412 Bond Program
106,900 0 106,900 106,900Avondale from Throckmorton to Oak Lawn
0 0Street Resurfacing 00
425
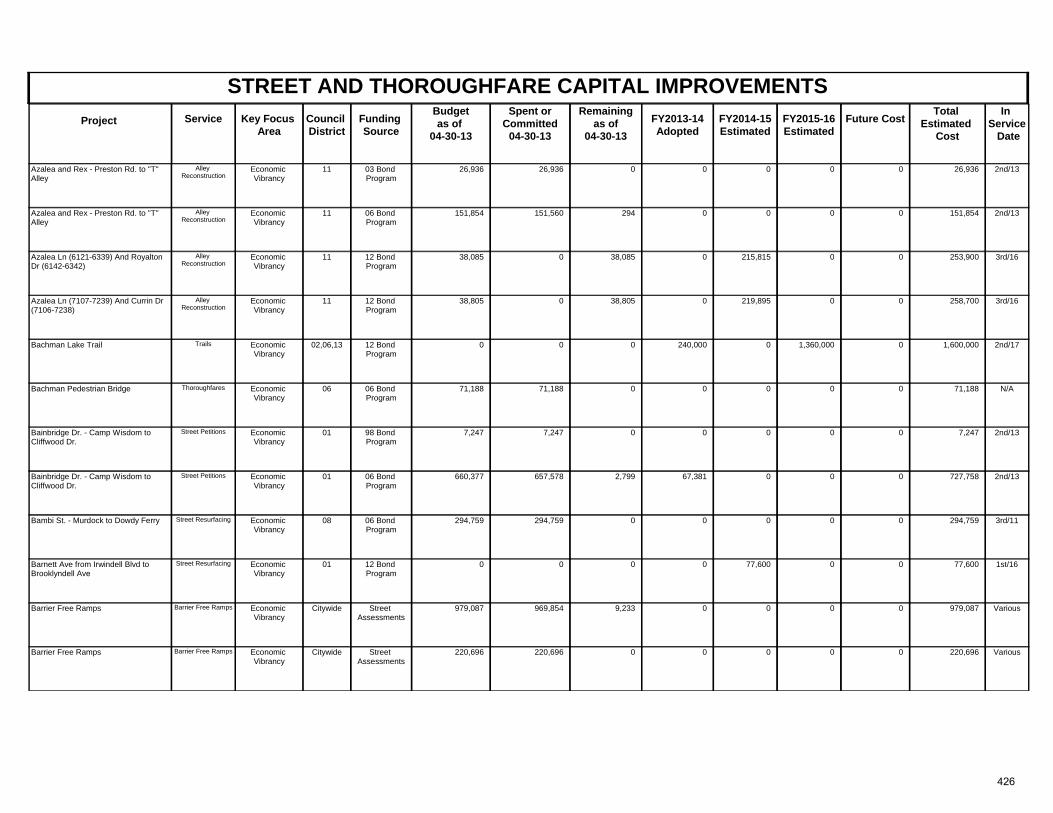
STREET AND THOROUGHFARE CAPITAL IMPROVEMENTSProject Key Focus
AreaCouncil District
Spent orCommitted
04-30-13
Total Estimated
Cost
In Service Date
Funding Source
Remainingas of
04-30-13 FY2013-14
AdoptedFuture CostService FY2014-15
Estimated FY2015-16 Estimated
Budgetas of
04-30-13
Economic Vibrancy
11 2nd/1303 Bond Program
26,936 26,936 0 26,936Azalea and Rex - Preston Rd. to "T" Alley
0 0Alley Reconstruction
00
Economic Vibrancy
11 2nd/1306 Bond Program
151,854 151,560 294 151,854Azalea and Rex - Preston Rd. to "T" Alley
0 0Alley Reconstruction
00
Economic Vibrancy
11 3rd/1612 Bond Program
38,085 0 38,085 253,900Azalea Ln (6121-6339) And Royalton Dr (6142-6342)
0 0Alley Reconstruction
0215,815
Economic Vibrancy
11 3rd/1612 Bond Program
38,805 0 38,805 258,700Azalea Ln (7107-7239) And Currin Dr (7106-7238)
0 0Alley Reconstruction
0219,895
Economic Vibrancy
02,06,13 2nd/1712 Bond Program
0 0 0 1,600,000Bachman Lake Trail 240,000 0Trails 1,360,0000
Economic Vibrancy
06 N/A06 Bond Program
71,188 71,188 0 71,188Bachman Pedestrian Bridge 0 0Thoroughfares 00
Economic Vibrancy
01 2nd/1398 Bond Program
7,247 7,247 0 7,247Bainbridge Dr. - Camp Wisdom to Cliffwood Dr.
0 0Street Petitions 00
Economic Vibrancy
01 2nd/1306 Bond Program
660,377 657,578 2,799 727,758Bainbridge Dr. - Camp Wisdom to Cliffwood Dr.
67,381 0Street Petitions 00
Economic Vibrancy
08 3rd/1106 Bond Program
294,759 294,759 0 294,759Bambi St. - Murdock to Dowdy Ferry 0 0Street Resurfacing 00
Economic Vibrancy
01 1st/1612 Bond Program
0 0 0 77,600Barnett Ave from Irwindell Blvd to Brooklyndell Ave
0 0Street Resurfacing 077,600
Economic Vibrancy
Citywide VariousStreet Assessments
979,087 969,854 9,233 979,087Barrier Free Ramps 0 0Barrier Free Ramps 00
Economic Vibrancy
Citywide VariousStreet Assessments
220,696 220,696 0 220,696Barrier Free Ramps 0 0Barrier Free Ramps 00
426
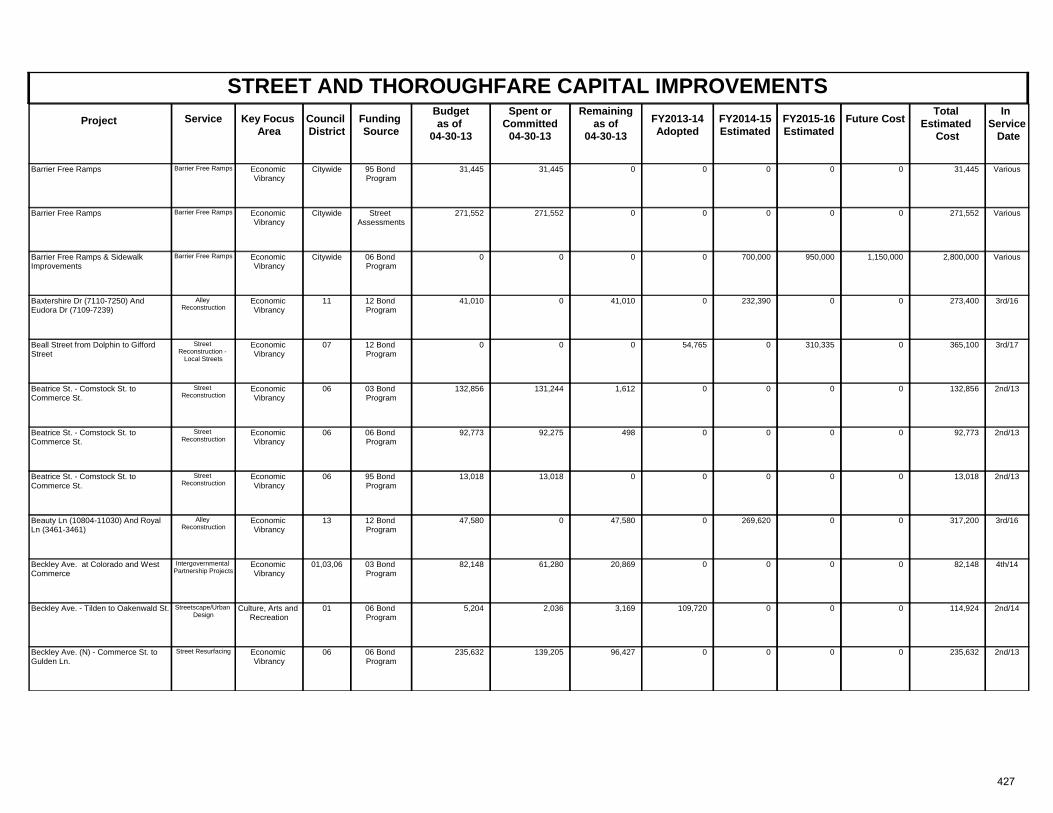
STREET AND THOROUGHFARE CAPITAL IMPROVEMENTSProject Key Focus
AreaCouncil District
Spent orCommitted
04-30-13
Total Estimated
Cost
In Service Date
Funding Source
Remainingas of
04-30-13 FY2013-14
AdoptedFuture CostService FY2014-15
Estimated FY2015-16 Estimated
Budgetas of
04-30-13
Economic Vibrancy
Citywide Various95 Bond Program
31,445 31,445 0 31,445Barrier Free Ramps 0 0Barrier Free Ramps 00
Economic Vibrancy
Citywide VariousStreet Assessments
271,552 271,552 0 271,552Barrier Free Ramps 0 0Barrier Free Ramps 00
Economic Vibrancy
Citywide Various06 Bond Program
0 0 0 2,800,000Barrier Free Ramps & Sidewalk Improvements
0 1,150,000Barrier Free Ramps 950,000700,000
Economic Vibrancy
11 3rd/1612 Bond Program
41,010 0 41,010 273,400Baxtershire Dr (7110-7250) And Eudora Dr (7109-7239)
0 0Alley Reconstruction
0232,390
Economic Vibrancy
07 3rd/1712 Bond Program
0 0 0 365,100Beall Street from Dolphin to Gifford Street
54,765 0Street Reconstruction -
Local Streets
310,3350
Economic Vibrancy
06 2nd/1303 Bond Program
132,856 131,244 1,612 132,856Beatrice St. - Comstock St. to Commerce St.
0 0Street Reconstruction
00
Economic Vibrancy
06 2nd/1306 Bond Program
92,773 92,275 498 92,773Beatrice St. - Comstock St. to Commerce St.
0 0Street Reconstruction
00
Economic Vibrancy
06 2nd/1395 Bond Program
13,018 13,018 0 13,018Beatrice St. - Comstock St. to Commerce St.
0 0Street Reconstruction
00
Economic Vibrancy
13 3rd/1612 Bond Program
47,580 0 47,580 317,200Beauty Ln (10804-11030) And Royal Ln (3461-3461)
0 0Alley Reconstruction
0269,620
Economic Vibrancy
01,03,06 4th/1403 Bond Program
82,148 61,280 20,869 82,148Beckley Ave. at Colorado and West Commerce
0 0Intergovernmental Partnership Projects
00
Culture, Arts and Recreation
01 2nd/1406 Bond Program
5,204 2,036 3,169 114,924Beckley Ave. - Tilden to Oakenwald St. 109,720 0Streetscape/Urban Design
00
Economic Vibrancy
06 2nd/1306 Bond Program
235,632 139,205 96,427 235,632Beckley Ave. (N) - Commerce St. to Gulden Ln.
0 0Street Resurfacing 00
427

STREET AND THOROUGHFARE CAPITAL IMPROVEMENTSProject Key Focus
AreaCouncil District
Spent orCommitted
04-30-13
Total Estimated
Cost
In Service Date
Funding Source
Remainingas of
04-30-13 FY2013-14
AdoptedFuture CostService FY2014-15
Estimated FY2015-16 Estimated
Budgetas of
04-30-13
Economic Vibrancy
01, 03, 06 4th/1206 Bond Program
0 0 0 1,428,000Beckley Ave. at Colorado and W. Commerce
1,428,000 0Street Improvements
00
Economic Vibrancy
07 1st/1612 Bond Program
0 0 0 257,000Belgrade Ave from Lawnview Ave to Bisbee Dr
0 0Street Resurfacing 0257,000
Economic Vibrancy
04 1st/1612 Bond Program
0 0 0 249,200Belknap Ave from Illinois Ave to Sutter St
0 0Street Resurfacing 0249,200
Economic Vibrancy
02 4th/1306 Bond Program
148,875 87,241 61,634 1,000,000Belleview - Akard to Ervay 851,125 0Thoroughfares 00
Economic Vibrancy
11 2nd/1106 Bond Program
74,792 74,792 0 127,503Bent Branch Ln. - Firelog Ln. to Flickering Shadow Dr.
52,711 0Street Resurfacing 00
Economic Vibrancy
01 2nd/1303 Bond Program
34,536 34,536 0 34,536Berkley and Newport - Waverly to Rugged
0 0Alley Reconstruction
00
Economic Vibrancy
01 2nd/1306 Bond Program
115,056 114,055 1,001 115,056Berkley and Newport - Waverly to Rugged
0 0Alley Reconstruction
00
Economic Vibrancy
11 4th/1712 Bond Program
0 0 0 753,300Berry Trail from Preston Rd to Copperhill Dr
112,995 0Street Reconstruction -
Local Streets
640,3050
Economic Vibrancy
04 2nd/1306 Bond Program
1,714,135 1,608,502 105,633 1,714,135Bexar St. - Levee to Municipal 0 0Thoroughfares 00
Economic Vibrancy
07 2nd/1406 Bond Program
901,901 887,466 14,435 1,639,318Bexar St. - Brigham to Myrtle 737,417 0Thoroughfares 00
Economic Vibrancy
07 2nd/1498 Bond Program
17,872 17,872 0 17,872Bexar St. - Brigham to Myrtle 0 0Thoroughfares 00
Culture, Arts and Recreation
07 4th/1303 Bond Program
3,258,764 3,057,743 201,021 3,258,764Bexar St. Corridor- US 175 to Rochester
0 0Streetscape/Urban Design
00
428
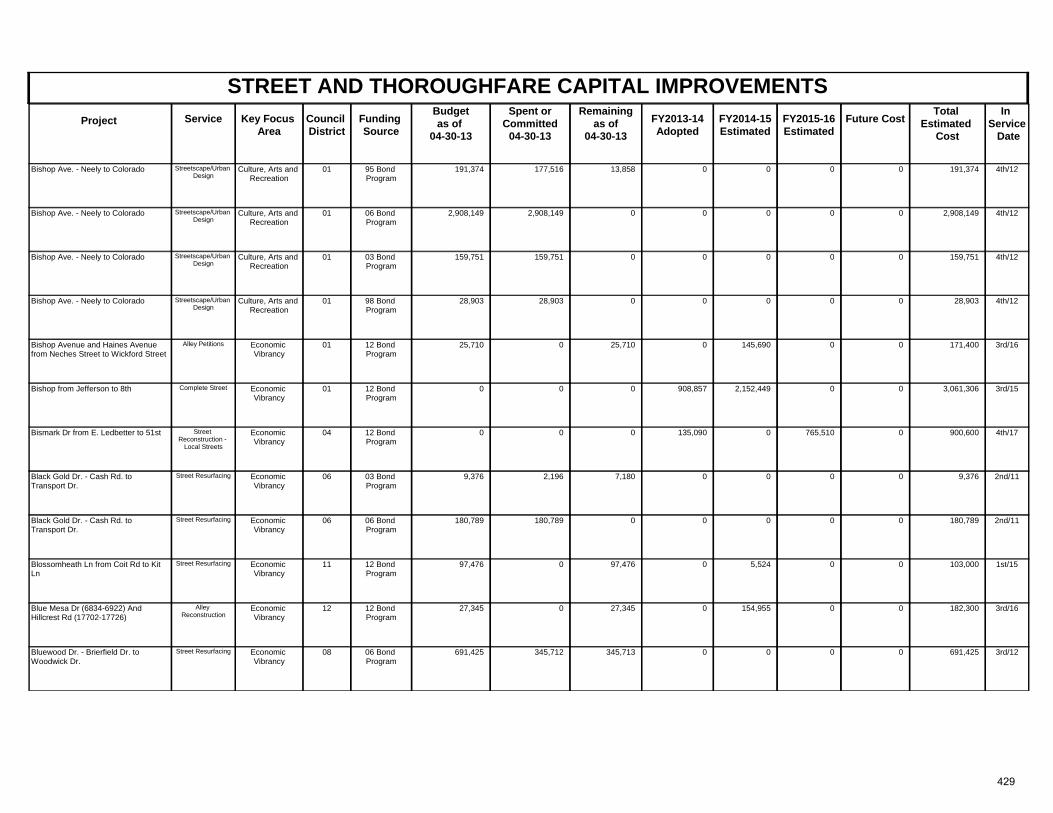
STREET AND THOROUGHFARE CAPITAL IMPROVEMENTSProject Key Focus
AreaCouncil District
Spent orCommitted
04-30-13
Total Estimated
Cost
In Service Date
Funding Source
Remainingas of
04-30-13 FY2013-14
AdoptedFuture CostService FY2014-15
Estimated FY2015-16 Estimated
Budgetas of
04-30-13
Culture, Arts and Recreation
01 4th/1295 Bond Program
191,374 177,516 13,858 191,374Bishop Ave. - Neely to Colorado 0 0Streetscape/Urban Design
00
Culture, Arts and Recreation
01 4th/1206 Bond Program
2,908,149 2,908,149 0 2,908,149Bishop Ave. - Neely to Colorado 0 0Streetscape/Urban Design
00
Culture, Arts and Recreation
01 4th/1203 Bond Program
159,751 159,751 0 159,751Bishop Ave. - Neely to Colorado 0 0Streetscape/Urban Design
00
Culture, Arts and Recreation
01 4th/1298 Bond Program
28,903 28,903 0 28,903Bishop Ave. - Neely to Colorado 0 0Streetscape/Urban Design
00
Economic Vibrancy
01 3rd/1612 Bond Program
25,710 0 25,710 171,400Bishop Avenue and Haines Avenue from Neches Street to Wickford Street
0 0Alley Petitions 0145,690
Economic Vibrancy
01 3rd/1512 Bond Program
0 0 0 3,061,306Bishop from Jefferson to 8th 908,857 0Complete Street 02,152,449
Economic Vibrancy
04 4th/1712 Bond Program
0 0 0 900,600Bismark Dr from E. Ledbetter to 51st 135,090 0Street Reconstruction -
Local Streets
765,5100
Economic Vibrancy
06 2nd/1103 Bond Program
9,376 2,196 7,180 9,376Black Gold Dr. - Cash Rd. to Transport Dr.
0 0Street Resurfacing 00
Economic Vibrancy
06 2nd/1106 Bond Program
180,789 180,789 0 180,789Black Gold Dr. - Cash Rd. to Transport Dr.
0 0Street Resurfacing 00
Economic Vibrancy
11 1st/1512 Bond Program
97,476 0 97,476 103,000Blossomheath Ln from Coit Rd to Kit Ln
0 0Street Resurfacing 05,524
Economic Vibrancy
12 3rd/1612 Bond Program
27,345 0 27,345 182,300Blue Mesa Dr (6834-6922) And Hillcrest Rd (17702-17726)
0 0Alley Reconstruction
0154,955
Economic Vibrancy
08 3rd/1206 Bond Program
691,425 345,712 345,713 691,425Bluewood Dr. - Brierfield Dr. to Woodwick Dr.
0 0Street Resurfacing 00
429
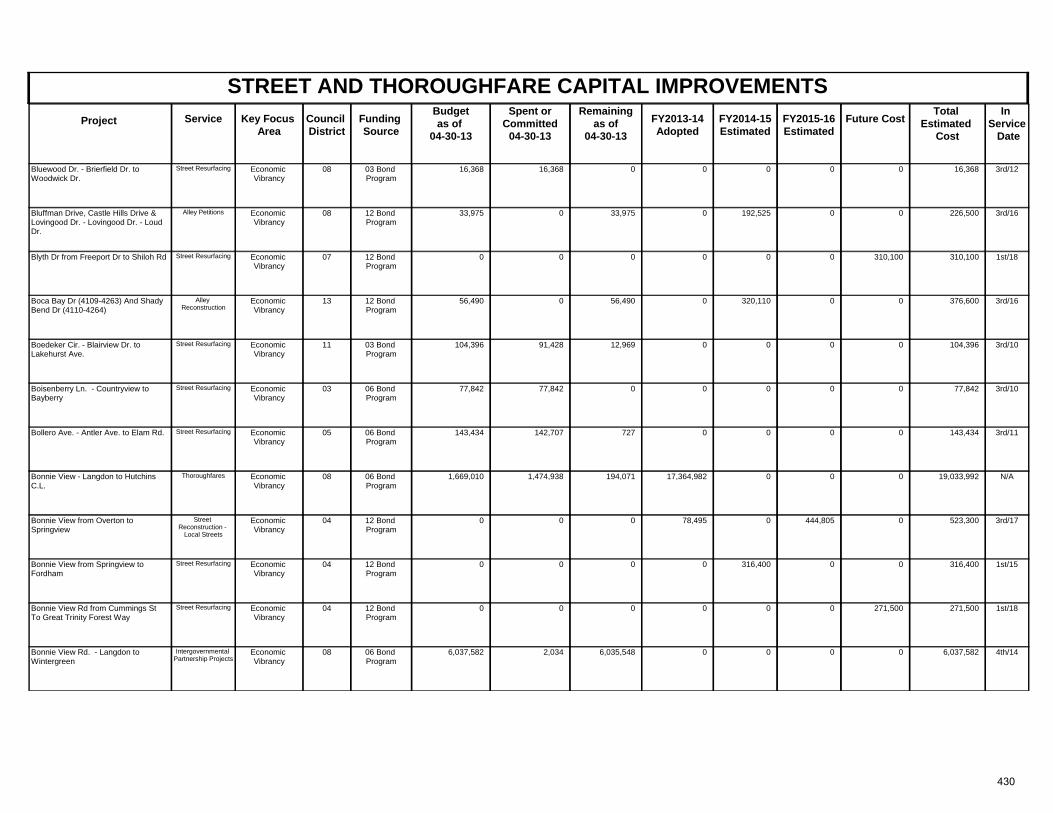
STREET AND THOROUGHFARE CAPITAL IMPROVEMENTSProject Key Focus
AreaCouncil District
Spent orCommitted
04-30-13
Total Estimated
Cost
In Service Date
Funding Source
Remainingas of
04-30-13 FY2013-14
AdoptedFuture CostService FY2014-15
Estimated FY2015-16 Estimated
Budgetas of
04-30-13
Economic Vibrancy
08 3rd/1203 Bond Program
16,368 16,368 0 16,368Bluewood Dr. - Brierfield Dr. to Woodwick Dr.
0 0Street Resurfacing 00
Economic Vibrancy
08 3rd/1612 Bond Program
33,975 0 33,975 226,500Bluffman Drive, Castle Hills Drive & Lovingood Dr. - Lovingood Dr. - Loud Dr.
0 0Alley Petitions 0192,525
Economic Vibrancy
07 1st/1812 Bond Program
0 0 0 310,100Blyth Dr from Freeport Dr to Shiloh Rd 0 310,100Street Resurfacing 00
Economic Vibrancy
13 3rd/1612 Bond Program
56,490 0 56,490 376,600Boca Bay Dr (4109-4263) And Shady Bend Dr (4110-4264)
0 0Alley Reconstruction
0320,110
Economic Vibrancy
11 3rd/1003 Bond Program
104,396 91,428 12,969 104,396Boedeker Cir. - Blairview Dr. to Lakehurst Ave.
0 0Street Resurfacing 00
Economic Vibrancy
03 3rd/1006 Bond Program
77,842 77,842 0 77,842Boisenberry Ln. - Countryview to Bayberry
0 0Street Resurfacing 00
Economic Vibrancy
05 3rd/1106 Bond Program
143,434 142,707 727 143,434Bollero Ave. - Antler Ave. to Elam Rd. 0 0Street Resurfacing 00
Economic Vibrancy
08 N/A06 Bond Program
1,669,010 1,474,938 194,071 19,033,992Bonnie View - Langdon to Hutchins C.L.
17,364,982 0Thoroughfares 00
Economic Vibrancy
04 3rd/1712 Bond Program
0 0 0 523,300Bonnie View from Overton to Springview
78,495 0Street Reconstruction -
Local Streets
444,8050
Economic Vibrancy
04 1st/1512 Bond Program
0 0 0 316,400Bonnie View from Springview to Fordham
0 0Street Resurfacing 0316,400
Economic Vibrancy
04 1st/1812 Bond Program
0 0 0 271,500Bonnie View Rd from Cummings St To Great Trinity Forest Way
0 271,500Street Resurfacing 00
Economic Vibrancy
08 4th/1406 Bond Program
6,037,582 2,034 6,035,548 6,037,582Bonnie View Rd. - Langdon to Wintergreen
0 0Intergovernmental Partnership Projects
00
430
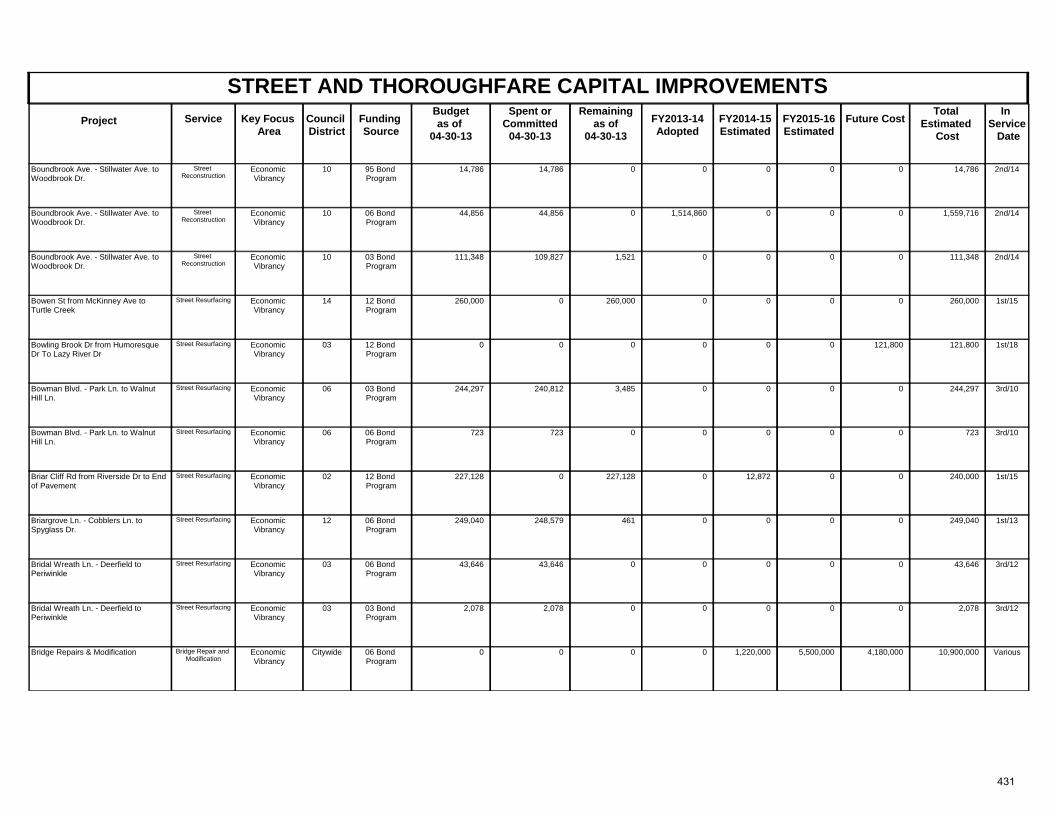
STREET AND THOROUGHFARE CAPITAL IMPROVEMENTSProject Key Focus
AreaCouncil District
Spent orCommitted
04-30-13
Total Estimated
Cost
In Service Date
Funding Source
Remainingas of
04-30-13 FY2013-14
AdoptedFuture CostService FY2014-15
Estimated FY2015-16 Estimated
Budgetas of
04-30-13
Economic Vibrancy
10 2nd/1495 Bond Program
14,786 14,786 0 14,786Boundbrook Ave. - Stillwater Ave. to Woodbrook Dr.
0 0Street Reconstruction
00
Economic Vibrancy
10 2nd/1406 Bond Program
44,856 44,856 0 1,559,716Boundbrook Ave. - Stillwater Ave. to Woodbrook Dr.
1,514,860 0Street Reconstruction
00
Economic Vibrancy
10 2nd/1403 Bond Program
111,348 109,827 1,521 111,348Boundbrook Ave. - Stillwater Ave. to Woodbrook Dr.
0 0Street Reconstruction
00
Economic Vibrancy
14 1st/1512 Bond Program
260,000 0 260,000 260,000Bowen St from McKinney Ave to Turtle Creek
0 0Street Resurfacing 00
Economic Vibrancy
03 1st/1812 Bond Program
0 0 0 121,800Bowling Brook Dr from Humoresque Dr To Lazy River Dr
0 121,800Street Resurfacing 00
Economic Vibrancy
06 3rd/1003 Bond Program
244,297 240,812 3,485 244,297Bowman Blvd. - Park Ln. to Walnut Hill Ln.
0 0Street Resurfacing 00
Economic Vibrancy
06 3rd/1006 Bond Program
723 723 0 723Bowman Blvd. - Park Ln. to Walnut Hill Ln.
0 0Street Resurfacing 00
Economic Vibrancy
02 1st/1512 Bond Program
227,128 0 227,128 240,000Briar Cliff Rd from Riverside Dr to End of Pavement
0 0Street Resurfacing 012,872
Economic Vibrancy
12 1st/1306 Bond Program
249,040 248,579 461 249,040Briargrove Ln. - Cobblers Ln. to Spyglass Dr.
0 0Street Resurfacing 00
Economic Vibrancy
03 3rd/1206 Bond Program
43,646 43,646 0 43,646Bridal Wreath Ln. - Deerfield to Periwinkle
0 0Street Resurfacing 00
Economic Vibrancy
03 3rd/1203 Bond Program
2,078 2,078 0 2,078Bridal Wreath Ln. - Deerfield to Periwinkle
0 0Street Resurfacing 00
Economic Vibrancy
Citywide Various06 Bond Program
0 0 0 10,900,000Bridge Repairs & Modification 0 4,180,000Bridge Repair and Modification
5,500,0001,220,000
431
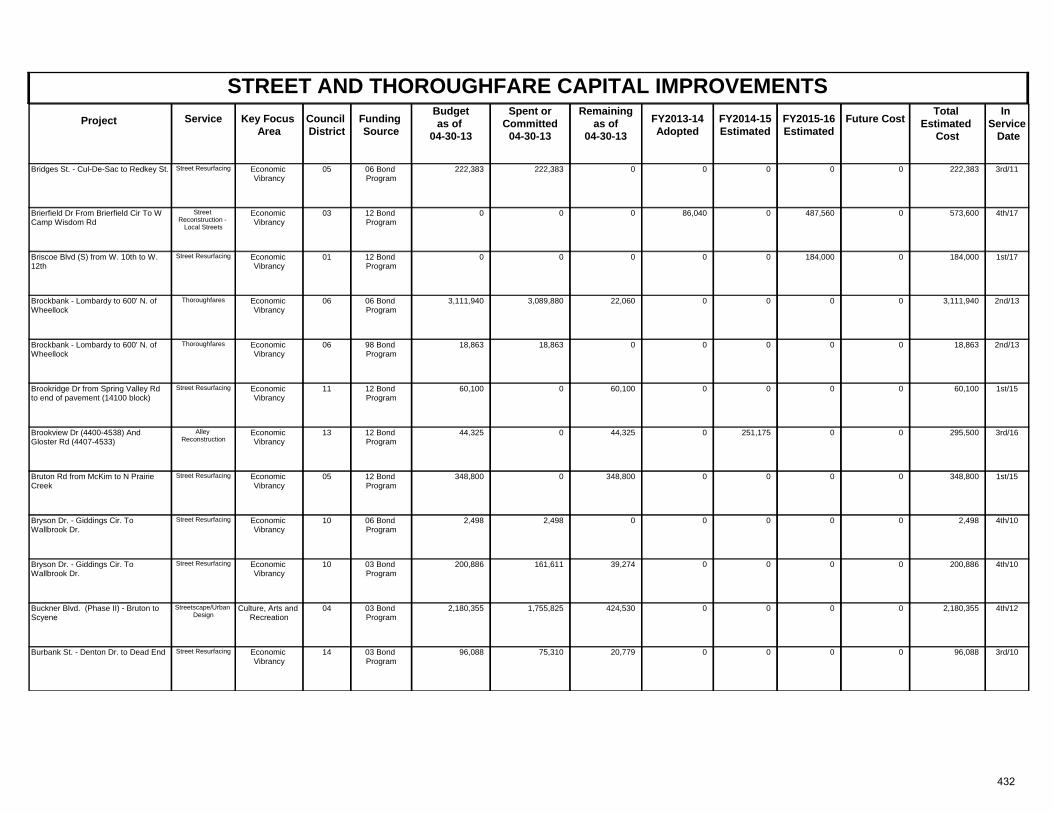
STREET AND THOROUGHFARE CAPITAL IMPROVEMENTSProject Key Focus
AreaCouncil District
Spent orCommitted
04-30-13
Total Estimated
Cost
In Service Date
Funding Source
Remainingas of
04-30-13 FY2013-14
AdoptedFuture CostService FY2014-15
Estimated FY2015-16 Estimated
Budgetas of
04-30-13
Economic Vibrancy
05 3rd/1106 Bond Program
222,383 222,383 0 222,383Bridges St. - Cul-De-Sac to Redkey St. 0 0Street Resurfacing 00
Economic Vibrancy
03 4th/1712 Bond Program
0 0 0 573,600Brierfield Dr From Brierfield Cir To W Camp Wisdom Rd
86,040 0Street Reconstruction -
Local Streets
487,5600
Economic Vibrancy
01 1st/1712 Bond Program
0 0 0 184,000Briscoe Blvd (S) from W. 10th to W. 12th
0 0Street Resurfacing 184,0000
Economic Vibrancy
06 2nd/1306 Bond Program
3,111,940 3,089,880 22,060 3,111,940Brockbank - Lombardy to 600' N. of Wheellock
0 0Thoroughfares 00
Economic Vibrancy
06 2nd/1398 Bond Program
18,863 18,863 0 18,863Brockbank - Lombardy to 600' N. of Wheellock
0 0Thoroughfares 00
Economic Vibrancy
11 1st/1512 Bond Program
60,100 0 60,100 60,100Brookridge Dr from Spring Valley Rd to end of pavement (14100 block)
0 0Street Resurfacing 00
Economic Vibrancy
13 3rd/1612 Bond Program
44,325 0 44,325 295,500Brookview Dr (4400-4538) And Gloster Rd (4407-4533)
0 0Alley Reconstruction
0251,175
Economic Vibrancy
05 1st/1512 Bond Program
348,800 0 348,800 348,800Bruton Rd from McKim to N Prairie Creek
0 0Street Resurfacing 00
Economic Vibrancy
10 4th/1006 Bond Program
2,498 2,498 0 2,498Bryson Dr. - Giddings Cir. To Wallbrook Dr.
0 0Street Resurfacing 00
Economic Vibrancy
10 4th/1003 Bond Program
200,886 161,611 39,274 200,886Bryson Dr. - Giddings Cir. To Wallbrook Dr.
0 0Street Resurfacing 00
Culture, Arts and Recreation
04 4th/1203 Bond Program
2,180,355 1,755,825 424,530 2,180,355Buckner Blvd. (Phase II) - Bruton to Scyene
0 0Streetscape/Urban Design
00
Economic Vibrancy
14 3rd/1003 Bond Program
96,088 75,310 20,779 96,088Burbank St. - Denton Dr. to Dead End 0 0Street Resurfacing 00
432
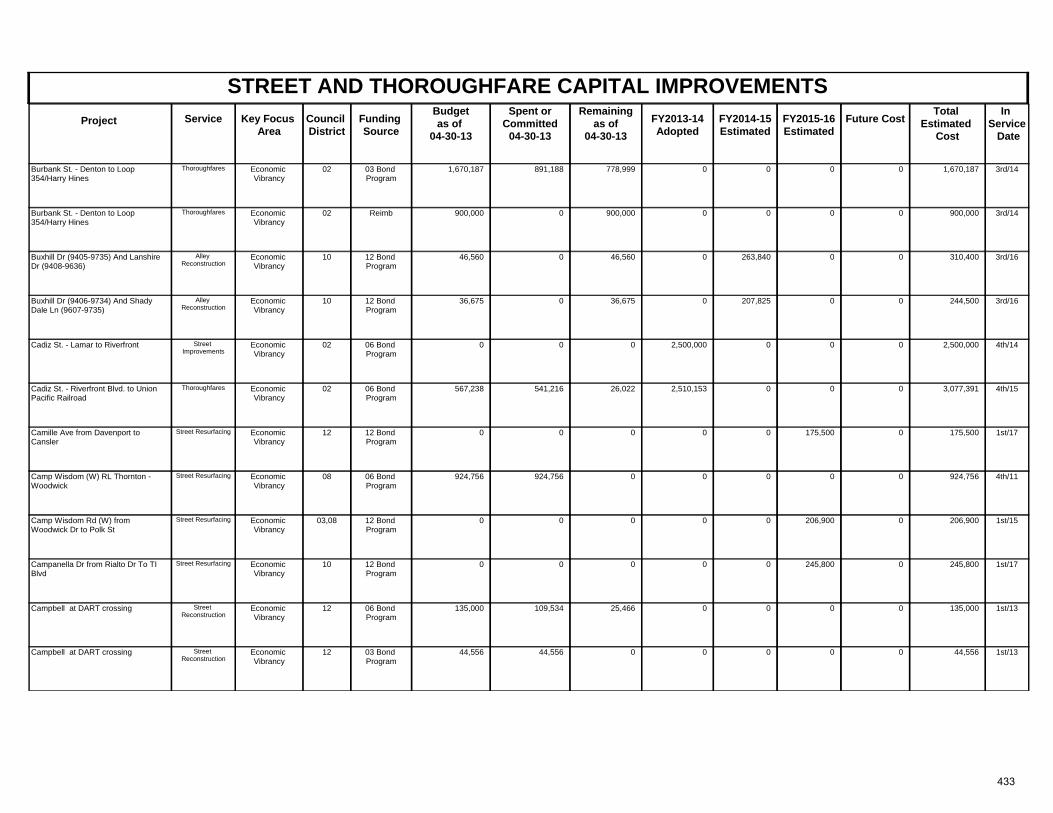
STREET AND THOROUGHFARE CAPITAL IMPROVEMENTSProject Key Focus
AreaCouncil District
Spent orCommitted
04-30-13
Total Estimated
Cost
In Service Date
Funding Source
Remainingas of
04-30-13 FY2013-14
AdoptedFuture CostService FY2014-15
Estimated FY2015-16 Estimated
Budgetas of
04-30-13
Economic Vibrancy
02 3rd/1403 Bond Program
1,670,187 891,188 778,999 1,670,187Burbank St. - Denton to Loop 354/Harry Hines
0 0Thoroughfares 00
Economic Vibrancy
02 3rd/14Reimb 900,000 0 900,000 900,000Burbank St. - Denton to Loop 354/Harry Hines
0 0Thoroughfares 00
Economic Vibrancy
10 3rd/1612 Bond Program
46,560 0 46,560 310,400Buxhill Dr (9405-9735) And Lanshire Dr (9408-9636)
0 0Alley Reconstruction
0263,840
Economic Vibrancy
10 3rd/1612 Bond Program
36,675 0 36,675 244,500Buxhill Dr (9406-9734) And Shady Dale Ln (9607-9735)
0 0Alley Reconstruction
0207,825
Economic Vibrancy
02 4th/1406 Bond Program
0 0 0 2,500,000Cadiz St. - Lamar to Riverfront 2,500,000 0Street Improvements
00
Economic Vibrancy
02 4th/1506 Bond Program
567,238 541,216 26,022 3,077,391Cadiz St. - Riverfront Blvd. to Union Pacific Railroad
2,510,153 0Thoroughfares 00
Economic Vibrancy
12 1st/1712 Bond Program
0 0 0 175,500Camille Ave from Davenport to Cansler
0 0Street Resurfacing 175,5000
Economic Vibrancy
08 4th/1106 Bond Program
924,756 924,756 0 924,756Camp Wisdom (W) RL Thornton - Woodwick
0 0Street Resurfacing 00
Economic Vibrancy
03,08 1st/1512 Bond Program
0 0 0 206,900Camp Wisdom Rd (W) from Woodwick Dr to Polk St
0 0Street Resurfacing 206,9000
Economic Vibrancy
10 1st/1712 Bond Program
0 0 0 245,800Campanella Dr from Rialto Dr To TI Blvd
0 0Street Resurfacing 245,8000
Economic Vibrancy
12 1st/1306 Bond Program
135,000 109,534 25,466 135,000Campbell at DART crossing 0 0Street Reconstruction
00
Economic Vibrancy
12 1st/1303 Bond Program
44,556 44,556 0 44,556Campbell at DART crossing 0 0Street Reconstruction
00
433
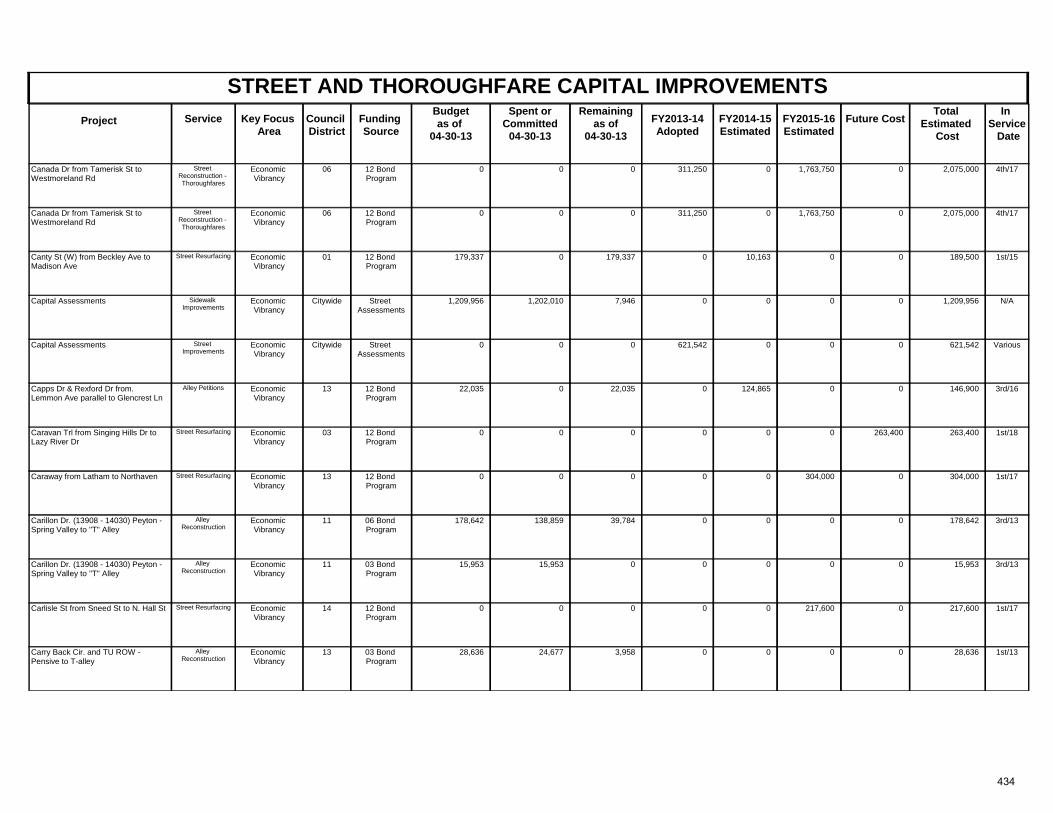
STREET AND THOROUGHFARE CAPITAL IMPROVEMENTSProject Key Focus
AreaCouncil District
Spent orCommitted
04-30-13
Total Estimated
Cost
In Service Date
Funding Source
Remainingas of
04-30-13 FY2013-14
AdoptedFuture CostService FY2014-15
Estimated FY2015-16 Estimated
Budgetas of
04-30-13
Economic Vibrancy
06 4th/1712 Bond Program
0 0 0 2,075,000Canada Dr from Tamerisk St to Westmoreland Rd
311,250 0Street Reconstruction - Thoroughfares
1,763,7500
Economic Vibrancy
06 4th/1712 Bond Program
0 0 0 2,075,000Canada Dr from Tamerisk St to Westmoreland Rd
311,250 0Street Reconstruction - Thoroughfares
1,763,7500
Economic Vibrancy
01 1st/1512 Bond Program
179,337 0 179,337 189,500Canty St (W) from Beckley Ave to Madison Ave
0 0Street Resurfacing 010,163
Economic Vibrancy
Citywide N/AStreet Assessments
1,209,956 1,202,010 7,946 1,209,956Capital Assessments 0 0Sidewalk Improvements
00
Economic Vibrancy
Citywide VariousStreet Assessments
0 0 0 621,542Capital Assessments 621,542 0Street Improvements
00
Economic Vibrancy
13 3rd/1612 Bond Program
22,035 0 22,035 146,900Capps Dr & Rexford Dr from. Lemmon Ave parallel to Glencrest Ln
0 0Alley Petitions 0124,865
Economic Vibrancy
03 1st/1812 Bond Program
0 0 0 263,400Caravan Trl from Singing Hills Dr to Lazy River Dr
0 263,400Street Resurfacing 00
Economic Vibrancy
13 1st/1712 Bond Program
0 0 0 304,000Caraway from Latham to Northaven 0 0Street Resurfacing 304,0000
Economic Vibrancy
11 3rd/1306 Bond Program
178,642 138,859 39,784 178,642Carillon Dr. (13908 - 14030) Peyton - Spring Valley to "T" Alley
0 0Alley Reconstruction
00
Economic Vibrancy
11 3rd/1303 Bond Program
15,953 15,953 0 15,953Carillon Dr. (13908 - 14030) Peyton - Spring Valley to "T" Alley
0 0Alley Reconstruction
00
Economic Vibrancy
14 1st/1712 Bond Program
0 0 0 217,600Carlisle St from Sneed St to N. Hall St 0 0Street Resurfacing 217,6000
Economic Vibrancy
13 1st/1303 Bond Program
28,636 24,677 3,958 28,636Carry Back Cir. and TU ROW - Pensive to T-alley
0 0Alley Reconstruction
00
434
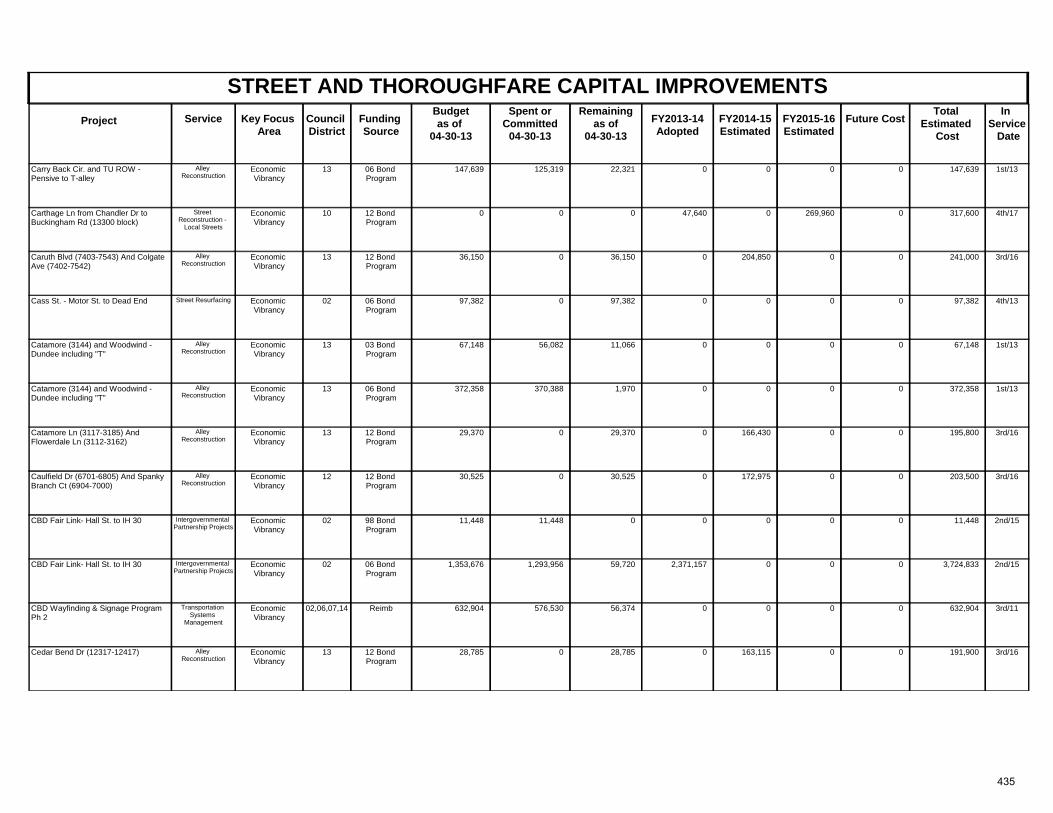
STREET AND THOROUGHFARE CAPITAL IMPROVEMENTSProject Key Focus
AreaCouncil District
Spent orCommitted
04-30-13
Total Estimated
Cost
In Service Date
Funding Source
Remainingas of
04-30-13 FY2013-14
AdoptedFuture CostService FY2014-15
Estimated FY2015-16 Estimated
Budgetas of
04-30-13
Economic Vibrancy
13 1st/1306 Bond Program
147,639 125,319 22,321 147,639Carry Back Cir. and TU ROW - Pensive to T-alley
0 0Alley Reconstruction
00
Economic Vibrancy
10 4th/1712 Bond Program
0 0 0 317,600Carthage Ln from Chandler Dr to Buckingham Rd (13300 block)
47,640 0Street Reconstruction -
Local Streets
269,9600
Economic Vibrancy
13 3rd/1612 Bond Program
36,150 0 36,150 241,000Caruth Blvd (7403-7543) And Colgate Ave (7402-7542)
0 0Alley Reconstruction
0204,850
Economic Vibrancy
02 4th/1306 Bond Program
97,382 0 97,382 97,382Cass St. - Motor St. to Dead End 0 0Street Resurfacing 00
Economic Vibrancy
13 1st/1303 Bond Program
67,148 56,082 11,066 67,148Catamore (3144) and Woodwind - Dundee including "T"
0 0Alley Reconstruction
00
Economic Vibrancy
13 1st/1306 Bond Program
372,358 370,388 1,970 372,358Catamore (3144) and Woodwind - Dundee including "T"
0 0Alley Reconstruction
00
Economic Vibrancy
13 3rd/1612 Bond Program
29,370 0 29,370 195,800Catamore Ln (3117-3185) And Flowerdale Ln (3112-3162)
0 0Alley Reconstruction
0166,430
Economic Vibrancy
12 3rd/1612 Bond Program
30,525 0 30,525 203,500Caulfield Dr (6701-6805) And Spanky Branch Ct (6904-7000)
0 0Alley Reconstruction
0172,975
Economic Vibrancy
02 2nd/1598 Bond Program
11,448 11,448 0 11,448CBD Fair Link- Hall St. to IH 30 0 0Intergovernmental Partnership Projects
00
Economic Vibrancy
02 2nd/1506 Bond Program
1,353,676 1,293,956 59,720 3,724,833CBD Fair Link- Hall St. to IH 30 2,371,157 0Intergovernmental Partnership Projects
00
Economic Vibrancy
02,06,07,14 3rd/11Reimb 632,904 576,530 56,374 632,904CBD Wayfinding & Signage Program Ph 2
0 0Transportation Systems
Management
00
Economic Vibrancy
13 3rd/1612 Bond Program
28,785 0 28,785 191,900Cedar Bend Dr (12317-12417) 0 0Alley Reconstruction
0163,115
435
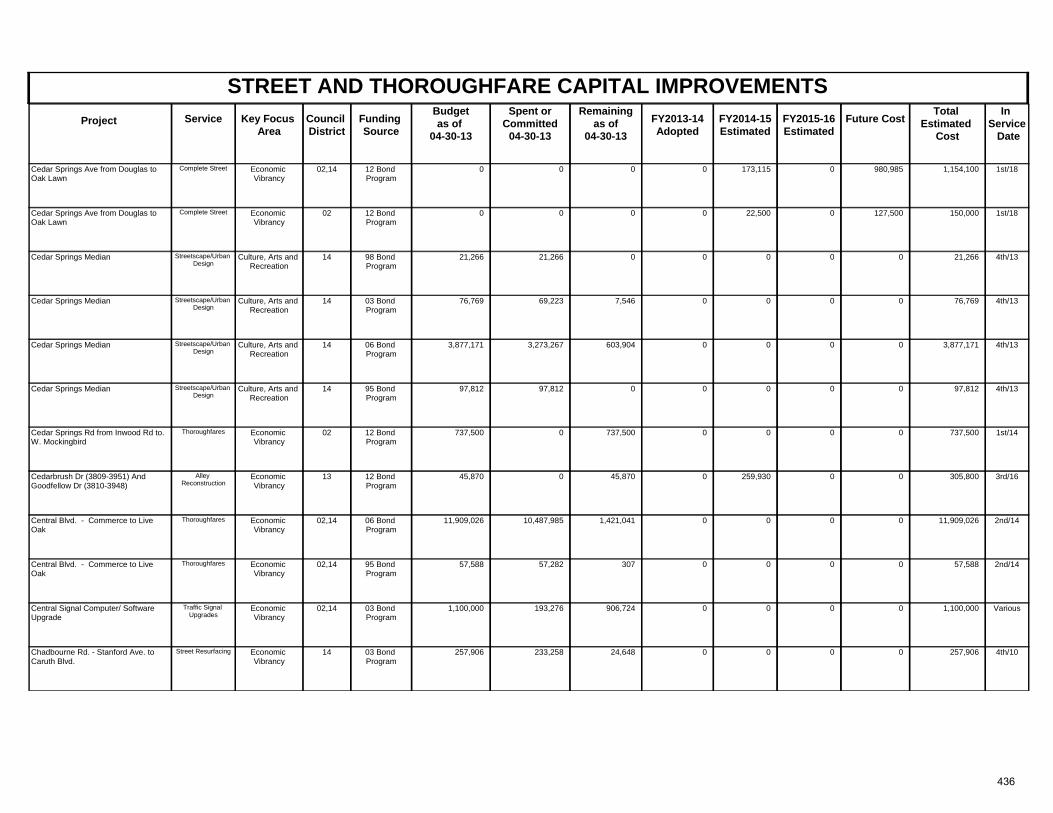
STREET AND THOROUGHFARE CAPITAL IMPROVEMENTSProject Key Focus
AreaCouncil District
Spent orCommitted
04-30-13
Total Estimated
Cost
In Service Date
Funding Source
Remainingas of
04-30-13 FY2013-14
AdoptedFuture CostService FY2014-15
Estimated FY2015-16 Estimated
Budgetas of
04-30-13
Economic Vibrancy
02,14 1st/1812 Bond Program
0 0 0 1,154,100Cedar Springs Ave from Douglas to Oak Lawn
0 980,985Complete Street 0173,115
Economic Vibrancy
02 1st/1812 Bond Program
0 0 0 150,000Cedar Springs Ave from Douglas to Oak Lawn
0 127,500Complete Street 022,500
Culture, Arts and Recreation
14 4th/1398 Bond Program
21,266 21,266 0 21,266Cedar Springs Median 0 0Streetscape/Urban Design
00
Culture, Arts and Recreation
14 4th/1303 Bond Program
76,769 69,223 7,546 76,769Cedar Springs Median 0 0Streetscape/Urban Design
00
Culture, Arts and Recreation
14 4th/1306 Bond Program
3,877,171 3,273,267 603,904 3,877,171Cedar Springs Median 0 0Streetscape/Urban Design
00
Culture, Arts and Recreation
14 4th/1395 Bond Program
97,812 97,812 0 97,812Cedar Springs Median 0 0Streetscape/Urban Design
00
Economic Vibrancy
02 1st/1412 Bond Program
737,500 0 737,500 737,500Cedar Springs Rd from Inwood Rd to. W. Mockingbird
0 0Thoroughfares 00
Economic Vibrancy
13 3rd/1612 Bond Program
45,870 0 45,870 305,800Cedarbrush Dr (3809-3951) And Goodfellow Dr (3810-3948)
0 0Alley Reconstruction
0259,930
Economic Vibrancy
02,14 2nd/1406 Bond Program
11,909,026 10,487,985 1,421,041 11,909,026Central Blvd. - Commerce to Live Oak
0 0Thoroughfares 00
Economic Vibrancy
02,14 2nd/1495 Bond Program
57,588 57,282 307 57,588Central Blvd. - Commerce to Live Oak
0 0Thoroughfares 00
Economic Vibrancy
02,14 Various03 Bond Program
1,100,000 193,276 906,724 1,100,000Central Signal Computer/ Software Upgrade
0 0Traffic Signal Upgrades
00
Economic Vibrancy
14 4th/1003 Bond Program
257,906 233,258 24,648 257,906Chadbourne Rd. - Stanford Ave. to Caruth Blvd.
0 0Street Resurfacing 00
436
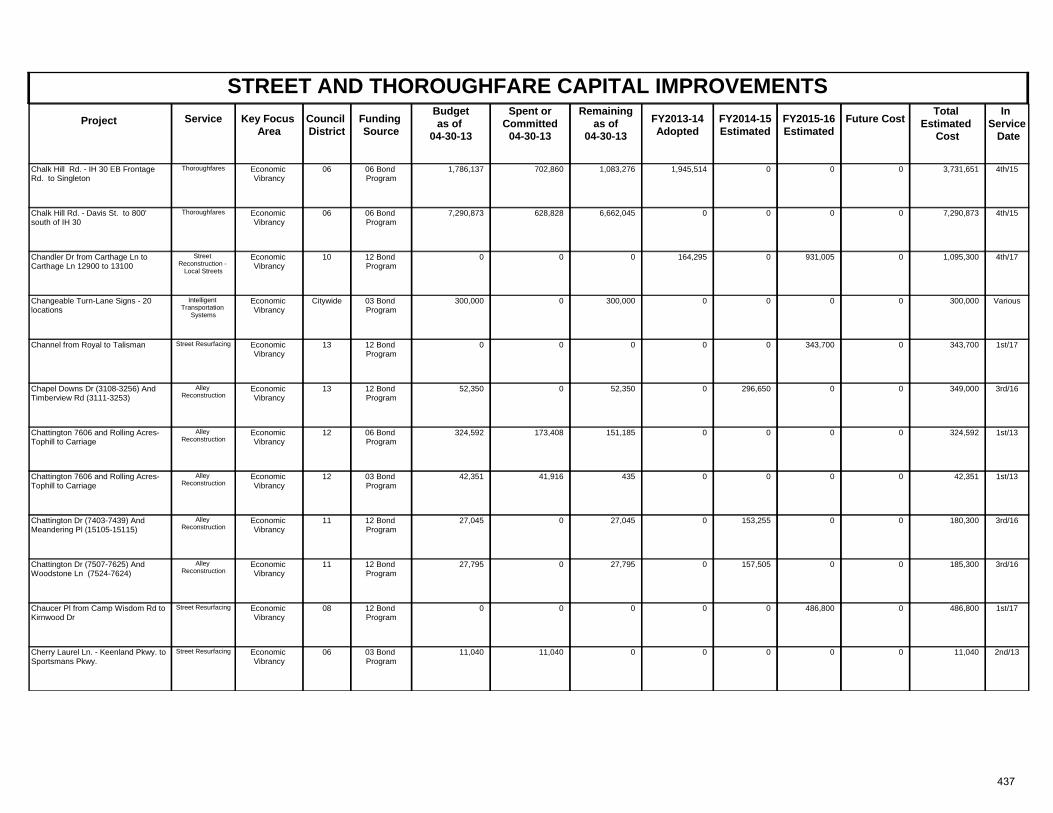
STREET AND THOROUGHFARE CAPITAL IMPROVEMENTSProject Key Focus
AreaCouncil District
Spent orCommitted
04-30-13
Total Estimated
Cost
In Service Date
Funding Source
Remainingas of
04-30-13 FY2013-14
AdoptedFuture CostService FY2014-15
Estimated FY2015-16 Estimated
Budgetas of
04-30-13
Economic Vibrancy
06 4th/1506 Bond Program
1,786,137 702,860 1,083,276 3,731,651Chalk Hill Rd. - IH 30 EB Frontage Rd. to Singleton
1,945,514 0Thoroughfares 00
Economic Vibrancy
06 4th/1506 Bond Program
7,290,873 628,828 6,662,045 7,290,873Chalk Hill Rd. - Davis St. to 800' south of IH 30
0 0Thoroughfares 00
Economic Vibrancy
10 4th/1712 Bond Program
0 0 0 1,095,300Chandler Dr from Carthage Ln to Carthage Ln 12900 to 13100
164,295 0Street Reconstruction -
Local Streets
931,0050
Economic Vibrancy
Citywide Various03 Bond Program
300,000 0 300,000 300,000Changeable Turn-Lane Signs - 20 locations
0 0Intelligent Transportation
Systems
00
Economic Vibrancy
13 1st/1712 Bond Program
0 0 0 343,700Channel from Royal to Talisman 0 0Street Resurfacing 343,7000
Economic Vibrancy
13 3rd/1612 Bond Program
52,350 0 52,350 349,000Chapel Downs Dr (3108-3256) And Timberview Rd (3111-3253)
0 0Alley Reconstruction
0296,650
Economic Vibrancy
12 1st/1306 Bond Program
324,592 173,408 151,185 324,592Chattington 7606 and Rolling Acres-Tophill to Carriage
0 0Alley Reconstruction
00
Economic Vibrancy
12 1st/1303 Bond Program
42,351 41,916 435 42,351Chattington 7606 and Rolling Acres-Tophill to Carriage
0 0Alley Reconstruction
00
Economic Vibrancy
11 3rd/1612 Bond Program
27,045 0 27,045 180,300Chattington Dr (7403-7439) And Meandering Pl (15105-15115)
0 0Alley Reconstruction
0153,255
Economic Vibrancy
11 3rd/1612 Bond Program
27,795 0 27,795 185,300Chattington Dr (7507-7625) And Woodstone Ln (7524-7624)
0 0Alley Reconstruction
0157,505
Economic Vibrancy
08 1st/1712 Bond Program
0 0 0 486,800Chaucer Pl from Camp Wisdom Rd to Kirnwood Dr
0 0Street Resurfacing 486,8000
Economic Vibrancy
06 2nd/1303 Bond Program
11,040 11,040 0 11,040Cherry Laurel Ln. - Keenland Pkwy. to Sportsmans Pkwy.
0 0Street Resurfacing 00
437
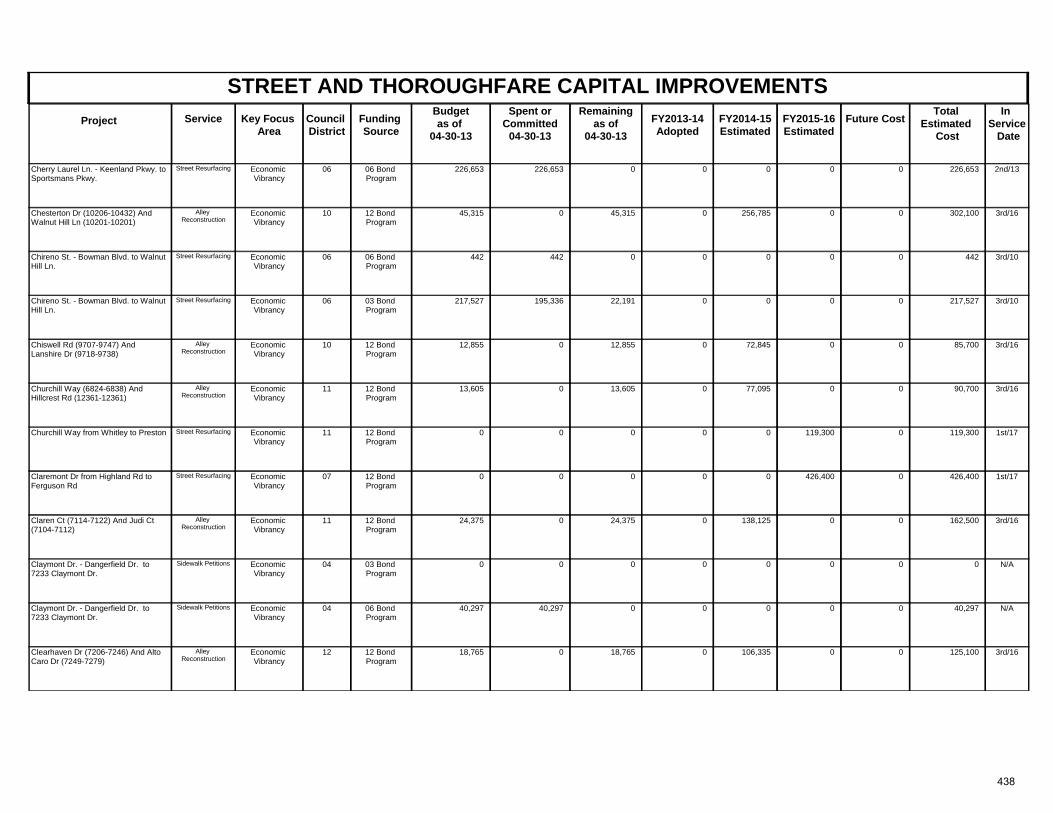
STREET AND THOROUGHFARE CAPITAL IMPROVEMENTSProject Key Focus
AreaCouncil District
Spent orCommitted
04-30-13
Total Estimated
Cost
In Service Date
Funding Source
Remainingas of
04-30-13 FY2013-14
AdoptedFuture CostService FY2014-15
Estimated FY2015-16 Estimated
Budgetas of
04-30-13
Economic Vibrancy
06 2nd/1306 Bond Program
226,653 226,653 0 226,653Cherry Laurel Ln. - Keenland Pkwy. to Sportsmans Pkwy.
0 0Street Resurfacing 00
Economic Vibrancy
10 3rd/1612 Bond Program
45,315 0 45,315 302,100Chesterton Dr (10206-10432) And Walnut Hill Ln (10201-10201)
0 0Alley Reconstruction
0256,785
Economic Vibrancy
06 3rd/1006 Bond Program
442 442 0 442Chireno St. - Bowman Blvd. to Walnut Hill Ln.
0 0Street Resurfacing 00
Economic Vibrancy
06 3rd/1003 Bond Program
217,527 195,336 22,191 217,527Chireno St. - Bowman Blvd. to Walnut Hill Ln.
0 0Street Resurfacing 00
Economic Vibrancy
10 3rd/1612 Bond Program
12,855 0 12,855 85,700Chiswell Rd (9707-9747) And Lanshire Dr (9718-9738)
0 0Alley Reconstruction
072,845
Economic Vibrancy
11 3rd/1612 Bond Program
13,605 0 13,605 90,700Churchill Way (6824-6838) And Hillcrest Rd (12361-12361)
0 0Alley Reconstruction
077,095
Economic Vibrancy
11 1st/1712 Bond Program
0 0 0 119,300Churchill Way from Whitley to Preston 0 0Street Resurfacing 119,3000
Economic Vibrancy
07 1st/1712 Bond Program
0 0 0 426,400Claremont Dr from Highland Rd to Ferguson Rd
0 0Street Resurfacing 426,4000
Economic Vibrancy
11 3rd/1612 Bond Program
24,375 0 24,375 162,500Claren Ct (7114-7122) And Judi Ct (7104-7112)
0 0Alley Reconstruction
0138,125
Economic Vibrancy
04 N/A03 Bond Program
0 0 0 0Claymont Dr. - Dangerfield Dr. to 7233 Claymont Dr.
0 0Sidewalk Petitions 00
Economic Vibrancy
04 N/A06 Bond Program
40,297 40,297 0 40,297Claymont Dr. - Dangerfield Dr. to 7233 Claymont Dr.
0 0Sidewalk Petitions 00
Economic Vibrancy
12 3rd/1612 Bond Program
18,765 0 18,765 125,100Clearhaven Dr (7206-7246) And Alto Caro Dr (7249-7279)
0 0Alley Reconstruction
0106,335
438
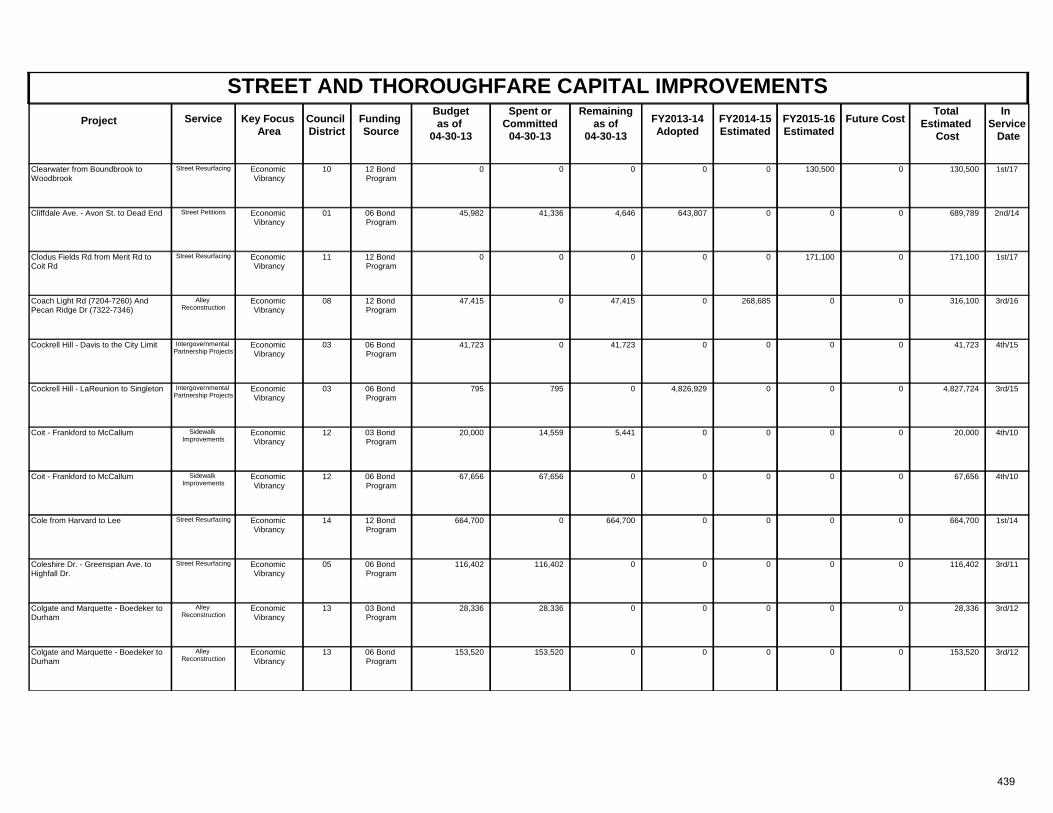
STREET AND THOROUGHFARE CAPITAL IMPROVEMENTSProject Key Focus
AreaCouncil District
Spent orCommitted
04-30-13
Total Estimated
Cost
In Service Date
Funding Source
Remainingas of
04-30-13 FY2013-14
AdoptedFuture CostService FY2014-15
Estimated FY2015-16 Estimated
Budgetas of
04-30-13
Economic Vibrancy
10 1st/1712 Bond Program
0 0 0 130,500Clearwater from Boundbrook to Woodbrook
0 0Street Resurfacing 130,5000
Economic Vibrancy
01 2nd/1406 Bond Program
45,982 41,336 4,646 689,789Cliffdale Ave. - Avon St. to Dead End 643,807 0Street Petitions 00
Economic Vibrancy
11 1st/1712 Bond Program
0 0 0 171,100Clodus Fields Rd from Merit Rd to Coit Rd
0 0Street Resurfacing 171,1000
Economic Vibrancy
08 3rd/1612 Bond Program
47,415 0 47,415 316,100Coach Light Rd (7204-7260) And Pecan Ridge Dr (7322-7346)
0 0Alley Reconstruction
0268,685
Economic Vibrancy
03 4th/1506 Bond Program
41,723 0 41,723 41,723Cockrell Hill - Davis to the City Limit 0 0Intergovernmental Partnership Projects
00
Economic Vibrancy
03 3rd/1506 Bond Program
795 795 0 4,827,724Cockrell Hill - LaReunion to Singleton 4,826,929 0Intergovernmental Partnership Projects
00
Economic Vibrancy
12 4th/1003 Bond Program
20,000 14,559 5,441 20,000Coit - Frankford to McCallum 0 0Sidewalk Improvements
00
Economic Vibrancy
12 4th/1006 Bond Program
67,656 67,656 0 67,656Coit - Frankford to McCallum 0 0Sidewalk Improvements
00
Economic Vibrancy
14 1st/1412 Bond Program
664,700 0 664,700 664,700Cole from Harvard to Lee 0 0Street Resurfacing 00
Economic Vibrancy
05 3rd/1106 Bond Program
116,402 116,402 0 116,402Coleshire Dr. - Greenspan Ave. to Highfall Dr.
0 0Street Resurfacing 00
Economic Vibrancy
13 3rd/1203 Bond Program
28,336 28,336 0 28,336Colgate and Marquette - Boedeker to Durham
0 0Alley Reconstruction
00
Economic Vibrancy
13 3rd/1206 Bond Program
153,520 153,520 0 153,520Colgate and Marquette - Boedeker to Durham
0 0Alley Reconstruction
00
439
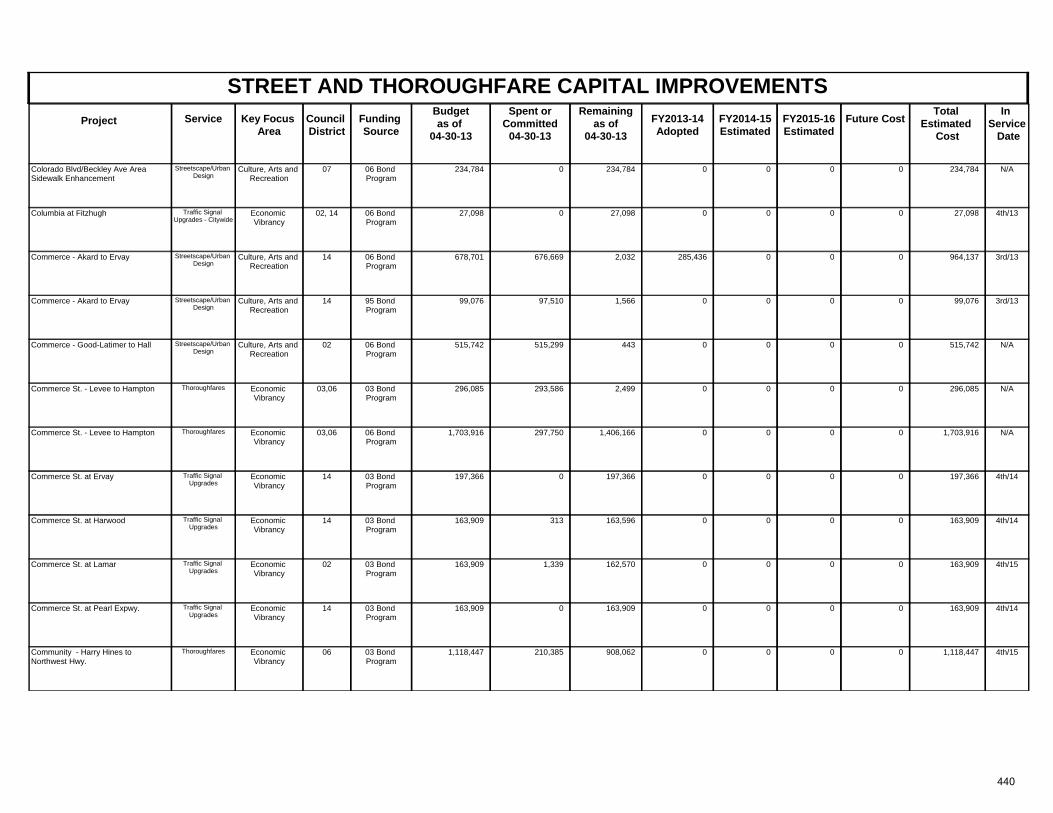
STREET AND THOROUGHFARE CAPITAL IMPROVEMENTSProject Key Focus
AreaCouncil District
Spent orCommitted
04-30-13
Total Estimated
Cost
In Service Date
Funding Source
Remainingas of
04-30-13 FY2013-14
AdoptedFuture CostService FY2014-15
Estimated FY2015-16 Estimated
Budgetas of
04-30-13
Culture, Arts and Recreation
07 N/A06 Bond Program
234,784 0 234,784 234,784Colorado Blvd/Beckley Ave Area Sidewalk Enhancement
0 0Streetscape/Urban Design
00
Economic Vibrancy
02, 14 4th/1306 Bond Program
27,098 0 27,098 27,098Columbia at Fitzhugh 0 0Traffic Signal Upgrades - Citywide
00
Culture, Arts and Recreation
14 3rd/1306 Bond Program
678,701 676,669 2,032 964,137Commerce - Akard to Ervay 285,436 0Streetscape/Urban Design
00
Culture, Arts and Recreation
14 3rd/1395 Bond Program
99,076 97,510 1,566 99,076Commerce - Akard to Ervay 0 0Streetscape/Urban Design
00
Culture, Arts and Recreation
02 N/A06 Bond Program
515,742 515,299 443 515,742Commerce - Good-Latimer to Hall 0 0Streetscape/Urban Design
00
Economic Vibrancy
03,06 N/A03 Bond Program
296,085 293,586 2,499 296,085Commerce St. - Levee to Hampton 0 0Thoroughfares 00
Economic Vibrancy
03,06 N/A06 Bond Program
1,703,916 297,750 1,406,166 1,703,916Commerce St. - Levee to Hampton 0 0Thoroughfares 00
Economic Vibrancy
14 4th/1403 Bond Program
197,366 0 197,366 197,366Commerce St. at Ervay 0 0Traffic Signal Upgrades
00
Economic Vibrancy
14 4th/1403 Bond Program
163,909 313 163,596 163,909Commerce St. at Harwood 0 0Traffic Signal Upgrades
00
Economic Vibrancy
02 4th/1503 Bond Program
163,909 1,339 162,570 163,909Commerce St. at Lamar 0 0Traffic Signal Upgrades
00
Economic Vibrancy
14 4th/1403 Bond Program
163,909 0 163,909 163,909Commerce St. at Pearl Expwy. 0 0Traffic Signal Upgrades
00
Economic Vibrancy
06 4th/1503 Bond Program
1,118,447 210,385 908,062 1,118,447Community - Harry Hines to Northwest Hwy.
0 0Thoroughfares 00
440
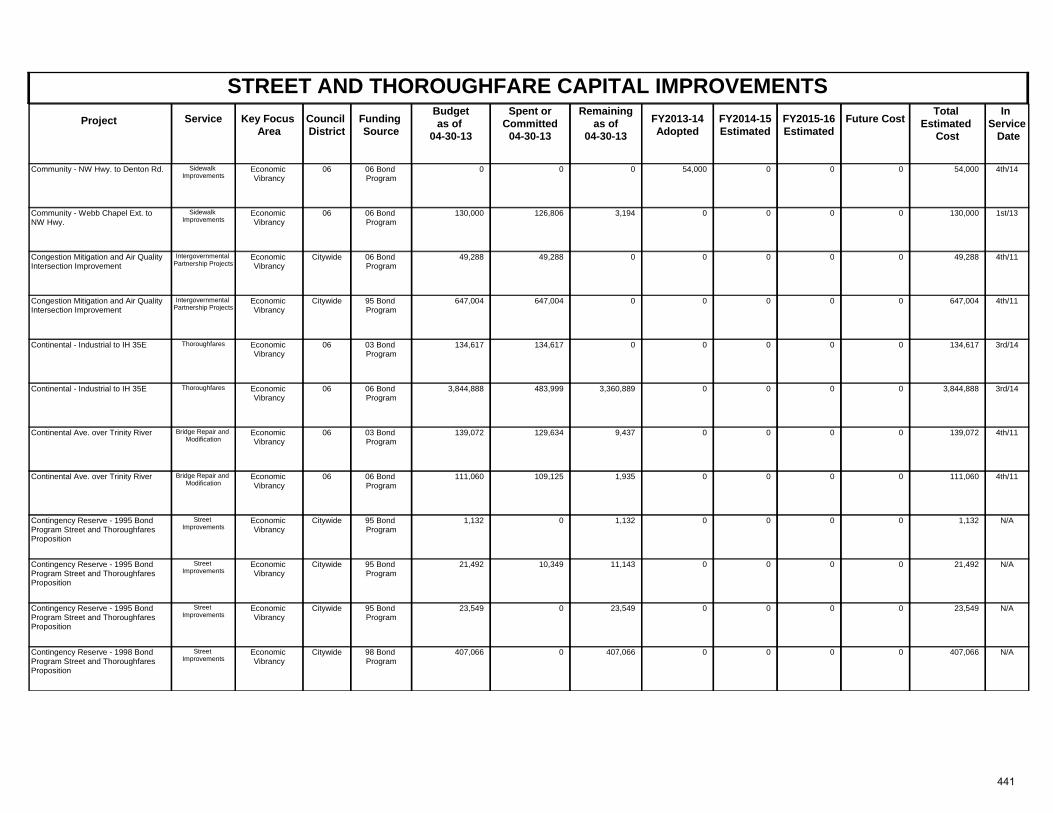
STREET AND THOROUGHFARE CAPITAL IMPROVEMENTSProject Key Focus
AreaCouncil District
Spent orCommitted
04-30-13
Total Estimated
Cost
In Service Date
Funding Source
Remainingas of
04-30-13 FY2013-14
AdoptedFuture CostService FY2014-15
Estimated FY2015-16 Estimated
Budgetas of
04-30-13
Economic Vibrancy
06 4th/1406 Bond Program
0 0 0 54,000Community - NW Hwy. to Denton Rd. 54,000 0Sidewalk Improvements
00
Economic Vibrancy
06 1st/1306 Bond Program
130,000 126,806 3,194 130,000Community - Webb Chapel Ext. to NW Hwy.
0 0Sidewalk Improvements
00
Economic Vibrancy
Citywide 4th/1106 Bond Program
49,288 49,288 0 49,288Congestion Mitigation and Air Quality Intersection Improvement
0 0Intergovernmental Partnership Projects
00
Economic Vibrancy
Citywide 4th/1195 Bond Program
647,004 647,004 0 647,004Congestion Mitigation and Air Quality Intersection Improvement
0 0Intergovernmental Partnership Projects
00
Economic Vibrancy
06 3rd/1403 Bond Program
134,617 134,617 0 134,617Continental - Industrial to IH 35E 0 0Thoroughfares 00
Economic Vibrancy
06 3rd/1406 Bond Program
3,844,888 483,999 3,360,889 3,844,888Continental - Industrial to IH 35E 0 0Thoroughfares 00
Economic Vibrancy
06 4th/1103 Bond Program
139,072 129,634 9,437 139,072Continental Ave. over Trinity River 0 0Bridge Repair and Modification
00
Economic Vibrancy
06 4th/1106 Bond Program
111,060 109,125 1,935 111,060Continental Ave. over Trinity River 0 0Bridge Repair and Modification
00
Economic Vibrancy
Citywide N/A95 Bond Program
1,132 0 1,132 1,132Contingency Reserve - 1995 Bond Program Street and Thoroughfares Proposition
0 0Street Improvements
00
Economic Vibrancy
Citywide N/A95 Bond Program
21,492 10,349 11,143 21,492Contingency Reserve - 1995 Bond Program Street and Thoroughfares Proposition
0 0Street Improvements
00
Economic Vibrancy
Citywide N/A95 Bond Program
23,549 0 23,549 23,549Contingency Reserve - 1995 Bond Program Street and Thoroughfares Proposition
0 0Street Improvements
00
Economic Vibrancy
Citywide N/A98 Bond Program
407,066 0 407,066 407,066Contingency Reserve - 1998 Bond Program Street and Thoroughfares Proposition
0 0Street Improvements
00
441
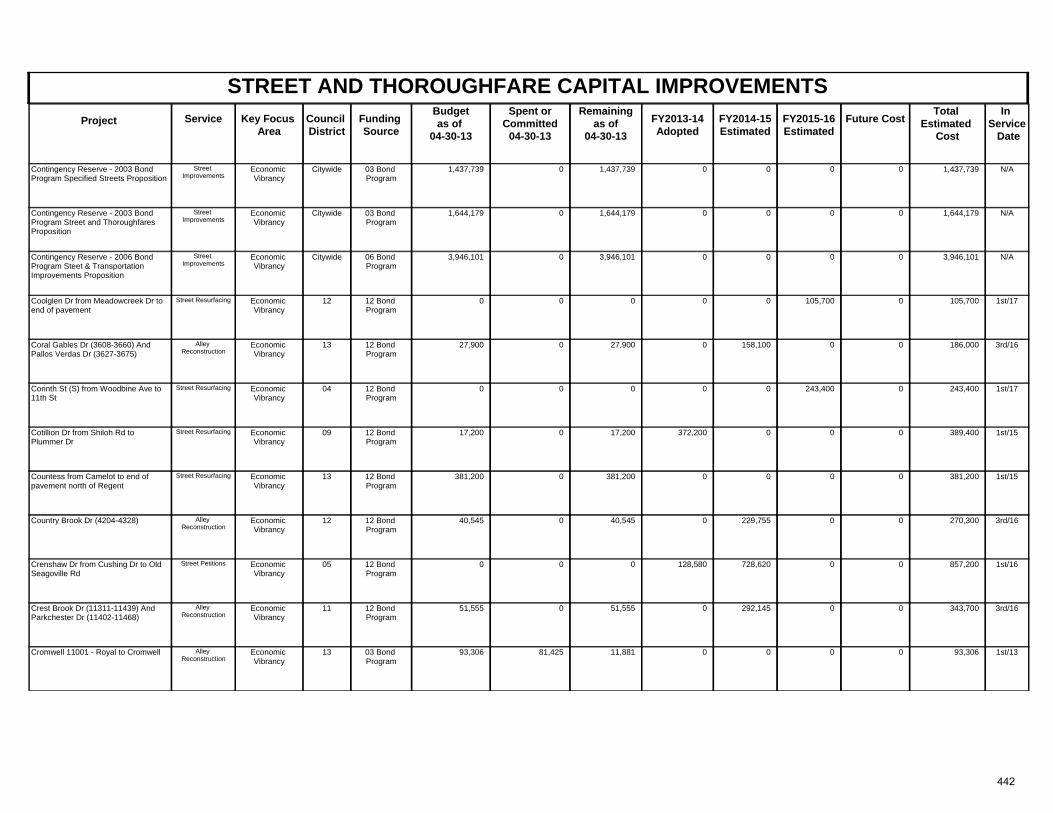
STREET AND THOROUGHFARE CAPITAL IMPROVEMENTSProject Key Focus
AreaCouncil District
Spent orCommitted
04-30-13
Total Estimated
Cost
In Service Date
Funding Source
Remainingas of
04-30-13 FY2013-14
AdoptedFuture CostService FY2014-15
Estimated FY2015-16 Estimated
Budgetas of
04-30-13
Economic Vibrancy
Citywide N/A03 Bond Program
1,437,739 0 1,437,739 1,437,739Contingency Reserve - 2003 Bond Program Specified Streets Proposition
0 0Street Improvements
00
Economic Vibrancy
Citywide N/A03 Bond Program
1,644,179 0 1,644,179 1,644,179Contingency Reserve - 2003 Bond Program Street and Thoroughfares Proposition
0 0Street Improvements
00
Economic Vibrancy
Citywide N/A06 Bond Program
3,946,101 0 3,946,101 3,946,101Contingency Reserve - 2006 Bond Program Steet & Transportation Improvements Proposition
0 0Street Improvements
00
Economic Vibrancy
12 1st/1712 Bond Program
0 0 0 105,700Coolglen Dr from Meadowcreek Dr to end of pavement
0 0Street Resurfacing 105,7000
Economic Vibrancy
13 3rd/1612 Bond Program
27,900 0 27,900 186,000Coral Gables Dr (3608-3660) And Pallos Verdas Dr (3627-3675)
0 0Alley Reconstruction
0158,100
Economic Vibrancy
04 1st/1712 Bond Program
0 0 0 243,400Corinth St (S) from Woodbine Ave to 11th St
0 0Street Resurfacing 243,4000
Economic Vibrancy
09 1st/1512 Bond Program
17,200 0 17,200 389,400Cotillion Dr from Shiloh Rd to Plummer Dr
372,200 0Street Resurfacing 00
Economic Vibrancy
13 1st/1512 Bond Program
381,200 0 381,200 381,200Countess from Camelot to end of pavement north of Regent
0 0Street Resurfacing 00
Economic Vibrancy
12 3rd/1612 Bond Program
40,545 0 40,545 270,300Country Brook Dr (4204-4328) 0 0Alley Reconstruction
0229,755
Economic Vibrancy
05 1st/1612 Bond Program
0 0 0 857,200Crenshaw Dr from Cushing Dr to Old Seagoville Rd
128,580 0Street Petitions 0728,620
Economic Vibrancy
11 3rd/1612 Bond Program
51,555 0 51,555 343,700Crest Brook Dr (11311-11439) And Parkchester Dr (11402-11468)
0 0Alley Reconstruction
0292,145
Economic Vibrancy
13 1st/1303 Bond Program
93,306 81,425 11,881 93,306Cromwell 11001 - Royal to Cromwell 0 0Alley Reconstruction
00
442
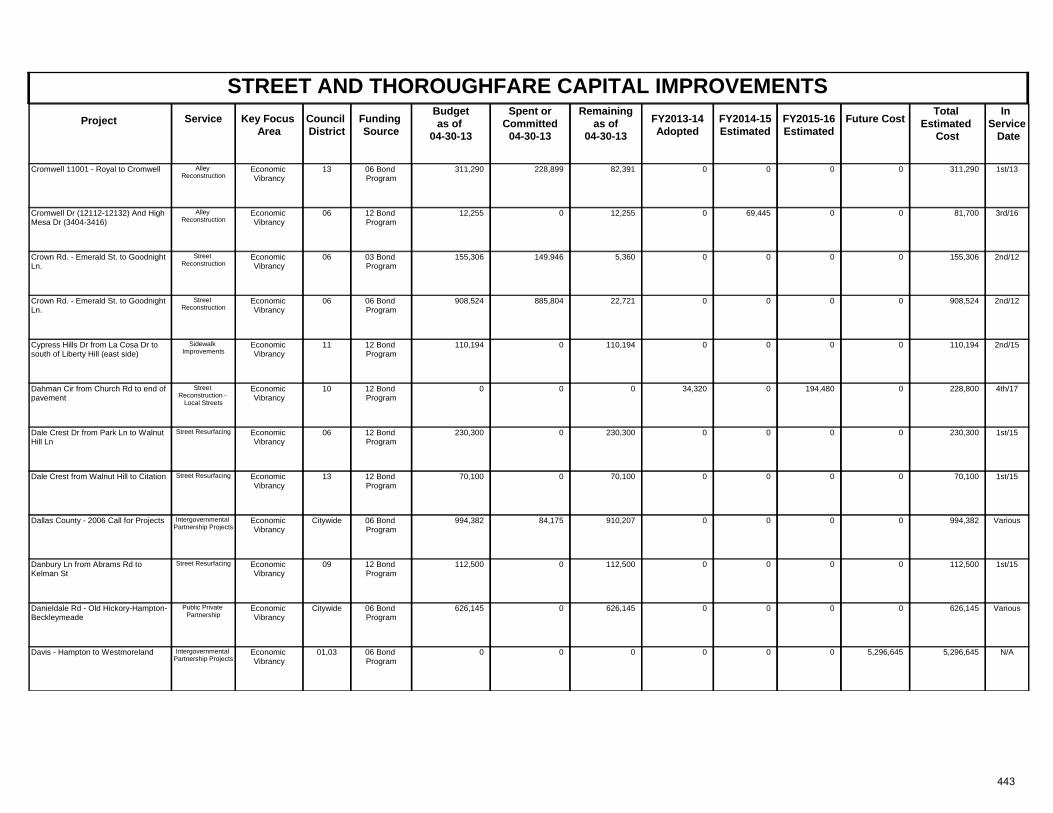
STREET AND THOROUGHFARE CAPITAL IMPROVEMENTSProject Key Focus
AreaCouncil District
Spent orCommitted
04-30-13
Total Estimated
Cost
In Service Date
Funding Source
Remainingas of
04-30-13 FY2013-14
AdoptedFuture CostService FY2014-15
Estimated FY2015-16 Estimated
Budgetas of
04-30-13
Economic Vibrancy
13 1st/1306 Bond Program
311,290 228,899 82,391 311,290Cromwell 11001 - Royal to Cromwell 0 0Alley Reconstruction
00
Economic Vibrancy
06 3rd/1612 Bond Program
12,255 0 12,255 81,700Cromwell Dr (12112-12132) And High Mesa Dr (3404-3416)
0 0Alley Reconstruction
069,445
Economic Vibrancy
06 2nd/1203 Bond Program
155,306 149,946 5,360 155,306Crown Rd. - Emerald St. to Goodnight Ln.
0 0Street Reconstruction
00
Economic Vibrancy
06 2nd/1206 Bond Program
908,524 885,804 22,721 908,524Crown Rd. - Emerald St. to Goodnight Ln.
0 0Street Reconstruction
00
Economic Vibrancy
11 2nd/1512 Bond Program
110,194 0 110,194 110,194Cypress Hills Dr from La Cosa Dr to south of Liberty Hill (east side)
0 0Sidewalk Improvements
00
Economic Vibrancy
10 4th/1712 Bond Program
0 0 0 228,800Dahman Cir from Church Rd to end of pavement
34,320 0Street Reconstruction -
Local Streets
194,4800
Economic Vibrancy
06 1st/1512 Bond Program
230,300 0 230,300 230,300Dale Crest Dr from Park Ln to Walnut Hill Ln
0 0Street Resurfacing 00
Economic Vibrancy
13 1st/1512 Bond Program
70,100 0 70,100 70,100Dale Crest from Walnut Hill to Citation 0 0Street Resurfacing 00
Economic Vibrancy
Citywide Various06 Bond Program
994,382 84,175 910,207 994,382Dallas County - 2006 Call for Projects 0 0Intergovernmental Partnership Projects
00
Economic Vibrancy
09 1st/1512 Bond Program
112,500 0 112,500 112,500Danbury Ln from Abrams Rd to Kelman St
0 0Street Resurfacing 00
Economic Vibrancy
Citywide Various06 Bond Program
626,145 0 626,145 626,145Danieldale Rd - Old Hickory-Hampton-Beckleymeade
0 0Public Private Partnership
00
Economic Vibrancy
01,03 N/A06 Bond Program
0 0 0 5,296,645Davis - Hampton to Westmoreland 0 5,296,645Intergovernmental Partnership Projects
00
443
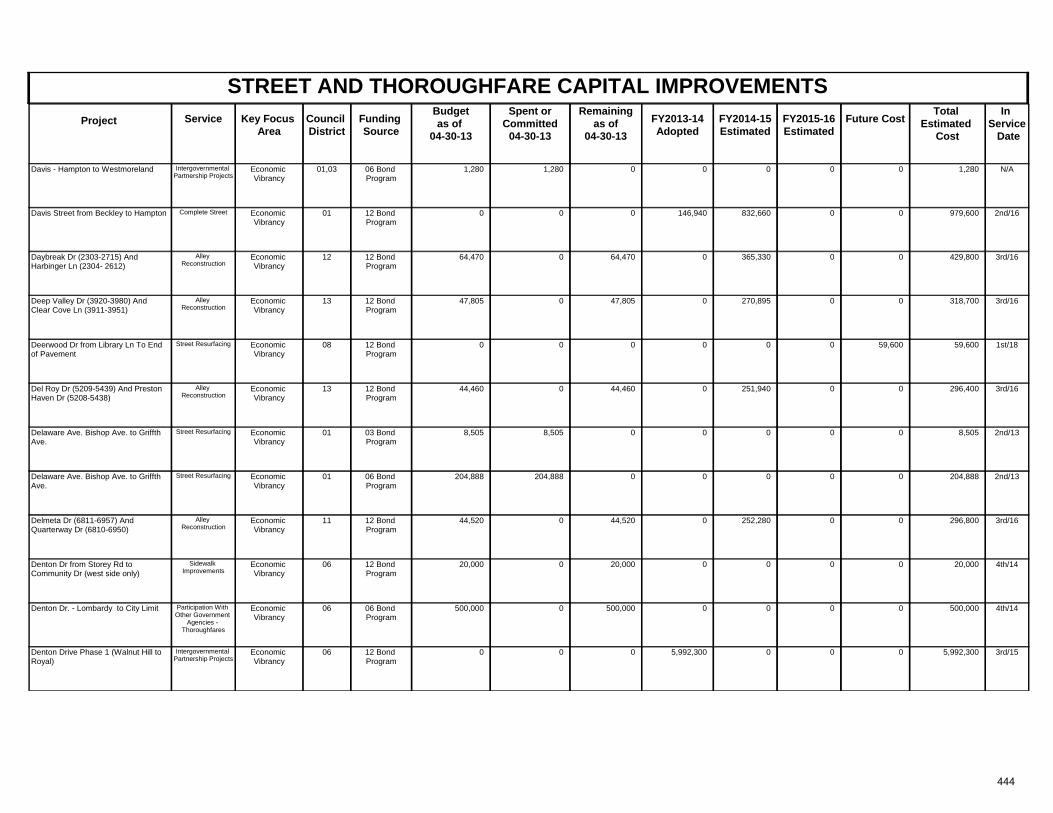
STREET AND THOROUGHFARE CAPITAL IMPROVEMENTSProject Key Focus
AreaCouncil District
Spent orCommitted
04-30-13
Total Estimated
Cost
In Service Date
Funding Source
Remainingas of
04-30-13 FY2013-14
AdoptedFuture CostService FY2014-15
Estimated FY2015-16 Estimated
Budgetas of
04-30-13
Economic Vibrancy
01,03 N/A06 Bond Program
1,280 1,280 0 1,280Davis - Hampton to Westmoreland 0 0Intergovernmental Partnership Projects
00
Economic Vibrancy
01 2nd/1612 Bond Program
0 0 0 979,600Davis Street from Beckley to Hampton 146,940 0Complete Street 0832,660
Economic Vibrancy
12 3rd/1612 Bond Program
64,470 0 64,470 429,800Daybreak Dr (2303-2715) And Harbinger Ln (2304- 2612)
0 0Alley Reconstruction
0365,330
Economic Vibrancy
13 3rd/1612 Bond Program
47,805 0 47,805 318,700Deep Valley Dr (3920-3980) And Clear Cove Ln (3911-3951)
0 0Alley Reconstruction
0270,895
Economic Vibrancy
08 1st/1812 Bond Program
0 0 0 59,600Deerwood Dr from Library Ln To End of Pavement
0 59,600Street Resurfacing 00
Economic Vibrancy
13 3rd/1612 Bond Program
44,460 0 44,460 296,400Del Roy Dr (5209-5439) And Preston Haven Dr (5208-5438)
0 0Alley Reconstruction
0251,940
Economic Vibrancy
01 2nd/1303 Bond Program
8,505 8,505 0 8,505Delaware Ave. Bishop Ave. to Griffth Ave.
0 0Street Resurfacing 00
Economic Vibrancy
01 2nd/1306 Bond Program
204,888 204,888 0 204,888Delaware Ave. Bishop Ave. to Griffth Ave.
0 0Street Resurfacing 00
Economic Vibrancy
11 3rd/1612 Bond Program
44,520 0 44,520 296,800Delmeta Dr (6811-6957) And Quarterway Dr (6810-6950)
0 0Alley Reconstruction
0252,280
Economic Vibrancy
06 4th/1412 Bond Program
20,000 0 20,000 20,000Denton Dr from Storey Rd to Community Dr (west side only)
0 0Sidewalk Improvements
00
Economic Vibrancy
06 4th/1406 Bond Program
500,000 0 500,000 500,000Denton Dr. - Lombardy to City Limit 0 0Participation With Other Government
Agencies - Thoroughfares
00
Economic Vibrancy
06 3rd/1512 Bond Program
0 0 0 5,992,300Denton Drive Phase 1 (Walnut Hill to Royal)
5,992,300 0Intergovernmental Partnership Projects
00
444
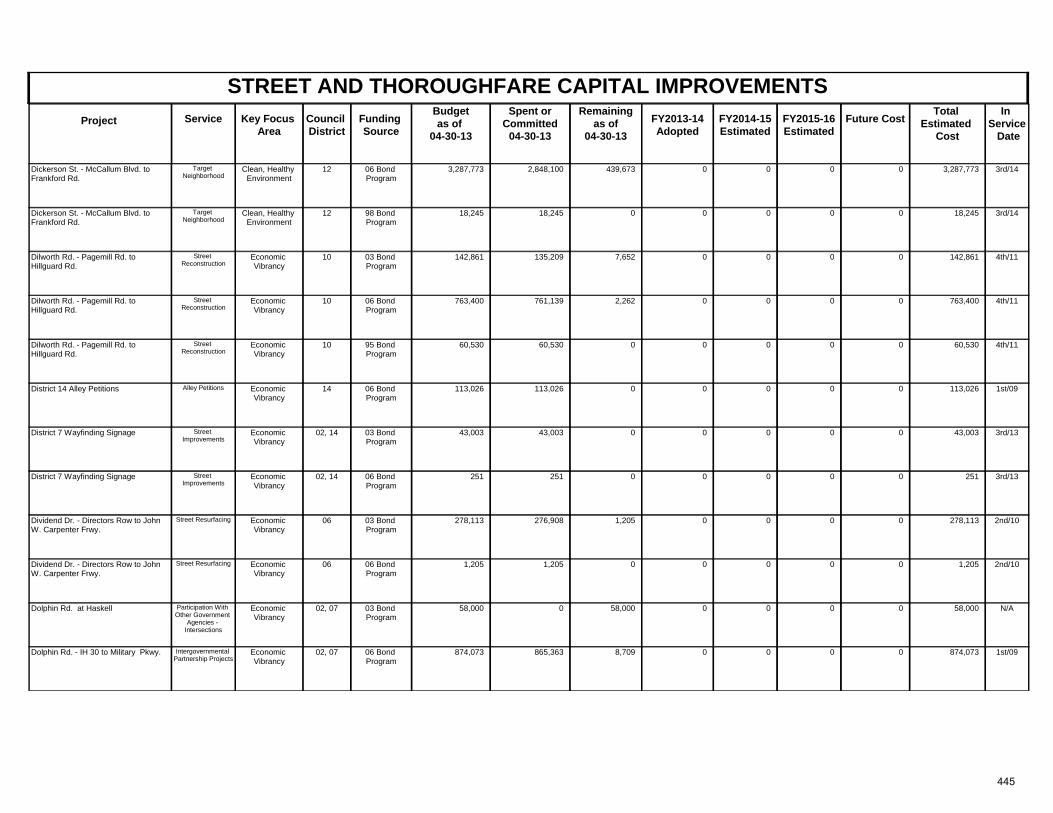
STREET AND THOROUGHFARE CAPITAL IMPROVEMENTSProject Key Focus
AreaCouncil District
Spent orCommitted
04-30-13
Total Estimated
Cost
In Service Date
Funding Source
Remainingas of
04-30-13 FY2013-14
AdoptedFuture CostService FY2014-15
Estimated FY2015-16 Estimated
Budgetas of
04-30-13
Clean, Healthy Environment
12 3rd/1406 Bond Program
3,287,773 2,848,100 439,673 3,287,773Dickerson St. - McCallum Blvd. to Frankford Rd.
0 0Target Neighborhood
00
Clean, Healthy Environment
12 3rd/1498 Bond Program
18,245 18,245 0 18,245Dickerson St. - McCallum Blvd. to Frankford Rd.
0 0Target Neighborhood
00
Economic Vibrancy
10 4th/1103 Bond Program
142,861 135,209 7,652 142,861Dilworth Rd. - Pagemill Rd. to Hillguard Rd.
0 0Street Reconstruction
00
Economic Vibrancy
10 4th/1106 Bond Program
763,400 761,139 2,262 763,400Dilworth Rd. - Pagemill Rd. to Hillguard Rd.
0 0Street Reconstruction
00
Economic Vibrancy
10 4th/1195 Bond Program
60,530 60,530 0 60,530Dilworth Rd. - Pagemill Rd. to Hillguard Rd.
0 0Street Reconstruction
00
Economic Vibrancy
14 1st/0906 Bond Program
113,026 113,026 0 113,026District 14 Alley Petitions 0 0Alley Petitions 00
Economic Vibrancy
02, 14 3rd/1303 Bond Program
43,003 43,003 0 43,003District 7 Wayfinding Signage 0 0Street Improvements
00
Economic Vibrancy
02, 14 3rd/1306 Bond Program
251 251 0 251District 7 Wayfinding Signage 0 0Street Improvements
00
Economic Vibrancy
06 2nd/1003 Bond Program
278,113 276,908 1,205 278,113Dividend Dr. - Directors Row to John W. Carpenter Frwy.
0 0Street Resurfacing 00
Economic Vibrancy
06 2nd/1006 Bond Program
1,205 1,205 0 1,205Dividend Dr. - Directors Row to John W. Carpenter Frwy.
0 0Street Resurfacing 00
Economic Vibrancy
02, 07 N/A03 Bond Program
58,000 0 58,000 58,000Dolphin Rd. at Haskell 0 0Participation With Other Government
Agencies - Intersections
00
Economic Vibrancy
02, 07 1st/0906 Bond Program
874,073 865,363 8,709 874,073Dolphin Rd. - IH 30 to Military Pkwy. 0 0Intergovernmental Partnership Projects
00
445
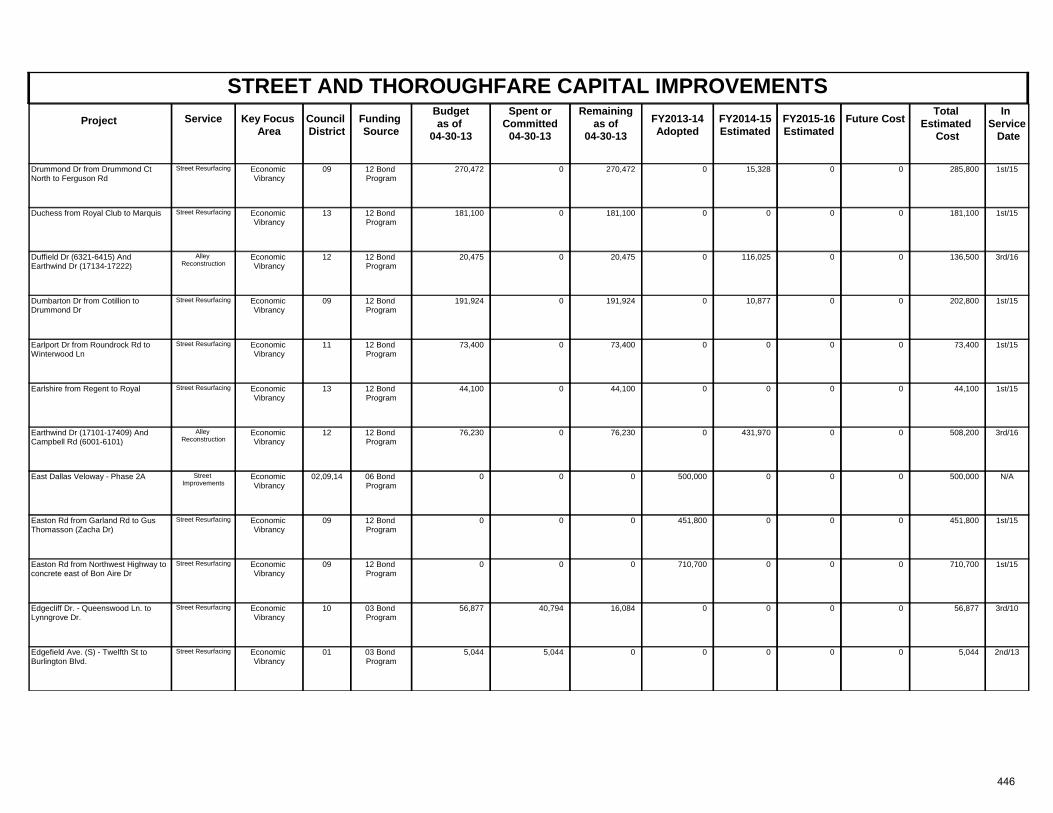
STREET AND THOROUGHFARE CAPITAL IMPROVEMENTSProject Key Focus
AreaCouncil District
Spent orCommitted
04-30-13
Total Estimated
Cost
In Service Date
Funding Source
Remainingas of
04-30-13 FY2013-14
AdoptedFuture CostService FY2014-15
Estimated FY2015-16 Estimated
Budgetas of
04-30-13
Economic Vibrancy
09 1st/1512 Bond Program
270,472 0 270,472 285,800Drummond Dr from Drummond Ct North to Ferguson Rd
0 0Street Resurfacing 015,328
Economic Vibrancy
13 1st/1512 Bond Program
181,100 0 181,100 181,100Duchess from Royal Club to Marquis 0 0Street Resurfacing 00
Economic Vibrancy
12 3rd/1612 Bond Program
20,475 0 20,475 136,500Duffield Dr (6321-6415) And Earthwind Dr (17134-17222)
0 0Alley Reconstruction
0116,025
Economic Vibrancy
09 1st/1512 Bond Program
191,924 0 191,924 202,800Dumbarton Dr from Cotillion to Drummond Dr
0 0Street Resurfacing 010,877
Economic Vibrancy
11 1st/1512 Bond Program
73,400 0 73,400 73,400Earlport Dr from Roundrock Rd to Winterwood Ln
0 0Street Resurfacing 00
Economic Vibrancy
13 1st/1512 Bond Program
44,100 0 44,100 44,100Earlshire from Regent to Royal 0 0Street Resurfacing 00
Economic Vibrancy
12 3rd/1612 Bond Program
76,230 0 76,230 508,200Earthwind Dr (17101-17409) And Campbell Rd (6001-6101)
0 0Alley Reconstruction
0431,970
Economic Vibrancy
02,09,14 N/A06 Bond Program
0 0 0 500,000East Dallas Veloway - Phase 2A 500,000 0Street Improvements
00
Economic Vibrancy
09 1st/1512 Bond Program
0 0 0 451,800Easton Rd from Garland Rd to Gus Thomasson (Zacha Dr)
451,800 0Street Resurfacing 00
Economic Vibrancy
09 1st/1512 Bond Program
0 0 0 710,700Easton Rd from Northwest Highway to concrete east of Bon Aire Dr
710,700 0Street Resurfacing 00
Economic Vibrancy
10 3rd/1003 Bond Program
56,877 40,794 16,084 56,877Edgecliff Dr. - Queenswood Ln. to Lynngrove Dr.
0 0Street Resurfacing 00
Economic Vibrancy
01 2nd/1303 Bond Program
5,044 5,044 0 5,044Edgefield Ave. (S) - Twelfth St to Burlington Blvd.
0 0Street Resurfacing 00
446
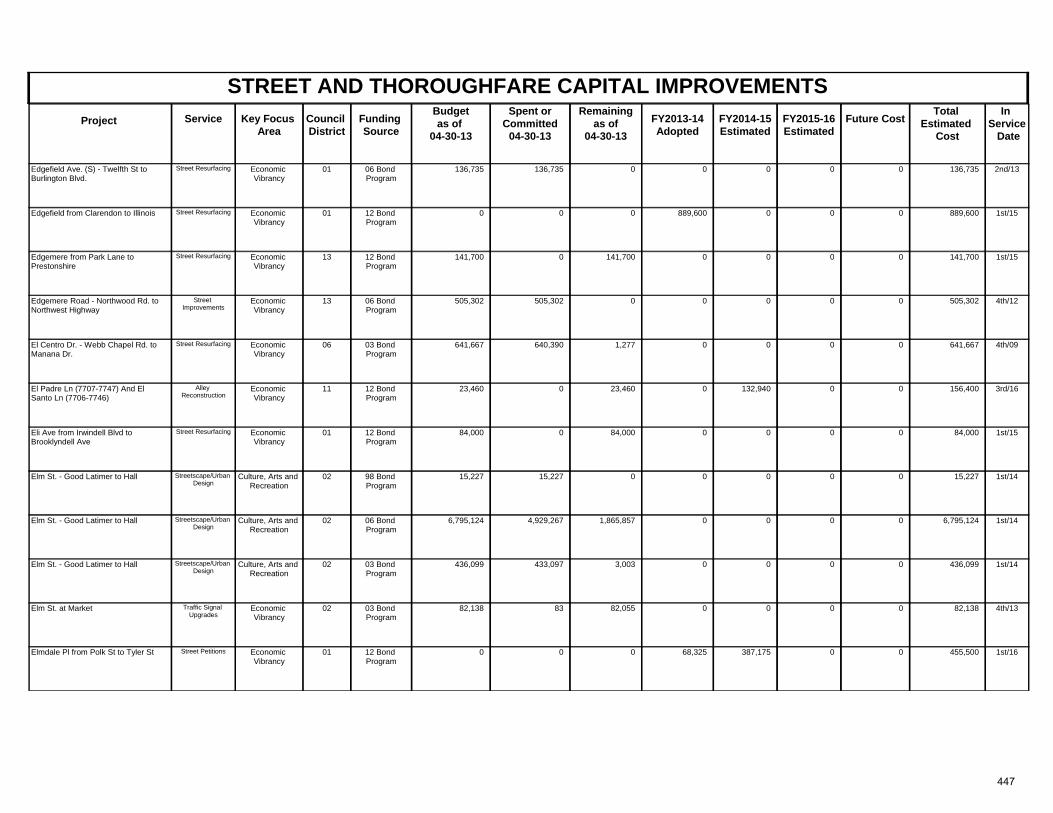
STREET AND THOROUGHFARE CAPITAL IMPROVEMENTSProject Key Focus
AreaCouncil District
Spent orCommitted
04-30-13
Total Estimated
Cost
In Service Date
Funding Source
Remainingas of
04-30-13 FY2013-14
AdoptedFuture CostService FY2014-15
Estimated FY2015-16 Estimated
Budgetas of
04-30-13
Economic Vibrancy
01 2nd/1306 Bond Program
136,735 136,735 0 136,735Edgefield Ave. (S) - Twelfth St to Burlington Blvd.
0 0Street Resurfacing 00
Economic Vibrancy
01 1st/1512 Bond Program
0 0 0 889,600Edgefield from Clarendon to Illinois 889,600 0Street Resurfacing 00
Economic Vibrancy
13 1st/1512 Bond Program
141,700 0 141,700 141,700Edgemere from Park Lane to Prestonshire
0 0Street Resurfacing 00
Economic Vibrancy
13 4th/1206 Bond Program
505,302 505,302 0 505,302Edgemere Road - Northwood Rd. to Northwest Highway
0 0Street Improvements
00
Economic Vibrancy
06 4th/0903 Bond Program
641,667 640,390 1,277 641,667El Centro Dr. - Webb Chapel Rd. to Manana Dr.
0 0Street Resurfacing 00
Economic Vibrancy
11 3rd/1612 Bond Program
23,460 0 23,460 156,400El Padre Ln (7707-7747) And El Santo Ln (7706-7746)
0 0Alley Reconstruction
0132,940
Economic Vibrancy
01 1st/1512 Bond Program
84,000 0 84,000 84,000Eli Ave from Irwindell Blvd to Brooklyndell Ave
0 0Street Resurfacing 00
Culture, Arts and Recreation
02 1st/1498 Bond Program
15,227 15,227 0 15,227Elm St. - Good Latimer to Hall 0 0Streetscape/Urban Design
00
Culture, Arts and Recreation
02 1st/1406 Bond Program
6,795,124 4,929,267 1,865,857 6,795,124Elm St. - Good Latimer to Hall 0 0Streetscape/Urban Design
00
Culture, Arts and Recreation
02 1st/1403 Bond Program
436,099 433,097 3,003 436,099Elm St. - Good Latimer to Hall 0 0Streetscape/Urban Design
00
Economic Vibrancy
02 4th/1303 Bond Program
82,138 83 82,055 82,138Elm St. at Market 0 0Traffic Signal Upgrades
00
Economic Vibrancy
01 1st/1612 Bond Program
0 0 0 455,500Elmdale Pl from Polk St to Tyler St 68,325 0Street Petitions 0387,175
447
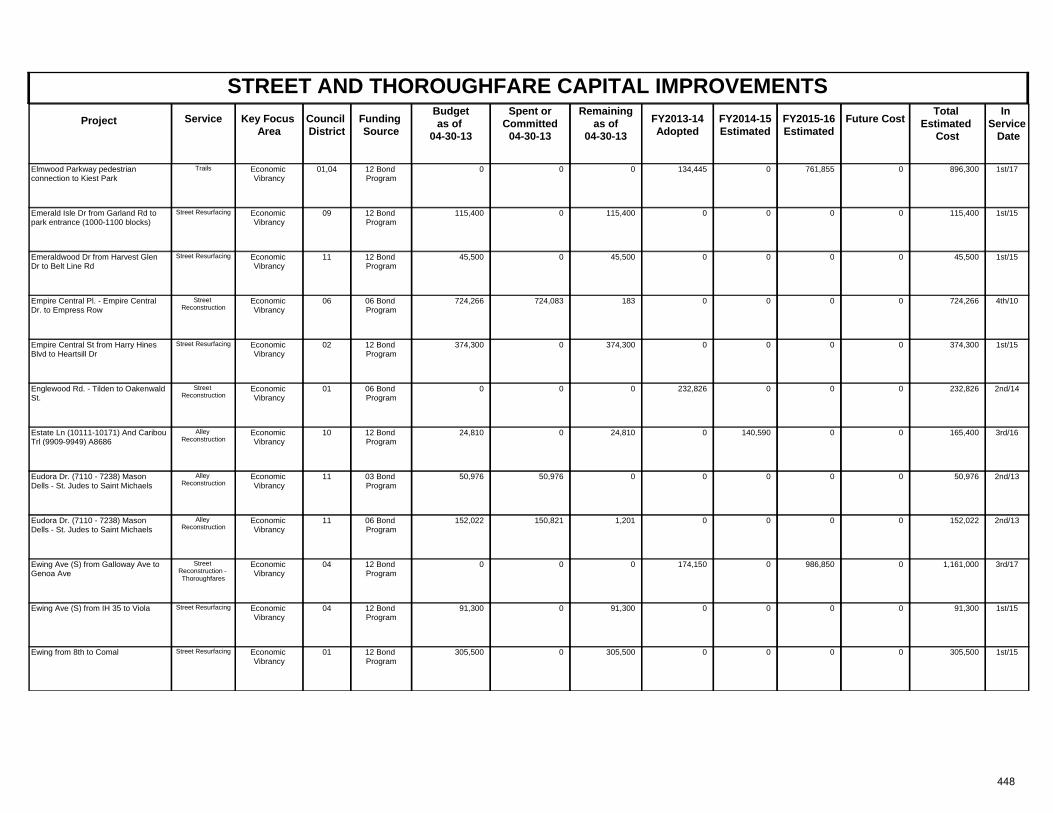
STREET AND THOROUGHFARE CAPITAL IMPROVEMENTSProject Key Focus
AreaCouncil District
Spent orCommitted
04-30-13
Total Estimated
Cost
In Service Date
Funding Source
Remainingas of
04-30-13 FY2013-14
AdoptedFuture CostService FY2014-15
Estimated FY2015-16 Estimated
Budgetas of
04-30-13
Economic Vibrancy
01,04 1st/1712 Bond Program
0 0 0 896,300Elmwood Parkway pedestrian connection to Kiest Park
134,445 0Trails 761,8550
Economic Vibrancy
09 1st/1512 Bond Program
115,400 0 115,400 115,400Emerald Isle Dr from Garland Rd to park entrance (1000-1100 blocks)
0 0Street Resurfacing 00
Economic Vibrancy
11 1st/1512 Bond Program
45,500 0 45,500 45,500Emeraldwood Dr from Harvest Glen Dr to Belt Line Rd
0 0Street Resurfacing 00
Economic Vibrancy
06 4th/1006 Bond Program
724,266 724,083 183 724,266Empire Central Pl. - Empire Central Dr. to Empress Row
0 0Street Reconstruction
00
Economic Vibrancy
02 1st/1512 Bond Program
374,300 0 374,300 374,300Empire Central St from Harry Hines Blvd to Heartsill Dr
0 0Street Resurfacing 00
Economic Vibrancy
01 2nd/1406 Bond Program
0 0 0 232,826Englewood Rd. - Tilden to Oakenwald St.
232,826 0Street Reconstruction
00
Economic Vibrancy
10 3rd/1612 Bond Program
24,810 0 24,810 165,400Estate Ln (10111-10171) And Caribou Trl (9909-9949) A8686
0 0Alley Reconstruction
0140,590
Economic Vibrancy
11 2nd/1303 Bond Program
50,976 50,976 0 50,976Eudora Dr. (7110 - 7238) Mason Dells - St. Judes to Saint Michaels
0 0Alley Reconstruction
00
Economic Vibrancy
11 2nd/1306 Bond Program
152,022 150,821 1,201 152,022Eudora Dr. (7110 - 7238) Mason Dells - St. Judes to Saint Michaels
0 0Alley Reconstruction
00
Economic Vibrancy
04 3rd/1712 Bond Program
0 0 0 1,161,000Ewing Ave (S) from Galloway Ave to Genoa Ave
174,150 0Street Reconstruction - Thoroughfares
986,8500
Economic Vibrancy
04 1st/1512 Bond Program
91,300 0 91,300 91,300Ewing Ave (S) from IH 35 to Viola 0 0Street Resurfacing 00
Economic Vibrancy
01 1st/1512 Bond Program
305,500 0 305,500 305,500Ewing from 8th to Comal 0 0Street Resurfacing 00
448
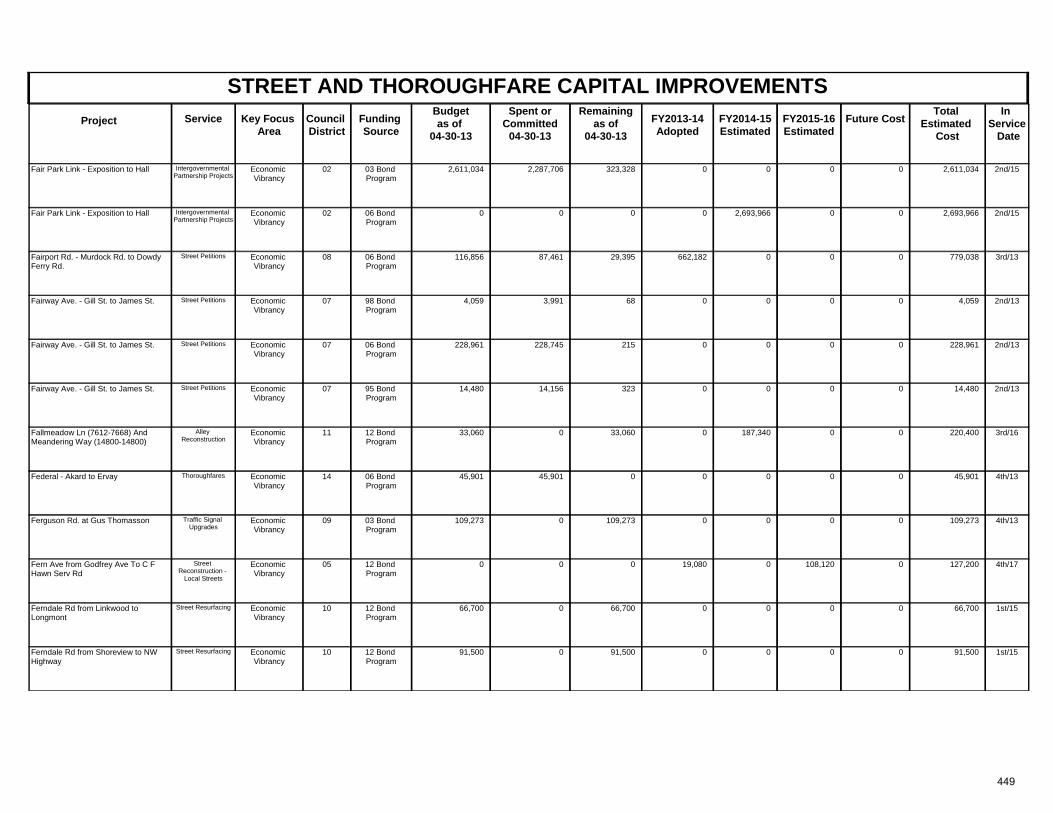
STREET AND THOROUGHFARE CAPITAL IMPROVEMENTSProject Key Focus
AreaCouncil District
Spent orCommitted
04-30-13
Total Estimated
Cost
In Service Date
Funding Source
Remainingas of
04-30-13 FY2013-14
AdoptedFuture CostService FY2014-15
Estimated FY2015-16 Estimated
Budgetas of
04-30-13
Economic Vibrancy
02 2nd/1503 Bond Program
2,611,034 2,287,706 323,328 2,611,034Fair Park Link - Exposition to Hall 0 0Intergovernmental Partnership Projects
00
Economic Vibrancy
02 2nd/1506 Bond Program
0 0 0 2,693,966Fair Park Link - Exposition to Hall 0 0Intergovernmental Partnership Projects
02,693,966
Economic Vibrancy
08 3rd/1306 Bond Program
116,856 87,461 29,395 779,038Fairport Rd. - Murdock Rd. to Dowdy Ferry Rd.
662,182 0Street Petitions 00
Economic Vibrancy
07 2nd/1398 Bond Program
4,059 3,991 68 4,059Fairway Ave. - Gill St. to James St. 0 0Street Petitions 00
Economic Vibrancy
07 2nd/1306 Bond Program
228,961 228,745 215 228,961Fairway Ave. - Gill St. to James St. 0 0Street Petitions 00
Economic Vibrancy
07 2nd/1395 Bond Program
14,480 14,156 323 14,480Fairway Ave. - Gill St. to James St. 0 0Street Petitions 00
Economic Vibrancy
11 3rd/1612 Bond Program
33,060 0 33,060 220,400Fallmeadow Ln (7612-7668) And Meandering Way (14800-14800)
0 0Alley Reconstruction
0187,340
Economic Vibrancy
14 4th/1306 Bond Program
45,901 45,901 0 45,901Federal - Akard to Ervay 0 0Thoroughfares 00
Economic Vibrancy
09 4th/1303 Bond Program
109,273 0 109,273 109,273Ferguson Rd. at Gus Thomasson 0 0Traffic Signal Upgrades
00
Economic Vibrancy
05 4th/1712 Bond Program
0 0 0 127,200Fern Ave from Godfrey Ave To C F Hawn Serv Rd
19,080 0Street Reconstruction -
Local Streets
108,1200
Economic Vibrancy
10 1st/1512 Bond Program
66,700 0 66,700 66,700Ferndale Rd from Linkwood to Longmont
0 0Street Resurfacing 00
Economic Vibrancy
10 1st/1512 Bond Program
91,500 0 91,500 91,500Ferndale Rd from Shoreview to NW Highway
0 0Street Resurfacing 00
449
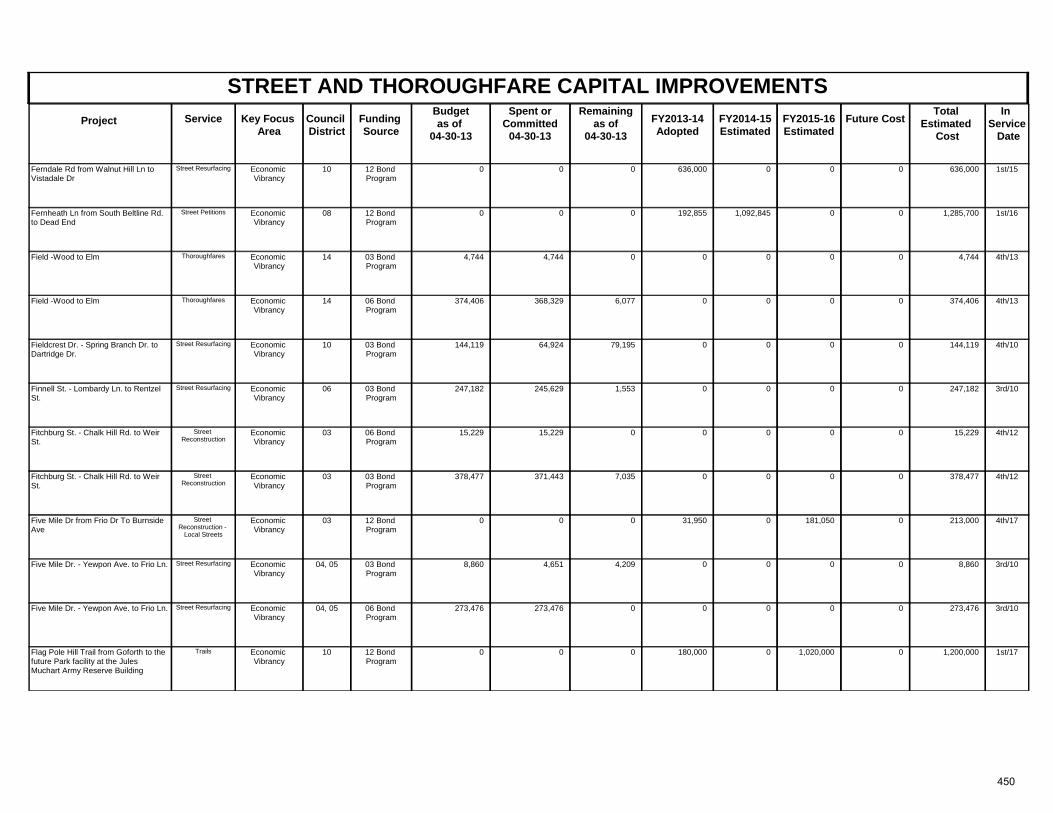
STREET AND THOROUGHFARE CAPITAL IMPROVEMENTSProject Key Focus
AreaCouncil District
Spent orCommitted
04-30-13
Total Estimated
Cost
In Service Date
Funding Source
Remainingas of
04-30-13 FY2013-14
AdoptedFuture CostService FY2014-15
Estimated FY2015-16 Estimated
Budgetas of
04-30-13
Economic Vibrancy
10 1st/1512 Bond Program
0 0 0 636,000Ferndale Rd from Walnut Hill Ln to Vistadale Dr
636,000 0Street Resurfacing 00
Economic Vibrancy
08 1st/1612 Bond Program
0 0 0 1,285,700Fernheath Ln from South Beltline Rd. to Dead End
192,855 0Street Petitions 01,092,845
Economic Vibrancy
14 4th/1303 Bond Program
4,744 4,744 0 4,744Field -Wood to Elm 0 0Thoroughfares 00
Economic Vibrancy
14 4th/1306 Bond Program
374,406 368,329 6,077 374,406Field -Wood to Elm 0 0Thoroughfares 00
Economic Vibrancy
10 4th/1003 Bond Program
144,119 64,924 79,195 144,119Fieldcrest Dr. - Spring Branch Dr. to Dartridge Dr.
0 0Street Resurfacing 00
Economic Vibrancy
06 3rd/1003 Bond Program
247,182 245,629 1,553 247,182Finnell St. - Lombardy Ln. to Rentzel St.
0 0Street Resurfacing 00
Economic Vibrancy
03 4th/1206 Bond Program
15,229 15,229 0 15,229Fitchburg St. - Chalk Hill Rd. to Weir St.
0 0Street Reconstruction
00
Economic Vibrancy
03 4th/1203 Bond Program
378,477 371,443 7,035 378,477Fitchburg St. - Chalk Hill Rd. to Weir St.
0 0Street Reconstruction
00
Economic Vibrancy
03 4th/1712 Bond Program
0 0 0 213,000Five Mile Dr from Frio Dr To Burnside Ave
31,950 0Street Reconstruction -
Local Streets
181,0500
Economic Vibrancy
04, 05 3rd/1003 Bond Program
8,860 4,651 4,209 8,860Five Mile Dr. - Yewpon Ave. to Frio Ln. 0 0Street Resurfacing 00
Economic Vibrancy
04, 05 3rd/1006 Bond Program
273,476 273,476 0 273,476Five Mile Dr. - Yewpon Ave. to Frio Ln. 0 0Street Resurfacing 00
Economic Vibrancy
10 1st/1712 Bond Program
0 0 0 1,200,000Flag Pole Hill Trail from Goforth to the future Park facility at the Jules Muchart Army Reserve Building
180,000 0Trails 1,020,0000
450
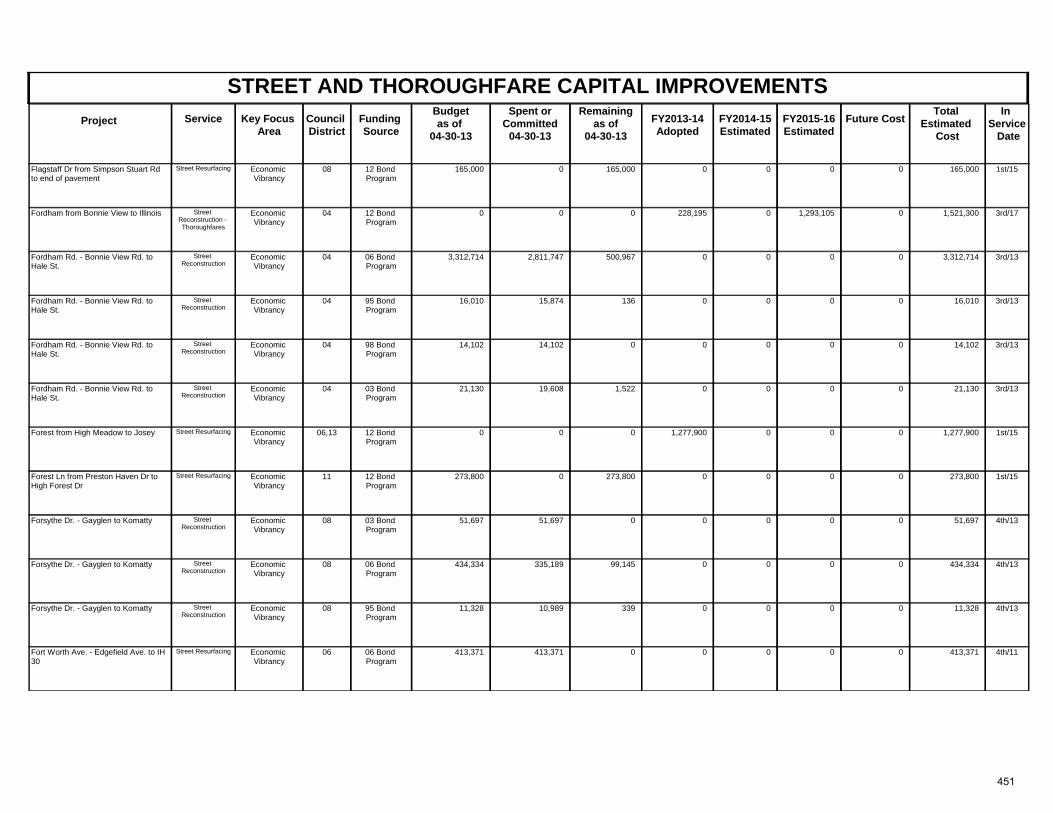
STREET AND THOROUGHFARE CAPITAL IMPROVEMENTSProject Key Focus
AreaCouncil District
Spent orCommitted
04-30-13
Total Estimated
Cost
In Service Date
Funding Source
Remainingas of
04-30-13 FY2013-14
AdoptedFuture CostService FY2014-15
Estimated FY2015-16 Estimated
Budgetas of
04-30-13
Economic Vibrancy
08 1st/1512 Bond Program
165,000 0 165,000 165,000Flagstaff Dr from Simpson Stuart Rd to end of pavement
0 0Street Resurfacing 00
Economic Vibrancy
04 3rd/1712 Bond Program
0 0 0 1,521,300Fordham from Bonnie View to Illinois 228,195 0Street Reconstruction - Thoroughfares
1,293,1050
Economic Vibrancy
04 3rd/1306 Bond Program
3,312,714 2,811,747 500,967 3,312,714Fordham Rd. - Bonnie View Rd. to Hale St.
0 0Street Reconstruction
00
Economic Vibrancy
04 3rd/1395 Bond Program
16,010 15,874 136 16,010Fordham Rd. - Bonnie View Rd. to Hale St.
0 0Street Reconstruction
00
Economic Vibrancy
04 3rd/1398 Bond Program
14,102 14,102 0 14,102Fordham Rd. - Bonnie View Rd. to Hale St.
0 0Street Reconstruction
00
Economic Vibrancy
04 3rd/1303 Bond Program
21,130 19,608 1,522 21,130Fordham Rd. - Bonnie View Rd. to Hale St.
0 0Street Reconstruction
00
Economic Vibrancy
06,13 1st/1512 Bond Program
0 0 0 1,277,900Forest from High Meadow to Josey 1,277,900 0Street Resurfacing 00
Economic Vibrancy
11 1st/1512 Bond Program
273,800 0 273,800 273,800Forest Ln from Preston Haven Dr to High Forest Dr
0 0Street Resurfacing 00
Economic Vibrancy
08 4th/1303 Bond Program
51,697 51,697 0 51,697Forsythe Dr. - Gayglen to Komatty 0 0Street Reconstruction
00
Economic Vibrancy
08 4th/1306 Bond Program
434,334 335,189 99,145 434,334Forsythe Dr. - Gayglen to Komatty 0 0Street Reconstruction
00
Economic Vibrancy
08 4th/1395 Bond Program
11,328 10,989 339 11,328Forsythe Dr. - Gayglen to Komatty 0 0Street Reconstruction
00
Economic Vibrancy
06 4th/1106 Bond Program
413,371 413,371 0 413,371Fort Worth Ave. - Edgefield Ave. to IH 30
0 0Street Resurfacing 00
451
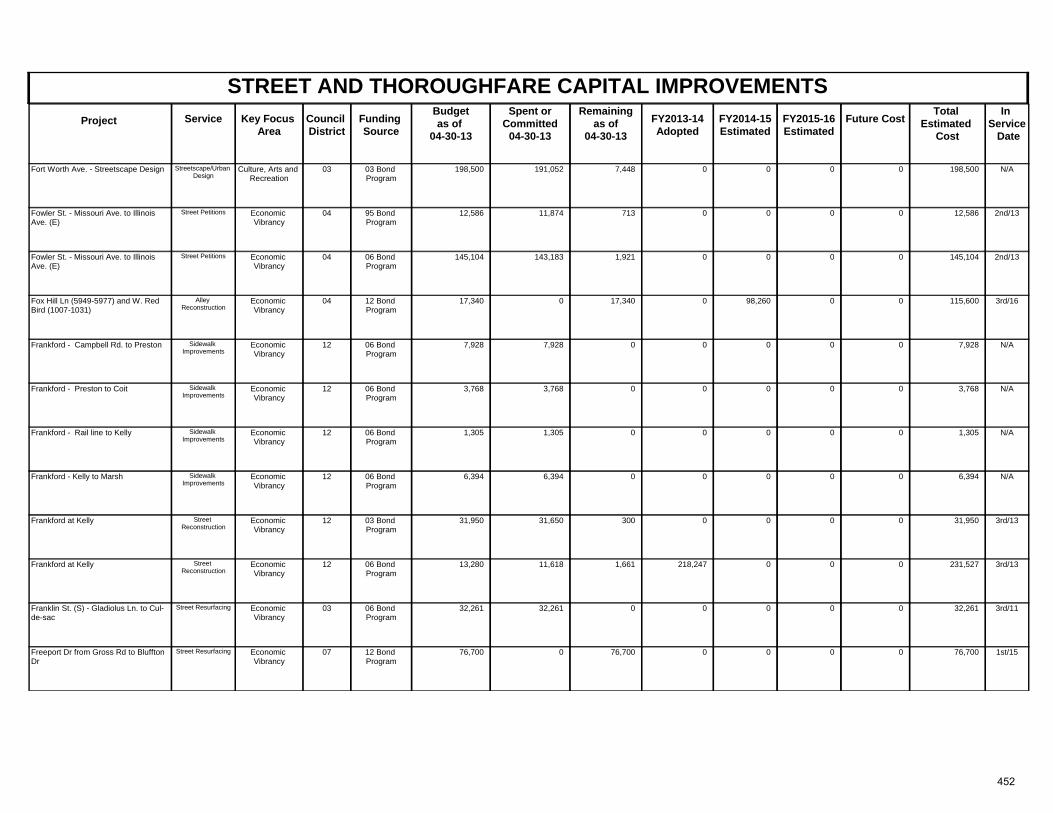
STREET AND THOROUGHFARE CAPITAL IMPROVEMENTSProject Key Focus
AreaCouncil District
Spent orCommitted
04-30-13
Total Estimated
Cost
In Service Date
Funding Source
Remainingas of
04-30-13 FY2013-14
AdoptedFuture CostService FY2014-15
Estimated FY2015-16 Estimated
Budgetas of
04-30-13
Culture, Arts and Recreation
03 N/A03 Bond Program
198,500 191,052 7,448 198,500Fort Worth Ave. - Streetscape Design 0 0Streetscape/Urban Design
00
Economic Vibrancy
04 2nd/1395 Bond Program
12,586 11,874 713 12,586Fowler St. - Missouri Ave. to Illinois Ave. (E)
0 0Street Petitions 00
Economic Vibrancy
04 2nd/1306 Bond Program
145,104 143,183 1,921 145,104Fowler St. - Missouri Ave. to Illinois Ave. (E)
0 0Street Petitions 00
Economic Vibrancy
04 3rd/1612 Bond Program
17,340 0 17,340 115,600Fox Hill Ln (5949-5977) and W. Red Bird (1007-1031)
0 0Alley Reconstruction
098,260
Economic Vibrancy
12 N/A06 Bond Program
7,928 7,928 0 7,928Frankford - Campbell Rd. to Preston 0 0Sidewalk Improvements
00
Economic Vibrancy
12 N/A06 Bond Program
3,768 3,768 0 3,768Frankford - Preston to Coit 0 0Sidewalk Improvements
00
Economic Vibrancy
12 N/A06 Bond Program
1,305 1,305 0 1,305Frankford - Rail line to Kelly 0 0Sidewalk Improvements
00
Economic Vibrancy
12 N/A06 Bond Program
6,394 6,394 0 6,394Frankford - Kelly to Marsh 0 0Sidewalk Improvements
00
Economic Vibrancy
12 3rd/1303 Bond Program
31,950 31,650 300 31,950Frankford at Kelly 0 0Street Reconstruction
00
Economic Vibrancy
12 3rd/1306 Bond Program
13,280 11,618 1,661 231,527Frankford at Kelly 218,247 0Street Reconstruction
00
Economic Vibrancy
03 3rd/1106 Bond Program
32,261 32,261 0 32,261Franklin St. (S) - Gladiolus Ln. to Cul-de-sac
0 0Street Resurfacing 00
Economic Vibrancy
07 1st/1512 Bond Program
76,700 0 76,700 76,700Freeport Dr from Gross Rd to Bluffton Dr
0 0Street Resurfacing 00
452
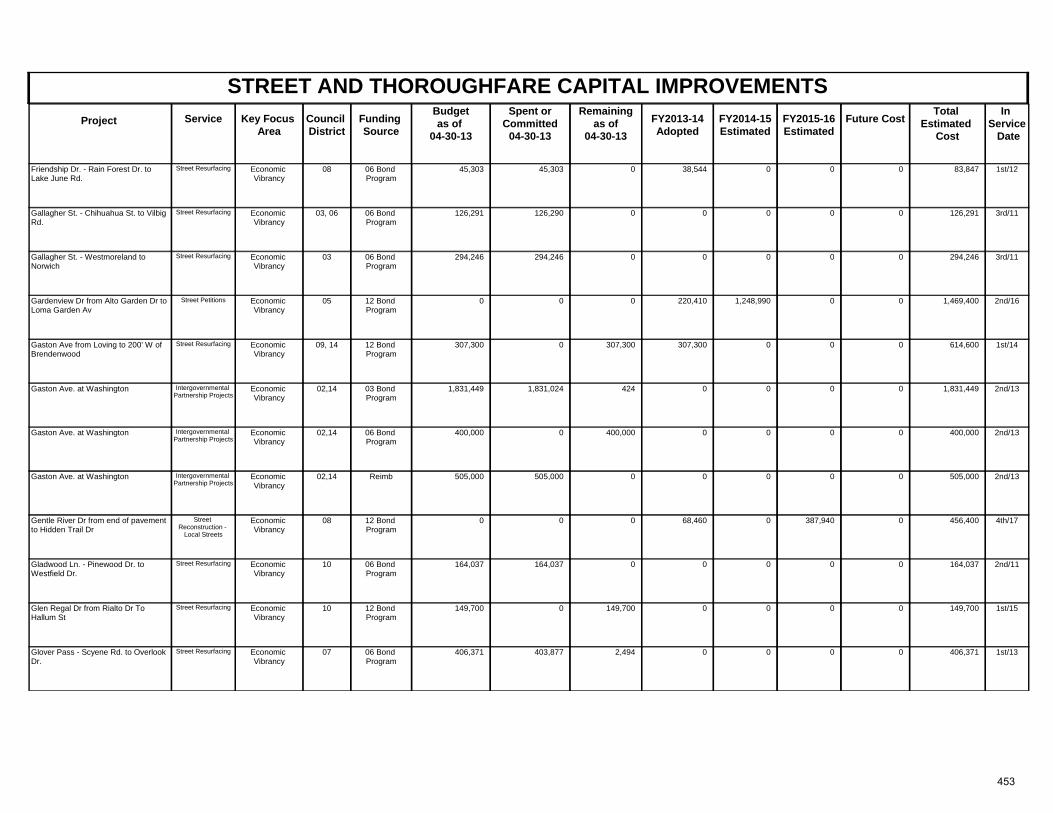
STREET AND THOROUGHFARE CAPITAL IMPROVEMENTSProject Key Focus
AreaCouncil District
Spent orCommitted
04-30-13
Total Estimated
Cost
In Service Date
Funding Source
Remainingas of
04-30-13 FY2013-14
AdoptedFuture CostService FY2014-15
Estimated FY2015-16 Estimated
Budgetas of
04-30-13
Economic Vibrancy
08 1st/1206 Bond Program
45,303 45,303 0 83,847Friendship Dr. - Rain Forest Dr. to Lake June Rd.
38,544 0Street Resurfacing 00
Economic Vibrancy
03, 06 3rd/1106 Bond Program
126,291 126,290 0 126,291Gallagher St. - Chihuahua St. to Vilbig Rd.
0 0Street Resurfacing 00
Economic Vibrancy
03 3rd/1106 Bond Program
294,246 294,246 0 294,246Gallagher St. - Westmoreland to Norwich
0 0Street Resurfacing 00
Economic Vibrancy
05 2nd/1612 Bond Program
0 0 0 1,469,400Gardenview Dr from Alto Garden Dr to Loma Garden Av
220,410 0Street Petitions 01,248,990
Economic Vibrancy
09, 14 1st/1412 Bond Program
307,300 0 307,300 614,600Gaston Ave from Loving to 200' W of Brendenwood
307,300 0Street Resurfacing 00
Economic Vibrancy
02,14 2nd/1303 Bond Program
1,831,449 1,831,024 424 1,831,449Gaston Ave. at Washington 0 0Intergovernmental Partnership Projects
00
Economic Vibrancy
02,14 2nd/1306 Bond Program
400,000 0 400,000 400,000Gaston Ave. at Washington 0 0Intergovernmental Partnership Projects
00
Economic Vibrancy
02,14 2nd/13Reimb 505,000 505,000 0 505,000Gaston Ave. at Washington 0 0Intergovernmental Partnership Projects
00
Economic Vibrancy
08 4th/1712 Bond Program
0 0 0 456,400Gentle River Dr from end of pavement to Hidden Trail Dr
68,460 0Street Reconstruction -
Local Streets
387,9400
Economic Vibrancy
10 2nd/1106 Bond Program
164,037 164,037 0 164,037Gladwood Ln. - Pinewood Dr. to Westfield Dr.
0 0Street Resurfacing 00
Economic Vibrancy
10 1st/1512 Bond Program
149,700 0 149,700 149,700Glen Regal Dr from Rialto Dr To Hallum St
0 0Street Resurfacing 00
Economic Vibrancy
07 1st/1306 Bond Program
406,371 403,877 2,494 406,371Glover Pass - Scyene Rd. to Overlook Dr.
0 0Street Resurfacing 00
453
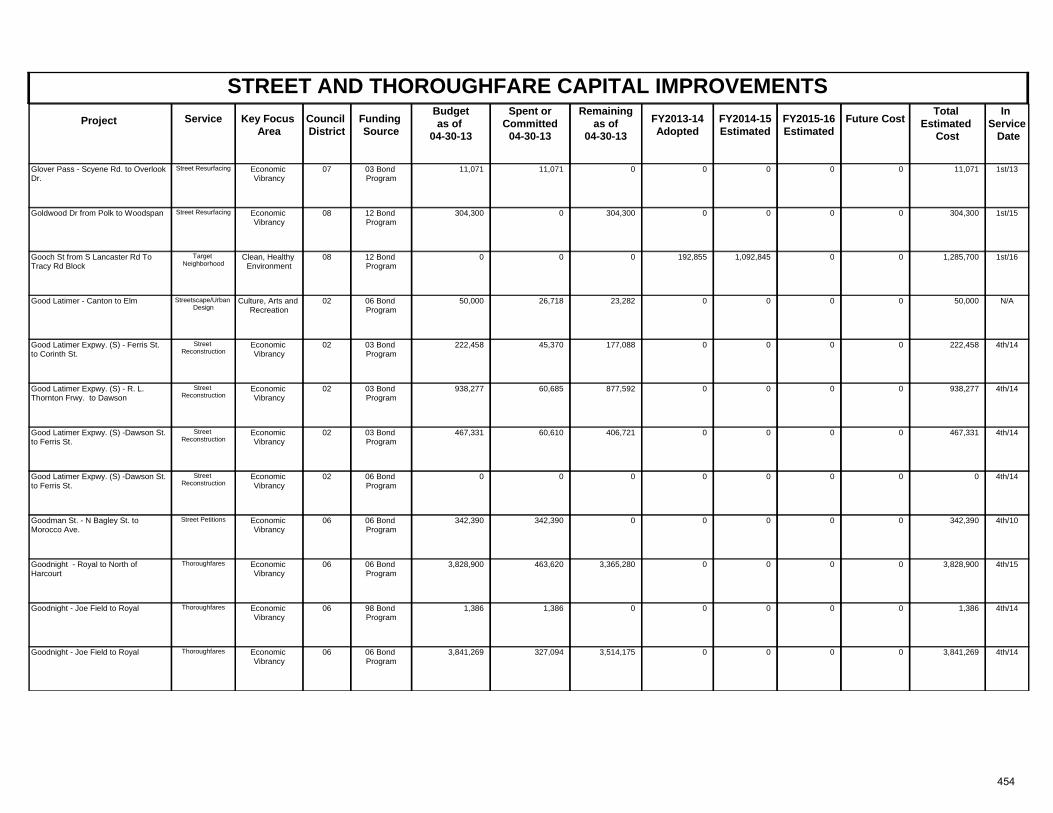
STREET AND THOROUGHFARE CAPITAL IMPROVEMENTSProject Key Focus
AreaCouncil District
Spent orCommitted
04-30-13
Total Estimated
Cost
In Service Date
Funding Source
Remainingas of
04-30-13 FY2013-14
AdoptedFuture CostService FY2014-15
Estimated FY2015-16 Estimated
Budgetas of
04-30-13
Economic Vibrancy
07 1st/1303 Bond Program
11,071 11,071 0 11,071Glover Pass - Scyene Rd. to Overlook Dr.
0 0Street Resurfacing 00
Economic Vibrancy
08 1st/1512 Bond Program
304,300 0 304,300 304,300Goldwood Dr from Polk to Woodspan 0 0Street Resurfacing 00
Clean, Healthy Environment
08 1st/1612 Bond Program
0 0 0 1,285,700Gooch St from S Lancaster Rd To Tracy Rd Block
192,855 0Target Neighborhood
01,092,845
Culture, Arts and Recreation
02 N/A06 Bond Program
50,000 26,718 23,282 50,000Good Latimer - Canton to Elm 0 0Streetscape/Urban Design
00
Economic Vibrancy
02 4th/1403 Bond Program
222,458 45,370 177,088 222,458Good Latimer Expwy. (S) - Ferris St. to Corinth St.
0 0Street Reconstruction
00
Economic Vibrancy
02 4th/1403 Bond Program
938,277 60,685 877,592 938,277Good Latimer Expwy. (S) - R. L. Thornton Frwy. to Dawson
0 0Street Reconstruction
00
Economic Vibrancy
02 4th/1403 Bond Program
467,331 60,610 406,721 467,331Good Latimer Expwy. (S) -Dawson St. to Ferris St.
0 0Street Reconstruction
00
Economic Vibrancy
02 4th/1406 Bond Program
0 0 0 0Good Latimer Expwy. (S) -Dawson St. to Ferris St.
0 0Street Reconstruction
00
Economic Vibrancy
06 4th/1006 Bond Program
342,390 342,390 0 342,390Goodman St. - N Bagley St. to Morocco Ave.
0 0Street Petitions 00
Economic Vibrancy
06 4th/1506 Bond Program
3,828,900 463,620 3,365,280 3,828,900Goodnight - Royal to North of Harcourt
0 0Thoroughfares 00
Economic Vibrancy
06 4th/1498 Bond Program
1,386 1,386 0 1,386Goodnight - Joe Field to Royal 0 0Thoroughfares 00
Economic Vibrancy
06 4th/1406 Bond Program
3,841,269 327,094 3,514,175 3,841,269Goodnight - Joe Field to Royal 0 0Thoroughfares 00
454
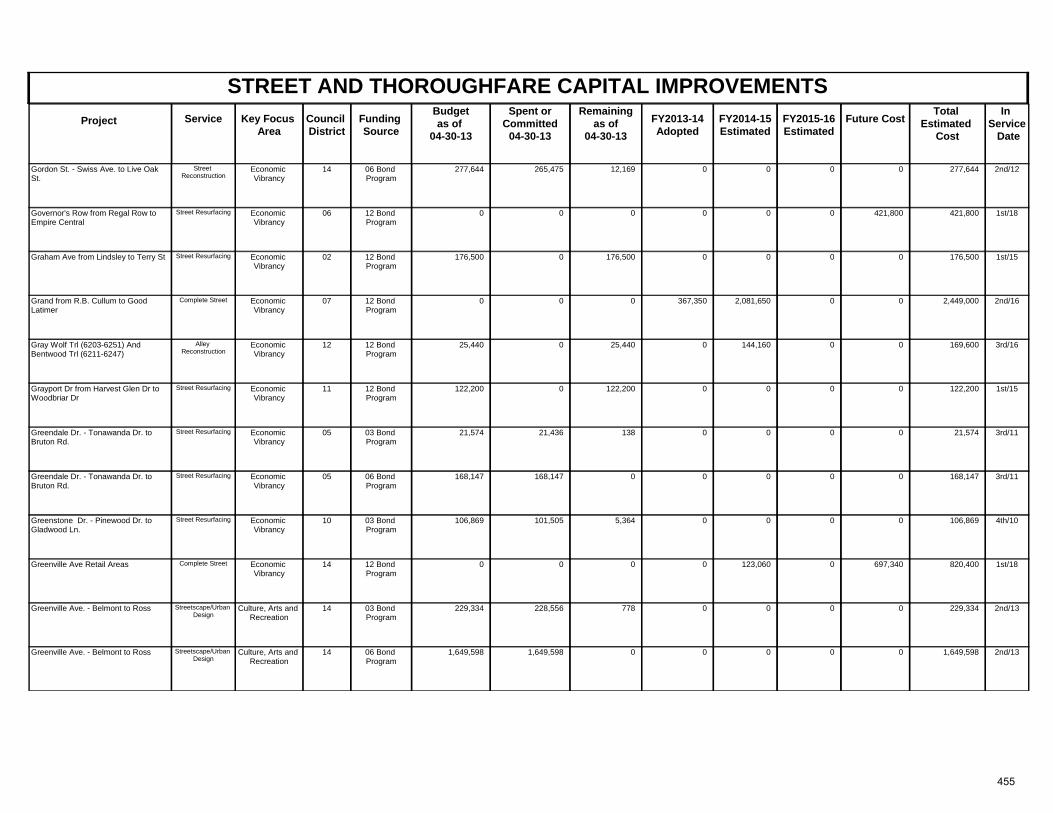
STREET AND THOROUGHFARE CAPITAL IMPROVEMENTSProject Key Focus
AreaCouncil District
Spent orCommitted
04-30-13
Total Estimated
Cost
In Service Date
Funding Source
Remainingas of
04-30-13 FY2013-14
AdoptedFuture CostService FY2014-15
Estimated FY2015-16 Estimated
Budgetas of
04-30-13
Economic Vibrancy
14 2nd/1206 Bond Program
277,644 265,475 12,169 277,644Gordon St. - Swiss Ave. to Live Oak St.
0 0Street Reconstruction
00
Economic Vibrancy
06 1st/1812 Bond Program
0 0 0 421,800Governor's Row from Regal Row to Empire Central
0 421,800Street Resurfacing 00
Economic Vibrancy
02 1st/1512 Bond Program
176,500 0 176,500 176,500Graham Ave from Lindsley to Terry St 0 0Street Resurfacing 00
Economic Vibrancy
07 2nd/1612 Bond Program
0 0 0 2,449,000Grand from R.B. Cullum to Good Latimer
367,350 0Complete Street 02,081,650
Economic Vibrancy
12 3rd/1612 Bond Program
25,440 0 25,440 169,600Gray Wolf Trl (6203-6251) And Bentwood Trl (6211-6247)
0 0Alley Reconstruction
0144,160
Economic Vibrancy
11 1st/1512 Bond Program
122,200 0 122,200 122,200Grayport Dr from Harvest Glen Dr to Woodbriar Dr
0 0Street Resurfacing 00
Economic Vibrancy
05 3rd/1103 Bond Program
21,574 21,436 138 21,574Greendale Dr. - Tonawanda Dr. to Bruton Rd.
0 0Street Resurfacing 00
Economic Vibrancy
05 3rd/1106 Bond Program
168,147 168,147 0 168,147Greendale Dr. - Tonawanda Dr. to Bruton Rd.
0 0Street Resurfacing 00
Economic Vibrancy
10 4th/1003 Bond Program
106,869 101,505 5,364 106,869Greenstone Dr. - Pinewood Dr. to Gladwood Ln.
0 0Street Resurfacing 00
Economic Vibrancy
14 1st/1812 Bond Program
0 0 0 820,400Greenville Ave Retail Areas 0 697,340Complete Street 0123,060
Culture, Arts and Recreation
14 2nd/1303 Bond Program
229,334 228,556 778 229,334Greenville Ave. - Belmont to Ross 0 0Streetscape/Urban Design
00
Culture, Arts and Recreation
14 2nd/1306 Bond Program
1,649,598 1,649,598 0 1,649,598Greenville Ave. - Belmont to Ross 0 0Streetscape/Urban Design
00
455
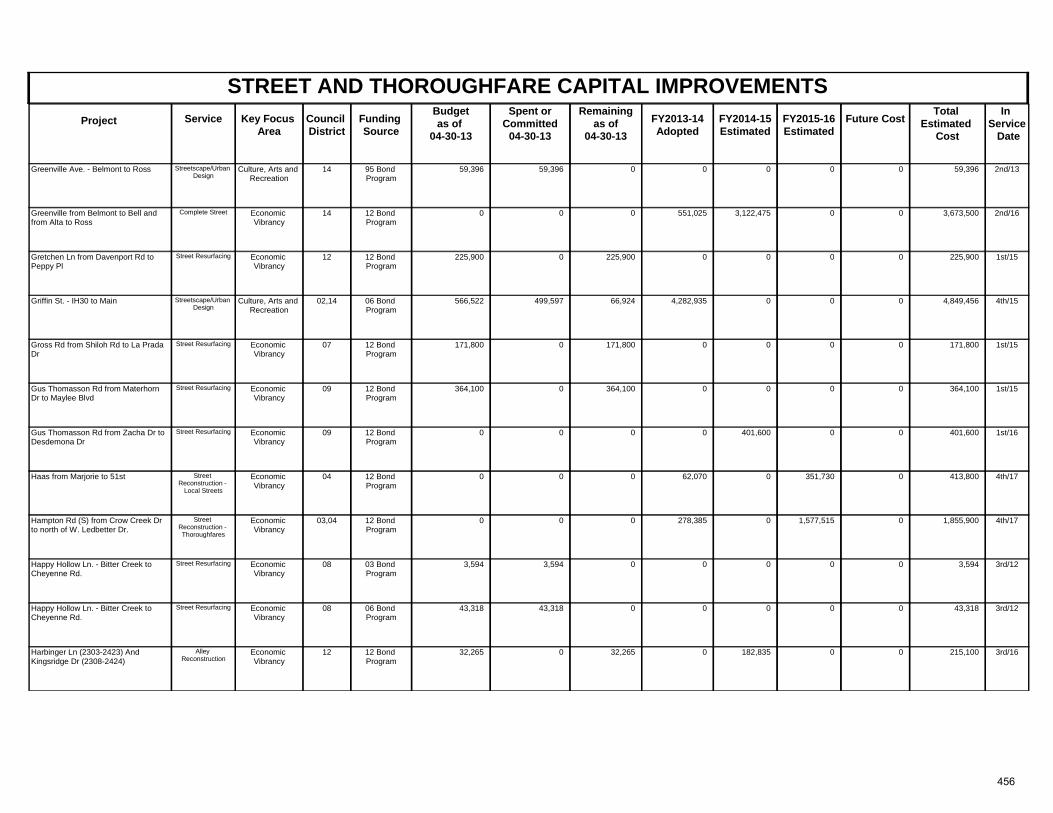
STREET AND THOROUGHFARE CAPITAL IMPROVEMENTSProject Key Focus
AreaCouncil District
Spent orCommitted
04-30-13
Total Estimated
Cost
In Service Date
Funding Source
Remainingas of
04-30-13 FY2013-14
AdoptedFuture CostService FY2014-15
Estimated FY2015-16 Estimated
Budgetas of
04-30-13
Culture, Arts and Recreation
14 2nd/1395 Bond Program
59,396 59,396 0 59,396Greenville Ave. - Belmont to Ross 0 0Streetscape/Urban Design
00
Economic Vibrancy
14 2nd/1612 Bond Program
0 0 0 3,673,500Greenville from Belmont to Bell and from Alta to Ross
551,025 0Complete Street 03,122,475
Economic Vibrancy
12 1st/1512 Bond Program
225,900 0 225,900 225,900Gretchen Ln from Davenport Rd to Peppy Pl
0 0Street Resurfacing 00
Culture, Arts and Recreation
02,14 4th/1506 Bond Program
566,522 499,597 66,924 4,849,456Griffin St. - IH30 to Main 4,282,935 0Streetscape/Urban Design
00
Economic Vibrancy
07 1st/1512 Bond Program
171,800 0 171,800 171,800Gross Rd from Shiloh Rd to La Prada Dr
0 0Street Resurfacing 00
Economic Vibrancy
09 1st/1512 Bond Program
364,100 0 364,100 364,100Gus Thomasson Rd from Materhorn Dr to Maylee Blvd
0 0Street Resurfacing 00
Economic Vibrancy
09 1st/1612 Bond Program
0 0 0 401,600Gus Thomasson Rd from Zacha Dr to Desdemona Dr
0 0Street Resurfacing 0401,600
Economic Vibrancy
04 4th/1712 Bond Program
0 0 0 413,800Haas from Marjorie to 51st 62,070 0Street Reconstruction -
Local Streets
351,7300
Economic Vibrancy
03,04 4th/1712 Bond Program
0 0 0 1,855,900Hampton Rd (S) from Crow Creek Dr to north of W. Ledbetter Dr.
278,385 0Street Reconstruction - Thoroughfares
1,577,5150
Economic Vibrancy
08 3rd/1203 Bond Program
3,594 3,594 0 3,594Happy Hollow Ln. - Bitter Creek to Cheyenne Rd.
0 0Street Resurfacing 00
Economic Vibrancy
08 3rd/1206 Bond Program
43,318 43,318 0 43,318Happy Hollow Ln. - Bitter Creek to Cheyenne Rd.
0 0Street Resurfacing 00
Economic Vibrancy
12 3rd/1612 Bond Program
32,265 0 32,265 215,100Harbinger Ln (2303-2423) And Kingsridge Dr (2308-2424)
0 0Alley Reconstruction
0182,835
456
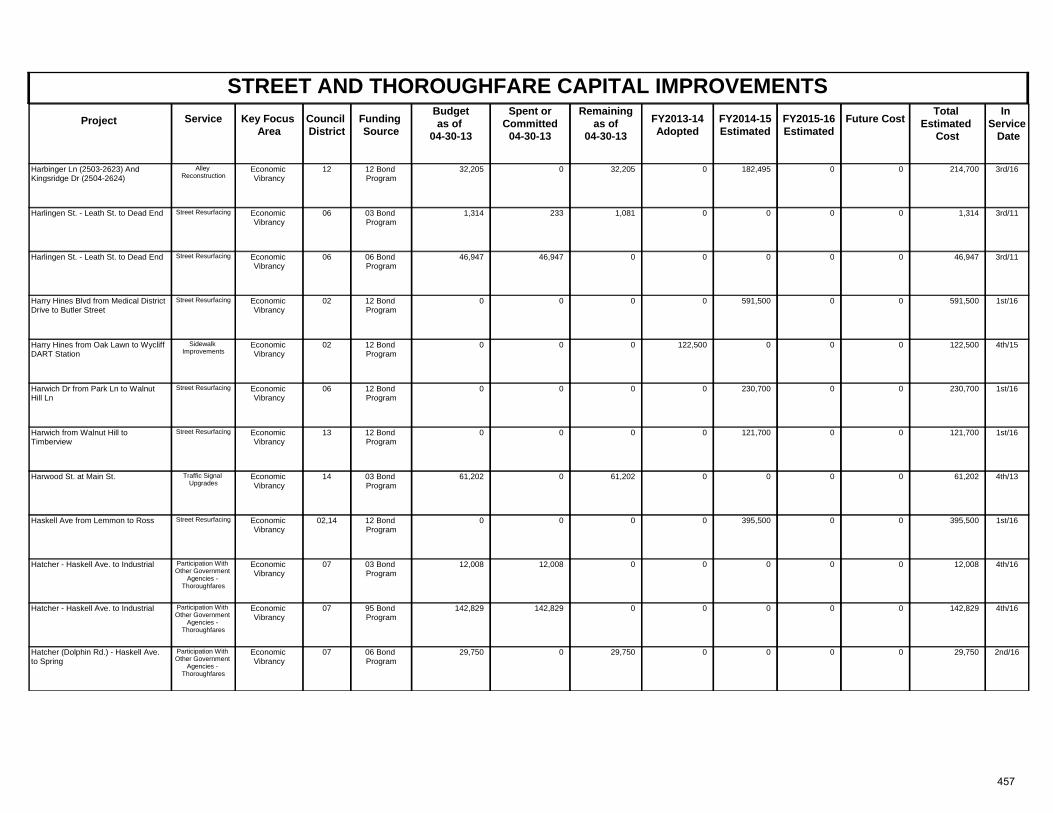
STREET AND THOROUGHFARE CAPITAL IMPROVEMENTSProject Key Focus
AreaCouncil District
Spent orCommitted
04-30-13
Total Estimated
Cost
In Service Date
Funding Source
Remainingas of
04-30-13 FY2013-14
AdoptedFuture CostService FY2014-15
Estimated FY2015-16 Estimated
Budgetas of
04-30-13
Economic Vibrancy
12 3rd/1612 Bond Program
32,205 0 32,205 214,700Harbinger Ln (2503-2623) And Kingsridge Dr (2504-2624)
0 0Alley Reconstruction
0182,495
Economic Vibrancy
06 3rd/1103 Bond Program
1,314 233 1,081 1,314Harlingen St. - Leath St. to Dead End 0 0Street Resurfacing 00
Economic Vibrancy
06 3rd/1106 Bond Program
46,947 46,947 0 46,947Harlingen St. - Leath St. to Dead End 0 0Street Resurfacing 00
Economic Vibrancy
02 1st/1612 Bond Program
0 0 0 591,500Harry Hines Blvd from Medical District Drive to Butler Street
0 0Street Resurfacing 0591,500
Economic Vibrancy
02 4th/1512 Bond Program
0 0 0 122,500Harry Hines from Oak Lawn to Wycliff DART Station
122,500 0Sidewalk Improvements
00
Economic Vibrancy
06 1st/1612 Bond Program
0 0 0 230,700Harwich Dr from Park Ln to Walnut Hill Ln
0 0Street Resurfacing 0230,700
Economic Vibrancy
13 1st/1612 Bond Program
0 0 0 121,700Harwich from Walnut Hill to Timberview
0 0Street Resurfacing 0121,700
Economic Vibrancy
14 4th/1303 Bond Program
61,202 0 61,202 61,202Harwood St. at Main St. 0 0Traffic Signal Upgrades
00
Economic Vibrancy
02,14 1st/1612 Bond Program
0 0 0 395,500Haskell Ave from Lemmon to Ross 0 0Street Resurfacing 0395,500
Economic Vibrancy
07 4th/1603 Bond Program
12,008 12,008 0 12,008Hatcher - Haskell Ave. to Industrial 0 0Participation With Other Government
Agencies - Thoroughfares
00
Economic Vibrancy
07 4th/1695 Bond Program
142,829 142,829 0 142,829Hatcher - Haskell Ave. to Industrial 0 0Participation With Other Government
Agencies - Thoroughfares
00
Economic Vibrancy
07 2nd/1606 Bond Program
29,750 0 29,750 29,750Hatcher (Dolphin Rd.) - Haskell Ave. to Spring
0 0Participation With Other Government
Agencies - Thoroughfares
00
457
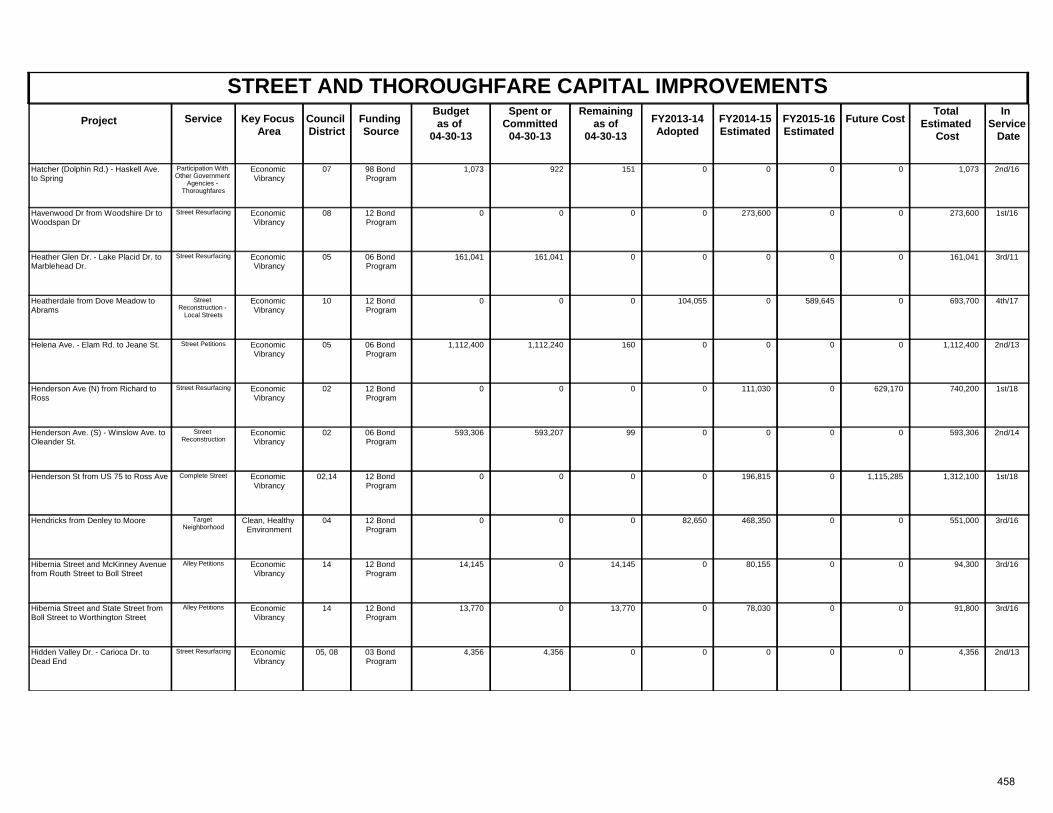
STREET AND THOROUGHFARE CAPITAL IMPROVEMENTSProject Key Focus
AreaCouncil District
Spent orCommitted
04-30-13
Total Estimated
Cost
In Service Date
Funding Source
Remainingas of
04-30-13 FY2013-14
AdoptedFuture CostService FY2014-15
Estimated FY2015-16 Estimated
Budgetas of
04-30-13
Economic Vibrancy
07 2nd/1698 Bond Program
1,073 922 151 1,073Hatcher (Dolphin Rd.) - Haskell Ave. to Spring
0 0Participation With Other Government
Agencies - Thoroughfares
00
Economic Vibrancy
08 1st/1612 Bond Program
0 0 0 273,600Havenwood Dr from Woodshire Dr to Woodspan Dr
0 0Street Resurfacing 0273,600
Economic Vibrancy
05 3rd/1106 Bond Program
161,041 161,041 0 161,041Heather Glen Dr. - Lake Placid Dr. to Marblehead Dr.
0 0Street Resurfacing 00
Economic Vibrancy
10 4th/1712 Bond Program
0 0 0 693,700Heatherdale from Dove Meadow to Abrams
104,055 0Street Reconstruction -
Local Streets
589,6450
Economic Vibrancy
05 2nd/1306 Bond Program
1,112,400 1,112,240 160 1,112,400Helena Ave. - Elam Rd. to Jeane St. 0 0Street Petitions 00
Economic Vibrancy
02 1st/1812 Bond Program
0 0 0 740,200Henderson Ave (N) from Richard to Ross
0 629,170Street Resurfacing 0111,030
Economic Vibrancy
02 2nd/1406 Bond Program
593,306 593,207 99 593,306Henderson Ave. (S) - Winslow Ave. to Oleander St.
0 0Street Reconstruction
00
Economic Vibrancy
02,14 1st/1812 Bond Program
0 0 0 1,312,100Henderson St from US 75 to Ross Ave 0 1,115,285Complete Street 0196,815
Clean, Healthy Environment
04 3rd/1612 Bond Program
0 0 0 551,000Hendricks from Denley to Moore 82,650 0Target Neighborhood
0468,350
Economic Vibrancy
14 3rd/1612 Bond Program
14,145 0 14,145 94,300Hibernia Street and McKinney Avenue from Routh Street to Boll Street
0 0Alley Petitions 080,155
Economic Vibrancy
14 3rd/1612 Bond Program
13,770 0 13,770 91,800Hibernia Street and State Street from Boll Street to Worthington Street
0 0Alley Petitions 078,030
Economic Vibrancy
05, 08 2nd/1303 Bond Program
4,356 4,356 0 4,356Hidden Valley Dr. - Carioca Dr. to Dead End
0 0Street Resurfacing 00
458
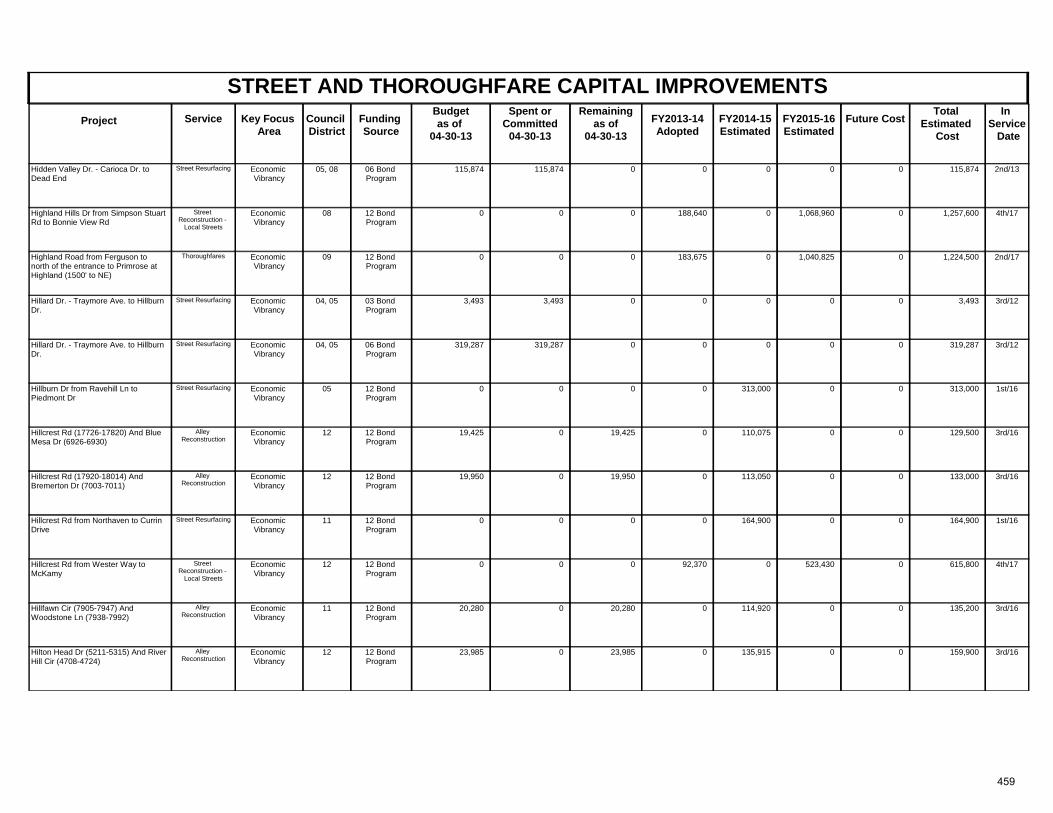
STREET AND THOROUGHFARE CAPITAL IMPROVEMENTSProject Key Focus
AreaCouncil District
Spent orCommitted
04-30-13
Total Estimated
Cost
In Service Date
Funding Source
Remainingas of
04-30-13 FY2013-14
AdoptedFuture CostService FY2014-15
Estimated FY2015-16 Estimated
Budgetas of
04-30-13
Economic Vibrancy
05, 08 2nd/1306 Bond Program
115,874 115,874 0 115,874Hidden Valley Dr. - Carioca Dr. to Dead End
0 0Street Resurfacing 00
Economic Vibrancy
08 4th/1712 Bond Program
0 0 0 1,257,600Highland Hills Dr from Simpson Stuart Rd to Bonnie View Rd
188,640 0Street Reconstruction -
Local Streets
1,068,9600
Economic Vibrancy
09 2nd/1712 Bond Program
0 0 0 1,224,500Highland Road from Ferguson to north of the entrance to Primrose at Highland (1500' to NE)
183,675 0Thoroughfares 1,040,8250
Economic Vibrancy
04, 05 3rd/1203 Bond Program
3,493 3,493 0 3,493Hillard Dr. - Traymore Ave. to Hillburn Dr.
0 0Street Resurfacing 00
Economic Vibrancy
04, 05 3rd/1206 Bond Program
319,287 319,287 0 319,287Hillard Dr. - Traymore Ave. to Hillburn Dr.
0 0Street Resurfacing 00
Economic Vibrancy
05 1st/1612 Bond Program
0 0 0 313,000Hillburn Dr from Ravehill Ln to Piedmont Dr
0 0Street Resurfacing 0313,000
Economic Vibrancy
12 3rd/1612 Bond Program
19,425 0 19,425 129,500Hillcrest Rd (17726-17820) And Blue Mesa Dr (6926-6930)
0 0Alley Reconstruction
0110,075
Economic Vibrancy
12 3rd/1612 Bond Program
19,950 0 19,950 133,000Hillcrest Rd (17920-18014) And Bremerton Dr (7003-7011)
0 0Alley Reconstruction
0113,050
Economic Vibrancy
11 1st/1612 Bond Program
0 0 0 164,900Hillcrest Rd from Northaven to Currin Drive
0 0Street Resurfacing 0164,900
Economic Vibrancy
12 4th/1712 Bond Program
0 0 0 615,800Hillcrest Rd from Wester Way to McKamy
92,370 0Street Reconstruction -
Local Streets
523,4300
Economic Vibrancy
11 3rd/1612 Bond Program
20,280 0 20,280 135,200Hillfawn Cir (7905-7947) And Woodstone Ln (7938-7992)
0 0Alley Reconstruction
0114,920
Economic Vibrancy
12 3rd/1612 Bond Program
23,985 0 23,985 159,900Hilton Head Dr (5211-5315) And River Hill Cir (4708-4724)
0 0Alley Reconstruction
0135,915
459
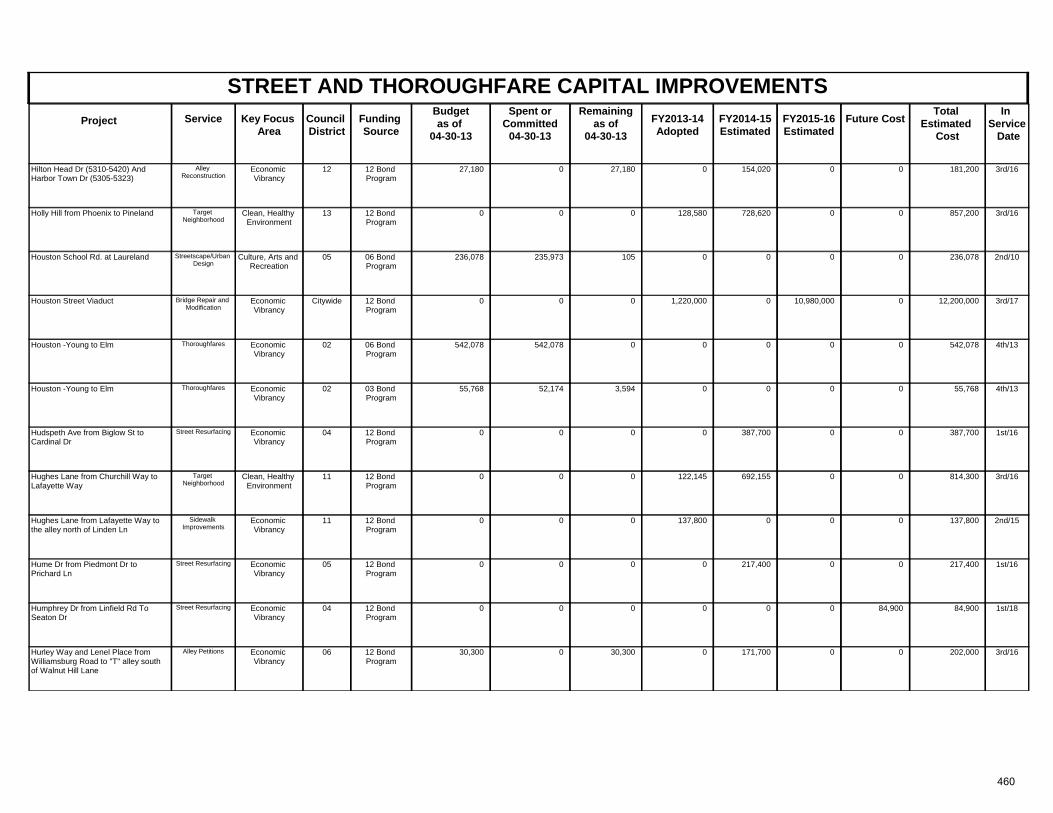
STREET AND THOROUGHFARE CAPITAL IMPROVEMENTSProject Key Focus
AreaCouncil District
Spent orCommitted
04-30-13
Total Estimated
Cost
In Service Date
Funding Source
Remainingas of
04-30-13 FY2013-14
AdoptedFuture CostService FY2014-15
Estimated FY2015-16 Estimated
Budgetas of
04-30-13
Economic Vibrancy
12 3rd/1612 Bond Program
27,180 0 27,180 181,200Hilton Head Dr (5310-5420) And Harbor Town Dr (5305-5323)
0 0Alley Reconstruction
0154,020
Clean, Healthy Environment
13 3rd/1612 Bond Program
0 0 0 857,200Holly Hill from Phoenix to Pineland 128,580 0Target Neighborhood
0728,620
Culture, Arts and Recreation
05 2nd/1006 Bond Program
236,078 235,973 105 236,078Houston School Rd. at Laureland 0 0Streetscape/Urban Design
00
Economic Vibrancy
Citywide 3rd/1712 Bond Program
0 0 0 12,200,000Houston Street Viaduct 1,220,000 0Bridge Repair and Modification
10,980,0000
Economic Vibrancy
02 4th/1306 Bond Program
542,078 542,078 0 542,078Houston -Young to Elm 0 0Thoroughfares 00
Economic Vibrancy
02 4th/1303 Bond Program
55,768 52,174 3,594 55,768Houston -Young to Elm 0 0Thoroughfares 00
Economic Vibrancy
04 1st/1612 Bond Program
0 0 0 387,700Hudspeth Ave from Biglow St to Cardinal Dr
0 0Street Resurfacing 0387,700
Clean, Healthy Environment
11 3rd/1612 Bond Program
0 0 0 814,300Hughes Lane from Churchill Way to Lafayette Way
122,145 0Target Neighborhood
0692,155
Economic Vibrancy
11 2nd/1512 Bond Program
0 0 0 137,800Hughes Lane from Lafayette Way to the alley north of Linden Ln
137,800 0Sidewalk Improvements
00
Economic Vibrancy
05 1st/1612 Bond Program
0 0 0 217,400Hume Dr from Piedmont Dr to Prichard Ln
0 0Street Resurfacing 0217,400
Economic Vibrancy
04 1st/1812 Bond Program
0 0 0 84,900Humphrey Dr from Linfield Rd To Seaton Dr
0 84,900Street Resurfacing 00
Economic Vibrancy
06 3rd/1612 Bond Program
30,300 0 30,300 202,000Hurley Way and Lenel Place from Williamsburg Road to "T" alley south of Walnut Hill Lane
0 0Alley Petitions 0171,700
460
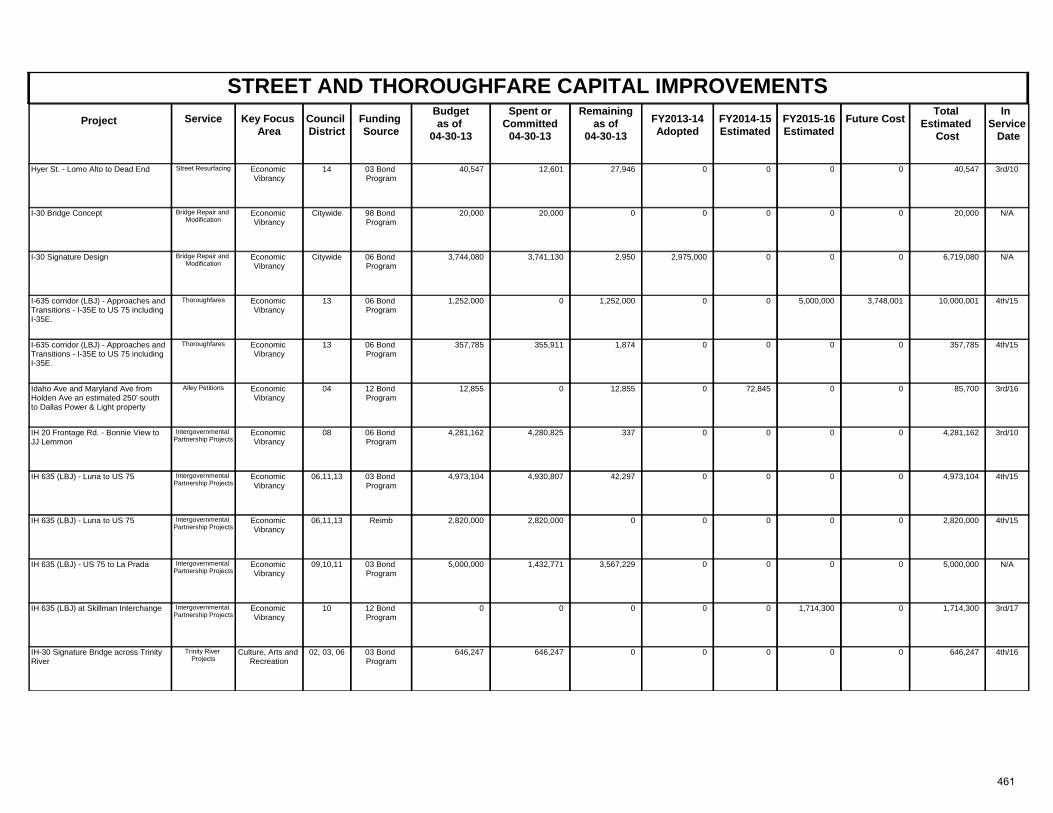
STREET AND THOROUGHFARE CAPITAL IMPROVEMENTSProject Key Focus
AreaCouncil District
Spent orCommitted
04-30-13
Total Estimated
Cost
In Service Date
Funding Source
Remainingas of
04-30-13 FY2013-14
AdoptedFuture CostService FY2014-15
Estimated FY2015-16 Estimated
Budgetas of
04-30-13
Economic Vibrancy
14 3rd/1003 Bond Program
40,547 12,601 27,946 40,547Hyer St. - Lomo Alto to Dead End 0 0Street Resurfacing 00
Economic Vibrancy
Citywide N/A98 Bond Program
20,000 20,000 0 20,000I-30 Bridge Concept 0 0Bridge Repair and Modification
00
Economic Vibrancy
Citywide N/A06 Bond Program
3,744,080 3,741,130 2,950 6,719,080I-30 Signature Design 2,975,000 0Bridge Repair and Modification
00
Economic Vibrancy
13 4th/1506 Bond Program
1,252,000 0 1,252,000 10,000,001I-635 corridor (LBJ) - Approaches and Transitions - I-35E to US 75 including I-35E.
0 3,748,001Thoroughfares 5,000,0000
Economic Vibrancy
13 4th/1506 Bond Program
357,785 355,911 1,874 357,785I-635 corridor (LBJ) - Approaches and Transitions - I-35E to US 75 including I-35E.
0 0Thoroughfares 00
Economic Vibrancy
04 3rd/1612 Bond Program
12,855 0 12,855 85,700Idaho Ave and Maryland Ave from Holden Ave an estimated 250' south to Dallas Power & Light property
0 0Alley Petitions 072,845
Economic Vibrancy
08 3rd/1006 Bond Program
4,281,162 4,280,825 337 4,281,162IH 20 Frontage Rd. - Bonnie View to JJ Lemmon
0 0Intergovernmental Partnership Projects
00
Economic Vibrancy
06,11,13 4th/1503 Bond Program
4,973,104 4,930,807 42,297 4,973,104IH 635 (LBJ) - Luna to US 75 0 0Intergovernmental Partnership Projects
00
Economic Vibrancy
06,11,13 4th/15Reimb 2,820,000 2,820,000 0 2,820,000IH 635 (LBJ) - Luna to US 75 0 0Intergovernmental Partnership Projects
00
Economic Vibrancy
09,10,11 N/A03 Bond Program
5,000,000 1,432,771 3,567,229 5,000,000IH 635 (LBJ) - US 75 to La Prada 0 0Intergovernmental Partnership Projects
00
Economic Vibrancy
10 3rd/1712 Bond Program
0 0 0 1,714,300IH 635 (LBJ) at Skillman Interchange 0 0Intergovernmental Partnership Projects
1,714,3000
Culture, Arts and Recreation
02, 03, 06 4th/1603 Bond Program
646,247 646,247 0 646,247IH-30 Signature Bridge across Trinity River
0 0Trinity River Projects
00
461
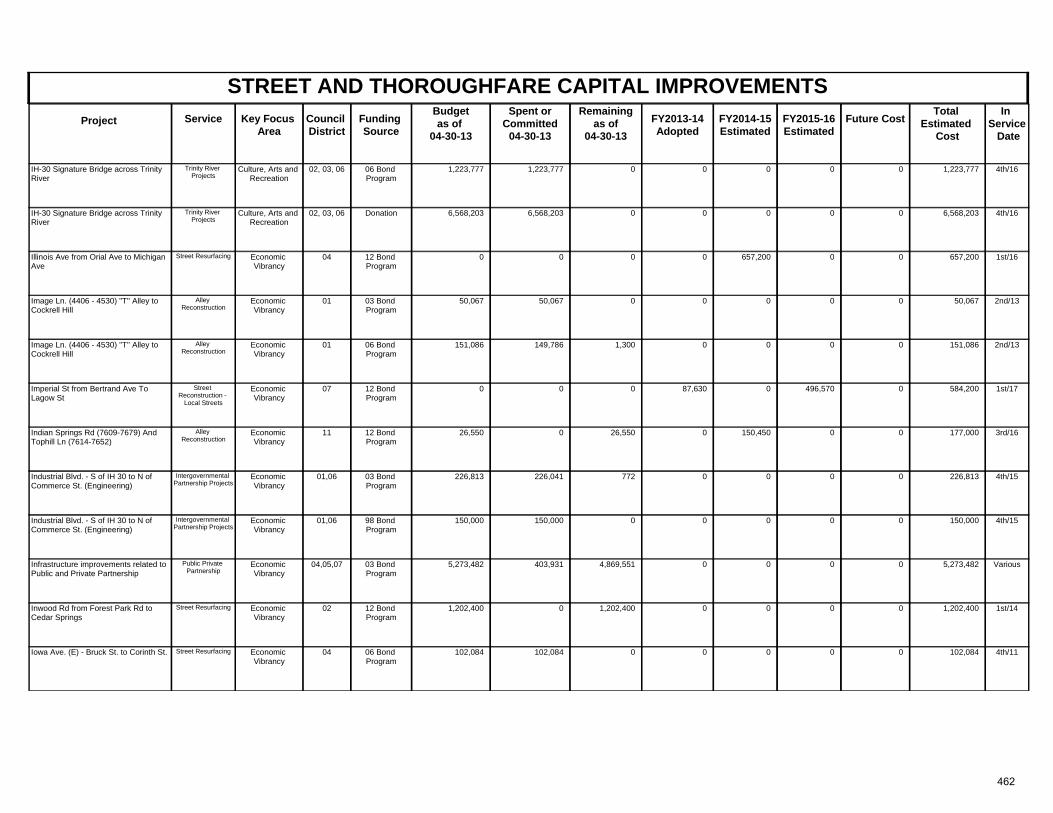
STREET AND THOROUGHFARE CAPITAL IMPROVEMENTSProject Key Focus
AreaCouncil District
Spent orCommitted
04-30-13
Total Estimated
Cost
In Service Date
Funding Source
Remainingas of
04-30-13 FY2013-14
AdoptedFuture CostService FY2014-15
Estimated FY2015-16 Estimated
Budgetas of
04-30-13
Culture, Arts and Recreation
02, 03, 06 4th/1606 Bond Program
1,223,777 1,223,777 0 1,223,777IH-30 Signature Bridge across Trinity River
0 0Trinity River Projects
00
Culture, Arts and Recreation
02, 03, 06 4th/16Donation 6,568,203 6,568,203 0 6,568,203IH-30 Signature Bridge across Trinity River
0 0Trinity River Projects
00
Economic Vibrancy
04 1st/1612 Bond Program
0 0 0 657,200Illinois Ave from Orial Ave to Michigan Ave
0 0Street Resurfacing 0657,200
Economic Vibrancy
01 2nd/1303 Bond Program
50,067 50,067 0 50,067Image Ln. (4406 - 4530) "T" Alley to Cockrell Hill
0 0Alley Reconstruction
00
Economic Vibrancy
01 2nd/1306 Bond Program
151,086 149,786 1,300 151,086Image Ln. (4406 - 4530) "T" Alley to Cockrell Hill
0 0Alley Reconstruction
00
Economic Vibrancy
07 1st/1712 Bond Program
0 0 0 584,200Imperial St from Bertrand Ave To Lagow St
87,630 0Street Reconstruction -
Local Streets
496,5700
Economic Vibrancy
11 3rd/1612 Bond Program
26,550 0 26,550 177,000Indian Springs Rd (7609-7679) And Tophill Ln (7614-7652)
0 0Alley Reconstruction
0150,450
Economic Vibrancy
01,06 4th/1503 Bond Program
226,813 226,041 772 226,813Industrial Blvd. - S of IH 30 to N of Commerce St. (Engineering)
0 0Intergovernmental Partnership Projects
00
Economic Vibrancy
01,06 4th/1598 Bond Program
150,000 150,000 0 150,000Industrial Blvd. - S of IH 30 to N of Commerce St. (Engineering)
0 0Intergovernmental Partnership Projects
00
Economic Vibrancy
04,05,07 Various03 Bond Program
5,273,482 403,931 4,869,551 5,273,482Infrastructure improvements related to Public and Private Partnership
0 0Public Private Partnership
00
Economic Vibrancy
02 1st/1412 Bond Program
1,202,400 0 1,202,400 1,202,400Inwood Rd from Forest Park Rd to Cedar Springs
0 0Street Resurfacing 00
Economic Vibrancy
04 4th/1106 Bond Program
102,084 102,084 0 102,084Iowa Ave. (E) - Bruck St. to Corinth St. 0 0Street Resurfacing 00
462
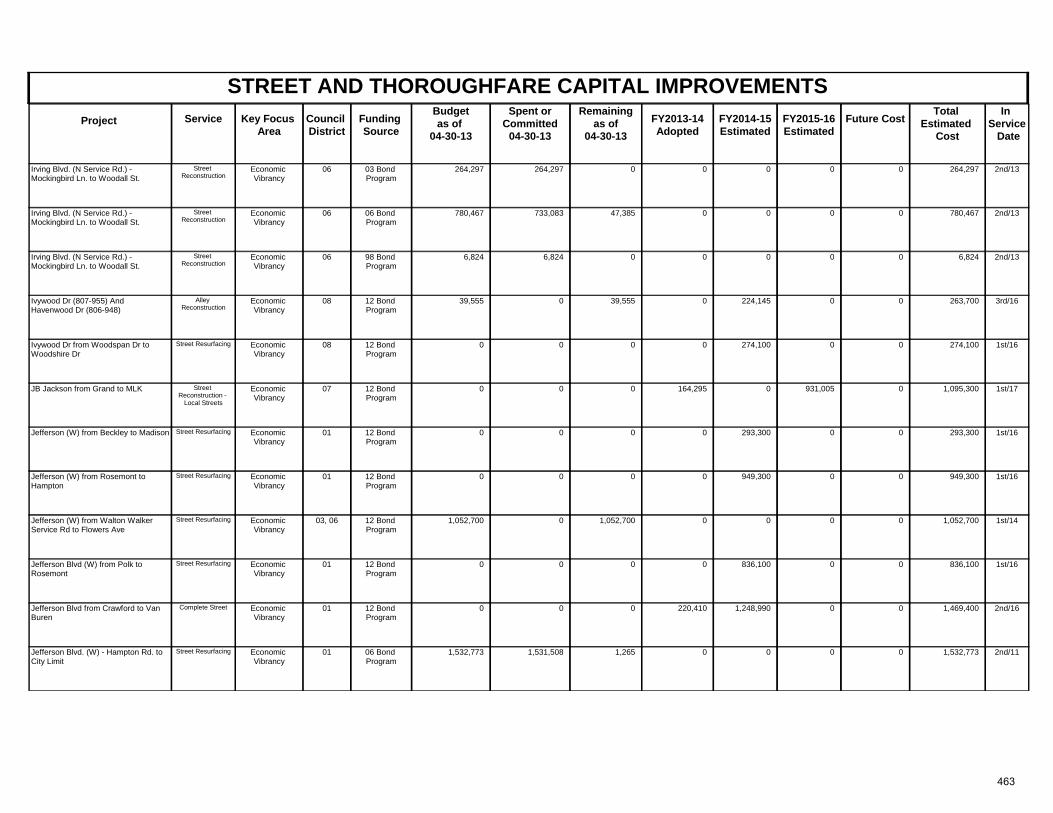
STREET AND THOROUGHFARE CAPITAL IMPROVEMENTSProject Key Focus
AreaCouncil District
Spent orCommitted
04-30-13
Total Estimated
Cost
In Service Date
Funding Source
Remainingas of
04-30-13 FY2013-14
AdoptedFuture CostService FY2014-15
Estimated FY2015-16 Estimated
Budgetas of
04-30-13
Economic Vibrancy
06 2nd/1303 Bond Program
264,297 264,297 0 264,297Irving Blvd. (N Service Rd.) - Mockingbird Ln. to Woodall St.
0 0Street Reconstruction
00
Economic Vibrancy
06 2nd/1306 Bond Program
780,467 733,083 47,385 780,467Irving Blvd. (N Service Rd.) - Mockingbird Ln. to Woodall St.
0 0Street Reconstruction
00
Economic Vibrancy
06 2nd/1398 Bond Program
6,824 6,824 0 6,824Irving Blvd. (N Service Rd.) - Mockingbird Ln. to Woodall St.
0 0Street Reconstruction
00
Economic Vibrancy
08 3rd/1612 Bond Program
39,555 0 39,555 263,700Ivywood Dr (807-955) And Havenwood Dr (806-948)
0 0Alley Reconstruction
0224,145
Economic Vibrancy
08 1st/1612 Bond Program
0 0 0 274,100Ivywood Dr from Woodspan Dr to Woodshire Dr
0 0Street Resurfacing 0274,100
Economic Vibrancy
07 1st/1712 Bond Program
0 0 0 1,095,300JB Jackson from Grand to MLK 164,295 0Street Reconstruction -
Local Streets
931,0050
Economic Vibrancy
01 1st/1612 Bond Program
0 0 0 293,300Jefferson (W) from Beckley to Madison 0 0Street Resurfacing 0293,300
Economic Vibrancy
01 1st/1612 Bond Program
0 0 0 949,300Jefferson (W) from Rosemont to Hampton
0 0Street Resurfacing 0949,300
Economic Vibrancy
03, 06 1st/1412 Bond Program
1,052,700 0 1,052,700 1,052,700Jefferson (W) from Walton Walker Service Rd to Flowers Ave
0 0Street Resurfacing 00
Economic Vibrancy
01 1st/1612 Bond Program
0 0 0 836,100Jefferson Blvd (W) from Polk to Rosemont
0 0Street Resurfacing 0836,100
Economic Vibrancy
01 2nd/1612 Bond Program
0 0 0 1,469,400Jefferson Blvd from Crawford to Van Buren
220,410 0Complete Street 01,248,990
Economic Vibrancy
01 2nd/1106 Bond Program
1,532,773 1,531,508 1,265 1,532,773Jefferson Blvd. (W) - Hampton Rd. to City Limit
0 0Street Resurfacing 00
463
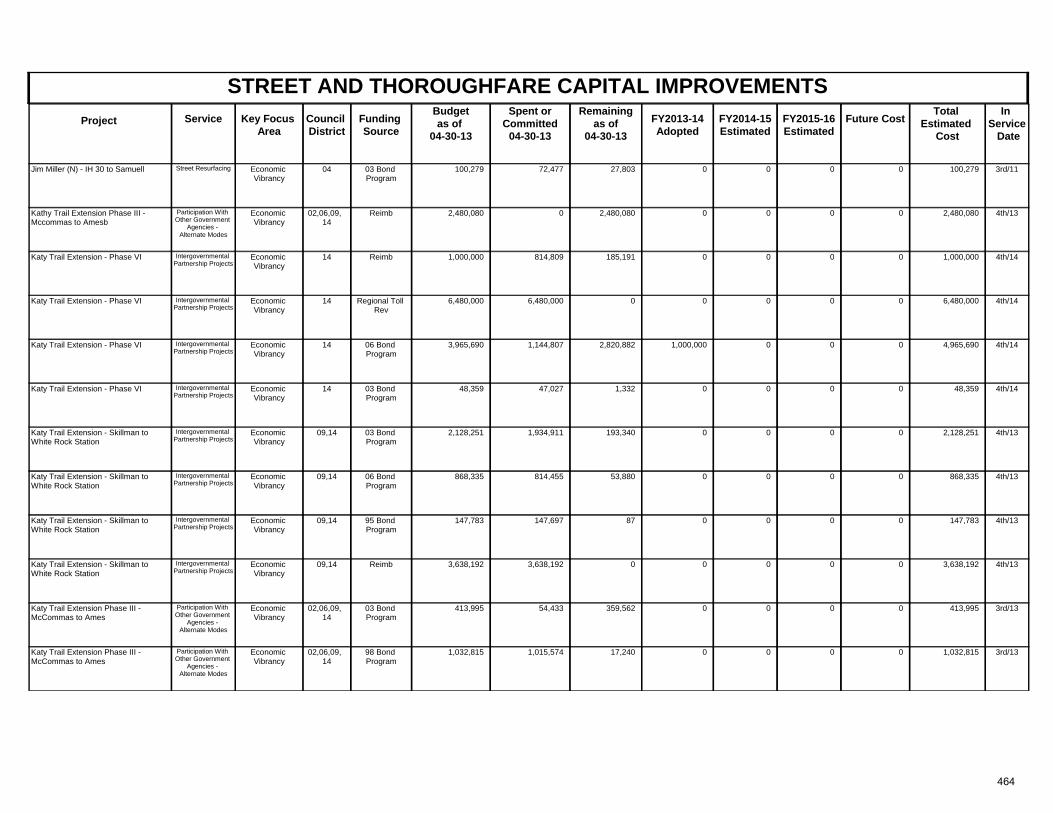
STREET AND THOROUGHFARE CAPITAL IMPROVEMENTSProject Key Focus
AreaCouncil District
Spent orCommitted
04-30-13
Total Estimated
Cost
In Service Date
Funding Source
Remainingas of
04-30-13 FY2013-14
AdoptedFuture CostService FY2014-15
Estimated FY2015-16 Estimated
Budgetas of
04-30-13
Economic Vibrancy
04 3rd/1103 Bond Program
100,279 72,477 27,803 100,279Jim Miller (N) - IH 30 to Samuell 0 0Street Resurfacing 00
Economic Vibrancy
02,06,09, 14
4th/13Reimb 2,480,080 0 2,480,080 2,480,080Kathy Trail Extension Phase III - Mccommas to Amesb
0 0Participation With Other Government
Agencies - Alternate Modes
00
Economic Vibrancy
14 4th/14Reimb 1,000,000 814,809 185,191 1,000,000Katy Trail Extension - Phase VI 0 0Intergovernmental Partnership Projects
00
Economic Vibrancy
14 4th/14Regional Toll Rev
6,480,000 6,480,000 0 6,480,000Katy Trail Extension - Phase VI 0 0Intergovernmental Partnership Projects
00
Economic Vibrancy
14 4th/1406 Bond Program
3,965,690 1,144,807 2,820,882 4,965,690Katy Trail Extension - Phase VI 1,000,000 0Intergovernmental Partnership Projects
00
Economic Vibrancy
14 4th/1403 Bond Program
48,359 47,027 1,332 48,359Katy Trail Extension - Phase VI 0 0Intergovernmental Partnership Projects
00
Economic Vibrancy
09,14 4th/1303 Bond Program
2,128,251 1,934,911 193,340 2,128,251Katy Trail Extension - Skillman to White Rock Station
0 0Intergovernmental Partnership Projects
00
Economic Vibrancy
09,14 4th/1306 Bond Program
868,335 814,455 53,880 868,335Katy Trail Extension - Skillman to White Rock Station
0 0Intergovernmental Partnership Projects
00
Economic Vibrancy
09,14 4th/1395 Bond Program
147,783 147,697 87 147,783Katy Trail Extension - Skillman to White Rock Station
0 0Intergovernmental Partnership Projects
00
Economic Vibrancy
09,14 4th/13Reimb 3,638,192 3,638,192 0 3,638,192Katy Trail Extension - Skillman to White Rock Station
0 0Intergovernmental Partnership Projects
00
Economic Vibrancy
02,06,09, 14
3rd/1303 Bond Program
413,995 54,433 359,562 413,995Katy Trail Extension Phase III - McCommas to Ames
0 0Participation With Other Government
Agencies - Alternate Modes
00
Economic Vibrancy
02,06,09, 14
3rd/1398 Bond Program
1,032,815 1,015,574 17,240 1,032,815Katy Trail Extension Phase III - McCommas to Ames
0 0Participation With Other Government
Agencies - Alternate Modes
00
464
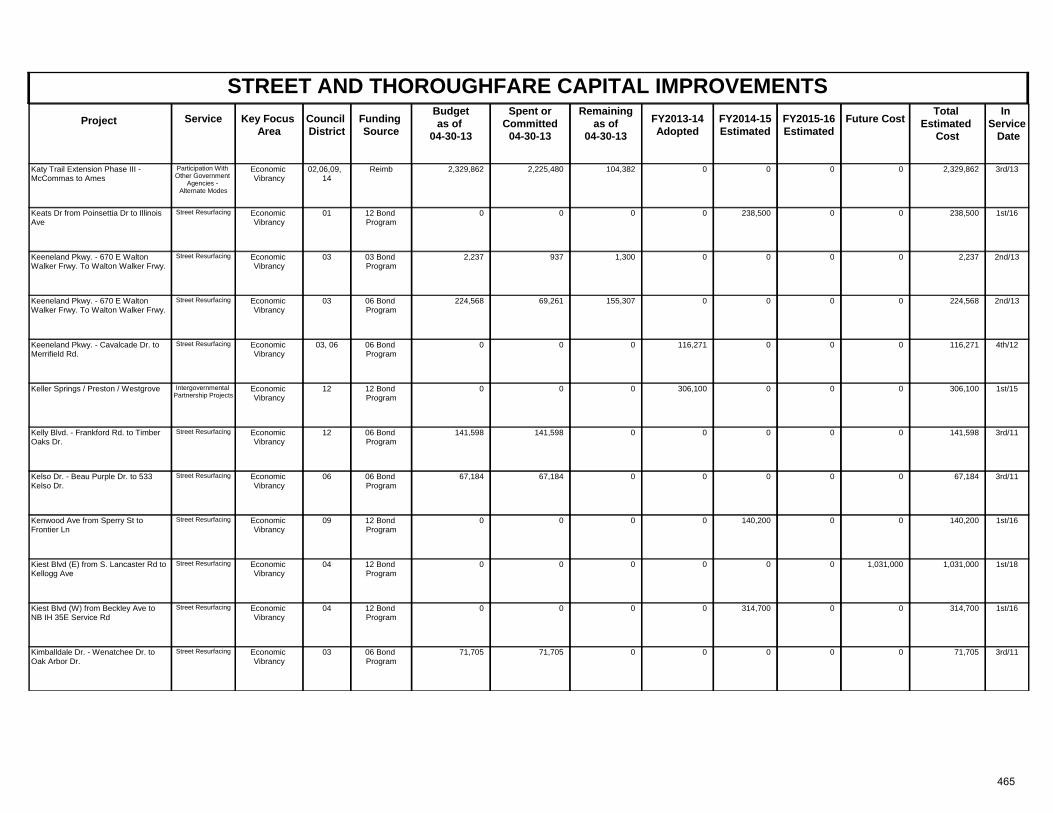
STREET AND THOROUGHFARE CAPITAL IMPROVEMENTSProject Key Focus
AreaCouncil District
Spent orCommitted
04-30-13
Total Estimated
Cost
In Service Date
Funding Source
Remainingas of
04-30-13 FY2013-14
AdoptedFuture CostService FY2014-15
Estimated FY2015-16 Estimated
Budgetas of
04-30-13
Economic Vibrancy
02,06,09, 14
3rd/13Reimb 2,329,862 2,225,480 104,382 2,329,862Katy Trail Extension Phase III - McCommas to Ames
0 0Participation With Other Government
Agencies - Alternate Modes
00
Economic Vibrancy
01 1st/1612 Bond Program
0 0 0 238,500Keats Dr from Poinsettia Dr to Illinois Ave
0 0Street Resurfacing 0238,500
Economic Vibrancy
03 2nd/1303 Bond Program
2,237 937 1,300 2,237Keeneland Pkwy. - 670 E Walton Walker Frwy. To Walton Walker Frwy.
0 0Street Resurfacing 00
Economic Vibrancy
03 2nd/1306 Bond Program
224,568 69,261 155,307 224,568Keeneland Pkwy. - 670 E Walton Walker Frwy. To Walton Walker Frwy.
0 0Street Resurfacing 00
Economic Vibrancy
03, 06 4th/1206 Bond Program
0 0 0 116,271Keeneland Pkwy. - Cavalcade Dr. to Merrifield Rd.
116,271 0Street Resurfacing 00
Economic Vibrancy
12 1st/1512 Bond Program
0 0 0 306,100Keller Springs / Preston / Westgrove 306,100 0Intergovernmental Partnership Projects
00
Economic Vibrancy
12 3rd/1106 Bond Program
141,598 141,598 0 141,598Kelly Blvd. - Frankford Rd. to Timber Oaks Dr.
0 0Street Resurfacing 00
Economic Vibrancy
06 3rd/1106 Bond Program
67,184 67,184 0 67,184Kelso Dr. - Beau Purple Dr. to 533 Kelso Dr.
0 0Street Resurfacing 00
Economic Vibrancy
09 1st/1612 Bond Program
0 0 0 140,200Kenwood Ave from Sperry St to Frontier Ln
0 0Street Resurfacing 0140,200
Economic Vibrancy
04 1st/1812 Bond Program
0 0 0 1,031,000Kiest Blvd (E) from S. Lancaster Rd to Kellogg Ave
0 1,031,000Street Resurfacing 00
Economic Vibrancy
04 1st/1612 Bond Program
0 0 0 314,700Kiest Blvd (W) from Beckley Ave to NB IH 35E Service Rd
0 0Street Resurfacing 0314,700
Economic Vibrancy
03 3rd/1106 Bond Program
71,705 71,705 0 71,705Kimballdale Dr. - Wenatchee Dr. to Oak Arbor Dr.
0 0Street Resurfacing 00
465
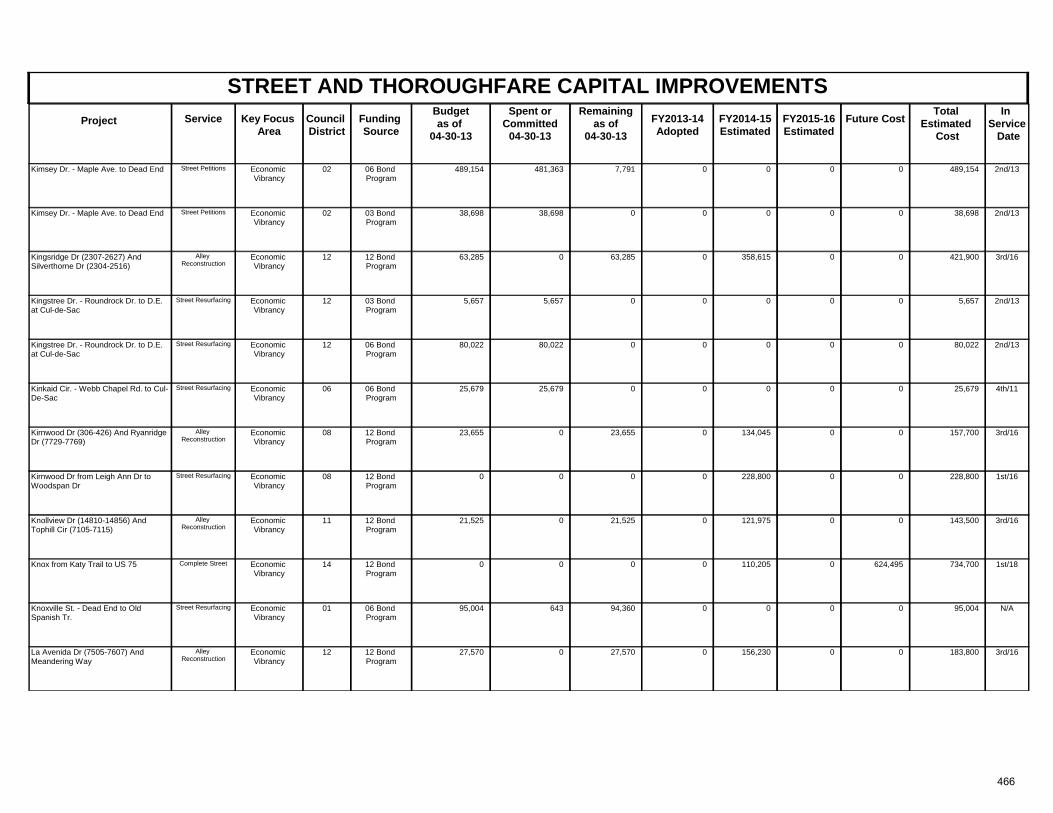
STREET AND THOROUGHFARE CAPITAL IMPROVEMENTSProject Key Focus
AreaCouncil District
Spent orCommitted
04-30-13
Total Estimated
Cost
In Service Date
Funding Source
Remainingas of
04-30-13 FY2013-14
AdoptedFuture CostService FY2014-15
Estimated FY2015-16 Estimated
Budgetas of
04-30-13
Economic Vibrancy
02 2nd/1306 Bond Program
489,154 481,363 7,791 489,154Kimsey Dr. - Maple Ave. to Dead End 0 0Street Petitions 00
Economic Vibrancy
02 2nd/1303 Bond Program
38,698 38,698 0 38,698Kimsey Dr. - Maple Ave. to Dead End 0 0Street Petitions 00
Economic Vibrancy
12 3rd/1612 Bond Program
63,285 0 63,285 421,900Kingsridge Dr (2307-2627) And Silverthorne Dr (2304-2516)
0 0Alley Reconstruction
0358,615
Economic Vibrancy
12 2nd/1303 Bond Program
5,657 5,657 0 5,657Kingstree Dr. - Roundrock Dr. to D.E. at Cul-de-Sac
0 0Street Resurfacing 00
Economic Vibrancy
12 2nd/1306 Bond Program
80,022 80,022 0 80,022Kingstree Dr. - Roundrock Dr. to D.E. at Cul-de-Sac
0 0Street Resurfacing 00
Economic Vibrancy
06 4th/1106 Bond Program
25,679 25,679 0 25,679Kinkaid Cir. - Webb Chapel Rd. to Cul-De-Sac
0 0Street Resurfacing 00
Economic Vibrancy
08 3rd/1612 Bond Program
23,655 0 23,655 157,700Kirnwood Dr (306-426) And Ryanridge Dr (7729-7769)
0 0Alley Reconstruction
0134,045
Economic Vibrancy
08 1st/1612 Bond Program
0 0 0 228,800Kirnwood Dr from Leigh Ann Dr to Woodspan Dr
0 0Street Resurfacing 0228,800
Economic Vibrancy
11 3rd/1612 Bond Program
21,525 0 21,525 143,500Knollview Dr (14810-14856) And Tophill Cir (7105-7115)
0 0Alley Reconstruction
0121,975
Economic Vibrancy
14 1st/1812 Bond Program
0 0 0 734,700Knox from Katy Trail to US 75 0 624,495Complete Street 0110,205
Economic Vibrancy
01 N/A06 Bond Program
95,004 643 94,360 95,004Knoxville St. - Dead End to Old Spanish Tr.
0 0Street Resurfacing 00
Economic Vibrancy
12 3rd/1612 Bond Program
27,570 0 27,570 183,800La Avenida Dr (7505-7607) And Meandering Way
0 0Alley Reconstruction
0156,230
466
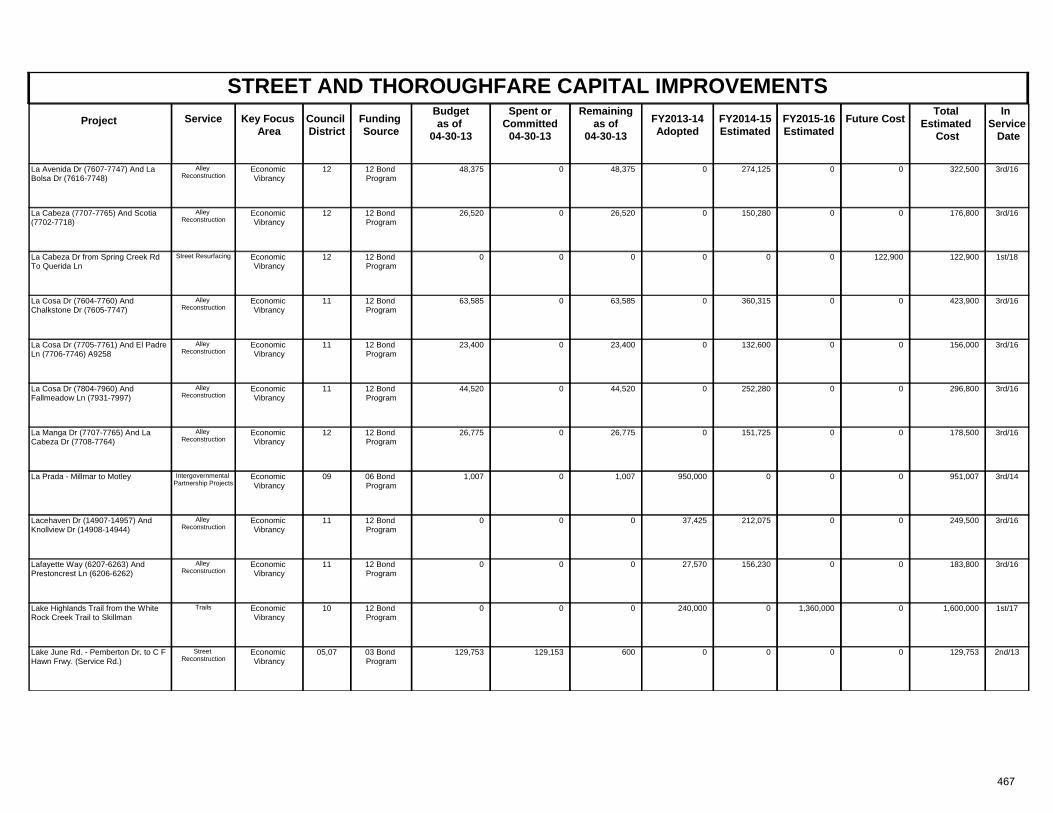
STREET AND THOROUGHFARE CAPITAL IMPROVEMENTSProject Key Focus
AreaCouncil District
Spent orCommitted
04-30-13
Total Estimated
Cost
In Service Date
Funding Source
Remainingas of
04-30-13 FY2013-14
AdoptedFuture CostService FY2014-15
Estimated FY2015-16 Estimated
Budgetas of
04-30-13
Economic Vibrancy
12 3rd/1612 Bond Program
48,375 0 48,375 322,500La Avenida Dr (7607-7747) And La Bolsa Dr (7616-7748)
0 0Alley Reconstruction
0274,125
Economic Vibrancy
12 3rd/1612 Bond Program
26,520 0 26,520 176,800La Cabeza (7707-7765) And Scotia (7702-7718)
0 0Alley Reconstruction
0150,280
Economic Vibrancy
12 1st/1812 Bond Program
0 0 0 122,900La Cabeza Dr from Spring Creek Rd To Querida Ln
0 122,900Street Resurfacing 00
Economic Vibrancy
11 3rd/1612 Bond Program
63,585 0 63,585 423,900La Cosa Dr (7604-7760) And Chalkstone Dr (7605-7747)
0 0Alley Reconstruction
0360,315
Economic Vibrancy
11 3rd/1612 Bond Program
23,400 0 23,400 156,000La Cosa Dr (7705-7761) And El Padre Ln (7706-7746) A9258
0 0Alley Reconstruction
0132,600
Economic Vibrancy
11 3rd/1612 Bond Program
44,520 0 44,520 296,800La Cosa Dr (7804-7960) And Fallmeadow Ln (7931-7997)
0 0Alley Reconstruction
0252,280
Economic Vibrancy
12 3rd/1612 Bond Program
26,775 0 26,775 178,500La Manga Dr (7707-7765) And La Cabeza Dr (7708-7764)
0 0Alley Reconstruction
0151,725
Economic Vibrancy
09 3rd/1406 Bond Program
1,007 0 1,007 951,007La Prada - Millmar to Motley 950,000 0Intergovernmental Partnership Projects
00
Economic Vibrancy
11 3rd/1612 Bond Program
0 0 0 249,500Lacehaven Dr (14907-14957) And Knollview Dr (14908-14944)
37,425 0Alley Reconstruction
0212,075
Economic Vibrancy
11 3rd/1612 Bond Program
0 0 0 183,800Lafayette Way (6207-6263) And Prestoncrest Ln (6206-6262)
27,570 0Alley Reconstruction
0156,230
Economic Vibrancy
10 1st/1712 Bond Program
0 0 0 1,600,000Lake Highlands Trail from the White Rock Creek Trail to Skillman
240,000 0Trails 1,360,0000
Economic Vibrancy
05,07 2nd/1303 Bond Program
129,753 129,153 600 129,753Lake June Rd. - Pemberton Dr. to C F Hawn Frwy. (Service Rd.)
0 0Street Reconstruction
00
467
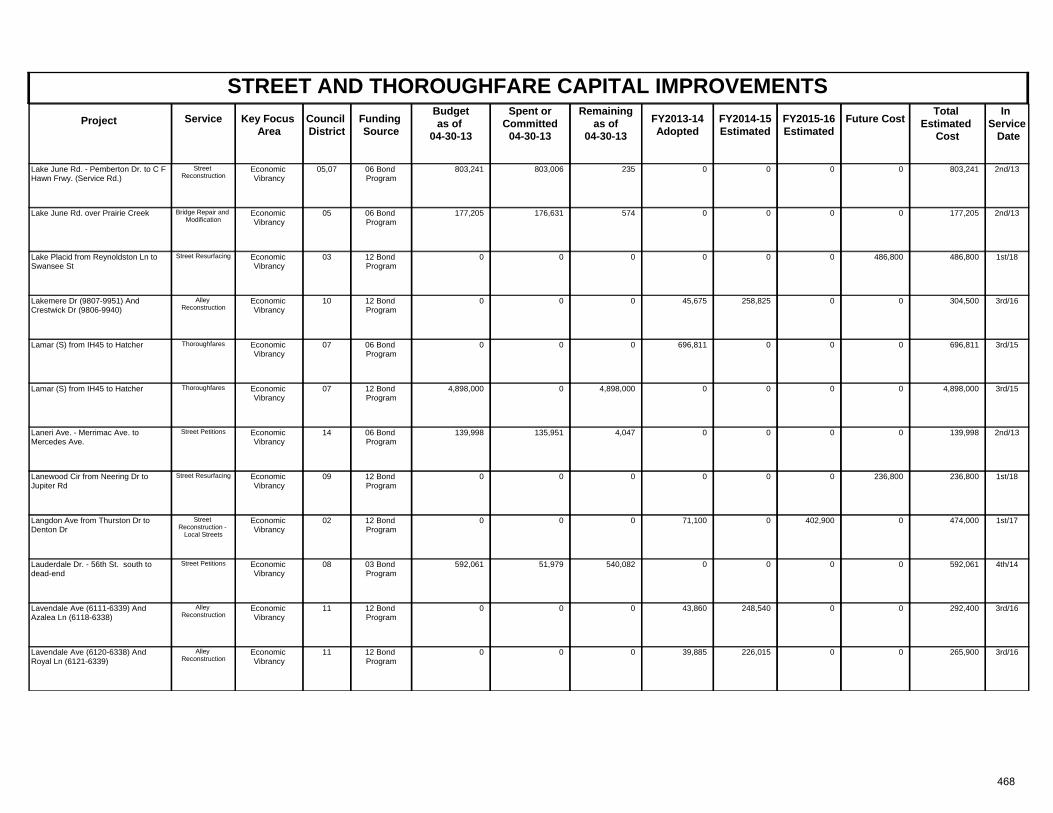
STREET AND THOROUGHFARE CAPITAL IMPROVEMENTSProject Key Focus
AreaCouncil District
Spent orCommitted
04-30-13
Total Estimated
Cost
In Service Date
Funding Source
Remainingas of
04-30-13 FY2013-14
AdoptedFuture CostService FY2014-15
Estimated FY2015-16 Estimated
Budgetas of
04-30-13
Economic Vibrancy
05,07 2nd/1306 Bond Program
803,241 803,006 235 803,241Lake June Rd. - Pemberton Dr. to C F Hawn Frwy. (Service Rd.)
0 0Street Reconstruction
00
Economic Vibrancy
05 2nd/1306 Bond Program
177,205 176,631 574 177,205Lake June Rd. over Prairie Creek 0 0Bridge Repair and Modification
00
Economic Vibrancy
03 1st/1812 Bond Program
0 0 0 486,800Lake Placid from Reynoldston Ln to Swansee St
0 486,800Street Resurfacing 00
Economic Vibrancy
10 3rd/1612 Bond Program
0 0 0 304,500Lakemere Dr (9807-9951) And Crestwick Dr (9806-9940)
45,675 0Alley Reconstruction
0258,825
Economic Vibrancy
07 3rd/1506 Bond Program
0 0 0 696,811Lamar (S) from IH45 to Hatcher 696,811 0Thoroughfares 00
Economic Vibrancy
07 3rd/1512 Bond Program
4,898,000 0 4,898,000 4,898,000Lamar (S) from IH45 to Hatcher 0 0Thoroughfares 00
Economic Vibrancy
14 2nd/1306 Bond Program
139,998 135,951 4,047 139,998Laneri Ave. - Merrimac Ave. to Mercedes Ave.
0 0Street Petitions 00
Economic Vibrancy
09 1st/1812 Bond Program
0 0 0 236,800Lanewood Cir from Neering Dr to Jupiter Rd
0 236,800Street Resurfacing 00
Economic Vibrancy
02 1st/1712 Bond Program
0 0 0 474,000Langdon Ave from Thurston Dr to Denton Dr
71,100 0Street Reconstruction -
Local Streets
402,9000
Economic Vibrancy
08 4th/1403 Bond Program
592,061 51,979 540,082 592,061Lauderdale Dr. - 56th St. south to dead-end
0 0Street Petitions 00
Economic Vibrancy
11 3rd/1612 Bond Program
0 0 0 292,400Lavendale Ave (6111-6339) And Azalea Ln (6118-6338)
43,860 0Alley Reconstruction
0248,540
Economic Vibrancy
11 3rd/1612 Bond Program
0 0 0 265,900Lavendale Ave (6120-6338) And Royal Ln (6121-6339)
39,885 0Alley Reconstruction
0226,015
468
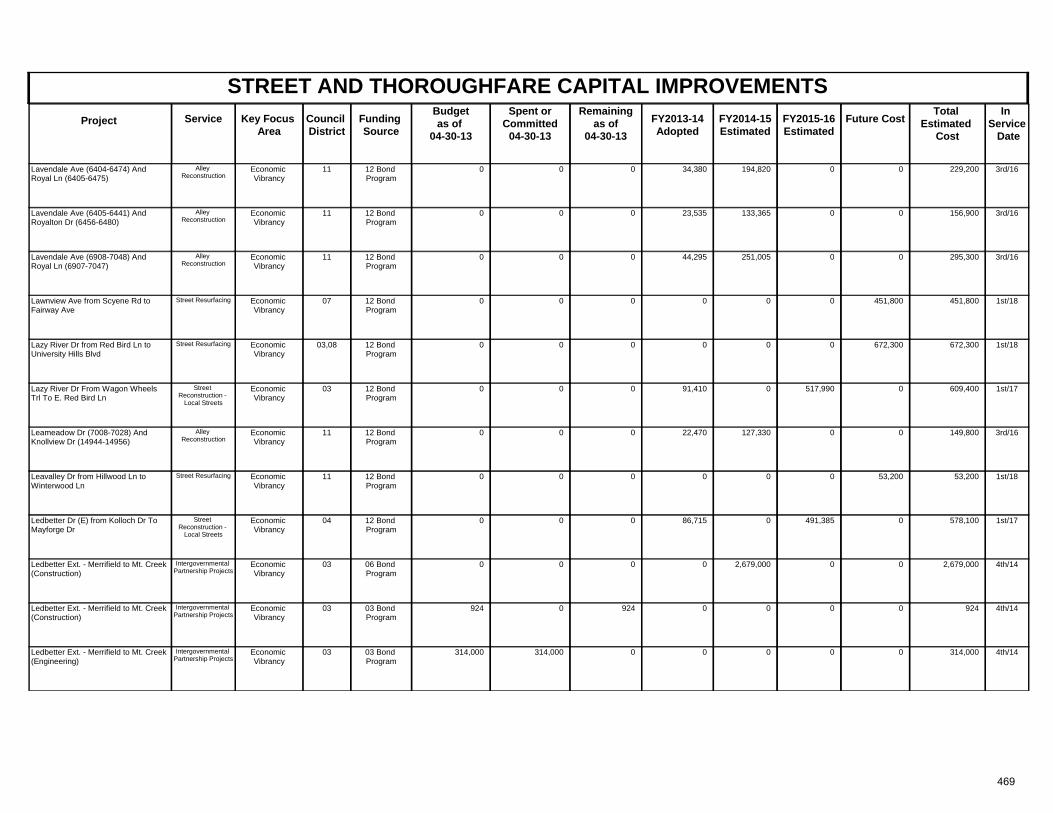
STREET AND THOROUGHFARE CAPITAL IMPROVEMENTSProject Key Focus
AreaCouncil District
Spent orCommitted
04-30-13
Total Estimated
Cost
In Service Date
Funding Source
Remainingas of
04-30-13 FY2013-14
AdoptedFuture CostService FY2014-15
Estimated FY2015-16 Estimated
Budgetas of
04-30-13
Economic Vibrancy
11 3rd/1612 Bond Program
0 0 0 229,200Lavendale Ave (6404-6474) And Royal Ln (6405-6475)
34,380 0Alley Reconstruction
0194,820
Economic Vibrancy
11 3rd/1612 Bond Program
0 0 0 156,900Lavendale Ave (6405-6441) And Royalton Dr (6456-6480)
23,535 0Alley Reconstruction
0133,365
Economic Vibrancy
11 3rd/1612 Bond Program
0 0 0 295,300Lavendale Ave (6908-7048) And Royal Ln (6907-7047)
44,295 0Alley Reconstruction
0251,005
Economic Vibrancy
07 1st/1812 Bond Program
0 0 0 451,800Lawnview Ave from Scyene Rd to Fairway Ave
0 451,800Street Resurfacing 00
Economic Vibrancy
03,08 1st/1812 Bond Program
0 0 0 672,300Lazy River Dr from Red Bird Ln to University Hills Blvd
0 672,300Street Resurfacing 00
Economic Vibrancy
03 1st/1712 Bond Program
0 0 0 609,400Lazy River Dr From Wagon Wheels Trl To E. Red Bird Ln
91,410 0Street Reconstruction -
Local Streets
517,9900
Economic Vibrancy
11 3rd/1612 Bond Program
0 0 0 149,800Leameadow Dr (7008-7028) And Knollview Dr (14944-14956)
22,470 0Alley Reconstruction
0127,330
Economic Vibrancy
11 1st/1812 Bond Program
0 0 0 53,200Leavalley Dr from Hillwood Ln to Winterwood Ln
0 53,200Street Resurfacing 00
Economic Vibrancy
04 1st/1712 Bond Program
0 0 0 578,100Ledbetter Dr (E) from Kolloch Dr To Mayforge Dr
86,715 0Street Reconstruction -
Local Streets
491,3850
Economic Vibrancy
03 4th/1406 Bond Program
0 0 0 2,679,000Ledbetter Ext. - Merrifield to Mt. Creek (Construction)
0 0Intergovernmental Partnership Projects
02,679,000
Economic Vibrancy
03 4th/1403 Bond Program
924 0 924 924Ledbetter Ext. - Merrifield to Mt. Creek (Construction)
0 0Intergovernmental Partnership Projects
00
Economic Vibrancy
03 4th/1403 Bond Program
314,000 314,000 0 314,000Ledbetter Ext. - Merrifield to Mt. Creek (Engineering)
0 0Intergovernmental Partnership Projects
00
469
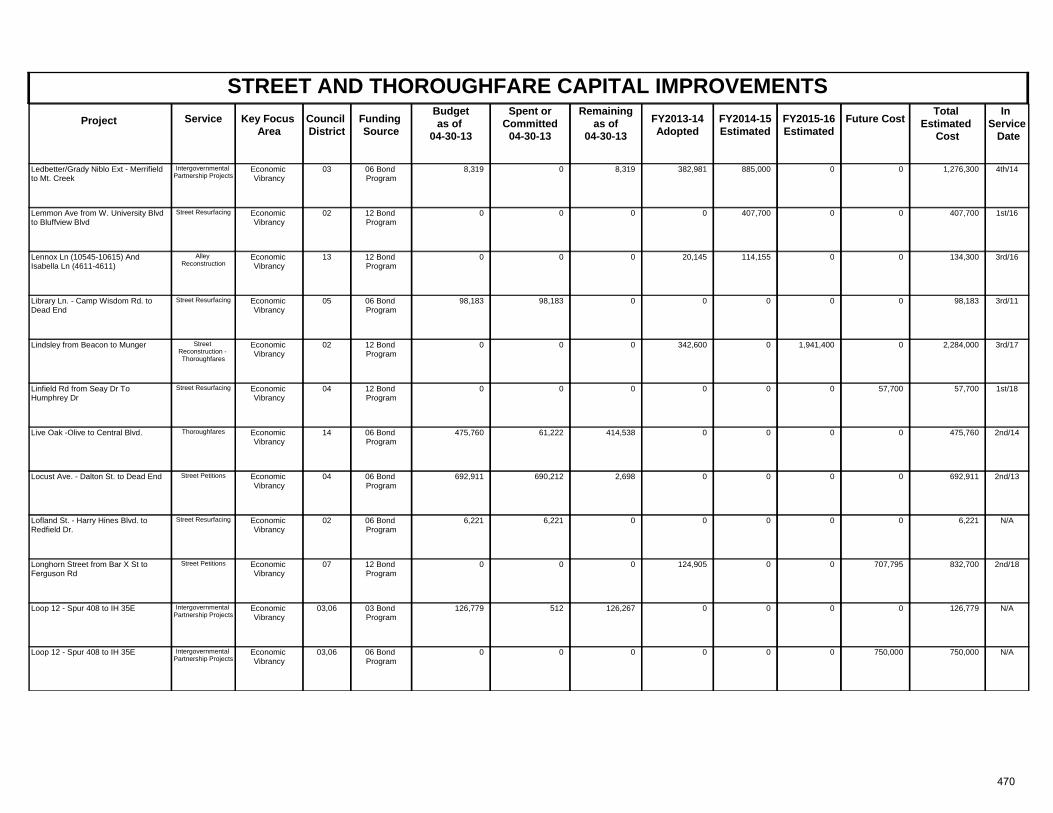
STREET AND THOROUGHFARE CAPITAL IMPROVEMENTSProject Key Focus
AreaCouncil District
Spent orCommitted
04-30-13
Total Estimated
Cost
In Service Date
Funding Source
Remainingas of
04-30-13 FY2013-14
AdoptedFuture CostService FY2014-15
Estimated FY2015-16 Estimated
Budgetas of
04-30-13
Economic Vibrancy
03 4th/1406 Bond Program
8,319 0 8,319 1,276,300Ledbetter/Grady Niblo Ext - Merrifield to Mt. Creek
382,981 0Intergovernmental Partnership Projects
0885,000
Economic Vibrancy
02 1st/1612 Bond Program
0 0 0 407,700Lemmon Ave from W. University Blvd to Bluffview Blvd
0 0Street Resurfacing 0407,700
Economic Vibrancy
13 3rd/1612 Bond Program
0 0 0 134,300Lennox Ln (10545-10615) And Isabella Ln (4611-4611)
20,145 0Alley Reconstruction
0114,155
Economic Vibrancy
05 3rd/1106 Bond Program
98,183 98,183 0 98,183Library Ln. - Camp Wisdom Rd. to Dead End
0 0Street Resurfacing 00
Economic Vibrancy
02 3rd/1712 Bond Program
0 0 0 2,284,000Lindsley from Beacon to Munger 342,600 0Street Reconstruction - Thoroughfares
1,941,4000
Economic Vibrancy
04 1st/1812 Bond Program
0 0 0 57,700Linfield Rd from Seay Dr To Humphrey Dr
0 57,700Street Resurfacing 00
Economic Vibrancy
14 2nd/1406 Bond Program
475,760 61,222 414,538 475,760Live Oak -Olive to Central Blvd. 0 0Thoroughfares 00
Economic Vibrancy
04 2nd/1306 Bond Program
692,911 690,212 2,698 692,911Locust Ave. - Dalton St. to Dead End 0 0Street Petitions 00
Economic Vibrancy
02 N/A06 Bond Program
6,221 6,221 0 6,221Lofland St. - Harry Hines Blvd. to Redfield Dr.
0 0Street Resurfacing 00
Economic Vibrancy
07 2nd/1812 Bond Program
0 0 0 832,700Longhorn Street from Bar X St to Ferguson Rd
124,905 707,795Street Petitions 00
Economic Vibrancy
03,06 N/A03 Bond Program
126,779 512 126,267 126,779Loop 12 - Spur 408 to IH 35E 0 0Intergovernmental Partnership Projects
00
Economic Vibrancy
03,06 N/A06 Bond Program
0 0 0 750,000Loop 12 - Spur 408 to IH 35E 0 750,000Intergovernmental Partnership Projects
00
470
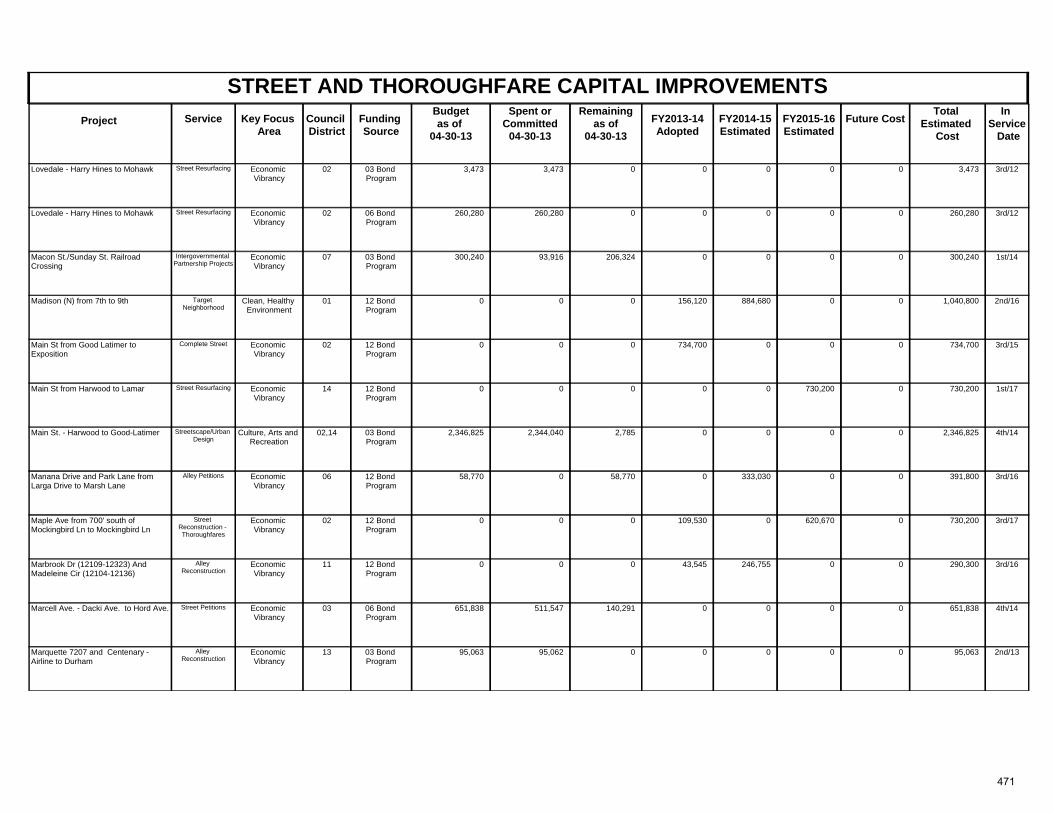
STREET AND THOROUGHFARE CAPITAL IMPROVEMENTSProject Key Focus
AreaCouncil District
Spent orCommitted
04-30-13
Total Estimated
Cost
In Service Date
Funding Source
Remainingas of
04-30-13 FY2013-14
AdoptedFuture CostService FY2014-15
Estimated FY2015-16 Estimated
Budgetas of
04-30-13
Economic Vibrancy
02 3rd/1203 Bond Program
3,473 3,473 0 3,473Lovedale - Harry Hines to Mohawk 0 0Street Resurfacing 00
Economic Vibrancy
02 3rd/1206 Bond Program
260,280 260,280 0 260,280Lovedale - Harry Hines to Mohawk 0 0Street Resurfacing 00
Economic Vibrancy
07 1st/1403 Bond Program
300,240 93,916 206,324 300,240Macon St./Sunday St. Railroad Crossing
0 0Intergovernmental Partnership Projects
00
Clean, Healthy Environment
01 2nd/1612 Bond Program
0 0 0 1,040,800Madison (N) from 7th to 9th 156,120 0Target Neighborhood
0884,680
Economic Vibrancy
02 3rd/1512 Bond Program
0 0 0 734,700Main St from Good Latimer to Exposition
734,700 0Complete Street 00
Economic Vibrancy
14 1st/1712 Bond Program
0 0 0 730,200Main St from Harwood to Lamar 0 0Street Resurfacing 730,2000
Culture, Arts and Recreation
02,14 4th/1403 Bond Program
2,346,825 2,344,040 2,785 2,346,825Main St. - Harwood to Good-Latimer 0 0Streetscape/Urban Design
00
Economic Vibrancy
06 3rd/1612 Bond Program
58,770 0 58,770 391,800Manana Drive and Park Lane from Larga Drive to Marsh Lane
0 0Alley Petitions 0333,030
Economic Vibrancy
02 3rd/1712 Bond Program
0 0 0 730,200Maple Ave from 700' south of Mockingbird Ln to Mockingbird Ln
109,530 0Street Reconstruction - Thoroughfares
620,6700
Economic Vibrancy
11 3rd/1612 Bond Program
0 0 0 290,300Marbrook Dr (12109-12323) And Madeleine Cir (12104-12136)
43,545 0Alley Reconstruction
0246,755
Economic Vibrancy
03 4th/1406 Bond Program
651,838 511,547 140,291 651,838Marcell Ave. - Dacki Ave. to Hord Ave. 0 0Street Petitions 00
Economic Vibrancy
13 2nd/1303 Bond Program
95,063 95,062 0 95,063Marquette 7207 and Centenary - Airline to Durham
0 0Alley Reconstruction
00
471
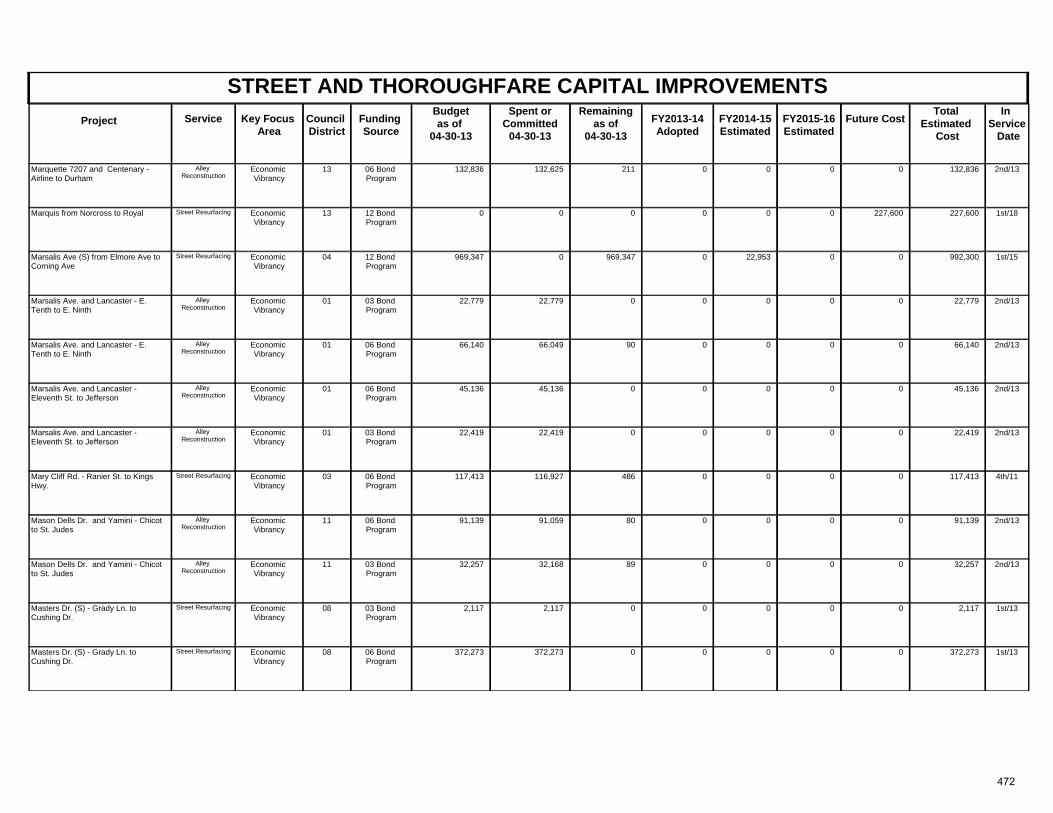
STREET AND THOROUGHFARE CAPITAL IMPROVEMENTSProject Key Focus
AreaCouncil District
Spent orCommitted
04-30-13
Total Estimated
Cost
In Service Date
Funding Source
Remainingas of
04-30-13 FY2013-14
AdoptedFuture CostService FY2014-15
Estimated FY2015-16 Estimated
Budgetas of
04-30-13
Economic Vibrancy
13 2nd/1306 Bond Program
132,836 132,625 211 132,836Marquette 7207 and Centenary - Airline to Durham
0 0Alley Reconstruction
00
Economic Vibrancy
13 1st/1812 Bond Program
0 0 0 227,600Marquis from Norcross to Royal 0 227,600Street Resurfacing 00
Economic Vibrancy
04 1st/1512 Bond Program
969,347 0 969,347 992,300Marsalis Ave (S) from Elmore Ave to Corning Ave
0 0Street Resurfacing 022,953
Economic Vibrancy
01 2nd/1303 Bond Program
22,779 22,779 0 22,779Marsalis Ave. and Lancaster - E. Tenth to E. Ninth
0 0Alley Reconstruction
00
Economic Vibrancy
01 2nd/1306 Bond Program
66,140 66,049 90 66,140Marsalis Ave. and Lancaster - E. Tenth to E. Ninth
0 0Alley Reconstruction
00
Economic Vibrancy
01 2nd/1306 Bond Program
45,136 45,136 0 45,136Marsalis Ave. and Lancaster - Eleventh St. to Jefferson
0 0Alley Reconstruction
00
Economic Vibrancy
01 2nd/1303 Bond Program
22,419 22,419 0 22,419Marsalis Ave. and Lancaster - Eleventh St. to Jefferson
0 0Alley Reconstruction
00
Economic Vibrancy
03 4th/1106 Bond Program
117,413 116,927 486 117,413Mary Cliff Rd. - Ranier St. to Kings Hwy.
0 0Street Resurfacing 00
Economic Vibrancy
11 2nd/1306 Bond Program
91,139 91,059 80 91,139Mason Dells Dr. and Yamini - Chicot to St. Judes
0 0Alley Reconstruction
00
Economic Vibrancy
11 2nd/1303 Bond Program
32,257 32,168 89 32,257Mason Dells Dr. and Yamini - Chicot to St. Judes
0 0Alley Reconstruction
00
Economic Vibrancy
08 1st/1303 Bond Program
2,117 2,117 0 2,117Masters Dr. (S) - Grady Ln. to Cushing Dr.
0 0Street Resurfacing 00
Economic Vibrancy
08 1st/1306 Bond Program
372,273 372,273 0 372,273Masters Dr. (S) - Grady Ln. to Cushing Dr.
0 0Street Resurfacing 00
472
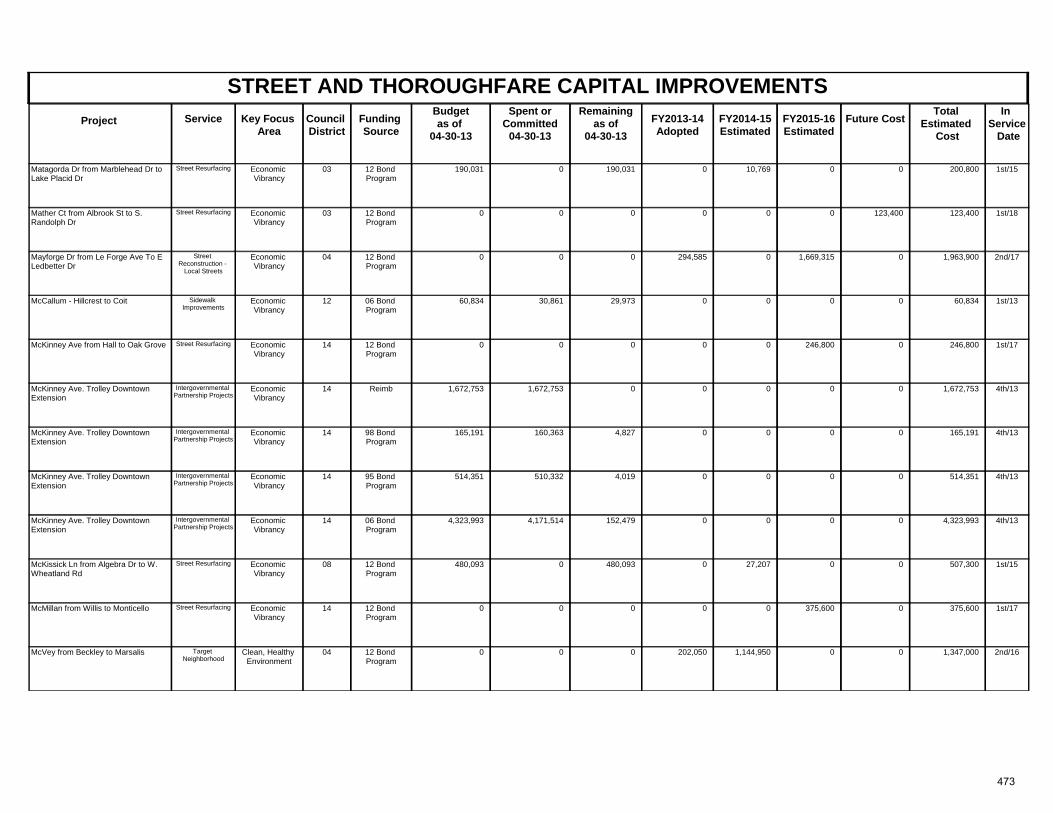
STREET AND THOROUGHFARE CAPITAL IMPROVEMENTSProject Key Focus
AreaCouncil District
Spent orCommitted
04-30-13
Total Estimated
Cost
In Service Date
Funding Source
Remainingas of
04-30-13 FY2013-14
AdoptedFuture CostService FY2014-15
Estimated FY2015-16 Estimated
Budgetas of
04-30-13
Economic Vibrancy
03 1st/1512 Bond Program
190,031 0 190,031 200,800Matagorda Dr from Marblehead Dr to Lake Placid Dr
0 0Street Resurfacing 010,769
Economic Vibrancy
03 1st/1812 Bond Program
0 0 0 123,400Mather Ct from Albrook St to S. Randolph Dr
0 123,400Street Resurfacing 00
Economic Vibrancy
04 2nd/1712 Bond Program
0 0 0 1,963,900Mayforge Dr from Le Forge Ave To E Ledbetter Dr
294,585 0Street Reconstruction -
Local Streets
1,669,3150
Economic Vibrancy
12 1st/1306 Bond Program
60,834 30,861 29,973 60,834McCallum - Hillcrest to Coit 0 0Sidewalk Improvements
00
Economic Vibrancy
14 1st/1712 Bond Program
0 0 0 246,800McKinney Ave from Hall to Oak Grove 0 0Street Resurfacing 246,8000
Economic Vibrancy
14 4th/13Reimb 1,672,753 1,672,753 0 1,672,753McKinney Ave. Trolley Downtown Extension
0 0Intergovernmental Partnership Projects
00
Economic Vibrancy
14 4th/1398 Bond Program
165,191 160,363 4,827 165,191McKinney Ave. Trolley Downtown Extension
0 0Intergovernmental Partnership Projects
00
Economic Vibrancy
14 4th/1395 Bond Program
514,351 510,332 4,019 514,351McKinney Ave. Trolley Downtown Extension
0 0Intergovernmental Partnership Projects
00
Economic Vibrancy
14 4th/1306 Bond Program
4,323,993 4,171,514 152,479 4,323,993McKinney Ave. Trolley Downtown Extension
0 0Intergovernmental Partnership Projects
00
Economic Vibrancy
08 1st/1512 Bond Program
480,093 0 480,093 507,300McKissick Ln from Algebra Dr to W. Wheatland Rd
0 0Street Resurfacing 027,207
Economic Vibrancy
14 1st/1712 Bond Program
0 0 0 375,600McMillan from Willis to Monticello 0 0Street Resurfacing 375,6000
Clean, Healthy Environment
04 2nd/1612 Bond Program
0 0 0 1,347,000McVey from Beckley to Marsalis 202,050 0Target Neighborhood
01,144,950
473
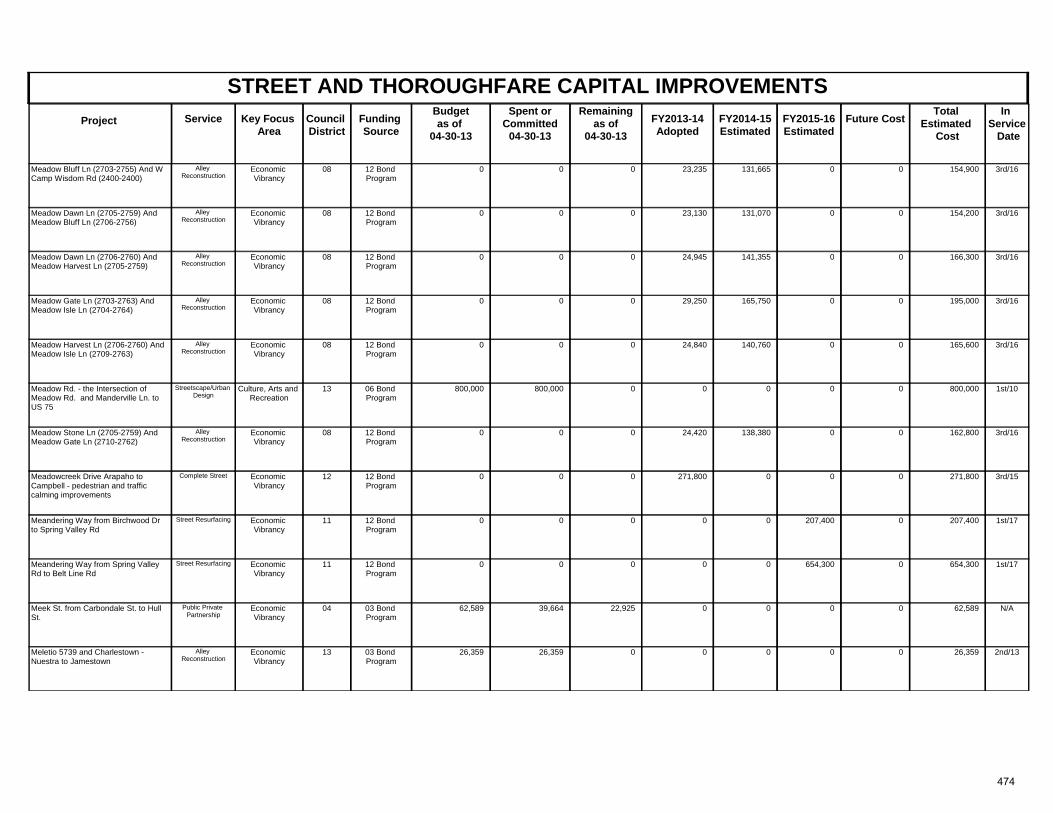
STREET AND THOROUGHFARE CAPITAL IMPROVEMENTSProject Key Focus
AreaCouncil District
Spent orCommitted
04-30-13
Total Estimated
Cost
In Service Date
Funding Source
Remainingas of
04-30-13 FY2013-14
AdoptedFuture CostService FY2014-15
Estimated FY2015-16 Estimated
Budgetas of
04-30-13
Economic Vibrancy
08 3rd/1612 Bond Program
0 0 0 154,900Meadow Bluff Ln (2703-2755) And W Camp Wisdom Rd (2400-2400)
23,235 0Alley Reconstruction
0131,665
Economic Vibrancy
08 3rd/1612 Bond Program
0 0 0 154,200Meadow Dawn Ln (2705-2759) And Meadow Bluff Ln (2706-2756)
23,130 0Alley Reconstruction
0131,070
Economic Vibrancy
08 3rd/1612 Bond Program
0 0 0 166,300Meadow Dawn Ln (2706-2760) And Meadow Harvest Ln (2705-2759)
24,945 0Alley Reconstruction
0141,355
Economic Vibrancy
08 3rd/1612 Bond Program
0 0 0 195,000Meadow Gate Ln (2703-2763) And Meadow Isle Ln (2704-2764)
29,250 0Alley Reconstruction
0165,750
Economic Vibrancy
08 3rd/1612 Bond Program
0 0 0 165,600Meadow Harvest Ln (2706-2760) And Meadow Isle Ln (2709-2763)
24,840 0Alley Reconstruction
0140,760
Culture, Arts and Recreation
13 1st/1006 Bond Program
800,000 800,000 0 800,000Meadow Rd. - the Intersection of Meadow Rd. and Manderville Ln. to US 75
0 0Streetscape/Urban Design
00
Economic Vibrancy
08 3rd/1612 Bond Program
0 0 0 162,800Meadow Stone Ln (2705-2759) And Meadow Gate Ln (2710-2762)
24,420 0Alley Reconstruction
0138,380
Economic Vibrancy
12 3rd/1512 Bond Program
0 0 0 271,800Meadowcreek Drive Arapaho to Campbell - pedestrian and traffic calming improvements
271,800 0Complete Street 00
Economic Vibrancy
11 1st/1712 Bond Program
0 0 0 207,400Meandering Way from Birchwood Dr to Spring Valley Rd
0 0Street Resurfacing 207,4000
Economic Vibrancy
11 1st/1712 Bond Program
0 0 0 654,300Meandering Way from Spring Valley Rd to Belt Line Rd
0 0Street Resurfacing 654,3000
Economic Vibrancy
04 N/A03 Bond Program
62,589 39,664 22,925 62,589Meek St. from Carbondale St. to Hull St.
0 0Public Private Partnership
00
Economic Vibrancy
13 2nd/1303 Bond Program
26,359 26,359 0 26,359Meletio 5739 and Charlestown - Nuestra to Jamestown
0 0Alley Reconstruction
00
474
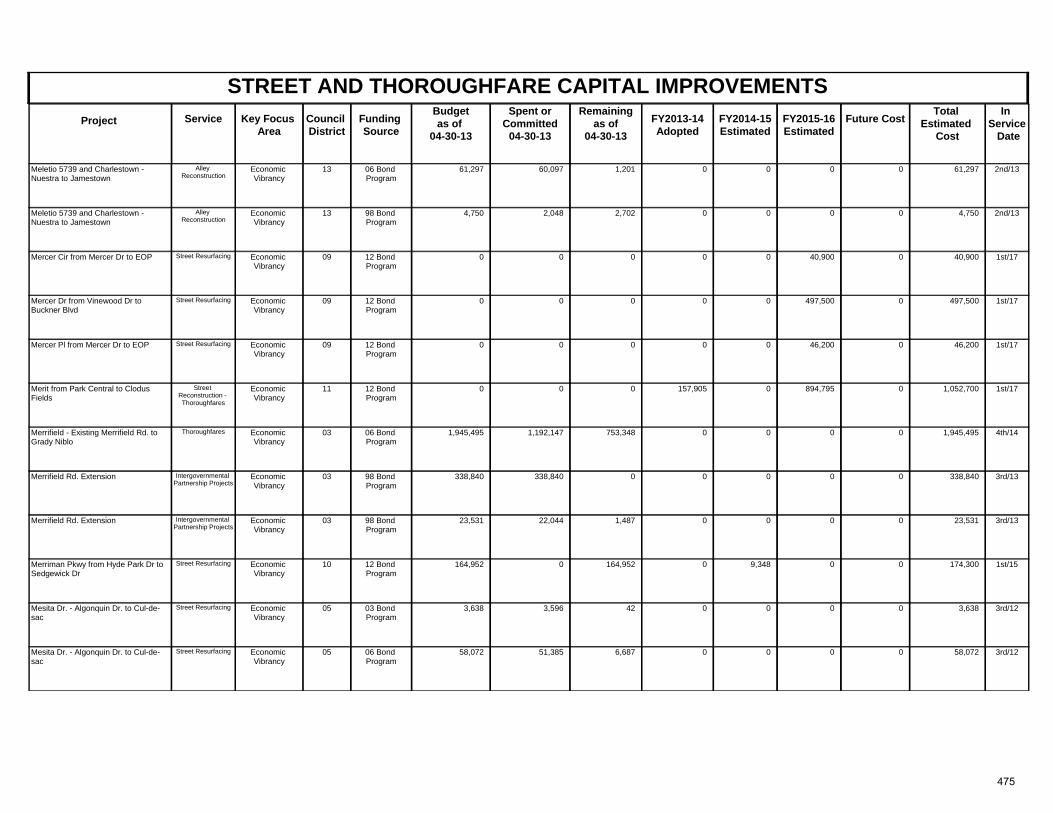
STREET AND THOROUGHFARE CAPITAL IMPROVEMENTSProject Key Focus
AreaCouncil District
Spent orCommitted
04-30-13
Total Estimated
Cost
In Service Date
Funding Source
Remainingas of
04-30-13 FY2013-14
AdoptedFuture CostService FY2014-15
Estimated FY2015-16 Estimated
Budgetas of
04-30-13
Economic Vibrancy
13 2nd/1306 Bond Program
61,297 60,097 1,201 61,297Meletio 5739 and Charlestown - Nuestra to Jamestown
0 0Alley Reconstruction
00
Economic Vibrancy
13 2nd/1398 Bond Program
4,750 2,048 2,702 4,750Meletio 5739 and Charlestown - Nuestra to Jamestown
0 0Alley Reconstruction
00
Economic Vibrancy
09 1st/1712 Bond Program
0 0 0 40,900Mercer Cir from Mercer Dr to EOP 0 0Street Resurfacing 40,9000
Economic Vibrancy
09 1st/1712 Bond Program
0 0 0 497,500Mercer Dr from Vinewood Dr to Buckner Blvd
0 0Street Resurfacing 497,5000
Economic Vibrancy
09 1st/1712 Bond Program
0 0 0 46,200Mercer Pl from Mercer Dr to EOP 0 0Street Resurfacing 46,2000
Economic Vibrancy
11 1st/1712 Bond Program
0 0 0 1,052,700Merit from Park Central to Clodus Fields
157,905 0Street Reconstruction - Thoroughfares
894,7950
Economic Vibrancy
03 4th/1406 Bond Program
1,945,495 1,192,147 753,348 1,945,495Merrifield - Existing Merrifield Rd. to Grady Niblo
0 0Thoroughfares 00
Economic Vibrancy
03 3rd/1398 Bond Program
338,840 338,840 0 338,840Merrifield Rd. Extension 0 0Intergovernmental Partnership Projects
00
Economic Vibrancy
03 3rd/1398 Bond Program
23,531 22,044 1,487 23,531Merrifield Rd. Extension 0 0Intergovernmental Partnership Projects
00
Economic Vibrancy
10 1st/1512 Bond Program
164,952 0 164,952 174,300Merriman Pkwy from Hyde Park Dr to Sedgewick Dr
0 0Street Resurfacing 09,348
Economic Vibrancy
05 3rd/1203 Bond Program
3,638 3,596 42 3,638Mesita Dr. - Algonquin Dr. to Cul-de-sac
0 0Street Resurfacing 00
Economic Vibrancy
05 3rd/1206 Bond Program
58,072 51,385 6,687 58,072Mesita Dr. - Algonquin Dr. to Cul-de-sac
0 0Street Resurfacing 00
475
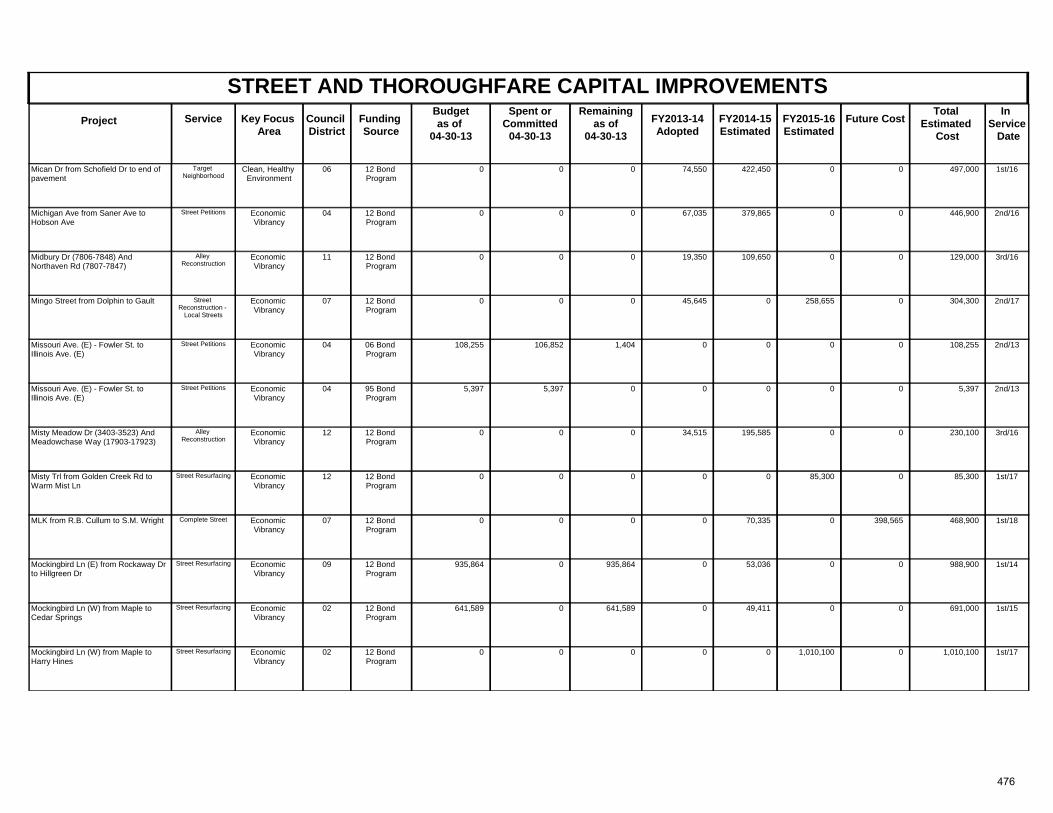
STREET AND THOROUGHFARE CAPITAL IMPROVEMENTSProject Key Focus
AreaCouncil District
Spent orCommitted
04-30-13
Total Estimated
Cost
In Service Date
Funding Source
Remainingas of
04-30-13 FY2013-14
AdoptedFuture CostService FY2014-15
Estimated FY2015-16 Estimated
Budgetas of
04-30-13
Clean, Healthy Environment
06 1st/1612 Bond Program
0 0 0 497,000Mican Dr from Schofield Dr to end of pavement
74,550 0Target Neighborhood
0422,450
Economic Vibrancy
04 2nd/1612 Bond Program
0 0 0 446,900Michigan Ave from Saner Ave to Hobson Ave
67,035 0Street Petitions 0379,865
Economic Vibrancy
11 3rd/1612 Bond Program
0 0 0 129,000Midbury Dr (7806-7848) And Northaven Rd (7807-7847)
19,350 0Alley Reconstruction
0109,650
Economic Vibrancy
07 2nd/1712 Bond Program
0 0 0 304,300Mingo Street from Dolphin to Gault 45,645 0Street Reconstruction -
Local Streets
258,6550
Economic Vibrancy
04 2nd/1306 Bond Program
108,255 106,852 1,404 108,255Missouri Ave. (E) - Fowler St. to Illinois Ave. (E)
0 0Street Petitions 00
Economic Vibrancy
04 2nd/1395 Bond Program
5,397 5,397 0 5,397Missouri Ave. (E) - Fowler St. to Illinois Ave. (E)
0 0Street Petitions 00
Economic Vibrancy
12 3rd/1612 Bond Program
0 0 0 230,100Misty Meadow Dr (3403-3523) And Meadowchase Way (17903-17923)
34,515 0Alley Reconstruction
0195,585
Economic Vibrancy
12 1st/1712 Bond Program
0 0 0 85,300Misty Trl from Golden Creek Rd to Warm Mist Ln
0 0Street Resurfacing 85,3000
Economic Vibrancy
07 1st/1812 Bond Program
0 0 0 468,900MLK from R.B. Cullum to S.M. Wright 0 398,565Complete Street 070,335
Economic Vibrancy
09 1st/1412 Bond Program
935,864 0 935,864 988,900Mockingbird Ln (E) from Rockaway Dr to Hillgreen Dr
0 0Street Resurfacing 053,036
Economic Vibrancy
02 1st/1512 Bond Program
641,589 0 641,589 691,000Mockingbird Ln (W) from Maple to Cedar Springs
0 0Street Resurfacing 049,411
Economic Vibrancy
02 1st/1712 Bond Program
0 0 0 1,010,100Mockingbird Ln (W) from Maple to Harry Hines
0 0Street Resurfacing 1,010,1000
476
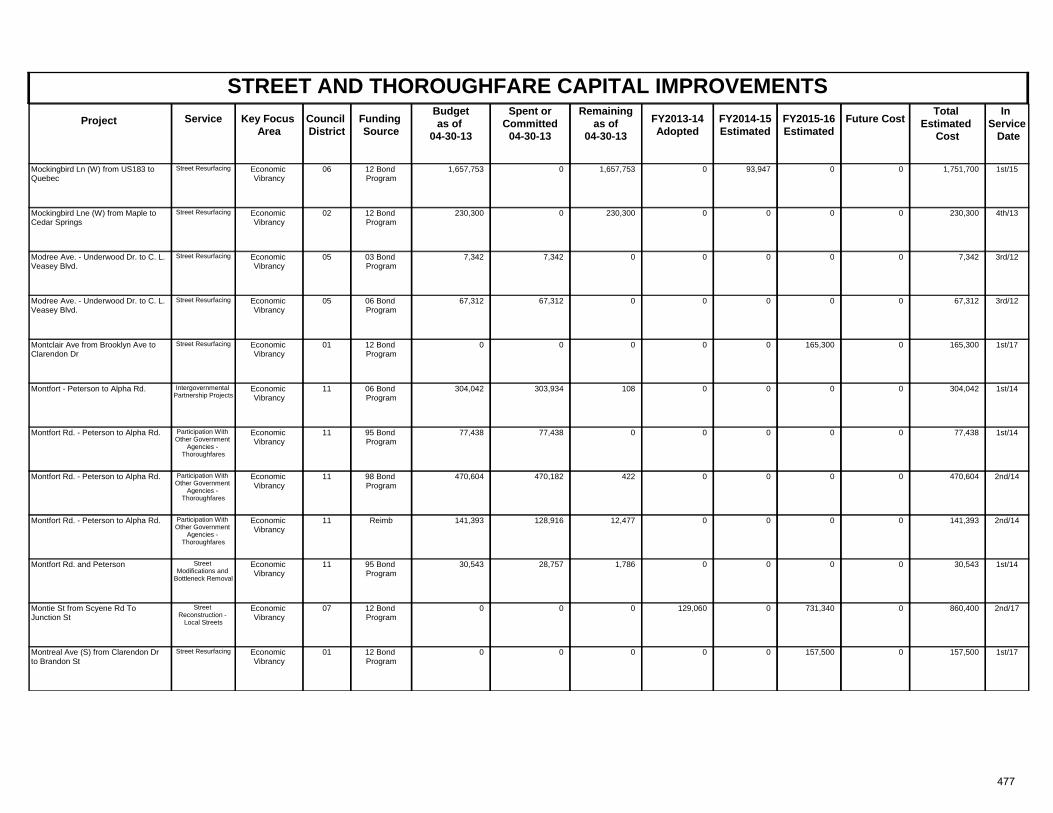
STREET AND THOROUGHFARE CAPITAL IMPROVEMENTSProject Key Focus
AreaCouncil District
Spent orCommitted
04-30-13
Total Estimated
Cost
In Service Date
Funding Source
Remainingas of
04-30-13 FY2013-14
AdoptedFuture CostService FY2014-15
Estimated FY2015-16 Estimated
Budgetas of
04-30-13
Economic Vibrancy
06 1st/1512 Bond Program
1,657,753 0 1,657,753 1,751,700Mockingbird Ln (W) from US183 to Quebec
0 0Street Resurfacing 093,947
Economic Vibrancy
02 4th/1312 Bond Program
230,300 0 230,300 230,300Mockingbird Lne (W) from Maple to Cedar Springs
0 0Street Resurfacing 00
Economic Vibrancy
05 3rd/1203 Bond Program
7,342 7,342 0 7,342Modree Ave. - Underwood Dr. to C. L. Veasey Blvd.
0 0Street Resurfacing 00
Economic Vibrancy
05 3rd/1206 Bond Program
67,312 67,312 0 67,312Modree Ave. - Underwood Dr. to C. L. Veasey Blvd.
0 0Street Resurfacing 00
Economic Vibrancy
01 1st/1712 Bond Program
0 0 0 165,300Montclair Ave from Brooklyn Ave to Clarendon Dr
0 0Street Resurfacing 165,3000
Economic Vibrancy
11 1st/1406 Bond Program
304,042 303,934 108 304,042Montfort - Peterson to Alpha Rd. 0 0Intergovernmental Partnership Projects
00
Economic Vibrancy
11 1st/1495 Bond Program
77,438 77,438 0 77,438Montfort Rd. - Peterson to Alpha Rd. 0 0Participation With Other Government
Agencies - Thoroughfares
00
Economic Vibrancy
11 2nd/1498 Bond Program
470,604 470,182 422 470,604Montfort Rd. - Peterson to Alpha Rd. 0 0Participation With Other Government
Agencies - Thoroughfares
00
Economic Vibrancy
11 2nd/14Reimb 141,393 128,916 12,477 141,393Montfort Rd. - Peterson to Alpha Rd. 0 0Participation With Other Government
Agencies - Thoroughfares
00
Economic Vibrancy
11 1st/1495 Bond Program
30,543 28,757 1,786 30,543Montfort Rd. and Peterson 0 0Street Modifications and
Bottleneck Removal
00
Economic Vibrancy
07 2nd/1712 Bond Program
0 0 0 860,400Montie St from Scyene Rd To Junction St
129,060 0Street Reconstruction -
Local Streets
731,3400
Economic Vibrancy
01 1st/1712 Bond Program
0 0 0 157,500Montreal Ave (S) from Clarendon Dr to Brandon St
0 0Street Resurfacing 157,5000
477
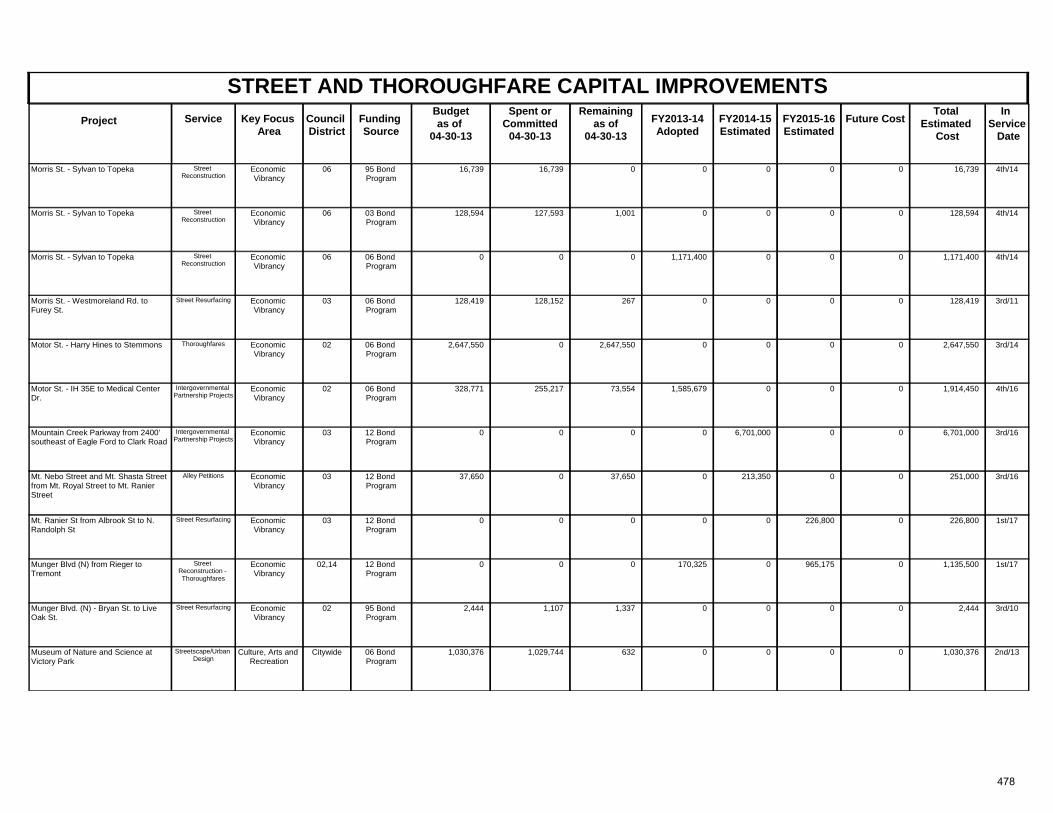
STREET AND THOROUGHFARE CAPITAL IMPROVEMENTSProject Key Focus
AreaCouncil District
Spent orCommitted
04-30-13
Total Estimated
Cost
In Service Date
Funding Source
Remainingas of
04-30-13 FY2013-14
AdoptedFuture CostService FY2014-15
Estimated FY2015-16 Estimated
Budgetas of
04-30-13
Economic Vibrancy
06 4th/1495 Bond Program
16,739 16,739 0 16,739Morris St. - Sylvan to Topeka 0 0Street Reconstruction
00
Economic Vibrancy
06 4th/1403 Bond Program
128,594 127,593 1,001 128,594Morris St. - Sylvan to Topeka 0 0Street Reconstruction
00
Economic Vibrancy
06 4th/1406 Bond Program
0 0 0 1,171,400Morris St. - Sylvan to Topeka 1,171,400 0Street Reconstruction
00
Economic Vibrancy
03 3rd/1106 Bond Program
128,419 128,152 267 128,419Morris St. - Westmoreland Rd. to Furey St.
0 0Street Resurfacing 00
Economic Vibrancy
02 3rd/1406 Bond Program
2,647,550 0 2,647,550 2,647,550Motor St. - Harry Hines to Stemmons 0 0Thoroughfares 00
Economic Vibrancy
02 4th/1606 Bond Program
328,771 255,217 73,554 1,914,450Motor St. - IH 35E to Medical Center Dr.
1,585,679 0Intergovernmental Partnership Projects
00
Economic Vibrancy
03 3rd/1612 Bond Program
0 0 0 6,701,000Mountain Creek Parkway from 2400’ southeast of Eagle Ford to Clark Road
0 0Intergovernmental Partnership Projects
06,701,000
Economic Vibrancy
03 3rd/1612 Bond Program
37,650 0 37,650 251,000Mt. Nebo Street and Mt. Shasta Street from Mt. Royal Street to Mt. Ranier Street
0 0Alley Petitions 0213,350
Economic Vibrancy
03 1st/1712 Bond Program
0 0 0 226,800Mt. Ranier St from Albrook St to N. Randolph St
0 0Street Resurfacing 226,8000
Economic Vibrancy
02,14 1st/1712 Bond Program
0 0 0 1,135,500Munger Blvd (N) from Rieger to Tremont
170,325 0Street Reconstruction - Thoroughfares
965,1750
Economic Vibrancy
02 3rd/1095 Bond Program
2,444 1,107 1,337 2,444Munger Blvd. (N) - Bryan St. to Live Oak St.
0 0Street Resurfacing 00
Culture, Arts and Recreation
Citywide 2nd/1306 Bond Program
1,030,376 1,029,744 632 1,030,376Museum of Nature and Science at Victory Park
0 0Streetscape/Urban Design
00
478
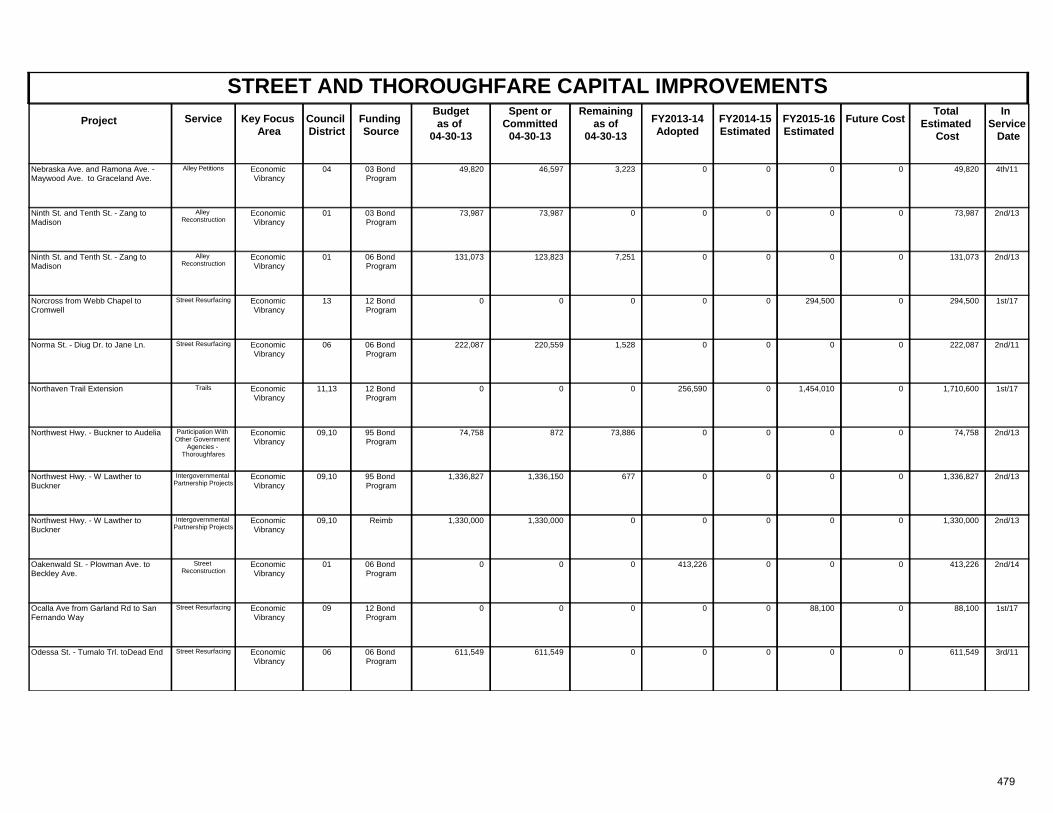
STREET AND THOROUGHFARE CAPITAL IMPROVEMENTSProject Key Focus
AreaCouncil District
Spent orCommitted
04-30-13
Total Estimated
Cost
In Service Date
Funding Source
Remainingas of
04-30-13 FY2013-14
AdoptedFuture CostService FY2014-15
Estimated FY2015-16 Estimated
Budgetas of
04-30-13
Economic Vibrancy
04 4th/1103 Bond Program
49,820 46,597 3,223 49,820Nebraska Ave. and Ramona Ave. - Maywood Ave. to Graceland Ave.
0 0Alley Petitions 00
Economic Vibrancy
01 2nd/1303 Bond Program
73,987 73,987 0 73,987Ninth St. and Tenth St. - Zang to Madison
0 0Alley Reconstruction
00
Economic Vibrancy
01 2nd/1306 Bond Program
131,073 123,823 7,251 131,073Ninth St. and Tenth St. - Zang to Madison
0 0Alley Reconstruction
00
Economic Vibrancy
13 1st/1712 Bond Program
0 0 0 294,500Norcross from Webb Chapel to Cromwell
0 0Street Resurfacing 294,5000
Economic Vibrancy
06 2nd/1106 Bond Program
222,087 220,559 1,528 222,087Norma St. - Diug Dr. to Jane Ln. 0 0Street Resurfacing 00
Economic Vibrancy
11,13 1st/1712 Bond Program
0 0 0 1,710,600Northaven Trail Extension 256,590 0Trails 1,454,0100
Economic Vibrancy
09,10 2nd/1395 Bond Program
74,758 872 73,886 74,758Northwest Hwy. - Buckner to Audelia 0 0Participation With Other Government
Agencies - Thoroughfares
00
Economic Vibrancy
09,10 2nd/1395 Bond Program
1,336,827 1,336,150 677 1,336,827Northwest Hwy. - W Lawther to Buckner
0 0Intergovernmental Partnership Projects
00
Economic Vibrancy
09,10 2nd/13Reimb 1,330,000 1,330,000 0 1,330,000Northwest Hwy. - W Lawther to Buckner
0 0Intergovernmental Partnership Projects
00
Economic Vibrancy
01 2nd/1406 Bond Program
0 0 0 413,226Oakenwald St. - Plowman Ave. to Beckley Ave.
413,226 0Street Reconstruction
00
Economic Vibrancy
09 1st/1712 Bond Program
0 0 0 88,100Ocalla Ave from Garland Rd to San Fernando Way
0 0Street Resurfacing 88,1000
Economic Vibrancy
06 3rd/1106 Bond Program
611,549 611,549 0 611,549Odessa St. - Tumalo Trl. toDead End 0 0Street Resurfacing 00
479
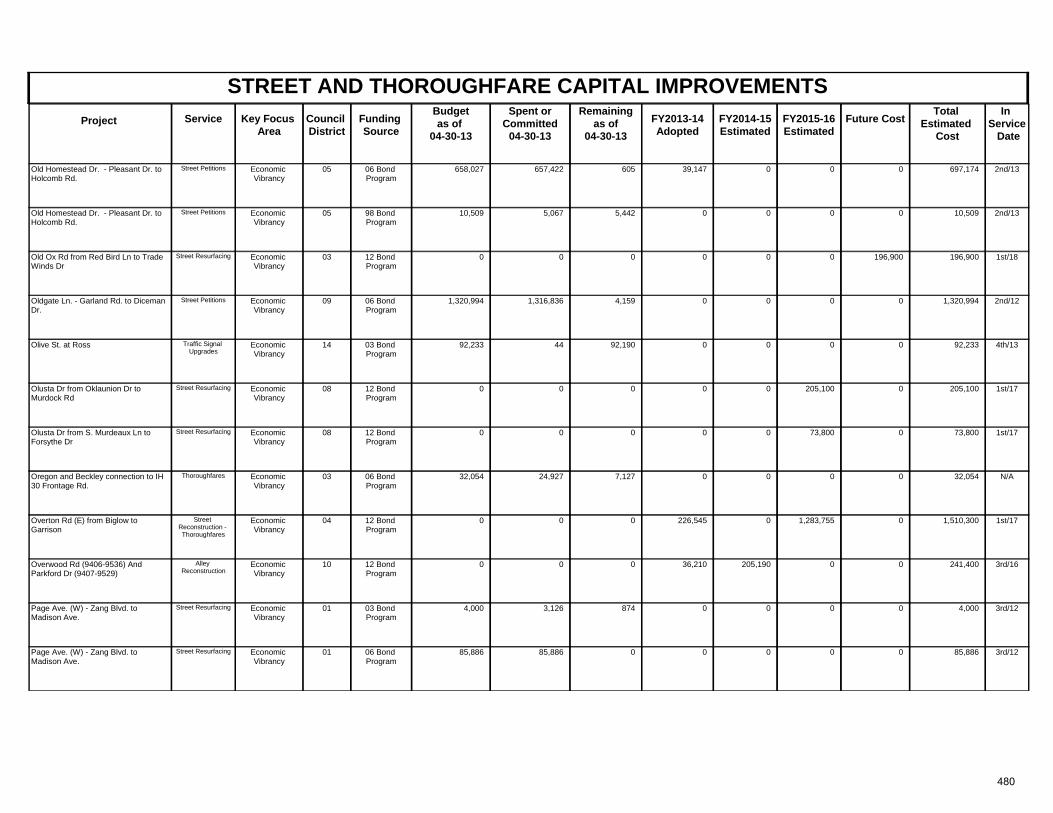
STREET AND THOROUGHFARE CAPITAL IMPROVEMENTSProject Key Focus
AreaCouncil District
Spent orCommitted
04-30-13
Total Estimated
Cost
In Service Date
Funding Source
Remainingas of
04-30-13 FY2013-14
AdoptedFuture CostService FY2014-15
Estimated FY2015-16 Estimated
Budgetas of
04-30-13
Economic Vibrancy
05 2nd/1306 Bond Program
658,027 657,422 605 697,174Old Homestead Dr. - Pleasant Dr. to Holcomb Rd.
39,147 0Street Petitions 00
Economic Vibrancy
05 2nd/1398 Bond Program
10,509 5,067 5,442 10,509Old Homestead Dr. - Pleasant Dr. to Holcomb Rd.
0 0Street Petitions 00
Economic Vibrancy
03 1st/1812 Bond Program
0 0 0 196,900Old Ox Rd from Red Bird Ln to Trade Winds Dr
0 196,900Street Resurfacing 00
Economic Vibrancy
09 2nd/1206 Bond Program
1,320,994 1,316,836 4,159 1,320,994Oldgate Ln. - Garland Rd. to Diceman Dr.
0 0Street Petitions 00
Economic Vibrancy
14 4th/1303 Bond Program
92,233 44 92,190 92,233Olive St. at Ross 0 0Traffic Signal Upgrades
00
Economic Vibrancy
08 1st/1712 Bond Program
0 0 0 205,100Olusta Dr from Oklaunion Dr to Murdock Rd
0 0Street Resurfacing 205,1000
Economic Vibrancy
08 1st/1712 Bond Program
0 0 0 73,800Olusta Dr from S. Murdeaux Ln to Forsythe Dr
0 0Street Resurfacing 73,8000
Economic Vibrancy
03 N/A06 Bond Program
32,054 24,927 7,127 32,054Oregon and Beckley connection to IH 30 Frontage Rd.
0 0Thoroughfares 00
Economic Vibrancy
04 1st/1712 Bond Program
0 0 0 1,510,300Overton Rd (E) from Biglow to Garrison
226,545 0Street Reconstruction - Thoroughfares
1,283,7550
Economic Vibrancy
10 3rd/1612 Bond Program
0 0 0 241,400Overwood Rd (9406-9536) And Parkford Dr (9407-9529)
36,210 0Alley Reconstruction
0205,190
Economic Vibrancy
01 3rd/1203 Bond Program
4,000 3,126 874 4,000Page Ave. (W) - Zang Blvd. to Madison Ave.
0 0Street Resurfacing 00
Economic Vibrancy
01 3rd/1206 Bond Program
85,886 85,886 0 85,886Page Ave. (W) - Zang Blvd. to Madison Ave.
0 0Street Resurfacing 00
480
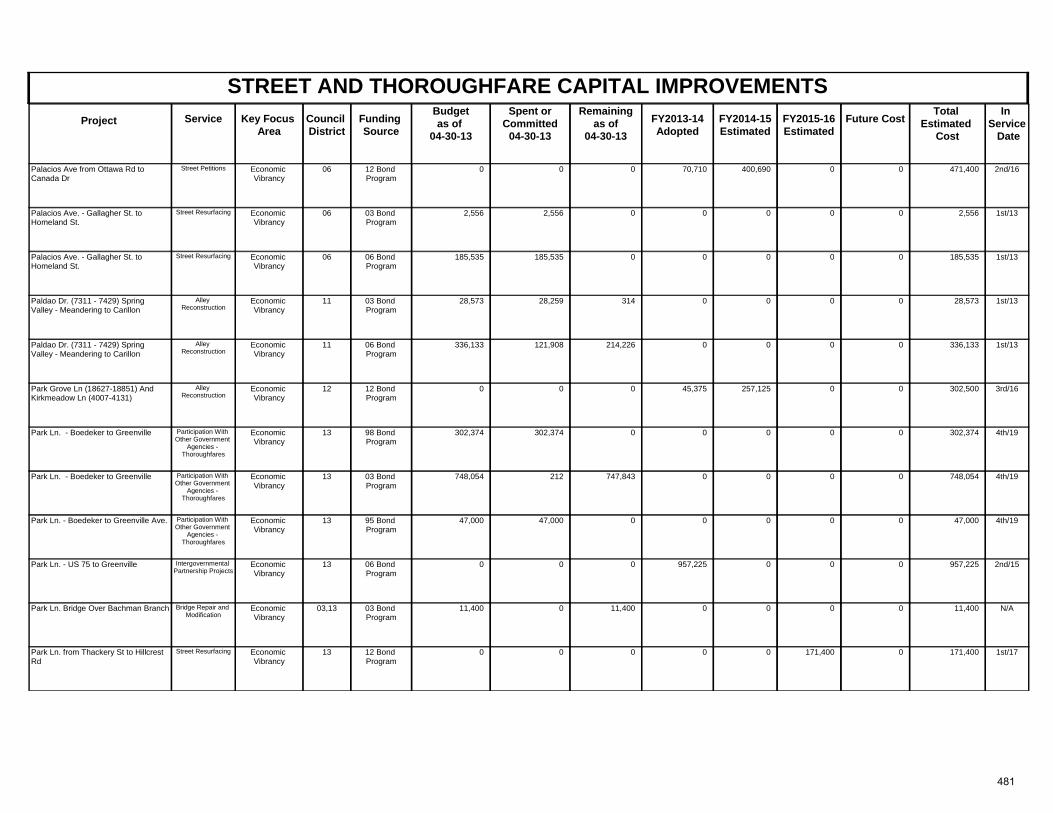
STREET AND THOROUGHFARE CAPITAL IMPROVEMENTSProject Key Focus
AreaCouncil District
Spent orCommitted
04-30-13
Total Estimated
Cost
In Service Date
Funding Source
Remainingas of
04-30-13 FY2013-14
AdoptedFuture CostService FY2014-15
Estimated FY2015-16 Estimated
Budgetas of
04-30-13
Economic Vibrancy
06 2nd/1612 Bond Program
0 0 0 471,400Palacios Ave from Ottawa Rd to Canada Dr
70,710 0Street Petitions 0400,690
Economic Vibrancy
06 1st/1303 Bond Program
2,556 2,556 0 2,556Palacios Ave. - Gallagher St. to Homeland St.
0 0Street Resurfacing 00
Economic Vibrancy
06 1st/1306 Bond Program
185,535 185,535 0 185,535Palacios Ave. - Gallagher St. to Homeland St.
0 0Street Resurfacing 00
Economic Vibrancy
11 1st/1303 Bond Program
28,573 28,259 314 28,573Paldao Dr. (7311 - 7429) Spring Valley - Meandering to Carillon
0 0Alley Reconstruction
00
Economic Vibrancy
11 1st/1306 Bond Program
336,133 121,908 214,226 336,133Paldao Dr. (7311 - 7429) Spring Valley - Meandering to Carillon
0 0Alley Reconstruction
00
Economic Vibrancy
12 3rd/1612 Bond Program
0 0 0 302,500Park Grove Ln (18627-18851) And Kirkmeadow Ln (4007-4131)
45,375 0Alley Reconstruction
0257,125
Economic Vibrancy
13 4th/1998 Bond Program
302,374 302,374 0 302,374Park Ln. - Boedeker to Greenville 0 0Participation With Other Government
Agencies - Thoroughfares
00
Economic Vibrancy
13 4th/1903 Bond Program
748,054 212 747,843 748,054Park Ln. - Boedeker to Greenville 0 0Participation With Other Government
Agencies - Thoroughfares
00
Economic Vibrancy
13 4th/1995 Bond Program
47,000 47,000 0 47,000Park Ln. - Boedeker to Greenville Ave. 0 0Participation With Other Government
Agencies - Thoroughfares
00
Economic Vibrancy
13 2nd/1506 Bond Program
0 0 0 957,225Park Ln. - US 75 to Greenville 957,225 0Intergovernmental Partnership Projects
00
Economic Vibrancy
03,13 N/A03 Bond Program
11,400 0 11,400 11,400Park Ln. Bridge Over Bachman Branch 0 0Bridge Repair and Modification
00
Economic Vibrancy
13 1st/1712 Bond Program
0 0 0 171,400Park Ln. from Thackery St to Hillcrest Rd
0 0Street Resurfacing 171,4000
481
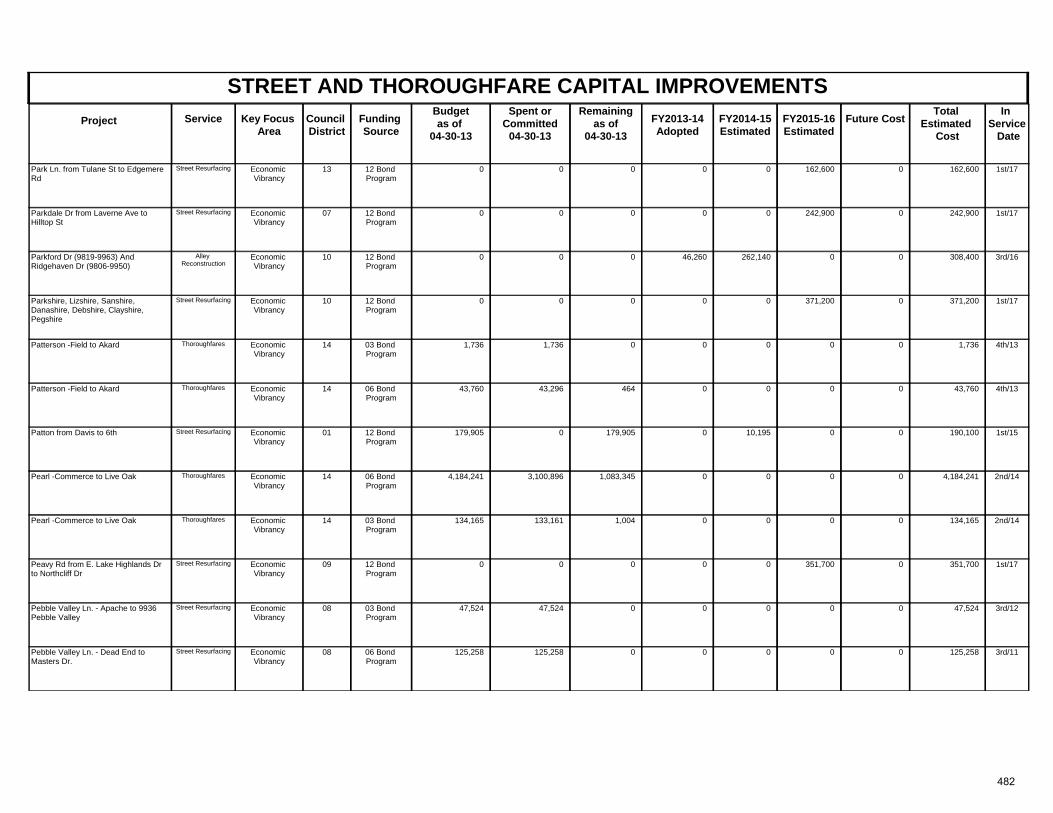
STREET AND THOROUGHFARE CAPITAL IMPROVEMENTSProject Key Focus
AreaCouncil District
Spent orCommitted
04-30-13
Total Estimated
Cost
In Service Date
Funding Source
Remainingas of
04-30-13 FY2013-14
AdoptedFuture CostService FY2014-15
Estimated FY2015-16 Estimated
Budgetas of
04-30-13
Economic Vibrancy
13 1st/1712 Bond Program
0 0 0 162,600Park Ln. from Tulane St to Edgemere Rd
0 0Street Resurfacing 162,6000
Economic Vibrancy
07 1st/1712 Bond Program
0 0 0 242,900Parkdale Dr from Laverne Ave to Hilltop St
0 0Street Resurfacing 242,9000
Economic Vibrancy
10 3rd/1612 Bond Program
0 0 0 308,400Parkford Dr (9819-9963) And Ridgehaven Dr (9806-9950)
46,260 0Alley Reconstruction
0262,140
Economic Vibrancy
10 1st/1712 Bond Program
0 0 0 371,200Parkshire, Lizshire, Sanshire, Danashire, Debshire, Clayshire, Pegshire
0 0Street Resurfacing 371,2000
Economic Vibrancy
14 4th/1303 Bond Program
1,736 1,736 0 1,736Patterson -Field to Akard 0 0Thoroughfares 00
Economic Vibrancy
14 4th/1306 Bond Program
43,760 43,296 464 43,760Patterson -Field to Akard 0 0Thoroughfares 00
Economic Vibrancy
01 1st/1512 Bond Program
179,905 0 179,905 190,100Patton from Davis to 6th 0 0Street Resurfacing 010,195
Economic Vibrancy
14 2nd/1406 Bond Program
4,184,241 3,100,896 1,083,345 4,184,241Pearl -Commerce to Live Oak 0 0Thoroughfares 00
Economic Vibrancy
14 2nd/1403 Bond Program
134,165 133,161 1,004 134,165Pearl -Commerce to Live Oak 0 0Thoroughfares 00
Economic Vibrancy
09 1st/1712 Bond Program
0 0 0 351,700Peavy Rd from E. Lake Highlands Dr to Northcliff Dr
0 0Street Resurfacing 351,7000
Economic Vibrancy
08 3rd/1203 Bond Program
47,524 47,524 0 47,524Pebble Valley Ln. - Apache to 9936 Pebble Valley
0 0Street Resurfacing 00
Economic Vibrancy
08 3rd/1106 Bond Program
125,258 125,258 0 125,258Pebble Valley Ln. - Dead End to Masters Dr.
0 0Street Resurfacing 00
482
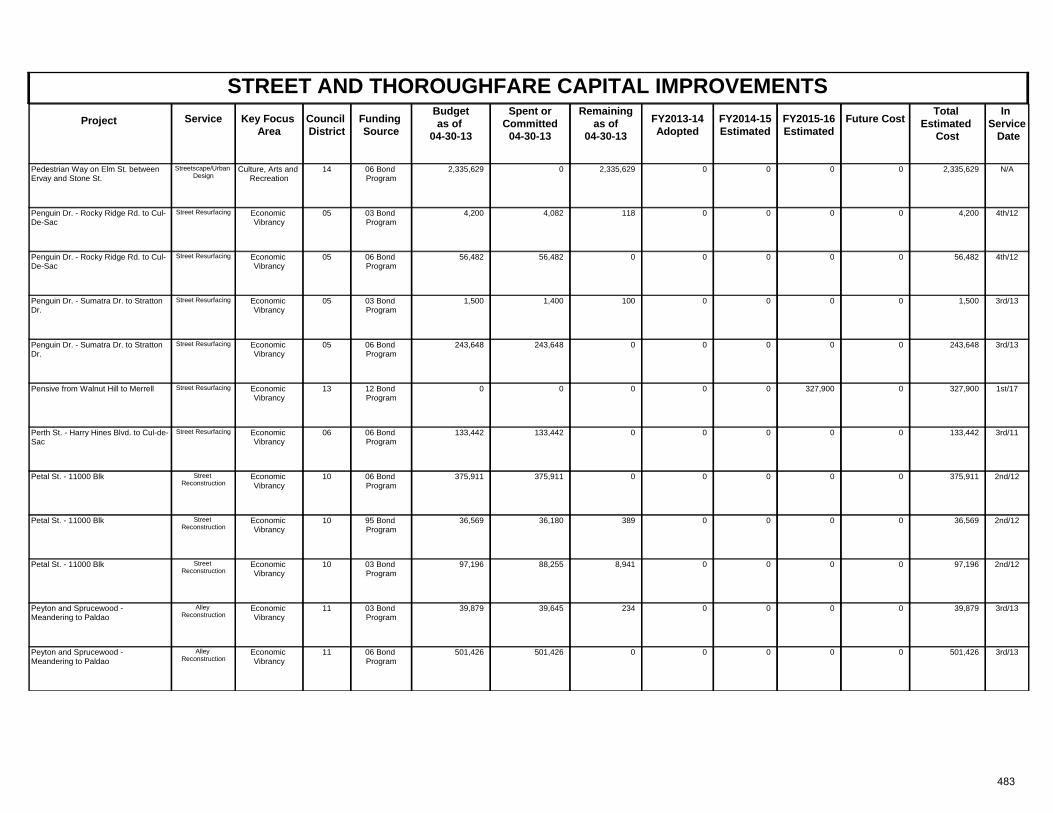
STREET AND THOROUGHFARE CAPITAL IMPROVEMENTSProject Key Focus
AreaCouncil District
Spent orCommitted
04-30-13
Total Estimated
Cost
In Service Date
Funding Source
Remainingas of
04-30-13 FY2013-14
AdoptedFuture CostService FY2014-15
Estimated FY2015-16 Estimated
Budgetas of
04-30-13
Culture, Arts and Recreation
14 N/A06 Bond Program
2,335,629 0 2,335,629 2,335,629Pedestrian Way on Elm St. between Ervay and Stone St.
0 0Streetscape/Urban Design
00
Economic Vibrancy
05 4th/1203 Bond Program
4,200 4,082 118 4,200Penguin Dr. - Rocky Ridge Rd. to Cul-De-Sac
0 0Street Resurfacing 00
Economic Vibrancy
05 4th/1206 Bond Program
56,482 56,482 0 56,482Penguin Dr. - Rocky Ridge Rd. to Cul-De-Sac
0 0Street Resurfacing 00
Economic Vibrancy
05 3rd/1303 Bond Program
1,500 1,400 100 1,500Penguin Dr. - Sumatra Dr. to Stratton Dr.
0 0Street Resurfacing 00
Economic Vibrancy
05 3rd/1306 Bond Program
243,648 243,648 0 243,648Penguin Dr. - Sumatra Dr. to Stratton Dr.
0 0Street Resurfacing 00
Economic Vibrancy
13 1st/1712 Bond Program
0 0 0 327,900Pensive from Walnut Hill to Merrell 0 0Street Resurfacing 327,9000
Economic Vibrancy
06 3rd/1106 Bond Program
133,442 133,442 0 133,442Perth St. - Harry Hines Blvd. to Cul-de-Sac
0 0Street Resurfacing 00
Economic Vibrancy
10 2nd/1206 Bond Program
375,911 375,911 0 375,911Petal St. - 11000 Blk 0 0Street Reconstruction
00
Economic Vibrancy
10 2nd/1295 Bond Program
36,569 36,180 389 36,569Petal St. - 11000 Blk 0 0Street Reconstruction
00
Economic Vibrancy
10 2nd/1203 Bond Program
97,196 88,255 8,941 97,196Petal St. - 11000 Blk 0 0Street Reconstruction
00
Economic Vibrancy
11 3rd/1303 Bond Program
39,879 39,645 234 39,879Peyton and Sprucewood - Meandering to Paldao
0 0Alley Reconstruction
00
Economic Vibrancy
11 3rd/1306 Bond Program
501,426 501,426 0 501,426Peyton and Sprucewood - Meandering to Paldao
0 0Alley Reconstruction
00
483
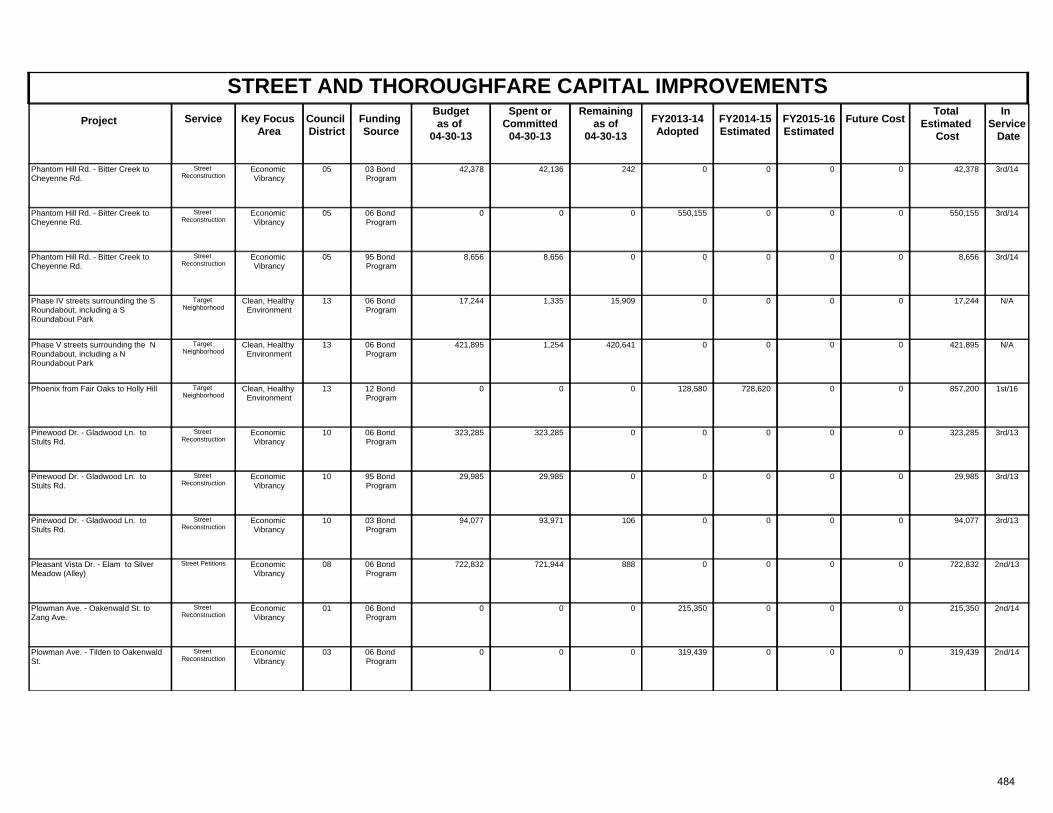
STREET AND THOROUGHFARE CAPITAL IMPROVEMENTSProject Key Focus
AreaCouncil District
Spent orCommitted
04-30-13
Total Estimated
Cost
In Service Date
Funding Source
Remainingas of
04-30-13 FY2013-14
AdoptedFuture CostService FY2014-15
Estimated FY2015-16 Estimated
Budgetas of
04-30-13
Economic Vibrancy
05 3rd/1403 Bond Program
42,378 42,136 242 42,378Phantom Hill Rd. - Bitter Creek to Cheyenne Rd.
0 0Street Reconstruction
00
Economic Vibrancy
05 3rd/1406 Bond Program
0 0 0 550,155Phantom Hill Rd. - Bitter Creek to Cheyenne Rd.
550,155 0Street Reconstruction
00
Economic Vibrancy
05 3rd/1495 Bond Program
8,656 8,656 0 8,656Phantom Hill Rd. - Bitter Creek to Cheyenne Rd.
0 0Street Reconstruction
00
Clean, Healthy Environment
13 N/A06 Bond Program
17,244 1,335 15,909 17,244Phase IV streets surrounding the S Roundabout, including a S Roundabout Park
0 0Target Neighborhood
00
Clean, Healthy Environment
13 N/A06 Bond Program
421,895 1,254 420,641 421,895Phase V streets surrounding the N Roundabout, including a N Roundabout Park
0 0Target Neighborhood
00
Clean, Healthy Environment
13 1st/1612 Bond Program
0 0 0 857,200Phoenix from Fair Oaks to Holly Hill 128,580 0Target Neighborhood
0728,620
Economic Vibrancy
10 3rd/1306 Bond Program
323,285 323,285 0 323,285Pinewood Dr. - Gladwood Ln. to Stults Rd.
0 0Street Reconstruction
00
Economic Vibrancy
10 3rd/1395 Bond Program
29,985 29,985 0 29,985Pinewood Dr. - Gladwood Ln. to Stults Rd.
0 0Street Reconstruction
00
Economic Vibrancy
10 3rd/1303 Bond Program
94,077 93,971 106 94,077Pinewood Dr. - Gladwood Ln. to Stults Rd.
0 0Street Reconstruction
00
Economic Vibrancy
08 2nd/1306 Bond Program
722,832 721,944 888 722,832Pleasant Vista Dr. - Elam to Silver Meadow (Alley)
0 0Street Petitions 00
Economic Vibrancy
01 2nd/1406 Bond Program
0 0 0 215,350Plowman Ave. - Oakenwald St. to Zang Ave.
215,350 0Street Reconstruction
00
Economic Vibrancy
03 2nd/1406 Bond Program
0 0 0 319,439Plowman Ave. - Tilden to Oakenwald St.
319,439 0Street Reconstruction
00
484
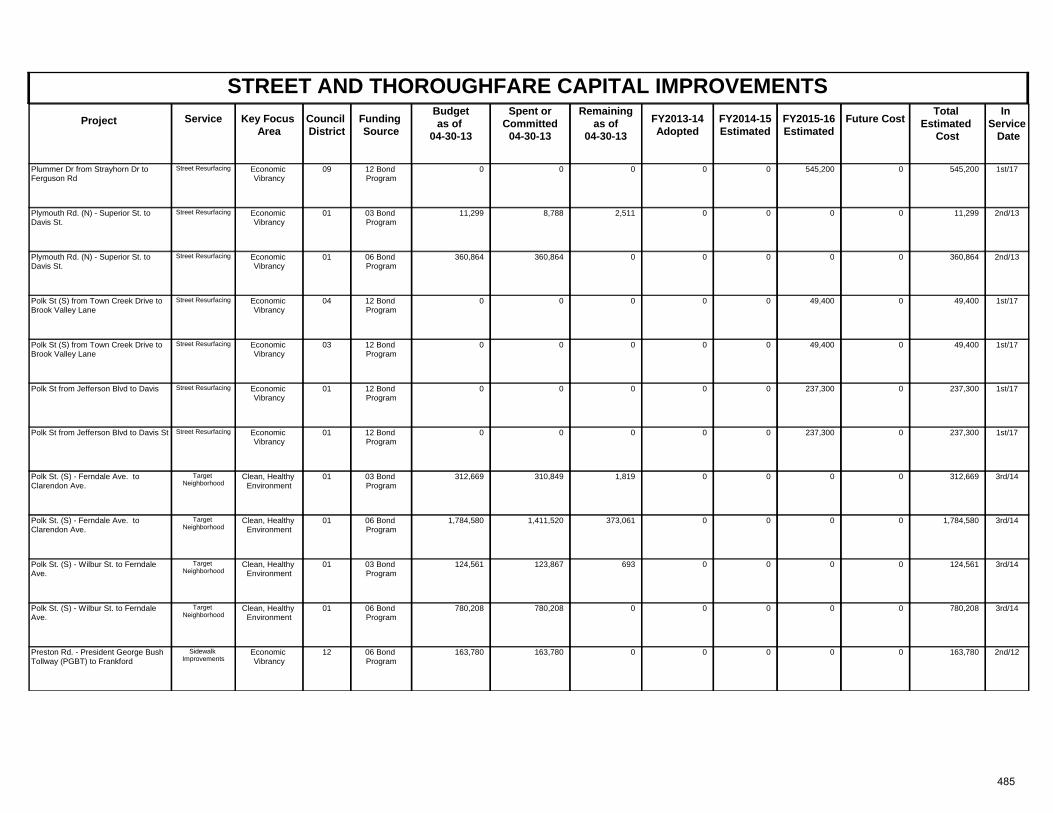
STREET AND THOROUGHFARE CAPITAL IMPROVEMENTSProject Key Focus
AreaCouncil District
Spent orCommitted
04-30-13
Total Estimated
Cost
In Service Date
Funding Source
Remainingas of
04-30-13 FY2013-14
AdoptedFuture CostService FY2014-15
Estimated FY2015-16 Estimated
Budgetas of
04-30-13
Economic Vibrancy
09 1st/1712 Bond Program
0 0 0 545,200Plummer Dr from Strayhorn Dr to Ferguson Rd
0 0Street Resurfacing 545,2000
Economic Vibrancy
01 2nd/1303 Bond Program
11,299 8,788 2,511 11,299Plymouth Rd. (N) - Superior St. to Davis St.
0 0Street Resurfacing 00
Economic Vibrancy
01 2nd/1306 Bond Program
360,864 360,864 0 360,864Plymouth Rd. (N) - Superior St. to Davis St.
0 0Street Resurfacing 00
Economic Vibrancy
04 1st/1712 Bond Program
0 0 0 49,400Polk St (S) from Town Creek Drive to Brook Valley Lane
0 0Street Resurfacing 49,4000
Economic Vibrancy
03 1st/1712 Bond Program
0 0 0 49,400Polk St (S) from Town Creek Drive to Brook Valley Lane
0 0Street Resurfacing 49,4000
Economic Vibrancy
01 1st/1712 Bond Program
0 0 0 237,300Polk St from Jefferson Blvd to Davis 0 0Street Resurfacing 237,3000
Economic Vibrancy
01 1st/1712 Bond Program
0 0 0 237,300Polk St from Jefferson Blvd to Davis St 0 0Street Resurfacing 237,3000
Clean, Healthy Environment
01 3rd/1403 Bond Program
312,669 310,849 1,819 312,669Polk St. (S) - Ferndale Ave. to Clarendon Ave.
0 0Target Neighborhood
00
Clean, Healthy Environment
01 3rd/1406 Bond Program
1,784,580 1,411,520 373,061 1,784,580Polk St. (S) - Ferndale Ave. to Clarendon Ave.
0 0Target Neighborhood
00
Clean, Healthy Environment
01 3rd/1403 Bond Program
124,561 123,867 693 124,561Polk St. (S) - Wilbur St. to Ferndale Ave.
0 0Target Neighborhood
00
Clean, Healthy Environment
01 3rd/1406 Bond Program
780,208 780,208 0 780,208Polk St. (S) - Wilbur St. to Ferndale Ave.
0 0Target Neighborhood
00
Economic Vibrancy
12 2nd/1206 Bond Program
163,780 163,780 0 163,780Preston Rd. - President George Bush Tollway (PGBT) to Frankford
0 0Sidewalk Improvements
00
485
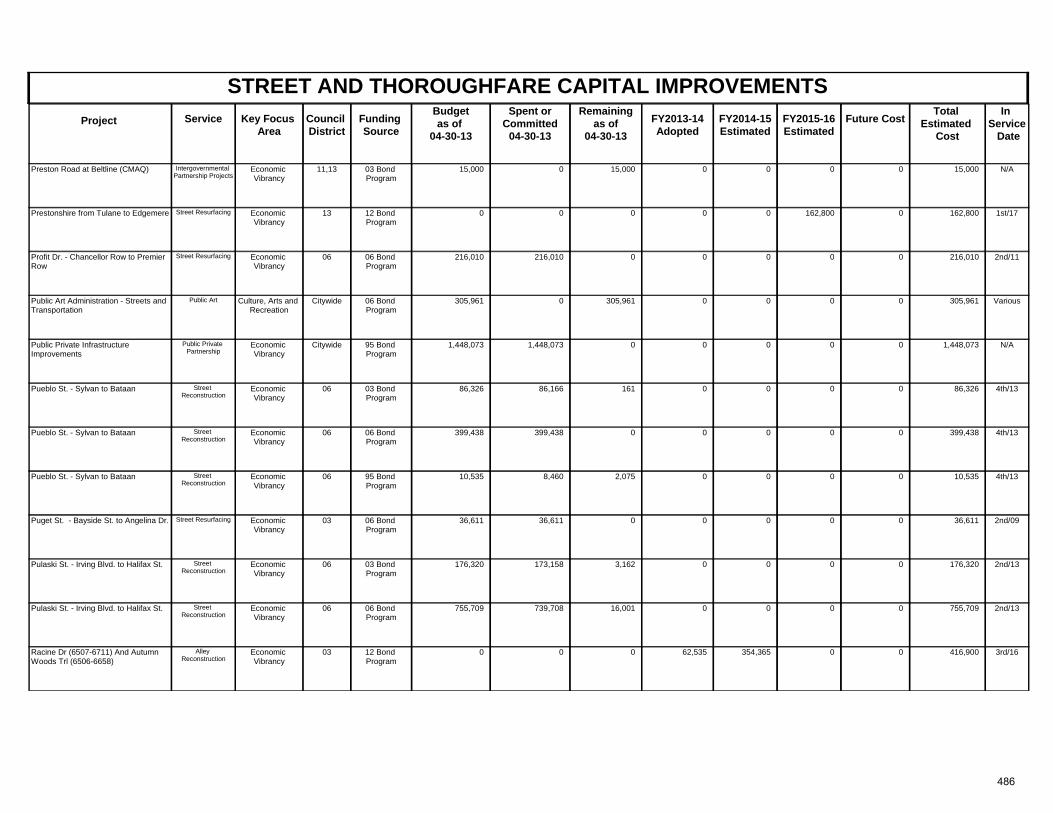
STREET AND THOROUGHFARE CAPITAL IMPROVEMENTSProject Key Focus
AreaCouncil District
Spent orCommitted
04-30-13
Total Estimated
Cost
In Service Date
Funding Source
Remainingas of
04-30-13 FY2013-14
AdoptedFuture CostService FY2014-15
Estimated FY2015-16 Estimated
Budgetas of
04-30-13
Economic Vibrancy
11,13 N/A03 Bond Program
15,000 0 15,000 15,000Preston Road at Beltline (CMAQ) 0 0Intergovernmental Partnership Projects
00
Economic Vibrancy
13 1st/1712 Bond Program
0 0 0 162,800Prestonshire from Tulane to Edgemere 0 0Street Resurfacing 162,8000
Economic Vibrancy
06 2nd/1106 Bond Program
216,010 216,010 0 216,010Profit Dr. - Chancellor Row to Premier Row
0 0Street Resurfacing 00
Culture, Arts and Recreation
Citywide Various06 Bond Program
305,961 0 305,961 305,961Public Art Administration - Streets and Transportation
0 0Public Art 00
Economic Vibrancy
Citywide N/A95 Bond Program
1,448,073 1,448,073 0 1,448,073Public Private Infrastructure Improvements
0 0Public Private Partnership
00
Economic Vibrancy
06 4th/1303 Bond Program
86,326 86,166 161 86,326Pueblo St. - Sylvan to Bataan 0 0Street Reconstruction
00
Economic Vibrancy
06 4th/1306 Bond Program
399,438 399,438 0 399,438Pueblo St. - Sylvan to Bataan 0 0Street Reconstruction
00
Economic Vibrancy
06 4th/1395 Bond Program
10,535 8,460 2,075 10,535Pueblo St. - Sylvan to Bataan 0 0Street Reconstruction
00
Economic Vibrancy
03 2nd/0906 Bond Program
36,611 36,611 0 36,611Puget St. - Bayside St. to Angelina Dr. 0 0Street Resurfacing 00
Economic Vibrancy
06 2nd/1303 Bond Program
176,320 173,158 3,162 176,320Pulaski St. - Irving Blvd. to Halifax St. 0 0Street Reconstruction
00
Economic Vibrancy
06 2nd/1306 Bond Program
755,709 739,708 16,001 755,709Pulaski St. - Irving Blvd. to Halifax St. 0 0Street Reconstruction
00
Economic Vibrancy
03 3rd/1612 Bond Program
0 0 0 416,900Racine Dr (6507-6711) And Autumn Woods Trl (6506-6658)
62,535 0Alley Reconstruction
0354,365
486
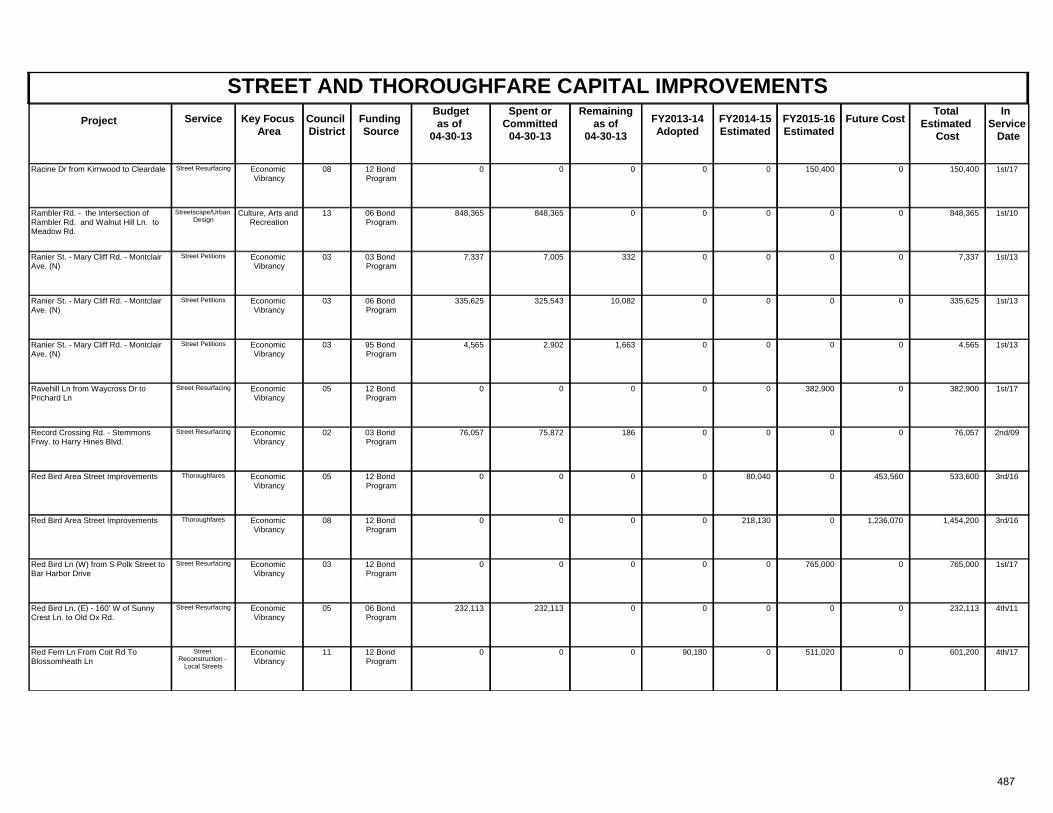
STREET AND THOROUGHFARE CAPITAL IMPROVEMENTSProject Key Focus
AreaCouncil District
Spent orCommitted
04-30-13
Total Estimated
Cost
In Service Date
Funding Source
Remainingas of
04-30-13 FY2013-14
AdoptedFuture CostService FY2014-15
Estimated FY2015-16 Estimated
Budgetas of
04-30-13
Economic Vibrancy
08 1st/1712 Bond Program
0 0 0 150,400Racine Dr from Kirnwood to Cleardale 0 0Street Resurfacing 150,4000
Culture, Arts and Recreation
13 1st/1006 Bond Program
848,365 848,365 0 848,365Rambler Rd. - the Intersection of Rambler Rd. and Walnut Hill Ln. to Meadow Rd.
0 0Streetscape/Urban Design
00
Economic Vibrancy
03 1st/1303 Bond Program
7,337 7,005 332 7,337Ranier St. - Mary Cliff Rd. - Montclair Ave. (N)
0 0Street Petitions 00
Economic Vibrancy
03 1st/1306 Bond Program
335,625 325,543 10,082 335,625Ranier St. - Mary Cliff Rd. - Montclair Ave. (N)
0 0Street Petitions 00
Economic Vibrancy
03 1st/1395 Bond Program
4,565 2,902 1,663 4,565Ranier St. - Mary Cliff Rd. - Montclair Ave. (N)
0 0Street Petitions 00
Economic Vibrancy
05 1st/1712 Bond Program
0 0 0 382,900Ravehill Ln from Waycross Dr to Prichard Ln
0 0Street Resurfacing 382,9000
Economic Vibrancy
02 2nd/0903 Bond Program
76,057 75,872 186 76,057Record Crossing Rd. - Stemmons Frwy. to Harry Hines Blvd.
0 0Street Resurfacing 00
Economic Vibrancy
05 3rd/1612 Bond Program
0 0 0 533,600Red Bird Area Street Improvements 0 453,560Thoroughfares 080,040
Economic Vibrancy
08 3rd/1612 Bond Program
0 0 0 1,454,200Red Bird Area Street Improvements 0 1,236,070Thoroughfares 0218,130
Economic Vibrancy
03 1st/1712 Bond Program
0 0 0 765,000Red Bird Ln (W) from S Polk Street to Bar Harbor Drive
0 0Street Resurfacing 765,0000
Economic Vibrancy
05 4th/1106 Bond Program
232,113 232,113 0 232,113Red Bird Ln. (E) - 160' W of Sunny Crest Ln. to Old Ox Rd.
0 0Street Resurfacing 00
Economic Vibrancy
11 4th/1712 Bond Program
0 0 0 601,200Red Fern Ln From Coit Rd To Blossomheath Ln
90,180 0Street Reconstruction -
Local Streets
511,0200
487
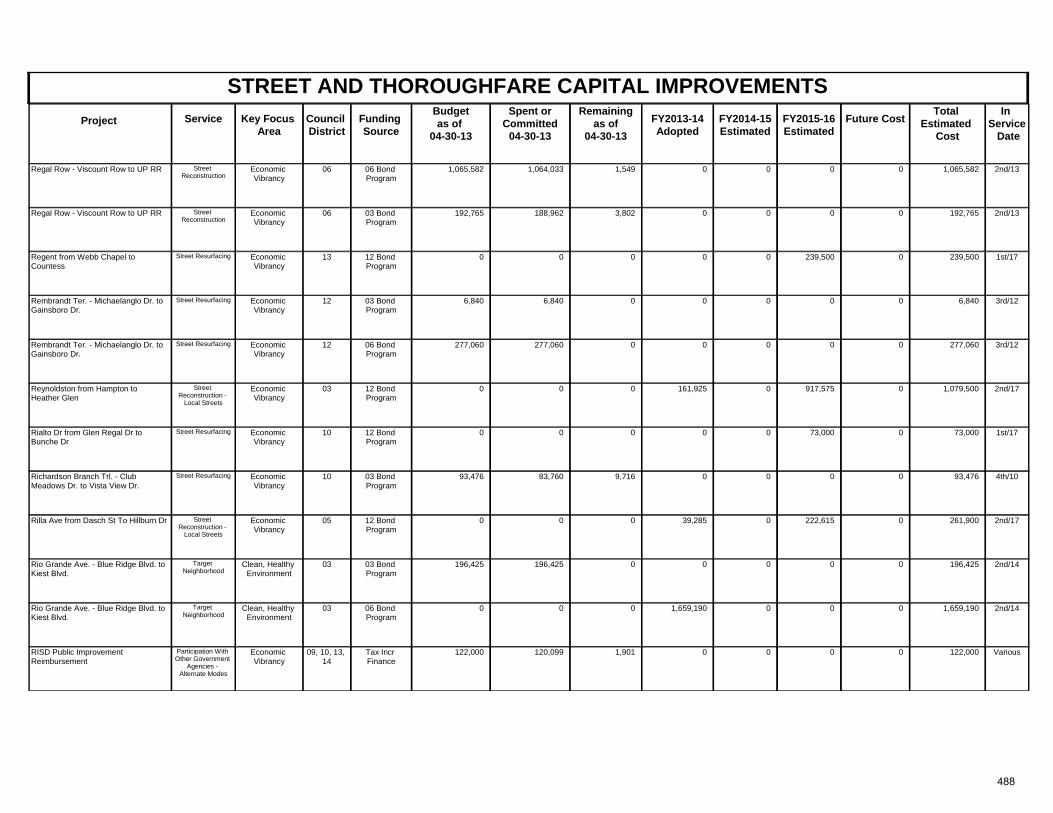
STREET AND THOROUGHFARE CAPITAL IMPROVEMENTSProject Key Focus
AreaCouncil District
Spent orCommitted
04-30-13
Total Estimated
Cost
In Service Date
Funding Source
Remainingas of
04-30-13 FY2013-14
AdoptedFuture CostService FY2014-15
Estimated FY2015-16 Estimated
Budgetas of
04-30-13
Economic Vibrancy
06 2nd/1306 Bond Program
1,065,582 1,064,033 1,549 1,065,582Regal Row - Viscount Row to UP RR 0 0Street Reconstruction
00
Economic Vibrancy
06 2nd/1303 Bond Program
192,765 188,962 3,802 192,765Regal Row - Viscount Row to UP RR 0 0Street Reconstruction
00
Economic Vibrancy
13 1st/1712 Bond Program
0 0 0 239,500Regent from Webb Chapel to Countess
0 0Street Resurfacing 239,5000
Economic Vibrancy
12 3rd/1203 Bond Program
6,840 6,840 0 6,840Rembrandt Ter. - Michaelanglo Dr. to Gainsboro Dr.
0 0Street Resurfacing 00
Economic Vibrancy
12 3rd/1206 Bond Program
277,060 277,060 0 277,060Rembrandt Ter. - Michaelanglo Dr. to Gainsboro Dr.
0 0Street Resurfacing 00
Economic Vibrancy
03 2nd/1712 Bond Program
0 0 0 1,079,500Reynoldston from Hampton to Heather Glen
161,925 0Street Reconstruction -
Local Streets
917,5750
Economic Vibrancy
10 1st/1712 Bond Program
0 0 0 73,000Rialto Dr from Glen Regal Dr to Bunche Dr
0 0Street Resurfacing 73,0000
Economic Vibrancy
10 4th/1003 Bond Program
93,476 83,760 9,716 93,476Richardson Branch Trl. - Club Meadows Dr. to Vista View Dr.
0 0Street Resurfacing 00
Economic Vibrancy
05 2nd/1712 Bond Program
0 0 0 261,900Rilla Ave from Dasch St To Hillburn Dr 39,285 0Street Reconstruction -
Local Streets
222,6150
Clean, Healthy Environment
03 2nd/1403 Bond Program
196,425 196,425 0 196,425Rio Grande Ave. - Blue Ridge Blvd. to Kiest Blvd.
0 0Target Neighborhood
00
Clean, Healthy Environment
03 2nd/1406 Bond Program
0 0 0 1,659,190Rio Grande Ave. - Blue Ridge Blvd. to Kiest Blvd.
1,659,190 0Target Neighborhood
00
Economic Vibrancy
09, 10, 13, 14
VariousTax Incr Finance
122,000 120,099 1,901 122,000RISD Public Improvement Reimbursement
0 0Participation With Other Government
Agencies - Alternate Modes
00
488
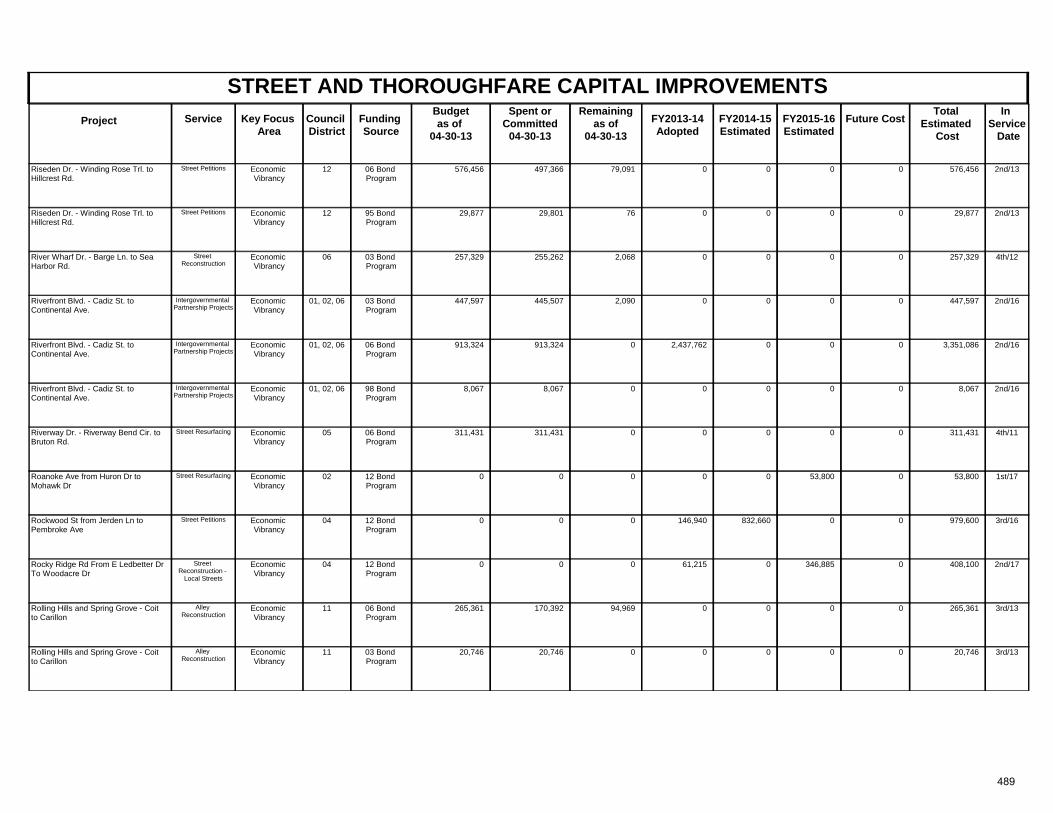
STREET AND THOROUGHFARE CAPITAL IMPROVEMENTSProject Key Focus
AreaCouncil District
Spent orCommitted
04-30-13
Total Estimated
Cost
In Service Date
Funding Source
Remainingas of
04-30-13 FY2013-14
AdoptedFuture CostService FY2014-15
Estimated FY2015-16 Estimated
Budgetas of
04-30-13
Economic Vibrancy
12 2nd/1306 Bond Program
576,456 497,366 79,091 576,456Riseden Dr. - Winding Rose Trl. to Hillcrest Rd.
0 0Street Petitions 00
Economic Vibrancy
12 2nd/1395 Bond Program
29,877 29,801 76 29,877Riseden Dr. - Winding Rose Trl. to Hillcrest Rd.
0 0Street Petitions 00
Economic Vibrancy
06 4th/1203 Bond Program
257,329 255,262 2,068 257,329River Wharf Dr. - Barge Ln. to Sea Harbor Rd.
0 0Street Reconstruction
00
Economic Vibrancy
01, 02, 06 2nd/1603 Bond Program
447,597 445,507 2,090 447,597Riverfront Blvd. - Cadiz St. to Continental Ave.
0 0Intergovernmental Partnership Projects
00
Economic Vibrancy
01, 02, 06 2nd/1606 Bond Program
913,324 913,324 0 3,351,086Riverfront Blvd. - Cadiz St. to Continental Ave.
2,437,762 0Intergovernmental Partnership Projects
00
Economic Vibrancy
01, 02, 06 2nd/1698 Bond Program
8,067 8,067 0 8,067Riverfront Blvd. - Cadiz St. to Continental Ave.
0 0Intergovernmental Partnership Projects
00
Economic Vibrancy
05 4th/1106 Bond Program
311,431 311,431 0 311,431Riverway Dr. - Riverway Bend Cir. to Bruton Rd.
0 0Street Resurfacing 00
Economic Vibrancy
02 1st/1712 Bond Program
0 0 0 53,800Roanoke Ave from Huron Dr to Mohawk Dr
0 0Street Resurfacing 53,8000
Economic Vibrancy
04 3rd/1612 Bond Program
0 0 0 979,600Rockwood St from Jerden Ln to Pembroke Ave
146,940 0Street Petitions 0832,660
Economic Vibrancy
04 2nd/1712 Bond Program
0 0 0 408,100Rocky Ridge Rd From E Ledbetter Dr To Woodacre Dr
61,215 0Street Reconstruction -
Local Streets
346,8850
Economic Vibrancy
11 3rd/1306 Bond Program
265,361 170,392 94,969 265,361Rolling Hills and Spring Grove - Coit to Carillon
0 0Alley Reconstruction
00
Economic Vibrancy
11 3rd/1303 Bond Program
20,746 20,746 0 20,746Rolling Hills and Spring Grove - Coit to Carillon
0 0Alley Reconstruction
00
489
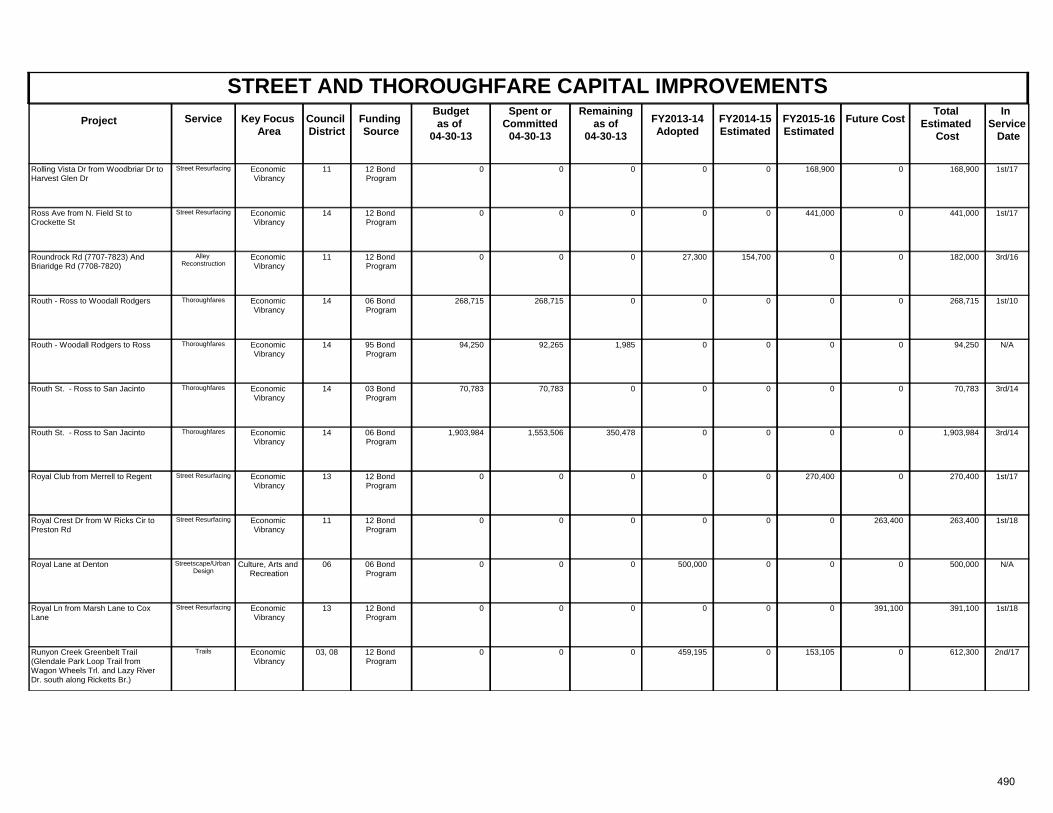
STREET AND THOROUGHFARE CAPITAL IMPROVEMENTSProject Key Focus
AreaCouncil District
Spent orCommitted
04-30-13
Total Estimated
Cost
In Service Date
Funding Source
Remainingas of
04-30-13 FY2013-14
AdoptedFuture CostService FY2014-15
Estimated FY2015-16 Estimated
Budgetas of
04-30-13
Economic Vibrancy
11 1st/1712 Bond Program
0 0 0 168,900Rolling Vista Dr from Woodbriar Dr to Harvest Glen Dr
0 0Street Resurfacing 168,9000
Economic Vibrancy
14 1st/1712 Bond Program
0 0 0 441,000Ross Ave from N. Field St to Crockette St
0 0Street Resurfacing 441,0000
Economic Vibrancy
11 3rd/1612 Bond Program
0 0 0 182,000Roundrock Rd (7707-7823) And Briaridge Rd (7708-7820)
27,300 0Alley Reconstruction
0154,700
Economic Vibrancy
14 1st/1006 Bond Program
268,715 268,715 0 268,715Routh - Ross to Woodall Rodgers 0 0Thoroughfares 00
Economic Vibrancy
14 N/A95 Bond Program
94,250 92,265 1,985 94,250Routh - Woodall Rodgers to Ross 0 0Thoroughfares 00
Economic Vibrancy
14 3rd/1403 Bond Program
70,783 70,783 0 70,783Routh St. - Ross to San Jacinto 0 0Thoroughfares 00
Economic Vibrancy
14 3rd/1406 Bond Program
1,903,984 1,553,506 350,478 1,903,984Routh St. - Ross to San Jacinto 0 0Thoroughfares 00
Economic Vibrancy
13 1st/1712 Bond Program
0 0 0 270,400Royal Club from Merrell to Regent 0 0Street Resurfacing 270,4000
Economic Vibrancy
11 1st/1812 Bond Program
0 0 0 263,400Royal Crest Dr from W Ricks Cir to Preston Rd
0 263,400Street Resurfacing 00
Culture, Arts and Recreation
06 N/A06 Bond Program
0 0 0 500,000Royal Lane at Denton 500,000 0Streetscape/Urban Design
00
Economic Vibrancy
13 1st/1812 Bond Program
0 0 0 391,100Royal Ln from Marsh Lane to Cox Lane
0 391,100Street Resurfacing 00
Economic Vibrancy
03, 08 2nd/1712 Bond Program
0 0 0 612,300Runyon Creek Greenbelt Trail (Glendale Park Loop Trail from Wagon Wheels Trl. and Lazy River Dr. south along Ricketts Br.)
459,195 0Trails 153,1050
490
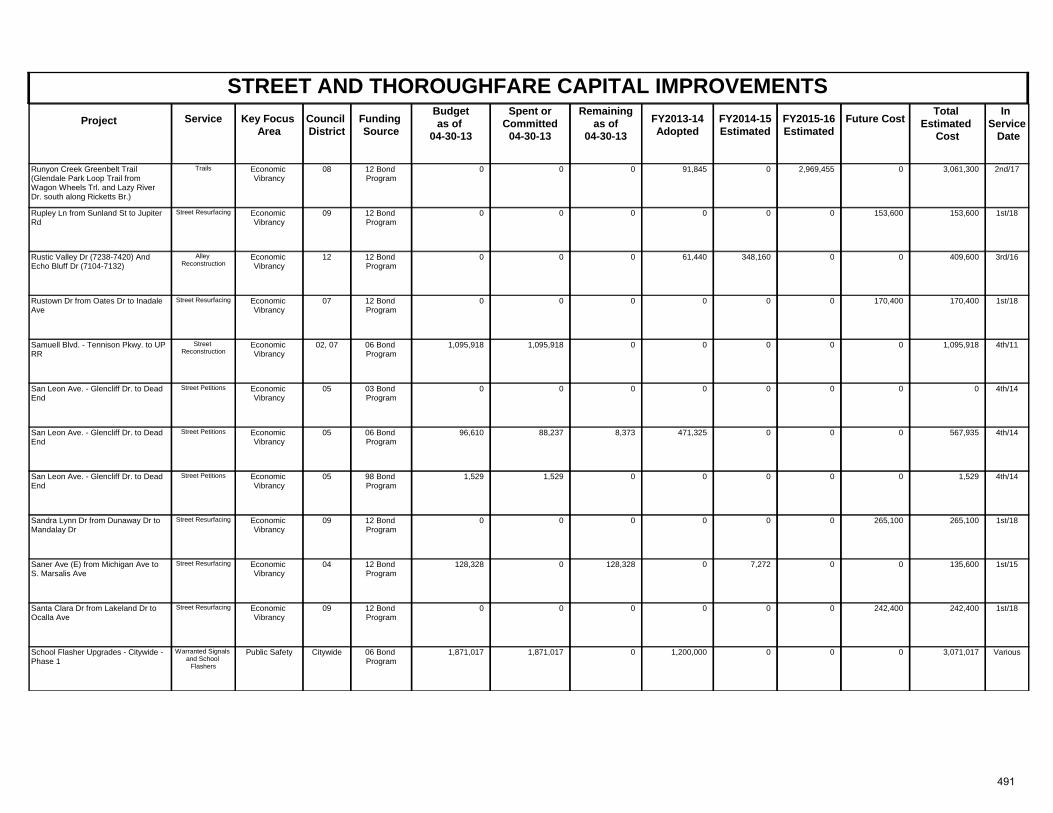
STREET AND THOROUGHFARE CAPITAL IMPROVEMENTSProject Key Focus
AreaCouncil District
Spent orCommitted
04-30-13
Total Estimated
Cost
In Service Date
Funding Source
Remainingas of
04-30-13 FY2013-14
AdoptedFuture CostService FY2014-15
Estimated FY2015-16 Estimated
Budgetas of
04-30-13
Economic Vibrancy
08 2nd/1712 Bond Program
0 0 0 3,061,300Runyon Creek Greenbelt Trail (Glendale Park Loop Trail from Wagon Wheels Trl. and Lazy River Dr. south along Ricketts Br.)
91,845 0Trails 2,969,4550
Economic Vibrancy
09 1st/1812 Bond Program
0 0 0 153,600Rupley Ln from Sunland St to Jupiter Rd
0 153,600Street Resurfacing 00
Economic Vibrancy
12 3rd/1612 Bond Program
0 0 0 409,600Rustic Valley Dr (7238-7420) And Echo Bluff Dr (7104-7132)
61,440 0Alley Reconstruction
0348,160
Economic Vibrancy
07 1st/1812 Bond Program
0 0 0 170,400Rustown Dr from Oates Dr to Inadale Ave
0 170,400Street Resurfacing 00
Economic Vibrancy
02, 07 4th/1106 Bond Program
1,095,918 1,095,918 0 1,095,918Samuell Blvd. - Tennison Pkwy. to UP RR
0 0Street Reconstruction
00
Economic Vibrancy
05 4th/1403 Bond Program
0 0 0 0San Leon Ave. - Glencliff Dr. to Dead End
0 0Street Petitions 00
Economic Vibrancy
05 4th/1406 Bond Program
96,610 88,237 8,373 567,935San Leon Ave. - Glencliff Dr. to Dead End
471,325 0Street Petitions 00
Economic Vibrancy
05 4th/1498 Bond Program
1,529 1,529 0 1,529San Leon Ave. - Glencliff Dr. to Dead End
0 0Street Petitions 00
Economic Vibrancy
09 1st/1812 Bond Program
0 0 0 265,100Sandra Lynn Dr from Dunaway Dr to Mandalay Dr
0 265,100Street Resurfacing 00
Economic Vibrancy
04 1st/1512 Bond Program
128,328 0 128,328 135,600Saner Ave (E) from Michigan Ave to S. Marsalis Ave
0 0Street Resurfacing 07,272
Economic Vibrancy
09 1st/1812 Bond Program
0 0 0 242,400Santa Clara Dr from Lakeland Dr to Ocalla Ave
0 242,400Street Resurfacing 00
Public Safety Citywide Various06 Bond Program
1,871,017 1,871,017 0 3,071,017School Flasher Upgrades - Citywide - Phase 1
1,200,000 0Warranted Signals and School
Flashers
00
491

STREET AND THOROUGHFARE CAPITAL IMPROVEMENTSProject Key Focus
AreaCouncil District
Spent orCommitted
04-30-13
Total Estimated
Cost
In Service Date
Funding Source
Remainingas of
04-30-13 FY2013-14
AdoptedFuture CostService FY2014-15
Estimated FY2015-16 Estimated
Budgetas of
04-30-13
Economic Vibrancy
08 1st/1812 Bond Program
0 0 0 176,500Sebring Dr from Tioga St to Soft Wind Dr
0 176,500Street Resurfacing 00
Economic Vibrancy
05 2nd/1303 Bond Program
4,394 4,098 296 4,394Sedalia St. - 51th St. to Dahlia Dr. 0 0Street Resurfacing 00
Economic Vibrancy
05 2nd/1306 Bond Program
109,900 109,900 0 109,900Sedalia St. - 51th St. to Dahlia Dr. 0 0Street Resurfacing 00
Economic Vibrancy
12 3rd/1612 Bond Program
0 0 0 353,100Seedling Ln (2304-2524) And Old Mill Rd (2311-2519)
52,965 0Alley Reconstruction
0300,135
Economic Vibrancy
12 1st/1812 Bond Program
0 0 0 37,000Selecman Dr from La Sobrina Dr to Foxworth Dr
0 37,000Street Resurfacing 00
Economic Vibrancy
03 1st/1812 Bond Program
0 0 0 201,300Serenade Ln from Singing Hills Dr to Wagon Wheels Trl
0 201,300Street Resurfacing 00
Economic Vibrancy
06 N/A06 Bond Program
0 0 0 750,000SH 183 - IH 35E to Elm Fork 0 750,000Intergovernmental Partnership Projects
00
Economic Vibrancy
09 4th/1406 Bond Program
0 0 0 191,445SH 78 - Buckner (Loop 12) to IH 635 0 191,445Intergovernmental Partnership Projects
00
Economic Vibrancy
13 1st/1812 Bond Program
0 0 0 205,900Shady Bend from Midway to Haydale 0 205,900Street Resurfacing 00
Economic Vibrancy
07 1st/1812 Bond Program
0 0 0 348,400Shiloh Rd from Blyth Dr to Lockhart Ave
0 348,400Street Resurfacing 00
Economic Vibrancy
09 1st/1812 Bond Program
0 0 0 177,900Shiloh Rd from Oates Dr to Larry Dr 0 177,900Street Resurfacing 00
Economic Vibrancy
05 3rd/1106 Bond Program
96,273 96,273 0 96,273Shorelark Dr. - Prairie Creek Rd. to Undercliff Dr.
0 0Street Resurfacing 00
492
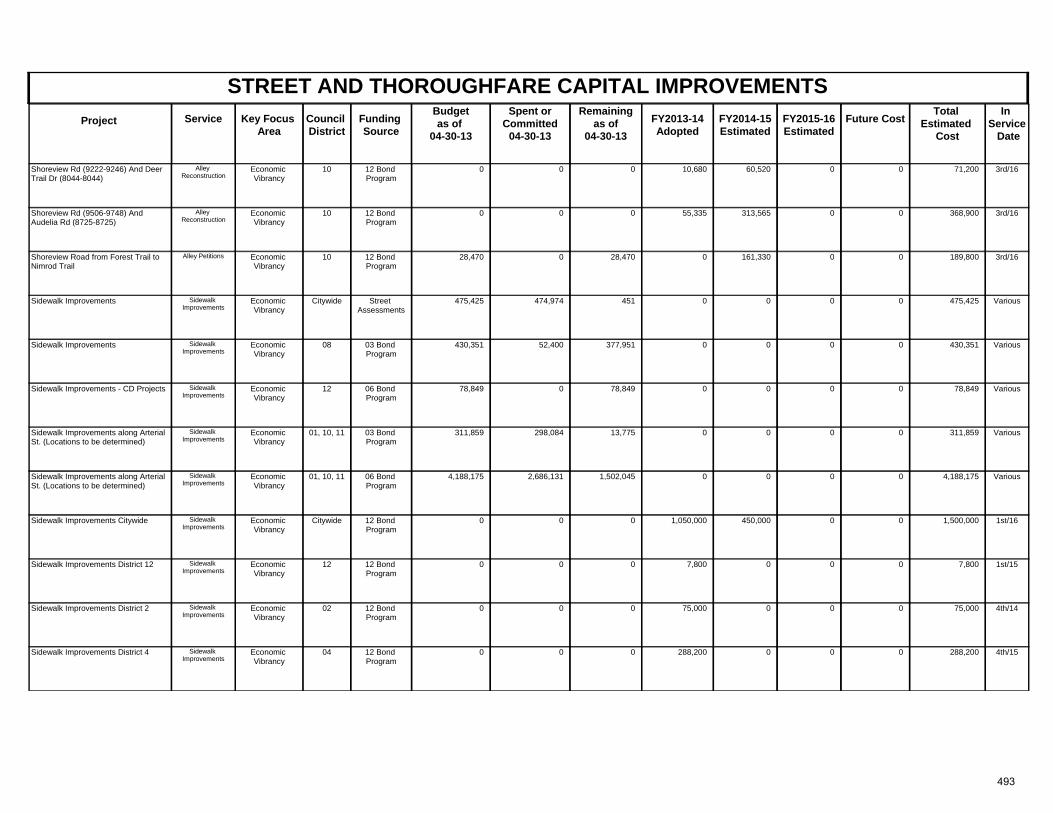
STREET AND THOROUGHFARE CAPITAL IMPROVEMENTSProject Key Focus
AreaCouncil District
Spent orCommitted
04-30-13
Total Estimated
Cost
In Service Date
Funding Source
Remainingas of
04-30-13 FY2013-14
AdoptedFuture CostService FY2014-15
Estimated FY2015-16 Estimated
Budgetas of
04-30-13
Economic Vibrancy
10 3rd/1612 Bond Program
0 0 0 71,200Shoreview Rd (9222-9246) And Deer Trail Dr (8044-8044)
10,680 0Alley Reconstruction
060,520
Economic Vibrancy
10 3rd/1612 Bond Program
0 0 0 368,900Shoreview Rd (9506-9748) And Audelia Rd (8725-8725)
55,335 0Alley Reconstruction
0313,565
Economic Vibrancy
10 3rd/1612 Bond Program
28,470 0 28,470 189,800Shoreview Road from Forest Trail to Nimrod Trail
0 0Alley Petitions 0161,330
Economic Vibrancy
Citywide VariousStreet Assessments
475,425 474,974 451 475,425Sidewalk Improvements 0 0Sidewalk Improvements
00
Economic Vibrancy
08 Various03 Bond Program
430,351 52,400 377,951 430,351Sidewalk Improvements 0 0Sidewalk Improvements
00
Economic Vibrancy
12 Various06 Bond Program
78,849 0 78,849 78,849Sidewalk Improvements - CD Projects 0 0Sidewalk Improvements
00
Economic Vibrancy
01, 10, 11 Various03 Bond Program
311,859 298,084 13,775 311,859Sidewalk Improvements along Arterial St. (Locations to be determined)
0 0Sidewalk Improvements
00
Economic Vibrancy
01, 10, 11 Various06 Bond Program
4,188,175 2,686,131 1,502,045 4,188,175Sidewalk Improvements along Arterial St. (Locations to be determined)
0 0Sidewalk Improvements
00
Economic Vibrancy
Citywide 1st/1612 Bond Program
0 0 0 1,500,000Sidewalk Improvements Citywide 1,050,000 0Sidewalk Improvements
0450,000
Economic Vibrancy
12 1st/1512 Bond Program
0 0 0 7,800Sidewalk Improvements District 12 7,800 0Sidewalk Improvements
00
Economic Vibrancy
02 4th/1412 Bond Program
0 0 0 75,000Sidewalk Improvements District 2 75,000 0Sidewalk Improvements
00
Economic Vibrancy
04 4th/1512 Bond Program
0 0 0 288,200Sidewalk Improvements District 4 288,200 0Sidewalk Improvements
00
493
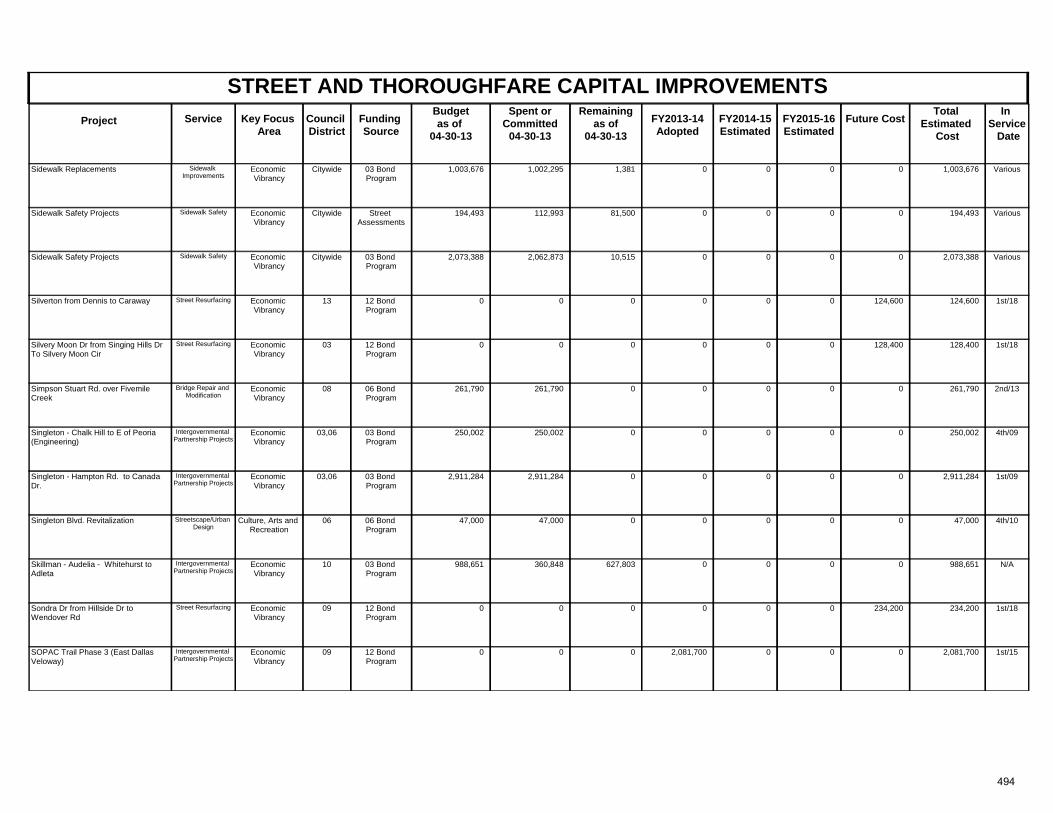
STREET AND THOROUGHFARE CAPITAL IMPROVEMENTSProject Key Focus
AreaCouncil District
Spent orCommitted
04-30-13
Total Estimated
Cost
In Service Date
Funding Source
Remainingas of
04-30-13 FY2013-14
AdoptedFuture CostService FY2014-15
Estimated FY2015-16 Estimated
Budgetas of
04-30-13
Economic Vibrancy
Citywide Various03 Bond Program
1,003,676 1,002,295 1,381 1,003,676Sidewalk Replacements 0 0Sidewalk Improvements
00
Economic Vibrancy
Citywide VariousStreet Assessments
194,493 112,993 81,500 194,493Sidewalk Safety Projects 0 0Sidewalk Safety 00
Economic Vibrancy
Citywide Various03 Bond Program
2,073,388 2,062,873 10,515 2,073,388Sidewalk Safety Projects 0 0Sidewalk Safety 00
Economic Vibrancy
13 1st/1812 Bond Program
0 0 0 124,600Silverton from Dennis to Caraway 0 124,600Street Resurfacing 00
Economic Vibrancy
03 1st/1812 Bond Program
0 0 0 128,400Silvery Moon Dr from Singing Hills Dr To Silvery Moon Cir
0 128,400Street Resurfacing 00
Economic Vibrancy
08 2nd/1306 Bond Program
261,790 261,790 0 261,790Simpson Stuart Rd. over Fivemile Creek
0 0Bridge Repair and Modification
00
Economic Vibrancy
03,06 4th/0903 Bond Program
250,002 250,002 0 250,002Singleton - Chalk Hill to E of Peoria (Engineering)
0 0Intergovernmental Partnership Projects
00
Economic Vibrancy
03,06 1st/0903 Bond Program
2,911,284 2,911,284 0 2,911,284Singleton - Hampton Rd. to Canada Dr.
0 0Intergovernmental Partnership Projects
00
Culture, Arts and Recreation
06 4th/1006 Bond Program
47,000 47,000 0 47,000Singleton Blvd. Revitalization 0 0Streetscape/Urban Design
00
Economic Vibrancy
10 N/A03 Bond Program
988,651 360,848 627,803 988,651Skillman - Audelia - Whitehurst to Adleta
0 0Intergovernmental Partnership Projects
00
Economic Vibrancy
09 1st/1812 Bond Program
0 0 0 234,200Sondra Dr from Hillside Dr to Wendover Rd
0 234,200Street Resurfacing 00
Economic Vibrancy
09 1st/1512 Bond Program
0 0 0 2,081,700SOPAC Trail Phase 3 (East Dallas Veloway)
2,081,700 0Intergovernmental Partnership Projects
00
494
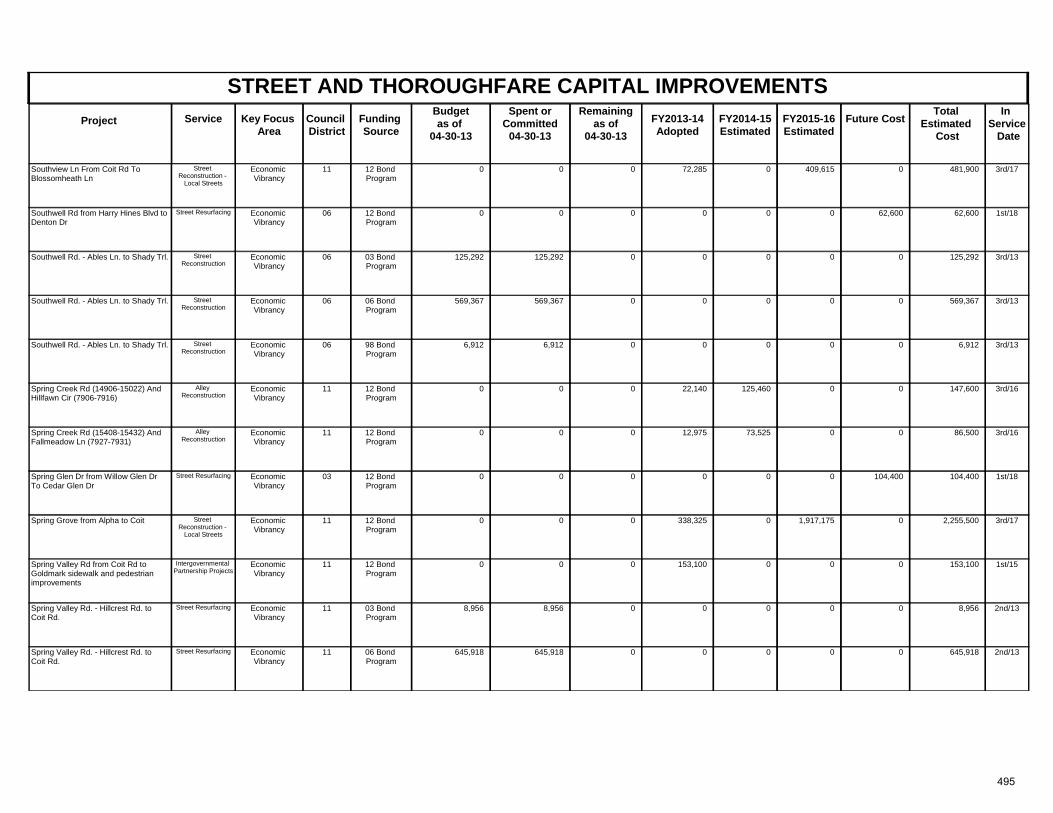
STREET AND THOROUGHFARE CAPITAL IMPROVEMENTSProject Key Focus
AreaCouncil District
Spent orCommitted
04-30-13
Total Estimated
Cost
In Service Date
Funding Source
Remainingas of
04-30-13 FY2013-14
AdoptedFuture CostService FY2014-15
Estimated FY2015-16 Estimated
Budgetas of
04-30-13
Economic Vibrancy
11 3rd/1712 Bond Program
0 0 0 481,900Southview Ln From Coit Rd To Blossomheath Ln
72,285 0Street Reconstruction -
Local Streets
409,6150
Economic Vibrancy
06 1st/1812 Bond Program
0 0 0 62,600Southwell Rd from Harry Hines Blvd to Denton Dr
0 62,600Street Resurfacing 00
Economic Vibrancy
06 3rd/1303 Bond Program
125,292 125,292 0 125,292Southwell Rd. - Ables Ln. to Shady Trl. 0 0Street Reconstruction
00
Economic Vibrancy
06 3rd/1306 Bond Program
569,367 569,367 0 569,367Southwell Rd. - Ables Ln. to Shady Trl. 0 0Street Reconstruction
00
Economic Vibrancy
06 3rd/1398 Bond Program
6,912 6,912 0 6,912Southwell Rd. - Ables Ln. to Shady Trl. 0 0Street Reconstruction
00
Economic Vibrancy
11 3rd/1612 Bond Program
0 0 0 147,600Spring Creek Rd (14906-15022) And Hillfawn Cir (7906-7916)
22,140 0Alley Reconstruction
0125,460
Economic Vibrancy
11 3rd/1612 Bond Program
0 0 0 86,500Spring Creek Rd (15408-15432) And Fallmeadow Ln (7927-7931)
12,975 0Alley Reconstruction
073,525
Economic Vibrancy
03 1st/1812 Bond Program
0 0 0 104,400Spring Glen Dr from Willow Glen Dr To Cedar Glen Dr
0 104,400Street Resurfacing 00
Economic Vibrancy
11 3rd/1712 Bond Program
0 0 0 2,255,500Spring Grove from Alpha to Coit 338,325 0Street Reconstruction -
Local Streets
1,917,1750
Economic Vibrancy
11 1st/1512 Bond Program
0 0 0 153,100Spring Valley Rd from Coit Rd to Goldmark sidewalk and pedestrian improvements
153,100 0Intergovernmental Partnership Projects
00
Economic Vibrancy
11 2nd/1303 Bond Program
8,956 8,956 0 8,956Spring Valley Rd. - Hillcrest Rd. to Coit Rd.
0 0Street Resurfacing 00
Economic Vibrancy
11 2nd/1306 Bond Program
645,918 645,918 0 645,918Spring Valley Rd. - Hillcrest Rd. to Coit Rd.
0 0Street Resurfacing 00
495
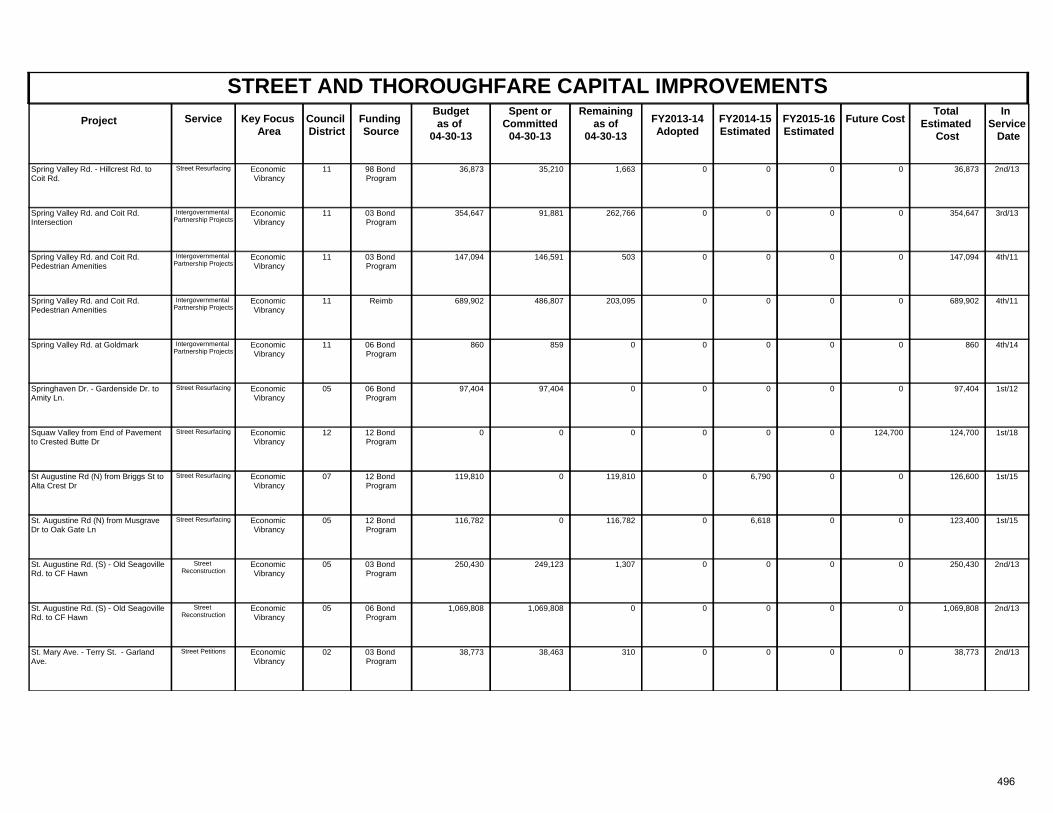
STREET AND THOROUGHFARE CAPITAL IMPROVEMENTSProject Key Focus
AreaCouncil District
Spent orCommitted
04-30-13
Total Estimated
Cost
In Service Date
Funding Source
Remainingas of
04-30-13 FY2013-14
AdoptedFuture CostService FY2014-15
Estimated FY2015-16 Estimated
Budgetas of
04-30-13
Economic Vibrancy
11 2nd/1398 Bond Program
36,873 35,210 1,663 36,873Spring Valley Rd. - Hillcrest Rd. to Coit Rd.
0 0Street Resurfacing 00
Economic Vibrancy
11 3rd/1303 Bond Program
354,647 91,881 262,766 354,647Spring Valley Rd. and Coit Rd. Intersection
0 0Intergovernmental Partnership Projects
00
Economic Vibrancy
11 4th/1103 Bond Program
147,094 146,591 503 147,094Spring Valley Rd. and Coit Rd. Pedestrian Amenities
0 0Intergovernmental Partnership Projects
00
Economic Vibrancy
11 4th/11Reimb 689,902 486,807 203,095 689,902Spring Valley Rd. and Coit Rd. Pedestrian Amenities
0 0Intergovernmental Partnership Projects
00
Economic Vibrancy
11 4th/1406 Bond Program
860 859 0 860Spring Valley Rd. at Goldmark 0 0Intergovernmental Partnership Projects
00
Economic Vibrancy
05 1st/1206 Bond Program
97,404 97,404 0 97,404Springhaven Dr. - Gardenside Dr. to Amity Ln.
0 0Street Resurfacing 00
Economic Vibrancy
12 1st/1812 Bond Program
0 0 0 124,700Squaw Valley from End of Pavement to Crested Butte Dr
0 124,700Street Resurfacing 00
Economic Vibrancy
07 1st/1512 Bond Program
119,810 0 119,810 126,600St Augustine Rd (N) from Briggs St to Alta Crest Dr
0 0Street Resurfacing 06,790
Economic Vibrancy
05 1st/1512 Bond Program
116,782 0 116,782 123,400St. Augustine Rd (N) from Musgrave Dr to Oak Gate Ln
0 0Street Resurfacing 06,618
Economic Vibrancy
05 2nd/1303 Bond Program
250,430 249,123 1,307 250,430St. Augustine Rd. (S) - Old Seagoville Rd. to CF Hawn
0 0Street Reconstruction
00
Economic Vibrancy
05 2nd/1306 Bond Program
1,069,808 1,069,808 0 1,069,808St. Augustine Rd. (S) - Old Seagoville Rd. to CF Hawn
0 0Street Reconstruction
00
Economic Vibrancy
02 2nd/1303 Bond Program
38,773 38,463 310 38,773St. Mary Ave. - Terry St. - Garland Ave.
0 0Street Petitions 00
496
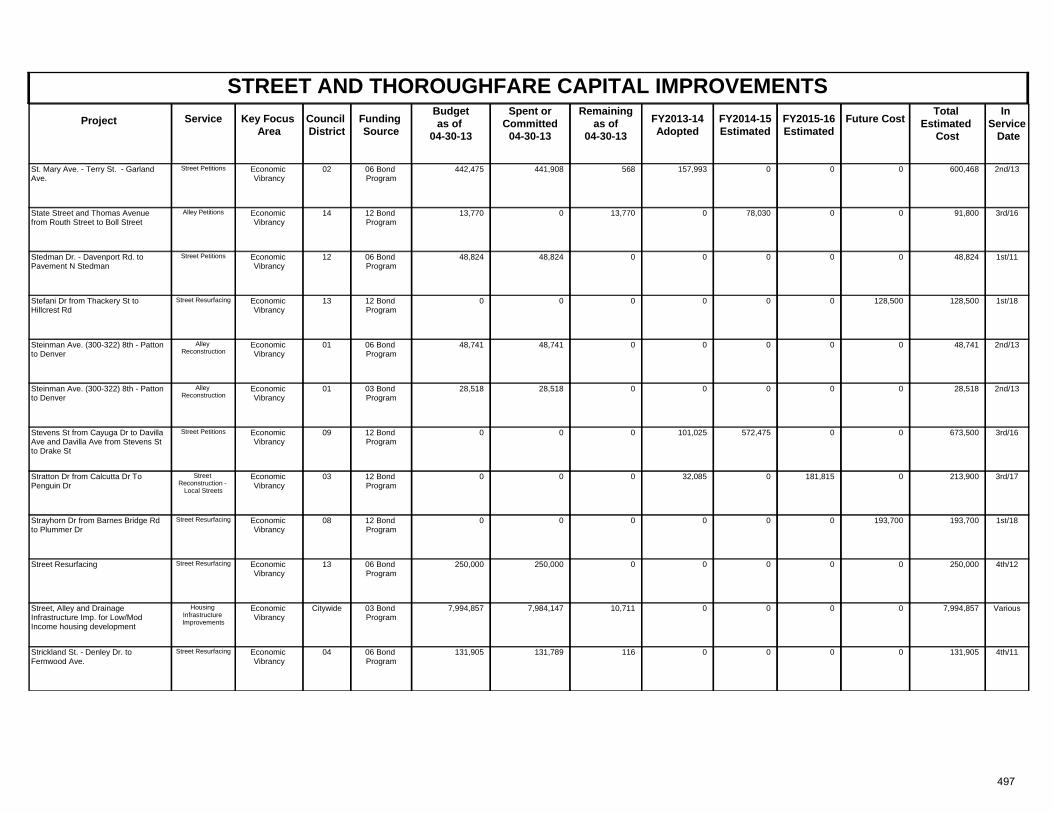
STREET AND THOROUGHFARE CAPITAL IMPROVEMENTSProject Key Focus
AreaCouncil District
Spent orCommitted
04-30-13
Total Estimated
Cost
In Service Date
Funding Source
Remainingas of
04-30-13 FY2013-14
AdoptedFuture CostService FY2014-15
Estimated FY2015-16 Estimated
Budgetas of
04-30-13
Economic Vibrancy
02 2nd/1306 Bond Program
442,475 441,908 568 600,468St. Mary Ave. - Terry St. - Garland Ave.
157,993 0Street Petitions 00
Economic Vibrancy
14 3rd/1612 Bond Program
13,770 0 13,770 91,800State Street and Thomas Avenue from Routh Street to Boll Street
0 0Alley Petitions 078,030
Economic Vibrancy
12 1st/1106 Bond Program
48,824 48,824 0 48,824Stedman Dr. - Davenport Rd. to Pavement N Stedman
0 0Street Petitions 00
Economic Vibrancy
13 1st/1812 Bond Program
0 0 0 128,500Stefani Dr from Thackery St to Hillcrest Rd
0 128,500Street Resurfacing 00
Economic Vibrancy
01 2nd/1306 Bond Program
48,741 48,741 0 48,741Steinman Ave. (300-322) 8th - Patton to Denver
0 0Alley Reconstruction
00
Economic Vibrancy
01 2nd/1303 Bond Program
28,518 28,518 0 28,518Steinman Ave. (300-322) 8th - Patton to Denver
0 0Alley Reconstruction
00
Economic Vibrancy
09 3rd/1612 Bond Program
0 0 0 673,500Stevens St from Cayuga Dr to Davilla Ave and Davilla Ave from Stevens St to Drake St
101,025 0Street Petitions 0572,475
Economic Vibrancy
03 3rd/1712 Bond Program
0 0 0 213,900Stratton Dr from Calcutta Dr To Penguin Dr
32,085 0Street Reconstruction -
Local Streets
181,8150
Economic Vibrancy
08 1st/1812 Bond Program
0 0 0 193,700Strayhorn Dr from Barnes Bridge Rd to Plummer Dr
0 193,700Street Resurfacing 00
Economic Vibrancy
13 4th/1206 Bond Program
250,000 250,000 0 250,000Street Resurfacing 0 0Street Resurfacing 00
Economic Vibrancy
Citywide Various03 Bond Program
7,994,857 7,984,147 10,711 7,994,857Street, Alley and Drainage Infrastructure Imp. for Low/Mod Income housing development
0 0Housing Infrastructure Improvements
00
Economic Vibrancy
04 4th/1106 Bond Program
131,905 131,789 116 131,905Strickland St. - Denley Dr. to Fernwood Ave.
0 0Street Resurfacing 00
497
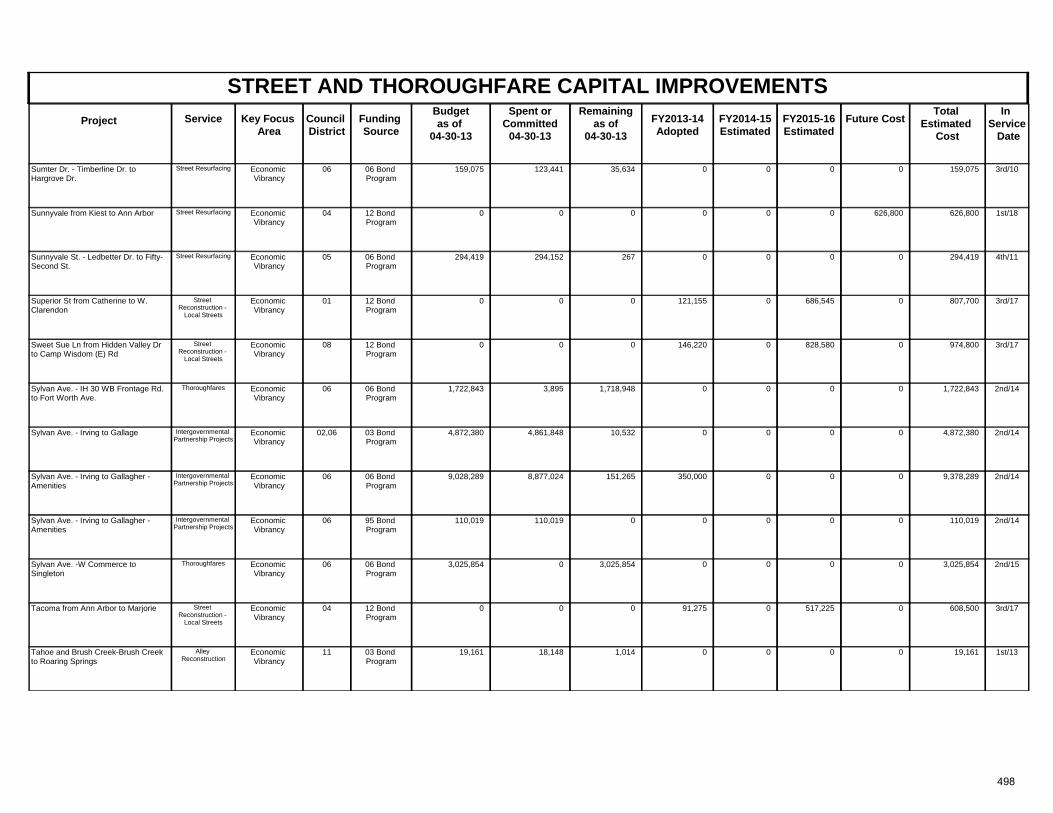
STREET AND THOROUGHFARE CAPITAL IMPROVEMENTSProject Key Focus
AreaCouncil District
Spent orCommitted
04-30-13
Total Estimated
Cost
In Service Date
Funding Source
Remainingas of
04-30-13 FY2013-14
AdoptedFuture CostService FY2014-15
Estimated FY2015-16 Estimated
Budgetas of
04-30-13
Economic Vibrancy
06 3rd/1006 Bond Program
159,075 123,441 35,634 159,075Sumter Dr. - Timberline Dr. to Hargrove Dr.
0 0Street Resurfacing 00
Economic Vibrancy
04 1st/1812 Bond Program
0 0 0 626,800Sunnyvale from Kiest to Ann Arbor 0 626,800Street Resurfacing 00
Economic Vibrancy
05 4th/1106 Bond Program
294,419 294,152 267 294,419Sunnyvale St. - Ledbetter Dr. to Fifty-Second St.
0 0Street Resurfacing 00
Economic Vibrancy
01 3rd/1712 Bond Program
0 0 0 807,700Superior St from Catherine to W. Clarendon
121,155 0Street Reconstruction -
Local Streets
686,5450
Economic Vibrancy
08 3rd/1712 Bond Program
0 0 0 974,800Sweet Sue Ln from Hidden Valley Dr to Camp Wisdom (E) Rd
146,220 0Street Reconstruction -
Local Streets
828,5800
Economic Vibrancy
06 2nd/1406 Bond Program
1,722,843 3,895 1,718,948 1,722,843Sylvan Ave. - IH 30 WB Frontage Rd. to Fort Worth Ave.
0 0Thoroughfares 00
Economic Vibrancy
02,06 2nd/1403 Bond Program
4,872,380 4,861,848 10,532 4,872,380Sylvan Ave. - Irving to Gallage 0 0Intergovernmental Partnership Projects
00
Economic Vibrancy
06 2nd/1406 Bond Program
9,028,289 8,877,024 151,265 9,378,289Sylvan Ave. - Irving to Gallagher - Amenities
350,000 0Intergovernmental Partnership Projects
00
Economic Vibrancy
06 2nd/1495 Bond Program
110,019 110,019 0 110,019Sylvan Ave. - Irving to Gallagher - Amenities
0 0Intergovernmental Partnership Projects
00
Economic Vibrancy
06 2nd/1506 Bond Program
3,025,854 0 3,025,854 3,025,854Sylvan Ave. -W Commerce to Singleton
0 0Thoroughfares 00
Economic Vibrancy
04 3rd/1712 Bond Program
0 0 0 608,500Tacoma from Ann Arbor to Marjorie 91,275 0Street Reconstruction -
Local Streets
517,2250
Economic Vibrancy
11 1st/1303 Bond Program
19,161 18,148 1,014 19,161Tahoe and Brush Creek-Brush Creek to Roaring Springs
0 0Alley Reconstruction
00
498
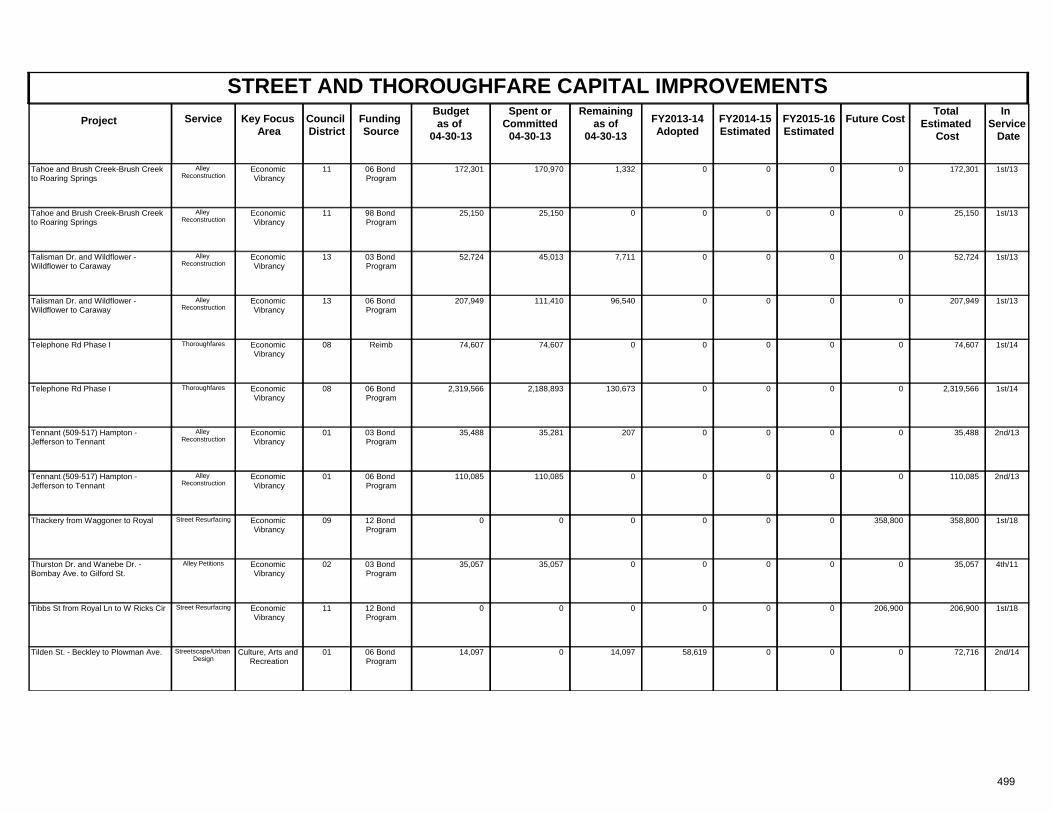
STREET AND THOROUGHFARE CAPITAL IMPROVEMENTSProject Key Focus
AreaCouncil District
Spent orCommitted
04-30-13
Total Estimated
Cost
In Service Date
Funding Source
Remainingas of
04-30-13 FY2013-14
AdoptedFuture CostService FY2014-15
Estimated FY2015-16 Estimated
Budgetas of
04-30-13
Economic Vibrancy
11 1st/1306 Bond Program
172,301 170,970 1,332 172,301Tahoe and Brush Creek-Brush Creek to Roaring Springs
0 0Alley Reconstruction
00
Economic Vibrancy
11 1st/1398 Bond Program
25,150 25,150 0 25,150Tahoe and Brush Creek-Brush Creek to Roaring Springs
0 0Alley Reconstruction
00
Economic Vibrancy
13 1st/1303 Bond Program
52,724 45,013 7,711 52,724Talisman Dr. and Wildflower - Wildflower to Caraway
0 0Alley Reconstruction
00
Economic Vibrancy
13 1st/1306 Bond Program
207,949 111,410 96,540 207,949Talisman Dr. and Wildflower - Wildflower to Caraway
0 0Alley Reconstruction
00
Economic Vibrancy
08 1st/14Reimb 74,607 74,607 0 74,607Telephone Rd Phase I 0 0Thoroughfares 00
Economic Vibrancy
08 1st/1406 Bond Program
2,319,566 2,188,893 130,673 2,319,566Telephone Rd Phase I 0 0Thoroughfares 00
Economic Vibrancy
01 2nd/1303 Bond Program
35,488 35,281 207 35,488Tennant (509-517) Hampton - Jefferson to Tennant
0 0Alley Reconstruction
00
Economic Vibrancy
01 2nd/1306 Bond Program
110,085 110,085 0 110,085Tennant (509-517) Hampton - Jefferson to Tennant
0 0Alley Reconstruction
00
Economic Vibrancy
09 1st/1812 Bond Program
0 0 0 358,800Thackery from Waggoner to Royal 0 358,800Street Resurfacing 00
Economic Vibrancy
02 4th/1103 Bond Program
35,057 35,057 0 35,057Thurston Dr. and Wanebe Dr. - Bombay Ave. to Gilford St.
0 0Alley Petitions 00
Economic Vibrancy
11 1st/1812 Bond Program
0 0 0 206,900Tibbs St from Royal Ln to W Ricks Cir 0 206,900Street Resurfacing 00
Culture, Arts and Recreation
01 2nd/1406 Bond Program
14,097 0 14,097 72,716Tilden St. - Beckley to Plowman Ave. 58,619 0Streetscape/Urban Design
00
499
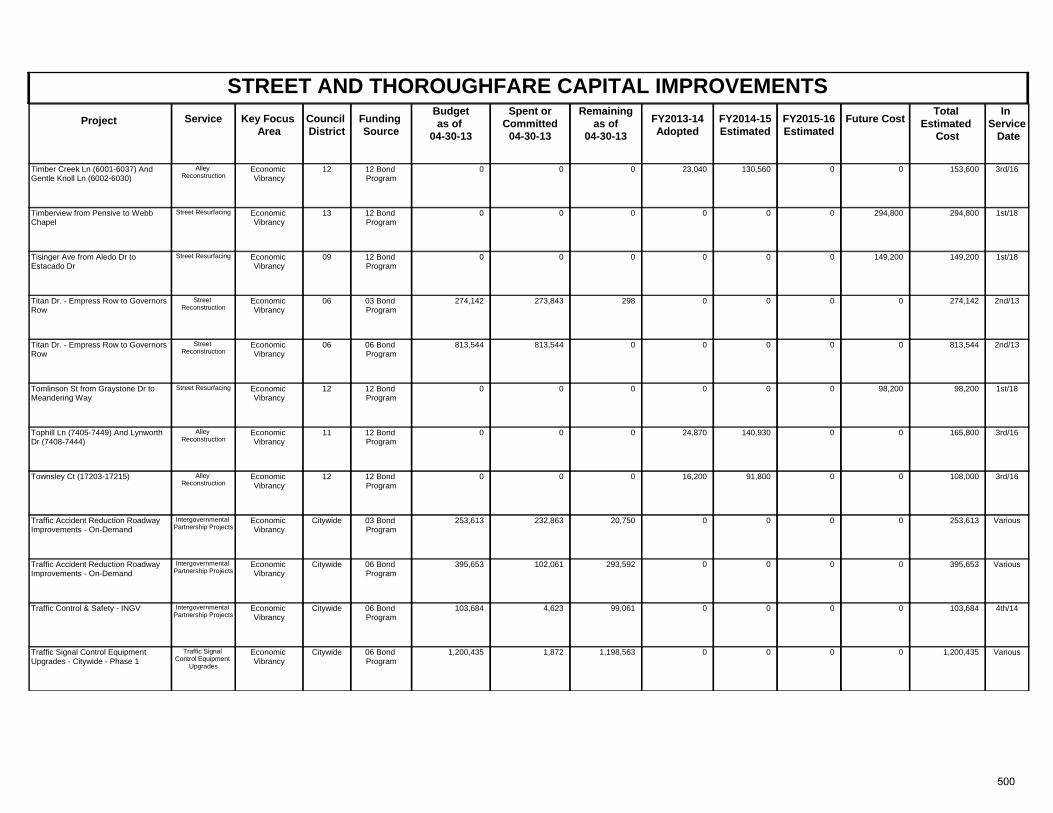
STREET AND THOROUGHFARE CAPITAL IMPROVEMENTSProject Key Focus
AreaCouncil District
Spent orCommitted
04-30-13
Total Estimated
Cost
In Service Date
Funding Source
Remainingas of
04-30-13 FY2013-14
AdoptedFuture CostService FY2014-15
Estimated FY2015-16 Estimated
Budgetas of
04-30-13
Economic Vibrancy
12 3rd/1612 Bond Program
0 0 0 153,600Timber Creek Ln (6001-6037) And Gentle Knoll Ln (6002-6030)
23,040 0Alley Reconstruction
0130,560
Economic Vibrancy
13 1st/1812 Bond Program
0 0 0 294,800Timberview from Pensive to Webb Chapel
0 294,800Street Resurfacing 00
Economic Vibrancy
09 1st/1812 Bond Program
0 0 0 149,200Tisinger Ave from Aledo Dr to Estacado Dr
0 149,200Street Resurfacing 00
Economic Vibrancy
06 2nd/1303 Bond Program
274,142 273,843 298 274,142Titan Dr. - Empress Row to Governors Row
0 0Street Reconstruction
00
Economic Vibrancy
06 2nd/1306 Bond Program
813,544 813,544 0 813,544Titan Dr. - Empress Row to Governors Row
0 0Street Reconstruction
00
Economic Vibrancy
12 1st/1812 Bond Program
0 0 0 98,200Tomlinson St from Graystone Dr to Meandering Way
0 98,200Street Resurfacing 00
Economic Vibrancy
11 3rd/1612 Bond Program
0 0 0 165,800Tophill Ln (7405-7449) And Lynworth Dr (7408-7444)
24,870 0Alley Reconstruction
0140,930
Economic Vibrancy
12 3rd/1612 Bond Program
0 0 0 108,000Townsley Ct (17203-17215) 16,200 0Alley Reconstruction
091,800
Economic Vibrancy
Citywide Various03 Bond Program
253,613 232,863 20,750 253,613Traffic Accident Reduction Roadway Improvements - On-Demand
0 0Intergovernmental Partnership Projects
00
Economic Vibrancy
Citywide Various06 Bond Program
395,653 102,061 293,592 395,653Traffic Accident Reduction Roadway Improvements - On-Demand
0 0Intergovernmental Partnership Projects
00
Economic Vibrancy
Citywide 4th/1406 Bond Program
103,684 4,623 99,061 103,684Traffic Control & Safety - INGV 0 0Intergovernmental Partnership Projects
00
Economic Vibrancy
Citywide Various06 Bond Program
1,200,435 1,872 1,198,563 1,200,435Traffic Signal Control Equipment Upgrades - Citywide - Phase 1
0 0Traffic Signal Control Equipment
Upgrades
00
500
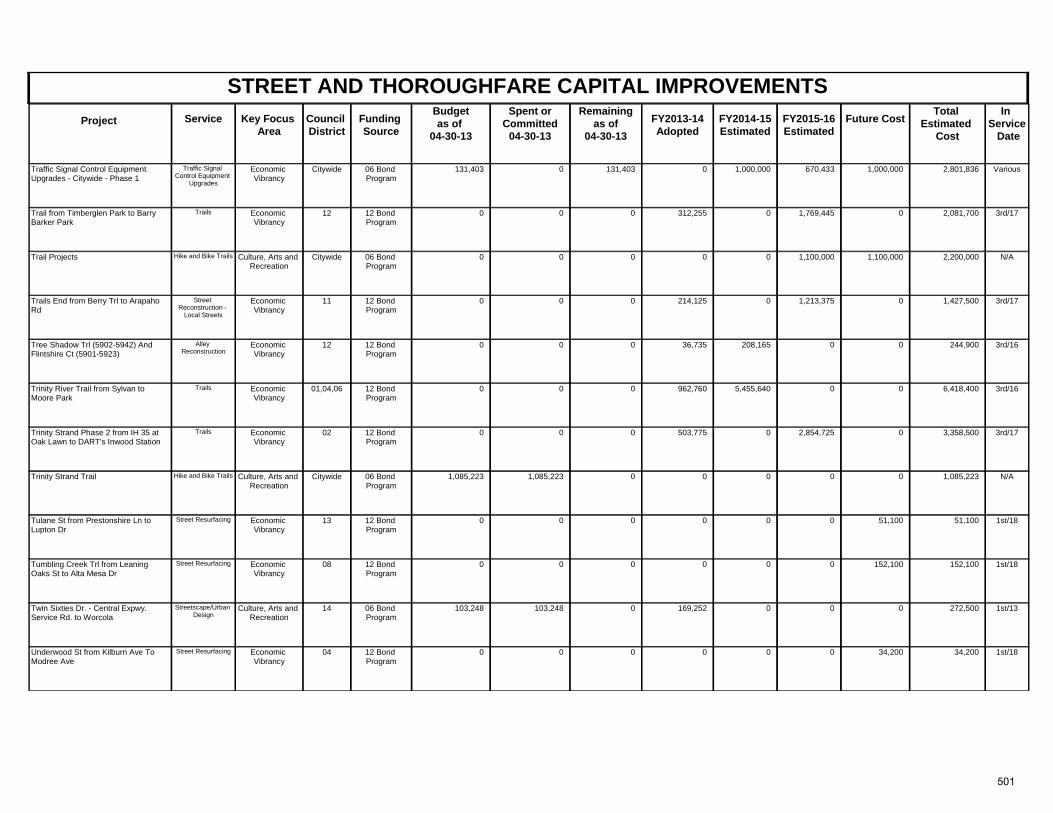
STREET AND THOROUGHFARE CAPITAL IMPROVEMENTSProject Key Focus
AreaCouncil District
Spent orCommitted
04-30-13
Total Estimated
Cost
In Service Date
Funding Source
Remainingas of
04-30-13 FY2013-14
AdoptedFuture CostService FY2014-15
Estimated FY2015-16 Estimated
Budgetas of
04-30-13
Economic Vibrancy
Citywide Various06 Bond Program
131,403 0 131,403 2,801,836Traffic Signal Control Equipment Upgrades - Citywide - Phase 1
0 1,000,000Traffic Signal Control Equipment
Upgrades
670,4331,000,000
Economic Vibrancy
12 3rd/1712 Bond Program
0 0 0 2,081,700Trail from Timberglen Park to Barry Barker Park
312,255 0Trails 1,769,4450
Culture, Arts and Recreation
Citywide N/A06 Bond Program
0 0 0 2,200,000Trail Projects 0 1,100,000Hike and Bike Trails 1,100,0000
Economic Vibrancy
11 3rd/1712 Bond Program
0 0 0 1,427,500Trails End from Berry Trl to Arapaho Rd
214,125 0Street Reconstruction -
Local Streets
1,213,3750
Economic Vibrancy
12 3rd/1612 Bond Program
0 0 0 244,900Tree Shadow Trl (5902-5942) And Flintshire Ct (5901-5923)
36,735 0Alley Reconstruction
0208,165
Economic Vibrancy
01,04,06 3rd/1612 Bond Program
0 0 0 6,418,400Trinity River Trail from Sylvan to Moore Park
962,760 0Trails 05,455,640
Economic Vibrancy
02 3rd/1712 Bond Program
0 0 0 3,358,500Trinity Strand Phase 2 from IH 35 at Oak Lawn to DART's Inwood Station
503,775 0Trails 2,854,7250
Culture, Arts and Recreation
Citywide N/A06 Bond Program
1,085,223 1,085,223 0 1,085,223Trinity Strand Trail 0 0Hike and Bike Trails 00
Economic Vibrancy
13 1st/1812 Bond Program
0 0 0 51,100Tulane St from Prestonshire Ln to Lupton Dr
0 51,100Street Resurfacing 00
Economic Vibrancy
08 1st/1812 Bond Program
0 0 0 152,100Tumbling Creek Trl from Leaning Oaks St to Alta Mesa Dr
0 152,100Street Resurfacing 00
Culture, Arts and Recreation
14 1st/1306 Bond Program
103,248 103,248 0 272,500Twin Sixties Dr. - Central Expwy. Service Rd. to Worcola
169,252 0Streetscape/Urban Design
00
Economic Vibrancy
04 1st/1812 Bond Program
0 0 0 34,200Underwood St from Kilburn Ave To Modree Ave
0 34,200Street Resurfacing 00
501
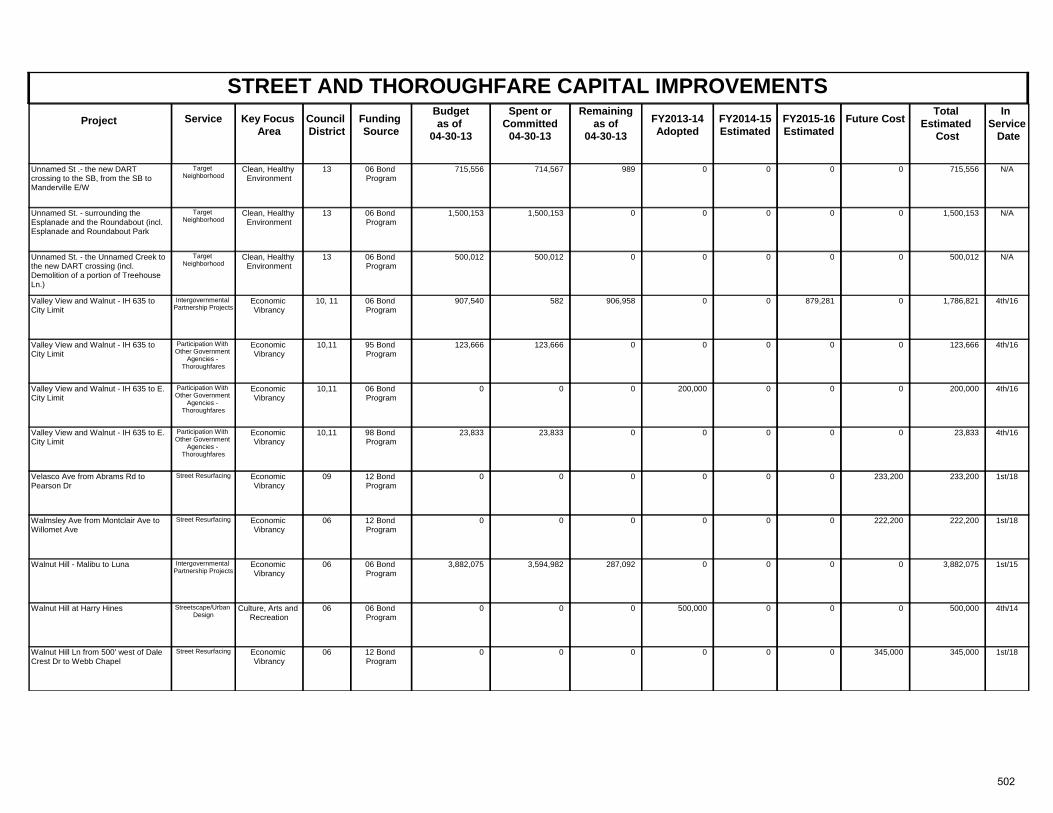
STREET AND THOROUGHFARE CAPITAL IMPROVEMENTSProject Key Focus
AreaCouncil District
Spent orCommitted
04-30-13
Total Estimated
Cost
In Service Date
Funding Source
Remainingas of
04-30-13 FY2013-14
AdoptedFuture CostService FY2014-15
Estimated FY2015-16 Estimated
Budgetas of
04-30-13
Clean, Healthy Environment
13 N/A06 Bond Program
715,556 714,567 989 715,556Unnamed St .- the new DART crossing to the SB, from the SB to Manderville E/W
0 0Target Neighborhood
00
Clean, Healthy Environment
13 N/A06 Bond Program
1,500,153 1,500,153 0 1,500,153Unnamed St. - surrounding the Esplanade and the Roundabout (incl. Esplanade and Roundabout Park
0 0Target Neighborhood
00
Clean, Healthy Environment
13 N/A06 Bond Program
500,012 500,012 0 500,012Unnamed St. - the Unnamed Creek to the new DART crossing (incl. Demolition of a portion of Treehouse Ln.)
0 0Target Neighborhood
00
Economic Vibrancy
10, 11 4th/1606 Bond Program
907,540 582 906,958 1,786,821Valley View and Walnut - IH 635 to City Limit
0 0Intergovernmental Partnership Projects
879,2810
Economic Vibrancy
10,11 4th/1695 Bond Program
123,666 123,666 0 123,666Valley View and Walnut - IH 635 to City Limit
0 0Participation With Other Government
Agencies - Thoroughfares
00
Economic Vibrancy
10,11 4th/1606 Bond Program
0 0 0 200,000Valley View and Walnut - IH 635 to E. City Limit
200,000 0Participation With Other Government
Agencies - Thoroughfares
00
Economic Vibrancy
10,11 4th/1698 Bond Program
23,833 23,833 0 23,833Valley View and Walnut - IH 635 to E. City Limit
0 0Participation With Other Government
Agencies - Thoroughfares
00
Economic Vibrancy
09 1st/1812 Bond Program
0 0 0 233,200Velasco Ave from Abrams Rd to Pearson Dr
0 233,200Street Resurfacing 00
Economic Vibrancy
06 1st/1812 Bond Program
0 0 0 222,200Walmsley Ave from Montclair Ave to Willomet Ave
0 222,200Street Resurfacing 00
Economic Vibrancy
06 1st/1506 Bond Program
3,882,075 3,594,982 287,092 3,882,075Walnut Hill - Malibu to Luna 0 0Intergovernmental Partnership Projects
00
Culture, Arts and Recreation
06 4th/1406 Bond Program
0 0 0 500,000Walnut Hill at Harry Hines 500,000 0Streetscape/Urban Design
00
Economic Vibrancy
06 1st/1812 Bond Program
0 0 0 345,000Walnut Hill Ln from 500' west of Dale Crest Dr to Webb Chapel
0 345,000Street Resurfacing 00
502
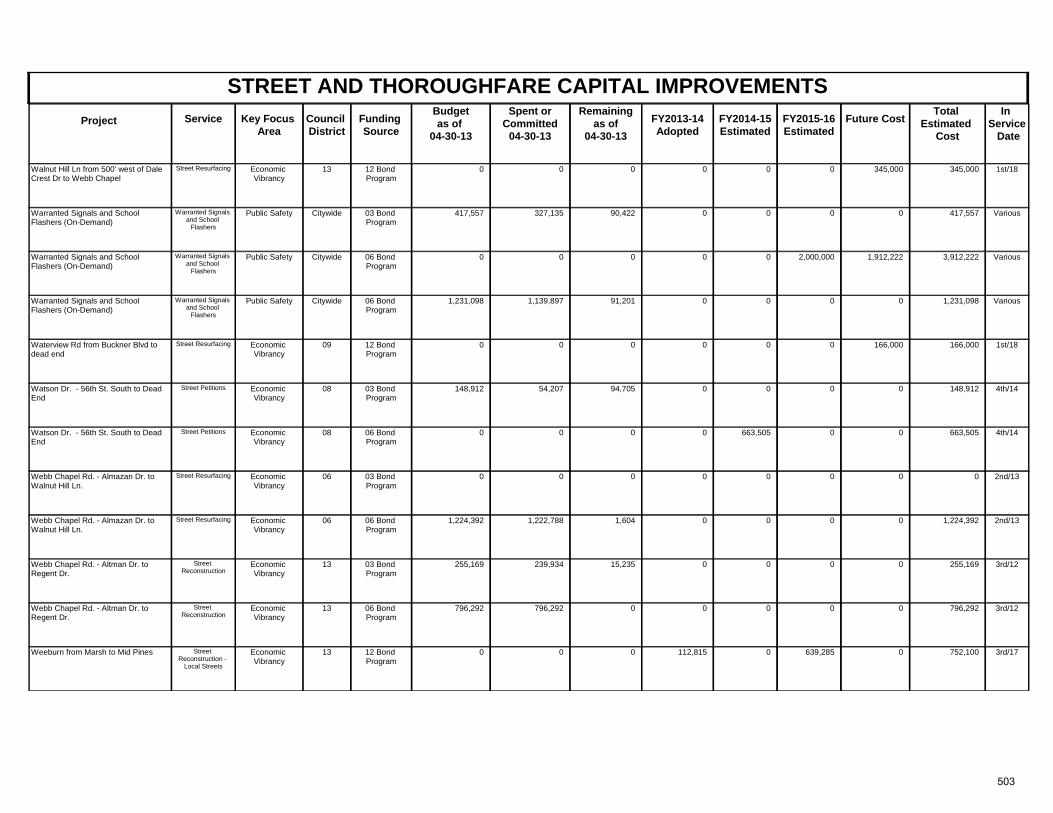
STREET AND THOROUGHFARE CAPITAL IMPROVEMENTSProject Key Focus
AreaCouncil District
Spent orCommitted
04-30-13
Total Estimated
Cost
In Service Date
Funding Source
Remainingas of
04-30-13 FY2013-14
AdoptedFuture CostService FY2014-15
Estimated FY2015-16 Estimated
Budgetas of
04-30-13
Economic Vibrancy
13 1st/1812 Bond Program
0 0 0 345,000Walnut Hill Ln from 500' west of Dale Crest Dr to Webb Chapel
0 345,000Street Resurfacing 00
Public Safety Citywide Various03 Bond Program
417,557 327,135 90,422 417,557Warranted Signals and School Flashers (On-Demand)
0 0Warranted Signals and School
Flashers
00
Public Safety Citywide Various06 Bond Program
0 0 0 3,912,222Warranted Signals and School Flashers (On-Demand)
0 1,912,222Warranted Signals and School
Flashers
2,000,0000
Public Safety Citywide Various06 Bond Program
1,231,098 1,139,897 91,201 1,231,098Warranted Signals and School Flashers (On-Demand)
0 0Warranted Signals and School
Flashers
00
Economic Vibrancy
09 1st/1812 Bond Program
0 0 0 166,000Waterview Rd from Buckner Blvd to dead end
0 166,000Street Resurfacing 00
Economic Vibrancy
08 4th/1403 Bond Program
148,912 54,207 94,705 148,912Watson Dr. - 56th St. South to Dead End
0 0Street Petitions 00
Economic Vibrancy
08 4th/1406 Bond Program
0 0 0 663,505Watson Dr. - 56th St. South to Dead End
0 0Street Petitions 0663,505
Economic Vibrancy
06 2nd/1303 Bond Program
0 0 0 0Webb Chapel Rd. - Almazan Dr. to Walnut Hill Ln.
0 0Street Resurfacing 00
Economic Vibrancy
06 2nd/1306 Bond Program
1,224,392 1,222,788 1,604 1,224,392Webb Chapel Rd. - Almazan Dr. to Walnut Hill Ln.
0 0Street Resurfacing 00
Economic Vibrancy
13 3rd/1203 Bond Program
255,169 239,934 15,235 255,169Webb Chapel Rd. - Altman Dr. to Regent Dr.
0 0Street Reconstruction
00
Economic Vibrancy
13 3rd/1206 Bond Program
796,292 796,292 0 796,292Webb Chapel Rd. - Altman Dr. to Regent Dr.
0 0Street Reconstruction
00
Economic Vibrancy
13 3rd/1712 Bond Program
0 0 0 752,100Weeburn from Marsh to Mid Pines 112,815 0Street Reconstruction -
Local Streets
639,2850
503
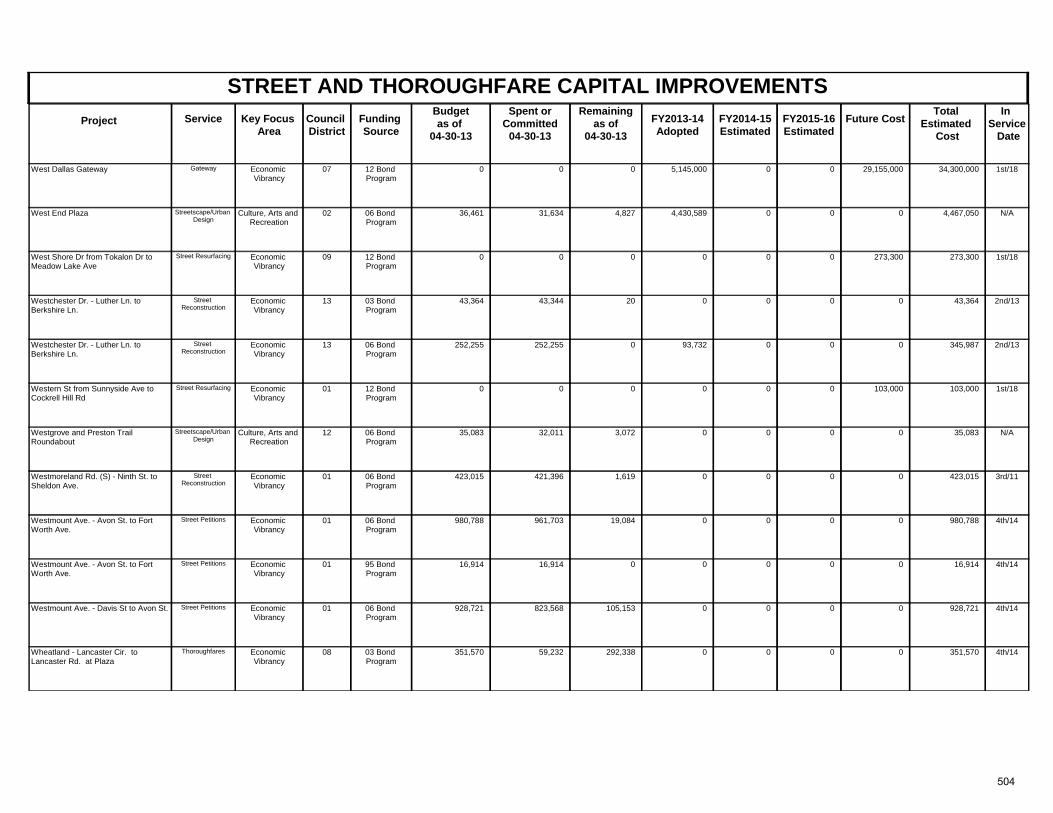
STREET AND THOROUGHFARE CAPITAL IMPROVEMENTSProject Key Focus
AreaCouncil District
Spent orCommitted
04-30-13
Total Estimated
Cost
In Service Date
Funding Source
Remainingas of
04-30-13 FY2013-14
AdoptedFuture CostService FY2014-15
Estimated FY2015-16 Estimated
Budgetas of
04-30-13
Economic Vibrancy
07 1st/1812 Bond Program
0 0 0 34,300,000West Dallas Gateway 5,145,000 29,155,000Gateway 00
Culture, Arts and Recreation
02 N/A06 Bond Program
36,461 31,634 4,827 4,467,050West End Plaza 4,430,589 0Streetscape/Urban Design
00
Economic Vibrancy
09 1st/1812 Bond Program
0 0 0 273,300West Shore Dr from Tokalon Dr to Meadow Lake Ave
0 273,300Street Resurfacing 00
Economic Vibrancy
13 2nd/1303 Bond Program
43,364 43,344 20 43,364Westchester Dr. - Luther Ln. to Berkshire Ln.
0 0Street Reconstruction
00
Economic Vibrancy
13 2nd/1306 Bond Program
252,255 252,255 0 345,987Westchester Dr. - Luther Ln. to Berkshire Ln.
93,732 0Street Reconstruction
00
Economic Vibrancy
01 1st/1812 Bond Program
0 0 0 103,000Western St from Sunnyside Ave to Cockrell Hill Rd
0 103,000Street Resurfacing 00
Culture, Arts and Recreation
12 N/A06 Bond Program
35,083 32,011 3,072 35,083Westgrove and Preston Trail Roundabout
0 0Streetscape/Urban Design
00
Economic Vibrancy
01 3rd/1106 Bond Program
423,015 421,396 1,619 423,015Westmoreland Rd. (S) - Ninth St. to Sheldon Ave.
0 0Street Reconstruction
00
Economic Vibrancy
01 4th/1406 Bond Program
980,788 961,703 19,084 980,788Westmount Ave. - Avon St. to Fort Worth Ave.
0 0Street Petitions 00
Economic Vibrancy
01 4th/1495 Bond Program
16,914 16,914 0 16,914Westmount Ave. - Avon St. to Fort Worth Ave.
0 0Street Petitions 00
Economic Vibrancy
01 4th/1406 Bond Program
928,721 823,568 105,153 928,721Westmount Ave. - Davis St to Avon St. 0 0Street Petitions 00
Economic Vibrancy
08 4th/1403 Bond Program
351,570 59,232 292,338 351,570Wheatland - Lancaster Cir. to Lancaster Rd. at Plaza
0 0Thoroughfares 00
504
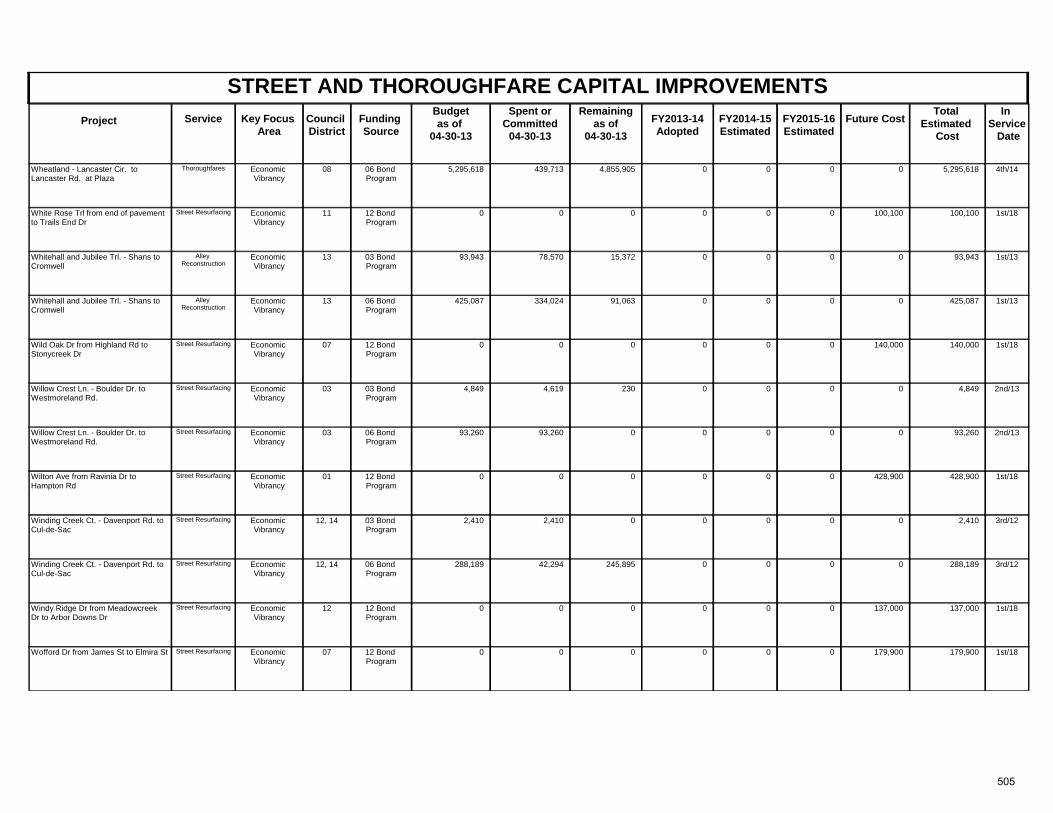
STREET AND THOROUGHFARE CAPITAL IMPROVEMENTSProject Key Focus
AreaCouncil District
Spent orCommitted
04-30-13
Total Estimated
Cost
In Service Date
Funding Source
Remainingas of
04-30-13 FY2013-14
AdoptedFuture CostService FY2014-15
Estimated FY2015-16 Estimated
Budgetas of
04-30-13
Economic Vibrancy
08 4th/1406 Bond Program
5,295,618 439,713 4,855,905 5,295,618Wheatland - Lancaster Cir. to Lancaster Rd. at Plaza
0 0Thoroughfares 00
Economic Vibrancy
11 1st/1812 Bond Program
0 0 0 100,100White Rose Trl from end of pavement to Trails End Dr
0 100,100Street Resurfacing 00
Economic Vibrancy
13 1st/1303 Bond Program
93,943 78,570 15,372 93,943Whitehall and Jubilee Trl. - Shans to Cromwell
0 0Alley Reconstruction
00
Economic Vibrancy
13 1st/1306 Bond Program
425,087 334,024 91,063 425,087Whitehall and Jubilee Trl. - Shans to Cromwell
0 0Alley Reconstruction
00
Economic Vibrancy
07 1st/1812 Bond Program
0 0 0 140,000Wild Oak Dr from Highland Rd to Stonycreek Dr
0 140,000Street Resurfacing 00
Economic Vibrancy
03 2nd/1303 Bond Program
4,849 4,619 230 4,849Willow Crest Ln. - Boulder Dr. to Westmoreland Rd.
0 0Street Resurfacing 00
Economic Vibrancy
03 2nd/1306 Bond Program
93,260 93,260 0 93,260Willow Crest Ln. - Boulder Dr. to Westmoreland Rd.
0 0Street Resurfacing 00
Economic Vibrancy
01 1st/1812 Bond Program
0 0 0 428,900Wilton Ave from Ravinia Dr to Hampton Rd
0 428,900Street Resurfacing 00
Economic Vibrancy
12, 14 3rd/1203 Bond Program
2,410 2,410 0 2,410Winding Creek Ct. - Davenport Rd. to Cul-de-Sac
0 0Street Resurfacing 00
Economic Vibrancy
12, 14 3rd/1206 Bond Program
288,189 42,294 245,895 288,189Winding Creek Ct. - Davenport Rd. to Cul-de-Sac
0 0Street Resurfacing 00
Economic Vibrancy
12 1st/1812 Bond Program
0 0 0 137,000Windy Ridge Dr from Meadowcreek Dr to Arbor Downs Dr
0 137,000Street Resurfacing 00
Economic Vibrancy
07 1st/1812 Bond Program
0 0 0 179,900Wofford Dr from James St to Elmira St 0 179,900Street Resurfacing 00
505
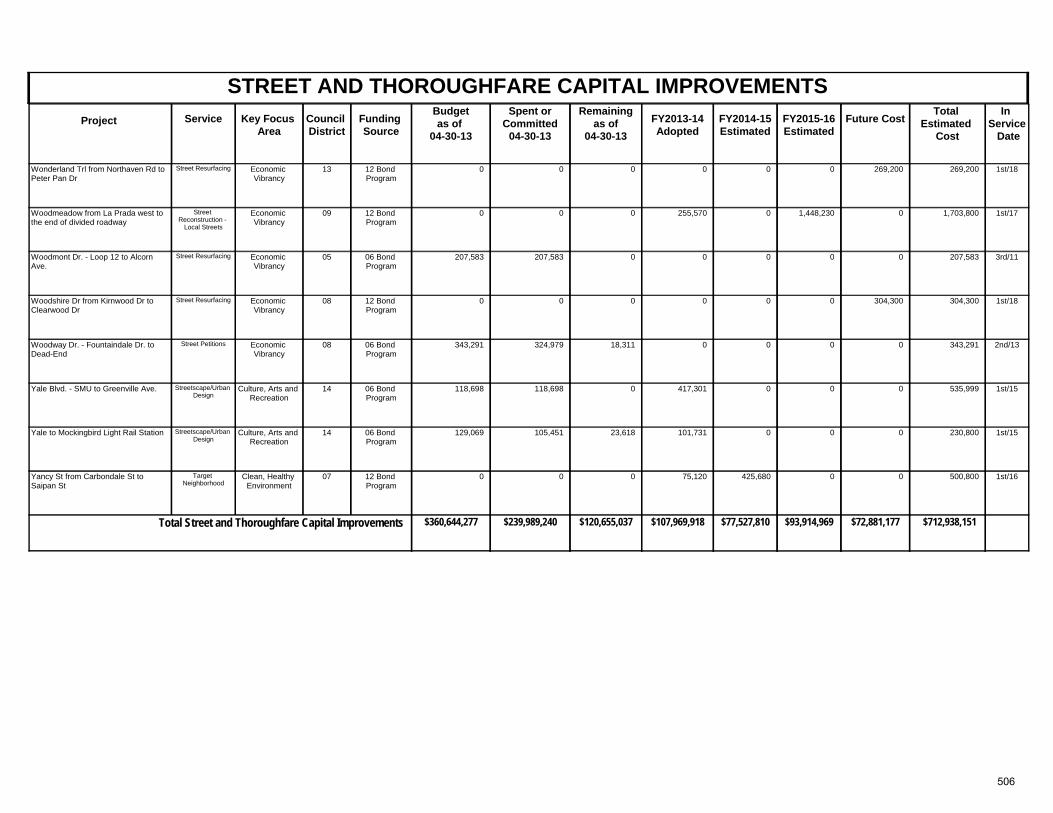
STREET AND THOROUGHFARE CAPITAL IMPROVEMENTSProject Key Focus
AreaCouncil District
Spent orCommitted
04-30-13
Total Estimated
Cost
In Service Date
Funding Source
Remainingas of
04-30-13 FY2013-14
AdoptedFuture CostService FY2014-15
Estimated FY2015-16 Estimated
Budgetas of
04-30-13
Economic Vibrancy
13 1st/1812 Bond Program
0 0 0 269,200Wonderland Trl from Northaven Rd to Peter Pan Dr
0 269,200Street Resurfacing 00
Economic Vibrancy
09 1st/1712 Bond Program
0 0 0 1,703,800Woodmeadow from La Prada west to the end of divided roadway
255,570 0Street Reconstruction -
Local Streets
1,448,2300
Economic Vibrancy
05 3rd/1106 Bond Program
207,583 207,583 0 207,583Woodmont Dr. - Loop 12 to Alcorn Ave.
0 0Street Resurfacing 00
Economic Vibrancy
08 1st/1812 Bond Program
0 0 0 304,300Woodshire Dr from Kirnwood Dr to Clearwood Dr
0 304,300Street Resurfacing 00
Economic Vibrancy
08 2nd/1306 Bond Program
343,291 324,979 18,311 343,291Woodway Dr. - Fountaindale Dr. to Dead-End
0 0Street Petitions 00
Culture, Arts and Recreation
14 1st/1506 Bond Program
118,698 118,698 0 535,999Yale Blvd. - SMU to Greenville Ave. 417,301 0Streetscape/Urban Design
00
Culture, Arts and Recreation
14 1st/1506 Bond Program
129,069 105,451 23,618 230,800Yale to Mockingbird Light Rail Station 101,731 0Streetscape/Urban Design
00
Clean, Healthy Environment
07 1st/1612 Bond Program
0 0 0 500,800Yancy St from Carbondale St to Saipan St
75,120 0Target Neighborhood
0425,680
$360,644,277 $120,655,037Total Street and Thoroughfare Capital Improvements $239,989,240 $712,938,151$107,969,918 $72,881,177$93,914,969$77,527,810
506
TRINITY RIVER CORRIDOR CAPITAL IMPROVEMENTS
MISSION This program consists of projects along the Trinity River Corridor that provide for flood protection, environmental restoration/preservation, recreation, transportation improvements and economic development. The current Trinity River Corridor projects include the Dallas Floodway Extension and development of flood improvements in the Elm Fork area. Also included are transportation improvements such as the Margaret Hunt Hill (formerly referred to as the Woodall Rodgers Extension) Bridge and the Trinity Parkway, both of which will provide reliever routes to allow the State to make improvements to the Canyon/Mixmaster/Lower Stemmons areas. Other projects will provide for recreational amenities in the Great Trinity Forest and lakes within the Floodway.
HIGHLIGHTED ACCOMPLISHMENTS FOR FY 2012-13
1. Completed construction of IH-20 Gateway Park.
2. Completed construction of Elm Fork Athletic Complex.
3. Completed installation of slurry cut-off walls along the Trinity River Levees.
4. Completed construction of Pavaho Pump Station.
5. Began construction of AT&T Trail (Trinity Forest Trail Phase 3 and 3A.), Trinity Trail along the Dallas Floodway. Completed Moore Gateway Park Phase II and Santa Fe Trestle Trail.
6. Began construction of Western Gateway and Continental Bridge.
7. Began construction of IH-30 (Margaret McDermott) Signature Bridge.
HIGHLIGHTED OBJECTIVES FOR FY 2013-14
1. Continue construction of Trinity Trail along the Dallas Floodway.
2. Complete construction of AT&T Trail (Trinity Forest Trail Phase 3 and 3A).
3. Complete construction of Western Gateway and Continental Bridge.
4. Continue construction of IH-30 (Margaret McDermott) Signature Bridge.
5. Begin construction of Able Sump Station improvements.
6. Complete construction of Baker (Hampton-Oak Lawn) Pump Station.
SERVICE DESCRIPTIONS
Professional Services and Debt Issuance Provides funding for certain costs associated with capital improvement projects. These costs include studies and long-range plans, debt issuance costs, and reimbursements to the General Fund for professional staff services such as design, survey, land acquisition fees and engineering. Debt issuance and CIP Engineering costs are paid from the interest earned on bond proceeds. These costs also include transfers to General Fund.
Public Art Includes the public art initiatives throughout the City of Dallas. Funds generated by Public Art appropriations are used for the design services of artists, for the selection, acquisition, commissioning and display of artworks and for administration of the public art projects.
Trinity River Projects Projects along the Trinity River Corridor for flood protection, environmental restoration/preservation, recreation, and transportation improvements.
507
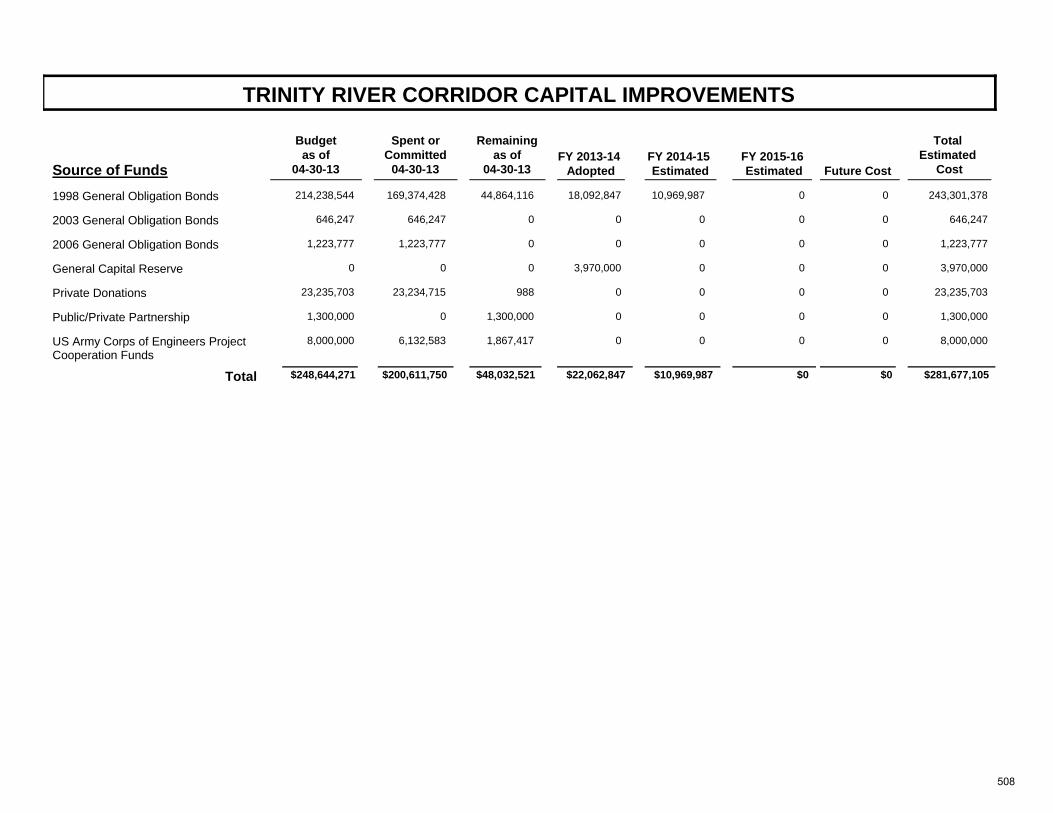
TRINITY RIVER CORRIDOR CAPITAL IMPROVEMENTS
Source of FundsFY 2013-14
Adopted
Total Estimated
CostFY 2014-15 Estimated
FY 2015-16 Estimated
Future Cost
Remainingas of
04-30-13
Spent orCommitted
04-30-13
Budgetas of
04-30-13
1998 General Obligation Bonds 214,238,544 169,374,428 18,092,84744,864,116 243,301,37810,969,987 0 0
2003 General Obligation Bonds 646,247 646,247 00 646,2470 0 0
2006 General Obligation Bonds 1,223,777 1,223,777 00 1,223,7770 0 0
General Capital Reserve 0 0 3,970,0000 3,970,0000 0 0
Private Donations 23,235,703 23,234,715 0988 23,235,7030 0 0
Public/Private Partnership 1,300,000 0 01,300,000 1,300,0000 0 0
US Army Corps of Engineers Project Cooperation Funds
8,000,000 6,132,583 01,867,417 8,000,0000 0 0
$200,611,750 $22,062,847Total $248,644,271 $48,032,521 $10,969,987 $281,677,105$0 $0
508
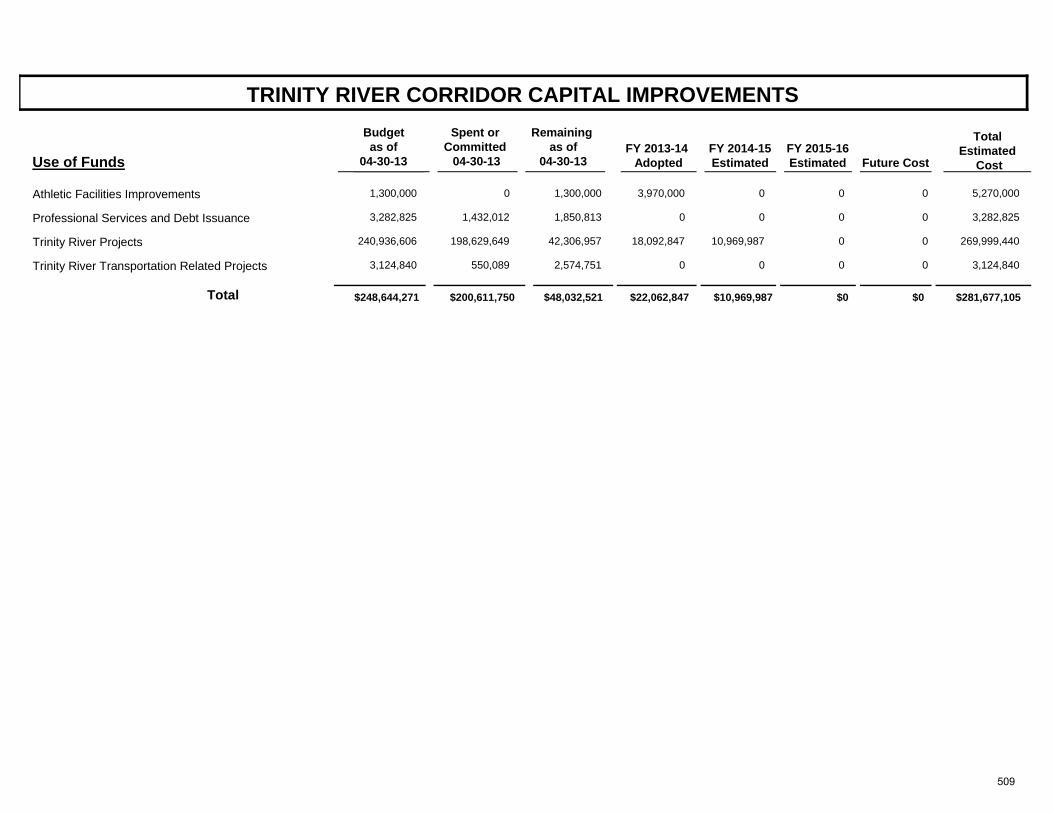
TRINITY RIVER CORRIDOR CAPITAL IMPROVEMENTS
Use of FundsFY 2013-14
Adopted
Total Estimated
Cost FY 2014-15 Estimated
FY 2015-16 Estimated
Future Cost
Spent or Committed
04-30-13
Remaining as of
04-30-13
Budget as of
04-30-13
Athletic Facilities Improvements 1,300,000 0 3,970,0001,300,000 5,270,0000 0 0
Professional Services and Debt Issuance 3,282,825 1,432,012 01,850,813 3,282,8250 0 0
Trinity River Projects 240,936,606 198,629,649 18,092,84742,306,957 269,999,44010,969,987 0 0
Trinity River Transportation Related Projects 3,124,840 550,089 02,574,751 3,124,8400 0 0
$200,611,750 $22,062,847Total $248,644,271 $48,032,521 $10,969,987 $281,677,105$0 $0
509
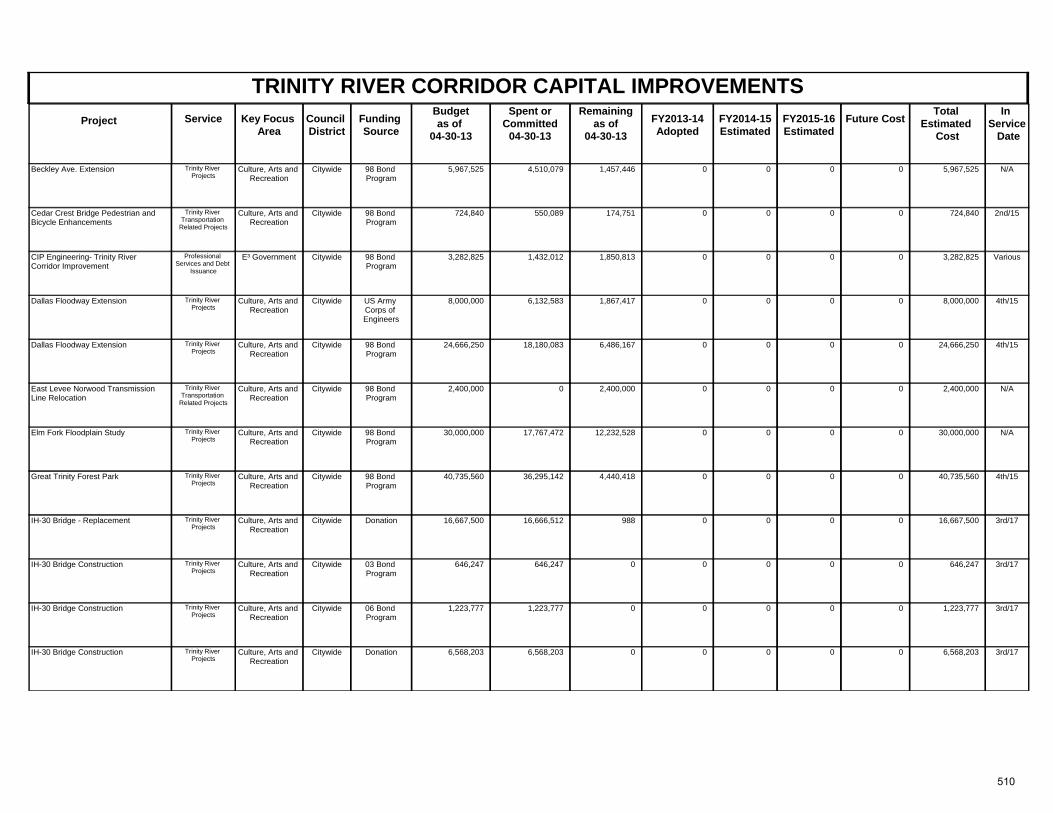
TRINITY RIVER CORRIDOR CAPITAL IMPROVEMENTSProject Key Focus
AreaCouncil District
Spent orCommitted
04-30-13
Total Estimated
Cost
In Service Date
Funding Source
Remainingas of
04-30-13 FY2013-14
AdoptedFuture CostService FY2014-15
Estimated FY2015-16 Estimated
Budgetas of
04-30-13
Culture, Arts and Recreation
Citywide N/A98 Bond Program
5,967,525 4,510,079 1,457,446 5,967,525Beckley Ave. Extension 0 0Trinity River Projects
00
Culture, Arts and Recreation
Citywide 2nd/1598 Bond Program
724,840 550,089 174,751 724,840Cedar Crest Bridge Pedestrian and Bicycle Enhancements
0 0Trinity River Transportation
Related Projects
00
E³ Government Citywide Various98 Bond Program
3,282,825 1,432,012 1,850,813 3,282,825CIP Engineering- Trinity River Corridor Improvement
0 0Professional Services and Debt
Issuance
00
Culture, Arts and Recreation
Citywide 4th/15US Army Corps of Engineers
8,000,000 6,132,583 1,867,417 8,000,000Dallas Floodway Extension 0 0Trinity River Projects
00
Culture, Arts and Recreation
Citywide 4th/1598 Bond Program
24,666,250 18,180,083 6,486,167 24,666,250Dallas Floodway Extension 0 0Trinity River Projects
00
Culture, Arts and Recreation
Citywide N/A98 Bond Program
2,400,000 0 2,400,000 2,400,000East Levee Norwood Transmission Line Relocation
0 0Trinity River Transportation
Related Projects
00
Culture, Arts and Recreation
Citywide N/A98 Bond Program
30,000,000 17,767,472 12,232,528 30,000,000Elm Fork Floodplain Study 0 0Trinity River Projects
00
Culture, Arts and Recreation
Citywide 4th/1598 Bond Program
40,735,560 36,295,142 4,440,418 40,735,560Great Trinity Forest Park 0 0Trinity River Projects
00
Culture, Arts and Recreation
Citywide 3rd/17Donation 16,667,500 16,666,512 988 16,667,500IH-30 Bridge - Replacement 0 0Trinity River Projects
00
Culture, Arts and Recreation
Citywide 3rd/1703 Bond Program
646,247 646,247 0 646,247IH-30 Bridge Construction 0 0Trinity River Projects
00
Culture, Arts and Recreation
Citywide 3rd/1706 Bond Program
1,223,777 1,223,777 0 1,223,777IH-30 Bridge Construction 0 0Trinity River Projects
00
Culture, Arts and Recreation
Citywide 3rd/17Donation 6,568,203 6,568,203 0 6,568,203IH-30 Bridge Construction 0 0Trinity River Projects
00
510
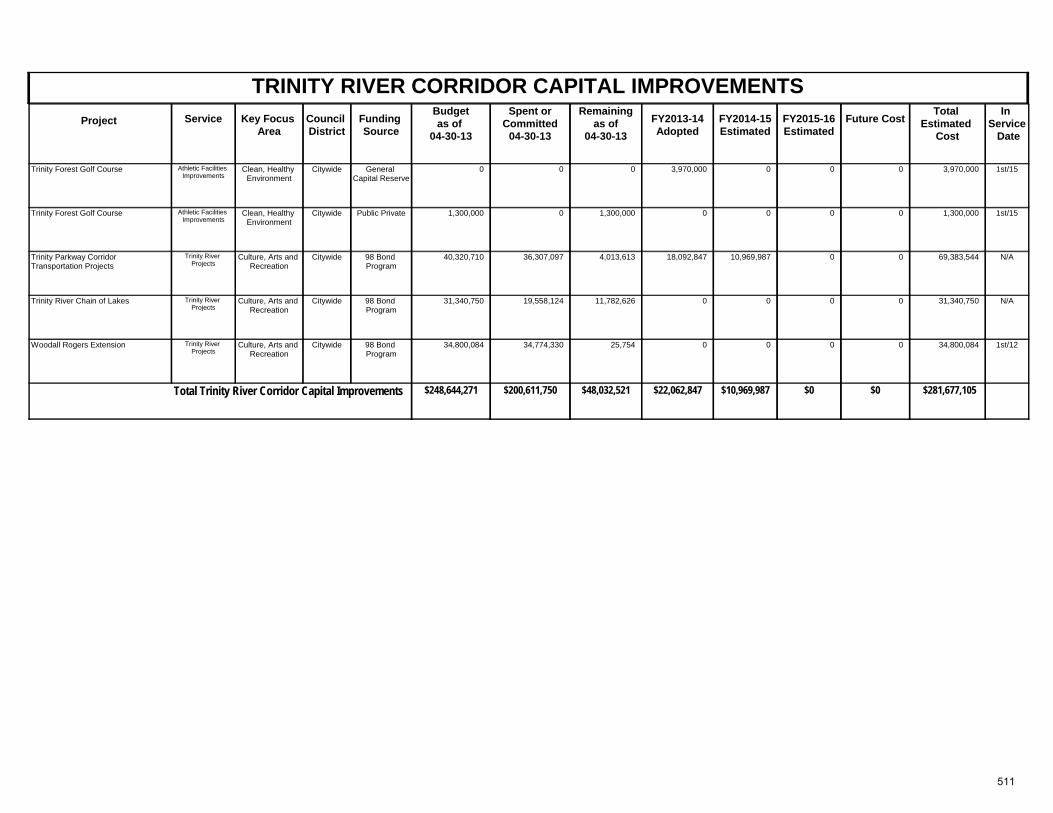
TRINITY RIVER CORRIDOR CAPITAL IMPROVEMENTSProject Key Focus
AreaCouncil District
Spent orCommitted
04-30-13
Total Estimated
Cost
In Service Date
Funding Source
Remainingas of
04-30-13 FY2013-14
AdoptedFuture CostService FY2014-15
Estimated FY2015-16 Estimated
Budgetas of
04-30-13
Clean, Healthy Environment
Citywide 1st/15General Capital Reserve
0 0 0 3,970,000Trinity Forest Golf Course 3,970,000 0Athletic Facilities Improvements
00
Clean, Healthy Environment
Citywide 1st/15Public Private 1,300,000 0 1,300,000 1,300,000Trinity Forest Golf Course 0 0Athletic Facilities Improvements
00
Culture, Arts and Recreation
Citywide N/A98 Bond Program
40,320,710 36,307,097 4,013,613 69,383,544Trinity Parkway Corridor Transportation Projects
18,092,847 0Trinity River Projects
010,969,987
Culture, Arts and Recreation
Citywide N/A98 Bond Program
31,340,750 19,558,124 11,782,626 31,340,750Trinity River Chain of Lakes 0 0Trinity River Projects
00
Culture, Arts and Recreation
Citywide 1st/1298 Bond Program
34,800,084 34,774,330 25,754 34,800,084Woodall Rogers Extension 0 0Trinity River Projects
00
$248,644,271 $48,032,521Total Trinity River Corridor Capital Improvements $200,611,750 $281,677,105$22,062,847 $0$0$10,969,987
511
WATER UTILITIES FACILITIES CAPITAL IMPROVEMENTS
MISSION The City of Dallas Water Utilities Department (DWU) is a City-owned enterprise utility providing regional water and wastewater services to the citizens of Dallas and to the surrounding customer cities. DWU’s mission is to provide services vital to the health and safety of Dallas citizens and our customers and to support the City’s efforts toward economic development, environmental protection and enhancement of quality of life, including water supply, treatment, and distribution; wastewater collection and treatment; and billing, credit and collection and customer service. The mission of the Water Utilities Department Capital Improvement Program is to provide an adequate water supply and wastewater treatment to its customers by the acquisition of future water and wastewater facilities and to renovate and construct improvements to existing water and wastewater facilities throughout the City of Dallas. HIGHLIGHTED ACCOMPLISHMENTS FOR FY 2012-13
1. Completed the construction of the dewatering facility at the
Southside Wastewater Treatment Plant and put the facility into operation. This project will optimize solids disposal at the plant and reduce personnel overtime with the elimination of 24-hour operations.
2. Awarded the construction of the grit removal and screenings
improvements project at the Central Wastewater Treatment Plant. Completion of this project will reduce operations and maintenance costs at both of the City’s wastewater treatment plants.
3. Awarded the design of the process control system improvements at the Central Wastewater Treatment Plant. This project will reduce operation, maintenance, chemical and electrical costs by optimizing operations at the plant.
4. Awarded the construction of East Side Water Treatment Plant electrical substation III to address increased electrical needs due to expanding the capacity of the plant to the 540 million gallons per day (MGD).
5. Awarded construction management services for the Elm Fork and Bachman Water Treatment Plants. These services will augment inspection and project management staff for a substantial level of critical process change projects and specialized mechanical, electrical and instrumentation needs.
6. Awarded water and wastewater main replacement contracts which resulted in the installation of approximately 130 miles of water and wastewater mains, including relocation and private development projects.
7. Finalized the construction of the recycle water phase I and II projects
which resulted in the installation of approximately 6 miles of 20-inch pipe. Use of the recycled water for irrigation will help reduce overall demand on Dallas’ drinking water system.
8. Awarded the business technology master plan project. This project
will provide a sustainable plan for the implementation of technology solutions and recommendations and improve the efficiency in business functions.
9. Awarded contracts to participate with other area water providers to
determine the feasibility of obtaining water from the Sulphur River Basin and also additional water from the Neches River Basin. The City needs to obtain and connect additional water supply to meet the future needs of the citizens, retail and wholesale customers of Dallas. It is important that Dallas continues to be a part of the regional process to determine the availability of water resources to meet our future needs and be able to use this information in the Long Range Water Supply Plan.
HIGHLIGHTED OBJECTIVES FOR FY 2013-14
1. Complete the construction of the new influent pump station at the Central Wastewater Treatment Plant (CWWTP) and put the facility into operation. This project will allow Dallas to decommission the Cadiz Street Wastewater Pump Station and consolidate pumping operations at CWWTP.
2. Award the construction of the process control system Improvements at the Central Wastewater Treatment Plant. This project will reduce
512
WATER UTILITIES FACILITIES CAPITAL IMPROVEMENTS
operation, maintenance, chemical and electrical costs by optimizing operations at the plant.
3. Award construction of White Rock Dam and Spillway Improvements and Bachman Dam replacement to comply with dam safety requirements and insure dependable water supply.
4. Award construction of Elm Fork Intake, Presedimentation Basins and Sludge Handling Improvements. Completion of this work improves the overall water quality and capacity at the Elm Fork Water Treatment Plant.
5. Award construction for Walcrest Pump Station and Reservoir
Improvements. These improvements will improve reliability of the water system and reduce maintenance costs by replacing aging infrastructure.
6. Award construction of East Side Water Treatment Plant Stage Five Filter project. Completion of this work improves the overall water quality and capacity at the East Side Water Treatment Plant.
7. Award Water and Wastewater Main Replacement contracts which
will result in the installation of approximately 54 miles of water and wastewater mains, including relocation and private development projects.
SERVICE DESCRIPTIONS Homeowner Extensions and Unserved Areas Construction of water and wastewater main extensions to homeowners and meters for water service. Inflow/Infiltration Remediation Design and construction of improvements to eliminate inflow and infiltration conditions within the wastewater collection system. Mains, Pump Stations and Associated Facilities Right-of-way acquisition, design and construction of new and replacement mains, pump stations, lift stations, ground storage reservoirs, and elevated tanks citywide as required by growth, development and obsolescence. Surveying, geotechnical and environmental services are also included.
Public Art Includes the public art initiatives throughout the City of Dallas. Funds generated by Public Art appropriations are used for the design services of artists, for the selection, acquisition, commissioning and display of artworks and for administration of the public art projects. Raw Water Pumping and Transmission Acquisition of right-of-way for transmission facilities and for the design and construction of water transmission facilities to include the Lake Fork Pump Station and pipeline. Rehabilitation and Equipment Maintenance and renovation of major water and wastewater facilities. Relocations In Advance of Paving Replacement and/or relocation of water mains, wastewater mains and related facilities to permit widening and paving of streets and highways and storm drainage in coordination with City, County and State programs. Service Centers, Offices and Research Facilities Renovation of existing service facilities and business and customer service systems. Studies and Master Plans Studies related to business, planning, water and wastewater operations and master plan updates. Wastewater Treatment Plants and Associated Facilities Design and construction of renovations, expansions, and improvements to the Central and Southside Wastewater Treatment Plants. Funding for the design and construction of the proposed future wastewater treatment plant(s). Water Supply Reservoirs and Dams Dam inspection, consultation, rehabilitation and erosion studies for various dams. Also includes acquisition of new water supply sources. Water Treatment Plants and Associated Facilities Design and construction of renovations, expansions and improvements to the City’s three water treatment plants: Bachman Plant, East Side Plant and Elm Fork Plant. Funding for the design and construction of the proposed future water treatment plant(s). Wholesale Customer Facilities Construction of facilities necessary to provide service to the Customer Cities.
513
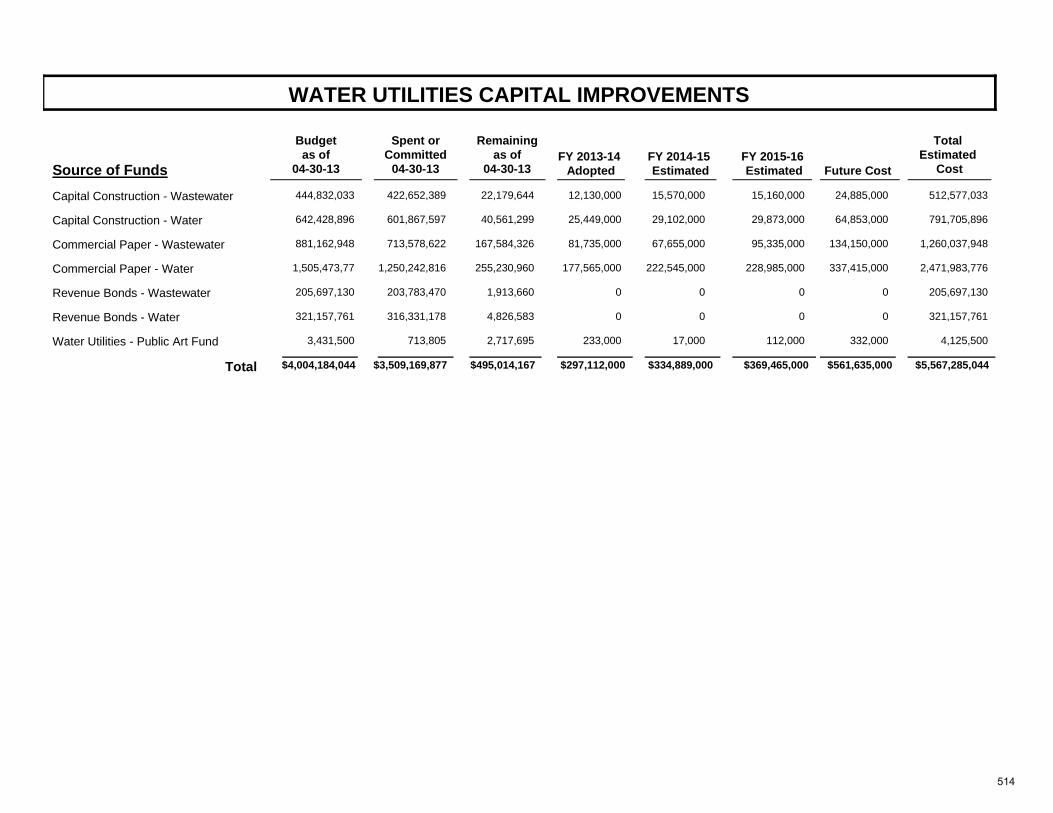
WATER UTILITIES CAPITAL IMPROVEMENTS
Source of FundsFY 2013-14
Adopted
Total Estimated
CostFY 2014-15 Estimated
FY 2015-16 Estimated
Future Cost
Remainingas of
04-30-13
Spent orCommitted
04-30-13
Budgetas of
04-30-13
Capital Construction - Wastewater 444,832,033 422,652,389 12,130,00022,179,644 512,577,03315,570,000 15,160,000 24,885,000
Capital Construction - Water 642,428,896 601,867,597 25,449,00040,561,299 791,705,89629,102,000 29,873,000 64,853,000
Commercial Paper - Wastewater 881,162,948 713,578,622 81,735,000167,584,326 1,260,037,94867,655,000 95,335,000 134,150,000
Commercial Paper - Water 1,505,473,77 1,250,242,816 177,565,000255,230,960 2,471,983,776222,545,000 228,985,000 337,415,000
Revenue Bonds - Wastewater 205,697,130 203,783,470 01,913,660 205,697,1300 0 0
Revenue Bonds - Water 321,157,761 316,331,178 04,826,583 321,157,7610 0 0
Water Utilities - Public Art Fund 3,431,500 713,805 233,0002,717,695 4,125,50017,000 112,000 332,000
$3,509,169,877 $297,112,000Total $4,004,184,044 $495,014,167 $334,889,000 $5,567,285,044$369,465,000 $561,635,000
514
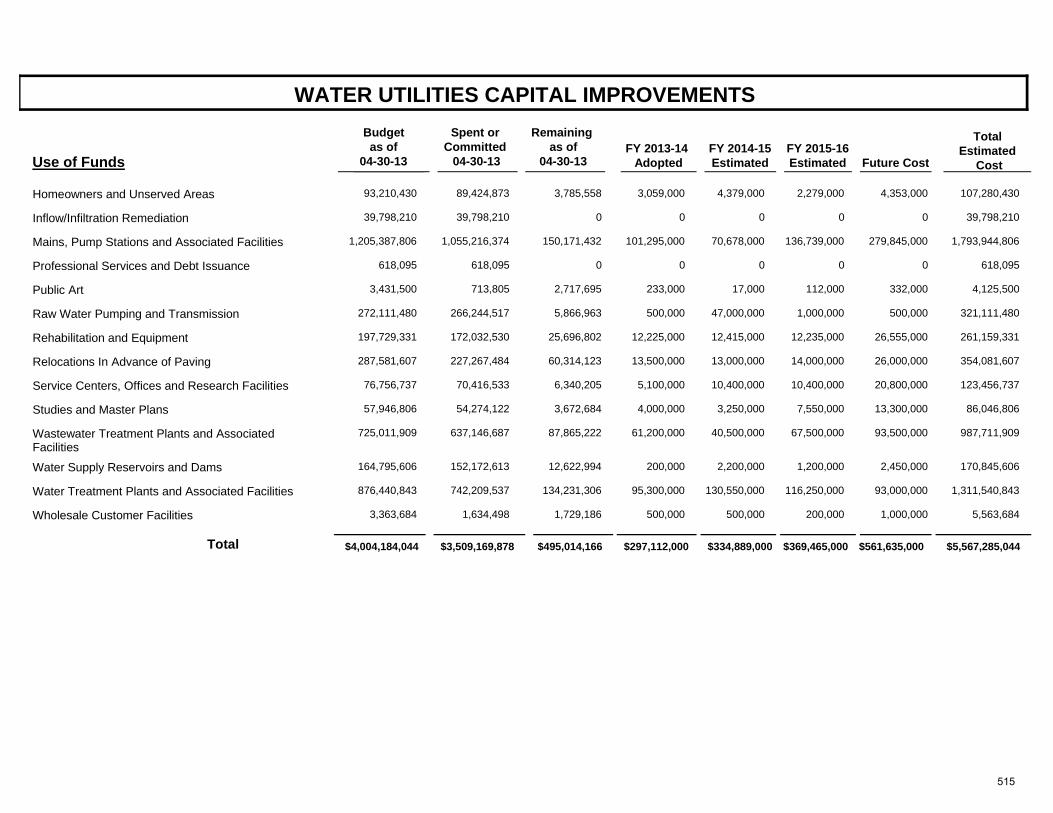
WATER UTILITIES CAPITAL IMPROVEMENTS
Use of FundsFY 2013-14
Adopted
Total Estimated
Cost FY 2014-15 Estimated
FY 2015-16 Estimated
Future Cost
Spent or Committed
04-30-13
Remaining as of
04-30-13
Budget as of
04-30-13
Homeowners and Unserved Areas 93,210,430 89,424,873 3,059,0003,785,558 107,280,4304,379,000 2,279,000 4,353,000
Inflow/Infiltration Remediation 39,798,210 39,798,210 00 39,798,2100 0 0
Mains, Pump Stations and Associated Facilities 1,205,387,806 1,055,216,374 101,295,000150,171,432 1,793,944,80670,678,000 136,739,000 279,845,000
Professional Services and Debt Issuance 618,095 618,095 00 618,0950 0 0
Public Art 3,431,500 713,805 233,0002,717,695 4,125,50017,000 112,000 332,000
Raw Water Pumping and Transmission 272,111,480 266,244,517 500,0005,866,963 321,111,48047,000,000 1,000,000 500,000
Rehabilitation and Equipment 197,729,331 172,032,530 12,225,00025,696,802 261,159,33112,415,000 12,235,000 26,555,000
Relocations In Advance of Paving 287,581,607 227,267,484 13,500,00060,314,123 354,081,60713,000,000 14,000,000 26,000,000
Service Centers, Offices and Research Facilities 76,756,737 70,416,533 5,100,0006,340,205 123,456,73710,400,000 10,400,000 20,800,000
Studies and Master Plans 57,946,806 54,274,122 4,000,0003,672,684 86,046,8063,250,000 7,550,000 13,300,000
Wastewater Treatment Plants and Associated Facilities
725,011,909 637,146,687 61,200,00087,865,222 987,711,90940,500,000 67,500,000 93,500,000
Water Supply Reservoirs and Dams 164,795,606 152,172,613 200,00012,622,994 170,845,6062,200,000 1,200,000 2,450,000
Water Treatment Plants and Associated Facilities 876,440,843 742,209,537 95,300,000134,231,306 1,311,540,843130,550,000 116,250,000 93,000,000
Wholesale Customer Facilities 3,363,684 1,634,498 500,0001,729,186 5,563,684500,000 200,000 1,000,000
$3,509,169,878 $297,112,000Total $4,004,184,044 $495,014,166 $334,889,000 $5,567,285,044$369,465,000 $561,635,000
515
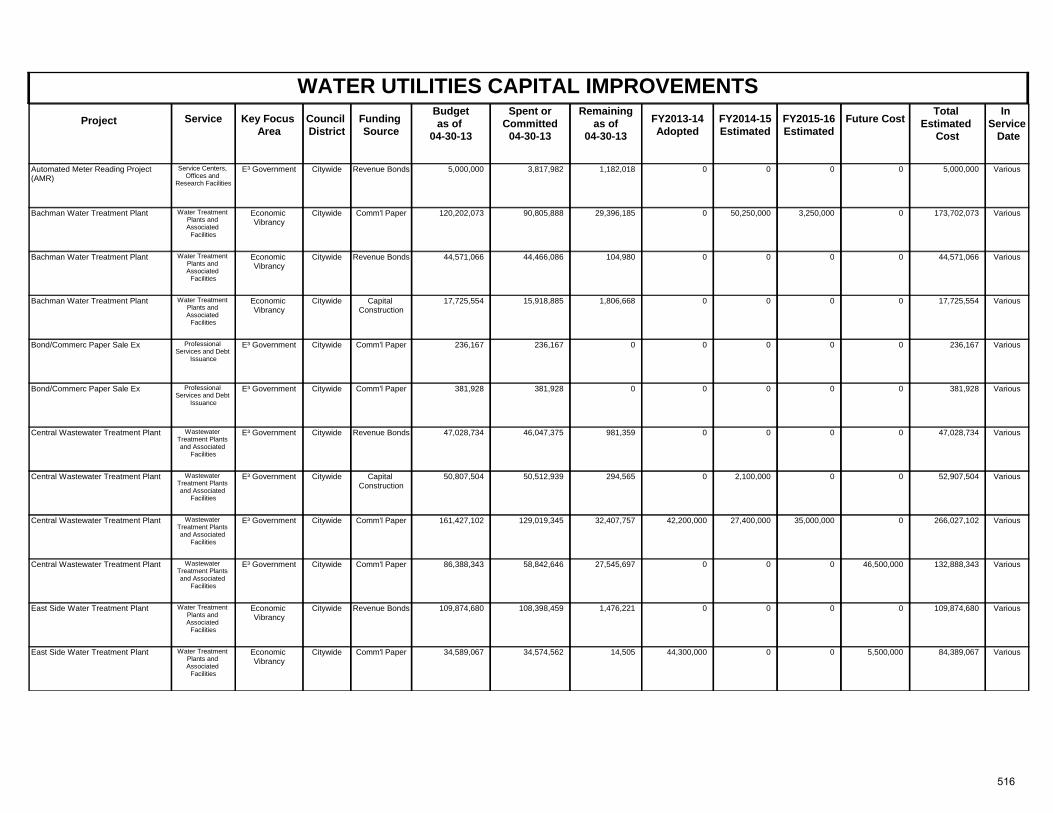
WATER UTILITIES CAPITAL IMPROVEMENTSProject Key Focus
AreaCouncil District
Spent orCommitted
04-30-13
Total Estimated
Cost
In Service Date
Funding Source
Remainingas of
04-30-13 FY2013-14
AdoptedFuture CostService FY2014-15
Estimated FY2015-16 Estimated
Budgetas of
04-30-13
E³ Government Citywide VariousRevenue Bonds 5,000,000 3,817,982 1,182,018 5,000,000Automated Meter Reading Project (AMR)
0 0Service Centers, Offices and
Research Facilities
00
Economic Vibrancy
Citywide VariousComm'l Paper 120,202,073 90,805,888 29,396,185 173,702,073Bachman Water Treatment Plant 0 0Water Treatment Plants and Associated
Facilities
3,250,00050,250,000
Economic Vibrancy
Citywide VariousRevenue Bonds 44,571,066 44,466,086 104,980 44,571,066Bachman Water Treatment Plant 0 0Water Treatment Plants and Associated
Facilities
00
Economic Vibrancy
Citywide VariousCapital Construction
17,725,554 15,918,885 1,806,668 17,725,554Bachman Water Treatment Plant 0 0Water Treatment Plants and Associated
Facilities
00
E³ Government Citywide VariousComm'l Paper 236,167 236,167 0 236,167Bond/Commerc Paper Sale Ex 0 0Professional Services and Debt
Issuance
00
E³ Government Citywide VariousComm'l Paper 381,928 381,928 0 381,928Bond/Commerc Paper Sale Ex 0 0Professional Services and Debt
Issuance
00
E³ Government Citywide VariousRevenue Bonds 47,028,734 46,047,375 981,359 47,028,734Central Wastewater Treatment Plant 0 0Wastewater Treatment Plants and Associated
Facilities
00
E³ Government Citywide VariousCapital Construction
50,807,504 50,512,939 294,565 52,907,504Central Wastewater Treatment Plant 0 0Wastewater Treatment Plants and Associated
Facilities
02,100,000
E³ Government Citywide VariousComm'l Paper 161,427,102 129,019,345 32,407,757 266,027,102Central Wastewater Treatment Plant 42,200,000 0Wastewater Treatment Plants and Associated
Facilities
35,000,00027,400,000
E³ Government Citywide VariousComm'l Paper 86,388,343 58,842,646 27,545,697 132,888,343Central Wastewater Treatment Plant 0 46,500,000Wastewater Treatment Plants and Associated
Facilities
00
Economic Vibrancy
Citywide VariousRevenue Bonds 109,874,680 108,398,459 1,476,221 109,874,680East Side Water Treatment Plant 0 0Water Treatment Plants and Associated
Facilities
00
Economic Vibrancy
Citywide VariousComm'l Paper 34,589,067 34,574,562 14,505 84,389,067East Side Water Treatment Plant 44,300,000 5,500,000Water Treatment Plants and Associated
Facilities
00
516
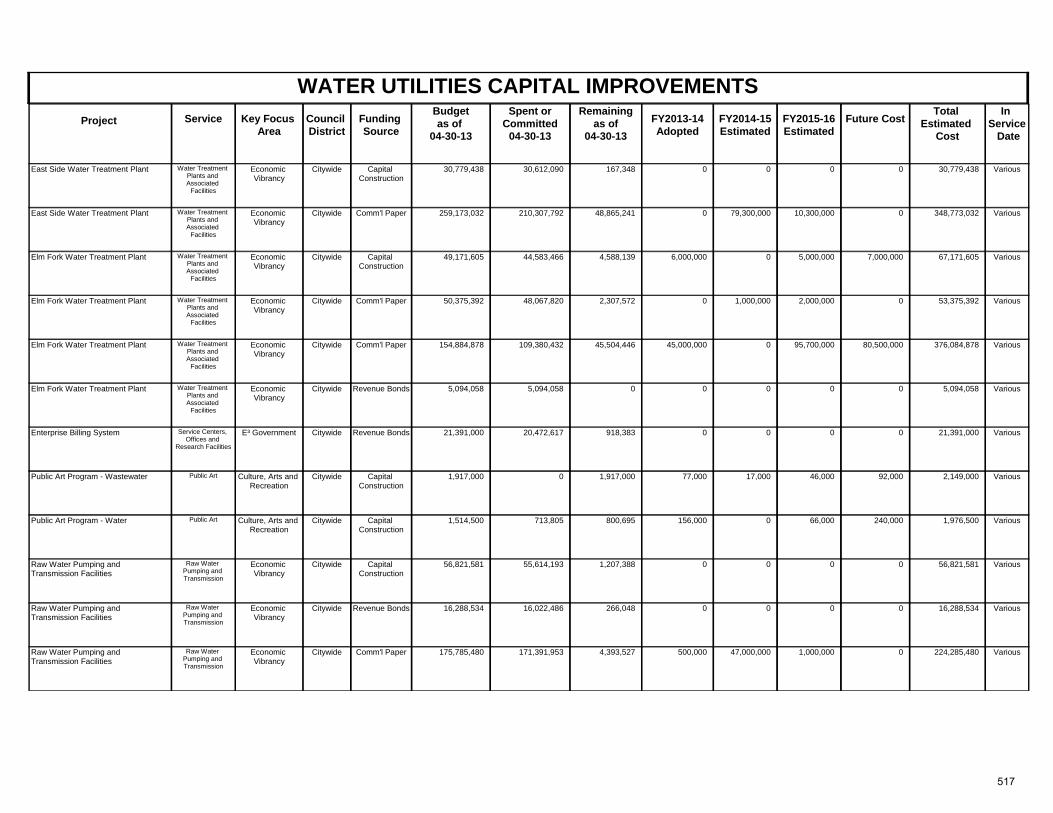
WATER UTILITIES CAPITAL IMPROVEMENTSProject Key Focus
AreaCouncil District
Spent orCommitted
04-30-13
Total Estimated
Cost
In Service Date
Funding Source
Remainingas of
04-30-13 FY2013-14
AdoptedFuture CostService FY2014-15
Estimated FY2015-16 Estimated
Budgetas of
04-30-13
Economic Vibrancy
Citywide VariousCapital Construction
30,779,438 30,612,090 167,348 30,779,438East Side Water Treatment Plant 0 0Water Treatment Plants and Associated
Facilities
00
Economic Vibrancy
Citywide VariousComm'l Paper 259,173,032 210,307,792 48,865,241 348,773,032East Side Water Treatment Plant 0 0Water Treatment Plants and Associated
Facilities
10,300,00079,300,000
Economic Vibrancy
Citywide VariousCapital Construction
49,171,605 44,583,466 4,588,139 67,171,605Elm Fork Water Treatment Plant 6,000,000 7,000,000Water Treatment Plants and Associated
Facilities
5,000,0000
Economic Vibrancy
Citywide VariousComm'l Paper 50,375,392 48,067,820 2,307,572 53,375,392Elm Fork Water Treatment Plant 0 0Water Treatment Plants and Associated
Facilities
2,000,0001,000,000
Economic Vibrancy
Citywide VariousComm'l Paper 154,884,878 109,380,432 45,504,446 376,084,878Elm Fork Water Treatment Plant 45,000,000 80,500,000Water Treatment Plants and Associated
Facilities
95,700,0000
Economic Vibrancy
Citywide VariousRevenue Bonds 5,094,058 5,094,058 0 5,094,058Elm Fork Water Treatment Plant 0 0Water Treatment Plants and Associated
Facilities
00
E³ Government Citywide VariousRevenue Bonds 21,391,000 20,472,617 918,383 21,391,000Enterprise Billing System 0 0Service Centers, Offices and
Research Facilities
00
Culture, Arts and Recreation
Citywide VariousCapital Construction
1,917,000 0 1,917,000 2,149,000Public Art Program - Wastewater 77,000 92,000Public Art 46,00017,000
Culture, Arts and Recreation
Citywide VariousCapital Construction
1,514,500 713,805 800,695 1,976,500Public Art Program - Water 156,000 240,000Public Art 66,0000
Economic Vibrancy
Citywide VariousCapital Construction
56,821,581 55,614,193 1,207,388 56,821,581Raw Water Pumping and Transmission Facilities
0 0Raw Water Pumping and Transmission
00
Economic Vibrancy
Citywide VariousRevenue Bonds 16,288,534 16,022,486 266,048 16,288,534Raw Water Pumping and Transmission Facilities
0 0Raw Water Pumping and Transmission
00
Economic Vibrancy
Citywide VariousComm'l Paper 175,785,480 171,391,953 4,393,527 224,285,480Raw Water Pumping and Transmission Facilities
500,000 0Raw Water Pumping and Transmission
1,000,00047,000,000
517
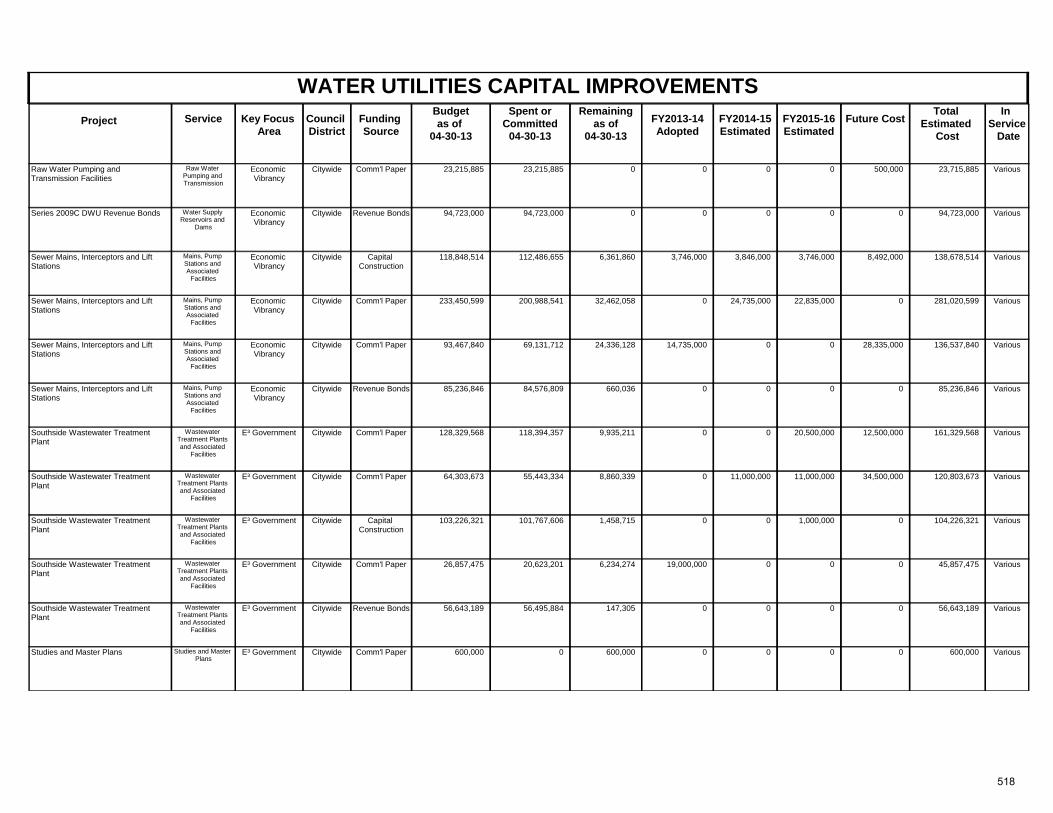
WATER UTILITIES CAPITAL IMPROVEMENTSProject Key Focus
AreaCouncil District
Spent orCommitted
04-30-13
Total Estimated
Cost
In Service Date
Funding Source
Remainingas of
04-30-13 FY2013-14
AdoptedFuture CostService FY2014-15
Estimated FY2015-16 Estimated
Budgetas of
04-30-13
Economic Vibrancy
Citywide VariousComm'l Paper 23,215,885 23,215,885 0 23,715,885Raw Water Pumping and Transmission Facilities
0 500,000Raw Water Pumping and Transmission
00
Economic Vibrancy
Citywide VariousRevenue Bonds 94,723,000 94,723,000 0 94,723,000Series 2009C DWU Revenue Bonds 0 0Water Supply Reservoirs and
Dams
00
Economic Vibrancy
Citywide VariousCapital Construction
118,848,514 112,486,655 6,361,860 138,678,514Sewer Mains, Interceptors and Lift Stations
3,746,000 8,492,000Mains, Pump Stations and Associated
Facilities
3,746,0003,846,000
Economic Vibrancy
Citywide VariousComm'l Paper 233,450,599 200,988,541 32,462,058 281,020,599Sewer Mains, Interceptors and Lift Stations
0 0Mains, Pump Stations and Associated
Facilities
22,835,00024,735,000
Economic Vibrancy
Citywide VariousComm'l Paper 93,467,840 69,131,712 24,336,128 136,537,840Sewer Mains, Interceptors and Lift Stations
14,735,000 28,335,000Mains, Pump Stations and Associated
Facilities
00
Economic Vibrancy
Citywide VariousRevenue Bonds 85,236,846 84,576,809 660,036 85,236,846Sewer Mains, Interceptors and Lift Stations
0 0Mains, Pump Stations and Associated
Facilities
00
E³ Government Citywide VariousComm'l Paper 128,329,568 118,394,357 9,935,211 161,329,568Southside Wastewater Treatment Plant
0 12,500,000Wastewater Treatment Plants and Associated
Facilities
20,500,0000
E³ Government Citywide VariousComm'l Paper 64,303,673 55,443,334 8,860,339 120,803,673Southside Wastewater Treatment Plant
0 34,500,000Wastewater Treatment Plants and Associated
Facilities
11,000,00011,000,000
E³ Government Citywide VariousCapital Construction
103,226,321 101,767,606 1,458,715 104,226,321Southside Wastewater Treatment Plant
0 0Wastewater Treatment Plants and Associated
Facilities
1,000,0000
E³ Government Citywide VariousComm'l Paper 26,857,475 20,623,201 6,234,274 45,857,475Southside Wastewater Treatment Plant
19,000,000 0Wastewater Treatment Plants and Associated
Facilities
00
E³ Government Citywide VariousRevenue Bonds 56,643,189 56,495,884 147,305 56,643,189Southside Wastewater Treatment Plant
0 0Wastewater Treatment Plants and Associated
Facilities
00
E³ Government Citywide VariousComm'l Paper 600,000 0 600,000 600,000Studies and Master Plans 0 0Studies and Master Plans
00
518
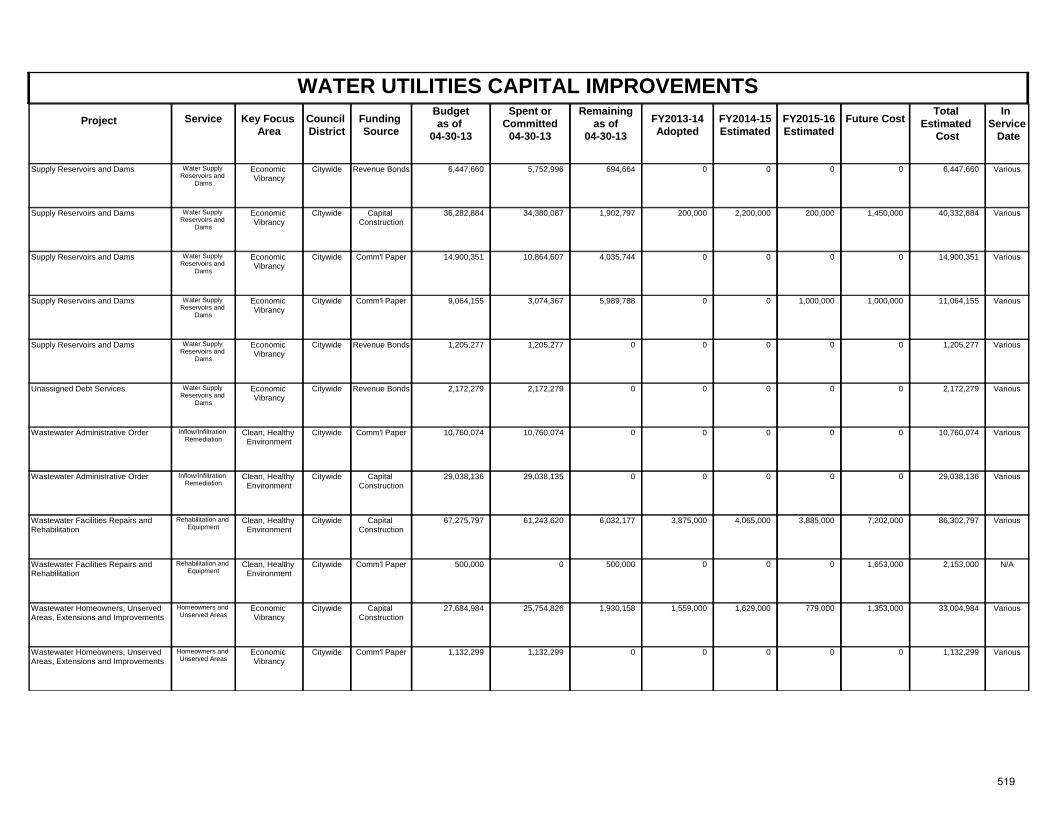
WATER UTILITIES CAPITAL IMPROVEMENTSProject Key Focus
AreaCouncil District
Spent orCommitted
04-30-13
Total Estimated
Cost
In Service Date
Funding Source
Remainingas of
04-30-13 FY2013-14
AdoptedFuture CostService FY2014-15
Estimated FY2015-16 Estimated
Budgetas of
04-30-13
Economic Vibrancy
Citywide VariousRevenue Bonds 6,447,660 5,752,996 694,664 6,447,660Supply Reservoirs and Dams 0 0Water Supply Reservoirs and
Dams
00
Economic Vibrancy
Citywide VariousCapital Construction
36,282,884 34,380,087 1,902,797 40,332,884Supply Reservoirs and Dams 200,000 1,450,000Water Supply Reservoirs and
Dams
200,0002,200,000
Economic Vibrancy
Citywide VariousComm'l Paper 14,900,351 10,864,607 4,035,744 14,900,351Supply Reservoirs and Dams 0 0Water Supply Reservoirs and
Dams
00
Economic Vibrancy
Citywide VariousComm'l Paper 9,064,155 3,074,367 5,989,788 11,064,155Supply Reservoirs and Dams 0 1,000,000Water Supply Reservoirs and
Dams
1,000,0000
Economic Vibrancy
Citywide VariousRevenue Bonds 1,205,277 1,205,277 0 1,205,277Supply Reservoirs and Dams 0 0Water Supply Reservoirs and
Dams
00
Economic Vibrancy
Citywide VariousRevenue Bonds 2,172,279 2,172,279 0 2,172,279Unassigned Debt Services 0 0Water Supply Reservoirs and
Dams
00
Clean, Healthy Environment
Citywide VariousComm'l Paper 10,760,074 10,760,074 0 10,760,074Wastewater Administrative Order 0 0Inflow/Infiltration Remediation
00
Clean, Healthy Environment
Citywide VariousCapital Construction
29,038,136 29,038,135 0 29,038,136Wastewater Administrative Order 0 0Inflow/Infiltration Remediation
00
Clean, Healthy Environment
Citywide VariousCapital Construction
67,275,797 61,243,620 6,032,177 86,302,797Wastewater Facilities Repairs and Rehabilitation
3,875,000 7,202,000Rehabilitation and Equipment
3,885,0004,065,000
Clean, Healthy Environment
Citywide N/AComm'l Paper 500,000 0 500,000 2,153,000Wastewater Facilities Repairs and Rehabilitation
0 1,653,000Rehabilitation and Equipment
00
Economic Vibrancy
Citywide VariousCapital Construction
27,684,984 25,754,826 1,930,158 33,004,984Wastewater Homeowners, Unserved Areas, Extensions and Improvements
1,559,000 1,353,000Homeowners and Unserved Areas
779,0001,629,000
Economic Vibrancy
Citywide VariousComm'l Paper 1,132,299 1,132,299 0 1,132,299Wastewater Homeowners, Unserved Areas, Extensions and Improvements
0 0Homeowners and Unserved Areas
00
519
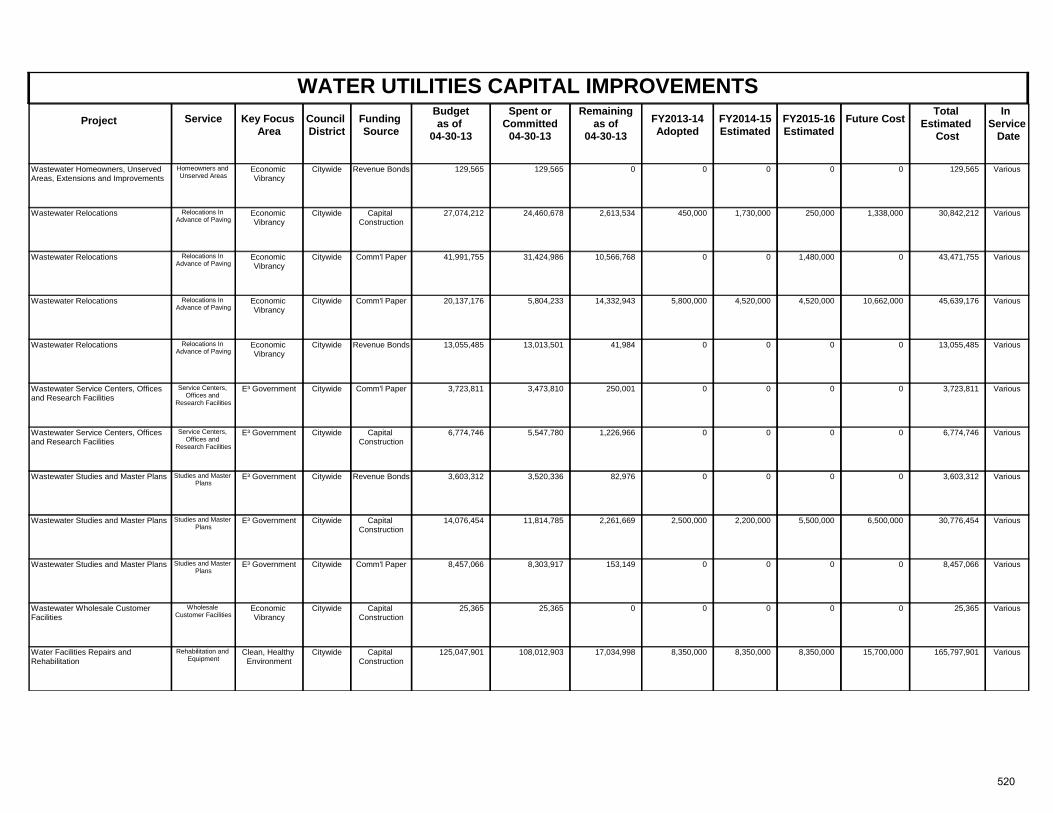
WATER UTILITIES CAPITAL IMPROVEMENTSProject Key Focus
AreaCouncil District
Spent orCommitted
04-30-13
Total Estimated
Cost
In Service Date
Funding Source
Remainingas of
04-30-13 FY2013-14
AdoptedFuture CostService FY2014-15
Estimated FY2015-16 Estimated
Budgetas of
04-30-13
Economic Vibrancy
Citywide VariousRevenue Bonds 129,565 129,565 0 129,565Wastewater Homeowners, Unserved Areas, Extensions and Improvements
0 0Homeowners and Unserved Areas
00
Economic Vibrancy
Citywide VariousCapital Construction
27,074,212 24,460,678 2,613,534 30,842,212Wastewater Relocations 450,000 1,338,000Relocations In Advance of Paving
250,0001,730,000
Economic Vibrancy
Citywide VariousComm'l Paper 41,991,755 31,424,986 10,566,768 43,471,755Wastewater Relocations 0 0Relocations In Advance of Paving
1,480,0000
Economic Vibrancy
Citywide VariousComm'l Paper 20,137,176 5,804,233 14,332,943 45,639,176Wastewater Relocations 5,800,000 10,662,000Relocations In Advance of Paving
4,520,0004,520,000
Economic Vibrancy
Citywide VariousRevenue Bonds 13,055,485 13,013,501 41,984 13,055,485Wastewater Relocations 0 0Relocations In Advance of Paving
00
E³ Government Citywide VariousComm'l Paper 3,723,811 3,473,810 250,001 3,723,811Wastewater Service Centers, Offices and Research Facilities
0 0Service Centers, Offices and
Research Facilities
00
E³ Government Citywide VariousCapital Construction
6,774,746 5,547,780 1,226,966 6,774,746Wastewater Service Centers, Offices and Research Facilities
0 0Service Centers, Offices and
Research Facilities
00
E³ Government Citywide VariousRevenue Bonds 3,603,312 3,520,336 82,976 3,603,312Wastewater Studies and Master Plans 0 0Studies and Master Plans
00
E³ Government Citywide VariousCapital Construction
14,076,454 11,814,785 2,261,669 30,776,454Wastewater Studies and Master Plans 2,500,000 6,500,000Studies and Master Plans
5,500,0002,200,000
E³ Government Citywide VariousComm'l Paper 8,457,066 8,303,917 153,149 8,457,066Wastewater Studies and Master Plans 0 0Studies and Master Plans
00
Economic Vibrancy
Citywide VariousCapital Construction
25,365 25,365 0 25,365Wastewater Wholesale Customer Facilities
0 0Wholesale Customer Facilities
00
Clean, Healthy Environment
Citywide VariousCapital Construction
125,047,901 108,012,903 17,034,998 165,797,901Water Facilities Repairs and Rehabilitation
8,350,000 15,700,000Rehabilitation and Equipment
8,350,0008,350,000
520
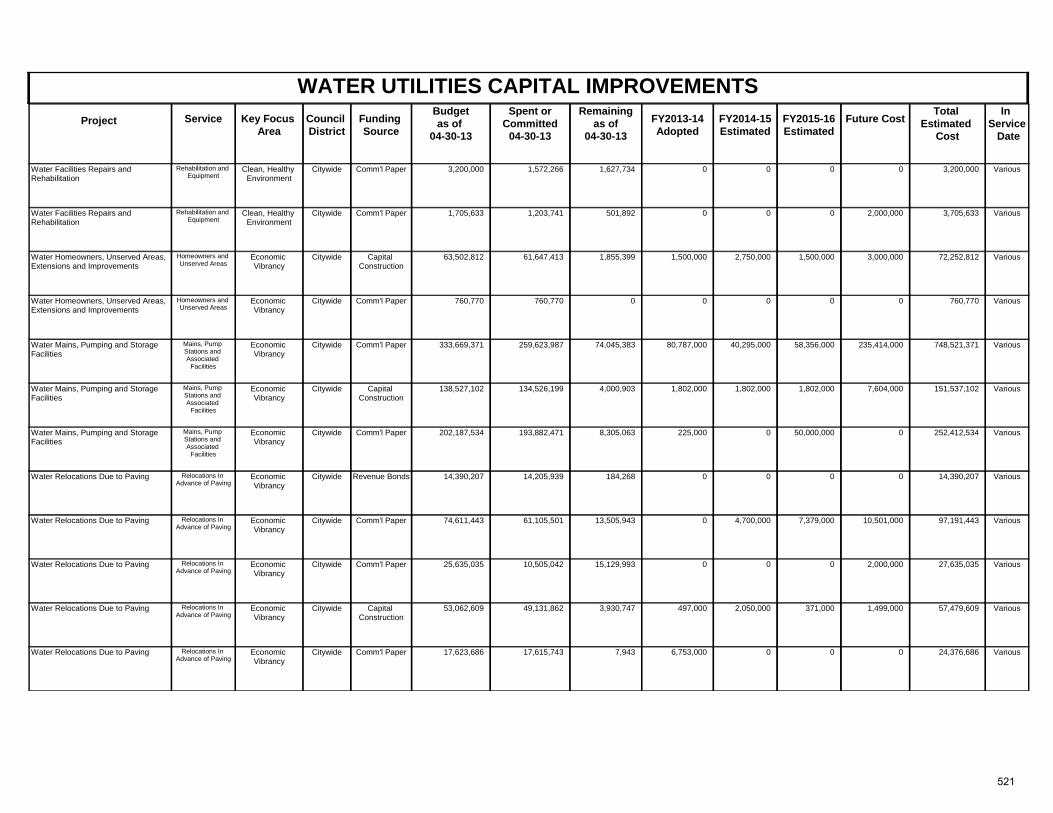
WATER UTILITIES CAPITAL IMPROVEMENTSProject Key Focus
AreaCouncil District
Spent orCommitted
04-30-13
Total Estimated
Cost
In Service Date
Funding Source
Remainingas of
04-30-13 FY2013-14
AdoptedFuture CostService FY2014-15
Estimated FY2015-16 Estimated
Budgetas of
04-30-13
Clean, Healthy Environment
Citywide VariousComm'l Paper 3,200,000 1,572,266 1,627,734 3,200,000Water Facilities Repairs and Rehabilitation
0 0Rehabilitation and Equipment
00
Clean, Healthy Environment
Citywide VariousComm'l Paper 1,705,633 1,203,741 501,892 3,705,633Water Facilities Repairs and Rehabilitation
0 2,000,000Rehabilitation and Equipment
00
Economic Vibrancy
Citywide VariousCapital Construction
63,502,812 61,647,413 1,855,399 72,252,812Water Homeowners, Unserved Areas, Extensions and Improvements
1,500,000 3,000,000Homeowners and Unserved Areas
1,500,0002,750,000
Economic Vibrancy
Citywide VariousComm'l Paper 760,770 760,770 0 760,770Water Homeowners, Unserved Areas, Extensions and Improvements
0 0Homeowners and Unserved Areas
00
Economic Vibrancy
Citywide VariousComm'l Paper 333,669,371 259,623,987 74,045,383 748,521,371Water Mains, Pumping and Storage Facilities
80,787,000 235,414,000Mains, Pump Stations and Associated
Facilities
58,356,00040,295,000
Economic Vibrancy
Citywide VariousCapital Construction
138,527,102 134,526,199 4,000,903 151,537,102Water Mains, Pumping and Storage Facilities
1,802,000 7,604,000Mains, Pump Stations and Associated
Facilities
1,802,0001,802,000
Economic Vibrancy
Citywide VariousComm'l Paper 202,187,534 193,882,471 8,305,063 252,412,534Water Mains, Pumping and Storage Facilities
225,000 0Mains, Pump Stations and Associated
Facilities
50,000,0000
Economic Vibrancy
Citywide VariousRevenue Bonds 14,390,207 14,205,939 184,268 14,390,207Water Relocations Due to Paving 0 0Relocations In Advance of Paving
00
Economic Vibrancy
Citywide VariousComm'l Paper 74,611,443 61,105,501 13,505,943 97,191,443Water Relocations Due to Paving 0 10,501,000Relocations In Advance of Paving
7,379,0004,700,000
Economic Vibrancy
Citywide VariousComm'l Paper 25,635,035 10,505,042 15,129,993 27,635,035Water Relocations Due to Paving 0 2,000,000Relocations In Advance of Paving
00
Economic Vibrancy
Citywide VariousCapital Construction
53,062,609 49,131,862 3,930,747 57,479,609Water Relocations Due to Paving 497,000 1,499,000Relocations In Advance of Paving
371,0002,050,000
Economic Vibrancy
Citywide VariousComm'l Paper 17,623,686 17,615,743 7,943 24,376,686Water Relocations Due to Paving 6,753,000 0Relocations In Advance of Paving
00
521
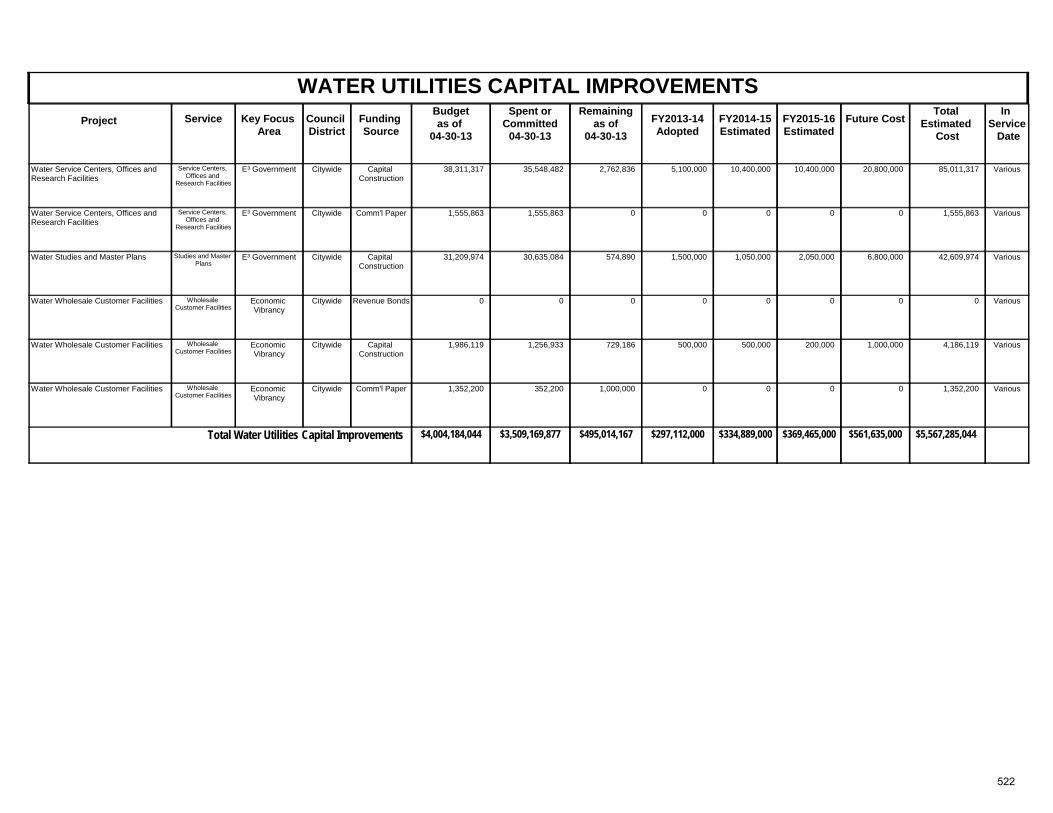
WATER UTILITIES CAPITAL IMPROVEMENTSProject Key Focus
AreaCouncil District
Spent orCommitted
04-30-13
Total Estimated
Cost
In Service Date
Funding Source
Remainingas of
04-30-13 FY2013-14
AdoptedFuture CostService FY2014-15
Estimated FY2015-16 Estimated
Budgetas of
04-30-13
E³ Government Citywide VariousCapital Construction
38,311,317 35,548,482 2,762,836 85,011,317Water Service Centers, Offices and Research Facilities
5,100,000 20,800,000Service Centers, Offices and
Research Facilities
10,400,00010,400,000
E³ Government Citywide VariousComm'l Paper 1,555,863 1,555,863 0 1,555,863Water Service Centers, Offices and Research Facilities
0 0Service Centers, Offices and
Research Facilities
00
E³ Government Citywide VariousCapital Construction
31,209,974 30,635,084 574,890 42,609,974Water Studies and Master Plans 1,500,000 6,800,000Studies and Master Plans
2,050,0001,050,000
Economic Vibrancy
Citywide VariousRevenue Bonds 0 0 0 0Water Wholesale Customer Facilities 0 0Wholesale Customer Facilities
00
Economic Vibrancy
Citywide VariousCapital Construction
1,986,119 1,256,933 729,186 4,186,119Water Wholesale Customer Facilities 500,000 1,000,000Wholesale Customer Facilities
200,000500,000
Economic Vibrancy
Citywide VariousComm'l Paper 1,352,200 352,200 1,000,000 1,352,200Water Wholesale Customer Facilities 0 0Wholesale Customer Facilities
00
$4,004,184,044 $495,014,167Total Water Utilities Capital Improvements $3,509,169,877 $5,567,285,044$297,112,000 $561,635,000$369,465,000$334,889,000
522
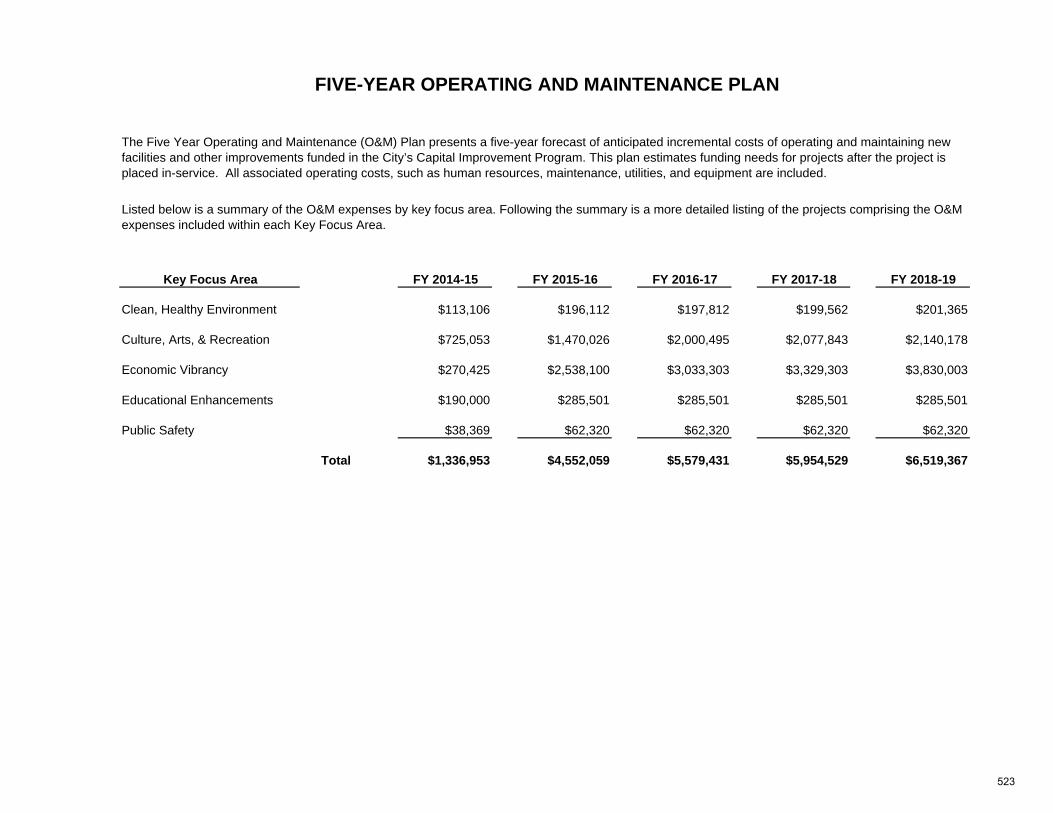
Key Focus Area FY 2014-15 FY 2015-16 FY 2016-17 FY 2017-18 FY 2018-19
Clean, Healthy Environment $113,106 $196,112 $197,812 $199,562 $201,365
Culture, Arts, & Recreation $725,053 $1,470,026 $2,000,495 $2,077,843 $2,140,178
Economic Vibrancy $270,425 $2,538,100 $3,033,303 $3,329,303 $3,830,003
Educational Enhancements $190,000 $285,501 $285,501 $285,501 $285,501
Public Safety $38,369 $62,320 $62,320 $62,320 $62,320
Total $1,336,953 $4,552,059 $5,579,431 $5,954,529 $6,519,367
The Five Year Operating and Maintenance (O&M) Plan presents a five-year forecast of anticipated incremental costs of operating and maintaining new facilities and other improvements funded in the City’s Capital Improvement Program. This plan estimates funding needs for projects after the project is placed in-service. All associated operating costs, such as human resources, maintenance, utilities, and equipment are included.
Listed below is a summary of the O&M expenses by key focus area. Following the summary is a more detailed listing of the projects comprising the O&M expenses included within each Key Focus Area.
FIVE-YEAR OPERATING AND MAINTENANCE PLAN
523
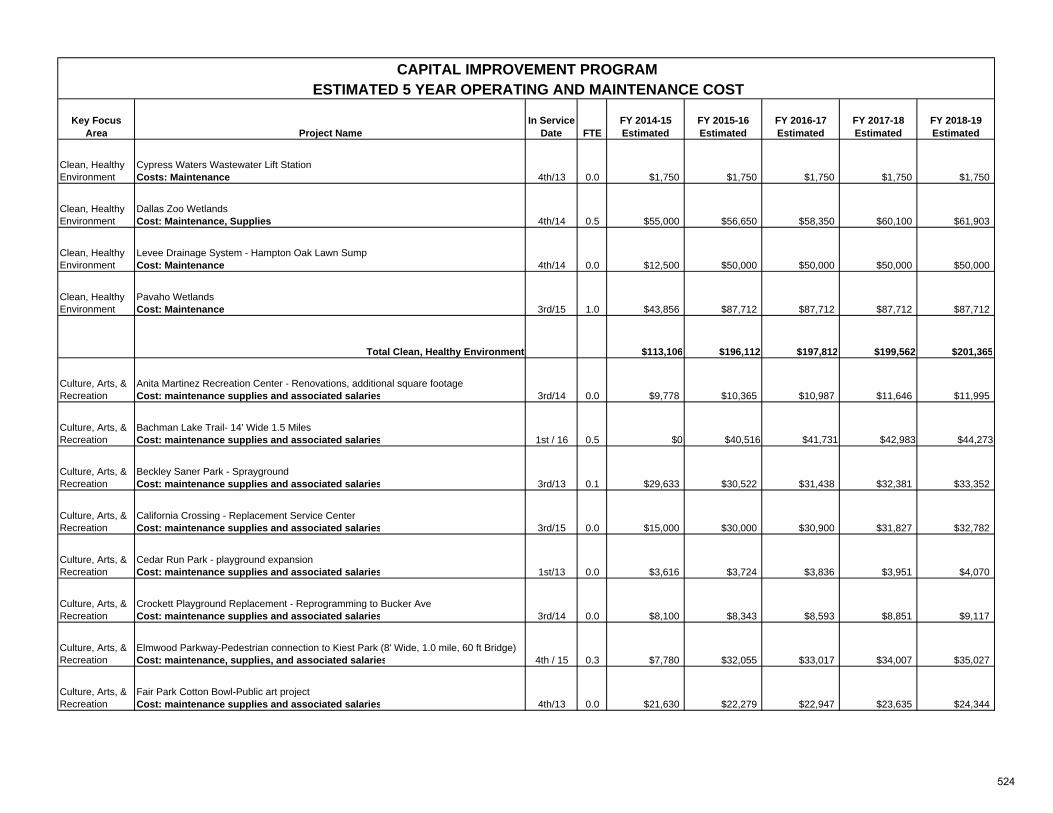
Key Focus Area Project Name
In Service Date FTE
FY 2014-15 Estimated
FY 2015-16 Estimated
FY 2016-17 Estimated
FY 2017-18 Estimated
FY 2018-19 Estimated
Clean, Healthy Environment
Cypress Waters Wastewater Lift StationCosts: Maintenance 4th/13 0.0 $1,750 $1,750 $1,750 $1,750 $1,750
Clean, Healthy Environment
Dallas Zoo WetlandsCost: Maintenance, Supplies 4th/14 0.5 $55,000 $56,650 $58,350 $60,100 $61,903
Clean, Healthy Environment
Levee Drainage System - Hampton Oak Lawn SumpCost: Maintenance 4th/14 0.0 $12,500 $50,000 $50,000 $50,000 $50,000
Clean, Healthy Environment
Pavaho WetlandsCost: Maintenance 3rd/15 1.0 $43,856 $87,712 $87,712 $87,712 $87,712
Total Clean, Healthy Environment $113,106 $196,112 $197,812 $199,562 $201,365
Culture, Arts, & Recreation
Anita Martinez Recreation Center - Renovations, additional square footage Cost: maintenance supplies and associated salaries 3rd/14 0.0 $9,778 $10,365 $10,987 $11,646 $11,995
Culture, Arts, & Recreation
Bachman Lake Trail- 14' Wide 1.5 MilesCost: maintenance supplies and associated salaries 1st / 16 0.5 $0 $40,516 $41,731 $42,983 $44,273
Culture, Arts, & Recreation
Beckley Saner Park - Sprayground Cost: maintenance supplies and associated salaries 3rd/13 0.1 $29,633 $30,522 $31,438 $32,381 $33,352
Culture, Arts, & Recreation
California Crossing - Replacement Service Center Cost: maintenance supplies and associated salaries 3rd/15 0.0 $15,000 $30,000 $30,900 $31,827 $32,782
Culture, Arts, & Recreation
Cedar Run Park - playground expansionCost: maintenance supplies and associated salaries 1st/13 0.0 $3,616 $3,724 $3,836 $3,951 $4,070
Culture, Arts, & Recreation
Crockett Playground Replacement - Reprogramming to Bucker Ave Cost: maintenance supplies and associated salaries 3rd/14 0.0 $8,100 $8,343 $8,593 $8,851 $9,117
Culture, Arts, & Recreation
Elmwood Parkway-Pedestrian connection to Kiest Park (8' Wide, 1.0 mile, 60 ft Bridge)Cost: maintenance, supplies, and associated salaries 4th / 15 0.3 $7,780 $32,055 $33,017 $34,007 $35,027
Culture, Arts, & Recreation
Fair Park Cotton Bowl-Public art project Cost: maintenance supplies and associated salaries 4th/13 0.0 $21,630 $22,279 $22,947 $23,635 $24,344
CAPITAL IMPROVEMENT PROGRAM ESTIMATED 5 YEAR OPERATING AND MAINTENANCE COST
524
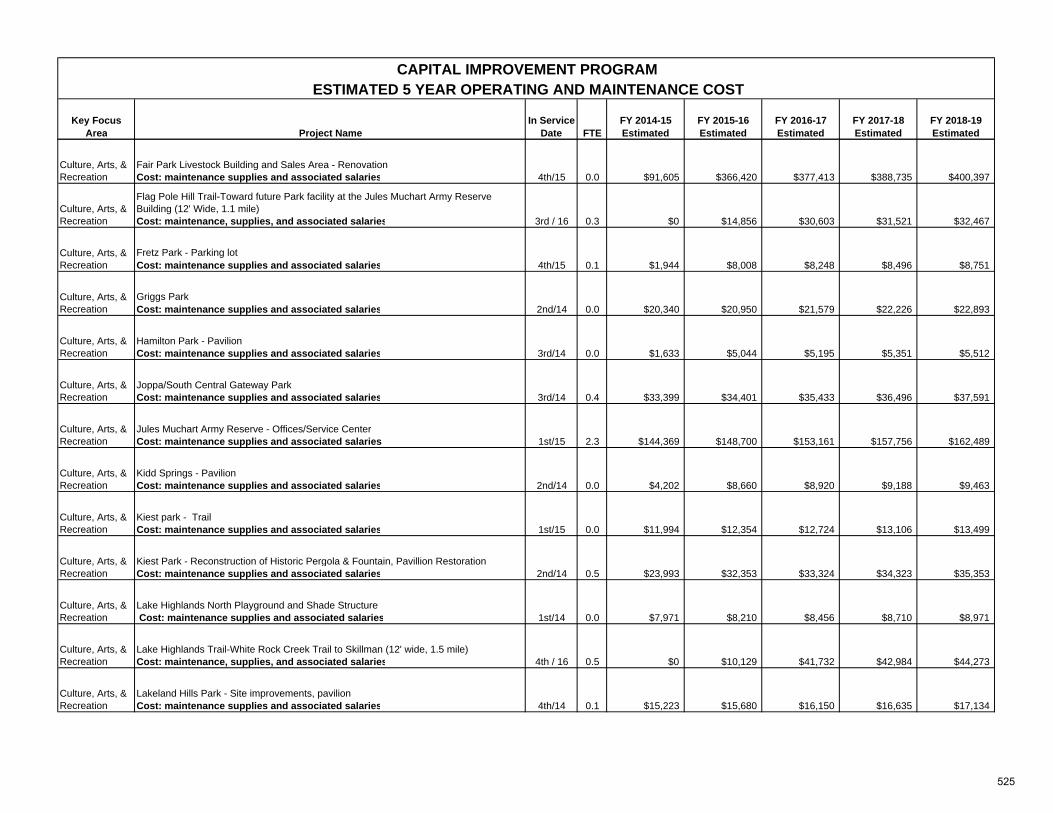
Key Focus Area Project Name
In Service Date FTE
FY 2014-15 Estimated
FY 2015-16 Estimated
FY 2016-17 Estimated
FY 2017-18 Estimated
FY 2018-19 Estimated
CAPITAL IMPROVEMENT PROGRAM ESTIMATED 5 YEAR OPERATING AND MAINTENANCE COST
Culture, Arts, & Recreation
Fair Park Livestock Building and Sales Area - Renovation Cost: maintenance supplies and associated salaries 4th/15 0.0 $91,605 $366,420 $377,413 $388,735 $400,397
Culture, Arts, & Recreation
Flag Pole Hill Trail-Toward future Park facility at the Jules Muchart Army Reserve Building (12' Wide, 1.1 mile)Cost: maintenance, supplies, and associated salaries 3rd / 16 0.3 $0 $14,856 $30,603 $31,521 $32,467
Culture, Arts, & Recreation
Fretz Park - Parking lot Cost: maintenance supplies and associated salaries 4th/15 0.1 $1,944 $8,008 $8,248 $8,496 $8,751
Culture, Arts, & Recreation
Griggs Park Cost: maintenance supplies and associated salaries 2nd/14 0.0 $20,340 $20,950 $21,579 $22,226 $22,893
Culture, Arts, & Recreation
Hamilton Park - Pavilion Cost: maintenance supplies and associated salaries 3rd/14 0.0 $1,633 $5,044 $5,195 $5,351 $5,512
Culture, Arts, & Recreation
Joppa/South Central Gateway Park Cost: maintenance supplies and associated salaries 3rd/14 0.4 $33,399 $34,401 $35,433 $36,496 $37,591
Culture, Arts, & Recreation
Jules Muchart Army Reserve - Offices/Service Center Cost: maintenance supplies and associated salaries 1st/15 2.3 $144,369 $148,700 $153,161 $157,756 $162,489
Culture, Arts, & Recreation
Kidd Springs - Pavilion Cost: maintenance supplies and associated salaries 2nd/14 0.0 $4,202 $8,660 $8,920 $9,188 $9,463
Culture, Arts, & Recreation
Kiest park - TrailCost: maintenance supplies and associated salaries 1st/15 0.0 $11,994 $12,354 $12,724 $13,106 $13,499
Culture, Arts, & Recreation
Kiest Park - Reconstruction of Historic Pergola & Fountain, Pavillion Restoration Cost: maintenance supplies and associated salaries 2nd/14 0.5 $23,993 $32,353 $33,324 $34,323 $35,353
Culture, Arts, & Recreation
Lake Highlands North Playground and Shade Structure Cost: maintenance supplies and associated salaries 1st/14 0.0 $7,971 $8,210 $8,456 $8,710 $8,971
Culture, Arts, & Recreation
Lake Highlands Trail-White Rock Creek Trail to Skillman (12' wide, 1.5 mile)Cost: maintenance, supplies, and associated salaries 4th / 16 0.5 $0 $10,129 $41,732 $42,984 $44,273
Culture, Arts, & Recreation
Lakeland Hills Park - Site improvements, pavilion Cost: maintenance supplies and associated salaries 4th/14 0.1 $15,223 $15,680 $16,150 $16,635 $17,134
525
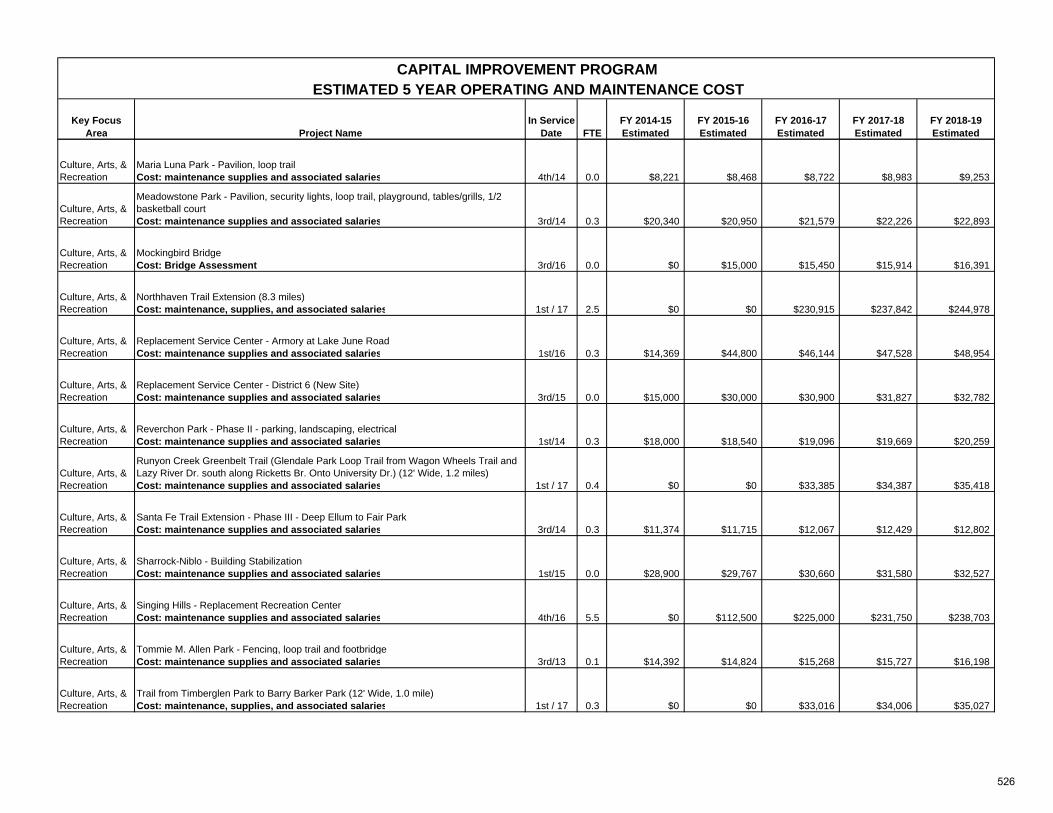
Key Focus Area Project Name
In Service Date FTE
FY 2014-15 Estimated
FY 2015-16 Estimated
FY 2016-17 Estimated
FY 2017-18 Estimated
FY 2018-19 Estimated
CAPITAL IMPROVEMENT PROGRAM ESTIMATED 5 YEAR OPERATING AND MAINTENANCE COST
Culture, Arts, & Recreation
Maria Luna Park - Pavilion, loop trail Cost: maintenance supplies and associated salaries 4th/14 0.0 $8,221 $8,468 $8,722 $8,983 $9,253
Culture, Arts, & Recreation
Meadowstone Park - Pavilion, security lights, loop trail, playground, tables/grills, 1/2 basketball court Cost: maintenance supplies and associated salaries 3rd/14 0.3 $20,340 $20,950 $21,579 $22,226 $22,893
Culture, Arts, & Recreation
Mockingbird BridgeCost: Bridge Assessment 3rd/16 0.0 $0 $15,000 $15,450 $15,914 $16,391
Culture, Arts, & Recreation
Northhaven Trail Extension (8.3 miles)Cost: maintenance, supplies, and associated salaries 1st / 17 2.5 $0 $0 $230,915 $237,842 $244,978
Culture, Arts, & Recreation
Replacement Service Center - Armory at Lake June Road Cost: maintenance supplies and associated salaries 1st/16 0.3 $14,369 $44,800 $46,144 $47,528 $48,954
Culture, Arts, & Recreation
Replacement Service Center - District 6 (New Site) Cost: maintenance supplies and associated salaries 3rd/15 0.0 $15,000 $30,000 $30,900 $31,827 $32,782
Culture, Arts, & Recreation
Reverchon Park - Phase II - parking, landscaping, electrical Cost: maintenance supplies and associated salaries 1st/14 0.3 $18,000 $18,540 $19,096 $19,669 $20,259
Culture, Arts, & Recreation
Runyon Creek Greenbelt Trail (Glendale Park Loop Trail from Wagon Wheels Trail and Lazy River Dr. south along Ricketts Br. Onto University Dr.) (12' Wide, 1.2 miles)Cost: maintenance supplies and associated salaries 1st / 17 0.4 $0 $0 $33,385 $34,387 $35,418
Culture, Arts, & Recreation
Santa Fe Trail Extension - Phase III - Deep Ellum to Fair Park Cost: maintenance supplies and associated salaries 3rd/14 0.3 $11,374 $11,715 $12,067 $12,429 $12,802
Culture, Arts, & Recreation
Sharrock-Niblo - Building Stabilization Cost: maintenance supplies and associated salaries 1st/15 0.0 $28,900 $29,767 $30,660 $31,580 $32,527
Culture, Arts, & Recreation
Singing Hills - Replacement Recreation Center Cost: maintenance supplies and associated salaries 4th/16 5.5 $0 $112,500 $225,000 $231,750 $238,703
Culture, Arts, & Recreation
Tommie M. Allen Park - Fencing, loop trail and footbridge Cost: maintenance supplies and associated salaries 3rd/13 0.1 $14,392 $14,824 $15,268 $15,727 $16,198
Culture, Arts, & Recreation
Trail from Timberglen Park to Barry Barker Park (12' Wide, 1.0 mile)Cost: maintenance, supplies, and associated salaries 1st / 17 0.3 $0 $0 $33,016 $34,006 $35,027
526
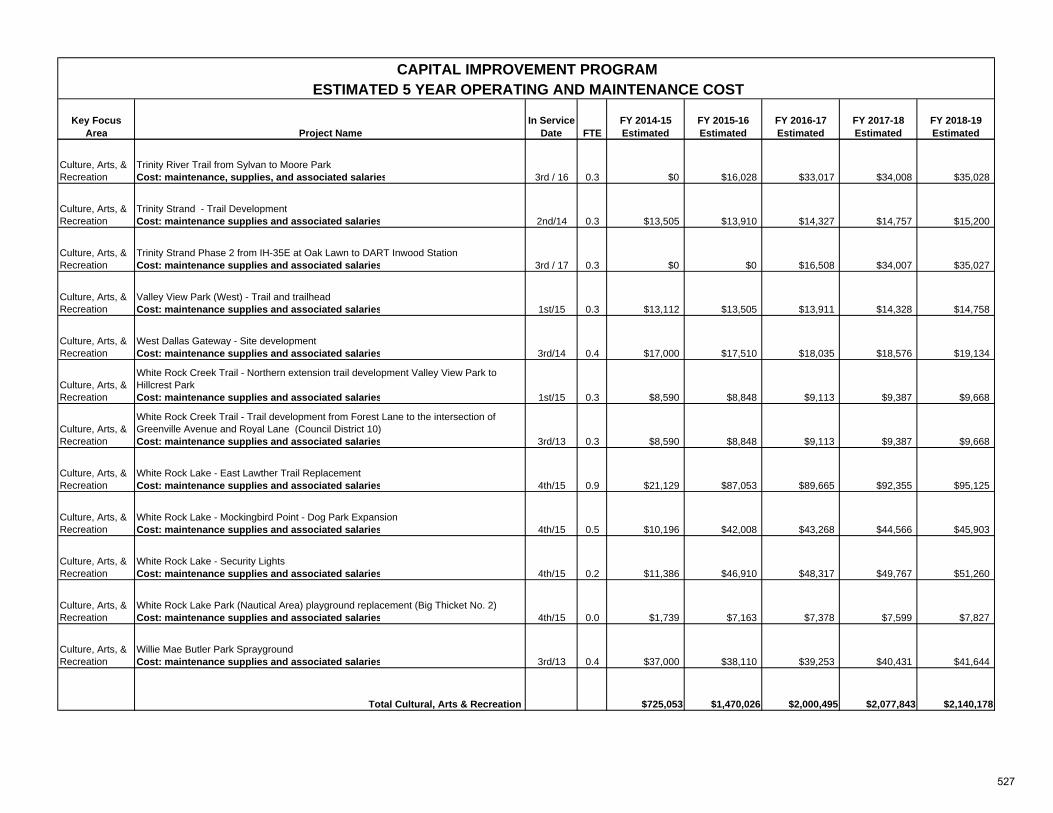
Key Focus Area Project Name
In Service Date FTE
FY 2014-15 Estimated
FY 2015-16 Estimated
FY 2016-17 Estimated
FY 2017-18 Estimated
FY 2018-19 Estimated
CAPITAL IMPROVEMENT PROGRAM ESTIMATED 5 YEAR OPERATING AND MAINTENANCE COST
Culture, Arts, & Recreation
Trinity River Trail from Sylvan to Moore ParkCost: maintenance, supplies, and associated salaries 3rd / 16 0.3 $0 $16,028 $33,017 $34,008 $35,028
Culture, Arts, & Recreation
Trinity Strand - Trail Development Cost: maintenance supplies and associated salaries 2nd/14 0.3 $13,505 $13,910 $14,327 $14,757 $15,200
Culture, Arts, & Recreation
Trinity Strand Phase 2 from IH-35E at Oak Lawn to DART Inwood StationCost: maintenance supplies and associated salaries 3rd / 17 0.3 $0 $0 $16,508 $34,007 $35,027
Culture, Arts, & Recreation
Valley View Park (West) - Trail and trailhead Cost: maintenance supplies and associated salaries 1st/15 0.3 $13,112 $13,505 $13,911 $14,328 $14,758
Culture, Arts, & Recreation
West Dallas Gateway - Site development Cost: maintenance supplies and associated salaries 3rd/14 0.4 $17,000 $17,510 $18,035 $18,576 $19,134
Culture, Arts, & Recreation
White Rock Creek Trail - Northern extension trail development Valley View Park to Hillcrest Park Cost: maintenance supplies and associated salaries 1st/15 0.3 $8,590 $8,848 $9,113 $9,387 $9,668
Culture, Arts, & Recreation
White Rock Creek Trail - Trail development from Forest Lane to the intersection of Greenville Avenue and Royal Lane (Council District 10) Cost: maintenance supplies and associated salaries 3rd/13 0.3 $8,590 $8,848 $9,113 $9,387 $9,668
Culture, Arts, & Recreation
White Rock Lake - East Lawther Trail ReplacementCost: maintenance supplies and associated salaries 4th/15 0.9 $21,129 $87,053 $89,665 $92,355 $95,125
Culture, Arts, & Recreation
White Rock Lake - Mockingbird Point - Dog Park ExpansionCost: maintenance supplies and associated salaries 4th/15 0.5 $10,196 $42,008 $43,268 $44,566 $45,903
Culture, Arts, & Recreation
White Rock Lake - Security LightsCost: maintenance supplies and associated salaries 4th/15 0.2 $11,386 $46,910 $48,317 $49,767 $51,260
Culture, Arts, & Recreation
White Rock Lake Park (Nautical Area) playground replacement (Big Thicket No. 2)Cost: maintenance supplies and associated salaries 4th/15 0.0 $1,739 $7,163 $7,378 $7,599 $7,827
Culture, Arts, & Recreation
Willie Mae Butler Park Sprayground Cost: maintenance supplies and associated salaries 3rd/13 0.4 $37,000 $38,110 $39,253 $40,431 $41,644
Total Cultural, Arts & Recreation $725,053 $1,470,026 $2,000,495 $2,077,843 $2,140,178
527
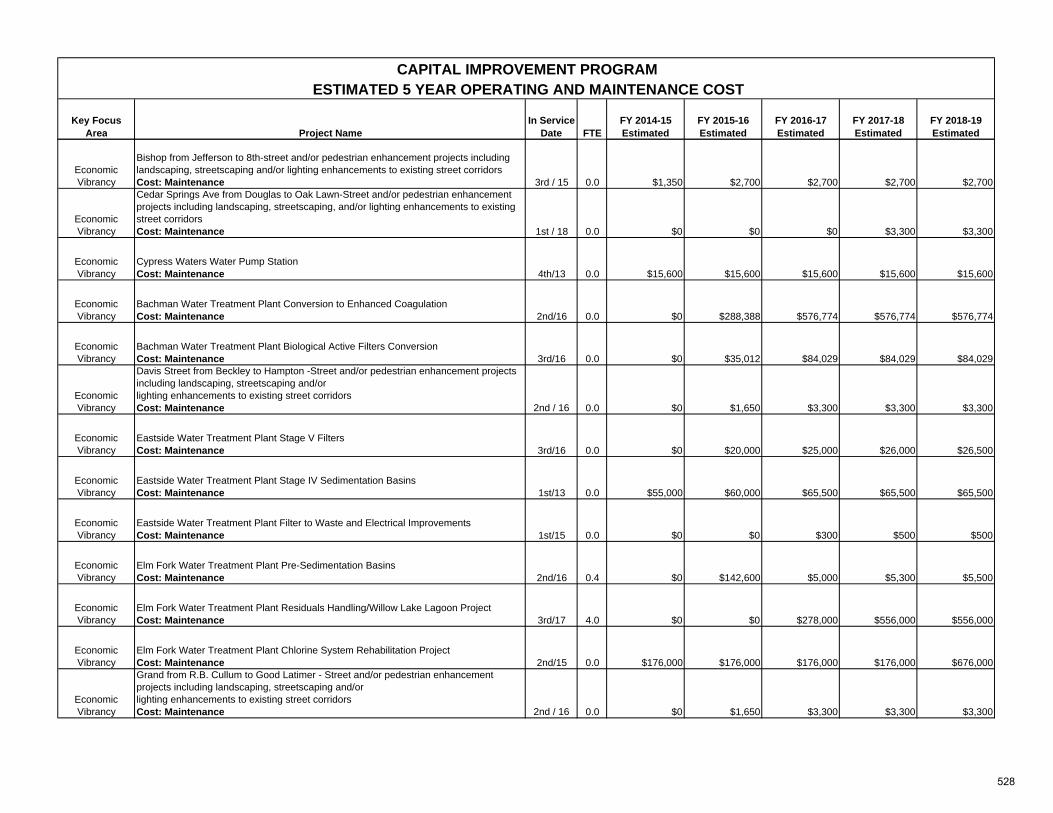
Key Focus Area Project Name
In Service Date FTE
FY 2014-15 Estimated
FY 2015-16 Estimated
FY 2016-17 Estimated
FY 2017-18 Estimated
FY 2018-19 Estimated
CAPITAL IMPROVEMENT PROGRAM ESTIMATED 5 YEAR OPERATING AND MAINTENANCE COST
Economic Vibrancy
Bishop from Jefferson to 8th-street and/or pedestrian enhancement projects including landscaping, streetscaping and/or lighting enhancements to existing street corridorsCost: Maintenance 3rd / 15 0.0 $1,350 $2,700 $2,700 $2,700 $2,700
Economic Vibrancy
Cedar Springs Ave from Douglas to Oak Lawn-Street and/or pedestrian enhancement projects including landscaping, streetscaping, and/or lighting enhancements to existing street corridorsCost: Maintenance 1st / 18 0.0 $0 $0 $0 $3,300 $3,300
Economic Vibrancy
Cypress Waters Water Pump StationCost: Maintenance 4th/13 0.0 $15,600 $15,600 $15,600 $15,600 $15,600
Economic Vibrancy
Bachman Water Treatment Plant Conversion to Enhanced CoagulationCost: Maintenance 2nd/16 0.0 $0 $288,388 $576,774 $576,774 $576,774
Economic Vibrancy
Bachman Water Treatment Plant Biological Active Filters ConversionCost: Maintenance 3rd/16 0.0 $0 $35,012 $84,029 $84,029 $84,029
Economic Vibrancy
Davis Street from Beckley to Hampton -Street and/or pedestrian enhancement projects including landscaping, streetscaping and/orlighting enhancements to existing street corridorsCost: Maintenance 2nd / 16 0.0 $0 $1,650 $3,300 $3,300 $3,300
Economic Vibrancy
Eastside Water Treatment Plant Stage V FiltersCost: Maintenance 3rd/16 0.0 $0 $20,000 $25,000 $26,000 $26,500
Economic Vibrancy
Eastside Water Treatment Plant Stage IV Sedimentation BasinsCost: Maintenance 1st/13 0.0 $55,000 $60,000 $65,500 $65,500 $65,500
Economic Vibrancy
Eastside Water Treatment Plant Filter to Waste and Electrical ImprovementsCost: Maintenance 1st/15 0.0 $0 $0 $300 $500 $500
Economic Vibrancy
Elm Fork Water Treatment Plant Pre-Sedimentation BasinsCost: Maintenance 2nd/16 0.4 $0 $142,600 $5,000 $5,300 $5,500
Economic Vibrancy
Elm Fork Water Treatment Plant Residuals Handling/Willow Lake Lagoon ProjectCost: Maintenance 3rd/17 4.0 $0 $0 $278,000 $556,000 $556,000
Economic Vibrancy
Elm Fork Water Treatment Plant Chlorine System Rehabilitation ProjectCost: Maintenance 2nd/15 0.0 $176,000 $176,000 $176,000 $176,000 $676,000
Economic Vibrancy
Grand from R.B. Cullum to Good Latimer - Street and/or pedestrian enhancement projects including landscaping, streetscaping and/orlighting enhancements to existing street corridorsCost: Maintenance 2nd / 16 0.0 $0 $1,650 $3,300 $3,300 $3,300
528
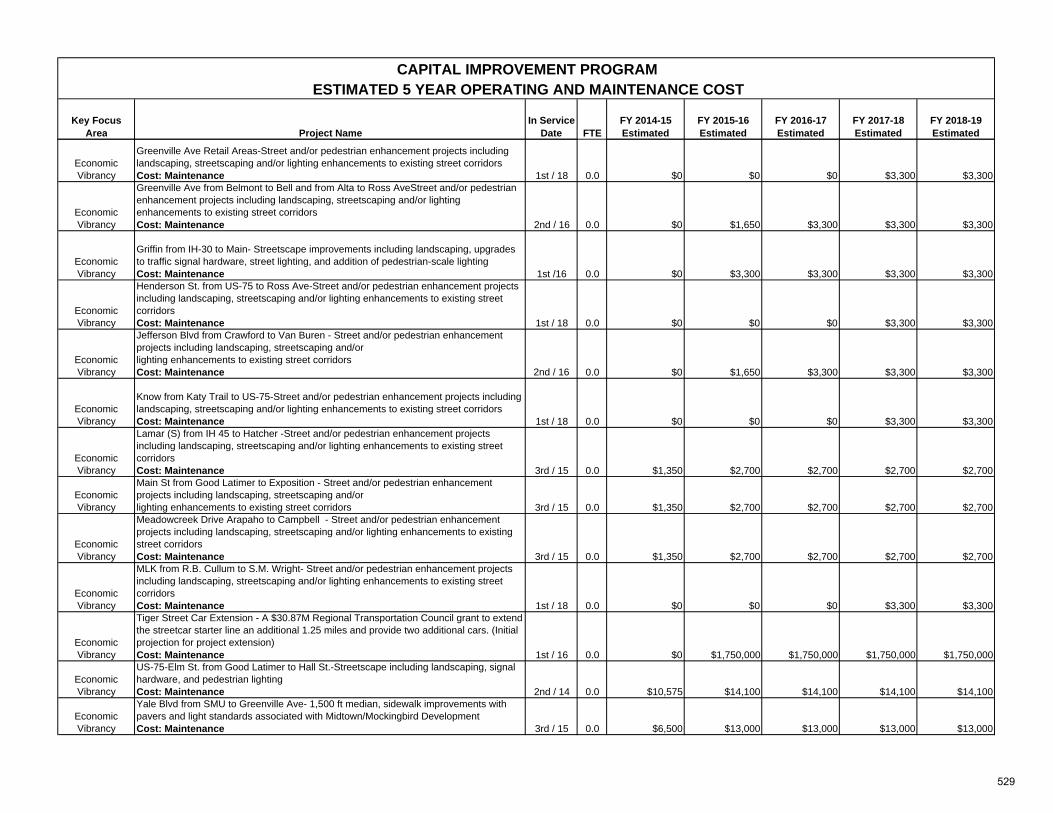
Key Focus Area Project Name
In Service Date FTE
FY 2014-15 Estimated
FY 2015-16 Estimated
FY 2016-17 Estimated
FY 2017-18 Estimated
FY 2018-19 Estimated
CAPITAL IMPROVEMENT PROGRAM ESTIMATED 5 YEAR OPERATING AND MAINTENANCE COST
Economic Vibrancy
Greenville Ave Retail Areas-Street and/or pedestrian enhancement projects including landscaping, streetscaping and/or lighting enhancements to existing street corridorsCost: Maintenance 1st / 18 0.0 $0 $0 $0 $3,300 $3,300
Economic Vibrancy
Greenville Ave from Belmont to Bell and from Alta to Ross AveStreet and/or pedestrian enhancement projects including landscaping, streetscaping and/or lighting enhancements to existing street corridorsCost: Maintenance 2nd / 16 0.0 $0 $1,650 $3,300 $3,300 $3,300
Economic Vibrancy
Griffin from IH-30 to Main- Streetscape improvements including landscaping, upgrades to traffic signal hardware, street lighting, and addition of pedestrian-scale lightingCost: Maintenance 1st /16 0.0 $0 $3,300 $3,300 $3,300 $3,300
Economic Vibrancy
Henderson St. from US-75 to Ross Ave-Street and/or pedestrian enhancement projects including landscaping, streetscaping and/or lighting enhancements to existing street corridorsCost: Maintenance 1st / 18 0.0 $0 $0 $0 $3,300 $3,300
Economic Vibrancy
Jefferson Blvd from Crawford to Van Buren - Street and/or pedestrian enhancement projects including landscaping, streetscaping and/orlighting enhancements to existing street corridorsCost: Maintenance 2nd / 16 0.0 $0 $1,650 $3,300 $3,300 $3,300
Economic Vibrancy
Know from Katy Trail to US-75-Street and/or pedestrian enhancement projects including landscaping, streetscaping and/or lighting enhancements to existing street corridorsCost: Maintenance 1st / 18 0.0 $0 $0 $0 $3,300 $3,300
Economic Vibrancy
Lamar (S) from IH 45 to Hatcher -Street and/or pedestrian enhancement projects including landscaping, streetscaping and/or lighting enhancements to existing street corridorsCost: Maintenance 3rd / 15 0.0 $1,350 $2,700 $2,700 $2,700 $2,700
Economic Vibrancy
Main St from Good Latimer to Exposition - Street and/or pedestrian enhancement projects including landscaping, streetscaping and/orlighting enhancements to existing street corridors 3rd / 15 0.0 $1,350 $2,700 $2,700 $2,700 $2,700
Economic Vibrancy
Meadowcreek Drive Arapaho to Campbell - Street and/or pedestrian enhancement projects including landscaping, streetscaping and/or lighting enhancements to existing street corridorsCost: Maintenance 3rd / 15 0.0 $1,350 $2,700 $2,700 $2,700 $2,700
Economic Vibrancy
MLK from R.B. Cullum to S.M. Wright- Street and/or pedestrian enhancement projects including landscaping, streetscaping and/or lighting enhancements to existing street corridorsCost: Maintenance 1st / 18 0.0 $0 $0 $0 $3,300 $3,300
Economic Vibrancy
Tiger Street Car Extension - A $30.87M Regional Transportation Council grant to extend the streetcar starter line an additional 1.25 miles and provide two additional cars. (Initial projection for project extension)Cost: Maintenance 1st / 16 0.0 $0 $1,750,000 $1,750,000 $1,750,000 $1,750,000
Economic Vibrancy
US-75-Elm St. from Good Latimer to Hall St.-Streetscape including landscaping, signal hardware, and pedestrian lightingCost: Maintenance 2nd / 14 0.0 $10,575 $14,100 $14,100 $14,100 $14,100
Economic Vibrancy
Yale Blvd from SMU to Greenville Ave- 1,500 ft median, sidewalk improvements with pavers and light standards associated with Midtown/Mockingbird DevelopmentCost: Maintenance 3rd / 15 0.0 $6,500 $13,000 $13,000 $13,000 $13,000
529
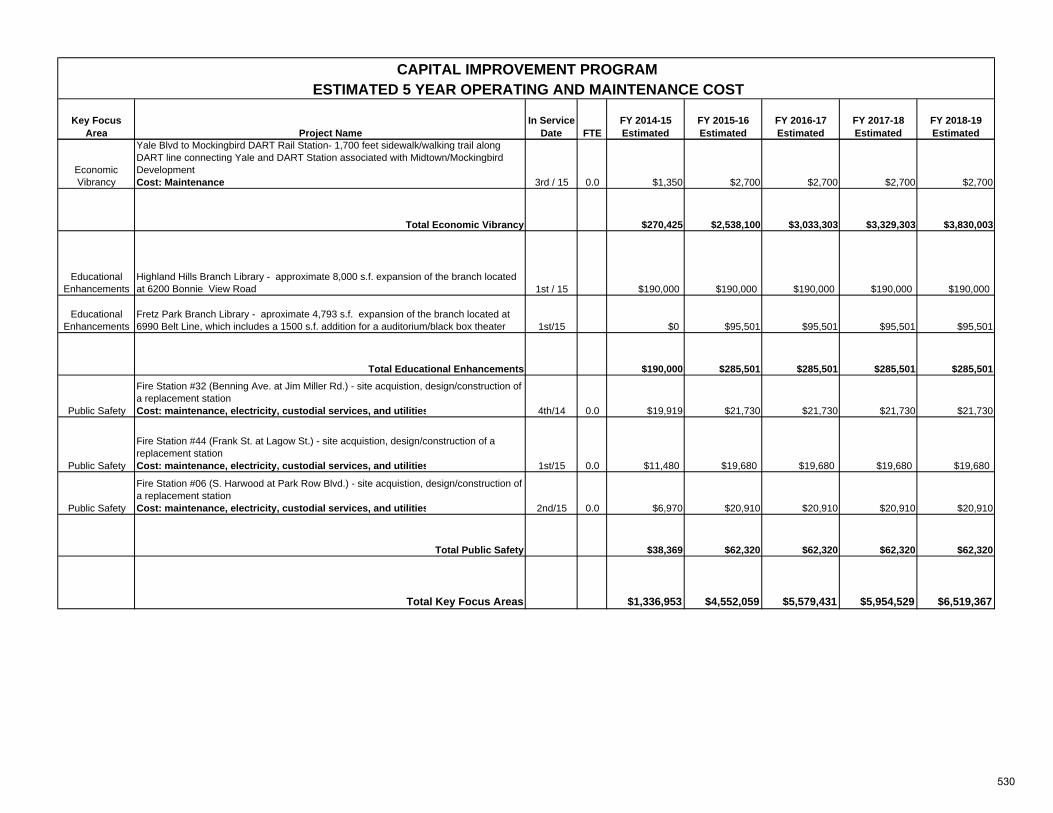
Key Focus Area Project Name
In Service Date FTE
FY 2014-15 Estimated
FY 2015-16 Estimated
FY 2016-17 Estimated
FY 2017-18 Estimated
FY 2018-19 Estimated
CAPITAL IMPROVEMENT PROGRAM ESTIMATED 5 YEAR OPERATING AND MAINTENANCE COST
Economic Vibrancy
Yale Blvd to Mockingbird DART Rail Station- 1,700 feet sidewalk/walking trail along DART line connecting Yale and DART Station associated with Midtown/Mockingbird DevelopmentCost: Maintenance 3rd / 15 0.0 $1,350 $2,700 $2,700 $2,700 $2,700
Total Economic Vibrancy $270,425 $2,538,100 $3,033,303 $3,329,303 $3,830,003
Educational Enhancements
Highland Hills Branch Library - approximate 8,000 s.f. expansion of the branch located at 6200 Bonnie View Road 1st / 15 $190,000 $190,000 $190,000 $190,000 $190,000
Educational Enhancements
Fretz Park Branch Library - aproximate 4,793 s.f. expansion of the branch located at 6990 Belt Line, which includes a 1500 s.f. addition for a auditorium/black box theater 1st/15 $0 $95,501 $95,501 $95,501 $95,501
Total Educational Enhancements $190,000 $285,501 $285,501 $285,501 $285,501
Public Safety
Fire Station #32 (Benning Ave. at Jim Miller Rd.) - site acquistion, design/construction of a replacement stationCost: maintenance, electricity, custodial services, and utilities 4th/14 0.0 $19,919 $21,730 $21,730 $21,730 $21,730
Public Safety
Fire Station #44 (Frank St. at Lagow St.) - site acquistion, design/construction of a replacement stationCost: maintenance, electricity, custodial services, and utilities 1st/15 0.0 $11,480 $19,680 $19,680 $19,680 $19,680
Public Safety
Fire Station #06 (S. Harwood at Park Row Blvd.) - site acquistion, design/construction of a replacement stationCost: maintenance, electricity, custodial services, and utilities 2nd/15 0.0 $6,970 $20,910 $20,910 $20,910 $20,910
Total Public Safety $38,369 $62,320 $62,320 $62,320 $62,320
Total Key Focus Areas $1,336,953 $4,552,059 $5,579,431 $5,954,529 $6,519,367
530
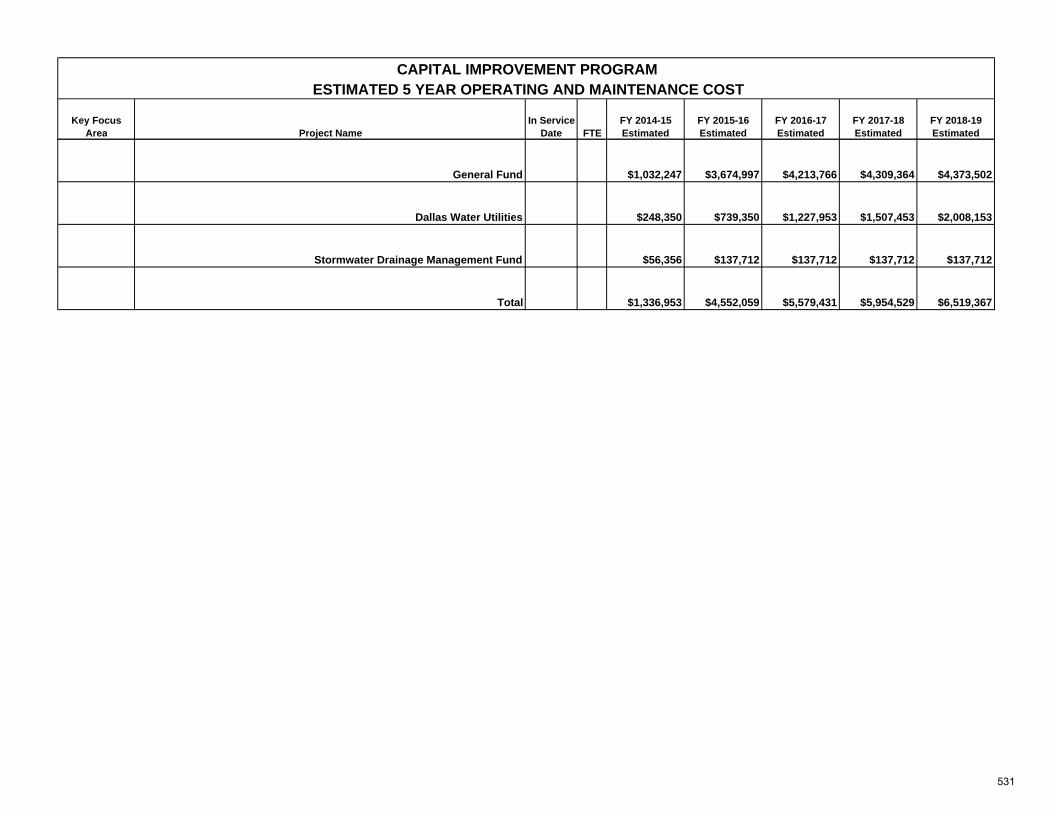
Key Focus Area Project Name
In Service Date FTE
FY 2014-15 Estimated
FY 2015-16 Estimated
FY 2016-17 Estimated
FY 2017-18 Estimated
FY 2018-19 Estimated
CAPITAL IMPROVEMENT PROGRAM ESTIMATED 5 YEAR OPERATING AND MAINTENANCE COST
General Fund $1,032,247 $3,674,997 $4,213,766 $4,309,364 $4,373,502
Dallas Water Utilities $248,350 $739,350 $1,227,953 $1,507,453 $2,008,153
Stormwater Drainage Management Fund $56,356 $137,712 $137,712 $137,712 $137,712
Total $1,336,953 $4,552,059 $5,579,431 $5,954,529 $6,519,367
531

532
Operating Budget Amendments
General Fund Expenditure Adjustments:
$200,000 Code Compliance Animal Services (Spay/Neuter and operational costs)
$290,000 Housing/Community Services Emergency Home Repair/Minor Repair for Seniors
$300,000 Office of Cultural AffairsProgramming for small arts groups with a $1M or less operating budget ($240,000); and funding for TeCo Theatrical Productions ($15,000), Bath House Cultural Center ($20,000), and Octavio Medellin stained glass windows as public art project ($25,000)
$320,000 Park and Recreation Recreation Centers - restore additional 5 hours/week at 14 centers
$70,000 Sanitation Services Texas Commission on Environmental Quality (TCEQ) expense at the landfill (additional required expense related to McCommas Landfill Private Disposal contract)
$1,180,000
General Fund Revenue Adjustments:$1,180,000 McCommas Landfill Private Disposal$1,180,000
CITY COUNCIL FY 2013-14 BUDGET AMENDMENTS
On September 10, 2013, City Council considered amendments to the FY 2013-14 Proposed Budget, including the use of an additional $1.18m one-time McCommas Landfill revenue. The below summarizes the council amendments that were subsequently included in the FY 2013-14 Adopted Budget.
533

534
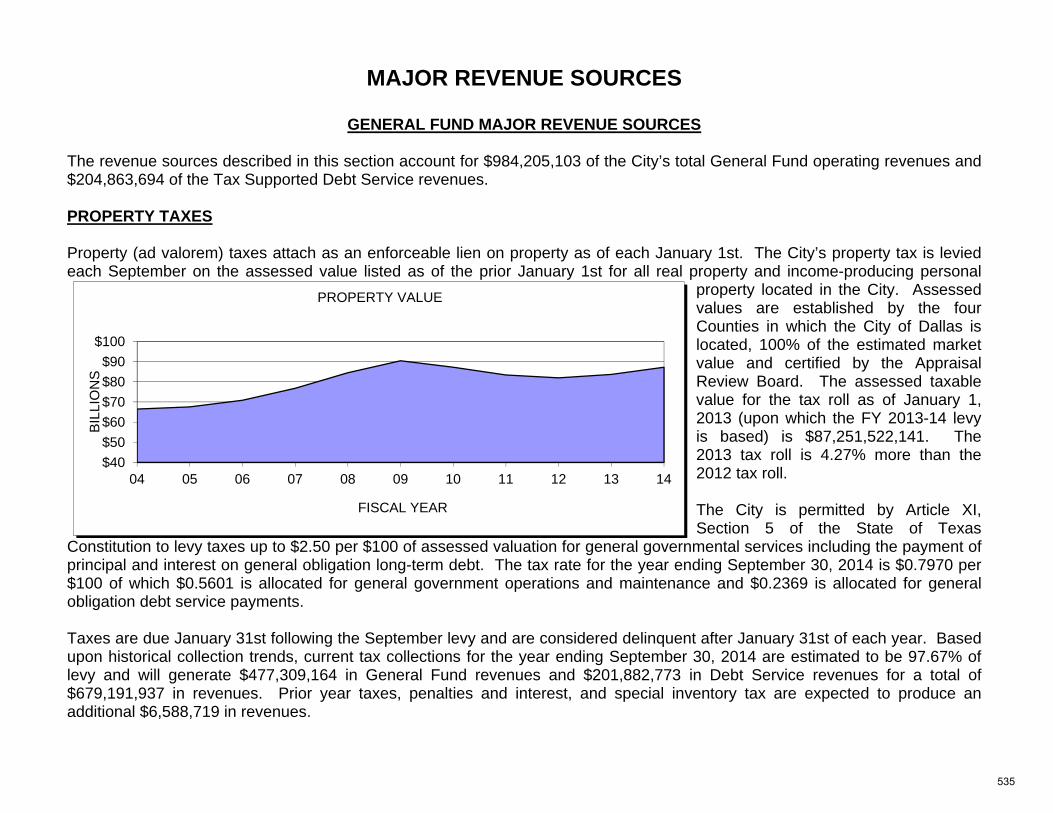
MAJOR REVENUE SOURCES
GENERAL FUND MAJOR REVENUE SOURCES The revenue sources described in this section account for $984,205,103 of the City’s total General Fund operating revenues and $204,863,694 of the Tax Supported Debt Service revenues. PROPERTY TAXES Property (ad valorem) taxes attach as an enforceable lien on property as of each January 1st. The City’s property tax is levied each September on the assessed value listed as of the prior January 1st for all real property and income-producing personal
property located in the City. Assessed values are established by the four Counties in which the City of Dallas is located, 100% of the estimated market value and certified by the Appraisal Review Board. The assessed taxable value for the tax roll as of January 1, 2013 (upon which the FY 2013-14 levy is based) is $87,251,522,141. The 2013 tax roll is 4.27% more than the 2012 tax roll. The City is permitted by Article XI, Section 5 of the State of Texas
Constitution to levy taxes up to $2.50 per $100 of assessed valuation for general governmental services including the payment of principal and interest on general obligation long-term debt. The tax rate for the year ending September 30, 2014 is $0.7970 per $100 of which $0.5601 is allocated for general government operations and maintenance and $0.2369 is allocated for general obligation debt service payments. Taxes are due January 31st following the September levy and are considered delinquent after January 31st of each year. Based upon historical collection trends, current tax collections for the year ending September 30, 2014 are estimated to be 97.67% of levy and will generate $477,309,164 in General Fund revenues and $201,882,773 in Debt Service revenues for a total of $679,191,937 in revenues. Prior year taxes, penalties and interest, and special inventory tax are expected to produce an additional $6,588,719 in revenues.
$40$50$60$70$80$90
$100
04 05 06 07 08 09 10 11 12 13 14
BIL
LIO
NS
FISCAL YEAR
PROPERTY VALUE
535
MAJOR REVENUE SOURCES
AMBULANCE REVENUES The Dallas Fire-Rescue Department provides emergency ambulance services within the boundaries of the City of Dallas to any person requesting aid. The emergency medical staff transports the individual or individuals to a hospital providing emergency aid for a transport charge plus itemized charges. The transport charge is $800 for residents and $900 for non-city residents, and $125 for treatment/non-transport services. The billing and collection of ambulance fees and additional supplemental payment from the federal government is provided by vendors contracted by the City of Dallas. To estimate the FY 2013-14 revenue, historical information is used to project the gross amount billed, and a projected collection rate is applied to this amount. FY 2013-14 also includes projected reimbursement revenue through Governmental Ambulance Supplemental Payment Program approved by the federal government through Texas Health and Human Services Commission. The program allows governmental ambulance providers to recover a portion of the ‘loss’ of providing services to Medicaid, Medicaid Managed Care and the Uninsured patients. The reimbursement amount is calculated by applying a Federal Matching Assistance Percentage (FMAP) which is 58.22% for Texas in FY 2011-12. This means that the program allows the ambulance providers to be reimbursed for 58.22% of the difference between the cost and the charges (subtracting payments) of providing ambulance services to Medicaid, Medicaid Managed Care and the Uninsured clients. SANITATION SERVICES REVENUE Sanitation Services Revenue is collected to match the cost of providing garbage collection, brush and bulky collection, and recyclables collection services for residential customers and a few small commercial customers. This revenue is based on fees, which are collected through the monthly utility bills issued by Dallas Water Utilities. The FY 2013-14 estimated revenue is determined by multiplying the current residential rate of $20.64 per month (increase $0.39 from FY 2012-13) by the projected number of residential customers, plus estimates for fees for “pack out” service, commercial customers’ fees, and fees for collection of dead animals from vets and pet rescue shelters. The Sanitation rate is directly offset by revenues from the residential recycling program – which is estimated to decrease by 33% from the FY 2012-13 recycling revenue budget due to changes in the recycling commodities market. In addition, an allowance of 1.56% is assumed for uncollectible accounts. PRIVATE DISPOSAL REVENUE Private Disposal Revenue is collected primarily at the McCommas Bluff Landfill from private (commercial) waste haulers for the privilege of disposing of solid waste at the site. The rate at the McCommas Bluff Landfill stays unchanged at $21.50 per ton in FY 2013-14. The Bachman Transfer Station rate remains unchanged at $47 per ton. City of Dallas residents hauling their own household and yard wastes are exempt from the fees. Commercial haulers may also elect to enter into a disposal contract with
536
MAJOR REVENUE SOURCES
the City, allowing for a discount from the posted rate in exchange for a guaranteed minimum amount of waste disposal over a specific time period. The FY 2013-14 figure is determined by projecting an estimate for commercial waste tons to be delivered to the landfill at the solid waste disposal fee, with consideration for waste tonnage under disposal contracts continuing into FY 2013-14. FRANCHISE FEE REVENUE The City of Dallas maintains non-exclusive franchise agreements with utilities and other service providers that use the City’s right-of-ways to provide services to the public. These franchise ordinances provide for compensation to the City in the form of franchise fees. These fees are in lieu of all other fees and charges related to the use of the right-of-ways. They are in addition to sales and ad valorem taxes. Generally, franchise fees are calculated based on a percentage of the companies’ gross receipts as a result of doing business in Dallas. Cable TV providers such as Time Warner, AT&T and Verizon, pay a fee equal to 5% of gross receipts, paid quarterly, 45 days after the end of the period covered. Franchise fees for Atmos Energy are 5% of their gross receipts, paid quarterly, by wire transfer. Projections for FY 2013-14 revenues for cable are based on historical data trended forward using regression analysis. Franchise fees for TXU Electric are based on a fee per kilowatt hour consumed and are projected for FY 2013-14 using historical data, trended forward by statistical analysis techniques and normalized for weather. Certificated telecommunications providers no longer pay franchise fees to the City. Pursuant to Local Government Code 283 telecommunications providers must compensate the City for use of the right-of-way on a per access line basis. These fees are to be paid to the City 45 days after the end of each calendar quarter. It is anticipated that these municipal fees for all telecommunications providers in the City will total $28,271,320 for FY 2013-14. MUNICIPAL COURT REVENUES Court and Detention Services collects fines and fees on Class C Misdemeanor citations, including moving/non-moving traffic violations and State law/City ordinance violations. Revenues are collected at cashier windows, by mail-in payments and through express mail depositories. Delinquent accounts are forwarded to a collection agency for additional collection efforts. The methodology used to project revenues is a combination of straight lining actuals, historical analysis and multi-year averaging.
537
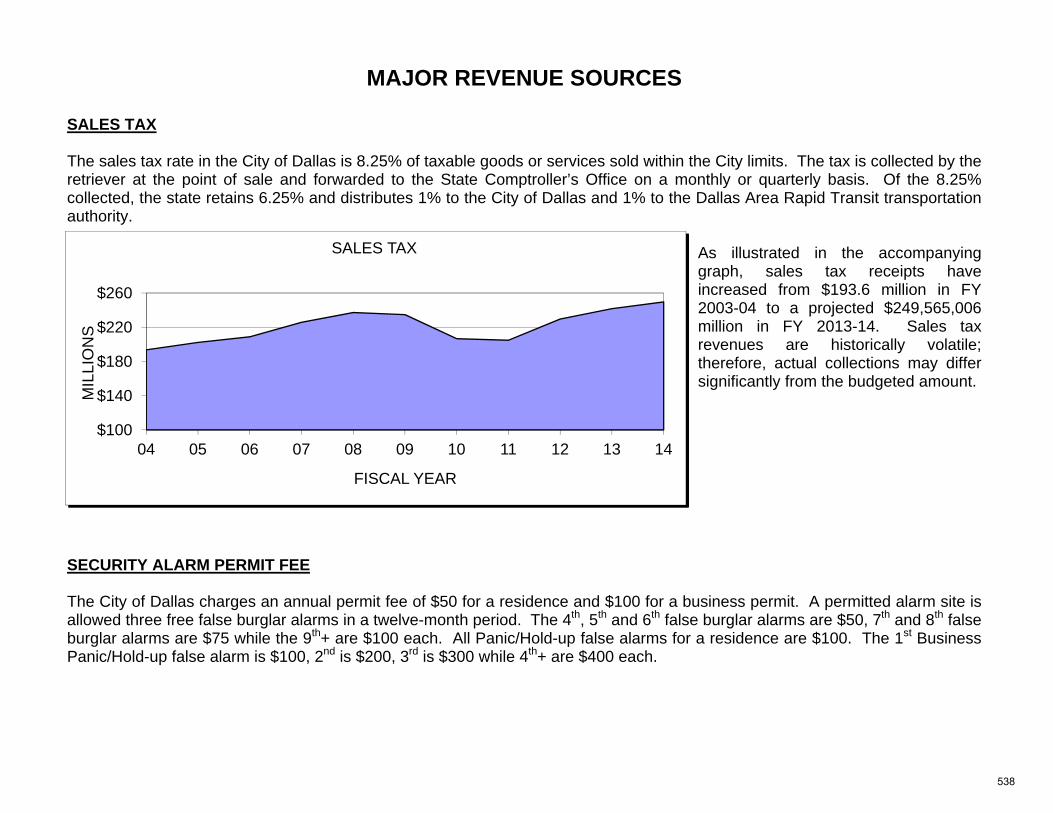
MAJOR REVENUE SOURCES
SALES TAX The sales tax rate in the City of Dallas is 8.25% of taxable goods or services sold within the City limits. The tax is collected by the retriever at the point of sale and forwarded to the State Comptroller’s Office on a monthly or quarterly basis. Of the 8.25% collected, the state retains 6.25% and distributes 1% to the City of Dallas and 1% to the Dallas Area Rapid Transit transportation authority.
As illustrated in the accompanying graph, sales tax receipts have increased from $193.6 million in FY 2003-04 to a projected $249,565,006 million in FY 2013-14. Sales tax revenues are historically volatile; therefore, actual collections may differ significantly from the budgeted amount.
SECURITY ALARM PERMIT FEE The City of Dallas charges an annual permit fee of $50 for a residence and $100 for a business permit. A permitted alarm site is allowed three free false burglar alarms in a twelve-month period. The 4th, 5th and 6th false burglar alarms are $50, 7th and 8th false burglar alarms are $75 while the 9th+ are $100 each. All Panic/Hold-up false alarms for a residence are $100. The 1st Business Panic/Hold-up false alarm is $100, 2nd is $200, 3rd is $300 while 4th+ are $400 each.
$100
$140
$180
$220
$260
04 05 06 07 08 09 10 11 12 13 14
MIL
LIO
NS
FISCAL YEAR
SALES TAX
538
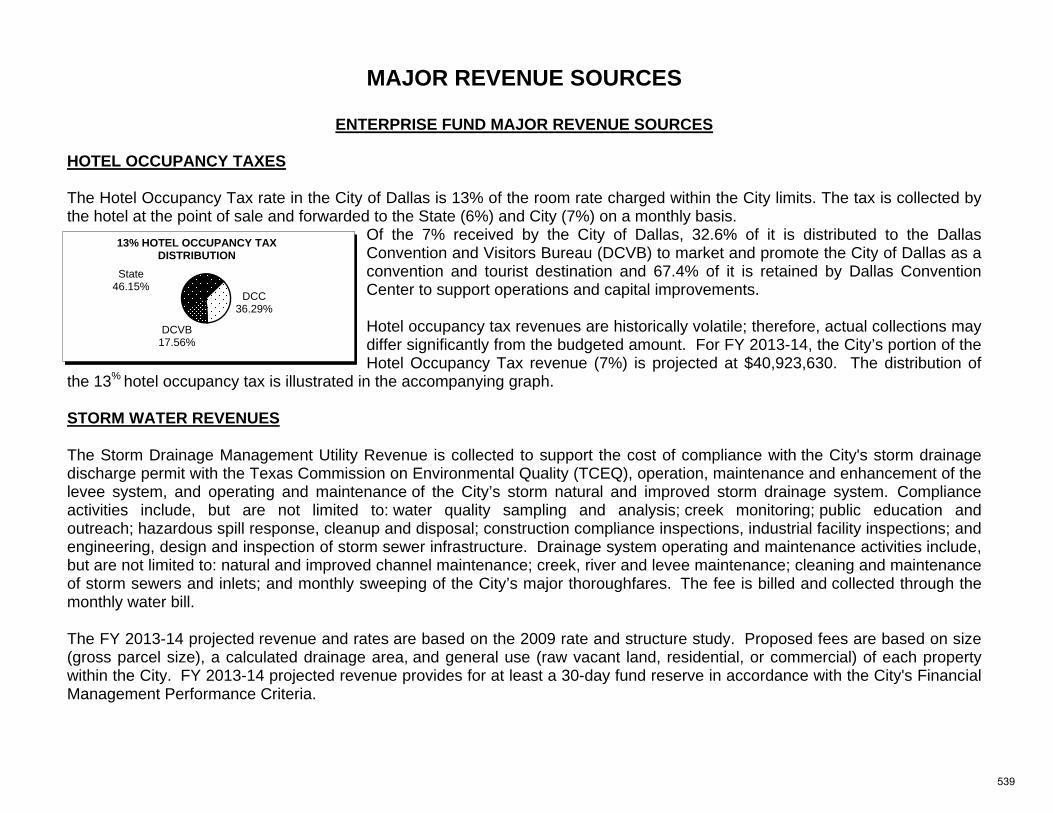
MAJOR REVENUE SOURCES
ENTERPRISE FUND MAJOR REVENUE SOURCES
HOTEL OCCUPANCY TAXES The Hotel Occupancy Tax rate in the City of Dallas is 13% of the room rate charged within the City limits. The tax is collected by the hotel at the point of sale and forwarded to the State (6%) and City (7%) on a monthly basis.
Of the 7% received by the City of Dallas, 32.6% of it is distributed to the Dallas Convention and Visitors Bureau (DCVB) to market and promote the City of Dallas as a convention and tourist destination and 67.4% of it is retained by Dallas Convention Center to support operations and capital improvements. Hotel occupancy tax revenues are historically volatile; therefore, actual collections may differ significantly from the budgeted amount. For FY 2013-14, the City’s portion of the Hotel Occupancy Tax revenue (7%) is projected at $40,923,630. The distribution of
the 13% hotel occupancy tax is illustrated in the accompanying graph. STORM WATER REVENUES
The Storm Drainage Management Utility Revenue is collected to support the cost of compliance with the City's storm drainage discharge permit with the Texas Commission on Environmental Quality (TCEQ), operation, maintenance and enhancement of the levee system, and operating and maintenance of the City’s storm natural and improved storm drainage system. Compliance activities include, but are not limited to: water quality sampling and analysis; creek monitoring; public education and outreach; hazardous spill response, cleanup and disposal; construction compliance inspections, industrial facility inspections; and engineering, design and inspection of storm sewer infrastructure. Drainage system operating and maintenance activities include, but are not limited to: natural and improved channel maintenance; creek, river and levee maintenance; cleaning and maintenance of storm sewers and inlets; and monthly sweeping of the City’s major thoroughfares. The fee is billed and collected through the monthly water bill.
The FY 2013-14 projected revenue and rates are based on the 2009 rate and structure study. Proposed fees are based on size (gross parcel size), a calculated drainage area, and general use (raw vacant land, residential, or commercial) of each property within the City. FY 2013-14 projected revenue provides for at least a 30-day fund reserve in accordance with the City's Financial Management Performance Criteria.
State46.15%
DCC36.29%
DCVB17.56%
13% HOTEL OCCUPANCY TAX DISTRIBUTION
539
MAJOR REVENUE SOURCES
WATER/WASTEWATER REVENUES The Water Utilities Department is owned and operated by the City of Dallas as a self-supporting enterprise fund. The department receives no tax dollars and earns its revenues through the sale of water and wastewater services in five customer classes. These classes are Residential, General Service, Municipal, Optional General Service, and Wholesale. The wholesale customer class is comprised of 23 communities outside the City of Dallas which receives water service, and 11 communities, which receive wastewater service. Rates for each class are determined by a cost of service study that assigns costs to each class based on the department’s cost to provide them with these services. The breakdown of the source of revenues from these customer classes is as follows:
36.8% of the revenues come from the Residential class, 42.1% comes from the General class, 0.9% comes from the Municipal class, 3.2% comes from the Optional General class 17.0% comes from the Wholesale class.
These revenues are used to pay for the following:
Operating and maintenance costs of providing water and wastewater service to customers, Debt service (principal and interest) on outstanding debt used to design and construct the facilities necessary to provide
these services, Street Rental payment (equivalent to franchise fees assessed to other utilities) to the General Fund for the use of the City’s
right-of-ways, Cash funding for capital improvement facilities not funded through the sale of revenue bonds or other debt.
The Water Utilities Department also receives other miscellaneous revenues such as, but not limited to, interest earnings, connection fees, and system improvement contributions. In FY 2013-14, water and wastewater revenues will total $595.3M including a 4.5% increase in retail revenues. Water revenues can fluctuate depending on the summer temperatures and the amount of rainfall in the area.
540
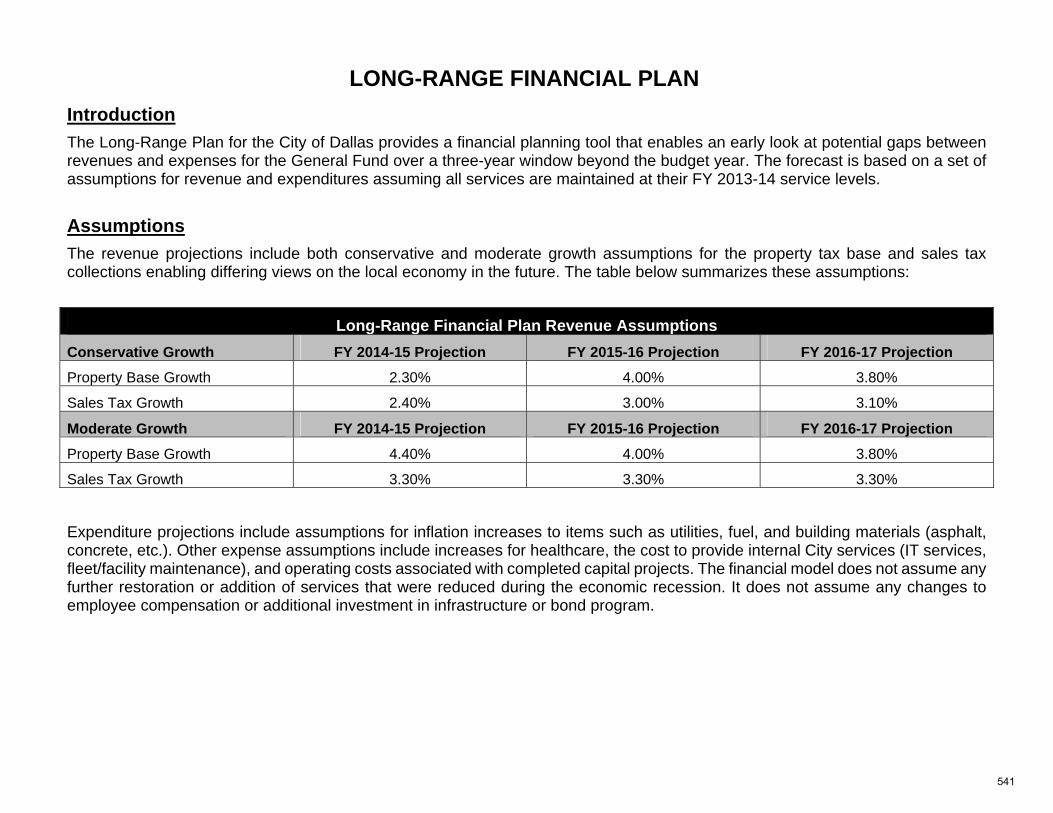
LONG-RANGE FINANCIAL PLAN
Introduction The Long-Range Plan for the City of Dallas provides a financial planning tool that enables an early look at potential gaps between revenues and expenses for the General Fund over a three-year window beyond the budget year. The forecast is based on a set of assumptions for revenue and expenditures assuming all services are maintained at their FY 2013-14 service levels. Assumptions The revenue projections include both conservative and moderate growth assumptions for the property tax base and sales tax collections enabling differing views on the local economy in the future. The table below summarizes these assumptions:
Long-Range Financial Plan Revenue Assumptions Conservative Growth FY 2014-15 Projection FY 2015-16 Projection FY 2016-17 Projection Property Base Growth 2.30% 4.00% 3.80%
Sales Tax Growth 2.40% 3.00% 3.10%
Moderate Growth FY 2014-15 Projection FY 2015-16 Projection FY 2016-17 Projection Property Base Growth 4.40% 4.00% 3.80%
Sales Tax Growth 3.30% 3.30% 3.30%
Expenditure projections include assumptions for inflation increases to items such as utilities, fuel, and building materials (asphalt, concrete, etc.). Other expense assumptions include increases for healthcare, the cost to provide internal City services (IT services, fleet/facility maintenance), and operating costs associated with completed capital projects. The financial model does not assume any further restoration or addition of services that were reduced during the economic recession. It does not assume any changes to employee compensation or additional investment in infrastructure or bond program.
541
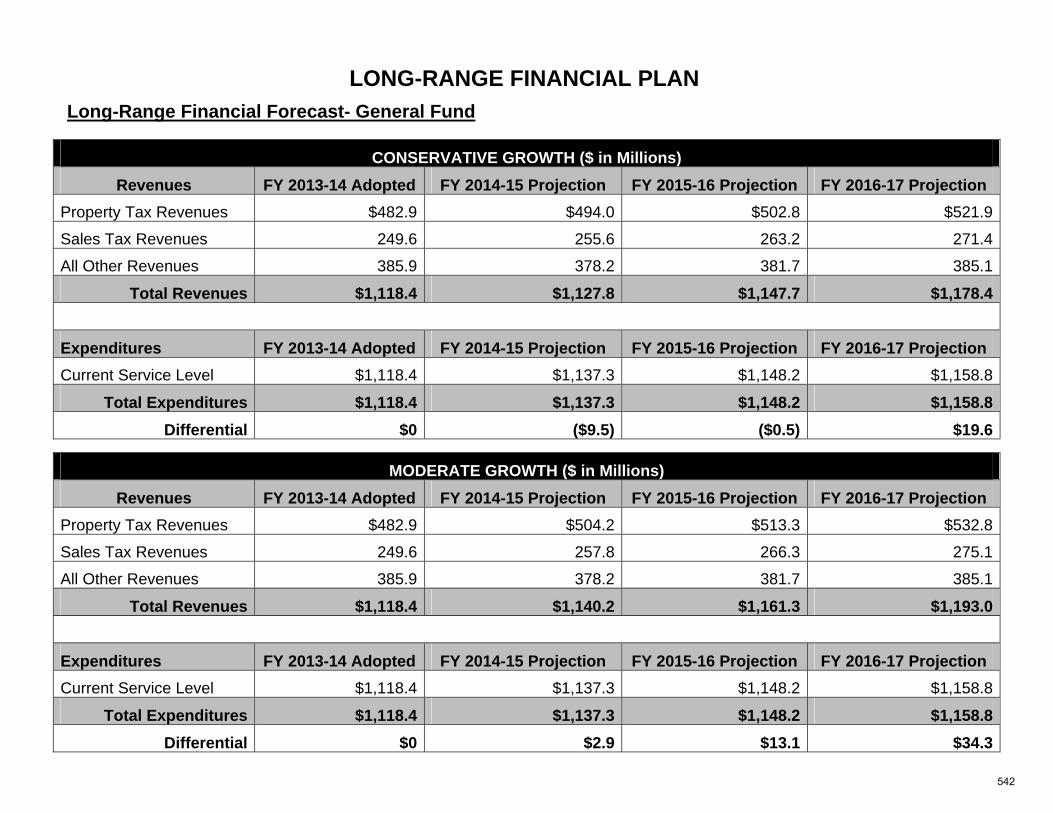
LONG-RANGE FINANCIAL PLAN
Long-Range Financial Forecast- General Fund
CONSERVATIVE GROWTH ($ in Millions) Revenues FY 2013-14 Adopted FY 2014-15 Projection FY 2015-16 Projection FY 2016-17 Projection
Property Tax Revenues $482.9 $494.0 $502.8 $521.9
Sales Tax Revenues 249.6 255.6 263.2 271.4
All Other Revenues 385.9 378.2 381.7 385.1
Total Revenues $1,118.4 $1,127.8 $1,147.7 $1,178.4 Expenditures FY 2013-14 Adopted FY 2014-15 Projection FY 2015-16 Projection FY 2016-17 Projection Current Service Level $1,118.4 $1,137.3 $1,148.2 $1,158.8
Total Expenditures $1,118.4 $1,137.3 $1,148.2 $1,158.8 Differential $0 ($9.5) ($0.5) $19.6
MODERATE GROWTH ($ in Millions) Revenues FY 2013-14 Adopted FY 2014-15 Projection FY 2015-16 Projection FY 2016-17 Projection
Property Tax Revenues $482.9 $504.2 $513.3 $532.8
Sales Tax Revenues 249.6 257.8 266.3 275.1
All Other Revenues 385.9 378.2 381.7 385.1
Total Revenues $1,118.4 $1,140.2 $1,161.3 $1,193.0 Expenditures FY 2013-14 Adopted FY 2014-15 Projection FY 2015-16 Projection FY 2016-17 Projection Current Service Level $1,118.4 $1,137.3 $1,148.2 $1,158.8
Total Expenditures $1,118.4 $1,137.3 $1,148.2 $1,158.8 Differential $0 $2.9 $13.1 $34.3
542
FINANCIAL MANAGEMENT PERFORMANCE CRITERIA
The City Council originally adopted the Financial Management Performance Criteria (FMPC) on March 15, 1978 to provide standards and guidelines for the City's financial and managerial decision making and to provide for a periodic review of the criteria to maintain standards and guidelines consistent with current economic conditions. The FMPC contains 52 criteria in 6 different categories in addition to 13 criteria specific to Dallas Water Utilities.
Operating Programs: Criteria 1 – 15 Capital and Debt Management: Criteria 16 – 40 Accounting, Auditing, and Financial Planning: Criteria 41 – 43 Budget: Criteria 44 – 47 Cash Management: Criteria 48 – 50 Grants and Trusts: Criteria 51 – 52
The most recent revision to the FMPC occurred in September 2011. The status of each criterion is updated annually and presented with the annual budget, at year-end, and for each debt issuance.
543
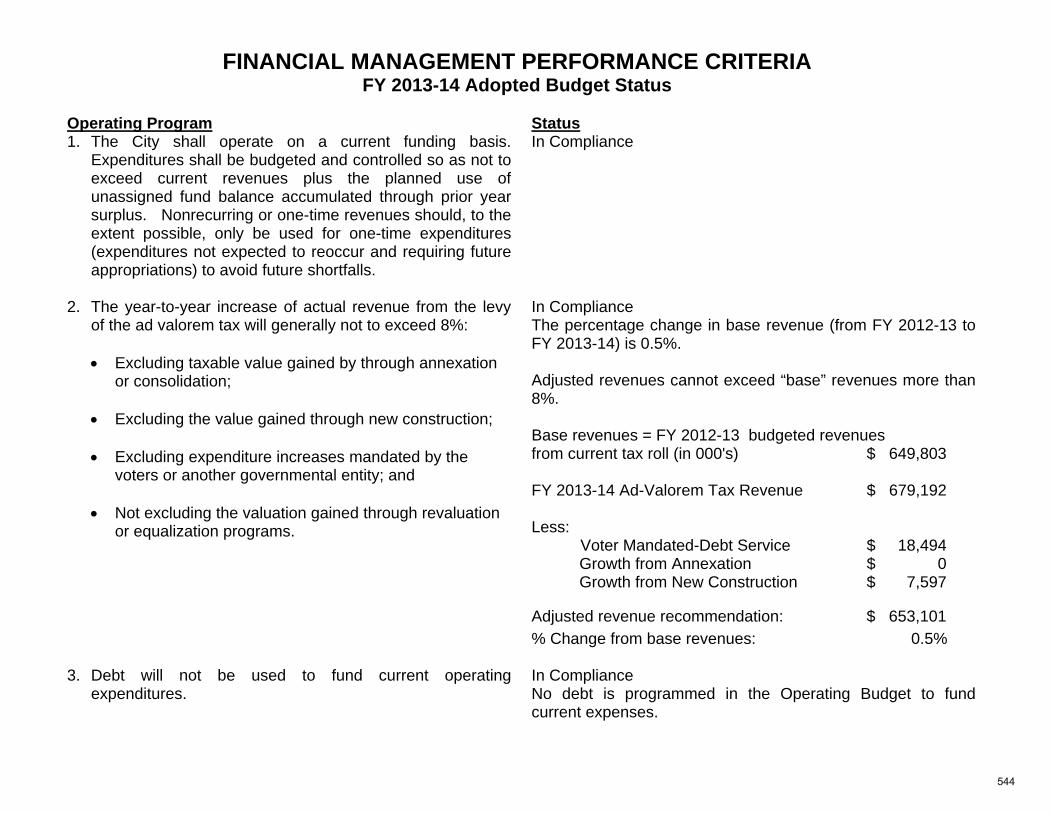
FINANCIAL MANAGEMENT PERFORMANCE CRITERIA FY 2013-14 Adopted Budget Status
Operating Program Status1. The City shall operate on a current funding basis.
Expenditures shall be budgeted and controlled so as not to exceed current revenues plus the planned use of unassigned fund balance accumulated through prior year surplus. Nonrecurring or one-time revenues should, to the extent possible, only be used for one-time expenditures (expenditures not expected to reoccur and requiring future appropriations) to avoid future shortfalls.
In Compliance
2. The year-to-year increase of actual revenue from the levy of the ad valorem tax will generally not to exceed 8%:
Excluding taxable value gained by through annexation
or consolidation;
Excluding the value gained through new construction;
Excluding expenditure increases mandated by the voters or another governmental entity; and
Not excluding the valuation gained through revaluation
or equalization programs.
In Compliance The percentage change in base revenue (from FY 2012-13 to FY 2013-14) is 0.5%. Adjusted revenues cannot exceed “base” revenues more than 8%. Base revenues = FY 2012-13 budgeted revenues from current tax roll (in 000's) $ 649,803 FY 2013-14 Ad-Valorem Tax Revenue $ 679,192 Less: Voter Mandated-Debt Service $ 18,494
Growth from Annexation $ 0 Growth from New Construction $ 7,597
Adjusted revenue recommendation: $ 653,101 % Change from base revenues: 0.5%
3. Debt will not be used to fund current operating expenditures.
In Compliance No debt is programmed in the Operating Budget to fund current expenses.
544
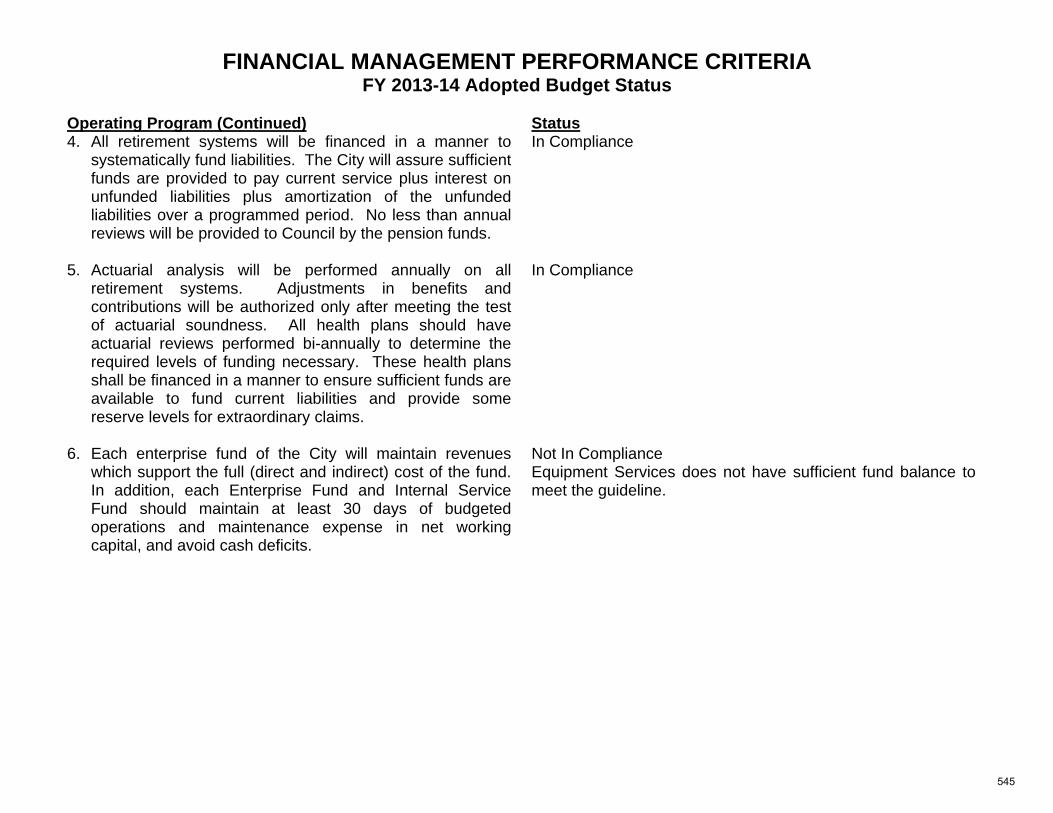
FINANCIAL MANAGEMENT PERFORMANCE CRITERIA FY 2013-14 Adopted Budget Status
Operating Program (Continued) Status
4. All retirement systems will be financed in a manner to systematically fund liabilities. The City will assure sufficient funds are provided to pay current service plus interest on unfunded liabilities plus amortization of the unfunded liabilities over a programmed period. No less than annual reviews will be provided to Council by the pension funds.
In Compliance
5. Actuarial analysis will be performed annually on all retirement systems. Adjustments in benefits and contributions will be authorized only after meeting the test of actuarial soundness. All health plans should have actuarial reviews performed bi-annually to determine the required levels of funding necessary. These health plans shall be financed in a manner to ensure sufficient funds are available to fund current liabilities and provide some reserve levels for extraordinary claims.
In Compliance
6. Each enterprise fund of the City will maintain revenues which support the full (direct and indirect) cost of the fund. In addition, each Enterprise Fund and Internal Service Fund should maintain at least 30 days of budgeted operations and maintenance expense in net working capital, and avoid cash deficits.
Not In Compliance Equipment Services does not have sufficient fund balance to meet the guideline.
545
FINANCIAL MANAGEMENT PERFORMANCE CRITERIA FY 2013-14 Adopted Budget Status
Operating Program (Continued) Status
7. The Emergency Reserve, a component of unassigned fund balance, shall be used to provide for temporary financing of unanticipated or unforeseen extraordinary needs of an emergency nature; for example, costs related to a natural disaster or calamity, a 5% decline in property values, or an unexpected liability created by Federal or State legislative action. Funds shall be allocated from the Emergency Reserve only after an analysis has been prepared by the City Manager and presented to City Council. The analysis shall provide sufficient evidence to establish that the remaining balance is adequate to offset potential downturns in revenue sources. The analysis shall address the nature of the adopted expenditure and the revenue requirement in subsequent budget years. Prior to allocating funds from the Emergency Reserve, the City Council shall find that an emergency or extraordinary need exists to justify the use of these funds. Funds shall be allocated each year in the budget process to replace any use of the Emergency Reserve funds during the preceding fiscal year to maintain the balance of the Emergency Reserve levels.
In Compliance
546
FINANCIAL MANAGEMENT PERFORMANCE CRITERIA FY 2013-14 Adopted Budget Status
Operating Program (Continued) Status
8. The Contingency Reserve, a component of unassigned fund balance, shall be used to provide for unanticipated needs that arise during the year: for example, expenses associated with new service needs that have been identified after the budget process, new public safety or health needs, revenue shortfalls, service enhancements, or opportunities to achieve cost savings. Funds shall be allocated from the Contingency Reserve only after an analysis has been prepared by the City Manager and presented to the City Council outlining the initial and recurring costs associated with the adopted expenditure. Additionally, these funds would be used prior to use of the Emergency Reserve funds. Funds shall be allocated each year in the budget process to replace any use of the Contingency Reserve funds during the preceding fiscal year and to maintain the balance of the Contingency Reserve at a level ranging from ½% to 1% of budgeted departmental expenditures.
In Compliance The adopted Contingency Reserve level is $5,700,000 or 0.5% of the General Fund budget. It will be funded from FY 2012-13 Contingency Reserve ending balance of $5,300,000 and FY 2013-14 General Fund contribution of $400,000.
547
FINANCIAL MANAGEMENT PERFORMANCE CRITERIA FY 2013-14 Adopted Budget Status
Operating Program (Continued) Status
9. The unassigned fund balance of the General Fund, which includes the Emergency and Contingency Reserves, shall be maintained at a level not less than 5% of the General Fund operating expenditures less debt service. (The Risk Reserve is not included in this calculation.)
In Compliance Emergency Reserve 9/30/13 (projected ending balance) $ 17.6M
Contingency Reserve 9/30/13 (projected ending balance) $ 5.3M FY2013-14 appropriations $ 0.4M Fund Balance 9/30/13 (projected) $ 76.3M Combined $ 99.6M $99.6M is 8.9% of the proposed General Fund budget
10. A Risk Reserve shall be maintained at a level, which, together with purchased insurance policies, adequately protects the City’s assets against loss. An analysis shall be conducted every three years or when the deductible level of the City’s property insurance is modified (whichever is earlier), to determine the appropriate level of this reserve.
In Compliance The adopted Risk Reserve level is $1,250,000. It will be funded from the FY 2012-13 Risk Reserve ending balance of $1,250,000.
548
FINANCIAL MANAGEMENT PERFORMANCE CRITERIA FY 2013-14 Adopted Budget Status
Operating Program (Continued) Status
11. A General Fund liability fund shall be budgeted annually to provide for outstanding and anticipated claims expense and resulting liabilities during the budget year. An individual judgment settlement cap is set at $5,000,000. The Emergency Reserve will be accessed should the cap be exceeded. An independent actuarial analysis shall be conducted every two years to determine the appropriate level of this fund.
In Compliance The adopted Liability/Claims Fund will be funded at $6,416,339. It will be funded from the Liability/Claims Fund FY2012-13 projected ending balance of $54,622, and FY2013-14 General Fund contribution of $5,088,371, General Fund departmental contributions of $665,690 and other funds contributions of $607,656.
12. Consider the establishment of a Landfill Closure / Post-Closure Reserve to provide for any future potential liabilities. Analysis will be performed periodically to determine appropriate timing and amount of funding needs. Funds could be allocated from an increase in user fees.
Establishment of reserve is not recommended at this time.
13. Operating expenditures will be programmed to include current costs of fully maintaining City facilities, including parks, streets, levees, vehicles, buildings, and equipment. A cost benefit analysis will be performed on replacement cost versus projected required maintenance costs to determine the level at which City facilities should be maintained. The analysis will also determine the long-term cost of any potential deferred maintenance cost. Normal maintenance will be funded through the operating budget.
In Compliance
14. An annual assessment and five year projection for all equipment and maintenance needs should be performed, and a maintenance and replacement schedule developed based on the projection.
In Compliance
549
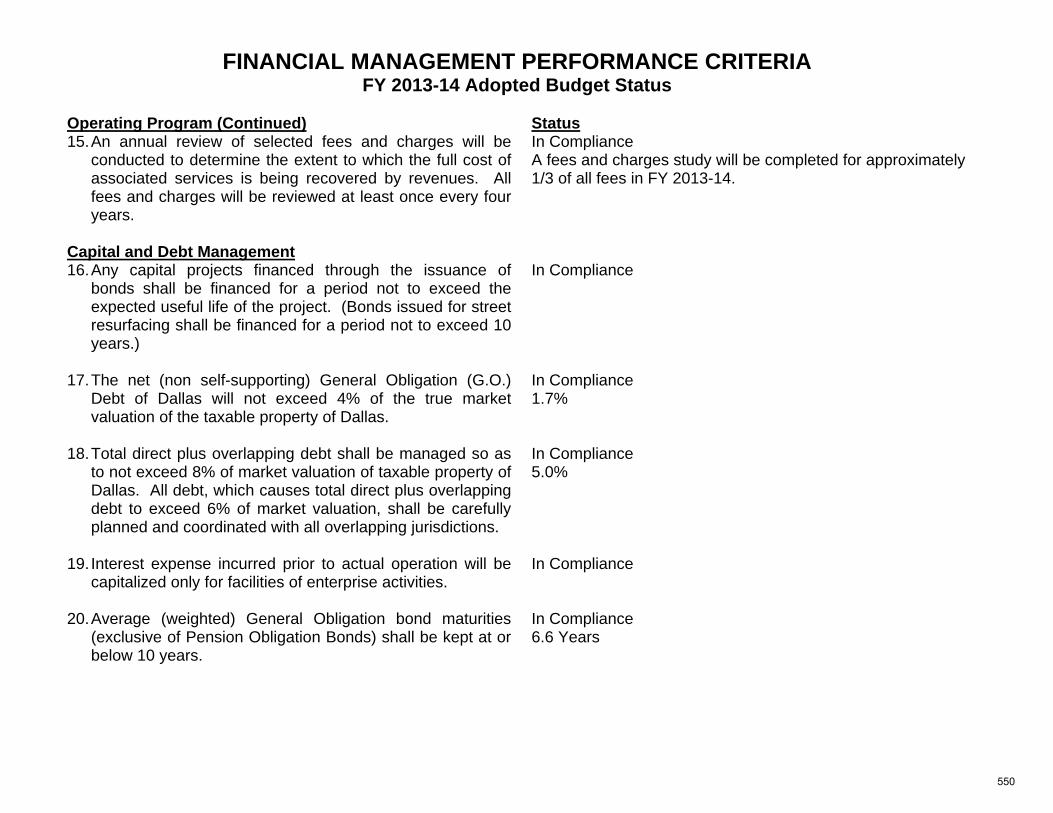
FINANCIAL MANAGEMENT PERFORMANCE CRITERIA FY 2013-14 Adopted Budget Status
Operating Program (Continued) Status
15. An annual review of selected fees and charges will be conducted to determine the extent to which the full cost of associated services is being recovered by revenues. All fees and charges will be reviewed at least once every four years.
In Compliance A fees and charges study will be completed for approximately 1/3 of all fees in FY 2013-14.
Capital and Debt Management 16. Any capital projects financed through the issuance of
bonds shall be financed for a period not to exceed the expected useful life of the project. (Bonds issued for street resurfacing shall be financed for a period not to exceed 10 years.)
In Compliance
17. The net (non self-supporting) General Obligation (G.O.) Debt of Dallas will not exceed 4% of the true market valuation of the taxable property of Dallas.
In Compliance 1.7%
18. Total direct plus overlapping debt shall be managed so as to not exceed 8% of market valuation of taxable property of Dallas. All debt, which causes total direct plus overlapping debt to exceed 6% of market valuation, shall be carefully planned and coordinated with all overlapping jurisdictions.
In Compliance 5.0%
19. Interest expense incurred prior to actual operation will be capitalized only for facilities of enterprise activities.
In Compliance
20. Average (weighted) General Obligation bond maturities (exclusive of Pension Obligation Bonds) shall be kept at or below 10 years.
In Compliance 6.6 Years
550
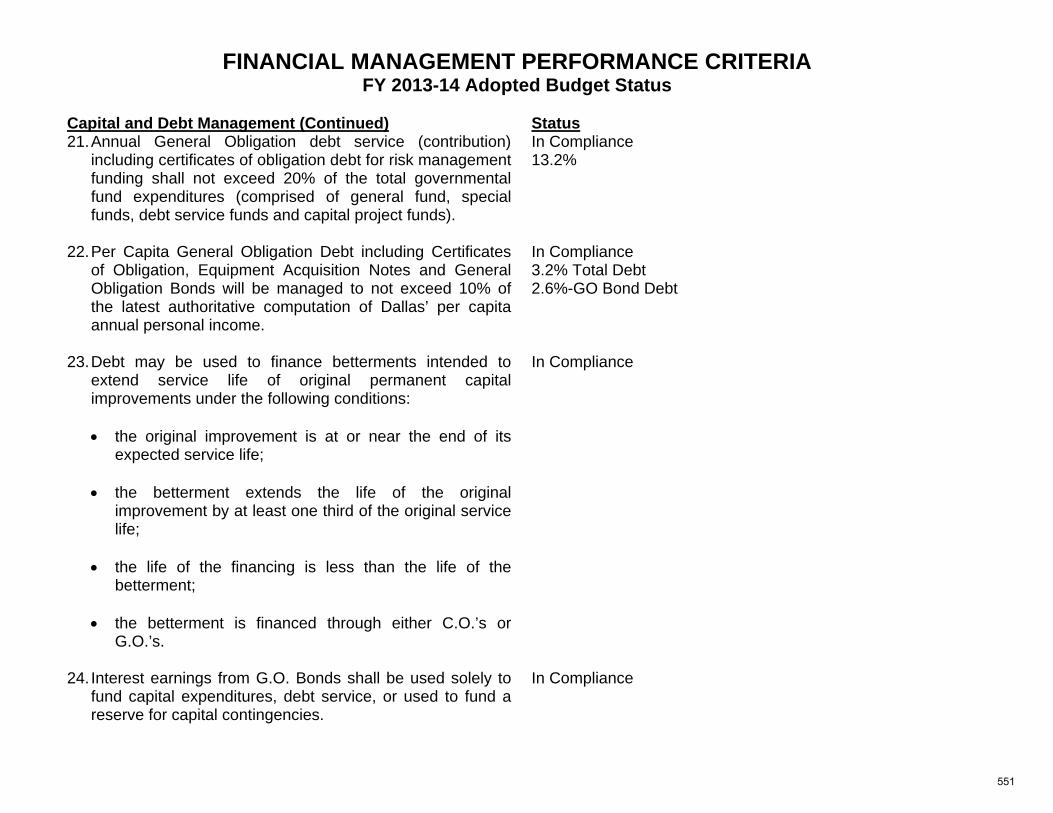
FINANCIAL MANAGEMENT PERFORMANCE CRITERIA FY 2013-14 Adopted Budget Status
Capital and Debt Management (Continued) Status
21. Annual General Obligation debt service (contribution) including certificates of obligation debt for risk management funding shall not exceed 20% of the total governmental fund expenditures (comprised of general fund, special funds, debt service funds and capital project funds).
In Compliance 13.2%
22. Per Capita General Obligation Debt including Certificates of Obligation, Equipment Acquisition Notes and General Obligation Bonds will be managed to not exceed 10% of the latest authoritative computation of Dallas’ per capita annual personal income.
In Compliance 3.2% Total Debt 2.6%-GO Bond Debt
23. Debt may be used to finance betterments intended to extend service life of original permanent capital improvements under the following conditions:
the original improvement is at or near the end of its
expected service life;
the betterment extends the life of the original improvement by at least one third of the original service life;
the life of the financing is less than the life of the
betterment;
the betterment is financed through either C.O.’s or G.O.’s.
In Compliance
24. Interest earnings from G.O. Bonds shall be used solely to fund capital expenditures, debt service, or used to fund a reserve for capital contingencies.
In Compliance
551
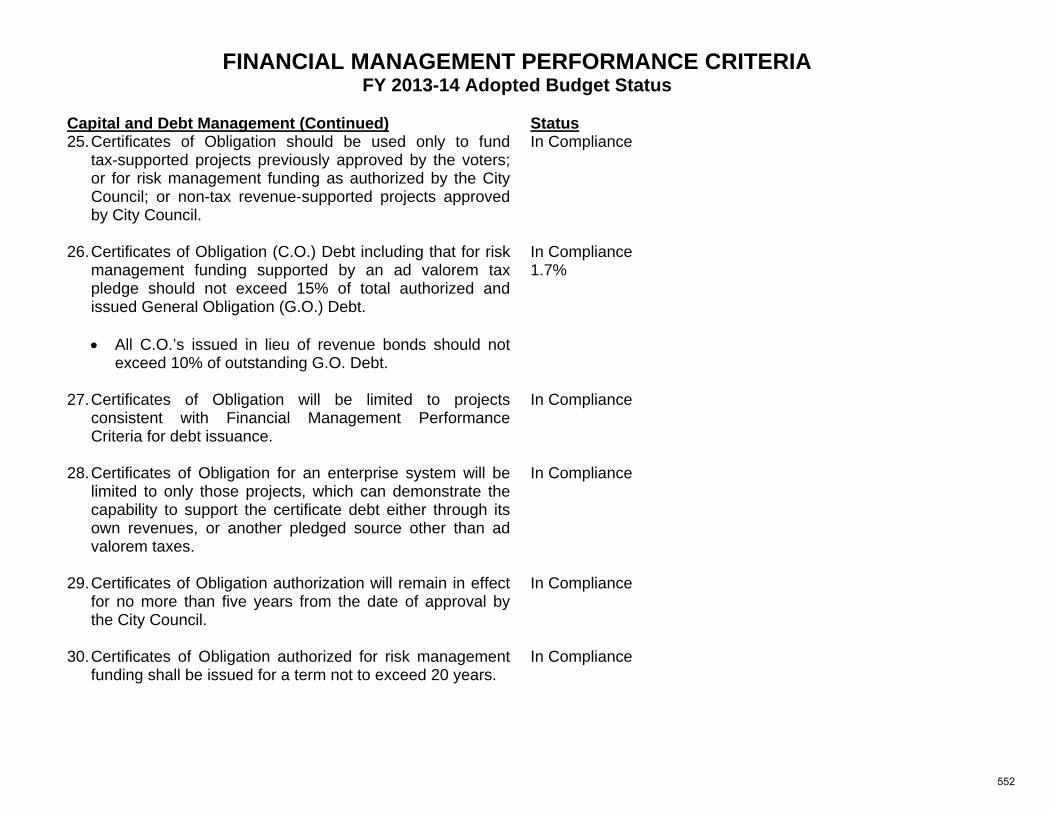
FINANCIAL MANAGEMENT PERFORMANCE CRITERIA FY 2013-14 Adopted Budget Status
Capital and Debt Management (Continued) Status 25. Certificates of Obligation should be used only to fund
tax-supported projects previously approved by the voters; or for risk management funding as authorized by the City Council; or non-tax revenue-supported projects approved by City Council.
In Compliance
26. Certificates of Obligation (C.O.) Debt including that for risk management funding supported by an ad valorem tax pledge should not exceed 15% of total authorized and issued General Obligation (G.O.) Debt.
All C.O.’s issued in lieu of revenue bonds should not
exceed 10% of outstanding G.O. Debt.
In Compliance 1.7%
27. Certificates of Obligation will be limited to projects consistent with Financial Management Performance Criteria for debt issuance.
In Compliance
28. Certificates of Obligation for an enterprise system will be limited to only those projects, which can demonstrate the capability to support the certificate debt either through its own revenues, or another pledged source other than ad valorem taxes.
In Compliance
29. Certificates of Obligation authorization will remain in effect for no more than five years from the date of approval by the City Council.
In Compliance
30. Certificates of Obligation authorized for risk management funding shall be issued for a term not to exceed 20 years.
In Compliance
552
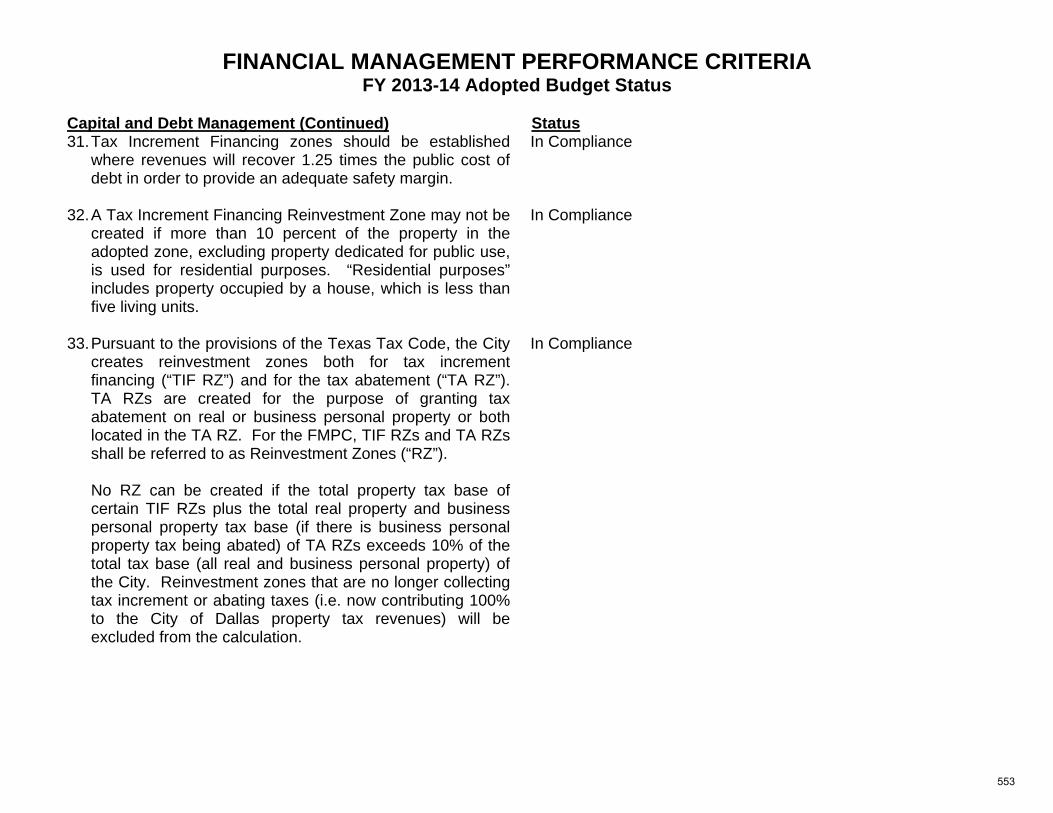
FINANCIAL MANAGEMENT PERFORMANCE CRITERIA FY 2013-14 Adopted Budget Status
Capital and Debt Management (Continued) Status
31. Tax Increment Financing zones should be established where revenues will recover 1.25 times the public cost of debt in order to provide an adequate safety margin.
In Compliance
32. A Tax Increment Financing Reinvestment Zone may not be created if more than 10 percent of the property in the adopted zone, excluding property dedicated for public use, is used for residential purposes. “Residential purposes” includes property occupied by a house, which is less than five living units.
In Compliance
33. Pursuant to the provisions of the Texas Tax Code, the City creates reinvestment zones both for tax increment financing (“TIF RZ”) and for the tax abatement (“TA RZ”). TA RZs are created for the purpose of granting tax abatement on real or business personal property or both located in the TA RZ. For the FMPC, TIF RZs and TA RZs shall be referred to as Reinvestment Zones (“RZ”).
No RZ can be created if the total property tax base of
certain TIF RZs plus the total real property and business personal property tax base (if there is business personal property tax being abated) of TA RZs exceeds 10% of the total tax base (all real and business personal property) of the City. Reinvestment zones that are no longer collecting tax increment or abating taxes (i.e. now contributing 100% to the City of Dallas property tax revenues) will be excluded from the calculation.
In Compliance
553
FINANCIAL MANAGEMENT PERFORMANCE CRITERIA FY 2013-14 Adopted Budget Status
Capital and Debt Management (Continued) Status
34. All PID and TIF proposals, even “pay-as-you-go” projects, will be evaluated for service impact. A five-year fiscal note must accompany any request to establish a PID or TIF including repayment terms of any inter-fund borrowing.
In Compliance
35. All adopted PID or TIF debt issuances supported by a district's revenues, are subject to the following criteria: Coverage Tests - The project should provide for
revenues, net of overlapping taxes, of 1.25 times maximum annual debt service requirement. The issuance of TIF bonds may be considered prior to achieving coverage ratio of 1.25 if:
o a developer or property owner provides a credit
enhancement such as a letter of credit or bond insurance from an AAA-rated financial institution for the entire amount of the debt issue; and
o in the event that there is insufficient TIF increment
revenues to retire TIF bonds, which event consequently requires that the credit enhancement mechanism be called upon to service the TIF bonded indebtedness, contingent liability to reimburse a credit-enhancer would be the sole liability of the developer or its affiliates; and
o in the event that there are changes in the rating of the
financial institution providing credit enhancement, then that institution shall be replaced with an AAA-rated financial institution within 90 days; and
In Compliance
554
FINANCIAL MANAGEMENT PERFORMANCE CRITERIA FY 2013-14 Adopted Budget Status
Capital and Debt Management (Continued) Status
o in the event that no replacement of an AAA-rated institution is provided, no further TIF bonds in advance of the 1.25 coverage ratio will be provided for any additional TIF projects undertaken by the developer or its affiliates.
Additional Bonds Test - the project should include an additional bonds test parallel to the coverage test.
Reserve Fund - the project should include a debt
service reserve fund equal to the maximum annual debt service requirements.
Limitations on Amount of PID/TIF Bonds- The total
amount of PID/TIF indebtedness will be included and managed as part of the City's overlapping debt, and
The total amount of PID/TIF debt outstanding should
generally not exceed 20% of the City's outstanding general obligation indebtedness.
PID/TIF bonds should be limited to projects consistent
with the City's previously adopted Financial Management Performance Criteria for debt issuance.
PID bonds should be limited to those projects, which
can demonstrate the ability to support the debt either through its own revenues or another pledge source other than ad valorem taxes.
PID/TIF bond authorizations should remain in effect for
no more than five years from the date of City Council approval.
555
FINANCIAL MANAGEMENT PERFORMANCE CRITERIA FY 2013-14 Adopted Budget Status
Capital and Debt Management (Continued) Status
36. All adopted PID or TIF debt issuances must mature on or before the termination date of the respective PID or TIF district and, further, all bonds must also conform to the district's Financial Plan by maturing on or before the plan's projected date by which all district expenses would be paid, repayment of bonds.
In Compliance
37. The City will not propose the issuance of any unrated, high yield PID/TIF bond which could be labeled a “high risk bond” except for small (less than $5 million) private placements coordinated with the City’s Financial Advisor.
All projects must be carefully evaluated for
credit-worthiness and meet the criteria above whether or not a credit rating is obtained.
In Compliance
38. The City should use PID/TIF bonds only when other options have been considered.
In Compliance
39. Advance refundings and forward delivery refunding transactions should be considered when the net present value savings as a percentage of the par amount of refunded bonds is at least 4%.
Current refunding transactions should be considered when
the net present value savings as a percentage of the par amount of refunded bonds is at least 3%.
In Compliance
556
FINANCIAL MANAGEMENT PERFORMANCE CRITERIA FY 2013-14 Adopted Budget Status
Capital and Debt Management (Continued) Status
40. Each Enterprise Fund (where applicable) will maintain fully funded debt service reserves. A surety bond (or other type of credit facility such as a letter of credit) may be used in lieu of funding the reserve if the former is economically advantageous.
In Compliance
Accounting, Auditing, and Financial Planning 41. The City will establish and maintain a high degree of
accounting practices; accounting practices will conform to generally accepted accounting principles as set forth by the authoritative standard setting body for units of local government.
In Compliance The basis of budgeting for all funds essentially follows the basis of accounting (modified accrual for government funds and full accrual for enterprise and internal service funds). The major differences between the budgeting and accounting basis are: 1) encumbrances are recorded as expenditures (budget basis) rather than assigned, committed, or restricted fund balance (accounting basis); 2) compensated absences (accrued but unused leave) and other long-term liabilities are not reflected in the budget; 3) depreciation expense is not included in the budget; 4) change in fair value of investments is not recognized as income (expenditure) in the budget.
42. An annual audit will be performed by an independent public accounting firm, with the subsequent issue of an official Comprehensive Annual Financial Report (CAFR) within 120 days of the City’s fiscal year end.
Not In Compliance FY 2011-12 CAFR was issued March 26, 2013.
43. Full disclosure will be provided in the annual financial statements and bond representations.
In Compliance
557
FINANCIAL MANAGEMENT PERFORMANCE CRITERIA FY 2013-14 Adopted Budget Status
Budget Status 44. Revenues and expenditures will be projected annually for
at least three years beyond the current budget projections.
In Compliance
45. Financial systems will be maintained to monitor expenditures, revenues and performance of all municipal programs on an ongoing basis.
In Compliance
46. Operating expenditures will be programmed to include the cost of implementing service of the capital improvements, and future revenues necessary for these expenditures will be estimated and provided for prior to undertaking the capital improvement.
In Compliance
47. A report reflecting end of fiscal year status of performance against these criteria will be prepared within 60 days after official presentation of the Comprehensive Annual Financial Report to the City Council. A pro forma report reflecting Adopted Budget status will be submitted with the City Manager’s Adopted Budget each year.
In Compliance
Cash Management 48. Investments will be made in conformance with the City’s
investment policy, with the primary objectives of preservation of capital, maintenance of sufficient liquidity and maximization of return on the portfolio.
In Compliance
49. The accounting system and cash forecasting system will provide regular information concerning cash position and investment.
In Compliance
558
FINANCIAL MANAGEMENT PERFORMANCE CRITERIA FY 2013-14 Adopted Budget Status
Cash Management (Continued) Status
50. Internal Service Funds and Enterprise Funds will maintain positive cash balances.
In Compliance
Grants and Trusts 51. All grants will be managed to comply with the laws,
regulations and guidance of the grantor; and all gifts and donations will be managed and expended according to the wishes and instructions of the donor.
In Compliance
52. Prior to acceptance of proposed gifts and donations and governmental grants a fiscal review will be conducted. The review should consider matching requirements, impacts on both revenues and expenditures for the next five years, whether the objectives of the gifts, donation or grants meet the strategic goals of the City, and any potential impact of loss of funds.
In Compliance
Dallas Water Utilities 1. Current revenues will be sufficient to support current
expenses including debt service and other obligations of the system.
In Compliance
2. Long-term debt will be used only for capital expansion, replacement and improvement of plant, not for current expenses.
In Compliance
559
FINANCIAL MANAGEMENT PERFORMANCE CRITERIA FY 2013-14 Adopted Budget Status
Dallas Water Utilities (Continued) Status
3. Short-term debt, including tax-exempt commercial paper, will be used as authorized for interim financing of projects which result in capital improvements. The authorization of tax-exempt commercial paper will be limited to 20% of the 10-year capital improvement program in effect at the time of the commercial paper authorization. No commercial paper program will be authorized for more than ten years. Outstanding tax-exempt commercial paper will never exceed the amount authorized by Council.
In Compliance
4. Contingency reserves will be appropriated at a level sufficient to provide for unanticipated, nonrecurring expenditures.
In Compliance
5. Debt financing for capital projects will not exceed the useful life of the asset, and in no case shall the term exceed 30 years.
In Compliance
6. An unreserved cash balance will be maintained such that it provides a minimum quick ratio of 1.50 and at least 30 days of budgeted expenditures for operations and maintenance in net working capital.
In Compliance
7. Net revenues available for debt service should be at least 1.5 times the maximum annual principal and interest requirements of relevant outstanding revenue bonds at the end of the fiscal year, and at least 1.3 times maximum-year requirements at all times, measured during a fiscal year using the previous year net revenues available for debt service.
In Compliance 1.70 times maximum annual principal and interest
560
FINANCIAL MANAGEMENT PERFORMANCE CRITERIA FY 2013-14 Adopted Budget Status
Dallas Water Utilities (Continued) Status
8. Current revenues which are more than operating expenses and debt service will be used for capital expenditures and other water and wastewater purposes.
In Compliance
9. Funds available from current rates in each fiscal year for system rehabilitation, replacement, and expansion will be appropriated equal to or more than financial statement depreciation expense reasonably estimated in the same year.
In Compliance
10. Capital financing will be provided through a combination of revenue bonds, current revenues, contributed capital, and short-term debt. An equity to debt ratio of at least 20% should be maintained on all capital projects.
In Compliance
11. Retail cost of service studies will be performed at least every two years and reviewed annually. Rate adjustments will be recommended when required, but, normally, no more frequently than annually.
In Compliance
12. Wholesale treated water rates for customer cities and other governmental entities will be determined on the basis of the inter-city agreement currently in effect. Wholesale wastewater and untreated water rates will be determined on the basis of contractual agreements with wholesale customers. Rates shall be adjusted annually if cost of service studies indicates a need therefore.
In Compliance, current agreement approved by Council in 2010.
13. Funds generated by Dallas Water Utilities will be used solely for the development, operation, and maintenance of the water and wastewater utility system.
In Compliance
561
GLOSSARY OF BUDGET TERMINOLOGY
ACCRUAL ACCOUNTING A measure of the City’s revenues earned and expenses incurred during the period, regardless of when cash is received or paid. AD VALOREM TAX A tax levied on the assessed valuation of real land and improvements and personal property located in the City. ADDITIONAL RESOURCES Grants, trusts, or any other source of funds (excluding Capital funds) that contribute to the service. AGENCY FUND Agency fund consists of resources retained by the governmental unit as an agent for another governmental unit. APPROPRIATION An authorization made by the City Council that permits officials to incur obligations against and make expenditures of governmental resources. ARBITRAGE The interest earnings derived from invested bond proceeds or debt service fund balances. ASSESSED VALUATION This represents the total valuation of land and improvements and personal property less all properties exempt from tax. Also identified as taxable valuation. BALANCED BUDGET A budget with revenues equal to expenditures. BOND A written promise to pay a sum of money on a specified date at a specified interest rate. General Obligation (GO) and Revenue Bonds are used for funding permanent capital improvements such as buildings, streets, and bridges. BUDGET A financial plan for a specified period of time that matches all planned revenues and expenditures with various municipal services. It is the primary means by which most of the expenditure and service delivery activities of a government are controlled.
562
GLOSSARY OF BUDGET TERMINOLOGY
CAPITAL CONSTRUCTION FUND Capital construction funds are used to pay for capital projects which are not debt financed. Funding is usually derived from operating fund transfers. CAPITAL EXPENDITURE A capital expenditure is the acquisition or construction of an asset that has a useful life greater than one year. CAPITAL GIFTS AND DONATIONS Contributions by individuals or organizations for the purpose of funding capital improvements within the scope of interest of the donor. CAPITAL IMPROVEMENT PROGRAM (CIP) The City's plan to finance major infrastructure development and improvement. It is primarily funded through General Obligation Bonds and Revenue Bonds. CAPITAL PROJECTS FUND Fund used to account for and report financial sources that are restricted, committed, or assigned to expenditure for capital outlays, including the acquisition or construction of capital facilities and other capital assets. CERTIFICATE OF OBLIGATION (CO) A written promise secured by the full faith and credit of the City. Used for funding permanent capital improvements. Debt Service is paid from ad valorem taxes or operating revenues. COMMERCIAL PAPER A short-term promissory note offering flexibility to borrow as needed at the time of the actual award of projects instead of sale of bond. Used for interim financing for water and wastewater improvements. COMMUNITY DEVELOPMENT BLOCK GRANTS (CDBG) Federal funds available to municipalities specifically for activities and programs to create viable urban communities for low and moderate income persons. CONTINGENCY RESERVE A budgetary reserve which provides for unanticipated expenditures of a non-recurring nature.
563
GLOSSARY OF BUDGET TERMINOLOGY
CONTRACTUAL SERVICE The cost related to services performed for the City by individuals, businesses, or utilities. DEBT SERVICE Sometimes referred to as the Interest and Sinking Fund, it is used to account for the accumulation of financial resources to meet the requirements of general obligation debt service and debt service reserve. DEFICIT Excess of expenses over revenues at a specific point in time. DEPARTMENT A major administrative division of the City that indicates overall management responsibility for an operation or a group of related operations within a functional area. DEPRECIATION A systematic allocation of cost for a tangible asset during its estimated useful life. EMERGENCY RESERVE A budgetary reserve which provides for temporary financing of unforeseen needs of an emergency nature, unanticipated fluctuations in revenue, and individual judgment/settlement payments exceeding a $5,000,000 liability cap. ENCUMBRANCE The commitment of appropriated funds to purchase an item or service. ENTERPRISE FUND These funds are fully supported by charges for service. Each fund establishes revenue-based fees and charges to recoup the costs of providing the services. EQUIPMENT ACQUISITION NOTES Short term note financing secured by the full faith and credit of the City used for funding capital equipment purchases. Debt service requirements are met with ad valorem or operating transfers from fee supported funds.
564
GLOSSARY OF BUDGET TERMINOLOGY
FIDUCIARY FUND This type of fund accounts for assets held by the City in a trustee or agency capacity. FINANCIAL MANAGEMENT PERFORMANCE CRITERIA The City maintains Financial Management Performance Criteria (FMPC), established in the late 1970’s to reflect financial policies that the City believes necessary for planning purposes and to measure sound financial condition. These criteria are applied to the ongoing management of the City’s finances and covers the following aspects of financial management: operating programs; capital and debt management; accounting, auditing and financial planning; cash management; grants and trusts; and Dallas Water Utilities. FINES AND FORFEITURES Charges levied by City departments to individuals and businesses that are resolved through payment or loss of property. FISCAL YEAR The twelve-month period beginning October 1st and ending the following September 30th to which the annual budget applies. FRANCHISE FEE A fee levied by the City Council on businesses that use the City’s right-of-way to deliver services. This fee is usually charged as a percentage of gross receipts. FULL TIME EQUIVALENTS (FTE) A unit used to quantify staffing. One FTE is a full year, 40 hour per week position. A part-time position working 20 hours per week or a temporary full-time position working six months would be 0.5 FTEs. FULL YEAR FUNDING The additional required funding necessary for twelve full months of operations related to positions and/or program funding added in the previous fiscal year. This funding complements prior year funding. FUND A fiscal and accounting entity with a self-balancing set of accounts (assets, liabilities, fund balance) which are segregated for the purpose of carrying on specific activities or attaining certain objectives in accordance with special regulations, restrictions, or limitations.
565
GLOSSARY OF BUDGET TERMINOLOGY
FUND BALANCE The difference between a fund’s assets and liabilities. For the purposes of this document, two different calculations are utilized. For the General Fund, the unreserved undesignated portion of fund balance is reported. For Other Funds, fund balance is reported as current assets less current liabilities less reserves for encumbrances. For non-enterprise funds, sick and vacation accruals are excluded. For multi-year funds, reserves for encumbrances are not excluded. For funds that utilize inventory accounting, inventory encumbrances are not deducted (to avoid double-reduction). GENERAL CAPITAL RESERVE Depository for proceeds from property sale, abandonments, or reimbursements of prior loans/advances providing funds for Capital Improvements and/or to provide interim financing for Capital Projects. GENERAL FUND This is the main operating fund of the City. It accounts for basic operating services such as Police, Fire, Streets, Sanitation, Code Enforcement, Park and Recreation, Library, Environmental and Health Services, and others. GENERAL OBLIGATION BOND Bonds used for funding permanent public capital improvements such as buildings, streets, and bridges. The repayment of these bonds is made from the levy of property tax. Voter approval is required to issue these bonds. GOVERNMENTAL FUNDS Governmental funds are made up of the general fund, special revenue funds, capital projects funds, debt service funds, and permanent funds. GRANT A contribution by a government or other organization to support a particular function. Typically, these contributions are made to a local government from the state or federal government. IN SERVICE DATE Date on which a City facility is available to the public. INTER-DEPARTMENT FINANCING Short-term interim financing from one City department to another City department (necessary due to timing of project with permanent financing mechanism) with the repayment of the loan plus interest once permanent financing is in place.
566
GLOSSARY OF BUDGET TERMINOLOGY
INTEREST EARNED Assets collected through investment of cash. INTERFUND REVENUE Assets transferred from one fund to another for services rendered. These are revenues from various funds that provide indirect cost payments to the General Fund. In addition, this revenue also includes Dallas Water Utilities street rental payment and surplus property auction revenue. INTERGOVERNMENTAL REVENUE Money collected from other governmental entities. INTERNAL SERVICE FUND Fund used to account for goods or services given to one department by another on a cost reimbursement basis. KEY FOCUS AREA Dallas City Council established the following Key Focus Areas: Public Safety; Economic Vibrancy; Clean, Healthy Environment; Culture, Arts and Recreation; Education and E3 Government. LIABILITY RESERVE Funds reserved for outstanding current and forecasted future liabilities. LICENSE AND PERMITS REVENUE These are revenues related to various license and permit fees. MASTER LEASE A short-term financing program offering flexibility to borrow as needed at the time of the actual purchase of equipment and technology improvements instead of the sale of equipment notes. MISCELLANEOUS REVENUE These are miscellaneous revenues from rental, gifts and donations, and collections for damages to City property.
567
GLOSSARY OF BUDGET TERMINOLOGY
MODIFIED ACCRUAL BASIS OF ACCOUNTING Basis of accounting according to which (a) revenues are recognized in the accounting period in which they became available and measurable and (b) expenditures are recognized in the accounting period in which the fund liability is incurred, if measurable, except for unmatured interest on general long-term debt and certain similar accrued obligations, which should be recognized when due. ONE TIME RESOURCES These are non-recurring revenues, which will be used for one-time expenses. OPERATING AND MAINTENANCE COST Operational cost incurred by a facility for one year. OPERATING BUDGET The personnel, supply, service, and short term capital expenditures of a department. PERMANENT FUND Fund used to account for and report resources that are restricted to the extent that only earnings, and not principal, may be used for the benefit of the government or its citizenry. PROGRAM A sub-unit of a department. PROPRIETARY FUND A proprietary fund is one having profit and loss aspects. The two types of proprietary funds are enterprise and internal service funds. REVENUE Receipt of cash from other entity that requires a cash receipt to be entered in the financial system. REIMBURSEMENT Repayment of funds from one fund or department to another for a specific purpose.
568
GLOSSARY OF BUDGET TERMINOLOGY
SERVICE A specific operation performed within a department or office. SPECIAL REVENUE FUND Fund used to account for and report the proceeds of specific revenue sources that are restricted or committed to expenditure for specified purposes other than debt service or capital projects.
569
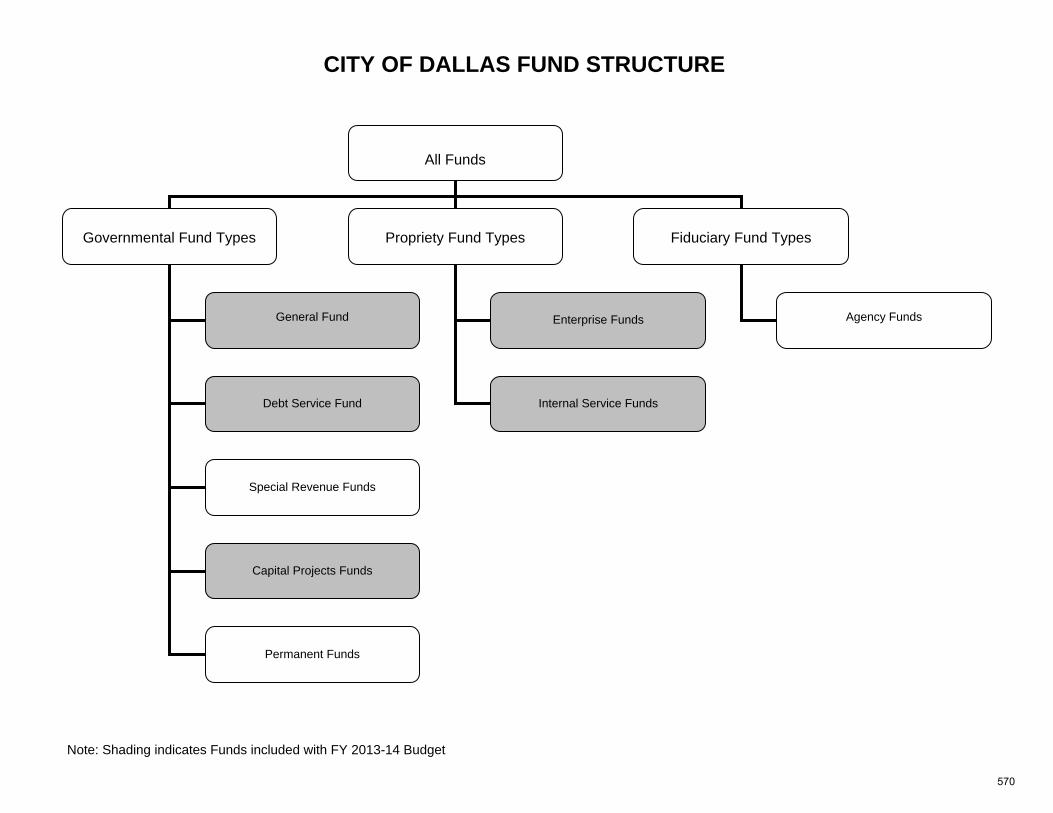
Note: Shading indicates Funds included with FY 2013-14 Budget
CITY OF DALLAS FUND STRUCTURE
All Funds
Governmental Fund Types
Propriety Fund Types
Fiduciary Fund Types
General Fund
Debt Service Fund
Special Revenue Funds
Capital Projects Funds
Enterprise Funds
Internal Service Funds
Agency Funds
Permanent Funds
570
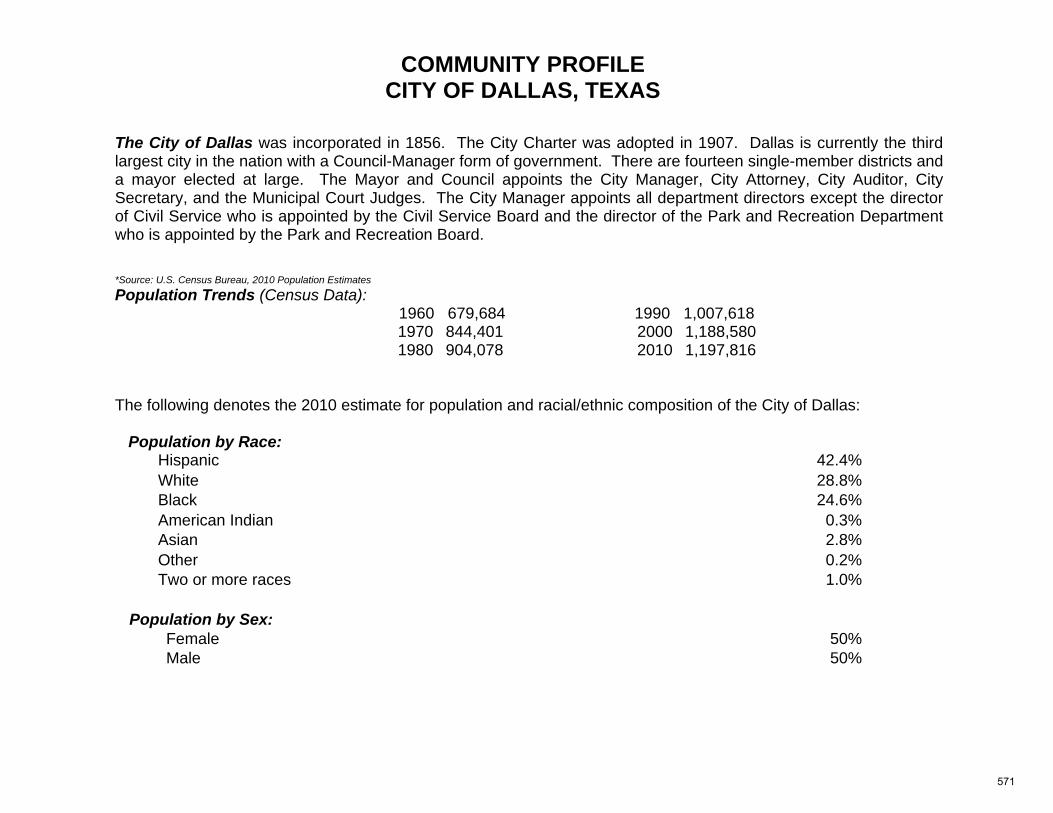
COMMUNITY PROFILE CITY OF DALLAS, TEXAS
The City of Dallas was incorporated in 1856. The City Charter was adopted in 1907. Dallas is currently the third largest city in the nation with a Council-Manager form of government. There are fourteen single-member districts and a mayor elected at large. The Mayor and Council appoints the City Manager, City Attorney, City Auditor, City Secretary, and the Municipal Court Judges. The City Manager appoints all department directors except the director of Civil Service who is appointed by the Civil Service Board and the director of the Park and Recreation Department who is appointed by the Park and Recreation Board. *Source: U.S. Census Bureau, 2010 Population Estimates Population Trends (Census Data):
1960 679,684 1990 1,007,618 1970 844,401 2000 1,188,580 1980 904,078 2010 1,197,816
The following denotes the 2010 estimate for population and racial/ethnic composition of the City of Dallas: Population by Race:
Hispanic 42.4% White 28.8% Black 24.6% American Indian 0.3% Asian 2.8% Other 0.2% Two or more races 1.0%
Population by Sex:
Female 50% Male 50%
571
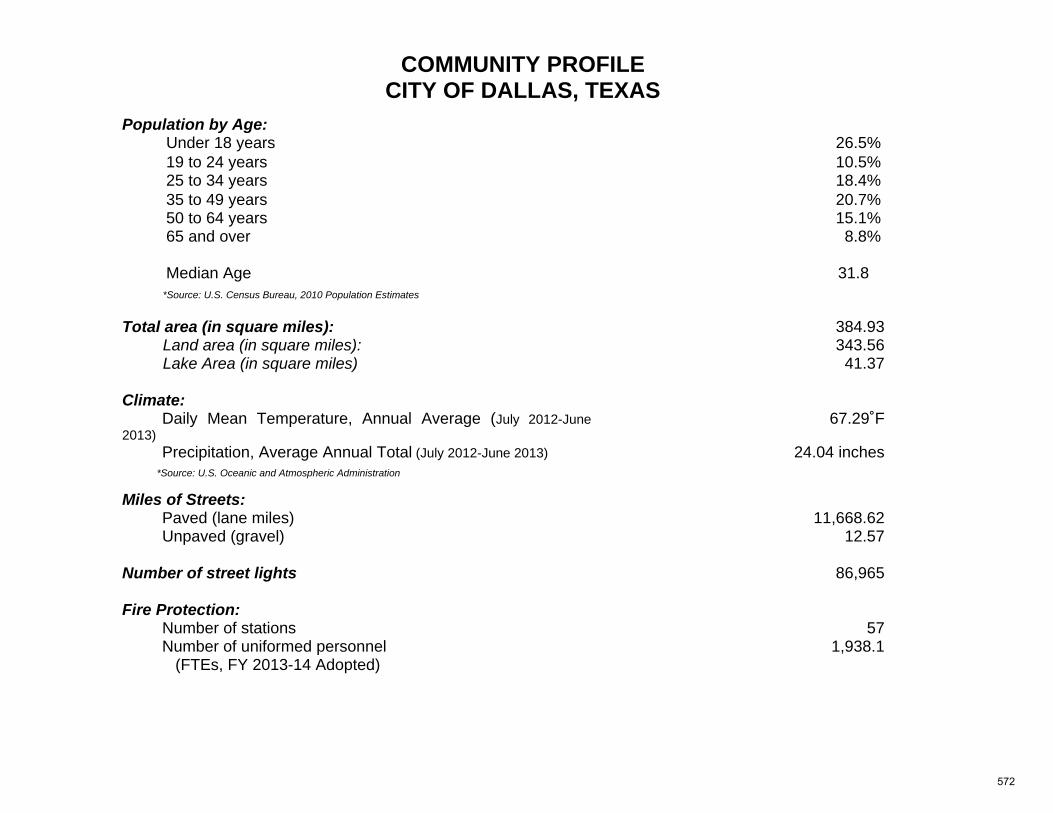
COMMUNITY PROFILE CITY OF DALLAS, TEXAS
Population by Age: Under 18 years 26.5%
19 to 24 years 10.5% 25 to 34 years 18.4% 35 to 49 years
50 to 64 years 65 and over
20.7% 15.1% 8.8%
Median Age 31.8
*Source: U.S. Census Bureau, 2010 Population Estimates Total area (in square miles):
Land area (in square miles): 384.93 343.56
Lake Area (in square miles) 41.37 Climate: Daily Mean Temperature, Annual Average (July 2012-June 2013)
67.29˚F
Precipitation, Average Annual Total (July 2012-June 2013) 24.04 inches
*Source: U.S. Oceanic and Atmospheric Administration
Miles of Streets: Paved (lane miles) 11,668.62 Unpaved (gravel) 12.57 Number of street lights 86,965 Fire Protection:
Number of stations 57 Number of uniformed personnel (FTEs, FY 2013-14 Adopted)
1,938.1
572
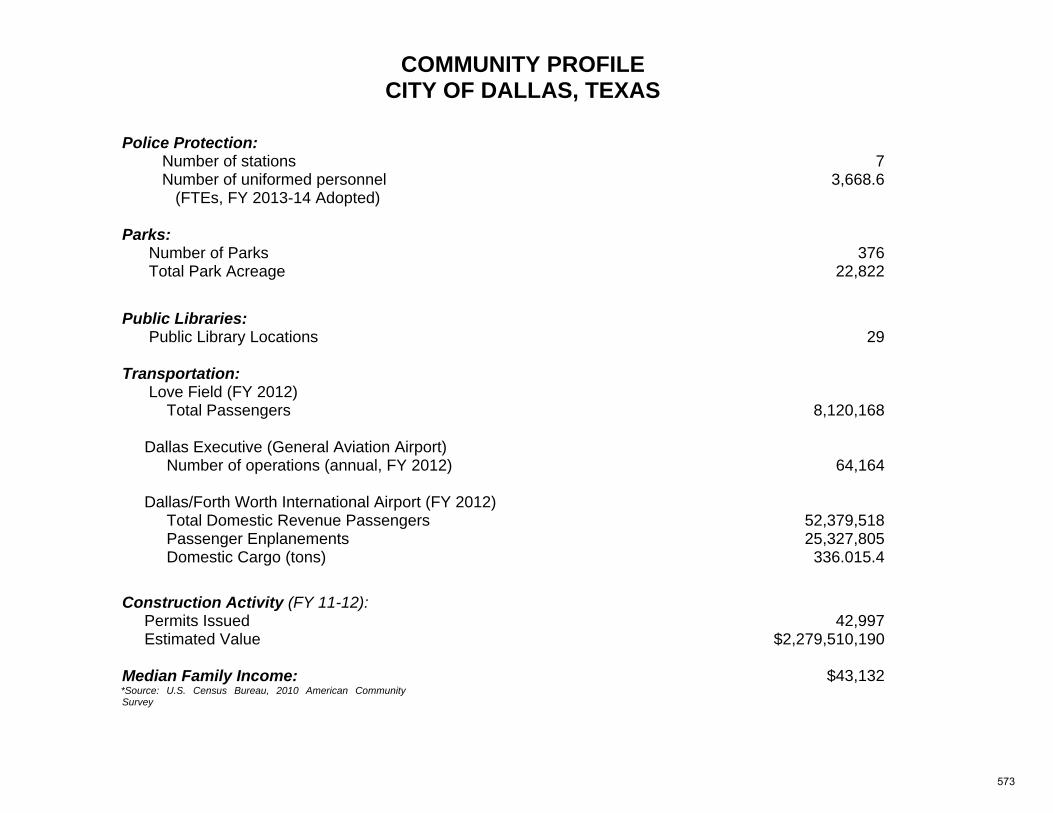
COMMUNITY PROFILE CITY OF DALLAS, TEXAS
Police Protection: Number of stations 7 Number of uniformed personnel (FTEs, FY 2013-14 Adopted)
3,668.6
Parks:
Number of Parks 376 Total Park Acreage 22,822
Public Libraries: Public Library Locations 29 Transportation:
Love Field (FY 2012) Total Passengers 8,120,168 Dallas Executive (General Aviation Airport)
Number of operations (annual, FY 2012) 64,164
Dallas/Forth Worth International Airport (FY 2012) Total Domestic Revenue Passengers 52,379,518 Passenger Enplanements 25,327,805 Domestic Cargo (tons) 336.015.4
Construction Activity (FY 11-12): Permits Issued 42,997 Estimated Value $2,279,510,190 Median Family Income: $43,132 *Source: U.S. Census Bureau, 2010 American Community Survey
573
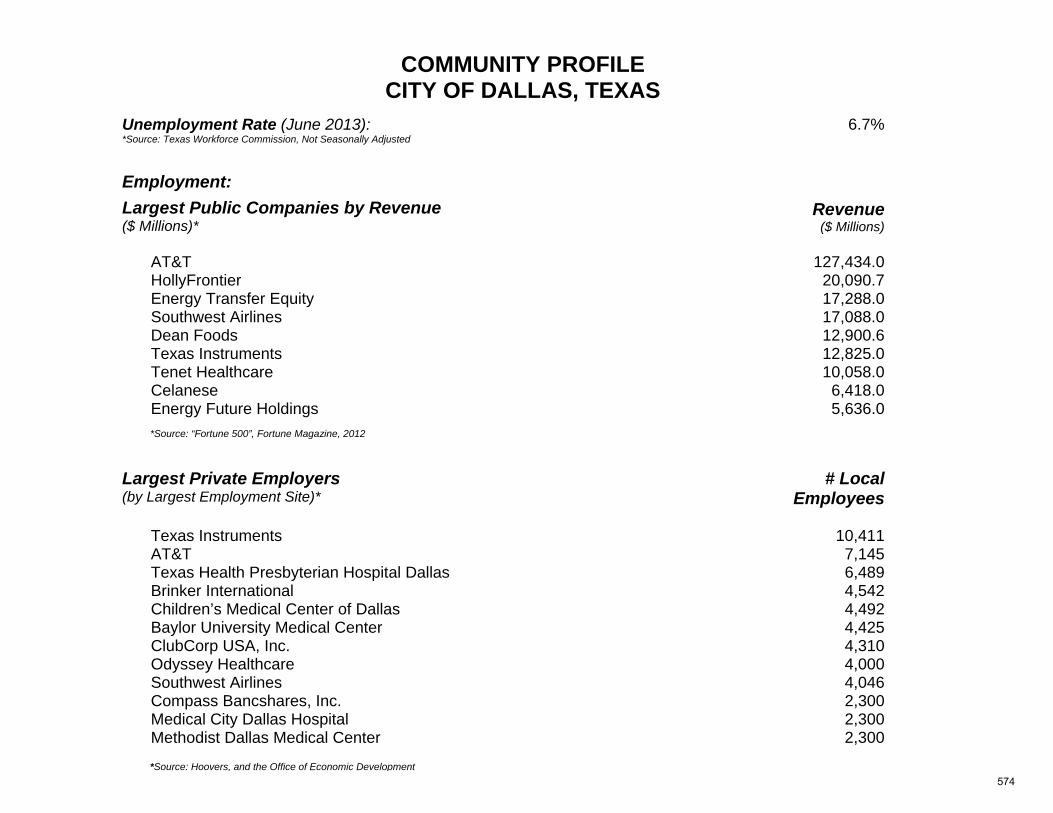
COMMUNITY PROFILE CITY OF DALLAS, TEXAS
Unemployment Rate (June 2013): 6.7% *Source: Texas Workforce Commission, Not Seasonally Adjusted Employment:
Largest Public Companies by Revenue ($ Millions)*
Revenue ($ Millions)
AT&T 127,434.0 HollyFrontier 20,090.7 Energy Transfer Equity 17,288.0 Southwest Airlines 17,088.0 Dean Foods 12,900.6 Texas Instruments 12,825.0 Tenet Healthcare 10,058.0 Celanese 6,418.0 Energy Future Holdings 5,636.0
Largest Private Employers (by Largest Employment Site)*
# Local Employees
Texas Instruments 10,411 AT&T 7,145 Texas Health Presbyterian Hospital Dallas 6,489 Brinker International 4,542 Children’s Medical Center of Dallas 4,492 Baylor University Medical Center 4,425 ClubCorp USA, Inc. 4,310 Odyssey Healthcare 4,000 Southwest Airlines 4,046 Compass Bancshares, Inc. 2,300 Medical City Dallas Hospital 2,300 Methodist Dallas Medical Center 2,300
*Source: “Fortune 500”, Fortune Magazine, 2012
*Source: Hoovers, and the Office of Economic Development574
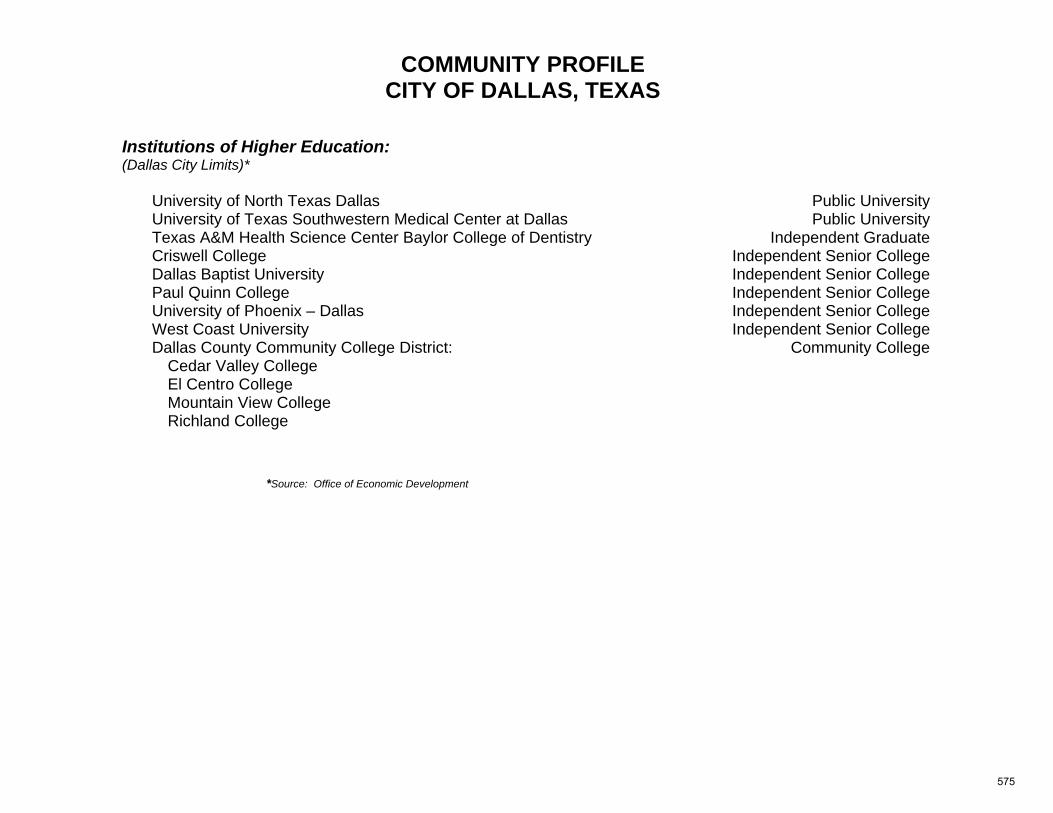
COMMUNITY PROFILE CITY OF DALLAS, TEXAS
Institutions of Higher Education: (Dallas City Limits)*
University of North Texas Dallas Public University University of Texas Southwestern Medical Center at Dallas Public University Texas A&M Health Science Center Baylor College of Dentistry Independent Graduate Criswell College Independent Senior College Dallas Baptist University Independent Senior College Paul Quinn College Independent Senior College University of Phoenix – Dallas Independent Senior College West Coast University Independent Senior College Dallas County Community College District: Community College
Cedar Valley College El Centro College Mountain View College Richland College
*Source: Office of Economic Development
575
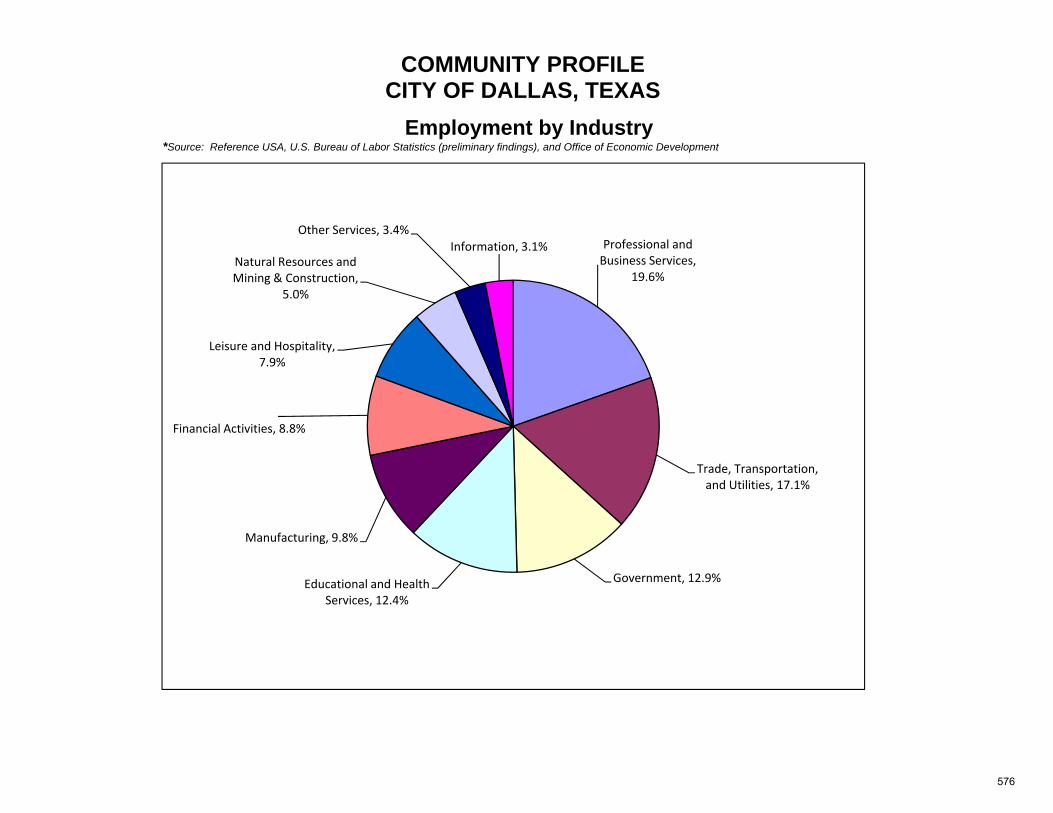
COMMUNITY PROFILE CITY OF DALLAS, TEXAS
Professional and Business Services,
19.6%
Trade, Transportation, and Utilities, 17.1%
Government, 12.9%Educational and Health Services, 12.4%
Manufacturing, 9.8%
Financial Activities, 8.8%
Leisure and Hospitality, 7.9%
Natural Resources and Mining & Construction,
5.0%
Other Services, 3.4%Information, 3.1%
Employment by Industry *Source: Reference USA, U.S. Bureau of Labor Statistics (preliminary findings), and Office of Economic Development
576
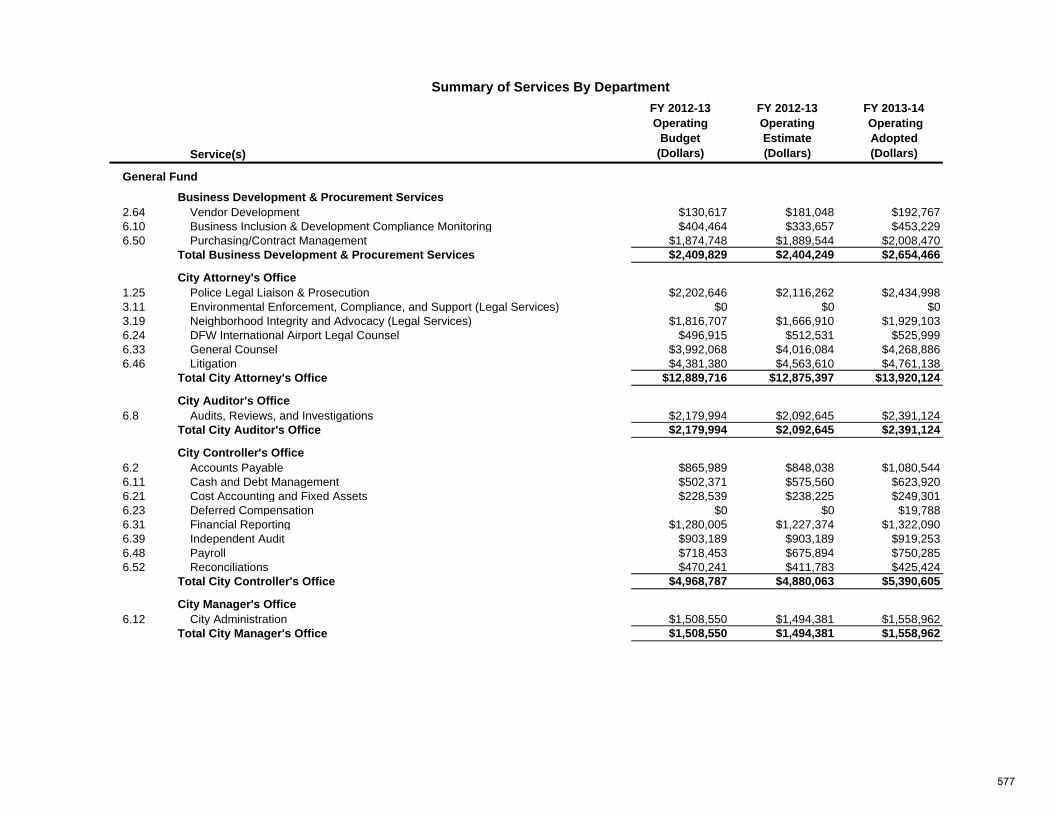
Service(s)
FY 2012-13Operating
Budget(Dollars)
FY 2012-13Operating Estimate(Dollars)
FY 2013-14 Operating Adopted(Dollars)
General Fund
2.64 Vendor Development $130,617 $181,048 $192,767 6.10 Business Inclusion & Development Compliance Monitoring $404,464 $333,657 $453,229 6.50 Purchasing/Contract Management $1,874,748 $1,889,544 $2,008,470
$2,409,829 $2,404,249 $2,654,466
1.25 Police Legal Liaison & Prosecution $2,202,646 $2,116,262 $2,434,998 3.11 Environmental Enforcement, Compliance, and Support (Legal Services) $0 $0 $0 3.19 Neighborhood Integrity and Advocacy (Legal Services) $1,816,707 $1,666,910 $1,929,103 6.24 DFW International Airport Legal Counsel $496,915 $512,531 $525,999 6.33 General Counsel $3,992,068 $4,016,084 $4,268,886 6.46 Litigation $4,381,380 $4,563,610 $4,761,138
$12,889,716 $12,875,397 $13,920,124
6.8 Audits, Reviews, and Investigations $2,179,994 $2,092,645 $2,391,124 $2,179,994 $2,092,645 $2,391,124
6.2 Accounts Payable $865,989 $848,038 $1,080,544 6.11 Cash and Debt Management $502,371 $575,560 $623,920 6.21 Cost Accounting and Fixed Assets $228,539 $238,225 $249,301 6.23 Deferred Compensation $0 $0 $19,788 6.31 Financial Reporting $1,280,005 $1,227,374 $1,322,090 6.39 Independent Audit $903,189 $903,189 $919,253 6.48 Payroll $718,453 $675,894 $750,285 6.52 Reconciliations $470,241 $411,783 $425,424
$4,968,787 $4,880,063 $5,390,605
6.12 City Administration $1,508,550 $1,494,381 $1,558,962 $1,508,550 $1,494,381 $1,558,962
Summary of Services By Department
City Manager's Office
Total City Manager's Office
City Controller's Office
Total City Controller's Office
Business Development & Procurement Services
Total Business Development & Procurement Services
City Attorney's Office
Total City Attorney's Office
City Auditor's Office
Total City Auditor's Office
577
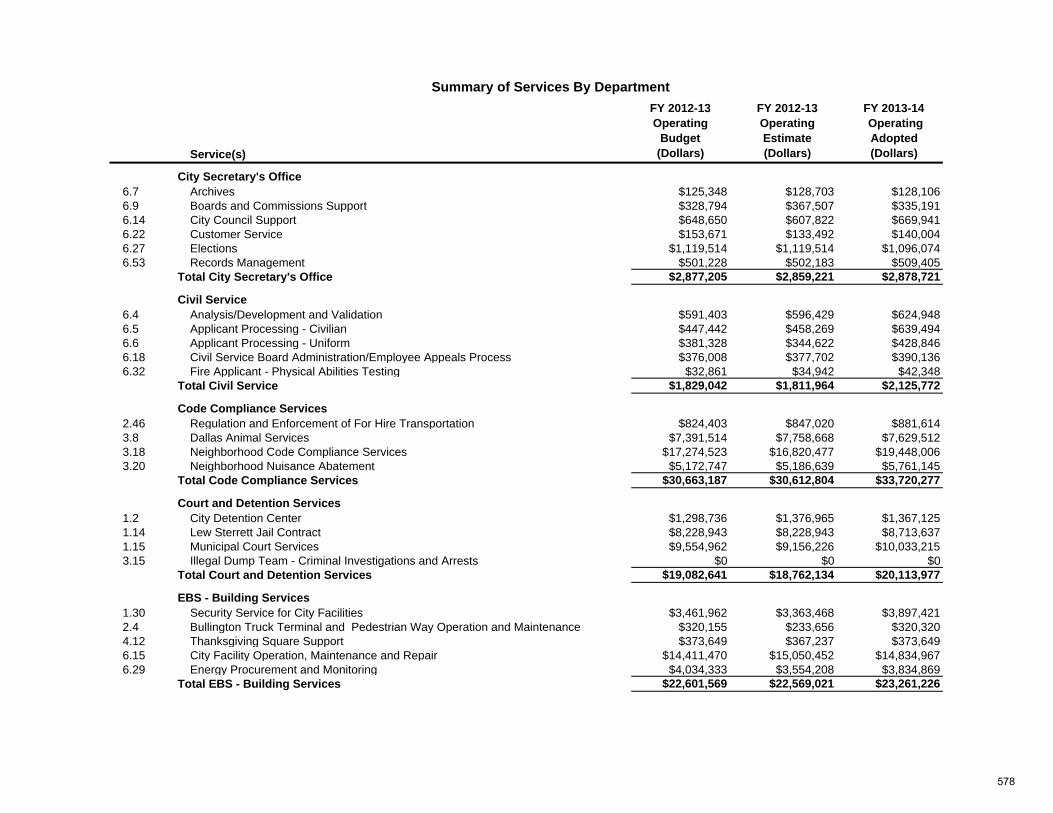
Service(s)
FY 2012-13Operating
Budget(Dollars)
FY 2012-13Operating Estimate(Dollars)
FY 2013-14 Operating Adopted(Dollars)
Summary of Services By Department
6.7 Archives $125,348 $128,703 $128,106 6.9 Boards and Commissions Support $328,794 $367,507 $335,191 6.14 City Council Support $648,650 $607,822 $669,941 6.22 Customer Service $153,671 $133,492 $140,004 6.27 Elections $1,119,514 $1,119,514 $1,096,074 6.53 Records Management $501,228 $502,183 $509,405
$2,877,205 $2,859,221 $2,878,721
6.4 Analysis/Development and Validation $591,403 $596,429 $624,948 6.5 Applicant Processing - Civilian $447,442 $458,269 $639,494 6.6 Applicant Processing - Uniform $381,328 $344,622 $428,846 6.18 Civil Service Board Administration/Employee Appeals Process $376,008 $377,702 $390,136 6.32 Fire Applicant - Physical Abilities Testing $32,861 $34,942 $42,348
$1,829,042 $1,811,964 $2,125,772
2.46 Regulation and Enforcement of For Hire Transportation $824,403 $847,020 $881,614 3.8 Dallas Animal Services $7,391,514 $7,758,668 $7,629,512 3.18 Neighborhood Code Compliance Services $17,274,523 $16,820,477 $19,448,006 3.20 Neighborhood Nuisance Abatement $5,172,747 $5,186,639 $5,761,145
$30,663,187 $30,612,804 $33,720,277
1.2 City Detention Center $1,298,736 $1,376,965 $1,367,125 1.14 Lew Sterrett Jail Contract $8,228,943 $8,228,943 $8,713,637 1.15 Municipal Court Services $9,554,962 $9,156,226 $10,033,215 3.15 Illegal Dump Team - Criminal Investigations and Arrests $0 $0 $0
$19,082,641 $18,762,134 $20,113,977
1.30 Security Service for City Facilities $3,461,962 $3,363,468 $3,897,421 2.4 Bullington Truck Terminal and Pedestrian Way Operation and Maintenance $320,155 $233,656 $320,320 4.12 Thanksgiving Square Support $373,649 $367,237 $373,649 6.15 City Facility Operation, Maintenance and Repair $14,411,470 $15,050,452 $14,834,967 6.29 Energy Procurement and Monitoring $4,034,333 $3,554,208 $3,834,869
$22,601,569 $22,569,021 $23,261,226
Total Code Compliance Services
Court and Detention Services
Total Court and Detention Services
EBS - Building Services
Total EBS - Building Services
City Secretary's Office
Total City Secretary's Office
Civil Service
Total Civil Service
Code Compliance Services
578
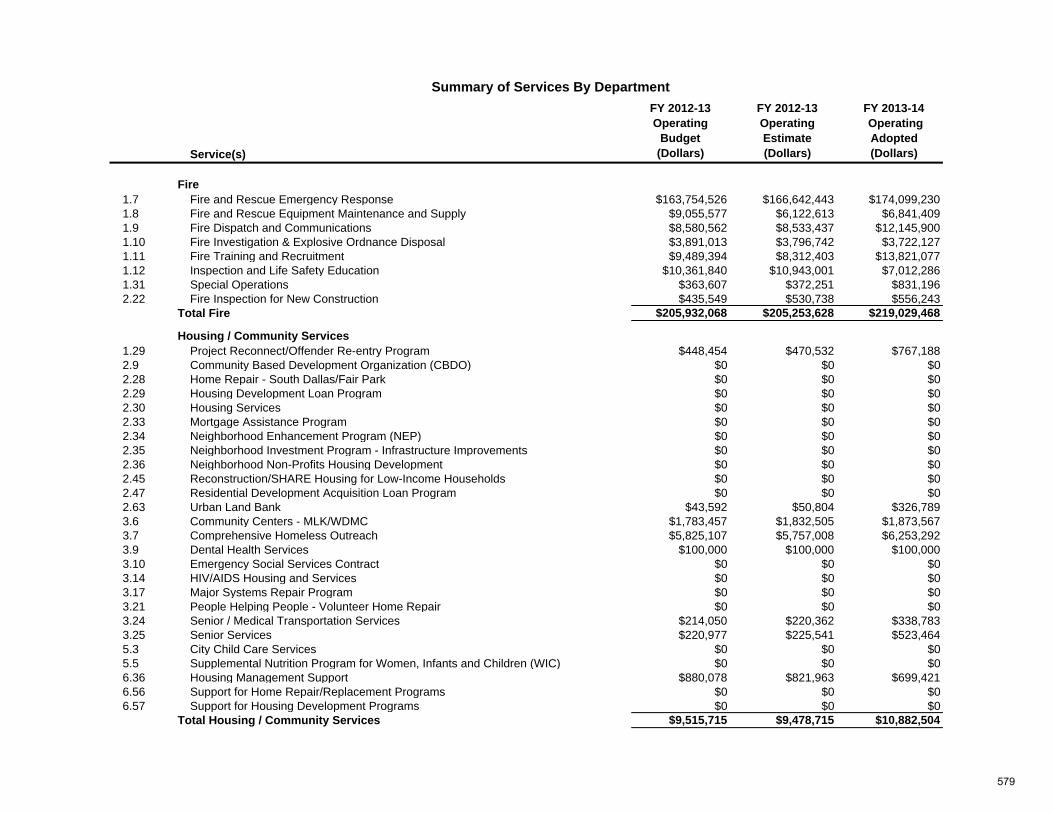
Service(s)
FY 2012-13Operating
Budget(Dollars)
FY 2012-13Operating Estimate(Dollars)
FY 2013-14 Operating Adopted(Dollars)
Summary of Services By Department
1.7 Fire and Rescue Emergency Response $163,754,526 $166,642,443 $174,099,230 1.8 Fire and Rescue Equipment Maintenance and Supply $9,055,577 $6,122,613 $6,841,409 1.9 Fire Dispatch and Communications $8,580,562 $8,533,437 $12,145,900 1.10 Fire Investigation & Explosive Ordnance Disposal $3,891,013 $3,796,742 $3,722,127 1.11 Fire Training and Recruitment $9,489,394 $8,312,403 $13,821,077 1.12 Inspection and Life Safety Education $10,361,840 $10,943,001 $7,012,286 1.31 Special Operations $363,607 $372,251 $831,196 2.22 Fire Inspection for New Construction $435,549 $530,738 $556,243
$205,932,068 $205,253,628 $219,029,468
1.29 Project Reconnect/Offender Re-entry Program $448,454 $470,532 $767,188 2.9 Community Based Development Organization (CBDO) $0 $0 $0 2.28 Home Repair - South Dallas/Fair Park $0 $0 $0 2.29 Housing Development Loan Program $0 $0 $0 2.30 Housing Services $0 $0 $0 2.33 Mortgage Assistance Program $0 $0 $0 2.34 Neighborhood Enhancement Program (NEP) $0 $0 $0 2.35 Neighborhood Investment Program - Infrastructure Improvements $0 $0 $0 2.36 Neighborhood Non-Profits Housing Development $0 $0 $0 2.45 Reconstruction/SHARE Housing for Low-Income Households $0 $0 $0 2.47 Residential Development Acquisition Loan Program $0 $0 $0 2.63 Urban Land Bank $43,592 $50,804 $326,789 3.6 Community Centers - MLK/WDMC $1,783,457 $1,832,505 $1,873,567 3.7 Comprehensive Homeless Outreach $5,825,107 $5,757,008 $6,253,292 3.9 Dental Health Services $100,000 $100,000 $100,000 3.10 Emergency Social Services Contract $0 $0 $0 3.14 HIV/AIDS Housing and Services $0 $0 $0 3.17 Major Systems Repair Program $0 $0 $0 3.21 People Helping People - Volunteer Home Repair $0 $0 $0 3.24 Senior / Medical Transportation Services $214,050 $220,362 $338,783 3.25 Senior Services $220,977 $225,541 $523,464 5.3 City Child Care Services $0 $0 $0 5.5 Supplemental Nutrition Program for Women, Infants and Children (WIC) $0 $0 $0 6.36 Housing Management Support $880,078 $821,963 $699,421 6.56 Support for Home Repair/Replacement Programs $0 $0 $0 6.57 Support for Housing Development Programs $0 $0 $0
$9,515,715 $9,478,715 $10,882,504 Total Housing / Community Services
Total Fire
Fire
Housing / Community Services
579
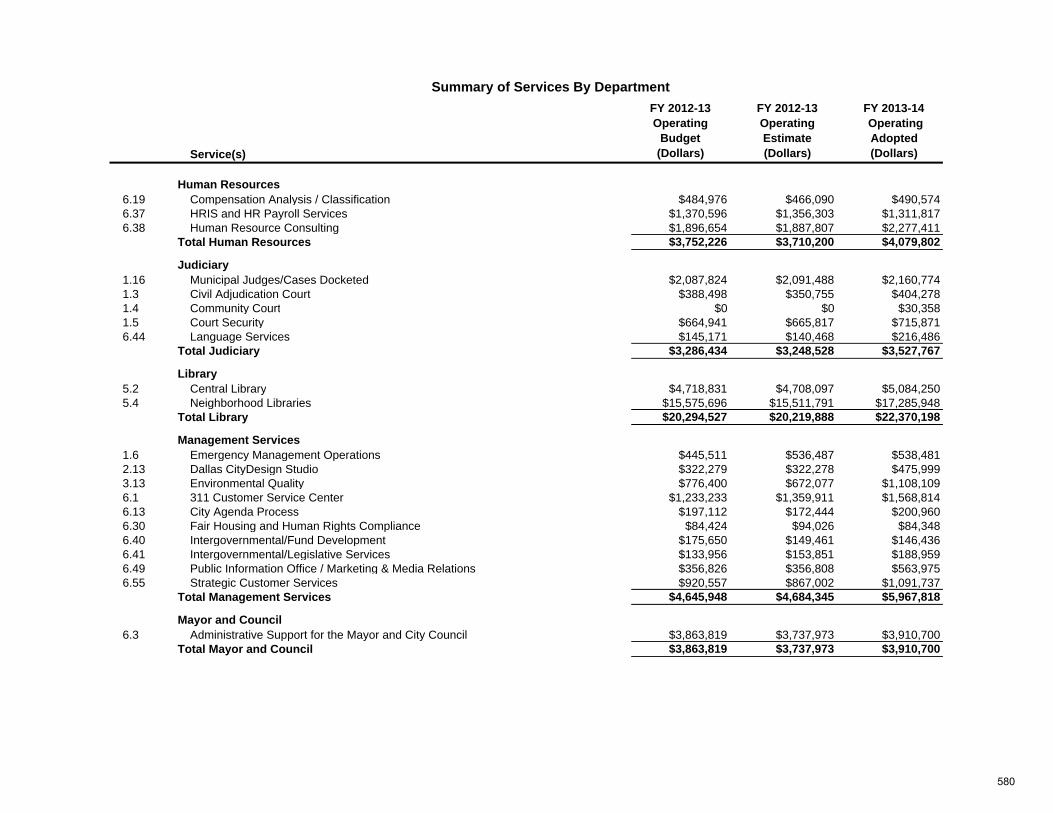
Service(s)
FY 2012-13Operating
Budget(Dollars)
FY 2012-13Operating Estimate(Dollars)
FY 2013-14 Operating Adopted(Dollars)
Summary of Services By Department
6.19 Compensation Analysis / Classification $484,976 $466,090 $490,574 6.37 HRIS and HR Payroll Services $1,370,596 $1,356,303 $1,311,817 6.38 Human Resource Consulting $1,896,654 $1,887,807 $2,277,411
$3,752,226 $3,710,200 $4,079,802
1.16 Municipal Judges/Cases Docketed $2,087,824 $2,091,488 $2,160,774 1.3 Civil Adjudication Court $388,498 $350,755 $404,278 1.4 Community Court $0 $0 $30,358 1.5 Court Security $664,941 $665,817 $715,871 6.44 Language Services $145,171 $140,468 $216,486
$3,286,434 $3,248,528 $3,527,767
5.2 Central Library $4,718,831 $4,708,097 $5,084,250 5.4 Neighborhood Libraries $15,575,696 $15,511,791 $17,285,948
$20,294,527 $20,219,888 $22,370,198
1.6 Emergency Management Operations $445,511 $536,487 $538,481 2.13 Dallas CityDesign Studio $322,279 $322,278 $475,999 3.13 Environmental Quality $776,400 $672,077 $1,108,109 6.1 311 Customer Service Center $1,233,233 $1,359,911 $1,568,814 6.13 City Agenda Process $197,112 $172,444 $200,960 6.30 Fair Housing and Human Rights Compliance $84,424 $94,026 $84,348 6.40 Intergovernmental/Fund Development $175,650 $149,461 $146,436 6.41 Intergovernmental/Legislative Services $133,956 $153,851 $188,959 6.49 Public Information Office / Marketing & Media Relations $356,826 $356,808 $563,975 6.55 Strategic Customer Services $920,557 $867,002 $1,091,737
$4,645,948 $4,684,345 $5,967,818
6.3 Administrative Support for the Mayor and City Council $3,863,819 $3,737,973 $3,910,700 $3,863,819 $3,737,973 $3,910,700
Management Services
Total Management Services
Mayor and Council
Total Mayor and Council
Human Resources
Total Human Resources
Total Judiciary
Library
Total Library
Judiciary
580
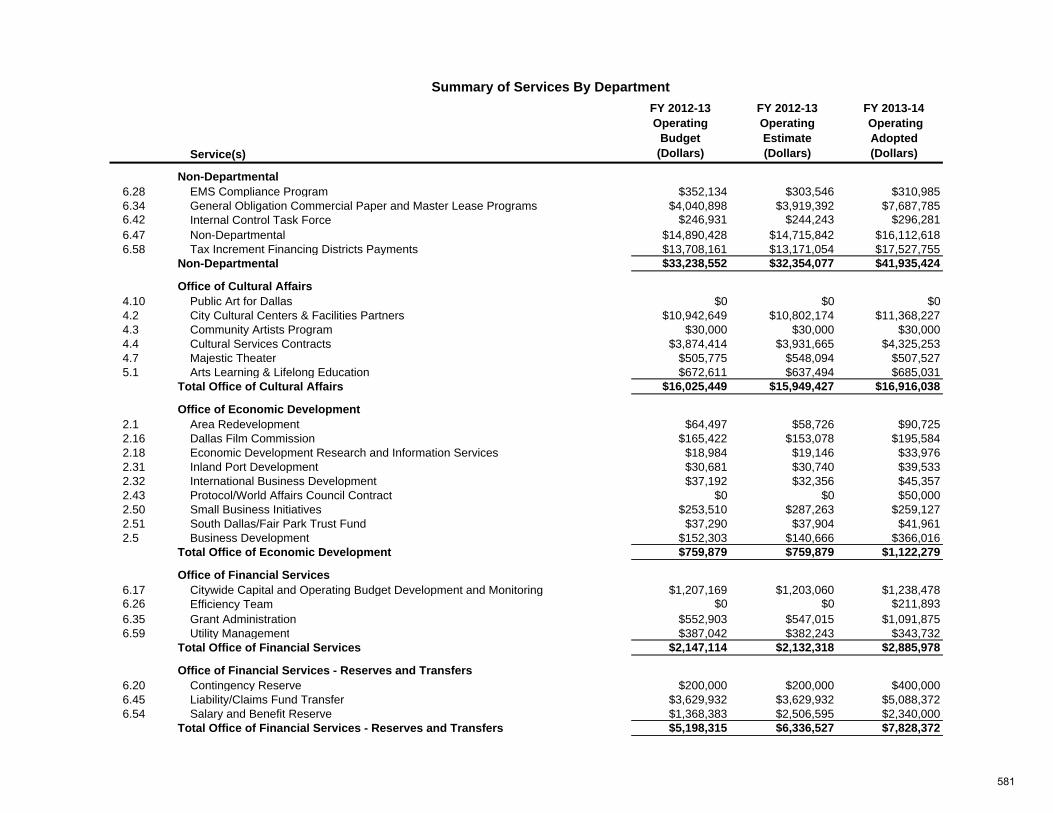
Service(s)
FY 2012-13Operating
Budget(Dollars)
FY 2012-13Operating Estimate(Dollars)
FY 2013-14 Operating Adopted(Dollars)
Summary of Services By Department
6.28 EMS Compliance Program $352,134 $303,546 $310,985 6.34 General Obligation Commercial Paper and Master Lease Programs $4,040,898 $3,919,392 $7,687,785 6.42 Internal Control Task Force $246,931 $244,243 $296,281 6.47 Non-Departmental $14,890,428 $14,715,842 $16,112,618 6.58 Tax Increment Financing Districts Payments $13,708,161 $13,171,054 $17,527,755
$33,238,552 $32,354,077 $41,935,424
4.10 Public Art for Dallas $0 $0 $0 4.2 City Cultural Centers & Facilities Partners $10,942,649 $10,802,174 $11,368,227 4.3 Community Artists Program $30,000 $30,000 $30,000 4.4 Cultural Services Contracts $3,874,414 $3,931,665 $4,325,253 4.7 Majestic Theater $505,775 $548,094 $507,527 5.1 Arts Learning & Lifelong Education $672,611 $637,494 $685,031
$16,025,449 $15,949,427 $16,916,038
2.1 Area Redevelopment $64,497 $58,726 $90,725 2.16 Dallas Film Commission $165,422 $153,078 $195,584 2.18 Economic Development Research and Information Services $18,984 $19,146 $33,976 2.31 Inland Port Development $30,681 $30,740 $39,533 2.32 International Business Development $37,192 $32,356 $45,357 2.43 Protocol/World Affairs Council Contract $0 $0 $50,000 2.50 Small Business Initiatives $253,510 $287,263 $259,127 2.51 South Dallas/Fair Park Trust Fund $37,290 $37,904 $41,961 2.5 Business Development $152,303 $140,666 $366,016
$759,879 $759,879 $1,122,279
6.17 Citywide Capital and Operating Budget Development and Monitoring $1,207,169 $1,203,060 $1,238,478 6.26 Efficiency Team $0 $0 $211,893 6.35 Grant Administration $552,903 $547,015 $1,091,875 6.59 Utility Management $387,042 $382,243 $343,732
$2,147,114 $2,132,318 $2,885,978
6.20 Contingency Reserve $200,000 $200,000 $400,000 6.45 Liability/Claims Fund Transfer $3,629,932 $3,629,932 $5,088,372 6.54 Salary and Benefit Reserve $1,368,383 $2,506,595 $2,340,000
$5,198,315 $6,336,527 $7,828,372
Office of Financial Services - Reserves and Transfers
Total Office of Financial Services - Reserves and Transfers
Office of Economic Development
Total Office of Economic Development
Office of Financial Services
Total Office of Financial Services
Office of Cultural Affairs
Total Office of Cultural Affairs
Non-Departmental
Non-Departmental
581
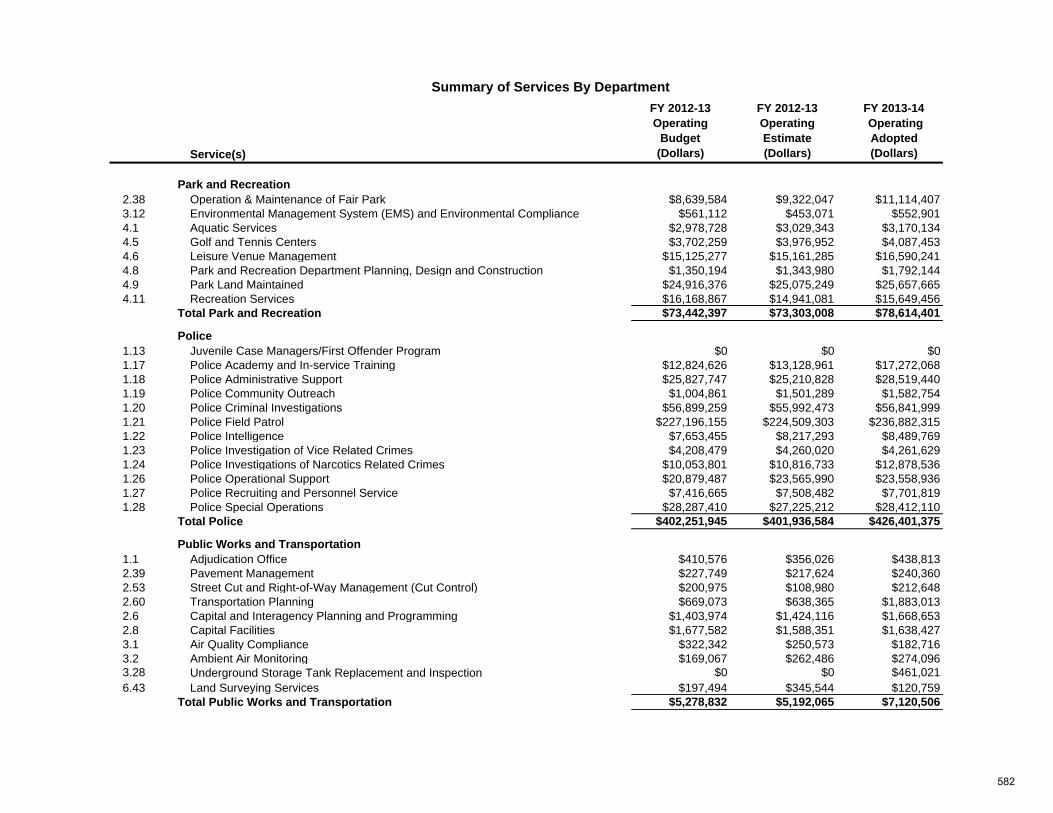
Service(s)
FY 2012-13Operating
Budget(Dollars)
FY 2012-13Operating Estimate(Dollars)
FY 2013-14 Operating Adopted(Dollars)
Summary of Services By Department
2.38 Operation & Maintenance of Fair Park $8,639,584 $9,322,047 $11,114,407 3.12 Environmental Management System (EMS) and Environmental Compliance $561,112 $453,071 $552,901 4.1 Aquatic Services $2,978,728 $3,029,343 $3,170,134 4.5 Golf and Tennis Centers $3,702,259 $3,976,952 $4,087,453 4.6 Leisure Venue Management $15,125,277 $15,161,285 $16,590,241 4.8 Park and Recreation Department Planning, Design and Construction $1,350,194 $1,343,980 $1,792,144 4.9 Park Land Maintained $24,916,376 $25,075,249 $25,657,665 4.11 Recreation Services $16,168,867 $14,941,081 $15,649,456
$73,442,397 $73,303,008 $78,614,401
1.13 Juvenile Case Managers/First Offender Program $0 $0 $0 1.17 Police Academy and In-service Training $12,824,626 $13,128,961 $17,272,068 1.18 Police Administrative Support $25,827,747 $25,210,828 $28,519,440 1.19 Police Community Outreach $1,004,861 $1,501,289 $1,582,754 1.20 Police Criminal Investigations $56,899,259 $55,992,473 $56,841,999 1.21 Police Field Patrol $227,196,155 $224,509,303 $236,882,315 1.22 Police Intelligence $7,653,455 $8,217,293 $8,489,769 1.23 Police Investigation of Vice Related Crimes $4,208,479 $4,260,020 $4,261,629 1.24 Police Investigations of Narcotics Related Crimes $10,053,801 $10,816,733 $12,878,536 1.26 Police Operational Support $20,879,487 $23,565,990 $23,558,936 1.27 Police Recruiting and Personnel Service $7,416,665 $7,508,482 $7,701,819 1.28 Police Special Operations $28,287,410 $27,225,212 $28,412,110
$402,251,945 $401,936,584 $426,401,375
1.1 Adjudication Office $410,576 $356,026 $438,813 2.39 Pavement Management $227,749 $217,624 $240,360 2.53 Street Cut and Right-of-Way Management (Cut Control) $200,975 $108,980 $212,648 2.60 Transportation Planning $669,073 $638,365 $1,883,013 2.6 Capital and Interagency Planning and Programming $1,403,974 $1,424,116 $1,668,653 2.8 Capital Facilities $1,677,582 $1,588,351 $1,638,427 3.1 Air Quality Compliance $322,342 $250,573 $182,716 3.2 Ambient Air Monitoring $169,067 $262,486 $274,096 3.28 Underground Storage Tank Replacement and Inspection $0 $0 $461,021 6.43 Land Surveying Services $197,494 $345,544 $120,759
$5,278,832 $5,192,065 $7,120,506
Park and Recreation
Total Park and Recreation
Police
Total Police
Public Works and Transportation
Total Public Works and Transportation
582
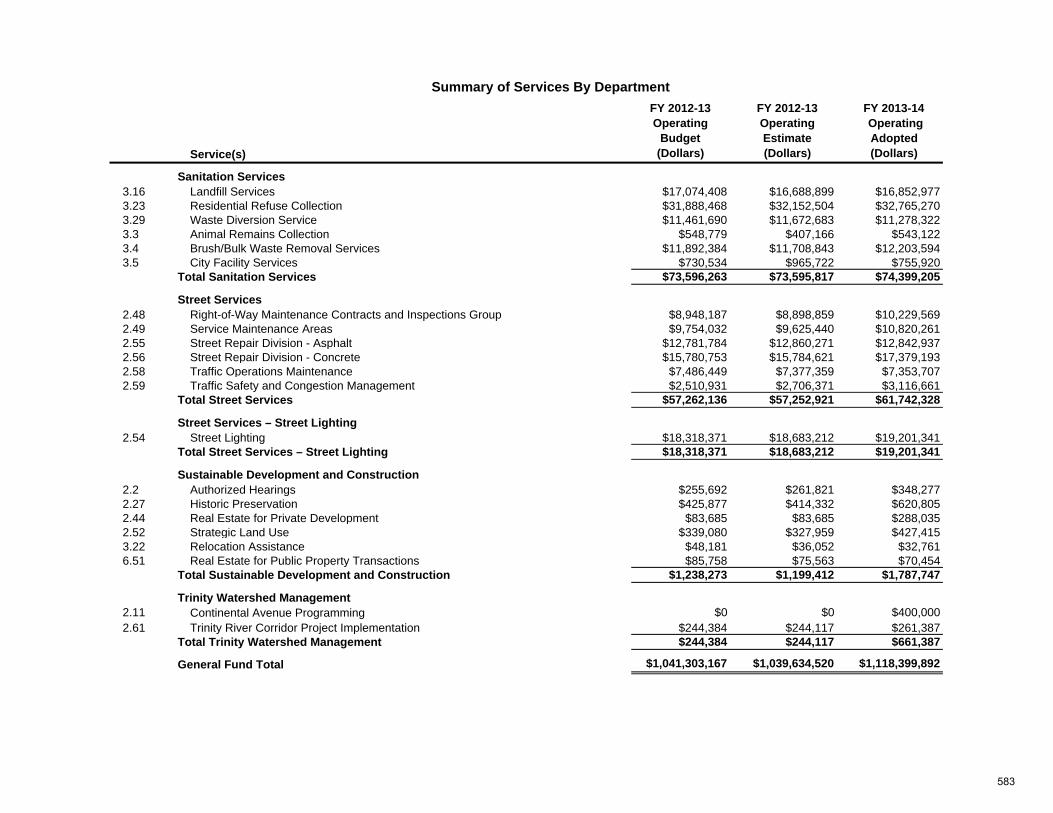
Service(s)
FY 2012-13Operating
Budget(Dollars)
FY 2012-13Operating Estimate(Dollars)
FY 2013-14 Operating Adopted(Dollars)
Summary of Services By Department
3.16 Landfill Services $17,074,408 $16,688,899 $16,852,977 3.23 Residential Refuse Collection $31,888,468 $32,152,504 $32,765,270 3.29 Waste Diversion Service $11,461,690 $11,672,683 $11,278,322 3.3 Animal Remains Collection $548,779 $407,166 $543,122 3.4 Brush/Bulk Waste Removal Services $11,892,384 $11,708,843 $12,203,594 3.5 City Facility Services $730,534 $965,722 $755,920
$73,596,263 $73,595,817 $74,399,205
2.48 Right-of-Way Maintenance Contracts and Inspections Group $8,948,187 $8,898,859 $10,229,569 2.49 Service Maintenance Areas $9,754,032 $9,625,440 $10,820,261 2.55 Street Repair Division - Asphalt $12,781,784 $12,860,271 $12,842,937 2.56 Street Repair Division - Concrete $15,780,753 $15,784,621 $17,379,193 2.58 Traffic Operations Maintenance $7,486,449 $7,377,359 $7,353,707 2.59 Traffic Safety and Congestion Management $2,510,931 $2,706,371 $3,116,661
$57,262,136 $57,252,921 $61,742,328
2.54 Street Lighting $18,318,371 $18,683,212 $19,201,341 $18,318,371 $18,683,212 $19,201,341
2.2 Authorized Hearings $255,692 $261,821 $348,277 2.27 Historic Preservation $425,877 $414,332 $620,805 2.44 Real Estate for Private Development $83,685 $83,685 $288,035 2.52 Strategic Land Use $339,080 $327,959 $427,415 3.22 Relocation Assistance $48,181 $36,052 $32,761 6.51 Real Estate for Public Property Transactions $85,758 $75,563 $70,454
$1,238,273 $1,199,412 $1,787,747
2.11 Continental Avenue Programming $0 $0 $400,000 2.61 Trinity River Corridor Project Implementation $244,384 $244,117 $261,387
$244,384 $244,117 $661,387
$1,041,303,167 $1,039,634,520 $1,118,399,892 General Fund Total
Sustainable Development and Construction
Total Sustainable Development and Construction
Total Street Services – Street Lighting
Trinity Watershed Management
Total Trinity Watershed Management
Sanitation Services
Total Sanitation Services
Street Services
Total Street Services
Street Services – Street Lighting
583
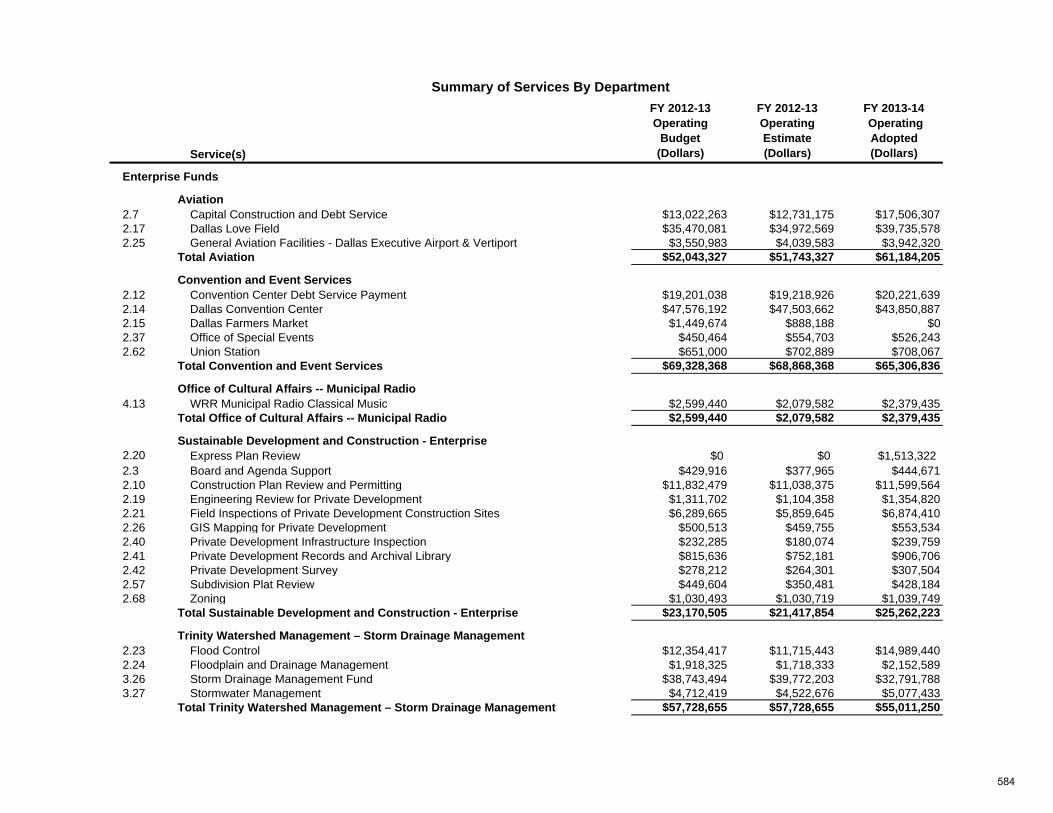
Service(s)
FY 2012-13Operating
Budget(Dollars)
FY 2012-13Operating Estimate(Dollars)
FY 2013-14 Operating Adopted(Dollars)
Summary of Services By Department
2.7 Capital Construction and Debt Service $13,022,263 $12,731,175 $17,506,307 2.17 Dallas Love Field $35,470,081 $34,972,569 $39,735,578 2.25 General Aviation Facilities - Dallas Executive Airport & Vertiport $3,550,983 $4,039,583 $3,942,320
$52,043,327 $51,743,327 $61,184,205
2.12 Convention Center Debt Service Payment $19,201,038 $19,218,926 $20,221,639 2.14 Dallas Convention Center $47,576,192 $47,503,662 $43,850,887 2.15 Dallas Farmers Market $1,449,674 $888,188 $0 2.37 Office of Special Events $450,464 $554,703 $526,243 2.62 Union Station $651,000 $702,889 $708,067
$69,328,368 $68,868,368 $65,306,836
4.13 WRR Municipal Radio Classical Music $2,599,440 $2,079,582 $2,379,435 $2,599,440 $2,079,582 $2,379,435
2.20 Express Plan Review $0 $0 $1,513,3222.3 Board and Agenda Support $429,916 $377,965 $444,671 2.10 Construction Plan Review and Permitting $11,832,479 $11,038,375 $11,599,564 2.19 Engineering Review for Private Development $1,311,702 $1,104,358 $1,354,820 2.21 Field Inspections of Private Development Construction Sites $6,289,665 $5,859,645 $6,874,410 2.26 GIS Mapping for Private Development $500,513 $459,755 $553,534 2.40 Private Development Infrastructure Inspection $232,285 $180,074 $239,759 2.41 Private Development Records and Archival Library $815,636 $752,181 $906,706 2.42 Private Development Survey $278,212 $264,301 $307,504 2.57 Subdivision Plat Review $449,604 $350,481 $428,184 2.68 Zoning $1,030,493 $1,030,719 $1,039,749
$23,170,505 $21,417,854 $25,262,223
2.23 Flood Control $12,354,417 $11,715,443 $14,989,440 2.24 Floodplain and Drainage Management $1,918,325 $1,718,333 $2,152,589 3.26 Storm Drainage Management Fund $38,743,494 $39,772,203 $32,791,788 3.27 Stormwater Management $4,712,419 $4,522,676 $5,077,433
$57,728,655 $57,728,655 $55,011,250
Office of Cultural Affairs -- Municipal Radio
Convention and Event Services
Total Convention and Event Services
Total Office of Cultural Affairs -- Municipal Radio
Sustainable Development and Construction - Enterprise
Total Trinity Watershed Management – Storm Drainage Management
Enterprise Funds
Aviation
Total Aviation
Total Sustainable Development and Construction - Enterprise
Trinity Watershed Management – Storm Drainage Management
584
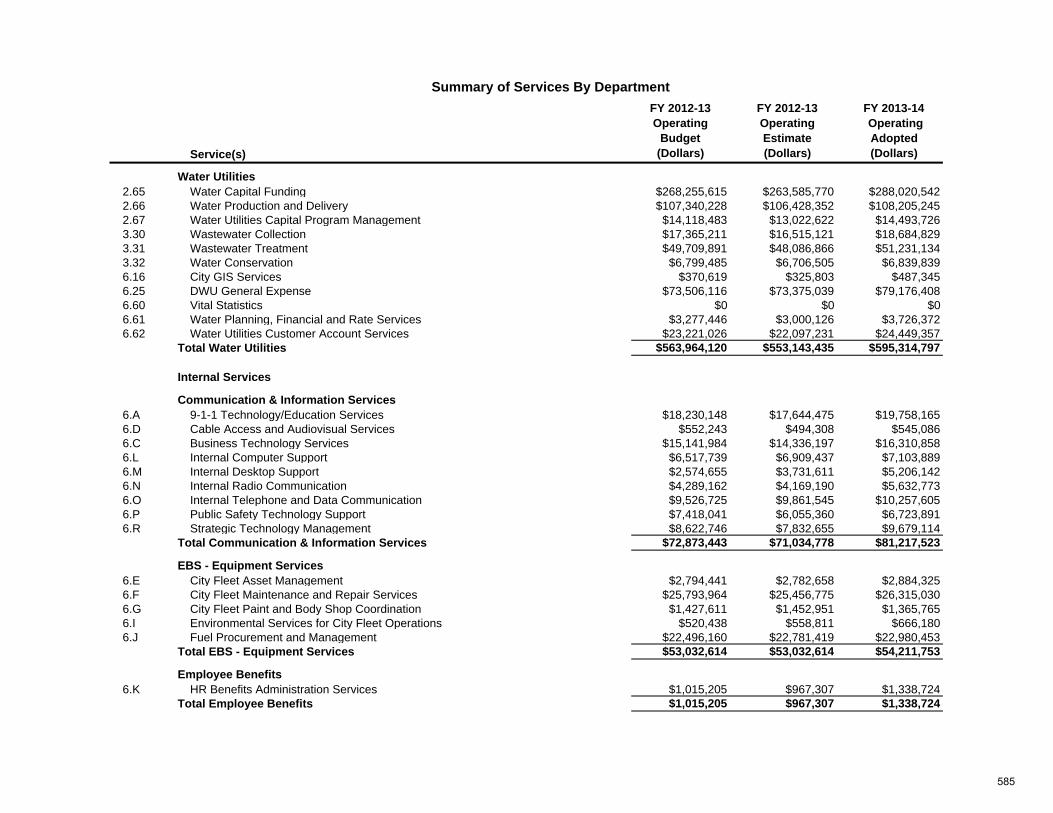
Service(s)
FY 2012-13Operating
Budget(Dollars)
FY 2012-13Operating Estimate(Dollars)
FY 2013-14 Operating Adopted(Dollars)
Summary of Services By Department
2.65 Water Capital Funding $268,255,615 $263,585,770 $288,020,542 2.66 Water Production and Delivery $107,340,228 $106,428,352 $108,205,245 2.67 Water Utilities Capital Program Management $14,118,483 $13,022,622 $14,493,726 3.30 Wastewater Collection $17,365,211 $16,515,121 $18,684,829 3.31 Wastewater Treatment $49,709,891 $48,086,866 $51,231,134 3.32 Water Conservation $6,799,485 $6,706,505 $6,839,839 6.16 City GIS Services $370,619 $325,803 $487,345 6.25 DWU General Expense $73,506,116 $73,375,039 $79,176,408 6.60 Vital Statistics $0 $0 $0 6.61 Water Planning, Financial and Rate Services $3,277,446 $3,000,126 $3,726,372 6.62 Water Utilities Customer Account Services $23,221,026 $22,097,231 $24,449,357
$563,964,120 $553,143,435 $595,314,797
6.A 9-1-1 Technology/Education Services $18,230,148 $17,644,475 $19,758,165 6.D Cable Access and Audiovisual Services $552,243 $494,308 $545,086 6.C Business Technology Services $15,141,984 $14,336,197 $16,310,858 6.L Internal Computer Support $6,517,739 $6,909,437 $7,103,889 6.M Internal Desktop Support $2,574,655 $3,731,611 $5,206,142 6.N Internal Radio Communication $4,289,162 $4,169,190 $5,632,773 6.O Internal Telephone and Data Communication $9,526,725 $9,861,545 $10,257,605 6.P Public Safety Technology Support $7,418,041 $6,055,360 $6,723,891 6.R Strategic Technology Management $8,622,746 $7,832,655 $9,679,114
$72,873,443 $71,034,778 $81,217,523
6.E City Fleet Asset Management $2,794,441 $2,782,658 $2,884,325 6.F City Fleet Maintenance and Repair Services $25,793,964 $25,456,775 $26,315,030 6.G City Fleet Paint and Body Shop Coordination $1,427,611 $1,452,951 $1,365,765 6.I Environmental Services for City Fleet Operations $520,438 $558,811 $666,180 6.J Fuel Procurement and Management $22,496,160 $22,781,419 $22,980,453
$53,032,614 $53,032,614 $54,211,753
6.K HR Benefits Administration Services $1,015,205 $967,307 $1,338,724 $1,015,205 $967,307 $1,338,724 Total Employee Benefits
Water Utilities
Total Water Utilities
EBS - Equipment Services
Employee Benefits
Total Communication & Information Services
Total EBS - Equipment Services
Internal Services
Communication & Information Services
585
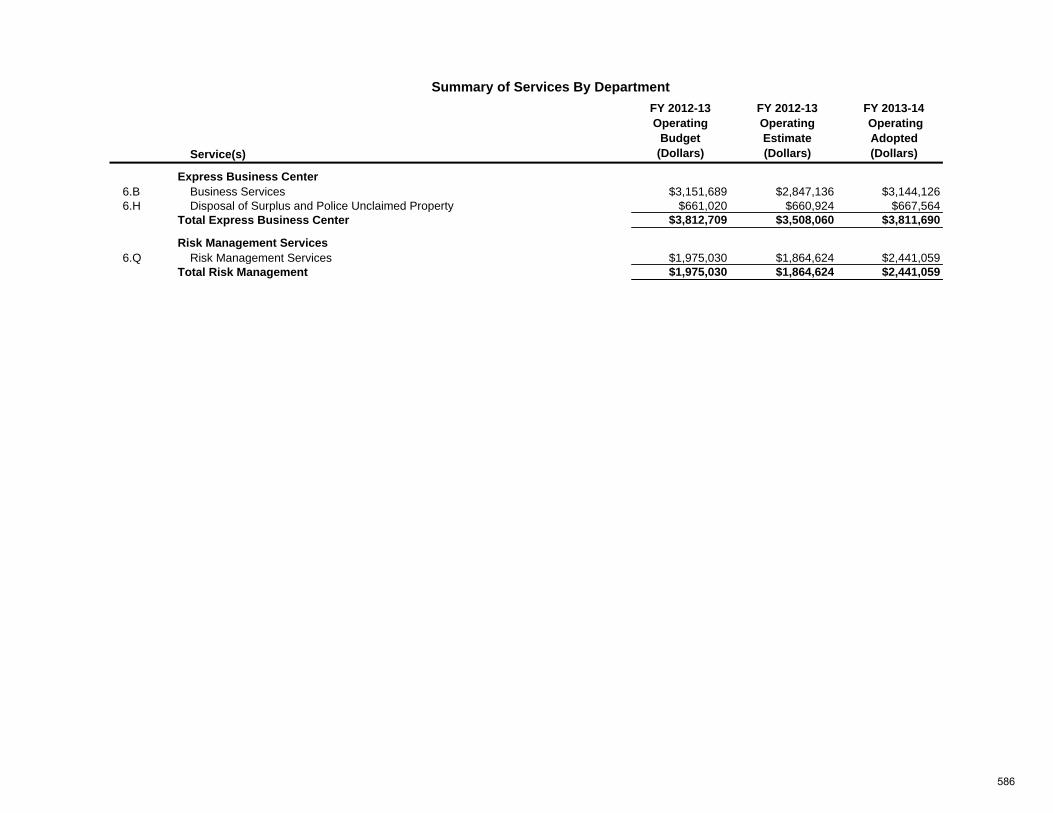
Service(s)
FY 2012-13Operating
Budget(Dollars)
FY 2012-13Operating Estimate(Dollars)
FY 2013-14 Operating Adopted(Dollars)
Summary of Services By Department
6.B Business Services $3,151,689 $2,847,136 $3,144,126 6.H Disposal of Surplus and Police Unclaimed Property $661,020 $660,924 $667,564
$3,812,709 $3,508,060 $3,811,690
6.Q Risk Management Services $1,975,030 $1,864,624 $2,441,059 $1,975,030 $1,864,624 $2,441,059
Risk Management Services
Total Risk Management
Express Business Center
Total Express Business Center
586
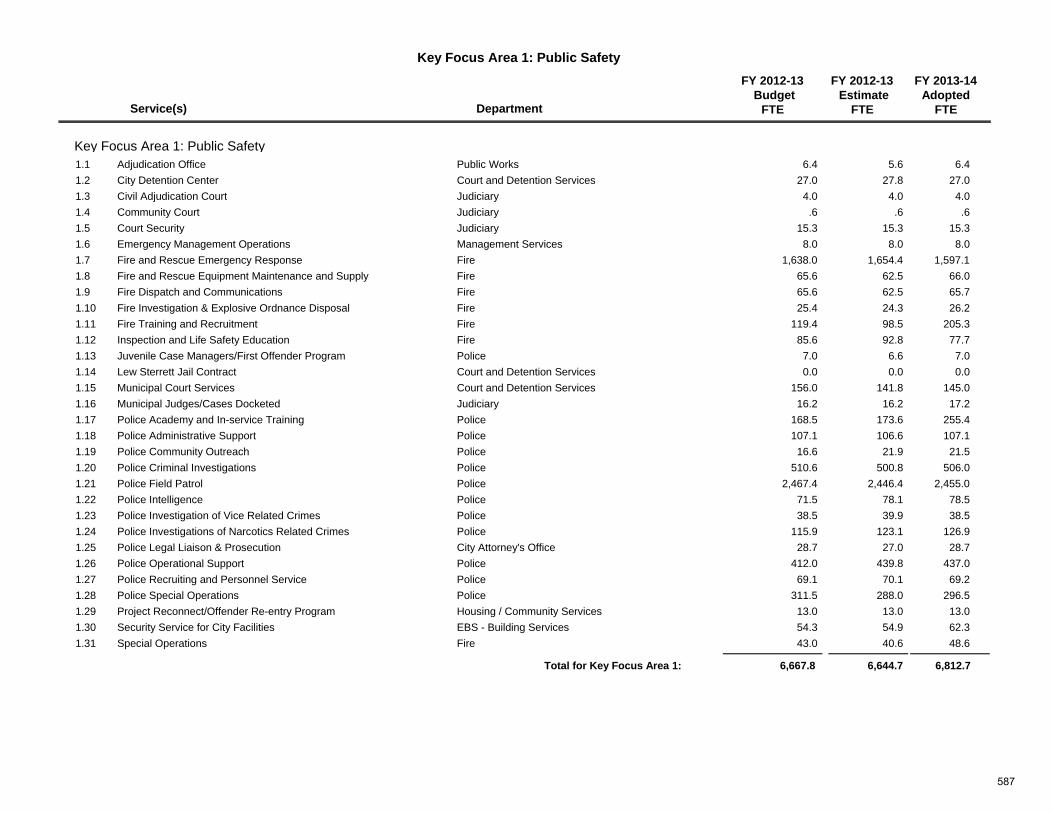
Key Focus Area 1: Public Safety
Service(s) Department
FY 2012-13 Budget
FTE
FY 2012-13 Estimate
FTE
FY 2013-14Adopted
FTE
Key Focus Area 1: Public Safety6.4 5.6 6.4Adjudication Office1.1 Public Works
27.0 27.8 27.0City Detention Center1.2 Court and Detention Services4.0 4.0 4.0Civil Adjudication Court1.3 Judiciary.6 .6 .6Community Court1.4 Judiciary
15.3 15.3 15.3Court Security1.5 Judiciary8.0 8.0 8.0Emergency Management Operations1.6 Management Services
1,638.0 1,654.4 1,597.1Fire and Rescue Emergency Response1.7 Fire65.6 62.5 66.0Fire and Rescue Equipment Maintenance and Supply1.8 Fire65.6 62.5 65.7Fire Dispatch and Communications1.9 Fire25.4 24.3 26.2Fire Investigation & Explosive Ordnance Disposal 1.10 Fire
119.4 98.5 205.3Fire Training and Recruitment1.11 Fire85.6 92.8 77.7Inspection and Life Safety Education1.12 Fire
7.0 6.6 7.0Juvenile Case Managers/First Offender Program1.13 Police0.0 0.0 0.0Lew Sterrett Jail Contract1.14 Court and Detention Services
156.0 141.8 145.0Municipal Court Services1.15 Court and Detention Services16.2 16.2 17.2Municipal Judges/Cases Docketed1.16 Judiciary
168.5 173.6 255.4Police Academy and In-service Training1.17 Police107.1 106.6 107.1Police Administrative Support 1.18 Police16.6 21.9 21.5Police Community Outreach1.19 Police
510.6 500.8 506.0Police Criminal Investigations1.20 Police2,467.4 2,446.4 2,455.0Police Field Patrol1.21 Police
71.5 78.1 78.5Police Intelligence1.22 Police38.5 39.9 38.5Police Investigation of Vice Related Crimes1.23 Police
115.9 123.1 126.9Police Investigations of Narcotics Related Crimes1.24 Police28.7 27.0 28.7Police Legal Liaison & Prosecution1.25 City Attorney's Office
412.0 439.8 437.0Police Operational Support1.26 Police69.1 70.1 69.2Police Recruiting and Personnel Service1.27 Police
311.5 288.0 296.5Police Special Operations1.28 Police13.0 13.0 13.0Project Reconnect/Offender Re-entry Program1.29 Housing / Community Services54.3 54.9 62.3Security Service for City Facilities1.30 EBS - Building Services43.0 40.6 48.6Special Operations1.31 Fire
6,644.7 6,812.76,667.8Total for Key Focus Area 1:
587
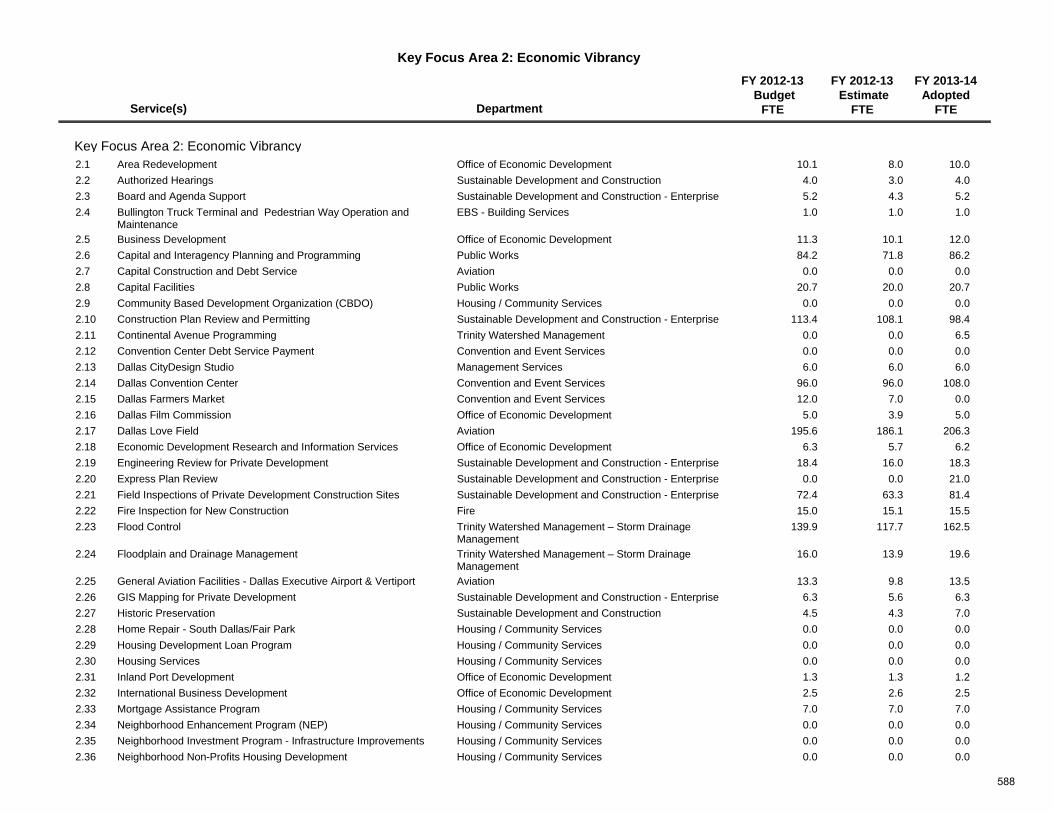
Key Focus Area 2: Economic Vibrancy
Service(s) Department
FY 2012-13 Budget
FTE
FY 2012-13 Estimate
FTE
FY 2013-14Adopted
FTE
Key Focus Area 2: Economic Vibrancy10.1 8.0 10.0Area Redevelopment2.1 Office of Economic Development4.0 3.0 4.0Authorized Hearings2.2 Sustainable Development and Construction5.2 4.3 5.2Board and Agenda Support2.3 Sustainable Development and Construction - Enterprise1.0 1.0 1.0Bullington Truck Terminal and Pedestrian Way Operation and
Maintenance2.4 EBS - Building Services
11.3 10.1 12.0Business Development2.5 Office of Economic Development84.2 71.8 86.2Capital and Interagency Planning and Programming2.6 Public Works
0.0 0.0 0.0Capital Construction and Debt Service2.7 Aviation 20.7 20.0 20.7Capital Facilities2.8 Public Works0.0 0.0 0.0Community Based Development Organization (CBDO)2.9 Housing / Community Services
113.4 108.1 98.4Construction Plan Review and Permitting2.10 Sustainable Development and Construction - Enterprise0.0 0.0 6.5Continental Avenue Programming2.11 Trinity Watershed Management0.0 0.0 0.0Convention Center Debt Service Payment2.12 Convention and Event Services6.0 6.0 6.0Dallas CityDesign Studio2.13 Management Services
96.0 96.0 108.0Dallas Convention Center2.14 Convention and Event Services12.0 7.0 0.0Dallas Farmers Market2.15 Convention and Event Services5.0 3.9 5.0Dallas Film Commission2.16 Office of Economic Development
195.6 186.1 206.3Dallas Love Field 2.17 Aviation 6.3 5.7 6.2Economic Development Research and Information Services2.18 Office of Economic Development
18.4 16.0 18.3Engineering Review for Private Development2.19 Sustainable Development and Construction - Enterprise0.0 0.0 21.0Express Plan Review2.20 Sustainable Development and Construction - Enterprise
72.4 63.3 81.4Field Inspections of Private Development Construction Sites2.21 Sustainable Development and Construction - Enterprise15.0 15.1 15.5Fire Inspection for New Construction2.22 Fire
139.9 117.7 162.5Flood Control2.23 Trinity Watershed Management – Storm Drainage Management
16.0 13.9 19.6Floodplain and Drainage Management2.24 Trinity Watershed Management – Storm Drainage Management
13.3 9.8 13.5General Aviation Facilities - Dallas Executive Airport & Vertiport2.25 Aviation 6.3 5.6 6.3GIS Mapping for Private Development2.26 Sustainable Development and Construction - Enterprise4.5 4.3 7.0Historic Preservation2.27 Sustainable Development and Construction0.0 0.0 0.0Home Repair - South Dallas/Fair Park2.28 Housing / Community Services0.0 0.0 0.0Housing Development Loan Program2.29 Housing / Community Services0.0 0.0 0.0Housing Services2.30 Housing / Community Services1.3 1.3 1.2Inland Port Development2.31 Office of Economic Development2.5 2.6 2.5International Business Development2.32 Office of Economic Development7.0 7.0 7.0Mortgage Assistance Program2.33 Housing / Community Services0.0 0.0 0.0Neighborhood Enhancement Program (NEP)2.34 Housing / Community Services0.0 0.0 0.0Neighborhood Investment Program - Infrastructure Improvements2.35 Housing / Community Services0.0 0.0 0.0Neighborhood Non-Profits Housing Development2.36 Housing / Community Services
588
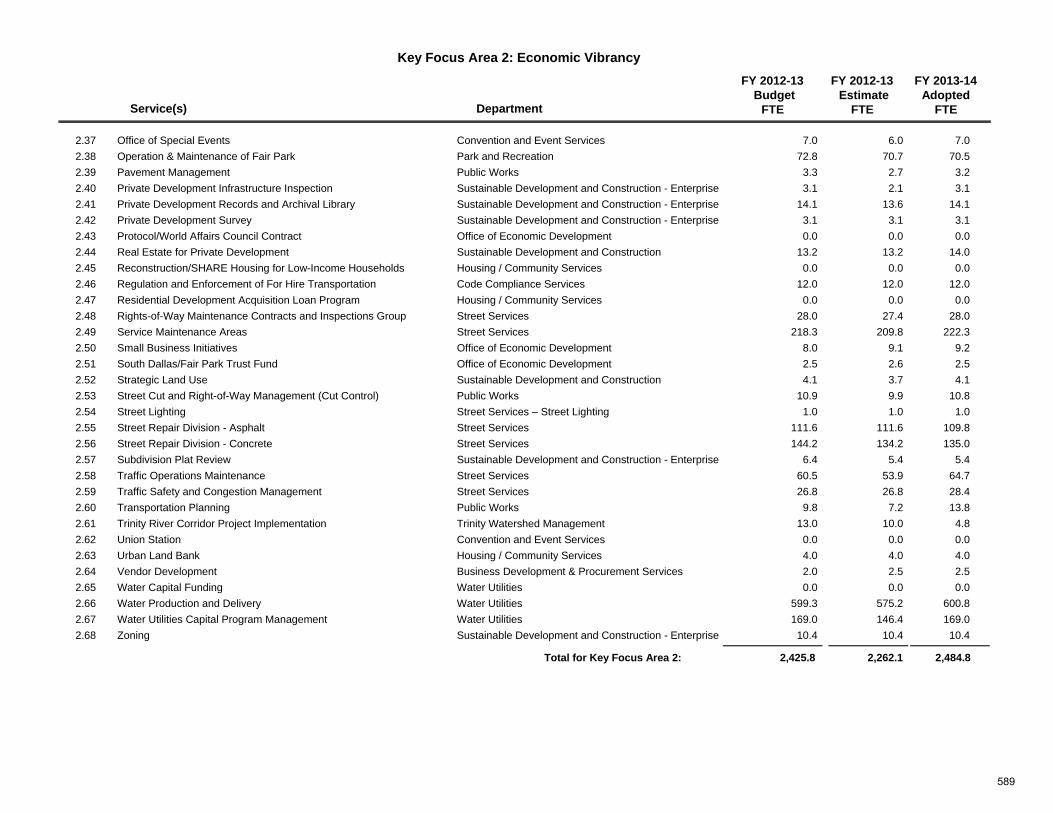
Key Focus Area 2: Economic Vibrancy
Service(s) Department
FY 2012-13 Budget
FTE
FY 2012-13 Estimate
FTE
FY 2013-14Adopted
FTE
7.0 6.0 7.0Office of Special Events2.37 Convention and Event Services72.8 70.7 70.5Operation & Maintenance of Fair Park2.38 Park and Recreation
3.3 2.7 3.2Pavement Management2.39 Public Works3.1 2.1 3.1Private Development Infrastructure Inspection2.40 Sustainable Development and Construction - Enterprise
14.1 13.6 14.1Private Development Records and Archival Library2.41 Sustainable Development and Construction - Enterprise3.1 3.1 3.1Private Development Survey2.42 Sustainable Development and Construction - Enterprise0.0 0.0 0.0Protocol/World Affairs Council Contract2.43 Office of Economic Development
13.2 13.2 14.0Real Estate for Private Development2.44 Sustainable Development and Construction0.0 0.0 0.0Reconstruction/SHARE Housing for Low-Income Households2.45 Housing / Community Services
12.0 12.0 12.0Regulation and Enforcement of For Hire Transportation2.46 Code Compliance Services0.0 0.0 0.0Residential Development Acquisition Loan Program2.47 Housing / Community Services
28.0 27.4 28.0Rights-of-Way Maintenance Contracts and Inspections Group2.48 Street Services218.3 209.8 222.3Service Maintenance Areas2.49 Street Services
8.0 9.1 9.2Small Business Initiatives2.50 Office of Economic Development2.5 2.6 2.5South Dallas/Fair Park Trust Fund2.51 Office of Economic Development4.1 3.7 4.1Strategic Land Use 2.52 Sustainable Development and Construction
10.9 9.9 10.8Street Cut and Right-of-Way Management (Cut Control)2.53 Public Works1.0 1.0 1.0Street Lighting2.54 Street Services – Street Lighting
111.6 111.6 109.8Street Repair Division - Asphalt2.55 Street Services144.2 134.2 135.0Street Repair Division - Concrete2.56 Street Services
6.4 5.4 5.4Subdivision Plat Review2.57 Sustainable Development and Construction - Enterprise60.5 53.9 64.7Traffic Operations Maintenance2.58 Street Services26.8 26.8 28.4Traffic Safety and Congestion Management2.59 Street Services9.8 7.2 13.8Transportation Planning2.60 Public Works
13.0 10.0 4.8Trinity River Corridor Project Implementation 2.61 Trinity Watershed Management0.0 0.0 0.0Union Station2.62 Convention and Event Services4.0 4.0 4.0Urban Land Bank2.63 Housing / Community Services2.0 2.5 2.5Vendor Development2.64 Business Development & Procurement Services0.0 0.0 0.0Water Capital Funding2.65 Water Utilities
599.3 575.2 600.8Water Production and Delivery2.66 Water Utilities169.0 146.4 169.0Water Utilities Capital Program Management2.67 Water Utilities10.4 10.4 10.4Zoning 2.68 Sustainable Development and Construction - Enterprise
2,262.1 2,484.82,425.8Total for Key Focus Area 2:
589
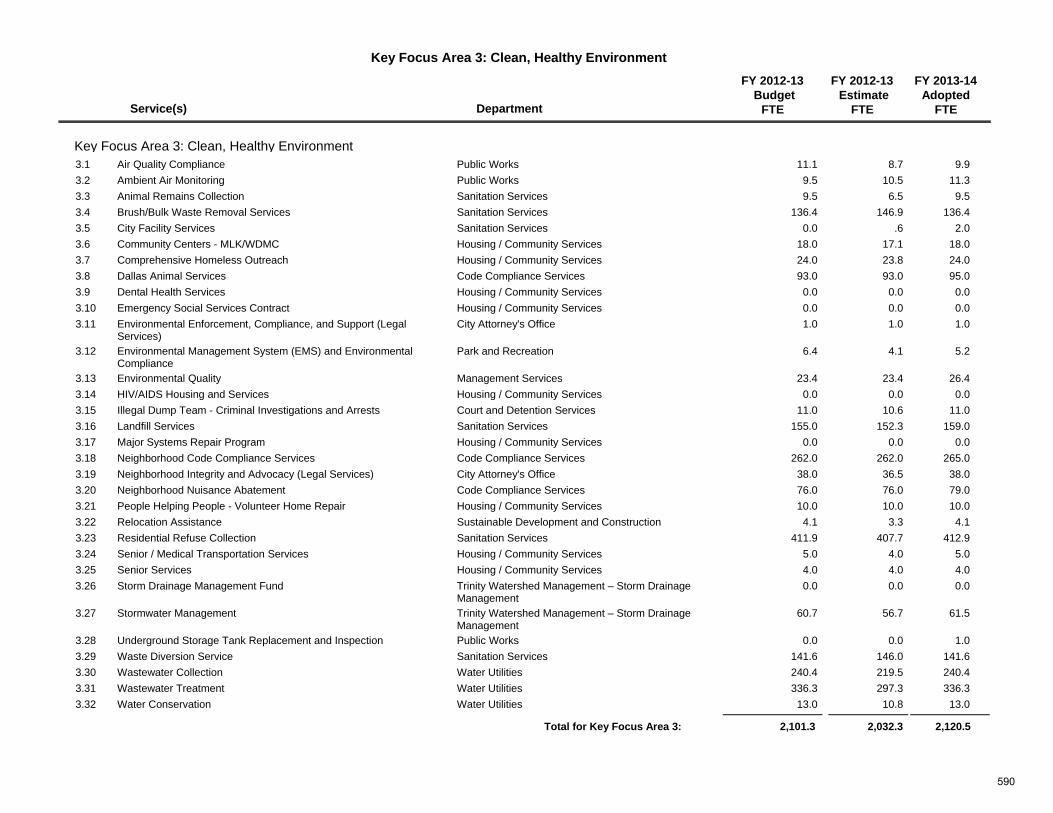
Key Focus Area 3: Clean, Healthy Environment
Service(s) Department
FY 2012-13 Budget
FTE
FY 2012-13 Estimate
FTE
FY 2013-14Adopted
FTE
Key Focus Area 3: Clean, Healthy Environment11.1 8.7 9.9Air Quality Compliance3.1 Public Works9.5 10.5 11.3Ambient Air Monitoring 3.2 Public Works9.5 6.5 9.5Animal Remains Collection3.3 Sanitation Services
136.4 146.9 136.4Brush/Bulk Waste Removal Services3.4 Sanitation Services 0.0 .6 2.0City Facility Services3.5 Sanitation Services
18.0 17.1 18.0Community Centers - MLK/WDMC3.6 Housing / Community Services24.0 23.8 24.0Comprehensive Homeless Outreach3.7 Housing / Community Services93.0 93.0 95.0Dallas Animal Services 3.8 Code Compliance Services0.0 0.0 0.0Dental Health Services3.9 Housing / Community Services0.0 0.0 0.0Emergency Social Services Contract3.10 Housing / Community Services1.0 1.0 1.0Environmental Enforcement, Compliance, and Support (Legal
Services)3.11 City Attorney's Office
6.4 4.1 5.2Environmental Management System (EMS) and Environmental Compliance
3.12 Park and Recreation
23.4 23.4 26.4Environmental Quality3.13 Management Services0.0 0.0 0.0HIV/AIDS Housing and Services3.14 Housing / Community Services
11.0 10.6 11.0Illegal Dump Team - Criminal Investigations and Arrests3.15 Court and Detention Services155.0 152.3 159.0Landfill Services3.16 Sanitation Services
0.0 0.0 0.0Major Systems Repair Program3.17 Housing / Community Services262.0 262.0 265.0Neighborhood Code Compliance Services3.18 Code Compliance Services38.0 36.5 38.0Neighborhood Integrity and Advocacy (Legal Services)3.19 City Attorney's Office76.0 76.0 79.0Neighborhood Nuisance Abatement3.20 Code Compliance Services10.0 10.0 10.0People Helping People - Volunteer Home Repair3.21 Housing / Community Services
4.1 3.3 4.1Relocation Assistance3.22 Sustainable Development and Construction411.9 407.7 412.9Residential Refuse Collection3.23 Sanitation Services
5.0 4.0 5.0Senior / Medical Transportation Services3.24 Housing / Community Services4.0 4.0 4.0Senior Services3.25 Housing / Community Services0.0 0.0 0.0Storm Drainage Management Fund3.26 Trinity Watershed Management – Storm Drainage
Management60.7 56.7 61.5Stormwater Management3.27 Trinity Watershed Management – Storm Drainage
Management0.0 0.0 1.0Underground Storage Tank Replacement and Inspection3.28 Public Works
141.6 146.0 141.6Waste Diversion Service3.29 Sanitation Services 240.4 219.5 240.4Wastewater Collection3.30 Water Utilities336.3 297.3 336.3Wastewater Treatment3.31 Water Utilities13.0 10.8 13.0Water Conservation3.32 Water Utilities
2,032.3 2,120.52,101.3Total for Key Focus Area 3:
590
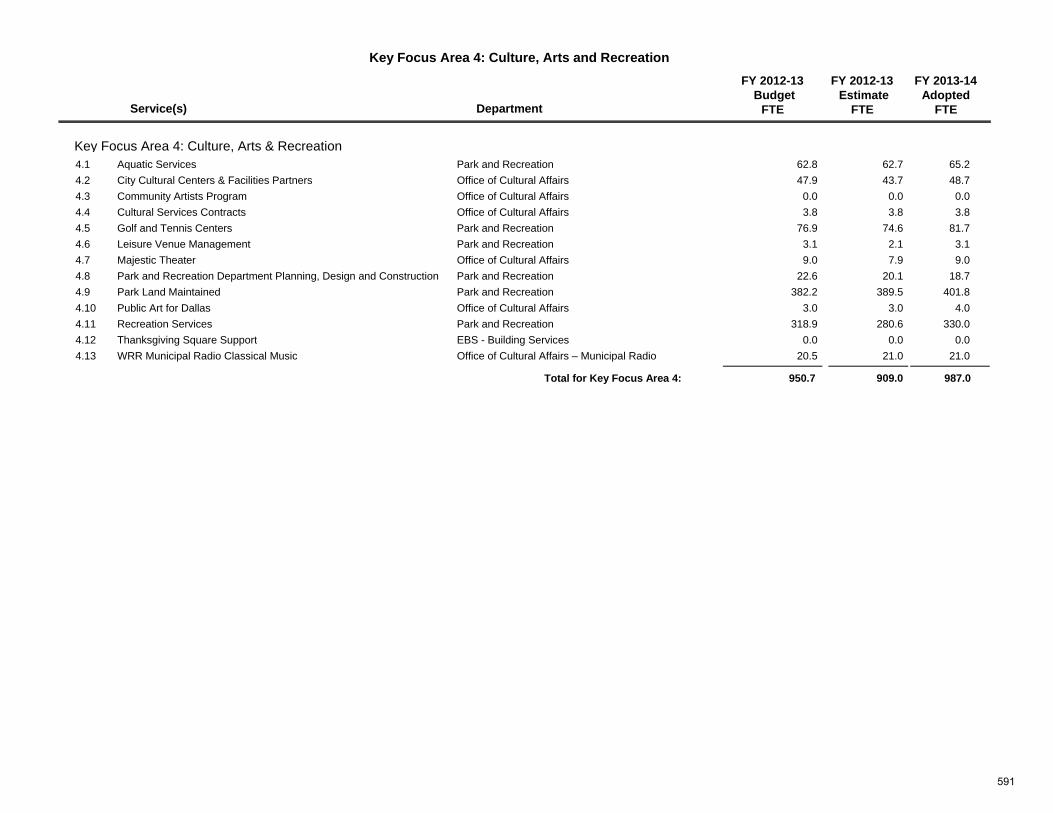
Key Focus Area 4: Culture, Arts and Recreation
Service(s) Department
FY 2012-13 Budget
FTE
FY 2012-13 Estimate
FTE
FY 2013-14Adopted
FTE
Key Focus Area 4: Culture, Arts & Recreation62.8 62.7 65.2Aquatic Services4.1 Park and Recreation47.9 43.7 48.7City Cultural Centers & Facilities Partners4.2 Office of Cultural Affairs
0.0 0.0 0.0Community Artists Program4.3 Office of Cultural Affairs3.8 3.8 3.8Cultural Services Contracts4.4 Office of Cultural Affairs
76.9 74.6 81.7Golf and Tennis Centers4.5 Park and Recreation3.1 2.1 3.1Leisure Venue Management4.6 Park and Recreation9.0 7.9 9.0Majestic Theater4.7 Office of Cultural Affairs
22.6 20.1 18.7Park and Recreation Department Planning, Design and Construction4.8 Park and Recreation382.2 389.5 401.8Park Land Maintained4.9 Park and Recreation
3.0 3.0 4.0Public Art for Dallas4.10 Office of Cultural Affairs318.9 280.6 330.0Recreation Services4.11 Park and Recreation
0.0 0.0 0.0Thanksgiving Square Support4.12 EBS - Building Services20.5 21.0 21.0WRR Municipal Radio Classical Music4.13 Office of Cultural Affairs – Municipal Radio
909.0 987.0950.7Total for Key Focus Area 4:
591
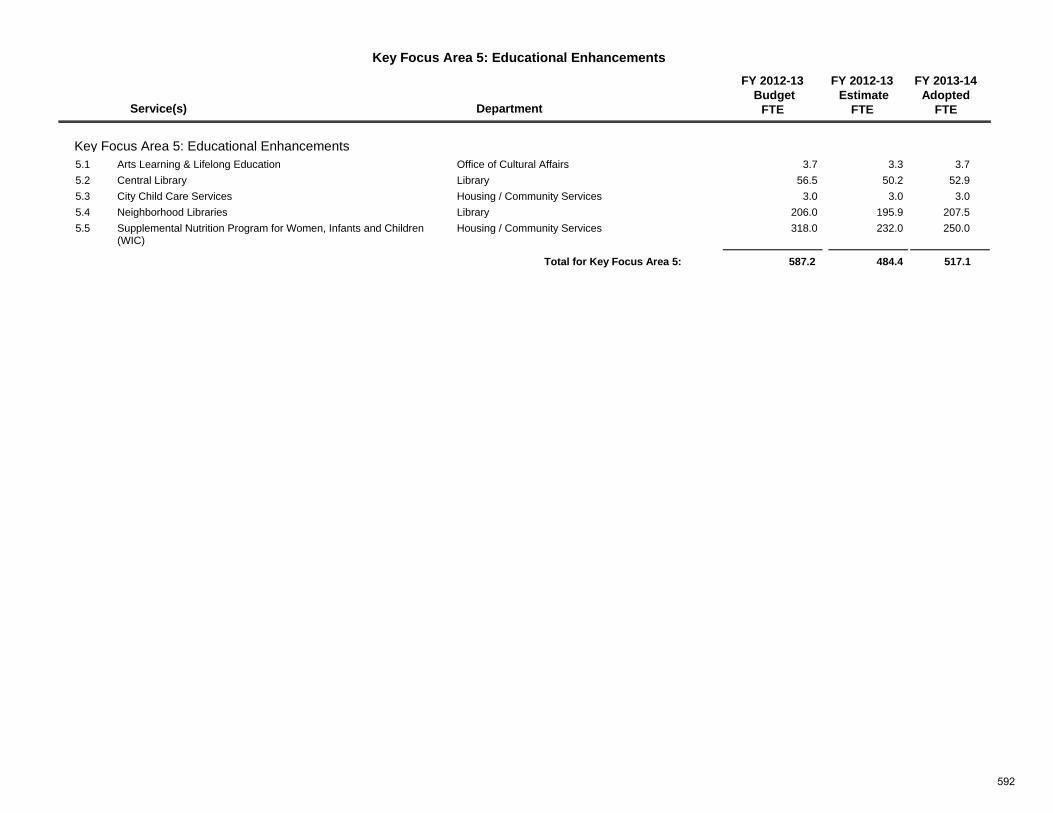
Key Focus Area 5: Educational Enhancements
Service(s) Department
FY 2012-13 Budget
FTE
FY 2012-13 Estimate
FTE
FY 2013-14Adopted
FTE
Key Focus Area 5: Educational Enhancements3.7 3.3 3.7Arts Learning & Lifelong Education 5.1 Office of Cultural Affairs
56.5 50.2 52.9Central Library5.2 Library3.0 3.0 3.0City Child Care Services5.3 Housing / Community Services
206.0 195.9 207.5Neighborhood Libraries5.4 Library318.0 232.0 250.0Supplemental Nutrition Program for Women, Infants and Children
(WIC)5.5 Housing / Community Services
484.4 517.1587.2Total for Key Focus Area 5:
592
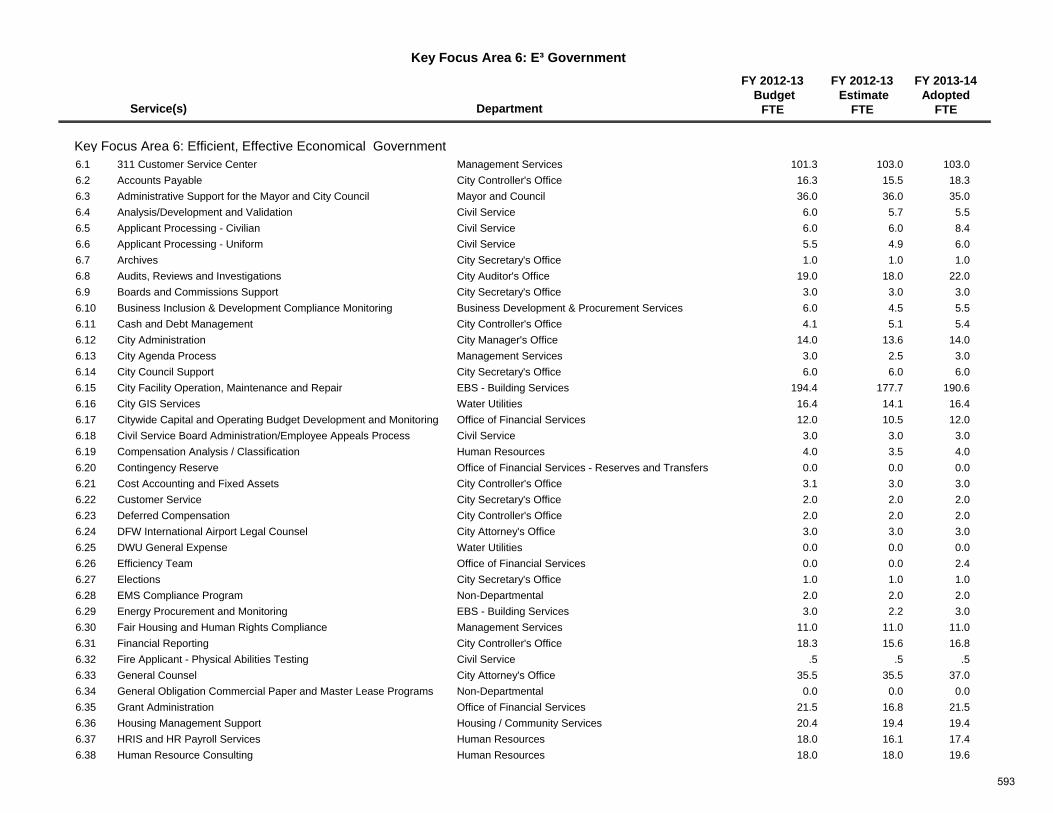
Key Focus Area 6: E³ Government
Service(s) Department
FY 2012-13 Budget
FTE
FY 2012-13 Estimate
FTE
FY 2013-14Adopted
FTE
Key Focus Area 6: Efficient, Effective Economical Government101.3 103.0 103.0311 Customer Service Center6.1 Management Services16.3 15.5 18.3Accounts Payable6.2 City Controller's Office36.0 36.0 35.0Administrative Support for the Mayor and City Council6.3 Mayor and Council6.0 5.7 5.5Analysis/Development and Validation6.4 Civil Service 6.0 6.0 8.4Applicant Processing - Civilian6.5 Civil Service 5.5 4.9 6.0Applicant Processing - Uniform6.6 Civil Service 1.0 1.0 1.0Archives6.7 City Secretary's Office
19.0 18.0 22.0Audits, Reviews and Investigations6.8 City Auditor's Office3.0 3.0 3.0Boards and Commissions Support6.9 City Secretary's Office6.0 4.5 5.5Business Inclusion & Development Compliance Monitoring6.10 Business Development & Procurement Services4.1 5.1 5.4Cash and Debt Management6.11 City Controller's Office
14.0 13.6 14.0City Administration6.12 City Manager's Office 3.0 2.5 3.0City Agenda Process6.13 Management Services6.0 6.0 6.0City Council Support6.14 City Secretary's Office
194.4 177.7 190.6City Facility Operation, Maintenance and Repair6.15 EBS - Building Services16.4 14.1 16.4City GIS Services6.16 Water Utilities12.0 10.5 12.0Citywide Capital and Operating Budget Development and Monitoring6.17 Office of Financial Services
3.0 3.0 3.0Civil Service Board Administration/Employee Appeals Process6.18 Civil Service 4.0 3.5 4.0Compensation Analysis / Classification6.19 Human Resources 0.0 0.0 0.0Contingency Reserve6.20 Office of Financial Services - Reserves and Transfers3.1 3.0 3.0Cost Accounting and Fixed Assets6.21 City Controller's Office2.0 2.0 2.0Customer Service6.22 City Secretary's Office2.0 2.0 2.0Deferred Compensation6.23 City Controller's Office3.0 3.0 3.0DFW International Airport Legal Counsel6.24 City Attorney's Office0.0 0.0 0.0DWU General Expense6.25 Water Utilities0.0 0.0 2.4Efficiency Team6.26 Office of Financial Services1.0 1.0 1.0Elections6.27 City Secretary's Office2.0 2.0 2.0EMS Compliance Program6.28 Non-Departmental3.0 2.2 3.0Energy Procurement and Monitoring 6.29 EBS - Building Services
11.0 11.0 11.0Fair Housing and Human Rights Compliance6.30 Management Services18.3 15.6 16.8Financial Reporting6.31 City Controller's Office
.5 .5 .5Fire Applicant - Physical Abilities Testing6.32 Civil Service 35.5 35.5 37.0General Counsel6.33 City Attorney's Office
0.0 0.0 0.0General Obligation Commercial Paper and Master Lease Programs6.34 Non-Departmental21.5 16.8 21.5Grant Administration6.35 Office of Financial Services20.4 19.4 19.4Housing Management Support6.36 Housing / Community Services18.0 16.1 17.4HRIS and HR Payroll Services6.37 Human Resources 18.0 18.0 19.6Human Resource Consulting6.38 Human Resources
593
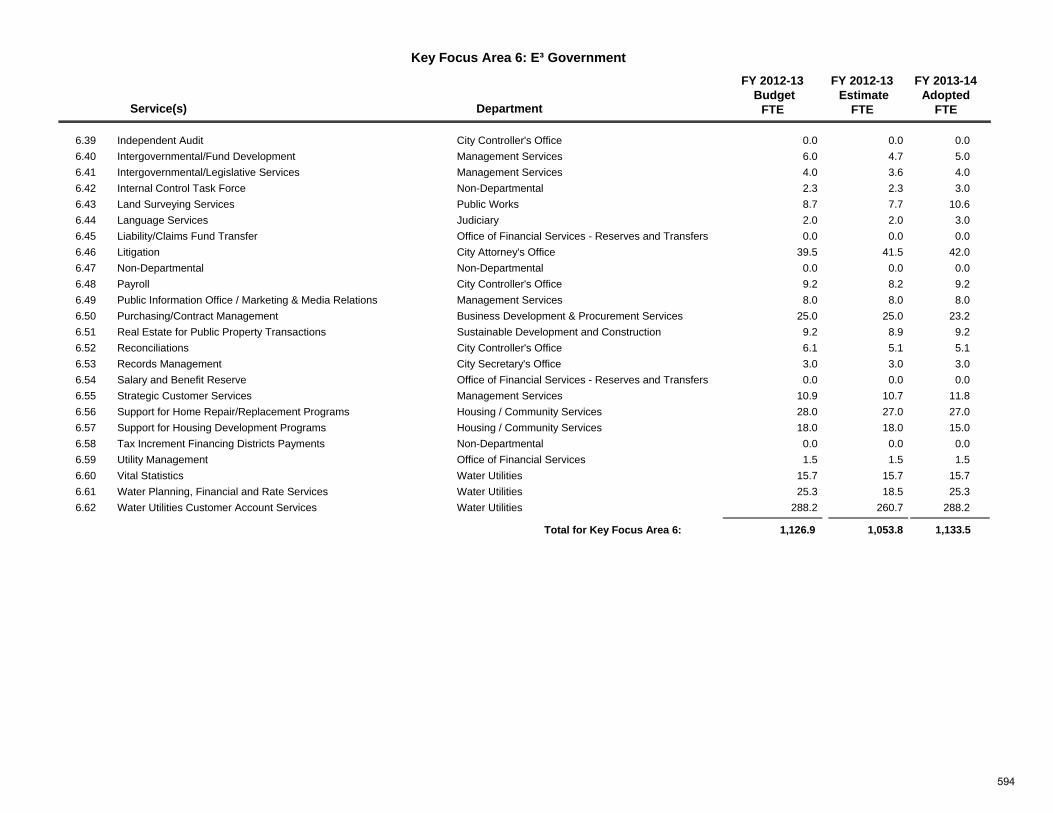
Key Focus Area 6: E³ Government
Service(s) Department
FY 2012-13 Budget
FTE
FY 2012-13 Estimate
FTE
FY 2013-14Adopted
FTE
0.0 0.0 0.0Independent Audit6.39 City Controller's Office6.0 4.7 5.0Intergovernmental/Fund Development6.40 Management Services4.0 3.6 4.0Intergovernmental/Legislative Services6.41 Management Services2.3 2.3 3.0Internal Control Task Force6.42 Non-Departmental8.7 7.7 10.6Land Surveying Services6.43 Public Works2.0 2.0 3.0Language Services6.44 Judiciary0.0 0.0 0.0Liability/Claims Fund Transfer6.45 Office of Financial Services - Reserves and Transfers
39.5 41.5 42.0Litigation6.46 City Attorney's Office0.0 0.0 0.0Non-Departmental6.47 Non-Departmental9.2 8.2 9.2Payroll6.48 City Controller's Office8.0 8.0 8.0Public Information Office / Marketing & Media Relations 6.49 Management Services
25.0 25.0 23.2Purchasing/Contract Management6.50 Business Development & Procurement Services9.2 8.9 9.2Real Estate for Public Property Transactions6.51 Sustainable Development and Construction6.1 5.1 5.1Reconciliations6.52 City Controller's Office3.0 3.0 3.0Records Management6.53 City Secretary's Office0.0 0.0 0.0Salary and Benefit Reserve6.54 Office of Financial Services - Reserves and Transfers
10.9 10.7 11.8Strategic Customer Services6.55 Management Services28.0 27.0 27.0Support for Home Repair/Replacement Programs6.56 Housing / Community Services18.0 18.0 15.0Support for Housing Development Programs6.57 Housing / Community Services
0.0 0.0 0.0Tax Increment Financing Districts Payments6.58 Non-Departmental1.5 1.5 1.5Utility Management6.59 Office of Financial Services
15.7 15.7 15.7Vital Statistics6.60 Water Utilities25.3 18.5 25.3Water Planning, Financial and Rate Services6.61 Water Utilities
288.2 260.7 288.2Water Utilities Customer Account Services6.62 Water Utilities
1,053.8 1,133.51,126.9Total for Key Focus Area 6:
594
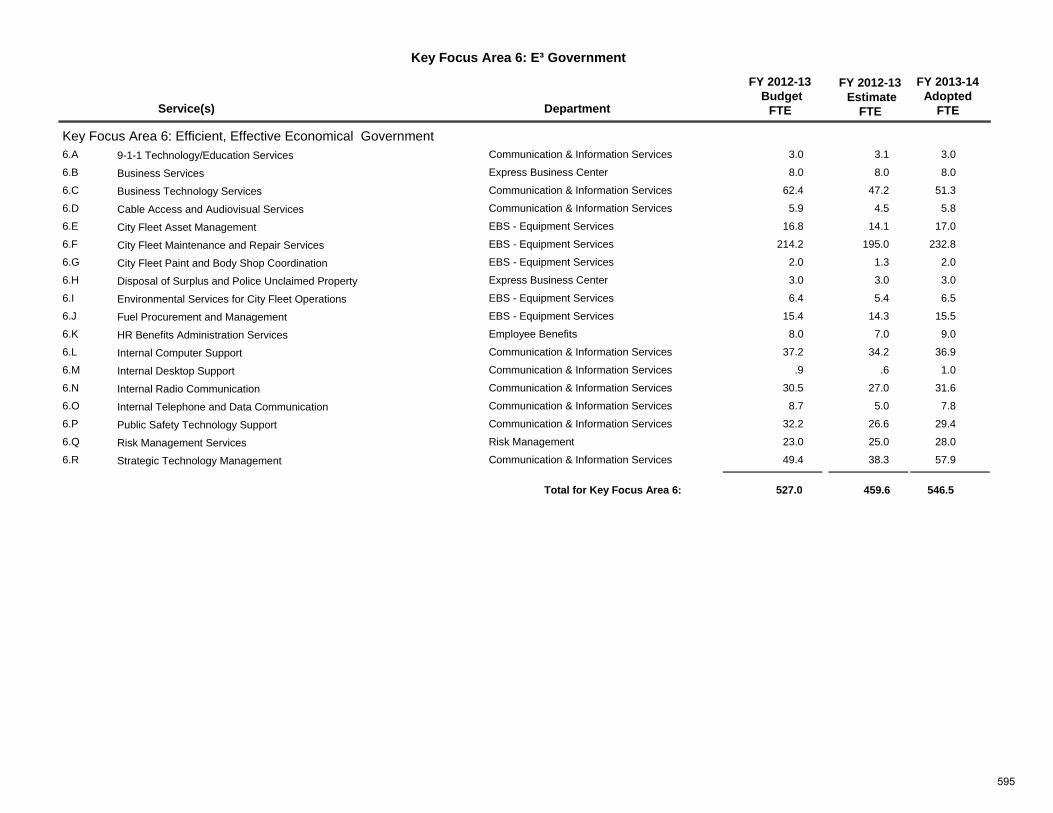
Key Focus Area 6: E³ Government
Service(s) Department
FY 2012-13 Budget
FTE
FY 2012-13 Estimate
FTE
FY 2013-14Adopted
FTE
Key Focus Area 6: Efficient, Effective Economical GovernmentCommunication & Information Services 3.0 3.1 3.09-1-1 Technology/Education Services6.A
Express Business Center 8.0 8.0 8.0Business Services6.B
Communication & Information Services 62.4 47.2 51.3Business Technology Services6.C
Communication & Information Services 5.9 4.5 5.8Cable Access and Audiovisual Services6.D
EBS - Equipment Services 16.8 14.1 17.0City Fleet Asset Management6.E
EBS - Equipment Services 214.2 195.0 232.8City Fleet Maintenance and Repair Services6.F
EBS - Equipment Services 2.0 1.3 2.0City Fleet Paint and Body Shop Coordination6.G
Express Business Center 3.0 3.0 3.0Disposal of Surplus and Police Unclaimed Property6.H
EBS - Equipment Services 6.4 5.4 6.5Environmental Services for City Fleet Operations6.I
EBS - Equipment Services 15.4 14.3 15.5Fuel Procurement and Management6.J
Employee Benefits 8.0 7.0 9.0HR Benefits Administration Services6.K
Communication & Information Services 37.2 34.2 36.9Internal Computer Support6.L
Communication & Information Services .9 .6 1.0Internal Desktop Support6.M
Communication & Information Services 30.5 27.0 31.6Internal Radio Communication6.N
Communication & Information Services 8.7 5.0 7.8Internal Telephone and Data Communication6.O
Communication & Information Services 32.2 26.6 29.4Public Safety Technology Support6.P
Risk Management 23.0 25.0 28.0Risk Management Services6.Q
Communication & Information Services 49.4 38.3 57.9Strategic Technology Management6.R
459.6 546.5527.0Total for Key Focus Area 6:
595
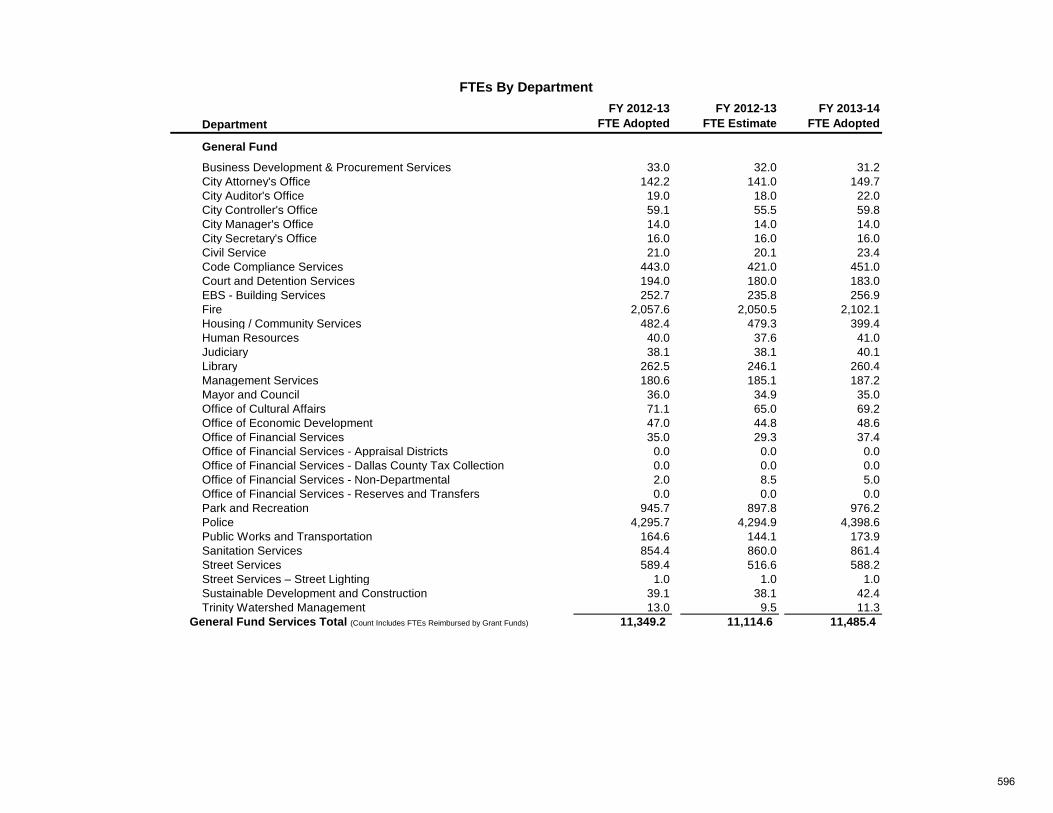
DepartmentFY 2012-13
FTE AdoptedFY 2012-13
FTE EstimateFY 2013-14
FTE Adopted
General Fund
Business Development & Procurement Services 33.0 32.0 31.2 City Attorney's Office 142.2 141.0 149.7 City Auditor's Office 19.0 18.0 22.0 City Controller's Office 59.1 55.5 59.8 City Manager's Office 14.0 14.0 14.0 City Secretary's Office 16.0 16.0 16.0 Civil Service 21.0 20.1 23.4 Code Compliance Services 443.0 421.0 451.0 Court and Detention Services 194.0 180.0 183.0 EBS - Building Services 252.7 235.8 256.9 Fire 2,057.6 2,050.5 2,102.1 Housing / Community Services 482.4 479.3 399.4 Human Resources 40.0 37.6 41.0 Judiciary 38.1 38.1 40.1 Library 262.5 246.1 260.4 Management Services 180.6 185.1 187.2 Mayor and Council 36.0 34.9 35.0 Office of Cultural Affairs 71.1 65.0 69.2 Office of Economic Development 47.0 44.8 48.6 Office of Financial Services 35.0 29.3 37.4 Office of Financial Services - Appraisal Districts 0 0 0 0 0 0
FTEs By Department
Office of Financial Services - Appraisal Districts 0.0 0.0 0.0 Office of Financial Services - Dallas County Tax Collection 0.0 0.0 0.0 Office of Financial Services - Non-Departmental 2.0 8.5 5.0 Office of Financial Services - Reserves and Transfers 0.0 0.0 0.0 Park and Recreation 945.7 897.8 976.2 Police 4,295.7 4,294.9 4,398.6 Public Works and Transportation 164.6 144.1 173.9 Sanitation Services 854.4 860.0 861.4 Street Services 589.4 516.6 588.2 Street Services – Street Lighting 1.0 1.0 1.0 Sustainable Development and Construction 39.1 38.1 42.4 Trinity Watershed Management 13.0 9.5 11.3
11,349.2 11,114.6 11,485.4General Fund Services Total (Count Includes FTEs Reimbursed by Grant Funds)
596
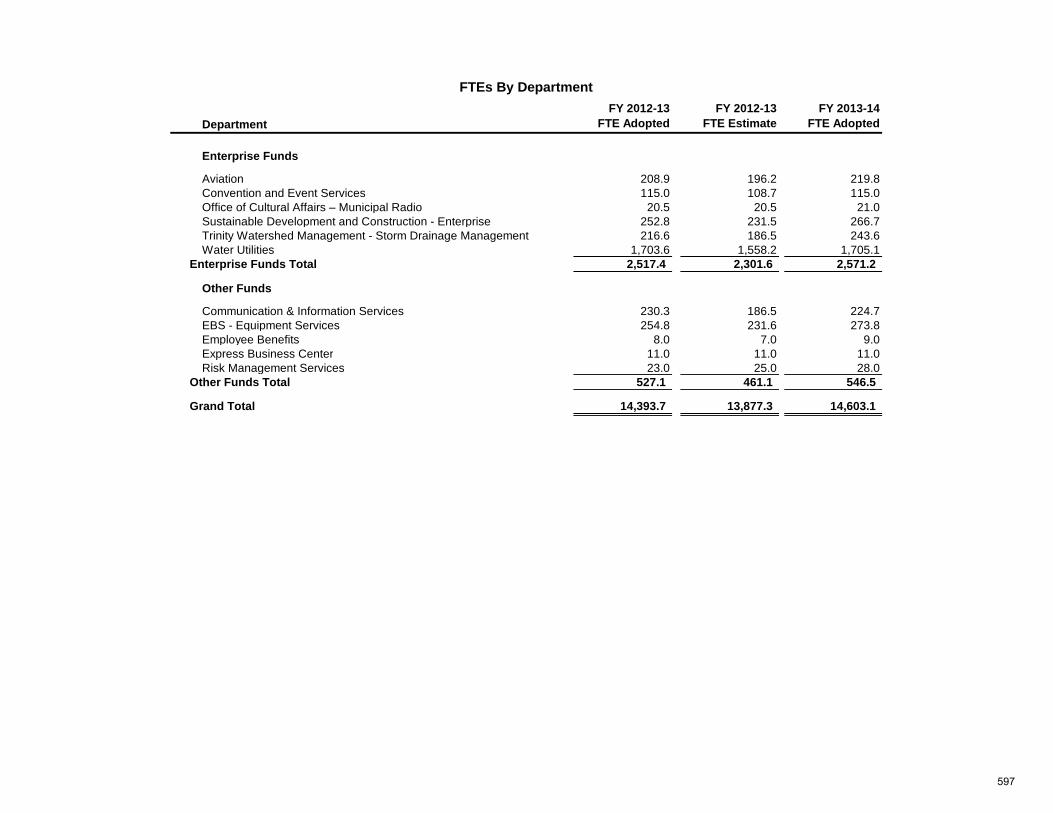
DepartmentFY 2012-13
FTE AdoptedFY 2012-13
FTE EstimateFY 2013-14
FTE Adopted
FTEs By Department
Enterprise Funds
Aviation 208.9 196.2 219.8 Convention and Event Services 115.0 108.7 115.0 Office of Cultural Affairs – Municipal Radio 20.5 20.5 21.0 Sustainable Development and Construction - Enterprise 252.8 231.5 266.7 Trinity Watershed Management - Storm Drainage Management 216.6 186.5 243.6 Water Utilities 1,703.6 1,558.2 1,705.1
2,517.4 2,301.6 2,571.2
Other Funds
Communication & Information Services 230.3 186.5 224.7 EBS - Equipment Services 254.8 231.6 273.8 Employee Benefits 8.0 7.0 9.0 Express Business Center 11.0 11.0 11.0 Risk Management Services 23.0 25.0 28.0
527.1 461.1 546.5
14,393.7 13,877.3 14,603.1
Enterprise Funds Total
Other Funds Total
Grand Total
597

598