2019 program budget - city of spokane
TRANSCRIPT
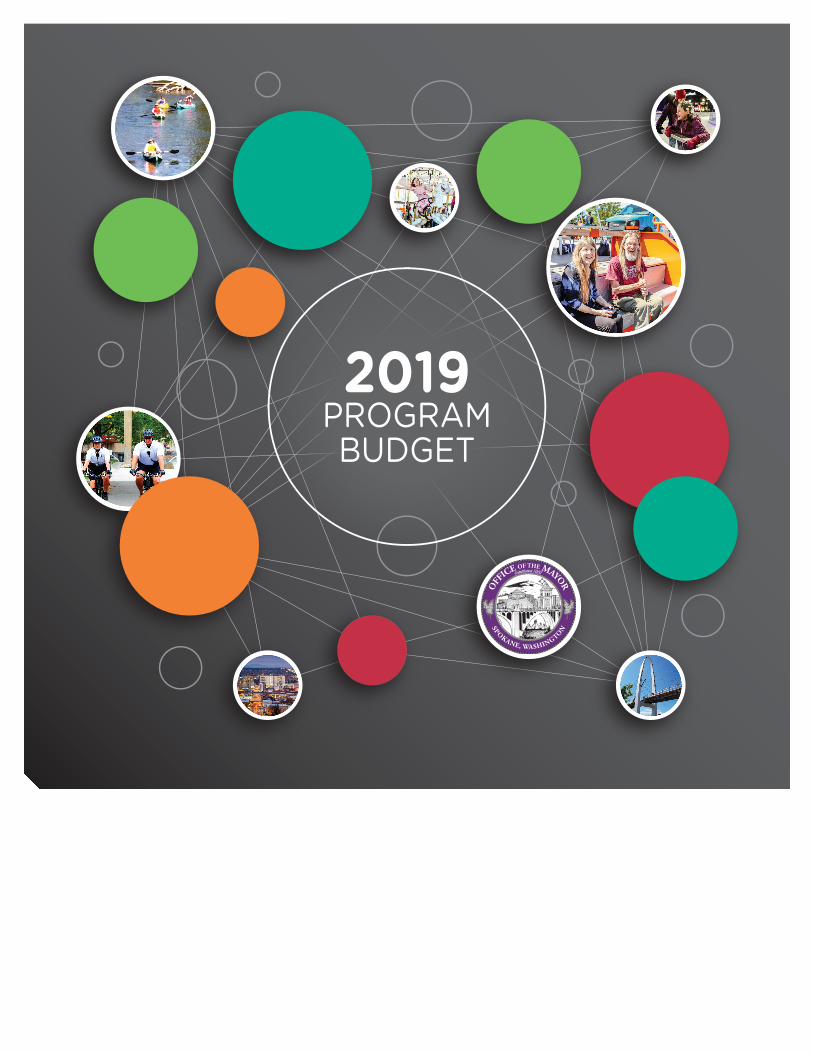
2019PROGRAMBUDGET
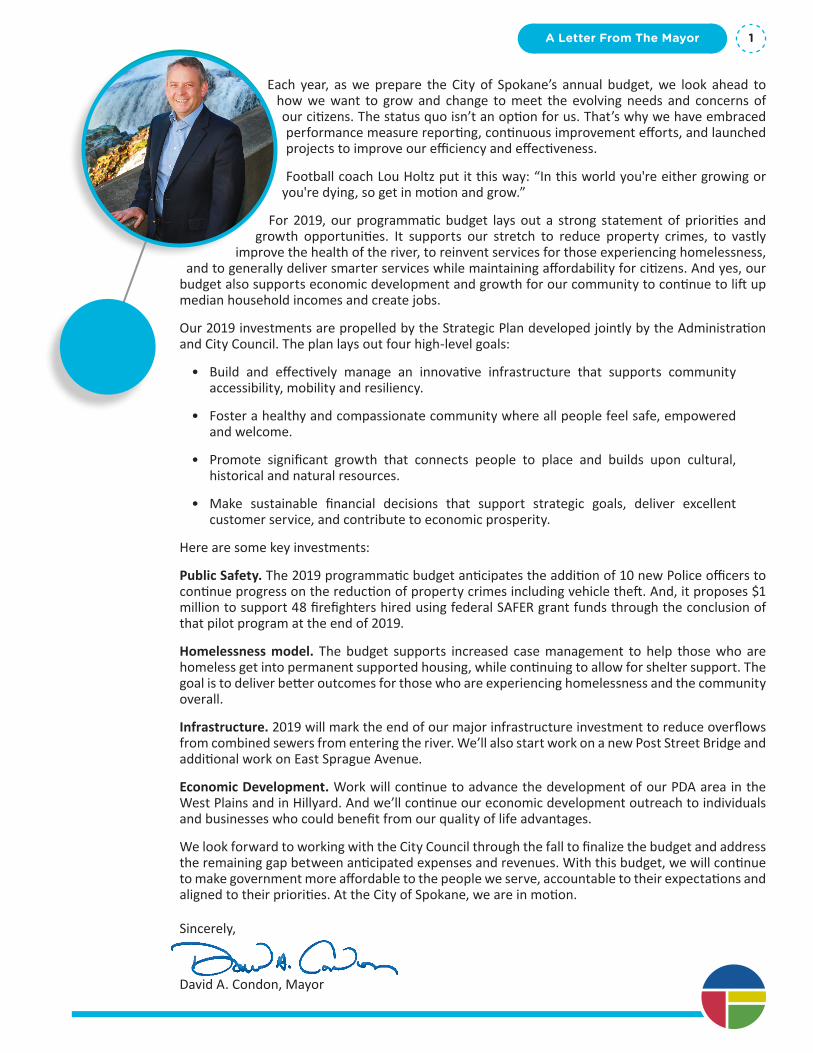
Each year, as we prepare the City of Spokane’s annual budget, we look ahead to how we want to grow and change to meet the evolving needs and concerns of our citizens. The status quo isn’t an option for us. That’s why we have embraced performance measure reporting, continuous improvement efforts, and launched projects to improve our efficiency and effectiveness.
Football coach Lou Holtz put it this way: “In this world you're either growing or you're dying, so get in motion and grow.”
For 2019, our programmatic budget lays out a strong statement of priorities and growth opportunities. It supports our stretch to reduce property crimes, to vastly
improve the health of the river, to reinvent services for those experiencing homelessness, and to generally deliver smarter services while maintaining affordability for citizens. And yes, our
budget also supports economic development and growth for our community to continue to lift up median household incomes and create jobs.
Our 2019 investments are propelled by the Strategic Plan developed jointly by the Administration and City Council. The plan lays out four high-level goals:
• Build and effectively manage an innovative infrastructure that supports community accessibility, mobility and resiliency.
• Foster a healthy and compassionate community where all people feel safe, empowered and welcome.
• Promote significant growth that connects people to place and builds upon cultural, historical and natural resources.
• Make sustainable financial decisions that support strategic goals, deliver excellent customer service, and contribute to economic prosperity.
Here are some key investments:
Public Safety. The 2019 programmatic budget anticipates the addition of 10 new Police officers to continue progress on the reduction of property crimes including vehicle theft. And, it proposes $1 million to support 48 firefighters hired using federal SAFER grant funds through the conclusion of that pilot program at the end of 2019.
Homelessness model. The budget supports increased case management to help those who are homeless get into permanent supported housing, while continuing to allow for shelter support. The goal is to deliver better outcomes for those who are experiencing homelessness and the community overall.
Infrastructure. 2019 will mark the end of our major infrastructure investment to reduce overflows from combined sewers from entering the river. We’ll also start work on a new Post Street Bridge and additional work on East Sprague Avenue.
Economic Development. Work will continue to advance the development of our PDA area in the West Plains and in Hillyard. And we’ll continue our economic development outreach to individuals and businesses who could benefit from our quality of life advantages.
We look forward to working with the City Council through the fall to finalize the budget and address the remaining gap between anticipated expenses and revenues. With this budget, we will continue to make government more affordable to the people we serve, accountable to their expectations and aligned to their priorities. At the City of Spokane, we are in motion.
Sincerely,
David A. Condon, Mayor
1A Letter From The Mayor
Our MissionAt its most basic level, the City’s mission is working every day to deliver a safer, smarter, healthier Spokane. That mission has been reaffirmed by many City Councils and Mayors. It reads:
To deliver efficient and effective services that facilitate economic opportunity and enhance quality of life.
Performance is evaluated daily and reviewed organization-wide every quarter to make sure the City is delivering “efficient and effective services” and that what we track provides relevant guidance to continue delivering the best quality services possible for the dollars the citizens of Spokane entrust to us.
Building a Safer, Smarter, Healthier SpokaneFocused and steady progress toward achieving the goals outlined in the joint City Council and Administration strategic plan has established a solid foundation for the future. Continued discipline in both budget and operations practices and focus on promoting economic growth and vitality will create new opportunities for Spokane and its citizens.
To that end, the organization’s commitment to building a safer, smarter and healthier Spokane requires us to remain focused on citizen top priorities to deliver against these important goals:
• To be the safest city of our size
• To be the fastest growing job market in the Intermountain West
• To be an innovative leader in cost-effective service delivery
• To be a municipal leader in innovation
• To be unequaled in living, learning and leisure
We continue to work diligently to control the cost of City government while investing in citizen’s top priorities resulting in an even safer, smarter and healthier community.
Safer – As the citizen’s top priority, property crime remains a focus for the Spokane Police Department. The Vehicle Theft Task Force, launched specifically to target and prosecute offenders, continues to make progress and has started to reduce incidents of vehicle theft. Identifying new ways to further increase investments to reduce property crime through implementation of a technical resource task team or “property crime technicians” is under consideration for 2019.
The Spokane Fire Department continues to be a leader in seeking new ways to better serve the most pressing citizen needs. Fire equipment will continue to be on a regular replacement schedule utilizing the 1% property tax set aside. More than $1M will be added to the 2019 draft budget to sustain federal SAFER grant-funded positions while alternative plans are being considered.
Smarter – Our integrated approach that is all about the river continues to deliver better outcomes and is getting us to a cleaner river faster. The nearly $100 million in capital investment in Wastewater planned in 2019 will contribute to the completion of our CSO plan on time to meet the 2019 deadline. Our 21st century workforce initiative continues to gain momentum and we’ll continue to focus investments in employee training and wellness.
Healthier – Redevelopment of Riverfront Park is well under way with upgrades to the Pavilion and the north bank slated to be completed in 2019. We continue to make advancements in connecting the community to the river with the CSO project immediately north of the downtown Spokane Public Library and the project at the gateway of Browne’s Addition. The projects will create new vistas of the river, serve as a new connection to the river gorge and planned trail loop and offer a variety of outdoor opportunities for citizens and visitors.
One Vision. One Plan. One Voice.
Fiscal Guidance2
Our Guiding Budget PrincipalsThe City Council has also established a set of core budget principals that guide our thinking in developing responsible, sustainable budgets across the organization. Each year, as a part of our budget process, we recommit to these principles:
• Don’t spend more than you take in
• Don’t spend one-time money on ongoing expenses
• Maintain prudent budget reserves
• Maintain strict controls on hiring and spending
• Fund the highest priority services first
Our Budget Philosophy: Affordable, Accountable, AlignedWe adopted a philosophy during the 2013 budget process that continues to guide our decisions to better serve citizens today. That philosophy requires us to consider affordability, accountability and alignment in all of our budget deliberations and actions.
AffordabilityFundamentally, government must be affordable to the citizens we serve. Our budget philosophy of affordability demands that we consider the financial impacts of our decisions and encourages us to consider how each dollar invested could result in multiple benefits.
AccountabilityIn addition to consideration of financial impacts, each action of the City and its employees must be accountable and transparent to our citizens. We must be open and easily understood, demonstrating that City resources have been invested responsibly.
AlignmentCity services must align with top citizen priorities and core municipal government competencies. Other services, though they may be desired, must be supported by our partner agencies or neighboring jurisdictions.
2017 Close Out & 2018 YTD ResultsThe City of Spokane General Fund closed 2017 better than forecast. Overall, General Fund revenue exceeded expenditures by about $9.6 million (including unrealized gains on investments) while the overall Fund Balance (General Fund only) increased by about 27%. Increased sales tax revenue and revenue from investments were the primary contributors to the positive variance. These positive results led to an almost $4 million increase in the General Fund “checkbook balance” at the end of 2017. At the end of 2017, the General Fund Contingency Reserve was approximately 8% of General Fund budgeted expenditures and the General Fund Revenue Stabilization Account was at about 0.5%. Targeted funding level for these two reserves is set at 10% and 3.5% respectively. City Council approved Resolution 2015-0059, which allows the City to shift positive General Fund variances into the General Fund Contingency Reserves. In early 2018, City Council directed that these positive variances be deposited in the Revenue Stabilization Account bringing the account balance to about 50% of the funding goal.
In the first half of 2018, total General Fund revenue is tracking right on budget; however, some of the various revenue components are tracking below budget. We monitor both revenues and expenses on a monthly basis so that we can be responsive if current trends begin to shift to the point of putting the overall General Fund out of balance. We do not expect revenue to exceed the forecast at year end.
Fiscal Guidance 3
2019 Fiscal GuidanceWe anticipate modest growth in 2019 and the ability to make any new investments depends entirely on the growth of the local economy. There are a number of factors to consider as we work through the 2019 budget process:
• Revenue Growth – For the purpose of developing the 2019 General Fund budget, we are projecting revenue growth of 3%. This is consistent with our long-range revenue forecast and was the recommendation of the City’s Economic Forecast Council.
• Median Household Income – Following up on a significant increase in MHI in 2014 (11%), MHI in the city increased by 1.5% in 2015 and another 3% in 2016 and now sits at $45,676. Although that is the highest MHI we have seen for the City of Spokane, it remains below our United Way ALICE (Asset Limited, Income Constrained, Employed) goal of $54,000. We remain among the lowest MHI in both categories in Spokane County. Our focus on affordability of government remains a top priority, and all budget decisions must consider citizens ability to pay.
• Investment in Our Employees – Working in partnership with our labor groups we have kept the growth in labor costs in line with revenue projections. The 2019 budget will include approximately $6.8 million in contractually obligated pay increases (cost of living increases (COLA) and longevity step increases) as well as budgeted increases in benefits costs of about $3.4 million.
• 1% to Public Safety Capital + Matching Funds – We remain committed to contributing the 1% property tax growth of about $450,000 as well as the $450,000 match from the General Fund to purchasing vehicles and equipment for public safety. City Council adopted Resolution 2014-0081 on July 14, 2014, to support this ongoing investment. We are just over halfway to our goal of creating a sustainable funding source for public safety vehicles. We will achieve this goal by continuing to commit the 1% increases through 2021. In 2021, the City will have approximately $6.5 million annually dedicated for this purpose and will no longer need to commit future property tax increases for this purpose.
• Investment in Public Safety Operations – Anticipated expiration of the federal SAFER grant requires an infusion of about $1 million of General Fund dollars to maintain these 48 positions through the end of 2019. Additionally, we continue to prioritize investment in property crime reduction and will work to invest in an additional 10 police offers, which will bring the department closer to nearly fully staffed status identified in a 2016 police staffing study.
• Unfunded Capital – We continue to look for solutions to the shortfall in our preliminary 2019 $762million 6-year capital budget, which currently stands at about $21million of projects that are unfunded and have no identified funding source.
• Reserves – The City Council approved Resolution 2015-0059, which established a formal plan allowing us to allocate positive General Fund variances into the General Fund Contingency Reserves. Allocating the 2017 net positive cash variance into the Revenue Stabilization Account will increase the level of funding to about 2%, just short of our 3.5% goal.
• Interest Income – General Fund interest income is expected to drop substantially by year end 2019 based largely on two factors: (1) decreases in the City’s investment portfolio from continued spend-down of the Wastewater “Green” revenue bonds, and the bonds for improvements in Riverfront Park, together with (2) increases in the amount of interest income credited to the utility and other non-General Fund areas of the City. (This will result in the event of anticipated continued increases in short-term interest rates on which the allocations are based).
One Vision. One Plan. One Voice.
Fiscal Guidance4
• 2.9% Utility Rate Cap – We are committed to supporting the Utility rate cap set by City Council at 2.9% (through 2020). The City’s long-range revenue growth as well as public works capital projects will be tied to that rate in 2019 and in future budgets. The Utilities capital plan is fully funded for 2019.
• Impact of State & Federal Policy – We anticipate that federal policy changes may have regulatory impacts related to the Affordable Care Act, and changes to EPA and state Department of Ecology regulations/rules could have a negative financial impact on the City budget.
• Spokane Employee Retirement System – City employees depend on SERS for their retirement, and it is a priority to improve the financial sustainability of SERS for currently retired employees and for future retirees. We continue to work with our employee labor groups to ensure the sustainability of this program now and into the future. During recent negotiations, the City and Bargaining Units under SERS agreed to adjust the contributions rate each year in accordance with the recommendation from the actuary, up to 1% per year for both the City and the employees.
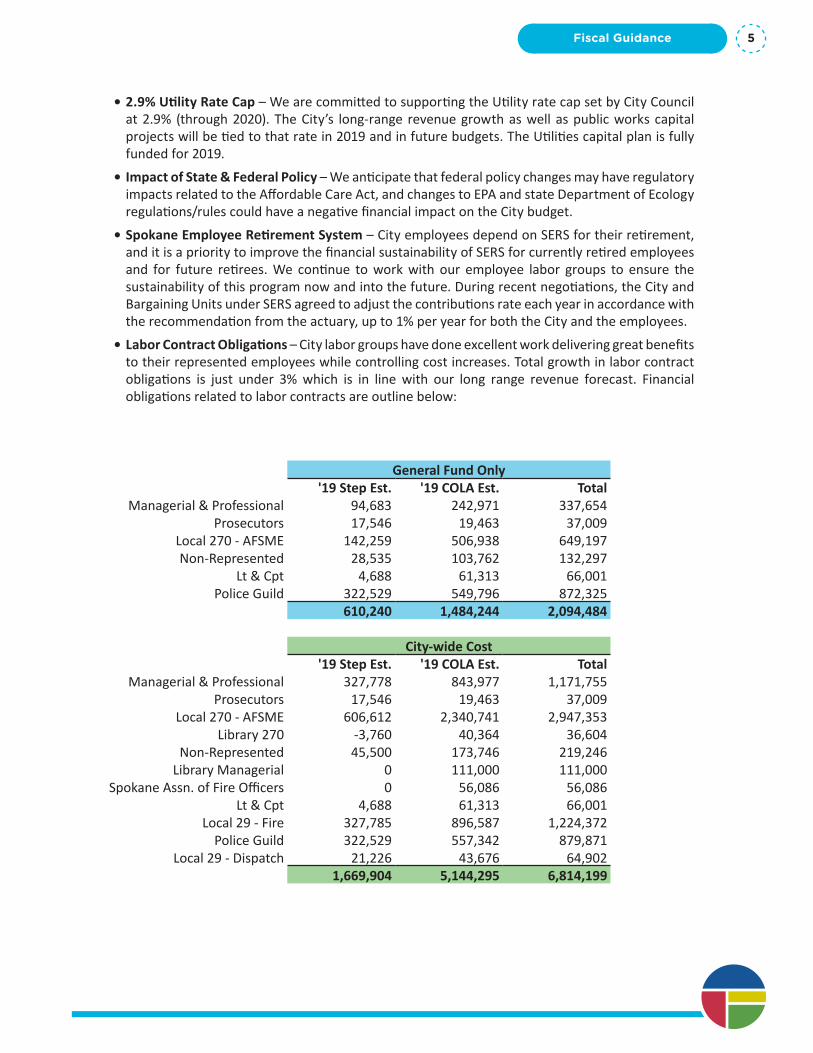
• Labor Contract Obligations – City labor groups have done excellent work delivering great benefits to their represented employees while controlling cost increases. Total growth in labor contract obligations is just under 3% which is in line with our long range revenue forecast. Financial obligations related to labor contracts are outline below:
General Fund Only'19 Step Est. '19 COLA Est. Total
Managerial & Professional 94,683 242,971 337,654Prosecutors 17,546 19,463 37,009
Local 270 - AFSME 142,259 506,938 649,197Non-Represented 28,535 103,762 132,297
Lt & Cpt 4,688 61,313 66,001Police Guild 322,529 549,796 872,325
610,240 1,484,244 2,094,484
City-wide Cost '19 Step Est. '19 COLA Est. Total
Managerial & Professional 327,778 843,977 1,171,755Prosecutors 17,546 19,463 37,009
Local 270 - AFSME 606,612 2,340,741 2,947,353Library 270 -3,760 40,364 36,604
Non-Represented 45,500 173,746 219,246Library Managerial 0 111,000 111,000
Spokane Assn. of Fire Officers 0 56,086 56,086Lt & Cpt 4,688 61,313 66,001
Local 29 - Fire 327,785 896,587 1,224,372Police Guild 322,529 557,342 879,871
Local 29 - Dispatch 21,226 43,676 64,9021,669,904 5,144,295 6,814,199
Fiscal Guidance 5
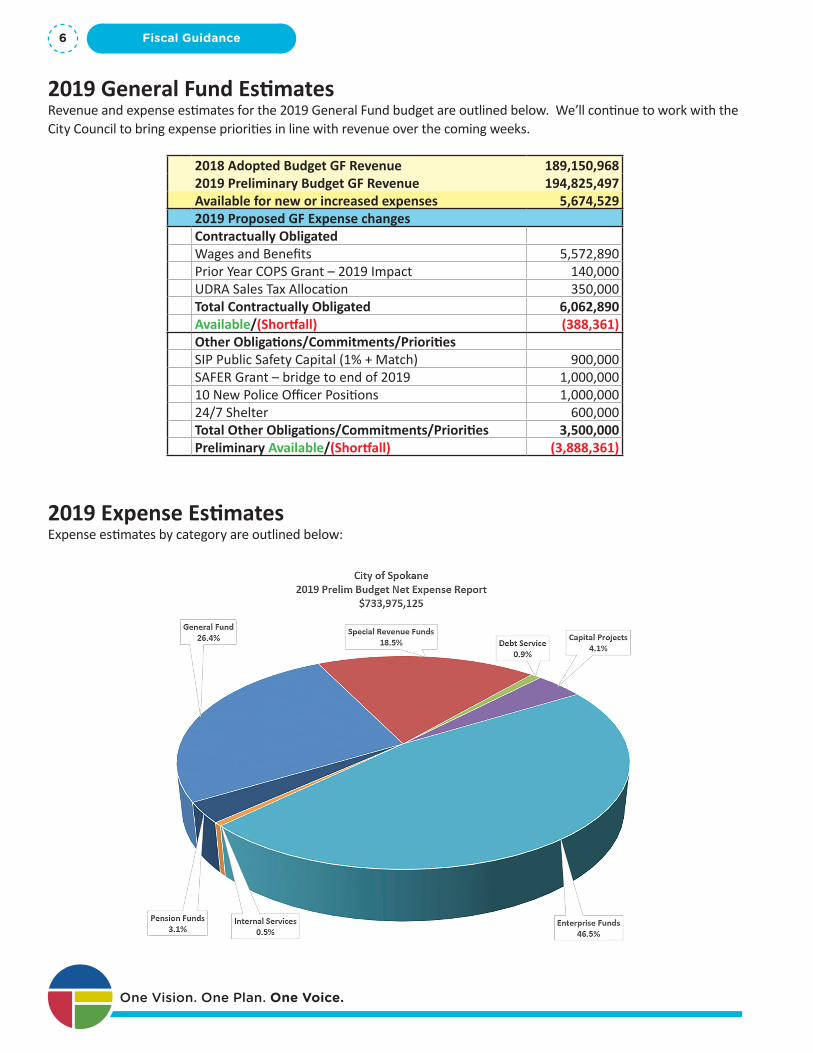
2019 General Fund EstimatesRevenue and expense estimates for the 2019 General Fund budget are outlined below. We’ll continue to work with the City Council to bring expense priorities in line with revenue over the coming weeks.
2018 Adopted Budget GF Revenue 189,150,9682019 Preliminary Budget GF Revenue 194,825,497Available for new or increased expenses 5,674,5292019 Proposed GF Expense changesContractually ObligatedWages and Benefits 5,572,890Prior Year COPS Grant – 2019 Impact 140,000UDRA Sales Tax Allocation 350,000Total Contractually Obligated 6,062,890Available/(Shortfall) (388,361)Other Obligations/Commitments/PrioritiesSIP Public Safety Capital (1% + Match) 900,000SAFER Grant – bridge to end of 2019 1,000,00010 New Police Officer Positions 1,000,00024/7 Shelter 600,000Total Other Obligations/Commitments/Priorities 3,500,000Preliminary Available/(Shortfall) (3,888,361)
2019 Expense EstimatesExpense estimates by category are outlined below:
One Vision. One Plan. One Voice.
Fiscal Guidance6
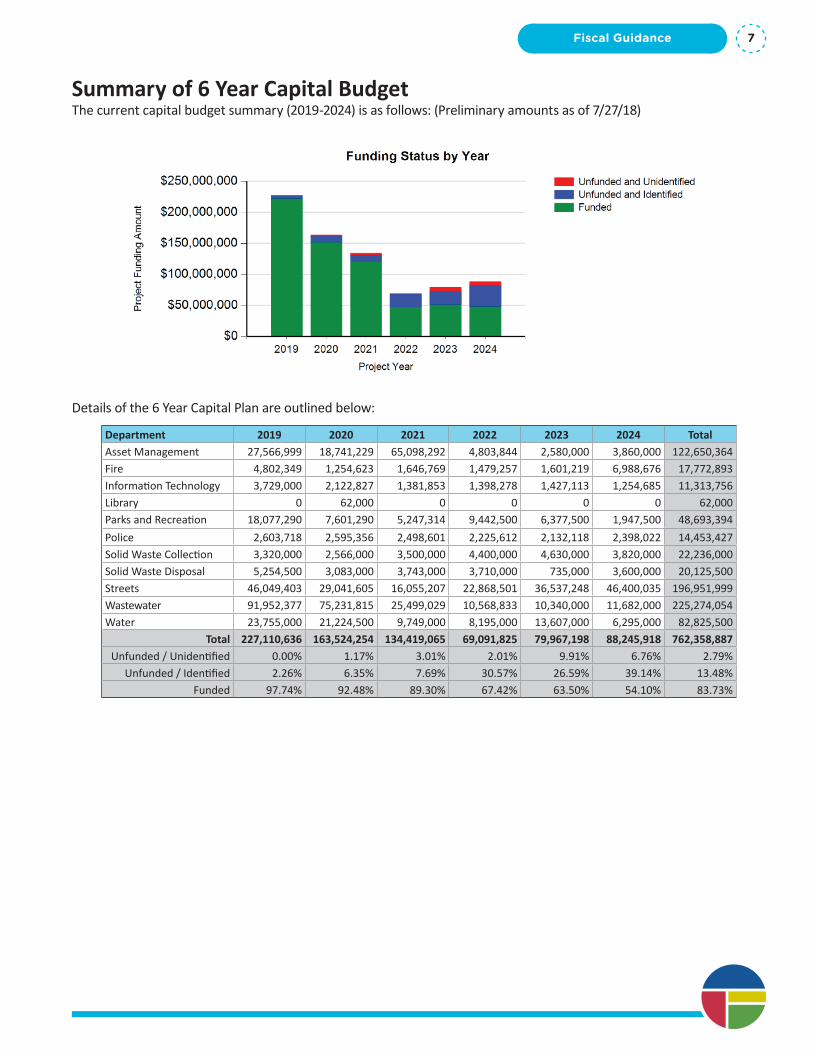
Summary of 6 Year Capital BudgetThe current capital budget summary (2019-2024) is as follows: (Preliminary amounts as of 7/27/18)
Department 2019 2020 2021 2022 2023 2024 TotalAsset Management 27,566,999 18,741,229 65,098,292 4,803,844 2,580,000 3,860,000 122,650,364Fire 4,802,349 1,254,623 1,646,769 1,479,257 1,601,219 6,988,676 17,772,893Information Technology 3,729,000 2,122,827 1,381,853 1,398,278 1,427,113 1,254,685 11,313,756Library 0 62,000 0 0 0 0 62,000Parks and Recreation 18,077,290 7,601,290 5,247,314 9,442,500 6,377,500 1,947,500 48,693,394Police 2,603,718 2,595,356 2,498,601 2,225,612 2,132,118 2,398,022 14,453,427Solid Waste Collection 3,320,000 2,566,000 3,500,000 4,400,000 4,630,000 3,820,000 22,236,000Solid Waste Disposal 5,254,500 3,083,000 3,743,000 3,710,000 735,000 3,600,000 20,125,500Streets 46,049,403 29,041,605 16,055,207 22,868,501 36,537,248 46,400,035 196,951,999Wastewater 91,952,377 75,231,815 25,499,029 10,568,833 10,340,000 11,682,000 225,274,054Water 23,755,000 21,224,500 9,749,000 8,195,000 13,607,000 6,295,000 82,825,500
Total 227,110,636 163,524,254 134,419,065 69,091,825 79,967,198 88,245,918 762,358,887Unfunded / Unidentified 0.00% 1.17% 3.01% 2.01% 9.91% 6.76% 2.79%
Unfunded / Identified 2.26% 6.35% 7.69% 30.57% 26.59% 39.14% 13.48%Funded 97.74% 92.48% 89.30% 67.42% 63.50% 54.10% 83.73%
Details of the 6 Year Capital Plan are outlined below:
Fiscal Guidance 7
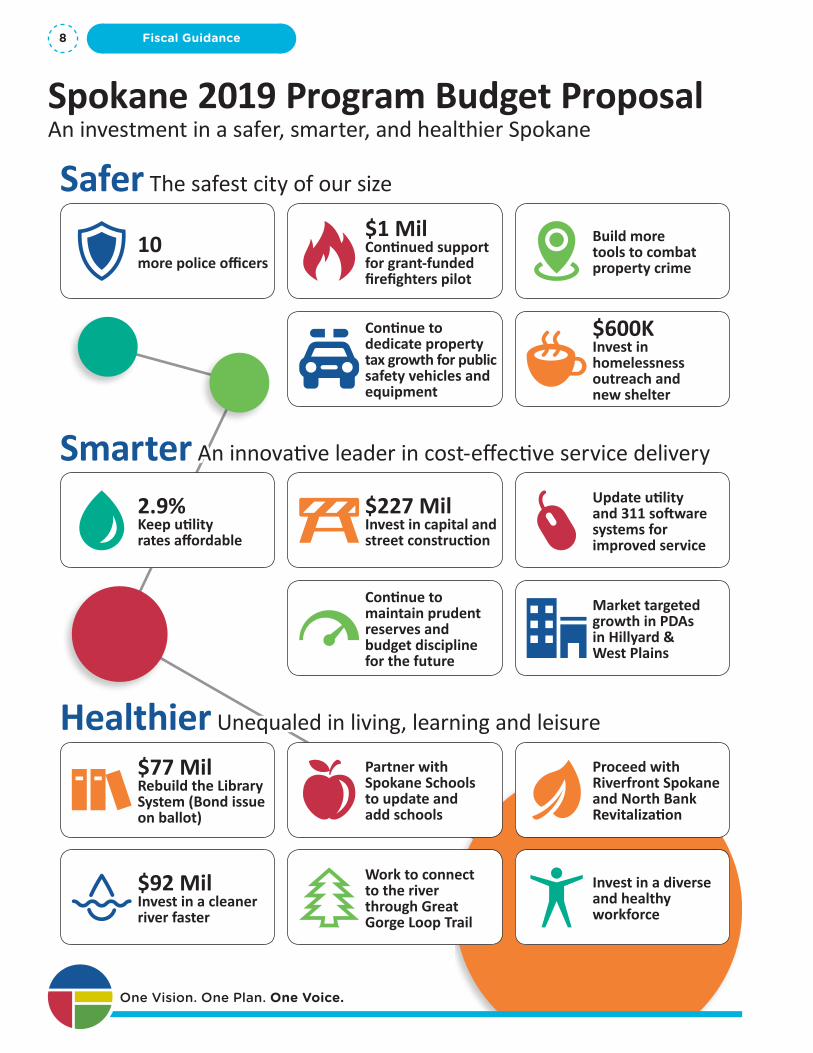
Spokane 2019 Program Budget ProposalAn investment in a safer, smarter, and healthier Spokane
Safer The safest city of our size
Smarter An innovative leader in cost-effective service delivery
Healthier Unequaled in living, learning and leisure
10 more police officers
2.9% Keep utility rates affordable
$77 Mil Rebuild the Library System (Bond issue on ballot)
$92 Mil Invest in a cleaner river faster
Continue to dedicate property tax growth for public safety vehicles and equipment
Continue to maintain prudent reserves and budget discipline for the future
Work to connect to the river through Great Gorge Loop Trail
$1 MilContinued support for grant-funded firefighters pilot
$227 MilInvest in capital and street construction
Partner with Spokane Schoolsto update and add schools
$600KInvest in homelessness outreach and new shelter
Market targeted growth in PDAs in Hillyard & West Plains
Invest in a diverse and healthy workforce
Build more tools to combat property crime
Update utility and 311 software systems for improved service
Proceed with Riverfront Spokane and North BankRevitalization
One Vision. One Plan. One Voice.
Fiscal Guidance8

Performance Measures
Performance M
easures
MichelleHughes,
AccountingDirector
Discussion Send Feedback
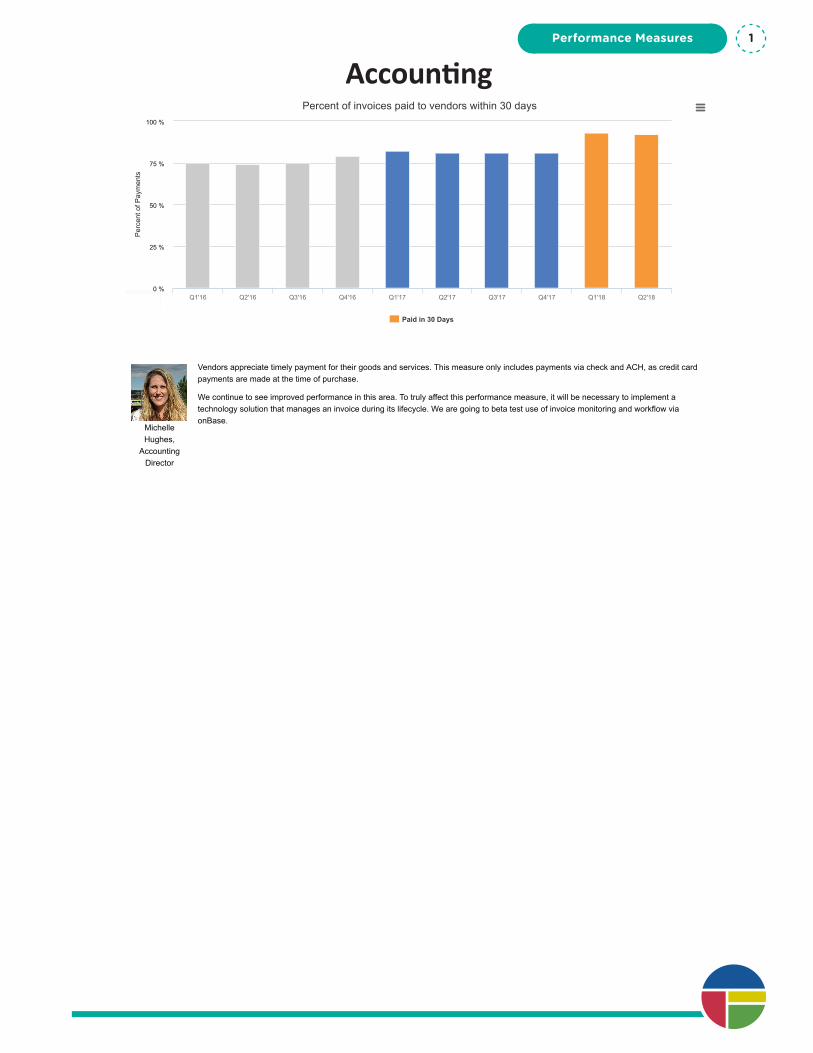
Vendors appreciate timely payment for their goods and services. This measure only includes payments via check and ACH, as credit cardpayments are made at the time of purchase.
We continue to see improved performance in this area. To truly affect this performance measure, it will be necessary to implement atechnology solution that manages an invoice during its lifecycle. We are going to beta test use of invoice monitoring and workflow viaonBase.
Per
cent
of P
aym
ents
Percent of invoices paid to vendors within 30 days
Paid in 30 Days
Q1'16 Q2'16 Q3'16 Q4'16 Q1'17 Q2'17 Q3'17 Q4'17 Q1'18 Q2'180 %
100 %
25 %
50 %
75 %
AccountingPerformance Measures 1
Ed Lukas,Director, AssetManagement
Discussion Send Feedback
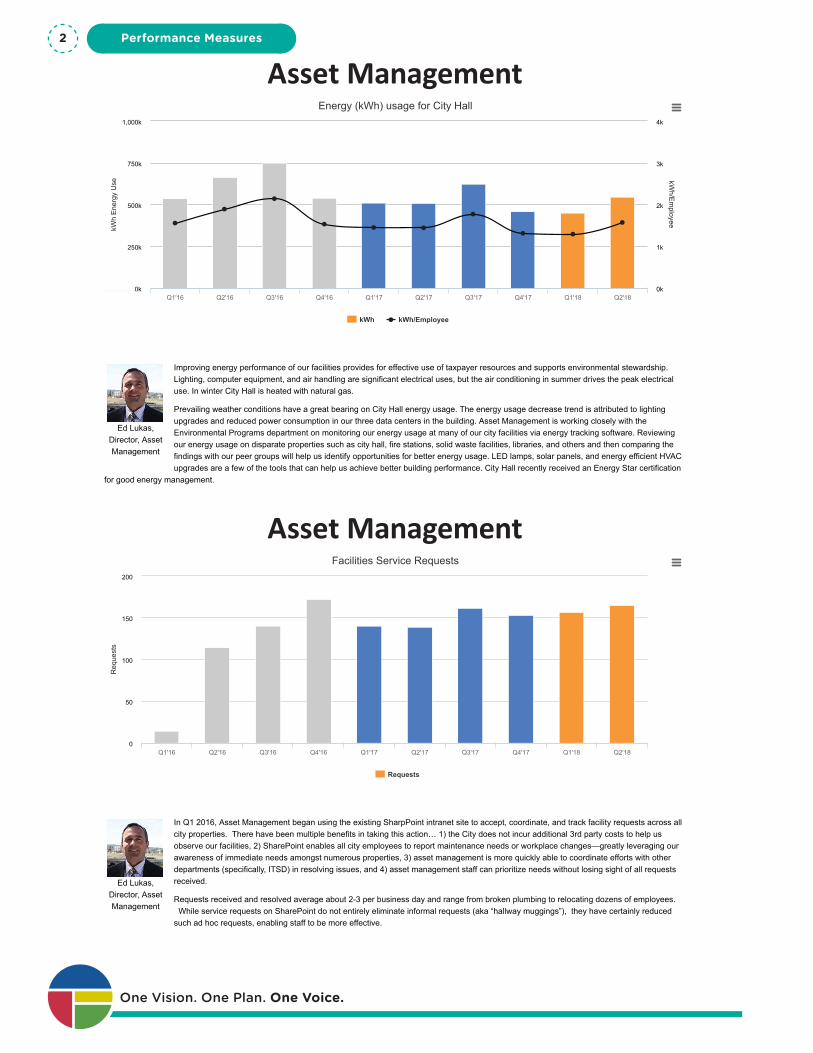
Improving energy performance of our facilities provides for effective use of taxpayer resources and supports environmental stewardship.Lighting, computer equipment, and air handling are significant electrical uses, but the air conditioning in summer drives the peak electricaluse. In winter City Hall is heated with natural gas.
Prevailing weather conditions have a great bearing on City Hall energy usage. The energy usage decrease trend is attributed to lightingupgrades and reduced power consumption in our three data centers in the building. Asset Management is working closely with theEnvironmental Programs department on monitoring our energy usage at many of our city facilities via energy tracking software. Reviewingour energy usage on disparate properties such as city hall, fire stations, solid waste facilities, libraries, and others and then comparing thefindings with our peer groups will help us identify opportunities for better energy usage. LED lamps, solar panels, and energy efficient HVACupgrades are a few of the tools that can help us achieve better building performance. City Hall recently received an Energy Star certification
for good energy management.
kWh
Ene
rgy
Use
kWh/E
mployee
Energy (kWh) usage for City Hall
kWh kWh/Employee
Q1'16 Q2'16 Q3'16 Q4'16 Q1'17 Q2'17 Q3'17 Q4'17 Q1'18 Q2'180k
1,000k
250k
500k
750k
0k
1k
2k
3k
4k
Ed Lukas,Director, AssetManagement
Discussion Send Feedback
In Q1 2016, Asset Management began using the existing SharpPoint intranet site to accept, coordinate, and track facility requests across allcity properties. There have been multiple benefits in taking this action… 1) the City does not incur additional 3rd party costs to help usobserve our facilities, 2) SharePoint enables all city employees to report maintenance needs or workplace changes—greatly leveraging ourawareness of immediate needs amongst numerous properties, 3) asset management is more quickly able to coordinate efforts with otherdepartments (specifically, ITSD) in resolving issues, and 4) asset management staff can prioritize needs without losing sight of all requestsreceived.
Requests received and resolved average about 2-3 per business day and range from broken plumbing to relocating dozens of employees. While service requests on SharePoint do not entirely eliminate informal requests (aka “hallway muggings”), they have certainly reducedsuch ad hoc requests, enabling staff to be more effective.
Req
uest
s
Facilities Service Requests
Requests
Q1'16 Q2'16 Q3'16 Q4'16 Q1'17 Q2'17 Q3'17 Q4'17 Q1'18 Q2'180
50
100
150
200
Asset Management
Asset Management
One Vision. One Plan. One Voice.
Performance Measures2
Kelly Keenan,Director, CHHS
Discussion Send Feedback
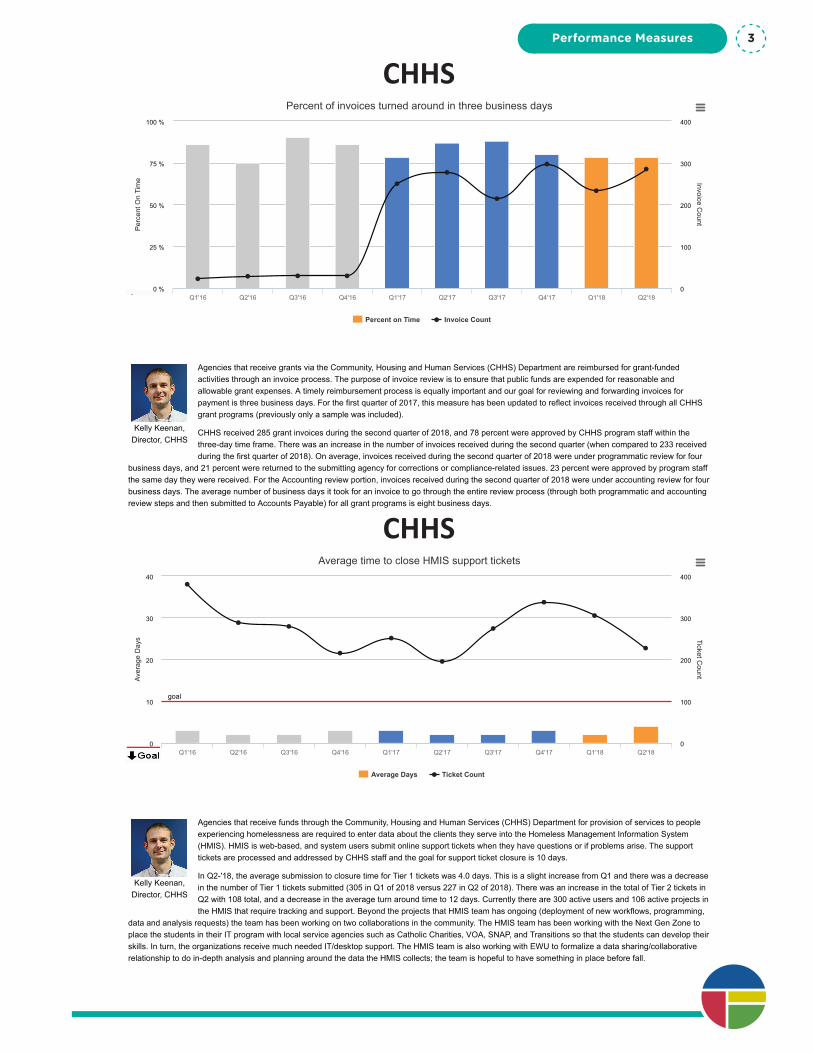
Agencies that receive grants via the Community, Housing and Human Services (CHHS) Department are reimbursed for grant-fundedactivities through an invoice process. The purpose of invoice review is to ensure that public funds are expended for reasonable andallowable grant expenses. A timely reimbursement process is equally important and our goal for reviewing and forwarding invoices forpayment is three business days. For the first quarter of 2017, this measure has been updated to reflect invoices received through all CHHSgrant programs (previously only a sample was included).
CHHS received 285 grant invoices during the second quarter of 2018, and 78 percent were approved by CHHS program staff within thethree-day time frame. There was an increase in the number of invoices received during the second quarter (when compared to 233 receivedduring the first quarter of 2018). On average, invoices received during the second quarter of 2018 were under programmatic review for four
business days, and 21 percent were returned to the submitting agency for corrections or compliance-related issues. 23 percent were approved by program staffthe same day they were received. For the Accounting review portion, invoices received during the second quarter of 2018 were under accounting review for fourbusiness days. The average number of business days it took for an invoice to go through the entire review process (through both programmatic and accountingreview steps and then submitted to Accounts Payable) for all grant programs is eight business days.
Per
cent
On
Tim
e Invoice Count
Percent of invoices turned around in three business days
Percent on Time Invoice Count
Q1'16 Q2'16 Q3'16 Q4'16 Q1'17 Q2'17 Q3'17 Q4'17 Q1'18 Q2'180 %
100 %
25 %
50 %
75 %
0
100
200
300
400
CHHS
Kelly Keenan,Director, CHHS
Discussion Send Feedback
Agencies that receive funds through the Community, Housing and Human Services (CHHS) Department for provision of services to peopleexperiencing homelessness are required to enter data about the clients they serve into the Homeless Management Information System(HMIS). HMIS is web-based, and system users submit online support tickets when they have questions or if problems arise. The supporttickets are processed and addressed by CHHS staff and the goal for support ticket closure is 10 days.
In Q2-'18, the average submission to closure time for Tier 1 tickets was 4.0 days. This is a slight increase from Q1 and there was a decreasein the number of Tier 1 tickets submitted (305 in Q1 of 2018 versus 227 in Q2 of 2018). There was an increase in the total of Tier 2 tickets inQ2 with 108 total, and a decrease in the average turn around time to 12 days. Currently there are 300 active users and 106 active projects inthe HMIS that require tracking and support. Beyond the projects that HMIS team has ongoing (deployment of new workflows, programming,
data and analysis requests) the team has been working on two collaborations in the community. The HMIS team has been working with the Next Gen Zone toplace the students in their IT program with local service agencies such as Catholic Charities, VOA, SNAP, and Transitions so that the students can develop theirskills. In turn, the organizations receive much needed IT/desktop support. The HMIS team is also working with EWU to formalize a data sharing/collaborativerelationship to do in-depth analysis and planning around the data the HMIS collects; the team is hopeful to have something in place before fall.
Aver
age
Day
s Ticket Count
Average time to close HMIS support tickets
goal
Average Days Ticket Count
Q1'16 Q2'16 Q3'16 Q4'16 Q1'17 Q2'17 Q3'17 Q4'17 Q1'18 Q2'180
10
20
30
40
0
100
200
300
400
CHHS
Performance Measures 3
Kelly Keenan,Director, CHHS
Discussion Send Feedback
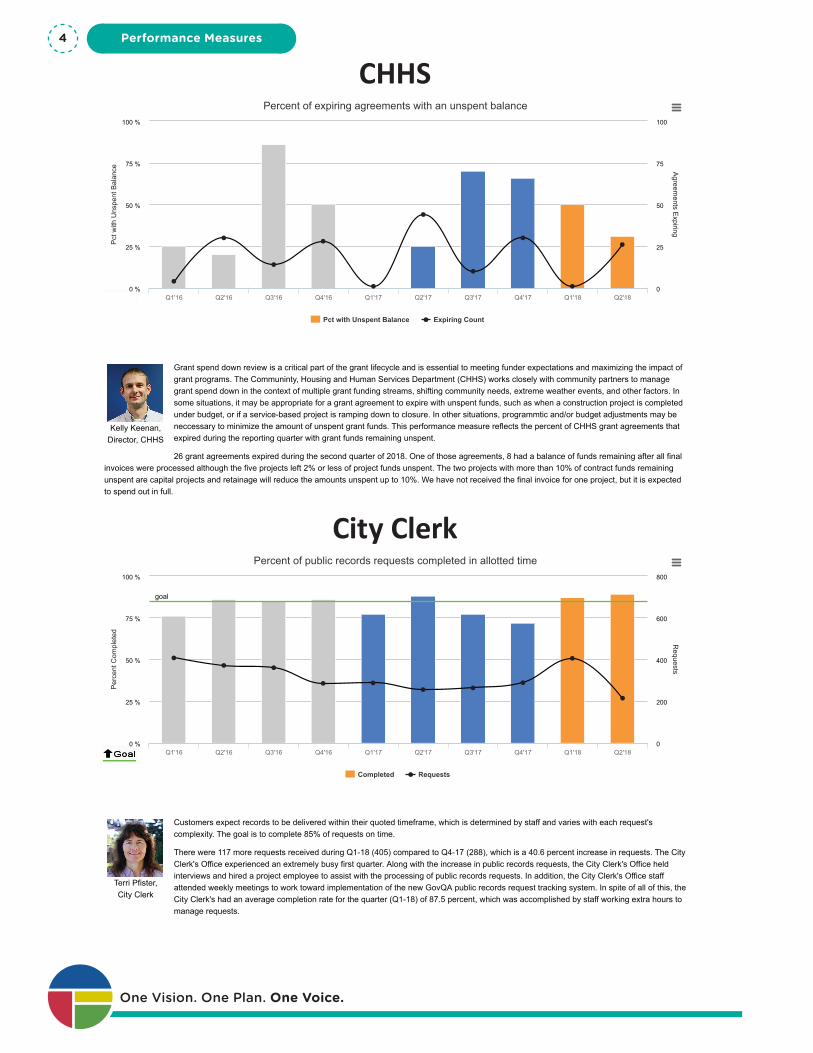
Grant spend down review is a critical part of the grant lifecycle and is essential to meeting funder expectations and maximizing the impact ofgrant programs. The Communinty, Housing and Human Services Department (CHHS) works closely with community partners to managegrant spend down in the context of multiple grant funding streams, shifting community needs, extreme weather events, and other factors. Insome situations, it may be appropriate for a grant agreement to expire with unspent funds, such as when a construction project is completedunder budget, or if a service-based project is ramping down to closure. In other situations, programmtic and/or budget adjustments may beneccessary to minimize the amount of unspent grant funds. This performance measure reflects the percent of CHHS grant agreements thatexpired during the reporting quarter with grant funds remaining unspent.
26 grant agreements expired during the second quarter of 2018. One of those agreements, 8 had a balance of funds remaining after all finalinvoices were processed although the five projects left 2% or less of project funds unspent. The two projects with more than 10% of contract funds remainingunspent are capital projects and retainage will reduce the amounts unspent up to 10%. We have not received the final invoice for one project, but it is expectedto spend out in full.
Pct
with
Uns
pent
Bal
ance A
greements E
xpiring
Percent of expiring agreements with an unspent balance
Pct with Unspent Balance Expiring Count
Q1'16 Q2'16 Q3'16 Q4'16 Q1'17 Q2'17 Q3'17 Q4'17 Q1'18 Q2'180 %
100 %
25 %
50 %
75 %
0
100
25
50
75
CHHS
Terri Pfister,City Clerk
Discussion Send Feedback
Customers expect records to be delivered within their quoted timeframe, which is determined by staff and varies with each request'scomplexity. The goal is to complete 85% of requests on time.
There were 117 more requests received during Q1-18 (405) compared to Q4-17 (288), which is a 40.6 percent increase in requests. The CityClerk's Office experienced an extremely busy first quarter. Along with the increase in public records requests, the City Clerk's Office heldinterviews and hired a project employee to assist with the processing of public records requests. In addition, the City Clerk's Office staffattended weekly meetings to work toward implementation of the new GovQA public records request tracking system. In spite of all of this, theCity Clerk's had an average completion rate for the quarter (Q1-18) of 87.5 percent, which was accomplished by staff working extra hours tomanage requests.
Per
cent
Com
plet
ed
Requests
Percent of public records requests completed in allotted time
goal
Completed Requests
Q1'16 Q2'16 Q3'16 Q4'16 Q1'17 Q2'17 Q3'17 Q4'17 Q1'18 Q2'180 %
100 %
25 %
50 %
75 %
0
200
400
600
800
City Clerk
One Vision. One Plan. One Voice.
Performance Measures4
Kris Becker,Director ,
DevelopmentServicesCenter,
Parking, &Code
Enforcement
Discussion Send Feedback
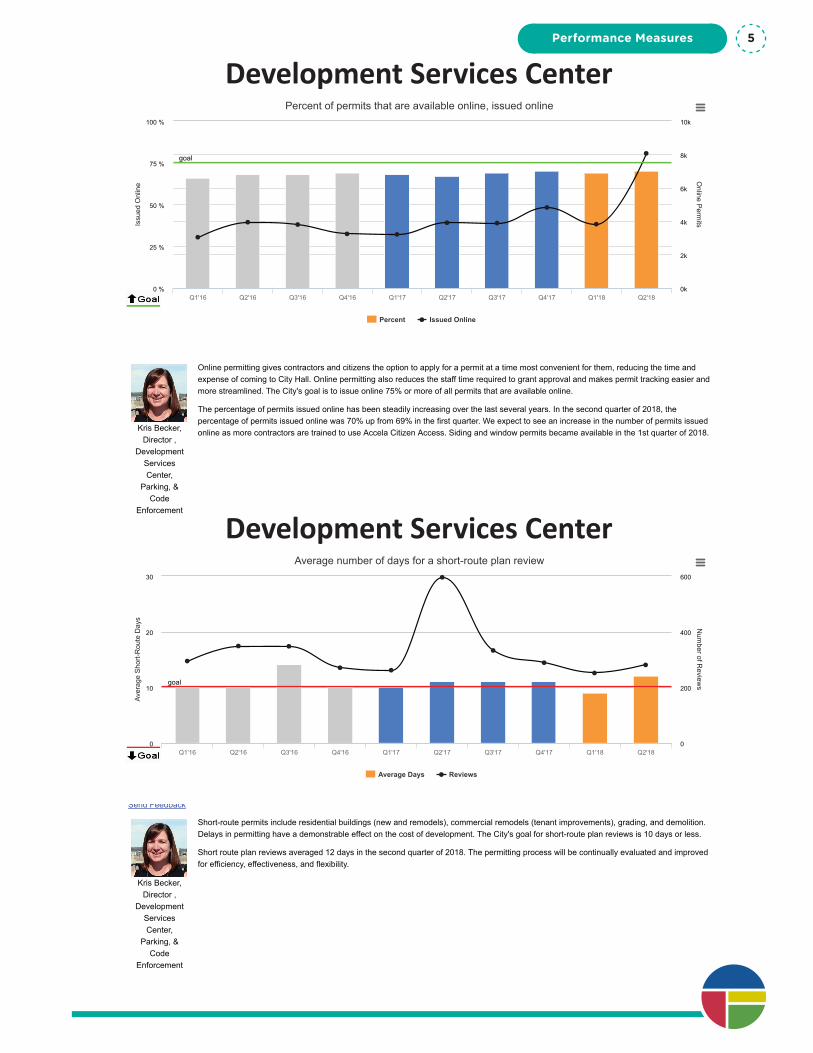
Online permitting gives contractors and citizens the option to apply for a permit at a time most convenient for them, reducing the time andexpense of coming to City Hall. Online permitting also reduces the staff time required to grant approval and makes permit tracking easier andmore streamlined. The City's goal is to issue online 75% or more of all permits that are available online.
The percentage of permits issued online has been steadily increasing over the last several years. In the second quarter of 2018, thepercentage of permits issued online was 70% up from 69% in the first quarter. We expect to see an increase in the number of permits issuedonline as more contractors are trained to use Accela Citizen Access. Siding and window permits became available in the 1st quarter of 2018.
Issu
ed O
nlin
e
Online P
ermits
Percent of permits that are available online, issued online
goal
Percent Issued Online
Q1'16 Q2'16 Q3'16 Q4'16 Q1'17 Q2'17 Q3'17 Q4'17 Q1'18 Q2'180 %
100 %
25 %
50 %
75 %
0k
2k
4k
6k
8k
10k
Development Services Center
Kris Becker,Director ,
DevelopmentServicesCenter,
Parking, &Code
Enforcement
Discussion Send Feedback
Short-route permits include residential buildings (new and remodels), commercial remodels (tenant improvements), grading, and demolition.Delays in permitting have a demonstrable effect on the cost of development. The City's goal for short-route plan reviews is 10 days or less.
Short route plan reviews averaged 12 days in the second quarter of 2018. The permitting process will be continually evaluated and improvedfor efficiency, effectiveness, and flexibility.
Aver
age
Sho
rt-R
oute
Day
s
Num
ber of Review
s
Average number of days for a short-route plan review
goal
Average Days Reviews
Q1'16 Q2'16 Q3'16 Q4'16 Q1'17 Q2'17 Q3'17 Q4'17 Q1'18 Q2'180
10
20
30
0
200
400
600
Development Services Center
Performance Measures 5
Kris Becker,Director ,
DevelopmentServicesCenter,
Parking, &Code
Enforcement
Discussion Send Feedback
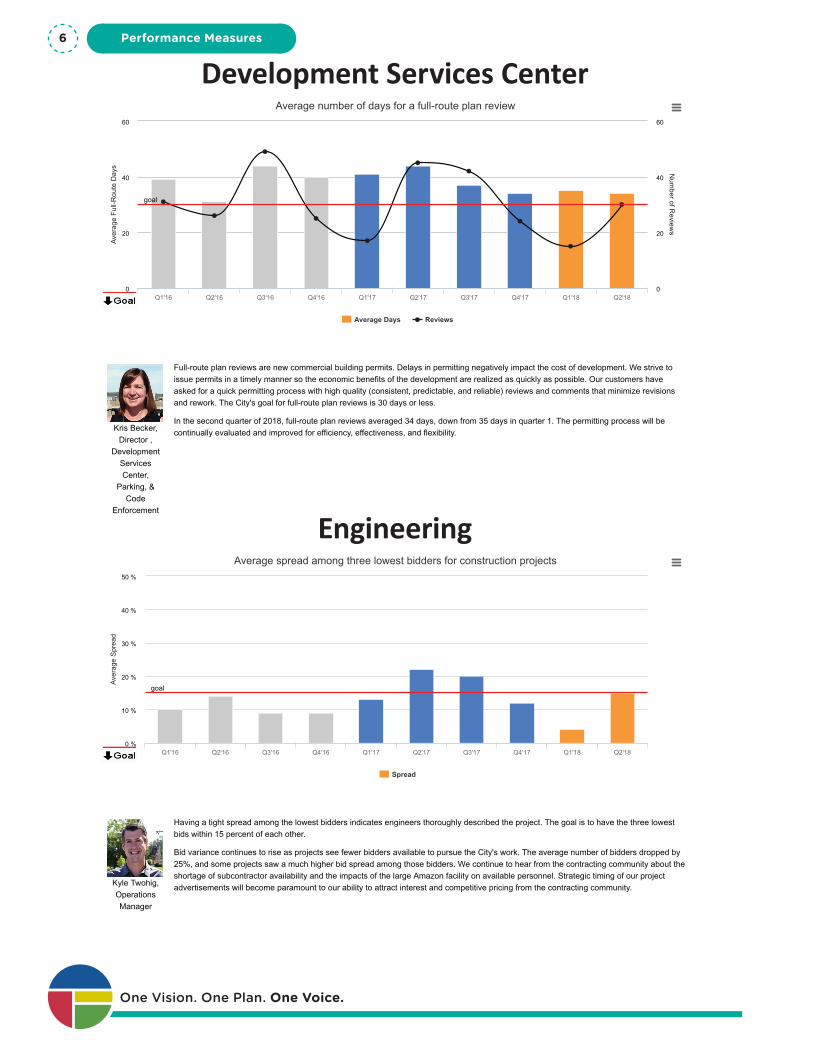
Full-route plan reviews are new commercial building permits. Delays in permitting negatively impact the cost of development. We strive toissue permits in a timely manner so the economic benefits of the development are realized as quickly as possible. Our customers haveasked for a quick permitting process with high quality (consistent, predictable, and reliable) reviews and comments that minimize revisionsand rework. The City's goal for full-route plan reviews is 30 days or less.
In the second quarter of 2018, full-route plan reviews averaged 34 days, down from 35 days in quarter 1. The permitting process will becontinually evaluated and improved for efficiency, effectiveness, and flexibility.
Aver
age
Full-
Rou
te D
ays
Num
ber of Review
s
Average number of days for a full-route plan review
goal
Average Days Reviews
Q1'16 Q2'16 Q3'16 Q4'16 Q1'17 Q2'17 Q3'17 Q4'17 Q1'18 Q2'180
20
40
60
0
20
40
60
Kyle Twohig,OperationsManager
Discussion Send Feedback
Having a tight spread among the lowest bidders indicates engineers thoroughly described the project. The goal is to have the three lowestbids within 15 percent of each other.
Bid variance continues to rise as projects see fewer bidders available to pursue the City's work. The average number of bidders dropped by25%, and some projects saw a much higher bid spread among those bidders. We continue to hear from the contracting community about theshortage of subcontractor availability and the impacts of the large Amazon facility on available personnel. Strategic timing of our projectadvertisements will become paramount to our ability to attract interest and competitive pricing from the contracting community.
Aver
age
Spr
ead
Average spread among three lowest bidders for construction projects
goal
Spread
Q1'16 Q2'16 Q3'16 Q4'16 Q1'17 Q2'17 Q3'17 Q4'17 Q1'18 Q2'180 %
10 %
20 %
30 %
40 %
50 %
Development Services Center
Engineering
One Vision. One Plan. One Voice.
Performance Measures6
BrianSchaeffer, Fire
Chief
Discussion Send Feedback
A timely response is necessary to provide sufficient resources to minimize the impacts of fire to life and property. The goal is to arrive to atleast 90 percent of these incidents within 8:30.
Response times improved in Q2 with the first Engine arriving, on average, in 7 minutes 02 seconds, 90% of the time. This places thedepartment in the 94.1% range in compliance.
Per
form
ance Incidents
Percent of structure fires responded to by an engine within eight and a half minutes
goal
Performance Incidents
Q1'16 Q2'16 Q3'16 Q4'16 Q1'17 Q2'17 Q3'17 Q4'17 Q1'18 Q2'180 %
100 %
25 %
50 %
75 %
0
50
100
150
200
Kyle Twohig,OperationsManager
Discussion Send Feedback
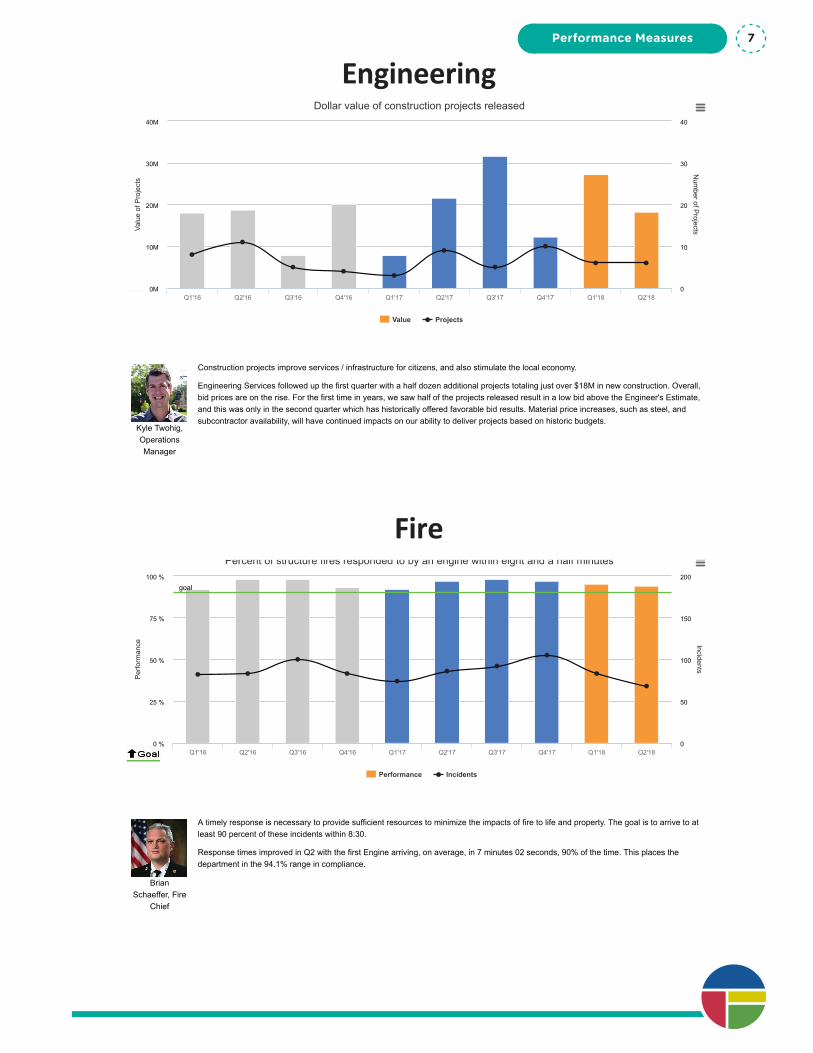
Construction projects improve services / infrastructure for citizens, and also stimulate the local economy.
Engineering Services followed up the first quarter with a half dozen additional projects totaling just over $18M in new construction. Overall,bid prices are on the rise. For the first time in years, we saw half of the projects released result in a low bid above the Engineer's Estimate,and this was only in the second quarter which has historically offered favorable bid results. Material price increases, such as steel, andsubcontractor availability, will have continued impacts on our ability to deliver projects based on historic budgets.
Valu
e of
Pro
ject
s
Num
ber of Projects
Dollar value of construction projects released
Value Projects
Q1'16 Q2'16 Q3'16 Q4'16 Q1'17 Q2'17 Q3'17 Q4'17 Q1'18 Q2'180M
10M
20M
30M
40M
0
10
20
30
40
Engineering
Fire
Performance Measures 7
BrianSchaeffer, Fire
Chief
Discussion Send Feedback
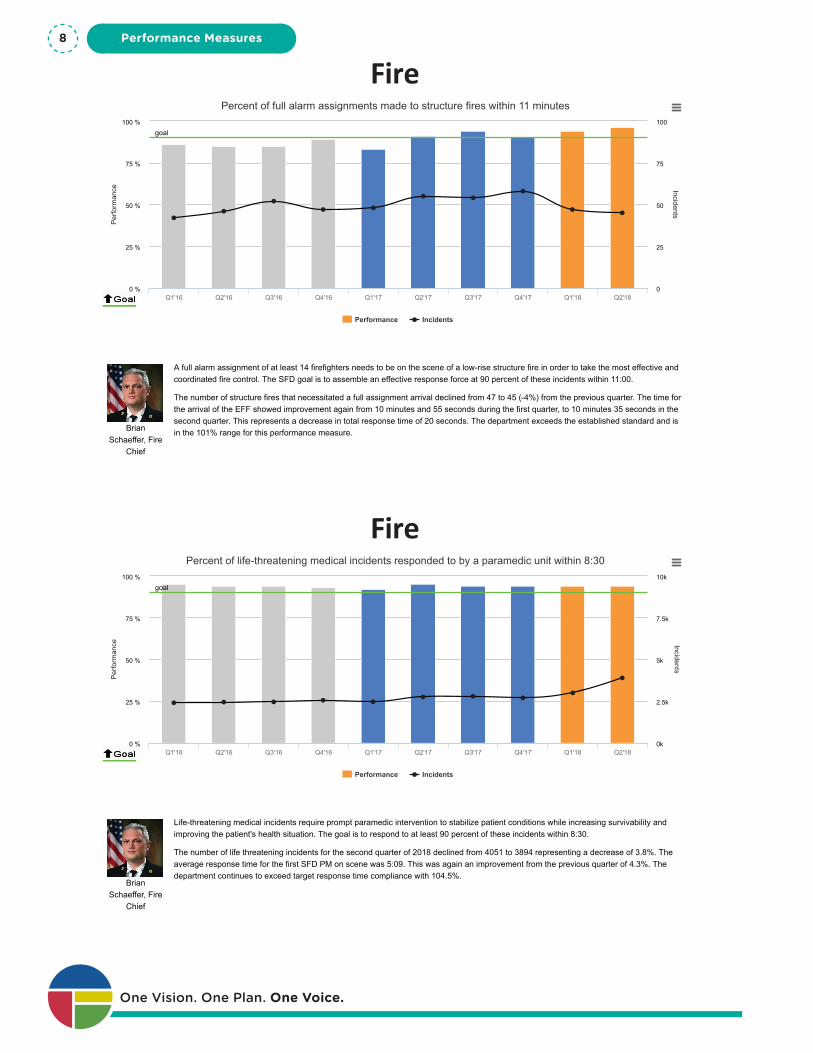
A full alarm assignment of at least 14 firefighters needs to be on the scene of a low-rise structure fire in order to take the most effective andcoordinated fire control. The SFD goal is to assemble an effective response force at 90 percent of these incidents within 11:00.
The number of structure fires that necessitated a full assignment arrival declined from 47 to 45 (-4%) from the previous quarter. The time forthe arrival of the EFF showed improvement again from 10 minutes and 55 seconds during the first quarter, to 10 minutes 35 seconds in thesecond quarter. This represents a decrease in total response time of 20 seconds. The department exceeds the established standard and isin the 101% range for this performance measure.
Per
form
ance Incidents
Percent of full alarm assignments made to structure fires within 11 minutes
goal
Performance Incidents
Q1'16 Q2'16 Q3'16 Q4'16 Q1'17 Q2'17 Q3'17 Q4'17 Q1'18 Q2'180 %
100 %
25 %
50 %
75 %
0
100
25
50
75
Fire
BrianSchaeffer, Fire
Chief
Discussion Send Feedback
Life-threatening medical incidents require prompt paramedic intervention to stabilize patient conditions while increasing survivability andimproving the patient's health situation. The goal is to respond to at least 90 percent of these incidents within 8:30.
The number of life threatening incidents for the second quarter of 2018 declined from 4051 to 3894 representing a decrease of 3.8%. Theaverage response time for the first SFD PM on scene was 5:09. This was again an improvement from the previous quarter of 4.3%. Thedepartment continues to exceed target response time compliance with 104.5%.
Per
form
ance Incidents
Percent of life-threatening medical incidents responded to by a paramedic unit within 8:30
goal
Performance Incidents
Q1'16 Q2'16 Q3'16 Q4'16 Q1'17 Q2'17 Q3'17 Q4'17 Q1'18 Q2'180 %
100 %
25 %
50 %
75 %
0k
10k
2.5k
5k
7.5k
Fire
One Vision. One Plan. One Voice.
Performance Measures8
Fire
BrianSchaeffer, Fire
Chief
Discussion Send Feedback
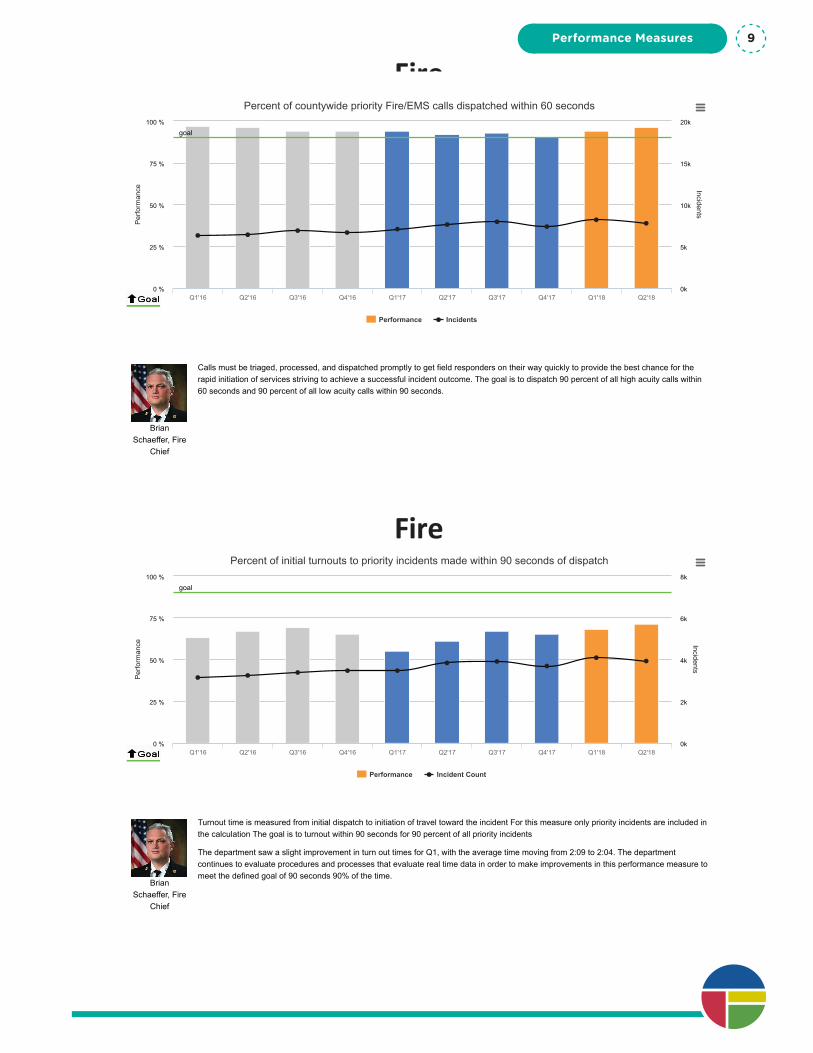
Calls must be triaged, processed, and dispatched promptly to get field responders on their way quickly to provide the best chance for therapid initiation of services striving to achieve a successful incident outcome. The goal is to dispatch 90 percent of all high acuity calls within60 seconds and 90 percent of all low acuity calls within 90 seconds.
Per
form
ance Incidents
Percent of countywide priority Fire/EMS calls dispatched within 60 seconds
goal
Performance Incidents
Q1'16 Q2'16 Q3'16 Q4'16 Q1'17 Q2'17 Q3'17 Q4'17 Q1'18 Q2'180 %
100 %
25 %
50 %
75 %
0k
5k
10k
15k
20k
BrianSchaeffer, Fire
Chief
Discussion Send Feedback
Turnout time is measured from initial dispatch to initiation of travel toward the incident For this measure only priority incidents are included inthe calculation The goal is to turnout within 90 seconds for 90 percent of all priority incidents
The department saw a slight improvement in turn out times for Q1, with the average time moving from 2:09 to 2:04. The departmentcontinues to evaluate procedures and processes that evaluate real time data in order to make improvements in this performance measure tomeet the defined goal of 90 seconds 90% of the time.
Per
form
ance Incidents
Percent of initial turnouts to priority incidents made within 90 seconds of dispatch
goal
Performance Incident Count
Q1'16 Q2'16 Q3'16 Q4'16 Q1'17 Q2'17 Q3'17 Q4'17 Q1'18 Q2'180 %
100 %
25 %
50 %
75 %
0k
2k
4k
6k
8k
Fire
Performance Measures 9
Steve Riggs,Fleet Services
Director
Discussion Send Feedback
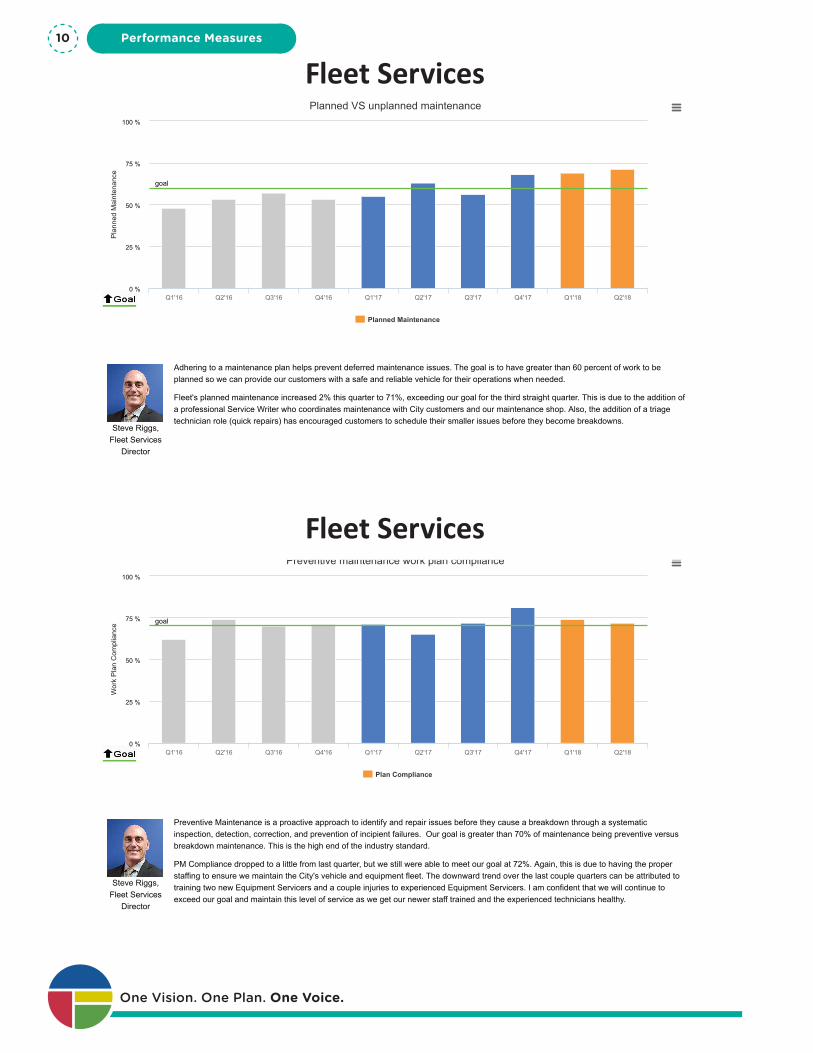
Preventive Maintenance is a proactive approach to identify and repair issues before they cause a breakdown through a systematicinspection, detection, correction, and prevention of incipient failures. Our goal is greater than 70% of maintenance being preventive versusbreakdown maintenance. This is the high end of the industry standard.
PM Compliance dropped to a little from last quarter, but we still were able to meet our goal at 72%. Again, this is due to having the properstaffing to ensure we maintain the City's vehicle and equipment fleet. The downward trend over the last couple quarters can be attributed totraining two new Equipment Servicers and a couple injuries to experienced Equipment Servicers. I am confident that we will continue toexceed our goal and maintain this level of service as we get our newer staff trained and the experienced technicians healthy.
Wor
k P
lan
Com
plia
nce
Preventive maintenance work plan compliance
goal
Plan Compliance
Q1'16 Q2'16 Q3'16 Q4'16 Q1'17 Q2'17 Q3'17 Q4'17 Q1'18 Q2'180 %
100 %
25 %
50 %
75 %
Steve Riggs,Fleet Services
Director
Discussion Send Feedback
Adhering to a maintenance plan helps prevent deferred maintenance issues. The goal is to have greater than 60 percent of work to beplanned so we can provide our customers with a safe and reliable vehicle for their operations when needed.
Fleet's planned maintenance increased 2% this quarter to 71%, exceeding our goal for the third straight quarter. This is due to the addition ofa professional Service Writer who coordinates maintenance with City customers and our maintenance shop. Also, the addition of a triagetechnician role (quick repairs) has encouraged customers to schedule their smaller issues before they become breakdowns.
Pla
nned
Mai
nten
ance
Planned VS unplanned maintenance
goal
Planned Maintenance
Q1'16 Q2'16 Q3'16 Q4'16 Q1'17 Q2'17 Q3'17 Q4'17 Q1'18 Q2'180 %
100 %
25 %
50 %
75 %
Fleet Services
Fleet Services
One Vision. One Plan. One Voice.
Performance Measures10
Steve Riggs,Fleet Services
Director
Discussion Send Feedback
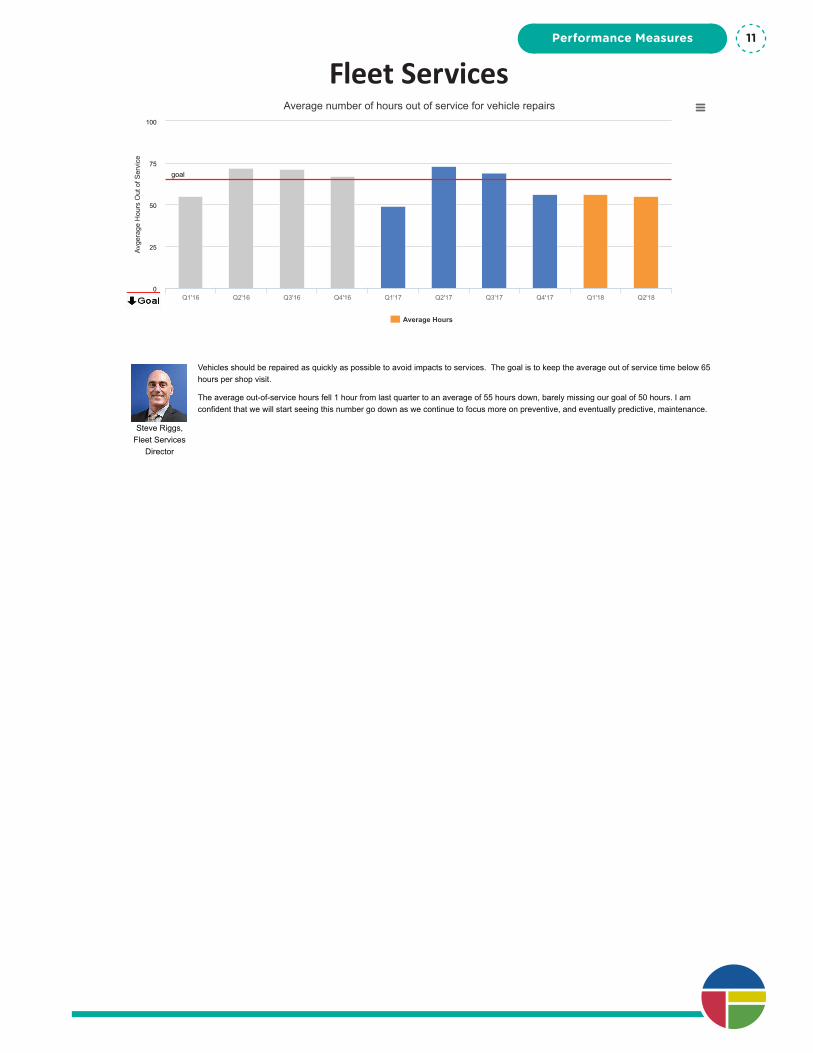
Vehicles should be repaired as quickly as possible to avoid impacts to services. The goal is to keep the average out of service time below 65hours per shop visit.
The average out-of-service hours fell 1 hour from last quarter to an average of 55 hours down, barely missing our goal of 50 hours. I amconfident that we will start seeing this number go down as we continue to focus more on preventive, and eventually predictive, maintenance.
Avge
rage
Hou
rs O
ut o
f Ser
vice
Average number of hours out of service for vehicle repairs
goal
Average Hours
Q1'16 Q2'16 Q3'16 Q4'16 Q1'17 Q2'17 Q3'17 Q4'17 Q1'18 Q2'180
100
25
50
75
Fleet ServicesPerformance Measures 11
Library
Library
AndrewChanse,Director
Discussion Send Feedback
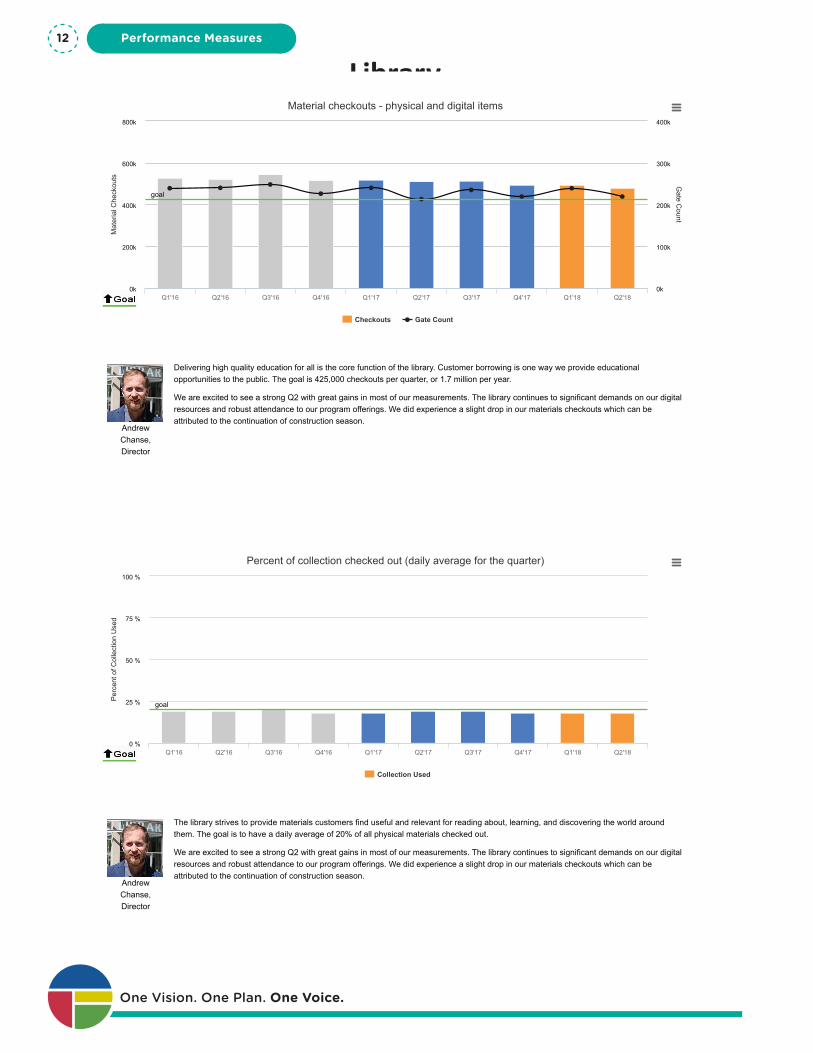
Delivering high quality education for all is the core function of the library. Customer borrowing is one way we provide educationalopportunities to the public. The goal is 425,000 checkouts per quarter, or 1.7 million per year.
We are excited to see a strong Q2 with great gains in most of our measurements. The library continues to significant demands on our digitalresources and robust attendance to our program offerings. We did experience a slight drop in our materials checkouts which can beattributed to the continuation of construction season.
Mat
eria
l Che
ckou
ts
Gate C
ount
Material checkouts - physical and digital items
goal
Checkouts Gate Count
Q1'16 Q2'16 Q3'16 Q4'16 Q1'17 Q2'17 Q3'17 Q4'17 Q1'18 Q2'180k
200k
400k
600k
800k
0k
100k
200k
300k
400k
AndrewChanse,Director
Discussion Send Feedback
The library strives to provide materials customers find useful and relevant for reading about, learning, and discovering the world aroundthem. The goal is to have a daily average of 20% of all physical materials checked out.
We are excited to see a strong Q2 with great gains in most of our measurements. The library continues to significant demands on our digitalresources and robust attendance to our program offerings. We did experience a slight drop in our materials checkouts which can beattributed to the continuation of construction season.
Per
cent
of C
olle
ctio
n U
sed
Percent of collection checked out (daily average for the quarter)
goal
Collection Used
Q1'16 Q2'16 Q3'16 Q4'16 Q1'17 Q2'17 Q3'17 Q4'17 Q1'18 Q2'180 %
100 %
25 %
50 %
75 %
One Vision. One Plan. One Voice.
Performance Measures12
Carly Cortright,CustomerServiceDirector
Discussion Send Feedback
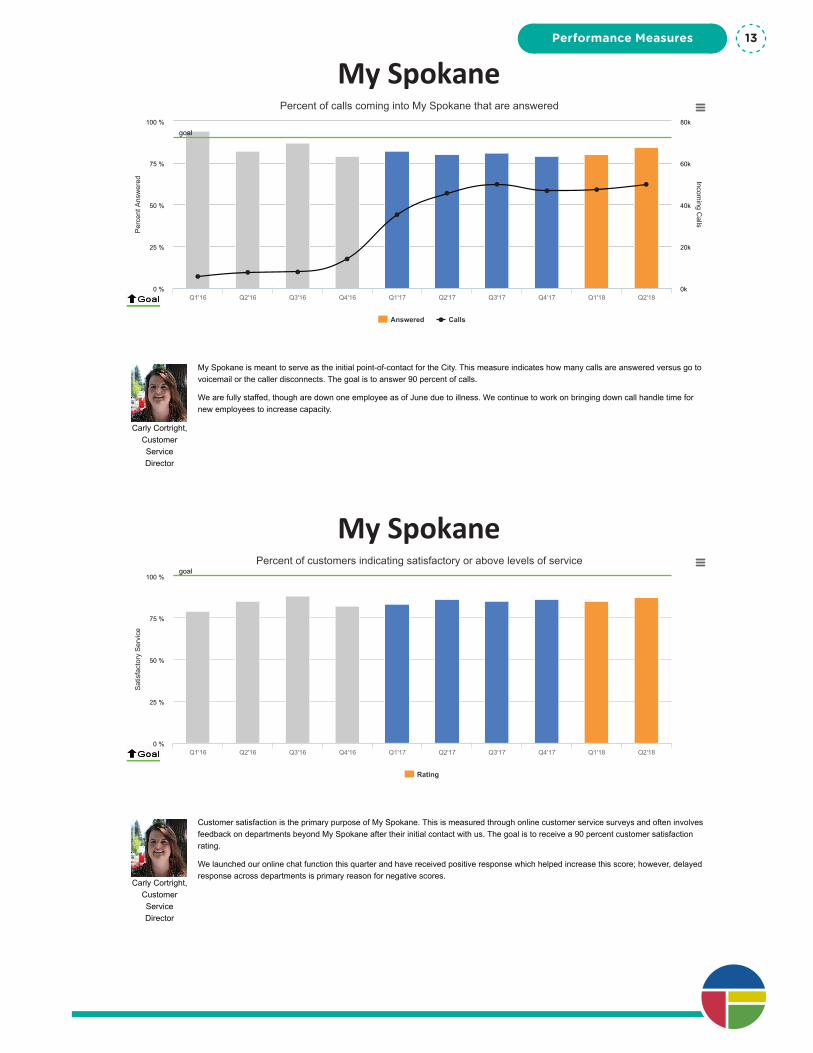
My Spokane is meant to serve as the initial point-of-contact for the City. This measure indicates how many calls are answered versus go tovoicemail or the caller disconnects. The goal is to answer 90 percent of calls.
We are fully staffed, though are down one employee as of June due to illness. We continue to work on bringing down call handle time fornew employees to increase capacity.
Per
cent
Ans
wer
ed Incoming C
allsPercent of calls coming into My Spokane that are answered
goal
Answered Calls
Q1'16 Q2'16 Q3'16 Q4'16 Q1'17 Q2'17 Q3'17 Q4'17 Q1'18 Q2'180 %
100 %
25 %
50 %
75 %
0k
20k
40k
60k
80k
Carly Cortright,CustomerServiceDirector
Discussion Send Feedback
Customer satisfaction is the primary purpose of My Spokane. This is measured through online customer service surveys and often involvesfeedback on departments beyond My Spokane after their initial contact with us. The goal is to receive a 90 percent customer satisfactionrating.
We launched our online chat function this quarter and have received positive response which helped increase this score; however, delayedresponse across departments is primary reason for negative scores.
Sat
isfa
ctor
y S
ervi
ce
Percent of customers indicating satisfactory or above levels of servicegoal
Rating
Q1'16 Q2'16 Q3'16 Q4'16 Q1'17 Q2'17 Q3'17 Q4'17 Q1'18 Q2'180 %
100 %
25 %
50 %
75 %
My Spokane
My Spokane
Performance Measures 13
Carly Cortright,CustomerServiceDirector
Discussion Send Feedback
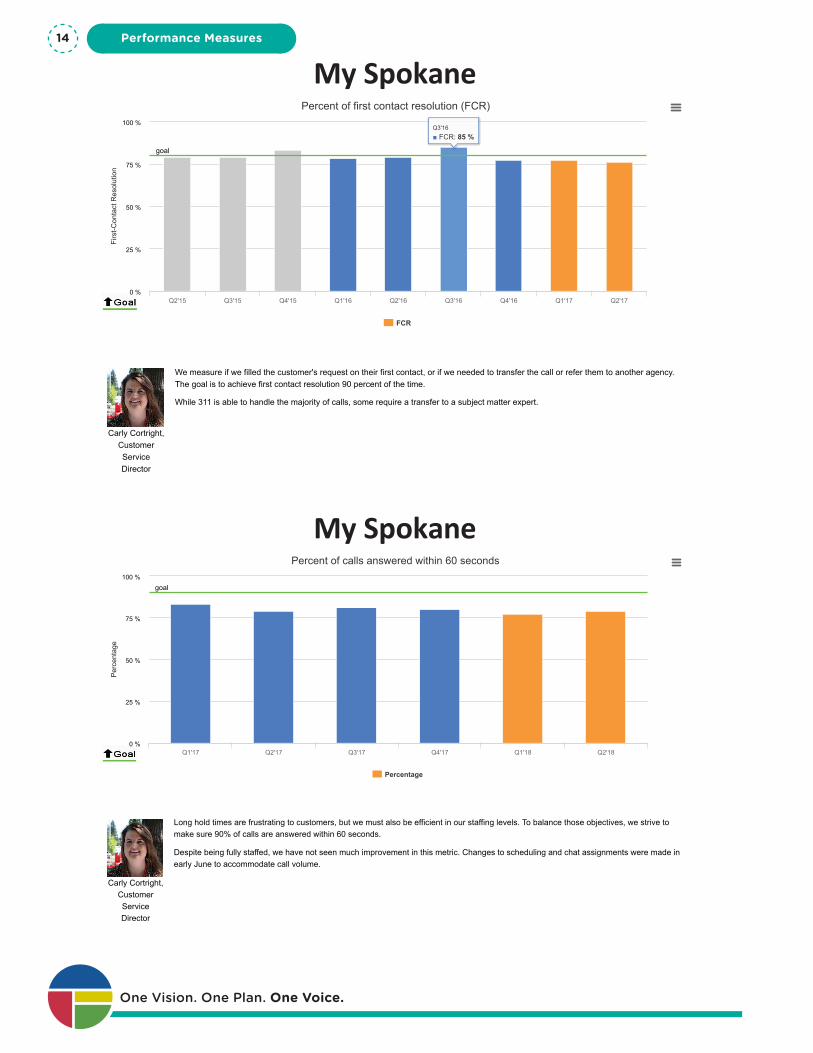
We measure if we filled the customer's request on their first contact, or if we needed to transfer the call or refer them to another agency.The goal is to achieve first contact resolution 90 percent of the time.
While 311 is able to handle the majority of calls, some require a transfer to a subject matter expert.
Firs
t-Con
tact
Res
olut
ion
Percent of first contact resolution (FCR)
goal
FCR
Q2'15 Q3'15 Q4'15 Q1'16 Q2'16 Q3'16 Q4'16 Q1'17 Q2'170 %
100 %
25 %
50 %
75 %
Q3'16■ FCR: 85 %
Carly Cortright,CustomerServiceDirector
Discussion Send Feedback
Long hold times are frustrating to customers, but we must also be efficient in our staffing levels. To balance those objectives, we strive tomake sure 90% of calls are answered within 60 seconds.
Despite being fully staffed, we have not seen much improvement in this metric. Changes to scheduling and chat assignments were made inearly June to accommodate call volume.
Per
cent
age
Percent of calls answered within 60 seconds
goal
Percentage
Q1'17 Q2'17 Q3'17 Q4'17 Q1'18 Q2'180 %
100 %
25 %
50 %
75 %
My Spokane
My Spokane
One Vision. One Plan. One Voice.
Performance Measures14
Carly Cortright,CustomerServiceDirector
Discussion Send Feedback
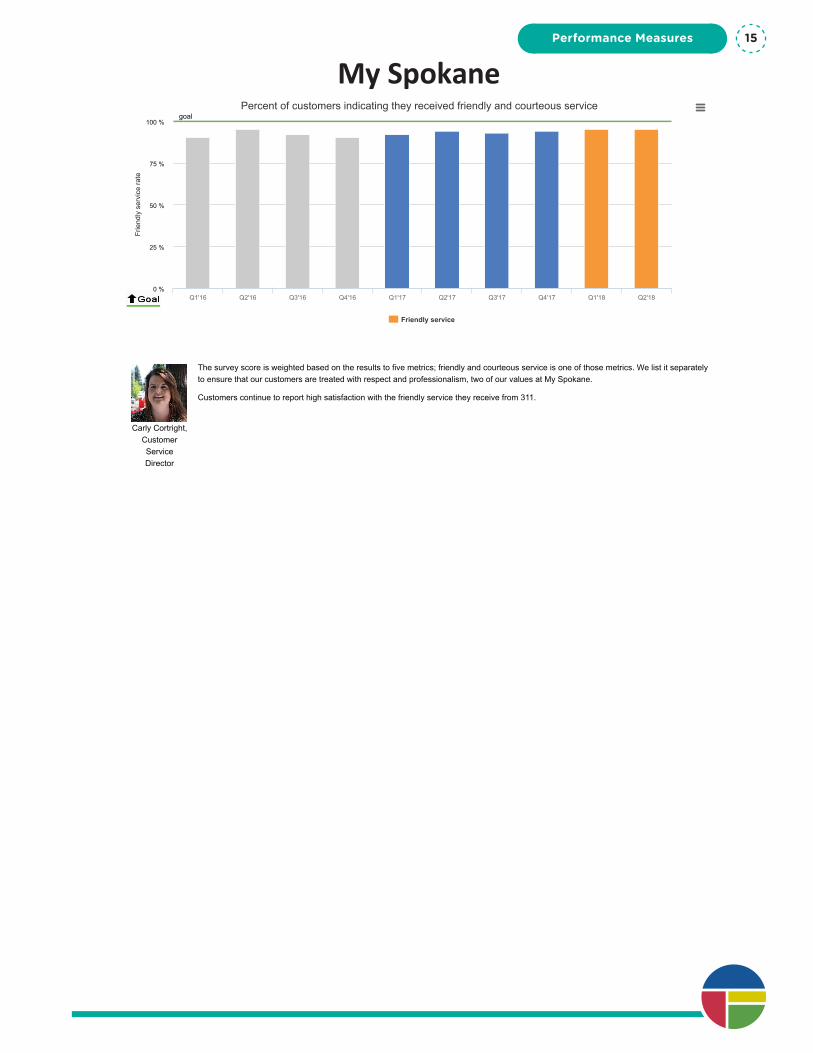
The survey score is weighted based on the results to five metrics; friendly and courteous service is one of those metrics. We list it separatelyto ensure that our customers are treated with respect and professionalism, two of our values at My Spokane.
Customers continue to report high satisfaction with the friendly service they receive from 311.
Frie
ndly
ser
vice
rate
Percent of customers indicating they received friendly and courteous servicegoal
Friendly service
Q1'16 Q2'16 Q3'16 Q4'16 Q1'17 Q2'17 Q3'17 Q4'17 Q1'18 Q2'180 %
100 %
25 %
50 %
75 %
My SpokanePerformance Measures 15
HeatherTrautman,Director
Discussion Send Feedback
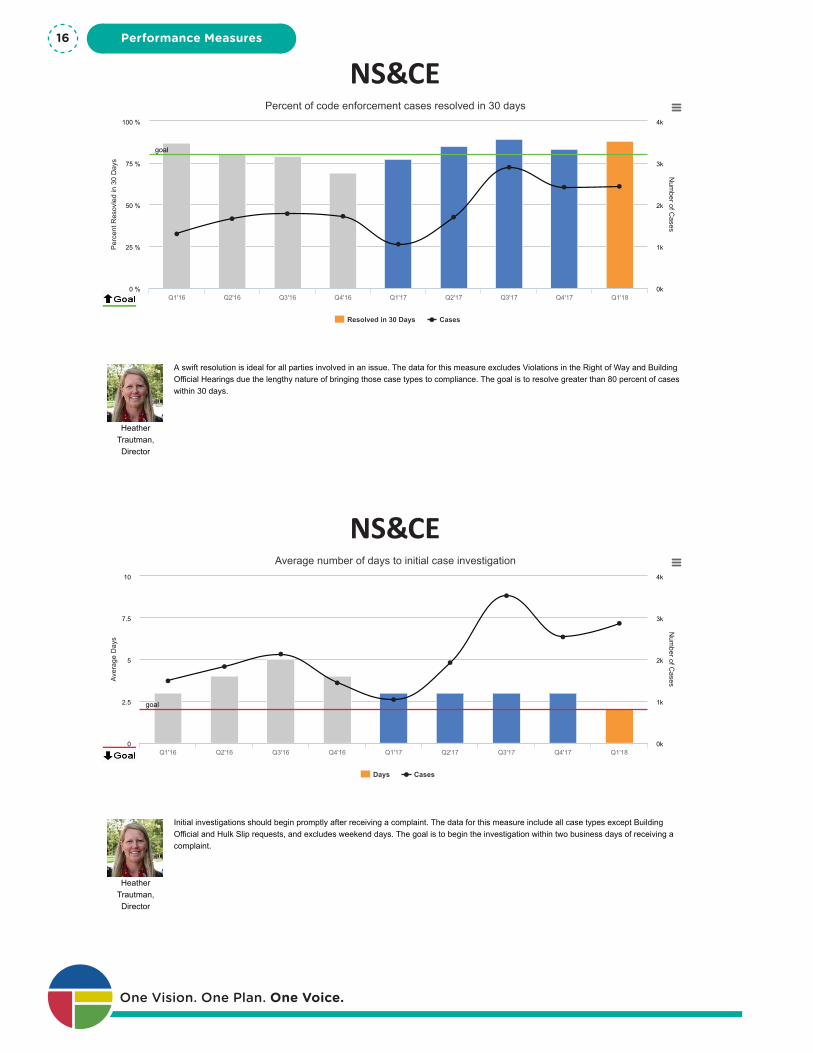
A swift resolution is ideal for all parties involved in an issue. The data for this measure excludes Violations in the Right of Way and BuildingOfficial Hearings due the lengthy nature of bringing those case types to compliance. The goal is to resolve greater than 80 percent of caseswithin 30 days.
Per
cent
Res
ovle
d in
30
Day
s
Num
ber of Cases
Percent of code enforcement cases resolved in 30 days
goal
Resolved in 30 Days Cases
Q1'16 Q2'16 Q3'16 Q4'16 Q1'17 Q2'17 Q3'17 Q4'17 Q1'180 %
100 %
25 %
50 %
75 %
0k
1k
2k
3k
4k
HeatherTrautman,Director
Discussion Send Feedback
Initial investigations should begin promptly after receiving a complaint. The data for this measure include all case types except BuildingOfficial and Hulk Slip requests, and excludes weekend days. The goal is to begin the investigation within two business days of receiving acomplaint.
Aver
age
Day
s
Num
ber of Cases
Average number of days to initial case investigation
goal
Days Cases
Q1'16 Q2'16 Q3'16 Q4'16 Q1'17 Q2'17 Q3'17 Q4'17 Q1'180
10
2.5
5
7.5
0k
1k
2k
3k
4k
NS&CE
NS&CE
One Vision. One Plan. One Voice.
Performance Measures16
JenniferPapich,
RecreationDirector
Discussion Send Feedback
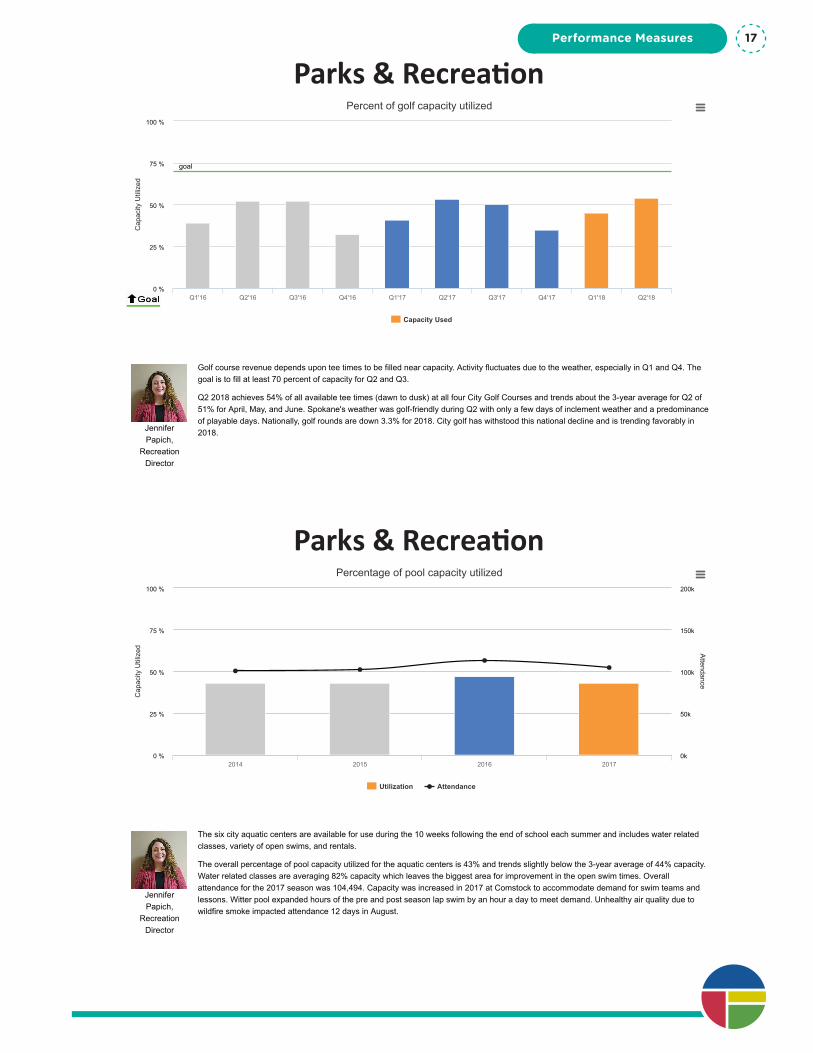
Golf course revenue depends upon tee times to be filled near capacity. Activity fluctuates due to the weather, especially in Q1 and Q4. Thegoal is to fill at least 70 percent of capacity for Q2 and Q3.
Q2 2018 achieves 54% of all available tee times (dawn to dusk) at all four City Golf Courses and trends about the 3-year average for Q2 of51% for April, May, and June. Spokane's weather was golf-friendly during Q2 with only a few days of inclement weather and a predominanceof playable days. Nationally, golf rounds are down 3.3% for 2018. City golf has withstood this national decline and is trending favorably in2018.
Cap
acity
Util
ized
Percent of golf capacity utilized
goal
Capacity Used
Q1'16 Q2'16 Q3'16 Q4'16 Q1'17 Q2'17 Q3'17 Q4'17 Q1'18 Q2'180 %
100 %
25 %
50 %
75 %
JenniferPapich,
RecreationDirector
Discussion Send Feedback
The six city aquatic centers are available for use during the 10 weeks following the end of school each summer and includes water relatedclasses, variety of open swims, and rentals.
The overall percentage of pool capacity utilized for the aquatic centers is 43% and trends slightly below the 3-year average of 44% capacity.Water related classes are averaging 82% capacity which leaves the biggest area for improvement in the open swim times. Overallattendance for the 2017 season was 104,494. Capacity was increased in 2017 at Comstock to accommodate demand for swim teams andlessons. Witter pool expanded hours of the pre and post season lap swim by an hour a day to meet demand. Unhealthy air quality due towildfire smoke impacted attendance 12 days in August.
Cap
acity
Util
ized A
ttendance
Percentage of pool capacity utilized
Utilization Attendance
2014 2015 2016 20170 %
100 %
25 %
50 %
75 %
0k
50k
100k
150k
200k
Parks & Recreation
Parks & RecreationPerformance Measures 17
Craig Meidl,Police Chief
Discussion Send Feedback
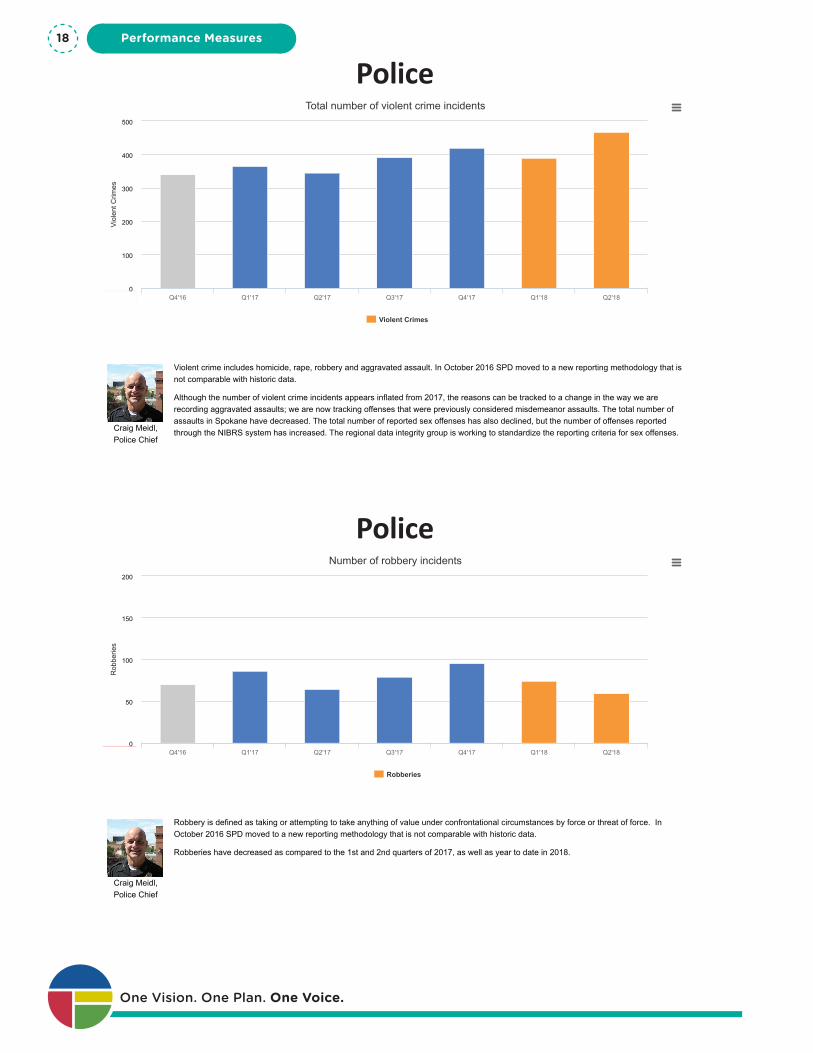
Violent crime includes homicide, rape, robbery and aggravated assault. In October 2016 SPD moved to a new reporting methodology that isnot comparable with historic data.
Although the number of violent crime incidents appears inflated from 2017, the reasons can be tracked to a change in the way we arerecording aggravated assaults; we are now tracking offenses that were previously considered misdemeanor assaults. The total number ofassaults in Spokane have decreased. The total number of reported sex offenses has also declined, but the number of offenses reportedthrough the NIBRS system has increased. The regional data integrity group is working to standardize the reporting criteria for sex offenses.
Viol
ent C
rimes
Total number of violent crime incidents
Violent Crimes
Q4'16 Q1'17 Q2'17 Q3'17 Q4'17 Q1'18 Q2'180
100
200
300
400
500
Craig Meidl,Police Chief
Discussion Send Feedback
Robbery is defined as taking or attempting to take anything of value under confrontational circumstances by force or threat of force. InOctober 2016 SPD moved to a new reporting methodology that is not comparable with historic data.
Robberies have decreased as compared to the 1st and 2nd quarters of 2017, as well as year to date in 2018.
Rob
berie
s
Number of robbery incidents
Robberies
Q4'16 Q1'17 Q2'17 Q3'17 Q4'17 Q1'18 Q2'180
50
100
150
200
Police
Police
One Vision. One Plan. One Voice.
Performance Measures18
Craig Meidl,Police Chief
Discussion Send Feedback
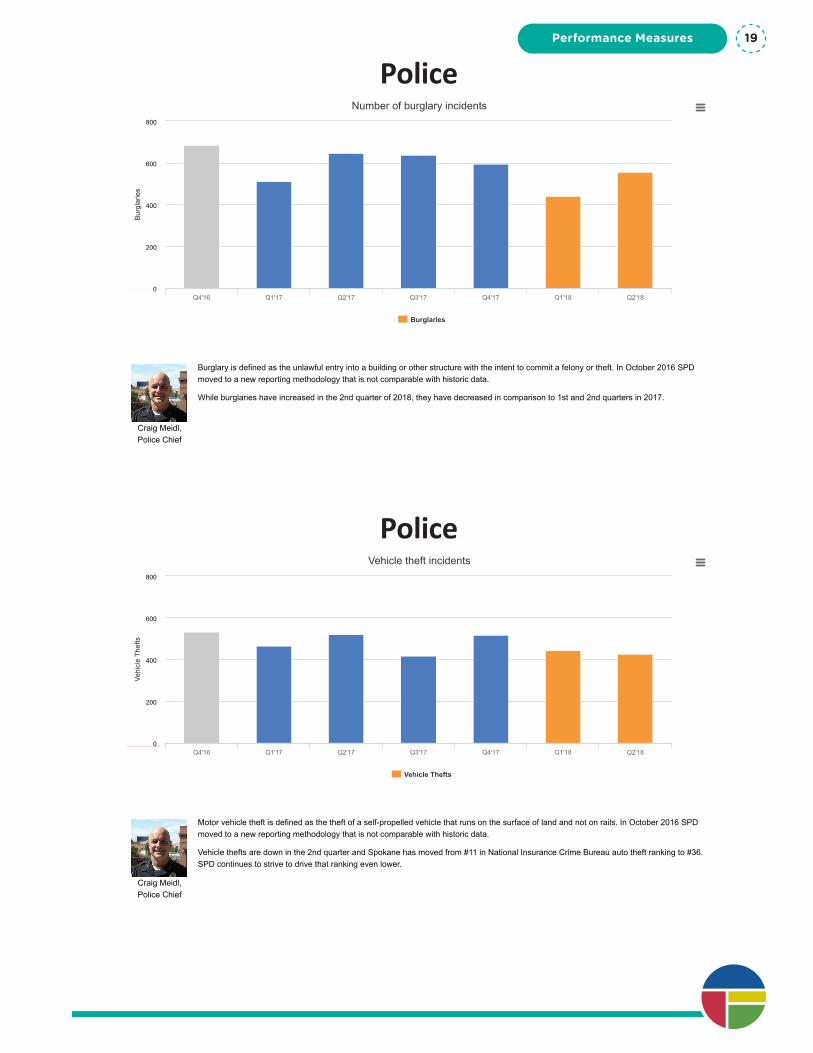
Burglary is defined as the unlawful entry into a building or other structure with the intent to commit a felony or theft. In October 2016 SPDmoved to a new reporting methodology that is not comparable with historic data.
While burglaries have increased in the 2nd quarter of 2018, they have decreased in comparison to 1st and 2nd quarters in 2017.
Bur
glar
ies
Number of burglary incidents
Burglaries
Q4'16 Q1'17 Q2'17 Q3'17 Q4'17 Q1'18 Q2'180
200
400
600
800
Craig Meidl,Police Chief
Discussion Send Feedback
Motor vehicle theft is defined as the theft of a self-propelled vehicle that runs on the surface of land and not on rails. In October 2016 SPDmoved to a new reporting methodology that is not comparable with historic data.
Vehicle thefts are down in the 2nd quarter and Spokane has moved from #11 in National Insurance Crime Bureau auto theft ranking to #36.SPD continues to strive to drive that ranking even lower.
Vehi
cle
Thef
ts
Vehicle theft incidents
Vehicle Thefts
Q4'16 Q1'17 Q2'17 Q3'17 Q4'17 Q1'18 Q2'180
200
400
600
800
Police
Police
Performance Measures 19
Kathy Knox,Public
Defender
Discussion Send Feedback
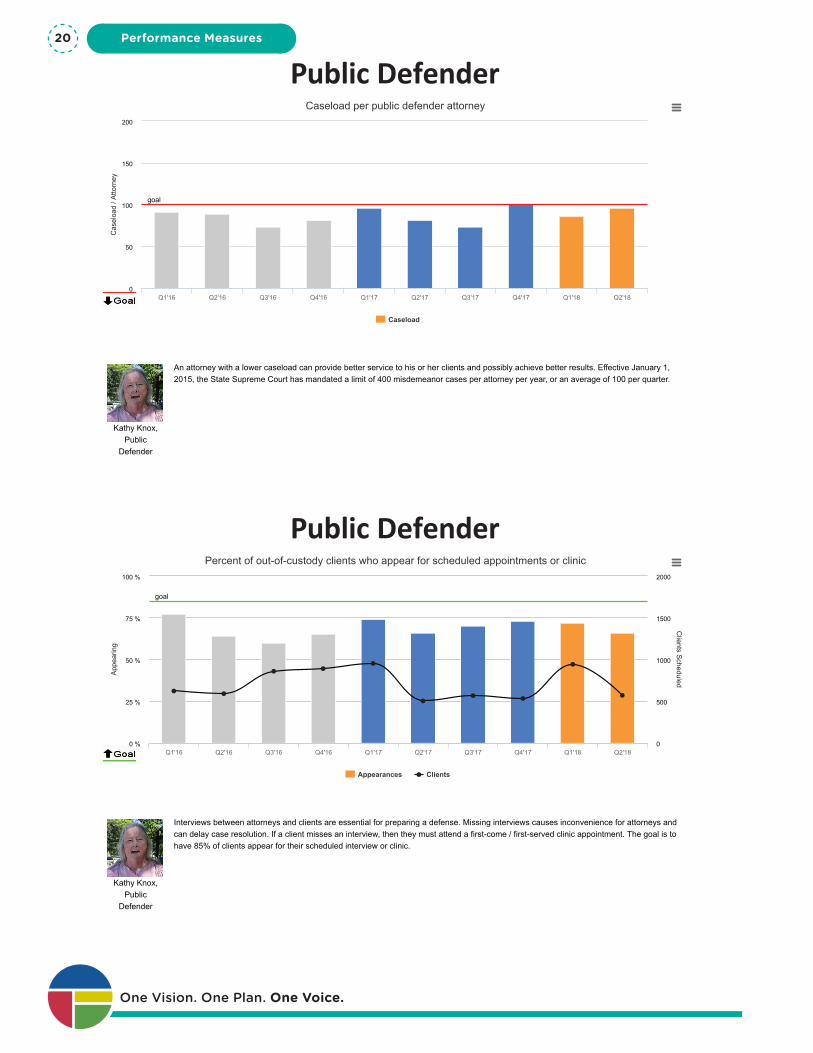
An attorney with a lower caseload can provide better service to his or her clients and possibly achieve better results. Effective January 1,2015, the State Supreme Court has mandated a limit of 400 misdemeanor cases per attorney per year, or an average of 100 per quarter.
Cas
eloa
d / A
ttorn
eyCaseload per public defender attorney
goal
Caseload
Q1'16 Q2'16 Q3'16 Q4'16 Q1'17 Q2'17 Q3'17 Q4'17 Q1'18 Q2'180
50
100
150
200
Kathy Knox,Public
Defender
Discussion Send Feedback
Interviews between attorneys and clients are essential for preparing a defense. Missing interviews causes inconvenience for attorneys andcan delay case resolution. If a client misses an interview, then they must attend a first-come / first-served clinic appointment. The goal is tohave 85% of clients appear for their scheduled interview or clinic.
App
earin
g
Clients S
cheduled
Percent of out-of-custody clients who appear for scheduled appointments or clinic
goal
Appearances Clients
Q1'16 Q2'16 Q3'16 Q4'16 Q1'17 Q2'17 Q3'17 Q4'17 Q1'18 Q2'180 %
100 %
25 %
50 %
75 %
0
500
1000
1500
2000
Public Defender
Public Defender
One Vision. One Plan. One Voice.
Performance Measures20
Kathy Knox,Public
Defender
Discussion Send Feedback
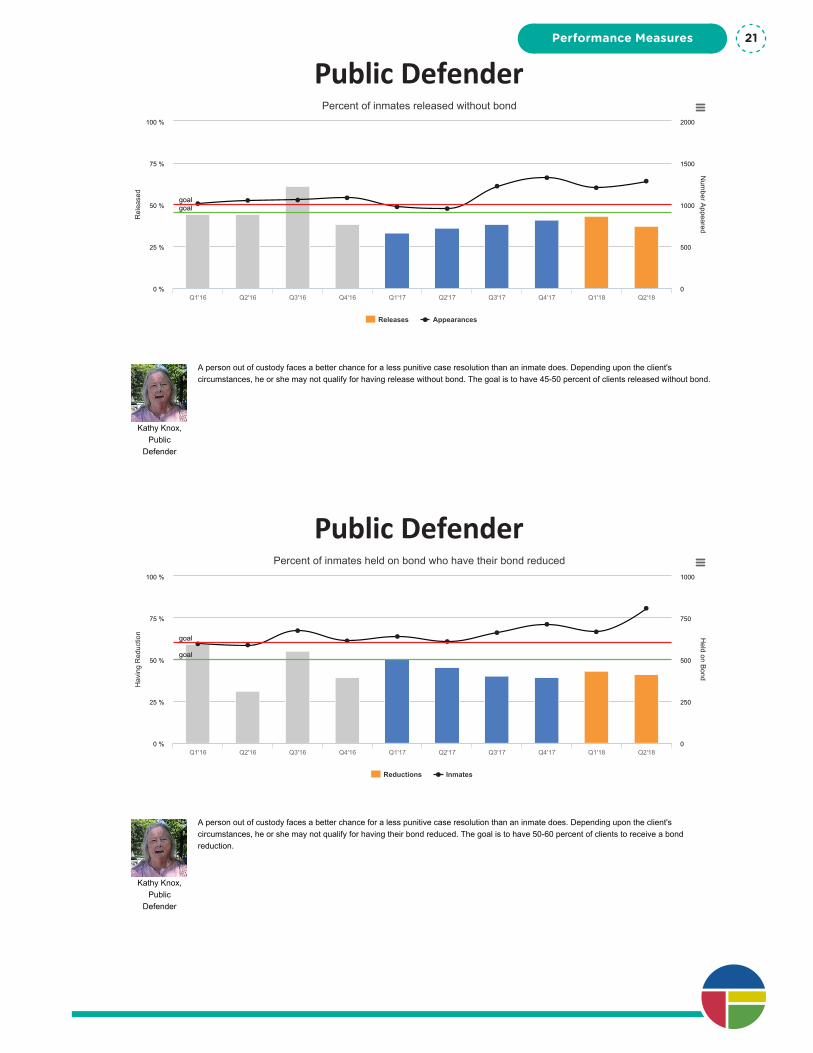
A person out of custody faces a better chance for a less punitive case resolution than an inmate does. Depending upon the client'scircumstances, he or she may not qualify for having release without bond. The goal is to have 45-50 percent of clients released without bond.
Rel
ease
d
Num
ber Appeared
Percent of inmates released without bond
goalgoal
Releases Appearances
Q1'16 Q2'16 Q3'16 Q4'16 Q1'17 Q2'17 Q3'17 Q4'17 Q1'18 Q2'180 %
100 %
25 %
50 %
75 %
0
500
1000
1500
2000
Kathy Knox,Public
Defender
Discussion Send Feedback
A person out of custody faces a better chance for a less punitive case resolution than an inmate does. Depending upon the client'scircumstances, he or she may not qualify for having their bond reduced. The goal is to have 50-60 percent of clients to receive a bondreduction.
Hav
ing
Red
uctio
n Held on B
ond
Percent of inmates held on bond who have their bond reduced
goal
goal
Reductions Inmates
Q1'16 Q2'16 Q3'16 Q4'16 Q1'17 Q2'17 Q3'17 Q4'17 Q1'18 Q2'180 %
100 %
25 %
50 %
75 %
0
1000
250
500
750
Public Defender
Public Defender
Performance Measures 21
Dustin Bender,Solid WasteCollectionManager
Discussion Send Feedback
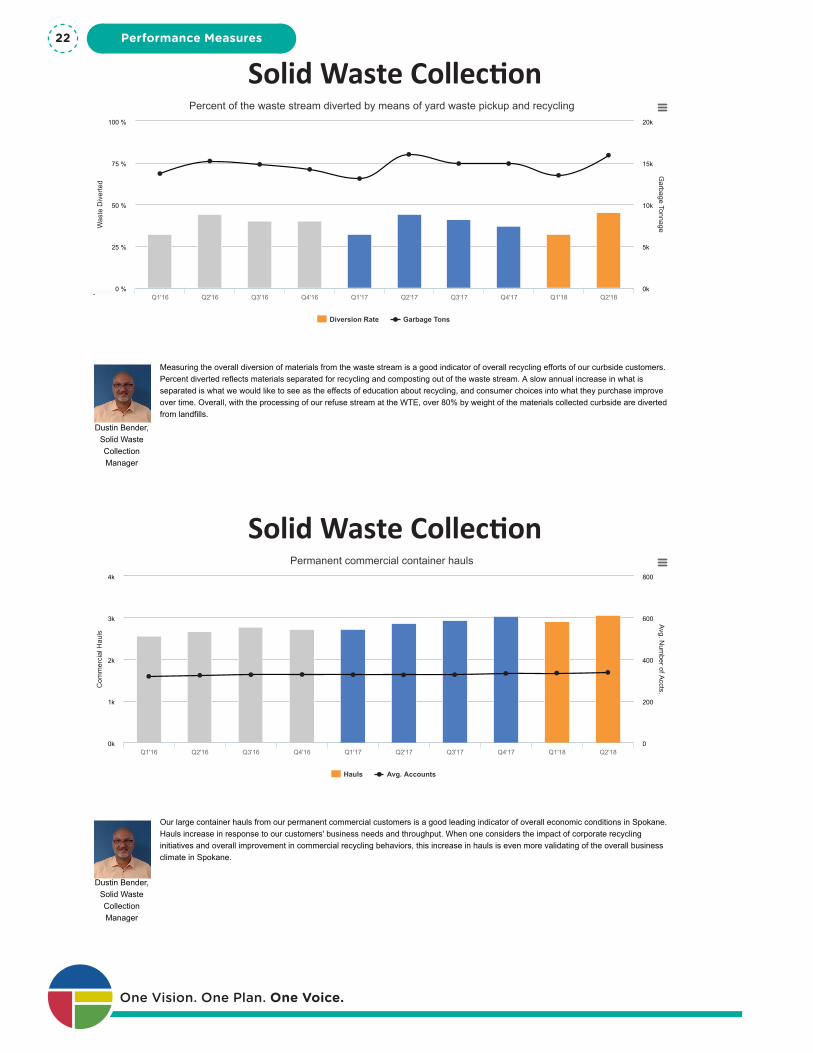
Measuring the overall diversion of materials from the waste stream is a good indicator of overall recycling efforts of our curbside customers.Percent diverted reflects materials separated for recycling and composting out of the waste stream. A slow annual increase in what isseparated is what we would like to see as the effects of education about recycling, and consumer choices into what they purchase improveover time. Overall, with the processing of our refuse stream at the WTE, over 80% by weight of the materials collected curbside are divertedfrom landfills.
Was
te D
iver
ted
Garbage Tonnage
Percent of the waste stream diverted by means of yard waste pickup and recycling
Diversion Rate Garbage Tons
Q1'16 Q2'16 Q3'16 Q4'16 Q1'17 Q2'17 Q3'17 Q4'17 Q1'18 Q2'180 %
100 %
25 %
50 %
75 %
0k
5k
10k
15k
20k
Dustin Bender,Solid WasteCollectionManager
Discussion Send Feedback
Our large container hauls from our permanent commercial customers is a good leading indicator of overall economic conditions in Spokane.Hauls increase in response to our customers' business needs and throughput. When one considers the impact of corporate recyclinginitiatives and overall improvement in commercial recycling behaviors, this increase in hauls is even more validating of the overall businessclimate in Spokane.
Com
mer
cial
Hau
ls
Avg. Num
ber of Accts.
Permanent commercial container hauls
Hauls Avg. Accounts
Q1'16 Q2'16 Q3'16 Q4'16 Q1'17 Q2'17 Q3'17 Q4'17 Q1'18 Q2'180k
1k
2k
3k
4k
0
200
400
600
800
Solid Waste Collection
Solid Waste Collection
One Vision. One Plan. One Voice.
Performance Measures22
Chuck Conklin,Director
Discussion Send Feedback
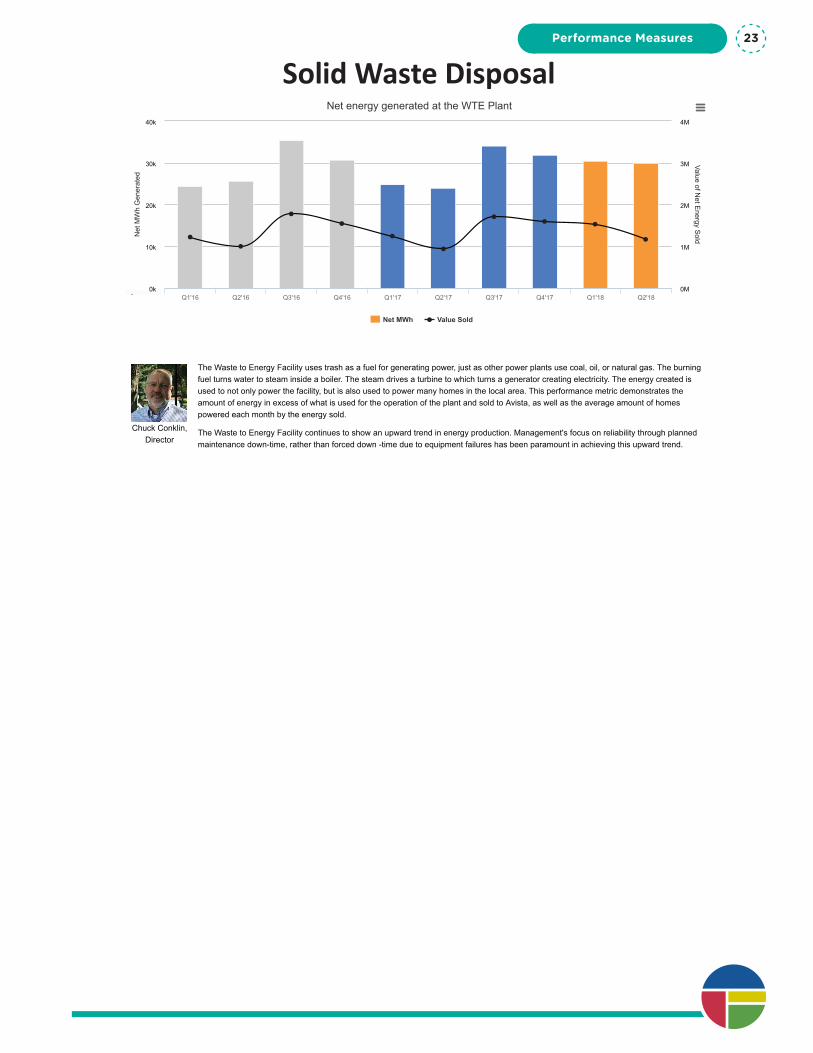
The Waste to Energy Facility uses trash as a fuel for generating power, just as other power plants use coal, oil, or natural gas. The burningfuel turns water to steam inside a boiler. The steam drives a turbine to which turns a generator creating electricity. The energy created isused to not only power the facility, but is also used to power many homes in the local area. This performance metric demonstrates theamount of energy in excess of what is used for the operation of the plant and sold to Avista, as well as the average amount of homespowered each month by the energy sold.
The Waste to Energy Facility continues to show an upward trend in energy production. Management's focus on reliability through plannedmaintenance down-time, rather than forced down -time due to equipment failures has been paramount in achieving this upward trend.
Net
MW
h G
ener
ated
Value of Net E
nergy Sold
Net energy generated at the WTE Plant
Net MWh Value Sold
Q1'16 Q2'16 Q3'16 Q4'16 Q1'17 Q2'17 Q3'17 Q4'17 Q1'18 Q2'180k
10k
20k
30k
40k
0M
1M
2M
3M
4M
Solid Waste DisposalPerformance Measures 23
Patrick Striker,Director
Discussion Send Feedback
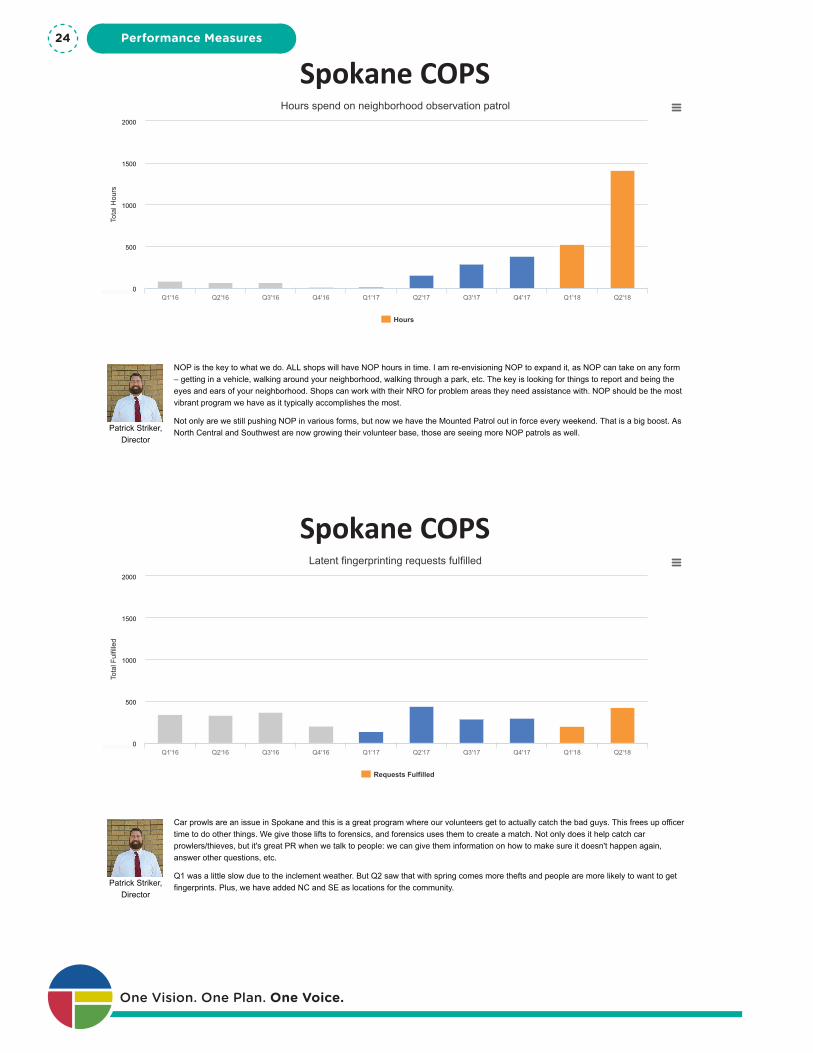
NOP is the key to what we do. ALL shops will have NOP hours in time. I am re-envisioning NOP to expand it, as NOP can take on any form– getting in a vehicle, walking around your neighborhood, walking through a park, etc. The key is looking for things to report and being theeyes and ears of your neighborhood. Shops can work with their NRO for problem areas they need assistance with. NOP should be the mostvibrant program we have as it typically accomplishes the most.
Not only are we still pushing NOP in various forms, but now we have the Mounted Patrol out in force every weekend. That is a big boost. AsNorth Central and Southwest are now growing their volunteer base, those are seeing more NOP patrols as well.
Tota
l Hou
rsHours spend on neighborhood observation patrol
Hours
Q1'16 Q2'16 Q3'16 Q4'16 Q1'17 Q2'17 Q3'17 Q4'17 Q1'18 Q2'180
500
1000
1500
2000
Patrick Striker,Director
Discussion Send Feedback
Car prowls are an issue in Spokane and this is a great program where our volunteers get to actually catch the bad guys. This frees up officertime to do other things. We give those lifts to forensics, and forensics uses them to create a match. Not only does it help catch carprowlers/thieves, but it's great PR when we talk to people: we can give them information on how to make sure it doesn't happen again,answer other questions, etc.
Q1 was a little slow due to the inclement weather. But Q2 saw that with spring comes more thefts and people are more likely to want to getfingerprints. Plus, we have added NC and SE as locations for the community.
Tota
l Ful
fille
d
Latent fingerprinting requests fulfilled
Requests Fulfilled
Q1'16 Q2'16 Q3'16 Q4'16 Q1'17 Q2'17 Q3'17 Q4'17 Q1'18 Q2'180
500
1000
1500
2000
Spokane COPS
Spokane COPS
One Vision. One Plan. One Voice.
Performance Measures24
Patrick Striker,Director
Discussion Send Feedback
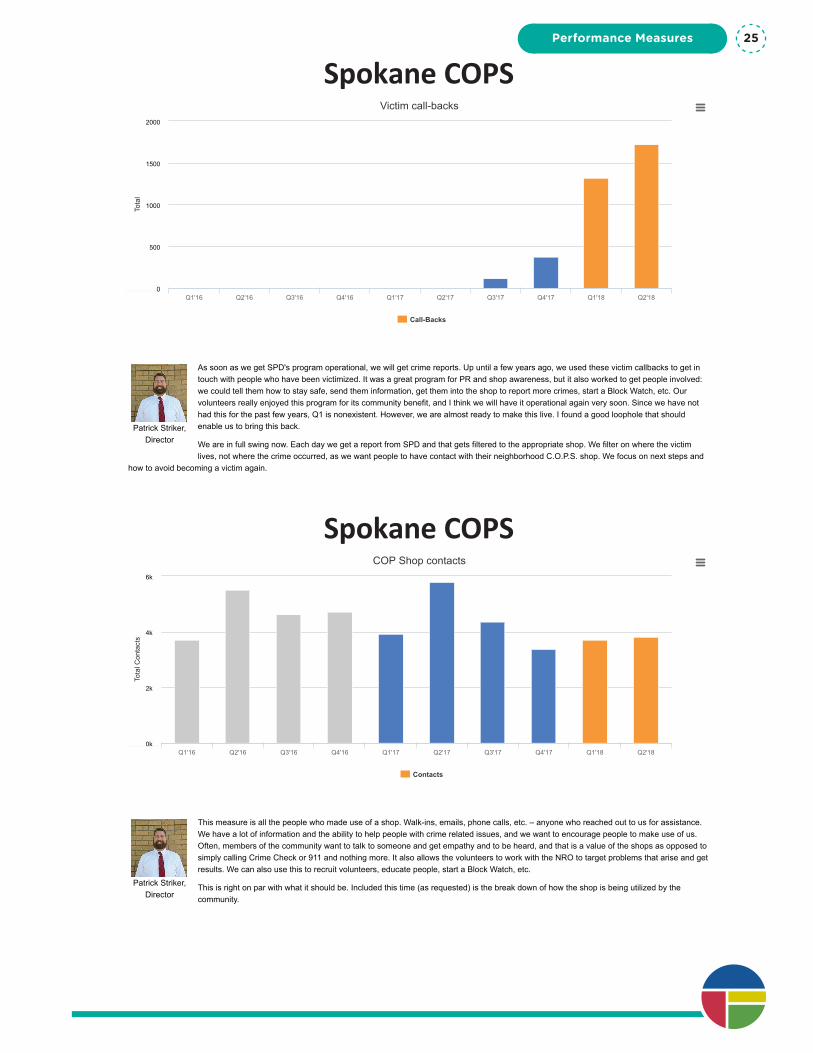
As soon as we get SPD's program operational, we will get crime reports. Up until a few years ago, we used these victim callbacks to get intouch with people who have been victimized. It was a great program for PR and shop awareness, but it also worked to get people involved:we could tell them how to stay safe, send them information, get them into the shop to report more crimes, start a Block Watch, etc. Ourvolunteers really enjoyed this program for its community benefit, and I think we will have it operational again very soon. Since we have nothad this for the past few years, Q1 is nonexistent. However, we are almost ready to make this live. I found a good loophole that shouldenable us to bring this back.
We are in full swing now. Each day we get a report from SPD and that gets filtered to the appropriate shop. We filter on where the victimlives, not where the crime occurred, as we want people to have contact with their neighborhood C.O.P.S. shop. We focus on next steps and
how to avoid becoming a victim again.
Tota
l
Victim call-backs
Call-Backs
Q1'16 Q2'16 Q3'16 Q4'16 Q1'17 Q2'17 Q3'17 Q4'17 Q1'18 Q2'180
500
1000
1500
2000
Patrick Striker,Director
Discussion Send Feedback
This measure is all the people who made use of a shop. Walk-ins, emails, phone calls, etc. – anyone who reached out to us for assistance.We have a lot of information and the ability to help people with crime related issues, and we want to encourage people to make use of us.Often, members of the community want to talk to someone and get empathy and to be heard, and that is a value of the shops as opposed tosimply calling Crime Check or 911 and nothing more. It also allows the volunteers to work with the NRO to target problems that arise and getresults. We can also use this to recruit volunteers, educate people, start a Block Watch, etc.
This is right on par with what it should be. Included this time (as requested) is the break down of how the shop is being utilized by thecommunity.
Tota
l Con
tact
s
COP Shop contacts
Contacts
Q1'16 Q2'16 Q3'16 Q4'16 Q1'17 Q2'17 Q3'17 Q4'17 Q1'18 Q2'180k
2k
4k
6k
Spokane COPS
Spokane COPS
Performance Measures 25
GaryKaesemeyer,
Director
Discussion Send Feedback
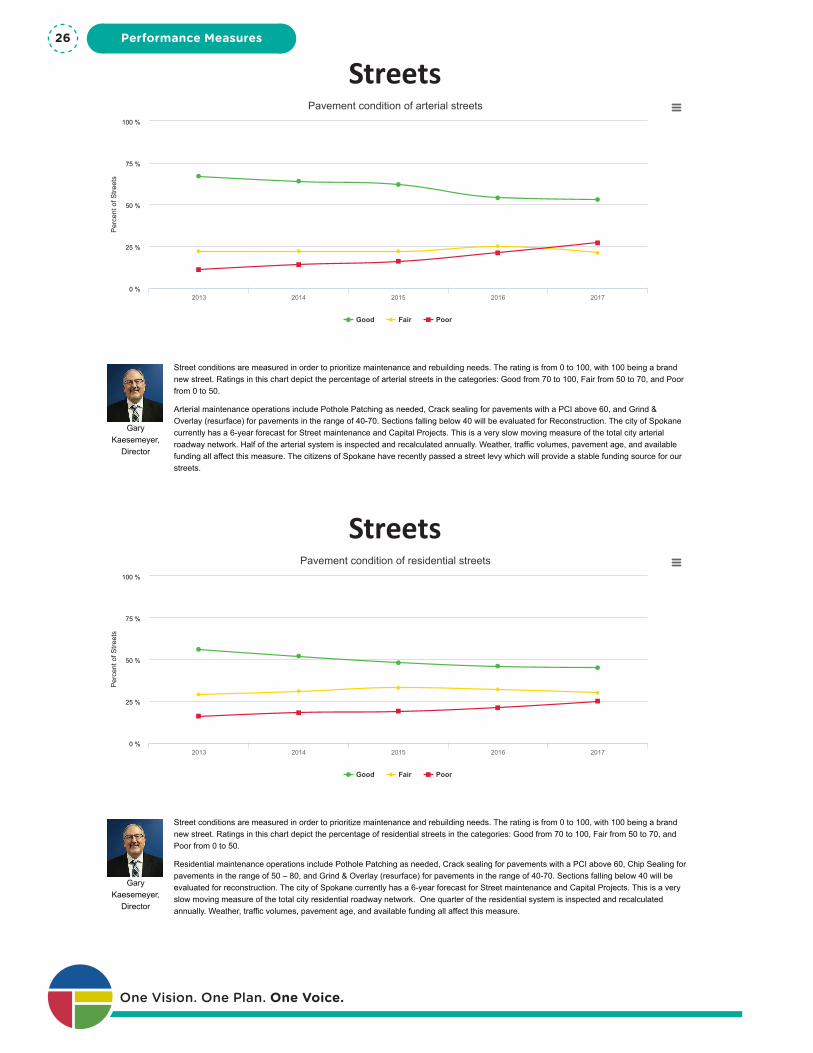
Street conditions are measured in order to prioritize maintenance and rebuilding needs. The rating is from 0 to 100, with 100 being a brandnew street. Ratings in this chart depict the percentage of arterial streets in the categories: Good from 70 to 100, Fair from 50 to 70, and Poorfrom 0 to 50.
Arterial maintenance operations include Pothole Patching as needed, Crack sealing for pavements with a PCI above 60, and Grind &Overlay (resurface) for pavements in the range of 40-70. Sections falling below 40 will be evaluated for Reconstruction. The city of Spokanecurrently has a 6-year forecast for Street maintenance and Capital Projects. This is a very slow moving measure of the total city arterialroadway network. Half of the arterial system is inspected and recalculated annually. Weather, traffic volumes, pavement age, and availablefunding all affect this measure. The citizens of Spokane have recently passed a street levy which will provide a stable funding source for ourstreets.
Per
cent
of S
treet
sPavement condition of arterial streets
Good Fair Poor
2013 2014 2015 2016 20170 %
100 %
25 %
50 %
75 %
GaryKaesemeyer,
Director
Discussion Send Feedback
Street conditions are measured in order to prioritize maintenance and rebuilding needs. The rating is from 0 to 100, with 100 being a brandnew street. Ratings in this chart depict the percentage of residential streets in the categories: Good from 70 to 100, Fair from 50 to 70, andPoor from 0 to 50.
Residential maintenance operations include Pothole Patching as needed, Crack sealing for pavements with a PCI above 60, Chip Sealing forpavements in the range of 50 – 80, and Grind & Overlay (resurface) for pavements in the range of 40-70. Sections falling below 40 will beevaluated for reconstruction. The city of Spokane currently has a 6-year forecast for Street maintenance and Capital Projects. This is a veryslow moving measure of the total city residential roadway network. One quarter of the residential system is inspected and recalculatedannually. Weather, traffic volumes, pavement age, and available funding all affect this measure.
Per
cent
of S
treet
s
Pavement condition of residential streets
Good Fair Poor
2013 2014 2015 2016 20170 %
100 %
25 %
50 %
75 %
Streets
Streets
One Vision. One Plan. One Voice.
Performance Measures26
Corin Morse,Utilities Division
CustomerService
Manager
Discussion Send Feedback
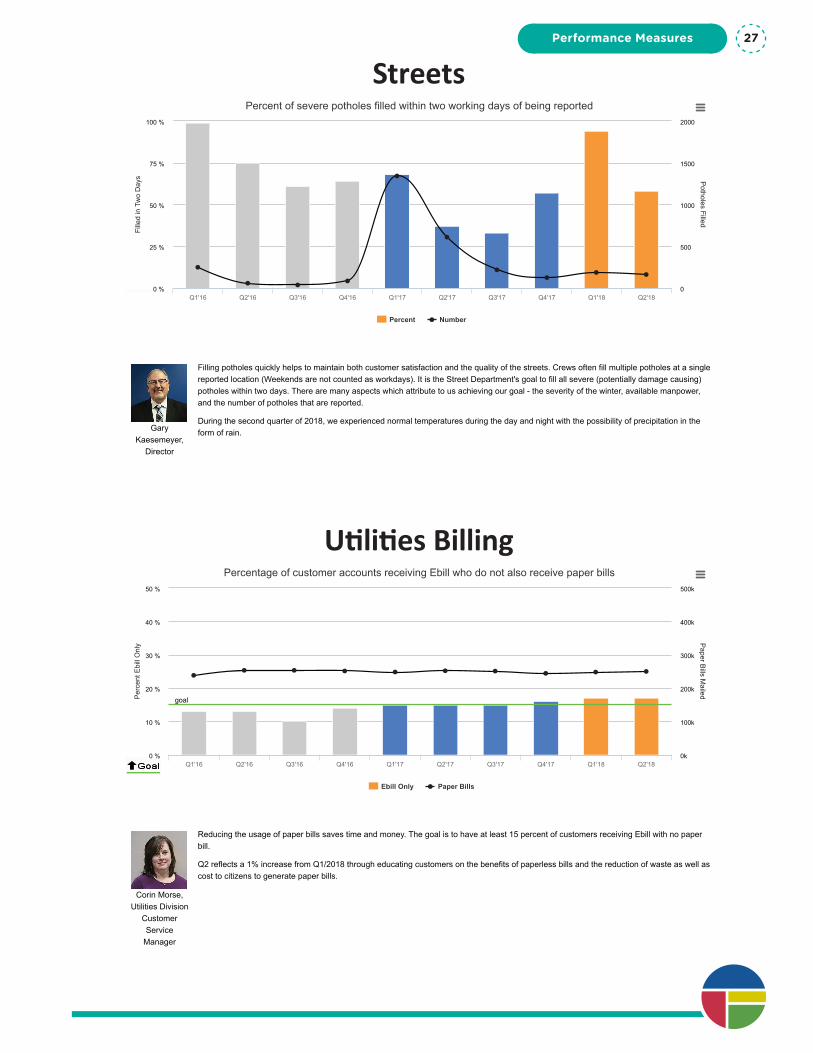
Reducing the usage of paper bills saves time and money. The goal is to have at least 15 percent of customers receiving Ebill with no paperbill.
Q2 reflects a 1% increase from Q1/2018 through educating customers on the benefits of paperless bills and the reduction of waste as well ascost to citizens to generate paper bills.
Per
cent
Ebi
ll O
nly P
aper Bills M
ailed
Percentage of customer accounts receiving Ebill who do not also receive paper bills
goal
Ebill Only Paper Bills
Q1'16 Q2'16 Q3'16 Q4'16 Q1'17 Q2'17 Q3'17 Q4'17 Q1'18 Q2'180 %
10 %
20 %
30 %
40 %
50 %
0k
100k
200k
300k
400k
500k
GaryKaesemeyer,
Director
Discussion Send Feedback
Filling potholes quickly helps to maintain both customer satisfaction and the quality of the streets. Crews often fill multiple potholes at a singlereported location (Weekends are not counted as workdays). It is the Street Department's goal to fill all severe (potentially damage causing)potholes within two days. There are many aspects which attribute to us achieving our goal - the severity of the winter, available manpower,and the number of potholes that are reported.
During the second quarter of 2018, we experienced normal temperatures during the day and night with the possibility of precipitation in theform of rain.
Fille
d in
Tw
o D
ays P
otholes FilledPercent of severe potholes filled within two working days of being reported
Percent Number
Q1'16 Q2'16 Q3'16 Q4'16 Q1'17 Q2'17 Q3'17 Q4'17 Q1'18 Q2'180 %
100 %
25 %
50 %
75 %
0
500
1000
1500
2000
Streets
Utilities Billing
Performance Measures 27
Chuck Conklin,Director
Discussion Send Feedback
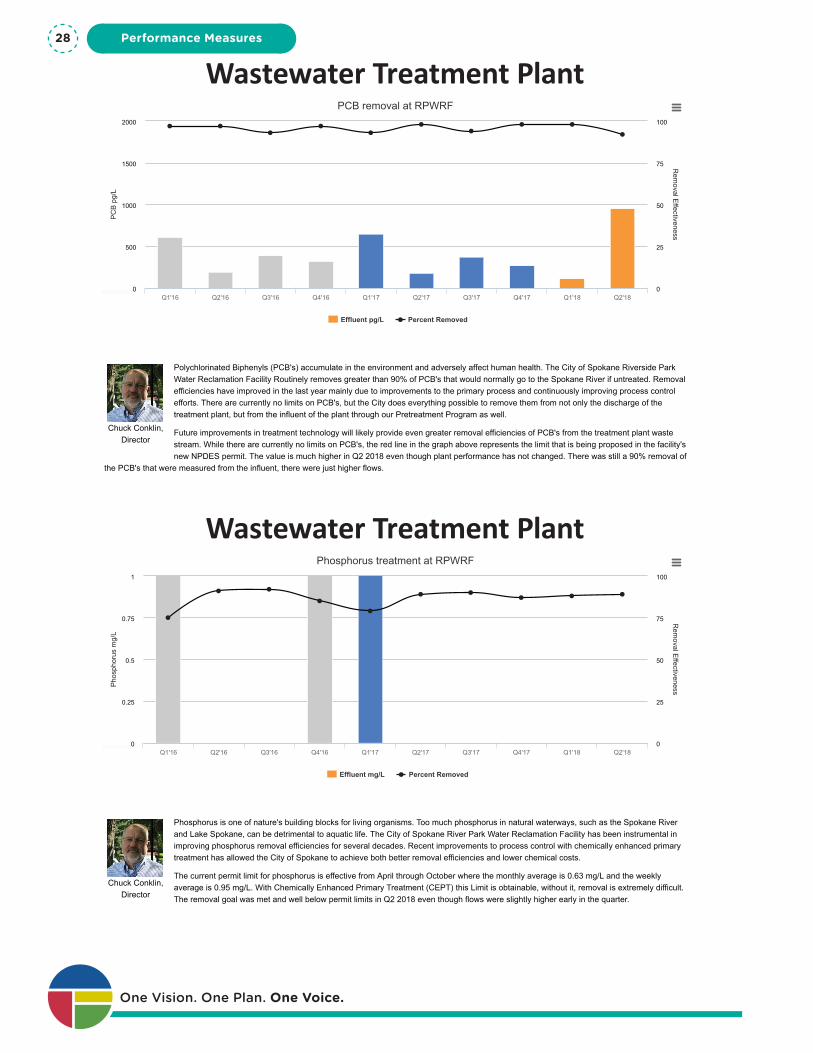
Polychlorinated Biphenyls (PCB's) accumulate in the environment and adversely affect human health. The City of Spokane Riverside ParkWater Reclamation Facility Routinely removes greater than 90% of PCB's that would normally go to the Spokane River if untreated. Removalefficiencies have improved in the last year mainly due to improvements to the primary process and continuously improving process controlefforts. There are currently no limits on PCB's, but the City does everything possible to remove them from not only the discharge of thetreatment plant, but from the influent of the plant through our Pretreatment Program as well.
Future improvements in treatment technology will likely provide even greater removal efficiencies of PCB's from the treatment plant wastestream. While there are currently no limits on PCB's, the red line in the graph above represents the limit that is being proposed in the facility'snew NPDES permit. The value is much higher in Q2 2018 even though plant performance has not changed. There was still a 90% removal of
the PCB's that were measured from the influent, there were just higher flows.
PC
B p
g/L
Rem
oval Effectiveness
PCB removal at RPWRF
Effluent pg/L Percent Removed
Q1'16 Q2'16 Q3'16 Q4'16 Q1'17 Q2'17 Q3'17 Q4'17 Q1'18 Q2'180
500
1000
1500
2000
0
100
25
50
75
Chuck Conklin,Director
Discussion Send Feedback
Phosphorus is one of nature's building blocks for living organisms. Too much phosphorus in natural waterways, such as the Spokane Riverand Lake Spokane, can be detrimental to aquatic life. The City of Spokane River Park Water Reclamation Facility has been instrumental inimproving phosphorus removal efficiencies for several decades. Recent improvements to process control with chemically enhanced primarytreatment has allowed the City of Spokane to achieve both better removal efficiencies and lower chemical costs.
The current permit limit for phosphorus is effective from April through October where the monthly average is 0.63 mg/L and the weeklyaverage is 0.95 mg/L. With Chemically Enhanced Primary Treatment (CEPT) this Limit is obtainable, without it, removal is extremely difficult.The removal goal was met and well below permit limits in Q2 2018 even though flows were slightly higher early in the quarter.
Pho
spho
rus
mg/
L
Rem
oval Effectiveness
Phosphorus treatment at RPWRF
Effluent mg/L Percent Removed
Q1'16 Q2'16 Q3'16 Q4'16 Q1'17 Q2'17 Q3'17 Q4'17 Q1'18 Q2'180
1
0.25
0.5
0.75
0
100
25
50
75
Wastewater Treatment Plant
Wastewater Treatment Plant
One Vision. One Plan. One Voice.
Performance Measures28
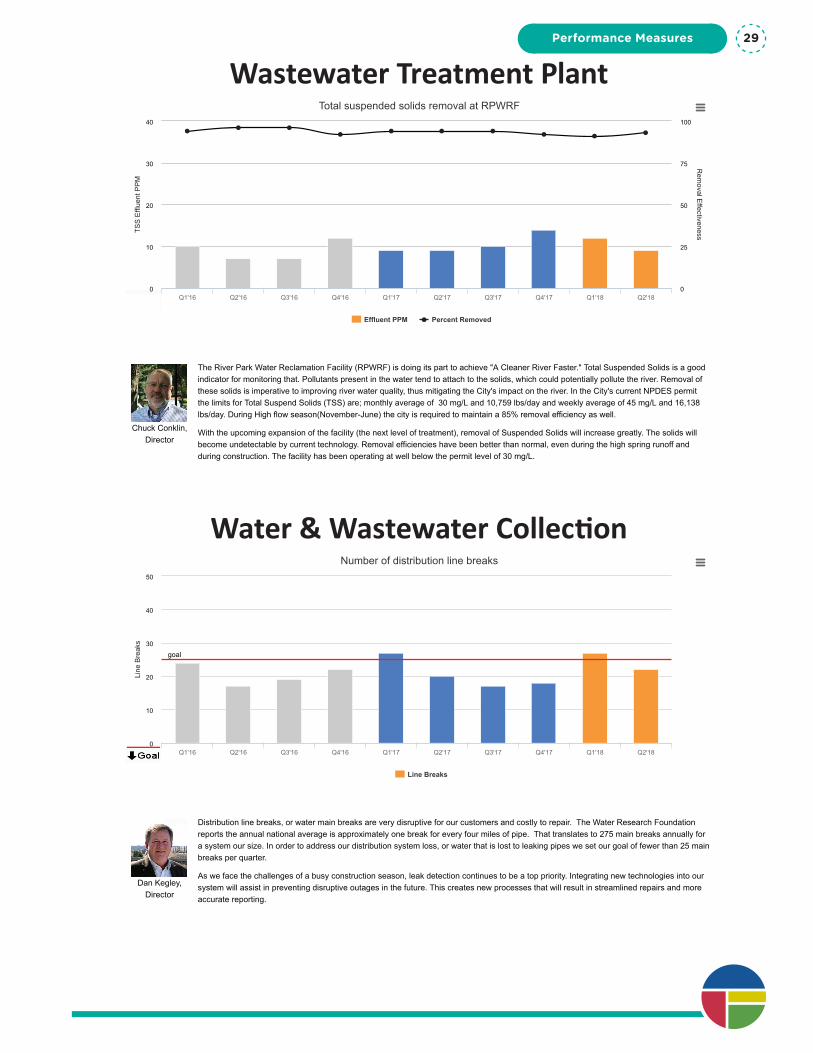
Chuck Conklin,Director
Discussion Send Feedback
The River Park Water Reclamation Facility (RPWRF) is doing its part to achieve "A Cleaner River Faster." Total Suspended Solids is a goodindicator for monitoring that. Pollutants present in the water tend to attach to the solids, which could potentially pollute the river. Removal ofthese solids is imperative to improving river water quality, thus mitigating the City's impact on the river. In the City's current NPDES permitthe limits for Total Suspend Solids (TSS) are; monthly average of 30 mg/L and 10,759 lbs/day and weekly average of 45 mg/L and 16,138lbs/day. During High flow season(November-June) the city is required to maintain a 85% removal efficiency as well.
With the upcoming expansion of the facility (the next level of treatment), removal of Suspended Solids will increase greatly. The solids willbecome undetectable by current technology. Removal efficiencies have been better than normal, even during the high spring runoff andduring construction. The facility has been operating at well below the permit level of 30 mg/L.
TSS
Effl
uent
PP
M
Rem
oval Effectiveness
Total suspended solids removal at RPWRF
Effluent PPM Percent Removed
Q1'16 Q2'16 Q3'16 Q4'16 Q1'17 Q2'17 Q3'17 Q4'17 Q1'18 Q2'180
10
20
30
40
0
100
25
50
75
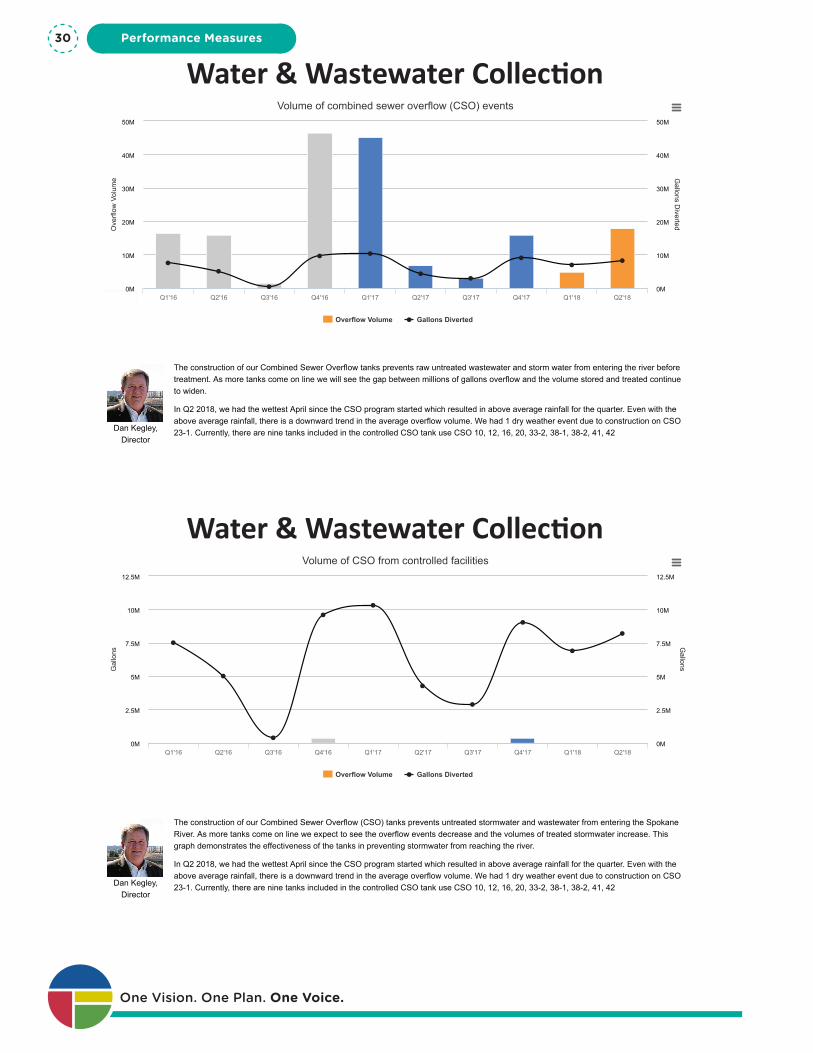
Dan Kegley,Director
Discussion Send Feedback
Distribution line breaks, or water main breaks are very disruptive for our customers and costly to repair. The Water Research Foundationreports the annual national average is approximately one break for every four miles of pipe. That translates to 275 main breaks annually fora system our size. In order to address our distribution system loss, or water that is lost to leaking pipes we set our goal of fewer than 25 mainbreaks per quarter.
As we face the challenges of a busy construction season, leak detection continues to be a top priority. Integrating new technologies into oursystem will assist in preventing disruptive outages in the future. This creates new processes that will result in streamlined repairs and moreaccurate reporting.
Line
Bre
aks
Number of distribution line breaks
goal
Line Breaks
Q1'16 Q2'16 Q3'16 Q4'16 Q1'17 Q2'17 Q3'17 Q4'17 Q1'18 Q2'180
10
20
30
40
50
Wastewater Treatment Plant
Water & Wastewater Collection
Performance Measures 29
Dan Kegley,Director
Discussion Send Feedback
The construction of our Combined Sewer Overflow tanks prevents raw untreated wastewater and storm water from entering the river beforetreatment. As more tanks come on line we will see the gap between millions of gallons overflow and the volume stored and treated continueto widen.
In Q2 2018, we had the wettest April since the CSO program started which resulted in above average rainfall for the quarter. Even with theabove average rainfall, there is a downward trend in the average overflow volume. We had 1 dry weather event due to construction on CSO23-1. Currently, there are nine tanks included in the controlled CSO tank use CSO 10, 12, 16, 20, 33-2, 38-1, 38-2, 41, 42
Ove
rflow
Vol
ume G
allons Diverted
Volume of combined sewer overflow (CSO) events
Overflow Volume Gallons Diverted
Q1'16 Q2'16 Q3'16 Q4'16 Q1'17 Q2'17 Q3'17 Q4'17 Q1'18 Q2'180M
10M
20M
30M
40M
50M
0M
10M
20M
30M
40M
50M
Dan Kegley,Director
Discussion Send Feedback
The construction of our Combined Sewer Overflow (CSO) tanks prevents untreated stormwater and wastewater from entering the SpokaneRiver. As more tanks come on line we expect to see the overflow events decrease and the volumes of treated stormwater increase. Thisgraph demonstrates the effectiveness of the tanks in preventing stormwater from reaching the river.
In Q2 2018, we had the wettest April since the CSO program started which resulted in above average rainfall for the quarter. Even with theabove average rainfall, there is a downward trend in the average overflow volume. We had 1 dry weather event due to construction on CSO23-1. Currently, there are nine tanks included in the controlled CSO tank use CSO 10, 12, 16, 20, 33-2, 38-1, 38-2, 41, 42
Gal
lons
Gallons
Volume of CSO from controlled facilities
Overflow Volume Gallons Diverted
Q1'16 Q2'16 Q3'16 Q4'16 Q1'17 Q2'17 Q3'17 Q4'17 Q1'18 Q2'180M
2.5M
5M
7.5M
10M
12.5M
0M
2.5M
5M
7.5M
10M
12.5M
Water & Wastewater Collection
Water & Wastewater Collection
One Vision. One Plan. One Voice.
Performance Measures30

Table of Contents
Table of Contents
Table of Contents
Community, Health, and EnvironmentCapital Improvements 2015 Parks ............................... 3Golf Fund ...................................................................... 7Library ........................................................................ 11Parks and Recreation ................................................. 15Parks Cumulative Reserve Fund ................................ 29
Finance & TechnologyAccounting Services ...................................................... 3Asset Management ...................................................... 7Asset Management Fund Capital ............................... 23Employee Benefits ..................................................... 27Finance ....................................................................... 31Grants Management .................................................. 39Human Resources ...................................................... 43Innovation and Technology Services ......................... 47IT Capital Replacement Fund ..................................... 71Purchasing .................................................................. 75Risk Management ...................................................... 79Treasury Services ....................................................... 83Unemployment .......................................................... 95Workers Compensation ............................................. 99
Planning and Economic DevelopmentCode Enforcement ....................................................... 3Community & Neighborhood Services Division ........ 13Community Centers ................................................... 17Community Housing & Human Services .................... 31Development Services Center ................................... 61Economic Development ............................................. 77Financial Partnership Fund ........................................ 81Historic Preservation ................................................. 85Intermodal Facility ..................................................... 89Kendall Yards TIF ........................................................ 93Miscellaneous Grants Fund ....................................... 97My Spokane ............................................................. 101Office of Neighborhood Services (ONS) ................... 109Office of Youth ......................................................... 113Parking Fund ............................................................ 117Planning Services ..................................................... 121Traffic Calming Measures ......................................... 129Under Freeway Parking ............................................ 133University District LRF ............................................. 137West Quadrant TIF ................................................... 141
Public SafetyCombined Communications Building .......................... 3Combined Communications Center ............................. 7Fire/EMS .................................................................... 11Forfeitures & Contributions ....................................... 45Police ......................................................................... 49Public Safety & Judicial Grant .................................. 101
Public WorksArterial Street Fund ..................................................... 3Engineering Services .................................................... 7Environmental Programs ........................................... 17Fleet Replacement Fund ............................................ 21Fleet Services ............................................................. 25Integrated Capital Management ............................... 37Paths and Trails .......................................................... 55Public Works and Utilities .......................................... 59Real Estate Excise Tax Fund ....................................... 67Sewer Construction ................................................... 71Solid Waste Collection ............................................... 75Solid Waste Disposal .................................................. 85Solid Waste Landfills .................................................. 99Stormwater .............................................................. 111Street Department ................................................... 115Transportation Benefit District ................................ 137Wastewater Collections and Maintenance .............. 141Wastewater Management RPWRF .......................... 151Water ....................................................................... 161Water/Wastewater Debt Service Fund .................... 175Water/Wastewater Revenue Bond Fund .................. 179
Stand Alone Departments457 Deferred Compensation Fund .............................. 3Channel 5 / PEG Capital ............................................... 7City Clerk .................................................................... 11City Council ................................................................ 15Civil Service ................................................................ 19Criminal Justice Assistance Fund ............................... 23Domestic Violence Prevention .................................. 27Firefighters Pension Fund .......................................... 31General Fund Allocations ........................................... 35General Fund Internal Service Charges ..................... 65Hearing Examiner ...................................................... 69Hotel/Motel Tax Fund ................................................ 73Legal ........................................................................... 77Mayor's Office ............................................................ 85Municipal Court ......................................................... 89Non-Departmental .................................................... 99Police Ombudsman .................................................. 103Police Pension Fund ................................................. 107Probation Services ................................................... 111Public Affairs/Communications ............................... 115Public Defender ....................................................... 119Reprographics .......................................................... 129Spokane Employees' Retirement System ................ 133Spokane Regional Emergency
Communications System (LEIS) ............................ 137Trial Court Improvement Fund ................................. 141
Table of Contents 1

One Vision. One Plan. One Voice.
Table of Contents2
Com
munity, H
ealth, and Environm
ent
Community, Health, and Environment
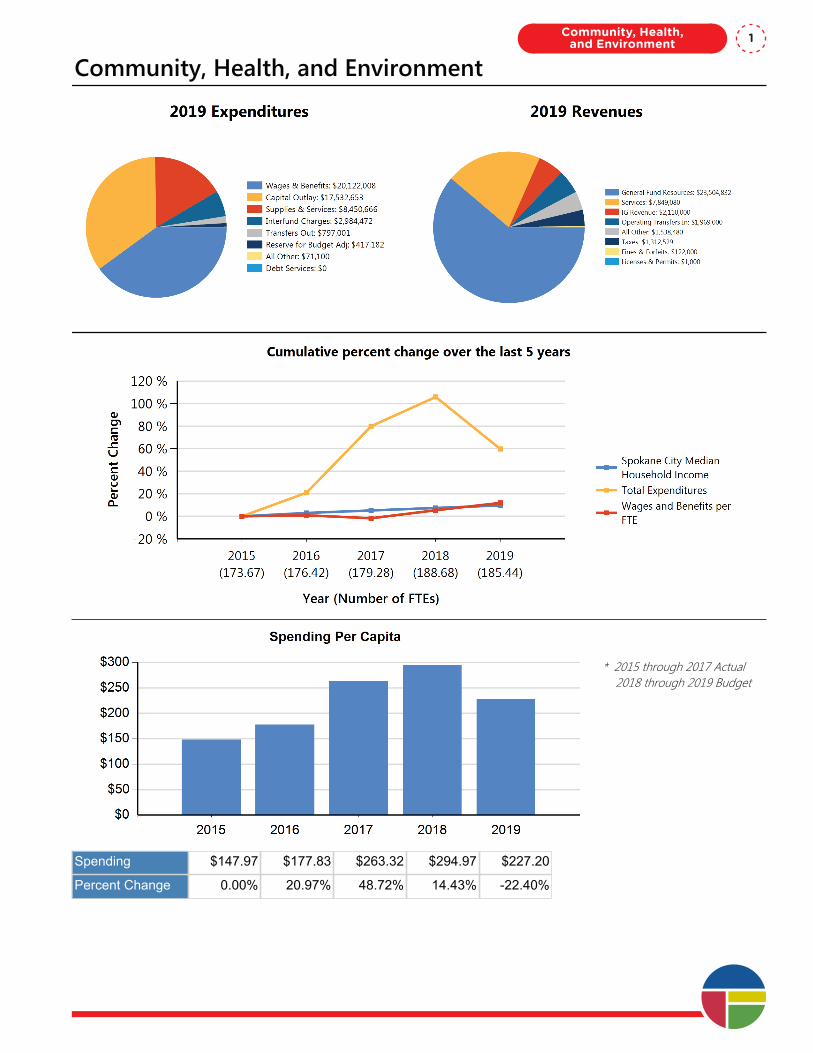
Community, Health, and Environment
* 2015 through 2017 Actual 2018 through 2019 Budget
Spending $147.97 $177.83 $263.32 $294.97 $227.20
Percent Change 0.00% 20.97% 48.72% 14.43% -22.40%
Community, Health, and Environment 1

One Vision. One Plan. One Voice.
Community, Health, and Environment2
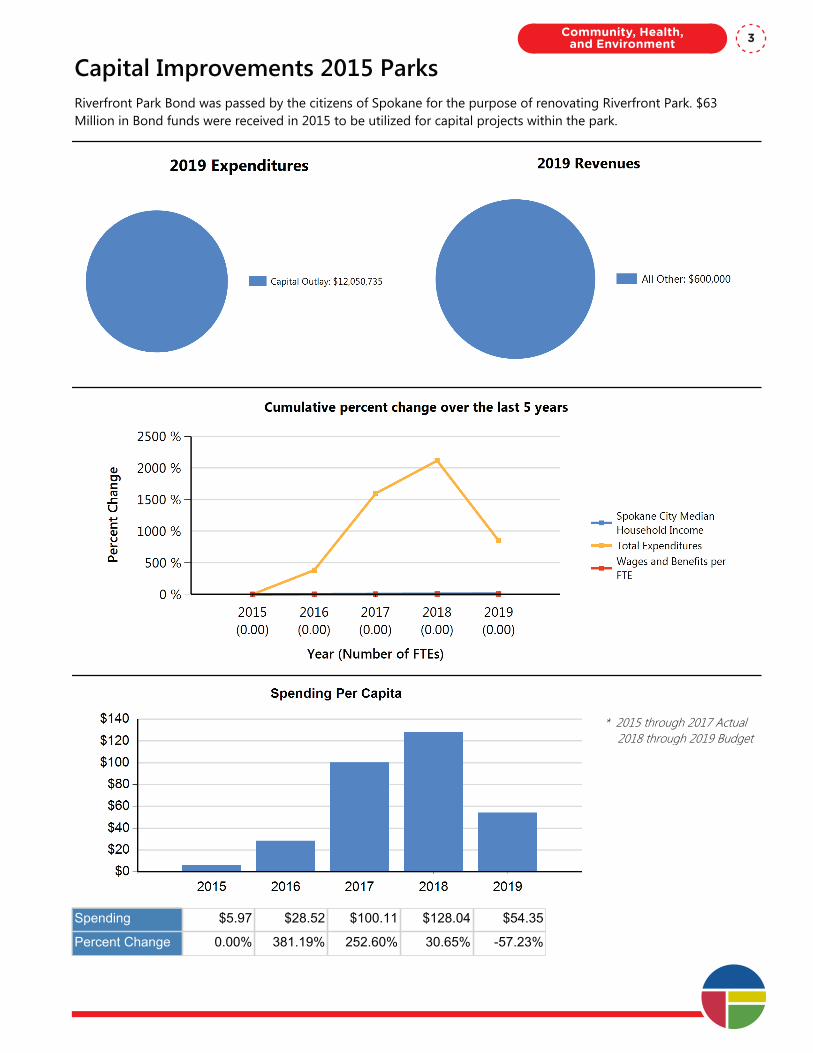
Capital Improvements 2015 ParksRiverfront Park Bond was passed by the citizens of Spokane for the purpose of renovating Riverfront Park. $63 Million in Bond funds were received in 2015 to be utilized for capital projects within the park.
* 2015 through 2017 Actual 2018 through 2019 Budget
Spending $5.97 $28.52 $100.11 $128.04 $54.35
Percent Change 0.00% 381.19% 252.60% 30.65% -57.23%
Community, Health, and Environment 3
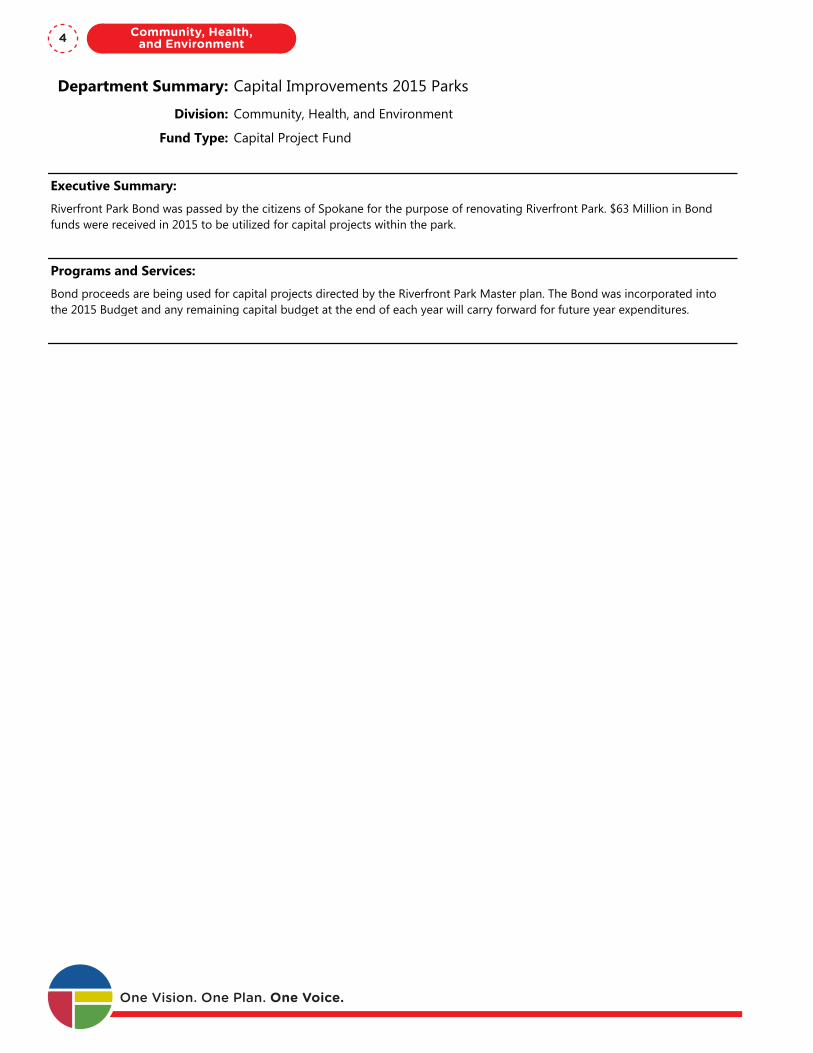
Department Summary: Capital Improvements 2015 Parks
Division: Community, Health, and Environment
Fund Type: Capital Project Fund
Executive Summary:
Riverfront Park Bond was passed by the citizens of Spokane for the purpose of renovating Riverfront Park. $63 Million in Bond funds were received in 2015 to be utilized for capital projects within the park.
Programs and Services:
Bond proceeds are being used for capital projects directed by the Riverfront Park Master plan. The Bond was incorporated into the 2015 Budget and any remaining capital budget at the end of each year will carry forward for future year expenditures.
FTEs
2015 Actual 2016 Actual 2017 Actual 2018 Budget 2019 Proposed
Total FTEs 0.00 0.00 0.00 0.00 0.00
Expenditures:
2015 Actual 2016 Actual 2017 Actual 2018 Budget 2019 Proposed
Capital Outlay 677,805 6,116,808 21,568,279 28,180,962 12,050,735
Interfund Charges 0 0 0 0 0
Reserve for Budget Adjustment 0 0 0 0 0
Transfers Out 0 0 0 0 0
Wages & Benefits 166,606 0 0 0 0
Supplies & Services 0 0 0 0 0
Debt Services 426,770 0 0 0 0
All Other 0 0 0 0 0
TOTAL 1,271,181 6,116,808 21,568,279 28,180,962 12,050,735
Expenditure Notes:
Total bond expenditures (actual and budgeted) exceed $65 million due to interest earnings on unspent fund balance
Revenues:
2015 Actual 2016 Actual 2017 Actual 2018 Budget 2019 Proposed
Taxes 0 0 0 0 0
Licenses & Permits 0 0 0 0 0
IG Revenue 0 0 0 0 0
Services 0 0 0 0 0
Fines & Forfeits 0 0 0 0 0
Operating Transfers In 0 0 0 0 0
General Fund Resources 0 0 0 0 0
All Other 65,263,585 (2,864,819) 1,736,130 600,000 600,000One Vision. One Plan. One Voice.
Community, Health, and Environment4
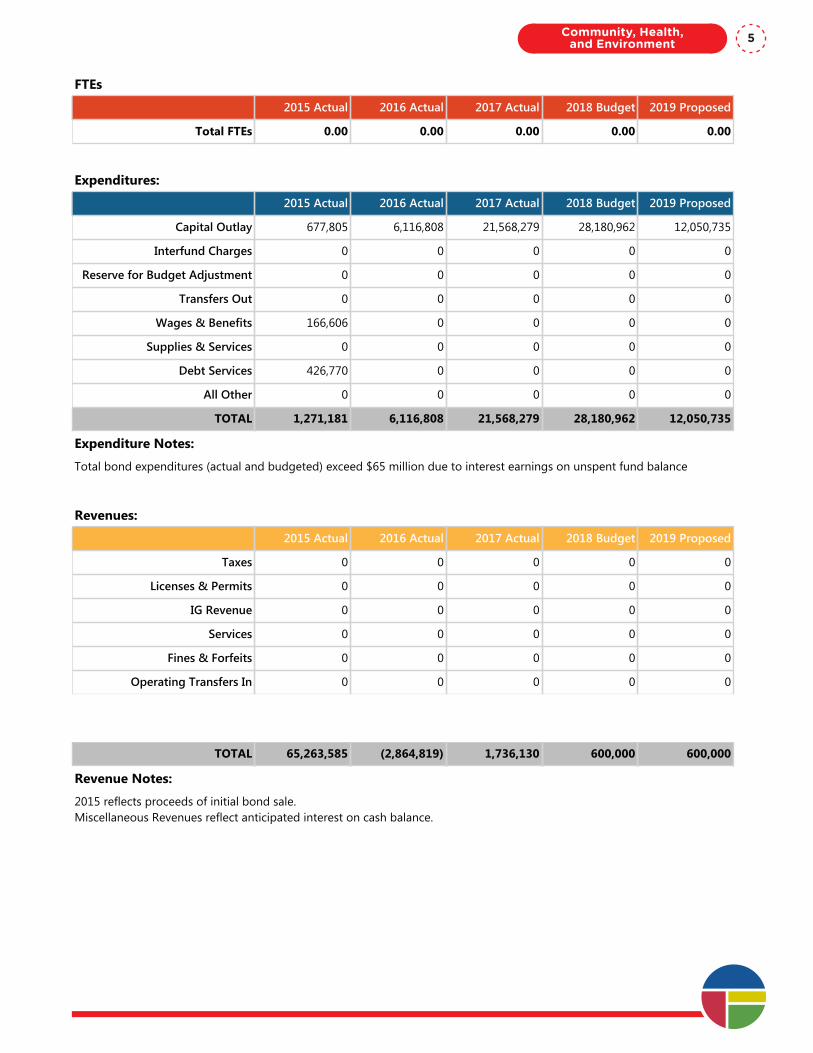
Department Summary: Capital Improvements 2015 Parks
Division: Community, Health, and Environment
Fund Type: Capital Project Fund
Executive Summary:
Riverfront Park Bond was passed by the citizens of Spokane for the purpose of renovating Riverfront Park. $63 Million in Bond funds were received in 2015 to be utilized for capital projects within the park.
Programs and Services:
Bond proceeds are being used for capital projects directed by the Riverfront Park Master plan. The Bond was incorporated into the 2015 Budget and any remaining capital budget at the end of each year will carry forward for future year expenditures.
FTEs
2015 Actual 2016 Actual 2017 Actual 2018 Budget 2019 Proposed
Total FTEs 0.00 0.00 0.00 0.00 0.00
Expenditures:
2015 Actual 2016 Actual 2017 Actual 2018 Budget 2019 Proposed
Capital Outlay 677,805 6,116,808 21,568,279 28,180,962 12,050,735
Interfund Charges 0 0 0 0 0
Reserve for Budget Adjustment 0 0 0 0 0
Transfers Out 0 0 0 0 0
Wages & Benefits 166,606 0 0 0 0
Supplies & Services 0 0 0 0 0
Debt Services 426,770 0 0 0 0
All Other 0 0 0 0 0
TOTAL 1,271,181 6,116,808 21,568,279 28,180,962 12,050,735
Expenditure Notes:
Total bond expenditures (actual and budgeted) exceed $65 million due to interest earnings on unspent fund balance
Revenues:
2015 Actual 2016 Actual 2017 Actual 2018 Budget 2019 Proposed
Taxes 0 0 0 0 0
Licenses & Permits 0 0 0 0 0
IG Revenue 0 0 0 0 0
Services 0 0 0 0 0
Fines & Forfeits 0 0 0 0 0
Operating Transfers In 0 0 0 0 0
General Fund Resources 0 0 0 0 0
All Other 65,263,585 (2,864,819) 1,736,130 600,000 600,000
TOTAL 65,263,585 (2,864,819) 1,736,130 600,000 600,000
Revenue Notes:
2015 reflects proceeds of initial bond sale.Miscellaneous Revenues reflect anticipated interest on cash balance.
Community, Health, and Environment 5

One Vision. One Plan. One Voice.
Community, Health, and Environment6
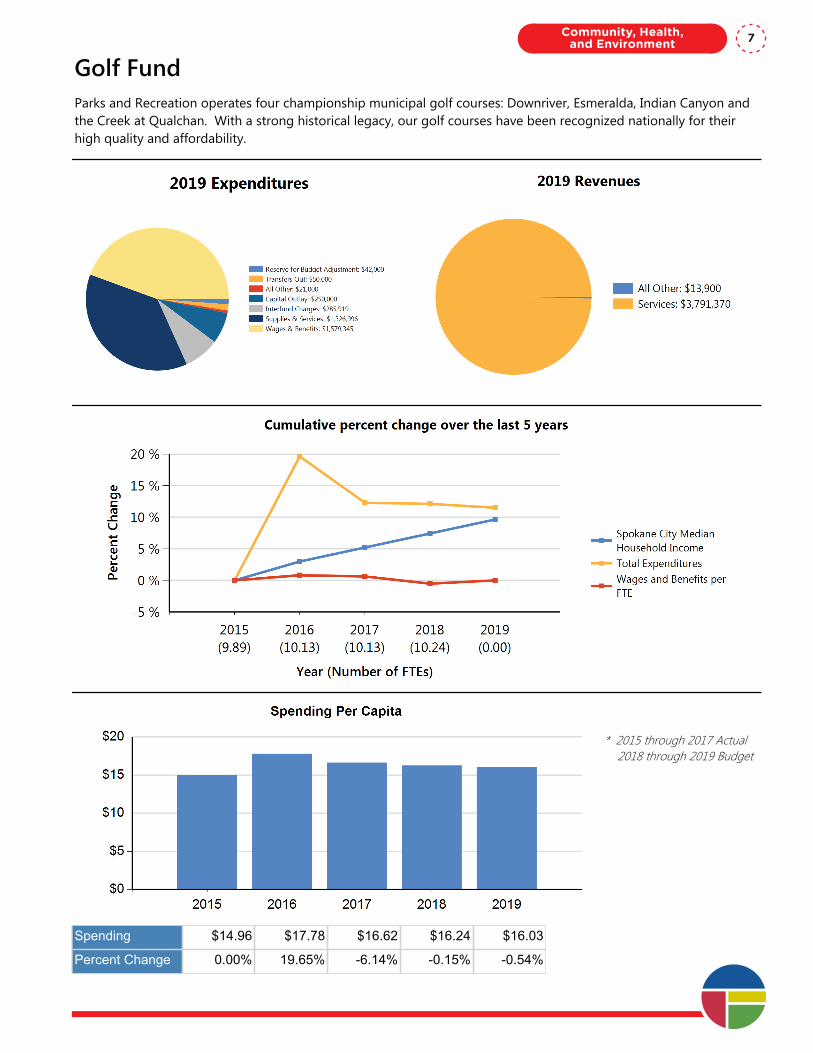
Golf FundParks and Recreation operates four championship municipal golf courses: Downriver, Esmeralda, Indian Canyon and the Creek at Qualchan. With a strong historical legacy, our golf courses have been recognized nationally for their high quality and affordability.
* 2015 through 2017 Actual 2018 through 2019 Budget
Spending $14.96 $17.78 $16.62 $16.24 $16.03
Percent Change 0.00% 19.65% -6.14% -0.15% -0.54%
Community, Health, and Environment 7
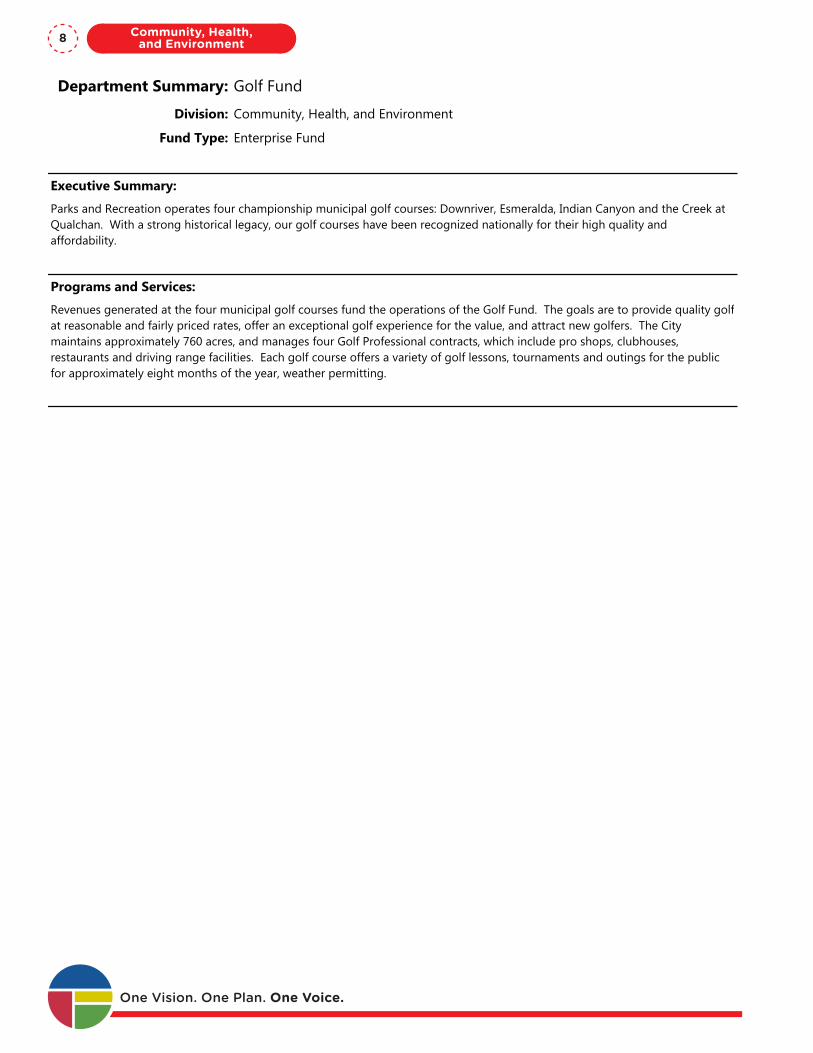
Department Summary: Golf Fund
Division: Community, Health, and Environment
Fund Type: Enterprise Fund
Executive Summary:
Parks and Recreation operates four championship municipal golf courses: Downriver, Esmeralda, Indian Canyon and the Creek at Qualchan. With a strong historical legacy, our golf courses have been recognized nationally for their high quality and affordability.
Programs and Services:
Revenues generated at the four municipal golf courses fund the operations of the Golf Fund. The goals are to provide quality golf at reasonable and fairly priced rates, offer an exceptional golf experience for the value, and attract new golfers. The City maintains approximately 760 acres, and manages four Golf Professional contracts, which include pro shops, clubhouses, restaurants and driving range facilities. Each golf course offers a variety of golf lessons, tournaments and outings for the public for approximately eight months of the year, weather permitting.
FTEs
2015 Actual 2016 Actual 2017 Actual 2018 Budget 2019 Proposed
Total FTEs 9.89 10.13 10.13 10.24 0.00
Expenditures:
2015 Actual 2016 Actual 2017 Actual 2018 Budget 2019 Proposed
Capital Outlay 116,798 221,247 196,332 250,000 250,000
Interfund Charges 385,014 346,453 341,800 361,684 285,919
Reserve for Budget Adjustment 0 0 0 42,000 42,000
Transfers Out 11,345 0 0 50,000 50,000
Wages & Benefits 1,478,609 1,526,865 1,523,947 1,522,925 1,579,345
Supplies & Services 1,175,684 1,245,201 1,455,740 1,326,996 1,326,996
Debt Services 0 453,712 41,668 0 0
All Other 20,650 21,302 20,742 21,000 21,000
TOTAL 3,188,100 3,814,780 3,580,229 3,574,605 3,555,260
Expenditure Notes:
All Other expenditure category reflects excise and sales taxes on Golf Fund activities.
Revenues:
2015 Actual 2016 Actual 2017 Actual 2018 Budget 2019 Proposed
Taxes 0 0 0 0 0
Licenses & Permits 0 0 0 0 0
IG Revenue 0 0 0 0 0
Services 3,146,044 3,215,891 3,102,697 3,791,370 3,791,370
Fines & Forfeits 0 0 0 0 0One Vision. One Plan. One Voice.
Community, Health, and Environment8
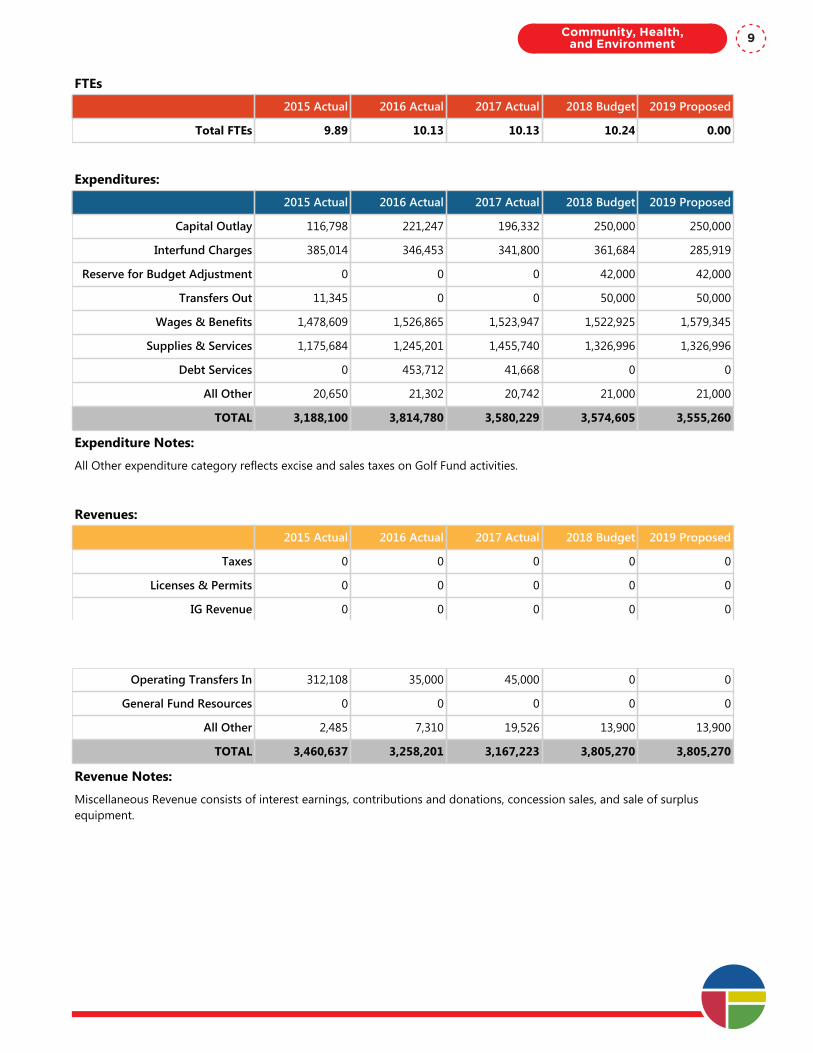
Department Summary: Golf Fund
Division: Community, Health, and Environment
Fund Type: Enterprise Fund
Executive Summary:
Parks and Recreation operates four championship municipal golf courses: Downriver, Esmeralda, Indian Canyon and the Creek at Qualchan. With a strong historical legacy, our golf courses have been recognized nationally for their high quality and affordability.
Programs and Services:
Revenues generated at the four municipal golf courses fund the operations of the Golf Fund. The goals are to provide quality golf at reasonable and fairly priced rates, offer an exceptional golf experience for the value, and attract new golfers. The City maintains approximately 760 acres, and manages four Golf Professional contracts, which include pro shops, clubhouses, restaurants and driving range facilities. Each golf course offers a variety of golf lessons, tournaments and outings for the public for approximately eight months of the year, weather permitting.
FTEs
2015 Actual 2016 Actual 2017 Actual 2018 Budget 2019 Proposed
Total FTEs 9.89 10.13 10.13 10.24 0.00
Expenditures:
2015 Actual 2016 Actual 2017 Actual 2018 Budget 2019 Proposed
Capital Outlay 116,798 221,247 196,332 250,000 250,000
Interfund Charges 385,014 346,453 341,800 361,684 285,919
Reserve for Budget Adjustment 0 0 0 42,000 42,000
Transfers Out 11,345 0 0 50,000 50,000
Wages & Benefits 1,478,609 1,526,865 1,523,947 1,522,925 1,579,345
Supplies & Services 1,175,684 1,245,201 1,455,740 1,326,996 1,326,996
Debt Services 0 453,712 41,668 0 0
All Other 20,650 21,302 20,742 21,000 21,000
TOTAL 3,188,100 3,814,780 3,580,229 3,574,605 3,555,260
Expenditure Notes:
All Other expenditure category reflects excise and sales taxes on Golf Fund activities.
Revenues:
2015 Actual 2016 Actual 2017 Actual 2018 Budget 2019 Proposed
Taxes 0 0 0 0 0
Licenses & Permits 0 0 0 0 0
IG Revenue 0 0 0 0 0
Services 3,146,044 3,215,891 3,102,697 3,791,370 3,791,370
Fines & Forfeits 0 0 0 0 0
Operating Transfers In 312,108 35,000 45,000 0 0
General Fund Resources 0 0 0 0 0
All Other 2,485 7,310 19,526 13,900 13,900
TOTAL 3,460,637 3,258,201 3,167,223 3,805,270 3,805,270
Revenue Notes:
Miscellaneous Revenue consists of interest earnings, contributions and donations, concession sales, and sale of surplus equipment.
Community, Health, and Environment 9

One Vision. One Plan. One Voice.
Community, Health, and Environment10
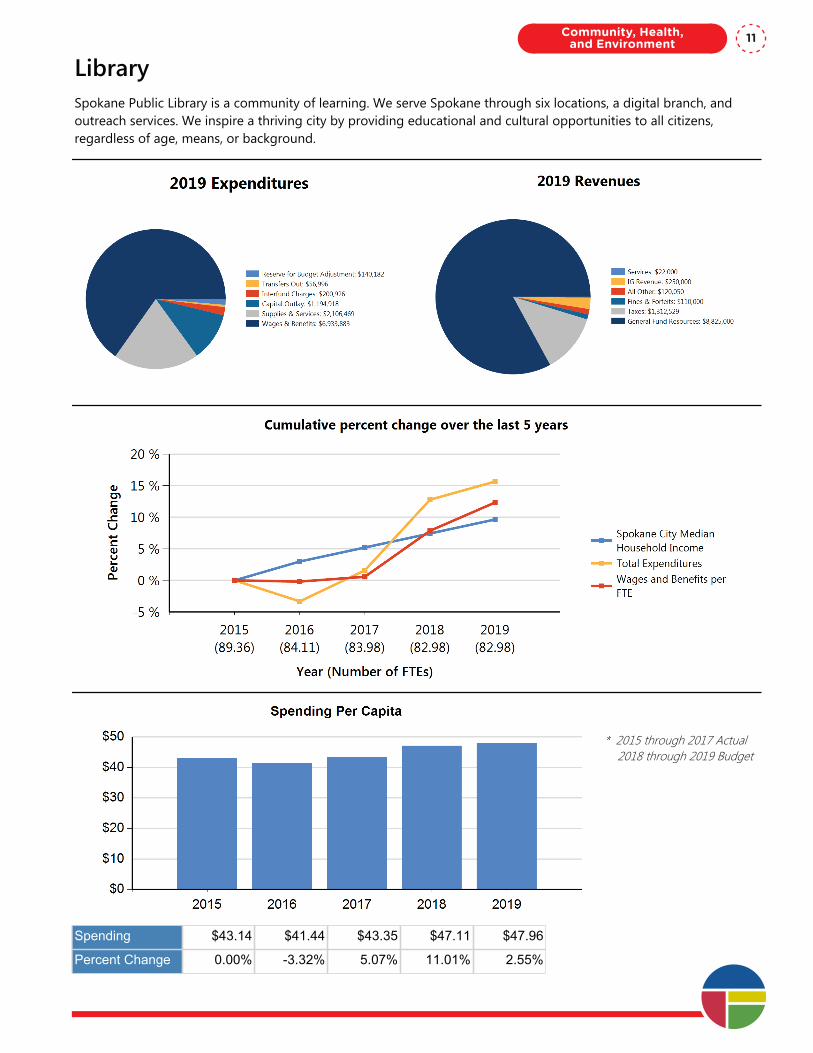
LibrarySpokane Public Library is a community of learning. We serve Spokane through six locations, a digital branch, and outreach services. We inspire a thriving city by providing educational and cultural opportunities to all citizens, regardless of age, means, or background.
* 2015 through 2017 Actual 2018 through 2019 Budget
Spending $43.14 $41.44 $43.35 $47.11 $47.96
Percent Change 0.00% -3.32% 5.07% 11.01% 2.55%
Community, Health, and Environment 11
Department Summary: Library
Division: Community, Health, and Environment
Fund Type: Special Revenue Fund
Executive Summary:
Spokane Public Library is a community of learning. We serve Spokane through six locations, a digital branch, and outreach services. We inspire a thriving city by providing educational and cultural opportunities to all citizens, regardless of age, means, or background.
Programs and Services:
EDUCATIONWe connect our community with education, information and programming. From early literacy to adult and digital literacy we are the source for free learning opportunities for Spokane citizens. Our collection includes print, audio, video and digital formats, specialized online research tools, historical collections and educational tools.
ENRICHMENTWe are a platform to provide Spokane citizens with opportunities for personal enrichment. We offer spaces for citizens to interact and collaborate. We cultivate a dynamic and informative programming calendar to bring interesting topics to our customers – both young and old. Through our Outreach services, we serve homebound residents, senior centers, daycare facilities, rehabilitation facilities, hospitals and prisons.
PARTNERSHIPWe align with community groups and local businesses and give them the cutting-edge resources they need to meet their goals. Through strategic relationships we maximize our reach and cultivate a strong sense of community. We improve the economy of Spokane by strengthening the workforce through high-quality business resources, training and workshops.
FTEs
2015 Actual 2016 Actual 2017 Actual 2018 Budget 2019 Proposed
Total FTEs 89.36 84.11 83.98 82.98 82.98
Expenditures:
2015 Actual 2016 Actual 2017 Actual 2018 Budget 2019 Proposed
Capital Outlay 935,510 1,090,488 1,245,198 1,194,918 1,194,918
Interfund Charges 158,210 202,988 210,535 212,302 200,926
Reserve for Budget Adjustment 0 0 0 140,000 140,182
Transfers Out 56,996 56,996 56,996 56,996 56,996
Wages & Benefits 6,623,265 6,222,526 6,260,428 6,636,217 6,933,883
Supplies & Services 1,419,528 1,314,833 1,566,071 2,127,969 2,106,469
Debt Services 0 0 0 0 0
All Other 0 0 0 0 0
One Vision. One Plan. One Voice.
Community, Health, and Environment12

Department Summary: Library
Division: Community, Health, and Environment
Fund Type: Special Revenue Fund
Executive Summary:
Spokane Public Library is a community of learning. We serve Spokane through six locations, a digital branch, and outreach services. We inspire a thriving city by providing educational and cultural opportunities to all citizens, regardless of age, means, or background.
Programs and Services:
EDUCATIONWe connect our community with education, information and programming. From early literacy to adult and digital literacy we are the source for free learning opportunities for Spokane citizens. Our collection includes print, audio, video and digital formats, specialized online research tools, historical collections and educational tools.
ENRICHMENTWe are a platform to provide Spokane citizens with opportunities for personal enrichment. We offer spaces for citizens to interact and collaborate. We cultivate a dynamic and informative programming calendar to bring interesting topics to our customers – both young and old. Through our Outreach services, we serve homebound residents, senior centers, daycare facilities, rehabilitation facilities, hospitals and prisons.
PARTNERSHIPWe align with community groups and local businesses and give them the cutting-edge resources they need to meet their goals. Through strategic relationships we maximize our reach and cultivate a strong sense of community. We improve the economy of Spokane by strengthening the workforce through high-quality business resources, training and workshops.
FTEs
2015 Actual 2016 Actual 2017 Actual 2018 Budget 2019 Proposed
Total FTEs 89.36 84.11 83.98 82.98 82.98
Expenditures:
2015 Actual 2016 Actual 2017 Actual 2018 Budget 2019 Proposed
Capital Outlay 935,510 1,090,488 1,245,198 1,194,918 1,194,918
Interfund Charges 158,210 202,988 210,535 212,302 200,926
Reserve for Budget Adjustment 0 0 0 140,000 140,182
Transfers Out 56,996 56,996 56,996 56,996 56,996
Wages & Benefits 6,623,265 6,222,526 6,260,428 6,636,217 6,933,883
Supplies & Services 1,419,528 1,314,833 1,566,071 2,127,969 2,106,469
Debt Services 0 0 0 0 0
All Other 0 0 0 0 0
TOTAL 9,193,509 8,887,831 9,339,228 10,368,402 10,633,374
Expenditure Notes:
Revenues:
2015 Actual 2016 Actual 2017 Actual 2018 Budget 2019 Proposed
Taxes 1,080,000 1,080,000 1,166,982 1,255,000 1,312,529
Licenses & Permits 0 0 0 0 0
IG Revenue 45,126 9,196 9,024 250,000 250,000
Services 18,006 18,050 18,867 22,000 22,000
Fines & Forfeits 146,954 123,343 122,690 140,000 110,000
Operating Transfers In 0 0 0 0 0
General Fund Resources 7,923,397 8,263,482 8,383,482 8,600,000 8,825,000
All Other 122,226 109,367 122,029 110,250 120,050
TOTAL 9,335,709 9,603,438 9,823,074 10,377,250 10,639,579
Revenue Notes:
Community, Health, and Environment 13

One Vision. One Plan. One Voice.
Community, Health, and Environment14
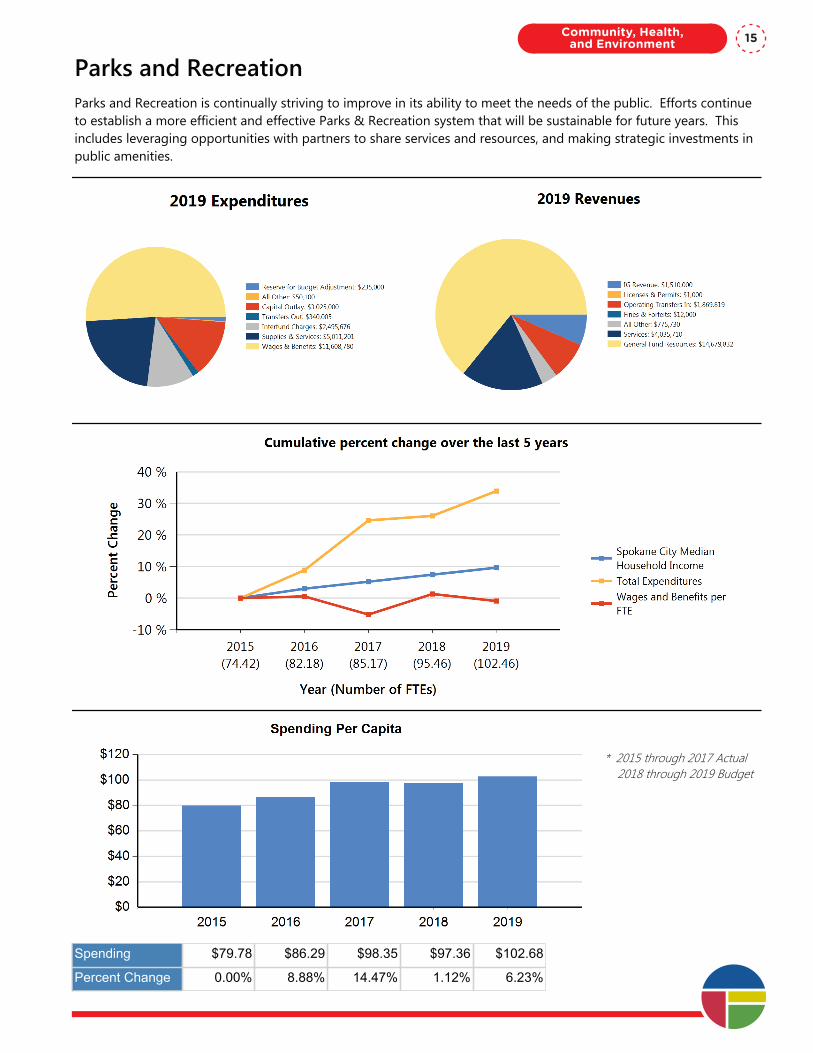
Parks and RecreationParks and Recreation is continually striving to improve in its ability to meet the needs of the public. Efforts continue to establish a more efficient and effective Parks & Recreation system that will be sustainable for future years. This includes leveraging opportunities with partners to share services and resources, and making strategic investments in public amenities.
* 2015 through 2017 Actual 2018 through 2019 Budget
Spending $79.78 $86.29 $98.35 $97.36 $102.68
Percent Change 0.00% 8.88% 14.47% 1.12% 6.23%
Community, Health, and Environment 15

Department Summary: Parks and Recreation
Division: Community, Health, and Environment
Fund Type: Special Revenue Fund
Executive Summary:
Parks and Recreation is continually striving to improve in its ability to meet the needs of the public. Efforts continue to establish a more efficient and effective Parks & Recreation system that will be sustainable for future years. This includes leveraging opportunities with partners to share services and resources, and making strategic investments in public amenities.
Programs and Services:
Parks and Recreation operates and maintains more than 4,100 acres meant to enhance the quality of life for our community. Our diverse portfolio includes developed parks and playgrounds, formal gardens, open natural conservation lands, an arboretum, a downtown urban park at the river falls, sports facilities, aquatic centers, and 40 miles of trails. We also program hundreds of recreational opportunities for all ages and abilities, to help people find their adventure, connect with one another and their city.
FTEs
2015 Actual 2016 Actual 2017 Actual 2018 Budget 2019 Proposed
Total FTEs 74.42 82.18 85.17 95.46 102.46
Expenditures:
2015 Actual 2016 Actual 2017 Actual 2018 Budget 2019 Proposed
Capital Outlay 595,917 1,044,335 4,273,075 2,191,223 3,025,000
Interfund Charges 2,169,345 2,562,749 2,294,138 2,661,552 2,495,676
Reserve for Budget Adjustment 0 0 0 252,856 235,000
Transfers Out 622,964 280,845 385,004 340,005 340,005
Wages & Benefits 8,544,508 9,485,756 9,266,521 11,062,483 11,608,780
Supplies & Services 5,041,185 5,120,499 4,941,365 4,903,914 5,011,201
Debt Services 0 0 0 0 0
All Other 26,245 15,599 29,239 16,700 50,100
TOTAL 17,000,164 18,509,783 21,189,342 21,428,733 22,765,762
Expenditure Notes:
All Other expenditure category reflects budget for sales and excise taxes. 2019 Staffing increases reflect 3.0 additional FTEs for Riverfront Park and 10 FTE for Recreation. 2019 Budget also reflects FTEs funded in 2018 and added during the year. 2015 and 2016 do not reflect expenditures related to the windstorm.
Revenues:
2015 Actual 2016 Actual 2017 Actual 2018 Budget 2019 Proposed
Taxes 0 0 0 0 0
Licenses & Permits 1,080 4,489 5,364 1,000 1,000
IG Revenue 0 0 0 891,000 1,510,000
Services 2,872,858 3,998,405 2,497,392 3,736,036 4,035,710One Vision. One Plan. One Voice.
Community, Health, and Environment16
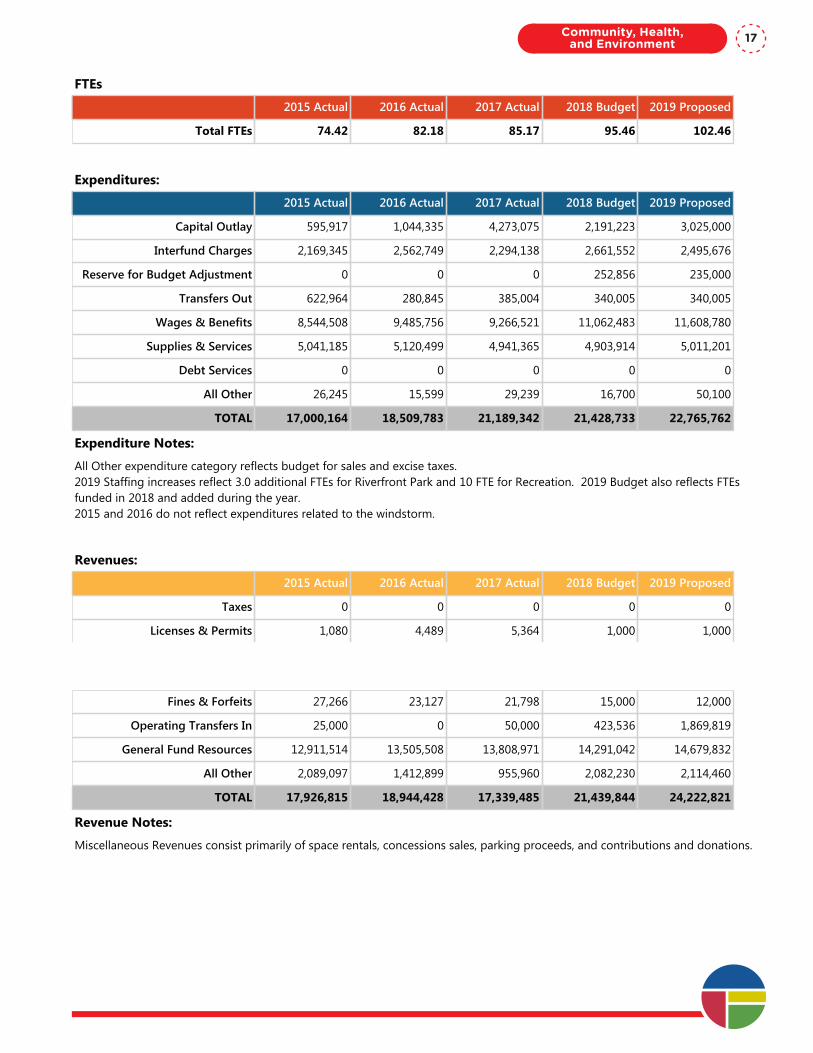
Department Summary: Parks and Recreation
Division: Community, Health, and Environment
Fund Type: Special Revenue Fund
Executive Summary:
Parks and Recreation is continually striving to improve in its ability to meet the needs of the public. Efforts continue to establish a more efficient and effective Parks & Recreation system that will be sustainable for future years. This includes leveraging opportunities with partners to share services and resources, and making strategic investments in public amenities.
Programs and Services:
Parks and Recreation operates and maintains more than 4,100 acres meant to enhance the quality of life for our community. Our diverse portfolio includes developed parks and playgrounds, formal gardens, open natural conservation lands, an arboretum, a downtown urban park at the river falls, sports facilities, aquatic centers, and 40 miles of trails. We also program hundreds of recreational opportunities for all ages and abilities, to help people find their adventure, connect with one another and their city.
FTEs
2015 Actual 2016 Actual 2017 Actual 2018 Budget 2019 Proposed
Total FTEs 74.42 82.18 85.17 95.46 102.46
Expenditures:
2015 Actual 2016 Actual 2017 Actual 2018 Budget 2019 Proposed
Capital Outlay 595,917 1,044,335 4,273,075 2,191,223 3,025,000
Interfund Charges 2,169,345 2,562,749 2,294,138 2,661,552 2,495,676
Reserve for Budget Adjustment 0 0 0 252,856 235,000
Transfers Out 622,964 280,845 385,004 340,005 340,005
Wages & Benefits 8,544,508 9,485,756 9,266,521 11,062,483 11,608,780
Supplies & Services 5,041,185 5,120,499 4,941,365 4,903,914 5,011,201
Debt Services 0 0 0 0 0
All Other 26,245 15,599 29,239 16,700 50,100
TOTAL 17,000,164 18,509,783 21,189,342 21,428,733 22,765,762
Expenditure Notes:
All Other expenditure category reflects budget for sales and excise taxes. 2019 Staffing increases reflect 3.0 additional FTEs for Riverfront Park and 10 FTE for Recreation. 2019 Budget also reflects FTEs funded in 2018 and added during the year. 2015 and 2016 do not reflect expenditures related to the windstorm.
Revenues:
2015 Actual 2016 Actual 2017 Actual 2018 Budget 2019 Proposed
Taxes 0 0 0 0 0
Licenses & Permits 1,080 4,489 5,364 1,000 1,000
IG Revenue 0 0 0 891,000 1,510,000
Services 2,872,858 3,998,405 2,497,392 3,736,036 4,035,710
Fines & Forfeits 27,266 23,127 21,798 15,000 12,000
Operating Transfers In 25,000 0 50,000 423,536 1,869,819
General Fund Resources 12,911,514 13,505,508 13,808,971 14,291,042 14,679,832
All Other 2,089,097 1,412,899 955,960 2,082,230 2,114,460
TOTAL 17,926,815 18,944,428 17,339,485 21,439,844 24,222,821
Revenue Notes:
Miscellaneous Revenues consist primarily of space rentals, concessions sales, parking proceeds, and contributions and donations.
Community, Health, and Environment 17

Program Summary: Park Operations
Division: Community, Health, and Environment
Fund Type: Special Revenue Fund
Executive Summary:
Operations for Parks and Recreation provides routine and major maintenance in grounds, parking lots, neighborhood parks and playgrounds, restrooms, buildings, facilities, and public safety. The Horticulture program maintains the grounds and features of Manito Park and Moore-Turner Garden.
Programs and Services:
Park Operations maintains the grounds and facilities at all of Spokane’s City parks and park properties in the right of way. This includes cutting grass, snow removal, repairing playground equipment, maintaining paths, walkways, and parking lots, and also provides project management and coordination for maintenance and repair of damages and vandalism on City assets. A primary goal is mitigating issues that could put the public in potential danger. The Horticulture program is responsible for the 90 acres of Manito Park and Moore-Turner Heritage Garden; these include a rose arbor, perennial garden staircase, botanical gardens, an arboretum and conservatory.
FTEs
2015 Actual 2016 Actual 2017 Actual 2018 Budget 2019 Proposed
Total FTEs 32.86 33.16 32.65 34.00 34.00
Expenditures:
2015 Actual 2016 Actual 2017 Actual 2018 Budget 2019 Proposed
Capital Outlay 483,623 398,161 435,786 0 0
Interfund Charges 0 0 0 0 0
Reserve for Budget Adjustment 0 0 0 0 0
Transfers Out 133,000 116,000 25,526 25,526 25,526
Wages & Benefits 2,937,829 3,129,665 3,170,912 3,469,621 3,576,885
Supplies & Services 1,181,691 1,276,478 1,402,866 1,265,009 1,265,009
Debt Services 0 0 0 0 0
All Other 0 0 6,618 0 0
TOTAL 4,736,143 4,920,304 5,041,708 4,760,156 4,867,420
Expenditure Notes:
Revenues:
2015 Actual 2016 Actual 2017 Actual 2018 Budget 2019 Proposed
Taxes 0 0 0 0 0
Licenses & Permits 0 0 0 0 0
IG Revenue 0 0 0 0 0
Services 81,554 74,017 66,004 40,000 40,000
Fines & Forfeits 0 0 0 0 0One Vision. One Plan. One Voice.
Community, Health, and Environment18
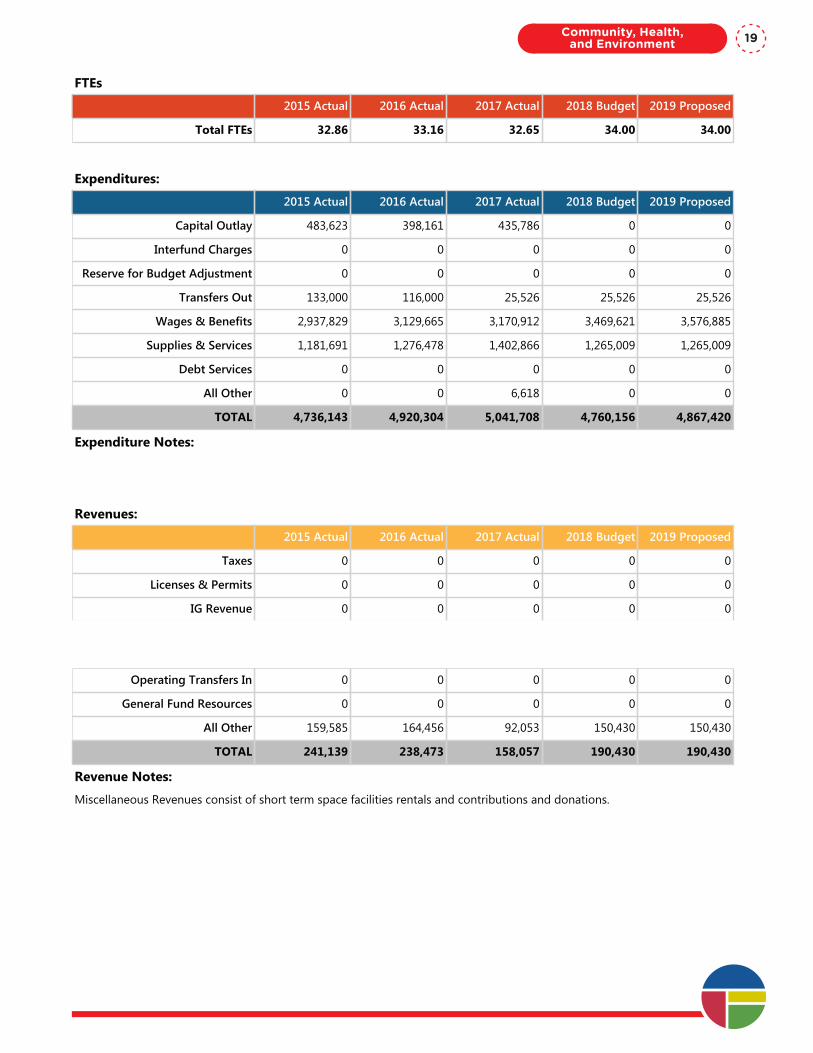
Program Summary: Park Operations
Division: Community, Health, and Environment
Fund Type: Special Revenue Fund
Executive Summary:
Operations for Parks and Recreation provides routine and major maintenance in grounds, parking lots, neighborhood parks and playgrounds, restrooms, buildings, facilities, and public safety. The Horticulture program maintains the grounds and features of Manito Park and Moore-Turner Garden.
Programs and Services:
Park Operations maintains the grounds and facilities at all of Spokane’s City parks and park properties in the right of way. This includes cutting grass, snow removal, repairing playground equipment, maintaining paths, walkways, and parking lots, and also provides project management and coordination for maintenance and repair of damages and vandalism on City assets. A primary goal is mitigating issues that could put the public in potential danger. The Horticulture program is responsible for the 90 acres of Manito Park and Moore-Turner Heritage Garden; these include a rose arbor, perennial garden staircase, botanical gardens, an arboretum and conservatory.
FTEs
2015 Actual 2016 Actual 2017 Actual 2018 Budget 2019 Proposed
Total FTEs 32.86 33.16 32.65 34.00 34.00
Expenditures:
2015 Actual 2016 Actual 2017 Actual 2018 Budget 2019 Proposed
Capital Outlay 483,623 398,161 435,786 0 0
Interfund Charges 0 0 0 0 0
Reserve for Budget Adjustment 0 0 0 0 0
Transfers Out 133,000 116,000 25,526 25,526 25,526
Wages & Benefits 2,937,829 3,129,665 3,170,912 3,469,621 3,576,885
Supplies & Services 1,181,691 1,276,478 1,402,866 1,265,009 1,265,009
Debt Services 0 0 0 0 0
All Other 0 0 6,618 0 0
TOTAL 4,736,143 4,920,304 5,041,708 4,760,156 4,867,420
Expenditure Notes:
Revenues:
2015 Actual 2016 Actual 2017 Actual 2018 Budget 2019 Proposed
Taxes 0 0 0 0 0
Licenses & Permits 0 0 0 0 0
IG Revenue 0 0 0 0 0
Services 81,554 74,017 66,004 40,000 40,000
Fines & Forfeits 0 0 0 0 0
Operating Transfers In 0 0 0 0 0
General Fund Resources 0 0 0 0 0
All Other 159,585 164,456 92,053 150,430 150,430
TOTAL 241,139 238,473 158,057 190,430 190,430
Revenue Notes:
Miscellaneous Revenues consist of short term space facilities rentals and contributions and donations.
Community, Health, and Environment 19
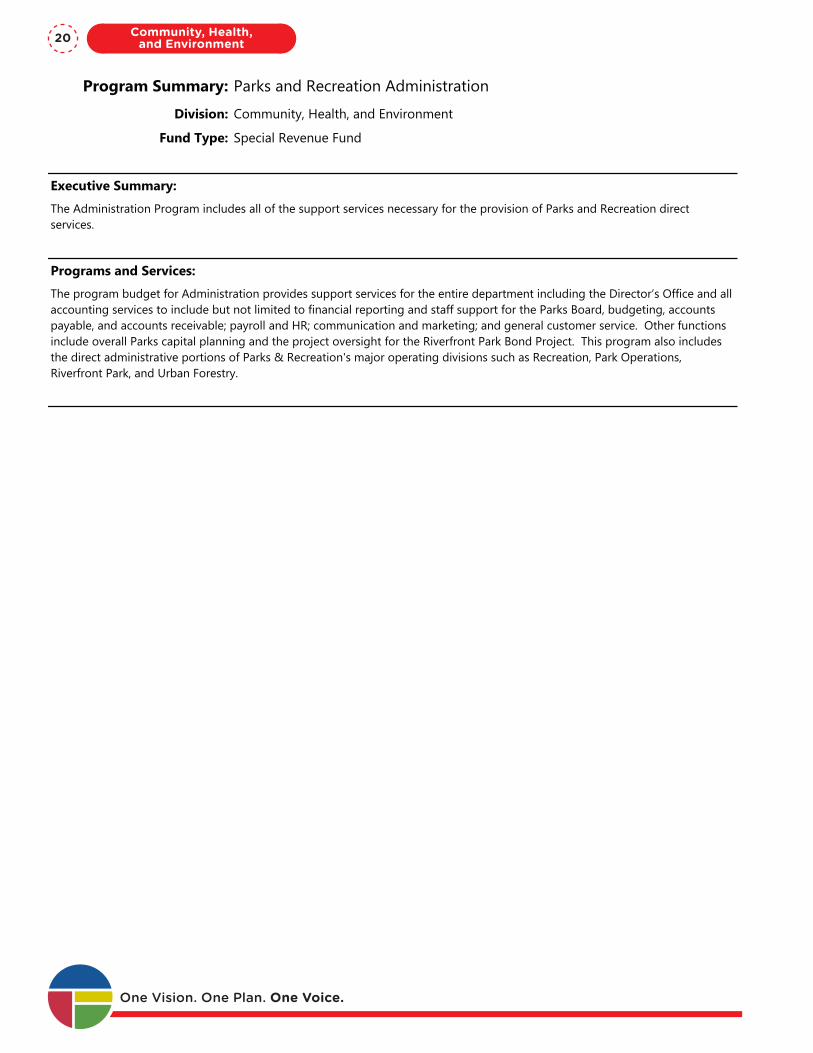
Program Summary: Parks and Recreation Administration
Division: Community, Health, and Environment
Fund Type: Special Revenue Fund
Executive Summary:
The Administration Program includes all of the support services necessary for the provision of Parks and Recreation direct services.
Programs and Services:
The program budget for Administration provides support services for the entire department including the Director’s Office and all accounting services to include but not limited to financial reporting and staff support for the Parks Board, budgeting, accounts payable, and accounts receivable; payroll and HR; communication and marketing; and general customer service. Other functions include overall Parks capital planning and the project oversight for the Riverfront Park Bond Project. This program also includes the direct administrative portions of Parks & Recreation's major operating divisions such as Recreation, Park Operations, Riverfront Park, and Urban Forestry.
FTEs
2015 Actual 2016 Actual 2017 Actual 2018 Budget 2019 Proposed
Total FTEs 18.31 24.27 24.77 28.26 28.26
Expenditures:
2015 Actual 2016 Actual 2017 Actual 2018 Budget 2019 Proposed
Capital Outlay 12,920 52,448 3,145,446 2,106,223 3,025,000
Interfund Charges 2,138,568 2,454,892 2,285,848 2,587,402 2,454,926
Reserve for Budget Adjustment 0 0 0 96,097 235,000
Transfers Out 304,000 86,345 103,195 58,195 58,195
Wages & Benefits 1,620,313 2,326,581 2,370,803 3,112,988 3,131,180
Supplies & Services 997,739 838,720 745,119 586,577 728,377
Debt Services 0 0 0 0 0
All Other 21,554 10,757 17,998 11,500 11,500
TOTAL 5,095,094 5,769,743 8,668,409 8,558,982 9,644,178
Expenditure Notes:
All Other expenditure category reflects excise and sales taxes on Park activities.Significant increases in 2017 Capital Outlay reflect grant expenditures and anticipated grant expenditures in 2019.
Revenues:
2015 Actual 2016 Actual 2017 Actual 2018 Budget 2019 Proposed
Taxes 0 0 0 0 0
Licenses & Permits 0 1,942 2,442 0 0
IG Revenue 0 0 0 881,000 1,500,000
Services 20,317 505,673 598,295 629,836 639,800
Fines & Forfeits 0 0 0 0 0One Vision. One Plan. One Voice.
Community, Health, and Environment20
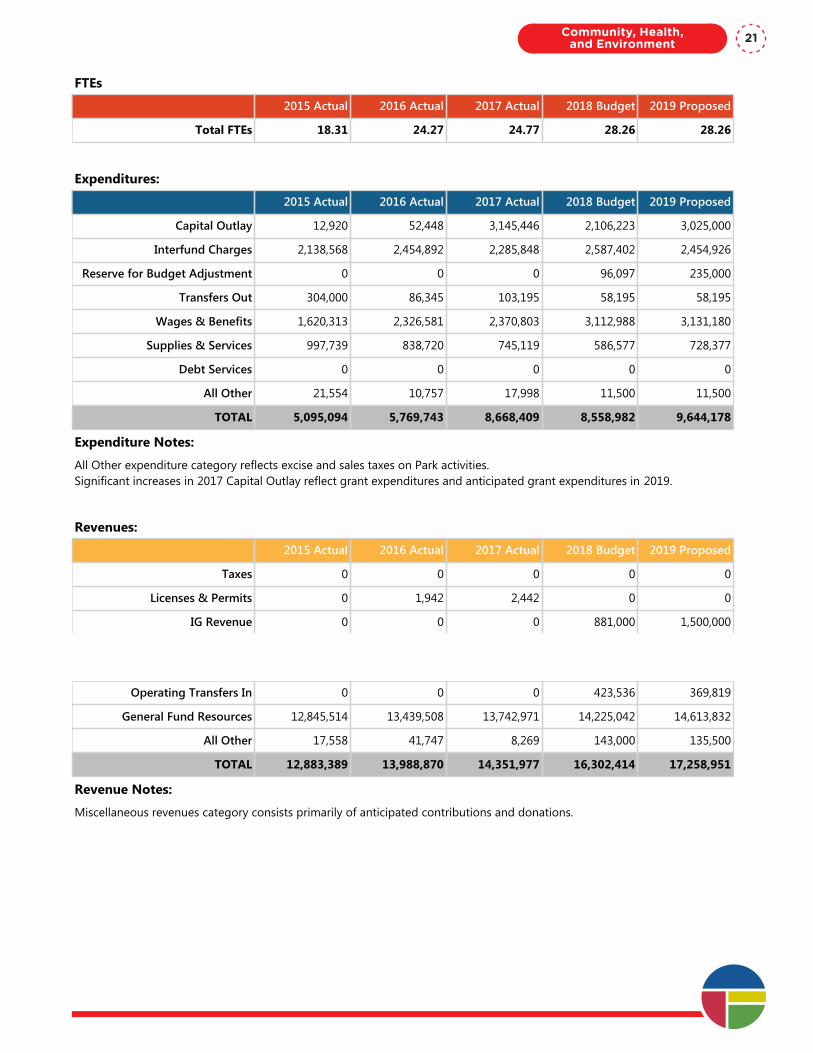
Program Summary: Parks and Recreation Administration
Division: Community, Health, and Environment
Fund Type: Special Revenue Fund
Executive Summary:
The Administration Program includes all of the support services necessary for the provision of Parks and Recreation direct services.
Programs and Services:
The program budget for Administration provides support services for the entire department including the Director’s Office and all accounting services to include but not limited to financial reporting and staff support for the Parks Board, budgeting, accounts payable, and accounts receivable; payroll and HR; communication and marketing; and general customer service. Other functions include overall Parks capital planning and the project oversight for the Riverfront Park Bond Project. This program also includes the direct administrative portions of Parks & Recreation's major operating divisions such as Recreation, Park Operations, Riverfront Park, and Urban Forestry.
FTEs
2015 Actual 2016 Actual 2017 Actual 2018 Budget 2019 Proposed
Total FTEs 18.31 24.27 24.77 28.26 28.26
Expenditures:
2015 Actual 2016 Actual 2017 Actual 2018 Budget 2019 Proposed
Capital Outlay 12,920 52,448 3,145,446 2,106,223 3,025,000
Interfund Charges 2,138,568 2,454,892 2,285,848 2,587,402 2,454,926
Reserve for Budget Adjustment 0 0 0 96,097 235,000
Transfers Out 304,000 86,345 103,195 58,195 58,195
Wages & Benefits 1,620,313 2,326,581 2,370,803 3,112,988 3,131,180
Supplies & Services 997,739 838,720 745,119 586,577 728,377
Debt Services 0 0 0 0 0
All Other 21,554 10,757 17,998 11,500 11,500
TOTAL 5,095,094 5,769,743 8,668,409 8,558,982 9,644,178
Expenditure Notes:
All Other expenditure category reflects excise and sales taxes on Park activities.Significant increases in 2017 Capital Outlay reflect grant expenditures and anticipated grant expenditures in 2019.
Revenues:
2015 Actual 2016 Actual 2017 Actual 2018 Budget 2019 Proposed
Taxes 0 0 0 0 0
Licenses & Permits 0 1,942 2,442 0 0
IG Revenue 0 0 0 881,000 1,500,000
Services 20,317 505,673 598,295 629,836 639,800
Fines & Forfeits 0 0 0 0 0
Operating Transfers In 0 0 0 423,536 369,819
General Fund Resources 12,845,514 13,439,508 13,742,971 14,225,042 14,613,832
All Other 17,558 41,747 8,269 143,000 135,500
TOTAL 12,883,389 13,988,870 14,351,977 16,302,414 17,258,951
Revenue Notes:
Miscellaneous revenues category consists primarily of anticipated contributions and donations.
Community, Health, and Environment 21
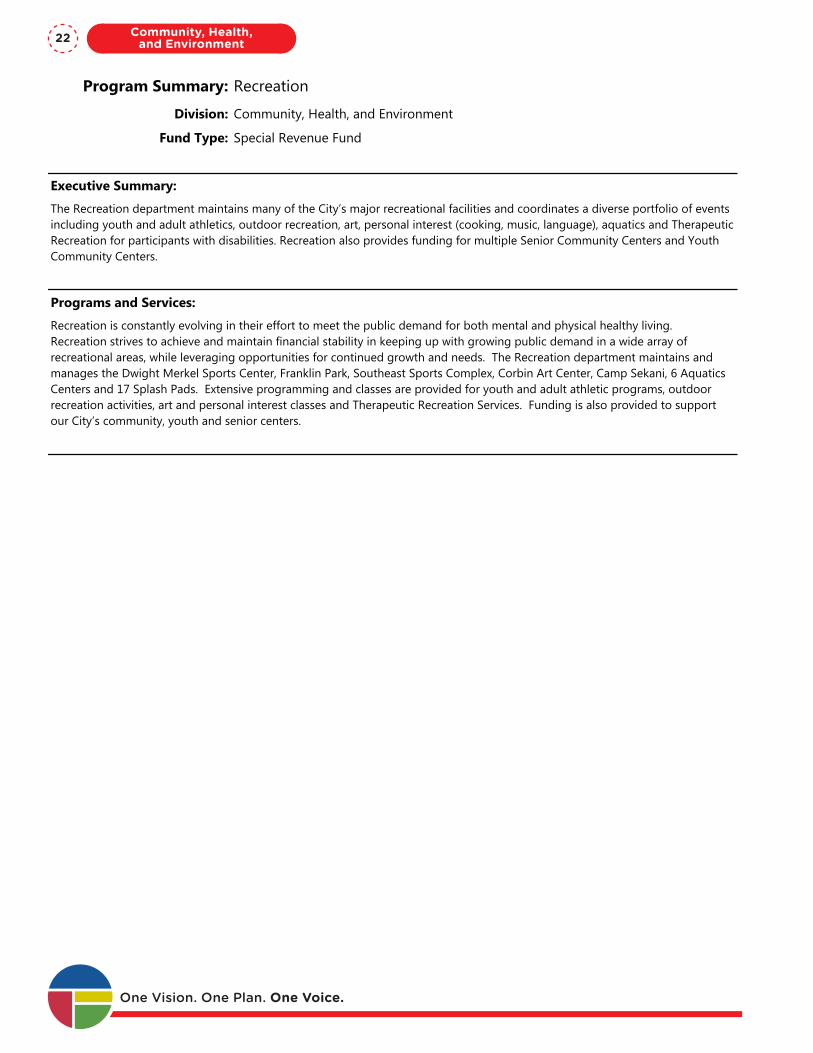
Program Summary: Recreation
Division: Community, Health, and Environment
Fund Type: Special Revenue Fund
Executive Summary:
The Recreation department maintains many of the City’s major recreational facilities and coordinates a diverse portfolio of events including youth and adult athletics, outdoor recreation, art, personal interest (cooking, music, language), aquatics and Therapeutic Recreation for participants with disabilities. Recreation also provides funding for multiple Senior Community Centers and Youth Community Centers.
Programs and Services:
Recreation is constantly evolving in their effort to meet the public demand for both mental and physical healthy living. Recreation strives to achieve and maintain financial stability in keeping up with growing public demand in a wide array of recreational areas, while leveraging opportunities for continued growth and needs. The Recreation department maintains and manages the Dwight Merkel Sports Center, Franklin Park, Southeast Sports Complex, Corbin Art Center, Camp Sekani, 6 Aquatics Centers and 17 Splash Pads. Extensive programming and classes are provided for youth and adult athletic programs, outdoor recreation activities, art and personal interest classes and Therapeutic Recreation Services. Funding is also provided to support our City’s community, youth and senior centers.
FTEs
2015 Actual 2016 Actual 2017 Actual 2018 Budget 2019 Proposed
Total FTEs 7.35 7.35 7.55 7.60 8.60
Expenditures:
2015 Actual 2016 Actual 2017 Actual 2018 Budget 2019 Proposed
Capital Outlay 73,798 438,449 389,444 0 0
Interfund Charges 0 76,967 0 16,950 16,950
Reserve for Budget Adjustment 0 0 0 0 0
Transfers Out 52,764 70,500 15,513 15,513 15,513
Wages & Benefits 1,551,673 1,637,803 1,813,924 1,510,221 1,634,542
Supplies & Services 1,640,714 1,696,661 1,757,698 1,638,267 1,638,767
Debt Services 0 0 0 0 0
All Other 4,691 4,842 4,623 5,200 5,200
TOTAL 3,323,640 3,925,222 3,981,202 3,186,151 3,310,972
Expenditure Notes:
All Other expenditure category reflects sales and excise taxes on Park activities.2019 Projected reflects 1.0 additional FTE for additional maintenance at Parks sports complexes.
Revenues:
2015 Actual 2016 Actual 2017 Actual 2018 Budget 2019 Proposed
Taxes 0 0 0 0 0
Licenses & Permits 0 0 0 0 0
IG Revenue 0 0 0 0 0One Vision. One Plan. One Voice.
Community, Health, and Environment22

Program Summary: Recreation
Division: Community, Health, and Environment
Fund Type: Special Revenue Fund
Executive Summary:
The Recreation department maintains many of the City’s major recreational facilities and coordinates a diverse portfolio of events including youth and adult athletics, outdoor recreation, art, personal interest (cooking, music, language), aquatics and Therapeutic Recreation for participants with disabilities. Recreation also provides funding for multiple Senior Community Centers and Youth Community Centers.
Programs and Services:
Recreation is constantly evolving in their effort to meet the public demand for both mental and physical healthy living. Recreation strives to achieve and maintain financial stability in keeping up with growing public demand in a wide array of recreational areas, while leveraging opportunities for continued growth and needs. The Recreation department maintains and manages the Dwight Merkel Sports Center, Franklin Park, Southeast Sports Complex, Corbin Art Center, Camp Sekani, 6 Aquatics Centers and 17 Splash Pads. Extensive programming and classes are provided for youth and adult athletic programs, outdoor recreation activities, art and personal interest classes and Therapeutic Recreation Services. Funding is also provided to support our City’s community, youth and senior centers.
FTEs
2015 Actual 2016 Actual 2017 Actual 2018 Budget 2019 Proposed
Total FTEs 7.35 7.35 7.55 7.60 8.60
Expenditures:
2015 Actual 2016 Actual 2017 Actual 2018 Budget 2019 Proposed
Capital Outlay 73,798 438,449 389,444 0 0
Interfund Charges 0 76,967 0 16,950 16,950
Reserve for Budget Adjustment 0 0 0 0 0
Transfers Out 52,764 70,500 15,513 15,513 15,513
Wages & Benefits 1,551,673 1,637,803 1,813,924 1,510,221 1,634,542
Supplies & Services 1,640,714 1,696,661 1,757,698 1,638,267 1,638,767
Debt Services 0 0 0 0 0
All Other 4,691 4,842 4,623 5,200 5,200
TOTAL 3,323,640 3,925,222 3,981,202 3,186,151 3,310,972
Expenditure Notes:
All Other expenditure category reflects sales and excise taxes on Park activities.2019 Projected reflects 1.0 additional FTE for additional maintenance at Parks sports complexes.
Revenues:
2015 Actual 2016 Actual 2017 Actual 2018 Budget 2019 Proposed
Taxes 0 0 0 0 0
Licenses & Permits 0 0 0 0 0
IG Revenue 0 0 0 0 0
Services 944,154 1,117,401 1,195,254 1,029,200 966,910
Fines & Forfeits 0 0 0 0 0
Operating Transfers In 25,000 0 0 0 0
General Fund Resources 0 0 0 0 0
All Other 553,547 430,784 327,464 470,800 464,800
TOTAL 1,522,701 1,548,185 1,522,718 1,500,000 1,431,710
Revenue Notes:
Miscellaneous Revenue consists primarily of short-term leases for sports facilities and concessions revenue.Reduced revenue in 2019 Budget reflects the implementation of the Free Swim Program.
Community, Health, and Environment 23
Program Summary: Riverfront Park
Division: Community, Health, and Environment
Fund Type: Special Revenue Fund
Executive Summary:
Riverfront Park is a main attraction for tourists and residents, drawing more than 2 million visitors annually, boasting 100 acres at the heart of the City’s roaring river falls, and hosting a variety of community events . The park is currently under a major voter-approved renovation to further drive Spokane’s economic vitality and ensure a legacy park for future generations.
Programs and Services:
Riverfront Park offers something for everyone, including quiet green walking trails, breathtaking views of the river falls, art sculptures, attractions, and community events. The Park recently opened a brand new Skate Ribbon and a newly renovated building to house the historic and unique Looff Carrousel. The renovation of the Pavilion structure is now underway, and the near future will also see a destination playground. Riverfront Park hosts several annual large public events such as the July 4th celebration, Hoopfest, and Pig Out in the Park, as well as smaller programming like free skate lessons, yoga sessions and art classes. In 2019, the major renovation of Riverfront Park will continue, and new amenities like the Pavilion will open as programming grows.
FTEs
2015 Actual 2016 Actual 2017 Actual 2018 Budget 2019 Proposed
Total FTEs 11.90 13.40 15.40 19.00 25.00
Expenditures:
2015 Actual 2016 Actual 2017 Actual 2018 Budget 2019 Proposed
Capital Outlay 25,576 40,788 194,238 85,000 0
Interfund Charges 30,777 30,890 8,290 33,400 0
Reserve for Budget Adjustment 0 0 0 156,759 0
Transfers Out 106,200 0 238,129 238,130 238,130
Wages & Benefits 2,001,134 1,919,278 1,384,227 2,363,677 2,655,941
Supplies & Services 1,121,968 1,160,081 760,902 1,165,856 1,131,143
Debt Services 0 0 0 0 0
All Other 0 0 0 0 33,400
TOTAL 3,285,655 3,151,037 2,585,786 4,042,822 4,058,614
Expenditure Notes:
All Other Expenditure category reflects anticipated sales tax and excise taxes on Riverfront Park activities.Riverfront Park budget reflects anticipated staffing increases for programming and Temp Seasonal costs for the opening of the Ice Ribbon and the Looff Carrousel.
Revenues:
2015 Actual 2016 Actual 2017 Actual 2018 Budget 2019 Proposed
Taxes 0 0 0 0 0
Licenses & Permits 0 1,242 1,617 0 0
IG Revenue 0 0 0 0 0One Vision. One Plan. One Voice.
Community, Health, and Environment24
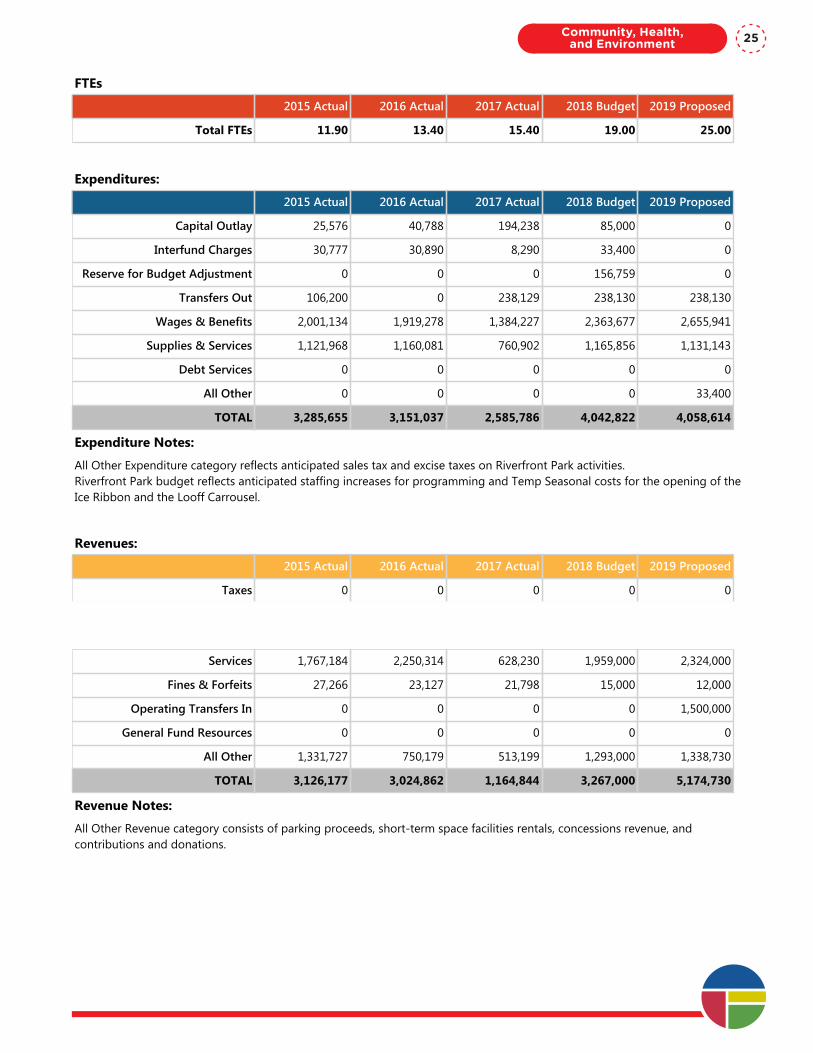
Program Summary: Riverfront Park
Division: Community, Health, and Environment
Fund Type: Special Revenue Fund
Executive Summary:
Riverfront Park is a main attraction for tourists and residents, drawing more than 2 million visitors annually, boasting 100 acres at the heart of the City’s roaring river falls, and hosting a variety of community events . The park is currently under a major voter-approved renovation to further drive Spokane’s economic vitality and ensure a legacy park for future generations.
Programs and Services:
Riverfront Park offers something for everyone, including quiet green walking trails, breathtaking views of the river falls, art sculptures, attractions, and community events. The Park recently opened a brand new Skate Ribbon and a newly renovated building to house the historic and unique Looff Carrousel. The renovation of the Pavilion structure is now underway, and the near future will also see a destination playground. Riverfront Park hosts several annual large public events such as the July 4th celebration, Hoopfest, and Pig Out in the Park, as well as smaller programming like free skate lessons, yoga sessions and art classes. In 2019, the major renovation of Riverfront Park will continue, and new amenities like the Pavilion will open as programming grows.
FTEs
2015 Actual 2016 Actual 2017 Actual 2018 Budget 2019 Proposed
Total FTEs 11.90 13.40 15.40 19.00 25.00
Expenditures:
2015 Actual 2016 Actual 2017 Actual 2018 Budget 2019 Proposed
Capital Outlay 25,576 40,788 194,238 85,000 0
Interfund Charges 30,777 30,890 8,290 33,400 0
Reserve for Budget Adjustment 0 0 0 156,759 0
Transfers Out 106,200 0 238,129 238,130 238,130
Wages & Benefits 2,001,134 1,919,278 1,384,227 2,363,677 2,655,941
Supplies & Services 1,121,968 1,160,081 760,902 1,165,856 1,131,143
Debt Services 0 0 0 0 0
All Other 0 0 0 0 33,400
TOTAL 3,285,655 3,151,037 2,585,786 4,042,822 4,058,614
Expenditure Notes:
All Other Expenditure category reflects anticipated sales tax and excise taxes on Riverfront Park activities.Riverfront Park budget reflects anticipated staffing increases for programming and Temp Seasonal costs for the opening of the Ice Ribbon and the Looff Carrousel.
Revenues:
2015 Actual 2016 Actual 2017 Actual 2018 Budget 2019 Proposed
Taxes 0 0 0 0 0
Licenses & Permits 0 1,242 1,617 0 0
IG Revenue 0 0 0 0 0
Services 1,767,184 2,250,314 628,230 1,959,000 2,324,000
Fines & Forfeits 27,266 23,127 21,798 15,000 12,000
Operating Transfers In 0 0 0 0 1,500,000
General Fund Resources 0 0 0 0 0
All Other 1,331,727 750,179 513,199 1,293,000 1,338,730
TOTAL 3,126,177 3,024,862 1,164,844 3,267,000 5,174,730
Revenue Notes:
All Other Revenue category consists of parking proceeds, short-term space facilities rentals, concessions revenue, and contributions and donations.
Community, Health, and Environment 25
Program Summary: Urban Forestry
Division: Community, Health, and Environment
Fund Type: Special Revenue Fund
Executive Summary:
The mission of Urban Forestry is to maintain and protect the public trees found in and around the parks, neighborhoods and public streets of Spokane.
Programs and Services:
Urban Forestry maintains the grounds of John A. Finch Arboretum, and engages the public on the importance of trees in the community through outreach programs such as the Heritage Tree Program and the Neighborhood Tree Program. Urban Forestry also partners with many community and government organizations to provide habitat restoration, and helps distribute appropriate trees to the residents of Spokane to foster our urban canopy.
FTEs
2015 Actual 2016 Actual 2017 Actual 2018 Budget 2019 Proposed
Total FTEs 4.00 4.00 4.80 6.60 6.60
Expenditures:
2015 Actual 2016 Actual 2017 Actual 2018 Budget 2019 Proposed
Capital Outlay 0 114,489 108,161 0 0
Interfund Charges 0 0 0 23,800 23,800
Reserve for Budget Adjustment 0 0 0 0 0
Transfers Out 27,000 8,000 2,641 2,641 2,641
Wages & Benefits 433,559 472,429 526,655 605,976 610,232
Supplies & Services 99,073 148,559 274,780 248,205 247,905
Debt Services 0 0 0 0 0
All Other 0 0 0 0 0
TOTAL 559,632 743,477 912,237 880,622 884,578
Expenditure Notes:
Revenues:
2015 Actual 2016 Actual 2017 Actual 2018 Budget 2019 Proposed
Taxes 0 0 0 0 0
Licenses & Permits 1,080 1,305 1,305 1,000 1,000
IG Revenue 0 0 0 10,000 10,000
Services 59,649 51,000 9,609 78,000 65,000
Fines & Forfeits 0 0 0 0 0
Operating Transfers In 0 0 50,000 0 0
General Fund Resources 66,000 66,000 66,000 66,000 66,000One Vision. One Plan. One Voice.
Community, Health, and Environment26
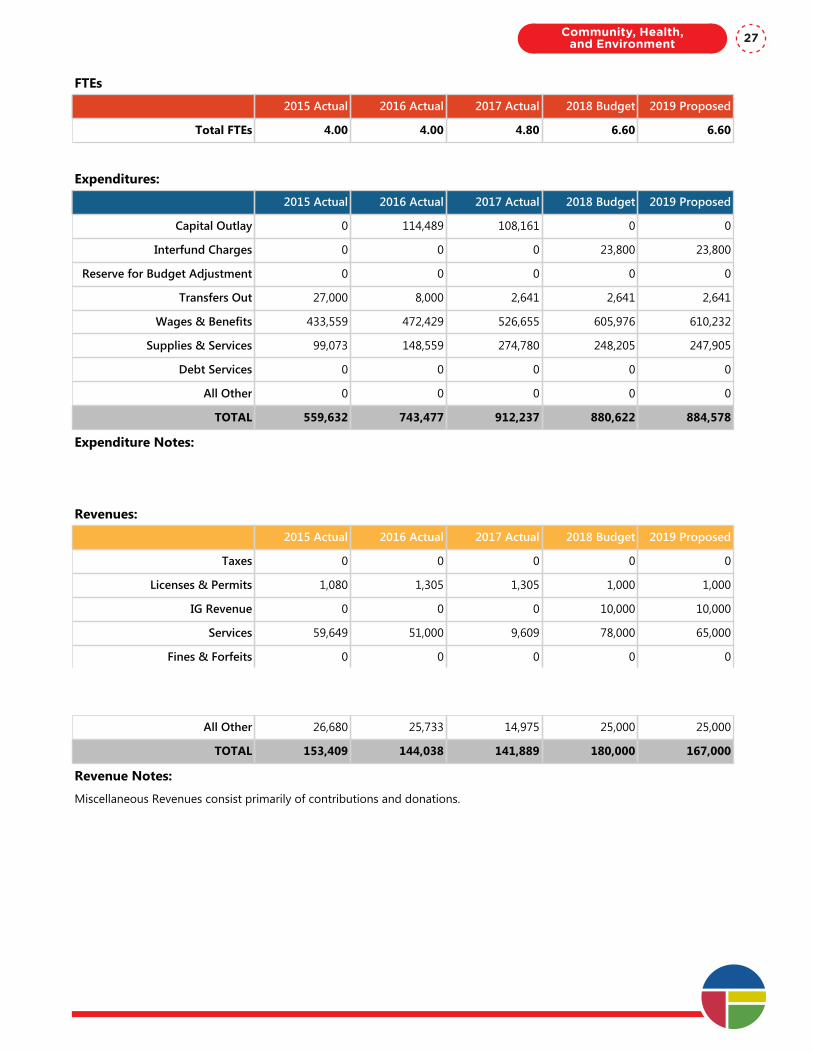
Program Summary: Urban Forestry
Division: Community, Health, and Environment
Fund Type: Special Revenue Fund
Executive Summary:
The mission of Urban Forestry is to maintain and protect the public trees found in and around the parks, neighborhoods and public streets of Spokane.
Programs and Services:
Urban Forestry maintains the grounds of John A. Finch Arboretum, and engages the public on the importance of trees in the community through outreach programs such as the Heritage Tree Program and the Neighborhood Tree Program. Urban Forestry also partners with many community and government organizations to provide habitat restoration, and helps distribute appropriate trees to the residents of Spokane to foster our urban canopy.
FTEs
2015 Actual 2016 Actual 2017 Actual 2018 Budget 2019 Proposed
Total FTEs 4.00 4.00 4.80 6.60 6.60
Expenditures:
2015 Actual 2016 Actual 2017 Actual 2018 Budget 2019 Proposed
Capital Outlay 0 114,489 108,161 0 0
Interfund Charges 0 0 0 23,800 23,800
Reserve for Budget Adjustment 0 0 0 0 0
Transfers Out 27,000 8,000 2,641 2,641 2,641
Wages & Benefits 433,559 472,429 526,655 605,976 610,232
Supplies & Services 99,073 148,559 274,780 248,205 247,905
Debt Services 0 0 0 0 0
All Other 0 0 0 0 0
TOTAL 559,632 743,477 912,237 880,622 884,578
Expenditure Notes:
Revenues:
2015 Actual 2016 Actual 2017 Actual 2018 Budget 2019 Proposed
Taxes 0 0 0 0 0
Licenses & Permits 1,080 1,305 1,305 1,000 1,000
IG Revenue 0 0 0 10,000 10,000
Services 59,649 51,000 9,609 78,000 65,000
Fines & Forfeits 0 0 0 0 0
Operating Transfers In 0 0 50,000 0 0
General Fund Resources 66,000 66,000 66,000 66,000 66,000
All Other 26,680 25,733 14,975 25,000 25,000
TOTAL 153,409 144,038 141,889 180,000 167,000
Revenue Notes:
Miscellaneous Revenues consist primarily of contributions and donations.
Community, Health, and Environment 27

One Vision. One Plan. One Voice.
Community, Health, and Environment28
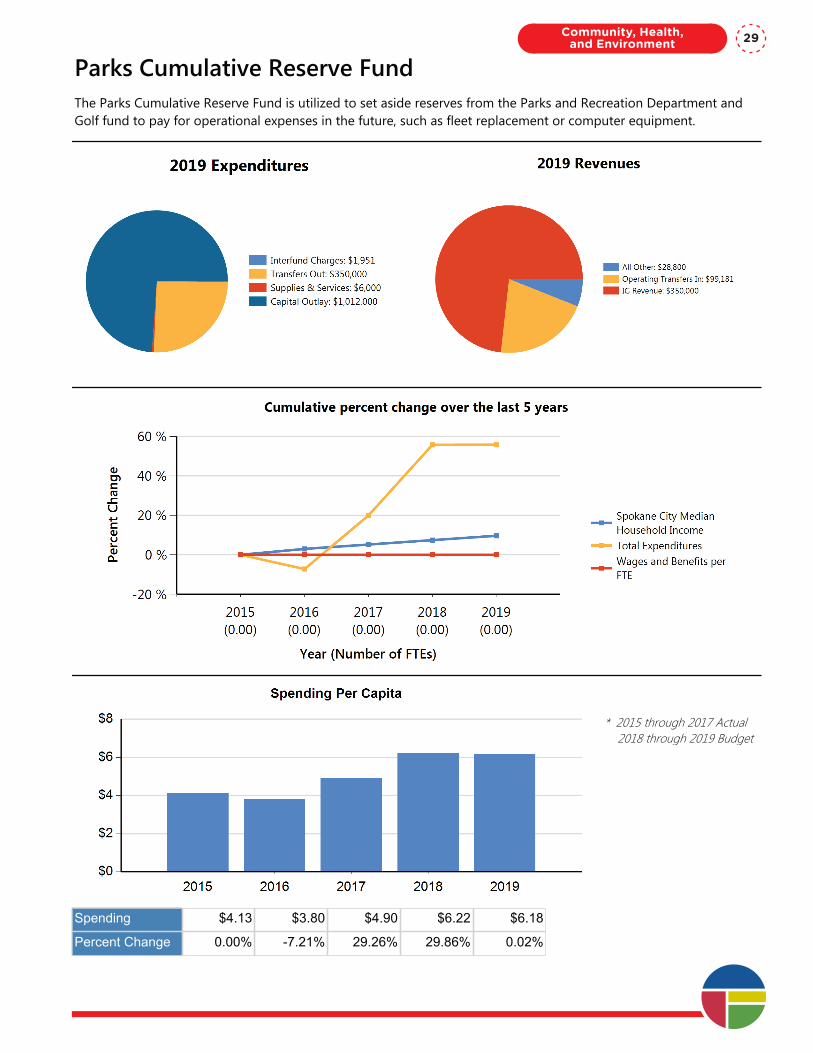
Parks Cumulative Reserve FundThe Parks Cumulative Reserve Fund is utilized to set aside reserves from the Parks and Recreation Department and Golf fund to pay for operational expenses in the future, such as fleet replacement or computer equipment.
* 2015 through 2017 Actual 2018 through 2019 Budget
Spending $4.13 $3.80 $4.90 $6.22 $6.18
Percent Change 0.00% -7.21% 29.26% 29.86% 0.02%
Community, Health, and Environment 29
Department Summary: Parks Cumulative Reserve Fund
Division: Community, Health, and Environment
Fund Type: Special Revenue Fund
Executive Summary:
The Parks Cumulative Reserve Fund is utilized to set aside reserves from the Parks and Recreation Department and Golf fund to pay for operational expenses in the future, such as fleet replacement or computer equipment.
Programs and Services:
The Parks Cumulative Reserve fund covers fleet and computer replacement, major repairs and replacement, Conservation Futures funds and earmarked special gifts and donations. All current funds in the Cumulative Reserve Fund are reserved or designated for specific purposes.
FTEs
2015 Actual 2016 Actual 2017 Actual 2018 Budget 2019 Proposed
Total FTEs 0.00 0.00 0.00 0.00 0.00
Expenditures:
2015 Actual 2016 Actual 2017 Actual 2018 Budget 2019 Proposed
Capital Outlay 420,999 412,861 699,625 1,012,000 1,012,000
Interfund Charges 3,476 1,677 2,173 1,648 1,951
Reserve for Budget Adjustment 0 0 0 0 0
Transfers Out 100,000 400,000 350,000 350,000 350,000
Wages & Benefits 0 0 0 0 0
Supplies & Services 354,845 1,324 2,838 6,000 6,000
Debt Services 0 0 0 0 0
All Other 0 0 0 0 0
TOTAL 879,320 815,862 1,054,636 1,369,648 1,369,951
Expenditure Notes:
Revenues:
2015 Actual 2016 Actual 2017 Actual 2018 Budget 2019 Proposed
Taxes 0 0 0 0 0
Licenses & Permits 0 0 0 0 0
IG Revenue 401,846 361,180 350,000 350,000 350,000
Services 8,300 11,030 18,211 0 0
Fines & Forfeits 0 0 0 0 0
Operating Transfers In 373,964 234,500 49,181 99,181 99,181
General Fund Resources 0 0 0 0 0One Vision. One Plan. One Voice.
Community, Health, and Environment30
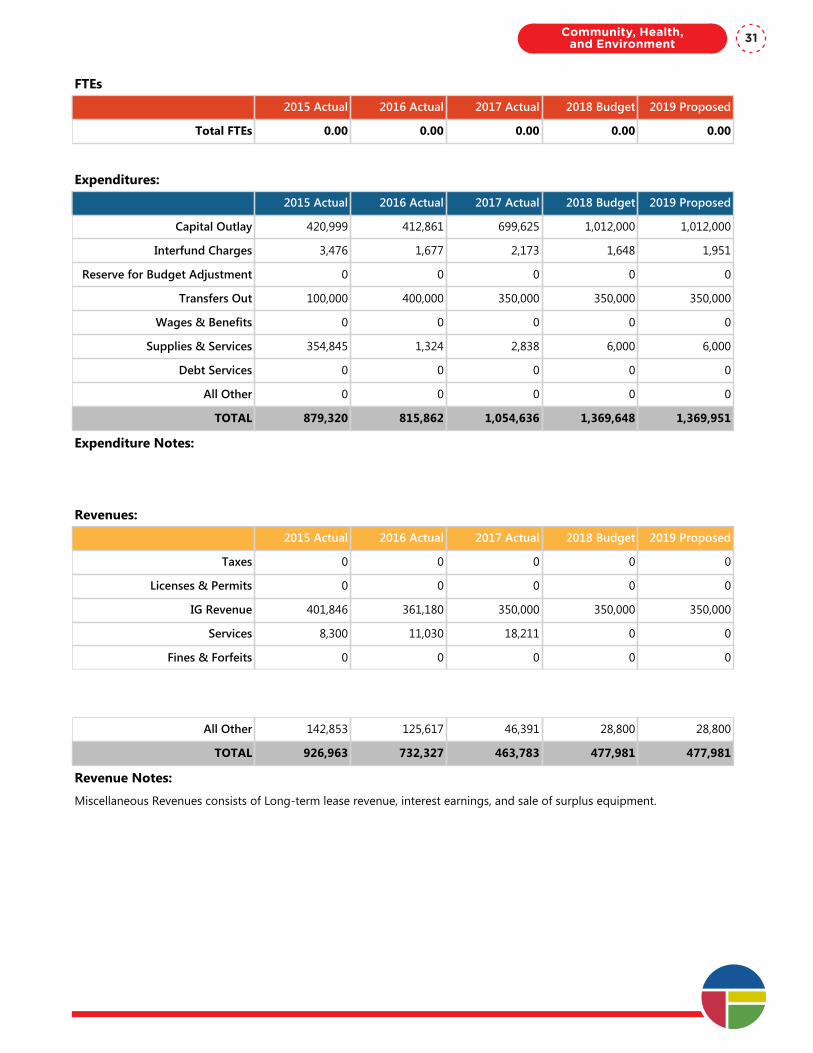
Department Summary: Parks Cumulative Reserve Fund
Division: Community, Health, and Environment
Fund Type: Special Revenue Fund
Executive Summary:
The Parks Cumulative Reserve Fund is utilized to set aside reserves from the Parks and Recreation Department and Golf fund to pay for operational expenses in the future, such as fleet replacement or computer equipment.
Programs and Services:
The Parks Cumulative Reserve fund covers fleet and computer replacement, major repairs and replacement, Conservation Futures funds and earmarked special gifts and donations. All current funds in the Cumulative Reserve Fund are reserved or designated for specific purposes.
FTEs
2015 Actual 2016 Actual 2017 Actual 2018 Budget 2019 Proposed
Total FTEs 0.00 0.00 0.00 0.00 0.00
Expenditures:
2015 Actual 2016 Actual 2017 Actual 2018 Budget 2019 Proposed
Capital Outlay 420,999 412,861 699,625 1,012,000 1,012,000
Interfund Charges 3,476 1,677 2,173 1,648 1,951
Reserve for Budget Adjustment 0 0 0 0 0
Transfers Out 100,000 400,000 350,000 350,000 350,000
Wages & Benefits 0 0 0 0 0
Supplies & Services 354,845 1,324 2,838 6,000 6,000
Debt Services 0 0 0 0 0
All Other 0 0 0 0 0
TOTAL 879,320 815,862 1,054,636 1,369,648 1,369,951
Expenditure Notes:
Revenues:
2015 Actual 2016 Actual 2017 Actual 2018 Budget 2019 Proposed
Taxes 0 0 0 0 0
Licenses & Permits 0 0 0 0 0
IG Revenue 401,846 361,180 350,000 350,000 350,000
Services 8,300 11,030 18,211 0 0
Fines & Forfeits 0 0 0 0 0
Operating Transfers In 373,964 234,500 49,181 99,181 99,181
General Fund Resources 0 0 0 0 0
All Other 142,853 125,617 46,391 28,800 28,800
TOTAL 926,963 732,327 463,783 477,981 477,981
Revenue Notes:
Miscellaneous Revenues consists of Long-term lease revenue, interest earnings, and sale of surplus equipment.
Community, Health, and Environment 31

One Vision. One Plan. One Voice.
Community, Health, and Environment32
Finance & Technology
Finance & Technology
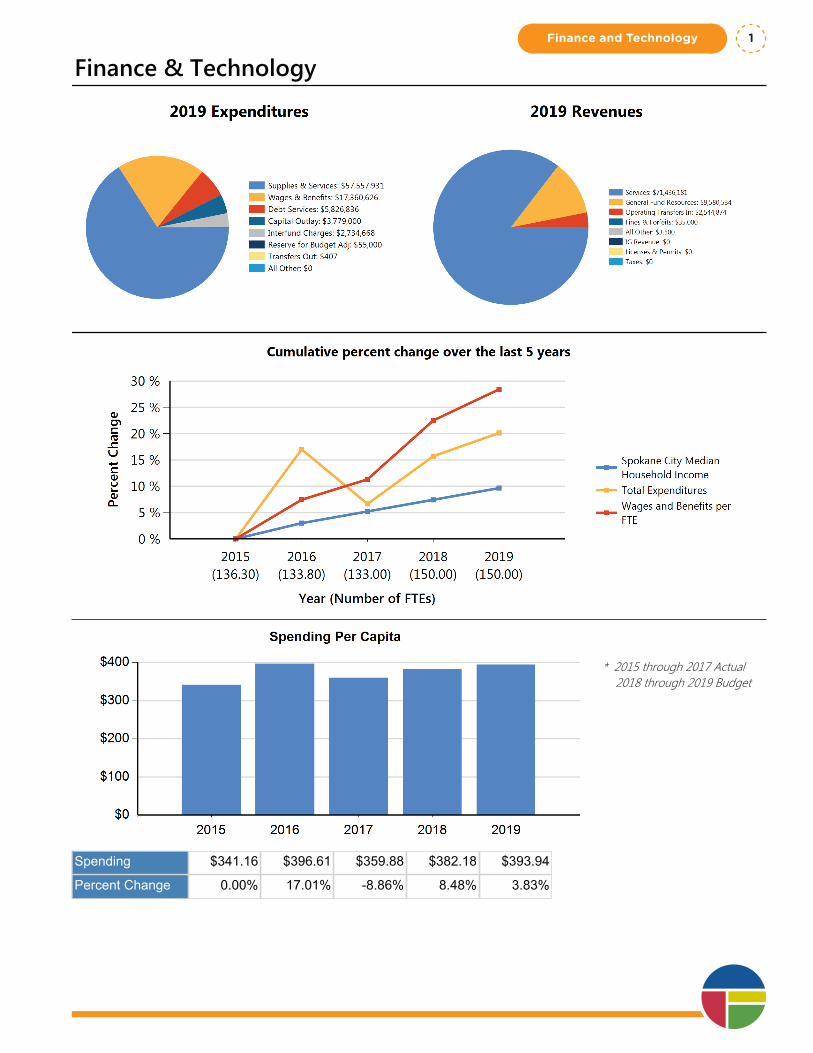
Finance & Technology
* 2015 through 2017 Actual 2018 through 2019 Budget
Spending $341.16 $396.61 $359.88 $382.18 $393.94
Percent Change 0.00% 17.01% -8.86% 8.48% 3.83%
Finance and Technology 1

One Vision. One Plan. One Voice.
Finance and Technology2
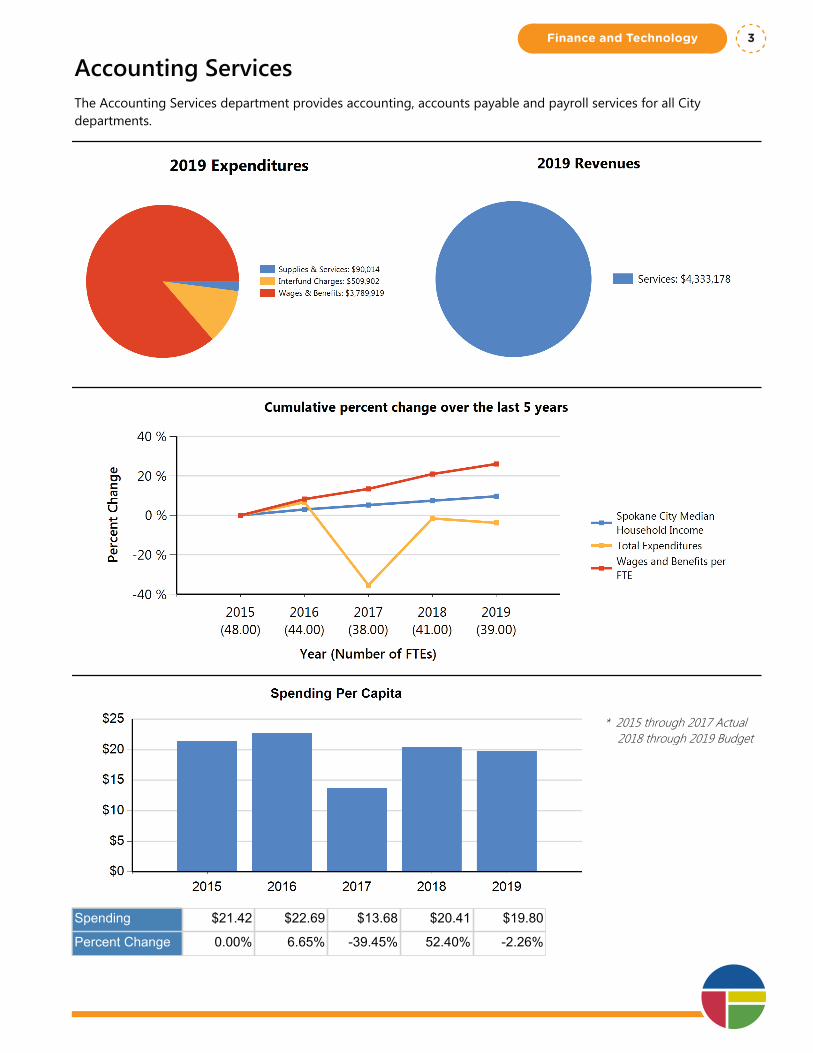
Accounting ServicesThe Accounting Services department provides accounting, accounts payable and payroll services for all City departments.
* 2015 through 2017 Actual 2018 through 2019 Budget
Spending $21.42 $22.69 $13.68 $20.41 $19.80
Percent Change 0.00% 6.65% -39.45% 52.40% -2.26%
Finance and Technology 3
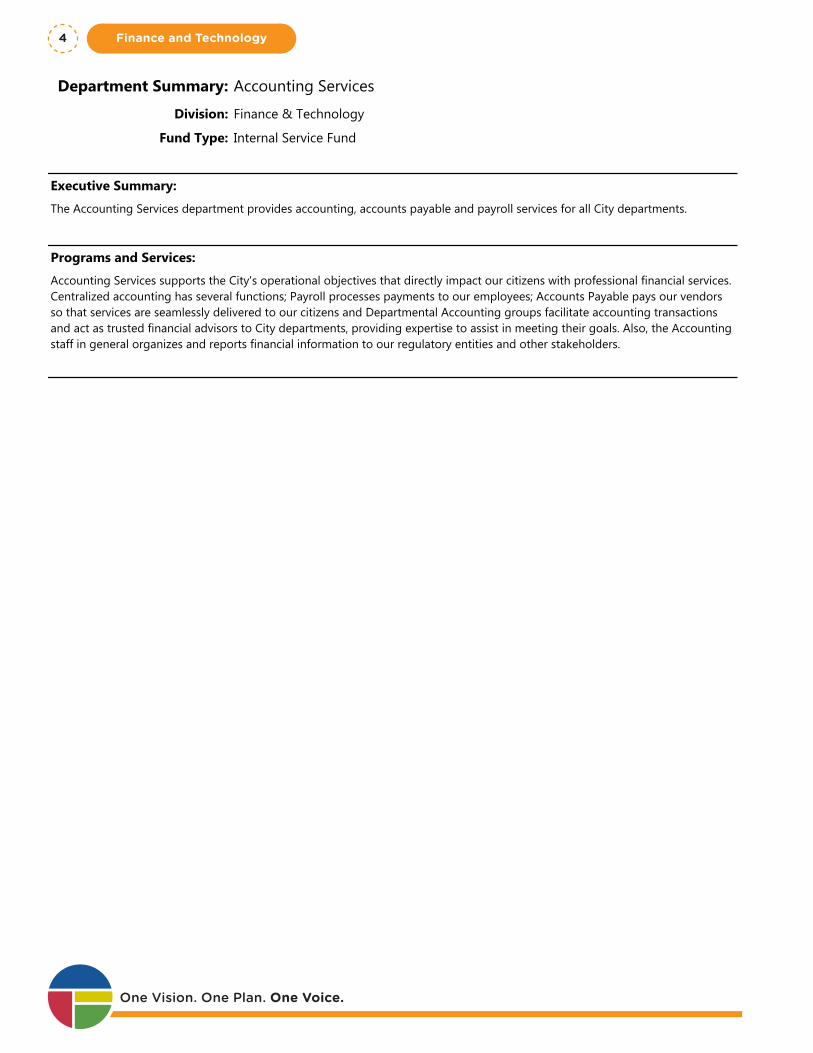
Department Summary: Accounting Services
Division: Finance & Technology
Fund Type: Internal Service Fund
Executive Summary:
The Accounting Services department provides accounting, accounts payable and payroll services for all City departments.
Programs and Services:
Accounting Services supports the City's operational objectives that directly impact our citizens with professional financial services. Centralized accounting has several functions; Payroll processes payments to our employees; Accounts Payable pays our vendors so that services are seamlessly delivered to our citizens and Departmental Accounting groups facilitate accounting transactions and act as trusted financial advisors to City departments, providing expertise to assist in meeting their goals. Also, the Accounting staff in general organizes and reports financial information to our regulatory entities and other stakeholders.
FTEs
2015 Actual 2016 Actual 2017 Actual 2018 Budget 2019 Proposed
Total FTEs 48.00 44.00 38.00 41.00 39.00
Expenditures:
2015 Actual 2016 Actual 2017 Actual 2018 Budget 2019 Proposed
Capital Outlay 5,453 601 0 0 0
Interfund Charges 513,643 699,218 548,783 504,838 509,902
Reserve for Budget Adjustment 0 0 0 0 0
Transfers Out 5,453 601 0 0 0
Wages & Benefits 3,625,444 3,596,745 3,267,514 3,790,859 3,789,919
Supplies & Services 413,914 570,312 (869,141) 195,860 90,014
Debt Services 0 0 0 0 0
All Other 0 0 0 0 0
TOTAL 4,563,907 4,867,477 2,947,156 4,491,557 4,389,835
Expenditure Notes:
The credit amount in 2017 under Other Services & Charges is due to recording of a pension adjustment.
Changes in FTE, and related costs in this budget, is a result of Accounting staff moving between the Accounting Services Department and other City Operational Departments to fit various business needs of the City.
Revenues:
2015 Actual 2016 Actual 2017 Actual 2018 Budget 2019 Proposed
Taxes 0 0 0 0 0
Licenses & Permits 0 0 0 0 0
IG Revenue 0 0 0 0 0
Services 4,289,725 4,109,719 4,063,289 4,415,743 4,333,178
Fines & Forfeits 41,954 26,921 38,797 25,000 0One Vision. One Plan. One Voice.
Finance and Technology4
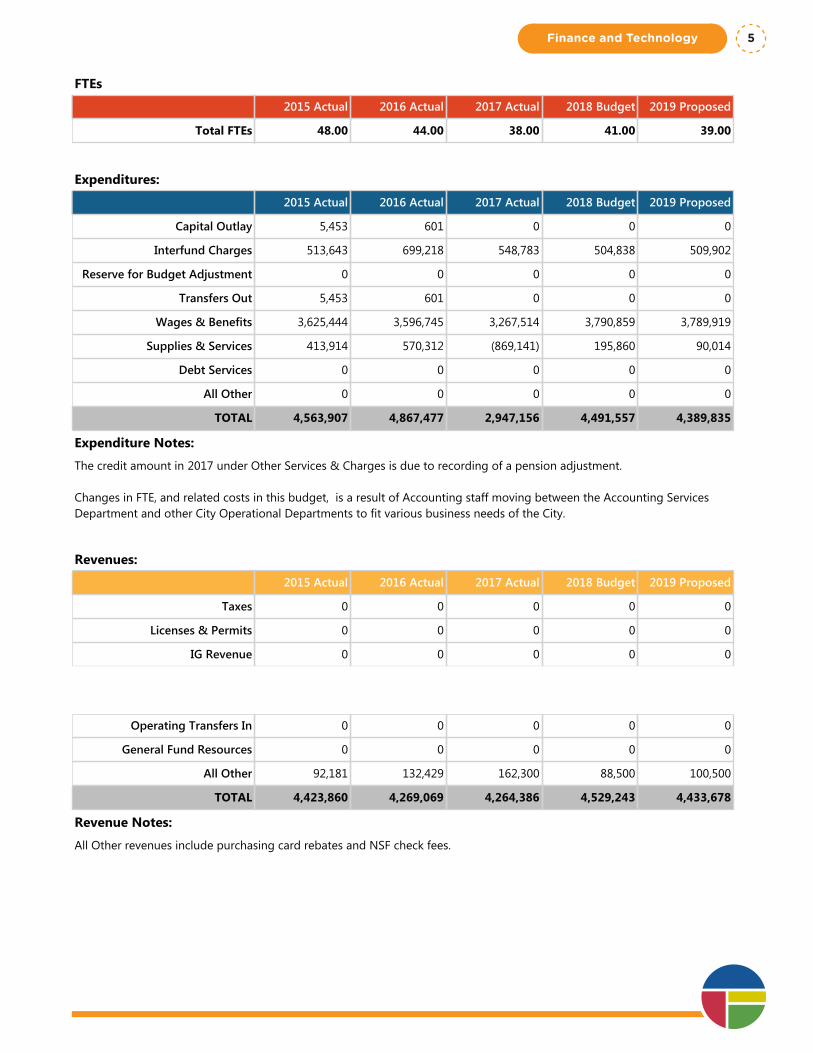
Department Summary: Accounting Services
Division: Finance & Technology
Fund Type: Internal Service Fund
Executive Summary:
The Accounting Services department provides accounting, accounts payable and payroll services for all City departments.
Programs and Services:
Accounting Services supports the City's operational objectives that directly impact our citizens with professional financial services. Centralized accounting has several functions; Payroll processes payments to our employees; Accounts Payable pays our vendors so that services are seamlessly delivered to our citizens and Departmental Accounting groups facilitate accounting transactions and act as trusted financial advisors to City departments, providing expertise to assist in meeting their goals. Also, the Accounting staff in general organizes and reports financial information to our regulatory entities and other stakeholders.
FTEs
2015 Actual 2016 Actual 2017 Actual 2018 Budget 2019 Proposed
Total FTEs 48.00 44.00 38.00 41.00 39.00
Expenditures:
2015 Actual 2016 Actual 2017 Actual 2018 Budget 2019 Proposed
Capital Outlay 5,453 601 0 0 0
Interfund Charges 513,643 699,218 548,783 504,838 509,902
Reserve for Budget Adjustment 0 0 0 0 0
Transfers Out 5,453 601 0 0 0
Wages & Benefits 3,625,444 3,596,745 3,267,514 3,790,859 3,789,919
Supplies & Services 413,914 570,312 (869,141) 195,860 90,014
Debt Services 0 0 0 0 0
All Other 0 0 0 0 0
TOTAL 4,563,907 4,867,477 2,947,156 4,491,557 4,389,835
Expenditure Notes:
The credit amount in 2017 under Other Services & Charges is due to recording of a pension adjustment.
Changes in FTE, and related costs in this budget, is a result of Accounting staff moving between the Accounting Services Department and other City Operational Departments to fit various business needs of the City.
Revenues:
2015 Actual 2016 Actual 2017 Actual 2018 Budget 2019 Proposed
Taxes 0 0 0 0 0
Licenses & Permits 0 0 0 0 0
IG Revenue 0 0 0 0 0
Services 4,289,725 4,109,719 4,063,289 4,415,743 4,333,178
Fines & Forfeits 41,954 26,921 38,797 25,000 0
Operating Transfers In 0 0 0 0 0
General Fund Resources 0 0 0 0 0
All Other 92,181 132,429 162,300 88,500 100,500
TOTAL 4,423,860 4,269,069 4,264,386 4,529,243 4,433,678
Revenue Notes:
All Other revenues include purchasing card rebates and NSF check fees.
Finance and Technology 5

One Vision. One Plan. One Voice.
Finance and Technology6
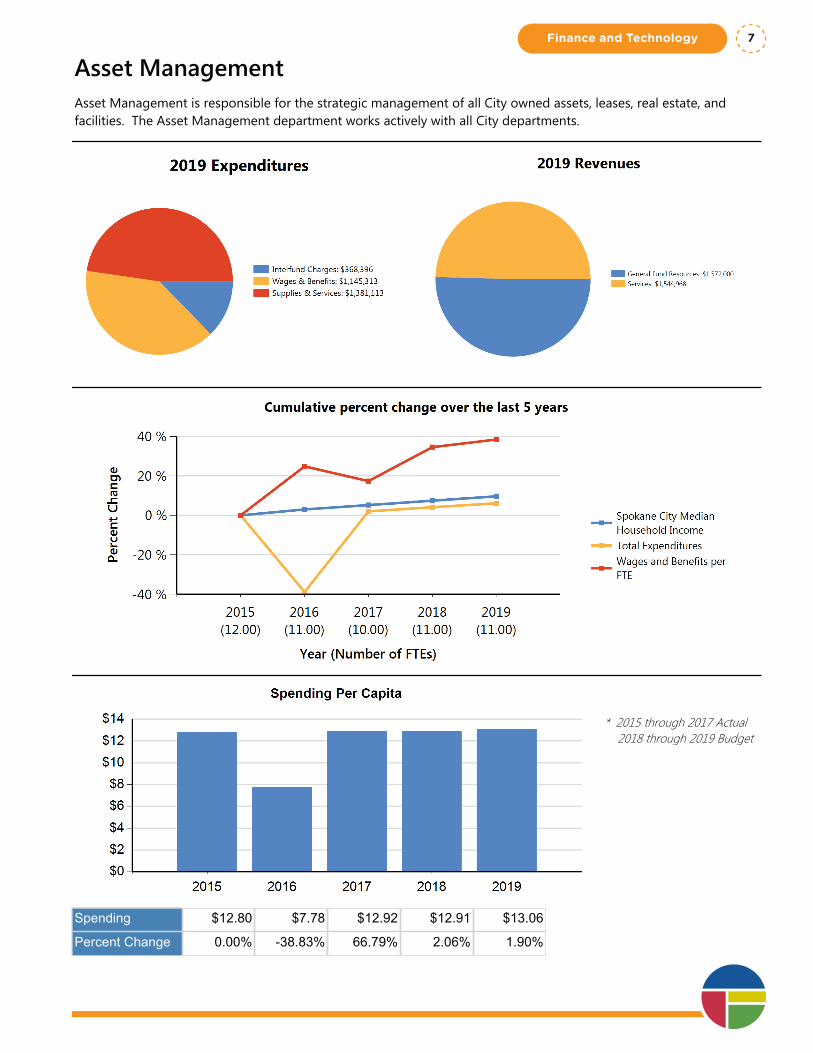
Asset ManagementAsset Management is responsible for the strategic management of all City owned assets, leases, real estate, and facilities. The Asset Management department works actively with all City departments.
* 2015 through 2017 Actual 2018 through 2019 Budget
Spending $12.80 $7.78 $12.92 $12.91 $13.06
Percent Change 0.00% -38.83% 66.79% 2.06% 1.90%
Finance and Technology 7
Department Summary: Asset Management
Division: Finance & Technology
Fund Type: Internal Service Fund
Executive Summary:
Asset Management is responsible for the strategic management of all City owned assets, leases, real estate, and facilities. The Asset Management department works actively with all City departments.
Programs and Services:
This Department is oriented toward returning value by monetizing assets, providing service to internal and external customers and stakeholders, identifying opportunities to partner, improving value by maintaining assets and developing systems that create revenues where possible. The Asset Management function is diverse in scope and impacts many areas of the City.
FTEs
2015 Actual 2016 Actual 2017 Actual 2018 Budget 2019 Proposed
Total FTEs 12.00 11.00 10.00 11.00 11.00
Expenditures:
2015 Actual 2016 Actual 2017 Actual 2018 Budget 2019 Proposed
Capital Outlay 235,439 2,795 (17) 0 0
Interfund Charges 429,415 445,458 369,490 439,995 368,396
Reserve for Budget Adjustment 0 0 0 0 0
Transfers Out 79,012 2,795 (17) 0 0
Wages & Benefits 888,523 1,016,703 855,202 1,102,682 1,145,313
Supplies & Services 1,083,751 173,959 1,531,640 1,298,081 1,381,113
Debt Services 0 0 0 0 0
All Other 12,115 27,030 27,030 0 0
TOTAL 2,728,255 1,668,740 2,783,328 2,840,758 2,894,822
Expenditure Notes:
Revenues:
2015 Actual 2016 Actual 2017 Actual 2018 Budget 2019 Proposed
Taxes 0 0 0 0 0
Licenses & Permits 0 0 0 0 0
IG Revenue 0 0 0 0 0
Services 1,295,686 1,624,783 1,588,314 1,548,968 1,544,968
Fines & Forfeits 0 0 0 0 0
Operating Transfers In 0 0 0 0 0
General Fund Resources 795,000 856,000 899,376 1,535,000 1,572,000One Vision. One Plan. One Voice.
Finance and Technology8

Department Summary: Asset Management
Division: Finance & Technology
Fund Type: Internal Service Fund
Executive Summary:
Asset Management is responsible for the strategic management of all City owned assets, leases, real estate, and facilities. The Asset Management department works actively with all City departments.
Programs and Services:
This Department is oriented toward returning value by monetizing assets, providing service to internal and external customers and stakeholders, identifying opportunities to partner, improving value by maintaining assets and developing systems that create revenues where possible. The Asset Management function is diverse in scope and impacts many areas of the City.
FTEs
2015 Actual 2016 Actual 2017 Actual 2018 Budget 2019 Proposed
Total FTEs 12.00 11.00 10.00 11.00 11.00
Expenditures:
2015 Actual 2016 Actual 2017 Actual 2018 Budget 2019 Proposed
Capital Outlay 235,439 2,795 (17) 0 0
Interfund Charges 429,415 445,458 369,490 439,995 368,396
Reserve for Budget Adjustment 0 0 0 0 0
Transfers Out 79,012 2,795 (17) 0 0
Wages & Benefits 888,523 1,016,703 855,202 1,102,682 1,145,313
Supplies & Services 1,083,751 173,959 1,531,640 1,298,081 1,381,113
Debt Services 0 0 0 0 0
All Other 12,115 27,030 27,030 0 0
TOTAL 2,728,255 1,668,740 2,783,328 2,840,758 2,894,822
Expenditure Notes:
Revenues:
2015 Actual 2016 Actual 2017 Actual 2018 Budget 2019 Proposed
Taxes 0 0 0 0 0
Licenses & Permits 0 0 0 0 0
IG Revenue 0 0 0 0 0
Services 1,295,686 1,624,783 1,588,314 1,548,968 1,544,968
Fines & Forfeits 0 0 0 0 0
Operating Transfers In 0 0 0 0 0
General Fund Resources 795,000 856,000 899,376 1,535,000 1,572,000
All Other 258,099 238,599 215,475 160,000 294,778
TOTAL 2,348,785 2,719,382 2,703,165 3,243,968 3,411,746
Revenue Notes:
Finance and Technology 9
Program Summary: Arts
Division: Finance & Technology
Fund Type: Internal Service Fund
Executive Summary:
This program represents the allocation of City funds to the Spokane Arts Fund.
Programs and Services:
The allocation of City dollars supports the programming of public art in public spaces through contribution to the Spokane Arts Fund.
FTEs
2015 Actual 2016 Actual 2017 Actual 2018 Budget 2019 Proposed
Total FTEs 0.00 0.00 0.00 0.00 0.00
Expenditures:
2015 Actual 2016 Actual 2017 Actual 2018 Budget 2019 Proposed
Capital Outlay 0 0 0 0 0
Interfund Charges 0 0 0 0 0
Reserve for Budget Adjustment 0 0 0 0 0
Transfers Out 0 0 0 0 0
Wages & Benefits 0 0 0 0 0
Supplies & Services 86,667 80,000 265,000 265,000 265,000
Debt Services 0 0 0 0 0
All Other 0 0 0 0 0
TOTAL 86,667 80,000 265,000 265,000 265,000
Expenditure Notes:
Revenues:
2015 Actual 2016 Actual 2017 Actual 2018 Budget 2019 Proposed
Taxes 0 0 0 0 0
Licenses & Permits 0 0 0 0 0
IG Revenue 0 0 0 0 0
Services 0 0 0 0 0
Fines & Forfeits 0 0 0 0 0
Operating Transfers In 0 0 0 0 0
General Fund Resources 84,826 80,000 155,267 265,000 302,000
All Other 285 0 0 0 0
TOTAL 85,111 80,000 155,267 265,000 302,000One Vision. One Plan. One Voice.
Finance and Technology10

Program Summary: Arts
Division: Finance & Technology
Fund Type: Internal Service Fund
Executive Summary:
This program represents the allocation of City funds to the Spokane Arts Fund.
Programs and Services:
The allocation of City dollars supports the programming of public art in public spaces through contribution to the Spokane Arts Fund.
FTEs
2015 Actual 2016 Actual 2017 Actual 2018 Budget 2019 Proposed
Total FTEs 0.00 0.00 0.00 0.00 0.00
Expenditures:
2015 Actual 2016 Actual 2017 Actual 2018 Budget 2019 Proposed
Capital Outlay 0 0 0 0 0
Interfund Charges 0 0 0 0 0
Reserve for Budget Adjustment 0 0 0 0 0
Transfers Out 0 0 0 0 0
Wages & Benefits 0 0 0 0 0
Supplies & Services 86,667 80,000 265,000 265,000 265,000
Debt Services 0 0 0 0 0
All Other 0 0 0 0 0
TOTAL 86,667 80,000 265,000 265,000 265,000
Expenditure Notes:
Revenues:
2015 Actual 2016 Actual 2017 Actual 2018 Budget 2019 Proposed
Taxes 0 0 0 0 0
Licenses & Permits 0 0 0 0 0
IG Revenue 0 0 0 0 0
Services 0 0 0 0 0
Fines & Forfeits 0 0 0 0 0
Operating Transfers In 0 0 0 0 0
General Fund Resources 84,826 80,000 155,267 265,000 302,000
All Other 285 0 0 0 0
TOTAL 85,111 80,000 155,267 265,000 302,000
Revenue Notes:
All Other revenue is misc revenue.
Finance and Technology 11
Program Summary: Asset Management Administration
Division: Finance & Technology
Fund Type: Internal Service Fund
Executive Summary:
The Asset Management Director coordinates a cross-functional team encompassing construction management, facilities maintenance, and real estate acquisitions and dispositions.
Programs and Services:
Administrative functions for the Asset Management Department are provided under this program.
FTEs
2015 Actual 2016 Actual 2017 Actual 2018 Budget 2019 Proposed
Total FTEs 3.00 2.00 1.00 1.00 1.00
Expenditures:
2015 Actual 2016 Actual 2017 Actual 2018 Budget 2019 Proposed
Capital Outlay 2,060 0 0 0 0
Interfund Charges 88,128 70,643 66,324 122,543 77,276
Reserve for Budget Adjustment 0 0 0 0 0
Transfers Out 2,060 0 0 0 0
Wages & Benefits 169,863 222,327 157,250 168,199 172,350
Supplies & Services 95,060 (807,296) 417,589 223,200 264,800
Debt Services 0 0 0 0 0
All Other 0 0 0 0 0
TOTAL 357,171 (514,326) 641,163 513,942 514,426
Expenditure Notes:
In 2016, there was a significant pension expense adjustment. In 2017, the pension expense represented 47% of the balance. Contractual services increased by $200k+ in both 2018 and 2019.
Revenues:
2015 Actual 2016 Actual 2017 Actual 2018 Budget 2019 Proposed
Taxes 0 0 0 0 0
Licenses & Permits 0 0 0 0 0
IG Revenue 0 0 0 0 0
Services 59,809 131,852 55,539 0 21,000
Fines & Forfeits 0 0 0 0 0
Operating Transfers In 0 0 0 0 0
General Fund Resources 0 500,000 410,139 700,000 700,000
All Other 792 6,966 1,298 0 0One Vision. One Plan. One Voice.
Finance and Technology12

Program Summary: Asset Management Administration
Division: Finance & Technology
Fund Type: Internal Service Fund
Executive Summary:
The Asset Management Director coordinates a cross-functional team encompassing construction management, facilities maintenance, and real estate acquisitions and dispositions.
Programs and Services:
Administrative functions for the Asset Management Department are provided under this program.
FTEs
2015 Actual 2016 Actual 2017 Actual 2018 Budget 2019 Proposed
Total FTEs 3.00 2.00 1.00 1.00 1.00
Expenditures:
2015 Actual 2016 Actual 2017 Actual 2018 Budget 2019 Proposed
Capital Outlay 2,060 0 0 0 0
Interfund Charges 88,128 70,643 66,324 122,543 77,276
Reserve for Budget Adjustment 0 0 0 0 0
Transfers Out 2,060 0 0 0 0
Wages & Benefits 169,863 222,327 157,250 168,199 172,350
Supplies & Services 95,060 (807,296) 417,589 223,200 264,800
Debt Services 0 0 0 0 0
All Other 0 0 0 0 0
TOTAL 357,171 (514,326) 641,163 513,942 514,426
Expenditure Notes:
In 2016, there was a significant pension expense adjustment. In 2017, the pension expense represented 47% of the balance. Contractual services increased by $200k+ in both 2018 and 2019.
Revenues:
2015 Actual 2016 Actual 2017 Actual 2018 Budget 2019 Proposed
Taxes 0 0 0 0 0
Licenses & Permits 0 0 0 0 0
IG Revenue 0 0 0 0 0
Services 59,809 131,852 55,539 0 21,000
Fines & Forfeits 0 0 0 0 0
Operating Transfers In 0 0 0 0 0
General Fund Resources 0 500,000 410,139 700,000 700,000
All Other 792 6,966 1,298 0 0
TOTAL 60,601 638,818 466,976 700,000 721,000
Revenue Notes:
All Other Revenue includes concession revenue and a one-time receipt of $6k in 2016.
Finance and Technology 13
Program Summary: City Hall Maintenance
Division: Finance & Technology
Fund Type: Internal Service Fund
Executive Summary:
Asset Management is responsible for the maintenance and care of City Hall. This includes custodial services, facilities management, energy management and exterior maintenance. City Hall supports work space for most departments in the City.
Programs and Services:
City Hall Maintenance staff includes one building engineer and four custodial personnel. Expenses include electricity, natural gas, HVAC maintenance, lighting replacement, and contract services for certain facility repairs, and other support services to departments located within City Hall.
FTEs
2015 Actual 2016 Actual 2017 Actual 2018 Budget 2019 Proposed
Total FTEs 5.00 4.00 4.00 5.00 5.00
Expenditures:
2015 Actual 2016 Actual 2017 Actual 2018 Budget 2019 Proposed
Capital Outlay 76,593 2,795 0 0 0
Interfund Charges 214,015 224,924 259,730 182,372 154,557
Reserve for Budget Adjustment 0 0 0 0 0
Transfers Out 47,845 2,795 0 0 0
Wages & Benefits 271,601 253,947 254,048 394,132 419,641
Supplies & Services 578,338 635,169 553,970 493,344 543,340
Debt Services 0 0 0 0 0
All Other 0 0 0 0 0
TOTAL 1,188,392 1,119,630 1,067,748 1,069,848 1,117,538
Expenditure Notes:
Revenues:
2015 Actual 2016 Actual 2017 Actual 2018 Budget 2019 Proposed
Taxes 0 0 0 0 0
Licenses & Permits 0 0 0 0 0
IG Revenue 0 0 0 0 0
Services 580,043 894,693 855,195 848,968 848,968
Fines & Forfeits 0 0 0 0 0
Operating Transfers In 0 0 0 0 0
General Fund Resources 561,827 136,000 251,942 430,000 430,000One Vision. One Plan. One Voice.
Finance and Technology14
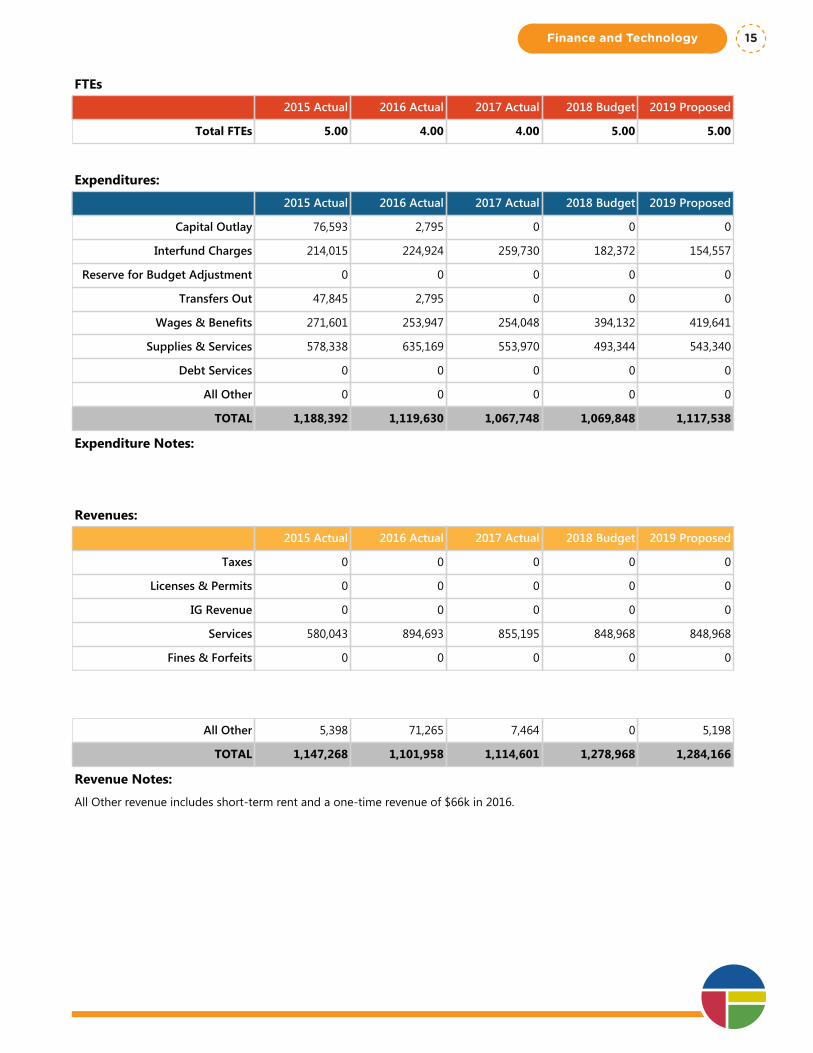
Program Summary: City Hall Maintenance
Division: Finance & Technology
Fund Type: Internal Service Fund
Executive Summary:
Asset Management is responsible for the maintenance and care of City Hall. This includes custodial services, facilities management, energy management and exterior maintenance. City Hall supports work space for most departments in the City.
Programs and Services:
City Hall Maintenance staff includes one building engineer and four custodial personnel. Expenses include electricity, natural gas, HVAC maintenance, lighting replacement, and contract services for certain facility repairs, and other support services to departments located within City Hall.
FTEs
2015 Actual 2016 Actual 2017 Actual 2018 Budget 2019 Proposed
Total FTEs 5.00 4.00 4.00 5.00 5.00
Expenditures:
2015 Actual 2016 Actual 2017 Actual 2018 Budget 2019 Proposed
Capital Outlay 76,593 2,795 0 0 0
Interfund Charges 214,015 224,924 259,730 182,372 154,557
Reserve for Budget Adjustment 0 0 0 0 0
Transfers Out 47,845 2,795 0 0 0
Wages & Benefits 271,601 253,947 254,048 394,132 419,641
Supplies & Services 578,338 635,169 553,970 493,344 543,340
Debt Services 0 0 0 0 0
All Other 0 0 0 0 0
TOTAL 1,188,392 1,119,630 1,067,748 1,069,848 1,117,538
Expenditure Notes:
Revenues:
2015 Actual 2016 Actual 2017 Actual 2018 Budget 2019 Proposed
Taxes 0 0 0 0 0
Licenses & Permits 0 0 0 0 0
IG Revenue 0 0 0 0 0
Services 580,043 894,693 855,195 848,968 848,968
Fines & Forfeits 0 0 0 0 0
Operating Transfers In 0 0 0 0 0
General Fund Resources 561,827 136,000 251,942 430,000 430,000
All Other 5,398 71,265 7,464 0 5,198
TOTAL 1,147,268 1,101,958 1,114,601 1,278,968 1,284,166
Revenue Notes:
All Other revenue includes short-term rent and a one-time revenue of $66k in 2016.
Finance and Technology 15
Program Summary: Facilities Maintenance
Division: Finance & Technology
Fund Type: Internal Service Fund
Executive Summary:
Facilities maintenance services include heating and ventilation, electrical, carpentry and contractual services.
Programs and Services:
Facilities staff consists of three personnel that respond to requests and make recommendation for facility repair, remodel and construction, and other capital improvements. The Facilities Maintenance Foreperson manages construction projects, develops contracts and supervises their team. Through the utilization of contractual labor and the staff electrician, this program provides skilled, licensed plumbers, electricians and heating mechanics to perform work in accordance with proper industry practices and codes. The facilities team ensures compliance with Labor and Industries, OSHA, and WISHA regulations and municipal codes as work is performed by City staff and outside contractors; maintains records of all work performed through the utilization of an automated management information system; ensures the mandatory annual inspections of fire suppression systems, boilers, cranes, lifts and compressors, etc. are performed.
FTEs
2015 Actual 2016 Actual 2017 Actual 2018 Budget 2019 Proposed
Total FTEs 2.00 3.00 3.00 3.00 3.00
Expenditures:
2015 Actual 2016 Actual 2017 Actual 2018 Budget 2019 Proposed
Capital Outlay 29,107 0 (17) 0 0
Interfund Charges 123,452 147,296 42,122 133,793 134,463
Reserve for Budget Adjustment 0 0 0 0 0
Transfers Out 29,107 0 (17) 0 0
Wages & Benefits 211,631 253,665 264,182 279,150 307,935
Supplies & Services 221,172 209,665 238,954 255,777 247,543
Debt Services 0 0 0 0 0
All Other 0 0 0 0 0
TOTAL 614,469 610,626 545,224 668,720 689,941
Expenditure Notes:
The 2019 budget includes $148k for repairs & maintenance supplies, which is offset by a related reduction in repairs & maintenance services.
Revenues:
2015 Actual 2016 Actual 2017 Actual 2018 Budget 2019 Proposed
Taxes 0 0 0 0 0
Licenses & Permits 0 0 0 0 0
IG Revenue 0 0 0 0 0One Vision. One Plan. One Voice.
Finance and Technology16
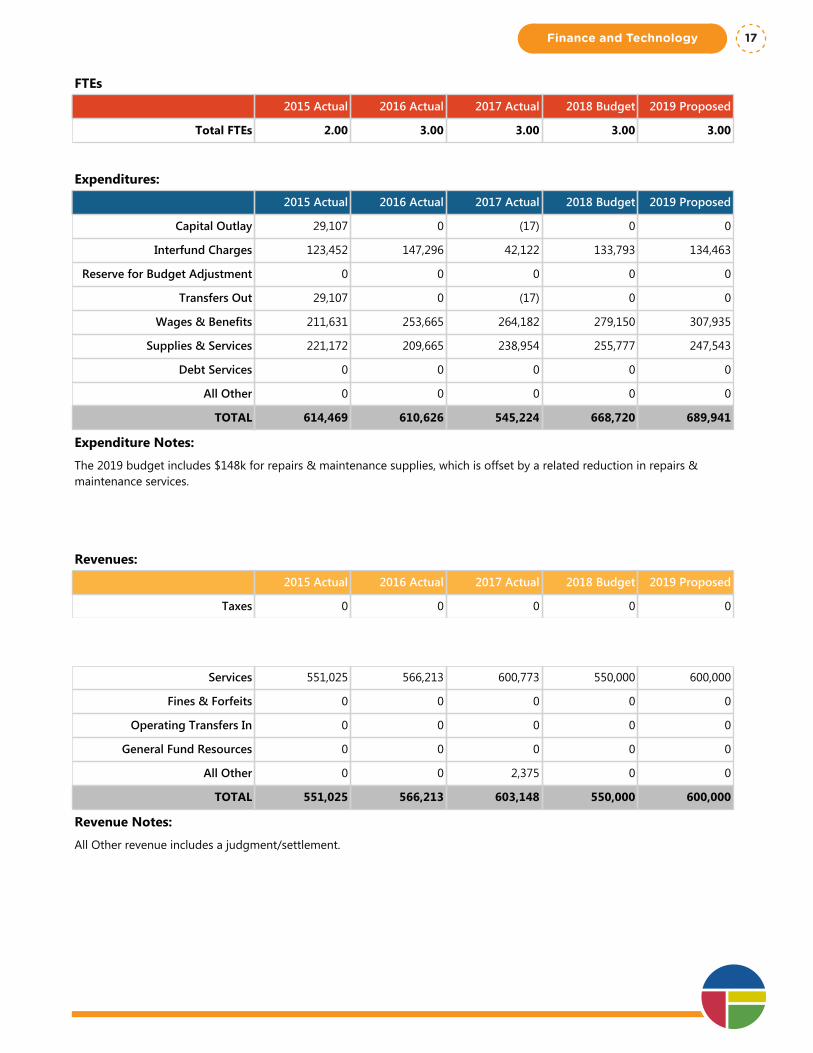
Program Summary: Facilities Maintenance
Division: Finance & Technology
Fund Type: Internal Service Fund
Executive Summary:
Facilities maintenance services include heating and ventilation, electrical, carpentry and contractual services.
Programs and Services:
Facilities staff consists of three personnel that respond to requests and make recommendation for facility repair, remodel and construction, and other capital improvements. The Facilities Maintenance Foreperson manages construction projects, develops contracts and supervises their team. Through the utilization of contractual labor and the staff electrician, this program provides skilled, licensed plumbers, electricians and heating mechanics to perform work in accordance with proper industry practices and codes. The facilities team ensures compliance with Labor and Industries, OSHA, and WISHA regulations and municipal codes as work is performed by City staff and outside contractors; maintains records of all work performed through the utilization of an automated management information system; ensures the mandatory annual inspections of fire suppression systems, boilers, cranes, lifts and compressors, etc. are performed.
FTEs
2015 Actual 2016 Actual 2017 Actual 2018 Budget 2019 Proposed
Total FTEs 2.00 3.00 3.00 3.00 3.00
Expenditures:
2015 Actual 2016 Actual 2017 Actual 2018 Budget 2019 Proposed
Capital Outlay 29,107 0 (17) 0 0
Interfund Charges 123,452 147,296 42,122 133,793 134,463
Reserve for Budget Adjustment 0 0 0 0 0
Transfers Out 29,107 0 (17) 0 0
Wages & Benefits 211,631 253,665 264,182 279,150 307,935
Supplies & Services 221,172 209,665 238,954 255,777 247,543
Debt Services 0 0 0 0 0
All Other 0 0 0 0 0
TOTAL 614,469 610,626 545,224 668,720 689,941
Expenditure Notes:
The 2019 budget includes $148k for repairs & maintenance supplies, which is offset by a related reduction in repairs & maintenance services.
Revenues:
2015 Actual 2016 Actual 2017 Actual 2018 Budget 2019 Proposed
Taxes 0 0 0 0 0
Licenses & Permits 0 0 0 0 0
IG Revenue 0 0 0 0 0
Services 551,025 566,213 600,773 550,000 600,000
Fines & Forfeits 0 0 0 0 0
Operating Transfers In 0 0 0 0 0
General Fund Resources 0 0 0 0 0
All Other 0 0 2,375 0 0
TOTAL 551,025 566,213 603,148 550,000 600,000
Revenue Notes:
All Other revenue includes a judgment/settlement.
Finance and Technology 17
Program Summary: Real Estate
Division: Finance & Technology
Fund Type: Internal Service Fund
Executive Summary:
The Real Estate program is responsible for the evaluation, management, acquisition, trading and monetization of all real estate assets owned by the City. Its role is to ensure the City's real assets are responsibly managed.
Programs and Services:
This program effectively manages the portfolio of properties currently owned by addressing each property and its relative value to the City. The portfolio will be scrutinized in the coming years and properties inconsistent with needs or that are functionally obsolete will be disposed. This department will look for partners to optimize and monetize current assets via trade, rental, or strategic partnering.
FTEs
2015 Actual 2016 Actual 2017 Actual 2018 Budget 2019 Proposed
Total FTEs 2.00 2.00 2.00 2.00 2.00
Expenditures:
2015 Actual 2016 Actual 2017 Actual 2018 Budget 2019 Proposed
Capital Outlay 0 0 0 0 0
Interfund Charges 3,820 1,551 1,314 0 2,100
Reserve for Budget Adjustment 0 0 0 0 0
Transfers Out 0 0 0 0 0
Wages & Benefits 235,428 286,764 179,722 261,201 245,387
Supplies & Services 27,066 8,535 4,882 7,720 5,700
Debt Services 0 0 0 0 0
All Other 468 0 0 0 0
TOTAL 266,782 296,850 185,918 268,921 253,187
Expenditure Notes:
Revenues:
2015 Actual 2016 Actual 2017 Actual 2018 Budget 2019 Proposed
Taxes 0 0 0 0 0
Licenses & Permits 0 0 0 0 0
IG Revenue 0 0 0 0 0
Services 104,809 32,025 76,807 150,000 75,000
Fines & Forfeits 0 0 0 0 0
Operating Transfers In 0 0 0 0 0
General Fund Resources 148,347 140,000 82,028 140,000 140,000One Vision. One Plan. One Voice.
Finance and Technology18
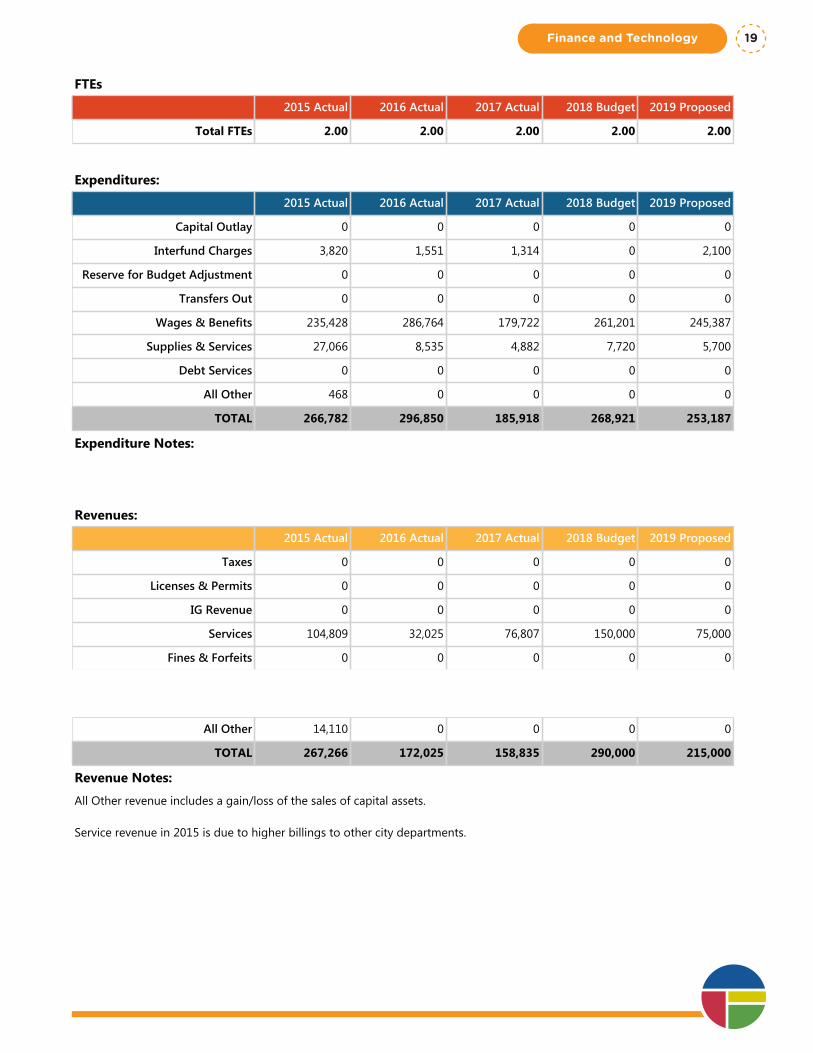
Program Summary: Real Estate
Division: Finance & Technology
Fund Type: Internal Service Fund
Executive Summary:
The Real Estate program is responsible for the evaluation, management, acquisition, trading and monetization of all real estate assets owned by the City. Its role is to ensure the City's real assets are responsibly managed.
Programs and Services:
This program effectively manages the portfolio of properties currently owned by addressing each property and its relative value to the City. The portfolio will be scrutinized in the coming years and properties inconsistent with needs or that are functionally obsolete will be disposed. This department will look for partners to optimize and monetize current assets via trade, rental, or strategic partnering.
FTEs
2015 Actual 2016 Actual 2017 Actual 2018 Budget 2019 Proposed
Total FTEs 2.00 2.00 2.00 2.00 2.00
Expenditures:
2015 Actual 2016 Actual 2017 Actual 2018 Budget 2019 Proposed
Capital Outlay 0 0 0 0 0
Interfund Charges 3,820 1,551 1,314 0 2,100
Reserve for Budget Adjustment 0 0 0 0 0
Transfers Out 0 0 0 0 0
Wages & Benefits 235,428 286,764 179,722 261,201 245,387
Supplies & Services 27,066 8,535 4,882 7,720 5,700
Debt Services 0 0 0 0 0
All Other 468 0 0 0 0
TOTAL 266,782 296,850 185,918 268,921 253,187
Expenditure Notes:
Revenues:
2015 Actual 2016 Actual 2017 Actual 2018 Budget 2019 Proposed
Taxes 0 0 0 0 0
Licenses & Permits 0 0 0 0 0
IG Revenue 0 0 0 0 0
Services 104,809 32,025 76,807 150,000 75,000
Fines & Forfeits 0 0 0 0 0
Operating Transfers In 0 0 0 0 0
General Fund Resources 148,347 140,000 82,028 140,000 140,000
All Other 14,110 0 0 0 0
TOTAL 267,266 172,025 158,835 290,000 215,000
Revenue Notes:
All Other revenue includes a gain/loss of the sales of capital assets.
Service revenue in 2015 is due to higher billings to other city departments.
Finance and Technology 19
Program Summary: Real Estate Rentals
Division: Finance & Technology
Fund Type: Internal Service Fund
Executive Summary:
The City owns several properties in the vicinity of East 37th Ave and S. Ray Street, near Joel E Ferris High School. This program covers both the rental revenue and associated maintenance costs of these properties.
Programs and Services:
The Real Estate Program serves multiple departments across the City. This program is responsible for meeting the real estate acquisition and disposition needs for departments and divisions such as Fire, Police, Parks, and Public Works. Properties can be acquired for immediate use such as a new water reservoir or may be acquired years in advance of a project such as a new arterial street. The Real Estate Program completes the acquisition of needed property and then will maintain the properties as needed until they are utilized. Maintenance can take the form of leasing properties (in the instance of residential or commercial properties) or simply maintaining a vacant site for litter, noxious weeds, or safety. The Real Estate Rental Program is utilized when properties are leased during the period of time the City owns the asset. The program tracks the rental revenues and expenditures related to the various leased properties.
FTEs
2015 Actual 2016 Actual 2017 Actual 2018 Budget 2019 Proposed
Total FTEs 0.00 0.00 0.00 0.00 0.00
Expenditures:
2015 Actual 2016 Actual 2017 Actual 2018 Budget 2019 Proposed
Capital Outlay 127,679 0 0 0 0
Interfund Charges 0 1,044 0 1,287 0
Reserve for Budget Adjustment 0 0 0 0 0
Transfers Out 0 0 0 0 0
Wages & Benefits 0 0 0 0 0
Supplies & Services 75,448 47,886 51,245 53,040 54,730
Debt Services 0 0 0 0 0
All Other 11,647 27,030 27,030 0 0
TOTAL 214,774 75,960 78,275 54,327 54,730
Expenditure Notes:
Revenues:
2015 Actual 2016 Actual 2017 Actual 2018 Budget 2019 Proposed
Taxes 0 0 0 0 0
Licenses & Permits 0 0 0 0 0
IG Revenue 0 0 0 0 0
Services 0 0 0 0 0One Vision. One Plan. One Voice.
Finance and Technology20

Program Summary: Real Estate Rentals
Division: Finance & Technology
Fund Type: Internal Service Fund
Executive Summary:
The City owns several properties in the vicinity of East 37th Ave and S. Ray Street, near Joel E Ferris High School. This program covers both the rental revenue and associated maintenance costs of these properties.
Programs and Services:
The Real Estate Program serves multiple departments across the City. This program is responsible for meeting the real estate acquisition and disposition needs for departments and divisions such as Fire, Police, Parks, and Public Works. Properties can be acquired for immediate use such as a new water reservoir or may be acquired years in advance of a project such as a new arterial street. The Real Estate Program completes the acquisition of needed property and then will maintain the properties as needed until they are utilized. Maintenance can take the form of leasing properties (in the instance of residential or commercial properties) or simply maintaining a vacant site for litter, noxious weeds, or safety. The Real Estate Rental Program is utilized when properties are leased during the period of time the City owns the asset. The program tracks the rental revenues and expenditures related to the various leased properties.
FTEs
2015 Actual 2016 Actual 2017 Actual 2018 Budget 2019 Proposed
Total FTEs 0.00 0.00 0.00 0.00 0.00
Expenditures:
2015 Actual 2016 Actual 2017 Actual 2018 Budget 2019 Proposed
Capital Outlay 127,679 0 0 0 0
Interfund Charges 0 1,044 0 1,287 0
Reserve for Budget Adjustment 0 0 0 0 0
Transfers Out 0 0 0 0 0
Wages & Benefits 0 0 0 0 0
Supplies & Services 75,448 47,886 51,245 53,040 54,730
Debt Services 0 0 0 0 0
All Other 11,647 27,030 27,030 0 0
TOTAL 214,774 75,960 78,275 54,327 54,730
Expenditure Notes:
Revenues:
2015 Actual 2016 Actual 2017 Actual 2018 Budget 2019 Proposed
Taxes 0 0 0 0 0
Licenses & Permits 0 0 0 0 0
IG Revenue 0 0 0 0 0
Services 0 0 0 0 0
Fines & Forfeits 0 0 0 0 0
Operating Transfers In 0 0 0 0 0
General Fund Resources 0 0 0 0 0
All Other 237,514 160,368 204,338 160,000 289,580
TOTAL 237,514 160,368 204,338 160,000 289,580
Revenue Notes:
Finance and Technology 21

One Vision. One Plan. One Voice.
Finance and Technology22
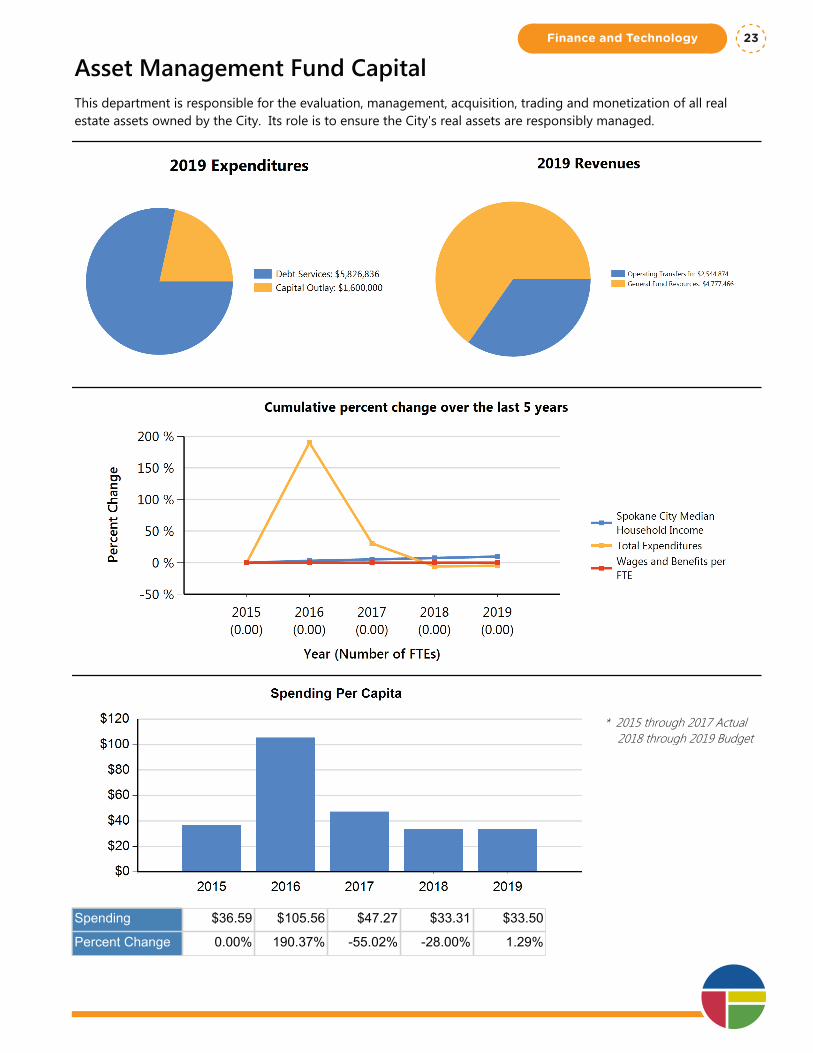
Asset Management Fund CapitalThis department is responsible for the evaluation, management, acquisition, trading and monetization of all real estate assets owned by the City. Its role is to ensure the City's real assets are responsibly managed.
* 2015 through 2017 Actual 2018 through 2019 Budget
Spending $36.59 $105.56 $47.27 $33.31 $33.50
Percent Change 0.00% 190.37% -55.02% -28.00% 1.29%
Finance and Technology 23

Department Summary: Asset Management Fund Capital
Division: Finance & Technology
Fund Type: Internal Service Fund
Executive Summary:
This department is responsible for the evaluation, management, acquisition, trading and monetization of all real estate assets owned by the City. Its role is to ensure the City's real assets are responsibly managed.
Programs and Services:
This department will effectively manage the portfolio of properties currently owned by addressing each property and its relative value to the City. This portfolio will be scrutinized in the coming years and properties inconsistent with needs or that are functionally obsolete will be disposed. This department will look for partners to optimize and monetize current assets via trade, rental, or strategic partnering.
FTEs
2015 Actual 2016 Actual 2017 Actual 2018 Budget 2019 Proposed
Total FTEs 0.00 0.00 0.00 0.00 0.00
Expenditures:
2015 Actual 2016 Actual 2017 Actual 2018 Budget 2019 Proposed
Capital Outlay 4,611,932 7,527,831 4,125,085 1,400,000 1,600,000
Interfund Charges 0 0 0 0 0
Reserve for Budget Adjustment 0 0 0 0 0
Transfers Out 0 5,218,782 0 0 0
Wages & Benefits 0 0 0 0 0
Supplies & Services 617,455 351,069 790,041 0 0
Debt Services 2,568,521 9,545,461 5,269,146 5,932,164 5,826,836
All Other 0 0 0 0 0
TOTAL 7,797,908 22,643,143 10,184,272 7,332,164 7,426,836
Expenditure Notes:
2016 included a one-time operating transfer out to the Asset Management fund.
The increase in Supplies in 2017 was related to Fire Department equipment.
The debt service principal amount in 2016 includes a payoff of $5.2 million for LTGO 2005A bonds.
Revenues:
2015 Actual 2016 Actual 2017 Actual 2018 Budget 2019 Proposed
Taxes 0 0 0 0 0
Licenses & Permits 0 0 0 0 0
IG Revenue 131,474 0 0 0 0
Services 4,628 0 0 0 0One Vision. One Plan. One Voice.
Finance and Technology24
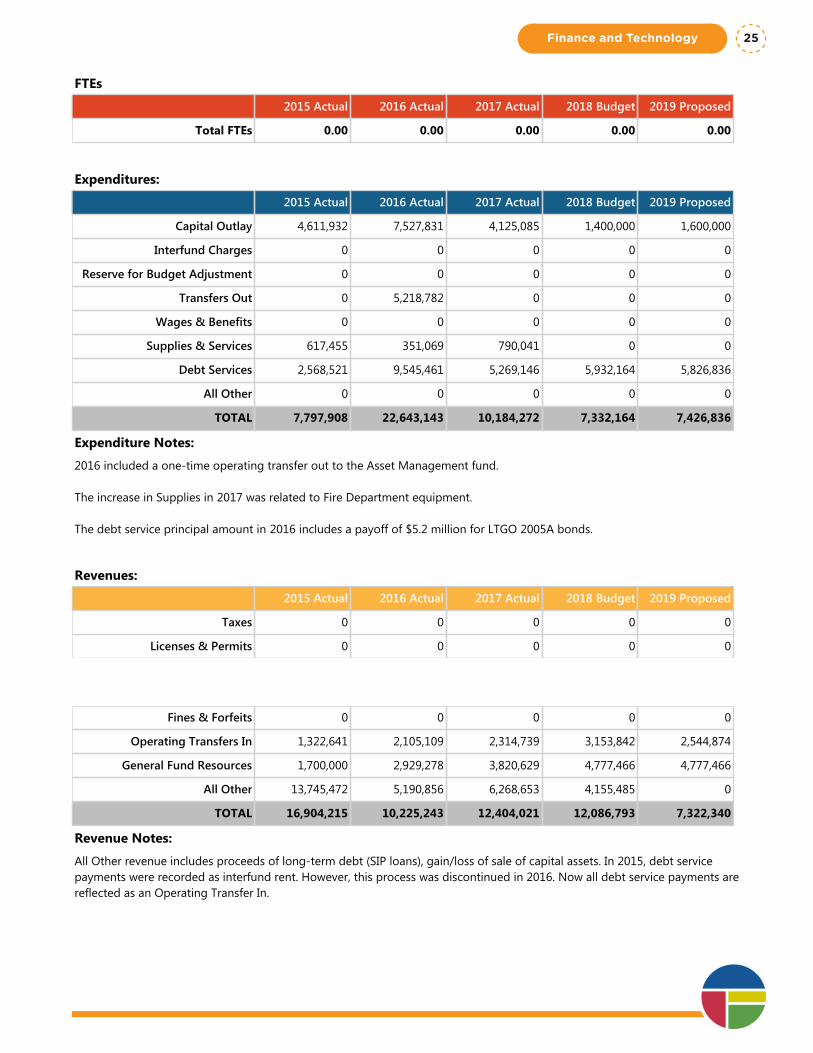
Department Summary: Asset Management Fund Capital
Division: Finance & Technology
Fund Type: Internal Service Fund
Executive Summary:
This department is responsible for the evaluation, management, acquisition, trading and monetization of all real estate assets owned by the City. Its role is to ensure the City's real assets are responsibly managed.
Programs and Services:
This department will effectively manage the portfolio of properties currently owned by addressing each property and its relative value to the City. This portfolio will be scrutinized in the coming years and properties inconsistent with needs or that are functionally obsolete will be disposed. This department will look for partners to optimize and monetize current assets via trade, rental, or strategic partnering.
FTEs
2015 Actual 2016 Actual 2017 Actual 2018 Budget 2019 Proposed
Total FTEs 0.00 0.00 0.00 0.00 0.00
Expenditures:
2015 Actual 2016 Actual 2017 Actual 2018 Budget 2019 Proposed
Capital Outlay 4,611,932 7,527,831 4,125,085 1,400,000 1,600,000
Interfund Charges 0 0 0 0 0
Reserve for Budget Adjustment 0 0 0 0 0
Transfers Out 0 5,218,782 0 0 0
Wages & Benefits 0 0 0 0 0
Supplies & Services 617,455 351,069 790,041 0 0
Debt Services 2,568,521 9,545,461 5,269,146 5,932,164 5,826,836
All Other 0 0 0 0 0
TOTAL 7,797,908 22,643,143 10,184,272 7,332,164 7,426,836
Expenditure Notes:
2016 included a one-time operating transfer out to the Asset Management fund.
The increase in Supplies in 2017 was related to Fire Department equipment.
The debt service principal amount in 2016 includes a payoff of $5.2 million for LTGO 2005A bonds.
Revenues:
2015 Actual 2016 Actual 2017 Actual 2018 Budget 2019 Proposed
Taxes 0 0 0 0 0
Licenses & Permits 0 0 0 0 0
IG Revenue 131,474 0 0 0 0
Services 4,628 0 0 0 0
Fines & Forfeits 0 0 0 0 0
Operating Transfers In 1,322,641 2,105,109 2,314,739 3,153,842 2,544,874
General Fund Resources 1,700,000 2,929,278 3,820,629 4,777,466 4,777,466
All Other 13,745,472 5,190,856 6,268,653 4,155,485 0
TOTAL 16,904,215 10,225,243 12,404,021 12,086,793 7,322,340
Revenue Notes:
All Other revenue includes proceeds of long-term debt (SIP loans), gain/loss of sale of capital assets. In 2015, debt service payments were recorded as interfund rent. However, this process was discontinued in 2016. Now all debt service payments are reflected as an Operating Transfer In.
Finance and Technology 25

One Vision. One Plan. One Voice.
Finance and Technology26
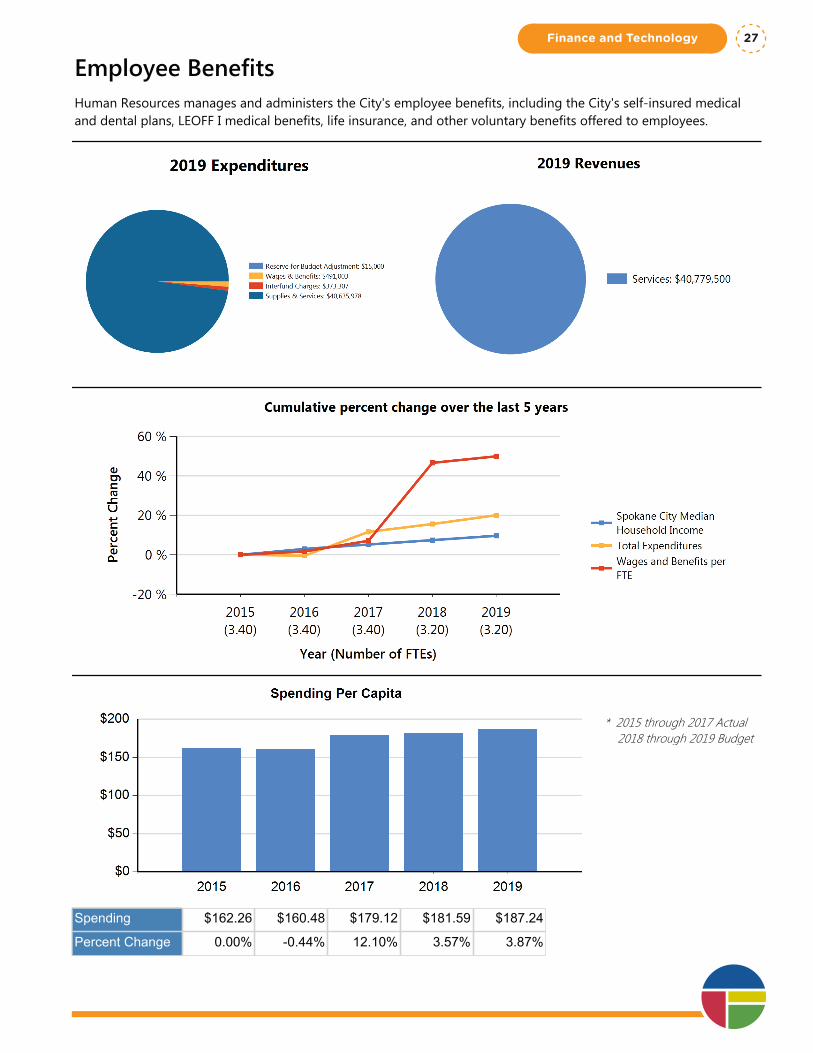
Employee BenefitsHuman Resources manages and administers the City's employee benefits, including the City's self-insured medical and dental plans, LEOFF I medical benefits, life insurance, and other voluntary benefits offered to employees.
* 2015 through 2017 Actual 2018 through 2019 Budget
Spending $162.26 $160.48 $179.12 $181.59 $187.24
Percent Change 0.00% -0.44% 12.10% 3.57% 3.87%
Finance and Technology 27
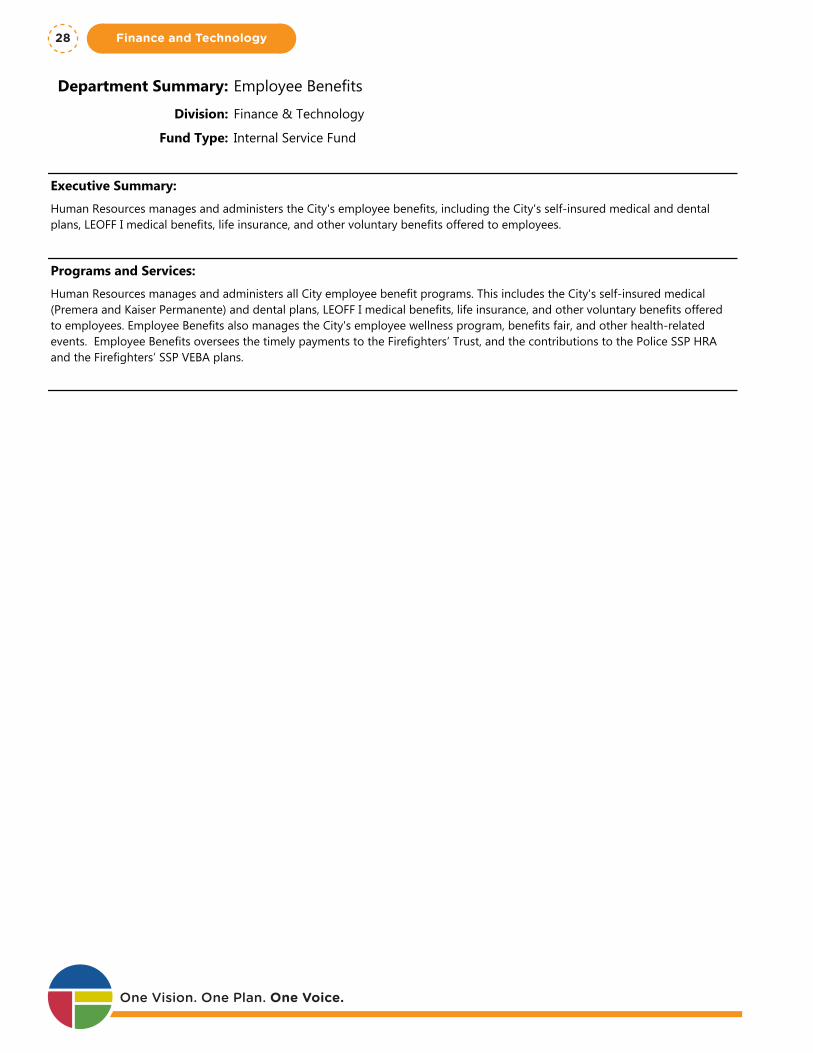
Department Summary: Employee Benefits
Division: Finance & Technology
Fund Type: Internal Service Fund
Executive Summary:
Human Resources manages and administers the City's employee benefits, including the City's self-insured medical and dental plans, LEOFF I medical benefits, life insurance, and other voluntary benefits offered to employees.
Programs and Services:
Human Resources manages and administers all City employee benefit programs. This includes the City's self-insured medical (Premera and Kaiser Permanente) and dental plans, LEOFF I medical benefits, life insurance, and other voluntary benefits offered to employees. Employee Benefits also manages the City's employee wellness program, benefits fair, and other health-related events. Employee Benefits oversees the timely payments to the Firefighters’ Trust, and the contributions to the Police SSP HRA and the Firefighters’ SSP VEBA plans.
FTEs
2015 Actual 2016 Actual 2017 Actual 2018 Budget 2019 Proposed
Total FTEs 3.40 3.40 3.40 3.20 3.20
Expenditures:
2015 Actual 2016 Actual 2017 Actual 2018 Budget 2019 Proposed
Capital Outlay 0 0 0 0 0
Interfund Charges 332,301 349,946 388,851 388,145 373,307
Reserve for Budget Adjustment 0 0 0 15,000 15,000
Transfers Out 0 0 0 0 0
Wages & Benefits 337,657 343,385 361,943 475,232 491,003
Supplies & Services 33,906,707 33,730,664 37,838,774 39,090,108 40,635,978
Debt Services 0 0 0 0 0
All Other 0 0 0 0 0
TOTAL 34,576,665 34,423,995 38,589,568 39,968,485 41,515,288
Expenditure Notes:
Other services & charges includes benefit claims costs; therefore, the amount will fluctuate depending on the amount of claims filed each year.
Revenues:
2015 Actual 2016 Actual 2017 Actual 2018 Budget 2019 Proposed
Taxes 0 0 0 0 0
Licenses & Permits 0 0 0 0 0
IG Revenue 0 0 0 0 0
Services 33,813,248 34,807,204 36,910,624 39,921,174 40,779,500
Fines & Forfeits 0 0 0 0 0
Operating Transfers In 0 0 0 0 0One Vision. One Plan. One Voice.
Finance and Technology28
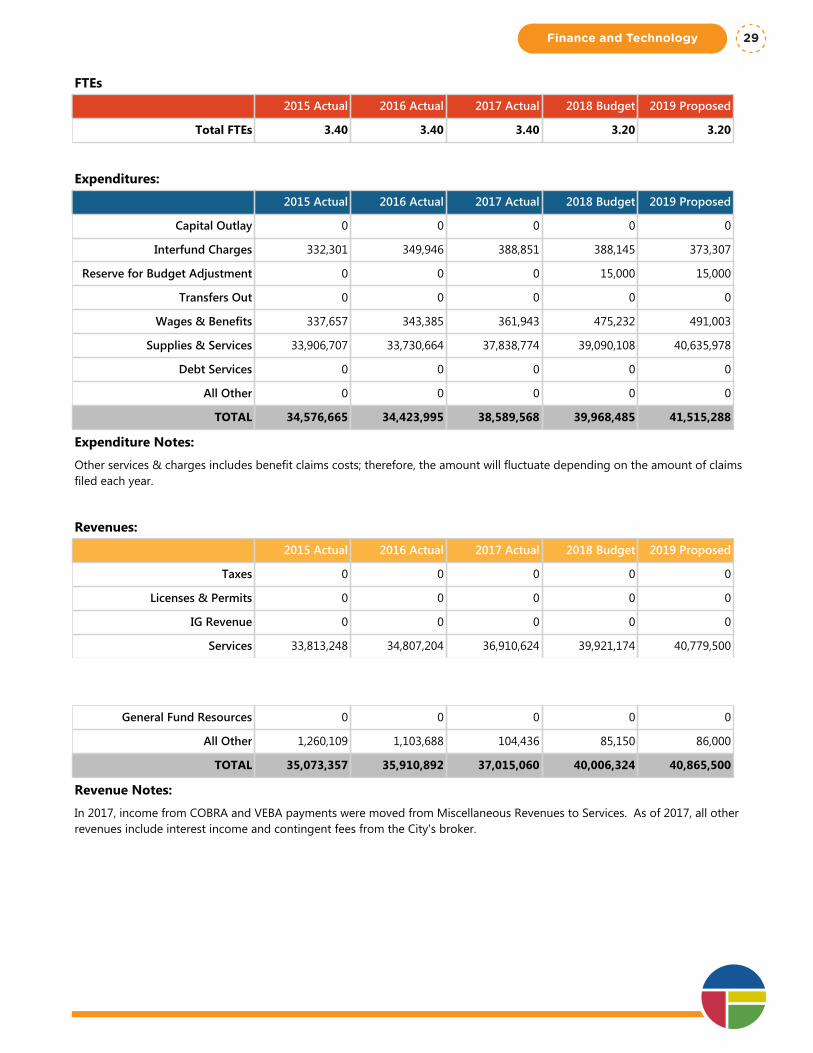
Department Summary: Employee Benefits
Division: Finance & Technology
Fund Type: Internal Service Fund
Executive Summary:
Human Resources manages and administers the City's employee benefits, including the City's self-insured medical and dental plans, LEOFF I medical benefits, life insurance, and other voluntary benefits offered to employees.
Programs and Services:
Human Resources manages and administers all City employee benefit programs. This includes the City's self-insured medical (Premera and Kaiser Permanente) and dental plans, LEOFF I medical benefits, life insurance, and other voluntary benefits offered to employees. Employee Benefits also manages the City's employee wellness program, benefits fair, and other health-related events. Employee Benefits oversees the timely payments to the Firefighters’ Trust, and the contributions to the Police SSP HRA and the Firefighters’ SSP VEBA plans.
FTEs
2015 Actual 2016 Actual 2017 Actual 2018 Budget 2019 Proposed
Total FTEs 3.40 3.40 3.40 3.20 3.20
Expenditures:
2015 Actual 2016 Actual 2017 Actual 2018 Budget 2019 Proposed
Capital Outlay 0 0 0 0 0
Interfund Charges 332,301 349,946 388,851 388,145 373,307
Reserve for Budget Adjustment 0 0 0 15,000 15,000
Transfers Out 0 0 0 0 0
Wages & Benefits 337,657 343,385 361,943 475,232 491,003
Supplies & Services 33,906,707 33,730,664 37,838,774 39,090,108 40,635,978
Debt Services 0 0 0 0 0
All Other 0 0 0 0 0
TOTAL 34,576,665 34,423,995 38,589,568 39,968,485 41,515,288
Expenditure Notes:
Other services & charges includes benefit claims costs; therefore, the amount will fluctuate depending on the amount of claims filed each year.
Revenues:
2015 Actual 2016 Actual 2017 Actual 2018 Budget 2019 Proposed
Taxes 0 0 0 0 0
Licenses & Permits 0 0 0 0 0
IG Revenue 0 0 0 0 0
Services 33,813,248 34,807,204 36,910,624 39,921,174 40,779,500
Fines & Forfeits 0 0 0 0 0
Operating Transfers In 0 0 0 0 0
General Fund Resources 0 0 0 0 0
All Other 1,260,109 1,103,688 104,436 85,150 86,000
TOTAL 35,073,357 35,910,892 37,015,060 40,006,324 40,865,500
Revenue Notes:
In 2017, income from COBRA and VEBA payments were moved from Miscellaneous Revenues to Services. As of 2017, all other revenues include interest income and contingent fees from the City's broker.
Finance and Technology 29

One Vision. One Plan. One Voice.
Finance and Technology30
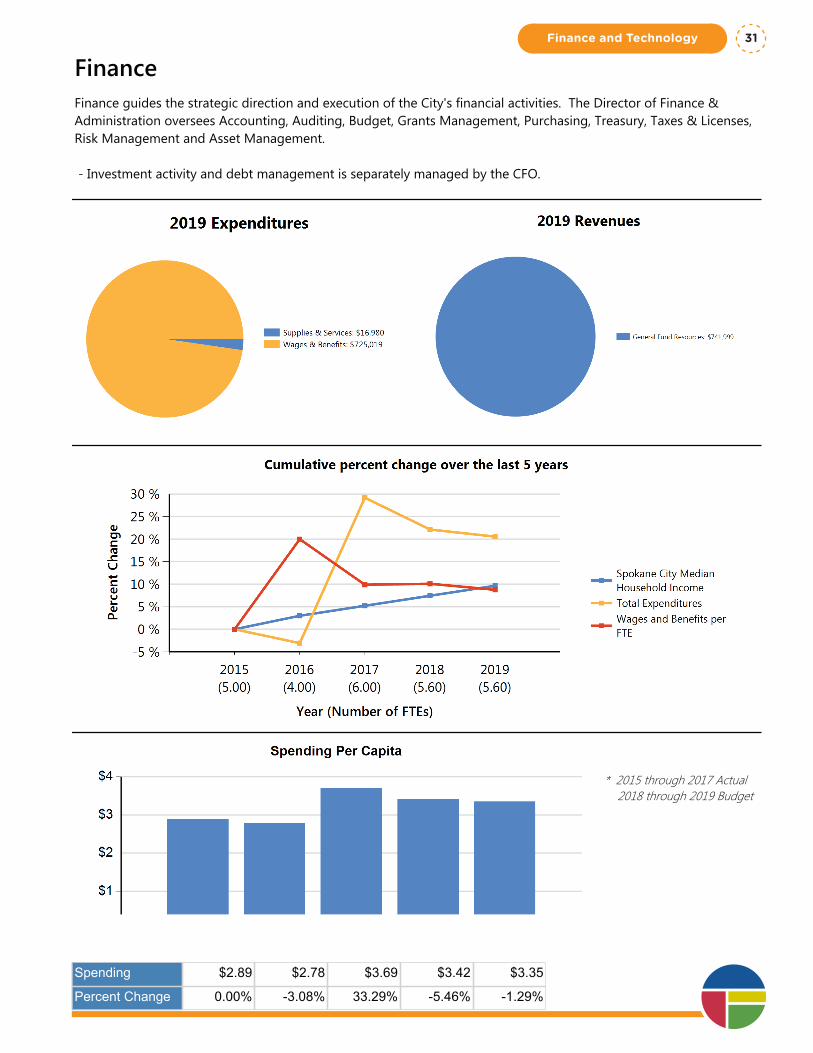
FinanceFinance guides the strategic direction and execution of the City's financial activities. The Director of Finance & Administration oversees Accounting, Auditing, Budget, Grants Management, Purchasing, Treasury, Taxes & Licenses, Risk Management and Asset Management.
- Investment activity and debt management is separately managed by the CFO.
* 2015 through 2017 Actual 2018 through 2019 Budget
Spending $2.89 $2.78 $3.69 $3.42 $3.35
Percent Change 0.00% -3.08% 33.29% -5.46% -1.29%
FinanceFinance guides the strategic direction and execution of the City's financial activities. The Director of Finance & Administration oversees Accounting, Auditing, Budget, Grants Management, Purchasing, Treasury, Taxes & Licenses, Risk Management and Asset Management.
- Investment activity and debt management is separately managed by the CFO.
* 2015 through 2017 Actual 2018 through 2019 Budget
Finance and Technology 31
Department Summary: Finance
Division: Finance & Technology
Fund Type: General Fund
Executive Summary:
Finance guides the strategic direction and execution of the City's financial activities. The Director of Finance & Administration oversees Accounting, Auditing, Budget, Grants Management, Purchasing, Treasury, Taxes & Licenses, Risk Management and Asset Management.
- Investment activity and debt management is separately managed by the CFO.
Programs and Services:
The Finance Department oversees activities and the strategic direction of the City's financial activities, including:
- Executing a budget process that matches City goals and objectives to the City's limited financial resources. This includes communicating all aspects of the budget process to the citizens to assure confidence that tax dollars are being spent judiciously and effectively.
- Planning, organizing, and directing the operations and activities of the Finance, Budget, Grants Management, Taxes and Licenses, Accounting, Purchasing, Treasury, Payroll, Risk Management, Auditing, and Asset Management functions for the City.
- Effective communication of financial matters to government and community stakeholders. This includes City Council, unions, management and all citizens and citizen groups.
FTEs
2015 Actual 2016 Actual 2017 Actual 2018 Budget 2019 Proposed
Total FTEs 5.00 4.00 6.00 5.60 5.60
Expenditures:
2015 Actual 2016 Actual 2017 Actual 2018 Budget 2019 Proposed
Capital Outlay 2,693 1,984 0 3,000 0
Interfund Charges 142 0 27 0 0
Reserve for Budget Adjustment 0 0 0 0 0
Transfers Out 0 0 0 0 0
Wages & Benefits 606,976 582,623 785,623 734,801 725,019
Supplies & Services 5,731 11,937 9,531 13,960 16,980
Debt Services 0 0 0 0 0
All Other 0 0 0 0 0
One Vision. One Plan. One Voice.
Finance and Technology32
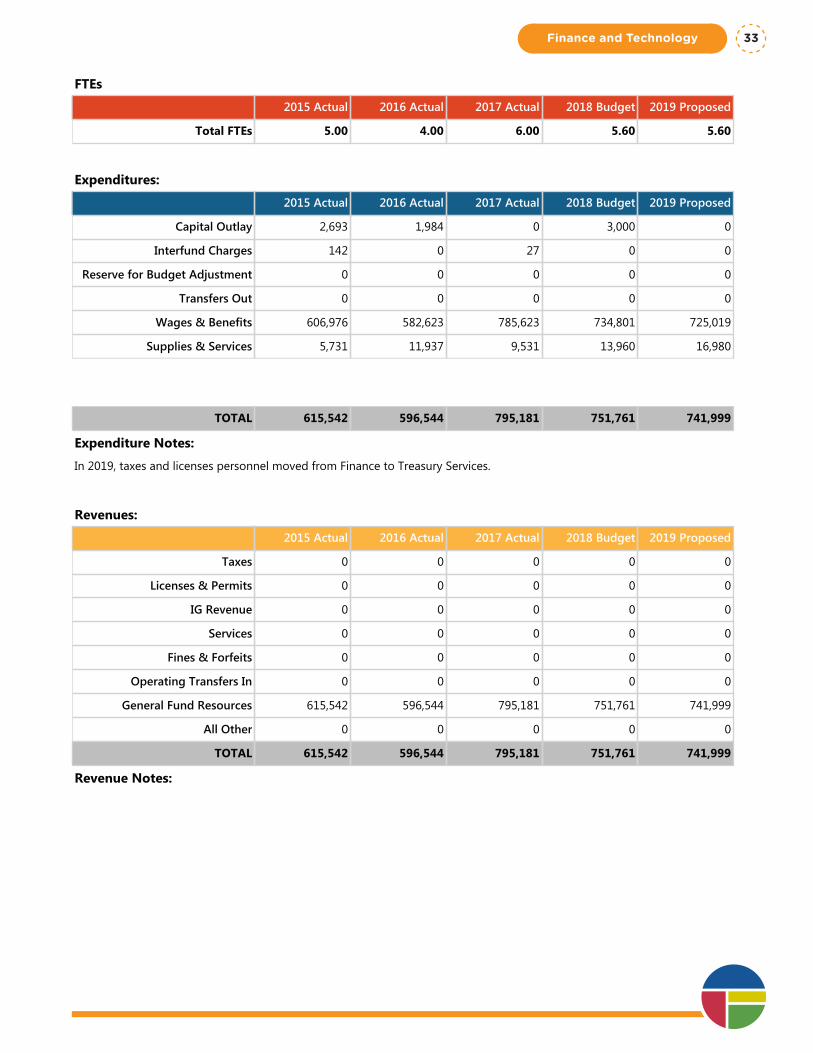
Department Summary: Finance
Division: Finance & Technology
Fund Type: General Fund
Executive Summary:
Finance guides the strategic direction and execution of the City's financial activities. The Director of Finance & Administration oversees Accounting, Auditing, Budget, Grants Management, Purchasing, Treasury, Taxes & Licenses, Risk Management and Asset Management.
- Investment activity and debt management is separately managed by the CFO.
Programs and Services:
The Finance Department oversees activities and the strategic direction of the City's financial activities, including:
- Executing a budget process that matches City goals and objectives to the City's limited financial resources. This includes communicating all aspects of the budget process to the citizens to assure confidence that tax dollars are being spent judiciously and effectively.
- Planning, organizing, and directing the operations and activities of the Finance, Budget, Grants Management, Taxes and Licenses, Accounting, Purchasing, Treasury, Payroll, Risk Management, Auditing, and Asset Management functions for the City.
- Effective communication of financial matters to government and community stakeholders. This includes City Council, unions, management and all citizens and citizen groups.
FTEs
2015 Actual 2016 Actual 2017 Actual 2018 Budget 2019 Proposed
Total FTEs 5.00 4.00 6.00 5.60 5.60
Expenditures:
2015 Actual 2016 Actual 2017 Actual 2018 Budget 2019 Proposed
Capital Outlay 2,693 1,984 0 3,000 0
Interfund Charges 142 0 27 0 0
Reserve for Budget Adjustment 0 0 0 0 0
Transfers Out 0 0 0 0 0
Wages & Benefits 606,976 582,623 785,623 734,801 725,019
Supplies & Services 5,731 11,937 9,531 13,960 16,980
Debt Services 0 0 0 0 0
All Other 0 0 0 0 0
TOTAL 615,542 596,544 795,181 751,761 741,999
Expenditure Notes:
In 2019, taxes and licenses personnel moved from Finance to Treasury Services.
Revenues:
2015 Actual 2016 Actual 2017 Actual 2018 Budget 2019 Proposed
Taxes 0 0 0 0 0
Licenses & Permits 0 0 0 0 0
IG Revenue 0 0 0 0 0
Services 0 0 0 0 0
Fines & Forfeits 0 0 0 0 0
Operating Transfers In 0 0 0 0 0
General Fund Resources 615,542 596,544 795,181 751,761 741,999
All Other 0 0 0 0 0
TOTAL 615,542 596,544 795,181 751,761 741,999
Revenue Notes:
Finance and Technology 33
Program Summary: Finance
Division: Finance & Technology
Fund Type: General Fund
Executive Summary:
The Finance program includes staff and operating expenses that support the functions of the entire Finance Division for the City. The Finance Division oversees activities and strategic direction of the City's financial activities.
Programs and Services:
The Director of Finance and Administration, Internal Audit, and support staff for the Division are budgeted in the Finance program, as well as overall operating expenses for the Division.
FTEs
2015 Actual 2016 Actual 2017 Actual 2018 Budget 2019 Proposed
Total FTEs 4.00 3.00 5.00 3.80 3.90
Expenditures:
2015 Actual 2016 Actual 2017 Actual 2018 Budget 2019 Proposed
Capital Outlay 2,693 1,984 0 3,000 0
Interfund Charges 142 0 27 0 0
Reserve for Budget Adjustment 0 0 0 0 0
Transfers Out 0 0 0 0 0
Wages & Benefits 453,566 415,796 601,479 486,522 488,580
Supplies & Services 3,711 10,368 6,612 8,060 11,060
Debt Services 0 0 0 0 0
All Other 0 0 0 0 0
TOTAL 460,112 428,148 608,118 497,582 499,640
Expenditure Notes:
Prior to 2018, staff and related expenses for the CFO and Business Analytics were included in the Finance Program Budget. Beginning in the 2018 Budget, these positions have moved to a separate Department, Treasury Services, within the Finance Division.
Revenues:
2015 Actual 2016 Actual 2017 Actual 2018 Budget 2019 Proposed
Taxes 0 0 0 0 0
Licenses & Permits 0 0 0 0 0
IG Revenue 0 0 0 0 0
Services 0 0 0 0 0
Fines & Forfeits 0 0 0 0 0
Operating Transfers In 0 0 0 0 0
General Fund Resources 460,112 428,148 608,118 497,582 499,640One Vision. One Plan. One Voice.
Finance and Technology34
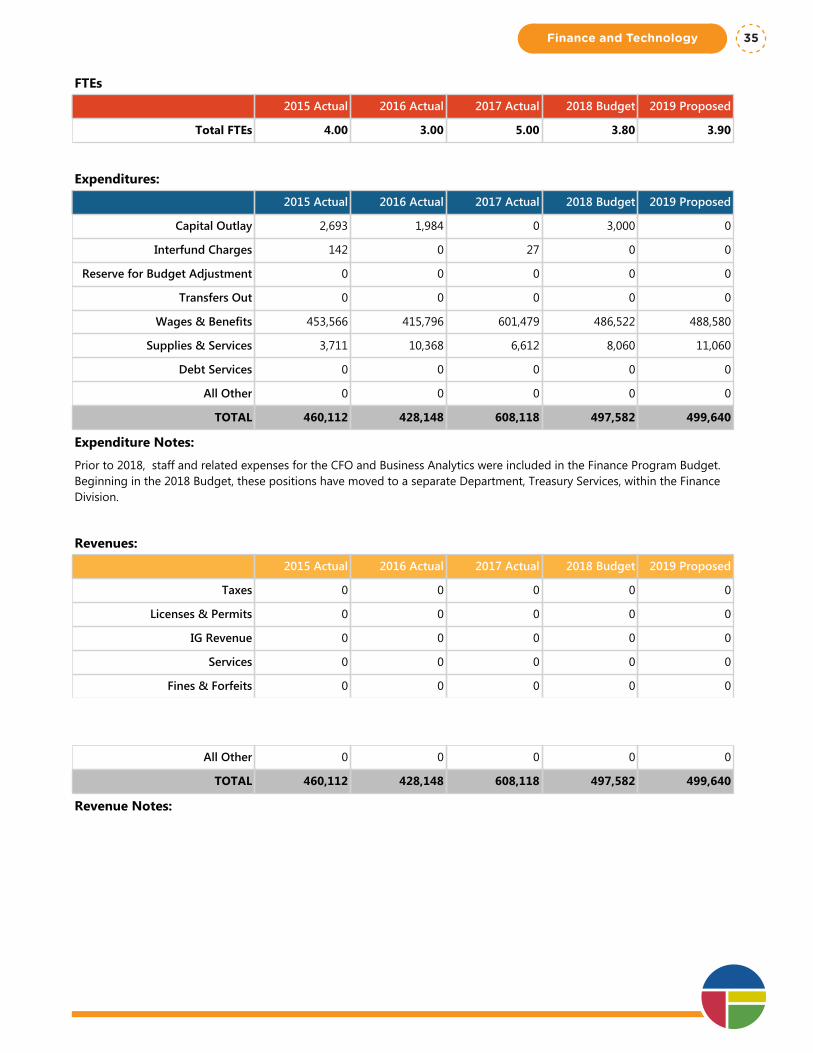
Program Summary: Finance
Division: Finance & Technology
Fund Type: General Fund
Executive Summary:
The Finance program includes staff and operating expenses that support the functions of the entire Finance Division for the City. The Finance Division oversees activities and strategic direction of the City's financial activities.
Programs and Services:
The Director of Finance and Administration, Internal Audit, and support staff for the Division are budgeted in the Finance program, as well as overall operating expenses for the Division.
FTEs
2015 Actual 2016 Actual 2017 Actual 2018 Budget 2019 Proposed
Total FTEs 4.00 3.00 5.00 3.80 3.90
Expenditures:
2015 Actual 2016 Actual 2017 Actual 2018 Budget 2019 Proposed
Capital Outlay 2,693 1,984 0 3,000 0
Interfund Charges 142 0 27 0 0
Reserve for Budget Adjustment 0 0 0 0 0
Transfers Out 0 0 0 0 0
Wages & Benefits 453,566 415,796 601,479 486,522 488,580
Supplies & Services 3,711 10,368 6,612 8,060 11,060
Debt Services 0 0 0 0 0
All Other 0 0 0 0 0
TOTAL 460,112 428,148 608,118 497,582 499,640
Expenditure Notes:
Prior to 2018, staff and related expenses for the CFO and Business Analytics were included in the Finance Program Budget. Beginning in the 2018 Budget, these positions have moved to a separate Department, Treasury Services, within the Finance Division.
Revenues:
2015 Actual 2016 Actual 2017 Actual 2018 Budget 2019 Proposed
Taxes 0 0 0 0 0
Licenses & Permits 0 0 0 0 0
IG Revenue 0 0 0 0 0
Services 0 0 0 0 0
Fines & Forfeits 0 0 0 0 0
Operating Transfers In 0 0 0 0 0
General Fund Resources 460,112 428,148 608,118 497,582 499,640
All Other 0 0 0 0 0
TOTAL 460,112 428,148 608,118 497,582 499,640
Revenue Notes:
Finance and Technology 35
Program Summary: Management/Budget
Division: Finance & Technology
Fund Type: General Fund
Executive Summary:
The Budget Office organizes, compiles and maintains the citywide operating and capital budgets and provides financial analysis to the Mayor, City Council, and all City departments.
Programs and Services:
The Budget Office executes a budget process that matches City goals and objectives within the constraints of the City's limited financial resources. This includes communicating all aspects of the budget process to the Mayor, Council, and citizens to assure confidence that tax dollars are being spent judiciously and effectively. Management and Budget maintains revenue and expenditure forecasts to ensure that the City stays within the parameters set forth in the Budget.
FTEs
2015 Actual 2016 Actual 2017 Actual 2018 Budget 2019 Proposed
Total FTEs 1.00 1.00 1.00 1.80 1.70
Expenditures:
2015 Actual 2016 Actual 2017 Actual 2018 Budget 2019 Proposed
Capital Outlay 0 0 0 0 0
Interfund Charges 0 0 0 0 0
Reserve for Budget Adjustment 0 0 0 0 0
Transfers Out 0 0 0 0 0
Wages & Benefits 153,410 166,827 184,144 248,279 236,439
Supplies & Services 2,020 1,569 2,919 5,900 5,920
Debt Services 0 0 0 0 0
All Other 0 0 0 0 0
TOTAL 155,430 168,396 187,063 254,179 242,359
Expenditure Notes:
Revenues:
2015 Actual 2016 Actual 2017 Actual 2018 Budget 2019 Proposed
Taxes 0 0 0 0 0
Licenses & Permits 0 0 0 0 0
IG Revenue 0 0 0 0 0
Services 0 0 0 0 0
Fines & Forfeits 0 0 0 0 0
Operating Transfers In 0 0 0 0 0
General Fund Resources 155,430 168,396 187,063 254,179 242,359One Vision. One Plan. One Voice.
Finance and Technology36

Program Summary: Management/Budget
Division: Finance & Technology
Fund Type: General Fund
Executive Summary:
The Budget Office organizes, compiles and maintains the citywide operating and capital budgets and provides financial analysis to the Mayor, City Council, and all City departments.
Programs and Services:
The Budget Office executes a budget process that matches City goals and objectives within the constraints of the City's limited financial resources. This includes communicating all aspects of the budget process to the Mayor, Council, and citizens to assure confidence that tax dollars are being spent judiciously and effectively. Management and Budget maintains revenue and expenditure forecasts to ensure that the City stays within the parameters set forth in the Budget.
FTEs
2015 Actual 2016 Actual 2017 Actual 2018 Budget 2019 Proposed
Total FTEs 1.00 1.00 1.00 1.80 1.70
Expenditures:
2015 Actual 2016 Actual 2017 Actual 2018 Budget 2019 Proposed
Capital Outlay 0 0 0 0 0
Interfund Charges 0 0 0 0 0
Reserve for Budget Adjustment 0 0 0 0 0
Transfers Out 0 0 0 0 0
Wages & Benefits 153,410 166,827 184,144 248,279 236,439
Supplies & Services 2,020 1,569 2,919 5,900 5,920
Debt Services 0 0 0 0 0
All Other 0 0 0 0 0
TOTAL 155,430 168,396 187,063 254,179 242,359
Expenditure Notes:
Revenues:
2015 Actual 2016 Actual 2017 Actual 2018 Budget 2019 Proposed
Taxes 0 0 0 0 0
Licenses & Permits 0 0 0 0 0
IG Revenue 0 0 0 0 0
Services 0 0 0 0 0
Fines & Forfeits 0 0 0 0 0
Operating Transfers In 0 0 0 0 0
General Fund Resources 155,430 168,396 187,063 254,179 242,359
All Other 0 0 0 0 0
TOTAL 155,430 168,396 187,063 254,179 242,359
Revenue Notes:
Finance and Technology 37

One Vision. One Plan. One Voice.
Finance and Technology38
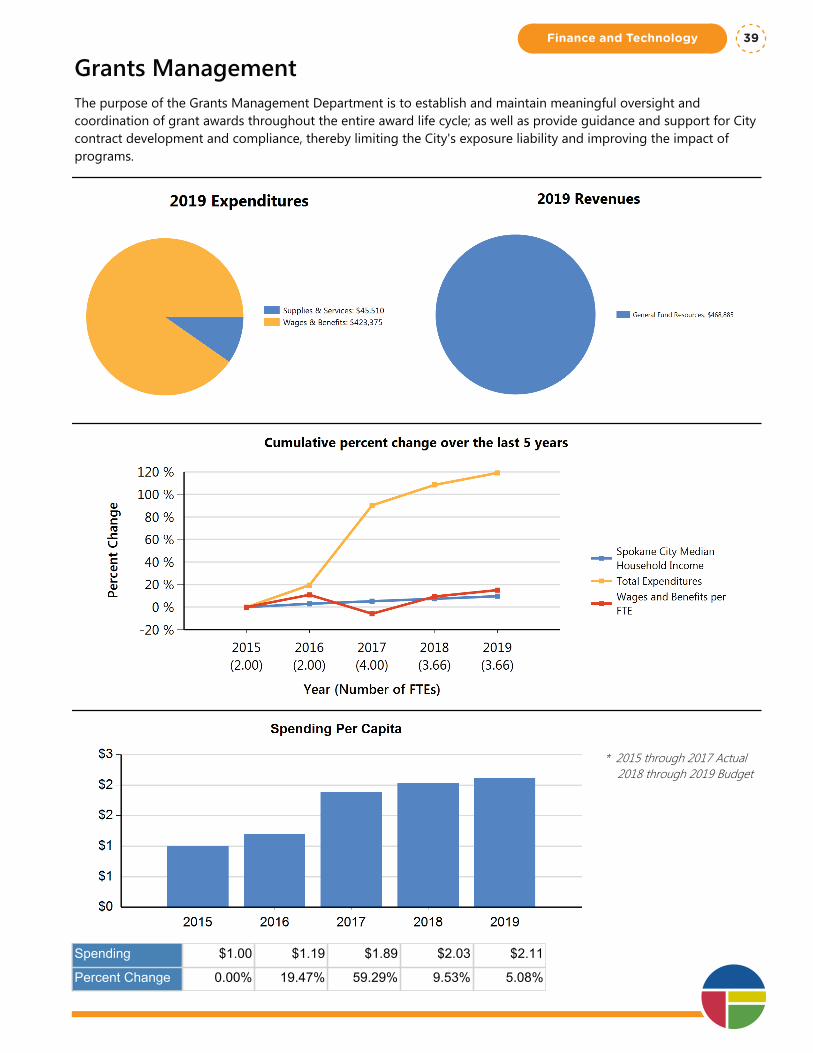
Grants ManagementThe purpose of the Grants Management Department is to establish and maintain meaningful oversight and coordination of grant awards throughout the entire award life cycle; as well as provide guidance and support for City contract development and compliance, thereby limiting the City's exposure liability and improving the impact of programs.
* 2015 through 2017 Actual 2018 through 2019 Budget
Spending $1.00 $1.19 $1.89 $2.03 $2.11
Percent Change 0.00% 19.47% 59.29% 9.53% 5.08%
Finance and Technology 39
Department Summary: Grants Management
Division: Finance & Technology
Fund Type: General Fund
Executive Summary:
The purpose of the Grants Management Department is to establish and maintain meaningful oversight and coordination of grant awards throughout the entire award life cycle; as well as provide guidance and support for City contract development and compliance, thereby limiting the City's exposure liability and improving the impact of programs.
Programs and Services:
The Department of Grants Management and Financial Assistance (GMFA) provides centralized management, oversight and other support services to City-wide activities involving the application, administration, reporting and close-out of grants and financial assistance.
Additionally, GMFA provides centralized consultation and coordination with City administration, City Council and City staff to develop and manage City contracts of all types.
Responsibilities of GMFA include strategic award planning, training of internal customers, promotion of funding opportunities, technical assistance, maintenance of informational web pages, identifying and investigating compliance issues that may arise with respect to the management of City grants and financial assistance awards, and mediation towards collaborative grant submittals between internal/external agencies, organizations and individuals.
FTEs
2015 Actual 2016 Actual 2017 Actual 2018 Budget 2019 Proposed
Total FTEs 2.00 2.00 4.00 3.66 3.66
Expenditures:
2015 Actual 2016 Actual 2017 Actual 2018 Budget 2019 Proposed
Capital Outlay 2,994 1,935 0 0 0
Interfund Charges 0 0 17 0 0
Reserve for Budget Adjustment 0 0 0 0 0
Transfers Out 0 0 0 0 0
Wages & Benefits 205,723 228,173 379,882 400,702 423,375
Supplies & Services 5,325 25,613 27,455 45,510 45,510
Debt Services 0 0 0 0 0
All Other 0 0 0 0 0
TOTAL 214,042 255,721 407,354 446,212 468,885
Expenditure Notes:
Two new positions for contract compliance were hired in 2017.
Revenues:
2015 Actual 2016 Actual 2017 Actual 2018 Budget 2019 Proposed
Taxes 0 0 0 0 0One Vision. One Plan. One Voice.
Finance and Technology40
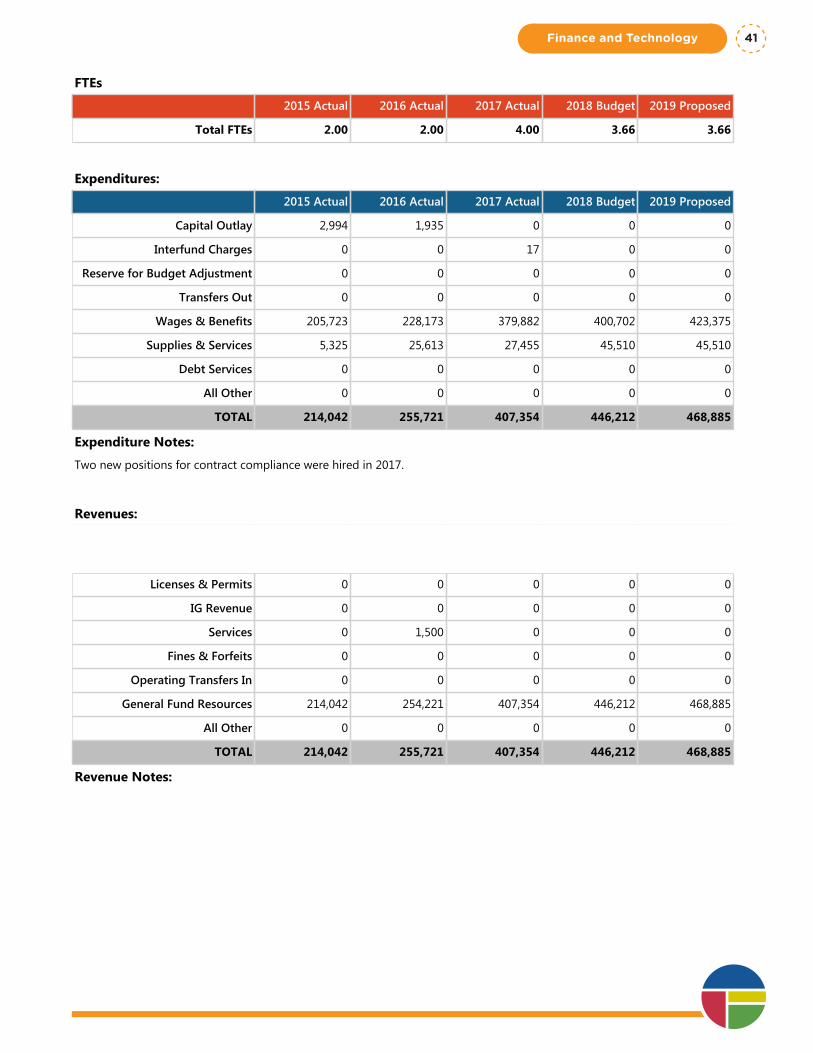
Department Summary: Grants Management
Division: Finance & Technology
Fund Type: General Fund
Executive Summary:
The purpose of the Grants Management Department is to establish and maintain meaningful oversight and coordination of grant awards throughout the entire award life cycle; as well as provide guidance and support for City contract development and compliance, thereby limiting the City's exposure liability and improving the impact of programs.
Programs and Services:
The Department of Grants Management and Financial Assistance (GMFA) provides centralized management, oversight and other support services to City-wide activities involving the application, administration, reporting and close-out of grants and financial assistance.
Additionally, GMFA provides centralized consultation and coordination with City administration, City Council and City staff to develop and manage City contracts of all types.
Responsibilities of GMFA include strategic award planning, training of internal customers, promotion of funding opportunities, technical assistance, maintenance of informational web pages, identifying and investigating compliance issues that may arise with respect to the management of City grants and financial assistance awards, and mediation towards collaborative grant submittals between internal/external agencies, organizations and individuals.
FTEs
2015 Actual 2016 Actual 2017 Actual 2018 Budget 2019 Proposed
Total FTEs 2.00 2.00 4.00 3.66 3.66
Expenditures:
2015 Actual 2016 Actual 2017 Actual 2018 Budget 2019 Proposed
Capital Outlay 2,994 1,935 0 0 0
Interfund Charges 0 0 17 0 0
Reserve for Budget Adjustment 0 0 0 0 0
Transfers Out 0 0 0 0 0
Wages & Benefits 205,723 228,173 379,882 400,702 423,375
Supplies & Services 5,325 25,613 27,455 45,510 45,510
Debt Services 0 0 0 0 0
All Other 0 0 0 0 0
TOTAL 214,042 255,721 407,354 446,212 468,885
Expenditure Notes:
Two new positions for contract compliance were hired in 2017.
Revenues:
2015 Actual 2016 Actual 2017 Actual 2018 Budget 2019 Proposed
Taxes 0 0 0 0 0
Licenses & Permits 0 0 0 0 0
IG Revenue 0 0 0 0 0
Services 0 1,500 0 0 0
Fines & Forfeits 0 0 0 0 0
Operating Transfers In 0 0 0 0 0
General Fund Resources 214,042 254,221 407,354 446,212 468,885
All Other 0 0 0 0 0
TOTAL 214,042 255,721 407,354 446,212 468,885
Revenue Notes:
Finance and Technology 41

One Vision. One Plan. One Voice.
Finance and Technology42
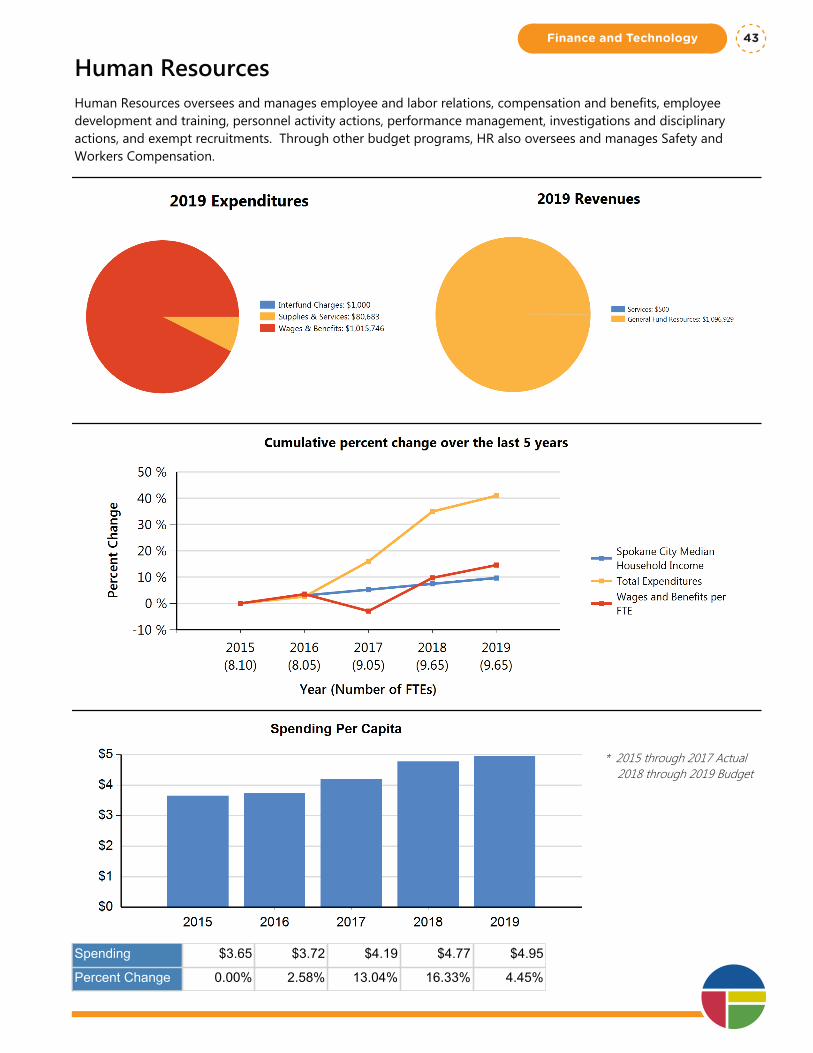
Human ResourcesHuman Resources oversees and manages employee and labor relations, compensation and benefits, employee development and training, personnel activity actions, performance management, investigations and disciplinary actions, and exempt recruitments. Through other budget programs, HR also oversees and manages Safety and Workers Compensation.
* 2015 through 2017 Actual 2018 through 2019 Budget
Spending $3.65 $3.72 $4.19 $4.77 $4.95
Percent Change 0.00% 2.58% 13.04% 16.33% 4.45%
Finance and Technology 43
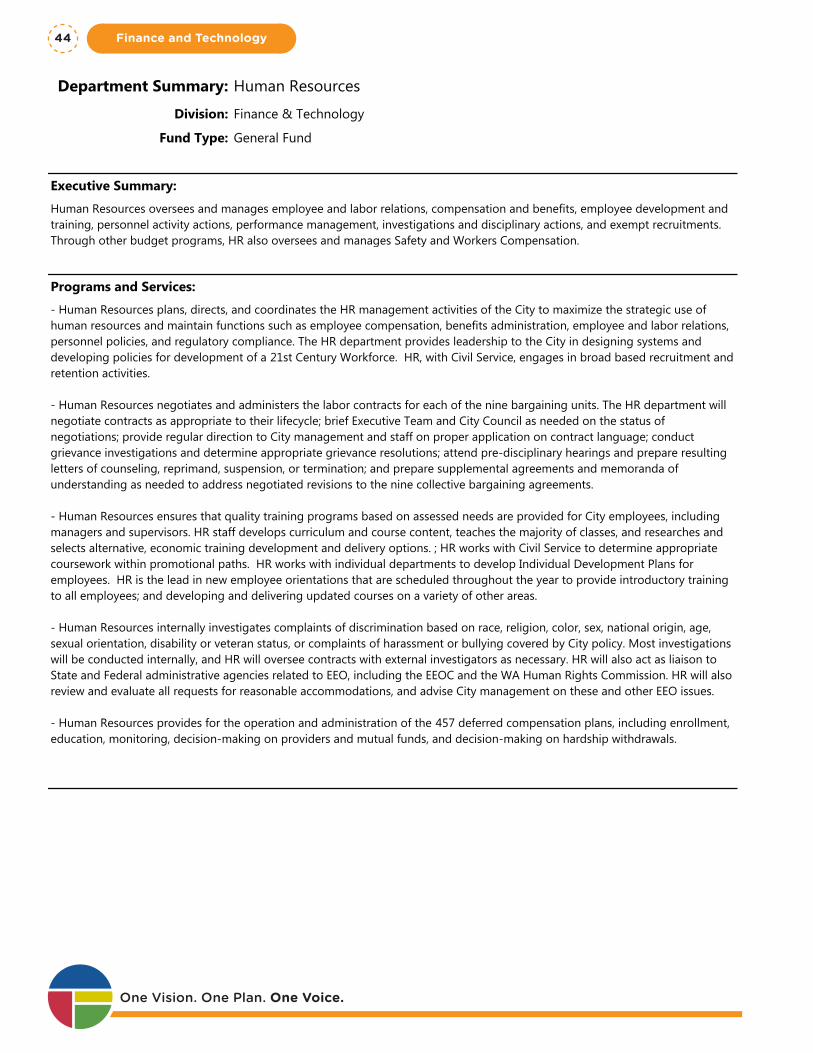
Department Summary: Human Resources
Division: Finance & Technology
Fund Type: General Fund
Executive Summary:
Human Resources oversees and manages employee and labor relations, compensation and benefits, employee development and training, personnel activity actions, performance management, investigations and disciplinary actions, and exempt recruitments. Through other budget programs, HR also oversees and manages Safety and Workers Compensation.
Programs and Services:
- Human Resources plans, directs, and coordinates the HR management activities of the City to maximize the strategic use of human resources and maintain functions such as employee compensation, benefits administration, employee and labor relations, personnel policies, and regulatory compliance. The HR department provides leadership to the City in designing systems and developing policies for development of a 21st Century Workforce. HR, with Civil Service, engages in broad based recruitment and retention activities.
- Human Resources negotiates and administers the labor contracts for each of the nine bargaining units. The HR department will negotiate contracts as appropriate to their lifecycle; brief Executive Team and City Council as needed on the status of negotiations; provide regular direction to City management and staff on proper application on contract language; conduct grievance investigations and determine appropriate grievance resolutions; attend pre-disciplinary hearings and prepare resulting letters of counseling, reprimand, suspension, or termination; and prepare supplemental agreements and memoranda of understanding as needed to address negotiated revisions to the nine collective bargaining agreements.
- Human Resources ensures that quality training programs based on assessed needs are provided for City employees, including managers and supervisors. HR staff develops curriculum and course content, teaches the majority of classes, and researches and selects alternative, economic training development and delivery options. ; HR works with Civil Service to determine appropriate coursework within promotional paths. HR works with individual departments to develop Individual Development Plans for employees. HR is the lead in new employee orientations that are scheduled throughout the year to provide introductory training to all employees; and developing and delivering updated courses on a variety of other areas.
- Human Resources internally investigates complaints of discrimination based on race, religion, color, sex, national origin, age, sexual orientation, disability or veteran status, or complaints of harassment or bullying covered by City policy. Most investigations will be conducted internally, and HR will oversee contracts with external investigators as necessary. HR will also act as liaison to State and Federal administrative agencies related to EEO, including the EEOC and the WA Human Rights Commission. HR will also review and evaluate all requests for reasonable accommodations, and advise City management on these and other EEO issues.
- Human Resources provides for the operation and administration of the 457 deferred compensation plans, including enrollment, education, monitoring, decision-making on providers and mutual funds, and decision-making on hardship withdrawals.
FTEs
2015 Actual 2016 Actual 2017 Actual 2018 Budget 2019 Proposed
Total FTEs 8.10 8.05 9.05 9.65 9.65
Expenditures:
2015 Actual 2016 Actual 2017 Actual 2018 Budget 2019 Proposed
Capital Outlay 0 0 0 0 0
Interfund Charges 858 755 325 1,000 1,000
Reserve for Budget Adjustment 0 0 0 0 0
Transfers Out 0 0 0 0 0One Vision. One Plan. One Voice.
Finance and Technology44
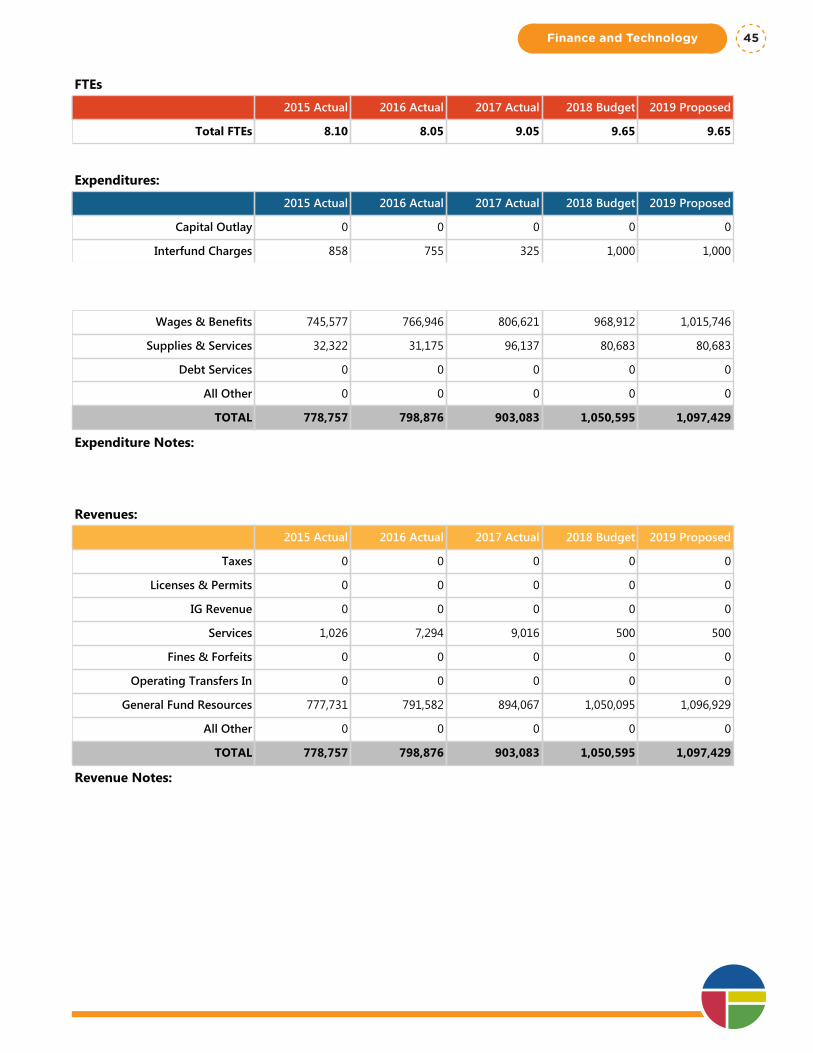
Department Summary: Human Resources
Division: Finance & Technology
Fund Type: General Fund
Executive Summary:
Human Resources oversees and manages employee and labor relations, compensation and benefits, employee development and training, personnel activity actions, performance management, investigations and disciplinary actions, and exempt recruitments. Through other budget programs, HR also oversees and manages Safety and Workers Compensation.
Programs and Services:
- Human Resources plans, directs, and coordinates the HR management activities of the City to maximize the strategic use of human resources and maintain functions such as employee compensation, benefits administration, employee and labor relations, personnel policies, and regulatory compliance. The HR department provides leadership to the City in designing systems and developing policies for development of a 21st Century Workforce. HR, with Civil Service, engages in broad based recruitment and retention activities.
- Human Resources negotiates and administers the labor contracts for each of the nine bargaining units. The HR department will negotiate contracts as appropriate to their lifecycle; brief Executive Team and City Council as needed on the status of negotiations; provide regular direction to City management and staff on proper application on contract language; conduct grievance investigations and determine appropriate grievance resolutions; attend pre-disciplinary hearings and prepare resulting letters of counseling, reprimand, suspension, or termination; and prepare supplemental agreements and memoranda of understanding as needed to address negotiated revisions to the nine collective bargaining agreements.
- Human Resources ensures that quality training programs based on assessed needs are provided for City employees, including managers and supervisors. HR staff develops curriculum and course content, teaches the majority of classes, and researches and selects alternative, economic training development and delivery options. ; HR works with Civil Service to determine appropriate coursework within promotional paths. HR works with individual departments to develop Individual Development Plans for employees. HR is the lead in new employee orientations that are scheduled throughout the year to provide introductory training to all employees; and developing and delivering updated courses on a variety of other areas.
- Human Resources internally investigates complaints of discrimination based on race, religion, color, sex, national origin, age, sexual orientation, disability or veteran status, or complaints of harassment or bullying covered by City policy. Most investigations will be conducted internally, and HR will oversee contracts with external investigators as necessary. HR will also act as liaison to State and Federal administrative agencies related to EEO, including the EEOC and the WA Human Rights Commission. HR will also review and evaluate all requests for reasonable accommodations, and advise City management on these and other EEO issues.
- Human Resources provides for the operation and administration of the 457 deferred compensation plans, including enrollment, education, monitoring, decision-making on providers and mutual funds, and decision-making on hardship withdrawals.
FTEs
2015 Actual 2016 Actual 2017 Actual 2018 Budget 2019 Proposed
Total FTEs 8.10 8.05 9.05 9.65 9.65
Expenditures:
2015 Actual 2016 Actual 2017 Actual 2018 Budget 2019 Proposed
Capital Outlay 0 0 0 0 0
Interfund Charges 858 755 325 1,000 1,000
Reserve for Budget Adjustment 0 0 0 0 0
Transfers Out 0 0 0 0 0
Wages & Benefits 745,577 766,946 806,621 968,912 1,015,746
Supplies & Services 32,322 31,175 96,137 80,683 80,683
Debt Services 0 0 0 0 0
All Other 0 0 0 0 0
TOTAL 778,757 798,876 903,083 1,050,595 1,097,429
Expenditure Notes:
Revenues:
2015 Actual 2016 Actual 2017 Actual 2018 Budget 2019 Proposed
Taxes 0 0 0 0 0
Licenses & Permits 0 0 0 0 0
IG Revenue 0 0 0 0 0
Services 1,026 7,294 9,016 500 500
Fines & Forfeits 0 0 0 0 0
Operating Transfers In 0 0 0 0 0
General Fund Resources 777,731 791,582 894,067 1,050,095 1,096,929
All Other 0 0 0 0 0
TOTAL 778,757 798,876 903,083 1,050,595 1,097,429
Revenue Notes:
Finance and Technology 45

One Vision. One Plan. One Voice.
Finance and Technology46
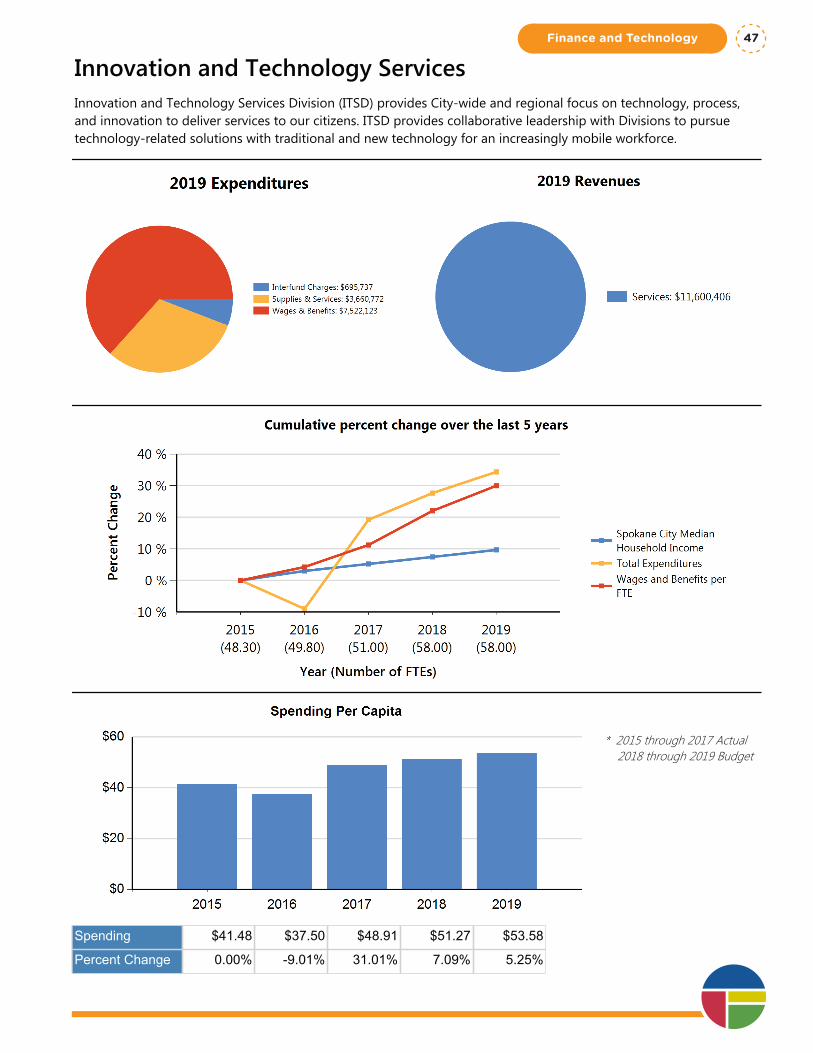
Innovation and Technology Services Innovation and Technology Services Division (ITSD) provides City-wide and regional focus on technology, process, and innovation to deliver services to our citizens. ITSD provides collaborative leadership with Divisions to pursue technology-related solutions with traditional and new technology for an increasingly mobile workforce.
* 2015 through 2017 Actual 2018 through 2019 Budget
Spending $41.48 $37.50 $48.91 $51.27 $53.58
Percent Change 0.00% -9.01% 31.01% 7.09% 5.25%
Finance and Technology 47
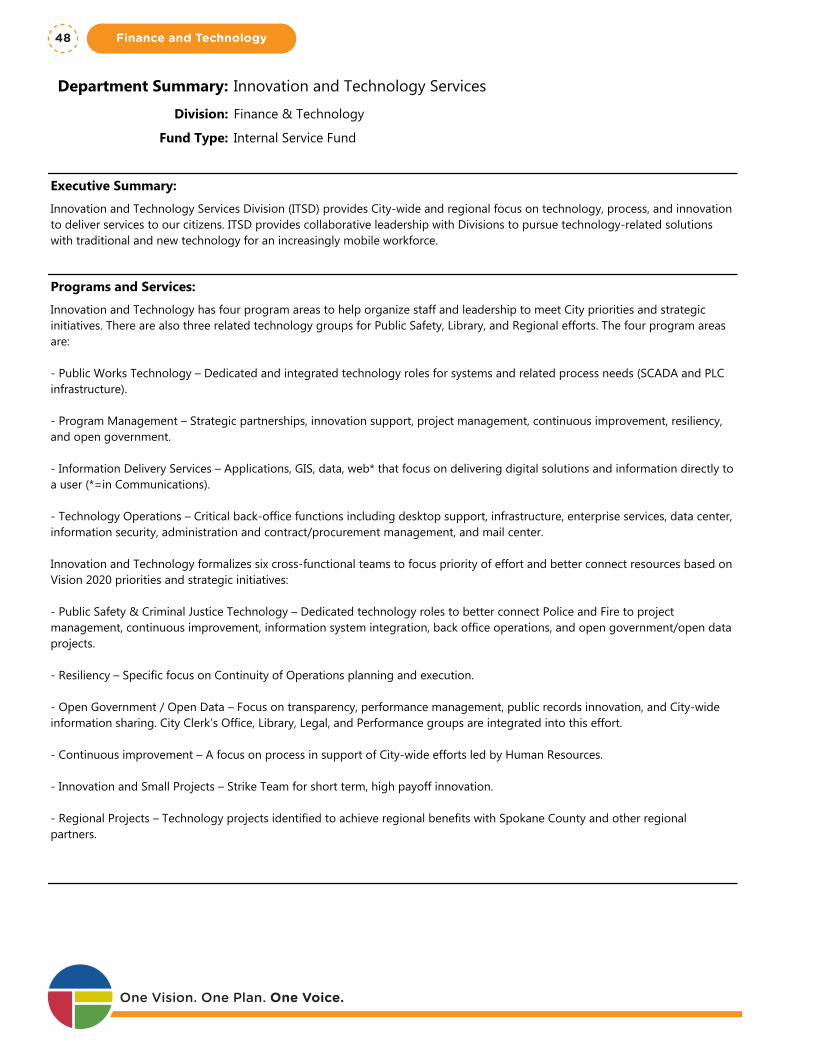
Department Summary: Innovation and Technology Services
Division: Finance & Technology
Fund Type: Internal Service Fund
Executive Summary:
Innovation and Technology Services Division (ITSD) provides City-wide and regional focus on technology, process, and innovation to deliver services to our citizens. ITSD provides collaborative leadership with Divisions to pursue technology-related solutions with traditional and new technology for an increasingly mobile workforce.
Programs and Services:
Innovation and Technology has four program areas to help organize staff and leadership to meet City priorities and strategic initiatives. There are also three related technology groups for Public Safety, Library, and Regional efforts. The four program areas are:
- Public Works Technology – Dedicated and integrated technology roles for systems and related process needs (SCADA and PLC infrastructure).
- Program Management – Strategic partnerships, innovation support, project management, continuous improvement, resiliency, and open government.
- Information Delivery Services – Applications, GIS, data, web* that focus on delivering digital solutions and information directly to a user (*=in Communications).
- Technology Operations – Critical back-office functions including desktop support, infrastructure, enterprise services, data center, information security, administration and contract/procurement management, and mail center.
Innovation and Technology formalizes six cross-functional teams to focus priority of effort and better connect resources based on Vision 2020 priorities and strategic initiatives:
- Public Safety & Criminal Justice Technology – Dedicated technology roles to better connect Police and Fire to project management, continuous improvement, information system integration, back office operations, and open government/open data projects.
- Resiliency – Specific focus on Continuity of Operations planning and execution.
- Open Government / Open Data – Focus on transparency, performance management, public records innovation, and City-wide information sharing. City Clerk’s Office, Library, Legal, and Performance groups are integrated into this effort.
- Continuous improvement – A focus on process in support of City-wide efforts led by Human Resources.
- Innovation and Small Projects – Strike Team for short term, high payoff innovation.
- Regional Projects – Technology projects identified to achieve regional benefits with Spokane County and other regional partners.
FTEs
2015 Actual 2016 Actual 2017 Actual 2018 Budget 2019 Proposed
Total FTEs 48.30 49.80 51.00 58.00 58.00
Expenditures:
2015 Actual 2016 Actual 2017 Actual 2018 Budget 2019 ProposedOne Vision. One Plan. One Voice.
Finance and Technology48
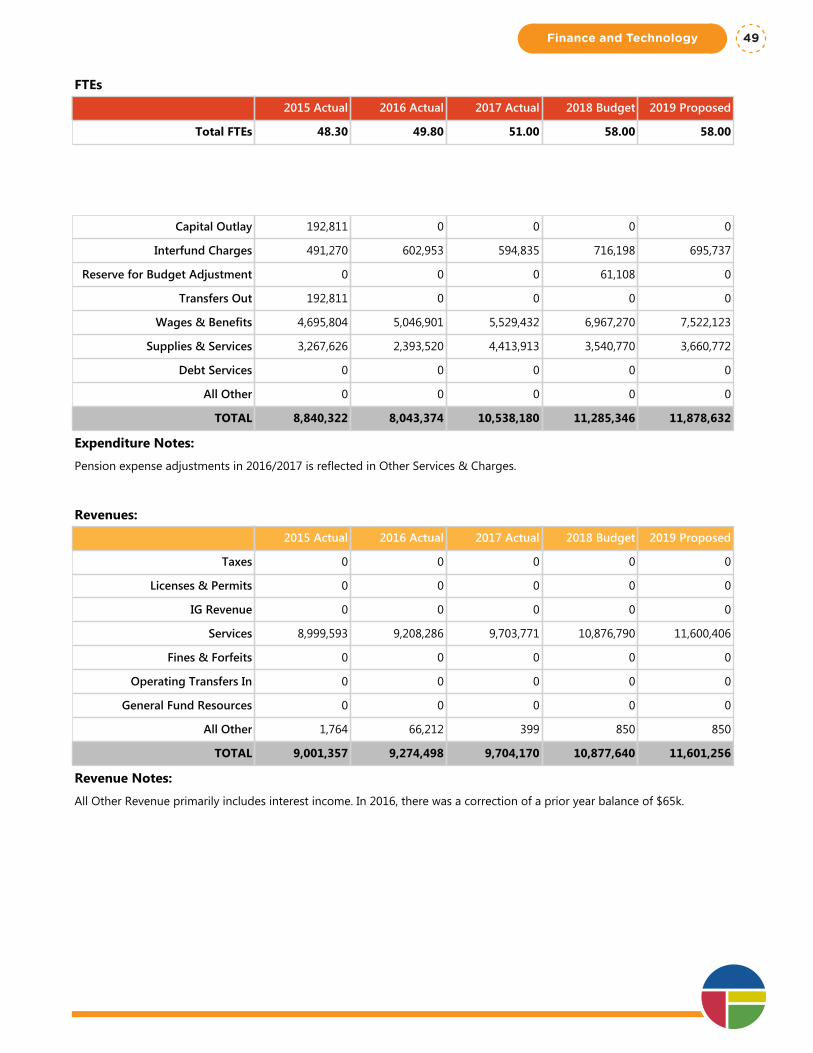
Department Summary: Innovation and Technology Services
Division: Finance & Technology
Fund Type: Internal Service Fund
Executive Summary:
Innovation and Technology Services Division (ITSD) provides City-wide and regional focus on technology, process, and innovation to deliver services to our citizens. ITSD provides collaborative leadership with Divisions to pursue technology-related solutions with traditional and new technology for an increasingly mobile workforce.
Programs and Services:
Innovation and Technology has four program areas to help organize staff and leadership to meet City priorities and strategic initiatives. There are also three related technology groups for Public Safety, Library, and Regional efforts. The four program areas are:
- Public Works Technology – Dedicated and integrated technology roles for systems and related process needs (SCADA and PLC infrastructure).
- Program Management – Strategic partnerships, innovation support, project management, continuous improvement, resiliency, and open government.
- Information Delivery Services – Applications, GIS, data, web* that focus on delivering digital solutions and information directly to a user (*=in Communications).
- Technology Operations – Critical back-office functions including desktop support, infrastructure, enterprise services, data center, information security, administration and contract/procurement management, and mail center.
Innovation and Technology formalizes six cross-functional teams to focus priority of effort and better connect resources based on Vision 2020 priorities and strategic initiatives:
- Public Safety & Criminal Justice Technology – Dedicated technology roles to better connect Police and Fire to project management, continuous improvement, information system integration, back office operations, and open government/open data projects.
- Resiliency – Specific focus on Continuity of Operations planning and execution.
- Open Government / Open Data – Focus on transparency, performance management, public records innovation, and City-wide information sharing. City Clerk’s Office, Library, Legal, and Performance groups are integrated into this effort.
- Continuous improvement – A focus on process in support of City-wide efforts led by Human Resources.
- Innovation and Small Projects – Strike Team for short term, high payoff innovation.
- Regional Projects – Technology projects identified to achieve regional benefits with Spokane County and other regional partners.
FTEs
2015 Actual 2016 Actual 2017 Actual 2018 Budget 2019 Proposed
Total FTEs 48.30 49.80 51.00 58.00 58.00
Expenditures:
2015 Actual 2016 Actual 2017 Actual 2018 Budget 2019 Proposed
Capital Outlay 192,811 0 0 0 0
Interfund Charges 491,270 602,953 594,835 716,198 695,737
Reserve for Budget Adjustment 0 0 0 61,108 0
Transfers Out 192,811 0 0 0 0
Wages & Benefits 4,695,804 5,046,901 5,529,432 6,967,270 7,522,123
Supplies & Services 3,267,626 2,393,520 4,413,913 3,540,770 3,660,772
Debt Services 0 0 0 0 0
All Other 0 0 0 0 0
TOTAL 8,840,322 8,043,374 10,538,180 11,285,346 11,878,632
Expenditure Notes:
Pension expense adjustments in 2016/2017 is reflected in Other Services & Charges.
Revenues:
2015 Actual 2016 Actual 2017 Actual 2018 Budget 2019 Proposed
Taxes 0 0 0 0 0
Licenses & Permits 0 0 0 0 0
IG Revenue 0 0 0 0 0
Services 8,999,593 9,208,286 9,703,771 10,876,790 11,600,406
Fines & Forfeits 0 0 0 0 0
Operating Transfers In 0 0 0 0 0
General Fund Resources 0 0 0 0 0
All Other 1,764 66,212 399 850 850
TOTAL 9,001,357 9,274,498 9,704,170 10,877,640 11,601,256
Revenue Notes:
All Other Revenue primarily includes interest income. In 2016, there was a correction of a prior year balance of $65k.
Finance and Technology 49
Program Summary: Applications
Division: Finance & Technology
Fund Type: Internal Service Fund
Executive Summary:
Applications are the computer programs designed or purchased, installed, and maintained by the IT department to support the business operations of all City departments.
Programs and Services:
Computer applications support nearly every function of City government. Examples are the financial management system, the utility billing system, the permitting and licensing system, the fixed assets system, the fleet maintenance management system, the infrastructure management system, the human resources/payroll system, the document management system, the parking enforcement system, and several smaller department specific applications, as well as, many single-user database systems. IT staff designs and builds or procures these systems, and installs and configures them for City users. Additionally, these systems are all in a continuous state of upgrade or maintenance.
FTEs
2015 Actual 2016 Actual 2017 Actual 2018 Budget 2019 Proposed
Total FTEs 20.43 20.43 18.58 17.00 16.00
Expenditures:
2015 Actual 2016 Actual 2017 Actual 2018 Budget 2019 Proposed
Capital Outlay 1,213 0 0 0 0
Interfund Charges 0 0 0 0 0
Reserve for Budget Adjustment 0 0 0 0 0
Transfers Out 1,213 0 0 0 0
Wages & Benefits 1,789,704 1,747,058 1,797,359 1,824,001 1,795,374
Supplies & Services 879,410 890,815 835,234 973,440 1,019,551
Debt Services 0 0 0 0 0
All Other 0 0 0 0 0
TOTAL 2,671,540 2,637,873 2,632,593 2,797,441 2,814,925
Expenditure Notes:
Revenues:
2015 Actual 2016 Actual 2017 Actual 2018 Budget 2019 Proposed
Taxes 0 0 0 0 0
Licenses & Permits 0 0 0 0 0
IG Revenue 0 0 0 0 0
Services 0 0 0 2,797,441 2,814,925
Fines & Forfeits 0 0 0 0 0One Vision. One Plan. One Voice.
Finance and Technology50
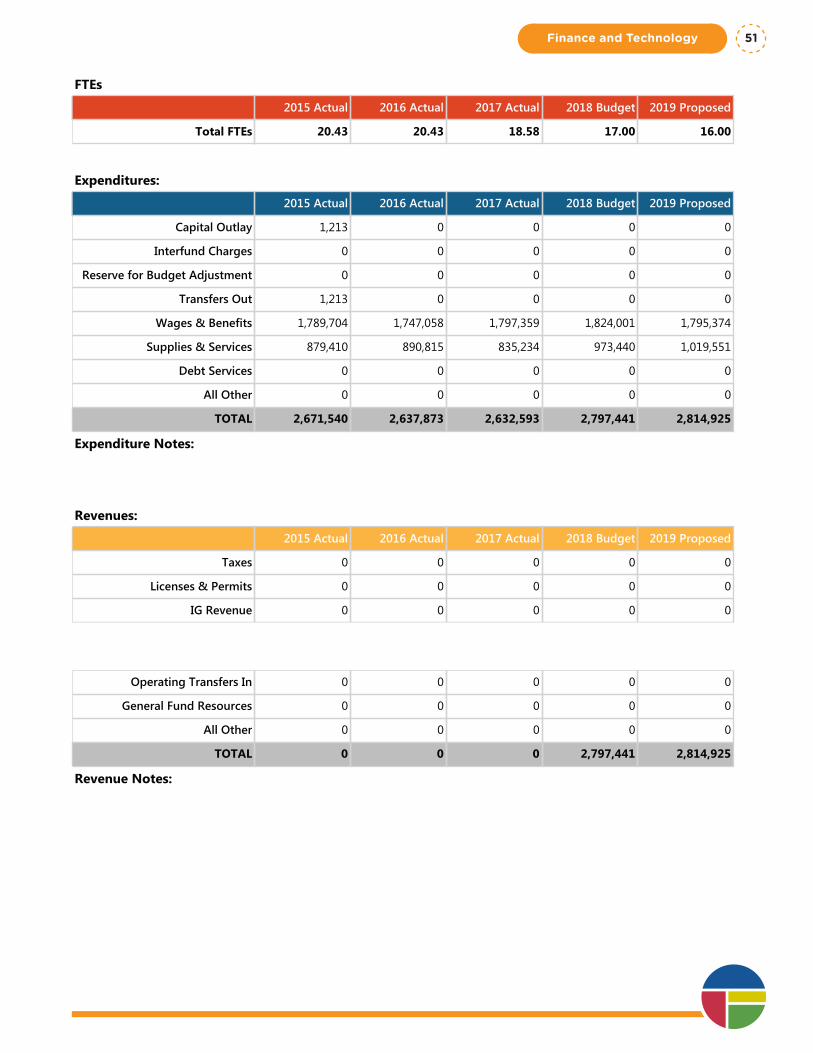
Program Summary: Applications
Division: Finance & Technology
Fund Type: Internal Service Fund
Executive Summary:
Applications are the computer programs designed or purchased, installed, and maintained by the IT department to support the business operations of all City departments.
Programs and Services:
Computer applications support nearly every function of City government. Examples are the financial management system, the utility billing system, the permitting and licensing system, the fixed assets system, the fleet maintenance management system, the infrastructure management system, the human resources/payroll system, the document management system, the parking enforcement system, and several smaller department specific applications, as well as, many single-user database systems. IT staff designs and builds or procures these systems, and installs and configures them for City users. Additionally, these systems are all in a continuous state of upgrade or maintenance.
FTEs
2015 Actual 2016 Actual 2017 Actual 2018 Budget 2019 Proposed
Total FTEs 20.43 20.43 18.58 17.00 16.00
Expenditures:
2015 Actual 2016 Actual 2017 Actual 2018 Budget 2019 Proposed
Capital Outlay 1,213 0 0 0 0
Interfund Charges 0 0 0 0 0
Reserve for Budget Adjustment 0 0 0 0 0
Transfers Out 1,213 0 0 0 0
Wages & Benefits 1,789,704 1,747,058 1,797,359 1,824,001 1,795,374
Supplies & Services 879,410 890,815 835,234 973,440 1,019,551
Debt Services 0 0 0 0 0
All Other 0 0 0 0 0
TOTAL 2,671,540 2,637,873 2,632,593 2,797,441 2,814,925
Expenditure Notes:
Revenues:
2015 Actual 2016 Actual 2017 Actual 2018 Budget 2019 Proposed
Taxes 0 0 0 0 0
Licenses & Permits 0 0 0 0 0
IG Revenue 0 0 0 0 0
Services 0 0 0 2,797,441 2,814,925
Fines & Forfeits 0 0 0 0 0
Operating Transfers In 0 0 0 0 0
General Fund Resources 0 0 0 0 0
All Other 0 0 0 0 0
TOTAL 0 0 0 2,797,441 2,814,925
Revenue Notes:
Finance and Technology 51
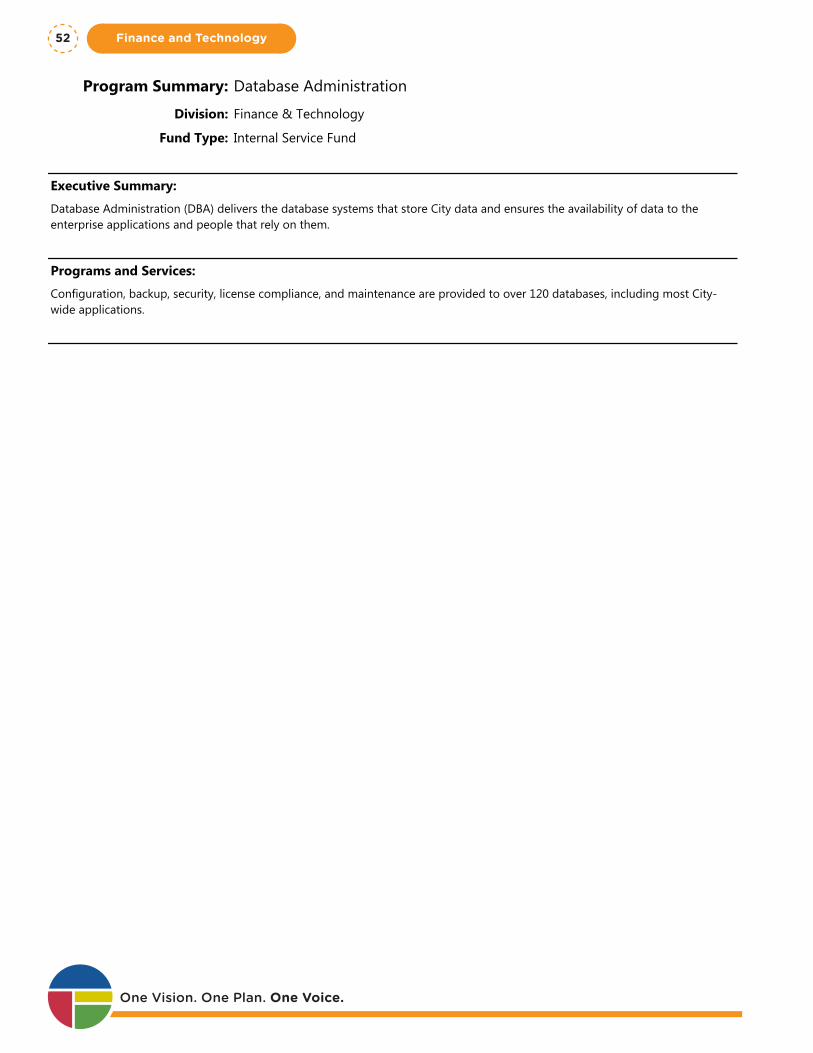
Program Summary: Database Administration
Division: Finance & Technology
Fund Type: Internal Service Fund
Executive Summary:
Database Administration (DBA) delivers the database systems that store City data and ensures the availability of data to the enterprise applications and people that rely on them.
Programs and Services:
Configuration, backup, security, license compliance, and maintenance are provided to over 120 databases, including most City-wide applications.
FTEs
2015 Actual 2016 Actual 2017 Actual 2018 Budget 2019 Proposed
Total FTEs 0.57 0.57 1.00 2.00 2.00
Expenditures:
2015 Actual 2016 Actual 2017 Actual 2018 Budget 2019 Proposed
Capital Outlay 0 0 0 0 0
Interfund Charges 0 0 0 0 0
Reserve for Budget Adjustment 0 0 0 0 0
Transfers Out 0 0 0 0 0
Wages & Benefits 71,308 74,698 190,664 312,401 301,352
Supplies & Services 116,148 40,996 107,278 107,485 167,649
Debt Services 0 0 0 0 0
All Other 0 0 0 0 0
TOTAL 187,456 115,694 297,942 419,886 469,001
Expenditure Notes:
Revenues:
2015 Actual 2016 Actual 2017 Actual 2018 Budget 2019 Proposed
Taxes 0 0 0 0 0
Licenses & Permits 0 0 0 0 0
IG Revenue 0 0 0 0 0
Services 0 0 0 419,886 469,001
Fines & Forfeits 0 0 0 0 0
Operating Transfers In 0 0 0 0 0
General Fund Resources 0 0 0 0 0
All Other 0 0 0 0 0One Vision. One Plan. One Voice.
Finance and Technology52
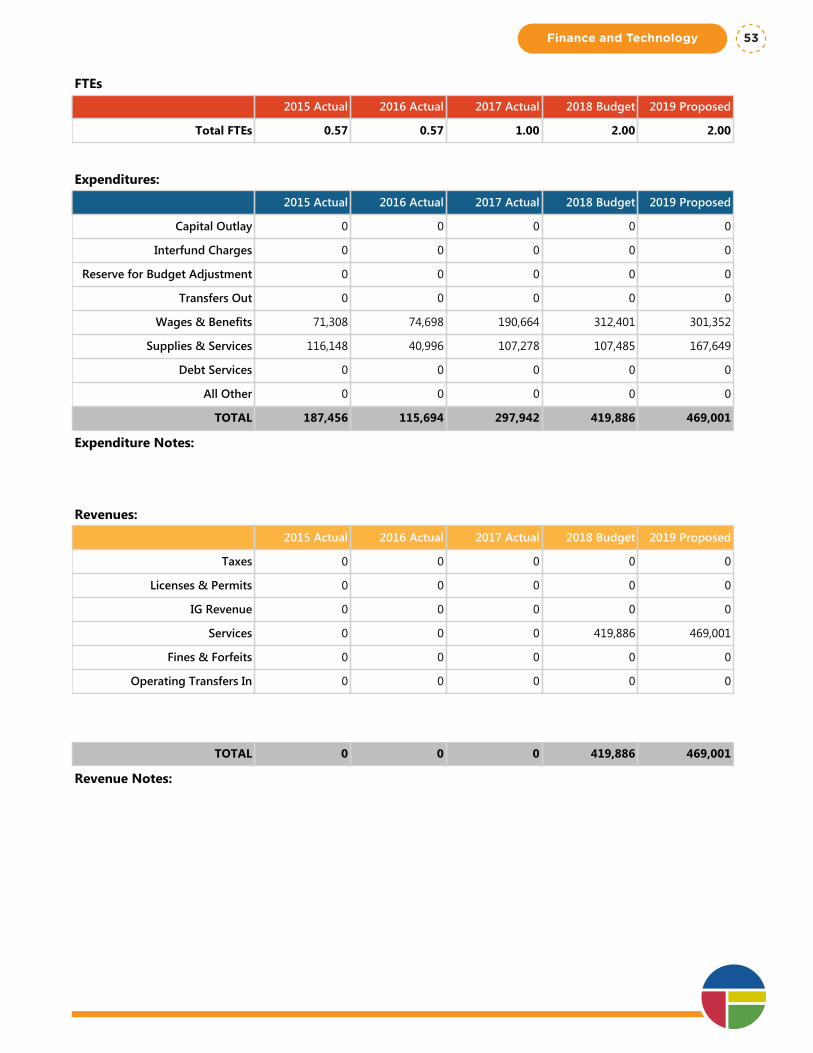
Program Summary: Database Administration
Division: Finance & Technology
Fund Type: Internal Service Fund
Executive Summary:
Database Administration (DBA) delivers the database systems that store City data and ensures the availability of data to the enterprise applications and people that rely on them.
Programs and Services:
Configuration, backup, security, license compliance, and maintenance are provided to over 120 databases, including most City-wide applications.
FTEs
2015 Actual 2016 Actual 2017 Actual 2018 Budget 2019 Proposed
Total FTEs 0.57 0.57 1.00 2.00 2.00
Expenditures:
2015 Actual 2016 Actual 2017 Actual 2018 Budget 2019 Proposed
Capital Outlay 0 0 0 0 0
Interfund Charges 0 0 0 0 0
Reserve for Budget Adjustment 0 0 0 0 0
Transfers Out 0 0 0 0 0
Wages & Benefits 71,308 74,698 190,664 312,401 301,352
Supplies & Services 116,148 40,996 107,278 107,485 167,649
Debt Services 0 0 0 0 0
All Other 0 0 0 0 0
TOTAL 187,456 115,694 297,942 419,886 469,001
Expenditure Notes:
Revenues:
2015 Actual 2016 Actual 2017 Actual 2018 Budget 2019 Proposed
Taxes 0 0 0 0 0
Licenses & Permits 0 0 0 0 0
IG Revenue 0 0 0 0 0
Services 0 0 0 419,886 469,001
Fines & Forfeits 0 0 0 0 0
Operating Transfers In 0 0 0 0 0
General Fund Resources 0 0 0 0 0
All Other 0 0 0 0 0
TOTAL 0 0 0 419,886 469,001
Revenue Notes:
Finance and Technology 53
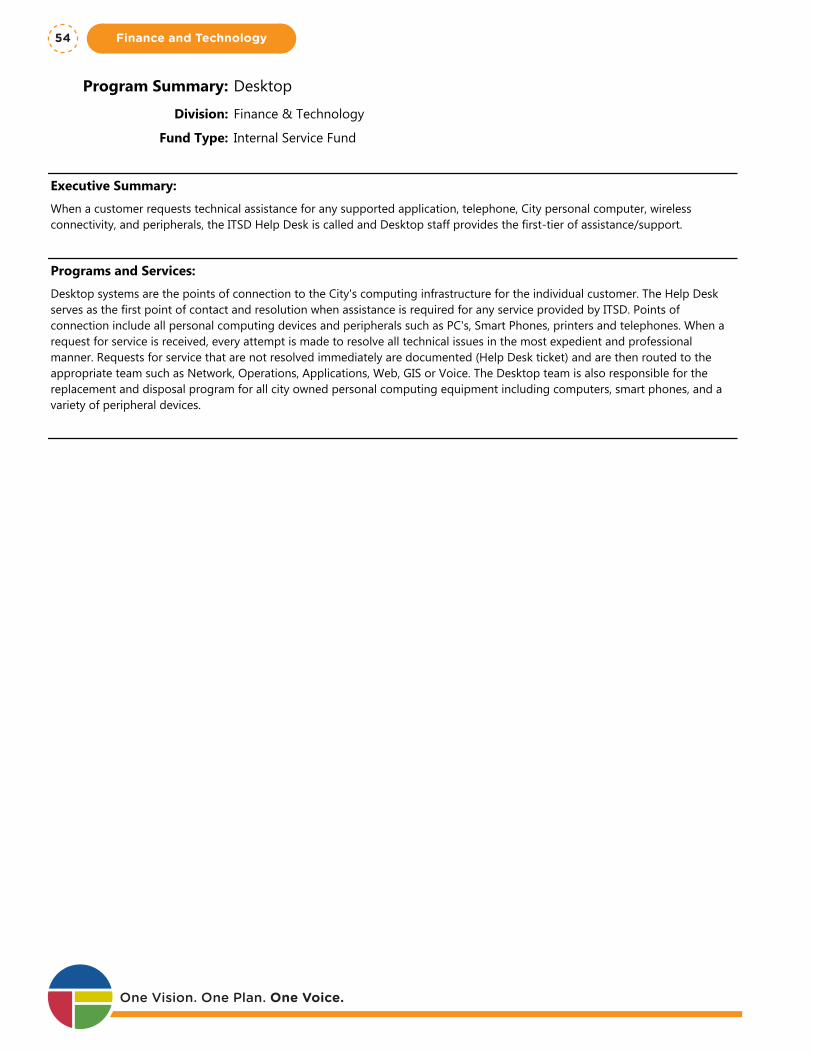
Program Summary: Desktop
Division: Finance & Technology
Fund Type: Internal Service Fund
Executive Summary:
When a customer requests technical assistance for any supported application, telephone, City personal computer, wireless connectivity, and peripherals, the ITSD Help Desk is called and Desktop staff provides the first-tier of assistance/support.
Programs and Services:
Desktop systems are the points of connection to the City's computing infrastructure for the individual customer. The Help Desk serves as the first point of contact and resolution when assistance is required for any service provided by ITSD. Points of connection include all personal computing devices and peripherals such as PC's, Smart Phones, printers and telephones. When a request for service is received, every attempt is made to resolve all technical issues in the most expedient and professional manner. Requests for service that are not resolved immediately are documented (Help Desk ticket) and are then routed to the appropriate team such as Network, Operations, Applications, Web, GIS or Voice. The Desktop team is also responsible for the replacement and disposal program for all city owned personal computing equipment including computers, smart phones, and a variety of peripheral devices.
FTEs
2015 Actual 2016 Actual 2017 Actual 2018 Budget 2019 Proposed
Total FTEs 7.50 8.00 8.00 9.00 9.25
Expenditures:
2015 Actual 2016 Actual 2017 Actual 2018 Budget 2019 Proposed
Capital Outlay 78,507 0 0 0 0
Interfund Charges 0 0 0 0 0
Reserve for Budget Adjustment 0 0 0 0 0
Transfers Out 78,507 0 0 0 0
Wages & Benefits 642,445 800,886 833,976 899,788 986,362
Supplies & Services 453,283 461,113 443,462 528,447 539,942
Debt Services 0 0 0 0 0
All Other 0 0 0 0 0
TOTAL 1,252,742 1,261,999 1,277,438 1,428,235 1,526,304
Expenditure Notes:
Revenues:
2015 Actual 2016 Actual 2017 Actual 2018 Budget 2019 Proposed
Taxes 0 0 0 0 0
Licenses & Permits 0 0 0 0 0
IG Revenue 0 0 0 0 0
Services 0 0 0 1,428,235 1,526,304One Vision. One Plan. One Voice.
Finance and Technology54

Program Summary: Desktop
Division: Finance & Technology
Fund Type: Internal Service Fund
Executive Summary:
When a customer requests technical assistance for any supported application, telephone, City personal computer, wireless connectivity, and peripherals, the ITSD Help Desk is called and Desktop staff provides the first-tier of assistance/support.
Programs and Services:
Desktop systems are the points of connection to the City's computing infrastructure for the individual customer. The Help Desk serves as the first point of contact and resolution when assistance is required for any service provided by ITSD. Points of connection include all personal computing devices and peripherals such as PC's, Smart Phones, printers and telephones. When a request for service is received, every attempt is made to resolve all technical issues in the most expedient and professional manner. Requests for service that are not resolved immediately are documented (Help Desk ticket) and are then routed to the appropriate team such as Network, Operations, Applications, Web, GIS or Voice. The Desktop team is also responsible for the replacement and disposal program for all city owned personal computing equipment including computers, smart phones, and a variety of peripheral devices.
FTEs
2015 Actual 2016 Actual 2017 Actual 2018 Budget 2019 Proposed
Total FTEs 7.50 8.00 8.00 9.00 9.25
Expenditures:
2015 Actual 2016 Actual 2017 Actual 2018 Budget 2019 Proposed
Capital Outlay 78,507 0 0 0 0
Interfund Charges 0 0 0 0 0
Reserve for Budget Adjustment 0 0 0 0 0
Transfers Out 78,507 0 0 0 0
Wages & Benefits 642,445 800,886 833,976 899,788 986,362
Supplies & Services 453,283 461,113 443,462 528,447 539,942
Debt Services 0 0 0 0 0
All Other 0 0 0 0 0
TOTAL 1,252,742 1,261,999 1,277,438 1,428,235 1,526,304
Expenditure Notes:
Revenues:
2015 Actual 2016 Actual 2017 Actual 2018 Budget 2019 Proposed
Taxes 0 0 0 0 0
Licenses & Permits 0 0 0 0 0
IG Revenue 0 0 0 0 0
Services 0 0 0 1,428,235 1,526,304
Fines & Forfeits 0 0 0 0 0
Operating Transfers In 0 0 0 0 0
General Fund Resources 0 0 0 0 0
All Other 0 0 0 0 0
TOTAL 0 0 0 1,428,235 1,526,304
Revenue Notes:
Finance and Technology 55
Program Summary: Enterprise Services
Division: Finance & Technology
Fund Type: Internal Service Fund
Executive Summary:
Technology Operations – Enterprise Services represent critical back-office functions including server administration, data center, cloud services, public records support, administration and systems access related efforts.
Programs and Services:
Services include administration and update of servers and data center systems to run more than 1000 applications, services and platforms so that departments can provides services to the City and it's citizens. This includes data storage and archival, cloud services, centralized printing, video security, business continuity and disaster recovery, records management, public records support, email management, access credentialing, and related server administration services.
FTEs
2015 Actual 2016 Actual 2017 Actual 2018 Budget 2019 Proposed
Total FTEs 5.00 5.00 5.00 5.70 5.50
Expenditures:
2015 Actual 2016 Actual 2017 Actual 2018 Budget 2019 Proposed
Capital Outlay 70,561 0 0 0 0
Interfund Charges 0 0 0 0 0
Reserve for Budget Adjustment 0 0 0 61,108 0
Transfers Out 70,561 0 0 0 0
Wages & Benefits 550,282 547,430 527,630 710,845 767,106
Supplies & Services 701,437 555,348 688,952 667,715 599,085
Debt Services 0 0 0 0 0
All Other 0 0 0 0 0
TOTAL 1,392,841 1,102,778 1,216,582 1,439,668 1,366,191
Expenditure Notes:
Revenues:
2015 Actual 2016 Actual 2017 Actual 2018 Budget 2019 Proposed
Taxes 0 0 0 0 0
Licenses & Permits 0 0 0 0 0
IG Revenue 0 0 0 0 0
Services 0 0 0 1,439,668 1,366,191
Fines & Forfeits 0 0 0 0 0
Operating Transfers In 0 0 0 0 0
General Fund Resources 0 0 0 0 0One Vision. One Plan. One Voice.
Finance and Technology56
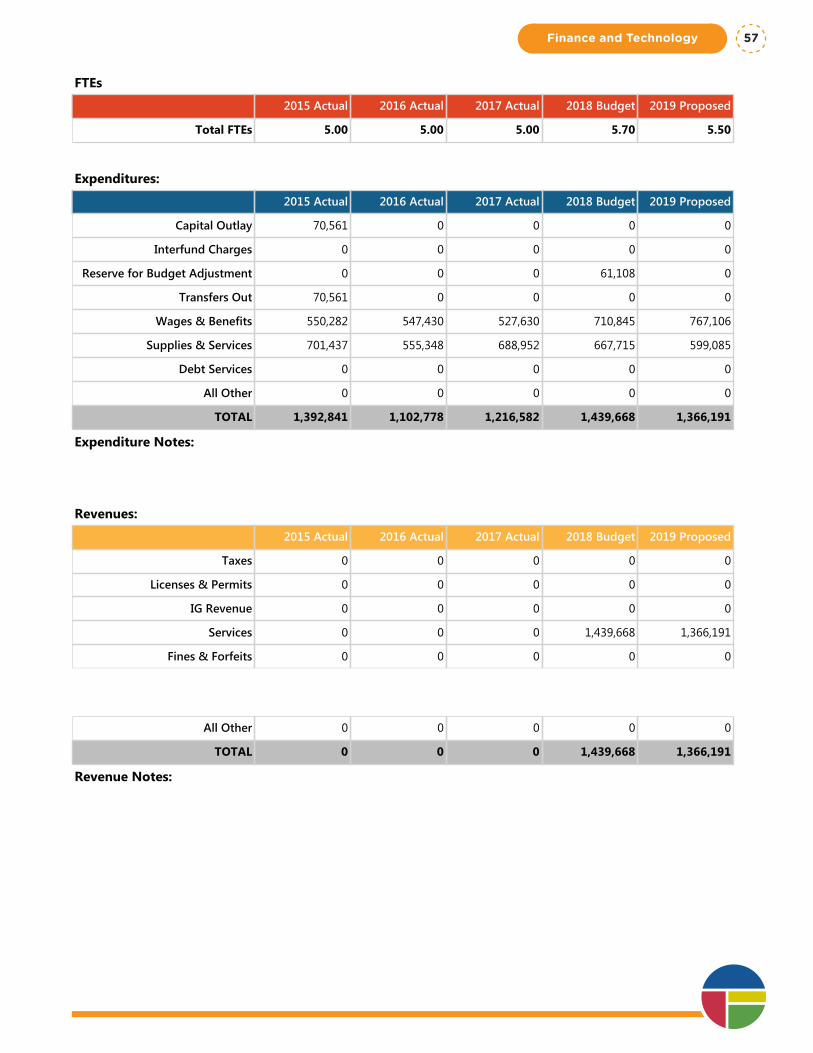
Program Summary: Enterprise Services
Division: Finance & Technology
Fund Type: Internal Service Fund
Executive Summary:
Technology Operations – Enterprise Services represent critical back-office functions including server administration, data center, cloud services, public records support, administration and systems access related efforts.
Programs and Services:
Services include administration and update of servers and data center systems to run more than 1000 applications, services and platforms so that departments can provides services to the City and it's citizens. This includes data storage and archival, cloud services, centralized printing, video security, business continuity and disaster recovery, records management, public records support, email management, access credentialing, and related server administration services.
FTEs
2015 Actual 2016 Actual 2017 Actual 2018 Budget 2019 Proposed
Total FTEs 5.00 5.00 5.00 5.70 5.50
Expenditures:
2015 Actual 2016 Actual 2017 Actual 2018 Budget 2019 Proposed
Capital Outlay 70,561 0 0 0 0
Interfund Charges 0 0 0 0 0
Reserve for Budget Adjustment 0 0 0 61,108 0
Transfers Out 70,561 0 0 0 0
Wages & Benefits 550,282 547,430 527,630 710,845 767,106
Supplies & Services 701,437 555,348 688,952 667,715 599,085
Debt Services 0 0 0 0 0
All Other 0 0 0 0 0
TOTAL 1,392,841 1,102,778 1,216,582 1,439,668 1,366,191
Expenditure Notes:
Revenues:
2015 Actual 2016 Actual 2017 Actual 2018 Budget 2019 Proposed
Taxes 0 0 0 0 0
Licenses & Permits 0 0 0 0 0
IG Revenue 0 0 0 0 0
Services 0 0 0 1,439,668 1,366,191
Fines & Forfeits 0 0 0 0 0
Operating Transfers In 0 0 0 0 0
General Fund Resources 0 0 0 0 0
All Other 0 0 0 0 0
TOTAL 0 0 0 1,439,668 1,366,191
Revenue Notes:
Finance and Technology 57
Program Summary: GIS
Division: Finance & Technology
Fund Type: Internal Service Fund
Executive Summary:
IT department supports the automated Geographic Information System (GIS). The system is used by most departments, available to City employees on the internet Map website, and Citizens on the external Map website. We use software tools from Environmental Research Systems Institute (ESRI) which is the industry standard.
Programs and Services:
IT provides user departments with computer GIS applications, data storage, and specialized output. Applications are available to customers 24 hours per day, seven days a week. Application support by the analysts is available from 7:30 am through 5:00 pm Monday through Friday. These services include, but are not restricted to, the following:
• Customer training, ad hoc reporting• Customer relations, problem resolution• Project management, software upgrades• Vendor management/contract compliance, design and analysis• Research, testing, documentation• Requirements definitions, programming• Set up and maintenance, data correction• Data base administration, software management tools
More than 1,500 Gigabytes of GIS data is stored. The City has an agreement with Spokane County for the timely exchange of parcel data. The City also has a license to use Digital Orthogonal Photography from AVISTA that is replaced annually. Internally various departments use applications developed by IT staff or GIS qualified staff in their departments to maintain data that is shared through the websites.
FTEs
2015 Actual 2016 Actual 2017 Actual 2018 Budget 2019 Proposed
Total FTEs 4.00 4.00 4.00 4.50 5.00
Expenditures:
2015 Actual 2016 Actual 2017 Actual 2018 Budget 2019 Proposed
Capital Outlay 3,148 0 0 0 0
Interfund Charges 0 0 0 0 0
Reserve for Budget Adjustment 0 0 0 0 0
Transfers Out 3,148 0 0 0 0
Wages & Benefits 414,304 471,005 449,297 518,679 569,924
Supplies & Services 179,766 229,342 306,874 366,514 366,206
Debt Services 0 0 0 0 0
All Other 0 0 0 0 0
One Vision. One Plan. One Voice.
Finance and Technology58
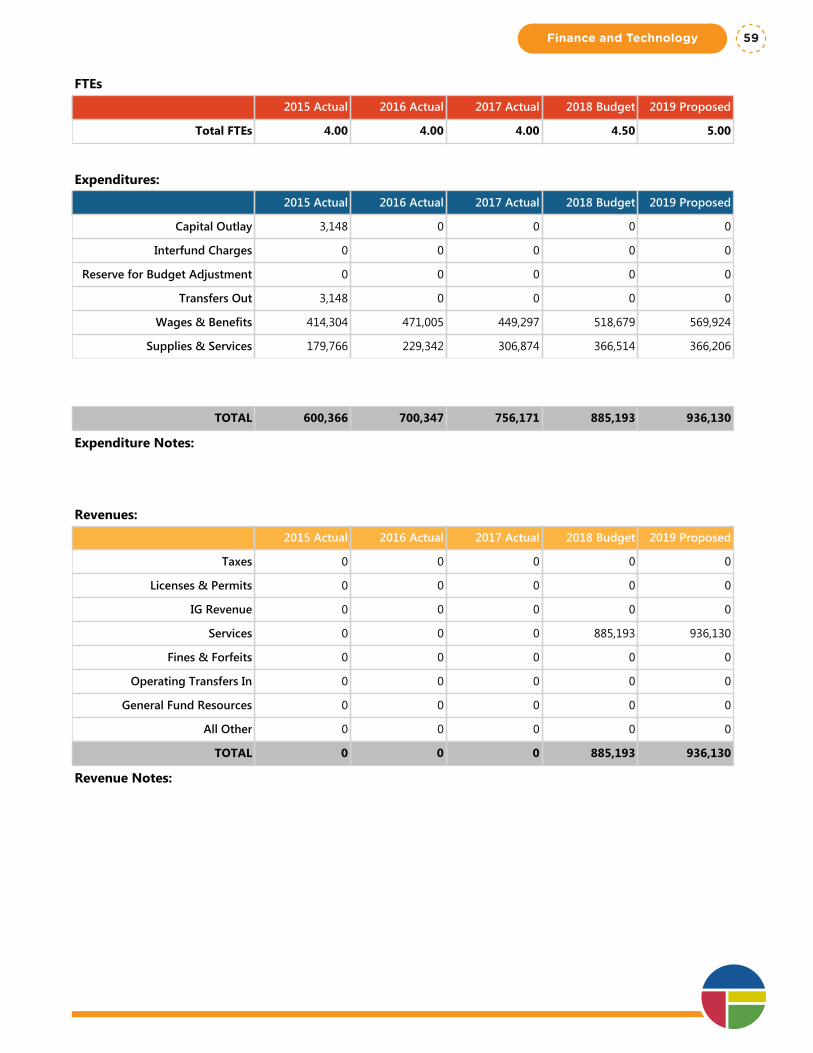
Program Summary: GIS
Division: Finance & Technology
Fund Type: Internal Service Fund
Executive Summary:
IT department supports the automated Geographic Information System (GIS). The system is used by most departments, available to City employees on the internet Map website, and Citizens on the external Map website. We use software tools from Environmental Research Systems Institute (ESRI) which is the industry standard.
Programs and Services:
IT provides user departments with computer GIS applications, data storage, and specialized output. Applications are available to customers 24 hours per day, seven days a week. Application support by the analysts is available from 7:30 am through 5:00 pm Monday through Friday. These services include, but are not restricted to, the following:
• Customer training, ad hoc reporting• Customer relations, problem resolution• Project management, software upgrades• Vendor management/contract compliance, design and analysis• Research, testing, documentation• Requirements definitions, programming• Set up and maintenance, data correction• Data base administration, software management tools
More than 1,500 Gigabytes of GIS data is stored. The City has an agreement with Spokane County for the timely exchange of parcel data. The City also has a license to use Digital Orthogonal Photography from AVISTA that is replaced annually. Internally various departments use applications developed by IT staff or GIS qualified staff in their departments to maintain data that is shared through the websites.
FTEs
2015 Actual 2016 Actual 2017 Actual 2018 Budget 2019 Proposed
Total FTEs 4.00 4.00 4.00 4.50 5.00
Expenditures:
2015 Actual 2016 Actual 2017 Actual 2018 Budget 2019 Proposed
Capital Outlay 3,148 0 0 0 0
Interfund Charges 0 0 0 0 0
Reserve for Budget Adjustment 0 0 0 0 0
Transfers Out 3,148 0 0 0 0
Wages & Benefits 414,304 471,005 449,297 518,679 569,924
Supplies & Services 179,766 229,342 306,874 366,514 366,206
Debt Services 0 0 0 0 0
All Other 0 0 0 0 0
TOTAL 600,366 700,347 756,171 885,193 936,130
Expenditure Notes:
Revenues:
2015 Actual 2016 Actual 2017 Actual 2018 Budget 2019 Proposed
Taxes 0 0 0 0 0
Licenses & Permits 0 0 0 0 0
IG Revenue 0 0 0 0 0
Services 0 0 0 885,193 936,130
Fines & Forfeits 0 0 0 0 0
Operating Transfers In 0 0 0 0 0
General Fund Resources 0 0 0 0 0
All Other 0 0 0 0 0
TOTAL 0 0 0 885,193 936,130
Revenue Notes:
Finance and Technology 59
Program Summary: Information Security
Division: Finance & Technology
Fund Type: Internal Service Fund
Executive Summary:
Ensure the confidentiality, integrity, compliance, and availability of systems, networks, and data through the planning, analysis, development, implementation, maintenance, and enhancement of information systems security programs, policies, procedures, and tools.
Programs and Services:
Provide security and risk assessments for all department systems and technologies. Plan and assist implementation of policies, procedures, and technologies to ensure City services meet privacy, compliance, and accessibility requirements. Conduct annual audits for certification requirements: Federal, Financial, SCADA, Risk, and State.Conduct annual security training for all City employees, and maintain current security awareness information and updates.
FTEs
2015 Actual 2016 Actual 2017 Actual 2018 Budget 2019 Proposed
Total FTEs 0.00 0.00 0.00 1.05 1.05
Expenditures:
2015 Actual 2016 Actual 2017 Actual 2018 Budget 2019 Proposed
Capital Outlay 0 0 0 0 0
Interfund Charges 0 0 0 0 0
Reserve for Budget Adjustment 0 0 0 0 0
Transfers Out 0 0 0 0 0
Wages & Benefits 0 0 0 153,749 232,452
Supplies & Services 0 0 0 103,800 130,900
Debt Services 0 0 0 0 0
All Other 0 0 0 0 0
TOTAL 0 0 0 257,549 363,352
Expenditure Notes:
Revenues:
2015 Actual 2016 Actual 2017 Actual 2018 Budget 2019 Proposed
Taxes 0 0 0 0 0
Licenses & Permits 0 0 0 0 0
IG Revenue 0 0 0 0 0
Services 0 0 0 257,549 363,352
Fines & Forfeits 0 0 0 0 0One Vision. One Plan. One Voice.
Finance and Technology60
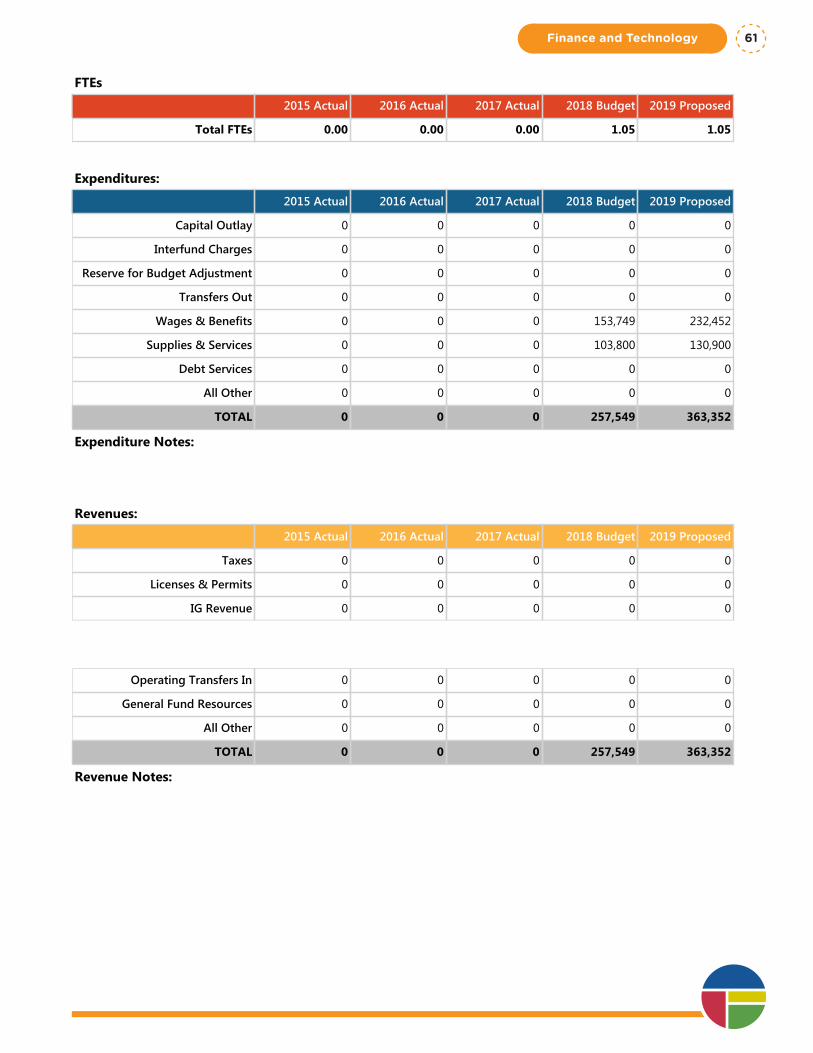
Program Summary: Information Security
Division: Finance & Technology
Fund Type: Internal Service Fund
Executive Summary:
Ensure the confidentiality, integrity, compliance, and availability of systems, networks, and data through the planning, analysis, development, implementation, maintenance, and enhancement of information systems security programs, policies, procedures, and tools.
Programs and Services:
Provide security and risk assessments for all department systems and technologies. Plan and assist implementation of policies, procedures, and technologies to ensure City services meet privacy, compliance, and accessibility requirements. Conduct annual audits for certification requirements: Federal, Financial, SCADA, Risk, and State.Conduct annual security training for all City employees, and maintain current security awareness information and updates.
FTEs
2015 Actual 2016 Actual 2017 Actual 2018 Budget 2019 Proposed
Total FTEs 0.00 0.00 0.00 1.05 1.05
Expenditures:
2015 Actual 2016 Actual 2017 Actual 2018 Budget 2019 Proposed
Capital Outlay 0 0 0 0 0
Interfund Charges 0 0 0 0 0
Reserve for Budget Adjustment 0 0 0 0 0
Transfers Out 0 0 0 0 0
Wages & Benefits 0 0 0 153,749 232,452
Supplies & Services 0 0 0 103,800 130,900
Debt Services 0 0 0 0 0
All Other 0 0 0 0 0
TOTAL 0 0 0 257,549 363,352
Expenditure Notes:
Revenues:
2015 Actual 2016 Actual 2017 Actual 2018 Budget 2019 Proposed
Taxes 0 0 0 0 0
Licenses & Permits 0 0 0 0 0
IG Revenue 0 0 0 0 0
Services 0 0 0 257,549 363,352
Fines & Forfeits 0 0 0 0 0
Operating Transfers In 0 0 0 0 0
General Fund Resources 0 0 0 0 0
All Other 0 0 0 0 0
TOTAL 0 0 0 257,549 363,352
Revenue Notes:
Finance and Technology 61
Program Summary: Infrastructure Services
Division: Finance & Technology
Fund Type: Internal Service Fund
Executive Summary:
Technology Operations – Infrastructure Services represent critical physical digital infrastructure for the City network including fiber investment between facilities, wireless capabilities, physical access layer, and related network technology services.
Programs and Services:
Services include all physical network layer hardware and services to connect facilities and in buildings to ensure ability to connect to the City network. This includes digital infrastructure in the ground, in buildings, wireless, voice and radio capabilities. Increasing effort goes to information security and business continuity to ensure resilience and accessibility of the City network 24/7 and during crisis events.
FTEs
2015 Actual 2016 Actual 2017 Actual 2018 Budget 2019 Proposed
Total FTEs 4.00 4.00 4.00 4.00 4.25
Expenditures:
2015 Actual 2016 Actual 2017 Actual 2018 Budget 2019 Proposed
Capital Outlay 25,307 0 0 0 0
Interfund Charges 0 0 0 0 0
Reserve for Budget Adjustment 0 0 0 0 0
Transfers Out 25,307 0 0 0 0
Wages & Benefits 454,035 482,193 541,389 542,138 584,871
Supplies & Services 579,731 605,373 591,962 617,510 645,380
Debt Services 0 0 0 0 0
All Other 0 0 0 0 0
TOTAL 1,084,380 1,087,566 1,133,351 1,159,648 1,230,251
Expenditure Notes:
Revenues:
2015 Actual 2016 Actual 2017 Actual 2018 Budget 2019 Proposed
Taxes 0 0 0 0 0
Licenses & Permits 0 0 0 0 0
IG Revenue 0 0 0 0 0
Services 434,748 435,848 412,243 1,159,648 1,230,251
Fines & Forfeits 0 0 0 0 0
Operating Transfers In 0 0 0 0 0
General Fund Resources 0 0 0 0 0One Vision. One Plan. One Voice.
Finance and Technology62
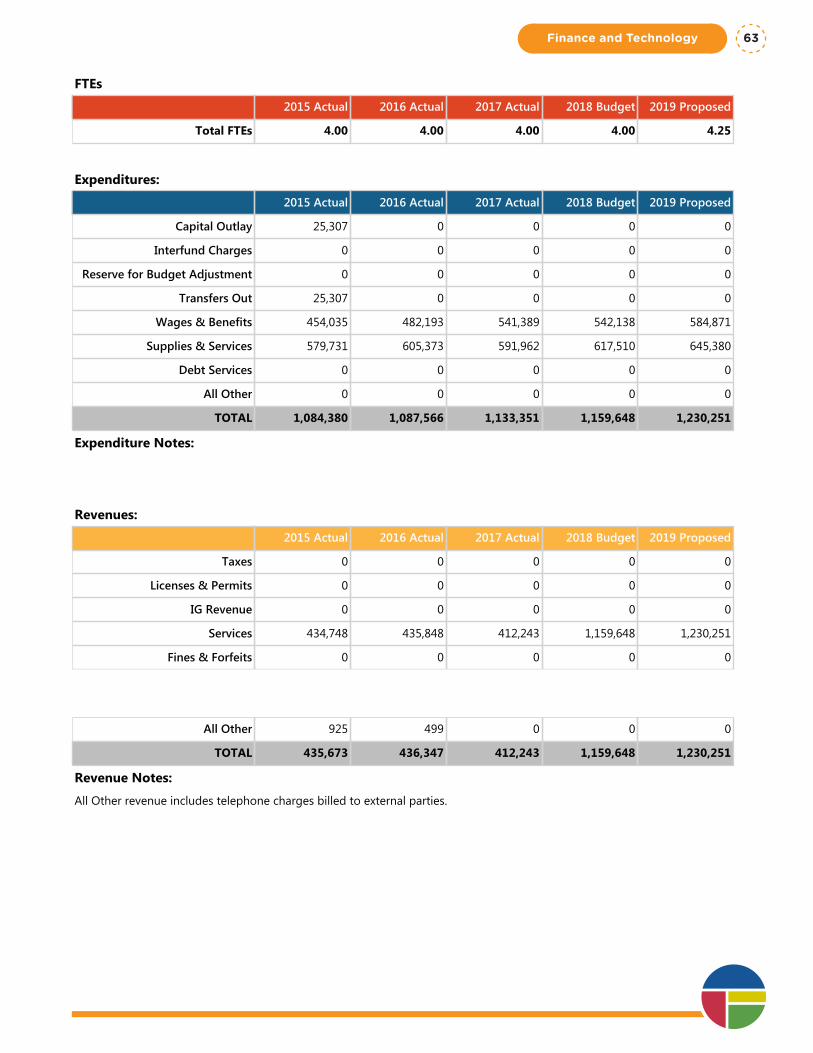
Program Summary: Infrastructure Services
Division: Finance & Technology
Fund Type: Internal Service Fund
Executive Summary:
Technology Operations – Infrastructure Services represent critical physical digital infrastructure for the City network including fiber investment between facilities, wireless capabilities, physical access layer, and related network technology services.
Programs and Services:
Services include all physical network layer hardware and services to connect facilities and in buildings to ensure ability to connect to the City network. This includes digital infrastructure in the ground, in buildings, wireless, voice and radio capabilities. Increasing effort goes to information security and business continuity to ensure resilience and accessibility of the City network 24/7 and during crisis events.
FTEs
2015 Actual 2016 Actual 2017 Actual 2018 Budget 2019 Proposed
Total FTEs 4.00 4.00 4.00 4.00 4.25
Expenditures:
2015 Actual 2016 Actual 2017 Actual 2018 Budget 2019 Proposed
Capital Outlay 25,307 0 0 0 0
Interfund Charges 0 0 0 0 0
Reserve for Budget Adjustment 0 0 0 0 0
Transfers Out 25,307 0 0 0 0
Wages & Benefits 454,035 482,193 541,389 542,138 584,871
Supplies & Services 579,731 605,373 591,962 617,510 645,380
Debt Services 0 0 0 0 0
All Other 0 0 0 0 0
TOTAL 1,084,380 1,087,566 1,133,351 1,159,648 1,230,251
Expenditure Notes:
Revenues:
2015 Actual 2016 Actual 2017 Actual 2018 Budget 2019 Proposed
Taxes 0 0 0 0 0
Licenses & Permits 0 0 0 0 0
IG Revenue 0 0 0 0 0
Services 434,748 435,848 412,243 1,159,648 1,230,251
Fines & Forfeits 0 0 0 0 0
Operating Transfers In 0 0 0 0 0
General Fund Resources 0 0 0 0 0
All Other 925 499 0 0 0
TOTAL 435,673 436,347 412,243 1,159,648 1,230,251
Revenue Notes:
All Other revenue includes telephone charges billed to external parties.
Finance and Technology 63
Program Summary: IT Administration
Division: Finance & Technology
Fund Type: Internal Service Fund
Executive Summary:
The administrative function of IT provides Leadership, Management, and Strategic Planning for City Information Technology staff.
Programs and Services:
Our goals are: 1) Deliver innovative and highly effective IT solutions, tools, and services, to the departments and agencies of the City of Spokane, 2) Provide outstanding customer service to city staff and the citizens we serve and support, and 3) Provide leadership for effective strategic and tactical planning in the use of technology.
FTEs
2015 Actual 2016 Actual 2017 Actual 2018 Budget 2019 Proposed
Total FTEs 3.75 3.75 6.17 6.40 4.95
Expenditures:
2015 Actual 2016 Actual 2017 Actual 2018 Budget 2019 Proposed
Capital Outlay 14,075 0 0 0 0
Interfund Charges 491,270 602,953 594,835 716,198 695,737
Reserve for Budget Adjustment 0 0 0 0 0
Transfers Out 14,075 0 0 0 0
Wages & Benefits 477,580 647,305 896,851 1,155,602 1,193,689
Supplies & Services 321,391 (444,718) 1,389,130 107,842 111,822
Debt Services 0 0 0 0 0
All Other 0 0 0 0 0
TOTAL 1,318,391 805,540 2,880,816 1,979,642 2,001,248
Expenditure Notes:
Pension expense adjustments in 2016/2017 are reflected in Other Services & Charges.
Revenues:
2015 Actual 2016 Actual 2017 Actual 2018 Budget 2019 Proposed
Taxes 0 0 0 0 0
Licenses & Permits 0 0 0 0 0
IG Revenue 0 0 0 0 0
Services 8,564,845 8,772,438 9,291,528 1,571,086 1,723,022
Fines & Forfeits 0 0 0 0 0
Operating Transfers In 0 0 0 0 0
General Fund Resources 0 0 0 0 0One Vision. One Plan. One Voice.
Finance and Technology64

Program Summary: IT Administration
Division: Finance & Technology
Fund Type: Internal Service Fund
Executive Summary:
The administrative function of IT provides Leadership, Management, and Strategic Planning for City Information Technology staff.
Programs and Services:
Our goals are: 1) Deliver innovative and highly effective IT solutions, tools, and services, to the departments and agencies of the City of Spokane, 2) Provide outstanding customer service to city staff and the citizens we serve and support, and 3) Provide leadership for effective strategic and tactical planning in the use of technology.
FTEs
2015 Actual 2016 Actual 2017 Actual 2018 Budget 2019 Proposed
Total FTEs 3.75 3.75 6.17 6.40 4.95
Expenditures:
2015 Actual 2016 Actual 2017 Actual 2018 Budget 2019 Proposed
Capital Outlay 14,075 0 0 0 0
Interfund Charges 491,270 602,953 594,835 716,198 695,737
Reserve for Budget Adjustment 0 0 0 0 0
Transfers Out 14,075 0 0 0 0
Wages & Benefits 477,580 647,305 896,851 1,155,602 1,193,689
Supplies & Services 321,391 (444,718) 1,389,130 107,842 111,822
Debt Services 0 0 0 0 0
All Other 0 0 0 0 0
TOTAL 1,318,391 805,540 2,880,816 1,979,642 2,001,248
Expenditure Notes:
Pension expense adjustments in 2016/2017 are reflected in Other Services & Charges.
Revenues:
2015 Actual 2016 Actual 2017 Actual 2018 Budget 2019 Proposed
Taxes 0 0 0 0 0
Licenses & Permits 0 0 0 0 0
IG Revenue 0 0 0 0 0
Services 8,564,845 8,772,438 9,291,528 1,571,086 1,723,022
Fines & Forfeits 0 0 0 0 0
Operating Transfers In 0 0 0 0 0
General Fund Resources 0 0 0 0 0
All Other 839 65,713 399 850 850
TOTAL 8,565,684 8,838,151 9,291,927 1,571,936 1,723,872
Revenue Notes:
Revenue allocated to program bids starting 2018 and Admin bid revenue reduced -$282,646 funded by ITSD cash reserve.
All other revenue is interest income. The 2016 balance includes a one-time prior year correction.
Finance and Technology 65
Program Summary: Mail Center
Division: Finance & Technology
Fund Type: Internal Service Fund
Executive Summary:
This program covers the City mail room operation, utility bills processing, and the City government internal mail distribution system.
Programs and Services:
The City Mail Center accepts and distributes all incoming and outgoing mail and packages from the United States Postal Service, Federal Express, UPS and DHL/Airborne for the City of Spokane. The Mail Center inserts, meters, and trays Utility Bills on a daily basis. All Payroll and Retirement payments are sealed, presorted, and metered if needed. The Mail Center processes monthly bulk mailings, which involves some, or all of the following functions: tabbing, sealing, addressing, packaging, sacking/traying and delivering to the USPS processing plant. The Mail Center is available Monday through Friday, 8 am to 5 pm to handle all incoming and outgoing mail processes for the 49 various departments of the City of Spokane.
FTEs
2015 Actual 2016 Actual 2017 Actual 2018 Budget 2019 Proposed
Total FTEs 3.05 4.05 4.25 3.35 4.00
Expenditures:
2015 Actual 2016 Actual 2017 Actual 2018 Budget 2019 Proposed
Capital Outlay 0 0 0 0 0
Interfund Charges 0 0 0 0 0
Reserve for Budget Adjustment 0 0 0 0 0
Transfers Out 0 0 0 0 0
Wages & Benefits 296,146 276,326 292,266 291,663 376,882
Supplies & Services 36,460 55,251 51,021 65,717 65,737
Debt Services 0 0 0 0 0
All Other 0 0 0 0 0
TOTAL 332,606 331,577 343,287 357,380 442,619
Expenditure Notes:
Revenues:
2015 Actual 2016 Actual 2017 Actual 2018 Budget 2019 Proposed
Taxes 0 0 0 0 0
Licenses & Permits 0 0 0 0 0
IG Revenue 0 0 0 0 0
Services 0 0 0 357,380 442,619
Fines & Forfeits 0 0 0 0 0One Vision. One Plan. One Voice.
Finance and Technology66
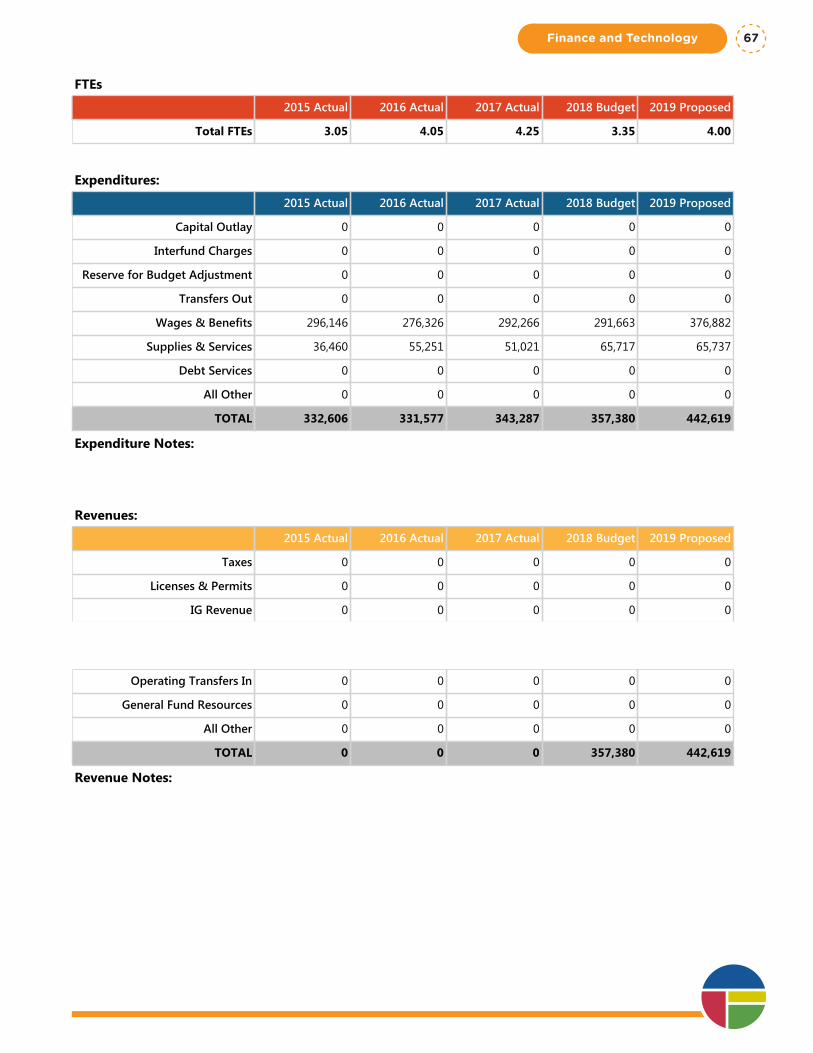
Program Summary: Mail Center
Division: Finance & Technology
Fund Type: Internal Service Fund
Executive Summary:
This program covers the City mail room operation, utility bills processing, and the City government internal mail distribution system.
Programs and Services:
The City Mail Center accepts and distributes all incoming and outgoing mail and packages from the United States Postal Service, Federal Express, UPS and DHL/Airborne for the City of Spokane. The Mail Center inserts, meters, and trays Utility Bills on a daily basis. All Payroll and Retirement payments are sealed, presorted, and metered if needed. The Mail Center processes monthly bulk mailings, which involves some, or all of the following functions: tabbing, sealing, addressing, packaging, sacking/traying and delivering to the USPS processing plant. The Mail Center is available Monday through Friday, 8 am to 5 pm to handle all incoming and outgoing mail processes for the 49 various departments of the City of Spokane.
FTEs
2015 Actual 2016 Actual 2017 Actual 2018 Budget 2019 Proposed
Total FTEs 3.05 4.05 4.25 3.35 4.00
Expenditures:
2015 Actual 2016 Actual 2017 Actual 2018 Budget 2019 Proposed
Capital Outlay 0 0 0 0 0
Interfund Charges 0 0 0 0 0
Reserve for Budget Adjustment 0 0 0 0 0
Transfers Out 0 0 0 0 0
Wages & Benefits 296,146 276,326 292,266 291,663 376,882
Supplies & Services 36,460 55,251 51,021 65,717 65,737
Debt Services 0 0 0 0 0
All Other 0 0 0 0 0
TOTAL 332,606 331,577 343,287 357,380 442,619
Expenditure Notes:
Revenues:
2015 Actual 2016 Actual 2017 Actual 2018 Budget 2019 Proposed
Taxes 0 0 0 0 0
Licenses & Permits 0 0 0 0 0
IG Revenue 0 0 0 0 0
Services 0 0 0 357,380 442,619
Fines & Forfeits 0 0 0 0 0
Operating Transfers In 0 0 0 0 0
General Fund Resources 0 0 0 0 0
All Other 0 0 0 0 0
TOTAL 0 0 0 357,380 442,619
Revenue Notes:
Finance and Technology 67
Program Summary: Project Management Office
Division: Finance & Technology
Fund Type: Internal Service Fund
Executive Summary:
The Project Management Office (PMO) supports City efforts with project management principles, tools, and methodology. Its primary goal is to continuously improve our ability to deliver structured, planned solutions within budget, on schedule, on scope, to contribute to accomplishing City strategic and operational goals.
Programs and Services:
The project work environment within the PMO is dynamic. Projects deal with evolving business needs in often uncertain or emerging customer requirements. It is the Project Manager's job to manage uncertainty and change in a manner that does not negatively affect the outcome of their projects. The PMO project support framework contains activity definitions, guidelines, and templates for the various project management activities undertaken to deliver successful projects. The methodology provides: •Defined best practices. •Standardized reporting. •Common language and term definitions. •More effective and efficient project management. •Monitoring of progress against pre-determined metrics. •An ability to think through and plan an entire project before ever starting. The framework establishes standards for all projects managed in conjunction with the PMO. Continue to build a repository of exemplary projects, best practices, and lessons learned, a Project Portal intake system, as well as train and engage project managers in key functional areas throughout the City of Spokane.
FTEs
2015 Actual 2016 Actual 2017 Actual 2018 Budget 2019 Proposed
Total FTEs 0.00 0.00 0.00 5.00 6.00
Expenditures:
2015 Actual 2016 Actual 2017 Actual 2018 Budget 2019 Proposed
Capital Outlay 0 0 0 0 0
Interfund Charges 0 0 0 0 0
Reserve for Budget Adjustment 0 0 0 0 0
Transfers Out 0 0 0 0 0
Wages & Benefits 0 0 0 558,404 714,111
Supplies & Services 0 0 0 2,300 14,500
Debt Services 0 0 0 0 0
All Other 0 0 0 0 0
TOTAL 0 0 0 560,704 728,611
Expenditure Notes:
Revenues:
2015 Actual 2016 Actual 2017 Actual 2018 Budget 2019 Proposed
Taxes 0 0 0 0 0
Licenses & Permits 0 0 0 0 0
IG Revenue 0 0 0 0 0One Vision. One Plan. One Voice.
Finance and Technology68

Program Summary: Project Management Office
Division: Finance & Technology
Fund Type: Internal Service Fund
Executive Summary:
The Project Management Office (PMO) supports City efforts with project management principles, tools, and methodology. Its primary goal is to continuously improve our ability to deliver structured, planned solutions within budget, on schedule, on scope, to contribute to accomplishing City strategic and operational goals.
Programs and Services:
The project work environment within the PMO is dynamic. Projects deal with evolving business needs in often uncertain or emerging customer requirements. It is the Project Manager's job to manage uncertainty and change in a manner that does not negatively affect the outcome of their projects. The PMO project support framework contains activity definitions, guidelines, and templates for the various project management activities undertaken to deliver successful projects. The methodology provides: •Defined best practices. •Standardized reporting. •Common language and term definitions. •More effective and efficient project management. •Monitoring of progress against pre-determined metrics. •An ability to think through and plan an entire project before ever starting. The framework establishes standards for all projects managed in conjunction with the PMO. Continue to build a repository of exemplary projects, best practices, and lessons learned, a Project Portal intake system, as well as train and engage project managers in key functional areas throughout the City of Spokane.
FTEs
2015 Actual 2016 Actual 2017 Actual 2018 Budget 2019 Proposed
Total FTEs 0.00 0.00 0.00 5.00 6.00
Expenditures:
2015 Actual 2016 Actual 2017 Actual 2018 Budget 2019 Proposed
Capital Outlay 0 0 0 0 0
Interfund Charges 0 0 0 0 0
Reserve for Budget Adjustment 0 0 0 0 0
Transfers Out 0 0 0 0 0
Wages & Benefits 0 0 0 558,404 714,111
Supplies & Services 0 0 0 2,300 14,500
Debt Services 0 0 0 0 0
All Other 0 0 0 0 0
TOTAL 0 0 0 560,704 728,611
Expenditure Notes:
Revenues:
2015 Actual 2016 Actual 2017 Actual 2018 Budget 2019 Proposed
Taxes 0 0 0 0 0
Licenses & Permits 0 0 0 0 0
IG Revenue 0 0 0 0 0
Services 0 0 0 560,704 728,611
Fines & Forfeits 0 0 0 0 0
Operating Transfers In 0 0 0 0 0
General Fund Resources 0 0 0 0 0
All Other 0 0 0 0 0
TOTAL 0 0 0 560,704 728,611
Revenue Notes:
Finance and Technology 69

One Vision. One Plan. One Voice.
Finance and Technology70
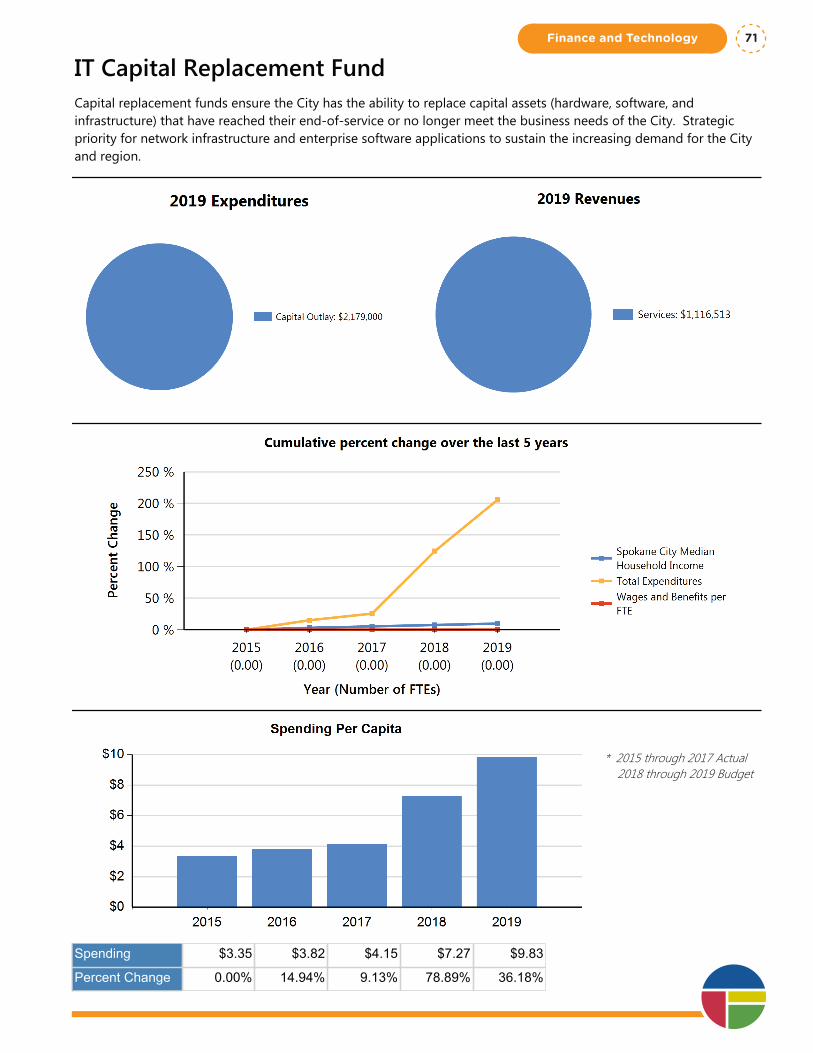
IT Capital Replacement FundCapital replacement funds ensure the City has the ability to replace capital assets (hardware, software, and infrastructure) that have reached their end-of-service or no longer meet the business needs of the City. Strategic priority for network infrastructure and enterprise software applications to sustain the increasing demand for the City and region.
* 2015 through 2017 Actual 2018 through 2019 Budget
Spending $3.35 $3.82 $4.15 $7.27 $9.83
Percent Change 0.00% 14.94% 9.13% 78.89% 36.18%
Finance and Technology 71
Department Summary: IT Capital Replacement Fund
Division: Finance & Technology
Fund Type: Internal Service Fund
Executive Summary:
Capital replacement funds ensure the City has the ability to replace capital assets (hardware, software, and infrastructure) that have reached their end-of-service or no longer meet the business needs of the City. Strategic priority for network infrastructure and enterprise software applications to sustain the increasing demand for the City and region.
Programs and Services:
ITSD Capital Replacement Funding is collected and segregated, over a period of time based on the expected/defined life-span of the asset (Modified Asset Cost Recovery System - MACRS), to cover the replacement cost of existing capital IT assets (computing hardware, network equipment), fiber infrastructure, and enterprise software applications.
FTEs
2015 Actual 2016 Actual 2017 Actual 2018 Budget 2019 Proposed
Total FTEs 0.00 0.00 0.00 0.00 0.00
Expenditures:
2015 Actual 2016 Actual 2017 Actual 2018 Budget 2019 Proposed
Capital Outlay 687,906 819,536 479,582 1,600,000 2,179,000
Interfund Charges 0 0 0 0 0
Reserve for Budget Adjustment 0 0 0 0 0
Transfers Out 25,101 0 (17) 0 0
Wages & Benefits 0 0 0 0 0
Supplies & Services 0 0 414,826 0 0
Debt Services 0 0 0 0 0
All Other 0 0 0 0 0
TOTAL 713,007 819,536 894,391 1,600,000 2,179,000
Expenditure Notes:
2019 Capital Outlay increase: $379,000 - eSuite Software & $200,000 CCB Project
Revenues:
2015 Actual 2016 Actual 2017 Actual 2018 Budget 2019 Proposed
Taxes 0 0 0 0 0
Licenses & Permits 0 0 0 0 0
IG Revenue 0 0 0 0 0
Services 1,308,501 1,048,867 1,219,874 1,081,032 1,116,513
Fines & Forfeits 0 0 0 0 0
Operating Transfers In 244,747 127,910 0 0 0
General Fund Resources 0 0 0 0 0One Vision. One Plan. One Voice.
Finance and Technology72
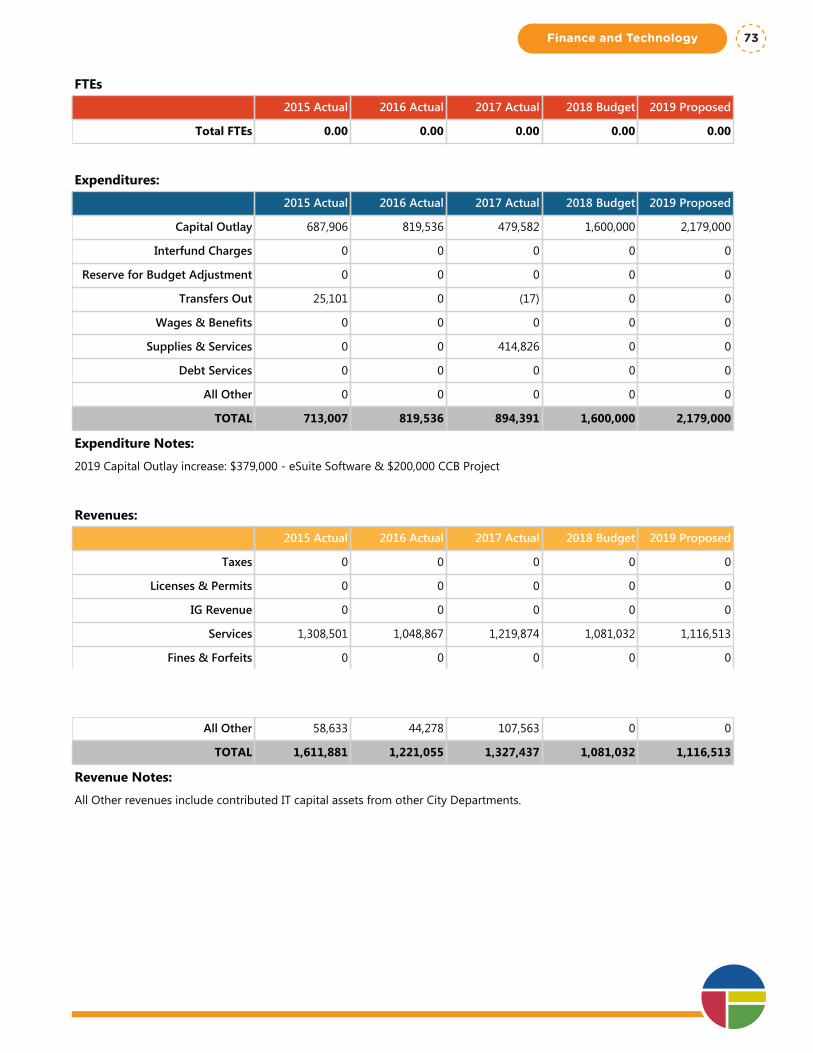
Department Summary: IT Capital Replacement Fund
Division: Finance & Technology
Fund Type: Internal Service Fund
Executive Summary:
Capital replacement funds ensure the City has the ability to replace capital assets (hardware, software, and infrastructure) that have reached their end-of-service or no longer meet the business needs of the City. Strategic priority for network infrastructure and enterprise software applications to sustain the increasing demand for the City and region.
Programs and Services:
ITSD Capital Replacement Funding is collected and segregated, over a period of time based on the expected/defined life-span of the asset (Modified Asset Cost Recovery System - MACRS), to cover the replacement cost of existing capital IT assets (computing hardware, network equipment), fiber infrastructure, and enterprise software applications.
FTEs
2015 Actual 2016 Actual 2017 Actual 2018 Budget 2019 Proposed
Total FTEs 0.00 0.00 0.00 0.00 0.00
Expenditures:
2015 Actual 2016 Actual 2017 Actual 2018 Budget 2019 Proposed
Capital Outlay 687,906 819,536 479,582 1,600,000 2,179,000
Interfund Charges 0 0 0 0 0
Reserve for Budget Adjustment 0 0 0 0 0
Transfers Out 25,101 0 (17) 0 0
Wages & Benefits 0 0 0 0 0
Supplies & Services 0 0 414,826 0 0
Debt Services 0 0 0 0 0
All Other 0 0 0 0 0
TOTAL 713,007 819,536 894,391 1,600,000 2,179,000
Expenditure Notes:
2019 Capital Outlay increase: $379,000 - eSuite Software & $200,000 CCB Project
Revenues:
2015 Actual 2016 Actual 2017 Actual 2018 Budget 2019 Proposed
Taxes 0 0 0 0 0
Licenses & Permits 0 0 0 0 0
IG Revenue 0 0 0 0 0
Services 1,308,501 1,048,867 1,219,874 1,081,032 1,116,513
Fines & Forfeits 0 0 0 0 0
Operating Transfers In 244,747 127,910 0 0 0
General Fund Resources 0 0 0 0 0
All Other 58,633 44,278 107,563 0 0
TOTAL 1,611,881 1,221,055 1,327,437 1,081,032 1,116,513
Revenue Notes:
All Other revenues include contributed IT capital assets from other City Departments.
Finance and Technology 73

One Vision. One Plan. One Voice.
Finance and Technology74
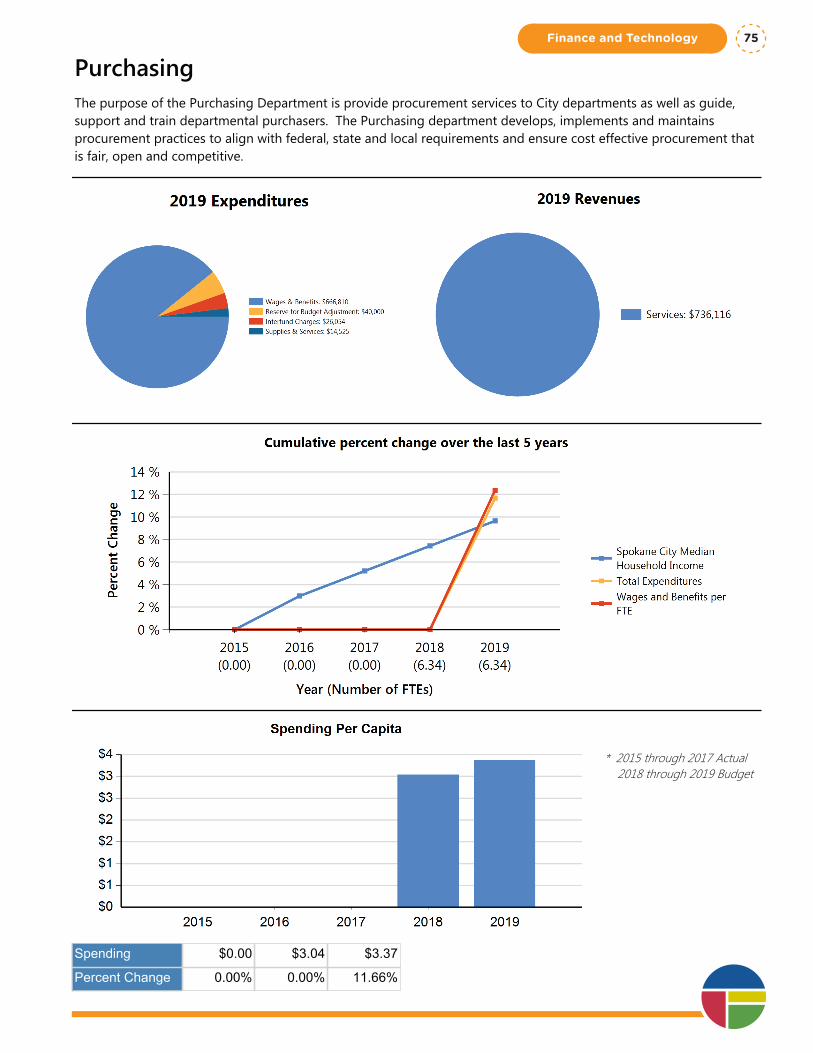
PurchasingThe purpose of the Purchasing Department is provide procurement services to City departments as well as guide, support and train departmental purchasers. The Purchasing department develops, implements and maintains procurement practices to align with federal, state and local requirements and ensure cost effective procurement that is fair, open and competitive.
* 2015 through 2017 Actual 2018 through 2019 Budget
Spending $0.00 $3.04 $3.37
Percent Change 0.00% 0.00% 11.66%
Finance and Technology 75
Department Summary: Purchasing
Division: Finance & Technology
Fund Type: Internal Service Fund
Executive Summary:
The purpose of the Purchasing Department is provide procurement services to City departments as well as guide, support and train departmental purchasers. The Purchasing department develops, implements and maintains procurement practices to align with federal, state and local requirements and ensure cost effective procurement that is fair, open and competitive.
Programs and Services:
The Purchasing Department conducts and oversees activities and strategic direction of the City's procurement activities, including purchasing of necessary services, materials, equipment, and construction while ensuring that quality, safety, best value and cost-effectiveness are achieved. It is also the role of the Purchasing Department to ensure that procurement transactions are conducted in a manner providing full and open competition, in compliance with all applicable procurement laws and regulations assuring equity for all parties involved in the procurement process.
FTEs
2015 Actual 2016 Actual 2017 Actual 2018 Budget 2019 Proposed
Total FTEs 0.00 0.00 0.00 6.34 6.34
Expenditures:
2015 Actual 2016 Actual 2017 Actual 2018 Budget 2019 Proposed
Capital Outlay 0 0 0 0 0
Interfund Charges 0 0 0 21,478 26,054
Reserve for Budget Adjustment 0 0 0 40,000 40,000
Transfers Out 0 0 0 0 0
Wages & Benefits 0 0 0 593,499 666,810
Supplies & Services 0 0 0 14,325 14,525
Debt Services 0 0 0 0 0
All Other 0 0 0 0 0
TOTAL 0 0 0 669,302 747,389
Expenditure Notes:
Purchasing was part of Accounting Services for 2015-2017.
Revenues:
2015 Actual 2016 Actual 2017 Actual 2018 Budget 2019 Proposed
Taxes 0 0 0 0 0
Licenses & Permits 0 0 0 0 0
IG Revenue 0 0 0 0 0
Services 0 0 0 669,330 736,116
Fines & Forfeits 0 0 0 0 0One Vision. One Plan. One Voice.
Finance and Technology76
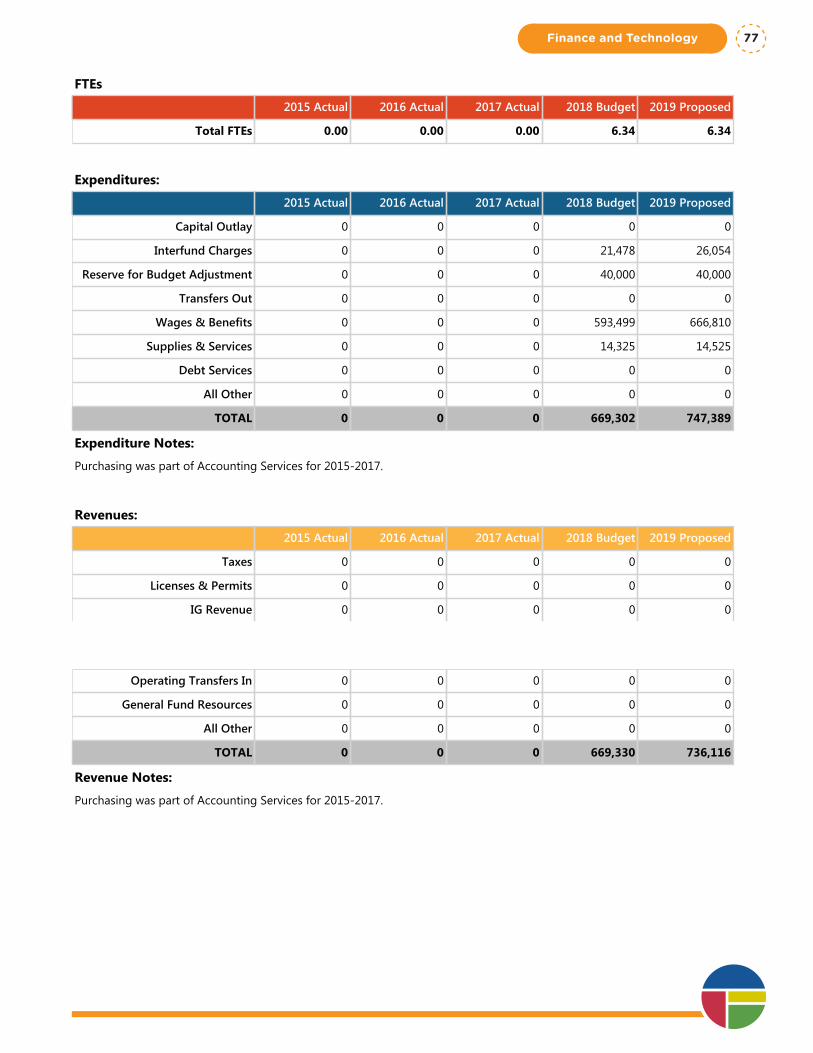
Department Summary: Purchasing
Division: Finance & Technology
Fund Type: Internal Service Fund
Executive Summary:
The purpose of the Purchasing Department is provide procurement services to City departments as well as guide, support and train departmental purchasers. The Purchasing department develops, implements and maintains procurement practices to align with federal, state and local requirements and ensure cost effective procurement that is fair, open and competitive.
Programs and Services:
The Purchasing Department conducts and oversees activities and strategic direction of the City's procurement activities, including purchasing of necessary services, materials, equipment, and construction while ensuring that quality, safety, best value and cost-effectiveness are achieved. It is also the role of the Purchasing Department to ensure that procurement transactions are conducted in a manner providing full and open competition, in compliance with all applicable procurement laws and regulations assuring equity for all parties involved in the procurement process.
FTEs
2015 Actual 2016 Actual 2017 Actual 2018 Budget 2019 Proposed
Total FTEs 0.00 0.00 0.00 6.34 6.34
Expenditures:
2015 Actual 2016 Actual 2017 Actual 2018 Budget 2019 Proposed
Capital Outlay 0 0 0 0 0
Interfund Charges 0 0 0 21,478 26,054
Reserve for Budget Adjustment 0 0 0 40,000 40,000
Transfers Out 0 0 0 0 0
Wages & Benefits 0 0 0 593,499 666,810
Supplies & Services 0 0 0 14,325 14,525
Debt Services 0 0 0 0 0
All Other 0 0 0 0 0
TOTAL 0 0 0 669,302 747,389
Expenditure Notes:
Purchasing was part of Accounting Services for 2015-2017.
Revenues:
2015 Actual 2016 Actual 2017 Actual 2018 Budget 2019 Proposed
Taxes 0 0 0 0 0
Licenses & Permits 0 0 0 0 0
IG Revenue 0 0 0 0 0
Services 0 0 0 669,330 736,116
Fines & Forfeits 0 0 0 0 0
Operating Transfers In 0 0 0 0 0
General Fund Resources 0 0 0 0 0
All Other 0 0 0 0 0
TOTAL 0 0 0 669,330 736,116
Revenue Notes:
Purchasing was part of Accounting Services for 2015-2017.
Finance and Technology 77

One Vision. One Plan. One Voice.
Finance and Technology78
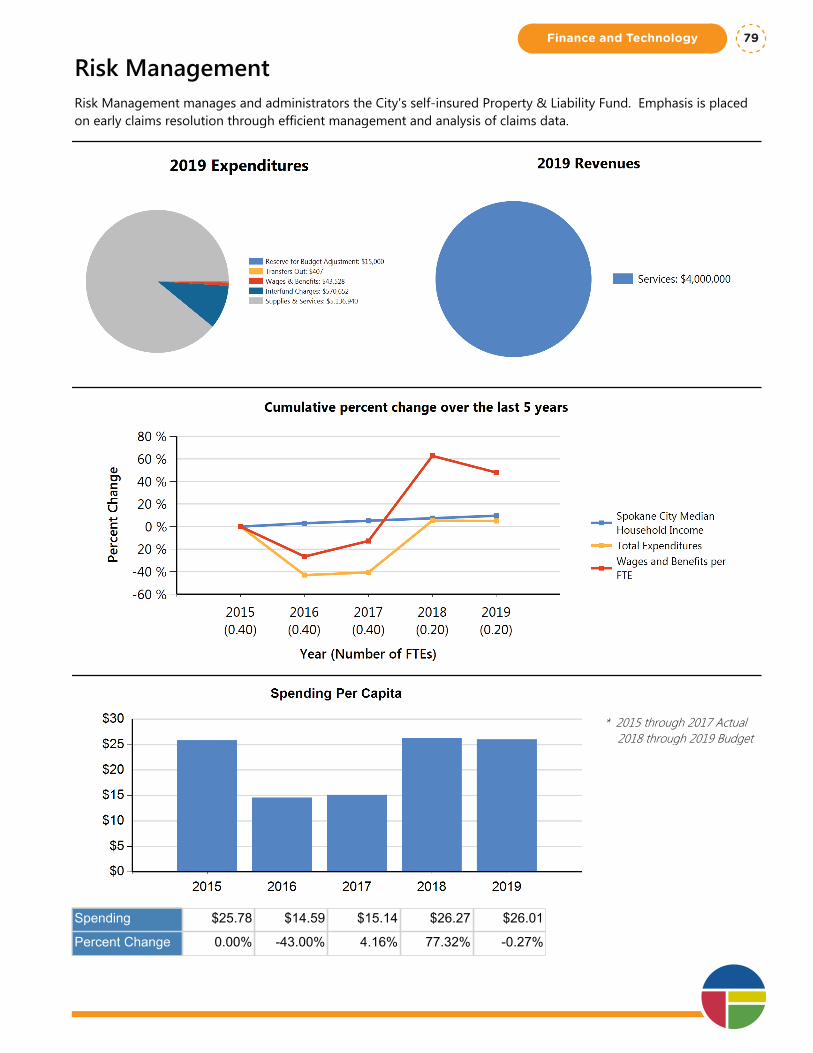
Risk ManagementRisk Management manages and administrators the City's self-insured Property & Liability Fund. Emphasis is placed on early claims resolution through efficient management and analysis of claims data.
* 2015 through 2017 Actual 2018 through 2019 Budget
Spending $25.78 $14.59 $15.14 $26.27 $26.01
Percent Change 0.00% -43.00% 4.16% 77.32% -0.27%
Finance and Technology 79
Department Summary: Risk Management
Division: Finance & Technology
Fund Type: Internal Service Fund
Executive Summary:
Risk Management manages and administrators the City's self-insured Property & Liability Fund. Emphasis is placed on early claims resolution through efficient management and analysis of claims data.
Programs and Services:
Risk Management provides program and claims management services. Responsibilities are similar to insurance company management, as the City has a self-insurance and reinsurance component. Services include rate promulgation and allocation, insurance renewals, and retention plan design. In addition to reserving and cost projections, we provide appropriate claims management for incurred claims, timely payment of claims for damages and/or benefits, and fair and equitable treatment to our citizens.
FTEs
2015 Actual 2016 Actual 2017 Actual 2018 Budget 2019 Proposed
Total FTEs 0.40 0.40 0.40 0.20 0.20
Expenditures:
2015 Actual 2016 Actual 2017 Actual 2018 Budget 2019 Proposed
Capital Outlay 0 0 0 0 0
Interfund Charges 265,084 192,661 208,021 589,353 570,652
Reserve for Budget Adjustment 0 0 0 15,000 15,000
Transfers Out 172 86 406 407 407
Wages & Benefits 69,621 51,146 58,208 51,077 43,528
Supplies & Services 5,157,963 2,886,543 2,994,340 5,126,574 5,136,940
Debt Services 0 0 0 0 0
All Other 0 0 0 0 0
TOTAL 5,492,840 3,130,436 3,260,975 5,782,411 5,766,527
Expenditure Notes:
Other services & charges include claims paid to citizens for damages incurred; therefore, the amount will fluctuate depending on the amount of claims filed each year. In 2015, there were higher claims costs.
Revenues:
2015 Actual 2016 Actual 2017 Actual 2018 Budget 2019 Proposed
Taxes 0 0 0 0 0
Licenses & Permits 0 0 0 0 0
IG Revenue 0 0 0 0 0
Services 5,996,445 5,355,147 5,299,998 5,000,014 4,000,000
Fines & Forfeits 0 0 0 0 0
Operating Transfers In 0 0 0 0 0One Vision. One Plan. One Voice.
Finance and Technology80
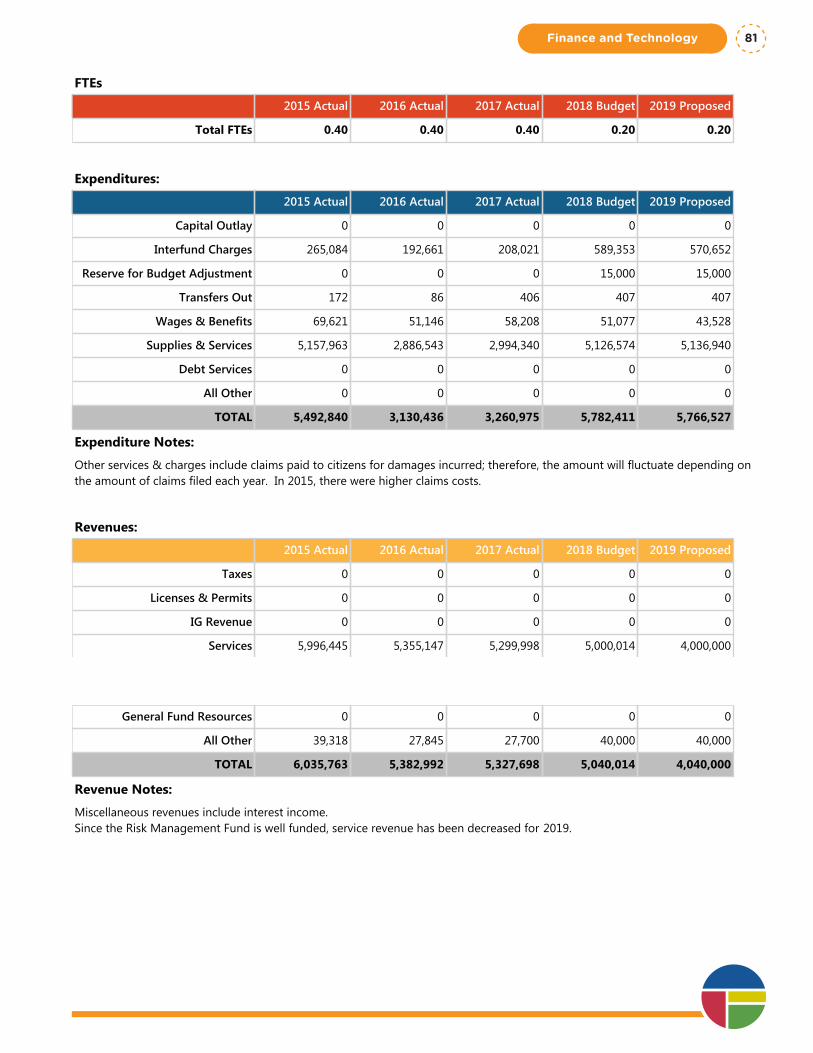
Department Summary: Risk Management
Division: Finance & Technology
Fund Type: Internal Service Fund
Executive Summary:
Risk Management manages and administrators the City's self-insured Property & Liability Fund. Emphasis is placed on early claims resolution through efficient management and analysis of claims data.
Programs and Services:
Risk Management provides program and claims management services. Responsibilities are similar to insurance company management, as the City has a self-insurance and reinsurance component. Services include rate promulgation and allocation, insurance renewals, and retention plan design. In addition to reserving and cost projections, we provide appropriate claims management for incurred claims, timely payment of claims for damages and/or benefits, and fair and equitable treatment to our citizens.
FTEs
2015 Actual 2016 Actual 2017 Actual 2018 Budget 2019 Proposed
Total FTEs 0.40 0.40 0.40 0.20 0.20
Expenditures:
2015 Actual 2016 Actual 2017 Actual 2018 Budget 2019 Proposed
Capital Outlay 0 0 0 0 0
Interfund Charges 265,084 192,661 208,021 589,353 570,652
Reserve for Budget Adjustment 0 0 0 15,000 15,000
Transfers Out 172 86 406 407 407
Wages & Benefits 69,621 51,146 58,208 51,077 43,528
Supplies & Services 5,157,963 2,886,543 2,994,340 5,126,574 5,136,940
Debt Services 0 0 0 0 0
All Other 0 0 0 0 0
TOTAL 5,492,840 3,130,436 3,260,975 5,782,411 5,766,527
Expenditure Notes:
Other services & charges include claims paid to citizens for damages incurred; therefore, the amount will fluctuate depending on the amount of claims filed each year. In 2015, there were higher claims costs.
Revenues:
2015 Actual 2016 Actual 2017 Actual 2018 Budget 2019 Proposed
Taxes 0 0 0 0 0
Licenses & Permits 0 0 0 0 0
IG Revenue 0 0 0 0 0
Services 5,996,445 5,355,147 5,299,998 5,000,014 4,000,000
Fines & Forfeits 0 0 0 0 0
Operating Transfers In 0 0 0 0 0
General Fund Resources 0 0 0 0 0
All Other 39,318 27,845 27,700 40,000 40,000
TOTAL 6,035,763 5,382,992 5,327,698 5,040,014 4,040,000
Revenue Notes:
Miscellaneous revenues include interest income.Since the Risk Management Fund is well funded, service revenue has been decreased for 2019.
Finance and Technology 81

One Vision. One Plan. One Voice.
Finance and Technology82
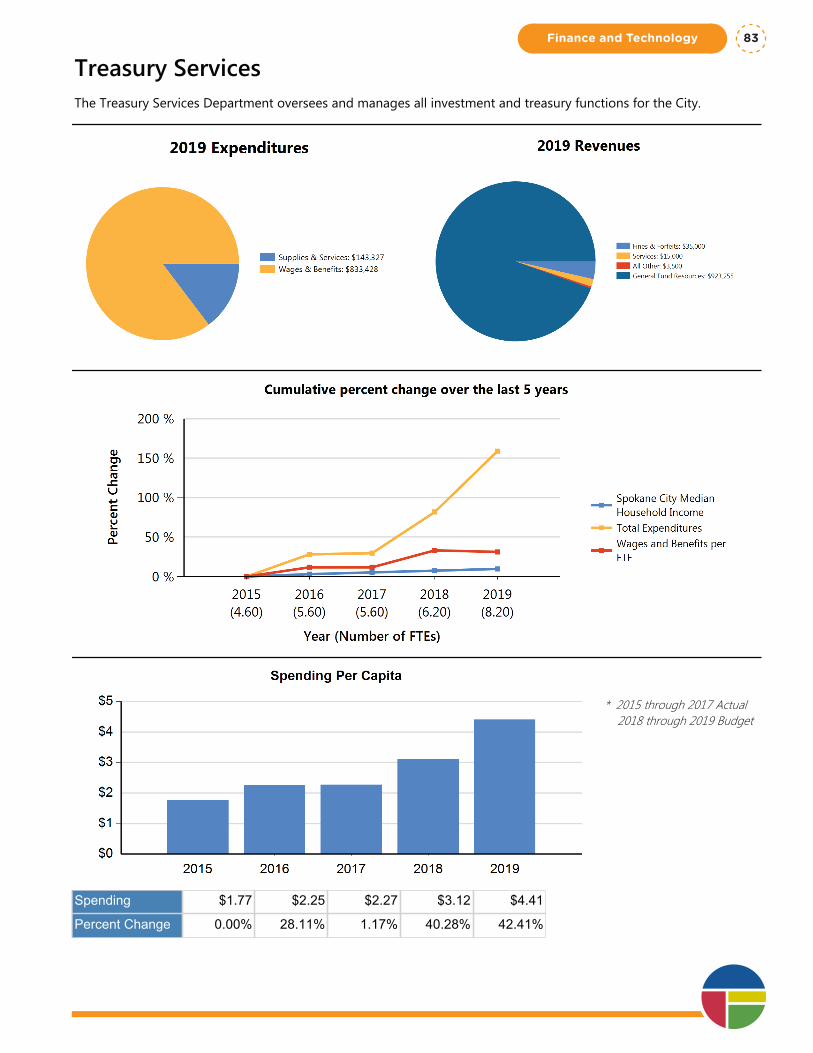
Treasury ServicesThe Treasury Services Department oversees and manages all investment and treasury functions for the City.
* 2015 through 2017 Actual 2018 through 2019 Budget
Spending $1.77 $2.25 $2.27 $3.12 $4.41
Percent Change 0.00% 28.11% 1.17% 40.28% 42.41%
Finance and Technology 83
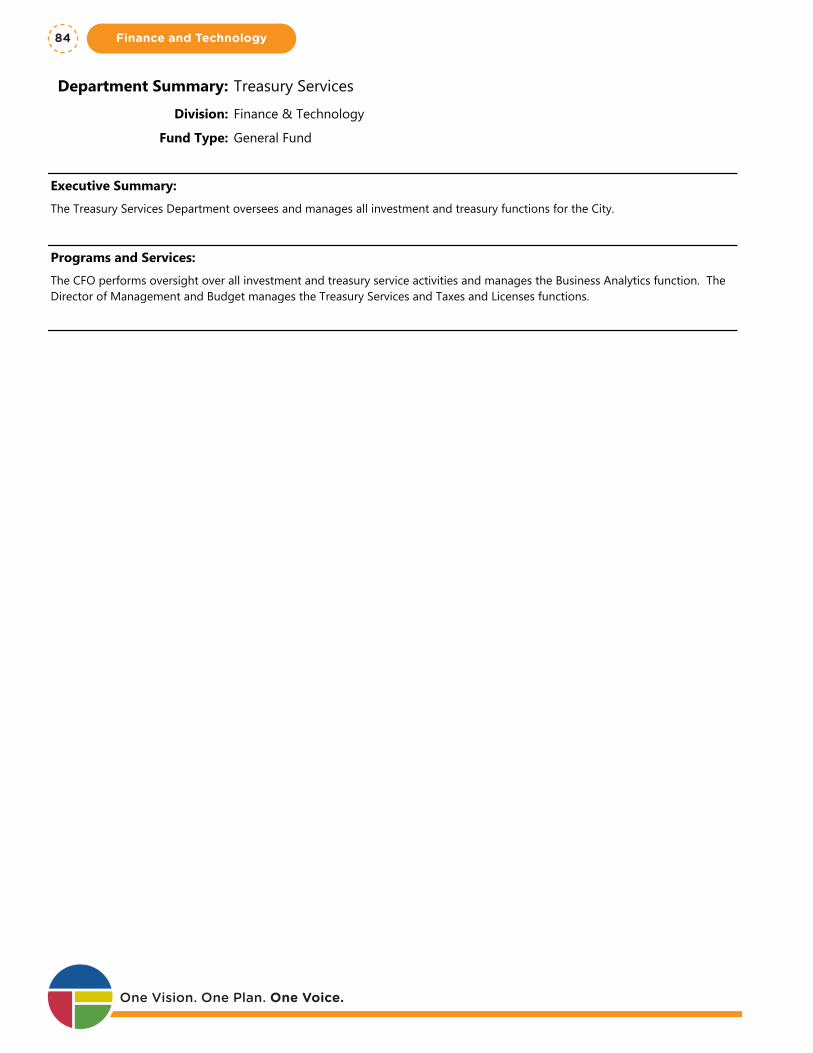
Department Summary: Treasury Services
Division: Finance & Technology
Fund Type: General Fund
Executive Summary:
The Treasury Services Department oversees and manages all investment and treasury functions for the City.
Programs and Services:
The CFO performs oversight over all investment and treasury service activities and manages the Business Analytics function. The Director of Management and Budget manages the Treasury Services and Taxes and Licenses functions.
FTEs
2015 Actual 2016 Actual 2017 Actual 2018 Budget 2019 Proposed
Total FTEs 4.60 5.60 5.60 6.20 8.20
Expenditures:
2015 Actual 2016 Actual 2017 Actual 2018 Budget 2019 Proposed
Capital Outlay 0 0 0 0 0
Interfund Charges 0 0 0 0 0
Reserve for Budget Adjustment 0 0 0 0 0
Transfers Out 0 0 0 0 0
Wages & Benefits 351,430 477,739 477,857 642,563 833,428
Supplies & Services 25,780 5,517 11,062 43,295 143,327
Debt Services 0 0 0 0 0
All Other 0 0 0 0 0
TOTAL 377,210 483,256 488,919 685,858 976,755
Expenditure Notes:
Treasury personnel moved from Accounting Services to the Treasury Department in 2019.
Revenues:
2015 Actual 2016 Actual 2017 Actual 2018 Budget 2019 Proposed
Taxes 0 0 0 0 0
Licenses & Permits 0 0 0 0 0
IG Revenue 0 0 0 0 0
Services 0 0 0 0 15,000
Fines & Forfeits 0 0 0 0 35,000
Operating Transfers In 0 0 0 0 0
General Fund Resources 377,210 483,256 488,919 685,858 923,255
All Other 0 0 0 0 3,500
TOTAL 377,210 483,256 488,919 685,858 976,755One Vision. One Plan. One Voice.
Finance and Technology84
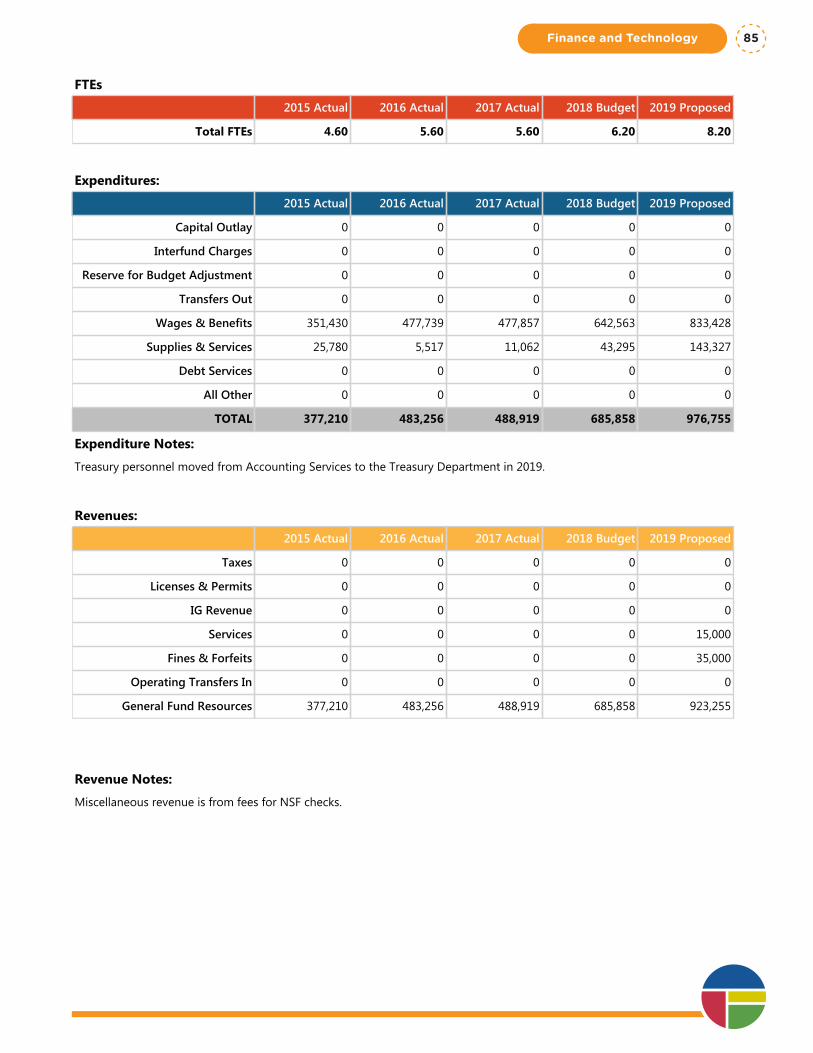
Department Summary: Treasury Services
Division: Finance & Technology
Fund Type: General Fund
Executive Summary:
The Treasury Services Department oversees and manages all investment and treasury functions for the City.
Programs and Services:
The CFO performs oversight over all investment and treasury service activities and manages the Business Analytics function. The Director of Management and Budget manages the Treasury Services and Taxes and Licenses functions.
FTEs
2015 Actual 2016 Actual 2017 Actual 2018 Budget 2019 Proposed
Total FTEs 4.60 5.60 5.60 6.20 8.20
Expenditures:
2015 Actual 2016 Actual 2017 Actual 2018 Budget 2019 Proposed
Capital Outlay 0 0 0 0 0
Interfund Charges 0 0 0 0 0
Reserve for Budget Adjustment 0 0 0 0 0
Transfers Out 0 0 0 0 0
Wages & Benefits 351,430 477,739 477,857 642,563 833,428
Supplies & Services 25,780 5,517 11,062 43,295 143,327
Debt Services 0 0 0 0 0
All Other 0 0 0 0 0
TOTAL 377,210 483,256 488,919 685,858 976,755
Expenditure Notes:
Treasury personnel moved from Accounting Services to the Treasury Department in 2019.
Revenues:
2015 Actual 2016 Actual 2017 Actual 2018 Budget 2019 Proposed
Taxes 0 0 0 0 0
Licenses & Permits 0 0 0 0 0
IG Revenue 0 0 0 0 0
Services 0 0 0 0 15,000
Fines & Forfeits 0 0 0 0 35,000
Operating Transfers In 0 0 0 0 0
General Fund Resources 377,210 483,256 488,919 685,858 923,255
All Other 0 0 0 0 3,500
TOTAL 377,210 483,256 488,919 685,858 976,755
Revenue Notes:
Miscellaneous revenue is from fees for NSF checks.
Finance and Technology 85
Program Summary: Business Analytics
Division: Finance & Technology
Fund Type: General Fund
Executive Summary:
Business Analytics develops and manages City performance measures and performs a wide range of financial and business analysis.
Programs and Services:
- Performance measure program development focused on outcome based measures for departments. - Creation and establishment of enterprise wide measures to assist organization in assessing performance against key metrics and identify opportunities to improve organizational policies and procedures.- Development of business plans and financial analysis that assist in the evaluation of key business decisions.- Leading enterprise level teams and projects for the purpose of solving identified issues, advancing key initiatives and improving outcomes across the organization.- Historical trending support for key metric indicators such as sales taxes, property taxes, real estate excise taxes, median household income, assessed values, new construction, population changes as well as benchmarking research and evaluation for comparison to peer cities- Regular data analysis support to assist in providing data driven business decision making.- Identifying opportunities for process improvement and working with key department personnel to advance process change for improving service levels and cost effectiveness.
FTEs
2015 Actual 2016 Actual 2017 Actual 2018 Budget 2019 Proposed
Total FTEs 0.00 1.00 1.00 1.00 1.00
Expenditures:
2015 Actual 2016 Actual 2017 Actual 2018 Budget 2019 Proposed
Capital Outlay 0 0 0 0 0
Interfund Charges 0 0 0 0 0
Reserve for Budget Adjustment 0 0 0 0 0
Transfers Out 0 0 0 0 0
Wages & Benefits 0 92,631 93,843 96,873 101,786
Supplies & Services 0 0 610 2,100 2,100
Debt Services 0 0 0 0 0
All Other 0 0 0 0 0
TOTAL 0 92,631 94,453 98,973 103,886
Expenditure Notes:
Prior to 2016, staff and related cost for the Business Analytics program, were included in the Finance Department budget.
Revenues:
2015 Actual 2016 Actual 2017 Actual 2018 Budget 2019 Proposed
Taxes 0 0 0 0 0One Vision. One Plan. One Voice.
Finance and Technology86
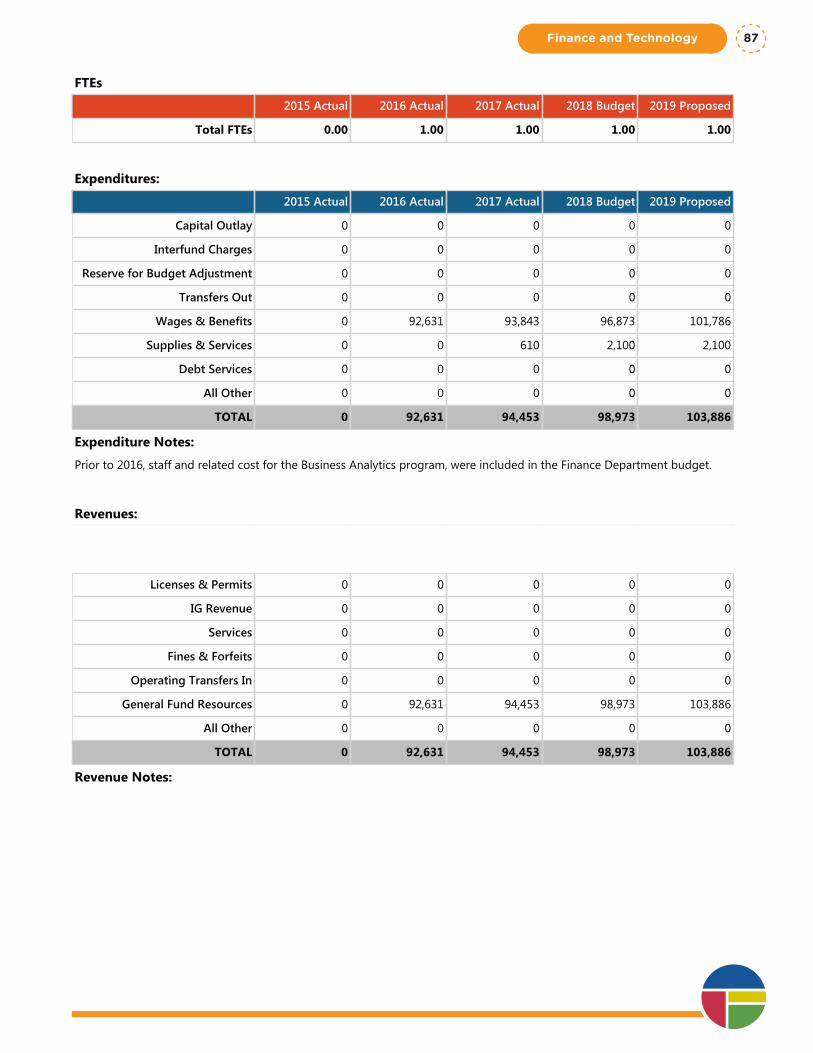
Program Summary: Business Analytics
Division: Finance & Technology
Fund Type: General Fund
Executive Summary:
Business Analytics develops and manages City performance measures and performs a wide range of financial and business analysis.
Programs and Services:
- Performance measure program development focused on outcome based measures for departments. - Creation and establishment of enterprise wide measures to assist organization in assessing performance against key metrics and identify opportunities to improve organizational policies and procedures.- Development of business plans and financial analysis that assist in the evaluation of key business decisions.- Leading enterprise level teams and projects for the purpose of solving identified issues, advancing key initiatives and improving outcomes across the organization.- Historical trending support for key metric indicators such as sales taxes, property taxes, real estate excise taxes, median household income, assessed values, new construction, population changes as well as benchmarking research and evaluation for comparison to peer cities- Regular data analysis support to assist in providing data driven business decision making.- Identifying opportunities for process improvement and working with key department personnel to advance process change for improving service levels and cost effectiveness.
FTEs
2015 Actual 2016 Actual 2017 Actual 2018 Budget 2019 Proposed
Total FTEs 0.00 1.00 1.00 1.00 1.00
Expenditures:
2015 Actual 2016 Actual 2017 Actual 2018 Budget 2019 Proposed
Capital Outlay 0 0 0 0 0
Interfund Charges 0 0 0 0 0
Reserve for Budget Adjustment 0 0 0 0 0
Transfers Out 0 0 0 0 0
Wages & Benefits 0 92,631 93,843 96,873 101,786
Supplies & Services 0 0 610 2,100 2,100
Debt Services 0 0 0 0 0
All Other 0 0 0 0 0
TOTAL 0 92,631 94,453 98,973 103,886
Expenditure Notes:
Prior to 2016, staff and related cost for the Business Analytics program, were included in the Finance Department budget.
Revenues:
2015 Actual 2016 Actual 2017 Actual 2018 Budget 2019 Proposed
Taxes 0 0 0 0 0
Licenses & Permits 0 0 0 0 0
IG Revenue 0 0 0 0 0
Services 0 0 0 0 0
Fines & Forfeits 0 0 0 0 0
Operating Transfers In 0 0 0 0 0
General Fund Resources 0 92,631 94,453 98,973 103,886
All Other 0 0 0 0 0
TOTAL 0 92,631 94,453 98,973 103,886
Revenue Notes:
Finance and Technology 87
Program Summary: Chief Financial Officer
Division: Finance & Technology
Fund Type: General Fund
Executive Summary:
The CFO performs oversight and management over all investment activities and manages the Business Analytics group.
Programs and Services:
Activities of the CFO include: - Administration of debt offerings including communication and support of key city initiatives involving the use of debt (e.g. streets initiative). - Overseeing and assuring optimum relationships with key monitoring organizations, including rating agencies (S&P, Moody’s, etc.) and State Auditor’s office. - Maintaining and optimizing key professional relationships, including the City’s financial advisor, debt underwriters and bond counsel. - Effective communication of financial matters to government and community stakeholders. - Management and oversight of Business Analytics.
FTEs
2015 Actual 2016 Actual 2017 Actual 2018 Budget 2019 Proposed
Total FTEs 0.00 0.00 0.00 1.00 1.00
Expenditures:
2015 Actual 2016 Actual 2017 Actual 2018 Budget 2019 Proposed
Capital Outlay 0 0 0 0 0
Interfund Charges 0 0 0 0 0
Reserve for Budget Adjustment 0 0 0 0 0
Transfers Out 0 0 0 0 0
Wages & Benefits 0 0 0 200,173 207,338
Supplies & Services 0 0 0 26,480 12,157
Debt Services 0 0 0 0 0
All Other 0 0 0 0 0
TOTAL 0 0 0 226,653 219,495
Expenditure Notes:
Prior to 2018, staff and related cost for the CFO program, were included in the Finance Department budget.
Revenues:
2015 Actual 2016 Actual 2017 Actual 2018 Budget 2019 Proposed
Taxes 0 0 0 0 0
Licenses & Permits 0 0 0 0 0
IG Revenue 0 0 0 0 0One Vision. One Plan. One Voice.
Finance and Technology88

Program Summary: Chief Financial Officer
Division: Finance & Technology
Fund Type: General Fund
Executive Summary:
The CFO performs oversight and management over all investment activities and manages the Business Analytics group.
Programs and Services:
Activities of the CFO include: - Administration of debt offerings including communication and support of key city initiatives involving the use of debt (e.g. streets initiative). - Overseeing and assuring optimum relationships with key monitoring organizations, including rating agencies (S&P, Moody’s, etc.) and State Auditor’s office. - Maintaining and optimizing key professional relationships, including the City’s financial advisor, debt underwriters and bond counsel. - Effective communication of financial matters to government and community stakeholders. - Management and oversight of Business Analytics.
FTEs
2015 Actual 2016 Actual 2017 Actual 2018 Budget 2019 Proposed
Total FTEs 0.00 0.00 0.00 1.00 1.00
Expenditures:
2015 Actual 2016 Actual 2017 Actual 2018 Budget 2019 Proposed
Capital Outlay 0 0 0 0 0
Interfund Charges 0 0 0 0 0
Reserve for Budget Adjustment 0 0 0 0 0
Transfers Out 0 0 0 0 0
Wages & Benefits 0 0 0 200,173 207,338
Supplies & Services 0 0 0 26,480 12,157
Debt Services 0 0 0 0 0
All Other 0 0 0 0 0
TOTAL 0 0 0 226,653 219,495
Expenditure Notes:
Prior to 2018, staff and related cost for the CFO program, were included in the Finance Department budget.
Revenues:
2015 Actual 2016 Actual 2017 Actual 2018 Budget 2019 Proposed
Taxes 0 0 0 0 0
Licenses & Permits 0 0 0 0 0
IG Revenue 0 0 0 0 0
Services 0 0 0 0 0
Fines & Forfeits 0 0 0 0 0
Operating Transfers In 0 0 0 0 0
General Fund Resources 0 0 0 226,653 219,495
All Other 0 0 0 0 0
TOTAL 0 0 0 226,653 219,495
Revenue Notes:
Finance and Technology 89
Program Summary: Taxes & Licenses
Division: Finance & Technology
Fund Type: General Fund
Executive Summary:
The Taxes & Licenses Office administers, bills, and collects City taxes and licenses. The office is also responsible for compliance auditing with respect to tax and license collections.
Programs and Services:
As authorized by the Spokane Municipal Code, City taxes and licenses include Admissions Tax, Amusement Device Licenses, Business Licenses, Charitable Solicitation Permits, Cabaret Licenses, Franchise Fees, Taxi Cab and Taxi Cab Driver Licenses, Gambling Tax, Leasehold Excise Tax, Temporary Licenses, Rent, Utility Tax, and Franchise Fees. The Taxes and Licenses Office collects all taxes and licenses equitably to ensure a level playing field for all entities doing business in Spokane. We respond to all customer inquires with the goal of providing accurate and timely information. Applications and tax returns are processed to ensure all accounts are correctly credited and entered in the City’s permit and accounting systems.
The result of Spokane’s participation in the State Business License program is an automatic comparison of City Business Licenses and the State’s existing business databases. This provides a more streamlined and cost effective audit process. This creates an additional layer of data for conducting compliance audits for utility taxes, business licenses, sales taxes and license/registration fees prescribed in the Municipal Code. This is a necessary process to promote tax fairness/equity.
FTEs
2015 Actual 2016 Actual 2017 Actual 2018 Budget 2019 Proposed
Total FTEs 4.60 4.60 4.60 4.20 3.60
Expenditures:
2015 Actual 2016 Actual 2017 Actual 2018 Budget 2019 Proposed
Capital Outlay 0 0 0 0 0
Interfund Charges 0 0 0 0 0
Reserve for Budget Adjustment 0 0 0 0 0
Transfers Out 0 0 0 0 0
Wages & Benefits 351,430 385,108 384,014 345,517 291,836
Supplies & Services 25,780 5,517 10,452 14,715 18,550
Debt Services 0 0 0 0 0
All Other 0 0 0 0 0
TOTAL 377,210 390,625 394,466 360,232 310,386
Expenditure Notes:
Revenues:
2015 Actual 2016 Actual 2017 Actual 2018 Budget 2019 Proposed
Taxes 0 0 0 0 0
Licenses & Permits 0 0 0 0 0One Vision. One Plan. One Voice.
Finance and Technology90
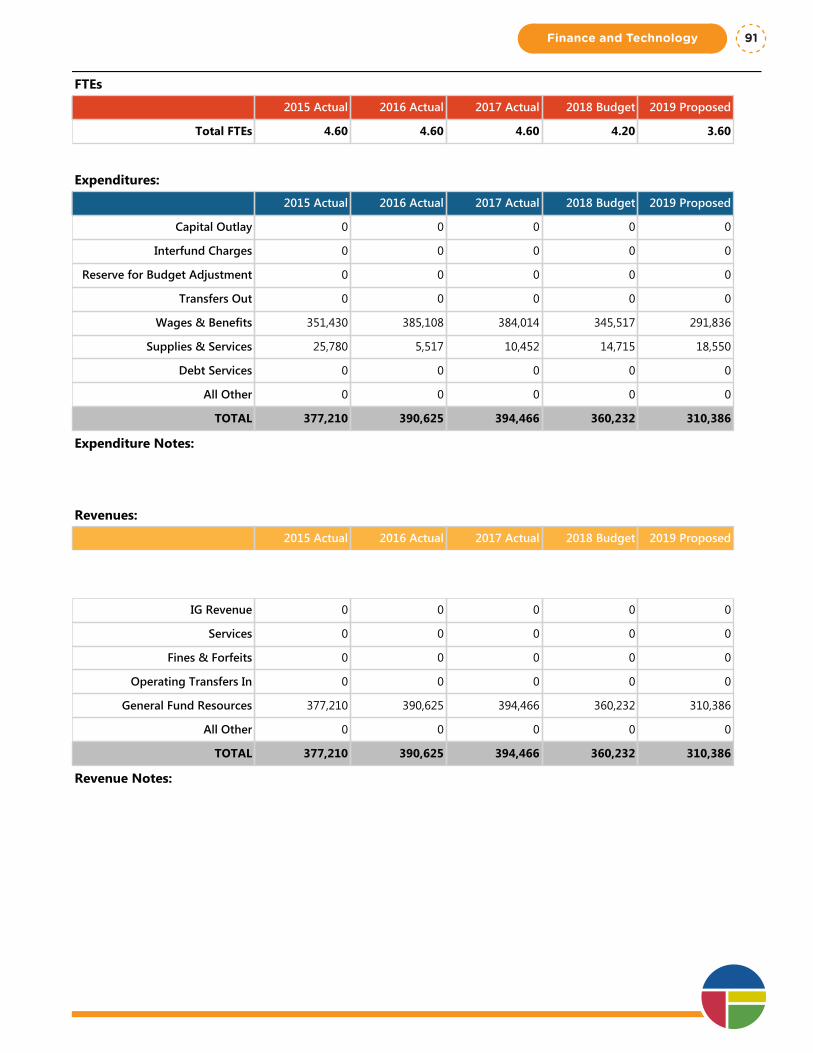
Program Summary: Taxes & Licenses
Division: Finance & Technology
Fund Type: General Fund
Executive Summary:
The Taxes & Licenses Office administers, bills, and collects City taxes and licenses. The office is also responsible for compliance auditing with respect to tax and license collections.
Programs and Services:
As authorized by the Spokane Municipal Code, City taxes and licenses include Admissions Tax, Amusement Device Licenses, Business Licenses, Charitable Solicitation Permits, Cabaret Licenses, Franchise Fees, Taxi Cab and Taxi Cab Driver Licenses, Gambling Tax, Leasehold Excise Tax, Temporary Licenses, Rent, Utility Tax, and Franchise Fees. The Taxes and Licenses Office collects all taxes and licenses equitably to ensure a level playing field for all entities doing business in Spokane. We respond to all customer inquires with the goal of providing accurate and timely information. Applications and tax returns are processed to ensure all accounts are correctly credited and entered in the City’s permit and accounting systems.
The result of Spokane’s participation in the State Business License program is an automatic comparison of City Business Licenses and the State’s existing business databases. This provides a more streamlined and cost effective audit process. This creates an additional layer of data for conducting compliance audits for utility taxes, business licenses, sales taxes and license/registration fees prescribed in the Municipal Code. This is a necessary process to promote tax fairness/equity.
FTEs
2015 Actual 2016 Actual 2017 Actual 2018 Budget 2019 Proposed
Total FTEs 4.60 4.60 4.60 4.20 3.60
Expenditures:
2015 Actual 2016 Actual 2017 Actual 2018 Budget 2019 Proposed
Capital Outlay 0 0 0 0 0
Interfund Charges 0 0 0 0 0
Reserve for Budget Adjustment 0 0 0 0 0
Transfers Out 0 0 0 0 0
Wages & Benefits 351,430 385,108 384,014 345,517 291,836
Supplies & Services 25,780 5,517 10,452 14,715 18,550
Debt Services 0 0 0 0 0
All Other 0 0 0 0 0
TOTAL 377,210 390,625 394,466 360,232 310,386
Expenditure Notes:
Revenues:
2015 Actual 2016 Actual 2017 Actual 2018 Budget 2019 Proposed
Taxes 0 0 0 0 0
Licenses & Permits 0 0 0 0 0
IG Revenue 0 0 0 0 0
Services 0 0 0 0 0
Fines & Forfeits 0 0 0 0 0
Operating Transfers In 0 0 0 0 0
General Fund Resources 377,210 390,625 394,466 360,232 310,386
All Other 0 0 0 0 0
TOTAL 377,210 390,625 394,466 360,232 310,386
Revenue Notes:
Finance and Technology 91
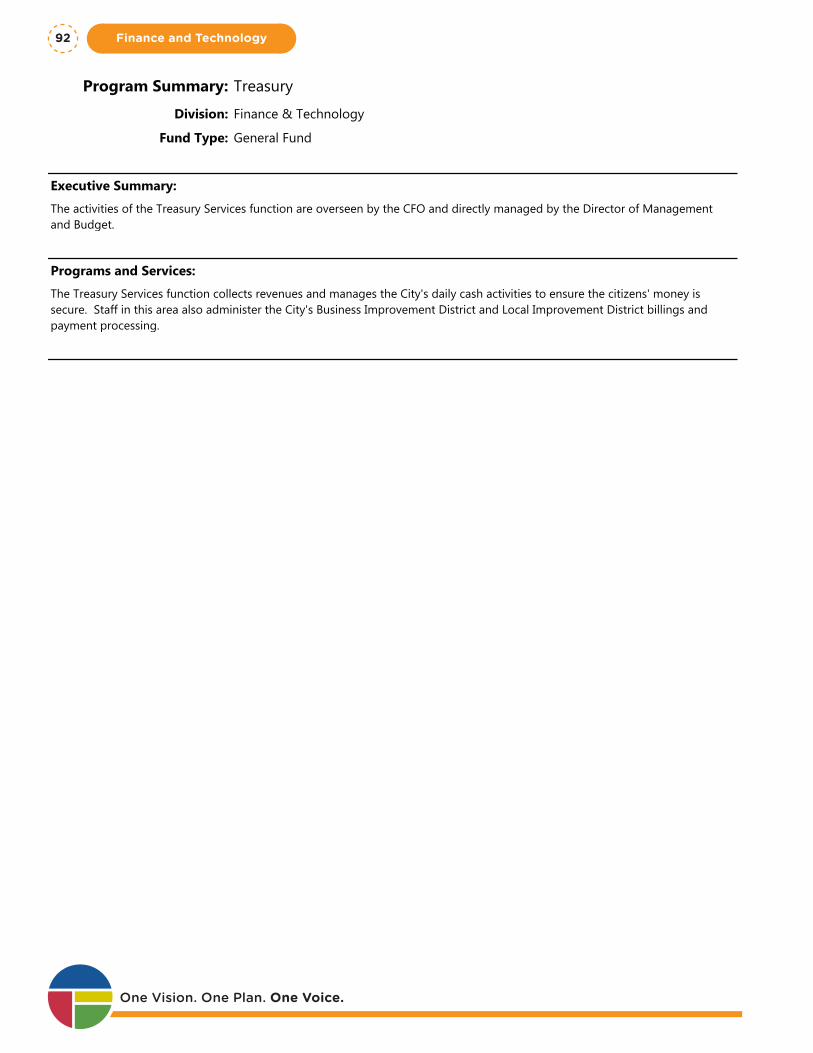
Program Summary: Treasury
Division: Finance & Technology
Fund Type: General Fund
Executive Summary:
The activities of the Treasury Services function are overseen by the CFO and directly managed by the Director of Management and Budget.
Programs and Services:
The Treasury Services function collects revenues and manages the City's daily cash activities to ensure the citizens' money is secure. Staff in this area also administer the City's Business Improvement District and Local Improvement District billings and payment processing.
FTEs
2015 Actual 2016 Actual 2017 Actual 2018 Budget 2019 Proposed
Total FTEs 0.00 0.00 0.00 0.00 2.60
Expenditures:
2015 Actual 2016 Actual 2017 Actual 2018 Budget 2019 Proposed
Capital Outlay 0 0 0 0 0
Interfund Charges 0 0 0 0 0
Reserve for Budget Adjustment 0 0 0 0 0
Transfers Out 0 0 0 0 0
Wages & Benefits 0 0 0 0 232,468
Supplies & Services 0 0 0 0 110,520
Debt Services 0 0 0 0 0
All Other 0 0 0 0 0
TOTAL 0 0 0 0 342,988
Expenditure Notes:
In 2019, Treasury Services personnel and related costs of the function, moved from another Department within the Finance Division, Accounting Services, to the Treasury Services Department.
Revenues:
2015 Actual 2016 Actual 2017 Actual 2018 Budget 2019 Proposed
Taxes 0 0 0 0 0
Licenses & Permits 0 0 0 0 0
IG Revenue 0 0 0 0 0
Services 0 0 0 0 15,000
Fines & Forfeits 0 0 0 0 35,000
Operating Transfers In 0 0 0 0 0
General Fund Resources 0 0 0 0 289,488One Vision. One Plan. One Voice.
Finance and Technology92
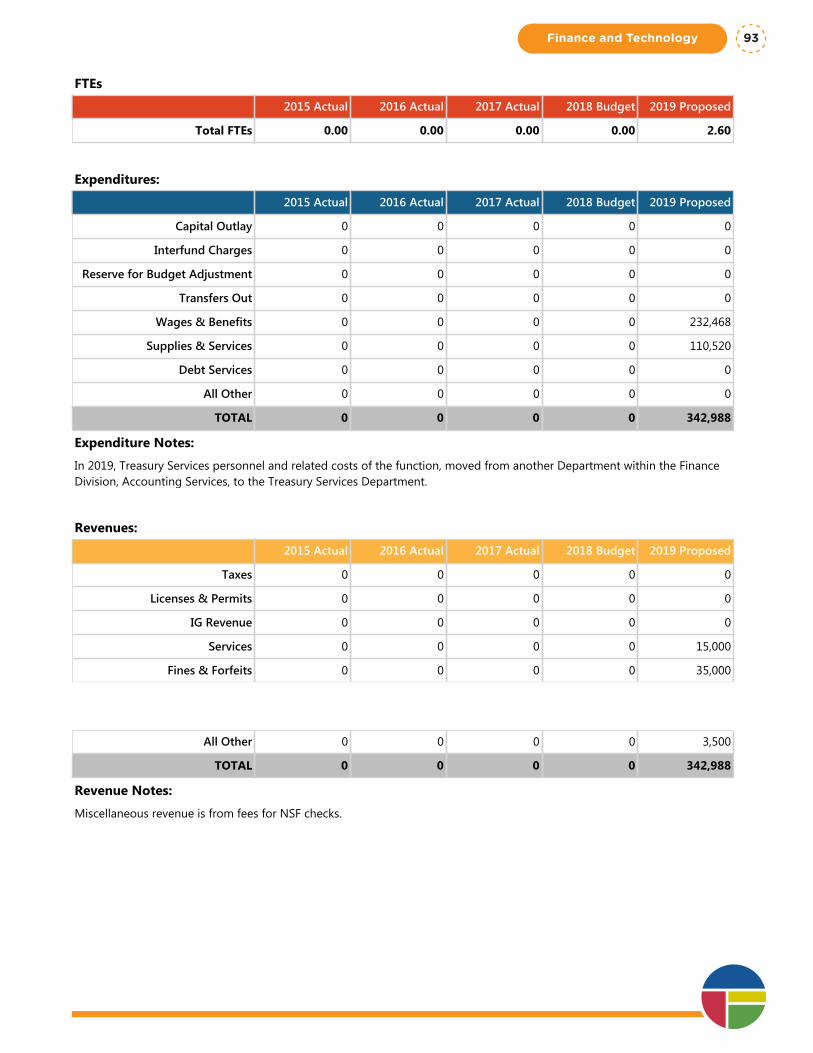
Program Summary: Treasury
Division: Finance & Technology
Fund Type: General Fund
Executive Summary:
The activities of the Treasury Services function are overseen by the CFO and directly managed by the Director of Management and Budget.
Programs and Services:
The Treasury Services function collects revenues and manages the City's daily cash activities to ensure the citizens' money is secure. Staff in this area also administer the City's Business Improvement District and Local Improvement District billings and payment processing.
FTEs
2015 Actual 2016 Actual 2017 Actual 2018 Budget 2019 Proposed
Total FTEs 0.00 0.00 0.00 0.00 2.60
Expenditures:
2015 Actual 2016 Actual 2017 Actual 2018 Budget 2019 Proposed
Capital Outlay 0 0 0 0 0
Interfund Charges 0 0 0 0 0
Reserve for Budget Adjustment 0 0 0 0 0
Transfers Out 0 0 0 0 0
Wages & Benefits 0 0 0 0 232,468
Supplies & Services 0 0 0 0 110,520
Debt Services 0 0 0 0 0
All Other 0 0 0 0 0
TOTAL 0 0 0 0 342,988
Expenditure Notes:
In 2019, Treasury Services personnel and related costs of the function, moved from another Department within the Finance Division, Accounting Services, to the Treasury Services Department.
Revenues:
2015 Actual 2016 Actual 2017 Actual 2018 Budget 2019 Proposed
Taxes 0 0 0 0 0
Licenses & Permits 0 0 0 0 0
IG Revenue 0 0 0 0 0
Services 0 0 0 0 15,000
Fines & Forfeits 0 0 0 0 35,000
Operating Transfers In 0 0 0 0 0
General Fund Resources 0 0 0 0 289,488
All Other 0 0 0 0 3,500
TOTAL 0 0 0 0 342,988
Revenue Notes:
Miscellaneous revenue is from fees for NSF checks.
Finance and Technology 93

One Vision. One Plan. One Voice.
Finance and Technology94
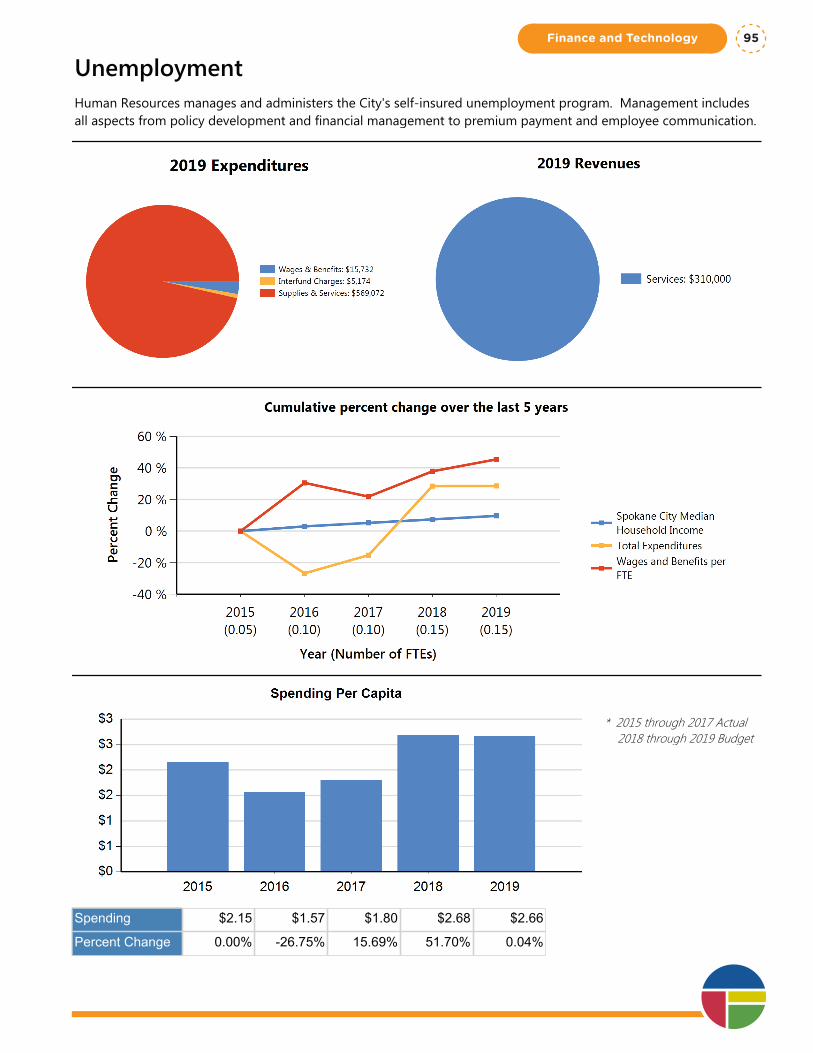
UnemploymentHuman Resources manages and administers the City's self-insured unemployment program. Management includes all aspects from policy development and financial management to premium payment and employee communication.
* 2015 through 2017 Actual 2018 through 2019 Budget
Spending $2.15 $1.57 $1.80 $2.68 $2.66
Percent Change 0.00% -26.75% 15.69% 51.70% 0.04%
Finance and Technology 95
Department Summary: Unemployment
Division: Finance & Technology
Fund Type: Internal Service Fund
Executive Summary:
Human Resources manages and administers the City's self-insured unemployment program. Management includes all aspects from policy development and financial management to premium payment and employee communication.
Programs and Services:
Human Resources provides program and claims management services for unemployment. Responsibilities are similar to insurance company management. This purpose of this program provide appropriate claims management for incurred claims, timely payment of benefits, and fair and equitable treatment to our employees, and coordination of benefits that will prevent over or under payment of benefits. Additionally, claims management attempts to minimize and/or mitigate the severity or costs of those claims to the City.
FTEs
2015 Actual 2016 Actual 2017 Actual 2018 Budget 2019 Proposed
Total FTEs 0.05 0.10 0.10 0.15 0.15
Expenditures:
2015 Actual 2016 Actual 2017 Actual 2018 Budget 2019 Proposed
Capital Outlay 0 0 0 0 0
Interfund Charges 8,725 7,219 6,283 6,023 5,174
Reserve for Budget Adjustment 0 0 0 0 0
Transfers Out 0 0 0 0 0
Wages & Benefits 3,525 9,206 8,403 14,628 15,732
Supplies & Services 446,452 319,565 374,038 569,072 569,072
Debt Services 0 0 0 0 0
All Other 0 0 0 0 0
TOTAL 458,702 335,990 388,724 589,723 589,978
Expenditure Notes:
Other services & charges includes claims for unemployment; therefore, the amount will fluctuate depending on the amount of claims filed each year.
Revenues:
2015 Actual 2016 Actual 2017 Actual 2018 Budget 2019 Proposed
Taxes 0 0 0 0 0
Licenses & Permits 0 0 0 0 0
IG Revenue 0 0 0 0 0
Services 549,997 550,001 350,000 300,000 310,000
Fines & Forfeits 0 0 0 0 0
Operating Transfers In 0 0 0 0 0One Vision. One Plan. One Voice.
Finance and Technology96
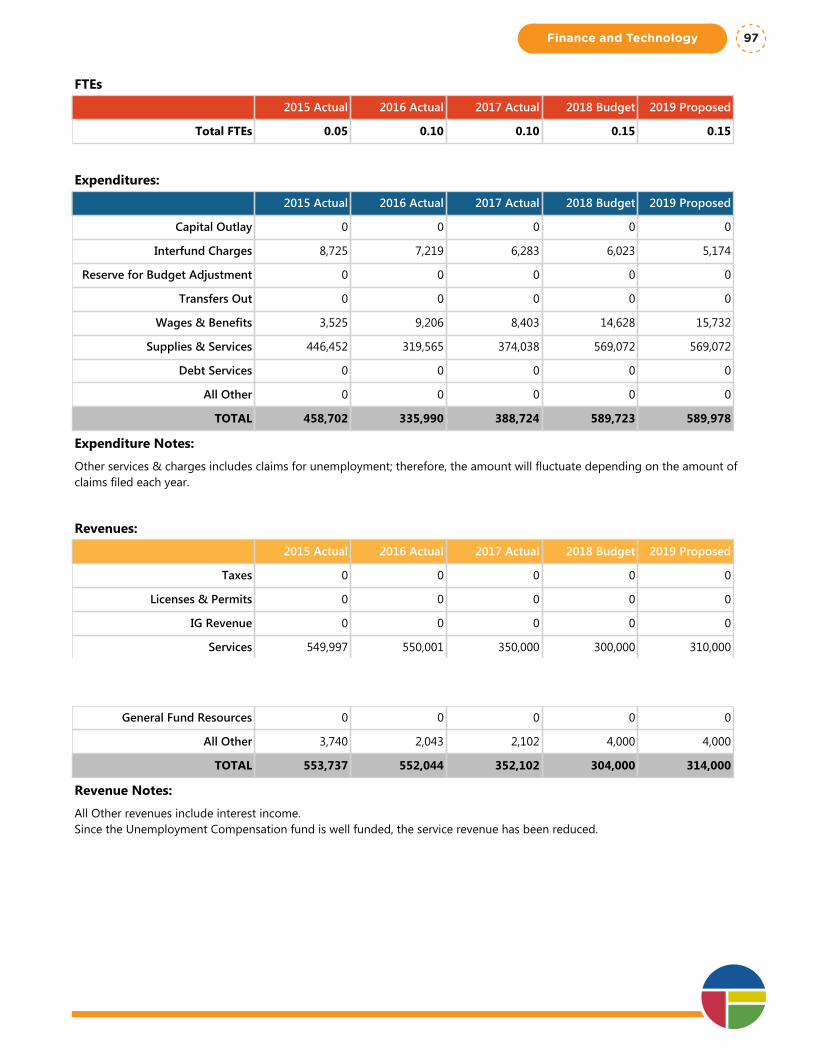
Department Summary: Unemployment
Division: Finance & Technology
Fund Type: Internal Service Fund
Executive Summary:
Human Resources manages and administers the City's self-insured unemployment program. Management includes all aspects from policy development and financial management to premium payment and employee communication.
Programs and Services:
Human Resources provides program and claims management services for unemployment. Responsibilities are similar to insurance company management. This purpose of this program provide appropriate claims management for incurred claims, timely payment of benefits, and fair and equitable treatment to our employees, and coordination of benefits that will prevent over or under payment of benefits. Additionally, claims management attempts to minimize and/or mitigate the severity or costs of those claims to the City.
FTEs
2015 Actual 2016 Actual 2017 Actual 2018 Budget 2019 Proposed
Total FTEs 0.05 0.10 0.10 0.15 0.15
Expenditures:
2015 Actual 2016 Actual 2017 Actual 2018 Budget 2019 Proposed
Capital Outlay 0 0 0 0 0
Interfund Charges 8,725 7,219 6,283 6,023 5,174
Reserve for Budget Adjustment 0 0 0 0 0
Transfers Out 0 0 0 0 0
Wages & Benefits 3,525 9,206 8,403 14,628 15,732
Supplies & Services 446,452 319,565 374,038 569,072 569,072
Debt Services 0 0 0 0 0
All Other 0 0 0 0 0
TOTAL 458,702 335,990 388,724 589,723 589,978
Expenditure Notes:
Other services & charges includes claims for unemployment; therefore, the amount will fluctuate depending on the amount of claims filed each year.
Revenues:
2015 Actual 2016 Actual 2017 Actual 2018 Budget 2019 Proposed
Taxes 0 0 0 0 0
Licenses & Permits 0 0 0 0 0
IG Revenue 0 0 0 0 0
Services 549,997 550,001 350,000 300,000 310,000
Fines & Forfeits 0 0 0 0 0
Operating Transfers In 0 0 0 0 0
General Fund Resources 0 0 0 0 0
All Other 3,740 2,043 2,102 4,000 4,000
TOTAL 553,737 552,044 352,102 304,000 314,000
Revenue Notes:
All Other revenues include interest income.Since the Unemployment Compensation fund is well funded, the service revenue has been reduced.
Finance and Technology 97

One Vision. One Plan. One Voice.
Finance and Technology98
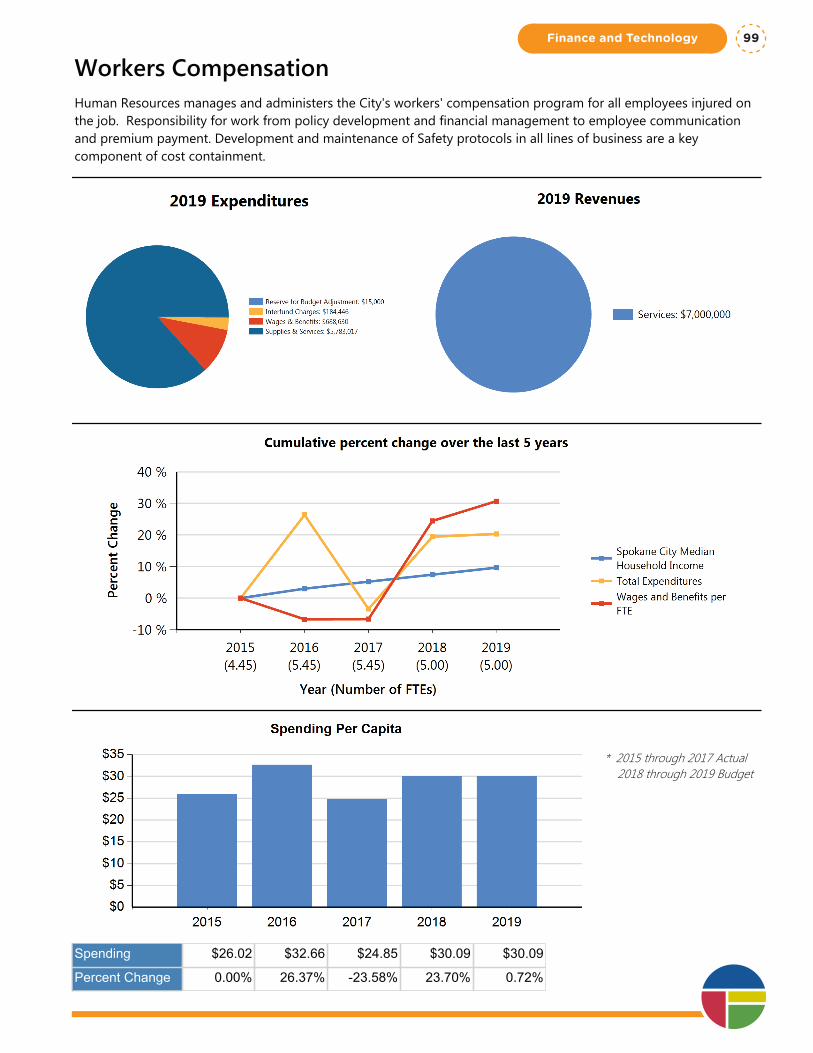
Workers CompensationHuman Resources manages and administers the City's workers' compensation program for all employees injured on the job. Responsibility for work from policy development and financial management to employee communication and premium payment. Development and maintenance of Safety protocols in all lines of business are a key component of cost containment.
* 2015 through 2017 Actual 2018 through 2019 Budget
Spending $26.02 $32.66 $24.85 $30.09 $30.09
Percent Change 0.00% 26.37% -23.58% 23.70% 0.72%
Finance and Technology 99
Department Summary: Workers Compensation
Division: Finance & Technology
Fund Type: Internal Service Fund
Executive Summary:
Human Resources manages and administers the City's workers' compensation program for all employees injured on the job. Responsibility for work from policy development and financial management to employee communication and premium payment. Development and maintenance of Safety protocols in all lines of business are a key component of cost containment.
Programs and Services:
Human Resources manages and administers the safety program to work with operational departments to develop and deliver effective safety protocols for all City of Spokane lines of business. We strive keep our workforce safe, minimize physical and financial loss to the City, and assure minimal disruption of service from such loss
Safety & Workers Compensation work with operational departments to develop light duty work and then job descriptions in order to return injured employees to a work environment as soon as they are released by a physician.
Safety manages the relationship and activities within the City of regulatory agencies such as DOSH, OSHA, EPA, LGSI, and SCAPCA.
Safety and Workers Compensation provide trending analysis and internal support to establish and maintain appropriate loss control measures, training and support mechanisms for City departments.
Workers Compensation establishes the initial reserving and cost projections, provides appropriate claims administration for incurred claims.
Workers Compensation manages timely payment of wages and benefits, and fair and equitable treatment to our employees who have been injured during work at the City.
Safety and Workers Compensation do make all appropriate efforts through training, light duty, and claims management to minimize and/or mitigate the severity or costs of those claims to the City.
FTEs
2015 Actual 2016 Actual 2017 Actual 2018 Budget 2019 Proposed
Total FTEs 4.45 5.45 5.45 5.00 5.00
Expenditures:
2015 Actual 2016 Actual 2017 Actual 2018 Budget 2019 Proposed
Capital Outlay 0 0 0 0 0
Interfund Charges 148,692 146,792 168,229 188,568 184,446
Reserve for Budget Adjustment 0 0 0 15,000 15,000
Transfers Out 0 0 0 0 0
Wages & Benefits 471,304 538,427 538,744 648,040 688,630
Supplies & Services 4,924,011 6,320,939 4,646,798 5,771,337 5,783,017
Debt Services 0 0 0 0 0
All Other 0 0 0 0 0One Vision. One Plan. One Voice.
Finance and Technology100
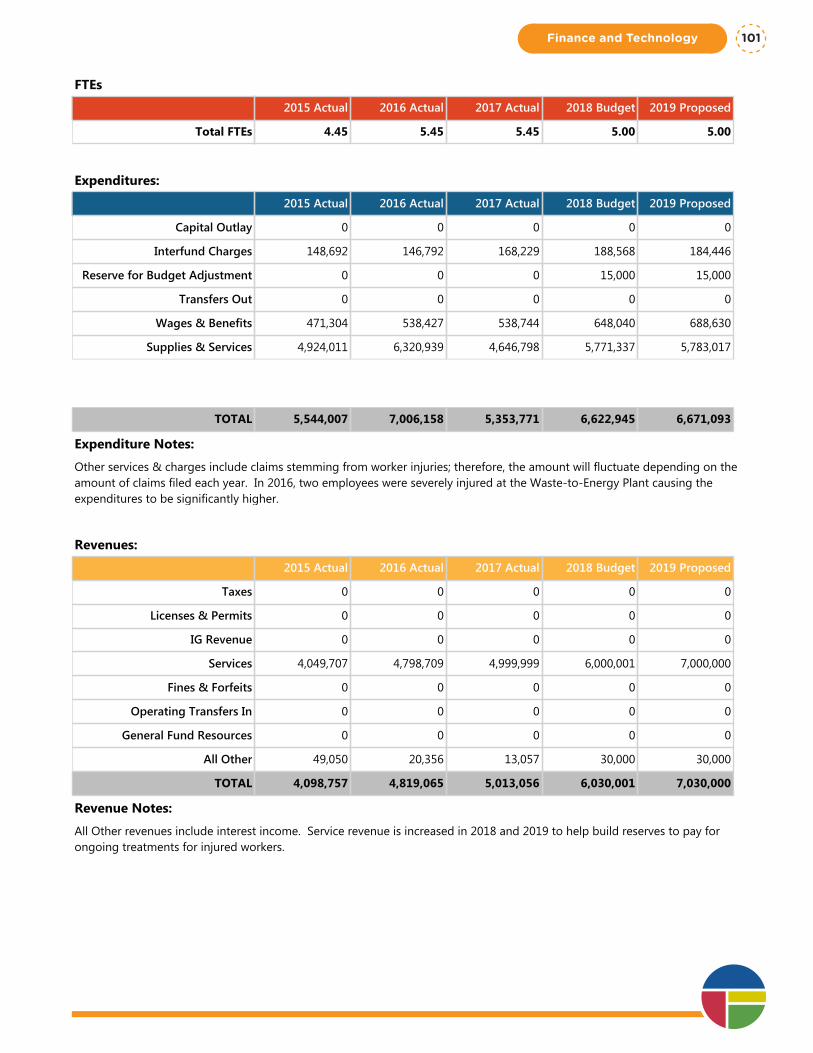
Department Summary: Workers Compensation
Division: Finance & Technology
Fund Type: Internal Service Fund
Executive Summary:
Human Resources manages and administers the City's workers' compensation program for all employees injured on the job. Responsibility for work from policy development and financial management to employee communication and premium payment. Development and maintenance of Safety protocols in all lines of business are a key component of cost containment.
Programs and Services:
Human Resources manages and administers the safety program to work with operational departments to develop and deliver effective safety protocols for all City of Spokane lines of business. We strive keep our workforce safe, minimize physical and financial loss to the City, and assure minimal disruption of service from such loss
Safety & Workers Compensation work with operational departments to develop light duty work and then job descriptions in order to return injured employees to a work environment as soon as they are released by a physician.
Safety manages the relationship and activities within the City of regulatory agencies such as DOSH, OSHA, EPA, LGSI, and SCAPCA.
Safety and Workers Compensation provide trending analysis and internal support to establish and maintain appropriate loss control measures, training and support mechanisms for City departments.
Workers Compensation establishes the initial reserving and cost projections, provides appropriate claims administration for incurred claims.
Workers Compensation manages timely payment of wages and benefits, and fair and equitable treatment to our employees who have been injured during work at the City.
Safety and Workers Compensation do make all appropriate efforts through training, light duty, and claims management to minimize and/or mitigate the severity or costs of those claims to the City.
FTEs
2015 Actual 2016 Actual 2017 Actual 2018 Budget 2019 Proposed
Total FTEs 4.45 5.45 5.45 5.00 5.00
Expenditures:
2015 Actual 2016 Actual 2017 Actual 2018 Budget 2019 Proposed
Capital Outlay 0 0 0 0 0
Interfund Charges 148,692 146,792 168,229 188,568 184,446
Reserve for Budget Adjustment 0 0 0 15,000 15,000
Transfers Out 0 0 0 0 0
Wages & Benefits 471,304 538,427 538,744 648,040 688,630
Supplies & Services 4,924,011 6,320,939 4,646,798 5,771,337 5,783,017
Debt Services 0 0 0 0 0
All Other 0 0 0 0 0
TOTAL 5,544,007 7,006,158 5,353,771 6,622,945 6,671,093
Expenditure Notes:
Other services & charges include claims stemming from worker injuries; therefore, the amount will fluctuate depending on the amount of claims filed each year. In 2016, two employees were severely injured at the Waste-to-Energy Plant causing the expenditures to be significantly higher.
Revenues:
2015 Actual 2016 Actual 2017 Actual 2018 Budget 2019 Proposed
Taxes 0 0 0 0 0
Licenses & Permits 0 0 0 0 0
IG Revenue 0 0 0 0 0
Services 4,049,707 4,798,709 4,999,999 6,000,001 7,000,000
Fines & Forfeits 0 0 0 0 0
Operating Transfers In 0 0 0 0 0
General Fund Resources 0 0 0 0 0
All Other 49,050 20,356 13,057 30,000 30,000
TOTAL 4,098,757 4,819,065 5,013,056 6,030,001 7,030,000
Revenue Notes:
All Other revenues include interest income. Service revenue is increased in 2018 and 2019 to help build reserves to pay for ongoing treatments for injured workers.
Finance and Technology 101

One Vision. One Plan. One Voice.
Finance and Technology102
Planning and Economic Development
Planning and Econom
ic Developm
ent
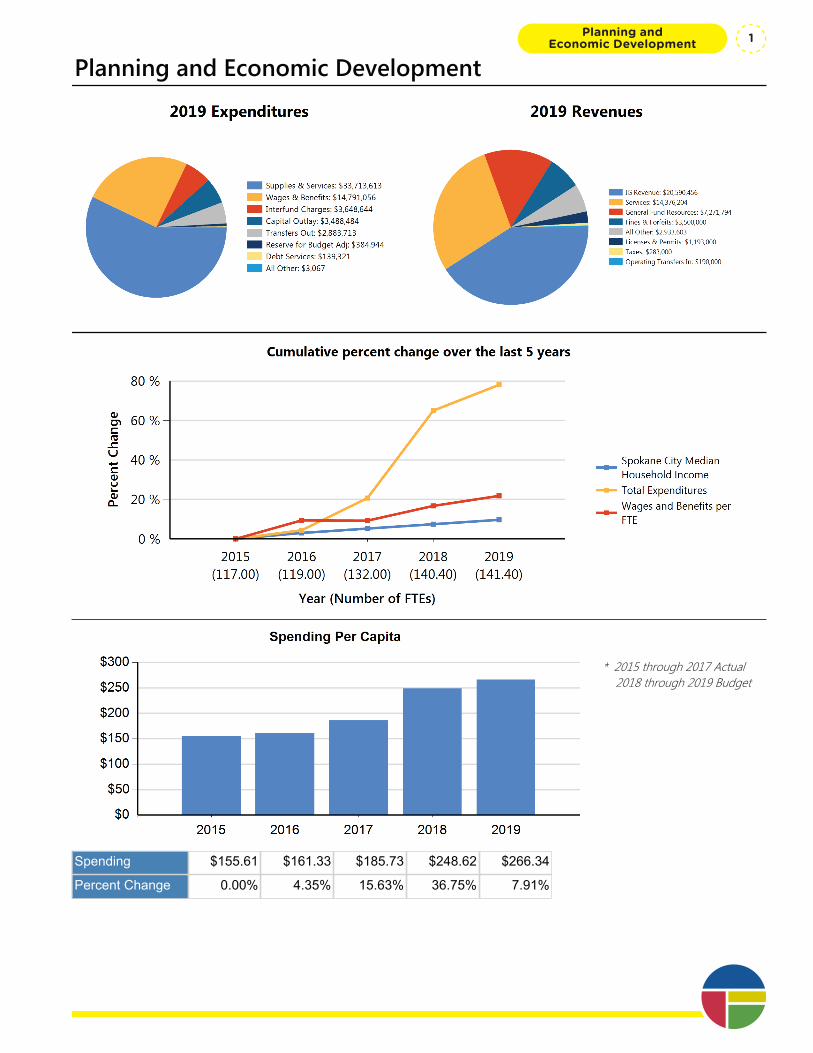
Planning and Economic Development
* 2015 through 2017 Actual 2018 through 2019 Budget
Spending $155.61 $161.33 $185.73 $248.62 $266.34
Percent Change 0.00% 4.35% 15.63% 36.75% 7.91%
Planning and Economic Development 1

One Vision. One Plan. One Voice.
Planning and Economic Development2
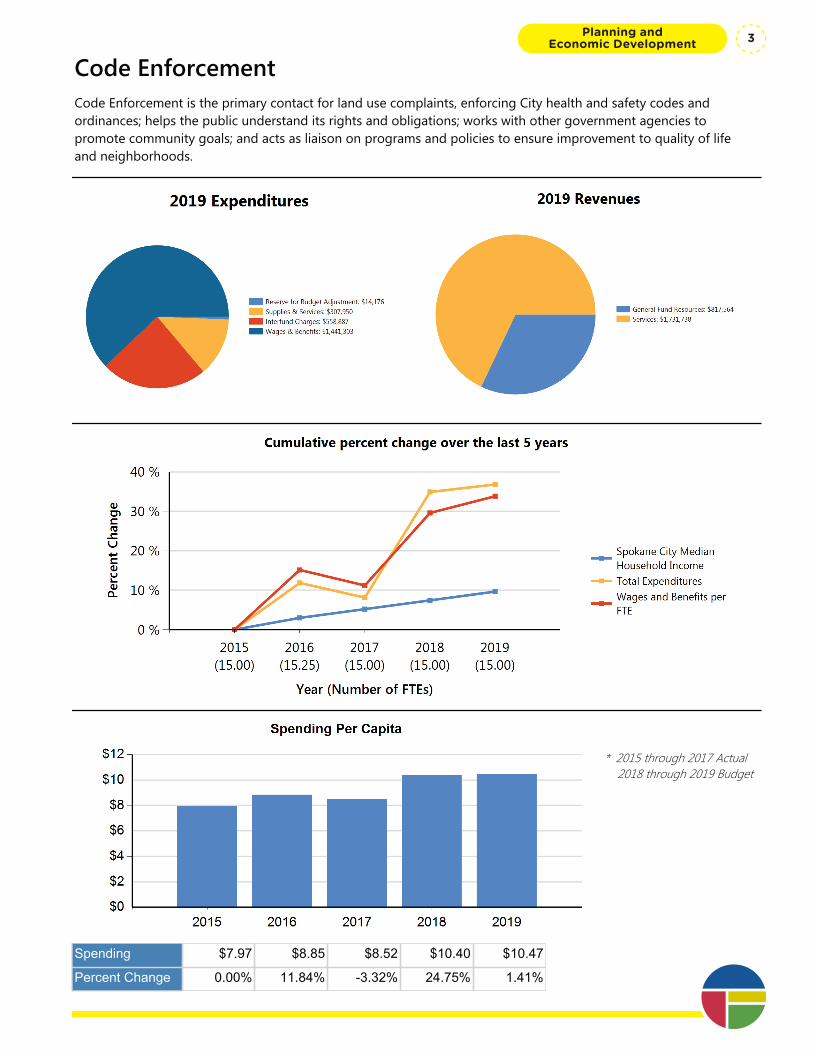
Code EnforcementCode Enforcement is the primary contact for land use complaints, enforcing City health and safety codes and ordinances; helps the public understand its rights and obligations; works with other government agencies to promote community goals; and acts as liaison on programs and policies to ensure improvement to quality of life and neighborhoods.
* 2015 through 2017 Actual 2018 through 2019 Budget
Spending $7.97 $8.85 $8.52 $10.40 $10.47
Percent Change 0.00% 11.84% -3.32% 24.75% 1.41%
Planning and Economic Development 3
Department Summary: Code Enforcement
Division: Planning and Economic Development
Fund Type: Special Revenue Fund
Executive Summary:
Code Enforcement is the primary contact for land use complaints, enforcing City health and safety codes and ordinances; helps the public understand its rights and obligations; works with other government agencies to promote community goals; and acts as liaison on programs and policies to ensure improvement to quality of life and neighborhoods.
Programs and Services:
Respond and resolve violations including: nuisances, solid waste accumulation, junk and abandoned vehicles, vacant and dangerous buildings, fire hazards from vegetation and debris, zoning violations, right-of-way obstructions, illegal dumping, graffiti and other land use violations. The department’s 15 FTEs respond to complaints and inquiries. The program provides one of the most comprehensive knowledge bases of City functions and resources for responding to citizens to call for assistance. Code Enforcement coordinates with numerous agencies for services, increasing resolution rates and decreasing response time.
FTEs
2015 Actual 2016 Actual 2017 Actual 2018 Budget 2019 Proposed
Total FTEs 15.00 15.25 15.00 15.00 15.00
Expenditures:
2015 Actual 2016 Actual 2017 Actual 2018 Budget 2019 Proposed
Capital Outlay 0 0 0 0 0
Interfund Charges 328,635 435,490 451,559 473,733 558,887
Reserve for Budget Adjustment 0 0 0 0 14,176
Transfers Out 0 0 0 0 0
Wages & Benefits 1,056,008 1,236,207 1,167,953 1,382,744 1,441,303
Supplies & Services 312,736 226,785 215,871 433,324 307,950
Debt Services 0 0 0 0 0
All Other 0 0 0 0 0
TOTAL 1,697,379 1,898,482 1,835,383 2,289,801 2,322,316
Expenditure Notes:
Revenues:
2015 Actual 2016 Actual 2017 Actual 2018 Budget 2019 Proposed
Taxes 19,289 22,134 22,957 0 0
Licenses & Permits 0 0 0 0 0
IG Revenue 0 0 0 0 0
Services 811,652 795,857 1,202,795 1,431,336 1,731,738
Fines & Forfeits 0 0 0 3,000 0One Vision. One Plan. One Voice.
Planning and Economic Development4
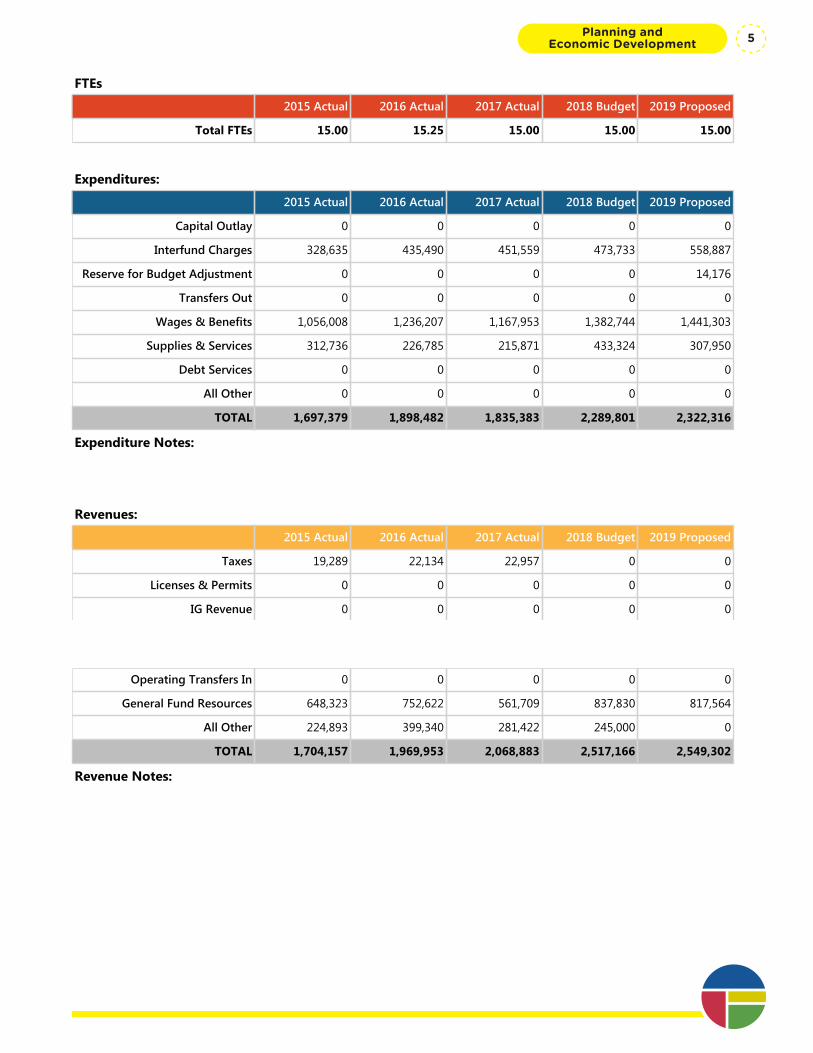
Department Summary: Code Enforcement
Division: Planning and Economic Development
Fund Type: Special Revenue Fund
Executive Summary:
Code Enforcement is the primary contact for land use complaints, enforcing City health and safety codes and ordinances; helps the public understand its rights and obligations; works with other government agencies to promote community goals; and acts as liaison on programs and policies to ensure improvement to quality of life and neighborhoods.
Programs and Services:
Respond and resolve violations including: nuisances, solid waste accumulation, junk and abandoned vehicles, vacant and dangerous buildings, fire hazards from vegetation and debris, zoning violations, right-of-way obstructions, illegal dumping, graffiti and other land use violations. The department’s 15 FTEs respond to complaints and inquiries. The program provides one of the most comprehensive knowledge bases of City functions and resources for responding to citizens to call for assistance. Code Enforcement coordinates with numerous agencies for services, increasing resolution rates and decreasing response time.
FTEs
2015 Actual 2016 Actual 2017 Actual 2018 Budget 2019 Proposed
Total FTEs 15.00 15.25 15.00 15.00 15.00
Expenditures:
2015 Actual 2016 Actual 2017 Actual 2018 Budget 2019 Proposed
Capital Outlay 0 0 0 0 0
Interfund Charges 328,635 435,490 451,559 473,733 558,887
Reserve for Budget Adjustment 0 0 0 0 14,176
Transfers Out 0 0 0 0 0
Wages & Benefits 1,056,008 1,236,207 1,167,953 1,382,744 1,441,303
Supplies & Services 312,736 226,785 215,871 433,324 307,950
Debt Services 0 0 0 0 0
All Other 0 0 0 0 0
TOTAL 1,697,379 1,898,482 1,835,383 2,289,801 2,322,316
Expenditure Notes:
Revenues:
2015 Actual 2016 Actual 2017 Actual 2018 Budget 2019 Proposed
Taxes 19,289 22,134 22,957 0 0
Licenses & Permits 0 0 0 0 0
IG Revenue 0 0 0 0 0
Services 811,652 795,857 1,202,795 1,431,336 1,731,738
Fines & Forfeits 0 0 0 3,000 0
Operating Transfers In 0 0 0 0 0
General Fund Resources 648,323 752,622 561,709 837,830 817,564
All Other 224,893 399,340 281,422 245,000 0
TOTAL 1,704,157 1,969,953 2,068,883 2,517,166 2,549,302
Revenue Notes:
Planning and Economic Development 5
Program Summary: Code Enforcement
Division: Planning and Economic Development
Fund Type: Special Revenue Fund
Executive Summary:
The Code Enforcement program is responsible for enforcement of land use, health and safety codes and ordinances through complaint based reporting. The program staff work closely with other departments, agencies and citizens to facilitate compliance and maintain clean neighborhoods.
Programs and Services:
The department’s 6 FTE officers respond to complaints and inquiries and verify conditions in the field. They coordinate with citizens and neighborhoods to bring properties up to code standards. The department’s housing staff, consisting of 2 FTE’s, facilitate and assist in the building official process and monitor substandard housing. Staff also works with the Development Services Center to insure compliance with codes and regulations in order to provide safe buildings and public spaces.
FTEs
2015 Actual 2016 Actual 2017 Actual 2018 Budget 2019 Proposed
Total FTEs 8.00 8.00 8.00 8.00 8.00
Expenditures:
2015 Actual 2016 Actual 2017 Actual 2018 Budget 2019 Proposed
Capital Outlay 0 0 0 0 0
Interfund Charges 15,456 21,274 18,009 23,725 27,125
Reserve for Budget Adjustment 0 0 0 0 0
Transfers Out 0 0 0 0 0
Wages & Benefits 624,883 731,641 684,016 792,475 836,098
Supplies & Services 156,804 182,208 153,671 133,539 103,859
Debt Services 0 0 0 0 0
All Other 0 0 0 0 0
TOTAL 797,143 935,123 855,696 949,739 967,082
Expenditure Notes:
Revenues:
2015 Actual 2016 Actual 2017 Actual 2018 Budget 2019 Proposed
Taxes 0 0 0 0 0
Licenses & Permits 0 0 0 0 0
IG Revenue 0 0 0 0 0
Services 69,604 (2,309) 65,949 238,876 356,763
Fines & Forfeits 0 0 0 0 0
Operating Transfers In 0 0 0 0 0One Vision. One Plan. One Voice.
Planning and Economic Development6

Program Summary: Code Enforcement
Division: Planning and Economic Development
Fund Type: Special Revenue Fund
Executive Summary:
The Code Enforcement program is responsible for enforcement of land use, health and safety codes and ordinances through complaint based reporting. The program staff work closely with other departments, agencies and citizens to facilitate compliance and maintain clean neighborhoods.
Programs and Services:
The department’s 6 FTE officers respond to complaints and inquiries and verify conditions in the field. They coordinate with citizens and neighborhoods to bring properties up to code standards. The department’s housing staff, consisting of 2 FTE’s, facilitate and assist in the building official process and monitor substandard housing. Staff also works with the Development Services Center to insure compliance with codes and regulations in order to provide safe buildings and public spaces.
FTEs
2015 Actual 2016 Actual 2017 Actual 2018 Budget 2019 Proposed
Total FTEs 8.00 8.00 8.00 8.00 8.00
Expenditures:
2015 Actual 2016 Actual 2017 Actual 2018 Budget 2019 Proposed
Capital Outlay 0 0 0 0 0
Interfund Charges 15,456 21,274 18,009 23,725 27,125
Reserve for Budget Adjustment 0 0 0 0 0
Transfers Out 0 0 0 0 0
Wages & Benefits 624,883 731,641 684,016 792,475 836,098
Supplies & Services 156,804 182,208 153,671 133,539 103,859
Debt Services 0 0 0 0 0
All Other 0 0 0 0 0
TOTAL 797,143 935,123 855,696 949,739 967,082
Expenditure Notes:
Revenues:
2015 Actual 2016 Actual 2017 Actual 2018 Budget 2019 Proposed
Taxes 0 0 0 0 0
Licenses & Permits 0 0 0 0 0
IG Revenue 0 0 0 0 0
Services 69,604 (2,309) 65,949 238,876 356,763
Fines & Forfeits 0 0 0 0 0
Operating Transfers In 0 0 0 0 0
General Fund Resources 256,025 0 0 0 0
All Other 0 35,200 60,000 0 0
TOTAL 325,629 32,891 125,949 238,876 356,763
Revenue Notes:
Planning and Economic Development 7

Program Summary: Code Enforcement Administration
Division: Planning and Economic Development
Fund Type: Special Revenue Fund
Executive Summary:
The administrative function provides overall management and leadership for the Code Enforcement and Litter Crew programs.
Programs and Services:
The code enforcement administration program of 3 FTE’s, includes the management and clerical staff who support the department. This section is responsible for setting and measuring performance goals, budget preparation, contractual services, personnel administration and long-term planning.
FTEs
2015 Actual 2016 Actual 2017 Actual 2018 Budget 2019 Proposed
Total FTEs 3.00 3.25 3.00 3.00 3.00
Expenditures:
2015 Actual 2016 Actual 2017 Actual 2018 Budget 2019 Proposed
Capital Outlay 0 0 0 0 0
Interfund Charges 286,544 362,843 389,361 410,200 465,705
Reserve for Budget Adjustment 0 0 0 0 14,176
Transfers Out 0 0 0 0 0
Wages & Benefits 206,734 214,536 197,290 271,737 256,782
Supplies & Services 123,340 19,423 33,199 256,811 151,616
Debt Services 0 0 0 0 0
All Other 0 0 0 0 0
TOTAL 616,618 596,802 619,850 938,748 888,279
Expenditure Notes:
Revenues:
2015 Actual 2016 Actual 2017 Actual 2018 Budget 2019 Proposed
Taxes 19,289 22,134 22,957 0 0
Licenses & Permits 0 0 0 0 0
IG Revenue 0 0 0 0 0
Services 742,048 439,222 759,692 733,319 897,937
Fines & Forfeits 0 0 0 3,000 0
Operating Transfers In 0 0 0 0 0
General Fund Resources 392,298 752,622 561,709 837,830 817,564
All Other 224,334 362,996 218,304 245,000 0One Vision. One Plan. One Voice.
Planning and Economic Development8

Program Summary: Code Enforcement Administration
Division: Planning and Economic Development
Fund Type: Special Revenue Fund
Executive Summary:
The administrative function provides overall management and leadership for the Code Enforcement and Litter Crew programs.
Programs and Services:
The code enforcement administration program of 3 FTE’s, includes the management and clerical staff who support the department. This section is responsible for setting and measuring performance goals, budget preparation, contractual services, personnel administration and long-term planning.
FTEs
2015 Actual 2016 Actual 2017 Actual 2018 Budget 2019 Proposed
Total FTEs 3.00 3.25 3.00 3.00 3.00
Expenditures:
2015 Actual 2016 Actual 2017 Actual 2018 Budget 2019 Proposed
Capital Outlay 0 0 0 0 0
Interfund Charges 286,544 362,843 389,361 410,200 465,705
Reserve for Budget Adjustment 0 0 0 0 14,176
Transfers Out 0 0 0 0 0
Wages & Benefits 206,734 214,536 197,290 271,737 256,782
Supplies & Services 123,340 19,423 33,199 256,811 151,616
Debt Services 0 0 0 0 0
All Other 0 0 0 0 0
TOTAL 616,618 596,802 619,850 938,748 888,279
Expenditure Notes:
Revenues:
2015 Actual 2016 Actual 2017 Actual 2018 Budget 2019 Proposed
Taxes 19,289 22,134 22,957 0 0
Licenses & Permits 0 0 0 0 0
IG Revenue 0 0 0 0 0
Services 742,048 439,222 759,692 733,319 897,937
Fines & Forfeits 0 0 0 3,000 0
Operating Transfers In 0 0 0 0 0
General Fund Resources 392,298 752,622 561,709 837,830 817,564
All Other 224,334 362,996 218,304 245,000 0
TOTAL 1,377,969 1,576,974 1,562,662 1,819,149 1,715,501
Revenue Notes:
Planning and Economic Development 9
Program Summary: Litter Control
Division: Planning and Economic Development
Fund Type: Special Revenue Fund
Executive Summary:
The Litter Control program is the primary agency for illegal dumps and litter complaints on public right-of-way and land. This includes addressing frequent litter sites, responding to complaints, and investigation, removal and disposal of illegal dumps. It also supports the Solid Waste Department with abatement of solid waste from private property resulting from non-compliance.
Programs and Services:
This program will continue to ensure that there are resources to abate illegally dumped trash and litter materials on the public right-of-way and public property.
FTEs
2015 Actual 2016 Actual 2017 Actual 2018 Budget 2019 Proposed
Total FTEs 4.00 4.00 4.00 4.00 4.00
Expenditures:
2015 Actual 2016 Actual 2017 Actual 2018 Budget 2019 Proposed
Capital Outlay 0 0 0 0 0
Interfund Charges 26,635 51,373 44,189 39,808 66,057
Reserve for Budget Adjustment 0 0 0 0 0
Transfers Out 0 0 0 0 0
Wages & Benefits 224,391 290,030 286,647 318,532 348,423
Supplies & Services 32,592 25,154 29,001 42,974 52,475
Debt Services 0 0 0 0 0
All Other 0 0 0 0 0
TOTAL 283,618 366,557 359,837 401,314 466,955
Expenditure Notes:
Revenues:
2015 Actual 2016 Actual 2017 Actual 2018 Budget 2019 Proposed
Taxes 0 0 0 0 0
Licenses & Permits 0 0 0 0 0
IG Revenue 0 0 0 0 0
Services 0 358,944 377,154 459,141 477,038
Fines & Forfeits 0 0 0 0 0
Operating Transfers In 0 0 0 0 0
General Fund Resources 0 0 0 0 0One Vision. One Plan. One Voice.
Planning and Economic Development10

Program Summary: Litter Control
Division: Planning and Economic Development
Fund Type: Special Revenue Fund
Executive Summary:
The Litter Control program is the primary agency for illegal dumps and litter complaints on public right-of-way and land. This includes addressing frequent litter sites, responding to complaints, and investigation, removal and disposal of illegal dumps. It also supports the Solid Waste Department with abatement of solid waste from private property resulting from non-compliance.
Programs and Services:
This program will continue to ensure that there are resources to abate illegally dumped trash and litter materials on the public right-of-way and public property.
FTEs
2015 Actual 2016 Actual 2017 Actual 2018 Budget 2019 Proposed
Total FTEs 4.00 4.00 4.00 4.00 4.00
Expenditures:
2015 Actual 2016 Actual 2017 Actual 2018 Budget 2019 Proposed
Capital Outlay 0 0 0 0 0
Interfund Charges 26,635 51,373 44,189 39,808 66,057
Reserve for Budget Adjustment 0 0 0 0 0
Transfers Out 0 0 0 0 0
Wages & Benefits 224,391 290,030 286,647 318,532 348,423
Supplies & Services 32,592 25,154 29,001 42,974 52,475
Debt Services 0 0 0 0 0
All Other 0 0 0 0 0
TOTAL 283,618 366,557 359,837 401,314 466,955
Expenditure Notes:
Revenues:
2015 Actual 2016 Actual 2017 Actual 2018 Budget 2019 Proposed
Taxes 0 0 0 0 0
Licenses & Permits 0 0 0 0 0
IG Revenue 0 0 0 0 0
Services 0 358,944 377,154 459,141 477,038
Fines & Forfeits 0 0 0 0 0
Operating Transfers In 0 0 0 0 0
General Fund Resources 0 0 0 0 0
All Other 559 1,144 3,118 0 0
TOTAL 559 360,088 380,272 459,141 477,038
Revenue Notes:
Planning and Economic Development 11

One Vision. One Plan. One Voice.
Planning and Economic Development12
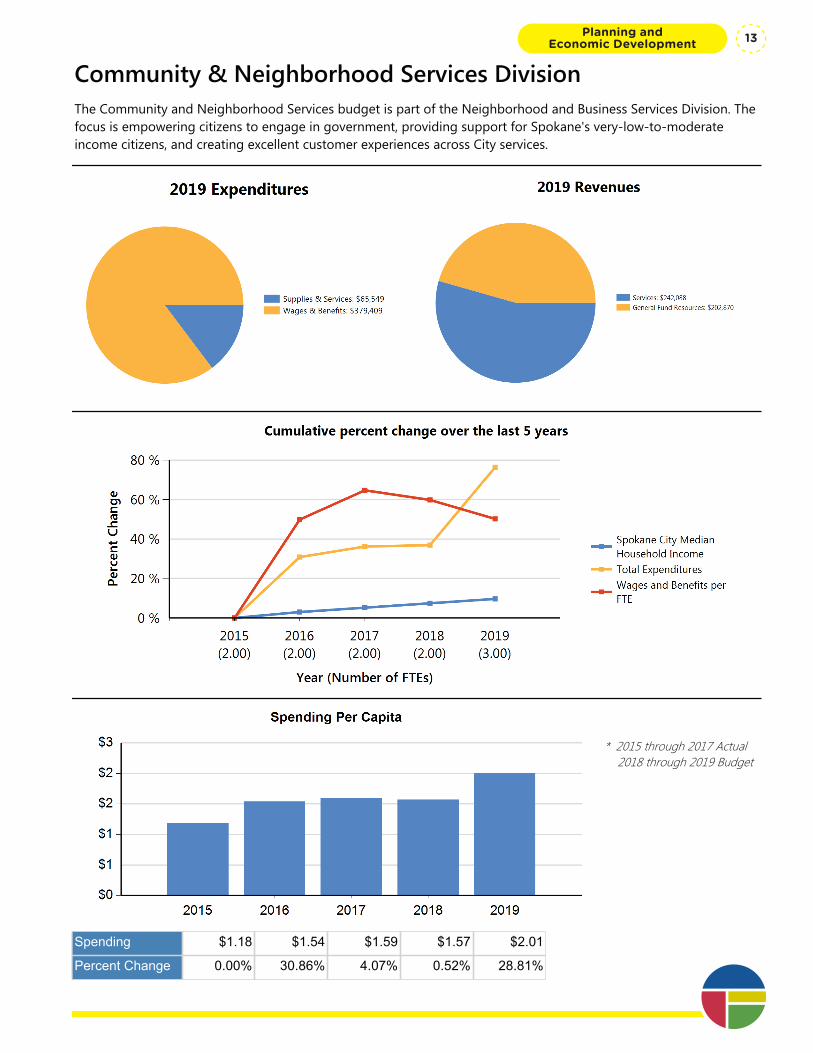
Community & Neighborhood Services DivisionThe Community and Neighborhood Services budget is part of the Neighborhood and Business Services Division. The focus is empowering citizens to engage in government, providing support for Spokane's very-low-to-moderate income citizens, and creating excellent customer experiences across City services.
* 2015 through 2017 Actual 2018 through 2019 Budget
Spending $1.18 $1.54 $1.59 $1.57 $2.01
Percent Change 0.00% 30.86% 4.07% 0.52% 28.81%
Planning and Economic Development 13
Department Summary: Community & Neighborhood Services Division
Division: Planning and Economic Development
Fund Type: General Fund
Executive Summary:
The Community and Neighborhood Services budget is part of the Neighborhood and Business Services Division. The focus is empowering citizens to engage in government, providing support for Spokane's very-low-to-moderate income citizens, and creating excellent customer experiences across City services.
Programs and Services:
This budget includes administrative support and management for the division of Neighborhood and Business Services.
FTEs
2015 Actual 2016 Actual 2017 Actual 2018 Budget 2019 Proposed
Total FTEs 2.00 2.00 2.00 2.00 3.00
Expenditures:
2015 Actual 2016 Actual 2017 Actual 2018 Budget 2019 Proposed
Capital Outlay 0 1,831 0 0 0
Interfund Charges 8 0 0 0 0
Reserve for Budget Adjustment 0 0 0 0 0
Transfers Out 0 0 0 0 0
Wages & Benefits 170,933 256,188 294,169 279,841 379,409
Supplies & Services 81,352 72,138 49,440 65,573 65,549
Debt Services 0 0 0 0 0
All Other 0 0 0 0 0
TOTAL 252,293 330,157 343,609 345,414 444,958
Expenditure Notes:
Revenues:
2015 Actual 2016 Actual 2017 Actual 2018 Budget 2019 Proposed
Taxes 0 0 0 0 0
Licenses & Permits 0 0 0 0 0
IG Revenue 0 0 0 0 0
Services 69,505 236,333 257,799 242,088 242,088
Fines & Forfeits 0 0 0 0 0
Operating Transfers In 0 0 55,000 0 0
General Fund Resources 183,058 93,983 35,834 103,326 202,870
All Other (270) (159) (24) 0 0One Vision. One Plan. One Voice.
Planning and Economic Development14

Department Summary: Community & Neighborhood Services Division
Division: Planning and Economic Development
Fund Type: General Fund
Executive Summary:
The Community and Neighborhood Services budget is part of the Neighborhood and Business Services Division. The focus is empowering citizens to engage in government, providing support for Spokane's very-low-to-moderate income citizens, and creating excellent customer experiences across City services.
Programs and Services:
This budget includes administrative support and management for the division of Neighborhood and Business Services.
FTEs
2015 Actual 2016 Actual 2017 Actual 2018 Budget 2019 Proposed
Total FTEs 2.00 2.00 2.00 2.00 3.00
Expenditures:
2015 Actual 2016 Actual 2017 Actual 2018 Budget 2019 Proposed
Capital Outlay 0 1,831 0 0 0
Interfund Charges 8 0 0 0 0
Reserve for Budget Adjustment 0 0 0 0 0
Transfers Out 0 0 0 0 0
Wages & Benefits 170,933 256,188 294,169 279,841 379,409
Supplies & Services 81,352 72,138 49,440 65,573 65,549
Debt Services 0 0 0 0 0
All Other 0 0 0 0 0
TOTAL 252,293 330,157 343,609 345,414 444,958
Expenditure Notes:
Revenues:
2015 Actual 2016 Actual 2017 Actual 2018 Budget 2019 Proposed
Taxes 0 0 0 0 0
Licenses & Permits 0 0 0 0 0
IG Revenue 0 0 0 0 0
Services 69,505 236,333 257,799 242,088 242,088
Fines & Forfeits 0 0 0 0 0
Operating Transfers In 0 0 55,000 0 0
General Fund Resources 183,058 93,983 35,834 103,326 202,870
All Other (270) (159) (24) 0 0
TOTAL 252,293 330,157 348,609 345,414 444,958
Revenue Notes:
Planning and Economic Development 15

One Vision. One Plan. One Voice.
Planning and Economic Development16
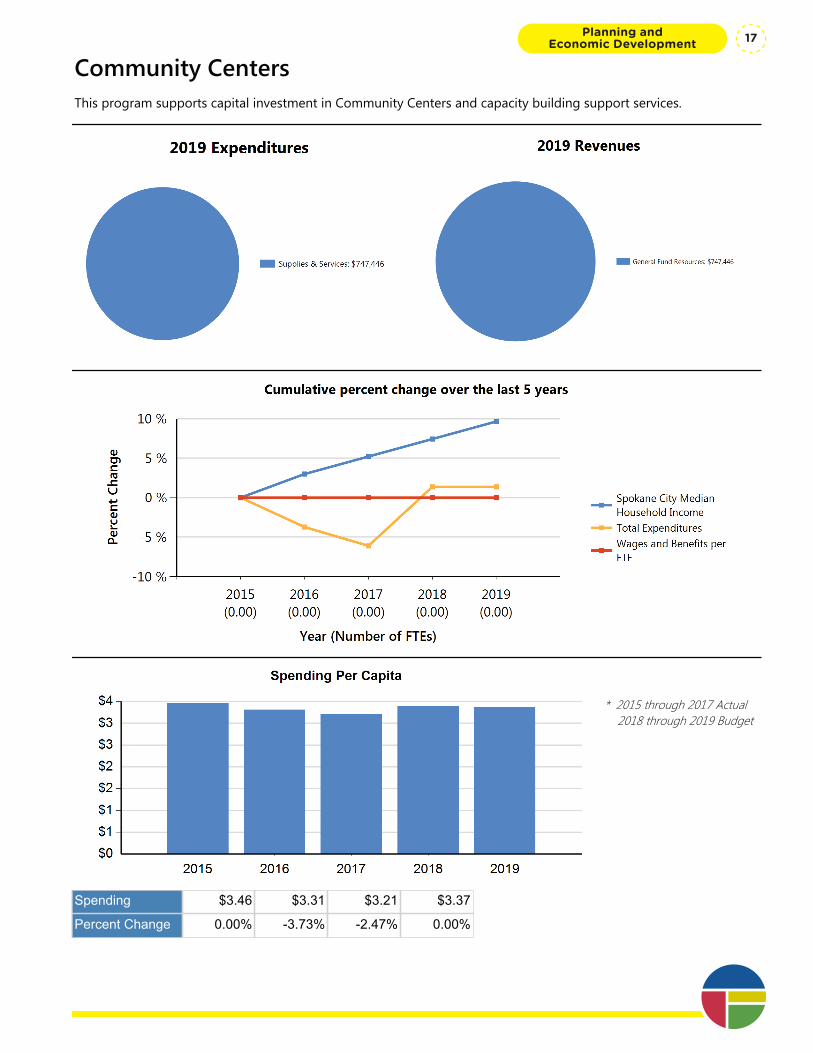
Community CentersThis program supports capital investment in Community Centers and capacity building support services.
* 2015 through 2017 Actual 2018 through 2019 Budget
Spending $3.46 $3.31 $3.21 $3.37
Percent Change 0.00% -3.73% -2.47% 0.00%
Planning and Economic Development 17
Department Summary: Community Centers
Division: Planning and Economic Development
Fund Type: General Fund
Executive Summary:
This program supports capital investment in Community Centers and capacity building support services.
Programs and Services:
In 2019, funded capital projects are to support centers to increase their capacity to serve, lowering operating costs and/or provide enhanced service to neighborhoods. Significant investments at the East Central Community Center are planned for 2019. This funding will be leveraged to support the creation of a new dental clinic and the immediate concerns addressed in the Capital Needs Assessment published early 2018 by BWA.
FTEs
2015 Actual 2016 Actual 2017 Actual 2018 Budget 2019 Proposed
Total FTEs 0.00 0.00 0.00 0.00 0.00
Expenditures:
2015 Actual 2016 Actual 2017 Actual 2018 Budget 2019 Proposed
Capital Outlay 68,992 9,433 0 0 0
Interfund Charges 6,750 0 0 0 0
Reserve for Budget Adjustment 0 0 0 0 0
Transfers Out 0 0 0 0 0
Wages & Benefits 0 0 0 0 0
Supplies & Services 661,647 700,443 692,337 747,446 747,446
Debt Services 0 0 0 0 0
All Other 0 0 0 0 0
TOTAL 737,389 709,876 692,337 747,446 747,446
Expenditure Notes:
Revenues:
2015 Actual 2016 Actual 2017 Actual 2018 Budget 2019 Proposed
Taxes 0 0 0 0 0
Licenses & Permits 0 0 0 0 0
IG Revenue 0 0 0 0 0
Services 0 0 0 0 0
Fines & Forfeits 0 0 0 0 0
Operating Transfers In 0 0 0 0 0
General Fund Resources 737,328 709,876 688,427 747,446 747,446One Vision. One Plan. One Voice.
Planning and Economic Development18

Department Summary: Community Centers
Division: Planning and Economic Development
Fund Type: General Fund
Executive Summary:
This program supports capital investment in Community Centers and capacity building support services.
Programs and Services:
In 2019, funded capital projects are to support centers to increase their capacity to serve, lowering operating costs and/or provide enhanced service to neighborhoods. Significant investments at the East Central Community Center are planned for 2019. This funding will be leveraged to support the creation of a new dental clinic and the immediate concerns addressed in the Capital Needs Assessment published early 2018 by BWA.
FTEs
2015 Actual 2016 Actual 2017 Actual 2018 Budget 2019 Proposed
Total FTEs 0.00 0.00 0.00 0.00 0.00
Expenditures:
2015 Actual 2016 Actual 2017 Actual 2018 Budget 2019 Proposed
Capital Outlay 68,992 9,433 0 0 0
Interfund Charges 6,750 0 0 0 0
Reserve for Budget Adjustment 0 0 0 0 0
Transfers Out 0 0 0 0 0
Wages & Benefits 0 0 0 0 0
Supplies & Services 661,647 700,443 692,337 747,446 747,446
Debt Services 0 0 0 0 0
All Other 0 0 0 0 0
TOTAL 737,389 709,876 692,337 747,446 747,446
Expenditure Notes:
Revenues:
2015 Actual 2016 Actual 2017 Actual 2018 Budget 2019 Proposed
Taxes 0 0 0 0 0
Licenses & Permits 0 0 0 0 0
IG Revenue 0 0 0 0 0
Services 0 0 0 0 0
Fines & Forfeits 0 0 0 0 0
Operating Transfers In 0 0 0 0 0
General Fund Resources 737,328 709,876 688,427 747,446 747,446
All Other 61 0 3,910 0 0
TOTAL 737,389 709,876 692,337 747,446 747,446
Revenue Notes:
Planning and Economic Development 19
Program Summary: Community Center Services Support
Division: Planning and Economic Development
Fund Type: General Fund
Executive Summary:
This department provides financial support for Community Centers. This program supports capital investment in Community Centers and capacity building support services.
Programs and Services:
In 2019, capital projects will be funded to support centers that increase their capacity to serve, lower operating costs and/or provide enhanced service to neighborhoods. Significant investments at the East Central Community Center are planned for 2019. This funding will be leveraged to support the creation of a new dental clinic and expansion of the Head Start program at East Central Community Center.
FTEs
2015 Actual 2016 Actual 2017 Actual 2018 Budget 2019 Proposed
Total FTEs 0.00 0.00 0.00 0.00 0.00
Expenditures:
2015 Actual 2016 Actual 2017 Actual 2018 Budget 2019 Proposed
Capital Outlay 45,736 0 0 0 0
Interfund Charges 0 0 0 0 0
Reserve for Budget Adjustment 0 0 0 0 0
Transfers Out 0 0 0 0 0
Wages & Benefits 0 0 0 0 0
Supplies & Services 0 37,321 0 100,554 37,500
Debt Services 0 0 0 0 0
All Other 0 0 0 0 0
TOTAL 45,736 37,321 0 100,554 37,500
Expenditure Notes:
Revenues:
2015 Actual 2016 Actual 2017 Actual 2018 Budget 2019 Proposed
Taxes 0 0 0 0 0
Licenses & Permits 0 0 0 0 0
IG Revenue 0 0 0 0 0
Services 0 0 0 0 0
Fines & Forfeits 0 0 0 0 0
Operating Transfers In 0 0 0 0 0
General Fund Resources 45,736 37,321 0 100,554 37,500One Vision. One Plan. One Voice.
Planning and Economic Development20
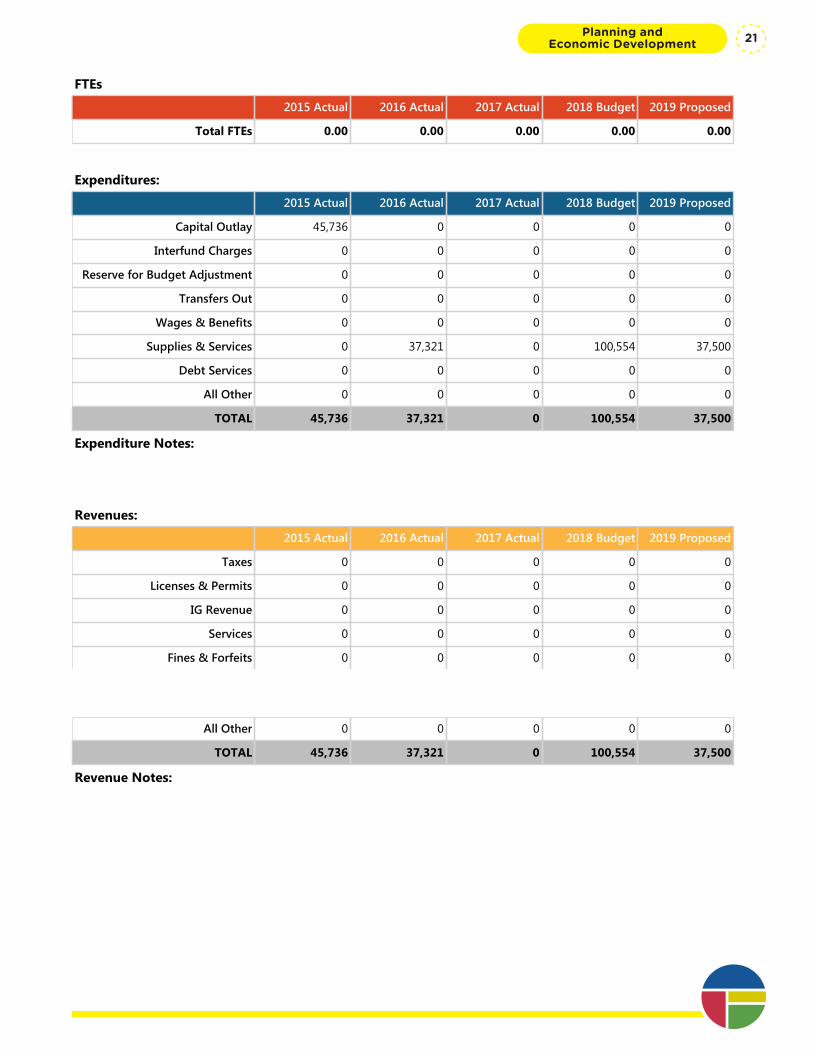
Program Summary: Community Center Services Support
Division: Planning and Economic Development
Fund Type: General Fund
Executive Summary:
This department provides financial support for Community Centers. This program supports capital investment in Community Centers and capacity building support services.
Programs and Services:
In 2019, capital projects will be funded to support centers that increase their capacity to serve, lower operating costs and/or provide enhanced service to neighborhoods. Significant investments at the East Central Community Center are planned for 2019. This funding will be leveraged to support the creation of a new dental clinic and expansion of the Head Start program at East Central Community Center.
FTEs
2015 Actual 2016 Actual 2017 Actual 2018 Budget 2019 Proposed
Total FTEs 0.00 0.00 0.00 0.00 0.00
Expenditures:
2015 Actual 2016 Actual 2017 Actual 2018 Budget 2019 Proposed
Capital Outlay 45,736 0 0 0 0
Interfund Charges 0 0 0 0 0
Reserve for Budget Adjustment 0 0 0 0 0
Transfers Out 0 0 0 0 0
Wages & Benefits 0 0 0 0 0
Supplies & Services 0 37,321 0 100,554 37,500
Debt Services 0 0 0 0 0
All Other 0 0 0 0 0
TOTAL 45,736 37,321 0 100,554 37,500
Expenditure Notes:
Revenues:
2015 Actual 2016 Actual 2017 Actual 2018 Budget 2019 Proposed
Taxes 0 0 0 0 0
Licenses & Permits 0 0 0 0 0
IG Revenue 0 0 0 0 0
Services 0 0 0 0 0
Fines & Forfeits 0 0 0 0 0
Operating Transfers In 0 0 0 0 0
General Fund Resources 45,736 37,321 0 100,554 37,500
All Other 0 0 0 0 0
TOTAL 45,736 37,321 0 100,554 37,500
Revenue Notes:
Planning and Economic Development 21
Program Summary: East Central Community Center
Division: Planning and Economic Development
Fund Type: General Fund
Executive Summary:
East Central Community Center serves as a one-stop neighborhood resource center. It provides social and recreational services primarily to low and moderate-income neighborhood residents.
Programs and Services:
The City transferred operational management of the East Central Community Center from the East Central Community Organization to the Martin Luther King Jr. Family Outreach Center (MLK) on January 1, 2018. MLK is working with ZBA to create a plan to expand the Center to accommodate Community Colleges of Spokane’s Early Head Start program, and MLK is simultaneously remodeling the garage to benefit their school aged Children’s programs.
FTEs
2015 Actual 2016 Actual 2017 Actual 2018 Budget 2019 Proposed
Total FTEs 0.00 0.00 0.00 0.00 0.00
Expenditures:
2015 Actual 2016 Actual 2017 Actual 2018 Budget 2019 Proposed
Capital Outlay 23,256 0 0 0 0
Interfund Charges 6,750 0 0 0 0
Reserve for Budget Adjustment 0 0 0 0 0
Transfers Out 0 0 0 0 0
Wages & Benefits 0 0 0 0 0
Supplies & Services 385,879 356,152 373,209 344,446 350,000
Debt Services 0 0 0 0 0
All Other 0 0 0 0 0
TOTAL 415,885 356,152 373,209 344,446 350,000
Expenditure Notes:
Revenues:
2015 Actual 2016 Actual 2017 Actual 2018 Budget 2019 Proposed
Taxes 0 0 0 0 0
Licenses & Permits 0 0 0 0 0
IG Revenue 0 0 0 0 0
Services 0 0 0 0 0
Fines & Forfeits 0 0 0 0 0
Operating Transfers In 0 0 0 0 0
General Fund Resources 415,834 356,152 369,299 344,446 350,000One Vision. One Plan. One Voice.
Planning and Economic Development22

Program Summary: East Central Community Center
Division: Planning and Economic Development
Fund Type: General Fund
Executive Summary:
East Central Community Center serves as a one-stop neighborhood resource center. It provides social and recreational services primarily to low and moderate-income neighborhood residents.
Programs and Services:
The City transferred operational management of the East Central Community Center from the East Central Community Organization to the Martin Luther King Jr. Family Outreach Center (MLK) on January 1, 2018. MLK is working with ZBA to create a plan to expand the Center to accommodate Community Colleges of Spokane’s Early Head Start program, and MLK is simultaneously remodeling the garage to benefit their school aged Children’s programs.
FTEs
2015 Actual 2016 Actual 2017 Actual 2018 Budget 2019 Proposed
Total FTEs 0.00 0.00 0.00 0.00 0.00
Expenditures:
2015 Actual 2016 Actual 2017 Actual 2018 Budget 2019 Proposed
Capital Outlay 23,256 0 0 0 0
Interfund Charges 6,750 0 0 0 0
Reserve for Budget Adjustment 0 0 0 0 0
Transfers Out 0 0 0 0 0
Wages & Benefits 0 0 0 0 0
Supplies & Services 385,879 356,152 373,209 344,446 350,000
Debt Services 0 0 0 0 0
All Other 0 0 0 0 0
TOTAL 415,885 356,152 373,209 344,446 350,000
Expenditure Notes:
Revenues:
2015 Actual 2016 Actual 2017 Actual 2018 Budget 2019 Proposed
Taxes 0 0 0 0 0
Licenses & Permits 0 0 0 0 0
IG Revenue 0 0 0 0 0
Services 0 0 0 0 0
Fines & Forfeits 0 0 0 0 0
Operating Transfers In 0 0 0 0 0
General Fund Resources 415,834 356,152 369,299 344,446 350,000
All Other 51 0 3,910 0 0
TOTAL 415,885 356,152 373,209 344,446 350,000
Revenue Notes:
Planning and Economic Development 23
Program Summary: Northeast Community Center
Division: Planning and Economic Development
Fund Type: Special Revenue Fund
Executive Summary:
This program covers the maintenance and operations contract between the City of Spokane and the Northeast Community Center Association.
Programs and Services:
This Contract requires the NECCA to continue to operate the North East Community Center, which is owned by the City. Community Centers serve as an integral part of the City of Spokane’s safety net for our citizens. The City provides funding for community centers for the purpose of serving the needs of the centers’ surrounding neighborhoods in the areas of health care, food security, education, employment, housing, family services and civic capital.
FTEs
2015 Actual 2016 Actual 2017 Actual 2018 Budget 2019 Proposed
Total FTEs 0.00 0.00 0.00 0.00 0.00
Expenditures:
2015 Actual 2016 Actual 2017 Actual 2018 Budget 2019 Proposed
Capital Outlay 0 0 0 0 0
Interfund Charges 0 0 0 0 0
Reserve for Budget Adjustment 0 0 0 0 0
Transfers Out 0 0 0 0 0
Wages & Benefits 0 0 0 0 0
Supplies & Services 125,904 127,915 155,088 138,405 210,905
Debt Services 0 0 0 0 0
All Other 0 0 0 0 0
TOTAL 125,904 127,915 155,088 138,405 210,905
Expenditure Notes:
Revenues:
2015 Actual 2016 Actual 2017 Actual 2018 Budget 2019 Proposed
Taxes 0 0 0 0 0
Licenses & Permits 0 0 0 0 0
IG Revenue 0 0 0 0 0
Services 0 0 0 0 0
Fines & Forfeits 0 0 0 0 0
Operating Transfers In 0 0 0 0 0
General Fund Resources 125,904 127,915 155,088 138,405 210,905One Vision. One Plan. One Voice.
Planning and Economic Development24

Program Summary: Northeast Community Center
Division: Planning and Economic Development
Fund Type: Special Revenue Fund
Executive Summary:
This program covers the maintenance and operations contract between the City of Spokane and the Northeast Community Center Association.
Programs and Services:
This Contract requires the NECCA to continue to operate the North East Community Center, which is owned by the City. Community Centers serve as an integral part of the City of Spokane’s safety net for our citizens. The City provides funding for community centers for the purpose of serving the needs of the centers’ surrounding neighborhoods in the areas of health care, food security, education, employment, housing, family services and civic capital.
FTEs
2015 Actual 2016 Actual 2017 Actual 2018 Budget 2019 Proposed
Total FTEs 0.00 0.00 0.00 0.00 0.00
Expenditures:
2015 Actual 2016 Actual 2017 Actual 2018 Budget 2019 Proposed
Capital Outlay 0 0 0 0 0
Interfund Charges 0 0 0 0 0
Reserve for Budget Adjustment 0 0 0 0 0
Transfers Out 0 0 0 0 0
Wages & Benefits 0 0 0 0 0
Supplies & Services 125,904 127,915 155,088 138,405 210,905
Debt Services 0 0 0 0 0
All Other 0 0 0 0 0
TOTAL 125,904 127,915 155,088 138,405 210,905
Expenditure Notes:
Revenues:
2015 Actual 2016 Actual 2017 Actual 2018 Budget 2019 Proposed
Taxes 0 0 0 0 0
Licenses & Permits 0 0 0 0 0
IG Revenue 0 0 0 0 0
Services 0 0 0 0 0
Fines & Forfeits 0 0 0 0 0
Operating Transfers In 0 0 0 0 0
General Fund Resources 125,904 127,915 155,088 138,405 210,905
All Other 0 0 0 0 0
TOTAL 125,904 127,915 155,088 138,405 210,905
Revenue Notes:
Planning and Economic Development 25

Program Summary: Peaceful Valley Community Center
Division: Planning and Economic Development
Fund Type: General Fund
Executive Summary:
This program represents the maintenance and operation contract between the City of Spokane and the Southwest Spokane Community Center. This Community Center provides critical childcare services for low and moderate income families in Southwest Spokane.
Programs and Services:
Southwest Spokane Community Center differs from the other community centers in the program in that its primary focus is services focused on youth, education and recreation, rather than serving as a one-stop neighborhood resource center.
FTEs
2015 Actual 2016 Actual 2017 Actual 2018 Budget 2019 Proposed
Total FTEs 0.00 0.00 0.00 0.00 0.00
Expenditures:
2015 Actual 2016 Actual 2017 Actual 2018 Budget 2019 Proposed
Capital Outlay 0 0 0 0 0
Interfund Charges 0 0 0 0 0
Reserve for Budget Adjustment 0 0 0 0 0
Transfers Out 0 0 0 0 0
Wages & Benefits 0 0 0 0 0
Supplies & Services 37,924 37,101 37,101 41,101 37,101
Debt Services 0 0 0 0 0
All Other 0 0 0 0 0
TOTAL 37,924 37,101 37,101 41,101 37,101
Expenditure Notes:
Revenues:
2015 Actual 2016 Actual 2017 Actual 2018 Budget 2019 Proposed
Taxes 0 0 0 0 0
Licenses & Permits 0 0 0 0 0
IG Revenue 0 0 0 0 0
Services 0 0 0 0 0
Fines & Forfeits 0 0 0 0 0
Operating Transfers In 0 0 0 0 0
General Fund Resources 37,924 37,101 37,101 41,101 37,101One Vision. One Plan. One Voice.
Planning and Economic Development26

Program Summary: Peaceful Valley Community Center
Division: Planning and Economic Development
Fund Type: General Fund
Executive Summary:
This program represents the maintenance and operation contract between the City of Spokane and the Southwest Spokane Community Center. This Community Center provides critical childcare services for low and moderate income families in Southwest Spokane.
Programs and Services:
Southwest Spokane Community Center differs from the other community centers in the program in that its primary focus is services focused on youth, education and recreation, rather than serving as a one-stop neighborhood resource center.
FTEs
2015 Actual 2016 Actual 2017 Actual 2018 Budget 2019 Proposed
Total FTEs 0.00 0.00 0.00 0.00 0.00
Expenditures:
2015 Actual 2016 Actual 2017 Actual 2018 Budget 2019 Proposed
Capital Outlay 0 0 0 0 0
Interfund Charges 0 0 0 0 0
Reserve for Budget Adjustment 0 0 0 0 0
Transfers Out 0 0 0 0 0
Wages & Benefits 0 0 0 0 0
Supplies & Services 37,924 37,101 37,101 41,101 37,101
Debt Services 0 0 0 0 0
All Other 0 0 0 0 0
TOTAL 37,924 37,101 37,101 41,101 37,101
Expenditure Notes:
Revenues:
2015 Actual 2016 Actual 2017 Actual 2018 Budget 2019 Proposed
Taxes 0 0 0 0 0
Licenses & Permits 0 0 0 0 0
IG Revenue 0 0 0 0 0
Services 0 0 0 0 0
Fines & Forfeits 0 0 0 0 0
Operating Transfers In 0 0 0 0 0
General Fund Resources 37,924 37,101 37,101 41,101 37,101
All Other 0 0 0 0 0
TOTAL 37,924 37,101 37,101 41,101 37,101
Revenue Notes:
Planning and Economic Development 27
Program Summary: West Central Community Center
Division: Planning and Economic Development
Fund Type: General Fund
Executive Summary:
This program covers the maintenance and operations contract between the City of Spokane and the West Central Community Development Association.
Programs and Services:
This contract requires the WCCDA to continue to operate the West Central Community Center, which is owned by the City. Community Centers serve as an integral part of the City of Spokane’s safety net for our citizens. The City provides funding for the community centers for the purpose of serving the needs of centers’ surrounding neighborhoods in the areas of health care, food security, education, employment, housing, family services and civic capital.
FTEs
2015 Actual 2016 Actual 2017 Actual 2018 Budget 2019 Proposed
Total FTEs 0.00 0.00 0.00 0.00 0.00
Expenditures:
2015 Actual 2016 Actual 2017 Actual 2018 Budget 2019 Proposed
Capital Outlay 0 9,433 0 0 0
Interfund Charges 0 0 0 0 0
Reserve for Budget Adjustment 0 0 0 0 0
Transfers Out 0 0 0 0 0
Wages & Benefits 0 0 0 0 0
Supplies & Services 111,940 141,954 126,939 122,940 111,940
Debt Services 0 0 0 0 0
All Other 0 0 0 0 0
TOTAL 111,940 151,387 126,939 122,940 111,940
Expenditure Notes:
Revenues:
2015 Actual 2016 Actual 2017 Actual 2018 Budget 2019 Proposed
Taxes 0 0 0 0 0
Licenses & Permits 0 0 0 0 0
IG Revenue 0 0 0 0 0
Services 0 0 0 0 0
Fines & Forfeits 0 0 0 0 0
Operating Transfers In 0 0 0 0 0
General Fund Resources 111,930 151,387 126,939 122,940 111,940One Vision. One Plan. One Voice.
Planning and Economic Development28

Program Summary: West Central Community Center
Division: Planning and Economic Development
Fund Type: General Fund
Executive Summary:
This program covers the maintenance and operations contract between the City of Spokane and the West Central Community Development Association.
Programs and Services:
This contract requires the WCCDA to continue to operate the West Central Community Center, which is owned by the City. Community Centers serve as an integral part of the City of Spokane’s safety net for our citizens. The City provides funding for the community centers for the purpose of serving the needs of centers’ surrounding neighborhoods in the areas of health care, food security, education, employment, housing, family services and civic capital.
FTEs
2015 Actual 2016 Actual 2017 Actual 2018 Budget 2019 Proposed
Total FTEs 0.00 0.00 0.00 0.00 0.00
Expenditures:
2015 Actual 2016 Actual 2017 Actual 2018 Budget 2019 Proposed
Capital Outlay 0 9,433 0 0 0
Interfund Charges 0 0 0 0 0
Reserve for Budget Adjustment 0 0 0 0 0
Transfers Out 0 0 0 0 0
Wages & Benefits 0 0 0 0 0
Supplies & Services 111,940 141,954 126,939 122,940 111,940
Debt Services 0 0 0 0 0
All Other 0 0 0 0 0
TOTAL 111,940 151,387 126,939 122,940 111,940
Expenditure Notes:
Revenues:
2015 Actual 2016 Actual 2017 Actual 2018 Budget 2019 Proposed
Taxes 0 0 0 0 0
Licenses & Permits 0 0 0 0 0
IG Revenue 0 0 0 0 0
Services 0 0 0 0 0
Fines & Forfeits 0 0 0 0 0
Operating Transfers In 0 0 0 0 0
General Fund Resources 111,930 151,387 126,939 122,940 111,940
All Other 10 0 0 0 0
TOTAL 111,940 151,387 126,939 122,940 111,940
Revenue Notes:
Planning and Economic Development 29

One Vision. One Plan. One Voice.
Planning and Economic Development30
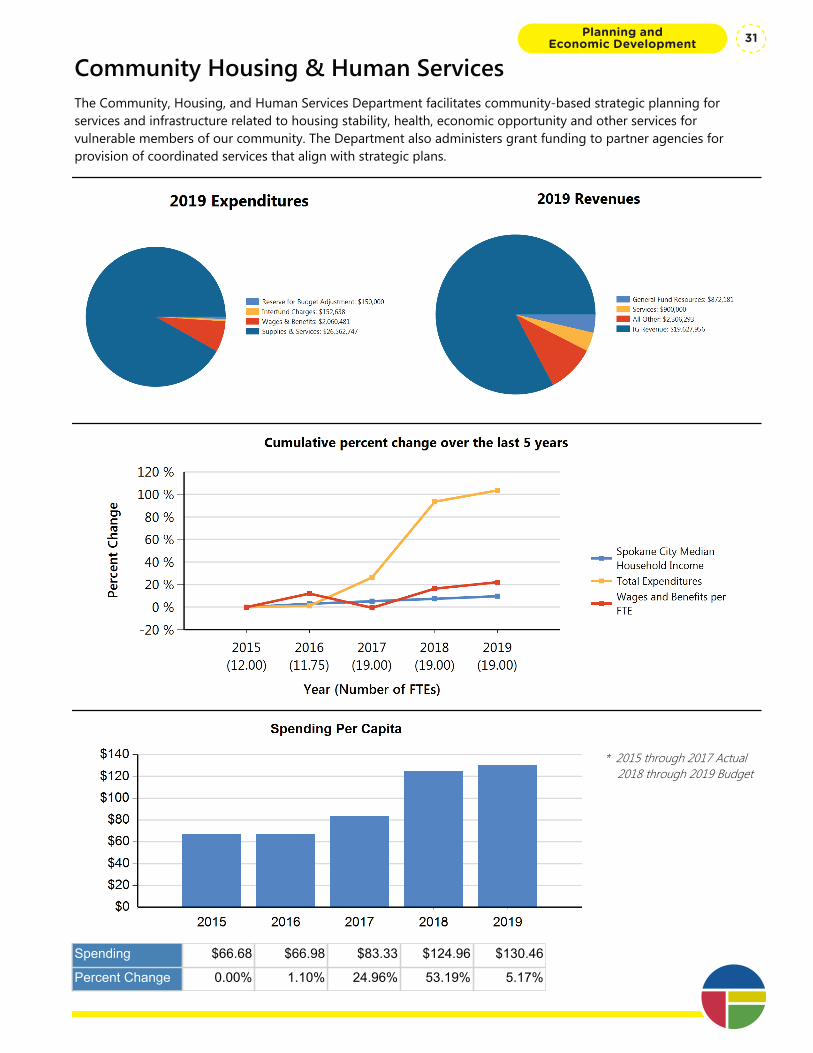
Community Housing & Human ServicesThe Community, Housing, and Human Services Department facilitates community-based strategic planning for services and infrastructure related to housing stability, health, economic opportunity and other services for vulnerable members of our community. The Department also administers grant funding to partner agencies for provision of coordinated services that align with strategic plans.
* 2015 through 2017 Actual 2018 through 2019 Budget
Spending $66.68 $66.98 $83.33 $124.96 $130.46
Percent Change 0.00% 1.10% 24.96% 53.19% 5.17%
Planning and Economic Development 31
Department Summary: Community Housing & Human Services
Division: Planning and Economic Development
Fund Type: Special Revenue Fund
Executive Summary:
The Community, Housing, and Human Services Department facilitates community-based strategic planning for services and infrastructure related to housing stability, health, economic opportunity and other services for vulnerable members of our community. The Department also administers grant funding to partner agencies for provision of coordinated services that align with strategic plans.
Programs and Services:
The Department administers federal, state and local grant funds for provision of services that meet locally-identified needs. Grant funds are allocated to local projects through competitive application processes and in consultation with community stakeholders including two volunteer boards, and elected officials. Department staff provide technical assistance to organizations that receive these funds to maximize benefit and to ensure that public grant funds are used for allowable and reasonable purposes in line with funder requirements. Where applicable, Department staff perform other services including grantee risk assessment, project underwriting, and environmental review as may be required by the funder.
Department staff also report to funders and the local community on the outcomes of grant-funded programs.
In addition to grants administration, this Department manages the Spokane region’s Homeless Management Information System, a community-wide database that contains information on the extent and nature of homelessness in our community.
FTEs
2015 Actual 2016 Actual 2017 Actual 2018 Budget 2019 Proposed
Total FTEs 12.00 11.75 19.00 19.00 19.00
Expenditures:
2015 Actual 2016 Actual 2017 Actual 2018 Budget 2019 Proposed
Capital Outlay 712,480 239,268 402,091 0 0
Interfund Charges 406,052 502,303 113,822 171,058 152,638
Reserve for Budget Adjustment 0 0 0 161,930 150,000
Transfers Out 0 0 0 0 0
Wages & Benefits 1,074,997 1,179,006 1,666,272 1,949,499 2,060,481
Supplies & Services 12,016,737 12,443,930 15,646,705 25,221,410 26,562,747
Debt Services 0 0 125,000 0 0
All Other 0 2,403 0 0 0
One Vision. One Plan. One Voice.
Planning and Economic Development32
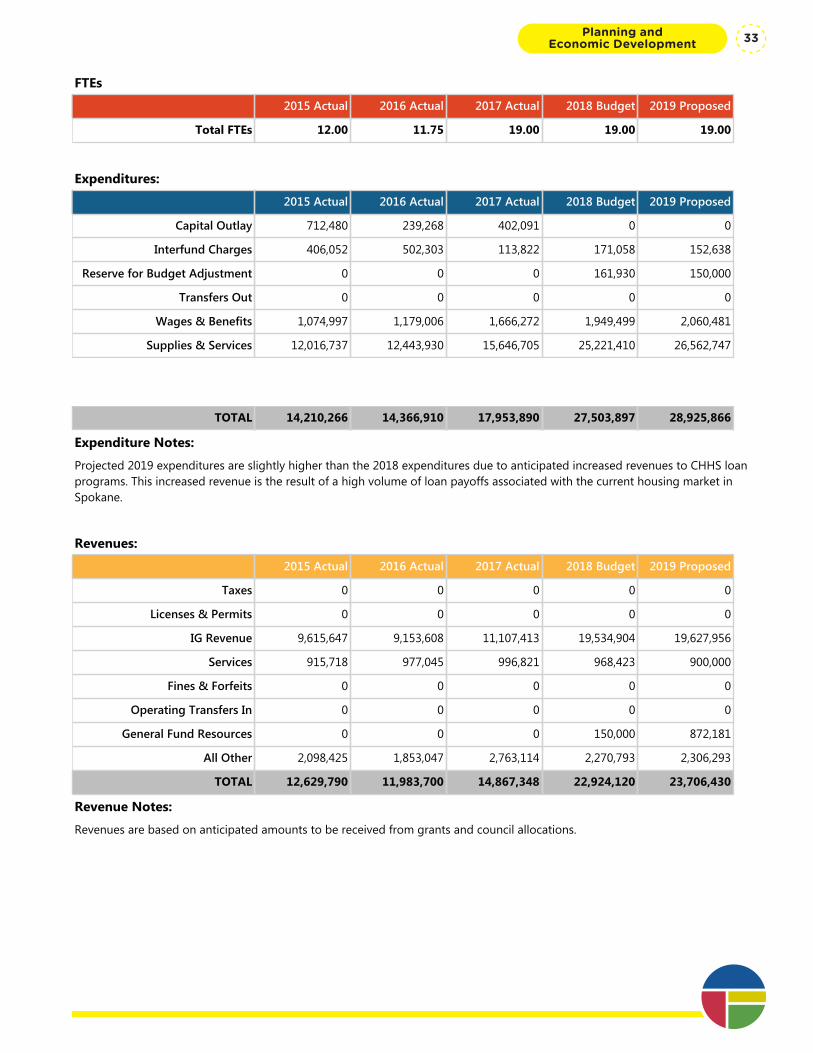
Department Summary: Community Housing & Human Services
Division: Planning and Economic Development
Fund Type: Special Revenue Fund
Executive Summary:
The Community, Housing, and Human Services Department facilitates community-based strategic planning for services and infrastructure related to housing stability, health, economic opportunity and other services for vulnerable members of our community. The Department also administers grant funding to partner agencies for provision of coordinated services that align with strategic plans.
Programs and Services:
The Department administers federal, state and local grant funds for provision of services that meet locally-identified needs. Grant funds are allocated to local projects through competitive application processes and in consultation with community stakeholders including two volunteer boards, and elected officials. Department staff provide technical assistance to organizations that receive these funds to maximize benefit and to ensure that public grant funds are used for allowable and reasonable purposes in line with funder requirements. Where applicable, Department staff perform other services including grantee risk assessment, project underwriting, and environmental review as may be required by the funder.
Department staff also report to funders and the local community on the outcomes of grant-funded programs.
In addition to grants administration, this Department manages the Spokane region’s Homeless Management Information System, a community-wide database that contains information on the extent and nature of homelessness in our community.
FTEs
2015 Actual 2016 Actual 2017 Actual 2018 Budget 2019 Proposed
Total FTEs 12.00 11.75 19.00 19.00 19.00
Expenditures:
2015 Actual 2016 Actual 2017 Actual 2018 Budget 2019 Proposed
Capital Outlay 712,480 239,268 402,091 0 0
Interfund Charges 406,052 502,303 113,822 171,058 152,638
Reserve for Budget Adjustment 0 0 0 161,930 150,000
Transfers Out 0 0 0 0 0
Wages & Benefits 1,074,997 1,179,006 1,666,272 1,949,499 2,060,481
Supplies & Services 12,016,737 12,443,930 15,646,705 25,221,410 26,562,747
Debt Services 0 0 125,000 0 0
All Other 0 2,403 0 0 0
TOTAL 14,210,266 14,366,910 17,953,890 27,503,897 28,925,866
Expenditure Notes:
Projected 2019 expenditures are slightly higher than the 2018 expenditures due to anticipated increased revenues to CHHS loan programs. This increased revenue is the result of a high volume of loan payoffs associated with the current housing market in Spokane.
Revenues:
2015 Actual 2016 Actual 2017 Actual 2018 Budget 2019 Proposed
Taxes 0 0 0 0 0
Licenses & Permits 0 0 0 0 0
IG Revenue 9,615,647 9,153,608 11,107,413 19,534,904 19,627,956
Services 915,718 977,045 996,821 968,423 900,000
Fines & Forfeits 0 0 0 0 0
Operating Transfers In 0 0 0 0 0
General Fund Resources 0 0 0 150,000 872,181
All Other 2,098,425 1,853,047 2,763,114 2,270,793 2,306,293
TOTAL 12,629,790 11,983,700 14,867,348 22,924,120 23,706,430
Revenue Notes:
Revenues are based on anticipated amounts to be received from grants and council allocations.
Planning and Economic Development 33
Program Summary: CD/HS Operations
Division: Planning and Economic Development
Fund Type: Special Revenue Fund
Executive Summary:
Administration and indirect expenses for the Community, Housing, and Human Services Department including, internal overhead expenses for services such as IT and Central Accounting, are represented in this Program.
Programs and Services:
This fund facilitates initial payment of all Department expenses including payroll and grantee reimbursements. Expenses are then moved to the appropriate Department funds based on the sources associated with those expenditures. Any expenditures that remain in this fund at the end of the fiscal year will be administration and overhead for the entire Department.
FTEs
2015 Actual 2016 Actual 2017 Actual 2018 Budget 2019 Proposed
Total FTEs 12.00 11.75 19.00 19.00 19.00
Expenditures:
2015 Actual 2016 Actual 2017 Actual 2018 Budget 2019 Proposed
Capital Outlay 0 0 0 0 0
Interfund Charges 188,596 212,559 112,102 171,058 152,638
Reserve for Budget Adjustment 0 0 0 161,930 150,000
Transfers Out 0 0 0 0 0
Wages & Benefits 300,619 375,473 635,980 587,286 674,214
Supplies & Services (288,654) (655,498) (679,140) (775,027) (826,852)
Debt Services 0 0 0 0 0
All Other 0 2,003 0 0 0
TOTAL 200,561 (65,463) 68,942 145,247 150,000
Expenditure Notes:
The CHHS operating fund is essentially a clearing fund for the department. All of the Department's payroll charges, and other charges that are applicable to the department as a whole and not related to a specific grant are housed in this fund.
Revenues:
2015 Actual 2016 Actual 2017 Actual 2018 Budget 2019 Proposed
Taxes 0 0 0 0 0
Licenses & Permits 0 0 0 0 0
IG Revenue 0 0 0 0 0
Services 0 0 0 0 0
Fines & Forfeits 0 0 0 0 0
Operating Transfers In 0 0 0 0 0
General Fund Resources 0 0 0 150,000 150,000One Vision. One Plan. One Voice.
Planning and Economic Development34
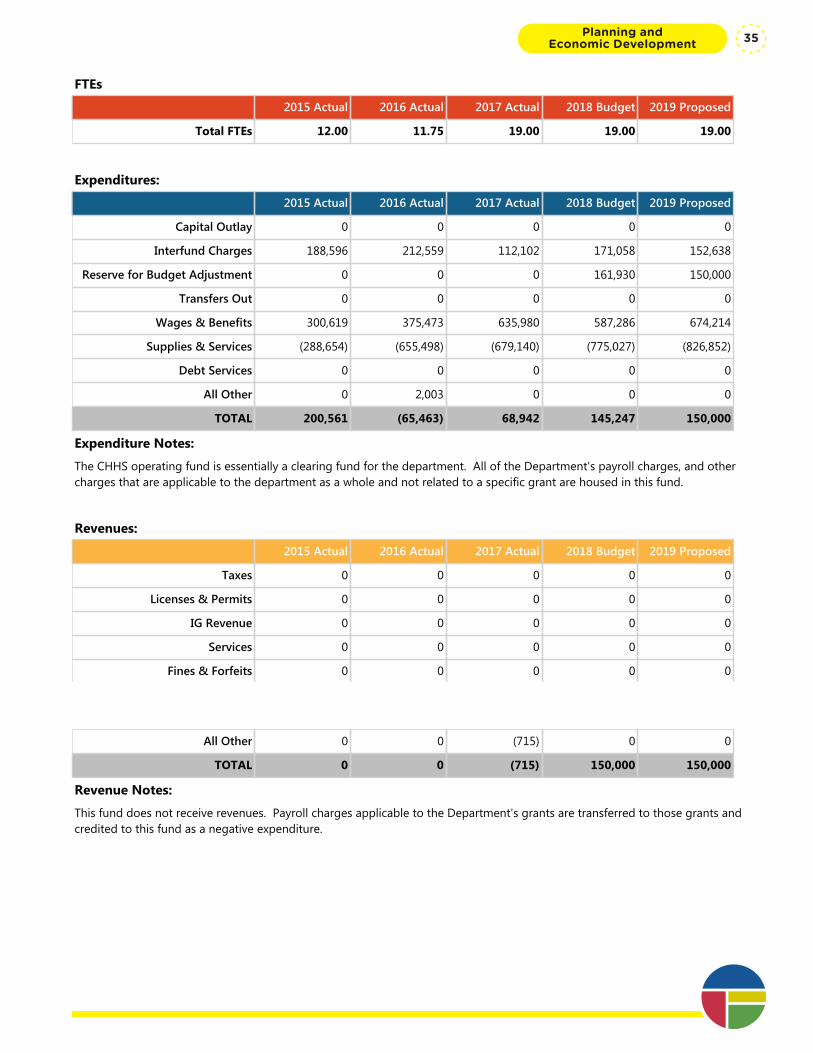
Program Summary: CD/HS Operations
Division: Planning and Economic Development
Fund Type: Special Revenue Fund
Executive Summary:
Administration and indirect expenses for the Community, Housing, and Human Services Department including, internal overhead expenses for services such as IT and Central Accounting, are represented in this Program.
Programs and Services:
This fund facilitates initial payment of all Department expenses including payroll and grantee reimbursements. Expenses are then moved to the appropriate Department funds based on the sources associated with those expenditures. Any expenditures that remain in this fund at the end of the fiscal year will be administration and overhead for the entire Department.
FTEs
2015 Actual 2016 Actual 2017 Actual 2018 Budget 2019 Proposed
Total FTEs 12.00 11.75 19.00 19.00 19.00
Expenditures:
2015 Actual 2016 Actual 2017 Actual 2018 Budget 2019 Proposed
Capital Outlay 0 0 0 0 0
Interfund Charges 188,596 212,559 112,102 171,058 152,638
Reserve for Budget Adjustment 0 0 0 161,930 150,000
Transfers Out 0 0 0 0 0
Wages & Benefits 300,619 375,473 635,980 587,286 674,214
Supplies & Services (288,654) (655,498) (679,140) (775,027) (826,852)
Debt Services 0 0 0 0 0
All Other 0 2,003 0 0 0
TOTAL 200,561 (65,463) 68,942 145,247 150,000
Expenditure Notes:
The CHHS operating fund is essentially a clearing fund for the department. All of the Department's payroll charges, and other charges that are applicable to the department as a whole and not related to a specific grant are housed in this fund.
Revenues:
2015 Actual 2016 Actual 2017 Actual 2018 Budget 2019 Proposed
Taxes 0 0 0 0 0
Licenses & Permits 0 0 0 0 0
IG Revenue 0 0 0 0 0
Services 0 0 0 0 0
Fines & Forfeits 0 0 0 0 0
Operating Transfers In 0 0 0 0 0
General Fund Resources 0 0 0 150,000 150,000
All Other 0 0 (715) 0 0
TOTAL 0 0 (715) 150,000 150,000
Revenue Notes:
This fund does not receive revenues. Payroll charges applicable to the Department's grants are transferred to those grants and credited to this fund as a negative expenditure.
Planning and Economic Development 35
Program Summary: CDBG Revolving Loan Fund
Division: Planning and Economic Development
Fund Type: Special Revenue Fund
Executive Summary:
The Community Development Block Grant Revolving Loan fund includes monies received from principal and interest payments from loans generated under the Single Family Rehabilitation Program.
Programs and Services:
The Revolving Loan fund supports the Single Family Rehabilitation Program home rehabilitation projects and loan servicing activities including administration and delivery of the program. This program ensures that low- and moderate-income residents can maintain safe and stable housing by completing necessary housing repairs that address health and safety deficiencies, and reduce operating costs (to the extent practicable).
FTEs
2015 Actual 2016 Actual 2017 Actual 2018 Budget 2019 Proposed
Total FTEs 0.00 0.00 0.00 0.00 0.00
Expenditures:
2015 Actual 2016 Actual 2017 Actual 2018 Budget 2019 Proposed
Capital Outlay 0 0 0 0 0
Interfund Charges 65,494 59,098 0 0 0
Reserve for Budget Adjustment 0 0 0 0 0
Transfers Out 0 0 0 0 0
Wages & Benefits 0 17,357 42,637 56,818 173,688
Supplies & Services 741,897 1,382,906 1,447,631 1,851,825 2,334,955
Debt Services 0 0 0 0 0
All Other 0 0 0 0 0
TOTAL 807,391 1,459,361 1,490,268 1,908,643 2,508,643
Expenditure Notes:
Expenditures aligned with anticipated revenues.
Revenues:
2015 Actual 2016 Actual 2017 Actual 2018 Budget 2019 Proposed
Taxes 0 0 0 0 0
Licenses & Permits 0 0 0 0 0
IG Revenue 0 0 0 0 0
Services 0 0 0 0 0
Fines & Forfeits 0 0 0 0 0
Operating Transfers In 0 0 0 0 0
General Fund Resources 0 0 0 0 0One Vision. One Plan. One Voice.
Planning and Economic Development36

Program Summary: CDBG Revolving Loan Fund
Division: Planning and Economic Development
Fund Type: Special Revenue Fund
Executive Summary:
The Community Development Block Grant Revolving Loan fund includes monies received from principal and interest payments from loans generated under the Single Family Rehabilitation Program.
Programs and Services:
The Revolving Loan fund supports the Single Family Rehabilitation Program home rehabilitation projects and loan servicing activities including administration and delivery of the program. This program ensures that low- and moderate-income residents can maintain safe and stable housing by completing necessary housing repairs that address health and safety deficiencies, and reduce operating costs (to the extent practicable).
FTEs
2015 Actual 2016 Actual 2017 Actual 2018 Budget 2019 Proposed
Total FTEs 0.00 0.00 0.00 0.00 0.00
Expenditures:
2015 Actual 2016 Actual 2017 Actual 2018 Budget 2019 Proposed
Capital Outlay 0 0 0 0 0
Interfund Charges 65,494 59,098 0 0 0
Reserve for Budget Adjustment 0 0 0 0 0
Transfers Out 0 0 0 0 0
Wages & Benefits 0 17,357 42,637 56,818 173,688
Supplies & Services 741,897 1,382,906 1,447,631 1,851,825 2,334,955
Debt Services 0 0 0 0 0
All Other 0 0 0 0 0
TOTAL 807,391 1,459,361 1,490,268 1,908,643 2,508,643
Expenditure Notes:
Expenditures aligned with anticipated revenues.
Revenues:
2015 Actual 2016 Actual 2017 Actual 2018 Budget 2019 Proposed
Taxes 0 0 0 0 0
Licenses & Permits 0 0 0 0 0
IG Revenue 0 0 0 0 0
Services 0 0 0 0 0
Fines & Forfeits 0 0 0 0 0
Operating Transfers In 0 0 0 0 0
General Fund Resources 0 0 0 0 0
All Other 1,456,071 1,213,918 1,689,284 1,878,643 1,908,643
TOTAL 1,456,071 1,213,918 1,689,284 1,878,643 1,908,643
Revenue Notes:
Revenues are based on expected receipts of loan payments.
Planning and Economic Development 37
Program Summary: Community Development Block Grants
Division: Planning and Economic Development
Fund Type: Special Revenue Fund
Executive Summary:
The Community Development Block Grant (CDBG) Program is supported by an annual entitlement grant from the U.S. Department of Housing and Urban Development.
Programs and Services:
Activities or projects funded by CDBG must meet one of three national objectives: 1) benefit low and moderate income persons; 2) aid in the prevention or elimination of slums and blight; and 3) meet an urgent need. CDBG funds support community centers, capital projects, public safety, parks, sidewalks, economic development and public services.
Program goals for 2019 Include:1) Preserving and expanding high quality, safe, and affordable housing choices; 2) Improving quality of life for extremely low to moderate income resident; 3) Preventing and reducing homelessness;4) Supporting vibrant neighborhoods;5) Expanding economic opportunities.
FTEs
2015 Actual 2016 Actual 2017 Actual 2018 Budget 2019 Proposed
Total FTEs 0.00 0.00 0.00 0.00 0.00
Expenditures:
2015 Actual 2016 Actual 2017 Actual 2018 Budget 2019 Proposed
Capital Outlay 712,480 239,268 402,091 0 0
Interfund Charges 66,411 94,082 20 0 0
Reserve for Budget Adjustment 0 0 0 0 0
Transfers Out 0 0 0 0 0
Wages & Benefits 316,874 337,893 341,863 396,013 332,705
Supplies & Services 1,689,687 2,230,302 2,381,841 7,820,796 7,704,104
Debt Services 0 0 0 0 0
All Other 0 0 0 0 0
TOTAL 2,785,452 2,901,545 3,125,815 8,216,809 8,036,809
Expenditure Notes:
This fund is Federal Grant funded. Expenditures aligned to meet anticipated revenues and beginning amounts available for use.
Revenues:
2015 Actual 2016 Actual 2017 Actual 2018 Budget 2019 Proposed
Taxes 0 0 0 0 0
Licenses & Permits 0 0 0 0 0One Vision. One Plan. One Voice.
Planning and Economic Development38

Program Summary: Community Development Block Grants
Division: Planning and Economic Development
Fund Type: Special Revenue Fund
Executive Summary:
The Community Development Block Grant (CDBG) Program is supported by an annual entitlement grant from the U.S. Department of Housing and Urban Development.
Programs and Services:
Activities or projects funded by CDBG must meet one of three national objectives: 1) benefit low and moderate income persons; 2) aid in the prevention or elimination of slums and blight; and 3) meet an urgent need. CDBG funds support community centers, capital projects, public safety, parks, sidewalks, economic development and public services.
Program goals for 2019 Include:1) Preserving and expanding high quality, safe, and affordable housing choices; 2) Improving quality of life for extremely low to moderate income resident; 3) Preventing and reducing homelessness;4) Supporting vibrant neighborhoods;5) Expanding economic opportunities.
FTEs
2015 Actual 2016 Actual 2017 Actual 2018 Budget 2019 Proposed
Total FTEs 0.00 0.00 0.00 0.00 0.00
Expenditures:
2015 Actual 2016 Actual 2017 Actual 2018 Budget 2019 Proposed
Capital Outlay 712,480 239,268 402,091 0 0
Interfund Charges 66,411 94,082 20 0 0
Reserve for Budget Adjustment 0 0 0 0 0
Transfers Out 0 0 0 0 0
Wages & Benefits 316,874 337,893 341,863 396,013 332,705
Supplies & Services 1,689,687 2,230,302 2,381,841 7,820,796 7,704,104
Debt Services 0 0 0 0 0
All Other 0 0 0 0 0
TOTAL 2,785,452 2,901,545 3,125,815 8,216,809 8,036,809
Expenditure Notes:
This fund is Federal Grant funded. Expenditures aligned to meet anticipated revenues and beginning amounts available for use.
Revenues:
2015 Actual 2016 Actual 2017 Actual 2018 Budget 2019 Proposed
Taxes 0 0 0 0 0
Licenses & Permits 0 0 0 0 0
IG Revenue 2,691,099 2,963,237 3,414,114 8,036,809 8,036,809
Services 0 0 0 0 0
Fines & Forfeits 0 0 0 0 0
Operating Transfers In 0 0 0 0 0
General Fund Resources 0 0 0 0 0
All Other 1,702 92,650 13,452 0 0
TOTAL 2,692,801 3,055,887 3,427,566 8,036,809 8,036,809
Revenue Notes:
Revenues are based on anticipated amounts to be received from Federal grants.
Planning and Economic Development 39
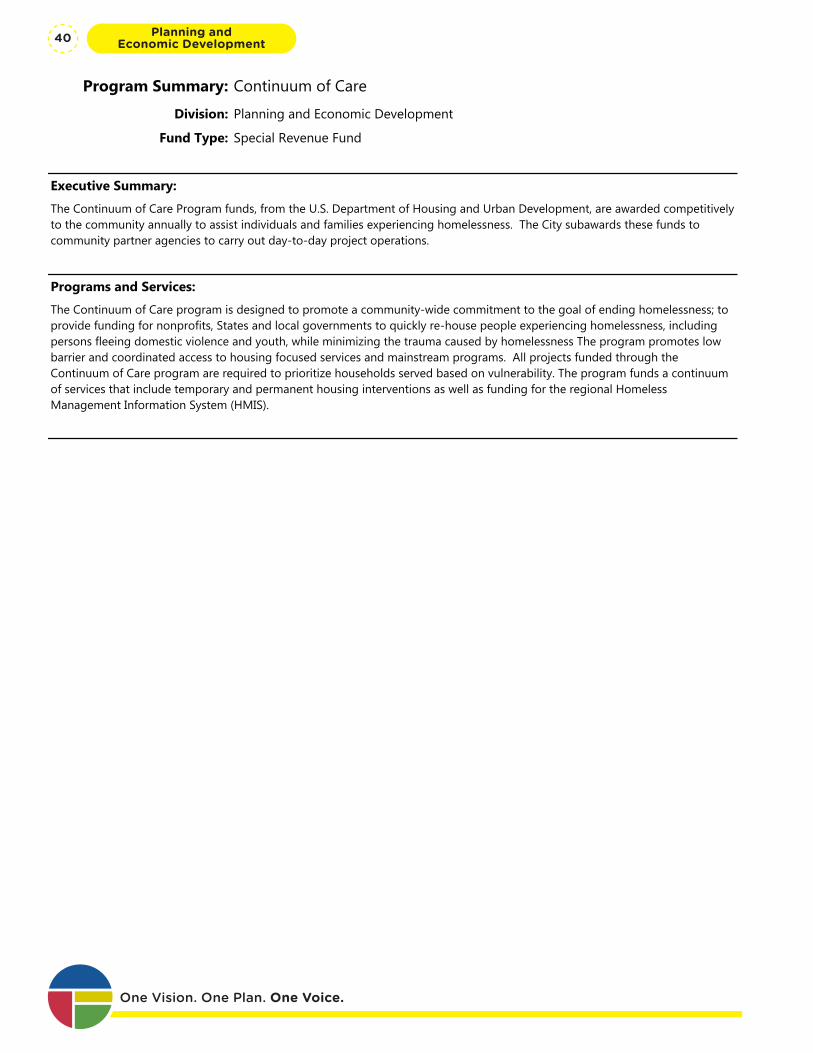
Program Summary: Continuum of Care
Division: Planning and Economic Development
Fund Type: Special Revenue Fund
Executive Summary:
The Continuum of Care Program funds, from the U.S. Department of Housing and Urban Development, are awarded competitively to the community annually to assist individuals and families experiencing homelessness. The City subawards these funds to community partner agencies to carry out day-to-day project operations.
Programs and Services:
The Continuum of Care program is designed to promote a community-wide commitment to the goal of ending homelessness; to provide funding for nonprofits, States and local governments to quickly re-house people experiencing homelessness, including persons fleeing domestic violence and youth, while minimizing the trauma caused by homelessness The program promotes low barrier and coordinated access to housing focused services and mainstream programs. All projects funded through the Continuum of Care program are required to prioritize households served based on vulnerability. The program funds a continuum of services that include temporary and permanent housing interventions as well as funding for the regional Homeless Management Information System (HMIS).
FTEs
2015 Actual 2016 Actual 2017 Actual 2018 Budget 2019 Proposed
Total FTEs 0.00 0.00 0.00 0.00 0.00
Expenditures:
2015 Actual 2016 Actual 2017 Actual 2018 Budget 2019 Proposed
Capital Outlay 0 0 0 0 0
Interfund Charges 19,350 24,605 0 0 0
Reserve for Budget Adjustment 0 0 0 0 0
Transfers Out 0 0 0 0 0
Wages & Benefits 52,763 110,898 203,541 380,580 264,779
Supplies & Services 2,804,345 3,064,688 3,083,451 3,807,783 3,923,584
Debt Services 0 0 0 0 0
All Other 0 0 0 0 0
TOTAL 2,876,458 3,200,191 3,286,992 4,188,363 4,188,363
Expenditure Notes:
This fund is Federal Grant funded. Expenditures aligned to meet anticipated revenues and beginning amounts available for use.
Revenues:
2015 Actual 2016 Actual 2017 Actual 2018 Budget 2019 Proposed
Taxes 0 0 0 0 0
Licenses & Permits 0 0 0 0 0
IG Revenue 2,876,929 3,208,114 3,298,788 4,188,363 4,188,363
Services 0 0 0 0 0One Vision. One Plan. One Voice.
Planning and Economic Development40
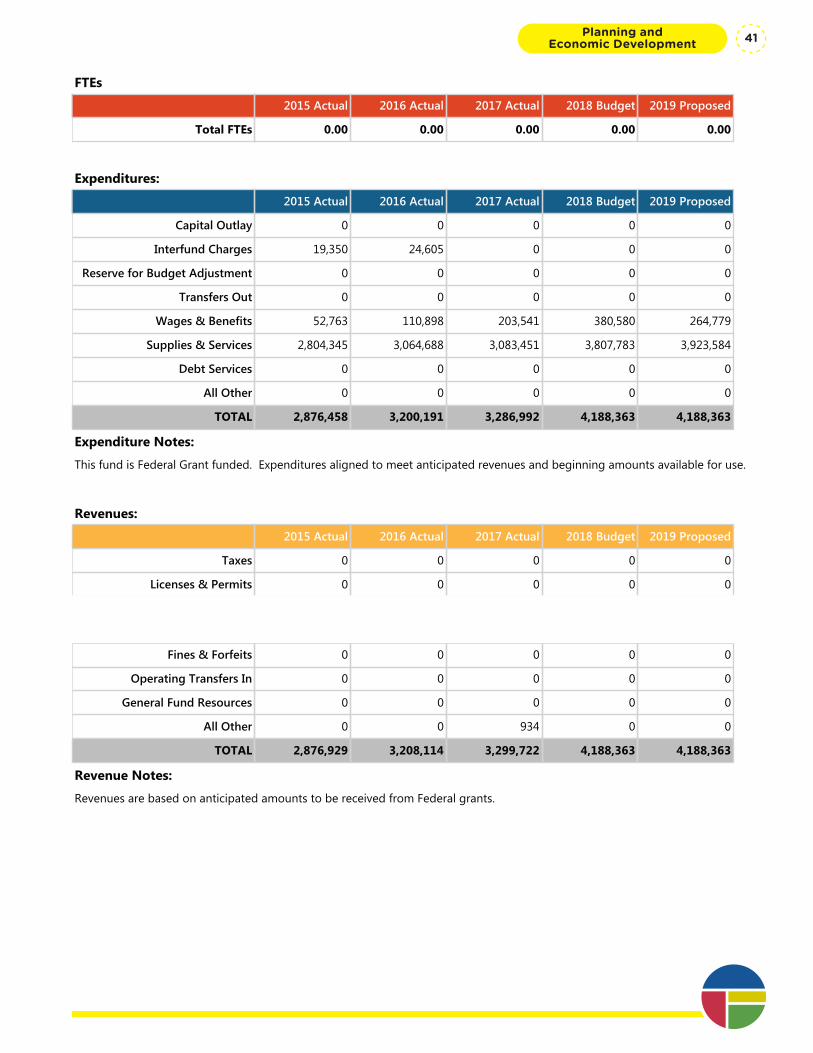
Program Summary: Continuum of Care
Division: Planning and Economic Development
Fund Type: Special Revenue Fund
Executive Summary:
The Continuum of Care Program funds, from the U.S. Department of Housing and Urban Development, are awarded competitively to the community annually to assist individuals and families experiencing homelessness. The City subawards these funds to community partner agencies to carry out day-to-day project operations.
Programs and Services:
The Continuum of Care program is designed to promote a community-wide commitment to the goal of ending homelessness; to provide funding for nonprofits, States and local governments to quickly re-house people experiencing homelessness, including persons fleeing domestic violence and youth, while minimizing the trauma caused by homelessness The program promotes low barrier and coordinated access to housing focused services and mainstream programs. All projects funded through the Continuum of Care program are required to prioritize households served based on vulnerability. The program funds a continuum of services that include temporary and permanent housing interventions as well as funding for the regional Homeless Management Information System (HMIS).
FTEs
2015 Actual 2016 Actual 2017 Actual 2018 Budget 2019 Proposed
Total FTEs 0.00 0.00 0.00 0.00 0.00
Expenditures:
2015 Actual 2016 Actual 2017 Actual 2018 Budget 2019 Proposed
Capital Outlay 0 0 0 0 0
Interfund Charges 19,350 24,605 0 0 0
Reserve for Budget Adjustment 0 0 0 0 0
Transfers Out 0 0 0 0 0
Wages & Benefits 52,763 110,898 203,541 380,580 264,779
Supplies & Services 2,804,345 3,064,688 3,083,451 3,807,783 3,923,584
Debt Services 0 0 0 0 0
All Other 0 0 0 0 0
TOTAL 2,876,458 3,200,191 3,286,992 4,188,363 4,188,363
Expenditure Notes:
This fund is Federal Grant funded. Expenditures aligned to meet anticipated revenues and beginning amounts available for use.
Revenues:
2015 Actual 2016 Actual 2017 Actual 2018 Budget 2019 Proposed
Taxes 0 0 0 0 0
Licenses & Permits 0 0 0 0 0
IG Revenue 2,876,929 3,208,114 3,298,788 4,188,363 4,188,363
Services 0 0 0 0 0
Fines & Forfeits 0 0 0 0 0
Operating Transfers In 0 0 0 0 0
General Fund Resources 0 0 0 0 0
All Other 0 0 934 0 0
TOTAL 2,876,929 3,208,114 3,299,722 4,188,363 4,188,363
Revenue Notes:
Revenues are based on anticipated amounts to be received from Federal grants.
Planning and Economic Development 41
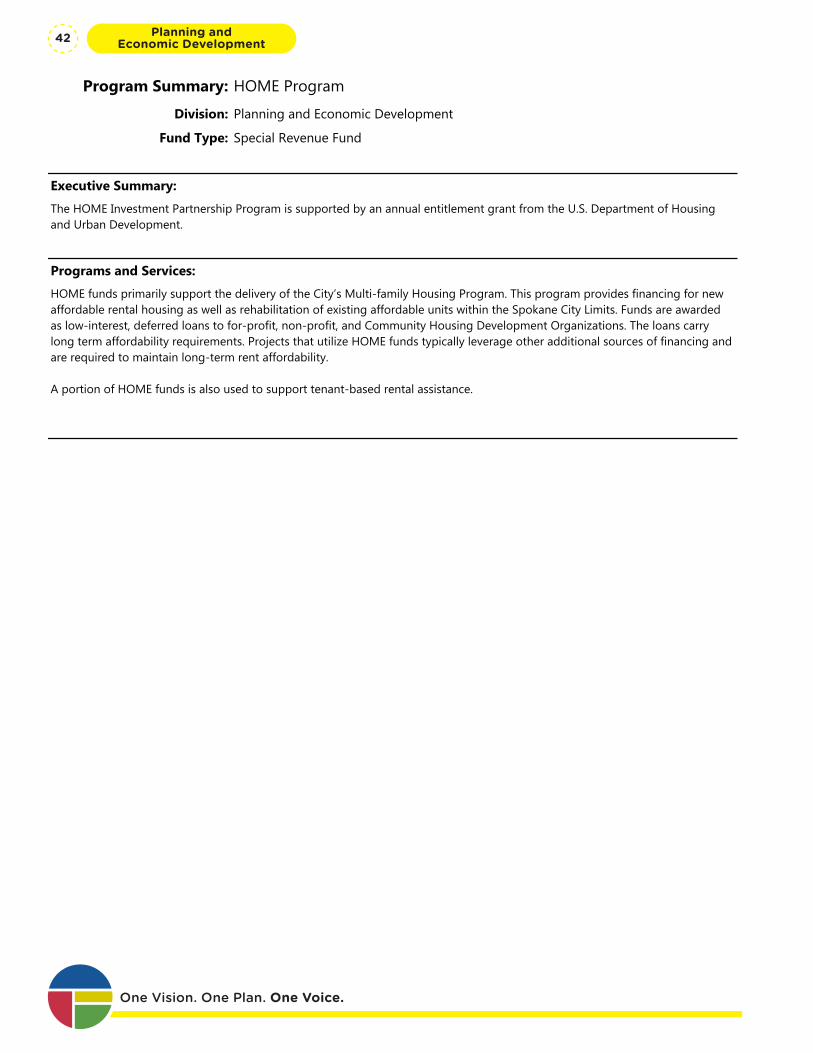
Program Summary: HOME Program
Division: Planning and Economic Development
Fund Type: Special Revenue Fund
Executive Summary:
The HOME Investment Partnership Program is supported by an annual entitlement grant from the U.S. Department of Housing and Urban Development.
Programs and Services:
HOME funds primarily support the delivery of the City’s Multi-family Housing Program. This program provides financing for new affordable rental housing as well as rehabilitation of existing affordable units within the Spokane City Limits. Funds are awarded as low-interest, deferred loans to for-profit, non-profit, and Community Housing Development Organizations. The loans carry long term affordability requirements. Projects that utilize HOME funds typically leverage other additional sources of financing and are required to maintain long-term rent affordability.
A portion of HOME funds is also used to support tenant-based rental assistance.
FTEs
2015 Actual 2016 Actual 2017 Actual 2018 Budget 2019 Proposed
Total FTEs 0.00 0.00 0.00 0.00 0.00
Expenditures:
2015 Actual 2016 Actual 2017 Actual 2018 Budget 2019 Proposed
Capital Outlay 0 0 0 0 0
Interfund Charges 15,529 20,778 0 0 0
Reserve for Budget Adjustment 0 0 0 0 0
Transfers Out 0 0 0 0 0
Wages & Benefits 51,753 42,460 82,163 106,832 126,268
Supplies & Services 1,865,739 1,312,409 1,461,149 3,158,146 4,163,706
Debt Services 0 0 0 0 0
All Other 0 0 0 0 0
TOTAL 1,933,021 1,375,647 1,543,312 3,264,978 4,289,974
Expenditure Notes:
This fund is Federal Grant funded. Expenditures aligned to meet anticipated revenues and beginning amounts available for use.
Revenues:
2015 Actual 2016 Actual 2017 Actual 2018 Budget 2019 Proposed
Taxes 0 0 0 0 0
Licenses & Permits 0 0 0 0 0
IG Revenue 957,155 380,309 1,462,375 2,314,778 3,139,774
Services 0 1,417 0 0 0One Vision. One Plan. One Voice.
Planning and Economic Development42
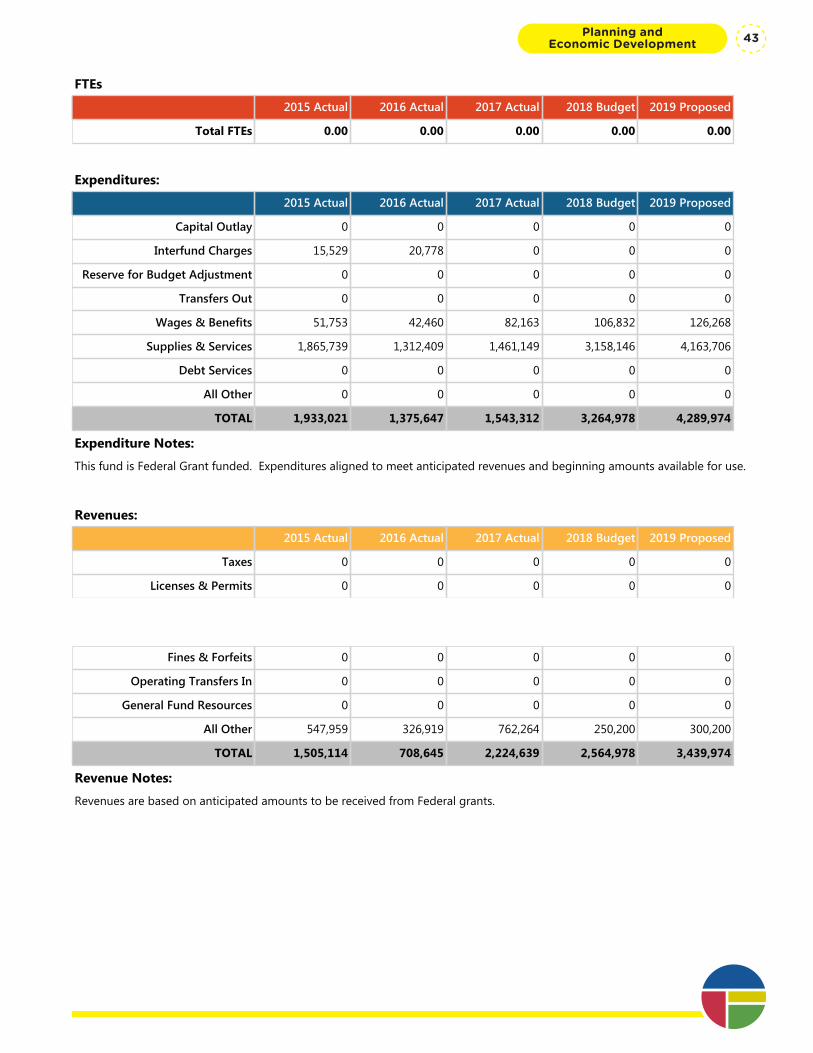
Program Summary: HOME Program
Division: Planning and Economic Development
Fund Type: Special Revenue Fund
Executive Summary:
The HOME Investment Partnership Program is supported by an annual entitlement grant from the U.S. Department of Housing and Urban Development.
Programs and Services:
HOME funds primarily support the delivery of the City’s Multi-family Housing Program. This program provides financing for new affordable rental housing as well as rehabilitation of existing affordable units within the Spokane City Limits. Funds are awarded as low-interest, deferred loans to for-profit, non-profit, and Community Housing Development Organizations. The loans carry long term affordability requirements. Projects that utilize HOME funds typically leverage other additional sources of financing and are required to maintain long-term rent affordability.
A portion of HOME funds is also used to support tenant-based rental assistance.
FTEs
2015 Actual 2016 Actual 2017 Actual 2018 Budget 2019 Proposed
Total FTEs 0.00 0.00 0.00 0.00 0.00
Expenditures:
2015 Actual 2016 Actual 2017 Actual 2018 Budget 2019 Proposed
Capital Outlay 0 0 0 0 0
Interfund Charges 15,529 20,778 0 0 0
Reserve for Budget Adjustment 0 0 0 0 0
Transfers Out 0 0 0 0 0
Wages & Benefits 51,753 42,460 82,163 106,832 126,268
Supplies & Services 1,865,739 1,312,409 1,461,149 3,158,146 4,163,706
Debt Services 0 0 0 0 0
All Other 0 0 0 0 0
TOTAL 1,933,021 1,375,647 1,543,312 3,264,978 4,289,974
Expenditure Notes:
This fund is Federal Grant funded. Expenditures aligned to meet anticipated revenues and beginning amounts available for use.
Revenues:
2015 Actual 2016 Actual 2017 Actual 2018 Budget 2019 Proposed
Taxes 0 0 0 0 0
Licenses & Permits 0 0 0 0 0
IG Revenue 957,155 380,309 1,462,375 2,314,778 3,139,774
Services 0 1,417 0 0 0
Fines & Forfeits 0 0 0 0 0
Operating Transfers In 0 0 0 0 0
General Fund Resources 0 0 0 0 0
All Other 547,959 326,919 762,264 250,200 300,200
TOTAL 1,505,114 708,645 2,224,639 2,564,978 3,439,974
Revenue Notes:
Revenues are based on anticipated amounts to be received from Federal grants.
Planning and Economic Development 43

Program Summary: HOPE Acquisition Fund
Division: Planning and Economic Development
Fund Type: Special Revenue Fund
Executive Summary:
The HOPE Acquisition fund includes monies received from principal and interest payments from loans generated under the U.S. Department of Housing and Urban Development’s Homeownership and Opportunity for People Everywhere Program (HOPE).
Programs and Services:
Funds can be used as cash match for HOME program expenditures as well as any activities eligible under the Community Development Block Grant (CDBG), including economic and community development, or human services. CDBG programs must meet one of three national objectives: 1) benefit to low and moderate income persons; 2) aid in the prevention or elimination of slums and blight; and 3) meet an urgent need.
FTEs
2015 Actual 2016 Actual 2017 Actual 2018 Budget 2019 Proposed
Total FTEs 0.00 0.00 0.00 0.00 0.00
Expenditures:
2015 Actual 2016 Actual 2017 Actual 2018 Budget 2019 Proposed
Capital Outlay 0 0 0 0 0
Interfund Charges 741 469 0 0 0
Reserve for Budget Adjustment 0 0 0 0 0
Transfers Out 0 0 0 0 0
Wages & Benefits 0 0 135 284 0
Supplies & Services 24,011 2,900 6,393 286,016 498,300
Debt Services 0 0 0 0 0
All Other 0 0 0 0 0
TOTAL 24,752 3,369 6,528 286,300 498,300
Expenditure Notes:
Expenditures aligned to meet anticipated revenues and beginning amounts from loan payment revenues.
Revenues:
2015 Actual 2016 Actual 2017 Actual 2018 Budget 2019 Proposed
Taxes 0 0 0 0 0
Licenses & Permits 0 0 0 0 0
IG Revenue 0 0 0 0 0
Services 0 0 0 0 0
Fines & Forfeits 0 0 0 0 0
Operating Transfers In 0 0 0 0 0
General Fund Resources 0 0 0 0 0One Vision. One Plan. One Voice.
Planning and Economic Development44

Program Summary: HOPE Acquisition Fund
Division: Planning and Economic Development
Fund Type: Special Revenue Fund
Executive Summary:
The HOPE Acquisition fund includes monies received from principal and interest payments from loans generated under the U.S. Department of Housing and Urban Development’s Homeownership and Opportunity for People Everywhere Program (HOPE).
Programs and Services:
Funds can be used as cash match for HOME program expenditures as well as any activities eligible under the Community Development Block Grant (CDBG), including economic and community development, or human services. CDBG programs must meet one of three national objectives: 1) benefit to low and moderate income persons; 2) aid in the prevention or elimination of slums and blight; and 3) meet an urgent need.
FTEs
2015 Actual 2016 Actual 2017 Actual 2018 Budget 2019 Proposed
Total FTEs 0.00 0.00 0.00 0.00 0.00
Expenditures:
2015 Actual 2016 Actual 2017 Actual 2018 Budget 2019 Proposed
Capital Outlay 0 0 0 0 0
Interfund Charges 741 469 0 0 0
Reserve for Budget Adjustment 0 0 0 0 0
Transfers Out 0 0 0 0 0
Wages & Benefits 0 0 135 284 0
Supplies & Services 24,011 2,900 6,393 286,016 498,300
Debt Services 0 0 0 0 0
All Other 0 0 0 0 0
TOTAL 24,752 3,369 6,528 286,300 498,300
Expenditure Notes:
Expenditures aligned to meet anticipated revenues and beginning amounts from loan payment revenues.
Revenues:
2015 Actual 2016 Actual 2017 Actual 2018 Budget 2019 Proposed
Taxes 0 0 0 0 0
Licenses & Permits 0 0 0 0 0
IG Revenue 0 0 0 0 0
Services 0 0 0 0 0
Fines & Forfeits 0 0 0 0 0
Operating Transfers In 0 0 0 0 0
General Fund Resources 0 0 0 0 0
All Other 29,496 10,275 211,046 8,300 8,300
TOTAL 29,496 10,275 211,046 8,300 8,300
Revenue Notes:
Revenues are based on anticipated loan payments to be received. In 2017 we also sold homes/properties that accounted for the Disposition of Fixed Assets.
Planning and Economic Development 45
Program Summary: Housing Assistance Program
Division: Planning and Economic Development
Fund Type: Special Revenue Fund
Executive Summary:
The Housing Assistance Program fund includes monies received from principal and interest payments from loans generated under the U.S. Department of Housing and Urban Development’s Homeownership and Opportunity for People Everywhere Program (HOPE).
Programs and Services:
Funds can be used as cash match for HOME program expenditures as well as any activities eligible under the Community Development Block Grant (CDBG), including economic and community development, or human services. CDBG programs must meet one of three national objectives: 1) benefit to low and moderate income persons; 2) aid in the prevention or elimination of slums and blight; and 3) meet an urgent need.
FTEs
2015 Actual 2016 Actual 2017 Actual 2018 Budget 2019 Proposed
Total FTEs 0.00 0.00 0.00 0.00 0.00
Expenditures:
2015 Actual 2016 Actual 2017 Actual 2018 Budget 2019 Proposed
Capital Outlay 0 0 0 0 0
Interfund Charges 267 209 0 0 0
Reserve for Budget Adjustment 0 0 0 0 0
Transfers Out 0 0 0 0 0
Wages & Benefits 0 0 83 284 0
Supplies & Services 0 0 61 276,216 157,800
Debt Services 0 0 125,000 0 0
All Other 0 0 0 0 0
TOTAL 267 209 125,144 276,500 157,800
Expenditure Notes:
Expenditures aligned to meet anticipated revenues and beginning amounts from loan payment revenues.
Revenues:
2015 Actual 2016 Actual 2017 Actual 2018 Budget 2019 Proposed
Taxes 0 0 0 0 0
Licenses & Permits 0 0 0 0 0
IG Revenue 0 0 0 0 0
Services 0 0 0 0 0
Fines & Forfeits 0 0 0 0 0
Operating Transfers In 0 0 0 0 0One Vision. One Plan. One Voice.
Planning and Economic Development46
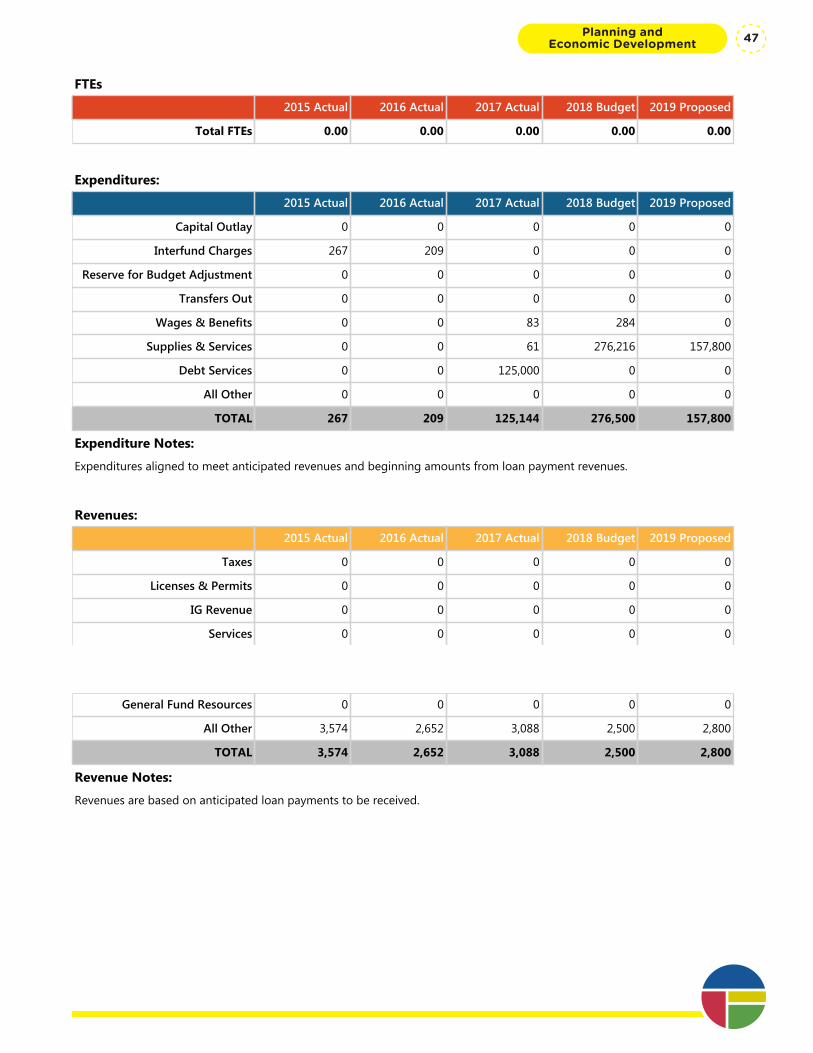
Program Summary: Housing Assistance Program
Division: Planning and Economic Development
Fund Type: Special Revenue Fund
Executive Summary:
The Housing Assistance Program fund includes monies received from principal and interest payments from loans generated under the U.S. Department of Housing and Urban Development’s Homeownership and Opportunity for People Everywhere Program (HOPE).
Programs and Services:
Funds can be used as cash match for HOME program expenditures as well as any activities eligible under the Community Development Block Grant (CDBG), including economic and community development, or human services. CDBG programs must meet one of three national objectives: 1) benefit to low and moderate income persons; 2) aid in the prevention or elimination of slums and blight; and 3) meet an urgent need.
FTEs
2015 Actual 2016 Actual 2017 Actual 2018 Budget 2019 Proposed
Total FTEs 0.00 0.00 0.00 0.00 0.00
Expenditures:
2015 Actual 2016 Actual 2017 Actual 2018 Budget 2019 Proposed
Capital Outlay 0 0 0 0 0
Interfund Charges 267 209 0 0 0
Reserve for Budget Adjustment 0 0 0 0 0
Transfers Out 0 0 0 0 0
Wages & Benefits 0 0 83 284 0
Supplies & Services 0 0 61 276,216 157,800
Debt Services 0 0 125,000 0 0
All Other 0 0 0 0 0
TOTAL 267 209 125,144 276,500 157,800
Expenditure Notes:
Expenditures aligned to meet anticipated revenues and beginning amounts from loan payment revenues.
Revenues:
2015 Actual 2016 Actual 2017 Actual 2018 Budget 2019 Proposed
Taxes 0 0 0 0 0
Licenses & Permits 0 0 0 0 0
IG Revenue 0 0 0 0 0
Services 0 0 0 0 0
Fines & Forfeits 0 0 0 0 0
Operating Transfers In 0 0 0 0 0
General Fund Resources 0 0 0 0 0
All Other 3,574 2,652 3,088 2,500 2,800
TOTAL 3,574 2,652 3,088 2,500 2,800
Revenue Notes:
Revenues are based on anticipated loan payments to be received.
Planning and Economic Development 47
Program Summary: Housing Trust Grant Fund
Division: Planning and Economic Development
Fund Type: Special Revenue Fund
Executive Summary:
The Housing Trust Grant fund includes monies received from principal and interest payments from loans generated under the State of Washington’s Housing Trust Program.
Programs and Services:
The objectives of this fund is to support the building and maintenance of affordable housing.
FTEs
2015 Actual 2016 Actual 2017 Actual 2018 Budget 2019 Proposed
Total FTEs 0.00 0.00 0.00 0.00 0.00
Expenditures:
2015 Actual 2016 Actual 2017 Actual 2018 Budget 2019 Proposed
Capital Outlay 0 0 0 0 0
Interfund Charges 266 194 0 0 0
Reserve for Budget Adjustment 0 0 0 0 0
Transfers Out 0 0 0 0 0
Wages & Benefits 0 0 546 284 380
Supplies & Services 0 0 412 210,016 213,920
Debt Services 0 0 0 0 0
All Other 0 0 0 0 0
TOTAL 266 194 958 210,300 214,300
Expenditure Notes:
Expenditures aligned to meet anticipated revenues and beginning amounts from loan payment revenues.
Revenues:
2015 Actual 2016 Actual 2017 Actual 2018 Budget 2019 Proposed
Taxes 0 0 0 0 0
Licenses & Permits 0 0 0 0 0
IG Revenue 0 0 0 0 0
Services 0 0 0 0 0
Fines & Forfeits 0 0 0 0 0
Operating Transfers In 0 0 0 0 0
General Fund Resources 0 0 0 0 0
All Other 2,970 2,902 2,885 3,300 3,300
TOTAL 2,970 2,902 2,885 3,300 3,300One Vision. One Plan. One Voice.
Planning and Economic Development48
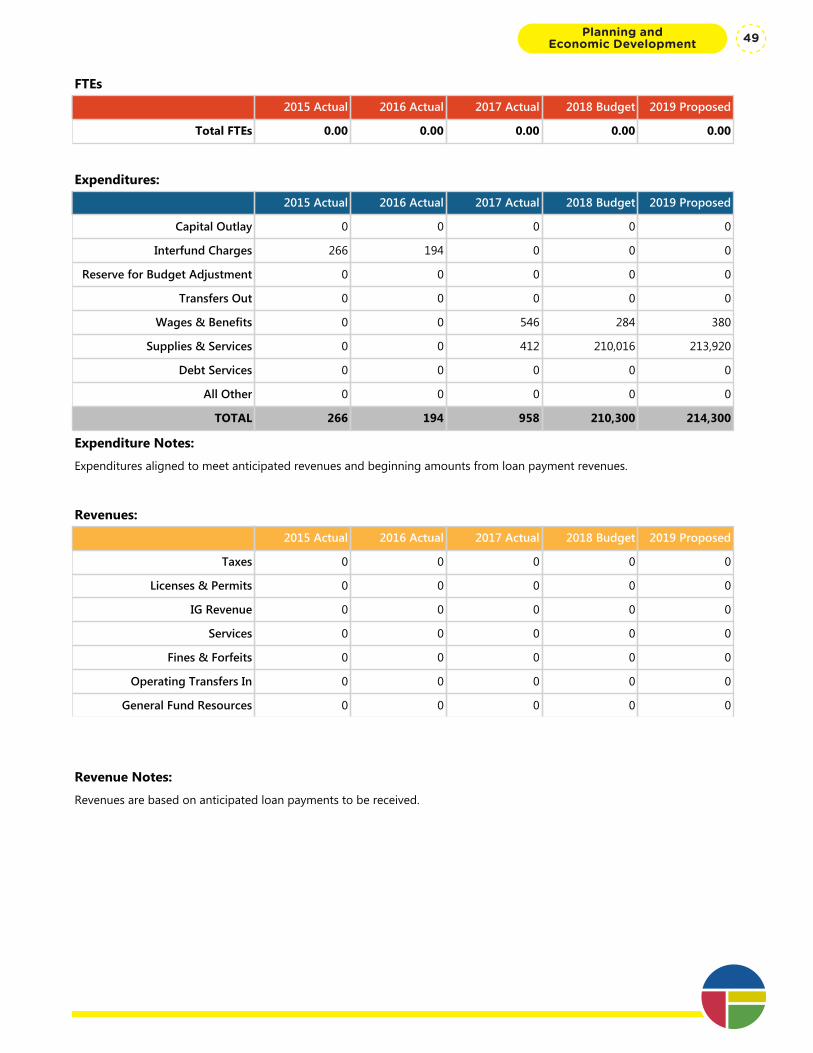
Program Summary: Housing Trust Grant Fund
Division: Planning and Economic Development
Fund Type: Special Revenue Fund
Executive Summary:
The Housing Trust Grant fund includes monies received from principal and interest payments from loans generated under the State of Washington’s Housing Trust Program.
Programs and Services:
The objectives of this fund is to support the building and maintenance of affordable housing.
FTEs
2015 Actual 2016 Actual 2017 Actual 2018 Budget 2019 Proposed
Total FTEs 0.00 0.00 0.00 0.00 0.00
Expenditures:
2015 Actual 2016 Actual 2017 Actual 2018 Budget 2019 Proposed
Capital Outlay 0 0 0 0 0
Interfund Charges 266 194 0 0 0
Reserve for Budget Adjustment 0 0 0 0 0
Transfers Out 0 0 0 0 0
Wages & Benefits 0 0 546 284 380
Supplies & Services 0 0 412 210,016 213,920
Debt Services 0 0 0 0 0
All Other 0 0 0 0 0
TOTAL 266 194 958 210,300 214,300
Expenditure Notes:
Expenditures aligned to meet anticipated revenues and beginning amounts from loan payment revenues.
Revenues:
2015 Actual 2016 Actual 2017 Actual 2018 Budget 2019 Proposed
Taxes 0 0 0 0 0
Licenses & Permits 0 0 0 0 0
IG Revenue 0 0 0 0 0
Services 0 0 0 0 0
Fines & Forfeits 0 0 0 0 0
Operating Transfers In 0 0 0 0 0
General Fund Resources 0 0 0 0 0
All Other 2,970 2,902 2,885 3,300 3,300
TOTAL 2,970 2,902 2,885 3,300 3,300
Revenue Notes:
Revenues are based on anticipated loan payments to be received.
Planning and Economic Development 49
Program Summary: Human Services
Division: Planning and Economic Development
Fund Type: Special Revenue Fund
Executive Summary:
This fund includes local dollars allocated by City Council to support programs that benefit vulnerable populations including shelters, domestic violence services, and other emergency needs.
Programs and Services:
Programs supported by this fund include outreach, emergency shelters, Aging and Long Term Care of Eastern Washington, and other critical services. These funds also support the Department administration of these programs that support low income and vulnerable citizens.
FTEs
2015 Actual 2016 Actual 2017 Actual 2018 Budget 2019 Proposed
Total FTEs 0.00 0.00 0.00 0.00 0.00
Expenditures:
2015 Actual 2016 Actual 2017 Actual 2018 Budget 2019 Proposed
Capital Outlay 0 0 0 0 0
Interfund Charges 17,271 32,879 0 0 0
Reserve for Budget Adjustment 0 0 0 0 0
Transfers Out 0 0 0 0 0
Wages & Benefits 205,707 115,177 143,416 162,232 170,005
Supplies & Services 1,278,890 1,464,763 1,928,280 1,811,298 1,776,525
Debt Services 0 0 0 0 0
All Other 0 0 0 0 0
TOTAL 1,501,868 1,612,819 2,071,696 1,973,530 1,946,530
Expenditure Notes:
Expenditures include General Fund Expenditures based upon Council Allocation and 24/7 Shelter Plan.
Revenues:
2015 Actual 2016 Actual 2017 Actual 2018 Budget 2019 Proposed
Taxes 0 0 0 0 0
Licenses & Permits 0 0 0 0 0
IG Revenue 25,584 28,488 28,673 59,000 32,000
Services 0 0 0 0 0
Fines & Forfeits 0 0 0 0 0
Operating Transfers In 0 0 0 0 0
General Fund Resources 0 0 0 0 0One Vision. One Plan. One Voice.
Planning and Economic Development50

Program Summary: Human Services
Division: Planning and Economic Development
Fund Type: Special Revenue Fund
Executive Summary:
This fund includes local dollars allocated by City Council to support programs that benefit vulnerable populations including shelters, domestic violence services, and other emergency needs.
Programs and Services:
Programs supported by this fund include outreach, emergency shelters, Aging and Long Term Care of Eastern Washington, and other critical services. These funds also support the Department administration of these programs that support low income and vulnerable citizens.
FTEs
2015 Actual 2016 Actual 2017 Actual 2018 Budget 2019 Proposed
Total FTEs 0.00 0.00 0.00 0.00 0.00
Expenditures:
2015 Actual 2016 Actual 2017 Actual 2018 Budget 2019 Proposed
Capital Outlay 0 0 0 0 0
Interfund Charges 17,271 32,879 0 0 0
Reserve for Budget Adjustment 0 0 0 0 0
Transfers Out 0 0 0 0 0
Wages & Benefits 205,707 115,177 143,416 162,232 170,005
Supplies & Services 1,278,890 1,464,763 1,928,280 1,811,298 1,776,525
Debt Services 0 0 0 0 0
All Other 0 0 0 0 0
TOTAL 1,501,868 1,612,819 2,071,696 1,973,530 1,946,530
Expenditure Notes:
Expenditures include General Fund Expenditures based upon Council Allocation and 24/7 Shelter Plan.
Revenues:
2015 Actual 2016 Actual 2017 Actual 2018 Budget 2019 Proposed
Taxes 0 0 0 0 0
Licenses & Permits 0 0 0 0 0
IG Revenue 25,584 28,488 28,673 59,000 32,000
Services 0 0 0 0 0
Fines & Forfeits 0 0 0 0 0
Operating Transfers In 0 0 0 0 0
General Fund Resources 0 0 0 0 0
All Other (7,718) 0 5,212 0 0
TOTAL 17,866 28,488 33,885 59,000 32,000
Revenue Notes:
Funds based on Council appropriations with the exception of liquor excise tax revenues.
Planning and Economic Development 51
Program Summary: Human Services Grants
Division: Planning and Economic Development
Fund Type: Special Revenue Fund
Executive Summary:
This fund includes federal, state, and local dollars that are intended to advance the objectives of the Strategic Plan to End Homelessness. The sources for this fund include the Emergency Solutions Grant, Consolidated Homeless Grant, Washington State Office of Homeless Youth funds, and Homeless Housing and Assistance Act funds.
Programs and Services:
The 2015-2020 Strategic Plan to End Homelessness (Homeless Plan) established objectives for needs related to serving homeless. Program goals as identified in the Homeless Plan Include: 1) increase leadership, collaboration and civic engagement; 2) increase access to stable and affordable housing; 3) support effective pathways toward self-sufficiency and reduced financial vulnerability; 4) transform homeless services to crisis response systems leading to improved health and safety; and 5) advance health and housing stability for youth experiencing homelessness, including unaccompanied homeless youth and youth aging out of systems such as foster care and juvenile justice.
The following types of projects will be used to achieve these objectives: • Emergency Shelter operations and staffing• Transitional Housing operations and staffing • Rental Assistance for homeless & at-risk households• Support services for permanent supportive housing• Outreach services• Housing and Essential Needs (HEN) specific projects• Coordinated assessment
FTEs
2015 Actual 2016 Actual 2017 Actual 2018 Budget 2019 Proposed
Total FTEs 0.00 0.00 0.00 0.00 0.00
Expenditures:
2015 Actual 2016 Actual 2017 Actual 2018 Budget 2019 Proposed
Capital Outlay 0 0 0 0 0
Interfund Charges 29,051 52,273 0 0 0
Reserve for Budget Adjustment 0 0 0 0 0
Transfers Out 0 0 0 0 0
Wages & Benefits 145,415 179,375 214,627 256,955 315,278
Supplies & Services 3,663,043 3,659,826 4,207,071 5,726,872 4,826,382
Debt Services 0 0 0 0 0
All Other 0 0 0 0 0
One Vision. One Plan. One Voice.
Planning and Economic Development52
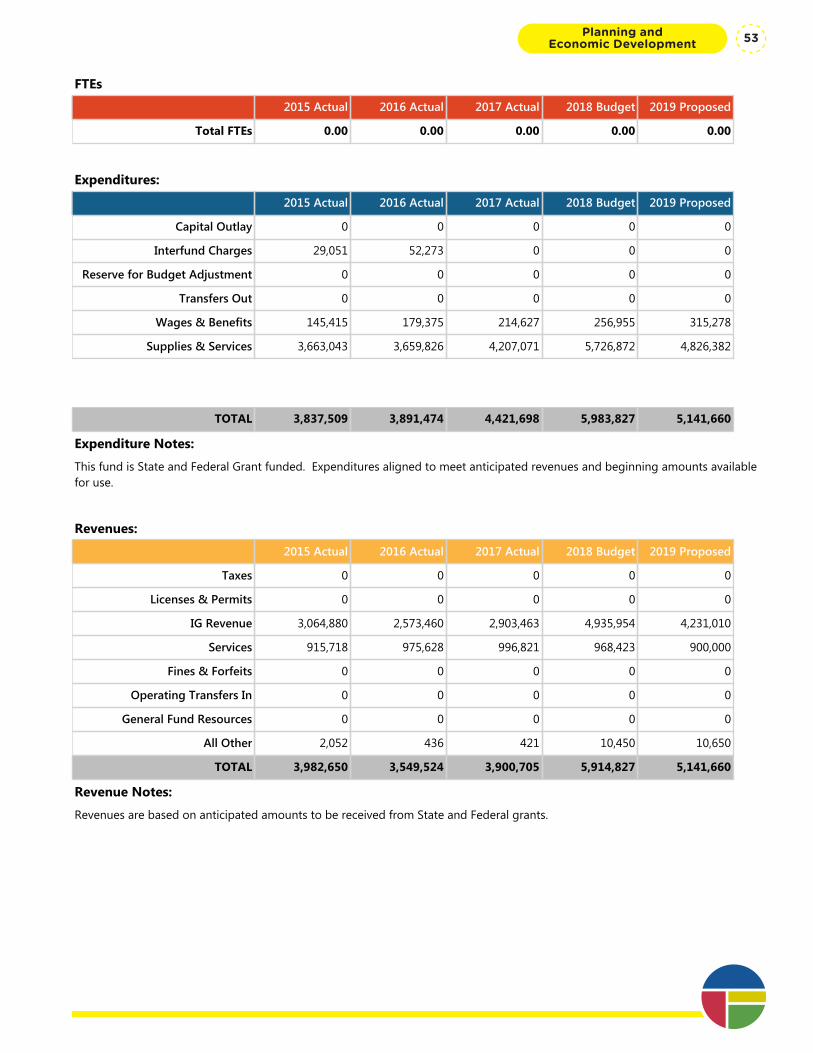
Program Summary: Human Services Grants
Division: Planning and Economic Development
Fund Type: Special Revenue Fund
Executive Summary:
This fund includes federal, state, and local dollars that are intended to advance the objectives of the Strategic Plan to End Homelessness. The sources for this fund include the Emergency Solutions Grant, Consolidated Homeless Grant, Washington State Office of Homeless Youth funds, and Homeless Housing and Assistance Act funds.
Programs and Services:
The 2015-2020 Strategic Plan to End Homelessness (Homeless Plan) established objectives for needs related to serving homeless. Program goals as identified in the Homeless Plan Include: 1) increase leadership, collaboration and civic engagement; 2) increase access to stable and affordable housing; 3) support effective pathways toward self-sufficiency and reduced financial vulnerability; 4) transform homeless services to crisis response systems leading to improved health and safety; and 5) advance health and housing stability for youth experiencing homelessness, including unaccompanied homeless youth and youth aging out of systems such as foster care and juvenile justice.
The following types of projects will be used to achieve these objectives: • Emergency Shelter operations and staffing• Transitional Housing operations and staffing • Rental Assistance for homeless & at-risk households• Support services for permanent supportive housing• Outreach services• Housing and Essential Needs (HEN) specific projects• Coordinated assessment
FTEs
2015 Actual 2016 Actual 2017 Actual 2018 Budget 2019 Proposed
Total FTEs 0.00 0.00 0.00 0.00 0.00
Expenditures:
2015 Actual 2016 Actual 2017 Actual 2018 Budget 2019 Proposed
Capital Outlay 0 0 0 0 0
Interfund Charges 29,051 52,273 0 0 0
Reserve for Budget Adjustment 0 0 0 0 0
Transfers Out 0 0 0 0 0
Wages & Benefits 145,415 179,375 214,627 256,955 315,278
Supplies & Services 3,663,043 3,659,826 4,207,071 5,726,872 4,826,382
Debt Services 0 0 0 0 0
All Other 0 0 0 0 0
TOTAL 3,837,509 3,891,474 4,421,698 5,983,827 5,141,660
Expenditure Notes:
This fund is State and Federal Grant funded. Expenditures aligned to meet anticipated revenues and beginning amounts available for use.
Revenues:
2015 Actual 2016 Actual 2017 Actual 2018 Budget 2019 Proposed
Taxes 0 0 0 0 0
Licenses & Permits 0 0 0 0 0
IG Revenue 3,064,880 2,573,460 2,903,463 4,935,954 4,231,010
Services 915,718 975,628 996,821 968,423 900,000
Fines & Forfeits 0 0 0 0 0
Operating Transfers In 0 0 0 0 0
General Fund Resources 0 0 0 0 0
All Other 2,052 436 421 10,450 10,650
TOTAL 3,982,650 3,549,524 3,900,705 5,914,827 5,141,660
Revenue Notes:
Revenues are based on anticipated amounts to be received from State and Federal grants.
Planning and Economic Development 53
Program Summary: Miscellaneous Community Development Block Grants
Division: Planning and Economic Development
Fund Type: Special Revenue Fund
Executive Summary:
This fund includes revenue generated from loans made under Lead Hazard Reduction Grant Programs (Lead program) as well as a special allocation for strategic affordable housing investments.
Programs and Services:
The revenue that continues to come in for active Lead loans is used to pay for the servicing of those loans. The special allocation for strategic affordable housing investments supports an expanded rental relocation program for those displaced due to increasing housing costs, a landlord mitigation program, and programming that supports affordable homeownership.
FTEs
2015 Actual 2016 Actual 2017 Actual 2018 Budget 2019 Proposed
Total FTEs 0.00 0.00 0.00 0.00 0.00
Expenditures:
2015 Actual 2016 Actual 2017 Actual 2018 Budget 2019 Proposed
Capital Outlay 0 0 0 0 0
Interfund Charges 1,784 4,214 0 0 0
Reserve for Budget Adjustment 0 0 0 0 0
Transfers Out 0 0 0 0 0
Wages & Benefits 1,866 373 511 1,136 3,041
Supplies & Services 235,551 (29,292) 26,120 49,864 780,140
Debt Services 0 0 0 0 0
All Other 0 0 0 0 0
TOTAL 239,201 (24,705) 26,631 51,000 783,181
Expenditure Notes:
This fund is Federal Grant funded. Expenditures aligned to meet anticipated revenues and beginning amounts available for use.
Beginning in the 2019 Budget, a General Fund contribution to this program will fund Safe and Healthy Strategic Investments in housing and vulnerable population. This funding will continue through 2021 to pursue the goals of the strategic plan.
Revenues:
2015 Actual 2016 Actual 2017 Actual 2018 Budget 2019 Proposed
Taxes 0 0 0 0 0
Licenses & Permits 0 0 0 0 0
IG Revenue 0 0 0 0 0
Services 0 0 0 0 0
Fines & Forfeits 0 0 0 0 0
Operating Transfers In 0 0 0 0 0One Vision. One Plan. One Voice.
Planning and Economic Development54
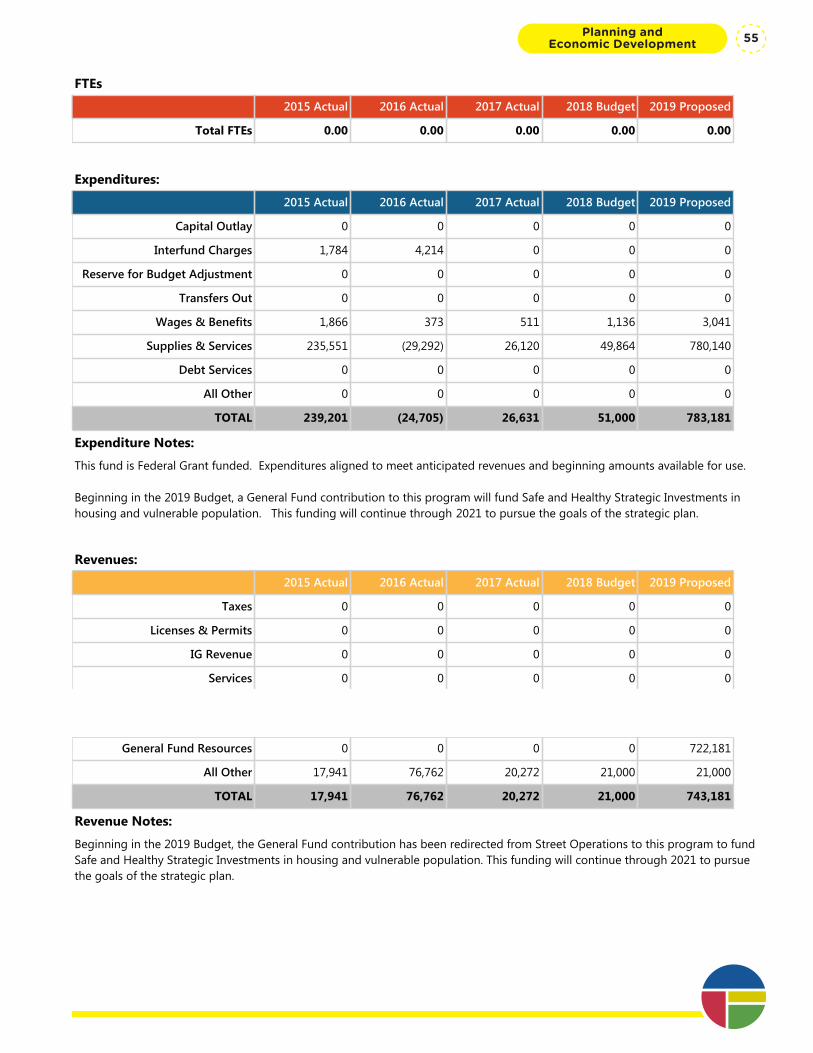
Program Summary: Miscellaneous Community Development Block Grants
Division: Planning and Economic Development
Fund Type: Special Revenue Fund
Executive Summary:
This fund includes revenue generated from loans made under Lead Hazard Reduction Grant Programs (Lead program) as well as a special allocation for strategic affordable housing investments.
Programs and Services:
The revenue that continues to come in for active Lead loans is used to pay for the servicing of those loans. The special allocation for strategic affordable housing investments supports an expanded rental relocation program for those displaced due to increasing housing costs, a landlord mitigation program, and programming that supports affordable homeownership.
FTEs
2015 Actual 2016 Actual 2017 Actual 2018 Budget 2019 Proposed
Total FTEs 0.00 0.00 0.00 0.00 0.00
Expenditures:
2015 Actual 2016 Actual 2017 Actual 2018 Budget 2019 Proposed
Capital Outlay 0 0 0 0 0
Interfund Charges 1,784 4,214 0 0 0
Reserve for Budget Adjustment 0 0 0 0 0
Transfers Out 0 0 0 0 0
Wages & Benefits 1,866 373 511 1,136 3,041
Supplies & Services 235,551 (29,292) 26,120 49,864 780,140
Debt Services 0 0 0 0 0
All Other 0 0 0 0 0
TOTAL 239,201 (24,705) 26,631 51,000 783,181
Expenditure Notes:
This fund is Federal Grant funded. Expenditures aligned to meet anticipated revenues and beginning amounts available for use.
Beginning in the 2019 Budget, a General Fund contribution to this program will fund Safe and Healthy Strategic Investments in housing and vulnerable population. This funding will continue through 2021 to pursue the goals of the strategic plan.
Revenues:
2015 Actual 2016 Actual 2017 Actual 2018 Budget 2019 Proposed
Taxes 0 0 0 0 0
Licenses & Permits 0 0 0 0 0
IG Revenue 0 0 0 0 0
Services 0 0 0 0 0
Fines & Forfeits 0 0 0 0 0
Operating Transfers In 0 0 0 0 0
General Fund Resources 0 0 0 0 722,181
All Other 17,941 76,762 20,272 21,000 21,000
TOTAL 17,941 76,762 20,272 21,000 743,181
Revenue Notes:
Beginning in the 2019 Budget, the General Fund contribution has been redirected from Street Operations to this program to fund Safe and Healthy Strategic Investments in housing and vulnerable population. This funding will continue through 2021 to pursue the goals of the strategic plan.
Planning and Economic Development 55
Program Summary: Rental Rehabilitation Fund
Division: Planning and Economic Development
Fund Type: Special Revenue Fund
Executive Summary:
The Rental Rehabilitation fund includes monies received from principal and interest payments from loans generated under the U.S. Department of Housing and Urban Development’s Rental Rehabilitation Fund.
Programs and Services:
These funds currently support the City’s Relocation Program and can be used for a variety of affordable housing purposes such as those that might be funded through the HOME and CDBG programs.
FTEs
2015 Actual 2016 Actual 2017 Actual 2018 Budget 2019 Proposed
Total FTEs 0.00 0.00 0.00 0.00 0.00
Expenditures:
2015 Actual 2016 Actual 2017 Actual 2018 Budget 2019 Proposed
Capital Outlay 0 0 0 0 0
Interfund Charges 1,292 943 1,700 0 0
Reserve for Budget Adjustment 0 0 0 0 0
Transfers Out 0 0 0 0 0
Wages & Benefits 0 0 770 795 123
Supplies & Services 2,228 10,926 1,783,436 115,605 125,277
Debt Services 0 0 0 0 0
All Other 0 400 0 0 0
TOTAL 3,520 12,269 1,785,906 116,400 125,400
Expenditure Notes:
Expenditures aligned to meet anticipated revenues and beginning amounts from loan payment revenues.
Revenues:
2015 Actual 2016 Actual 2017 Actual 2018 Budget 2019 Proposed
Taxes 0 0 0 0 0
Licenses & Permits 0 0 0 0 0
IG Revenue 0 0 0 0 0
Services 0 0 0 0 0
Fines & Forfeits 0 0 0 0 0
Operating Transfers In 0 0 0 0 0
General Fund Resources 0 0 0 0 0
All Other 40,857 125,725 53,403 95,400 50,400One Vision. One Plan. One Voice.
Planning and Economic Development56

Program Summary: Rental Rehabilitation Fund
Division: Planning and Economic Development
Fund Type: Special Revenue Fund
Executive Summary:
The Rental Rehabilitation fund includes monies received from principal and interest payments from loans generated under the U.S. Department of Housing and Urban Development’s Rental Rehabilitation Fund.
Programs and Services:
These funds currently support the City’s Relocation Program and can be used for a variety of affordable housing purposes such as those that might be funded through the HOME and CDBG programs.
FTEs
2015 Actual 2016 Actual 2017 Actual 2018 Budget 2019 Proposed
Total FTEs 0.00 0.00 0.00 0.00 0.00
Expenditures:
2015 Actual 2016 Actual 2017 Actual 2018 Budget 2019 Proposed
Capital Outlay 0 0 0 0 0
Interfund Charges 1,292 943 1,700 0 0
Reserve for Budget Adjustment 0 0 0 0 0
Transfers Out 0 0 0 0 0
Wages & Benefits 0 0 770 795 123
Supplies & Services 2,228 10,926 1,783,436 115,605 125,277
Debt Services 0 0 0 0 0
All Other 0 400 0 0 0
TOTAL 3,520 12,269 1,785,906 116,400 125,400
Expenditure Notes:
Expenditures aligned to meet anticipated revenues and beginning amounts from loan payment revenues.
Revenues:
2015 Actual 2016 Actual 2017 Actual 2018 Budget 2019 Proposed
Taxes 0 0 0 0 0
Licenses & Permits 0 0 0 0 0
IG Revenue 0 0 0 0 0
Services 0 0 0 0 0
Fines & Forfeits 0 0 0 0 0
Operating Transfers In 0 0 0 0 0
General Fund Resources 0 0 0 0 0
All Other 40,857 125,725 53,403 95,400 50,400
TOTAL 40,857 125,725 53,403 95,400 50,400
Revenue Notes:
Revenues are based on anticipated loan payments to be received.
Planning and Economic Development 57
Program Summary: UDAG Fund
Division: Planning and Economic Development
Fund Type: Special Revenue Fund
Executive Summary:
The UDAG fund includes monies received from principal and interest payments from loans generated under the closed out U.S. Department of Housing and Urban Development’s Urban Development Action Grant Program.
Programs and Services:
This funding can support affordable housing programs or any activities eligible under the Community Development Block Grant (CDBG), including economic and community development, or human services.
FTEs
2015 Actual 2016 Actual 2017 Actual 2018 Budget 2019 Proposed
Total FTEs 0.00 0.00 0.00 0.00 0.00
Expenditures:
2015 Actual 2016 Actual 2017 Actual 2018 Budget 2019 Proposed
Capital Outlay 0 0 0 0 0
Interfund Charges 0 0 0 0 0
Reserve for Budget Adjustment 0 0 0 0 0
Transfers Out 0 0 0 0 0
Wages & Benefits 0 0 0 0 0
Supplies & Services 0 0 0 882,000 884,906
Debt Services 0 0 0 0 0
All Other 0 0 0 0 0
TOTAL 0 0 0 882,000 884,906
Expenditure Notes:
Expenditures aligned to meet anticipated revenues and beginning amounts from loan payment revenues.
Revenues:
2015 Actual 2016 Actual 2017 Actual 2018 Budget 2019 Proposed
Taxes 0 0 0 0 0
Licenses & Permits 0 0 0 0 0
IG Revenue 0 0 0 0 0
Services 0 0 0 0 0
Fines & Forfeits 0 0 0 0 0
Operating Transfers In 0 0 0 0 0
General Fund Resources 0 0 0 0 0
All Other 3,521 808 1,568 1,000 1,000One Vision. One Plan. One Voice.
Planning and Economic Development58

Program Summary: UDAG Fund
Division: Planning and Economic Development
Fund Type: Special Revenue Fund
Executive Summary:
The UDAG fund includes monies received from principal and interest payments from loans generated under the closed out U.S. Department of Housing and Urban Development’s Urban Development Action Grant Program.
Programs and Services:
This funding can support affordable housing programs or any activities eligible under the Community Development Block Grant (CDBG), including economic and community development, or human services.
FTEs
2015 Actual 2016 Actual 2017 Actual 2018 Budget 2019 Proposed
Total FTEs 0.00 0.00 0.00 0.00 0.00
Expenditures:
2015 Actual 2016 Actual 2017 Actual 2018 Budget 2019 Proposed
Capital Outlay 0 0 0 0 0
Interfund Charges 0 0 0 0 0
Reserve for Budget Adjustment 0 0 0 0 0
Transfers Out 0 0 0 0 0
Wages & Benefits 0 0 0 0 0
Supplies & Services 0 0 0 882,000 884,906
Debt Services 0 0 0 0 0
All Other 0 0 0 0 0
TOTAL 0 0 0 882,000 884,906
Expenditure Notes:
Expenditures aligned to meet anticipated revenues and beginning amounts from loan payment revenues.
Revenues:
2015 Actual 2016 Actual 2017 Actual 2018 Budget 2019 Proposed
Taxes 0 0 0 0 0
Licenses & Permits 0 0 0 0 0
IG Revenue 0 0 0 0 0
Services 0 0 0 0 0
Fines & Forfeits 0 0 0 0 0
Operating Transfers In 0 0 0 0 0
General Fund Resources 0 0 0 0 0
All Other 3,521 808 1,568 1,000 1,000
TOTAL 3,521 808 1,568 1,000 1,000
Revenue Notes:
Revenues are based on anticipated loan payments to be received and interest gained on beginning balance in the fund.
Planning and Economic Development 59

One Vision. One Plan. One Voice.
Planning and Economic Development60
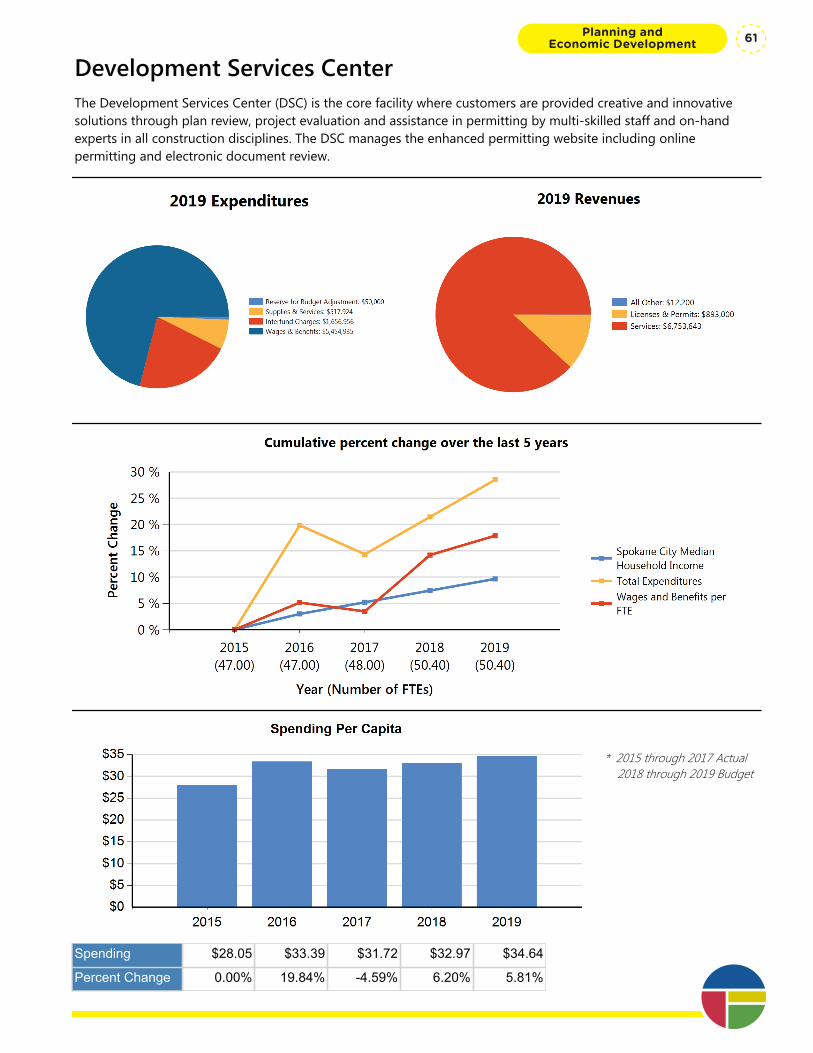
Development Services CenterThe Development Services Center (DSC) is the core facility where customers are provided creative and innovative solutions through plan review, project evaluation and assistance in permitting by multi-skilled staff and on-hand experts in all construction disciplines. The DSC manages the enhanced permitting website including online permitting and electronic document review.
* 2015 through 2017 Actual 2018 through 2019 Budget
Spending $28.05 $33.39 $31.72 $32.97 $34.64
Percent Change 0.00% 19.84% -4.59% 6.20% 5.81%
Planning and Economic Development 61
Department Summary: Development Services Center
Division: Planning and Economic Development
Fund Type: Enterprise Fund
Executive Summary:
The Development Services Center (DSC) is the core facility where customers are provided creative and innovative solutions through plan review, project evaluation and assistance in permitting by multi-skilled staff and on-hand experts in all construction disciplines. The DSC manages the enhanced permitting website including online permitting and electronic document review.
Programs and Services:
Traditional plan review and permits are issued from the DSC. Project enhancement is offered through pre-development conferences and direct consultation with planning, design, engineering, and construction professional staff.
FTEs
2015 Actual 2016 Actual 2017 Actual 2018 Budget 2019 Proposed
Total FTEs 47.00 47.00 48.00 50.40 50.40
Expenditures:
2015 Actual 2016 Actual 2017 Actual 2018 Budget 2019 Proposed
Capital Outlay 6,972 2,284 62,925 0 0
Interfund Charges 1,169,979 1,233,851 1,297,832 1,576,499 1,656,956
Reserve for Budget Adjustment 0 0 0 50,000 50,000
Transfers Out 6,972 2,284 65,404 0 0
Wages & Benefits 4,286,703 4,507,618 4,525,960 5,261,873 5,454,935
Supplies & Services 505,967 1,416,893 881,510 369,293 517,924
Debt Services 0 0 0 0 0
All Other 0 0 0 0 0
TOTAL 5,976,593 7,162,930 6,833,631 7,257,665 7,679,815
Expenditure Notes:
Revenues:
2015 Actual 2016 Actual 2017 Actual 2018 Budget 2019 Proposed
Taxes 0 0 0 0 0
Licenses & Permits 822,681 1,015,345 983,176 916,000 893,000
IG Revenue 0 0 0 0 0
Services 5,348,885 6,536,308 6,469,344 6,311,234 6,753,643
Fines & Forfeits 0 0 0 0 0
Operating Transfers In 0 0 0 0 0
General Fund Resources 0 0 0 0 0One Vision. One Plan. One Voice.
Planning and Economic Development62
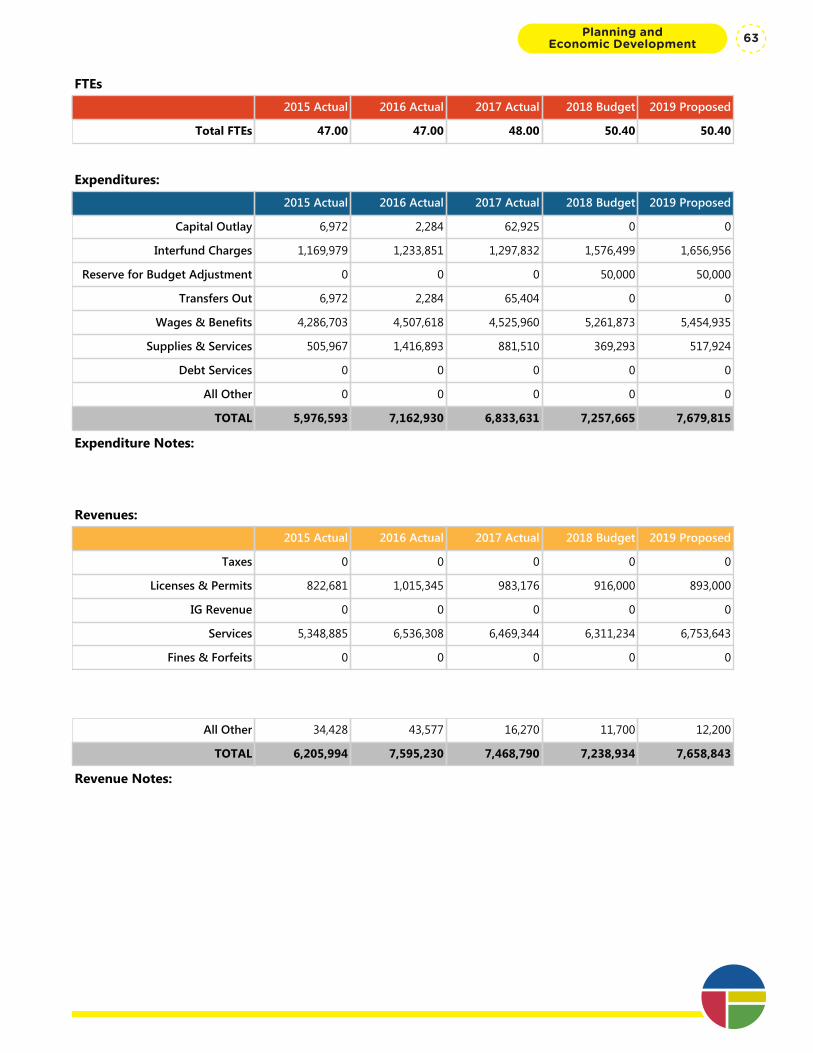
Department Summary: Development Services Center
Division: Planning and Economic Development
Fund Type: Enterprise Fund
Executive Summary:
The Development Services Center (DSC) is the core facility where customers are provided creative and innovative solutions through plan review, project evaluation and assistance in permitting by multi-skilled staff and on-hand experts in all construction disciplines. The DSC manages the enhanced permitting website including online permitting and electronic document review.
Programs and Services:
Traditional plan review and permits are issued from the DSC. Project enhancement is offered through pre-development conferences and direct consultation with planning, design, engineering, and construction professional staff.
FTEs
2015 Actual 2016 Actual 2017 Actual 2018 Budget 2019 Proposed
Total FTEs 47.00 47.00 48.00 50.40 50.40
Expenditures:
2015 Actual 2016 Actual 2017 Actual 2018 Budget 2019 Proposed
Capital Outlay 6,972 2,284 62,925 0 0
Interfund Charges 1,169,979 1,233,851 1,297,832 1,576,499 1,656,956
Reserve for Budget Adjustment 0 0 0 50,000 50,000
Transfers Out 6,972 2,284 65,404 0 0
Wages & Benefits 4,286,703 4,507,618 4,525,960 5,261,873 5,454,935
Supplies & Services 505,967 1,416,893 881,510 369,293 517,924
Debt Services 0 0 0 0 0
All Other 0 0 0 0 0
TOTAL 5,976,593 7,162,930 6,833,631 7,257,665 7,679,815
Expenditure Notes:
Revenues:
2015 Actual 2016 Actual 2017 Actual 2018 Budget 2019 Proposed
Taxes 0 0 0 0 0
Licenses & Permits 822,681 1,015,345 983,176 916,000 893,000
IG Revenue 0 0 0 0 0
Services 5,348,885 6,536,308 6,469,344 6,311,234 6,753,643
Fines & Forfeits 0 0 0 0 0
Operating Transfers In 0 0 0 0 0
General Fund Resources 0 0 0 0 0
All Other 34,428 43,577 16,270 11,700 12,200
TOTAL 6,205,994 7,595,230 7,468,790 7,238,934 7,658,843
Revenue Notes:
Planning and Economic Development 63
Program Summary: Building Permiting
Division: Planning and Economic Development
Fund Type: Enterprise Fund
Executive Summary:
The Permitting staff are the front-line of the Development Services Center. With a primary focus on customer service, Permitting staff issue permits, certifications, and coordinate and respond to customer inquiries.
Programs and Services:
The Permitting function is responsible for issuing permits for right of way obstruction work, sewer, water taps, water meters, block parties and blasting permits. Staff also issue all commercial and residential building permits including those for the trades: plumbing, electrical, and mechanical systems. Trade licenses and operating permits for boilers, elevators and other conveyances are also issued by this group. The Permitting Team issues official addresses for parcel segregations and new plats, as well as issues address changes with notification to all affected agencies. Staff are responsible for receiving and handling all money transactions for the DSC: credit cards, checks, and cash in the collection of permit fees, utility connection fees, transportation mitigation fees, plan review fees and other miscellaneous fees. The Permitting staff provides customer service to contractors, citizens, businesses, and other agencies regarding issuance of permits, request for sewer and water information, property line and parcel information, right of way use information, and other miscellaneous information.
FTEs
2015 Actual 2016 Actual 2017 Actual 2018 Budget 2019 Proposed
Total FTEs 8.00 9.00 9.00 7.00 6.00
Expenditures:
2015 Actual 2016 Actual 2017 Actual 2018 Budget 2019 Proposed
Capital Outlay 0 0 0 0 0
Interfund Charges 2,470 14,026 7,602 0 0
Reserve for Budget Adjustment 0 0 0 0 0
Transfers Out 0 0 0 0 0
Wages & Benefits 544,475 590,316 495,200 520,410 498,304
Supplies & Services 178 193 85 0 0
Debt Services 0 0 0 0 0
All Other 0 0 0 0 0
TOTAL 547,123 604,535 502,887 520,410 498,304
Expenditure Notes:
Revenues:
2015 Actual 2016 Actual 2017 Actual 2018 Budget 2019 Proposed
Taxes 0 0 0 0 0
Licenses & Permits 545,861 660,959 626,330 663,000 648,000
IG Revenue 0 0 0 0 0
Services 102,295 119,860 121,618 12,500 120,500One Vision. One Plan. One Voice.
Planning and Economic Development64
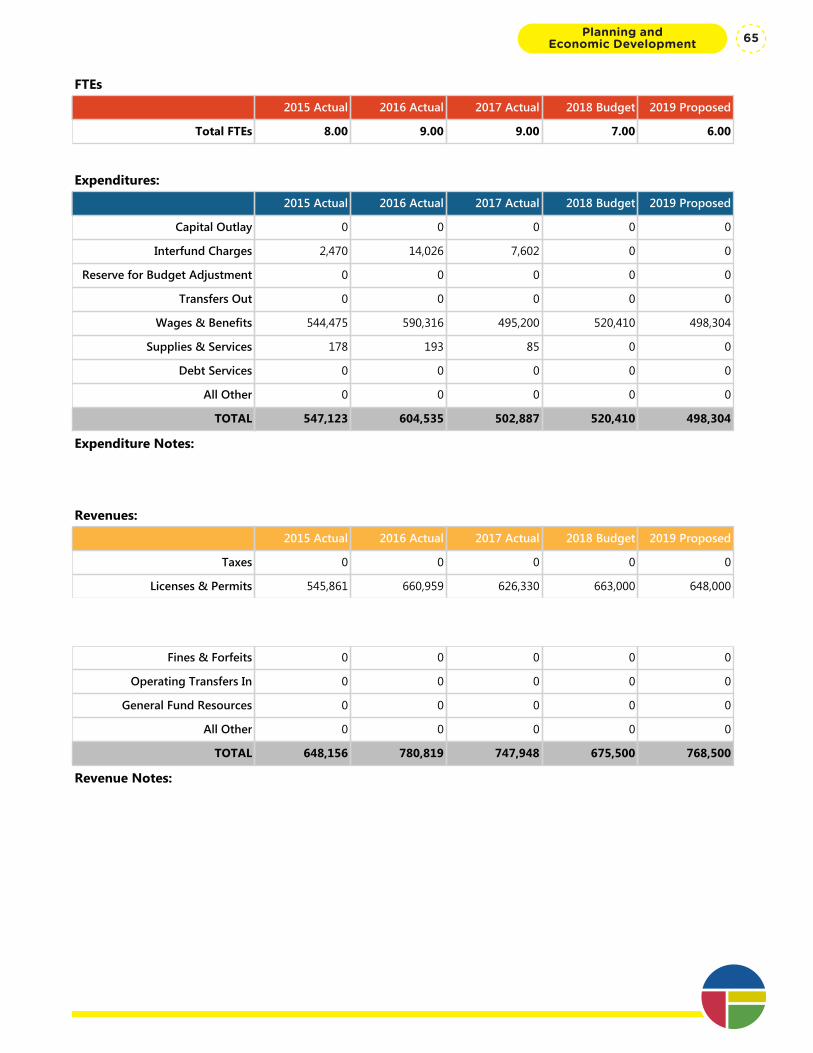
Program Summary: Building Permiting
Division: Planning and Economic Development
Fund Type: Enterprise Fund
Executive Summary:
The Permitting staff are the front-line of the Development Services Center. With a primary focus on customer service, Permitting staff issue permits, certifications, and coordinate and respond to customer inquiries.
Programs and Services:
The Permitting function is responsible for issuing permits for right of way obstruction work, sewer, water taps, water meters, block parties and blasting permits. Staff also issue all commercial and residential building permits including those for the trades: plumbing, electrical, and mechanical systems. Trade licenses and operating permits for boilers, elevators and other conveyances are also issued by this group. The Permitting Team issues official addresses for parcel segregations and new plats, as well as issues address changes with notification to all affected agencies. Staff are responsible for receiving and handling all money transactions for the DSC: credit cards, checks, and cash in the collection of permit fees, utility connection fees, transportation mitigation fees, plan review fees and other miscellaneous fees. The Permitting staff provides customer service to contractors, citizens, businesses, and other agencies regarding issuance of permits, request for sewer and water information, property line and parcel information, right of way use information, and other miscellaneous information.
FTEs
2015 Actual 2016 Actual 2017 Actual 2018 Budget 2019 Proposed
Total FTEs 8.00 9.00 9.00 7.00 6.00
Expenditures:
2015 Actual 2016 Actual 2017 Actual 2018 Budget 2019 Proposed
Capital Outlay 0 0 0 0 0
Interfund Charges 2,470 14,026 7,602 0 0
Reserve for Budget Adjustment 0 0 0 0 0
Transfers Out 0 0 0 0 0
Wages & Benefits 544,475 590,316 495,200 520,410 498,304
Supplies & Services 178 193 85 0 0
Debt Services 0 0 0 0 0
All Other 0 0 0 0 0
TOTAL 547,123 604,535 502,887 520,410 498,304
Expenditure Notes:
Revenues:
2015 Actual 2016 Actual 2017 Actual 2018 Budget 2019 Proposed
Taxes 0 0 0 0 0
Licenses & Permits 545,861 660,959 626,330 663,000 648,000
IG Revenue 0 0 0 0 0
Services 102,295 119,860 121,618 12,500 120,500
Fines & Forfeits 0 0 0 0 0
Operating Transfers In 0 0 0 0 0
General Fund Resources 0 0 0 0 0
All Other 0 0 0 0 0
TOTAL 648,156 780,819 747,948 675,500 768,500
Revenue Notes:
Planning and Economic Development 65
Program Summary: Building Plan Checking
Division: Planning and Economic Development
Fund Type: Enterprise Fund
Executive Summary:
The Plan Checking program is responsible for plan review on all permits issued by the DSC. This includes building, engineering, and land use applications. Plan Review staff are responsible for coordination with multiple departments and agencies to ensure efficient permit processing.
Programs and Services:
The Plan Checking staffs’ primary focus is on customer service and private development requests. They provide high quality and cost effective project review for all building, engineering, and land use applications for compliance with applicable standards and regulations.
The Plan Review team is an integrated organization of planners, architects, building experts, engineers, development technicians, and support staff organized to deliver professional, consistent, predictable, reliable, and value-added information to development customers. Large, complex projects are assigned a permit manager as a single point-of-contact. Smaller "mom-and-pop" projects are escorted through the permitting system by a single person trained to handle a wide variety of permitting needs. The Plan Review team is also responsible for coordinating plan review activities with multiple city departments and outside agencies such as County Health, the Department of Ecology, and WSDOT. This approach allows for developers to work with one department who facilitates the process and coordinates with the other affected departments.
The Plan Review team provides support for proposed projects through the Pre-Development Conferences as well as direct consultation with developers and their design professionals. The staff also responds to inquiries and complaints from citizens. The team is responsible for coordinating other right of way activities such as street vacations, sidewalk cafes, revocable license and permits, and franchises.
FTEs
2015 Actual 2016 Actual 2017 Actual 2018 Budget 2019 Proposed
Total FTEs 15.00 15.00 15.00 18.40 17.40
Expenditures:
2015 Actual 2016 Actual 2017 Actual 2018 Budget 2019 Proposed
Capital Outlay 0 0 0 0 0
Interfund Charges 3,146 3,118 2,366 0 0
Reserve for Budget Adjustment 0 0 0 0 0
Transfers Out 0 0 0 0 0
Wages & Benefits 1,529,241 1,597,244 1,554,937 2,068,420 2,074,668
Supplies & Services 228 69 5,185 0 0
Debt Services 0 0 0 0 0
All Other 0 0 0 0 0
One Vision. One Plan. One Voice.
Planning and Economic Development66
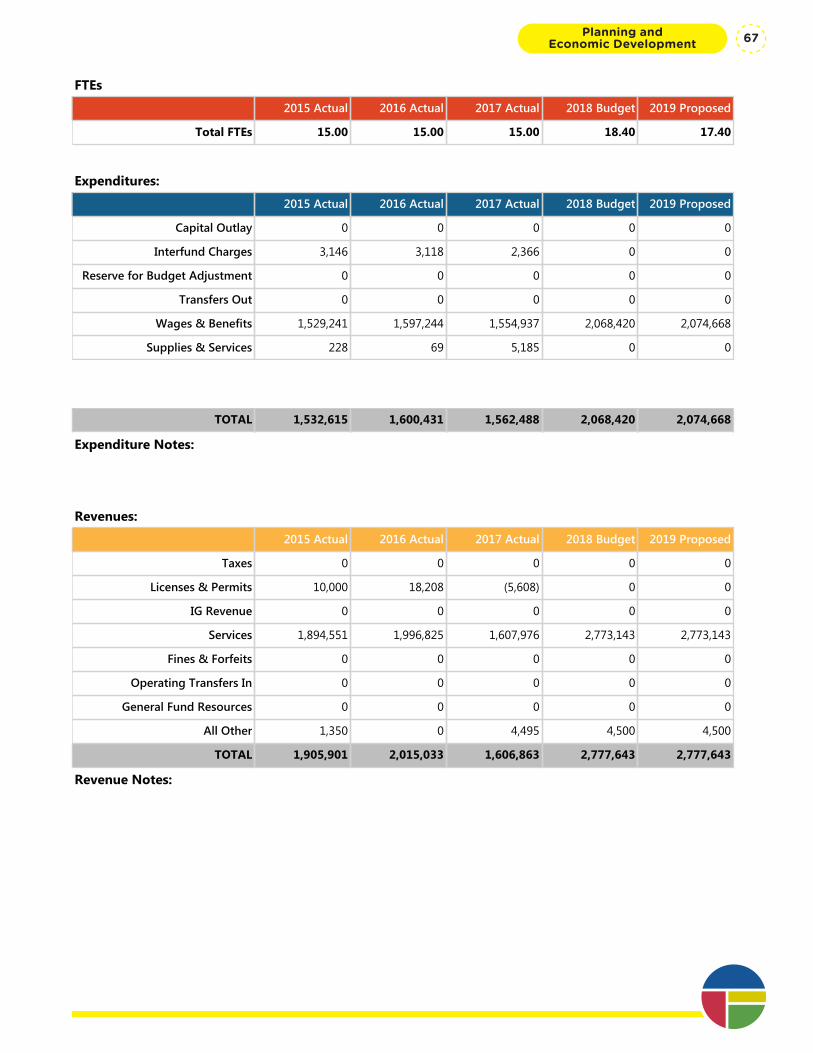
Program Summary: Building Plan Checking
Division: Planning and Economic Development
Fund Type: Enterprise Fund
Executive Summary:
The Plan Checking program is responsible for plan review on all permits issued by the DSC. This includes building, engineering, and land use applications. Plan Review staff are responsible for coordination with multiple departments and agencies to ensure efficient permit processing.
Programs and Services:
The Plan Checking staffs’ primary focus is on customer service and private development requests. They provide high quality and cost effective project review for all building, engineering, and land use applications for compliance with applicable standards and regulations.
The Plan Review team is an integrated organization of planners, architects, building experts, engineers, development technicians, and support staff organized to deliver professional, consistent, predictable, reliable, and value-added information to development customers. Large, complex projects are assigned a permit manager as a single point-of-contact. Smaller "mom-and-pop" projects are escorted through the permitting system by a single person trained to handle a wide variety of permitting needs. The Plan Review team is also responsible for coordinating plan review activities with multiple city departments and outside agencies such as County Health, the Department of Ecology, and WSDOT. This approach allows for developers to work with one department who facilitates the process and coordinates with the other affected departments.
The Plan Review team provides support for proposed projects through the Pre-Development Conferences as well as direct consultation with developers and their design professionals. The staff also responds to inquiries and complaints from citizens. The team is responsible for coordinating other right of way activities such as street vacations, sidewalk cafes, revocable license and permits, and franchises.
FTEs
2015 Actual 2016 Actual 2017 Actual 2018 Budget 2019 Proposed
Total FTEs 15.00 15.00 15.00 18.40 17.40
Expenditures:
2015 Actual 2016 Actual 2017 Actual 2018 Budget 2019 Proposed
Capital Outlay 0 0 0 0 0
Interfund Charges 3,146 3,118 2,366 0 0
Reserve for Budget Adjustment 0 0 0 0 0
Transfers Out 0 0 0 0 0
Wages & Benefits 1,529,241 1,597,244 1,554,937 2,068,420 2,074,668
Supplies & Services 228 69 5,185 0 0
Debt Services 0 0 0 0 0
All Other 0 0 0 0 0
TOTAL 1,532,615 1,600,431 1,562,488 2,068,420 2,074,668
Expenditure Notes:
Revenues:
2015 Actual 2016 Actual 2017 Actual 2018 Budget 2019 Proposed
Taxes 0 0 0 0 0
Licenses & Permits 10,000 18,208 (5,608) 0 0
IG Revenue 0 0 0 0 0
Services 1,894,551 1,996,825 1,607,976 2,773,143 2,773,143
Fines & Forfeits 0 0 0 0 0
Operating Transfers In 0 0 0 0 0
General Fund Resources 0 0 0 0 0
All Other 1,350 0 4,495 4,500 4,500
TOTAL 1,905,901 2,015,033 1,606,863 2,777,643 2,777,643
Revenue Notes:
Planning and Economic Development 67
Program Summary: Building Regulation Enforcement
Division: Planning and Economic Development
Fund Type: Enterprise Fund
Executive Summary:
The Building Regulation and Enforcement program is responsible for building-related inspections to insure compliance with building, plumbing, electrical, and mechanical codes.
Programs and Services:
This program includes all building, plumbing, electrical, and mechanical inspectors and the inspector supervisor. The 16 inspectors complete over 35,000 inspections per year. Staff also work with Code Enforcement and the Development Services Center staff to improve compliance and insure safe buildings and public spaces.
FTEs
2015 Actual 2016 Actual 2017 Actual 2018 Budget 2019 Proposed
Total FTEs 13.00 13.00 14.00 14.00 14.00
Expenditures:
2015 Actual 2016 Actual 2017 Actual 2018 Budget 2019 Proposed
Capital Outlay 0 0 0 0 0
Interfund Charges 74,042 96,311 80,178 32,175 36,075
Reserve for Budget Adjustment 0 0 0 0 0
Transfers Out 0 0 0 0 0
Wages & Benefits 1,259,004 1,368,117 1,477,119 1,513,212 1,519,107
Supplies & Services 235,791 1,145,380 650,631 16,069 17,292
Debt Services 0 0 0 0 0
All Other 0 0 0 0 0
TOTAL 1,568,837 2,609,808 2,207,928 1,561,456 1,572,474
Expenditure Notes:
Revenues:
2015 Actual 2016 Actual 2017 Actual 2018 Budget 2019 Proposed
Taxes 0 0 0 0 0
Licenses & Permits 16,238 15,970 17,565 15,000 15,000
IG Revenue 0 0 0 0 0
Services 2,654,483 3,420,804 3,823,832 2,810,000 3,410,000
Fines & Forfeits 0 0 0 0 0
Operating Transfers In 0 0 0 0 0
General Fund Resources 0 0 0 0 0One Vision. One Plan. One Voice.
Planning and Economic Development68

Program Summary: Building Regulation Enforcement
Division: Planning and Economic Development
Fund Type: Enterprise Fund
Executive Summary:
The Building Regulation and Enforcement program is responsible for building-related inspections to insure compliance with building, plumbing, electrical, and mechanical codes.
Programs and Services:
This program includes all building, plumbing, electrical, and mechanical inspectors and the inspector supervisor. The 16 inspectors complete over 35,000 inspections per year. Staff also work with Code Enforcement and the Development Services Center staff to improve compliance and insure safe buildings and public spaces.
FTEs
2015 Actual 2016 Actual 2017 Actual 2018 Budget 2019 Proposed
Total FTEs 13.00 13.00 14.00 14.00 14.00
Expenditures:
2015 Actual 2016 Actual 2017 Actual 2018 Budget 2019 Proposed
Capital Outlay 0 0 0 0 0
Interfund Charges 74,042 96,311 80,178 32,175 36,075
Reserve for Budget Adjustment 0 0 0 0 0
Transfers Out 0 0 0 0 0
Wages & Benefits 1,259,004 1,368,117 1,477,119 1,513,212 1,519,107
Supplies & Services 235,791 1,145,380 650,631 16,069 17,292
Debt Services 0 0 0 0 0
All Other 0 0 0 0 0
TOTAL 1,568,837 2,609,808 2,207,928 1,561,456 1,572,474
Expenditure Notes:
Revenues:
2015 Actual 2016 Actual 2017 Actual 2018 Budget 2019 Proposed
Taxes 0 0 0 0 0
Licenses & Permits 16,238 15,970 17,565 15,000 15,000
IG Revenue 0 0 0 0 0
Services 2,654,483 3,420,804 3,823,832 2,810,000 3,410,000
Fines & Forfeits 0 0 0 0 0
Operating Transfers In 0 0 0 0 0
General Fund Resources 0 0 0 0 0
All Other 1 0 0 0 0
TOTAL 2,670,722 3,436,774 3,841,397 2,825,000 3,425,000
Revenue Notes:
Planning and Economic Development 69

Program Summary: DSC Administration
Division: Planning and Economic Development
Fund Type: Enterprise Fund
Executive Summary:
The Administrative function provides overall management and leadership for the Development Services Center – the “One-Stop shop” for permitting in the City.
Programs and Services:
The DSC administration includes the Department Head, Program Manager, Office Manager, and the clerical support staff. This section is responsible for setting and measuring performance goals, budget preparation, personnel administration, long-term planning, and continuous improvement of the DSC operations.
FTEs
2015 Actual 2016 Actual 2017 Actual 2018 Budget 2019 Proposed
Total FTEs 5.00 4.00 4.00 5.00 7.00
Expenditures:
2015 Actual 2016 Actual 2017 Actual 2018 Budget 2019 Proposed
Capital Outlay 6,972 2,284 62,925 0 0
Interfund Charges 1,090,321 1,120,396 1,207,686 1,544,324 1,620,881
Reserve for Budget Adjustment 0 0 0 50,000 50,000
Transfers Out 6,972 2,284 65,404 0 0
Wages & Benefits 421,623 406,570 421,553 543,426 694,451
Supplies & Services 269,627 271,108 224,636 353,224 500,632
Debt Services 0 0 0 0 0
All Other 0 0 0 0 0
TOTAL 1,795,515 1,802,642 1,982,204 2,490,974 2,865,964
Expenditure Notes:
Revenues:
2015 Actual 2016 Actual 2017 Actual 2018 Budget 2019 Proposed
Taxes 0 0 0 0 0
Licenses & Permits 249,618 314,213 342,969 0 0
IG Revenue 0 0 0 0 0
Services 538,853 814,320 755,218 0 0
Fines & Forfeits 0 0 0 0 0
Operating Transfers In 0 0 0 0 0
General Fund Resources 0 0 0 0 0One Vision. One Plan. One Voice.
Planning and Economic Development70
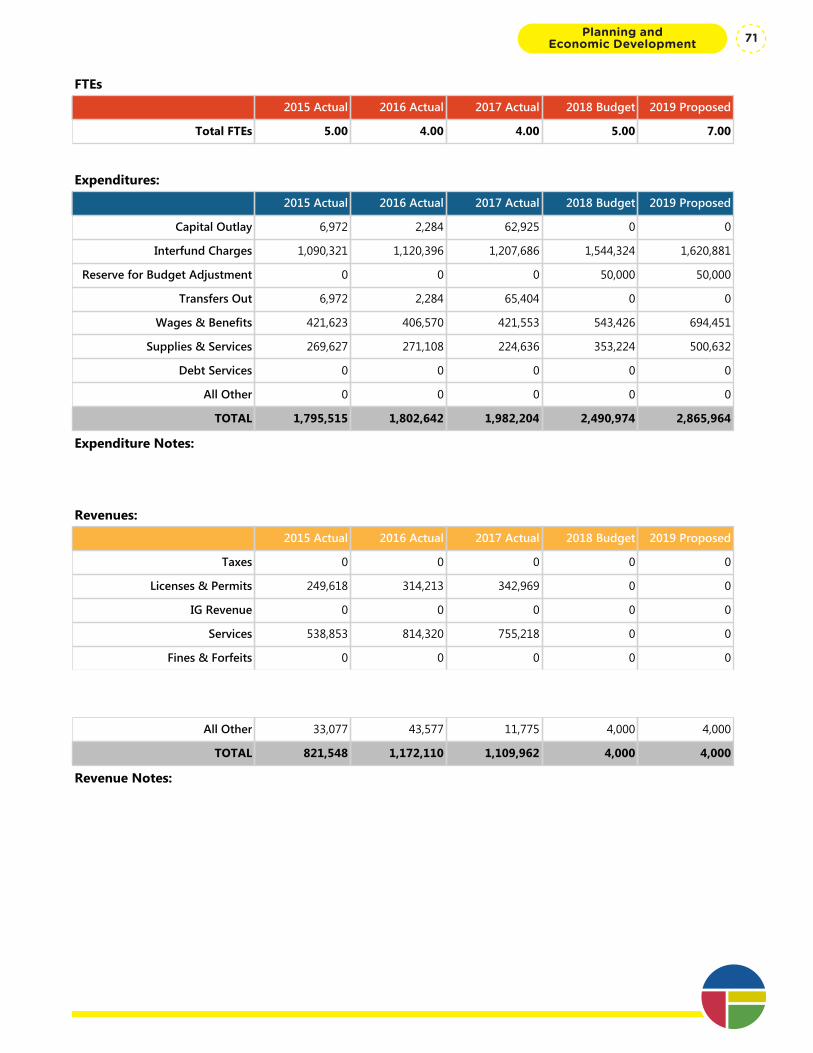
Program Summary: DSC Administration
Division: Planning and Economic Development
Fund Type: Enterprise Fund
Executive Summary:
The Administrative function provides overall management and leadership for the Development Services Center – the “One-Stop shop” for permitting in the City.
Programs and Services:
The DSC administration includes the Department Head, Program Manager, Office Manager, and the clerical support staff. This section is responsible for setting and measuring performance goals, budget preparation, personnel administration, long-term planning, and continuous improvement of the DSC operations.
FTEs
2015 Actual 2016 Actual 2017 Actual 2018 Budget 2019 Proposed
Total FTEs 5.00 4.00 4.00 5.00 7.00
Expenditures:
2015 Actual 2016 Actual 2017 Actual 2018 Budget 2019 Proposed
Capital Outlay 6,972 2,284 62,925 0 0
Interfund Charges 1,090,321 1,120,396 1,207,686 1,544,324 1,620,881
Reserve for Budget Adjustment 0 0 0 50,000 50,000
Transfers Out 6,972 2,284 65,404 0 0
Wages & Benefits 421,623 406,570 421,553 543,426 694,451
Supplies & Services 269,627 271,108 224,636 353,224 500,632
Debt Services 0 0 0 0 0
All Other 0 0 0 0 0
TOTAL 1,795,515 1,802,642 1,982,204 2,490,974 2,865,964
Expenditure Notes:
Revenues:
2015 Actual 2016 Actual 2017 Actual 2018 Budget 2019 Proposed
Taxes 0 0 0 0 0
Licenses & Permits 249,618 314,213 342,969 0 0
IG Revenue 0 0 0 0 0
Services 538,853 814,320 755,218 0 0
Fines & Forfeits 0 0 0 0 0
Operating Transfers In 0 0 0 0 0
General Fund Resources 0 0 0 0 0
All Other 33,077 43,577 11,775 4,000 4,000
TOTAL 821,548 1,172,110 1,109,962 4,000 4,000
Revenue Notes:
Planning and Economic Development 71
Program Summary: DSC Boilers & Elevators
Division: Planning and Economic Development
Fund Type: Enterprise Fund
Executive Summary:
The DSC Boilers and Elevators program is responsible for plan review for new installations and modifications to boilers and elevators. They are also responsible for annual and biannual inspections to insure compliance with the boiler and elevator codes.
Programs and Services:
This program includes one boiler inspector and two elevator inspectors. These inspectors complete annual and biannual inspections on all boilers and conveyances as required by state law. They also coordinate inspections performed by private, third-party inspectors. The elevator inspectors investigate accidents and incidents involving conveyances – elevators and escalators. The staff are responsible for administering the annual operating permits for elevators and boiler to insure safe buildings and public spaces.
FTEs
2015 Actual 2016 Actual 2017 Actual 2018 Budget 2019 Proposed
Total FTEs 3.00 3.00 3.00 3.00 3.00
Expenditures:
2015 Actual 2016 Actual 2017 Actual 2018 Budget 2019 Proposed
Capital Outlay 0 0 0 0 0
Interfund Charges 0 0 0 0 0
Reserve for Budget Adjustment 0 0 0 0 0
Transfers Out 0 0 0 0 0
Wages & Benefits 265,705 298,854 334,961 345,615 359,109
Supplies & Services 64 71 970 0 0
Debt Services 0 0 0 0 0
All Other 0 0 0 0 0
TOTAL 265,769 298,925 335,931 345,615 359,109
Expenditure Notes:
Revenues:
2015 Actual 2016 Actual 2017 Actual 2018 Budget 2019 Proposed
Taxes 0 0 0 0 0
Licenses & Permits 964 250 900 0 0
IG Revenue 0 0 0 0 0
Services 152,261 183,542 160,700 460,000 450,000
Fines & Forfeits 0 0 0 0 0
Operating Transfers In 0 0 0 0 0One Vision. One Plan. One Voice.
Planning and Economic Development72

Program Summary: DSC Boilers & Elevators
Division: Planning and Economic Development
Fund Type: Enterprise Fund
Executive Summary:
The DSC Boilers and Elevators program is responsible for plan review for new installations and modifications to boilers and elevators. They are also responsible for annual and biannual inspections to insure compliance with the boiler and elevator codes.
Programs and Services:
This program includes one boiler inspector and two elevator inspectors. These inspectors complete annual and biannual inspections on all boilers and conveyances as required by state law. They also coordinate inspections performed by private, third-party inspectors. The elevator inspectors investigate accidents and incidents involving conveyances – elevators and escalators. The staff are responsible for administering the annual operating permits for elevators and boiler to insure safe buildings and public spaces.
FTEs
2015 Actual 2016 Actual 2017 Actual 2018 Budget 2019 Proposed
Total FTEs 3.00 3.00 3.00 3.00 3.00
Expenditures:
2015 Actual 2016 Actual 2017 Actual 2018 Budget 2019 Proposed
Capital Outlay 0 0 0 0 0
Interfund Charges 0 0 0 0 0
Reserve for Budget Adjustment 0 0 0 0 0
Transfers Out 0 0 0 0 0
Wages & Benefits 265,705 298,854 334,961 345,615 359,109
Supplies & Services 64 71 970 0 0
Debt Services 0 0 0 0 0
All Other 0 0 0 0 0
TOTAL 265,769 298,925 335,931 345,615 359,109
Expenditure Notes:
Revenues:
2015 Actual 2016 Actual 2017 Actual 2018 Budget 2019 Proposed
Taxes 0 0 0 0 0
Licenses & Permits 964 250 900 0 0
IG Revenue 0 0 0 0 0
Services 152,261 183,542 160,700 460,000 450,000
Fines & Forfeits 0 0 0 0 0
Operating Transfers In 0 0 0 0 0
General Fund Resources 0 0 0 0 0
All Other 0 0 0 3,200 3,700
TOTAL 153,225 183,792 161,600 463,200 453,700
Revenue Notes:
Planning and Economic Development 73
Program Summary: DSC Public Works Inspectors
Division: Planning and Economic Development
Fund Type: Enterprise Fund
Executive Summary:
The DSC Public Works Inspectors are responsible for enforcing construction standards used by contractors working in the public right of way.
Programs and Services:
The two public works inspectors inspect the quality of contractor’s work and insure that there is no damage to the area beyond the work zone. They maintain the safety of the pedestrians, bicyclists, and the motoring public by insuring traffic control is in place for contractors working within the public right of way. The inspectors keep detailed records of inspection permits. They also address citizen complaints with regard to sidewalk repair issues, unpermitted work, insufficient traffic control, and obstructions in the public right of way.
FTEs
2015 Actual 2016 Actual 2017 Actual 2018 Budget 2019 Proposed
Total FTEs 3.00 3.00 3.00 3.00 3.00
Expenditures:
2015 Actual 2016 Actual 2017 Actual 2018 Budget 2019 Proposed
Capital Outlay 0 0 0 0 0
Interfund Charges 0 0 0 0 0
Reserve for Budget Adjustment 0 0 0 0 0
Transfers Out 0 0 0 0 0
Wages & Benefits 266,655 246,517 242,190 270,790 309,296
Supplies & Services 79 72 3 0 0
Debt Services 0 0 0 0 0
All Other 0 0 0 0 0
TOTAL 266,734 246,589 242,193 270,790 309,296
Expenditure Notes:
Revenues:
2015 Actual 2016 Actual 2017 Actual 2018 Budget 2019 Proposed
Taxes 0 0 0 0 0
Licenses & Permits 0 5,745 1,020 238,000 230,000
IG Revenue 0 0 0 0 0
Services 6,442 957 0 255,591 0
Fines & Forfeits 0 0 0 0 0
Operating Transfers In 0 0 0 0 0One Vision. One Plan. One Voice.
Planning and Economic Development74

Program Summary: DSC Public Works Inspectors
Division: Planning and Economic Development
Fund Type: Enterprise Fund
Executive Summary:
The DSC Public Works Inspectors are responsible for enforcing construction standards used by contractors working in the public right of way.
Programs and Services:
The two public works inspectors inspect the quality of contractor’s work and insure that there is no damage to the area beyond the work zone. They maintain the safety of the pedestrians, bicyclists, and the motoring public by insuring traffic control is in place for contractors working within the public right of way. The inspectors keep detailed records of inspection permits. They also address citizen complaints with regard to sidewalk repair issues, unpermitted work, insufficient traffic control, and obstructions in the public right of way.
FTEs
2015 Actual 2016 Actual 2017 Actual 2018 Budget 2019 Proposed
Total FTEs 3.00 3.00 3.00 3.00 3.00
Expenditures:
2015 Actual 2016 Actual 2017 Actual 2018 Budget 2019 Proposed
Capital Outlay 0 0 0 0 0
Interfund Charges 0 0 0 0 0
Reserve for Budget Adjustment 0 0 0 0 0
Transfers Out 0 0 0 0 0
Wages & Benefits 266,655 246,517 242,190 270,790 309,296
Supplies & Services 79 72 3 0 0
Debt Services 0 0 0 0 0
All Other 0 0 0 0 0
TOTAL 266,734 246,589 242,193 270,790 309,296
Expenditure Notes:
Revenues:
2015 Actual 2016 Actual 2017 Actual 2018 Budget 2019 Proposed
Taxes 0 0 0 0 0
Licenses & Permits 0 5,745 1,020 238,000 230,000
IG Revenue 0 0 0 0 0
Services 6,442 957 0 255,591 0
Fines & Forfeits 0 0 0 0 0
Operating Transfers In 0 0 0 0 0
General Fund Resources 0 0 0 0 0
All Other 0 0 0 0 0
TOTAL 6,442 6,702 1,020 493,591 230,000
Revenue Notes:
Planning and Economic Development 75

One Vision. One Plan. One Voice.
Planning and Economic Development76
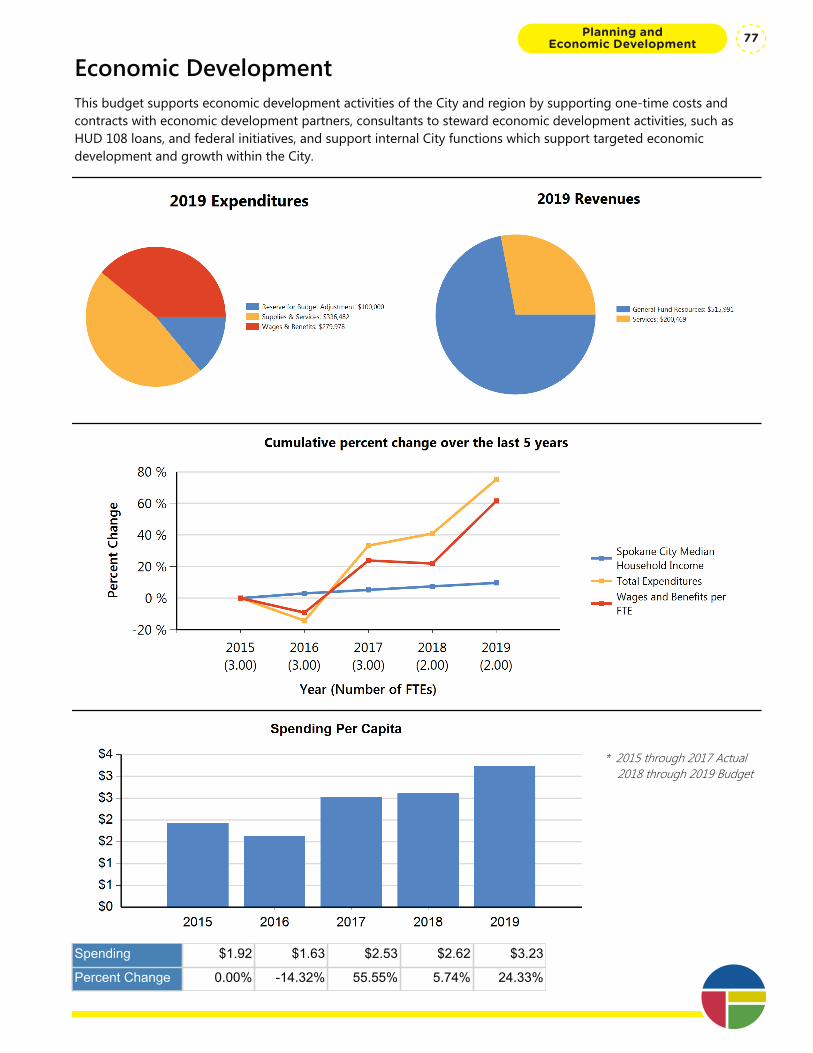
Economic DevelopmentThis budget supports economic development activities of the City and region by supporting one-time costs and contracts with economic development partners, consultants to steward economic development activities, such as HUD 108 loans, and federal initiatives, and support internal City functions which support targeted economic development and growth within the City.
* 2015 through 2017 Actual 2018 through 2019 Budget
Spending $1.92 $1.63 $2.53 $2.62 $3.23
Percent Change 0.00% -14.32% 55.55% 5.74% 24.33%
Planning and Economic Development 77
Department Summary: Economic Development
Division: Planning and Economic Development
Fund Type: General Fund
Executive Summary:
This budget supports economic development activities of the City and region by supporting one-time costs and contracts with economic development partners, consultants to steward economic development activities, such as HUD 108 loans, and federal initiatives, and support internal City functions which support targeted economic development and growth within the City.
Programs and Services:
The Economic Development department budget supports contracts with third-party economic development organizations responsible for recruitment and retention of business and federal legislative advocacy for the City.
FTEs
2015 Actual 2016 Actual 2017 Actual 2018 Budget 2019 Proposed
Total FTEs 3.00 3.00 3.00 2.00 2.00
Expenditures:
2015 Actual 2016 Actual 2017 Actual 2018 Budget 2019 Proposed
Capital Outlay 1,461 1,529 0 0 0
Interfund Charges 621 0 36 0 0
Reserve for Budget Adjustment 0 0 0 100,000 100,000
Transfers Out 0 0 0 0 0
Wages & Benefits 253,824 230,467 306,647 200,469 279,978
Supplies & Services 152,967 118,304 238,228 275,764 336,482
Debt Services 0 0 0 0 0
All Other 0 0 0 0 0
TOTAL 408,873 350,300 544,911 576,233 716,460
Expenditure Notes:
Revenues:
2015 Actual 2016 Actual 2017 Actual 2018 Budget 2019 Proposed
Taxes 0 0 0 0 0
Licenses & Permits 0 0 0 0 0
IG Revenue 0 0 0 0 0
Services 242,170 92,151 108,867 200,469 200,469
Fines & Forfeits 0 0 0 0 0
Operating Transfers In 0 0 0 0 0
General Fund Resources 166,703 258,149 436,044 375,764 515,991One Vision. One Plan. One Voice.
Planning and Economic Development78

Department Summary: Economic Development
Division: Planning and Economic Development
Fund Type: General Fund
Executive Summary:
This budget supports economic development activities of the City and region by supporting one-time costs and contracts with economic development partners, consultants to steward economic development activities, such as HUD 108 loans, and federal initiatives, and support internal City functions which support targeted economic development and growth within the City.
Programs and Services:
The Economic Development department budget supports contracts with third-party economic development organizations responsible for recruitment and retention of business and federal legislative advocacy for the City.
FTEs
2015 Actual 2016 Actual 2017 Actual 2018 Budget 2019 Proposed
Total FTEs 3.00 3.00 3.00 2.00 2.00
Expenditures:
2015 Actual 2016 Actual 2017 Actual 2018 Budget 2019 Proposed
Capital Outlay 1,461 1,529 0 0 0
Interfund Charges 621 0 36 0 0
Reserve for Budget Adjustment 0 0 0 100,000 100,000
Transfers Out 0 0 0 0 0
Wages & Benefits 253,824 230,467 306,647 200,469 279,978
Supplies & Services 152,967 118,304 238,228 275,764 336,482
Debt Services 0 0 0 0 0
All Other 0 0 0 0 0
TOTAL 408,873 350,300 544,911 576,233 716,460
Expenditure Notes:
Revenues:
2015 Actual 2016 Actual 2017 Actual 2018 Budget 2019 Proposed
Taxes 0 0 0 0 0
Licenses & Permits 0 0 0 0 0
IG Revenue 0 0 0 0 0
Services 242,170 92,151 108,867 200,469 200,469
Fines & Forfeits 0 0 0 0 0
Operating Transfers In 0 0 0 0 0
General Fund Resources 166,703 258,149 436,044 375,764 515,991
All Other 0 0 0 0 0
TOTAL 408,873 350,300 544,911 576,233 716,460
Revenue Notes:
Planning and Economic Development 79

One Vision. One Plan. One Voice.
Planning and Economic Development80
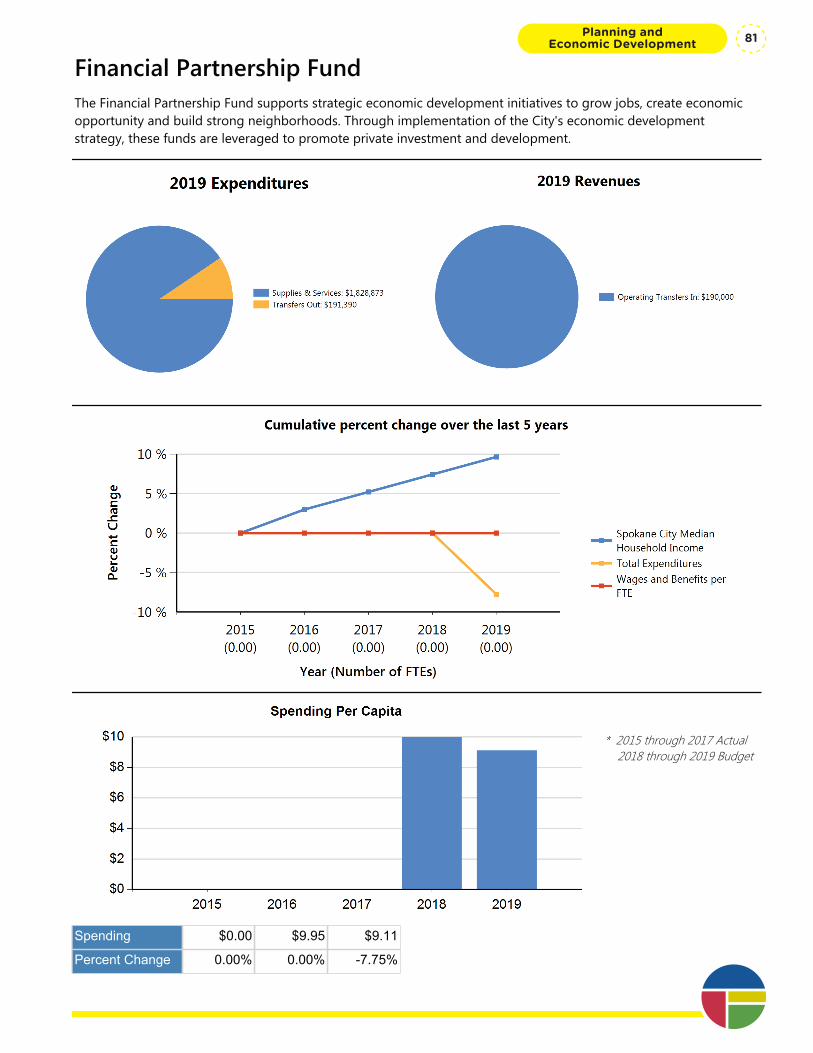
Financial Partnership FundThe Financial Partnership Fund supports strategic economic development initiatives to grow jobs, create economic opportunity and build strong neighborhoods. Through implementation of the City's economic development strategy, these funds are leveraged to promote private investment and development.
* 2015 through 2017 Actual 2018 through 2019 Budget
Spending $0.00 $9.95 $9.11
Percent Change 0.00% 0.00% -7.75%
Planning and Economic Development 81
Department Summary: Financial Partnership Fund
Division: Planning and Economic Development
Fund Type: Special Revenue Fund
Executive Summary:
The Financial Partnership Fund supports strategic economic development initiatives to grow jobs, create economic opportunity and build strong neighborhoods. Through implementation of the City's economic development strategy, these funds are leveraged to promote private investment and development.
Programs and Services:
The Financial Partnership Fund is the funding source for the projects of citywide significance program.
FTEs
2015 Actual 2016 Actual 2017 Actual 2018 Budget 2019 Proposed
Total FTEs 0.00 0.00 0.00 0.00 0.00
Expenditures:
2015 Actual 2016 Actual 2017 Actual 2018 Budget 2019 Proposed
Capital Outlay 0 0 0 0 0
Interfund Charges 0 0 0 0 0
Reserve for Budget Adjustment 0 0 0 0 0
Transfers Out 0 0 0 191,390 191,390
Wages & Benefits 0 0 0 0 0
Supplies & Services 0 0 0 1,998,610 1,828,873
Debt Services 0 0 0 0 0
All Other 0 0 0 0 0
TOTAL 0 0 0 2,190,000 2,020,263
Expenditure Notes:
Revenues:
2015 Actual 2016 Actual 2017 Actual 2018 Budget 2019 Proposed
Taxes 0 0 0 0 0
Licenses & Permits 0 0 0 0 0
IG Revenue 0 0 0 0 0
Services 0 0 0 0 0
Fines & Forfeits 0 0 0 0 0
Operating Transfers In 0 0 190,000 190,000 190,000
General Fund Resources 0 0 0 0 0
All Other 0 0 0 0 0One Vision. One Plan. One Voice.
Planning and Economic Development82
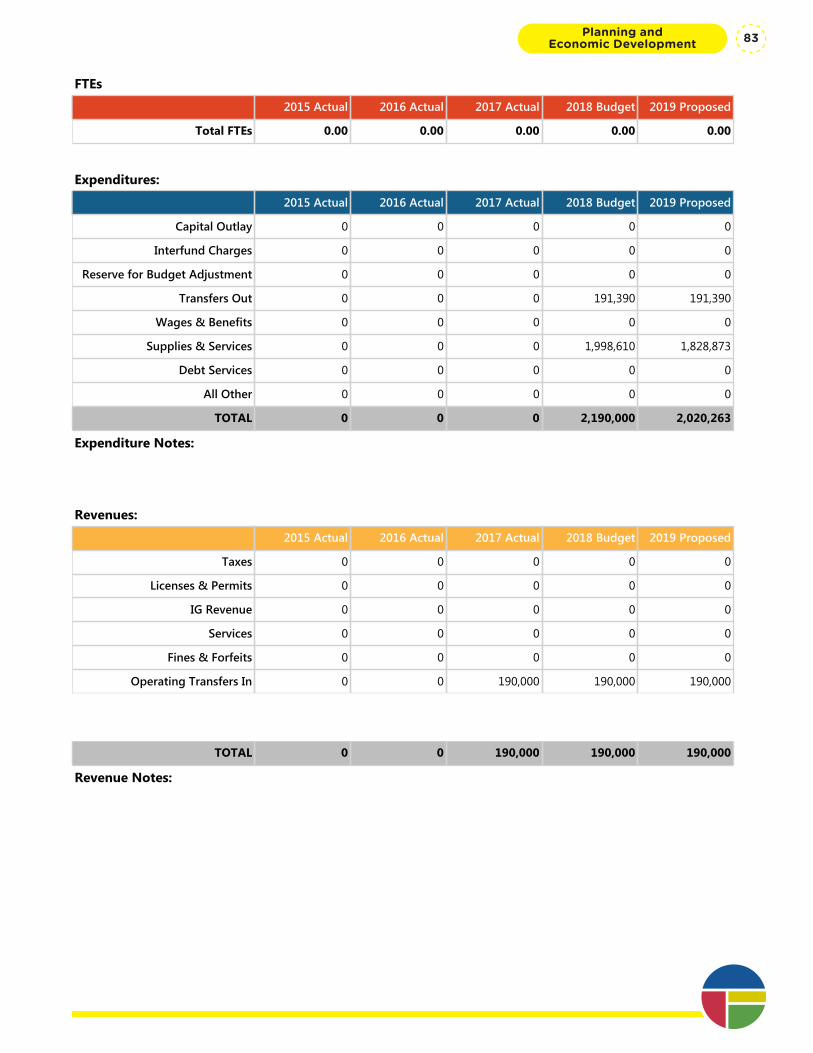
Department Summary: Financial Partnership Fund
Division: Planning and Economic Development
Fund Type: Special Revenue Fund
Executive Summary:
The Financial Partnership Fund supports strategic economic development initiatives to grow jobs, create economic opportunity and build strong neighborhoods. Through implementation of the City's economic development strategy, these funds are leveraged to promote private investment and development.
Programs and Services:
The Financial Partnership Fund is the funding source for the projects of citywide significance program.
FTEs
2015 Actual 2016 Actual 2017 Actual 2018 Budget 2019 Proposed
Total FTEs 0.00 0.00 0.00 0.00 0.00
Expenditures:
2015 Actual 2016 Actual 2017 Actual 2018 Budget 2019 Proposed
Capital Outlay 0 0 0 0 0
Interfund Charges 0 0 0 0 0
Reserve for Budget Adjustment 0 0 0 0 0
Transfers Out 0 0 0 191,390 191,390
Wages & Benefits 0 0 0 0 0
Supplies & Services 0 0 0 1,998,610 1,828,873
Debt Services 0 0 0 0 0
All Other 0 0 0 0 0
TOTAL 0 0 0 2,190,000 2,020,263
Expenditure Notes:
Revenues:
2015 Actual 2016 Actual 2017 Actual 2018 Budget 2019 Proposed
Taxes 0 0 0 0 0
Licenses & Permits 0 0 0 0 0
IG Revenue 0 0 0 0 0
Services 0 0 0 0 0
Fines & Forfeits 0 0 0 0 0
Operating Transfers In 0 0 190,000 190,000 190,000
General Fund Resources 0 0 0 0 0
All Other 0 0 0 0 0
TOTAL 0 0 190,000 190,000 190,000
Revenue Notes:
Planning and Economic Development 83

One Vision. One Plan. One Voice.
Planning and Economic Development84
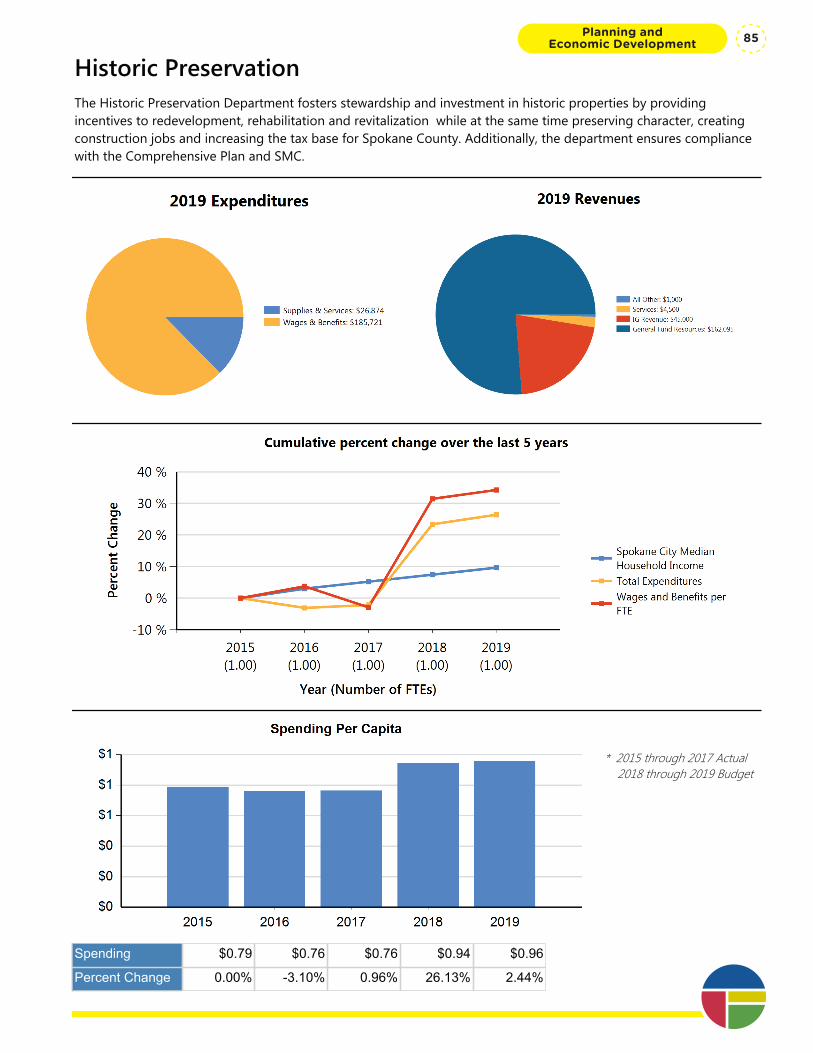
Historic PreservationThe Historic Preservation Department fosters stewardship and investment in historic properties by providing incentives to redevelopment, rehabilitation and revitalization while at the same time preserving character, creating construction jobs and increasing the tax base for Spokane County. Additionally, the department ensures compliance with the Comprehensive Plan and SMC.
* 2015 through 2017 Actual 2018 through 2019 Budget
Spending $0.79 $0.76 $0.76 $0.94 $0.96
Percent Change 0.00% -3.10% 0.96% 26.13% 2.44%
Planning and Economic Development 85
Department Summary: Historic Preservation
Division: Planning and Economic Development
Fund Type: General Fund
Executive Summary:
The Historic Preservation Department fosters stewardship and investment in historic properties by providing incentives to redevelopment, rehabilitation and revitalization while at the same time preserving character, creating construction jobs and increasing the tax base for Spokane County. Additionally, the department ensures compliance with the Comprehensive Plan and SMC.
Programs and Services:
Programs and incentives that support private investment are the most effective way to encourage both the use and re-use of under-utilized historic buildings in our community. Historic Preservation is a valuable tool in the rehabilitation of older buildings, furthering the City's distinct "Urban Experience." Spokane is a unique City full of historic resources that tell our story - the job of the Historic Preservation Department and the Spokane Historic Landmarks Commission is to help owners, developers, and citizens understand Spokane's distinct and special heritage; and at the same time offer incentives to owners who protect and revitalize our shared historic fabric. The Historic Preservation Department executes our primary incentive tool, Special Tax Valuation, in conjunction with Spokane County to encourage historic building rehabilitation.
New initiatives to Historic Preservation include the ability to create historic districts in neighborhoods of distinction in Spokane when a simple majority of owners agree to the designation. These new districts will allow public input into neighborhood development through the Landmarks Commission's review process. Districts will help to manage change while still maintaining the historic character and sense of place of the neighborhood. It will also allow for a broader number of properties to take advantage of Special Tax Valuation when significant improvements are invested in historic properties within the district.
The Historic Preservation Officer is a member of the Neighborhood and Business Services leadership team.
FTEs
2015 Actual 2016 Actual 2017 Actual 2018 Budget 2019 Proposed
Total FTEs 1.00 1.00 1.00 1.00 1.00
Expenditures:
2015 Actual 2016 Actual 2017 Actual 2018 Budget 2019 Proposed
Capital Outlay 0 0 0 0 0
Interfund Charges 376 341 147 300 0
Reserve for Budget Adjustment 0 0 0 0 0
Transfers Out 0 0 0 0 0
Wages & Benefits 138,827 144,018 134,443 180,648 185,721
Supplies & Services 28,982 18,598 29,933 26,574 26,874
Debt Services 0 0 0 0 0
All Other 0 0 0 0 0
One Vision. One Plan. One Voice.
Planning and Economic Development86

Department Summary: Historic Preservation
Division: Planning and Economic Development
Fund Type: General Fund
Executive Summary:
The Historic Preservation Department fosters stewardship and investment in historic properties by providing incentives to redevelopment, rehabilitation and revitalization while at the same time preserving character, creating construction jobs and increasing the tax base for Spokane County. Additionally, the department ensures compliance with the Comprehensive Plan and SMC.
Programs and Services:
Programs and incentives that support private investment are the most effective way to encourage both the use and re-use of under-utilized historic buildings in our community. Historic Preservation is a valuable tool in the rehabilitation of older buildings, furthering the City's distinct "Urban Experience." Spokane is a unique City full of historic resources that tell our story - the job of the Historic Preservation Department and the Spokane Historic Landmarks Commission is to help owners, developers, and citizens understand Spokane's distinct and special heritage; and at the same time offer incentives to owners who protect and revitalize our shared historic fabric. The Historic Preservation Department executes our primary incentive tool, Special Tax Valuation, in conjunction with Spokane County to encourage historic building rehabilitation.
New initiatives to Historic Preservation include the ability to create historic districts in neighborhoods of distinction in Spokane when a simple majority of owners agree to the designation. These new districts will allow public input into neighborhood development through the Landmarks Commission's review process. Districts will help to manage change while still maintaining the historic character and sense of place of the neighborhood. It will also allow for a broader number of properties to take advantage of Special Tax Valuation when significant improvements are invested in historic properties within the district.
The Historic Preservation Officer is a member of the Neighborhood and Business Services leadership team.
FTEs
2015 Actual 2016 Actual 2017 Actual 2018 Budget 2019 Proposed
Total FTEs 1.00 1.00 1.00 1.00 1.00
Expenditures:
2015 Actual 2016 Actual 2017 Actual 2018 Budget 2019 Proposed
Capital Outlay 0 0 0 0 0
Interfund Charges 376 341 147 300 0
Reserve for Budget Adjustment 0 0 0 0 0
Transfers Out 0 0 0 0 0
Wages & Benefits 138,827 144,018 134,443 180,648 185,721
Supplies & Services 28,982 18,598 29,933 26,574 26,874
Debt Services 0 0 0 0 0
All Other 0 0 0 0 0
TOTAL 168,185 162,957 164,523 207,522 212,595
Expenditure Notes:
Revenues:
2015 Actual 2016 Actual 2017 Actual 2018 Budget 2019 Proposed
Taxes 0 0 0 0 0
Licenses & Permits 0 0 0 0 0
IG Revenue 45,000 37,200 48,079 45,000 45,000
Services 11,025 4,745 3,775 4,500 4,500
Fines & Forfeits 0 0 0 0 0
Operating Transfers In 0 0 0 0 0
General Fund Resources 108,610 117,497 111,369 157,022 162,095
All Other 3,550 3,515 1,300 1,000 1,000
TOTAL 168,185 162,957 164,523 207,522 212,595
Revenue Notes:
Planning and Economic Development 87

One Vision. One Plan. One Voice.
Planning and Economic Development88
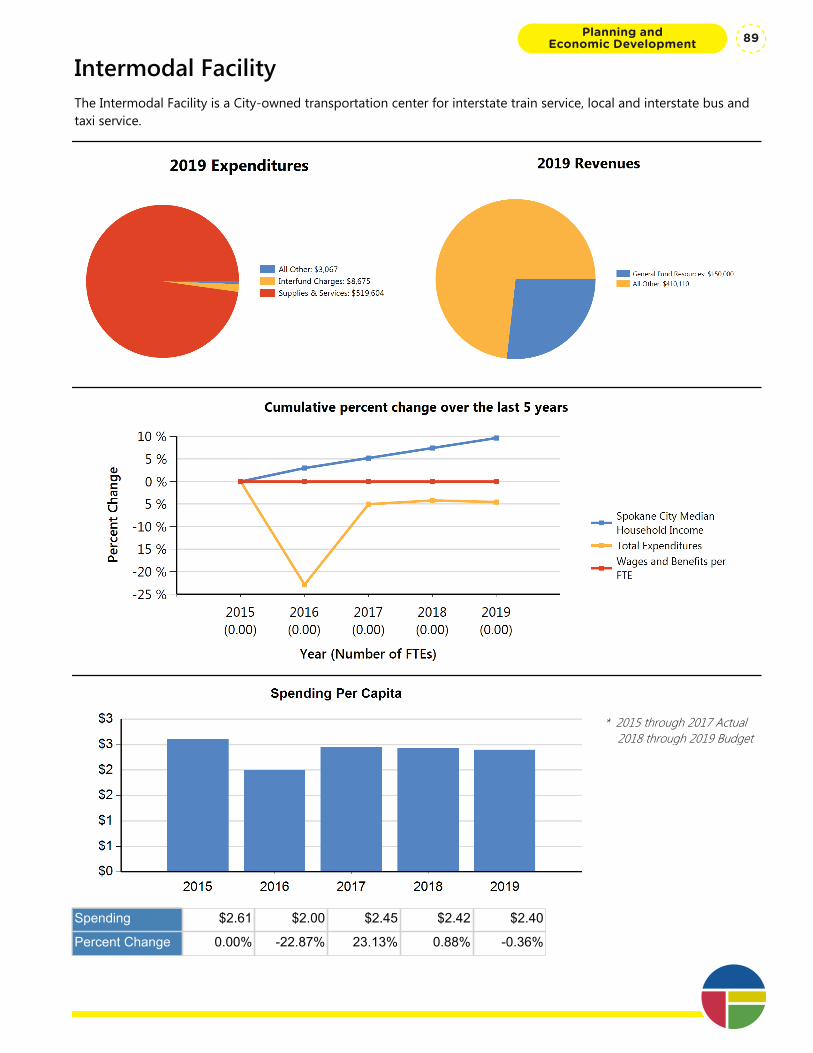
Intermodal FacilityThe Intermodal Facility is a City-owned transportation center for interstate train service, local and interstate bus and taxi service.
* 2015 through 2017 Actual 2018 through 2019 Budget
Spending $2.61 $2.00 $2.45 $2.42 $2.40
Percent Change 0.00% -22.87% 23.13% 0.88% -0.36%
Planning and Economic Development 89

Department Summary: Intermodal Facility
Division: Planning and Economic Development
Fund Type: Special Revenue Fund
Executive Summary:
The Intermodal Facility is a City-owned transportation center for interstate train service, local and interstate bus and taxi service.
Programs and Services:
The Intermodal Facility is a transportation center for interstate train service, interstate and intercity bus service and taxi service for the traveling public. The Burlington Northern railroad station building was acquired by the City in 1993. At that time, the City entered into a 99-year lease with Burlington Northern Railroad Co. for the land the building sits on. Private management company, Goodale & Barbieri, manages the facility. Asset Management oversees the contract with the management company, negotiates lease terms for new tenants, responds to complaints and inquiries and reviews maintenance and capital improvement.
FTEs
2015 Actual 2016 Actual 2017 Actual 2018 Budget 2019 Proposed
Total FTEs 0.00 0.00 0.00 0.00 0.00
Expenditures:
2015 Actual 2016 Actual 2017 Actual 2018 Budget 2019 Proposed
Capital Outlay 0 0 0 17,254 0
Interfund Charges 11,827 7,294 9,121 30,607 8,675
Reserve for Budget Adjustment 0 0 0 0 0
Transfers Out 0 0 0 0 0
Wages & Benefits 0 0 0 0 0
Supplies & Services 542,470 419,652 517,077 481,150 519,604
Debt Services 0 0 0 0 0
All Other 2,346 2,354 2,412 4,267 3,067
TOTAL 556,643 429,300 528,610 533,278 531,346
Expenditure Notes:
Revenues:
2015 Actual 2016 Actual 2017 Actual 2018 Budget 2019 Proposed
Taxes 0 0 0 0 0
Licenses & Permits 0 0 0 0 0
IG Revenue 0 0 0 0 0
Services 0 0 0 0 0
Fines & Forfeits 0 0 0 0 0
Operating Transfers In 0 0 0 0 0
General Fund Resources 121,983 75,000 145,000 150,000 150,000One Vision. One Plan. One Voice.
Planning and Economic Development90

Department Summary: Intermodal Facility
Division: Planning and Economic Development
Fund Type: Special Revenue Fund
Executive Summary:
The Intermodal Facility is a City-owned transportation center for interstate train service, local and interstate bus and taxi service.
Programs and Services:
The Intermodal Facility is a transportation center for interstate train service, interstate and intercity bus service and taxi service for the traveling public. The Burlington Northern railroad station building was acquired by the City in 1993. At that time, the City entered into a 99-year lease with Burlington Northern Railroad Co. for the land the building sits on. Private management company, Goodale & Barbieri, manages the facility. Asset Management oversees the contract with the management company, negotiates lease terms for new tenants, responds to complaints and inquiries and reviews maintenance and capital improvement.
FTEs
2015 Actual 2016 Actual 2017 Actual 2018 Budget 2019 Proposed
Total FTEs 0.00 0.00 0.00 0.00 0.00
Expenditures:
2015 Actual 2016 Actual 2017 Actual 2018 Budget 2019 Proposed
Capital Outlay 0 0 0 17,254 0
Interfund Charges 11,827 7,294 9,121 30,607 8,675
Reserve for Budget Adjustment 0 0 0 0 0
Transfers Out 0 0 0 0 0
Wages & Benefits 0 0 0 0 0
Supplies & Services 542,470 419,652 517,077 481,150 519,604
Debt Services 0 0 0 0 0
All Other 2,346 2,354 2,412 4,267 3,067
TOTAL 556,643 429,300 528,610 533,278 531,346
Expenditure Notes:
Revenues:
2015 Actual 2016 Actual 2017 Actual 2018 Budget 2019 Proposed
Taxes 0 0 0 0 0
Licenses & Permits 0 0 0 0 0
IG Revenue 0 0 0 0 0
Services 0 0 0 0 0
Fines & Forfeits 0 0 0 0 0
Operating Transfers In 0 0 0 0 0
General Fund Resources 121,983 75,000 145,000 150,000 150,000
All Other 435,287 385,285 430,559 495,848 410,110
TOTAL 557,270 460,285 575,559 645,848 560,110
Revenue Notes:
Planning and Economic Development 91

One Vision. One Plan. One Voice.
Planning and Economic Development92
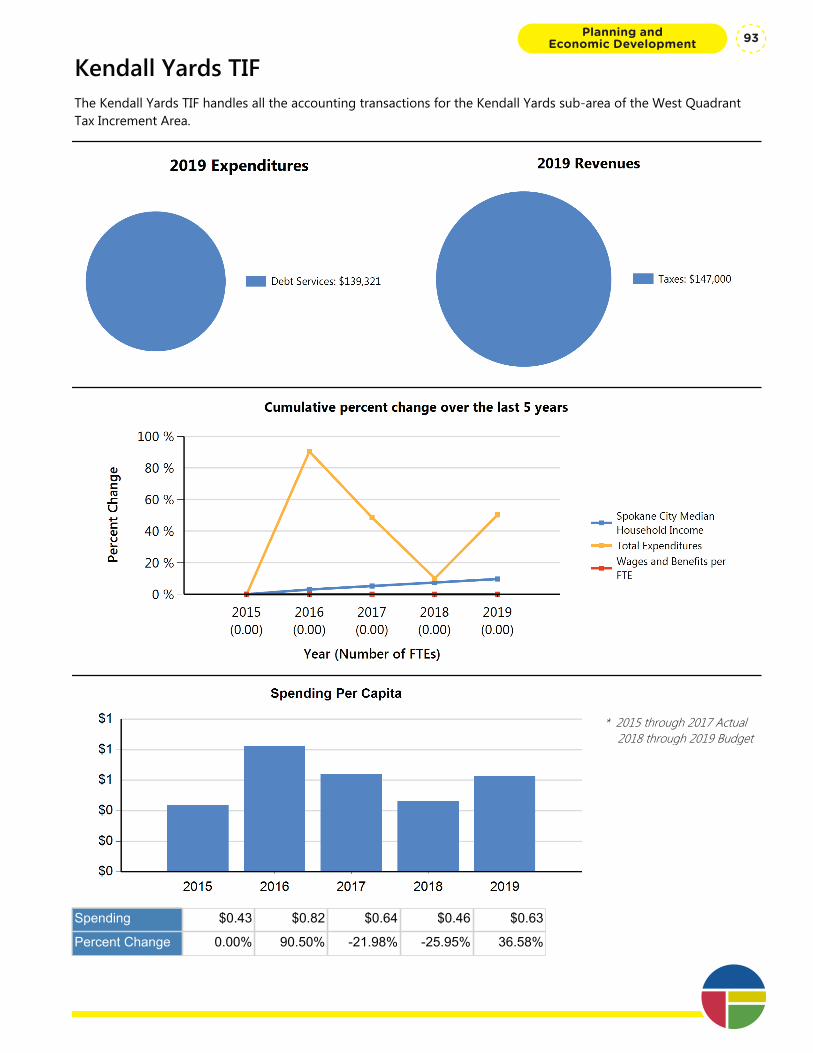
Kendall Yards TIFThe Kendall Yards TIF handles all the accounting transactions for the Kendall Yards sub-area of the West Quadrant Tax Increment Area.
* 2015 through 2017 Actual 2018 through 2019 Budget
Spending $0.43 $0.82 $0.64 $0.46 $0.63
Percent Change 0.00% 90.50% -21.98% -25.95% 36.58%
Planning and Economic Development 93
Department Summary: Kendall Yards TIF
Division: Planning and Economic Development
Fund Type: Capital Project Fund
Executive Summary:
The Kendall Yards TIF handles all the accounting transactions for the Kendall Yards sub-area of the West Quadrant Tax Increment Area.
Programs and Services:
The Kendall Yards TIF is used for the transactions of all eligible project costs associated with the Kendall Yards Sub-area public improvements. The Kendall Yards sub-area of the West Quadrant Tax Increment Area No. 2007-1 was created by Council Ordinance No. C34032 to use incremental property tax revenue from the sub-area to finance public improvements within the Kendall Yards development area pursuant to the amended and restated Reimbursement Agreement (Ordinance No. C34758). This bid acts as the cash flow account for the Kendall Yards sub-area fund
FTEs
2015 Actual 2016 Actual 2017 Actual 2018 Budget 2019 Proposed
Total FTEs 0.00 0.00 0.00 0.00 0.00
Expenditures:
2015 Actual 2016 Actual 2017 Actual 2018 Budget 2019 Proposed
Capital Outlay 0 0 0 0 0
Interfund Charges 0 0 0 0 0
Reserve for Budget Adjustment 0 0 0 0 0
Transfers Out 0 0 0 0 0
Wages & Benefits 0 0 0 0 0
Supplies & Services 0 69,753 0 0 0
Debt Services 92,693 106,836 137,763 102,000 139,321
All Other 0 0 0 0 0
TOTAL 92,693 176,589 137,763 102,000 139,321
Expenditure Notes:
Revenues:
2015 Actual 2016 Actual 2017 Actual 2018 Budget 2019 Proposed
Taxes 92,802 106,790 137,764 127,000 147,000
Licenses & Permits 0 0 0 0 0
IG Revenue 0 0 0 0 0
Services 0 0 0 0 0
Fines & Forfeits 0 0 0 0 0
Operating Transfers In 0 0 0 0 0One Vision. One Plan. One Voice.
Planning and Economic Development94

Department Summary: Kendall Yards TIF
Division: Planning and Economic Development
Fund Type: Capital Project Fund
Executive Summary:
The Kendall Yards TIF handles all the accounting transactions for the Kendall Yards sub-area of the West Quadrant Tax Increment Area.
Programs and Services:
The Kendall Yards TIF is used for the transactions of all eligible project costs associated with the Kendall Yards Sub-area public improvements. The Kendall Yards sub-area of the West Quadrant Tax Increment Area No. 2007-1 was created by Council Ordinance No. C34032 to use incremental property tax revenue from the sub-area to finance public improvements within the Kendall Yards development area pursuant to the amended and restated Reimbursement Agreement (Ordinance No. C34758). This bid acts as the cash flow account for the Kendall Yards sub-area fund
FTEs
2015 Actual 2016 Actual 2017 Actual 2018 Budget 2019 Proposed
Total FTEs 0.00 0.00 0.00 0.00 0.00
Expenditures:
2015 Actual 2016 Actual 2017 Actual 2018 Budget 2019 Proposed
Capital Outlay 0 0 0 0 0
Interfund Charges 0 0 0 0 0
Reserve for Budget Adjustment 0 0 0 0 0
Transfers Out 0 0 0 0 0
Wages & Benefits 0 0 0 0 0
Supplies & Services 0 69,753 0 0 0
Debt Services 92,693 106,836 137,763 102,000 139,321
All Other 0 0 0 0 0
TOTAL 92,693 176,589 137,763 102,000 139,321
Expenditure Notes:
Revenues:
2015 Actual 2016 Actual 2017 Actual 2018 Budget 2019 Proposed
Taxes 92,802 106,790 137,764 127,000 147,000
Licenses & Permits 0 0 0 0 0
IG Revenue 0 0 0 0 0
Services 0 0 0 0 0
Fines & Forfeits 0 0 0 0 0
Operating Transfers In 0 0 0 0 0
General Fund Resources 0 0 0 0 0
All Other 0 0 0 0 0
TOTAL 92,802 106,790 137,764 127,000 147,000
Revenue Notes:
Planning and Economic Development 95

One Vision. One Plan. One Voice.
Planning and Economic Development96
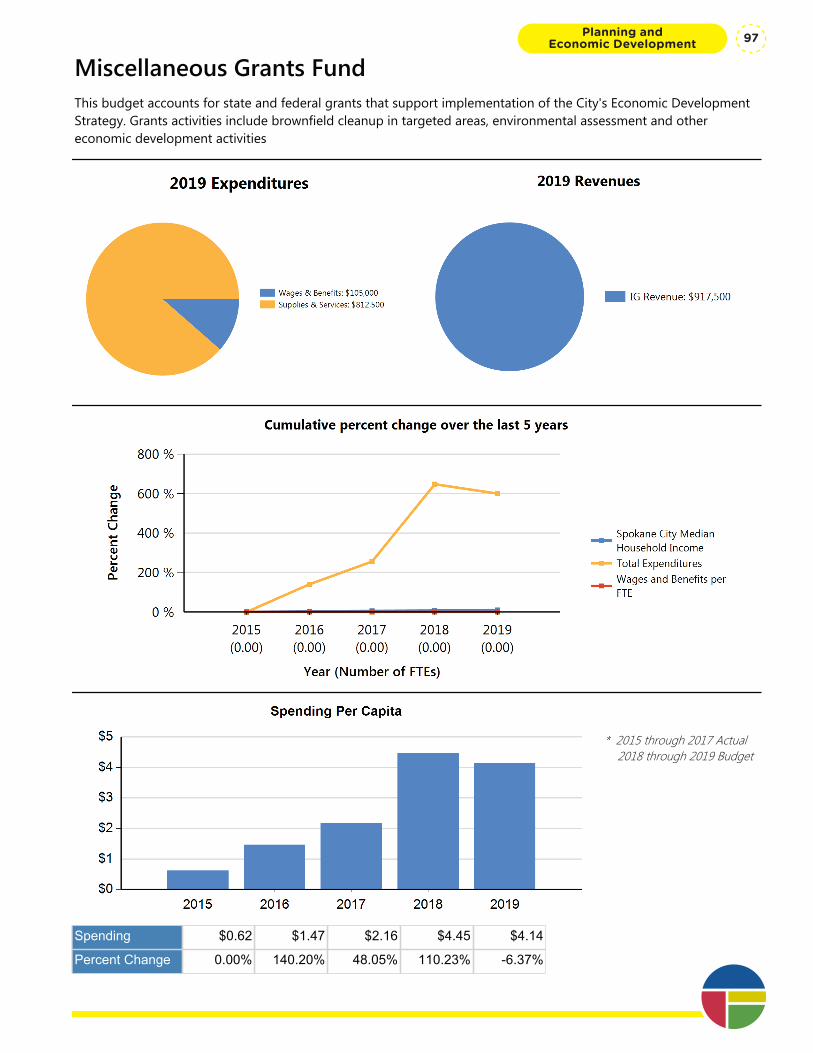
Miscellaneous Grants FundThis budget accounts for state and federal grants that support implementation of the City's Economic Development Strategy. Grants activities include brownfield cleanup in targeted areas, environmental assessment and other economic development activities
* 2015 through 2017 Actual 2018 through 2019 Budget
Spending $0.62 $1.47 $2.16 $4.45 $4.14
Percent Change 0.00% 140.20% 48.05% 110.23% -6.37%
Planning and Economic Development 97

Department Summary: Miscellaneous Grants Fund
Division: Planning and Economic Development
Fund Type: Special Revenue Fund
Executive Summary:
This budget accounts for state and federal grants that support implementation of the City's Economic Development Strategy. Grants activities include brownfield cleanup in targeted areas, environmental assessment and other economic development activities
Programs and Services:
Grants sought are paired with development partnerships to leverage more than 1:1 private investment for each dollar of public investment.
FTEs
2015 Actual 2016 Actual 2017 Actual 2018 Budget 2019 Proposed
Total FTEs 0.00 0.00 0.00 0.00 0.00
Expenditures:
2015 Actual 2016 Actual 2017 Actual 2018 Budget 2019 Proposed
Capital Outlay 0 0 0 0 0
Interfund Charges 0 0 1,351 0 0
Reserve for Budget Adjustment 0 0 0 0 0
Transfers Out 0 0 0 0 0
Wages & Benefits 0 29,064 107,094 100,000 105,000
Supplies & Services 131,076 285,783 357,698 880,000 812,500
Debt Services 0 0 0 0 0
All Other 0 0 0 0 0
TOTAL 131,076 314,847 466,143 980,000 917,500
Expenditure Notes:
Revenues:
2015 Actual 2016 Actual 2017 Actual 2018 Budget 2019 Proposed
Taxes 0 0 0 0 0
Licenses & Permits 0 0 0 0 0
IG Revenue 131,076 293,398 433,081 980,000 917,500
Services 0 0 0 0 0
Fines & Forfeits 0 0 0 0 0
Operating Transfers In 0 0 0 0 0
General Fund Resources 0 0 0 0 0One Vision. One Plan. One Voice.
Planning and Economic Development98
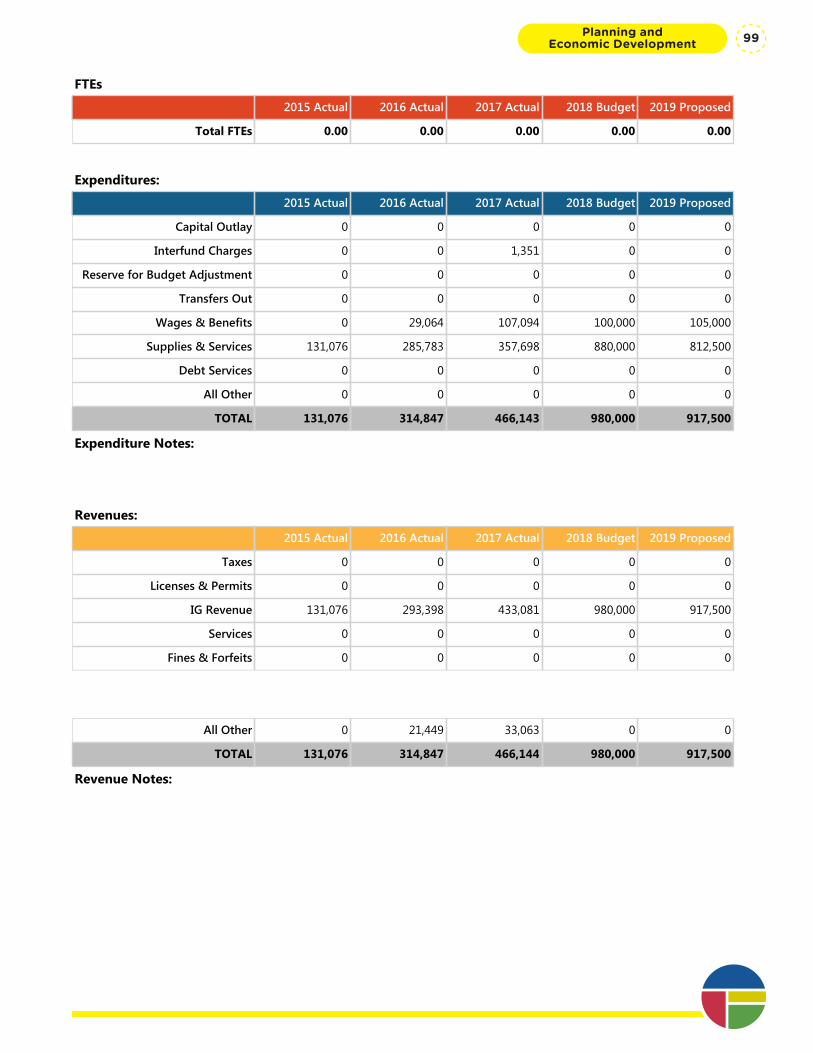
Department Summary: Miscellaneous Grants Fund
Division: Planning and Economic Development
Fund Type: Special Revenue Fund
Executive Summary:
This budget accounts for state and federal grants that support implementation of the City's Economic Development Strategy. Grants activities include brownfield cleanup in targeted areas, environmental assessment and other economic development activities
Programs and Services:
Grants sought are paired with development partnerships to leverage more than 1:1 private investment for each dollar of public investment.
FTEs
2015 Actual 2016 Actual 2017 Actual 2018 Budget 2019 Proposed
Total FTEs 0.00 0.00 0.00 0.00 0.00
Expenditures:
2015 Actual 2016 Actual 2017 Actual 2018 Budget 2019 Proposed
Capital Outlay 0 0 0 0 0
Interfund Charges 0 0 1,351 0 0
Reserve for Budget Adjustment 0 0 0 0 0
Transfers Out 0 0 0 0 0
Wages & Benefits 0 29,064 107,094 100,000 105,000
Supplies & Services 131,076 285,783 357,698 880,000 812,500
Debt Services 0 0 0 0 0
All Other 0 0 0 0 0
TOTAL 131,076 314,847 466,143 980,000 917,500
Expenditure Notes:
Revenues:
2015 Actual 2016 Actual 2017 Actual 2018 Budget 2019 Proposed
Taxes 0 0 0 0 0
Licenses & Permits 0 0 0 0 0
IG Revenue 131,076 293,398 433,081 980,000 917,500
Services 0 0 0 0 0
Fines & Forfeits 0 0 0 0 0
Operating Transfers In 0 0 0 0 0
General Fund Resources 0 0 0 0 0
All Other 0 21,449 33,063 0 0
TOTAL 131,076 314,847 466,144 980,000 917,500
Revenue Notes:
Planning and Economic Development 99

One Vision. One Plan. One Voice.
Planning and Economic Development100
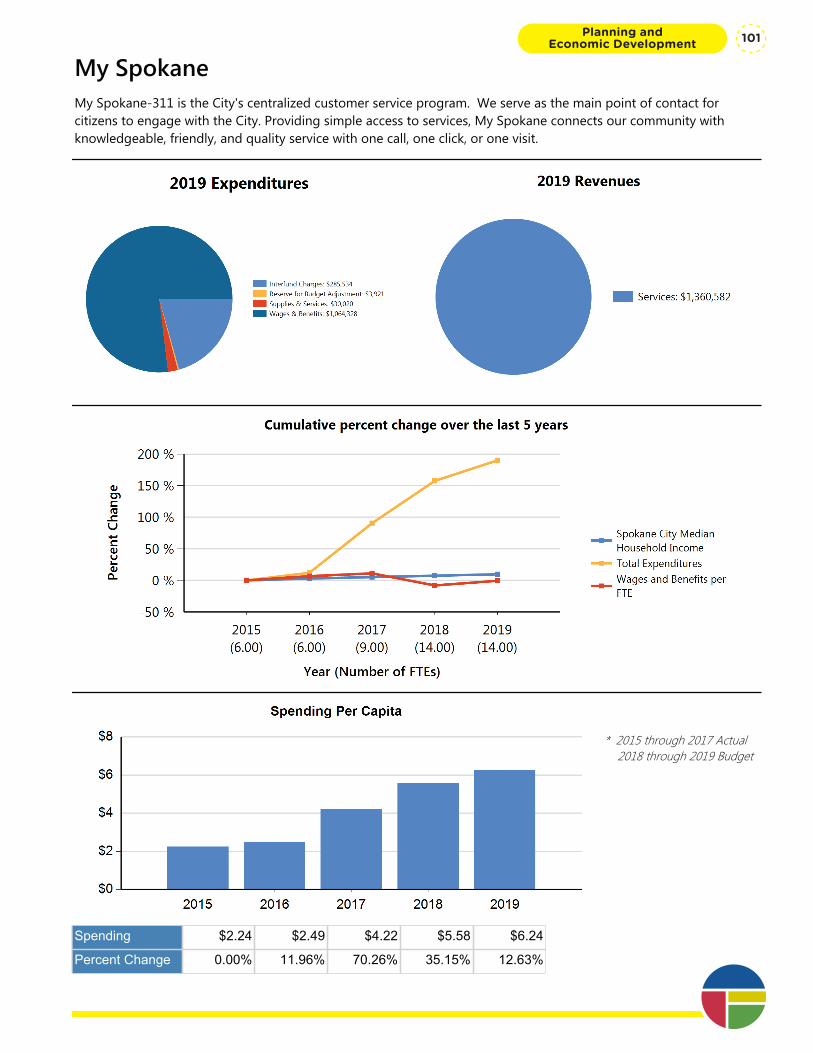
My SpokaneMy Spokane-311 is the City's centralized customer service program. We serve as the main point of contact for citizens to engage with the City. Providing simple access to services, My Spokane connects our community with knowledgeable, friendly, and quality service with one call, one click, or one visit.
* 2015 through 2017 Actual 2018 through 2019 Budget
Spending $2.24 $2.49 $4.22 $5.58 $6.24
Percent Change 0.00% 11.96% 70.26% 35.15% 12.63%
Planning and Economic Development 101
Department Summary: My Spokane
Division: Planning and Economic Development
Fund Type: Internal Service Fund
Executive Summary:
My Spokane-311 is the City's centralized customer service program. We serve as the main point of contact for citizens to engage with the City. Providing simple access to services, My Spokane connects our community with knowledgeable, friendly, and quality service with one call, one click, or one visit.
Programs and Services:
My Spokane staff are the first stop for customers whether they need help in person, by phone, or by internet. My Spokane believes receiving help from the City should be easy. You shouldn’t have to understand how government works in order to receive excellent service. We also know how important your time is, so we want to make things easy for you.
FTEs
2015 Actual 2016 Actual 2017 Actual 2018 Budget 2019 Proposed
Total FTEs 6.00 6.00 9.00 14.00 14.00
Expenditures:
2015 Actual 2016 Actual 2017 Actual 2018 Budget 2019 Proposed
Capital Outlay 732 4,574 0 0 0
Interfund Charges 0 0 102,400 219,618 285,534
Reserve for Budget Adjustment 0 0 0 0 3,921
Transfers Out 0 0 0 0 0
Wages & Benefits 471,489 502,991 788,145 991,402 1,064,328
Supplies & Services 4,621 26,334 18,481 17,570 30,020
Debt Services 0 0 0 0 0
All Other 0 0 0 0 0
TOTAL 476,842 533,899 909,026 1,228,590 1,383,803
Expenditure Notes:
Revenues:
2015 Actual 2016 Actual 2017 Actual 2018 Budget 2019 Proposed
Taxes 0 0 0 0 0
Licenses & Permits 0 0 0 0 0
IG Revenue 0 0 0 0 0
Services 279,467 393,405 891,256 947,843 1,360,582
Fines & Forfeits 0 0 0 0 0
Operating Transfers In 0 0 0 0 0
General Fund Resources 197,375 162,042 30,697 280,747 0One Vision. One Plan. One Voice.
Planning and Economic Development102

Department Summary: My Spokane
Division: Planning and Economic Development
Fund Type: Internal Service Fund
Executive Summary:
My Spokane-311 is the City's centralized customer service program. We serve as the main point of contact for citizens to engage with the City. Providing simple access to services, My Spokane connects our community with knowledgeable, friendly, and quality service with one call, one click, or one visit.
Programs and Services:
My Spokane staff are the first stop for customers whether they need help in person, by phone, or by internet. My Spokane believes receiving help from the City should be easy. You shouldn’t have to understand how government works in order to receive excellent service. We also know how important your time is, so we want to make things easy for you.
FTEs
2015 Actual 2016 Actual 2017 Actual 2018 Budget 2019 Proposed
Total FTEs 6.00 6.00 9.00 14.00 14.00
Expenditures:
2015 Actual 2016 Actual 2017 Actual 2018 Budget 2019 Proposed
Capital Outlay 732 4,574 0 0 0
Interfund Charges 0 0 102,400 219,618 285,534
Reserve for Budget Adjustment 0 0 0 0 3,921
Transfers Out 0 0 0 0 0
Wages & Benefits 471,489 502,991 788,145 991,402 1,064,328
Supplies & Services 4,621 26,334 18,481 17,570 30,020
Debt Services 0 0 0 0 0
All Other 0 0 0 0 0
TOTAL 476,842 533,899 909,026 1,228,590 1,383,803
Expenditure Notes:
Revenues:
2015 Actual 2016 Actual 2017 Actual 2018 Budget 2019 Proposed
Taxes 0 0 0 0 0
Licenses & Permits 0 0 0 0 0
IG Revenue 0 0 0 0 0
Services 279,467 393,405 891,256 947,843 1,360,582
Fines & Forfeits 0 0 0 0 0
Operating Transfers In 0 0 0 0 0
General Fund Resources 197,375 162,042 30,697 280,747 0
All Other 0 0 (231) 0 0
TOTAL 476,842 555,447 921,722 1,228,590 1,360,582
Revenue Notes:
2017 all other is cash/over short
Planning and Economic Development 103
Program Summary: My Spokane 311
Division: Planning and Economic Development
Fund Type: Internal Service Fund
Executive Summary:
My Spokane customer service representatives answer your phone calls to 311 to answer general city questions, process your request for service, or transfer you to the right person to help you. We also have counter staff to help our walk-in customers as well as online questions and emails.
Programs and Services:
My Spokane Customer Service is here to help answer your questions. 311 staff serve as the gateway to city services and information. Our staff are trained to be courteous and friendly and to make sure you receive the right answer from us, or if we don’t know the answer, to help you reach the city employee who does know. 311 staff help you register for parks classes or making changes to your garbage services, such as changing cart size or adding yard waste services. We also will process your complaints about potholes and snowy road conditions, as well as code and parking complaints such as graffiti and abandoned autos. We also handle initial customer service for utility billing, such as billing inquiries or payment arrangements. So if you are moving or simply have a question regarding a payment, we are here to help.
While we try to handle all your requests, we know some need to go to another department that specializes in that area. But we help get you to the right place, so instead of trying to figure out who to call in the City, just dial 311 and we will do that for you. We will even explain why we are transferring the call so you don’t have to repeat yourself. Everything we do is to make Spokane a safe and welcoming city for all.
The My Spokane Service Desk is located on the first floor of City Hall. If you need to pay your utility bill or parking ticket, you will find help at our counter. In fact, counter staff can do the same things the 311 phone staff do, so if you prefer to do business in person, they are there to help you. They also are the employees who respond to your emails or online chat requests. The My Spokane counter staff also process deposits and financial transactions for internal departments and assist with processing utility bills that come into City via drop boxes.
FTEs
2015 Actual 2016 Actual 2017 Actual 2018 Budget 2019 Proposed
Total FTEs 5.00 5.00 8.00 11.00 11.00
Expenditures:
2015 Actual 2016 Actual 2017 Actual 2018 Budget 2019 Proposed
Capital Outlay 0 4,574 0 0 0
Interfund Charges 0 0 0 0 0
Reserve for Budget Adjustment 0 0 0 0 3,921
Transfers Out 0 0 0 0 0
Wages & Benefits 326,829 376,530 616,391 691,333 742,934
Supplies & Services 4,358 20,999 4,902 0 0
Debt Services 0 0 0 0 0
All Other 0 0 0 0 0
One Vision. One Plan. One Voice.
Planning and Economic Development104

Program Summary: My Spokane 311
Division: Planning and Economic Development
Fund Type: Internal Service Fund
Executive Summary:
My Spokane customer service representatives answer your phone calls to 311 to answer general city questions, process your request for service, or transfer you to the right person to help you. We also have counter staff to help our walk-in customers as well as online questions and emails.
Programs and Services:
My Spokane Customer Service is here to help answer your questions. 311 staff serve as the gateway to city services and information. Our staff are trained to be courteous and friendly and to make sure you receive the right answer from us, or if we don’t know the answer, to help you reach the city employee who does know. 311 staff help you register for parks classes or making changes to your garbage services, such as changing cart size or adding yard waste services. We also will process your complaints about potholes and snowy road conditions, as well as code and parking complaints such as graffiti and abandoned autos. We also handle initial customer service for utility billing, such as billing inquiries or payment arrangements. So if you are moving or simply have a question regarding a payment, we are here to help.
While we try to handle all your requests, we know some need to go to another department that specializes in that area. But we help get you to the right place, so instead of trying to figure out who to call in the City, just dial 311 and we will do that for you. We will even explain why we are transferring the call so you don’t have to repeat yourself. Everything we do is to make Spokane a safe and welcoming city for all.
The My Spokane Service Desk is located on the first floor of City Hall. If you need to pay your utility bill or parking ticket, you will find help at our counter. In fact, counter staff can do the same things the 311 phone staff do, so if you prefer to do business in person, they are there to help you. They also are the employees who respond to your emails or online chat requests. The My Spokane counter staff also process deposits and financial transactions for internal departments and assist with processing utility bills that come into City via drop boxes.
FTEs
2015 Actual 2016 Actual 2017 Actual 2018 Budget 2019 Proposed
Total FTEs 5.00 5.00 8.00 11.00 11.00
Expenditures:
2015 Actual 2016 Actual 2017 Actual 2018 Budget 2019 Proposed
Capital Outlay 0 4,574 0 0 0
Interfund Charges 0 0 0 0 0
Reserve for Budget Adjustment 0 0 0 0 3,921
Transfers Out 0 0 0 0 0
Wages & Benefits 326,829 376,530 616,391 691,333 742,934
Supplies & Services 4,358 20,999 4,902 0 0
Debt Services 0 0 0 0 0
All Other 0 0 0 0 0
TOTAL 331,187 402,103 621,293 691,333 746,855
Expenditure Notes:
Revenues:
2015 Actual 2016 Actual 2017 Actual 2018 Budget 2019 Proposed
Taxes 0 0 0 0 0
Licenses & Permits 0 0 0 0 0
IG Revenue 0 0 0 0 0
Services 279,467 240,061 809,319 947,843 1,360,582
Fines & Forfeits 0 0 0 0 0
Operating Transfers In 0 0 0 0 0
General Fund Resources 51,720 162,042 30,697 280,747 0
All Other 0 0 0 0 0
TOTAL 331,187 402,103 840,016 1,228,590 1,360,582
Revenue Notes:
Planning and Economic Development 105
Program Summary: My Spokane Administration
Division: Planning and Economic Development
Fund Type: Internal Service Fund
Executive Summary:
Great teams need strong leaders and necessary tools to do their jobs. This program supports our 311 team so they can provide you with great customer service.
Programs and Services:
My Spokane-311 uses technology, such as our phone system, computer software programs, and online chat function, to help our staff process your request or answer your questions. We believe that great customer service can be affordable, and funding our software systems helps keep overall costs lower as we are more efficient so less manpower is needed. Our computer systems also allow customers to submit requests online in case you want help when we are closed or simply prefer connecting over the Internet. These same systems also help us automate updates, sent via email or through your account portal. This way you are kept updated on your request.
Providing excellent customer service means we need to make sure our staff is always up-to-date on training. That way we can ensure we are meeting our mission to provide consistent information. We also need tools, such as wireless headsets and credit card machines to be able to provide effortless service to you.
Our leadership team uses your feedback to make changes to 311. We are accountable to you, the customer. We read your surveys and use your comments to improve our service. We also look for ways we can make changes to keep costs down while still providing excellent customer service.
FTEs
2015 Actual 2016 Actual 2017 Actual 2018 Budget 2019 Proposed
Total FTEs 1.00 1.00 1.00 3.00 3.00
Expenditures:
2015 Actual 2016 Actual 2017 Actual 2018 Budget 2019 Proposed
Capital Outlay 732 0 0 0 0
Interfund Charges 0 0 102,400 219,618 285,534
Reserve for Budget Adjustment 0 0 0 0 0
Transfers Out 0 0 0 0 0
Wages & Benefits 144,660 126,461 171,754 300,069 321,394
Supplies & Services 263 5,335 13,579 17,570 30,020
Debt Services 0 0 0 0 0
All Other 0 0 0 0 0
One Vision. One Plan. One Voice.
Planning and Economic Development106
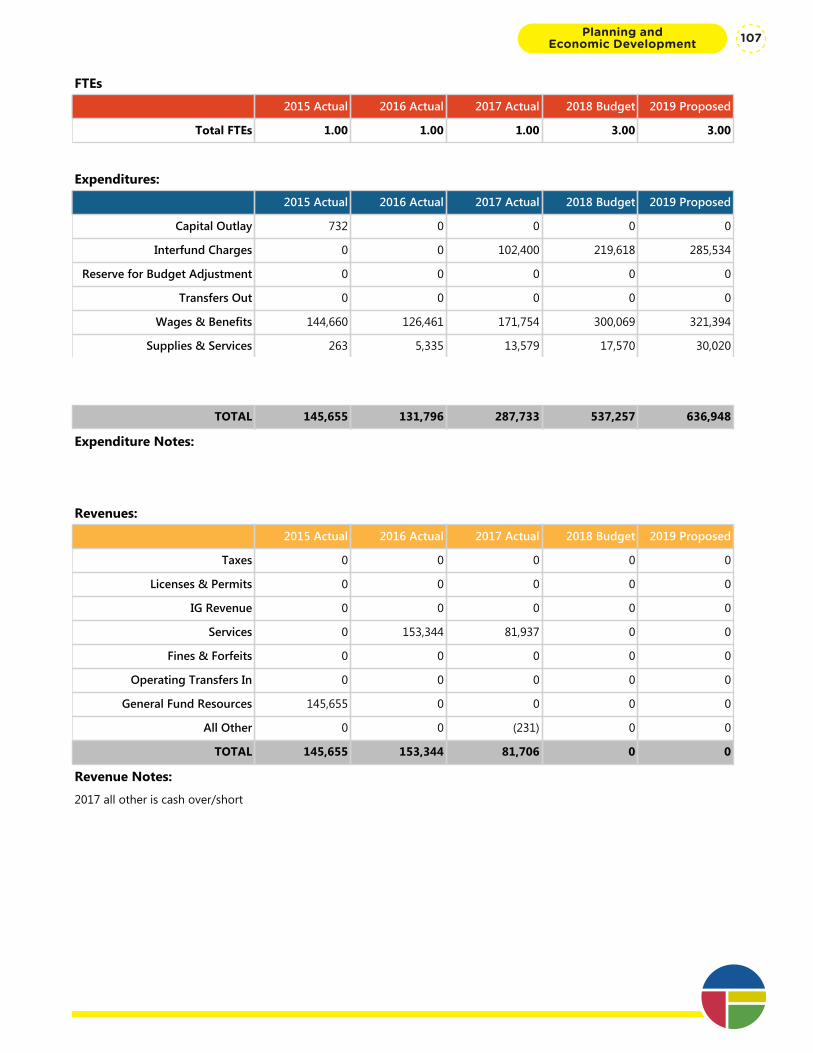
Program Summary: My Spokane Administration
Division: Planning and Economic Development
Fund Type: Internal Service Fund
Executive Summary:
Great teams need strong leaders and necessary tools to do their jobs. This program supports our 311 team so they can provide you with great customer service.
Programs and Services:
My Spokane-311 uses technology, such as our phone system, computer software programs, and online chat function, to help our staff process your request or answer your questions. We believe that great customer service can be affordable, and funding our software systems helps keep overall costs lower as we are more efficient so less manpower is needed. Our computer systems also allow customers to submit requests online in case you want help when we are closed or simply prefer connecting over the Internet. These same systems also help us automate updates, sent via email or through your account portal. This way you are kept updated on your request.
Providing excellent customer service means we need to make sure our staff is always up-to-date on training. That way we can ensure we are meeting our mission to provide consistent information. We also need tools, such as wireless headsets and credit card machines to be able to provide effortless service to you.
Our leadership team uses your feedback to make changes to 311. We are accountable to you, the customer. We read your surveys and use your comments to improve our service. We also look for ways we can make changes to keep costs down while still providing excellent customer service.
FTEs
2015 Actual 2016 Actual 2017 Actual 2018 Budget 2019 Proposed
Total FTEs 1.00 1.00 1.00 3.00 3.00
Expenditures:
2015 Actual 2016 Actual 2017 Actual 2018 Budget 2019 Proposed
Capital Outlay 732 0 0 0 0
Interfund Charges 0 0 102,400 219,618 285,534
Reserve for Budget Adjustment 0 0 0 0 0
Transfers Out 0 0 0 0 0
Wages & Benefits 144,660 126,461 171,754 300,069 321,394
Supplies & Services 263 5,335 13,579 17,570 30,020
Debt Services 0 0 0 0 0
All Other 0 0 0 0 0
TOTAL 145,655 131,796 287,733 537,257 636,948
Expenditure Notes:
Revenues:
2015 Actual 2016 Actual 2017 Actual 2018 Budget 2019 Proposed
Taxes 0 0 0 0 0
Licenses & Permits 0 0 0 0 0
IG Revenue 0 0 0 0 0
Services 0 153,344 81,937 0 0
Fines & Forfeits 0 0 0 0 0
Operating Transfers In 0 0 0 0 0
General Fund Resources 145,655 0 0 0 0
All Other 0 0 (231) 0 0
TOTAL 145,655 153,344 81,706 0 0
Revenue Notes:
2017 all other is cash over/short
Planning and Economic Development 107

One Vision. One Plan. One Voice.
Planning and Economic Development108
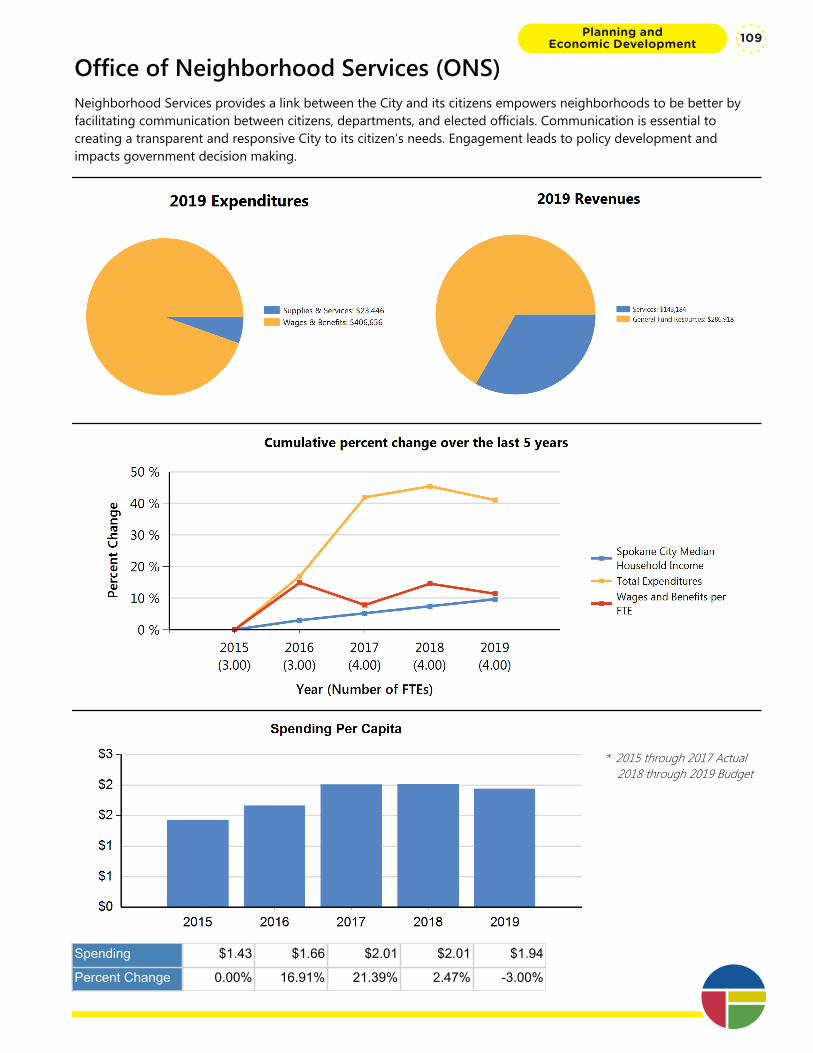
Office of Neighborhood Services (ONS)Neighborhood Services provides a link between the City and its citizens empowers neighborhoods to be better by facilitating communication between citizens, departments, and elected officials. Communication is essential to creating a transparent and responsive City to its citizen’s needs. Engagement leads to policy development and impacts government decision making.
* 2015 through 2017 Actual 2018 through 2019 Budget
Spending $1.43 $1.66 $2.01 $2.01 $1.94
Percent Change 0.00% 16.91% 21.39% 2.47% -3.00%
Planning and Economic Development 109
Department Summary: Office of Neighborhood Services (ONS)
Division: Planning and Economic Development
Fund Type: General Fund
Executive Summary:
Neighborhood Services provides a link between the City and its citizens empowers neighborhoods to be better by facilitating communication between citizens, departments, and elected officials. Communication is essential to creating a transparent and responsive City to its citizen’s needs. Engagement leads to policy development and impacts government decision making.
Programs and Services:
Neighborhood Services will provide the necessary resources to respond to the community, department and agencies needs through effective and continuous communication, process engagement and program implementation. The department’s community program coordinators manage grant programs, facilitate communication and meetings, provide technical assistance and training on a wide variety of needs and concerns, and mediate conflicts for the best resolution possible. The staff will liaise with internal and external groups on a variety of issues from neighborhood cleanup, traffic calming, neighborhood safety, community development and improvement
FTEs
2015 Actual 2016 Actual 2017 Actual 2018 Budget 2019 Proposed
Total FTEs 3.00 3.00 4.00 4.00 4.00
Expenditures:
2015 Actual 2016 Actual 2017 Actual 2018 Budget 2019 Proposed
Capital Outlay 5,600 0 0 0 0
Interfund Charges 0 0 0 0 0
Reserve for Budget Adjustment 0 0 0 0 0
Transfers Out 0 0 0 0 0
Wages & Benefits 276,412 317,620 393,418 420,081 406,656
Supplies & Services 22,881 38,832 39,312 23,347 23,446
Debt Services 0 0 0 0 0
All Other 0 0 0 0 0
TOTAL 304,893 356,452 432,730 443,428 430,102
Expenditure Notes:
Revenues:
2015 Actual 2016 Actual 2017 Actual 2018 Budget 2019 Proposed
Taxes 0 0 0 0 0
Licenses & Permits 0 0 0 0 0
IG Revenue 0 0 0 0 0
Services 0 143,430 171,494 125,184 143,184
Fines & Forfeits 0 0 0 0 0One Vision. One Plan. One Voice.
Planning and Economic Development110

Department Summary: Office of Neighborhood Services (ONS)
Division: Planning and Economic Development
Fund Type: General Fund
Executive Summary:
Neighborhood Services provides a link between the City and its citizens empowers neighborhoods to be better by facilitating communication between citizens, departments, and elected officials. Communication is essential to creating a transparent and responsive City to its citizen’s needs. Engagement leads to policy development and impacts government decision making.
Programs and Services:
Neighborhood Services will provide the necessary resources to respond to the community, department and agencies needs through effective and continuous communication, process engagement and program implementation. The department’s community program coordinators manage grant programs, facilitate communication and meetings, provide technical assistance and training on a wide variety of needs and concerns, and mediate conflicts for the best resolution possible. The staff will liaise with internal and external groups on a variety of issues from neighborhood cleanup, traffic calming, neighborhood safety, community development and improvement
FTEs
2015 Actual 2016 Actual 2017 Actual 2018 Budget 2019 Proposed
Total FTEs 3.00 3.00 4.00 4.00 4.00
Expenditures:
2015 Actual 2016 Actual 2017 Actual 2018 Budget 2019 Proposed
Capital Outlay 5,600 0 0 0 0
Interfund Charges 0 0 0 0 0
Reserve for Budget Adjustment 0 0 0 0 0
Transfers Out 0 0 0 0 0
Wages & Benefits 276,412 317,620 393,418 420,081 406,656
Supplies & Services 22,881 38,832 39,312 23,347 23,446
Debt Services 0 0 0 0 0
All Other 0 0 0 0 0
TOTAL 304,893 356,452 432,730 443,428 430,102
Expenditure Notes:
Revenues:
2015 Actual 2016 Actual 2017 Actual 2018 Budget 2019 Proposed
Taxes 0 0 0 0 0
Licenses & Permits 0 0 0 0 0
IG Revenue 0 0 0 0 0
Services 0 143,430 171,494 125,184 143,184
Fines & Forfeits 0 0 0 0 0
Operating Transfers In 0 0 0 0 0
General Fund Resources 304,893 213,022 261,236 318,244 286,918
All Other 0 0 0 0 0
TOTAL 304,893 356,452 432,730 443,428 430,102
Revenue Notes:
Planning and Economic Development 111

One Vision. One Plan. One Voice.
Planning and Economic Development112
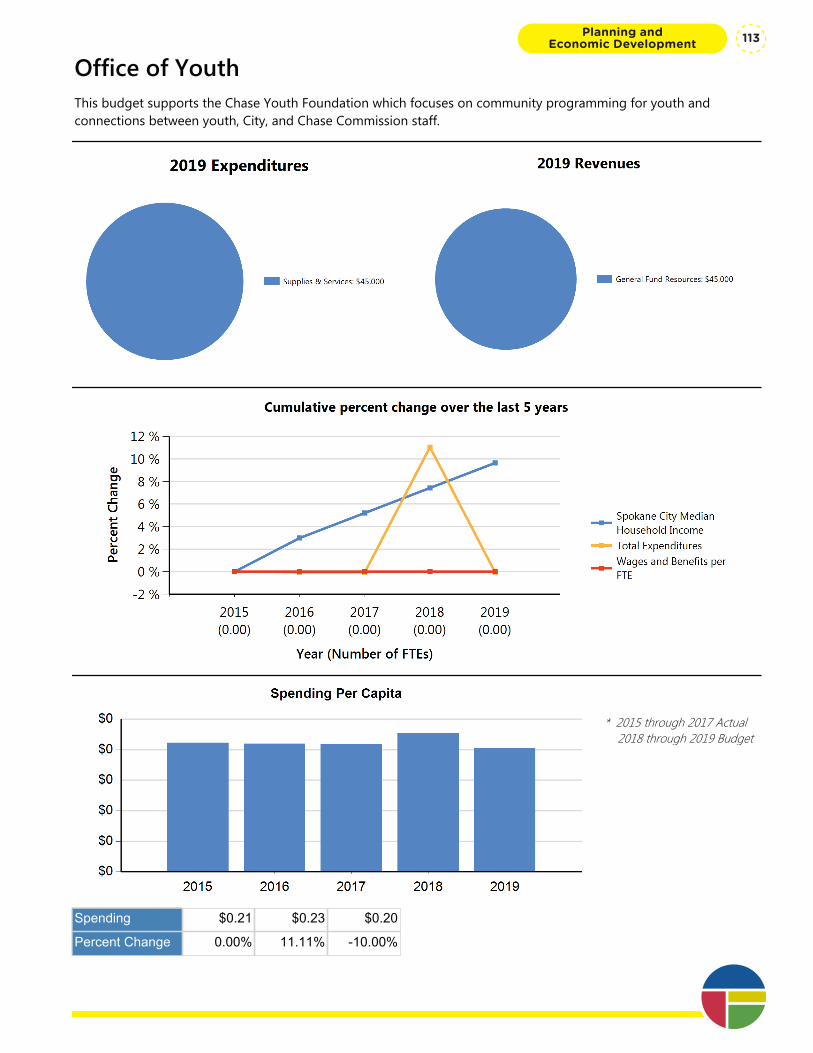
Office of YouthThis budget supports the Chase Youth Foundation which focuses on community programming for youth and connections between youth, City, and Chase Commission staff.
* 2015 through 2017 Actual 2018 through 2019 Budget
Spending $0.21 $0.23 $0.20
Percent Change 0.00% 11.11% -10.00%
Planning and Economic Development 113
Department Summary: Office of Youth
Division: Planning and Economic Development
Fund Type: General Fund
Executive Summary:
This budget supports the Chase Youth Foundation which focuses on community programming for youth and connections between youth, City, and Chase Commission staff.
Programs and Services:
The Chase Youth Commission gives youth a voice in bringing about change in our community. They provide a positive environment to collaborate with young people and empower them to become leaders.
FTEs
2015 Actual 2016 Actual 2017 Actual 2018 Budget 2019 Proposed
Total FTEs 0.00 0.00 0.00 0.00 0.00
Expenditures:
2015 Actual 2016 Actual 2017 Actual 2018 Budget 2019 Proposed
Capital Outlay 0 0 0 0 0
Interfund Charges 0 0 0 0 0
Reserve for Budget Adjustment 0 0 0 0 0
Transfers Out 0 0 0 0 0
Wages & Benefits 0 0 0 0 0
Supplies & Services 45,024 45,000 45,000 50,000 45,000
Debt Services 0 0 0 0 0
All Other 0 0 0 0 0
TOTAL 45,024 45,000 45,000 50,000 45,000
Expenditure Notes:
Revenues:
2015 Actual 2016 Actual 2017 Actual 2018 Budget 2019 Proposed
Taxes 0 0 0 0 0
Licenses & Permits 0 0 0 0 0
IG Revenue 0 0 0 0 0
Services 0 0 0 0 0
Fines & Forfeits 0 0 0 0 0
Operating Transfers In 0 0 0 0 0
General Fund Resources 45,024 45,000 45,000 50,000 45,000
All Other 0 0 0 0 0One Vision. One Plan. One Voice.
Planning and Economic Development114
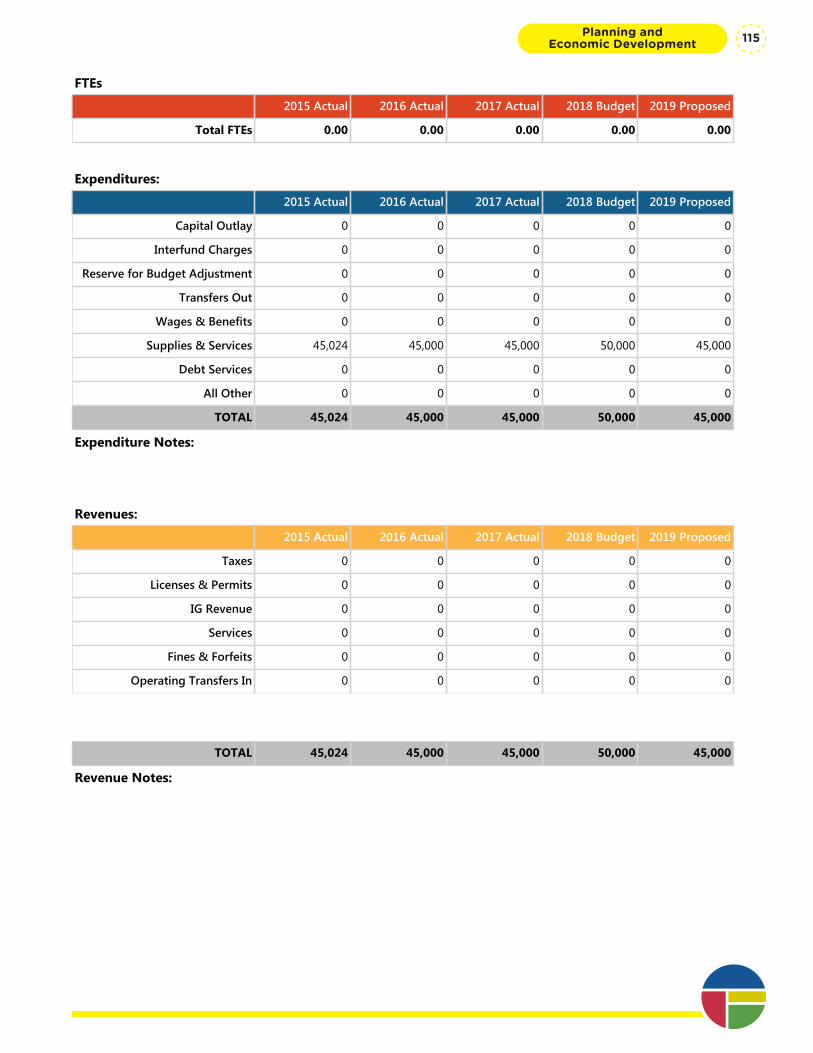
Department Summary: Office of Youth
Division: Planning and Economic Development
Fund Type: General Fund
Executive Summary:
This budget supports the Chase Youth Foundation which focuses on community programming for youth and connections between youth, City, and Chase Commission staff.
Programs and Services:
The Chase Youth Commission gives youth a voice in bringing about change in our community. They provide a positive environment to collaborate with young people and empower them to become leaders.
FTEs
2015 Actual 2016 Actual 2017 Actual 2018 Budget 2019 Proposed
Total FTEs 0.00 0.00 0.00 0.00 0.00
Expenditures:
2015 Actual 2016 Actual 2017 Actual 2018 Budget 2019 Proposed
Capital Outlay 0 0 0 0 0
Interfund Charges 0 0 0 0 0
Reserve for Budget Adjustment 0 0 0 0 0
Transfers Out 0 0 0 0 0
Wages & Benefits 0 0 0 0 0
Supplies & Services 45,024 45,000 45,000 50,000 45,000
Debt Services 0 0 0 0 0
All Other 0 0 0 0 0
TOTAL 45,024 45,000 45,000 50,000 45,000
Expenditure Notes:
Revenues:
2015 Actual 2016 Actual 2017 Actual 2018 Budget 2019 Proposed
Taxes 0 0 0 0 0
Licenses & Permits 0 0 0 0 0
IG Revenue 0 0 0 0 0
Services 0 0 0 0 0
Fines & Forfeits 0 0 0 0 0
Operating Transfers In 0 0 0 0 0
General Fund Resources 45,024 45,000 45,000 50,000 45,000
All Other 0 0 0 0 0
TOTAL 45,024 45,000 45,000 50,000 45,000
Revenue Notes:
Planning and Economic Development 115

One Vision. One Plan. One Voice.
Planning and Economic Development116
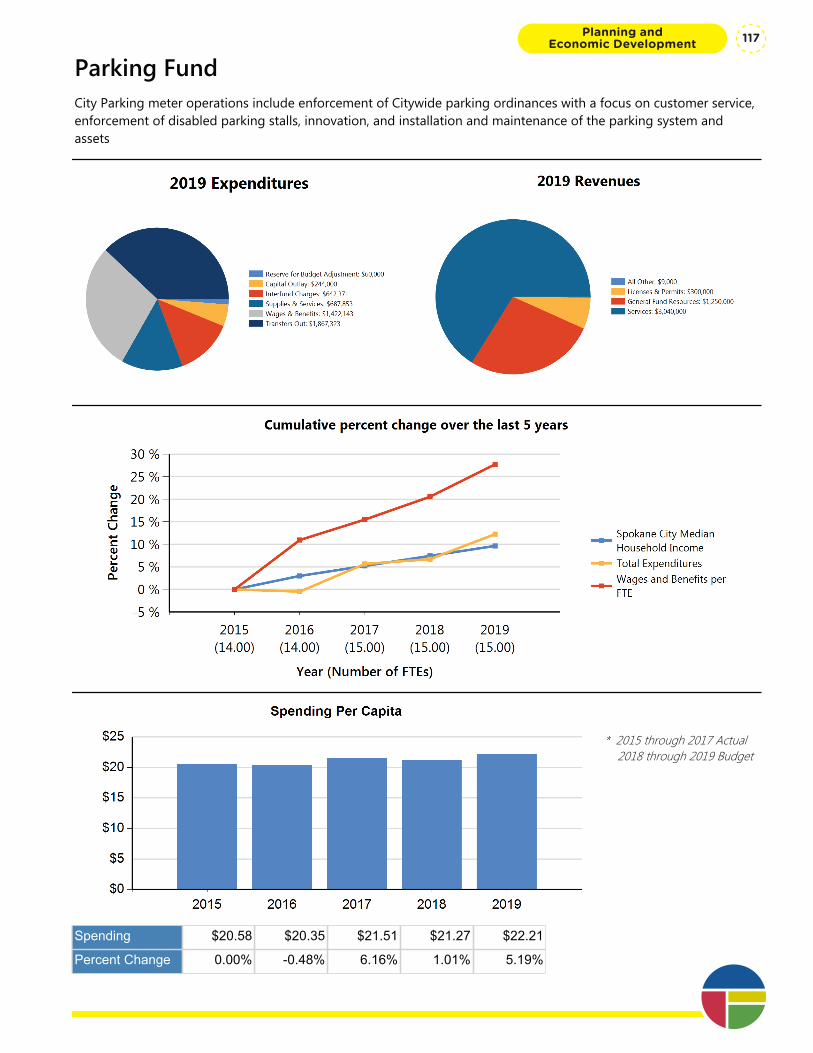
Parking FundCity Parking meter operations include enforcement of Citywide parking ordinances with a focus on customer service, enforcement of disabled parking stalls, innovation, and installation and maintenance of the parking system and assets
* 2015 through 2017 Actual 2018 through 2019 Budget
Spending $20.58 $20.35 $21.51 $21.27 $22.21
Percent Change 0.00% -0.48% 6.16% 1.01% 5.19%
Planning and Economic Development 117
Department Summary: Parking Fund
Division: Planning and Economic Development
Fund Type: Special Revenue Fund
Executive Summary:
City Parking meter operations include enforcement of Citywide parking ordinances with a focus on customer service, enforcement of disabled parking stalls, innovation, and installation and maintenance of the parking system and assets
Programs and Services:
The Parking Department establishes, installs and maintains parking meters as required throughout the approved meter zone. All monies from the parking devices must be regularly collected, counted and receipted to ensure proper handling of the $2.3 million average annual revenues generated from coin transactions. New Smart Meters, which accept credit cards, were installed in some portions of the parking environment which has reduced the frequency of coin collection and manual effort of coin transportation and sorting. Parking system management activities will include enforcement and customer service to provide the recommended turnover and availability of convenient parking spaces within the Central Business District and new areas of expansion. Parking enforcement services will also provide City-wide coverage into residential neighborhoods and commercial/business districts to ensure vehicle and pedestrian safety, mobility and accessibility for all citizens. Enforcement efforts will be accomplished utilizing handheld technologies that provide real time information, data driven decision making and faster response times than previous technologies.
The proposed budget includes funding to enhance operations through the use of emerging software applications and hardware technologies. These funds will be used to implement the recommendations of the Downtown Parking Study. These enhancements will allow for better measures and investment in and around the parking environment.
FTEs
2015 Actual 2016 Actual 2017 Actual 2018 Budget 2019 Proposed
Total FTEs 14.00 14.00 15.00 15.00 15.00
Expenditures:
2015 Actual 2016 Actual 2017 Actual 2018 Budget 2019 Proposed
Capital Outlay 138,111 627,244 57,123 300,000 244,000
Interfund Charges 396,296 398,005 581,069 350,251 642,371
Reserve for Budget Adjustment 0 0 0 0 60,000
Transfers Out 2,257,422 1,743,662 2,254,455 2,218,863 1,867,323
Wages & Benefits 1,016,115 1,127,370 1,262,739 1,326,713 1,422,143
Supplies & Services 577,982 468,287 478,295 484,719 687,853
Debt Services 0 0 0 0 0
All Other 0 0 0 0 0
One Vision. One Plan. One Voice.
Planning and Economic Development118
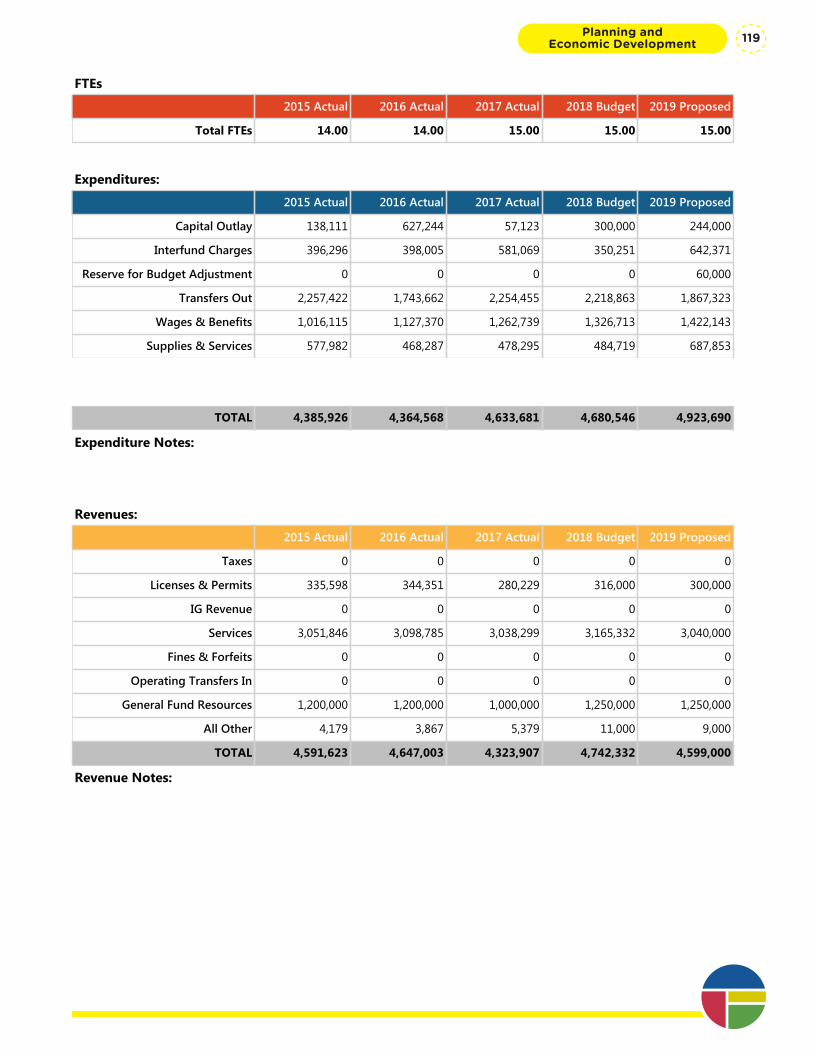
Department Summary: Parking Fund
Division: Planning and Economic Development
Fund Type: Special Revenue Fund
Executive Summary:
City Parking meter operations include enforcement of Citywide parking ordinances with a focus on customer service, enforcement of disabled parking stalls, innovation, and installation and maintenance of the parking system and assets
Programs and Services:
The Parking Department establishes, installs and maintains parking meters as required throughout the approved meter zone. All monies from the parking devices must be regularly collected, counted and receipted to ensure proper handling of the $2.3 million average annual revenues generated from coin transactions. New Smart Meters, which accept credit cards, were installed in some portions of the parking environment which has reduced the frequency of coin collection and manual effort of coin transportation and sorting. Parking system management activities will include enforcement and customer service to provide the recommended turnover and availability of convenient parking spaces within the Central Business District and new areas of expansion. Parking enforcement services will also provide City-wide coverage into residential neighborhoods and commercial/business districts to ensure vehicle and pedestrian safety, mobility and accessibility for all citizens. Enforcement efforts will be accomplished utilizing handheld technologies that provide real time information, data driven decision making and faster response times than previous technologies.
The proposed budget includes funding to enhance operations through the use of emerging software applications and hardware technologies. These funds will be used to implement the recommendations of the Downtown Parking Study. These enhancements will allow for better measures and investment in and around the parking environment.
FTEs
2015 Actual 2016 Actual 2017 Actual 2018 Budget 2019 Proposed
Total FTEs 14.00 14.00 15.00 15.00 15.00
Expenditures:
2015 Actual 2016 Actual 2017 Actual 2018 Budget 2019 Proposed
Capital Outlay 138,111 627,244 57,123 300,000 244,000
Interfund Charges 396,296 398,005 581,069 350,251 642,371
Reserve for Budget Adjustment 0 0 0 0 60,000
Transfers Out 2,257,422 1,743,662 2,254,455 2,218,863 1,867,323
Wages & Benefits 1,016,115 1,127,370 1,262,739 1,326,713 1,422,143
Supplies & Services 577,982 468,287 478,295 484,719 687,853
Debt Services 0 0 0 0 0
All Other 0 0 0 0 0
TOTAL 4,385,926 4,364,568 4,633,681 4,680,546 4,923,690
Expenditure Notes:
Revenues:
2015 Actual 2016 Actual 2017 Actual 2018 Budget 2019 Proposed
Taxes 0 0 0 0 0
Licenses & Permits 335,598 344,351 280,229 316,000 300,000
IG Revenue 0 0 0 0 0
Services 3,051,846 3,098,785 3,038,299 3,165,332 3,040,000
Fines & Forfeits 0 0 0 0 0
Operating Transfers In 0 0 0 0 0
General Fund Resources 1,200,000 1,200,000 1,000,000 1,250,000 1,250,000
All Other 4,179 3,867 5,379 11,000 9,000
TOTAL 4,591,623 4,647,003 4,323,907 4,742,332 4,599,000
Revenue Notes:
Planning and Economic Development 119

One Vision. One Plan. One Voice.
Planning and Economic Development120
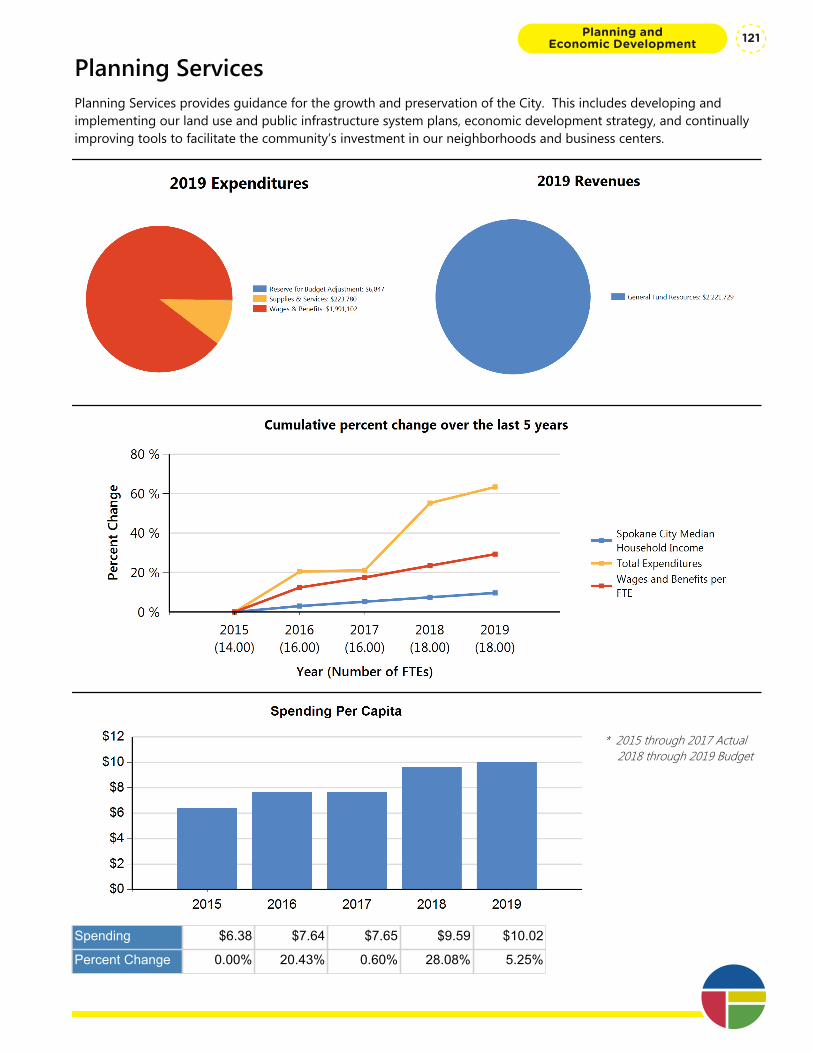
Planning ServicesPlanning Services provides guidance for the growth and preservation of the City. This includes developing and implementing our land use and public infrastructure system plans, economic development strategy, and continually improving tools to facilitate the community’s investment in our neighborhoods and business centers.
* 2015 through 2017 Actual 2018 through 2019 Budget
Spending $6.38 $7.64 $7.65 $9.59 $10.02
Percent Change 0.00% 20.43% 0.60% 28.08% 5.25%
Planning and Economic Development 121
Department Summary: Planning Services
Division: Planning and Economic Development
Fund Type: General Fund
Executive Summary:
Planning Services provides guidance for the growth and preservation of the City. This includes developing and implementing our land use and public infrastructure system plans, economic development strategy, and continually improving tools to facilitate the community’s investment in our neighborhoods and business centers.
Programs and Services:
The program provides comprehensive planning, economic analysis, strategic planning, and advanced project development services for the City, with a focus on targeted investment areas and catalyst projects. The program team collaborates and partners with Neighborhood Councils and community organization, business associations, PDAs, and agencies. It coordinates the maintenance and implementation of the City's Comprehensive Plan, the Unified Development Code, and economic development incentive programs.
FTEs
2015 Actual 2016 Actual 2017 Actual 2018 Budget 2019 Proposed
Total FTEs 14.00 16.00 16.00 18.00 18.00
Expenditures:
2015 Actual 2016 Actual 2017 Actual 2018 Budget 2019 Proposed
Capital Outlay 0 3,096 0 0 0
Interfund Charges 282 384 0 55,591 0
Reserve for Budget Adjustment 0 0 0 29,741 6,847
Transfers Out 0 0 0 0 0
Wages & Benefits 1,168,924 1,501,783 1,577,974 1,881,097 1,991,102
Supplies & Services 190,819 132,630 69,871 144,291 223,780
Debt Services 0 0 0 0 0
All Other 0 0 0 0 0
TOTAL 1,360,025 1,637,893 1,647,845 2,110,720 2,221,729
Expenditure Notes:
Revenues:
2015 Actual 2016 Actual 2017 Actual 2018 Budget 2019 Proposed
Taxes 0 0 0 0 0
Licenses & Permits 0 0 0 0 0
IG Revenue 0 0 0 0 0
Services 11,825 22,112 5,034 38,588 0
Fines & Forfeits 0 0 0 0 0One Vision. One Plan. One Voice.
Planning and Economic Development122

Department Summary: Planning Services
Division: Planning and Economic Development
Fund Type: General Fund
Executive Summary:
Planning Services provides guidance for the growth and preservation of the City. This includes developing and implementing our land use and public infrastructure system plans, economic development strategy, and continually improving tools to facilitate the community’s investment in our neighborhoods and business centers.
Programs and Services:
The program provides comprehensive planning, economic analysis, strategic planning, and advanced project development services for the City, with a focus on targeted investment areas and catalyst projects. The program team collaborates and partners with Neighborhood Councils and community organization, business associations, PDAs, and agencies. It coordinates the maintenance and implementation of the City's Comprehensive Plan, the Unified Development Code, and economic development incentive programs.
FTEs
2015 Actual 2016 Actual 2017 Actual 2018 Budget 2019 Proposed
Total FTEs 14.00 16.00 16.00 18.00 18.00
Expenditures:
2015 Actual 2016 Actual 2017 Actual 2018 Budget 2019 Proposed
Capital Outlay 0 3,096 0 0 0
Interfund Charges 282 384 0 55,591 0
Reserve for Budget Adjustment 0 0 0 29,741 6,847
Transfers Out 0 0 0 0 0
Wages & Benefits 1,168,924 1,501,783 1,577,974 1,881,097 1,991,102
Supplies & Services 190,819 132,630 69,871 144,291 223,780
Debt Services 0 0 0 0 0
All Other 0 0 0 0 0
TOTAL 1,360,025 1,637,893 1,647,845 2,110,720 2,221,729
Expenditure Notes:
Revenues:
2015 Actual 2016 Actual 2017 Actual 2018 Budget 2019 Proposed
Taxes 0 0 0 0 0
Licenses & Permits 0 0 0 0 0
IG Revenue 0 0 0 0 0
Services 11,825 22,112 5,034 38,588 0
Fines & Forfeits 0 0 0 0 0
Operating Transfers In 0 0 50,000 0 0
General Fund Resources 1,348,200 1,615,781 1,592,286 2,072,132 2,221,729
All Other 0 0 525 0 0
TOTAL 1,360,025 1,637,893 1,647,845 2,110,720 2,221,729
Revenue Notes:
Planning and Economic Development 123
Program Summary: Planning & Development
Division: Planning and Economic Development
Fund Type: General Fund
Executive Summary:
Provide guidance for growth and preservation of the City. This includes the sub-area and neighborhood planning, economic development strategy and funding, Comprehensive Plan maintenance and updates, updates to the Unified Development Code including standards and guidelines.
Programs and Services:
The program provides comprehensive planning, economic analysis, and advanced project development services for targeted development and geographic areas in concert with development partners such as the Downtown Spokane Partnership, Greater Spokane Incorporated, City created PDAs, U-District Board, Spokane Airports, Neighborhoods and Neighborhood Business organizations and others. It coordinates the maintenance of the Comprehensive Plan, the Unified Development Code, and Incentive Programs.
FTEs
2015 Actual 2016 Actual 2017 Actual 2018 Budget 2019 Proposed
Total FTEs 11.00 13.00 13.00 15.00 15.00
Expenditures:
2015 Actual 2016 Actual 2017 Actual 2018 Budget 2019 Proposed
Capital Outlay 0 0 0 0 0
Interfund Charges 0 0 0 27,113 0
Reserve for Budget Adjustment 0 0 0 19,500 0
Transfers Out 0 0 0 0 0
Wages & Benefits 944,322 1,201,144 1,291,682 1,579,665 1,672,353
Supplies & Services 128 0 0 288 0
Debt Services 0 0 0 0 0
All Other 0 0 0 0 0
TOTAL 944,450 1,201,144 1,291,682 1,626,566 1,672,353
Expenditure Notes:
Revenues:
2015 Actual 2016 Actual 2017 Actual 2018 Budget 2019 Proposed
Taxes 0 0 0 0 0
Licenses & Permits 0 0 0 0 0
IG Revenue 0 0 0 0 0
Services 0 0 0 0 0
Fines & Forfeits 0 0 0 0 0One Vision. One Plan. One Voice.
Planning and Economic Development124

Program Summary: Planning & Development
Division: Planning and Economic Development
Fund Type: General Fund
Executive Summary:
Provide guidance for growth and preservation of the City. This includes the sub-area and neighborhood planning, economic development strategy and funding, Comprehensive Plan maintenance and updates, updates to the Unified Development Code including standards and guidelines.
Programs and Services:
The program provides comprehensive planning, economic analysis, and advanced project development services for targeted development and geographic areas in concert with development partners such as the Downtown Spokane Partnership, Greater Spokane Incorporated, City created PDAs, U-District Board, Spokane Airports, Neighborhoods and Neighborhood Business organizations and others. It coordinates the maintenance of the Comprehensive Plan, the Unified Development Code, and Incentive Programs.
FTEs
2015 Actual 2016 Actual 2017 Actual 2018 Budget 2019 Proposed
Total FTEs 11.00 13.00 13.00 15.00 15.00
Expenditures:
2015 Actual 2016 Actual 2017 Actual 2018 Budget 2019 Proposed
Capital Outlay 0 0 0 0 0
Interfund Charges 0 0 0 27,113 0
Reserve for Budget Adjustment 0 0 0 19,500 0
Transfers Out 0 0 0 0 0
Wages & Benefits 944,322 1,201,144 1,291,682 1,579,665 1,672,353
Supplies & Services 128 0 0 288 0
Debt Services 0 0 0 0 0
All Other 0 0 0 0 0
TOTAL 944,450 1,201,144 1,291,682 1,626,566 1,672,353
Expenditure Notes:
Revenues:
2015 Actual 2016 Actual 2017 Actual 2018 Budget 2019 Proposed
Taxes 0 0 0 0 0
Licenses & Permits 0 0 0 0 0
IG Revenue 0 0 0 0 0
Services 0 0 0 0 0
Fines & Forfeits 0 0 0 0 0
Operating Transfers In 0 0 0 0 0
General Fund Resources 944,450 1,201,144 1,291,157 1,626,566 1,672,353
All Other 0 0 525 0 0
TOTAL 944,450 1,201,144 1,291,682 1,626,566 1,672,353
Revenue Notes:
Planning and Economic Development 125
Program Summary: Planning Services Administration
Division: Planning and Economic Development
Fund Type: General Fund
Executive Summary:
Management and administration expenses for the Planning Services Department.
Programs and Services:
This fund includes the Director and clerks who support the Department and various boards and commission such as the Design Review Board, City Plan Commission and Plan Commission Transportation Subcommittee. This also includes contractual services, employee training, supplies, and interdepartmental service funds.
FTEs
2015 Actual 2016 Actual 2017 Actual 2018 Budget 2019 Proposed
Total FTEs 3.00 3.00 3.00 3.00 3.00
Expenditures:
2015 Actual 2016 Actual 2017 Actual 2018 Budget 2019 Proposed
Capital Outlay 0 3,096 0 0 0
Interfund Charges 282 384 0 28,478 0
Reserve for Budget Adjustment 0 0 0 10,241 6,847
Transfers Out 0 0 0 0 0
Wages & Benefits 224,602 300,639 286,292 301,432 318,749
Supplies & Services 190,691 132,630 69,871 144,003 223,780
Debt Services 0 0 0 0 0
All Other 0 0 0 0 0
TOTAL 415,575 436,749 356,163 484,154 549,376
Expenditure Notes:
Revenues:
2015 Actual 2016 Actual 2017 Actual 2018 Budget 2019 Proposed
Taxes 0 0 0 0 0
Licenses & Permits 0 0 0 0 0
IG Revenue 0 0 0 0 0
Services 11,825 22,112 5,034 38,588 0
Fines & Forfeits 0 0 0 0 0
Operating Transfers In 0 0 50,000 0 0
General Fund Resources 403,750 414,637 301,129 445,566 549,376
All Other 0 0 0 0 0One Vision. One Plan. One Voice.
Planning and Economic Development126
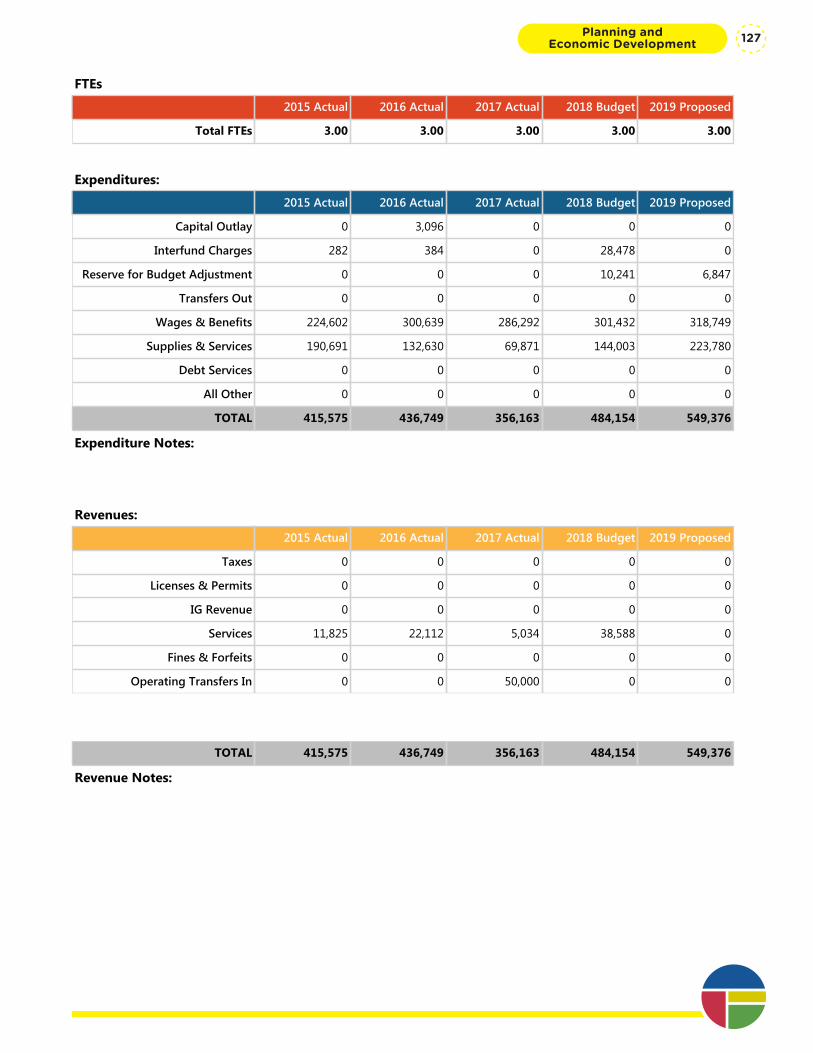
Program Summary: Planning Services Administration
Division: Planning and Economic Development
Fund Type: General Fund
Executive Summary:
Management and administration expenses for the Planning Services Department.
Programs and Services:
This fund includes the Director and clerks who support the Department and various boards and commission such as the Design Review Board, City Plan Commission and Plan Commission Transportation Subcommittee. This also includes contractual services, employee training, supplies, and interdepartmental service funds.
FTEs
2015 Actual 2016 Actual 2017 Actual 2018 Budget 2019 Proposed
Total FTEs 3.00 3.00 3.00 3.00 3.00
Expenditures:
2015 Actual 2016 Actual 2017 Actual 2018 Budget 2019 Proposed
Capital Outlay 0 3,096 0 0 0
Interfund Charges 282 384 0 28,478 0
Reserve for Budget Adjustment 0 0 0 10,241 6,847
Transfers Out 0 0 0 0 0
Wages & Benefits 224,602 300,639 286,292 301,432 318,749
Supplies & Services 190,691 132,630 69,871 144,003 223,780
Debt Services 0 0 0 0 0
All Other 0 0 0 0 0
TOTAL 415,575 436,749 356,163 484,154 549,376
Expenditure Notes:
Revenues:
2015 Actual 2016 Actual 2017 Actual 2018 Budget 2019 Proposed
Taxes 0 0 0 0 0
Licenses & Permits 0 0 0 0 0
IG Revenue 0 0 0 0 0
Services 11,825 22,112 5,034 38,588 0
Fines & Forfeits 0 0 0 0 0
Operating Transfers In 0 0 50,000 0 0
General Fund Resources 403,750 414,637 301,129 445,566 549,376
All Other 0 0 0 0 0
TOTAL 415,575 436,749 356,163 484,154 549,376
Revenue Notes:
Planning and Economic Development 127

One Vision. One Plan. One Voice.
Planning and Economic Development128
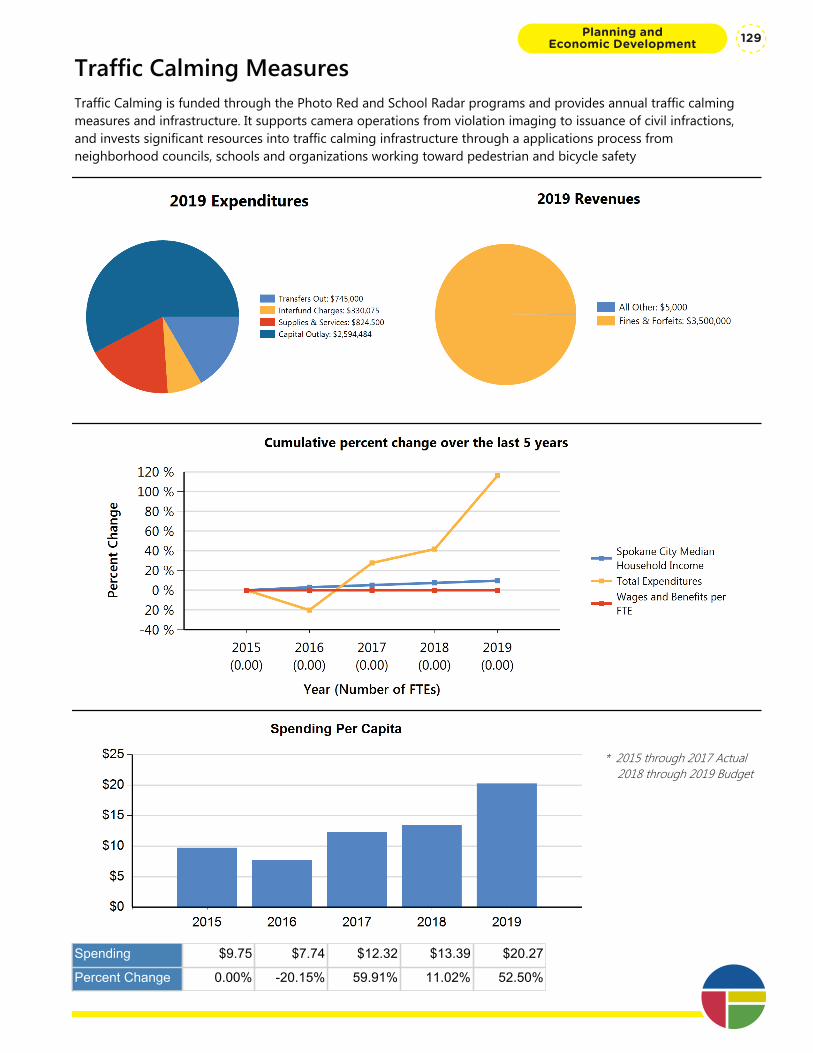
Traffic Calming MeasuresTraffic Calming is funded through the Photo Red and School Radar programs and provides annual traffic calming measures and infrastructure. It supports camera operations from violation imaging to issuance of civil infractions, and invests significant resources into traffic calming infrastructure through a applications process from neighborhood councils, schools and organizations working toward pedestrian and bicycle safety
* 2015 through 2017 Actual 2018 through 2019 Budget
Spending $9.75 $7.74 $12.32 $13.39 $20.27
Percent Change 0.00% -20.15% 59.91% 11.02% 52.50%
Planning and Economic Development 129
Department Summary: Traffic Calming Measures
Division: Planning and Economic Development
Fund Type: Special Revenue Fund
Executive Summary:
Traffic Calming is funded through the Photo Red and School Radar programs and provides annual traffic calming measures and infrastructure. It supports camera operations from violation imaging to issuance of civil infractions, and invests significant resources into traffic calming infrastructure through a applications process from neighborhood councils, schools and organizations working toward pedestrian and bicycle safety
Programs and Services:
Traffic Calming and School Safety programming is managed through the Neighborhood Services Program. Education, program training, application processing and project oversight are provided for the 29 neighborhoods, schools and community groups. The process is coordinated with an interdisciplinary team of City Engineers, Traffic Engineers and work with a sub-committee of elected officials. The projects requested for implementation includes improvements to sidewalks, bicycle lanes, curbing for reduced speed, safety features (cross walks, traffic circles, and speed feedback signage) and increased pedestrian buffers. Under Freeway Parking
FTEs
2015 Actual 2016 Actual 2017 Actual 2018 Budget 2019 Proposed
Total FTEs 0.00 0.00 0.00 0.00 0.00
Expenditures:
2015 Actual 2016 Actual 2017 Actual 2018 Budget 2019 Proposed
Capital Outlay 1,154,143 588,639 957,479 1,232,063 2,594,484
Interfund Charges 138,119 222,946 167,398 188,857 330,075
Reserve for Budget Adjustment 0 0 0 0 0
Transfers Out 100,000 72,257 760,000 745,000 745,000
Wages & Benefits 0 0 0 0 0
Supplies & Services 686,420 775,909 769,311 781,000 824,500
Debt Services 0 0 0 0 0
All Other 0 0 0 0 0
TOTAL 2,078,682 1,659,751 2,654,188 2,946,920 4,494,059
Expenditure Notes:
Revenues:
2015 Actual 2016 Actual 2017 Actual 2018 Budget 2019 Proposed
Taxes 0 0 0 0 0
Licenses & Permits 0 0 0 0 0
IG Revenue 0 0 0 0 0
Services 0 0 0 0 0One Vision. One Plan. One Voice.
Planning and Economic Development130
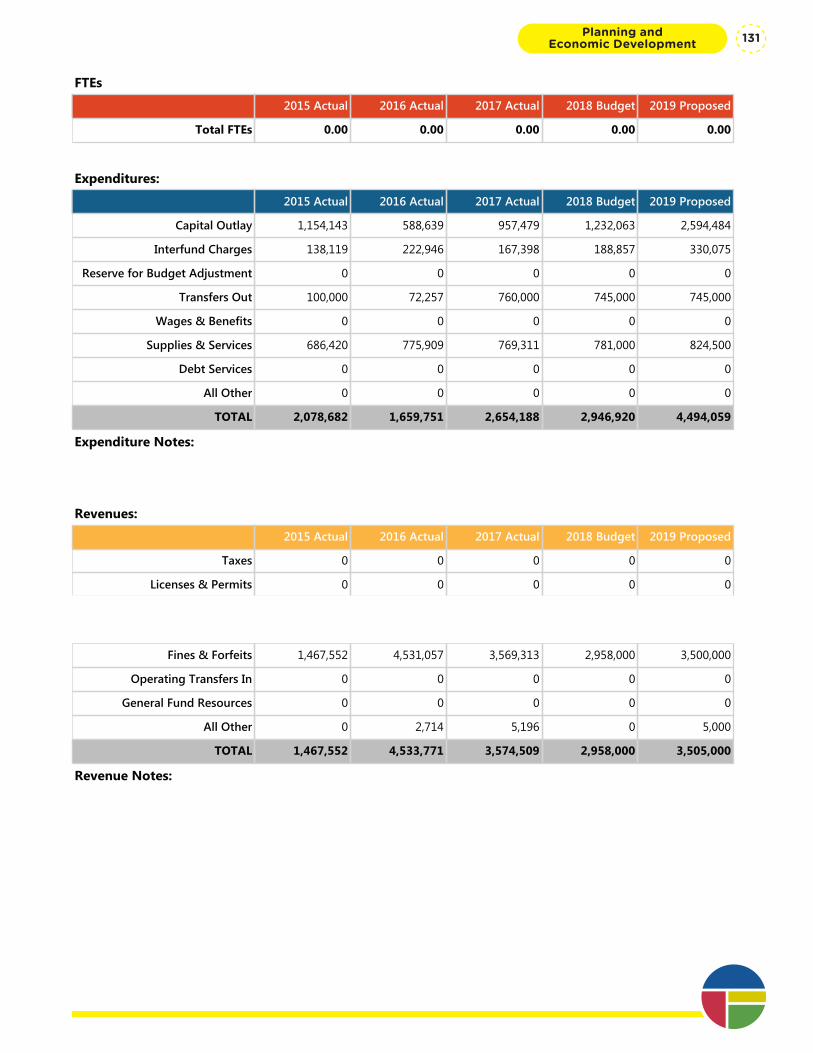
Department Summary: Traffic Calming Measures
Division: Planning and Economic Development
Fund Type: Special Revenue Fund
Executive Summary:
Traffic Calming is funded through the Photo Red and School Radar programs and provides annual traffic calming measures and infrastructure. It supports camera operations from violation imaging to issuance of civil infractions, and invests significant resources into traffic calming infrastructure through a applications process from neighborhood councils, schools and organizations working toward pedestrian and bicycle safety
Programs and Services:
Traffic Calming and School Safety programming is managed through the Neighborhood Services Program. Education, program training, application processing and project oversight are provided for the 29 neighborhoods, schools and community groups. The process is coordinated with an interdisciplinary team of City Engineers, Traffic Engineers and work with a sub-committee of elected officials. The projects requested for implementation includes improvements to sidewalks, bicycle lanes, curbing for reduced speed, safety features (cross walks, traffic circles, and speed feedback signage) and increased pedestrian buffers. Under Freeway Parking
FTEs
2015 Actual 2016 Actual 2017 Actual 2018 Budget 2019 Proposed
Total FTEs 0.00 0.00 0.00 0.00 0.00
Expenditures:
2015 Actual 2016 Actual 2017 Actual 2018 Budget 2019 Proposed
Capital Outlay 1,154,143 588,639 957,479 1,232,063 2,594,484
Interfund Charges 138,119 222,946 167,398 188,857 330,075
Reserve for Budget Adjustment 0 0 0 0 0
Transfers Out 100,000 72,257 760,000 745,000 745,000
Wages & Benefits 0 0 0 0 0
Supplies & Services 686,420 775,909 769,311 781,000 824,500
Debt Services 0 0 0 0 0
All Other 0 0 0 0 0
TOTAL 2,078,682 1,659,751 2,654,188 2,946,920 4,494,059
Expenditure Notes:
Revenues:
2015 Actual 2016 Actual 2017 Actual 2018 Budget 2019 Proposed
Taxes 0 0 0 0 0
Licenses & Permits 0 0 0 0 0
IG Revenue 0 0 0 0 0
Services 0 0 0 0 0
Fines & Forfeits 1,467,552 4,531,057 3,569,313 2,958,000 3,500,000
Operating Transfers In 0 0 0 0 0
General Fund Resources 0 0 0 0 0
All Other 0 2,714 5,196 0 5,000
TOTAL 1,467,552 4,533,771 3,574,509 2,958,000 3,505,000
Revenue Notes:
Planning and Economic Development 131

One Vision. One Plan. One Voice.
Planning and Economic Development132
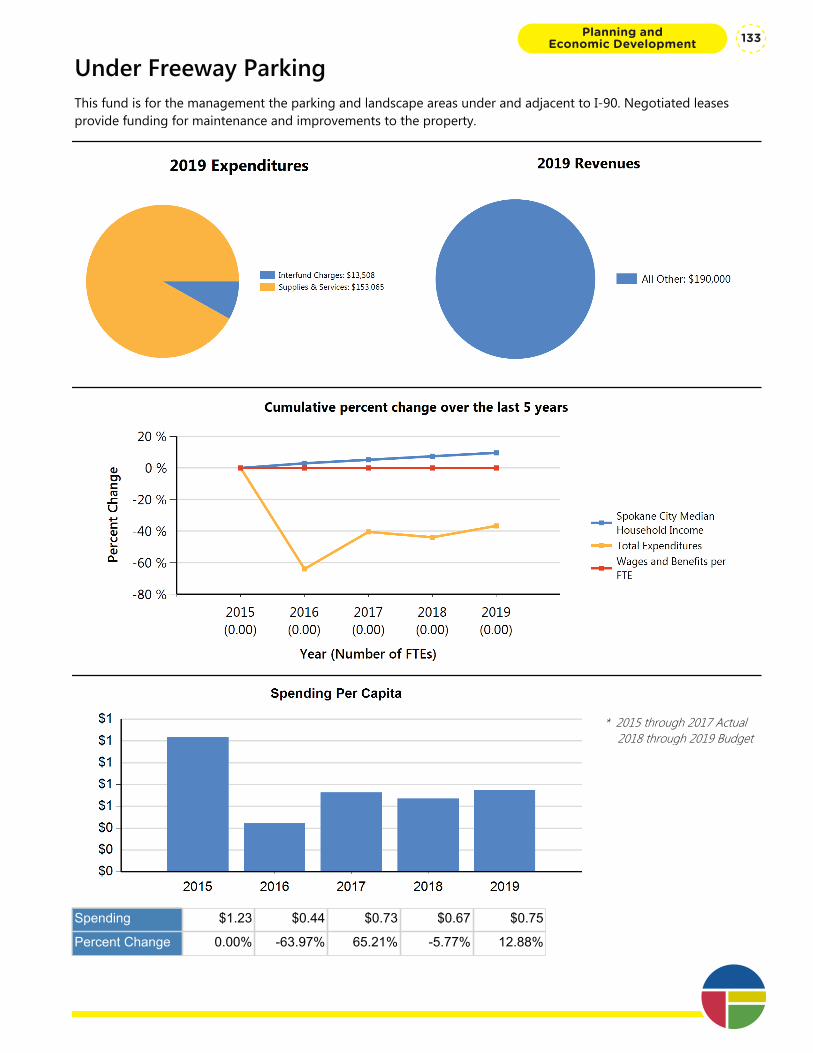
Under Freeway ParkingThis fund is for the management the parking and landscape areas under and adjacent to I-90. Negotiated leases provide funding for maintenance and improvements to the property.
* 2015 through 2017 Actual 2018 through 2019 Budget
Spending $1.23 $0.44 $0.73 $0.67 $0.75
Percent Change 0.00% -63.97% 65.21% -5.77% 12.88%
Planning and Economic Development 133
Department Summary: Under Freeway Parking
Division: Planning and Economic Development
Fund Type: Special Revenue Fund
Executive Summary:
This fund is for the management the parking and landscape areas under and adjacent to I-90. Negotiated leases provide funding for maintenance and improvements to the property.
Programs and Services:
The Washington State Department of Transportation has contracted with the City of Spokane for maintenance of state-owned property located under Interstate I-90. Additionally, the City has leased at no cost this property and subsequently entered into subleases with individuals and companies for parking facilities.
FTEs
2015 Actual 2016 Actual 2017 Actual 2018 Budget 2019 Proposed
Total FTEs 0.00 0.00 0.00 0.00 0.00
Expenditures:
2015 Actual 2016 Actual 2017 Actual 2018 Budget 2019 Proposed
Capital Outlay 83,467 0 48,625 0 0
Interfund Charges 21,466 7,040 11,628 9,056 13,508
Reserve for Budget Adjustment 0 0 0 0 0
Transfers Out 0 0 0 0 0
Wages & Benefits 7,046 4,341 0 0 0
Supplies & Services 151,118 83,412 93,331 138,504 153,065
Debt Services 0 0 0 0 0
All Other 0 0 3,027 0 0
TOTAL 263,097 94,793 156,611 147,560 166,573
Expenditure Notes:
Revenues:
2015 Actual 2016 Actual 2017 Actual 2018 Budget 2019 Proposed
Taxes 0 0 0 0 0
Licenses & Permits 0 0 0 0 0
IG Revenue 0 0 0 0 0
Services 0 0 0 0 0
Fines & Forfeits 0 0 0 0 0
Operating Transfers In 0 0 0 0 0
General Fund Resources 0 0 0 0 0One Vision. One Plan. One Voice.
Planning and Economic Development134

Department Summary: Under Freeway Parking
Division: Planning and Economic Development
Fund Type: Special Revenue Fund
Executive Summary:
This fund is for the management the parking and landscape areas under and adjacent to I-90. Negotiated leases provide funding for maintenance and improvements to the property.
Programs and Services:
The Washington State Department of Transportation has contracted with the City of Spokane for maintenance of state-owned property located under Interstate I-90. Additionally, the City has leased at no cost this property and subsequently entered into subleases with individuals and companies for parking facilities.
FTEs
2015 Actual 2016 Actual 2017 Actual 2018 Budget 2019 Proposed
Total FTEs 0.00 0.00 0.00 0.00 0.00
Expenditures:
2015 Actual 2016 Actual 2017 Actual 2018 Budget 2019 Proposed
Capital Outlay 83,467 0 48,625 0 0
Interfund Charges 21,466 7,040 11,628 9,056 13,508
Reserve for Budget Adjustment 0 0 0 0 0
Transfers Out 0 0 0 0 0
Wages & Benefits 7,046 4,341 0 0 0
Supplies & Services 151,118 83,412 93,331 138,504 153,065
Debt Services 0 0 0 0 0
All Other 0 0 3,027 0 0
TOTAL 263,097 94,793 156,611 147,560 166,573
Expenditure Notes:
Revenues:
2015 Actual 2016 Actual 2017 Actual 2018 Budget 2019 Proposed
Taxes 0 0 0 0 0
Licenses & Permits 0 0 0 0 0
IG Revenue 0 0 0 0 0
Services 0 0 0 0 0
Fines & Forfeits 0 0 0 0 0
Operating Transfers In 0 0 0 0 0
General Fund Resources 0 0 0 0 0
All Other 159,434 173,705 193,767 173,108 190,000
TOTAL 159,434 173,705 193,767 173,108 190,000
Revenue Notes:
Planning and Economic Development 135

One Vision. One Plan. One Voice.
Planning and Economic Development136
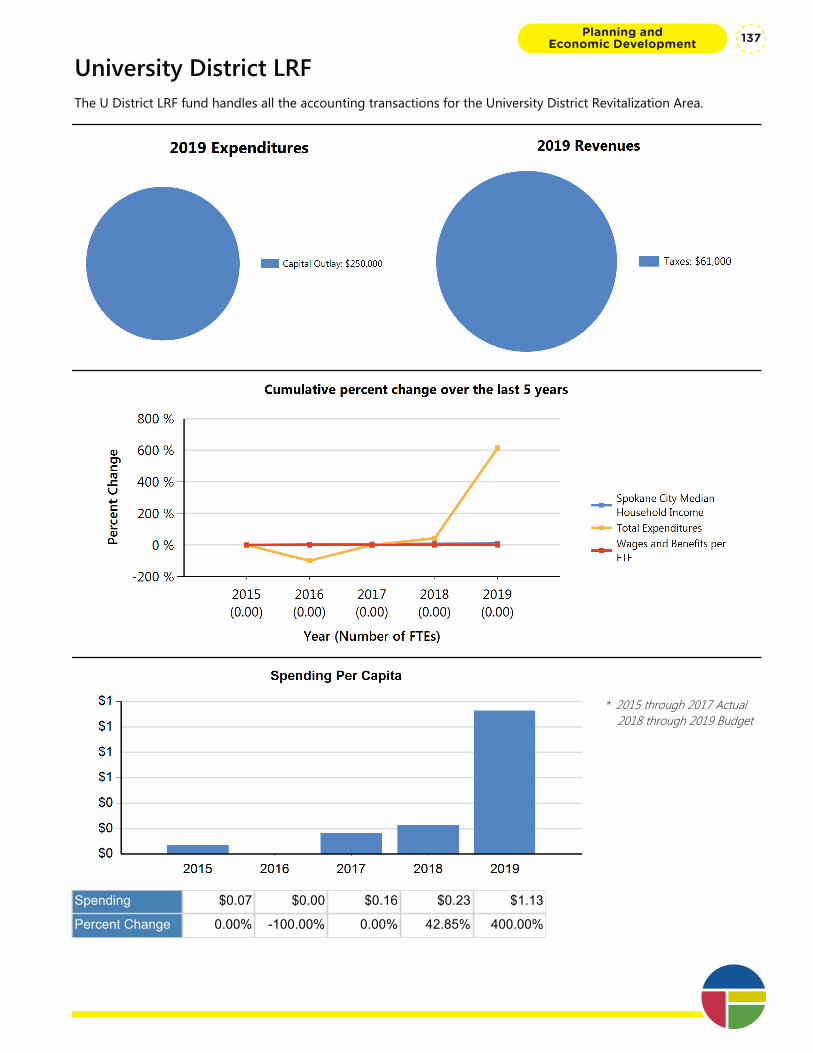
University District LRFThe U District LRF fund handles all the accounting transactions for the University District Revitalization Area.
* 2015 through 2017 Actual 2018 through 2019 Budget
Spending $0.07 $0.00 $0.16 $0.23 $1.13
Percent Change 0.00% -100.00% 0.00% 42.85% 400.00%
Planning and Economic Development 137
Department Summary: University District LRF
Division: Planning and Economic Development
Fund Type: Capital Project Fund
Executive Summary:
The U District LRF fund handles all the accounting transactions for the University District Revitalization Area.
Programs and Services:
The U District LRF is used for the transactions of all eligible project costs associated with the Spokane University District Revitalization Area public improvements. The Spokane University District Revitalization Area was created by Ordinance of the City Council (Ordinance No. C34470) to use incremental local property and sales tax revenue together with a state-approved match implemented through a sales tax credit (Ord. No. 34730) to finance public improvements within the Spokane University District as provided for in RCW 39.104. This bid acts as the cash flow account for the Spokane University District Revitalization Area (UDRA) fund.
FTEs
2015 Actual 2016 Actual 2017 Actual 2018 Budget 2019 Proposed
Total FTEs 0.00 0.00 0.00 0.00 0.00
Expenditures:
2015 Actual 2016 Actual 2017 Actual 2018 Budget 2019 Proposed
Capital Outlay 15,000 0 0 50,000 250,000
Interfund Charges 0 0 0 0 0
Reserve for Budget Adjustment 0 0 0 0 0
Transfers Out 0 0 0 0 0
Wages & Benefits 0 0 0 0 0
Supplies & Services 0 0 35,000 0 0
Debt Services 0 0 0 0 0
All Other 0 0 0 0 0
TOTAL 15,000 0 35,000 50,000 250,000
Expenditure Notes:
Revenues:
2015 Actual 2016 Actual 2017 Actual 2018 Budget 2019 Proposed
Taxes 38,079 48,438 62,339 73,500 61,000
Licenses & Permits 0 0 0 0 0
IG Revenue 0 0 0 0 0
Services 0 0 0 0 0
Fines & Forfeits 0 0 0 0 0
Operating Transfers In 0 0 0 0 0One Vision. One Plan. One Voice.
Planning and Economic Development138

Department Summary: University District LRF
Division: Planning and Economic Development
Fund Type: Capital Project Fund
Executive Summary:
The U District LRF fund handles all the accounting transactions for the University District Revitalization Area.
Programs and Services:
The U District LRF is used for the transactions of all eligible project costs associated with the Spokane University District Revitalization Area public improvements. The Spokane University District Revitalization Area was created by Ordinance of the City Council (Ordinance No. C34470) to use incremental local property and sales tax revenue together with a state-approved match implemented through a sales tax credit (Ord. No. 34730) to finance public improvements within the Spokane University District as provided for in RCW 39.104. This bid acts as the cash flow account for the Spokane University District Revitalization Area (UDRA) fund.
FTEs
2015 Actual 2016 Actual 2017 Actual 2018 Budget 2019 Proposed
Total FTEs 0.00 0.00 0.00 0.00 0.00
Expenditures:
2015 Actual 2016 Actual 2017 Actual 2018 Budget 2019 Proposed
Capital Outlay 15,000 0 0 50,000 250,000
Interfund Charges 0 0 0 0 0
Reserve for Budget Adjustment 0 0 0 0 0
Transfers Out 0 0 0 0 0
Wages & Benefits 0 0 0 0 0
Supplies & Services 0 0 35,000 0 0
Debt Services 0 0 0 0 0
All Other 0 0 0 0 0
TOTAL 15,000 0 35,000 50,000 250,000
Expenditure Notes:
Revenues:
2015 Actual 2016 Actual 2017 Actual 2018 Budget 2019 Proposed
Taxes 38,079 48,438 62,339 73,500 61,000
Licenses & Permits 0 0 0 0 0
IG Revenue 0 0 0 0 0
Services 0 0 0 0 0
Fines & Forfeits 0 0 0 0 0
Operating Transfers In 0 0 0 0 0
General Fund Resources 0 0 0 0 0
All Other 0 0 0 0 0
TOTAL 38,079 48,438 62,339 73,500 61,000
Revenue Notes:
Planning and Economic Development 139

One Vision. One Plan. One Voice.
Planning and Economic Development140
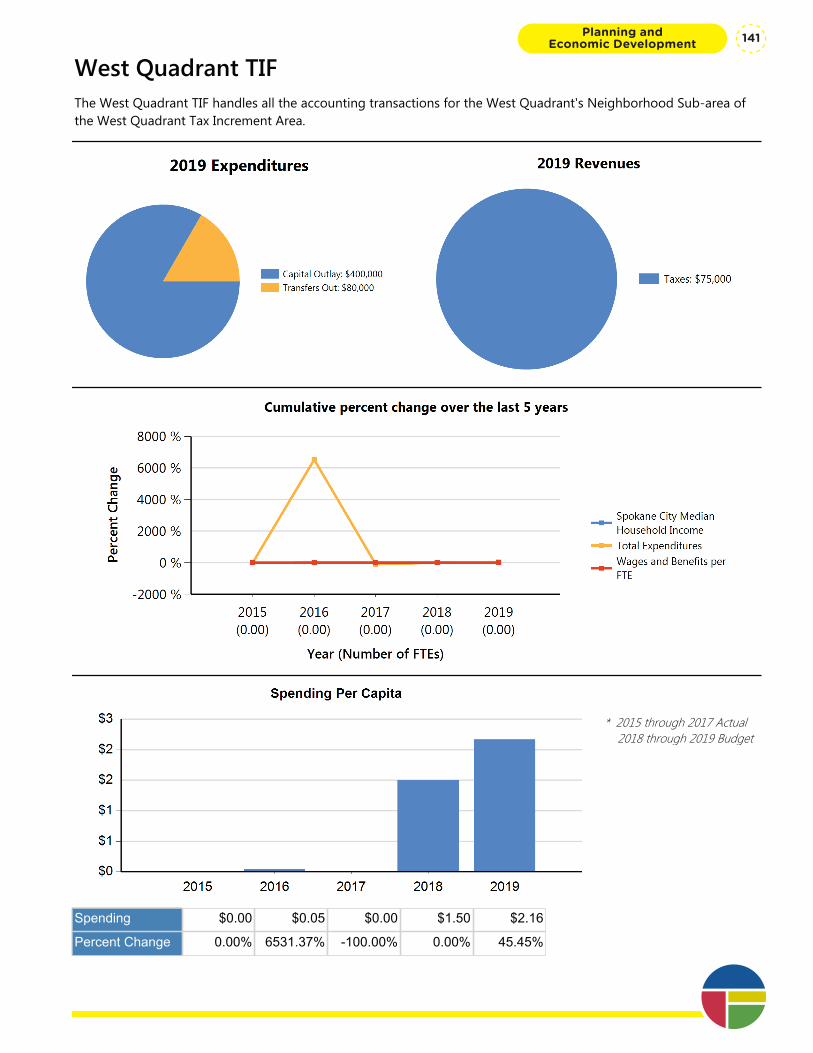
West Quadrant TIFThe West Quadrant TIF handles all the accounting transactions for the West Quadrant's Neighborhood Sub-area of the West Quadrant Tax Increment Area.
* 2015 through 2017 Actual 2018 through 2019 Budget
Spending $0.00 $0.05 $0.00 $1.50 $2.16
Percent Change 0.00% 6531.37% -100.00% 0.00% 45.45%
Planning and Economic Development 141
Department Summary: West Quadrant TIF
Division: Planning and Economic Development
Fund Type: Capital Project Fund
Executive Summary:
The West Quadrant TIF handles all the accounting transactions for the West Quadrant's Neighborhood Sub-area of the West Quadrant Tax Increment Area.
Programs and Services:
The West Quadrant TIF is used for the transactions of all eligible project costs associated with the West Quadrant Neighborhood Sub-area public improvements. The West Quadrant Tax Increment Area No. 2007-1 was created by Council Ordinance No. C34032 to use incremental property tax revenue from the subarea to finance public improvements within the West Quadrant neighborhoods as provided in Ordinance No. C34032. This bid acts as the cash flow account for the West Quadrant Neighborhood project fund
FTEs
2015 Actual 2016 Actual 2017 Actual 2018 Budget 2019 Proposed
Total FTEs 0.00 0.00 0.00 0.00 0.00
Expenditures:
2015 Actual 2016 Actual 2017 Actual 2018 Budget 2019 Proposed
Capital Outlay 0 0 0 250,000 400,000
Interfund Charges 0 0 0 0 0
Reserve for Budget Adjustment 0 0 0 0 0
Transfers Out 0 10,000 0 80,000 80,000
Wages & Benefits 0 0 0 0 0
Supplies & Services 153 146 0 0 0
Debt Services 0 0 0 0 0
All Other 0 0 0 0 0
TOTAL 153 10,146 0 330,000 480,000
Expenditure Notes:
Revenues:
2015 Actual 2016 Actual 2017 Actual 2018 Budget 2019 Proposed
Taxes 70,384 71,870 86,121 75,000 75,000
Licenses & Permits 0 0 0 0 0
IG Revenue 0 0 0 0 0
Services 0 0 0 0 0
Fines & Forfeits 0 0 0 0 0
Operating Transfers In 0 0 0 0 0One Vision. One Plan. One Voice.
Planning and Economic Development142
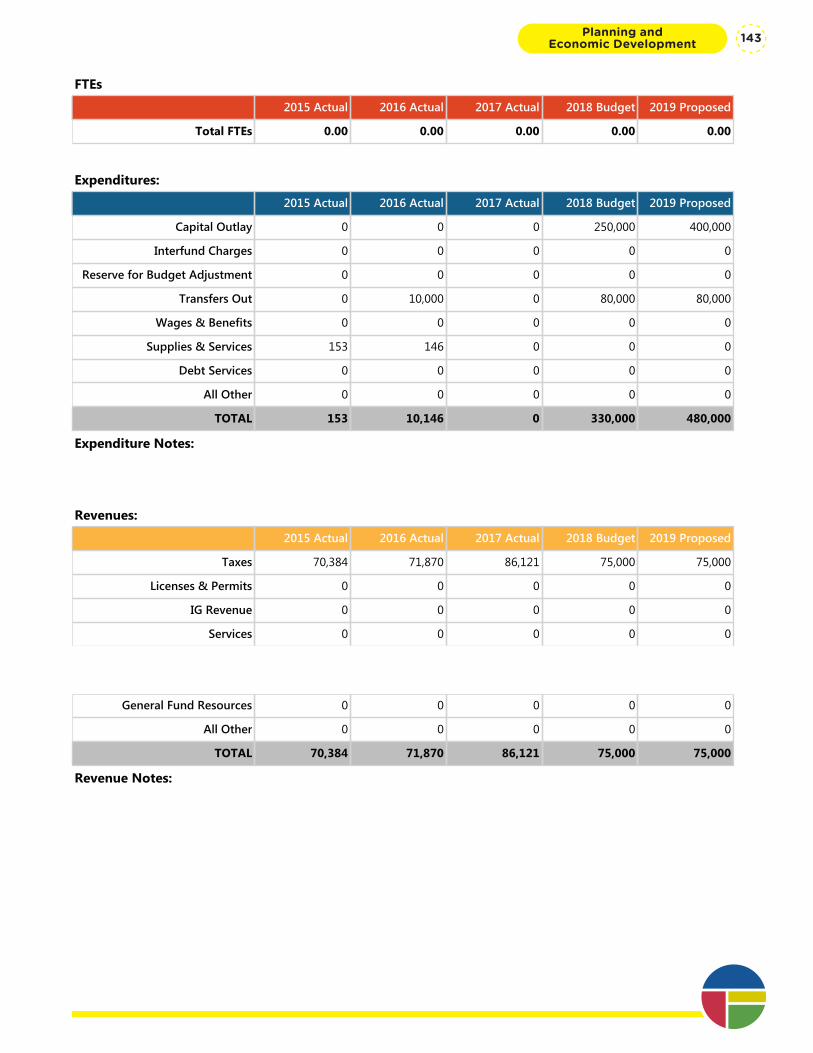
Department Summary: West Quadrant TIF
Division: Planning and Economic Development
Fund Type: Capital Project Fund
Executive Summary:
The West Quadrant TIF handles all the accounting transactions for the West Quadrant's Neighborhood Sub-area of the West Quadrant Tax Increment Area.
Programs and Services:
The West Quadrant TIF is used for the transactions of all eligible project costs associated with the West Quadrant Neighborhood Sub-area public improvements. The West Quadrant Tax Increment Area No. 2007-1 was created by Council Ordinance No. C34032 to use incremental property tax revenue from the subarea to finance public improvements within the West Quadrant neighborhoods as provided in Ordinance No. C34032. This bid acts as the cash flow account for the West Quadrant Neighborhood project fund
FTEs
2015 Actual 2016 Actual 2017 Actual 2018 Budget 2019 Proposed
Total FTEs 0.00 0.00 0.00 0.00 0.00
Expenditures:
2015 Actual 2016 Actual 2017 Actual 2018 Budget 2019 Proposed
Capital Outlay 0 0 0 250,000 400,000
Interfund Charges 0 0 0 0 0
Reserve for Budget Adjustment 0 0 0 0 0
Transfers Out 0 10,000 0 80,000 80,000
Wages & Benefits 0 0 0 0 0
Supplies & Services 153 146 0 0 0
Debt Services 0 0 0 0 0
All Other 0 0 0 0 0
TOTAL 153 10,146 0 330,000 480,000
Expenditure Notes:
Revenues:
2015 Actual 2016 Actual 2017 Actual 2018 Budget 2019 Proposed
Taxes 70,384 71,870 86,121 75,000 75,000
Licenses & Permits 0 0 0 0 0
IG Revenue 0 0 0 0 0
Services 0 0 0 0 0
Fines & Forfeits 0 0 0 0 0
Operating Transfers In 0 0 0 0 0
General Fund Resources 0 0 0 0 0
All Other 0 0 0 0 0
TOTAL 70,384 71,870 86,121 75,000 75,000
Revenue Notes:
Planning and Economic Development 143

One Vision. One Plan. One Voice.
Planning and Economic Development144

Public Safety
Public Safety
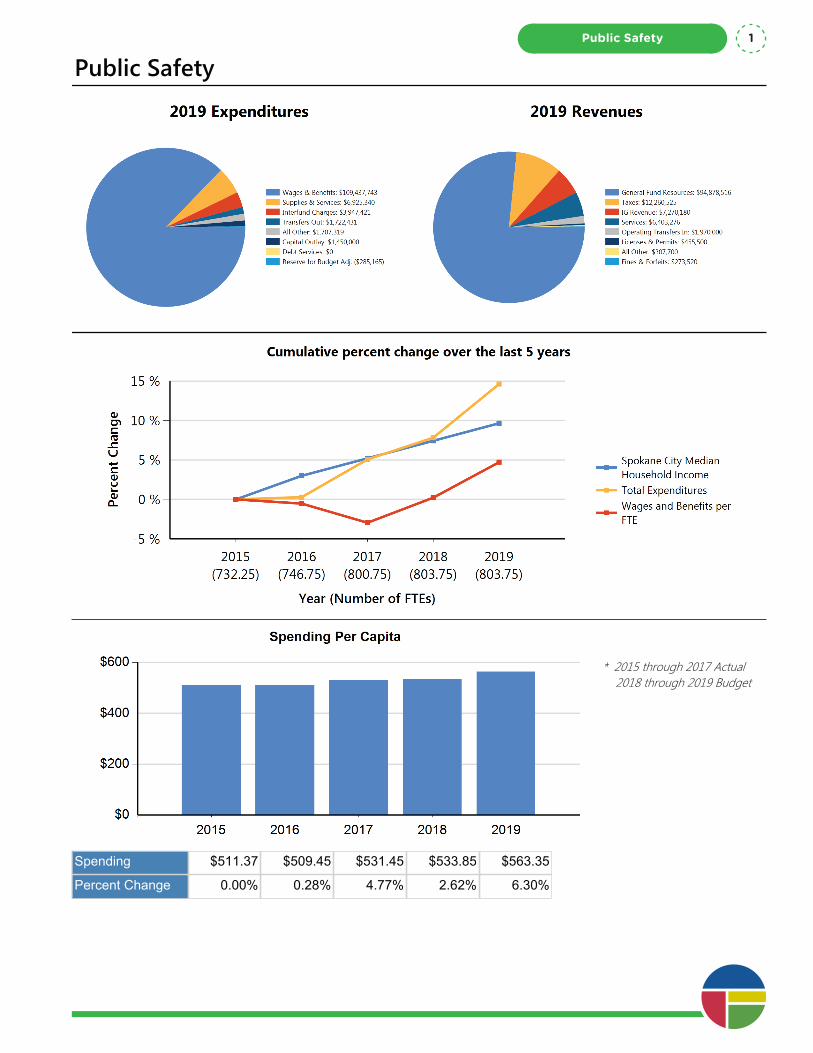
Public Safety
* 2015 through 2017 Actual 2018 through 2019 Budget
Spending $511.37 $509.45 $531.45 $533.85 $563.35
Percent Change 0.00% 0.28% 4.77% 2.62% 6.30%
Public Safety 1

One Vision. One Plan. One Voice.
Public Safety2
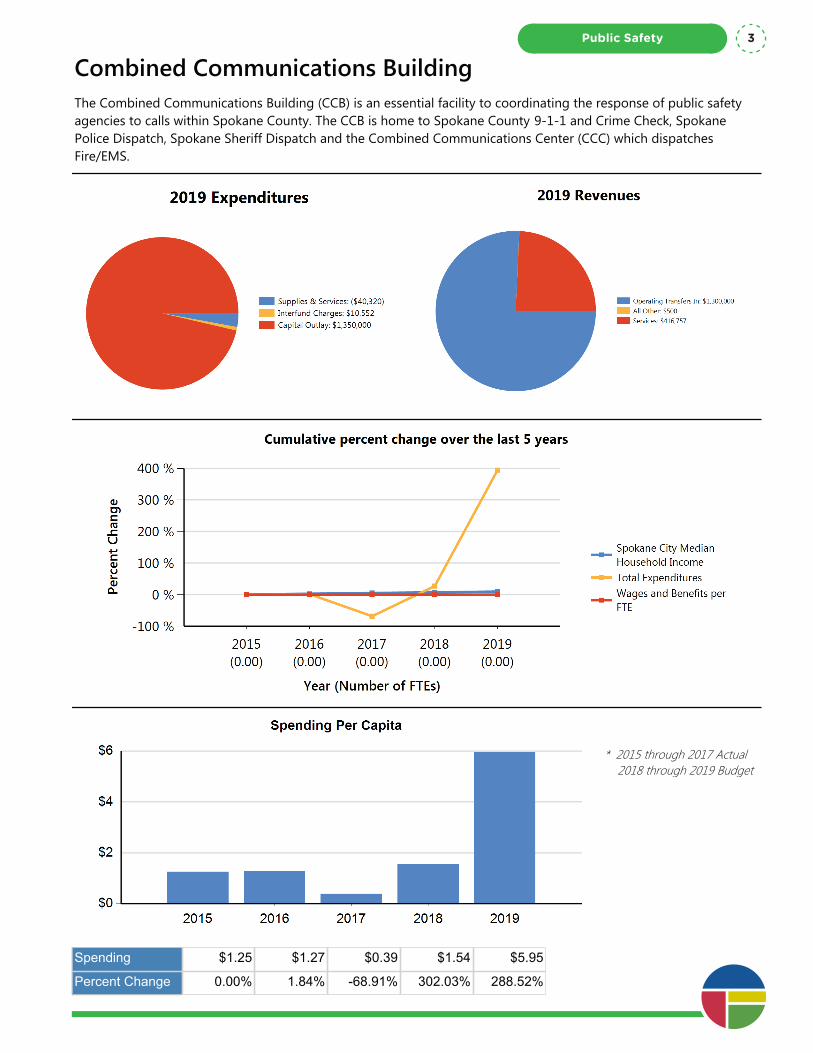
Combined Communications BuildingThe Combined Communications Building (CCB) is an essential facility to coordinating the response of public safety agencies to calls within Spokane County. The CCB is home to Spokane County 9-1-1 and Crime Check, Spokane Police Dispatch, Spokane Sheriff Dispatch and the Combined Communications Center (CCC) which dispatches Fire/EMS.
* 2015 through 2017 Actual 2018 through 2019 Budget
Spending $1.25 $1.27 $0.39 $1.54 $5.95
Percent Change 0.00% 1.84% -68.91% 302.03% 288.52%
Public Safety 3
Department Summary: Combined Communications Building
Division: Public Safety
Fund Type: Special Revenue Fund
Executive Summary:
The Combined Communications Building (CCB) is an essential facility to coordinating the response of public safety agencies to calls within Spokane County. The CCB is home to Spokane County 9-1-1 and Crime Check, Spokane Police Dispatch, Spokane Sheriff Dispatch and the Combined Communications Center (CCC) which dispatches Fire/EMS.
Programs and Services:
The CCB operates through an Interlocal Agreement that outlines the sharing of the facilities operational costs based on space occupancy of the individual resident organizations. The CCB is a state of the art communications facility that houses 9-1-1 and the majority of the public safety dispatch operations in Spokane County. Located at the Spokane Fire Department’s Readiness Complex, the CCB opened in 2004. The cost of construction was shared by the resident agencies based on the square footage of the space they utilize/ occupy within the structure. The approach of operating in a shared facility is not only cost effective for the community but also enhances operational effectiveness and efficiency for all public safety agencies throughout Spokane County. On-going costs to maintain and operate the building are also shared among the occupants of the CCB based on percentage of space allocation to the agency. The CCC Fire Communications Division Chief is responsible for the day to day oversight of the facility with support from the FD’s Maintenance Division. Operationally, there is a backup Center in place at a separate remote location to provide for relocation of CCB functions, if needed. The Backup Center has redundant phone, computer and radio systems in place that will provide for operations by each of the CCB agencies.
FTEs
2015 Actual 2016 Actual 2017 Actual 2018 Budget 2019 Proposed
Total FTEs 0.00 0.00 0.00 0.00 0.00
Expenditures:
2015 Actual 2016 Actual 2017 Actual 2018 Budget 2019 Proposed
Capital Outlay 24,819 27,829 0 50,000 1,350,000
Interfund Charges 22,719 19,480 22,306 9,258 10,552
Reserve for Budget Adjustment 0 0 0 0 0
Transfers Out 0 0 0 0 0
Wages & Benefits 0 0 0 0 0
Supplies & Services 219,444 224,610 62,214 280,546 (40,320)
Debt Services 0 0 0 0 0
All Other 0 0 0 0 0
One Vision. One Plan. One Voice.
Public Safety4
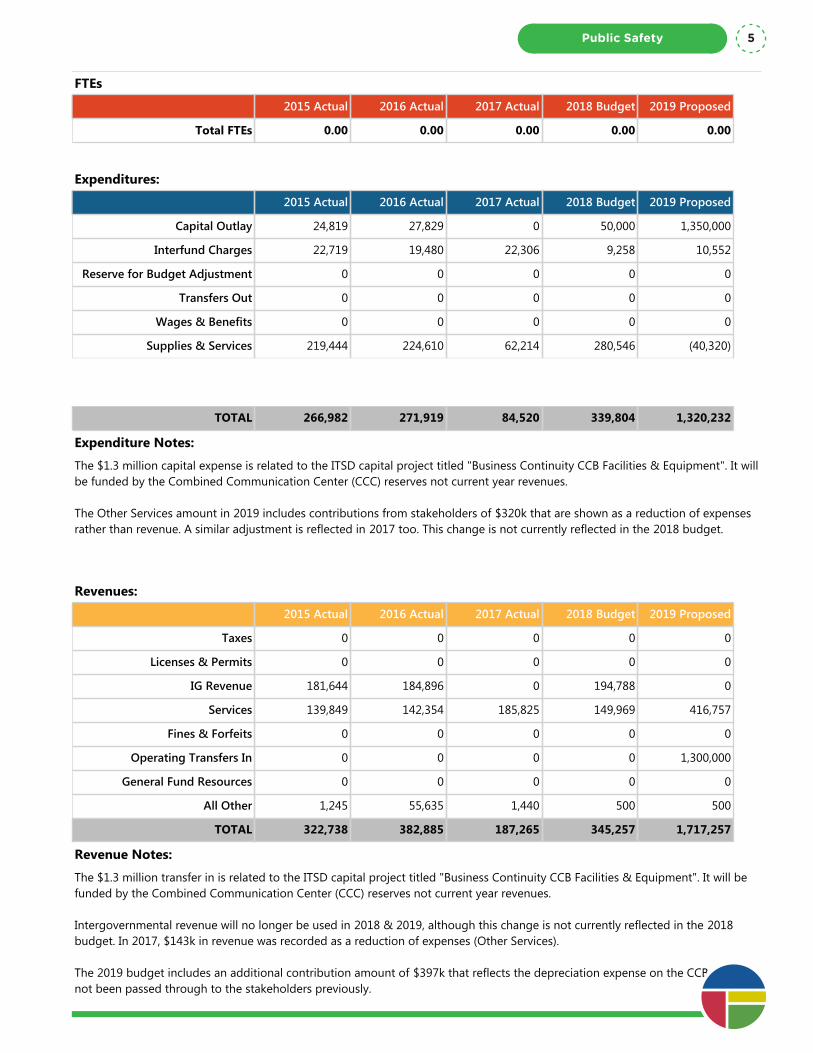
Department Summary: Combined Communications Building
Division: Public Safety
Fund Type: Special Revenue Fund
Executive Summary:
The Combined Communications Building (CCB) is an essential facility to coordinating the response of public safety agencies to calls within Spokane County. The CCB is home to Spokane County 9-1-1 and Crime Check, Spokane Police Dispatch, Spokane Sheriff Dispatch and the Combined Communications Center (CCC) which dispatches Fire/EMS.
Programs and Services:
The CCB operates through an Interlocal Agreement that outlines the sharing of the facilities operational costs based on space occupancy of the individual resident organizations. The CCB is a state of the art communications facility that houses 9-1-1 and the majority of the public safety dispatch operations in Spokane County. Located at the Spokane Fire Department’s Readiness Complex, the CCB opened in 2004. The cost of construction was shared by the resident agencies based on the square footage of the space they utilize/ occupy within the structure. The approach of operating in a shared facility is not only cost effective for the community but also enhances operational effectiveness and efficiency for all public safety agencies throughout Spokane County. On-going costs to maintain and operate the building are also shared among the occupants of the CCB based on percentage of space allocation to the agency. The CCC Fire Communications Division Chief is responsible for the day to day oversight of the facility with support from the FD’s Maintenance Division. Operationally, there is a backup Center in place at a separate remote location to provide for relocation of CCB functions, if needed. The Backup Center has redundant phone, computer and radio systems in place that will provide for operations by each of the CCB agencies.
FTEs
2015 Actual 2016 Actual 2017 Actual 2018 Budget 2019 Proposed
Total FTEs 0.00 0.00 0.00 0.00 0.00
Expenditures:
2015 Actual 2016 Actual 2017 Actual 2018 Budget 2019 Proposed
Capital Outlay 24,819 27,829 0 50,000 1,350,000
Interfund Charges 22,719 19,480 22,306 9,258 10,552
Reserve for Budget Adjustment 0 0 0 0 0
Transfers Out 0 0 0 0 0
Wages & Benefits 0 0 0 0 0
Supplies & Services 219,444 224,610 62,214 280,546 (40,320)
Debt Services 0 0 0 0 0
All Other 0 0 0 0 0
TOTAL 266,982 271,919 84,520 339,804 1,320,232
Expenditure Notes:
The $1.3 million capital expense is related to the ITSD capital project titled "Business Continuity CCB Facilities & Equipment". It will be funded by the Combined Communication Center (CCC) reserves not current year revenues.
The Other Services amount in 2019 includes contributions from stakeholders of $320k that are shown as a reduction of expenses rather than revenue. A similar adjustment is reflected in 2017 too. This change is not currently reflected in the 2018 budget.
Revenues:
2015 Actual 2016 Actual 2017 Actual 2018 Budget 2019 Proposed
Taxes 0 0 0 0 0
Licenses & Permits 0 0 0 0 0
IG Revenue 181,644 184,896 0 194,788 0
Services 139,849 142,354 185,825 149,969 416,757
Fines & Forfeits 0 0 0 0 0
Operating Transfers In 0 0 0 0 1,300,000
General Fund Resources 0 0 0 0 0
All Other 1,245 55,635 1,440 500 500
TOTAL 322,738 382,885 187,265 345,257 1,717,257
Revenue Notes:
The $1.3 million transfer in is related to the ITSD capital project titled "Business Continuity CCB Facilities & Equipment". It will be funded by the Combined Communication Center (CCC) reserves not current year revenues.
Intergovernmental revenue will no longer be used in 2018 & 2019, although this change is not currently reflected in the 2018 budget. In 2017, $143k in revenue was recorded as a reduction of expenses (Other Services).
The 2019 budget includes an additional contribution amount of $397k that reflects the depreciation expense on the CCB that had not been passed through to the stakeholders previously.
Public Safety 5

One Vision. One Plan. One Voice.
Public Safety6
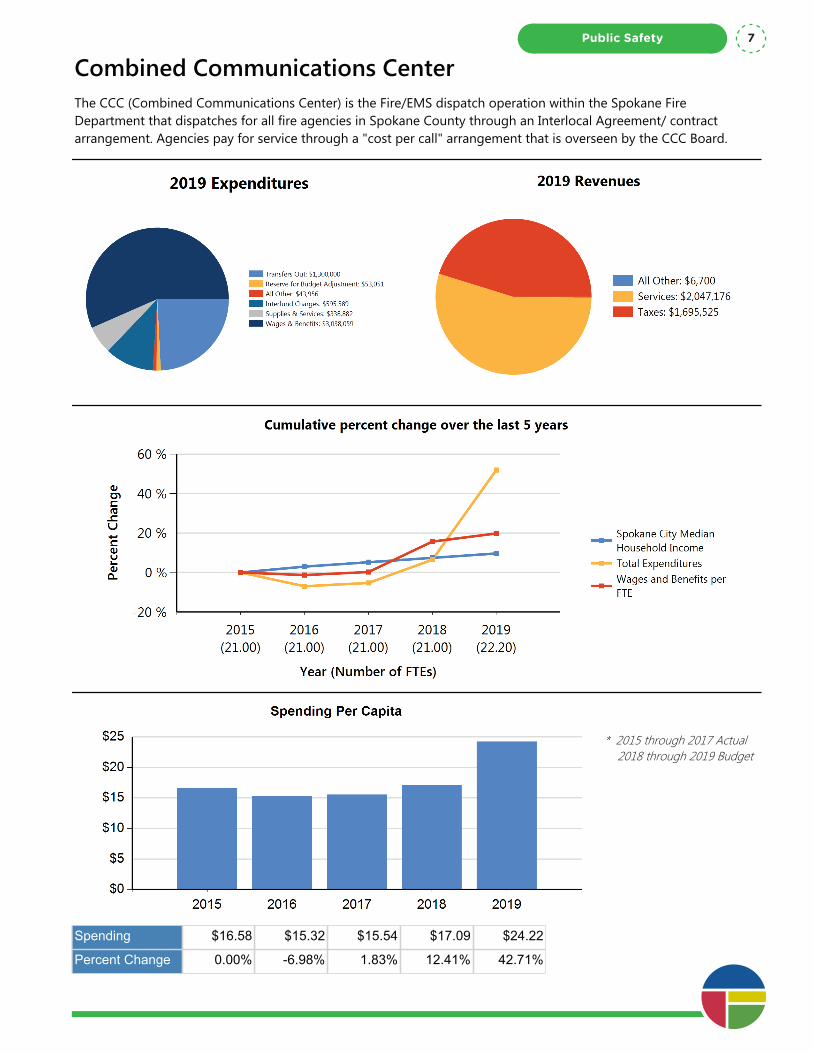
Combined Communications CenterThe CCC (Combined Communications Center) is the Fire/EMS dispatch operation within the Spokane Fire Department that dispatches for all fire agencies in Spokane County through an Interlocal Agreement/ contract arrangement. Agencies pay for service through a "cost per call" arrangement that is overseen by the CCC Board.
* 2015 through 2017 Actual 2018 through 2019 Budget
Spending $16.58 $15.32 $15.54 $17.09 $24.22
Percent Change 0.00% -6.98% 1.83% 12.41% 42.71%
Public Safety 7
Department Summary: Combined Communications Center
Division: Public Safety
Fund Type: Special Revenue Fund
Executive Summary:
The CCC (Combined Communications Center) is the Fire/EMS dispatch operation within the Spokane Fire Department that dispatches for all fire agencies in Spokane County through an Interlocal Agreement/ contract arrangement. Agencies pay for service through a "cost per call" arrangement that is overseen by the CCC Board.
Programs and Services:
The CCC receives calls through the county-wide 9-1-1 system and dispatches over 78,000 calls per year. The CCC's Communications Specialist are trained to quickly answer calls received from 9-1-1 operators; question callers while entering essential information in the Computer Aided Dispatch (CAD) system; dispatch appropriate resources; and support those resources by radio and other communications mediums, until the incident is concluded. CCC personnel are constantly working to improve their skills to offer the best services possible to those calling for help and to those field providers who are responding to the incidents. The CAD system is a critical tool in helping the Communications Specialist to perform their job. The CCC uses a "Quick Dispatch" process to get information to responders as quickly as possible so response times are as short as possible. After they obtain basic information through the first 5-6 questions, the call is shipped through CAD to the interfaced "Locution" system that provides a verbal dispatch of the call through a software driven system. The Locution system allows the Communications Specialist to remain on the phone with the caller to obtain all necessary information and/ or to provide protocol driven medical assistance until responders arrive at the scene. 90% of the time, the CCC meets its performance measure of dispatching emergency service calls within 60 seconds from the receipt of the call. Funding for the CCC is generated through a cost per call formula among the agencies that receive CCC Fire/ EMS dispatch services. The CCC is led and managed by the Spokane Fire Department and is overseen by a CCC Policy Board that is made up of representatives of the user agencies. The CCC operates at the CCB (Combined Communications Building) along with 9-1-1; Spokane Police Dispatch and Spokane Sheriff Dispatch. The approach of operating in a shared facility is not only cost effective for the community but also enhances operational effectiveness and efficiency for all public safety agencies throughout Spokane County. Likewise, the combining of the 4 separate Fire Dispatch Centers into the CCC in the late 1990's has improved operational effectiveness and gained efficiencies for all of the Fire Agencies that are part of the CCC. Operationally, there is a backup Center in place at a separate remote location to provide for relocation of CCB functions, if needed. The Backup Center has redundant phone, computer and radio systems in place that will provide for operations by each of the CCB agencies if relocation is necessary.
FTEs
2015 Actual 2016 Actual 2017 Actual 2018 Budget 2019 Proposed
Total FTEs 21.00 21.00 21.00 21.00 22.20
Expenditures:
2015 Actual 2016 Actual 2017 Actual 2018 Budget 2019 Proposed
Capital Outlay 393,711 245,342 180,296 75,000 0
Interfund Charges 275,682 365,081 446,211 564,533 595,589
Reserve for Budget Adjustment 0 0 0 0 53,051
Transfers Out 0 0 0 0 1,300,000
Wages & Benefits 2,385,802 2,354,908 2,391,240 2,760,233 3,038,059
Supplies & Services 438,870 284,107 288,834 362,689 338,882
Debt Services 0 0 0 0 0
All Other 39,426 37,364 40,477 0 43,956One Vision. One Plan. One Voice.
Public Safety8
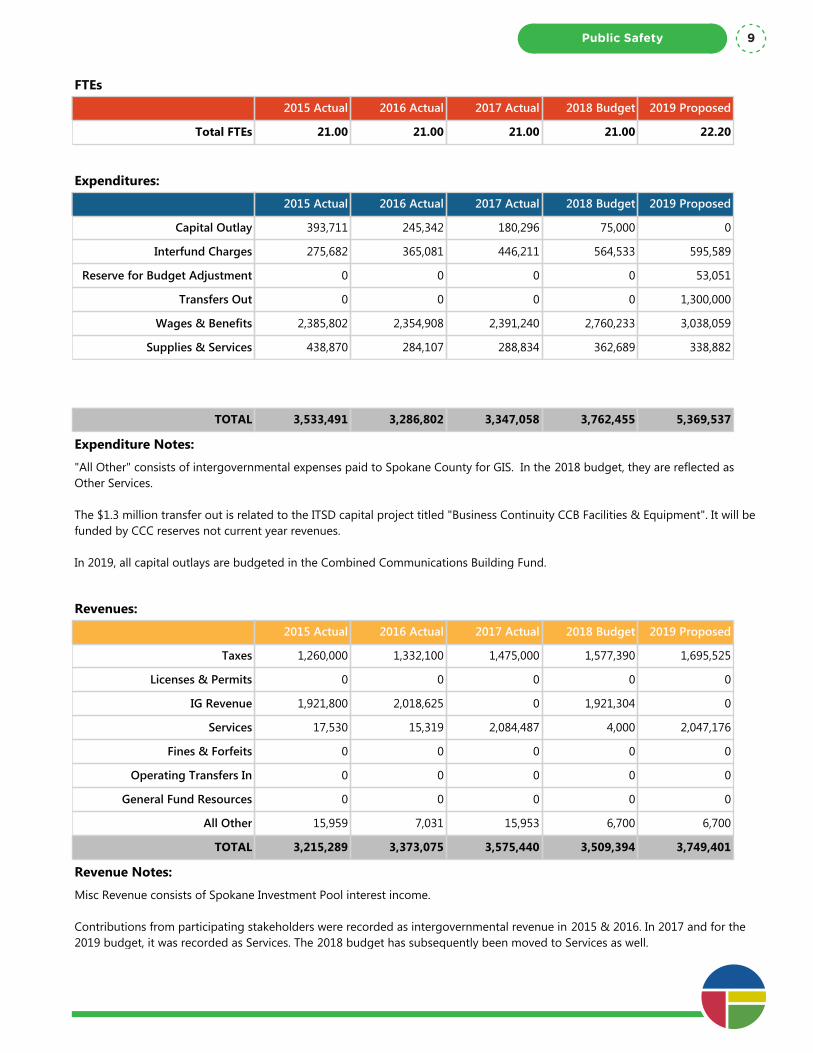
Department Summary: Combined Communications Center
Division: Public Safety
Fund Type: Special Revenue Fund
Executive Summary:
The CCC (Combined Communications Center) is the Fire/EMS dispatch operation within the Spokane Fire Department that dispatches for all fire agencies in Spokane County through an Interlocal Agreement/ contract arrangement. Agencies pay for service through a "cost per call" arrangement that is overseen by the CCC Board.
Programs and Services:
The CCC receives calls through the county-wide 9-1-1 system and dispatches over 78,000 calls per year. The CCC's Communications Specialist are trained to quickly answer calls received from 9-1-1 operators; question callers while entering essential information in the Computer Aided Dispatch (CAD) system; dispatch appropriate resources; and support those resources by radio and other communications mediums, until the incident is concluded. CCC personnel are constantly working to improve their skills to offer the best services possible to those calling for help and to those field providers who are responding to the incidents. The CAD system is a critical tool in helping the Communications Specialist to perform their job. The CCC uses a "Quick Dispatch" process to get information to responders as quickly as possible so response times are as short as possible. After they obtain basic information through the first 5-6 questions, the call is shipped through CAD to the interfaced "Locution" system that provides a verbal dispatch of the call through a software driven system. The Locution system allows the Communications Specialist to remain on the phone with the caller to obtain all necessary information and/ or to provide protocol driven medical assistance until responders arrive at the scene. 90% of the time, the CCC meets its performance measure of dispatching emergency service calls within 60 seconds from the receipt of the call. Funding for the CCC is generated through a cost per call formula among the agencies that receive CCC Fire/ EMS dispatch services. The CCC is led and managed by the Spokane Fire Department and is overseen by a CCC Policy Board that is made up of representatives of the user agencies. The CCC operates at the CCB (Combined Communications Building) along with 9-1-1; Spokane Police Dispatch and Spokane Sheriff Dispatch. The approach of operating in a shared facility is not only cost effective for the community but also enhances operational effectiveness and efficiency for all public safety agencies throughout Spokane County. Likewise, the combining of the 4 separate Fire Dispatch Centers into the CCC in the late 1990's has improved operational effectiveness and gained efficiencies for all of the Fire Agencies that are part of the CCC. Operationally, there is a backup Center in place at a separate remote location to provide for relocation of CCB functions, if needed. The Backup Center has redundant phone, computer and radio systems in place that will provide for operations by each of the CCB agencies if relocation is necessary.
FTEs
2015 Actual 2016 Actual 2017 Actual 2018 Budget 2019 Proposed
Total FTEs 21.00 21.00 21.00 21.00 22.20
Expenditures:
2015 Actual 2016 Actual 2017 Actual 2018 Budget 2019 Proposed
Capital Outlay 393,711 245,342 180,296 75,000 0
Interfund Charges 275,682 365,081 446,211 564,533 595,589
Reserve for Budget Adjustment 0 0 0 0 53,051
Transfers Out 0 0 0 0 1,300,000
Wages & Benefits 2,385,802 2,354,908 2,391,240 2,760,233 3,038,059
Supplies & Services 438,870 284,107 288,834 362,689 338,882
Debt Services 0 0 0 0 0
All Other 39,426 37,364 40,477 0 43,956
TOTAL 3,533,491 3,286,802 3,347,058 3,762,455 5,369,537
Expenditure Notes:
"All Other" consists of intergovernmental expenses paid to Spokane County for GIS. In the 2018 budget, they are reflected as Other Services.
The $1.3 million transfer out is related to the ITSD capital project titled "Business Continuity CCB Facilities & Equipment". It will be funded by CCC reserves not current year revenues.
In 2019, all capital outlays are budgeted in the Combined Communications Building Fund.
Revenues:
2015 Actual 2016 Actual 2017 Actual 2018 Budget 2019 Proposed
Taxes 1,260,000 1,332,100 1,475,000 1,577,390 1,695,525
Licenses & Permits 0 0 0 0 0
IG Revenue 1,921,800 2,018,625 0 1,921,304 0
Services 17,530 15,319 2,084,487 4,000 2,047,176
Fines & Forfeits 0 0 0 0 0
Operating Transfers In 0 0 0 0 0
General Fund Resources 0 0 0 0 0
All Other 15,959 7,031 15,953 6,700 6,700
TOTAL 3,215,289 3,373,075 3,575,440 3,509,394 3,749,401
Revenue Notes:
Misc Revenue consists of Spokane Investment Pool interest income.
Contributions from participating stakeholders were recorded as intergovernmental revenue in 2015 & 2016. In 2017 and for the 2019 budget, it was recorded as Services. The 2018 budget has subsequently been moved to Services as well.
Public Safety 9

One Vision. One Plan. One Voice.
Public Safety10
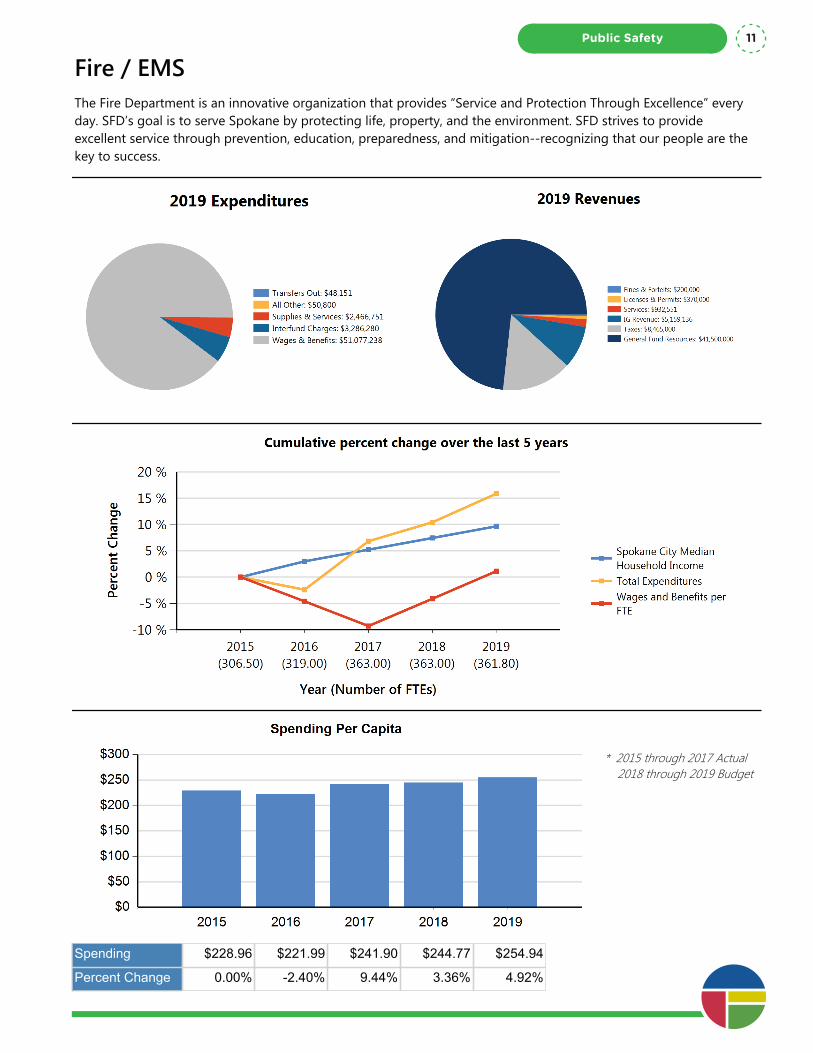
Fire / EMSThe Fire Department is an innovative organization that provides “Service and Protection Through Excellence” every day. SFD’s goal is to serve Spokane by protecting life, property, and the environment. SFD strives to provide excellent service through prevention, education, preparedness, and mitigation--recognizing that our people are the key to success.
* 2015 through 2017 Actual 2018 through 2019 Budget
Spending $228.96 $221.99 $241.90 $244.77 $254.94
Percent Change 0.00% -2.40% 9.44% 3.36% 4.92%
Public Safety 11
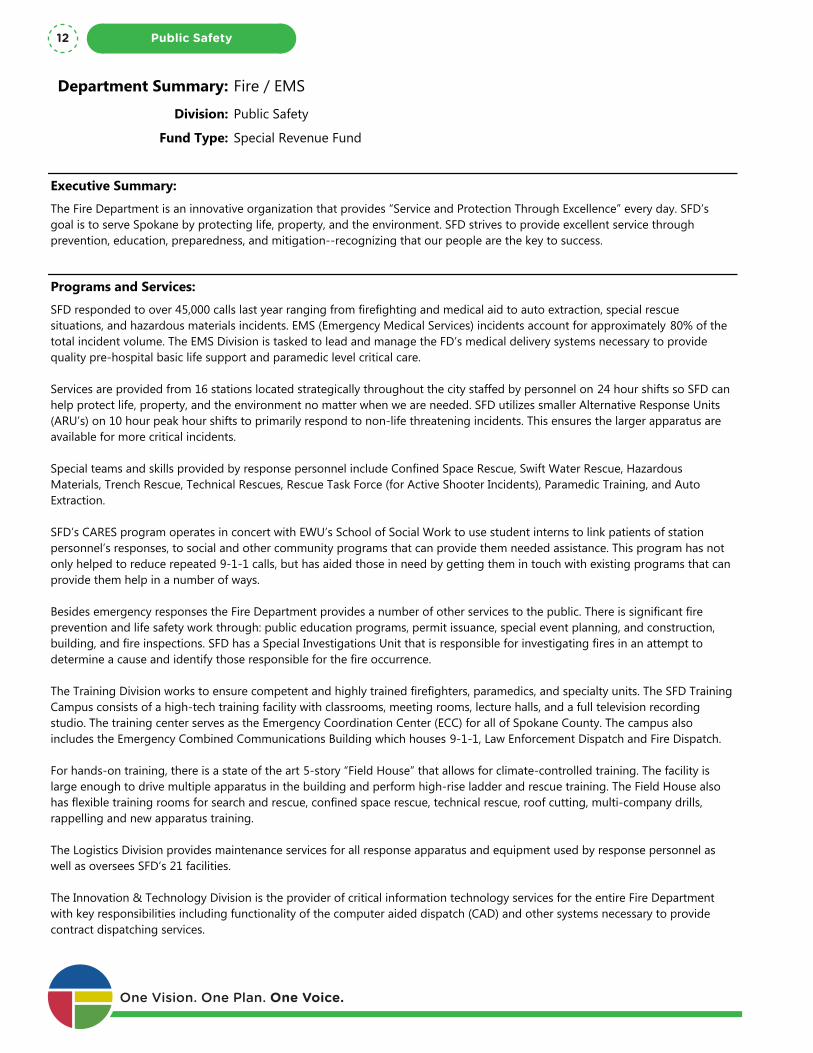
Department Summary: Fire / EMS
Division: Public Safety
Fund Type: Special Revenue Fund
Executive Summary:
The Fire Department is an innovative organization that provides “Service and Protection Through Excellence” every day. SFD’s goal is to serve Spokane by protecting life, property, and the environment. SFD strives to provide excellent service through prevention, education, preparedness, and mitigation--recognizing that our people are the key to success.
Programs and Services:
SFD responded to over 45,000 calls last year ranging from firefighting and medical aid to auto extraction, special rescue situations, and hazardous materials incidents. EMS (Emergency Medical Services) incidents account for approximately 80% of the total incident volume. The EMS Division is tasked to lead and manage the FD’s medical delivery systems necessary to provide quality pre-hospital basic life support and paramedic level critical care.
Services are provided from 16 stations located strategically throughout the city staffed by personnel on 24 hour shifts so SFD can help protect life, property, and the environment no matter when we are needed. SFD utilizes smaller Alternative Response Units (ARU’s) on 10 hour peak hour shifts to primarily respond to non-life threatening incidents. This ensures the larger apparatus are available for more critical incidents.
Special teams and skills provided by response personnel include Confined Space Rescue, Swift Water Rescue, Hazardous Materials, Trench Rescue, Technical Rescues, Rescue Task Force (for Active Shooter Incidents), Paramedic Training, and Auto Extraction.
SFD’s CARES program operates in concert with EWU’s School of Social Work to use student interns to link patients of station personnel’s responses, to social and other community programs that can provide them needed assistance. This program has not only helped to reduce repeated 9-1-1 calls, but has aided those in need by getting them in touch with existing programs that can provide them help in a number of ways.
Besides emergency responses the Fire Department provides a number of other services to the public. There is significant fire prevention and life safety work through: public education programs, permit issuance, special event planning, and construction, building, and fire inspections. SFD has a Special Investigations Unit that is responsible for investigating fires in an attempt to determine a cause and identify those responsible for the fire occurrence.
The Training Division works to ensure competent and highly trained firefighters, paramedics, and specialty units. The SFD Training Campus consists of a high-tech training facility with classrooms, meeting rooms, lecture halls, and a full television recording studio. The training center serves as the Emergency Coordination Center (ECC) for all of Spokane County. The campus also includes the Emergency Combined Communications Building which houses 9-1-1, Law Enforcement Dispatch and Fire Dispatch.
For hands-on training, there is a state of the art 5-story “Field House” that allows for climate-controlled training. The facility is large enough to drive multiple apparatus in the building and perform high-rise ladder and rescue training. The Field House also has flexible training rooms for search and rescue, confined space rescue, technical rescue, roof cutting, multi-company drills, rappelling and new apparatus training.
The Logistics Division provides maintenance services for all response apparatus and equipment used by response personnel as well as oversees SFD’s 21 facilities.
The Innovation & Technology Division is the provider of critical information technology services for the entire Fire Department with key responsibilities including functionality of the computer aided dispatch (CAD) and other systems necessary to provide contract dispatching services.
FTEs
2015 Actual 2016 Actual 2017 Actual 2018 Budget 2019 ProposedOne Vision. One Plan. One Voice.
Public Safety12
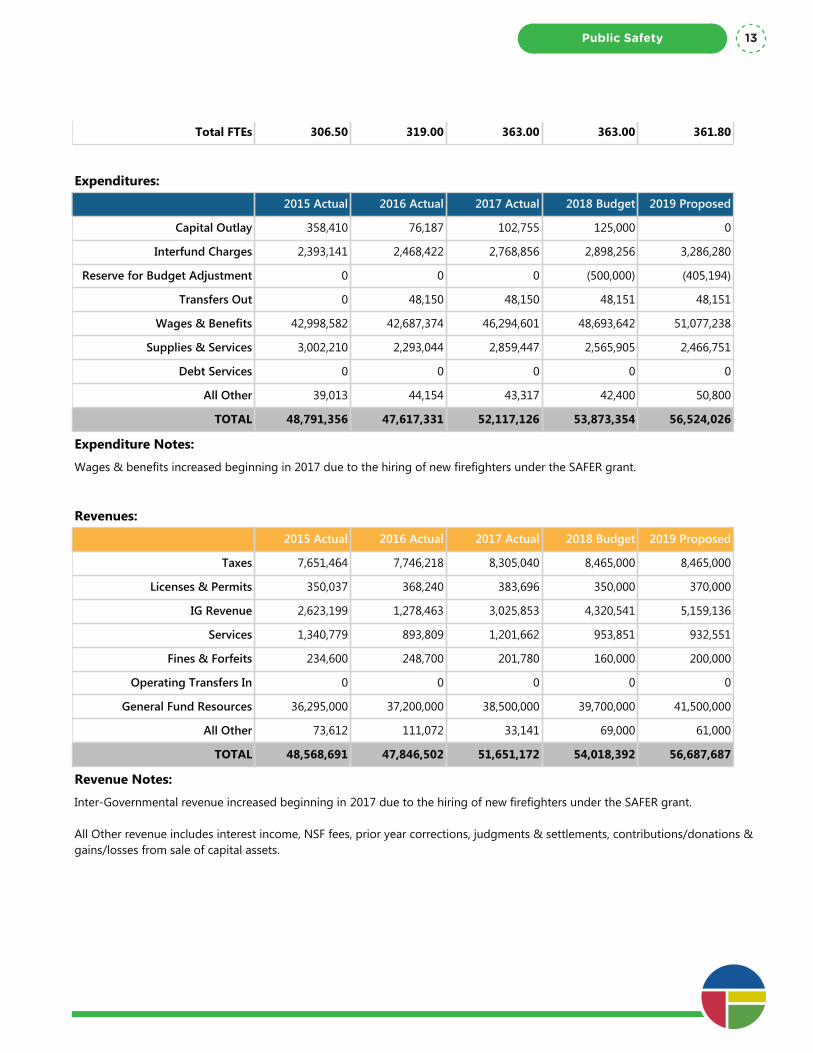
Department Summary: Fire / EMS
Division: Public Safety
Fund Type: Special Revenue Fund
Executive Summary:
The Fire Department is an innovative organization that provides “Service and Protection Through Excellence” every day. SFD’s goal is to serve Spokane by protecting life, property, and the environment. SFD strives to provide excellent service through prevention, education, preparedness, and mitigation--recognizing that our people are the key to success.
Programs and Services:
SFD responded to over 45,000 calls last year ranging from firefighting and medical aid to auto extraction, special rescue situations, and hazardous materials incidents. EMS (Emergency Medical Services) incidents account for approximately 80% of the total incident volume. The EMS Division is tasked to lead and manage the FD’s medical delivery systems necessary to provide quality pre-hospital basic life support and paramedic level critical care.
Services are provided from 16 stations located strategically throughout the city staffed by personnel on 24 hour shifts so SFD can help protect life, property, and the environment no matter when we are needed. SFD utilizes smaller Alternative Response Units (ARU’s) on 10 hour peak hour shifts to primarily respond to non-life threatening incidents. This ensures the larger apparatus are available for more critical incidents.
Special teams and skills provided by response personnel include Confined Space Rescue, Swift Water Rescue, Hazardous Materials, Trench Rescue, Technical Rescues, Rescue Task Force (for Active Shooter Incidents), Paramedic Training, and Auto Extraction.
SFD’s CARES program operates in concert with EWU’s School of Social Work to use student interns to link patients of station personnel’s responses, to social and other community programs that can provide them needed assistance. This program has not only helped to reduce repeated 9-1-1 calls, but has aided those in need by getting them in touch with existing programs that can provide them help in a number of ways.
Besides emergency responses the Fire Department provides a number of other services to the public. There is significant fire prevention and life safety work through: public education programs, permit issuance, special event planning, and construction, building, and fire inspections. SFD has a Special Investigations Unit that is responsible for investigating fires in an attempt to determine a cause and identify those responsible for the fire occurrence.
The Training Division works to ensure competent and highly trained firefighters, paramedics, and specialty units. The SFD Training Campus consists of a high-tech training facility with classrooms, meeting rooms, lecture halls, and a full television recording studio. The training center serves as the Emergency Coordination Center (ECC) for all of Spokane County. The campus also includes the Emergency Combined Communications Building which houses 9-1-1, Law Enforcement Dispatch and Fire Dispatch.
For hands-on training, there is a state of the art 5-story “Field House” that allows for climate-controlled training. The facility is large enough to drive multiple apparatus in the building and perform high-rise ladder and rescue training. The Field House also has flexible training rooms for search and rescue, confined space rescue, technical rescue, roof cutting, multi-company drills, rappelling and new apparatus training.
The Logistics Division provides maintenance services for all response apparatus and equipment used by response personnel as well as oversees SFD’s 21 facilities.
The Innovation & Technology Division is the provider of critical information technology services for the entire Fire Department with key responsibilities including functionality of the computer aided dispatch (CAD) and other systems necessary to provide contract dispatching services.
FTEs
2015 Actual 2016 Actual 2017 Actual 2018 Budget 2019 Proposed
Total FTEs 306.50 319.00 363.00 363.00 361.80
Expenditures:
2015 Actual 2016 Actual 2017 Actual 2018 Budget 2019 Proposed
Capital Outlay 358,410 76,187 102,755 125,000 0
Interfund Charges 2,393,141 2,468,422 2,768,856 2,898,256 3,286,280
Reserve for Budget Adjustment 0 0 0 (500,000) (405,194)
Transfers Out 0 48,150 48,150 48,151 48,151
Wages & Benefits 42,998,582 42,687,374 46,294,601 48,693,642 51,077,238
Supplies & Services 3,002,210 2,293,044 2,859,447 2,565,905 2,466,751
Debt Services 0 0 0 0 0
All Other 39,013 44,154 43,317 42,400 50,800
TOTAL 48,791,356 47,617,331 52,117,126 53,873,354 56,524,026
Expenditure Notes:
Wages & benefits increased beginning in 2017 due to the hiring of new firefighters under the SAFER grant.
Revenues:
2015 Actual 2016 Actual 2017 Actual 2018 Budget 2019 Proposed
Taxes 7,651,464 7,746,218 8,305,040 8,465,000 8,465,000
Licenses & Permits 350,037 368,240 383,696 350,000 370,000
IG Revenue 2,623,199 1,278,463 3,025,853 4,320,541 5,159,136
Services 1,340,779 893,809 1,201,662 953,851 932,551
Fines & Forfeits 234,600 248,700 201,780 160,000 200,000
Operating Transfers In 0 0 0 0 0
General Fund Resources 36,295,000 37,200,000 38,500,000 39,700,000 41,500,000
All Other 73,612 111,072 33,141 69,000 61,000
TOTAL 48,568,691 47,846,502 51,651,172 54,018,392 56,687,687
Revenue Notes:
Inter-Governmental revenue increased beginning in 2017 due to the hiring of new firefighters under the SAFER grant.
All Other revenue includes interest income, NSF fees, prior year corrections, judgments & settlements, contributions/donations & gains/losses from sale of capital assets.
Public Safety 13
Program Summary: Apparatus & Equipment
Division: Public Safety
Fund Type: Special Revenue Fund
Executive Summary:
SFD maintains fire apparatus and equipment in an operational state to enable the Department to respond to approximately 45,000 + calls annually. In addition to emergency response vehicles, SFD maintains support vehicles, small engines, ground ladders, and thousands of pieces of firefighting and emergency medical equipment carried on emergency response vehicles.
Programs and Services:
The SFD Logistics Division supports all fire suppression and emergency medical operations by maintaining and repairing the vehicles and equipment utilized by the SFD. This support enables the Operations Division to provide incident response to the community. Without the services of Logistics personnel, it would be virtually impossible for the SFD to serve the community. The aintenance facility, located at 1610 N. Rebecca, is co-located with the Training/Readiness Complex. This close proximity maximizes the productivity of site visits by combining maintenance actions with training obligations. SFD's Logistics Division maintains approximately 75 emergency response vehicles, approximately 65 support vehicles, over 225 small engines, more than 130 ground ladders, 200 nozzles, and literally thousands of pieces of equipment carried on emergency response vehicles. Additionally, the division provides support to the 16 fire stations and 5 other FD facilities. Services provided by the FD Logistics Division include: 1. Routine preventive maintenance to nearly 140 FD front-line and reserve, staff, and support vehicles, which reduces breakdowns and expensive repairs. 2. Major and minor repairs to all apparatus and equipment utilized by the FD. 3. Equipment familiarization, operation, & maintenance training to FD field personnel. 4. Use of historical data for damage/breakdown analysis, to minimize breakdowns. 5. Design and fabrication of vehicles and equipment to meet department demands. 6. Conduct ongoing updates to vehicles to stay current with new technologies and standards. 7. Develop specifications for all new vehicles for purchase. 8. Ensure mechanics receive & maintain Emergency Vehicle Technician EVT and Automotive Service Excellence ASE certifications. 9. Perform annual testing on apparatus & equipment to comply with all laws and standards. 10. Coordinate and schedule contract maintenance and repairs on SFD apparatus and equipment with outside vendors.
FTEs
2015 Actual 2016 Actual 2017 Actual 2018 Budget 2019 Proposed
Total FTEs 0.00 6.00 6.00 6.00 6.00
Expenditures:
2015 Actual 2016 Actual 2017 Actual 2018 Budget 2019 Proposed
Capital Outlay 9,022 0 0 100,000 0
Interfund Charges 0 0 0 0 0
Reserve for Budget Adjustment 0 0 0 0 25,000
Transfers Out 0 0 0 0 0
Wages & Benefits 647,597 618,136 634,919 690,139 703,188
Supplies & Services 309,327 258,282 307,693 211,059 267,127
Debt Services 0 0 0 0 0
All Other 0 0 0 0 0
One Vision. One Plan. One Voice.
Public Safety14
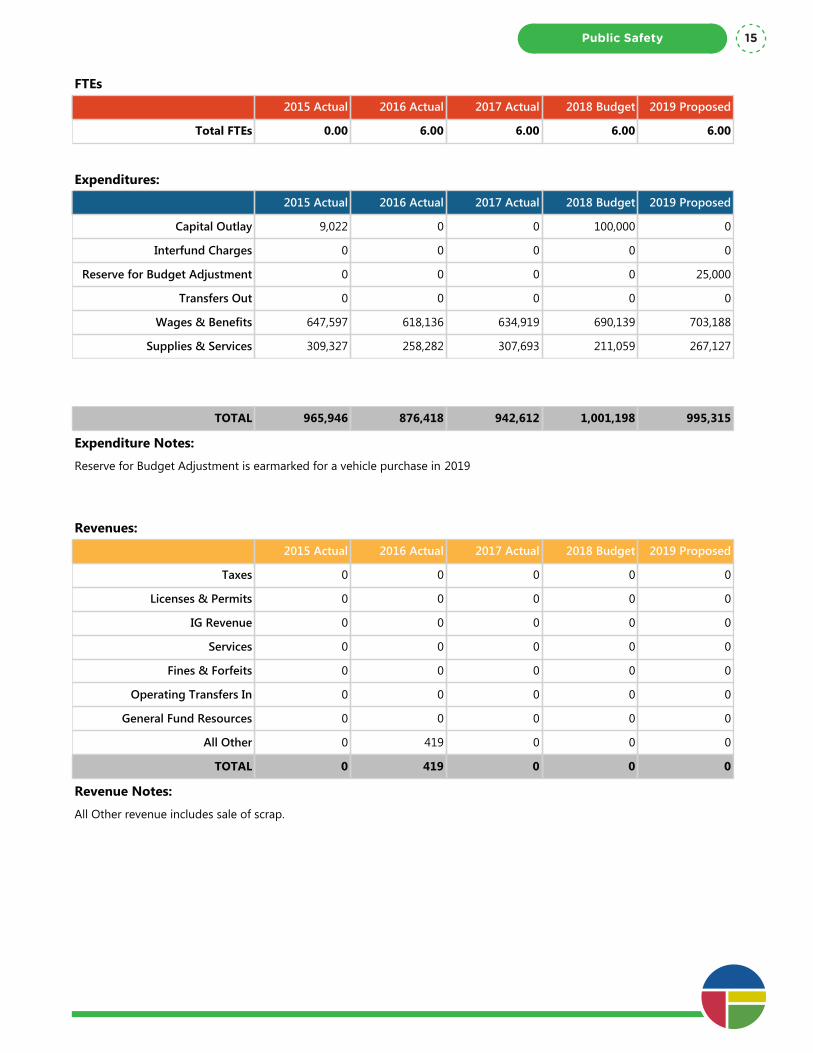
Program Summary: Apparatus & Equipment
Division: Public Safety
Fund Type: Special Revenue Fund
Executive Summary:
SFD maintains fire apparatus and equipment in an operational state to enable the Department to respond to approximately 45,000 + calls annually. In addition to emergency response vehicles, SFD maintains support vehicles, small engines, ground ladders, and thousands of pieces of firefighting and emergency medical equipment carried on emergency response vehicles.
Programs and Services:
The SFD Logistics Division supports all fire suppression and emergency medical operations by maintaining and repairing the vehicles and equipment utilized by the SFD. This support enables the Operations Division to provide incident response to the community. Without the services of Logistics personnel, it would be virtually impossible for the SFD to serve the community. The aintenance facility, located at 1610 N. Rebecca, is co-located with the Training/Readiness Complex. This close proximity maximizes the productivity of site visits by combining maintenance actions with training obligations. SFD's Logistics Division maintains approximately 75 emergency response vehicles, approximately 65 support vehicles, over 225 small engines, more than 130 ground ladders, 200 nozzles, and literally thousands of pieces of equipment carried on emergency response vehicles. Additionally, the division provides support to the 16 fire stations and 5 other FD facilities. Services provided by the FD Logistics Division include: 1. Routine preventive maintenance to nearly 140 FD front-line and reserve, staff, and support vehicles, which reduces breakdowns and expensive repairs. 2. Major and minor repairs to all apparatus and equipment utilized by the FD. 3. Equipment familiarization, operation, & maintenance training to FD field personnel. 4. Use of historical data for damage/breakdown analysis, to minimize breakdowns. 5. Design and fabrication of vehicles and equipment to meet department demands. 6. Conduct ongoing updates to vehicles to stay current with new technologies and standards. 7. Develop specifications for all new vehicles for purchase. 8. Ensure mechanics receive & maintain Emergency Vehicle Technician EVT and Automotive Service Excellence ASE certifications. 9. Perform annual testing on apparatus & equipment to comply with all laws and standards. 10. Coordinate and schedule contract maintenance and repairs on SFD apparatus and equipment with outside vendors.
FTEs
2015 Actual 2016 Actual 2017 Actual 2018 Budget 2019 Proposed
Total FTEs 0.00 6.00 6.00 6.00 6.00
Expenditures:
2015 Actual 2016 Actual 2017 Actual 2018 Budget 2019 Proposed
Capital Outlay 9,022 0 0 100,000 0
Interfund Charges 0 0 0 0 0
Reserve for Budget Adjustment 0 0 0 0 25,000
Transfers Out 0 0 0 0 0
Wages & Benefits 647,597 618,136 634,919 690,139 703,188
Supplies & Services 309,327 258,282 307,693 211,059 267,127
Debt Services 0 0 0 0 0
All Other 0 0 0 0 0
TOTAL 965,946 876,418 942,612 1,001,198 995,315
Expenditure Notes:
Reserve for Budget Adjustment is earmarked for a vehicle purchase in 2019
Revenues:
2015 Actual 2016 Actual 2017 Actual 2018 Budget 2019 Proposed
Taxes 0 0 0 0 0
Licenses & Permits 0 0 0 0 0
IG Revenue 0 0 0 0 0
Services 0 0 0 0 0
Fines & Forfeits 0 0 0 0 0
Operating Transfers In 0 0 0 0 0
General Fund Resources 0 0 0 0 0
All Other 0 419 0 0 0
TOTAL 0 419 0 0 0
Revenue Notes:
All Other revenue includes sale of scrap.
Public Safety 15
Program Summary: CARES (Community Assistance Response)
Division: Public Safety
Fund Type: Special Revenue Fund
Executive Summary:
The Spokane Fire Department Community Assistance Response (CARES) Team is a valuable resource to assist vulnerable populations to meet the on-going or long-term needs of individuals that have used fire department resources to meet basic or primary health care needs.
Programs and Services:
The Spokane Fire Department CARES team works with some of the most vulnerable populations in the City and County of Spokane. Often, when individuals are using the fire department to meet their basic or primary health care needs they generate many 9-1-1 calls. The CARES referrals are received from the firefighters and paramedics in the field. Once the CARES team receives a referral, members of the team will make contact with the client. The Team provides crisis intervention to clients, addressing their immediate and long-term needs. This includes accessing referral services and helpful community resources with clients. By assisting clients in meeting their needs, CARES envisions a reduction of non-emergency 911 calls and the creation of greater fire department availability for emergent 911 calls. The CARES team received 284 referrals for the 2017 year. In the first 6 months of 2018, CARES has already received 209 referrals. The average number of 9-1-1 calls in a 3 month time frame per client before CARES intervention was 3.97 calls, after CARES intervention, 9-1-1 calls were reduced to 1.48 calls. In addition to the increase in referrals, acceptance rates of referrals has increased. In 2017, during quarter 1 the CARES team had a 69% service acceptance rate and in 2018, during quarter 1, the CARES team had a 74% service acceptance rate. During quarter 4 of 2017, the CARES team had an 81% reduction in 9-1-1 calls for clients that accepted CARES services.As the population ages, there is an increased need for social, community, and home services. For some people, this is the first time they will need assistance from outside the home in helping care for themselves or family members. The CARES Team provides essential resources in helping these individuals and families identify and connect with appropriate services. In 2017, the median age of CARES clients was 70 years old. The CARES Team provides a valuable resource to the Spokane Fire Department and the City of Spokane. Through the work of the CARES team, there has been a reduction in 9-1-1 calls by the individuals that accepted services. The reduction in non-emergent 9-1-1 calls allows the fire personnel to focus on the critical lifesaving effects it provides to the City of Spokane. The individuals that the CARES team has worked with are benefitted by the connection to appropriate social and health services, which can improve quality of life and health outcomes. The CARES team has had a large increase in referrals and acceptance of services which can be expected to grow as the population ages and needs increase.
FTEs
2015 Actual 2016 Actual 2017 Actual 2018 Budget 2019 Proposed
Total FTEs 0.00 1.00 1.00 1.00 1.00
Expenditures:
2015 Actual 2016 Actual 2017 Actual 2018 Budget 2019 Proposed
Capital Outlay 0 0 0 0 0
Interfund Charges 0 107 144 0 0
Reserve for Budget Adjustment 0 0 0 0 0
Transfers Out 0 0 0 0 0
Wages & Benefits 68,250 76,204 66,599 80,857 84,130
Supplies & Services 1,254 2,355 6,283 1,700 200
Debt Services 0 0 0 0 0
All Other 0 0 0 0 0One Vision. One Plan. One Voice.
Public Safety16
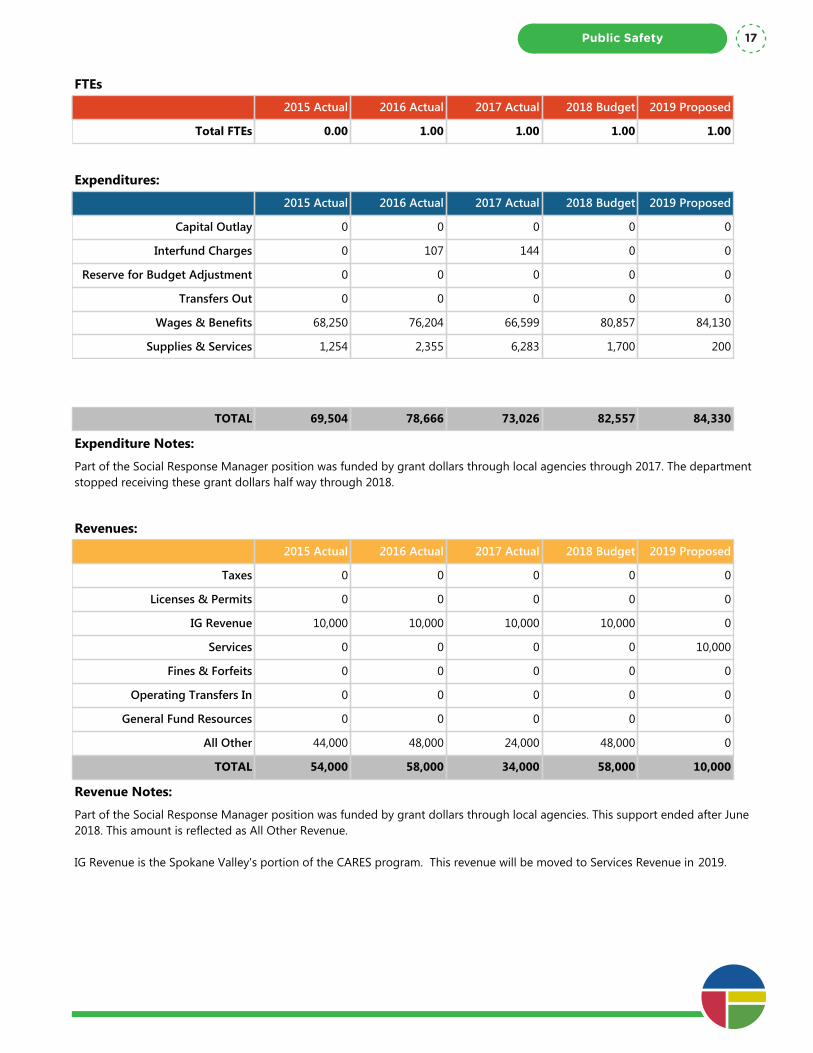
Program Summary: CARES (Community Assistance Response)
Division: Public Safety
Fund Type: Special Revenue Fund
Executive Summary:
The Spokane Fire Department Community Assistance Response (CARES) Team is a valuable resource to assist vulnerable populations to meet the on-going or long-term needs of individuals that have used fire department resources to meet basic or primary health care needs.
Programs and Services:
The Spokane Fire Department CARES team works with some of the most vulnerable populations in the City and County of Spokane. Often, when individuals are using the fire department to meet their basic or primary health care needs they generate many 9-1-1 calls. The CARES referrals are received from the firefighters and paramedics in the field. Once the CARES team receives a referral, members of the team will make contact with the client. The Team provides crisis intervention to clients, addressing their immediate and long-term needs. This includes accessing referral services and helpful community resources with clients. By assisting clients in meeting their needs, CARES envisions a reduction of non-emergency 911 calls and the creation of greater fire department availability for emergent 911 calls. The CARES team received 284 referrals for the 2017 year. In the first 6 months of 2018, CARES has already received 209 referrals. The average number of 9-1-1 calls in a 3 month time frame per client before CARES intervention was 3.97 calls, after CARES intervention, 9-1-1 calls were reduced to 1.48 calls. In addition to the increase in referrals, acceptance rates of referrals has increased. In 2017, during quarter 1 the CARES team had a 69% service acceptance rate and in 2018, during quarter 1, the CARES team had a 74% service acceptance rate. During quarter 4 of 2017, the CARES team had an 81% reduction in 9-1-1 calls for clients that accepted CARES services.As the population ages, there is an increased need for social, community, and home services. For some people, this is the first time they will need assistance from outside the home in helping care for themselves or family members. The CARES Team provides essential resources in helping these individuals and families identify and connect with appropriate services. In 2017, the median age of CARES clients was 70 years old. The CARES Team provides a valuable resource to the Spokane Fire Department and the City of Spokane. Through the work of the CARES team, there has been a reduction in 9-1-1 calls by the individuals that accepted services. The reduction in non-emergent 9-1-1 calls allows the fire personnel to focus on the critical lifesaving effects it provides to the City of Spokane. The individuals that the CARES team has worked with are benefitted by the connection to appropriate social and health services, which can improve quality of life and health outcomes. The CARES team has had a large increase in referrals and acceptance of services which can be expected to grow as the population ages and needs increase.
FTEs
2015 Actual 2016 Actual 2017 Actual 2018 Budget 2019 Proposed
Total FTEs 0.00 1.00 1.00 1.00 1.00
Expenditures:
2015 Actual 2016 Actual 2017 Actual 2018 Budget 2019 Proposed
Capital Outlay 0 0 0 0 0
Interfund Charges 0 107 144 0 0
Reserve for Budget Adjustment 0 0 0 0 0
Transfers Out 0 0 0 0 0
Wages & Benefits 68,250 76,204 66,599 80,857 84,130
Supplies & Services 1,254 2,355 6,283 1,700 200
Debt Services 0 0 0 0 0
All Other 0 0 0 0 0
TOTAL 69,504 78,666 73,026 82,557 84,330
Expenditure Notes:
Part of the Social Response Manager position was funded by grant dollars through local agencies through 2017. The department stopped receiving these grant dollars half way through 2018.
Revenues:
2015 Actual 2016 Actual 2017 Actual 2018 Budget 2019 Proposed
Taxes 0 0 0 0 0
Licenses & Permits 0 0 0 0 0
IG Revenue 10,000 10,000 10,000 10,000 0
Services 0 0 0 0 10,000
Fines & Forfeits 0 0 0 0 0
Operating Transfers In 0 0 0 0 0
General Fund Resources 0 0 0 0 0
All Other 44,000 48,000 24,000 48,000 0
TOTAL 54,000 58,000 34,000 58,000 10,000
Revenue Notes:
Part of the Social Response Manager position was funded by grant dollars through local agencies. This support ended after June 2018. This amount is reflected as All Other Revenue.
IG Revenue is the Spokane Valley's portion of the CARES program. This revenue will be moved to Services Revenue in 2019.
Public Safety 17

Program Summary: Community Risk Reduction (CRR)
Division: Public Safety
Fund Type: Special Revenue Fund
Executive Summary:
CRR is the data driven, fire and life safety education program we provide for our community. Through social media, presentations, structured school age programs, smoke alarm installation activities, community equity events, and the Youth Firesetter Prevention Program, CRR educates the community about pertinent risks and appropriate mitigation strategies.
Programs and Services:
Educational programming through the Prevention Division provides data driven, fire and life safety information to our community. Various community programs are offered with increased emphasis placed on the national Community Risk Reduction priority populations: older adults, people living with disabilities, immigrants and refugees, families with young children and low income households. Examples of programming include: smoke alarm installation, home safety visits for low income households, preschool and grade school fire safety curriculum, first responder interaction for refugees and immigrants, and fire and fall prevention programming for older adults.
The CRR office responds to community needs as well as schedules educational activities based on community trends. Examples include: Remembering When (fire and fall prevention for older adults), Immigrant/refugee fire safety presentations with World Relief and Refugee Connections, ARC family summer event, low income apartment complex fire safety presentation, Fire Safety nights at area Elementary Schools. Groups included: college students, senior housing, refugees, young family fire safety, Early Head Start, Crime Free Multi Housing, case management teams serving older adults and people living with disabilities, and Refugee service providers and program participants.
FTEs
2015 Actual 2016 Actual 2017 Actual 2018 Budget 2019 Proposed
Total FTEs 0.00 1.00 1.00 1.00 1.00
Expenditures:
2015 Actual 2016 Actual 2017 Actual 2018 Budget 2019 Proposed
Capital Outlay 0 5,652 0 0 0
Interfund Charges 0 5,697 1,766 0 0
Reserve for Budget Adjustment 0 0 0 0 0
Transfers Out 0 0 0 0 0
Wages & Benefits 92,581 80,053 80,858 87,619 95,050
Supplies & Services 10,614 5,759 9,734 5,254 5,723
Debt Services 0 0 0 0 0
All Other 0 0 0 0 0
One Vision. One Plan. One Voice.
Public Safety18

Program Summary: Community Risk Reduction (CRR)
Division: Public Safety
Fund Type: Special Revenue Fund
Executive Summary:
CRR is the data driven, fire and life safety education program we provide for our community. Through social media, presentations, structured school age programs, smoke alarm installation activities, community equity events, and the Youth Firesetter Prevention Program, CRR educates the community about pertinent risks and appropriate mitigation strategies.
Programs and Services:
Educational programming through the Prevention Division provides data driven, fire and life safety information to our community. Various community programs are offered with increased emphasis placed on the national Community Risk Reduction priority populations: older adults, people living with disabilities, immigrants and refugees, families with young children and low income households. Examples of programming include: smoke alarm installation, home safety visits for low income households, preschool and grade school fire safety curriculum, first responder interaction for refugees and immigrants, and fire and fall prevention programming for older adults.
The CRR office responds to community needs as well as schedules educational activities based on community trends. Examples include: Remembering When (fire and fall prevention for older adults), Immigrant/refugee fire safety presentations with World Relief and Refugee Connections, ARC family summer event, low income apartment complex fire safety presentation, Fire Safety nights at area Elementary Schools. Groups included: college students, senior housing, refugees, young family fire safety, Early Head Start, Crime Free Multi Housing, case management teams serving older adults and people living with disabilities, and Refugee service providers and program participants.
FTEs
2015 Actual 2016 Actual 2017 Actual 2018 Budget 2019 Proposed
Total FTEs 0.00 1.00 1.00 1.00 1.00
Expenditures:
2015 Actual 2016 Actual 2017 Actual 2018 Budget 2019 Proposed
Capital Outlay 0 5,652 0 0 0
Interfund Charges 0 5,697 1,766 0 0
Reserve for Budget Adjustment 0 0 0 0 0
Transfers Out 0 0 0 0 0
Wages & Benefits 92,581 80,053 80,858 87,619 95,050
Supplies & Services 10,614 5,759 9,734 5,254 5,723
Debt Services 0 0 0 0 0
All Other 0 0 0 0 0
TOTAL 103,195 97,161 92,358 92,873 100,773
Expenditure Notes:
Revenues:
2015 Actual 2016 Actual 2017 Actual 2018 Budget 2019 Proposed
Taxes 0 0 0 0 0
Licenses & Permits 0 0 0 0 0
IG Revenue 0 0 0 0 0
Services 0 0 0 0 0
Fines & Forfeits 0 0 0 0 0
Operating Transfers In 0 0 0 0 0
General Fund Resources 0 0 0 0 0
All Other 0 0 0 0 0
TOTAL 0 0 0 0 0
Revenue Notes:
Public Safety 19
Program Summary: Facilities
Division: Public Safety
Fund Type: Special Revenue Fund
Executive Summary:
SFD operates from 21 facilities. There are 16 fire stations that are strategically located throughout Spokane. In addition, 5 support buildings are located on the SFD's Readiness complex: the Maintenance Shop, the Combined Communications Building, the Training/EOC Building, the Field House, and the Burn Building.
Programs and Services:
The maintenance of Fire Department facilities are managed by the Division Chief of Logistics. Most work is done through contracts for service. Funding needs for repairs/ upgrades and new construction of SFD facilities has been identified in the City's Capital Budget, though the majority are not funded. The City is working to establish a funding mechanism for the SFD and other City Division's/ Department's Capital Facility needs.
FTEs
2015 Actual 2016 Actual 2017 Actual 2018 Budget 2019 Proposed
Total FTEs 0.00 0.00 0.00 0.00 0.00
Expenditures:
2015 Actual 2016 Actual 2017 Actual 2018 Budget 2019 Proposed
Capital Outlay 34,299 18,788 27,637 0 0
Interfund Charges 0 1,617 12,233 0 10,000
Reserve for Budget Adjustment 0 0 0 0 0
Transfers Out 0 0 0 0 0
Wages & Benefits 0 0 0 0 0
Supplies & Services 663,117 661,318 653,154 666,734 664,934
Debt Services 0 0 0 0 0
All Other 0 383 775 400 800
TOTAL 697,416 682,106 693,799 667,134 675,734
Expenditure Notes:
Revenues:
2015 Actual 2016 Actual 2017 Actual 2018 Budget 2019 Proposed
Taxes 0 0 0 0 0
Licenses & Permits 0 0 0 0 0
IG Revenue 0 0 0 0 0
Services 0 0 0 0 0
Fines & Forfeits 0 0 0 0 0
Operating Transfers In 0 0 0 0 0One Vision. One Plan. One Voice.
Public Safety20

Program Summary: Facilities
Division: Public Safety
Fund Type: Special Revenue Fund
Executive Summary:
SFD operates from 21 facilities. There are 16 fire stations that are strategically located throughout Spokane. In addition, 5 support buildings are located on the SFD's Readiness complex: the Maintenance Shop, the Combined Communications Building, the Training/EOC Building, the Field House, and the Burn Building.
Programs and Services:
The maintenance of Fire Department facilities are managed by the Division Chief of Logistics. Most work is done through contracts for service. Funding needs for repairs/ upgrades and new construction of SFD facilities has been identified in the City's Capital Budget, though the majority are not funded. The City is working to establish a funding mechanism for the SFD and other City Division's/ Department's Capital Facility needs.
FTEs
2015 Actual 2016 Actual 2017 Actual 2018 Budget 2019 Proposed
Total FTEs 0.00 0.00 0.00 0.00 0.00
Expenditures:
2015 Actual 2016 Actual 2017 Actual 2018 Budget 2019 Proposed
Capital Outlay 34,299 18,788 27,637 0 0
Interfund Charges 0 1,617 12,233 0 10,000
Reserve for Budget Adjustment 0 0 0 0 0
Transfers Out 0 0 0 0 0
Wages & Benefits 0 0 0 0 0
Supplies & Services 663,117 661,318 653,154 666,734 664,934
Debt Services 0 0 0 0 0
All Other 0 383 775 400 800
TOTAL 697,416 682,106 693,799 667,134 675,734
Expenditure Notes:
Revenues:
2015 Actual 2016 Actual 2017 Actual 2018 Budget 2019 Proposed
Taxes 0 0 0 0 0
Licenses & Permits 0 0 0 0 0
IG Revenue 0 0 0 0 0
Services 0 0 0 0 0
Fines & Forfeits 0 0 0 0 0
Operating Transfers In 0 0 0 0 0
General Fund Resources 0 0 0 0 0
All Other 0 2 0 0 0
TOTAL 0 2 0 0 0
Revenue Notes:
All Other revenue include sale of scrap.
Public Safety 21
Program Summary: Fire Administration
Division: Public Safety
Fund Type: Special Revenue Fund
Executive Summary:
The Administrative function of the Fire Department provides leadership and management for the largest FD in eastern Washington. Fire Administration is responsible for organizational oversight and direction of the agency, budget preparation and management, personnel administration, payroll, purchasing and accounts payable, labor relations, long-term planning and community information.
Programs and Services:
Providing Fire Department (FD) Public Safety Services to the second largest City in Washington involves a complex operation with many moving parts. Most citizens look to their Fire Department to provide professional services in a timely manner, responsive to their needs with a positive customer service approach. The public calls on the Fire Department during their time of crisis, whether it is a fire situation, a medical incident or any circumstance where they need help and do not know who to call. The Fire personnel must be ready to respond to those calls 24-7-365, with a system that is well organized and has the capability to adapt and manage a myriad of occurrences. Fire Administration must ensure all aspects of the Fire Department are prepared and responsive to regularly fulfilling their part of the FD’s mission. Due to our mission and nature of providing emergency services, the Fire Department must actively interact with other City departments as well as a host of governmental and private sector operations. SFD must be effective in informing, educating, listening to and interacting with the public. Additionally, the City and SFD rely on financial and other support of our citizens for voted levies and bonds so it is essential that the SFD engages the community to answer questions and help explain the services provided by the SFD. This requires the use of social media as well as face to face interaction at all levels of the organizations, and we strive to be active and participate in as many events as time and resources will allow.
FTEs
2015 Actual 2016 Actual 2017 Actual 2018 Budget 2019 Proposed
Total FTEs 26.50 3.00 3.00 3.00 3.00
Expenditures:
2015 Actual 2016 Actual 2017 Actual 2018 Budget 2019 Proposed
Capital Outlay 0 0 0 0 0
Interfund Charges 2,391,183 2,455,360 2,748,031 2,895,856 3,270,380
Reserve for Budget Adjustment 0 0 0 0 0
Transfers Out 0 48,150 48,150 48,151 48,151
Wages & Benefits 1,566,191 758,290 735,095 675,869 667,637
Supplies & Services 255,569 228,855 309,081 219,218 103,254
Debt Services 0 0 0 0 0
All Other 0 0 0 0 0
One Vision. One Plan. One Voice.
Public Safety22
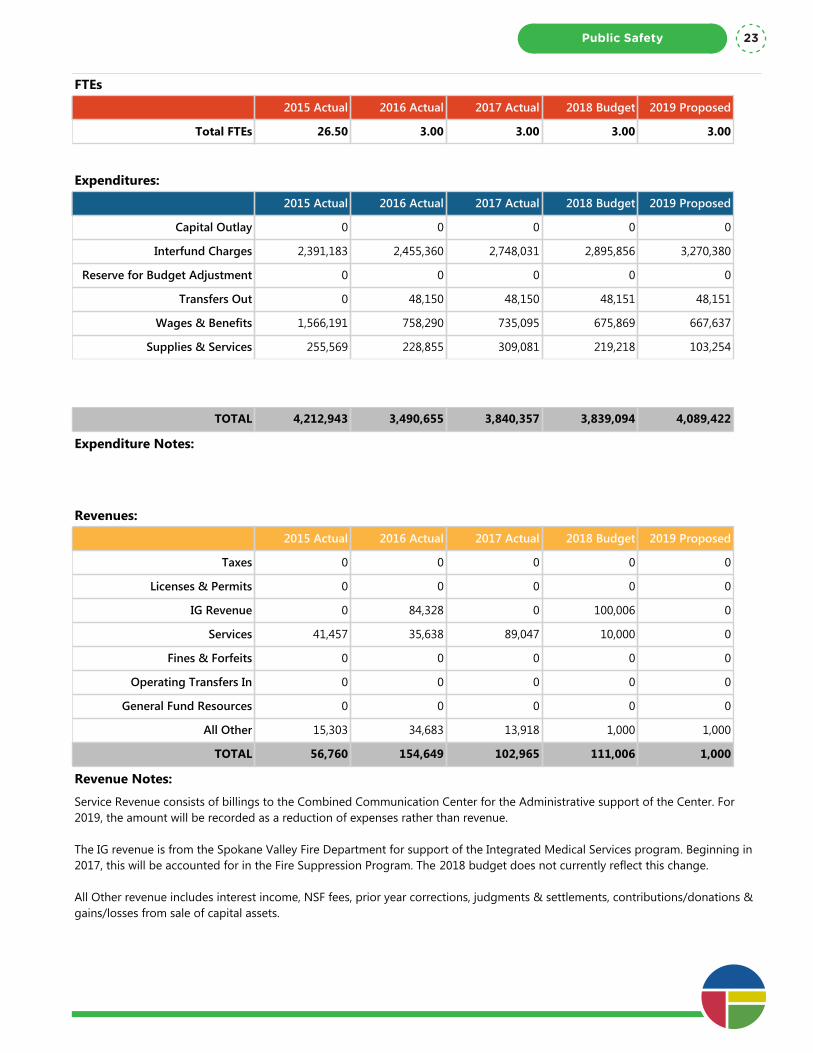
Program Summary: Fire Administration
Division: Public Safety
Fund Type: Special Revenue Fund
Executive Summary:
The Administrative function of the Fire Department provides leadership and management for the largest FD in eastern Washington. Fire Administration is responsible for organizational oversight and direction of the agency, budget preparation and management, personnel administration, payroll, purchasing and accounts payable, labor relations, long-term planning and community information.
Programs and Services:
Providing Fire Department (FD) Public Safety Services to the second largest City in Washington involves a complex operation with many moving parts. Most citizens look to their Fire Department to provide professional services in a timely manner, responsive to their needs with a positive customer service approach. The public calls on the Fire Department during their time of crisis, whether it is a fire situation, a medical incident or any circumstance where they need help and do not know who to call. The Fire personnel must be ready to respond to those calls 24-7-365, with a system that is well organized and has the capability to adapt and manage a myriad of occurrences. Fire Administration must ensure all aspects of the Fire Department are prepared and responsive to regularly fulfilling their part of the FD’s mission. Due to our mission and nature of providing emergency services, the Fire Department must actively interact with other City departments as well as a host of governmental and private sector operations. SFD must be effective in informing, educating, listening to and interacting with the public. Additionally, the City and SFD rely on financial and other support of our citizens for voted levies and bonds so it is essential that the SFD engages the community to answer questions and help explain the services provided by the SFD. This requires the use of social media as well as face to face interaction at all levels of the organizations, and we strive to be active and participate in as many events as time and resources will allow.
FTEs
2015 Actual 2016 Actual 2017 Actual 2018 Budget 2019 Proposed
Total FTEs 26.50 3.00 3.00 3.00 3.00
Expenditures:
2015 Actual 2016 Actual 2017 Actual 2018 Budget 2019 Proposed
Capital Outlay 0 0 0 0 0
Interfund Charges 2,391,183 2,455,360 2,748,031 2,895,856 3,270,380
Reserve for Budget Adjustment 0 0 0 0 0
Transfers Out 0 48,150 48,150 48,151 48,151
Wages & Benefits 1,566,191 758,290 735,095 675,869 667,637
Supplies & Services 255,569 228,855 309,081 219,218 103,254
Debt Services 0 0 0 0 0
All Other 0 0 0 0 0
TOTAL 4,212,943 3,490,655 3,840,357 3,839,094 4,089,422
Expenditure Notes:
Revenues:
2015 Actual 2016 Actual 2017 Actual 2018 Budget 2019 Proposed
Taxes 0 0 0 0 0
Licenses & Permits 0 0 0 0 0
IG Revenue 0 84,328 0 100,006 0
Services 41,457 35,638 89,047 10,000 0
Fines & Forfeits 0 0 0 0 0
Operating Transfers In 0 0 0 0 0
General Fund Resources 0 0 0 0 0
All Other 15,303 34,683 13,918 1,000 1,000
TOTAL 56,760 154,649 102,965 111,006 1,000
Revenue Notes:
Service Revenue consists of billings to the Combined Communication Center for the Administrative support of the Center. For 2019, the amount will be recorded as a reduction of expenses rather than revenue.
The IG revenue is from the Spokane Valley Fire Department for support of the Integrated Medical Services program. Beginning in 2017, this will be accounted for in the Fire Suppression Program. The 2018 budget does not currently reflect this change.
All Other revenue includes interest income, NSF fees, prior year corrections, judgments & settlements, contributions/donations & gains/losses from sale of capital assets.
Public Safety 23
Program Summary: Fire Suppression-EMS
Division: Public Safety
Fund Type: Special Revenue Fund
Executive Summary:
SFD Operations is a critical public safety service provided by the City. Responding to 45,000+ incidents annually from 16 stations on 21 strategically located units, this division makes a vital difference in lives in Spokane daily. Incidents encompass all risks including: EMS, structure fire, technical rescue, hazardous materials and wildfire.
Programs and Services:
The Operations section responds to emergency and non-emergency incidents while also performing community risk reduction assignments dictated by availability. SFD Operations provides one of the only true emergency response services by the City. The Operations Division responds to more than 45,000 incidents per year.
A growing population and increasing requests for services challenges the Operations group to provide effective response to incidents. With limited resources, strategic placement of personnel and apparatus is essential for response to fire and EMS related incidents. To maximize cost-effectiveness, firefighters work as multi-role providers and cross-staff numerous specialty functions. All Spokane Fire Operations personnel are highly trained to provide fire and emergency medical services to the citizens of Spokane. All SFD apparatus are capable of responding to and resolving a variety of emergency incidents ranging from providing care for a patient in cardiac arrest up to and including a multiple alarm high-rise fire. All SFD personnel who work within the Operations Division and are assigned to Fire Stations provide both Fire and EMS operations. The Operations Department addresses the following operational goals:
1. Provide an efficient, effective Citywide fire suppression program designed to control and/or extinguish fires to protect citizens from death, injury, or property loss.2. Provide an efficient, effective Emergency Medical Services (EMS) program City wide, serving the community with first response Basic Life Support (BLS), Advanced Life Support (ALS) patient care and Detox transport services.3. Provide community wide training opportunities for business and industry in subjects such as hazardous materials incidents, the Incident Command System, pre-incident planning, medical care and community wide response to disaster situations.4. Establish procedures with other local emergency services partners to mitigate major and special incidents through multi-agency planning and coordination.5. Maintain and assure SFD facilities are in a constant state of readiness 24/7/365 to meet the needs of the public as well as our providers. In order to protect life, property and the environment, SFD must have adequate resources that allow the City to provide effective response to calls for assistance. The level of service for fire protection is a function of response time, call volumes and expected outcomes.
FTEs
2015 Actual 2016 Actual 2017 Actual 2018 Budget 2019 Proposed
Total FTEs 271.00 286.00 327.00 329.00 330.00
Expenditures:
2015 Actual 2016 Actual 2017 Actual 2018 Budget 2019 Proposed
Capital Outlay 300,154 51,747 32,814 25,000 0
Interfund Charges 0 1,155 1,127 0 0
Reserve for Budget Adjustment 0 0 0 (500,000) (450,000)
Transfers Out 0 0 0 0 0
Wages & Benefits 36,689,462 37,098,210 39,957,288 42,828,154 45,393,213
Supplies & Services 1,381,303 794,445 1,135,738 996,689 728,952One Vision. One Plan. One Voice.
Public Safety24
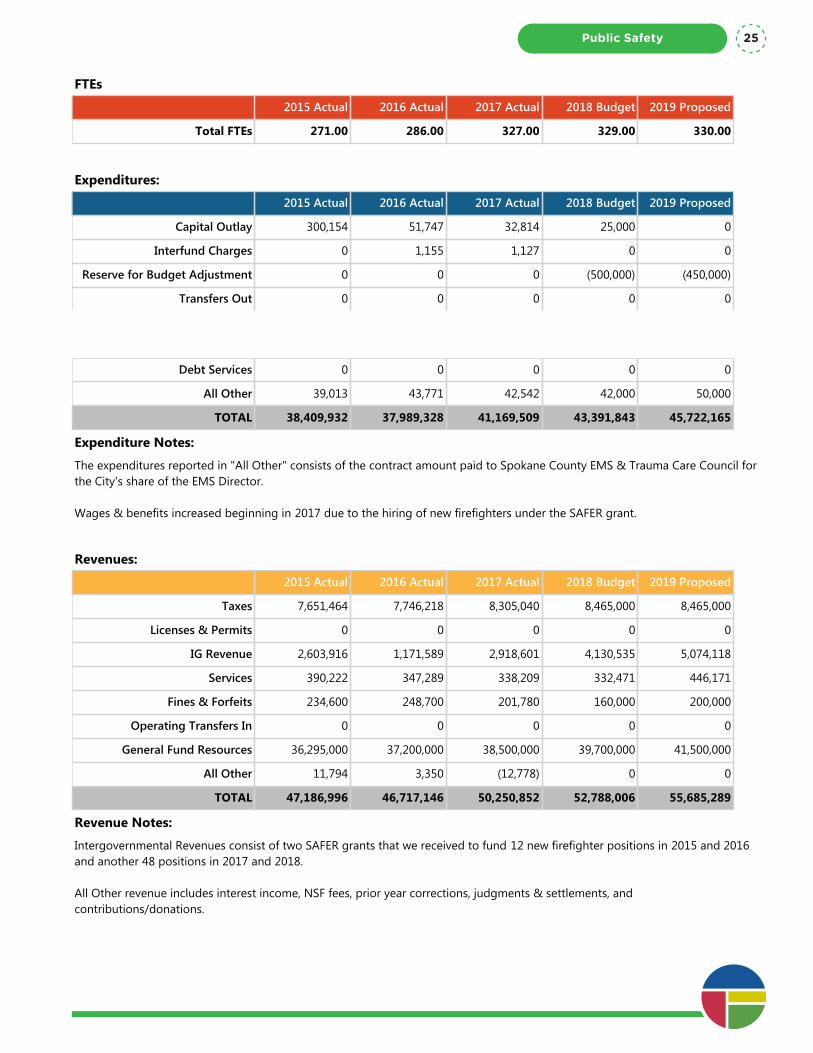
Program Summary: Fire Suppression-EMS
Division: Public Safety
Fund Type: Special Revenue Fund
Executive Summary:
SFD Operations is a critical public safety service provided by the City. Responding to 45,000+ incidents annually from 16 stations on 21 strategically located units, this division makes a vital difference in lives in Spokane daily. Incidents encompass all risks including: EMS, structure fire, technical rescue, hazardous materials and wildfire.
Programs and Services:
The Operations section responds to emergency and non-emergency incidents while also performing community risk reduction assignments dictated by availability. SFD Operations provides one of the only true emergency response services by the City. The Operations Division responds to more than 45,000 incidents per year.
A growing population and increasing requests for services challenges the Operations group to provide effective response to incidents. With limited resources, strategic placement of personnel and apparatus is essential for response to fire and EMS related incidents. To maximize cost-effectiveness, firefighters work as multi-role providers and cross-staff numerous specialty functions. All Spokane Fire Operations personnel are highly trained to provide fire and emergency medical services to the citizens of Spokane. All SFD apparatus are capable of responding to and resolving a variety of emergency incidents ranging from providing care for a patient in cardiac arrest up to and including a multiple alarm high-rise fire. All SFD personnel who work within the Operations Division and are assigned to Fire Stations provide both Fire and EMS operations. The Operations Department addresses the following operational goals:
1. Provide an efficient, effective Citywide fire suppression program designed to control and/or extinguish fires to protect citizens from death, injury, or property loss.2. Provide an efficient, effective Emergency Medical Services (EMS) program City wide, serving the community with first response Basic Life Support (BLS), Advanced Life Support (ALS) patient care and Detox transport services.3. Provide community wide training opportunities for business and industry in subjects such as hazardous materials incidents, the Incident Command System, pre-incident planning, medical care and community wide response to disaster situations.4. Establish procedures with other local emergency services partners to mitigate major and special incidents through multi-agency planning and coordination.5. Maintain and assure SFD facilities are in a constant state of readiness 24/7/365 to meet the needs of the public as well as our providers. In order to protect life, property and the environment, SFD must have adequate resources that allow the City to provide effective response to calls for assistance. The level of service for fire protection is a function of response time, call volumes and expected outcomes.
FTEs
2015 Actual 2016 Actual 2017 Actual 2018 Budget 2019 Proposed
Total FTEs 271.00 286.00 327.00 329.00 330.00
Expenditures:
2015 Actual 2016 Actual 2017 Actual 2018 Budget 2019 Proposed
Capital Outlay 300,154 51,747 32,814 25,000 0
Interfund Charges 0 1,155 1,127 0 0
Reserve for Budget Adjustment 0 0 0 (500,000) (450,000)
Transfers Out 0 0 0 0 0
Wages & Benefits 36,689,462 37,098,210 39,957,288 42,828,154 45,393,213
Supplies & Services 1,381,303 794,445 1,135,738 996,689 728,952
Debt Services 0 0 0 0 0
All Other 39,013 43,771 42,542 42,000 50,000
TOTAL 38,409,932 37,989,328 41,169,509 43,391,843 45,722,165
Expenditure Notes:
The expenditures reported in "All Other" consists of the contract amount paid to Spokane County EMS & Trauma Care Council for the City's share of the EMS Director.
Wages & benefits increased beginning in 2017 due to the hiring of new firefighters under the SAFER grant.
Revenues:
2015 Actual 2016 Actual 2017 Actual 2018 Budget 2019 Proposed
Taxes 7,651,464 7,746,218 8,305,040 8,465,000 8,465,000
Licenses & Permits 0 0 0 0 0
IG Revenue 2,603,916 1,171,589 2,918,601 4,130,535 5,074,118
Services 390,222 347,289 338,209 332,471 446,171
Fines & Forfeits 234,600 248,700 201,780 160,000 200,000
Operating Transfers In 0 0 0 0 0
General Fund Resources 36,295,000 37,200,000 38,500,000 39,700,000 41,500,000
All Other 11,794 3,350 (12,778) 0 0
TOTAL 47,186,996 46,717,146 50,250,852 52,788,006 55,685,289
Revenue Notes:
Intergovernmental Revenues consist of two SAFER grants that we received to fund 12 new firefighter positions in 2015 and 2016 and another 48 positions in 2017 and 2018.
All Other revenue includes interest income, NSF fees, prior year corrections, judgments & settlements, and contributions/donations.
Public Safety 25
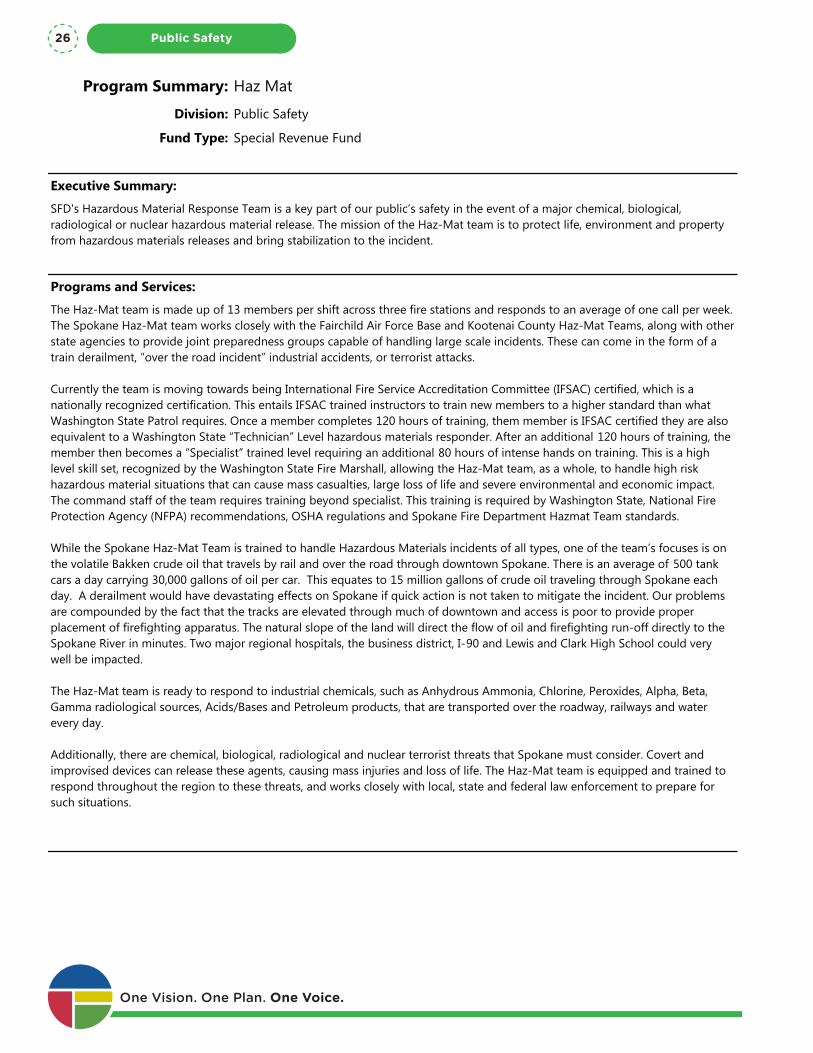
Program Summary: Haz Mat
Division: Public Safety
Fund Type: Special Revenue Fund
Executive Summary:
SFD's Hazardous Material Response Team is a key part of our public’s safety in the event of a major chemical, biological, radiological or nuclear hazardous material release. The mission of the Haz-Mat team is to protect life, environment and property from hazardous materials releases and bring stabilization to the incident.
Programs and Services:
The Haz-Mat team is made up of 13 members per shift across three fire stations and responds to an average of one call per week. The Spokane Haz-Mat team works closely with the Fairchild Air Force Base and Kootenai County Haz-Mat Teams, along with other state agencies to provide joint preparedness groups capable of handling large scale incidents. These can come in the form of a train derailment, “over the road incident” industrial accidents, or terrorist attacks.
Currently the team is moving towards being International Fire Service Accreditation Committee (IFSAC) certified, which is a nationally recognized certification. This entails IFSAC trained instructors to train new members to a higher standard than what Washington State Patrol requires. Once a member completes 120 hours of training, them member is IFSAC certified they are also equivalent to a Washington State “Technician” Level hazardous materials responder. After an additional 120 hours of training, the member then becomes a “Specialist” trained level requiring an additional 80 hours of intense hands on training. This is a high level skill set, recognized by the Washington State Fire Marshall, allowing the Haz-Mat team, as a whole, to handle high risk hazardous material situations that can cause mass casualties, large loss of life and severe environmental and economic impact. The command staff of the team requires training beyond specialist. This training is required by Washington State, National Fire Protection Agency (NFPA) recommendations, OSHA regulations and Spokane Fire Department Hazmat Team standards.
While the Spokane Haz-Mat Team is trained to handle Hazardous Materials incidents of all types, one of the team’s focuses is on the volatile Bakken crude oil that travels by rail and over the road through downtown Spokane. There is an average of 500 tank cars a day carrying 30,000 gallons of oil per car. This equates to 15 million gallons of crude oil traveling through Spokane each day. A derailment would have devastating effects on Spokane if quick action is not taken to mitigate the incident. Our problems are compounded by the fact that the tracks are elevated through much of downtown and access is poor to provide proper placement of firefighting apparatus. The natural slope of the land will direct the flow of oil and firefighting run-off directly to the Spokane River in minutes. Two major regional hospitals, the business district, I-90 and Lewis and Clark High School could very well be impacted.
The Haz-Mat team is ready to respond to industrial chemicals, such as Anhydrous Ammonia, Chlorine, Peroxides, Alpha, Beta, Gamma radiological sources, Acids/Bases and Petroleum products, that are transported over the roadway, railways and water every day.
Additionally, there are chemical, biological, radiological and nuclear terrorist threats that Spokane must consider. Covert and improvised devices can release these agents, causing mass injuries and loss of life. The Haz-Mat team is equipped and trained to respond throughout the region to these threats, and works closely with local, state and federal law enforcement to prepare for such situations.
FTEs
2015 Actual 2016 Actual 2017 Actual 2018 Budget 2019 Proposed
Total FTEs 0.00 0.00 0.00 0.00 0.00
Expenditures:
2015 Actual 2016 Actual 2017 Actual 2018 Budget 2019 Proposed
Capital Outlay 0 0 16,184 0 0One Vision. One Plan. One Voice.
Public Safety26
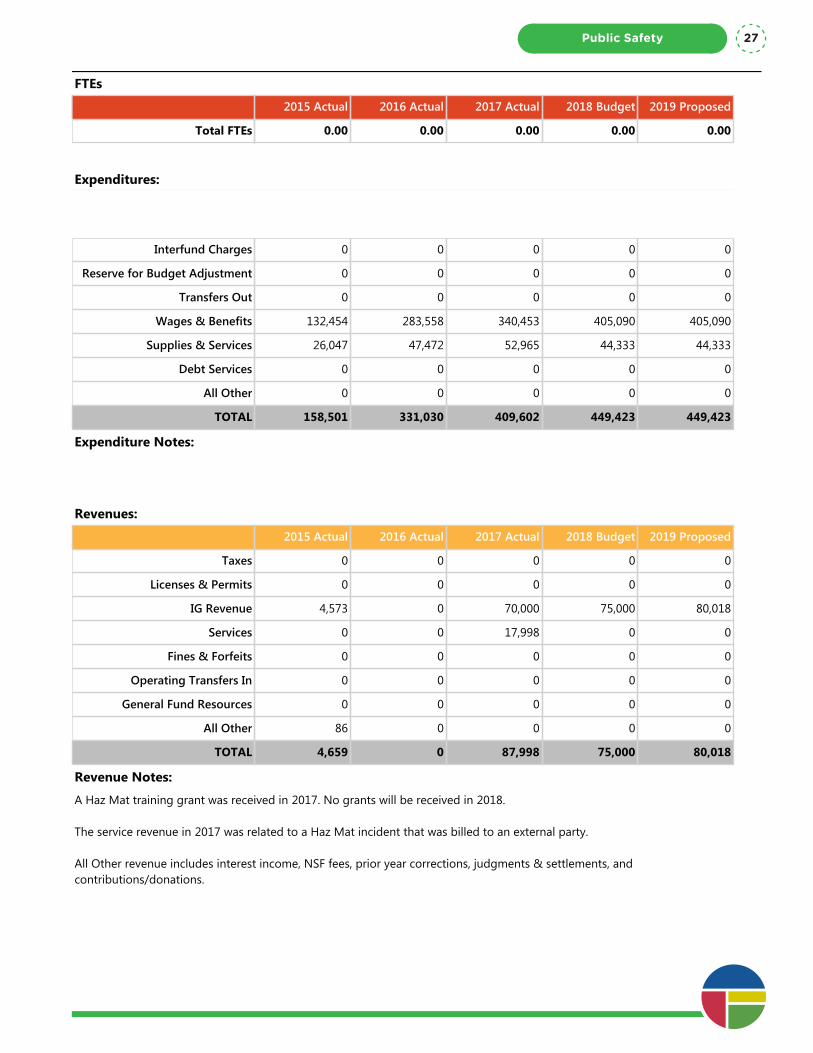
Program Summary: Haz Mat
Division: Public Safety
Fund Type: Special Revenue Fund
Executive Summary:
SFD's Hazardous Material Response Team is a key part of our public’s safety in the event of a major chemical, biological, radiological or nuclear hazardous material release. The mission of the Haz-Mat team is to protect life, environment and property from hazardous materials releases and bring stabilization to the incident.
Programs and Services:
The Haz-Mat team is made up of 13 members per shift across three fire stations and responds to an average of one call per week. The Spokane Haz-Mat team works closely with the Fairchild Air Force Base and Kootenai County Haz-Mat Teams, along with other state agencies to provide joint preparedness groups capable of handling large scale incidents. These can come in the form of a train derailment, “over the road incident” industrial accidents, or terrorist attacks.
Currently the team is moving towards being International Fire Service Accreditation Committee (IFSAC) certified, which is a nationally recognized certification. This entails IFSAC trained instructors to train new members to a higher standard than what Washington State Patrol requires. Once a member completes 120 hours of training, them member is IFSAC certified they are also equivalent to a Washington State “Technician” Level hazardous materials responder. After an additional 120 hours of training, the member then becomes a “Specialist” trained level requiring an additional 80 hours of intense hands on training. This is a high level skill set, recognized by the Washington State Fire Marshall, allowing the Haz-Mat team, as a whole, to handle high risk hazardous material situations that can cause mass casualties, large loss of life and severe environmental and economic impact. The command staff of the team requires training beyond specialist. This training is required by Washington State, National Fire Protection Agency (NFPA) recommendations, OSHA regulations and Spokane Fire Department Hazmat Team standards.
While the Spokane Haz-Mat Team is trained to handle Hazardous Materials incidents of all types, one of the team’s focuses is on the volatile Bakken crude oil that travels by rail and over the road through downtown Spokane. There is an average of 500 tank cars a day carrying 30,000 gallons of oil per car. This equates to 15 million gallons of crude oil traveling through Spokane each day. A derailment would have devastating effects on Spokane if quick action is not taken to mitigate the incident. Our problems are compounded by the fact that the tracks are elevated through much of downtown and access is poor to provide proper placement of firefighting apparatus. The natural slope of the land will direct the flow of oil and firefighting run-off directly to the Spokane River in minutes. Two major regional hospitals, the business district, I-90 and Lewis and Clark High School could very well be impacted.
The Haz-Mat team is ready to respond to industrial chemicals, such as Anhydrous Ammonia, Chlorine, Peroxides, Alpha, Beta, Gamma radiological sources, Acids/Bases and Petroleum products, that are transported over the roadway, railways and water every day.
Additionally, there are chemical, biological, radiological and nuclear terrorist threats that Spokane must consider. Covert and improvised devices can release these agents, causing mass injuries and loss of life. The Haz-Mat team is equipped and trained to respond throughout the region to these threats, and works closely with local, state and federal law enforcement to prepare for such situations.
FTEs
2015 Actual 2016 Actual 2017 Actual 2018 Budget 2019 Proposed
Total FTEs 0.00 0.00 0.00 0.00 0.00
Expenditures:
2015 Actual 2016 Actual 2017 Actual 2018 Budget 2019 Proposed
Capital Outlay 0 0 16,184 0 0
Interfund Charges 0 0 0 0 0
Reserve for Budget Adjustment 0 0 0 0 0
Transfers Out 0 0 0 0 0
Wages & Benefits 132,454 283,558 340,453 405,090 405,090
Supplies & Services 26,047 47,472 52,965 44,333 44,333
Debt Services 0 0 0 0 0
All Other 0 0 0 0 0
TOTAL 158,501 331,030 409,602 449,423 449,423
Expenditure Notes:
Revenues:
2015 Actual 2016 Actual 2017 Actual 2018 Budget 2019 Proposed
Taxes 0 0 0 0 0
Licenses & Permits 0 0 0 0 0
IG Revenue 4,573 0 70,000 75,000 80,018
Services 0 0 17,998 0 0
Fines & Forfeits 0 0 0 0 0
Operating Transfers In 0 0 0 0 0
General Fund Resources 0 0 0 0 0
All Other 86 0 0 0 0
TOTAL 4,659 0 87,998 75,000 80,018
Revenue Notes:
A Haz Mat training grant was received in 2017. No grants will be received in 2018.
The service revenue in 2017 was related to a Haz Mat incident that was billed to an external party.
All Other revenue includes interest income, NSF fees, prior year corrections, judgments & settlements, and contributions/donations.
Public Safety 27
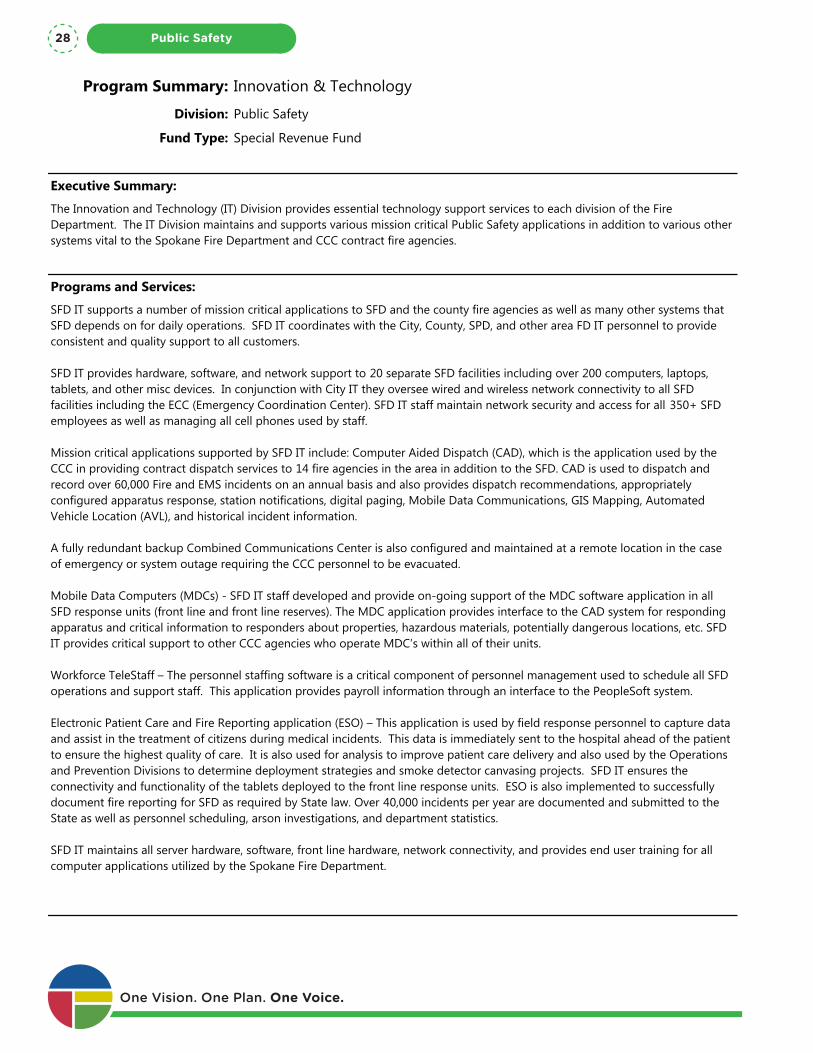
Program Summary: Innovation & Technology
Division: Public Safety
Fund Type: Special Revenue Fund
Executive Summary:
The Innovation and Technology (IT) Division provides essential technology support services to each division of the Fire Department. The IT Division maintains and supports various mission critical Public Safety applications in addition to various other systems vital to the Spokane Fire Department and CCC contract fire agencies.
Programs and Services:
SFD IT supports a number of mission critical applications to SFD and the county fire agencies as well as many other systems that SFD depends on for daily operations. SFD IT coordinates with the City, County, SPD, and other area FD IT personnel to provide consistent and quality support to all customers.
SFD IT provides hardware, software, and network support to 20 separate SFD facilities including over 200 computers, laptops, tablets, and other misc devices. In conjunction with City IT they oversee wired and wireless network connectivity to all SFD facilities including the ECC (Emergency Coordination Center). SFD IT staff maintain network security and access for all 350+ SFD employees as well as managing all cell phones used by staff.
Mission critical applications supported by SFD IT include: Computer Aided Dispatch (CAD), which is the application used by the CCC in providing contract dispatch services to 14 fire agencies in the area in addition to the SFD. CAD is used to dispatch and record over 60,000 Fire and EMS incidents on an annual basis and also provides dispatch recommendations, appropriately configured apparatus response, station notifications, digital paging, Mobile Data Communications, GIS Mapping, Automated Vehicle Location (AVL), and historical incident information.
A fully redundant backup Combined Communications Center is also configured and maintained at a remote location in the case of emergency or system outage requiring the CCC personnel to be evacuated.
Mobile Data Computers (MDCs) - SFD IT staff developed and provide on-going support of the MDC software application in all SFD response units (front line and front line reserves). The MDC application provides interface to the CAD system for responding apparatus and critical information to responders about properties, hazardous materials, potentially dangerous locations, etc. SFD IT provides critical support to other CCC agencies who operate MDC’s within all of their units.
Workforce TeleStaff – The personnel staffing software is a critical component of personnel management used to schedule all SFD operations and support staff. This application provides payroll information through an interface to the PeopleSoft system.
Electronic Patient Care and Fire Reporting application (ESO) – This application is used by field response personnel to capture data and assist in the treatment of citizens during medical incidents. This data is immediately sent to the hospital ahead of the patient to ensure the highest quality of care. It is also used for analysis to improve patient care delivery and also used by the Operations and Prevention Divisions to determine deployment strategies and smoke detector canvasing projects. SFD IT ensures the connectivity and functionality of the tablets deployed to the front line response units. ESO is also implemented to successfully document fire reporting for SFD as required by State law. Over 40,000 incidents per year are documented and submitted to the State as well as personnel scheduling, arson investigations, and department statistics.
SFD IT maintains all server hardware, software, front line hardware, network connectivity, and provides end user training for all computer applications utilized by the Spokane Fire Department.
FTEs
2015 Actual 2016 Actual 2017 Actual 2018 Budget 2019 Proposed
Total FTEs 0.00 4.00 4.00 4.00 2.80
One Vision. One Plan. One Voice.
Public Safety28
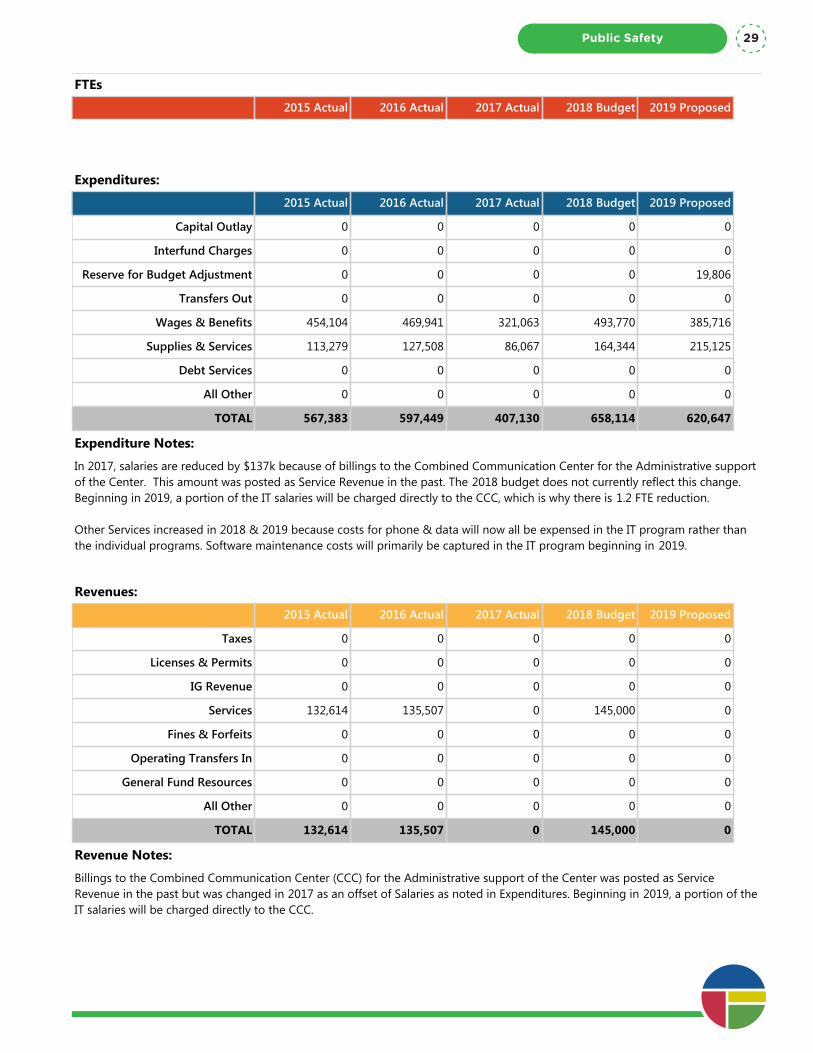
Program Summary: Innovation & Technology
Division: Public Safety
Fund Type: Special Revenue Fund
Executive Summary:
The Innovation and Technology (IT) Division provides essential technology support services to each division of the Fire Department. The IT Division maintains and supports various mission critical Public Safety applications in addition to various other systems vital to the Spokane Fire Department and CCC contract fire agencies.
Programs and Services:
SFD IT supports a number of mission critical applications to SFD and the county fire agencies as well as many other systems that SFD depends on for daily operations. SFD IT coordinates with the City, County, SPD, and other area FD IT personnel to provide consistent and quality support to all customers.
SFD IT provides hardware, software, and network support to 20 separate SFD facilities including over 200 computers, laptops, tablets, and other misc devices. In conjunction with City IT they oversee wired and wireless network connectivity to all SFD facilities including the ECC (Emergency Coordination Center). SFD IT staff maintain network security and access for all 350+ SFD employees as well as managing all cell phones used by staff.
Mission critical applications supported by SFD IT include: Computer Aided Dispatch (CAD), which is the application used by the CCC in providing contract dispatch services to 14 fire agencies in the area in addition to the SFD. CAD is used to dispatch and record over 60,000 Fire and EMS incidents on an annual basis and also provides dispatch recommendations, appropriately configured apparatus response, station notifications, digital paging, Mobile Data Communications, GIS Mapping, Automated Vehicle Location (AVL), and historical incident information.
A fully redundant backup Combined Communications Center is also configured and maintained at a remote location in the case of emergency or system outage requiring the CCC personnel to be evacuated.
Mobile Data Computers (MDCs) - SFD IT staff developed and provide on-going support of the MDC software application in all SFD response units (front line and front line reserves). The MDC application provides interface to the CAD system for responding apparatus and critical information to responders about properties, hazardous materials, potentially dangerous locations, etc. SFD IT provides critical support to other CCC agencies who operate MDC’s within all of their units.
Workforce TeleStaff – The personnel staffing software is a critical component of personnel management used to schedule all SFD operations and support staff. This application provides payroll information through an interface to the PeopleSoft system.
Electronic Patient Care and Fire Reporting application (ESO) – This application is used by field response personnel to capture data and assist in the treatment of citizens during medical incidents. This data is immediately sent to the hospital ahead of the patient to ensure the highest quality of care. It is also used for analysis to improve patient care delivery and also used by the Operations and Prevention Divisions to determine deployment strategies and smoke detector canvasing projects. SFD IT ensures the connectivity and functionality of the tablets deployed to the front line response units. ESO is also implemented to successfully document fire reporting for SFD as required by State law. Over 40,000 incidents per year are documented and submitted to the State as well as personnel scheduling, arson investigations, and department statistics.
SFD IT maintains all server hardware, software, front line hardware, network connectivity, and provides end user training for all computer applications utilized by the Spokane Fire Department.
FTEs
2015 Actual 2016 Actual 2017 Actual 2018 Budget 2019 Proposed
Total FTEs 0.00 4.00 4.00 4.00 2.80
Expenditures:
2015 Actual 2016 Actual 2017 Actual 2018 Budget 2019 Proposed
Capital Outlay 0 0 0 0 0
Interfund Charges 0 0 0 0 0
Reserve for Budget Adjustment 0 0 0 0 19,806
Transfers Out 0 0 0 0 0
Wages & Benefits 454,104 469,941 321,063 493,770 385,716
Supplies & Services 113,279 127,508 86,067 164,344 215,125
Debt Services 0 0 0 0 0
All Other 0 0 0 0 0
TOTAL 567,383 597,449 407,130 658,114 620,647
Expenditure Notes:
In 2017, salaries are reduced by $137k because of billings to the Combined Communication Center for the Administrative support of the Center. This amount was posted as Service Revenue in the past. The 2018 budget does not currently reflect this change. Beginning in 2019, a portion of the IT salaries will be charged directly to the CCC, which is why there is 1.2 FTE reduction.
Other Services increased in 2018 & 2019 because costs for phone & data will now all be expensed in the IT program rather than the individual programs. Software maintenance costs will primarily be captured in the IT program beginning in 2019.
Revenues:
2015 Actual 2016 Actual 2017 Actual 2018 Budget 2019 Proposed
Taxes 0 0 0 0 0
Licenses & Permits 0 0 0 0 0
IG Revenue 0 0 0 0 0
Services 132,614 135,507 0 145,000 0
Fines & Forfeits 0 0 0 0 0
Operating Transfers In 0 0 0 0 0
General Fund Resources 0 0 0 0 0
All Other 0 0 0 0 0
TOTAL 132,614 135,507 0 145,000 0
Revenue Notes:
Billings to the Combined Communication Center (CCC) for the Administrative support of the Center was posted as Service Revenue in the past but was changed in 2017 as an offset of Salaries as noted in Expenditures. Beginning in 2019, a portion of the IT salaries will be charged directly to the CCC.
Public Safety 29
Program Summary: Investigation
Division: Public Safety
Fund Type: Special Revenue Fund
Executive Summary:
Investigation plays an important role in identifying the causes and reducing the incidences of destructive fires. Our investigative findings assist in convicting criminal fire setters, identifying faulty consumer products that pose a danger to our citizens, and identifying behaviors that pose a fire risk to individuals or populations.
Programs and Services:
The primary responsibility of the Special Investigation Office is to conduct fire origin and cause investigations as required by RCW 43.44.050. We utilize the Scientific Method and conduct our investigations in accordance with NFPA 921 Guide for Fire and Explosion Investigations and NFPA 1033 Standard for Professional Qualifications for Fire Investigator. We are called to investigate structure fires, vehicle fires, wildland fires, rubbish fires, and attempted fire starts. These investigations involve conducting a fire scene examination, documenting the fire scene through notes, photographs, measurements, and sketches, interviewing witnesses, victims, owners, and fire fighters, collecting items of potential evidence and arranging for testing, conducting research and testing to evaluate origin and cause hypotheses, and producing written reports to document the investigative findings and the investigator’s opinion as to the origin and cause of the fire. When a fire is determined to be a criminal act, we work in conjunction with Spokane Police Detectives, the Spokane County Prosecuting Attorney Office, and the United States Bureau of Alcohol, Tobacco, Firearms, and Explosives Special Agents to identify and prosecute the person or persons responsible. At trial, we will testify as an expert witness to our findings of the origin and cause of the fire. If our investigation shows the fire was the result of a consumer product malfunction, we can report our findings to the Consumer Product Safety Commission for further investigation. After the conclusion of our scene examination, we may participate in a joint scene examination with investigators from involved insurance companies, utilities, contractors, and others.
Additional duties and responsibilities of the Special Investigation Office include:1. Internal investigations and documentation of incidents including complaints against Fire Department Personnel, medication checks and inventories, damaged or stolen equipment, and others.2. Completing and submitting a required Washington State Patrol Fire Fatality report on all fatal fires within two days.3. Documenting civilian fire related burn injuries.4. Collecting and maintaining documentation regarding incidents included in the Unusual Occurrence Manual and forwarding the completed documentation to Risk Management.5. Investigating, documenting, and reporting on certain fire fighter injuries, and securing any involved equipment and PPE.6. Conducting fire origin and cause investigations for outside agencies though the Mutual Aid Agreement.7. Reviewing NFIRS Fire Reports completed by the fire crews for fires where a fire investigator was called to the scene.8. Maintaining all reports, documents, photographs, evidence, and other materials collected during fire investigations.9. Receiving and fulfilling Public Records Requests from the City Clerk for fire incidents in accordance with city policy and Washington State Law.10. Identifying, documenting, and referring juvenile fire setters to the SFD Youth Firesetter Program.11. Conducting administrative and technical reviews of all fire investigation reports prior to completion.12. Assisting the SFD Community Risk Reduction officer with public education and outreach.
FTEs
2015 Actual 2016 Actual 2017 Actual 2018 Budget 2019 Proposed
Total FTEs 0.00 2.00 2.00 2.00 2.00
Expenditures:
2015 Actual 2016 Actual 2017 Actual 2018 Budget 2019 Proposed
Capital Outlay 0 0 0 0 0
Interfund Charges 1,167 888 147 0 0One Vision. One Plan. One Voice.
Public Safety30
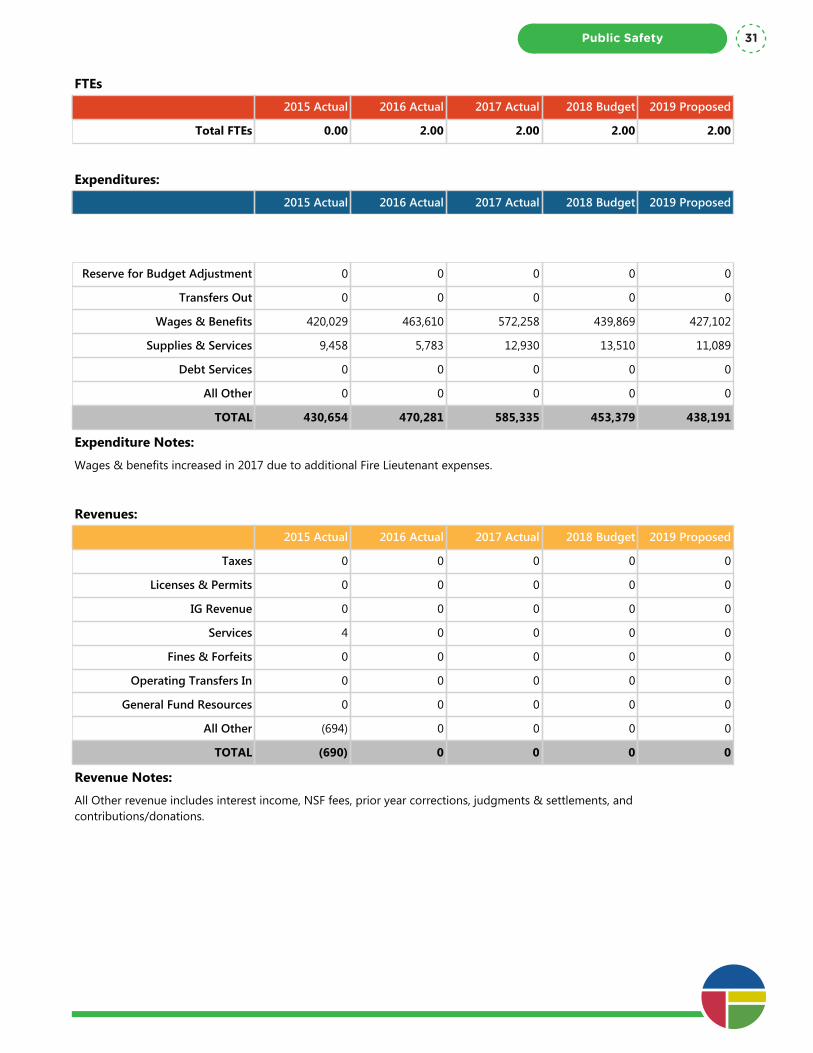
Program Summary: Investigation
Division: Public Safety
Fund Type: Special Revenue Fund
Executive Summary:
Investigation plays an important role in identifying the causes and reducing the incidences of destructive fires. Our investigative findings assist in convicting criminal fire setters, identifying faulty consumer products that pose a danger to our citizens, and identifying behaviors that pose a fire risk to individuals or populations.
Programs and Services:
The primary responsibility of the Special Investigation Office is to conduct fire origin and cause investigations as required by RCW 43.44.050. We utilize the Scientific Method and conduct our investigations in accordance with NFPA 921 Guide for Fire and Explosion Investigations and NFPA 1033 Standard for Professional Qualifications for Fire Investigator. We are called to investigate structure fires, vehicle fires, wildland fires, rubbish fires, and attempted fire starts. These investigations involve conducting a fire scene examination, documenting the fire scene through notes, photographs, measurements, and sketches, interviewing witnesses, victims, owners, and fire fighters, collecting items of potential evidence and arranging for testing, conducting research and testing to evaluate origin and cause hypotheses, and producing written reports to document the investigative findings and the investigator’s opinion as to the origin and cause of the fire. When a fire is determined to be a criminal act, we work in conjunction with Spokane Police Detectives, the Spokane County Prosecuting Attorney Office, and the United States Bureau of Alcohol, Tobacco, Firearms, and Explosives Special Agents to identify and prosecute the person or persons responsible. At trial, we will testify as an expert witness to our findings of the origin and cause of the fire. If our investigation shows the fire was the result of a consumer product malfunction, we can report our findings to the Consumer Product Safety Commission for further investigation. After the conclusion of our scene examination, we may participate in a joint scene examination with investigators from involved insurance companies, utilities, contractors, and others.
Additional duties and responsibilities of the Special Investigation Office include:1. Internal investigations and documentation of incidents including complaints against Fire Department Personnel, medication checks and inventories, damaged or stolen equipment, and others.2. Completing and submitting a required Washington State Patrol Fire Fatality report on all fatal fires within two days.3. Documenting civilian fire related burn injuries.4. Collecting and maintaining documentation regarding incidents included in the Unusual Occurrence Manual and forwarding the completed documentation to Risk Management.5. Investigating, documenting, and reporting on certain fire fighter injuries, and securing any involved equipment and PPE.6. Conducting fire origin and cause investigations for outside agencies though the Mutual Aid Agreement.7. Reviewing NFIRS Fire Reports completed by the fire crews for fires where a fire investigator was called to the scene.8. Maintaining all reports, documents, photographs, evidence, and other materials collected during fire investigations.9. Receiving and fulfilling Public Records Requests from the City Clerk for fire incidents in accordance with city policy and Washington State Law.10. Identifying, documenting, and referring juvenile fire setters to the SFD Youth Firesetter Program.11. Conducting administrative and technical reviews of all fire investigation reports prior to completion.12. Assisting the SFD Community Risk Reduction officer with public education and outreach.
FTEs
2015 Actual 2016 Actual 2017 Actual 2018 Budget 2019 Proposed
Total FTEs 0.00 2.00 2.00 2.00 2.00
Expenditures:
2015 Actual 2016 Actual 2017 Actual 2018 Budget 2019 Proposed
Capital Outlay 0 0 0 0 0
Interfund Charges 1,167 888 147 0 0
Reserve for Budget Adjustment 0 0 0 0 0
Transfers Out 0 0 0 0 0
Wages & Benefits 420,029 463,610 572,258 439,869 427,102
Supplies & Services 9,458 5,783 12,930 13,510 11,089
Debt Services 0 0 0 0 0
All Other 0 0 0 0 0
TOTAL 430,654 470,281 585,335 453,379 438,191
Expenditure Notes:
Wages & benefits increased in 2017 due to additional Fire Lieutenant expenses.
Revenues:
2015 Actual 2016 Actual 2017 Actual 2018 Budget 2019 Proposed
Taxes 0 0 0 0 0
Licenses & Permits 0 0 0 0 0
IG Revenue 0 0 0 0 0
Services 4 0 0 0 0
Fines & Forfeits 0 0 0 0 0
Operating Transfers In 0 0 0 0 0
General Fund Resources 0 0 0 0 0
All Other (694) 0 0 0 0
TOTAL (690) 0 0 0 0
Revenue Notes:
All Other revenue includes interest income, NSF fees, prior year corrections, judgments & settlements, and contributions/donations.
Public Safety 31

Program Summary: Mobilizations
Division: Public Safety
Fund Type: Special Revenue Fund
Executive Summary:
The State Mobilization (MOBE) program provides resources and overhead support to any agency in Washington State when properly vetted through a regulated process. This allows SFD to participate with personnel and equipment when conflagrations occur.
Programs and Services:
The State MOBE program supports the department's ability to send apparatus, equipment and firefighting personnel to emergencies and receive reimbursement for the City's upfront costs.
FTEs
2015 Actual 2016 Actual 2017 Actual 2018 Budget 2019 Proposed
Total FTEs 0.00 0.00 0.00 0.00 0.00
Expenditures:
2015 Actual 2016 Actual 2017 Actual 2018 Budget 2019 Proposed
Capital Outlay 0 0 0 0 0
Interfund Charges 0 0 0 0 0
Reserve for Budget Adjustment 0 0 0 0 0
Transfers Out 0 0 0 0 0
Wages & Benefits 402,032 196,743 508,410 213,380 213,380
Supplies & Services 9,079 3,616 8,881 20,000 20,000
Debt Services 0 0 0 0 0
All Other 0 0 0 0 0
TOTAL 411,111 200,359 517,291 233,380 233,380
Expenditure Notes:
Mobilization expenditures vary year to year based on the severity of the Wildland Fire Season.
Revenues:
2015 Actual 2016 Actual 2017 Actual 2018 Budget 2019 Proposed
Taxes 0 0 0 0 0
Licenses & Permits 0 0 0 0 0
IG Revenue 0 0 0 0 0
Services 551,854 136,744 502,080 233,380 233,380
Fines & Forfeits 0 0 0 0 0
Operating Transfers In 0 0 0 0 0
General Fund Resources 0 0 0 0 0One Vision. One Plan. One Voice.
Public Safety32

Program Summary: Mobilizations
Division: Public Safety
Fund Type: Special Revenue Fund
Executive Summary:
The State Mobilization (MOBE) program provides resources and overhead support to any agency in Washington State when properly vetted through a regulated process. This allows SFD to participate with personnel and equipment when conflagrations occur.
Programs and Services:
The State MOBE program supports the department's ability to send apparatus, equipment and firefighting personnel to emergencies and receive reimbursement for the City's upfront costs.
FTEs
2015 Actual 2016 Actual 2017 Actual 2018 Budget 2019 Proposed
Total FTEs 0.00 0.00 0.00 0.00 0.00
Expenditures:
2015 Actual 2016 Actual 2017 Actual 2018 Budget 2019 Proposed
Capital Outlay 0 0 0 0 0
Interfund Charges 0 0 0 0 0
Reserve for Budget Adjustment 0 0 0 0 0
Transfers Out 0 0 0 0 0
Wages & Benefits 402,032 196,743 508,410 213,380 213,380
Supplies & Services 9,079 3,616 8,881 20,000 20,000
Debt Services 0 0 0 0 0
All Other 0 0 0 0 0
TOTAL 411,111 200,359 517,291 233,380 233,380
Expenditure Notes:
Mobilization expenditures vary year to year based on the severity of the Wildland Fire Season.
Revenues:
2015 Actual 2016 Actual 2017 Actual 2018 Budget 2019 Proposed
Taxes 0 0 0 0 0
Licenses & Permits 0 0 0 0 0
IG Revenue 0 0 0 0 0
Services 551,854 136,744 502,080 233,380 233,380
Fines & Forfeits 0 0 0 0 0
Operating Transfers In 0 0 0 0 0
General Fund Resources 0 0 0 0 0
All Other 0 0 0 0 0
TOTAL 551,854 136,744 502,080 233,380 233,380
Revenue Notes:
Mobilization revenues vary year to year based on the severity of the Wildland Fire Season.
Public Safety 33
Program Summary: Plan Review
Division: Public Safety
Fund Type: Special Revenue Fund
Executive Summary:
Plan review services are an essential part of effective community risk management strategies. Plans review minimizes risk to the public and emergency responders through pre-construction review of new and remodel projects and coordination of fire code requirements with the Developer Services and other departments and agencies.
Programs and Services:
The SFD Plan Review function is in place to improve the level of safety for the public as well as firefighters and the quality of the plans reviews that occurs by the SFD and the City. The function is performed by a certified Fire Protection Engineer (FPE) who performs as a reviewer and subject matter expert for plans and requirements of both the Fire and Building Codes. SFD works closely with Developer Services to coordinate work and improve customer service. The FPE plays an integral and critical role and works with both departments. Besides the plans review expertise, the FPE has become a go-to person for technical questions. The FPE provides advice to employees in DCS and SFD, in other City departments, as well as design professionals in the City and surrounding area.The Plan review function/service generates revenues through fees for service. Activities include the following: • Conducts approx. ~500 permit plan reviews for life-safety systems (alarm, sprinkler, private hydrants). • Almost half of the above listed plan reviews are planned to be done "over-the-counter." • Participates in pre-development review sessions. • Reviews PUDs for site fire flow and Fire Department access. • Reviews SEPA (State Environmental Policy Act) checklists. • Reviews approx. 500 building permits. • Provides training to FD staff, other City departments, regional code personnel and the Community about life-safety codes and their intent. • Supports SFD Operations on a variety of matters regarding building/site safety. • Acts as a regional advisor on important code and other life-safety issues. • Participates in policy and code development with other City Departments. • Responds to numerous inquiries and/or complaints each year. • Provides special analysis for Hazardous Materials operations and occupancies and Special Event applications. • Promptly responds to questions from the public on interpretation/application of fire/building codes. New editions of Fire and Building Codes are adopted by the State every three years and amended as often as necessary. Standards referenced by the Codes from the National Fire Protection Association (NFPA) and other agencies undergo regular updates as well. These recurring modifications require constant training by Fire Prevention personnel to stay abreast of the codes.
FTEs
2015 Actual 2016 Actual 2017 Actual 2018 Budget 2019 Proposed
Total FTEs 0.00 1.00 1.00 1.00 1.00
Expenditures:
2015 Actual 2016 Actual 2017 Actual 2018 Budget 2019 Proposed
Capital Outlay 0 0 0 0 0
Interfund Charges 0 57 0 0 0
Reserve for Budget Adjustment 0 0 0 0 0
Transfers Out 0 0 0 0 0
Wages & Benefits 130,228 132,890 136,212 139,758 146,600
Supplies & Services 274 537 776 450 450
Debt Services 0 0 0 0 0
All Other 0 0 0 0 0One Vision. One Plan. One Voice.
Public Safety34
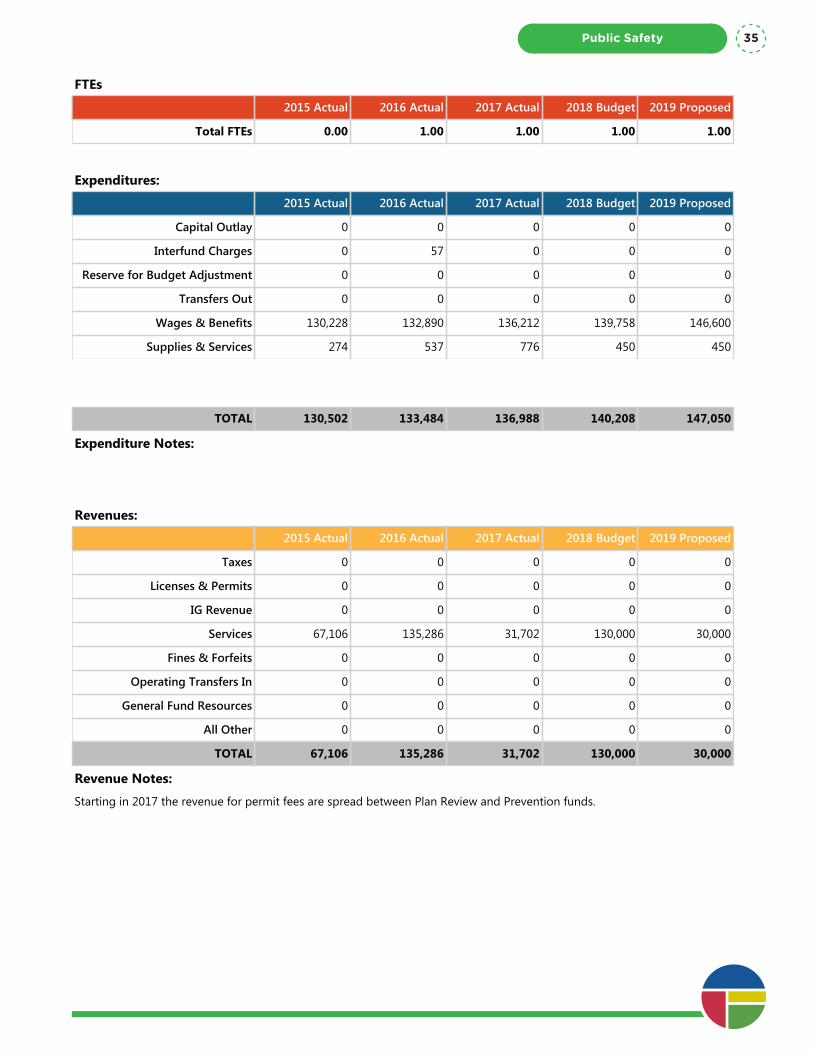
Program Summary: Plan Review
Division: Public Safety
Fund Type: Special Revenue Fund
Executive Summary:
Plan review services are an essential part of effective community risk management strategies. Plans review minimizes risk to the public and emergency responders through pre-construction review of new and remodel projects and coordination of fire code requirements with the Developer Services and other departments and agencies.
Programs and Services:
The SFD Plan Review function is in place to improve the level of safety for the public as well as firefighters and the quality of the plans reviews that occurs by the SFD and the City. The function is performed by a certified Fire Protection Engineer (FPE) who performs as a reviewer and subject matter expert for plans and requirements of both the Fire and Building Codes. SFD works closely with Developer Services to coordinate work and improve customer service. The FPE plays an integral and critical role and works with both departments. Besides the plans review expertise, the FPE has become a go-to person for technical questions. The FPE provides advice to employees in DCS and SFD, in other City departments, as well as design professionals in the City and surrounding area.The Plan review function/service generates revenues through fees for service. Activities include the following: • Conducts approx. ~500 permit plan reviews for life-safety systems (alarm, sprinkler, private hydrants). • Almost half of the above listed plan reviews are planned to be done "over-the-counter." • Participates in pre-development review sessions. • Reviews PUDs for site fire flow and Fire Department access. • Reviews SEPA (State Environmental Policy Act) checklists. • Reviews approx. 500 building permits. • Provides training to FD staff, other City departments, regional code personnel and the Community about life-safety codes and their intent. • Supports SFD Operations on a variety of matters regarding building/site safety. • Acts as a regional advisor on important code and other life-safety issues. • Participates in policy and code development with other City Departments. • Responds to numerous inquiries and/or complaints each year. • Provides special analysis for Hazardous Materials operations and occupancies and Special Event applications. • Promptly responds to questions from the public on interpretation/application of fire/building codes. New editions of Fire and Building Codes are adopted by the State every three years and amended as often as necessary. Standards referenced by the Codes from the National Fire Protection Association (NFPA) and other agencies undergo regular updates as well. These recurring modifications require constant training by Fire Prevention personnel to stay abreast of the codes.
FTEs
2015 Actual 2016 Actual 2017 Actual 2018 Budget 2019 Proposed
Total FTEs 0.00 1.00 1.00 1.00 1.00
Expenditures:
2015 Actual 2016 Actual 2017 Actual 2018 Budget 2019 Proposed
Capital Outlay 0 0 0 0 0
Interfund Charges 0 57 0 0 0
Reserve for Budget Adjustment 0 0 0 0 0
Transfers Out 0 0 0 0 0
Wages & Benefits 130,228 132,890 136,212 139,758 146,600
Supplies & Services 274 537 776 450 450
Debt Services 0 0 0 0 0
All Other 0 0 0 0 0
TOTAL 130,502 133,484 136,988 140,208 147,050
Expenditure Notes:
Revenues:
2015 Actual 2016 Actual 2017 Actual 2018 Budget 2019 Proposed
Taxes 0 0 0 0 0
Licenses & Permits 0 0 0 0 0
IG Revenue 0 0 0 0 0
Services 67,106 135,286 31,702 130,000 30,000
Fines & Forfeits 0 0 0 0 0
Operating Transfers In 0 0 0 0 0
General Fund Resources 0 0 0 0 0
All Other 0 0 0 0 0
TOTAL 67,106 135,286 31,702 130,000 30,000
Revenue Notes:
Starting in 2017 the revenue for permit fees are spread between Plan Review and Prevention funds.
Public Safety 35
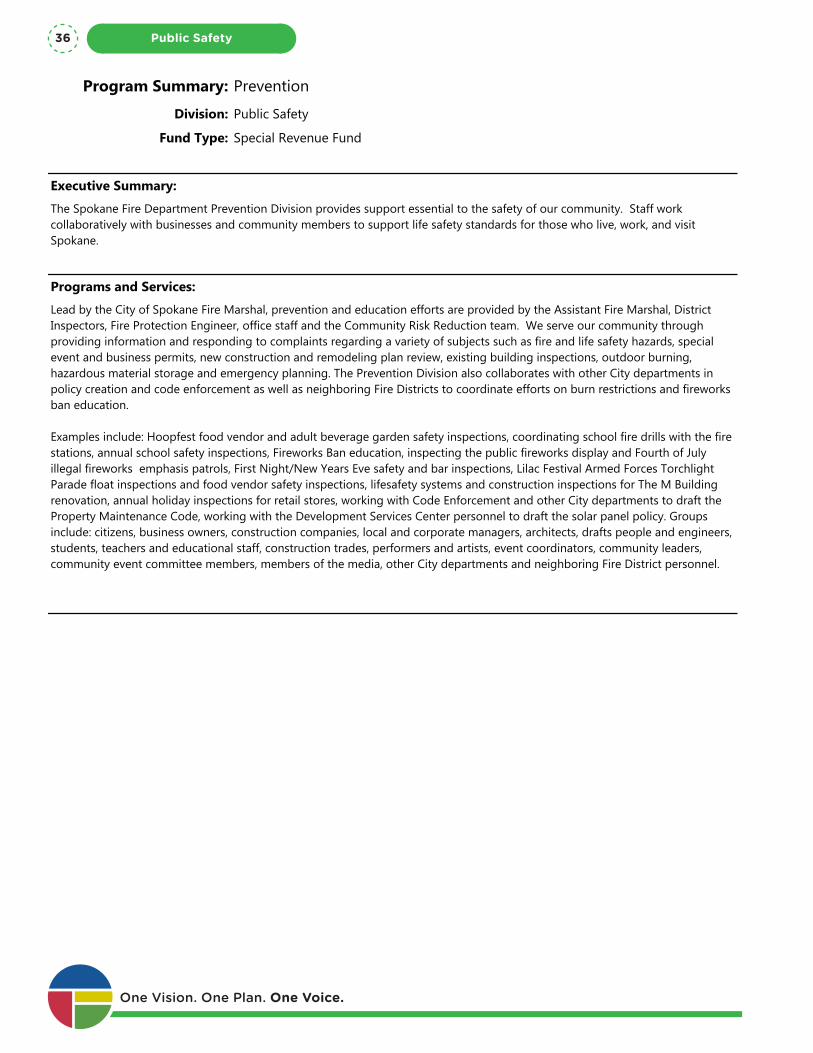
Program Summary: Prevention
Division: Public Safety
Fund Type: Special Revenue Fund
Executive Summary:
The Spokane Fire Department Prevention Division provides support essential to the safety of our community. Staff work collaboratively with businesses and community members to support life safety standards for those who live, work, and visit Spokane.
Programs and Services:
Lead by the City of Spokane Fire Marshal, prevention and education efforts are provided by the Assistant Fire Marshal, District Inspectors, Fire Protection Engineer, office staff and the Community Risk Reduction team. We serve our community through providing information and responding to complaints regarding a variety of subjects such as fire and life safety hazards, special event and business permits, new construction and remodeling plan review, existing building inspections, outdoor burning, hazardous material storage and emergency planning. The Prevention Division also collaborates with other City departments in policy creation and code enforcement as well as neighboring Fire Districts to coordinate efforts on burn restrictions and fireworks ban education.
Examples include: Hoopfest food vendor and adult beverage garden safety inspections, coordinating school fire drills with the fire stations, annual school safety inspections, Fireworks Ban education, inspecting the public fireworks display and Fourth of July illegal fireworks emphasis patrols, First Night/New Years Eve safety and bar inspections, Lilac Festival Armed Forces Torchlight Parade float inspections and food vendor safety inspections, lifesafety systems and construction inspections for The M Building renovation, annual holiday inspections for retail stores, working with Code Enforcement and other City departments to draft the Property Maintenance Code, working with the Development Services Center personnel to draft the solar panel policy. Groups include: citizens, business owners, construction companies, local and corporate managers, architects, drafts people and engineers, students, teachers and educational staff, construction trades, performers and artists, event coordinators, community leaders, community event committee members, members of the media, other City departments and neighboring Fire District personnel.
FTEs
2015 Actual 2016 Actual 2017 Actual 2018 Budget 2019 Proposed
Total FTEs 9.00 10.00 11.00 10.00 10.00
Expenditures:
2015 Actual 2016 Actual 2017 Actual 2018 Budget 2019 Proposed
Capital Outlay 0 0 26,120 0 0
Interfund Charges 0 1,324 1,890 1,900 1,900
Reserve for Budget Adjustment 0 0 0 0 0
Transfers Out 0 0 0 0 0
Wages & Benefits 1,214,292 1,297,222 1,230,097 1,274,368 1,283,108
Supplies & Services 46,067 23,580 31,685 33,062 16,827
Debt Services 0 0 0 0 0
All Other 0 0 0 0 0
One Vision. One Plan. One Voice.
Public Safety36
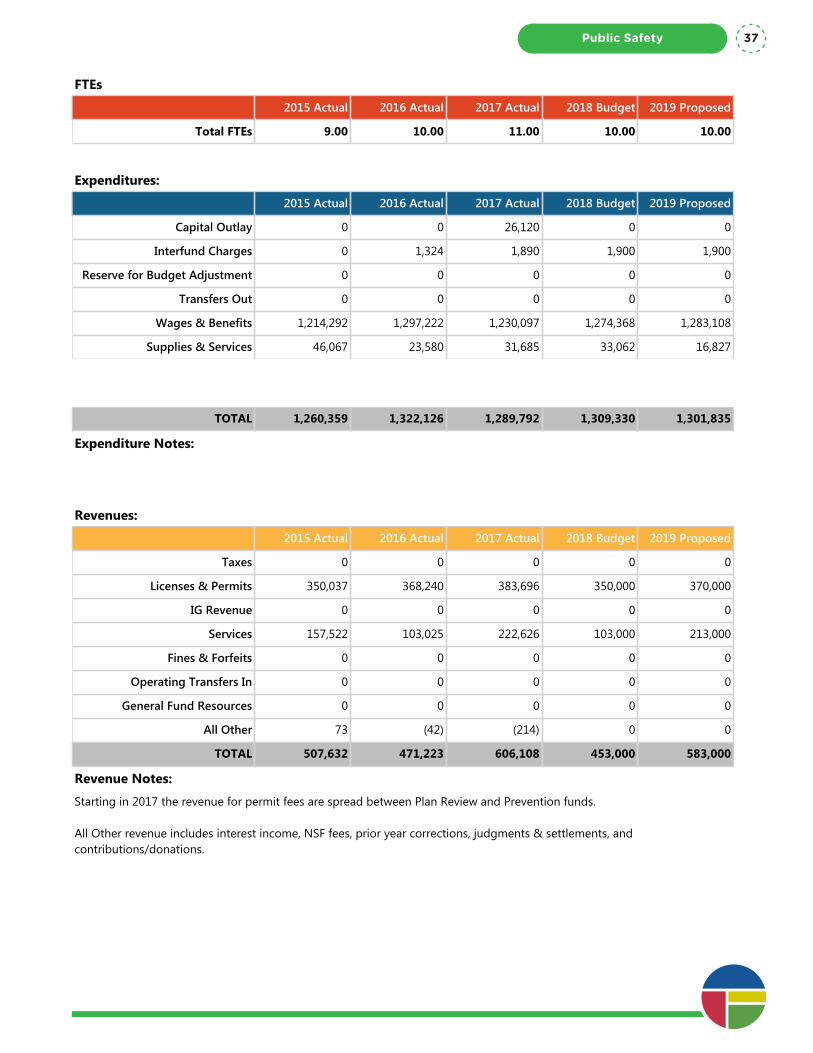
Program Summary: Prevention
Division: Public Safety
Fund Type: Special Revenue Fund
Executive Summary:
The Spokane Fire Department Prevention Division provides support essential to the safety of our community. Staff work collaboratively with businesses and community members to support life safety standards for those who live, work, and visit Spokane.
Programs and Services:
Lead by the City of Spokane Fire Marshal, prevention and education efforts are provided by the Assistant Fire Marshal, District Inspectors, Fire Protection Engineer, office staff and the Community Risk Reduction team. We serve our community through providing information and responding to complaints regarding a variety of subjects such as fire and life safety hazards, special event and business permits, new construction and remodeling plan review, existing building inspections, outdoor burning, hazardous material storage and emergency planning. The Prevention Division also collaborates with other City departments in policy creation and code enforcement as well as neighboring Fire Districts to coordinate efforts on burn restrictions and fireworks ban education.
Examples include: Hoopfest food vendor and adult beverage garden safety inspections, coordinating school fire drills with the fire stations, annual school safety inspections, Fireworks Ban education, inspecting the public fireworks display and Fourth of July illegal fireworks emphasis patrols, First Night/New Years Eve safety and bar inspections, Lilac Festival Armed Forces Torchlight Parade float inspections and food vendor safety inspections, lifesafety systems and construction inspections for The M Building renovation, annual holiday inspections for retail stores, working with Code Enforcement and other City departments to draft the Property Maintenance Code, working with the Development Services Center personnel to draft the solar panel policy. Groups include: citizens, business owners, construction companies, local and corporate managers, architects, drafts people and engineers, students, teachers and educational staff, construction trades, performers and artists, event coordinators, community leaders, community event committee members, members of the media, other City departments and neighboring Fire District personnel.
FTEs
2015 Actual 2016 Actual 2017 Actual 2018 Budget 2019 Proposed
Total FTEs 9.00 10.00 11.00 10.00 10.00
Expenditures:
2015 Actual 2016 Actual 2017 Actual 2018 Budget 2019 Proposed
Capital Outlay 0 0 26,120 0 0
Interfund Charges 0 1,324 1,890 1,900 1,900
Reserve for Budget Adjustment 0 0 0 0 0
Transfers Out 0 0 0 0 0
Wages & Benefits 1,214,292 1,297,222 1,230,097 1,274,368 1,283,108
Supplies & Services 46,067 23,580 31,685 33,062 16,827
Debt Services 0 0 0 0 0
All Other 0 0 0 0 0
TOTAL 1,260,359 1,322,126 1,289,792 1,309,330 1,301,835
Expenditure Notes:
Revenues:
2015 Actual 2016 Actual 2017 Actual 2018 Budget 2019 Proposed
Taxes 0 0 0 0 0
Licenses & Permits 350,037 368,240 383,696 350,000 370,000
IG Revenue 0 0 0 0 0
Services 157,522 103,025 222,626 103,000 213,000
Fines & Forfeits 0 0 0 0 0
Operating Transfers In 0 0 0 0 0
General Fund Resources 0 0 0 0 0
All Other 73 (42) (214) 0 0
TOTAL 507,632 471,223 606,108 453,000 583,000
Revenue Notes:
Starting in 2017 the revenue for permit fees are spread between Plan Review and Prevention funds.
All Other revenue includes interest income, NSF fees, prior year corrections, judgments & settlements, and contributions/donations.
Public Safety 37
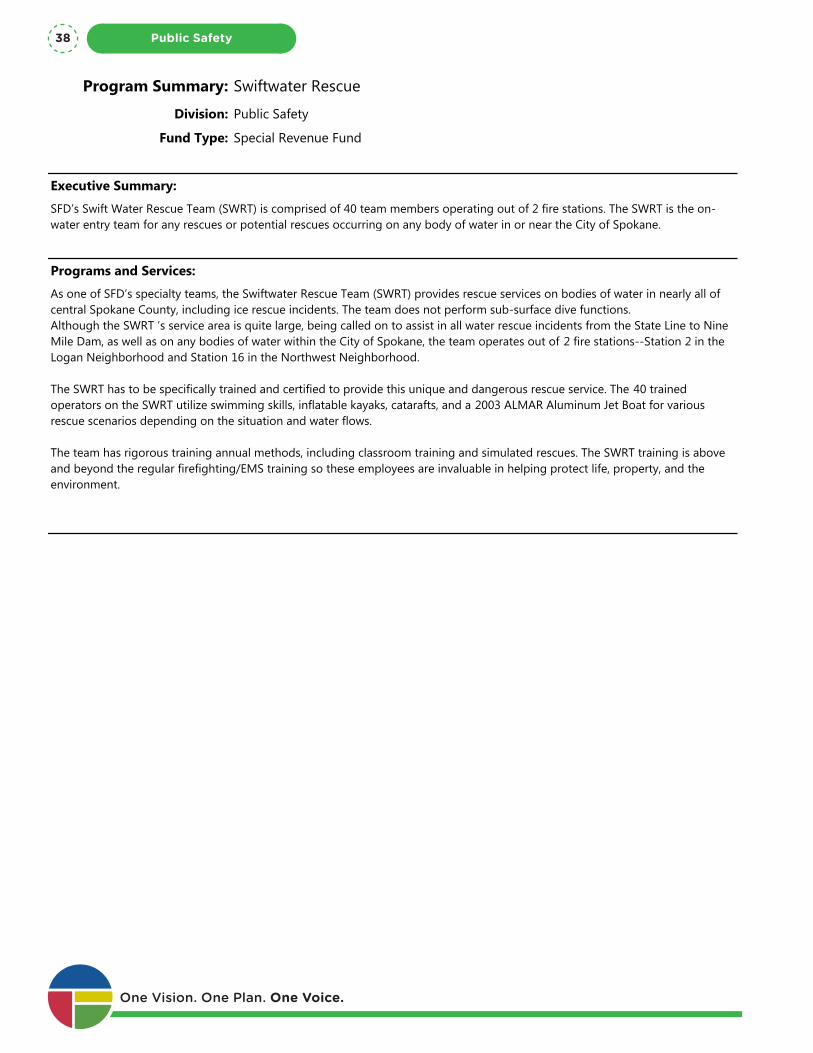
Program Summary: Swiftwater Rescue
Division: Public Safety
Fund Type: Special Revenue Fund
Executive Summary:
SFD’s Swift Water Rescue Team (SWRT) is comprised of 40 team members operating out of 2 fire stations. The SWRT is the on-water entry team for any rescues or potential rescues occurring on any body of water in or near the City of Spokane.
Programs and Services:
As one of SFD’s specialty teams, the Swiftwater Rescue Team (SWRT) provides rescue services on bodies of water in nearly all of central Spokane County, including ice rescue incidents. The team does not perform sub-surface dive functions.Although the SWRT ’s service area is quite large, being called on to assist in all water rescue incidents from the State Line to Nine Mile Dam, as well as on any bodies of water within the City of Spokane, the team operates out of 2 fire stations--Station 2 in the Logan Neighborhood and Station 16 in the Northwest Neighborhood.
The SWRT has to be specifically trained and certified to provide this unique and dangerous rescue service. The 40 trained operators on the SWRT utilize swimming skills, inflatable kayaks, catarafts, and a 2003 ALMAR Aluminum Jet Boat for various rescue scenarios depending on the situation and water flows.
The team has rigorous training annual methods, including classroom training and simulated rescues. The SWRT training is above and beyond the regular firefighting/EMS training so these employees are invaluable in helping protect life, property, and the environment.
FTEs
2015 Actual 2016 Actual 2017 Actual 2018 Budget 2019 Proposed
Total FTEs 0.00 0.00 0.00 0.00 0.00
Expenditures:
2015 Actual 2016 Actual 2017 Actual 2018 Budget 2019 Proposed
Capital Outlay 0 0 0 0 0
Interfund Charges 0 0 0 0 0
Reserve for Budget Adjustment 0 0 0 0 0
Transfers Out 0 0 0 0 0
Wages & Benefits 49,965 126,050 175,397 174,186 167,785
Supplies & Services 18,420 13,810 2,105 14,750 6,250
Debt Services 0 0 0 0 0
All Other 0 0 0 0 0
One Vision. One Plan. One Voice.
Public Safety38
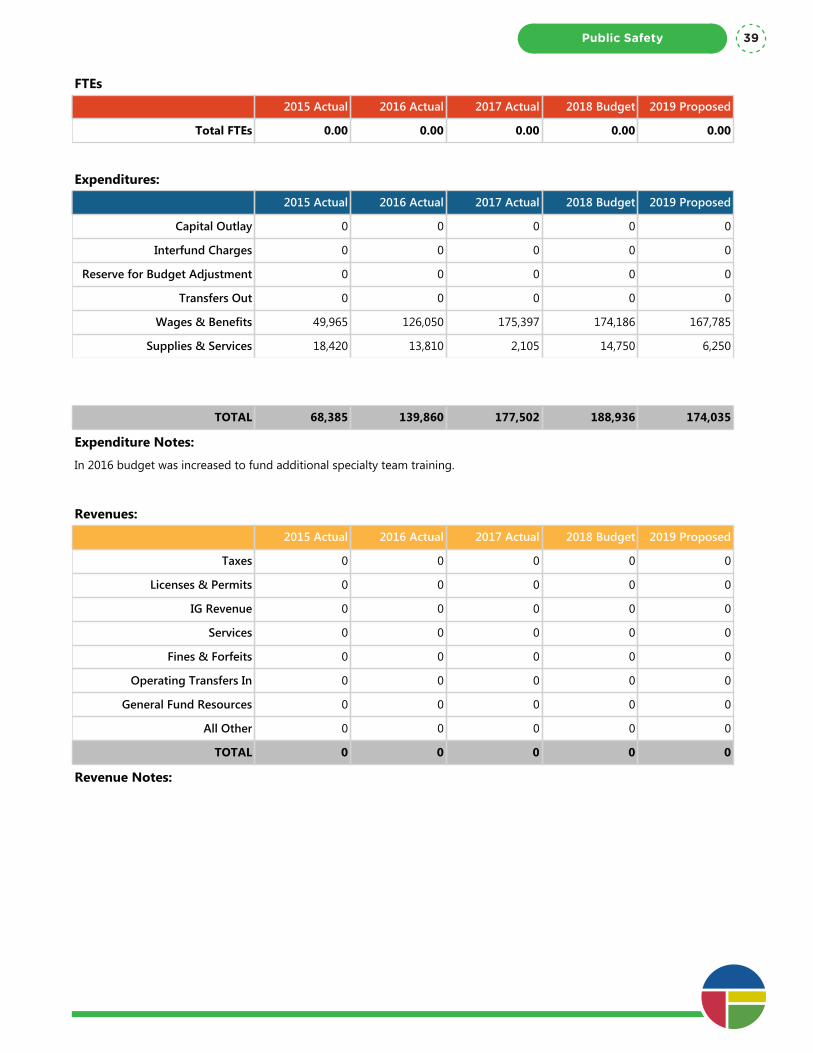
Program Summary: Swiftwater Rescue
Division: Public Safety
Fund Type: Special Revenue Fund
Executive Summary:
SFD’s Swift Water Rescue Team (SWRT) is comprised of 40 team members operating out of 2 fire stations. The SWRT is the on-water entry team for any rescues or potential rescues occurring on any body of water in or near the City of Spokane.
Programs and Services:
As one of SFD’s specialty teams, the Swiftwater Rescue Team (SWRT) provides rescue services on bodies of water in nearly all of central Spokane County, including ice rescue incidents. The team does not perform sub-surface dive functions.Although the SWRT ’s service area is quite large, being called on to assist in all water rescue incidents from the State Line to Nine Mile Dam, as well as on any bodies of water within the City of Spokane, the team operates out of 2 fire stations--Station 2 in the Logan Neighborhood and Station 16 in the Northwest Neighborhood.
The SWRT has to be specifically trained and certified to provide this unique and dangerous rescue service. The 40 trained operators on the SWRT utilize swimming skills, inflatable kayaks, catarafts, and a 2003 ALMAR Aluminum Jet Boat for various rescue scenarios depending on the situation and water flows.
The team has rigorous training annual methods, including classroom training and simulated rescues. The SWRT training is above and beyond the regular firefighting/EMS training so these employees are invaluable in helping protect life, property, and the environment.
FTEs
2015 Actual 2016 Actual 2017 Actual 2018 Budget 2019 Proposed
Total FTEs 0.00 0.00 0.00 0.00 0.00
Expenditures:
2015 Actual 2016 Actual 2017 Actual 2018 Budget 2019 Proposed
Capital Outlay 0 0 0 0 0
Interfund Charges 0 0 0 0 0
Reserve for Budget Adjustment 0 0 0 0 0
Transfers Out 0 0 0 0 0
Wages & Benefits 49,965 126,050 175,397 174,186 167,785
Supplies & Services 18,420 13,810 2,105 14,750 6,250
Debt Services 0 0 0 0 0
All Other 0 0 0 0 0
TOTAL 68,385 139,860 177,502 188,936 174,035
Expenditure Notes:
In 2016 budget was increased to fund additional specialty team training.
Revenues:
2015 Actual 2016 Actual 2017 Actual 2018 Budget 2019 Proposed
Taxes 0 0 0 0 0
Licenses & Permits 0 0 0 0 0
IG Revenue 0 0 0 0 0
Services 0 0 0 0 0
Fines & Forfeits 0 0 0 0 0
Operating Transfers In 0 0 0 0 0
General Fund Resources 0 0 0 0 0
All Other 0 0 0 0 0
TOTAL 0 0 0 0 0
Revenue Notes:
Public Safety 39
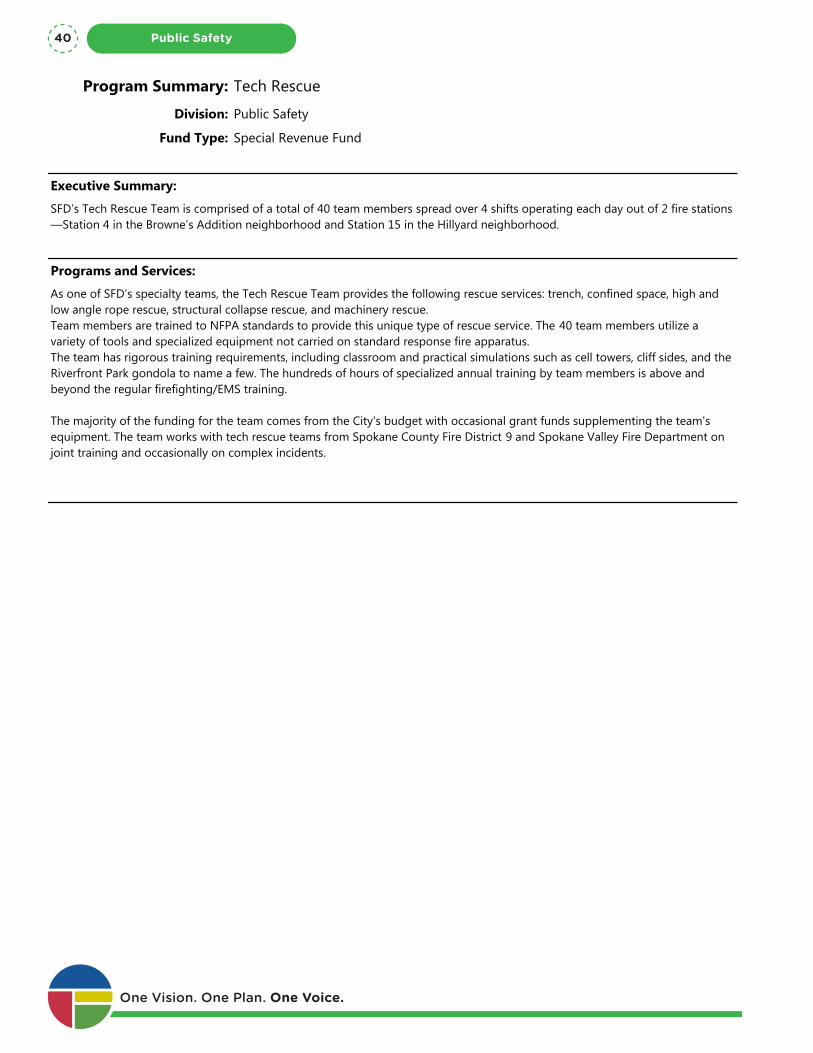
Program Summary: Tech Rescue
Division: Public Safety
Fund Type: Special Revenue Fund
Executive Summary:
SFD’s Tech Rescue Team is comprised of a total of 40 team members spread over 4 shifts operating each day out of 2 fire stations—Station 4 in the Browne’s Addition neighborhood and Station 15 in the Hillyard neighborhood.
Programs and Services:
As one of SFD’s specialty teams, the Tech Rescue Team provides the following rescue services: trench, confined space, high and low angle rope rescue, structural collapse rescue, and machinery rescue.Team members are trained to NFPA standards to provide this unique type of rescue service. The 40 team members utilize a variety of tools and specialized equipment not carried on standard response fire apparatus.The team has rigorous training requirements, including classroom and practical simulations such as cell towers, cliff sides, and the Riverfront Park gondola to name a few. The hundreds of hours of specialized annual training by team members is above and beyond the regular firefighting/EMS training.
The majority of the funding for the team comes from the City's budget with occasional grant funds supplementing the team's equipment. The team works with tech rescue teams from Spokane County Fire District 9 and Spokane Valley Fire Department on joint training and occasionally on complex incidents.
FTEs
2015 Actual 2016 Actual 2017 Actual 2018 Budget 2019 Proposed
Total FTEs 0.00 0.00 0.00 0.00 0.00
Expenditures:
2015 Actual 2016 Actual 2017 Actual 2018 Budget 2019 Proposed
Capital Outlay 0 0 0 0 0
Interfund Charges 0 0 0 0 0
Reserve for Budget Adjustment 0 0 0 0 0
Transfers Out 0 0 0 0 0
Wages & Benefits 121,359 166,777 136,677 156,314 171,251
Supplies & Services 21,127 4,768 6,898 18,360 7,860
Debt Services 0 0 0 0 0
All Other 0 0 0 0 0
TOTAL 142,486 171,545 143,575 174,674 179,111
Expenditure Notes:
In 2016 budget was increased to fund additional training for specialty teams.
Revenues:
2015 Actual 2016 Actual 2017 Actual 2018 Budget 2019 Proposed
Taxes 0 0 0 0 0
Licenses & Permits 0 0 0 0 0One Vision. One Plan. One Voice.
Public Safety40

Program Summary: Tech Rescue
Division: Public Safety
Fund Type: Special Revenue Fund
Executive Summary:
SFD’s Tech Rescue Team is comprised of a total of 40 team members spread over 4 shifts operating each day out of 2 fire stations—Station 4 in the Browne’s Addition neighborhood and Station 15 in the Hillyard neighborhood.
Programs and Services:
As one of SFD’s specialty teams, the Tech Rescue Team provides the following rescue services: trench, confined space, high and low angle rope rescue, structural collapse rescue, and machinery rescue.Team members are trained to NFPA standards to provide this unique type of rescue service. The 40 team members utilize a variety of tools and specialized equipment not carried on standard response fire apparatus.The team has rigorous training requirements, including classroom and practical simulations such as cell towers, cliff sides, and the Riverfront Park gondola to name a few. The hundreds of hours of specialized annual training by team members is above and beyond the regular firefighting/EMS training.
The majority of the funding for the team comes from the City's budget with occasional grant funds supplementing the team's equipment. The team works with tech rescue teams from Spokane County Fire District 9 and Spokane Valley Fire Department on joint training and occasionally on complex incidents.
FTEs
2015 Actual 2016 Actual 2017 Actual 2018 Budget 2019 Proposed
Total FTEs 0.00 0.00 0.00 0.00 0.00
Expenditures:
2015 Actual 2016 Actual 2017 Actual 2018 Budget 2019 Proposed
Capital Outlay 0 0 0 0 0
Interfund Charges 0 0 0 0 0
Reserve for Budget Adjustment 0 0 0 0 0
Transfers Out 0 0 0 0 0
Wages & Benefits 121,359 166,777 136,677 156,314 171,251
Supplies & Services 21,127 4,768 6,898 18,360 7,860
Debt Services 0 0 0 0 0
All Other 0 0 0 0 0
TOTAL 142,486 171,545 143,575 174,674 179,111
Expenditure Notes:
In 2016 budget was increased to fund additional training for specialty teams.
Revenues:
2015 Actual 2016 Actual 2017 Actual 2018 Budget 2019 Proposed
Taxes 0 0 0 0 0
Licenses & Permits 0 0 0 0 0
IG Revenue 0 0 0 0 0
Services 0 0 0 0 0
Fines & Forfeits 0 0 0 0 0
Operating Transfers In 0 0 0 0 0
General Fund Resources 0 0 0 0 0
All Other 0 0 0 0 0
TOTAL 0 0 0 0 0
Revenue Notes:
Public Safety 41
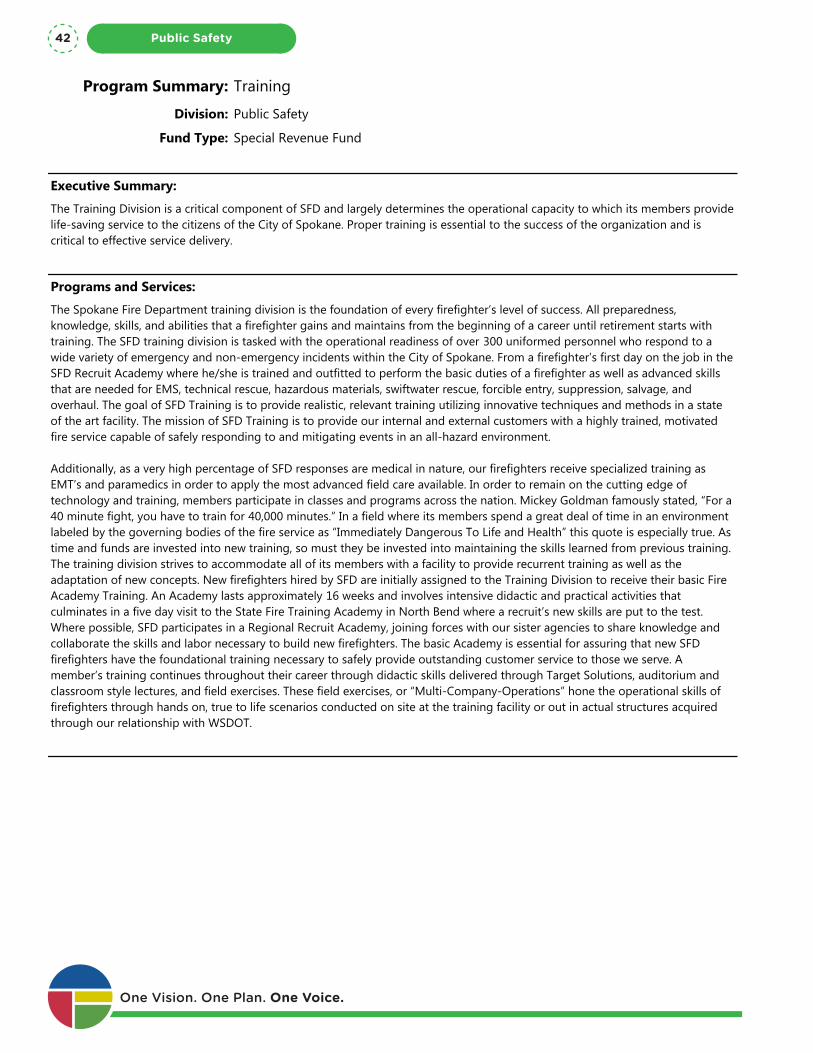
Program Summary: Training
Division: Public Safety
Fund Type: Special Revenue Fund
Executive Summary:
The Training Division is a critical component of SFD and largely determines the operational capacity to which its members provide life-saving service to the citizens of the City of Spokane. Proper training is essential to the success of the organization and is critical to effective service delivery.
Programs and Services:
The Spokane Fire Department training division is the foundation of every firefighter’s level of success. All preparedness, knowledge, skills, and abilities that a firefighter gains and maintains from the beginning of a career until retirement starts with training. The SFD training division is tasked with the operational readiness of over 300 uniformed personnel who respond to a wide variety of emergency and non-emergency incidents within the City of Spokane. From a firefighter’s first day on the job in the SFD Recruit Academy where he/she is trained and outfitted to perform the basic duties of a firefighter as well as advanced skills that are needed for EMS, technical rescue, hazardous materials, swiftwater rescue, forcible entry, suppression, salvage, and overhaul. The goal of SFD Training is to provide realistic, relevant training utilizing innovative techniques and methods in a state of the art facility. The mission of SFD Training is to provide our internal and external customers with a highly trained, motivated fire service capable of safely responding to and mitigating events in an all-hazard environment.
Additionally, as a very high percentage of SFD responses are medical in nature, our firefighters receive specialized training as EMT’s and paramedics in order to apply the most advanced field care available. In order to remain on the cutting edge of technology and training, members participate in classes and programs across the nation. Mickey Goldman famously stated, “For a 40 minute fight, you have to train for 40,000 minutes.” In a field where its members spend a great deal of time in an environment labeled by the governing bodies of the fire service as “Immediately Dangerous To Life and Health” this quote is especially true. As time and funds are invested into new training, so must they be invested into maintaining the skills learned from previous training. The training division strives to accommodate all of its members with a facility to provide recurrent training as well as the adaptation of new concepts. New firefighters hired by SFD are initially assigned to the Training Division to receive their basic Fire Academy Training. An Academy lasts approximately 16 weeks and involves intensive didactic and practical activities that culminates in a five day visit to the State Fire Training Academy in North Bend where a recruit’s new skills are put to the test. Where possible, SFD participates in a Regional Recruit Academy, joining forces with our sister agencies to share knowledge and collaborate the skills and labor necessary to build new firefighters. The basic Academy is essential for assuring that new SFD firefighters have the foundational training necessary to safely provide outstanding customer service to those we serve. A member’s training continues throughout their career through didactic skills delivered through Target Solutions, auditorium and classroom style lectures, and field exercises. These field exercises, or “Multi-Company-Operations” hone the operational skills of firefighters through hands on, true to life scenarios conducted on site at the training facility or out in actual structures acquired through our relationship with WSDOT.
FTEs
2015 Actual 2016 Actual 2017 Actual 2018 Budget 2019 Proposed
Total FTEs 0.00 5.00 7.00 6.00 5.00
Expenditures:
2015 Actual 2016 Actual 2017 Actual 2018 Budget 2019 Proposed
Capital Outlay 14,935 0 0 0 0
Interfund Charges 791 2,217 3,518 500 4,000
Reserve for Budget Adjustment 0 0 0 0 0
Transfers Out 0 0 0 0 0
Wages & Benefits 1,010,038 919,690 1,399,275 1,034,269 933,988One Vision. One Plan. One Voice.
Public Safety42
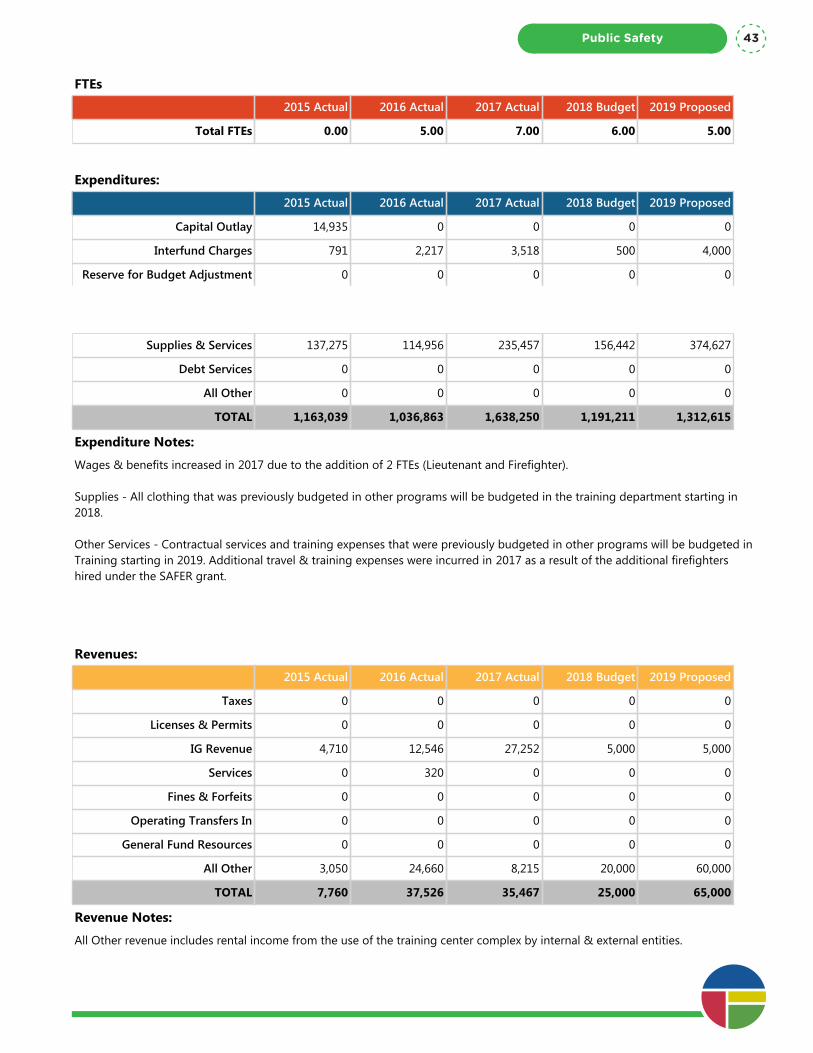
Program Summary: Training
Division: Public Safety
Fund Type: Special Revenue Fund
Executive Summary:
The Training Division is a critical component of SFD and largely determines the operational capacity to which its members provide life-saving service to the citizens of the City of Spokane. Proper training is essential to the success of the organization and is critical to effective service delivery.
Programs and Services:
The Spokane Fire Department training division is the foundation of every firefighter’s level of success. All preparedness, knowledge, skills, and abilities that a firefighter gains and maintains from the beginning of a career until retirement starts with training. The SFD training division is tasked with the operational readiness of over 300 uniformed personnel who respond to a wide variety of emergency and non-emergency incidents within the City of Spokane. From a firefighter’s first day on the job in the SFD Recruit Academy where he/she is trained and outfitted to perform the basic duties of a firefighter as well as advanced skills that are needed for EMS, technical rescue, hazardous materials, swiftwater rescue, forcible entry, suppression, salvage, and overhaul. The goal of SFD Training is to provide realistic, relevant training utilizing innovative techniques and methods in a state of the art facility. The mission of SFD Training is to provide our internal and external customers with a highly trained, motivated fire service capable of safely responding to and mitigating events in an all-hazard environment.
Additionally, as a very high percentage of SFD responses are medical in nature, our firefighters receive specialized training as EMT’s and paramedics in order to apply the most advanced field care available. In order to remain on the cutting edge of technology and training, members participate in classes and programs across the nation. Mickey Goldman famously stated, “For a 40 minute fight, you have to train for 40,000 minutes.” In a field where its members spend a great deal of time in an environment labeled by the governing bodies of the fire service as “Immediately Dangerous To Life and Health” this quote is especially true. As time and funds are invested into new training, so must they be invested into maintaining the skills learned from previous training. The training division strives to accommodate all of its members with a facility to provide recurrent training as well as the adaptation of new concepts. New firefighters hired by SFD are initially assigned to the Training Division to receive their basic Fire Academy Training. An Academy lasts approximately 16 weeks and involves intensive didactic and practical activities that culminates in a five day visit to the State Fire Training Academy in North Bend where a recruit’s new skills are put to the test. Where possible, SFD participates in a Regional Recruit Academy, joining forces with our sister agencies to share knowledge and collaborate the skills and labor necessary to build new firefighters. The basic Academy is essential for assuring that new SFD firefighters have the foundational training necessary to safely provide outstanding customer service to those we serve. A member’s training continues throughout their career through didactic skills delivered through Target Solutions, auditorium and classroom style lectures, and field exercises. These field exercises, or “Multi-Company-Operations” hone the operational skills of firefighters through hands on, true to life scenarios conducted on site at the training facility or out in actual structures acquired through our relationship with WSDOT.
FTEs
2015 Actual 2016 Actual 2017 Actual 2018 Budget 2019 Proposed
Total FTEs 0.00 5.00 7.00 6.00 5.00
Expenditures:
2015 Actual 2016 Actual 2017 Actual 2018 Budget 2019 Proposed
Capital Outlay 14,935 0 0 0 0
Interfund Charges 791 2,217 3,518 500 4,000
Reserve for Budget Adjustment 0 0 0 0 0
Transfers Out 0 0 0 0 0
Wages & Benefits 1,010,038 919,690 1,399,275 1,034,269 933,988
Supplies & Services 137,275 114,956 235,457 156,442 374,627
Debt Services 0 0 0 0 0
All Other 0 0 0 0 0
TOTAL 1,163,039 1,036,863 1,638,250 1,191,211 1,312,615
Expenditure Notes:
Wages & benefits increased in 2017 due to the addition of 2 FTEs (Lieutenant and Firefighter).
Supplies - All clothing that was previously budgeted in other programs will be budgeted in the training department starting in 2018.
Other Services - Contractual services and training expenses that were previously budgeted in other programs will be budgeted in Training starting in 2019. Additional travel & training expenses were incurred in 2017 as a result of the additional firefighters hired under the SAFER grant.
Revenues:
2015 Actual 2016 Actual 2017 Actual 2018 Budget 2019 Proposed
Taxes 0 0 0 0 0
Licenses & Permits 0 0 0 0 0
IG Revenue 4,710 12,546 27,252 5,000 5,000
Services 0 320 0 0 0
Fines & Forfeits 0 0 0 0 0
Operating Transfers In 0 0 0 0 0
General Fund Resources 0 0 0 0 0
All Other 3,050 24,660 8,215 20,000 60,000
TOTAL 7,760 37,526 35,467 25,000 65,000
Revenue Notes:
All Other revenue includes rental income from the use of the training center complex by internal & external entities.
Public Safety 43

One Vision. One Plan. One Voice.
Public Safety44
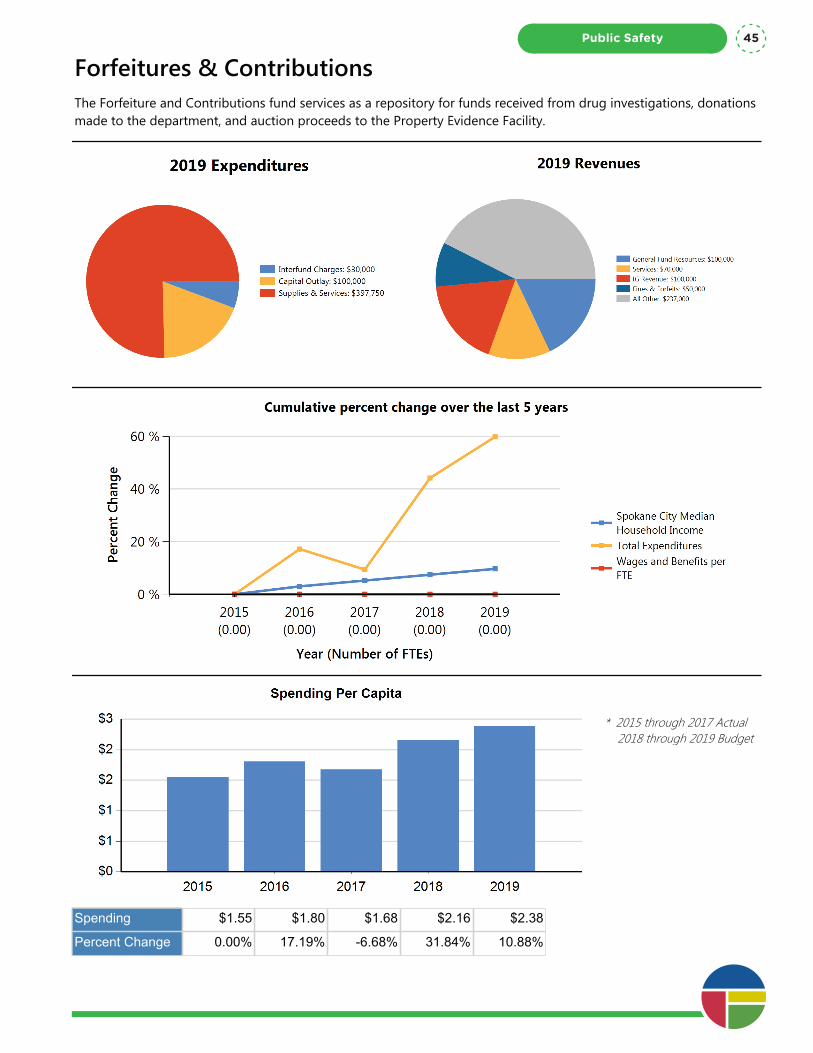
Forfeitures & ContributionsThe Forfeiture and Contributions fund services as a repository for funds received from drug investigations, donations made to the department, and auction proceeds to the Property Evidence Facility.
* 2015 through 2017 Actual 2018 through 2019 Budget
Spending $1.55 $1.80 $1.68 $2.16 $2.38
Percent Change 0.00% 17.19% -6.68% 31.84% 10.88%
Public Safety 45
Department Summary: Forfeitures & Contributions
Division: Public Safety
Fund Type: Special Revenue Fund
Executive Summary:
The Forfeiture and Contributions fund services as a repository for funds received from drug investigations, donations made to the department, and auction proceeds to the Property Evidence Facility.
Programs and Services:
Proceeds in this fund are for restricted purposes. There are multiple funds in this Special Revenue Fund comprised of regular contributions from Citizens to asset forfeitures. Per law, drug seizure funds must be utilized for drug investigations or related law enforcement activities (utilizing SWAT for serving a high risk drug warrant, for example). These seizure funds are the result of money, weapons, and vehicles seized during investigation. Law Enforcement can seize property if they have probable cause the suspect intended to use the property in the commission of a crime.
FTEs
2015 Actual 2016 Actual 2017 Actual 2018 Budget 2019 Proposed
Total FTEs 0.00 0.00 0.00 0.00 0.00
Expenditures:
2015 Actual 2016 Actual 2017 Actual 2018 Budget 2019 Proposed
Capital Outlay 76,607 122,097 154,159 100,000 100,000
Interfund Charges 25,207 0 0 30,000 30,000
Reserve for Budget Adjustment 0 0 0 0 0
Transfers Out 0 0 0 0 0
Wages & Benefits 0 0 0 0 0
Supplies & Services 228,292 264,763 206,841 345,950 397,750
Debt Services 0 0 0 0 0
All Other 0 0 0 0 0
TOTAL 330,106 386,860 361,000 475,950 527,750
Expenditure Notes:
Revenues:
2015 Actual 2016 Actual 2017 Actual 2018 Budget 2019 Proposed
Taxes 0 0 0 0 0
Licenses & Permits 0 0 0 0 0
IG Revenue 53,273 32,589 29,299 30,000 100,000
Services 25,163 65,223 65,280 65,000 70,000
Fines & Forfeits 148,565 1,729 6,193 15,000 50,000
Operating Transfers In 0 0 0 0 0One Vision. One Plan. One Voice.
Public Safety46

Department Summary: Forfeitures & Contributions
Division: Public Safety
Fund Type: Special Revenue Fund
Executive Summary:
The Forfeiture and Contributions fund services as a repository for funds received from drug investigations, donations made to the department, and auction proceeds to the Property Evidence Facility.
Programs and Services:
Proceeds in this fund are for restricted purposes. There are multiple funds in this Special Revenue Fund comprised of regular contributions from Citizens to asset forfeitures. Per law, drug seizure funds must be utilized for drug investigations or related law enforcement activities (utilizing SWAT for serving a high risk drug warrant, for example). These seizure funds are the result of money, weapons, and vehicles seized during investigation. Law Enforcement can seize property if they have probable cause the suspect intended to use the property in the commission of a crime.
FTEs
2015 Actual 2016 Actual 2017 Actual 2018 Budget 2019 Proposed
Total FTEs 0.00 0.00 0.00 0.00 0.00
Expenditures:
2015 Actual 2016 Actual 2017 Actual 2018 Budget 2019 Proposed
Capital Outlay 76,607 122,097 154,159 100,000 100,000
Interfund Charges 25,207 0 0 30,000 30,000
Reserve for Budget Adjustment 0 0 0 0 0
Transfers Out 0 0 0 0 0
Wages & Benefits 0 0 0 0 0
Supplies & Services 228,292 264,763 206,841 345,950 397,750
Debt Services 0 0 0 0 0
All Other 0 0 0 0 0
TOTAL 330,106 386,860 361,000 475,950 527,750
Expenditure Notes:
Revenues:
2015 Actual 2016 Actual 2017 Actual 2018 Budget 2019 Proposed
Taxes 0 0 0 0 0
Licenses & Permits 0 0 0 0 0
IG Revenue 53,273 32,589 29,299 30,000 100,000
Services 25,163 65,223 65,280 65,000 70,000
Fines & Forfeits 148,565 1,729 6,193 15,000 50,000
Operating Transfers In 0 0 0 0 0
General Fund Resources 0 0 0 0 100,000
All Other 178,044 218,368 221,146 247,000 237,000
TOTAL 405,045 317,909 321,918 357,000 557,000
Revenue Notes:
Public Safety 47

One Vision. One Plan. One Voice.
Public Safety48
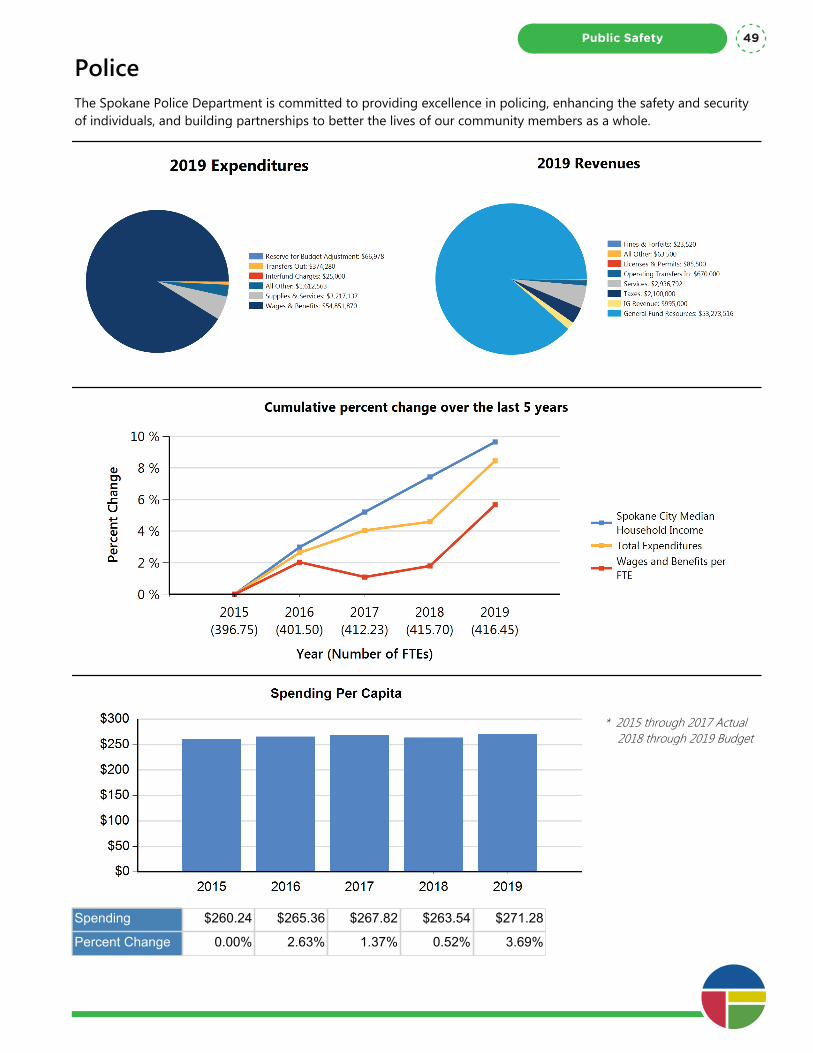
PoliceThe Spokane Police Department is committed to providing excellence in policing, enhancing the safety and security of individuals, and building partnerships to better the lives of our community members as a whole.
* 2015 through 2017 Actual 2018 through 2019 Budget
Spending $260.24 $265.36 $267.82 $263.54 $271.28
Percent Change 0.00% 2.63% 1.37% 0.52% 3.69%
Public Safety 49
Department Summary: Police
Division: Public Safety
Fund Type: General Fund
Executive Summary:
The Spokane Police Department is committed to providing excellence in policing, enhancing the safety and security of individuals, and building partnerships to better the lives of our community members as a whole.
Programs and Services:
Programs included in this summary are direct line operations.
Public safety is a community responsibility. Neighbors, parents, youth, business owners, city employees, school employees and teachers, as well as county, state and federal law enforcement agencies all play a role in making Spokane a safer city. The Department will work diligently to continue to create and maintain the kind of partnerships necessary to transform neighborhoods and improve the quality of life in our city.
We will collaborate with our partners in the social service and public health community to address the challenges posed by mental health, developmental disabilities, autism, domestic violence, and drug and alcohol dependency. We will continue to train all members of the SPD in 40-hours of crisis intervention techniques, expand our Enhanced Crisis Intervention Training Program, and begin integrating mental health practitioners into our crisis response program. We will also continue to work with our community, faith and school partners to expand our programs focused on preventing youth violence and their involvement in the criminal justice system.
FTEs
2015 Actual 2016 Actual 2017 Actual 2018 Budget 2019 Proposed
Total FTEs 396.75 401.50 412.23 415.70 416.45
Expenditures:
2015 Actual 2016 Actual 2017 Actual 2018 Budget 2019 Proposed
Capital Outlay 28,895 30,935 38,355 0 0
Interfund Charges 704,810 436,027 38,989 88,159 25,000
Reserve for Budget Adjustment 0 0 0 66,978 66,978
Transfers Out 40,000 233,279 246,819 403,996 374,280
Wages & Benefits 49,426,955 51,034,115 51,905,875 52,709,660 54,851,870
Supplies & Services 3,206,967 2,867,682 2,747,324 3,210,262 3,217,137
Debt Services 0 0 0 0 0
All Other 2,049,796 2,317,639 2,722,783 1,526,563 1,612,563
One Vision. One Plan. One Voice.
Public Safety50
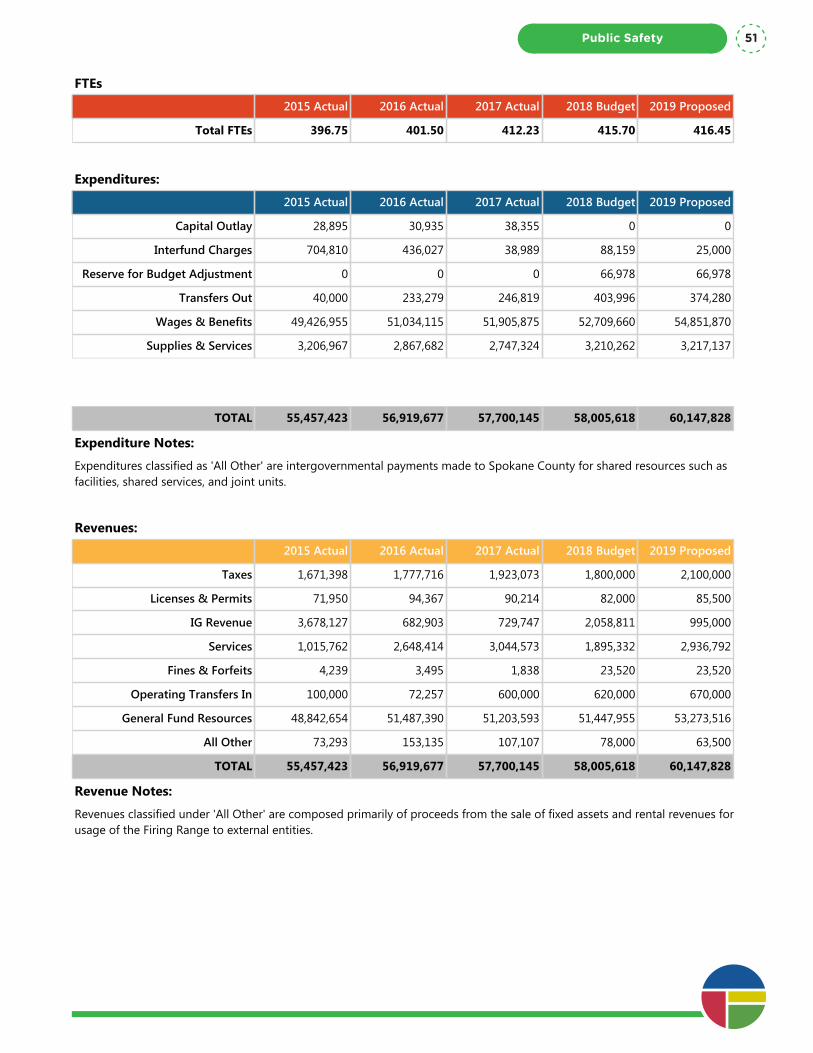
Department Summary: Police
Division: Public Safety
Fund Type: General Fund
Executive Summary:
The Spokane Police Department is committed to providing excellence in policing, enhancing the safety and security of individuals, and building partnerships to better the lives of our community members as a whole.
Programs and Services:
Programs included in this summary are direct line operations.
Public safety is a community responsibility. Neighbors, parents, youth, business owners, city employees, school employees and teachers, as well as county, state and federal law enforcement agencies all play a role in making Spokane a safer city. The Department will work diligently to continue to create and maintain the kind of partnerships necessary to transform neighborhoods and improve the quality of life in our city.
We will collaborate with our partners in the social service and public health community to address the challenges posed by mental health, developmental disabilities, autism, domestic violence, and drug and alcohol dependency. We will continue to train all members of the SPD in 40-hours of crisis intervention techniques, expand our Enhanced Crisis Intervention Training Program, and begin integrating mental health practitioners into our crisis response program. We will also continue to work with our community, faith and school partners to expand our programs focused on preventing youth violence and their involvement in the criminal justice system.
FTEs
2015 Actual 2016 Actual 2017 Actual 2018 Budget 2019 Proposed
Total FTEs 396.75 401.50 412.23 415.70 416.45
Expenditures:
2015 Actual 2016 Actual 2017 Actual 2018 Budget 2019 Proposed
Capital Outlay 28,895 30,935 38,355 0 0
Interfund Charges 704,810 436,027 38,989 88,159 25,000
Reserve for Budget Adjustment 0 0 0 66,978 66,978
Transfers Out 40,000 233,279 246,819 403,996 374,280
Wages & Benefits 49,426,955 51,034,115 51,905,875 52,709,660 54,851,870
Supplies & Services 3,206,967 2,867,682 2,747,324 3,210,262 3,217,137
Debt Services 0 0 0 0 0
All Other 2,049,796 2,317,639 2,722,783 1,526,563 1,612,563
TOTAL 55,457,423 56,919,677 57,700,145 58,005,618 60,147,828
Expenditure Notes:
Expenditures classified as 'All Other' are intergovernmental payments made to Spokane County for shared resources such as facilities, shared services, and joint units.
Revenues:
2015 Actual 2016 Actual 2017 Actual 2018 Budget 2019 Proposed
Taxes 1,671,398 1,777,716 1,923,073 1,800,000 2,100,000
Licenses & Permits 71,950 94,367 90,214 82,000 85,500
IG Revenue 3,678,127 682,903 729,747 2,058,811 995,000
Services 1,015,762 2,648,414 3,044,573 1,895,332 2,936,792
Fines & Forfeits 4,239 3,495 1,838 23,520 23,520
Operating Transfers In 100,000 72,257 600,000 620,000 670,000
General Fund Resources 48,842,654 51,487,390 51,203,593 51,447,955 53,273,516
All Other 73,293 153,135 107,107 78,000 63,500
TOTAL 55,457,423 56,919,677 57,700,145 58,005,618 60,147,828
Revenue Notes:
Revenues classified under 'All Other' are composed primarily of proceeds from the sale of fixed assets and rental revenues for usage of the Firing Range to external entities.
Public Safety 51
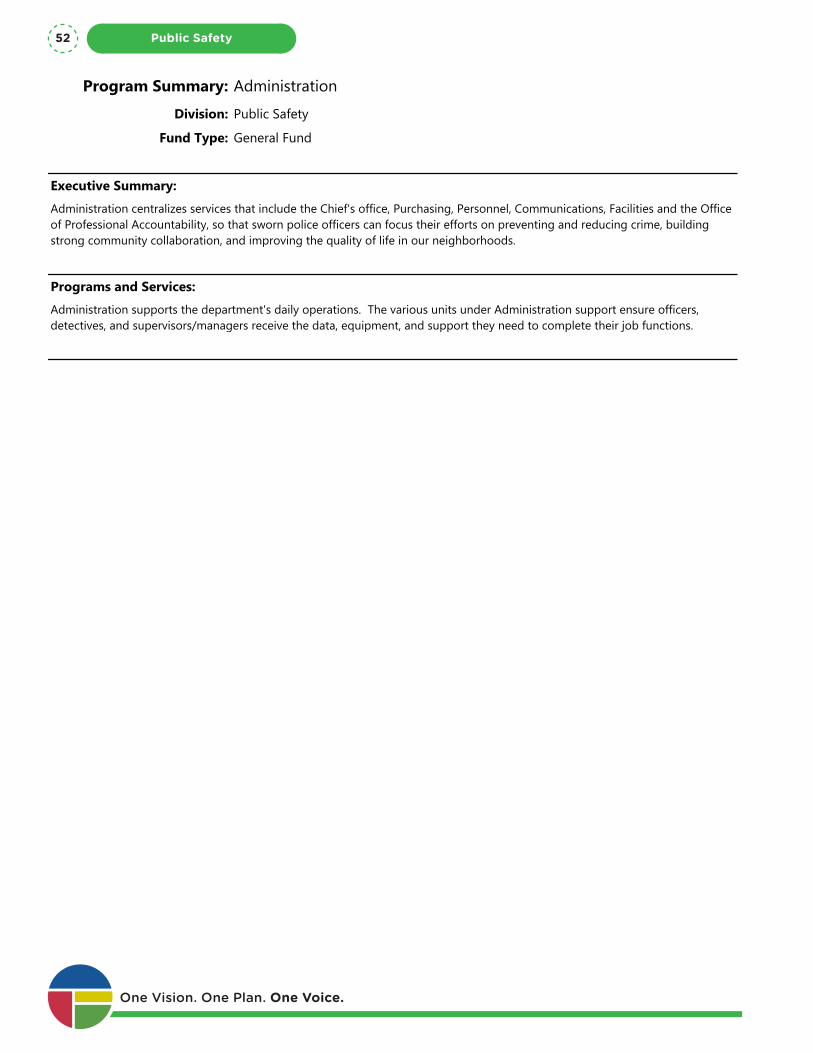
Program Summary: Administration
Division: Public Safety
Fund Type: General Fund
Executive Summary:
Administration centralizes services that include the Chief's office, Purchasing, Personnel, Communications, Facilities and the Office of Professional Accountability, so that sworn police officers can focus their efforts on preventing and reducing crime, building strong community collaboration, and improving the quality of life in our neighborhoods.
Programs and Services:
Administration supports the department's daily operations. The various units under Administration support ensure officers, detectives, and supervisors/managers receive the data, equipment, and support they need to complete their job functions.
FTEs
2015 Actual 2016 Actual 2017 Actual 2018 Budget 2019 Proposed
Total FTEs 27.00 23.00 25.40 17.90 17.90
Expenditures:
2015 Actual 2016 Actual 2017 Actual 2018 Budget 2019 Proposed
Capital Outlay 21,076 1,768 9,349 0 0
Interfund Charges 664,097 400,000 0 0 0
Reserve for Budget Adjustment 0 0 0 0 0
Transfers Out 0 0 0 134,717 105,000
Wages & Benefits 3,179,771 2,809,737 3,012,585 2,825,690 2,893,552
Supplies & Services 627,687 501,840 556,888 617,980 618,599
Debt Services 0 0 0 0 0
All Other 1,362,098 675,073 1,921,995 1,526,563 1,592,563
TOTAL 5,854,729 4,388,418 5,500,817 5,104,950 5,209,714
Expenditure Notes:
Expenditures classified as 'All Other' are intergovernmental payments made to Spokane County for shared resources such as facilities, shared services, and joint units.
Revenues:
2015 Actual 2016 Actual 2017 Actual 2018 Budget 2019 Proposed
Taxes 1,671,398 1,777,716 1,923,073 1,800,000 2,100,000
Licenses & Permits 0 0 0 82,000 0
IG Revenue 1,331,741 12,147 222,595 1,955,000 215,000
Services 8,465 513 52 125,000 0
Fines & Forfeits 0 0 0 0 0
Operating Transfers In 0 0 0 0 0
General Fund Resources 2,843,115 2,598,042 3,345,933 1,085,950 2,894,714One Vision. One Plan. One Voice.
Public Safety52
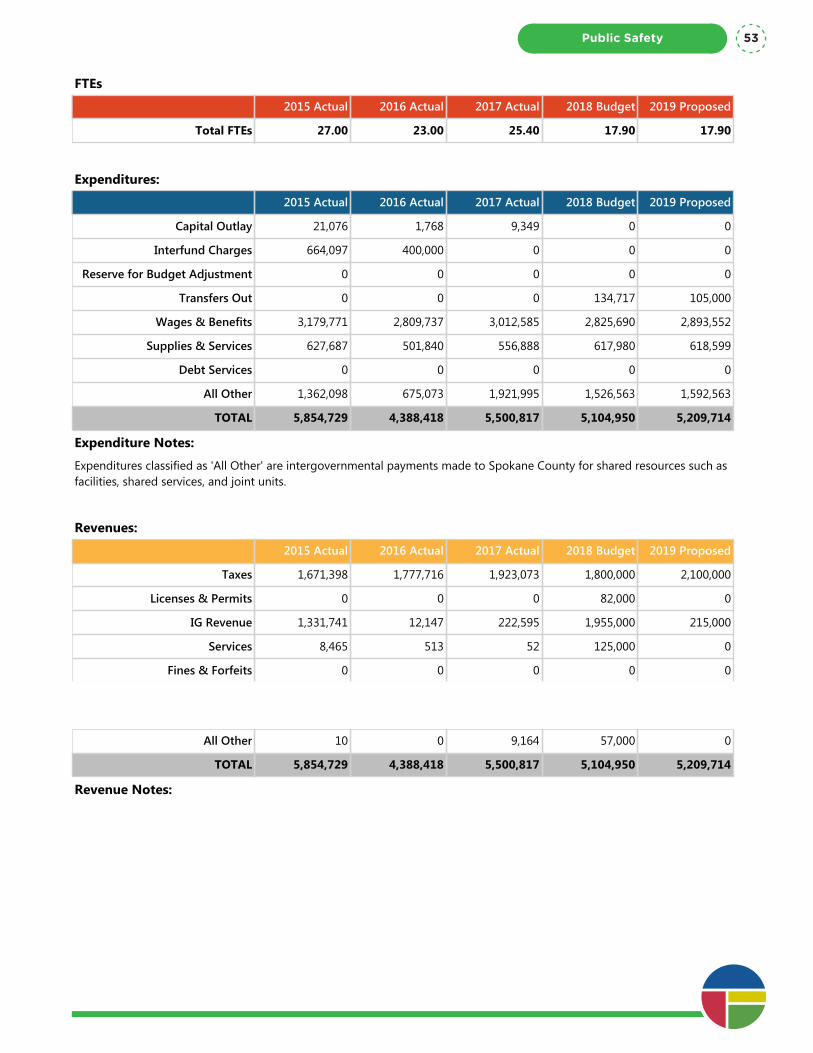
Program Summary: Administration
Division: Public Safety
Fund Type: General Fund
Executive Summary:
Administration centralizes services that include the Chief's office, Purchasing, Personnel, Communications, Facilities and the Office of Professional Accountability, so that sworn police officers can focus their efforts on preventing and reducing crime, building strong community collaboration, and improving the quality of life in our neighborhoods.
Programs and Services:
Administration supports the department's daily operations. The various units under Administration support ensure officers, detectives, and supervisors/managers receive the data, equipment, and support they need to complete their job functions.
FTEs
2015 Actual 2016 Actual 2017 Actual 2018 Budget 2019 Proposed
Total FTEs 27.00 23.00 25.40 17.90 17.90
Expenditures:
2015 Actual 2016 Actual 2017 Actual 2018 Budget 2019 Proposed
Capital Outlay 21,076 1,768 9,349 0 0
Interfund Charges 664,097 400,000 0 0 0
Reserve for Budget Adjustment 0 0 0 0 0
Transfers Out 0 0 0 134,717 105,000
Wages & Benefits 3,179,771 2,809,737 3,012,585 2,825,690 2,893,552
Supplies & Services 627,687 501,840 556,888 617,980 618,599
Debt Services 0 0 0 0 0
All Other 1,362,098 675,073 1,921,995 1,526,563 1,592,563
TOTAL 5,854,729 4,388,418 5,500,817 5,104,950 5,209,714
Expenditure Notes:
Expenditures classified as 'All Other' are intergovernmental payments made to Spokane County for shared resources such as facilities, shared services, and joint units.
Revenues:
2015 Actual 2016 Actual 2017 Actual 2018 Budget 2019 Proposed
Taxes 1,671,398 1,777,716 1,923,073 1,800,000 2,100,000
Licenses & Permits 0 0 0 82,000 0
IG Revenue 1,331,741 12,147 222,595 1,955,000 215,000
Services 8,465 513 52 125,000 0
Fines & Forfeits 0 0 0 0 0
Operating Transfers In 0 0 0 0 0
General Fund Resources 2,843,115 2,598,042 3,345,933 1,085,950 2,894,714
All Other 10 0 9,164 57,000 0
TOTAL 5,854,729 4,388,418 5,500,817 5,104,950 5,209,714
Revenue Notes:
Public Safety 53

Program Summary: Reimbursed Contracts
Division: Public Safety
Fund Type: General Fund
Executive Summary:
Contractual Obligations through interlocal agreements or other task force agencies to provide support and be reimbursed.
Programs and Services:
Reimbursements in this budget consist of agreements between federal and state and local agencies for various task forces or other means of joint services. They do not meet the definition of a grant, but are included in this section as a reimbursement to the general fund.
FTEs
2015 Actual 2016 Actual 2017 Actual 2018 Budget 2019 Proposed
Total FTEs 0.00 2.40 1.40 2.00 2.00
Expenditures:
2015 Actual 2016 Actual 2017 Actual 2018 Budget 2019 Proposed
Capital Outlay 0 0 0 0 0
Interfund Charges 0 0 0 0 0
Reserve for Budget Adjustment 0 0 0 0 0
Transfers Out 0 0 0 0 0
Wages & Benefits 370,257 383,904 574,146 516,952 524,028
Supplies & Services 2,635 3,359 5,568 0 0
Debt Services 0 0 0 0 0
All Other 0 0 0 0 0
TOTAL 372,892 387,263 579,714 516,952 524,028
Expenditure Notes:
Revenues:
2015 Actual 2016 Actual 2017 Actual 2018 Budget 2019 Proposed
Taxes 0 0 0 0 0
Licenses & Permits 0 0 0 0 0
IG Revenue 380,270 0 0 0 0
Services 0 343,595 470,042 577,040 575,500
Fines & Forfeits 4,239 3,495 1,838 23,520 23,520
Operating Transfers In 0 0 0 0 0
General Fund Resources (11,617) 40,173 107,755 (83,608) (74,992)
All Other 0 0 79 0 0One Vision. One Plan. One Voice.
Public Safety54

Program Summary: Reimbursed Contracts
Division: Public Safety
Fund Type: General Fund
Executive Summary:
Contractual Obligations through interlocal agreements or other task force agencies to provide support and be reimbursed.
Programs and Services:
Reimbursements in this budget consist of agreements between federal and state and local agencies for various task forces or other means of joint services. They do not meet the definition of a grant, but are included in this section as a reimbursement to the general fund.
FTEs
2015 Actual 2016 Actual 2017 Actual 2018 Budget 2019 Proposed
Total FTEs 0.00 2.40 1.40 2.00 2.00
Expenditures:
2015 Actual 2016 Actual 2017 Actual 2018 Budget 2019 Proposed
Capital Outlay 0 0 0 0 0
Interfund Charges 0 0 0 0 0
Reserve for Budget Adjustment 0 0 0 0 0
Transfers Out 0 0 0 0 0
Wages & Benefits 370,257 383,904 574,146 516,952 524,028
Supplies & Services 2,635 3,359 5,568 0 0
Debt Services 0 0 0 0 0
All Other 0 0 0 0 0
TOTAL 372,892 387,263 579,714 516,952 524,028
Expenditure Notes:
Revenues:
2015 Actual 2016 Actual 2017 Actual 2018 Budget 2019 Proposed
Taxes 0 0 0 0 0
Licenses & Permits 0 0 0 0 0
IG Revenue 380,270 0 0 0 0
Services 0 343,595 470,042 577,040 575,500
Fines & Forfeits 4,239 3,495 1,838 23,520 23,520
Operating Transfers In 0 0 0 0 0
General Fund Resources (11,617) 40,173 107,755 (83,608) (74,992)
All Other 0 0 79 0 0
TOTAL 372,892 387,263 579,714 516,952 524,028
Revenue Notes:
Public Safety 55
Sub-Department Summary:
SPD Community/Special Events/Services
Division: Public Safety
Fund Type: General Fund
Executive Summary:
Community Outreach, Special Events, and Services involves all the programs that have direct intervention with the public in order to communicate better and build relationships with the community.
Programs and Services:
Programs in outreach include the C.O.P.S. program, Special Events Coordination, Youth Police Initiative and Police Athletic League, Chronic Offender Unit, Traffic School, Extra Duty and the Volunteer program.
FTEs
2015 Actual 2016 Actual 2017 Actual 2018 Budget 2019 Proposed
Total FTEs 9.00 8.00 6.00 4.70 6.00
Expenditures:
2015 Actual 2016 Actual 2017 Actual 2018 Budget 2019 Proposed
Capital Outlay 0 0 0 0 0
Interfund Charges 10,498 10,181 8,445 25,000 0
Reserve for Budget Adjustment 0 0 0 0 0
Transfers Out 0 0 0 0 0
Wages & Benefits 1,400,302 1,555,929 1,668,095 1,430,113 1,702,798
Supplies & Services 577,731 479,985 469,045 532,321 566,142
Debt Services 0 0 0 0 0
All Other 0 0 0 0 0
TOTAL 1,988,531 2,046,095 2,145,585 1,987,434 2,268,940
Expenditure Notes:
Revenues:
2015 Actual 2016 Actual 2017 Actual 2018 Budget 2019 Proposed
Taxes 0 0 0 0 0
Licenses & Permits 0 2,791 3,092 0 3,000
IG Revenue 234,673 215,978 0 23,811 0
Services 589,259 597,299 646,168 630,687 626,187
Fines & Forfeits 0 0 0 0 0
Operating Transfers In 0 0 0 0 0
General Fund Resources 1,164,885 1,205,602 1,496,085 1,332,936 1,639,753One Vision. One Plan. One Voice.
Public Safety56

Sub-Department Summary:
SPD Community/Special Events/Services
Division: Public Safety
Fund Type: General Fund
Executive Summary:
Community Outreach, Special Events, and Services involves all the programs that have direct intervention with the public in order to communicate better and build relationships with the community.
Programs and Services:
Programs in outreach include the C.O.P.S. program, Special Events Coordination, Youth Police Initiative and Police Athletic League, Chronic Offender Unit, Traffic School, Extra Duty and the Volunteer program.
FTEs
2015 Actual 2016 Actual 2017 Actual 2018 Budget 2019 Proposed
Total FTEs 9.00 8.00 6.00 4.70 6.00
Expenditures:
2015 Actual 2016 Actual 2017 Actual 2018 Budget 2019 Proposed
Capital Outlay 0 0 0 0 0
Interfund Charges 10,498 10,181 8,445 25,000 0
Reserve for Budget Adjustment 0 0 0 0 0
Transfers Out 0 0 0 0 0
Wages & Benefits 1,400,302 1,555,929 1,668,095 1,430,113 1,702,798
Supplies & Services 577,731 479,985 469,045 532,321 566,142
Debt Services 0 0 0 0 0
All Other 0 0 0 0 0
TOTAL 1,988,531 2,046,095 2,145,585 1,987,434 2,268,940
Expenditure Notes:
Revenues:
2015 Actual 2016 Actual 2017 Actual 2018 Budget 2019 Proposed
Taxes 0 0 0 0 0
Licenses & Permits 0 2,791 3,092 0 3,000
IG Revenue 234,673 215,978 0 23,811 0
Services 589,259 597,299 646,168 630,687 626,187
Fines & Forfeits 0 0 0 0 0
Operating Transfers In 0 0 0 0 0
General Fund Resources 1,164,885 1,205,602 1,496,085 1,332,936 1,639,753
All Other (286) 24,425 240 0 0
TOTAL 1,988,531 2,046,095 2,145,585 1,987,434 2,268,940
Revenue Notes:
Revenues classified as 'All Other' are comprised of interest earned on late payments and funding support toward the Spokane COPS Program.
Public Safety 57
Sub-Department Summary:
SPD Operations
Division: Public Safety
Fund Type: General Fund
Executive Summary:
Field Operations oversees front-line deployment of Patrol resources, to include patrol officers, traffic, and K9. These units respond to citizen calls for service to 911 and Crime Check to prevent and reduce crime.
Programs and Services:
Programs include Patrol, K9, Traffic, Investigations, and Reimbursed Contract Services.
FTEs
2015 Actual 2016 Actual 2017 Actual 2018 Budget 2019 Proposed
Total FTEs 278.60 282.75 294.08 305.55 306.30
Expenditures:
2015 Actual 2016 Actual 2017 Actual 2018 Budget 2019 Proposed
Capital Outlay 7,819 6,189 18,335 0 0
Interfund Charges 2,586 0 0 0 0
Reserve for Budget Adjustment 0 0 0 66,978 66,978
Transfers Out 0 159,676 177,216 179,205 130,074
Wages & Benefits 36,522,068 35,404,383 36,078,329 38,402,645 40,040,760
Supplies & Services 430,901 390,324 373,921 407,251 396,519
Debt Services 0 0 0 0 0
All Other 0 0 0 0 0
TOTAL 36,963,374 35,960,572 36,647,801 39,056,079 40,634,331
Expenditure Notes:
Revenues:
2015 Actual 2016 Actual 2017 Actual 2018 Budget 2019 Proposed
Taxes 0 0 0 0 0
Licenses & Permits 0 0 0 0 0
IG Revenue 101,082 454,778 507,152 80,000 780,000
Services 363,255 230,199 239,149 99,000 237,000
Fines & Forfeits 0 0 0 0 0
Operating Transfers In 100,000 72,257 600,000 620,000 670,000
General Fund Resources 36,398,205 35,202,303 35,293,846 38,257,079 38,942,831
All Other 832 1,035 7,654 0 4,500One Vision. One Plan. One Voice.
Public Safety58

Sub-Department Summary:
SPD Operations
Division: Public Safety
Fund Type: General Fund
Executive Summary:
Field Operations oversees front-line deployment of Patrol resources, to include patrol officers, traffic, and K9. These units respond to citizen calls for service to 911 and Crime Check to prevent and reduce crime.
Programs and Services:
Programs include Patrol, K9, Traffic, Investigations, and Reimbursed Contract Services.
FTEs
2015 Actual 2016 Actual 2017 Actual 2018 Budget 2019 Proposed
Total FTEs 278.60 282.75 294.08 305.55 306.30
Expenditures:
2015 Actual 2016 Actual 2017 Actual 2018 Budget 2019 Proposed
Capital Outlay 7,819 6,189 18,335 0 0
Interfund Charges 2,586 0 0 0 0
Reserve for Budget Adjustment 0 0 0 66,978 66,978
Transfers Out 0 159,676 177,216 179,205 130,074
Wages & Benefits 36,522,068 35,404,383 36,078,329 38,402,645 40,040,760
Supplies & Services 430,901 390,324 373,921 407,251 396,519
Debt Services 0 0 0 0 0
All Other 0 0 0 0 0
TOTAL 36,963,374 35,960,572 36,647,801 39,056,079 40,634,331
Expenditure Notes:
Revenues:
2015 Actual 2016 Actual 2017 Actual 2018 Budget 2019 Proposed
Taxes 0 0 0 0 0
Licenses & Permits 0 0 0 0 0
IG Revenue 101,082 454,778 507,152 80,000 780,000
Services 363,255 230,199 239,149 99,000 237,000
Fines & Forfeits 0 0 0 0 0
Operating Transfers In 100,000 72,257 600,000 620,000 670,000
General Fund Resources 36,398,205 35,202,303 35,293,846 38,257,079 38,942,831
All Other 832 1,035 7,654 0 4,500
TOTAL 36,963,374 35,960,572 36,647,801 39,056,079 40,634,331
Revenue Notes:
Public Safety 59
Sub-Department Summary:
SPD Operations Support
Division: Public Safety
Fund Type: General Fund
Executive Summary:
The Operations Support centralizes support services such as Records, Property, Dispatch and the Training Academy so sworn police officers can focus their efforts on preventing and reducing crime, building strong community collaboration, and improving the quality of life in our neighborhoods.
Programs and Services:
Operations support supports the rest of the department's daily operations. The various units under Operations support ensure officers, detectives, and supervisors/managers receive the data, equipment, and support they need to complete their job functions.
FTEs
2015 Actual 2016 Actual 2017 Actual 2018 Budget 2019 Proposed
Total FTEs 81.15 85.35 85.35 85.05 83.75
Expenditures:
2015 Actual 2016 Actual 2017 Actual 2018 Budget 2019 Proposed
Capital Outlay 0 22,978 10,671 0 0
Interfund Charges 27,629 25,846 30,544 63,159 25,000
Reserve for Budget Adjustment 0 0 0 0 0
Transfers Out 40,000 73,603 69,603 90,074 139,206
Wages & Benefits 7,360,717 10,272,421 10,004,295 9,215,277 9,369,742
Supplies & Services 1,472,409 1,352,570 1,251,772 1,556,828 1,520,027
Debt Services 0 0 0 0 0
All Other 662,196 1,621,882 781,085 0 0
TOTAL 9,562,951 13,369,300 12,147,970 10,925,338 11,053,975
Expenditure Notes:
Revenues:
2015 Actual 2016 Actual 2017 Actual 2018 Budget 2019 Proposed
Taxes 0 0 0 0 0
Licenses & Permits 71,950 91,576 87,122 0 82,500
IG Revenue 1,630,361 0 0 0 0
Services 52,753 1,473,160 1,689,162 460,605 1,493,105
Fines & Forfeits 0 0 0 0 0
Operating Transfers In 0 0 0 0 0One Vision. One Plan. One Voice.
Public Safety60

Sub-Department Summary:
SPD Operations Support
Division: Public Safety
Fund Type: General Fund
Executive Summary:
The Operations Support centralizes support services such as Records, Property, Dispatch and the Training Academy so sworn police officers can focus their efforts on preventing and reducing crime, building strong community collaboration, and improving the quality of life in our neighborhoods.
Programs and Services:
Operations support supports the rest of the department's daily operations. The various units under Operations support ensure officers, detectives, and supervisors/managers receive the data, equipment, and support they need to complete their job functions.
FTEs
2015 Actual 2016 Actual 2017 Actual 2018 Budget 2019 Proposed
Total FTEs 81.15 85.35 85.35 85.05 83.75
Expenditures:
2015 Actual 2016 Actual 2017 Actual 2018 Budget 2019 Proposed
Capital Outlay 0 22,978 10,671 0 0
Interfund Charges 27,629 25,846 30,544 63,159 25,000
Reserve for Budget Adjustment 0 0 0 0 0
Transfers Out 40,000 73,603 69,603 90,074 139,206
Wages & Benefits 7,360,717 10,272,421 10,004,295 9,215,277 9,369,742
Supplies & Services 1,472,409 1,352,570 1,251,772 1,556,828 1,520,027
Debt Services 0 0 0 0 0
All Other 662,196 1,621,882 781,085 0 0
TOTAL 9,562,951 13,369,300 12,147,970 10,925,338 11,053,975
Expenditure Notes:
Revenues:
2015 Actual 2016 Actual 2017 Actual 2018 Budget 2019 Proposed
Taxes 0 0 0 0 0
Licenses & Permits 71,950 91,576 87,122 0 82,500
IG Revenue 1,630,361 0 0 0 0
Services 52,753 1,473,160 1,689,162 460,605 1,493,105
Fines & Forfeits 0 0 0 0 0
Operating Transfers In 0 0 0 0 0
General Fund Resources 7,735,150 11,733,901 10,285,899 10,455,733 9,419,370
All Other 72,737 70,663 85,787 9,000 59,000
TOTAL 9,562,951 13,369,300 12,147,970 10,925,338 11,053,975
Revenue Notes:
Revenues classified as 'All Other' are comprised primarily of funds received from the sale of fixed assets and value of assets received from external agencies.
Public Safety 61
Program Summary: Specialty Units
Division: Public Safety
Fund Type: General Fund
Executive Summary:
Specialty teams are comprised of commissioned officers that support the mission of the department that require special skills and training. Composed of personnel whose primary assignment varies from Explosive Device Unit, SWAT, Hostage TAC, Dignitary Protection, & Breaching.
Programs and Services:
The mission of the SPD SWAT team is to support the SPD and any other requesting law enforcement agency approved by the Chief of Police, or his designee, with a tactical response to critical incidents. Critical incidents include hostage, barricade, or sniper situations, high-risk apprehension, high-risk warrant service, personal protection, and special assignments.
The Hostage Negotiation Team provides specialized skills needed in crisis diffusion and acts in cooperation with other specialty units within the Spokane Police Department. Additionally, the HNT has the priorities of preserving the lives of hostages, police, public and suspect(s) in crisis situations.
The Explosives Disposal Unit is a cooperative effort between the Spokane Police and the County Sheriffs Departments. Its mission is to render safe any explosive device or explosive material, and investigate items that are found and believed to be explosive in nature.
The Dignitary Protection Team members provide close security to those individuals who need additional protection. These include, but are not limited to local dignitaries, visiting national and foreign dignitaries, high profile speakers, and witnesses involved in high profile criminal and court cases.
The TAC Team is a unit specializing in crowd management (e.g., at demonstrations, concerts, special events, etc.) and civil disturbance response and control. Currently, the SPD TAC Team is the only team from a Washington agency providing instruction through the Washington State Training Commission on riot control tactics and civil disturbance tactics.
FTEs
2015 Actual 2016 Actual 2017 Actual 2018 Budget 2019 Proposed
Total FTEs 1.00 0.00 0.00 0.50 0.50
Expenditures:
2015 Actual 2016 Actual 2017 Actual 2018 Budget 2019 Proposed
Capital Outlay 0 0 0 0 0
Interfund Charges 0 0 0 0 0
Reserve for Budget Adjustment 0 0 0 0 0
Transfers Out 0 0 0 0 0
Wages & Benefits 593,840 607,741 568,425 318,983 320,990
Supplies & Services 95,604 139,604 90,130 95,882 115,850
Debt Services 0 0 0 0 0
All Other 25,502 20,684 19,703 0 20,000
One Vision. One Plan. One Voice.
Public Safety62

Program Summary: Specialty Units
Division: Public Safety
Fund Type: General Fund
Executive Summary:
Specialty teams are comprised of commissioned officers that support the mission of the department that require special skills and training. Composed of personnel whose primary assignment varies from Explosive Device Unit, SWAT, Hostage TAC, Dignitary Protection, & Breaching.
Programs and Services:
The mission of the SPD SWAT team is to support the SPD and any other requesting law enforcement agency approved by the Chief of Police, or his designee, with a tactical response to critical incidents. Critical incidents include hostage, barricade, or sniper situations, high-risk apprehension, high-risk warrant service, personal protection, and special assignments.
The Hostage Negotiation Team provides specialized skills needed in crisis diffusion and acts in cooperation with other specialty units within the Spokane Police Department. Additionally, the HNT has the priorities of preserving the lives of hostages, police, public and suspect(s) in crisis situations.
The Explosives Disposal Unit is a cooperative effort between the Spokane Police and the County Sheriffs Departments. Its mission is to render safe any explosive device or explosive material, and investigate items that are found and believed to be explosive in nature.
The Dignitary Protection Team members provide close security to those individuals who need additional protection. These include, but are not limited to local dignitaries, visiting national and foreign dignitaries, high profile speakers, and witnesses involved in high profile criminal and court cases.
The TAC Team is a unit specializing in crowd management (e.g., at demonstrations, concerts, special events, etc.) and civil disturbance response and control. Currently, the SPD TAC Team is the only team from a Washington agency providing instruction through the Washington State Training Commission on riot control tactics and civil disturbance tactics.
FTEs
2015 Actual 2016 Actual 2017 Actual 2018 Budget 2019 Proposed
Total FTEs 1.00 0.00 0.00 0.50 0.50
Expenditures:
2015 Actual 2016 Actual 2017 Actual 2018 Budget 2019 Proposed
Capital Outlay 0 0 0 0 0
Interfund Charges 0 0 0 0 0
Reserve for Budget Adjustment 0 0 0 0 0
Transfers Out 0 0 0 0 0
Wages & Benefits 593,840 607,741 568,425 318,983 320,990
Supplies & Services 95,604 139,604 90,130 95,882 115,850
Debt Services 0 0 0 0 0
All Other 25,502 20,684 19,703 0 20,000
TOTAL 714,946 768,029 678,258 414,865 456,840
Expenditure Notes:
All Other costs are charges from Spokane County for the City's portion of the shared Explosion Disposal Unit(EDU). EDU costs are shared between the City and County on a 60/40 split.
Revenues:
2015 Actual 2016 Actual 2017 Actual 2018 Budget 2019 Proposed
Taxes 0 0 0 0 0
Licenses & Permits 0 0 0 0 0
IG Revenue 0 0 0 0 0
Services 2,030 3,648 0 3,000 5,000
Fines & Forfeits 0 0 0 0 0
Operating Transfers In 0 0 0 0 0
General Fund Resources 712,916 707,369 674,075 399,865 451,840
All Other 0 57,012 4,183 12,000 0
TOTAL 714,946 768,029 678,258 414,865 456,840
Revenue Notes:
Revenues classified as 'All Other' are comprised primarily of funds received from the sale of fixed assets and value of assets received from external agencies.
Public Safety 63
Program Summary: Investigations
Division: Public Safety
Fund Type: General Fund
Executive Summary:
SPD's Investigative Division works closely with SPD's Criminal Intelligence Analysts to collect and review real-time information and data regarding crime trends, arrests, and patterns of criminal activity. Detectives utilize this information as they conduct investigations within their respective units.
Programs and Services:
The Spokane Police Department Investigations Division houses the investigative arm of the Spokane Police Department. The Division is comprised of the Major Crimes Unit (MCU), the Collision Investigation Unit, the Special Victims Unit (SVU), the Special Investigative Unit (SIU), the Targeted Crimes Unit (TCU), the Chronic Offender Unit (COU), the Regional Safe Streets Task Force (SSTF), the Criminal Intelligence Unit (CIU), the Domestic Violence Unit (DVU), the Civil Enforcement Unit (CEU), The Police Anti-Crime Team (PACT/2 Teams) and General Detectives. TCU assets, one PACT unit and the detective assigned to Washington Auto Theft Prevention Authority task force comprise the department’s Vehicle Theft Task Force. These units work to serve citizens and actively fight crime through comprehensive and thorough investigations, victim assistance, and crime prevention efforts. In the Investigative Division, detectives from each of the various investigative units are under a single command to ensure rapid response to emerging crime and quality of life issues.
FTEs
2015 Actual 2016 Actual 2017 Actual 2018 Budget 2019 Proposed
Total FTEs 67.00 62.00 77.00 70.20 69.70
Expenditures:
2015 Actual 2016 Actual 2017 Actual 2018 Budget 2019 Proposed
Capital Outlay 7,819 0 11,969 0 0
Interfund Charges 0 0 0 0 0
Reserve for Budget Adjustment 0 0 0 0 0
Transfers Out 0 159,676 177,216 179,205 130,074
Wages & Benefits 8,689,310 9,177,599 10,140,309 9,369,223 9,636,425
Supplies & Services 151,373 216,856 206,290 213,090 195,062
Debt Services 0 0 0 0 0
All Other 0 0 0 0 0
TOTAL 8,848,502 9,554,131 10,535,784 9,761,518 9,961,561
Expenditure Notes:
Revenues:
2015 Actual 2016 Actual 2017 Actual 2018 Budget 2019 Proposed
Taxes 0 0 0 0 0
Licenses & Permits 0 0 0 0 0
IG Revenue 72,711 454,778 507,152 80,000 780,000One Vision. One Plan. One Voice.
Public Safety64

Program Summary: Investigations
Division: Public Safety
Fund Type: General Fund
Executive Summary:
SPD's Investigative Division works closely with SPD's Criminal Intelligence Analysts to collect and review real-time information and data regarding crime trends, arrests, and patterns of criminal activity. Detectives utilize this information as they conduct investigations within their respective units.
Programs and Services:
The Spokane Police Department Investigations Division houses the investigative arm of the Spokane Police Department. The Division is comprised of the Major Crimes Unit (MCU), the Collision Investigation Unit, the Special Victims Unit (SVU), the Special Investigative Unit (SIU), the Targeted Crimes Unit (TCU), the Chronic Offender Unit (COU), the Regional Safe Streets Task Force (SSTF), the Criminal Intelligence Unit (CIU), the Domestic Violence Unit (DVU), the Civil Enforcement Unit (CEU), The Police Anti-Crime Team (PACT/2 Teams) and General Detectives. TCU assets, one PACT unit and the detective assigned to Washington Auto Theft Prevention Authority task force comprise the department’s Vehicle Theft Task Force. These units work to serve citizens and actively fight crime through comprehensive and thorough investigations, victim assistance, and crime prevention efforts. In the Investigative Division, detectives from each of the various investigative units are under a single command to ensure rapid response to emerging crime and quality of life issues.
FTEs
2015 Actual 2016 Actual 2017 Actual 2018 Budget 2019 Proposed
Total FTEs 67.00 62.00 77.00 70.20 69.70
Expenditures:
2015 Actual 2016 Actual 2017 Actual 2018 Budget 2019 Proposed
Capital Outlay 7,819 0 11,969 0 0
Interfund Charges 0 0 0 0 0
Reserve for Budget Adjustment 0 0 0 0 0
Transfers Out 0 159,676 177,216 179,205 130,074
Wages & Benefits 8,689,310 9,177,599 10,140,309 9,369,223 9,636,425
Supplies & Services 151,373 216,856 206,290 213,090 195,062
Debt Services 0 0 0 0 0
All Other 0 0 0 0 0
TOTAL 8,848,502 9,554,131 10,535,784 9,761,518 9,961,561
Expenditure Notes:
Revenues:
2015 Actual 2016 Actual 2017 Actual 2018 Budget 2019 Proposed
Taxes 0 0 0 0 0
Licenses & Permits 0 0 0 0 0
IG Revenue 72,711 454,778 507,152 80,000 780,000
Services 0 740 2,500 0 0
Fines & Forfeits 0 0 0 0 0
Operating Transfers In 0 0 0 0 0
General Fund Resources 8,775,791 9,098,613 10,026,132 9,681,518 9,181,561
All Other 0 0 0 0 0
TOTAL 8,848,502 9,554,131 10,535,784 9,761,518 9,961,561
Revenue Notes:
Public Safety 65
Program Summary: K-9
Division: Public Safety
Fund Type: General Fund
Executive Summary:
K-9 dogs are used for locating criminal suspects; search buildings and open areas, track suspects that have fled an area, locate the scent of various explosives, provide enhanced safety in police operations and to the community, and to locate the scent of cocaine, heroin, and methamphetamine.
Programs and Services:
K-9 Patrol dogs are used for locating criminal suspects; they search buildings and open areas, and track suspects that have fled an area. A Patrol dog can search a building, vehicle, or area faster, safer, with less manpower, and more accurately than officers can. A Patrol dog is also able to locate evidence that a suspect may have discarded. The dog may find this evidence while on a track or when called to search an area after a suspect has already been located. The K-9 Bomb dog and Drug dogs can search a building, vehicle, or area faster, safer, with less manpower, and more accurately than officers could in locating an explosive and drugs.
FTEs
2015 Actual 2016 Actual 2017 Actual 2018 Budget 2019 Proposed
Total FTEs 4.00 5.00 6.00 6.00 7.00
Expenditures:
2015 Actual 2016 Actual 2017 Actual 2018 Budget 2019 Proposed
Capital Outlay 0 6,189 6,366 0 0
Interfund Charges 0 0 0 0 0
Reserve for Budget Adjustment 0 0 0 0 0
Transfers Out 0 0 0 0 0
Wages & Benefits 745,242 756,627 907,915 827,263 945,021
Supplies & Services 22,512 26,768 29,568 25,085 41,250
Debt Services 0 0 0 0 0
All Other 0 0 0 0 0
TOTAL 767,754 789,584 943,849 852,348 986,271
Expenditure Notes:
Revenues:
2015 Actual 2016 Actual 2017 Actual 2018 Budget 2019 Proposed
Taxes 0 0 0 0 0
Licenses & Permits 0 0 0 0 0
IG Revenue 20,700 0 0 0 0
Services 0 8,700 8,250 0 10,000
Fines & Forfeits 0 0 0 0 0One Vision. One Plan. One Voice.
Public Safety66

Program Summary: K-9
Division: Public Safety
Fund Type: General Fund
Executive Summary:
K-9 dogs are used for locating criminal suspects; search buildings and open areas, track suspects that have fled an area, locate the scent of various explosives, provide enhanced safety in police operations and to the community, and to locate the scent of cocaine, heroin, and methamphetamine.
Programs and Services:
K-9 Patrol dogs are used for locating criminal suspects; they search buildings and open areas, and track suspects that have fled an area. A Patrol dog can search a building, vehicle, or area faster, safer, with less manpower, and more accurately than officers can. A Patrol dog is also able to locate evidence that a suspect may have discarded. The dog may find this evidence while on a track or when called to search an area after a suspect has already been located. The K-9 Bomb dog and Drug dogs can search a building, vehicle, or area faster, safer, with less manpower, and more accurately than officers could in locating an explosive and drugs.
FTEs
2015 Actual 2016 Actual 2017 Actual 2018 Budget 2019 Proposed
Total FTEs 4.00 5.00 6.00 6.00 7.00
Expenditures:
2015 Actual 2016 Actual 2017 Actual 2018 Budget 2019 Proposed
Capital Outlay 0 6,189 6,366 0 0
Interfund Charges 0 0 0 0 0
Reserve for Budget Adjustment 0 0 0 0 0
Transfers Out 0 0 0 0 0
Wages & Benefits 745,242 756,627 907,915 827,263 945,021
Supplies & Services 22,512 26,768 29,568 25,085 41,250
Debt Services 0 0 0 0 0
All Other 0 0 0 0 0
TOTAL 767,754 789,584 943,849 852,348 986,271
Expenditure Notes:
Revenues:
2015 Actual 2016 Actual 2017 Actual 2018 Budget 2019 Proposed
Taxes 0 0 0 0 0
Licenses & Permits 0 0 0 0 0
IG Revenue 20,700 0 0 0 0
Services 0 8,700 8,250 0 10,000
Fines & Forfeits 0 0 0 0 0
Operating Transfers In 0 0 0 0 0
General Fund Resources 747,054 780,884 935,599 852,348 976,271
All Other 0 0 0 0 0
TOTAL 767,754 789,584 943,849 852,348 986,271
Revenue Notes:
Public Safety 67
Program Summary: Patrol
Division: Public Safety
Fund Type: General Fund
Executive Summary:
Patrol officers and supervisors are the front-line responders to calls for service from citizens to 911 or Crime Check.
Programs and Services:
Patrol officers and supervisors are the front-line responders to calls for service from citizens to 911 or Crime Check. These officers take reports, conduct preliminary investigations in the field, and respond to citizen inquiries. In addition to these citizen calls, which range from domestic violence to vehicle collisions to burglary, officers also conduct self-initiated activity. This includes stops of suspicious people, surveillance, citizen and business contacts, and traffic stops. Patrol officers also conduct preventive patrols in known hot spot areas to prevent crime before it occurs. Patrol also consists of the precinct areas and the detectives assigned to those precincts.
FTEs
2015 Actual 2016 Actual 2017 Actual 2018 Budget 2019 Proposed
Total FTEs 197.60 204.75 201.08 219.35 217.60
Expenditures:
2015 Actual 2016 Actual 2017 Actual 2018 Budget 2019 Proposed
Capital Outlay 0 0 0 0 0
Interfund Charges 2,086 0 0 0 0
Reserve for Budget Adjustment 0 0 0 66,978 66,978
Transfers Out 0 0 0 0 0
Wages & Benefits 25,767,294 24,354,981 23,896,398 26,954,220 27,945,034
Supplies & Services 232,321 124,838 111,107 141,876 119,607
Debt Services 0 0 0 0 0
All Other 0 0 0 0 0
TOTAL 26,001,701 24,479,819 24,007,505 27,163,074 28,131,619
Expenditure Notes:
Revenues:
2015 Actual 2016 Actual 2017 Actual 2018 Budget 2019 Proposed
Taxes 0 0 0 0 0
Licenses & Permits 0 0 0 0 0
IG Revenue 7,521 0 0 0 0
Services 186,935 57,933 106,918 99,000 87,000
Fines & Forfeits 0 0 0 0 0
Operating Transfers In 0 0 500,000 500,000 550,000One Vision. One Plan. One Voice.
Public Safety68

Program Summary: Patrol
Division: Public Safety
Fund Type: General Fund
Executive Summary:
Patrol officers and supervisors are the front-line responders to calls for service from citizens to 911 or Crime Check.
Programs and Services:
Patrol officers and supervisors are the front-line responders to calls for service from citizens to 911 or Crime Check. These officers take reports, conduct preliminary investigations in the field, and respond to citizen inquiries. In addition to these citizen calls, which range from domestic violence to vehicle collisions to burglary, officers also conduct self-initiated activity. This includes stops of suspicious people, surveillance, citizen and business contacts, and traffic stops. Patrol officers also conduct preventive patrols in known hot spot areas to prevent crime before it occurs. Patrol also consists of the precinct areas and the detectives assigned to those precincts.
FTEs
2015 Actual 2016 Actual 2017 Actual 2018 Budget 2019 Proposed
Total FTEs 197.60 204.75 201.08 219.35 217.60
Expenditures:
2015 Actual 2016 Actual 2017 Actual 2018 Budget 2019 Proposed
Capital Outlay 0 0 0 0 0
Interfund Charges 2,086 0 0 0 0
Reserve for Budget Adjustment 0 0 0 66,978 66,978
Transfers Out 0 0 0 0 0
Wages & Benefits 25,767,294 24,354,981 23,896,398 26,954,220 27,945,034
Supplies & Services 232,321 124,838 111,107 141,876 119,607
Debt Services 0 0 0 0 0
All Other 0 0 0 0 0
TOTAL 26,001,701 24,479,819 24,007,505 27,163,074 28,131,619
Expenditure Notes:
Revenues:
2015 Actual 2016 Actual 2017 Actual 2018 Budget 2019 Proposed
Taxes 0 0 0 0 0
Licenses & Permits 0 0 0 0 0
IG Revenue 7,521 0 0 0 0
Services 186,935 57,933 106,918 99,000 87,000
Fines & Forfeits 0 0 0 0 0
Operating Transfers In 0 0 500,000 500,000 550,000
General Fund Resources 25,806,413 24,421,886 23,396,578 26,564,074 27,491,119
All Other 832 0 4,009 0 3,500
TOTAL 26,001,701 24,479,819 24,007,505 27,163,074 28,131,619
Revenue Notes:
Revenues classified as 'All Other' are funds received from the sale of surplus equipment.
Public Safety 69

Program Summary: Traffic
Division: Public Safety
Fund Type: General Fund
Executive Summary:
Traffic is a specialized unit that provides general traffic enforcement for the entire city.
Programs and Services:
The goals and objectives of the Spokane Police Traffic Unit are to reduce the number and severity of traffic collisions in the City of Spokane. The Department takes a three-prong approach to the problem: education, engineering, and enforcement. Besides the motorcycle officers who provide traffic enforcement, there are two Commercial Vehicle Officers that target commercial vehicles for compliance with regulations, and one Photo Red Enforcement Officer who is funded by and administers the Photo Red program.
FTEs
2015 Actual 2016 Actual 2017 Actual 2018 Budget 2019 Proposed
Total FTEs 10.00 11.00 10.00 10.00 12.00
Expenditures:
2015 Actual 2016 Actual 2017 Actual 2018 Budget 2019 Proposed
Capital Outlay 0 0 0 0 0
Interfund Charges 500 0 0 0 0
Reserve for Budget Adjustment 0 0 0 0 0
Transfers Out 0 0 0 0 0
Wages & Benefits 1,320,222 1,115,176 1,133,707 1,251,939 1,514,280
Supplies & Services 24,695 21,862 26,956 27,200 40,600
Debt Services 0 0 0 0 0
All Other 0 0 0 0 0
TOTAL 1,345,417 1,137,038 1,160,663 1,279,139 1,554,880
Expenditure Notes:
Revenues:
2015 Actual 2016 Actual 2017 Actual 2018 Budget 2019 Proposed
Taxes 0 0 0 0 0
Licenses & Permits 0 0 0 0 0
IG Revenue 150 0 0 0 0
Services 176,320 162,826 121,481 0 140,000
Fines & Forfeits 0 0 0 0 0
Operating Transfers In 100,000 72,257 100,000 120,000 120,000
General Fund Resources 1,068,947 900,920 935,537 1,159,139 1,293,880One Vision. One Plan. One Voice.
Public Safety70
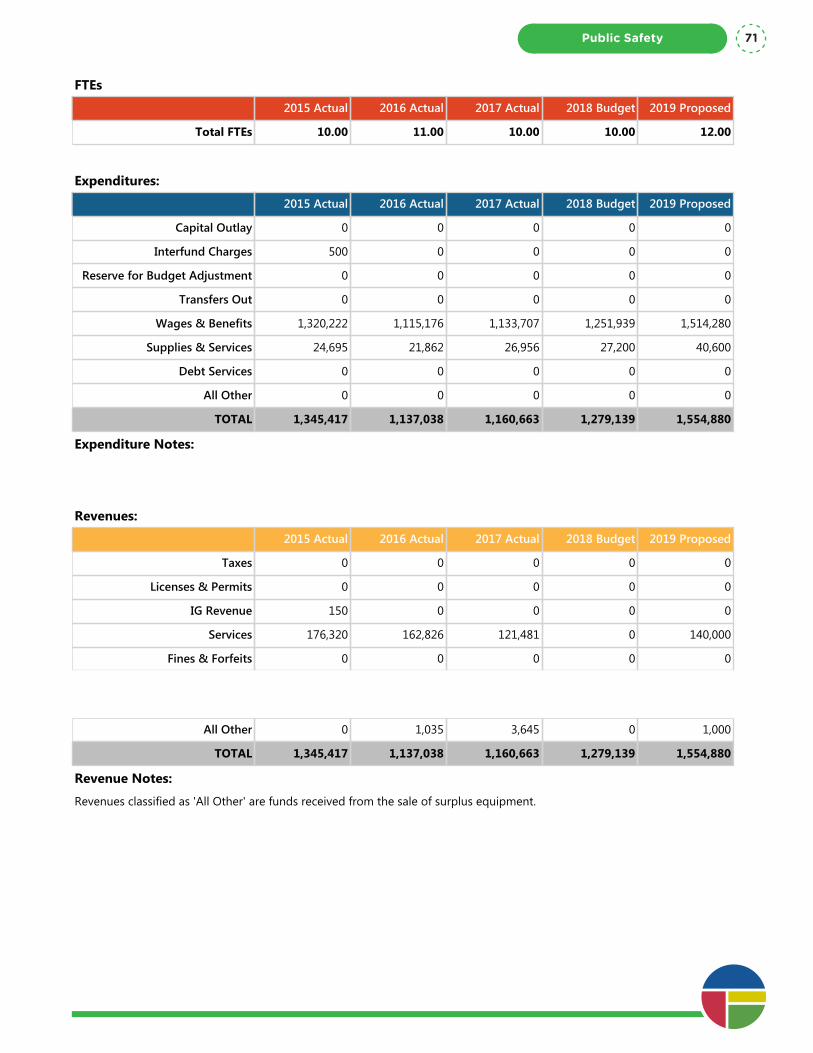
Program Summary: Traffic
Division: Public Safety
Fund Type: General Fund
Executive Summary:
Traffic is a specialized unit that provides general traffic enforcement for the entire city.
Programs and Services:
The goals and objectives of the Spokane Police Traffic Unit are to reduce the number and severity of traffic collisions in the City of Spokane. The Department takes a three-prong approach to the problem: education, engineering, and enforcement. Besides the motorcycle officers who provide traffic enforcement, there are two Commercial Vehicle Officers that target commercial vehicles for compliance with regulations, and one Photo Red Enforcement Officer who is funded by and administers the Photo Red program.
FTEs
2015 Actual 2016 Actual 2017 Actual 2018 Budget 2019 Proposed
Total FTEs 10.00 11.00 10.00 10.00 12.00
Expenditures:
2015 Actual 2016 Actual 2017 Actual 2018 Budget 2019 Proposed
Capital Outlay 0 0 0 0 0
Interfund Charges 500 0 0 0 0
Reserve for Budget Adjustment 0 0 0 0 0
Transfers Out 0 0 0 0 0
Wages & Benefits 1,320,222 1,115,176 1,133,707 1,251,939 1,514,280
Supplies & Services 24,695 21,862 26,956 27,200 40,600
Debt Services 0 0 0 0 0
All Other 0 0 0 0 0
TOTAL 1,345,417 1,137,038 1,160,663 1,279,139 1,554,880
Expenditure Notes:
Revenues:
2015 Actual 2016 Actual 2017 Actual 2018 Budget 2019 Proposed
Taxes 0 0 0 0 0
Licenses & Permits 0 0 0 0 0
IG Revenue 150 0 0 0 0
Services 176,320 162,826 121,481 0 140,000
Fines & Forfeits 0 0 0 0 0
Operating Transfers In 100,000 72,257 100,000 120,000 120,000
General Fund Resources 1,068,947 900,920 935,537 1,159,139 1,293,880
All Other 0 1,035 3,645 0 1,000
TOTAL 1,345,417 1,137,038 1,160,663 1,279,139 1,554,880
Revenue Notes:
Revenues classified as 'All Other' are funds received from the sale of surplus equipment.
Public Safety 71
Program Summary: Community Outreach
Division: Public Safety
Fund Type: General Fund
Executive Summary:
Community Outreach and Engagement includes many different aspects of not only proactive policing, but coming up with ways for the department to engage with the community in both traditional and non-traditional forums.
Programs and Services:
Building positive relationships with the community is paramount to "community policing" and involves the community in solutions to combat crime and build on-going relationships for long term solutions.
This unit is often the "face" of the police department. Ideally, through Community Outreach and Engagement efforts, not only will positive relationships between the police and community continue, the department will experience an increase in diverse applicants to become police officers in the future.
Explained below are the many examples of the mission of what the Community Outreach and Engagement (COE) officers support.
The Youth Police Initiative (YPI) and Police Athletic League (PAL) are two time intensive programs that provide an opportunity for at-risk youth throughout Spokane to engage with the police department in a non-traditional setting. These programs often create long term relationships between the youth involved and different officers involved in the programs. The goal is to prevent negative involvement with Law Enforcement and/or reduce recidivism for those that have already been involved in the Criminal Justice system.
COE officers work with Juvenile Probation and attend programs that Probation has with juveniles who are in the system and their families. The goal is for the juveniles to see officers as people and not just a uniform, as people who care about them. Ideally these programs will reduce recidivism amongst the youth involved. The COE officers regularly engage different groups throughout Spokane who either historically have not had positive relationships with the Police Department or who have had no relationship with the Police Department to build the bridges between the police department and the community. The COE officers attend Refugee Provider meetings and attend events for refugees. It is important to establish positive relationships with refugees upon their arrival to Spokane especially given the fact that many come from countries where their experiences with police are negative and sometimes violent.
FTEs
2015 Actual 2016 Actual 2017 Actual 2018 Budget 2019 Proposed
Total FTEs 7.00 7.00 3.00 2.00 3.00
Expenditures:
2015 Actual 2016 Actual 2017 Actual 2018 Budget 2019 Proposed
Capital Outlay 0 0 0 0 0
Interfund Charges 0 0 0 0 0
Reserve for Budget Adjustment 0 0 0 0 0
Transfers Out 0 0 0 0 0
Wages & Benefits 479,133 367,760 329,340 343,793 458,292
Supplies & Services 17,683 6,375 856 3,825 13,550
Debt Services 0 0 0 0 0One Vision. One Plan. One Voice.
Public Safety72
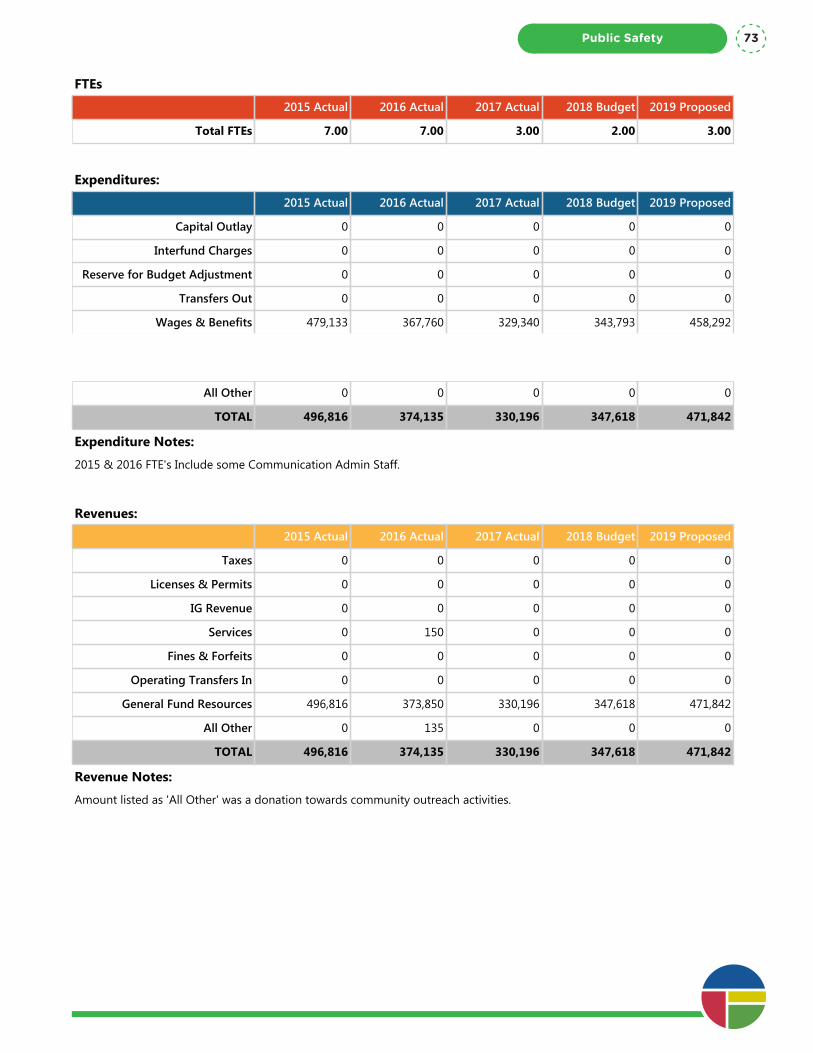
Program Summary: Community Outreach
Division: Public Safety
Fund Type: General Fund
Executive Summary:
Community Outreach and Engagement includes many different aspects of not only proactive policing, but coming up with ways for the department to engage with the community in both traditional and non-traditional forums.
Programs and Services:
Building positive relationships with the community is paramount to "community policing" and involves the community in solutions to combat crime and build on-going relationships for long term solutions.
This unit is often the "face" of the police department. Ideally, through Community Outreach and Engagement efforts, not only will positive relationships between the police and community continue, the department will experience an increase in diverse applicants to become police officers in the future.
Explained below are the many examples of the mission of what the Community Outreach and Engagement (COE) officers support.
The Youth Police Initiative (YPI) and Police Athletic League (PAL) are two time intensive programs that provide an opportunity for at-risk youth throughout Spokane to engage with the police department in a non-traditional setting. These programs often create long term relationships between the youth involved and different officers involved in the programs. The goal is to prevent negative involvement with Law Enforcement and/or reduce recidivism for those that have already been involved in the Criminal Justice system.
COE officers work with Juvenile Probation and attend programs that Probation has with juveniles who are in the system and their families. The goal is for the juveniles to see officers as people and not just a uniform, as people who care about them. Ideally these programs will reduce recidivism amongst the youth involved. The COE officers regularly engage different groups throughout Spokane who either historically have not had positive relationships with the Police Department or who have had no relationship with the Police Department to build the bridges between the police department and the community. The COE officers attend Refugee Provider meetings and attend events for refugees. It is important to establish positive relationships with refugees upon their arrival to Spokane especially given the fact that many come from countries where their experiences with police are negative and sometimes violent.
FTEs
2015 Actual 2016 Actual 2017 Actual 2018 Budget 2019 Proposed
Total FTEs 7.00 7.00 3.00 2.00 3.00
Expenditures:
2015 Actual 2016 Actual 2017 Actual 2018 Budget 2019 Proposed
Capital Outlay 0 0 0 0 0
Interfund Charges 0 0 0 0 0
Reserve for Budget Adjustment 0 0 0 0 0
Transfers Out 0 0 0 0 0
Wages & Benefits 479,133 367,760 329,340 343,793 458,292
Supplies & Services 17,683 6,375 856 3,825 13,550
Debt Services 0 0 0 0 0
All Other 0 0 0 0 0
TOTAL 496,816 374,135 330,196 347,618 471,842
Expenditure Notes:
2015 & 2016 FTE's Include some Communication Admin Staff.
Revenues:
2015 Actual 2016 Actual 2017 Actual 2018 Budget 2019 Proposed
Taxes 0 0 0 0 0
Licenses & Permits 0 0 0 0 0
IG Revenue 0 0 0 0 0
Services 0 150 0 0 0
Fines & Forfeits 0 0 0 0 0
Operating Transfers In 0 0 0 0 0
General Fund Resources 496,816 373,850 330,196 347,618 471,842
All Other 0 135 0 0 0
TOTAL 496,816 374,135 330,196 347,618 471,842
Revenue Notes:
Amount listed as 'All Other' was a donation towards community outreach activities.
Public Safety 73
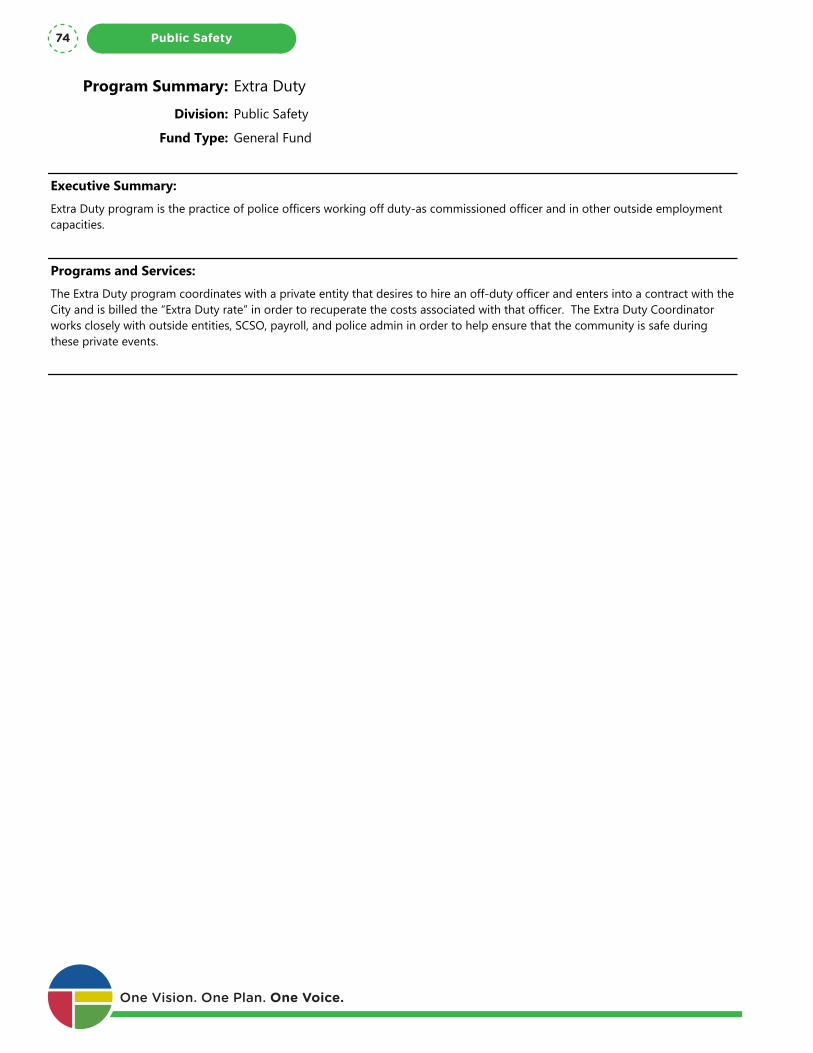
Program Summary: Extra Duty
Division: Public Safety
Fund Type: General Fund
Executive Summary:
Extra Duty program is the practice of police officers working off duty-as commissioned officer and in other outside employment capacities.
Programs and Services:
The Extra Duty program coordinates with a private entity that desires to hire an off-duty officer and enters into a contract with the City and is billed the “Extra Duty rate” in order to recuperate the costs associated with that officer. The Extra Duty Coordinator works closely with outside entities, SCSO, payroll, and police admin in order to help ensure that the community is safe during these private events.
FTEs
2015 Actual 2016 Actual 2017 Actual 2018 Budget 2019 Proposed
Total FTEs 0.00 0.00 0.00 0.00 0.00
Expenditures:
2015 Actual 2016 Actual 2017 Actual 2018 Budget 2019 Proposed
Capital Outlay 0 0 0 0 0
Interfund Charges 0 0 0 0 0
Reserve for Budget Adjustment 0 0 0 0 0
Transfers Out 0 0 0 0 0
Wages & Benefits 220,376 190,470 216,205 155,447 155,447
Supplies & Services 37,907 37,796 36,823 37,194 37,194
Debt Services 0 0 0 0 0
All Other 0 0 0 0 0
TOTAL 258,283 228,266 253,028 192,641 192,641
Expenditure Notes:
Revenues:
2015 Actual 2016 Actual 2017 Actual 2018 Budget 2019 Proposed
Taxes 0 0 0 0 0
Licenses & Permits 0 0 0 0 0
IG Revenue 0 0 0 0 0
Services 245,233 178,821 214,341 226,187 226,187
Fines & Forfeits 0 0 0 0 0
Operating Transfers In 0 0 0 0 0
General Fund Resources 13,040 48,587 38,650 (33,546) (33,546)One Vision. One Plan. One Voice.
Public Safety74

Program Summary: Extra Duty
Division: Public Safety
Fund Type: General Fund
Executive Summary:
Extra Duty program is the practice of police officers working off duty-as commissioned officer and in other outside employment capacities.
Programs and Services:
The Extra Duty program coordinates with a private entity that desires to hire an off-duty officer and enters into a contract with the City and is billed the “Extra Duty rate” in order to recuperate the costs associated with that officer. The Extra Duty Coordinator works closely with outside entities, SCSO, payroll, and police admin in order to help ensure that the community is safe during these private events.
FTEs
2015 Actual 2016 Actual 2017 Actual 2018 Budget 2019 Proposed
Total FTEs 0.00 0.00 0.00 0.00 0.00
Expenditures:
2015 Actual 2016 Actual 2017 Actual 2018 Budget 2019 Proposed
Capital Outlay 0 0 0 0 0
Interfund Charges 0 0 0 0 0
Reserve for Budget Adjustment 0 0 0 0 0
Transfers Out 0 0 0 0 0
Wages & Benefits 220,376 190,470 216,205 155,447 155,447
Supplies & Services 37,907 37,796 36,823 37,194 37,194
Debt Services 0 0 0 0 0
All Other 0 0 0 0 0
TOTAL 258,283 228,266 253,028 192,641 192,641
Expenditure Notes:
Revenues:
2015 Actual 2016 Actual 2017 Actual 2018 Budget 2019 Proposed
Taxes 0 0 0 0 0
Licenses & Permits 0 0 0 0 0
IG Revenue 0 0 0 0 0
Services 245,233 178,821 214,341 226,187 226,187
Fines & Forfeits 0 0 0 0 0
Operating Transfers In 0 0 0 0 0
General Fund Resources 13,040 48,587 38,650 (33,546) (33,546)
All Other 10 858 37 0 0
TOTAL 258,283 228,266 253,028 192,641 192,641
Revenue Notes:
Revenues classified as 'All Other' are interest charges on late payments for extra duty services.
Public Safety 75
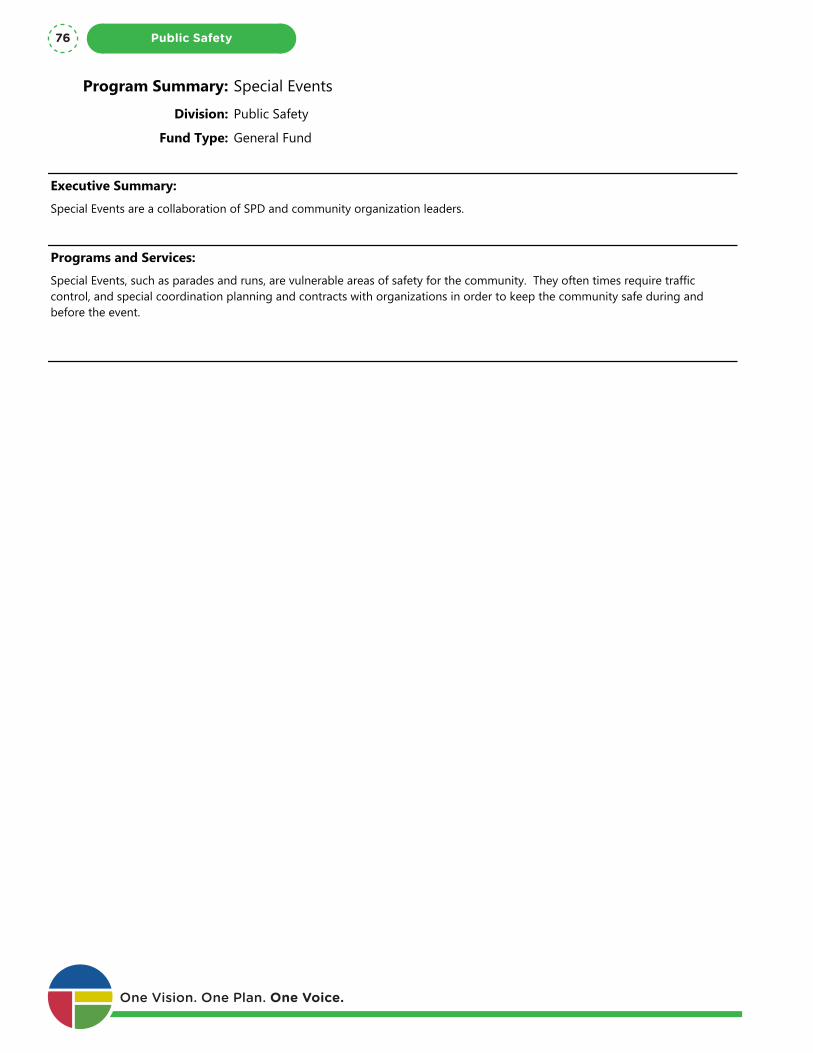
Program Summary: Special Events
Division: Public Safety
Fund Type: General Fund
Executive Summary:
Special Events are a collaboration of SPD and community organization leaders.
Programs and Services:
Special Events, such as parades and runs, are vulnerable areas of safety for the community. They often times require traffic control, and special coordination planning and contracts with organizations in order to keep the community safe during and before the event.
FTEs
2015 Actual 2016 Actual 2017 Actual 2018 Budget 2019 Proposed
Total FTEs 0.00 0.00 1.00 0.70 1.00
Expenditures:
2015 Actual 2016 Actual 2017 Actual 2018 Budget 2019 Proposed
Capital Outlay 0 0 0 0 0
Interfund Charges 0 0 0 0 0
Reserve for Budget Adjustment 0 0 0 0 0
Transfers Out 0 0 0 0 0
Wages & Benefits 483,699 649,551 824,294 644,887 794,232
Supplies & Services 13,606 606 153 0 0
Debt Services 0 0 0 0 0
All Other 0 0 0 0 0
TOTAL 497,305 650,157 824,447 644,887 794,232
Expenditure Notes:
Revenues:
2015 Actual 2016 Actual 2017 Actual 2018 Budget 2019 Proposed
Taxes 0 0 0 0 0
Licenses & Permits 0 2,791 3,092 0 3,000
IG Revenue 1,899 0 0 0 0
Services 183,412 259,436 312,007 152,000 250,000
Fines & Forfeits 0 0 0 0 0
Operating Transfers In 0 0 0 0 0
General Fund Resources 312,290 387,909 509,145 492,887 541,232One Vision. One Plan. One Voice.
Public Safety76
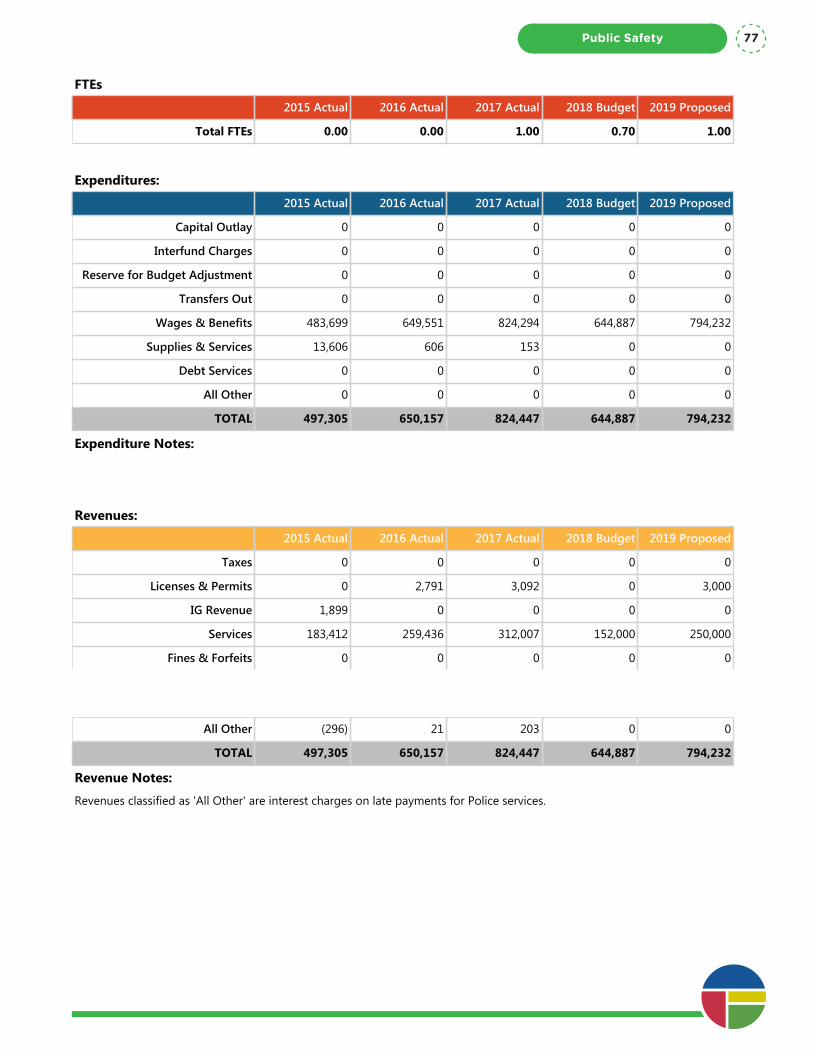
Program Summary: Special Events
Division: Public Safety
Fund Type: General Fund
Executive Summary:
Special Events are a collaboration of SPD and community organization leaders.
Programs and Services:
Special Events, such as parades and runs, are vulnerable areas of safety for the community. They often times require traffic control, and special coordination planning and contracts with organizations in order to keep the community safe during and before the event.
FTEs
2015 Actual 2016 Actual 2017 Actual 2018 Budget 2019 Proposed
Total FTEs 0.00 0.00 1.00 0.70 1.00
Expenditures:
2015 Actual 2016 Actual 2017 Actual 2018 Budget 2019 Proposed
Capital Outlay 0 0 0 0 0
Interfund Charges 0 0 0 0 0
Reserve for Budget Adjustment 0 0 0 0 0
Transfers Out 0 0 0 0 0
Wages & Benefits 483,699 649,551 824,294 644,887 794,232
Supplies & Services 13,606 606 153 0 0
Debt Services 0 0 0 0 0
All Other 0 0 0 0 0
TOTAL 497,305 650,157 824,447 644,887 794,232
Expenditure Notes:
Revenues:
2015 Actual 2016 Actual 2017 Actual 2018 Budget 2019 Proposed
Taxes 0 0 0 0 0
Licenses & Permits 0 2,791 3,092 0 3,000
IG Revenue 1,899 0 0 0 0
Services 183,412 259,436 312,007 152,000 250,000
Fines & Forfeits 0 0 0 0 0
Operating Transfers In 0 0 0 0 0
General Fund Resources 312,290 387,909 509,145 492,887 541,232
All Other (296) 21 203 0 0
TOTAL 497,305 650,157 824,447 644,887 794,232
Revenue Notes:
Revenues classified as 'All Other' are interest charges on late payments for Police services.
Public Safety 77
Program Summary: Spokane COPS Contract
Division: Public Safety
Fund Type: General Fund
Executive Summary:
The mission of Spokane Community Oriented Policing Services (COPS) is to help promote and support an environment for a safe community. The COPS program is not directed by Spokane Police Department, but the majority of their funding is through a contract with SPD.
Programs and Services:
The COPS program runs various different programs out of their COPS Shops. They run the front desks of the COPS shops, Blockwatch, Neighborhood Observation Patrols, Bike Registration, Operation Family ID, Graffiti, Latent Finger Printing, Safe Streets & various other programs.
In partnership with the City of Spokane and its residents, and through collaboration with the Spokane Police Department, the Washington State Department of Corrections and community stakeholders, they provide services to neighborhoods that increase volunteer efforts and improve the quality of life throughout the community.
Budget is comprised of leases for COPS Shops and Contract w/ Spokane COPS 501C3. The contract carries staff salaries and benefits, rent and lease expenses, utilities, and general supplies.
FTEs
2015 Actual 2016 Actual 2017 Actual 2018 Budget 2019 Proposed
Total FTEs 0.00 0.00 0.00 0.00 0.00
Expenditures:
2015 Actual 2016 Actual 2017 Actual 2018 Budget 2019 Proposed
Capital Outlay 0 0 0 0 0
Interfund Charges 1,487 0 0 0 0
Reserve for Budget Adjustment 0 0 0 0 0
Transfers Out 0 0 0 0 0
Wages & Benefits 0 0 0 0 0
Supplies & Services 413,088 364,575 364,575 384,575 384,575
Debt Services 0 0 0 0 0
All Other 0 0 0 0 0
TOTAL 414,575 364,575 364,575 384,575 384,575
Expenditure Notes:
Revenues:
2015 Actual 2016 Actual 2017 Actual 2018 Budget 2019 Proposed
Taxes 0 0 0 0 0
Licenses & Permits 0 0 0 0 0One Vision. One Plan. One Voice.
Public Safety78

Program Summary: Spokane COPS Contract
Division: Public Safety
Fund Type: General Fund
Executive Summary:
The mission of Spokane Community Oriented Policing Services (COPS) is to help promote and support an environment for a safe community. The COPS program is not directed by Spokane Police Department, but the majority of their funding is through a contract with SPD.
Programs and Services:
The COPS program runs various different programs out of their COPS Shops. They run the front desks of the COPS shops, Blockwatch, Neighborhood Observation Patrols, Bike Registration, Operation Family ID, Graffiti, Latent Finger Printing, Safe Streets & various other programs.
In partnership with the City of Spokane and its residents, and through collaboration with the Spokane Police Department, the Washington State Department of Corrections and community stakeholders, they provide services to neighborhoods that increase volunteer efforts and improve the quality of life throughout the community.
Budget is comprised of leases for COPS Shops and Contract w/ Spokane COPS 501C3. The contract carries staff salaries and benefits, rent and lease expenses, utilities, and general supplies.
FTEs
2015 Actual 2016 Actual 2017 Actual 2018 Budget 2019 Proposed
Total FTEs 0.00 0.00 0.00 0.00 0.00
Expenditures:
2015 Actual 2016 Actual 2017 Actual 2018 Budget 2019 Proposed
Capital Outlay 0 0 0 0 0
Interfund Charges 1,487 0 0 0 0
Reserve for Budget Adjustment 0 0 0 0 0
Transfers Out 0 0 0 0 0
Wages & Benefits 0 0 0 0 0
Supplies & Services 413,088 364,575 364,575 384,575 384,575
Debt Services 0 0 0 0 0
All Other 0 0 0 0 0
TOTAL 414,575 364,575 364,575 384,575 384,575
Expenditure Notes:
Revenues:
2015 Actual 2016 Actual 2017 Actual 2018 Budget 2019 Proposed
Taxes 0 0 0 0 0
Licenses & Permits 0 0 0 0 0
IG Revenue 232,774 215,978 0 23,811 0
Services 0 0 0 0 0
Fines & Forfeits 0 0 0 0 0
Operating Transfers In 0 0 0 0 0
General Fund Resources 181,801 125,186 364,575 360,764 384,575
All Other 0 23,411 0 0 0
TOTAL 414,575 364,575 364,575 384,575 384,575
Revenue Notes:
Revenues classified as 'All Other' came from the WA Dept. of Corrections as support for the Spokane COPS program.
Public Safety 79
Program Summary: Traffic School
Division: Public Safety
Fund Type: General Fund
Executive Summary:
Safe Traffic Operations Program (STOP) is designed to improve driver awareness and understanding of traffic laws, and to promote safe driving skills.
Programs and Services:
Safe Traffic Operations Program (STOP) is a voluntary class offered by the Spokane Police Department. It is designed to improve driver awareness and understanding of traffic laws and to promote safe driving skills. Upon successful completion of STOP, your ticket will be dismissed and will not be reported to the Department of Licensing.
FTEs
2015 Actual 2016 Actual 2017 Actual 2018 Budget 2019 Proposed
Total FTEs 0.00 0.00 0.00 0.00 0.00
Expenditures:
2015 Actual 2016 Actual 2017 Actual 2018 Budget 2019 Proposed
Capital Outlay 0 0 0 0 0
Interfund Charges 9,011 10,181 8,445 25,000 0
Reserve for Budget Adjustment 0 0 0 0 0
Transfers Out 0 0 0 0 0
Wages & Benefits 68,742 64,798 58,844 38,304 38,304
Supplies & Services 42,511 62,139 57,538 86,604 110,700
Debt Services 0 0 0 0 0
All Other 0 0 0 0 0
TOTAL 120,264 137,118 124,827 149,908 149,004
Expenditure Notes:
Revenues:
2015 Actual 2016 Actual 2017 Actual 2018 Budget 2019 Proposed
Taxes 0 0 0 0 0
Licenses & Permits 0 0 0 0 0
IG Revenue 0 0 0 0 0
Services 160,614 158,892 119,820 252,500 150,000
Fines & Forfeits 0 0 0 0 0
Operating Transfers In 0 0 0 0 0
General Fund Resources (40,350) (21,774) 5,007 (102,592) (996)One Vision. One Plan. One Voice.
Public Safety80

Program Summary: Traffic School
Division: Public Safety
Fund Type: General Fund
Executive Summary:
Safe Traffic Operations Program (STOP) is designed to improve driver awareness and understanding of traffic laws, and to promote safe driving skills.
Programs and Services:
Safe Traffic Operations Program (STOP) is a voluntary class offered by the Spokane Police Department. It is designed to improve driver awareness and understanding of traffic laws and to promote safe driving skills. Upon successful completion of STOP, your ticket will be dismissed and will not be reported to the Department of Licensing.
FTEs
2015 Actual 2016 Actual 2017 Actual 2018 Budget 2019 Proposed
Total FTEs 0.00 0.00 0.00 0.00 0.00
Expenditures:
2015 Actual 2016 Actual 2017 Actual 2018 Budget 2019 Proposed
Capital Outlay 0 0 0 0 0
Interfund Charges 9,011 10,181 8,445 25,000 0
Reserve for Budget Adjustment 0 0 0 0 0
Transfers Out 0 0 0 0 0
Wages & Benefits 68,742 64,798 58,844 38,304 38,304
Supplies & Services 42,511 62,139 57,538 86,604 110,700
Debt Services 0 0 0 0 0
All Other 0 0 0 0 0
TOTAL 120,264 137,118 124,827 149,908 149,004
Expenditure Notes:
Revenues:
2015 Actual 2016 Actual 2017 Actual 2018 Budget 2019 Proposed
Taxes 0 0 0 0 0
Licenses & Permits 0 0 0 0 0
IG Revenue 0 0 0 0 0
Services 160,614 158,892 119,820 252,500 150,000
Fines & Forfeits 0 0 0 0 0
Operating Transfers In 0 0 0 0 0
General Fund Resources (40,350) (21,774) 5,007 (102,592) (996)
All Other 0 0 0 0 0
TOTAL 120,264 137,118 124,827 149,908 149,004
Revenue Notes:
Public Safety 81
Program Summary: Volunteer Services
Division: Public Safety
Fund Type: General Fund
Executive Summary:
The Volunteer program consists of many different types of volunteers in order to augment duties both commissioned and noncommissioned.
Programs and Services:
The Citizen Volunteer program is essentially a service program. This program fills the gap between college-age volunteers and retired senior volunteers. Applicants must be 18 years of age.
The Reserve program is comprised of men and women who either aspire to be police officers or want to serve on the front line. Reserves are comprised of community members who volunteer their time to fulfill many of the roles handled by full-time, sworn police officers.
The Cooperative Education Program (CO-OP) is a joint venture between the Spokane Police Department and local colleges and universities to support SPD's Patrol Division. It is designed to provide non-law enforcement services and tasks that do not require law enforcement power or police legal authority. CO-OPs assist patrol at accident scenes, take cold crime reports, and pick up found property and evidence for the Patrol Division. CO-OPs attend a 40-hour academy and are required to contribute a minimum of 20 volunteer hours monthly (including two monthly evening meetings). CO-OPs must be at least 18 years of age and currently enrolled in college (any field) as a full or part-time student maintaining a 2.5 cumulative GPA. Applicants must possess a valid driver's license.
Rretired men and women have a great wealth of knowledge and skill to bring to the Spokane Police Department through the Senior Volunteer program.
Senior Volunteers are trained to:•Work the front desk or information booth at the Public Safety Building•Work in the Records Division, Crime Analysis Unit, Police Administration, Special Investigations Unit, etc.•Perform vacation home checks•Pick up property/fraud items•Give tours and help to staff the SPD Historical Museum•Serve as McGruff the Crime Dog or as a McGruff escort•Work to prevent citizen identity theft
Senior Volunteers have training meetings throughout the year and are encouraged to volunteer a minimum of 16 hours per month.
FTEs
2015 Actual 2016 Actual 2017 Actual 2018 Budget 2019 Proposed
Total FTEs 2.00 1.00 2.00 2.00 2.00
Expenditures:
2015 Actual 2016 Actual 2017 Actual 2018 Budget 2019 Proposed
Capital Outlay 0 0 0 0 0
Interfund Charges 0 0 0 0 0
Reserve for Budget Adjustment 0 0 0 0 0
Transfers Out 0 0 0 0 0One Vision. One Plan. One Voice.
Public Safety82

Program Summary: Volunteer Services
Division: Public Safety
Fund Type: General Fund
Executive Summary:
The Volunteer program consists of many different types of volunteers in order to augment duties both commissioned and noncommissioned.
Programs and Services:
The Citizen Volunteer program is essentially a service program. This program fills the gap between college-age volunteers and retired senior volunteers. Applicants must be 18 years of age.
The Reserve program is comprised of men and women who either aspire to be police officers or want to serve on the front line. Reserves are comprised of community members who volunteer their time to fulfill many of the roles handled by full-time, sworn police officers.
The Cooperative Education Program (CO-OP) is a joint venture between the Spokane Police Department and local colleges and universities to support SPD's Patrol Division. It is designed to provide non-law enforcement services and tasks that do not require law enforcement power or police legal authority. CO-OPs assist patrol at accident scenes, take cold crime reports, and pick up found property and evidence for the Patrol Division. CO-OPs attend a 40-hour academy and are required to contribute a minimum of 20 volunteer hours monthly (including two monthly evening meetings). CO-OPs must be at least 18 years of age and currently enrolled in college (any field) as a full or part-time student maintaining a 2.5 cumulative GPA. Applicants must possess a valid driver's license.
Rretired men and women have a great wealth of knowledge and skill to bring to the Spokane Police Department through the Senior Volunteer program.
Senior Volunteers are trained to:•Work the front desk or information booth at the Public Safety Building•Work in the Records Division, Crime Analysis Unit, Police Administration, Special Investigations Unit, etc.•Perform vacation home checks•Pick up property/fraud items•Give tours and help to staff the SPD Historical Museum•Serve as McGruff the Crime Dog or as a McGruff escort•Work to prevent citizen identity theft
Senior Volunteers have training meetings throughout the year and are encouraged to volunteer a minimum of 16 hours per month.
FTEs
2015 Actual 2016 Actual 2017 Actual 2018 Budget 2019 Proposed
Total FTEs 2.00 1.00 2.00 2.00 2.00
Expenditures:
2015 Actual 2016 Actual 2017 Actual 2018 Budget 2019 Proposed
Capital Outlay 0 0 0 0 0
Interfund Charges 0 0 0 0 0
Reserve for Budget Adjustment 0 0 0 0 0
Transfers Out 0 0 0 0 0
Wages & Benefits 148,352 283,350 239,412 247,682 256,523
Supplies & Services 52,936 8,494 9,100 20,123 20,123
Debt Services 0 0 0 0 0
All Other 0 0 0 0 0
TOTAL 201,288 291,844 248,512 267,805 276,646
Expenditure Notes:
Revenues:
2015 Actual 2016 Actual 2017 Actual 2018 Budget 2019 Proposed
Taxes 0 0 0 0 0
Licenses & Permits 0 0 0 0 0
IG Revenue 0 0 0 0 0
Services 0 0 0 0 0
Fines & Forfeits 0 0 0 0 0
Operating Transfers In 0 0 0 0 0
General Fund Resources 201,288 291,844 248,512 267,805 276,646
All Other 0 0 0 0 0
TOTAL 201,288 291,844 248,512 267,805 276,646
Revenue Notes:
Public Safety 83
Program Summary: Crime Analysis
Division: Public Safety
Fund Type: General Fund
Executive Summary:
Crime Analysis works under the direction of Administration and Investigations to aid in the tracking of criminals and patterns.
Programs and Services:
Staff prepare weekly Compare Statistics reports for command staff and others to review in order to hone in and know where to focus crime reduction efforts.
FTEs
2015 Actual 2016 Actual 2017 Actual 2018 Budget 2019 Proposed
Total FTEs 6.00 6.00 7.00 6.00 6.00
Expenditures:
2015 Actual 2016 Actual 2017 Actual 2018 Budget 2019 Proposed
Capital Outlay 0 0 0 0 0
Interfund Charges 0 0 0 0 0
Reserve for Budget Adjustment 0 0 0 0 0
Transfers Out 0 0 0 0 0
Wages & Benefits 467,989 386,561 382,753 566,369 603,307
Supplies & Services 9,341 6,038 10,657 15,095 15,250
Debt Services 0 0 0 0 0
All Other 0 0 0 0 0
TOTAL 477,330 392,599 393,410 581,464 618,557
Expenditure Notes:
Revenues:
2015 Actual 2016 Actual 2017 Actual 2018 Budget 2019 Proposed
Taxes 0 0 0 0 0
Licenses & Permits 0 0 0 0 0
IG Revenue 0 0 0 0 0
Services 0 0 0 0 0
Fines & Forfeits 0 0 0 0 0
Operating Transfers In 0 0 0 0 0
General Fund Resources 477,330 392,599 393,410 581,464 618,557
All Other 0 0 0 0 0
TOTAL 477,330 392,599 393,410 581,464 618,557One Vision. One Plan. One Voice.
Public Safety84
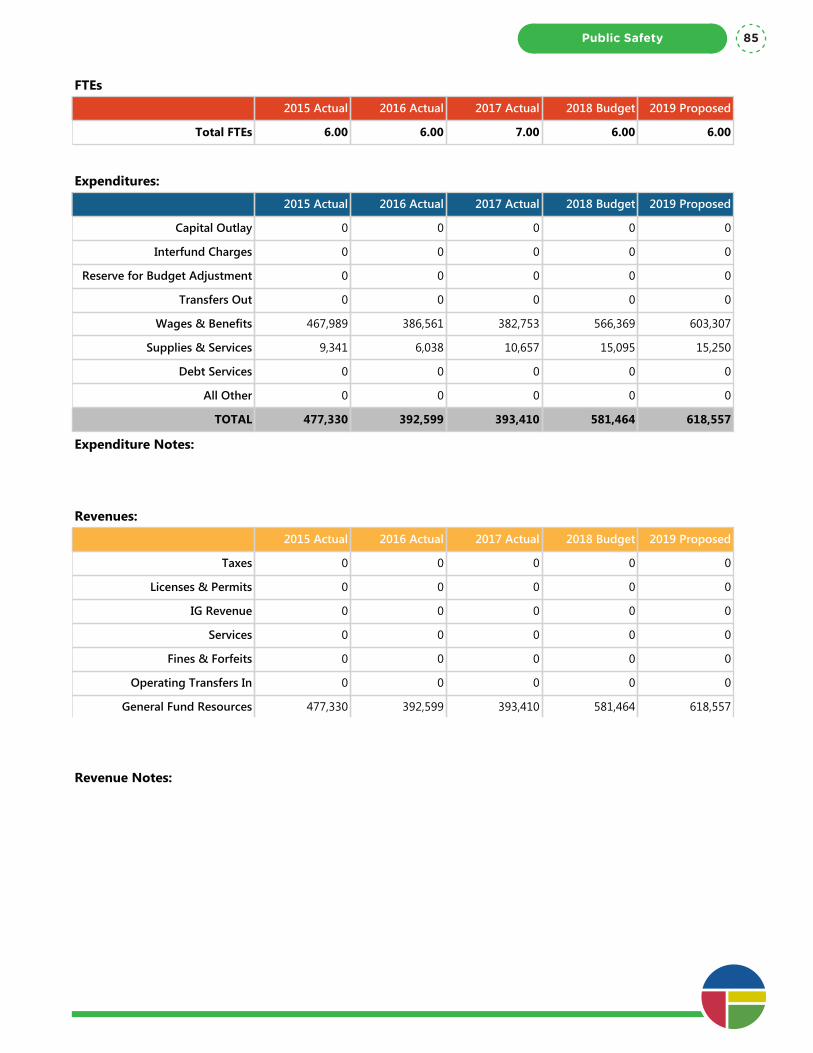
Program Summary: Crime Analysis
Division: Public Safety
Fund Type: General Fund
Executive Summary:
Crime Analysis works under the direction of Administration and Investigations to aid in the tracking of criminals and patterns.
Programs and Services:
Staff prepare weekly Compare Statistics reports for command staff and others to review in order to hone in and know where to focus crime reduction efforts.
FTEs
2015 Actual 2016 Actual 2017 Actual 2018 Budget 2019 Proposed
Total FTEs 6.00 6.00 7.00 6.00 6.00
Expenditures:
2015 Actual 2016 Actual 2017 Actual 2018 Budget 2019 Proposed
Capital Outlay 0 0 0 0 0
Interfund Charges 0 0 0 0 0
Reserve for Budget Adjustment 0 0 0 0 0
Transfers Out 0 0 0 0 0
Wages & Benefits 467,989 386,561 382,753 566,369 603,307
Supplies & Services 9,341 6,038 10,657 15,095 15,250
Debt Services 0 0 0 0 0
All Other 0 0 0 0 0
TOTAL 477,330 392,599 393,410 581,464 618,557
Expenditure Notes:
Revenues:
2015 Actual 2016 Actual 2017 Actual 2018 Budget 2019 Proposed
Taxes 0 0 0 0 0
Licenses & Permits 0 0 0 0 0
IG Revenue 0 0 0 0 0
Services 0 0 0 0 0
Fines & Forfeits 0 0 0 0 0
Operating Transfers In 0 0 0 0 0
General Fund Resources 477,330 392,599 393,410 581,464 618,557
All Other 0 0 0 0 0
TOTAL 477,330 392,599 393,410 581,464 618,557
Revenue Notes:
Public Safety 85
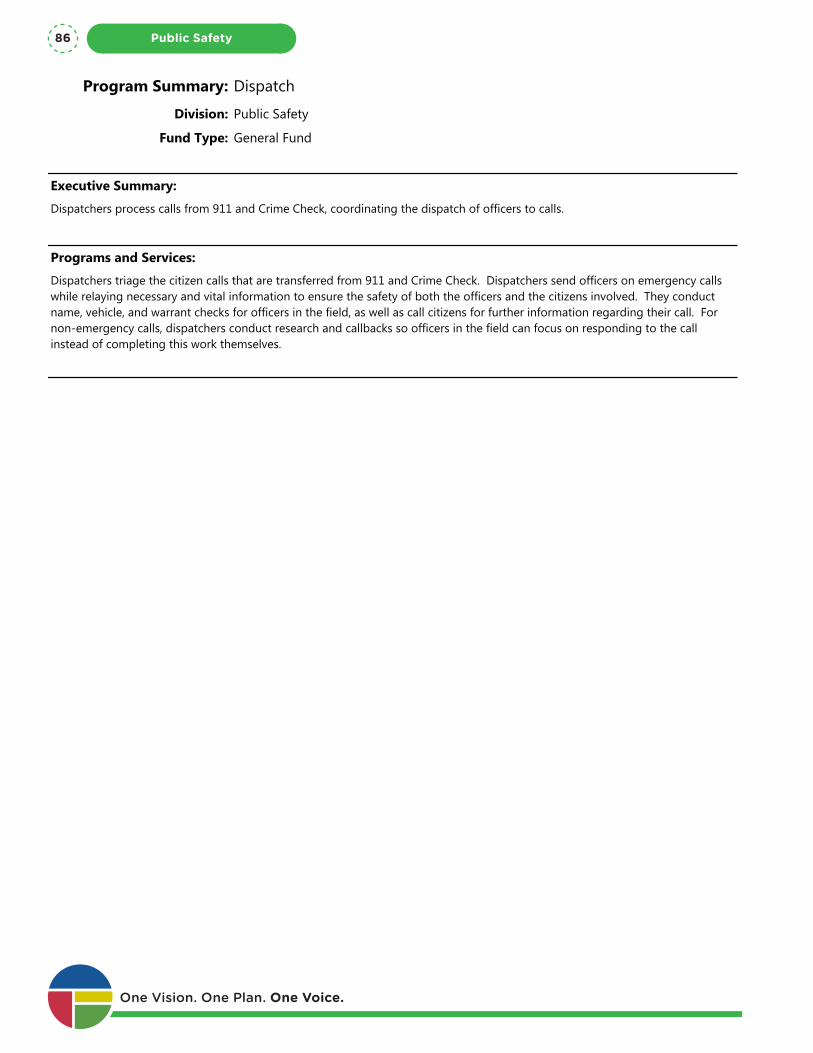
Program Summary: Dispatch
Division: Public Safety
Fund Type: General Fund
Executive Summary:
Dispatchers process calls from 911 and Crime Check, coordinating the dispatch of officers to calls.
Programs and Services:
Dispatchers triage the citizen calls that are transferred from 911 and Crime Check. Dispatchers send officers on emergency calls while relaying necessary and vital information to ensure the safety of both the officers and the citizens involved. They conduct name, vehicle, and warrant checks for officers in the field, as well as call citizens for further information regarding their call. For non-emergency calls, dispatchers conduct research and callbacks so officers in the field can focus on responding to the call instead of completing this work themselves.
FTEs
2015 Actual 2016 Actual 2017 Actual 2018 Budget 2019 Proposed
Total FTEs 21.00 21.00 21.00 21.00 21.00
Expenditures:
2015 Actual 2016 Actual 2017 Actual 2018 Budget 2019 Proposed
Capital Outlay 0 0 0 0 0
Interfund Charges 0 0 0 63,159 0
Reserve for Budget Adjustment 0 0 0 0 0
Transfers Out 0 0 0 0 0
Wages & Benefits 2,210,108 2,351,796 2,338,625 2,469,430 2,555,055
Supplies & Services 85,549 77,171 75,027 21,199 83,158
Debt Services 0 0 0 0 0
All Other 642,719 651,971 681,861 0 0
TOTAL 2,938,376 3,080,938 3,095,513 2,553,788 2,638,213
Expenditure Notes:
All Other expenses are intergovernmental payments to Spokane County for costs associated with 911/Emergency Communications services.
Revenues:
2015 Actual 2016 Actual 2017 Actual 2018 Budget 2019 Proposed
Taxes 0 0 0 0 0
Licenses & Permits 0 0 0 0 0
IG Revenue 312,086 0 0 0 0
Services 5,846 313,373 323,051 335,000 335,000
Fines & Forfeits 0 0 0 0 0
Operating Transfers In 0 0 0 0 0One Vision. One Plan. One Voice.
Public Safety86
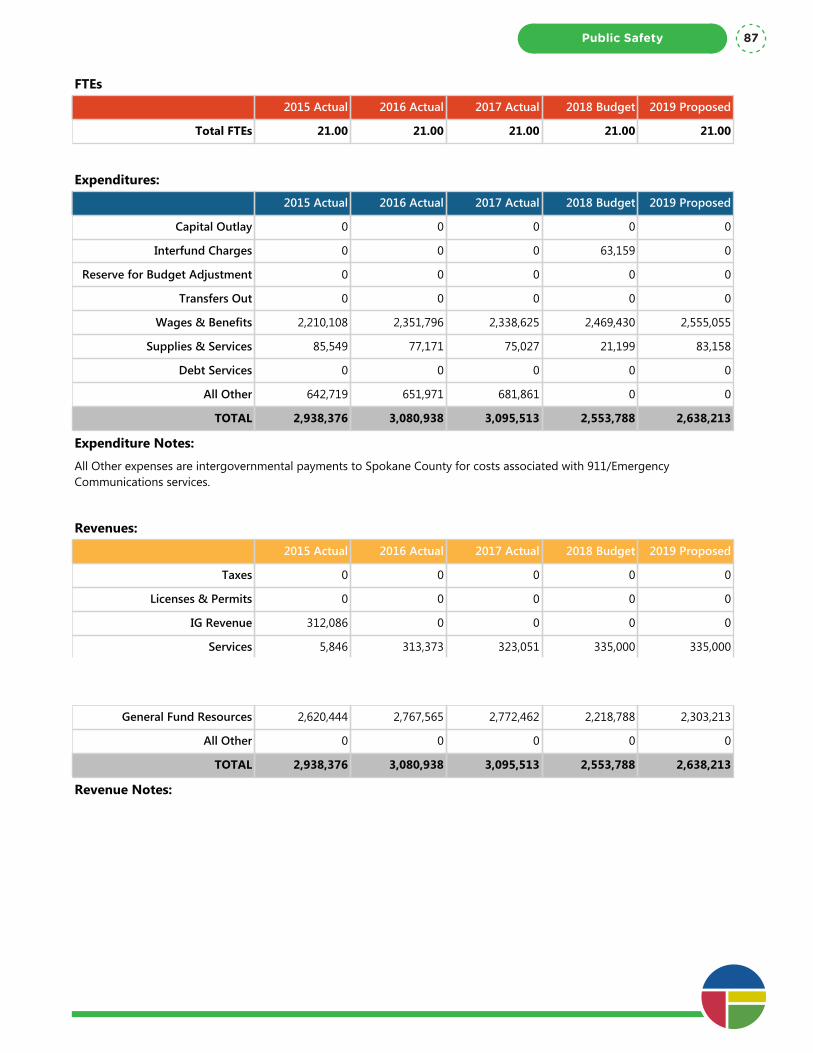
Program Summary: Dispatch
Division: Public Safety
Fund Type: General Fund
Executive Summary:
Dispatchers process calls from 911 and Crime Check, coordinating the dispatch of officers to calls.
Programs and Services:
Dispatchers triage the citizen calls that are transferred from 911 and Crime Check. Dispatchers send officers on emergency calls while relaying necessary and vital information to ensure the safety of both the officers and the citizens involved. They conduct name, vehicle, and warrant checks for officers in the field, as well as call citizens for further information regarding their call. For non-emergency calls, dispatchers conduct research and callbacks so officers in the field can focus on responding to the call instead of completing this work themselves.
FTEs
2015 Actual 2016 Actual 2017 Actual 2018 Budget 2019 Proposed
Total FTEs 21.00 21.00 21.00 21.00 21.00
Expenditures:
2015 Actual 2016 Actual 2017 Actual 2018 Budget 2019 Proposed
Capital Outlay 0 0 0 0 0
Interfund Charges 0 0 0 63,159 0
Reserve for Budget Adjustment 0 0 0 0 0
Transfers Out 0 0 0 0 0
Wages & Benefits 2,210,108 2,351,796 2,338,625 2,469,430 2,555,055
Supplies & Services 85,549 77,171 75,027 21,199 83,158
Debt Services 0 0 0 0 0
All Other 642,719 651,971 681,861 0 0
TOTAL 2,938,376 3,080,938 3,095,513 2,553,788 2,638,213
Expenditure Notes:
All Other expenses are intergovernmental payments to Spokane County for costs associated with 911/Emergency Communications services.
Revenues:
2015 Actual 2016 Actual 2017 Actual 2018 Budget 2019 Proposed
Taxes 0 0 0 0 0
Licenses & Permits 0 0 0 0 0
IG Revenue 312,086 0 0 0 0
Services 5,846 313,373 323,051 335,000 335,000
Fines & Forfeits 0 0 0 0 0
Operating Transfers In 0 0 0 0 0
General Fund Resources 2,620,444 2,767,565 2,772,462 2,218,788 2,303,213
All Other 0 0 0 0 0
TOTAL 2,938,376 3,080,938 3,095,513 2,553,788 2,638,213
Revenue Notes:
Public Safety 87
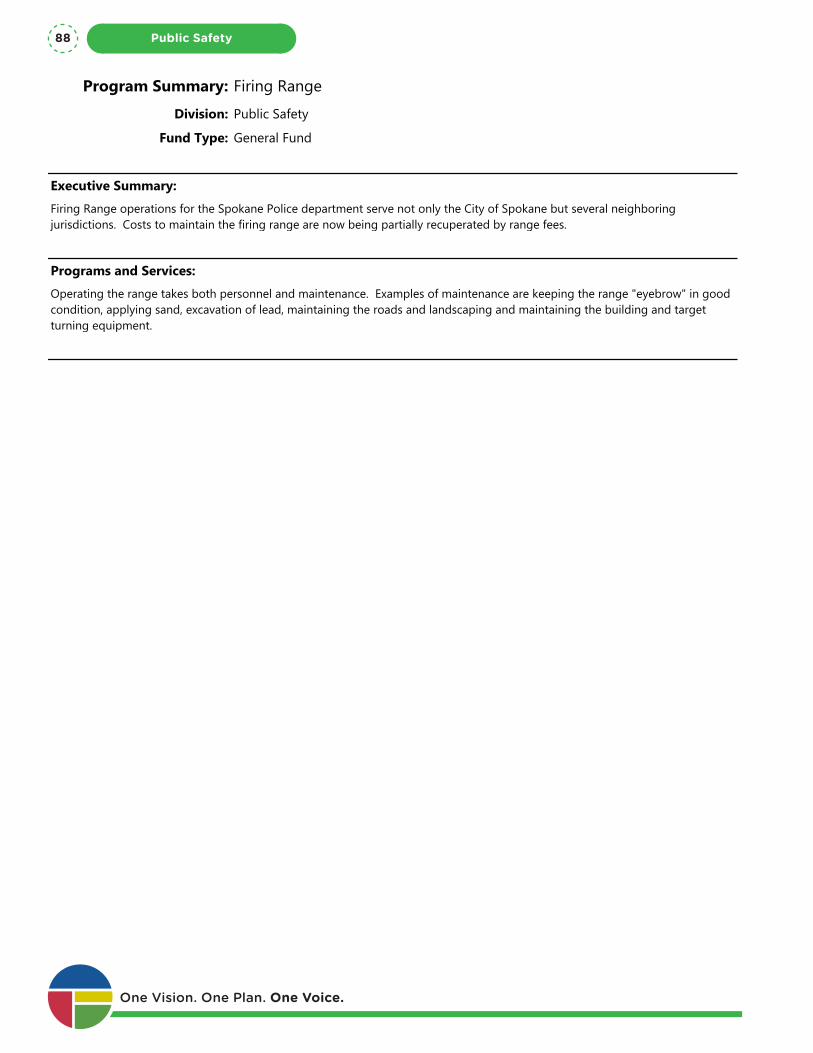
Program Summary: Firing Range
Division: Public Safety
Fund Type: General Fund
Executive Summary:
Firing Range operations for the Spokane Police department serve not only the City of Spokane but several neighboring jurisdictions. Costs to maintain the firing range are now being partially recuperated by range fees.
Programs and Services:
Operating the range takes both personnel and maintenance. Examples of maintenance are keeping the range "eyebrow" in good condition, applying sand, excavation of lead, maintaining the roads and landscaping and maintaining the building and target turning equipment.
FTEs
2015 Actual 2016 Actual 2017 Actual 2018 Budget 2019 Proposed
Total FTEs 0.00 0.00 0.00 0.00 0.00
Expenditures:
2015 Actual 2016 Actual 2017 Actual 2018 Budget 2019 Proposed
Capital Outlay 0 0 0 0 0
Interfund Charges 0 0 0 0 0
Reserve for Budget Adjustment 0 0 0 0 0
Transfers Out 0 0 0 0 0
Wages & Benefits 0 38,648 22,140 1,077 1,077
Supplies & Services 0 7,508 126,225 130,000 14,000
Debt Services 0 0 0 0 0
All Other 0 0 0 0 0
TOTAL 0 46,156 148,365 131,077 15,077
Expenditure Notes:
Revenues:
2015 Actual 2016 Actual 2017 Actual 2018 Budget 2019 Proposed
Taxes 0 0 0 0 0
Licenses & Permits 0 0 0 0 0
IG Revenue 0 0 0 0 0
Services 0 19,105 0 0 0
Fines & Forfeits 0 0 0 0 0
Operating Transfers In 0 0 0 0 0
General Fund Resources 0 27,051 99,215 131,077 (19,923)One Vision. One Plan. One Voice.
Public Safety88
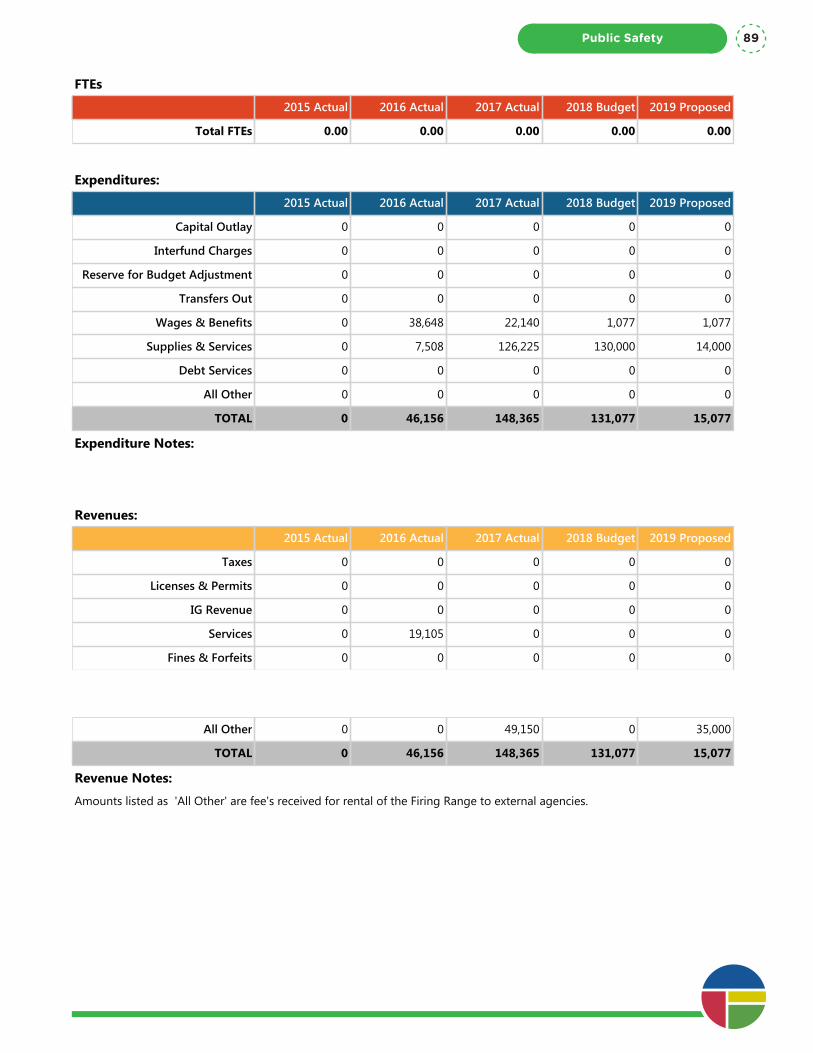
Program Summary: Firing Range
Division: Public Safety
Fund Type: General Fund
Executive Summary:
Firing Range operations for the Spokane Police department serve not only the City of Spokane but several neighboring jurisdictions. Costs to maintain the firing range are now being partially recuperated by range fees.
Programs and Services:
Operating the range takes both personnel and maintenance. Examples of maintenance are keeping the range "eyebrow" in good condition, applying sand, excavation of lead, maintaining the roads and landscaping and maintaining the building and target turning equipment.
FTEs
2015 Actual 2016 Actual 2017 Actual 2018 Budget 2019 Proposed
Total FTEs 0.00 0.00 0.00 0.00 0.00
Expenditures:
2015 Actual 2016 Actual 2017 Actual 2018 Budget 2019 Proposed
Capital Outlay 0 0 0 0 0
Interfund Charges 0 0 0 0 0
Reserve for Budget Adjustment 0 0 0 0 0
Transfers Out 0 0 0 0 0
Wages & Benefits 0 38,648 22,140 1,077 1,077
Supplies & Services 0 7,508 126,225 130,000 14,000
Debt Services 0 0 0 0 0
All Other 0 0 0 0 0
TOTAL 0 46,156 148,365 131,077 15,077
Expenditure Notes:
Revenues:
2015 Actual 2016 Actual 2017 Actual 2018 Budget 2019 Proposed
Taxes 0 0 0 0 0
Licenses & Permits 0 0 0 0 0
IG Revenue 0 0 0 0 0
Services 0 19,105 0 0 0
Fines & Forfeits 0 0 0 0 0
Operating Transfers In 0 0 0 0 0
General Fund Resources 0 27,051 99,215 131,077 (19,923)
All Other 0 0 49,150 0 35,000
TOTAL 0 46,156 148,365 131,077 15,077
Revenue Notes:
Amounts listed as 'All Other' are fee's received for rental of the Firing Range to external agencies.
Public Safety 89
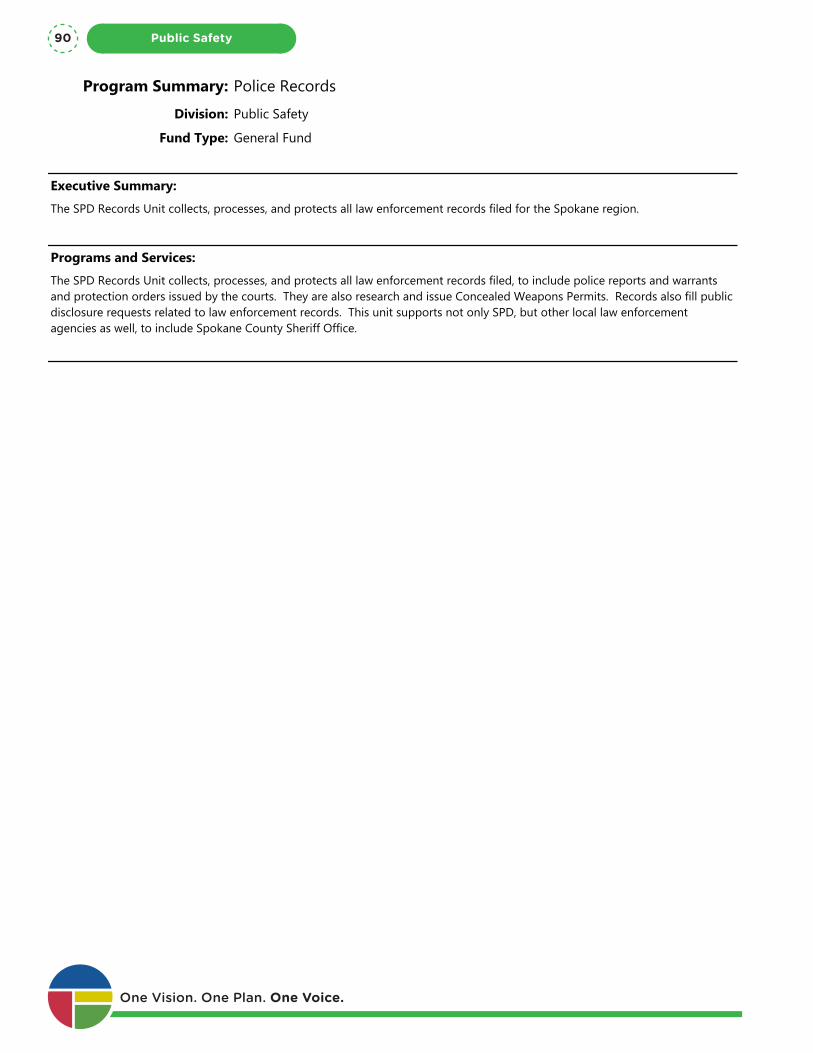
Program Summary: Police Records
Division: Public Safety
Fund Type: General Fund
Executive Summary:
The SPD Records Unit collects, processes, and protects all law enforcement records filed for the Spokane region.
Programs and Services:
The SPD Records Unit collects, processes, and protects all law enforcement records filed, to include police reports and warrants and protection orders issued by the courts. They are also research and issue Concealed Weapons Permits. Records also fill public disclosure requests related to law enforcement records. This unit supports not only SPD, but other local law enforcement agencies as well, to include Spokane County Sheriff Office.
FTEs
2015 Actual 2016 Actual 2017 Actual 2018 Budget 2019 Proposed
Total FTEs 32.00 33.00 32.00 35.00 34.75
Expenditures:
2015 Actual 2016 Actual 2017 Actual 2018 Budget 2019 Proposed
Capital Outlay 0 0 0 0 0
Interfund Charges 0 306 4,297 0 0
Reserve for Budget Adjustment 0 0 0 0 0
Transfers Out 0 0 0 0 0
Wages & Benefits 2,142,924 2,441,500 2,454,535 2,879,381 2,988,220
Supplies & Services 83,857 59,758 97,646 61,251 58,797
Debt Services 0 0 0 0 0
All Other 0 0 79,244 0 0
TOTAL 2,226,781 2,501,564 2,635,722 2,940,632 3,047,017
Expenditure Notes:
All Other expenses were intergovernmental payments to City of Liberty Lake for contracted services.
Revenues:
2015 Actual 2016 Actual 2017 Actual 2018 Budget 2019 Proposed
Taxes 0 0 0 0 0
Licenses & Permits 71,950 91,576 87,122 0 82,500
IG Revenue 1,062,500 0 0 0 0
Services 178 719,430 1,037,195 0 800,000
Fines & Forfeits 0 0 0 0 0
Operating Transfers In 0 0 0 0 0
General Fund Resources 1,092,067 1,690,116 1,511,465 2,940,632 2,164,517One Vision. One Plan. One Voice.
Public Safety90
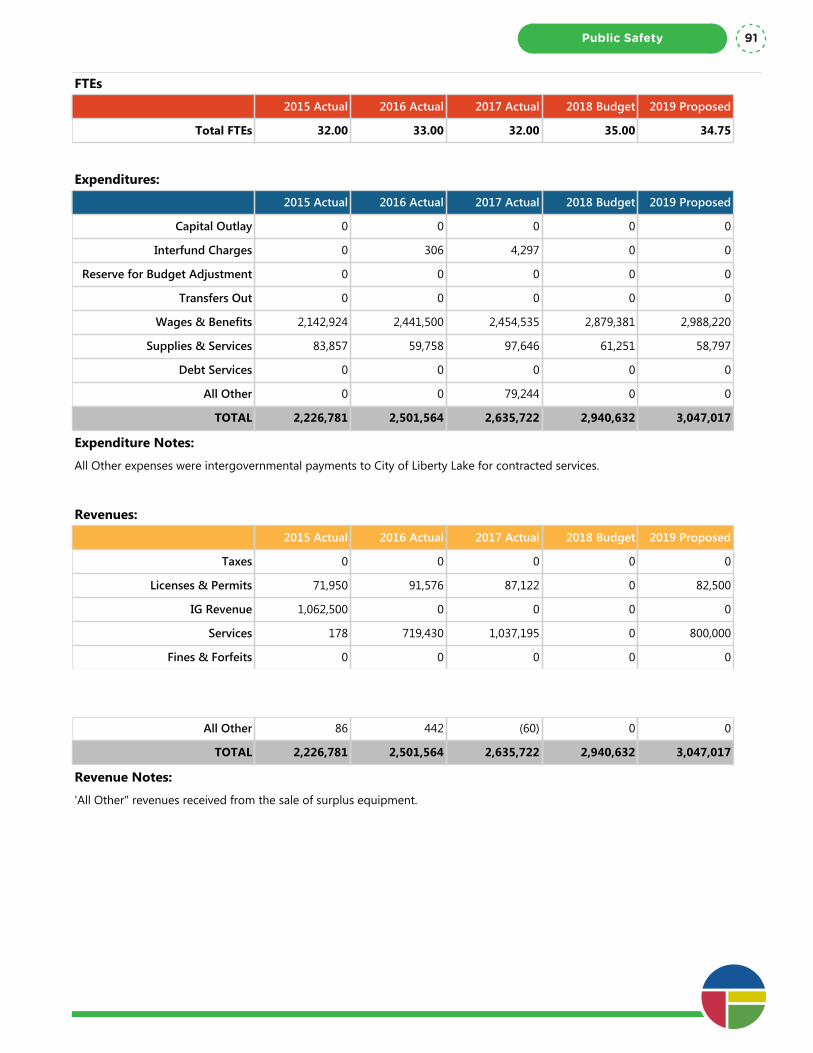
Program Summary: Police Records
Division: Public Safety
Fund Type: General Fund
Executive Summary:
The SPD Records Unit collects, processes, and protects all law enforcement records filed for the Spokane region.
Programs and Services:
The SPD Records Unit collects, processes, and protects all law enforcement records filed, to include police reports and warrants and protection orders issued by the courts. They are also research and issue Concealed Weapons Permits. Records also fill public disclosure requests related to law enforcement records. This unit supports not only SPD, but other local law enforcement agencies as well, to include Spokane County Sheriff Office.
FTEs
2015 Actual 2016 Actual 2017 Actual 2018 Budget 2019 Proposed
Total FTEs 32.00 33.00 32.00 35.00 34.75
Expenditures:
2015 Actual 2016 Actual 2017 Actual 2018 Budget 2019 Proposed
Capital Outlay 0 0 0 0 0
Interfund Charges 0 306 4,297 0 0
Reserve for Budget Adjustment 0 0 0 0 0
Transfers Out 0 0 0 0 0
Wages & Benefits 2,142,924 2,441,500 2,454,535 2,879,381 2,988,220
Supplies & Services 83,857 59,758 97,646 61,251 58,797
Debt Services 0 0 0 0 0
All Other 0 0 79,244 0 0
TOTAL 2,226,781 2,501,564 2,635,722 2,940,632 3,047,017
Expenditure Notes:
All Other expenses were intergovernmental payments to City of Liberty Lake for contracted services.
Revenues:
2015 Actual 2016 Actual 2017 Actual 2018 Budget 2019 Proposed
Taxes 0 0 0 0 0
Licenses & Permits 71,950 91,576 87,122 0 82,500
IG Revenue 1,062,500 0 0 0 0
Services 178 719,430 1,037,195 0 800,000
Fines & Forfeits 0 0 0 0 0
Operating Transfers In 0 0 0 0 0
General Fund Resources 1,092,067 1,690,116 1,511,465 2,940,632 2,164,517
All Other 86 442 (60) 0 0
TOTAL 2,226,781 2,501,564 2,635,722 2,940,632 3,047,017
Revenue Notes:
'All Other" revenues received from the sale of surplus equipment.
Public Safety 91
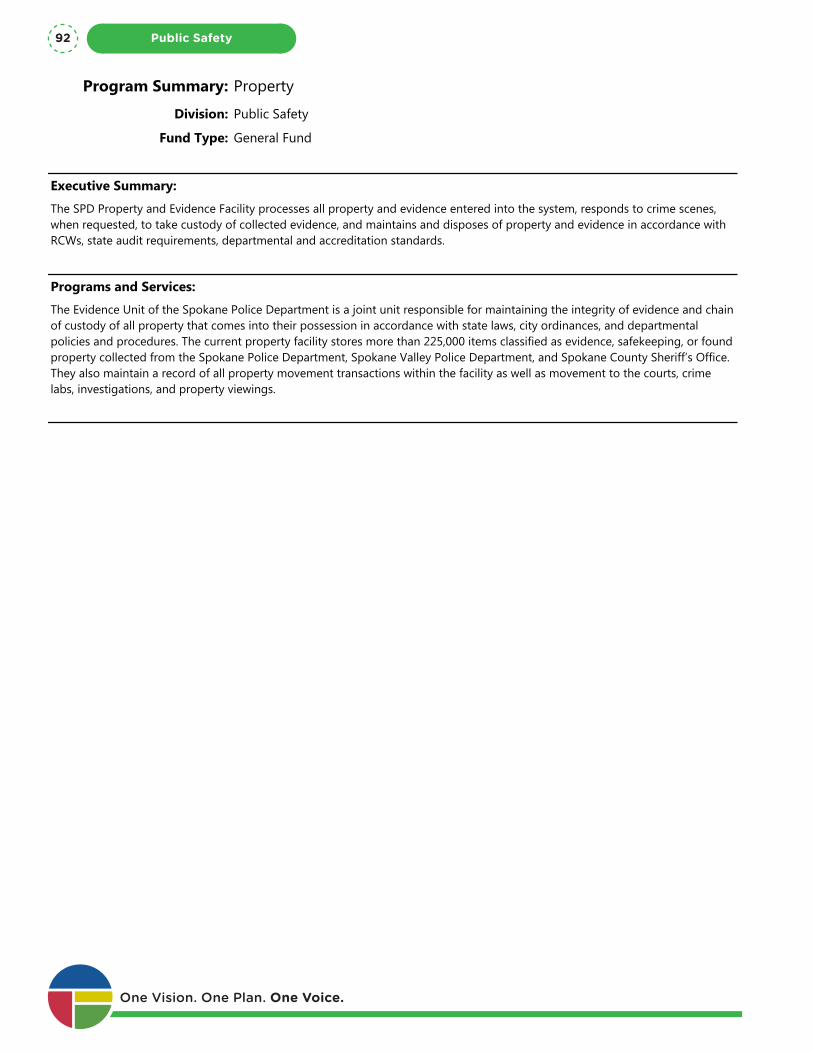
Program Summary: Property
Division: Public Safety
Fund Type: General Fund
Executive Summary:
The SPD Property and Evidence Facility processes all property and evidence entered into the system, responds to crime scenes, when requested, to take custody of collected evidence, and maintains and disposes of property and evidence in accordance with RCWs, state audit requirements, departmental and accreditation standards.
Programs and Services:
The Evidence Unit of the Spokane Police Department is a joint unit responsible for maintaining the integrity of evidence and chain of custody of all property that comes into their possession in accordance with state laws, city ordinances, and departmental policies and procedures. The current property facility stores more than 225,000 items classified as evidence, safekeeping, or found property collected from the Spokane Police Department, Spokane Valley Police Department, and Spokane County Sheriff’s Office. They also maintain a record of all property movement transactions within the facility as well as movement to the courts, crime labs, investigations, and property viewings.
FTEs
2015 Actual 2016 Actual 2017 Actual 2018 Budget 2019 Proposed
Total FTEs 6.75 6.75 6.75 6.75 7.00
Expenditures:
2015 Actual 2016 Actual 2017 Actual 2018 Budget 2019 Proposed
Capital Outlay 0 22,978 0 0 0
Interfund Charges 0 80 727 0 0
Reserve for Budget Adjustment 0 0 0 0 0
Transfers Out 40,000 73,603 69,603 90,074 139,206
Wages & Benefits 543,142 555,171 562,807 626,202 685,228
Supplies & Services 171,725 23,220 30,958 27,670 27,920
Debt Services 0 0 0 0 0
All Other 0 0 0 0 0
TOTAL 754,867 675,052 664,095 743,946 852,354
Expenditure Notes:
Revenues:
2015 Actual 2016 Actual 2017 Actual 2018 Budget 2019 Proposed
Taxes 0 0 0 0 0
Licenses & Permits 0 0 0 0 0
IG Revenue 235,000 0 0 0 0
Services 0 319,622 318,991 0 300,000
Fines & Forfeits 0 0 0 0 0One Vision. One Plan. One Voice.
Public Safety92

Program Summary: Property
Division: Public Safety
Fund Type: General Fund
Executive Summary:
The SPD Property and Evidence Facility processes all property and evidence entered into the system, responds to crime scenes, when requested, to take custody of collected evidence, and maintains and disposes of property and evidence in accordance with RCWs, state audit requirements, departmental and accreditation standards.
Programs and Services:
The Evidence Unit of the Spokane Police Department is a joint unit responsible for maintaining the integrity of evidence and chain of custody of all property that comes into their possession in accordance with state laws, city ordinances, and departmental policies and procedures. The current property facility stores more than 225,000 items classified as evidence, safekeeping, or found property collected from the Spokane Police Department, Spokane Valley Police Department, and Spokane County Sheriff’s Office. They also maintain a record of all property movement transactions within the facility as well as movement to the courts, crime labs, investigations, and property viewings.
FTEs
2015 Actual 2016 Actual 2017 Actual 2018 Budget 2019 Proposed
Total FTEs 6.75 6.75 6.75 6.75 7.00
Expenditures:
2015 Actual 2016 Actual 2017 Actual 2018 Budget 2019 Proposed
Capital Outlay 0 22,978 0 0 0
Interfund Charges 0 80 727 0 0
Reserve for Budget Adjustment 0 0 0 0 0
Transfers Out 40,000 73,603 69,603 90,074 139,206
Wages & Benefits 543,142 555,171 562,807 626,202 685,228
Supplies & Services 171,725 23,220 30,958 27,670 27,920
Debt Services 0 0 0 0 0
All Other 0 0 0 0 0
TOTAL 754,867 675,052 664,095 743,946 852,354
Expenditure Notes:
Revenues:
2015 Actual 2016 Actual 2017 Actual 2018 Budget 2019 Proposed
Taxes 0 0 0 0 0
Licenses & Permits 0 0 0 0 0
IG Revenue 235,000 0 0 0 0
Services 0 319,622 318,991 0 300,000
Fines & Forfeits 0 0 0 0 0
Operating Transfers In 0 0 0 0 0
General Fund Resources 519,867 355,430 345,104 743,946 552,354
All Other 0 0 0 0 0
TOTAL 754,867 675,052 664,095 743,946 852,354
Revenue Notes:
Public Safety 93
Program Summary: Protective Services
Division: Public Safety
Fund Type: General Fund
Executive Summary:
Protective Services is used for general operations and support and distributed through a Cost Allocation Plan.
Programs and Services:
General equipment, services, and training that is not attributed to a specific Unit or services of the Police Department is recorded under Protective Services. These items and services benefit the department as a whole and are outside of the specific operating budget of the individual Units.
FTEs
2015 Actual 2016 Actual 2017 Actual 2018 Budget 2019 Proposed
Total FTEs 0.00 0.00 0.00 0.00 0.00
Expenditures:
2015 Actual 2016 Actual 2017 Actual 2018 Budget 2019 Proposed
Capital Outlay 0 0 0 0 0
Interfund Charges 27,629 24,960 25,520 0 25,000
Reserve for Budget Adjustment 0 0 0 0 0
Transfers Out 0 0 0 0 0
Wages & Benefits 776,904 2,536,566 2,245,852 594,098 594,125
Supplies & Services 709,858 444,247 307,195 620,150 458,550
Debt Services 0 0 0 0 0
All Other 19,477 1,503 0 0 0
TOTAL 1,533,868 3,007,276 2,578,567 1,214,248 1,077,675
Expenditure Notes:
All other expenditures were payments made to Spokane County for various services regarding search warrants.
Revenues:
2015 Actual 2016 Actual 2017 Actual 2018 Budget 2019 Proposed
Taxes 0 0 0 0 0
Licenses & Permits 0 0 0 0 0
IG Revenue 0 0 0 0 0
Services 10,212 8,851 3,000 59,000 0
Fines & Forfeits 0 0 0 0 0
Operating Transfers In 0 0 0 0 0
General Fund Resources 1,451,005 2,940,980 2,542,416 1,155,248 1,055,175
All Other 72,651 57,445 33,151 0 22,500One Vision. One Plan. One Voice.
Public Safety94

Program Summary: Protective Services
Division: Public Safety
Fund Type: General Fund
Executive Summary:
Protective Services is used for general operations and support and distributed through a Cost Allocation Plan.
Programs and Services:
General equipment, services, and training that is not attributed to a specific Unit or services of the Police Department is recorded under Protective Services. These items and services benefit the department as a whole and are outside of the specific operating budget of the individual Units.
FTEs
2015 Actual 2016 Actual 2017 Actual 2018 Budget 2019 Proposed
Total FTEs 0.00 0.00 0.00 0.00 0.00
Expenditures:
2015 Actual 2016 Actual 2017 Actual 2018 Budget 2019 Proposed
Capital Outlay 0 0 0 0 0
Interfund Charges 27,629 24,960 25,520 0 25,000
Reserve for Budget Adjustment 0 0 0 0 0
Transfers Out 0 0 0 0 0
Wages & Benefits 776,904 2,536,566 2,245,852 594,098 594,125
Supplies & Services 709,858 444,247 307,195 620,150 458,550
Debt Services 0 0 0 0 0
All Other 19,477 1,503 0 0 0
TOTAL 1,533,868 3,007,276 2,578,567 1,214,248 1,077,675
Expenditure Notes:
All other expenditures were payments made to Spokane County for various services regarding search warrants.
Revenues:
2015 Actual 2016 Actual 2017 Actual 2018 Budget 2019 Proposed
Taxes 0 0 0 0 0
Licenses & Permits 0 0 0 0 0
IG Revenue 0 0 0 0 0
Services 10,212 8,851 3,000 59,000 0
Fines & Forfeits 0 0 0 0 0
Operating Transfers In 0 0 0 0 0
General Fund Resources 1,451,005 2,940,980 2,542,416 1,155,248 1,055,175
All Other 72,651 57,445 33,151 0 22,500
TOTAL 1,533,868 3,007,276 2,578,567 1,214,248 1,077,675
Revenue Notes:
Revenues classified under 'All Other' primarily comprised of monies received from the sale of fixed assets and surplus equipment.
Public Safety 95
Program Summary: Technical Assistance Resource Unit- TARU
Division: Public Safety
Fund Type: General Fund
Executive Summary:
Technical Assistance Response Unit (TARU) helps to identify and correct technical issues for commissioned officers out in the field.
Programs and Services:
This program supports purchasing of technical equipment and maintenance. Personnel include a blend of both IT staff and Police officers in order to have a global understanding of technical issues. This program also has responsibility to administer the department’s Body Worn Camera (BWC) program, Mobile Data Computer program, and provides support for New World (CAD) Mobile support. The program also provides investigative support for all video evidence obtained for crime reports.
FTEs
2015 Actual 2016 Actual 2017 Actual 2018 Budget 2019 Proposed
Total FTEs 7.00 10.00 12.00 11.30 10.00
Expenditures:
2015 Actual 2016 Actual 2017 Actual 2018 Budget 2019 Proposed
Capital Outlay 0 0 10,671 0 0
Interfund Charges 0 500 0 0 0
Reserve for Budget Adjustment 0 0 0 0 0
Transfers Out 0 0 0 0 0
Wages & Benefits 372,586 1,017,526 1,136,553 1,264,972 1,165,250
Supplies & Services 1,076 496,998 546,225 604,740 625,428
Debt Services 0 0 0 0 0
All Other 0 968,408 19,980 0 0
TOTAL 373,662 2,483,432 1,713,429 1,869,712 1,790,678
Expenditure Notes:
7 Employees were assigned to TARU in 2015, but they were budgeted in multiple departments and were left in those departments for ease of Planner Prep and reconciliation. 4 were in Admin and 3 were in Protective Services.
Costs under 'All Other' are charges from Spokane County for services related to their Forensics lab. These costs were subsequently moved in recent years to be accounted for under "Administration".
Revenues:
2015 Actual 2016 Actual 2017 Actual 2018 Budget 2019 Proposed
Taxes 0 0 0 0 0
Licenses & Permits 0 0 0 0 0
IG Revenue 0 0 0 0 0
Services 31,032 76,439 0 46,605 46,605
Fines & Forfeits 0 0 0 0 0One Vision. One Plan. One Voice.
Public Safety96
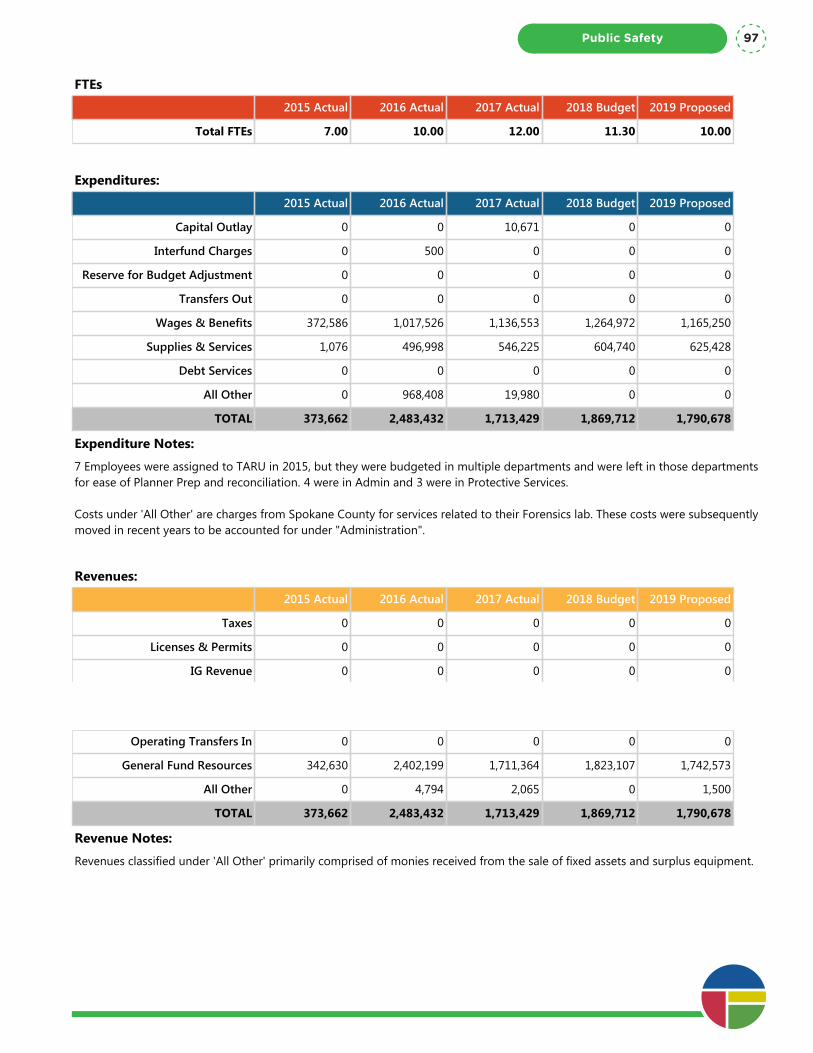
Program Summary: Technical Assistance Resource Unit- TARU
Division: Public Safety
Fund Type: General Fund
Executive Summary:
Technical Assistance Response Unit (TARU) helps to identify and correct technical issues for commissioned officers out in the field.
Programs and Services:
This program supports purchasing of technical equipment and maintenance. Personnel include a blend of both IT staff and Police officers in order to have a global understanding of technical issues. This program also has responsibility to administer the department’s Body Worn Camera (BWC) program, Mobile Data Computer program, and provides support for New World (CAD) Mobile support. The program also provides investigative support for all video evidence obtained for crime reports.
FTEs
2015 Actual 2016 Actual 2017 Actual 2018 Budget 2019 Proposed
Total FTEs 7.00 10.00 12.00 11.30 10.00
Expenditures:
2015 Actual 2016 Actual 2017 Actual 2018 Budget 2019 Proposed
Capital Outlay 0 0 10,671 0 0
Interfund Charges 0 500 0 0 0
Reserve for Budget Adjustment 0 0 0 0 0
Transfers Out 0 0 0 0 0
Wages & Benefits 372,586 1,017,526 1,136,553 1,264,972 1,165,250
Supplies & Services 1,076 496,998 546,225 604,740 625,428
Debt Services 0 0 0 0 0
All Other 0 968,408 19,980 0 0
TOTAL 373,662 2,483,432 1,713,429 1,869,712 1,790,678
Expenditure Notes:
7 Employees were assigned to TARU in 2015, but they were budgeted in multiple departments and were left in those departments for ease of Planner Prep and reconciliation. 4 were in Admin and 3 were in Protective Services.
Costs under 'All Other' are charges from Spokane County for services related to their Forensics lab. These costs were subsequently moved in recent years to be accounted for under "Administration".
Revenues:
2015 Actual 2016 Actual 2017 Actual 2018 Budget 2019 Proposed
Taxes 0 0 0 0 0
Licenses & Permits 0 0 0 0 0
IG Revenue 0 0 0 0 0
Services 31,032 76,439 0 46,605 46,605
Fines & Forfeits 0 0 0 0 0
Operating Transfers In 0 0 0 0 0
General Fund Resources 342,630 2,402,199 1,711,364 1,823,107 1,742,573
All Other 0 4,794 2,065 0 1,500
TOTAL 373,662 2,483,432 1,713,429 1,869,712 1,790,678
Revenue Notes:
Revenues classified under 'All Other' primarily comprised of monies received from the sale of fixed assets and surplus equipment.
Public Safety 97
Program Summary: Training
Division: Public Safety
Fund Type: General Fund
Executive Summary:
The Spokane Police Department offers comprehensive training for both the community and law enforcement officers.
Programs and Services:
Proper training for the men and women of the Spokane Police Department is a top priority for the Department. SPD holds mandatory, department-wide training several times throughout a given year in order to keep officers and other employees up to date on their knowledge and technique with the ultimate goal of protecting and serving citizens. Examples of training provided throughout the year are mandatory in-service for commissioned employees (at least twice a year), mandatory in-service for non-commissioned employees (at least once a year), monthly sergeant training, defensive tactics updates, reality based training exercises, citizens police academies, media police academies, CIT training and more.
The Academy is responsible for the on-going training of department members as well as the screening and hiring of applicants. Additionally, we will implement leadership training at all levels, recognizing that every police officer and civilian staff member is a leader. The academy develops and implements specific training to ensure we are preparing our mid-level and senior leaders to meet the challenges of a dynamic and ever changing profession.
The Academy continuously assesses and evaluates training policies, practices, and methods to ensure they are consistent with Washington State Police Training requirements and the best practices of the police profession.
FTEs
2015 Actual 2016 Actual 2017 Actual 2018 Budget 2019 Proposed
Total FTEs 8.40 8.60 6.60 5.00 5.00
Expenditures:
2015 Actual 2016 Actual 2017 Actual 2018 Budget 2019 Proposed
Capital Outlay 0 0 0 0 0
Interfund Charges 0 0 0 0 0
Reserve for Budget Adjustment 0 0 0 0 0
Transfers Out 0 0 0 0 0
Wages & Benefits 847,064 944,653 861,030 813,748 777,480
Supplies & Services 411,003 237,630 57,839 76,723 236,924
Debt Services 0 0 0 0 0
All Other 0 0 0 0 0
One Vision. One Plan. One Voice.
Public Safety98

Program Summary: Training
Division: Public Safety
Fund Type: General Fund
Executive Summary:
The Spokane Police Department offers comprehensive training for both the community and law enforcement officers.
Programs and Services:
Proper training for the men and women of the Spokane Police Department is a top priority for the Department. SPD holds mandatory, department-wide training several times throughout a given year in order to keep officers and other employees up to date on their knowledge and technique with the ultimate goal of protecting and serving citizens. Examples of training provided throughout the year are mandatory in-service for commissioned employees (at least twice a year), mandatory in-service for non-commissioned employees (at least once a year), monthly sergeant training, defensive tactics updates, reality based training exercises, citizens police academies, media police academies, CIT training and more.
The Academy is responsible for the on-going training of department members as well as the screening and hiring of applicants. Additionally, we will implement leadership training at all levels, recognizing that every police officer and civilian staff member is a leader. The academy develops and implements specific training to ensure we are preparing our mid-level and senior leaders to meet the challenges of a dynamic and ever changing profession.
The Academy continuously assesses and evaluates training policies, practices, and methods to ensure they are consistent with Washington State Police Training requirements and the best practices of the police profession.
FTEs
2015 Actual 2016 Actual 2017 Actual 2018 Budget 2019 Proposed
Total FTEs 8.40 8.60 6.60 5.00 5.00
Expenditures:
2015 Actual 2016 Actual 2017 Actual 2018 Budget 2019 Proposed
Capital Outlay 0 0 0 0 0
Interfund Charges 0 0 0 0 0
Reserve for Budget Adjustment 0 0 0 0 0
Transfers Out 0 0 0 0 0
Wages & Benefits 847,064 944,653 861,030 813,748 777,480
Supplies & Services 411,003 237,630 57,839 76,723 236,924
Debt Services 0 0 0 0 0
All Other 0 0 0 0 0
TOTAL 1,258,067 1,182,283 918,869 890,471 1,014,404
Expenditure Notes:
Revenues:
2015 Actual 2016 Actual 2017 Actual 2018 Budget 2019 Proposed
Taxes 0 0 0 0 0
Licenses & Permits 0 0 0 0 0
IG Revenue 20,775 0 0 0 0
Services 5,485 16,340 6,925 20,000 11,500
Fines & Forfeits 0 0 0 0 0
Operating Transfers In 0 0 0 0 0
General Fund Resources 1,231,807 1,157,961 910,463 861,471 1,002,904
All Other 0 7,982 1,481 9,000 0
TOTAL 1,258,067 1,182,283 918,869 890,471 1,014,404
Revenue Notes:
Revenues classified under 'All Other' primarily comprised of monies received from the sale of fixed assets and surplus equipment.
Public Safety 99

One Vision. One Plan. One Voice.
Public Safety100
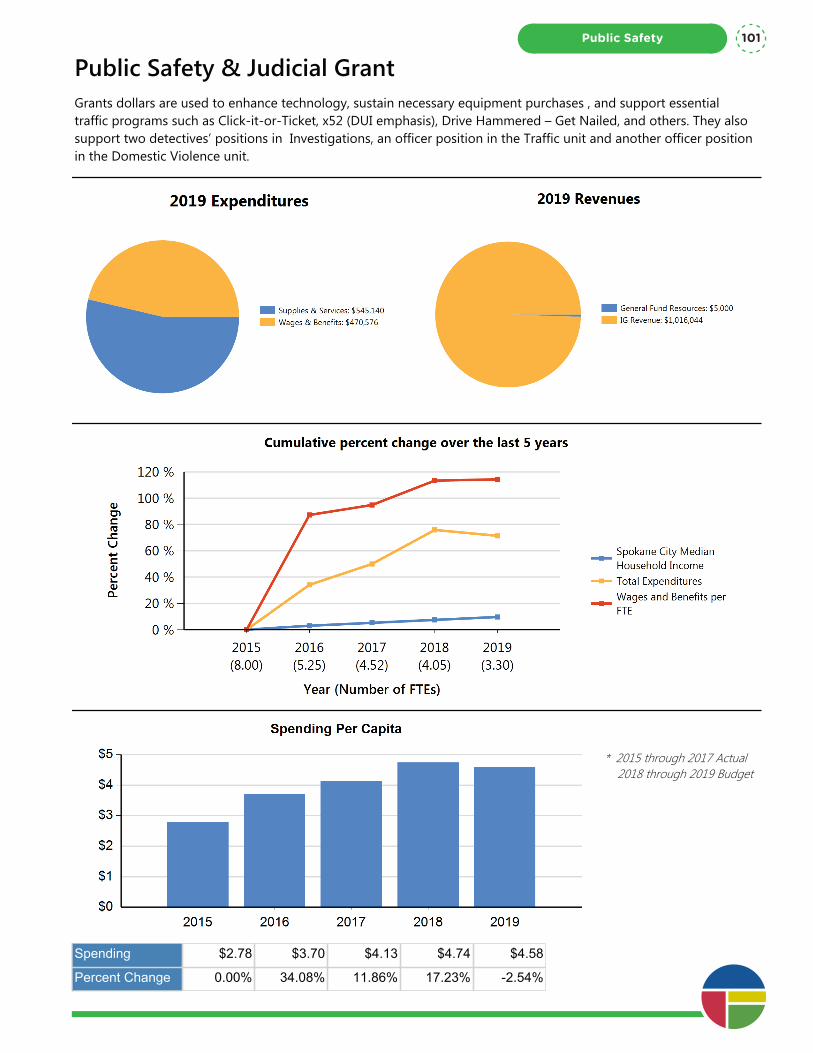
Public Safety & Judicial GrantGrants dollars are used to enhance technology, sustain necessary equipment purchases , and support essential traffic programs such as Click-it-or-Ticket, x52 (DUI emphasis), Drive Hammered – Get Nailed, and others. They also support two detectives’ positions in Investigations, an officer position in the Traffic unit and another officer position in the Domestic Violence unit.
* 2015 through 2017 Actual 2018 through 2019 Budget
Spending $2.78 $3.70 $4.13 $4.74 $4.58
Percent Change 0.00% 34.08% 11.86% 17.23% -2.54%
Public Safety 101
Department Summary: Public Safety & Judicial Grant
Division: Public Safety
Fund Type: Special Revenue Fund
Executive Summary:
Grants dollars are used to enhance technology, sustain necessary equipment purchases , and support essential traffic programs such as Click-it-or-Ticket, x52 (DUI emphasis), Drive Hammered – Get Nailed, and others. They also support two detectives’ positions in Investigations, an officer position in the Traffic unit and another officer position in the Domestic Violence unit.
Programs and Services:
The Spokane Police Department has received and administered more than $20 million dollars in grants over the past decade. Technology grants have been critical to our ability to acquire new information systems and make equipment purchases such as in-car cameras and the new targeting system at the Spokane Police Academy Range. Other grants have contributed to traffic safety, graffiti reporting and prevention, vehicle theft investigations, registered sex offender monitoring, elder abuse investigations and intervention, domestic violence, and gang intervention and prevention. The SPD Traffic unit receives many grants annually, primarily from the Washington Traffic Safety Commission (WTSC). These grants support overtime and training to focus on specific enforcement activities, such as drinking and driving and seatbelt use. They also support events for car seat checks. These programs help make Spokane a safer community for drivers and passengers, as well as others who share the road. Recently WTSC has started providing funding for a full time position dedicated to DUI enforcement. Annual block grants such as the Justice Assistance Grant (JAG) ensure SPD is able to make equipment purchases such as computers and weapons as well as software purchases to enhance efficiency. Without these block grants, these purchases would need to be made from the General Fund, which would impact our ability to provide other services. Four FTEs are currently funded through grants and support services. The Washington Auto Theft Prevention Association (WATPA) currently funds one detective who works in Targeted Crimes (TCU). This detective supports the investigation of vehicle theft and those prolific offenders responsible for these and other related crimes, such as identity theft. Another grant through the Washington Association of Sheriffs and Police Chiefs (WASPC) supports a detective assigned to the Special Victims Unit (SVU) to monitor registered sex offenders living in the city. This detective provides three levels of notification on the release of sex offenders to the community. WTSC currently funds a position dedicated for DUI enforcement. Through this grant, SPD is working on reducing instances of DUI serious injury and fatality collisions in the City of Spokane. The fourth position being funded with grant funds is in the Domestic Violence Unit under the Office of Violence Against Women’s Victim Safety and Offender Accountability Program. Elimination of these grants would result in a dramatic in these services provided to our community.
FTEs
2015 Actual 2016 Actual 2017 Actual 2018 Budget 2019 Proposed
Total FTEs 8.00 5.25 4.52 4.05 3.30
Expenditures:
2015 Actual 2016 Actual 2017 Actual 2018 Budget 2019 Proposed
Capital Outlay 0 0 111,042 50,000 0
Interfund Charges 0 0 1,458 0 0
Reserve for Budget Adjustment 0 0 0 0 0
Transfers Out 0 0 0 0 0
Wages & Benefits 473,296 581,513 538,751 572,241 470,576
Supplies & Services 119,402 213,190 237,734 420,000 545,140
Debt Services 0 0 0 0 0
All Other 0 0 0 0 0One Vision. One Plan. One Voice.
Public Safety102

Department Summary: Public Safety & Judicial Grant
Division: Public Safety
Fund Type: Special Revenue Fund
Executive Summary:
Grants dollars are used to enhance technology, sustain necessary equipment purchases , and support essential traffic programs such as Click-it-or-Ticket, x52 (DUI emphasis), Drive Hammered – Get Nailed, and others. They also support two detectives’ positions in Investigations, an officer position in the Traffic unit and another officer position in the Domestic Violence unit.
Programs and Services:
The Spokane Police Department has received and administered more than $20 million dollars in grants over the past decade. Technology grants have been critical to our ability to acquire new information systems and make equipment purchases such as in-car cameras and the new targeting system at the Spokane Police Academy Range. Other grants have contributed to traffic safety, graffiti reporting and prevention, vehicle theft investigations, registered sex offender monitoring, elder abuse investigations and intervention, domestic violence, and gang intervention and prevention. The SPD Traffic unit receives many grants annually, primarily from the Washington Traffic Safety Commission (WTSC). These grants support overtime and training to focus on specific enforcement activities, such as drinking and driving and seatbelt use. They also support events for car seat checks. These programs help make Spokane a safer community for drivers and passengers, as well as others who share the road. Recently WTSC has started providing funding for a full time position dedicated to DUI enforcement. Annual block grants such as the Justice Assistance Grant (JAG) ensure SPD is able to make equipment purchases such as computers and weapons as well as software purchases to enhance efficiency. Without these block grants, these purchases would need to be made from the General Fund, which would impact our ability to provide other services. Four FTEs are currently funded through grants and support services. The Washington Auto Theft Prevention Association (WATPA) currently funds one detective who works in Targeted Crimes (TCU). This detective supports the investigation of vehicle theft and those prolific offenders responsible for these and other related crimes, such as identity theft. Another grant through the Washington Association of Sheriffs and Police Chiefs (WASPC) supports a detective assigned to the Special Victims Unit (SVU) to monitor registered sex offenders living in the city. This detective provides three levels of notification on the release of sex offenders to the community. WTSC currently funds a position dedicated for DUI enforcement. Through this grant, SPD is working on reducing instances of DUI serious injury and fatality collisions in the City of Spokane. The fourth position being funded with grant funds is in the Domestic Violence Unit under the Office of Violence Against Women’s Victim Safety and Offender Accountability Program. Elimination of these grants would result in a dramatic in these services provided to our community.
FTEs
2015 Actual 2016 Actual 2017 Actual 2018 Budget 2019 Proposed
Total FTEs 8.00 5.25 4.52 4.05 3.30
Expenditures:
2015 Actual 2016 Actual 2017 Actual 2018 Budget 2019 Proposed
Capital Outlay 0 0 111,042 50,000 0
Interfund Charges 0 0 1,458 0 0
Reserve for Budget Adjustment 0 0 0 0 0
Transfers Out 0 0 0 0 0
Wages & Benefits 473,296 581,513 538,751 572,241 470,576
Supplies & Services 119,402 213,190 237,734 420,000 545,140
Debt Services 0 0 0 0 0
All Other 0 0 0 0 0
TOTAL 592,698 794,703 888,985 1,042,241 1,015,716
Expenditure Notes:
Revenues:
2015 Actual 2016 Actual 2017 Actual 2018 Budget 2019 Proposed
Taxes 0 0 0 0 0
Licenses & Permits 0 0 0 0 0
IG Revenue 592,698 794,703 888,369 982,711 1,016,044
Services 0 0 0 0 0
Fines & Forfeits 0 0 0 0 0
Operating Transfers In 0 0 0 0 0
General Fund Resources 0 0 0 134,717 5,000
All Other 0 0 293 0 0
TOTAL 592,698 794,703 888,662 1,117,428 1,021,044
Revenue Notes:
Public Safety 103

One Vision. One Plan. One Voice.
Public Safety104
Public Works
Public Works
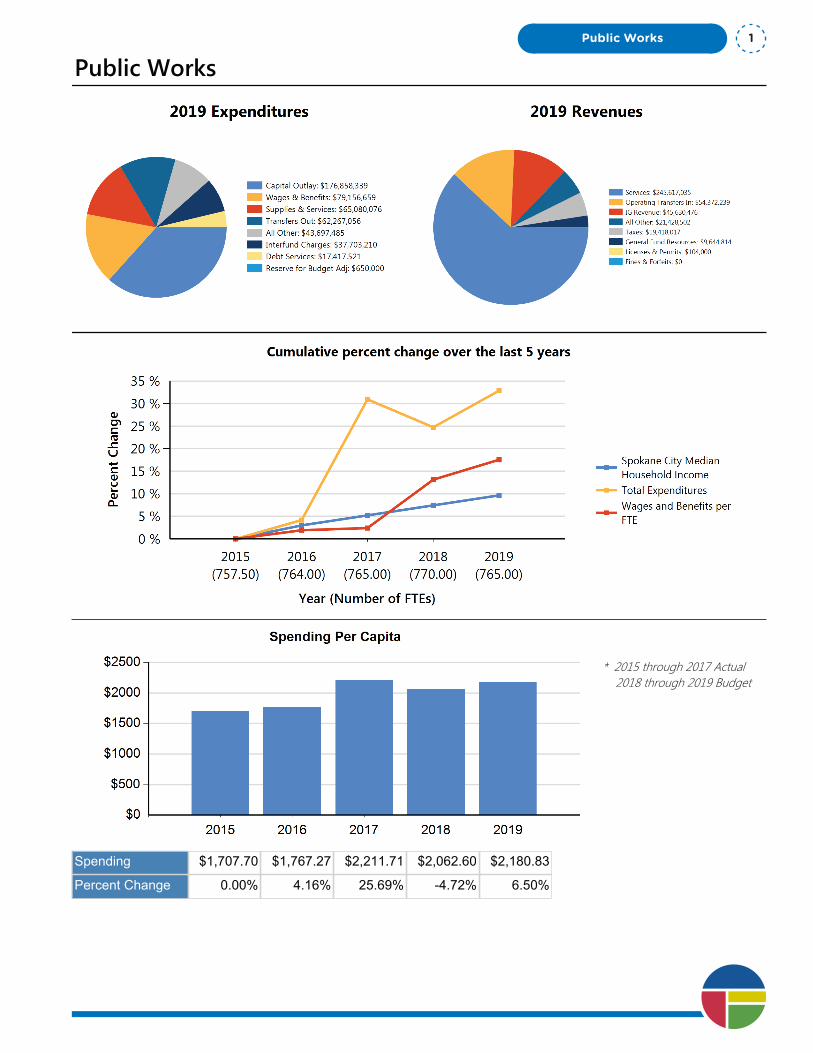
Public Works
* 2015 through 2017 Actual 2018 through 2019 Budget
Spending $1,707.70 $1,767.27 $2,211.71 $2,062.60 $2,180.83
Percent Change 0.00% 4.16% 25.69% -4.72% 6.50%
Public Works 1

One Vision. One Plan. One Voice.
Public Works2
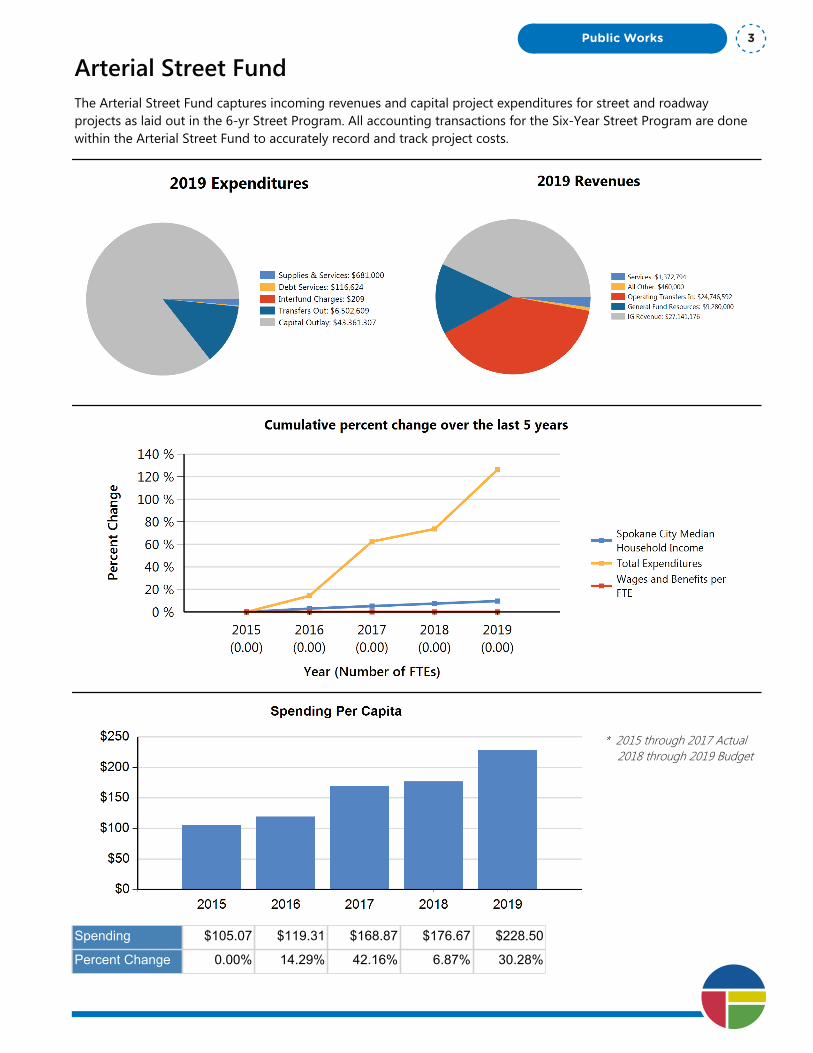
Arterial Street FundThe Arterial Street Fund captures incoming revenues and capital project expenditures for street and roadway projects as laid out in the 6-yr Street Program. All accounting transactions for the Six-Year Street Program are done within the Arterial Street Fund to accurately record and track project costs.
* 2015 through 2017 Actual 2018 through 2019 Budget
Spending $105.07 $119.31 $168.87 $176.67 $228.50
Percent Change 0.00% 14.29% 42.16% 6.87% 30.28%
Public Works 3

Department Summary: Arterial Street Fund
Division: Public Works
Fund Type: Capital Project Fund
Executive Summary:
The Arterial Street Fund captures incoming revenues and capital project expenditures for street and roadway projects as laid out in the 6-yr Street Program. All accounting transactions for the Six-Year Street Program are done within the Arterial Street Fund to accurately record and track project costs.
Programs and Services:
The Integrated Capital Management Department coordinates and prioritizes all the interrelated infrastructure requirements within the City’s right of way. Treating the array of necessary streets and utilities within the right of way in a holistic, system-wide manner is recognized as a best practice. The Arterial Street Fund: 6-yr Street Program is used in the transaction of all roadway project costs incurred for projects found within the Six-Year Street Program. The City relies upon federal and state funding sources to design, purchase right-of-way and construct capital transportation projects. Federal and state transportation funds are provided to the City as reimbursements to actual expenses incurred and because of this reimbursement-only policy, this fund acts as the cash flow account for all the projects within the Street Program.
FTEs
2015 Actual 2016 Actual 2017 Actual 2018 Budget 2019 Proposed
Total FTEs 0.00 0.00 0.00 0.00 0.00
Expenditures:
2015 Actual 2016 Actual 2017 Actual 2018 Budget 2019 Proposed
Capital Outlay 14,698,750 21,546,352 23,237,374 31,523,476 43,361,307
Interfund Charges 287,636 532,635 565,953 50,601 209
Reserve for Budget Adjustment 0 0 0 0 0
Transfers Out 7,111,668 3,023,904 11,231,512 6,501,888 6,502,609
Wages & Benefits 0 0 0 0 0
Supplies & Services 174,263 371,136 1,230,911 810,000 681,000
Debt Services 117,751 117,187 116,622 0 116,624
All Other 473 473 473 0 0
TOTAL 22,390,541 25,591,687 36,382,845 38,885,965 50,661,749
Expenditure Notes:
Revenues:
2015 Actual 2016 Actual 2017 Actual 2018 Budget 2019 Proposed
Taxes 0 0 0 0 0
Licenses & Permits 1,000 0 1,000 0 0
IG Revenue 8,640,604 11,296,479 18,831,909 18,145,800 27,141,176
Services 781,395 0 138,226 65,882 1,372,794One Vision. One Plan. One Voice.
Public Works4
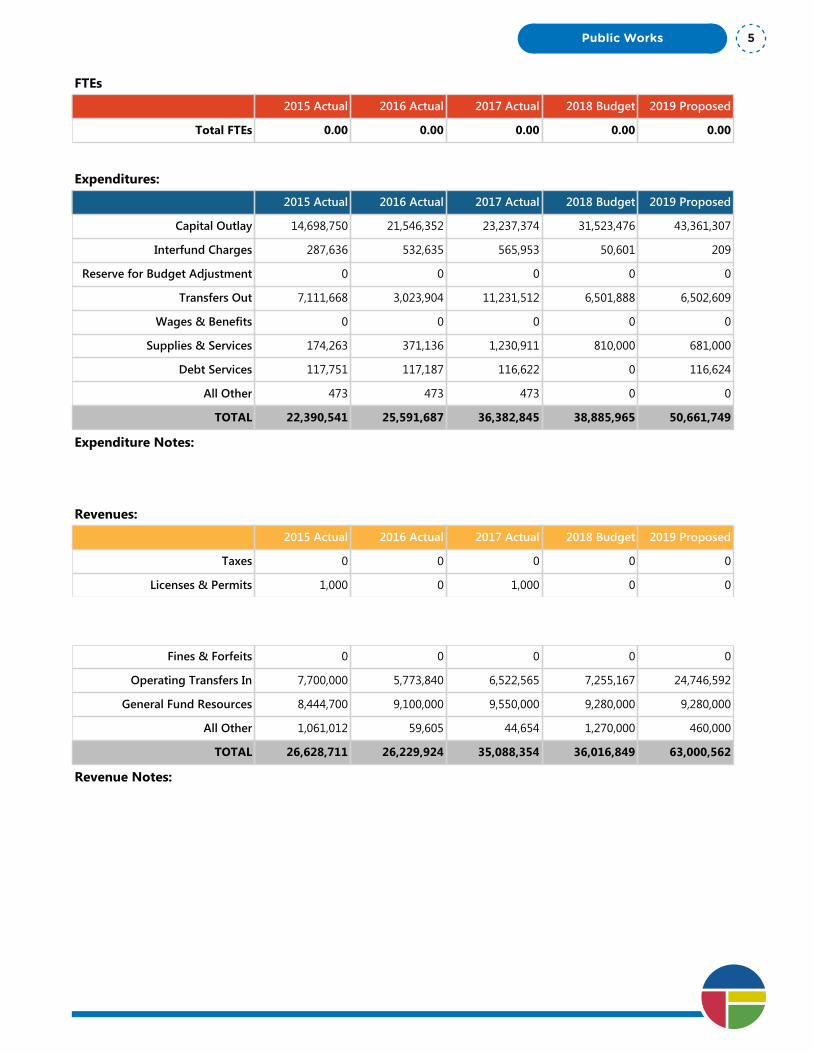
Department Summary: Arterial Street Fund
Division: Public Works
Fund Type: Capital Project Fund
Executive Summary:
The Arterial Street Fund captures incoming revenues and capital project expenditures for street and roadway projects as laid out in the 6-yr Street Program. All accounting transactions for the Six-Year Street Program are done within the Arterial Street Fund to accurately record and track project costs.
Programs and Services:
The Integrated Capital Management Department coordinates and prioritizes all the interrelated infrastructure requirements within the City’s right of way. Treating the array of necessary streets and utilities within the right of way in a holistic, system-wide manner is recognized as a best practice. The Arterial Street Fund: 6-yr Street Program is used in the transaction of all roadway project costs incurred for projects found within the Six-Year Street Program. The City relies upon federal and state funding sources to design, purchase right-of-way and construct capital transportation projects. Federal and state transportation funds are provided to the City as reimbursements to actual expenses incurred and because of this reimbursement-only policy, this fund acts as the cash flow account for all the projects within the Street Program.
FTEs
2015 Actual 2016 Actual 2017 Actual 2018 Budget 2019 Proposed
Total FTEs 0.00 0.00 0.00 0.00 0.00
Expenditures:
2015 Actual 2016 Actual 2017 Actual 2018 Budget 2019 Proposed
Capital Outlay 14,698,750 21,546,352 23,237,374 31,523,476 43,361,307
Interfund Charges 287,636 532,635 565,953 50,601 209
Reserve for Budget Adjustment 0 0 0 0 0
Transfers Out 7,111,668 3,023,904 11,231,512 6,501,888 6,502,609
Wages & Benefits 0 0 0 0 0
Supplies & Services 174,263 371,136 1,230,911 810,000 681,000
Debt Services 117,751 117,187 116,622 0 116,624
All Other 473 473 473 0 0
TOTAL 22,390,541 25,591,687 36,382,845 38,885,965 50,661,749
Expenditure Notes:
Revenues:
2015 Actual 2016 Actual 2017 Actual 2018 Budget 2019 Proposed
Taxes 0 0 0 0 0
Licenses & Permits 1,000 0 1,000 0 0
IG Revenue 8,640,604 11,296,479 18,831,909 18,145,800 27,141,176
Services 781,395 0 138,226 65,882 1,372,794
Fines & Forfeits 0 0 0 0 0
Operating Transfers In 7,700,000 5,773,840 6,522,565 7,255,167 24,746,592
General Fund Resources 8,444,700 9,100,000 9,550,000 9,280,000 9,280,000
All Other 1,061,012 59,605 44,654 1,270,000 460,000
TOTAL 26,628,711 26,229,924 35,088,354 36,016,849 63,000,562
Revenue Notes:
Public Works 5

One Vision. One Plan. One Voice.
Public Works6
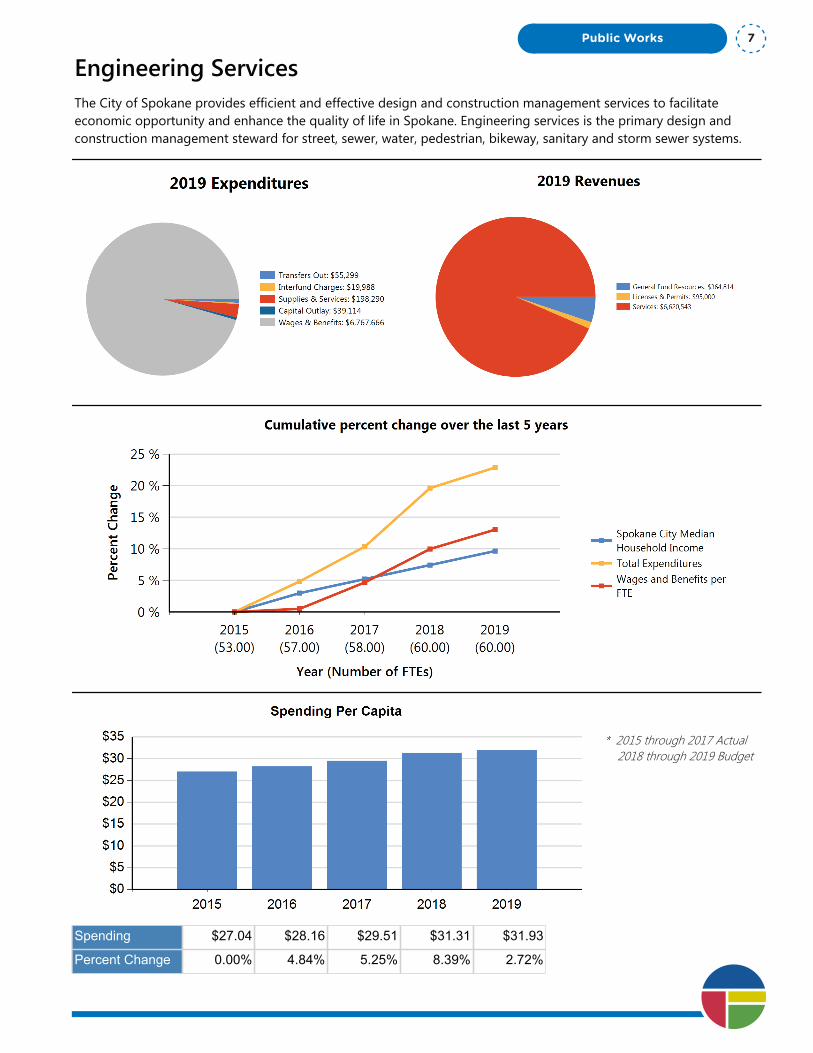
Engineering ServicesThe City of Spokane provides efficient and effective design and construction management services to facilitate economic opportunity and enhance the quality of life in Spokane. Engineering services is the primary design and construction management steward for street, sewer, water, pedestrian, bikeway, sanitary and storm sewer systems.
* 2015 through 2017 Actual 2018 through 2019 Budget
Spending $27.04 $28.16 $29.51 $31.31 $31.93
Percent Change 0.00% 4.84% 5.25% 8.39% 2.72%
Public Works 7

Department Summary: Engineering Services
Division: Public Works
Fund Type: General Fund
Executive Summary:
The City of Spokane provides efficient and effective design and construction management services to facilitate economic opportunity and enhance the quality of life in Spokane. Engineering services is the primary design and construction management steward for street, sewer, water, pedestrian, bikeway, sanitary and storm sewer systems.
Programs and Services:
For infrastructure stewardship, a thorough understanding of the systems, their context, capacities and conditions is essential. These are the fundamental tools for their responsible planning, efficient design and construction management to assure that these services are reliably and responsibly available where and when required for a vibrant economy.
FTEs
2015 Actual 2016 Actual 2017 Actual 2018 Budget 2019 Proposed
Total FTEs 53.00 57.00 58.00 60.00 60.00
Expenditures:
2015 Actual 2016 Actual 2017 Actual 2018 Budget 2019 Proposed
Capital Outlay 312,140 117,955 91,931 39,114 39,114
Interfund Charges 5,452 44,097 20,212 19,988 19,988
Reserve for Budget Adjustment 0 0 0 4,148 0
Transfers Out 686 343 28,463 55,299 55,299
Wages & Benefits 5,261,492 5,686,691 6,028,767 6,566,314 6,767,666
Supplies & Services 182,263 192,157 189,361 207,568 198,290
Debt Services 0 0 0 0 0
All Other 0 0 0 0 0
TOTAL 5,762,033 6,041,243 6,358,734 6,892,431 7,080,357
Expenditure Notes:
Revenues:
2015 Actual 2016 Actual 2017 Actual 2018 Budget 2019 Proposed
Taxes 0 0 0 0 0
Licenses & Permits 85,000 96,410 97,830 10,000 95,000
IG Revenue 0 0 0 0 0
Services 6,586,300 8,595,162 8,807,848 6,488,601 6,620,543
Fines & Forfeits 0 0 0 0 0
Operating Transfers In 0 0 0 0 0
General Fund Resources 0 0 0 0 364,814One Vision. One Plan. One Voice.
Public Works8

Department Summary: Engineering Services
Division: Public Works
Fund Type: General Fund
Executive Summary:
The City of Spokane provides efficient and effective design and construction management services to facilitate economic opportunity and enhance the quality of life in Spokane. Engineering services is the primary design and construction management steward for street, sewer, water, pedestrian, bikeway, sanitary and storm sewer systems.
Programs and Services:
For infrastructure stewardship, a thorough understanding of the systems, their context, capacities and conditions is essential. These are the fundamental tools for their responsible planning, efficient design and construction management to assure that these services are reliably and responsibly available where and when required for a vibrant economy.
FTEs
2015 Actual 2016 Actual 2017 Actual 2018 Budget 2019 Proposed
Total FTEs 53.00 57.00 58.00 60.00 60.00
Expenditures:
2015 Actual 2016 Actual 2017 Actual 2018 Budget 2019 Proposed
Capital Outlay 312,140 117,955 91,931 39,114 39,114
Interfund Charges 5,452 44,097 20,212 19,988 19,988
Reserve for Budget Adjustment 0 0 0 4,148 0
Transfers Out 686 343 28,463 55,299 55,299
Wages & Benefits 5,261,492 5,686,691 6,028,767 6,566,314 6,767,666
Supplies & Services 182,263 192,157 189,361 207,568 198,290
Debt Services 0 0 0 0 0
All Other 0 0 0 0 0
TOTAL 5,762,033 6,041,243 6,358,734 6,892,431 7,080,357
Expenditure Notes:
Revenues:
2015 Actual 2016 Actual 2017 Actual 2018 Budget 2019 Proposed
Taxes 0 0 0 0 0
Licenses & Permits 85,000 96,410 97,830 10,000 95,000
IG Revenue 0 0 0 0 0
Services 6,586,300 8,595,162 8,807,848 6,488,601 6,620,543
Fines & Forfeits 0 0 0 0 0
Operating Transfers In 0 0 0 0 0
General Fund Resources 0 0 0 0 364,814
All Other (2,283) 0 17 0 0
TOTAL 6,669,017 8,691,572 8,905,695 6,498,601 7,080,357
Revenue Notes:
Public Works 9
Program Summary: Construction Management
Division: Public Works
Fund Type: General Fund
Executive Summary:
Provide high-quality and cost effective construction management services focused on capital infrastructure including sewer, water, streets, stormwater, bridges, signals, pedestrian, bikeways. Services include on-site inspection of public and private infrastructure for consistency and compliance with internal/external standards, with an emphasis on strong coordination.
Programs and Services:
The economic vitality of the community is key to the City’s ability to provide services to its citizens and is a core characteristic of an overall thriving community. Construction Management supports capital projects with services that include: coordinated construction management for water, sewer, streets, bridges, sidewalks, bikeways/paths, landscaping, signals, signs/markers, stormwater, and combined sewer overflows projects. It provides all construction inspection, materials testing/certification, progress payments, public relations, negotiation of change orders, and record keeping per funding requirements/ audits for all public works construction contracts (both public and private). Perform all survey work for public works projects (public and private), including preliminary and final design surveys, construction staking, real estate surveys, as-built GPS data collection. Other services include small contract projects for other City departments, customer service in response to data, questions, concerns on other projects, all as-built records and drawings for the Department and City, constructability reviews on all public projects, actual field design of small projects such as alleys and street rehabilitation projects in coordination with the Design.
FTEs
2015 Actual 2016 Actual 2017 Actual 2018 Budget 2019 Proposed
Total FTEs 33.00 37.00 38.00 38.00 38.00
Expenditures:
2015 Actual 2016 Actual 2017 Actual 2018 Budget 2019 Proposed
Capital Outlay 126,757 32,651 (17) 0 0
Interfund Charges 4,885 0 0 0 0
Reserve for Budget Adjustment 0 0 0 0 0
Transfers Out 0 0 0 0 0
Wages & Benefits 3,435,358 3,736,515 3,938,061 4,192,148 4,292,590
Supplies & Services 748 4,353 7,088 720 2,000
Debt Services 0 0 0 0 0
All Other 0 0 0 0 0
TOTAL 3,567,748 3,773,519 3,945,132 4,192,868 4,294,590
Expenditure Notes:
Revenues:
2015 Actual 2016 Actual 2017 Actual 2018 Budget 2019 Proposed
Taxes 0 0 0 0 0
Licenses & Permits 0 0 0 0 0One Vision. One Plan. One Voice.
Public Works10
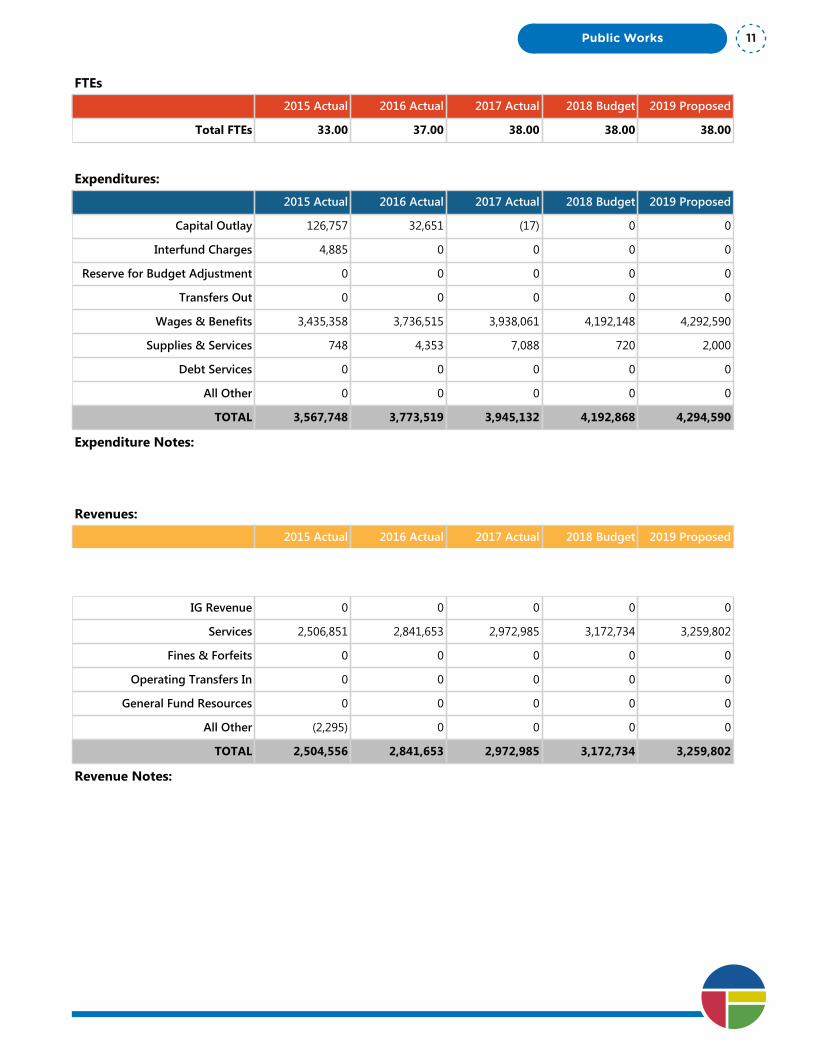
Program Summary: Construction Management
Division: Public Works
Fund Type: General Fund
Executive Summary:
Provide high-quality and cost effective construction management services focused on capital infrastructure including sewer, water, streets, stormwater, bridges, signals, pedestrian, bikeways. Services include on-site inspection of public and private infrastructure for consistency and compliance with internal/external standards, with an emphasis on strong coordination.
Programs and Services:
The economic vitality of the community is key to the City’s ability to provide services to its citizens and is a core characteristic of an overall thriving community. Construction Management supports capital projects with services that include: coordinated construction management for water, sewer, streets, bridges, sidewalks, bikeways/paths, landscaping, signals, signs/markers, stormwater, and combined sewer overflows projects. It provides all construction inspection, materials testing/certification, progress payments, public relations, negotiation of change orders, and record keeping per funding requirements/ audits for all public works construction contracts (both public and private). Perform all survey work for public works projects (public and private), including preliminary and final design surveys, construction staking, real estate surveys, as-built GPS data collection. Other services include small contract projects for other City departments, customer service in response to data, questions, concerns on other projects, all as-built records and drawings for the Department and City, constructability reviews on all public projects, actual field design of small projects such as alleys and street rehabilitation projects in coordination with the Design.
FTEs
2015 Actual 2016 Actual 2017 Actual 2018 Budget 2019 Proposed
Total FTEs 33.00 37.00 38.00 38.00 38.00
Expenditures:
2015 Actual 2016 Actual 2017 Actual 2018 Budget 2019 Proposed
Capital Outlay 126,757 32,651 (17) 0 0
Interfund Charges 4,885 0 0 0 0
Reserve for Budget Adjustment 0 0 0 0 0
Transfers Out 0 0 0 0 0
Wages & Benefits 3,435,358 3,736,515 3,938,061 4,192,148 4,292,590
Supplies & Services 748 4,353 7,088 720 2,000
Debt Services 0 0 0 0 0
All Other 0 0 0 0 0
TOTAL 3,567,748 3,773,519 3,945,132 4,192,868 4,294,590
Expenditure Notes:
Revenues:
2015 Actual 2016 Actual 2017 Actual 2018 Budget 2019 Proposed
Taxes 0 0 0 0 0
Licenses & Permits 0 0 0 0 0
IG Revenue 0 0 0 0 0
Services 2,506,851 2,841,653 2,972,985 3,172,734 3,259,802
Fines & Forfeits 0 0 0 0 0
Operating Transfers In 0 0 0 0 0
General Fund Resources 0 0 0 0 0
All Other (2,295) 0 0 0 0
TOTAL 2,504,556 2,841,653 2,972,985 3,172,734 3,259,802
Revenue Notes:
Public Works 11

Program Summary: Engineering Administration
Division: Public Works
Fund Type: General Fund
Executive Summary:
Engineering Administration is vital to providing leadership that allows Engineering to function efficiently and effectively. It includes the Department Director and administrative support staff. The Administration function sets direction for the department by developing and implementing policies, guidelines and budgets as well as providing leadership for Engineering Services.
Programs and Services:
The Administrative Function of Engineering ensures that coordination of all projects is done properly with adherence to all City policies, and procedures. This includes meticulous record keeping, project tracking, contract processing, and coordination of bidding processes.
FTEs
2015 Actual 2016 Actual 2017 Actual 2018 Budget 2019 Proposed
Total FTEs 5.00 5.00 5.00 5.00 5.00
Expenditures:
2015 Actual 2016 Actual 2017 Actual 2018 Budget 2019 Proposed
Capital Outlay 185,383 85,304 91,948 39,114 39,114
Interfund Charges 567 44,097 20,212 19,988 19,988
Reserve for Budget Adjustment 0 0 0 4,148 0
Transfers Out 686 343 28,463 55,299 55,299
Wages & Benefits 379,809 440,261 381,150 499,877 492,662
Supplies & Services 176,563 187,588 182,264 206,320 196,290
Debt Services 0 0 0 0 0
All Other 0 0 0 0 0
TOTAL 743,008 757,593 704,037 824,746 803,353
Expenditure Notes:
Revenues:
2015 Actual 2016 Actual 2017 Actual 2018 Budget 2019 Proposed
Taxes 0 0 0 0 0
Licenses & Permits 85,000 96,410 97,830 10,000 95,000
IG Revenue 0 0 0 0 0
Services 2,929,443 4,488,547 4,442,795 2,031,267 1,752,988
Fines & Forfeits 0 0 0 0 0
Operating Transfers In 0 0 0 0 0
General Fund Resources 0 0 0 0 364,814One Vision. One Plan. One Voice.
Public Works12

Program Summary: Engineering Administration
Division: Public Works
Fund Type: General Fund
Executive Summary:
Engineering Administration is vital to providing leadership that allows Engineering to function efficiently and effectively. It includes the Department Director and administrative support staff. The Administration function sets direction for the department by developing and implementing policies, guidelines and budgets as well as providing leadership for Engineering Services.
Programs and Services:
The Administrative Function of Engineering ensures that coordination of all projects is done properly with adherence to all City policies, and procedures. This includes meticulous record keeping, project tracking, contract processing, and coordination of bidding processes.
FTEs
2015 Actual 2016 Actual 2017 Actual 2018 Budget 2019 Proposed
Total FTEs 5.00 5.00 5.00 5.00 5.00
Expenditures:
2015 Actual 2016 Actual 2017 Actual 2018 Budget 2019 Proposed
Capital Outlay 185,383 85,304 91,948 39,114 39,114
Interfund Charges 567 44,097 20,212 19,988 19,988
Reserve for Budget Adjustment 0 0 0 4,148 0
Transfers Out 686 343 28,463 55,299 55,299
Wages & Benefits 379,809 440,261 381,150 499,877 492,662
Supplies & Services 176,563 187,588 182,264 206,320 196,290
Debt Services 0 0 0 0 0
All Other 0 0 0 0 0
TOTAL 743,008 757,593 704,037 824,746 803,353
Expenditure Notes:
Revenues:
2015 Actual 2016 Actual 2017 Actual 2018 Budget 2019 Proposed
Taxes 0 0 0 0 0
Licenses & Permits 85,000 96,410 97,830 10,000 95,000
IG Revenue 0 0 0 0 0
Services 2,929,443 4,488,547 4,442,795 2,031,267 1,752,988
Fines & Forfeits 0 0 0 0 0
Operating Transfers In 0 0 0 0 0
General Fund Resources 0 0 0 0 364,814
All Other 12 0 17 0 0
TOTAL 3,014,455 4,584,957 4,540,642 2,041,267 2,212,802
Revenue Notes:
Public Works 13

Program Summary: Engineering Design
Division: Public Works
Fund Type: General Fund
Executive Summary:
Engineering provides high-quality and cost-effective engineering design services with emphasis on capital infrastructure in the right of way. Services include design and construction management of capital projects for consistency and compliance with standards.
Programs and Services:
The economic vitality of the community is key to the City’s ability to provide services to its citizens and is a core characteristic of an overall thriving community. This function includes all preliminary and final design elements, including bid and award, permitting, right-of-way identification and certifications, and adherence to all applicable federal, state and local standards.
FTEs
2015 Actual 2016 Actual 2017 Actual 2018 Budget 2019 Proposed
Total FTEs 15.00 15.00 15.00 17.00 17.00
Expenditures:
2015 Actual 2016 Actual 2017 Actual 2018 Budget 2019 Proposed
Capital Outlay 0 0 0 0 0
Interfund Charges 0 0 0 0 0
Reserve for Budget Adjustment 0 0 0 0 0
Transfers Out 0 0 0 0 0
Wages & Benefits 1,446,325 1,509,915 1,709,556 1,874,289 1,982,414
Supplies & Services 4,952 216 9 528 0
Debt Services 0 0 0 0 0
All Other 0 0 0 0 0
TOTAL 1,451,277 1,510,131 1,709,565 1,874,817 1,982,414
Expenditure Notes:
Revenues:
2015 Actual 2016 Actual 2017 Actual 2018 Budget 2019 Proposed
Taxes 0 0 0 0 0
Licenses & Permits 0 0 0 0 0
IG Revenue 0 0 0 0 0
Services 1,150,006 1,264,962 1,392,068 1,284,600 1,607,753
Fines & Forfeits 0 0 0 0 0
Operating Transfers In 0 0 0 0 0
General Fund Resources 0 0 0 0 0One Vision. One Plan. One Voice.
Public Works14

Program Summary: Engineering Design
Division: Public Works
Fund Type: General Fund
Executive Summary:
Engineering provides high-quality and cost-effective engineering design services with emphasis on capital infrastructure in the right of way. Services include design and construction management of capital projects for consistency and compliance with standards.
Programs and Services:
The economic vitality of the community is key to the City’s ability to provide services to its citizens and is a core characteristic of an overall thriving community. This function includes all preliminary and final design elements, including bid and award, permitting, right-of-way identification and certifications, and adherence to all applicable federal, state and local standards.
FTEs
2015 Actual 2016 Actual 2017 Actual 2018 Budget 2019 Proposed
Total FTEs 15.00 15.00 15.00 17.00 17.00
Expenditures:
2015 Actual 2016 Actual 2017 Actual 2018 Budget 2019 Proposed
Capital Outlay 0 0 0 0 0
Interfund Charges 0 0 0 0 0
Reserve for Budget Adjustment 0 0 0 0 0
Transfers Out 0 0 0 0 0
Wages & Benefits 1,446,325 1,509,915 1,709,556 1,874,289 1,982,414
Supplies & Services 4,952 216 9 528 0
Debt Services 0 0 0 0 0
All Other 0 0 0 0 0
TOTAL 1,451,277 1,510,131 1,709,565 1,874,817 1,982,414
Expenditure Notes:
Revenues:
2015 Actual 2016 Actual 2017 Actual 2018 Budget 2019 Proposed
Taxes 0 0 0 0 0
Licenses & Permits 0 0 0 0 0
IG Revenue 0 0 0 0 0
Services 1,150,006 1,264,962 1,392,068 1,284,600 1,607,753
Fines & Forfeits 0 0 0 0 0
Operating Transfers In 0 0 0 0 0
General Fund Resources 0 0 0 0 0
All Other 0 0 0 0 0
TOTAL 1,150,006 1,264,962 1,392,068 1,284,600 1,607,753
Revenue Notes:
Public Works 15

One Vision. One Plan. One Voice.
Public Works16
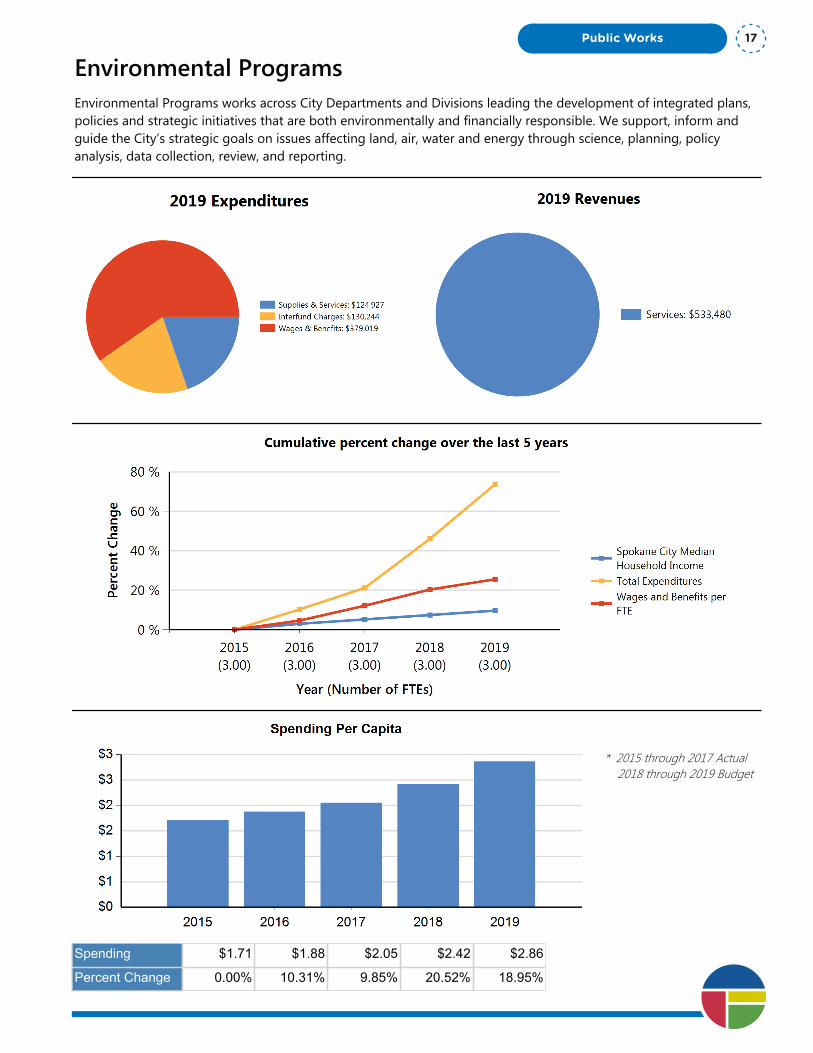
Environmental ProgramsEnvironmental Programs works across City Departments and Divisions leading the development of integrated plans, policies and strategic initiatives that are both environmentally and financially responsible. We support, inform and guide the City’s strategic goals on issues affecting land, air, water and energy through science, planning, policy analysis, data collection, review, and reporting.
* 2015 through 2017 Actual 2018 through 2019 Budget
Spending $1.71 $1.88 $2.05 $2.42 $2.86
Percent Change 0.00% 10.31% 9.85% 20.52% 18.95%
Public Works 17

Department Summary: Environmental Programs
Division: Public Works
Fund Type: Enterprise Fund
Executive Summary:
Environmental Programs works across City Departments and Divisions leading the development of integrated plans, policies and strategic initiatives that are both environmentally and financially responsible. We support, inform and guide the City’s strategic goals on issues affecting land, air, water and energy through science, planning, policy analysis, data collection, review, and reporting.
Programs and Services:
Environmental Programs provides scientific consulting and regulatory strategies to other City departments, communicating environmental science and policy. In particular, we work closely with the City’s utility departments, water, wastewater, stormwater, solid waste collection and solid waste disposal, in meeting environmental goals. Environmental Programs works to develop promote and implement sustainable practices throughout the City through education, community partnerships and performance management. We engage in collaborative governance through our relationships with local, state, and federal agencies, as well as business and citizens. We represent the City’s perspective in regional environmental processes, oversee the city and community-wide greenhouse gas inventory and coordinate the City's sustainability program. We support each department as they lead compliance and reporting on environmental regulations specific to their operations. We also work to bring the City’s views and perspectives to regional environmental processes, such as conservation and watershed planning. We produce reports on the quality and quantity of the City's water resources, energy use and water use by the City's departments.
FTEs
2015 Actual 2016 Actual 2017 Actual 2018 Budget 2019 Proposed
Total FTEs 3.00 3.00 3.00 3.00 3.00
Expenditures:
2015 Actual 2016 Actual 2017 Actual 2018 Budget 2019 Proposed
Capital Outlay 0 0 0 0 0
Interfund Charges 52,133 52,208 64,455 78,923 130,244
Reserve for Budget Adjustment 0 0 0 0 0
Transfers Out 0 0 0 0 0
Wages & Benefits 295,999 309,681 333,023 360,279 379,019
Supplies & Services 16,870 40,753 44,849 93,927 124,927
Debt Services 0 0 0 0 0
All Other 0 0 0 0 0
TOTAL 365,002 402,642 442,327 533,129 634,190
Expenditure Notes:
Expenditures increased in interfund IT and interfund professional services
Revenues:
2015 Actual 2016 Actual 2017 Actual 2018 Budget 2019 Proposed
Taxes 0 0 0 0 0
Licenses & Permits 0 0 0 0 0One Vision. One Plan. One Voice.
Public Works18

Department Summary: Environmental Programs
Division: Public Works
Fund Type: Enterprise Fund
Executive Summary:
Environmental Programs works across City Departments and Divisions leading the development of integrated plans, policies and strategic initiatives that are both environmentally and financially responsible. We support, inform and guide the City’s strategic goals on issues affecting land, air, water and energy through science, planning, policy analysis, data collection, review, and reporting.
Programs and Services:
Environmental Programs provides scientific consulting and regulatory strategies to other City departments, communicating environmental science and policy. In particular, we work closely with the City’s utility departments, water, wastewater, stormwater, solid waste collection and solid waste disposal, in meeting environmental goals. Environmental Programs works to develop promote and implement sustainable practices throughout the City through education, community partnerships and performance management. We engage in collaborative governance through our relationships with local, state, and federal agencies, as well as business and citizens. We represent the City’s perspective in regional environmental processes, oversee the city and community-wide greenhouse gas inventory and coordinate the City's sustainability program. We support each department as they lead compliance and reporting on environmental regulations specific to their operations. We also work to bring the City’s views and perspectives to regional environmental processes, such as conservation and watershed planning. We produce reports on the quality and quantity of the City's water resources, energy use and water use by the City's departments.
FTEs
2015 Actual 2016 Actual 2017 Actual 2018 Budget 2019 Proposed
Total FTEs 3.00 3.00 3.00 3.00 3.00
Expenditures:
2015 Actual 2016 Actual 2017 Actual 2018 Budget 2019 Proposed
Capital Outlay 0 0 0 0 0
Interfund Charges 52,133 52,208 64,455 78,923 130,244
Reserve for Budget Adjustment 0 0 0 0 0
Transfers Out 0 0 0 0 0
Wages & Benefits 295,999 309,681 333,023 360,279 379,019
Supplies & Services 16,870 40,753 44,849 93,927 124,927
Debt Services 0 0 0 0 0
All Other 0 0 0 0 0
TOTAL 365,002 402,642 442,327 533,129 634,190
Expenditure Notes:
Expenditures increased in interfund IT and interfund professional services
Revenues:
2015 Actual 2016 Actual 2017 Actual 2018 Budget 2019 Proposed
Taxes 0 0 0 0 0
Licenses & Permits 0 0 0 0 0
IG Revenue 0 0 0 0 0
Services 345,517 369,345 438,074 521,048 533,480
Fines & Forfeits 0 0 0 0 0
Operating Transfers In 0 0 0 0 0
General Fund Resources 0 0 0 0 0
All Other 0 0 0 0 0
TOTAL 345,517 369,345 438,074 521,048 533,480
Revenue Notes:
Public Works 19

One Vision. One Plan. One Voice.
Public Works20
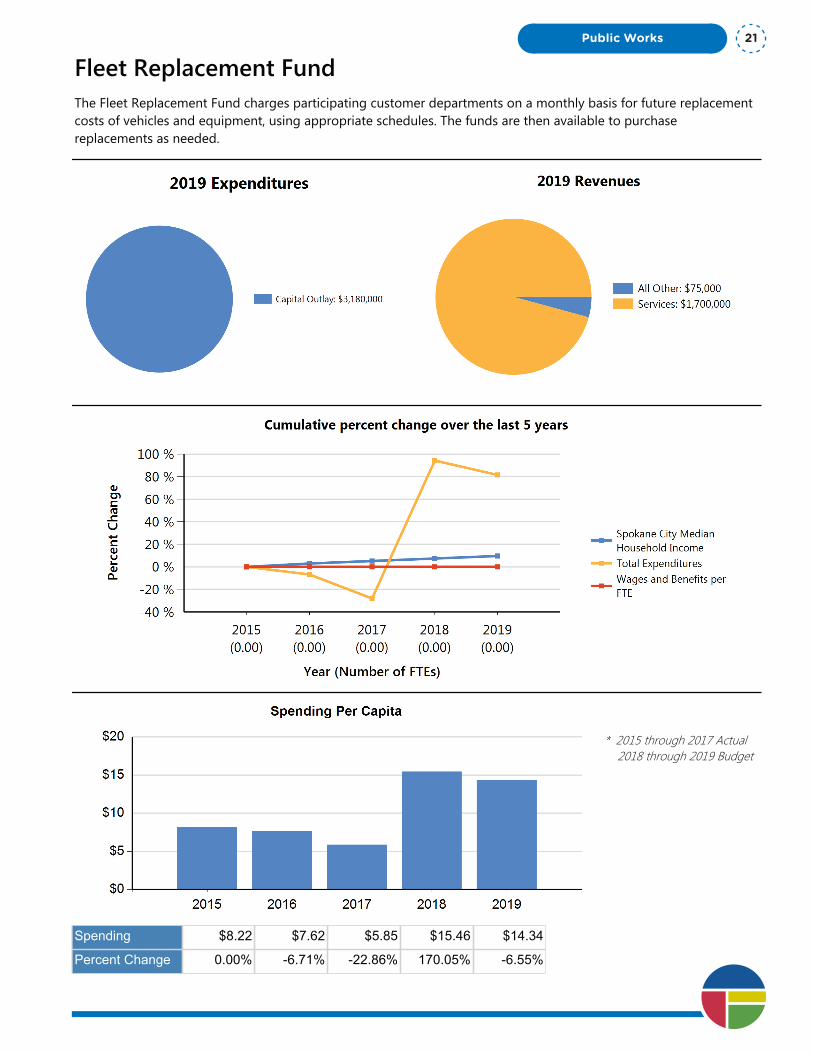
Fleet Replacement FundThe Fleet Replacement Fund charges participating customer departments on a monthly basis for future replacement costs of vehicles and equipment, using appropriate schedules. The funds are then available to purchase replacements as needed.
* 2015 through 2017 Actual 2018 through 2019 Budget
Spending $8.22 $7.62 $5.85 $15.46 $14.34
Percent Change 0.00% -6.71% -22.86% 170.05% -6.55%
Public Works 21
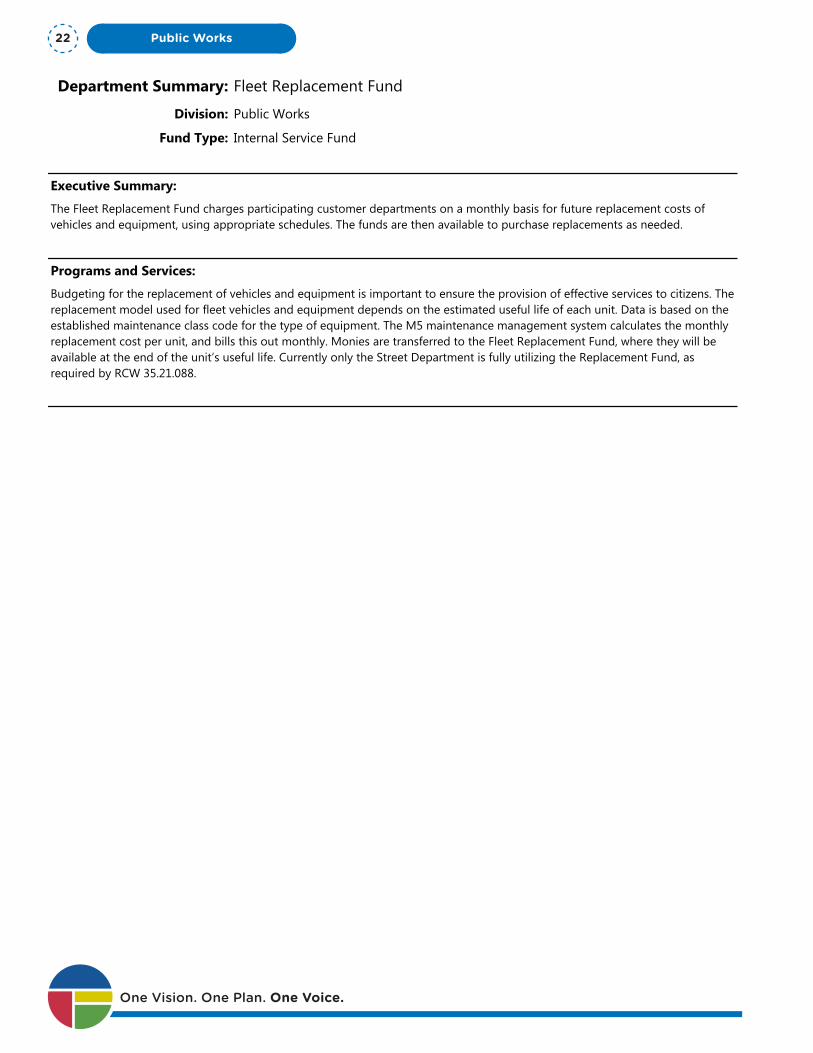
Department Summary: Fleet Replacement Fund
Division: Public Works
Fund Type: Internal Service Fund
Executive Summary:
The Fleet Replacement Fund charges participating customer departments on a monthly basis for future replacement costs of vehicles and equipment, using appropriate schedules. The funds are then available to purchase replacements as needed.
Programs and Services:
Budgeting for the replacement of vehicles and equipment is important to ensure the provision of effective services to citizens. The replacement model used for fleet vehicles and equipment depends on the estimated useful life of each unit. Data is based on the established maintenance class code for the type of equipment. The M5 maintenance management system calculates the monthly replacement cost per unit, and bills this out monthly. Monies are transferred to the Fleet Replacement Fund, where they will be available at the end of the unit’s useful life. Currently only the Street Department is fully utilizing the Replacement Fund, as required by RCW 35.21.088.
FTEs
2015 Actual 2016 Actual 2017 Actual 2018 Budget 2019 Proposed
Total FTEs 0.00 0.00 0.00 0.00 0.00
Expenditures:
2015 Actual 2016 Actual 2017 Actual 2018 Budget 2019 Proposed
Capital Outlay 1,366,849 1,576,565 1,225,043 3,367,000 3,180,000
Interfund Charges 82,870 56,071 33,185 35,000 0
Reserve for Budget Adjustment 0 0 0 0 0
Transfers Out 300,000 0 0 0 0
Wages & Benefits 0 0 0 0 0
Supplies & Services 1,592 1,086 1,983 1,200 0
Debt Services 0 0 0 0 0
All Other 0 0 0 0 0
TOTAL 1,751,311 1,633,722 1,260,211 3,403,200 3,180,000
Expenditure Notes:
Revenues:
2015 Actual 2016 Actual 2017 Actual 2018 Budget 2019 Proposed
Taxes 0 0 0 0 0
Licenses & Permits 0 0 0 0 0
IG Revenue 0 0 0 0 0
Services 1,735,121 1,800,821 1,707,114 2,000,000 1,700,000
Fines & Forfeits 0 0 0 0 0One Vision. One Plan. One Voice.
Public Works22
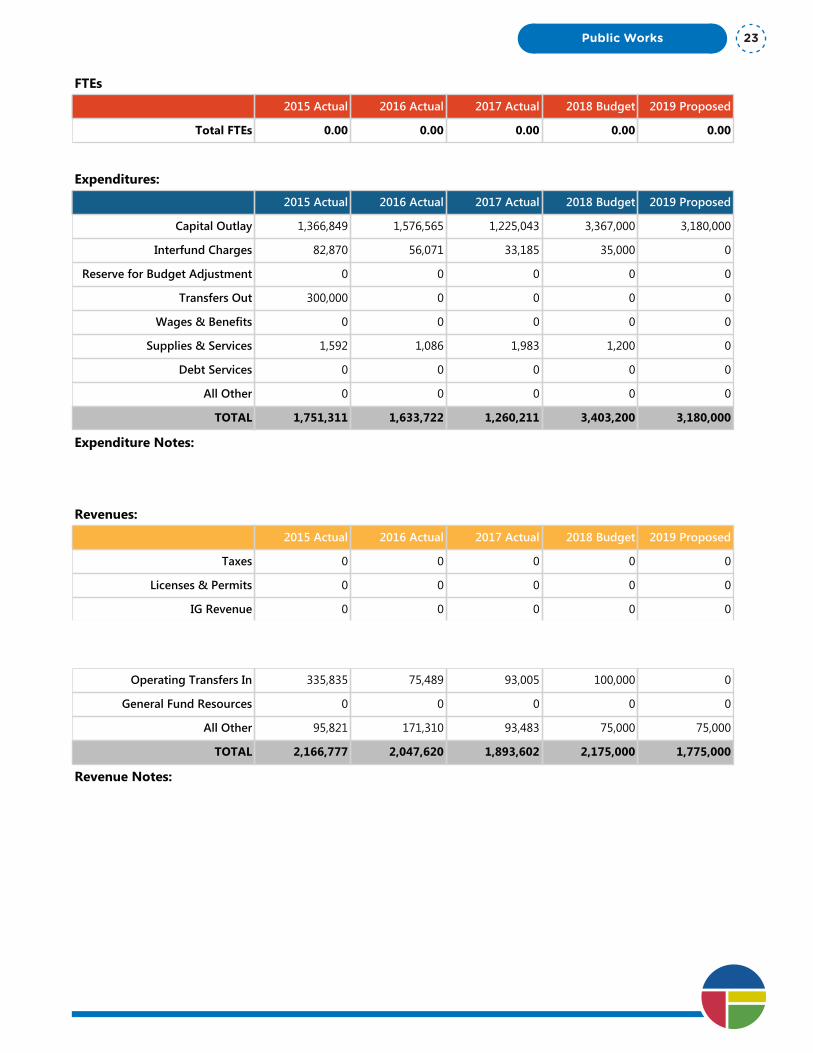
Department Summary: Fleet Replacement Fund
Division: Public Works
Fund Type: Internal Service Fund
Executive Summary:
The Fleet Replacement Fund charges participating customer departments on a monthly basis for future replacement costs of vehicles and equipment, using appropriate schedules. The funds are then available to purchase replacements as needed.
Programs and Services:
Budgeting for the replacement of vehicles and equipment is important to ensure the provision of effective services to citizens. The replacement model used for fleet vehicles and equipment depends on the estimated useful life of each unit. Data is based on the established maintenance class code for the type of equipment. The M5 maintenance management system calculates the monthly replacement cost per unit, and bills this out monthly. Monies are transferred to the Fleet Replacement Fund, where they will be available at the end of the unit’s useful life. Currently only the Street Department is fully utilizing the Replacement Fund, as required by RCW 35.21.088.
FTEs
2015 Actual 2016 Actual 2017 Actual 2018 Budget 2019 Proposed
Total FTEs 0.00 0.00 0.00 0.00 0.00
Expenditures:
2015 Actual 2016 Actual 2017 Actual 2018 Budget 2019 Proposed
Capital Outlay 1,366,849 1,576,565 1,225,043 3,367,000 3,180,000
Interfund Charges 82,870 56,071 33,185 35,000 0
Reserve for Budget Adjustment 0 0 0 0 0
Transfers Out 300,000 0 0 0 0
Wages & Benefits 0 0 0 0 0
Supplies & Services 1,592 1,086 1,983 1,200 0
Debt Services 0 0 0 0 0
All Other 0 0 0 0 0
TOTAL 1,751,311 1,633,722 1,260,211 3,403,200 3,180,000
Expenditure Notes:
Revenues:
2015 Actual 2016 Actual 2017 Actual 2018 Budget 2019 Proposed
Taxes 0 0 0 0 0
Licenses & Permits 0 0 0 0 0
IG Revenue 0 0 0 0 0
Services 1,735,121 1,800,821 1,707,114 2,000,000 1,700,000
Fines & Forfeits 0 0 0 0 0
Operating Transfers In 335,835 75,489 93,005 100,000 0
General Fund Resources 0 0 0 0 0
All Other 95,821 171,310 93,483 75,000 75,000
TOTAL 2,166,777 2,047,620 1,893,602 2,175,000 1,775,000
Revenue Notes:
Public Works 23

One Vision. One Plan. One Voice.
Public Works24
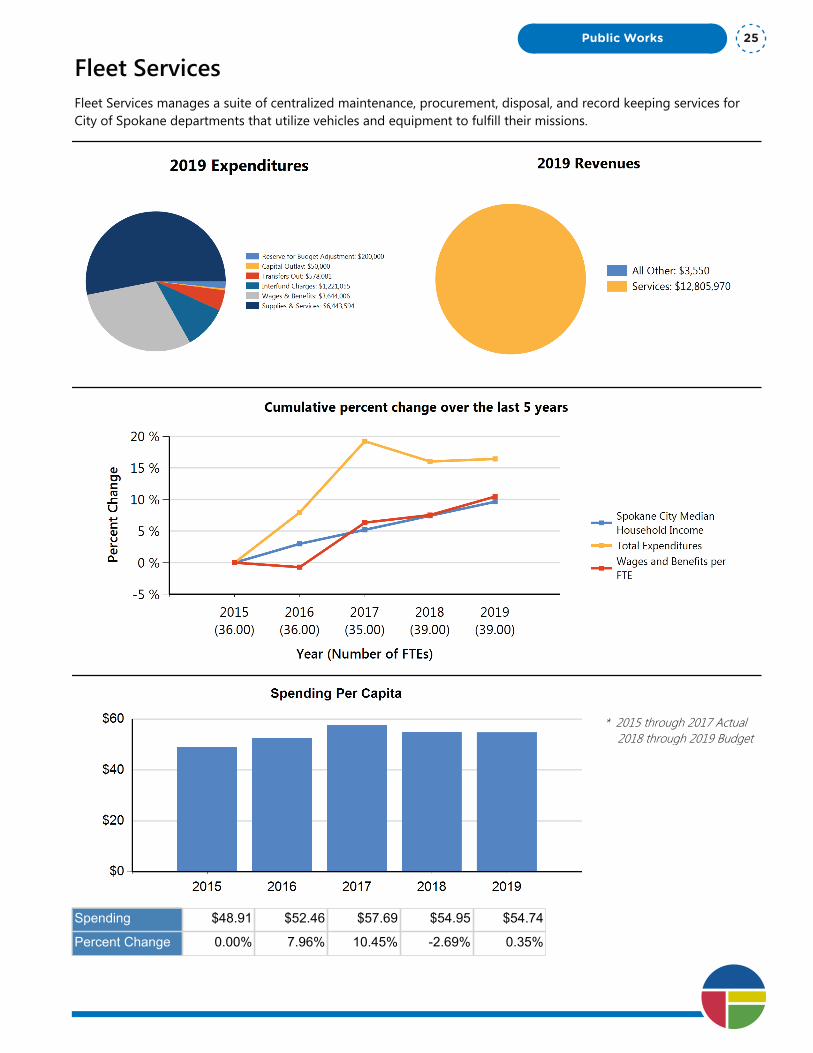
Fleet ServicesFleet Services manages a suite of centralized maintenance, procurement, disposal, and record keeping services for City of Spokane departments that utilize vehicles and equipment to fulfill their missions.
* 2015 through 2017 Actual 2018 through 2019 Budget
Spending $48.91 $52.46 $57.69 $54.95 $54.74
Percent Change 0.00% 7.96% 10.45% -2.69% 0.35%
Public Works 25

Department Summary: Fleet Services
Division: Public Works
Fund Type: Internal Service Fund
Executive Summary:
Fleet Services manages a suite of centralized maintenance, procurement, disposal, and record keeping services for City of Spokane departments that utilize vehicles and equipment to fulfill their missions.
Programs and Services:
Fleet Services provides city departments and some external customers with safe, reliable, economical and environmentally sound transportation and related support services that are responsive to their needs and that conserve vehicle value and equipment investment. The employees of Fleet Services are based out of one facility and provide service and centralized fleet management services for more than 1,400 vehicles and related pieces of equipment.
FTEs
2015 Actual 2016 Actual 2017 Actual 2018 Budget 2019 Proposed
Total FTEs 36.00 36.00 35.00 39.00 39.00
Expenditures:
2015 Actual 2016 Actual 2017 Actual 2018 Budget 2019 Proposed
Capital Outlay 38,387 3,158 40,567 50,000 50,000
Interfund Charges 1,237,005 1,286,778 1,099,144 1,332,953 1,221,055
Reserve for Budget Adjustment 0 0 0 200,000 200,000
Transfers Out 292,085 642,613 620,715 678,081 578,081
Wages & Benefits 3,038,146 3,016,449 3,139,818 3,540,474 3,644,006
Supplies & Services 5,817,483 6,304,000 7,526,858 6,292,772 6,443,594
Debt Services 0 0 0 0 0
All Other 0 0 2,067 0 0
TOTAL 10,423,106 11,252,998 12,429,169 12,094,280 12,136,736
Expenditure Notes:
Revenues:
2015 Actual 2016 Actual 2017 Actual 2018 Budget 2019 Proposed
Taxes 0 0 0 0 0
Licenses & Permits 0 0 0 0 0
IG Revenue 0 1,674 0 0 0
Services 10,281,026 11,434,140 12,576,442 12,143,465 12,805,970
Fines & Forfeits 0 0 0 0 0
Operating Transfers In 0 0 0 0 0
General Fund Resources 0 0 0 0 0One Vision. One Plan. One Voice.
Public Works26

Department Summary: Fleet Services
Division: Public Works
Fund Type: Internal Service Fund
Executive Summary:
Fleet Services manages a suite of centralized maintenance, procurement, disposal, and record keeping services for City of Spokane departments that utilize vehicles and equipment to fulfill their missions.
Programs and Services:
Fleet Services provides city departments and some external customers with safe, reliable, economical and environmentally sound transportation and related support services that are responsive to their needs and that conserve vehicle value and equipment investment. The employees of Fleet Services are based out of one facility and provide service and centralized fleet management services for more than 1,400 vehicles and related pieces of equipment.
FTEs
2015 Actual 2016 Actual 2017 Actual 2018 Budget 2019 Proposed
Total FTEs 36.00 36.00 35.00 39.00 39.00
Expenditures:
2015 Actual 2016 Actual 2017 Actual 2018 Budget 2019 Proposed
Capital Outlay 38,387 3,158 40,567 50,000 50,000
Interfund Charges 1,237,005 1,286,778 1,099,144 1,332,953 1,221,055
Reserve for Budget Adjustment 0 0 0 200,000 200,000
Transfers Out 292,085 642,613 620,715 678,081 578,081
Wages & Benefits 3,038,146 3,016,449 3,139,818 3,540,474 3,644,006
Supplies & Services 5,817,483 6,304,000 7,526,858 6,292,772 6,443,594
Debt Services 0 0 0 0 0
All Other 0 0 2,067 0 0
TOTAL 10,423,106 11,252,998 12,429,169 12,094,280 12,136,736
Expenditure Notes:
Revenues:
2015 Actual 2016 Actual 2017 Actual 2018 Budget 2019 Proposed
Taxes 0 0 0 0 0
Licenses & Permits 0 0 0 0 0
IG Revenue 0 1,674 0 0 0
Services 10,281,026 11,434,140 12,576,442 12,143,465 12,805,970
Fines & Forfeits 0 0 0 0 0
Operating Transfers In 0 0 0 0 0
General Fund Resources 0 0 0 0 0
All Other 216,020 30,137 9,357 14,550 3,550
TOTAL 10,497,046 11,465,951 12,585,799 12,158,015 12,809,520
Revenue Notes:
Public Works 27
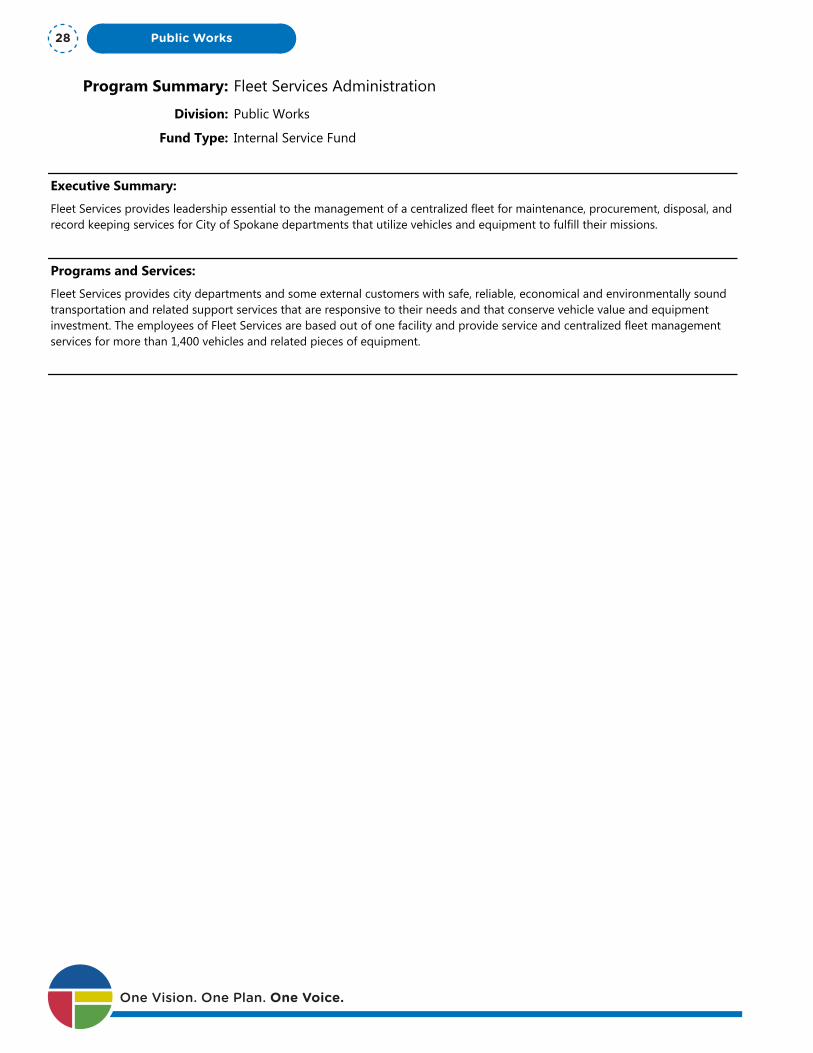
Program Summary: Fleet Services Administration
Division: Public Works
Fund Type: Internal Service Fund
Executive Summary:
Fleet Services provides leadership essential to the management of a centralized fleet for maintenance, procurement, disposal, and record keeping services for City of Spokane departments that utilize vehicles and equipment to fulfill their missions.
Programs and Services:
Fleet Services provides city departments and some external customers with safe, reliable, economical and environmentally sound transportation and related support services that are responsive to their needs and that conserve vehicle value and equipment investment. The employees of Fleet Services are based out of one facility and provide service and centralized fleet management services for more than 1,400 vehicles and related pieces of equipment.
FTEs
2015 Actual 2016 Actual 2017 Actual 2018 Budget 2019 Proposed
Total FTEs 11.00 11.00 10.00 10.00 10.00
Expenditures:
2015 Actual 2016 Actual 2017 Actual 2018 Budget 2019 Proposed
Capital Outlay 0 0 0 0 0
Interfund Charges 1,230,767 1,163,673 977,519 1,322,753 1,220,855
Reserve for Budget Adjustment 0 0 0 200,000 200,000
Transfers Out 2,914 44 0 0 0
Wages & Benefits 970,961 1,044,916 953,492 972,924 1,005,330
Supplies & Services 463,475 218,964 239,173 241,073 368,827
Debt Services 0 0 0 0 0
All Other 0 0 0 0 0
TOTAL 2,668,117 2,427,597 2,170,184 2,736,750 2,795,012
Expenditure Notes:
2019 supplies now includes minor tools and equipment moved from operations and maintenance program.
Revenues:
2015 Actual 2016 Actual 2017 Actual 2018 Budget 2019 Proposed
Taxes 0 0 0 0 0
Licenses & Permits 0 0 0 0 0
IG Revenue 0 0 0 0 0
Services 0 0 0 0 0
Fines & Forfeits 0 0 0 0 0
Operating Transfers In 0 0 0 0 0
General Fund Resources 0 0 0 0 0One Vision. One Plan. One Voice.
Public Works28
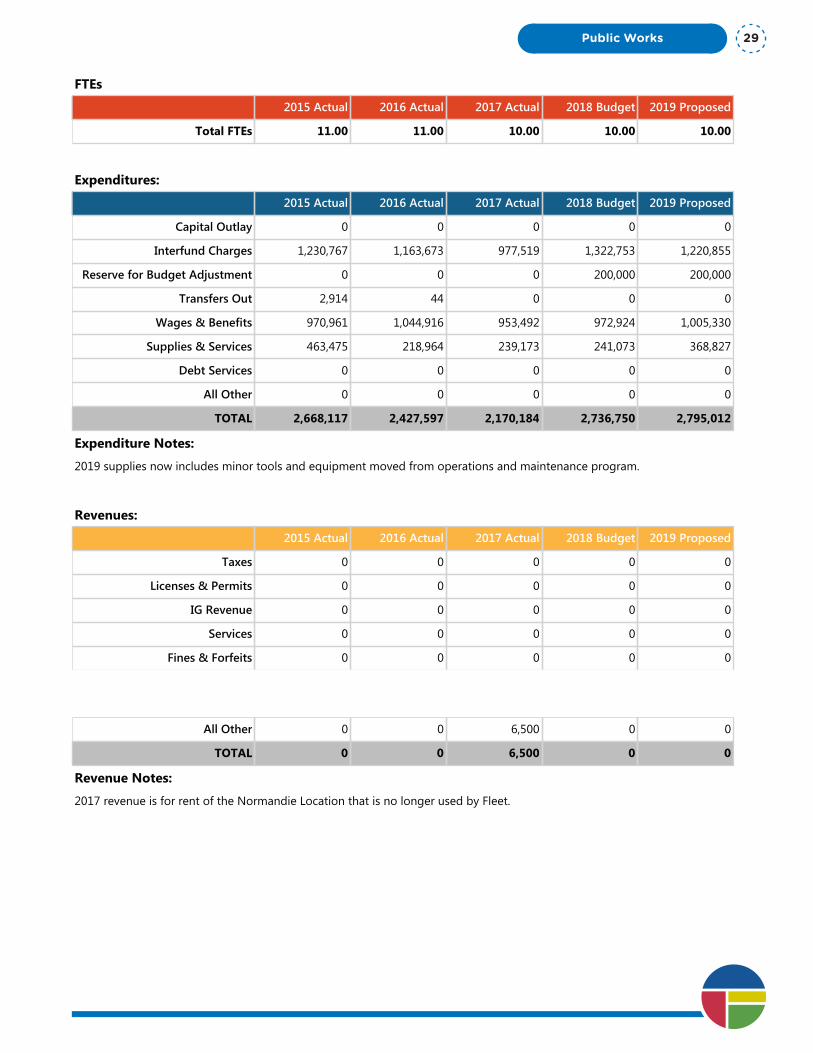
Program Summary: Fleet Services Administration
Division: Public Works
Fund Type: Internal Service Fund
Executive Summary:
Fleet Services provides leadership essential to the management of a centralized fleet for maintenance, procurement, disposal, and record keeping services for City of Spokane departments that utilize vehicles and equipment to fulfill their missions.
Programs and Services:
Fleet Services provides city departments and some external customers with safe, reliable, economical and environmentally sound transportation and related support services that are responsive to their needs and that conserve vehicle value and equipment investment. The employees of Fleet Services are based out of one facility and provide service and centralized fleet management services for more than 1,400 vehicles and related pieces of equipment.
FTEs
2015 Actual 2016 Actual 2017 Actual 2018 Budget 2019 Proposed
Total FTEs 11.00 11.00 10.00 10.00 10.00
Expenditures:
2015 Actual 2016 Actual 2017 Actual 2018 Budget 2019 Proposed
Capital Outlay 0 0 0 0 0
Interfund Charges 1,230,767 1,163,673 977,519 1,322,753 1,220,855
Reserve for Budget Adjustment 0 0 0 200,000 200,000
Transfers Out 2,914 44 0 0 0
Wages & Benefits 970,961 1,044,916 953,492 972,924 1,005,330
Supplies & Services 463,475 218,964 239,173 241,073 368,827
Debt Services 0 0 0 0 0
All Other 0 0 0 0 0
TOTAL 2,668,117 2,427,597 2,170,184 2,736,750 2,795,012
Expenditure Notes:
2019 supplies now includes minor tools and equipment moved from operations and maintenance program.
Revenues:
2015 Actual 2016 Actual 2017 Actual 2018 Budget 2019 Proposed
Taxes 0 0 0 0 0
Licenses & Permits 0 0 0 0 0
IG Revenue 0 0 0 0 0
Services 0 0 0 0 0
Fines & Forfeits 0 0 0 0 0
Operating Transfers In 0 0 0 0 0
General Fund Resources 0 0 0 0 0
All Other 0 0 6,500 0 0
TOTAL 0 0 6,500 0 0
Revenue Notes:
2017 revenue is for rent of the Normandie Location that is no longer used by Fleet.
Public Works 29

Program Summary: Fleet Services Operations & Maintenance
Division: Public Works
Fund Type: Internal Service Fund
Executive Summary:
Fleet Services provides centralized fleet management, maintenance, procurement, disposal, and record keeping services for City of Spokane departments that utilize vehicles and equipment to fulfill their missions.
Programs and Services:
Fleet Services is an internal services fund that ensures the highest quality of service, efficiency and reliability of vehicle and equipment maintenance through the implementation of a full-range of maintenance programs.
Fleet Services provides City departments and some external customers with safe, reliable, economical and environmentally sound transportation and related support services that are responsive to their needs and that conserve vehicle value and equipment investment. The employees of Fleet Services are based out of one facility and provide service and centralized fleet management services for more than 1,400 vehicles and related pieces of equipment.
FTEs
2015 Actual 2016 Actual 2017 Actual 2018 Budget 2019 Proposed
Total FTEs 25.00 25.00 25.00 29.00 29.00
Expenditures:
2015 Actual 2016 Actual 2017 Actual 2018 Budget 2019 Proposed
Capital Outlay 21,061 3,158 40,567 50,000 50,000
Interfund Charges 1,578 110,270 113,556 0 0
Reserve for Budget Adjustment 0 0 0 0 0
Transfers Out 289,171 642,569 620,715 678,081 578,081
Wages & Benefits 2,055,336 1,971,533 2,186,326 2,567,550 2,638,676
Supplies & Services 3,975,041 4,392,752 5,556,536 3,809,955 3,832,948
Debt Services 0 0 0 0 0
All Other 0 0 2,067 0 0
TOTAL 6,342,187 7,120,282 8,519,767 7,105,586 7,099,705
Expenditure Notes:
Revenues:
2015 Actual 2016 Actual 2017 Actual 2018 Budget 2019 Proposed
Taxes 0 0 0 0 0
Licenses & Permits 0 0 0 0 0
IG Revenue 0 1,674 0 0 0
Services 8,657,429 9,319,209 10,601,092 8,953,465 10,298,480One Vision. One Plan. One Voice.
Public Works30

Program Summary: Fleet Services Operations & Maintenance
Division: Public Works
Fund Type: Internal Service Fund
Executive Summary:
Fleet Services provides centralized fleet management, maintenance, procurement, disposal, and record keeping services for City of Spokane departments that utilize vehicles and equipment to fulfill their missions.
Programs and Services:
Fleet Services is an internal services fund that ensures the highest quality of service, efficiency and reliability of vehicle and equipment maintenance through the implementation of a full-range of maintenance programs.
Fleet Services provides City departments and some external customers with safe, reliable, economical and environmentally sound transportation and related support services that are responsive to their needs and that conserve vehicle value and equipment investment. The employees of Fleet Services are based out of one facility and provide service and centralized fleet management services for more than 1,400 vehicles and related pieces of equipment.
FTEs
2015 Actual 2016 Actual 2017 Actual 2018 Budget 2019 Proposed
Total FTEs 25.00 25.00 25.00 29.00 29.00
Expenditures:
2015 Actual 2016 Actual 2017 Actual 2018 Budget 2019 Proposed
Capital Outlay 21,061 3,158 40,567 50,000 50,000
Interfund Charges 1,578 110,270 113,556 0 0
Reserve for Budget Adjustment 0 0 0 0 0
Transfers Out 289,171 642,569 620,715 678,081 578,081
Wages & Benefits 2,055,336 1,971,533 2,186,326 2,567,550 2,638,676
Supplies & Services 3,975,041 4,392,752 5,556,536 3,809,955 3,832,948
Debt Services 0 0 0 0 0
All Other 0 0 2,067 0 0
TOTAL 6,342,187 7,120,282 8,519,767 7,105,586 7,099,705
Expenditure Notes:
Revenues:
2015 Actual 2016 Actual 2017 Actual 2018 Budget 2019 Proposed
Taxes 0 0 0 0 0
Licenses & Permits 0 0 0 0 0
IG Revenue 0 1,674 0 0 0
Services 8,657,429 9,319,209 10,601,092 8,953,465 10,298,480
Fines & Forfeits 0 0 0 0 0
Operating Transfers In 0 0 0 0 0
General Fund Resources 0 0 0 0 0
All Other 216,020 9,820 2,857 14,550 3,550
TOTAL 8,873,449 9,330,703 10,603,949 8,968,015 10,302,030
Revenue Notes:
Public Works 31
Program Summary: Fuel/Wash Site-Broadway
Division: Public Works
Fund Type: Internal Service Fund
Executive Summary:
Fleet Services provides city departments and some external customers with safe, reliable, economical and environmentally sound transportation and related support services that are responsive to their needs and that conserve vehicle value and equipment investment.
Programs and Services:
Fleet Services provides city departments and some external customers with fuel and wash site at Broadway.
FTEs
2015 Actual 2016 Actual 2017 Actual 2018 Budget 2019 Proposed
Total FTEs 0.00 0.00 0.00 0.00 0.00
Expenditures:
2015 Actual 2016 Actual 2017 Actual 2018 Budget 2019 Proposed
Capital Outlay 17,326 0 0 0 0
Interfund Charges 0 1,306 0 0 0
Reserve for Budget Adjustment 0 0 0 0 0
Transfers Out 0 0 0 0 0
Wages & Benefits 11,849 0 0 0 0
Supplies & Services 1,377,025 1,692,284 1,731,149 2,239,844 2,233,319
Debt Services 0 0 0 0 0
All Other 0 0 0 0 0
TOTAL 1,406,200 1,693,590 1,731,149 2,239,844 2,233,319
Expenditure Notes:
Revenues:
2015 Actual 2016 Actual 2017 Actual 2018 Budget 2019 Proposed
Taxes 0 0 0 0 0
Licenses & Permits 0 0 0 0 0
IG Revenue 0 0 0 0 0
Services 1,604,694 2,098,149 1,957,833 3,175,000 2,492,490
Fines & Forfeits 0 0 0 0 0
Operating Transfers In 0 0 0 0 0
General Fund Resources 0 0 0 0 0
All Other 0 20,317 0 0 0One Vision. One Plan. One Voice.
Public Works32

Program Summary: Fuel/Wash Site-Broadway
Division: Public Works
Fund Type: Internal Service Fund
Executive Summary:
Fleet Services provides city departments and some external customers with safe, reliable, economical and environmentally sound transportation and related support services that are responsive to their needs and that conserve vehicle value and equipment investment.
Programs and Services:
Fleet Services provides city departments and some external customers with fuel and wash site at Broadway.
FTEs
2015 Actual 2016 Actual 2017 Actual 2018 Budget 2019 Proposed
Total FTEs 0.00 0.00 0.00 0.00 0.00
Expenditures:
2015 Actual 2016 Actual 2017 Actual 2018 Budget 2019 Proposed
Capital Outlay 17,326 0 0 0 0
Interfund Charges 0 1,306 0 0 0
Reserve for Budget Adjustment 0 0 0 0 0
Transfers Out 0 0 0 0 0
Wages & Benefits 11,849 0 0 0 0
Supplies & Services 1,377,025 1,692,284 1,731,149 2,239,844 2,233,319
Debt Services 0 0 0 0 0
All Other 0 0 0 0 0
TOTAL 1,406,200 1,693,590 1,731,149 2,239,844 2,233,319
Expenditure Notes:
Revenues:
2015 Actual 2016 Actual 2017 Actual 2018 Budget 2019 Proposed
Taxes 0 0 0 0 0
Licenses & Permits 0 0 0 0 0
IG Revenue 0 0 0 0 0
Services 1,604,694 2,098,149 1,957,833 3,175,000 2,492,490
Fines & Forfeits 0 0 0 0 0
Operating Transfers In 0 0 0 0 0
General Fund Resources 0 0 0 0 0
All Other 0 20,317 0 0 0
TOTAL 1,604,694 2,118,466 1,957,833 3,175,000 2,492,490
Revenue Notes:
Public Works 33
Program Summary: Motor Pool
Division: Public Works
Fund Type: Internal Service Fund
Executive Summary:
Fleet Services provides city departments and some external customers with safe, reliable, economical and environmentally sound transportation and related support services that are responsive to their needs and that conserve vehicle value and equipment investment.
Programs and Services:
Fleet Services provides city departments and some external customers with motor pool vehicles that are safe, reliable, economical and environmentally sound transportation. As well as related support services that are responsive to their needs and that conserve vehicle value and equipment investment.
FTEs
2015 Actual 2016 Actual 2017 Actual 2018 Budget 2019 Proposed
Total FTEs 0.00 0.00 0.00 0.00 0.00
Expenditures:
2015 Actual 2016 Actual 2017 Actual 2018 Budget 2019 Proposed
Capital Outlay 0 0 0 0 0
Interfund Charges 4,660 11,529 8,069 10,200 200
Reserve for Budget Adjustment 0 0 0 0 0
Transfers Out 0 0 0 0 0
Wages & Benefits 0 0 0 0 0
Supplies & Services 1,942 0 0 1,900 8,500
Debt Services 0 0 0 0 0
All Other 0 0 0 0 0
TOTAL 6,602 11,529 8,069 12,100 8,700
Expenditure Notes:
Revenues:
2015 Actual 2016 Actual 2017 Actual 2018 Budget 2019 Proposed
Taxes 0 0 0 0 0
Licenses & Permits 0 0 0 0 0
IG Revenue 0 0 0 0 0
Services 18,903 16,782 17,517 15,000 15,000
Fines & Forfeits 0 0 0 0 0
Operating Transfers In 0 0 0 0 0
General Fund Resources 0 0 0 0 0One Vision. One Plan. One Voice.
Public Works34

Program Summary: Motor Pool
Division: Public Works
Fund Type: Internal Service Fund
Executive Summary:
Fleet Services provides city departments and some external customers with safe, reliable, economical and environmentally sound transportation and related support services that are responsive to their needs and that conserve vehicle value and equipment investment.
Programs and Services:
Fleet Services provides city departments and some external customers with motor pool vehicles that are safe, reliable, economical and environmentally sound transportation. As well as related support services that are responsive to their needs and that conserve vehicle value and equipment investment.
FTEs
2015 Actual 2016 Actual 2017 Actual 2018 Budget 2019 Proposed
Total FTEs 0.00 0.00 0.00 0.00 0.00
Expenditures:
2015 Actual 2016 Actual 2017 Actual 2018 Budget 2019 Proposed
Capital Outlay 0 0 0 0 0
Interfund Charges 4,660 11,529 8,069 10,200 200
Reserve for Budget Adjustment 0 0 0 0 0
Transfers Out 0 0 0 0 0
Wages & Benefits 0 0 0 0 0
Supplies & Services 1,942 0 0 1,900 8,500
Debt Services 0 0 0 0 0
All Other 0 0 0 0 0
TOTAL 6,602 11,529 8,069 12,100 8,700
Expenditure Notes:
Revenues:
2015 Actual 2016 Actual 2017 Actual 2018 Budget 2019 Proposed
Taxes 0 0 0 0 0
Licenses & Permits 0 0 0 0 0
IG Revenue 0 0 0 0 0
Services 18,903 16,782 17,517 15,000 15,000
Fines & Forfeits 0 0 0 0 0
Operating Transfers In 0 0 0 0 0
General Fund Resources 0 0 0 0 0
All Other 0 0 0 0 0
TOTAL 18,903 16,782 17,517 15,000 15,000
Revenue Notes:
Public Works 35

One Vision. One Plan. One Voice.
Public Works36
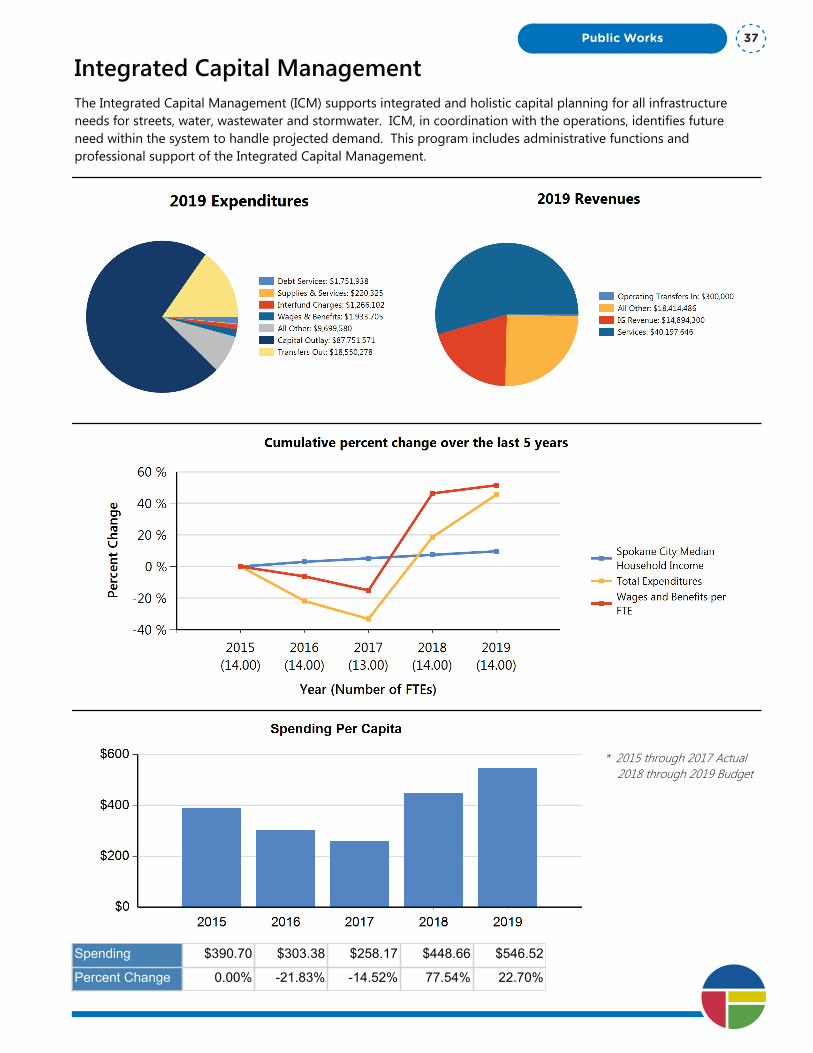
Integrated Capital ManagementThe Integrated Capital Management (ICM) supports integrated and holistic capital planning for all infrastructure needs for streets, water, wastewater and stormwater. ICM, in coordination with the operations, identifies future need within the system to handle projected demand. This program includes administrative functions and professional support of the Integrated Capital Management.
* 2015 through 2017 Actual 2018 through 2019 Budget
Spending $390.70 $303.38 $258.17 $448.66 $546.52
Percent Change 0.00% -21.83% -14.52% 77.54% 22.70%
Public Works 37
Department Summary: Integrated Capital Management
Division: Public Works
Fund Type: Enterprise Fund
Executive Summary:
The Integrated Capital Management (ICM) supports integrated and holistic capital planning for all infrastructure needs for streets, water, wastewater and stormwater. ICM, in coordination with the operations, identifies future need within the system to handle projected demand. This program includes administrative functions and professional support of the Integrated Capital Management.
Programs and Services:
The Integrated Capital Management Department coordinates and prioritizes all the interrelated infrastructure requirements within the city’s right of way. This program also manages all the capital projects for water and wastewater outside of the right of way. This includes major upgrades at the City’s Riverside Park Water Reclamation Facility and at Upriver Dam.
FTEs
2015 Actual 2016 Actual 2017 Actual 2018 Budget 2019 Proposed
Total FTEs 14.00 14.00 13.00 14.00 14.00
Expenditures:
2015 Actual 2016 Actual 2017 Actual 2018 Budget 2019 Proposed
Capital Outlay 33,075,615 17,301,613 12,244,663 66,018,150 87,751,571
Interfund Charges 649,320 840,275 1,398,653 1,073,208 1,266,102
Reserve for Budget Adjustment 0 0 0 0 0
Transfers Out 40,775,616 35,913,940 30,631,838 18,551,778 18,550,278
Wages & Benefits 1,332,667 1,249,453 1,057,744 1,838,961 1,933,705
Supplies & Services 145,690 2,249,629 212,894 1,177,220 220,325
Debt Services 0 17,149 649,232 1,506,578 1,751,938
All Other 7,280,205 7,503,934 9,426,219 8,584,825 9,699,580
TOTAL 83,259,113 65,075,993 55,621,243 98,750,720 121,173,499
Expenditure Notes:
All other includes excise taxes on utility revenues paid to Department of Revenue.
Revenues:
2015 Actual 2016 Actual 2017 Actual 2018 Budget 2019 Proposed
Taxes 0 0 0 0 0
Licenses & Permits 0 0 0 0 0
IG Revenue 638,615 1,178,412 1,321,806 7,243,500 14,894,300
Services 35,023,482 36,876,995 39,073,977 38,138,514 40,197,646
Fines & Forfeits 0 0 0 0 0
Operating Transfers In 0 0 0 960,000 300,000One Vision. One Plan. One Voice.
Public Works38

Department Summary: Integrated Capital Management
Division: Public Works
Fund Type: Enterprise Fund
Executive Summary:
The Integrated Capital Management (ICM) supports integrated and holistic capital planning for all infrastructure needs for streets, water, wastewater and stormwater. ICM, in coordination with the operations, identifies future need within the system to handle projected demand. This program includes administrative functions and professional support of the Integrated Capital Management.
Programs and Services:
The Integrated Capital Management Department coordinates and prioritizes all the interrelated infrastructure requirements within the city’s right of way. This program also manages all the capital projects for water and wastewater outside of the right of way. This includes major upgrades at the City’s Riverside Park Water Reclamation Facility and at Upriver Dam.
FTEs
2015 Actual 2016 Actual 2017 Actual 2018 Budget 2019 Proposed
Total FTEs 14.00 14.00 13.00 14.00 14.00
Expenditures:
2015 Actual 2016 Actual 2017 Actual 2018 Budget 2019 Proposed
Capital Outlay 33,075,615 17,301,613 12,244,663 66,018,150 87,751,571
Interfund Charges 649,320 840,275 1,398,653 1,073,208 1,266,102
Reserve for Budget Adjustment 0 0 0 0 0
Transfers Out 40,775,616 35,913,940 30,631,838 18,551,778 18,550,278
Wages & Benefits 1,332,667 1,249,453 1,057,744 1,838,961 1,933,705
Supplies & Services 145,690 2,249,629 212,894 1,177,220 220,325
Debt Services 0 17,149 649,232 1,506,578 1,751,938
All Other 7,280,205 7,503,934 9,426,219 8,584,825 9,699,580
TOTAL 83,259,113 65,075,993 55,621,243 98,750,720 121,173,499
Expenditure Notes:
All other includes excise taxes on utility revenues paid to Department of Revenue.
Revenues:
2015 Actual 2016 Actual 2017 Actual 2018 Budget 2019 Proposed
Taxes 0 0 0 0 0
Licenses & Permits 0 0 0 0 0
IG Revenue 638,615 1,178,412 1,321,806 7,243,500 14,894,300
Services 35,023,482 36,876,995 39,073,977 38,138,514 40,197,646
Fines & Forfeits 0 0 0 0 0
Operating Transfers In 0 0 0 960,000 300,000
General Fund Resources 0 0 0 0 0
All Other 10,874,867 11,943,325 19,700,822 33,269,099 18,414,486
TOTAL 46,536,964 49,998,732 60,096,605 79,611,113 73,806,432
Revenue Notes:
Public Works 39
Program Summary: Capital Department of Ecology - Clean Water
Division: Public Works
Fund Type: Enterprise Fund
Executive Summary:
The Capital Department Ecology - Clean Water supports the grants received from the Department of Ecology related to Clean Water projects. These are vital to projects that improve and protect water quality through Water/Wastewater and stormwater infrastructure.
Programs and Services:
The Integrated Capital Management Department coordinates and prioritizes all the interrelated infrastructure requirements within the City’s right of way. The Capital Department Ecology - Clean Water supports the grants received from the Department of Ecology related to Clean Water projects. These are vital to projects that improve and protect water quality through Water/Wastewater and stormwater infrastructure.
FTEs
2015 Actual 2016 Actual 2017 Actual 2018 Budget 2019 Proposed
Total FTEs 0.00 0.00 0.00 0.00 0.00
Expenditures:
2015 Actual 2016 Actual 2017 Actual 2018 Budget 2019 Proposed
Capital Outlay 0 0 6,095,392 0 10,876,346
Interfund Charges 0 0 0 0 0
Reserve for Budget Adjustment 0 0 0 0 0
Transfers Out 0 0 0 0 0
Wages & Benefits 0 0 0 0 0
Supplies & Services 0 0 0 0 0
Debt Services 0 0 0 0 0
All Other 0 0 0 0 0
TOTAL 0 0 6,095,392 0 10,876,346
Expenditure Notes:
Newer program to track Ecology funded projects. Began using in 2017 but not budgeted for until 2019.
Revenues:
2015 Actual 2016 Actual 2017 Actual 2018 Budget 2019 Proposed
Taxes 0 0 0 0 0
Licenses & Permits 0 0 0 0 0
IG Revenue 0 0 517,866 0 4,847,300
Services 0 0 0 0 0
Fines & Forfeits 0 0 0 0 0
Operating Transfers In 0 0 0 0 0One Vision. One Plan. One Voice.
Public Works40

Program Summary: Capital Department of Ecology - Clean Water
Division: Public Works
Fund Type: Enterprise Fund
Executive Summary:
The Capital Department Ecology - Clean Water supports the grants received from the Department of Ecology related to Clean Water projects. These are vital to projects that improve and protect water quality through Water/Wastewater and stormwater infrastructure.
Programs and Services:
The Integrated Capital Management Department coordinates and prioritizes all the interrelated infrastructure requirements within the City’s right of way. The Capital Department Ecology - Clean Water supports the grants received from the Department of Ecology related to Clean Water projects. These are vital to projects that improve and protect water quality through Water/Wastewater and stormwater infrastructure.
FTEs
2015 Actual 2016 Actual 2017 Actual 2018 Budget 2019 Proposed
Total FTEs 0.00 0.00 0.00 0.00 0.00
Expenditures:
2015 Actual 2016 Actual 2017 Actual 2018 Budget 2019 Proposed
Capital Outlay 0 0 6,095,392 0 10,876,346
Interfund Charges 0 0 0 0 0
Reserve for Budget Adjustment 0 0 0 0 0
Transfers Out 0 0 0 0 0
Wages & Benefits 0 0 0 0 0
Supplies & Services 0 0 0 0 0
Debt Services 0 0 0 0 0
All Other 0 0 0 0 0
TOTAL 0 0 6,095,392 0 10,876,346
Expenditure Notes:
Newer program to track Ecology funded projects. Began using in 2017 but not budgeted for until 2019.
Revenues:
2015 Actual 2016 Actual 2017 Actual 2018 Budget 2019 Proposed
Taxes 0 0 0 0 0
Licenses & Permits 0 0 0 0 0
IG Revenue 0 0 517,866 0 4,847,300
Services 0 0 0 0 0
Fines & Forfeits 0 0 0 0 0
Operating Transfers In 0 0 0 0 0
General Fund Resources 0 0 0 0 0
All Other 0 0 2,450,401 0 6,066,546
TOTAL 0 0 2,968,267 0 10,913,846
Revenue Notes:
Newer program to track Ecology funded projects. Began using in 2017 but not budgeted for until 2019.
Public Works 41
Program Summary: Capital Department of Health - Drinking Water
Division: Public Works
Fund Type: Enterprise Fund
Executive Summary:
The Capital Department Health - Drinking Water supports the grants received from the Department of Health related to water infrastructure projects. These are vital to projects that ensure clean drinking water through water infrastructure.
Programs and Services:
The Integrated Capital Management Department coordinates and prioritizes all the interrelated infrastructure requirements within the City’s right of way. The Capital Department Health – Drinking Water supports the grants received from the Department of Health related to drinking water projects. These are vital to projects that provide clean drinking water through water infrastructure.
FTEs
2015 Actual 2016 Actual 2017 Actual 2018 Budget 2019 Proposed
Total FTEs 0.00 0.00 0.00 0.00 0.00
Expenditures:
2015 Actual 2016 Actual 2017 Actual 2018 Budget 2019 Proposed
Capital Outlay 0 411,519 970,025 0 0
Interfund Charges 0 0 0 0 0
Reserve for Budget Adjustment 0 0 0 0 0
Transfers Out 0 0 0 0 0
Wages & Benefits 0 0 0 0 0
Supplies & Services 0 0 0 0 0
Debt Services 0 0 0 0 0
All Other 0 0 0 0 0
TOTAL 0 411,519 970,025 0 0
Expenditure Notes:
Revenues:
2015 Actual 2016 Actual 2017 Actual 2018 Budget 2019 Proposed
Taxes 0 0 0 0 0
Licenses & Permits 0 0 0 0 0
IG Revenue 0 0 0 0 0
Services 0 0 0 0 0
Fines & Forfeits 0 0 0 0 0
Operating Transfers In 0 0 0 0 0
General Fund Resources 0 0 0 0 0One Vision. One Plan. One Voice.
Public Works42
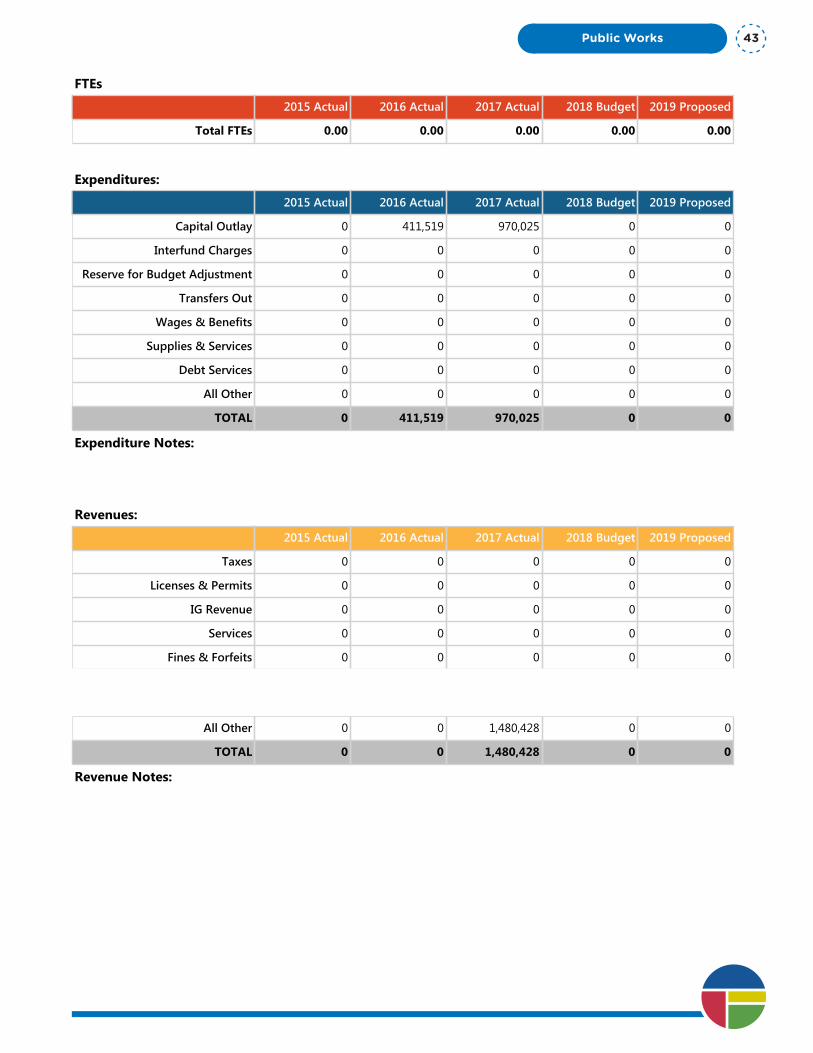
Program Summary: Capital Department of Health - Drinking Water
Division: Public Works
Fund Type: Enterprise Fund
Executive Summary:
The Capital Department Health - Drinking Water supports the grants received from the Department of Health related to water infrastructure projects. These are vital to projects that ensure clean drinking water through water infrastructure.
Programs and Services:
The Integrated Capital Management Department coordinates and prioritizes all the interrelated infrastructure requirements within the City’s right of way. The Capital Department Health – Drinking Water supports the grants received from the Department of Health related to drinking water projects. These are vital to projects that provide clean drinking water through water infrastructure.
FTEs
2015 Actual 2016 Actual 2017 Actual 2018 Budget 2019 Proposed
Total FTEs 0.00 0.00 0.00 0.00 0.00
Expenditures:
2015 Actual 2016 Actual 2017 Actual 2018 Budget 2019 Proposed
Capital Outlay 0 411,519 970,025 0 0
Interfund Charges 0 0 0 0 0
Reserve for Budget Adjustment 0 0 0 0 0
Transfers Out 0 0 0 0 0
Wages & Benefits 0 0 0 0 0
Supplies & Services 0 0 0 0 0
Debt Services 0 0 0 0 0
All Other 0 0 0 0 0
TOTAL 0 411,519 970,025 0 0
Expenditure Notes:
Revenues:
2015 Actual 2016 Actual 2017 Actual 2018 Budget 2019 Proposed
Taxes 0 0 0 0 0
Licenses & Permits 0 0 0 0 0
IG Revenue 0 0 0 0 0
Services 0 0 0 0 0
Fines & Forfeits 0 0 0 0 0
Operating Transfers In 0 0 0 0 0
General Fund Resources 0 0 0 0 0
All Other 0 0 1,480,428 0 0
TOTAL 0 0 1,480,428 0 0
Revenue Notes:
Public Works 43

Program Summary: Capital Sewer
Division: Public Works
Fund Type: Enterprise Fund
Executive Summary:
The Integrated Capital Management (ICM) supports integrated and holistic capital planning for all infrastructure needs for streets, water, wastewater and stormwater. ICM, in coordination with wastewater operations, identifies future need within the system to handle projected demand. Resulting capital projects are developed by ICM. This program funds capital wastewater infrastructure.
Programs and Services:
The Integrated Capital Management Department coordinates and prioritizes all the interrelated capital infrastructure requirements within the city’s wastewater system. The resulting program provides individual scope, schedule and funding for each capital wastewater project. This program manages all the capital construction for wastewater needs, including projects for the collection system and upgrades at the Riverside Park Water Reclamation Facility.
FTEs
2015 Actual 2016 Actual 2017 Actual 2018 Budget 2019 Proposed
Total FTEs 0.00 0.00 0.00 0.00 0.00
Expenditures:
2015 Actual 2016 Actual 2017 Actual 2018 Budget 2019 Proposed
Capital Outlay 6,663,265 3,714,246 1,239,475 35,446,150 50,318,911
Interfund Charges 0 0 0 0 0
Reserve for Budget Adjustment 0 0 0 0 0
Transfers Out 0 0 0 0 0
Wages & Benefits 0 0 0 0 0
Supplies & Services 0 0 0 0 0
Debt Services 0 0 0 0 0
All Other 0 0 0 0 0
TOTAL 6,663,265 3,714,246 1,239,475 35,446,150 50,318,911
Expenditure Notes:
Revenues:
2015 Actual 2016 Actual 2017 Actual 2018 Budget 2019 Proposed
Taxes 0 0 0 0 0
Licenses & Permits 0 0 0 0 0
IG Revenue 558,015 0 8,937 2,797,000 2,250,000
Services 0 0 0 0 0
Fines & Forfeits 0 0 0 0 0One Vision. One Plan. One Voice.
Public Works44

Program Summary: Capital Sewer
Division: Public Works
Fund Type: Enterprise Fund
Executive Summary:
The Integrated Capital Management (ICM) supports integrated and holistic capital planning for all infrastructure needs for streets, water, wastewater and stormwater. ICM, in coordination with wastewater operations, identifies future need within the system to handle projected demand. Resulting capital projects are developed by ICM. This program funds capital wastewater infrastructure.
Programs and Services:
The Integrated Capital Management Department coordinates and prioritizes all the interrelated capital infrastructure requirements within the city’s wastewater system. The resulting program provides individual scope, schedule and funding for each capital wastewater project. This program manages all the capital construction for wastewater needs, including projects for the collection system and upgrades at the Riverside Park Water Reclamation Facility.
FTEs
2015 Actual 2016 Actual 2017 Actual 2018 Budget 2019 Proposed
Total FTEs 0.00 0.00 0.00 0.00 0.00
Expenditures:
2015 Actual 2016 Actual 2017 Actual 2018 Budget 2019 Proposed
Capital Outlay 6,663,265 3,714,246 1,239,475 35,446,150 50,318,911
Interfund Charges 0 0 0 0 0
Reserve for Budget Adjustment 0 0 0 0 0
Transfers Out 0 0 0 0 0
Wages & Benefits 0 0 0 0 0
Supplies & Services 0 0 0 0 0
Debt Services 0 0 0 0 0
All Other 0 0 0 0 0
TOTAL 6,663,265 3,714,246 1,239,475 35,446,150 50,318,911
Expenditure Notes:
Revenues:
2015 Actual 2016 Actual 2017 Actual 2018 Budget 2019 Proposed
Taxes 0 0 0 0 0
Licenses & Permits 0 0 0 0 0
IG Revenue 558,015 0 8,937 2,797,000 2,250,000
Services 0 0 0 0 0
Fines & Forfeits 0 0 0 0 0
Operating Transfers In 0 0 0 0 0
General Fund Resources 0 0 0 0 0
All Other 7,456,854 1,904,711 3,042,313 1,645,430 0
TOTAL 8,014,869 1,904,711 3,051,250 4,442,430 2,250,000
Revenue Notes:
Public Works 45

Program Summary: Capital Stormwater
Division: Public Works
Fund Type: Enterprise Fund
Executive Summary:
The Integrated Capital Management (ICM) supports integrated and holistic capital planning for all infrastructure needs for streets, water, wastewater and stormwater. ICM, in coordination with stormwater operations, identifies future need within the system to handle projected demand. Resulting capital projects are developed by ICM. This program funds capital stormwater infrastructure.
Programs and Services:
The Integrated Capital Management Department coordinates and prioritizes all the interrelated capital infrastructure requirements within the city’s stormwater system. The resulting program provides individual scope, schedule and funding for each capital stormwater project. This program manages all the capital construction for stormwater needs, including projects for the collection system and upgrades at the Riverside Park Water Reclamation Facility.
FTEs
2015 Actual 2016 Actual 2017 Actual 2018 Budget 2019 Proposed
Total FTEs 0.00 0.00 0.00 0.00 0.00
Expenditures:
2015 Actual 2016 Actual 2017 Actual 2018 Budget 2019 Proposed
Capital Outlay 2,230,711 3,100,894 283,696 9,963,000 5,217,227
Interfund Charges 0 0 0 0 0
Reserve for Budget Adjustment 0 0 0 0 0
Transfers Out 0 0 0 0 0
Wages & Benefits 0 0 0 0 0
Supplies & Services 0 0 0 0 0
Debt Services 0 0 0 0 0
All Other 0 0 0 0 0
TOTAL 2,230,711 3,100,894 283,696 9,963,000 5,217,227
Expenditure Notes:
Revenues:
2015 Actual 2016 Actual 2017 Actual 2018 Budget 2019 Proposed
Taxes 0 0 0 0 0
Licenses & Permits 0 0 0 0 0
IG Revenue 80,600 755,304 525,209 2,996,500 0
Services 0 0 0 0 0
Fines & Forfeits 0 0 0 0 0One Vision. One Plan. One Voice.
Public Works46

Program Summary: Capital Stormwater
Division: Public Works
Fund Type: Enterprise Fund
Executive Summary:
The Integrated Capital Management (ICM) supports integrated and holistic capital planning for all infrastructure needs for streets, water, wastewater and stormwater. ICM, in coordination with stormwater operations, identifies future need within the system to handle projected demand. Resulting capital projects are developed by ICM. This program funds capital stormwater infrastructure.
Programs and Services:
The Integrated Capital Management Department coordinates and prioritizes all the interrelated capital infrastructure requirements within the city’s stormwater system. The resulting program provides individual scope, schedule and funding for each capital stormwater project. This program manages all the capital construction for stormwater needs, including projects for the collection system and upgrades at the Riverside Park Water Reclamation Facility.
FTEs
2015 Actual 2016 Actual 2017 Actual 2018 Budget 2019 Proposed
Total FTEs 0.00 0.00 0.00 0.00 0.00
Expenditures:
2015 Actual 2016 Actual 2017 Actual 2018 Budget 2019 Proposed
Capital Outlay 2,230,711 3,100,894 283,696 9,963,000 5,217,227
Interfund Charges 0 0 0 0 0
Reserve for Budget Adjustment 0 0 0 0 0
Transfers Out 0 0 0 0 0
Wages & Benefits 0 0 0 0 0
Supplies & Services 0 0 0 0 0
Debt Services 0 0 0 0 0
All Other 0 0 0 0 0
TOTAL 2,230,711 3,100,894 283,696 9,963,000 5,217,227
Expenditure Notes:
Revenues:
2015 Actual 2016 Actual 2017 Actual 2018 Budget 2019 Proposed
Taxes 0 0 0 0 0
Licenses & Permits 0 0 0 0 0
IG Revenue 80,600 755,304 525,209 2,996,500 0
Services 0 0 0 0 0
Fines & Forfeits 0 0 0 0 0
Operating Transfers In 0 0 0 0 0
General Fund Resources 0 0 0 0 0
All Other 213,261 5,600,604 1,563,315 1,900,000 0
TOTAL 293,861 6,355,908 2,088,524 4,896,500 0
Revenue Notes:
Public Works 47

Program Summary: Capital Water
Division: Public Works
Fund Type: Enterprise Fund
Executive Summary:
The Integrated Capital Management (ICM) supports integrated and holistic capital planning for all infrastructure needs for streets, water, wastewater and stormwater. ICM, in coordination with water operations, identifies future need within the system to handle projected demand. Resulting capital projects are developed by ICM. This program funds capital water infrastructure.
Programs and Services:
The Integrated Capital Management Department coordinates and prioritizes all the interrelated capital infrastructure requirements within the city’s water system. The resulting program provides individual scope, schedule and funding for each capital water project. Projects include design and construction within the right of way and outside of it, including upgrades at Upriver Dam.
FTEs
2015 Actual 2016 Actual 2017 Actual 2018 Budget 2019 Proposed
Total FTEs 0.00 0.00 0.00 0.00 0.00
Expenditures:
2015 Actual 2016 Actual 2017 Actual 2018 Budget 2019 Proposed
Capital Outlay 7,001,744 7,845,638 1,737,846 12,079,000 19,478,000
Interfund Charges 0 0 0 0 0
Reserve for Budget Adjustment 0 0 0 0 0
Transfers Out 0 0 0 0 0
Wages & Benefits 0 0 0 0 0
Supplies & Services 0 0 0 0 0
Debt Services 0 0 0 0 0
All Other 0 0 0 0 0
TOTAL 7,001,744 7,845,638 1,737,846 12,079,000 19,478,000
Expenditure Notes:
Increase in water main, storage system and well & booster station projects in 2019.
Revenues:
2015 Actual 2016 Actual 2017 Actual 2018 Budget 2019 Proposed
Taxes 0 0 0 0 0
Licenses & Permits 0 0 0 0 0
IG Revenue 0 0 0 550,000 7,797,000
Services 0 0 0 0 0
Fines & Forfeits 0 0 0 0 0
Operating Transfers In 0 0 0 0 0One Vision. One Plan. One Voice.
Public Works48
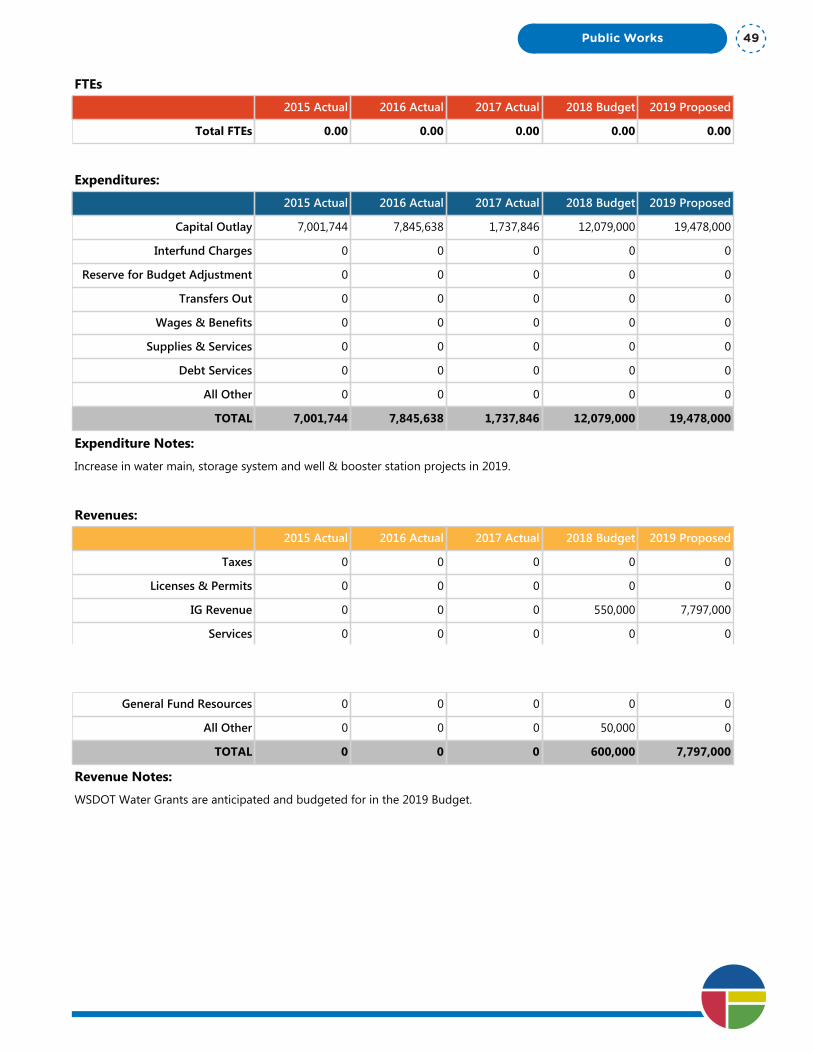
Program Summary: Capital Water
Division: Public Works
Fund Type: Enterprise Fund
Executive Summary:
The Integrated Capital Management (ICM) supports integrated and holistic capital planning for all infrastructure needs for streets, water, wastewater and stormwater. ICM, in coordination with water operations, identifies future need within the system to handle projected demand. Resulting capital projects are developed by ICM. This program funds capital water infrastructure.
Programs and Services:
The Integrated Capital Management Department coordinates and prioritizes all the interrelated capital infrastructure requirements within the city’s water system. The resulting program provides individual scope, schedule and funding for each capital water project. Projects include design and construction within the right of way and outside of it, including upgrades at Upriver Dam.
FTEs
2015 Actual 2016 Actual 2017 Actual 2018 Budget 2019 Proposed
Total FTEs 0.00 0.00 0.00 0.00 0.00
Expenditures:
2015 Actual 2016 Actual 2017 Actual 2018 Budget 2019 Proposed
Capital Outlay 7,001,744 7,845,638 1,737,846 12,079,000 19,478,000
Interfund Charges 0 0 0 0 0
Reserve for Budget Adjustment 0 0 0 0 0
Transfers Out 0 0 0 0 0
Wages & Benefits 0 0 0 0 0
Supplies & Services 0 0 0 0 0
Debt Services 0 0 0 0 0
All Other 0 0 0 0 0
TOTAL 7,001,744 7,845,638 1,737,846 12,079,000 19,478,000
Expenditure Notes:
Increase in water main, storage system and well & booster station projects in 2019.
Revenues:
2015 Actual 2016 Actual 2017 Actual 2018 Budget 2019 Proposed
Taxes 0 0 0 0 0
Licenses & Permits 0 0 0 0 0
IG Revenue 0 0 0 550,000 7,797,000
Services 0 0 0 0 0
Fines & Forfeits 0 0 0 0 0
Operating Transfers In 0 0 0 0 0
General Fund Resources 0 0 0 0 0
All Other 0 0 0 50,000 0
TOTAL 0 0 0 600,000 7,797,000
Revenue Notes:
WSDOT Water Grants are anticipated and budgeted for in the 2019 Budget.
Public Works 49
Program Summary: ICM Administration
Division: Public Works
Fund Type: Enterprise Fund
Executive Summary:
The Integrated Capital Management (ICM) supports integrated and holistic capital planning for all infrastructure needs for streets, water, wastewater and stormwater. ICM, in coordination with the operations, identifies future need within the system to handle projected demand. This program includes administrative functions and professional support of the Integrated Capital Management.
Programs and Services:
The Integrated Capital Management Department coordinates and prioritizes all the interrelated infrastructure requirements within the city’s right of way. This program also manages all the capital projects for water and wastewater outside of the right of way. This includes major upgrades at the City’s Riverside Park Water Reclamation Facility and at Upriver Dam. In summary, this fund includes: departmental staff, production expenses and actual capital dollars. These resources essentially fund our department's operations and allow us to model, scope, schedule, and budget city infrastructure through an integrated approach. In addition to administrative and professional support expenses, this program also includes payment of City and State taxes on the department's revenues.
FTEs
2015 Actual 2016 Actual 2017 Actual 2018 Budget 2019 Proposed
Total FTEs 14.00 14.00 13.00 14.00 14.00
Expenditures:
2015 Actual 2016 Actual 2017 Actual 2018 Budget 2019 Proposed
Capital Outlay 15,302 0 210,352 0 50,000
Interfund Charges 649,320 840,275 1,398,653 1,073,208 1,266,102
Reserve for Budget Adjustment 0 0 0 0 0
Transfers Out 40,775,616 35,913,940 30,631,838 18,551,778 18,550,278
Wages & Benefits 1,332,667 1,249,453 1,057,744 1,838,961 1,933,705
Supplies & Services 145,690 2,249,629 212,894 1,177,220 220,325
Debt Services 0 17,149 0 1,506,578 1,751,938
All Other 7,280,205 7,503,934 9,426,219 8,584,825 9,699,580
TOTAL 50,198,800 47,774,380 42,937,700 32,732,570 33,471,928
Expenditure Notes:
All other includes excise taxes paid on Utility Revenue paid to Department of Revenue
Revenues:
2015 Actual 2016 Actual 2017 Actual 2018 Budget 2019 Proposed
Taxes 0 0 0 0 0
Licenses & Permits 0 0 0 0 0
IG Revenue 0 0 0 0 0One Vision. One Plan. One Voice.
Public Works50
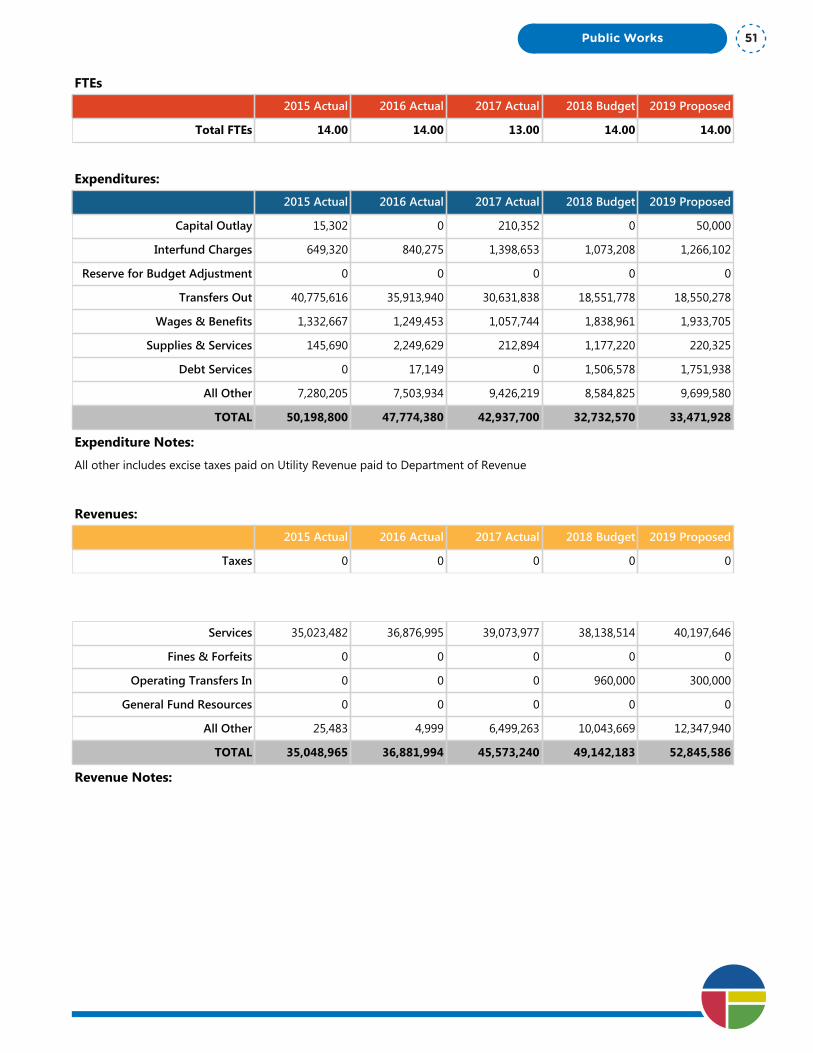
Program Summary: ICM Administration
Division: Public Works
Fund Type: Enterprise Fund
Executive Summary:
The Integrated Capital Management (ICM) supports integrated and holistic capital planning for all infrastructure needs for streets, water, wastewater and stormwater. ICM, in coordination with the operations, identifies future need within the system to handle projected demand. This program includes administrative functions and professional support of the Integrated Capital Management.
Programs and Services:
The Integrated Capital Management Department coordinates and prioritizes all the interrelated infrastructure requirements within the city’s right of way. This program also manages all the capital projects for water and wastewater outside of the right of way. This includes major upgrades at the City’s Riverside Park Water Reclamation Facility and at Upriver Dam. In summary, this fund includes: departmental staff, production expenses and actual capital dollars. These resources essentially fund our department's operations and allow us to model, scope, schedule, and budget city infrastructure through an integrated approach. In addition to administrative and professional support expenses, this program also includes payment of City and State taxes on the department's revenues.
FTEs
2015 Actual 2016 Actual 2017 Actual 2018 Budget 2019 Proposed
Total FTEs 14.00 14.00 13.00 14.00 14.00
Expenditures:
2015 Actual 2016 Actual 2017 Actual 2018 Budget 2019 Proposed
Capital Outlay 15,302 0 210,352 0 50,000
Interfund Charges 649,320 840,275 1,398,653 1,073,208 1,266,102
Reserve for Budget Adjustment 0 0 0 0 0
Transfers Out 40,775,616 35,913,940 30,631,838 18,551,778 18,550,278
Wages & Benefits 1,332,667 1,249,453 1,057,744 1,838,961 1,933,705
Supplies & Services 145,690 2,249,629 212,894 1,177,220 220,325
Debt Services 0 17,149 0 1,506,578 1,751,938
All Other 7,280,205 7,503,934 9,426,219 8,584,825 9,699,580
TOTAL 50,198,800 47,774,380 42,937,700 32,732,570 33,471,928
Expenditure Notes:
All other includes excise taxes paid on Utility Revenue paid to Department of Revenue
Revenues:
2015 Actual 2016 Actual 2017 Actual 2018 Budget 2019 Proposed
Taxes 0 0 0 0 0
Licenses & Permits 0 0 0 0 0
IG Revenue 0 0 0 0 0
Services 35,023,482 36,876,995 39,073,977 38,138,514 40,197,646
Fines & Forfeits 0 0 0 0 0
Operating Transfers In 0 0 0 960,000 300,000
General Fund Resources 0 0 0 0 0
All Other 25,483 4,999 6,499,263 10,043,669 12,347,940
TOTAL 35,048,965 36,881,994 45,573,240 49,142,183 52,845,586
Revenue Notes:
Public Works 51

Program Summary: Major CSO Projects
Division: Public Works
Fund Type: Enterprise Fund
Executive Summary:
The City is committed through its Integrated Clean Water Plan and NPDES permit to limit combine sewer outflows to the river. One of the solutions to limit outflows is to construct several combine sewer overflow (CSO) tanks to capture CSO during storm events.
Programs and Services:
All major CSO tank projects have been designed and are in process of being constructed All CSO tanks are expected to be operational by the end of 2019.
FTEs
2015 Actual 2016 Actual 2017 Actual 2018 Budget 2019 Proposed
Total FTEs 0.00 0.00 0.00 0.00 0.00
Expenditures:
2015 Actual 2016 Actual 2017 Actual 2018 Budget 2019 Proposed
Capital Outlay 17,164,593 2,229,316 1,707,877 8,530,000 1,811,087
Interfund Charges 0 0 0 0 0
Reserve for Budget Adjustment 0 0 0 0 0
Transfers Out 0 0 0 0 0
Wages & Benefits 0 0 0 0 0
Supplies & Services 0 0 0 0 0
Debt Services 0 0 649,232 0 0
All Other 0 0 0 0 0
TOTAL 17,164,593 2,229,316 2,357,109 8,530,000 1,811,087
Expenditure Notes:
Revenues:
2015 Actual 2016 Actual 2017 Actual 2018 Budget 2019 Proposed
Taxes 0 0 0 0 0
Licenses & Permits 0 0 0 0 0
IG Revenue 0 423,108 269,794 900,000 0
Services 0 0 0 0 0
Fines & Forfeits 0 0 0 0 0
Operating Transfers In 0 0 0 0 0
General Fund Resources 0 0 0 0 0One Vision. One Plan. One Voice.
Public Works52
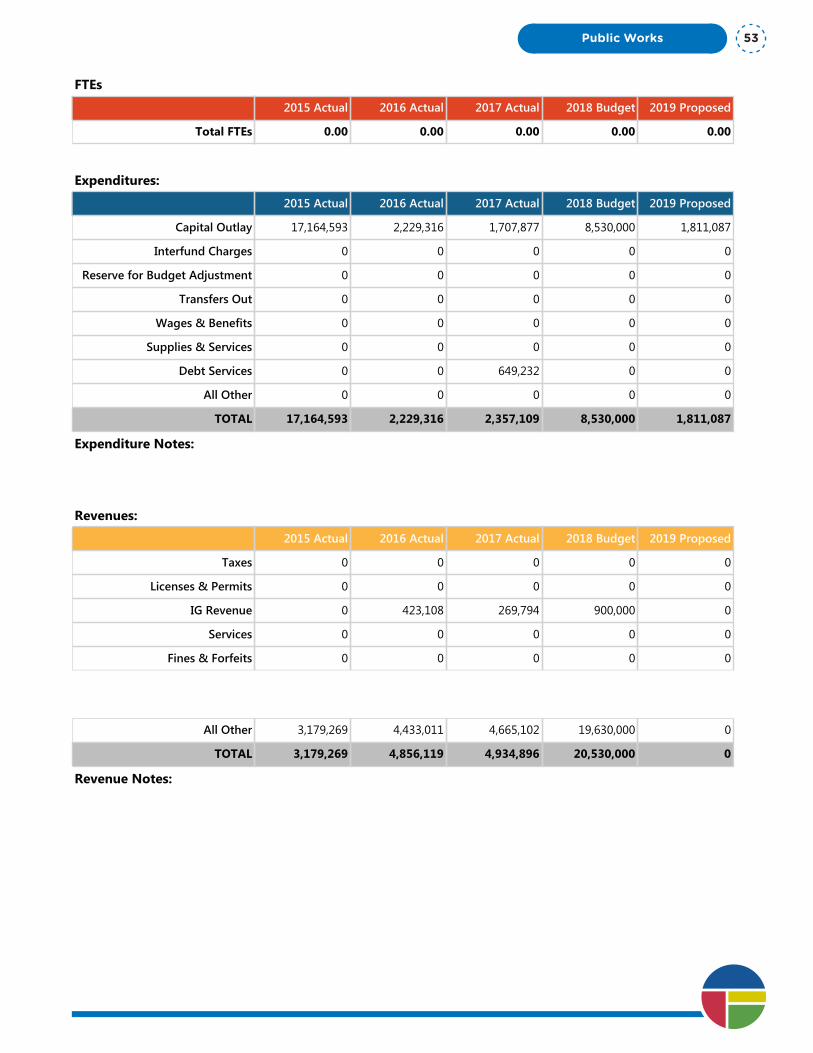
Program Summary: Major CSO Projects
Division: Public Works
Fund Type: Enterprise Fund
Executive Summary:
The City is committed through its Integrated Clean Water Plan and NPDES permit to limit combine sewer outflows to the river. One of the solutions to limit outflows is to construct several combine sewer overflow (CSO) tanks to capture CSO during storm events.
Programs and Services:
All major CSO tank projects have been designed and are in process of being constructed All CSO tanks are expected to be operational by the end of 2019.
FTEs
2015 Actual 2016 Actual 2017 Actual 2018 Budget 2019 Proposed
Total FTEs 0.00 0.00 0.00 0.00 0.00
Expenditures:
2015 Actual 2016 Actual 2017 Actual 2018 Budget 2019 Proposed
Capital Outlay 17,164,593 2,229,316 1,707,877 8,530,000 1,811,087
Interfund Charges 0 0 0 0 0
Reserve for Budget Adjustment 0 0 0 0 0
Transfers Out 0 0 0 0 0
Wages & Benefits 0 0 0 0 0
Supplies & Services 0 0 0 0 0
Debt Services 0 0 649,232 0 0
All Other 0 0 0 0 0
TOTAL 17,164,593 2,229,316 2,357,109 8,530,000 1,811,087
Expenditure Notes:
Revenues:
2015 Actual 2016 Actual 2017 Actual 2018 Budget 2019 Proposed
Taxes 0 0 0 0 0
Licenses & Permits 0 0 0 0 0
IG Revenue 0 423,108 269,794 900,000 0
Services 0 0 0 0 0
Fines & Forfeits 0 0 0 0 0
Operating Transfers In 0 0 0 0 0
General Fund Resources 0 0 0 0 0
All Other 3,179,269 4,433,011 4,665,102 19,630,000 0
TOTAL 3,179,269 4,856,119 4,934,896 20,530,000 0
Revenue Notes:
Public Works 53

One Vision. One Plan. One Voice.
Public Works54
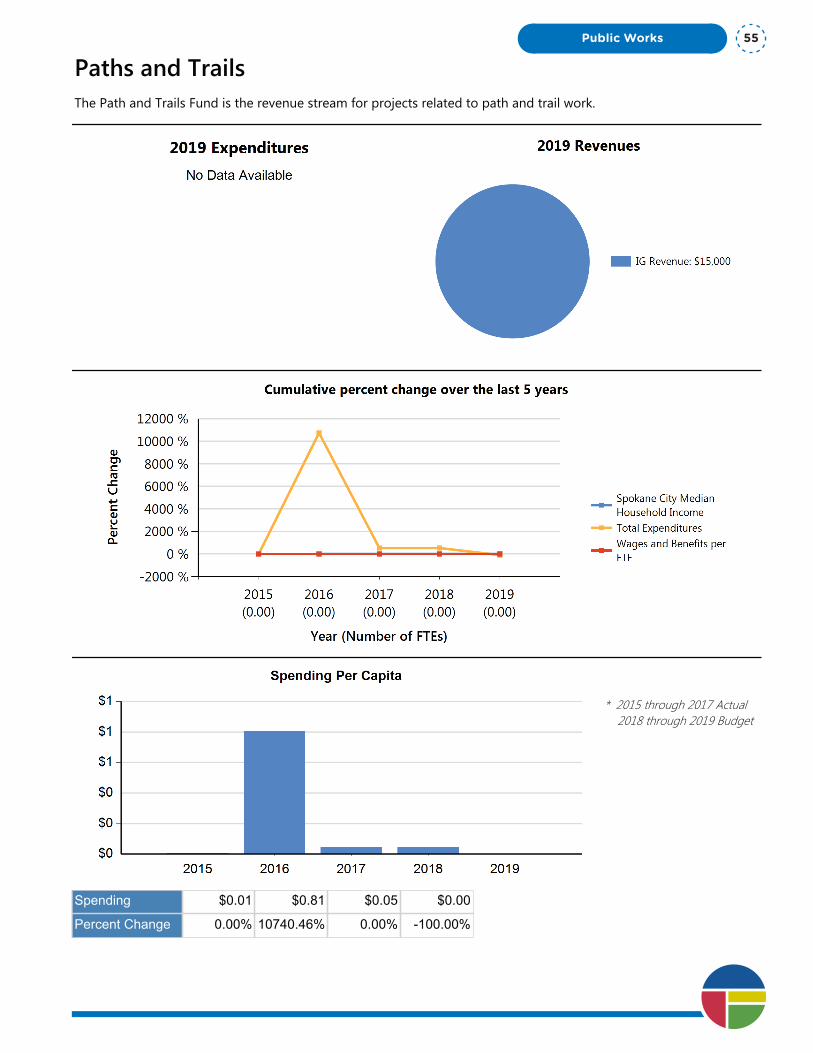
Paths and TrailsThe Path and Trails Fund is the revenue stream for projects related to path and trail work.
* 2015 through 2017 Actual 2018 through 2019 Budget
Spending $0.01 $0.81 $0.05 $0.00
Percent Change 0.00% 10740.46% 0.00% -100.00%
Public Works 55
Department Summary: Paths and Trails
Division: Public Works
Fund Type: Special Revenue Fund
Executive Summary:
The Path and Trails Fund is the revenue stream for projects related to path and trail work.
Programs and Services:
A portion of state gasoline tax revenue is returned to local governments to be used for the development and maintenance of paths and trails. One half of one percent (0.5%) of the tax is returned to the City. Presently, the City receives approximately $15,000 per year from this funding source. Both pedestrian and bike facilities can utilize these funds, however, historically these funds have been extremely limited. This revenue source has been used as matching funds, which are typically required from federal and state funding sources on minor pedestrian and or bike projects. Typically this bid has been used to cover incidental costs such as minor striping and signage replacement that support a bike or pedestrian facility.
FTEs
2015 Actual 2016 Actual 2017 Actual 2018 Budget 2019 Proposed
Total FTEs 0.00 0.00 0.00 0.00 0.00
Expenditures:
2015 Actual 2016 Actual 2017 Actual 2018 Budget 2019 Proposed
Capital Outlay 0 0 0 0 0
Interfund Charges 0 0 0 0 0
Reserve for Budget Adjustment 0 0 0 0 0
Transfers Out 0 172,788 10,000 10,000 0
Wages & Benefits 0 0 0 0 0
Supplies & Services 1,594 9 0 0 0
Debt Services 0 0 0 0 0
All Other 0 0 0 0 0
TOTAL 1,594 172,797 10,000 10,000 0
Expenditure Notes:
Currently there are no capital projects planned in Arterial Streets that will require funding from the Paths & Trails department in 2019.
Revenues:
2015 Actual 2016 Actual 2017 Actual 2018 Budget 2019 Proposed
Taxes 0 0 0 0 0
Licenses & Permits 0 0 0 0 0
IG Revenue 15,757 16,011 16,433 15,000 15,000
Services 0 0 0 0 0
Fines & Forfeits 0 0 0 0 0One Vision. One Plan. One Voice.
Public Works56
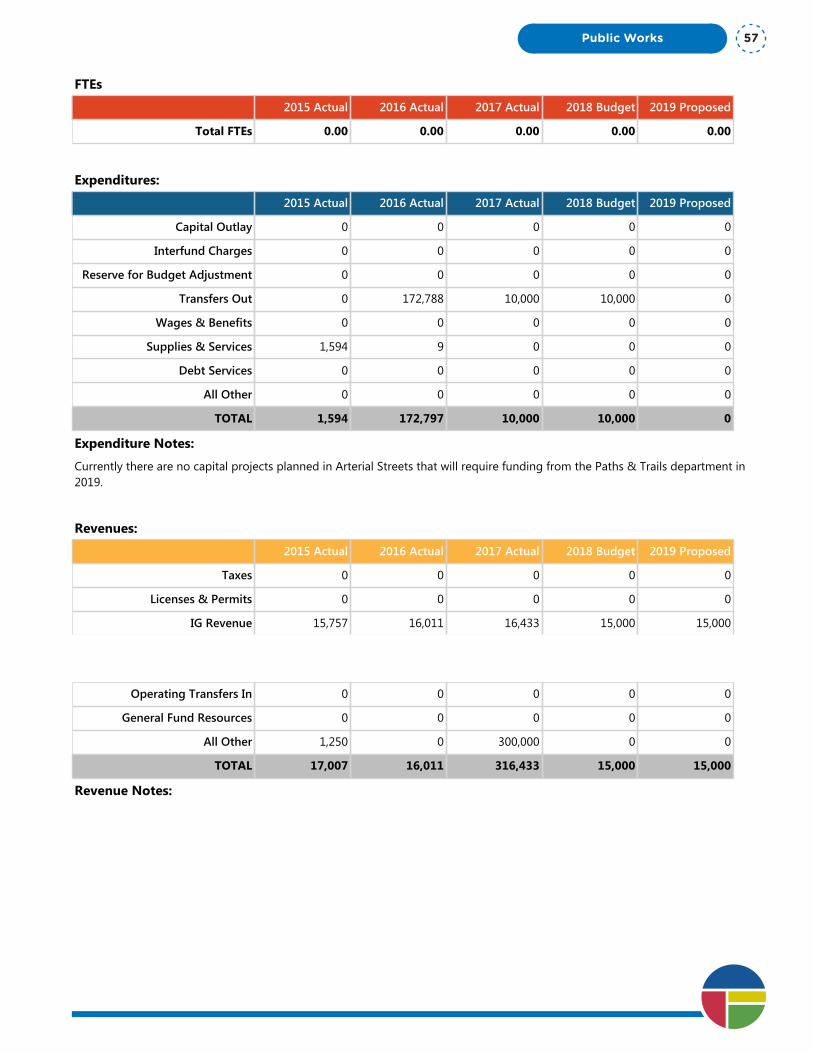
Department Summary: Paths and Trails
Division: Public Works
Fund Type: Special Revenue Fund
Executive Summary:
The Path and Trails Fund is the revenue stream for projects related to path and trail work.
Programs and Services:
A portion of state gasoline tax revenue is returned to local governments to be used for the development and maintenance of paths and trails. One half of one percent (0.5%) of the tax is returned to the City. Presently, the City receives approximately $15,000 per year from this funding source. Both pedestrian and bike facilities can utilize these funds, however, historically these funds have been extremely limited. This revenue source has been used as matching funds, which are typically required from federal and state funding sources on minor pedestrian and or bike projects. Typically this bid has been used to cover incidental costs such as minor striping and signage replacement that support a bike or pedestrian facility.
FTEs
2015 Actual 2016 Actual 2017 Actual 2018 Budget 2019 Proposed
Total FTEs 0.00 0.00 0.00 0.00 0.00
Expenditures:
2015 Actual 2016 Actual 2017 Actual 2018 Budget 2019 Proposed
Capital Outlay 0 0 0 0 0
Interfund Charges 0 0 0 0 0
Reserve for Budget Adjustment 0 0 0 0 0
Transfers Out 0 172,788 10,000 10,000 0
Wages & Benefits 0 0 0 0 0
Supplies & Services 1,594 9 0 0 0
Debt Services 0 0 0 0 0
All Other 0 0 0 0 0
TOTAL 1,594 172,797 10,000 10,000 0
Expenditure Notes:
Currently there are no capital projects planned in Arterial Streets that will require funding from the Paths & Trails department in 2019.
Revenues:
2015 Actual 2016 Actual 2017 Actual 2018 Budget 2019 Proposed
Taxes 0 0 0 0 0
Licenses & Permits 0 0 0 0 0
IG Revenue 15,757 16,011 16,433 15,000 15,000
Services 0 0 0 0 0
Fines & Forfeits 0 0 0 0 0
Operating Transfers In 0 0 0 0 0
General Fund Resources 0 0 0 0 0
All Other 1,250 0 300,000 0 0
TOTAL 17,007 16,011 316,433 15,000 15,000
Revenue Notes:
Public Works 57

One Vision. One Plan. One Voice.
Public Works58
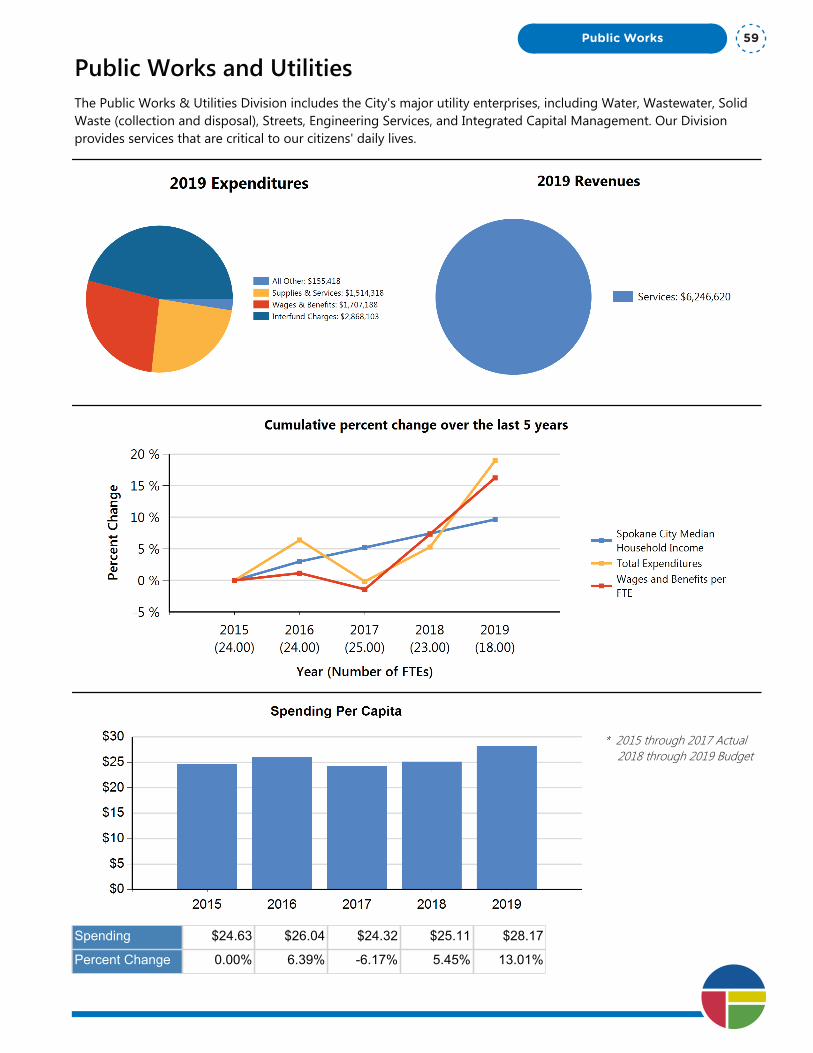
Public Works and UtilitiesThe Public Works & Utilities Division includes the City's major utility enterprises, including Water, Wastewater, Solid Waste (collection and disposal), Streets, Engineering Services, and Integrated Capital Management. Our Division provides services that are critical to our citizens' daily lives.
* 2015 through 2017 Actual 2018 through 2019 Budget
Spending $24.63 $26.04 $24.32 $25.11 $28.17
Percent Change 0.00% 6.39% -6.17% 5.45% 13.01%
Public Works 59
Department Summary: Public Works and Utilities
Division: Public Works
Fund Type: Internal Service Fund
Executive Summary:
The Public Works & Utilities Division includes the City's major utility enterprises, including Water, Wastewater, Solid Waste (collection and disposal), Streets, Engineering Services, and Integrated Capital Management. Our Division provides services that are critical to our citizens' daily lives.
Programs and Services:
The Public Works & Utilities Division leadership is driving meaningful change to provide exceptional services to our citizens. We are working to deliver the best value for the dollar in daily operations and in major capital construction that will serve our community for decades. The Division is working to address a series of environmental regulations, particularly the requirements of the federal Clean Water Act. We are taking an integrated approach to this work to create results that are environmentally and financially responsible. The Division is also focused on integrating utility work and stormwater management with street reconstruction and maintenance. Outcomes from these efforts will include significant above-ground benefits when underground utilities are upgraded, as well as other public improvements that will help drive economic investment in our community.
FTEs
2015 Actual 2016 Actual 2017 Actual 2018 Budget 2019 Proposed
Total FTEs 24.00 24.00 25.00 23.00 18.00
Expenditures:
2015 Actual 2016 Actual 2017 Actual 2018 Budget 2019 Proposed
Capital Outlay 1,372 2,156 0 0 0
Interfund Charges 1,851,054 1,930,046 2,228,741 2,260,826 2,868,103
Reserve for Budget Adjustment 0 0 0 0 0
Transfers Out 1,372 2,156 330 0 0
Wages & Benefits 1,950,005 1,972,465 2,001,910 2,002,712 1,707,188
Supplies & Services 1,286,676 1,531,745 863,654 1,106,853 1,514,318
Debt Services 0 0 0 0 0
All Other 158,550 145,994 145,223 155,418 155,418
TOTAL 5,249,029 5,584,562 5,239,858 5,525,809 6,245,027
Expenditure Notes:
Expenses in the All Other category are City Utility taxes and Washington State Excise taxes paid by the City of Spokane’s Utility Departments.
Revenues:
2015 Actual 2016 Actual 2017 Actual 2018 Budget 2019 Proposed
Taxes 0 0 0 0 0
Licenses & Permits 0 0 0 0 0
IG Revenue 0 0 0 0 0
Services 5,057,883 5,538,188 5,084,085 5,522,596 6,246,620One Vision. One Plan. One Voice.
Public Works60
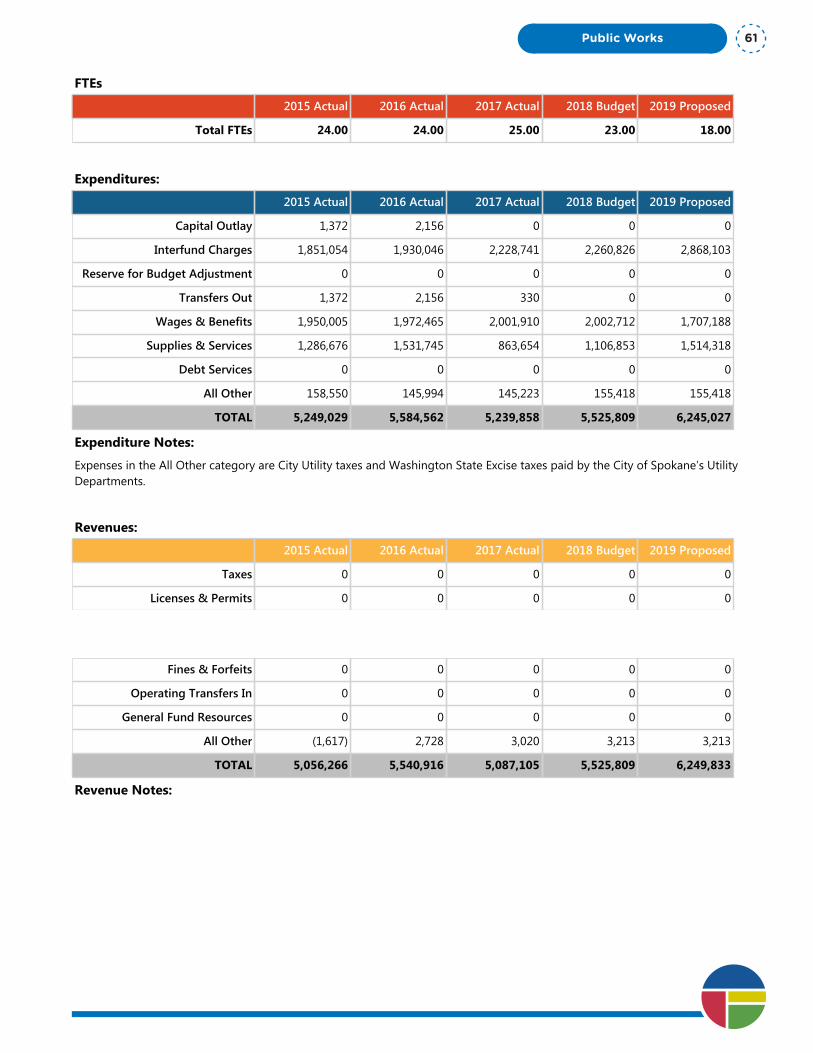
Department Summary: Public Works and Utilities
Division: Public Works
Fund Type: Internal Service Fund
Executive Summary:
The Public Works & Utilities Division includes the City's major utility enterprises, including Water, Wastewater, Solid Waste (collection and disposal), Streets, Engineering Services, and Integrated Capital Management. Our Division provides services that are critical to our citizens' daily lives.
Programs and Services:
The Public Works & Utilities Division leadership is driving meaningful change to provide exceptional services to our citizens. We are working to deliver the best value for the dollar in daily operations and in major capital construction that will serve our community for decades. The Division is working to address a series of environmental regulations, particularly the requirements of the federal Clean Water Act. We are taking an integrated approach to this work to create results that are environmentally and financially responsible. The Division is also focused on integrating utility work and stormwater management with street reconstruction and maintenance. Outcomes from these efforts will include significant above-ground benefits when underground utilities are upgraded, as well as other public improvements that will help drive economic investment in our community.
FTEs
2015 Actual 2016 Actual 2017 Actual 2018 Budget 2019 Proposed
Total FTEs 24.00 24.00 25.00 23.00 18.00
Expenditures:
2015 Actual 2016 Actual 2017 Actual 2018 Budget 2019 Proposed
Capital Outlay 1,372 2,156 0 0 0
Interfund Charges 1,851,054 1,930,046 2,228,741 2,260,826 2,868,103
Reserve for Budget Adjustment 0 0 0 0 0
Transfers Out 1,372 2,156 330 0 0
Wages & Benefits 1,950,005 1,972,465 2,001,910 2,002,712 1,707,188
Supplies & Services 1,286,676 1,531,745 863,654 1,106,853 1,514,318
Debt Services 0 0 0 0 0
All Other 158,550 145,994 145,223 155,418 155,418
TOTAL 5,249,029 5,584,562 5,239,858 5,525,809 6,245,027
Expenditure Notes:
Expenses in the All Other category are City Utility taxes and Washington State Excise taxes paid by the City of Spokane’s Utility Departments.
Revenues:
2015 Actual 2016 Actual 2017 Actual 2018 Budget 2019 Proposed
Taxes 0 0 0 0 0
Licenses & Permits 0 0 0 0 0
IG Revenue 0 0 0 0 0
Services 5,057,883 5,538,188 5,084,085 5,522,596 6,246,620
Fines & Forfeits 0 0 0 0 0
Operating Transfers In 0 0 0 0 0
General Fund Resources 0 0 0 0 0
All Other (1,617) 2,728 3,020 3,213 3,213
TOTAL 5,056,266 5,540,916 5,087,105 5,525,809 6,249,833
Revenue Notes:
Public Works 61

Program Summary: Customer Service
Division: Public Works
Fund Type: Internal Service Fund
Executive Summary:
Utility Billing consists of 3 sections including Customer Service, Bill Production/Proofing; and Credit/Collections. Utility Billing is responsible for the accurate billing and collection of the water, sewer, garbage, stormwater and capital rates. During 2017, the department billed an over 76,000 customers for rate revenue of more than $186 million.
Programs and Services:
Customer Service: The City of Spokane exists to serve our citizens. This workgroup is not only the frontline to answering calls and CRM request that come in from 3-1-1, refund requests, process/research returned mail and the input of closing requests.Bill Production/Proofing: Accurate, consistent and timely billing is a top priority. We strive to provide customers with bills that are easy to understand, helpful comparisons and comprehensive explanation of charges. This workgroup proofs data for daily billings imported from meter reads, refuse routes, etc. Service usage and consumption data errors reject bills being generated which requires staff to research, identify and correct before that bill can be issued. BP is also is responsible for billing of new construction, commercial sewer; repair/inspection orders, closing bill charge, etc. BP serves both the internal customers from multiple City departments providing public works services as well as the external customers.Credit and Collections: We must always be good stewards of public resources, and we have a responsibility to work to keep our customers current on payments. The offering of repayment arrangements and the collection of delinquent balances is critical for providing low cost services and reduction of adverse action such as service termination for the citizens of Spokane. This workgroup plays a key role in coordination of daily work to field staff, inbound calls and CRM responses, bankruptcy, foreclosure, payment arrangements, agency assistance, returned payments, inspection orders, field service orders, transfer of ownership and/or new tenant account processing, payment research and processing of payments.
FTEs
2015 Actual 2016 Actual 2017 Actual 2018 Budget 2019 Proposed
Total FTEs 21.00 21.00 21.00 19.00 14.00
Expenditures:
2015 Actual 2016 Actual 2017 Actual 2018 Budget 2019 Proposed
Capital Outlay 1,372 2,156 0 0 0
Interfund Charges 282 53,545 173,100 15,400 0
Reserve for Budget Adjustment 0 0 0 0 0
Transfers Out 1,372 2,156 330 0 0
Wages & Benefits 1,537,851 1,473,868 1,490,107 1,463,977 1,141,029
Supplies & Services 1,125,018 1,223,639 932,248 1,069,603 1,459,008
Debt Services 0 0 0 0 0
All Other 0 0 0 0 0
One Vision. One Plan. One Voice.
Public Works62
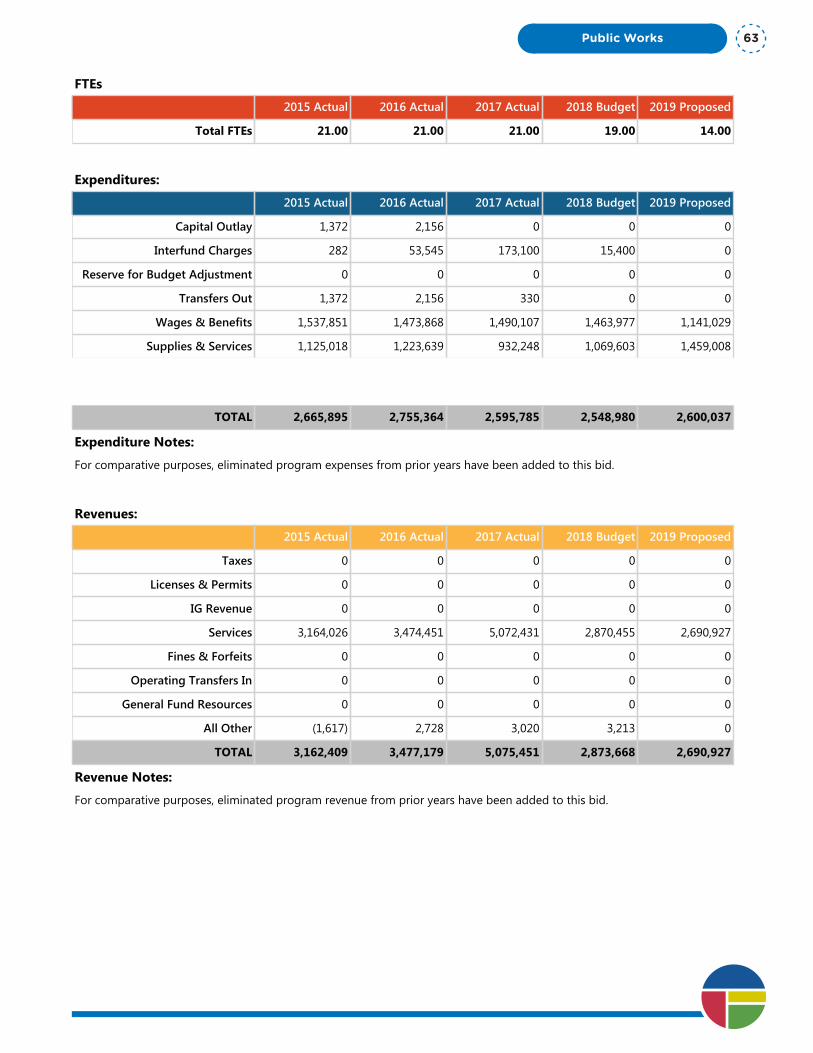
Program Summary: Customer Service
Division: Public Works
Fund Type: Internal Service Fund
Executive Summary:
Utility Billing consists of 3 sections including Customer Service, Bill Production/Proofing; and Credit/Collections. Utility Billing is responsible for the accurate billing and collection of the water, sewer, garbage, stormwater and capital rates. During 2017, the department billed an over 76,000 customers for rate revenue of more than $186 million.
Programs and Services:
Customer Service: The City of Spokane exists to serve our citizens. This workgroup is not only the frontline to answering calls and CRM request that come in from 3-1-1, refund requests, process/research returned mail and the input of closing requests.Bill Production/Proofing: Accurate, consistent and timely billing is a top priority. We strive to provide customers with bills that are easy to understand, helpful comparisons and comprehensive explanation of charges. This workgroup proofs data for daily billings imported from meter reads, refuse routes, etc. Service usage and consumption data errors reject bills being generated which requires staff to research, identify and correct before that bill can be issued. BP is also is responsible for billing of new construction, commercial sewer; repair/inspection orders, closing bill charge, etc. BP serves both the internal customers from multiple City departments providing public works services as well as the external customers.Credit and Collections: We must always be good stewards of public resources, and we have a responsibility to work to keep our customers current on payments. The offering of repayment arrangements and the collection of delinquent balances is critical for providing low cost services and reduction of adverse action such as service termination for the citizens of Spokane. This workgroup plays a key role in coordination of daily work to field staff, inbound calls and CRM responses, bankruptcy, foreclosure, payment arrangements, agency assistance, returned payments, inspection orders, field service orders, transfer of ownership and/or new tenant account processing, payment research and processing of payments.
FTEs
2015 Actual 2016 Actual 2017 Actual 2018 Budget 2019 Proposed
Total FTEs 21.00 21.00 21.00 19.00 14.00
Expenditures:
2015 Actual 2016 Actual 2017 Actual 2018 Budget 2019 Proposed
Capital Outlay 1,372 2,156 0 0 0
Interfund Charges 282 53,545 173,100 15,400 0
Reserve for Budget Adjustment 0 0 0 0 0
Transfers Out 1,372 2,156 330 0 0
Wages & Benefits 1,537,851 1,473,868 1,490,107 1,463,977 1,141,029
Supplies & Services 1,125,018 1,223,639 932,248 1,069,603 1,459,008
Debt Services 0 0 0 0 0
All Other 0 0 0 0 0
TOTAL 2,665,895 2,755,364 2,595,785 2,548,980 2,600,037
Expenditure Notes:
For comparative purposes, eliminated program expenses from prior years have been added to this bid.
Revenues:
2015 Actual 2016 Actual 2017 Actual 2018 Budget 2019 Proposed
Taxes 0 0 0 0 0
Licenses & Permits 0 0 0 0 0
IG Revenue 0 0 0 0 0
Services 3,164,026 3,474,451 5,072,431 2,870,455 2,690,927
Fines & Forfeits 0 0 0 0 0
Operating Transfers In 0 0 0 0 0
General Fund Resources 0 0 0 0 0
All Other (1,617) 2,728 3,020 3,213 0
TOTAL 3,162,409 3,477,179 5,075,451 2,873,668 2,690,927
Revenue Notes:
For comparative purposes, eliminated program revenue from prior years have been added to this bid.
Public Works 63
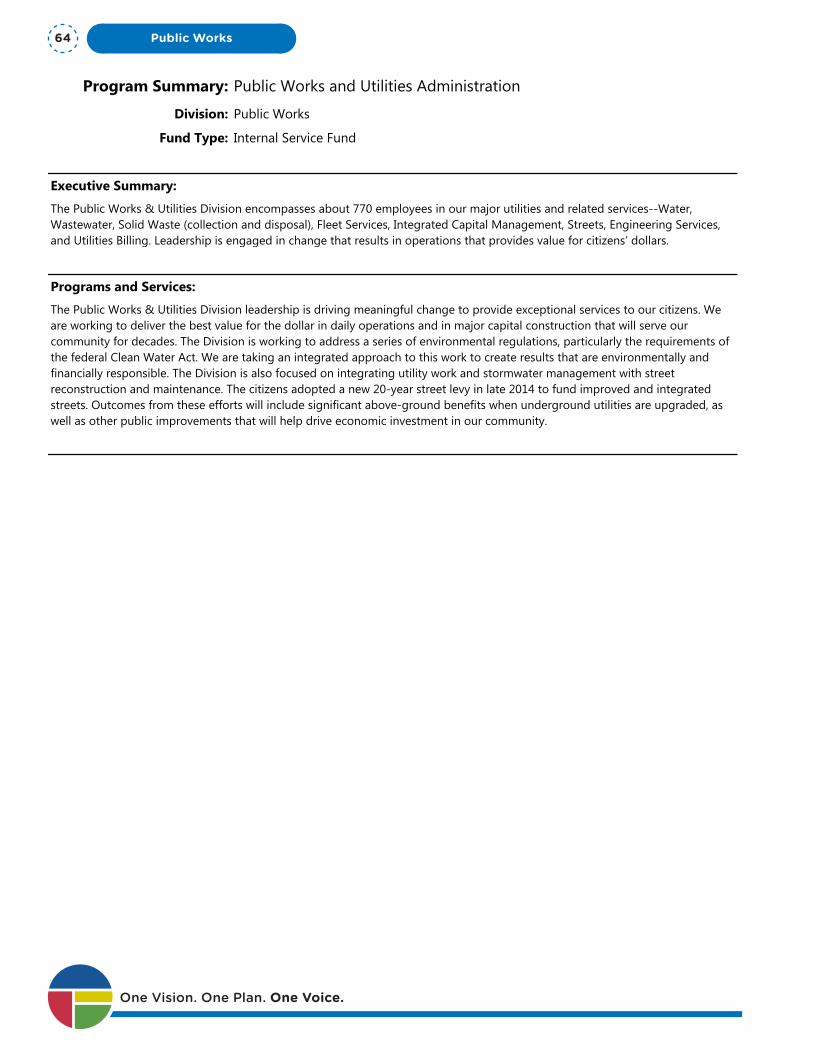
Program Summary: Public Works and Utilities Administration
Division: Public Works
Fund Type: Internal Service Fund
Executive Summary:
The Public Works & Utilities Division encompasses about 770 employees in our major utilities and related services--Water, Wastewater, Solid Waste (collection and disposal), Fleet Services, Integrated Capital Management, Streets, Engineering Services, and Utilities Billing. Leadership is engaged in change that results in operations that provides value for citizens’ dollars.
Programs and Services:
The Public Works & Utilities Division leadership is driving meaningful change to provide exceptional services to our citizens. We are working to deliver the best value for the dollar in daily operations and in major capital construction that will serve our community for decades. The Division is working to address a series of environmental regulations, particularly the requirements of the federal Clean Water Act. We are taking an integrated approach to this work to create results that are environmentally and financially responsible. The Division is also focused on integrating utility work and stormwater management with street reconstruction and maintenance. The citizens adopted a new 20-year street levy in late 2014 to fund improved and integrated streets. Outcomes from these efforts will include significant above-ground benefits when underground utilities are upgraded, as well as other public improvements that will help drive economic investment in our community.
FTEs
2015 Actual 2016 Actual 2017 Actual 2018 Budget 2019 Proposed
Total FTEs 3.00 3.00 4.00 4.00 4.00
Expenditures:
2015 Actual 2016 Actual 2017 Actual 2018 Budget 2019 Proposed
Capital Outlay 0 0 0 0 0
Interfund Charges 1,850,772 1,876,501 2,055,641 2,245,426 2,868,103
Reserve for Budget Adjustment 0 0 0 0 0
Transfers Out 0 0 0 0 0
Wages & Benefits 412,154 498,597 511,803 538,735 566,159
Supplies & Services 161,658 308,106 (68,594) 37,250 55,310
Debt Services 0 0 0 0 0
All Other 158,550 145,994 145,223 155,418 155,418
TOTAL 2,583,134 2,829,198 2,644,073 2,976,829 3,644,990
Expenditure Notes:
Expenses in the All Other category are City Utility taxes and Washington State Excise taxes paid by the City of Spokane’s Utility Departments.
Revenues:
2015 Actual 2016 Actual 2017 Actual 2018 Budget 2019 Proposed
Taxes 0 0 0 0 0
Licenses & Permits 0 0 0 0 0
IG Revenue 0 0 0 0 0One Vision. One Plan. One Voice.
Public Works64

Program Summary: Public Works and Utilities Administration
Division: Public Works
Fund Type: Internal Service Fund
Executive Summary:
The Public Works & Utilities Division encompasses about 770 employees in our major utilities and related services--Water, Wastewater, Solid Waste (collection and disposal), Fleet Services, Integrated Capital Management, Streets, Engineering Services, and Utilities Billing. Leadership is engaged in change that results in operations that provides value for citizens’ dollars.
Programs and Services:
The Public Works & Utilities Division leadership is driving meaningful change to provide exceptional services to our citizens. We are working to deliver the best value for the dollar in daily operations and in major capital construction that will serve our community for decades. The Division is working to address a series of environmental regulations, particularly the requirements of the federal Clean Water Act. We are taking an integrated approach to this work to create results that are environmentally and financially responsible. The Division is also focused on integrating utility work and stormwater management with street reconstruction and maintenance. The citizens adopted a new 20-year street levy in late 2014 to fund improved and integrated streets. Outcomes from these efforts will include significant above-ground benefits when underground utilities are upgraded, as well as other public improvements that will help drive economic investment in our community.
FTEs
2015 Actual 2016 Actual 2017 Actual 2018 Budget 2019 Proposed
Total FTEs 3.00 3.00 4.00 4.00 4.00
Expenditures:
2015 Actual 2016 Actual 2017 Actual 2018 Budget 2019 Proposed
Capital Outlay 0 0 0 0 0
Interfund Charges 1,850,772 1,876,501 2,055,641 2,245,426 2,868,103
Reserve for Budget Adjustment 0 0 0 0 0
Transfers Out 0 0 0 0 0
Wages & Benefits 412,154 498,597 511,803 538,735 566,159
Supplies & Services 161,658 308,106 (68,594) 37,250 55,310
Debt Services 0 0 0 0 0
All Other 158,550 145,994 145,223 155,418 155,418
TOTAL 2,583,134 2,829,198 2,644,073 2,976,829 3,644,990
Expenditure Notes:
Expenses in the All Other category are City Utility taxes and Washington State Excise taxes paid by the City of Spokane’s Utility Departments.
Revenues:
2015 Actual 2016 Actual 2017 Actual 2018 Budget 2019 Proposed
Taxes 0 0 0 0 0
Licenses & Permits 0 0 0 0 0
IG Revenue 0 0 0 0 0
Services 1,893,857 2,063,737 11,654 2,652,141 3,555,693
Fines & Forfeits 0 0 0 0 0
Operating Transfers In 0 0 0 0 0
General Fund Resources 0 0 0 0 0
All Other 0 0 0 0 3,213
TOTAL 1,893,857 2,063,737 11,654 2,652,141 3,558,906
Revenue Notes:
Public Works 65

One Vision. One Plan. One Voice.
Public Works66
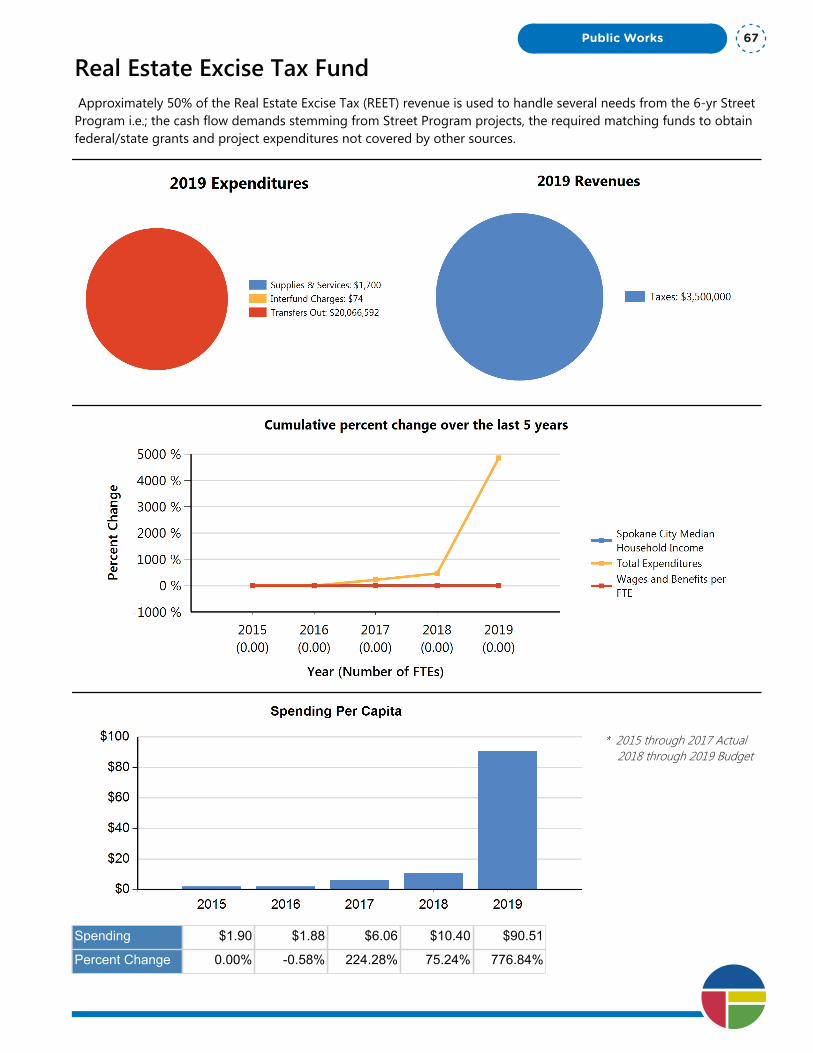
Real Estate Excise Tax Fund Approximately 50% of the Real Estate Excise Tax (REET) revenue is used to handle several needs from the 6-yr Street Program i.e.; the cash flow demands stemming from Street Program projects, the required matching funds to obtain federal/state grants and project expenditures not covered by other sources.
* 2015 through 2017 Actual 2018 through 2019 Budget
Spending $1.90 $1.88 $6.06 $10.40 $90.51
Percent Change 0.00% -0.58% 224.28% 75.24% 776.84%
Public Works 67
Department Summary: Real Estate Excise Tax Fund
Division: Public Works
Fund Type: Special Revenue Fund
Executive Summary:
Approximately 50% of the Real Estate Excise Tax (REET) revenue is used to handle several needs from the 6-yr Street Program i.e.; the cash flow demands stemming from Street Program projects, the required matching funds to obtain federal/state grants and project expenditures not covered by other sources.
Programs and Services:
These funds are the only source of significant “local” funds used to maintain the 6-yr Street Program. This revenue source is used in several different ways. During the construction season, hundreds of thousands of dollars are transacted, and a positive cash flow is needed to cover expenditures. This budget is needed to ensure construction is not delayed due to the City’s inability to cover expenditures in a timely manner. This fund is also the most significant source of matching funds the City is required to pledge when grant applications are being sought. The City relies upon federal and state funding sources for a majority of the cost to design, purchase right-of-way and construct capital transportation projects. Typically a grant criteria from federal and state funding sources includes the requirement for local agencies to provide local funds as a match. The match typically ranges between 20% and 13%. For every dollar the City spends, it typically receives $4 in grant funds from federal and/or state sources. This is a significant return on investment for this size of community and this bid enables the City to pursue grant dollars. Finally, this source of funds covers any expenditure not covered by other sources. Cost increases, change orders or other expenditures that are impossible to account for prior to their occurrence still must be covered after all other funding sources have been depleted. Since grant funding sources are obtained months, if not years, prior to actual construction, the City must have available a funding source that will cover any remaining expenses at the end of each project.
FTEs
2015 Actual 2016 Actual 2017 Actual 2018 Budget 2019 Proposed
Total FTEs 0.00 0.00 0.00 0.00 0.00
Expenditures:
2015 Actual 2016 Actual 2017 Actual 2018 Budget 2019 Proposed
Capital Outlay 0 0 0 0 0
Interfund Charges 3,730 1,411 1,746 2,031 74
Reserve for Budget Adjustment 0 0 0 0 0
Transfers Out 400,000 400,000 1,302,565 2,285,167 20,066,592
Wages & Benefits 0 0 0 0 0
Supplies & Services 1,372 1,311 1,656 1,500 1,700
Debt Services 0 0 0 0 0
All Other 0 0 0 0 0
One Vision. One Plan. One Voice.
Public Works68

Department Summary: Real Estate Excise Tax Fund
Division: Public Works
Fund Type: Special Revenue Fund
Executive Summary:
Approximately 50% of the Real Estate Excise Tax (REET) revenue is used to handle several needs from the 6-yr Street Program i.e.; the cash flow demands stemming from Street Program projects, the required matching funds to obtain federal/state grants and project expenditures not covered by other sources.
Programs and Services:
These funds are the only source of significant “local” funds used to maintain the 6-yr Street Program. This revenue source is used in several different ways. During the construction season, hundreds of thousands of dollars are transacted, and a positive cash flow is needed to cover expenditures. This budget is needed to ensure construction is not delayed due to the City’s inability to cover expenditures in a timely manner. This fund is also the most significant source of matching funds the City is required to pledge when grant applications are being sought. The City relies upon federal and state funding sources for a majority of the cost to design, purchase right-of-way and construct capital transportation projects. Typically a grant criteria from federal and state funding sources includes the requirement for local agencies to provide local funds as a match. The match typically ranges between 20% and 13%. For every dollar the City spends, it typically receives $4 in grant funds from federal and/or state sources. This is a significant return on investment for this size of community and this bid enables the City to pursue grant dollars. Finally, this source of funds covers any expenditure not covered by other sources. Cost increases, change orders or other expenditures that are impossible to account for prior to their occurrence still must be covered after all other funding sources have been depleted. Since grant funding sources are obtained months, if not years, prior to actual construction, the City must have available a funding source that will cover any remaining expenses at the end of each project.
FTEs
2015 Actual 2016 Actual 2017 Actual 2018 Budget 2019 Proposed
Total FTEs 0.00 0.00 0.00 0.00 0.00
Expenditures:
2015 Actual 2016 Actual 2017 Actual 2018 Budget 2019 Proposed
Capital Outlay 0 0 0 0 0
Interfund Charges 3,730 1,411 1,746 2,031 74
Reserve for Budget Adjustment 0 0 0 0 0
Transfers Out 400,000 400,000 1,302,565 2,285,167 20,066,592
Wages & Benefits 0 0 0 0 0
Supplies & Services 1,372 1,311 1,656 1,500 1,700
Debt Services 0 0 0 0 0
All Other 0 0 0 0 0
TOTAL 405,102 402,722 1,305,967 2,288,698 20,068,366
Expenditure Notes:
The increased transfer-out budget in 2019 reflects estimated funding to Arterial Street capital projects. Funding sources for Arterial Street capital projects are being finalized and this budget line will adjust accordingly.
Revenues:
2015 Actual 2016 Actual 2017 Actual 2018 Budget 2019 Proposed
Taxes 2,400,705 2,765,868 3,516,594 3,000,000 3,500,000
Licenses & Permits 0 0 0 0 0
IG Revenue 0 0 0 0 0
Services 0 0 0 0 0
Fines & Forfeits 0 0 0 0 0
Operating Transfers In 0 0 0 0 0
General Fund Resources 0 0 0 0 0
All Other 0 0 0 0 0
TOTAL 2,400,705 2,765,868 3,516,594 3,000,000 3,500,000
Revenue Notes:
Public Works 69

One Vision. One Plan. One Voice.
Public Works70
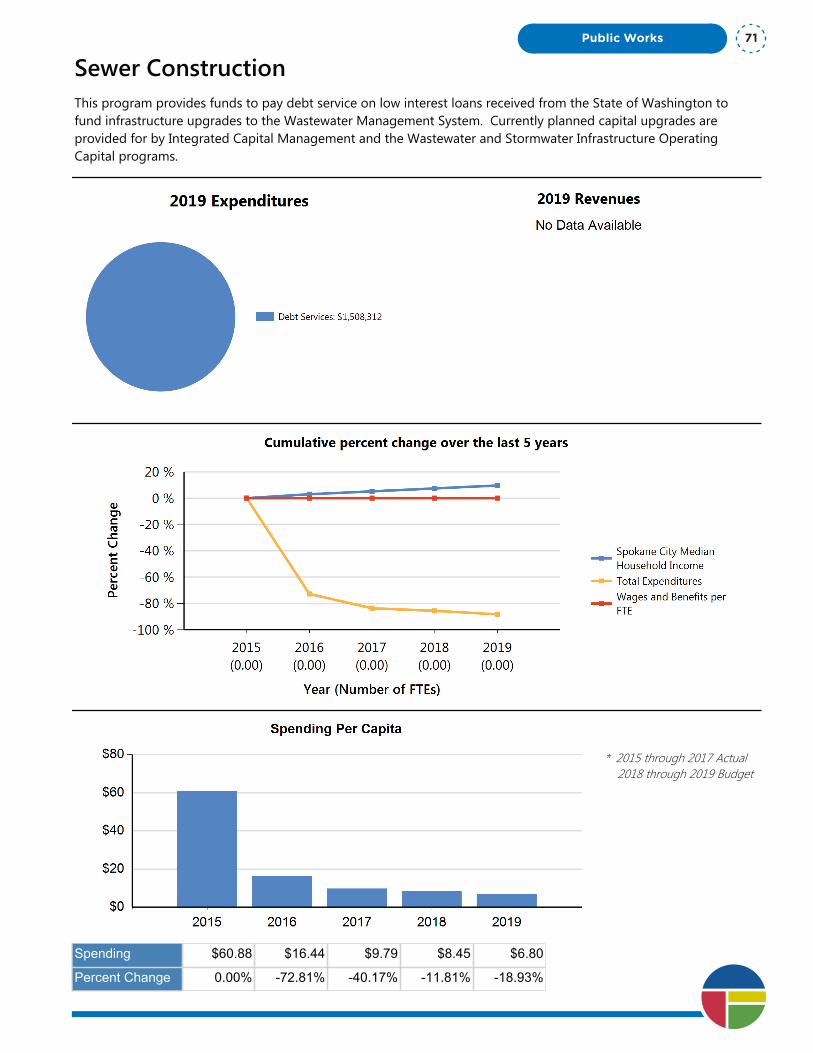
Sewer ConstructionThis program provides funds to pay debt service on low interest loans received from the State of Washington to fund infrastructure upgrades to the Wastewater Management System. Currently planned capital upgrades are provided for by Integrated Capital Management and the Wastewater and Stormwater Infrastructure Operating Capital programs.
* 2015 through 2017 Actual 2018 through 2019 Budget
Spending $60.88 $16.44 $9.79 $8.45 $6.80
Percent Change 0.00% -72.81% -40.17% -11.81% -18.93%
Public Works 71

Department Summary: Sewer Construction
Division: Public Works
Fund Type: Enterprise Fund
Executive Summary:
This program provides funds to pay debt service on low interest loans received from the State of Washington to fund infrastructure upgrades to the Wastewater Management System. Currently planned capital upgrades are provided for by Integrated Capital Management and the Wastewater and Stormwater Infrastructure Operating Capital programs.
Programs and Services:
This program is to pay debt service and does not provide for programs and services.
FTEs
2015 Actual 2016 Actual 2017 Actual 2018 Budget 2019 Proposed
Total FTEs 0.00 0.00 0.00 0.00 0.00
Expenditures:
2015 Actual 2016 Actual 2017 Actual 2018 Budget 2019 Proposed
Capital Outlay 11,501,009 2,026,681 (1,340,540) 2,469 0
Interfund Charges 0 0 0 0 0
Reserve for Budget Adjustment 0 0 0 0 0
Transfers Out 0 0 0 0 0
Wages & Benefits 0 0 0 0 0
Supplies & Services 969 927 1,439,332 48,700 0
Debt Services 753,069 672,508 1,750,740 1,809,540 1,508,312
All Other 717,804 826,740 260,506 0 0
TOTAL 12,972,851 3,526,856 2,110,038 1,860,709 1,508,312
Expenditure Notes:
Revenues:
2015 Actual 2016 Actual 2017 Actual 2018 Budget 2019 Proposed
Taxes 0 0 0 0 0
Licenses & Permits 0 0 0 0 0
IG Revenue 1,094,693 9,252 7,279 5,259 0
Services 171,139 230,600 211,694 141,347 0
Fines & Forfeits 0 0 0 0 0
Operating Transfers In 0 0 0 0 0
General Fund Resources 0 0 0 0 0
All Other 10,749,006 11,540,387 1,084,431 1,000,000 0One Vision. One Plan. One Voice.
Public Works72

Department Summary: Sewer Construction
Division: Public Works
Fund Type: Enterprise Fund
Executive Summary:
This program provides funds to pay debt service on low interest loans received from the State of Washington to fund infrastructure upgrades to the Wastewater Management System. Currently planned capital upgrades are provided for by Integrated Capital Management and the Wastewater and Stormwater Infrastructure Operating Capital programs.
Programs and Services:
This program is to pay debt service and does not provide for programs and services.
FTEs
2015 Actual 2016 Actual 2017 Actual 2018 Budget 2019 Proposed
Total FTEs 0.00 0.00 0.00 0.00 0.00
Expenditures:
2015 Actual 2016 Actual 2017 Actual 2018 Budget 2019 Proposed
Capital Outlay 11,501,009 2,026,681 (1,340,540) 2,469 0
Interfund Charges 0 0 0 0 0
Reserve for Budget Adjustment 0 0 0 0 0
Transfers Out 0 0 0 0 0
Wages & Benefits 0 0 0 0 0
Supplies & Services 969 927 1,439,332 48,700 0
Debt Services 753,069 672,508 1,750,740 1,809,540 1,508,312
All Other 717,804 826,740 260,506 0 0
TOTAL 12,972,851 3,526,856 2,110,038 1,860,709 1,508,312
Expenditure Notes:
Revenues:
2015 Actual 2016 Actual 2017 Actual 2018 Budget 2019 Proposed
Taxes 0 0 0 0 0
Licenses & Permits 0 0 0 0 0
IG Revenue 1,094,693 9,252 7,279 5,259 0
Services 171,139 230,600 211,694 141,347 0
Fines & Forfeits 0 0 0 0 0
Operating Transfers In 0 0 0 0 0
General Fund Resources 0 0 0 0 0
All Other 10,749,006 11,540,387 1,084,431 1,000,000 0
TOTAL 12,014,838 11,780,239 1,303,404 1,146,606 0
Revenue Notes:
Revenues are no longer being budgeted in this program. Expenditures will be paid for from the Department's reserves.
Public Works 73

One Vision. One Plan. One Voice.
Public Works74
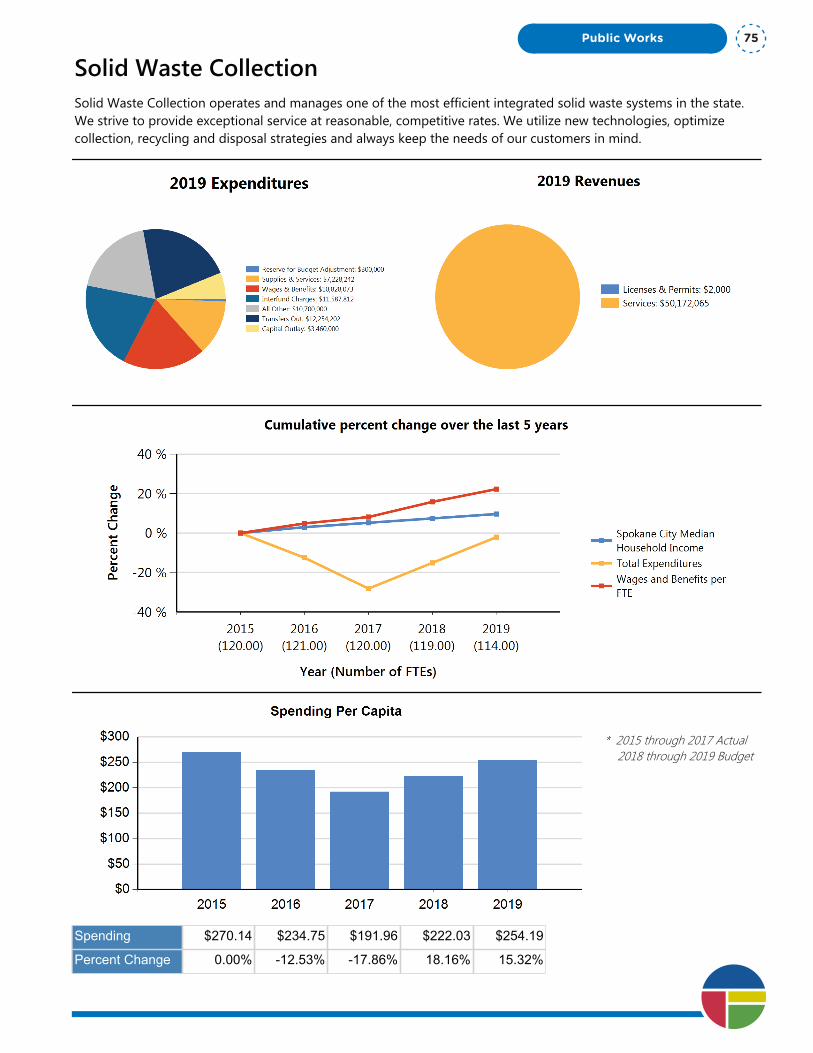
Solid Waste CollectionSolid Waste Collection operates and manages one of the most efficient integrated solid waste systems in the state. We strive to provide exceptional service at reasonable, competitive rates. We utilize new technologies, optimize collection, recycling and disposal strategies and always keep the needs of our customers in mind.
* 2015 through 2017 Actual 2018 through 2019 Budget
Spending $270.14 $234.75 $191.96 $222.03 $254.19
Percent Change 0.00% -12.53% -17.86% 18.16% 15.32%
Public Works 75

Department Summary: Solid Waste Collection
Division: Public Works
Fund Type: Enterprise Fund
Executive Summary:
Solid Waste Collection operates and manages one of the most efficient integrated solid waste systems in the state. We strive to provide exceptional service at reasonable, competitive rates. We utilize new technologies, optimize collection, recycling and disposal strategies and always keep the needs of our customers in mind.
Programs and Services:
The Solid Waste Collection Department provides citizens and businesses with a suite of convenient and dependable solid waste collection services at an affordable price. We offer weekly commercial and residential solid waste collection and recycling. In addition, we offer an optional yard and food waste collection service for nine months of the year. Single stream recycling system allows customers to put all their recyclables in a large, 64-gallon rolling cart without sorting. The service allows for significantly more recyclables to be collected curbside and allows for fully automated collection, increasing efficiencies and reducing operating costs. Solid Waste operations were relocated with Fleet maintenance services at the Spokane Central Service Center. We continue to convert the garbage collection vehicles from diesel fuel to compressed natural gas, which will provide significant environmental and financial benefits. A route optimization study was performed to allow us to deploy our fleet of collection vehicles in the most efficient and effective way possible from the new location. The City continues to provide solid waste collection and disposal services for City of Spokane businesses and residents and is working cooperatively with Spokane County for the future of regional solid waste services.
FTEs
2015 Actual 2016 Actual 2017 Actual 2018 Budget 2019 Proposed
Total FTEs 120.00 121.00 120.00 119.00 114.00
Expenditures:
2015 Actual 2016 Actual 2017 Actual 2018 Budget 2019 Proposed
Capital Outlay 16,759,677 3,672,549 2,136,744 100,000 3,460,000
Interfund Charges 7,382,028 8,743,258 9,748,771 9,913,234 11,587,812
Reserve for Budget Adjustment 0 0 0 300,000 300,000
Transfers Out 9,351,737 12,918,289 10,591,475 11,463,550 12,254,202
Wages & Benefits 9,182,619 9,710,791 9,943,258 10,620,013 10,828,073
Supplies & Services 6,203,158 6,034,999 (767,420) 6,673,092 7,228,242
Debt Services 0 0 0 0 0
All Other 8,686,820 9,272,920 9,704,947 9,800,000 10,700,000
TOTAL 57,566,039 50,352,806 41,357,775 48,869,889 56,358,329
Expenditure Notes:
Expenses in the All Other category are City Utility taxes and Washington State Excise taxes paid by the City of Spokane’s Utility Departments.
Revenues:
2015 Actual 2016 Actual 2017 Actual 2018 Budget 2019 Proposed
Taxes 0 0 0 0 0One Vision. One Plan. One Voice.
Public Works76
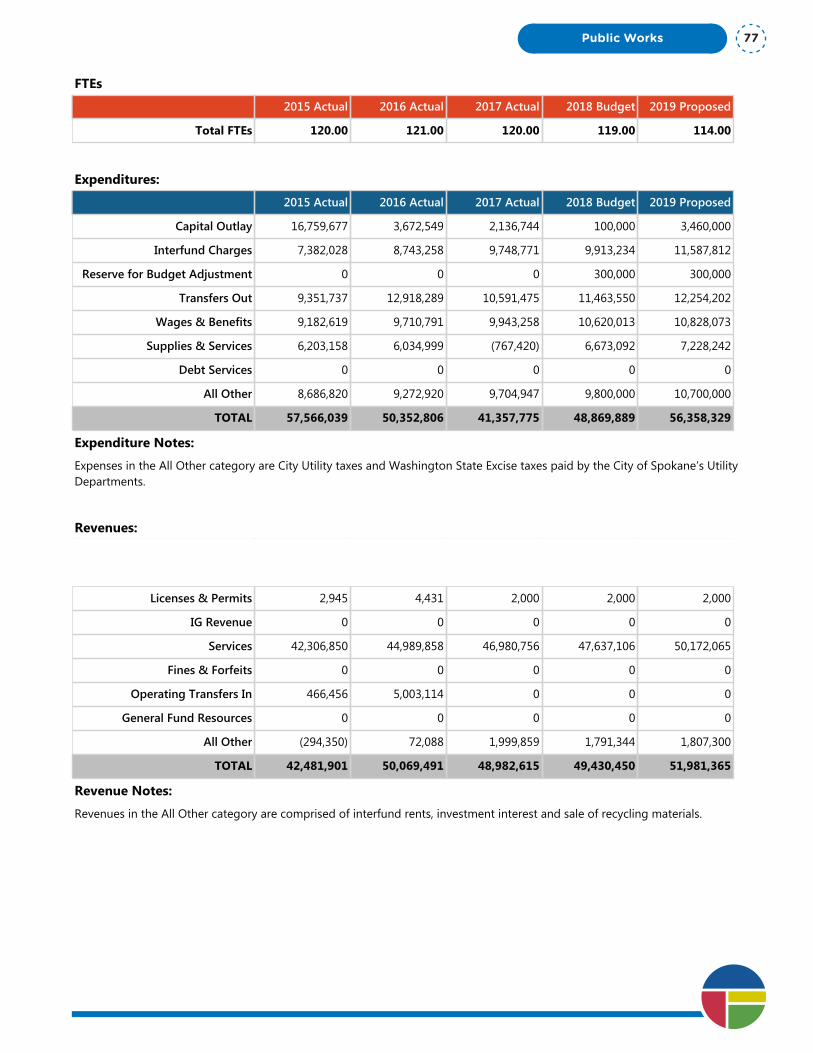
Department Summary: Solid Waste Collection
Division: Public Works
Fund Type: Enterprise Fund
Executive Summary:
Solid Waste Collection operates and manages one of the most efficient integrated solid waste systems in the state. We strive to provide exceptional service at reasonable, competitive rates. We utilize new technologies, optimize collection, recycling and disposal strategies and always keep the needs of our customers in mind.
Programs and Services:
The Solid Waste Collection Department provides citizens and businesses with a suite of convenient and dependable solid waste collection services at an affordable price. We offer weekly commercial and residential solid waste collection and recycling. In addition, we offer an optional yard and food waste collection service for nine months of the year. Single stream recycling system allows customers to put all their recyclables in a large, 64-gallon rolling cart without sorting. The service allows for significantly more recyclables to be collected curbside and allows for fully automated collection, increasing efficiencies and reducing operating costs. Solid Waste operations were relocated with Fleet maintenance services at the Spokane Central Service Center. We continue to convert the garbage collection vehicles from diesel fuel to compressed natural gas, which will provide significant environmental and financial benefits. A route optimization study was performed to allow us to deploy our fleet of collection vehicles in the most efficient and effective way possible from the new location. The City continues to provide solid waste collection and disposal services for City of Spokane businesses and residents and is working cooperatively with Spokane County for the future of regional solid waste services.
FTEs
2015 Actual 2016 Actual 2017 Actual 2018 Budget 2019 Proposed
Total FTEs 120.00 121.00 120.00 119.00 114.00
Expenditures:
2015 Actual 2016 Actual 2017 Actual 2018 Budget 2019 Proposed
Capital Outlay 16,759,677 3,672,549 2,136,744 100,000 3,460,000
Interfund Charges 7,382,028 8,743,258 9,748,771 9,913,234 11,587,812
Reserve for Budget Adjustment 0 0 0 300,000 300,000
Transfers Out 9,351,737 12,918,289 10,591,475 11,463,550 12,254,202
Wages & Benefits 9,182,619 9,710,791 9,943,258 10,620,013 10,828,073
Supplies & Services 6,203,158 6,034,999 (767,420) 6,673,092 7,228,242
Debt Services 0 0 0 0 0
All Other 8,686,820 9,272,920 9,704,947 9,800,000 10,700,000
TOTAL 57,566,039 50,352,806 41,357,775 48,869,889 56,358,329
Expenditure Notes:
Expenses in the All Other category are City Utility taxes and Washington State Excise taxes paid by the City of Spokane’s Utility Departments.
Revenues:
2015 Actual 2016 Actual 2017 Actual 2018 Budget 2019 Proposed
Taxes 0 0 0 0 0
Licenses & Permits 2,945 4,431 2,000 2,000 2,000
IG Revenue 0 0 0 0 0
Services 42,306,850 44,989,858 46,980,756 47,637,106 50,172,065
Fines & Forfeits 0 0 0 0 0
Operating Transfers In 466,456 5,003,114 0 0 0
General Fund Resources 0 0 0 0 0
All Other (294,350) 72,088 1,999,859 1,791,344 1,807,300
TOTAL 42,481,901 50,069,491 48,982,615 49,430,450 51,981,365
Revenue Notes:
Revenues in the All Other category are comprised of interfund rents, investment interest and sale of recycling materials.
Public Works 77
Program Summary: Recycling
Division: Public Works
Fund Type: Enterprise Fund
Executive Summary:
The Solid Waste Collection Department offers curbside collection of residential single stream recycling on a weekly basis. Inexpensive recycling options are provided to City businesses as needed. Recycling has a large impact on greenhouse gas reductions.
Programs and Services:
The Solid Waste Collection Department provides citizens and businesses with a suite of convenient and dependable solid waste collection services at an affordable price. We offer weekly commercial and residential solid waste collection and recycling. Single stream recycling system allows customers to put all their recyclables in a large, 64-gallon rolling cart without sorting. The service allows for significantly more recyclables to be collected curbside and allows for fully automated collection, increasing efficiencies and reducing operating costs.
FTEs
2015 Actual 2016 Actual 2017 Actual 2018 Budget 2019 Proposed
Total FTEs 32.00 32.00 32.00 33.00 33.00
Expenditures:
2015 Actual 2016 Actual 2017 Actual 2018 Budget 2019 Proposed
Capital Outlay 41,869 0 0 40,000 1,577,000
Interfund Charges 1,219,871 1,976,408 2,100,533 1,777,050 2,451,575
Reserve for Budget Adjustment 0 0 0 0 0
Transfers Out 18,535 14,349 26,446 18,922 23,108
Wages & Benefits 2,569,305 2,554,213 2,635,586 2,865,321 2,996,143
Supplies & Services 2,531,188 2,668,978 2,511,803 2,989,396 3,182,196
Debt Services 0 0 0 0 0
All Other 0 4,771 0 5,000 0
TOTAL 6,380,768 7,218,719 7,274,368 7,695,689 10,230,022
Expenditure Notes:
Revenues:
2015 Actual 2016 Actual 2017 Actual 2018 Budget 2019 Proposed
Taxes 0 0 0 0 0
Licenses & Permits 0 0 0 0 0
IG Revenue 0 0 0 0 0
Services 4,246,388 4,617,609 5,010,059 4,675,000 5,520,000
Fines & Forfeits 0 0 0 0 0One Vision. One Plan. One Voice.
Public Works78

Program Summary: Recycling
Division: Public Works
Fund Type: Enterprise Fund
Executive Summary:
The Solid Waste Collection Department offers curbside collection of residential single stream recycling on a weekly basis. Inexpensive recycling options are provided to City businesses as needed. Recycling has a large impact on greenhouse gas reductions.
Programs and Services:
The Solid Waste Collection Department provides citizens and businesses with a suite of convenient and dependable solid waste collection services at an affordable price. We offer weekly commercial and residential solid waste collection and recycling. Single stream recycling system allows customers to put all their recyclables in a large, 64-gallon rolling cart without sorting. The service allows for significantly more recyclables to be collected curbside and allows for fully automated collection, increasing efficiencies and reducing operating costs.
FTEs
2015 Actual 2016 Actual 2017 Actual 2018 Budget 2019 Proposed
Total FTEs 32.00 32.00 32.00 33.00 33.00
Expenditures:
2015 Actual 2016 Actual 2017 Actual 2018 Budget 2019 Proposed
Capital Outlay 41,869 0 0 40,000 1,577,000
Interfund Charges 1,219,871 1,976,408 2,100,533 1,777,050 2,451,575
Reserve for Budget Adjustment 0 0 0 0 0
Transfers Out 18,535 14,349 26,446 18,922 23,108
Wages & Benefits 2,569,305 2,554,213 2,635,586 2,865,321 2,996,143
Supplies & Services 2,531,188 2,668,978 2,511,803 2,989,396 3,182,196
Debt Services 0 0 0 0 0
All Other 0 4,771 0 5,000 0
TOTAL 6,380,768 7,218,719 7,274,368 7,695,689 10,230,022
Expenditure Notes:
Revenues:
2015 Actual 2016 Actual 2017 Actual 2018 Budget 2019 Proposed
Taxes 0 0 0 0 0
Licenses & Permits 0 0 0 0 0
IG Revenue 0 0 0 0 0
Services 4,246,388 4,617,609 5,010,059 4,675,000 5,520,000
Fines & Forfeits 0 0 0 0 0
Operating Transfers In 0 0 0 0 0
General Fund Resources 0 0 0 0 0
All Other 899,890 530,879 1,518,207 1,359,800 1,359,800
TOTAL 5,146,278 5,148,488 6,528,266 6,034,800 6,879,800
Revenue Notes:
Public Works 79

Program Summary: Solid Waste Collection Administration
Division: Public Works
Fund Type: Enterprise Fund
Executive Summary:
The Solid Waste Collection Department manages the collection of solid waste from our residents and businesses and continually seeks new solutions and methods to improve the services offered to our customers. The administration is dedicated to improving the quality of our customer service.
Programs and Services:
The Solid Waste Collection Department provides citizens and businesses with a suite of convenient and dependable solid waste collection services at an affordable price. We offer weekly commercial and residential solid waste collection and recycling. In addition, we offer an optional yard and food waste collection service for nine months of the year. Single stream recycling system allows customers to put all their recyclables in a large, 64-gallon rolling cart without sorting. The service allows for significantly more recyclables to be collected curbside and allows for fully automated collection, increasing efficiencies and reducing operating costs. Solid Waste operations were relocated with Fleet maintenance services at the Spokane Central Service Center. We continue to convert the garbage collection vehicles from diesel fuel to compressed natural gas, which will provide significant environmental and financial benefits. A route optimization study was performed to allow us to deploy our fleet of collection vehicles in the most efficient and effective way possible from the new location. The City continues to provide solid waste collection and disposal services for City of Spokane businesses and residents and is working cooperatively with Spokane County for the future of regional solid waste services.
FTEs
2015 Actual 2016 Actual 2017 Actual 2018 Budget 2019 Proposed
Total FTEs 9.00 10.00 10.00 13.00 13.00
Expenditures:
2015 Actual 2016 Actual 2017 Actual 2018 Budget 2019 Proposed
Capital Outlay 0 0 0 0 0
Interfund Charges 3,670,852 3,338,153 3,692,666 3,889,744 4,305,576
Reserve for Budget Adjustment 0 0 0 300,000 300,000
Transfers Out 0 0 0 700,000 700,000
Wages & Benefits 788,192 862,465 932,856 1,220,701 1,241,271
Supplies & Services 22,281 25,177 323,716 574,510 575,060
Debt Services 0 0 0 0 0
All Other 8,686,820 9,268,149 9,704,947 9,795,000 10,700,000
TOTAL 13,168,145 13,493,944 14,654,185 16,479,955 17,821,907
Expenditure Notes:
Expenses in the All Other category are City Utility taxes and Washington State Excise taxes paid by the City of Spokane’s Utility Departments.
Revenues:
2015 Actual 2016 Actual 2017 Actual 2018 Budget 2019 Proposed
Taxes 0 0 0 0 0One Vision. One Plan. One Voice.
Public Works80

Program Summary: Solid Waste Collection Administration
Division: Public Works
Fund Type: Enterprise Fund
Executive Summary:
The Solid Waste Collection Department manages the collection of solid waste from our residents and businesses and continually seeks new solutions and methods to improve the services offered to our customers. The administration is dedicated to improving the quality of our customer service.
Programs and Services:
The Solid Waste Collection Department provides citizens and businesses with a suite of convenient and dependable solid waste collection services at an affordable price. We offer weekly commercial and residential solid waste collection and recycling. In addition, we offer an optional yard and food waste collection service for nine months of the year. Single stream recycling system allows customers to put all their recyclables in a large, 64-gallon rolling cart without sorting. The service allows for significantly more recyclables to be collected curbside and allows for fully automated collection, increasing efficiencies and reducing operating costs. Solid Waste operations were relocated with Fleet maintenance services at the Spokane Central Service Center. We continue to convert the garbage collection vehicles from diesel fuel to compressed natural gas, which will provide significant environmental and financial benefits. A route optimization study was performed to allow us to deploy our fleet of collection vehicles in the most efficient and effective way possible from the new location. The City continues to provide solid waste collection and disposal services for City of Spokane businesses and residents and is working cooperatively with Spokane County for the future of regional solid waste services.
FTEs
2015 Actual 2016 Actual 2017 Actual 2018 Budget 2019 Proposed
Total FTEs 9.00 10.00 10.00 13.00 13.00
Expenditures:
2015 Actual 2016 Actual 2017 Actual 2018 Budget 2019 Proposed
Capital Outlay 0 0 0 0 0
Interfund Charges 3,670,852 3,338,153 3,692,666 3,889,744 4,305,576
Reserve for Budget Adjustment 0 0 0 300,000 300,000
Transfers Out 0 0 0 700,000 700,000
Wages & Benefits 788,192 862,465 932,856 1,220,701 1,241,271
Supplies & Services 22,281 25,177 323,716 574,510 575,060
Debt Services 0 0 0 0 0
All Other 8,686,820 9,268,149 9,704,947 9,795,000 10,700,000
TOTAL 13,168,145 13,493,944 14,654,185 16,479,955 17,821,907
Expenditure Notes:
Expenses in the All Other category are City Utility taxes and Washington State Excise taxes paid by the City of Spokane’s Utility Departments.
Revenues:
2015 Actual 2016 Actual 2017 Actual 2018 Budget 2019 Proposed
Taxes 0 0 0 0 0
Licenses & Permits 0 0 0 0 0
IG Revenue 0 0 0 0 0
Services 0 0 0 154,865 154,865
Fines & Forfeits 0 0 0 0 0
Operating Transfers In 0 0 0 0 0
General Fund Resources 0 0 0 0 0
All Other 0 0 125,000 155,000 155,000
TOTAL 0 0 125,000 309,865 309,865
Revenue Notes:
Public Works 81

Program Summary: Solid Waste Collection Operations and Maintenance
Division: Public Works
Fund Type: Enterprise Fund
Executive Summary:
Solid Waste Collection operates and manages one of the most efficient integrated solid waste systems in the state. We strive to provide exceptional service at reasonable, competitive rates. We utilize new technologies, optimize collection, recycling and disposal strategies and always keep the needs of our customers in mind.
Programs and Services:
Solid Waste operations were relocated with Fleet maintenance services at the Spokane Central Service Center. We continue to convert the garbage collection vehicles from diesel fuel to compressed natural gas, which will provide significant environmental and financial benefits. A route optimization study was performed to allow us to deploy our fleet of collection vehicles in the most efficient and effective way possible from the new location.
FTEs
2015 Actual 2016 Actual 2017 Actual 2018 Budget 2019 Proposed
Total FTEs 79.00 79.00 78.00 73.00 68.00
Expenditures:
2015 Actual 2016 Actual 2017 Actual 2018 Budget 2019 Proposed
Capital Outlay 6,721,388 2,580,083 2,136,744 60,000 1,743,000
Interfund Charges 1,841,512 2,613,342 3,122,458 3,145,980 3,733,980
Reserve for Budget Adjustment 0 0 0 0 0
Transfers Out 9,333,202 12,903,940 10,565,029 10,744,628 11,531,094
Wages & Benefits 5,825,122 6,294,113 6,374,816 6,533,991 6,590,659
Supplies & Services 3,189,234 2,915,657 (3,970,818) 2,766,686 3,110,986
Debt Services 0 0 0 0 0
All Other 0 0 0 0 0
TOTAL 26,910,458 27,307,135 18,228,229 23,251,285 26,709,719
Expenditure Notes:
2015 Actuals include amounts from transfer station and landfill programs. The transfer stations are no longer operated by the City of Spokane. The landfill programs are now budgeted for in a separate department within the Solid Waste Fund.
Revenues:
2015 Actual 2016 Actual 2017 Actual 2018 Budget 2019 Proposed
Taxes 0 0 0 0 0
Licenses & Permits 2,945 4,431 2,000 2,000 2,000
IG Revenue 0 0 0 0 0
Services 37,904,061 40,177,028 41,808,162 42,807,241 44,497,200
Fines & Forfeits 0 0 0 0 0
Operating Transfers In 0 0 0 0 0One Vision. One Plan. One Voice.
Public Works82
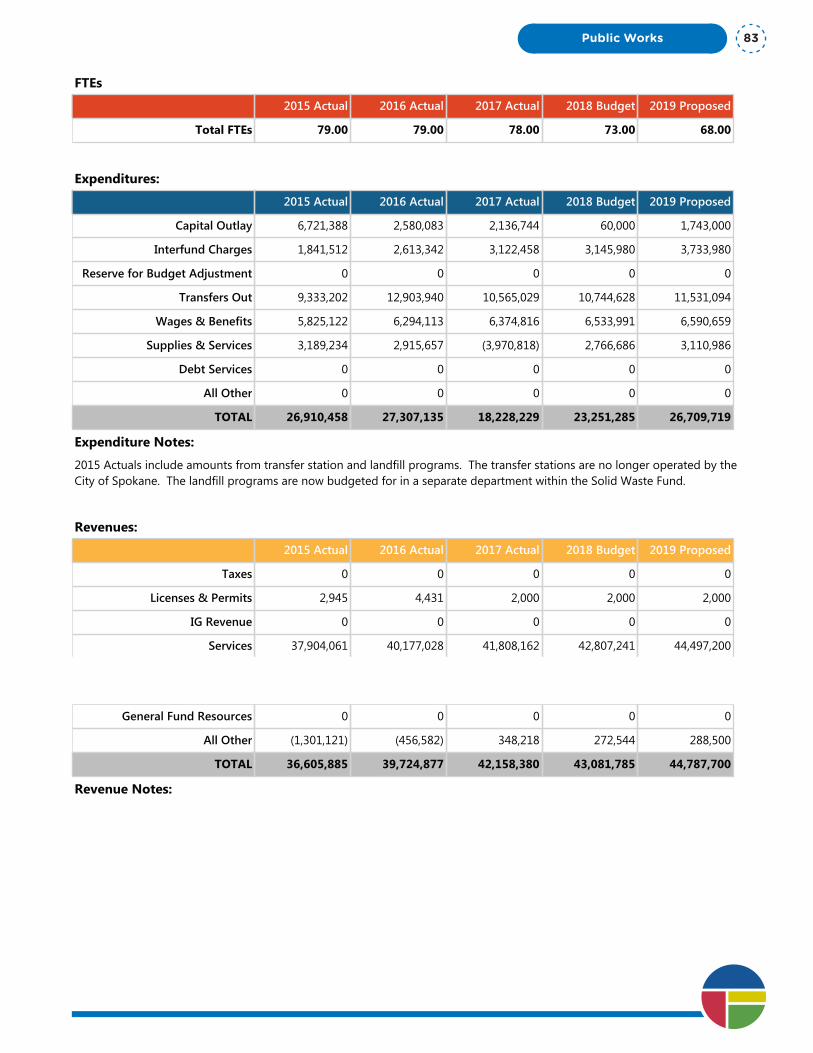
Program Summary: Solid Waste Collection Operations and Maintenance
Division: Public Works
Fund Type: Enterprise Fund
Executive Summary:
Solid Waste Collection operates and manages one of the most efficient integrated solid waste systems in the state. We strive to provide exceptional service at reasonable, competitive rates. We utilize new technologies, optimize collection, recycling and disposal strategies and always keep the needs of our customers in mind.
Programs and Services:
Solid Waste operations were relocated with Fleet maintenance services at the Spokane Central Service Center. We continue to convert the garbage collection vehicles from diesel fuel to compressed natural gas, which will provide significant environmental and financial benefits. A route optimization study was performed to allow us to deploy our fleet of collection vehicles in the most efficient and effective way possible from the new location.
FTEs
2015 Actual 2016 Actual 2017 Actual 2018 Budget 2019 Proposed
Total FTEs 79.00 79.00 78.00 73.00 68.00
Expenditures:
2015 Actual 2016 Actual 2017 Actual 2018 Budget 2019 Proposed
Capital Outlay 6,721,388 2,580,083 2,136,744 60,000 1,743,000
Interfund Charges 1,841,512 2,613,342 3,122,458 3,145,980 3,733,980
Reserve for Budget Adjustment 0 0 0 0 0
Transfers Out 9,333,202 12,903,940 10,565,029 10,744,628 11,531,094
Wages & Benefits 5,825,122 6,294,113 6,374,816 6,533,991 6,590,659
Supplies & Services 3,189,234 2,915,657 (3,970,818) 2,766,686 3,110,986
Debt Services 0 0 0 0 0
All Other 0 0 0 0 0
TOTAL 26,910,458 27,307,135 18,228,229 23,251,285 26,709,719
Expenditure Notes:
2015 Actuals include amounts from transfer station and landfill programs. The transfer stations are no longer operated by the City of Spokane. The landfill programs are now budgeted for in a separate department within the Solid Waste Fund.
Revenues:
2015 Actual 2016 Actual 2017 Actual 2018 Budget 2019 Proposed
Taxes 0 0 0 0 0
Licenses & Permits 2,945 4,431 2,000 2,000 2,000
IG Revenue 0 0 0 0 0
Services 37,904,061 40,177,028 41,808,162 42,807,241 44,497,200
Fines & Forfeits 0 0 0 0 0
Operating Transfers In 0 0 0 0 0
General Fund Resources 0 0 0 0 0
All Other (1,301,121) (456,582) 348,218 272,544 288,500
TOTAL 36,605,885 39,724,877 42,158,380 43,081,785 44,787,700
Revenue Notes:
Public Works 83

One Vision. One Plan. One Voice.
Public Works84
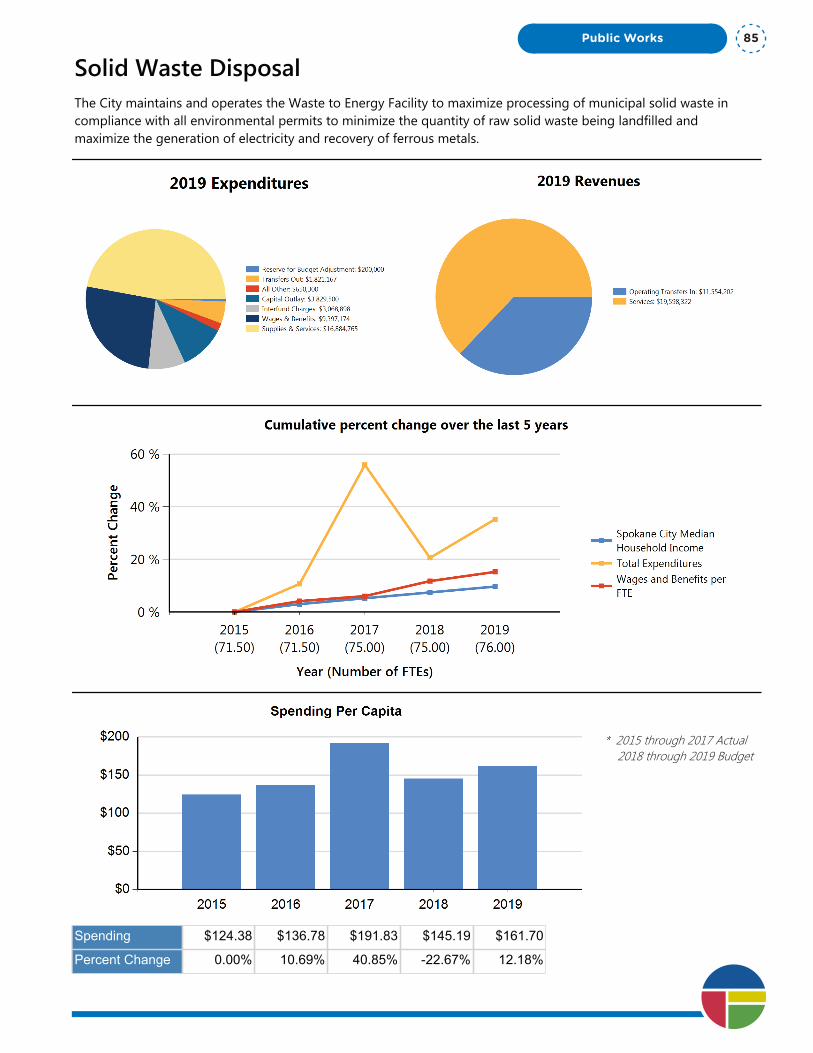
Solid Waste DisposalThe City maintains and operates the Waste to Energy Facility to maximize processing of municipal solid waste in compliance with all environmental permits to minimize the quantity of raw solid waste being landfilled and maximize the generation of electricity and recovery of ferrous metals.
* 2015 through 2017 Actual 2018 through 2019 Budget
Spending $124.38 $136.78 $191.83 $145.19 $161.70
Percent Change 0.00% 10.69% 40.85% -22.67% 12.18%
Public Works 85
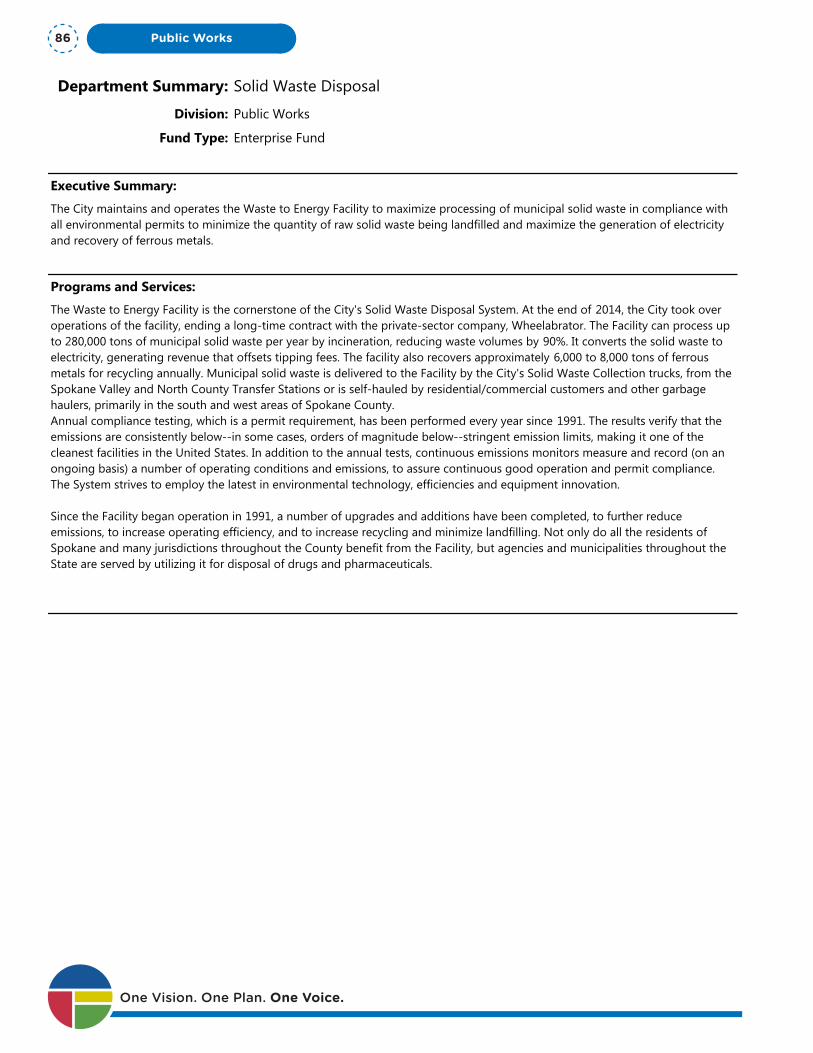
Department Summary: Solid Waste Disposal
Division: Public Works
Fund Type: Enterprise Fund
Executive Summary:
The City maintains and operates the Waste to Energy Facility to maximize processing of municipal solid waste in compliance with all environmental permits to minimize the quantity of raw solid waste being landfilled and maximize the generation of electricity and recovery of ferrous metals.
Programs and Services:
The Waste to Energy Facility is the cornerstone of the City's Solid Waste Disposal System. At the end of 2014, the City took over operations of the facility, ending a long-time contract with the private-sector company, Wheelabrator. The Facility can process up to 280,000 tons of municipal solid waste per year by incineration, reducing waste volumes by 90%. It converts the solid waste to electricity, generating revenue that offsets tipping fees. The facility also recovers approximately 6,000 to 8,000 tons of ferrous metals for recycling annually. Municipal solid waste is delivered to the Facility by the City's Solid Waste Collection trucks, from the Spokane Valley and North County Transfer Stations or is self-hauled by residential/commercial customers and other garbage haulers, primarily in the south and west areas of Spokane County. Annual compliance testing, which is a permit requirement, has been performed every year since 1991. The results verify that the emissions are consistently below--in some cases, orders of magnitude below--stringent emission limits, making it one of the cleanest facilities in the United States. In addition to the annual tests, continuous emissions monitors measure and record (on an ongoing basis) a number of operating conditions and emissions, to assure continuous good operation and permit compliance. The System strives to employ the latest in environmental technology, efficiencies and equipment innovation.
Since the Facility began operation in 1991, a number of upgrades and additions have been completed, to further reduce emissions, to increase operating efficiency, and to increase recycling and minimize landfilling. Not only do all the residents of Spokane and many jurisdictions throughout the County benefit from the Facility, but agencies and municipalities throughout the State are served by utilizing it for disposal of drugs and pharmaceuticals.
FTEs
2015 Actual 2016 Actual 2017 Actual 2018 Budget 2019 Proposed
Total FTEs 71.50 71.50 75.00 75.00 76.00
Expenditures:
2015 Actual 2016 Actual 2017 Actual 2018 Budget 2019 Proposed
Capital Outlay 881,380 1,841,691 2,587,961 5,457,500 3,829,500
Interfund Charges 1,421,189 1,982,261 2,256,263 2,299,346 3,068,898
Reserve for Budget Adjustment 0 0 0 200,000 200,000
Transfers Out 149 2,957 0 0 1,821,167
Wages & Benefits 7,615,999 7,929,703 8,476,722 8,960,448 9,397,174
Supplies & Services 16,004,712 17,033,548 27,427,332 14,510,730 16,884,765
Debt Services 0 0 0 0 0
All Other 581,759 550,014 579,923 529,000 650,300
One Vision. One Plan. One Voice.
Public Works86
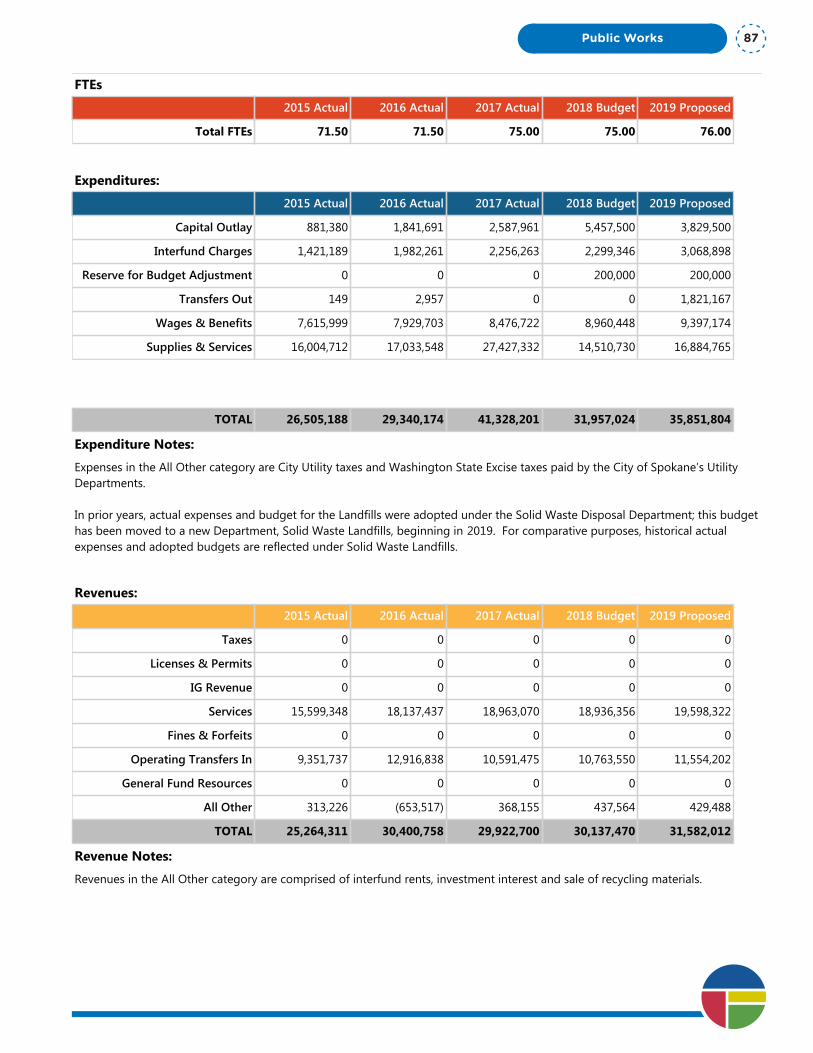
Department Summary: Solid Waste Disposal
Division: Public Works
Fund Type: Enterprise Fund
Executive Summary:
The City maintains and operates the Waste to Energy Facility to maximize processing of municipal solid waste in compliance with all environmental permits to minimize the quantity of raw solid waste being landfilled and maximize the generation of electricity and recovery of ferrous metals.
Programs and Services:
The Waste to Energy Facility is the cornerstone of the City's Solid Waste Disposal System. At the end of 2014, the City took over operations of the facility, ending a long-time contract with the private-sector company, Wheelabrator. The Facility can process up to 280,000 tons of municipal solid waste per year by incineration, reducing waste volumes by 90%. It converts the solid waste to electricity, generating revenue that offsets tipping fees. The facility also recovers approximately 6,000 to 8,000 tons of ferrous metals for recycling annually. Municipal solid waste is delivered to the Facility by the City's Solid Waste Collection trucks, from the Spokane Valley and North County Transfer Stations or is self-hauled by residential/commercial customers and other garbage haulers, primarily in the south and west areas of Spokane County. Annual compliance testing, which is a permit requirement, has been performed every year since 1991. The results verify that the emissions are consistently below--in some cases, orders of magnitude below--stringent emission limits, making it one of the cleanest facilities in the United States. In addition to the annual tests, continuous emissions monitors measure and record (on an ongoing basis) a number of operating conditions and emissions, to assure continuous good operation and permit compliance. The System strives to employ the latest in environmental technology, efficiencies and equipment innovation.
Since the Facility began operation in 1991, a number of upgrades and additions have been completed, to further reduce emissions, to increase operating efficiency, and to increase recycling and minimize landfilling. Not only do all the residents of Spokane and many jurisdictions throughout the County benefit from the Facility, but agencies and municipalities throughout the State are served by utilizing it for disposal of drugs and pharmaceuticals.
FTEs
2015 Actual 2016 Actual 2017 Actual 2018 Budget 2019 Proposed
Total FTEs 71.50 71.50 75.00 75.00 76.00
Expenditures:
2015 Actual 2016 Actual 2017 Actual 2018 Budget 2019 Proposed
Capital Outlay 881,380 1,841,691 2,587,961 5,457,500 3,829,500
Interfund Charges 1,421,189 1,982,261 2,256,263 2,299,346 3,068,898
Reserve for Budget Adjustment 0 0 0 200,000 200,000
Transfers Out 149 2,957 0 0 1,821,167
Wages & Benefits 7,615,999 7,929,703 8,476,722 8,960,448 9,397,174
Supplies & Services 16,004,712 17,033,548 27,427,332 14,510,730 16,884,765
Debt Services 0 0 0 0 0
All Other 581,759 550,014 579,923 529,000 650,300
TOTAL 26,505,188 29,340,174 41,328,201 31,957,024 35,851,804
Expenditure Notes:
Expenses in the All Other category are City Utility taxes and Washington State Excise taxes paid by the City of Spokane’s Utility Departments.
In prior years, actual expenses and budget for the Landfills were adopted under the Solid Waste Disposal Department; this budget has been moved to a new Department, Solid Waste Landfills, beginning in 2019. For comparative purposes, historical actual expenses and adopted budgets are reflected under Solid Waste Landfills.
Revenues:
2015 Actual 2016 Actual 2017 Actual 2018 Budget 2019 Proposed
Taxes 0 0 0 0 0
Licenses & Permits 0 0 0 0 0
IG Revenue 0 0 0 0 0
Services 15,599,348 18,137,437 18,963,070 18,936,356 19,598,322
Fines & Forfeits 0 0 0 0 0
Operating Transfers In 9,351,737 12,916,838 10,591,475 10,763,550 11,554,202
General Fund Resources 0 0 0 0 0
All Other 313,226 (653,517) 368,155 437,564 429,488
TOTAL 25,264,311 30,400,758 29,922,700 30,137,470 31,582,012
Revenue Notes:
Revenues in the All Other category are comprised of interfund rents, investment interest and sale of recycling materials.
Public Works 87
Program Summary: 6 yr Capital Plan
Division: Public Works
Fund Type: Enterprise Fund
Executive Summary:
The City maintains and operates the Waste to Energy Facility. The Six-Year Capital plan provides for replacement, upgrades and maintenance of the components at the facility to keep it functioning at its optimal capacity. Planning for repairs and maintenance of the Waste to Energy Facility protects this community’s ongoing investment in this vital asset.
Programs and Services:
The Six-Year Capital plan provides for replacement, upgrades and maintenance of the components at the facility to keep it functioning at its optimal capacity. Planning for repairs and maintenance of the Waste to Energy Facility protects this community’s ongoing investment in this vital asset.
The Waste to Energy Facility can process up to 280,000 tons of municipal solid waste per year by incineration, reducing waste volumes by 90%. It converts the solid waste to electricity, generating revenue that offsets tipping fees. The facility also recovers approximately 6,000 to 8,000 tons of ferrous metals for recycling annually.
Since the Facility began operation in 1991, a number of upgrades and additions have been completed, to further reduce emissions, to increase operating efficiency, and to increase recycling and minimize landfilling. Not only do all the residents of Spokane and many jurisdictions throughout the County benefit from the Facility, but agencies and municipalities throughout the State are served by utilizing it for disposal of drugs and pharmaceuticals.
FTEs
2015 Actual 2016 Actual 2017 Actual 2018 Budget 2019 Proposed
Total FTEs 0.00 0.00 0.00 0.00 0.00
Expenditures:
2015 Actual 2016 Actual 2017 Actual 2018 Budget 2019 Proposed
Capital Outlay 0 0 0 0 3,719,500
Interfund Charges 0 0 0 0 0
Reserve for Budget Adjustment 0 0 0 0 0
Transfers Out 0 0 0 0 0
Wages & Benefits 0 0 0 0 0
Supplies & Services 0 0 0 0 0
Debt Services 0 0 0 0 0
All Other 0 0 0 0 0
One Vision. One Plan. One Voice.
Public Works88

Program Summary: 6 yr Capital Plan
Division: Public Works
Fund Type: Enterprise Fund
Executive Summary:
The City maintains and operates the Waste to Energy Facility. The Six-Year Capital plan provides for replacement, upgrades and maintenance of the components at the facility to keep it functioning at its optimal capacity. Planning for repairs and maintenance of the Waste to Energy Facility protects this community’s ongoing investment in this vital asset.
Programs and Services:
The Six-Year Capital plan provides for replacement, upgrades and maintenance of the components at the facility to keep it functioning at its optimal capacity. Planning for repairs and maintenance of the Waste to Energy Facility protects this community’s ongoing investment in this vital asset.
The Waste to Energy Facility can process up to 280,000 tons of municipal solid waste per year by incineration, reducing waste volumes by 90%. It converts the solid waste to electricity, generating revenue that offsets tipping fees. The facility also recovers approximately 6,000 to 8,000 tons of ferrous metals for recycling annually.
Since the Facility began operation in 1991, a number of upgrades and additions have been completed, to further reduce emissions, to increase operating efficiency, and to increase recycling and minimize landfilling. Not only do all the residents of Spokane and many jurisdictions throughout the County benefit from the Facility, but agencies and municipalities throughout the State are served by utilizing it for disposal of drugs and pharmaceuticals.
FTEs
2015 Actual 2016 Actual 2017 Actual 2018 Budget 2019 Proposed
Total FTEs 0.00 0.00 0.00 0.00 0.00
Expenditures:
2015 Actual 2016 Actual 2017 Actual 2018 Budget 2019 Proposed
Capital Outlay 0 0 0 0 3,719,500
Interfund Charges 0 0 0 0 0
Reserve for Budget Adjustment 0 0 0 0 0
Transfers Out 0 0 0 0 0
Wages & Benefits 0 0 0 0 0
Supplies & Services 0 0 0 0 0
Debt Services 0 0 0 0 0
All Other 0 0 0 0 0
TOTAL 0 0 0 0 3,719,500
Expenditure Notes:
This is a new program for the 2019 budget. Previously capital budget was accounted for under the various programs within the Solid Waste Disposal Department.
Revenues:
2015 Actual 2016 Actual 2017 Actual 2018 Budget 2019 Proposed
Taxes 0 0 0 0 0
Licenses & Permits 0 0 0 0 0
IG Revenue 0 0 0 0 0
Services 0 0 0 0 0
Fines & Forfeits 0 0 0 0 0
Operating Transfers In 0 0 0 0 0
General Fund Resources 0 0 0 0 0
All Other 0 0 0 0 0
TOTAL 0 0 0 0 0
Revenue Notes:
Public Works 89
Program Summary: Composting
Division: Public Works
Fund Type: Enterprise Fund
Executive Summary:
The program provides for composting of source-separated clean green yard waste and food waste. This process minimizes landfilling and reduces average disposal costs. Managing organics as a recyclable rather than as waste reduces disposal costs for the City.
Programs and Services:
The City contracts to haul clean green yard debris and food scraps collected at the Waste to Energy facility to its composting facility. Composting converts an organic waste into an environmentally beneficial soil amendment. Compost promotes soil health by reducing erosion, enriching soil nutrient capacity and acting as a non-toxic weed control tool. Soil supplemented with compost conserves water resources by providing high water retention qualities. Managing organics as a recyclable rather than as waste reduces disposal costs for the City. The public also benefits from this reduced cost.
FTEs
2015 Actual 2016 Actual 2017 Actual 2018 Budget 2019 Proposed
Total FTEs 0.00 0.00 0.00 0.00 0.00
Expenditures:
2015 Actual 2016 Actual 2017 Actual 2018 Budget 2019 Proposed
Capital Outlay 0 0 0 0 0
Interfund Charges 0 0 0 0 0
Reserve for Budget Adjustment 0 0 0 0 0
Transfers Out 0 0 0 0 0
Wages & Benefits 0 0 0 0 0
Supplies & Services 2,900 389,647 336,114 0 0
Debt Services 0 0 0 0 0
All Other 0 0 0 0 0
TOTAL 2,900 389,647 336,114 0 0
Expenditure Notes:
Barr-Tech contract in this program was moved to Moderate Risk Waste in 2018 Budget
Revenues:
2015 Actual 2016 Actual 2017 Actual 2018 Budget 2019 Proposed
Taxes 0 0 0 0 0
Licenses & Permits 0 0 0 0 0
IG Revenue 0 0 0 0 0
Services 0 0 0 0 0
Fines & Forfeits 0 0 0 0 0One Vision. One Plan. One Voice.
Public Works90
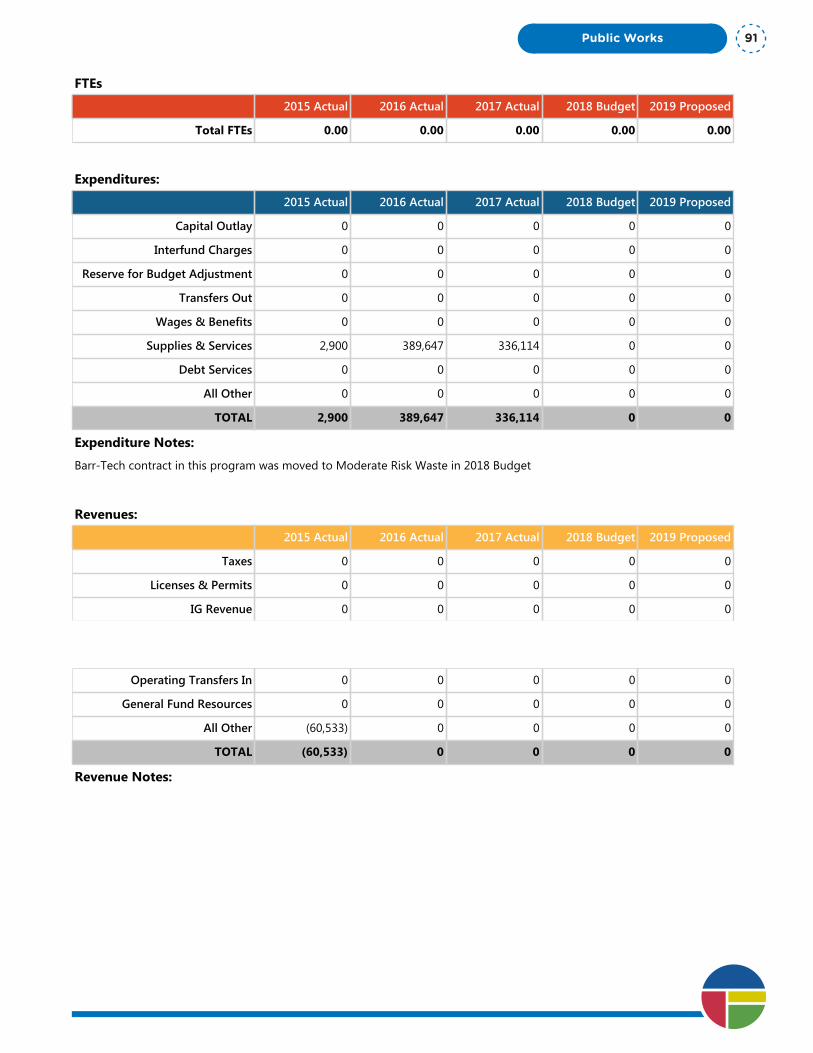
Program Summary: Composting
Division: Public Works
Fund Type: Enterprise Fund
Executive Summary:
The program provides for composting of source-separated clean green yard waste and food waste. This process minimizes landfilling and reduces average disposal costs. Managing organics as a recyclable rather than as waste reduces disposal costs for the City.
Programs and Services:
The City contracts to haul clean green yard debris and food scraps collected at the Waste to Energy facility to its composting facility. Composting converts an organic waste into an environmentally beneficial soil amendment. Compost promotes soil health by reducing erosion, enriching soil nutrient capacity and acting as a non-toxic weed control tool. Soil supplemented with compost conserves water resources by providing high water retention qualities. Managing organics as a recyclable rather than as waste reduces disposal costs for the City. The public also benefits from this reduced cost.
FTEs
2015 Actual 2016 Actual 2017 Actual 2018 Budget 2019 Proposed
Total FTEs 0.00 0.00 0.00 0.00 0.00
Expenditures:
2015 Actual 2016 Actual 2017 Actual 2018 Budget 2019 Proposed
Capital Outlay 0 0 0 0 0
Interfund Charges 0 0 0 0 0
Reserve for Budget Adjustment 0 0 0 0 0
Transfers Out 0 0 0 0 0
Wages & Benefits 0 0 0 0 0
Supplies & Services 2,900 389,647 336,114 0 0
Debt Services 0 0 0 0 0
All Other 0 0 0 0 0
TOTAL 2,900 389,647 336,114 0 0
Expenditure Notes:
Barr-Tech contract in this program was moved to Moderate Risk Waste in 2018 Budget
Revenues:
2015 Actual 2016 Actual 2017 Actual 2018 Budget 2019 Proposed
Taxes 0 0 0 0 0
Licenses & Permits 0 0 0 0 0
IG Revenue 0 0 0 0 0
Services 0 0 0 0 0
Fines & Forfeits 0 0 0 0 0
Operating Transfers In 0 0 0 0 0
General Fund Resources 0 0 0 0 0
All Other (60,533) 0 0 0 0
TOTAL (60,533) 0 0 0 0
Revenue Notes:
Public Works 91
Program Summary: Recycling
Division: Public Works
Fund Type: Enterprise Fund
Executive Summary:
This program provides waste reduction, reuse and recycling programs for citizens and businesses in the City of Spokane. The education and outreach programs help the public and businesses maximize recycling and minimize the amount of solid waste requiring disposal.
Programs and Services:
The City's Solid Waste Disposal Department uses a variety of approaches to educate the public regarding re-use/recycling opportunities, including: informational materials and advertising media; information on the web; and hands-on presentations and community events. These materials and events emphasize the preferred solid waste management hierarchy of (in order of preference) waste reduction, reuse, recycling and proper waste disposal to sustain a healthy environment.
FTEs
2015 Actual 2016 Actual 2017 Actual 2018 Budget 2019 Proposed
Total FTEs 0.00 0.00 1.00 1.00 1.00
Expenditures:
2015 Actual 2016 Actual 2017 Actual 2018 Budget 2019 Proposed
Capital Outlay 0 0 0 0 0
Interfund Charges 0 6,096 4,136 7,000 8,725
Reserve for Budget Adjustment 0 0 0 0 0
Transfers Out 0 0 0 0 0
Wages & Benefits 276 0 91,859 90,940 95,336
Supplies & Services 29,859 21,020 20,504 27,674 26,075
Debt Services 0 0 0 0 0
All Other 109,519 0 0 0 0
TOTAL 139,654 27,116 116,499 125,614 130,136
Expenditure Notes:
Revenues:
2015 Actual 2016 Actual 2017 Actual 2018 Budget 2019 Proposed
Taxes 0 0 0 0 0
Licenses & Permits 0 0 0 0 0
IG Revenue 0 0 0 0 0
Services 0 0 37,544 0 0
Fines & Forfeits 0 0 0 0 0
Operating Transfers In 18,535 14,170 26,446 18,922 23,108One Vision. One Plan. One Voice.
Public Works92

Program Summary: Recycling
Division: Public Works
Fund Type: Enterprise Fund
Executive Summary:
This program provides waste reduction, reuse and recycling programs for citizens and businesses in the City of Spokane. The education and outreach programs help the public and businesses maximize recycling and minimize the amount of solid waste requiring disposal.
Programs and Services:
The City's Solid Waste Disposal Department uses a variety of approaches to educate the public regarding re-use/recycling opportunities, including: informational materials and advertising media; information on the web; and hands-on presentations and community events. These materials and events emphasize the preferred solid waste management hierarchy of (in order of preference) waste reduction, reuse, recycling and proper waste disposal to sustain a healthy environment.
FTEs
2015 Actual 2016 Actual 2017 Actual 2018 Budget 2019 Proposed
Total FTEs 0.00 0.00 1.00 1.00 1.00
Expenditures:
2015 Actual 2016 Actual 2017 Actual 2018 Budget 2019 Proposed
Capital Outlay 0 0 0 0 0
Interfund Charges 0 6,096 4,136 7,000 8,725
Reserve for Budget Adjustment 0 0 0 0 0
Transfers Out 0 0 0 0 0
Wages & Benefits 276 0 91,859 90,940 95,336
Supplies & Services 29,859 21,020 20,504 27,674 26,075
Debt Services 0 0 0 0 0
All Other 109,519 0 0 0 0
TOTAL 139,654 27,116 116,499 125,614 130,136
Expenditure Notes:
Revenues:
2015 Actual 2016 Actual 2017 Actual 2018 Budget 2019 Proposed
Taxes 0 0 0 0 0
Licenses & Permits 0 0 0 0 0
IG Revenue 0 0 0 0 0
Services 0 0 37,544 0 0
Fines & Forfeits 0 0 0 0 0
Operating Transfers In 18,535 14,170 26,446 18,922 23,108
General Fund Resources 0 0 0 0 0
All Other 0 0 0 0 0
TOTAL 18,535 14,170 63,990 18,922 23,108
Revenue Notes:
Public Works 93

Program Summary: Solid Waste Disposal Administration
Division: Public Works
Fund Type: Enterprise Fund
Executive Summary:
The Solid Waste Disposal Administration strives to maintain an efficient and effective municipal solid waste disposal service for the citizens, businesses within the City of Spokane, our partners in Spokane County and the surrounding area.
Programs and Services:
The Solid Waste Disposal Administration is lean and effective. After 20 years as the sole-source municipal solid waste disposal option within Spokane County, the interlocal agreement between the City and Spokane County that created the Spokane Regional Solid Waste System in the late 1980s expired in 2014. New agreements were entered into with the County for the sale of the transfer stations to the County and the disposal of County waste at the Waste to Energy Facility. The City internalized operations of the Waste to Energy Facility, in lieu of outsourcing. This program also accounts for various taxes and interfund charges.
FTEs
2015 Actual 2016 Actual 2017 Actual 2018 Budget 2019 Proposed
Total FTEs 6.00 6.00 18.00 18.00 17.00
Expenditures:
2015 Actual 2016 Actual 2017 Actual 2018 Budget 2019 Proposed
Capital Outlay 0 0 0 0 0
Interfund Charges 1,200,565 1,661,921 2,235,156 1,983,239 2,745,516
Reserve for Budget Adjustment 0 0 0 200,000 200,000
Transfers Out 149 1,724 0 0 1,821,167
Wages & Benefits 1,037,209 749,577 1,719,143 1,702,910 1,646,294
Supplies & Services 142,146 846,567 11,697,631 1,513,853 1,489,621
Debt Services 0 0 0 0 0
All Other 458,883 538,193 579,923 529,000 650,300
TOTAL 2,838,952 3,797,982 16,231,853 5,929,002 8,552,898
Expenditure Notes:
Expenses in the All Other category are City Utility taxes and Washington State Excise taxes paid by the City of Spokane’s Utility Departments.
Revenues:
2015 Actual 2016 Actual 2017 Actual 2018 Budget 2019 Proposed
Taxes 0 0 0 0 0
Licenses & Permits 0 0 0 0 0
IG Revenue 0 0 0 0 0
Services 15,599,327 18,137,437 18,925,526 18,936,356 19,598,322
Fines & Forfeits 0 0 0 0 0One Vision. One Plan. One Voice.
Public Works94
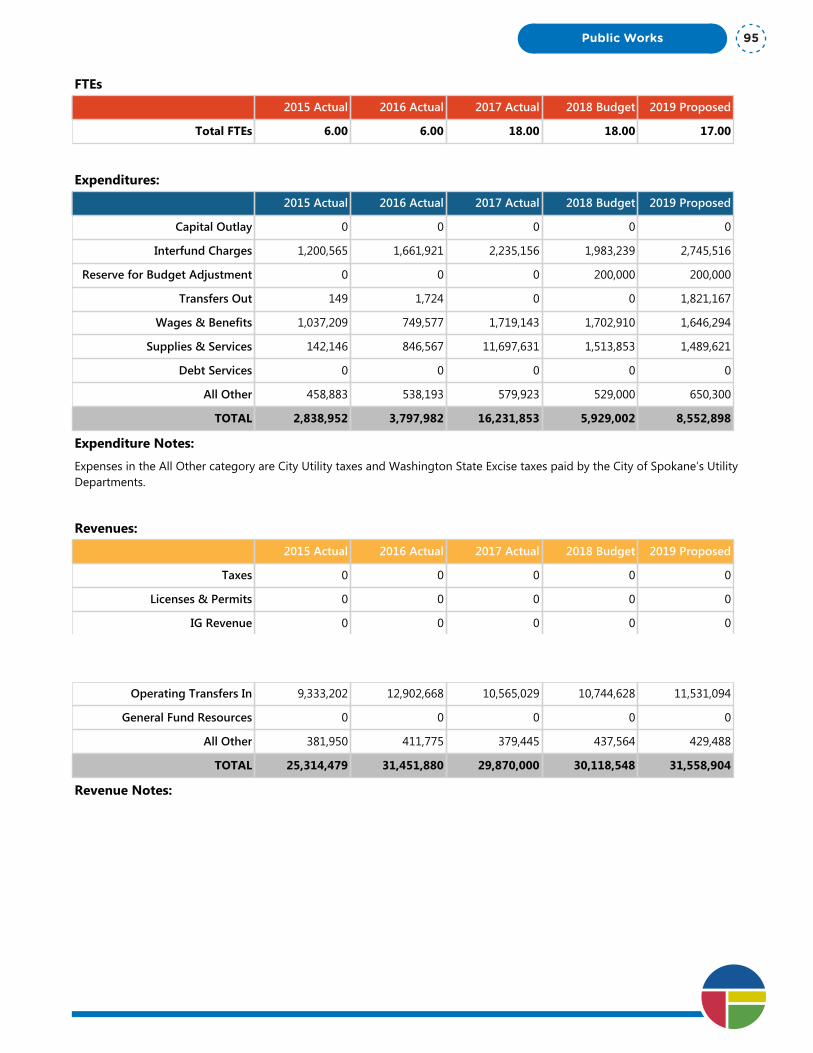
Program Summary: Solid Waste Disposal Administration
Division: Public Works
Fund Type: Enterprise Fund
Executive Summary:
The Solid Waste Disposal Administration strives to maintain an efficient and effective municipal solid waste disposal service for the citizens, businesses within the City of Spokane, our partners in Spokane County and the surrounding area.
Programs and Services:
The Solid Waste Disposal Administration is lean and effective. After 20 years as the sole-source municipal solid waste disposal option within Spokane County, the interlocal agreement between the City and Spokane County that created the Spokane Regional Solid Waste System in the late 1980s expired in 2014. New agreements were entered into with the County for the sale of the transfer stations to the County and the disposal of County waste at the Waste to Energy Facility. The City internalized operations of the Waste to Energy Facility, in lieu of outsourcing. This program also accounts for various taxes and interfund charges.
FTEs
2015 Actual 2016 Actual 2017 Actual 2018 Budget 2019 Proposed
Total FTEs 6.00 6.00 18.00 18.00 17.00
Expenditures:
2015 Actual 2016 Actual 2017 Actual 2018 Budget 2019 Proposed
Capital Outlay 0 0 0 0 0
Interfund Charges 1,200,565 1,661,921 2,235,156 1,983,239 2,745,516
Reserve for Budget Adjustment 0 0 0 200,000 200,000
Transfers Out 149 1,724 0 0 1,821,167
Wages & Benefits 1,037,209 749,577 1,719,143 1,702,910 1,646,294
Supplies & Services 142,146 846,567 11,697,631 1,513,853 1,489,621
Debt Services 0 0 0 0 0
All Other 458,883 538,193 579,923 529,000 650,300
TOTAL 2,838,952 3,797,982 16,231,853 5,929,002 8,552,898
Expenditure Notes:
Expenses in the All Other category are City Utility taxes and Washington State Excise taxes paid by the City of Spokane’s Utility Departments.
Revenues:
2015 Actual 2016 Actual 2017 Actual 2018 Budget 2019 Proposed
Taxes 0 0 0 0 0
Licenses & Permits 0 0 0 0 0
IG Revenue 0 0 0 0 0
Services 15,599,327 18,137,437 18,925,526 18,936,356 19,598,322
Fines & Forfeits 0 0 0 0 0
Operating Transfers In 9,333,202 12,902,668 10,565,029 10,744,628 11,531,094
General Fund Resources 0 0 0 0 0
All Other 381,950 411,775 379,445 437,564 429,488
TOTAL 25,314,479 31,451,880 29,870,000 30,118,548 31,558,904
Revenue Notes:
Public Works 95
Program Summary: Waste to Energy Facility
Division: Public Works
Fund Type: Enterprise Fund
Executive Summary:
The City maintains and operates the Waste to Energy Facility to maximize processing of municipal solid waste in compliance with all environmental permits to minimize the quantity of raw solid waste being landfilled and maximize the generation of electricity and recovery of ferrous metals.
Programs and Services:
The Waste to Energy Facility is the cornerstone of the City's Solid Waste Disposal System. At the end of 2014, the City took over operations of the Facility, ending a long-time contract with the private-sector company, Wheelabrator. The Facility can process up to 280,000 tons of municipal solid waste per year by incineration, reducing waste volumes by 90%. It converts the solid waste to electricity, generating revenue that offsets tipping fees. The facility also recovers approximately 6,000 to 8,000 tons of ferrous metals for recycling annually. Municipal solid waste is delivered to the Facility by the City's Solid Waste Collection trucks, from the Spokane Valley and North County Transfer Stations or is self-hauled by residential/commercial customers and other garbage haulers, primarily in the south and west areas of Spokane County. Since the Facility began operation in 1991, a number of upgrades and additions have been completed, to further reduce emissions, to increase operating efficiency, and to increase recycling and minimize landfilling. Not only do all the residents of Spokane and many jurisdictions throughout the County benefit from the Facility, but agencies and municipalities throughout the State are served by utilizing it for disposal of drugs and pharmaceuticals. Through the Facility’s Assured Destruction Service the Health Care Industry and Law enforcement agencies can dispose of seizure items such as controlled or banned substances, legend drugs and over-the-counter drugs by incineration as solid waste at Spokane's Waste to Energy Facility, the only permitted facility in the state that can accept these items.
FTEs
2015 Actual 2016 Actual 2017 Actual 2018 Budget 2019 Proposed
Total FTEs 62.50 62.50 42.00 42.00 42.00
Expenditures:
2015 Actual 2016 Actual 2017 Actual 2018 Budget 2019 Proposed
Capital Outlay 881,380 1,841,691 2,587,961 5,347,500 0
Interfund Charges 210,122 291,509 16,872 305,782 311,382
Reserve for Budget Adjustment 0 0 0 0 0
Transfers Out 0 1,233 0 0 0
Wages & Benefits 6,312,974 6,943,820 5,196,975 5,631,076 5,877,630
Supplies & Services 11,774,439 11,425,613 10,151,800 12,513,367 14,872,394
Debt Services 0 0 0 0 0
All Other 13,357 11,821 0 0 0
One Vision. One Plan. One Voice.
Public Works96

Program Summary: Waste to Energy Facility
Division: Public Works
Fund Type: Enterprise Fund
Executive Summary:
The City maintains and operates the Waste to Energy Facility to maximize processing of municipal solid waste in compliance with all environmental permits to minimize the quantity of raw solid waste being landfilled and maximize the generation of electricity and recovery of ferrous metals.
Programs and Services:
The Waste to Energy Facility is the cornerstone of the City's Solid Waste Disposal System. At the end of 2014, the City took over operations of the Facility, ending a long-time contract with the private-sector company, Wheelabrator. The Facility can process up to 280,000 tons of municipal solid waste per year by incineration, reducing waste volumes by 90%. It converts the solid waste to electricity, generating revenue that offsets tipping fees. The facility also recovers approximately 6,000 to 8,000 tons of ferrous metals for recycling annually. Municipal solid waste is delivered to the Facility by the City's Solid Waste Collection trucks, from the Spokane Valley and North County Transfer Stations or is self-hauled by residential/commercial customers and other garbage haulers, primarily in the south and west areas of Spokane County. Since the Facility began operation in 1991, a number of upgrades and additions have been completed, to further reduce emissions, to increase operating efficiency, and to increase recycling and minimize landfilling. Not only do all the residents of Spokane and many jurisdictions throughout the County benefit from the Facility, but agencies and municipalities throughout the State are served by utilizing it for disposal of drugs and pharmaceuticals. Through the Facility’s Assured Destruction Service the Health Care Industry and Law enforcement agencies can dispose of seizure items such as controlled or banned substances, legend drugs and over-the-counter drugs by incineration as solid waste at Spokane's Waste to Energy Facility, the only permitted facility in the state that can accept these items.
FTEs
2015 Actual 2016 Actual 2017 Actual 2018 Budget 2019 Proposed
Total FTEs 62.50 62.50 42.00 42.00 42.00
Expenditures:
2015 Actual 2016 Actual 2017 Actual 2018 Budget 2019 Proposed
Capital Outlay 881,380 1,841,691 2,587,961 5,347,500 0
Interfund Charges 210,122 291,509 16,872 305,782 311,382
Reserve for Budget Adjustment 0 0 0 0 0
Transfers Out 0 1,233 0 0 0
Wages & Benefits 6,312,974 6,943,820 5,196,975 5,631,076 5,877,630
Supplies & Services 11,774,439 11,425,613 10,151,800 12,513,367 14,872,394
Debt Services 0 0 0 0 0
All Other 13,357 11,821 0 0 0
TOTAL 19,192,272 20,515,687 17,953,608 23,797,725 21,061,406
Expenditure Notes:
Revenues:
2015 Actual 2016 Actual 2017 Actual 2018 Budget 2019 Proposed
Taxes 0 0 0 0 0
Licenses & Permits 0 0 0 0 0
IG Revenue 0 0 0 0 0
Services 0 0 0 0 0
Fines & Forfeits 0 0 0 0 0
Operating Transfers In 0 0 0 0 0
General Fund Resources 0 0 0 0 0
All Other (8,191) (1,065,292) (11,290) 0 0
TOTAL (8,191) (1,065,292) (11,290) 0 0
Revenue Notes:
Public Works 97

One Vision. One Plan. One Voice.
Public Works98
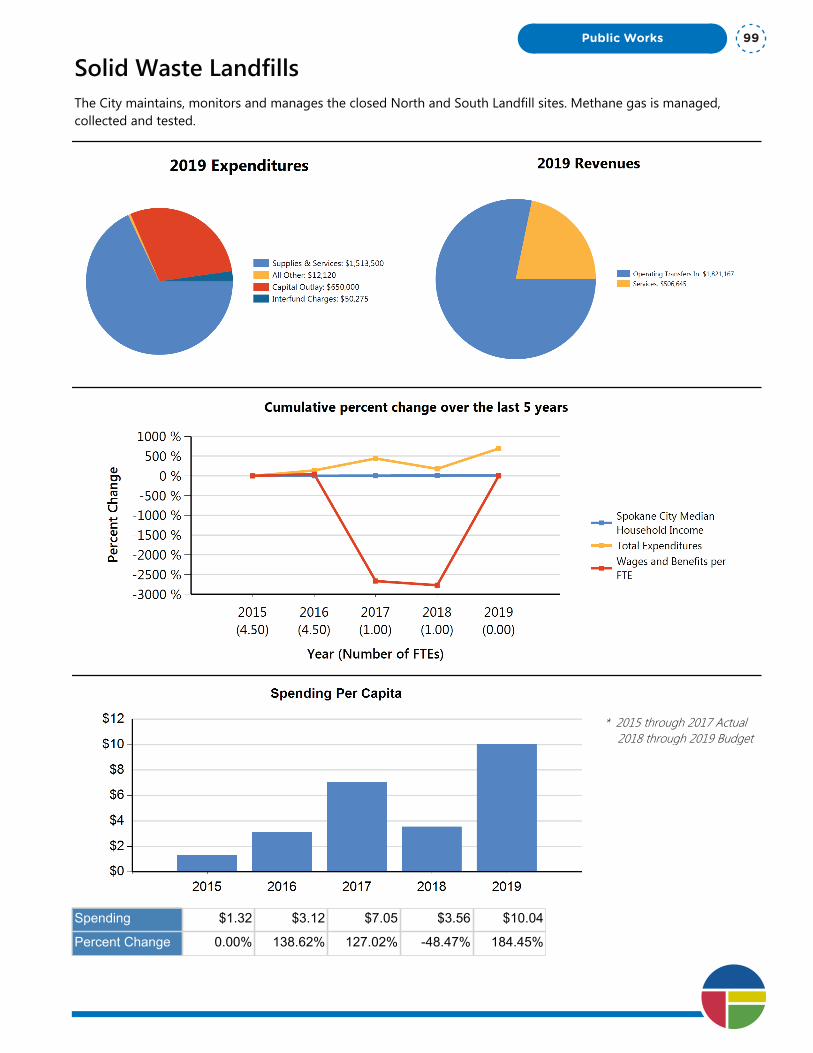
Solid Waste LandfillsThe City maintains, monitors and manages the closed North and South Landfill sites. Methane gas is managed, collected and tested.
* 2015 through 2017 Actual 2018 through 2019 Budget
Spending $1.32 $3.12 $7.05 $3.56 $10.04
Percent Change 0.00% 138.62% 127.02% -48.47% 184.45%
Public Works 99

Department Summary: Solid Waste Landfills
Division: Public Works
Fund Type: Enterprise Fund
Executive Summary:
The City maintains, monitors and manages the closed North and South Landfill sites. Methane gas is managed, collected and tested.
Programs and Services:
The City maintains the landfill caps, access roads and flare stations in compliance with permits. Monitoring, analyzing and reporting of groundwater data prevent offsite migration of contaminants into the environment. All environmental compliance regulations with local, state and federal authorities are met.
FTEs
2015 Actual 2016 Actual 2017 Actual 2018 Budget 2019 Proposed
Total FTEs 4.50 4.50 1.00 1.00 0.00
Expenditures:
2015 Actual 2016 Actual 2017 Actual 2018 Budget 2019 Proposed
Capital Outlay 85,387 16,715 0 0 650,000
Interfund Charges 106,049 91,122 239,512 45,825 50,275
Reserve for Budget Adjustment 0 0 0 0 0
Transfers Out 920,134 316,841 0 0 0
Wages & Benefits 213,810 306,904 (1,780,046) 95,171 0
Supplies & Services (1,061,879) (73,284) 3,055,191 629,504 1,513,500
Debt Services 0 0 0 0 0
All Other 16,835 10,647 4,022 12,000 12,120
TOTAL 280,336 668,945 1,518,679 782,500 2,225,895
Expenditure Notes:
In prior years, actual expenses and budget for the Landfills were adopted under the Solid Waste Disposal Department. For comparative purposes, historical actual expenses and adopted budgets are reflected in this bid. All Other expenses are contracted services with Spokane Correctional Facility for litter control and other related services.
Revenues:
2015 Actual 2016 Actual 2017 Actual 2018 Budget 2019 Proposed
Taxes 0 0 0 0 0
Licenses & Permits 0 0 0 0 0
IG Revenue 0 0 0 0 0
Services 220,309 247,336 213,575 442,000 506,645
Fines & Forfeits 0 0 0 0 0
Operating Transfers In 0 316,841 0 0 1,821,167One Vision. One Plan. One Voice.
Public Works100
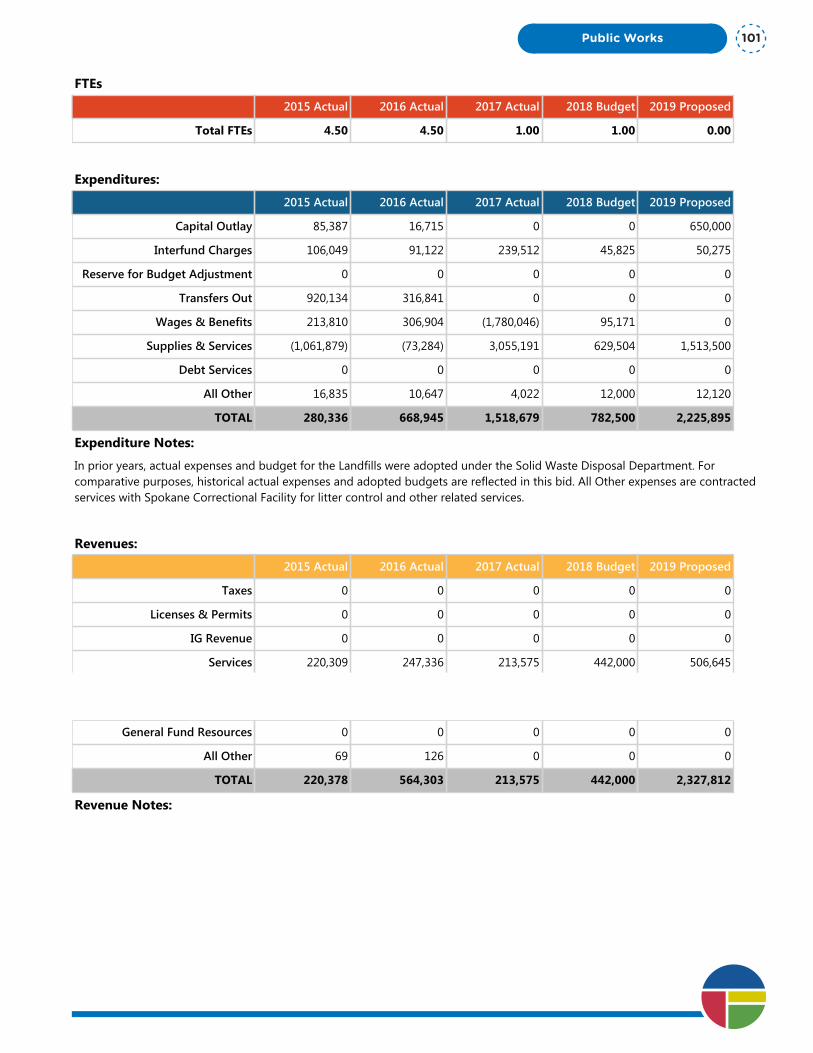
Department Summary: Solid Waste Landfills
Division: Public Works
Fund Type: Enterprise Fund
Executive Summary:
The City maintains, monitors and manages the closed North and South Landfill sites. Methane gas is managed, collected and tested.
Programs and Services:
The City maintains the landfill caps, access roads and flare stations in compliance with permits. Monitoring, analyzing and reporting of groundwater data prevent offsite migration of contaminants into the environment. All environmental compliance regulations with local, state and federal authorities are met.
FTEs
2015 Actual 2016 Actual 2017 Actual 2018 Budget 2019 Proposed
Total FTEs 4.50 4.50 1.00 1.00 0.00
Expenditures:
2015 Actual 2016 Actual 2017 Actual 2018 Budget 2019 Proposed
Capital Outlay 85,387 16,715 0 0 650,000
Interfund Charges 106,049 91,122 239,512 45,825 50,275
Reserve for Budget Adjustment 0 0 0 0 0
Transfers Out 920,134 316,841 0 0 0
Wages & Benefits 213,810 306,904 (1,780,046) 95,171 0
Supplies & Services (1,061,879) (73,284) 3,055,191 629,504 1,513,500
Debt Services 0 0 0 0 0
All Other 16,835 10,647 4,022 12,000 12,120
TOTAL 280,336 668,945 1,518,679 782,500 2,225,895
Expenditure Notes:
In prior years, actual expenses and budget for the Landfills were adopted under the Solid Waste Disposal Department. For comparative purposes, historical actual expenses and adopted budgets are reflected in this bid. All Other expenses are contracted services with Spokane Correctional Facility for litter control and other related services.
Revenues:
2015 Actual 2016 Actual 2017 Actual 2018 Budget 2019 Proposed
Taxes 0 0 0 0 0
Licenses & Permits 0 0 0 0 0
IG Revenue 0 0 0 0 0
Services 220,309 247,336 213,575 442,000 506,645
Fines & Forfeits 0 0 0 0 0
Operating Transfers In 0 316,841 0 0 1,821,167
General Fund Resources 0 0 0 0 0
All Other 69 126 0 0 0
TOTAL 220,378 564,303 213,575 442,000 2,327,812
Revenue Notes:
Public Works 101
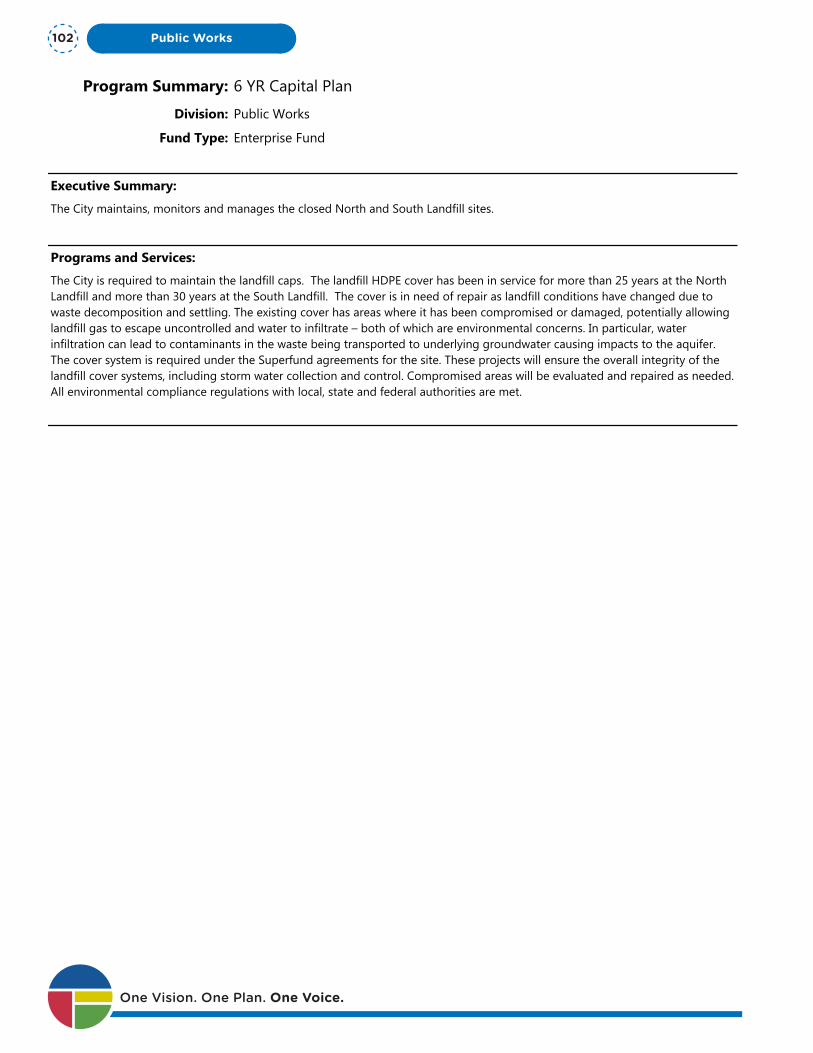
Program Summary: 6 YR Capital Plan
Division: Public Works
Fund Type: Enterprise Fund
Executive Summary:
The City maintains, monitors and manages the closed North and South Landfill sites.
Programs and Services:
The City is required to maintain the landfill caps. The landfill HDPE cover has been in service for more than 25 years at the North Landfill and more than 30 years at the South Landfill. The cover is in need of repair as landfill conditions have changed due to waste decomposition and settling. The existing cover has areas where it has been compromised or damaged, potentially allowing landfill gas to escape uncontrolled and water to infiltrate – both of which are environmental concerns. In particular, water infiltration can lead to contaminants in the waste being transported to underlying groundwater causing impacts to the aquifer. The cover system is required under the Superfund agreements for the site. These projects will ensure the overall integrity of the landfill cover systems, including storm water collection and control. Compromised areas will be evaluated and repaired as needed. All environmental compliance regulations with local, state and federal authorities are met.
FTEs
2015 Actual 2016 Actual 2017 Actual 2018 Budget 2019 Proposed
Total FTEs 0.00 0.00 0.00 0.00 0.00
Expenditures:
2015 Actual 2016 Actual 2017 Actual 2018 Budget 2019 Proposed
Capital Outlay 0 0 0 0 0
Interfund Charges 0 0 0 0 0
Reserve for Budget Adjustment 0 0 0 0 0
Transfers Out 0 0 0 0 0
Wages & Benefits 0 0 0 0 0
Supplies & Services 0 0 0 0 775,000
Debt Services 0 0 0 0 0
All Other 0 0 0 0 0
TOTAL 0 0 0 0 775,000
Expenditure Notes:
Revenues:
2015 Actual 2016 Actual 2017 Actual 2018 Budget 2019 Proposed
Taxes 0 0 0 0 0
Licenses & Permits 0 0 0 0 0
IG Revenue 0 0 0 0 0
Services 0 0 0 0 0
Fines & Forfeits 0 0 0 0 0One Vision. One Plan. One Voice.
Public Works102

Program Summary: 6 YR Capital Plan
Division: Public Works
Fund Type: Enterprise Fund
Executive Summary:
The City maintains, monitors and manages the closed North and South Landfill sites.
Programs and Services:
The City is required to maintain the landfill caps. The landfill HDPE cover has been in service for more than 25 years at the North Landfill and more than 30 years at the South Landfill. The cover is in need of repair as landfill conditions have changed due to waste decomposition and settling. The existing cover has areas where it has been compromised or damaged, potentially allowing landfill gas to escape uncontrolled and water to infiltrate – both of which are environmental concerns. In particular, water infiltration can lead to contaminants in the waste being transported to underlying groundwater causing impacts to the aquifer. The cover system is required under the Superfund agreements for the site. These projects will ensure the overall integrity of the landfill cover systems, including storm water collection and control. Compromised areas will be evaluated and repaired as needed. All environmental compliance regulations with local, state and federal authorities are met.
FTEs
2015 Actual 2016 Actual 2017 Actual 2018 Budget 2019 Proposed
Total FTEs 0.00 0.00 0.00 0.00 0.00
Expenditures:
2015 Actual 2016 Actual 2017 Actual 2018 Budget 2019 Proposed
Capital Outlay 0 0 0 0 0
Interfund Charges 0 0 0 0 0
Reserve for Budget Adjustment 0 0 0 0 0
Transfers Out 0 0 0 0 0
Wages & Benefits 0 0 0 0 0
Supplies & Services 0 0 0 0 775,000
Debt Services 0 0 0 0 0
All Other 0 0 0 0 0
TOTAL 0 0 0 0 775,000
Expenditure Notes:
Revenues:
2015 Actual 2016 Actual 2017 Actual 2018 Budget 2019 Proposed
Taxes 0 0 0 0 0
Licenses & Permits 0 0 0 0 0
IG Revenue 0 0 0 0 0
Services 0 0 0 0 0
Fines & Forfeits 0 0 0 0 0
Operating Transfers In 0 0 0 0 0
General Fund Resources 0 0 0 0 0
All Other 0 0 0 0 0
TOTAL 0 0 0 0 0
Revenue Notes:
Public Works 103

Program Summary: Landfill Closure
Division: Public Works
Fund Type: Enterprise Fund
Executive Summary:
The City maintains, monitors and manages the closed North and South Landfill sites. The long-term care of the closed landfills requires financial resources and long-range planning including periodic inspections, regular intervals of monitoring, repairs and maintenance when necessary. This ensures the landfills continue to meet all regulations including achieving groundwater protection standards.
Programs and Services:
The long-term care of the closed landfills requires financial resources and long-range planning including periodic inspections, regular intervals of monitoring, repairs and maintenance when necessary. This ensures the landfills continue to meet all regulations including achieving groundwater protection standards.
The City maintains the landfill caps, access roads and flare stations in compliance with permits. Monitoring, analyzing and reporting of groundwater data prevent offsite migration of contaminants into the environment. All environmental compliance regulations with local, state and federal authorities are met.
FTEs
2015 Actual 2016 Actual 2017 Actual 2018 Budget 2019 Proposed
Total FTEs 2.40 2.40 0.00 0.00 0.00
Expenditures:
2015 Actual 2016 Actual 2017 Actual 2018 Budget 2019 Proposed
Capital Outlay 2,761 0 0 0 150,000
Interfund Charges 71,637 (41,152) (25,467) 0 0
Reserve for Budget Adjustment 0 0 0 0 0
Transfers Out 310 0 0 0 0
Wages & Benefits 110,068 441,239 (1,249,710) 0 0
Supplies & Services (669,675) (127,445) 2,078,475 191,781 269,833
Debt Services 0 0 0 0 0
All Other 6,219 4,140 1,388 5,000 5,000
One Vision. One Plan. One Voice.
Public Works104
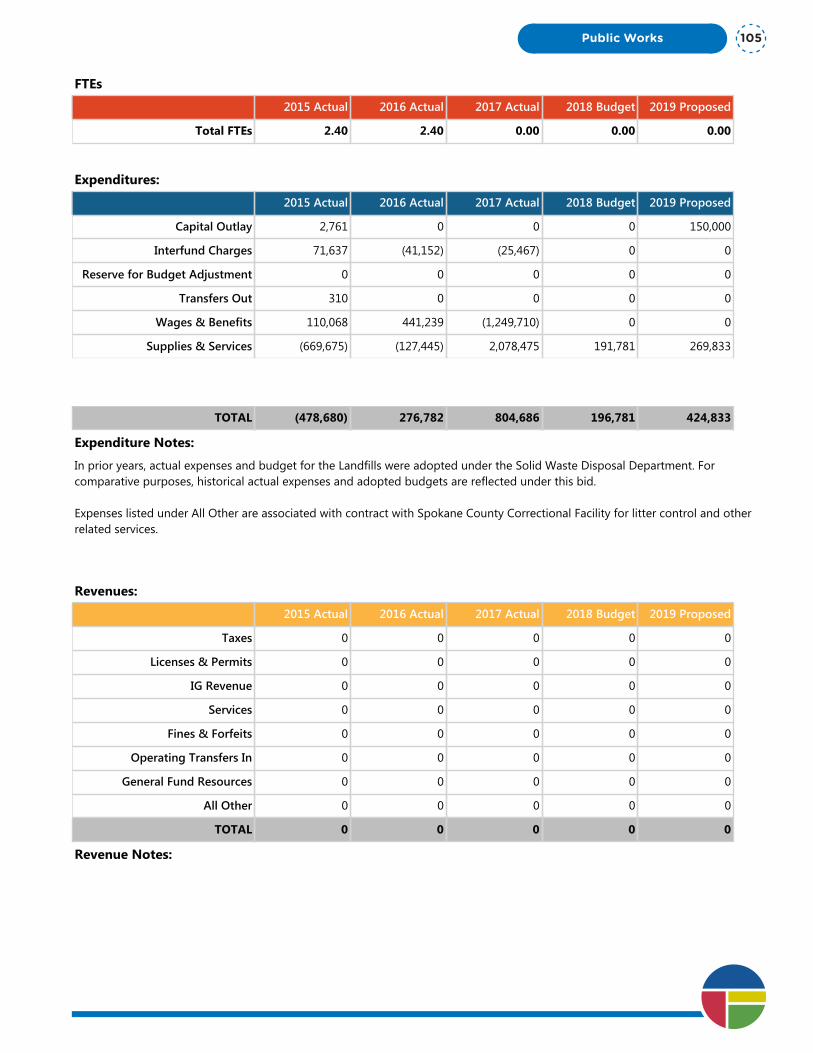
Program Summary: Landfill Closure
Division: Public Works
Fund Type: Enterprise Fund
Executive Summary:
The City maintains, monitors and manages the closed North and South Landfill sites. The long-term care of the closed landfills requires financial resources and long-range planning including periodic inspections, regular intervals of monitoring, repairs and maintenance when necessary. This ensures the landfills continue to meet all regulations including achieving groundwater protection standards.
Programs and Services:
The long-term care of the closed landfills requires financial resources and long-range planning including periodic inspections, regular intervals of monitoring, repairs and maintenance when necessary. This ensures the landfills continue to meet all regulations including achieving groundwater protection standards.
The City maintains the landfill caps, access roads and flare stations in compliance with permits. Monitoring, analyzing and reporting of groundwater data prevent offsite migration of contaminants into the environment. All environmental compliance regulations with local, state and federal authorities are met.
FTEs
2015 Actual 2016 Actual 2017 Actual 2018 Budget 2019 Proposed
Total FTEs 2.40 2.40 0.00 0.00 0.00
Expenditures:
2015 Actual 2016 Actual 2017 Actual 2018 Budget 2019 Proposed
Capital Outlay 2,761 0 0 0 150,000
Interfund Charges 71,637 (41,152) (25,467) 0 0
Reserve for Budget Adjustment 0 0 0 0 0
Transfers Out 310 0 0 0 0
Wages & Benefits 110,068 441,239 (1,249,710) 0 0
Supplies & Services (669,675) (127,445) 2,078,475 191,781 269,833
Debt Services 0 0 0 0 0
All Other 6,219 4,140 1,388 5,000 5,000
TOTAL (478,680) 276,782 804,686 196,781 424,833
Expenditure Notes:
In prior years, actual expenses and budget for the Landfills were adopted under the Solid Waste Disposal Department. For comparative purposes, historical actual expenses and adopted budgets are reflected under this bid.
Expenses listed under All Other are associated with contract with Spokane County Correctional Facility for litter control and other related services.
Revenues:
2015 Actual 2016 Actual 2017 Actual 2018 Budget 2019 Proposed
Taxes 0 0 0 0 0
Licenses & Permits 0 0 0 0 0
IG Revenue 0 0 0 0 0
Services 0 0 0 0 0
Fines & Forfeits 0 0 0 0 0
Operating Transfers In 0 0 0 0 0
General Fund Resources 0 0 0 0 0
All Other 0 0 0 0 0
TOTAL 0 0 0 0 0
Revenue Notes:
Public Works 105

Program Summary: Northside Landfill
Division: Public Works
Fund Type: Enterprise Fund
Executive Summary:
The City manages and operates a municipal solid waste landfill. This facility primarily serves as an emergency backup facility, but also disposes of certain wastes not suitable for combustion.
Programs and Services:
The Northside Landfill contains a municipal solid waste cell, which is the only permitted landfill for disposal of such wastes in Spokane County. It is also the only facility available for disposal of large animal carcasses and disposal of building waste contaminated with seepage. This site is critical as an emergency backup facility when other options are not available. As an emergency backup, this facility is used at least twice a year for unplanned disposal needs. It was used during ice storms, windstorms and during wildfires as well as for disposal of material from the Wastewater Treatment Plant digester. This facility may also be used for waste which cannot be processed at the Waste to Energy Facility during plant shutdowns or other operational issues. This site also houses a closed landfill location.
FTEs
2015 Actual 2016 Actual 2017 Actual 2018 Budget 2019 Proposed
Total FTEs 0.80 0.80 0.00 0.00 0.00
Expenditures:
2015 Actual 2016 Actual 2017 Actual 2018 Budget 2019 Proposed
Capital Outlay 2,761 0 0 0 0
Interfund Charges 29,690 122,196 334,195 30,225 34,675
Reserve for Budget Adjustment 0 0 0 0 0
Transfers Out 296,301 316,396 0 0 0
Wages & Benefits 97,343 (38,576) (291,809) 0 0
Supplies & Services 90,014 104,881 1,085,145 225,363 237,349
Debt Services 0 0 0 0 0
All Other 9,359 4,782 2,514 5,000 5,000
TOTAL 525,468 509,679 1,130,045 260,588 277,024
Expenditure Notes:
In prior years, actual expenses and budget for the Landfills were adopted under the Solid Waste Disposal Department. For comparative purposes, historical actual expenses and adopted budgets are reflected under this bid.
Expenses listed under All Other are associated with contract with Spokane County Correctional Facility for litter control and other related services.
Revenues:
2015 Actual 2016 Actual 2017 Actual 2018 Budget 2019 Proposed
Taxes 0 0 0 0 0
Licenses & Permits 0 0 0 0 0One Vision. One Plan. One Voice.
Public Works106
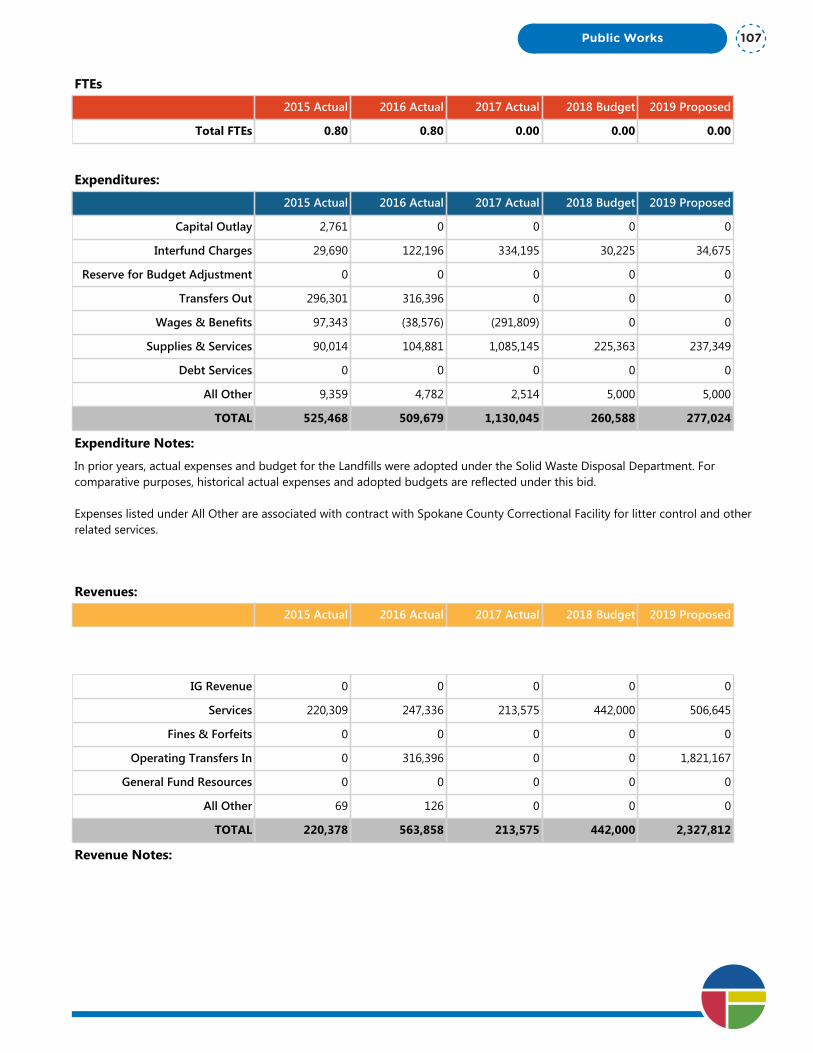
Program Summary: Northside Landfill
Division: Public Works
Fund Type: Enterprise Fund
Executive Summary:
The City manages and operates a municipal solid waste landfill. This facility primarily serves as an emergency backup facility, but also disposes of certain wastes not suitable for combustion.
Programs and Services:
The Northside Landfill contains a municipal solid waste cell, which is the only permitted landfill for disposal of such wastes in Spokane County. It is also the only facility available for disposal of large animal carcasses and disposal of building waste contaminated with seepage. This site is critical as an emergency backup facility when other options are not available. As an emergency backup, this facility is used at least twice a year for unplanned disposal needs. It was used during ice storms, windstorms and during wildfires as well as for disposal of material from the Wastewater Treatment Plant digester. This facility may also be used for waste which cannot be processed at the Waste to Energy Facility during plant shutdowns or other operational issues. This site also houses a closed landfill location.
FTEs
2015 Actual 2016 Actual 2017 Actual 2018 Budget 2019 Proposed
Total FTEs 0.80 0.80 0.00 0.00 0.00
Expenditures:
2015 Actual 2016 Actual 2017 Actual 2018 Budget 2019 Proposed
Capital Outlay 2,761 0 0 0 0
Interfund Charges 29,690 122,196 334,195 30,225 34,675
Reserve for Budget Adjustment 0 0 0 0 0
Transfers Out 296,301 316,396 0 0 0
Wages & Benefits 97,343 (38,576) (291,809) 0 0
Supplies & Services 90,014 104,881 1,085,145 225,363 237,349
Debt Services 0 0 0 0 0
All Other 9,359 4,782 2,514 5,000 5,000
TOTAL 525,468 509,679 1,130,045 260,588 277,024
Expenditure Notes:
In prior years, actual expenses and budget for the Landfills were adopted under the Solid Waste Disposal Department. For comparative purposes, historical actual expenses and adopted budgets are reflected under this bid.
Expenses listed under All Other are associated with contract with Spokane County Correctional Facility for litter control and other related services.
Revenues:
2015 Actual 2016 Actual 2017 Actual 2018 Budget 2019 Proposed
Taxes 0 0 0 0 0
Licenses & Permits 0 0 0 0 0
IG Revenue 0 0 0 0 0
Services 220,309 247,336 213,575 442,000 506,645
Fines & Forfeits 0 0 0 0 0
Operating Transfers In 0 316,396 0 0 1,821,167
General Fund Resources 0 0 0 0 0
All Other 69 126 0 0 0
TOTAL 220,378 563,858 213,575 442,000 2,327,812
Revenue Notes:
Public Works 107
Program Summary: Southside Landfill
Division: Public Works
Fund Type: Enterprise Fund
Executive Summary:
The City maintains, monitors and manages the closed South Landfill. Methane gas is managed, collected and tested at this landfill site.
Programs and Services:
The City maintains the landfill caps, access roads and flare stations in compliance with permits. Monitoring, analyzing and reporting of groundwater data prevent offsite migration of contaminants into the environment. All environmental compliance regulations with local, state and federal authorities are met.
FTEs
2015 Actual 2016 Actual 2017 Actual 2018 Budget 2019 Proposed
Total FTEs 1.30 1.30 1.00 1.00 0.00
Expenditures:
2015 Actual 2016 Actual 2017 Actual 2018 Budget 2019 Proposed
Capital Outlay 79,865 16,715 0 0 500,000
Interfund Charges 4,722 10,078 (69,216) 15,600 15,600
Reserve for Budget Adjustment 0 0 0 0 0
Transfers Out 623,523 445 0 0 0
Wages & Benefits 6,399 (95,759) (238,527) 95,171 0
Supplies & Services (482,218) (50,720) (108,429) 212,360 231,318
Debt Services 0 0 0 0 0
All Other 1,257 1,725 120 2,000 2,120
TOTAL 233,548 (117,516) (416,052) 325,131 749,038
Expenditure Notes:
In prior years, actual expenses and budget for the Landfills were adopted under the Solid Waste Disposal Department. For comparative purposes, historical actual expenses and adopted budgets are reflected under this bid.
Expenses listed under All Other are associated with contract with Spokane County Correctional Facility for litter control and other related services.
Revenues:
2015 Actual 2016 Actual 2017 Actual 2018 Budget 2019 Proposed
Taxes 0 0 0 0 0
Licenses & Permits 0 0 0 0 0
IG Revenue 0 0 0 0 0
Services 0 0 0 0 0One Vision. One Plan. One Voice.
Public Works108
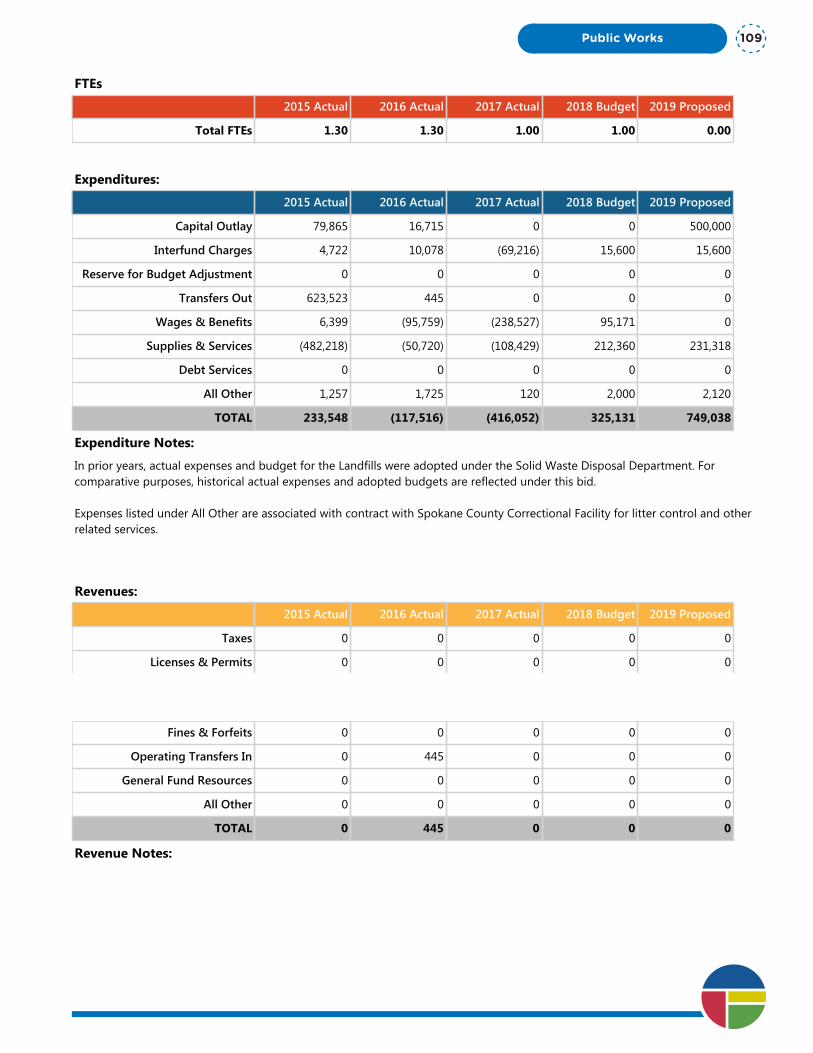
Program Summary: Southside Landfill
Division: Public Works
Fund Type: Enterprise Fund
Executive Summary:
The City maintains, monitors and manages the closed South Landfill. Methane gas is managed, collected and tested at this landfill site.
Programs and Services:
The City maintains the landfill caps, access roads and flare stations in compliance with permits. Monitoring, analyzing and reporting of groundwater data prevent offsite migration of contaminants into the environment. All environmental compliance regulations with local, state and federal authorities are met.
FTEs
2015 Actual 2016 Actual 2017 Actual 2018 Budget 2019 Proposed
Total FTEs 1.30 1.30 1.00 1.00 0.00
Expenditures:
2015 Actual 2016 Actual 2017 Actual 2018 Budget 2019 Proposed
Capital Outlay 79,865 16,715 0 0 500,000
Interfund Charges 4,722 10,078 (69,216) 15,600 15,600
Reserve for Budget Adjustment 0 0 0 0 0
Transfers Out 623,523 445 0 0 0
Wages & Benefits 6,399 (95,759) (238,527) 95,171 0
Supplies & Services (482,218) (50,720) (108,429) 212,360 231,318
Debt Services 0 0 0 0 0
All Other 1,257 1,725 120 2,000 2,120
TOTAL 233,548 (117,516) (416,052) 325,131 749,038
Expenditure Notes:
In prior years, actual expenses and budget for the Landfills were adopted under the Solid Waste Disposal Department. For comparative purposes, historical actual expenses and adopted budgets are reflected under this bid.
Expenses listed under All Other are associated with contract with Spokane County Correctional Facility for litter control and other related services.
Revenues:
2015 Actual 2016 Actual 2017 Actual 2018 Budget 2019 Proposed
Taxes 0 0 0 0 0
Licenses & Permits 0 0 0 0 0
IG Revenue 0 0 0 0 0
Services 0 0 0 0 0
Fines & Forfeits 0 0 0 0 0
Operating Transfers In 0 445 0 0 0
General Fund Resources 0 0 0 0 0
All Other 0 0 0 0 0
TOTAL 0 445 0 0 0
Revenue Notes:
Public Works 109

One Vision. One Plan. One Voice.
Public Works110
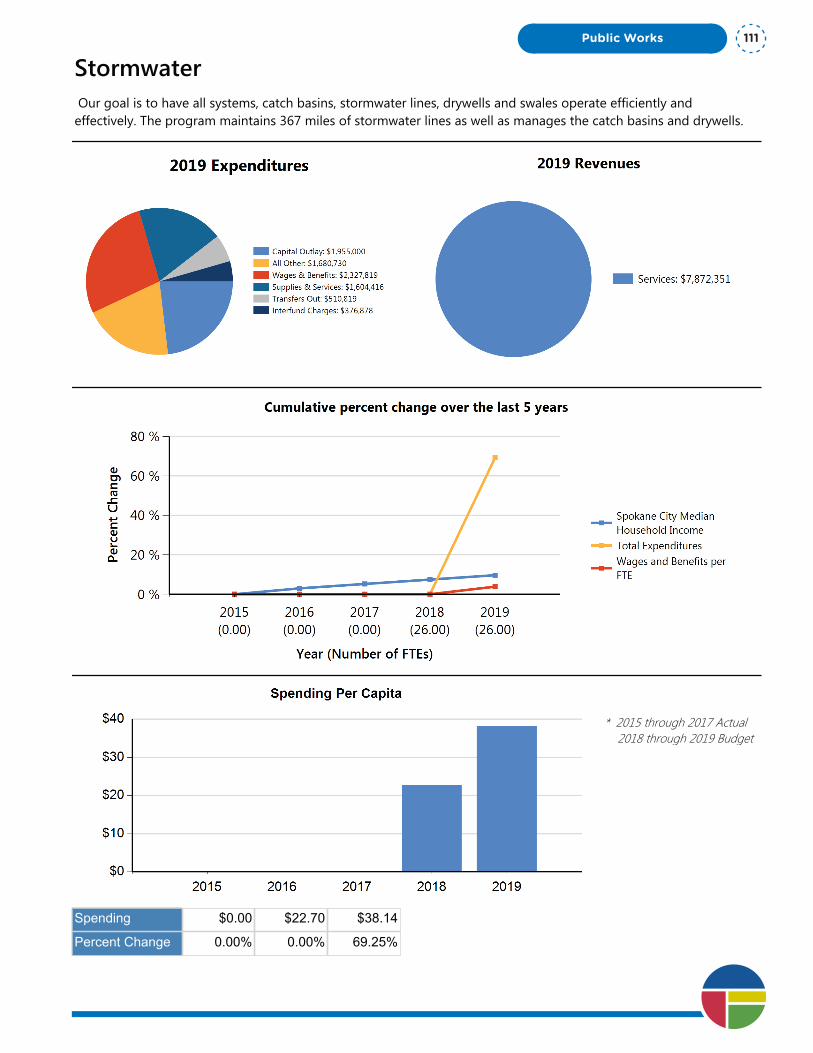
Stormwater Our goal is to have all systems, catch basins, stormwater lines, drywells and swales operate efficiently and effectively. The program maintains 367 miles of stormwater lines as well as manages the catch basins and drywells.
* 2015 through 2017 Actual 2018 through 2019 Budget
Spending $0.00 $22.70 $38.14
Percent Change 0.00% 0.00% 69.25%
Public Works 111
Department Summary: Stormwater
Division: Public Works
Fund Type: Enterprise Fund
Executive Summary:
Our goal is to have all systems, catch basins, stormwater lines, drywells and swales operate efficiently and effectively. The program maintains 367 miles of stormwater lines as well as manages the catch basins and drywells.
Programs and Services:
This program includes eliminating blockages in storm sewer mains, pumping debris from catch basins and drywells, maintaining and rebuilding "208" grassy percolation swales for right of way drainage and a mosquito abatement program to limit the possibility of West Nile Virus in our community. We accomplish these tasks with a variety of methods: high volume vacuum pumpers, hydro cleaning, design and installation of stormwater retention ponds and excavation for repair/replacement of stormwater infrastructure. Additional duties including meeting with private engineering firms to ensure compliance and maintenance on complicated drainage issues, working with Developer Services on stormwater design approvals, and inspecting all new stormwater facilities, working with developers, builders and homeowners. We approve of projects by using a closed-circuit TV system to inspect all new stormwater pipe installed in conjunction with Engineering Services for final approval and acceptance by the City. We also manage replacement of existing drywells, used extensively in the City's far north and far south sides that have an expected lifespan of 20 to 30 years. Management of stormwater is growing area of responsibility for the City, as we work to manage more stormwater on site through the use of green infrastructure techniques, including storm gardens, pervious pavements, and other techniques.
FTEs
2015 Actual 2016 Actual 2017 Actual 2018 Budget 2019 Proposed
Total FTEs 0.00 0.00 0.00 26.00 26.00
Expenditures:
2015 Actual 2016 Actual 2017 Actual 2018 Budget 2019 Proposed
Capital Outlay 0 0 0 375,000 1,955,000
Interfund Charges 0 0 0 433,035 376,878
Reserve for Budget Adjustment 0 0 0 0 0
Transfers Out 0 0 0 663,536 510,819
Wages & Benefits 0 0 0 2,241,492 2,327,819
Supplies & Services 0 0 0 1,282,687 1,604,416
Debt Services 0 0 0 0 0
All Other 0 0 0 0 1,680,730
One Vision. One Plan. One Voice.
Public Works112
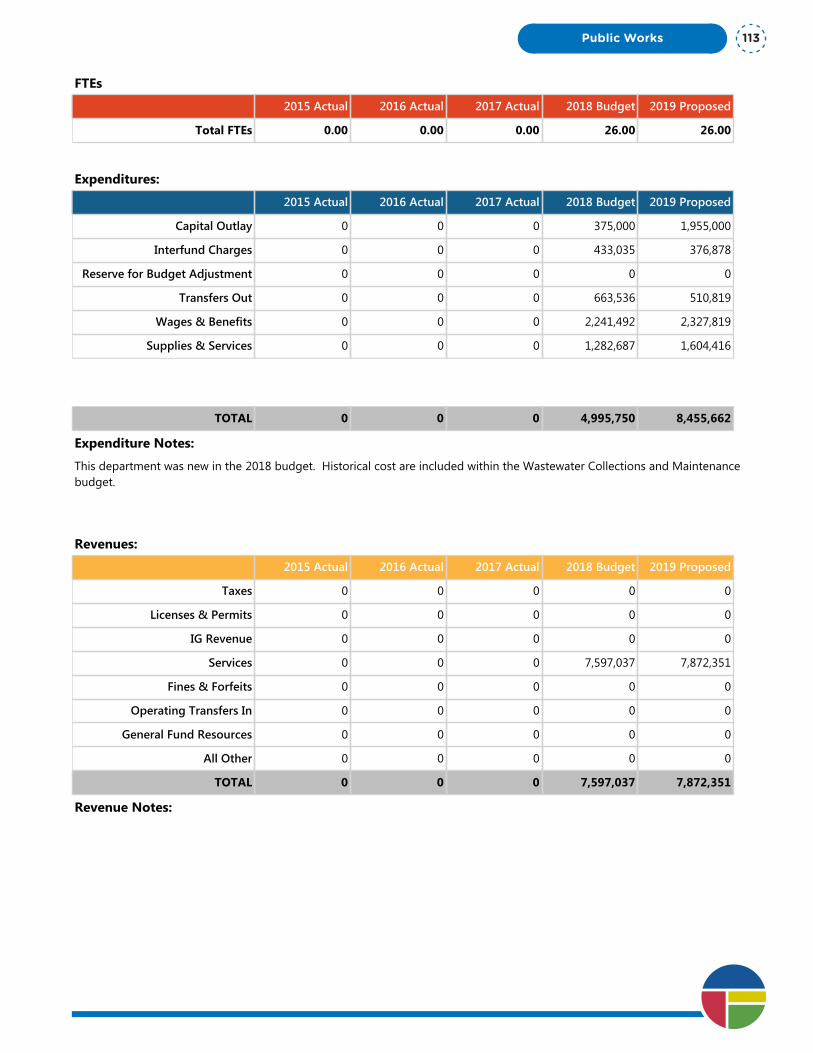
Department Summary: Stormwater
Division: Public Works
Fund Type: Enterprise Fund
Executive Summary:
Our goal is to have all systems, catch basins, stormwater lines, drywells and swales operate efficiently and effectively. The program maintains 367 miles of stormwater lines as well as manages the catch basins and drywells.
Programs and Services:
This program includes eliminating blockages in storm sewer mains, pumping debris from catch basins and drywells, maintaining and rebuilding "208" grassy percolation swales for right of way drainage and a mosquito abatement program to limit the possibility of West Nile Virus in our community. We accomplish these tasks with a variety of methods: high volume vacuum pumpers, hydro cleaning, design and installation of stormwater retention ponds and excavation for repair/replacement of stormwater infrastructure. Additional duties including meeting with private engineering firms to ensure compliance and maintenance on complicated drainage issues, working with Developer Services on stormwater design approvals, and inspecting all new stormwater facilities, working with developers, builders and homeowners. We approve of projects by using a closed-circuit TV system to inspect all new stormwater pipe installed in conjunction with Engineering Services for final approval and acceptance by the City. We also manage replacement of existing drywells, used extensively in the City's far north and far south sides that have an expected lifespan of 20 to 30 years. Management of stormwater is growing area of responsibility for the City, as we work to manage more stormwater on site through the use of green infrastructure techniques, including storm gardens, pervious pavements, and other techniques.
FTEs
2015 Actual 2016 Actual 2017 Actual 2018 Budget 2019 Proposed
Total FTEs 0.00 0.00 0.00 26.00 26.00
Expenditures:
2015 Actual 2016 Actual 2017 Actual 2018 Budget 2019 Proposed
Capital Outlay 0 0 0 375,000 1,955,000
Interfund Charges 0 0 0 433,035 376,878
Reserve for Budget Adjustment 0 0 0 0 0
Transfers Out 0 0 0 663,536 510,819
Wages & Benefits 0 0 0 2,241,492 2,327,819
Supplies & Services 0 0 0 1,282,687 1,604,416
Debt Services 0 0 0 0 0
All Other 0 0 0 0 1,680,730
TOTAL 0 0 0 4,995,750 8,455,662
Expenditure Notes:
This department was new in the 2018 budget. Historical cost are included within the Wastewater Collections and Maintenance budget.
Revenues:
2015 Actual 2016 Actual 2017 Actual 2018 Budget 2019 Proposed
Taxes 0 0 0 0 0
Licenses & Permits 0 0 0 0 0
IG Revenue 0 0 0 0 0
Services 0 0 0 7,597,037 7,872,351
Fines & Forfeits 0 0 0 0 0
Operating Transfers In 0 0 0 0 0
General Fund Resources 0 0 0 0 0
All Other 0 0 0 0 0
TOTAL 0 0 0 7,597,037 7,872,351
Revenue Notes:
Public Works 113

One Vision. One Plan. One Voice.
Public Works114
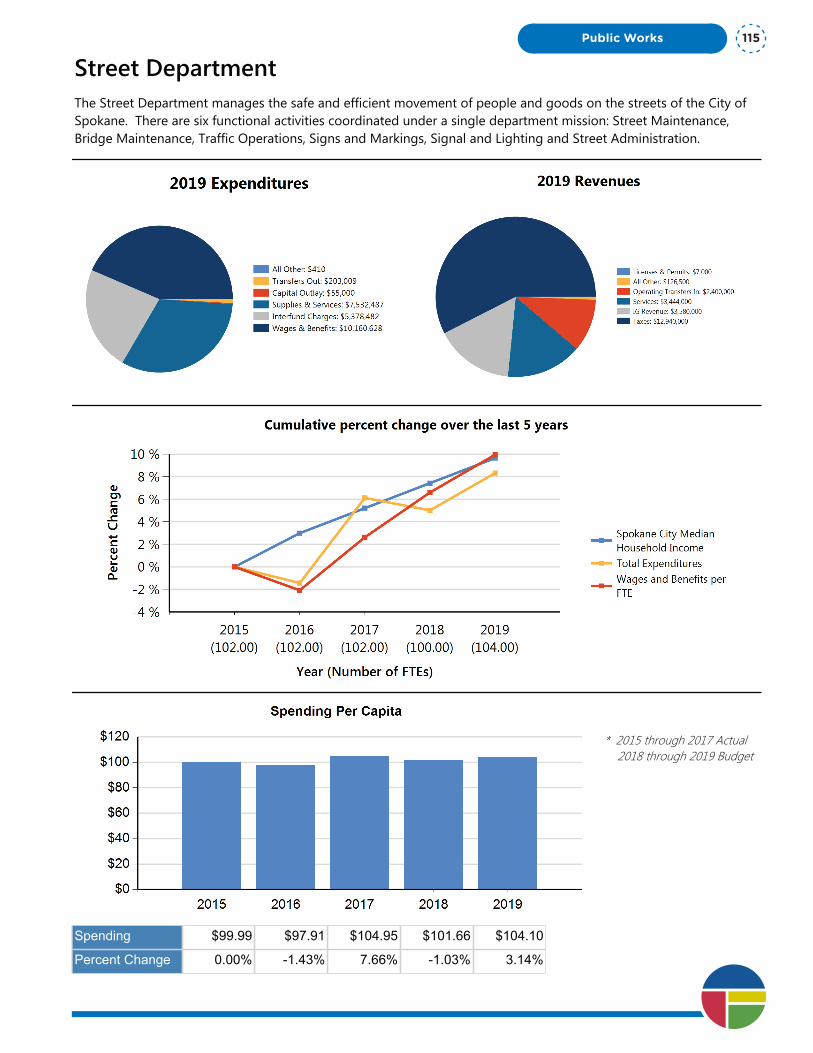
Street DepartmentThe Street Department manages the safe and efficient movement of people and goods on the streets of the City of Spokane. There are six functional activities coordinated under a single department mission: Street Maintenance, Bridge Maintenance, Traffic Operations, Signs and Markings, Signal and Lighting and Street Administration.
* 2015 through 2017 Actual 2018 through 2019 Budget
Spending $99.99 $97.91 $104.95 $101.66 $104.10
Percent Change 0.00% -1.43% 7.66% -1.03% 3.14%
Public Works 115

Department Summary: Street Department
Division: Public Works
Fund Type: Special Revenue Fund
Executive Summary:
The Street Department manages the safe and efficient movement of people and goods on the streets of the City of Spokane. There are six functional activities coordinated under a single department mission: Street Maintenance, Bridge Maintenance, Traffic Operations, Signs and Markings, Signal and Lighting and Street Administration.
Programs and Services:
The Street Department is responsible for approximately 2,100 lane miles of paved roadways, 41 vehicular bridges, almost 470 traffic signal devices, approximately 88,000 traffic signs, 3.2 million lineal feet of pavement striping, and over 13,000 street lights. This is all provided to the traveling public 24 hours per day 365 days per year. We continue to evaluate solutions to funding street maintenance to care for the roads we build in a timely manner, eliminating the need to rebuild as often.
FTEs
2015 Actual 2016 Actual 2017 Actual 2018 Budget 2019 Proposed
Total FTEs 102.00 102.00 102.00 100.00 104.00
Expenditures:
2015 Actual 2016 Actual 2017 Actual 2018 Budget 2019 Proposed
Capital Outlay 101,233 67,933 176,094 50,000 55,000
Interfund Charges 5,517,494 5,672,914 6,085,969 5,447,545 5,378,482
Reserve for Budget Adjustment 0 0 0 (250,000) (250,000)
Transfers Out 85,632 42,816 203,009 203,009 203,009
Wages & Benefits 9,044,985 8,857,108 9,273,422 9,453,412 10,160,628
Supplies & Services 6,557,594 6,360,145 6,872,070 7,471,239 7,532,487
Debt Services 0 0 0 0 0
All Other 0 0 0 410 410
TOTAL 21,306,938 21,000,916 22,610,564 22,375,615 23,080,016
Expenditure Notes:
Revenues:
2015 Actual 2016 Actual 2017 Actual 2018 Budget 2019 Proposed
Taxes 11,540,134 11,876,397 12,775,573 12,280,000 12,940,000
Licenses & Permits 6,882 20,255 6,676 3,500 7,000
IG Revenue 3,174,041 4,184,922 3,614,340 3,445,000 3,580,000
Services 3,172,951 3,520,947 3,217,662 3,623,875 3,444,000
Fines & Forfeits 0 0 0 0 0
Operating Transfers In 2,000,000 1,700,000 1,700,000 2,400,000 2,400,000One Vision. One Plan. One Voice.
Public Works116
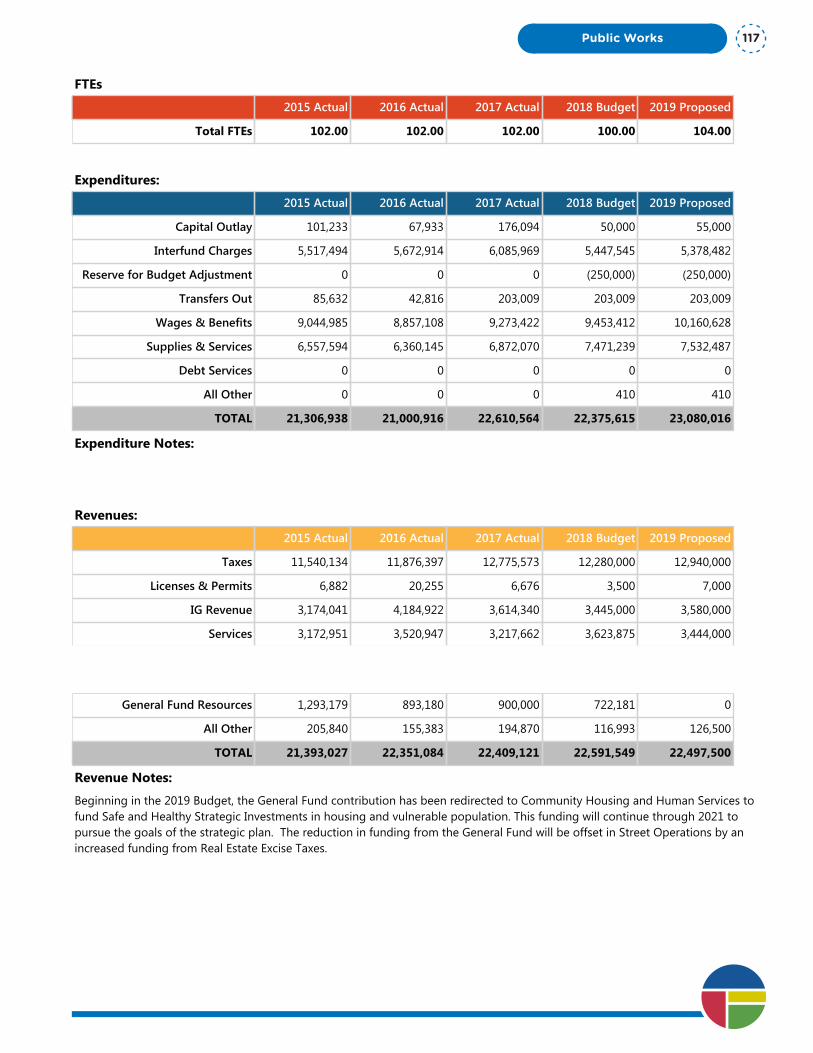
Department Summary: Street Department
Division: Public Works
Fund Type: Special Revenue Fund
Executive Summary:
The Street Department manages the safe and efficient movement of people and goods on the streets of the City of Spokane. There are six functional activities coordinated under a single department mission: Street Maintenance, Bridge Maintenance, Traffic Operations, Signs and Markings, Signal and Lighting and Street Administration.
Programs and Services:
The Street Department is responsible for approximately 2,100 lane miles of paved roadways, 41 vehicular bridges, almost 470 traffic signal devices, approximately 88,000 traffic signs, 3.2 million lineal feet of pavement striping, and over 13,000 street lights. This is all provided to the traveling public 24 hours per day 365 days per year. We continue to evaluate solutions to funding street maintenance to care for the roads we build in a timely manner, eliminating the need to rebuild as often.
FTEs
2015 Actual 2016 Actual 2017 Actual 2018 Budget 2019 Proposed
Total FTEs 102.00 102.00 102.00 100.00 104.00
Expenditures:
2015 Actual 2016 Actual 2017 Actual 2018 Budget 2019 Proposed
Capital Outlay 101,233 67,933 176,094 50,000 55,000
Interfund Charges 5,517,494 5,672,914 6,085,969 5,447,545 5,378,482
Reserve for Budget Adjustment 0 0 0 (250,000) (250,000)
Transfers Out 85,632 42,816 203,009 203,009 203,009
Wages & Benefits 9,044,985 8,857,108 9,273,422 9,453,412 10,160,628
Supplies & Services 6,557,594 6,360,145 6,872,070 7,471,239 7,532,487
Debt Services 0 0 0 0 0
All Other 0 0 0 410 410
TOTAL 21,306,938 21,000,916 22,610,564 22,375,615 23,080,016
Expenditure Notes:
Revenues:
2015 Actual 2016 Actual 2017 Actual 2018 Budget 2019 Proposed
Taxes 11,540,134 11,876,397 12,775,573 12,280,000 12,940,000
Licenses & Permits 6,882 20,255 6,676 3,500 7,000
IG Revenue 3,174,041 4,184,922 3,614,340 3,445,000 3,580,000
Services 3,172,951 3,520,947 3,217,662 3,623,875 3,444,000
Fines & Forfeits 0 0 0 0 0
Operating Transfers In 2,000,000 1,700,000 1,700,000 2,400,000 2,400,000
General Fund Resources 1,293,179 893,180 900,000 722,181 0
All Other 205,840 155,383 194,870 116,993 126,500
TOTAL 21,393,027 22,351,084 22,409,121 22,591,549 22,497,500
Revenue Notes:
Beginning in the 2019 Budget, the General Fund contribution has been redirected to Community Housing and Human Services to fund Safe and Healthy Strategic Investments in housing and vulnerable population. This funding will continue through 2021 to pursue the goals of the strategic plan. The reduction in funding from the General Fund will be offset in Street Operations by an increased funding from Real Estate Excise Taxes.
Public Works 117

Program Summary: Streets Administration
Division: Public Works
Fund Type: Special Revenue Fund
Executive Summary:
The administrative function develops and implements policies, guidelines and budgets that set the Street Department direction. This section manages the personnel, equipment and resources within the department. It provides the Human Resource support, coordinates training, equipment purchases and replacement and manages the budget.
Programs and Services:
Street Department administration includes the Director, Manager, and Clerks who support for the entire department. The clerks are responsible for the maintenance management system, which tracks the labor, equipment and materials for every activity within the Street Department.
FTEs
2015 Actual 2016 Actual 2017 Actual 2018 Budget 2019 Proposed
Total FTEs 8.00 8.00 8.00 8.00 8.00
Expenditures:
2015 Actual 2016 Actual 2017 Actual 2018 Budget 2019 Proposed
Capital Outlay 0 0 43,000 0 0
Interfund Charges 2,013,420 1,370,625 1,436,835 1,474,748 1,513,305
Reserve for Budget Adjustment 0 0 0 0 0
Transfers Out 0 0 0 0 0
Wages & Benefits 141,722 142,185 155,653 877,263 909,900
Supplies & Services 283,190 279,814 228,069 229,781 217,095
Debt Services 0 0 0 0 0
All Other 0 0 0 410 410
TOTAL 2,438,332 1,792,624 1,863,557 2,582,202 2,640,710
Expenditure Notes:
Revenues:
2015 Actual 2016 Actual 2017 Actual 2018 Budget 2019 Proposed
Taxes 0 0 0 0 0
Licenses & Permits 0 0 0 0 0
IG Revenue 0 655,585 754 0 0
Services 0 0 0 0 0
Fines & Forfeits 0 0 0 0 0
Operating Transfers In 1,300,000 1,300,000 1,300,000 1,300,000 1,300,000
General Fund Resources 0 0 0 0 0One Vision. One Plan. One Voice.
Public Works118

Program Summary: Streets Administration
Division: Public Works
Fund Type: Special Revenue Fund
Executive Summary:
The administrative function develops and implements policies, guidelines and budgets that set the Street Department direction. This section manages the personnel, equipment and resources within the department. It provides the Human Resource support, coordinates training, equipment purchases and replacement and manages the budget.
Programs and Services:
Street Department administration includes the Director, Manager, and Clerks who support for the entire department. The clerks are responsible for the maintenance management system, which tracks the labor, equipment and materials for every activity within the Street Department.
FTEs
2015 Actual 2016 Actual 2017 Actual 2018 Budget 2019 Proposed
Total FTEs 8.00 8.00 8.00 8.00 8.00
Expenditures:
2015 Actual 2016 Actual 2017 Actual 2018 Budget 2019 Proposed
Capital Outlay 0 0 43,000 0 0
Interfund Charges 2,013,420 1,370,625 1,436,835 1,474,748 1,513,305
Reserve for Budget Adjustment 0 0 0 0 0
Transfers Out 0 0 0 0 0
Wages & Benefits 141,722 142,185 155,653 877,263 909,900
Supplies & Services 283,190 279,814 228,069 229,781 217,095
Debt Services 0 0 0 0 0
All Other 0 0 0 410 410
TOTAL 2,438,332 1,792,624 1,863,557 2,582,202 2,640,710
Expenditure Notes:
Revenues:
2015 Actual 2016 Actual 2017 Actual 2018 Budget 2019 Proposed
Taxes 0 0 0 0 0
Licenses & Permits 0 0 0 0 0
IG Revenue 0 655,585 754 0 0
Services 0 0 0 0 0
Fines & Forfeits 0 0 0 0 0
Operating Transfers In 1,300,000 1,300,000 1,300,000 1,300,000 1,300,000
General Fund Resources 0 0 0 0 0
All Other 84 0 (25) 0 0
TOTAL 1,300,084 1,955,585 1,300,729 1,300,000 1,300,000
Revenue Notes:
Public Works 119

Program Summary: Streets Bridge Maintenance
Division: Public Works
Fund Type: Special Revenue Fund
Executive Summary:
Bridge inspection and maintenance delivers services for safe and efficient travel by the public over our many bridge structures within the City. This service contributes personnel, equipment and resources to other street maintenance programs needed to maximize the fall, winter and spring activities thus minimizing costs and optimizing services.
Programs and Services:
The City Bridge Division inspects, maintains, and rates 41 vehicular bridges and inspects 22 pedestrian bridges as required by FHWA in accordance with the National Bridge Inspection Standards (NBIS). An additional 64 bridges are inspected and reports provided to the owners, these include the downtown skywalks and railroad bridges. Bridge Maintenance also maintains approximately 17 miles of guardrail.
FTEs
2015 Actual 2016 Actual 2017 Actual 2018 Budget 2019 Proposed
Total FTEs 5.60 5.60 5.60 6.30 6.30
Expenditures:
2015 Actual 2016 Actual 2017 Actual 2018 Budget 2019 Proposed
Capital Outlay 0 0 25,977 0 0
Interfund Charges 143,957 178,329 119,895 152,200 112,850
Reserve for Budget Adjustment 0 0 0 0 0
Transfers Out 0 0 0 0 0
Wages & Benefits 577,526 542,741 532,052 568,120 603,041
Supplies & Services 114,106 26,923 37,703 75,005 96,650
Debt Services 0 0 0 0 0
All Other 0 0 0 0 0
TOTAL 835,589 747,993 715,627 795,325 812,541
Expenditure Notes:
Revenues:
2015 Actual 2016 Actual 2017 Actual 2018 Budget 2019 Proposed
Taxes 0 0 0 0 0
Licenses & Permits 0 0 0 0 0
IG Revenue 0 0 0 0 0
Services 13,956 0 8,293 20,000 20,000
Fines & Forfeits 0 0 0 0 0
Operating Transfers In 0 0 0 0 0One Vision. One Plan. One Voice.
Public Works120

Program Summary: Streets Bridge Maintenance
Division: Public Works
Fund Type: Special Revenue Fund
Executive Summary:
Bridge inspection and maintenance delivers services for safe and efficient travel by the public over our many bridge structures within the City. This service contributes personnel, equipment and resources to other street maintenance programs needed to maximize the fall, winter and spring activities thus minimizing costs and optimizing services.
Programs and Services:
The City Bridge Division inspects, maintains, and rates 41 vehicular bridges and inspects 22 pedestrian bridges as required by FHWA in accordance with the National Bridge Inspection Standards (NBIS). An additional 64 bridges are inspected and reports provided to the owners, these include the downtown skywalks and railroad bridges. Bridge Maintenance also maintains approximately 17 miles of guardrail.
FTEs
2015 Actual 2016 Actual 2017 Actual 2018 Budget 2019 Proposed
Total FTEs 5.60 5.60 5.60 6.30 6.30
Expenditures:
2015 Actual 2016 Actual 2017 Actual 2018 Budget 2019 Proposed
Capital Outlay 0 0 25,977 0 0
Interfund Charges 143,957 178,329 119,895 152,200 112,850
Reserve for Budget Adjustment 0 0 0 0 0
Transfers Out 0 0 0 0 0
Wages & Benefits 577,526 542,741 532,052 568,120 603,041
Supplies & Services 114,106 26,923 37,703 75,005 96,650
Debt Services 0 0 0 0 0
All Other 0 0 0 0 0
TOTAL 835,589 747,993 715,627 795,325 812,541
Expenditure Notes:
Revenues:
2015 Actual 2016 Actual 2017 Actual 2018 Budget 2019 Proposed
Taxes 0 0 0 0 0
Licenses & Permits 0 0 0 0 0
IG Revenue 0 0 0 0 0
Services 13,956 0 8,293 20,000 20,000
Fines & Forfeits 0 0 0 0 0
Operating Transfers In 0 0 0 0 0
General Fund Resources 0 0 0 0 0
All Other 12,167 41,799 51,101 14,000 14,000
TOTAL 26,123 41,799 59,394 34,000 34,000
Revenue Notes:
Public Works 121

Program Summary: Streets Cleaning/PM10
Division: Public Works
Fund Type: Special Revenue Fund
Executive Summary:
Street Cleaning provides for safe and efficient travel by the public. This service contributes staff, equipment and other resources needed to maximize the fall, winter and spring maintenance activities. Street sweeping activities are preformed year round unless needed for other critical activities (snow and ice removal, storm debris removal, etc.).
Programs and Services:
Street crews clean streets by flushing, sweeping road debris and removing leaves. These services prevent the air quality from falling below federally required PM-10 air quality standards, helps to prevent flooding by keeping storm drain inlets clean and free of debris.
FTEs
2015 Actual 2016 Actual 2017 Actual 2018 Budget 2019 Proposed
Total FTEs 10.60 10.60 9.90 10.00 10.00
Expenditures:
2015 Actual 2016 Actual 2017 Actual 2018 Budget 2019 Proposed
Capital Outlay 0 0 0 0 0
Interfund Charges 1,126,736 1,330,360 987,768 1,448,500 1,342,025
Reserve for Budget Adjustment 0 0 0 0 0
Transfers Out 0 0 0 0 0
Wages & Benefits 1,351,069 1,144,548 1,115,961 857,175 868,152
Supplies & Services 285,716 189,921 127,729 186,366 185,100
Debt Services 0 0 0 0 0
All Other 0 0 0 0 0
TOTAL 2,763,521 2,664,829 2,231,458 2,492,041 2,395,277
Expenditure Notes:
Revenues:
2015 Actual 2016 Actual 2017 Actual 2018 Budget 2019 Proposed
Taxes 0 0 0 0 0
Licenses & Permits 0 0 0 0 0
IG Revenue 0 0 0 0 0
Services 883,912 1,180,662 1,032,643 1,200,000 1,200,000
Fines & Forfeits 0 0 0 0 0
Operating Transfers In 0 0 0 0 0
General Fund Resources 0 0 0 0 0One Vision. One Plan. One Voice.
Public Works122
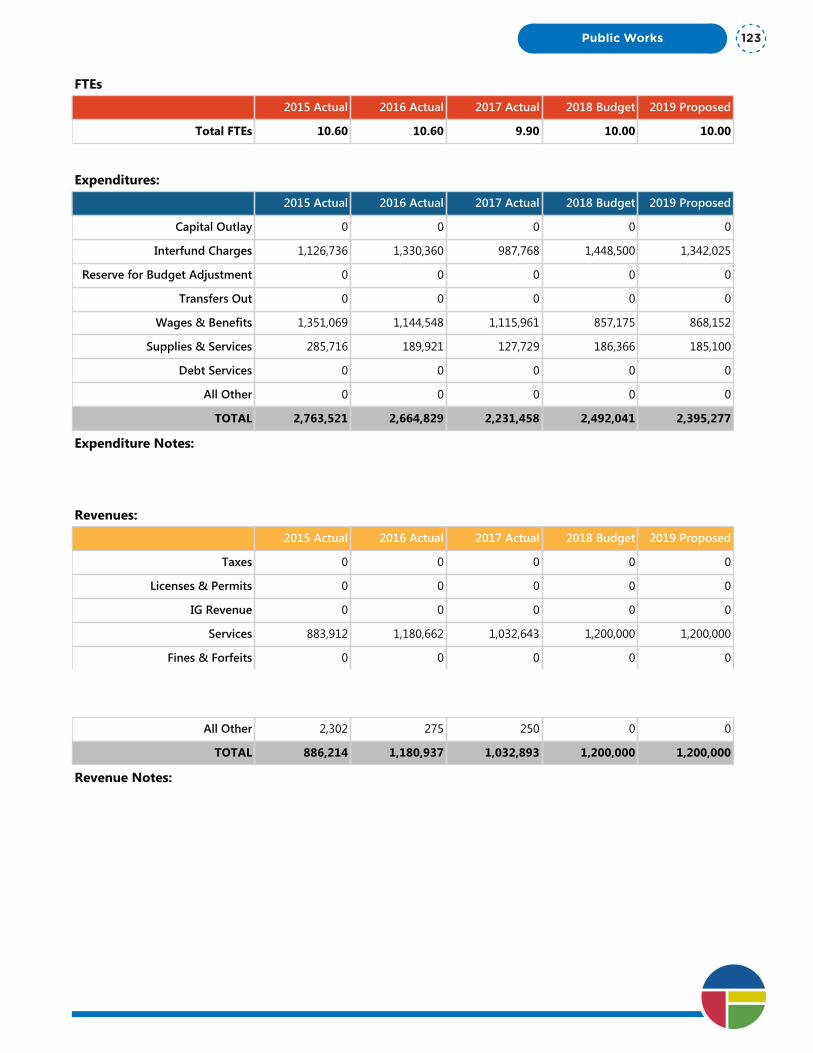
Program Summary: Streets Cleaning/PM10
Division: Public Works
Fund Type: Special Revenue Fund
Executive Summary:
Street Cleaning provides for safe and efficient travel by the public. This service contributes staff, equipment and other resources needed to maximize the fall, winter and spring maintenance activities. Street sweeping activities are preformed year round unless needed for other critical activities (snow and ice removal, storm debris removal, etc.).
Programs and Services:
Street crews clean streets by flushing, sweeping road debris and removing leaves. These services prevent the air quality from falling below federally required PM-10 air quality standards, helps to prevent flooding by keeping storm drain inlets clean and free of debris.
FTEs
2015 Actual 2016 Actual 2017 Actual 2018 Budget 2019 Proposed
Total FTEs 10.60 10.60 9.90 10.00 10.00
Expenditures:
2015 Actual 2016 Actual 2017 Actual 2018 Budget 2019 Proposed
Capital Outlay 0 0 0 0 0
Interfund Charges 1,126,736 1,330,360 987,768 1,448,500 1,342,025
Reserve for Budget Adjustment 0 0 0 0 0
Transfers Out 0 0 0 0 0
Wages & Benefits 1,351,069 1,144,548 1,115,961 857,175 868,152
Supplies & Services 285,716 189,921 127,729 186,366 185,100
Debt Services 0 0 0 0 0
All Other 0 0 0 0 0
TOTAL 2,763,521 2,664,829 2,231,458 2,492,041 2,395,277
Expenditure Notes:
Revenues:
2015 Actual 2016 Actual 2017 Actual 2018 Budget 2019 Proposed
Taxes 0 0 0 0 0
Licenses & Permits 0 0 0 0 0
IG Revenue 0 0 0 0 0
Services 883,912 1,180,662 1,032,643 1,200,000 1,200,000
Fines & Forfeits 0 0 0 0 0
Operating Transfers In 0 0 0 0 0
General Fund Resources 0 0 0 0 0
All Other 2,302 275 250 0 0
TOTAL 886,214 1,180,937 1,032,893 1,200,000 1,200,000
Revenue Notes:
Public Works 123
Program Summary: Streets Ice/Snow Removal
Division: Public Works
Fund Type: Special Revenue Fund
Executive Summary:
Ice and Snow removal provides services for safe and efficient travel by the public during the winter season. This service contributes personnel, equipment and resources to other street maintenance programs needed to maximize the spring, summer, and fall activities thus minimizing costs and optimizing services.
Programs and Services:
Whenever there is a danger of icy conditions on the roadways, the Street Department activates the approved Snow and Ice Control Plan. The goal of snow and ice control is to facilitate the movement of people and goods on the City’s street system during the winter months and enhance safety for residents and visitors using multiple modes of transportation.
The City of Spokane updated its Snow Response Plan for the 2017-18 Snow Season. The new plan includes:• More plowing, sooner.• More equipment and people available for snow removal.• Completion of a full-City plow during heavier snowfalls more quickly – in about three days, down from four.• The use of equipment to reduce driveway berms.• Greater emphasis on plowing snow away from sidewalks.
The official snow season runs from Nov. 15 to March 15 of each year, and the Street Department provides coverage 20 hours a day during this time. Coverage increases to 24 hours a day when conditions warrant that. Street crews are supplemented with crews from the City’s water and wastewater departments to complete these critical tasks.
FTEs
2015 Actual 2016 Actual 2017 Actual 2018 Budget 2019 Proposed
Total FTEs 7.45 7.45 7.30 7.45 7.45
Expenditures:
2015 Actual 2016 Actual 2017 Actual 2018 Budget 2019 Proposed
Capital Outlay 0 0 0 15,000 15,000
Interfund Charges 563,987 929,896 1,572,890 680,040 600,240
Reserve for Budget Adjustment 0 0 0 0 0
Transfers Out 0 0 0 0 0
Wages & Benefits 805,041 895,481 1,345,107 772,964 820,618
Supplies & Services 839,202 1,065,002 1,773,486 1,097,643 1,165,897
Debt Services 0 0 0 0 0
All Other 0 0 0 0 0
One Vision. One Plan. One Voice.
Public Works124

Program Summary: Streets Ice/Snow Removal
Division: Public Works
Fund Type: Special Revenue Fund
Executive Summary:
Ice and Snow removal provides services for safe and efficient travel by the public during the winter season. This service contributes personnel, equipment and resources to other street maintenance programs needed to maximize the spring, summer, and fall activities thus minimizing costs and optimizing services.
Programs and Services:
Whenever there is a danger of icy conditions on the roadways, the Street Department activates the approved Snow and Ice Control Plan. The goal of snow and ice control is to facilitate the movement of people and goods on the City’s street system during the winter months and enhance safety for residents and visitors using multiple modes of transportation.
The City of Spokane updated its Snow Response Plan for the 2017-18 Snow Season. The new plan includes:• More plowing, sooner.• More equipment and people available for snow removal.• Completion of a full-City plow during heavier snowfalls more quickly – in about three days, down from four.• The use of equipment to reduce driveway berms.• Greater emphasis on plowing snow away from sidewalks.
The official snow season runs from Nov. 15 to March 15 of each year, and the Street Department provides coverage 20 hours a day during this time. Coverage increases to 24 hours a day when conditions warrant that. Street crews are supplemented with crews from the City’s water and wastewater departments to complete these critical tasks.
FTEs
2015 Actual 2016 Actual 2017 Actual 2018 Budget 2019 Proposed
Total FTEs 7.45 7.45 7.30 7.45 7.45
Expenditures:
2015 Actual 2016 Actual 2017 Actual 2018 Budget 2019 Proposed
Capital Outlay 0 0 0 15,000 15,000
Interfund Charges 563,987 929,896 1,572,890 680,040 600,240
Reserve for Budget Adjustment 0 0 0 0 0
Transfers Out 0 0 0 0 0
Wages & Benefits 805,041 895,481 1,345,107 772,964 820,618
Supplies & Services 839,202 1,065,002 1,773,486 1,097,643 1,165,897
Debt Services 0 0 0 0 0
All Other 0 0 0 0 0
TOTAL 2,208,230 2,890,379 4,691,483 2,565,647 2,601,755
Expenditure Notes:
Revenues:
2015 Actual 2016 Actual 2017 Actual 2018 Budget 2019 Proposed
Taxes 0 0 0 0 0
Licenses & Permits 0 0 0 0 0
IG Revenue 0 0 0 0 0
Services 0 2,359 897 0 0
Fines & Forfeits 0 0 0 0 0
Operating Transfers In 0 0 0 0 0
General Fund Resources 0 0 0 0 0
All Other 0 0 0 0 0
TOTAL 0 2,359 897 0 0
Revenue Notes:
Public Works 125

Program Summary: Streets Lighting
Division: Public Works
Fund Type: Special Revenue Fund
Executive Summary:
This program pays to operate (Street Light electricity), install and maintain Avista-owned Street Lights located within the City.
Programs and Services:
This program pays to operate (Street Light electricity), install and maintain more than 10,725 Avista-owned Street Lights located in the City. Installation and removal of these street lights is performed under the direction of the City Street Department. In addition to the lights owned and maintained by Avista, the City also owns and maintains 2,355 roadway lights. The department is undertaking the replacement of 857 Cobra head luminaires and upgrading them to LED luminaires. This will result in significant power savings and deliver better light for the roadways and bridges. The maintenance cost for the City-owned lights is located in the Bid for "Signals & Lighting."
FTEs
2015 Actual 2016 Actual 2017 Actual 2018 Budget 2019 Proposed
Total FTEs 0.00 0.00 0.00 0.00 0.00
Expenditures:
2015 Actual 2016 Actual 2017 Actual 2018 Budget 2019 Proposed
Capital Outlay 0 0 0 0 0
Interfund Charges 0 0 0 0 0
Reserve for Budget Adjustment 0 0 0 0 0
Transfers Out 0 0 0 0 0
Wages & Benefits 0 0 0 0 0
Supplies & Services 2,470,415 2,428,616 2,467,294 2,525,500 2,525,181
Debt Services 0 0 0 0 0
All Other 0 0 0 0 0
TOTAL 2,470,415 2,428,616 2,467,294 2,525,500 2,525,181
Expenditure Notes:
Revenues:
2015 Actual 2016 Actual 2017 Actual 2018 Budget 2019 Proposed
Taxes 2,087,499 2,092,584 2,720,503 2,400,000 2,600,000
Licenses & Permits 0 0 0 0 0
IG Revenue 0 0 0 0 0
Services 0 2,974 3,667 0 3,000
Fines & Forfeits 0 0 0 0 0
Operating Transfers In 0 0 0 0 0One Vision. One Plan. One Voice.
Public Works126
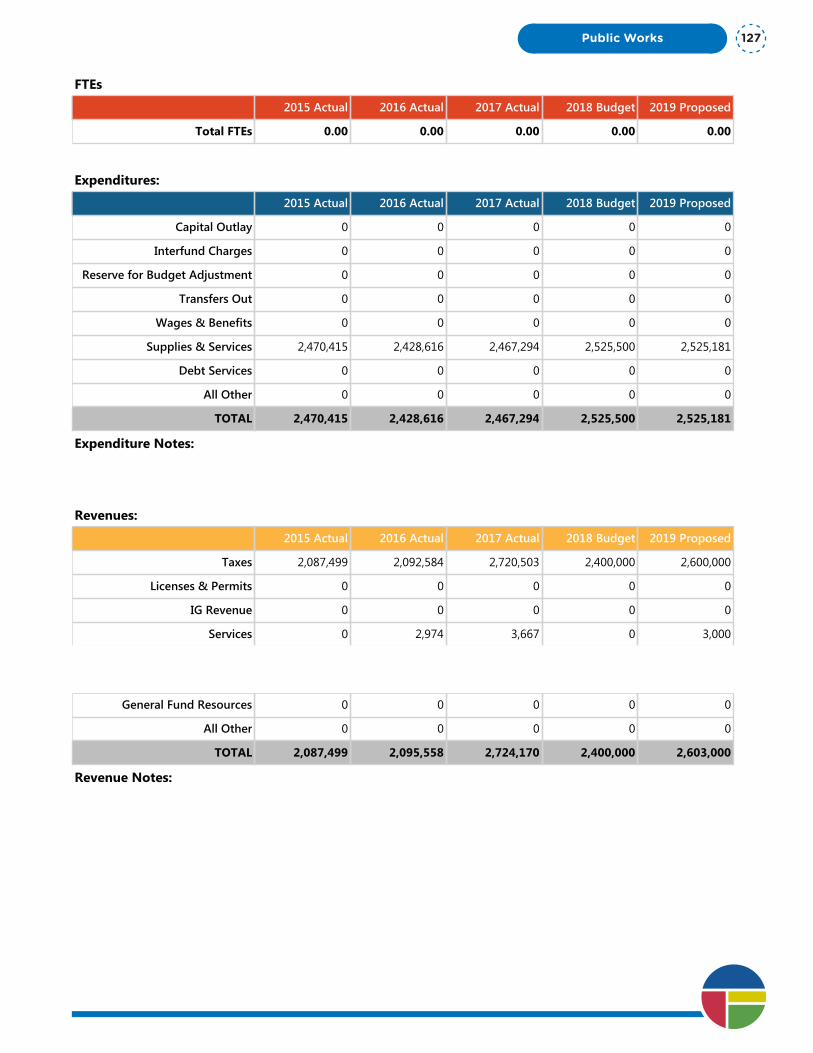
Program Summary: Streets Lighting
Division: Public Works
Fund Type: Special Revenue Fund
Executive Summary:
This program pays to operate (Street Light electricity), install and maintain Avista-owned Street Lights located within the City.
Programs and Services:
This program pays to operate (Street Light electricity), install and maintain more than 10,725 Avista-owned Street Lights located in the City. Installation and removal of these street lights is performed under the direction of the City Street Department. In addition to the lights owned and maintained by Avista, the City also owns and maintains 2,355 roadway lights. The department is undertaking the replacement of 857 Cobra head luminaires and upgrading them to LED luminaires. This will result in significant power savings and deliver better light for the roadways and bridges. The maintenance cost for the City-owned lights is located in the Bid for "Signals & Lighting."
FTEs
2015 Actual 2016 Actual 2017 Actual 2018 Budget 2019 Proposed
Total FTEs 0.00 0.00 0.00 0.00 0.00
Expenditures:
2015 Actual 2016 Actual 2017 Actual 2018 Budget 2019 Proposed
Capital Outlay 0 0 0 0 0
Interfund Charges 0 0 0 0 0
Reserve for Budget Adjustment 0 0 0 0 0
Transfers Out 0 0 0 0 0
Wages & Benefits 0 0 0 0 0
Supplies & Services 2,470,415 2,428,616 2,467,294 2,525,500 2,525,181
Debt Services 0 0 0 0 0
All Other 0 0 0 0 0
TOTAL 2,470,415 2,428,616 2,467,294 2,525,500 2,525,181
Expenditure Notes:
Revenues:
2015 Actual 2016 Actual 2017 Actual 2018 Budget 2019 Proposed
Taxes 2,087,499 2,092,584 2,720,503 2,400,000 2,600,000
Licenses & Permits 0 0 0 0 0
IG Revenue 0 0 0 0 0
Services 0 2,974 3,667 0 3,000
Fines & Forfeits 0 0 0 0 0
Operating Transfers In 0 0 0 0 0
General Fund Resources 0 0 0 0 0
All Other 0 0 0 0 0
TOTAL 2,087,499 2,095,558 2,724,170 2,400,000 2,603,000
Revenue Notes:
Public Works 127

Program Summary: Streets Roadway Maintenance
Division: Public Works
Fund Type: Special Revenue Fund
Executive Summary:
Roadway maintenance provides services for safe and efficient travel by the public. This service contributes personnel, equipment and other resources to street maintenance programs needed to maximize fall, winter and spring activities thus minimizing costs and optimizing services.
Programs and Services:
Roadway maintenance maintains approximately 2,100 lane miles of paved streets and over 60 miles of gravel roads. This section also provides pavement inspection and management as required by law. This department performs crack sealing, grinder patching, skin patching, pothole patching, and grading of gravel streets as a means to combat the deteriorating street infrastructure.
FTEs
2015 Actual 2016 Actual 2017 Actual 2018 Budget 2019 Proposed
Total FTEs 38.35 38.35 38.20 38.25 42.25
Expenditures:
2015 Actual 2016 Actual 2017 Actual 2018 Budget 2019 Proposed
Capital Outlay 0 0 0 0 0
Interfund Charges 1,512,827 1,721,066 1,795,250 1,433,625 1,532,125
Reserve for Budget Adjustment 0 0 0 (250,000) (250,000)
Transfers Out 85,632 42,816 203,009 203,009 203,009
Wages & Benefits 3,316,907 3,210,803 3,214,816 3,374,341 3,809,279
Supplies & Services 1,762,975 1,549,261 1,382,635 2,384,515 2,397,069
Debt Services 0 0 0 0 0
All Other 0 0 0 0 0
TOTAL 6,678,341 6,523,946 6,595,710 7,145,490 7,691,482
Expenditure Notes:
Revenues:
2015 Actual 2016 Actual 2017 Actual 2018 Budget 2019 Proposed
Taxes 9,452,635 9,783,813 10,055,070 9,880,000 10,340,000
Licenses & Permits 1,872 3,118 3,241 1,500 3,000
IG Revenue 3,158,113 3,512,984 3,613,586 3,440,000 3,575,000
Services 1,390,352 1,308,616 1,012,258 1,620,476 1,200,000
Fines & Forfeits 0 0 0 0 0
Operating Transfers In 700,000 400,000 400,000 1,100,000 1,100,000One Vision. One Plan. One Voice.
Public Works128
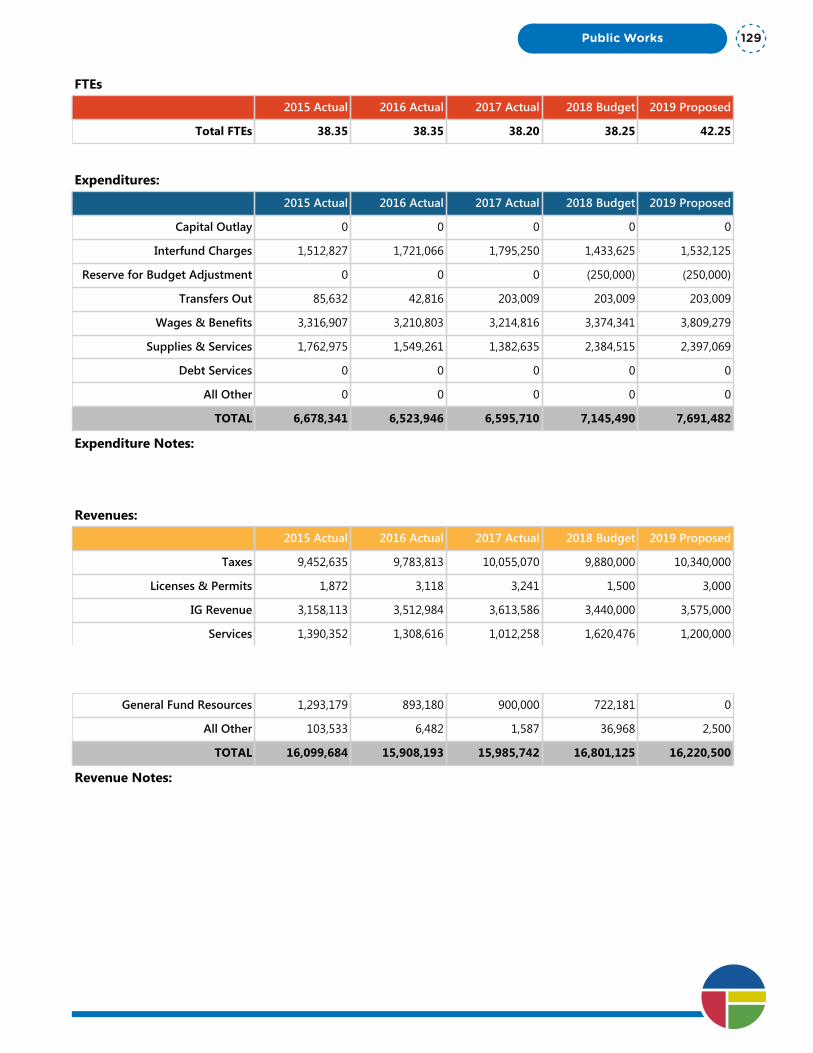
Program Summary: Streets Roadway Maintenance
Division: Public Works
Fund Type: Special Revenue Fund
Executive Summary:
Roadway maintenance provides services for safe and efficient travel by the public. This service contributes personnel, equipment and other resources to street maintenance programs needed to maximize fall, winter and spring activities thus minimizing costs and optimizing services.
Programs and Services:
Roadway maintenance maintains approximately 2,100 lane miles of paved streets and over 60 miles of gravel roads. This section also provides pavement inspection and management as required by law. This department performs crack sealing, grinder patching, skin patching, pothole patching, and grading of gravel streets as a means to combat the deteriorating street infrastructure.
FTEs
2015 Actual 2016 Actual 2017 Actual 2018 Budget 2019 Proposed
Total FTEs 38.35 38.35 38.20 38.25 42.25
Expenditures:
2015 Actual 2016 Actual 2017 Actual 2018 Budget 2019 Proposed
Capital Outlay 0 0 0 0 0
Interfund Charges 1,512,827 1,721,066 1,795,250 1,433,625 1,532,125
Reserve for Budget Adjustment 0 0 0 (250,000) (250,000)
Transfers Out 85,632 42,816 203,009 203,009 203,009
Wages & Benefits 3,316,907 3,210,803 3,214,816 3,374,341 3,809,279
Supplies & Services 1,762,975 1,549,261 1,382,635 2,384,515 2,397,069
Debt Services 0 0 0 0 0
All Other 0 0 0 0 0
TOTAL 6,678,341 6,523,946 6,595,710 7,145,490 7,691,482
Expenditure Notes:
Revenues:
2015 Actual 2016 Actual 2017 Actual 2018 Budget 2019 Proposed
Taxes 9,452,635 9,783,813 10,055,070 9,880,000 10,340,000
Licenses & Permits 1,872 3,118 3,241 1,500 3,000
IG Revenue 3,158,113 3,512,984 3,613,586 3,440,000 3,575,000
Services 1,390,352 1,308,616 1,012,258 1,620,476 1,200,000
Fines & Forfeits 0 0 0 0 0
Operating Transfers In 700,000 400,000 400,000 1,100,000 1,100,000
General Fund Resources 1,293,179 893,180 900,000 722,181 0
All Other 103,533 6,482 1,587 36,968 2,500
TOTAL 16,099,684 15,908,193 15,985,742 16,801,125 16,220,500
Revenue Notes:
Public Works 129

Program Summary: Streets Signals/Lighting
Division: Public Works
Fund Type: Special Revenue Fund
Executive Summary:
The Signals and Lighting Section of the Street Department performs all preventive and corrective maintenance functions for every traffic control device within the City of Spokane. This includes traffic signals; ITS traffic cameras, city owned street lights, communications cable including underground and aerial lines utilizing both copper and fiber conductors.
Programs and Services:
The Street Department will install, inspect and maintain the 469 traffic signal devices and associated systems authorized within the City. This includes 256 signalized intersections located on major arterials, various school crossings, flashing school speed limit signs, radar-equipped speed advisory signs, emergency vehicle pre-emption systems, traffic flashers and other control devices.
The drivers and pedestrians utilizing the various arterials in Spokane deserve the safest and most reliable traffic control devices available. Most of these public safety devices are connected via a communications cable plant containing more than 40 miles of underground and aerial copper and fiber cabling, also installed, inspected and maintained by Signal Technicians. This cable plant also provides communications, data and alarm functions for other departments and agencies throughout the City. Potential damage to the cable plant is controlled by continually mapping all of underground facilities and marking them when notified by the regional One-Call locating service.
More than 2,325 street lights are maintained in designated areas and signalized locations, including the core area of the Central Business District. The remainder is serviced by Avista Utilities under the Department’s direction and coordination. The signal crews are on-call during non-working hours and respond promptly for emergency repairs at night and on weekends/holidays.
FTEs
2015 Actual 2016 Actual 2017 Actual 2018 Budget 2019 Proposed
Total FTEs 10.00 10.00 10.00 9.00 9.00
Expenditures:
2015 Actual 2016 Actual 2017 Actual 2018 Budget 2019 Proposed
Capital Outlay 82,971 67,933 99,383 25,000 25,000
Interfund Charges 82,714 77,553 85,092 96,524 113,750
Reserve for Budget Adjustment 0 0 0 0 0
Transfers Out 0 0 0 0 0
Wages & Benefits 930,082 977,719 954,136 902,627 961,672
Supplies & Services 401,469 464,080 507,467 553,524 539,957
Debt Services 0 0 0 0 0
All Other 0 0 0 0 0
One Vision. One Plan. One Voice.
Public Works130

Program Summary: Streets Signals/Lighting
Division: Public Works
Fund Type: Special Revenue Fund
Executive Summary:
The Signals and Lighting Section of the Street Department performs all preventive and corrective maintenance functions for every traffic control device within the City of Spokane. This includes traffic signals; ITS traffic cameras, city owned street lights, communications cable including underground and aerial lines utilizing both copper and fiber conductors.
Programs and Services:
The Street Department will install, inspect and maintain the 469 traffic signal devices and associated systems authorized within the City. This includes 256 signalized intersections located on major arterials, various school crossings, flashing school speed limit signs, radar-equipped speed advisory signs, emergency vehicle pre-emption systems, traffic flashers and other control devices.
The drivers and pedestrians utilizing the various arterials in Spokane deserve the safest and most reliable traffic control devices available. Most of these public safety devices are connected via a communications cable plant containing more than 40 miles of underground and aerial copper and fiber cabling, also installed, inspected and maintained by Signal Technicians. This cable plant also provides communications, data and alarm functions for other departments and agencies throughout the City. Potential damage to the cable plant is controlled by continually mapping all of underground facilities and marking them when notified by the regional One-Call locating service.
More than 2,325 street lights are maintained in designated areas and signalized locations, including the core area of the Central Business District. The remainder is serviced by Avista Utilities under the Department’s direction and coordination. The signal crews are on-call during non-working hours and respond promptly for emergency repairs at night and on weekends/holidays.
FTEs
2015 Actual 2016 Actual 2017 Actual 2018 Budget 2019 Proposed
Total FTEs 10.00 10.00 10.00 9.00 9.00
Expenditures:
2015 Actual 2016 Actual 2017 Actual 2018 Budget 2019 Proposed
Capital Outlay 82,971 67,933 99,383 25,000 25,000
Interfund Charges 82,714 77,553 85,092 96,524 113,750
Reserve for Budget Adjustment 0 0 0 0 0
Transfers Out 0 0 0 0 0
Wages & Benefits 930,082 977,719 954,136 902,627 961,672
Supplies & Services 401,469 464,080 507,467 553,524 539,957
Debt Services 0 0 0 0 0
All Other 0 0 0 0 0
TOTAL 1,497,236 1,587,285 1,646,078 1,577,675 1,640,379
Expenditure Notes:
Revenues:
2015 Actual 2016 Actual 2017 Actual 2018 Budget 2019 Proposed
Taxes 0 0 0 0 0
Licenses & Permits 2,939 14,077 1,732 0 2,000
IG Revenue 634 0 0 0 0
Services 143,012 221,969 316,847 118,299 201,000
Fines & Forfeits 0 0 0 0 0
Operating Transfers In 0 0 0 0 0
General Fund Resources 0 0 0 0 0
All Other 59,608 85,717 104,493 55,000 82,000
TOTAL 206,193 321,763 423,072 173,299 285,000
Revenue Notes:
Public Works 131
Program Summary: Streets Signs/Markers
Division: Public Works
Fund Type: Special Revenue Fund
Executive Summary:
The Signs and Markers Section installs, maintains and replaces traffic signs and pavement markings that have become worn out, damaged or removed. Representatives of this section also assist in traffic design review for construction projects.
Programs and Services:
This section is responsible for maintaining more than 88,000 traffic signs. Regulatory and warning signs are required to be replaced when the retro reflectivity deteriorates below the minimum standards set forth by the Federal Highway Administration. The manufacturers-recommended replacement cycle is every 7 to 10 years. The average age of Spokane’s 88,000 sign plates is 11.5 years. This section is responsible for the maintenance of more than 3.2 million lineal feet of striping, 1,387 crosswalks and 1,096 pavement markings on the streets of Spokane. All public agencies have been required by federal environmental policy to use waterborne paints. Waterborne paints cannot be applied at ground temperatures below 50 degrees. Therefore crews’ time to apply waterborne paint has decreased from past years, which allows more time during the winter season for the paint to wear off the roadway. It is desirable to apply more expensive durable markings in locations of high-use where the paint typically wears-off and disappears from the roadway. Durable markings last 3 to 5 years or more with inlay tape, but they have a higher life cycle cost than waterborne paints.
FTEs
2015 Actual 2016 Actual 2017 Actual 2018 Budget 2019 Proposed
Total FTEs 11.00 11.00 12.00 12.00 12.00
Expenditures:
2015 Actual 2016 Actual 2017 Actual 2018 Budget 2019 Proposed
Capital Outlay 0 0 6,735 10,000 15,000
Interfund Charges 69,721 62,843 85,218 87,093 90,956
Reserve for Budget Adjustment 0 0 0 0 0
Transfers Out 0 0 0 0 0
Wages & Benefits 921,378 878,772 907,547 1,085,177 1,107,835
Supplies & Services 379,111 324,417 327,141 383,868 376,588
Debt Services 0 0 0 0 0
All Other 0 0 0 0 0
TOTAL 1,370,210 1,266,032 1,326,641 1,566,138 1,590,379
Expenditure Notes:
Revenues:
2015 Actual 2016 Actual 2017 Actual 2018 Budget 2019 Proposed
Taxes 0 0 0 0 0
Licenses & Permits 2,071 3,060 1,703 2,000 2,000
IG Revenue 15,294 16,353 0 5,000 5,000One Vision. One Plan. One Voice.
Public Works132

Program Summary: Streets Signs/Markers
Division: Public Works
Fund Type: Special Revenue Fund
Executive Summary:
The Signs and Markers Section installs, maintains and replaces traffic signs and pavement markings that have become worn out, damaged or removed. Representatives of this section also assist in traffic design review for construction projects.
Programs and Services:
This section is responsible for maintaining more than 88,000 traffic signs. Regulatory and warning signs are required to be replaced when the retro reflectivity deteriorates below the minimum standards set forth by the Federal Highway Administration. The manufacturers-recommended replacement cycle is every 7 to 10 years. The average age of Spokane’s 88,000 sign plates is 11.5 years. This section is responsible for the maintenance of more than 3.2 million lineal feet of striping, 1,387 crosswalks and 1,096 pavement markings on the streets of Spokane. All public agencies have been required by federal environmental policy to use waterborne paints. Waterborne paints cannot be applied at ground temperatures below 50 degrees. Therefore crews’ time to apply waterborne paint has decreased from past years, which allows more time during the winter season for the paint to wear off the roadway. It is desirable to apply more expensive durable markings in locations of high-use where the paint typically wears-off and disappears from the roadway. Durable markings last 3 to 5 years or more with inlay tape, but they have a higher life cycle cost than waterborne paints.
FTEs
2015 Actual 2016 Actual 2017 Actual 2018 Budget 2019 Proposed
Total FTEs 11.00 11.00 12.00 12.00 12.00
Expenditures:
2015 Actual 2016 Actual 2017 Actual 2018 Budget 2019 Proposed
Capital Outlay 0 0 6,735 10,000 15,000
Interfund Charges 69,721 62,843 85,218 87,093 90,956
Reserve for Budget Adjustment 0 0 0 0 0
Transfers Out 0 0 0 0 0
Wages & Benefits 921,378 878,772 907,547 1,085,177 1,107,835
Supplies & Services 379,111 324,417 327,141 383,868 376,588
Debt Services 0 0 0 0 0
All Other 0 0 0 0 0
TOTAL 1,370,210 1,266,032 1,326,641 1,566,138 1,590,379
Expenditure Notes:
Revenues:
2015 Actual 2016 Actual 2017 Actual 2018 Budget 2019 Proposed
Taxes 0 0 0 0 0
Licenses & Permits 2,071 3,060 1,703 2,000 2,000
IG Revenue 15,294 16,353 0 5,000 5,000
Services 91,969 77,802 78,485 90,000 70,000
Fines & Forfeits 0 0 0 0 0
Operating Transfers In 0 0 0 0 0
General Fund Resources 0 0 0 0 0
All Other 28,146 21,110 37,464 11,000 28,000
TOTAL 137,480 118,325 117,652 108,000 105,000
Revenue Notes:
Public Works 133

Program Summary: Traffic, Engineering, Planning, and Operations
Division: Public Works
Fund Type: Special Revenue Fund
Executive Summary:
Traffic Engineering functions were consolidated into the Street Department to improve service and provide a safer, more efficient movement of all traffic modes for the citizens of Spokane. Responsibilities include traffic functions such as planning, design, transportation operations, signal operations, and ITS operations.
Programs and Services:
Traffic planning evaluates existing and long-range needs for street infrastructure in coordination with the city's comp plan. Traffic planning also coordinates traffic impacts from developers, neighborhoods, and other projects from outside agencies. Traffic design develops and reviews traffic control plans, signal and its designs, signing and striping plans, and the city's traffic standard plans for both internal and external projects. Traffic operations performs intersection analysis and responds to citizens’ requests and inquiries. Traffic operations monitors and provides professional engineering to optimize the system. Signal and its operations maintain, optimize, and coordinate the city's signal/its infrastructure, which will result in reduced congestion and stop delays while moving all mode of transportation through the city's street network. Traffic control devices are designed and installed to provide roadway users with nationally recognized indications for traffic movement. These are defined in the federal highway administration’s manual on uniform traffic control devices. While new developer-driven projects install new streets and associated devices, the city has an ongoing responsibility, with legal and financial liability, to effectively maintain and operate those devices. Measures of effective performance may be monitored through accident data, air quality data, traffic volume reports, intersection performance measures and public input.
FTEs
2015 Actual 2016 Actual 2017 Actual 2018 Budget 2019 Proposed
Total FTEs 11.00 11.00 11.00 9.00 9.00
Expenditures:
2015 Actual 2016 Actual 2017 Actual 2018 Budget 2019 Proposed
Capital Outlay 18,262 0 999 0 0
Interfund Charges 4,132 2,242 3,021 74,815 73,231
Reserve for Budget Adjustment 0 0 0 0 0
Transfers Out 0 0 0 0 0
Wages & Benefits 1,001,260 1,064,859 1,048,150 1,015,745 1,080,131
Supplies & Services 21,410 32,111 20,546 35,037 28,950
Debt Services 0 0 0 0 0
All Other 0 0 0 0 0
TOTAL 1,045,064 1,099,212 1,072,716 1,125,597 1,182,312
Expenditure Notes:
Revenues:
2015 Actual 2016 Actual 2017 Actual 2018 Budget 2019 Proposed
Taxes 0 0 0 0 0One Vision. One Plan. One Voice.
Public Works134

Program Summary: Traffic, Engineering, Planning, and Operations
Division: Public Works
Fund Type: Special Revenue Fund
Executive Summary:
Traffic Engineering functions were consolidated into the Street Department to improve service and provide a safer, more efficient movement of all traffic modes for the citizens of Spokane. Responsibilities include traffic functions such as planning, design, transportation operations, signal operations, and ITS operations.
Programs and Services:
Traffic planning evaluates existing and long-range needs for street infrastructure in coordination with the city's comp plan. Traffic planning also coordinates traffic impacts from developers, neighborhoods, and other projects from outside agencies. Traffic design develops and reviews traffic control plans, signal and its designs, signing and striping plans, and the city's traffic standard plans for both internal and external projects. Traffic operations performs intersection analysis and responds to citizens’ requests and inquiries. Traffic operations monitors and provides professional engineering to optimize the system. Signal and its operations maintain, optimize, and coordinate the city's signal/its infrastructure, which will result in reduced congestion and stop delays while moving all mode of transportation through the city's street network. Traffic control devices are designed and installed to provide roadway users with nationally recognized indications for traffic movement. These are defined in the federal highway administration’s manual on uniform traffic control devices. While new developer-driven projects install new streets and associated devices, the city has an ongoing responsibility, with legal and financial liability, to effectively maintain and operate those devices. Measures of effective performance may be monitored through accident data, air quality data, traffic volume reports, intersection performance measures and public input.
FTEs
2015 Actual 2016 Actual 2017 Actual 2018 Budget 2019 Proposed
Total FTEs 11.00 11.00 11.00 9.00 9.00
Expenditures:
2015 Actual 2016 Actual 2017 Actual 2018 Budget 2019 Proposed
Capital Outlay 18,262 0 999 0 0
Interfund Charges 4,132 2,242 3,021 74,815 73,231
Reserve for Budget Adjustment 0 0 0 0 0
Transfers Out 0 0 0 0 0
Wages & Benefits 1,001,260 1,064,859 1,048,150 1,015,745 1,080,131
Supplies & Services 21,410 32,111 20,546 35,037 28,950
Debt Services 0 0 0 0 0
All Other 0 0 0 0 0
TOTAL 1,045,064 1,099,212 1,072,716 1,125,597 1,182,312
Expenditure Notes:
Revenues:
2015 Actual 2016 Actual 2017 Actual 2018 Budget 2019 Proposed
Taxes 0 0 0 0 0
Licenses & Permits 0 0 0 0 0
IG Revenue 0 0 0 0 0
Services 649,750 726,565 764,572 575,100 750,000
Fines & Forfeits 0 0 0 0 0
Operating Transfers In 0 0 0 0 0
General Fund Resources 0 0 0 0 0
All Other 0 0 0 25 0
TOTAL 649,750 726,565 764,572 575,125 750,000
Revenue Notes:
Public Works 135

One Vision. One Plan. One Voice.
Public Works136
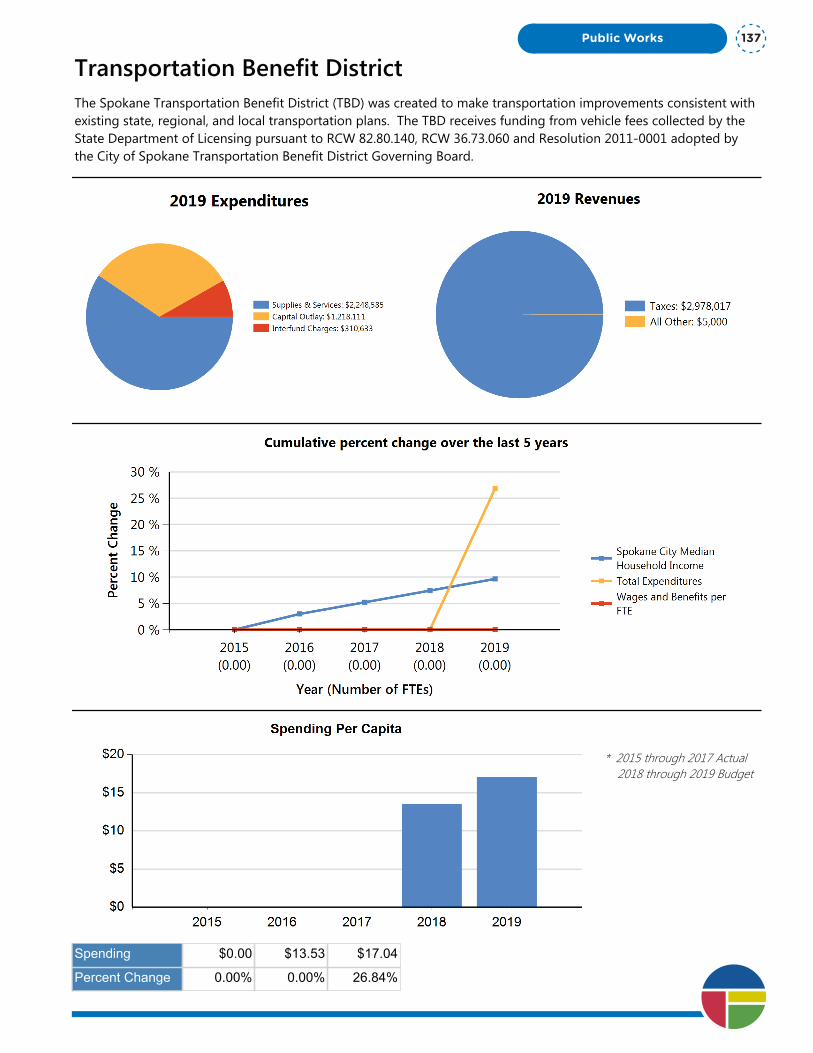
Transportation Benefit DistrictThe Spokane Transportation Benefit District (TBD) was created to make transportation improvements consistent with existing state, regional, and local transportation plans. The TBD receives funding from vehicle fees collected by the State Department of Licensing pursuant to RCW 82.80.140, RCW 36.73.060 and Resolution 2011-0001 adopted by the City of Spokane Transportation Benefit District Governing Board.
* 2015 through 2017 Actual 2018 through 2019 Budget
Spending $0.00 $13.53 $17.04
Percent Change 0.00% 0.00% 26.84%
Public Works 137

Department Summary: Transportation Benefit District
Division: Public Works
Fund Type: Special Revenue Fund
Executive Summary:
The Spokane Transportation Benefit District (TBD) was created to make transportation improvements consistent with existing state, regional, and local transportation plans. The TBD receives funding from vehicle fees collected by the State Department of Licensing pursuant to RCW 82.80.140, RCW 36.73.060 and Resolution 2011-0001 adopted by the City of Spokane Transportation Benefit District Governing Board.
Programs and Services:
Transportation improvements, authorized pursuant to Chapter 36.73 RCW, Chapter 8.16 SMC and Resolution 2011-0001, are provided for under this program.
FTEs
2015 Actual 2016 Actual 2017 Actual 2018 Budget 2019 Proposed
Total FTEs 0.00 0.00 0.00 0.00 0.00
Expenditures:
2015 Actual 2016 Actual 2017 Actual 2018 Budget 2019 Proposed
Capital Outlay 0 0 0 594,881 1,218,111
Interfund Charges 0 0 0 0 310,633
Reserve for Budget Adjustment 0 0 0 0 0
Transfers Out 0 0 0 0 0
Wages & Benefits 0 0 0 0 0
Supplies & Services 0 0 0 2,383,136 2,248,585
Debt Services 0 0 0 0 0
All Other 0 0 0 0 0
TOTAL 0 0 0 2,978,017 3,777,329
Expenditure Notes:
Designated as a special revenue fund beginning in the 2018 budget year.
Revenues:
2015 Actual 2016 Actual 2017 Actual 2018 Budget 2019 Proposed
Taxes 0 0 0 2,978,017 2,978,017
Licenses & Permits 0 0 0 0 0
IG Revenue 0 0 0 0 0
Services 0 0 0 0 0
Fines & Forfeits 0 0 0 0 0
Operating Transfers In 0 0 0 0 0
General Fund Resources 0 0 0 0 0One Vision. One Plan. One Voice.
Public Works138
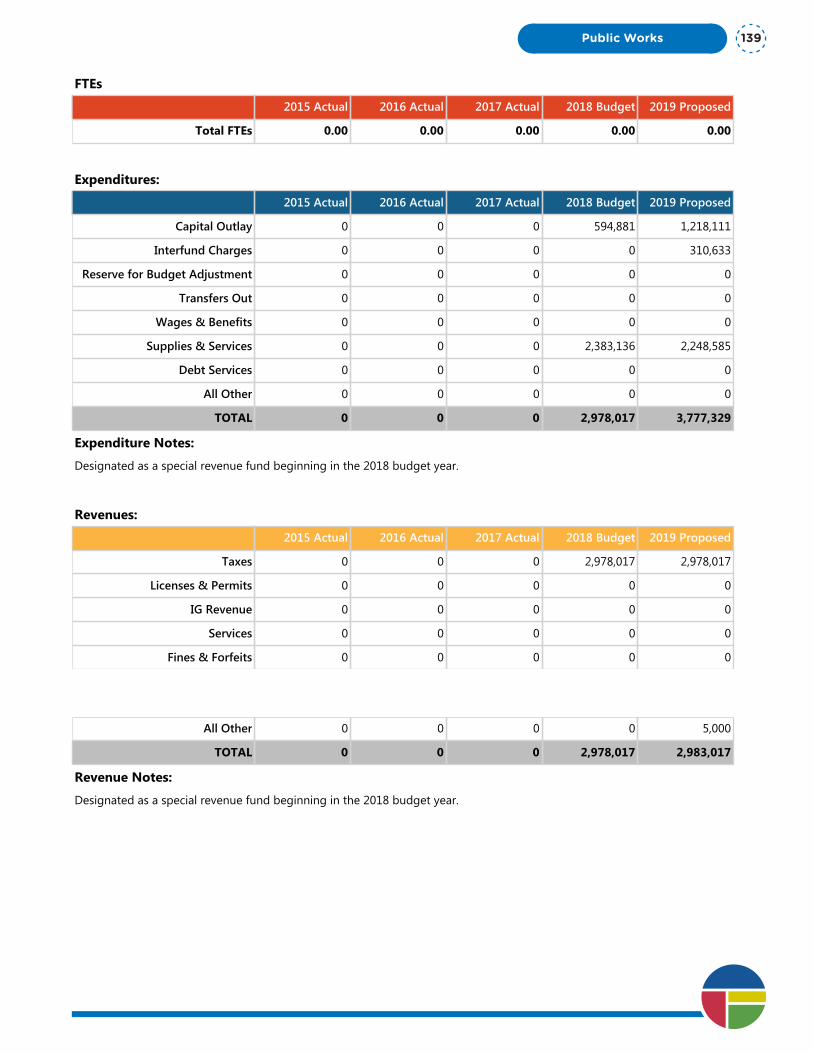
Department Summary: Transportation Benefit District
Division: Public Works
Fund Type: Special Revenue Fund
Executive Summary:
The Spokane Transportation Benefit District (TBD) was created to make transportation improvements consistent with existing state, regional, and local transportation plans. The TBD receives funding from vehicle fees collected by the State Department of Licensing pursuant to RCW 82.80.140, RCW 36.73.060 and Resolution 2011-0001 adopted by the City of Spokane Transportation Benefit District Governing Board.
Programs and Services:
Transportation improvements, authorized pursuant to Chapter 36.73 RCW, Chapter 8.16 SMC and Resolution 2011-0001, are provided for under this program.
FTEs
2015 Actual 2016 Actual 2017 Actual 2018 Budget 2019 Proposed
Total FTEs 0.00 0.00 0.00 0.00 0.00
Expenditures:
2015 Actual 2016 Actual 2017 Actual 2018 Budget 2019 Proposed
Capital Outlay 0 0 0 594,881 1,218,111
Interfund Charges 0 0 0 0 310,633
Reserve for Budget Adjustment 0 0 0 0 0
Transfers Out 0 0 0 0 0
Wages & Benefits 0 0 0 0 0
Supplies & Services 0 0 0 2,383,136 2,248,585
Debt Services 0 0 0 0 0
All Other 0 0 0 0 0
TOTAL 0 0 0 2,978,017 3,777,329
Expenditure Notes:
Designated as a special revenue fund beginning in the 2018 budget year.
Revenues:
2015 Actual 2016 Actual 2017 Actual 2018 Budget 2019 Proposed
Taxes 0 0 0 2,978,017 2,978,017
Licenses & Permits 0 0 0 0 0
IG Revenue 0 0 0 0 0
Services 0 0 0 0 0
Fines & Forfeits 0 0 0 0 0
Operating Transfers In 0 0 0 0 0
General Fund Resources 0 0 0 0 0
All Other 0 0 0 0 5,000
TOTAL 0 0 0 2,978,017 2,983,017
Revenue Notes:
Designated as a special revenue fund beginning in the 2018 budget year.
Public Works 139

One Vision. One Plan. One Voice.
Public Works140
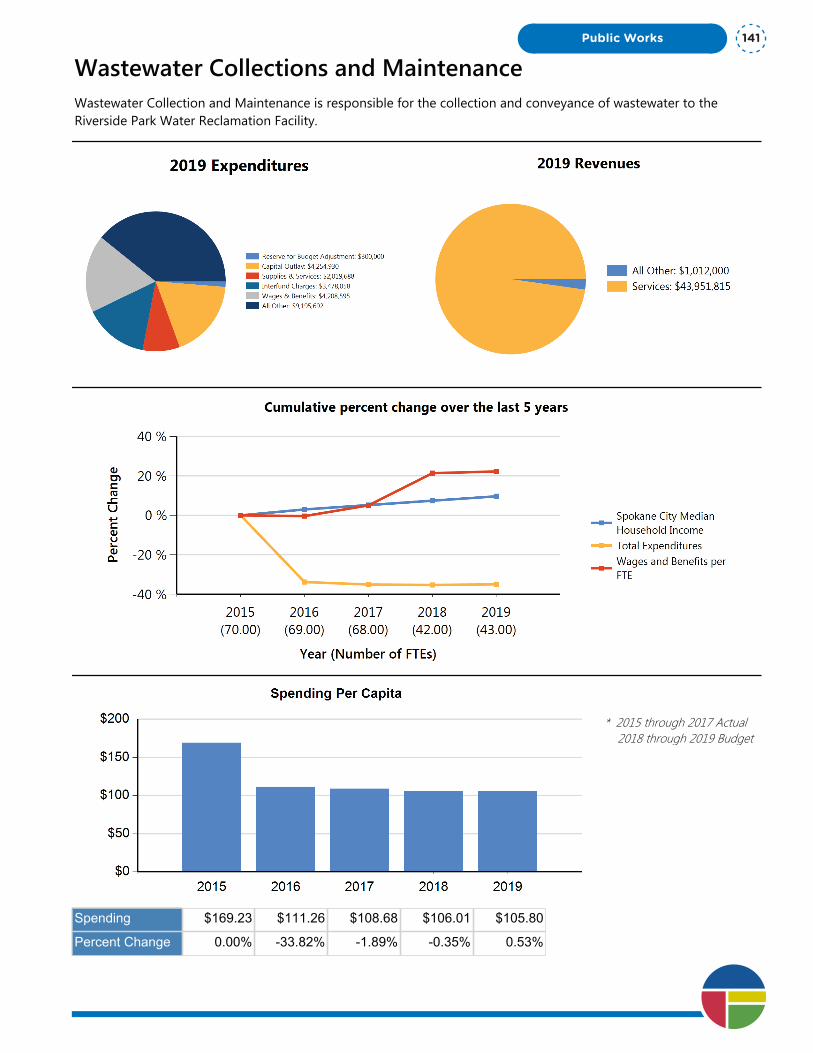
Wastewater Collections and MaintenanceWastewater Collection and Maintenance is responsible for the collection and conveyance of wastewater to the Riverside Park Water Reclamation Facility.
* 2015 through 2017 Actual 2018 through 2019 Budget
Spending $169.23 $111.26 $108.68 $106.01 $105.80
Percent Change 0.00% -33.82% -1.89% -0.35% 0.53%
Public Works 141

Department Summary: Wastewater Collections and Maintenance
Division: Public Works
Fund Type: Enterprise Fund
Executive Summary:
Wastewater Collection and Maintenance is responsible for the collection and conveyance of wastewater to the Riverside Park Water Reclamation Facility.
Programs and Services:
Wastewater Collections and Maintenance manages a comprehensive program to efficiently operate the sanitary sewer and stormwater collection systems for the benefit of the citizens and the environment. We maintain 865 miles of sanitary sewer lines, 367 miles of stormwater lines, 18,823 catch basins and drywells, and numerous swales and stormwater detention facilities.
FTEs
2015 Actual 2016 Actual 2017 Actual 2018 Budget 2019 Proposed
Total FTEs 70.00 69.00 68.00 42.00 43.00
Expenditures:
2015 Actual 2016 Actual 2017 Actual 2018 Budget 2019 Proposed
Capital Outlay 1,547,838 615,143 1,159,963 2,817,700 4,254,930
Interfund Charges 3,446,685 3,640,138 5,203,804 3,648,277 3,478,058
Reserve for Budget Adjustment 0 0 0 300,000 300,000
Transfers Out 13,524,443 10,962 0 0 0
Wages & Benefits 5,558,905 5,459,114 5,672,048 4,074,898 4,208,595
Supplies & Services 2,485,449 3,297,281 1,135,005 1,922,306 2,019,688
Debt Services 0 0 0 0 0
All Other 9,500,249 10,843,688 10,244,370 10,569,895 9,195,692
TOTAL 36,063,569 23,866,326 23,415,190 23,333,076 23,456,963
Expenditure Notes:
"All Other" expenditures are City Utility and State taxes paid on sewer maintenance revenues.
Revenues:
2015 Actual 2016 Actual 2017 Actual 2018 Budget 2019 Proposed
Taxes 0 0 0 0 0
Licenses & Permits 0 0 0 0 0
IG Revenue 7,166 9,544 75,000 0 0
Services 44,951,263 45,878,369 47,677,199 42,498,279 43,951,815
Fines & Forfeits 0 0 0 0 0
Operating Transfers In 0 0 0 0 0
General Fund Resources 0 0 0 0 0One Vision. One Plan. One Voice.
Public Works142

Department Summary: Wastewater Collections and Maintenance
Division: Public Works
Fund Type: Enterprise Fund
Executive Summary:
Wastewater Collection and Maintenance is responsible for the collection and conveyance of wastewater to the Riverside Park Water Reclamation Facility.
Programs and Services:
Wastewater Collections and Maintenance manages a comprehensive program to efficiently operate the sanitary sewer and stormwater collection systems for the benefit of the citizens and the environment. We maintain 865 miles of sanitary sewer lines, 367 miles of stormwater lines, 18,823 catch basins and drywells, and numerous swales and stormwater detention facilities.
FTEs
2015 Actual 2016 Actual 2017 Actual 2018 Budget 2019 Proposed
Total FTEs 70.00 69.00 68.00 42.00 43.00
Expenditures:
2015 Actual 2016 Actual 2017 Actual 2018 Budget 2019 Proposed
Capital Outlay 1,547,838 615,143 1,159,963 2,817,700 4,254,930
Interfund Charges 3,446,685 3,640,138 5,203,804 3,648,277 3,478,058
Reserve for Budget Adjustment 0 0 0 300,000 300,000
Transfers Out 13,524,443 10,962 0 0 0
Wages & Benefits 5,558,905 5,459,114 5,672,048 4,074,898 4,208,595
Supplies & Services 2,485,449 3,297,281 1,135,005 1,922,306 2,019,688
Debt Services 0 0 0 0 0
All Other 9,500,249 10,843,688 10,244,370 10,569,895 9,195,692
TOTAL 36,063,569 23,866,326 23,415,190 23,333,076 23,456,963
Expenditure Notes:
"All Other" expenditures are City Utility and State taxes paid on sewer maintenance revenues.
Revenues:
2015 Actual 2016 Actual 2017 Actual 2018 Budget 2019 Proposed
Taxes 0 0 0 0 0
Licenses & Permits 0 0 0 0 0
IG Revenue 7,166 9,544 75,000 0 0
Services 44,951,263 45,878,369 47,677,199 42,498,279 43,951,815
Fines & Forfeits 0 0 0 0 0
Operating Transfers In 0 0 0 0 0
General Fund Resources 0 0 0 0 0
All Other (235,415) (237,554) 36,794 7,000 1,012,000
TOTAL 44,723,014 45,650,359 47,788,993 42,505,279 44,963,815
Revenue Notes:
Public Works 143

Program Summary: Wastewater 6 YR Capital PLan
Division: Public Works
Fund Type: Enterprise Fund
Executive Summary:
Wastewater Collections, Maintenance and Stormwater Management is dedicated to providing leadership and education, while ensuring our system investments are properly maintained.
Programs and Services:
The City maintains three types of collection pipes: Sanitary sewers only, combined sanitary and stormwater sewers, and separated stormwater sewers. Sewer Collections capital projects ensure that the wastewater collection system and the associated sewer pipes and pump station facilities consistently meet the needs of the community, are properly operated and maintained, and meet water quality standards.
FTEs
2015 Actual 2016 Actual 2017 Actual 2018 Budget 2019 Proposed
Total FTEs 0.00 0.00 0.00 0.00 0.00
Expenditures:
2015 Actual 2016 Actual 2017 Actual 2018 Budget 2019 Proposed
Capital Outlay 0 0 0 0 2,770,430
Interfund Charges 0 0 0 0 0
Reserve for Budget Adjustment 0 0 0 0 0
Transfers Out 0 0 0 0 0
Wages & Benefits 0 0 0 0 0
Supplies & Services 0 0 0 0 0
Debt Services 0 0 0 0 0
All Other 0 0 0 0 0
TOTAL 0 0 0 0 2,770,430
Expenditure Notes:
This is a new program in the 2019 Budget. Previously capital expenses were accounted for in various programs within the Wastewater Collections and Maintenance Department.
Revenues:
2015 Actual 2016 Actual 2017 Actual 2018 Budget 2019 Proposed
Taxes 0 0 0 0 0
Licenses & Permits 0 0 0 0 0
IG Revenue 0 0 0 0 0
Services 0 0 0 0 0
Fines & Forfeits 0 0 0 0 0
Operating Transfers In 0 0 0 0 0One Vision. One Plan. One Voice.
Public Works144

Program Summary: Wastewater 6 YR Capital PLan
Division: Public Works
Fund Type: Enterprise Fund
Executive Summary:
Wastewater Collections, Maintenance and Stormwater Management is dedicated to providing leadership and education, while ensuring our system investments are properly maintained.
Programs and Services:
The City maintains three types of collection pipes: Sanitary sewers only, combined sanitary and stormwater sewers, and separated stormwater sewers. Sewer Collections capital projects ensure that the wastewater collection system and the associated sewer pipes and pump station facilities consistently meet the needs of the community, are properly operated and maintained, and meet water quality standards.
FTEs
2015 Actual 2016 Actual 2017 Actual 2018 Budget 2019 Proposed
Total FTEs 0.00 0.00 0.00 0.00 0.00
Expenditures:
2015 Actual 2016 Actual 2017 Actual 2018 Budget 2019 Proposed
Capital Outlay 0 0 0 0 2,770,430
Interfund Charges 0 0 0 0 0
Reserve for Budget Adjustment 0 0 0 0 0
Transfers Out 0 0 0 0 0
Wages & Benefits 0 0 0 0 0
Supplies & Services 0 0 0 0 0
Debt Services 0 0 0 0 0
All Other 0 0 0 0 0
TOTAL 0 0 0 0 2,770,430
Expenditure Notes:
This is a new program in the 2019 Budget. Previously capital expenses were accounted for in various programs within the Wastewater Collections and Maintenance Department.
Revenues:
2015 Actual 2016 Actual 2017 Actual 2018 Budget 2019 Proposed
Taxes 0 0 0 0 0
Licenses & Permits 0 0 0 0 0
IG Revenue 0 0 0 0 0
Services 0 0 0 0 0
Fines & Forfeits 0 0 0 0 0
Operating Transfers In 0 0 0 0 0
General Fund Resources 0 0 0 0 0
All Other 0 0 0 0 0
TOTAL 0 0 0 0 0
Revenue Notes:
Public Works 145

Program Summary: Wastewater Collections and Maintenance Administration
Division: Public Works
Fund Type: Enterprise Fund
Executive Summary:
The Administrative program for Wastewater Collections, Maintenance and Stormwater Management is dedicated to providing leadership and education, while ensuring our system investments are properly maintained.
Programs and Services:
Through rigorous inspection and risk-based analysis, Wastewater Collections and Maintenance can ensure continued public health and maintain system reliability. Staying current and in compliance with our NPDES (National Pollutant Discharge Elimination System) Permits is also a function of this program.
FTEs
2015 Actual 2016 Actual 2017 Actual 2018 Budget 2019 Proposed
Total FTEs 2.00 1.00 3.00 3.00 4.00
Expenditures:
2015 Actual 2016 Actual 2017 Actual 2018 Budget 2019 Proposed
Capital Outlay 0 0 29,027 20,000 20,000
Interfund Charges 2,757,312 2,934,740 3,376,895 3,648,277 3,478,058
Reserve for Budget Adjustment 0 0 0 300,000 300,000
Transfers Out 0 0 0 0 0
Wages & Benefits 153,976 72,475 246,067 337,548 393,788
Supplies & Services 169,282 563,851 857,459 454,391 556,783
Debt Services 0 0 0 0 0
All Other 9,485,661 10,833,303 10,242,645 10,569,895 9,195,692
TOTAL 12,566,231 14,404,369 14,752,093 15,330,111 13,944,321
Expenditure Notes:
Expenses in the All Other category are City Utility taxes and Washington State Excise taxes paid by the City of Spokane’s Utility Departments.
Revenues:
2015 Actual 2016 Actual 2017 Actual 2018 Budget 2019 Proposed
Taxes 0 0 0 0 0
Licenses & Permits 0 0 0 0 0
IG Revenue 0 0 0 0 0
Services 0 0 0 0 0
Fines & Forfeits 0 0 0 0 0
Operating Transfers In 0 0 0 0 0
General Fund Resources 0 0 0 0 0One Vision. One Plan. One Voice.
Public Works146
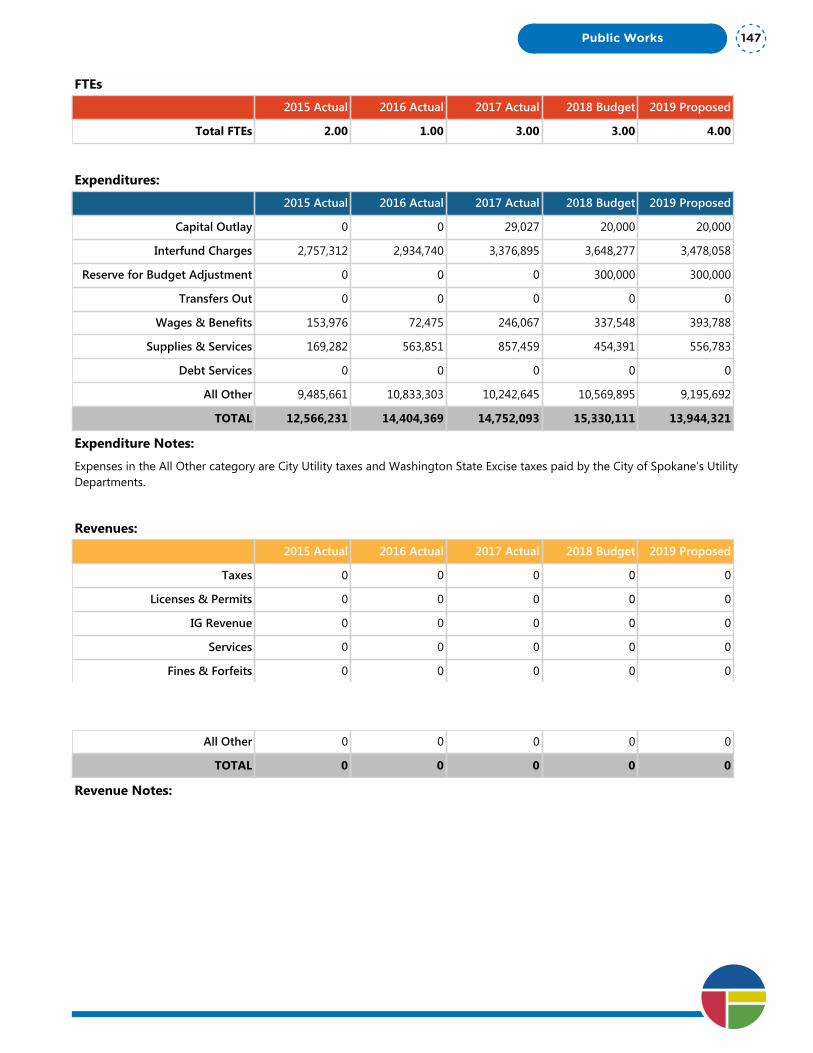
Program Summary: Wastewater Collections and Maintenance Administration
Division: Public Works
Fund Type: Enterprise Fund
Executive Summary:
The Administrative program for Wastewater Collections, Maintenance and Stormwater Management is dedicated to providing leadership and education, while ensuring our system investments are properly maintained.
Programs and Services:
Through rigorous inspection and risk-based analysis, Wastewater Collections and Maintenance can ensure continued public health and maintain system reliability. Staying current and in compliance with our NPDES (National Pollutant Discharge Elimination System) Permits is also a function of this program.
FTEs
2015 Actual 2016 Actual 2017 Actual 2018 Budget 2019 Proposed
Total FTEs 2.00 1.00 3.00 3.00 4.00
Expenditures:
2015 Actual 2016 Actual 2017 Actual 2018 Budget 2019 Proposed
Capital Outlay 0 0 29,027 20,000 20,000
Interfund Charges 2,757,312 2,934,740 3,376,895 3,648,277 3,478,058
Reserve for Budget Adjustment 0 0 0 300,000 300,000
Transfers Out 0 0 0 0 0
Wages & Benefits 153,976 72,475 246,067 337,548 393,788
Supplies & Services 169,282 563,851 857,459 454,391 556,783
Debt Services 0 0 0 0 0
All Other 9,485,661 10,833,303 10,242,645 10,569,895 9,195,692
TOTAL 12,566,231 14,404,369 14,752,093 15,330,111 13,944,321
Expenditure Notes:
Expenses in the All Other category are City Utility taxes and Washington State Excise taxes paid by the City of Spokane’s Utility Departments.
Revenues:
2015 Actual 2016 Actual 2017 Actual 2018 Budget 2019 Proposed
Taxes 0 0 0 0 0
Licenses & Permits 0 0 0 0 0
IG Revenue 0 0 0 0 0
Services 0 0 0 0 0
Fines & Forfeits 0 0 0 0 0
Operating Transfers In 0 0 0 0 0
General Fund Resources 0 0 0 0 0
All Other 0 0 0 0 0
TOTAL 0 0 0 0 0
Revenue Notes:
Public Works 147
Sub-Department Summary:
Wastewater Operations & Maintenance
Division: Public Works
Fund Type: Enterprise Fund
Executive Summary:
The sanitary sewer system maintenance program is in place to alleviate any system backups into residential or commercial buildings throughout the City sanitary sewer collection system.
Programs and Services:
This program supports closed circuit TV inspection crews, mechanical rodders, combination sewer cleaners, service trucks and construction crews, when needed. We also provide private sides sewer inspections and construction locates throughout the City. These crews operate two different sanitary sewer systems, along with CSO tanks and a separate stormwater system.
FTEs
2015 Actual 2016 Actual 2017 Actual 2018 Budget 2019 Proposed
Total FTEs 68.00 68.00 65.00 39.00 39.00
Expenditures:
2015 Actual 2016 Actual 2017 Actual 2018 Budget 2019 Proposed
Capital Outlay 1,547,838 615,143 1,130,936 2,797,700 1,464,500
Interfund Charges 689,373 705,398 1,826,909 0 0
Reserve for Budget Adjustment 0 0 0 0 0
Transfers Out 13,524,443 10,962 0 0 0
Wages & Benefits 5,404,929 5,386,639 5,425,981 3,737,350 3,814,807
Supplies & Services 2,316,167 2,733,430 277,546 1,467,915 1,462,905
Debt Services 0 0 0 0 0
All Other 14,588 10,385 1,725 0 0
TOTAL 23,497,338 9,461,957 8,663,097 8,002,965 6,742,212
Expenditure Notes:
"All Other" expenditures are City Utility and State taxes paid on sewer maintenance revenues.
Revenues:
2015 Actual 2016 Actual 2017 Actual 2018 Budget 2019 Proposed
Taxes 0 0 0 0 0
Licenses & Permits 0 0 0 0 0
IG Revenue 7,166 9,544 75,000 0 0
Services 44,951,263 45,878,369 47,677,199 42,498,279 43,951,815
Fines & Forfeits 0 0 0 0 0
Operating Transfers In 0 0 0 0 0One Vision. One Plan. One Voice.
Public Works148

Sub-Department Summary:
Wastewater Operations & Maintenance
Division: Public Works
Fund Type: Enterprise Fund
Executive Summary:
The sanitary sewer system maintenance program is in place to alleviate any system backups into residential or commercial buildings throughout the City sanitary sewer collection system.
Programs and Services:
This program supports closed circuit TV inspection crews, mechanical rodders, combination sewer cleaners, service trucks and construction crews, when needed. We also provide private sides sewer inspections and construction locates throughout the City. These crews operate two different sanitary sewer systems, along with CSO tanks and a separate stormwater system.
FTEs
2015 Actual 2016 Actual 2017 Actual 2018 Budget 2019 Proposed
Total FTEs 68.00 68.00 65.00 39.00 39.00
Expenditures:
2015 Actual 2016 Actual 2017 Actual 2018 Budget 2019 Proposed
Capital Outlay 1,547,838 615,143 1,130,936 2,797,700 1,464,500
Interfund Charges 689,373 705,398 1,826,909 0 0
Reserve for Budget Adjustment 0 0 0 0 0
Transfers Out 13,524,443 10,962 0 0 0
Wages & Benefits 5,404,929 5,386,639 5,425,981 3,737,350 3,814,807
Supplies & Services 2,316,167 2,733,430 277,546 1,467,915 1,462,905
Debt Services 0 0 0 0 0
All Other 14,588 10,385 1,725 0 0
TOTAL 23,497,338 9,461,957 8,663,097 8,002,965 6,742,212
Expenditure Notes:
"All Other" expenditures are City Utility and State taxes paid on sewer maintenance revenues.
Revenues:
2015 Actual 2016 Actual 2017 Actual 2018 Budget 2019 Proposed
Taxes 0 0 0 0 0
Licenses & Permits 0 0 0 0 0
IG Revenue 7,166 9,544 75,000 0 0
Services 44,951,263 45,878,369 47,677,199 42,498,279 43,951,815
Fines & Forfeits 0 0 0 0 0
Operating Transfers In 0 0 0 0 0
General Fund Resources 0 0 0 0 0
All Other (235,415) (237,554) 36,794 7,000 1,012,000
TOTAL 44,723,014 45,650,359 47,788,993 42,505,279 44,963,815
Revenue Notes:
Public Works 149

One Vision. One Plan. One Voice.
Public Works150
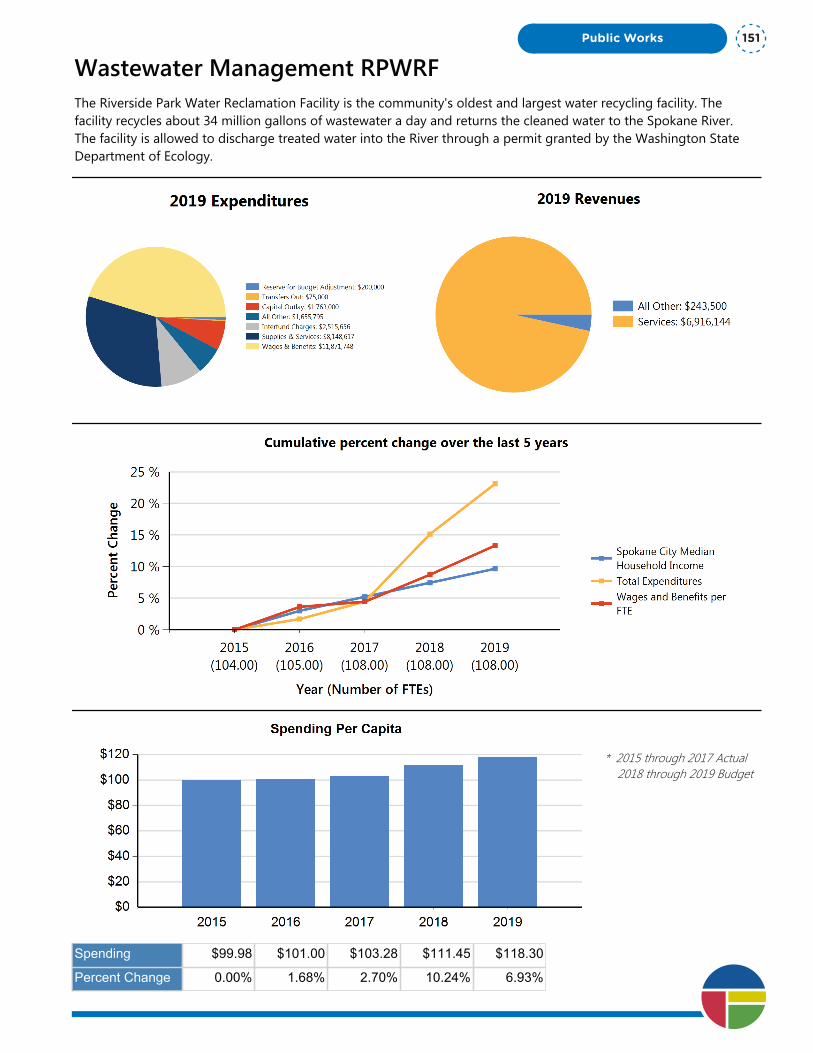
Wastewater Management RPWRFThe Riverside Park Water Reclamation Facility is the community's oldest and largest water recycling facility. The facility recycles about 34 million gallons of wastewater a day and returns the cleaned water to the Spokane River. The facility is allowed to discharge treated water into the River through a permit granted by the Washington State Department of Ecology.
* 2015 through 2017 Actual 2018 through 2019 Budget
Spending $99.98 $101.00 $103.28 $111.45 $118.30
Percent Change 0.00% 1.68% 2.70% 10.24% 6.93%
Public Works 151
Department Summary: Wastewater Management RPWRF
Division: Public Works
Fund Type: Enterprise Fund
Executive Summary:
The Riverside Park Water Reclamation Facility is the community's oldest and largest water recycling facility. The facility recycles about 34 million gallons of wastewater a day and returns the cleaned water to the Spokane River. The facility is allowed to discharge treated water into the River through a permit granted by the Washington State Department of Ecology.
Programs and Services:
The Riverside Park facility can handle peak flows up to 150 million gallons a day, and runs that wastewater through a number of processing steps including • Preliminary: Rocks, grit and larger debris are removed.• Primary: solids settle to the bottom, and oils and grease float to the top. The solids and oils removed.• Secondary: smaller dissolved and suspended particles are separated and removed from the water.• Disinfection: the water is disinfected before it is released to the River.• Solids: Digesters are used to process all removed solids, oils, and suspended particles. Final, processed solids are dewatered and spread on fields where livestock grain is grown.Construction for the tertiary treatment, often referred to as the Next Level of Treatment, is underway now and encompasses a number of different elements, including a new solids digester, a fifth primary clarifier, a new chemical building, and the membrane facility itself. This technology will further reduce pollutants, like heavy metals, PCBs, and Phosphorus, and improve the quality of the water released to the River.
FTEs
2015 Actual 2016 Actual 2017 Actual 2018 Budget 2019 Proposed
Total FTEs 104.00 105.00 108.00 108.00 108.00
Expenditures:
2015 Actual 2016 Actual 2017 Actual 2018 Budget 2019 Proposed
Capital Outlay 400,826 512,476 339,985 1,383,500 1,763,000
Interfund Charges 2,046,614 2,140,472 2,022,305 2,129,179 2,515,656
Reserve for Budget Adjustment 0 0 0 200,000 200,000
Transfers Out 2,109 13,801 0 240,000 75,000
Wages & Benefits 10,031,693 10,494,433 10,881,724 11,347,771 11,871,748
Supplies & Services 7,203,308 7,212,535 7,460,956 7,668,565 8,148,617
Debt Services 0 0 0 0 0
All Other 1,620,387 1,290,586 1,545,134 1,560,186 1,655,795
One Vision. One Plan. One Voice.
Public Works152

Department Summary: Wastewater Management RPWRF
Division: Public Works
Fund Type: Enterprise Fund
Executive Summary:
The Riverside Park Water Reclamation Facility is the community's oldest and largest water recycling facility. The facility recycles about 34 million gallons of wastewater a day and returns the cleaned water to the Spokane River. The facility is allowed to discharge treated water into the River through a permit granted by the Washington State Department of Ecology.
Programs and Services:
The Riverside Park facility can handle peak flows up to 150 million gallons a day, and runs that wastewater through a number of processing steps including • Preliminary: Rocks, grit and larger debris are removed.• Primary: solids settle to the bottom, and oils and grease float to the top. The solids and oils removed.• Secondary: smaller dissolved and suspended particles are separated and removed from the water.• Disinfection: the water is disinfected before it is released to the River.• Solids: Digesters are used to process all removed solids, oils, and suspended particles. Final, processed solids are dewatered and spread on fields where livestock grain is grown.Construction for the tertiary treatment, often referred to as the Next Level of Treatment, is underway now and encompasses a number of different elements, including a new solids digester, a fifth primary clarifier, a new chemical building, and the membrane facility itself. This technology will further reduce pollutants, like heavy metals, PCBs, and Phosphorus, and improve the quality of the water released to the River.
FTEs
2015 Actual 2016 Actual 2017 Actual 2018 Budget 2019 Proposed
Total FTEs 104.00 105.00 108.00 108.00 108.00
Expenditures:
2015 Actual 2016 Actual 2017 Actual 2018 Budget 2019 Proposed
Capital Outlay 400,826 512,476 339,985 1,383,500 1,763,000
Interfund Charges 2,046,614 2,140,472 2,022,305 2,129,179 2,515,656
Reserve for Budget Adjustment 0 0 0 200,000 200,000
Transfers Out 2,109 13,801 0 240,000 75,000
Wages & Benefits 10,031,693 10,494,433 10,881,724 11,347,771 11,871,748
Supplies & Services 7,203,308 7,212,535 7,460,956 7,668,565 8,148,617
Debt Services 0 0 0 0 0
All Other 1,620,387 1,290,586 1,545,134 1,560,186 1,655,795
TOTAL 21,304,937 21,664,303 22,250,104 24,529,201 26,229,816
Expenditure Notes:
Expenses in the All Other category are City Utility taxes and Washington State Excise taxes paid by the City of Spokane’s Utility Departments.
Revenues:
2015 Actual 2016 Actual 2017 Actual 2018 Budget 2019 Proposed
Taxes 0 0 0 0 0
Licenses & Permits 0 0 0 0 0
IG Revenue 0 0 0 0 0
Services 6,245,107 5,588,548 5,431,151 6,374,423 6,916,144
Fines & Forfeits 0 0 0 0 0
Operating Transfers In 0 0 0 0 0
General Fund Resources 0 0 0 0 0
All Other 545,346 106,148 321,898 125,600 243,500
TOTAL 6,790,453 5,694,696 5,753,049 6,500,023 7,159,644
Revenue Notes:
Public Works 153
Sub-Department Summary:
RPWRF Operations & Maintenance
Division: Public Works
Fund Type: Enterprise Fund
Executive Summary:
The Riverside Park Water Reclamation Facility (RPWRF) recycles approximately 34 million gallons of wastewater per day, with peak flows of up to 150 million gallons, thereby helping the Spokane River enjoy its status as an increasingly treasured community amenity. This program provides resources necessary for the safe, dependable, and regulatory-compliant operation of the Riverside Park Water Reclamation Facility.
Programs and Services:
The continued safe, dependable, and regulatory-compliant operation of the Riverside Park Water Reclamation Facility depends upon the efforts of its operations and maintenance staff, which oversees complex wastewater treatment component processes and responds in an effective and appropriate manner to ensure that wastewater generated by the community is rendered suitable for discharge to the Spokane River. The size of the facility and its stringent federal and state discharge permit necessitates that the facility be staffed around the clock, every day of the year.
FTEs
2015 Actual 2016 Actual 2017 Actual 2018 Budget 2019 Proposed
Total FTEs 97.00 97.00 99.00 99.00 98.00
Expenditures:
2015 Actual 2016 Actual 2017 Actual 2018 Budget 2019 Proposed
Capital Outlay 106,160 512,476 339,985 1,383,500 40,000
Interfund Charges 0 0 0 0 0
Reserve for Budget Adjustment 0 0 0 0 0
Transfers Out 1,553 0 0 0 0
Wages & Benefits 9,200,129 9,450,845 9,742,878 10,227,662 10,590,692
Supplies & Services 5,443,983 5,346,045 5,152,982 5,011,908 5,417,716
Debt Services 0 0 0 0 0
All Other 0 0 0 0 0
TOTAL 14,751,825 15,309,366 15,235,845 16,623,070 16,048,408
Expenditure Notes:
Revenues:
2015 Actual 2016 Actual 2017 Actual 2018 Budget 2019 Proposed
Taxes 0 0 0 0 0
Licenses & Permits 0 0 0 0 0
IG Revenue 0 0 0 0 0
Services 342,531 (295,583) 16,516 8,000 16,995One Vision. One Plan. One Voice.
Public Works154
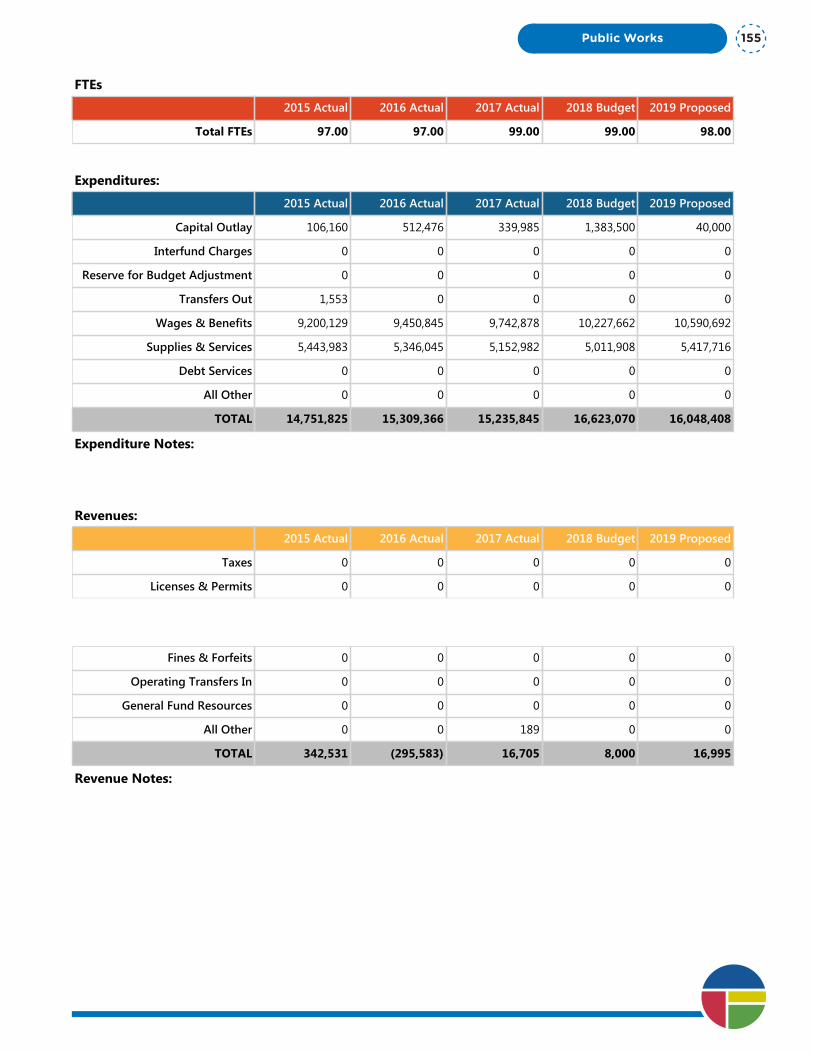
Sub-Department Summary:
RPWRF Operations & Maintenance
Division: Public Works
Fund Type: Enterprise Fund
Executive Summary:
The Riverside Park Water Reclamation Facility (RPWRF) recycles approximately 34 million gallons of wastewater per day, with peak flows of up to 150 million gallons, thereby helping the Spokane River enjoy its status as an increasingly treasured community amenity. This program provides resources necessary for the safe, dependable, and regulatory-compliant operation of the Riverside Park Water Reclamation Facility.
Programs and Services:
The continued safe, dependable, and regulatory-compliant operation of the Riverside Park Water Reclamation Facility depends upon the efforts of its operations and maintenance staff, which oversees complex wastewater treatment component processes and responds in an effective and appropriate manner to ensure that wastewater generated by the community is rendered suitable for discharge to the Spokane River. The size of the facility and its stringent federal and state discharge permit necessitates that the facility be staffed around the clock, every day of the year.
FTEs
2015 Actual 2016 Actual 2017 Actual 2018 Budget 2019 Proposed
Total FTEs 97.00 97.00 99.00 99.00 98.00
Expenditures:
2015 Actual 2016 Actual 2017 Actual 2018 Budget 2019 Proposed
Capital Outlay 106,160 512,476 339,985 1,383,500 40,000
Interfund Charges 0 0 0 0 0
Reserve for Budget Adjustment 0 0 0 0 0
Transfers Out 1,553 0 0 0 0
Wages & Benefits 9,200,129 9,450,845 9,742,878 10,227,662 10,590,692
Supplies & Services 5,443,983 5,346,045 5,152,982 5,011,908 5,417,716
Debt Services 0 0 0 0 0
All Other 0 0 0 0 0
TOTAL 14,751,825 15,309,366 15,235,845 16,623,070 16,048,408
Expenditure Notes:
Revenues:
2015 Actual 2016 Actual 2017 Actual 2018 Budget 2019 Proposed
Taxes 0 0 0 0 0
Licenses & Permits 0 0 0 0 0
IG Revenue 0 0 0 0 0
Services 342,531 (295,583) 16,516 8,000 16,995
Fines & Forfeits 0 0 0 0 0
Operating Transfers In 0 0 0 0 0
General Fund Resources 0 0 0 0 0
All Other 0 0 189 0 0
TOTAL 342,531 (295,583) 16,705 8,000 16,995
Revenue Notes:
Public Works 155

Program Summary: Wastewater Management RPWRF 6 YR Capital Plan
Division: Public Works
Fund Type: Enterprise Fund
Executive Summary:
Clean water is fundamental to life and we strive to protect public health, property, and the environment. We will provide service utilizing sound financial and natural resource management practices. We will continue to give our customers the best service in the Pacific Northwest.
Programs and Services:
The City of Spokane’s Wastewater Treatment Facility receives and treats combined sewage from the City’s Sewer Collection System, Spokane County, and Fairchild Air Force Base (FAFB), as well as septage from private septic tank servicers. The six year capital plan includes the Next Level of Treatment plant upgrades as well as the plant wide SCADA upgrade. Other improvements lift station improvements, flow monitor replacements and various vehicle replacements.
FTEs
2015 Actual 2016 Actual 2017 Actual 2018 Budget 2019 Proposed
Total FTEs 0.00 0.00 0.00 0.00 0.00
Expenditures:
2015 Actual 2016 Actual 2017 Actual 2018 Budget 2019 Proposed
Capital Outlay 0 0 0 0 1,723,000
Interfund Charges 0 0 0 0 0
Reserve for Budget Adjustment 0 0 0 0 0
Transfers Out 0 0 0 0 0
Wages & Benefits 0 0 0 0 0
Supplies & Services 0 0 0 0 260,000
Debt Services 0 0 0 0 0
All Other 0 0 0 0 0
TOTAL 0 0 0 0 1,983,000
Expenditure Notes:
This is a new program in the 2019 Budget. Previously capital expenses were accounted for in various programs within the Wastewater Management RPWRF Department.
Revenues:
2015 Actual 2016 Actual 2017 Actual 2018 Budget 2019 Proposed
Taxes 0 0 0 0 0
Licenses & Permits 0 0 0 0 0
IG Revenue 0 0 0 0 0
Services 0 0 0 0 0
Fines & Forfeits 0 0 0 0 0
Operating Transfers In 0 0 0 0 0One Vision. One Plan. One Voice.
Public Works156

Program Summary: Wastewater Management RPWRF 6 YR Capital Plan
Division: Public Works
Fund Type: Enterprise Fund
Executive Summary:
Clean water is fundamental to life and we strive to protect public health, property, and the environment. We will provide service utilizing sound financial and natural resource management practices. We will continue to give our customers the best service in the Pacific Northwest.
Programs and Services:
The City of Spokane’s Wastewater Treatment Facility receives and treats combined sewage from the City’s Sewer Collection System, Spokane County, and Fairchild Air Force Base (FAFB), as well as septage from private septic tank servicers. The six year capital plan includes the Next Level of Treatment plant upgrades as well as the plant wide SCADA upgrade. Other improvements lift station improvements, flow monitor replacements and various vehicle replacements.
FTEs
2015 Actual 2016 Actual 2017 Actual 2018 Budget 2019 Proposed
Total FTEs 0.00 0.00 0.00 0.00 0.00
Expenditures:
2015 Actual 2016 Actual 2017 Actual 2018 Budget 2019 Proposed
Capital Outlay 0 0 0 0 1,723,000
Interfund Charges 0 0 0 0 0
Reserve for Budget Adjustment 0 0 0 0 0
Transfers Out 0 0 0 0 0
Wages & Benefits 0 0 0 0 0
Supplies & Services 0 0 0 0 260,000
Debt Services 0 0 0 0 0
All Other 0 0 0 0 0
TOTAL 0 0 0 0 1,983,000
Expenditure Notes:
This is a new program in the 2019 Budget. Previously capital expenses were accounted for in various programs within the Wastewater Management RPWRF Department.
Revenues:
2015 Actual 2016 Actual 2017 Actual 2018 Budget 2019 Proposed
Taxes 0 0 0 0 0
Licenses & Permits 0 0 0 0 0
IG Revenue 0 0 0 0 0
Services 0 0 0 0 0
Fines & Forfeits 0 0 0 0 0
Operating Transfers In 0 0 0 0 0
General Fund Resources 0 0 0 0 0
All Other 0 0 0 0 0
TOTAL 0 0 0 0 0
Revenue Notes:
Public Works 157

Program Summary: WW Management Administration
Division: Public Works
Fund Type: Enterprise Fund
Executive Summary:
The City's Riverside Park Water Reclamation Facility administration strives to provide efficient and effective processing of some 34 million gallons of wastewater every day, protecting the health of our citizens and our environment while planning for future needs.
Programs and Services:
Leadership at the Riverside Park Water Reclamation Facility is working to maintain efficient and effective operations today, while moving ahead with plans for the future. Construction is under way for what's commonly called the Next Level of Treatment at the facility. This tertiary level of treatment will be in addition to the primary and secondary treatment of wastewater that already occurs at the facility. This level of treatment will filter out additional pollutants and nutrients as required by the state and federally approved permit and other regulations that govern the plant. The project is being implemented using a GC/CM (General Contractor/Construction Management) alternate project delivery model. Leadership is working to create the greatest value for the citizens--to develop a project that achieves environmental standards at the best possible price. This important work also includes integration with plans to reduce outfalls to the river from combined sewers.
FTEs
2015 Actual 2016 Actual 2017 Actual 2018 Budget 2019 Proposed
Total FTEs 7.00 8.00 9.00 9.00 10.00
Expenditures:
2015 Actual 2016 Actual 2017 Actual 2018 Budget 2019 Proposed
Capital Outlay 294,666 0 0 0 0
Interfund Charges 2,046,614 2,140,472 2,022,305 2,129,179 2,515,656
Reserve for Budget Adjustment 0 0 0 200,000 200,000
Transfers Out 556 13,801 0 240,000 75,000
Wages & Benefits 831,564 1,043,588 1,138,846 1,120,109 1,281,056
Supplies & Services 1,759,325 1,866,490 2,307,974 2,656,657 2,470,901
Debt Services 0 0 0 0 0
All Other 1,620,387 1,290,586 1,545,134 1,560,186 1,655,795
TOTAL 6,553,112 6,354,937 7,014,259 7,906,131 8,198,408
Expenditure Notes:
Expenses in the All Other category are City Utility taxes and Washington State Excise taxes paid by the City of Spokane’s Utility Departments.
Revenues:
2015 Actual 2016 Actual 2017 Actual 2018 Budget 2019 Proposed
Taxes 0 0 0 0 0
Licenses & Permits 0 0 0 0 0
IG Revenue 0 0 0 0 0One Vision. One Plan. One Voice.
Public Works158

Program Summary: WW Management Administration
Division: Public Works
Fund Type: Enterprise Fund
Executive Summary:
The City's Riverside Park Water Reclamation Facility administration strives to provide efficient and effective processing of some 34 million gallons of wastewater every day, protecting the health of our citizens and our environment while planning for future needs.
Programs and Services:
Leadership at the Riverside Park Water Reclamation Facility is working to maintain efficient and effective operations today, while moving ahead with plans for the future. Construction is under way for what's commonly called the Next Level of Treatment at the facility. This tertiary level of treatment will be in addition to the primary and secondary treatment of wastewater that already occurs at the facility. This level of treatment will filter out additional pollutants and nutrients as required by the state and federally approved permit and other regulations that govern the plant. The project is being implemented using a GC/CM (General Contractor/Construction Management) alternate project delivery model. Leadership is working to create the greatest value for the citizens--to develop a project that achieves environmental standards at the best possible price. This important work also includes integration with plans to reduce outfalls to the river from combined sewers.
FTEs
2015 Actual 2016 Actual 2017 Actual 2018 Budget 2019 Proposed
Total FTEs 7.00 8.00 9.00 9.00 10.00
Expenditures:
2015 Actual 2016 Actual 2017 Actual 2018 Budget 2019 Proposed
Capital Outlay 294,666 0 0 0 0
Interfund Charges 2,046,614 2,140,472 2,022,305 2,129,179 2,515,656
Reserve for Budget Adjustment 0 0 0 200,000 200,000
Transfers Out 556 13,801 0 240,000 75,000
Wages & Benefits 831,564 1,043,588 1,138,846 1,120,109 1,281,056
Supplies & Services 1,759,325 1,866,490 2,307,974 2,656,657 2,470,901
Debt Services 0 0 0 0 0
All Other 1,620,387 1,290,586 1,545,134 1,560,186 1,655,795
TOTAL 6,553,112 6,354,937 7,014,259 7,906,131 8,198,408
Expenditure Notes:
Expenses in the All Other category are City Utility taxes and Washington State Excise taxes paid by the City of Spokane’s Utility Departments.
Revenues:
2015 Actual 2016 Actual 2017 Actual 2018 Budget 2019 Proposed
Taxes 0 0 0 0 0
Licenses & Permits 0 0 0 0 0
IG Revenue 0 0 0 0 0
Services 5,902,576 5,884,131 5,414,635 6,366,423 6,899,149
Fines & Forfeits 0 0 0 0 0
Operating Transfers In 0 0 0 0 0
General Fund Resources 0 0 0 0 0
All Other 545,346 106,148 321,709 125,600 243,500
TOTAL 6,447,922 5,990,279 5,736,344 6,492,023 7,142,649
Revenue Notes:
Public Works 159

One Vision. One Plan. One Voice.
Public Works160
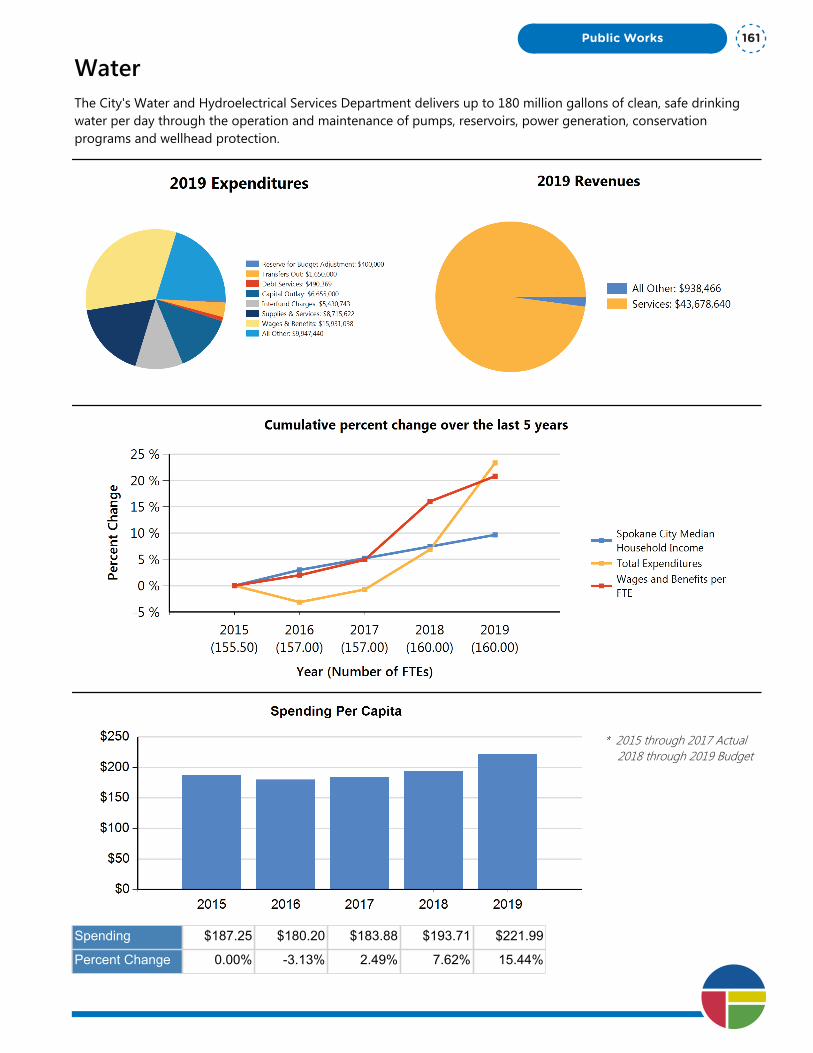
WaterThe City's Water and Hydroelectrical Services Department delivers up to 180 million gallons of clean, safe drinking water per day through the operation and maintenance of pumps, reservoirs, power generation, conservation programs and wellhead protection.
* 2015 through 2017 Actual 2018 through 2019 Budget
Spending $187.25 $180.20 $183.88 $193.71 $221.99
Percent Change 0.00% -3.13% 2.49% 7.62% 15.44%
Public Works 161

Department Summary: Water
Division: Public Works
Fund Type: Enterprise Fund
Executive Summary:
The City's Water and Hydroelectrical Services Department delivers up to 180 million gallons of clean, safe drinking water per day through the operation and maintenance of pumps, reservoirs, power generation, conservation programs and wellhead protection.
Programs and Services:
The Water Department maintains a reliable drinking water system in adequate volume and pressure, while providing reliable fire flows. We work to optimize resources and assets of the Water Department so we may provide safe drinking water at an affordable price with minimal service outages. We strive to provide these services while remaining in 100% compliance with all regulatory agencies.
FTEs
2015 Actual 2016 Actual 2017 Actual 2018 Budget 2019 Proposed
Total FTEs 155.50 157.00 157.00 160.00 160.00
Expenditures:
2015 Actual 2016 Actual 2017 Actual 2018 Budget 2019 Proposed
Capital Outlay 4,244,825 2,898,410 2,043,480 3,543,150 6,655,000
Interfund Charges 4,453,051 4,922,774 5,138,068 5,218,033 5,430,743
Reserve for Budget Adjustment 0 0 0 400,000 400,000
Transfers Out 135,857 4,444 0 480,000 1,650,000
Wages & Benefits 12,668,865 13,045,774 13,430,137 15,202,128 15,931,038
Supplies & Services 8,025,820 7,376,096 8,108,767 7,363,376 8,715,622
Debt Services 919,774 894,807 919,703 783,483 490,369
All Other 9,455,026 9,509,756 9,974,873 9,646,169 9,947,440
TOTAL 39,903,218 38,652,061 39,615,028 42,636,339 49,220,212
Expenditure Notes:
"All Other' expenditures are City Utility taxes and State taxes paid on Water Department Revenues
Revenues:
2015 Actual 2016 Actual 2017 Actual 2018 Budget 2019 Proposed
Taxes 0 0 0 0 0
Licenses & Permits 400 0 0 0 0
IG Revenue 0 46,649 100 0 0
Services 40,263,673 42,265,977 43,110,278 41,624,683 43,678,640
Fines & Forfeits 0 0 0 0 0
Operating Transfers In 6,091,402 0 0 0 0
General Fund Resources 0 0 0 0 0One Vision. One Plan. One Voice.
Public Works162
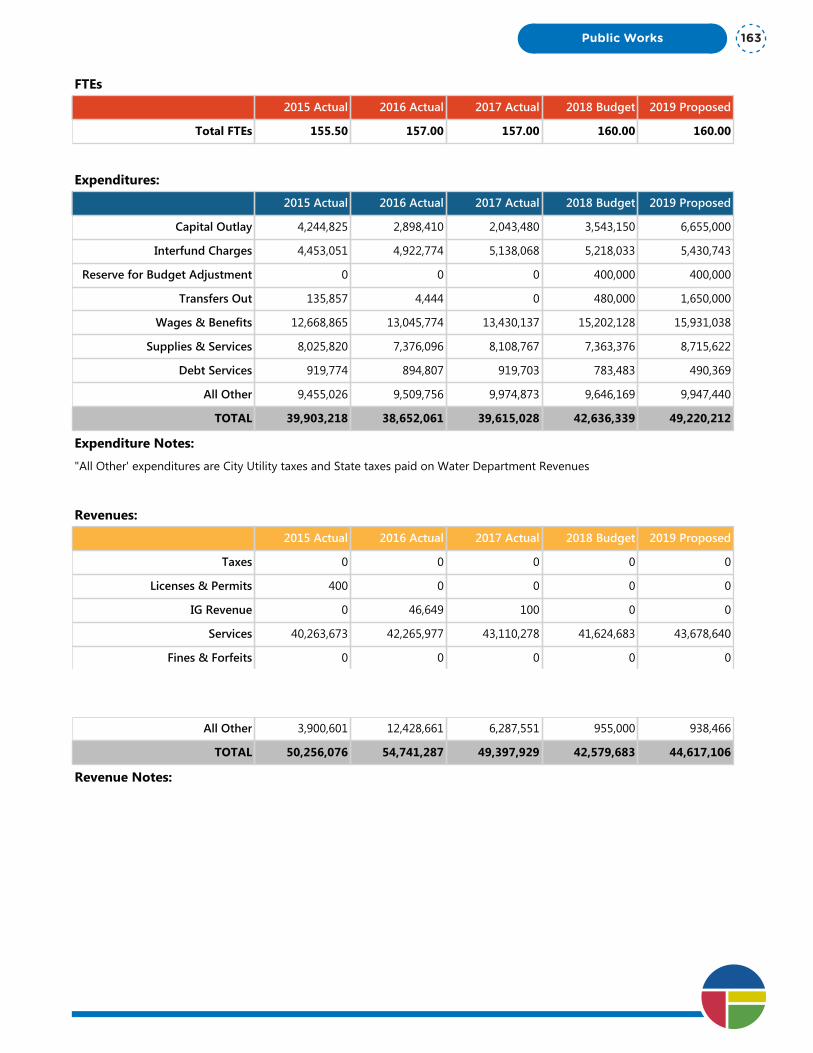
Department Summary: Water
Division: Public Works
Fund Type: Enterprise Fund
Executive Summary:
The City's Water and Hydroelectrical Services Department delivers up to 180 million gallons of clean, safe drinking water per day through the operation and maintenance of pumps, reservoirs, power generation, conservation programs and wellhead protection.
Programs and Services:
The Water Department maintains a reliable drinking water system in adequate volume and pressure, while providing reliable fire flows. We work to optimize resources and assets of the Water Department so we may provide safe drinking water at an affordable price with minimal service outages. We strive to provide these services while remaining in 100% compliance with all regulatory agencies.
FTEs
2015 Actual 2016 Actual 2017 Actual 2018 Budget 2019 Proposed
Total FTEs 155.50 157.00 157.00 160.00 160.00
Expenditures:
2015 Actual 2016 Actual 2017 Actual 2018 Budget 2019 Proposed
Capital Outlay 4,244,825 2,898,410 2,043,480 3,543,150 6,655,000
Interfund Charges 4,453,051 4,922,774 5,138,068 5,218,033 5,430,743
Reserve for Budget Adjustment 0 0 0 400,000 400,000
Transfers Out 135,857 4,444 0 480,000 1,650,000
Wages & Benefits 12,668,865 13,045,774 13,430,137 15,202,128 15,931,038
Supplies & Services 8,025,820 7,376,096 8,108,767 7,363,376 8,715,622
Debt Services 919,774 894,807 919,703 783,483 490,369
All Other 9,455,026 9,509,756 9,974,873 9,646,169 9,947,440
TOTAL 39,903,218 38,652,061 39,615,028 42,636,339 49,220,212
Expenditure Notes:
"All Other' expenditures are City Utility taxes and State taxes paid on Water Department Revenues
Revenues:
2015 Actual 2016 Actual 2017 Actual 2018 Budget 2019 Proposed
Taxes 0 0 0 0 0
Licenses & Permits 400 0 0 0 0
IG Revenue 0 46,649 100 0 0
Services 40,263,673 42,265,977 43,110,278 41,624,683 43,678,640
Fines & Forfeits 0 0 0 0 0
Operating Transfers In 6,091,402 0 0 0 0
General Fund Resources 0 0 0 0 0
All Other 3,900,601 12,428,661 6,287,551 955,000 938,466
TOTAL 50,256,076 54,741,287 49,397,929 42,579,683 44,617,106
Revenue Notes:
Public Works 163

Program Summary: Water 6 YR Capital Plan
Division: Public Works
Fund Type: Enterprise Fund
Executive Summary:
The Water Department's six-year capital plan provides for thoughtful planning of capital maintenance improvements, equipment, vehicles, and projects related to the Water System. This plan allows the Water Department to meet the needs of present and future customers
Programs and Services:
The City's Water Department has ongoing operational equipment and capital maintenance needs. The details of these needs is provided in the six-year capital plan and budgeted for in this program of the Water Department's budget.
FTEs
2015 Actual 2016 Actual 2017 Actual 2018 Budget 2019 Proposed
Total FTEs 0.00 0.00 0.00 0.00 0.00
Expenditures:
2015 Actual 2016 Actual 2017 Actual 2018 Budget 2019 Proposed
Capital Outlay 3,014,455 1,150,627 391,772 1,245,000 3,960,000
Interfund Charges 4,862 940 36 0 0
Reserve for Budget Adjustment 0 0 0 0 0
Transfers Out 0 0 0 0 0
Wages & Benefits 0 0 0 0 0
Supplies & Services 917,991 293,980 1,198,836 600,000 1,560,000
Debt Services 0 0 0 0 0
All Other 0 0 0 0 0
TOTAL 3,937,308 1,445,547 1,590,644 1,845,000 5,520,000
Expenditure Notes:
This is a new program in the 2019 Budget. Previously capital expenses were accounted for in various programs within the Water Collections Department.
Revenues:
2015 Actual 2016 Actual 2017 Actual 2018 Budget 2019 Proposed
Taxes 0 0 0 0 0
Licenses & Permits 0 0 0 0 0
IG Revenue 0 0 0 0 0
Services 0 0 0 0 0
Fines & Forfeits 0 0 0 0 0
Operating Transfers In 0 0 0 0 0
General Fund Resources 0 0 0 0 0One Vision. One Plan. One Voice.
Public Works164
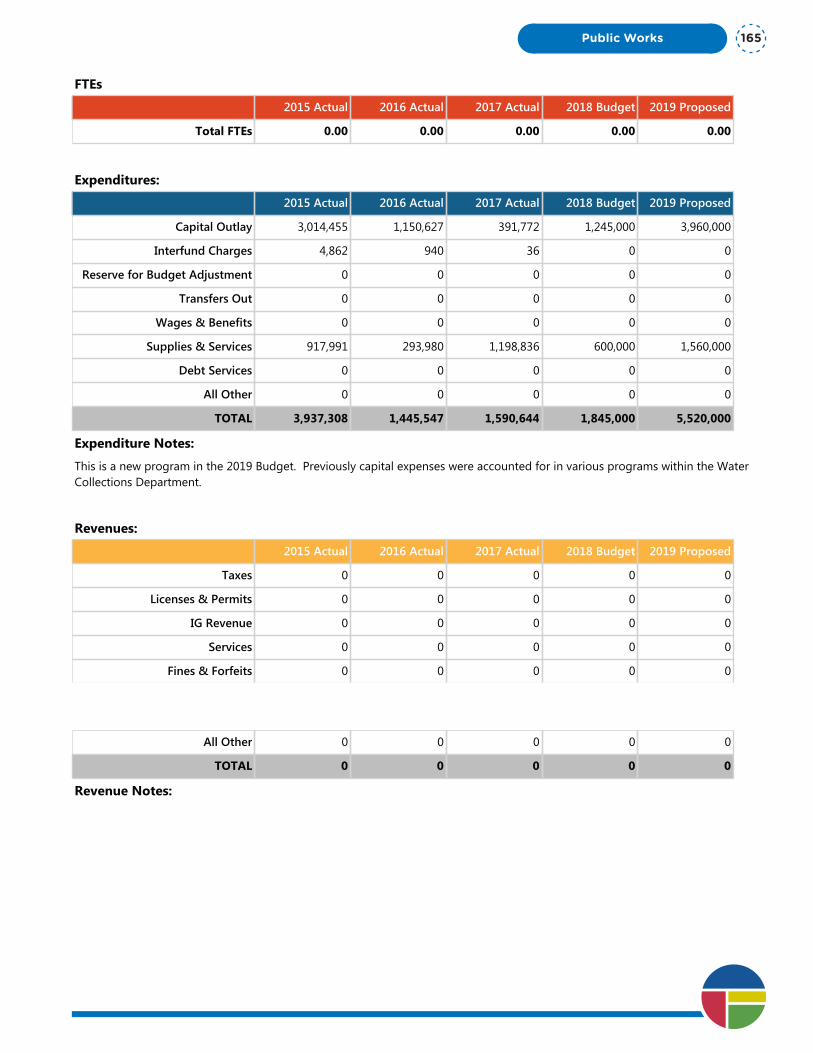
Program Summary: Water 6 YR Capital Plan
Division: Public Works
Fund Type: Enterprise Fund
Executive Summary:
The Water Department's six-year capital plan provides for thoughtful planning of capital maintenance improvements, equipment, vehicles, and projects related to the Water System. This plan allows the Water Department to meet the needs of present and future customers
Programs and Services:
The City's Water Department has ongoing operational equipment and capital maintenance needs. The details of these needs is provided in the six-year capital plan and budgeted for in this program of the Water Department's budget.
FTEs
2015 Actual 2016 Actual 2017 Actual 2018 Budget 2019 Proposed
Total FTEs 0.00 0.00 0.00 0.00 0.00
Expenditures:
2015 Actual 2016 Actual 2017 Actual 2018 Budget 2019 Proposed
Capital Outlay 3,014,455 1,150,627 391,772 1,245,000 3,960,000
Interfund Charges 4,862 940 36 0 0
Reserve for Budget Adjustment 0 0 0 0 0
Transfers Out 0 0 0 0 0
Wages & Benefits 0 0 0 0 0
Supplies & Services 917,991 293,980 1,198,836 600,000 1,560,000
Debt Services 0 0 0 0 0
All Other 0 0 0 0 0
TOTAL 3,937,308 1,445,547 1,590,644 1,845,000 5,520,000
Expenditure Notes:
This is a new program in the 2019 Budget. Previously capital expenses were accounted for in various programs within the Water Collections Department.
Revenues:
2015 Actual 2016 Actual 2017 Actual 2018 Budget 2019 Proposed
Taxes 0 0 0 0 0
Licenses & Permits 0 0 0 0 0
IG Revenue 0 0 0 0 0
Services 0 0 0 0 0
Fines & Forfeits 0 0 0 0 0
Operating Transfers In 0 0 0 0 0
General Fund Resources 0 0 0 0 0
All Other 0 0 0 0 0
TOTAL 0 0 0 0 0
Revenue Notes:
Public Works 165
Program Summary: Water Administration
Division: Public Works
Fund Type: Enterprise Fund
Executive Summary:
Water Administration provides guidance, leadership, and support to maintain and grow the second-largest, class "A" water system in the state of Washington.
Programs and Services:
Water Administration is dedicated to maintaining affordable, safe, and reliable service to the customers served by the City of Spokane. Water service is critical to the health and safety of our citizens and for the long-term growth of our economy and business base.
FTEs
2015 Actual 2016 Actual 2017 Actual 2018 Budget 2019 Proposed
Total FTEs 14.00 14.00 14.00 15.00 15.00
Expenditures:
2015 Actual 2016 Actual 2017 Actual 2018 Budget 2019 Proposed
Capital Outlay 0 0 0 0 0
Interfund Charges 4,448,189 4,911,062 5,128,089 5,208,033 5,430,743
Reserve for Budget Adjustment 0 0 0 400,000 400,000
Transfers Out 132,201 2,268 0 480,000 1,650,000
Wages & Benefits 1,139,485 1,154,784 1,487,851 1,686,312 1,626,562
Supplies & Services 1,613,335 2,070,830 1,705,058 908,865 868,037
Debt Services 919,774 894,807 919,703 783,483 490,369
All Other 9,455,026 9,509,756 9,974,873 9,646,169 9,927,440
TOTAL 17,708,010 18,543,507 19,215,574 19,112,862 20,393,151
Expenditure Notes:
"All Other" expenditures are City Utility and State taxes on Water department revenues.
Revenues:
2015 Actual 2016 Actual 2017 Actual 2018 Budget 2019 Proposed
Taxes 0 0 0 0 0
Licenses & Permits 400 0 0 0 0
IG Revenue 0 46,649 100 0 0
Services 38,159,088 38,800,596 40,378,404 39,224,683 41,278,640
Fines & Forfeits 0 0 0 0 0
Operating Transfers In 6,091,402 0 0 0 0
General Fund Resources 0 0 0 0 0One Vision. One Plan. One Voice.
Public Works166

Program Summary: Water Administration
Division: Public Works
Fund Type: Enterprise Fund
Executive Summary:
Water Administration provides guidance, leadership, and support to maintain and grow the second-largest, class "A" water system in the state of Washington.
Programs and Services:
Water Administration is dedicated to maintaining affordable, safe, and reliable service to the customers served by the City of Spokane. Water service is critical to the health and safety of our citizens and for the long-term growth of our economy and business base.
FTEs
2015 Actual 2016 Actual 2017 Actual 2018 Budget 2019 Proposed
Total FTEs 14.00 14.00 14.00 15.00 15.00
Expenditures:
2015 Actual 2016 Actual 2017 Actual 2018 Budget 2019 Proposed
Capital Outlay 0 0 0 0 0
Interfund Charges 4,448,189 4,911,062 5,128,089 5,208,033 5,430,743
Reserve for Budget Adjustment 0 0 0 400,000 400,000
Transfers Out 132,201 2,268 0 480,000 1,650,000
Wages & Benefits 1,139,485 1,154,784 1,487,851 1,686,312 1,626,562
Supplies & Services 1,613,335 2,070,830 1,705,058 908,865 868,037
Debt Services 919,774 894,807 919,703 783,483 490,369
All Other 9,455,026 9,509,756 9,974,873 9,646,169 9,927,440
TOTAL 17,708,010 18,543,507 19,215,574 19,112,862 20,393,151
Expenditure Notes:
"All Other" expenditures are City Utility and State taxes on Water department revenues.
Revenues:
2015 Actual 2016 Actual 2017 Actual 2018 Budget 2019 Proposed
Taxes 0 0 0 0 0
Licenses & Permits 400 0 0 0 0
IG Revenue 0 46,649 100 0 0
Services 38,159,088 38,800,596 40,378,404 39,224,683 41,278,640
Fines & Forfeits 0 0 0 0 0
Operating Transfers In 6,091,402 0 0 0 0
General Fund Resources 0 0 0 0 0
All Other 3,900,601 12,428,661 6,287,551 955,000 938,466
TOTAL 48,151,491 51,275,906 46,666,055 40,179,683 42,217,106
Revenue Notes:
Public Works 167
Program Summary: Water Conservation
Division: Public Works
Fund Type: Enterprise Fund
Executive Summary:
The Water Conservation Program is responsible for public education and outreach about the importance of conserving water, along with tips that help the public achieve this important goal. Water Stewardship designs and implements programs such as SpokaneScape, as well as leading the joint Mayor-Council Strategic Initiative on Water Conservation.
Programs and Services:
The City encourages its water customers to “Slow the Flow” of water and promote water stewardship. Protecting and preserving our water resources is a long-term goal of the City and is part of our sustainability efforts. The City also must meet water conservation goals as part of state and federal requirements. Using less water also translates into savings on citizens’ utility bills and helps ease the need for projects to expand the capacity of the City’s water and wastewater systems. It provides technical assistance to water department customers and other City departments. Water conservation efforts also help protect our aquifer and Spokane River flows.The Water Conservation Program developed and administers SpokaneScape. The Program consists of educational classes, a media outreach program with purchased television and radio spots as well as technical support for the Water Smart Strategic Initiative. Working with regional partners such as the Idaho Washington Aquifer Collaborative to develop and implement regional conservation messages and regionally appropriate design standards for irrigation and landscaping to achieve the goal of 30% reduction.
FTEs
2015 Actual 2016 Actual 2017 Actual 2018 Budget 2019 Proposed
Total FTEs 0.50 1.00 1.00 1.00 1.00
Expenditures:
2015 Actual 2016 Actual 2017 Actual 2018 Budget 2019 Proposed
Capital Outlay 0 0 0 0 0
Interfund Charges 0 10,772 9,943 10,000 0
Reserve for Budget Adjustment 0 0 0 0 0
Transfers Out 0 0 0 0 0
Wages & Benefits 50,098 75,290 82,714 94,050 122,242
Supplies & Services 101,794 147,957 23,090 150,024 240,024
Debt Services 0 0 0 0 0
All Other 0 0 0 0 20,000
TOTAL 151,892 234,019 115,747 254,074 382,266
Expenditure Notes:
Revenues:
2015 Actual 2016 Actual 2017 Actual 2018 Budget 2019 Proposed
Taxes 0 0 0 0 0One Vision. One Plan. One Voice.
Public Works168
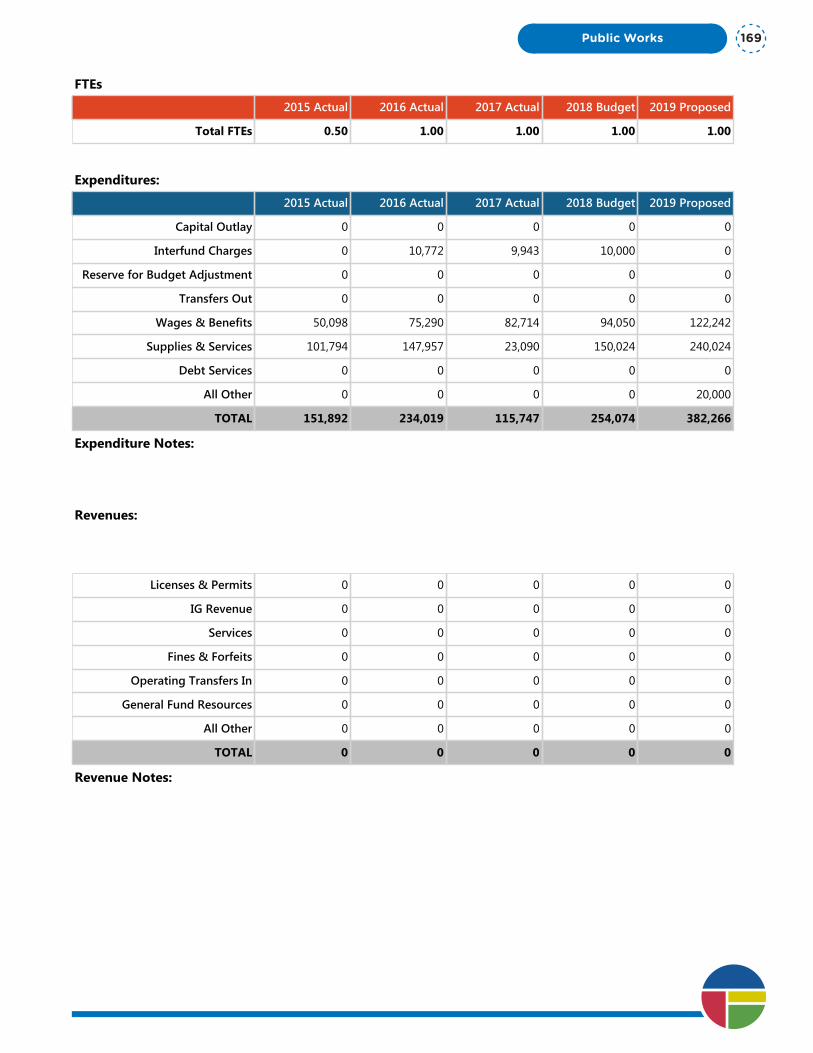
Program Summary: Water Conservation
Division: Public Works
Fund Type: Enterprise Fund
Executive Summary:
The Water Conservation Program is responsible for public education and outreach about the importance of conserving water, along with tips that help the public achieve this important goal. Water Stewardship designs and implements programs such as SpokaneScape, as well as leading the joint Mayor-Council Strategic Initiative on Water Conservation.
Programs and Services:
The City encourages its water customers to “Slow the Flow” of water and promote water stewardship. Protecting and preserving our water resources is a long-term goal of the City and is part of our sustainability efforts. The City also must meet water conservation goals as part of state and federal requirements. Using less water also translates into savings on citizens’ utility bills and helps ease the need for projects to expand the capacity of the City’s water and wastewater systems. It provides technical assistance to water department customers and other City departments. Water conservation efforts also help protect our aquifer and Spokane River flows.The Water Conservation Program developed and administers SpokaneScape. The Program consists of educational classes, a media outreach program with purchased television and radio spots as well as technical support for the Water Smart Strategic Initiative. Working with regional partners such as the Idaho Washington Aquifer Collaborative to develop and implement regional conservation messages and regionally appropriate design standards for irrigation and landscaping to achieve the goal of 30% reduction.
FTEs
2015 Actual 2016 Actual 2017 Actual 2018 Budget 2019 Proposed
Total FTEs 0.50 1.00 1.00 1.00 1.00
Expenditures:
2015 Actual 2016 Actual 2017 Actual 2018 Budget 2019 Proposed
Capital Outlay 0 0 0 0 0
Interfund Charges 0 10,772 9,943 10,000 0
Reserve for Budget Adjustment 0 0 0 0 0
Transfers Out 0 0 0 0 0
Wages & Benefits 50,098 75,290 82,714 94,050 122,242
Supplies & Services 101,794 147,957 23,090 150,024 240,024
Debt Services 0 0 0 0 0
All Other 0 0 0 0 20,000
TOTAL 151,892 234,019 115,747 254,074 382,266
Expenditure Notes:
Revenues:
2015 Actual 2016 Actual 2017 Actual 2018 Budget 2019 Proposed
Taxes 0 0 0 0 0
Licenses & Permits 0 0 0 0 0
IG Revenue 0 0 0 0 0
Services 0 0 0 0 0
Fines & Forfeits 0 0 0 0 0
Operating Transfers In 0 0 0 0 0
General Fund Resources 0 0 0 0 0
All Other 0 0 0 0 0
TOTAL 0 0 0 0 0
Revenue Notes:
Public Works 169
Sub-Department Summary:
Water System Operations & Maintenance
Division: Public Works
Fund Type: Enterprise Fund
Executive Summary:
This program provides for the continuous repair and maintenance of the water distribution system for the City of Spokane.
Programs and Services:
This program is responsible for the repairs and maintenance of more than 1,000 miles of Water main and appurtenance, as well as repair and maintenance of more than 73,000 service connections. In addition, we provide support for Engineering, Capital Programs and leak surveys.
FTEs
2015 Actual 2016 Actual 2017 Actual 2018 Budget 2019 Proposed
Total FTEs 121.00 122.00 122.00 124.00 124.00
Expenditures:
2015 Actual 2016 Actual 2017 Actual 2018 Budget 2019 Proposed
Capital Outlay 1,207,767 1,633,499 1,615,985 2,247,800 2,604,000
Interfund Charges 0 0 0 0 0
Reserve for Budget Adjustment 0 0 0 0 0
Transfers Out 3,656 2,176 0 0 0
Wages & Benefits 9,667,016 9,882,370 9,861,934 11,366,405 12,030,529
Supplies & Services 2,345,507 2,448,870 2,478,134 2,639,901 2,911,606
Debt Services 0 0 0 0 0
All Other 0 0 0 0 0
TOTAL 13,223,946 13,966,915 13,956,053 16,254,106 17,546,135
Expenditure Notes:
Revenues:
2015 Actual 2016 Actual 2017 Actual 2018 Budget 2019 Proposed
Taxes 0 0 0 0 0
Licenses & Permits 0 0 0 0 0
IG Revenue 0 0 0 0 0
Services 152,173 176,052 216,479 0 0
Fines & Forfeits 0 0 0 0 0
Operating Transfers In 0 0 0 0 0
General Fund Resources 0 0 0 0 0One Vision. One Plan. One Voice.
Public Works170

Sub-Department Summary:
Water System Operations & Maintenance
Division: Public Works
Fund Type: Enterprise Fund
Executive Summary:
This program provides for the continuous repair and maintenance of the water distribution system for the City of Spokane.
Programs and Services:
This program is responsible for the repairs and maintenance of more than 1,000 miles of Water main and appurtenance, as well as repair and maintenance of more than 73,000 service connections. In addition, we provide support for Engineering, Capital Programs and leak surveys.
FTEs
2015 Actual 2016 Actual 2017 Actual 2018 Budget 2019 Proposed
Total FTEs 121.00 122.00 122.00 124.00 124.00
Expenditures:
2015 Actual 2016 Actual 2017 Actual 2018 Budget 2019 Proposed
Capital Outlay 1,207,767 1,633,499 1,615,985 2,247,800 2,604,000
Interfund Charges 0 0 0 0 0
Reserve for Budget Adjustment 0 0 0 0 0
Transfers Out 3,656 2,176 0 0 0
Wages & Benefits 9,667,016 9,882,370 9,861,934 11,366,405 12,030,529
Supplies & Services 2,345,507 2,448,870 2,478,134 2,639,901 2,911,606
Debt Services 0 0 0 0 0
All Other 0 0 0 0 0
TOTAL 13,223,946 13,966,915 13,956,053 16,254,106 17,546,135
Expenditure Notes:
Revenues:
2015 Actual 2016 Actual 2017 Actual 2018 Budget 2019 Proposed
Taxes 0 0 0 0 0
Licenses & Permits 0 0 0 0 0
IG Revenue 0 0 0 0 0
Services 152,173 176,052 216,479 0 0
Fines & Forfeits 0 0 0 0 0
Operating Transfers In 0 0 0 0 0
General Fund Resources 0 0 0 0 0
All Other 0 0 0 0 0
TOTAL 152,173 176,052 216,479 0 0
Revenue Notes:
Public Works 171
Program Summary: Water Upriver
Division: Public Works
Fund Type: Enterprise Fund
Executive Summary:
This activity provides assurance of the quality of our drinking water and manages the City's water pumping and storage system. The program helps provide 200,000 people with reliable potable water supplies of excellent quality for the most affordable price possible. Approximately 22 billion gallons are supplied annually.
Programs and Services:
The Upriver Dam program maintains and operates the water quality program and certified lab providing for and meeting standards for protecting the health of our customers from waterborne diseases and other possible contaminants that could enter the water they consume. In addition, it controls and operates the City water pumping and storage system, including 7 well stations with 26 pumps, 26 booster pump stations with 75 pumps, and 34 water reservoirs, located at 67 different locations on a 24/7 basis.
Upriver also operates and maintains the Department's hydroelectric facilities at Upriver Dam, providing electricity for some water pumps and surplus sales of electricity.
FTEs
2015 Actual 2016 Actual 2017 Actual 2018 Budget 2019 Proposed
Total FTEs 20.00 20.00 20.00 20.00 20.00
Expenditures:
2015 Actual 2016 Actual 2017 Actual 2018 Budget 2019 Proposed
Capital Outlay 22,603 114,284 35,723 50,350 91,000
Interfund Charges 0 0 0 0 0
Reserve for Budget Adjustment 0 0 0 0 0
Transfers Out 0 0 0 0 0
Wages & Benefits 1,812,266 1,933,330 1,997,638 2,055,361 2,151,705
Supplies & Services 3,047,193 2,414,459 2,703,649 3,064,586 3,135,955
Debt Services 0 0 0 0 0
All Other 0 0 0 0 0
TOTAL 4,882,062 4,462,073 4,737,010 5,170,297 5,378,660
Expenditure Notes:
Revenues:
2015 Actual 2016 Actual 2017 Actual 2018 Budget 2019 Proposed
Taxes 0 0 0 0 0
Licenses & Permits 0 0 0 0 0
IG Revenue 0 0 0 0 0One Vision. One Plan. One Voice.
Public Works172

Program Summary: Water Upriver
Division: Public Works
Fund Type: Enterprise Fund
Executive Summary:
This activity provides assurance of the quality of our drinking water and manages the City's water pumping and storage system. The program helps provide 200,000 people with reliable potable water supplies of excellent quality for the most affordable price possible. Approximately 22 billion gallons are supplied annually.
Programs and Services:
The Upriver Dam program maintains and operates the water quality program and certified lab providing for and meeting standards for protecting the health of our customers from waterborne diseases and other possible contaminants that could enter the water they consume. In addition, it controls and operates the City water pumping and storage system, including 7 well stations with 26 pumps, 26 booster pump stations with 75 pumps, and 34 water reservoirs, located at 67 different locations on a 24/7 basis.
Upriver also operates and maintains the Department's hydroelectric facilities at Upriver Dam, providing electricity for some water pumps and surplus sales of electricity.
FTEs
2015 Actual 2016 Actual 2017 Actual 2018 Budget 2019 Proposed
Total FTEs 20.00 20.00 20.00 20.00 20.00
Expenditures:
2015 Actual 2016 Actual 2017 Actual 2018 Budget 2019 Proposed
Capital Outlay 22,603 114,284 35,723 50,350 91,000
Interfund Charges 0 0 0 0 0
Reserve for Budget Adjustment 0 0 0 0 0
Transfers Out 0 0 0 0 0
Wages & Benefits 1,812,266 1,933,330 1,997,638 2,055,361 2,151,705
Supplies & Services 3,047,193 2,414,459 2,703,649 3,064,586 3,135,955
Debt Services 0 0 0 0 0
All Other 0 0 0 0 0
TOTAL 4,882,062 4,462,073 4,737,010 5,170,297 5,378,660
Expenditure Notes:
Revenues:
2015 Actual 2016 Actual 2017 Actual 2018 Budget 2019 Proposed
Taxes 0 0 0 0 0
Licenses & Permits 0 0 0 0 0
IG Revenue 0 0 0 0 0
Services 1,952,412 3,289,329 2,515,395 2,400,000 2,400,000
Fines & Forfeits 0 0 0 0 0
Operating Transfers In 0 0 0 0 0
General Fund Resources 0 0 0 0 0
All Other 0 0 0 0 0
TOTAL 1,952,412 3,289,329 2,515,395 2,400,000 2,400,000
Revenue Notes:
Public Works 173

One Vision. One Plan. One Voice.
Public Works174
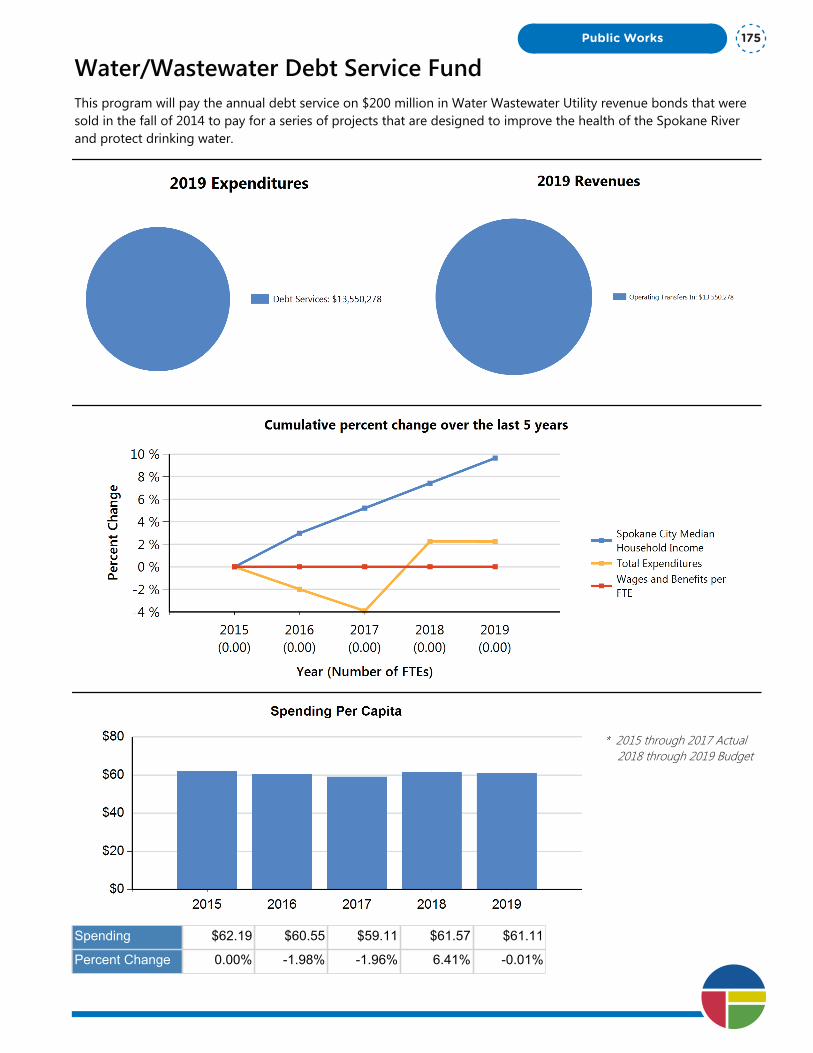
Water/Wastewater Debt Service FundThis program will pay the annual debt service on $200 million in Water Wastewater Utility revenue bonds that were sold in the fall of 2014 to pay for a series of projects that are designed to improve the health of the Spokane River and protect drinking water.
* 2015 through 2017 Actual 2018 through 2019 Budget
Spending $62.19 $60.55 $59.11 $61.57 $61.11
Percent Change 0.00% -1.98% -1.96% 6.41% -0.01%
Public Works 175

Department Summary: Water/Wastewater Debt Service Fund
Division: Public Works
Fund Type: Enterprise Fund
Executive Summary:
This program will pay the annual debt service on $200 million in Water Wastewater Utility revenue bonds that were sold in the fall of 2014 to pay for a series of projects that are designed to improve the health of the Spokane River and protect drinking water.
Programs and Services:
In November 2014, the City sold $200 million in Water Wastewater Utility revenue bonds to pay for a series of projects that are designed to improve the health of the Spokane River and to protect the aquifer that provides Spokane residents with their drinking water. The bonds were designated as "green" bonds because they will be used to pay for "green" projects that provide environmental benefits. The work will improve water quality, protect water resources, and save energy, among other things. In large part, the bond funding will help the City implement its Integrated Clean Water Plan. The plan includes work to manage overflows from combined sanitary and stormwater sewers, address untreated stormwater going to the river, and to add an additional level of wastewater treatment at the City's Riverside Park Water Reclamation Facility. The City will be able to repay these bonds, while maintaining affordable and predictable utility rates. The City has committed to limit the annual rate increases to the cost of inflation -- or about 2.9 percent annually.
FTEs
2015 Actual 2016 Actual 2017 Actual 2018 Budget 2019 Proposed
Total FTEs 0.00 0.00 0.00 0.00 0.00
Expenditures:
2015 Actual 2016 Actual 2017 Actual 2018 Budget 2019 Proposed
Capital Outlay 0 0 0 0 0
Interfund Charges 0 0 0 0 0
Reserve for Budget Adjustment 0 0 0 0 0
Transfers Out 0 0 0 0 0
Wages & Benefits 0 0 0 0 0
Supplies & Services 0 0 0 0 0
Debt Services 13,252,433 12,988,930 12,734,316 13,551,778 13,550,278
All Other 0 0 0 0 0
TOTAL 13,252,433 12,988,930 12,734,316 13,551,778 13,550,278
Expenditure Notes:
Revenues:
2015 Actual 2016 Actual 2017 Actual 2018 Budget 2019 Proposed
Taxes 0 0 0 0 0
Licenses & Permits 0 0 0 0 0
IG Revenue 0 0 0 0 0
Services 0 0 0 0 0One Vision. One Plan. One Voice.
Public Works176
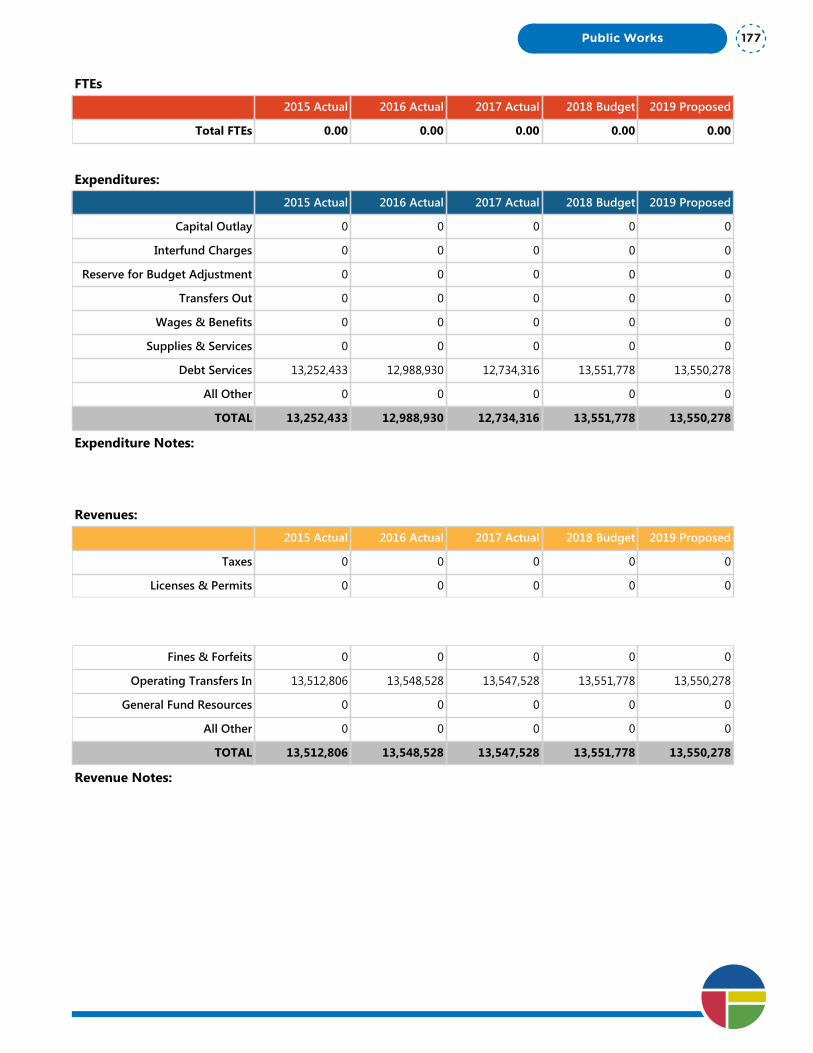
Department Summary: Water/Wastewater Debt Service Fund
Division: Public Works
Fund Type: Enterprise Fund
Executive Summary:
This program will pay the annual debt service on $200 million in Water Wastewater Utility revenue bonds that were sold in the fall of 2014 to pay for a series of projects that are designed to improve the health of the Spokane River and protect drinking water.
Programs and Services:
In November 2014, the City sold $200 million in Water Wastewater Utility revenue bonds to pay for a series of projects that are designed to improve the health of the Spokane River and to protect the aquifer that provides Spokane residents with their drinking water. The bonds were designated as "green" bonds because they will be used to pay for "green" projects that provide environmental benefits. The work will improve water quality, protect water resources, and save energy, among other things. In large part, the bond funding will help the City implement its Integrated Clean Water Plan. The plan includes work to manage overflows from combined sanitary and stormwater sewers, address untreated stormwater going to the river, and to add an additional level of wastewater treatment at the City's Riverside Park Water Reclamation Facility. The City will be able to repay these bonds, while maintaining affordable and predictable utility rates. The City has committed to limit the annual rate increases to the cost of inflation -- or about 2.9 percent annually.
FTEs
2015 Actual 2016 Actual 2017 Actual 2018 Budget 2019 Proposed
Total FTEs 0.00 0.00 0.00 0.00 0.00
Expenditures:
2015 Actual 2016 Actual 2017 Actual 2018 Budget 2019 Proposed
Capital Outlay 0 0 0 0 0
Interfund Charges 0 0 0 0 0
Reserve for Budget Adjustment 0 0 0 0 0
Transfers Out 0 0 0 0 0
Wages & Benefits 0 0 0 0 0
Supplies & Services 0 0 0 0 0
Debt Services 13,252,433 12,988,930 12,734,316 13,551,778 13,550,278
All Other 0 0 0 0 0
TOTAL 13,252,433 12,988,930 12,734,316 13,551,778 13,550,278
Expenditure Notes:
Revenues:
2015 Actual 2016 Actual 2017 Actual 2018 Budget 2019 Proposed
Taxes 0 0 0 0 0
Licenses & Permits 0 0 0 0 0
IG Revenue 0 0 0 0 0
Services 0 0 0 0 0
Fines & Forfeits 0 0 0 0 0
Operating Transfers In 13,512,806 13,548,528 13,547,528 13,551,778 13,550,278
General Fund Resources 0 0 0 0 0
All Other 0 0 0 0 0
TOTAL 13,512,806 13,548,528 13,547,528 13,551,778 13,550,278
Revenue Notes:
Public Works 177

One Vision. One Plan. One Voice.
Public Works178
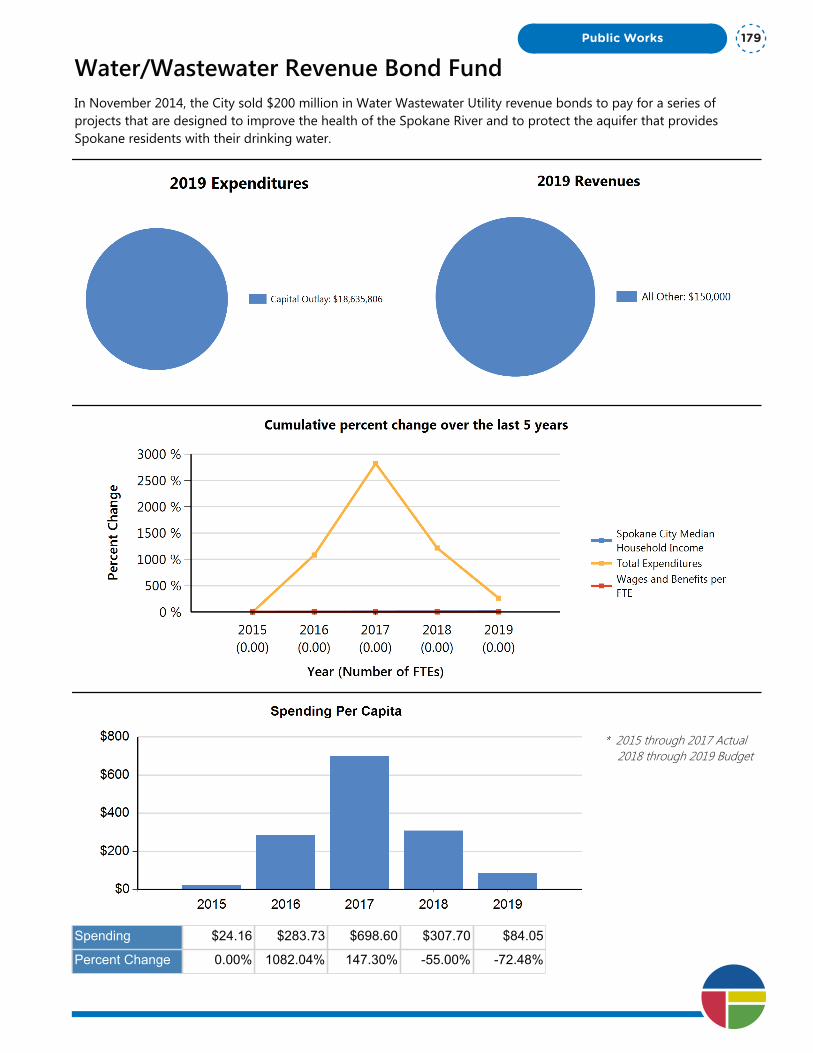
Water/Wastewater Revenue Bond FundIn November 2014, the City sold $200 million in Water Wastewater Utility revenue bonds to pay for a series of projects that are designed to improve the health of the Spokane River and to protect the aquifer that provides Spokane residents with their drinking water.
* 2015 through 2017 Actual 2018 through 2019 Budget
Spending $24.16 $283.73 $698.60 $307.70 $84.05
Percent Change 0.00% 1082.04% 147.30% -55.00% -72.48%
Public Works 179
Department Summary: Water/Wastewater Revenue Bond Fund
Division: Public Works
Fund Type: Enterprise Fund
Executive Summary:
In November 2014, the City sold $200 million in Water Wastewater Utility revenue bonds to pay for a series of projects that are designed to improve the health of the Spokane River and to protect the aquifer that provides Spokane residents with their drinking water.
Programs and Services:
The plan includes work to manage overflows from combined sanitary and stormwater sewers, address untreated stormwater going to the river, and to add an additional level of wastewater treatment at the City's Riverside Park Water Reclamation Facility. Net proceeds of the Bonds are being applied toward Clean Water and Drinking Water projects which provide environmental benefits, including the following: Improve the health of the Spokane River and other surface water bodies by reducing flows of stormwater and wastewater into these water bodies and improve the quality of the effluent discharged from the City's wastewater treatment plant. Protect the aquifer, the sole source of drinking water for more than a half million people in the Spokane region, by protecting wellhead influence zones, ensuring the integrity of underground wastewater infrastructure, and employing green infrastructure techniques to treat stormwater runoff. Preserve aquifer water resources by reducing system leakage and effectively managing the water distribution system. Promote efficient energy use by maintaining and updating distribution and treatment systems. Enable resilience in anticipation of climate change and population growth by ensuring redundancies in water and wastewater systems and treating more stormwater on site to free up piping and treatment capacity to accommodate change. The money raised through the bond sale, in large part, will help the City implement its Integrated Clean Water Plan.
FTEs
2015 Actual 2016 Actual 2017 Actual 2018 Budget 2019 Proposed
Total FTEs 0.00 0.00 0.00 0.00 0.00
Expenditures:
2015 Actual 2016 Actual 2017 Actual 2018 Budget 2019 Proposed
Capital Outlay 2,574,365 30,430,032 75,255,320 67,725,000 18,635,806
Interfund Charges 0 0 0 0 0
Reserve for Budget Adjustment 0 0 0 0 0
Transfers Out 2,574,365 30,430,032 75,255,320 0 0
Wages & Benefits 0 0 0 0 0
Supplies & Services 0 0 0 0 0
Debt Services 0 0 0 0 0
All Other 0 0 0 0 0
TOTAL 5,148,730 60,860,064 150,510,640 67,725,000 18,635,806
Expenditure Notes:
Capital outlay reduced to available cash expected to be left for Next Level of Treatment expenditures in 2019
Revenues:
2015 Actual 2016 Actual 2017 Actual 2018 Budget 2019 Proposed
Taxes 0 0 0 0 0One Vision. One Plan. One Voice.
Public Works180
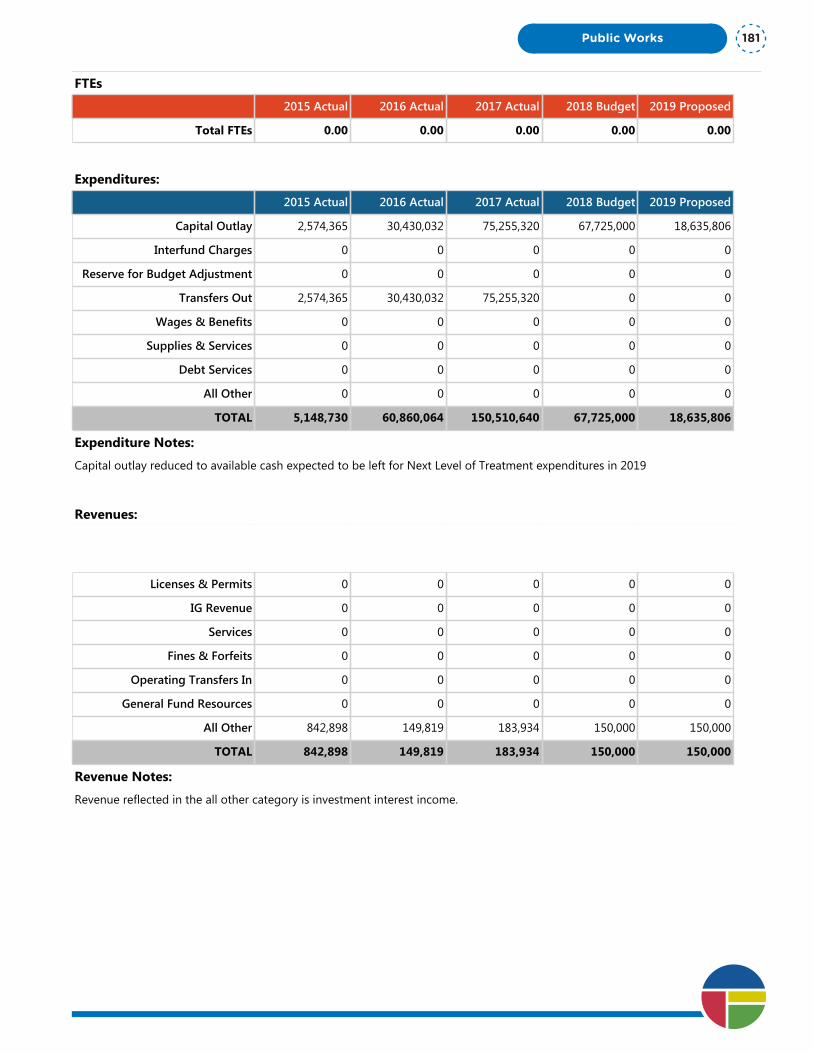
Department Summary: Water/Wastewater Revenue Bond Fund
Division: Public Works
Fund Type: Enterprise Fund
Executive Summary:
In November 2014, the City sold $200 million in Water Wastewater Utility revenue bonds to pay for a series of projects that are designed to improve the health of the Spokane River and to protect the aquifer that provides Spokane residents with their drinking water.
Programs and Services:
The plan includes work to manage overflows from combined sanitary and stormwater sewers, address untreated stormwater going to the river, and to add an additional level of wastewater treatment at the City's Riverside Park Water Reclamation Facility. Net proceeds of the Bonds are being applied toward Clean Water and Drinking Water projects which provide environmental benefits, including the following: Improve the health of the Spokane River and other surface water bodies by reducing flows of stormwater and wastewater into these water bodies and improve the quality of the effluent discharged from the City's wastewater treatment plant. Protect the aquifer, the sole source of drinking water for more than a half million people in the Spokane region, by protecting wellhead influence zones, ensuring the integrity of underground wastewater infrastructure, and employing green infrastructure techniques to treat stormwater runoff. Preserve aquifer water resources by reducing system leakage and effectively managing the water distribution system. Promote efficient energy use by maintaining and updating distribution and treatment systems. Enable resilience in anticipation of climate change and population growth by ensuring redundancies in water and wastewater systems and treating more stormwater on site to free up piping and treatment capacity to accommodate change. The money raised through the bond sale, in large part, will help the City implement its Integrated Clean Water Plan.
FTEs
2015 Actual 2016 Actual 2017 Actual 2018 Budget 2019 Proposed
Total FTEs 0.00 0.00 0.00 0.00 0.00
Expenditures:
2015 Actual 2016 Actual 2017 Actual 2018 Budget 2019 Proposed
Capital Outlay 2,574,365 30,430,032 75,255,320 67,725,000 18,635,806
Interfund Charges 0 0 0 0 0
Reserve for Budget Adjustment 0 0 0 0 0
Transfers Out 2,574,365 30,430,032 75,255,320 0 0
Wages & Benefits 0 0 0 0 0
Supplies & Services 0 0 0 0 0
Debt Services 0 0 0 0 0
All Other 0 0 0 0 0
TOTAL 5,148,730 60,860,064 150,510,640 67,725,000 18,635,806
Expenditure Notes:
Capital outlay reduced to available cash expected to be left for Next Level of Treatment expenditures in 2019
Revenues:
2015 Actual 2016 Actual 2017 Actual 2018 Budget 2019 Proposed
Taxes 0 0 0 0 0
Licenses & Permits 0 0 0 0 0
IG Revenue 0 0 0 0 0
Services 0 0 0 0 0
Fines & Forfeits 0 0 0 0 0
Operating Transfers In 0 0 0 0 0
General Fund Resources 0 0 0 0 0
All Other 842,898 149,819 183,934 150,000 150,000
TOTAL 842,898 149,819 183,934 150,000 150,000
Revenue Notes:
Revenue reflected in the all other category is investment interest income.
Public Works 181

One Vision. One Plan. One Voice.
Public Works182
Stand Alone
Departm
ents
Stand Alone Departments
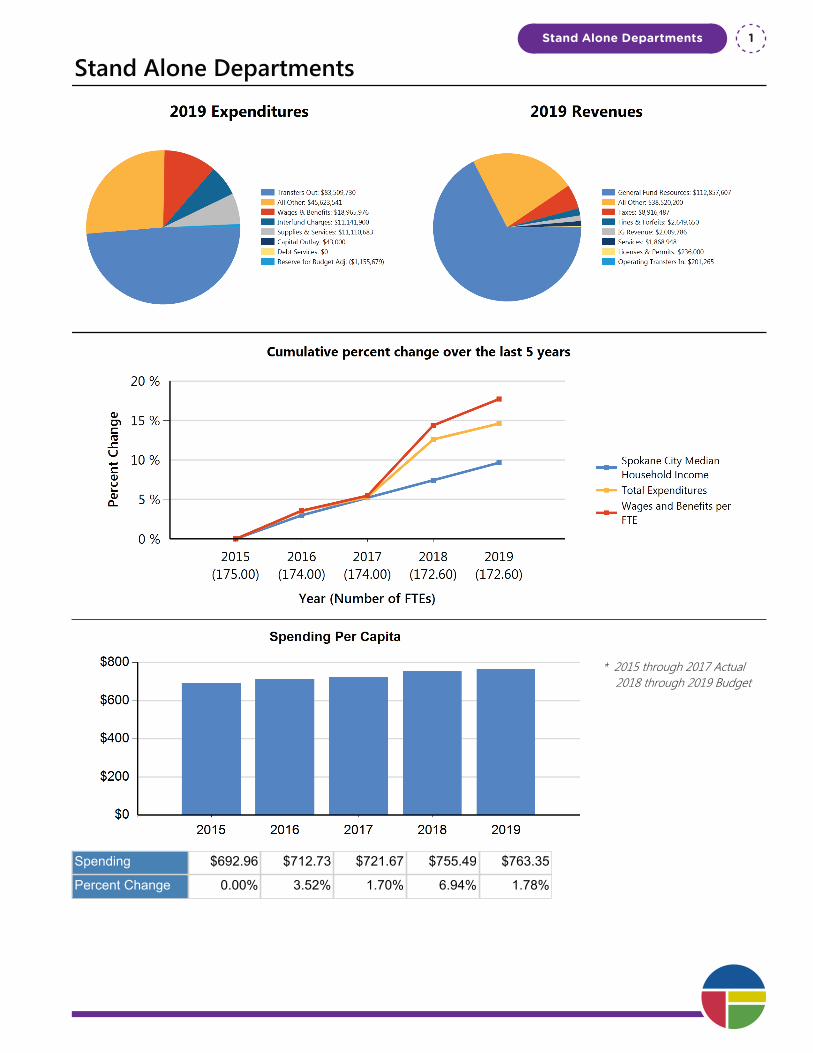
Stand Alone Departments
* 2015 through 2017 Actual 2018 through 2019 Budget
Spending $692.96 $712.73 $721.67 $755.49 $763.35
Percent Change 0.00% 3.52% 1.70% 6.94% 1.78%
Stand Alone Departments 1

One Vision. One Plan. One Voice.
Stand Alone Departments2
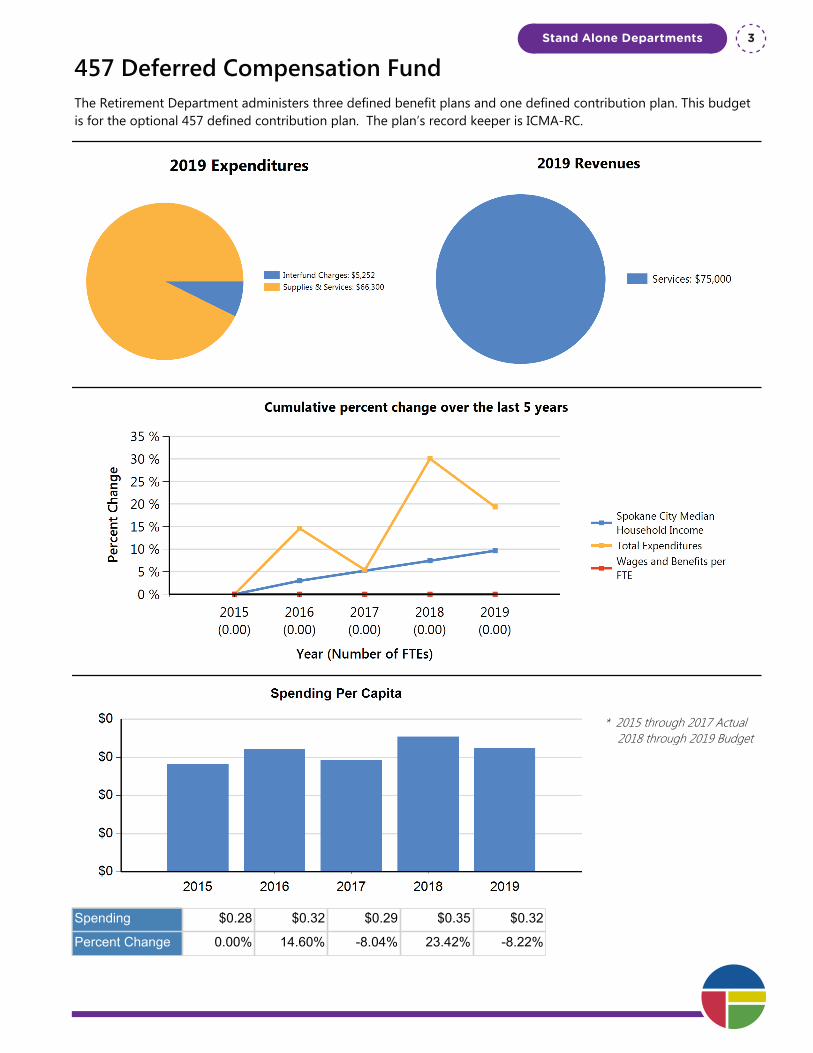
457 Deferred Compensation FundThe Retirement Department administers three defined benefit plans and one defined contribution plan. This budget is for the optional 457 defined contribution plan. The plan’s record keeper is ICMA-RC.
* 2015 through 2017 Actual 2018 through 2019 Budget
Spending $0.28 $0.32 $0.29 $0.35 $0.32
Percent Change 0.00% 14.60% -8.04% 23.42% -8.22%
Stand Alone Departments 3
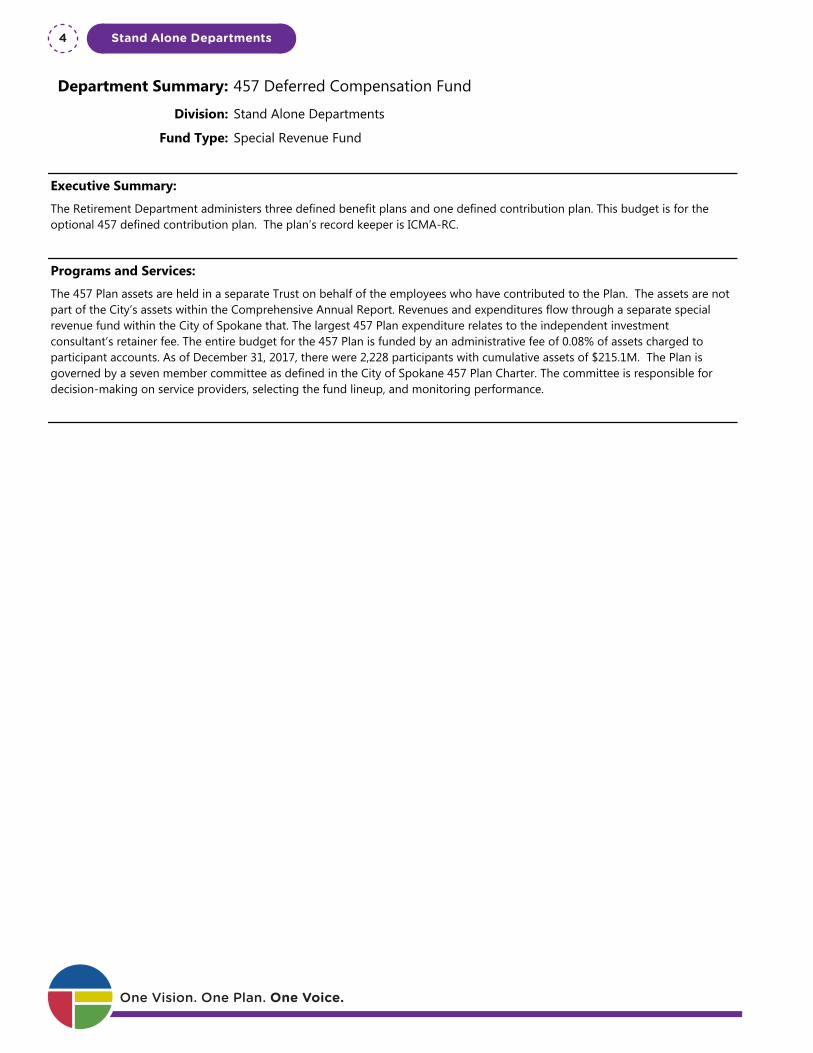
Department Summary: 457 Deferred Compensation Fund
Division: Stand Alone Departments
Fund Type: Special Revenue Fund
Executive Summary:
The Retirement Department administers three defined benefit plans and one defined contribution plan. This budget is for the optional 457 defined contribution plan. The plan’s record keeper is ICMA-RC.
Programs and Services:
The 457 Plan assets are held in a separate Trust on behalf of the employees who have contributed to the Plan. The assets are not part of the City’s assets within the Comprehensive Annual Report. Revenues and expenditures flow through a separate special revenue fund within the City of Spokane that. The largest 457 Plan expenditure relates to the independent investment consultant’s retainer fee. The entire budget for the 457 Plan is funded by an administrative fee of 0.08% of assets charged to participant accounts. As of December 31, 2017, there were 2,228 participants with cumulative assets of $215.1M. The Plan is governed by a seven member committee as defined in the City of Spokane 457 Plan Charter. The committee is responsible for decision-making on service providers, selecting the fund lineup, and monitoring performance.
FTEs
2015 Actual 2016 Actual 2017 Actual 2018 Budget 2019 Proposed
Total FTEs 0.00 0.00 0.00 0.00 0.00
Expenditures:
2015 Actual 2016 Actual 2017 Actual 2018 Budget 2019 Proposed
Capital Outlay 0 0 0 0 0
Interfund Charges 6,180 9,415 5,206 10,666 5,252
Reserve for Budget Adjustment 0 0 0 0 0
Transfers Out 0 0 0 0 0
Wages & Benefits 0 0 0 0 0
Supplies & Services 53,763 59,285 57,965 67,300 66,300
Debt Services 0 0 0 0 0
All Other 0 0 0 0 0
TOTAL 59,943 68,700 63,171 77,966 71,552
Expenditure Notes:
Revenues:
2015 Actual 2016 Actual 2017 Actual 2018 Budget 2019 Proposed
Taxes 0 0 0 0 0
Licenses & Permits 0 0 0 0 0
IG Revenue 0 0 0 0 0
Services 90,000 45,000 110,000 80,000 75,000
Fines & Forfeits 0 0 0 0 0One Vision. One Plan. One Voice.
Stand Alone Departments4
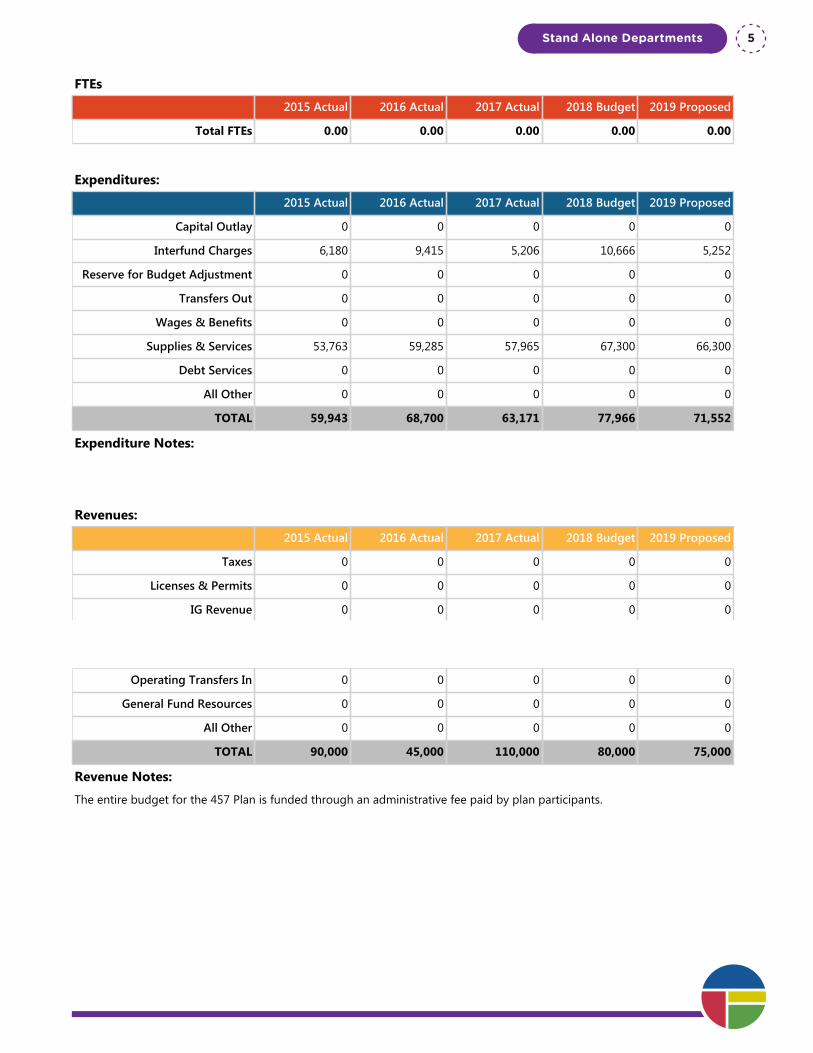
Department Summary: 457 Deferred Compensation Fund
Division: Stand Alone Departments
Fund Type: Special Revenue Fund
Executive Summary:
The Retirement Department administers three defined benefit plans and one defined contribution plan. This budget is for the optional 457 defined contribution plan. The plan’s record keeper is ICMA-RC.
Programs and Services:
The 457 Plan assets are held in a separate Trust on behalf of the employees who have contributed to the Plan. The assets are not part of the City’s assets within the Comprehensive Annual Report. Revenues and expenditures flow through a separate special revenue fund within the City of Spokane that. The largest 457 Plan expenditure relates to the independent investment consultant’s retainer fee. The entire budget for the 457 Plan is funded by an administrative fee of 0.08% of assets charged to participant accounts. As of December 31, 2017, there were 2,228 participants with cumulative assets of $215.1M. The Plan is governed by a seven member committee as defined in the City of Spokane 457 Plan Charter. The committee is responsible for decision-making on service providers, selecting the fund lineup, and monitoring performance.
FTEs
2015 Actual 2016 Actual 2017 Actual 2018 Budget 2019 Proposed
Total FTEs 0.00 0.00 0.00 0.00 0.00
Expenditures:
2015 Actual 2016 Actual 2017 Actual 2018 Budget 2019 Proposed
Capital Outlay 0 0 0 0 0
Interfund Charges 6,180 9,415 5,206 10,666 5,252
Reserve for Budget Adjustment 0 0 0 0 0
Transfers Out 0 0 0 0 0
Wages & Benefits 0 0 0 0 0
Supplies & Services 53,763 59,285 57,965 67,300 66,300
Debt Services 0 0 0 0 0
All Other 0 0 0 0 0
TOTAL 59,943 68,700 63,171 77,966 71,552
Expenditure Notes:
Revenues:
2015 Actual 2016 Actual 2017 Actual 2018 Budget 2019 Proposed
Taxes 0 0 0 0 0
Licenses & Permits 0 0 0 0 0
IG Revenue 0 0 0 0 0
Services 90,000 45,000 110,000 80,000 75,000
Fines & Forfeits 0 0 0 0 0
Operating Transfers In 0 0 0 0 0
General Fund Resources 0 0 0 0 0
All Other 0 0 0 0 0
TOTAL 90,000 45,000 110,000 80,000 75,000
Revenue Notes:
The entire budget for the 457 Plan is funded through an administrative fee paid by plan participants.
Stand Alone Departments 5

One Vision. One Plan. One Voice.
Stand Alone Departments6
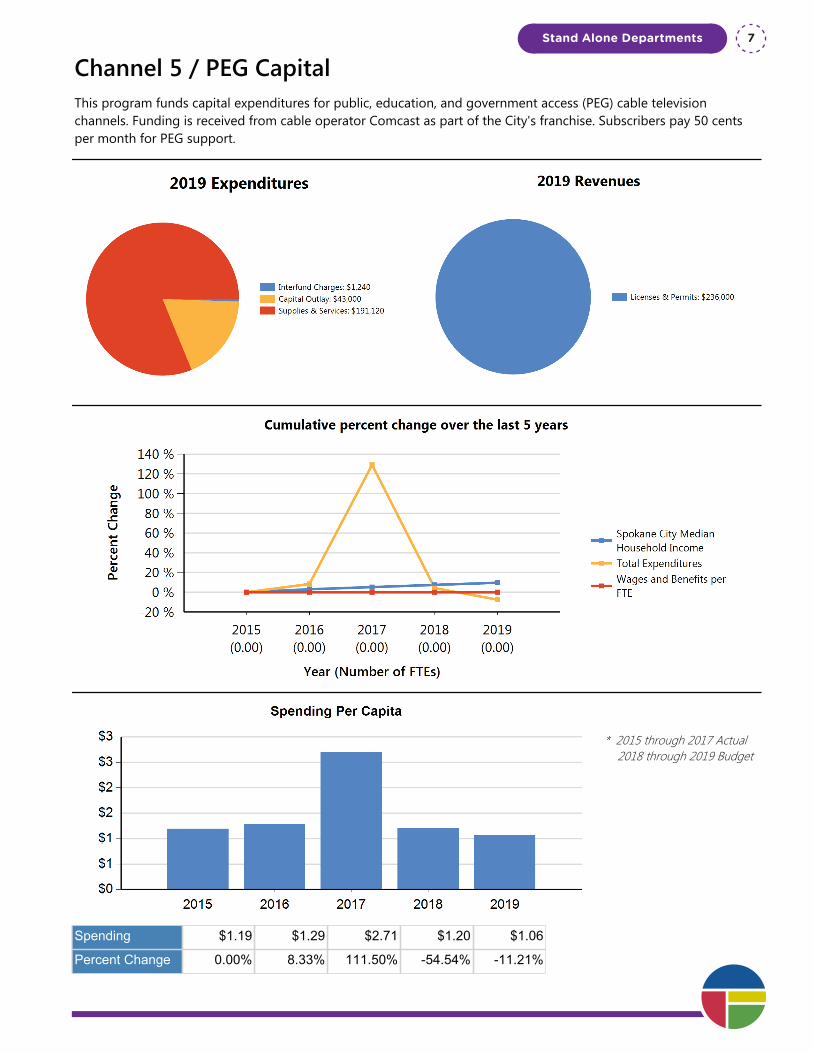
Channel 5 / PEG CapitalThis program funds capital expenditures for public, education, and government access (PEG) cable television channels. Funding is received from cable operator Comcast as part of the City's franchise. Subscribers pay 50 cents per month for PEG support.
* 2015 through 2017 Actual 2018 through 2019 Budget
Spending $1.19 $1.29 $2.71 $1.20 $1.06
Percent Change 0.00% 8.33% 111.50% -54.54% -11.21%
Stand Alone Departments 7

Department Summary: Channel 5 / PEG Capital
Division: Stand Alone Departments
Fund Type: Special Revenue Fund
Executive Summary:
This program funds capital expenditures for public, education, and government access (PEG) cable television channels. Funding is received from cable operator Comcast as part of the City's franchise. Subscribers pay 50 cents per month for PEG support.
Programs and Services:
The City renewed its cable television franchise with Comcast in 2005. This 12-year franchise is currently in the renewal process and includes a fee to fund capital equipment purchases for public, education, and government access channels. These channels includes CityCable 5, Fire's training channel (Channel 95), five education access channels managed by the group, CABLE, and its partner education institutions; and a community access channel operated by contract with Community-Minded Enterprises. Expenditures are restricted to capital and equipment costs for the purpose of assisting with getting programming on the PEG channels.
FTEs
2015 Actual 2016 Actual 2017 Actual 2018 Budget 2019 Proposed
Total FTEs 0.00 0.00 0.00 0.00 0.00
Expenditures:
2015 Actual 2016 Actual 2017 Actual 2018 Budget 2019 Proposed
Capital Outlay 105,062 45,633 464,284 64,200 43,000
Interfund Charges 1,415 915 1,114 981 1,240
Reserve for Budget Adjustment 0 0 0 0 0
Transfers Out 0 0 0 0 0
Wages & Benefits 0 0 0 0 0
Supplies & Services 148,061 229,201 117,831 199,920 191,120
Debt Services 0 0 0 0 0
All Other 0 0 0 0 0
TOTAL 254,538 275,749 583,229 265,101 235,360
Expenditure Notes:
2017 Capital Outlay expenditure increase was for Council Chamber remodeling project.
Revenues:
2015 Actual 2016 Actual 2017 Actual 2018 Budget 2019 Proposed
Taxes 0 0 0 0 0
Licenses & Permits 192,772 195,323 235,289 265,094 236,000
IG Revenue 0 0 0 0 0
Services 0 0 0 0 0
Fines & Forfeits 0 0 0 0 0One Vision. One Plan. One Voice.
Stand Alone Departments8

Department Summary: Channel 5 / PEG Capital
Division: Stand Alone Departments
Fund Type: Special Revenue Fund
Executive Summary:
This program funds capital expenditures for public, education, and government access (PEG) cable television channels. Funding is received from cable operator Comcast as part of the City's franchise. Subscribers pay 50 cents per month for PEG support.
Programs and Services:
The City renewed its cable television franchise with Comcast in 2005. This 12-year franchise is currently in the renewal process and includes a fee to fund capital equipment purchases for public, education, and government access channels. These channels includes CityCable 5, Fire's training channel (Channel 95), five education access channels managed by the group, CABLE, and its partner education institutions; and a community access channel operated by contract with Community-Minded Enterprises. Expenditures are restricted to capital and equipment costs for the purpose of assisting with getting programming on the PEG channels.
FTEs
2015 Actual 2016 Actual 2017 Actual 2018 Budget 2019 Proposed
Total FTEs 0.00 0.00 0.00 0.00 0.00
Expenditures:
2015 Actual 2016 Actual 2017 Actual 2018 Budget 2019 Proposed
Capital Outlay 105,062 45,633 464,284 64,200 43,000
Interfund Charges 1,415 915 1,114 981 1,240
Reserve for Budget Adjustment 0 0 0 0 0
Transfers Out 0 0 0 0 0
Wages & Benefits 0 0 0 0 0
Supplies & Services 148,061 229,201 117,831 199,920 191,120
Debt Services 0 0 0 0 0
All Other 0 0 0 0 0
TOTAL 254,538 275,749 583,229 265,101 235,360
Expenditure Notes:
2017 Capital Outlay expenditure increase was for Council Chamber remodeling project.
Revenues:
2015 Actual 2016 Actual 2017 Actual 2018 Budget 2019 Proposed
Taxes 0 0 0 0 0
Licenses & Permits 192,772 195,323 235,289 265,094 236,000
IG Revenue 0 0 0 0 0
Services 0 0 0 0 0
Fines & Forfeits 0 0 0 0 0
Operating Transfers In 0 0 0 0 0
General Fund Resources 0 0 0 0 0
All Other 1,260 628 212 0 0
TOTAL 194,032 195,951 235,501 265,094 236,000
Revenue Notes:
Stand Alone Departments 9

One Vision. One Plan. One Voice.
Stand Alone Departments10
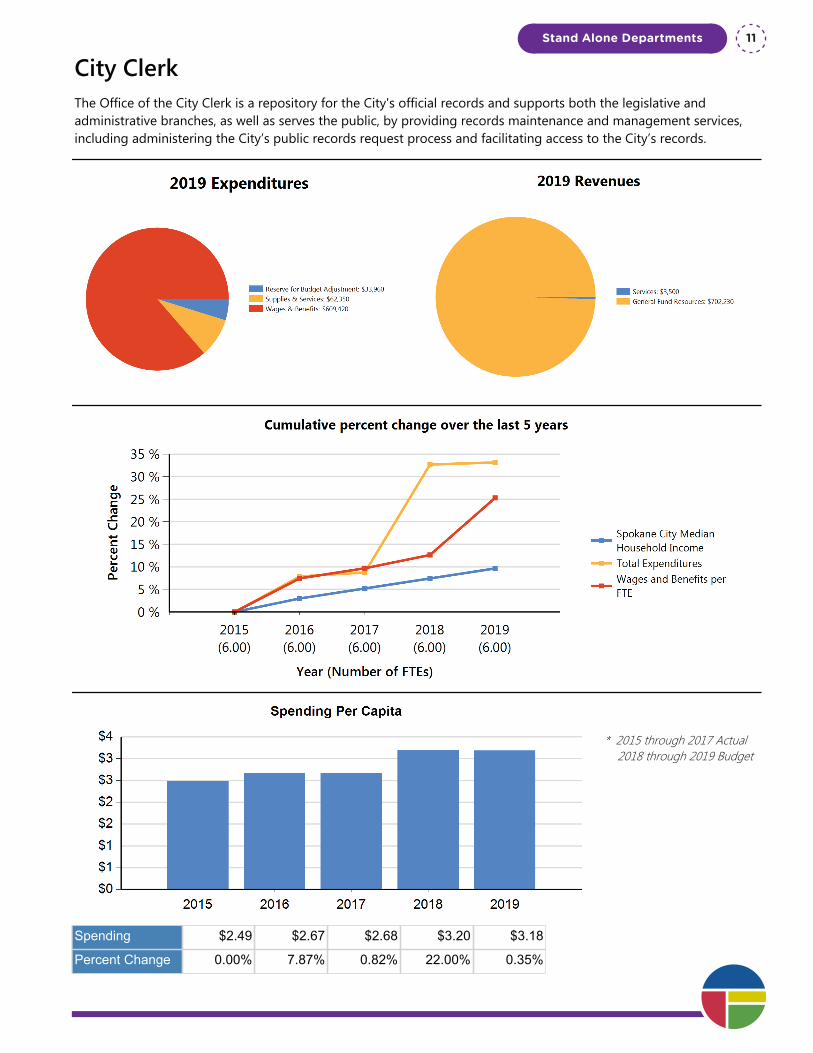
City ClerkThe Office of the City Clerk is a repository for the City's official records and supports both the legislative and administrative branches, as well as serves the public, by providing records maintenance and management services, including administering the City’s public records request process and facilitating access to the City’s records.
* 2015 through 2017 Actual 2018 through 2019 Budget
Spending $2.49 $2.67 $2.68 $3.20 $3.18
Percent Change 0.00% 7.87% 0.82% 22.00% 0.35%
Stand Alone Departments 11
Department Summary: City Clerk
Division: Stand Alone Departments
Fund Type: General Fund
Executive Summary:
The Office of the City Clerk is a repository for the City's official records and supports both the legislative and administrative branches, as well as serves the public, by providing records maintenance and management services, including administering the City’s public records request process and facilitating access to the City’s records.
Programs and Services:
- Records Maintenance and Management: Attest, index, scan, distribute and file contracts, ordinances, resolutions, and other official documents; attend bid openings; process claims, lawsuits, and garnishments; coordinate election matters with County (actual costs for elections and validation of initiative/referendum signatures is not paid out of this office); hold annual Retirement Board Election; issue hearing notices for appeals, LIDs and street vacations; record necessary documents; perform annual purging and destruction of City Clerk records that have passed their required retention; process, distribute, and publish executive orders and policies and procedures; process initiatives and referendums; and maintain Spokane Municipal Code. Assist departments in complying with state retention guidelines; coordinate transfer of archival records to the state; oversee City's compliance with the public records disclosure requirements and track and respond to public records requests; oversee City's offsite records storage contract; and oversee inventory of off-site records and activity.
- City Council Agenda and Meetings: Prepare, publish, and distribute weekly current and advance council agendas and packets; post agendas and agenda packet materials to the City website; and keep legislative record of Council proceedings.
- Official Gazette: Act as editor and responsible for typesetting and layout of the Official Gazette and posting to City website; responsible for publication of City Council minutes, executive orders, ordinances, policies and procedures, and hearing notices and preparation of affidavits of publication.
- Customer Service and Other Services: Assist internal and external customers with inquiries via telephone, email, and walk-in; perform notarization services on city documents; accept service on claims, lawsuits, and garnishments; and assist staff in locating older records that may be relevant to current projects and/or lawsuits. In addition, the City Clerk serves as a member on the Police and Fire Pension Boards.
FTEs
2015 Actual 2016 Actual 2017 Actual 2018 Budget 2019 Proposed
Total FTEs 6.00 6.00 6.00 6.00 6.00
Expenditures:
2015 Actual 2016 Actual 2017 Actual 2018 Budget 2019 Proposed
Capital Outlay 0 0 0 0 0
Interfund Charges 0 0 0 0 0
Reserve for Budget Adjustment 0 0 0 100,000 33,960
Transfers Out 0 0 0 0 0
Wages & Benefits 478,299 513,923 525,457 540,913 609,420
Supplies & Services 51,675 57,789 50,988 62,350 62,350
Debt Services 0 0 0 0 0
All Other 0 0 0 0 0One Vision. One Plan. One Voice.
Stand Alone Departments12
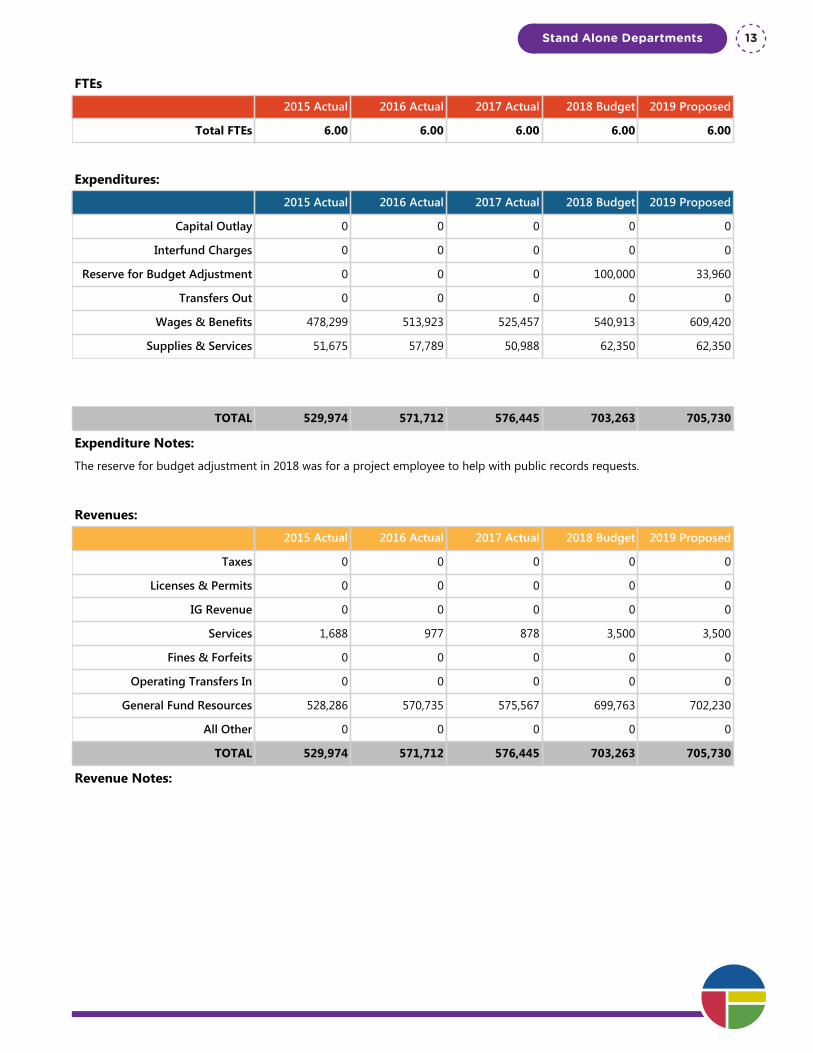
Department Summary: City Clerk
Division: Stand Alone Departments
Fund Type: General Fund
Executive Summary:
The Office of the City Clerk is a repository for the City's official records and supports both the legislative and administrative branches, as well as serves the public, by providing records maintenance and management services, including administering the City’s public records request process and facilitating access to the City’s records.
Programs and Services:
- Records Maintenance and Management: Attest, index, scan, distribute and file contracts, ordinances, resolutions, and other official documents; attend bid openings; process claims, lawsuits, and garnishments; coordinate election matters with County (actual costs for elections and validation of initiative/referendum signatures is not paid out of this office); hold annual Retirement Board Election; issue hearing notices for appeals, LIDs and street vacations; record necessary documents; perform annual purging and destruction of City Clerk records that have passed their required retention; process, distribute, and publish executive orders and policies and procedures; process initiatives and referendums; and maintain Spokane Municipal Code. Assist departments in complying with state retention guidelines; coordinate transfer of archival records to the state; oversee City's compliance with the public records disclosure requirements and track and respond to public records requests; oversee City's offsite records storage contract; and oversee inventory of off-site records and activity.
- City Council Agenda and Meetings: Prepare, publish, and distribute weekly current and advance council agendas and packets; post agendas and agenda packet materials to the City website; and keep legislative record of Council proceedings.
- Official Gazette: Act as editor and responsible for typesetting and layout of the Official Gazette and posting to City website; responsible for publication of City Council minutes, executive orders, ordinances, policies and procedures, and hearing notices and preparation of affidavits of publication.
- Customer Service and Other Services: Assist internal and external customers with inquiries via telephone, email, and walk-in; perform notarization services on city documents; accept service on claims, lawsuits, and garnishments; and assist staff in locating older records that may be relevant to current projects and/or lawsuits. In addition, the City Clerk serves as a member on the Police and Fire Pension Boards.
FTEs
2015 Actual 2016 Actual 2017 Actual 2018 Budget 2019 Proposed
Total FTEs 6.00 6.00 6.00 6.00 6.00
Expenditures:
2015 Actual 2016 Actual 2017 Actual 2018 Budget 2019 Proposed
Capital Outlay 0 0 0 0 0
Interfund Charges 0 0 0 0 0
Reserve for Budget Adjustment 0 0 0 100,000 33,960
Transfers Out 0 0 0 0 0
Wages & Benefits 478,299 513,923 525,457 540,913 609,420
Supplies & Services 51,675 57,789 50,988 62,350 62,350
Debt Services 0 0 0 0 0
All Other 0 0 0 0 0
TOTAL 529,974 571,712 576,445 703,263 705,730
Expenditure Notes:
The reserve for budget adjustment in 2018 was for a project employee to help with public records requests.
Revenues:
2015 Actual 2016 Actual 2017 Actual 2018 Budget 2019 Proposed
Taxes 0 0 0 0 0
Licenses & Permits 0 0 0 0 0
IG Revenue 0 0 0 0 0
Services 1,688 977 878 3,500 3,500
Fines & Forfeits 0 0 0 0 0
Operating Transfers In 0 0 0 0 0
General Fund Resources 528,286 570,735 575,567 699,763 702,230
All Other 0 0 0 0 0
TOTAL 529,974 571,712 576,445 703,263 705,730
Revenue Notes:
Stand Alone Departments 13

One Vision. One Plan. One Voice.
Stand Alone Departments14

City CouncilAs provided in the City Charter a Council President and six Council Members (two Members for each of the three districts) comprise the Spokane City Council. Together they constitute a legislative body which is given authority by the Washington State Constitution and State law to make local law.
* 2015 through 2017 Actual 2018 through 2019 Budget
Spending $5.42 $5.38 $6.12 $6.58 $6.73
Percent Change 0.00% -0.14% 14.33% 9.84% 3.06%
Stand Alone Departments 15
Department Summary: City Council
Division: Stand Alone Departments
Fund Type: General Fund
Executive Summary:
As provided in the City Charter a Council President and six Council Members (two Members for each of the three districts) comprise the Spokane City Council. Together they constitute a legislative body which is given authority by the Washington State Constitution and State law to make local law.
Programs and Services:
The Council President and City Council Members:
1. Appoint and discharge the Hearing Examiner; 2. Appoint, evaluate, and discharge the City Council’s Senior Research & Policy Analyst and the Policy Adviser; 3. Confirm the appointment by the Mayor of the City Attorney, the City Clerk, and the Administrative Head in each department; 4. Appoint nominees of the mayor to boards, commissions, and other official City agencies, unless otherwise provided; 5. Hire, supervise, and remove their own administrative staff; 6. Hire, supervise, and discharge their individual legislative assistants.
The Council President reviews the preparation of the agenda for City Council meetings, briefings, and study session meetings and presides at meetings of the Council. The Council President also serves as the Mayor Pro Tem.
Each Council Member is provided with the budget to employ a Legislative Assistant. Council staff also includes a Senior Research & Policy Analyst, a Policy Adviser, as well as occasional temporary employees.
FTEs
2015 Actual 2016 Actual 2017 Actual 2018 Budget 2019 Proposed
Total FTEs 16.00 16.00 16.00 16.00 16.00
Expenditures:
2015 Actual 2016 Actual 2017 Actual 2018 Budget 2019 Proposed
Capital Outlay 1,575 682 0 0 0
Interfund Charges 0 0 0 0 0
Reserve for Budget Adjustment 0 0 0 24,124 24,124
Transfers Out 0 0 0 0 0
Wages & Benefits 951,283 1,003,292 1,144,796 1,210,217 1,247,418
Supplies & Services 202,298 149,457 173,990 214,337 221,537
Debt Services 0 0 0 0 0
All Other 0 0 0 0 0
One Vision. One Plan. One Voice.
Stand Alone Departments16
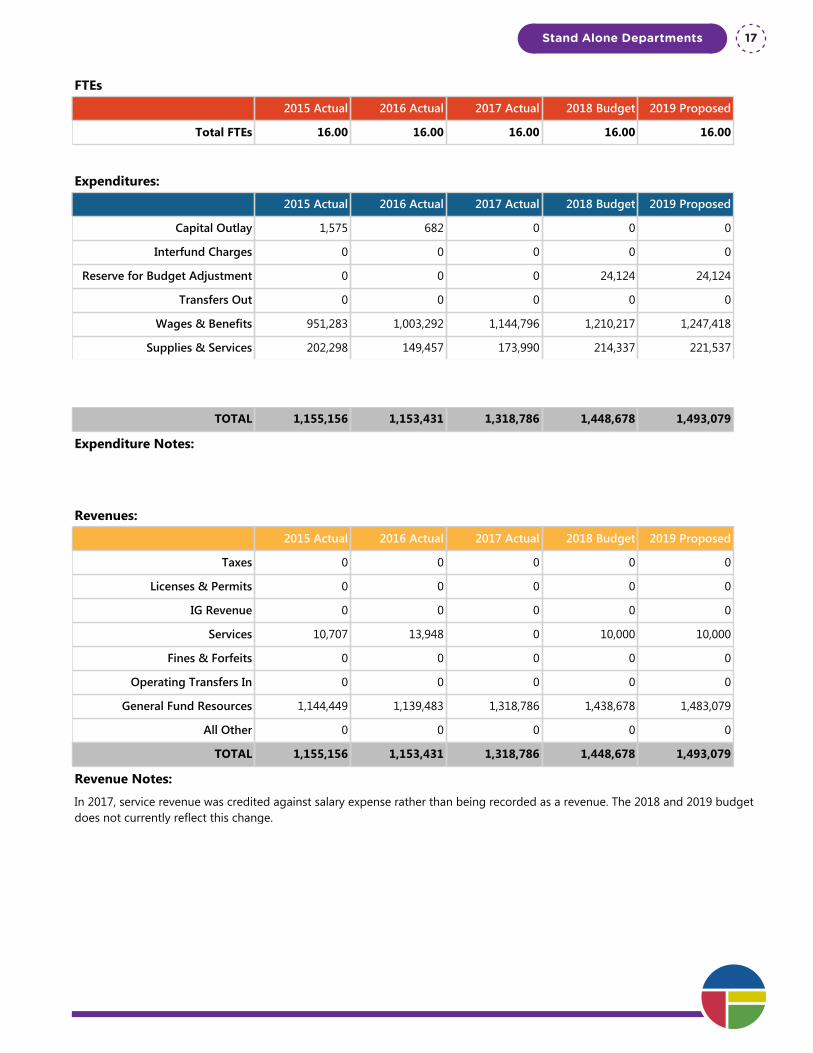
Department Summary: City Council
Division: Stand Alone Departments
Fund Type: General Fund
Executive Summary:
As provided in the City Charter a Council President and six Council Members (two Members for each of the three districts) comprise the Spokane City Council. Together they constitute a legislative body which is given authority by the Washington State Constitution and State law to make local law.
Programs and Services:
The Council President and City Council Members:
1. Appoint and discharge the Hearing Examiner; 2. Appoint, evaluate, and discharge the City Council’s Senior Research & Policy Analyst and the Policy Adviser; 3. Confirm the appointment by the Mayor of the City Attorney, the City Clerk, and the Administrative Head in each department; 4. Appoint nominees of the mayor to boards, commissions, and other official City agencies, unless otherwise provided; 5. Hire, supervise, and remove their own administrative staff; 6. Hire, supervise, and discharge their individual legislative assistants.
The Council President reviews the preparation of the agenda for City Council meetings, briefings, and study session meetings and presides at meetings of the Council. The Council President also serves as the Mayor Pro Tem.
Each Council Member is provided with the budget to employ a Legislative Assistant. Council staff also includes a Senior Research & Policy Analyst, a Policy Adviser, as well as occasional temporary employees.
FTEs
2015 Actual 2016 Actual 2017 Actual 2018 Budget 2019 Proposed
Total FTEs 16.00 16.00 16.00 16.00 16.00
Expenditures:
2015 Actual 2016 Actual 2017 Actual 2018 Budget 2019 Proposed
Capital Outlay 1,575 682 0 0 0
Interfund Charges 0 0 0 0 0
Reserve for Budget Adjustment 0 0 0 24,124 24,124
Transfers Out 0 0 0 0 0
Wages & Benefits 951,283 1,003,292 1,144,796 1,210,217 1,247,418
Supplies & Services 202,298 149,457 173,990 214,337 221,537
Debt Services 0 0 0 0 0
All Other 0 0 0 0 0
TOTAL 1,155,156 1,153,431 1,318,786 1,448,678 1,493,079
Expenditure Notes:
Revenues:
2015 Actual 2016 Actual 2017 Actual 2018 Budget 2019 Proposed
Taxes 0 0 0 0 0
Licenses & Permits 0 0 0 0 0
IG Revenue 0 0 0 0 0
Services 10,707 13,948 0 10,000 10,000
Fines & Forfeits 0 0 0 0 0
Operating Transfers In 0 0 0 0 0
General Fund Resources 1,144,449 1,139,483 1,318,786 1,438,678 1,483,079
All Other 0 0 0 0 0
TOTAL 1,155,156 1,153,431 1,318,786 1,448,678 1,493,079
Revenue Notes:
In 2017, service revenue was credited against salary expense rather than being recorded as a revenue. The 2018 and 2019 budget does not currently reflect this change.
Stand Alone Departments 17

One Vision. One Plan. One Voice.
Stand Alone Departments18
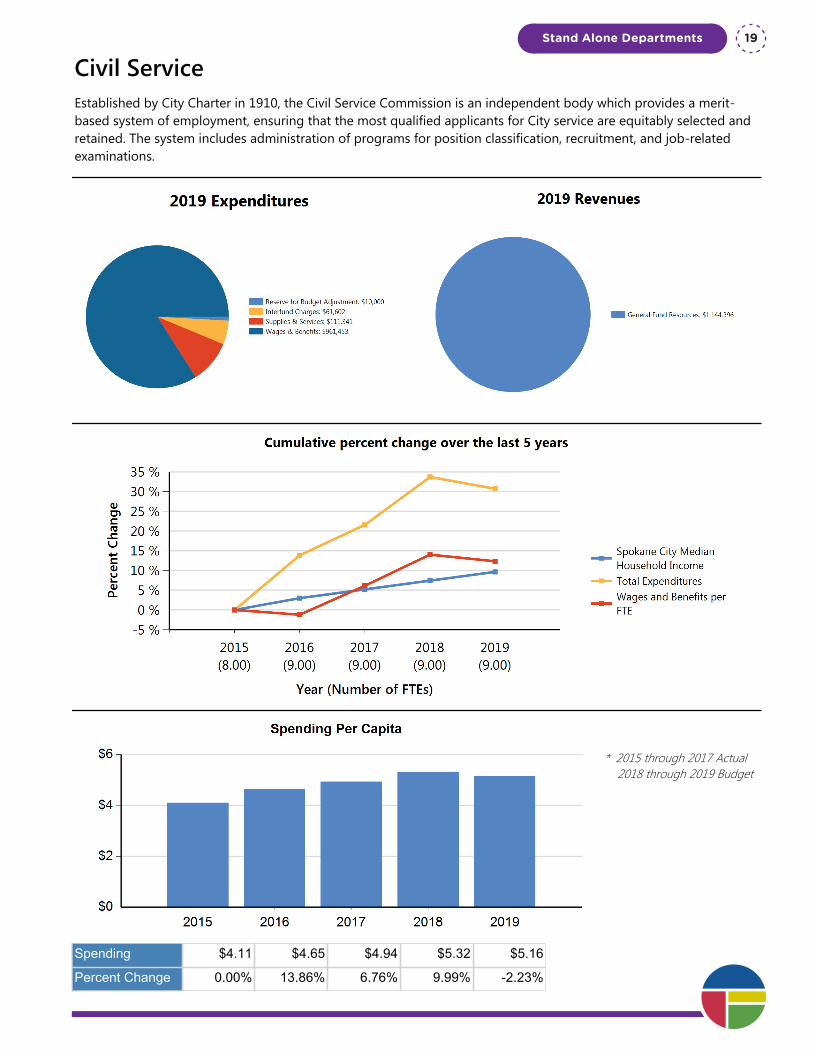
Civil ServiceEstablished by City Charter in 1910, the Civil Service Commission is an independent body which provides a merit-based system of employment, ensuring that the most qualified applicants for City service are equitably selected and retained. The system includes administration of programs for position classification, recruitment, and job-related examinations.
* 2015 through 2017 Actual 2018 through 2019 Budget
Spending $4.11 $4.65 $4.94 $5.32 $5.16
Percent Change 0.00% 13.86% 6.76% 9.99% -2.23%
Stand Alone Departments 19
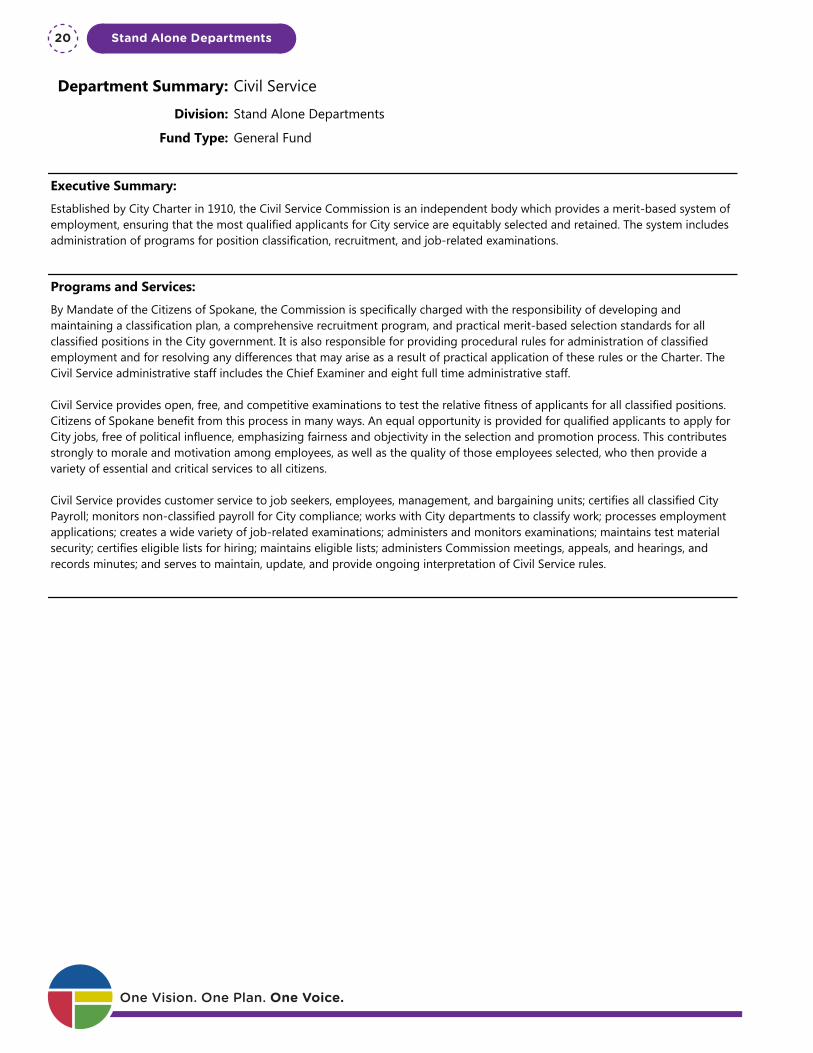
Department Summary: Civil Service
Division: Stand Alone Departments
Fund Type: General Fund
Executive Summary:
Established by City Charter in 1910, the Civil Service Commission is an independent body which provides a merit-based system of employment, ensuring that the most qualified applicants for City service are equitably selected and retained. The system includes administration of programs for position classification, recruitment, and job-related examinations.
Programs and Services:
By Mandate of the Citizens of Spokane, the Commission is specifically charged with the responsibility of developing and maintaining a classification plan, a comprehensive recruitment program, and practical merit-based selection standards for all classified positions in the City government. It is also responsible for providing procedural rules for administration of classified employment and for resolving any differences that may arise as a result of practical application of these rules or the Charter. The Civil Service administrative staff includes the Chief Examiner and eight full time administrative staff.
Civil Service provides open, free, and competitive examinations to test the relative fitness of applicants for all classified positions. Citizens of Spokane benefit from this process in many ways. An equal opportunity is provided for qualified applicants to apply for City jobs, free of political influence, emphasizing fairness and objectivity in the selection and promotion process. This contributes strongly to morale and motivation among employees, as well as the quality of those employees selected, who then provide a variety of essential and critical services to all citizens.
Civil Service provides customer service to job seekers, employees, management, and bargaining units; certifies all classified City Payroll; monitors non-classified payroll for City compliance; works with City departments to classify work; processes employment applications; creates a wide variety of job-related examinations; administers and monitors examinations; maintains test material security; certifies eligible lists for hiring; maintains eligible lists; administers Commission meetings, appeals, and hearings, and records minutes; and serves to maintain, update, and provide ongoing interpretation of Civil Service rules.
FTEs
2015 Actual 2016 Actual 2017 Actual 2018 Budget 2019 Proposed
Total FTEs 8.00 9.00 9.00 9.00 9.00
Expenditures:
2015 Actual 2016 Actual 2017 Actual 2018 Budget 2019 Proposed
Capital Outlay 1,119 6,388 0 0 0
Interfund Charges 42,849 47,187 47,709 68,789 61,602
Reserve for Budget Adjustment 0 0 0 10,000 10,000
Transfers Out 0 0 0 0 0
Wages & Benefits 759,786 844,436 906,451 977,911 961,453
Supplies & Services 71,646 98,727 110,026 113,800 111,341
Debt Services 0 0 0 0 0
All Other 0 0 0 0 0
One Vision. One Plan. One Voice.
Stand Alone Departments20

Department Summary: Civil Service
Division: Stand Alone Departments
Fund Type: General Fund
Executive Summary:
Established by City Charter in 1910, the Civil Service Commission is an independent body which provides a merit-based system of employment, ensuring that the most qualified applicants for City service are equitably selected and retained. The system includes administration of programs for position classification, recruitment, and job-related examinations.
Programs and Services:
By Mandate of the Citizens of Spokane, the Commission is specifically charged with the responsibility of developing and maintaining a classification plan, a comprehensive recruitment program, and practical merit-based selection standards for all classified positions in the City government. It is also responsible for providing procedural rules for administration of classified employment and for resolving any differences that may arise as a result of practical application of these rules or the Charter. The Civil Service administrative staff includes the Chief Examiner and eight full time administrative staff.
Civil Service provides open, free, and competitive examinations to test the relative fitness of applicants for all classified positions. Citizens of Spokane benefit from this process in many ways. An equal opportunity is provided for qualified applicants to apply for City jobs, free of political influence, emphasizing fairness and objectivity in the selection and promotion process. This contributes strongly to morale and motivation among employees, as well as the quality of those employees selected, who then provide a variety of essential and critical services to all citizens.
Civil Service provides customer service to job seekers, employees, management, and bargaining units; certifies all classified City Payroll; monitors non-classified payroll for City compliance; works with City departments to classify work; processes employment applications; creates a wide variety of job-related examinations; administers and monitors examinations; maintains test material security; certifies eligible lists for hiring; maintains eligible lists; administers Commission meetings, appeals, and hearings, and records minutes; and serves to maintain, update, and provide ongoing interpretation of Civil Service rules.
FTEs
2015 Actual 2016 Actual 2017 Actual 2018 Budget 2019 Proposed
Total FTEs 8.00 9.00 9.00 9.00 9.00
Expenditures:
2015 Actual 2016 Actual 2017 Actual 2018 Budget 2019 Proposed
Capital Outlay 1,119 6,388 0 0 0
Interfund Charges 42,849 47,187 47,709 68,789 61,602
Reserve for Budget Adjustment 0 0 0 10,000 10,000
Transfers Out 0 0 0 0 0
Wages & Benefits 759,786 844,436 906,451 977,911 961,453
Supplies & Services 71,646 98,727 110,026 113,800 111,341
Debt Services 0 0 0 0 0
All Other 0 0 0 0 0
TOTAL 875,400 996,738 1,064,186 1,170,500 1,144,396
Expenditure Notes:
Interfund charges in the 2018 & 2019 budgets are increasing over historical actuals as a result of increased IT service and software support expenses.
Revenues:
2015 Actual 2016 Actual 2017 Actual 2018 Budget 2019 Proposed
Taxes 0 0 0 0 0
Licenses & Permits 0 0 0 0 0
IG Revenue 0 0 0 0 0
Services 0 0 0 0 0
Fines & Forfeits 0 0 0 0 0
Operating Transfers In 0 0 0 0 0
General Fund Resources 875,400 996,709 1,064,186 1,170,500 1,144,396
All Other 0 29 0 0 0
TOTAL 875,400 996,738 1,064,186 1,170,500 1,144,396
Revenue Notes:
Stand Alone Departments 21

One Vision. One Plan. One Voice.
Stand Alone Departments22
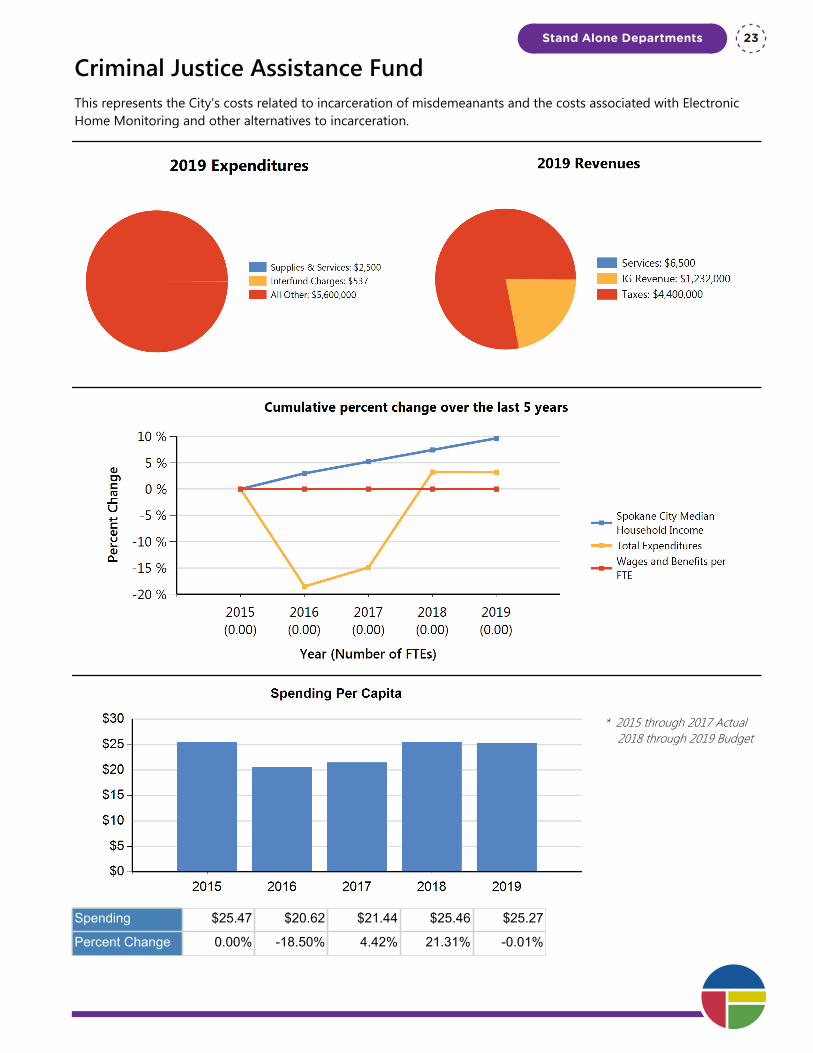
Criminal Justice Assistance FundThis represents the City's costs related to incarceration of misdemeanants and the costs associated with Electronic Home Monitoring and other alternatives to incarceration.
* 2015 through 2017 Actual 2018 through 2019 Budget
Spending $25.47 $20.62 $21.44 $25.46 $25.27
Percent Change 0.00% -18.50% 4.42% 21.31% -0.01%
Stand Alone Departments 23

Department Summary: Criminal Justice Assistance Fund
Division: Stand Alone Departments
Fund Type: Special Revenue Fund
Executive Summary:
This represents the City's costs related to incarceration of misdemeanants and the costs associated with Electronic Home Monitoring and other alternatives to incarceration.
Programs and Services:
Jail and Geiger correctional facilities play an integral role in the justice process by providing facilities to securely house individuals awaiting trial or after they have been incarcerated. However, because Spokane does not possess its own correctional facilities, these services must be contracted out through various sources. The primary source of jail and correctional services is Spokane County Detention Services, which includes the Spokane County Jail and Geiger Correctional Facility. In addition to incarceration programs, the City offers other alternatives such as Electronic Home Monitoring.
FTEs
2015 Actual 2016 Actual 2017 Actual 2018 Budget 2019 Proposed
Total FTEs 0.00 0.00 0.00 0.00 0.00
Expenditures:
2015 Actual 2016 Actual 2017 Actual 2018 Budget 2019 Proposed
Capital Outlay 0 0 0 0 0
Interfund Charges 3,140 3,211 2,841 1,610 537
Reserve for Budget Adjustment 0 0 0 0 0
Transfers Out 0 0 0 0 0
Wages & Benefits 0 0 0 0 0
Supplies & Services 2,568 2,455 1,993 2,500 2,500
Debt Services 0 0 0 0 0
All Other 5,422,703 4,418,201 4,614,630 5,600,000 5,600,000
TOTAL 5,428,411 4,423,867 4,619,464 5,604,110 5,603,037
Expenditure Notes:
All other includes housing inmates at the county jail.
Revenues:
2015 Actual 2016 Actual 2017 Actual 2018 Budget 2019 Proposed
Taxes 3,826,905 4,085,761 4,402,281 4,100,000 4,400,000
Licenses & Permits 0 0 0 0 0
IG Revenue 1,252,778 932,557 1,632,820 928,000 1,232,000
Services 45,291 11,371 6,031 6,500 6,500
Fines & Forfeits 0 0 0 0 0
Operating Transfers In 0 0 0 0 0One Vision. One Plan. One Voice.
Stand Alone Departments24

Department Summary: Criminal Justice Assistance Fund
Division: Stand Alone Departments
Fund Type: Special Revenue Fund
Executive Summary:
This represents the City's costs related to incarceration of misdemeanants and the costs associated with Electronic Home Monitoring and other alternatives to incarceration.
Programs and Services:
Jail and Geiger correctional facilities play an integral role in the justice process by providing facilities to securely house individuals awaiting trial or after they have been incarcerated. However, because Spokane does not possess its own correctional facilities, these services must be contracted out through various sources. The primary source of jail and correctional services is Spokane County Detention Services, which includes the Spokane County Jail and Geiger Correctional Facility. In addition to incarceration programs, the City offers other alternatives such as Electronic Home Monitoring.
FTEs
2015 Actual 2016 Actual 2017 Actual 2018 Budget 2019 Proposed
Total FTEs 0.00 0.00 0.00 0.00 0.00
Expenditures:
2015 Actual 2016 Actual 2017 Actual 2018 Budget 2019 Proposed
Capital Outlay 0 0 0 0 0
Interfund Charges 3,140 3,211 2,841 1,610 537
Reserve for Budget Adjustment 0 0 0 0 0
Transfers Out 0 0 0 0 0
Wages & Benefits 0 0 0 0 0
Supplies & Services 2,568 2,455 1,993 2,500 2,500
Debt Services 0 0 0 0 0
All Other 5,422,703 4,418,201 4,614,630 5,600,000 5,600,000
TOTAL 5,428,411 4,423,867 4,619,464 5,604,110 5,603,037
Expenditure Notes:
All other includes housing inmates at the county jail.
Revenues:
2015 Actual 2016 Actual 2017 Actual 2018 Budget 2019 Proposed
Taxes 3,826,905 4,085,761 4,402,281 4,100,000 4,400,000
Licenses & Permits 0 0 0 0 0
IG Revenue 1,252,778 932,557 1,632,820 928,000 1,232,000
Services 45,291 11,371 6,031 6,500 6,500
Fines & Forfeits 0 0 0 0 0
Operating Transfers In 0 0 0 0 0
General Fund Resources 0 0 0 0 0
All Other 5,711 (590) 1,125 1,000 3,000
TOTAL 5,130,685 5,029,099 6,042,257 5,035,500 5,641,500
Revenue Notes:
All Other revenue includes interest income.Revenue from Inter-government (IG) and taxes varies depending on the sales and use tax collected and distributed each year.
Stand Alone Departments 25

One Vision. One Plan. One Voice.
Stand Alone Departments26
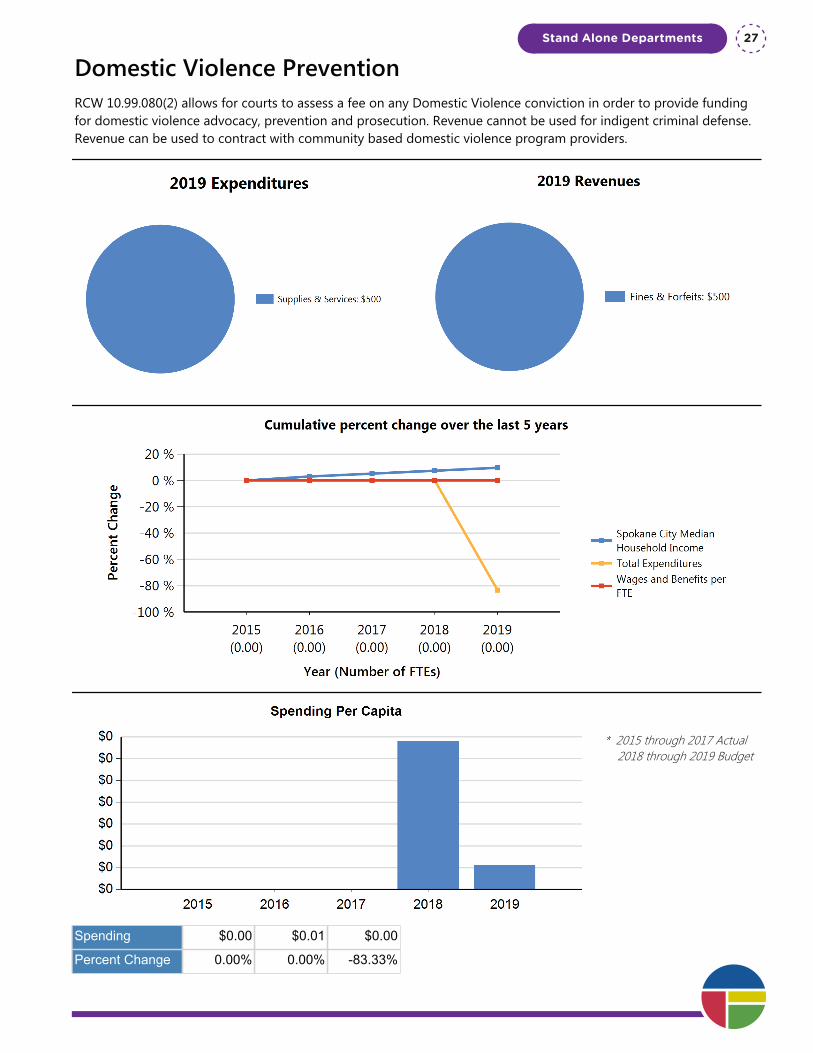
Domestic Violence PreventionRCW 10.99.080(2) allows for courts to assess a fee on any Domestic Violence conviction in order to provide funding for domestic violence advocacy, prevention and prosecution. Revenue cannot be used for indigent criminal defense. Revenue can be used to contract with community based domestic violence program providers.
* 2015 through 2017 Actual 2018 through 2019 Budget
Spending $0.00 $0.01 $0.00
Percent Change 0.00% 0.00% -83.33%
Stand Alone Departments 27
Department Summary: Domestic Violence Prevention
Division: Stand Alone Departments
Fund Type: Special Revenue Fund
Executive Summary:
RCW 10.99.080(2) allows for courts to assess a fee on any Domestic Violence conviction in order to provide funding for domestic violence advocacy, prevention and prosecution. Revenue cannot be used for indigent criminal defense. Revenue can be used to contract with community based domestic violence program providers.
Programs and Services:
Because of the age of the program, collection of assessment fees has been minimal to date. As the program grows, anticipated services include: 1) Expanded coordination of domestic violence victim services, 2) Public education campaign focused on domestic violence prevention, 3) Emergency fund for domestic violence victims and 4) Enhanced domestic violence training for prosecutors.
FTEs
2015 Actual 2016 Actual 2017 Actual 2018 Budget 2019 Proposed
Total FTEs 0.00 0.00 0.00 0.00 0.00
Expenditures:
2015 Actual 2016 Actual 2017 Actual 2018 Budget 2019 Proposed
Capital Outlay 0 0 0 0 0
Interfund Charges 0 0 0 0 0
Reserve for Budget Adjustment 0 0 0 0 0
Transfers Out 0 0 0 0 0
Wages & Benefits 0 0 0 0 0
Supplies & Services 0 0 0 3,000 500
Debt Services 0 0 0 0 0
All Other 0 0 0 0 0
TOTAL 0 0 0 3,000 500
Expenditure Notes:
Revenues:
2015 Actual 2016 Actual 2017 Actual 2018 Budget 2019 Proposed
Taxes 0 0 0 0 0
Licenses & Permits 0 0 0 0 0
IG Revenue 0 0 0 0 0
Services 0 0 0 0 0
Fines & Forfeits 435 1,698 540 500 500
Operating Transfers In 0 0 0 0 0One Vision. One Plan. One Voice.
Stand Alone Departments28

Department Summary: Domestic Violence Prevention
Division: Stand Alone Departments
Fund Type: Special Revenue Fund
Executive Summary:
RCW 10.99.080(2) allows for courts to assess a fee on any Domestic Violence conviction in order to provide funding for domestic violence advocacy, prevention and prosecution. Revenue cannot be used for indigent criminal defense. Revenue can be used to contract with community based domestic violence program providers.
Programs and Services:
Because of the age of the program, collection of assessment fees has been minimal to date. As the program grows, anticipated services include: 1) Expanded coordination of domestic violence victim services, 2) Public education campaign focused on domestic violence prevention, 3) Emergency fund for domestic violence victims and 4) Enhanced domestic violence training for prosecutors.
FTEs
2015 Actual 2016 Actual 2017 Actual 2018 Budget 2019 Proposed
Total FTEs 0.00 0.00 0.00 0.00 0.00
Expenditures:
2015 Actual 2016 Actual 2017 Actual 2018 Budget 2019 Proposed
Capital Outlay 0 0 0 0 0
Interfund Charges 0 0 0 0 0
Reserve for Budget Adjustment 0 0 0 0 0
Transfers Out 0 0 0 0 0
Wages & Benefits 0 0 0 0 0
Supplies & Services 0 0 0 3,000 500
Debt Services 0 0 0 0 0
All Other 0 0 0 0 0
TOTAL 0 0 0 3,000 500
Expenditure Notes:
Revenues:
2015 Actual 2016 Actual 2017 Actual 2018 Budget 2019 Proposed
Taxes 0 0 0 0 0
Licenses & Permits 0 0 0 0 0
IG Revenue 0 0 0 0 0
Services 0 0 0 0 0
Fines & Forfeits 435 1,698 540 500 500
Operating Transfers In 0 0 0 0 0
General Fund Resources 0 0 0 0 0
All Other 0 0 0 0 0
TOTAL 435 1,698 540 500 500
Revenue Notes:
Stand Alone Departments 29

One Vision. One Plan. One Voice.
Stand Alone Departments30
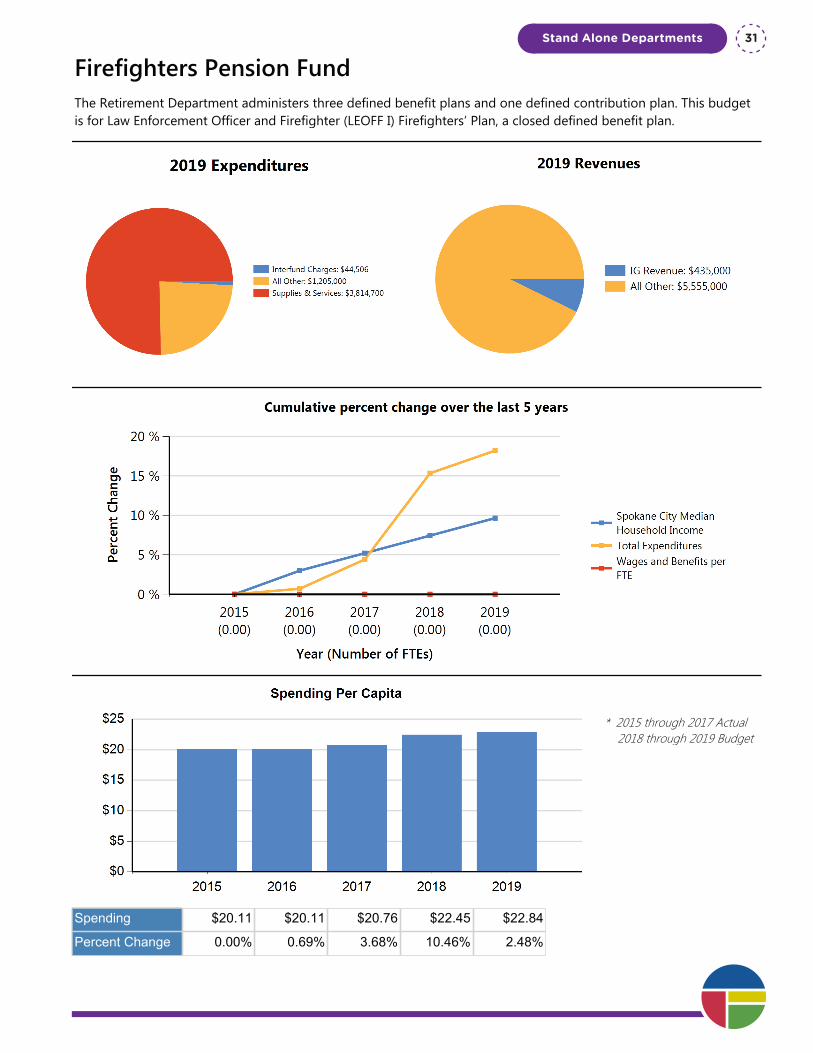
Firefighters Pension FundThe Retirement Department administers three defined benefit plans and one defined contribution plan. This budget is for Law Enforcement Officer and Firefighter (LEOFF I) Firefighters’ Plan, a closed defined benefit plan.
* 2015 through 2017 Actual 2018 through 2019 Budget
Spending $20.11 $20.11 $20.76 $22.45 $22.84
Percent Change 0.00% 0.69% 3.68% 10.46% 2.48%
Stand Alone Departments 31
Department Summary: Firefighters Pension Fund
Division: Stand Alone Departments
Fund Type: Trust and Agency Fund
Executive Summary:
The Retirement Department administers three defined benefit plans and one defined contribution plan. This budget is for Law Enforcement Officer and Firefighter (LEOFF I) Firefighters’ Plan, a closed defined benefit plan.
Programs and Services:
The LEOFF I Firefighters’ Plan provides pension benefits related to retirement, disability, and death. In addition, the Plan pays for medical and dental expenses for its members, along with reimbursement of Medicare premium payments. At December 31, 2017, there were 210 members of the City of Spokane LEOFF I Firefighters’ Plan, all but 1 of whom are retired. A five-member board, as defined in the Revised Code of Washington, governs the Plan.
LEOFF I Firefighters’ Plan general staff duties include processing pension and medical payments; counseling retirees; structuring and monitoring a $31 million investment portfolio; and ensuring compliance with Local, State, and Federal Laws. The medical expenditures comprise the largest portion of the LEOFF I Firefighters’ budget and, like pensions, represent an earned benefit payable by the System. For the medical portion of the benefit, the Benefits Department (HR) verifies medical claims, which are then processed by the Retirement Department. For the 2019 budget, overall expenses of the LEOFF I Firefighters’ Plan increased by $123k (2.5%). This is primarily due to an increase in medical costs as the population ages. LEOFF I Firefighter assets are separately held in a trust fund; LEOFF I Firefighter revenues and expenditures separately accounted for inside a trust fund within the City of Spokane.
FTEs
2015 Actual 2016 Actual 2017 Actual 2018 Budget 2019 Proposed
Total FTEs 0.00 0.00 0.00 0.00 0.00
Expenditures:
2015 Actual 2016 Actual 2017 Actual 2018 Budget 2019 Proposed
Capital Outlay 0 0 0 0 0
Interfund Charges 43,618 41,223 42,885 45,203 44,506
Reserve for Budget Adjustment 0 0 0 0 0
Transfers Out 0 0 0 0 0
Wages & Benefits 0 0 0 0 0
Supplies & Services 2,933,946 3,102,387 3,377,096 3,691,200 3,814,700
Debt Services 0 0 0 0 0
All Other 1,306,840 1,170,686 1,053,418 1,205,000 1,205,000
One Vision. One Plan. One Voice.
Stand Alone Departments32

Department Summary: Firefighters Pension Fund
Division: Stand Alone Departments
Fund Type: Trust and Agency Fund
Executive Summary:
The Retirement Department administers three defined benefit plans and one defined contribution plan. This budget is for Law Enforcement Officer and Firefighter (LEOFF I) Firefighters’ Plan, a closed defined benefit plan.
Programs and Services:
The LEOFF I Firefighters’ Plan provides pension benefits related to retirement, disability, and death. In addition, the Plan pays for medical and dental expenses for its members, along with reimbursement of Medicare premium payments. At December 31, 2017, there were 210 members of the City of Spokane LEOFF I Firefighters’ Plan, all but 1 of whom are retired. A five-member board, as defined in the Revised Code of Washington, governs the Plan.
LEOFF I Firefighters’ Plan general staff duties include processing pension and medical payments; counseling retirees; structuring and monitoring a $31 million investment portfolio; and ensuring compliance with Local, State, and Federal Laws. The medical expenditures comprise the largest portion of the LEOFF I Firefighters’ budget and, like pensions, represent an earned benefit payable by the System. For the medical portion of the benefit, the Benefits Department (HR) verifies medical claims, which are then processed by the Retirement Department. For the 2019 budget, overall expenses of the LEOFF I Firefighters’ Plan increased by $123k (2.5%). This is primarily due to an increase in medical costs as the population ages. LEOFF I Firefighter assets are separately held in a trust fund; LEOFF I Firefighter revenues and expenditures separately accounted for inside a trust fund within the City of Spokane.
FTEs
2015 Actual 2016 Actual 2017 Actual 2018 Budget 2019 Proposed
Total FTEs 0.00 0.00 0.00 0.00 0.00
Expenditures:
2015 Actual 2016 Actual 2017 Actual 2018 Budget 2019 Proposed
Capital Outlay 0 0 0 0 0
Interfund Charges 43,618 41,223 42,885 45,203 44,506
Reserve for Budget Adjustment 0 0 0 0 0
Transfers Out 0 0 0 0 0
Wages & Benefits 0 0 0 0 0
Supplies & Services 2,933,946 3,102,387 3,377,096 3,691,200 3,814,700
Debt Services 0 0 0 0 0
All Other 1,306,840 1,170,686 1,053,418 1,205,000 1,205,000
TOTAL 4,284,404 4,314,296 4,473,399 4,941,403 5,064,206
Expenditure Notes:
“All Other” includes Pension annuity claims and death benefit payments. Medical payments and Medicare reimbursements comprise the majority of “Other Services & charges”.
Revenues:
2015 Actual 2016 Actual 2017 Actual 2018 Budget 2019 Proposed
Taxes 613 1,298 0 0 0
Licenses & Permits 0 0 0 0 0
IG Revenue 399,863 428,402 456,494 405,000 435,000
Services 0 0 0 0 0
Fines & Forfeits 0 0 0 0 0
Operating Transfers In 0 0 0 0 0
General Fund Resources 0 0 0 0 0
All Other 5,028,314 5,058,641 5,349,334 6,015,000 5,555,000
TOTAL 5,428,790 5,488,341 5,805,828 6,420,000 5,990,000
Revenue Notes:
“Miscellaneous Revenues” includes investment earnings and employer contributions.
Stand Alone Departments 33

One Vision. One Plan. One Voice.
Stand Alone Departments34
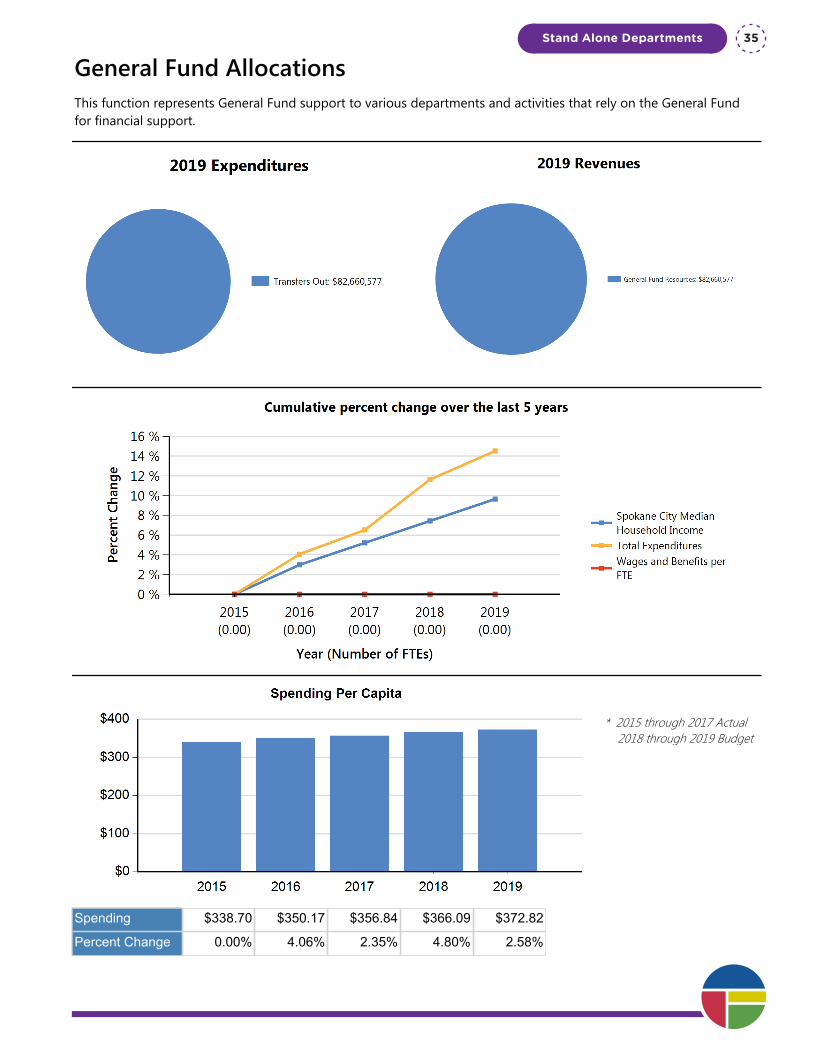
General Fund AllocationsThis function represents General Fund support to various departments and activities that rely on the General Fund for financial support.
* 2015 through 2017 Actual 2018 through 2019 Budget
Spending $338.70 $350.17 $356.84 $366.09 $372.82
Percent Change 0.00% 4.06% 2.35% 4.80% 2.58%
Stand Alone Departments 35

Department Summary: General Fund Allocations
Division: Stand Alone Departments
Fund Type: General Fund
Executive Summary:
This function represents General Fund support to various departments and activities that rely on the General Fund for financial support.
Programs and Services:
See the department specific program summaries for details on how the funds are used. The General Fund provides monetary support to several departments including:Streets, Code Enforcement, Library, Parks and Recreation, Fire/Emergency Medical Services, Asset Management, and Parking.
FTEs
2015 Actual 2016 Actual 2017 Actual 2018 Budget 2019 Proposed
Total FTEs 0.00 0.00 0.00 0.00 0.00
Expenditures:
2015 Actual 2016 Actual 2017 Actual 2018 Budget 2019 Proposed
Capital Outlay 0 0 0 0 0
Interfund Charges 0 0 0 0 0
Reserve for Budget Adjustment 0 0 0 0 0
Transfers Out 72,177,591 75,110,791 76,879,235 80,576,800 82,660,577
Wages & Benefits 0 0 0 0 0
Supplies & Services 0 0 0 0 0
Debt Services 0 0 0 0 0
All Other 0 0 0 0 0
TOTAL 72,177,591 75,110,791 76,879,235 80,576,800 82,660,577
Expenditure Notes:
Revenues:
2015 Actual 2016 Actual 2017 Actual 2018 Budget 2019 Proposed
Taxes 0 0 0 0 0
Licenses & Permits 0 0 0 0 0
IG Revenue 0 0 0 0 0
Services 0 0 0 0 0
Fines & Forfeits 0 0 0 0 0
Operating Transfers In 0 0 0 0 0
General Fund Resources 72,177,591 75,110,791 76,879,235 80,576,800 82,660,577One Vision. One Plan. One Voice.
Stand Alone Departments36

Department Summary: General Fund Allocations
Division: Stand Alone Departments
Fund Type: General Fund
Executive Summary:
This function represents General Fund support to various departments and activities that rely on the General Fund for financial support.
Programs and Services:
See the department specific program summaries for details on how the funds are used. The General Fund provides monetary support to several departments including:Streets, Code Enforcement, Library, Parks and Recreation, Fire/Emergency Medical Services, Asset Management, and Parking.
FTEs
2015 Actual 2016 Actual 2017 Actual 2018 Budget 2019 Proposed
Total FTEs 0.00 0.00 0.00 0.00 0.00
Expenditures:
2015 Actual 2016 Actual 2017 Actual 2018 Budget 2019 Proposed
Capital Outlay 0 0 0 0 0
Interfund Charges 0 0 0 0 0
Reserve for Budget Adjustment 0 0 0 0 0
Transfers Out 72,177,591 75,110,791 76,879,235 80,576,800 82,660,577
Wages & Benefits 0 0 0 0 0
Supplies & Services 0 0 0 0 0
Debt Services 0 0 0 0 0
All Other 0 0 0 0 0
TOTAL 72,177,591 75,110,791 76,879,235 80,576,800 82,660,577
Expenditure Notes:
Revenues:
2015 Actual 2016 Actual 2017 Actual 2018 Budget 2019 Proposed
Taxes 0 0 0 0 0
Licenses & Permits 0 0 0 0 0
IG Revenue 0 0 0 0 0
Services 0 0 0 0 0
Fines & Forfeits 0 0 0 0 0
Operating Transfers In 0 0 0 0 0
General Fund Resources 72,177,591 75,110,791 76,879,235 80,576,800 82,660,577
All Other 0 0 0 0 0
TOTAL 72,177,591 75,110,791 76,879,235 80,576,800 82,660,577
Revenue Notes:
Stand Alone Departments 37

Program Summary: GF Allocation to Arterial Street Fund-Street Levy
Division: Stand Alone Departments
Fund Type: General Fund
Executive Summary:
This represents the General Fund All0cation to Arterial Streets. The annual allocation to Arterial Streets will be equivalent to the amount of the Street Levy for the year.
Programs and Services:
This General Fund allocation will be used to support the Debt Service for existing Street Bonds and to provide additional Street Capital & Maintenance dollars that will be used in coordination with Integrated Capital dollars and any State and Federal matching dollars. See Arterial Street Fund budget summary for more details.
FTEs
2015 Actual 2016 Actual 2017 Actual 2018 Budget 2019 Proposed
Total FTEs 0.00 0.00 0.00 0.00 0.00
Expenditures:
2015 Actual 2016 Actual 2017 Actual 2018 Budget 2019 Proposed
Capital Outlay 0 0 0 0 0
Interfund Charges 0 0 0 0 0
Reserve for Budget Adjustment 0 0 0 0 0
Transfers Out 8,444,700 9,100,000 9,550,000 9,280,000 9,280,000
Wages & Benefits 0 0 0 0 0
Supplies & Services 0 0 0 0 0
Debt Services 0 0 0 0 0
All Other 0 0 0 0 0
TOTAL 8,444,700 9,100,000 9,550,000 9,280,000 9,280,000
Expenditure Notes:
Revenues:
2015 Actual 2016 Actual 2017 Actual 2018 Budget 2019 Proposed
Taxes 0 0 0 0 0
Licenses & Permits 0 0 0 0 0
IG Revenue 0 0 0 0 0
Services 0 0 0 0 0
Fines & Forfeits 0 0 0 0 0
Operating Transfers In 0 0 0 0 0
General Fund Resources 8,444,700 9,100,000 9,550,000 9,280,000 9,280,000One Vision. One Plan. One Voice.
Stand Alone Departments38

Program Summary: GF Allocation to Arterial Street Fund-Street Levy
Division: Stand Alone Departments
Fund Type: General Fund
Executive Summary:
This represents the General Fund All0cation to Arterial Streets. The annual allocation to Arterial Streets will be equivalent to the amount of the Street Levy for the year.
Programs and Services:
This General Fund allocation will be used to support the Debt Service for existing Street Bonds and to provide additional Street Capital & Maintenance dollars that will be used in coordination with Integrated Capital dollars and any State and Federal matching dollars. See Arterial Street Fund budget summary for more details.
FTEs
2015 Actual 2016 Actual 2017 Actual 2018 Budget 2019 Proposed
Total FTEs 0.00 0.00 0.00 0.00 0.00
Expenditures:
2015 Actual 2016 Actual 2017 Actual 2018 Budget 2019 Proposed
Capital Outlay 0 0 0 0 0
Interfund Charges 0 0 0 0 0
Reserve for Budget Adjustment 0 0 0 0 0
Transfers Out 8,444,700 9,100,000 9,550,000 9,280,000 9,280,000
Wages & Benefits 0 0 0 0 0
Supplies & Services 0 0 0 0 0
Debt Services 0 0 0 0 0
All Other 0 0 0 0 0
TOTAL 8,444,700 9,100,000 9,550,000 9,280,000 9,280,000
Expenditure Notes:
Revenues:
2015 Actual 2016 Actual 2017 Actual 2018 Budget 2019 Proposed
Taxes 0 0 0 0 0
Licenses & Permits 0 0 0 0 0
IG Revenue 0 0 0 0 0
Services 0 0 0 0 0
Fines & Forfeits 0 0 0 0 0
Operating Transfers In 0 0 0 0 0
General Fund Resources 8,444,700 9,100,000 9,550,000 9,280,000 9,280,000
All Other 0 0 0 0 0
TOTAL 8,444,700 9,100,000 9,550,000 9,280,000 9,280,000
Revenue Notes:
Stand Alone Departments 39

Program Summary: GF Allocation to Asset Management Operations
Division: Stand Alone Departments
Fund Type: General Fund
Executive Summary:
This represents the General Fund contribution to the Asset Management Fund.
Programs and Services:
The General Fund contribution covers the cost of City Hall Maintenance and other portions of Asset Management that cannot be billed to other departments.
FTEs
2015 Actual 2016 Actual 2017 Actual 2018 Budget 2019 Proposed
Total FTEs 0.00 0.00 0.00 0.00 0.00
Expenditures:
2015 Actual 2016 Actual 2017 Actual 2018 Budget 2019 Proposed
Capital Outlay 0 0 0 0 0
Interfund Charges 0 0 0 0 0
Reserve for Budget Adjustment 0 0 0 0 0
Transfers Out 795,000 856,000 899,376 1,535,000 1,572,000
Wages & Benefits 0 0 0 0 0
Supplies & Services 0 0 0 0 0
Debt Services 0 0 0 0 0
All Other 0 0 0 0 0
TOTAL 795,000 856,000 899,376 1,535,000 1,572,000
Expenditure Notes:
Revenues:
2015 Actual 2016 Actual 2017 Actual 2018 Budget 2019 Proposed
Taxes 0 0 0 0 0
Licenses & Permits 0 0 0 0 0
IG Revenue 0 0 0 0 0
Services 0 0 0 0 0
Fines & Forfeits 0 0 0 0 0
Operating Transfers In 0 0 0 0 0
General Fund Resources 795,000 856,000 899,376 1,535,000 1,572,000
All Other 0 0 0 0 0
TOTAL 795,000 856,000 899,376 1,535,000 1,572,000One Vision. One Plan. One Voice.
Stand Alone Departments40

Program Summary: GF Allocation to Asset Management Operations
Division: Stand Alone Departments
Fund Type: General Fund
Executive Summary:
This represents the General Fund contribution to the Asset Management Fund.
Programs and Services:
The General Fund contribution covers the cost of City Hall Maintenance and other portions of Asset Management that cannot be billed to other departments.
FTEs
2015 Actual 2016 Actual 2017 Actual 2018 Budget 2019 Proposed
Total FTEs 0.00 0.00 0.00 0.00 0.00
Expenditures:
2015 Actual 2016 Actual 2017 Actual 2018 Budget 2019 Proposed
Capital Outlay 0 0 0 0 0
Interfund Charges 0 0 0 0 0
Reserve for Budget Adjustment 0 0 0 0 0
Transfers Out 795,000 856,000 899,376 1,535,000 1,572,000
Wages & Benefits 0 0 0 0 0
Supplies & Services 0 0 0 0 0
Debt Services 0 0 0 0 0
All Other 0 0 0 0 0
TOTAL 795,000 856,000 899,376 1,535,000 1,572,000
Expenditure Notes:
Revenues:
2015 Actual 2016 Actual 2017 Actual 2018 Budget 2019 Proposed
Taxes 0 0 0 0 0
Licenses & Permits 0 0 0 0 0
IG Revenue 0 0 0 0 0
Services 0 0 0 0 0
Fines & Forfeits 0 0 0 0 0
Operating Transfers In 0 0 0 0 0
General Fund Resources 795,000 856,000 899,376 1,535,000 1,572,000
All Other 0 0 0 0 0
TOTAL 795,000 856,000 899,376 1,535,000 1,572,000
Revenue Notes:
Stand Alone Departments 41

Program Summary: GF Allocation to Code Enforcement
Division: Stand Alone Departments
Fund Type: General Fund
Executive Summary:
This represents the estimated General Fund Contribution to the Code Enforcement Special Revenue Fund.
Programs and Services:
For specifics on how these funds are used, refer to the Code Enforcement program summary.
FTEs
2015 Actual 2016 Actual 2017 Actual 2018 Budget 2019 Proposed
Total FTEs 0.00 0.00 0.00 0.00 0.00
Expenditures:
2015 Actual 2016 Actual 2017 Actual 2018 Budget 2019 Proposed
Capital Outlay 0 0 0 0 0
Interfund Charges 0 0 0 0 0
Reserve for Budget Adjustment 0 0 0 0 0
Transfers Out 562,817 752,622 561,709 837,830 817,564
Wages & Benefits 0 0 0 0 0
Supplies & Services 0 0 0 0 0
Debt Services 0 0 0 0 0
All Other 0 0 0 0 0
TOTAL 562,817 752,622 561,709 837,830 817,564
Expenditure Notes:
Revenues:
2015 Actual 2016 Actual 2017 Actual 2018 Budget 2019 Proposed
Taxes 0 0 0 0 0
Licenses & Permits 0 0 0 0 0
IG Revenue 0 0 0 0 0
Services 0 0 0 0 0
Fines & Forfeits 0 0 0 0 0
Operating Transfers In 0 0 0 0 0
General Fund Resources 562,817 752,622 561,709 837,830 817,564
All Other 0 0 0 0 0
TOTAL 562,817 752,622 561,709 837,830 817,564One Vision. One Plan. One Voice.
Stand Alone Departments42

Program Summary: GF Allocation to Code Enforcement
Division: Stand Alone Departments
Fund Type: General Fund
Executive Summary:
This represents the estimated General Fund Contribution to the Code Enforcement Special Revenue Fund.
Programs and Services:
For specifics on how these funds are used, refer to the Code Enforcement program summary.
FTEs
2015 Actual 2016 Actual 2017 Actual 2018 Budget 2019 Proposed
Total FTEs 0.00 0.00 0.00 0.00 0.00
Expenditures:
2015 Actual 2016 Actual 2017 Actual 2018 Budget 2019 Proposed
Capital Outlay 0 0 0 0 0
Interfund Charges 0 0 0 0 0
Reserve for Budget Adjustment 0 0 0 0 0
Transfers Out 562,817 752,622 561,709 837,830 817,564
Wages & Benefits 0 0 0 0 0
Supplies & Services 0 0 0 0 0
Debt Services 0 0 0 0 0
All Other 0 0 0 0 0
TOTAL 562,817 752,622 561,709 837,830 817,564
Expenditure Notes:
Revenues:
2015 Actual 2016 Actual 2017 Actual 2018 Budget 2019 Proposed
Taxes 0 0 0 0 0
Licenses & Permits 0 0 0 0 0
IG Revenue 0 0 0 0 0
Services 0 0 0 0 0
Fines & Forfeits 0 0 0 0 0
Operating Transfers In 0 0 0 0 0
General Fund Resources 562,817 752,622 561,709 837,830 817,564
All Other 0 0 0 0 0
TOTAL 562,817 752,622 561,709 837,830 817,564
Revenue Notes:
Stand Alone Departments 43

Program Summary: GF Allocation to Fire/EMS
Division: Stand Alone Departments
Fund Type: General Fund
Executive Summary:
This represents the estimated General Fund Contribution to the Fire/EMS Special Revenue Fund.
Programs and Services:
For specifics on how these funds are used, refer to the Fire/EMS program summary.
FTEs
2015 Actual 2016 Actual 2017 Actual 2018 Budget 2019 Proposed
Total FTEs 0.00 0.00 0.00 0.00 0.00
Expenditures:
2015 Actual 2016 Actual 2017 Actual 2018 Budget 2019 Proposed
Capital Outlay 0 0 0 0 0
Interfund Charges 0 0 0 0 0
Reserve for Budget Adjustment 0 0 0 0 0
Transfers Out 36,295,000 37,200,000 38,500,000 39,700,000 41,500,000
Wages & Benefits 0 0 0 0 0
Supplies & Services 0 0 0 0 0
Debt Services 0 0 0 0 0
All Other 0 0 0 0 0
TOTAL 36,295,000 37,200,000 38,500,000 39,700,000 41,500,000
Expenditure Notes:
Revenues:
2015 Actual 2016 Actual 2017 Actual 2018 Budget 2019 Proposed
Taxes 0 0 0 0 0
Licenses & Permits 0 0 0 0 0
IG Revenue 0 0 0 0 0
Services 0 0 0 0 0
Fines & Forfeits 0 0 0 0 0
Operating Transfers In 0 0 0 0 0
General Fund Resources 36,295,000 37,200,000 38,500,000 39,700,000 41,500,000
All Other 0 0 0 0 0
TOTAL 36,295,000 37,200,000 38,500,000 39,700,000 41,500,000One Vision. One Plan. One Voice.
Stand Alone Departments44

Program Summary: GF Allocation to Fire/EMS
Division: Stand Alone Departments
Fund Type: General Fund
Executive Summary:
This represents the estimated General Fund Contribution to the Fire/EMS Special Revenue Fund.
Programs and Services:
For specifics on how these funds are used, refer to the Fire/EMS program summary.
FTEs
2015 Actual 2016 Actual 2017 Actual 2018 Budget 2019 Proposed
Total FTEs 0.00 0.00 0.00 0.00 0.00
Expenditures:
2015 Actual 2016 Actual 2017 Actual 2018 Budget 2019 Proposed
Capital Outlay 0 0 0 0 0
Interfund Charges 0 0 0 0 0
Reserve for Budget Adjustment 0 0 0 0 0
Transfers Out 36,295,000 37,200,000 38,500,000 39,700,000 41,500,000
Wages & Benefits 0 0 0 0 0
Supplies & Services 0 0 0 0 0
Debt Services 0 0 0 0 0
All Other 0 0 0 0 0
TOTAL 36,295,000 37,200,000 38,500,000 39,700,000 41,500,000
Expenditure Notes:
Revenues:
2015 Actual 2016 Actual 2017 Actual 2018 Budget 2019 Proposed
Taxes 0 0 0 0 0
Licenses & Permits 0 0 0 0 0
IG Revenue 0 0 0 0 0
Services 0 0 0 0 0
Fines & Forfeits 0 0 0 0 0
Operating Transfers In 0 0 0 0 0
General Fund Resources 36,295,000 37,200,000 38,500,000 39,700,000 41,500,000
All Other 0 0 0 0 0
TOTAL 36,295,000 37,200,000 38,500,000 39,700,000 41,500,000
Revenue Notes:
Stand Alone Departments 45

Program Summary: GF Allocation to Intermodal Facility
Division: Stand Alone Departments
Fund Type: General Fund
Executive Summary:
This represents the estimated General Fund Contribution for Intermodal Facility operations.
Programs and Services:
For specifics on how these funds are used, refer to the Intermodal Facility program summary.
FTEs
2015 Actual 2016 Actual 2017 Actual 2018 Budget 2019 Proposed
Total FTEs 0.00 0.00 0.00 0.00 0.00
Expenditures:
2015 Actual 2016 Actual 2017 Actual 2018 Budget 2019 Proposed
Capital Outlay 0 0 0 0 0
Interfund Charges 0 0 0 0 0
Reserve for Budget Adjustment 0 0 0 0 0
Transfers Out 121,984 75,000 145,000 150,000 150,000
Wages & Benefits 0 0 0 0 0
Supplies & Services 0 0 0 0 0
Debt Services 0 0 0 0 0
All Other 0 0 0 0 0
TOTAL 121,984 75,000 145,000 150,000 150,000
Expenditure Notes:
Revenues:
2015 Actual 2016 Actual 2017 Actual 2018 Budget 2019 Proposed
Taxes 0 0 0 0 0
Licenses & Permits 0 0 0 0 0
IG Revenue 0 0 0 0 0
Services 0 0 0 0 0
Fines & Forfeits 0 0 0 0 0
Operating Transfers In 0 0 0 0 0
General Fund Resources 121,984 75,000 145,000 150,000 150,000
All Other 0 0 0 0 0
TOTAL 121,984 75,000 145,000 150,000 150,000One Vision. One Plan. One Voice.
Stand Alone Departments46

Program Summary: GF Allocation to Intermodal Facility
Division: Stand Alone Departments
Fund Type: General Fund
Executive Summary:
This represents the estimated General Fund Contribution for Intermodal Facility operations.
Programs and Services:
For specifics on how these funds are used, refer to the Intermodal Facility program summary.
FTEs
2015 Actual 2016 Actual 2017 Actual 2018 Budget 2019 Proposed
Total FTEs 0.00 0.00 0.00 0.00 0.00
Expenditures:
2015 Actual 2016 Actual 2017 Actual 2018 Budget 2019 Proposed
Capital Outlay 0 0 0 0 0
Interfund Charges 0 0 0 0 0
Reserve for Budget Adjustment 0 0 0 0 0
Transfers Out 121,984 75,000 145,000 150,000 150,000
Wages & Benefits 0 0 0 0 0
Supplies & Services 0 0 0 0 0
Debt Services 0 0 0 0 0
All Other 0 0 0 0 0
TOTAL 121,984 75,000 145,000 150,000 150,000
Expenditure Notes:
Revenues:
2015 Actual 2016 Actual 2017 Actual 2018 Budget 2019 Proposed
Taxes 0 0 0 0 0
Licenses & Permits 0 0 0 0 0
IG Revenue 0 0 0 0 0
Services 0 0 0 0 0
Fines & Forfeits 0 0 0 0 0
Operating Transfers In 0 0 0 0 0
General Fund Resources 121,984 75,000 145,000 150,000 150,000
All Other 0 0 0 0 0
TOTAL 121,984 75,000 145,000 150,000 150,000
Revenue Notes:
Stand Alone Departments 47
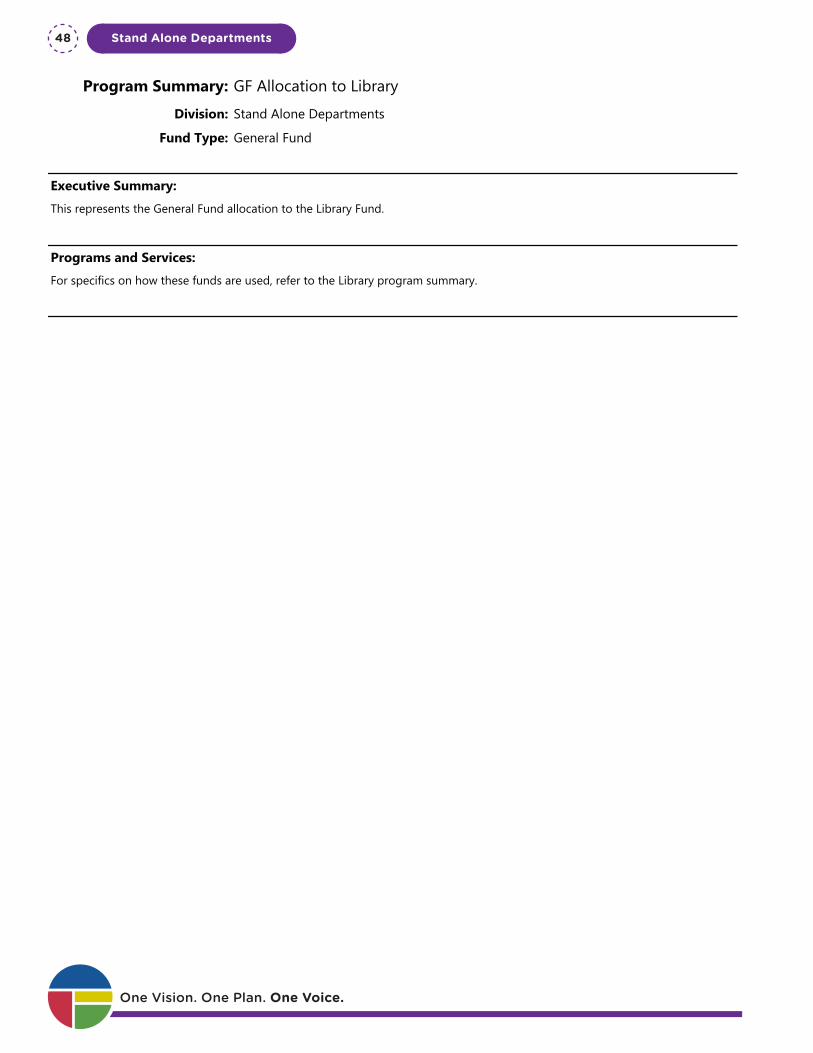
Program Summary: GF Allocation to Library
Division: Stand Alone Departments
Fund Type: General Fund
Executive Summary:
This represents the General Fund allocation to the Library Fund.
Programs and Services:
For specifics on how these funds are used, refer to the Library program summary.
FTEs
2015 Actual 2016 Actual 2017 Actual 2018 Budget 2019 Proposed
Total FTEs 0.00 0.00 0.00 0.00 0.00
Expenditures:
2015 Actual 2016 Actual 2017 Actual 2018 Budget 2019 Proposed
Capital Outlay 0 0 0 0 0
Interfund Charges 0 0 0 0 0
Reserve for Budget Adjustment 0 0 0 0 0
Transfers Out 9,003,397 9,228,482 8,383,482 8,600,000 8,825,000
Wages & Benefits 0 0 0 0 0
Supplies & Services 0 0 0 0 0
Debt Services 0 0 0 0 0
All Other 0 0 0 0 0
TOTAL 9,003,397 9,228,482 8,383,482 8,600,000 8,825,000
Expenditure Notes:
Revenues:
2015 Actual 2016 Actual 2017 Actual 2018 Budget 2019 Proposed
Taxes 0 0 0 0 0
Licenses & Permits 0 0 0 0 0
IG Revenue 0 0 0 0 0
Services 0 0 0 0 0
Fines & Forfeits 0 0 0 0 0
Operating Transfers In 0 0 0 0 0
General Fund Resources 9,003,397 9,228,482 8,383,482 8,600,000 8,825,000
All Other 0 0 0 0 0
TOTAL 9,003,397 9,228,482 8,383,482 8,600,000 8,825,000One Vision. One Plan. One Voice.
Stand Alone Departments48

Program Summary: GF Allocation to Library
Division: Stand Alone Departments
Fund Type: General Fund
Executive Summary:
This represents the General Fund allocation to the Library Fund.
Programs and Services:
For specifics on how these funds are used, refer to the Library program summary.
FTEs
2015 Actual 2016 Actual 2017 Actual 2018 Budget 2019 Proposed
Total FTEs 0.00 0.00 0.00 0.00 0.00
Expenditures:
2015 Actual 2016 Actual 2017 Actual 2018 Budget 2019 Proposed
Capital Outlay 0 0 0 0 0
Interfund Charges 0 0 0 0 0
Reserve for Budget Adjustment 0 0 0 0 0
Transfers Out 9,003,397 9,228,482 8,383,482 8,600,000 8,825,000
Wages & Benefits 0 0 0 0 0
Supplies & Services 0 0 0 0 0
Debt Services 0 0 0 0 0
All Other 0 0 0 0 0
TOTAL 9,003,397 9,228,482 8,383,482 8,600,000 8,825,000
Expenditure Notes:
Revenues:
2015 Actual 2016 Actual 2017 Actual 2018 Budget 2019 Proposed
Taxes 0 0 0 0 0
Licenses & Permits 0 0 0 0 0
IG Revenue 0 0 0 0 0
Services 0 0 0 0 0
Fines & Forfeits 0 0 0 0 0
Operating Transfers In 0 0 0 0 0
General Fund Resources 9,003,397 9,228,482 8,383,482 8,600,000 8,825,000
All Other 0 0 0 0 0
TOTAL 9,003,397 9,228,482 8,383,482 8,600,000 8,825,000
Revenue Notes:
Stand Alone Departments 49

Program Summary: GF Allocation to Miscellaneous Community Development Grants
Division: Stand Alone Departments
Fund Type: General Fund
Executive Summary:
This represents the General Fund allocation to the Community Housing and Human Services Miscellaneous Community Development Grants fund.
Programs and Services:
This General Fund contribution funds Safe and Healthy Strategic Investments in housing and vulnerable population. This funding will continue through 2021 to pursue the goals of the strategic plan.
FTEs
2015 Actual 2016 Actual 2017 Actual 2018 Budget 2019 Proposed
Total FTEs 0.00 0.00 0.00 0.00 0.00
Expenditures:
2015 Actual 2016 Actual 2017 Actual 2018 Budget 2019 Proposed
Capital Outlay 0 0 0 0 0
Interfund Charges 0 0 0 0 0
Reserve for Budget Adjustment 0 0 0 0 0
Transfers Out 0 0 0 0 722,181
Wages & Benefits 0 0 0 0 0
Supplies & Services 0 0 0 0 0
Debt Services 0 0 0 0 0
All Other 0 0 0 0 0
TOTAL 0 0 0 0 722,181
Expenditure Notes:
Beginning in the 2019 Budget, this General Fund contribution has been redirected from Street Operations to Community Housing and Human Services to fund Safe and Healthy Strategic Investments in housing and vulnerable population. This funding will continue through 2021 to pursue the goals of the strategic plan.
Revenues:
2015 Actual 2016 Actual 2017 Actual 2018 Budget 2019 Proposed
Taxes 0 0 0 0 0
Licenses & Permits 0 0 0 0 0
IG Revenue 0 0 0 0 0
Services 0 0 0 0 0
Fines & Forfeits 0 0 0 0 0
Operating Transfers In 0 0 0 0 0
General Fund Resources 0 0 0 0 722,181One Vision. One Plan. One Voice.
Stand Alone Departments50

Program Summary: GF Allocation to Miscellaneous Community Development Grants
Division: Stand Alone Departments
Fund Type: General Fund
Executive Summary:
This represents the General Fund allocation to the Community Housing and Human Services Miscellaneous Community Development Grants fund.
Programs and Services:
This General Fund contribution funds Safe and Healthy Strategic Investments in housing and vulnerable population. This funding will continue through 2021 to pursue the goals of the strategic plan.
FTEs
2015 Actual 2016 Actual 2017 Actual 2018 Budget 2019 Proposed
Total FTEs 0.00 0.00 0.00 0.00 0.00
Expenditures:
2015 Actual 2016 Actual 2017 Actual 2018 Budget 2019 Proposed
Capital Outlay 0 0 0 0 0
Interfund Charges 0 0 0 0 0
Reserve for Budget Adjustment 0 0 0 0 0
Transfers Out 0 0 0 0 722,181
Wages & Benefits 0 0 0 0 0
Supplies & Services 0 0 0 0 0
Debt Services 0 0 0 0 0
All Other 0 0 0 0 0
TOTAL 0 0 0 0 722,181
Expenditure Notes:
Beginning in the 2019 Budget, this General Fund contribution has been redirected from Street Operations to Community Housing and Human Services to fund Safe and Healthy Strategic Investments in housing and vulnerable population. This funding will continue through 2021 to pursue the goals of the strategic plan.
Revenues:
2015 Actual 2016 Actual 2017 Actual 2018 Budget 2019 Proposed
Taxes 0 0 0 0 0
Licenses & Permits 0 0 0 0 0
IG Revenue 0 0 0 0 0
Services 0 0 0 0 0
Fines & Forfeits 0 0 0 0 0
Operating Transfers In 0 0 0 0 0
General Fund Resources 0 0 0 0 722,181
All Other 0 0 0 0 0
TOTAL 0 0 0 0 722,181
Revenue Notes:
Stand Alone Departments 51
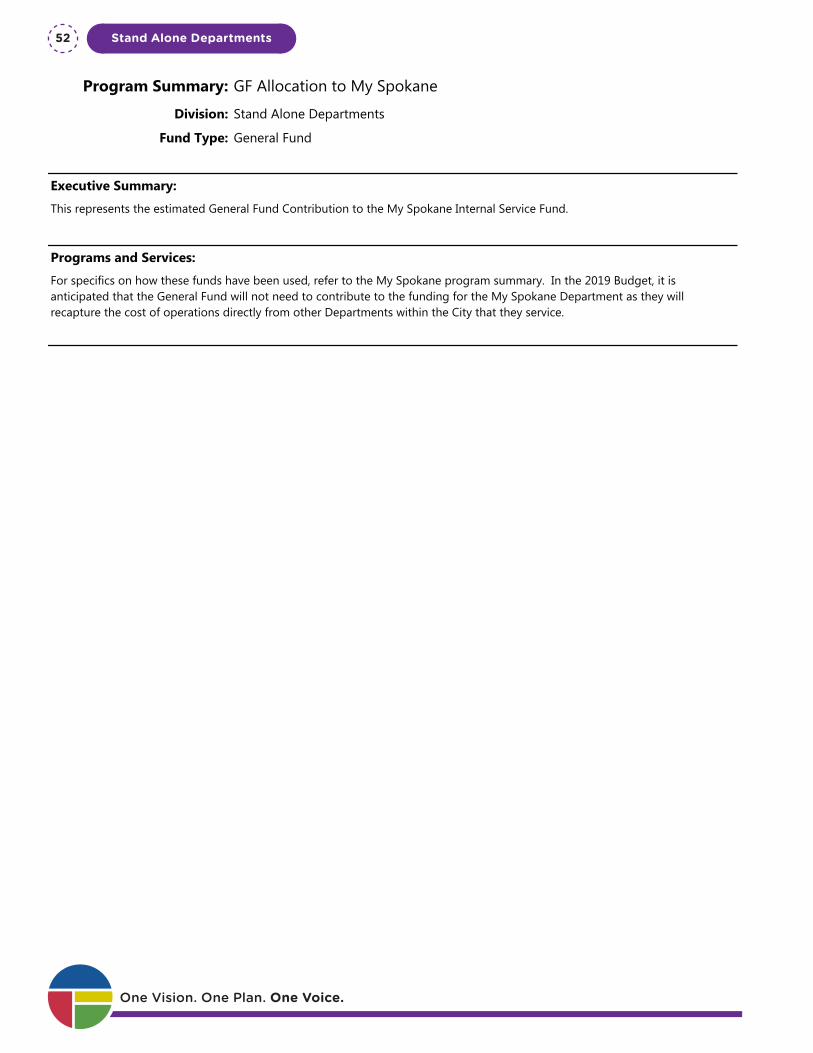
Program Summary: GF Allocation to My Spokane
Division: Stand Alone Departments
Fund Type: General Fund
Executive Summary:
This represents the estimated General Fund Contribution to the My Spokane Internal Service Fund.
Programs and Services:
For specifics on how these funds have been used, refer to the My Spokane program summary. In the 2019 Budget, it is anticipated that the General Fund will not need to contribute to the funding for the My Spokane Department as they will recapture the cost of operations directly from other Departments within the City that they service.
FTEs
2015 Actual 2016 Actual 2017 Actual 2018 Budget 2019 Proposed
Total FTEs 0.00 0.00 0.00 0.00 0.00
Expenditures:
2015 Actual 2016 Actual 2017 Actual 2018 Budget 2019 Proposed
Capital Outlay 0 0 0 0 0
Interfund Charges 0 0 0 0 0
Reserve for Budget Adjustment 0 0 0 0 0
Transfers Out 0 0 30,697 280,747 0
Wages & Benefits 0 0 0 0 0
Supplies & Services 0 0 0 0 0
Debt Services 0 0 0 0 0
All Other 0 0 0 0 0
TOTAL 0 0 30,697 280,747 0
Expenditure Notes:
Revenues:
2015 Actual 2016 Actual 2017 Actual 2018 Budget 2019 Proposed
Taxes 0 0 0 0 0
Licenses & Permits 0 0 0 0 0
IG Revenue 0 0 0 0 0
Services 0 0 0 0 0
Fines & Forfeits 0 0 0 0 0
Operating Transfers In 0 0 0 0 0
General Fund Resources 0 0 30,697 280,747 0
All Other 0 0 0 0 0One Vision. One Plan. One Voice.
Stand Alone Departments52

Program Summary: GF Allocation to My Spokane
Division: Stand Alone Departments
Fund Type: General Fund
Executive Summary:
This represents the estimated General Fund Contribution to the My Spokane Internal Service Fund.
Programs and Services:
For specifics on how these funds have been used, refer to the My Spokane program summary. In the 2019 Budget, it is anticipated that the General Fund will not need to contribute to the funding for the My Spokane Department as they will recapture the cost of operations directly from other Departments within the City that they service.
FTEs
2015 Actual 2016 Actual 2017 Actual 2018 Budget 2019 Proposed
Total FTEs 0.00 0.00 0.00 0.00 0.00
Expenditures:
2015 Actual 2016 Actual 2017 Actual 2018 Budget 2019 Proposed
Capital Outlay 0 0 0 0 0
Interfund Charges 0 0 0 0 0
Reserve for Budget Adjustment 0 0 0 0 0
Transfers Out 0 0 30,697 280,747 0
Wages & Benefits 0 0 0 0 0
Supplies & Services 0 0 0 0 0
Debt Services 0 0 0 0 0
All Other 0 0 0 0 0
TOTAL 0 0 30,697 280,747 0
Expenditure Notes:
Revenues:
2015 Actual 2016 Actual 2017 Actual 2018 Budget 2019 Proposed
Taxes 0 0 0 0 0
Licenses & Permits 0 0 0 0 0
IG Revenue 0 0 0 0 0
Services 0 0 0 0 0
Fines & Forfeits 0 0 0 0 0
Operating Transfers In 0 0 0 0 0
General Fund Resources 0 0 30,697 280,747 0
All Other 0 0 0 0 0
TOTAL 0 0 30,697 280,747 0
Revenue Notes:
Stand Alone Departments 53

Program Summary: GF Allocation to Parking Fund
Division: Stand Alone Departments
Fund Type: General Fund
Executive Summary:
This represents the estimated General Fund Contribution to the Parking Fund Special Revenue Fund.
Programs and Services:
For specifics on how these funds are used, refer to the Parking System program summary.
FTEs
2015 Actual 2016 Actual 2017 Actual 2018 Budget 2019 Proposed
Total FTEs 0.00 0.00 0.00 0.00 0.00
Expenditures:
2015 Actual 2016 Actual 2017 Actual 2018 Budget 2019 Proposed
Capital Outlay 0 0 0 0 0
Interfund Charges 0 0 0 0 0
Reserve for Budget Adjustment 0 0 0 0 0
Transfers Out 1,200,000 1,200,000 1,000,000 1,250,000 1,250,000
Wages & Benefits 0 0 0 0 0
Supplies & Services 0 0 0 0 0
Debt Services 0 0 0 0 0
All Other 0 0 0 0 0
TOTAL 1,200,000 1,200,000 1,000,000 1,250,000 1,250,000
Expenditure Notes:
Revenues:
2015 Actual 2016 Actual 2017 Actual 2018 Budget 2019 Proposed
Taxes 0 0 0 0 0
Licenses & Permits 0 0 0 0 0
IG Revenue 0 0 0 0 0
Services 0 0 0 0 0
Fines & Forfeits 0 0 0 0 0
Operating Transfers In 0 0 0 0 0
General Fund Resources 1,200,000 1,200,000 1,000,000 1,250,000 1,250,000
All Other 0 0 0 0 0
TOTAL 1,200,000 1,200,000 1,000,000 1,250,000 1,250,000One Vision. One Plan. One Voice.
Stand Alone Departments54
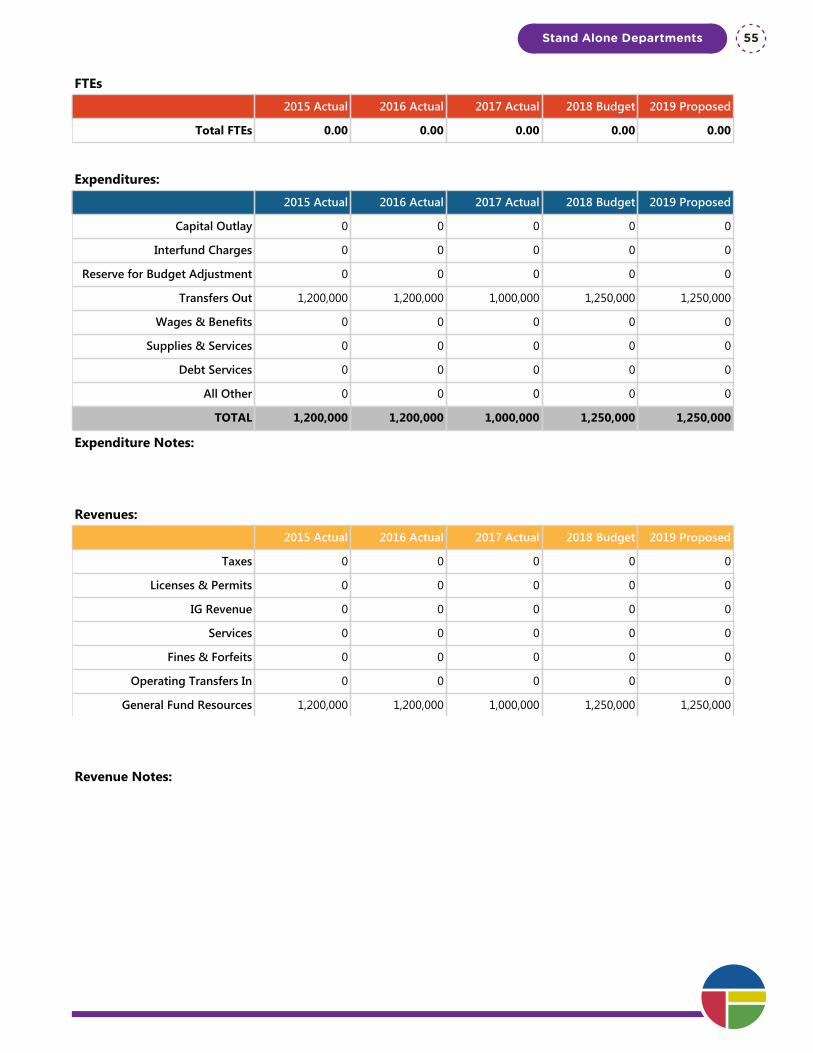
Program Summary: GF Allocation to Parking Fund
Division: Stand Alone Departments
Fund Type: General Fund
Executive Summary:
This represents the estimated General Fund Contribution to the Parking Fund Special Revenue Fund.
Programs and Services:
For specifics on how these funds are used, refer to the Parking System program summary.
FTEs
2015 Actual 2016 Actual 2017 Actual 2018 Budget 2019 Proposed
Total FTEs 0.00 0.00 0.00 0.00 0.00
Expenditures:
2015 Actual 2016 Actual 2017 Actual 2018 Budget 2019 Proposed
Capital Outlay 0 0 0 0 0
Interfund Charges 0 0 0 0 0
Reserve for Budget Adjustment 0 0 0 0 0
Transfers Out 1,200,000 1,200,000 1,000,000 1,250,000 1,250,000
Wages & Benefits 0 0 0 0 0
Supplies & Services 0 0 0 0 0
Debt Services 0 0 0 0 0
All Other 0 0 0 0 0
TOTAL 1,200,000 1,200,000 1,000,000 1,250,000 1,250,000
Expenditure Notes:
Revenues:
2015 Actual 2016 Actual 2017 Actual 2018 Budget 2019 Proposed
Taxes 0 0 0 0 0
Licenses & Permits 0 0 0 0 0
IG Revenue 0 0 0 0 0
Services 0 0 0 0 0
Fines & Forfeits 0 0 0 0 0
Operating Transfers In 0 0 0 0 0
General Fund Resources 1,200,000 1,200,000 1,000,000 1,250,000 1,250,000
All Other 0 0 0 0 0
TOTAL 1,200,000 1,200,000 1,000,000 1,250,000 1,250,000
Revenue Notes:
Stand Alone Departments 55

Program Summary: GF Allocation to Parks & Recreation
Division: Stand Alone Departments
Fund Type: General Fund
Executive Summary:
This represents the General Fund allocation to Parks and Recreation.
Programs and Services:
For specifics on how these funds are used, please refer to the various Parks Department program summaries.
FTEs
2015 Actual 2016 Actual 2017 Actual 2018 Budget 2019 Proposed
Total FTEs 0.00 0.00 0.00 0.00 0.00
Expenditures:
2015 Actual 2016 Actual 2017 Actual 2018 Budget 2019 Proposed
Capital Outlay 0 0 0 0 0
Interfund Charges 0 0 0 0 0
Reserve for Budget Adjustment 0 0 0 0 0
Transfers Out 12,870,514 13,439,508 13,742,971 14,225,042 14,547,832
Wages & Benefits 0 0 0 0 0
Supplies & Services 0 0 0 0 0
Debt Services 0 0 0 0 0
All Other 0 0 0 0 0
TOTAL 12,870,514 13,439,508 13,742,971 14,225,042 14,547,832
Expenditure Notes:
Revenues:
2015 Actual 2016 Actual 2017 Actual 2018 Budget 2019 Proposed
Taxes 0 0 0 0 0
Licenses & Permits 0 0 0 0 0
IG Revenue 0 0 0 0 0
Services 0 0 0 0 0
Fines & Forfeits 0 0 0 0 0
Operating Transfers In 0 0 0 0 0
General Fund Resources 12,870,514 13,439,508 13,742,971 14,225,042 14,547,832
All Other 0 0 0 0 0
TOTAL 12,870,514 13,439,508 13,742,971 14,225,042 14,547,832One Vision. One Plan. One Voice.
Stand Alone Departments56

Program Summary: GF Allocation to Parks & Recreation
Division: Stand Alone Departments
Fund Type: General Fund
Executive Summary:
This represents the General Fund allocation to Parks and Recreation.
Programs and Services:
For specifics on how these funds are used, please refer to the various Parks Department program summaries.
FTEs
2015 Actual 2016 Actual 2017 Actual 2018 Budget 2019 Proposed
Total FTEs 0.00 0.00 0.00 0.00 0.00
Expenditures:
2015 Actual 2016 Actual 2017 Actual 2018 Budget 2019 Proposed
Capital Outlay 0 0 0 0 0
Interfund Charges 0 0 0 0 0
Reserve for Budget Adjustment 0 0 0 0 0
Transfers Out 12,870,514 13,439,508 13,742,971 14,225,042 14,547,832
Wages & Benefits 0 0 0 0 0
Supplies & Services 0 0 0 0 0
Debt Services 0 0 0 0 0
All Other 0 0 0 0 0
TOTAL 12,870,514 13,439,508 13,742,971 14,225,042 14,547,832
Expenditure Notes:
Revenues:
2015 Actual 2016 Actual 2017 Actual 2018 Budget 2019 Proposed
Taxes 0 0 0 0 0
Licenses & Permits 0 0 0 0 0
IG Revenue 0 0 0 0 0
Services 0 0 0 0 0
Fines & Forfeits 0 0 0 0 0
Operating Transfers In 0 0 0 0 0
General Fund Resources 12,870,514 13,439,508 13,742,971 14,225,042 14,547,832
All Other 0 0 0 0 0
TOTAL 12,870,514 13,439,508 13,742,971 14,225,042 14,547,832
Revenue Notes:
Stand Alone Departments 57
Program Summary: GF Allocation to Public Safety Capital
Division: Stand Alone Departments
Fund Type: General Fund
Executive Summary:
This allocation represents a General Fund allocation for public safety capital. The funds will be used for Debt Service on a Public Safety Capital Bond that was approved in 2014. Bond proceeds will be used to procure police vehicles, fire apparatus, and other operational capital items.
Programs and Services:
In the early years of this program, the allocation from the General Fund will be higher than the scheduled Debt Service. These excess dollars will be set aside to cover the higher debt service in the later years.
FTEs
2015 Actual 2016 Actual 2017 Actual 2018 Budget 2019 Proposed
Total FTEs 0.00 0.00 0.00 0.00 0.00
Expenditures:
2015 Actual 2016 Actual 2017 Actual 2018 Budget 2019 Proposed
Capital Outlay 0 0 0 0 0
Interfund Charges 0 0 0 0 0
Reserve for Budget Adjustment 0 0 0 0 0
Transfers Out 1,500,000 2,300,000 3,100,000 3,930,000 3,930,000
Wages & Benefits 0 0 0 0 0
Supplies & Services 0 0 0 0 0
Debt Services 0 0 0 0 0
All Other 0 0 0 0 0
TOTAL 1,500,000 2,300,000 3,100,000 3,930,000 3,930,000
Expenditure Notes:
Revenues:
2015 Actual 2016 Actual 2017 Actual 2018 Budget 2019 Proposed
Taxes 0 0 0 0 0
Licenses & Permits 0 0 0 0 0
IG Revenue 0 0 0 0 0
Services 0 0 0 0 0
Fines & Forfeits 0 0 0 0 0
Operating Transfers In 0 0 0 0 0
General Fund Resources 1,500,000 2,300,000 3,100,000 3,930,000 3,930,000One Vision. One Plan. One Voice.
Stand Alone Departments58

Program Summary: GF Allocation to Public Safety Capital
Division: Stand Alone Departments
Fund Type: General Fund
Executive Summary:
This allocation represents a General Fund allocation for public safety capital. The funds will be used for Debt Service on a Public Safety Capital Bond that was approved in 2014. Bond proceeds will be used to procure police vehicles, fire apparatus, and other operational capital items.
Programs and Services:
In the early years of this program, the allocation from the General Fund will be higher than the scheduled Debt Service. These excess dollars will be set aside to cover the higher debt service in the later years.
FTEs
2015 Actual 2016 Actual 2017 Actual 2018 Budget 2019 Proposed
Total FTEs 0.00 0.00 0.00 0.00 0.00
Expenditures:
2015 Actual 2016 Actual 2017 Actual 2018 Budget 2019 Proposed
Capital Outlay 0 0 0 0 0
Interfund Charges 0 0 0 0 0
Reserve for Budget Adjustment 0 0 0 0 0
Transfers Out 1,500,000 2,300,000 3,100,000 3,930,000 3,930,000
Wages & Benefits 0 0 0 0 0
Supplies & Services 0 0 0 0 0
Debt Services 0 0 0 0 0
All Other 0 0 0 0 0
TOTAL 1,500,000 2,300,000 3,100,000 3,930,000 3,930,000
Expenditure Notes:
Revenues:
2015 Actual 2016 Actual 2017 Actual 2018 Budget 2019 Proposed
Taxes 0 0 0 0 0
Licenses & Permits 0 0 0 0 0
IG Revenue 0 0 0 0 0
Services 0 0 0 0 0
Fines & Forfeits 0 0 0 0 0
Operating Transfers In 0 0 0 0 0
General Fund Resources 1,500,000 2,300,000 3,100,000 3,930,000 3,930,000
All Other 0 0 0 0 0
TOTAL 1,500,000 2,300,000 3,100,000 3,930,000 3,930,000
Revenue Notes:
Stand Alone Departments 59

Program Summary: GF Allocation to Street Maintenance
Division: Stand Alone Departments
Fund Type: General Fund
Executive Summary:
This represents the General Fund Contribution to the Street Department Special Revenue Fund.
Programs and Services:
For specifics on how these funds have been used, refer to the various Street Department program summaries.
FTEs
2015 Actual 2016 Actual 2017 Actual 2018 Budget 2019 Proposed
Total FTEs 0.00 0.00 0.00 0.00 0.00
Expenditures:
2015 Actual 2016 Actual 2017 Actual 2018 Budget 2019 Proposed
Capital Outlay 0 0 0 0 0
Interfund Charges 0 0 0 0 0
Reserve for Budget Adjustment 0 0 0 0 0
Transfers Out 1,293,179 893,179 900,000 722,181 0
Wages & Benefits 0 0 0 0 0
Supplies & Services 0 0 0 0 0
Debt Services 0 0 0 0 0
All Other 0 0 0 0 0
TOTAL 1,293,179 893,179 900,000 722,181 0
Expenditure Notes:
Beginning in the 2019 Budget, the General Fund contribution has been redirected to Community Housing and Human Services to fund Safe and Healthy Strategic Investments in housing and vulnerable population. This funding will continue through 2021 to pursue the goals of the strategic plan. The reduction in funding from the General Fund will be offset in Street Operations by an increased funding from Real Estate Excise Taxes.
Revenues:
2015 Actual 2016 Actual 2017 Actual 2018 Budget 2019 Proposed
Taxes 0 0 0 0 0
Licenses & Permits 0 0 0 0 0
IG Revenue 0 0 0 0 0
Services 0 0 0 0 0
Fines & Forfeits 0 0 0 0 0
Operating Transfers In 0 0 0 0 0
General Fund Resources 1,293,179 893,179 900,000 722,181 0One Vision. One Plan. One Voice.
Stand Alone Departments60
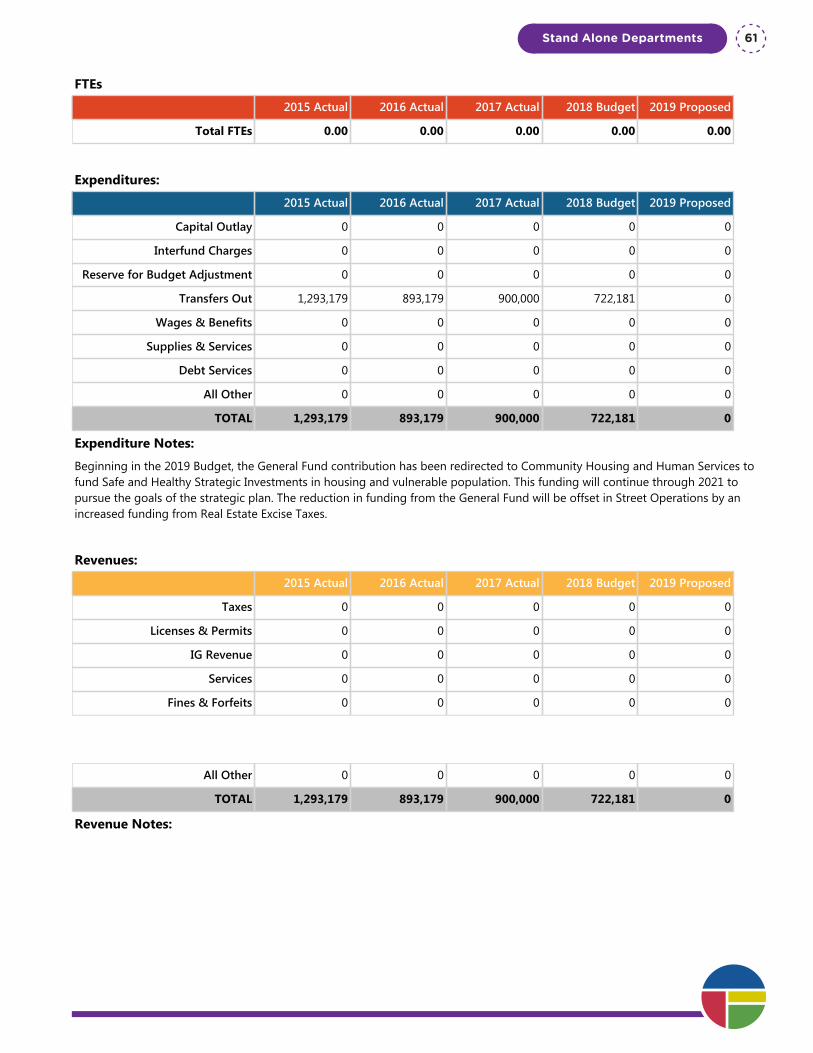
Program Summary: GF Allocation to Street Maintenance
Division: Stand Alone Departments
Fund Type: General Fund
Executive Summary:
This represents the General Fund Contribution to the Street Department Special Revenue Fund.
Programs and Services:
For specifics on how these funds have been used, refer to the various Street Department program summaries.
FTEs
2015 Actual 2016 Actual 2017 Actual 2018 Budget 2019 Proposed
Total FTEs 0.00 0.00 0.00 0.00 0.00
Expenditures:
2015 Actual 2016 Actual 2017 Actual 2018 Budget 2019 Proposed
Capital Outlay 0 0 0 0 0
Interfund Charges 0 0 0 0 0
Reserve for Budget Adjustment 0 0 0 0 0
Transfers Out 1,293,179 893,179 900,000 722,181 0
Wages & Benefits 0 0 0 0 0
Supplies & Services 0 0 0 0 0
Debt Services 0 0 0 0 0
All Other 0 0 0 0 0
TOTAL 1,293,179 893,179 900,000 722,181 0
Expenditure Notes:
Beginning in the 2019 Budget, the General Fund contribution has been redirected to Community Housing and Human Services to fund Safe and Healthy Strategic Investments in housing and vulnerable population. This funding will continue through 2021 to pursue the goals of the strategic plan. The reduction in funding from the General Fund will be offset in Street Operations by an increased funding from Real Estate Excise Taxes.
Revenues:
2015 Actual 2016 Actual 2017 Actual 2018 Budget 2019 Proposed
Taxes 0 0 0 0 0
Licenses & Permits 0 0 0 0 0
IG Revenue 0 0 0 0 0
Services 0 0 0 0 0
Fines & Forfeits 0 0 0 0 0
Operating Transfers In 0 0 0 0 0
General Fund Resources 1,293,179 893,179 900,000 722,181 0
All Other 0 0 0 0 0
TOTAL 1,293,179 893,179 900,000 722,181 0
Revenue Notes:
Stand Alone Departments 61
Program Summary: GF Allocation to Urban Forstry
Division: Stand Alone Departments
Fund Type: General Fund
Executive Summary:
This represents the General Fund allocation to Urban Forestry.
Programs and Services:
For specifics on how these funds will be used, please refer to the Urban Forestry program summary in the Parks and Recreation Department.
FTEs
2015 Actual 2016 Actual 2017 Actual 2018 Budget 2019 Proposed
Total FTEs 0.00 0.00 0.00 0.00 0.00
Expenditures:
2015 Actual 2016 Actual 2017 Actual 2018 Budget 2019 Proposed
Capital Outlay 0 0 0 0 0
Interfund Charges 0 0 0 0 0
Reserve for Budget Adjustment 0 0 0 0 0
Transfers Out 66,000 66,000 66,000 66,000 66,000
Wages & Benefits 0 0 0 0 0
Supplies & Services 0 0 0 0 0
Debt Services 0 0 0 0 0
All Other 0 0 0 0 0
TOTAL 66,000 66,000 66,000 66,000 66,000
Expenditure Notes:
Revenues:
2015 Actual 2016 Actual 2017 Actual 2018 Budget 2019 Proposed
Taxes 0 0 0 0 0
Licenses & Permits 0 0 0 0 0
IG Revenue 0 0 0 0 0
Services 0 0 0 0 0
Fines & Forfeits 0 0 0 0 0
Operating Transfers In 0 0 0 0 0
General Fund Resources 66,000 66,000 66,000 66,000 66,000
All Other 0 0 0 0 0
TOTAL 66,000 66,000 66,000 66,000 66,000One Vision. One Plan. One Voice.
Stand Alone Departments62

Program Summary: GF Allocation to Urban Forstry
Division: Stand Alone Departments
Fund Type: General Fund
Executive Summary:
This represents the General Fund allocation to Urban Forestry.
Programs and Services:
For specifics on how these funds will be used, please refer to the Urban Forestry program summary in the Parks and Recreation Department.
FTEs
2015 Actual 2016 Actual 2017 Actual 2018 Budget 2019 Proposed
Total FTEs 0.00 0.00 0.00 0.00 0.00
Expenditures:
2015 Actual 2016 Actual 2017 Actual 2018 Budget 2019 Proposed
Capital Outlay 0 0 0 0 0
Interfund Charges 0 0 0 0 0
Reserve for Budget Adjustment 0 0 0 0 0
Transfers Out 66,000 66,000 66,000 66,000 66,000
Wages & Benefits 0 0 0 0 0
Supplies & Services 0 0 0 0 0
Debt Services 0 0 0 0 0
All Other 0 0 0 0 0
TOTAL 66,000 66,000 66,000 66,000 66,000
Expenditure Notes:
Revenues:
2015 Actual 2016 Actual 2017 Actual 2018 Budget 2019 Proposed
Taxes 0 0 0 0 0
Licenses & Permits 0 0 0 0 0
IG Revenue 0 0 0 0 0
Services 0 0 0 0 0
Fines & Forfeits 0 0 0 0 0
Operating Transfers In 0 0 0 0 0
General Fund Resources 66,000 66,000 66,000 66,000 66,000
All Other 0 0 0 0 0
TOTAL 66,000 66,000 66,000 66,000 66,000
Revenue Notes:
Stand Alone Departments 63

One Vision. One Plan. One Voice.
Stand Alone Departments64
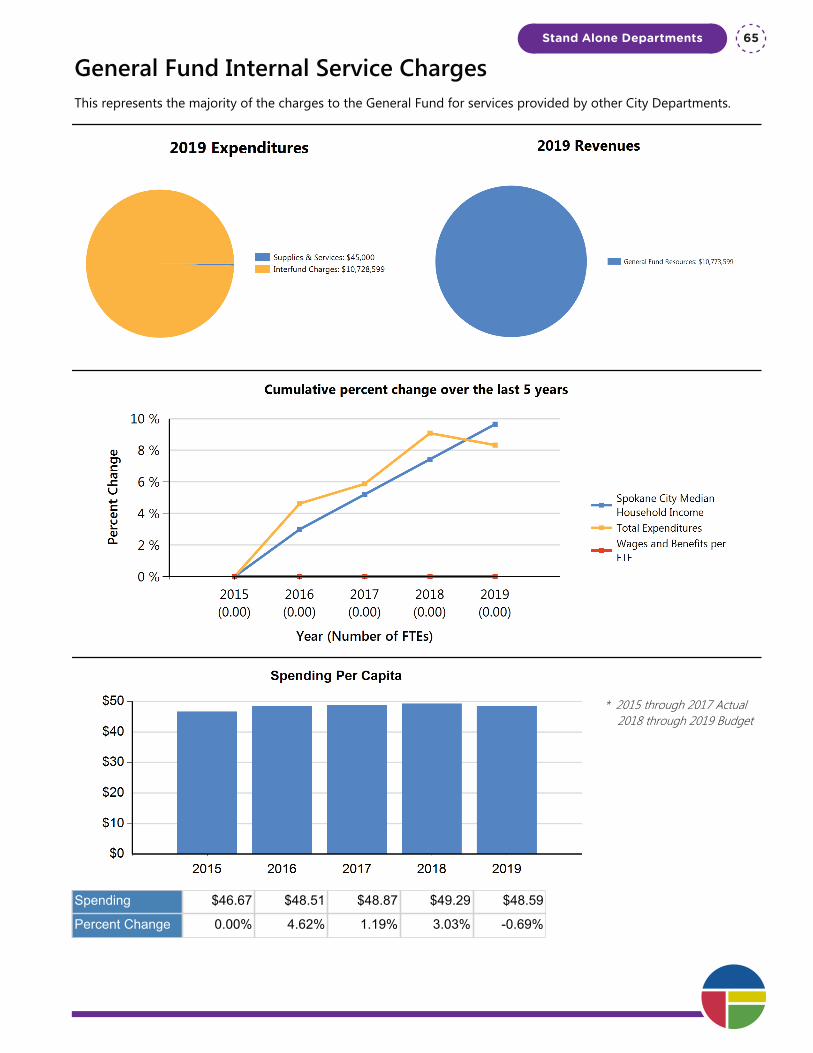
General Fund Internal Service ChargesThis represents the majority of the charges to the General Fund for services provided by other City Departments.
* 2015 through 2017 Actual 2018 through 2019 Budget
Spending $46.67 $48.51 $48.87 $49.29 $48.59
Percent Change 0.00% 4.62% 1.19% 3.03% -0.69%
Stand Alone Departments 65

Department Summary: General Fund Internal Service Charges
Division: Stand Alone Departments
Fund Type: General Fund
Executive Summary:
This represents the majority of the charges to the General Fund for services provided by other City Departments.
Programs and Services:
General Fund Internal Service expenses include Accounting Services, Purchasing Services, IT Services , Insurance (Liability, Workers Compensation, Unemployment) and Fleet Maintenance and Fuel.
FTEs
2015 Actual 2016 Actual 2017 Actual 2018 Budget 2019 Proposed
Total FTEs 0.00 0.00 0.00 0.00 0.00
Expenditures:
2015 Actual 2016 Actual 2017 Actual 2018 Budget 2019 Proposed
Capital Outlay 156,574 93,797 4,306 0 0
Interfund Charges 9,028,733 10,237,444 10,472,159 10,795,569 10,728,599
Reserve for Budget Adjustment 0 0 0 0 0
Transfers Out 0 0 0 0 0
Wages & Benefits 0 0 0 0 0
Supplies & Services 759,761 73,975 52,858 52,918 45,000
Debt Services 0 0 0 0 0
All Other 0 12 0 0 0
TOTAL 9,945,068 10,405,228 10,529,323 10,848,487 10,773,599
Expenditure Notes:
Revenues:
2015 Actual 2016 Actual 2017 Actual 2018 Budget 2019 Proposed
Taxes 0 0 0 0 0
Licenses & Permits 0 0 0 0 0
IG Revenue 0 0 0 0 0
Services 0 0 0 0 0
Fines & Forfeits 0 0 0 0 0
Operating Transfers In 0 0 0 0 0
General Fund Resources 9,945,068 10,405,228 10,529,323 10,848,487 10,773,599
All Other 0 0 0 0 0
TOTAL 9,945,068 10,405,228 10,529,323 10,848,487 10,773,599One Vision. One Plan. One Voice.
Stand Alone Departments66

Department Summary: General Fund Internal Service Charges
Division: Stand Alone Departments
Fund Type: General Fund
Executive Summary:
This represents the majority of the charges to the General Fund for services provided by other City Departments.
Programs and Services:
General Fund Internal Service expenses include Accounting Services, Purchasing Services, IT Services , Insurance (Liability, Workers Compensation, Unemployment) and Fleet Maintenance and Fuel.
FTEs
2015 Actual 2016 Actual 2017 Actual 2018 Budget 2019 Proposed
Total FTEs 0.00 0.00 0.00 0.00 0.00
Expenditures:
2015 Actual 2016 Actual 2017 Actual 2018 Budget 2019 Proposed
Capital Outlay 156,574 93,797 4,306 0 0
Interfund Charges 9,028,733 10,237,444 10,472,159 10,795,569 10,728,599
Reserve for Budget Adjustment 0 0 0 0 0
Transfers Out 0 0 0 0 0
Wages & Benefits 0 0 0 0 0
Supplies & Services 759,761 73,975 52,858 52,918 45,000
Debt Services 0 0 0 0 0
All Other 0 12 0 0 0
TOTAL 9,945,068 10,405,228 10,529,323 10,848,487 10,773,599
Expenditure Notes:
Revenues:
2015 Actual 2016 Actual 2017 Actual 2018 Budget 2019 Proposed
Taxes 0 0 0 0 0
Licenses & Permits 0 0 0 0 0
IG Revenue 0 0 0 0 0
Services 0 0 0 0 0
Fines & Forfeits 0 0 0 0 0
Operating Transfers In 0 0 0 0 0
General Fund Resources 9,945,068 10,405,228 10,529,323 10,848,487 10,773,599
All Other 0 0 0 0 0
TOTAL 9,945,068 10,405,228 10,529,323 10,848,487 10,773,599
Revenue Notes:
Stand Alone Departments 67

One Vision. One Plan. One Voice.
Stand Alone Departments68
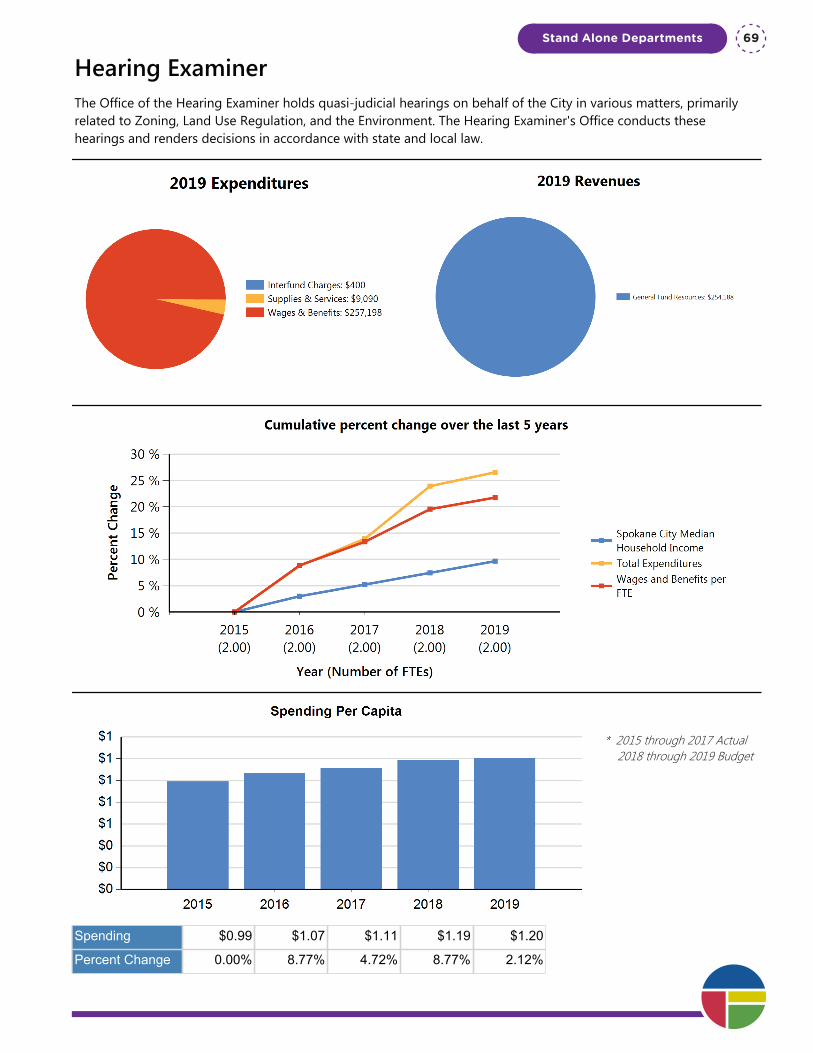
Hearing ExaminerThe Office of the Hearing Examiner holds quasi-judicial hearings on behalf of the City in various matters, primarily related to Zoning, Land Use Regulation, and the Environment. The Hearing Examiner's Office conducts these hearings and renders decisions in accordance with state and local law.
* 2015 through 2017 Actual 2018 through 2019 Budget
Spending $0.99 $1.07 $1.11 $1.19 $1.20
Percent Change 0.00% 8.77% 4.72% 8.77% 2.12%
Stand Alone Departments 69
Department Summary: Hearing Examiner
Division: Stand Alone Departments
Fund Type: General Fund
Executive Summary:
The Office of the Hearing Examiner holds quasi-judicial hearings on behalf of the City in various matters, primarily related to Zoning, Land Use Regulation, and the Environment. The Hearing Examiner's Office conducts these hearings and renders decisions in accordance with state and local law.
Programs and Services:
Citizens have a right to appear at a hearing and comment upon a project being proposed in their neighborhood or which affects their property. The development community has the right to have permit applications handled expeditiously, in a consistent way, and in accordance with the relevant laws, rules and policies. Citizens should also have the right to appeal an administrative decision that the feel is wrong within the City structure without having to incur the expense of going to court. It is important that these hearings not only be fair but appear fair, and that the decisions made on these matters be not only fair but consistent. The City could face liability if its decisions, especially its land use decisions, are found to be arbitrary. Therefore, the Hearing Examiner’s Office has an obligation, which it will carry out, to hold fair and impartial hearings and render consistent and legally defensible decisions. Expediency is also an important issue. The Hearing Examiner’s Office has the experience and expertise to schedule hearings as quickly as possible and render decisions in a timely fashion. This office has the knowledge and expertise to provide information and respond to the questions and requests coming from the public and from other City departments on all the various matters. This serves the citizens, the business community, and the City at large. Some revenues are derived through the Examiner holding hearings for other cities and agencies, although the amount of that revenue varies from year to year.
FTEs
2015 Actual 2016 Actual 2017 Actual 2018 Budget 2019 Proposed
Total FTEs 2.00 2.00 2.00 2.00 2.00
Expenditures:
2015 Actual 2016 Actual 2017 Actual 2018 Budget 2019 Proposed
Capital Outlay 0 0 0 0 0
Interfund Charges 0 109 125 400 400
Reserve for Budget Adjustment 0 0 0 0 0
Transfers Out 0 0 0 0 0
Wages & Benefits 208,334 226,815 236,962 251,637 257,198
Supplies & Services 2,407 2,302 2,967 9,090 9,090
Debt Services 0 0 0 0 0
All Other 0 0 0 0 0
TOTAL 210,741 229,226 240,054 261,127 266,688
Expenditure Notes:
Revenues:
2015 Actual 2016 Actual 2017 Actual 2018 Budget 2019 Proposed
Taxes 0 0 0 0 0One Vision. One Plan. One Voice.
Stand Alone Departments70

Department Summary: Hearing Examiner
Division: Stand Alone Departments
Fund Type: General Fund
Executive Summary:
The Office of the Hearing Examiner holds quasi-judicial hearings on behalf of the City in various matters, primarily related to Zoning, Land Use Regulation, and the Environment. The Hearing Examiner's Office conducts these hearings and renders decisions in accordance with state and local law.
Programs and Services:
Citizens have a right to appear at a hearing and comment upon a project being proposed in their neighborhood or which affects their property. The development community has the right to have permit applications handled expeditiously, in a consistent way, and in accordance with the relevant laws, rules and policies. Citizens should also have the right to appeal an administrative decision that the feel is wrong within the City structure without having to incur the expense of going to court. It is important that these hearings not only be fair but appear fair, and that the decisions made on these matters be not only fair but consistent. The City could face liability if its decisions, especially its land use decisions, are found to be arbitrary. Therefore, the Hearing Examiner’s Office has an obligation, which it will carry out, to hold fair and impartial hearings and render consistent and legally defensible decisions. Expediency is also an important issue. The Hearing Examiner’s Office has the experience and expertise to schedule hearings as quickly as possible and render decisions in a timely fashion. This office has the knowledge and expertise to provide information and respond to the questions and requests coming from the public and from other City departments on all the various matters. This serves the citizens, the business community, and the City at large. Some revenues are derived through the Examiner holding hearings for other cities and agencies, although the amount of that revenue varies from year to year.
FTEs
2015 Actual 2016 Actual 2017 Actual 2018 Budget 2019 Proposed
Total FTEs 2.00 2.00 2.00 2.00 2.00
Expenditures:
2015 Actual 2016 Actual 2017 Actual 2018 Budget 2019 Proposed
Capital Outlay 0 0 0 0 0
Interfund Charges 0 109 125 400 400
Reserve for Budget Adjustment 0 0 0 0 0
Transfers Out 0 0 0 0 0
Wages & Benefits 208,334 226,815 236,962 251,637 257,198
Supplies & Services 2,407 2,302 2,967 9,090 9,090
Debt Services 0 0 0 0 0
All Other 0 0 0 0 0
TOTAL 210,741 229,226 240,054 261,127 266,688
Expenditure Notes:
Revenues:
2015 Actual 2016 Actual 2017 Actual 2018 Budget 2019 Proposed
Taxes 0 0 0 0 0
Licenses & Permits 0 0 0 0 0
IG Revenue 0 0 0 0 0
Services 0 0 10,229 0 0
Fines & Forfeits 0 0 0 0 0
Operating Transfers In 0 0 0 0 0
General Fund Resources 201,463 221,654 229,825 248,627 254,188
All Other 9,278 7,572 0 12,500 12,500
TOTAL 210,741 229,226 240,054 261,127 266,688
Revenue Notes:
All Other revenue is related to building official appeals or hearings. In 2017, this revenue was moved to Services. The 2018 & 2019 has not yet been updated to reflect this change.
Stand Alone Departments 71

One Vision. One Plan. One Voice.
Stand Alone Departments72
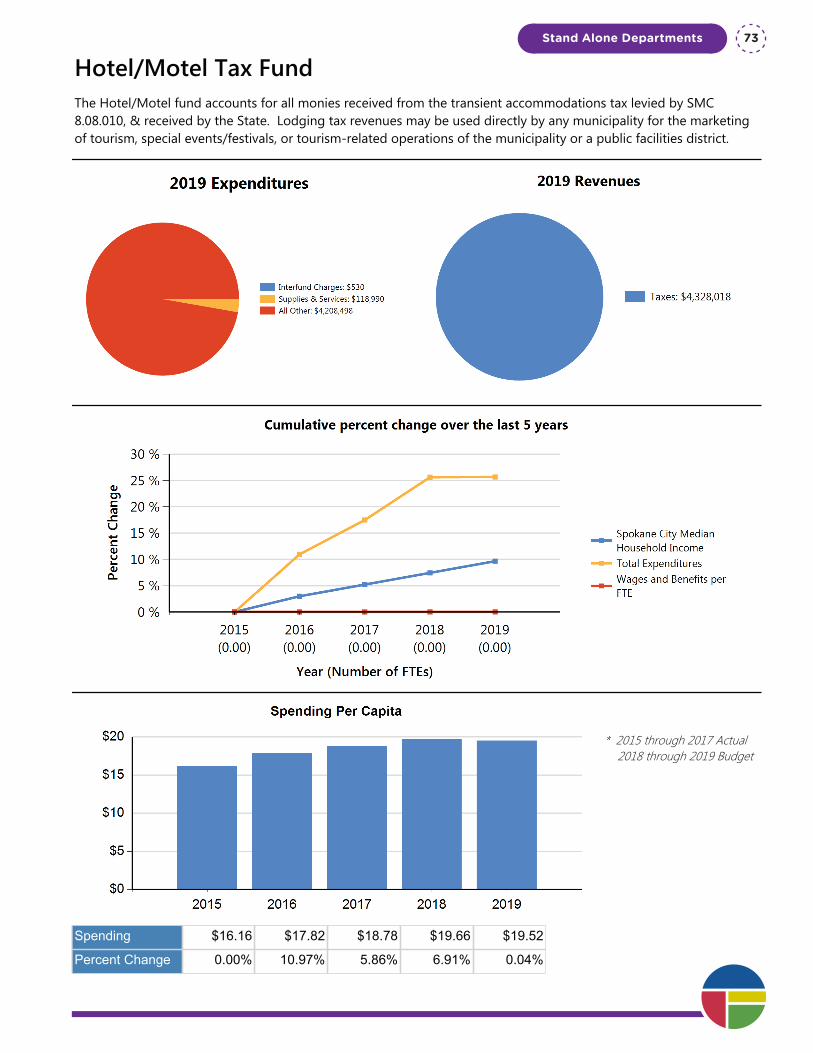
Hotel/Motel Tax FundThe Hotel/Motel fund accounts for all monies received from the transient accommodations tax levied by SMC 8.08.010, & received by the State. Lodging tax revenues may be used directly by any municipality for the marketing of tourism, special events/festivals, or tourism-related operations of the municipality or a public facilities district.
* 2015 through 2017 Actual 2018 through 2019 Budget
Spending $16.16 $17.82 $18.78 $19.66 $19.52
Percent Change 0.00% 10.97% 5.86% 6.91% 0.04%
Stand Alone Departments 73
Department Summary: Hotel/Motel Tax Fund
Division: Stand Alone Departments
Fund Type: Special Revenue Fund
Executive Summary:
The Hotel/Motel fund accounts for all monies received from the transient accommodations tax levied by SMC 8.08.010, & received by the State. Lodging tax revenues may be used directly by any municipality for the marketing of tourism, special events/festivals, or tourism-related operations of the municipality or a public facilities district.
Programs and Services:
The Interlocal Agreement between the City and the Spokane Public Facilities District (PFD) provides that 100% of the lodging tax revenues is remitted to the PFD. Each year, $100,000 (adjusted annually by CPI) is reserved by the City for tourism-generating activities/entities.
The amount reserved for tourism activities in 2019 is estimated at $ $118,990, as reflected in the Supplies/Services budget. Annually, the Lodging Tax Committee determines which projects to fund from this amount.
FTEs
2015 Actual 2016 Actual 2017 Actual 2018 Budget 2019 Proposed
Total FTEs 0.00 0.00 0.00 0.00 0.00
Expenditures:
2015 Actual 2016 Actual 2017 Actual 2018 Budget 2019 Proposed
Capital Outlay 0 0 0 0 0
Interfund Charges 456 388 459 403 530
Reserve for Budget Adjustment 0 0 0 0 0
Transfers Out 0 0 0 0 0
Wages & Benefits 0 0 0 0 0
Supplies & Services 111,409 101,347 75,902 117,362 118,990
Debt Services 0 0 0 0 0
All Other 3,332,223 3,720,412 3,969,901 4,208,498 4,208,498
TOTAL 3,444,088 3,822,147 4,046,262 4,326,263 4,328,018
Expenditure Notes:
Other Services & Changes is mostly support for local events to help increase tourism. The remainder is accounting & audit charges. All Other is pass through to the Public Facilities District.
Revenues:
2015 Actual 2016 Actual 2017 Actual 2018 Budget 2019 Proposed
Taxes 3,441,870 3,831,512 4,083,230 4,326,279 4,328,018
Licenses & Permits 0 0 0 0 0
IG Revenue 0 0 0 0 0
Services 0 0 0 0 0One Vision. One Plan. One Voice.
Stand Alone Departments74

Department Summary: Hotel/Motel Tax Fund
Division: Stand Alone Departments
Fund Type: Special Revenue Fund
Executive Summary:
The Hotel/Motel fund accounts for all monies received from the transient accommodations tax levied by SMC 8.08.010, & received by the State. Lodging tax revenues may be used directly by any municipality for the marketing of tourism, special events/festivals, or tourism-related operations of the municipality or a public facilities district.
Programs and Services:
The Interlocal Agreement between the City and the Spokane Public Facilities District (PFD) provides that 100% of the lodging tax revenues is remitted to the PFD. Each year, $100,000 (adjusted annually by CPI) is reserved by the City for tourism-generating activities/entities.
The amount reserved for tourism activities in 2019 is estimated at $ $118,990, as reflected in the Supplies/Services budget. Annually, the Lodging Tax Committee determines which projects to fund from this amount.
FTEs
2015 Actual 2016 Actual 2017 Actual 2018 Budget 2019 Proposed
Total FTEs 0.00 0.00 0.00 0.00 0.00
Expenditures:
2015 Actual 2016 Actual 2017 Actual 2018 Budget 2019 Proposed
Capital Outlay 0 0 0 0 0
Interfund Charges 456 388 459 403 530
Reserve for Budget Adjustment 0 0 0 0 0
Transfers Out 0 0 0 0 0
Wages & Benefits 0 0 0 0 0
Supplies & Services 111,409 101,347 75,902 117,362 118,990
Debt Services 0 0 0 0 0
All Other 3,332,223 3,720,412 3,969,901 4,208,498 4,208,498
TOTAL 3,444,088 3,822,147 4,046,262 4,326,263 4,328,018
Expenditure Notes:
Other Services & Changes is mostly support for local events to help increase tourism. The remainder is accounting & audit charges. All Other is pass through to the Public Facilities District.
Revenues:
2015 Actual 2016 Actual 2017 Actual 2018 Budget 2019 Proposed
Taxes 3,441,870 3,831,512 4,083,230 4,326,279 4,328,018
Licenses & Permits 0 0 0 0 0
IG Revenue 0 0 0 0 0
Services 0 0 0 0 0
Fines & Forfeits 0 0 0 0 0
Operating Transfers In 0 0 0 0 0
General Fund Resources 0 0 0 0 0
All Other 0 0 0 0 0
TOTAL 3,441,870 3,831,512 4,083,230 4,326,279 4,328,018
Revenue Notes:
Stand Alone Departments 75

One Vision. One Plan. One Voice.
Stand Alone Departments76
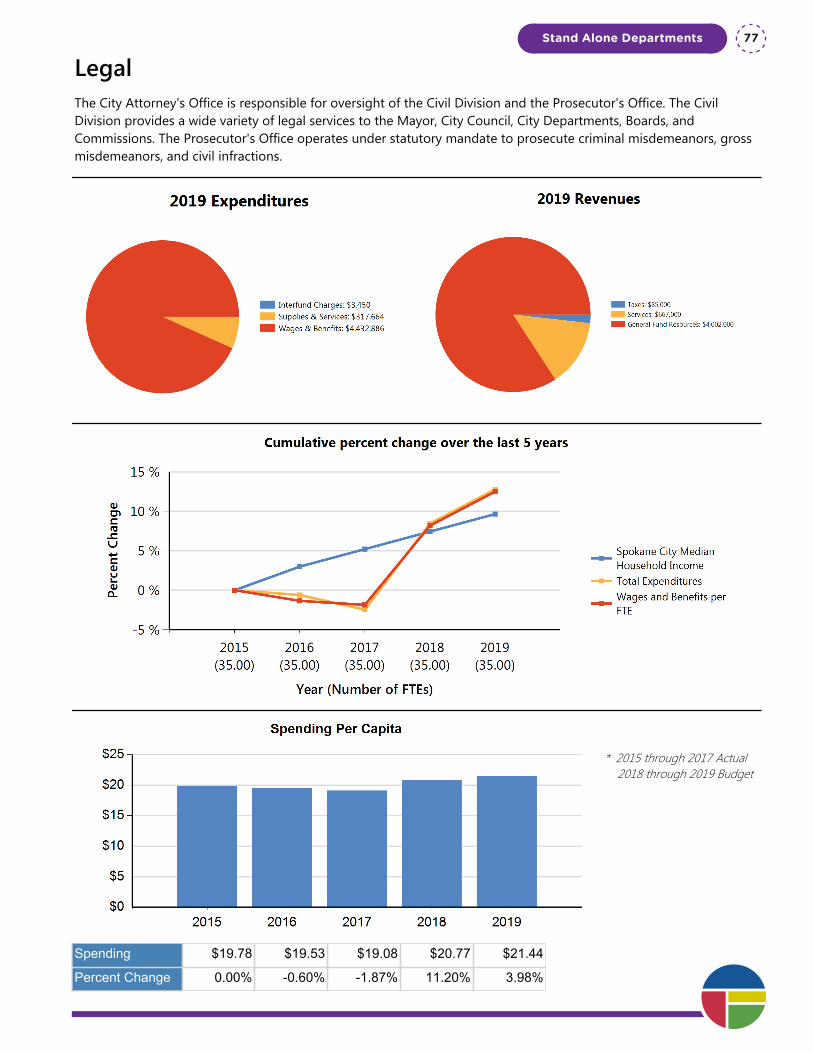
LegalThe City Attorney's Office is responsible for oversight of the Civil Division and the Prosecutor's Office. The Civil Division provides a wide variety of legal services to the Mayor, City Council, City Departments, Boards, and Commissions. The Prosecutor's Office operates under statutory mandate to prosecute criminal misdemeanors, gross misdemeanors, and civil infractions.
* 2015 through 2017 Actual 2018 through 2019 Budget
Spending $19.78 $19.53 $19.08 $20.77 $21.44
Percent Change 0.00% -0.60% -1.87% 11.20% 3.98%
Stand Alone Departments 77
Department Summary: Legal
Division: Stand Alone Departments
Fund Type: General Fund
Executive Summary:
The City Attorney's Office is responsible for oversight of the Civil Division and the Prosecutor's Office. The Civil Division provides a wide variety of legal services to the Mayor, City Council, City Departments, Boards, and Commissions. The Prosecutor's Office operates under statutory mandate to prosecute criminal misdemeanors, gross misdemeanors, and civil infractions.
Programs and Services:
Civil Division:Members of the City’s legal team provide oral and written legal opinions on specific matters of law and policy. Attorneys in the office have wide and deep experience in the matters of core competency necessary to address legal matters for the City. These functions include, but are not limited to, litigation (defense and prosecution), police advisory, and in-house advice and consultation for various departments requiring specific legal advice. The office prosecutes or defends all litigation matters, whether in federal, state, or local court, or before administrative tribunals. When the use of an outside law firm is required, the City Attorney supervises the activities of special counsel to ensure the interests of the City and the individual clients are being well- served and represented. Contract negotiation and contract compliance are critical to protecting the City’s interest. Routine and regular review of City contracts to ensure compliance with the law and best practices is essential.
Criminal Division:The Prosecutors Office is responsible for the prosecution of all criminal misdemeanors, civil violations, Photo Red tickets, traffic infractions and parking infractions issued under the Spokane Municipal Code. The Prosecutor’s Office participates in a myriad of diversion and specialty court programs, including a strong community court. The Prosecutor’s Office effectively reduces systemic legal risk through the use of its appellate attorney. This attorney provides an important line of defense against adverse and far-reaching court decisions by aggressively defending cases against legal motions, and other collateral attacks on the validity of City statutes. The Prosecutors Office continues to be at the forefront of the criminal justice reform efforts underway in the Spokane region. Additionally, the Prosecutors Office is committed to the area of victim’s rights through its continued participation in the Family Justice Center at the Spokane YWCA.
FTEs
2015 Actual 2016 Actual 2017 Actual 2018 Budget 2019 Proposed
Total FTEs 35.00 35.00 35.00 35.00 35.00
Expenditures:
2015 Actual 2016 Actual 2017 Actual 2018 Budget 2019 Proposed
Capital Outlay 383 7,041 0 0 0
Interfund Charges 8,669 9,092 0 10,100 3,450
Reserve for Budget Adjustment 0 0 0 0 0
Transfers Out 0 0 0 0 0
Wages & Benefits 3,934,561 3,881,692 3,861,635 4,249,285 4,432,886
Supplies & Services 271,658 291,931 249,672 312,579 317,664
Debt Services 0 0 0 0 0
All Other 0 0 0 0 0One Vision. One Plan. One Voice.
Stand Alone Departments78
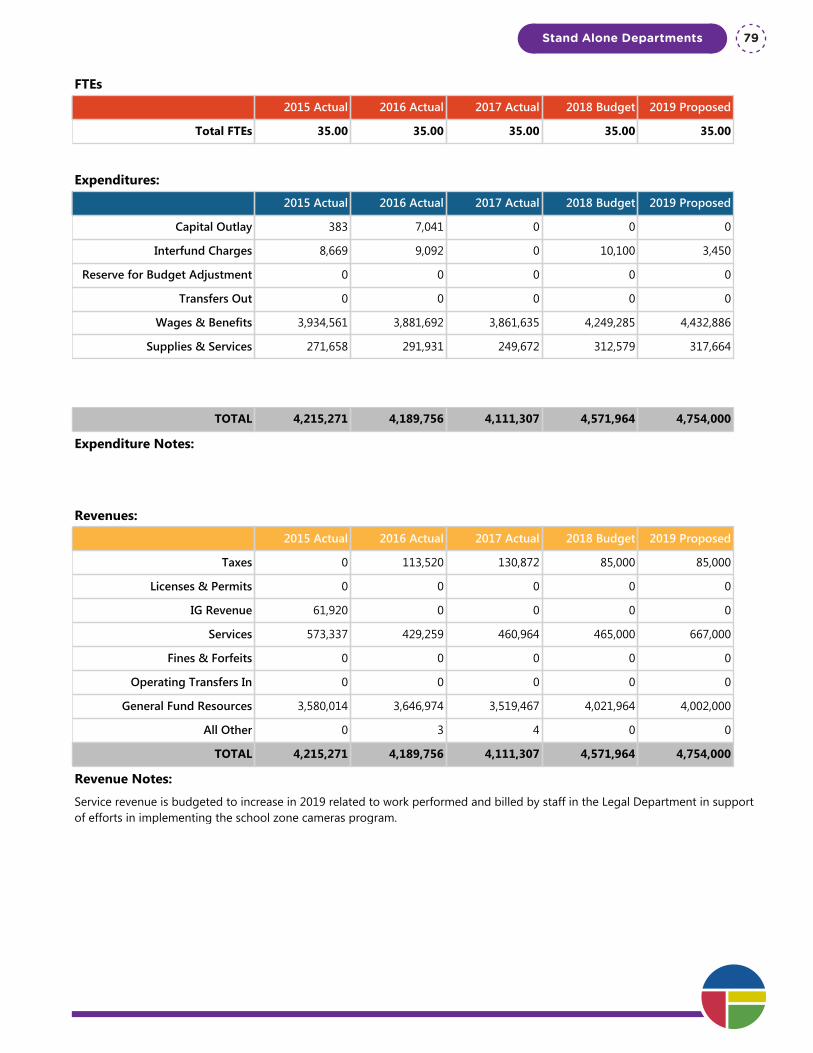
Department Summary: Legal
Division: Stand Alone Departments
Fund Type: General Fund
Executive Summary:
The City Attorney's Office is responsible for oversight of the Civil Division and the Prosecutor's Office. The Civil Division provides a wide variety of legal services to the Mayor, City Council, City Departments, Boards, and Commissions. The Prosecutor's Office operates under statutory mandate to prosecute criminal misdemeanors, gross misdemeanors, and civil infractions.
Programs and Services:
Civil Division:Members of the City’s legal team provide oral and written legal opinions on specific matters of law and policy. Attorneys in the office have wide and deep experience in the matters of core competency necessary to address legal matters for the City. These functions include, but are not limited to, litigation (defense and prosecution), police advisory, and in-house advice and consultation for various departments requiring specific legal advice. The office prosecutes or defends all litigation matters, whether in federal, state, or local court, or before administrative tribunals. When the use of an outside law firm is required, the City Attorney supervises the activities of special counsel to ensure the interests of the City and the individual clients are being well- served and represented. Contract negotiation and contract compliance are critical to protecting the City’s interest. Routine and regular review of City contracts to ensure compliance with the law and best practices is essential.
Criminal Division:The Prosecutors Office is responsible for the prosecution of all criminal misdemeanors, civil violations, Photo Red tickets, traffic infractions and parking infractions issued under the Spokane Municipal Code. The Prosecutor’s Office participates in a myriad of diversion and specialty court programs, including a strong community court. The Prosecutor’s Office effectively reduces systemic legal risk through the use of its appellate attorney. This attorney provides an important line of defense against adverse and far-reaching court decisions by aggressively defending cases against legal motions, and other collateral attacks on the validity of City statutes. The Prosecutors Office continues to be at the forefront of the criminal justice reform efforts underway in the Spokane region. Additionally, the Prosecutors Office is committed to the area of victim’s rights through its continued participation in the Family Justice Center at the Spokane YWCA.
FTEs
2015 Actual 2016 Actual 2017 Actual 2018 Budget 2019 Proposed
Total FTEs 35.00 35.00 35.00 35.00 35.00
Expenditures:
2015 Actual 2016 Actual 2017 Actual 2018 Budget 2019 Proposed
Capital Outlay 383 7,041 0 0 0
Interfund Charges 8,669 9,092 0 10,100 3,450
Reserve for Budget Adjustment 0 0 0 0 0
Transfers Out 0 0 0 0 0
Wages & Benefits 3,934,561 3,881,692 3,861,635 4,249,285 4,432,886
Supplies & Services 271,658 291,931 249,672 312,579 317,664
Debt Services 0 0 0 0 0
All Other 0 0 0 0 0
TOTAL 4,215,271 4,189,756 4,111,307 4,571,964 4,754,000
Expenditure Notes:
Revenues:
2015 Actual 2016 Actual 2017 Actual 2018 Budget 2019 Proposed
Taxes 0 113,520 130,872 85,000 85,000
Licenses & Permits 0 0 0 0 0
IG Revenue 61,920 0 0 0 0
Services 573,337 429,259 460,964 465,000 667,000
Fines & Forfeits 0 0 0 0 0
Operating Transfers In 0 0 0 0 0
General Fund Resources 3,580,014 3,646,974 3,519,467 4,021,964 4,002,000
All Other 0 3 4 0 0
TOTAL 4,215,271 4,189,756 4,111,307 4,571,964 4,754,000
Revenue Notes:
Service revenue is budgeted to increase in 2019 related to work performed and billed by staff in the Legal Department in support of efforts in implementing the school zone cameras program.
Stand Alone Departments 79
Program Summary: City Prosecutor
Division: Stand Alone Departments
Fund Type: General Fund
Executive Summary:
The City Prosecutor’s Office operates under statutory mandate to prosecute criminal charges and civil infractions. Emphasis includes: Pre-filing diversion, Technology in court, Domestic Violence prosecution, and crime victim services. The Prosecutor participates in Mental Health, Veterans, and Community Courts, as well as the YWCA Family Justice Center.
Programs and Services:
The City Prosecutor’s Office filed approximately 7,226 misdemeanor cases in 2017 in Spokane Municipal Court. The Prosecutor’s Office is the sole authority responsible for carrying out this legally mandated function. Additionally, the Prosecutor’s Office is responsible for the prosecution of all civil violations of the Spokane Municipal Code, including nuisance, building and fire code violations, traffic violation infractions, Photo Red tickets and parking infractions issued in the City. The Prosecutor’s Office also effectively reduces systemic legal risk through the use of its appellate attorney. This attorney provides an important line of defense against adverse and far-reaching court decisions by aggressively defending cases against legal motions and other collateral attacks on the validity of City statutes. Based upon the introduction of “caseload standards” for public defense attorneys, the Prosecutor’s Office has relied heavily on a pre-filing diversion program for Driving While License Suspended 3rd Degree cases. This strategy was designed to save costs on public defense services, while proactively reducing jail costs by keeping these offenders out of jail. The DWLS 3rd Diversion Program works in conjunction with the Community Relicensing Program to educate offenders and find solutions to getting their driving licenses reinstated. The use of JustWare as a case management system has had positive effects in the Office and new efficiencies continue to be realized. JustWare continues to set the City’s prosecution efforts apart from other agencies because of its ease of use, electronic transmission of discovery and the availability of data collection. The Prosecutor’s Office has co-located its dedicated Domestic Violence attorneys and staff to the Family Justice Center in the YWCA. This approach to Domestic Violence prosecution has led to increased victim safety and offender accountability through better collaboration with law enforcement, victim advocates and other prosecutors. The Prosecutor’s Office is actively engaged in the downtown Community Court. This innovative approach attempts to address crime through solving the criminal defendant’s underlying issues (e.g. homelessness, mental illness and substance abuse) instead of lengthy jail sentences. While Community Court has proven to be labor-intensive, the Prosecutor’s Office is dedicated to insuring Community Court’s success. Mental Health Court and Veteran’s Court have both provided the Prosecutor’s Office innovative opportunities to better the lives of criminal defendants, while strengthening public safety. The Prosecutor’s Office has taken a leading role with the Spokane Regional Law and Justice Commission’s efforts to reform the criminal justice system, as well as the implementation of the MacArthur Foundation grant to reduce the jail population. Due to state and local budget cuts, the Prosecuting Attorney has increasingly relied upon the support of Rule 9 qualified law students, who are authorized to appear in court, to handle the preliminary criminal dockets and infraction dockets. While there are increased demands upon its resources, the Prosecutor’s Office continues to lead the way in criminal justice reform through the implementation of innovative strategies and remains committed to continuous evaluation and reform.
FTEs
2015 Actual 2016 Actual 2017 Actual 2018 Budget 2019 Proposed
Total FTEs 19.00 19.00 19.00 19.00 19.00
Expenditures:
2015 Actual 2016 Actual 2017 Actual 2018 Budget 2019 Proposed
Capital Outlay 0 7,041 0 0 0
Interfund Charges 8,651 9,060 0 10,100 3,450
Reserve for Budget Adjustment 0 0 0 0 0
Transfers Out 0 0 0 0 0
Wages & Benefits 1,689,571 1,726,112 1,786,456 1,862,602 1,962,754One Vision. One Plan. One Voice.
Stand Alone Departments80

Program Summary: City Prosecutor
Division: Stand Alone Departments
Fund Type: General Fund
Executive Summary:
The City Prosecutor’s Office operates under statutory mandate to prosecute criminal charges and civil infractions. Emphasis includes: Pre-filing diversion, Technology in court, Domestic Violence prosecution, and crime victim services. The Prosecutor participates in Mental Health, Veterans, and Community Courts, as well as the YWCA Family Justice Center.
Programs and Services:
The City Prosecutor’s Office filed approximately 7,226 misdemeanor cases in 2017 in Spokane Municipal Court. The Prosecutor’s Office is the sole authority responsible for carrying out this legally mandated function. Additionally, the Prosecutor’s Office is responsible for the prosecution of all civil violations of the Spokane Municipal Code, including nuisance, building and fire code violations, traffic violation infractions, Photo Red tickets and parking infractions issued in the City. The Prosecutor’s Office also effectively reduces systemic legal risk through the use of its appellate attorney. This attorney provides an important line of defense against adverse and far-reaching court decisions by aggressively defending cases against legal motions and other collateral attacks on the validity of City statutes. Based upon the introduction of “caseload standards” for public defense attorneys, the Prosecutor’s Office has relied heavily on a pre-filing diversion program for Driving While License Suspended 3rd Degree cases. This strategy was designed to save costs on public defense services, while proactively reducing jail costs by keeping these offenders out of jail. The DWLS 3rd Diversion Program works in conjunction with the Community Relicensing Program to educate offenders and find solutions to getting their driving licenses reinstated. The use of JustWare as a case management system has had positive effects in the Office and new efficiencies continue to be realized. JustWare continues to set the City’s prosecution efforts apart from other agencies because of its ease of use, electronic transmission of discovery and the availability of data collection. The Prosecutor’s Office has co-located its dedicated Domestic Violence attorneys and staff to the Family Justice Center in the YWCA. This approach to Domestic Violence prosecution has led to increased victim safety and offender accountability through better collaboration with law enforcement, victim advocates and other prosecutors. The Prosecutor’s Office is actively engaged in the downtown Community Court. This innovative approach attempts to address crime through solving the criminal defendant’s underlying issues (e.g. homelessness, mental illness and substance abuse) instead of lengthy jail sentences. While Community Court has proven to be labor-intensive, the Prosecutor’s Office is dedicated to insuring Community Court’s success. Mental Health Court and Veteran’s Court have both provided the Prosecutor’s Office innovative opportunities to better the lives of criminal defendants, while strengthening public safety. The Prosecutor’s Office has taken a leading role with the Spokane Regional Law and Justice Commission’s efforts to reform the criminal justice system, as well as the implementation of the MacArthur Foundation grant to reduce the jail population. Due to state and local budget cuts, the Prosecuting Attorney has increasingly relied upon the support of Rule 9 qualified law students, who are authorized to appear in court, to handle the preliminary criminal dockets and infraction dockets. While there are increased demands upon its resources, the Prosecutor’s Office continues to lead the way in criminal justice reform through the implementation of innovative strategies and remains committed to continuous evaluation and reform.
FTEs
2015 Actual 2016 Actual 2017 Actual 2018 Budget 2019 Proposed
Total FTEs 19.00 19.00 19.00 19.00 19.00
Expenditures:
2015 Actual 2016 Actual 2017 Actual 2018 Budget 2019 Proposed
Capital Outlay 0 7,041 0 0 0
Interfund Charges 8,651 9,060 0 10,100 3,450
Reserve for Budget Adjustment 0 0 0 0 0
Transfers Out 0 0 0 0 0
Wages & Benefits 1,689,571 1,726,112 1,786,456 1,862,602 1,962,754
Supplies & Services 146,878 142,950 159,805 171,172 176,983
Debt Services 0 0 0 0 0
All Other 0 0 0 0 0
TOTAL 1,845,100 1,885,163 1,946,261 2,043,874 2,143,187
Expenditure Notes:
Revenues:
2015 Actual 2016 Actual 2017 Actual 2018 Budget 2019 Proposed
Taxes 0 113,520 130,872 85,000 85,000
Licenses & Permits 0 0 0 0 0
IG Revenue 61,920 0 0 0 0
Services 85,452 46,600 32,491 100,000 240,000
Fines & Forfeits 0 0 0 0 0
Operating Transfers In 0 0 0 0 0
General Fund Resources 1,697,728 1,725,040 1,782,894 1,858,874 1,818,187
All Other 0 3 4 0 0
TOTAL 1,845,100 1,885,163 1,946,261 2,043,874 2,143,187
Revenue Notes:
Service revenue is budgeted to increase in 2019 related to work performed and billed by staff in the Legal Department in support of efforts in implementing the school zone cameras program.
Stand Alone Departments 81
Program Summary: Civil Division
Division: Stand Alone Departments
Fund Type: General Fund
Executive Summary:
The Civil Division provides legal services to the Mayor, City Council, the Administration and Departments, Boards and Commissions, including advice and consultation, document drafting and review, contracts, policies, resolutions, procedures and ordinances. City attorneys defend against claims and lawsuits, and prosecute all City civil and administrative claims. Outside counsel may be hired as needed.
Programs and Services:
Members of the City’s legal team provide oral and written legal opinions on specific matters of law and policy. Attorneys in the office have wide and deep experience in the matters of core competency necessary to address legal matters for the City. These services range from litigation (defense and prosecution) and advising the police department to navigating complex public records issues and representing City boards and commissions. In its public records function, attorneys assist the City Clerk in responding to countless public records requests. These requests are frequent and often voluminous, and require a timely and complete response to avoid litigation.
The office prosecutes or defends all litigation matters, whether in federal, state, or local court, or before administrative tribunals. When a conflict or the need for specialized legal advice requires the use of an outside law firm, the City Attorney engages and supervises the activities of special counsel to ensure the interests of the City and the individual clients are being well-served and represented. The City Attorney’s Office is giving special emphasis to contract negotiation and contract compliance, both of which are critical to protecting the City’s interest. The City Attorney has enhanced contract drafting, review and implementation with an emphasis on involvement in contract negotiation prior to finalization. This has enhanced the delivery of services and streamlined approval. Routine and regular review of City contracts to ensure compliance with the law and best practices is essential.
Additionally, the Office of the City Attorney provides necessary support for budget and economic development objectives pursued by the City. Four recently emphasized responsibilities of the office include 1) developing, implementing and coordinating with other City departments the processes to deal with abandoned and nuisance properties; 2) continuing the work of the City with our other partners on improvements to the criminal justice system and better coordination for providing services to those in need; 3) continued improvements to the public records system; and 4) reduction in the number of risk cases defended by the City reducing both amounts paid for settlements and defense costs.
FTEs
2015 Actual 2016 Actual 2017 Actual 2018 Budget 2019 Proposed
Total FTEs 16.00 16.00 16.00 16.00 16.00
Expenditures:
2015 Actual 2016 Actual 2017 Actual 2018 Budget 2019 Proposed
Capital Outlay 383 0 0 0 0
Interfund Charges 18 32 0 0 0
Reserve for Budget Adjustment 0 0 0 0 0
Transfers Out 0 0 0 0 0
Wages & Benefits 2,244,990 2,155,580 2,075,179 2,386,683 2,470,132
Supplies & Services 124,780 148,981 89,867 141,407 140,681
Debt Services 0 0 0 0 0
All Other 0 0 0 0 0One Vision. One Plan. One Voice.
Stand Alone Departments82

Program Summary: Civil Division
Division: Stand Alone Departments
Fund Type: General Fund
Executive Summary:
The Civil Division provides legal services to the Mayor, City Council, the Administration and Departments, Boards and Commissions, including advice and consultation, document drafting and review, contracts, policies, resolutions, procedures and ordinances. City attorneys defend against claims and lawsuits, and prosecute all City civil and administrative claims. Outside counsel may be hired as needed.
Programs and Services:
Members of the City’s legal team provide oral and written legal opinions on specific matters of law and policy. Attorneys in the office have wide and deep experience in the matters of core competency necessary to address legal matters for the City. These services range from litigation (defense and prosecution) and advising the police department to navigating complex public records issues and representing City boards and commissions. In its public records function, attorneys assist the City Clerk in responding to countless public records requests. These requests are frequent and often voluminous, and require a timely and complete response to avoid litigation.
The office prosecutes or defends all litigation matters, whether in federal, state, or local court, or before administrative tribunals. When a conflict or the need for specialized legal advice requires the use of an outside law firm, the City Attorney engages and supervises the activities of special counsel to ensure the interests of the City and the individual clients are being well-served and represented. The City Attorney’s Office is giving special emphasis to contract negotiation and contract compliance, both of which are critical to protecting the City’s interest. The City Attorney has enhanced contract drafting, review and implementation with an emphasis on involvement in contract negotiation prior to finalization. This has enhanced the delivery of services and streamlined approval. Routine and regular review of City contracts to ensure compliance with the law and best practices is essential.
Additionally, the Office of the City Attorney provides necessary support for budget and economic development objectives pursued by the City. Four recently emphasized responsibilities of the office include 1) developing, implementing and coordinating with other City departments the processes to deal with abandoned and nuisance properties; 2) continuing the work of the City with our other partners on improvements to the criminal justice system and better coordination for providing services to those in need; 3) continued improvements to the public records system; and 4) reduction in the number of risk cases defended by the City reducing both amounts paid for settlements and defense costs.
FTEs
2015 Actual 2016 Actual 2017 Actual 2018 Budget 2019 Proposed
Total FTEs 16.00 16.00 16.00 16.00 16.00
Expenditures:
2015 Actual 2016 Actual 2017 Actual 2018 Budget 2019 Proposed
Capital Outlay 383 0 0 0 0
Interfund Charges 18 32 0 0 0
Reserve for Budget Adjustment 0 0 0 0 0
Transfers Out 0 0 0 0 0
Wages & Benefits 2,244,990 2,155,580 2,075,179 2,386,683 2,470,132
Supplies & Services 124,780 148,981 89,867 141,407 140,681
Debt Services 0 0 0 0 0
All Other 0 0 0 0 0
TOTAL 2,370,171 2,304,593 2,165,046 2,528,090 2,610,813
Expenditure Notes:
Revenues:
2015 Actual 2016 Actual 2017 Actual 2018 Budget 2019 Proposed
Taxes 0 0 0 0 0
Licenses & Permits 0 0 0 0 0
IG Revenue 0 0 0 0 0
Services 487,885 382,659 428,473 365,000 427,000
Fines & Forfeits 0 0 0 0 0
Operating Transfers In 0 0 0 0 0
General Fund Resources 1,882,286 1,921,934 1,736,573 2,163,090 2,183,813
All Other 0 0 0 0 0
TOTAL 2,370,171 2,304,593 2,165,046 2,528,090 2,610,813
Revenue Notes:
Stand Alone Departments 83

One Vision. One Plan. One Voice.
Stand Alone Departments84
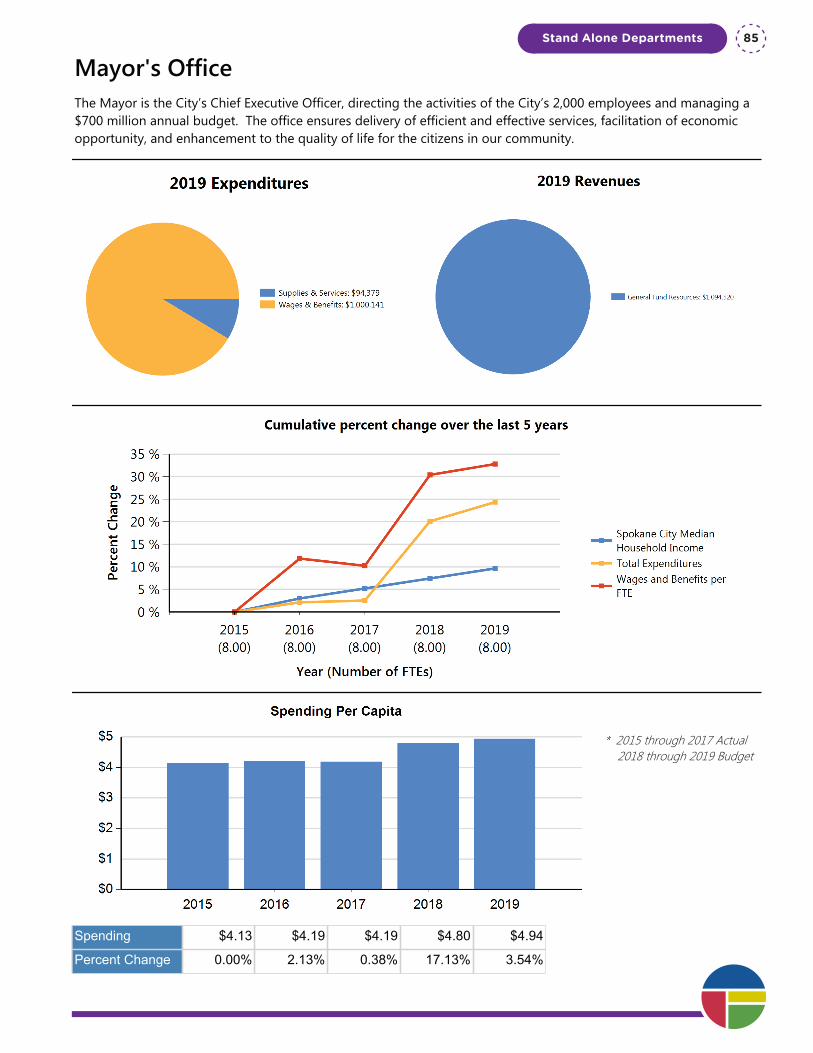
Mayor's OfficeThe Mayor is the City’s Chief Executive Officer, directing the activities of the City’s 2,000 employees and managing a $700 million annual budget. The office ensures delivery of efficient and effective services, facilitation of economic opportunity, and enhancement to the quality of life for the citizens in our community.
* 2015 through 2017 Actual 2018 through 2019 Budget
Spending $4.13 $4.19 $4.19 $4.80 $4.94
Percent Change 0.00% 2.13% 0.38% 17.13% 3.54%
Stand Alone Departments 85
Department Summary: Mayor's Office
Division: Stand Alone Departments
Fund Type: General Fund
Executive Summary:
The Mayor is the City’s Chief Executive Officer, directing the activities of the City’s 2,000 employees and managing a $700 million annual budget. The office ensures delivery of efficient and effective services, facilitation of economic opportunity, and enhancement to the quality of life for the citizens in our community.
Programs and Services:
The Office of the Mayor engages in: Administrative oversight for the City of Spokane, partnership with the Office of the Police Ombudsman, Constituent Services, Legislative Policy Research, and outreach to local government and labor relations.
FTEs
2015 Actual 2016 Actual 2017 Actual 2018 Budget 2019 Proposed
Total FTEs 8.00 8.00 8.00 8.00 8.00
Expenditures:
2015 Actual 2016 Actual 2017 Actual 2018 Budget 2019 Proposed
Capital Outlay 0 2,678 0 0 0
Interfund Charges 0 0 0 0 0
Reserve for Budget Adjustment 0 0 0 0 0
Transfers Out 0 0 0 0 0
Wages & Benefits 738,563 826,011 812,774 976,669 1,000,141
Supplies & Services 141,554 70,223 89,642 80,379 94,379
Debt Services 0 0 0 0 0
All Other 0 0 0 0 0
TOTAL 880,117 898,912 902,416 1,057,048 1,094,520
Expenditure Notes:
Revenues:
2015 Actual 2016 Actual 2017 Actual 2018 Budget 2019 Proposed
Taxes 0 0 0 0 0
Licenses & Permits 0 0 0 0 0
IG Revenue 0 0 0 0 0
Services 0 0 0 0 0
Fines & Forfeits 0 0 0 0 0
Operating Transfers In 0 0 0 0 0
General Fund Resources 880,117 898,912 902,416 1,057,048 1,094,520One Vision. One Plan. One Voice.
Stand Alone Departments86

Department Summary: Mayor's Office
Division: Stand Alone Departments
Fund Type: General Fund
Executive Summary:
The Mayor is the City’s Chief Executive Officer, directing the activities of the City’s 2,000 employees and managing a $700 million annual budget. The office ensures delivery of efficient and effective services, facilitation of economic opportunity, and enhancement to the quality of life for the citizens in our community.
Programs and Services:
The Office of the Mayor engages in: Administrative oversight for the City of Spokane, partnership with the Office of the Police Ombudsman, Constituent Services, Legislative Policy Research, and outreach to local government and labor relations.
FTEs
2015 Actual 2016 Actual 2017 Actual 2018 Budget 2019 Proposed
Total FTEs 8.00 8.00 8.00 8.00 8.00
Expenditures:
2015 Actual 2016 Actual 2017 Actual 2018 Budget 2019 Proposed
Capital Outlay 0 2,678 0 0 0
Interfund Charges 0 0 0 0 0
Reserve for Budget Adjustment 0 0 0 0 0
Transfers Out 0 0 0 0 0
Wages & Benefits 738,563 826,011 812,774 976,669 1,000,141
Supplies & Services 141,554 70,223 89,642 80,379 94,379
Debt Services 0 0 0 0 0
All Other 0 0 0 0 0
TOTAL 880,117 898,912 902,416 1,057,048 1,094,520
Expenditure Notes:
Revenues:
2015 Actual 2016 Actual 2017 Actual 2018 Budget 2019 Proposed
Taxes 0 0 0 0 0
Licenses & Permits 0 0 0 0 0
IG Revenue 0 0 0 0 0
Services 0 0 0 0 0
Fines & Forfeits 0 0 0 0 0
Operating Transfers In 0 0 0 0 0
General Fund Resources 880,117 898,912 902,416 1,057,048 1,094,520
All Other 0 0 0 0 0
TOTAL 880,117 898,912 902,416 1,057,048 1,094,520
Revenue Notes:
Stand Alone Departments 87

One Vision. One Plan. One Voice.
Stand Alone Departments88
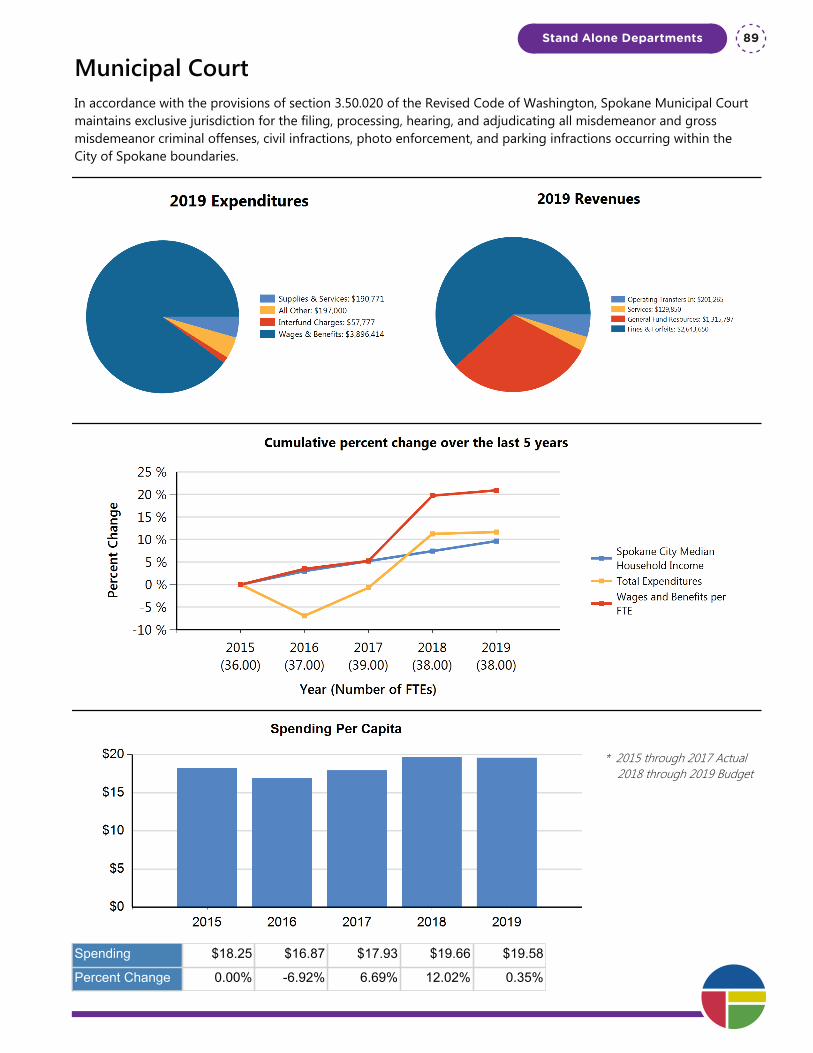
Municipal CourtIn accordance with the provisions of section 3.50.020 of the Revised Code of Washington, Spokane Municipal Court maintains exclusive jurisdiction for the filing, processing, hearing, and adjudicating all misdemeanor and gross misdemeanor criminal offenses, civil infractions, photo enforcement, and parking infractions occurring within the City of Spokane boundaries.
* 2015 through 2017 Actual 2018 through 2019 Budget
Spending $18.25 $16.87 $17.93 $19.66 $19.58
Percent Change 0.00% -6.92% 6.69% 12.02% 0.35%
Stand Alone Departments 89
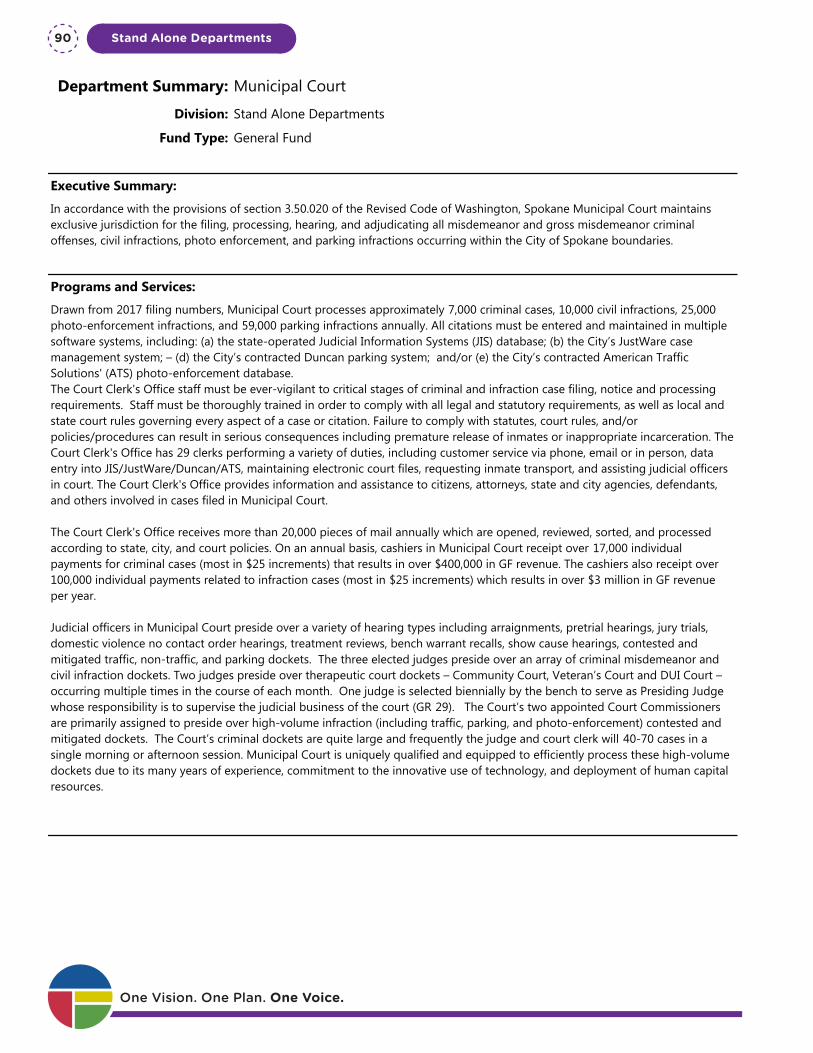
Department Summary: Municipal Court
Division: Stand Alone Departments
Fund Type: General Fund
Executive Summary:
In accordance with the provisions of section 3.50.020 of the Revised Code of Washington, Spokane Municipal Court maintains exclusive jurisdiction for the filing, processing, hearing, and adjudicating all misdemeanor and gross misdemeanor criminal offenses, civil infractions, photo enforcement, and parking infractions occurring within the City of Spokane boundaries.
Programs and Services:
Drawn from 2017 filing numbers, Municipal Court processes approximately 7,000 criminal cases, 10,000 civil infractions, 25,000 photo-enforcement infractions, and 59,000 parking infractions annually. All citations must be entered and maintained in multiple software systems, including: (a) the state-operated Judicial Information Systems (JIS) database; (b) the City’s JustWare case management system; – (d) the City’s contracted Duncan parking system; and/or (e) the City’s contracted American Traffic Solutions' (ATS) photo-enforcement database.The Court Clerk's Office staff must be ever-vigilant to critical stages of criminal and infraction case filing, notice and processing requirements. Staff must be thoroughly trained in order to comply with all legal and statutory requirements, as well as local and state court rules governing every aspect of a case or citation. Failure to comply with statutes, court rules, and/or policies/procedures can result in serious consequences including premature release of inmates or inappropriate incarceration. The Court Clerk's Office has 29 clerks performing a variety of duties, including customer service via phone, email or in person, data entry into JIS/JustWare/Duncan/ATS, maintaining electronic court files, requesting inmate transport, and assisting judicial officers in court. The Court Clerk's Office provides information and assistance to citizens, attorneys, state and city agencies, defendants, and others involved in cases filed in Municipal Court.
The Court Clerk's Office receives more than 20,000 pieces of mail annually which are opened, reviewed, sorted, and processed according to state, city, and court policies. On an annual basis, cashiers in Municipal Court receipt over 17,000 individual payments for criminal cases (most in $25 increments) that results in over $400,000 in GF revenue. The cashiers also receipt over 100,000 individual payments related to infraction cases (most in $25 increments) which results in over $3 million in GF revenue per year.
Judicial officers in Municipal Court preside over a variety of hearing types including arraignments, pretrial hearings, jury trials, domestic violence no contact order hearings, treatment reviews, bench warrant recalls, show cause hearings, contested and mitigated traffic, non-traffic, and parking dockets. The three elected judges preside over an array of criminal misdemeanor and civil infraction dockets. Two judges preside over therapeutic court dockets – Community Court, Veteran’s Court and DUI Court – occurring multiple times in the course of each month. One judge is selected biennially by the bench to serve as Presiding Judge whose responsibility is to supervise the judicial business of the court (GR 29). The Court’s two appointed Court Commissioners are primarily assigned to preside over high-volume infraction (including traffic, parking, and photo-enforcement) contested and mitigated dockets. The Court’s criminal dockets are quite large and frequently the judge and court clerk will 40-70 cases in a single morning or afternoon session. Municipal Court is uniquely qualified and equipped to efficiently process these high-volume dockets due to its many years of experience, commitment to the innovative use of technology, and deployment of human capital resources.
FTEs
2015 Actual 2016 Actual 2017 Actual 2018 Budget 2019 Proposed
Total FTEs 36.00 37.00 39.00 38.00 38.00
Expenditures:
2015 Actual 2016 Actual 2017 Actual 2018 Budget 2019 Proposed
Capital Outlay 2,357 5,388 0 12,000 0
Interfund Charges 543,502 108,130 95,033 96,053 57,777One Vision. One Plan. One Voice.
Stand Alone Departments90

Department Summary: Municipal Court
Division: Stand Alone Departments
Fund Type: General Fund
Executive Summary:
In accordance with the provisions of section 3.50.020 of the Revised Code of Washington, Spokane Municipal Court maintains exclusive jurisdiction for the filing, processing, hearing, and adjudicating all misdemeanor and gross misdemeanor criminal offenses, civil infractions, photo enforcement, and parking infractions occurring within the City of Spokane boundaries.
Programs and Services:
Drawn from 2017 filing numbers, Municipal Court processes approximately 7,000 criminal cases, 10,000 civil infractions, 25,000 photo-enforcement infractions, and 59,000 parking infractions annually. All citations must be entered and maintained in multiple software systems, including: (a) the state-operated Judicial Information Systems (JIS) database; (b) the City’s JustWare case management system; – (d) the City’s contracted Duncan parking system; and/or (e) the City’s contracted American Traffic Solutions' (ATS) photo-enforcement database.The Court Clerk's Office staff must be ever-vigilant to critical stages of criminal and infraction case filing, notice and processing requirements. Staff must be thoroughly trained in order to comply with all legal and statutory requirements, as well as local and state court rules governing every aspect of a case or citation. Failure to comply with statutes, court rules, and/or policies/procedures can result in serious consequences including premature release of inmates or inappropriate incarceration. The Court Clerk's Office has 29 clerks performing a variety of duties, including customer service via phone, email or in person, data entry into JIS/JustWare/Duncan/ATS, maintaining electronic court files, requesting inmate transport, and assisting judicial officers in court. The Court Clerk's Office provides information and assistance to citizens, attorneys, state and city agencies, defendants, and others involved in cases filed in Municipal Court.
The Court Clerk's Office receives more than 20,000 pieces of mail annually which are opened, reviewed, sorted, and processed according to state, city, and court policies. On an annual basis, cashiers in Municipal Court receipt over 17,000 individual payments for criminal cases (most in $25 increments) that results in over $400,000 in GF revenue. The cashiers also receipt over 100,000 individual payments related to infraction cases (most in $25 increments) which results in over $3 million in GF revenue per year.
Judicial officers in Municipal Court preside over a variety of hearing types including arraignments, pretrial hearings, jury trials, domestic violence no contact order hearings, treatment reviews, bench warrant recalls, show cause hearings, contested and mitigated traffic, non-traffic, and parking dockets. The three elected judges preside over an array of criminal misdemeanor and civil infraction dockets. Two judges preside over therapeutic court dockets – Community Court, Veteran’s Court and DUI Court – occurring multiple times in the course of each month. One judge is selected biennially by the bench to serve as Presiding Judge whose responsibility is to supervise the judicial business of the court (GR 29). The Court’s two appointed Court Commissioners are primarily assigned to preside over high-volume infraction (including traffic, parking, and photo-enforcement) contested and mitigated dockets. The Court’s criminal dockets are quite large and frequently the judge and court clerk will 40-70 cases in a single morning or afternoon session. Municipal Court is uniquely qualified and equipped to efficiently process these high-volume dockets due to its many years of experience, commitment to the innovative use of technology, and deployment of human capital resources.
FTEs
2015 Actual 2016 Actual 2017 Actual 2018 Budget 2019 Proposed
Total FTEs 36.00 37.00 39.00 38.00 38.00
Expenditures:
2015 Actual 2016 Actual 2017 Actual 2018 Budget 2019 Proposed
Capital Outlay 2,357 5,388 0 12,000 0
Interfund Charges 543,502 108,130 95,033 96,053 57,777
Reserve for Budget Adjustment 0 0 0 13,614 0
Transfers Out 0 0 0 0 0
Wages & Benefits 3,026,263 3,218,846 3,452,468 3,851,052 3,896,414
Supplies & Services 159,406 121,924 133,085 156,776 190,771
Debt Services 0 0 0 0 0
All Other 157,296 165,159 181,276 196,937 197,000
TOTAL 3,888,824 3,619,447 3,861,862 4,326,432 4,341,962
Expenditure Notes:
All Other expenditures includes the rent for the Public Safety Building and juror costs.In 2016, interfund charges for the Municipal Court program were moved to the General Fund Internal Service Charges Department while interfund charges for Parking Violations remains in the Municipal Court budget.
Revenues:
2015 Actual 2016 Actual 2017 Actual 2018 Budget 2019 Proposed
Taxes 0 0 0 0 0
Licenses & Permits 0 0 0 0 0
IG Revenue 0 0 0 82,000 0
Services 126,191 107,133 79,450 129,850 129,850
Fines & Forfeits 2,853,049 2,804,021 3,004,533 2,693,650 2,643,650
Operating Transfers In 63,420 65,265 185,265 190,265 201,265
General Fund Resources 779,776 581,451 542,039 1,179,267 1,315,797
All Other 66,388 61,577 50,575 51,400 51,400
TOTAL 3,888,824 3,619,447 3,861,862 4,326,432 4,341,962
Revenue Notes:
All Other revenue includes interest income, NSF fees, prior year corrections, judgments & settlements, over & short, & contributions/donations.
Stand Alone Departments 91

Program Summary: Community Court Grant
Division: Stand Alone Departments
Fund Type: General Fund
Executive Summary:
Spokane Municipal Community Court (SMCC) aims to reduce quality-of-life offenses and connect offenders with essential services in downtown Spokane through a collaborative, problem-solving approach. The SMCC endeavors to hold offenders accountable, address factors impacting criminal behavior, fulfill victims’ needs, increase public confidence and bring enhanced quality-of-life to Spokane.
Programs and Services:
In 2016, SMCC was awarded a Center for Court Innovation (CCI)/BJA enhancement grant for nearly $200,000. It is anticipated that the grant funds will be fully expended in 2018. The grant has not been renewed for 2019.
FTEs
2015 Actual 2016 Actual 2017 Actual 2018 Budget 2019 Proposed
Total FTEs 0.00 0.00 1.00 0.00 0.00
Expenditures:
2015 Actual 2016 Actual 2017 Actual 2018 Budget 2019 Proposed
Capital Outlay 0 0 0 0 0
Interfund Charges 0 0 0 0 0
Reserve for Budget Adjustment 0 0 0 13,614 0
Transfers Out 0 0 0 0 0
Wages & Benefits 0 0 0 95,980 0
Supplies & Services 0 0 0 21,000 0
Debt Services 0 0 0 0 0
All Other 0 0 0 0 0
TOTAL 0 0 0 130,594 0
Expenditure Notes:
Actual expenditures for 2016 and 2017 were moved to the miscellaneous grant fund quarterly. The grant has not been renewed for 2019.
Revenues:
2015 Actual 2016 Actual 2017 Actual 2018 Budget 2019 Proposed
Taxes 0 0 0 0 0
Licenses & Permits 0 0 0 0 0
IG Revenue 0 0 0 82,000 0
Services 0 0 0 0 0
Fines & Forfeits 0 0 0 0 0
Operating Transfers In 0 0 0 0 0One Vision. One Plan. One Voice.
Stand Alone Departments92

Program Summary: Community Court Grant
Division: Stand Alone Departments
Fund Type: General Fund
Executive Summary:
Spokane Municipal Community Court (SMCC) aims to reduce quality-of-life offenses and connect offenders with essential services in downtown Spokane through a collaborative, problem-solving approach. The SMCC endeavors to hold offenders accountable, address factors impacting criminal behavior, fulfill victims’ needs, increase public confidence and bring enhanced quality-of-life to Spokane.
Programs and Services:
In 2016, SMCC was awarded a Center for Court Innovation (CCI)/BJA enhancement grant for nearly $200,000. It is anticipated that the grant funds will be fully expended in 2018. The grant has not been renewed for 2019.
FTEs
2015 Actual 2016 Actual 2017 Actual 2018 Budget 2019 Proposed
Total FTEs 0.00 0.00 1.00 0.00 0.00
Expenditures:
2015 Actual 2016 Actual 2017 Actual 2018 Budget 2019 Proposed
Capital Outlay 0 0 0 0 0
Interfund Charges 0 0 0 0 0
Reserve for Budget Adjustment 0 0 0 13,614 0
Transfers Out 0 0 0 0 0
Wages & Benefits 0 0 0 95,980 0
Supplies & Services 0 0 0 21,000 0
Debt Services 0 0 0 0 0
All Other 0 0 0 0 0
TOTAL 0 0 0 130,594 0
Expenditure Notes:
Actual expenditures for 2016 and 2017 were moved to the miscellaneous grant fund quarterly. The grant has not been renewed for 2019.
Revenues:
2015 Actual 2016 Actual 2017 Actual 2018 Budget 2019 Proposed
Taxes 0 0 0 0 0
Licenses & Permits 0 0 0 0 0
IG Revenue 0 0 0 82,000 0
Services 0 0 0 0 0
Fines & Forfeits 0 0 0 0 0
Operating Transfers In 0 0 0 0 0
General Fund Resources 0 0 0 48,594 0
All Other 0 0 0 0 0
TOTAL 0 0 0 130,594 0
Revenue Notes:
Actual revenues for 2016 and 2017 were moved to the miscellaneous grant fund quarterly. The grant has not been renewed for 2019.
Stand Alone Departments 93

Program Summary: Municipal Court
Division: Stand Alone Departments
Fund Type: General Fund
Executive Summary:
In accordance with the provisions of section 3.50.020 of the Revised Code of Washington, Spokane Municipal Court maintains exclusive jurisdiction for the filing, processing, hearing, and adjudicating all misdemeanor and gross misdemeanor criminal offenses, civil infractions, photo enforcement, and parking infractions occurring within the City of Spokane boundaries.
Programs and Services:
Drawn from 2017 filing numbers, Municipal Court processes approximately 7,000 criminal cases, 10,000 civil infractions, 25,000 photo-enforcement infractions, and 59,000 parking infractions annually. All citations must be entered and maintained in multiple software systems, including: (a) the state-operated Judicial Information Systems (JIS) database; (b) the City’s JustWare case management system; – (d) the City’s contracted Duncan parking system; and/or (e) the City’s contracted American Traffic Solutions' (ATS) photo-enforcement database.The Court Clerk's Office staff must be ever-vigilant to critical stages of criminal and infraction case filing, notice and processing requirements. Staff must be thoroughly trained in order to comply with all legal and statutory requirements, as well as local and state court rules governing every aspect of a case or citation. Failure to comply with statutes, court rules, and/or policies/procedures can result in serious consequences including premature release of inmates or inappropriate incarceration. The Court Clerk's Office has 29 clerks performing a variety of duties, including customer service via phone, email or in person, data entry into JIS/JustWare/Duncan/ATS, maintaining electronic court files, requesting inmate transport, and assisting judicial officers in court. The Court Clerk's Office provides information and assistance to citizens, attorneys, state and city agencies, defendants, and others involved in cases filed in Municipal Court.
The Court Clerk's Office receives more than 00,000 pieces of mail annually which are opened, reviewed, sorted, and processed according to state, city, and court policies. On an annual basis, cashiers in Municipal Court receipt over 17,000 individual payments for criminal cases (most in $25 increments) that results in over $400,000 in GF revenue. The cashiers also receipt over 100,000 individual payments related to infraction cases (most in $25 increments) which results in over $3 million in GF revenue per year.
Judicial officers in Municipal Court preside over a variety of hearing types including arraignments, pretrial hearings, jury trials, domestic violence no contact order hearings, treatment reviews, bench warrant recalls, show cause hearings, contested and mitigated traffic, non-traffic, and parking dockets. The three elected judges preside over an array of criminal misdemeanor and civil infraction dockets. Two judges preside over therapeutic court dockets – Community Court, Veteran’s Court and DUI Court – occurring multiple times in the course of each month. One judge is selected biennially by the bench to serve as Presiding Judge whose responsibility is to supervise the judicial business of the court (GR 29). The Court’s two appointed Court Commissioners are primarily assigned to preside over high-volume infraction (including traffic, parking, and photo-enforcement) contested and mitigated dockets. The Court’s criminal dockets are quite large and frequently the judge and court clerk will 40-70 cases in a single morning or afternoon session. Municipal Court is uniquely qualified and equipped to efficiently process these high-volume dockets due to its many years of experience, commitment to the innovative use of technology, and deployment of human capital resources.
FTEs
2015 Actual 2016 Actual 2017 Actual 2018 Budget 2019 Proposed
Total FTEs 33.00 34.00 35.00 35.00 35.00
Expenditures:
2015 Actual 2016 Actual 2017 Actual 2018 Budget 2019 Proposed
Capital Outlay 2,357 5,388 0 12,000 0
Interfund Charges 378,444 6,547 0 30,000 0One Vision. One Plan. One Voice.
Stand Alone Departments94
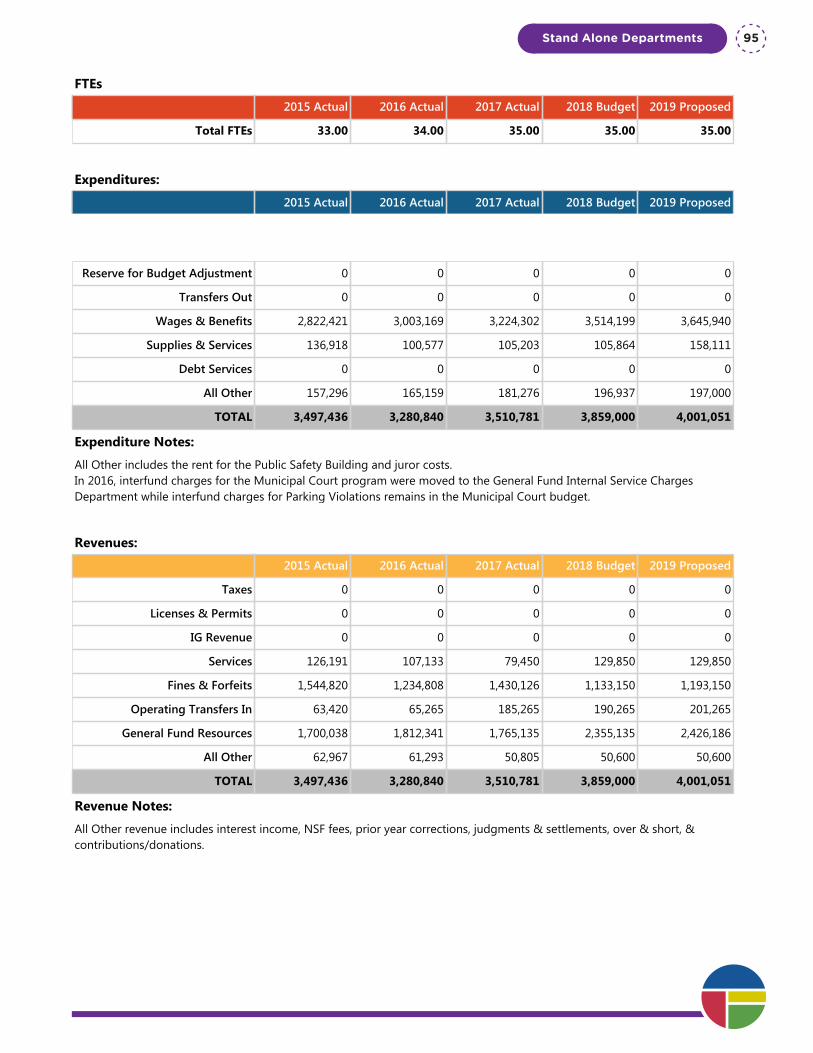
Program Summary: Municipal Court
Division: Stand Alone Departments
Fund Type: General Fund
Executive Summary:
In accordance with the provisions of section 3.50.020 of the Revised Code of Washington, Spokane Municipal Court maintains exclusive jurisdiction for the filing, processing, hearing, and adjudicating all misdemeanor and gross misdemeanor criminal offenses, civil infractions, photo enforcement, and parking infractions occurring within the City of Spokane boundaries.
Programs and Services:
Drawn from 2017 filing numbers, Municipal Court processes approximately 7,000 criminal cases, 10,000 civil infractions, 25,000 photo-enforcement infractions, and 59,000 parking infractions annually. All citations must be entered and maintained in multiple software systems, including: (a) the state-operated Judicial Information Systems (JIS) database; (b) the City’s JustWare case management system; – (d) the City’s contracted Duncan parking system; and/or (e) the City’s contracted American Traffic Solutions' (ATS) photo-enforcement database.The Court Clerk's Office staff must be ever-vigilant to critical stages of criminal and infraction case filing, notice and processing requirements. Staff must be thoroughly trained in order to comply with all legal and statutory requirements, as well as local and state court rules governing every aspect of a case or citation. Failure to comply with statutes, court rules, and/or policies/procedures can result in serious consequences including premature release of inmates or inappropriate incarceration. The Court Clerk's Office has 29 clerks performing a variety of duties, including customer service via phone, email or in person, data entry into JIS/JustWare/Duncan/ATS, maintaining electronic court files, requesting inmate transport, and assisting judicial officers in court. The Court Clerk's Office provides information and assistance to citizens, attorneys, state and city agencies, defendants, and others involved in cases filed in Municipal Court.
The Court Clerk's Office receives more than 00,000 pieces of mail annually which are opened, reviewed, sorted, and processed according to state, city, and court policies. On an annual basis, cashiers in Municipal Court receipt over 17,000 individual payments for criminal cases (most in $25 increments) that results in over $400,000 in GF revenue. The cashiers also receipt over 100,000 individual payments related to infraction cases (most in $25 increments) which results in over $3 million in GF revenue per year.
Judicial officers in Municipal Court preside over a variety of hearing types including arraignments, pretrial hearings, jury trials, domestic violence no contact order hearings, treatment reviews, bench warrant recalls, show cause hearings, contested and mitigated traffic, non-traffic, and parking dockets. The three elected judges preside over an array of criminal misdemeanor and civil infraction dockets. Two judges preside over therapeutic court dockets – Community Court, Veteran’s Court and DUI Court – occurring multiple times in the course of each month. One judge is selected biennially by the bench to serve as Presiding Judge whose responsibility is to supervise the judicial business of the court (GR 29). The Court’s two appointed Court Commissioners are primarily assigned to preside over high-volume infraction (including traffic, parking, and photo-enforcement) contested and mitigated dockets. The Court’s criminal dockets are quite large and frequently the judge and court clerk will 40-70 cases in a single morning or afternoon session. Municipal Court is uniquely qualified and equipped to efficiently process these high-volume dockets due to its many years of experience, commitment to the innovative use of technology, and deployment of human capital resources.
FTEs
2015 Actual 2016 Actual 2017 Actual 2018 Budget 2019 Proposed
Total FTEs 33.00 34.00 35.00 35.00 35.00
Expenditures:
2015 Actual 2016 Actual 2017 Actual 2018 Budget 2019 Proposed
Capital Outlay 2,357 5,388 0 12,000 0
Interfund Charges 378,444 6,547 0 30,000 0
Reserve for Budget Adjustment 0 0 0 0 0
Transfers Out 0 0 0 0 0
Wages & Benefits 2,822,421 3,003,169 3,224,302 3,514,199 3,645,940
Supplies & Services 136,918 100,577 105,203 105,864 158,111
Debt Services 0 0 0 0 0
All Other 157,296 165,159 181,276 196,937 197,000
TOTAL 3,497,436 3,280,840 3,510,781 3,859,000 4,001,051
Expenditure Notes:
All Other includes the rent for the Public Safety Building and juror costs.In 2016, interfund charges for the Municipal Court program were moved to the General Fund Internal Service Charges Department while interfund charges for Parking Violations remains in the Municipal Court budget.
Revenues:
2015 Actual 2016 Actual 2017 Actual 2018 Budget 2019 Proposed
Taxes 0 0 0 0 0
Licenses & Permits 0 0 0 0 0
IG Revenue 0 0 0 0 0
Services 126,191 107,133 79,450 129,850 129,850
Fines & Forfeits 1,544,820 1,234,808 1,430,126 1,133,150 1,193,150
Operating Transfers In 63,420 65,265 185,265 190,265 201,265
General Fund Resources 1,700,038 1,812,341 1,765,135 2,355,135 2,426,186
All Other 62,967 61,293 50,805 50,600 50,600
TOTAL 3,497,436 3,280,840 3,510,781 3,859,000 4,001,051
Revenue Notes:
All Other revenue includes interest income, NSF fees, prior year corrections, judgments & settlements, over & short, & contributions/donations.
Stand Alone Departments 95
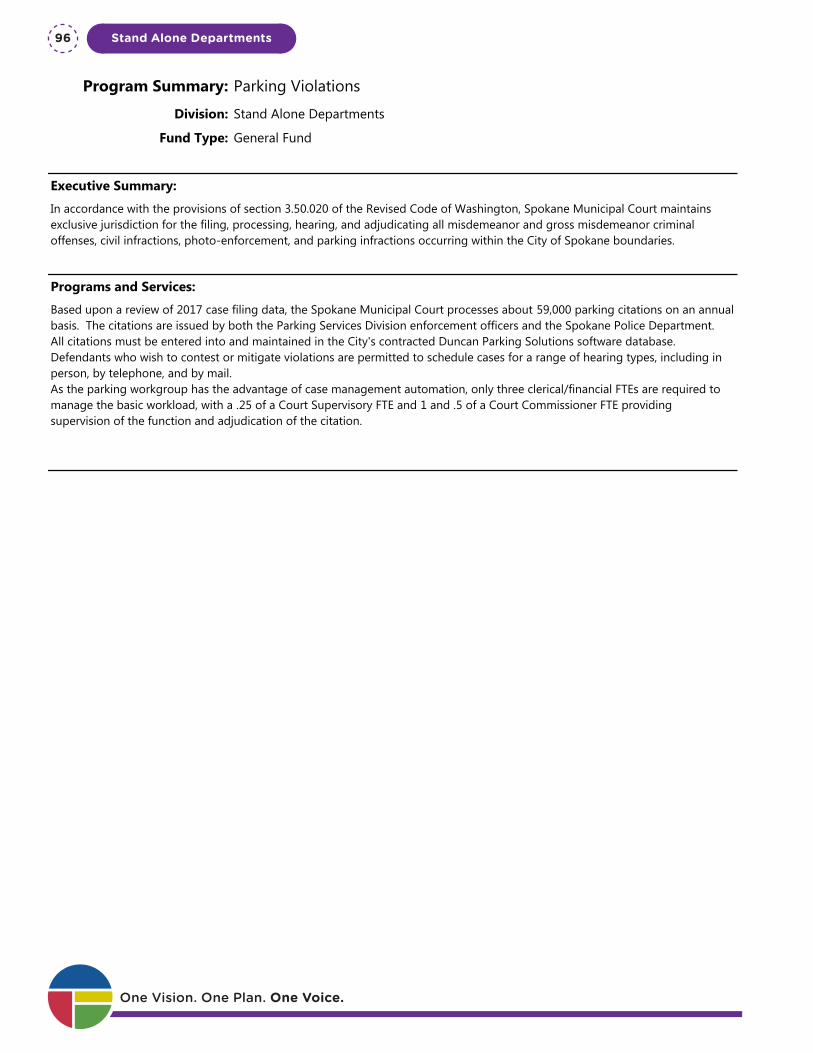
Program Summary: Parking Violations
Division: Stand Alone Departments
Fund Type: General Fund
Executive Summary:
In accordance with the provisions of section 3.50.020 of the Revised Code of Washington, Spokane Municipal Court maintains exclusive jurisdiction for the filing, processing, hearing, and adjudicating all misdemeanor and gross misdemeanor criminal offenses, civil infractions, photo-enforcement, and parking infractions occurring within the City of Spokane boundaries.
Programs and Services:
Based upon a review of 2017 case filing data, the Spokane Municipal Court processes about 59,000 parking citations on an annual basis. The citations are issued by both the Parking Services Division enforcement officers and the Spokane Police Department.All citations must be entered into and maintained in the City's contracted Duncan Parking Solutions software database. Defendants who wish to contest or mitigate violations are permitted to schedule cases for a range of hearing types, including in person, by telephone, and by mail.As the parking workgroup has the advantage of case management automation, only three clerical/financial FTEs are required to manage the basic workload, with a .25 of a Court Supervisory FTE and 1 and .5 of a Court Commissioner FTE providing supervision of the function and adjudication of the citation.
FTEs
2015 Actual 2016 Actual 2017 Actual 2018 Budget 2019 Proposed
Total FTEs 3.00 3.00 3.00 3.00 3.00
Expenditures:
2015 Actual 2016 Actual 2017 Actual 2018 Budget 2019 Proposed
Capital Outlay 0 0 0 0 0
Interfund Charges 165,058 101,583 95,033 66,053 57,777
Reserve for Budget Adjustment 0 0 0 0 0
Transfers Out 0 0 0 0 0
Wages & Benefits 203,842 215,677 228,166 240,873 250,474
Supplies & Services 22,488 21,347 27,882 29,912 32,660
Debt Services 0 0 0 0 0
All Other 0 0 0 0 0
TOTAL 391,388 338,607 351,081 336,838 340,911
Expenditure Notes:
Revenues:
2015 Actual 2016 Actual 2017 Actual 2018 Budget 2019 Proposed
Taxes 0 0 0 0 0
Licenses & Permits 0 0 0 0 0
IG Revenue 0 0 0 0 0One Vision. One Plan. One Voice.
Stand Alone Departments96
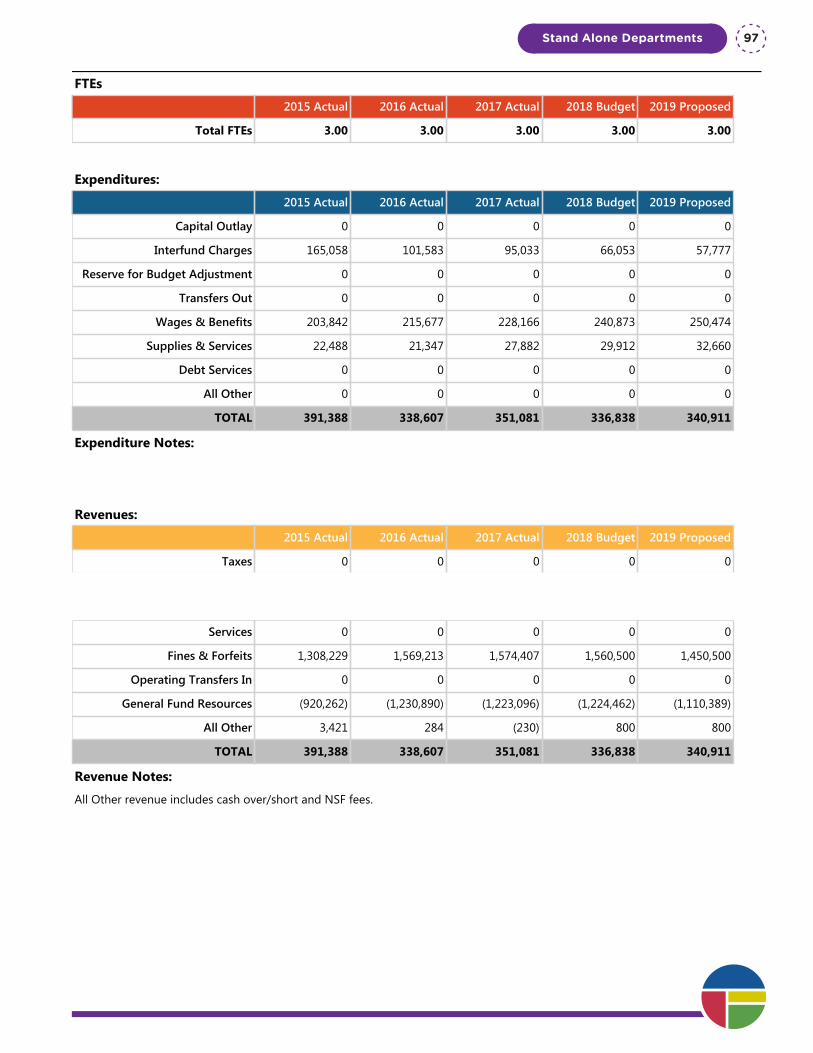
Program Summary: Parking Violations
Division: Stand Alone Departments
Fund Type: General Fund
Executive Summary:
In accordance with the provisions of section 3.50.020 of the Revised Code of Washington, Spokane Municipal Court maintains exclusive jurisdiction for the filing, processing, hearing, and adjudicating all misdemeanor and gross misdemeanor criminal offenses, civil infractions, photo-enforcement, and parking infractions occurring within the City of Spokane boundaries.
Programs and Services:
Based upon a review of 2017 case filing data, the Spokane Municipal Court processes about 59,000 parking citations on an annual basis. The citations are issued by both the Parking Services Division enforcement officers and the Spokane Police Department.All citations must be entered into and maintained in the City's contracted Duncan Parking Solutions software database. Defendants who wish to contest or mitigate violations are permitted to schedule cases for a range of hearing types, including in person, by telephone, and by mail.As the parking workgroup has the advantage of case management automation, only three clerical/financial FTEs are required to manage the basic workload, with a .25 of a Court Supervisory FTE and 1 and .5 of a Court Commissioner FTE providing supervision of the function and adjudication of the citation.
FTEs
2015 Actual 2016 Actual 2017 Actual 2018 Budget 2019 Proposed
Total FTEs 3.00 3.00 3.00 3.00 3.00
Expenditures:
2015 Actual 2016 Actual 2017 Actual 2018 Budget 2019 Proposed
Capital Outlay 0 0 0 0 0
Interfund Charges 165,058 101,583 95,033 66,053 57,777
Reserve for Budget Adjustment 0 0 0 0 0
Transfers Out 0 0 0 0 0
Wages & Benefits 203,842 215,677 228,166 240,873 250,474
Supplies & Services 22,488 21,347 27,882 29,912 32,660
Debt Services 0 0 0 0 0
All Other 0 0 0 0 0
TOTAL 391,388 338,607 351,081 336,838 340,911
Expenditure Notes:
Revenues:
2015 Actual 2016 Actual 2017 Actual 2018 Budget 2019 Proposed
Taxes 0 0 0 0 0
Licenses & Permits 0 0 0 0 0
IG Revenue 0 0 0 0 0
Services 0 0 0 0 0
Fines & Forfeits 1,308,229 1,569,213 1,574,407 1,560,500 1,450,500
Operating Transfers In 0 0 0 0 0
General Fund Resources (920,262) (1,230,890) (1,223,096) (1,224,462) (1,110,389)
All Other 3,421 284 (230) 800 800
TOTAL 391,388 338,607 351,081 336,838 340,911
Revenue Notes:
All Other revenue includes cash over/short and NSF fees.
Stand Alone Departments 97

One Vision. One Plan. One Voice.
Stand Alone Departments98
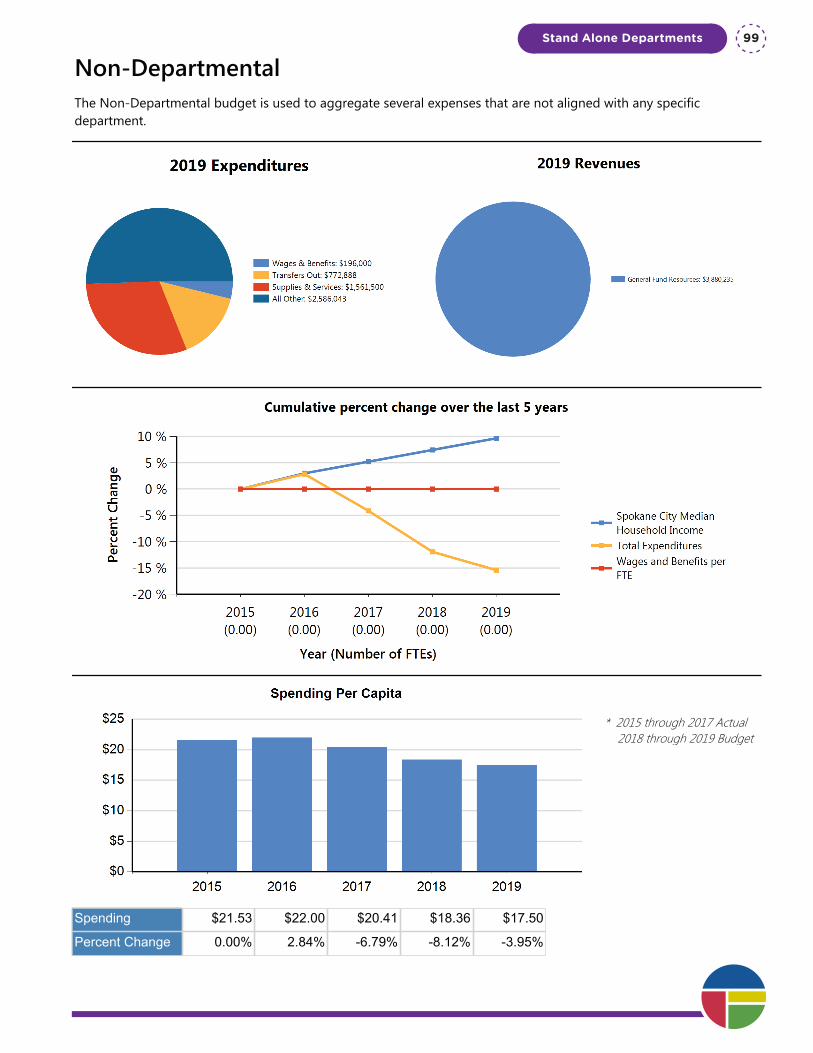
Non-DepartmentalThe Non-Departmental budget is used to aggregate several expenses that are not aligned with any specific department.
* 2015 through 2017 Actual 2018 through 2019 Budget
Spending $21.53 $22.00 $20.41 $18.36 $17.50
Percent Change 0.00% 2.84% -6.79% -8.12% -3.95%
Stand Alone Departments 99
Department Summary: Non-Departmental
Division: Stand Alone Departments
Fund Type: General Fund
Executive Summary:
The Non-Departmental budget is used to aggregate several expenses that are not aligned with any specific department.
Programs and Services:
Listed below are some of the key programs included in the Non-Departmental budget: -Animal Control -Citywide Memberships/Dues-Outside Legal Counsel -Election & Voter Registration Expenses-Dept of Emergency Management-Spokane County Pollution Control-Annexation Mitigation -Support for Spokane Regional Transportation
FTEs
2015 Actual 2016 Actual 2017 Actual 2018 Budget 2019 Proposed
Total FTEs 0.00 0.00 0.00 0.00 0.00
Expenditures:
2015 Actual 2016 Actual 2017 Actual 2018 Budget 2019 Proposed
Capital Outlay 0 0 0 0 0
Interfund Charges 0 0 0 0 0
Reserve for Budget Adjustment 0 0 0 (1,183,444) (1,236,196)
Transfers Out 312,033 764,076 462,888 807,908 772,888
Wages & Benefits 184,004 210,975 176,715 196,000 196,000
Supplies & Services 1,445,459 1,680,821 1,572,202 1,727,500 1,561,500
Debt Services 0 66,518 (3,488) 0 0
All Other 2,646,174 1,995,573 2,189,148 2,492,200 2,586,043
TOTAL 4,587,670 4,717,963 4,397,465 4,040,164 3,880,235
Expenditure Notes:
Revenues:
2015 Actual 2016 Actual 2017 Actual 2018 Budget 2019 Proposed
Taxes 0 0 0 0 0
Licenses & Permits 0 0 0 0 0
IG Revenue 0 0 0 0 0One Vision. One Plan. One Voice.
Stand Alone Departments100
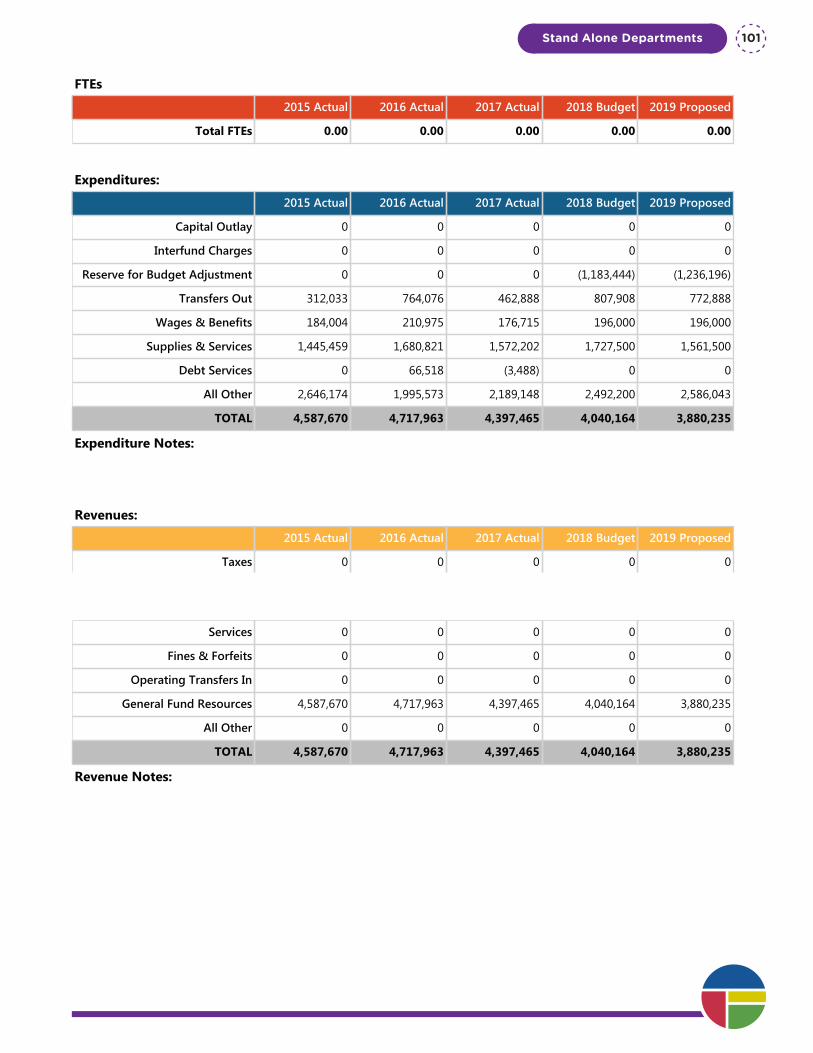
Department Summary: Non-Departmental
Division: Stand Alone Departments
Fund Type: General Fund
Executive Summary:
The Non-Departmental budget is used to aggregate several expenses that are not aligned with any specific department.
Programs and Services:
Listed below are some of the key programs included in the Non-Departmental budget: -Animal Control -Citywide Memberships/Dues-Outside Legal Counsel -Election & Voter Registration Expenses-Dept of Emergency Management-Spokane County Pollution Control-Annexation Mitigation -Support for Spokane Regional Transportation
FTEs
2015 Actual 2016 Actual 2017 Actual 2018 Budget 2019 Proposed
Total FTEs 0.00 0.00 0.00 0.00 0.00
Expenditures:
2015 Actual 2016 Actual 2017 Actual 2018 Budget 2019 Proposed
Capital Outlay 0 0 0 0 0
Interfund Charges 0 0 0 0 0
Reserve for Budget Adjustment 0 0 0 (1,183,444) (1,236,196)
Transfers Out 312,033 764,076 462,888 807,908 772,888
Wages & Benefits 184,004 210,975 176,715 196,000 196,000
Supplies & Services 1,445,459 1,680,821 1,572,202 1,727,500 1,561,500
Debt Services 0 66,518 (3,488) 0 0
All Other 2,646,174 1,995,573 2,189,148 2,492,200 2,586,043
TOTAL 4,587,670 4,717,963 4,397,465 4,040,164 3,880,235
Expenditure Notes:
Revenues:
2015 Actual 2016 Actual 2017 Actual 2018 Budget 2019 Proposed
Taxes 0 0 0 0 0
Licenses & Permits 0 0 0 0 0
IG Revenue 0 0 0 0 0
Services 0 0 0 0 0
Fines & Forfeits 0 0 0 0 0
Operating Transfers In 0 0 0 0 0
General Fund Resources 4,587,670 4,717,963 4,397,465 4,040,164 3,880,235
All Other 0 0 0 0 0
TOTAL 4,587,670 4,717,963 4,397,465 4,040,164 3,880,235
Revenue Notes:
Stand Alone Departments 101

One Vision. One Plan. One Voice.
Stand Alone Departments102
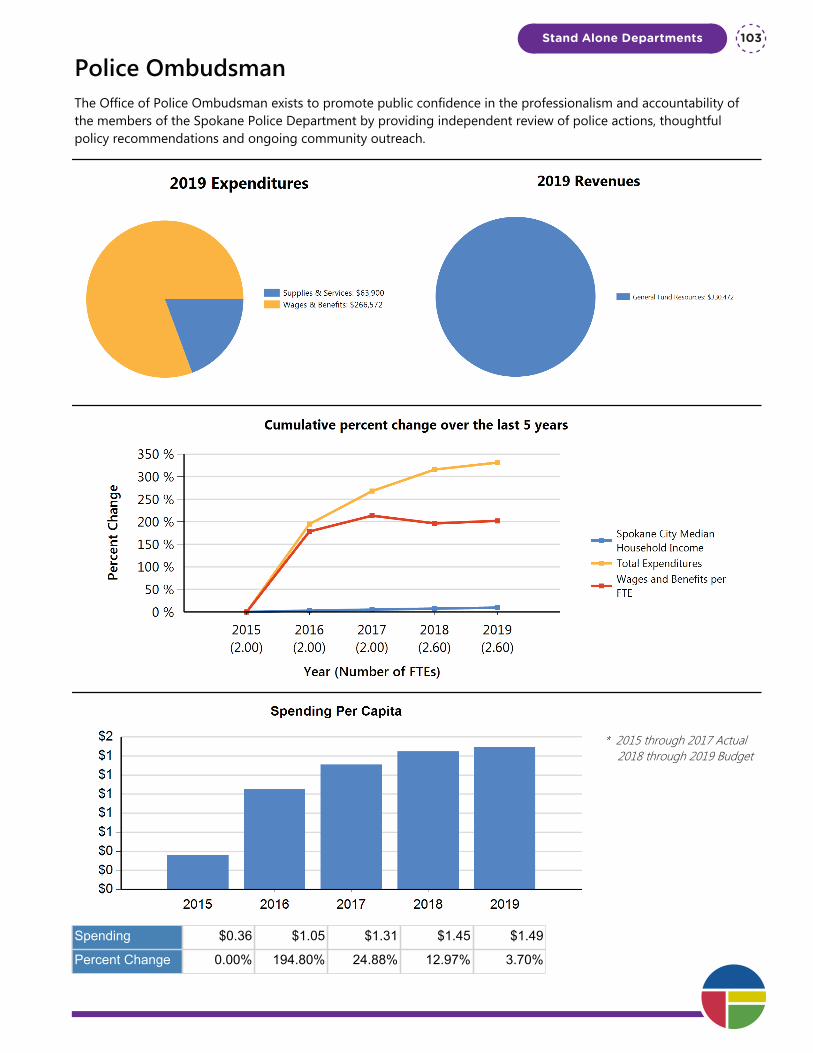
Police OmbudsmanThe Office of Police Ombudsman exists to promote public confidence in the professionalism and accountability of the members of the Spokane Police Department by providing independent review of police actions, thoughtful policy recommendations and ongoing community outreach.
* 2015 through 2017 Actual 2018 through 2019 Budget
Spending $0.36 $1.05 $1.31 $1.45 $1.49
Percent Change 0.00% 194.80% 24.88% 12.97% 3.70%
Stand Alone Departments 103

Department Summary: Police Ombudsman
Division: Stand Alone Departments
Fund Type: General Fund
Executive Summary:
The Office of Police Ombudsman exists to promote public confidence in the professionalism and accountability of the members of the Spokane Police Department by providing independent review of police actions, thoughtful policy recommendations and ongoing community outreach.
Programs and Services:
The Office of the Police Ombudsman: receives complaints involving employees of the Spokane Police Department (SPD); monitors SPD complaints and investigations; attends and observes Internal Affairs interviews of Officers, complainants and witnesses; mediates complaints; responds to critical incidents and acts as an observer; conducts closing interviews with a complainant once a complaint has been closed; certifies all SPD Internal Affairs investigations that are timely, thorough and objective; maintains a regular program of community outreach; makes monthly and annual reports to the City Council; audits the complaint resolution process; and recommends policies and procedures to improve the quality of SPD practices.
FTEs
2015 Actual 2016 Actual 2017 Actual 2018 Budget 2019 Proposed
Total FTEs 2.00 2.00 2.00 2.60 2.60
Expenditures:
2015 Actual 2016 Actual 2017 Actual 2018 Budget 2019 Proposed
Capital Outlay 0 1,579 0 0 0
Interfund Charges 0 0 0 0 0
Reserve for Budget Adjustment 0 0 0 0 0
Transfers Out 0 0 0 0 0
Wages & Benefits 62,258 173,405 234,112 252,368 266,572
Supplies & Services 14,355 50,872 47,951 66,300 63,900
Debt Services 0 0 0 0 0
All Other 0 0 0 0 0
TOTAL 76,613 225,856 282,063 318,668 330,472
Expenditure Notes:
Vacancies in 2015 resulted in wages & benefit expenses coming in under the budgeted cost.
Revenues:
2015 Actual 2016 Actual 2017 Actual 2018 Budget 2019 Proposed
Taxes 0 0 0 0 0
Licenses & Permits 0 0 0 0 0
IG Revenue 0 0 0 0 0
Services 0 0 0 0 0
Fines & Forfeits 0 0 0 0 0One Vision. One Plan. One Voice.
Stand Alone Departments104

Department Summary: Police Ombudsman
Division: Stand Alone Departments
Fund Type: General Fund
Executive Summary:
The Office of Police Ombudsman exists to promote public confidence in the professionalism and accountability of the members of the Spokane Police Department by providing independent review of police actions, thoughtful policy recommendations and ongoing community outreach.
Programs and Services:
The Office of the Police Ombudsman: receives complaints involving employees of the Spokane Police Department (SPD); monitors SPD complaints and investigations; attends and observes Internal Affairs interviews of Officers, complainants and witnesses; mediates complaints; responds to critical incidents and acts as an observer; conducts closing interviews with a complainant once a complaint has been closed; certifies all SPD Internal Affairs investigations that are timely, thorough and objective; maintains a regular program of community outreach; makes monthly and annual reports to the City Council; audits the complaint resolution process; and recommends policies and procedures to improve the quality of SPD practices.
FTEs
2015 Actual 2016 Actual 2017 Actual 2018 Budget 2019 Proposed
Total FTEs 2.00 2.00 2.00 2.60 2.60
Expenditures:
2015 Actual 2016 Actual 2017 Actual 2018 Budget 2019 Proposed
Capital Outlay 0 1,579 0 0 0
Interfund Charges 0 0 0 0 0
Reserve for Budget Adjustment 0 0 0 0 0
Transfers Out 0 0 0 0 0
Wages & Benefits 62,258 173,405 234,112 252,368 266,572
Supplies & Services 14,355 50,872 47,951 66,300 63,900
Debt Services 0 0 0 0 0
All Other 0 0 0 0 0
TOTAL 76,613 225,856 282,063 318,668 330,472
Expenditure Notes:
Vacancies in 2015 resulted in wages & benefit expenses coming in under the budgeted cost.
Revenues:
2015 Actual 2016 Actual 2017 Actual 2018 Budget 2019 Proposed
Taxes 0 0 0 0 0
Licenses & Permits 0 0 0 0 0
IG Revenue 0 0 0 0 0
Services 0 0 0 0 0
Fines & Forfeits 0 0 0 0 0
Operating Transfers In 0 0 0 0 0
General Fund Resources 76,613 225,856 282,063 318,668 330,472
All Other 0 0 0 0 0
TOTAL 76,613 225,856 282,063 318,668 330,472
Revenue Notes:
Stand Alone Departments 105

One Vision. One Plan. One Voice.
Stand Alone Departments106
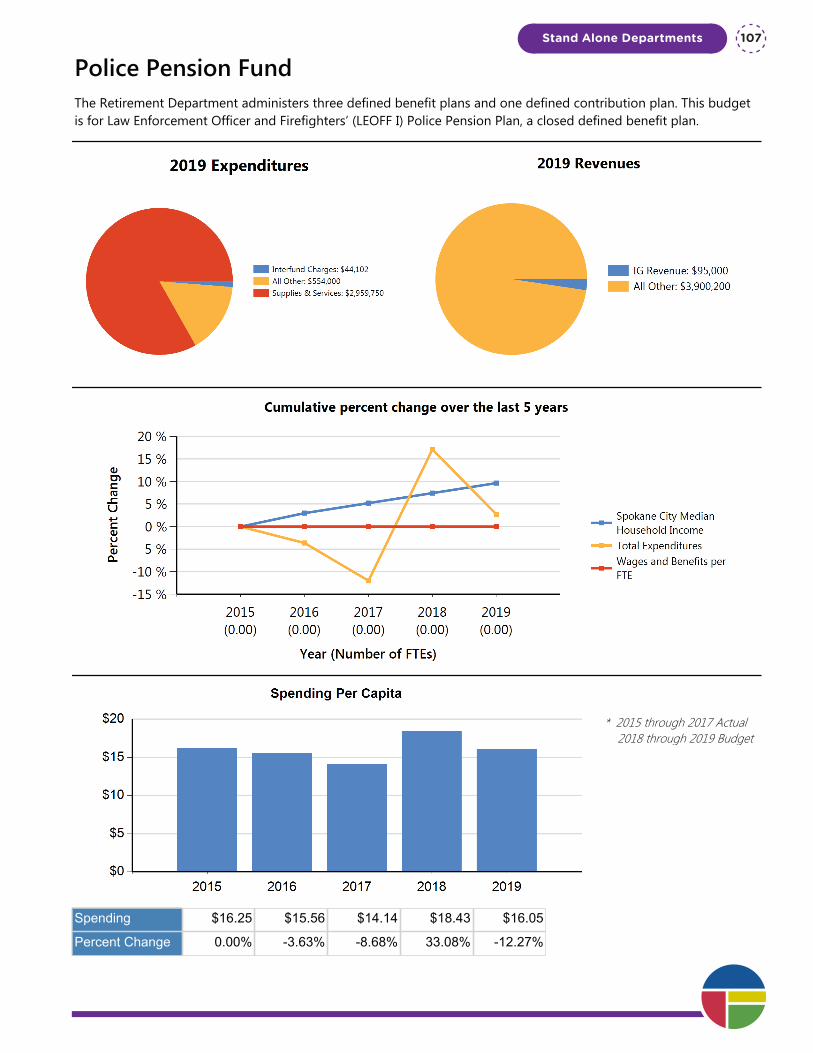
Police Pension FundThe Retirement Department administers three defined benefit plans and one defined contribution plan. This budget is for Law Enforcement Officer and Firefighters’ (LEOFF I) Police Pension Plan, a closed defined benefit plan.
* 2015 through 2017 Actual 2018 through 2019 Budget
Spending $16.25 $15.56 $14.14 $18.43 $16.05
Percent Change 0.00% -3.63% -8.68% 33.08% -12.27%
Stand Alone Departments 107
Department Summary: Police Pension Fund
Division: Stand Alone Departments
Fund Type: Trust and Agency Fund
Executive Summary:
The Retirement Department administers three defined benefit plans and one defined contribution plan. This budget is for Law Enforcement Officer and Firefighters’ (LEOFF I) Police Pension Plan, a closed defined benefit plan.
Programs and Services:
The LEOFF I Police Plan provides pension benefits related to retirement, disability, and death. In addition, the Plan pays for medical and dental expenses for its members, along with reimbursement of Medicare premium payments. At December 31, 2017, there were 168 members of the City of Spokane LEOFF I Police Plan all but 1 of whom are retired. A seven-member board, as defined in the Revised Code of Washington, governs the Plan.
LEOFF I Police Plan general staff duties include processing pension and medical payments counseling retirees, and ensuring compliance with State and Federal Laws. The medical expenditures comprise the largest portion of the LEOFF I Police budget and, like pensions, represent an earned benefit payable by the System. For the medical portion of the benefit, the Benefits Department (HR) verifies medical claims, which are then processed by the Retirement Department. For the 2019 budget, total expenses for the Plan have been reduced by $498k (-12.3%). LEOFF I Police revenues and expenditures are separately accounted for inside a trust fund within the City of Spokane.
FTEs
2015 Actual 2016 Actual 2017 Actual 2018 Budget 2019 Proposed
Total FTEs 0.00 0.00 0.00 0.00 0.00
Expenditures:
2015 Actual 2016 Actual 2017 Actual 2018 Budget 2019 Proposed
Capital Outlay 0 0 0 0 0
Interfund Charges 42,705 38,400 41,717 44,870 44,102
Reserve for Budget Adjustment 0 0 0 0 0
Transfers Out 0 0 0 0 0
Wages & Benefits 0 0 0 0 0
Supplies & Services 2,714,874 2,679,790 2,503,857 3,301,600 2,959,750
Debt Services 0 0 0 0 0
All Other 705,257 618,629 501,605 709,000 554,000
TOTAL 3,462,836 3,336,819 3,047,179 4,055,470 3,557,852
Expenditure Notes:
“All Other” includes Pension annuity claims and death benefit payments. Medical payments and Medicare reimbursements comprise the vast majority of the “Other Services & Charges”
Revenues:
2015 Actual 2016 Actual 2017 Actual 2018 Budget 2019 Proposed
Taxes 0 0 0 0 0One Vision. One Plan. One Voice.
Stand Alone Departments108
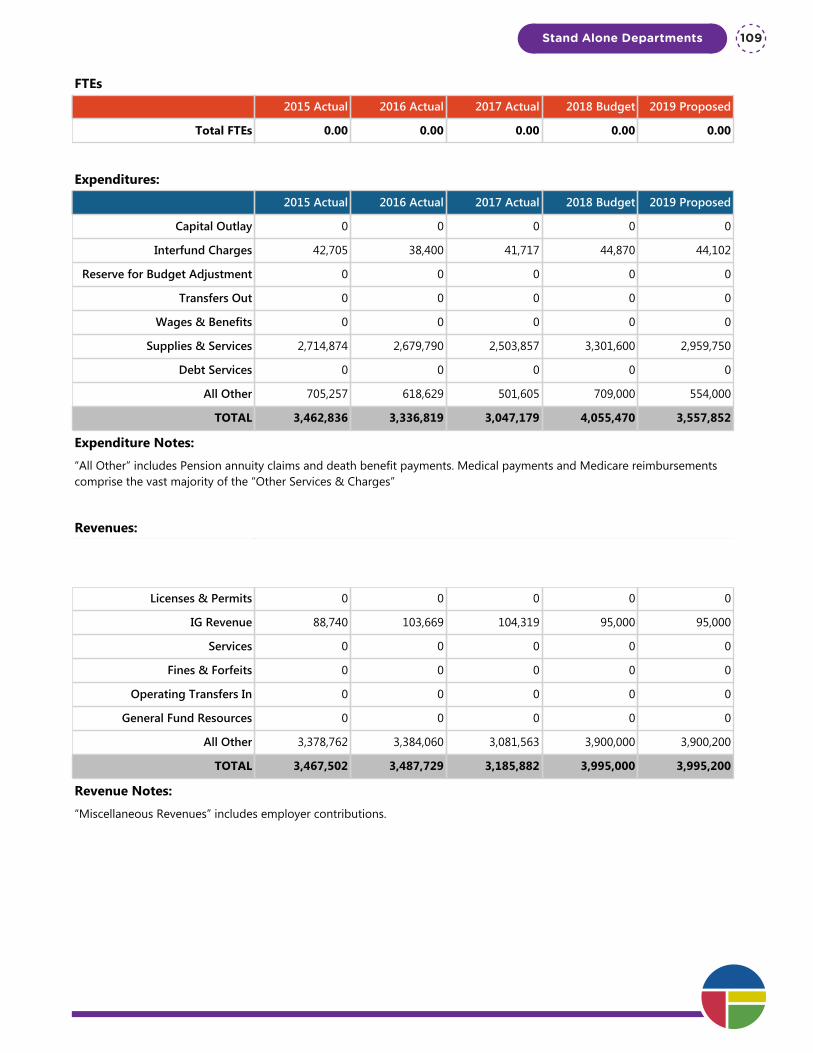
Department Summary: Police Pension Fund
Division: Stand Alone Departments
Fund Type: Trust and Agency Fund
Executive Summary:
The Retirement Department administers three defined benefit plans and one defined contribution plan. This budget is for Law Enforcement Officer and Firefighters’ (LEOFF I) Police Pension Plan, a closed defined benefit plan.
Programs and Services:
The LEOFF I Police Plan provides pension benefits related to retirement, disability, and death. In addition, the Plan pays for medical and dental expenses for its members, along with reimbursement of Medicare premium payments. At December 31, 2017, there were 168 members of the City of Spokane LEOFF I Police Plan all but 1 of whom are retired. A seven-member board, as defined in the Revised Code of Washington, governs the Plan.
LEOFF I Police Plan general staff duties include processing pension and medical payments counseling retirees, and ensuring compliance with State and Federal Laws. The medical expenditures comprise the largest portion of the LEOFF I Police budget and, like pensions, represent an earned benefit payable by the System. For the medical portion of the benefit, the Benefits Department (HR) verifies medical claims, which are then processed by the Retirement Department. For the 2019 budget, total expenses for the Plan have been reduced by $498k (-12.3%). LEOFF I Police revenues and expenditures are separately accounted for inside a trust fund within the City of Spokane.
FTEs
2015 Actual 2016 Actual 2017 Actual 2018 Budget 2019 Proposed
Total FTEs 0.00 0.00 0.00 0.00 0.00
Expenditures:
2015 Actual 2016 Actual 2017 Actual 2018 Budget 2019 Proposed
Capital Outlay 0 0 0 0 0
Interfund Charges 42,705 38,400 41,717 44,870 44,102
Reserve for Budget Adjustment 0 0 0 0 0
Transfers Out 0 0 0 0 0
Wages & Benefits 0 0 0 0 0
Supplies & Services 2,714,874 2,679,790 2,503,857 3,301,600 2,959,750
Debt Services 0 0 0 0 0
All Other 705,257 618,629 501,605 709,000 554,000
TOTAL 3,462,836 3,336,819 3,047,179 4,055,470 3,557,852
Expenditure Notes:
“All Other” includes Pension annuity claims and death benefit payments. Medical payments and Medicare reimbursements comprise the vast majority of the “Other Services & Charges”
Revenues:
2015 Actual 2016 Actual 2017 Actual 2018 Budget 2019 Proposed
Taxes 0 0 0 0 0
Licenses & Permits 0 0 0 0 0
IG Revenue 88,740 103,669 104,319 95,000 95,000
Services 0 0 0 0 0
Fines & Forfeits 0 0 0 0 0
Operating Transfers In 0 0 0 0 0
General Fund Resources 0 0 0 0 0
All Other 3,378,762 3,384,060 3,081,563 3,900,000 3,900,200
TOTAL 3,467,502 3,487,729 3,185,882 3,995,000 3,995,200
Revenue Notes:
“Miscellaneous Revenues” includes employer contributions.
Stand Alone Departments 109

One Vision. One Plan. One Voice.
Stand Alone Departments110
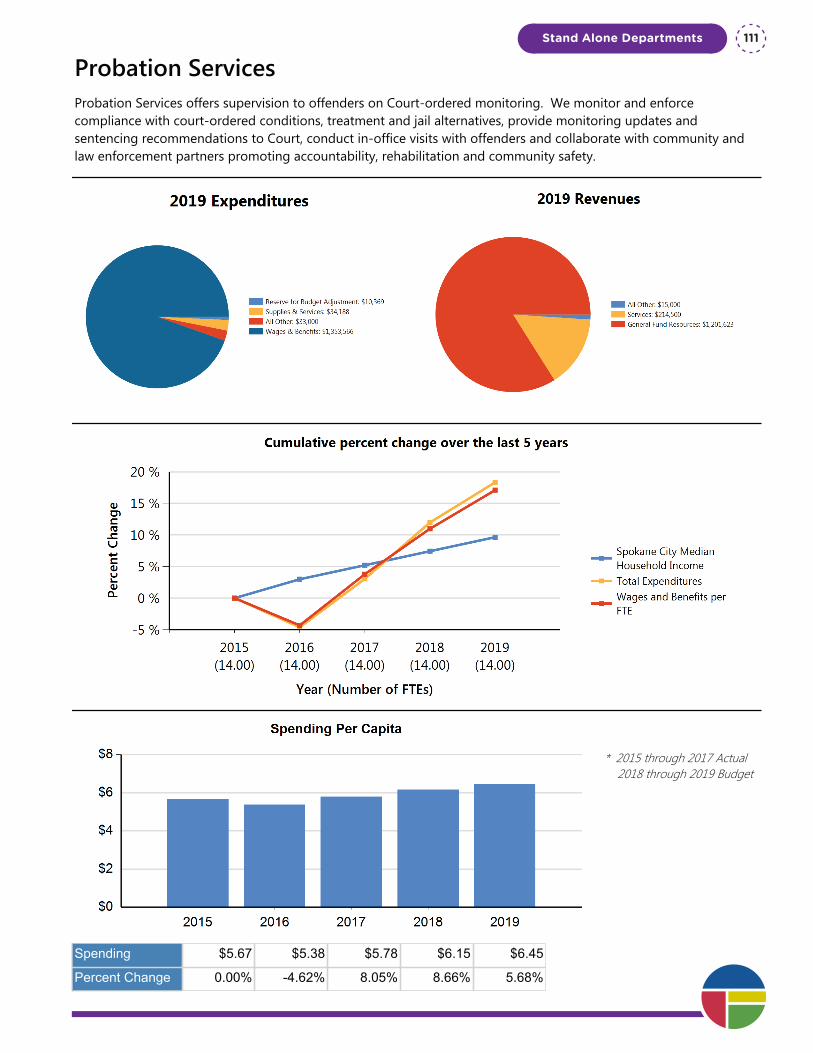
Probation ServicesProbation Services offers supervision to offenders on Court-ordered monitoring. We monitor and enforce compliance with court-ordered conditions, treatment and jail alternatives, provide monitoring updates and sentencing recommendations to Court, conduct in-office visits with offenders and collaborate with community and law enforcement partners promoting accountability, rehabilitation and community safety.
* 2015 through 2017 Actual 2018 through 2019 Budget
Spending $5.67 $5.38 $5.78 $6.15 $6.45
Percent Change 0.00% -4.62% 8.05% 8.66% 5.68%
Stand Alone Departments 111

Department Summary: Probation Services
Division: Stand Alone Departments
Fund Type: General Fund
Executive Summary:
Probation Services offers supervision to offenders on Court-ordered monitoring. We monitor and enforce compliance with court-ordered conditions, treatment and jail alternatives, provide monitoring updates and sentencing recommendations to Court, conduct in-office visits with offenders and collaborate with community and law enforcement partners promoting accountability, rehabilitation and community safety.
Programs and Services:
The primary function of Probation Services is being the first jail alternative. We offer work crew and in-house electronic home monitoring (EHM) programs as alternative sanctions reducing the City’s jail costs and allowing offenders the opportunity to fulfill their employment and household obligations while still complying with a court order. Our EHM unit will be switching gear under a newly contracted agency in August 2018. This change is slated to save the City around $100,000 in cost, as well as some added time efficiencies.
We actively participate in problem-solving courts such as Community Court, Veteran's Court, Mental Health Court and DUI Court. The newly formed DUI Court had its first participant on February 26, 2018.
We conduct post-sentence risk assessments on our supervised offenders to determine the frequency of office visits. Probation Services is in the process of creating and implementing our new case management tool with an anticipated launch date of February 2019. Our plan is to incorporate a risk-based supervision model so that we can focus our case-planning and service referrals for those in our system who need it most. This restructuring should lower our caseload sizes by only keeping our medium to high risk and need individuals. We are also working on tools to determine appropriate sanctions and sentencing that provide accountability with the opportunity for behavioral change. Probation is currently involved in the development of a validated risk-needs assessment tool to enhance our upgraded case management database. We investigate best practices and evidence-based programs to determine what promotes optimal compliance and rehabilitation of offenders. We offer and promote cognitive behavioral programs such as Alive at 25 (defensive driving program) and have probation officers trained in Moral Reconation Therapy (MRT) and Thinking for a Change.
FTEs
2015 Actual 2016 Actual 2017 Actual 2018 Budget 2019 Proposed
Total FTEs 14.00 14.00 14.00 14.00 14.00
Expenditures:
2015 Actual 2016 Actual 2017 Actual 2018 Budget 2019 Proposed
Capital Outlay 1,779 0 0 2,000 0
Interfund Charges 1,753 2,849 0 2,800 0
Reserve for Budget Adjustment 0 0 0 10,369 10,369
Transfers Out 0 0 0 0 0
Wages & Benefits 1,150,326 1,100,668 1,189,910 1,275,564 1,353,566
Supplies & Services 24,968 20,835 27,367 30,471 34,188
Debt Services 0 0 0 0 0
All Other 30,498 29,024 28,997 33,000 33,000One Vision. One Plan. One Voice.
Stand Alone Departments112
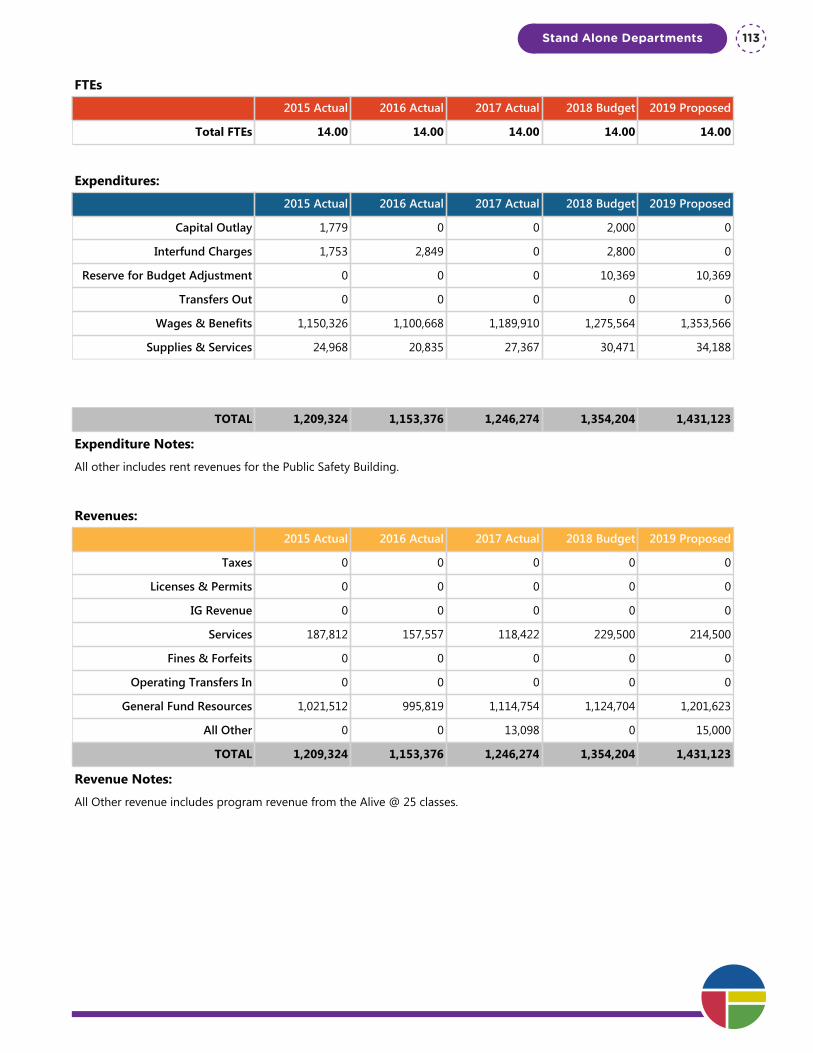
Department Summary: Probation Services
Division: Stand Alone Departments
Fund Type: General Fund
Executive Summary:
Probation Services offers supervision to offenders on Court-ordered monitoring. We monitor and enforce compliance with court-ordered conditions, treatment and jail alternatives, provide monitoring updates and sentencing recommendations to Court, conduct in-office visits with offenders and collaborate with community and law enforcement partners promoting accountability, rehabilitation and community safety.
Programs and Services:
The primary function of Probation Services is being the first jail alternative. We offer work crew and in-house electronic home monitoring (EHM) programs as alternative sanctions reducing the City’s jail costs and allowing offenders the opportunity to fulfill their employment and household obligations while still complying with a court order. Our EHM unit will be switching gear under a newly contracted agency in August 2018. This change is slated to save the City around $100,000 in cost, as well as some added time efficiencies.
We actively participate in problem-solving courts such as Community Court, Veteran's Court, Mental Health Court and DUI Court. The newly formed DUI Court had its first participant on February 26, 2018.
We conduct post-sentence risk assessments on our supervised offenders to determine the frequency of office visits. Probation Services is in the process of creating and implementing our new case management tool with an anticipated launch date of February 2019. Our plan is to incorporate a risk-based supervision model so that we can focus our case-planning and service referrals for those in our system who need it most. This restructuring should lower our caseload sizes by only keeping our medium to high risk and need individuals. We are also working on tools to determine appropriate sanctions and sentencing that provide accountability with the opportunity for behavioral change. Probation is currently involved in the development of a validated risk-needs assessment tool to enhance our upgraded case management database. We investigate best practices and evidence-based programs to determine what promotes optimal compliance and rehabilitation of offenders. We offer and promote cognitive behavioral programs such as Alive at 25 (defensive driving program) and have probation officers trained in Moral Reconation Therapy (MRT) and Thinking for a Change.
FTEs
2015 Actual 2016 Actual 2017 Actual 2018 Budget 2019 Proposed
Total FTEs 14.00 14.00 14.00 14.00 14.00
Expenditures:
2015 Actual 2016 Actual 2017 Actual 2018 Budget 2019 Proposed
Capital Outlay 1,779 0 0 2,000 0
Interfund Charges 1,753 2,849 0 2,800 0
Reserve for Budget Adjustment 0 0 0 10,369 10,369
Transfers Out 0 0 0 0 0
Wages & Benefits 1,150,326 1,100,668 1,189,910 1,275,564 1,353,566
Supplies & Services 24,968 20,835 27,367 30,471 34,188
Debt Services 0 0 0 0 0
All Other 30,498 29,024 28,997 33,000 33,000
TOTAL 1,209,324 1,153,376 1,246,274 1,354,204 1,431,123
Expenditure Notes:
All other includes rent revenues for the Public Safety Building.
Revenues:
2015 Actual 2016 Actual 2017 Actual 2018 Budget 2019 Proposed
Taxes 0 0 0 0 0
Licenses & Permits 0 0 0 0 0
IG Revenue 0 0 0 0 0
Services 187,812 157,557 118,422 229,500 214,500
Fines & Forfeits 0 0 0 0 0
Operating Transfers In 0 0 0 0 0
General Fund Resources 1,021,512 995,819 1,114,754 1,124,704 1,201,623
All Other 0 0 13,098 0 15,000
TOTAL 1,209,324 1,153,376 1,246,274 1,354,204 1,431,123
Revenue Notes:
All Other revenue includes program revenue from the Alive @ 25 classes.
Stand Alone Departments 113

One Vision. One Plan. One Voice.
Stand Alone Departments114
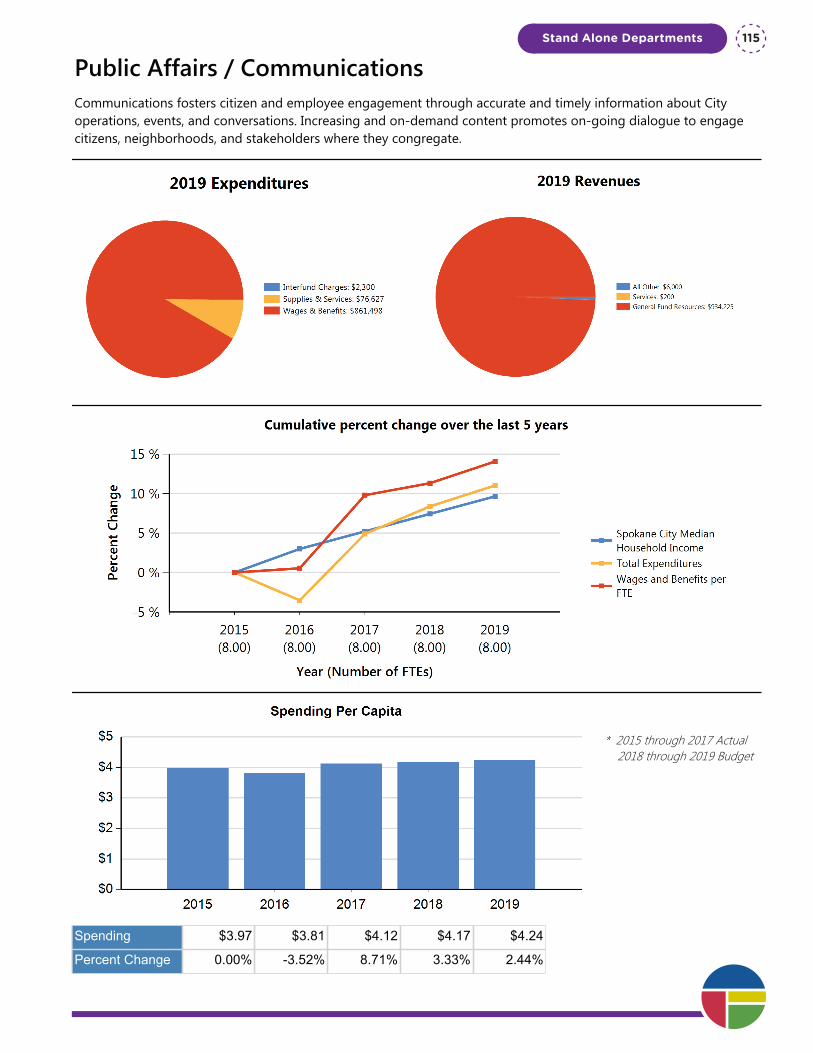
Public Affairs / CommunicationsCommunications fosters citizen and employee engagement through accurate and timely information about City operations, events, and conversations. Increasing and on-demand content promotes on-going dialogue to engage citizens, neighborhoods, and stakeholders where they congregate.
* 2015 through 2017 Actual 2018 through 2019 Budget
Spending $3.97 $3.81 $4.12 $4.17 $4.24
Percent Change 0.00% -3.52% 8.71% 3.33% 2.44%
Stand Alone Departments 115
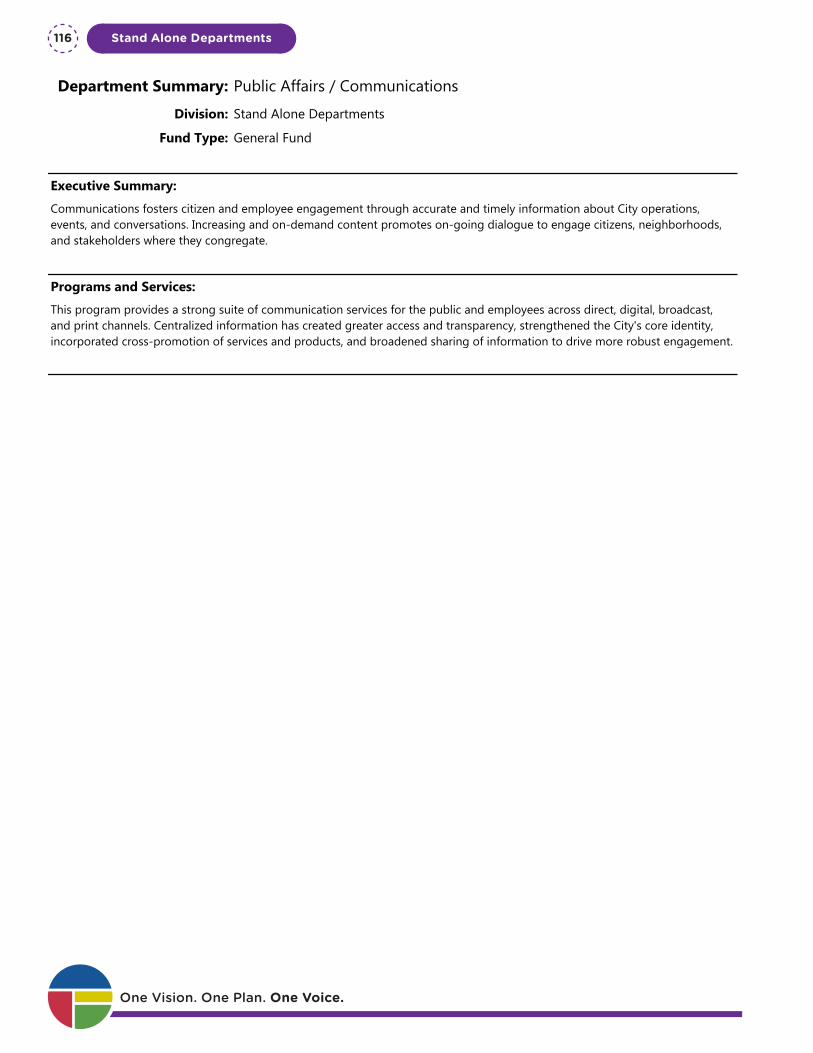
Department Summary: Public Affairs / Communications
Division: Stand Alone Departments
Fund Type: General Fund
Executive Summary:
Communications fosters citizen and employee engagement through accurate and timely information about City operations, events, and conversations. Increasing and on-demand content promotes on-going dialogue to engage citizens, neighborhoods, and stakeholders where they congregate.
Programs and Services:
This program provides a strong suite of communication services for the public and employees across direct, digital, broadcast, and print channels. Centralized information has created greater access and transparency, strengthened the City's core identity, incorporated cross-promotion of services and products, and broadened sharing of information to drive more robust engagement.
FTEs
2015 Actual 2016 Actual 2017 Actual 2018 Budget 2019 Proposed
Total FTEs 8.00 8.00 8.00 8.00 8.00
Expenditures:
2015 Actual 2016 Actual 2017 Actual 2018 Budget 2019 Proposed
Capital Outlay 154 2,656 0 0 0
Interfund Charges 1,811 2,068 1,800 2,300 2,300
Reserve for Budget Adjustment 0 0 0 0 0
Transfers Out 0 0 0 0 0
Wages & Benefits 751,813 755,812 825,862 838,418 861,498
Supplies & Services 93,219 56,601 60,729 77,281 76,627
Debt Services 0 0 0 0 0
All Other 0 0 0 0 0
TOTAL 846,997 817,137 888,391 917,999 940,425
Expenditure Notes:
Revenues:
2015 Actual 2016 Actual 2017 Actual 2018 Budget 2019 Proposed
Taxes 0 0 0 0 0
Licenses & Permits 0 0 0 0 0
IG Revenue 0 0 0 0 0
Services 65 27 79 200 200
Fines & Forfeits 0 0 0 0 0
Operating Transfers In 0 0 0 0 0
General Fund Resources 846,932 817,110 888,312 911,799 934,225One Vision. One Plan. One Voice.
Stand Alone Departments116

Department Summary: Public Affairs / Communications
Division: Stand Alone Departments
Fund Type: General Fund
Executive Summary:
Communications fosters citizen and employee engagement through accurate and timely information about City operations, events, and conversations. Increasing and on-demand content promotes on-going dialogue to engage citizens, neighborhoods, and stakeholders where they congregate.
Programs and Services:
This program provides a strong suite of communication services for the public and employees across direct, digital, broadcast, and print channels. Centralized information has created greater access and transparency, strengthened the City's core identity, incorporated cross-promotion of services and products, and broadened sharing of information to drive more robust engagement.
FTEs
2015 Actual 2016 Actual 2017 Actual 2018 Budget 2019 Proposed
Total FTEs 8.00 8.00 8.00 8.00 8.00
Expenditures:
2015 Actual 2016 Actual 2017 Actual 2018 Budget 2019 Proposed
Capital Outlay 154 2,656 0 0 0
Interfund Charges 1,811 2,068 1,800 2,300 2,300
Reserve for Budget Adjustment 0 0 0 0 0
Transfers Out 0 0 0 0 0
Wages & Benefits 751,813 755,812 825,862 838,418 861,498
Supplies & Services 93,219 56,601 60,729 77,281 76,627
Debt Services 0 0 0 0 0
All Other 0 0 0 0 0
TOTAL 846,997 817,137 888,391 917,999 940,425
Expenditure Notes:
Revenues:
2015 Actual 2016 Actual 2017 Actual 2018 Budget 2019 Proposed
Taxes 0 0 0 0 0
Licenses & Permits 0 0 0 0 0
IG Revenue 0 0 0 0 0
Services 65 27 79 200 200
Fines & Forfeits 0 0 0 0 0
Operating Transfers In 0 0 0 0 0
General Fund Resources 846,932 817,110 888,312 911,799 934,225
All Other 0 0 0 6,000 6,000
TOTAL 846,997 817,137 888,391 917,999 940,425
Revenue Notes:
Stand Alone Departments 117

One Vision. One Plan. One Voice.
Stand Alone Departments118
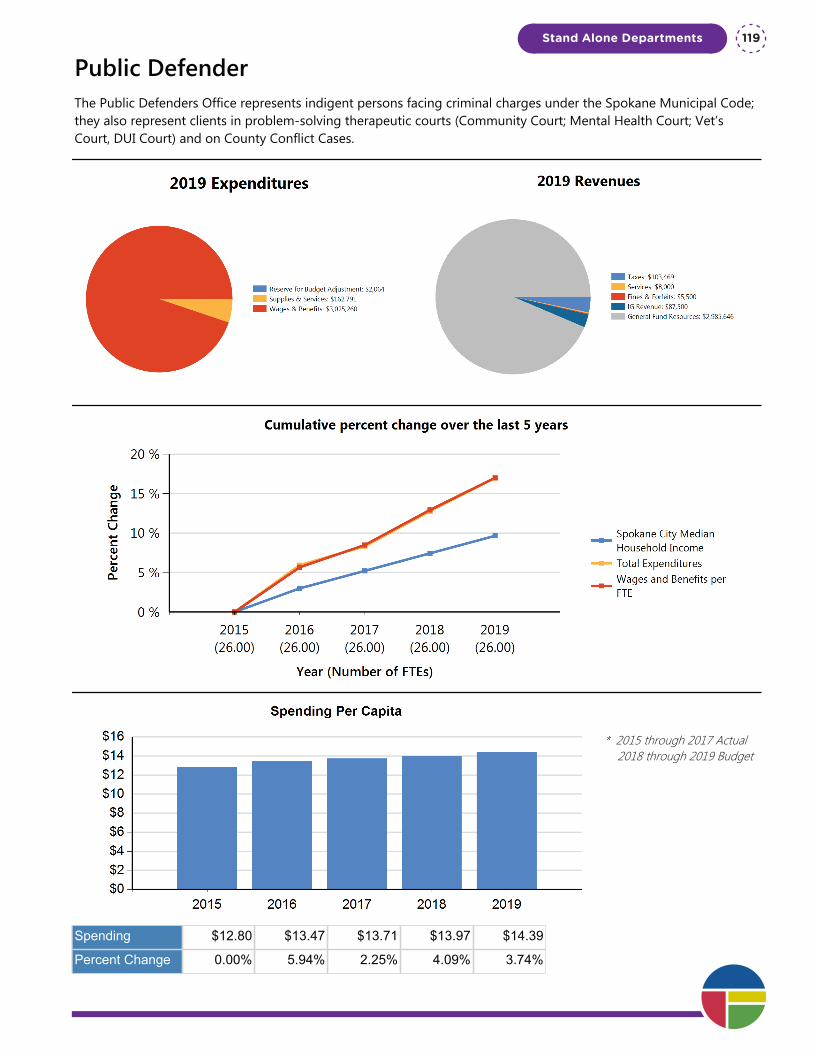
Public DefenderThe Public Defenders Office represents indigent persons facing criminal charges under the Spokane Municipal Code; they also represent clients in problem-solving therapeutic courts (Community Court; Mental Health Court; Vet’s Court, DUI Court) and on County Conflict Cases.
* 2015 through 2017 Actual 2018 through 2019 Budget
Spending $12.80 $13.47 $13.71 $13.97 $14.39
Percent Change 0.00% 5.94% 2.25% 4.09% 3.74%
Stand Alone Departments 119
Department Summary: Public Defender
Division: Stand Alone Departments
Fund Type: General Fund
Executive Summary:
The Public Defenders Office represents indigent persons facing criminal charges under the Spokane Municipal Code; they also represent clients in problem-solving therapeutic courts (Community Court; Mental Health Court; Vet’s Court, DUI Court) and on County Conflict Cases.
Programs and Services:
City Public Defenders operate under Supreme Court rules that require quarterly certifications that they are adhering to Standards, and must follow WSBA Performance Guidelines which include public defender caseload standards and the quality of a proper, effective defense. Several recent State and federal court cases have emphasized the importance of providing a proper and effective defense including the consequences that flow from a conviction, such as immigration consequences, loss of privileges as to driving or owning or possessing firearms, and various professional and other licenses, housing, and some benefits or entitlements. The standards and guidelines also address the use of investigators and the need for sufficient support staff and experts to have a proper defense. These are necessary so that the client can make an informed decision as to whether or not to go to trial, or to assist the attorney in negotiations on case resolutions with the prosecuting attorney.
FTEs
2015 Actual 2016 Actual 2017 Actual 2018 Budget 2019 Proposed
Total FTEs 26.00 26.00 26.00 26.00 26.00
Expenditures:
2015 Actual 2016 Actual 2017 Actual 2018 Budget 2019 Proposed
Capital Outlay 1,776 0 0 0 0
Interfund Charges 0 0 0 0 0
Reserve for Budget Adjustment 0 0 0 4,358 2,064
Transfers Out 0 0 0 0 0
Wages & Benefits 2,561,797 2,706,896 2,783,380 2,907,032 3,025,260
Supplies & Services 163,226 181,887 170,652 163,523 162,791
Debt Services 0 0 0 0 0
All Other 0 0 0 0 0
TOTAL 2,726,799 2,888,783 2,954,032 3,074,913 3,190,115
Expenditure Notes:
Revenues:
2015 Actual 2016 Actual 2017 Actual 2018 Budget 2019 Proposed
Taxes 0 123,120 130,875 103,469 103,469
Licenses & Permits 0 0 0 0 0
IG Revenue 173,840 60,000 58,800 87,500 87,500
Services 0 0 7,693 0 8,000One Vision. One Plan. One Voice.
Stand Alone Departments120

Department Summary: Public Defender
Division: Stand Alone Departments
Fund Type: General Fund
Executive Summary:
The Public Defenders Office represents indigent persons facing criminal charges under the Spokane Municipal Code; they also represent clients in problem-solving therapeutic courts (Community Court; Mental Health Court; Vet’s Court, DUI Court) and on County Conflict Cases.
Programs and Services:
City Public Defenders operate under Supreme Court rules that require quarterly certifications that they are adhering to Standards, and must follow WSBA Performance Guidelines which include public defender caseload standards and the quality of a proper, effective defense. Several recent State and federal court cases have emphasized the importance of providing a proper and effective defense including the consequences that flow from a conviction, such as immigration consequences, loss of privileges as to driving or owning or possessing firearms, and various professional and other licenses, housing, and some benefits or entitlements. The standards and guidelines also address the use of investigators and the need for sufficient support staff and experts to have a proper defense. These are necessary so that the client can make an informed decision as to whether or not to go to trial, or to assist the attorney in negotiations on case resolutions with the prosecuting attorney.
FTEs
2015 Actual 2016 Actual 2017 Actual 2018 Budget 2019 Proposed
Total FTEs 26.00 26.00 26.00 26.00 26.00
Expenditures:
2015 Actual 2016 Actual 2017 Actual 2018 Budget 2019 Proposed
Capital Outlay 1,776 0 0 0 0
Interfund Charges 0 0 0 0 0
Reserve for Budget Adjustment 0 0 0 4,358 2,064
Transfers Out 0 0 0 0 0
Wages & Benefits 2,561,797 2,706,896 2,783,380 2,907,032 3,025,260
Supplies & Services 163,226 181,887 170,652 163,523 162,791
Debt Services 0 0 0 0 0
All Other 0 0 0 0 0
TOTAL 2,726,799 2,888,783 2,954,032 3,074,913 3,190,115
Expenditure Notes:
Revenues:
2015 Actual 2016 Actual 2017 Actual 2018 Budget 2019 Proposed
Taxes 0 123,120 130,875 103,469 103,469
Licenses & Permits 0 0 0 0 0
IG Revenue 173,840 60,000 58,800 87,500 87,500
Services 0 0 7,693 0 8,000
Fines & Forfeits 4,777 5,086 3,128 5,500 5,500
Operating Transfers In 0 0 0 0 0
General Fund Resources 2,548,182 2,700,576 2,753,536 2,878,444 2,985,646
All Other 0 1 0 0 0
TOTAL 2,726,799 2,888,783 2,954,032 3,074,913 3,190,115
Revenue Notes:
Stand Alone Departments 121

Program Summary: Mental Health Court
Division: Stand Alone Departments
Fund Type: General Fund
Executive Summary:
Cases in the Spokane City/County Mental Health Court are presided over by a District Court judge. The County and City have a public defender assigned to work collaboratively to represent mutual clients. Funding for therapeutic courts and personnel comes from a county-wide one-tenth of a percent sales tax.
Programs and Services:
Non-violent mentally ill defendants with severe mental health diagnoses are accepted into the Mental Health Court. Medicaid pays for treatment, and there are multiple efforts to get housing and other services for the participants. The court employs a structured team approach to help establish or maintain services for individual participants. Services include continuous, intensive supervision, counseling and other rehabilitative services, treatment reviews and drug testing. The court imposes sanctions for non-compliance.
FTEs
2015 Actual 2016 Actual 2017 Actual 2018 Budget 2019 Proposed
Total FTEs 1.00 1.00 1.00 1.00 1.00
Expenditures:
2015 Actual 2016 Actual 2017 Actual 2018 Budget 2019 Proposed
Capital Outlay 0 0 0 0 0
Interfund Charges 0 0 0 0 0
Reserve for Budget Adjustment 0 0 0 2,294 0
Transfers Out 0 0 0 0 0
Wages & Benefits 69,490 92,725 97,215 95,811 108,776
Supplies & Services 132 24 1 1,004 1,034
Debt Services 0 0 0 0 0
All Other 0 0 0 0 0
TOTAL 69,622 92,749 97,216 99,109 109,810
Expenditure Notes:
Revenues:
2015 Actual 2016 Actual 2017 Actual 2018 Budget 2019 Proposed
Taxes 0 123,120 130,875 103,469 103,469
Licenses & Permits 0 0 0 0 0
IG Revenue 109,440 0 0 0 0
Services 0 0 0 0 0
Fines & Forfeits 0 0 0 0 0One Vision. One Plan. One Voice.
Stand Alone Departments122
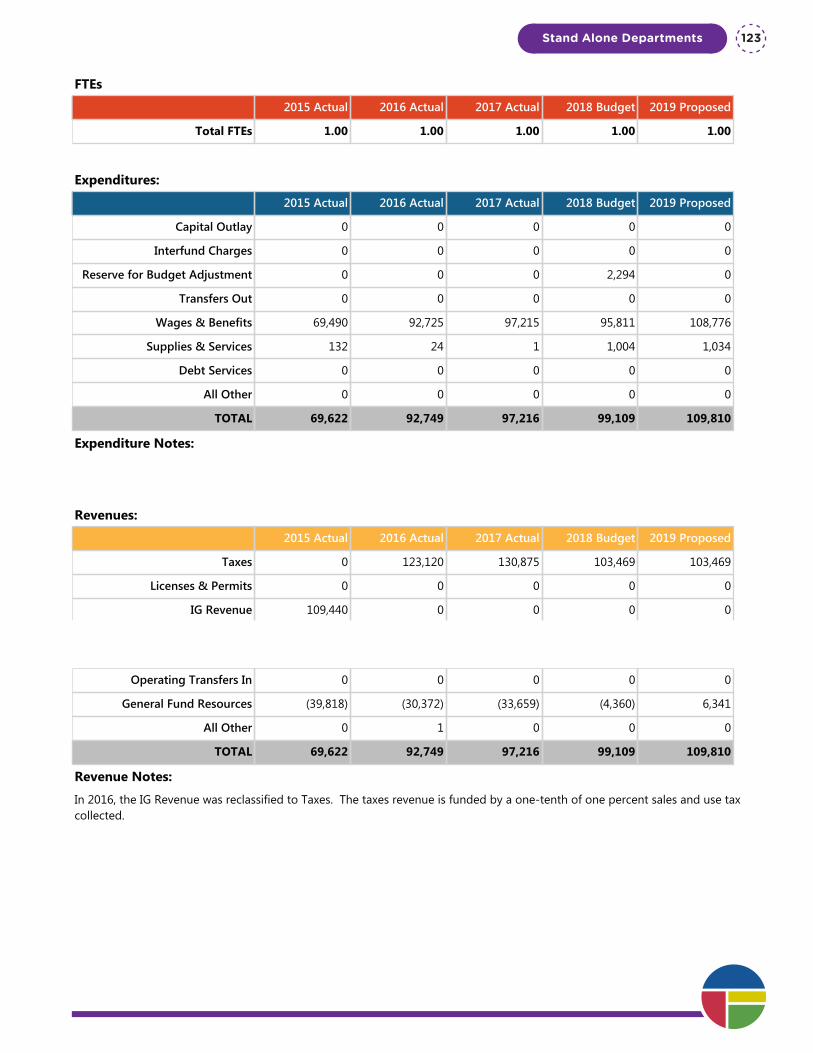
Program Summary: Mental Health Court
Division: Stand Alone Departments
Fund Type: General Fund
Executive Summary:
Cases in the Spokane City/County Mental Health Court are presided over by a District Court judge. The County and City have a public defender assigned to work collaboratively to represent mutual clients. Funding for therapeutic courts and personnel comes from a county-wide one-tenth of a percent sales tax.
Programs and Services:
Non-violent mentally ill defendants with severe mental health diagnoses are accepted into the Mental Health Court. Medicaid pays for treatment, and there are multiple efforts to get housing and other services for the participants. The court employs a structured team approach to help establish or maintain services for individual participants. Services include continuous, intensive supervision, counseling and other rehabilitative services, treatment reviews and drug testing. The court imposes sanctions for non-compliance.
FTEs
2015 Actual 2016 Actual 2017 Actual 2018 Budget 2019 Proposed
Total FTEs 1.00 1.00 1.00 1.00 1.00
Expenditures:
2015 Actual 2016 Actual 2017 Actual 2018 Budget 2019 Proposed
Capital Outlay 0 0 0 0 0
Interfund Charges 0 0 0 0 0
Reserve for Budget Adjustment 0 0 0 2,294 0
Transfers Out 0 0 0 0 0
Wages & Benefits 69,490 92,725 97,215 95,811 108,776
Supplies & Services 132 24 1 1,004 1,034
Debt Services 0 0 0 0 0
All Other 0 0 0 0 0
TOTAL 69,622 92,749 97,216 99,109 109,810
Expenditure Notes:
Revenues:
2015 Actual 2016 Actual 2017 Actual 2018 Budget 2019 Proposed
Taxes 0 123,120 130,875 103,469 103,469
Licenses & Permits 0 0 0 0 0
IG Revenue 109,440 0 0 0 0
Services 0 0 0 0 0
Fines & Forfeits 0 0 0 0 0
Operating Transfers In 0 0 0 0 0
General Fund Resources (39,818) (30,372) (33,659) (4,360) 6,341
All Other 0 1 0 0 0
TOTAL 69,622 92,749 97,216 99,109 109,810
Revenue Notes:
In 2016, the IG Revenue was reclassified to Taxes. The taxes revenue is funded by a one-tenth of one percent sales and use tax collected.
Stand Alone Departments 123

Program Summary: Public Defender
Division: Stand Alone Departments
Fund Type: General Fund
Executive Summary:
The Public Defenders Office represents persons charged with a criminal violation of the Spokane Municipal Code who qualify financially for such services, as determined by Spokane Municipal Court or its designee.
Programs and Services:
The Public Defenders Office represents persons charged with a criminal violation of the Spokane Municipal Code who qualify financially for such services, as determined by Spokane Municipal Court or its designee. It is the responsibility of the department head to maintain independence from the City from whom the charge is filed, while providing effective representation and fair and equal treatment to all clients and to ensure that the annual caseload per attorney does not exceed 400 cases.
This is the main program for the Public Defenders Office. These program revenues and expenses do not include monies from the State Office of Public Defense (OPD) or from a County-wide one tenth of one percent sales tax for therapeutic courts, nor the FTEs funded under those programs.
FTEs
2015 Actual 2016 Actual 2017 Actual 2018 Budget 2019 Proposed
Total FTEs 24.00 24.00 24.00 24.00 24.00
Expenditures:
2015 Actual 2016 Actual 2017 Actual 2018 Budget 2019 Proposed
Capital Outlay 1,776 0 0 0 0
Interfund Charges 0 0 0 0 0
Reserve for Budget Adjustment 0 0 0 0 0
Transfers Out 0 0 0 0 0
Wages & Benefits 2,416,037 2,539,743 2,599,570 2,727,683 2,822,408
Supplies & Services 163,078 181,846 170,650 134,015 133,223
Debt Services 0 0 0 0 0
All Other 0 0 0 0 0
TOTAL 2,580,891 2,721,589 2,770,220 2,861,698 2,955,631
Expenditure Notes:
Revenues:
2015 Actual 2016 Actual 2017 Actual 2018 Budget 2019 Proposed
Taxes 0 0 0 0 0
Licenses & Permits 0 0 0 0 0
IG Revenue 0 0 0 0 0
Services 0 0 7,693 0 8,000One Vision. One Plan. One Voice.
Stand Alone Departments124

Program Summary: Public Defender
Division: Stand Alone Departments
Fund Type: General Fund
Executive Summary:
The Public Defenders Office represents persons charged with a criminal violation of the Spokane Municipal Code who qualify financially for such services, as determined by Spokane Municipal Court or its designee.
Programs and Services:
The Public Defenders Office represents persons charged with a criminal violation of the Spokane Municipal Code who qualify financially for such services, as determined by Spokane Municipal Court or its designee. It is the responsibility of the department head to maintain independence from the City from whom the charge is filed, while providing effective representation and fair and equal treatment to all clients and to ensure that the annual caseload per attorney does not exceed 400 cases.
This is the main program for the Public Defenders Office. These program revenues and expenses do not include monies from the State Office of Public Defense (OPD) or from a County-wide one tenth of one percent sales tax for therapeutic courts, nor the FTEs funded under those programs.
FTEs
2015 Actual 2016 Actual 2017 Actual 2018 Budget 2019 Proposed
Total FTEs 24.00 24.00 24.00 24.00 24.00
Expenditures:
2015 Actual 2016 Actual 2017 Actual 2018 Budget 2019 Proposed
Capital Outlay 1,776 0 0 0 0
Interfund Charges 0 0 0 0 0
Reserve for Budget Adjustment 0 0 0 0 0
Transfers Out 0 0 0 0 0
Wages & Benefits 2,416,037 2,539,743 2,599,570 2,727,683 2,822,408
Supplies & Services 163,078 181,846 170,650 134,015 133,223
Debt Services 0 0 0 0 0
All Other 0 0 0 0 0
TOTAL 2,580,891 2,721,589 2,770,220 2,861,698 2,955,631
Expenditure Notes:
Revenues:
2015 Actual 2016 Actual 2017 Actual 2018 Budget 2019 Proposed
Taxes 0 0 0 0 0
Licenses & Permits 0 0 0 0 0
IG Revenue 0 0 0 0 0
Services 0 0 7,693 0 8,000
Fines & Forfeits 4,777 5,086 3,128 5,500 5,500
Operating Transfers In 0 0 0 0 0
General Fund Resources 2,576,114 2,716,503 2,759,399 2,856,198 2,942,131
All Other 0 0 0 0 0
TOTAL 2,580,891 2,721,589 2,770,220 2,861,698 2,955,631
Revenue Notes:
Stand Alone Departments 125

Program Summary: Public Defense Grant
Division: Stand Alone Departments
Fund Type: General Fund
Executive Summary:
The State Office of Public Defense provides money from the Legislature for public defense improvements through an application process for municipalities. The applications from 2017 covered 2018 and 2019. The City was awarded $87,500 for 2019.
Programs and Services:
The most recent application process was for a two-year budget cycle. We have applied for and received monies for several years. The funds awarded partially fund a public defender attorney position and assist in investigator expenses.
FTEs
2015 Actual 2016 Actual 2017 Actual 2018 Budget 2019 Proposed
Total FTEs 1.00 1.00 1.00 1.00 1.00
Expenditures:
2015 Actual 2016 Actual 2017 Actual 2018 Budget 2019 Proposed
Capital Outlay 0 0 0 0 0
Interfund Charges 0 0 0 0 0
Reserve for Budget Adjustment 0 0 0 2,064 2,064
Transfers Out 0 0 0 0 0
Wages & Benefits 76,270 74,428 86,595 83,538 94,076
Supplies & Services 16 17 1 28,504 28,534
Debt Services 0 0 0 0 0
All Other 0 0 0 0 0
TOTAL 76,286 74,445 86,596 114,106 124,674
Expenditure Notes:
In 2018 and 2019, the Public defense Grant included funds to help pay for investigative services.
Revenues:
2015 Actual 2016 Actual 2017 Actual 2018 Budget 2019 Proposed
Taxes 0 0 0 0 0
Licenses & Permits 0 0 0 0 0
IG Revenue 64,400 60,000 58,800 87,500 87,500
Services 0 0 0 0 0
Fines & Forfeits 0 0 0 0 0
Operating Transfers In 0 0 0 0 0
General Fund Resources 11,886 14,445 27,796 26,606 37,174
All Other 0 0 0 0 0One Vision. One Plan. One Voice.
Stand Alone Departments126

Program Summary: Public Defense Grant
Division: Stand Alone Departments
Fund Type: General Fund
Executive Summary:
The State Office of Public Defense provides money from the Legislature for public defense improvements through an application process for municipalities. The applications from 2017 covered 2018 and 2019. The City was awarded $87,500 for 2019.
Programs and Services:
The most recent application process was for a two-year budget cycle. We have applied for and received monies for several years. The funds awarded partially fund a public defender attorney position and assist in investigator expenses.
FTEs
2015 Actual 2016 Actual 2017 Actual 2018 Budget 2019 Proposed
Total FTEs 1.00 1.00 1.00 1.00 1.00
Expenditures:
2015 Actual 2016 Actual 2017 Actual 2018 Budget 2019 Proposed
Capital Outlay 0 0 0 0 0
Interfund Charges 0 0 0 0 0
Reserve for Budget Adjustment 0 0 0 2,064 2,064
Transfers Out 0 0 0 0 0
Wages & Benefits 76,270 74,428 86,595 83,538 94,076
Supplies & Services 16 17 1 28,504 28,534
Debt Services 0 0 0 0 0
All Other 0 0 0 0 0
TOTAL 76,286 74,445 86,596 114,106 124,674
Expenditure Notes:
In 2018 and 2019, the Public defense Grant included funds to help pay for investigative services.
Revenues:
2015 Actual 2016 Actual 2017 Actual 2018 Budget 2019 Proposed
Taxes 0 0 0 0 0
Licenses & Permits 0 0 0 0 0
IG Revenue 64,400 60,000 58,800 87,500 87,500
Services 0 0 0 0 0
Fines & Forfeits 0 0 0 0 0
Operating Transfers In 0 0 0 0 0
General Fund Resources 11,886 14,445 27,796 26,606 37,174
All Other 0 0 0 0 0
TOTAL 76,286 74,445 86,596 114,106 124,674
Revenue Notes:
In 2018 and 2019, the Public defense Grant amount increased to help pay for investigative services.
Stand Alone Departments 127

One Vision. One Plan. One Voice.
Stand Alone Departments128
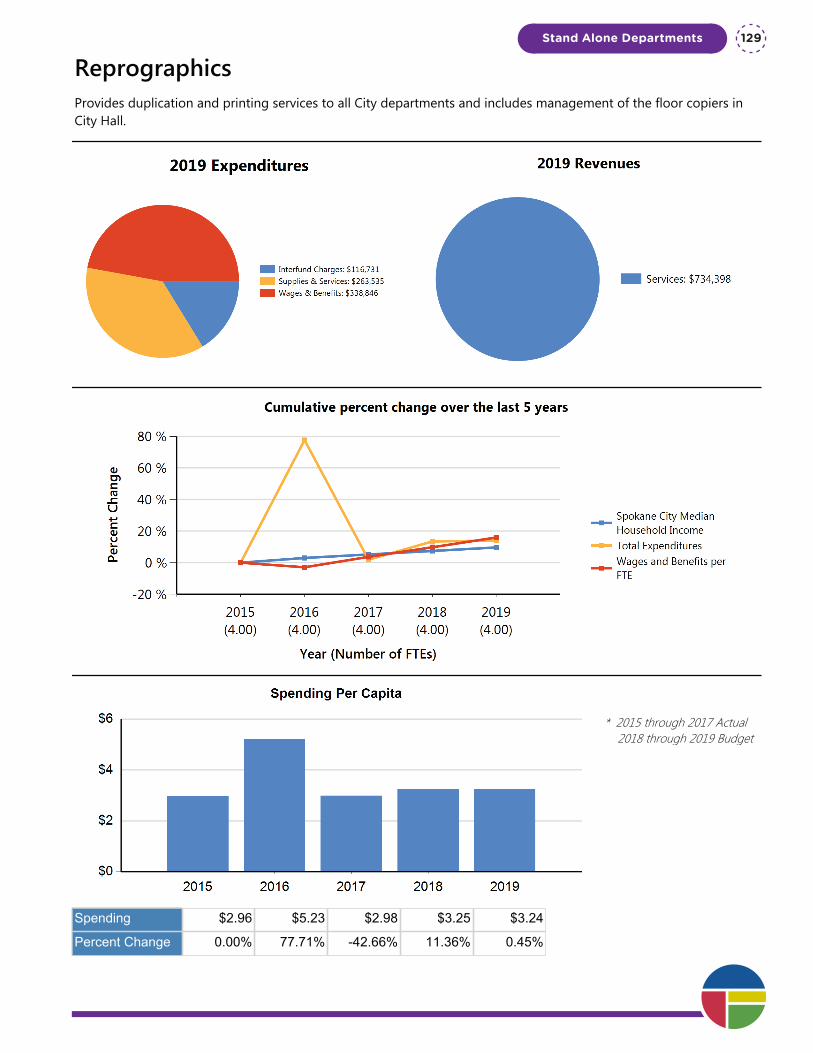
ReprographicsProvides duplication and printing services to all City departments and includes management of the floor copiers in City Hall.
* 2015 through 2017 Actual 2018 through 2019 Budget
Spending $2.96 $5.23 $2.98 $3.25 $3.24
Percent Change 0.00% 77.71% -42.66% 11.36% 0.45%
Stand Alone Departments 129

Department Summary: Reprographics
Division: Stand Alone Departments
Fund Type: Internal Service Fund
Executive Summary:
Provides duplication and printing services to all City departments and includes management of the floor copiers in City Hall.
Programs and Services:
Reprographics supports and enhances the image of the City through quality publications. As a partner and support system service to City departments, Reprographics operates a centralized in-house print and copy shop, and manages the networked floor copiers in City Hall for the convenience and efficiency of employees. Quality and customer service is the focus of Reprographics.
FTEs
2015 Actual 2016 Actual 2017 Actual 2018 Budget 2019 Proposed
Total FTEs 4.00 4.00 4.00 4.00 4.00
Expenditures:
2015 Actual 2016 Actual 2017 Actual 2018 Budget 2019 Proposed
Capital Outlay 0 0 0 0 0
Interfund Charges 92,275 134,226 109,451 132,634 116,731
Reserve for Budget Adjustment 0 0 0 0 0
Transfers Out 0 0 0 0 0
Wages & Benefits 290,612 282,115 300,721 319,085 338,846
Supplies & Services 244,862 704,845 232,654 264,135 263,535
Debt Services 0 0 0 0 0
All Other 3,150 0 0 0 0
TOTAL 630,899 1,121,186 642,826 715,854 719,112
Expenditure Notes:
One time pension expense adjustment, $427k, in 2016 Other Services & Charge. 2015 All Other - use tax paid to the State for printing labor.
Revenues:
2015 Actual 2016 Actual 2017 Actual 2018 Budget 2019 Proposed
Taxes 0 0 0 0 0
Licenses & Permits 0 0 0 0 0
IG Revenue 0 0 0 0 0
Services 616,236 761,367 704,536 695,603 734,398
Fines & Forfeits 0 0 0 0 0
Operating Transfers In 0 0 0 0 0
General Fund Resources 0 0 0 0 0One Vision. One Plan. One Voice.
Stand Alone Departments130
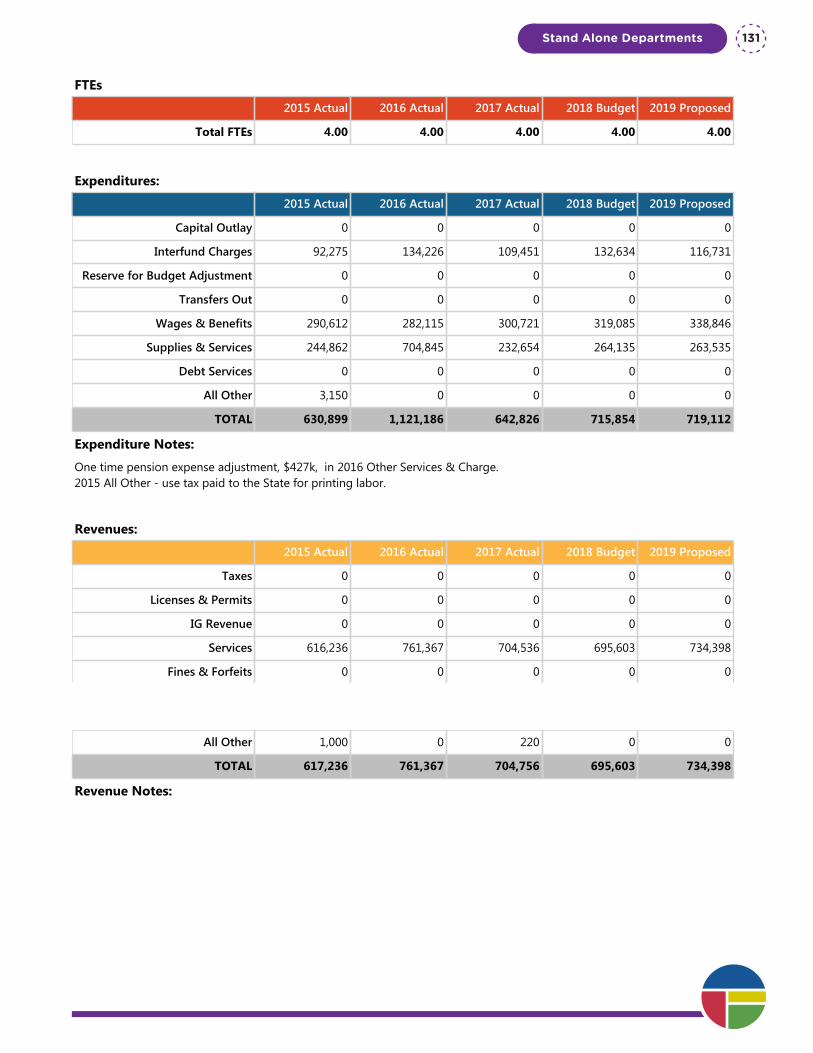
Department Summary: Reprographics
Division: Stand Alone Departments
Fund Type: Internal Service Fund
Executive Summary:
Provides duplication and printing services to all City departments and includes management of the floor copiers in City Hall.
Programs and Services:
Reprographics supports and enhances the image of the City through quality publications. As a partner and support system service to City departments, Reprographics operates a centralized in-house print and copy shop, and manages the networked floor copiers in City Hall for the convenience and efficiency of employees. Quality and customer service is the focus of Reprographics.
FTEs
2015 Actual 2016 Actual 2017 Actual 2018 Budget 2019 Proposed
Total FTEs 4.00 4.00 4.00 4.00 4.00
Expenditures:
2015 Actual 2016 Actual 2017 Actual 2018 Budget 2019 Proposed
Capital Outlay 0 0 0 0 0
Interfund Charges 92,275 134,226 109,451 132,634 116,731
Reserve for Budget Adjustment 0 0 0 0 0
Transfers Out 0 0 0 0 0
Wages & Benefits 290,612 282,115 300,721 319,085 338,846
Supplies & Services 244,862 704,845 232,654 264,135 263,535
Debt Services 0 0 0 0 0
All Other 3,150 0 0 0 0
TOTAL 630,899 1,121,186 642,826 715,854 719,112
Expenditure Notes:
One time pension expense adjustment, $427k, in 2016 Other Services & Charge. 2015 All Other - use tax paid to the State for printing labor.
Revenues:
2015 Actual 2016 Actual 2017 Actual 2018 Budget 2019 Proposed
Taxes 0 0 0 0 0
Licenses & Permits 0 0 0 0 0
IG Revenue 0 0 0 0 0
Services 616,236 761,367 704,536 695,603 734,398
Fines & Forfeits 0 0 0 0 0
Operating Transfers In 0 0 0 0 0
General Fund Resources 0 0 0 0 0
All Other 1,000 0 220 0 0
TOTAL 617,236 761,367 704,756 695,603 734,398
Revenue Notes:
Stand Alone Departments 131

One Vision. One Plan. One Voice.
Stand Alone Departments132
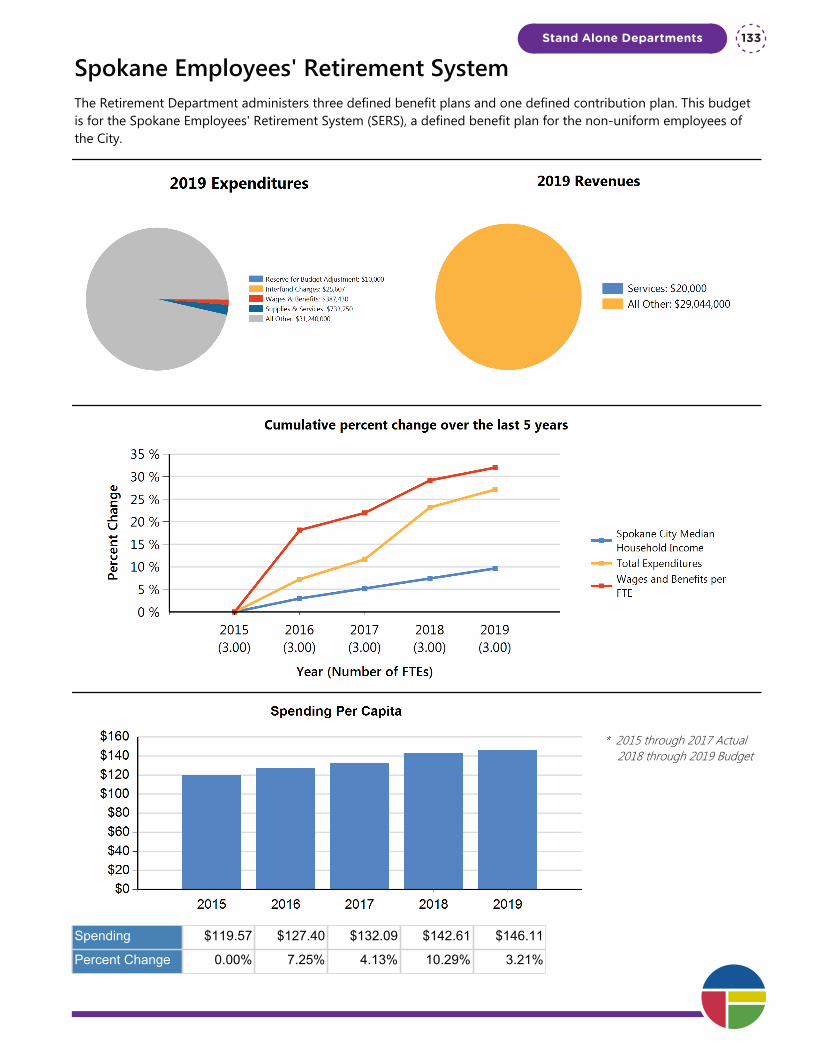
Spokane Employees' Retirement SystemThe Retirement Department administers three defined benefit plans and one defined contribution plan. This budget is for the Spokane Employees' Retirement System (SERS), a defined benefit plan for the non-uniform employees of the City.
* 2015 through 2017 Actual 2018 through 2019 Budget
Spending $119.57 $127.40 $132.09 $142.61 $146.11
Percent Change 0.00% 7.25% 4.13% 10.29% 3.21%
Stand Alone Departments 133
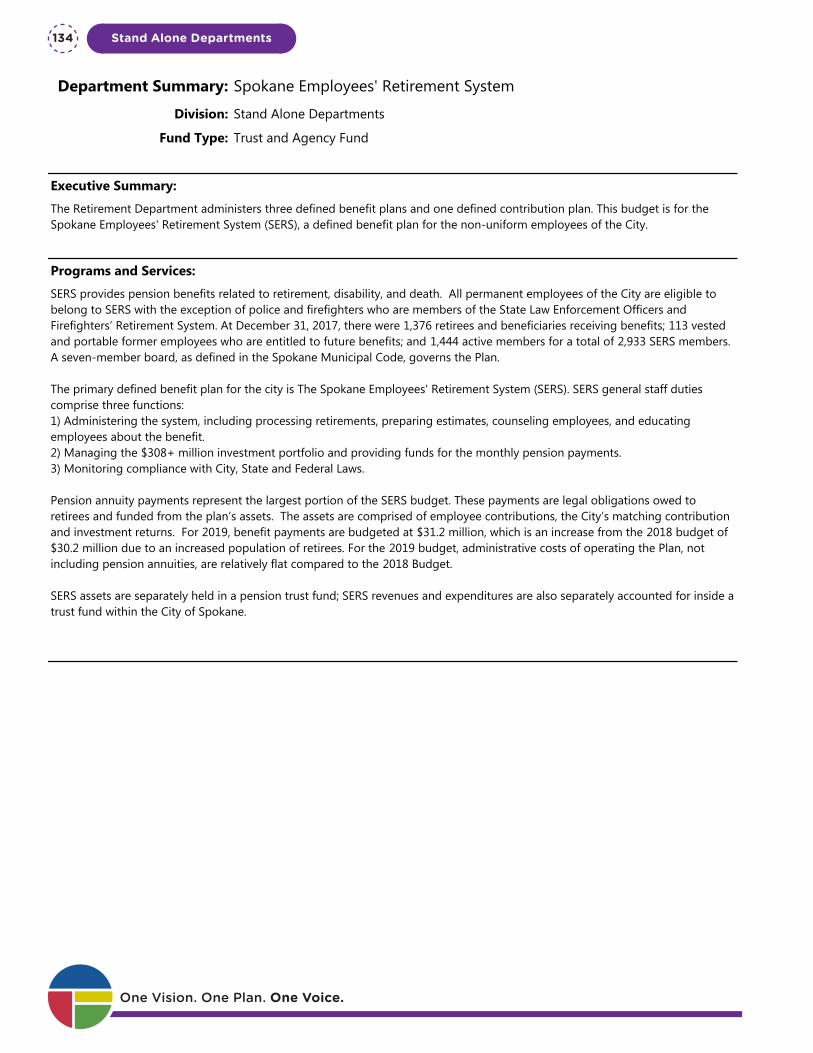
Department Summary: Spokane Employees' Retirement System
Division: Stand Alone Departments
Fund Type: Trust and Agency Fund
Executive Summary:
The Retirement Department administers three defined benefit plans and one defined contribution plan. This budget is for the Spokane Employees' Retirement System (SERS), a defined benefit plan for the non-uniform employees of the City.
Programs and Services:
SERS provides pension benefits related to retirement, disability, and death. All permanent employees of the City are eligible to belong to SERS with the exception of police and firefighters who are members of the State Law Enforcement Officers and Firefighters’ Retirement System. At December 31, 2017, there were 1,376 retirees and beneficiaries receiving benefits; 113 vested and portable former employees who are entitled to future benefits; and 1,444 active members for a total of 2,933 SERS members. A seven-member board, as defined in the Spokane Municipal Code, governs the Plan.
The primary defined benefit plan for the city is The Spokane Employees' Retirement System (SERS). SERS general staff duties comprise three functions:1) Administering the system, including processing retirements, preparing estimates, counseling employees, and educating employees about the benefit.2) Managing the $308+ million investment portfolio and providing funds for the monthly pension payments. 3) Monitoring compliance with City, State and Federal Laws.
Pension annuity payments represent the largest portion of the SERS budget. These payments are legal obligations owed to retirees and funded from the plan’s assets. The assets are comprised of employee contributions, the City’s matching contribution and investment returns. For 2019, benefit payments are budgeted at $31.2 million, which is an increase from the 2018 budget of $30.2 million due to an increased population of retirees. For the 2019 budget, administrative costs of operating the Plan, not including pension annuities, are relatively flat compared to the 2018 Budget.
SERS assets are separately held in a pension trust fund; SERS revenues and expenditures are also separately accounted for inside a trust fund within the City of Spokane.
FTEs
2015 Actual 2016 Actual 2017 Actual 2018 Budget 2019 Proposed
Total FTEs 3.00 3.00 3.00 3.00 3.00
Expenditures:
2015 Actual 2016 Actual 2017 Actual 2018 Budget 2019 Proposed
Capital Outlay 0 0 0 0 0
Interfund Charges 23,734 25,588 29,286 27,624 25,607
Reserve for Budget Adjustment 0 0 0 10,000 10,000
Transfers Out 0 0 0 0 0
Wages & Benefits 286,494 338,517 351,437 376,814 387,430
Supplies & Services 572,284 495,840 633,917 733,750 733,250
Debt Services 0 0 0 0 0
All Other 24,597,020 26,467,256 27,443,693 30,240,000 31,240,000One Vision. One Plan. One Voice.
Stand Alone Departments134

Department Summary: Spokane Employees' Retirement System
Division: Stand Alone Departments
Fund Type: Trust and Agency Fund
Executive Summary:
The Retirement Department administers three defined benefit plans and one defined contribution plan. This budget is for the Spokane Employees' Retirement System (SERS), a defined benefit plan for the non-uniform employees of the City.
Programs and Services:
SERS provides pension benefits related to retirement, disability, and death. All permanent employees of the City are eligible to belong to SERS with the exception of police and firefighters who are members of the State Law Enforcement Officers and Firefighters’ Retirement System. At December 31, 2017, there were 1,376 retirees and beneficiaries receiving benefits; 113 vested and portable former employees who are entitled to future benefits; and 1,444 active members for a total of 2,933 SERS members. A seven-member board, as defined in the Spokane Municipal Code, governs the Plan.
The primary defined benefit plan for the city is The Spokane Employees' Retirement System (SERS). SERS general staff duties comprise three functions:1) Administering the system, including processing retirements, preparing estimates, counseling employees, and educating employees about the benefit.2) Managing the $308+ million investment portfolio and providing funds for the monthly pension payments. 3) Monitoring compliance with City, State and Federal Laws.
Pension annuity payments represent the largest portion of the SERS budget. These payments are legal obligations owed to retirees and funded from the plan’s assets. The assets are comprised of employee contributions, the City’s matching contribution and investment returns. For 2019, benefit payments are budgeted at $31.2 million, which is an increase from the 2018 budget of $30.2 million due to an increased population of retirees. For the 2019 budget, administrative costs of operating the Plan, not including pension annuities, are relatively flat compared to the 2018 Budget.
SERS assets are separately held in a pension trust fund; SERS revenues and expenditures are also separately accounted for inside a trust fund within the City of Spokane.
FTEs
2015 Actual 2016 Actual 2017 Actual 2018 Budget 2019 Proposed
Total FTEs 3.00 3.00 3.00 3.00 3.00
Expenditures:
2015 Actual 2016 Actual 2017 Actual 2018 Budget 2019 Proposed
Capital Outlay 0 0 0 0 0
Interfund Charges 23,734 25,588 29,286 27,624 25,607
Reserve for Budget Adjustment 0 0 0 10,000 10,000
Transfers Out 0 0 0 0 0
Wages & Benefits 286,494 338,517 351,437 376,814 387,430
Supplies & Services 572,284 495,840 633,917 733,750 733,250
Debt Services 0 0 0 0 0
All Other 24,597,020 26,467,256 27,443,693 30,240,000 31,240,000
TOTAL 25,479,532 27,327,201 28,458,333 31,388,188 32,396,287
Expenditure Notes:
"All Other" includes pension annuity claims and terminated employee refunds of contributions.
Revenues:
2015 Actual 2016 Actual 2017 Actual 2018 Budget 2019 Proposed
Taxes 0 0 0 0 0
Licenses & Permits 0 0 0 0 0
IG Revenue 0 0 0 0 0
Services 22,061 19,375 19,374 20,000 20,000
Fines & Forfeits 0 0 0 0 0
Operating Transfers In 0 0 0 0 0
General Fund Resources 0 0 0 0 0
All Other 12,003,590 32,355,964 59,762,048 37,837,200 29,044,000
TOTAL 12,025,651 32,375,339 59,781,422 37,857,200 29,064,000
Revenue Notes:
“Miscellaneous Revenues” includes investment earnings, participant contributions, and employer contributions.
Stand Alone Departments 135

One Vision. One Plan. One Voice.
Stand Alone Departments136
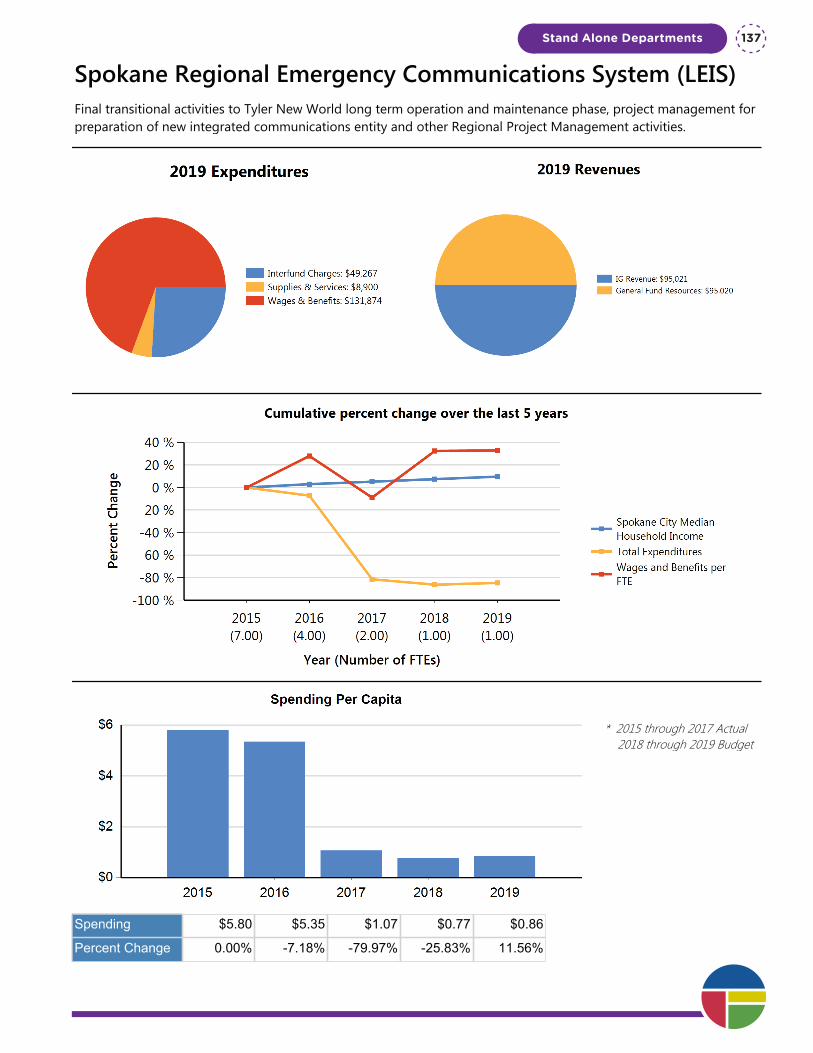
Spokane Regional Emergency Communications System (LEIS)Final transitional activities to Tyler New World long term operation and maintenance phase, project management for preparation of new integrated communications entity and other Regional Project Management activities.
* 2015 through 2017 Actual 2018 through 2019 Budget
Spending $5.80 $5.35 $1.07 $0.77 $0.86
Percent Change 0.00% -7.18% -79.97% -25.83% 11.56%
Stand Alone Departments 137

Department Summary: Spokane Regional Emergency Communications System (LEIS)
Division: Stand Alone Departments
Fund Type: Special Revenue Fund
Executive Summary:
Final transitional activities to Tyler New World long term operation and maintenance phase, project management for preparation of new integrated communications entity and other Regional Project Management activities.
Programs and Services:
Services are primarily project management, technology, analytic in nature for programs in public safety and regional justice.
FTEs
2015 Actual 2016 Actual 2017 Actual 2018 Budget 2019 Proposed
Total FTEs 7.00 4.00 2.00 1.00 1.00
Expenditures:
2015 Actual 2016 Actual 2017 Actual 2018 Budget 2019 Proposed
Capital Outlay 0 0 0 0 0
Interfund Charges 72,562 130,532 39,756 30,181 49,267
Reserve for Budget Adjustment 0 0 0 0 0
Transfers Out 0 0 0 0 0
Wages & Benefits 804,964 588,645 185,709 131,253 131,874
Supplies & Services 310,726 251,657 4,199 8,900 8,900
Debt Services 0 0 0 0 0
All Other 47,612 176,177 0 0 0
TOTAL 1,235,864 1,147,011 229,664 170,334 190,041
Expenditure Notes:
All Other Expenses includes payments to Spokane County for CADRMS & LEIS management.
As the transitional activities are in final stages, there have been corresponding staff reductions the past few years.
Interfund expenses decreased in 2017 due to eliminated chargeback from Spokane Police Department.
Other services decreased in 2017 due to eliminated costs for CAD maintenance.
Revenues:
2015 Actual 2016 Actual 2017 Actual 2018 Budget 2019 Proposed
Taxes 0 0 0 0 0
Licenses & Permits 0 0 0 0 0One Vision. One Plan. One Voice.
Stand Alone Departments138
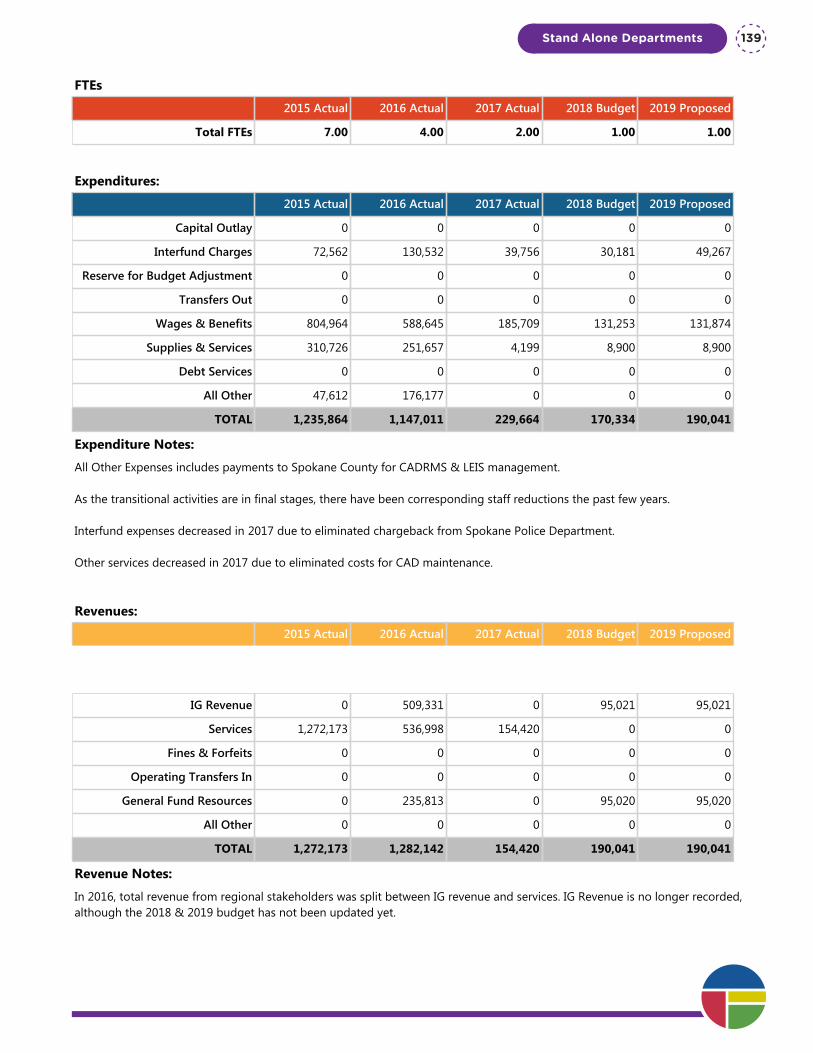
Department Summary: Spokane Regional Emergency Communications System (LEIS)
Division: Stand Alone Departments
Fund Type: Special Revenue Fund
Executive Summary:
Final transitional activities to Tyler New World long term operation and maintenance phase, project management for preparation of new integrated communications entity and other Regional Project Management activities.
Programs and Services:
Services are primarily project management, technology, analytic in nature for programs in public safety and regional justice.
FTEs
2015 Actual 2016 Actual 2017 Actual 2018 Budget 2019 Proposed
Total FTEs 7.00 4.00 2.00 1.00 1.00
Expenditures:
2015 Actual 2016 Actual 2017 Actual 2018 Budget 2019 Proposed
Capital Outlay 0 0 0 0 0
Interfund Charges 72,562 130,532 39,756 30,181 49,267
Reserve for Budget Adjustment 0 0 0 0 0
Transfers Out 0 0 0 0 0
Wages & Benefits 804,964 588,645 185,709 131,253 131,874
Supplies & Services 310,726 251,657 4,199 8,900 8,900
Debt Services 0 0 0 0 0
All Other 47,612 176,177 0 0 0
TOTAL 1,235,864 1,147,011 229,664 170,334 190,041
Expenditure Notes:
All Other Expenses includes payments to Spokane County for CADRMS & LEIS management.
As the transitional activities are in final stages, there have been corresponding staff reductions the past few years.
Interfund expenses decreased in 2017 due to eliminated chargeback from Spokane Police Department.
Other services decreased in 2017 due to eliminated costs for CAD maintenance.
Revenues:
2015 Actual 2016 Actual 2017 Actual 2018 Budget 2019 Proposed
Taxes 0 0 0 0 0
Licenses & Permits 0 0 0 0 0
IG Revenue 0 509,331 0 95,021 95,021
Services 1,272,173 536,998 154,420 0 0
Fines & Forfeits 0 0 0 0 0
Operating Transfers In 0 0 0 0 0
General Fund Resources 0 235,813 0 95,020 95,020
All Other 0 0 0 0 0
TOTAL 1,272,173 1,282,142 154,420 190,041 190,041
Revenue Notes:
In 2016, total revenue from regional stakeholders was split between IG revenue and services. IG Revenue is no longer recorded, although the 2018 & 2019 budget has not been updated yet.
Stand Alone Departments 139

One Vision. One Plan. One Voice.
Stand Alone Departments140
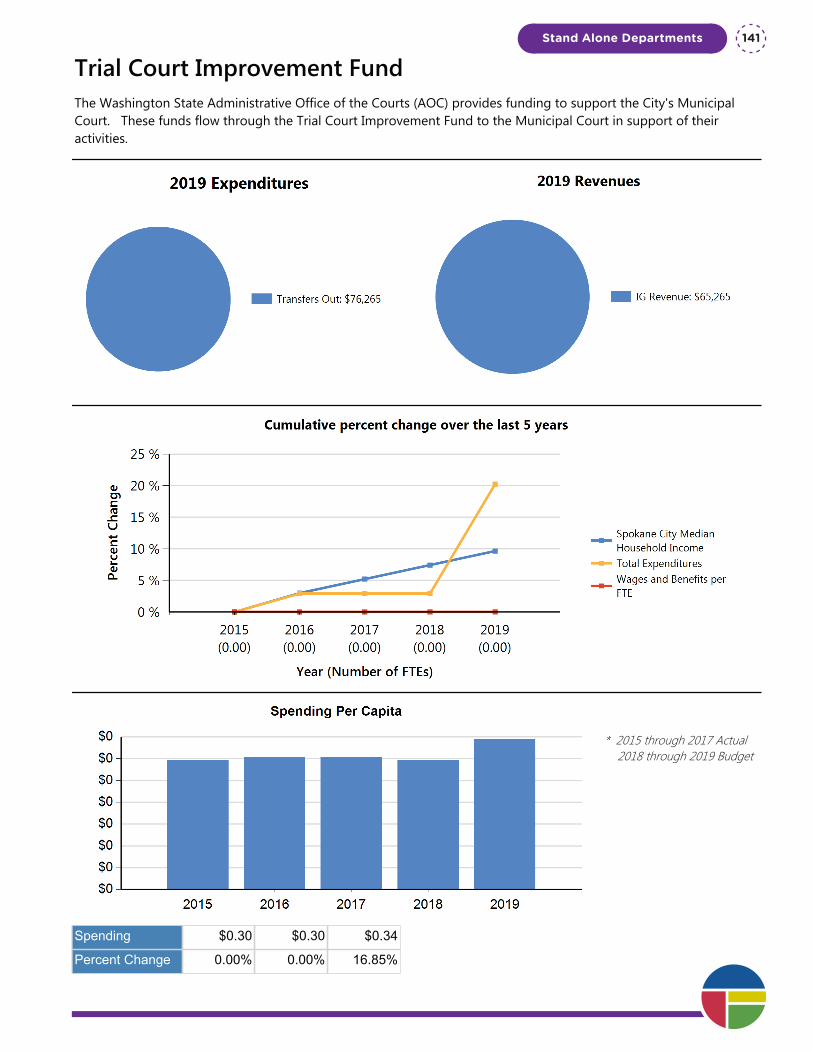
Trial Court Improvement FundThe Washington State Administrative Office of the Courts (AOC) provides funding to support the City's Municipal Court. These funds flow through the Trial Court Improvement Fund to the Municipal Court in support of their activities.
* 2015 through 2017 Actual 2018 through 2019 Budget
Spending $0.30 $0.30 $0.34
Percent Change 0.00% 0.00% 16.85%
Stand Alone Departments 141
Department Summary: Trial Court Improvement Fund
Division: Stand Alone Departments
Fund Type: Special Revenue Fund
Executive Summary:
The Washington State Administrative Office of the Courts (AOC) provides funding to support the City's Municipal Court. These funds flow through the Trial Court Improvement Fund to the Municipal Court in support of their activities.
Programs and Services:
Spokane Municipal Court qualifies for funding as provided in E2SSB 5454 since the establishment of 05A.05.040(B) of the Spokane Municipal Code which sets the annual base salary of its municipal court judges at ninety five percent of the salary for a district court judge as determined by the Washington State Citizen’s Commission on salaries for elected officials.
Each year, the presiding judge submits certification to the Administrative Office of the Courts to receive distribution of funds as a qualifying municipal court in the state of Washington. Disbursements are received quarterly and applied directly to the salaries of our three elected judges who are responsible for the adjudication of misdemeanor and gross misdemeanor offenses committed by adults within our jurisdiction pursuant to section 39.34.180 of the Revised Code of Washington.
FTEs
2015 Actual 2016 Actual 2017 Actual 2018 Budget 2019 Proposed
Total FTEs 0.00 0.00 0.00 0.00 0.00
Expenditures:
2015 Actual 2016 Actual 2017 Actual 2018 Budget 2019 Proposed
Capital Outlay 0 0 0 0 0
Interfund Charges 0 0 0 0 0
Reserve for Budget Adjustment 0 0 0 0 0
Transfers Out 63,420 65,265 65,265 65,265 76,265
Wages & Benefits 0 0 0 0 0
Supplies & Services 0 0 0 0 0
Debt Services 0 0 0 0 0
All Other 0 0 0 0 0
TOTAL 63,420 65,265 65,265 65,265 76,265
Expenditure Notes:
Revenues:
2015 Actual 2016 Actual 2017 Actual 2018 Budget 2019 Proposed
Taxes 0 0 0 0 0
Licenses & Permits 0 0 0 0 0
IG Revenue 66,112 70,708 67,845 65,265 65,265
Services 0 0 0 0 0One Vision. One Plan. One Voice.
Stand Alone Departments142
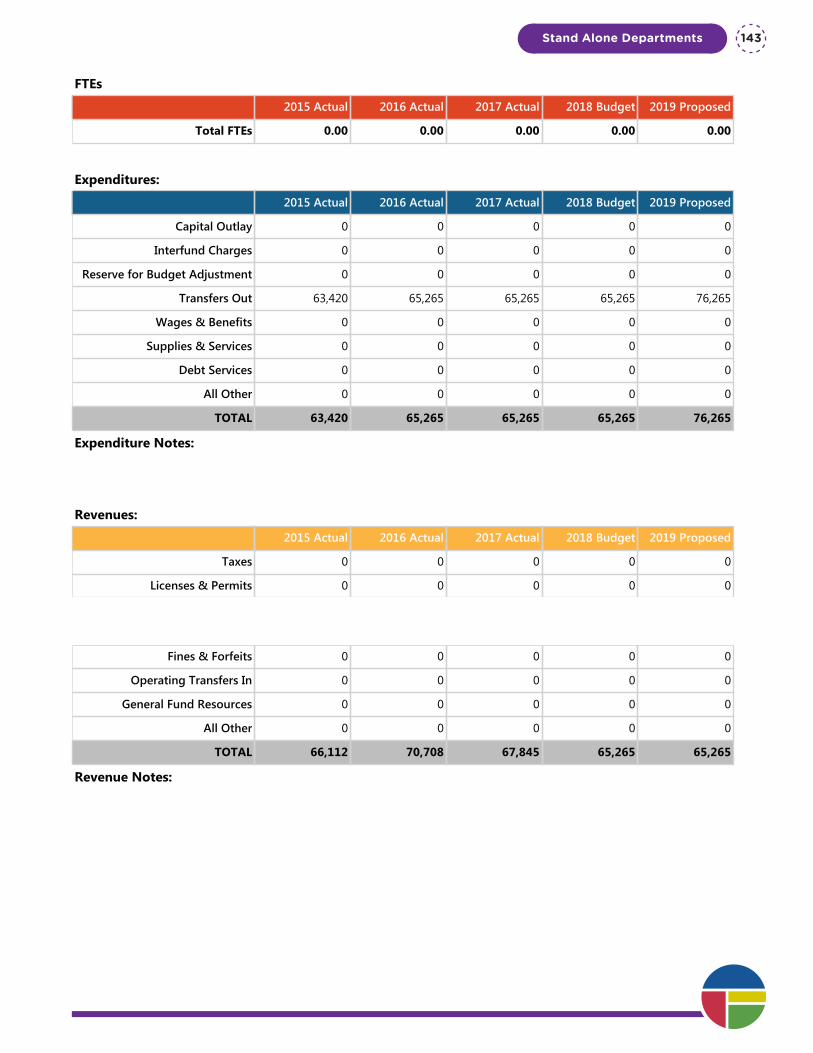
Department Summary: Trial Court Improvement Fund
Division: Stand Alone Departments
Fund Type: Special Revenue Fund
Executive Summary:
The Washington State Administrative Office of the Courts (AOC) provides funding to support the City's Municipal Court. These funds flow through the Trial Court Improvement Fund to the Municipal Court in support of their activities.
Programs and Services:
Spokane Municipal Court qualifies for funding as provided in E2SSB 5454 since the establishment of 05A.05.040(B) of the Spokane Municipal Code which sets the annual base salary of its municipal court judges at ninety five percent of the salary for a district court judge as determined by the Washington State Citizen’s Commission on salaries for elected officials.
Each year, the presiding judge submits certification to the Administrative Office of the Courts to receive distribution of funds as a qualifying municipal court in the state of Washington. Disbursements are received quarterly and applied directly to the salaries of our three elected judges who are responsible for the adjudication of misdemeanor and gross misdemeanor offenses committed by adults within our jurisdiction pursuant to section 39.34.180 of the Revised Code of Washington.
FTEs
2015 Actual 2016 Actual 2017 Actual 2018 Budget 2019 Proposed
Total FTEs 0.00 0.00 0.00 0.00 0.00
Expenditures:
2015 Actual 2016 Actual 2017 Actual 2018 Budget 2019 Proposed
Capital Outlay 0 0 0 0 0
Interfund Charges 0 0 0 0 0
Reserve for Budget Adjustment 0 0 0 0 0
Transfers Out 63,420 65,265 65,265 65,265 76,265
Wages & Benefits 0 0 0 0 0
Supplies & Services 0 0 0 0 0
Debt Services 0 0 0 0 0
All Other 0 0 0 0 0
TOTAL 63,420 65,265 65,265 65,265 76,265
Expenditure Notes:
Revenues:
2015 Actual 2016 Actual 2017 Actual 2018 Budget 2019 Proposed
Taxes 0 0 0 0 0
Licenses & Permits 0 0 0 0 0
IG Revenue 66,112 70,708 67,845 65,265 65,265
Services 0 0 0 0 0
Fines & Forfeits 0 0 0 0 0
Operating Transfers In 0 0 0 0 0
General Fund Resources 0 0 0 0 0
All Other 0 0 0 0 0
TOTAL 66,112 70,708 67,845 65,265 65,265
Revenue Notes:
Stand Alone Departments 143

One Vision. One Plan. One Voice.
Stand Alone Departments144