osara dam work 1
TRANSCRIPT
Lineament Analysis using Landsat MSS Data and Engineering Properties of some Rocks within the vicinity of Osara Dam, Itakpe-Okene area, North Central Nigeria.
*Kolawole, M.S.; Daniel, A. and Zakari, E. S.
Earth Sciences Department, Kogi State University, Anyigba. Nigeria.
*Corresponding Author
Introduction
A lineament is a mappable, simple or composite linear feature of a surface whose
parts are aligned in a rectilinear or slightly curvilinear relationship and
which differs distinctly from the pattern of adjacent features and presumably
represents a subsurface phenomenon (O’Leary et al., 1976). Geologic lineament
mapping is considered as a very important issue for problem solving in
engineering, especially in site selection for construction (dams, bridges, roads
etc) seismic and landslide risk assessment, mineral exploration, hot spring
detection and hydrogeological researches etc.
An effective approach for delineation of fracture zones is based on lineament
indices extracted from satellite imagery for a detailed structural analysis and
understanding of the tectonic evolution of the area. It also provides useful
information for geological mapping and understanding of groundwater flow and
occurrence in fractured rocks (Marghany and Hashim 2010). The few studies done
in Nigeria using modern remote sensing include that of Ananaba and
Ajakaiye(1987) that shows evidence of tectonic control of mineralization in
Nigeria from lineament density analysis and Goki et al (2005) that used digitally
processed Landsat 5 imageries to map mineralized pegmatites around Nasarawa
state. Other studies that focused on hydrogeological applications include those
of Bala (1987); Bala (1997); Edet et al.(1994); Odeyemi et al.(1999); Bala (2000b)and
Ayok(2009).
There have been reports of frequent lowering of the water level in the dam
reservoir, with the consequent disruptions of the electricity supply to many
parts of the country and neighboring countries. Ananaba (1991) attributed this
lowering of the water level to high evaporation, and or a possible leakage of
1
the water through unmapped fractures in the vicinity of the dams. Lineament
analysis techniques using remotely sensed data help researchers identify
different structural regimes and mineralization zones (Kavak and Cetin 2007).
The construction of many infrastructural facilities by government and other
related agencies have sparked off unequal demand for rocks aggregates which are
products of engineering materials including marble, gniesses, and banded
ironstone that abound in the study area. Though, these rocks appear to be
homogenous on the surface, natural processes that the rocks have been subjected
to over the years have caused serious weathering and fracturing thereby
degrading their desirable engineering properties (Mclean and Gribble 1979). The
fractured and weathered state of these rocks cannot be ignored in dam
construction as a highly fractured rock, if saturated will not only reduce the
total quality of rock aggregate but their strength will also be degraded. (Akpan
et al 2010).
In this study, several image processing procedures such as Principal Component
Analysis, band rationing technique and directional edge enhancement technique
using convolution kernels filtering along with visual interpretations have been
used to delineate geologic lineaments in the vicinity of Osara Dam built to
supply water to Nigeria Iron Ore Mining Company (NIOMCO), Itakpe. Faults of
various types and sizes, alignments of tonal features, systematic fracture
patterns and dentritic drainage networks are some of the lineaments found in the
study area using ILWIS 3.2. Geological and geotechnical techniques were also
employed to identify and appraise the strength and engineering attributes of
some rocks at the vicinity of the dam.
Location, geomorphology and geology of the study area.
The Osara dam is located in Okehi Local Government area of Kogi State in the
north central part of Nigeria. It is bounded between Latitude 70 401 and 70 471
North of equator and longitude 60 151 and 60 261 East of the Prime Meridian. The
Dam site is situated about 6km north of the NIOMCO and it is accessible through
Lokoja-Okene highway and Abobo-Dam untarred road. The outcrops in this area were
accessed through these routes and cattle tracks, footpaths and river and stream
channels.
2
The iron ore deposit mined by this company forms ridges that is approximately 1
km wide and 5km long and reaches a maximum elevation of about 500m above the
surrounding lowland which is 200 m above sea level (Olade 1978), the granitic
rocks and gneisses in the area also occur as inselberg or low lying . The
vegetation is typically a southern savanna with long grasses and shrubs. Annual
rainfall ranges from 1524 to 1916 mm in May to October, with surface temperature
of about 270C (Olade 1978).
The study area is within the southwestern Basement Complex of Nigerian which
forms a part of the Pan- African mobile belt that is situated between the east
of the West African Craton, north -west of the Congo cratons and south of the
Tuareg Shield as defined by Black et al (1979). The basement rocks comprise of
crystalline complex of gneisses, migmatites and quartzites (>2000 m.y.),
overlain by sequence of low-grade metamorphic rocks (~800m.y. old), and intruded
by a suite of granitic and charnockitic rocks (~600 m.y. old). In this area that
form part of the geology of Okene investigated by Olade (1978) consist of
strongly foliated gniess of granodiorite composition with alternating dark
(biotitic and/or honblendic) and light (quartzo-feldspathic) bands. Other
varieties of gniesses mapped in the area are of granite compositions that
contain either biotite or biotite-hornblende as the dominant mafic minerals
consisting of fine-grained leucocratic gniess that consist of about 70% of
quartz, 25% of microcline and 5% of biotite that forms a major topographic
feature and structural marker unit in the area. The iron –bearing rocks in the
area can in part be considered as ferruginous quartzites that comprise
alternating bands of quartz and iron oxides. Intrusive rocks include gabbro,
biotite-hornblede granites, pegmatites and numerous lamprophyre dykes.
Materials and methods
To detect lineaments from Landsat MSS data, two procedures were carried out.
Initially, visual interpretations were used to extract geologic lineament using
false color composites of bands 1, 4, 5 and 6 of the imagery. In addition to
this manual interpretation, the imagery of the area was evaluated using various
digital image processing techniques. The preprocessing and edge enhancement
3
techniques used are contrast stretching, directional filtering, color composites
and color band ratio composites which according Kasak and Cetin (2007) are good
in enhancing geological features and to extract structural lineaments in the
study area.
For the engineering properties of the rocks, two representative samples of the
granitic and granite gniess were collected at ten different locations around the
dam site for laboratory tests. The tests conducted on the samples are specific
gravity measurement, compressive strength, and aggregate crushing value test, as
well as unit weight, void ratio and porosity test. The pycnometer method was
used for determination of specific gravity. The compressive strength of the
rocks was determined using an ELE instrument. The geotechnical property tests
were carried out at Rock Mechanics Laboratory, Federal University of Technology,
Akure Nigeria and result obtained compared favourably well with the ASTM D2938-
79 (1980) and ISRM (1979) standards and are summarized in Table 1 below.
RESULTS AND DISCUSSION
The Landsat MSS image of the area used was acquired on 21st April, 1992 and
processed at National Remote Sensing Centre, Jos Nigeria. The subscene covers
approximately 1000km2 including the dam site that occur at the southern portion
of the area.
4
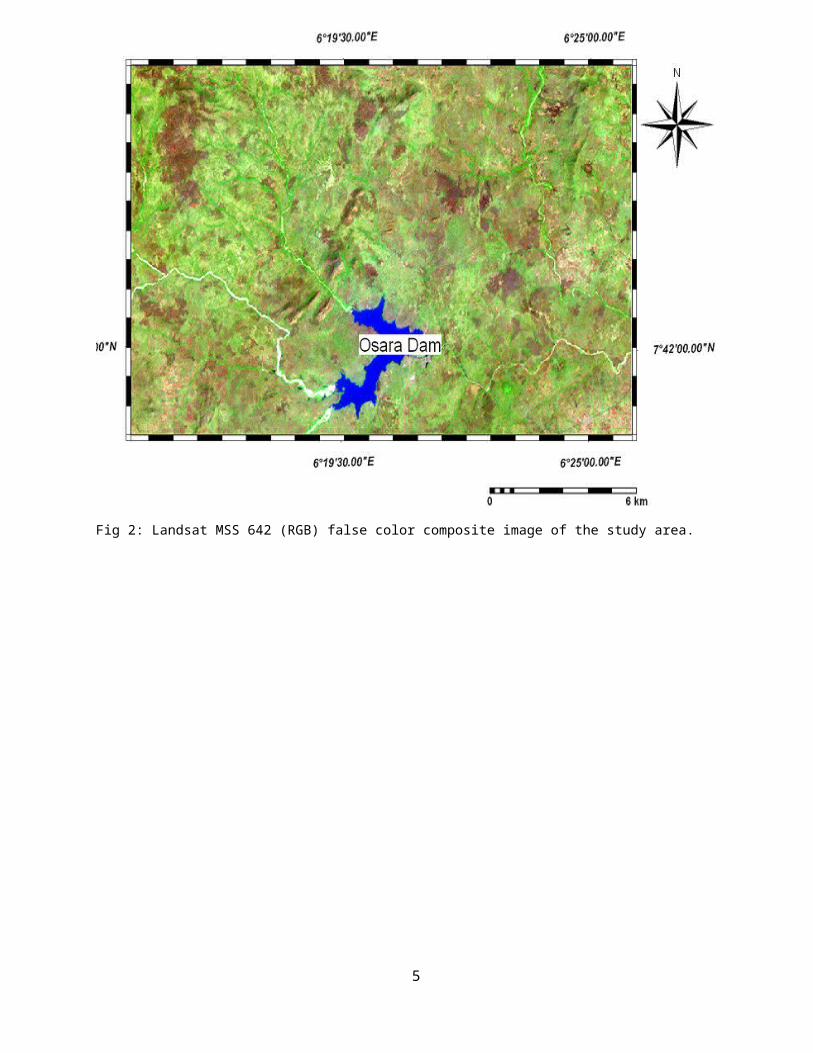
Fig 2: Landsat MSS 642 (RGB) false color composite image of the study area.
5
(a)
(b)
(c)
(d)
6
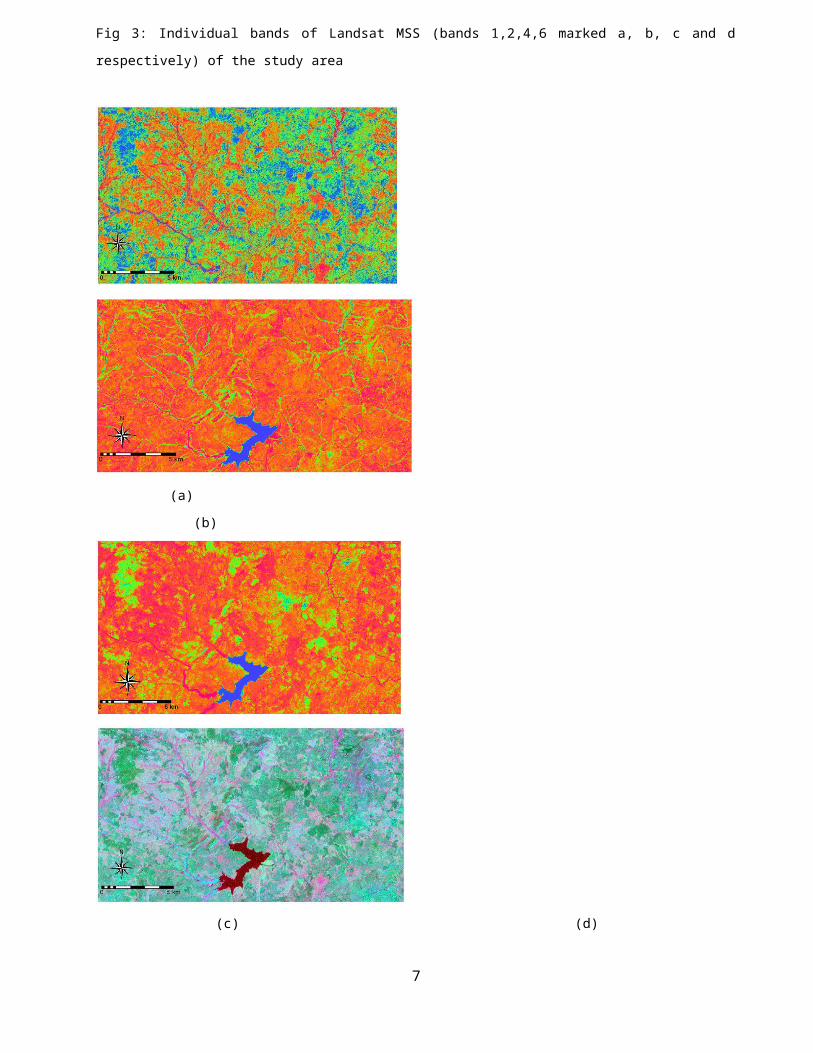
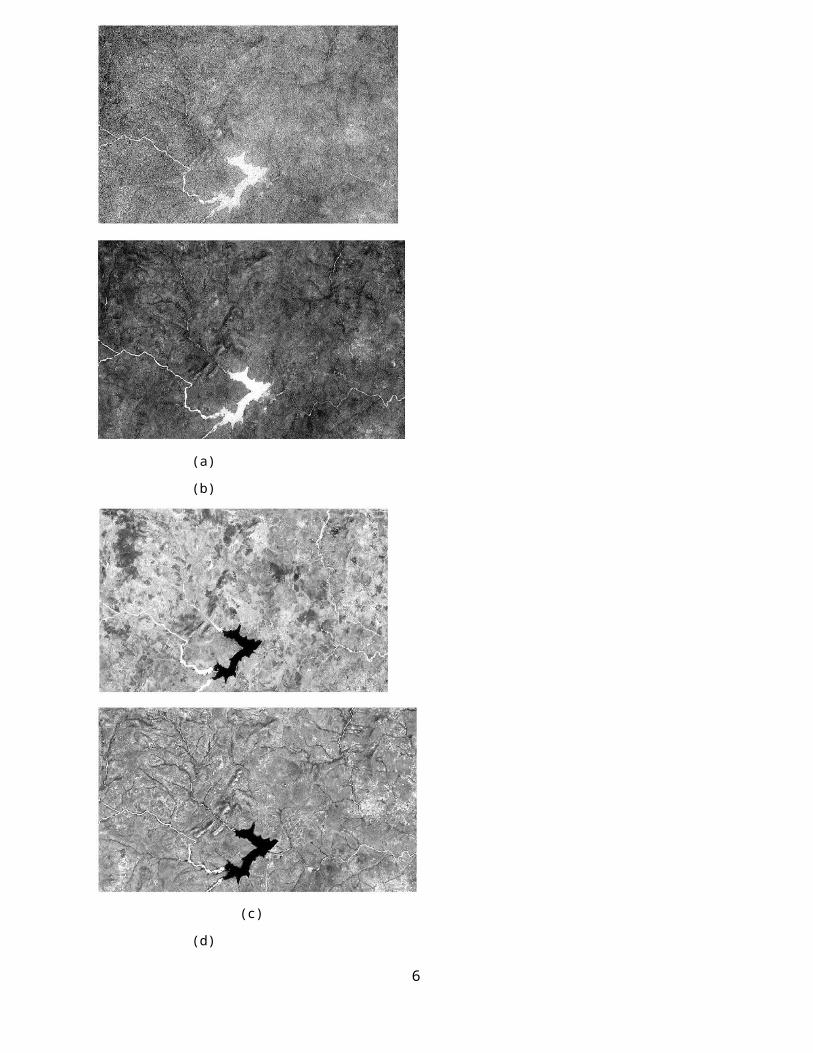
Fig 3: Individual bands of Landsat MSS (bands 1,2,4,6 marked a, b, c and d
respectively) of the study area
(a)
(b)
(c) (d)
7
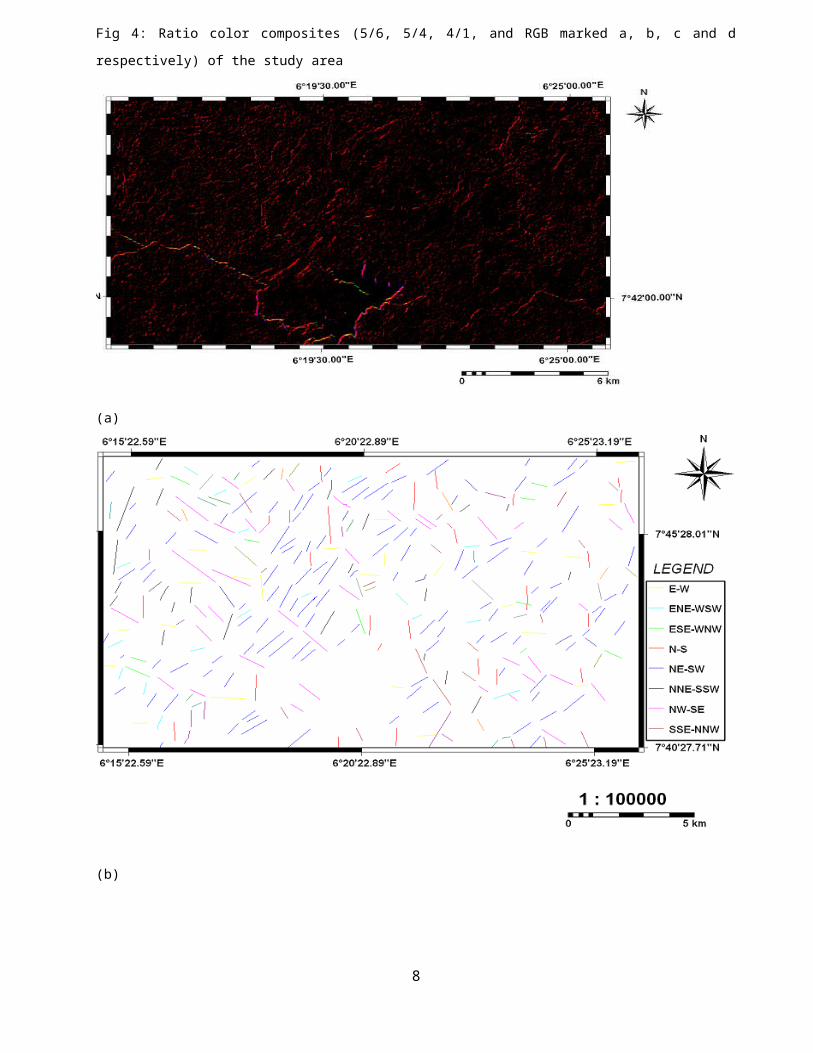
Fig 4: Ratio color composites (5/6, 5/4, 4/1, and RGB marked a, b, c and d
respectively) of the study area
(a)
(b)
8
01000020000300004000050000600007000080000
Leng
th of s
egmen
ts
(c)
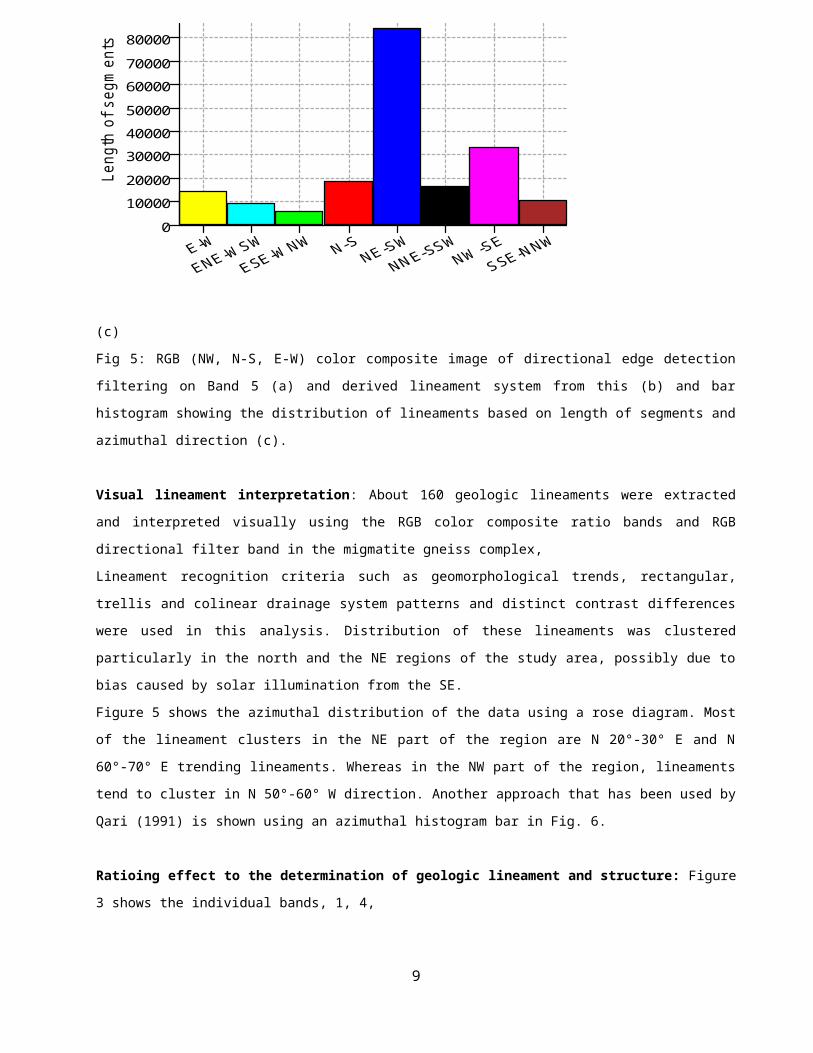
Fig 5: RGB (NW, N-S, E-W) color composite image of directional edge detection
filtering on Band 5 (a) and derived lineament system from this (b) and bar
histogram showing the distribution of lineaments based on length of segments and
azimuthal direction (c).
Visual lineament interpretation: About 160 geologic lineaments were extracted
and interpreted visually using the RGB color composite ratio bands and RGB
directional filter band in the migmatite gneiss complex,
Lineament recognition criteria such as geomorphological trends, rectangular,
trellis and colinear drainage system patterns and distinct contrast differences
were used in this analysis. Distribution of these lineaments was clustered
particularly in the north and the NE regions of the study area, possibly due to
bias caused by solar illumination from the SE.
Figure 5 shows the azimuthal distribution of the data using a rose diagram. Most
of the lineament clusters in the NE part of the region are N 20°-30° E and N
60°-70° E trending lineaments. Whereas in the NW part of the region, lineaments
tend to cluster in N 50°-60° W direction. Another approach that has been used by
Qari (1991) is shown using an azimuthal histogram bar in Fig. 6.
Ratioing effect to the determination of geologic lineament and structure: Figure
3 shows the individual bands, 1, 4,
9
2 and 6, of the Landsat MSS data set of the region. Several analysis techniques
such as visual interpretation and compass gradient enhancement are routinely
used for lineament studies. In this study, ratio color composite subscene images
of the region were also used to enhance the lineament systems that were not
clearly enhanced by other methods. Ratio images generally enhance different
lithologies and features of a region. For example, various kinds of land-cover
types such as rocks, vegetation and water are represented in different colors in
ratio color composite images. Geological contacts can be enhanced using
different colors that can help researchers interpret lineament systems easily.
Figure 8 A shows a ratio color composite image using Landsat MSS 5/6 (red), 5/4
(green) and 4/1 (blue) ratios in RGB form.
Directional filtering: Edge enhancement filters are used in geological
applications to highlight faults and lineaments that occur in specific azimuths
(Kavak and Cetin (2007). The band 5 of the Landsat MSS dataset is one of the best
bands showing most of the features in the area and different filter types which
enhance particular spatial directions (Kavak and Cetin 2007). To enhance such
edges, filters are designed to map the contrast gradient orthogonal to the
preferred direction (Berhe and Rothery, 1986) that will detect and highlight
diagonal, horizontal and vertical edges in digital images (Richards 1986).
Directional filters are very useful for producing artificial effects suggesting
tectonically controlled linear features (Drury, 1986). Another characteristic of
these kernels is the distribution of nonzero weighting factors parallel to the
direction. Therefore, asymmetrical filters are ideal for lineament analysis
studies (Kavak and Cetin (2007).
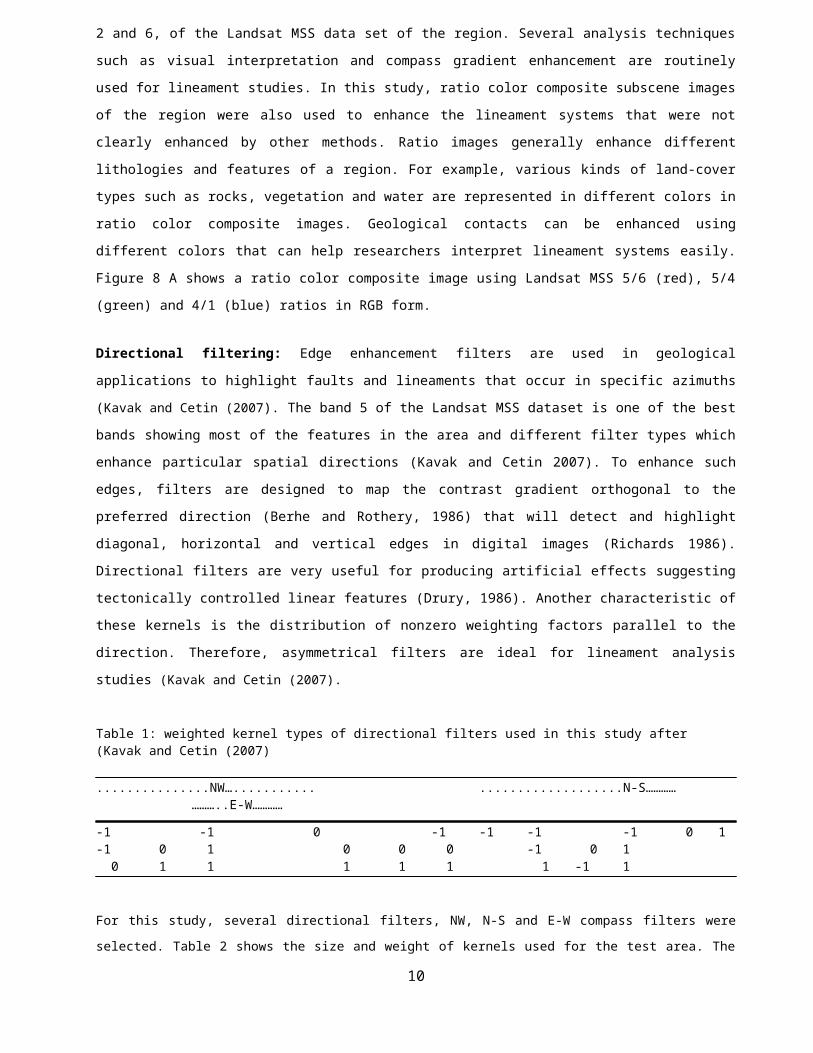
Table 1: weighted kernel types of directional filters used in this study after (Kavak and Cetin (2007)
...............NW…........... ...................N-S………… ………..E-W…………
-1 -1 0 -1 -1 -1 -1 0 1-1 0 1 0 0 0 -1 0 1 0 1 1 1 1 1 1 -1 1
For this study, several directional filters, NW, N-S and E-W compass filters were
selected. Table 2 shows the size and weight of kernels used for the test area. The
10
filters that have been used in this study had 3×3 kernel size. Some authors also
used these filters as first derivative kernels for airborne radiometric and
aeromagnetic data (Fernandez and Tahon, 1991; Lee et al., 1990). To provide a better
visual interpretation for every filtering type, contrast enhancement procedure was
also applied to three different edge detection filters. Later, filtered images taken
from NW, N-S and E-W were displayed in RGB color space mode Fig. 9. A total of 116
lineaments were observed using a color composite image of the test area. Similar to
the visual lineament interpretation results, the dominant directions were 20-30 (16
lineaments) and 60-70 (13 lineaments) azimuthal intervals. Similarly, 280-290
intervals (9 lineaments) represents densely populated interval in the NW direction.
According to the total length of the lineaments, 20-30 and 60-70 intervals
demonstrated the dominant directions values. Most of the longer lineaments are
concentrated in the NW direction, which is similar to the visual interpretation
results.
Engineering properties of rocks: the rocks in the study area have specific gravity
values that range from 2.739 to 2.756 (average of 2.746). The American Rock
Mechanics Association (ARMA) and International Society of Rock Mechanic (ISRM 1979)
recommends specific gravity of not below 2.65 for rock to be suitable for
construction. These results also conform to Bs 1377 specification for hard rock
materials.
Water absorption values range from 0.512% for granite to 0.671% for granite gniess
(average of 0.592%) which show that the rock fabrics are well cemented and non
porous. According to McWorter and Sunada (1977) the porosity of weathered granite
should be between 0.34-0.57 and the water absorption value should not be more than
0.7 per unit by weight. The fresh rocks on the surface have very high mechanical
strength properties with low water absorption capacity which is an indication of the
low porosity state of the rocks.
Compressive strength results for the rocks vary from 78.46 to 79.55 mpa (average of
79.005mpa). American Society for Test and Materials (ASTM D2938-79, 1980) recommends
that for granite to be suitable as a construction material as well as a foundation,
it must have compressive strength of 75-131 mpa. This strength of the rock is
influenced by the mineralogy of the material, rock structure and weathered degree of
the rock that increases with the rate of loading.
11
Aggregate crushing values of the rocks vary from 28.5 for the granite to 28.1% for
the gniess; this implies that the rocks when crushed will for good aggregate that
will be useful for construction works.
Weathering and fracturing of the rocks seems to be topography controlled as hard
rocks at ridges are fresher than those along stream channels and swamps (Akpan et al
2010).
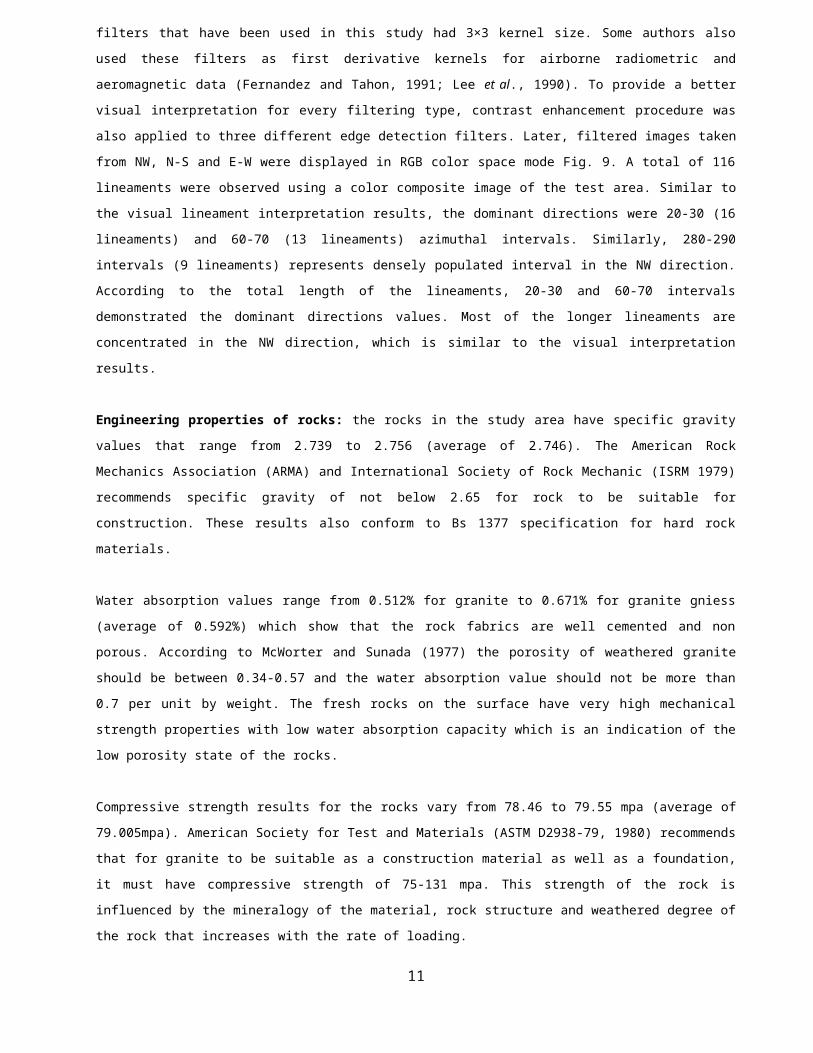
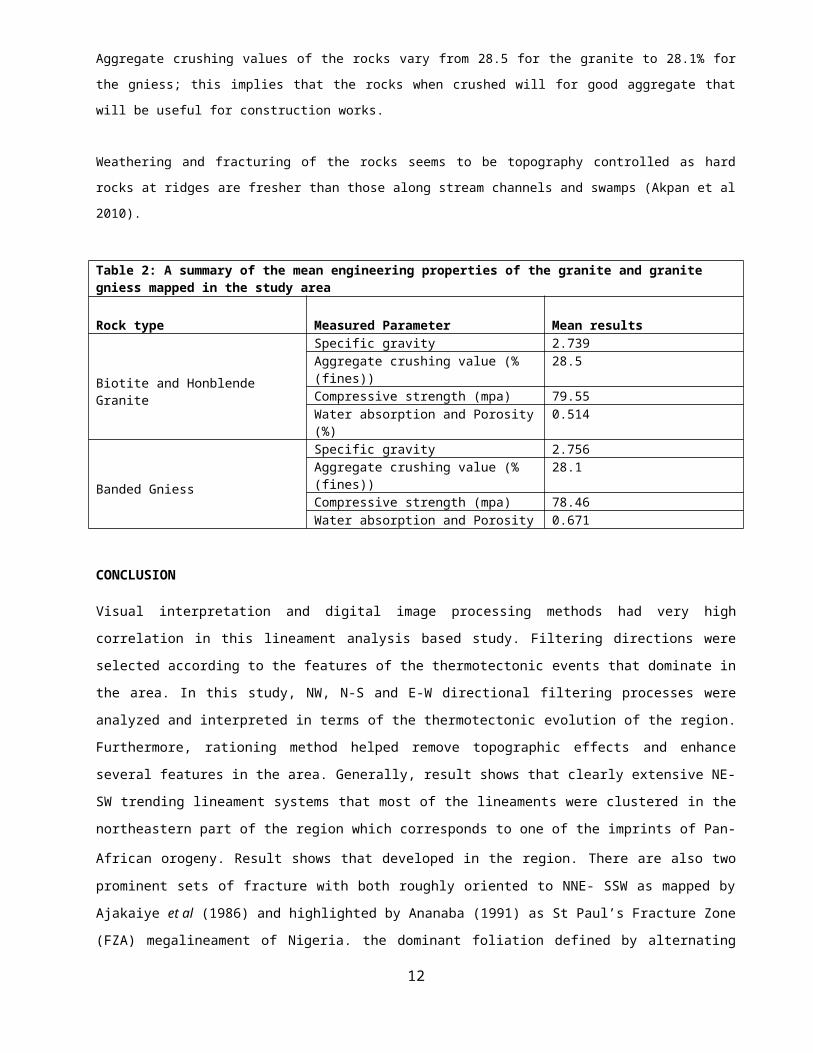
Table 2: A summary of the mean engineering properties of the granite and granite gniess mapped in the study area
Rock type Measured Parameter Mean results
Biotite and Honblende Granite
Specific gravity 2.739Aggregate crushing value (% (fines))
28.5
Compressive strength (mpa) 79.55Water absorption and Porosity(%)
0.514
Banded Gniess
Specific gravity 2.756Aggregate crushing value (% (fines))
28.1
Compressive strength (mpa) 78.46Water absorption and Porosity 0.671
CONCLUSION
Visual interpretation and digital image processing methods had very high
correlation in this lineament analysis based study. Filtering directions were
selected according to the features of the thermotectonic events that dominate in
the area. In this study, NW, N-S and E-W directional filtering processes were
analyzed and interpreted in terms of the thermotectonic evolution of the region.
Furthermore, rationing method helped remove topographic effects and enhance
several features in the area. Generally, result shows that clearly extensive NE-
SW trending lineament systems that most of the lineaments were clustered in the
northeastern part of the region which corresponds to one of the imprints of Pan-
African orogeny. Result shows that developed in the region. There are also twoprominent sets of fracture with both roughly oriented to NNE- SSW as mapped by
Ajakaiye et al (1986) and highlighted by Ananaba (1991) as St Paul’s Fracture Zone
(FZA) megalineament of Nigeria. the dominant foliation defined by alternating
12
dark and light bands and prominent gneissossity trends roughly N-S with
variation between NE-SW and NW-SE. E-W foliations are the oldest and mostly
preserved as relicts.
Principal fractures directions are in the N-S, NNE-SSW, NNW-SSW and NW-SE and to
a lesser extent E-W, with the N-S fractures marked by considerable shearing and
brecciations. The NE-SW and NW-SE conjugate sets are mostly strike slip faults
with the north easterly characterized by dextral sense of movement. The NE-SW
and NW-SE conjugate sets are mostly strike slip faults with the north easterly
characterized by dextral sense of movement. Some of the important fault systems
are the Ifewara , Zungeru ,Anka and kalangai with wide zones of mylonites,
cataclastic and silicified rocks. They are interpreted to have resulted from
transcurrent movements. These lineaments are as long as 25km or less which could
be part of subsidiary faults suggested by Garba (2002).
Field and remote sensing studies indicate that most of the lineaments are
extensional fractures that correspond to either dikes emplacement or normal
faults which were subsequently reactivated into strike-slip shear fractures. The
NW–SE and NNE–SSW lineaments represent dilatational fractures (Garba 2002). The
NNE–SSW trending lineaments are the oldest. The N–S and WNW–ESE lineaments form
conjugate shear fractures and are younger than the NNE–SSW lineaments (Danbatta
and Ajibade 1995). The N-S trending lineaments are prominent around
metasedimentary rocks while NE-SW and NW-SE sets of lineaments are mostly common
around gneisses and migmatite rocks (Kogbe 1981). Blomquist and Wladis (2002)
reported that lineaments represent zones of weakness in the bedrock and are
assumed to also represent a topographic depression that streams usually flow
along which could be tectonically controlled. It has been proven in other area
that the area of higher points of fracture or lineament intersections usually
become a good target for economic mineral exploration (Sabin, 1987).
The fresh rocks on the surface have very high mechanical strength properties
with very low water absorption capacity. This low water absorption capacity is
an indication of low porosity state of the rocks. The results show that the
rocks that outcrop in the area possess good engineering properties and
characteristic and are therefore suitable for the use in the dam construction
13
and other civil engineering works. The test results also compare favorably well
with standard values of ASTM D2938-79 (1980) and ISRM (1979).
REFERENCE
Ahmad, F., 1983. Relationships of mineral deposits and lineament analysis of theRea Sea region, northern Sudan. Advance Space Research, 3: 71-79.
Ajakaiye, D.E, Hall,, D.H, Millar, T.W, Verheijen, P.J.T, Awad, M.B. and Ojo,S.B. 1986. Aeromagnetic anomalies and tectonic trends in and around theBenue Trough, Nigeria. Nature 319. No 6054 pp 582-584.
Akpan, A.E., Ukwang E.E. and Esu, E.O. 2010. Assessment of the potential of somematerials in part of Akamkpa, SE Nigeria, Jour. of Min. Geol. 42(2) pp113-119.
Ananaba, S.E. 1991. Dam sites and crustal megalineament in Nigeria. ITC journalpp 158-160.
Ananaba, S.E. and Ajakaiye, D.E. 1987. Evidence of Tectonic Control ofMineralization in Nigeria from Lineament Density Analyses. Intl. Journalof Remote Sensing, vol.8 No. 10, 1445- 1453
ASTM D-2938-79, 1980. Standard method of test for compressive strength of rockcore samples. In 1980 Annual Book of ASTM standards. Part 19 440-443.
Ayok, J. 2009. Digital Lithological Mapping of The Eastern Gongola Basin,northeastern Nigeria, from Landsat 7. Dept. of Geology, Ahmadu BelloUniversity Zaria-Nigeria.
Bala, A. E. 1997. Remote Sensed Groundwater Potential of The Basement ComplexAround Dutsinma, Katsina state, Nigeria. Unpublished M. Sc. Theses, InterUniversity Program in water resources Engineering, Vrije Universiteit,Brussels, 70pp
Bala, A. E., Batelaan, O. and De Smedt, F. 2000. Using Landsat 5 Imagery in TheAssessment of Groundwater Resources In The Crystalline Rocks AroundDutsinma, northwestern Nigeria. Jornal of of Mining And Geology, 36(1).85-92
Berhe, S.M. and D.A. Rothery, 1986. Interactive processing of satellite images forstructural and lithological mapping in northeast Africa. Geol. Mag., 123: 393-403.
Black, R. Ba, H.E, Betrand, J.M., Boullier A.M., Caby R. Dickson I., Fabre J.Leblanc M. and Wright L.I 1979. Outline of the Pan-African geology ofAdras des Iforas (Mali) Geol. 74 pp 1435-1444.
14
Blomquist, N. and Wladis, D. 2002. Radarsat-SAR Data for mapping of crustalstructure and tectonic in groundwater applications. Chalmas University ofTechnology S-41296 Gutenberg Pub. Canadian Space Agency. P 223.
Edett, A. E.,Teme, S.C., Okereke, C.S. and Esu, E.O.(1994): Lineament Analysisfor Groundwater Exploration in Precambrian Oban Massif and Obudu Plateau,SE Nigeria. Journal of Mining and Geology, 30(1), 87-95
Fernandez-Alonso, M. and A. Tahon, 1991. Lithological discrimination and structuraltrends in W-Rwanda (Africa) on images of airborne radiometric and aeromagneticsurveys, coregistered to a Landsat TM scene, Photogrammetric Engineering andRemote Sensing, 57: 1155-1162.
Goki, N.G.,Oha, I.A., Ike, E.C. and Bala, E.A. 2005.The Use of DigitallyProcessed Landsat 5 T TM Imagery To Map mineralized Pegmatites AroundNassarawa, Central Nigeria. first international Workshop on Geodesy andGeodynamics in Toro, Bauchi State.
Garba I. 2002. Origin of Pan-African mesothermal gold mineralization in BiniYauri Nig. J. of Afri. Earth science vol. 31. No 2 pp 433-449.
Danbatta U.A and Ajibade A.C 1995. Geological study of the SE part of Zuruschist belt in Precambrian Basement of NW Nigeria (Abstract vol.) Nig.Min. & Geol. Society. p 2
Drury, S., 1986. Remote Sensing of Geological structure in temperate agriculturalareas. Geological Magazine,
123: 113-121.
Halbouty, M. T., 1976. Application of Landsat imagery to petroleum and mineralexploration American Association Petroleum Geologists Bulletin, 60. 745-793.
Hung L.Q, Dinh NQ, Batelaan O. Tam VT, Lagrou D. 2002. Remote Sensing and GIS-base analysis of cave development in the Suoimuoi Catechment, Sonla NW,Vietnam. J of Cave and Karst studies 64 (1) pp 23-33.
ISRM, 1979. Suggested methods for determining the uniaxial compressive strengthand deformability of rock materials. International Jour. of Rock Mech.Min. Sci. Geomech. Abstr. 16: 135-140.
Juhari M.A and Ibrahim A 1997. Geological Application of Landsat TM imagery:Mapping and Analysis of Lineaments in NW Penisula Malysis, GISDevelopment- AARS, ACRS.
Kavak K.S. and Cetin H. 2007. A detailed geologic Lineament analysis usingLandsat TM Data of Golmermara/ Manisa Region, Turkey. Medwell J. of EarthSciences vol. (3) pp 145-153.
15
Kogbe, C.A. 1981. Geological interpretation of Landsat Imageries of Part ofCentral Nigeria. Jour. of Min. Geol. 18(1) pp 66-69.
Lee, M.K., T.C. Pharaoh and N.J. Soper, 1990. Structural trends in central Britainfrom images of gravity and aeromagnetic fields. J. Geol. Soc., London, 147:241-258.
Marghany, M. and Hashim M. 2010. Lineament mapping using multispectral Remotesensing satellite Data, Research J. of Applied Sciences, Medwell J. Vol 5(2) pp 125-130.
Mclean, A. C. and Gribble, C.D. 1979. Geology for civil engineers. George Allen& Unwin, London. Pp 310.
Odeyemi, I.B.,Anifowose, Y.B. and Asiwaju Y. A. 1999. Multi-technique GraphicalAnalysis of Fractures from Remote Sensing Images of Basement Regions ofNigeria. Journal of Mining and Geology, 33(1),
Offield, T. W., Abbort, E. A., Gillespie, A. R. and Loguercio, S. O. 1977.Structural mapping n enhanced Landsat images of southern Brazil tectoniccontrol of mineralization and speculations on metallogeny. Geophysics, 42.482-500.
O’leary, D.W., Friedman, J.D. and Pohn, H.A. 1976. Lineament, linear lineationsome proposed new standards for old terms. Geological Society AmericaBulletin, 87. 1463-1469.
Olade, M.A. 1978. General features of a Precambrian Iron Ore deposit and itsenvironment at Itakpe ridge, Okene, Nigeria, extract fromTransactions/section B of the inst. Of mining and Metallugy vol.87 B1-B9.
Qari, M.Y.H.T., 1991. Application of Landsat TM data to geological studies, Al-Khabt area, southern Arabian Sensing, 5: 421-429.
Richards, J.A., 1986. Remote Sensing Digital Image Analysis, New York: Springer-Verlag, pp: 281. graben (West Turkey) and its tectonic implications,
Sabin, F. F. Jr., 1987. Remote sensing-principles and interpretation secondedition (New York: W. H. Freeman and Company), 449p.
16