optimising home automation systems: a comparative study on tabu search and evolutionary algorithms
TRANSCRIPT
Optimising Home Automation Systems:a Comparative Study on Tabu Search
and Evolutionary AlgorithmsG. Morganti, A. M. Perdon, G. Conte and D. Scaradozzi
Dipartimento di Ingegneria Informatica, Gestionale e dell’AutomazioneUniversita Politecnica delle Marche
via Brecce Bianche, 12 - 60131 Ancona - ItalyEmail: [email protected]; (perdon, gconte, d.scaradozzi)@univpm.it
A. BrintrupInstitute for ManufacturingUniversity of Cambridge
Cambridge, CB2 1RX, UKEmail: [email protected]
Abstract—We use the Multi Agent System paradigm to modeland analyse Home Automation System performance in exploitinglimited resources such as electricity and hot water. In this paperwe evaluate several approaches to the optimisation of HomeAutomation System performance using Tabu Search, and Singleand Multi-objective Genetic Algorithms. The results show thatthe Genetic Algorithms achieve faster convergence than TabuSearch. Multi-objective Genetic Algorithm provides a diverse setof solutions for the decision maker.
I. INTRODUCTION
In this paper the authors extend the work done in the lastyears on developing a set of tools and procedures for establish-ing control strategies for Home Automation Systems modelledusing Multi Agent System theory, analyse the performancesand optimise the resource management.
A Home Automation System (HAS) consists of a set ofappliances and devices for home management which can beviewed as individual agents acting in a common environmentand sharing common resources, like electricity, gas and water.Since resource availability is limited, concurrent use maycause conflicts that degrade the performances of individualappliances with respect to the user expectations and/or increasethe costs for accomplishing individual tasks [1].
In previous papers, a rich simulation and emulation envi-ronment has been constructed, described (see [2], [3]) andcompared to different resource control strategies.
The exploitation of limited resources depends on be-havioural parameters of the individual appliances. In order todeal with the problem of developing systematic design and val-idation procedures for control strategies, global performanceindices for the system were introduced [3].
Different strategies for allocating resources and establishingpriorities in their use could therefore be tested and compared:in [4] a heuristic search for the best configuration of the homeautomation system parameters was introduced.
A first attempt of a more structured parameter optimisationprocedure can be found in [5], where a Tabu Search approachfor the parameter optimisation was proposed.
Here we introduce single and multiple objective GeneticAlgorithms for parameter optimisation of control strategiesand compare their performances to the Tabu Search approach.The aim of the comparison is to understand how differentsearch algorithms behave in the home automation problem,and provide a comparative case study of different algorithmsto the literature.
Section II describes the case study. Sections III and IV de-scribe the Tabu Search, and Single and Multi-objective GeneticAlgorithm approaches taken respectively, while Section Vdiscusses our findings and Section VI concludes the paper.
II. CASE STUDY
A. The simulator
The simulator consists of a software environment, developedusing LabVIEW, where programs that represent the singleagents are executed simultaneously. Each program implementsthe sequence of state transitions that characterises an agent.Agents exchange information by sharing global variables. Atevery state transition, each agent updates the global variablethat represents its consumption of a specific resource. Thepresence of human users can also be emulated.
The Home Automation System is composed of a combi-nation of the following appliances: dishwasher, washing ma-chine, boiler, human user and metering devices. The appliancesare connected by a communication network; communicationmay happen through the power line.
The dishwasher and the washing machine use electricity andhot water, produced by the gas boiler and made available as aglobal resource. As an alternative, hot water can be producedat a higher cost, for internal use by employing electricity.
Therefore, in our environment agents compete both forelectricity and for hot water.
The boiler has no competitors in the use of gas and itactivates when one of the other agents demands hot water,e.g. when a valve is opened. While producing hot water, theboiler uses also electricity and, since it is not endowed with therequired capacity, it cannot detect overload nor implement any
17th Mediterranean Conference on Control & AutomationMakedonia Palace, Thessaloniki, GreeceJune 24 - 26, 2009
978-1-4244-4685-8/09/$25.00 ©2009 IEEE 1044
control strategy. This choice, actually, implies that the boilerhas the highest priority in the use of electricity.
The maximum appliance consumptions are 2 kW for thewashing machine, 1.85 kW for the dishwasher and 90 W forthe boiler.
In the simulation scenario, that is fixed in advance andrepresents the typical use of appliances at home in a holidayeve, the washing machine and the dishwasher activate at thesame time and the duration of the washing cycle for thedishwasher is about 2/3 of the duration of the washing cyclefor the washing machine. We assume that there is an additionalconsumption of electricity by the human user, in order to stresscompetition; for simplicity we suppose that it is constant andequal to 2.5 kW. Obviously, it could be possible, as well, tosimulate an additional consumption that changes constantly.
For the sake of simplicity, we assume that the boiler andthe human user alone cannot give rise to electric overloads.Therefore, in case the action of the human user causes anelectric overload, there is one other agent that will yield first.If the human user is using hot water, e.g. for taking a shower,the other agents will wait for a given period of time.
The metering devices do not consume resources; theysimply evaluate actual consumption and update the globalvariables indicating availability.
The need of a control strategy for electricity consumptionis particularly perceived in typical Italian home installations,where the contract with the provider determines expressly a3 kW threshold (the same value is used in our scenario) thatcan be exceeded only for a few minutes. If consumption staysover the threshold for a longer time a blackout occurs. In thiscase the user has to switch off some appliance to go backunder the threshold and put the master switch on again, whichis undoubtedly an unwanted event.
The system is able to detect overload situations by receivinginformation from metering devices and to implement thecontrol strategies described in the following.
B. Control strategies
To solve conflicts between competing agents, we assumethat limitation of resources means that the actual consumptionmust not exceed the fixed threshold. The overload denotes thecondition in which the threshold is surpassed.
By analysing available resources and their quantitative lim-its, we have found convenient to classify the resources in twogroups:
1) resources for which overload can persist, without caus-ing degradation in quality, for a (short) time Tlim > 0,after which, if overload persists, its use becomes unac-ceptably expensive or the resource is cut off, makingnecessary to intervene for restarting the system;
2) resources for which overload could persist indefinitely,without causing cut off, but whose persistence in timedegrades the quality of the resource itself, so that it isappropriate to chose Tlim = 0.
Two paradigmatic examples are that of electricity, for whichTlim is greater than 0 and that of hot water, for which Tlim
is ideally 0, since overloads would cause an abrupt decreaseof temperature and/or flow.
Resources belonging to different groups have to be managedwith different strategies.
Overall control strategies for managing resources for whichTlim is greater than 0 can be designed following the lines ofthe Power Levelling strategy introduced and discussed in [2].This means that the action of each home automation agentis determined by two parameters, the Overload Time to andthe Suspension Time ts. The Overload Time to representsthe time the agent waits before stopping its action in casean overload occurs. The Suspension Time ts represents thetime the agent waits before restarting its action after havingstopped it because of an overload.
Overall control strategies for managing resources for whichTlim is equal to 0 can be designed following the lines of asimilar strategy, Water Levelling. Since in this work we areinterested in optimising only Power Levelling parameters, thereader is referred to [2] for a detailed description of WaterLevelling strategy.
C. Performance indices
In order to compare the results of different simulation sce-narios, determining thereby which strategies and policies arethe best, we need one or possibly more indices of performance.
We have defined two indices, that point at important aspects:relative delay in completion of tasks and number of overloads.The simulator is programmed to compute them automatically,according to the definitions given in the following.
1) Relative delay: Let the duration of task i, when all therequired resources are available, be indicated by TNi and callit nominal duration. In case of conflict and competition, duringa simulation, the time needed to complete the task may takea higher value TAi ≥ TNi. Then, we consider the relativedelay
∆i =TAi − TNi
TNi(1)
and, letting N be the number of tasks in the consideredscenario, we define the global percent relative delay ∆% as
∆% = 100 ·
N∑i=1
pi∆i
N(2)
where the pi are weights that can be chosen according to thecharacteristics of the task. Clearly, user satisfaction increaseswhen this index approaches 0. To obtain numerical results,nominal durations have been determined using real appliancesand the weights have been chosen all equal to 1.
2) Number of overloads: This index simply counts theoccurrences of overloads during the simulation and it isdenoted by OL. Overloads stress the system and put it at riskor cause a great increase of costs, so the Home AutomationSystem is performing better if OL is kept small.
The overall performance index has to take into account thesetwo indices.
1045
Therefore, it should be an appropriate combination of OLand ∆%, where the user decides the weights of each index.
On the basis of the results obtained in [4], a suitable formulathat balances the contribution given by the two indices througha simple scaling is given as:
f(S) = 10 ∗OL + ∆% (3)
Our aim is to design an efficient control set of individualparameters for the appliances.
However it is possible to observe that even changing oneonly parameter, the scheduling of all the system could changeunpredictably. This inherent unpredictability in the relationshipbetween parameters and performance indices has been thereason behind selecting simulation as an optimisation tool.
III. TABU SEARCH
The first method we have developed to optimise the choiceof parameters with the aim of achieving better performancewas a Tabu Search type method in [5].
Let us recall a few definitions:Definition 1: Let p1, p2, . . . , pn be the n parameters we
want to fine-tune. A solution to the optimisation problem isgiven by the following set of parameters
S0 = (p1, p2, . . . , pn) (4)
and its performance index is f(S0).Definition 2: Assume that each parameter can be increased
or decreased of a given step: let d1, d2, . . . , dn be thestep values (di is the step pertaining to parameter pi). Giventhe solution S0, its neighbourhood N(S0) is composed of thefollowing solutions:
S1 = (p1 − d1, p2, . . . , pn);S2 = (p1 + d1, p2, . . . , pn);S3 = (p1, p2 − d2, . . . , pn);S4 = (p1, p2 + d2, . . . , pn);
. . .S2n−1 = (p1, p2, . . . , pn − dn);
S2n = (p1, p2, . . . , pn + dn).
(5)
The neighbourhood is therefore formed by a number ofnew solutions which is equal to the double of the numberof parameters. The parameters of each pair of new solutionsare equal to the parameters of the original solution but one,which is alternatively decreased or increased by its prior step.
The search method starts with the choice of an initialsolution S0, i.e. an initial set of parameters; with which werun a simulation and record its performance index f(S0).
Then we run 2n simulations Si, each using the parametervalues of one of the 2n solutions in the neighbourhood N(S0),and we examine their performance indices f(Si) using Eq. 3.
If there are solutions whose performance index is better,f(Si) < f(S0), we choose the best one as the new startingsolution. We generate its neighbourhood and then we repeatthe process described above. We can repeat this procedureuntil we get a solution such that all of the solutions in its
neighbourhood have worst performance indices. It is evidentthat this solution is highly likely to be a local minimum.
To avoid this, and to escape thus the local minima we haveto take into account the possibility of selecting a new solutionin the current solution neighbourhood, even if its performanceindex is greater than or equal to the current one. It is important,however, to keep record of all the previously visited solutions,to avoid repeating a simulation with a set of parameters alreadyused. In this way, when the current solution does not have inthe neighbourhood solutions performing better than itself, thesearch is not terminated but the exploration of the solutionspace continues.
It is evident that this approach is leading towards a TabuSearch, a well-known optimisation method. Tabu Search (TS)is a variation of Local Search method, in which, to avoidbeing trapped in local minima, among all the solutions inthe neighbourhood of the current solution, the best one isvisited, even if the latter has a worst performance index. Thisstrategy can lead to looping over previously visited solutions.To prevent this, certain moves from a solution to its neighboursare marked as “tabu”.
A. Tabu Search Implementation
In our case, as we said in Sect. II, we want to apply theWater Levelling control strategy. Since the appliances involvedare two (i.e. the washing machine and the dishwasher), andthe Water Levelling parameters are two (i.e. Overload Timeand Suspension Time), the overall number of parameters to beoptimised is four. This means that at each algorithm iteration,eight neighbours of each solutions are generated.
The step for the increase or the decrease of the parametersin neighbourhood generation is 10 s for the Overload Timeand 100 s for the Suspension Time.
The search algorithm is terminated after three iterations inwhich the best solution of each neighbour does not improvethe best overall solution found so far.
The dependence of the solution found by this method on thestarting point makes it necessary to carry out multiple runs ofthe method in order to obtain meaningful results. Therefore,we ran our algorithm five times starting from random differentpoints.
IV. GENETIC ALGORITHM
Our next step of analysis is conducted through the use ofGenetic Algorithms (GAs), an adaptive heuristic search algo-rithm premised on the evolutionary ideas of natural selectionand genetics.
GAs represent an intelligent exploitation of a random searchwithin a defined search space to solve a problem; and havebeen widely studied, experimented and applied in many fieldsof engineering.
Many problems in real life have several, possibly conflictingobjectives to be satisfied. In such a scenario we ideallywould have a diverse set of trade off solutions that arenon-dominating to each other, known as the Pareto front,which changes the definition of the optimum. A solution is
1046
Pareto optimal if there exists no other feasible solution whichwould decrease some criterion without causing a simultaneousincrease in at least one other criterion.
Traditionally multi-objective problems have been optimisedby single objective optimisation techniques by transformingall but one objective into constraints. With the advent oftechniques to deal with these problems more efficiently, multi-objective optimisation became a popular research topic. TheMultiobjective Optimisation Problem can be defined as theproblem of finding a vector of decision variables whichsatisfies constraints and optimises a vector function whoseelements represent the objective functions. These functionsform a mathematical description of performance criteria whichare usually in conflict with each other.
In our case we do not know the relationship between theparameters of the home automation problem. Hence we usemulti-objective optimisation to explore the search space andfind out if the approach gives better solutions than the TS.
Evolutionary approaches, particularly GAs have proved tobe a popular method to solve multi-objective problems. Theprimary reasons cited are [6]: GAs’ ability to deal withmultiple solutions in a single run, hence correlating with ourobjective to achieve multiple solutions, GAs’ ability to exploremultiple local optima, to deal with discontinuity of the Paretofront, and their successful application to many engineeringproblems. Hence we have chosen a GA based multi-objectiveoptimisation algorithm in our study: NSGA-II.
NSGA-II, has been proposed by Kalyanmoy Deb in [7],as a revision on the previous NSGA [8]. The algorithm iscomputationally efficient (O(M2)), uses elitism to preservefit members of the population, and uses a crowded distanceoperator to achieve diversity without having to specify addi-tional parameters like its predecessors did. The algorithm hasbeen widely popular [9].
A. Multi-Objective Genetic Algorithm Implementation
Each solution is represented by a chromosome composed ofan array of integers. Since the parameters we are optimisingare four, as in the TS implementation of the problem, thechromosome consists of four real-valued parameters.
We deployed the NSGA-II with a crossover probabilityof 0.9 and a mutation probability of 0.1. Simulated binarycrossover and mutation has been used as reproductive opera-tors (see [10] for a detailed description). The selection methodincluded tournament selection.
The steps for the change of the Overload Times andSuspension Times were chosen as in the TS.
As GAs are stochastic, we need multiple runs for assessingtheir effectiveness. We therefore decided to perform five runswith each alteration, as we did in the previous method.
B. Single Objective Genetic Algorithm Implementation
In order to have a broader comparison among differentoptimisation methods, we decided to experiment with a classicSingle Objective GA.
Average Index
0
50
100
150
200
250
300
0 2 4 6 8 10 12 14 16 18
TS M O G A S O G A
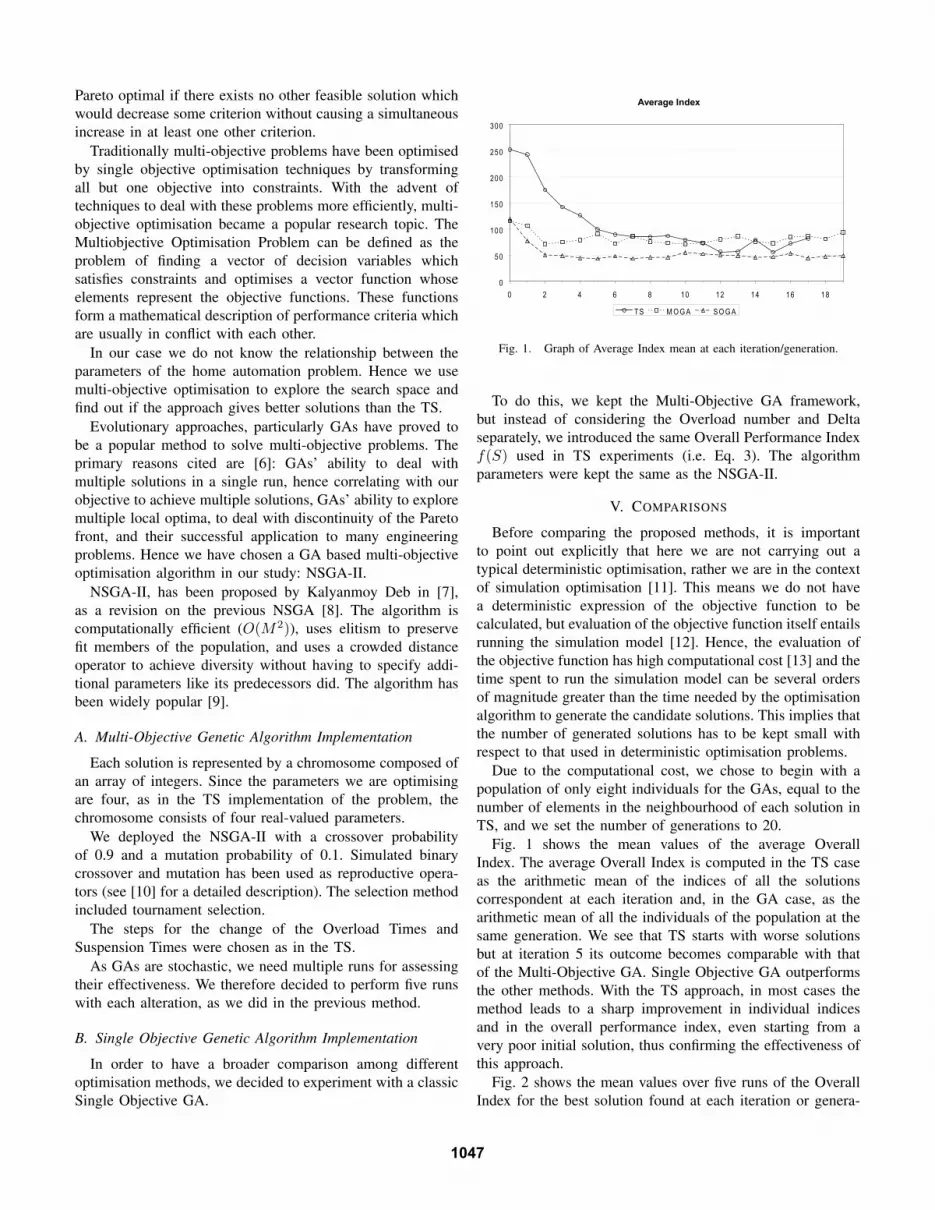
Fig. 1. Graph of Average Index mean at each iteration/generation.
To do this, we kept the Multi-Objective GA framework,but instead of considering the Overload number and Deltaseparately, we introduced the same Overall Performance Indexf(S) used in TS experiments (i.e. Eq. 3). The algorithmparameters were kept the same as the NSGA-II.
V. COMPARISONS
Before comparing the proposed methods, it is importantto point out explicitly that here we are not carrying out atypical deterministic optimisation, rather we are in the contextof simulation optimisation [11]. This means we do not havea deterministic expression of the objective function to becalculated, but evaluation of the objective function itself entailsrunning the simulation model [12]. Hence, the evaluation ofthe objective function has high computational cost [13] and thetime spent to run the simulation model can be several ordersof magnitude greater than the time needed by the optimisationalgorithm to generate the candidate solutions. This implies thatthe number of generated solutions has to be kept small withrespect to that used in deterministic optimisation problems.
Due to the computational cost, we chose to begin with apopulation of only eight individuals for the GAs, equal to thenumber of elements in the neighbourhood of each solution inTS, and we set the number of generations to 20.
Fig. 1 shows the mean values of the average OverallIndex. The average Overall Index is computed in the TS caseas the arithmetic mean of the indices of all the solutionscorrespondent at each iteration and, in the GA case, as thearithmetic mean of all the individuals of the population at thesame generation. We see that TS starts with worse solutionsbut at iteration 5 its outcome becomes comparable with thatof the Multi-Objective GA. Single Objective GA outperformsthe other methods. With the TS approach, in most cases themethod leads to a sharp improvement in individual indicesand in the overall performance index, even starting from avery poor initial solution, thus confirming the effectiveness ofthis approach.
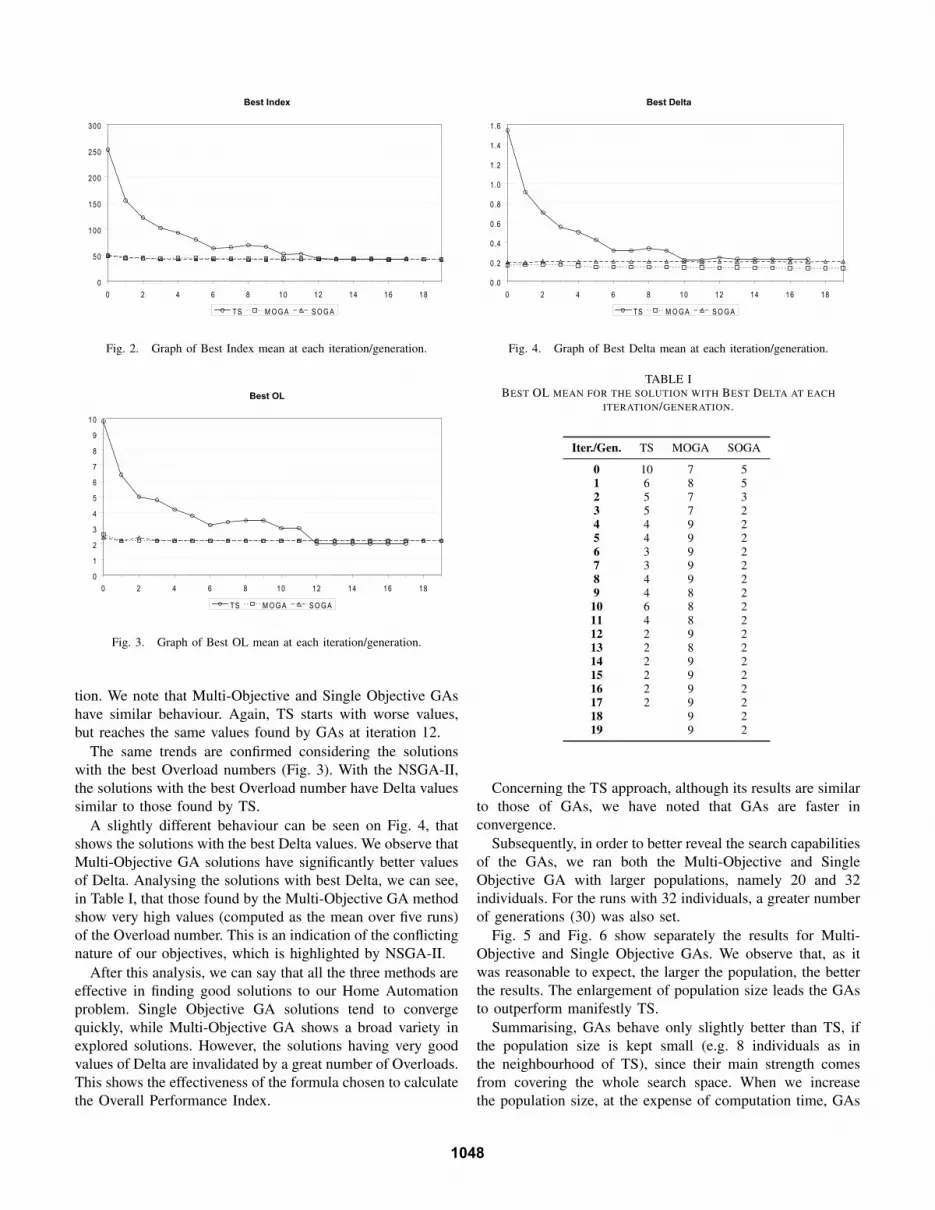
Fig. 2 shows the mean values over five runs of the OverallIndex for the best solution found at each iteration or genera-
1047
Best Index
0
50
100
150
200
250
300
0 2 4 6 8 10 12 14 16 18
TS M O G A S O G A
Fig. 2. Graph of Best Index mean at each iteration/generation.
Best OL
0
1
2
3
4
5
6
7
8
9
10
0 2 4 6 8 10 12 14 16 18
TS M O G A S O G A
Fig. 3. Graph of Best OL mean at each iteration/generation.
tion. We note that Multi-Objective and Single Objective GAshave similar behaviour. Again, TS starts with worse values,but reaches the same values found by GAs at iteration 12.
The same trends are confirmed considering the solutionswith the best Overload numbers (Fig. 3). With the NSGA-II,the solutions with the best Overload number have Delta valuessimilar to those found by TS.
A slightly different behaviour can be seen on Fig. 4, thatshows the solutions with the best Delta values. We observe thatMulti-Objective GA solutions have significantly better valuesof Delta. Analysing the solutions with best Delta, we can see,in Table I, that those found by the Multi-Objective GA methodshow very high values (computed as the mean over five runs)of the Overload number. This is an indication of the conflictingnature of our objectives, which is highlighted by NSGA-II.
After this analysis, we can say that all the three methods areeffective in finding good solutions to our Home Automationproblem. Single Objective GA solutions tend to convergequickly, while Multi-Objective GA shows a broad variety inexplored solutions. However, the solutions having very goodvalues of Delta are invalidated by a great number of Overloads.This shows the effectiveness of the formula chosen to calculatethe Overall Performance Index.
Best Delta
0.0
0 .2
0 .4
0 .6
0 .8
1 .0
1 .2
1 .4
1 .6
0 2 4 6 8 10 12 14 16 18
TS M O G A S O G A
Fig. 4. Graph of Best Delta mean at each iteration/generation.
TABLE IBEST OL MEAN FOR THE SOLUTION WITH BEST DELTA AT EACH
ITERATION/GENERATION.
Iter./Gen. TS MOGA SOGA
0 10 7 51 6 8 52 5 7 33 5 7 24 4 9 25 4 9 26 3 9 27 3 9 28 4 9 29 4 8 210 6 8 211 4 8 212 2 9 213 2 8 214 2 9 215 2 9 216 2 9 217 2 9 218 9 219 9 2
Concerning the TS approach, although its results are similarto those of GAs, we have noted that GAs are faster inconvergence.
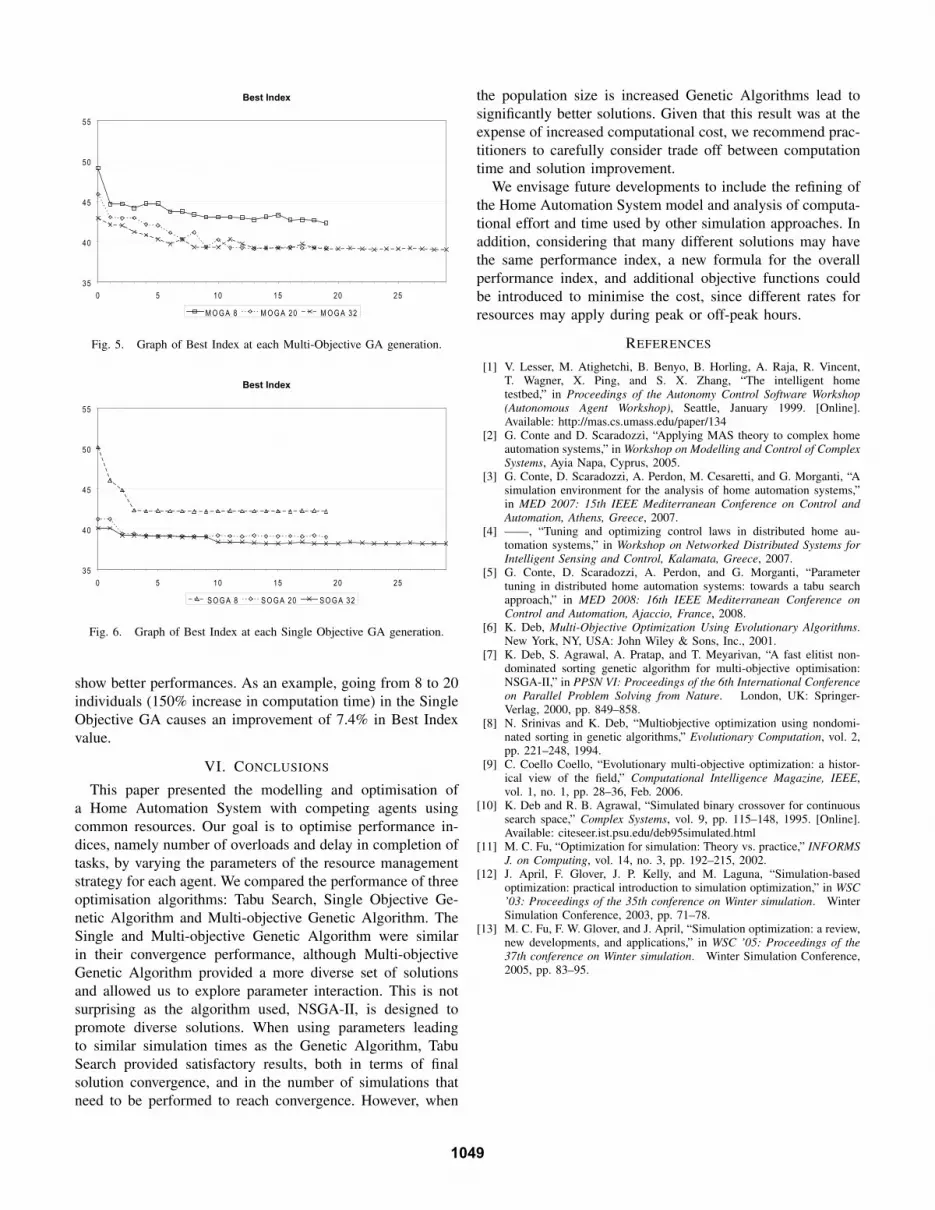
Subsequently, in order to better reveal the search capabilitiesof the GAs, we ran both the Multi-Objective and SingleObjective GA with larger populations, namely 20 and 32individuals. For the runs with 32 individuals, a greater numberof generations (30) was also set.
Fig. 5 and Fig. 6 show separately the results for Multi-Objective and Single Objective GAs. We observe that, as itwas reasonable to expect, the larger the population, the betterthe results. The enlargement of population size leads the GAsto outperform manifestly TS.
Summarising, GAs behave only slightly better than TS, ifthe population size is kept small (e.g. 8 individuals as inthe neighbourhood of TS), since their main strength comesfrom covering the whole search space. When we increasethe population size, at the expense of computation time, GAs
1048
Best Index
35
40
45
50
55
0 5 10 15 20 25
M O G A 8 M O G A 20 M O G A 32
Fig. 5. Graph of Best Index at each Multi-Objective GA generation.
Best Index
35
40
45
50
55
0 5 10 15 20 25
S O G A 8 S O G A 20 S O G A 32
Fig. 6. Graph of Best Index at each Single Objective GA generation.
show better performances. As an example, going from 8 to 20individuals (150% increase in computation time) in the SingleObjective GA causes an improvement of 7.4% in Best Indexvalue.
VI. CONCLUSIONS
This paper presented the modelling and optimisation ofa Home Automation System with competing agents usingcommon resources. Our goal is to optimise performance in-dices, namely number of overloads and delay in completion oftasks, by varying the parameters of the resource managementstrategy for each agent. We compared the performance of threeoptimisation algorithms: Tabu Search, Single Objective Ge-netic Algorithm and Multi-objective Genetic Algorithm. TheSingle and Multi-objective Genetic Algorithm were similarin their convergence performance, although Multi-objectiveGenetic Algorithm provided a more diverse set of solutionsand allowed us to explore parameter interaction. This is notsurprising as the algorithm used, NSGA-II, is designed topromote diverse solutions. When using parameters leadingto similar simulation times as the Genetic Algorithm, TabuSearch provided satisfactory results, both in terms of finalsolution convergence, and in the number of simulations thatneed to be performed to reach convergence. However, when
the population size is increased Genetic Algorithms lead tosignificantly better solutions. Given that this result was at theexpense of increased computational cost, we recommend prac-titioners to carefully consider trade off between computationtime and solution improvement.
We envisage future developments to include the refining ofthe Home Automation System model and analysis of computa-tional effort and time used by other simulation approaches. Inaddition, considering that many different solutions may havethe same performance index, a new formula for the overallperformance index, and additional objective functions couldbe introduced to minimise the cost, since different rates forresources may apply during peak or off-peak hours.
REFERENCES
[1] V. Lesser, M. Atighetchi, B. Benyo, B. Horling, A. Raja, R. Vincent,T. Wagner, X. Ping, and S. X. Zhang, “The intelligent hometestbed,” in Proceedings of the Autonomy Control Software Workshop(Autonomous Agent Workshop), Seattle, January 1999. [Online].Available: http://mas.cs.umass.edu/paper/134
[2] G. Conte and D. Scaradozzi, “Applying MAS theory to complex homeautomation systems,” in Workshop on Modelling and Control of ComplexSystems, Ayia Napa, Cyprus, 2005.
[3] G. Conte, D. Scaradozzi, A. Perdon, M. Cesaretti, and G. Morganti, “Asimulation environment for the analysis of home automation systems,”in MED 2007: 15th IEEE Mediterranean Conference on Control andAutomation, Athens, Greece, 2007.
[4] ——, “Tuning and optimizing control laws in distributed home au-tomation systems,” in Workshop on Networked Distributed Systems forIntelligent Sensing and Control, Kalamata, Greece, 2007.
[5] G. Conte, D. Scaradozzi, A. Perdon, and G. Morganti, “Parametertuning in distributed home automation systems: towards a tabu searchapproach,” in MED 2008: 16th IEEE Mediterranean Conference onControl and Automation, Ajaccio, France, 2008.
[6] K. Deb, Multi-Objective Optimization Using Evolutionary Algorithms.New York, NY, USA: John Wiley & Sons, Inc., 2001.
[7] K. Deb, S. Agrawal, A. Pratap, and T. Meyarivan, “A fast elitist non-dominated sorting genetic algorithm for multi-objective optimisation:NSGA-II,” in PPSN VI: Proceedings of the 6th International Conferenceon Parallel Problem Solving from Nature. London, UK: Springer-Verlag, 2000, pp. 849–858.
[8] N. Srinivas and K. Deb, “Multiobjective optimization using nondomi-nated sorting in genetic algorithms,” Evolutionary Computation, vol. 2,pp. 221–248, 1994.
[9] C. Coello Coello, “Evolutionary multi-objective optimization: a histor-ical view of the field,” Computational Intelligence Magazine, IEEE,vol. 1, no. 1, pp. 28–36, Feb. 2006.
[10] K. Deb and R. B. Agrawal, “Simulated binary crossover for continuoussearch space,” Complex Systems, vol. 9, pp. 115–148, 1995. [Online].Available: citeseer.ist.psu.edu/deb95simulated.html
[11] M. C. Fu, “Optimization for simulation: Theory vs. practice,” INFORMSJ. on Computing, vol. 14, no. 3, pp. 192–215, 2002.
[12] J. April, F. Glover, J. P. Kelly, and M. Laguna, “Simulation-basedoptimization: practical introduction to simulation optimization,” in WSC’03: Proceedings of the 35th conference on Winter simulation. WinterSimulation Conference, 2003, pp. 71–78.
[13] M. C. Fu, F. W. Glover, and J. April, “Simulation optimization: a review,new developments, and applications,” in WSC ’05: Proceedings of the37th conference on Winter simulation. Winter Simulation Conference,2005, pp. 83–95.
1049