optimising control of disease spread on networks
TRANSCRIPT
Vol. 36 (2005) ACTA PHYSICA POLONICA B No 5
OPTIMISING CONTROL OF DISEASE SPREAD
ON NETWORKS∗
B. Dybiec
Institute of Physics, Jagellonian UniversityReymonta 4, 30–059 Kraków, Poland
e-mail: [email protected]
A. Kleczkowski† and C.A. Gilligan‡
Dept. of Plant Sciences, University of Cambridge
Cambridge CB2 3EA, England
(Received January 31, 2005)
Dedicated to Professor Andrzej Fuliński on the occasion of his 70th birthday
We consider models for control of epidemics on local, global, small-worldand scale-free networks, with only partial information accessible about thestatus of individuals and their connections. The effectiveness of local (e.g.ring vaccination or culling) vs global (e.g. random vaccination) controlmeasures is evaluated, with the aim of minimising the total cost of an epi-demic. The costs include direct costs of treating infected individuals aswell as costs of treatment. We first consider a random (global) vaccina-tion strategy designed to stop any potential outbreak. We show that ifthe costs of the preventive vaccination are ignored, the optimal strategyis to vaccinate the whole population, although most of the resources arewasted on preventing a small number of cases. If the vaccination costsare included, or if a local strategy (within a certain neighbourhood of asymptomatic individual) is chosen, there is an optimum number of treatedindividuals. Inclusion of non-local contacts (‘small-worlds’ or scale-free net-works) increases the levels of preventive (random) vaccination and radiusof local treatment necessary for stopping the outbreak at a minimal cost.The number of initial foci also influences our choice of optimal strategy.The size of epidemics and the number of treated individuals increase foroutbreaks that are initiated from a larger number of initial foci, but the op-timal radius of local control actually decreases. The results are importantfor designing control strategies based on cost effectiveness.
PACS numbers: 87.19.Xx, 04.60.Nc, 05.50.+q, 87.23.Cc
∗ Presented at the XVII Marian Smoluchowski Symposium on Statistical Physics,
Zakopane, Poland, September 4–9, 2004.† e-mail: [email protected]‡ e-mail: [email protected]
(1509)

1510 B. Dybiec, A. Kleczkowski, C.A. Gilligan
1. Introduction
One of the main goals of epidemiological modelling is to provide guide-lines for controlling disease outbreaks [1]. Traditionally this has been un-derstood in terms of reducing the number of infected individuals. Recentoutbreaks of large-scale epidemics like AIDS, malaria, foot-and-mouth, avianinfluenza or rhizomania as well as a possibility of a smallpox pandemic havebrought a new dimension to the studies. Not only must the epidemic bestopped as quickly as possible but also at manageable cost and with poten-tially limited resources. The problem of minimising the number of infectedindividuals becomes only a part of an optimisation problem in which infec-tion on one side and control measures on the other side generate costs.
Typically two cases of disease spread are considered, with appropriatecontrol measures. Thus, for a purely local case, local measures like ringculling, vaccination or quarantine are suggested [2]. At the other extreme,when any individual can be in contact with any other individual in thepopulation (even if the number of contacts is limited), global measures likea mass vaccination [1] seems to be a better option. More recently, attentionhas been given to another mode of disease spread, in which the contactstructure presents a mixture of local and global links. Termed ‘small-world’networks [3], the underlying structure of contacts potentially leading to adisease advance, present an interesting and challenging case for the control ofdiseases. While the choice between local and global control measures seemsto be clear for local and random networks, it is not clear how to designcontrol for ‘small-worlds’.
The modelling and prediction is made even more complicated by the factthat not all information about disease dynamics and about the underlyingnetwork structure is available. Among the epidemiological parameters andprocesses, the key problem lies in a difference between the onset of infec-tiousness and the earliest detectability of the disease and then application ofcontrol measures. For the network structure, long-range links are notoriouslydifficult to identify and to follow.
In this paper we compare the suitability of various control measuresdesigned for the spread of diseases on networks with local, global and ‘small-world’ connectivity. We have recently shown [4] that under some conditionsit is possible to control disease spread by using purely local methods appliedin a neighbourhood centred around a detected infectious individual, evenfor networks with non-local interactions. We have shown that if all costsof disease are included, there exists an optimal radius for such a controlneighbourhood leading to the lowest severity of the epidemic in terms ofeconomic costs associated with disease and treatment [5]. The efficiency ofsuch a local control strategy is very sensitive to the choice of the radius.

Optimising Control of Disease Spread on Networks 1511
However, many unresolved issues remain. In this paper we extend theanalysis in [4] in several directions. First, in addition to local control strate-gies, we also include a preventive random vaccination, in which susceptibleindividuals are treated before any potential outbreak. Traditional modellingconcentrated on the potential risks and costs associated with the outbreak,characterised by the total number of individuals who have been throughthe disease progress by the end of the outbreak. However, in many casesvaccination is in itself a source of costs and any potential strategy shouldincluded this as well. In this paper we show that inclusion of vaccinationcosts leads to an optimal control strategy that is different to the ‘traditional’one, based on minimising disease risks.
Second, we study the effect of initial conditions on the spread and controlof disease outbreaks on lattices including both local and non-local interac-tions. In particular, we show that the size of potential outbreaks, the numberof treated individuals and the optimal radius of a local control, depend in anon-trivial way on the number of initial foci.
Finally, we formulate the detailed mechanism responsible for a largedifference between regular networks and scale-free networks in the behaviourof the control of epidemics at the optimum strategy. For scale-free networks[6] that involve a lot of long-range contacts, it is necessary to treat almosteverybody in the population, even at the optimum [4]. This stands in acontrast to local networks and small-world networks with a small numberof links. In this paper we show that this behaviour is caused directly by astructure of the scale-free networks, whereby even a single neighbourhood ofan order larger than one, covers on average a large proportion of individualson the whole network.
Although our work deals mainly with the theory of networks, it hasimportant biological applications. Notable among these are SARS [7], sealdistemper virus (SDV) [8], foot-and-mouth disease (FMD) [2], Dutch Elmdisease [9], citrus canker [10], sudden oak death [11] and rhizomania [12].The nodes on the networks are formed by individual people or groups ofpeople (SARS), animals or farms (seal distemper virus, FMD), fields orfarms growing sugar beet (rhizomania) or trees (Dutch Elm disease, citruscanker and sudden oak death). The structure of network edges is dictatedby spread of infectious agents, either by a direct contact (SARS, SDV),by sharing farm machinery (rhizomania, FMD), or by rain, wind or insectvectors (Dutch Elm disease, sudden oak death, citrus canker).

1512 B. Dybiec, A. Kleczkowski, C.A. Gilligan
2. Model
2.1. Network structure
The structure of interactions between individuals in a population can becaptured by a network topology that includes short- and long-range links [4].We consider two types of topologies, networks with short-range links onlyand networks with a mixture of short- and long-range links. Most of thetime individuals are in a direct contact with their geographical neighbours,leading to the following topological structures: a 1-dimensional chain withperiodic boundary conditions (ring) and a 2-dimensional regular lattice withperiodic boundary conditions. In addition to these local contacts, individ-uals sporadically interact on longer distances. Thus, more realistic inter-actions are implemented by adding a given number of shortcuts to thesestructures. Addition of shortcuts results in the 1-dimensional small worldtopology (SW1D) and the 2-dimensional small world topology (SW2D) re-spectively [3]. Finally, we consider the scale-free topology (SF), characterisedby preferential attachment [6] whereby some individuals are very highly con-nected, while most have only few links. The scale-free network is constructedby adding nodes to the initially fully connected core, in such a way that theprobability that a new node is attached to a given node is proportional tothe number of nodes already attached to that node.
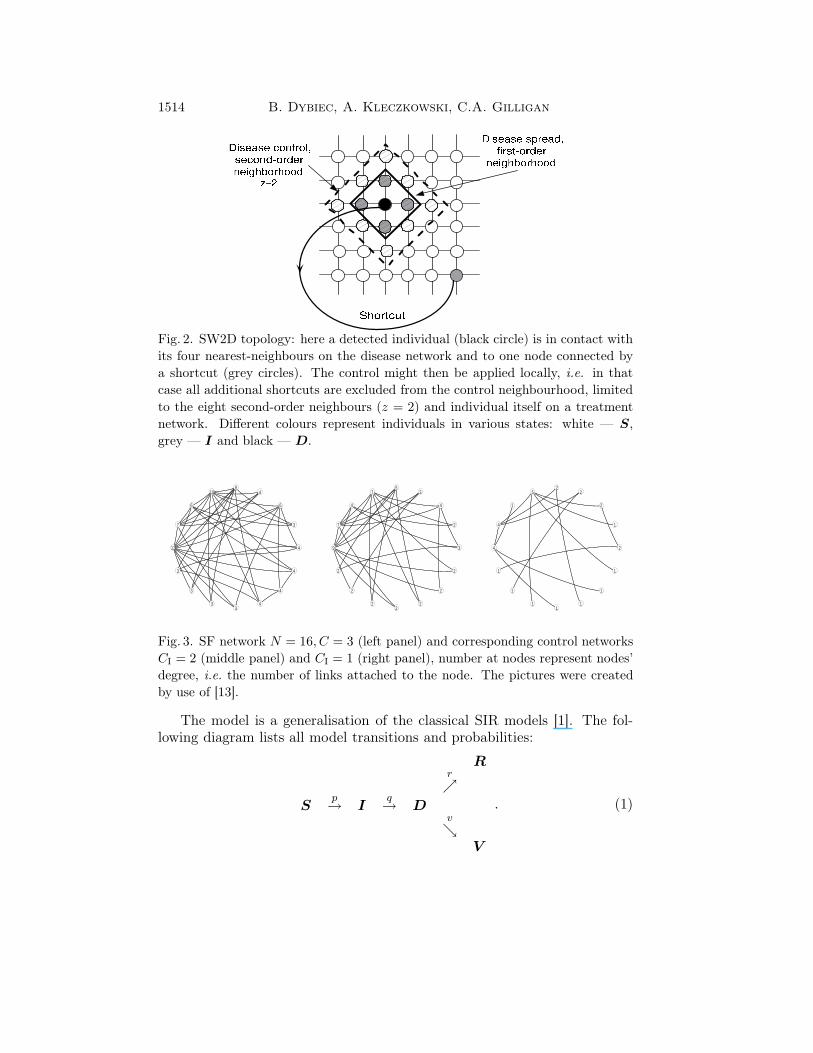
We also distinguish between an epidemic network and control network,with the latter being a subset of the former, reflecting limited knowledgeabout long-range contacts. For the SW1D topology, the disease spreadson a ring with addition of shortcuts, whereas the basic control topologyencompasses the ring only, Fig. 1. The same mechanism is applied for theSW2D topology, Fig. 2, where the control topology corresponds to a squarelattice with 4 nearest neighbours. For the SF network, a more complicatedalgorithm is needed to reflect various levels of knowledge about the contactstructure. In this case, for nodes outside a fully connected core of size C, onlythe first CI or C (whichever is smaller) links were chosen. This mechanismreflects our limited ability to track contacts. For nodes from the core, everynode is connected to up to CI or C − 1 (whichever is smaller) older nodes.Due to the fact that links are not directed, such a mechanism guaranteesthat resulting control network is not disconnected and with increasing CI alarger ratio of links from the full topology is included in the control topology,Fig. 3. For CI = C, the control topology is equivalent to the disease spreadtopology.
The local control is performed onto another topology, which forms onlya subset of a full topology on which disease spreads. In our approach thisreflects our limited knowledge about interactions between individuals.

Optimising Control of Disease Spread on Networks 1513
2.2. Disease dynamics
Disease spreads on networks, changing status of individuals which areplaced on the nodes. The individuals can be in one of five exclusive states:
1. S — susceptible, can be infected with probability p by any infectiousor detected individual that is in its epidemic neighbourhood;
2. I — infectious (infected but pre-symptomatic), can infect other nodeswithin its epidemic neighbourhood but cannot trigger a control mea-sure; can spontaneously move with probability q to the detected class,when symptoms become observable;
3. D — detected (infected and symptomatic), spreads disease in a similarway as infectious nodes. Furthermore, it can spontaneously move tothe recovered class (with probability r) or can trigger a treatmentmeasure with probability v;
4. R — recovered. Individuals in this class can be treated but cannotbecome re-infected, i.e. they do not return to S class;
5. V — vaccinated (treated). Individuals in this class are in a controlneighbourhood of a detected individual when the treatment event istriggered. They cannot become re-infected, i.e. they do not return toS class again.
5
4
4
66
4
5
5
5
5
4
64
4
7
6
4
4
4
44
4
4
4
4
4
4
44
4
4
4
Fig. 1. SW1D network N = 16 with additional 8 shortcuts (left panel) and corre-
sponding control network (right panel). The pictures were created by use of [13].
1514 B. Dybiec, A. Kleczkowski, C.A. Gilligan
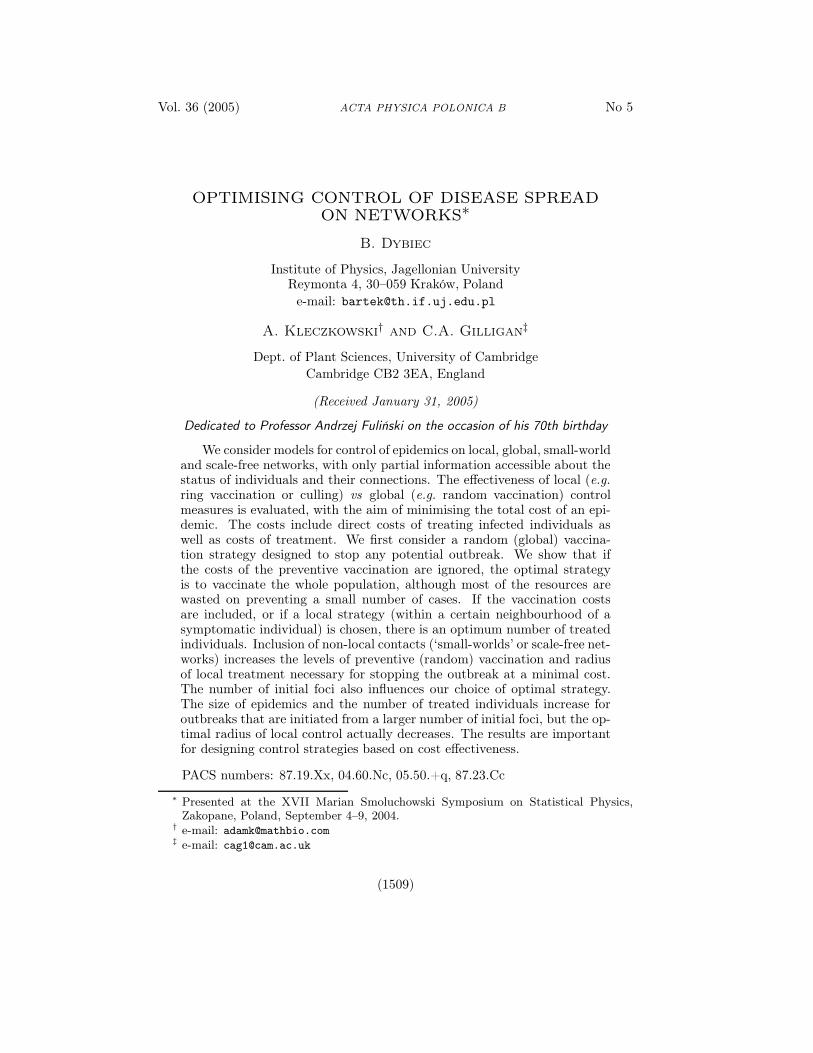
Fig. 2. SW2D topology: here a detected individual (black circle) is in contact with
its four nearest-neighbours on the disease network and to one node connected by
a shortcut (grey circles). The control might then be applied locally, i.e. in that
case all additional shortcuts are excluded from the control neighbourhood, limited
to the eight second-order neighbours (z = 2) and individual itself on a treatment
network. Different colours represent individuals in various states: white — S,
grey — I and black — D.
12
7
6
108
4
6
3
4
4
4
43
3
3
3
9
7
4
75
3
4
2
3
2
2
22
2
2
2
4
4
1
52
2
2
1
2
1
1
11
1
1
1
Fig. 3. SF network N = 16, C = 3 (left panel) and corresponding control networks
CI = 2 (middle panel) and CI = 1 (right panel), number at nodes represent nodes’
degree, i.e. the number of links attached to the node. The pictures were created
by use of [13].
The model is a generalisation of the classical SIR models [1]. The fol-lowing diagram lists all model transitions and probabilities:
Rr
ր
Sp
→ Iq
→ Dv
ցV
. (1)

Optimising Control of Disease Spread on Networks 1515
2.3. Control strategies
We consider a range of control schemes, broadly divided into non-localand local strategies. The simplest example of a non-local strategy is a ran-dom vaccination of a given ratio of individuals in the population. The mainadvantage of this strategy is that no information about social contacts andstate of individuals is required. This strategy can also be applied preven-tively before epidemics outbreak. However, for highly infectious diseases,a large proportion of the individuals needs to be vaccinated [1], and so itis only optimal if the vaccination is cheap. We will discuss the choice ofoptimal strategies in the next section.
The alternative group of strategies assumes that we possess some knowl-edge about a location and timing of disease cases, at least for symptomaticindividuals. In our approach, an appearance of a symptomatic individualmay trigger a treatment ‘event’ with a certain probability v, and for localstrategies we assume that treatment is limited to the control neighbourhoodof the symptomatic individual, on a control network constructed as above.The control neighbourhood of a given order, z, is constructed in an itera-tive way. Starting from the infected (and symptomatic) individual all thefirst order neighbours on its control network are allocated. Subsequently,starting from the first order neighbours, the same procedure is applied inorder to find the second order neighbours. The whole procedure is repeatedz times. In a single control event, all (or only some) individuals in a con-trol neighbourhood of a given range are treated, with the neighbourhoodcentred on the symptomatic individual, Fig. 2. The diameter of vaccinationneighbourhood, z, is a parameter in the simulation.
2.4. Simulations
Simulations were performed for each topology consisting of N = 2500 in-dividuals (for SW2D topology the starting point was a 2-dimensional squarelattice 50×50 with periodic boundary conditions). We also studied individ-ual disease progress curves (see the next section) and used a larger system(300 × 300) to decrease variability. All results were averaged over 50 reali-sations. At t = 0, the system with a given proportion (0.005%, 0.1%, 0.5%or 5% of the total population) of infectious symptomatic individuals (D) isgenerated. The system is updated in a synchronous way till the time whenepidemic die out due to lack of infectious individuals, i.e. for t < Tmax suchthat I(Tmax) + D(Tmax) ≡ 0. In every iteration the status of each node ischecked and all admissible transitions described by Eq. (1) performed.
1516 B. Dybiec, A. Kleczkowski, C.A. Gilligan
2.5. Optimal strategy
In our paper we consider the existence and form of an optimal strategythat allows to stop epidemics at a manageable cost. The economics of dis-ease and its control are summarised here by introducing a severity indexX = aR(∞) + b V (∞). Thus, the severity index depends linearly on thenumber of individuals that have been through the disease R(∞), with anindividual cost of each case a. The cost might include hospitalisation, drugtreatment and loss of work. The second term represents individuals thathave been treated preventively V (∞), for example by vaccination, with anindividual cost of b. In general, more sophisticated cost functions are pos-sible, including non-linear terms. Our approach differs from the ‘usual’ oneused in epidemiology in designing vaccination strategies, in that we intendto minimise X rather than R(∞).
3. Results
3.1. Epidemic outbreaks without control
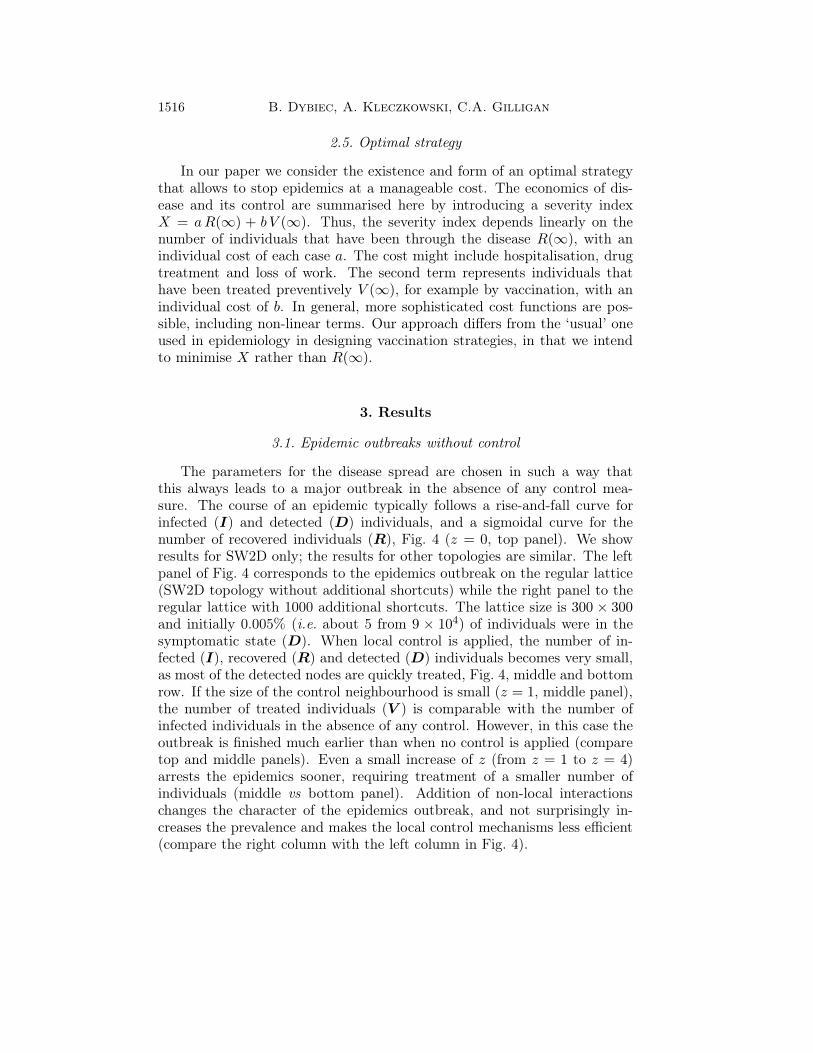
The parameters for the disease spread are chosen in such a way thatthis always leads to a major outbreak in the absence of any control mea-sure. The course of an epidemic typically follows a rise-and-fall curve forinfected (I) and detected (D) individuals, and a sigmoidal curve for thenumber of recovered individuals (R), Fig. 4 (z = 0, top panel). We showresults for SW2D only; the results for other topologies are similar. The leftpanel of Fig. 4 corresponds to the epidemics outbreak on the regular lattice(SW2D topology without additional shortcuts) while the right panel to theregular lattice with 1000 additional shortcuts. The lattice size is 300 × 300and initially 0.005% (i.e. about 5 from 9 × 10⁴) of individuals were in thesymptomatic state (D). When local control is applied, the number of in-fected (I), recovered (R) and detected (D) individuals becomes very small,as most of the detected nodes are quickly treated, Fig. 4, middle and bottomrow. If the size of the control neighbourhood is small (z = 1, middle panel),the number of treated individuals (V ) is comparable with the number ofinfected individuals in the absence of any control. However, in this case theoutbreak is finished much earlier than when no control is applied (comparetop and middle panels). Even a small increase of z (from z = 1 to z = 4)arrests the epidemics sooner, requiring treatment of a smaller number ofindividuals (middle vs bottom panel). Addition of non-local interactionschanges the character of the epidemics outbreak, and not surprisingly in-creases the prevalence and makes the local control mechanisms less efficient(compare the right column with the left column in Fig. 4).

Optimising Control of Disease Spread on Networks 1517
0
20
40
60
80
100
0 50 100 150 200 250 300
... [%
]
t
SI
DRV
0
20
40
60
80
100
0 50 100 150 200 250 300
... [%
]
t
SI
DRV
0
20
40
60
80
100
0 50 100 150 200 250 300
... [%
]
t
SI
DRV
0
20
40
60
80
100
0 50 100 150 200 250 300
... [%
]
t
SI
DRV
0
20
40
60
80
100
0 50 100 150 200 250 300
... [%
]
t
SI
DRV
0
20
40
60
80
100
0 50 100 150 200 250 300
... [%
]
t
SI
DRV
Fig. 4. The epidemics outbreak for SW2D 300 × 300 topology without additional
shortcuts (left panel) and with 1000 shortcuts (right panel). In the top panel no
control action is taken (z = 0). In the middle panel z = 1 and z = 4 in the bottom
panel. Values of the other parameters p = 0.5, q = 0.09, r = 0.01, v = 0.1.
Initially, 0.005% of population was in the symptomatic state.
3.2. Preventive random blind vaccination
In this strategy, a given proportion of randomly chosen individuals isvaccinated and afterwards no control mechanisms are applied. In Fig. 5the severity index X = R(∞) + V (0) is plotted for various topologies andfor various infection probabilities (V (∞) = V (0) in this case). With theincreasing numbers of additional random shortcuts, the costs of the control

1518 B. Dybiec, A. Kleczkowski, C.A. Gilligan
mechanisms increase and a larger number of individuals need to be vacci-nated preventively. The same effect is caused by the increasing infectionprobability, p. There is an optimal vaccination proportion, which increaseswith an infection probability and with an addition of shortcuts.
0
25
50
75
100
0 20 40 60 80 100
X [%
]
V [%]
0
25
50
75
100
0 20 40 60 80 100
X [%
]
V [%]
0
25
50
75
100
0 20 40 60 80 100
X [%
]
V [%]
0
25
50
75
100
0 20 40 60 80 100X
[%]
V [%]
0
25
50
75
100
0 20 40 60 80 100
X [%
]
V [%]
0
25
50
75
100
0 20 40 60 80 100
X [%
]
V [%]
Fig. 5. X = R(∞) + V (∞) as a function of proportion of initially vaccinated
individuals for SW1D topology (left panel) and SW2D topology (right panel) for
various values of infection probability, p: p = 0.01 (top panel), p = 0.05 (middle
panel) and p = 0.5 (lower panel). Other parameters: q = 0.5, r = 0.01. Different
symbols correspond to various numbers of additional shortcuts: + — 0 shortcuts,
× — 63 shortcuts, ∗ — 255 shortcuts, � — 1023 shortcuts and � for the SF
topology. Initially, at t = 0, 0.5% of all individuals were in the symptomatic class.
Because the treatment does not change in time, V (∞) ≡ V (0).
It is also easier to prevent the epidemic in the 1-dimensional case, eventhough the number of neighbours in the first order epidemic neighbourhoodis the same (four nearest neighbours). These results are in contrast to the‘usual’ approach in designing optimal vaccination strategies, where the finalsize of an epidemic R(∞) is only being minimised (see Fig. 6). If X = R(∞)only, there is no discernible minimum in the severity index (reflecting totalcosts of the epidemic and its attempted control), so — formally speaking— the optimal strategy in this case is to vaccinate the whole population.However, in most cases, R(∞) is initially high, but drops rapidly to al-most zero at a certain critical proportion of vaccinated individuals. This

Optimising Control of Disease Spread on Networks 1519
drop corresponds to a classical critical vaccination proportion, well knownin epidemiology [1, 14]. Thus, when this critical level of preventive treat-ment is reached, increasing vaccination levels only marginally increases theeffectiveness of the control strategy (Fig. 6).
The difference is particularly clear for the SF topology. When the vac-cination costs are included (X = R(∞) + V (0)), there is a clear optimalvaccination strategy leading to a reduction in the severity index (Fig. 5).However, no such threshold appears for the case when vaccination is as-sumed to have no costs, i.e. X = R(∞), (Fig. 6).
0
25
50
75
100
0 20 40 60 80 100
R [%
]
V [%]
0
25
50
75
100
0 20 40 60 80 100
R [%
]V [%]
0
25
50
75
100
0 20 40 60 80 100
R [%
]
V [%]
0
25
50
75
100
0 20 40 60 80 100
R [%
]
V [%]
0
25
50
75
100
0 20 40 60 80 100
R [%
]
V [%]
0
25
50
75
100
0 20 40 60 80 100
R [%
]
V [%]
Fig. 6. X = R(∞) as a function of proportion of initially vaccinated individuals for
SW1D topology (left panel) and SW2D topology (right panel) for various values of
infection probability, p: p = 0.01 (top panel), p = 0.05 (middle panel) and p = 0.5
(lower panel). Other parameters as in Fig. 5. Different symbols correspond to
various numbers of additional shortcuts: + — 0 shortcuts, × — 63 shortcuts, ∗ —
255 shortcuts, � — 1023 shortcuts and � for the SF topology. Initially, at t = 0,
0.5% of all individuals were in the symptomatic class.
3.3. Vaccination of all individuals in a given neighbourhood
This strategy assumes that each symptomatic individual (D) triggersa treatment ‘event’ with probability v. However, because it is only symp-tomatic individuals that trigger such ‘events’, the disease can spread unde-tected for a substantial time. How far it can proliferate, depends on the

1520 B. Dybiec, A. Kleczkowski, C.A. Gilligan
probability of detection q and the probability of treating once detected v.To compensate for this cryptic spread, we extend the control neighbourhoodbeyond the epidemic one, and assume that all individuals within the givenradius need to be treated. Fig. 7 shows that for all networks there is anoptimal control neighbourhood that minimises X = R(∞) + V (∞).
0
10
20
30
40
0 2 4 6 8 10 12 14 16
X [%
]
z
0
25
50
75
100
0 2 4 6 8 10 12 14 16
X [%
]
z
90 92 94 96 98
100
0 2 4 6 8 10 12 14 16
X [%
]
z
Fig. 7. Severity index (X = R(∞) + V (∞)) as a function of the treatment neigh-
bourhood, z, for different values of the probability of infection, p, for (from
top to bottom) the SW1D, SW2D and SF topologies (averaged over 50 repli-
cates). There were no shortcuts for the SW1D and SW2D networks. p = 0.25,
0.5, 0.75 and 1 for curves from the bottom to the top. Other parameters are:
q = 0.5, r = 0.01, v = 0.1, C = 5, CI = 1.
We also examined the influence of additional random shortcuts on theseverity index X for SW1D and SW2D topologies. Simulation were per-formed for various numbers of additional shortcuts {0, 3, 15, 63, 255, 1023}.The addition of random shortcuts increases the duration of the epidemic,epidemic severity (as measured by X = R(∞) + V (∞)) and also the opti-mal range of vaccination zc (Fig. 8). Increasing the number of shortcuts forSW1D or SW2D topologies produces results that approach those obtained
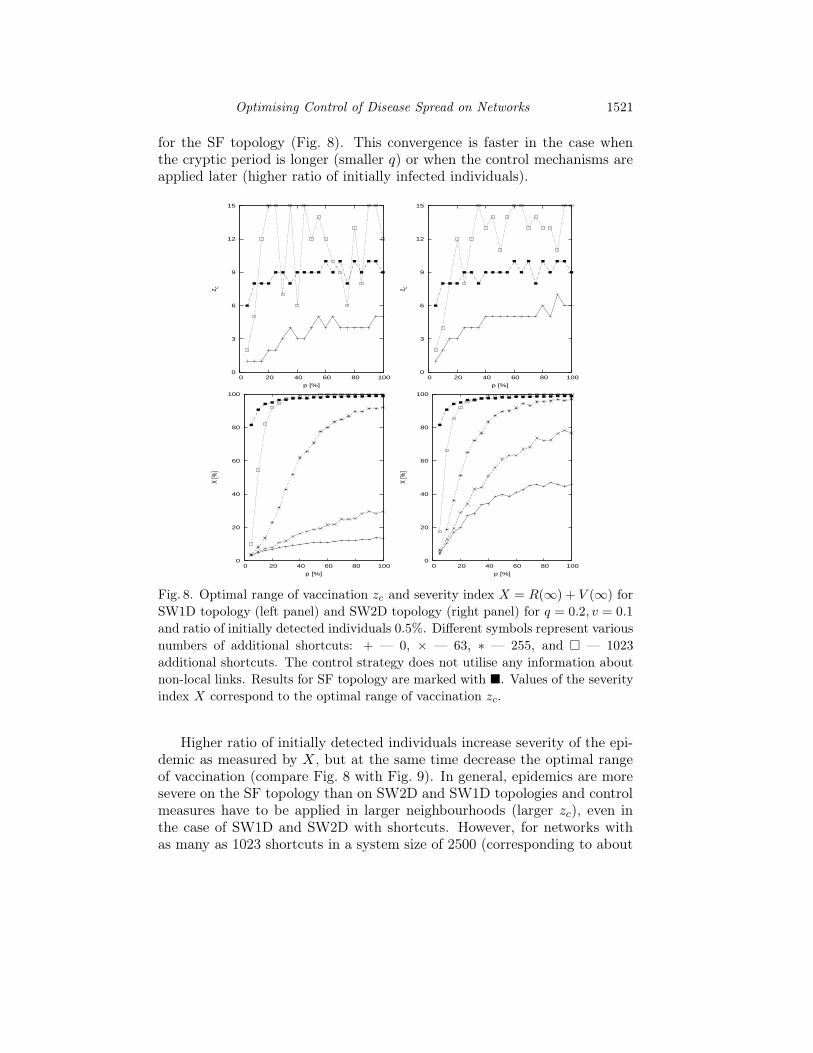
Optimising Control of Disease Spread on Networks 1521
for the SF topology (Fig. 8). This convergence is faster in the case whenthe cryptic period is longer (smaller q) or when the control mechanisms areapplied later (higher ratio of initially infected individuals).
0
20
40
60
80
100
0 20 40 60 80 100
X [%
]
p [%]
0
20
40
60
80
100
0 20 40 60 80 100
X [%
]
p [%]
0
3
6
9
12
15
0 20 40 60 80 100
z c
p [%]
0
3
6
9
12
15
0 20 40 60 80 100
z c
p [%]
Fig. 8. Optimal range of vaccination zc and severity index X = R(∞) + V (∞) for
SW1D topology (left panel) and SW2D topology (right panel) for q = 0.2, v = 0.1
and ratio of initially detected individuals 0.5%. Different symbols represent various
numbers of additional shortcuts: + — 0, × — 63, ∗ — 255, and � — 1023
additional shortcuts. The control strategy does not utilise any information about
non-local links. Results for SF topology are marked with �. Values of the severity
index X correspond to the optimal range of vaccination zc.
Higher ratio of initially detected individuals increase severity of the epi-demic as measured by X, but at the same time decrease the optimal rangeof vaccination (compare Fig. 8 with Fig. 9). In general, epidemics are moresevere on the SF topology than on SW2D and SW1D topologies and controlmeasures have to be applied in larger neighbourhoods (larger zc), even inthe case of SW1D and SW2D with shortcuts. However, for networks withas many as 1023 shortcuts in a system size of 2500 (corresponding to about

1522 B. Dybiec, A. Kleczkowski, C.A. Gilligan
20
40
60
80
100
0 20 40 60 80 100
X [%
]
p [%]
20
40
60
80
100
0 20 40 60 80 100
X [%
]
p [%]
0
3
6
9
12
15
0 20 40 60 80 100
z c
p [%]
0
3
6
9
12
15
0 20 40 60 80 100
z c
p [%]
Fig. 9. The same as in Fig. 8. All parameters as in Fig. 8, except the ratio of
initially detected individuals is now 5%.
10% increase in the number of links), the optimal range is smaller than forSF topology. The link between the severity of epidemics, the optimal rangeof control and the neighbourhood size for different network topologies isexplored below.
3.4. Neighbourhood size
The addition of long-range interactions generally renders the local controlless effective. The natural way to compensate for this is to increase thesize of the control neighbourhood. This leads, however, to a fast increasein the number of individuals treated in a single ‘event’. In our model, theneighbourhood order z is a measure of how far the disease can spread (for theepidemic neighbourhood), or how far the control measures can extend in asingle ‘event’ (for the control neighbourhood). Two factors are of importancehere, the number of the individuals that are added to the neighbourhood

Optimising Control of Disease Spread on Networks 1523
if the order increases by 1 (the size of a ‘shell’) and the total size of theneighbourhood of a given order. Tables I, II and III list both characteristicsin absolute numbers or as the ratio of the total population size. Results forthe SW1D and SW2D topologies were calculated analytically, while for theSF topology we used a Monte Carlo method [15].
TABLE I
Number of individuals and percentage of the whole population in neighbourhoodsof order z and in the neighbourhood up to order z for the SW1D topology with2500 nodes.
z in z up to z
# indv. % of pop. # indv. % of pop.
1 4 0.2 4 0.22 4 0.2 8 0.33 4 0.2 12 0.54 4 0.2 16 0.75 4 0.2 20 0.86 4 0.2 24 1.07 4 0.2 28 1.28 4 0.2 32 1.3≥9 2468 98.7 2500 100
TABLE II
Number of individuals and percentage of the whole population in neighbourhoodsof order z and in the neighbourhood up to order z for the SW2D topology with2500 nodes.
z in z up to z
# indv. % of pop. # indv. % of pop.
1 4 0.2 4 0.22 8 0.3 12 0.53 12 0.5 24 1.04 16 0.6 40 1.65 20 0.8 60 2.46 24 1 84 3.47 28 1.1 112 4.58 32 1.3 144 5.8≥9 2356 94.2 2500 100

1524 B. Dybiec, A. Kleczkowski, C.A. Gilligan
TABLE III
Average number of individuals and percentage of the whole population in neigh-bourhoods of order z and in the neighbourhood up to order z for the SF topologywith 2500 nodes, C = 5 and CI = 1.
z in z up to z
# indv. % of pop. # indv. % of pop.
1 1.9 0.1 1.9 0.12 8.8 0.4 10.7 0.43 31.0 1.2 41.8 1.74 77.2 3.1 119.0 4.85 148.6 5.9 267.6 10.76 235.3 9.4 502.9 20.27 322.2 12.9 825.1 33.08 375.0 15.0 1200.0 48.0≥9 1300.0 52.0 2500 100
For the SW1D topology (Table I), the number of individuals in the ‘shell’is constant and equal to four. It is caused by the fact that SW1D is a 1Dring. For the other topologies, the number of individuals in the ‘shell’ isan increasing function of the neighbourhood order z. Due to the clusteredcharacter of the SF topology (Table III), the size of the neighbourhood growsvery fast and quickly extends to the whole population.
4. Discussion
In this paper we have analysed a spatially-extended, modified SIR modelfor disease spread with varying network complexity and with different spa-tial control strategies. The goal is to find an optimal strategy, leading toa minimal combined cost of treatment and disease [4]. Search for such astrategy is complicated because of uncertainty caused by our limited knowl-edge about the status of individuals (whether infectious or not) and theirinteractions (not all contacts are known). We considered two contrastingcases. In the first one, the population is treated to a random vaccinationapplied before any potential outbreak. In the second case, treatment is ap-plied locally around each individual that has been detected at the onset ofsymptoms. We have shown that an optimal strategy exists in both cases, andstudied its dependence on a range of factors. We found that the proportionof treated individuals (for the global strategy) and the radius of treatmentneighbourhood (for the local strategy) increase with the probability of dis-ease transmission and the number of shortcuts.

Optimising Control of Disease Spread on Networks 1525
However, increased number of initial foci increases the number of treatedindividuals, but decreases the optimal range of treatment. Decrease in theoptimal range of vaccination reflects two possible ways in which an optimalstrategy can be constructed. For a small number of initial foci, it is moreefficient to apply control within a larger neighbourhood, and less frequently.For a large number of initial foci, when the disease has already spread veryfar, control can be applied within a smaller neighbourhood, but has to beapplied in many initial places.
Interesting difference in designing control strategies have been noticedfor the random vaccination applied in order to prevent any potential out-break. The traditional approach is to try to minimise the final size of theepidemic [1, 14]. However, this leads to a strategy in which a large propor-tion of individuals is treated. If we define an optimal strategy as the onethat minimises the total size of an outbreak, the whole population mustbe treated regardless of the disease parameters. In this approach, most ofthe resources are spent on an attempt to prevent disease spreading to veryfew individuals. However, when the cost of the treatment is included, it ispreferable to lower the vaccination level, even though this will allow somelimited disease spread, in order to minimise the total costs of containing theoutbreak.
There are several ways in which the search for improved control strate-gies can be extended. One possibility is to vaccinate up to a given numberof randomly chosen individuals in a given control neighbourhood, or to treatindividuals at the perimeter of the control neighbourhood only (ring vaccina-tion). This kind of strategy can be applied when the number of individualsin a single control neighbourhood is large and it is impossible to treat allof them, due to lack of time or resources. Nevertheless, such strategies, dueto the fact that not all information about contacts between individuals isrecognised, are less efficient that a treatment of all individuals in the localcontrol neighbourhood.
We have found that small-world shortcuts have a major impact on thesize and duration of epidemics and on the effectiveness of control strategies,both local and global. It is possible to extend control strategies to includecontact tracking [16] and to include some of long-range links in the controlnetwork. For the scale-free networks, control targeted at highly connectedindividuals has been shown to be a promising strategy [17].
Our approach is based on a linear relationship between a number ofinfected or treated individuals and associated costs. This might not bealways true, and nonlinear relationships might change the particular choiceof an optimal strategy.

1526 B. Dybiec, A. Kleczkowski, C.A. Gilligan
B.D. was supported by the British Council–Polish State Committee forScientific Research (KBN) grant WAR 342/01 and Polish State Committeefor Scientific Research (KBN) grants 1P03B0 6626 and 2P03B0 8225. A.K.was partially supported by DEFRA and C.A.G. by BBSRC.
REFERENCES
[1] R.M. Anderson, R.M. May, Infectious Diseases of Humans: Dynamics andControl, Oxford University Press, Oxford 1991.
[2] M.J. Keeling, M.E.J. Woolhouse, D.J. Shaw, L. Matthews, M. Chase-Topping,D.T. Haydon, S.J. Cornell, J. Kappey, J. Wilesmith, B.T. Grenfell, Science294, 813 (2001).
[3] D.J. Watts, S.H. Strogatz, Nature (London) 393, 440 (1998); D.J. Watts,Small Worlds, Princeton University Press, Princeton NJ 1999; A. Kleczkowski,B.T. Grenfell, Physica A274, 355 (1999); C. Moore, M.E.J. Newman, Phys.Rev. E62, 7059 (2000).
[4] B. Dybiec, A. Kleczkowski, C.A. Gilligan, Phys. Rev. E70, 066145 (2004).
[5] C.A. Gilligan in Battling Resistance to Antibiotics and Pesticides: An Eco-nomic Approach, ed. R. Laxminarayan, Resources for the Future, Washington2003, pp. 221–243.
[6] R. Albert, A.L. Barabási, Rev. Mod. Phys. 74, 47 (2002).
[7] C. Dye, N. Gay, Science 300, 1884 (2003).
[8] J. Swinton, J. Harwood, B.T. Grenfell, C.A. Gilligan, J. Anim. Ecol. 67, 54(1998).
[9] J. Swinton, C.A. Gilligan, Philos. Trans. R. Soc. Lond. Ser. B. 351, 605(1996).
[10] T.R. Gottwald, G. Hughes, J.H. Graham, X. Sun, T. Riley, Phytopathology91, 30 (2001).
[11] D.M. Rizzo, M. Garbelotto, J.M. Davidson, G.W. Slaughter, S.T. Koike, PlantDisease 86, 205 (2002).
[12] A.J. Stacey, J.E. Truscott, M.J.C. Asher, C.A. Gilligan, Phytopathology 94,209 (2004).
[13] V. Batagelj, A. Mrvar, Pajek Program for Large Network Analysis,http://vlado.fmf.uni-lj.si/pub/networks/pajek/
[14] W. Otten, D.J. Bailey, C.A. Gilligan, New Phytologist 163, 125 (2004).
[15] M.E.J. Newman and G.T. Barkema, Monte Carlo Methods in StatisticalPhysics, Clarendon Press, Oxford 1999.
[16] K.T.D. Eames, M.J. Keeling, Proc. Royal Soc. B270, 2565 (2003).
[17] R. Pastor-Satorras, A. Vespignani, Phys. Rev. E65, 036104 (2002); Z. Dezső,A.L. Barabási, Phys. Rev. E65, 055103 (2002).