optimising scimago journal & country rank classification by community detection
TRANSCRIPT
1
Pre‐print of: Journal of Informetrics, 2014, vol. 8(2), p. 369‐383.
http://dx.doi.org/10.1016/j.joi.2014.01.011
Optimising SCImago Journal & Country Rank classification by community
detection
Gómez‐Núñez, Antonio J.a; Batagelj, Vladimirb; Vargas‐Quesada, Benjamínc,e; Moya‐Anegón, Félixd,e; Chinchilla‐Rodríguez, Zaidad,e
(a) CSIC, SCImago Research Group Associated Unit. Faculty of Communication and
Documentation, Campus de Cartuja s/n, 18071 Granada, Spain
(b) University of Ljubljana, Faculty of Mathematics and Physics. Jadranska 19, 1000
Ljubljana, Slovenia [email protected]‐lj.si
(c) University of Granada, Department of Information and Communication. Faculty of
Communication and Documentation, Campus de Cartuja s/n, 18071 Granada, Spain
(d) CSIC, Institute of Public Goods and Policies. Albasanz 26‐28, 28037 Madrid, Spain
[email protected], [email protected]
(e) SCImago Research Group
Abstract
Subject classification arises as an important topic for bibliometrics and scientometrics as to
develop reliable and consistent tools and outputs. For this matter, a well delimited underlying
subject classification scheme reflecting science fields becomes essential. Within the broad
ensemble of classification techniques clustering analysis is one of the most successful.
Two clustering algorithms based on modularity, namely, VOS and Louvain methods, are
presented in order to update and optimise journal classification of SCImago Journal & Country
Rank (SJR) platform. We used network analysis and visualization software Pajek to run both
algorithms on a network of more than 18,000 SJR journals combining three citation‐based
measures, that is, direct citation, co‐citation and bibliographic coupling. The set of clusters
obtained was termed through category labels assigned to SJR journals and significant words
from journal titles.
Despite of both algorithms exhibiting slight performance differences, the results showed a
similar behaviour in grouping journals and, consequently, they seem to be appropriate
solutions for classification purposes. The two new generated algorithm‐based classifications
were compared to other bibliometric classification systems such as the original SJR one and
WoS Subject Categories in order to validate their consistency, adequacy and accuracy.
Although there are notable differences among the four classification systems analysed, we
found a certain coherence and homogeneity among them.
2
Keywords: Community detection; Clustering; SCImago Journal & Country Rank; Journal
classification; Citation‐based network.
1.‐ Introduction
Classification is a broadly covered topic in Bibliometrics and Scientometrics because of its
significance in developing of final bibliometric and scientometric outputs, mainly based on
scientific literature included in databases and repositories. Thus, the literature collected by
these information and reference sources need to be organized through an appropriate and
consistent classification scheme not only for information retrieval purposes, but also for
designing reliable and solid tools as rankings, domain analysis or scientograms, which are of an
outstanding value, for instance, in science policy design and science evaluation processes.
Normally, database subject classification schemes are constructed on the basis of a disciplinary
structure which pretends to replicate the main fields and subfields of research and scientific
knowledge recorded in the literature stored in databases. Then, classification of scientific
literature can be made at journal or paper level. The most highly reputed scientific databases
at present, namely, Web of Science (Thomson Reuters, 2009) and Scopus (Elsevier, 2004), have
a very similar two‐level hierarchical subject classification schemes consisting of subject areas
at a high and wider level and subject categories at low and more specific level. In both
databases, journals are assigned to one or more categories and their papers are inheriting
subject categories of journals which they belong to. In Web of Science (WoS) case, journal
assignment is executed by ISI (currently, Thomson Reuters) staff taking into account several
criteria as journal titles or citation patterns (Pudovkin & Garfield, 2002).
Delimitation of scientific fields required in developing disciplinary subject classification
schemes can be done through many different approaches varying from empirical and
pragmatic techniques to automated procedures based on statistics and computerized methods.
Within the latter ones, clustering analysis is one of the most valuable and usual methods used
for classification tasks in several and distinct scientific fields as Library and Information Science,
Psychology, Medicine or Biology among others.
2.‐ Related Works
Many clustering algorithms and techniques have been developed in order to get optimal
solutions for the classification problems befallen in scientific fields above mentioned. However,
clustering methods have been widely used by researchers dealing with information
visualization techniques in order to map the structure of scientific knowledge and research.
For this reason, they needed a good underlying classification of fields and subfields to be
mapped. A total of 20 representative approaches in mapping science fields and their relations
working from Web of Knowledge and Scopus database literature were compared and
condensed by Klavans and Boyack (2009).
Clustering and mapping procedures have been conducted on different levels of aggregation, or
in other words, using different units of analyses. Thus, at journal level a large number of
researchers have applied different cluster algorithms to journal‐journal relation matrices or

3
networks based on citations, co‐citations or bibliographic coupling. Chang and Chen (2011)
applied the minimum span clustering (MSC) method to a citation square matrix of roughly
1,600 SSCI journals. Leydesdorff, Hammarfelt and Salah (2011) tried to merge a map of
humanities based on Thomson Reuters’ A&HCI database in a global map of science previously
developed (Rafols, Porter, & Leydesdorff, 2010) and used the k‐core algorithm for mapping 25
specific A&HCI subject categories. Archambault, Beauchesne and Caruso (2011) designed a
scientific journal ontology aimed to simplify the output of bibliometric data and analysis. The
new journal ontology was built on feedback from previous existing journal classification whose
categories were considered as “seeds” for the initial journal assignment. Three automatic
classification procedures using either text or citation data from papers published in around
34,000 journals and conference proceedings from Scopus and WoS were executed. However,
the final solution was generated according to the iterative analysis of citation and references
patterns between subject fields and journals. Leydesdorff and Rafols (2012) collaborative work
produced a study where a 9,162 journal‐journal citation matrix extracted from the 2009
volume of the SCI‐Expanded was used to map interactive global journal maps. They compared
several methods and, among them, different clustering algorithms to group journals into
clusters. More recently, Börner et al. (2012) introduced a methodology to design and
subsequently update a map of science and classification system solicited by the University of
California, San Diego (UCSD). To build the map a combination of text and link journal‐journal
similarity matrices based on Scopus and WoS data were used. Then, journal clustering was
executed on a filtered matrix derived from modified cosine similarities. Finally, the calculation
of similarities among clusters as well as their positions and relationships enabled depicting the
UCSD map.
Lately, there has existed a research trend working with clustering algorithms for analysis,
validation, and improvement of classification schemes based on journals from various
perspectives. ECOOM research group of KU Leuven has addressed this topic throughout
several publications where different clustering algorithms as Ward clustering or Multi‐level
Aggregation Method (also known as Louvain method) were applied on journal cross‐citation
and hybrid (text/citation) matrices (Janssens, Zhang, Moor, & Glänzel, 2009; Zhang, Glänzel, &
Liang, 2009; Zhang, Janssens, Liang, & Glänzel, 2010).
On the other side, by taking documents as unit of analysis Small (1999) developed a
methodology to visualize and to obtain a hierarchical multidisciplinary map of science through
a method combining fractional citation counting of cited papers, co‐citation single‐linkage
clustering with limits on cluster size, and two‐dimensional ordination according to a geometric
triangulation process. Ahlgren and Colliander (2009) studied different document‐document
similarity approaches based on text, coupling and a combination of both as well as several
methods to map and classify a set of 43 documents from the journal Information Retrieval.
Complete‐linkage clustering was applied to group articles and the final result of assignment
was compared with an expert‐based classification using adjusted Rand Index. Similarly, Boyack
et al. (2011) employed a combination of graph layout and average‐link clustering to different
text‐based similarity‐measure matrices constructed through relevant information from titles,
abstracts, and MeSH subject headings of 2.15 million of papers extracted from the Medline
database. They compared and assessed nine similarity approaches through Jensen‐Chanon
4
divergence and concentration measures. Later on, Waltman and Van Eck (2012) faced an even
more complex challenge by designing a detailed methodology to create a publication‐level
classification system using a multilevel clustering algorithm on a direct citation (disregarding
the direction) network constituted of almost 10 million publications. In their opinion, the
methodology strength is sustained on transparency and simplicity as well as modest
computing and memory requirements. Klavans, Small and Boyack (2013) introduced the
reference pair proximities as a new variable to improve accuracy of co‐citation clustering. To
do so, they used a corpus of 270,521 Scopus full text documents from 2007 and compared the
results of traditional co‐citation clustering approach to their new co‐citation clustering, which
evidenced a significant accuracy improvement.
Generally, clustering procedures on networks and matrices involves complex and hard
calculations. This fact is more relevant when large datasets are being manipulated since
hardware and software requirements are generally high. Another important issue is related to
visualization of clustered data which should be clear and comprehensible. Both software
VOSViewer (Van Eck & Waltman, 2010) and Pajek (Batagelj & Mrvar, 1997; Nooy, Mrvar, &
Batagelj, 2012) arise as good tools for network analysis and information visualization,
especially when large networks have to be manipulated. Additionally, VOSViewer includes its
own classification algorithm whereas Pajek integrates different clustering algorithms that can
be run easily once dataset is adapted to appropriated format required by the software.
3.‐ Objectives
The main goal of this study is to optimise and update journal classification of SCImago Journal
& Country Rank (SJR) platform (SCImago, 2007) via clustering techniques. Using the software
Pajek, we ran two automatic classification algorithms as to detect and extract communities
(subject clusters) from a SJR journal network combining three citation‐based measures. The set
of automatic‐extracted communities is representing the subject disciplinary structure of
science and research recorded in SJR journals. Finally, the new resulted cluster‐based systems
will be compared to other classification systems such as WoS Subject Categories and the
original SJR Classification to validate their consistency and accuracy by analysing and discussing
the strengths and weakness of the results.
4.‐ Material
Our data set, covering a total number of 18,891 journals for a two‐year time window (2009‐
2010), was gathered from SCImago Journal & Country Rank (SJR) database. In this set, only
cited references going back from 2010 to 2000 were contemplated. All references were
counted at paper level and later aggregated to journal level.
5.‐ Methods
In order to clarify and favour a better understanding of the distinct procedures developed in
performing our study we have divided this section in 7 stages covering and detailing the
required steps to follow.
5
5.1.‐ SJR Journal Classification: The Starting Point
Scopus classification system, and by extension, SJR original classification, is an a‐priori two‐
level hierarchical classification system originally designed according to an up‐bottom approach.
Hence, at first level, the classification covers a total of 27 broad subject areas which, at once,
comprise a set of 308 specific subject categories at second level. Then, journals recorded at
database are ascribed to one or several subject categories. Areas and categories tags were
determined on the basis of All Science Journal Classification (ASJC). Generally, each subject
area includes a subject category taking the same tag followed by ‘miscellaneous’ addition.
Journal assignment to categories was made on the basis of items adscription. Then, SCImago
Research Group conducted some improvements on classification based on journal scope
analysis and a constant feedback from journal editors. From the point of view of improving
journal classification, feedback from editors may be an interesting argument to take into
account. Thus, Archambault et al. (2011) even claim to be interested in feedback from
researchers and practitioners using their journal ontology as to persist in refining journal
assignment. However, in spite of various attempts, a wider improvement of SJR journal
classification is needed in order to remove inconsistencies inherited from Scopus by allowing
to final users to customise the journal‐sets of SJR subject categories as to generate tailored
rankings (Jacsó, 2013). A previous work based on SJR journal reference analysis (Gómez‐Núñez,
Vargas‐Quesada, Moya‐Anegón, & Glänzel, 2011) was oriented to this end.
5.2.‐ Journal Citation‐based Relatedness Measures: Calculation and Formatting
A plenty of publications dealing with classification and mapping of science and research have
adopted text‐based networks (Cantos‐Mateos, Vargas‐Quesada, Chinchilla‐Rodríguez, &
Zulueta, 2012; Liu, Hu, & Wang, 2011), citation‐based networks (Leydesdorff & Rafols, 2012;
Rafols & Leydesdorff, 2009) or combination of both (Glänzel, 2012; Janssens et al., 2009).
Boyack y Klavans (2010) applied Jensen‐Shannon divergence and concentration metrics as to
prove the accuracy of clustering solutions emerging from different citation‐based mapping
methods. The results revealed the best performance in bibliographic coupling approach,
followed closely by co‐citation and direct citation further. Also, Waltman and Van Eck (2012)
analysed advantages and disadvantages of three citation‐based approaches. After that, they
chose direct citation as relatedness measure in constructing a publication‐level classification.
Primarily, they based their decision on saving computer resources for processing the large data
set of almost 10 million of publications that they copied with. However, they argued that direct
citation are expected to provide strongest relatedness links between publication, contrary to
co‐citation and bibliographic coupling, which could be considered more indirect mechanisms.
On the other hand, they noted that the use of direct citations can lead up to a loss of
information because of citations to earlier publications and, similarly, citations from later
publications are not being contemplated.
In this work, we are exploiting citation‐based approaches on journal networks. This allows us
to cover the three main types of citation links expressing a degree of relatedness between
journals. In this way, we will be adding both strengths and weakness from each measure.
Thereby, our approach could be considered a ‘fair’ and balanced one by offsetting all weakness
coming from direct citation, co‐citation and bibliographic coupling separately. When these
important points were reflected, we constructed three journal networks, one for each citation‐

6
based measure. The three networks were calculated at the document level and then
aggregated to journals. For co‐citation and bibliographic coupling calculation, references co‐
occurring were counted only once per paper by following the binary counting described by
Rousseau and Zuccala (2004) and avoiding what Vargas‐Quesada and Moya‐Anegón (2007)
named latent co‐citation.
5.3.‐ Citation‐based Measures Combination
Once the three citation‐based networks were generated we combined them into a new one
collecting pairwise journals and their relatedness strength expressed by the sum of direct
citation, co‐citation and bibliographic coupling links. By doing so, we got a final network based
on raw data and containing what Persson (Persson, 2010) named Weighted Direct Citation
(WDC) links. Below, we can display the diagram used by Persson in order to integrate these
three citation‐based measures and calculate the WDC. Nevertheless, we have introduced a
small shift referring to both senses of the direct citation links.
C
A B
D
Thus, we have used the next formula in citation based‐measures combination:
c_ij = cu_ij + cc_ij + max(ci_ij,ci_ji)
Where cu_ij = coupling, cc_ij= co‐citation, ci_ij = direct citacion from i to j and ci_ji = direct
citation from j to i.
Also, by knowing that A, B, C and D are journals we can adapt this formula according to
Person’s diagram in this way:
c_ij = ABC + DAB + max(AB,BA)
5.4.‐ Network Normalization
At the following stage of out method, the final network resulted from aggregation of raw data
links was normalized using Geo similarity formula as follows:
s_ij = c_ij / sqrt(c_i*c_j), c_i = sum{ j: j!=i: c_ij }
This similarity measure is close to Cosine one and performs dividing elements of the matrix by
geometric mean of both diagonal elements (Batagelj & Mrvar, 2003). Thereby, raw data were
corrected and relatedness values between pairwise journals were transformed to values
ranging from 0 to 1. This avoids problems related to misleading representations and
overestimation of some science fields characterized by strong citation habits or covering large‐
size journals with a high power of attraction.

7
5.5.‐ Clustering Procedures
The next step in our methodology was to run clustering algorithms included in Pajek software
on the normalized network. Pajek integrates several clustering methods in order to
decompose networks by extracting different partitions such as islands, k‐neighbours or block
modelling. However, after several initial tests, we targeted on communities detection
algorithms, namely, VOS Clustering (Waltman, Van Eck, & Noyons, 2010) and Louvain Method
(Blondel, Guillaume, Lambiotte, & Lefebvre, 2008). Both methods are grounded in modularity
clustering proposed by Newman and Girvan (2004). However, while Louvain method optimizes
modularity, VOS Clustering focused on optimizing a quality function (Batagelj & Mrvar, 2011).
For this experiment, we chose Louvain and VOS methods based on Multilevel Coarsening +
Single Refinement. Moreover, we had to set up several options regarding resolution parameter,
random restarts, maximum number of levels in each iteration, and maximum number of
repetitions in each level. Here, we fixed just the same options for VOS and Louvain algorithms.
Firstly, we introduced distinct values in resolution parameter, moving them from 10 to 20 in
order to get different Pajek partitions depicting diverse solutions in decomposing network and
producing different set of clusters or communities. Then, the remaining parameters were
configured with default values.
By analysing certain relevant indicators for each parameterized clustering algorithm solution,
basically, the number of clusters generated and the number of journal per clusters, we
estimated that network decompositions providing between 250 and 300 groups would be
interesting for our final journal classification objective. Here, some important issues were
considered. Firstly, we took into account the 250 subject categories currently included in WoS
database since this scientific information source is not only an international referent within
bibliometric and scientometric fields but also for scientists and researchers in general.
Presently, SJR is including 308 subject categories and, therefore, we thought that a final set
ranging from 250‐300 categories will provide a balanced and refined subject structure. This
point was reinforced with the experience acquired in a previous work (Gómez‐Núñez et al.,
2011). There, we noticed a regular behaviour in grouping journals which reveals a strong
concentration of them in a few leading categories from a final set of 198 SJR categories. These
leading categories are characterized by a high attractiveness, especially, when iterative
reference analysis method was used. As commented earlier, this behaviour may be derived
from citation habits of some scientific fields with an intense and well‐defined citation practice
such as the Medicine and allied sciences or some social science subfields as Economics or
Education.
Apart from indicators above mentioned we applied some others (see Results section) to VOS
and Louvain partitions matching with different 10‐20 resolution parameters and we proceed to
compare the results of both of them. Every partition was executed in Pajek and, later, saved to
files as to be processed using spreadsheets and statistical software. Concretely, we selected
VOS partition referring to resolution parameter 15, while a resolution parameter 18 was
appointed in the Louvain case. In this decision, we basically looked for similar partitions in
terms of the final number of clusters generated by VOS and Louvain methods under the
premise of making comparable the results and the classification solutions in both clustering
8
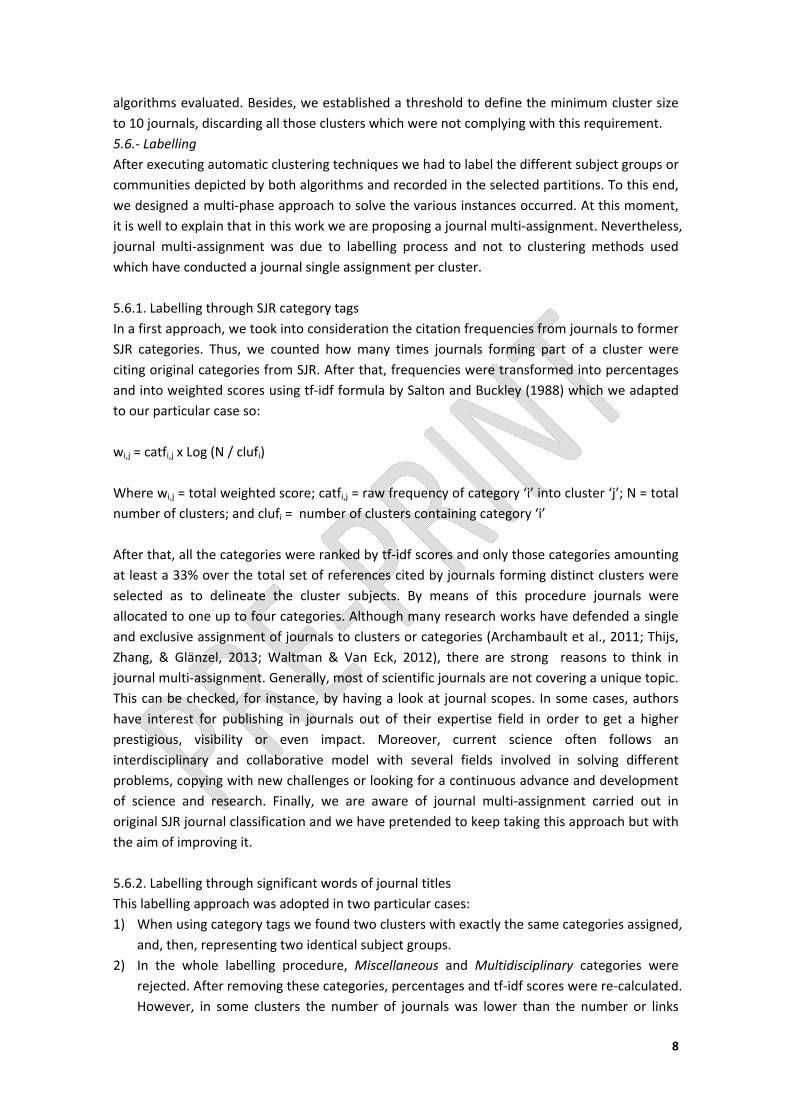
algorithms evaluated. Besides, we established a threshold to define the minimum cluster size
to 10 journals, discarding all those clusters which were not complying with this requirement.
5.6.‐ Labelling
After executing automatic clustering techniques we had to label the different subject groups or
communities depicted by both algorithms and recorded in the selected partitions. To this end,
we designed a multi‐phase approach to solve the various instances occurred. At this moment,
it is well to explain that in this work we are proposing a journal multi‐assignment. Nevertheless,
journal multi‐assignment was due to labelling process and not to clustering methods used
which have conducted a journal single assignment per cluster.
5.6.1. Labelling through SJR category tags
In a first approach, we took into consideration the citation frequencies from journals to former
SJR categories. Thus, we counted how many times journals forming part of a cluster were
citing original categories from SJR. After that, frequencies were transformed into percentages
and into weighted scores using tf‐idf formula by Salton and Buckley (1988) which we adapted
to our particular case so:
wi,j = catfi,j x Log (N / clufi)
Where wi,j = total weighted score; catfi,j = raw frequency of category ‘i’ into cluster ‘j’; N = total
number of clusters; and clufi = number of clusters containing category ‘i’
After that, all the categories were ranked by tf‐idf scores and only those categories amounting
at least a 33% over the total set of references cited by journals forming distinct clusters were
selected as to delineate the cluster subjects. By means of this procedure journals were
allocated to one up to four categories. Although many research works have defended a single
and exclusive assignment of journals to clusters or categories (Archambault et al., 2011; Thijs,
Zhang, & Glänzel, 2013; Waltman & Van Eck, 2012), there are strong reasons to think in
journal multi‐assignment. Generally, most of scientific journals are not covering a unique topic.
This can be checked, for instance, by having a look at journal scopes. In some cases, authors
have interest for publishing in journals out of their expertise field in order to get a higher
prestigious, visibility or even impact. Moreover, current science often follows an
interdisciplinary and collaborative model with several fields involved in solving different
problems, copying with new challenges or looking for a continuous advance and development
of science and research. Finally, we are aware of journal multi‐assignment carried out in
original SJR journal classification and we have pretended to keep taking this approach but with
the aim of improving it.
5.6.2. Labelling through significant words of journal titles
This labelling approach was adopted in two particular cases:
1) When using category tags we found two clusters with exactly the same categories assigned,
and, then, representing two identical subject groups.
2) In the whole labelling procedure, Miscellaneous and Multidisciplinary categories were
rejected. After removing these categories, percentages and tf‐idf scores were re‐calculated.
However, in some clusters the number of journals was lower than the number or links

9
pointing to SJR categories. This was not satisfying the condition of at least one link to
category per journal.
In the two instances above noted, we reconsidered the labelling approach for clusters by using
a textual component, such as significant words extracted from journal titles. After counting
them, frequencies of most repeated words were taken as to delineate the subject topic of
clusters. To support the text‐based labelling stage and to fine‐tune in denoting clusters we
used some Voyeur Tools platform, which provides a set of online text analysis tools forming
part of Hermeneuti.ca collaborative project (Sinclair & Rockwell, 2009).
5.7.‐ Validating Classification Proposals.
In closing our method, a validation of classifications generated by algorithms was desirable.
There are different approaches aimed to this end. Expert assessment could be the best one,
but, generally, it is very time‐ and cost‐consuming. We thought that a suitable and less
resource‐consuming method is a comparison with some other classification systems. Especially
useful would be a comparison versus the original SJR classification since the journal data set is
just the same which facilitates the process. Nevertheless, we also included a comparison with
ISI Subject Categories which is the subject classification system of the referent database in
bibliometric scope, namely, WoS (and consequently, JCR + Arts & Humanities). To make
possible this comparison we prepared a combined list consisting of SCI+SSCI journals collected
from JCR 2010 release. JCR do not include journals of Arts & Humanities areas so an extra list
of A&HCI journals of 2012 release downloaded from Thomson Reuter’s website was added.
The final list of journals was integrated by 11,715 journals, pertaining 8,005 to SCI, 2,678 to
SSCI and 1,758 to A&HCI respectively. Therefore, there is a certain level of overlapping because
a total of 726 journals were covered by distinct indexes together. Finally, we used ISSN field as
to generate matching between journals of SJR, WoS, VOS and Louvain classifications which rise
to 9694 journals, that is, an 82.75% from the total set.
6.‐ Results
6.1. Analysis of results derived from algorithm solutions
In an attempt to optimise and update SJR journal classification we analysed and compared the
results derived from VOS and Louvain clustering methods according to distinct indicators
related to the proper performance of both algorithms, such as (1) number of given clusters, (2)
number of journals classified after applying the threshold of 10 journals as the minimum
cluster size, and (3) mean number of journals per cluster. Besides, we developed two indicators
coming from cluster labelling process, just as the (4) journal multi‐assignment, and the (5)
weighted average of categories assigned to journals. Again, we would like to remark that
journal multi‐assignment was a consequence of our labelling procedure and not due to VOS
and Louvain performance which carries out a journal single assignment as they are hard
clustering techniques.
Table 1 captures the values of the indicators (1), (2) and (3). As we pointed in the previous
section, we projected around 250‐300 journal subject groups to trace a basic and cohesive
disciplinary structure in order to classify scientific journals. Therefore, we retained this premise
during the parameterization of VOS and Louvain algorithms as well as in choosing final
partitions giving suitable results and better adapting to our final classification aim.

10
(1) number of given clusters (2) number of journals classified (3) mean number of journals per cluster
VOS Louvain VOS Threshold 10
Louvain Threshold 10
VOS Louvain VOS Threshold 10
Louvain Threshold 10
VOS Louvain VOS Threshold 10
Louvain Threshold 10
Resolution Parameter
10 531 550 174 153 18,891 18,891 18,271 18,170 35.6 34.3 105.0 118.8
11 593 601 200 173 18,891 18,891 18,212 18,085 31.9 31.4 91.1 104.5
12 662 666 225 186 18,891 18,891 18,080 17,966 28.5 28.4 80.4 96.6
13 723 727 234 201 18,891 18,891 18,018 17,890 26.1 26.0 77.0 89.0
14 787 794 261 216 18,891 18,891 17,896 17,739 24.0 23.8 68.6 82.1
15 848 862 270 234 18,891 18,891 17,729 17,652 22.3 21.9 65.7 75.4
16 904 932 297 245 18,891 18,891 17,665 17,488 20.9 20.3 59.5 71.4
17 973 999 308 266 18,891 18,891 17,504 17,412 19.4 18.9 56.8 65.5
18 1,043 1,064 337 280 18,891 18,891 17,422 17,287 18.1 17.8 51.7 61.7
19 1,120 1,126 348 301 18,891 18,891 17,266 17,235 16.9 16.8 49.6 57.3
20 1,170 1,195 367 319 18,891 18,891 17,135 17,086 16.1 15.8 46.7 53.6
Table 1: Number of clusters, number of journals classified and mean number of journals per cluster according to the diverse resolution parameters of VOS and Louvain
11
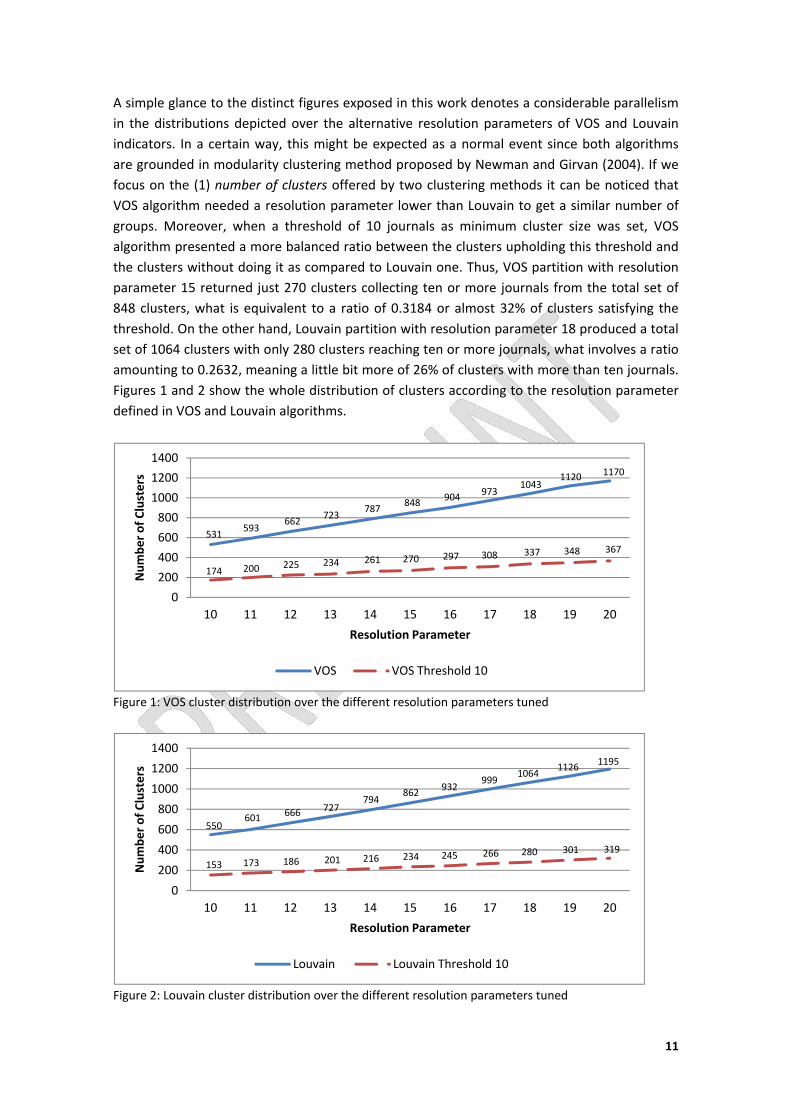
A simple glance to the distinct figures exposed in this work denotes a considerable parallelism
in the distributions depicted over the alternative resolution parameters of VOS and Louvain
indicators. In a certain way, this might be expected as a normal event since both algorithms
are grounded in modularity clustering method proposed by Newman and Girvan (2004). If we
focus on the (1) number of clusters offered by two clustering methods it can be noticed that
VOS algorithm needed a resolution parameter lower than Louvain to get a similar number of
groups. Moreover, when a threshold of 10 journals as minimum cluster size was set, VOS
algorithm presented a more balanced ratio between the clusters upholding this threshold and
the clusters without doing it as compared to Louvain one. Thus, VOS partition with resolution
parameter 15 returned just 270 clusters collecting ten or more journals from the total set of
848 clusters, what is equivalent to a ratio of 0.3184 or almost 32% of clusters satisfying the
threshold. On the other hand, Louvain partition with resolution parameter 18 produced a total
set of 1064 clusters with only 280 clusters reaching ten or more journals, what involves a ratio
amounting to 0.2632, meaning a little bit more of 26% of clusters with more than ten journals.
Figures 1 and 2 show the whole distribution of clusters according to the resolution parameter
defined in VOS and Louvain algorithms.
Figure 1: VOS cluster distribution over the different resolution parameters tuned
Figure 2: Louvain cluster distribution over the different resolution parameters tuned
531593
662723
787848
904973
10431120 1170
174 200 225 234 261 270 297 308 337 348 367
0
200
400
600
800
1000
1200
1400
10 11 12 13 14 15 16 17 18 19 20
Number of Clusters
Resolution Parameter
VOS VOS Threshold 10
550601 666 727
794862
932999
10641126
1195
153 173 186 201 216 234 245 266 280 301 319
0
200
400
600
800
1000
1200
1400
10 11 12 13 14 15 16 17 18 19 20
Number of Clusters
Resolution Parameter
Louvain Louvain Threshold 10

12
In the own words of the authors of VOS clustering algorithm the resolution parameter included
in their algorithm “helps to deal with the resolution limit problem of modularity‐based
clustering”. They also claim that by introducing a sufficiently large value for the resolution
parameter of their clustering technique all small clusters can always be determined, being the
number of clusters generated larger when the value of resolution parameter is higher
(Waltman et al., 2010). Then, the final number of clusters is directly proportional to the value
of resolution parameter. Indeed, VOS and Louvain methods permitted to classify the 18,891
journals forming part of the initial network explored through the set of clusters provided.
Nevertheless, a wide amount of this clusters were too small and were not able to form reliable
and solid groups of journals. We have pointed out that only 31.84% of the total number of VOS
clusters had a size higher than 10, while a mere 26.32% of clusters reached this threshold in
Louvain method. This phenomenon could be due to the use of citation and their derivatives as
measure units. Earlier on, we mentioned that some scientific fields portray a strong
concentration and an outstanding attraction power of citations linking to publications
including in them, normally, because of the own marked citation habits occurring inside these
fields. So, the subject categories defining these fields are characterized by a great variance
aggregation derived from the high quantity of citation received.
By observing indicators related to the (2) number of journals classified and the (3) mean
number of journals per cluster, we detected a general behaviour which describes a better
performance of VOS algorithm in classifying journals, that is, including journals in a particular
cluster. In general, the mean of journals per cluster over the different resolution parameters
returned by Louvain algorithm was higher. However, by examining the two partitions selected
for our classification purpose, the mean number of journals per cluster was also a bit higher in
favour of VOS resolution parameter 15. Figure 3 shows the whole distribution of journals
classified in VOS and Louvain clusters over the distinct resolution parameters executed. In the
same way, Figure 4 exposes the mean number of journals per cluster in two selected VOS and
Louvain partitions.
Figure 3: Distribution of classified journals over the different resolution parameters tuned in VOS &
Louvain clustering algorithms
18271 1821218080
1801817896
1772917665
1750417422
1726617135
1817018085
1796617890
1773917652
1748817412 17287
1723517086
16400
16600
16800
17000
17200
17400
17600
17800
18000
18200
18400
10 11 12 13 14 15 16 17 18 19 20
Number of Clusters
Resolution Parameter
VOS Threshold 10 Louvain Threshold 10
13
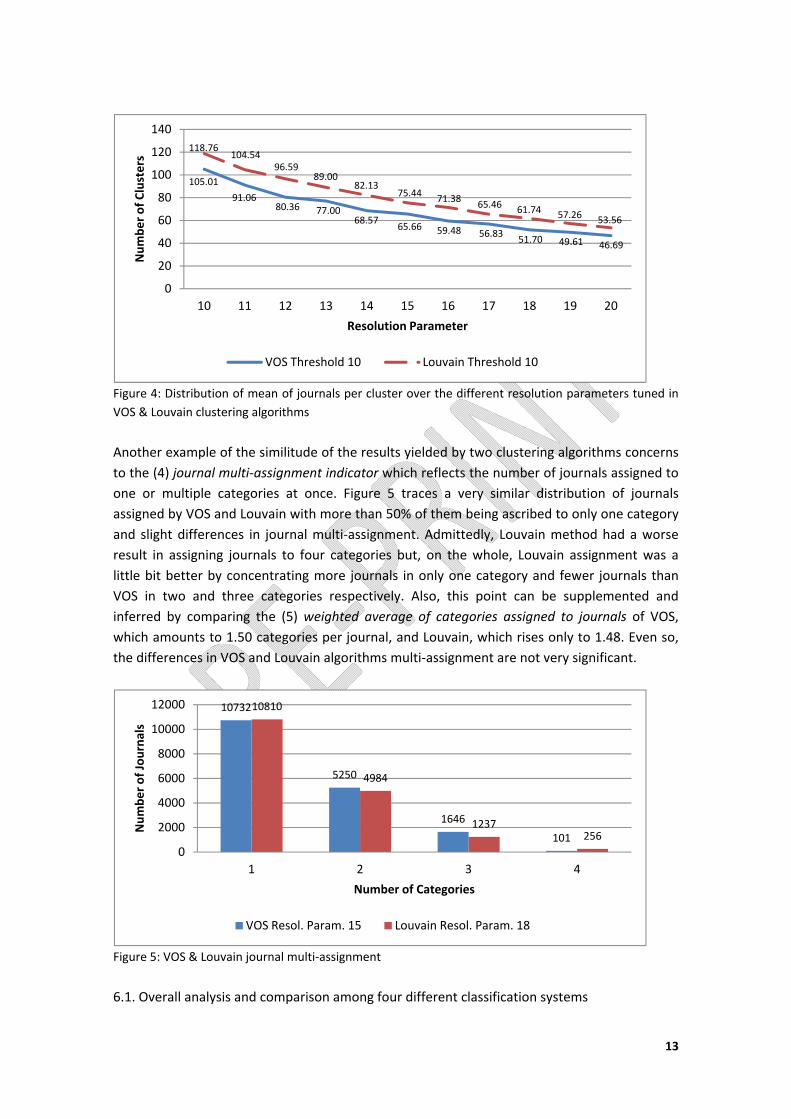
Figure 4: Distribution of mean of journals per cluster over the different resolution parameters tuned in
VOS & Louvain clustering algorithms
Another example of the similitude of the results yielded by two clustering algorithms concerns
to the (4) journal multi‐assignment indicator which reflects the number of journals assigned to
one or multiple categories at once. Figure 5 traces a very similar distribution of journals
assigned by VOS and Louvain with more than 50% of them being ascribed to only one category
and slight differences in journal multi‐assignment. Admittedly, Louvain method had a worse
result in assigning journals to four categories but, on the whole, Louvain assignment was a
little bit better by concentrating more journals in only one category and fewer journals than
VOS in two and three categories respectively. Also, this point can be supplemented and
inferred by comparing the (5) weighted average of categories assigned to journals of VOS,
which amounts to 1.50 categories per journal, and Louvain, which rises only to 1.48. Even so,
the differences in VOS and Louvain algorithms multi‐assignment are not very significant.
Figure 5: VOS & Louvain journal multi‐assignment
6.1. Overall analysis and comparison among four different classification systems
105.01
91.0680.36 77.00
68.5765.66 59.48 56.83
51.70 49.61 46.69
118.76104.54
96.5989.00
82.1375.44
71.3865.46 61.74 57.26 53.56
0
20
40
60
80
100
120
140
10 11 12 13 14 15 16 17 18 19 20
Number of Clusters
Resolution Parameter
VOS Threshold 10 Louvain Threshold 10
10732
5250
1646
101
10810
4984
1237256
0
2000
4000
6000
8000
10000
12000
1 2 3 4
Number of Journals
Number of Categories
VOS Resol. Param. 15 Louvain Resol. Param. 18

14
Hitherto, we have highlighted only the analysis of VOS and Louvain clustering algorithms on
the basis of statistical data and indicators. At this moment, we are detailing results related to
differences and resemblances in journal final classification obtained after applying both
algorithms. To do so, we are going to analyse and compare classifications originated by both
clustering techniques together with original SJR classification and WoS (ISI Subject Categories).
WoS SJR Louvain 18 VOS 15
Total Set of Journals
11,715 18,891 18,891 18,891
Number of Classified Journals
11,715 18,891 17,287 17,729
Number of Categories
251 308 272 267
Mean Number of Journals per Category
46.67 61.33 63.56 66.40
Mean Number of Categories per Journal
1.54 1.61 1.48 1.50
Overlapping Percentage
54.48% 60.73% 47.58% 49.89%
Journals changing their Classification
‐ ‐ 7,159 7,606
Journal Multi‐Assignment
Number of Categories Number of Categories Number of Categories Number of Categories
1 2 3 4 + 1 2 3 4 + 1 2 3 4 + 1 2 3 4 +
6,990 3,432 986 261 46 12,025 3,893 1,863 751 359 10,806 4,986 1,237 256 0 10,730 5,251 1,646 101 0
59.7% 29.3% 8.4% 2.2% 0.4% 63.7% 20.6% 9.9% 4.0% 1.9% 62.5% 28.8% 7.2% 1.5% 0% 60.5% 29.6% 9.3% 0.6% 0%
Table 2: Overall comparison among four classifications systems analysed. The Number of Classified
Journals in Louvain and VOS systems results from application of minimum cluster size threshold (t ≥ 10)
Table 2 captures overall data about four classifications compared. A detailed analysis of it
enables to note some important observations. Regarding the total set of journals included, it is
worth to mention that the number of journals covered by SJR overcomes the WoS set more
than 1/3. Related to the number of classified journals we can see that after fixing threshold 10
in Louvain and VOS algorithms, the number of journals being classified descended to 17287
and 17729 respectively. This is not a result of performance of algorithms which were able to
classify the whole set of 18891 original SJR journals. Journals left out the final set will have to
be classified separately by a different solution. Reference analysis applied in a previous work
(Gómez‐Núñez et al., 2011) or ‘sibling journals’ which can be defined as those journals
originally sharing former SJR categories and then extending their new cluster‐based
classification to journals under the threshold could be used.
The next point to address is the final number of categories forming part of the classification
system. Here is convenient to clarify why the number of clusters expressed in Table 1 for VOS
and Louvain methods are not in consensus with the number of categories (subject clusters)
displayed in Table 2. Table 1 collects the number of clusters generated by algorithms without
labelling. On its side, Table 2 is reflecting the number of clusters after our labelling process.

15
Our approach made possible to have some clusters with different number and tags of
categories assigned. For instance, cluster #82 in Louvain solution was labelled as ‘Artificial
Intelligence’ + ‘Information Systems’ + ‘Software’ category tags, while cluster #90 was assigned
to ‘Artificial Intelligence’ + ‘Theoretical Computer Science’ categories. The potential
combinations of different number and tags of categories among the set of clusters is, therefore,
the main reason to explain the difference in the number of categories included in Table 2. The
final number of categories in VOS and Louvain decreased meaningfully in comparison to
original SJR subject classification system and being closer to WoS system. This can be
understood as a broad improvement, especially when data referring to overlap (Table 2) and
distribution of journals over categories (Table 3) are observed. After indicating the number of
classified journals and the final number of categories we can calculate the mean number of
journals per category. VOS, Louvain and SJR systems overcome the value of 60 journals per
category, being the highest value for VOS one with a total of 66.4. On his side, WoS system
mean number only amounts to 46.67 journals per category although it is true that WoS journal
coverage is much more reduced in comparison to the other three systems.
Other two interesting points of Table 2 are concerning the mean number of categories per
journal and overlapping percentage. Both indicators are totally correlated and show the level
of overlapping existing in four classifications compared. The main difference holds that mean
number of categories per journal is expressed as per unit. The lowest level of overlapping was
reached by Louvain system, followed closely by VOS. In both cases, overlapping levels are not
going over the 50%. WoS and SJR systems surpass this level, being the worst overlapping figure
the SJR one with a 60.73%. In this sense, again VOS and Louvain methods evidenced better
solutions than SJR and WoS. Overlapping percentage was calculated by subtracting the
number of records corresponding to (A) journals covered by the system (or in other words, the
set of journals under consideration) from the number of records referring to final (B) journal
multi‐assignment (set of classified journals including multi‐assigned journals), then multiplying
by 100 and dividing the total by the (A) journals covered by the system [B‐A/A*100].
The next row displayed in the table 2 is dealing with the number of journals changing their
classification from SJR to Louvain and VOS system. Again VOS system get the highest figures by
allocating a total of 7606 journals in new subject categories either by changing or by adding a
new subject category to journals. This is equal to a 42.0% of the total set of journals classified.
On the other hand, Louvain rise a 41.4% of journals changing their old classification. Such as
the whole comparison process, both algorithm solutions yielded very similar results.
Finally, Table 2 is displaying the figures related to journal multi‐assignment in four
classification systems compared. Here, the best assignment of journals to one category was for
SJR system with a 63.7% of the total set. The last place in the ranking was for WoS with a
59.7%. However, the four classification systems offered close percentages of journals assigned
to one category. By taking into account our desire of allowing journal multi‐assignment, the
results obtained by Louvain and VOS can be judged as convenient because they concentrated
the most of the journals in one and two categories. Louvain and VOS relative figures
representing journal assignment executed on three and four categories are outperforming SJR
and WoS systems by far. In addition, SJR and WoS systems made possible a journal assignment
16
to more than four categories. Louvain and VOS solutions did not enable this kind of multi‐
assignment and, therefore, they provided a more balanced classification system.
A last important issue to analyse among the four classification systems is the proper
distribution of journals over the set of subject clusters or categories generated. Table 3 is
covering the top‐20 categories regarding the number of journals included and expressed in
raw data and percentage. Finally, we added a cumulative percentage in order to calculate the
continuing aggregation of journals spread over categories. Now, the slightest distribution of
journals over categories becomes WoS one. However, when classified journal set of WoS is
compared with Louvain or VOS ones, then, these distributions are very similar among them.
This is underscored through the percentage values of journals calculated in three classification
systems. Admittedly SJR system has the largest set of classified journals it achieved the worst
distribution of journals over categories as well. Furthermore, ‘Medicine (miscellaneous)’
category resulted especially remarkable by showing a high concentration of journals in it. More
concretely, a 5.2% of the total set of SJR journals was included in this category. Of course, all
indicators and calculations relating journals and categories were made considering journal
overlap in four classification systems. A last thing to mind in Table 3 is related to the number of
the same or really close categories which appear in 20‐top ranking. A detailed analysis allowed
uncovering that 7 of 20‐top categories covered by the four classification systems were
appearing in four systems together. This leads to think that despite the fact of having four
different classification systems, there are certain coherence and homogeneity among them.
Thus, while changes in number and position of categories may imply, in the case of algorithm
systems a refinement of original SJR classification, a matching of a considerable number of
categories may be a symptom of stability and consistency. The seven categories matching in
WoS are: (1) ‘HISTORY’; (2) ‘ECONOMICS’; (3) ‘MATHEMATICS’; (4) ‘ENGINEERING, ELECTRICAL
& ELECTRONIC’; (5) ‘PSYCHIATRY’; (6) ‘LANGUAGE & LINGUISTICS’; (7) ‘EDUCATION &
EDUCATIONAL RESEARCH’. The correspondence of these categories in SJR is: (1) ‘History’; (2)
‘Economics and Econometrics’; (3) ‘Mathematics (miscellaneous)’; (4) ‘Electrical and Electronic
Engineering’; (5) ‘Psychiatry and Mental Health’; (6) ‘Language and Linguistics’; (7) ‘Education’.
Finally, the set of categories in Louvain and VOS system was identical to SJR one, except for the
category (3) ‘Mathematics (miscellaneous)’ which were labelled as ‘Mathematics (general)’.
The final master tables covering the new classification of SJR journals proceeding from VOS
and Louvain clustering methods can be accessed through the following links:
VOS Classification: http://www.ugr.es/local/benjamin/vos15_classification.pdf
Louvain Classification: http://www.ugr.es/local/benjamin/louvain18_classification.pdf

17
WoS SJR LOUVAIN RES. PAR. 18 VOS RES. PAR. 15
Category Num. of Journals
% Journals
Cumul. %
Category Num. of Journals
% Journals
Cumul. %
Category Num. of Journals
% Journals
Cumul. %
Category Num. of Journals
% Journals
Cumul. %
HISTORY 331 1.829 1.829 Medicine (miscellaneous)
1,579 5.200 5.200 Sociology and Political Science
496 1.944 1.944 Electrical and Electronic Engineering
534 2.009 2.009
ECONOMICS 302 1.669 3.498 Education 524 1.726 6.926 Geology 417 1.634 3.579 Sociology and Political Science
480 1.806 3.816
BIOCHEMISTRY & MOLECULAR BIOLOGY
284 1.569 5.067 Sociology and Political Science
460 1.515 8.441 Literature and Literary Theory
415 1.627 5.205 Literature and Literary Theory
427 1.607 5.423
MATHEMATICS 276 1.525 6.592 Geography, Planning and Development
450 1.482 9.923 Geography, Planning and Development
393 1.540 6.746 Plant Science 393 1.479 6.901
PUBLIC, ENVIRONMENTAL & OCCUPATIONAL HEALTH
254 1.404 7.996 History 444 1.462 11.386 Electrical and Electronic Engineering
393 1.540 8.286 Geology 380 1.430 8.331
PHARMACOLOGY & PHARMACY
249 1.376 9.372 Electrical and Electronic Engineering
406 1.337 12.723 Psychiatry and Mental Health
372 1.458 9.744 Artificial Intelligence
371 1.396 9.728
ENGINEERING, ELECTRICAL & ELECTRONIC
247 1.365 10.737 Cultural Studies 375 1.235 13.958 Software 331 1.297 11.041 Education 369 1.389 11.116
NEUROSCIENCES 235 1.299 12.035 Social Sciences (miscellaneous)
374 1.232 15.190 Education 331 1.297 12.339 Software 352 1.325 12.441
MATHEMATICS, APPLIED
235 1.299 13.334 Economics and Econometrics
368 1.212 16.402 Hardware and Architecture
297 1.164 13.503 Psychiatry and Mental Health
341 1.283 13.724
PSYCHIATRY 233 1.288 14.621 Literature and Literary Theory
366 1.205 17.607 Religious Studies
297 1.164 14.667 Water Science and Technology
338 1.272 14.996
MATERIALS SCIENCE, MULTIDISCIPLINARY
219 1.210 15.831 Engineering (miscellaneous)
356 1.172 18.779 Applied Mathematics
283 1.109 15.776 Mathematics (general)
334 1.257 16.253
ENVIRONMENTAL SCIENCES
192 1.061 16.892 Psychology (miscellaneous)
351 1.156 19.935 Geochemistry and Petrology
282 1.105 16.882 Economics and Econometrics
318 1.197 17.449

18
LANGUAGE & LINGUISTICS
192 1.061 17.953
Public Health, Environmental and Occupational Health
335 1.103 21.039 Cultural Studies
264 1.035 17.916 Agronomy and Crop Science
312 1.174 18.623
SURGERY 186 1.028 18.981 Plant Science 327 1.077 22.116 Economics and Econometrics
252 0.988 18.904 Paleontology 309 1.163 19.786
CLINICAL NEUROLOGY 185 1.022 20.003 Language and Linguistics
327 1.077 23.193 History 250 0.980 19.884 History 300 1.129 20.915
PLANT SCIENCES 185 1.022 21.026 Psychiatry and Mental Health
325 1.070 24.263 Mechanical Engineering
245 0.960 20.844 Geography, Planning and Development
283 1.065 21.980
ONCOLOGY 181 1.000 22.026 Animal Science and Zoology
315 1.037 25.301 Civil and Structural Engineering
242 0.949 21.793 Mechanical Engineering
279 1.050 23.030
PHILOSOPHY 178 0.984 23.009 Mathematics (miscellaneous)
306 1.008 26.308 Rehabilitation 240 0.941 22.734 Developmental and Educational Psychology
278 1.046 24.076
EDUCATION & EDUCATIONAL RESEARCH
177 0.978 23.987 Cardiology and Cardiovascular Medicine
273 0.899 27.207 Mathematics (general)
235 0.921 23.655 Language and Linguistics
274 1.031 25.107
CELL BIOLOGY 174 0.961 24.949
Agricultural and Biological Sciences (miscellaneous)
269 0.886 28.093 Language and Linguistics
222 0.870 24.525 Cultural Studies 269 1.012 26.120
Table 3: Top‐20 categories of the four classifications systems analysed
19
7.‐ Discussion and conclusions
A wide variety of research works have approached the problem of science classification for
mapping, knowledge organisation, information retrieval or bibliometric and scientometric
purposes. Up to date, some authors have commented the non‐existence of a classification
system which is considered an international standard in bibliometric fields (Gomez & Bordons,
1996; Archambault et al., 2011; Waltman & Van Eck, 2012) Different levels of aggregation, the
distinct systems adopted for organising information as well as the degrees of specialisation or
multidisciplinary of several scientific databases, are reasons enough to make difficult the
construction of an international classification system for bibliometric ends. At this work,
however, we have proposed a methodology to update and refine SJR journal classification
system which can be applied to others through clustering and bibliometric techniques.
Another topic commonly addressed over the scientific literature on classification is the
adequacy and possibility of developing automatic classification systems which avoids as far as
possible the human intervention. First works on it were developed by authors as Luhn (Luhn,
1957) in Information Retrieval scope at the end of 1950s, but the interest kept holding over
the 1960s (Garland, 1982) and further, especially, with the advance and development of
scientific databases, bibliometric indicators, science mapping, etc., and spanning up to the
present. Some of research works reviewed here have tried to avoid human intervention and
they conclude it was not possible to do it completely. Waltman and Van Eck (2012) ensured
that human involvement was minimized to the choice of certain values in parameters.
Archambault et al. (2011) asserted that human intelligence and expertise originates more
useful and flexible classification schemes as the same time as they can be considered
inadequate and biased systems. They continue claiming that “From the outset, we decided
that it would also be necessary to use expert judgment to finalize the work. In the end, it took
substantially more work than initially expected, with alternating iterations using an algorithmic
approach followed by manual fine‐tuning”.
In accordance with above cited works and the own experience gained from our previous
studies we thought that a classification system based on a fully automatic approach has been
not possible to be conducted up to date. Furthermore, there are many choices which can be
enriched by expertise and human learning. Some relevant stages emanating from automatic
classification implementations such as labelling in clustering approaches are very complicated
to conduct without human involvement. Decisions as labelling based on significant words or
citation links, single or multiple assignments, definition of thresholds, etc., are really difficult to
do. Moreover, human expertise and guidance can become very helpful during these tasks. In
this work, we have avoided human intervention as much as possible, but now, we think that a
mixed approach could be very realistic and convenient, particularly, after examining the final
results. There is no doubt that clustering algorithms used here work fine in classifying journals.
This is clearly evident when results of our tests are checked. However, once our algorithms
have been run and the set of clusters have been labelled, we have found that some of them
have been termed through adjacent and close categories. In some cases, these categories
were coming from original tags of SJR system, and others, resulting from our text‐based
approach. For instance, in VOS system we obtained categories as ‘Anatomy’ or ‘Anatomy and
Morphology’ covering 18 and 15 journals respectively. Also, in Louvain system we got
20
‘Women's Reproductive Health’ and ‘Women's and Children's Health’ categories including 10
and 28 journals respectively. Following our expertise and insight of SJR database we have
considered that we can group categories covering very close knowledge domains, above all,
after checking journals inside them. Then, we could obtain a VOS final category named
‘Anatomy and Morphology’ and consisting of 33 journals and a Louvain final category termed
‘Women's and Children's Health’ and embracing a total of 38 journals. These examples can be
extended to approximately two tens of categories in both algorithm classifications.
After analysing and comparing clustering methods introduced in this work it should be
emphasized the similitude in final results of VOS and Louvain clustering solutions in relation to
facets studied, as evidence figures and tables shown throughout the text. However, the same
value for resolution parameter produces a higher number of clusters in Louvain method which
reveals a finer granularity than VOS one. According to the initial objectives pursued, this could
be an important criterion to consider in selecting one or other algorithm. Anyway, by taking
into consideration the several points analysed it is hard to decide which one of clustering
algorithms analysed is suiting better to our journal classification aim. In our particular case, we
consider that both VOS and Louvain clustering solutions provide a good performance in
classifying SJR journals deriving from the extensive journal citation‐based measures network. A
particular analysis of journals assigned to clusters of specific and well‐known knowledge field
for authors (such as Library and Information Science) and, additionally, one or some cluster
validation techniques based on expert opinions or statistical methods to validate the number
and the goodness of clusters generated (Rand Index, Silhouette, Entropy, etc.) might be useful
in selecting a final clustering solution.
In comparison with the original SJR journal classification, we have found an especially marked
improvement regarding the distribution of journals over categories and the final number of
categories available in the new solutions based on VOS and Louvain methods. The original SJR
classification scheme includes 304 categories where a number of 29 have less than 10 journals
assigned and the remaining categories are covering more than 10. This means that almost the
totality of 18,891 journals is included in only 275 categories. Besides, journal multi‐assignment
is reduced and ‘Miscellaneous’ categories are removed so that, by extension, overlapping is
minimized for both algorithm solutions provided. In addition, we have compared our algorithm
classifications with WoS Subject Categories and we have found a certain consistency and
consensus among the several classification systems both in the number of journals distributed
over categories and in the number of categories appearing in top‐20 categories together.
A final but not less important issue arises with regards to large and leading Multidisciplinary
journals such as Science, Nature or PNAS which are not included in any cluster of size higher
than 10. This might be due to their special features, with a citation pattern characterized by a
vast quantity of citations emitted and received which differentiate them from the remaining
journals. By looking at the whole set of clusters, including those below the threshold 10, we
uncovered Science, Nature and PNAS are allocated in different singletons. Thus, it seems
necessary to look for an alternative method in classifying Multidisciplinary journals. A good
and reasonable choice may be to classify these journals on the basis of the papers published in
them. Multidisciplinary label could be ascribed to analysed journals with papers covering a
21
broad spectrum of topics and overcoming a limit in journal multi‐assignment previously
defined.
This work corresponds to a succession of several studies (Gómez‐Núñez, Vargas‐Quesada, &
Moya‐Anegón, ('unpublished results'); Gómez‐Núñez et al., 2011) concerned with optimising
and boosting of SJR journal classification system and the related subsequent journal
assignment. We can articulate the future research by testing new clustering algorithms and
automatic techniques (factor analysis) as well as different units of analysis (papers) and
measures (text‐approaches). However, we do not pretend to proclaim none of these
classification proposals as definitive or exclusive among them. For sure, we think it is necessary
to keep working in combining several techniques and processing units of analysis in order to
get a consensus from scientific community aimed to develop a new final SJR classification.
8.‐ Acknowledgments
The authors thank María Montserrat Posse Moure for editing the text and the reviewers for
their helpful and relevant comments.
9.‐ Bibliographic References
Ahlgren, P., & Colliander, C. (2009). Document–document similarity approaches and science mapping: Experimental comparison of five approaches. Journal of Informetrics, 3(1), 49–63. doi:10.1016/j.joi.2008.11.003
Archambault, É., Beauchesne, O. H., & Caruso, J. (2011). Towards a Multilingual , Comprehensive and Open Scientific Journal Ontology. In E.C.M. Noyons, P. Ngulube, & J. Leta (Eds.), Proceedings of the 13th International Conference of the International Society for Scientometrics and Informetrics (pp. 66–77).
Batagelj, V., & Mrvar, A. (1997). Pajek – Program for Large Network Analysis. Retrieved from http://pajek.imfm.si/doku.php
Batagelj, V., & Mrvar, A. (2003). Density based approaches to network analysis Analysis of Reuters terror news network, 1–20. Retrieved from http://www.cs.cmu.edu/~dunja/LinkKDD2003/papers/Batagelj.pdf
Batagelj, V., & Mrvar, A. (2011). Pajek: Program for Analysis and Visualization of Large Networks: Reference Manual. version 3.13. Retrieved September 02, 2013, from http://pajek.imfm.si/lib/exe/fetch.php?media=dl:pajekman.pdf
Blondel, V. D., Guillaume, J.‐L., Lambiotte, R., & Lefebvre, E. (2008). Fast unfolding of communities in large networks. Journal of Statistical Mechanics: Theory and Experiment, October(10), P10008. doi:10.1088/1742‐5468/2008/10/P10008
Börner, K., Klavans, R., Patek, M., Zoss, A. M., Biberstine, J. R., Light, R. P., … Boyack, K. W. (2012). Design and update of a classification system: the UCSD map of science. PloS one, 7(7), e39464. doi:10.1371/journal.pone.0039464
22
Boyack, K. W., & Klavans, R. (2010). Co‐Citation Analysis , Bibliographic Coupling , and Direct Citation�: Which Citation Approach Represents the Research Front Most Accurately?, 61(12), 2389–2404. doi:10.1002/asi
Boyack, K. W., Newman, D., Duhon, R. J., Klavans, R., Patek, M., Biberstine, J. R., … Börner, K. (2011). Clustering more than two million biomedical publications: comparing the accuracies of nine text‐based similarity approaches. PloS one, 6(3), e18029. doi:10.1371/journal.pone.0018029
Boyack, K. W., Small, H., & Klavans, R. (2013). Improving the accuracy of co‐citation clustering using full text. Journal of the American Society for Information Science and Technology, 64(9), 1759–1767. doi:10.1002/asi.22896
Cantos‐Mateos, G., Vargas‐Quesada, B., Chinchilla‐Rodríguez, Z., & Zulueta, M. A. (2012). Stem cell research: bibliometric analysis of main research areas through KeyWords Plus. Aslib Proceedings, 64(6), 561–590. doi:10.1108/00012531211281698
Chang, Y. F., & Chen, C. (2011). Classification and Visualization of the Social Science Network by the Minimum Span Clustering Method, 62(12), 2404–2413. doi:10.1002/asi
Van Eck, N. J., & Waltman, L. (2010). Software survey: VOSviewer, a computer program for bibliometric mapping. Scientometrics, 84(2), 523–538. doi:10.1007/s11192‐009‐0146‐3
Elsevier. (2004). Scopus. Retrieved May 30, 2013, from http://www.scopus.com/home.url
Garland, K. (1982). An experiment in automatic hierarchical document classification. Information Processing & Management, 19(3), 113–120.
Glänzel, W. (2012). Bibliometric methods for detecting and analysing emerging research topics. El Profesional de la Informacion, 21(2), 194–201. doi:10.3145/epi.2012.mar.11
Gomez, I., & Bordons, M. (1996). Coping with the problem of subject classification diversity, 35(2), 223–235.
Gómez‐Núñez, A. J., Vargas‐Quesada, B., & Moya‐Anegón, F. ('unpublished results'). A new SJR journal classification through a combination of citation measures.
Gómez‐Núñez, A. J., Vargas‐Quesada, B., Moya‐Anegón, F., & Glänzel, W. (2011). Improving SCImago Journal & Country Rank (SJR) subject classification through reference analysis. Scientometrics, 89(3), 741–758. doi:10.1007/s11192‐011‐0485‐8
Jacsó, P. (2013). The need for end‐user customization of the journal‐sets of the subject categories in the SCImago Journal Ranking database for more appropriate league lists. A case study for the Library & Information Science field. El Profesional de la Informacion, 22(5), 459–473. Retrieved from http://dx.doi.org/10.3145/epi.2013.sep.12
Janssens, F., Zhang, L., Moor, B. De, & Glänzel, W. (2009). Hybrid clustering for validation and improvement of subject‐classification schemes. Information Processing & Management, 45(6), 683–702. doi:10.1016/j.ipm.2009.06.003
23
Klavans, R., & Boyack, K. W. (2009). Toward a consensus map of science. Journal of the American Society for Information Science and Technology, 60(3), 455–476. doi:10.1002/asi.20991
Leydesdorff, L., Hammarfelt, B., & Salah, A. (2011). The Structure of the Arts & Humanities Citation Index�: A Mapping on the Basis of Aggregated Citations Among 1 , 157 Journals, 62(12), 2414–2426. doi:10.1002/asi
Leydesdorff, L., & Rafols, I. (2012). Interactive overlays: A new method for generating global journal maps from Web‐of‐Science data. Journal of Informetrics, 6(2), 318–332. doi:10.1016/j.joi.2011.11.003
Liu, G.‐Y., Hu, J.‐M., & Wang, H.‐L. (2011). A co‐word analysis of digital library field in China. Scientometrics, 91(1), 203–217. doi:10.1007/s11192‐011‐0586‐4
Luhn, H. P. (1957). A Statistical Approach to Mechanized Encoding and Searching of Literary Information. IBM Journal of Research and Development, 1(4), 309–317. doi:10.1147/rd.14.0309
Newman, M., & Girvan, M. (2004). Finding and evaluating community structure in networks. Physical Review E, 69(2), 026113. doi:10.1103/PhysRevE.69.026113
Nooy, W. de, Mrvar, A., & Batagelj, V. (2012). Exploratory Social Network Analysis with Pajek, Revised and Expanded 2nd Edition. Cambridge University Press. (Revised an.). Cambridge [etc.]: Cambridge University Press.
Persson, O. (2010). Identifying research themes with weighted direct citation links. Journal of Informetrics, 4(3), 415–422. doi:10.1016/j.joi.2010.03.006
Pudovkin, A. I., & Garfield, E. (2002). Algorithmic procedure for finding semantically related journals, 53(13), 1113–1119.
Rafols, I., & Leydesdorff, L. (2009). Content‐based and algorithmic classifications of journals: Perspectives on the dynamics of scientific communication and indexer effects. Journal of the American Society for Information Science and Technology, 60(9), 1823–1835. doi:10.1002/asi.21086
Rafols, I., Porter, A. L., & Leydesdorff, L. (2010). Science Overlay Maps�: A New Tool for Research Policy and Library Management. Journal of the American Society for Information Science and Technology, 61(9), 1871–1887. doi:10.1002/asi
Rousseau, R., & Zuccala, A. (2004). A classification of author co‐citations: Definitions and search strategies. Journal of the American Society for Information Science and Technology, 55(6), 513–529. doi:10.1002/asi.10401
Salton, G., & Buckley, C. (1988). Term‐weighting approaches in automatic text retrieval. Information Processing & Management, 24(5), 513–523.
Scimago. (2007). Scimago Journal & Country Rank (SJR). Retrieved April 15, 2011, from http://www.scimagojr.com/
24
Sinclair, S., & Rockwell, G. (2009). Voyeur Tools: See Through Your Texts. Hermeneuti.ca – The Rhetoric of Text Analysis. Retrieved September 01, 2013, from http://hermeneuti.ca/
Small, H. (1999). Visualizing Science by Citation Mapping, 50(1973), 799–813.
Thijs, B., Zhang, L., & Glänzel, W. (2013). Bibliographic Coupling and Hierarchical Clustering for the validation and improvement of subject‐classification schemes. In 14th International Conference on Scientometrics and Informetrics (15–19 July, 2013), Vienna (Austria) (pp. 237–250). Viena: International Society of Scientometrics and Informetrics. Retrieved from http://www.mtakszi.hu/kszi_aktak/
Thomson Reuters. (2009). ISI Web of Knowledge. Retrieved September 01, 2013, from http://thomsonreuters.com/web‐of‐science/
Vargas‐Quesada, B., & Moya‐Anegón, F. (2007). Visualizing the structure of science. New York: Springer.
Waltman, L., Van Eck, N. J., & Noyons, E. C. M. (2010). A unified approach to mapping and clustering of bibliometric networks. Journal of Informetrics, 4(4), 629–635. doi:10.1016/j.joi.2010.07.002
Waltman, L., & Van Eck, N. J. (2012). A New Methodology for Constructing a Publication‐Level Classification System of Science, 63(12), 2378–2392. doi:10.1002/asi
Zhang, L., Glänzel, W., & Liang, L. (2009). Tracing the role of individual journals in a cross‐citation network based on different indicators. Scientometrics, 81(3), 821–838. doi:10.1007/s11192‐008‐2245‐y
Zhang, L., Janssens, F., Liang, L., & Glänzel, W. (2010). Journal cross‐citation analysis for validation and improvement of journal‐based subject classification in bibliometric research. Scientometrics, 82(3), 687–706. doi:10.1007/s11192‐010‐0180‐1