optimising tropical fruit juice quality using
TRANSCRIPT
Optimising Tropical Fruit Juice Quality Using Thermosonication-AssistedExtraction via Blocked Face-Centered Composite Design
Authors:
Norazlin Abdullah, Nyuk Ling Chin
Date Submitted: 2021-08-02
Keywords: soursop, pomelo, guava, ultrasound, response surface methodology
Abstract:
Extraction of tropical fruit juice using simple, efficient, and environmentally friendly technologies is gaining importance to produce highquality juices. Juice from pink-fleshed guava, pink-fleshed pomelo, and soursop was extracted using direct and indirectthermosonication methods by varying intensity, time, and temperature, and compared to those extracted using water bath incubation.Improvised models of juice yield, ascorbic acid, and total soluble solids responses were generated by eliminating insignificant modelterms of the factors in full quadratic model using backward eliminating procedure. Main effects, 3D, or 4D plots for each response weredeveloped based on factors that influenced the response. Results showed that the best extraction method for guava and pomelo juiceswere within indirect thermosonication method of 1 kW, 55 °C and 30 min, and 2.5 kW, 54 °C and 23 min, respectively. Directthermosonication method at 10% amplitude, 55 °C for 2 to 10 min was more suitable for soursop juice. Thermosonicated extraction oftropical fruit juice can improve its juice yield, ascorbic acid content, and total soluble solids content.
Record Type: Published Article
Submitted To: LAPSE (Living Archive for Process Systems Engineering)
Citation (overall record, always the latest version): LAPSE:2021.0698Citation (this specific file, latest version): LAPSE:2021.0698-1Citation (this specific file, this version): LAPSE:2021.0698-1v1
DOI of Published Version: https://doi.org/10.3390/pr9010003
License: Creative Commons Attribution 4.0 International (CC BY 4.0)
Powered by TCPDF (www.tcpdf.org)

processes
Article
Optimising Tropical Fruit Juice Quality UsingThermosonication-Assisted Extraction via BlockedFace-Centered Composite Design
Norazlin Abdullah 1,2 and Nyuk Ling Chin 2,*
�����������������
Citation: Abdullah N. and Chin N.L.
Optimising Tropical Fruit Juice Qual-
ity Using Thermosonication-Assisted
Extraction via Blocked Face-Centered
Composite Design. Processes 2021, 9,
3. https://dx.doi.org/10.3390/pr9
010003
Received: 26 October 2020
Accepted: 16 November 2020
Published: 22 December 2020
Publisher’s Note: MDPI stays neu-
tral with regard to jurisdictional claims
in published maps and institutional
affiliations.
Copyright: © 2020 by the authors. Li-
censee MDPI, Basel, Switzerland. This
article is an open access article distributed
under the terms and conditions of the
Creative Commons Attribution (CC BY)
license (https://creativecommons.org/
licenses/by/4.0/).
1 Department of Technology and Natural Resources, Faculty of Applied Sciences and Technology,Universiti Tun Hussein Onn Malaysia, UTHM Pagoh Campus, Pagoh Higher Education Hub, KM 1,Jalan Panchor, Muar 84600, Johor, Malaysia; [email protected]
2 Department of Process and Food Engineering, Faculty of Engineering, Universiti Putra Malaysia, UPM,Serdang 43400, Selangor, Malaysia
* Correspondence: [email protected]; Tel.: +60-3-97696353
Abstract: Extraction of tropical fruit juice using simple, efficient, and environmentally friendlytechnologies is gaining importance to produce high quality juices. Juice from pink-fleshed guava,pink-fleshed pomelo, and soursop was extracted using direct and indirect thermosonication methodsby varying intensity, time, and temperature, and compared to those extracted using water bathincubation. Improvised models of juice yield, ascorbic acid, and total soluble solids responses weregenerated by eliminating insignificant model terms of the factors in full quadratic model usingbackward eliminating procedure. Main effects, 3D, or 4D plots for each response were developedbased on factors that influenced the response. Results showed that the best extraction method forguava and pomelo juices were within indirect thermosonication method of 1 kW, 55 ◦C and 30 min,and 2.5 kW, 54 ◦C and 23 min, respectively. Direct thermosonication method at 10% amplitude, 55 ◦Cfor 2 to 10 min was more suitable for soursop juice. Thermosonicated extraction of tropical fruit juicecan improve its juice yield, ascorbic acid content, and total soluble solids content.
Keywords: response surface methodology; ultrasound; guava; pomelo; soursop
1. Introduction
Preserving pink-fleshed guava, pink-fleshed pomelo, and soursop fruits in the formof juice concentrates is useful, as these three fruits are excellent in terms of fighting cancerand are claimed as cancer therapy fruits [1,2]. The pink-fleshed guava contains lycopene,which can prevent skin damage from ultraviolet rays and offers protection from prostatecancer. It is also rich in carotene, which can protect against lung and oral cavity cancers.The high vitamin C content of the pink-fleshed pomelo helps to strengthen and maintainelasticity of arteries. In addition to being good for the digestive system, pomelo can aidin weight loss process because the fat burning enzyme in pomelo can help to absorband reduce starch and sugar in the body. The pink-fleshed pomelo is slightly sweeterand more nutritious than other pomelos because of its darker pigment. Soursop pulpis white and juicy and has a delightful sour-sweet aroma with a yogurt-like taste [3],in addition to containing annonaceous acetogenins, which are prostate cancer chemo-preventive compounds [1]. The fruit is widely used in anticancer folk therapies in North,Central, and South America, and Southeast Asia [4].
In the ascending order of the amount of free-run juice from fresh fruit, the pink-fleshedguava ranks the lowest, followed by the soursop, and pink-fleshed pomelo. The pink-fleshed guava and soursop both contain high starch levels of 13% [5] and 27.3% [6],respectively. The high starch content and the thick, creamy, and fleshy, pink-fleshed guavaand soursop pulps result in difficulty in cell wall disruption of the fruit tissue. Thus, only a
Processes 2021, 9, 3. https://dx.doi.org/10.3390/pr9010003 https://www.mdpi.com/journal/processes
Processes 2021, 9, 3 2 of 15
small amount of juice can be pressed or squeezed out. A more advanced extraction processis needed for production of these fruit juices. The pink-fleshed pomelo fruit, which isnon-starchy [7] and has high watery properties, can serve as a control for extraction pro-cess comparisons.
Ultrasound is well known for its use in inactivating food spoilage, yeast, and pathogenicmicroorganisms [8–13]. In juice extraction, ultrasound can produce greater yields ofjuice [14], reduce time of juice extraction because of heat and mass transfer enhance-ment, and save extraction energy via facilitating extraction at medium temperature lev-els. The combination of low frequency ultrasound with mild heat can help in reducingprocessing temperature and time by 16 and 55%, respectively, minimising the negativeeffects on fruit juices quality and makes the processing more economically feasible [15].The combination of ultrasound and mild heat treatment is also known as thermosonication.The thermosonication treatment is useful in acting against thermo-resistant enzymes whereit is difficult to denature by thermal treatment alone. The use of extreme heat could lead toadverse changes in juice quality like cooked flavour and caramelisation [15–19]. Since en-zymes are more thermo-resistant than microorganisms in citrus juices, the inactivation ofenzymes promises achievement of required number of microbial destruction for spoilageprevention [20]. The thermosonication treatment can also penetrate fruit cell walls andrelease cell contents trapped inside fruit tissues. Although ultrasonically assisted extractionprocesses are able to release contents such as sugar, medicinal compounds, carotenoids,and protein from biological materials by disrupting cell walls [21,22], such techniques havenot been used to extract juice from difficult-to-juice produce such as those having highstarch content and creamy fruit pulp. Sin et al. [23] and Lee et al. [24] applied hot water ex-traction method to extract sapodilla and banana juice, respectively, while Cendres et al. [25]extracted juice from grapes, plums, and apricots using microwaves.
In extraction experiments that cannot be completed within a day, a blocking approachis used to obtain more precise and consistent results. The blocked face-centred centralcomposite design, an experimental design in response surface methodology (RSM) is usedto generate predictive equations to optimise thermosonic-assisted juice extraction processas opposed to the unblocked face-centred central composite design used in optimising hotwater extraction for sapodilla juice [23] and banana juice [24]. The objective of this studywas to determine the optimum extraction method and conditions for producing higherjuice yield with maximum ascorbic acid and total soluble solids levels of pink-fleshedguava, pink-fleshed pomelo, and soursop fruit juices.
2. Materials and Methods2.1. Fruit Pulp Preparation
Matured, pink-fleshed guava fruits at 75% ripeness with a pronounced typical aromaand yellow skin were purchased from Sime Darby Beverages Sdn. Bhd. The ripened fruitswere washed under running tap water and any floral remnants at the apex were removedafter the outer part dried. Then, the tip ends were cut with a sharp knife prior to dicing thefruit into small pieces.
Pink-fleshed pomelo fruits were purchased from Perniagaan Buah-buahan Ah Yew,Bidor, Perak. Pomelo with yellow rinds were chosen for peeling process. The very thickspongy rind was cut into four sections as close as possible to the flesh of the pomelo.Each section of peel was pulled away from the fruit prior to slicing the fruit and breaking itin half. The seeds and remaining pith, which are bitter, were completely removed.
Matured green soursop fruits were purchased from Federal Agricultural MarketingAuthority (FAMA) of Malaysia. The fruits were allowed to ripen in an air-conditioned(18 ± 2 ◦C) room for 3 to 4 days prior to processing. They were considered ripened whenthey were soft to touch and the shiny green colour turned to lack-lustre green or yellowish-green. Approximately 5 kg of ripened fruits were processed while waiting for remainingfruits to ripen within 1 to 2 days. The fruits were washed and cut into half, cored, their skinhand-peeled, and seeds removed from the pulp manually.
Processes 2021, 9, 3 3 of 15
For each fruit, 2.5 kg of pulp was crushed into a mash using a 1300 W commercial foodblender (XB409, Ceado, Italy) with a pulse duration of 60 s at a high speed of 28,000 rpm,then 30 s off and 60 s at a low speed of 22,000 rpm for complete homogenisation ofpulp mash.
2.2. Thermosonic-Assisted Extraction
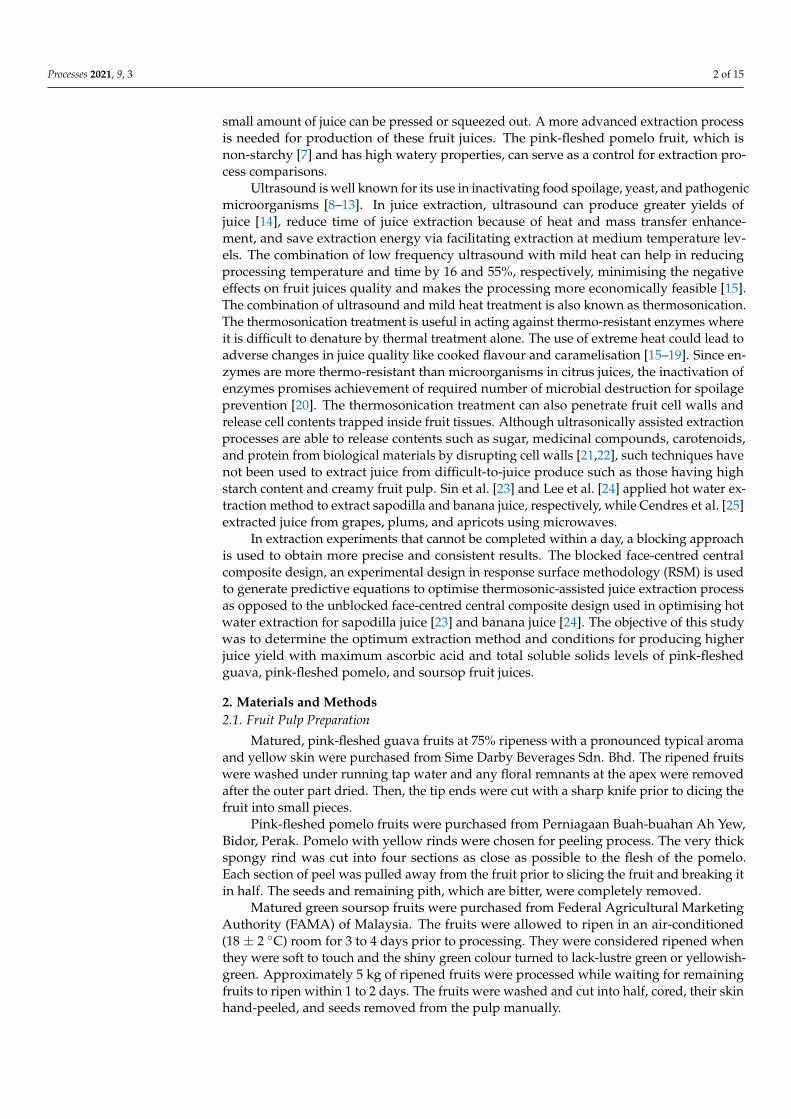
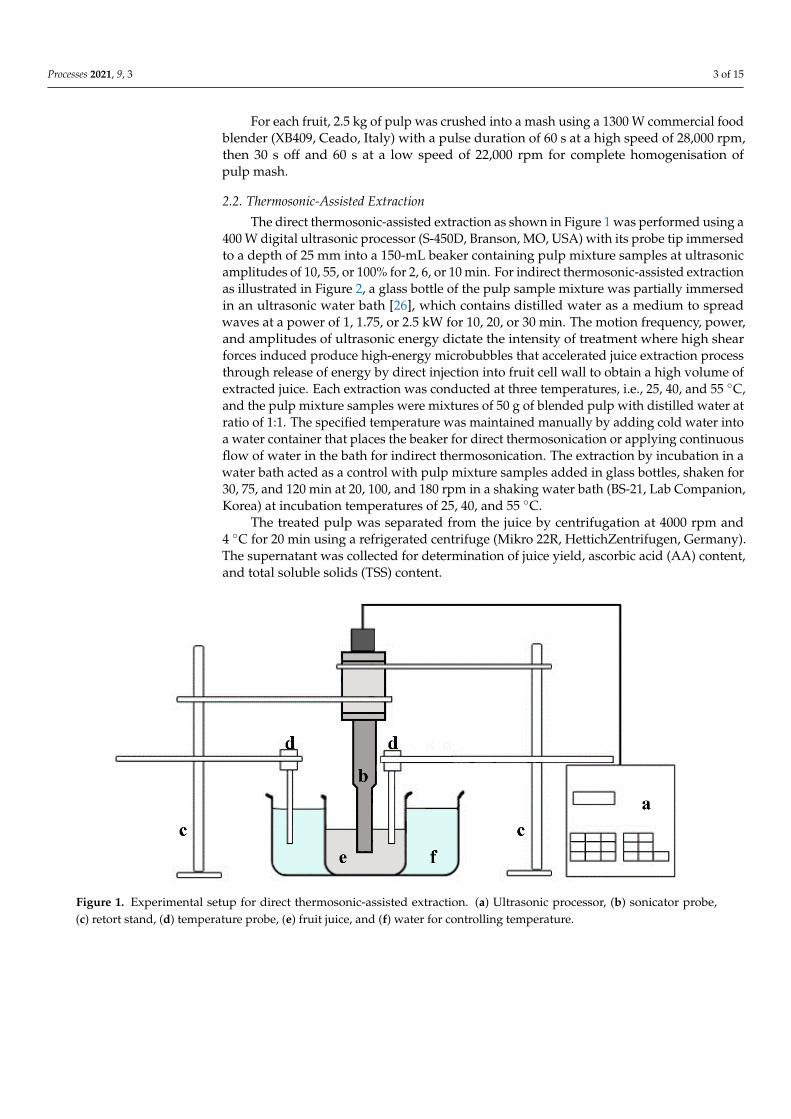
The direct thermosonic-assisted extraction as shown in Figure 1 was performed using a400 W digital ultrasonic processor (S-450D, Branson, MO, USA) with its probe tip immersedto a depth of 25 mm into a 150-mL beaker containing pulp mixture samples at ultrasonicamplitudes of 10, 55, or 100% for 2, 6, or 10 min. For indirect thermosonic-assisted extractionas illustrated in Figure 2, a glass bottle of the pulp sample mixture was partially immersedin an ultrasonic water bath [26], which contains distilled water as a medium to spreadwaves at a power of 1, 1.75, or 2.5 kW for 10, 20, or 30 min. The motion frequency, power,and amplitudes of ultrasonic energy dictate the intensity of treatment where high shearforces induced produce high-energy microbubbles that accelerated juice extraction processthrough release of energy by direct injection into fruit cell wall to obtain a high volume ofextracted juice. Each extraction was conducted at three temperatures, i.e., 25, 40, and 55 ◦C,and the pulp mixture samples were mixtures of 50 g of blended pulp with distilled water atratio of 1:1. The specified temperature was maintained manually by adding cold water intoa water container that places the beaker for direct thermosonication or applying continuousflow of water in the bath for indirect thermosonication. The extraction by incubation in awater bath acted as a control with pulp mixture samples added in glass bottles, shaken for30, 75, and 120 min at 20, 100, and 180 rpm in a shaking water bath (BS-21, Lab Companion,Korea) at incubation temperatures of 25, 40, and 55 ◦C.
The treated pulp was separated from the juice by centrifugation at 4000 rpm and4 ◦C for 20 min using a refrigerated centrifuge (Mikro 22R, HettichZentrifugen, Germany).The supernatant was collected for determination of juice yield, ascorbic acid (AA) content,and total soluble solids (TSS) content.
Processes 2020, 8, x FOR PEER REVIEW 3 of 15
For each fruit, 2.5 kg of pulp was crushed into a mash using a 1300 W commercial food blender (XB409, Ceado, Italy) with a pulse duration of 60 s at a high speed of 28,000 rpm, then 30 s off and 60 s at a low speed of 22,000 rpm for complete homogenisation of pulp mash.
2.2. Thermosonic-Assisted Extraction
The direct thermosonic-assisted extraction as shown in Figure 1 was performed using a 400 W digital ultrasonic processor (S-450D, Branson, MO, USA) with its probe tip immersed to a depth of 25 mm into a 150-mL beaker containing pulp mixture samples at ultrasonic amplitudes of 10, 55, or 100% for 2, 6, or 10 min. For indirect thermosonic-assisted extraction as illustrated in Figure 2, a glass bottle of the pulp sample mixture was partially immersed in an ultrasonic water bath [26], which contains distilled water as a medium to spread waves at a power of 1, 1.75, or 2.5 kW for 10, 20, or 30 min. The motion frequency, power, and amplitudes of ultrasonic energy dictate the intensity of treatment where high shear forces induced produce high-energy microbubbles that accelerated juice extraction process through release of energy by direct injection into fruit cell wall to obtain a high volume of extracted juice. Each extraction was conducted at three temperatures, i.e., 25, 40, and 55 °C, and the pulp mixture samples were mixtures of 50 g of blended pulp with distilled water at ratio of 1:1. The specified temperature was maintained manually by adding cold water into a water container that places the beaker for direct thermosonication or applying continuous flow of water in the bath for indirect thermosonication. The extraction by incubation in a water bath acted as a control with pulp mixture samples added in glass bottles, shaken for 30, 75, and 120 min at 20, 100, and 180 rpm in a shaking water bath (BS-21, Lab Companion, Korea) at incubation temperatures of 25, 40, and 55 °C.
The treated pulp was separated from the juice by centrifugation at 4000 rpm and 4 °C for 20 min using a refrigerated centrifuge (Mikro 22R, HettichZentrifugen, Germany). The supernatant was collected for determination of juice yield, ascorbic acid (AA) content, and total soluble solids (TSS) content.
Figure 1. Experimental setup for direct thermosonic-assisted extraction. (a) Ultrasonic processor, (b) sonicator probe, (c) retort stand, (d) temperature probe, (e) fruit juice, and (f) water for controlling temperature.
Figure 1. Experimental setup for direct thermosonic-assisted extraction. (a) Ultrasonic processor, (b) sonicator probe,(c) retort stand, (d) temperature probe, (e) fruit juice, and (f) water for controlling temperature.
Processes 2021, 9, 3 4 of 15
Processes 2020, 8, x FOR PEER REVIEW 4 of 15
Figure 2. Experimental setup for indirect thermosonic-assisted extraction. (a) Ultrasonic generator, (b) transducer, (c) water inlet valve, (d) water drain valve, (e) retort stand, (f) ultrasonic tank, (g) fruit juice, (h) overflow outlet, (i) heater, and (j) temperature probe.
2.3. Blocked Face-Centred Central Composite Design
The blocked face-centred central composite design provides high-quality predictions over the entire design space and does not require using points outside the original factor range. Blocking was required to increase precision of experiments as variations of each batch of fruits could not be controlled, and all runs could not be completed within a day. Face-centred refers to alpha value of one and was chosen because the points were at operational limits, and equipment used could set the parameters to certain values only. The combination of factors for each run was generated and arranged using commercial software (MINITAB® Release 14, Minitab Inc., State College, PA, USA).
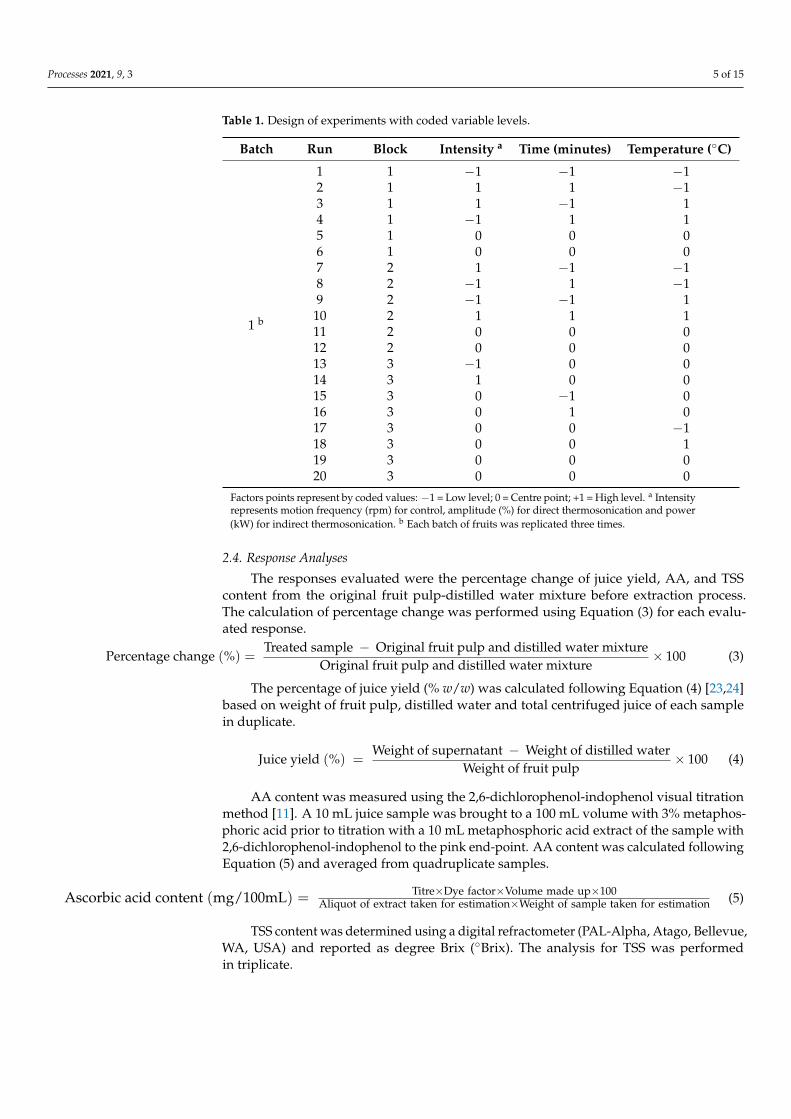
Table 1 shows experimental runs designed for one batch of fruits. There were 20 runs for each batch of fruits with three replications for each block and batch varying three factors, intensity, time, and temperature, at three levels, −1, 0, and 1, which gave total runs of 60. Responses were measured as percentage change of juice yield, ascorbic acid (AA), and total soluble solids (TSS) content. Fitted regression models were obtained using MINITAB, whereas 4D surface plot was generated using ThreeDify Excel Grapher (v.3.3.8, ThreeDify Inc., Ottawa, ON, Canada) software. The plotted graph chosen depended on the significant factors involved in the improvised models.
The second-order model is widely used in RSM because of its flexibility in taking on a wide variety of functional forms and a good capability to estimate the true response surface [27]. As blocking was used in this study, the second-order model, Equations (1) and (2), were necessary to fit the data [28,29]. The best-fitted models were chosen, and values for the combined factors that satisfied all optimum responses simultaneously were generated.
< ===
++++++++++++=i
k
jjiij
k
jjjj
k
jjj xxxxY
21
2
10908070605040302010 βββββββββββββ
(1)
( )080706050403020109 βββββββββ +++++++−= (2)
where Y is the response; β0 is the constant for intercept; β01 to β09 are the constant for blocks; βj is the linear coefficient; βjj is the quadratic coefficient, and βij is the interaction coefficient. xi and xj are independent variables (i and j are in the range of 1 to k). k is the number of independent variables (k = 3).
Figure 2. Experimental setup for indirect thermosonic-assisted extraction. (a) Ultrasonic generator, (b) transducer, (c) waterinlet valve, (d) water drain valve, (e) retort stand, (f) ultrasonic tank, (g) fruit juice, (h) overflow outlet, (i) heater, and (j)temperature probe.
2.3. Blocked Face-Centred Central Composite Design
The blocked face-centred central composite design provides high-quality predictionsover the entire design space and does not require using points outside the original factorrange. Blocking was required to increase precision of experiments as variations of eachbatch of fruits could not be controlled, and all runs could not be completed within aday. Face-centred refers to alpha value of one and was chosen because the points were atoperational limits, and equipment used could set the parameters to certain values only.The combination of factors for each run was generated and arranged using commercialsoftware (MINITAB® Release 14, Minitab Inc., State College, PA, USA).
Table 1 shows experimental runs designed for one batch of fruits. There were 20 runsfor each batch of fruits with three replications for each block and batch varying three factors,intensity, time, and temperature, at three levels, −1, 0, and 1, which gave total runs of 60.Responses were measured as percentage change of juice yield, ascorbic acid (AA), andtotal soluble solids (TSS) content. Fitted regression models were obtained using MINITAB,whereas 4D surface plot was generated using ThreeDify Excel Grapher (v.3.3.8, ThreeDifyInc., Ottawa, ON, Canada) software. The plotted graph chosen depended on the significantfactors involved in the improvised models.
The second-order model is widely used in RSM because of its flexibility in taking on awide variety of functional forms and a good capability to estimate the true response sur-face [27]. As blocking was used in this study, the second-order model, Equations (1) and (2),were necessary to fit the data [28,29]. The best-fitted models were chosen, and values forthe combined factors that satisfied all optimum responses simultaneously were generated.
Y = β0 + β01 + β02 + β03 + β04 + β05 + β06 + β07 + β08 + β09 +k
∑j=1
β jxj +k
∑j=1
β jjx2j + ∑
i<
k
∑j=2
βijxixj (1)
β09 = −(β01 + β02 + β03 + β04 + β05 + β06 + β07 + β08) (2)
where Y is the response; β0 is the constant for intercept; β01 to β09 are the constant forblocks; βj is the linear coefficient; βjj is the quadratic coefficient, and βij is the interactioncoefficient. xi and xj are independent variables (i and j are in the range of 1 to k). k is thenumber of independent variables (k = 3).
Processes 2021, 9, 3 5 of 15
Table 1. Design of experiments with coded variable levels.
Batch Run Block Intensity a Time (minutes) Temperature (◦C)
1 b
1 1 −1 −1 −12 1 1 1 −13 1 1 −1 14 1 −1 1 15 1 0 0 06 1 0 0 07 2 1 −1 −18 2 −1 1 −19 2 −1 −1 1
10 2 1 1 111 2 0 0 012 2 0 0 013 3 −1 0 014 3 1 0 015 3 0 −1 016 3 0 1 017 3 0 0 −118 3 0 0 119 3 0 0 020 3 0 0 0
Factors points represent by coded values: −1 = Low level; 0 = Centre point; +1 = High level. a Intensityrepresents motion frequency (rpm) for control, amplitude (%) for direct thermosonication and power(kW) for indirect thermosonication. b Each batch of fruits was replicated three times.
2.4. Response Analyses
The responses evaluated were the percentage change of juice yield, AA, and TSScontent from the original fruit pulp-distilled water mixture before extraction process.The calculation of percentage change was performed using Equation (3) for each evalu-ated response.
Percentage change (%) =Treated sample − Original fruit pulp and distilled water mixture
Original fruit pulp and distilled water mixture× 100 (3)
The percentage of juice yield (% w/w) was calculated following Equation (4) [23,24]based on weight of fruit pulp, distilled water and total centrifuged juice of each samplein duplicate.
Juice yield (%) =Weight of supernatant − Weight of distilled water
Weight of fruit pulp× 100 (4)
AA content was measured using the 2,6-dichlorophenol-indophenol visual titrationmethod [11]. A 10 mL juice sample was brought to a 100 mL volume with 3% metaphos-phoric acid prior to titration with a 10 mL metaphosphoric acid extract of the sample with2,6-dichlorophenol-indophenol to the pink end-point. AA content was calculated followingEquation (5) and averaged from quadruplicate samples.
Ascorbic acid content (mg/100mL) = Titre×Dye factor×Volume made up×100Aliquot of extract taken for estimation×Weight of sample taken for estimation (5)
TSS content was determined using a digital refractometer (PAL-Alpha, Atago, Bellevue,WA, USA) and reported as degree Brix (◦Brix). The analysis for TSS was performedin triplicate.
Processes 2021, 9, 3 6 of 15
3. Results and Discussion3.1. Materials Characterisation
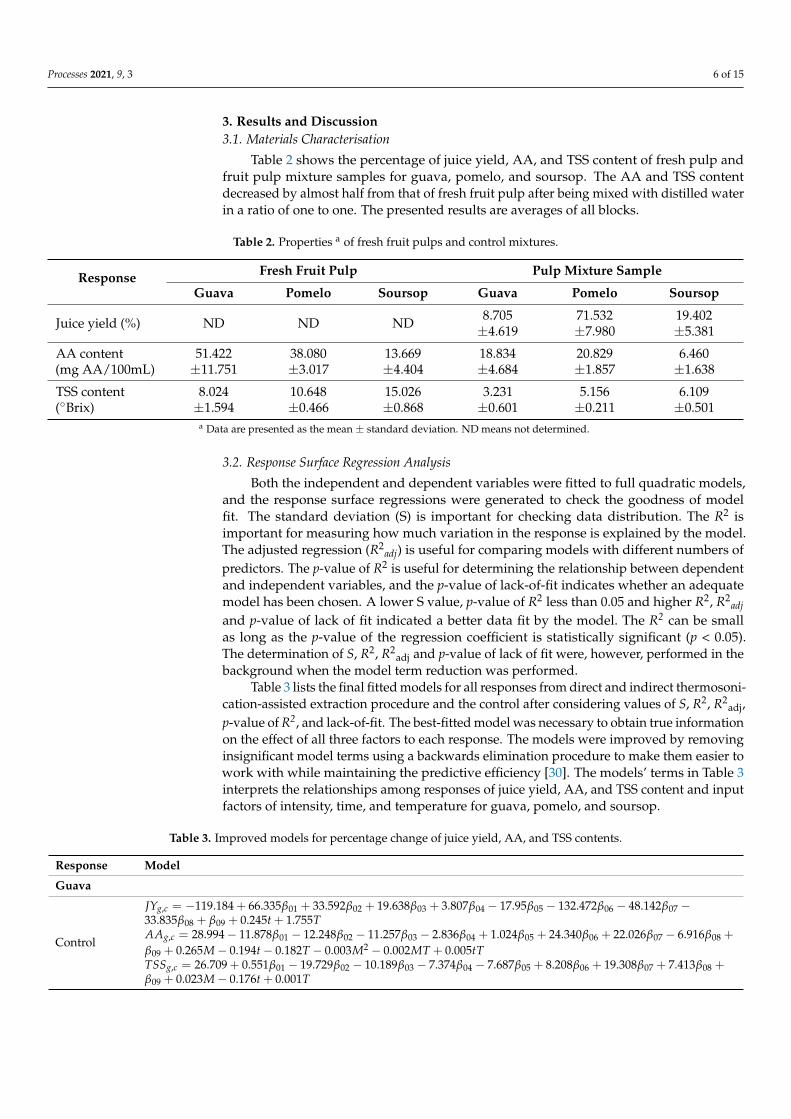
Table 2 shows the percentage of juice yield, AA, and TSS content of fresh pulp andfruit pulp mixture samples for guava, pomelo, and soursop. The AA and TSS contentdecreased by almost half from that of fresh fruit pulp after being mixed with distilled waterin a ratio of one to one. The presented results are averages of all blocks.
Table 2. Properties a of fresh fruit pulps and control mixtures.
Response Fresh Fruit Pulp Pulp Mixture Sample
Guava Pomelo Soursop Guava Pomelo Soursop
Juice yield (%) ND ND ND 8.705±4.619
71.532±7.980
19.402±5.381
AA content(mg AA/100mL)
51.422±11.751
38.080±3.017
13.669±4.404
18.834±4.684
20.829±1.857
6.460±1.638
TSS content(◦Brix)
8.024±1.594
10.648±0.466
15.026±0.868
3.231±0.601
5.156±0.211
6.109±0.501
a Data are presented as the mean ± standard deviation. ND means not determined.
3.2. Response Surface Regression Analysis
Both the independent and dependent variables were fitted to full quadratic models,and the response surface regressions were generated to check the goodness of modelfit. The standard deviation (S) is important for checking data distribution. The R2 isimportant for measuring how much variation in the response is explained by the model.The adjusted regression (R2
adj) is useful for comparing models with different numbers ofpredictors. The p-value of R2 is useful for determining the relationship between dependentand independent variables, and the p-value of lack-of-fit indicates whether an adequatemodel has been chosen. A lower S value, p-value of R2 less than 0.05 and higher R2, R2
adj
and p-value of lack of fit indicated a better data fit by the model. The R2 can be smallas long as the p-value of the regression coefficient is statistically significant (p < 0.05).The determination of S, R2, R2
adj and p-value of lack of fit were, however, performed in thebackground when the model term reduction was performed.
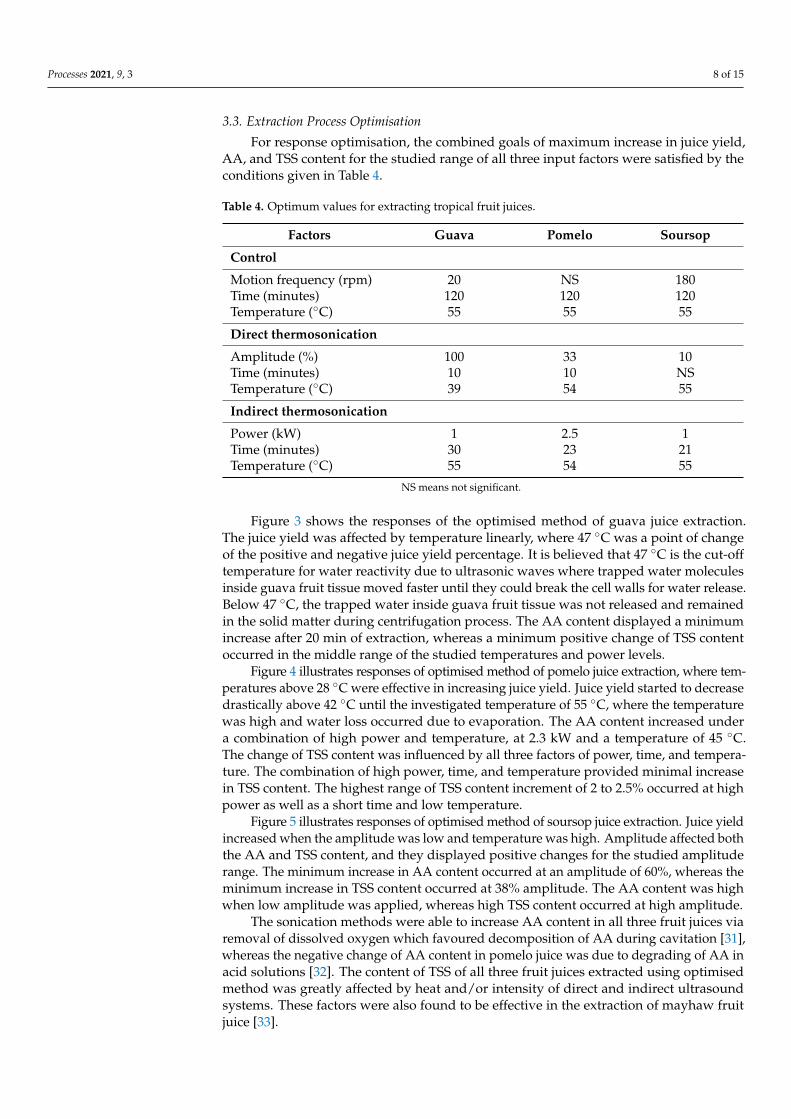
Table 3 lists the final fitted models for all responses from direct and indirect thermosoni-cation-assisted extraction procedure and the control after considering values of S, R2, R2
adj,p-value of R2, and lack-of-fit. The best-fitted model was necessary to obtain true informationon the effect of all three factors to each response. The models were improved by removinginsignificant model terms using a backwards elimination procedure to make them easier towork with while maintaining the predictive efficiency [30]. The models’ terms in Table 3interprets the relationships among responses of juice yield, AA, and TSS content and inputfactors of intensity, time, and temperature for guava, pomelo, and soursop.
Table 3. Improved models for percentage change of juice yield, AA, and TSS contents.
Response Model
Guava
Control
JYg,c = −119.184 + 66.335β01 + 33.592β02 + 19.638β03 + 3.807β04 − 17.95β05 − 132.472β06 − 48.142β07 −33.835β08 + β09 + 0.245t + 1.755TAAg,c = 28.994 − 11.878β01 − 12.248β02 − 11.257β03 − 2.836β04 + 1.024β05 + 24.340β06 + 22.026β07 − 6.916β08 +
β09 + 0.265M − 0.194t − 0.182T − 0.003M2 − 0.002MT + 0.005tTTSSg,c = 26.709 + 0.551β01 − 19.729β02 − 10.189β03 − 7.374β04 − 7.687β05 + 8.208β06 + 19.308β07 + 7.413β08 +β09 + 0.023M − 0.176t + 0.001T

Processes 2021, 9, 3 7 of 15
Table 3. Cont.
Response Model
Direct thermo-sonication
JYg,ds = −358.544 + 29.421β01 + 42.911β02 + 33.138β03 + 75.117β04 + 19.311β05 − 80.813β06 − 53.193β07 −30.769β08 + β09 − 4.454A + 20.147T + 0.032A2 − 0.257T2
AAg,ds = 1.967 − 4.092β01 − 4.647β02 + 2.543β03 − 9.729β04 − 5.947β05 + 12.754β06 + 19.029β07 − 9.351β08 + β09 +0.192A + 1.125tTSSg,ds = 1.849 + 9.301β01 − 12.067β02 − 3.032β03 − 5.049β04 − 2.751β05 + 1.509β06 + 4.093β07 + 2.321β08 + β09 +
0.382A + 0.529t − 0.002A2
Indirectthermo-sonication
JYg,is = −207.698 + 8.571β01 + 22.168β02 + 9.177β03 + 18.419β04 − 35.592β05 − 44.681β06 − 60.351β07 −88.409β08 + β09 + 4.323TAAg,is = 35.697 − 0.757β01 − 6.128β02 + 1.696β03 − 8.022β04 − 5.418β05 + 12.125β06 + 24.723β07 − 11.015β08 +
β09 − 1.844t + 0.047t2
TSSg,is = 59.548 + 2.596β01 − 15.611β02 − 8.043β03 − 6.927β04 − 3.599β05 + 9.601β06 + 11.603β07 + 2.356β08 +
β09 − 23.038P − 1.082T + 6.491P2 + 0.014T2
Pomelo
Control
JYp,c =−14.473+ 1.021β01 − 11.193β02 − 8.285β03 − 7.267β04 − 10.846β05 + 13.429β06 − 4.978β07 + 4.132β08 + β09 + 0.368TAAp,c =−6.706 + 1.924β01 − 2.790β02 + 5.741β03 − 3.565β04 − 8.983β05 + 4.753β06 + 0.193β07 − 0.752β08 + β09 + 0.0356tTSSp,c = −4.672 − 0.739β01 + 0.410β02 − 1.101β03 − 0.531β04 + 3.331β05 + 1.204β06 − 0.425β07 − 0.328β08 + β09 +
0.005t + 0.221T − 0.002T2
Direct thermo-sonication
JYp,ds = 4.929 + 3.142β01 + 9.273β02 − 4.372β03 − 6.998β04 − 5.789β05 + 5.629β06 − 5.781β07 + 6.174β08 + β09 −0.021A + 0.135t − 0.013AtAAp,ds = −23.401 + 3.475β01 + 1.600β02 + 5.993β03 − 4.219β04 − 9.351β05 + 0.359β06 − 0.648β07 − 0.691β08 +
β09 + 0.067A + 0.016t + 0.929T − 0.009T2 − 0.002ATTSSp,ds = −0.730 − 0.184β01 − 0.070β02 − 1.784β03 − 0.796β04 + 3.026β05 + 1.182β06 + 0.682β07 + 0.524β08 +β09 + 0.008A + 0.034t + 0.029T + 0.003At
Indirectthermo-sonication
JYp,is = −35.908 + 2.264β01 + 7.274β02 − 9.292β03 − 2.880β04 − 14.726β05 + 11.261β06 − 2.517β07 + 5.100β08 +
β09 + 1.861T − 0.021T2
AAp,is = 1.272 + 2.407β01 − 1.476β02 + 4.210β03 − 2.825β04 − 7.596β05 − 1.258β06 + 2.863β07 − 0.667β08 + β09 −2.134P − 0.164T + 0.101PTTSSp,is = −1.735 + 0.367β01 − 0.463β02 − 1.477β03 − 0.330β04 + 2.693β05 + 1.545β06 − 0.429β07 − 0.033β08 + β09 +
1.682P + 0.199t − 0.034T − 0.782P2 − 0.004t2 + 0.031PT
Soursop
Control
JYs,c = −98.879 − 9.461β01 − 40.967β02 − 28.190β03 + 39.719β04 − 20.356β05 + 0.347β06 + 2.809β07 + 10.248β08 +β09 + 0.272M + 0.197t + 1.456TAAs,c =6.471+ 14.336β01 − 22.515β02 + 8.432β03 + 24.046β04 − 12.567β05 + 1.852β06 − 5.9679β07 − 7.471β08 + β09 − 0.290TTSSs,c = −6.729 − 2.236β01 + 7.774β02 − 9.679β03 + 21.366β04 − 6.394β05 − 6.120β06 − 8.946β07 + 7.293β08 +β09 + 0.001M + 0.414T + 0.001M2 − 0.002MT
Direct thermo-sonication
JYs,ds = −8.500 + 0.887β01 − 17.136β02 − 6.785β03 − 37.821β04 + 17.277β05 + 14.581β06 − 2.340β07 − 8.890β08 +β09 − 0.779A + 0.427TAAs,ds = 17.871 + 5.324β01 − 23.631β02 + 18.792β03 + 14.569β04 − 13.571β05 + 21.751β06 − 13.381β07 − 3.718β08 +
β09 − 0.576A + 0.005A2
TSSs,ds = 9.100 − 3.037β01 + 6.608β02 − 9.097β03 + 13.090β04 − 6.514β05 − 6.467β06 − 6.879β07 + 10.683β08 +
β09 − 0.152A + 0.002A2
Indirectthermo-sonication
JYs,is = −183.544 + 1.882β01 − 40.425β02 − 32.511β03 + 20.379β04 − 7.181β05 − 15.234β06 + 7.54β07 + 30.705β08 +β09 + 10.345t + 1.758T − 0.248t2
AAs,is =10.877 + 4.169β01 − 25.789β02 + 23.169β03 + 7.841β04 − 16.359β05 − 4.051β06 + 1.871β07 + 7.278β08 + β09 − 0.319TTSSs,is = 1.909 − 1.125β01 + 7.76β02 − 10.196β03 + 13.617β04 − 7.685β05 − 4.491β06 − 7.662β07 + 10.642β08 +β09 − 7.420P + 0.362T + 4.191P2 − 0.1400PT
JY = juice yield; g = guava; p = pomelo; s = soursop; c = control; ds = direct thermosonication; is = indirect thermosonication; M = motionfrequency; t = time; T = temperature; A = amplitude; P = power, β01 to β09 are the constant for blocks: at each block, one of them is equal to1 for involved block, whereas the rest are equal to zero, except for β09 (Equation (2)).
Processes 2021, 9, 3 8 of 15
3.3. Extraction Process Optimisation
For response optimisation, the combined goals of maximum increase in juice yield,AA, and TSS content for the studied range of all three input factors were satisfied by theconditions given in Table 4.
Table 4. Optimum values for extracting tropical fruit juices.
Factors Guava Pomelo Soursop
Control
Motion frequency (rpm) 20 NS 180Time (minutes) 120 120 120Temperature (◦C) 55 55 55
Direct thermosonication
Amplitude (%) 100 33 10Time (minutes) 10 10 NSTemperature (◦C) 39 54 55
Indirect thermosonication
Power (kW) 1 2.5 1Time (minutes) 30 23 21Temperature (◦C) 55 54 55
NS means not significant.
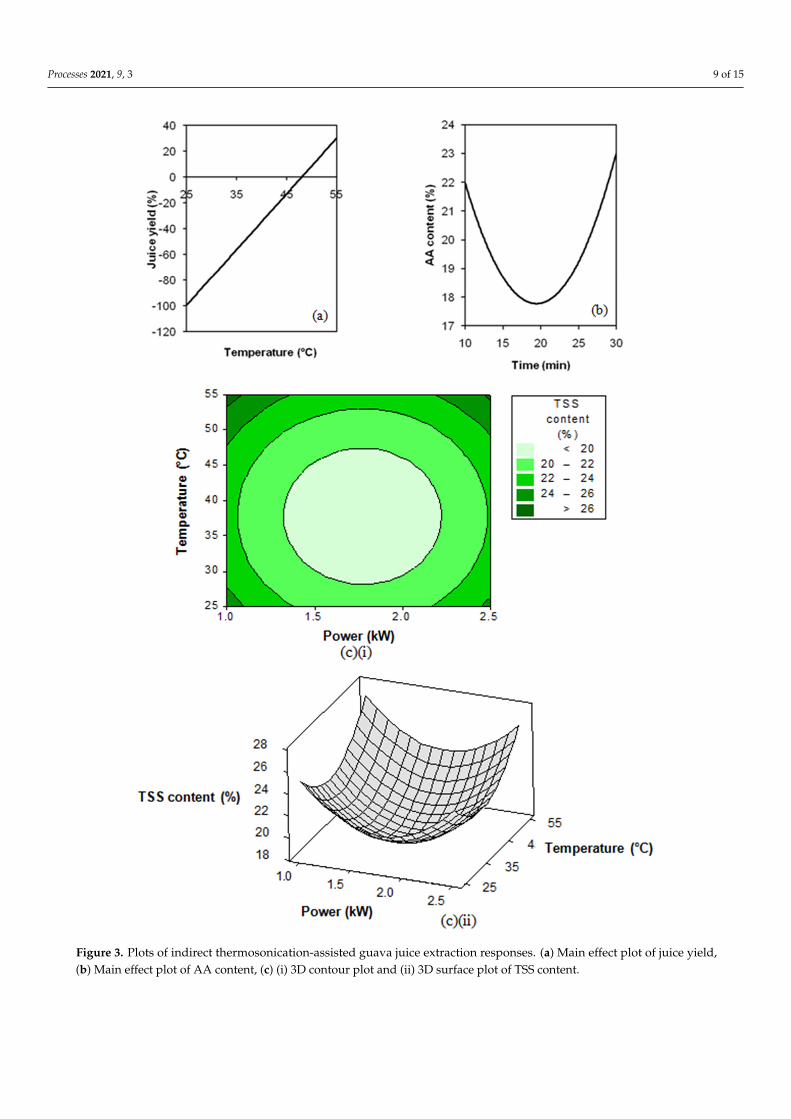
Figure 3 shows the responses of the optimised method of guava juice extraction.The juice yield was affected by temperature linearly, where 47 ◦C was a point of changeof the positive and negative juice yield percentage. It is believed that 47 ◦C is the cut-offtemperature for water reactivity due to ultrasonic waves where trapped water moleculesinside guava fruit tissue moved faster until they could break the cell walls for water release.Below 47 ◦C, the trapped water inside guava fruit tissue was not released and remainedin the solid matter during centrifugation process. The AA content displayed a minimumincrease after 20 min of extraction, whereas a minimum positive change of TSS contentoccurred in the middle range of the studied temperatures and power levels.
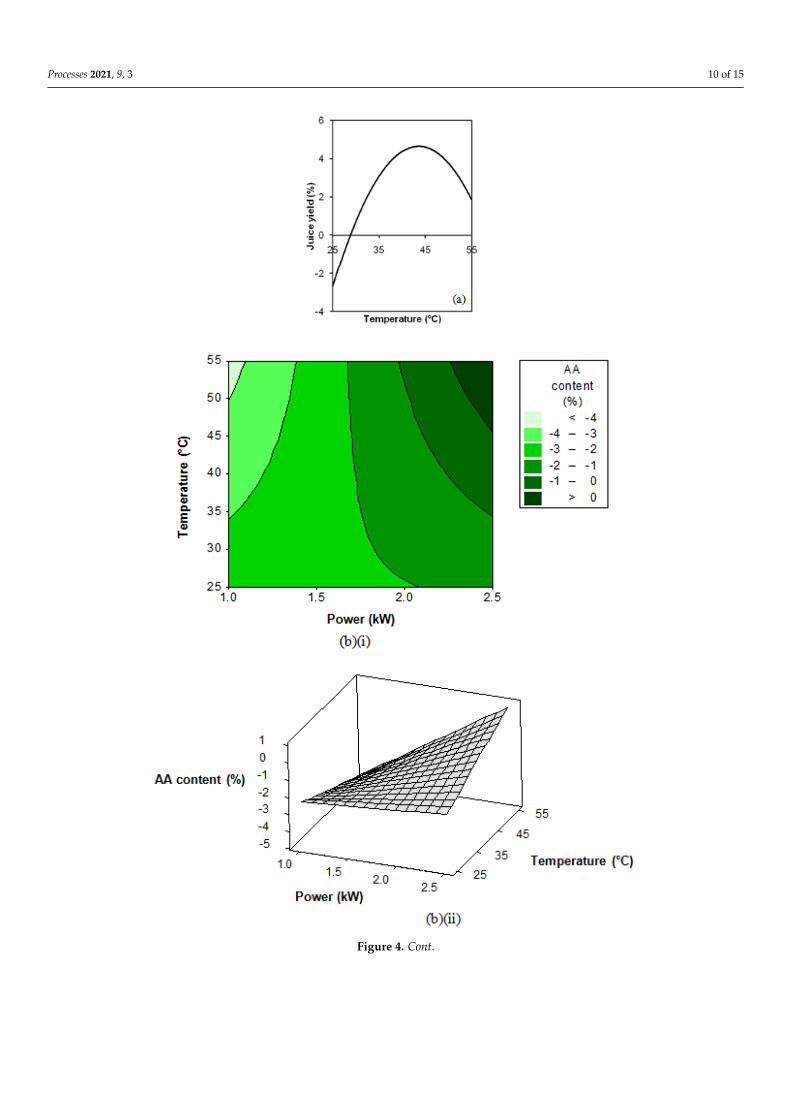
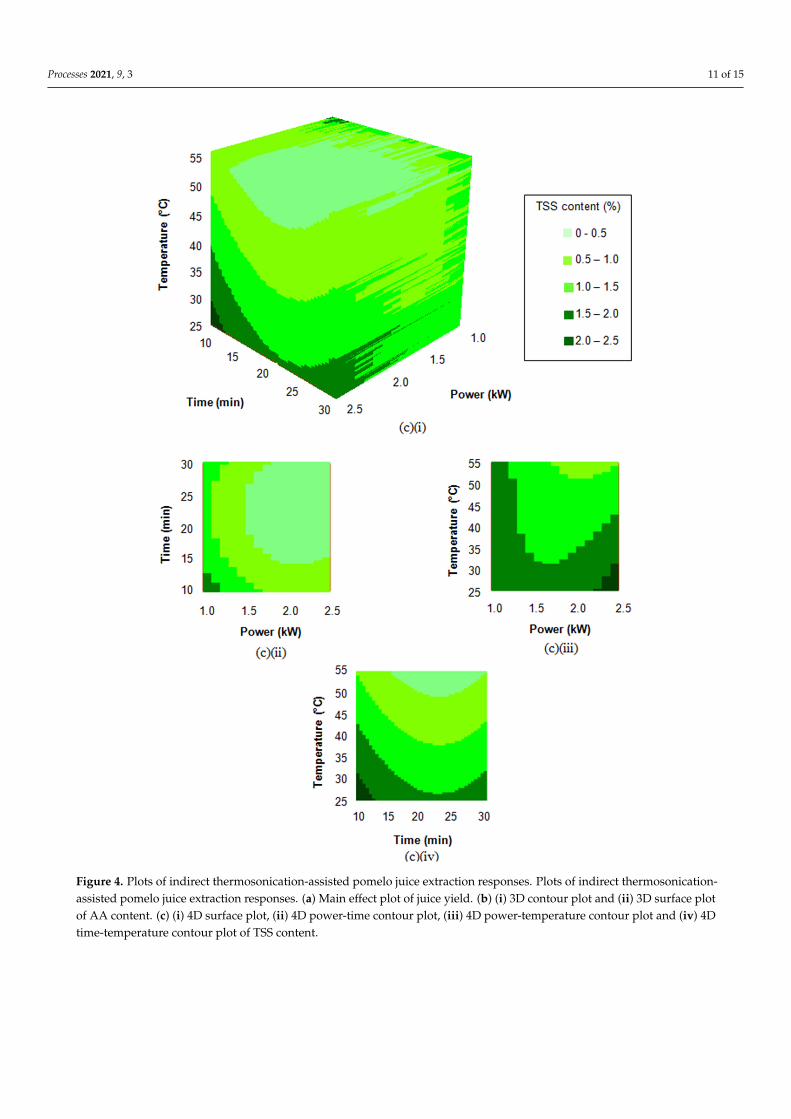
Figure 4 illustrates responses of optimised method of pomelo juice extraction, where tem-peratures above 28 ◦C were effective in increasing juice yield. Juice yield started to decreasedrastically above 42 ◦C until the investigated temperature of 55 ◦C, where the temperaturewas high and water loss occurred due to evaporation. The AA content increased undera combination of high power and temperature, at 2.3 kW and a temperature of 45 ◦C.The change of TSS content was influenced by all three factors of power, time, and tempera-ture. The combination of high power, time, and temperature provided minimal increasein TSS content. The highest range of TSS content increment of 2 to 2.5% occurred at highpower as well as a short time and low temperature.
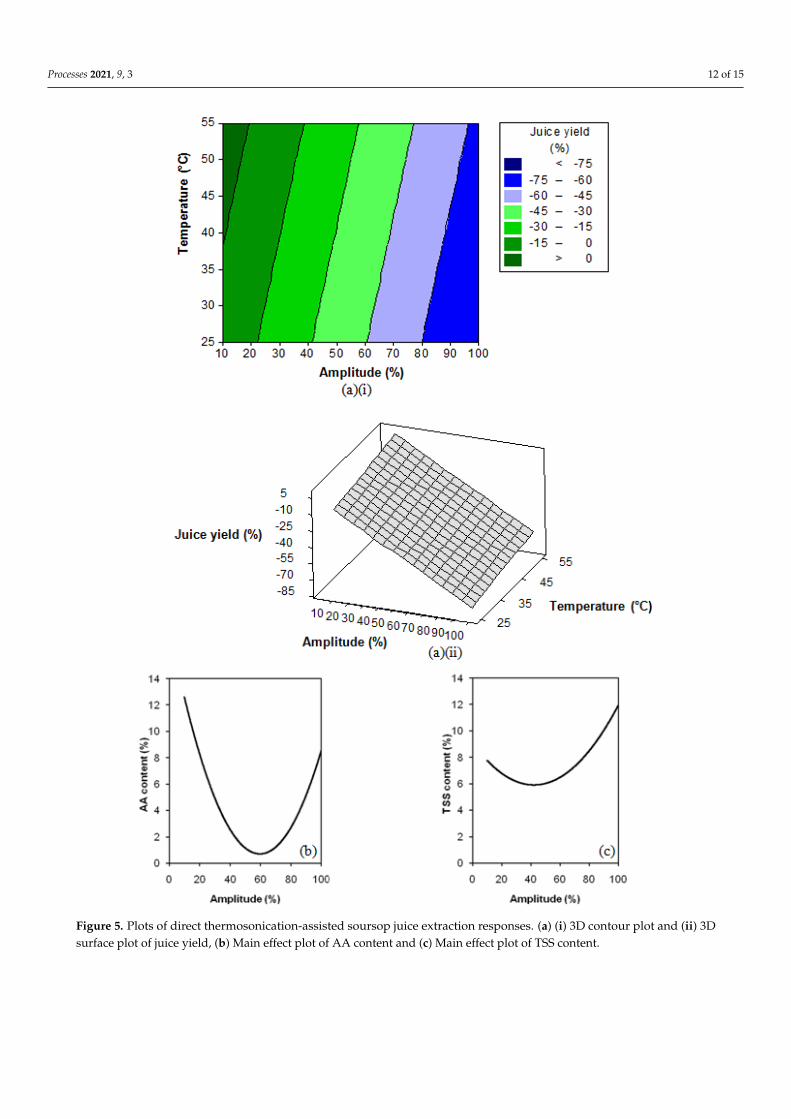
Figure 5 illustrates responses of optimised method of soursop juice extraction. Juice yieldincreased when the amplitude was low and temperature was high. Amplitude affected boththe AA and TSS content, and they displayed positive changes for the studied amplituderange. The minimum increase in AA content occurred at an amplitude of 60%, whereas theminimum increase in TSS content occurred at 38% amplitude. The AA content was highwhen low amplitude was applied, whereas high TSS content occurred at high amplitude.
The sonication methods were able to increase AA content in all three fruit juices viaremoval of dissolved oxygen which favoured decomposition of AA during cavitation [31],whereas the negative change of AA content in pomelo juice was due to degrading of AA inacid solutions [32]. The content of TSS of all three fruit juices extracted using optimisedmethod was greatly affected by heat and/or intensity of direct and indirect ultrasoundsystems. These factors were also found to be effective in the extraction of mayhaw fruitjuice [33].
Processes 2021, 9, 3 9 of 15Processes 2020, 8, x FOR PEER REVIEW 9 of 15
Figure 3. Plots of indirect thermosonication-assisted guava juice extraction responses. (a) Main effect plot of
juice yield, (b) Main effect plot of AA content, (c) (i) 3D contour plot and (ii) 3D surface plot of TSS content.
Figure 3. Plots of indirect thermosonication-assisted guava juice extraction responses. (a) Main effect plot of juice yield,(b) Main effect plot of AA content, (c) (i) 3D contour plot and (ii) 3D surface plot of TSS content.
Processes 2021, 9, 3 10 of 15Processes 2020, 8, x FOR PEER REVIEW 10 of 15
Figure 4. Cont.
Processes 2021, 9, 3 11 of 15Processes 2020, 8, x FOR PEER REVIEW 11 of 15
Figure 4. Plots of indirect thermosonication-assisted pomelo juice extraction responses. Plots of indirect thermosonication-assisted pomelo juice extraction responses. (a) Main effect plot of juice yield. (b)(i) 3D contour plot and (ii) 3D surface plot of AA content. (c) (i) 4D surface plot, (ii) 4D power-time contour plot, (iii) 4D power-temperature contour plot and (iv) 4D time-temperature contour plot of TSS content.
Figure 4. Plots of indirect thermosonication-assisted pomelo juice extraction responses. Plots of indirect thermosonication-assisted pomelo juice extraction responses. (a) Main effect plot of juice yield. (b) (i) 3D contour plot and (ii) 3D surface plotof AA content. (c) (i) 4D surface plot, (ii) 4D power-time contour plot, (iii) 4D power-temperature contour plot and (iv) 4Dtime-temperature contour plot of TSS content.
Processes 2021, 9, 3 12 of 15
Processes 2020, 8, x FOR PEER REVIEW 12 of 15
Figure 5. Plots of direct thermosonication-assisted soursop juice extraction responses. (a) (i) 3D contour plot and (ii) 3D surface plot of juice yield, (b) Main effect plot of AA content and (c) Main effect plot of TSS content.
Figure 5. Plots of direct thermosonication-assisted soursop juice extraction responses. (a) (i) 3D contour plot and (ii) 3Dsurface plot of juice yield, (b) Main effect plot of AA content and (c) Main effect plot of TSS content.

Processes 2021, 9, 3 13 of 15
3.4. Adequacy of Models and Verification
The adequacy of the models to predict optimum combined responses was validatedexperimentally using optimum conditions listed in Table 4. Table 5 shows that the trendsand sequences were reasonably close between the predicted and experimental. The indirectthermosonication method was chosen for extracting guava juice because it achieved thehighest increases in juice yield and TSS content. The indirect thermosonication method wasalso good for extracting pomelo juice as all response variables displayed positive trendsas the other two methods presented decrease in AA content. The juice yield obtained viaindirect thermosonication, however, had lower juice yield than the control. For extractionof soursop juice, the direct thermosonication method was suitable because it achieved apositive change of AA content as compared with the other two methods. A lower value ofjuice yield and TSS content increase was acceptable as long as AA content did not degrade,because it is the main nutrient that needs to be preserved in fruit juice production. AA alsoplays a role as an antioxidant, and it is an unstable compound that can degrade easilyunder inappropriate conditions [32].
Table 5. Predicted and experimental optimal responses of guava, pomelo, and soursop extraction.
ParametersChanges (%)
Control DirectThermosonication
IndirectThermosonication
Predicted Experiment Predicted Experiment Predicted Experiment
Guava
Juice yield 6.7 7.6 −85.0 −79.3 30.1 28.1AA content 22.9 25.1 32.4 32.5 23.0 27.1TSS content 25.7 26.5 26.3 25.9 26.8 27.4
Pomelo
Juice yield 5.8 8.7 1.3 0.6 2.4 3.7AA content −2.4 −3.5 −1.1 −2.5 0.7 1.2TSS content 1.5 1.7 2.6 2.1 2.2 3.4
Soursop
Juice yield 53.6 48.3 7.2 9.2 21.0 20.8AA content −9.5 −8.8 12.6 14.7 −6.7 −5.1TSS content 22.1 25.2 7.8 7.7 10.9 11.5
Bold fonts indicate optimised extraction.
4. Conclusions
The blocked face-centred central composite design was suitable for tropical fruitjuice extraction optimisation because blocking helps to control the variations of the fruits’properties. Based on advantages of extraction time reduction and prevention of AA contentloss, ultrasound-assisted extraction methods were found to be helpful in the studies ofthree difficult-to-extract fruit juices. The best method for guava juice extraction wasindirect thermosonication at 1 kW using distilled water incubated at 55 ◦C for 30 min.The indirect thermosonication was also good for extracting pomelo juice at 2.5 kW withwater incubation temperature of 54 ◦C for 23 min. Extraction of soursop juice was suitablevia direct thermosonication at 10% amplitude with distilled water at 55 ◦C for 2 to 10 min.
Author Contributions: N.A. designed the experiments, collected and analyzed the data, and wrotethe manuscript. N.L.C. conceptualized the study, supervised the research, edited, and revised themanuscript. All authors have read and agreed to the published version of the manuscript.
Funding: The study was funded by the Malaysian Ministry of Higher Education’s FundamentalResearch Grant Scheme with project number 02-10-10-929FR.
Processes 2021, 9, 3 14 of 15
Conflicts of Interest: The authors declare no conflict of interest.
References1. Atawodi, S. Nigerian foodstuffs with prostate cancer chemopreventive polyphenols. Infect. Agents Cancer. 2011, 6 (Suppl. 2), S9. [CrossRef]2. Van Breemen, R.B.; Pajkovic, N. Multitargeted therapy of cancer by lycopene. Cancer Lett. 2008, 269, 339–351. [CrossRef] [PubMed]3. Worrell, D.B.; Carrington, C.M.S.; Huber, D.J. Growth, maturation and ripening of soursop (Annona muricata L.) fruit. Sci. Hortic-
Amsterdam. 1994, 57, 7–15. [CrossRef]4. Ko, Y.-M.; Wu, T.-Y.; Wu, Y.-C.; Chang, F.-R.; Guh, J.-Y.; Chuang, L.-Y. Annonacin induces cell cycle-dependent growth arrest and
apoptosis in estrogen receptor-α-related pathways in MCF-7 cells. J. Ethnopharmacol. 2011, 137, 1283–1290. [CrossRef] [PubMed]5. Chek Zaini, H.; Zaiton, H.; Zanariah, C.W.; Sakinah, N. High Fiber Cookies Made from Pink Guava (Psidium guajava) De-
canter/Agro Waste. 2020. Available online: https://www.doc-developpement-durable.org/file/Arbres-Fruitiers/FICHES_ARBRES/goyavier_Psidium%20guajava/High%20fiber%20cookies%20made%20from%20pink%20guava.pdf (accessed on 18November 2020).
6. Nwokocha, L.M.; Williams, P.A. New starches: Physicochemical properties of sweetsop (Annona squamosa) and soursop (Anonnamuricata) starches. Carbohyd Polym. 2009, 78, 462–468. [CrossRef]
7. Economos, C.; Clay, W.D. Food, Nutrition and Agriculture: Nutritional and Health Benefits of Citrus Fruits. 1999. Available online:http://www.fao.org/docrep/x2650T/x2650t03.htm (accessed on 18 November 2020).
8. Tiwari, B.K.; Muthukumarappan, K.; O’Donnell, C.P.; Cullen, P.J. Colour degradation and quality parameters of sonicated orangejuice using response surface methodology. LWT Food Sci. Technol. 2008, 41, 1876–1883. [CrossRef]
9. Adekunte, A.; Tiwari, B.K.; Scannell, A.; Cullen, P.J.; O’Donnell, C. Modelling of yeast inactivation in sonicated tomato juice.Int. J. Food Microbiol. 2010, 137, 116–120. [CrossRef] [PubMed]
10. Adekunte, A.O.; Tiwari, B.K.; Cullen, P.J.; Scannell, A.G.M.; O’Donnell, C.P. Effect of sonication on colour, ascorbic acid and yeastinactivation in tomato juice. Food Chem. 2010, 122, 500–507. [CrossRef]
11. Bhat, R.; Kamaruddin, N.S.B.C.; Min-Tze, L.; Karim, A.A. Sonication improves kasturi lime (Citrus microcarpa) juice quality.Ultrason Sonochem. 2011, 18, 1295–1300. [CrossRef]
12. Tiwari, B.K.; O’Donnell, C.P.; Muthukumarappan, K.; Cullen, P.J. Effect of sonication on orange juice quality parameters duringstorage. Int. J. Food Sci. Tech. 2009, 44, 586–595. [CrossRef]
13. Valero, M.; Recrosio, N.; Saura, D.; Muñoz, N.; Martí, N.; Lizama, V. Effects of ultrasonic treatments in orange juice processing.J. Food Eng. 2007, 80, 509–516. [CrossRef]
14. Chemat, F.; Zill, E.H.; Khan, M.K. Applications of ultrasound in food technology: Processing, preservation and extraction.Ultrason Sonochem. 2011, 18, 813–835. [CrossRef] [PubMed]
15. Koshani, R.; Ziaee, E.; Niakousari, M.; Golmakani, M.T. Optimization of thermal and thermosonication treatments on pectinmethyl esterase inactivation of sour orange juice (Citrus aurantium). J. Food Process. Preserv. 2014, 39, 567–573. [CrossRef]
16. Tribess, T.B.; Tadini, C.C. Inactivation kinetics of pectin methylesterase in orange juice as a function of pH and temperature/timeprocess conditions. J. Sci. Food Agric. 2006, 86, 1328–1335. [CrossRef]
17. de Carvalho, J.M.; Maia, G.A.; da Fonseca, A.V.V.; de Sousa, P.H.M.; Rodrigues, S. Effect of processing on physicochemicalcomposition, bioactive compounds and enzymatic activity of yellow mombin (Spondias mombin L.) tropical juice. J. Food Sci. Technol.2013, 52, 1182–1187. [CrossRef]
18. Wu, J.; Gamage, T.V.; Vilkhu, K.S.; Simons, L.K.; Mawson, R. Effect of thermosonication on quality improvement of tomato juice.Innov. Food Sci. Emerg. Technol. 2008, 9, 86–195. [CrossRef]
19. Terefe, N.S.; Gamage, M.; Vilkhu, K.; Simons, L.; Mawson, R.; Versteeg, C. The kinetics of inactivation of pectin methylesteraseand polygalacturonase in tomato juice by thermosonication. Food Chem. 2009, 117, 20–27. [CrossRef]
20. Torres, E.F.; Bayarri, S.; Sampedro, F.; Martinez, A.; Carbonell, J.V. Improvement of the fresh taste intensity of processed clementinejuice by separate pasteurization of its serum and pulp. Food Sci. Technol. Int. 2008, 14, 525–529. [CrossRef]
21. Mason, T.J.; Paniwnyk, L.; Lorimer, J.P. The uses of ultrasound in food technology. Ultrason Sonochem. 1996, 3, S253–S260. [CrossRef]22. Ofori-Boateng, C.; Lee, K. Response surface optimization of ultrasonic-assisted extraction of carotenoids from oil palm (Elaeis guineensis
Jacq.) fronds. Food Sci. Nutr. 2013, 1, 209–221. [CrossRef]23. Sin, H.N.; Yusof, S.; Abdul Hamid, N.S.; Rahman, R. Optimization of hot water extraction for sapodilla juice using response
surface methodology. J. Food Eng. 2006, 74, 352–358. [CrossRef]24. Lee, W.C.; Yusof, S.; Hamid, N.S.A.; Baharin, B.S. Optimizing conditions for hot water extraction of banana juice using response
surface methodology (RSM). J. Food Eng. 2006, 75, 473–479. [CrossRef]25. Cendres, A.; Chemat, F.; Maingonnat, J.F.; Renard, C.M.G.C. An innovative process for extraction of fruit juice using microwave
heating. LWT Food Sci. Technol. 2011, 44, 1035–1041. [CrossRef]26. Chin, L.N.; Tan, C.M.; Pa, N.F.; Yusof, Y.A. Method and Apparatus for High Intensity Ultrasonic Treatment of Baking Materials.
U.S. Patent 2013/01894.07 A1, 25 July 2013.27. Carley, K.M.; Kamneva, N.Y.; Reminga, J. Response Surface Methodology; Technical Report CMU-ISRI-04-136; CASOS: Pittsburgh,
PA, USA, 2004.28. Khuri, A.I.; Mukhopadhyay, S. Response surface methodology. Wires Comput. Stat. 2010, 2, 128–149. [CrossRef]29. Lenth, R.V. Response-surface methods in R using RSM. J. Stat. Softw. 2009, 32, 1–17. [CrossRef]

Processes 2021, 9, 3 15 of 15
30. Noordin, M.Y.; Venkatesh, V.C.; Sharif, S.; Elting, S.; Abdullah, A. Application of response surface methodology in describing theperformance of coated carbide tools when turning AISI 1045 steel. J. Mater. Process Technol. 2004, 145, 46–58. [CrossRef]
31. Cheng, L.H.; Soh, C.Y.; Liew, S.C.; Teh, F.F. Effects of sonication and carbonation on guava juice quality. Food Chem. 2007, 104,1396–1401. [CrossRef]
32. Burdurlu, H.S.; Koca, N.; Karadeniz, F. Degradation of vitamin C in citrus juice concentrates during storage. J. Food Eng. 2006, 74,211–216. [CrossRef]
33. Trappey, A.F.; Johnson, C.E.; Wilson, P.W. Characterization of juice extraction methods utilizing fresh mayhaw (Crataegus opacaHook.) fruit. Int. J. Fruit Sci. 2008, 8, 318–331. [CrossRef]
Powered by TCPDF (www.tcpdf.org)