optimal strategies in immunology
TRANSCRIPT

J. Math. Biology 5, 213-256 (1978) Journal of
�9 by Springer-Verlag 1978
Optimal Strategies in Immunology
IL B Memory Cell Production*
Alan S. Perelson, ~ Majded in M i r m i r a n i 2 and George F. Oster 3
1 Theoretical Division, University of California, Los Alamos Scientific Laboratory, Los Alamos, New Mexico 87545, USA Department of Mechanical Engineering, University of California, Berkeley, California 94720, USA
a Division of Entomology, University of California, Berkeley, California 94720, USA
I. Introduction 214 II. Models 214
A. Response to Single Antigen Encounter 214 B. Response to Multiple Antigen Encounters 216 C. Memory Cells 217 D. A Two-Infection Model 218 E. An N-Infection Model 223
III. Results and Discussion 224 A. Extremal Strategies 224 B. Features of the Results 230 C. Evidence in Support of the Optimal Strategy 235 D. The Optimal Number of Responding Lymphocytes
and Memory Cells 237 Appendix: Optimal Control Calculations
A.1 Problem Formulation 238 A.2 Pontryagin's Minimum Principle for the Terminal
Cost Problem 239 A.3 Necessary Conditions for Minimizing the Cost 240 A.4 Integrating the State Equations 246 A~ Exclusion of Singular Controls 250 A.6 The Multi-Stage Model 251
Summary. After a first encounter with mos t antigens, the immune system responds to subsequent encounters with a faster, more efficient and more s t renuous an t ibody response. The m e m o r y o f previous antigen contacts is carr ied by lymphocytes . Expand ing on the model developed in Par t I of this paper , we examine the op t ima l s t ra tegy avai lable to the immune system for B
* Part I of this study is Perelson, A. S., Mirmirani, M. and Oster, G. F. 'Optimal Strategies in Immunology. I. B-Cell Differentiation and Proliferation', J. Math. Biol. 3, 325-367 (1976)
0303-6812/78/0005/0213/$08.80

214 A.S. Perelson et al.
memory cell production. We again find that the strategy should be of the bang-bang variety.
The model we consider assumes that antigen triggers a subpopulation of B- lymphocytes. These triggered lymphocytes can proliferate and secrete modest amounts of antibody, differentiate into non-dividing plasma cells which secrete large amounts of antibody, or differentiate into non-antibody secreting memory cells. Given injections of antigen at two widely spaced times we compute the strategy which minimizes a linear combination of the primary and secondary response times. We find that for all biologically reasonable parameter values the best strategies are ones in which memory cells are produced at the end of the primary response. Experimental results which bear on the actual strategies employed are discussed.
Key words: Optimal control theory-Pontryagin's minimum principle- B cells - Differentiation and proliferation - Memory cells
I. Introduction
In Part I of this study we posed the following question: assuming that natural selection has acted on the mammalian immune system so as to maximize its effectiveness, what should be the pattern of lymphocyte proliferation and differen- tiation so as to deal with an antigenic assault in an optimal fashion ? In order to answer this question we constructed a mathematical model of lymphocyte and plasma cell populations responding to a single encounter with a T-independent antigen and solved the resulting optimization problem for the best strategy. Although data of sufficient resolution to test the model quantitatively was not available, the qualitative conclusions we drew from the model agreed with the observed behavior of experimental systems. In this paper we shall extend the model so as to account for the production of so-called 'B memory cells', B lymphocytes preadapted to produce antibody of relatively high affinity for an antigen that has been encountered previously by the organism. The production of such preadapted cells is of obvious advantage to an animal which is likely to encounter a given antigen more than once in its lifetime.
II. Models
.4. Response to a Single Antigen Encounter
The structure of the model analyzed in Part I is shown in Figure 1 a; we refer to this previous paper for a detailed discussion of the underlying biological assumptions. The model assumed that a clone of small B lymphocytes stimulated by a T-indepen- dent non-proliferating antigen at time zero, is transformed into Lo large lympho- cytes, which commence dividing at rate b per cell and secrete antibody at a rate kL(t), where L(t) is the number of large lymphocytes at time t. The model also assumed that large lymphocytes can differentiate at rate d into plasma cells, P(t), which secrete antibody at a much higher rate, 7kP(t) (7 > 1), but do not divide.

Optimal Strategies in Immunology. II 215
~ - ' L I '~P E ,_Q_. Irk
(a)
dpv r
.... t: I . L . . . .
Fig. 1. (a) Model of B cell proliferation and differentiation studied in Part I. A fraction u of the large lymphocytes, L, divide with birth rate b and a fraction 1 - u differentiate into plasma cells, P, at rate d. Lymphocytes and plasma cells die at rates /~L and /zp, respectively, and secrete antibody, A, at rates k and 7k, 7 i> 1, respectively. (b) Modification of the model in (a) to allow for the generation of memory cells, M, at rate d~
I f the total amoun t o f ant ibody secreted during the interval [0, t] is A(t) , then the govern ingequa t ions in the simplest case analyzed in Part I are:
d = k (L + yP) , A(0) = 0 (1)
L = bu( t )L - a[1 - u(t)]L - IZLL, L(O) = Lo (2)
P = d[1 - u(t)]L - tzeP, P(0) = 0 (3)
where 0 ~< u(t) ~< 1 is the fraction o f stimulated cells which remain as proliferating large lymphocytes, and 1 - u(t) is the fraction which is undergoing differentiation to plasma ceils at t ime t. One reasonable optimizat ion problem addressed in Part I was to determine the pat tern o f lymphocyte proliferation and differentiation so as to minimize the time required to produce an amount of ant ibody A* sufficient to neutralize the antigenic assault. That is, we determined the function u(. ) such that
min f r dt, A ( T ) = A*. (4) u(.) Jo
The solution to this opt imizat ion problem, under biologically reasonable para- meter assumptions, depended upon the value o f the lumped parameter ~ & A*/kLo? For c, > ~o, where c,o is some critical value o f c~,
1, 0 ~< t < t* u ( t ) = O, t* < t <~ T*
where T* is the optimal total time. 2 The switching time t* is determined by the full set o f model parameters {b, d,/ZL,/*p, k, y, Lo and A*). This ' a l l -o r -none" strategy was found to be robust under a number o f model elaborations, and in general agreement with experimental observations.
1 The symbol ~ means equal by definition. In Part I we denoted the optimal total time by T. Here we use the more precise notation of
T* for the optimal total time in order to distinguish it from the total time T obtained with a non-optimal control strategy.

216 A.S. Perelson et al.
For ~ < ac the optimal strategy was computed to be
u(t ) = O, 0<<. t <~ T* .
Using typical biological parameter values a~ was found to be quite small and hence this latter strategy of immediate differentiation into plasma cells is only optimal for choices of A* which are very small. Generally with such low antigen doses no response is observed.
B. Response to Multiple Antigen Encounters
One limitation of this model was the restriction to a single antigenic assault. In the normal course of the evolution of the immune system, an organism would be expected to encounter a given antigen repeatedly during its lifetime. The initial exposure to an antigen that stimulates a humoral immune response (an immunogen) is handled by a spectrum of small clones of B lymphocytes each producing antibody of different affinity. The method of generation of these diverse initial clones, which can recognize essentially any alien molecule (of sufficient size), represents one of the outstanding unsolved problems in immunology. However, it would certainly appear inefficient to depend on these small initial clones to handle every antigenic assault after the first. One might speculate that the effectiveness of the immune response to secondary encounters could be considerably enhanced by 'storing' some high affinity antibody producing cells from the first infection so as to form a large initial clone for subsequent encounters. Rather than 'starting from scratch' every time, such a strategy would ensure that both the speed and fidelity of the immune response becomes successively greater after each infection. Indeed, such a facilitation of an immune response is in fact what is observed for most antigens (e.g. T-dependent antigens).
The immune response of an animal injected with an antigen it has seen previously is different from the response produced by the first encounter. A typical pattern for the primary and secondary response to a non-proliferating antigen is shown in Figure 2. By comparison with the primary response, the secondary response is characterized by a shorter lag phase, a higher rate and longer persistance of anti- body synthesis, and higher antibody titres in the blood (Eisen, 1973). Moreover, a dose of antigen substantially lower than that required to initiate a primary response can cause a secondary response. The class of antibody secreted during a secondary response is predominantly IgG. During a primary response to a T- dependent antigen first IgM and then IgG is secreted. All responses to the same antigen after the primary response have the general characteristics of a secondary response.
The difference in response to all encounters with antigen after the first has been called immunological memory. One of the most remarkable features of this memory system is that times of the same order of magnitude as the life span of the organism can elapse between the first and second antigen contact without loss of the capacity to produce a secondary response (Celada, 1971). Immunological memory is

Optimal Strategies in Immunology. II 217
Fig. 2. Time course of the changes in serum antibody concentration during typical pri- mary and secondary immune responses
m c
c
8 o
o
IO0
IO
~ 1 I I [ I
p ..,
g Exponentlol ~l 'mr iogl I / \
:[7 ~ - F ,ponenf',o, o. / \ // 0 , 0 1 I I I I I ~ I
Time Fir=t an|igen Second oatigsn
In jec t~ injectim~
believed to be carried by cells which for obvious reasons have been called memory cells.
C. M e m o r y Cells
Lymphocytes, in addition to proliferating or differentiating into plasma cells, can differentiate into long-lived B memory cells. The exact mechanism of memory cell formation is not known (Mason and Gowans, 1976), but if agents which prevent cell division such as X-rays or 6-mercaptopurine are administered 2 to 3 days after the primary antigen stimulus no secondary response can be elicited, showing the requirement for cell proliferation in the production of memory cells (Eisen, 1973, p. 486). Strober (1976) has shown that both small non-dividing and large dividing B lymphocytes can transfer immunological memory into a host animal deprived of B cells by radiation treatment. Although the relationship between the populations is not clear, Strober speculates that the large cells are activated B cells which have arisen from recent triggering of virgin B cells and which after several divisions give rise to long-lived recirculating small B memory cells. Eisen (1973, p. 457) and Mackinodan and Albright (1964) also suggest that proliferating large lymphocytes can differentiate into small memory lymphocytes. Although this model of memory cell production is the one we shall adopt (see Fig. lb), other differentiation schemes have been proposed (cf., Greaves et al., 1974; Miller, 1973; Cunningham and Sercarz, 1971; Byers and Sercatz, 1968; Sercatz and Coons, 1962). For example, Sercarz and Coons (1962) suggested an X - Y - Z scheme of immune cell maturation in which a virgin antigen sensitive cell, or X cell, upon initial contact with antigen differentiates to a Y or memory cell. Further contact with antigen results in the division and irreversible maturation of Y cells into a plasmacytic series of antibody secreting Z cells whose terminal member is the mature plasma cell (Byers and Sercarz, 1968). Sterzl and Silverstein (1967) suggest that after antigen triggers the X--~ Y change, the Y cells may proliferate before becoming quiescent in the absence of antigen. At present the X - Y - Z scheme is not entirely compatible with some kinetic data available (Tannenberg and Jehn, 1972), which has been taken to indicate the formation of at least some memory cells from 'retired' antibody secretors (Greaves et al., 1974, p. 177) as in the model we

218 A.S. Perelson et al.
propose to adopt. Another suggested differentiation scheme supposes that two different types of B cells are involved in the response to antigen. One is driven to produce a clone of antibody forming cells and the other a clone of memory cells (cf., Miller, 1973). Alternatively, one type of B cell may respond but of the clone of cells it forms some members differentiate into memory cells while others become antibody secreters (Byers and Sercarz, 1968; Miller, 1973; Williamson et al., 1974). These X - Y or Z models were proposed to account for observations on the dissociation between memory and antibody production which are now more readily interpreted in terms of T-B cell interactions (Greaves et al. 1974, p. 177).
Memory cells circulate through the blood, lymph and tissues, probably do not manufacture antibody (Cunningham, 1969), but when exposed to a second anti- genic stimulus commence differentiating into large lymphocytes capable of producing high affinity antibody preselected for the specific antigen that had stimulated the primary response.
Although memory cells are believed to be small lymphocytes (Gowans and Uhr, 1966) and have been modeled (Bell, 1970; 1971) as if they were identical to the small B lymphocytes which initiate the primary response ('virgin' B cells), memory and virgin B lymphocytes appear to have different biological characteris- tics. Strober (1972) and Strober and Dilley (1973a,b) have shown that in the rat, memory B lymphocytes are relatively long-lived cells that recirculate from the blood to the lymph and return via the lymphatic drainage to the circulatory system, while virgin B cells are short-lived and do not recirculate. In mice it has been proposed that there are two classes of memory cells, one of which recirculates and the other of which resides in the lymph node draining the site of original antigen administration (Jacobson and Thorbecke, 1969; Thursh and Emeson, 1972; Stavitsky and Folds, 1972; Emeson and Thursh, 1971; Inchley et al., 1975). Differences in the electrophoretic mobility of virgin and memory B cells have been reported (Schlegel et al., 1975) as well as differences in the adherence to glass bead columns (Schlegel and Shortman, 1975; Schrader, 1974; Schrader and Vadas, 1976). Differences in cell density (L'age Stehr and Herzenberg, 1970), in the classes of surface immunoglobulin (Strober, 1976; Hammerling, Masuda and McDevitt, 1973), and in the density of receptors (Willcox and Klaus, 1976; Strober, 1975; Klinman, 1972) on virgin and memory B cells have also been reported. Further, an analysis of the maximum average amount of antibody produced per unit time in fragment cultures indicates that the progeny of stimulated B memory cells secrete antibody at a higher rate than the progeny of B cells derived from non- immune mice (Klinman et al., 1974).
D. A Two-Infection Model
The phenomenon of immune memory suggests an interesting evolutionary question: what is the optimal inventory of memory cells to ensure that repeated infections will be handled as efficiently as possible ? A moment's reflection reveals that the problem as stated is not well posed, since certain tradeoffs are implied. Converting

Optimal Strategies in Immunology. II 219
lymphocytes into memory cells decreases the pool of plasma ceils available to handle the present antigenic challenge. Also excessive production of memory cells for a particular antigen could decrease an animal's ability to respond to other antigens. The question is really how to weight protection from future infections against survival from the current one.
We shall approach the situation by modifying our previous model as shown in Figure l b and consider the response to two encounters with the same non- proliferating antigen. The effects of attacks by other (non-cross reacting) antigens presents a more complicated problem discussed in Section IIID. Although T cells will be assumed to be present since they are required for a normal immune response to a T-dependent antigen, we shall not specifically incorporate them into the model. This is partially because their interactions with B cells have not been completely elucidated and because the induction of B cell memory appears to be a T-independent event (Roelants and Askonas, 1972; Diamantstein and Blitstein- Willinger, 1974; Schrader, 1975; Okumura et al., 1976). Further, for simplicity we shall not distinguish between IgG and lgM antibody and between IgG and IgM memory. A model concerned with the switch from IgM to IgG production will be published soon (Perelson, Goldstein and Rocklin, in preparation).
The equations governing our model are:
A = k ( L + ~,P) (5)
L = bu( t )L - dvv( t )L - dMw(t)L - tLzL (6)
P = dev( t )L - /~eP (7)
2~ = dMw(t)L (8)
u(t) + v(t) + w(t) = 1 (9)
where dp and dM represent the rates at which large lymphocytes differentiate into plasma cells and memory cells, respectively. For simplicity we shall assume dv =dM = d. Since memory cells are long-lived (Feldbush and Gowans, 1971; Cunningham, 1969) we have not included a death term for these cells. The difference between this model and Eqs. (1)-(4) is that we allow a fraction w(t) of the large lymphocytes to differentiate to non-antibody secreting memory cells, M ( t ) . The initial conditions for the primary response are:
A(O) = 0 (lOa)
L(O) = Lo (lOb)
P(O) = 0 (lOc)
M(O) = O. (lOd)
The equations of motion for the secondary response are the same as for the primary response, except that the initial conditions are:
A(O) = 0
L(O) = AM(Tt) + L2o
e(o) = o
M(O) = 3'/2o.
( l la)
(1 Ib)
(l I c)
(I Id)

220 A.S. Perelson et al.
where/'1 is the time needed to neutralize the primary antigen attack by secreting A1 antibodies. Here we have assumed that the second encounter with antigen occurs sufficiently long after the first encounter that the primary response has died down, all remaining plasma cells have died, and all secreted antibody has been catabolized. For secondary responses that occur sooner different initial con- ditions are needed. The size of the initial clone of lymphocytes available for the secondary response is assumed to be the fraction 0 ~< A ~< 1 of memory cells left at the end of the primary response which have survived until the second infection and which were stimulated by antigen, plus any small clones of antigen specific naive lymphocytes present at the second infection which become stimulated, L2o. The number of memory cells which survived until the initiation of the secondary response but which were not stimulated by antigen is given by Mzo. Since memory cells are easily stimulated M2o should be small. Recently, using the method of adoptive secondary transfer, several investigators have presented evidence which suggests that memory cells may be able to proliferate and form new memory cells, potentiating the survival of immune memory (cf., Feldbush and Van der Hoven, 1976). At time T1 enough antibody has been secreted to neutralize the antigen. However, memory cell production need not end at T1. In order to explore the consequences of memory cell proliferation and production after the termination of the primary response, but before the initiation of the secondary response, one can allow A to take on values greater than one. Although we have not done so, another method of accounting for memory cell production at times t > 7"1 is to assume that all lymphocytes remaining at T1 are converted into memory cells. This leads to a modification of Eq. (1 lb).
Our model implicity assumes that the organism has survived the primary antigenic challenge and is not immunologically incapacitated in any way. Marchuk (1975) has proposed a model of the immune response to a virus disease in which injury to the immune system can occur.
The optimal strategy involves choosing the functions u(-) and v(.) to accomplish the following two objectives: (1) minimize the total time T~ required to secrete an amount of antibody, A*, sufficient to neutralize the initial antigenic assault, while (2) producing enough memory cells to ensure an enhanced elimination of the antigen in case of a later infection. That is, we must simultaneously
f? min J~ = dr, (12)
max J2 = M(T1), (13)
where Tx is determined by the condition A(T1) = A*~. Generally, we cannot expect to find a strategy (u*, v*) which simultaneously fulfills both of these objectives (Starr and Ho, 1969). Since memory cells are assumed not to secrete antibody, diverting lymphocytes into memory cells must lengthen the time of the primary response. Thus, we must decide on the optimal tradeoff which has presumably evolved. Optima which involve such tradeoffs have been dealt with extensively in economics by the notion of a 'Pareto optimum' (Intriligator, 1971; Karlin, 1959). Movement from such an optimum either has no effect on the values of the objective

Optimal Strategies in Immunology. 1I 221
functions, or worsens at least one objective function. To maximize, simultaneously, a set of objective functions J~, i = 1, 2 . . . . , N, an admissible control u*(.) (i.e. piece- wise continuous vector function such that Uu(t)ll ~< 1 for all t) is Pareto optimal if and only if for every admissible u(.) either
AJ~ a= J~(u) - J~(u*) = 0, for all i = {1, 2 . . . . , N}
or there exists at least one i ~ {1, 2, . . . , N} such that AJ~ < 0 (Schmitendorff and Leitmann, 1974). A Pareto optimum need not be unique. If an optimum were not a Pareto point then some objective function could be improved without making others worse off.
In Figure 3 we have sketched hypothetical contour plots for ,/1 and J~. For
simplicity temporarily assume J1 = - f r~dt so that we simultaneously wish to
maximize -/1 and J2. From the figure it is clear that in general the maxima of ,/1 and J2 do not coincide and hence it is not possible to maximize both simultaneously. The line II, which is the locus of points at which the contours of J1 and J2 are tangent represent the Pareto set, i.e. II = {(u, v) [ VJ~(u, v) = - ~VJ2(u, v), ~ >t 0}. Let p be a point on II. Then movement from p either off of II or along fl will decrease one of the objective functions. Notice that along the Pareto set V(J~ + ~J2) = 0. Thus one can replace this vector optimization problem by an equivalent scalar optimization problem with objective function J1 + ~Jz. The magnitude of ~ can be interpreted as a measure of the relative importance of the two objectives. However, since J1 and ,12 measure different quantities, time and numbers of cells, ~ must be scaled properly. In economics one can usually convert all quantities to a common denominator, money. Because of the difficulty of interpreting a factor such as ~ which converts memory cells into an equivalent time we proceed as follows. In Part I we computed the optimal time, T*, for the secretion of an amount of antibody A* in the absence of memory cell production. In a multi- stage process, it is optimal for the last stage to be carried out exactly as proscribed by the optimal solution to the single stage problem (Bellman, 1957). That is, if we consider only a two-infection sequence no memory cells should be produced in the optimal secondary response since antigen is sure never to be seen again. Thus
d I = constant
rr = c o n s t a n t
u
Fig, 3. Contour plots of the cost criteria ./1 and ,/2 with maxima at (Jx)m~x and (Ja) . . . . respectively. The Pareto set (II) is also shown

222 A . S . Perelson et al.
the secondary response should be carried out in the fashion computed in Part I. There we showed that the optimal total time was (Eq. A.39, Part I):
1 [A_~*(__b - /~L) + kL(0)l T* = r* + ~ In t (b - ~ ) ~ ( O ) G - - ~ J ' (14)
where r* is the optimal switching time measured backwards from the optimal final time, T*, and G(z*) was a complicated function of ~-* and the system para- meters only (of., Eq. A.38, Part I). If we assume that the number of antigen reactive cells available to initiate the secondary response is given by Eq. (1 lb), then Eq. (14) also gives the time to complete the secondary response:
1 [A*(b - I~n) + k 2 { A M ( r t ) + L20}] T * = + In = [ (b - ~L)kzGO-*){AM(T1 ) + L2o} J T*[M(T1)] (15)
where the subscripts 1 and 2 now pertain to the primary and secondary responses, respectively.
Here we are not proposing that an animal would ever know that only two encoun- ters with antigen will occur during its lifetime, although this might be the case for some rare antigens. Even though an analysis of this simple case may not provide realistic information about strategies for memory cell production during secondary responses, it does provide such information about primary responses as will be
the more realistic case of N encounters with antigen is discussed in shown when Section IIE.
For this two stage model we shall hypothesize that natural selection has acted to minimize the time required to generate enough antibody to neutralize the antigen in both the primary and secondary responses. Specifically, we assume that the optimization criterion is
rain J = dt + pT* (16) [u(.),v(-)]
where T*[M(T0] is given by Eq. (15). We have included a factor p 1> 0 weighting the importance of minimizing T* in the overall response. It is important from our evolutionary viewpoint to include this 'discount' factor, which we shall interpret phenomenologically. More detailed models, possibly including the age structure of the population under study, would be needed to precisely specify p. Most simply, we can view p as the probability of the organism encountering the same antigen again in the remainder of its reproductive lifespan. One can also imagine that we should weight the value of the secondary response by the expected decrease in reproductive value (Fisher, 1930) between the first and second infection since genes controlling the immune response will be propagated in proportion to this quantity. The reproductive value of an individual of age a2 relative to the value at age at is given by
S~ e- '~l(x)m(x) dx va~ = val l(az - al) e -T~%-al) (17)
where l(a) and m(a) are the age-specific survivorship and fecundity functions, respectively, and r is the intrinsic rate of increase for the population [see, for exam- ple, Wilson and Bossert (1971)]. Roughly speaking, the reproductive value is a

Optimal Strategies in Immunology. II 223
measure of the worth of an individual in terms of the number of offspring it is destined to contribute to the next generation. This value is usually highest for females just at the age where they start to reproduce, and for females falls to zero beyond the age of reproduction unless the female has been a contributing member of a social organization. However, the decline in reproductive value with advancing age probably played no role during the evolutionary development of the immune system which occurred with lower organisms. Even for humans only recently have lifespans surpassed the age of reproduction. The antigen dose and virulence may also affect p, since one needs to devote sufficient effort to the primary response to ensure survival. In our model we have assumed neither death nor debilitation occurs as a result of the primary infection. However, one could clearly associate a proba- bility of survival or debilitation with the dose and length of time it takes to cope with the antigen.
Incorporating the notion of reproductive value into the optimization criteria, Eq. (16)would read
_ivory.., (181 s = at +
Henceforth, we shall assume that p may take on values somewhat greater than one, so that factors such as vaJva~ can be included in the definition of p. The central result we shall extract from the model is the optimal strategy as a function of the parameter, p.
Summarizing, we must solve the optimal control problem of minimizing the cost functional J, given by Eq. (16), subject to the 2-stage dynamic constraints (5)-(9) with the successive boundary conditions (10) and (11).
E. An N-Infection Model
There is no way of estimating the exact number of exposures an individual will have to an antigen during its lifetime. However, it is conceivable that the immune system may have evolved to estimate the probability of an exposure to a given antigen, especially since it is now well known that there are ' immune response genes' that control the level of response to some antigens (cf., Katz and Benacerraf, 1976). Thus for an N-infection problem we can hypothesize that the immune system has evolved to minimize a discounted sum of response times, that is,
iV
min J ' = ~ p,(t} - t]) (19
where t} - t~o is the time needed to neutralize the antigen in the ith infection by producing A* antibodies, t~ < tt ~ < . . . < t~ < t~, Pl = l, and p , i/> 2, is the weighting parameter, e.g. the probability of reencountering the antigen multiplied by the expected change in reproductive value between the i - 1 st and ith infection.
If we assume that the equations of motion for the ith infection are given by Eqs. (5)-(9) with initial conditions for N t> 2
A,(td) = P~(t~) = M,(to ~) = 0
L,(t~) = A,M,_ l( t}- 1) + L,o.

224 A.S. Perelson et al.
Then as we show in the Appendix (section A6) one can expect to find the same qualitative behavior for the optimal solution of the ith stage, i ~< N - 1 as the optimal behavior of the first stage in the two-stage problem, while the Nth stage optimal behavior has the same qualitative behavior as the last stage in the two- infection model. Consequently, we shall only study the two-stage model in detail.
The quantitative behavior of an optimal strategy in an N-stage model depends on the values of the parameters {b, y, d, ~L, t~P}, the values of A*, k~, A,, L~0, p, and the value of N. Thus the optimal behavior for the primary response is a function of N, the number of infections. For large iV, an estimate of the most realistic optimal primary response can be obtained by letting N---> oo and computing the limiting strategy (if it exists). For the model under study this is a very difficult computation which we have rtot attempted. However, for other N-stage models this has been done (see Mirmirani, 1977).
f l l . Results and Discussions
A. Extremal Strategies
The optimization problems formulated in Section II may be treated by the methods of optimal control theory. We have relegated the mathematical development to the Appendix, and shall discuss here the results of our calculations, for the two- stage model.
(1) The extremal strategy 1 is "all-or-none' or 'bang-bang' as was the case in the absence of memory cells. That is, the control vector U(t) = [u(t), v(t), w(t)] takes values only at the apexes of the unit simplex, shown in Figure 4a. The ortly thing to be determined is the timing and sequence of the switches. Furthermore, since we already know that the optimal strategy during the secondary response is the same as the single stage strategy calculated in Part I [with L0 replaced by AM(T1) + L20] we need only determine the switching sequence and timing for the primary response.
(2) Using the same reasonable assumptions about the parameter set {b,/ZL,/xp, k, y, d} that were made in Part I we can reduce the possible switching sequences to one of the following: If A*, the required antibody production, is larger than some critical value, an initial proliferative stage of large lymphocytes [U = (1, 0, 0)] should be followed by (A) a switch to plasma cell differentiation, U = (0, 1, 0), followed by a switch to memory cell production, U = (0, 0, 1), or (B) a switch to plasma cells followed by a second switch back to lymphocyte proliferation and then a final switch to memory cell production, or (C) a switch to memory cell differentiation, with no plasma cell production. As a shorthand we refer to these three strategies as (L, P, M), (L, P, L, M) and (L, M). These strategies are shown in Figure 4b.
For sufficiently small antigenic doses A* may be so small that a single generation of plasma cells can handle the infection. In that case no initial lymphocyte pro- liferation is necessary. A complete listing of possible control sequences is given by
1 we have only found a set of controls which are extremal; that is, satisfy all the necessary conditions provided by Pontryagin's principle. We have not shown that they satisfy the suffi- cient conditions for optimality as we did in Part I.

Optimal Strategies in Immunology. II 225
u
U + Y + W = l
I w
v
(a)
L L L
Switching Switching Switching Strotegy (L, P, M) Strote(jy (L, P, L, M) Strotegy (L, M)
(b)
Fig. 4. (a) The control vector U = (u, v, w) is restricted to the unit simplex defined by u + v + w = 1, 0 ~< u, v, w ~< 1. A bang-bang strategy corresponds to controls which take on values only at the apexes of the simplex. (b) Possible optimal switching strategies for sizable values of A*
Eq. (A.50). Observe that in all cases memory cells are only produced at the end of the response.
(3) The extremal switching sequence and switching times depend on the system parameters {b,/~L,/~e, kl, k2, y, d}, the initial lymphocyte populations, Lo and L20, the final antibody required, A* and A* 2, as well as the weighting parameter p. It is the dependence on p which most concerns us here.
Using a numerical technique described in the Appendix we have computed the optimal switching times and sequence as a function of the selection parameter, p, for the case of large antigenic assaults in which A* is greater than its critical value. Figure 4b summarizes the extremal strategies. Which of the 3 switching sequences is best depends on the value of p. For small values of p the strategy (L, P, M) is superior, while for large values of p the strategy (L, M) is best. Our numerical simulations show that in a very restricted range of intermediate p values the three switch strategy (L, P, L, M) is very slightly better than the (L, P, M) strategy and hence as p increases the preferred strategy changes as follows: (L, P, M) -+ (L, P, L, M) ~ (L, P, M) --~ (L, M).
In order to see the dependence of the extremal strategy on antigen dose and the antibody secretion rates during the primary and secondary reponses, we have

226 A . S . Perelson et al.
considered three cases: V2 - A*2/k2 = 8 x 10⁸ hr, 8 x 10⁹ hr, and 8 x 101~ hr. The value of L2o was fixed at 4 x 10³, while the values of the other parameters were chosen as in the typical case studied in Part I for the immune response in mice: ~1 = A*/klLo = 2 x 10⁵ hr, b = 0.1 hr -1, d = 0.1 hr -1, /~p = 0.02 hr -1, /ZL = 10 -~ hr -1, 7 = 10 andLo --- 4 x 10⁴. We also chose A -- 1.0. This standard set of parameter values was used throughout our numerical studies. Since A*/kl = 8 x 10⁹ hr, we can view the three cases we have considered as ones in which A* = A* and kl = 0.1, 1.0 and 10k2. Alternatively, if we let k2 = ilk1, where fl is say 10 or 100 since one expects higher antibody affinities 1 and secretion rates during a secondary response, then these three cases correspond to A* = 0.1, 1.0, and lOflA*.
The objective function J defined by Eq. (16) contains constant terms contributed by the functional form of T*. For computational purposes we have utilized a modified objective function J ' (defined by Eq. A.3) which lacks the constant parts of 7"*.
Figure 5a shows how the cost, J ' , varies with choice of strategy and p. Here and in all subsequent plots, J ' has been minimized with respect to all possible switching times consistent with the given strategy as described in section A.4. In Figure 5b we show the strategy which gives the minimum cost for each value of p. For example, for V9 = 8 x 10⁹ hr the strategy (L, P, M) gives the minimum cost, for 0 6 p ~< 0.53. When p is between 0.54 and 0.63, (L, P, L, M) renders the minimum cost, but J ' for this strategy is less than 0.02 hr smaller than J ' for the (L, P, M) strategy. For 0.64 ~< p < 0.78 the extremal strategy reverts to (L, P, M). Finally with p >t 0.78 the strategy (L, M) becomes extremal. For the cases in which V2 = 8 x l0 s hr and Vz = 8 x l0 x~ hr one gets a similar sequence of strategies asp is increased. However, the value o fp at which a strategy switch occurs increases as ~72 decreases, causing the (L, P, M) strategy to be preferred for a larger para- meter range. In all three cases the switch to (L, P, L, M) saves less than 0.02 hr over the (L, P, M) strategy. Since the (L, P, L, M) is for all practical purposes no better than the (L, P, M) strategy, and more complicated to implement, we do not consider it as a realistic biological strategy for the range of ~Tz values studied. Neglecting the (L, P, L, M) strategy we see from Figure 5b that the (L, P, M) strategy yields the minimum cost fo rp < 0.61, 0.78, and 2.5, for V2 = 8 x 10¹⁹ hr, 8 x l0 s hr and 8 x l08 hr, respectively. For V2 = 8 x 10⁷ hr (not shown) the (L, P, M) strategy is preferred for all values o fp of practical interest. (Atp = 20.0 the switch to (L, M) had not yet occurred.)
In Figure 6 for V2 = 8 x 10⁹ hr we plot the times devoted to lymphocyte pro- liferation, plasma cell production, and memory cell production versus p for the (L, P, M), (L, M) and (L, P, L, M) strategies. Notice from Figure 6a that for the (L, P, M) strategy the time devoted to plasma cell production, ~2, approaches zero for p I> 0.78. Thus one would expect that the (L, M) strategy would be extremal
1 In Part I we discuss the representation of a change in antibody affinity by an equivalent change in the antibody secretion rate.

Optimal Strategies in Immunology. II 227
a= v
200
160
12G
-L,P, M
~/t =8x I0 K) hr
,= 8 x lOehr
f/2 = 8 X I01 hr
L, P, L,
L, P,L, M,
L,P, L , M - ~
L, M P,M
0 0.4 0.8 1.2 1.6 2.0 2.4 2.8 3.2 3.6 4D 4.4 4.8 5.Z
P
(a )
~ . . o ~ Io 'h . I L P . ILPL.r , L,P. . I L . , , - -
rLPLM
LM
r LPLM
~= = o x'lo '~ hr! L P . i ~ L P ' - LM
0 0.4 0:8 ,:2 ,'.6 2:0 s s 3!2 316- P
(b)
Fig. 5. (a) The cost J ' plotted against p for various choices of strategy and 72 --- A*]k2 with b = d = 0.1 hr -z, pp = 0.02 hr -1, /~L = 10 -5 hr, az = 2 x 10⁵ hr, and A = 1.0. For each strategy J ' has been minimized with respect to all possible switching times. (b) Strategy which minimizes the cost J" plotted against p for various values of 72.

228 A.S. Perelson et al.
tS~
140
1 3 0
1 2 0
(a) (L, P~ M)
/
L
70
I I I I I I I I I , ~ J - 0 0.2 0.4 0.6 0,8 1.0 L2 i,4 1.6 L8 2 , 0
P
tSO (b) i I I I i (L, M)
1 4 0
i50
~ ( . - -~, + .r=
" t I t. 7'0
I I I I I 0 02, 0.4 0.6 0.8 1.0 1.2
P
I I [ t
I I I L4 L6 L8 2D
Fig. 6. The minimized cost J', and the durations of lymphocyte pro- liferation, [-1 in (a)-(c), and Ta in (c)], plasma cell differentiation [*2 in (a) and (c)l and memory cell differentiation [To in (a), ~'2 in (b), and ~a in (c)] plotted against p for various strategies with v~ = 8 x 10 9 hr. (a) (L, P, M); (b) (L, M); (c) (L,P,L,M)
15~
IdC
120
"C IIG
~ I 0 0
90
8 C
?C
0
I I I I I I I I I {c ) (L,P, L,M)
" ' - - - " - j'rl + ~'e+ r ~ M
] i I I I I I ! I / 0.2 0.4 0.6 0.8 1.0 1.2 1.4 1,6 L8 2.0
P
forp >/ 0.78 as is, in fact, the case. For each strategy we have also plotted the cost, J', which increases monotonical ly with p. This is expected since p weights the time for the secondary response. One would also anticipate that the number of memory cells produced during the primary response, M(T*), would increase with p. This is seen to be the case in Figure 7. Figure 8 shows the extremal proliferation and production times, z*, for ~72 = 8 • 109 hr. The switch to (L, P, L, M) has been deleted from the figure. For the complete figure plus detailed results for the case in which ~j2 = 8 x 10 l~ hr see Mirmirani 0977) .
In order to see the consequences of the bang-bang strategy on the dynamics of the primary and secondary immune responses we have plotted in Figure 9a the temporal variation in the lymphocyte, plasma ceil, and memory cell populations during a primary response using the external strategy (L, P, M ) when p = 0.1, A = 1.0, A* = A* = 5 x 10 -a moles, k1 = k2 = 6.25 x 10 - l s m o l e hr -1 cell -1, L0 = 4 x 10⁴ cells and L20 = 4 x 10 acells so that ~72= 8 x 10⁹ hr. Observe that L increases exponentially for 82.2 hr, while P and M remain at zero. At t = t* = 82.2 hr the production of plasma cells is turned on and at t = 89.4 hr lymphocytes begin differentiating into memory cells. As shown in Figure 9b the total time of the primary response is 93.3 hr with the majority o f the antibody

Optimal Strategies in Immunology. II 229
f~= = 8 X l O I0 hr
X
=E
= 8 x IO t hr
= 8 x I0 a hr
1.0
1.0 2 0 5D
Fig. 7. The number of memory cells produced by the end of an extremal primary response plotted against p for ~72 = 8 x 10 a hr, 8 x 10⁹ hr, and 8 • 101~ hr. The extremal strategy is assumed to be (L, P, M) for p < 2.5, 0.78, 0.61 ; (L, M) is the extremal strategy for p > 2.5, 0.78, 0.62 when Vz = 8 x 10 a, 8 x 10⁹, and 8 x 10 z~ hr, respectively
being produced during the last 10 hr. By the end of the response 2.3 • 107 memory cells have been produced which, with A = 1.0, are all assumed to become activated by the secondary challenge. Figures 9c and 9d show the dynamics of the secondary response. N o memory cells are produced, lymphocytes grow exponentially until t = 17,1 hr and then differentiate into plasma cells. The full secondary response takes T* = 29.3 hr as compared with T* = 93.3 hr for the pr imary response. One should notice that in the secondary response there is no lag in ant ibody product ion, while for the pr imary response the ant ibody concentrat ion is so low as to be offscale in Figure 9b until t = 40 hr. The magni tude o f the secondary response, as measured by the size o f the reacting cell populations, is about the same as the magnitude o f the pr imary response.
For larger values of p the dynamics of the response change. In Figure 10 we examine the pr imary and secondary response f o r p = 0.8, A = 1.0, A* = 5 • 10 -8 m~ A* = 5 x 10 -7m o l e , k l = k 2 = 6 . 2 5 • 10 -18 m o l e h r -1ce l l -1, L8 = 4 • 104, L2o = 4 • 103 and ~72 = 8 • 101~ hr. For this value o f p the number of memory cells produced by the end of the pr imary response is so large (2.5 x 10⁸) that with A = 1.0 no plasma cells need be produced in the secondary response for A~' = A* = 5 • 10 -8 mole. (See Part I for a discussion of the criteria determining plasma cell product ion.) Thus we choose A* = 5 • 10 -7 so that a switch to plasma

2 3 0 A . S . P e r e l s o n et a l .
I 1 0 - - I 1 I 1 I [ I I I t I
1 0 5
I O 0
V-
I l r I I I J L I I I 0 O.I 0. 9' '0 .3 0.4 0.5 0.6 0.7 OB 0.9 10 1.1 i.2
P
F i g . 8 . The optimal durations of lymphocyte proliferation (L), plasma cell differentiation (P) and memory cell differentiation (M) plotted against p with ~2 -- 8 x l0 g hr. The extremal strategy is assumed to switch from (L, P, M) to (L, M) at p = 0.'/8
cell production would be necessary. For these parameter values the extremal strategy is (L, M). In Figure 10a we show the time course of lymphocyte growth and memory cell production. The switch from proliferation to differentiation occurs at t = 95.3 hr. The total time of the primary response, T* = 101.4 hr. During the last 6.1 hr, 2.5 x 10⁸ memory cells were produced. Figure 10b shows the mono- tonic production of antibody during the primary response. The dynamics of the secondary response is shown in Figure 10c. The lymphocyte population increases exponentially until t = 16.4 hr; then the differentiation of plasma cells begins. The secondary response takes T~' - 28.5 hr. Antibody is produced with no time lag (Figure 10d) and 5.0 x 10 -~ moles is secreted by the lymphocyte and plasma cell populations in 30% of the time it takes for the secretion of 5 x 10 -8 moles during the primary response. The secondary response is strikingly efficient.
B. Features of Results
Memory is a feature of most immune responses. A second contact with an antigen gives rise to an enhanced and more rapid antibody response revealing the existence of a memory of the initial contact with antigen. Although immune memory has been shown to be mediated by recirculating lymphocytes (Gowans and Uhr, 1966), the mechanism and time course of generation of B memory cells is not fully under-

Optimal Strategies in Immunology. II 231
~.6 / I I I I
I ' a)
1.4
1.2
1.0 x
~ 0.8
0.4
0.2
0 . 0 I O. 20. 40. 60. 80. I00 .
t (h r )
2=
=_o x r
6.0
5 , 0 - -
4 .0 --
310 - -
2.0 - -
1.0 - -
0 . 0 O.
I I I - I
20. 40. 60. 80.
t (hr)
I00.
o x
u
i Z
1 .4
1.2
1.0
0.8
0 .6
0 .4
0 . 2
O.C O.
I I I I l ( c )
L
p -
5. IO. 15, 20. 25. 30.
A =
=o x
5 .0 ( d l I E I I I
4.0
3 .0
2 . 0
1.0
0 . 0 ~- O " 5l IO' 15" 2 0 . 25 30'
t ( h r ) f ( h r )
Fig. 9. Dynamics of the optimal primary and secondary responses with p = 0.1, kz = k2 = 6.25 x 10 -za moles cell - z h r -z, A* = A* = 5 x 10 -amoles , L o = 4 x 10⁴ , and L2o = 4 x 10 a. (a) The number of large lymphocytes, plasma cells and memory cells produced as a function of time during the primary response. (b) The number of moles of antibodies secreted as a function of time during the primary response. (c) The number of large lymphocytes and plasma cells produced during the secondary response. (d) The antibody secretion during the secondary response

~o
~
.o,,
~
~"
~,,
~
~o
= �9
,.~
,.,..]
X
e n
n ~o
~.
== =
, ,.,
~=
.,
~
Nu
mb
er
Of
Ce
lls
x
I0 -
e
o o
b b
b o
~o
~ I
oi
I, 1
b
~ ~
I ~ ~
" .
~.~
r'
~'1
Cz,
0
Ii
='
"=
2 ~
,,-,
r=
A
x
10
I'
(mo
les)
~
~
0
~
~
0
~ ~
,'-,-
~ ~z
, ,~
O
ct
~,.o
c,,
,, tl
~ ,.,
~"
W
=,
.
u
0"
C:
=
Nu
mb
er
Of
Ce
lls
x 1
0 4
b b
b I
1 I
I o o
1
r-
I o
, I
A x
I0 s
(mol
es)
p o b
' t
I
i I
I
Ch 0
Q
m 0
cr
.>

Optimal Strategies in Immunology. II 233
stood. In order to gain some insight into possible mechanisms controlling the development of B memory cells we have computed, using optimal control theory, a strategy which minimizes the time to neutralize a given antigen on both the primary and secondary responses. Since memory cells make no antibody the diversion of any cells of a responding clone into memory cells lengthens the time of the current response but shortens the time of a future response. In order to weight the importance of future responses with respect to the present response, we introduced a parameter p and minimized T~ + pT2, where T~ and/'2 are the lengths of the primary and secondary response, respectively. Irrespective of the value of p we found that a 'bang-bang' control policy should be followed in which memory cells are only produced at the end of a response. In biological terms bang-bang control corresponds to "all-or-none" responses. Thus for small values of p, stimulated lymphocytes should all proliferate until some critical time, t*, where- upon the whole population should cease growing and begin differentiating into plasma cells. At a later time, t*, the remaining population of lymphocytes should end the process of differentiating into plasma ceils and instead begin differentiating into memory cells. Figure 9a illustrates the population dynamics of such a process. If the secondary response is weighted heavily enough (p /> 2.5, 0.8, and 0.62 for ~72 = 8 x 10 a hr, 8 x 10⁹ hr, and 8 x 10 l~ hr, respectively) our calculations show that no plasma cells should be made. This is reasonable given that for large values of p great numbers of memory cells are required (see Fig. 7), which can only be produced from even greater numbers of lymphocytes (see Fig. 10a). Such large populations of lymphocytes secrete enough antibody to reach A* without switching to plasma cells. However, a careful examination of Figure 10 will show that in order to attain such behavior the predicted cell populations become greater than the 4 x 10⁸ lymphocytes generally found in a mouse. This is a failure of the model attributable to the linear growth term in Eq. (6) which allows lymphocytes to grow exponentially independent of their population size. A more realistic model would require replacing the linear growth term by a logistic growth term, i.e.
~ ( L ) - d - b u ( t ) L 1 - ~ - d p v ( t ) L - d M w ( t ) L - ~ L L
where Lm,x is the largest allowed population level for the lymphocytes of a given antigen specificity. Unfortunately such a replacement makes the state equations non-linear and the optimal control problem intractable in closed form. Although we have not performed any numerical calculations for the logistic model, one might expect that limiting the size of the lymphocyte population to realistic levels would make it necessary to switch to plasma cell production for all values o fp if A* were sufficiently high. From numerical studies of other population systems where linear growth equations were replaced by logistic ones we expect the extremal control to stay bang-bang, but with somewhat different switching times. For values of A* smaller than those considered here, the number of lymphocytes produced by the (L, M) strategy could stay considerably below 4 x 10⁸, eliminating the need for a logistic treatment.
Our optimal control calculations showed that for some intermediate range of values for p (0.54-0.63 when ~/2 = 8 x 10⁹ hr) the strategy which minimized

234 A . S . Perelson et al.
1"i + pTa was (L, P, L, M); that is, lymphocytes should first proliferate, then stop growing and differentiate into plasma cells. At some later critical time the remaining lymphocytes should cease differentiating into plasma cells and proliferate again before differentiating into memory cells. This second stage of proliferation increases the lymphocyte population, so that large numbers of memory cells can be formed. Examining the actual response times for such a strategy shows that it produces a negligible improvement over the simpler (L, P, M) strategy, at least for the parameter values that we studied numerically. If this is in fact true for most other realistic parameter values, and we have no reason to believe otherwise, then it would seem pointless for a biological system to adopt the more complicated (L, P, L, M) strategy over the simpler (L, P, M) strategy. One could easily envision that there are costs associated with switching the control which our model has not taken into account, but which would tend to favor the adoption of the (L, P, M) rather than the (L, P, L, M) strategy.
The (L, P, M) strategy minimizes the cost J for small and intermediate values ofp (p ~< 0.53, and 0.63 ~<p ~<0.78 for ~2= 8 x 10ahr). If one excludes the (L, P, L, M) strategy as discussed above, then the range of p values for which the (L, P, M) strategy is preferred becomes quite large, and for small values of ~a (V2 = 8 x l0 T hr or 8 x 10 a hr) encompasses all realistic values ofp.
The difference in response times, measured by J ' , among the three strategies is not very great when each is performed in an optimal fashion (see Figs. 5a and 6). For all three strategies lymphocyte proliferation occupies the majority of the primary response, demonstrating both the importance and efficacy of cell proliferation in a humoral immune response.
For an animal challenged with antigen N times we were able to show that the extremal behavior in each of the first N - 1 encounters is qualitatively the same as in the extremal primary response computed for the two-stage problem, justifying our in-depth study of the simple two-infection problem. The quantitative behavior of the extremal primary responses is a function of N, the number of antigen encounters. One might expect that as N increases the number of memory cells produced during the primary response increases. However, if one imposes a limit on the total lymphocyte population by utilizing a logistic growth equation then one might expect the number of memory cells to increase with N, but to asymptoti- cally approach some upper limit, Mm~x, which may be on the order of a few percent of the total lymphocytes. In order to test this hypothesis one can let N ~ ~ and attempt to find the limiting strategy. In Section IIID we further discuss the problem of computing Mm~x.
The basic and most significant feature of all the extremal strategies that we found (see Eq. A.50) both for the 2-stage and N-stage models was that memory cells should be produced only at the end of the primary response. Given the premise that memory cells secrete no antibody and hence in our model (Fig. lb) have no value in the current response, it is almost self-evident that they should be produced only after the neutralization of the antigen has been assured. Other models, such as the X - Y - Z scheme of immune cell maturation (Sercarz and Coons, 1962) have been

Optimal Strategies in Immunology. II 235
proposed where this is not the case, and which have the property of leading to the formation of immune memory before antigen neutralization. Although such behavior is clearly possible, it is suboptimal from our viewpoint. The early diversion of immunocompetent cells into a memory compartment provides no advantage to the organism.
One deficit of our model is that we do not explicitly allow memory cell production after the end of the primary response, i.e. for t > /'1. For the purposes of com- puting an optimal strategy all memory cell production cannot be relegated to post- primary response times, since one would then have no a priori way of assuring that enough lymphocytes would be present at T1 to produce the required number of memory cells. From our simulations (Figs. 9a and 10a) one can see that the time devoted to memory cell production is very short (2.9 hr and 6.1 hr in the cases studied) and hence restricting memory cell production to t < /'1 has very little effect on the dynamics of antibody production and is of no consequence with regard to our prediction of late memory cell production.
C. Evidence in Support of the Optimal Strategy
There is some experimental evidence that indicates that memory cells may in fact be produced late in the primary response, but other evidence exists which is contradictory. Studies by Cunningham and Sercarz (1971) and Niederhuber and Moller (1973) on the time course of generation of B cell memory after primary immunization lead to the conclusion that the major increase in memory occurred after the peak of antibody forming cells had been detected, and that memory continued to increase gradually over a period of several weeks. Mitchison (1971), Schirrmacher and Rajewsky (1970), and Kreth and Williamson (1973) also found that B memory development required many weeks for full expression. However, studies by Kreth and Williamson (1973) and Williamson et al. (1974) showed that the gradual increase in memory was accompanied by an increase in the number of different clones contributing to the response. Thus for a single clone memory might not be developed after the peak of antibody secretion. In fact, by following a single clone in cell transfer experiments Williamson et al. (1974) concluded that generation of memory cells occurs simultaneously with the generation of antibody forming cells. This finding is in direct contradiction to the predictions of our model. However, if the antibody forming cells detected by Williamson et al. (1974) were plasma and not large lymphocytes then as one can see from Figure 9a it would be easy to conclude that antibody forming cells and memory cells were generated at approximately the same time, especially since Williamson et al. only tested their cell populations every few days. The method Williamson et al. (1974) used to detect antibody forming cells was the hemolytic plaque technique which, in general, is sensitive enough to detect large lymphocytes. As another explanation, one might suggest that these transfer experiments would not have detected clones generated from cells secreting IgM early, since the plaque assay was only performed first at day 2 and then at day 4. In fact, at day 2 there were IgM plaques seen although no memory was detected. Thus the 'early' memory cells Williamson et al. observed may, in fact, have

236 A.S. Perelson et al.
differentiated from IgM secreting cells. Other reasons for the discrepancy between these experiments and our predictions might be due to failings of the model. First, as we showed in Part I, if the optimal control model is generalized so that the heterogeneity of the cell populations is taken into account, then the strict bang- bang control is replaced by a sequence of step function changes in the control which has the overall appearance of a graded control. For a single clone of cells such heterogeneity should be minimal. Graded control can also appear if our deterministic model is replaced by a stochastic one. Studies on a single clone of cells, such as Williamson's, might very well require a stochastic model. From our experience a third method of obtaining a graded control in population models is to utilize a model in which the control enters as a non-linear concave function, i.e. if the state equations Yc --- f(x, u) instead of being bilinear in x and u had the property that f(x, .) were a concave function (Oster and Wilson, in press; Oster and Macewicz, in preparation).
There is rather interesting additional in vivo evidence that memory develops late in an immune reponse. It has been proposed by Cottier, Nossal, Thorbecke and other workers that B cell memory is developed in the germinal centers of lymph nodes and the spleen (cf., Thorbeeke et al., 1967). Since as we shall detail below, germinal centers are formed late in an immune response, after antibody produc- tion, this would imply late development of memory. In fact, we shall discuss an experiment which shows memory development occurs after the development of plasma cells.
After antigen is injected into an animal it is usually trapped by the draining lymph nodes and the spleen. Where the antigen is retained and for how long will depend on a number of factors such as its route of administration (cf., Nossal and Ada, 1971; Humphrey, 1976). Both in the primary and secondary responses to antigen antibody formation is seen first to occur in the medulla of lymph nodes (after 4--6 days in the primary response and 2-4 days in the secondary) and/or at the margin of the white and red pulp of the spleen (after 2-4 days). New germinal centers, induced by the antigen, do not appear until 5-7 days in the primary and 4-6 days in the secondary response, implying that they cannot be involved in the initiation of antibody production. According to Humphrey (1976) the clearest evidence that germinal centers are a site, and perhaps the only site, of B memory cell production in vivo comes from an experiment by Cottier and colleagues (Grobler et al., 1974). In this experiment mice primed against the antigen tetanus toxoid were given a second injection of the toxoid into their foot pads. This elicited a transient appearance of a large number of plasma cells in the medulla of the regional popliteal lymph nodes. The number of plasma cells was maximal at day 3 and had dropped substantially by day 5 after the antigen injection. Germinal center enlargement began a little later than plasma cell development and reached a maximum at day 5 followed by a decline at day 7 and a second increase in size at day 10. When mice were irradiated with 600r 4 days after antigen stimulation, the germinal centers disappeared within one day and did not reappear. The dynamics of synthesis and release of antibody against the toxoid was almost unaffected by the irradiation and was attributed to the radioresistance of mature plasma cells.

Optimal Strategies in Immunology. II 237
However, when given a third injection of antigen the irradiated mice showed no evidence of immunological memory, while unirradiated controls gave a vigorous tertiary antibody response. Although other explanations may be possible, the most obvious is that germinal centers are required for generating new B memory cells and that such generation takes place after the production of plasma ceils as predicted by our model. Stavitsky and Folds (1972), using rabbits, injected antigen into one hind foot pad and examined the immune response in the draining and contralateral popliteal lymph nodes. They found that the peak of the antibody response occurred between days 4 and 8 and that memory was only first detectable on day 8. This again supports our prediction of late memory cell production.
There is one further experimental observation that is consistent with the notion of late memory cell formation. During a primary immune response the affinity of antibody detected in the serum gradually increases (Siskind and Benacerraf, 1969). This 'maturation' of the immune response is thought to reflect the preferential proliferation of those clones of cells in the animal which bind the antigen best. The high affinity of antibody produced during a secondary response, which is characteristic of antibody forming cells late in a primary response, supports the hypothesis that memory cells develop late in the primary response from matured large lymphocytes.
D. The Optimal Number of Responding Lymphocytes and Memory Cells
One interesting question raised by the logistic formulation of lymphocyte growth is how to choose Lmax. Clearly Lmax must be less than the total number of lympho- cytes in an animal. However, since our model only concerns itself with the response of lymphocytes to a single antigen, Lr~ax must be the total number of lymphocytes an animal commits to a given antigen specificity. Experimentally, using red blood cells as antigens, L ~ has been found to be no greater than a few percent of the total population of immunocompetent cells implying the existence of a regulatory mechanism limiting the size of the response (Dutton and Mishell, 1967; Makinodan, Kastenbaum, and Peterson, 1962). If such a mechanism exists what is the optimal value ofLm~x ? Should it be the same for all antigens ? Questions such as these could be answered by methods similar to those employed in this paper.
The number of memory cells that an animal commits to a given antigen was not constrained in our model. As one can see from Figure 7 the optimal number of memory cells depends on p, but is of order 108 for a mouse. Although M(T*) decreases with antigen dose, i.e. ~72, the optimal number of memory cells is too large considering L~x is of order 10L One can easily envision that an animal would not only control L~a~ but would also set some Mm~, i.e. some maximum level of memory commitment for a specified antigen. For common or dangerous antigens Mm,~ might be high while for uncommon or innoxious antigens Mm~ might be low. Given that a mouse not undergoing an active immune response maintains a total population of approximately 4 • 108 lymphocytes, it must allocate these cells in some way between the different antigen specificities. An initial setting might be established during ontogeny and during subsequent generation of virgin B cells.

238 A.S. Perelson et al.
In fact, several investigators have demonstrated that the ability of developing animals to respond t o various antigens is acquired in a well-defined sequence (Rowlands et al., 1974; Sherwin and Rowlands, 1974; Press and Klinman, 1974; Klinman and Press, 1975). D'Eustachio, Cohen and Edelman (1976) have shown that within a given strain of mice the fraction of nucleated cells binding a particular antigen in the spleens of fetuses is a constant which is characteristic of the mouse strain and antigen. These facts strongly suggest the presence of genetic controls in establishing the size of the initial cell populations responsive to a given antigen. The phenomena of immune memory could then be viewed as a way of resetting the cell allocations to a given antigen specificity. Computing the optimal memory cell allocation then becomes an interesting problem in stochastic allocation (cf., Derman, 1975). That is, given NTOT lymphocytes (or for simplicity MToT memory cells) and given a set of diseases (or antigens) which impinge randomly on an organism, how should the lymphocytes and memory cells be allocated among all possible antigen specificities ?
Acknowledgements. We thank G. Leitman and B. Goldstein for valuable discussions and comments throughout the course of this work. We also acknowledge the critical comments of G. Bell and A. R. Williamson, and the excellent assistance of Mrs. Mary Plehn in the prepara- tion of this manuscript. The work of A. S. P. was performed under the auspices of the U.S. Energy Research and Development Administration. M. M. and G. F. O. were supported by NSF Grant No. DEB74-21240 A01.
Appendix. Optimal Control Calculations
A.1 Problem Formulation
The optimal control problem formulated in Section IID is
min J(u, v) = dt + pT* (A.1) [u(.),v(.)]
where T* is a function of the memory cell population at the end of the primary response; i.e. from Eq. (A.39a, Part I)
1 In [A__2*(b- /~L) + k , {AM(T , ) + L,o}] T* = 7~* + b /z~ [ (b - - ~ L ) " ~ 2 G - ( r ~ + L--~'o} J" (A.2)
Since, as shown in Part I, r* is a constant for a given parameter set {d, b,/~L,/~e, 7} we can simplify the cost functional J by subtracting the constant terms. Thus if suffices to minimize
I? J' = dt + pK(M*) (A.3)

Optimal Strategies in Immunology. II 239
where
1 [a2bL + A'M* + 1] (A.4) K ( M * ) = ~ In [' A-rM~ ~ ' 1
bL ~-- b -- ta (A.5a)
~2 & A*/k2L2o (A.5b)
A" & A/L2o (A.5c)
and
M * = M(TI ) . (A.6)
The state equations governing the motion of the system during the primary response are:
.,t = k~(L + 7P)
L = bu( t )L - dv( t )L - d[1 - u(t) - v(t)]L - t~LL (A.7)
P = dv( t )L - I~,P
3;/--- d[1 - u(t) - v(t)]L
with initial conditions
A(0) = P(0) = M(0) = 0, L(0) = Lo (A.8)
The controls satisfy the constraints
u(t) >>. O, v(t) >t O, u(t) + v(t) ~< 1. (A.9)
The terminal manifold is the surface in R 4 defined by
O & A( t ) - A* = 0. (A.10)
For ease in stating optimal control results we define the state vector x = (.4, L, P, M ) T, the control vector u = (u, v) T, and rewrite Eq. (A.7) in the form k = f ( x , u). The superscript T denotes the transpose of a vector.
A.2 Pontryagin's Minimum Principle for the Terminal Cost Problem
The type of control problem we have formulated is known as a minimum time problem with terminal cost. In order to solve it we shall apply the following form of Pontryagin's minimum principle 1 which is a restatement of theorem 5-11 in Athans and Falb (1966):
Theorem: Let u*( . ) be a bounded and piecewise continuous control which transfers (Xo, to) to S = (x = ( A , L , P , M)T] O(x, t) = x l ( t ) -- Al* = 0). Let x*( . ) be the trajectory o f ~ = f [ x ( t ), u(t)] corresponding to u*, originating at (Xo, to) and meeting S at T*. Let H, the Hamiltonian, be the scalar function given by H(x , X, u) =
1 + Xrf(x, u). In order that u*( . ) be optimal for the costfunctionalJ(u) = ftzo 1 dt +
pK[x(T1)] it is necessary that there exist a vector function X(-) such that
x In Part I we utilized Pontryagin's maximum principle.
240 A.S. Perelson et al.
1) X(t) and x*( t ) are a solution o f the canonical system
~*(t) = ~ [x*(t), X(t), u*(t)] (A.11)
OH [x*(t), X(t), ,*(t)] X(t) ----- ----~-~-
satisfying the boundary conditions
x*(to) = Xo, x * ( r * ) e S.
2) The function H[x* ( t ) ,X ( t ) , .] has an absolute minimum t s [to, T*]; that is,
rain H[x*( t ) , X(t), u] = H[x*( t ) , X(t), u*(t)]. (A.13)
3) H[x*( t ) , X(t), n*(t)] = 0, t e [to, T*]. (A.14)
4) X(T*) -p(OK/~x)[x*(T*)] is transversal to O(x, t) at x*(T*); that is,
OK , , O0 X(TD - p ~x Ix (T,~)] = d
where e is a constant vector.
(,4,.12) at . = u*( t ) f o r
(AAS)
A.3 Necessary Conditions f o r Minimizing the Cost
In order to apply Pontryagin's minimum principle, let 7, be the costate vector. Then the Hamiltonian is
H = 1 + Alk l (L + 7P) + a2[bu - dv - d(1 - u - v) - /~z ]L
+ ~a(dvL - I~eP) + ~4 d(1 - u - v)L. (A.16)
Factoring we see that
H = a iLu + azLv + 1 + ~Ik~(L + yP) - ~2(d + tzz)L
- ~ a t ~ , P + ~ dL (A.17) where
ol & (b + d)a2 - dA4
a2 & d(Aa - A4)
are the switching functions. We also define
a & a x - ~ r 2 = (b + d ) A z - dAa.
(A.18a) (A.18b)
(A.18c)
By the minimum principle extremal controls must minimize H for all t ~ [0, T*]. Since H i s a linear function of u and v with 0 ~< u ~< 1, 0 ~< v ~< 1 and 0 ~< u + v ~< 1, it is easily seen that H is minimized when
u* = 0 i f ~ l ( t ) > 0 o r a ( t ) > 0
u* = 1 i fa l ( t ) < 0 a n d a ( t ) < 0 t~[0 , T*] (A.19)
v* = 0 ifa2(t) > 0 o r a ( t ) < 0
v* = 1 ff a~(t) < 0 and a(t) > O.
Optimal Strategies in Immunology. H 241
When al( t ) = 0 and e(t) ~< 0 or az(t) = 0 and g(t) /> 0 on some non-zero time interval u*(t), v*(t), or both u*(t) and v*(t) are not determined by Eq. (A.19). These cases of singular control are shown not to occur in Section A5.
The adjoint or costate vector ;~(t) obeys the equations
,~1 = ~ H 0 ~A
(A.20a)
~, = _ a/-/" = O. (A.20d) OM
The boundary conditions are:
;~I(T*) = c (A.21a)
A2(T*) = ha(T*) = 0 (A.21b)
~K I - p a 2 A ' ,~,(T*) = p ~ t=r~ = ( A ' M * + 1)(a2br. + A ' M * + 1) < 0, (A.21c)
where c is an arbi t rary constant. We conclude from Eqs. (A.20a) and (A.21a) that hi(t) is constant for all t e L I ~ [0, T*]. Similarly, Eqs. (A.20d) and (A.21c) imply h4(t) = A4(T~) < 0 for t ~ L Let ~4 = - ) ~ ( T * ) > 0 be a positive constant.
There is a constraint on the relative values of ~ and At. Since H[x*( t ) , ~,(t), u*(t)] = 0, t e / , we have
H[x*(T*) , X(T*), . * (T*) ] = 1 + )qk , [L(T*) + yP(T*)]
-- ~,d[1 -- u*(T~*) -- v*(T*)]L(T*) = O. Thus
~ = ~, d[1 - u*(T*) - v*(T*)]L(T*) - 1 k~[L(T~) + 7P(T*)] (A.22)
In order to determine the extremal control , * ( . ) f rom Eq. (A. 19) we need to com- pute the switching functions or1(.) and a2(.). Since the adjoint equations for As and h4 are independent o f the control and state variables, cry(.) does not depend on u( . ) and v(.). At t = T*, a2(T*) = dh4 > 0. Integrating the adjoint equat ion (A.20c) backwards in t ime with initial condit ion ha(T*) = 0 yields
ha(t) = 7k1~ {1 - exp [ -p .p (T* - t)]}, t e I. (A.23) /zv
Therefore
a2(t) = dTkl ,~ {1 - exp [ - /~p(T* - t)]} + d~4, t e I. (A.24) /xp
At t = T*, cq(T*) = a2(T* ) = d~, > 0. Because a l ( . ) and a2(.) are continuous functions there exists a non-zero interval 1' = (t*, T*] on which both ol( t) and a2(t ) are positive. Hence by Eq. (A.19)
u*(t) = O, v*(t) = O, t e I ' . (A.25)
OH ~L = -k1~1 - (bu - d + du - k~r.)2~2 - dv,~a
- d(1 - u - v);~ (A.20b)
c~P = -k lyA1 +/~pAa (A.20c)
242 A . S . Perelson et al.
Integrating the adjoint equation (A.20b) backwards in time with the initial condi- tion Az(T*) = 0 yields
)t2(t) = kt;~a - d~, {1 - exp [--I~La(T * - t)]}, t e I ' (A.26) IZLa
where I~La ~-- I~L + d. Hence, using the definition (A. 18a)
ax(t) = (b + d) (k tA t - d~4) {1 - exp [ - -#La(T* -- t)]} + d~4, t ~ I ' . (A.27) #La
Substituting u* (T* ) = v* (T*) = 0 into Eq. (A.22) we see that
~ 4 d L ( T * ) - 1 (A.28) )ta = k ~ [ L ( T * ) + ~,P(T~*)]
Equation (A.28) indicates that )h can be positive, zero or negative. We consider two cases: (A))~x >i 0 and (B) Ax < 0.
Case A : hi >>. 0
It follows from Eq. (A.24) that a2(t) > 0 for all t ~ L Equation (A.19) then implies
v*( t ) = O, t e L (A.29)
The function al(t) is positive on I ' = (t*, T*] and or(t*) = 0. If At >/d~/k~, Eq. (A.27) implies al(t) > 0 for all t ~ L and by Eq. (A.19), u*( t ) = O, t ~ L With this strategy lymphocytes would immediately begin differentiating into memory cells and no plasma cells would be produced. On the other hand if hi < dA,/kx then for t < t*, with 0 < t* < T*, az(t) may be negative. Assume ~rl(t) < 0 for t e I " , 1 " = ( t ' , t * ) , where t ' < t*. Thus by Eq. (A.19) u * ( t ) = 1 for t ~ I " . Continuing to integrate the adjoint equation (A.20b) backwards in time from t = t* with u*( t ) = 1 and v*( t ) = 0 yields
ha(t) = exp [bL(t* -- t)]a~(h*) + ~ {exp [bL(t*~ t)] 1} (A.30)
with
bL & b - I~L (A.31)
and
- d~, (A.32) )t2(t*) = b + d
determined from the condition ax(t*) = (b + d)A2(t*) + d~4 = 0. Therefore
[(d + b ) k ~ l dA4]{exp [bL(t* -- t ) ] - 1}, t ~ I" (A.33) Gl(t) [ bL ]
and
6x(t) = -- [(d + b)kiA~ - dbL~4] exp [bL(t* -- t)], t ~ I" . (A.34)

Optimal Strategies in Immunology. H 243
At t = t*, ax(t) crosses the time axis going from negative to positive. Thus
fix(t*) = - [ ( d + b)kxA1 - dbzS,] > 0
and
#x(t) > 0, t < t*. (A.35)
By this argument we can conclude that al can change sign at most once on the interval [0, T~*], and that there are two possible control strategies when ;~x I> 0:
i) ~1 /> dS4/kl
u*(t) = O, v*(t) = O, t e [0, T*] (A.36)
ii) 0 ~< ;~1 < dS~/kl
u*(t) = 1, v*(t) = O, 0 <<. t < t* (A.37a)
u*(t) = O, v*(t) = O, t* < t <<. T* (A.37b)
Case B: ;~ < 0
Both a~ and a2 are positive on some terminal sub-interval of L Let t* and t2 be the first points of intersection of a~ and a~ with zero, respectively, when t decreases from its final value T*. (t* and ts need not belong to L) One of the following cases must occur:
i ) t* ~< O, ts ~< 0 (Fig. l la).
~r 1 and as remain positive on all of I. Therefore u*(t) = v * ( t ) = O, t e I.
ii) t~* > ts, t~* e I (Fig. 1 lb,c).
At t = t*, a~(t*) = 0, a2(t*) > 0 and a(t*) = -as( t*) < 0. Therefore on some time interval 12 ~ (t*, t*), ax(t) and a(t) are both negative and hence u*(t) = 1 and v*(t) = O, t e 12. On this interval ha(t ) is given by Eq. (A.23), ;~2(t) is given by Eq. (A.30) and hence
ax(t) = [(d + b)klS~ ] - "b~ + aS, {exp [bL(t* - t)] -- 1} (A.38)
a2(t) = dTk~S~ (1 - exp [-/~,(T* - t)]) + d ~ , teI~. (A.39) /zp
[(d + b)klS~ ] a(t) = - [. ~ + aS,] exp [bz(t* - t)]
+ d~k~S~ {1 - e x p [ - / ~ p ( T * - t ) l } + (d + b)k~S~ ( A . 4 0 ) t~p bL
where
$1 &-A1 > 0. (A.41)
For all t < t*, exp [bL(t* - t)] > 1 and al(t) < 0. The signs of az and a are not determined. Therefore we consider two subcases: either o(t) remains negative for all t < t* in which case /2 extends to the interval [0, t*] (Fig. l ib), or a(t) is zero at some time t*, and positive for t < t* (see Fig. llc). In the latter case, the control strategy changes and u * ( t ) = 0 and v * ( t ) = 1 on some interval

244 A.S. Perelson et al.
{a)
//./4• ';' T[
Ic) Idl
Fig. 11. Sketches of possible switching functions
/3 & (t*, t*). (Over this interval cr~ < 0 and cr = ~x - % > 0 implying % < a~ < 0.) Continuing the backward integration of the adjoint equations ove r /3 gives:
)~3(t) = ),a(t*) exp [- t~p(t* - - t ) ] + ykl~l {exp [-/~e(t2* - t)] - 1} P-e
~2(t) = B1 exp [--I~La(t* -- t)] + C1 exp [ - /~ . ( t * - t)] + D1,
where
B1 = )~2(t*) - C1 - D1
d ~ , ) t a ( t * ) + ~,k~l c~ = - - ~ ( ~
I~r.a)
DI = - kl~_..L (tz~" + dy) < 0 FoelXLa
and
e(t) = B e x p [--IZLa(t* -- t)] + C e x p [--/z~,(tz* -- t)] + D
where
B = (b + d )B1
C = d [/~,t3(t*) + yk~](~] I �9 - - t~a + 1
D = k ~ [dr(b - IZL) + Izp(d + b)] < O. ~ P L a
t~I3
(A.42)
(A.43)
(A.44a)
(A.44b)
(A.44c)
(A.45)
(A.46a)
(A.46b)
(A.46c)

Optimal Strategies in Immunology. II 245
Since b > ~L, D is negative. Thus for sufficiently large (t* - t), ,r(t) must also be negative. The interval la over which o(t) > 0 will therefore end at t*, or(t*) = 0, and ~(ta*) > 0. If t* > 0 we must consider the interval 14 ~ (t*, t*) in which o(t) < 0 (see Fig. 1 ld). Since ,r t < 0 for all t < t* the extremal strategy in 14 is u*(t) = 1, v*(t) = 0. By analogy with Eqs. (A.30) and (A.42) we can obtain A2(t) and Aa(t ) for this interval. From the definition of cr(t) and the fact that cr(t*) = (b + d)A2(t*) - dAa(t*) = 0 one gets
~(t) -- B2 exp [bL(t* -- t)] + C2 exp [-I~e(t* - t)] + D2 (A.47)
where
B2 = dAa(t*) (d + b)kl~l bL < 0
C2 -d[Aa(t*) + k w k l ] = < 0 (A.48) t~P J
D2 = (d + b)klSq + dkw~____!" bz t~e
The coefficients B2 and C2 are negative since
?tyAq
Differentiating Eq. (A.47) one finds:
o(t) = - b z B2 exp [bz(t* - t)] + tzvCz exp [-t~p(t* - t)]. (A.49)
Since 6(t*) > 0, -bLB2 > -t~pC2 and o(t) > 0 for all t < t*. We thus conclude that no additional switches can occur.
iii) t* = t2 = t*, t* e [0, T*].
iv) h* < tz, t2 e [0, TI*].
The analysis of cases (iii) and (iv) are similar to the analysis of case (ii), and no new switching strategies appear. Thus, if At is negative, the following are possible optimal strategies:
i) u* = 0 no switch M
V * = 0 ii) u* = 1, 0
switching time t* L, M v* = 0,0
iii) u* = 0 , 0 switching time t* P, M
V* = 1,0
iv) u* = 1 ,0 ,0 switching times t*, t* L, P, M
v* = 0, 1, 0
v) u* = 0 ,1 ,0 switching times t*, t* P, L, M
v* = 1 ,0 ,0
vi) u* = 1,0, 1,0 switching times t*, t*2, t* L, P, L, M.
v* = 0, 1 ,0 ,0
(A.50)

246 A . S . Perelson et al.
Strategy (i), immediately differentiating into memory cells, could only apply if A* is exceedingly small. Similarly strategy (iii), immediately differentiating into plasma cells and then switching to memory cell production, could only be adopted if A* is sufficiently small that one generation of plasma cells could secrete nearly 1 this amount of antibody during their lifetime. One would also expect that strategy (v) would only come into play when A~* is small since there is no initial proliferation of lymphocytes to provide a large population of cells which could then differentiate into plasma cells. For the remainder of the analysis we shall assume that A* is sufficiently large that the only possible strategies are (ii), (iv) and (vi), in which there is an initial phase of lymphocyte proliferation. 2 Symbolically we shall identify these strategies by the sequences: (L, M), (L, P, M), and (L, P, L, M). L implies a stage of lymphocyte proliferation, and M and P denote periods of lymphocyte differentiation into memory cells and plasma cells, respectively.
A.4 Integrating the State Equations
In order to determine which of the extrenial strategies minimize the cost functional J ' for a given value ofp we shall integrate the state equations along the trajectories determined by the control strategies [Eq. (A.50), (ii), (iv) and (vi)], determine A(t) , and then minimize J ' subject to the constraint A(T1) = A*.
Strategy (L, M ) : u* = 1, 0 switching time t*
v* = 0, 0
Integrating the state equations (A.7) over the initial interval of lymphocyte pro- liferation [0, t*) gives
L( t ) = Lo exp (bzt)
P ( t ) = 0 M ( t ) = 0 t ~ [0, t*] (A.51)
k iLo A( t ) = ~ [exp (b~.t) - 1]
Continuing the integration over the interval (t*, 7"1] with u*(t) = 0 and v*(t) = 0 yields
L(t ) = L(t*) exp ~La(t - t*)]
P( t ) = 0
M ( t ) = dL(t*) {1 - exp [--I~La(t -- t*)]} t e [t*, T~] (A.52) /*La
A(t) = k lL ( t* ) {1 - exp [-~,La(t - t*)]} + A(t*)
where L(t*) and A(t*) are given by Eq. (A.51).
t Lymphocytes which had not yet differentiated would also be available to secrete antibody. 2 See part I for methods of estimating A* from immunological data.
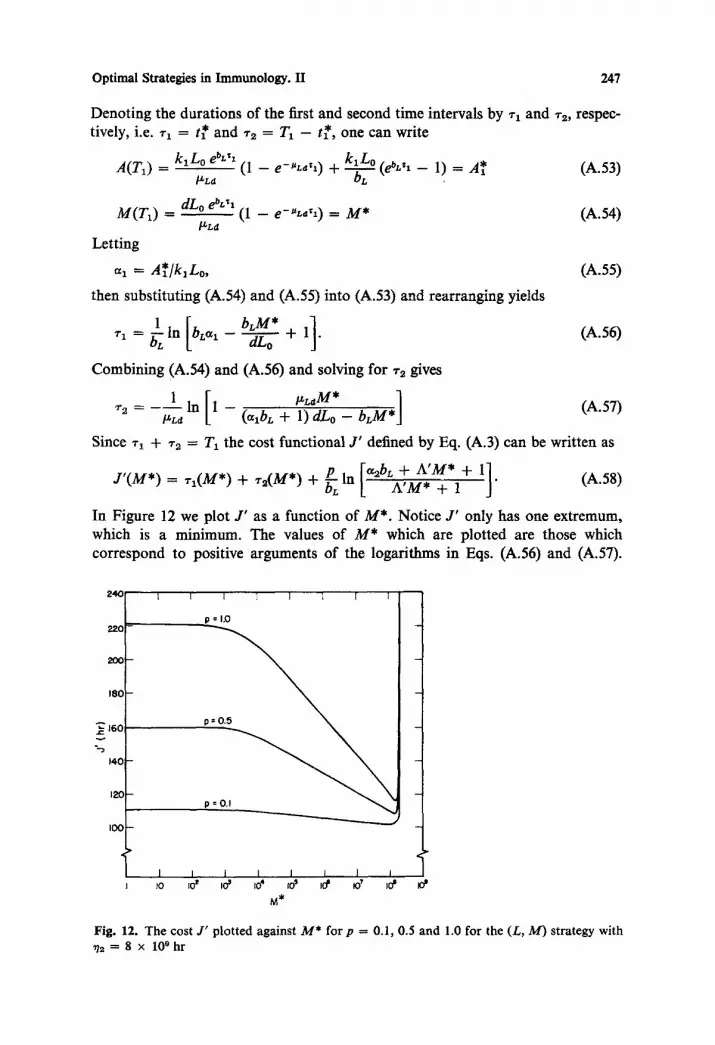
Optimal Strategies in Immunology. II 247
Denot ing the durat ions of the first and second t ime intervals by ~'1 and ~2, respec- tively, i.e. r l = t* and ~rz = /'1 - t*, one can write
kiLo (ebL,x _ 1) = A* (A.53) A(T1) = klLOlzLaebL'l (1 -- e-"L'' 0 +
M(TO = dLo eb"~....__~ (1 - e-"~, '~) = M * (A.54) t~La
Lett ing
~,~ = a * / k , Lo, (A.55) then substi tut ing (A.54) and (A.55) into (A.53) and rearranging yields
1 [ b L M * ] �9 1 = ~ In bLat dL-----~ + 1 . (A.56)
Combin ing (A.54) and (A.56) and solving for *2 gives
[ ~LaM* ] ~'z = _ 1 In 1 - (A.57) IZLn (c*lbL + 1)dLo - bLM*
Since -q + r2 = Tt the cost funct ional J ' defined by Eq. (A.3) can be writ ten as
J ' ( M * ) = TI (M*) + "r=(M*) + ~ In [[aabL-A-;-M ~ + A'M*~ 1 + 1] . (A.58)
In Figure 12 we plot J ' as a funct ion of M * . Not ice J ' only has one ext remum, which is a min imum. The values of M * which are plot ted are those which cor respond to positive arguments of the logar i thms in Eqs. (A.56) and (A.57).
2 4 0 - - "
2 2 0 - -
L: '00--
180 -
""G 160 .r_
140
IL:~3
100
L I I 1 [ ~ [ i
p = l , O
I I I I I I I i
M* Fig. 12. The cost J ' plotted against M* forp = 0.1, 0.5 and 1.0 for the (L, M) strategy with ~?a = 8 x 1 0 9 h r
248 A . S . Perelson et al.
Setting the derivative of J ' with respect to M* to zero gives the cubic equation
(b + d)M*(a2bL + A ' M * + 1)(A'M* + 1) -pA'a2[((z~bL + 1)dLo
- (b + d)M*][((zlbL + 1)dLo - bLM*] = 0 (A.59)
which can be solved for M*. For convenience we do this numerically. Substituting the result into Eqs. (A.56)-(A.58) then gives the minimum value of J ' , J ~ n , and the corresponding values of ~1 and ~2. In Figure 5b we plot J'=~, ,~ and ~1 + ~2 as a function of p.
S t ra tegy (L , P, M ) : u* = 1, 0, 0 v* = 0, 1, 0 switching times t*, t*
Integrating the state equations (A.7) over the interval of lymphocyte proliferation [0, t*) with u*( t ) = 1 and v*( t ) = 0 gives Eqs. (A.51). Continuing the integration over the interval of plasma cell production (t*, t*) with u*( t ) = 0 and v*( t ) = 1
yields
L ( t ) = L ( t * ) exp [--I~La(t -- t*)]
P ( t ) = d L ( t * ) {exp [--IzLa(t -- t*)] -- exp [-/~r(t - t*)]} b~p -- i~La
M ( t ) = 0
A(t)
k~Lo x exp [ - I ~ v ( t - t*)] bL
Integrating over the final interval of memory cell production with u*( t ) = 0 and v* ( t ) = 0 gives
L ( t ) = L ( t * ) exp [--IzLa(t - t*)]
P ( t ) = P ( t * ) exp [ - t z v ( t - t*)]
M ( t ) = d L ( t * ) (1 - exp [- IZza( t - t*)]} t e [t*, T1] (A.61) I~La
A ( t ) = k I L ( t * ) {1 - exp [--t~La(t -- t*)]} + kwP(t*___~) tzLa Izv
• {1 - exp [ - i z v ( t - t*)]} + A ( t * )
where * * L(t2 ), P ( t * ) and A(ta ) are given by Eq. (A.60). At the final time
e-ULa'2 (1 - e - ~ ' , ' ~ ) A(T1) = k i L o e bL'~ cl + Cz e -~'L'a~ + Ca e -~','~ + ~La
k i L o (A.62) + c3(e-ULa*2 -- e-uL*2)(1 -- e -re'a) bL
Optimal Strategies in Immunology. II 249
and
M(Tx) = dLo ebL, 1 e_,L,,2[ 1 _ e-"L,'s] = M * (A.63) IXLa
where
1 i~v + y d cl = ~ + ~ (A,64a)
I~Lala.v
c2 = ~v - IZLa + 7 d (A.64b) t~LaO~v - I~La)
9' d (A.64c) ca = I~ .~v - IZLa)
and rl, z2 and ra denote the durations of the three time intervals, i.e. rl = t*, z2 = t* -- t** and ra = /'1 -- &*.
The cost functional J ' for this strategy is
['[a2bLjk-rM ~ + A'M*_+ "1 + 1,] J ' = rl + r= + ra + pbLln (A.65)
where M* is a function of rx, % and ra, given by Eq. (A.63). We can minimize this cost functional subject to the constraint A(T~) = A* by the method of Lagrange multipliers or more straightforwardly by solving the constraint equation A(T1) = A* for r I and substituting the result into Eqs. (A.63) and (A.65). Setting to zero the first partial derivatives of the resulting function J'(rz, ra) gives rise to two non- linear algebraic equations. We solved these equations numerically using the sub- routine ZSYSTM in the International Mathematical and Statistical Library available from the IMSL corporation.
Setting the derivatives of J'(r2, ra) equal to zero only provides necessary conditions for an extremum. In order to check that the extremum was actually a minimum, a two-dimensional search was also used to find J~u~, the minimum value of J ' . The results of the two methods agreed. For some values of p, J ' attained its minimum in R 2 with zz < 0. In such cases only the search procedure was used and J~ln was found with % and za confined to the positive quadrant of R 2. In Figure 6a J~ln, %, rl + r2, and r~ + r2 + ra are plotted against p.
Strategy (L, P, L, M ) : u* -- l, 0, l, 0 v* = 0, 1, 0, 0 switching times t*, t*, t*
The integration of the state equations for the first two intervals proceeds as in the previous section. For the third interval one finds
L( t ) = L ( t * ) e x p [bL(t -- t*)]
P ( t ) = P ( t* ) exp [-/~v(t -- t*)]
M ( t ) = 0 t ~ [t*, t*] (A.66)
A( t ) k~L( t*) {exp [bL(t -- t*)] -- 1} + 7k~ P( t* )
t* • {1 - exp [- i~v( t - t*)]} + ,4(2)

250 A . S . Perelson et al.
where L( t*) , P(ta*) and A ( t * ) are given by Eq. (A.60). Integrating over the final interval o f memory cell product ion with u*( t ) = 0 and v*( t ) = 0 gives
L ( t ) = L(ta*) exp [--ttLa(t -- t*)
P ( t ) = P ( t ~ ) exp [ - t t p ( t - ts*)]
M ( t ) = dL( t* ) {1 - exp [--I~Ln(t - t*)]} t~L~ t ~ [ t*, / '1] (A.67)
A ( t ) = k~L( t* ) [1 - exp [--~L~(t -- t*)]} + k~yP( t* ) tzLa tsp
X {1 -- exp [--t~r(t -- t*)]} + A ( t * )
where L( t*) , P ( t * ) and A ( t * ) are given by Eq. (A.66). At the final t ime
e-~L"~ (ebL'3 -- 1) A(T1) = k i L o e bL'~ cl + ca e -~L,*2 + c3 e -~e** +
-4- ca(e -ttLa*2 -- e-~,'~)(1 - e -#a'a e -~P,,)
k i l o (A.68) + e-"La~3 ebL~(1 -- e-"La',) + b---'S
M ( T 1 ) = dLo_ ebL, 1 e_UL,, 2 ebL,~( 1 -- e--ULd',) = M * (A.69) I.r Ltl
and the intervals ~x = t*, ~'2 = t* - t*, z3 = t* - t* and z4 = / ' 1 - t*.
The cost functional J ' for this strategy
['[a2bLjk-rM ~ + A'M*~ "1" + I] J ' = ~ + za + "r3 + ~', + poL In
was minimized subject to the constraints A(T~) = A*, ~-~ t> 0, i = 1, 2, 3, 4, by Lagrange multiplier and search techniques. The minimum value of J ' and the corresponding intervals ~-, are plot ted against p in Figure 6c.
A.5 Exclusion o f Singular Controls
The Hamil tonian H can be minimized with the controls u and/or v taking on values not equal to zero or one only when ol = 0 or or2 = 0 [see Eq. (A.17)]. In fact, from Eq. (A. 19) one sees that singular control is possible only if one of the following cases occur"
i) ~ ( t ) = 0, ~r~(t) = 0, ~,(t) = 0 ~ u*(t) , v*(t) ~ [0, 11, t e Is
ii) ~ ( t ) = 0, cry(t) > 0, or(t) < 0 =~ u*( t ) ~ [0, I], v*( t ) = O, t E Is
iii) ~ ( t ) > 0, cr2(t) = 0, ~(t) > 0 =~ u*( t ) = O, v*( t ) ~ [0, 1], t e Is
where Is is a non-zero time interval. We shall show that cases (i)-(iii) are inconsis- tent with the adjoint equations (A.20) and hence can never occur.
Assume ~2(t) = 0, t ~ Is. Then by Eqs. (A.18b) and (A.20d) we must have A~(t) = )t 4 = constant , t ~ Is. We see f rom Eq. (A.23) that )ta is constant only if 2~1 --- 0,
Optimal Strategies in Immunology. II 251
and then ;%(0 = 0 for all t. Since 2~ is a constant and equal to 2a, 24 must also be zero. This is a contradiction since 24(T1) < 0 and hence there can be no singular control with a2( t ) = O, t e Is .
Only case (ii) remains. If a l ( t ) = O, t e Is , then by Eq. (A.18a)
d24 = constant < 0. (A.70) 2~(t) = b + d
Notice that Is can not be a terminal interval in view of the boundary condition 22(T1) = 0.
Substituting v = 0 and Eq. (A.70) into the adjoint equation (A.20b) for 22 results in
d ( b - tLz)~4 (A.71) 21 = k l ( b + d )
where ~4 = - 2 4 > 0. Equation (A.71) implies 21 > 0 and thus by the analysis of case A in Section A3, v*(t) = 0, t e [0, T~]. Since ls is not the terminal interval we can integrate the adjoint equations backwards from T1, and again obtain Eq. (A.27). Since ~ = 0 [Eq. (A.20a)], 21 is a constant and Eq. (A.71) applies for all t e [0, T1]. Substituting Eq. (A.71) into Eq. (A.27) results in
al(t) = d ~ exp [- I~La(T~ -- t] > 0 for all t. (A.72)
Thus the final interval on which u * ( t ) = v * ( t ) = 0 can be extended to [0, T1], contradicting the fact that there is a non-zero singular interval Is on which ~ l ( t ) = 0.
A . 6 T h e M u l t i - S t a g e M o d e l
We shall show that the optimal strategy for the N-stage infection problem, N > 2, formulated in Section IIE has the same qualitative behavior as the two-exposure problem. In an N-stage model the immune system is hypothesized to minimize a discounted sum of the response times; that is,
N
m i n J ' = ~ p,(t~ - t~) (A.73)
where t~ - t~ is the time needed to neutralize the antigen in the ith infection by producing A* amount of antibody, Pl = l, and p~, i/> 2, is the weighting para- meter, e.g. the probability of re-encountering the antigen multiplied by the expected change in reproductive value between the i - 1st and ith infection. Generally p~ is a monotonically decreasing function of i. One might assume, for example, a geometric model by letting
p~ = p~-l, i = 1 . . . . , N. (A.74)
The equation of motion in the ith stage is
A , = k , ( L , + ~,P,)
L = bu~(t ' )L, - dv , ( t ' )L , - d[1 - u~(t') - v , ( t ' ) ]L , - ~LL , (A.75)
P , = dv , ( t ' )L , - # ~ P ,
h;/~ = d[1 - u,(t") - v,(t*)]L~,

252 A.S. Perelson et al.
to ~ <~ t ~ <~ t~, i = 1, 2, . . . . N with initial and state coupling conditions
A,(to ~) = P,(to ~) = M,(t~) = 0 L~(t~) = A,M~_I(t~ -1) + L,o i = 1, 2 . . . . . N (A.76)
A(t ) -- A*.
The controls must satisfy the conditions
u~(t r) >i O, v,(t ~) >1 O, u,(t f) + v,(tO <<. 1, i = 1, 2 . . . . . N (A.77)
where
to 1 <~ t 1 ~< t~ < to 2 ~<-.. <to N <~ t N ~< t~. (A.78)
For r e { l , 2 . . . . . N - 1}, let
f;I [~+ t ' d t K , + ~ (A.79) dt + p~T* = f + J[= 'o i= i Jt'o
where T* = t~" - to ~" is the optimal response time for the ith stage, i = t + 1, f + 2, . . . , N. Evidently, K~+I is a decreasing function of M*, the final population of memory cells at the end of the fth stage. That is, if more memory cells are produced at the end of the ith stage, we should expect shorter optimal response times in the subsequent stages.
By the principle of optimality (Bellman, 1957), an optimal control sequence {u*(-), u*(-) . . . . . u~(')} must minimize J~'. Since u~(-), . . . , u~*-l(-) only affect the initial conditions for t he / th stage, u*(.) must minimize
J; = f dt + K,+t(M*) (A.80) Jt 'o
where Kt+~(M*) = Y~=(+~ p~T* is a decreasing function of M*.
Now consider the problem of minimizing J; subject to the dynamical equations (A.75) with initial conditions
A,(0) = P~(0) = M,(0) = 0, L,(0) = constant, (A.81)
and constraints (A.77). If we apply the necessary conditions laid forth in section
A.2, since
OK~+ t(M*) < 0 (A.82) O M~*
we obtain exactly the same conditions as those obtained in Section A3. Thus we expect the same qualitative behavior for the optimal strategy.
N o t a t i o n
a age A concentration of secreted antibody A* concentration of antibody that must be secreted to eliminate antigen b birth rate of large lymphocytes

Optimal Strategies in Immunology. II 253
b/,
e
d d~ dp G(~) H I k K Lo L2o
M g 2 o
M* P P S t t* T T* R
U //
V
Va
W X
Greek ~2
7
0 A
A' X pL pe IZLa l I
r
~e
net growth of large lymphocytes, b - ~L a constant rate of differentiation of large lymphocytes rate of differentiation of large lymphocytes into memory cells rate of differentiation of large lymphocytes into plasma cells defined by Eq. (A.38, Part I) Hamiltonian time interval antibody secretion rate terminal cost function, defined by Eq. (A.4) concentration of large lymphoeytes at the initiation of the primary response concentration of large lymphocytes at the initiation of the secondary response that are derived from virgin (non-memory) small lymphocytes concentration of memory cells concentration of non-stimulated memory cells at the initiation of the secondary response concentration of memory cells at Tx, M(Tx) concentration of plasma cells factor weighting the importance of the secondary response target set time switching time final time optimal final time control vector, (u, v) control vector, (u, v, w) fraction of large lymphocytes that proliferate fraction of large lymphocytes that differentiate into plasma cells reproductive value at age a fraction of large lymphocytes that differentiate into memory cells state vector, (.4, L, P, M) T
letters scaled final antibody concentration, A*/k2Lao ratio of plasma cell to large lymphocyte antibody secretion rates A~/kz function defining terminal manifold ratio of memory cells that become large lymphocytes at the initiation of the secondary response to the number of memory cells at the end of the primary response A/L2o costate vector death rate of large lymphocytes death rate of plasma cells net loss rate of large lymphocytes, pL + d Pareto set switching function time interval
Subscripts 1 denotes primary response 2 denotes secondary response
References
Bellman, R.: Dynamic Programming. Princeton, New Jersey: Princeton University Press (1957) Byers, V. A., Sercarz, E. E.: The X - Y - Z scheme of immunoeyte maturation. IV. The Exhaus-
tion of memory cells. J. Exp. Med. 127, 307-325 (1968) Celada, F.: The cellular basis of immunologic memory. Progr. Allergy 15, 223-267 (1971)
254 A.S. Perelson et al.
Cunningham, A. J.: Studies on the cellular basis of IgM immunological memory. Immunology 16, 621-632 (1969)
Cunningham, A. J., Sercarz, E. E. : The asynchonous development of immunological memory in helper (T) and precursor (B) cell lines. Eur. J. Immunol. 1, 413-421 (1971)
D'Eustachio, P., Cohen, J. E., Edelman, G. M. : Variation and control of specific antigen- binding cell populations in individual fetal mice. J. Exp. Med. 144, 259-265 (1976)
Derman, C.: A stochastic sequential allocation model. Operations Research 23, 1120-1130 (1975)
Diamantstein, T., Blitstein-Willinger, I~.: T cell-independent development of B memory cells. Eur. J. Immunol. 4, 830-832 (1974)
Dutton, R. W., Mishell, R. L: Cellular events in the immune response. The in vitro response of normal spleen cells to erythrocyte antigens. Cold Spring Harbor Syrup. Quant. Biol. 32, 407--414 (1967)
Eisen, H. N. : Immunology: in Microbiology, 2rid ed. (Davis, B. D., Dulbecco, R., Eisen, H. N., Ginsberg, H. S., Wood, W. B., Eds.) New York: Harper and Row 1973
Feldbush, T. L., Gowans, J. L.: Antigen modulation of the immune response. The effect of delayed challenge on the affinity of anti-dinitrophenylated bovine gamma globulin antibody produced in adoptive recipients. J. Exp. Med. 134, 1453-1465 (1971)
Feldbush, T. L., Van der Hoven, A. : Antigen modulation of the immune response. IV. Selective triggering of antibody production and memory cell proliferation. Cell. Immunol. 25, 152-162 (1976)
Fisher, R. A.: The Genetical Theory of Natural Selection. Oxford: Oxford University Press 1930
Gowans, J. L., Uhr, J. W. : The carriage of immunological memory by small lymphocytes in the rat. J. Exp. Med. 124, 1017-1030 (1966)
Greaves, M. F., Owen, J. J. T., Raft, M. C.: T and B Lymphocytes, Amsterdam: Excerpta Medica 1974
Grobler, P., Buerki, H., Cottier, H., Hess, M. W., Stoner, R. D. : Cellular bases for relative radioresistance of the antibody-forming system at advanced stages of the secondary response to tetanus toxoid in mice. J. Immunol. 112, 2154-2165 (1974)
H~immeding, G. J., Masuda, T., McDevitt, H. O.: Genetic control of the immune response. Frequency and characteristics of antigen binding ceils in high and low responder mice. J. Exp. Med. 137, 1180-1211 (1973)
Humphrey, J. H.: The still unsolved germinal center mystery. Adv. Exp. Med. Biol. 66, 711-723 (1976)
Inchley, C. J., Black, S. J., Mackay, E. : Characteristics of immunological memory in mice. II. Resistance of nonrecirculating memory ceils to antigen=mediated suppression of the secondary antibody response. Eur. J. Immunol. 5, 100-104 (1975)
Intriligator, M. D.: Mathematical Optimization and Economic Theory. Englewood Cliffs, New Jersey: Prentice-Hall (1971)
Karlin, S.: Mathematical Methods and Theory in Games, Programming and Economics, Vol. I, Reading, Massacusetts: Addison-Wesley 1959
Katz, D., Benacerraf, B. : The Role of Products of the Histocompatibility Gene Complex in Immune Responses. New York: Academic Press (1976)
Klinman, N. R. : The mechanism of antigenic stimulation of primary and secondary clonal precursor cells. J. Exp. Med. 136, 241-260 (1972)
Klinman, N. R., Press, J. L., Pickard, A. R., Woodland, R. T., Dewey, A. F.: Biography of the B cell, in: The Immune System: Genes, Receptors, Signals (Sercarz, E. E., Williamson, A. R., Fox, C. F., Eds.) New York: Academic Press 1974
Klinman, N. R., Press, J. L. : The characterization of the B-cell repertoire specific for the 2,4- dinitrophenyl and 2,4,6-trinitrophenyl determinants in neonatal BALB/c mice. J. Exp. Med. 141, 1133-1146 (1975)
Kreth, H. W., WiUiamson, A. R.: The extent of diversity of anti-hapten antibodies in inbred mice: Anti-NIP (4-hydroxy-5-iodo=3-nitro-phenacetyl) antibodies in CBA/H mice. Eur. J. Immunol. 3, 141-147 (1973)

Optimal Strategies in Immunology. II 255
L'age-Stehr, J., Herzenberg, L. A. : Immunological memory in mice. L Physical separation and partial characterization of memory cells for different immunoglobulin classes from each other and from antibody-producing cells. J. Exp. Med. 131, 1093-1108 (1970)
Makinodan, T., Albright, J. F. : Cytokinetics of antibody responses, in: Immunopathology, 3rd Int. Symp.; La Jolla, California: Basel: Schwabe and Co. 1964
Makinodan, T., Kastenbaum, A., Peterson, W. J. : Radiosensitivity of spleen cells from normal and preimmunized mice and its significance to intact animals. J. Immunol. 88, 31-37 (1962)
Marchuk, G. I. : A simple methametical model of a virus disease. Preprint (1975) Mason, D. W., Gowans, J. L. : Subpopulations of B lymphocytes and the carriage of immuno-
logical memory. Ann. Immunol. (Inst. Pasteur) 127C, 657-666 (1976) Miller, J. F. A. P.: Immunological memory, in: Contemporary Topics in Immunobiology,
Vol. 2 (Davies, A. J. S., Carter, R. L., Eds.) New York, Plenum Press (1973) Mirmirani, M. : Optimization Studies in Population Dynamics, Ph.D. dissertation University
of California, Berkeley (1977) Mitchison, N. A. : The carrier effect in the secondary response to hapten-protein conjugates.
II. Cellular cooperation. Eur. J. Immunol. 1, 18-27 (1971) Niederhuber, J. E., Moller, E. : Antigenic markers on mouse lymphoid cells: Origin of cells
mediating immunological memory. Cell. Immunol. 6, 407-419 (1973) Nossal, G. J. V., Ada, G. L. : Antigens, Lymphoid Cells and The Immune Response. New York:
Academic Press 1971 Okumura, K., Metzler, C. M., Tsu, T. T., Herzenberg, L. A., Herzenberg, L. A. : Two stages of
B-cell memory development with different T-cell requirements. J. Exp. Med. 144, 345-357 (1976)
Oster, G. F., Wilson, E. O. : Ecology and Evolution of Castes in Social Insets. Princeton, New Jersey: Princeton University Press (in press)
Press, J. L., Klinman, N. R. : Frequency of hapten-specific B cells in neonatal and adult murine spleens. Eur. J. Immunol. 4, 155-159 (1974)
Roelants, G. E., Askonas, B. A.: Immunological B memory in thymus derived mice. Nature New Biol. 239, 63-64 (1972)
Rowlands, D. T., Blakeslee, D., Angala, E.: Acquired immunity in opossum (Didelphis virginiana) embryos. J. Immunol. 112, 2148-2153 (1974)
Schirrmacher, V., Rajewsky, K.: Determination of antibody class in a system of cooperating antigenic determinants. J. Exp. Med. 132, 1019-1934 (1970)
Schmitendorf, W. E., Leitman, G.: A simple derivation of necessary conditions for Pareto optimality. IEEE Trans. Automatic Control AC-19, 601-602 (1974)
Schrader, J. W.: Evidence for the presence in unimmunized mice of two populations of bone marrow derived B lymphocytes, defined by differences in adherence properties. Cell. Immunol. 10, 380-383 (1974)
Schrader, J. W.: The role of T cells in IgG production; thymus-dependent antigens induce B cell memory in the absence of Tcells. J. Immunol. 114, 1665-1669 (1975)
Schrader, J. W., Vadas, M. : Differences between virgin and memory IgM-antibody-forming- cell precursor B-cells, and correlations with the heterogeneity present in B-cell populations from unimmunized mice. Cell. Immunol. 21, 217-225 (1976)
Schlegel, R. A., yon Boehmer, H., Shortman, K. : Antigen-initiated B lymphocyte differentia- tion. V. Electrophoretic separation of different subpopulations of AFC progenitors for un- primed IgM and memory IgG responses to the NIP determinant. Cell. Immunol. 16, 203- 217 (1975)
Schlegel, R. A., Shortman, K.: Antigen-initiated B lymphocyte differentiation. IV. The ad- herence properties of antibody-forming cell progenitors from primed and unprimed mice. J. Immunol. 115, 94--99 (1975)
Sercarz, E., Coons, A. H.: The exhaustion of specific antibody producing capacity during a secondary response, in: Mechanisms of Immunological Tolerance (Hagek, M., Langerov~i, A., Vojttskov~i, M., Eds.) New York: Academic Press 1962
Sherwin, W. K., Rowlands, D. T.: Development of humoral immunity in lethally irradiated mice reconstituted with fetal liver. J. Immunol. 113, 1353-1360 (1974)

256 A.S. Perelson et al.
Siskind, G. W., Benacerraf, B.: Cell selection by antigen in the immune response. Adv. Immunol. 10, 1-50 (1969)
Starr, A. W., Ho, Y. C.: Nonzero-sum differential games, J. Optimization Theory and Applica- tion 3, 184--206 (1969)
Stavitsky, A. B., Folds, J. D. : The differential localization of antibody synthesis and of immuno- logical memory in lymph nodes draining and not draining the site of primary immunization with hemoCyanin. J. Immunol. 108, 152-160 (1972)
Sterzl, J., Silverstein, A. M. : Developmental aspects of immunity. Adv. Immunol. 6, 337--459 (1967)
Strober, S.: Initiation of antibody responses by different classes of lymphocytes. V. Fundamental changes in the physiological characteristics of virgin thymus-independent (' B') lymphocytes and 'B ' memory cells. J. Exp. Med. 136, 851-871 (1972)
Strober, S. : Maturation of B lymphocytes in rats. III. Two subpopulations of memory B cells in the thoracic duct lymph differ by size, turnover rate, and surface immunoglobulin. J. Immunol. 117, 1288-1294 (1976)
Strober, S., Dilley, J.: Biological characteristics of T and B memory lymphocytes in the rat. J. Exp. Med. 137, 1275-1292 (1973a)
Strober, S., Dilley, J.: Maturation of B lymphocytes in the rat. I. Migration pattern, tissue distribution, and turnover rate of unprimed and primed B lymphocytes involved in the adoptive antidinitrophenyl response. J. Exp. Med. 138, 1331-1334 (1973b)
Tannenberg, W. J. K., Jehn, U. W. : The life cycle of antibody forming cells, iI. Evidence for steady state proliferation of direct haemolytic plaque+forming cells during the primary and secondary responses. Immunology 22, 589-600 (1972)
Thorbecke, G. J., Cohen, M. W., Jacobson, E. B.: Germinal Center in Immune Response (Cottier, H., Odartchenko, N., Schindler, R. and Congdon, C. C., Eds.) p. 259. New York: Springer 1967
Willcox, H. N. A., Klaus, G. G. B. : B cell tolerance induced by polymeric antigens. V. Different avldities of primed and virgin precursor ceils for paucivalent antigen. Eur. J. Immunol. 6, 379-382 (1976)
Williamson, A. R., McMichael, A. J., Zitron, I. M. : B memory cells in the propagation of stable clones of antibody forming cells, in: The Immune System: Genes, Receptors, Signals (Sercarz, E. E., Williamson, A. R., Fox, C. F., Eds.) New York: Academic Press 1974
Wilson, E. O., Bossert, W. H.: A Primer of Population Biology: Stanford, Connecticut: Sinauer 1971
Received March 1, I977/Revised July 10, 1977