on imperfect node protection in complex communication networks
TRANSCRIPT
On Imperfect Node Protection in Complex
Communication Networks Shi Xiao1 and Gaoxi Xiao2
1 Hubei Province Key Laboratory of Intelligent Robot
& School of Computer Science and Engineering
Wuhan Institute of Technology, Wuhan, China 430073 2 Division of Communication Engineering
School of Electrical and Electronic Engineering
Nanyang Technological University, Singapore 639798
Email: [email protected], [email protected]
Abstract — Motivated by recent research on complex networks, we study enhancing complex
communication networks against intentional attack which takes down network nodes in a
decreasing order of their degrees. Specifically, we evaluate an effect which has been largely
ignored in existing studies: many real-life systems, especially communication systems, have
protection mechanisms for their important components. Due to the existence of such protection,
it is generally quite difficult to totally crash a protected node, though partially paralyzing it may
still be feasible. Our analytical and simulation results show that such “imperfect” protections
generally speaking still help significantly enhance network robustness. Such insight may be
helpful for the future developments of efficient network attack and protection schemes.
Index Terms — Complex network, scale-free network, network robustness, intentional attack.
1. Introduction
Recent research results showed that many different real-life systems, including the Internet,
world-wide web (WWW), airline transportation systems, food web, protein-protein reactions,
co-authorship, and terrorist activities etc., when formulated into network models, share some
stunning common features. Such interesting observations encourage even more research efforts on
these network models, which have spawned a new research area named complex networks [1-7].
The most important complex network model is probably the scale-free network [1-2]. In such
networks the fraction of nodes with a degree k, denoted as P(k), is proportional to k α− , where α is the
exponent which typically lies between 2 and 3 in real-life systems. With a power-law nodal-degree
distribution, scale-free networks are very different from the well-known Erdős-Rényi random graph
[1], with an easily visible feature of having a relatively large number of high-degree hub nodes.
Studies on complex networks shed new light which helps better understand complex systems
and networks. One of the most important results is that while a scale-free network is robust against
random failures, it is very fragile under intentional attack which crashes network nodes in a
decreasing order of their nodal degrees [8].
Extensive research efforts have been made to study the robustness of scale-free networks [8-19].
Theoretical models for analyzing the robustness of scale-free networks under random failures and
intentional attack were developed in [9] and [10], respectively. The applicable ranges of these
theories were discussed in [11]. It was shown that, under either random failure or intentional attack,
there exists a phase transition in the fraction of node loss, below which the network remain to
function reasonably well [12]. A different model considered in [13] is that the probability that a node
gets crashed is a function of its degree. To enhance network robustness against the intentional attack,
different methods have been proposed including link insertion [14-15], link rewiring [16] and link
recovery [17], etc. Though these methods appear to be effective, they may not be easily implemented
in self-organized, extra-large networks, e.g., the Internet.
We evaluate an effect which has been largely ignored in existing studies: in real-life complex
systems especially communication systems, usually there exist protection mechanisms for protecting
critical components against hostile attack. Due to the existence of such mechanisms, it is generally
quite difficult to totally crash a protected node though partially paralyzing it may still be feasible. In
this paper, we term such protection as imperfect node protection. With theoretical analysis and
extensive simulations, we show that such protection nevertheless helps significantly enhance network
robustness.
The rest of the paper is organized as follows. A few different scenarios of imperfect node
protection are defined in Section II. Theoretical analysis and simulation results on the effects of such
protections in random scale-free networks (to be defined later) are presented in Section III and
Section IV, respectively. Numerical evaluations of the proposed scenarios in a few real-life network
models are presented in Section V. Finally, Section VI concludes the paper.
2. Imperfect node protection
We consider a few different scenarios of imperfect node protection where the protected nodes
are partially paralyzed rather than totally crashed under intentional attack.
• Scenario I: all the nodes in the network are imperfectly protected. When a node is attacked, each
of the links connected to it is blocked or removed at a probability of Pf.
• Scenario II: only high-degree nodes in the network have protection mechanism. Specifically, we
assume that there exists a threshold value T. Each node with its degree no less than T is
imperfectly protected. When such a node is attacked, each of the links connected to it is blocked
or removed at a probability Pf. For any node with its degree lower than T, it is totally crashed once
attacked.
• Scenario III: similar to the Scenario II, only that links between high-degree nodes are perfectly
protected. Specifically, when nodes with degrees no less than T are attacked, they do not lose any
links between them, meanwhile however the links between these nodes and those nodes with
degrees lower than T will be removed at a probability of Pf . For nodes with degrees lower than T,
they are totally crashed once attacked.
None of these three scenarios may easily happen in real-life systems since (i) there is hardly any
system with equal protection over all its nodes; and (ii) strictly perfect protection probably does not
exist at all. However, these scenarios nevertheless provide some useful benchmarks for estimating the
effects of more realistic cases. Specifically, the three scenarios loosely resemble the real-life cases
where (i) most nodes have some protection; (2) only important nodes (usually high-degree hubs) are
heavily guarded; and (3) important nodes are protected and the links between them are also carefully
safeguarded, respectively.
Note that the these three scenarios differentiate themselves from all the existing models such as
the one where the probability that a node is crashed is a function of its degree [8], or imperfect
protection over hub nodes for epidemic control [19], etc,
3. Analysis
The random network is defined as a network with random connections between different nodes,
only subject to the given nodal-degree distribution ( )P k [18]. It is well known that a random network
loses its global connectivity when 2
2,kk
κ ≡ ≤ (1)
where k denotes the average nodal degree and 2k the average of the square of nodal degree [4].
The conclusion also holds in correlated random networks where network nodes are randomly
connected subject to given distributions of {eij}; eij denotes the probability that degree-i nodes are
connected to degree-j nodes [11]. In this paper, theoretical analysis is conducted on uncorrelated
random networks with given ( )P k , while analysis on different types of correlated networks is of our
future research interest.
For a random scale-free network, denote its lowest nodal degree as m and its cutoff nodal degree
as K. To facilitate the discussions, we term a node that has ever been attacked when a network is
crashed as an attacked node; and an un-attacked node otherwise. Below we analyze the three different
scenarios in random scale-free networks separately.
Scenario I:
Assume that the network is crashed after a fraction cp of all the nodes has been attacked.
Hereafter we term the value of cp as the crash threshold. Also assume that when a node is attacked,
each link connected to it has a probability of fP to get removed. In this paper, we name fP as the
link-removal probability. Denote the lowest original degree of the attacked nodes as K~ . We have
[10]
αα
αα
−−
−−
−−
== ∑ 11
11
~
~)(
mKKKkpp
K
Kc . (2)
The fraction of links connected to all the attacked nodes, denoted as p~ , can be expressed as [10]
2 2
2 2
( )K
K
kp k K Kpk K m
α α
α α
− −
− −
−= =
−∑ . (3)
For a link connecting an attacked node and an un-attacked node in the original network, it has a
probability of fP to be removed; for a link connecting two attacked nodes in the original network,
since both of its two ends are attacked, it has a probability of 21 (1 )fP⎡ ⎤− −⎣ ⎦ to be removed.
Therefore, denoting the link loss probability of an attacked node and an un-attacked node as +p~ and −p~ respectively, we have
2(1 ) 1 (1 ).f f
f
p P p p P
p P p
+
−
⎧ ⎡ ⎤= − + − −⎪ ⎣ ⎦⎨
= ⋅⎪⎩ (4)
After attack, the network nodal-degree distribution is changed from )(kp to )(~ kp where

( ) ( ) ( )
( ) ( ) ( ) ( ) ( )
0
0
00
0 0
0
0
0 0
0 0
1 ,
1 1 ,
( )
Kk k k
k K
K Kk k k k k k
k K k m
kp k p p k K
k
k kp k p p p k p p k K
k k
p k
−+ +
=
− −+ + − −
= =
− ≥
− + − <
⎧ ⎛ ⎞⎜ ⎟⎪ ⎝ ⎠⎪= ⎨⎛ ⎞ ⎛ ⎞⎪⎜ ⎟ ⎜ ⎟⎪ ⎝ ⎠ ⎝ ⎠⎩
∑
∑ ∑ (5)
For the attacked nodes, their average nodal degree in the original network, denoted as +k , is
( )
cc
K
K
ppk
p
kkpk
~~ ⋅
==∑
+ . (6)
After attack, their average nodal degree is reduced to
(1 )
c
p k pk
p
++ − ⋅ ⋅
′ = . (7)
As to the average square of nodal degree of the attacked nodes, before attack it is
2
3 32( )
( )(3 )
K
K
c c
k p kC
K Kp p
k α α
α− −
+= −
−=∑
. (8)
After attack, it becomes
2 2
3 3
2 (1 ) (1 )
1 (1 ) ( ) .
3c
p k k p p
p p CK K p k p
p
k
α α
α
+ ++ + +
+ +− − +
+− + ⋅ ⋅ −
− −= − + ⋅ ⋅
−
′ =
⎡ ⎤⎢ ⎥⎣ ⎦
(9)
For the un-attacked nodes, before attack, their average nodal degree is
cppk
k−
−=−
1)~1(
. (10)
After attack, it becomes
(1 ) (1 )(1 )c
p k pk
p
−− − ⋅ ⋅ −
′ =−
. (11)
Before attack, the average square of nodal degree of the un-attacked nodes is
2
3 32( )
( ).1 (1 )(3 )
K
m
c c
k p kC
K mp p
k α α
α
− −−
= −− − −
=∑
(12)
After attack, it becomes

2 2 2
3 3
(1 ) (1 )
1 (1 ) ( ) (1 ) .1 3c
k p k k p p
p p C K m k p pp
α α
α
− − −− − −
− −− − −
′ = − + ⋅ ⋅ −
⎡ ⎤− −= − + − ⋅⎢ ⎥− −⎣ ⎦
(13)
From Eqs. (6)-(13), we have that after attack the value of κ~ is
2 2 2' (1 )' (1 )
c c
c c
k p k p kk p k p k
κ+ −
+ −
′ ′+ −= =
′ ′+ − . (14)
From Eqs. (1)-(4), (7), (9), (11), (13) and (14), the crash threshold cp can be numerically
obtained.
Consider the extreme case where all the nodes in the network are attacked. We have 4 2 2 2
2
2 2
(1 ) [1 (1 ) ](1 )
(1 )
(1 ) 1 (1 ) .
f f f
f
f f
P k P P k
P k
P P
κ
κ
− + − − −
−=
= − + − −
(15)
It shows that when 111fP
κ< −
−, or in other words if each node can protect at least a fraction of
11κ −
of all the links connected to it, in Scenario I a random scale-free network will never be totally
crashed by the intentional attack.
Scenario II:
In such scenario, only nodes with degrees no less than T have protection. Denote the crash
threshold under such case as cp′ and the lowest original degree of the attacked nodes as K ′~ . When
KT ′≤ ~ , the analysis remains the same as that for Scenario I. Hereafter we only consider the case
where KT ′> ~ . Denote the fraction of links connected to the attacked nodes as p′~ . We have
1 1
1 1
2 2
2 2
( ) ,
( ) .
K
cK
K
K
K Kp kp kK m
kp k K Kpk K m
α α
α α
α α
α α
− −
− −′
− −
− −′
′⎧ −′ = =⎪ −⎪⎨ ′−⎪ ′ = ==⎪ −⎩
∑
∑ (16)
Denote the fraction of nodes with degrees no less T as tp , and the fraction of links connected to
these nodes as tp~ . They can be expressed as
1 1
1 1
2 2
2 2
( ) ,
( ) .
K
tT
K
tT
K Tp kp kK m
kp k K Tpk K m
α α
α α
α α
α α
− −
− −
− −
− −
⎧ −= =⎪ −⎪
⎨−⎪ = =
⎪ −⎩
∑
∑ (17)
Now we calculate link loss probabilities of different nodes with different degrees. For those
nodes with degrees between K ′ and T, since they have no protection, they will be totally crashed.
Their link loss probability is therefore 100%. Denote the link loss probability of the nodes with
degrees no less than T as +′p~ , and the link loss probability of un-attached nodes as −′p~ . It can be
derived that
( )2(1 ) 1 (1 )
(1 )
,
.f f t t
f t
p P p P p p p
p p P p
+
−
′ ′ ′= − + − − ⋅ + −
′ ′= − −
⎧ ⎡ ⎤⎪ ⎣ ⎦⎨⎪⎩
(18)
Note that the first equation of (18) contains three different parts, calculating the link-loss
probabilities between high-degree (no less than T) and low-degree (lower than K ′ ) nodes, between
high-degree and high-degree nodes, and connected to the in-between nodes, respectively.
After attack, the network degree distribution is changed to
( ) ( )
( ) ( ) ( ) ( )
0
0
0 0
0 0
0
0
0 0
0 0
1 ,
1 1 ,
( )
Kk k k
k T
K Kk kk k k k
k T k m
kp k p p k K
k
k kp k p p p k p p k K
k k
p k
−+ +
=
′− −+ + − −
= =
′ ′ ′− ≥
′ ′ ′ ′ ′− + − <
⎧ ⎛ ⎞⎜ ⎟⎪ ⎝ ⎠⎪= ⎨⎛ ⎞ ⎛ ⎞⎪⎜ ⎟ ⎜ ⎟⎪ ⎝ ⎠ ⎝ ⎠⎩
∑
∑ ∑ (19)
For the nodes with original degrees no less than T, after attack their average nodal degree,
denoted as +′′k , becomes
(1 ) t
t
p k pk
p
++ ′− ⋅ ⋅
′′ = . (20)
And their average square of nodal degree is
2 3 31 (1 ) ( )3 t
t
p p Ck K T p k pp
α α
α
+ ++ − − +′ ′⎡ ⎤− −′′ ′= − + ⋅ ⋅⎢ ⎥−⎣ ⎦. (21)
For the un-attacked nodes, after attack, their average nodal degree, denoted as −′′k , is
(1 ) (1 )(1 )c
p k pk
p
−− ′ ′− ⋅ ⋅ −
′′ =′−
; (22)
and their average square of nodal degree is

3 32 1 (1 )( ) (1 )
1 3.
c
p p CK m k p p
pk α α
α
− −− −− ′ ′− − ′ ′ ′− + − ⋅
′− −⎡ ⎤′′ = ⎢ ⎥⎣ ⎦
(23)
Hence,
( )( ) −+
−+
′′′−+′′
′′′−+′′=
′′
′′=
kpkp
kpkpkk
ct
ct
1
1~222
κ . (24)
From Eqs. (16)-(18), (20)-(24), the crash threshold cp′ can be numerically solved.
Scenario III:
Similar to that in Scenario II, only those nodes with degrees no less than T have protection. The
difference is that the links between these high-degree nodes will never be removed. Denote the crash
threshold for such case as cp ′′ , and the lowest degree of the attacked nodes as K ′′~ . Similar to that for
Scenario II, we only need to consider the case where KT ′′> ~ .
Denote the fraction of the links connected to the attacked nodes as p ′′~ . The derivations of all the
equations keep very similar to those for Scenario II. The only difference lies in the calculations of the
link loss probability of those nodes with degrees no less than T. Denoting such probability as +′′p~ , we
have
tf pppPp ~~)~1(~ −′′+′′−=′′ + . (25)
Replace p +′ with +′′p~ in Eqs. (20) and (21), cp ′′ can be numerically solved.
In addition to the crash threshold, another parameter useful for measuring the robustness of
complex networks, especially complex communication networks, is their cluster diameter, defined as
the average hop length of the shortest paths between all the source-destination node pairs in the
largest connected component [10]. A network with a large cluster diameter, though may be still
connected, cannot efficiently support communication applications. Accurate analysis on the cluster
diameter, however, largely remains as an open issue. The best existing result, as far as we know, is
that approximately the cluster diameter )1log(log −= ∞ κNPd , where ∞P denotes the probability of
an arbitrary node belonging to the largest connected component in the network and kk 2=κ [12].
In this paper, we evaluate cluster diameter by numerical simulations.
4. Simulation results on random scale-free networks and discussion
In our simulations, random scale-free network are generated by adopting the algorithm proposed
in [14], with exponent ranging from 2 to 3. The network size N is 10,000. The minimum degree is 1
and the cutoff degree is 100, which equals to N . Unless otherwise specified, the simulation results
come from 50 independent realizations.
All the three scenarios have been simulated. We adopt the definition that a network is crashed
once 22 ≤kk is achieved [9, 16].
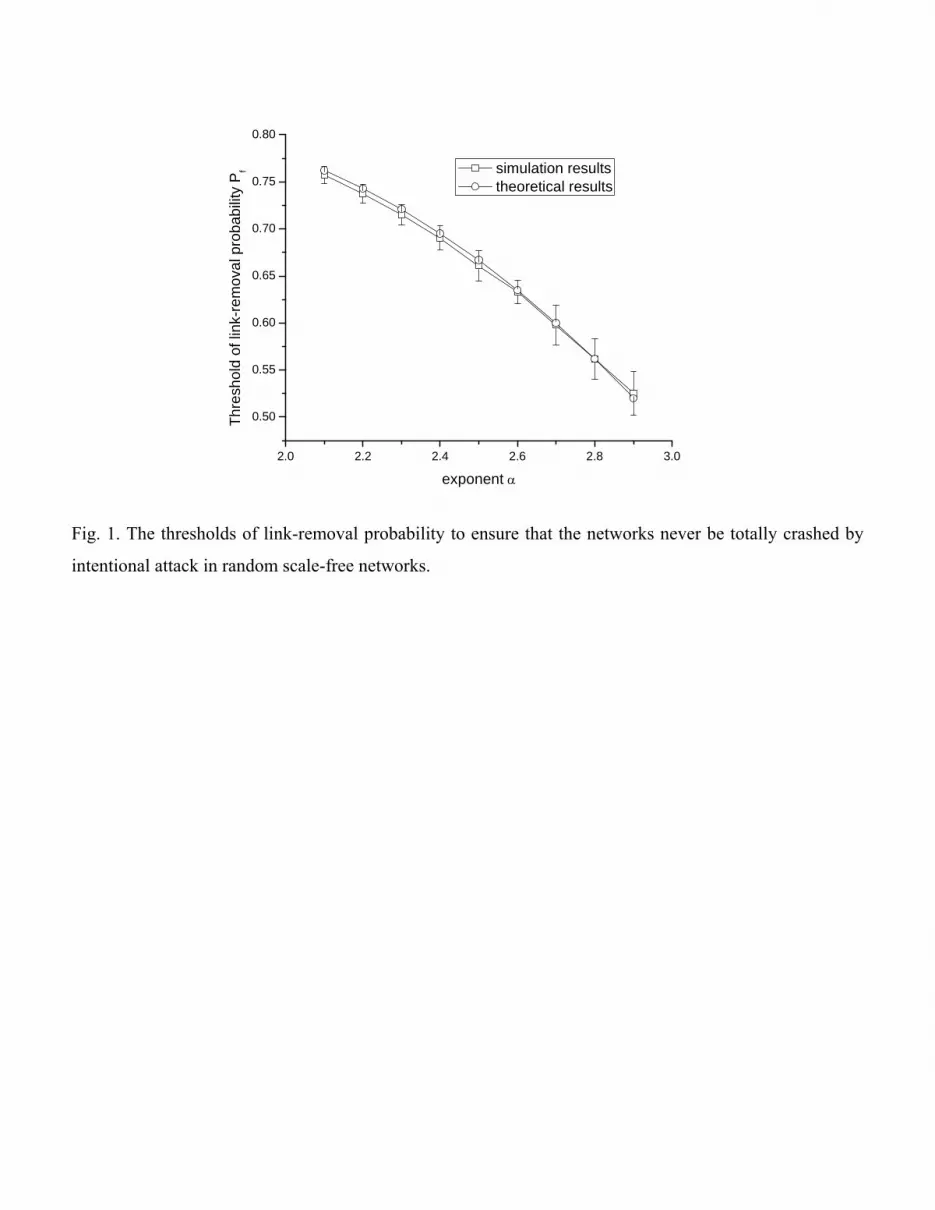
As discussed in Section III, for Scenario I there exists a threshold value of fP , below which the
intentional attack can never completely crash a random scale-free network. Fig. 1 shows this
threshold for networks with different exponents. The simulation results are calculated by the
trial-and-error method with a step length of 1%. As we can see, subject to the same minimum and
cutoff nodal degrees, networks with smaller exponents have higher average nodal degrees and
consequently higher crash thresholds. A higher average nodal degree also tends to make imperfect
node protection more effective in enhancing network robustness. That explains our observation in Fig.
1 that networks with smaller exponents have higher values of κ and consequently higher thresholds
of link-removal probability.
The influences of link-removal probability on network robustness are further evaluated for all
the three different scenarios. The results for the case where 2.5α = are plotted in Fig. 2. For
scenarios II and III, we let the top 0.5% highest-degree nodes be protected. An interesting observation
is that there exists a phase transition in the network crash threshold: once the link-removal probability
is low enough, the threshold quickly jumps up from a rather low value to 1. This can be explained: for
both scenarios II and III, similar to that of Scenario I, there exists a threshold of the link-removal
probability below which the network will never be crashed. The network remains to be fragile under
intentional attack until the link-removal probability gets close to the threshold. The threshold value
therefore may set a target for network protection side to achieve.
Fig. 3 makes the comparisons between analytical and simulation results. The link-removal
probability is set as 80% for all the three scenarios. For scenarios II and III, we still let the top 0.5%
hub nodes be protected. It can be observed that the analytical results match well with the simulation
results. Also we can see that even by protecting only 20% of the links connected to an attacked node,
the network crash threshold can be significantly increased.
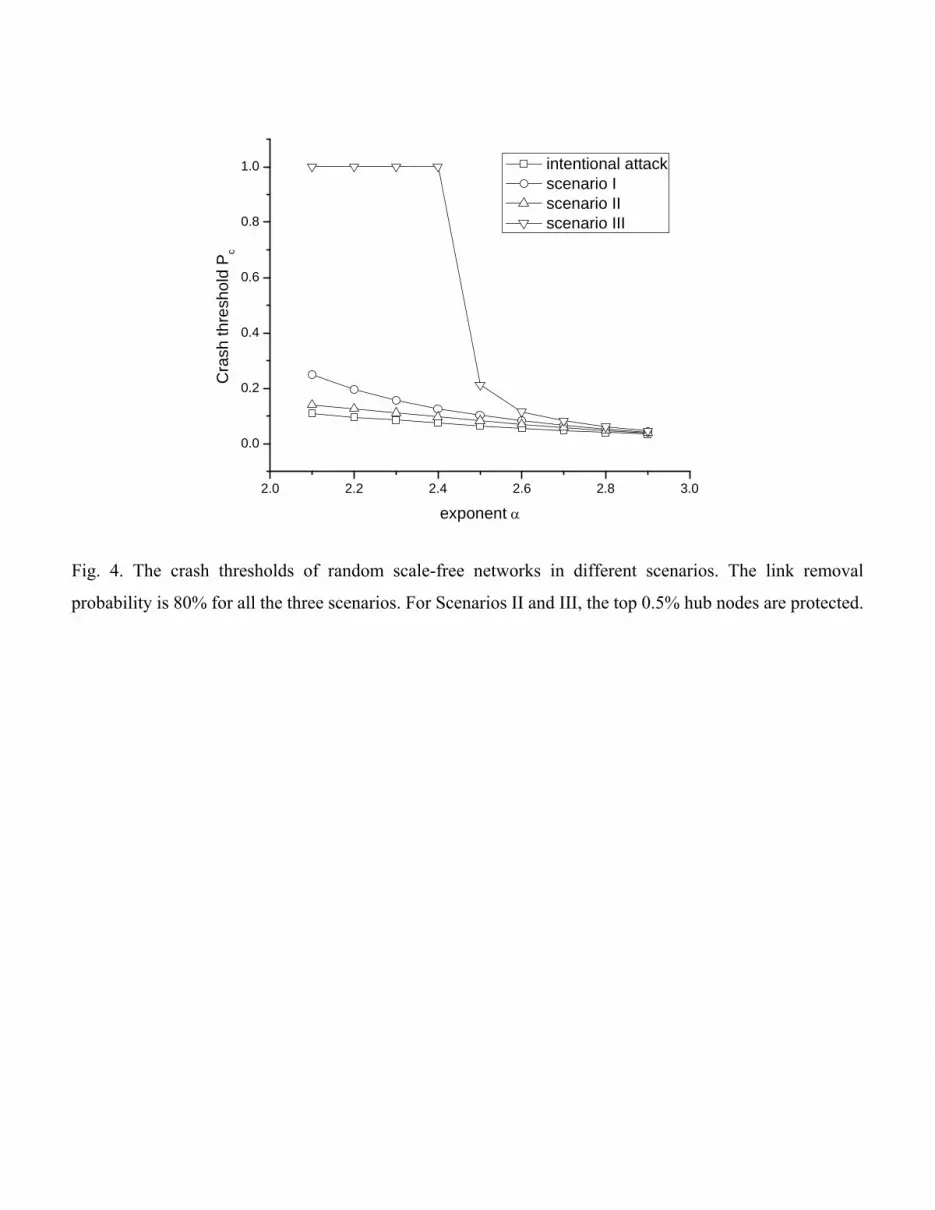
The comparisons between the effects of the three scenarios are presented in Fig. 4. We adopt the
same parameters of link-removal probability and node protection percentage as those in Fig. 3. Since
simulation results match well with theoretical analysis results, to avoid making the figure too
crowded, only the analytical results are plotted. We see that Scenario I slightly outperforms the other
two scenarios when the exponent α has a high value. When the exponent value is low, however,
Scenario III leads to a much larger crash threshold. In fact, as we can easily observe, the networks will
never be crashed when 2.4α ≤ , which can be explained as follows: in Scenario III, the sub-network
composed of a small number of hub nodes and the connections between them are strictly protected.
The survival of this sub-network helps keep 2 2k k > in networks under attack. In networks with
smaller threshold values, the numbers of moderate-degree nodes are relatively larger. The protected
sub-network together with these moderate-degree nodes make a network extremely difficult to be
totally crashed. Note that Scenario III puts only a small number of links between hub nodes under
perfect protection, which nevertheless significantly enhances network robustness. For example, for
the case where 2.1α = , a total of 168 links are perfectly protected, which enhances the network to be
almost never crashed. For another case where 2.9α = , an even smaller number of 46 links between
hubs are protected, The enhanced network can tolerate additional removals of about 300 links before
it is crashed. It is efficient to enhance network robustness, if measured by crash threshold, by
protecting links between hub nodes.
Fig. 5 shows in Scenarios II and III the improvements to network robustness when more hub
nodes are protected. The simulation results are for the case where 2.5α = and the link-removal
probability is 80%. We see that protecting a larger number of hub nodes only gradually increases
network crash threshold in Scenario II, whereas in Scenario III since the links between the protected
hubs are also protected, the threshold value boosts up with the number of protected hubs. In other
words, protecting more hub nodes may not be effective unless the links between these hubs are also
protected.
Figs. 4 and 5 may leave the impression that Scenario III is clearly the winner over the other two
in enhancing network robustness. While this may be true in measuring the crash threshold, especially
in random scale-free networks with small exponents, Fig. 6 shows that the situation is actually not
that simple. In this figure, we plot the largest cluster size, defined as the number of nodes in the
biggest connected component versus the number of nodes in the original network during the
procedure of attack [3]. Due to space limitation, we show only the results with 2.1,α = 2.5 and 2.9,

respectively. The link-removal probability is 80% and the top 0.5% hub nodes are protected in
Scenarios II and III. It can be observed that though Scenario III pushes the crash threshold to be very
high when 2.1α = and 2.5, most of time during the procedure of intentional attack, it does not make
the largest connected component be much larger than that in Scenario I. The small set of protected
hubs makes the network to stay with 2 2k k > even when the connected component size is
already quite small.
Finally we show in Fig. 7 the cluster diameters in all the three different scenarios. All the
parameters remain the same as those in Fig. 6. The basic observation is that all the three scenarios
help reduce the cluster diameter under attack. Among them, the most effective one is Scenario III.
The existence of the links between hubs not only keeps network connected but also effectively lowers
the cluster diameter in the largest connected component. Scenario III may indeed become the
favourable option when keeping a small cluster diameter is of high importance.
5. Simulations on real-life network models
To evaluate the effects of the proposed node protection schemes in communication networks,
we carry out simulations on two different models as follows:
• A real-life Internet model on the AS-level as measured by the Applied Network Research
(NLANR) Project on January 2, 2000 [22], which contains 6470 inter-connected nodes and
12,566 links. We have verified that it is indeed a scale-free network.
• A real-life Internet model on the router level as measured by the Cooperative Association for
Internet Data Analysis (CAIDA), which contains 192,244 nodes and 609,066 links [23].
As that in most existing studies (e.g., [8-11]), we evaluate during the procedure of intentional
attack the largest cluster size and the cluster diameter.
The earlier definition of crash threshold cp given by 2 2k k ≤ does not apply to these two
networks since neither of them is a random network. To differentiate, we evaluate the threshold of
crash (TOC), defined as the percentage of network nodes that has to be removed to reduce the largest
cluster size to be no more than 5%. It is shown in Fig. 8 and Fig. 9 that without any protection, the
two real-life models have their TOC values at about 3.2% and 14% respectively.
We still consider all the three different scenarios. For each scenario, we consider different cases
where the link removal probability is 50%, 70% and 80%, respectively. For Scenarios II and III, we
still let the top 0.5% of hub nodes be protected. For all the cases, the presented simulation results for
the AS-level model come from average values of 100 independent realizations. For the router-level
model, due to its extra-large size, it is prohibitively time-consuming to carry out extensive
realizations. Therefore only 5 realizations have been conducted.
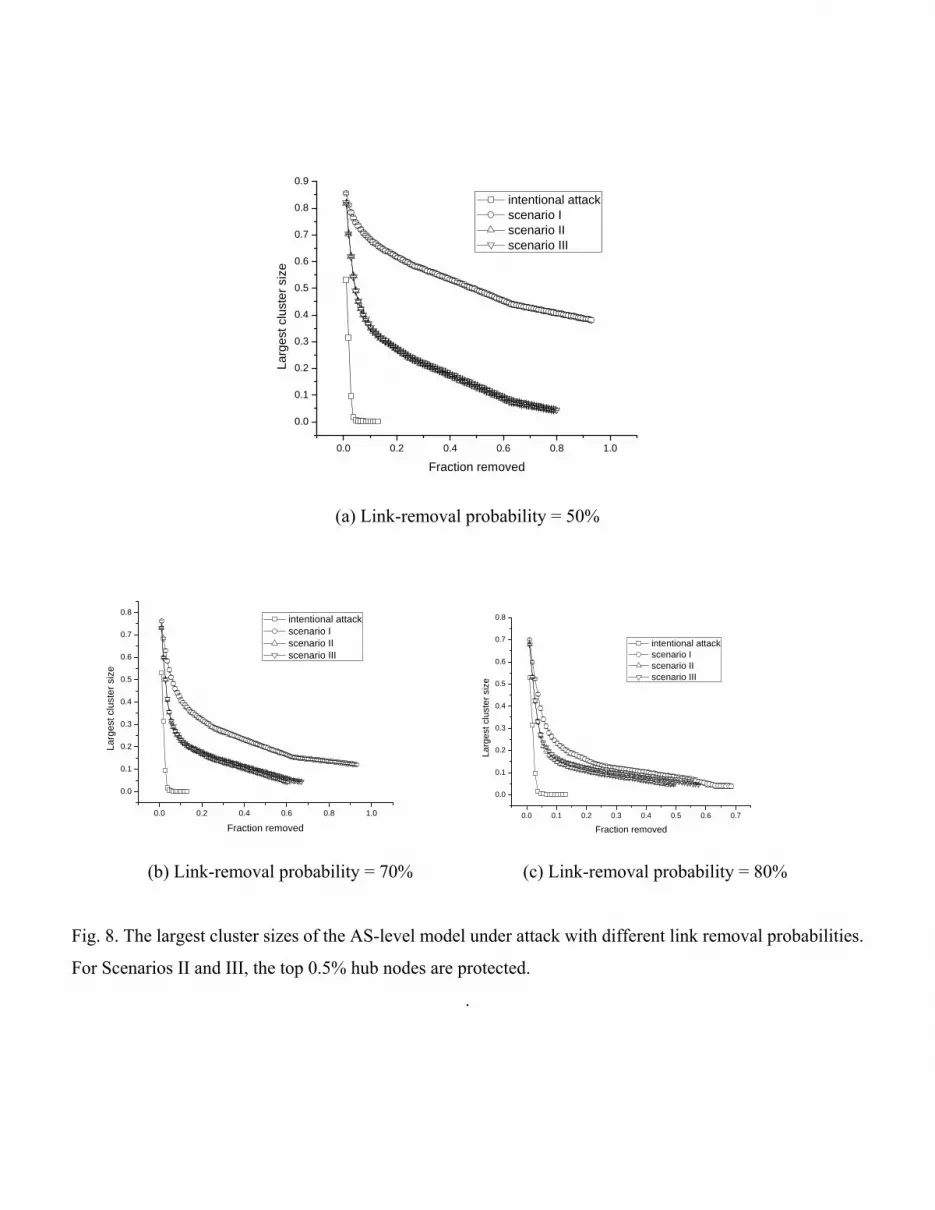
The simulation results on the AS-level model are shown in Fig. 8. The three subfigures are for
the three different cases where link removal probabilities are 50%, 70% and 80%, respectively. We
observe that Scenario I steadily leads to the best performance among the three. In fact, since the
threshold value of link removal probability to ensure that the network never be crashed in Scenario I
is 78%, the network never gets crashed when the link removal probabilities are 50% and 70%
respectively. Even when the link removal probability is 80%, TOC remains to be quite high at 60.3%.
Scenarios III performs only slightly better than Scenario II. Their corresponding TOC values are
75.1% vs. 77.9%, 58.4% vs. 64%, and 46.4% vs. 55.6% in the three different cases with different link
removal probabilities, respectively. As we have observed in the last section, the extra protection over
the links between a small number of hubs does not significantly increase the largest cluster size
though it does decrease the cluster diameter. The TOC value therefore may not be significantly
increased by such extra protection unless the number of the protected hubs is large enough to increase
the largest cluster size to be higher than the threshold value (5% in our simulation) with the existence
of the links between them.
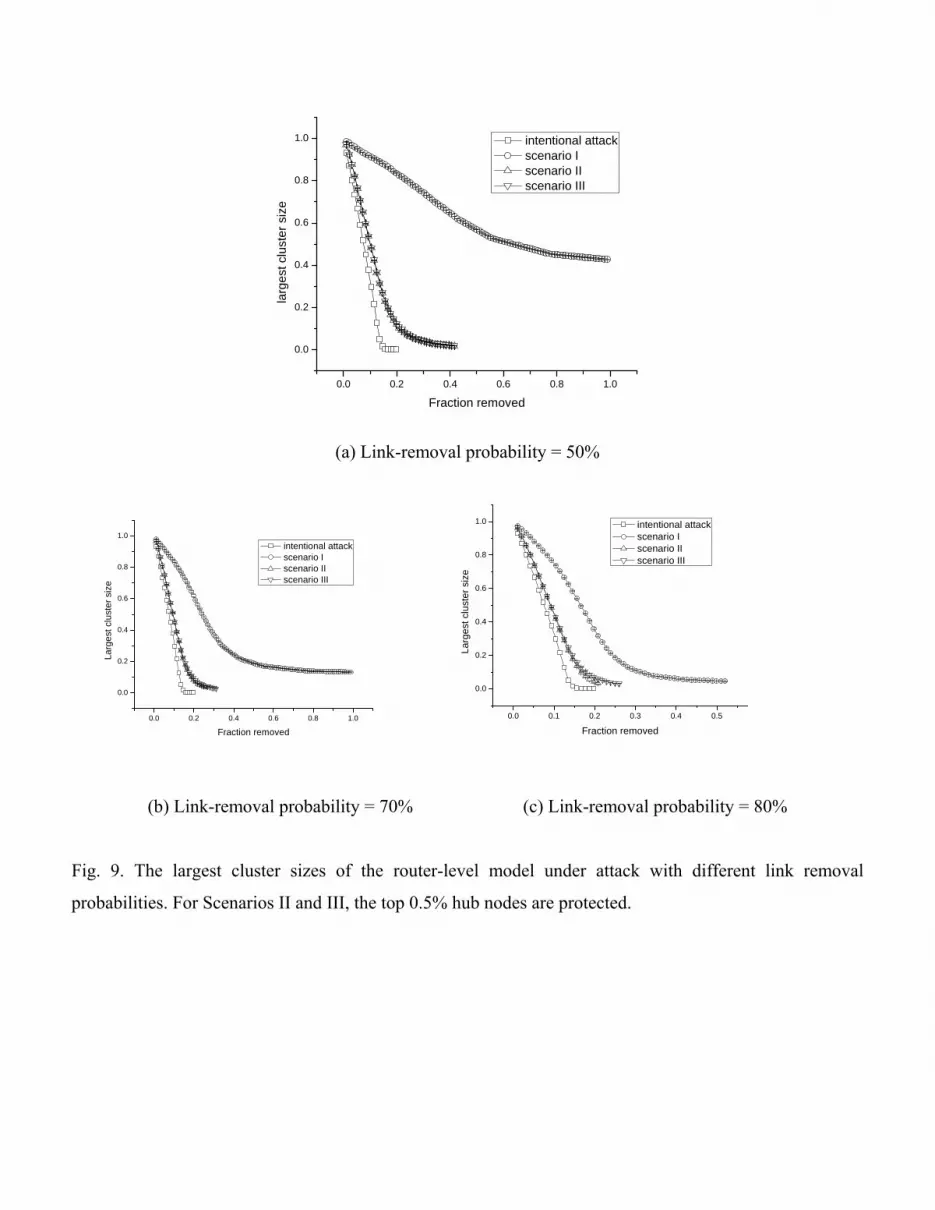
Fig. 9 shows the simulation results in the router-level models where all the parameter values
remain the same as those in Fig. 8. Once again we can easily observe that Scenario I leads to the best
performance. The threshold value of the link removal probability to crash the network in Scenario I is
75%. When the link-removal probability is 80%, the TOC value of Scenario I is 48.9%.
Similar to that in the AS-level model, Scenario III only slightly outperforms Scenario II. The
TOC values under different link removal probabilities are 28.1% vs. 28.1%, 22.9% vs. 25%, and
19.8% vs. 22.9%, respectively. The most visible difference between Fig. 8 and Fig. 9 is probably that
Scenarios II and III become much less effective in enhancing network robustness in the router-level
model than that in the AS-level model. This difference mainly comes from the degrees of their hub
nodes: The biggest hub in the AS-level modal has a degree of 1458. The top 0.5% hubs combined
together have a total degree of 6937. Putting these nodes under protection therefore strongly enhances
network robustness even when such protection is imperfect. In the router-level model, on the contrary,
the biggest hub has a degree of only 1071, a small value compared to the network size. The top 0.5%
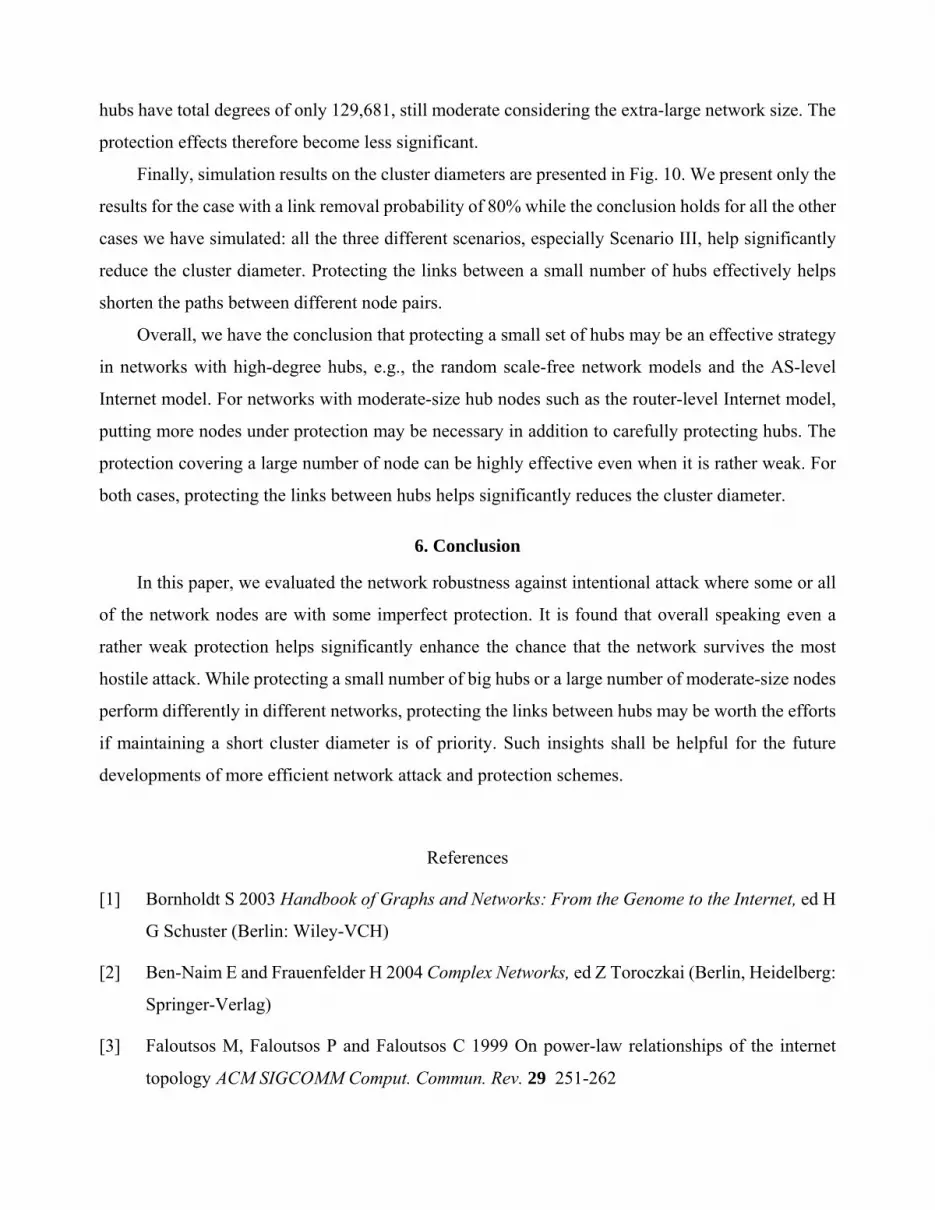
hubs have total degrees of only 129,681, still moderate considering the extra-large network size. The
protection effects therefore become less significant.
Finally, simulation results on the cluster diameters are presented in Fig. 10. We present only the
results for the case with a link removal probability of 80% while the conclusion holds for all the other
cases we have simulated: all the three different scenarios, especially Scenario III, help significantly
reduce the cluster diameter. Protecting the links between a small number of hubs effectively helps
shorten the paths between different node pairs.
Overall, we have the conclusion that protecting a small set of hubs may be an effective strategy
in networks with high-degree hubs, e.g., the random scale-free network models and the AS-level
Internet model. For networks with moderate-size hub nodes such as the router-level Internet model,
putting more nodes under protection may be necessary in addition to carefully protecting hubs. The
protection covering a large number of node can be highly effective even when it is rather weak. For
both cases, protecting the links between hubs helps significantly reduces the cluster diameter.
6. Conclusion
In this paper, we evaluated the network robustness against intentional attack where some or all
of the network nodes are with some imperfect protection. It is found that overall speaking even a
rather weak protection helps significantly enhance the chance that the network survives the most
hostile attack. While protecting a small number of big hubs or a large number of moderate-size nodes
perform differently in different networks, protecting the links between hubs may be worth the efforts
if maintaining a short cluster diameter is of priority. Such insights shall be helpful for the future
developments of more efficient network attack and protection schemes.
References
[1] Bornholdt S 2003 Handbook of Graphs and Networks: From the Genome to the Internet, ed H
G Schuster (Berlin: Wiley-VCH)
[2] Ben-Naim E and Frauenfelder H 2004 Complex Networks, ed Z Toroczkai (Berlin, Heidelberg:
Springer-Verlag)
[3] Faloutsos M, Faloutsos P and Faloutsos C 1999 On power-law relationships of the internet
topology ACM SIGCOMM Comput. Commun. Rev. 29 251-262

[4] Redner S 1998 How popular is your paper? An empirical study of the citation distribution Eur.
Phys. J. B. 4 131.
[5] Barbosa L A, Silva A C and Silva J K L 2006 Scaling relations in food webs Phys. Rev. E 73
41903
[6] Wardil L and Silva J K L 2008 A discrete inhomogeneous model for the yeast cell cycle Braz.
J. Phys. 38 350
[7] Jeong H, Tombor B, Albert R, Oltvai Z N and Barabasi A L 2000 The large-scale organization
of metabolic networks Nature 407 651-654.
[8] Albert R, Jeong H and Barabási A -L 2000 Error and attack tolerance of complex networks
Nature 406 378-82
[9] Cohen R, Erez K, ben-Avraham D and Havlin S 2000 Resilience of the Internet to random
breakdown Phy. Review Lett. 85 4626
[10] Cohen R, Erez K, ben-Avraham D and Havlin S 2001 Breakdown of the Internet under
intentional attack Phy. Review Lett. 86 3682
[11] Paul G, Sreenivasan S and Stanley H E 2005 Resilience of complex networks to random
breakdown Phy. Rev. E 72 056130
[12] Lόpez E, Parshani R, Cohen R, Carmi S and Havlin S 2007 Limited path percolation in
complex networks Phys. Rev. Lett. 99 188701
[13] Gallos L K, Cohen R, Argyrakis P, Bunde A and Havlin S 2005 Stability and topology of
scale-free networks under attack and defense strategies Phys. Rev. Lett. 94 188701
[14] Beygelzimer A, Grinstein G M, Linsker R and Rish I 2005 Improving network robustness by
edge modification Physica A 357 593-612
[15] Zhao J and Xu K 2009 Enhancing the robustness of scale-free networks J. Phys. A: Math.
Theor. 42 195003
[16] Xiao S, Xiao G, Cheng T H, Ma S, Fu X and Soh H 2010 Robustness of Complex
Communication Networks under Rewiring Operations Europhysics Lett. 89 38002

[17] Rezaei B A, Sarshar N, Boykin P O and Roychowdhury V P 2007 Disaster management in
power-law networks: recovery from and protection against intentional attacks Physical A 381
497-514
[18] Xiao S, Xiao G and Cheng T H 2010 Tolerance of local information-based intentional attacks
in complex networks Journal of Physics A 43 335101
[19] Wang Y, Xiao G, Hu J, Cheng T H and Wang L 2009 Imperfect Targeted Immunization in
Scale-Free Networks Physica A 388 2535-2546
[20] Erdös P and Rényi A 1959 On random graphs I Publ. Math. Debrecen 6 290-7.
[21] Catanzaro M, Boguñá M and Pastor-Satorras R 2005 Generation of uncorrelated random
scale-free networks Phy. Review E 71 027103
[22] http://moat.nlanr.net/Routing/rawdata
[23] http://www.caida.org/tools/measurement/skitter/router_topology/
2.0 2.2 2.4 2.6 2.8 3.0
0.50
0.55
0.60
0.65
0.70
0.75
0.80
Thre
shol
d of
link
-rem
oval
pro
babi
lity
Pf
exponent α
simulation results theoretical results
Fig. 1. The thresholds of link-removal probability to ensure that the networks never be totally crashed by
intentional attack in random scale-free networks.

0.5 0.6 0.7 0.8 0.9 1.0
0.0
0.2
0.4
0.6
0.8
1.0
Cra
sh th
resh
old
P c
Link-removal probability Pf
simulation results theoretical results
(a) Scenario I
0.5 0.6 0.7 0.8 0.9 1.0
0.0
0.2
0.4
0.6
0.8
1.0
Cra
sh th
resh
old
Pc
Link-removal probability Pf
simulation results theoretical results
0.5 0.6 0.7 0.8 0.9 1.0
0.0
0.2
0.4
0.6
0.8
1.0
Cra
sh th
resh
old
Pc
link-removal probability Pf
simulation results theoretical results
(b) Scenario II (c) Scenario III
Fig. 2. The effects of link-removal probability on network crash threshold in the random scale-free network.
We let α=2.5. For Scenarios II and III, the top 0.5% highest-degree nodes are protected.

2.0 2.2 2.4 2.6 2.8 3.00.00
0.05
0.10
0.15
0.20
0.25
0.30
Cra
sh th
resh
old
P c
exponent α
intentional attack link-removel probability=0.8 theoretical results
(a) Scenario I
2.0 2.2 2.4 2.6 2.8 3.0
0.04
0.06
0.08
0.10
0.12
0.14
0.16
Cra
sh th
resh
old
Pc
exponent α
intentional attack simulation results theoretical results
2.0 2.2 2.4 2.6 2.8 3.0
0.0
0.2
0.4
0.6
0.8
1.0
1.2
Cra
sh th
resh
old
Pc
exponent α
intentional attack simulation results theoretical results
(b) Scenario II (c) Scenario III
Fig. 3. Comparisons between theoretical and simulation results of crash thresholds in random scale-free
networks. The link-removal probability is 80% for all the three scenarios. For Scenarios II and III, the top
0.5% hub nodes are protected.
2.0 2.2 2.4 2.6 2.8 3.0
0.0
0.2
0.4
0.6
0.8
1.0
Cra
sh th
resh
old
Pc
exponent α
intentional attack scenario I scenario II scenario III
Fig. 4. The crash thresholds of random scale-free networks in different scenarios. The link removal
probability is 80% for all the three scenarios. For Scenarios II and III, the top 0.5% hub nodes are protected.

0.00 0.02 0.04 0.06 0.08 0.100.05
0.06
0.07
0.08
0.09
0.10
0.11
0.12
0.13
0.14
0.15
Cra
sh th
resh
old
Pc
top nodes protection probability Pt
simulation results theoretical results
(a) Scenario II
0.00 0.02 0.04 0.06 0.08 0.100.0
0.2
0.4
0.6
0.8
1.0
Cra
sh th
resh
old
Pc
top nodes protection probability Pt
simulation results theoretical results
(b) Scenario III
Fig. 5. The relationship between the crash threshold and the portion of hub nodes being protected in random
scale-free network. We used α=2.5 and 8.0=fP .

0.00 0.05 0.10 0.15 0.20 0.25 0.30
0.0
0.2
0.4
0.6
0.8
1.0
Larg
est c
lust
er s
ize
Fraction removed
intentional attack scenario I scenario II scenario III
(a) α=2.1
0.00 0.05 0.10 0.15 0.20 0.25-0.1
0.0
0.1
0.2
0.3
0.4
0.5
0.6
0.7
0.8
Larg
est c
lust
er s
ize
Fraction removed
intentional attack scenario I scenario II scenario III
0.00 0.05 0.10 0.15
0.0
0.1
0.2
0.3
0.4
0.5
0.6
Larg
est c
lust
er s
ize
Fraction removed
intentional attack scenario I scenario II scenario III
(b) α=2.5 (c) α=2.9
Fig. 6. The largest cluster sizes in random scale-free networks during the procedure of attack. The link
removal probability is 80% for all the three scenarios. For Scenarios II and III, the top 0.5% hub nodes are
protected.

0.00 0.05 0.10 0.15 0.20 0.25 0.300
5
10
15
20
25
30
35
40
45
Clu
ster
dia
met
er
Fraction attacked
intentional attack scenario I scenario II scenario III
(a) α=2.1
0.00 0.05 0.10 0.15 0.20 0.250
5
10
15
20
25
30
35
Clu
ster
dia
met
er
Fraction attacked
intentional attack scenario I scenario II scenario III
0.00 0.02 0.04 0.06 0.08 0.10 0.12 0.14 0.160
5
10
15
20
25
30
35
Clu
ster
dia
met
er
Fraction attacked
intentional attack scenario I scenario II scenario III
(b) α=2.5 (c) α=2.9
Fig. 7. The cluster diameters of random scale-free networks under attack. The link removal probability is
80% for all the three scenarios. For Scenarios II and III, the top 0.5% hub nodes are protected.
0.0 0.2 0.4 0.6 0.8 1.0
0.0
0.1
0.2
0.3
0.4
0.5
0.6
0.7
0.8
0.9
Larg
est c
lust
er s
ize
Fraction removed
intentional attack scenario I scenario II scenario III
(a) Link-removal probability = 50%
0.0 0.2 0.4 0.6 0.8 1.0
0.0
0.1
0.2
0.3
0.4
0.5
0.6
0.7
0.8
Larg
est c
lust
er s
ize
Fraction removed
intentional attack scenario I scenario II scenario III
0.0 0.1 0.2 0.3 0.4 0.5 0.6 0.7
0.0
0.1
0.2
0.3
0.4
0.5
0.6
0.7
0.8
Larg
est c
lust
er s
ize
Fraction removed
intentional attack scenario I scenario II scenario III
(b) Link-removal probability = 70% (c) Link-removal probability = 80%
Fig. 8. The largest cluster sizes of the AS-level model under attack with different link removal probabilities.
For Scenarios II and III, the top 0.5% hub nodes are protected.
.
0.0 0.2 0.4 0.6 0.8 1.0
0.0
0.2
0.4
0.6
0.8
1.0
larg
est c
lust
er s
ize
Fraction removed
intentional attack scenario I scenario II scenario III
(a) Link-removal probability = 50%
0.0 0.2 0.4 0.6 0.8 1.0
0.0
0.2
0.4
0.6
0.8
1.0
Larg
est c
lust
er s
ize
Fraction removed
intentional attack scenario I scenario II scenario III
0.0 0.1 0.2 0.3 0.4 0.5
0.0
0.2
0.4
0.6
0.8
1.0
Larg
est c
lust
er s
ize
Fraction removed
intentional attack scenario I scenario II scenario III
(b) Link-removal probability = 70% (c) Link-removal probability = 80%
Fig. 9. The largest cluster sizes of the router-level model under attack with different link removal
probabilities. For Scenarios II and III, the top 0.5% hub nodes are protected.

0.0 0.1 0.2 0.3 0.4 0.5 0.6 0.7
2
4
6
8
10
12
14
16
Clu
ster
dia
met
er
Fraction removed
intentional attack scenario I scenario II scenario III
(a) AS-level model
0.0 0.1 0.2 0.3 0.4 0.55
10
15
20
25
30
35
40
45
50
Clu
ster
dia
met
er
Fraction removed
intentional attack scenario I scenario II scenario III
(b) Router-level model
Fig. 10. The cluster diameters of the AS-level and router-level Internet models under attack. The link
removal probability is 80%. The top 0.5% nodes are protected in Scenarios II and III.