imperfect competition: monopoly, oligopoly and monopolistic competition
TRANSCRIPT

Imperfect Competition: Monopoly,
Oligopoly and Monopolistic
Competition
Topics 9-10
11/03/2016

Market Structures
• Three important characteristics of market in
structures:
• Number of firms
• Degree of product differentiation
• Ease of entry and exit.
11/03/2016

Types of Market Structure
•Railways
Monopoly
• Toothpaste
• Movies
Monopolistic
Competition
• Electricity• Crude oil
Oligopoly
Number of Firms?
Perfect
• Wheat
• Milk
Competition
Type of Products?
Identical
products
Differentiated
products
One
firm
Few
firms
Many
firms
11/03/2016

Source: Samuelson, Economics, 19th Edition11/03/2016

Imperfect Competition
• Imperfect Competition prevails in an industry
when the firms belonging to this industry can
exercise some control over price of the output
which they sell.
• It does not mean absolute control over the
price and the absence of rivals except in the
case of monopoly.

Sources of Imperfect Competition:1) Costs and market imperfections
– If economies of scale exist, large firms have an advantage over the small firms. In such a situation, AC will be declining till a large fraction of industry output is produced.
2) Barriers to entrya) Legal restriction
o Imposed by govt. such as patents to innovator
o Entry restriction such as franchise monopolies to public sector undertakings.
o Import restrictions.
b) High Costs of Entry: It is not possible to have a large number of producers selling aircraft, quality cars, software products, electricity, etc., as these need huge investments.
c) Advertising and product differentiation
3) Ownership of a key inputs.
E.g., DeBeers owns most of the world’s diamond mines

MONOPOLY:
• One seller and many buyers, A monopoly is a firm that is the sole seller of a product without close substitutes.
• Difficult to enter the markets due to barriers to entry.
• Natural monopolies due to declining costs
• Artificial monopolies: Legal and government policy induced.
• The key difference: A monopoly firm has market power, the ability to influence the market price of the product it sells. A competitive firm has no market power.

Source: Mankiw: Principles of Economics
Natural monopoly: a single firm can produce the entire market Q at lower AC than could several firms.
Q
Cost per unit of
electricity
AC
1000
Rs 50
Example: 1000 homes
need electricity.
Electricity
Economies of
scale due to
huge FC
AC is lower if
one firm services
all 1000 homes
than if two firms
each service
500 homes.
500
Rs 80

Source: Mankiw: Principles of Economics
Monopoly vs. Competition: Demand Curves
In a competitive market, the
market demand curve slopes
downward.
but the demand curve
for any individual firm’s
product is horizontal
at the market price.
The firm can increase Q
without lowering P,
so MR = P for the competitive
firm.
D
P
Q
A competitive firm’s
demand curve

Source: Mankiw: Principles of Economics
Monopoly vs. Competition: Demand Curves
A monopolist is the only
seller, so she faces the
downward sloping market
demand curve.
To sell a larger Q,
the firm must reduce P.
Thus, MR ≠ P.
If P or AR is falling, MR lies
below AR. D = AR
P= AR,
MR
Q
A monopolist’s
demand curve
MR

Source: Mankiw: Principles of Economics
Profit-Maximization
• Like a competitive firm, a monopolist
maximizes profit by producing the quantity
where MR = MC (Marginal cost based
pricing).
• Once the monopolist identifies this quantity,
it sets the highest price consumers are willing
to pay for that quantity.
• It finds this price from the D curve.

Source: Samuelson, Economics.19ed

Source: Samuelson, Economics.19ed9/20/2010

Source: Samuelson, Economics.19ed

Relationship between
Marginal revenue, Total
revenue and elasticity of
demand
Source: Samuelson, Economics.19ed

Profit maximization problem of a monopolist• TC= 50 + Q2
• P = 40 - Q
• R= 40Q - Q2
• Π= 40Q - Q2 - 50 - Q2
• dΠ/dQ = 40 -2Q -2Q
• Π max if (i) dΠ/dQ = 0; and (ii) d2Π/dQ 2 < 0
• MC= 2Q and MR = 40 -2Q
• (i) dΠ/dQ = 0 in this case when 4Q = 40:
• Profit maxima : Q=10; P = 30
• d2Π/dQ 2 = - 4 and < 0 and hence (ii) is also satisfied.
• When tangents to Total Revenue and Total Cost functions are parallel the profit function attains maxima.

Sales maximization: Goal of the firm• R= 40Q - Q2
(i) dR/DQ = 0
• 40 – 2Q = 0
• Q = 20
• P = 20
(ii) d2R/DQ2 < 0
-2 < 0
Note: Output is higher and price lower as
compared to profit maximization

Concentration Ratio
• Percentage of total industry output/shipment,
which is accounted for by the topmost firms.
Concentration ratio zero for perfect
competition and 1 for monopoly.

• Imperfect Competition prevails in an industry
when the firms belonging to this industry can
exercise some control over price of the output
which they sell.
• It does not mean absolute control over the
price and the absence of rivals except in the
case of monopoly.

A monopoly’s revenue
Following data shows
demand schedule for a
monopolist.
Fill in the missing
spaces of the table.
What is the relation
between P and AR?
Between P and MR?
20
Q P TR AR MR
0 4.50
1 4.00
2 3.50
3 3.00
4 2.50
5 2.00
6 1.50

The Welfare Cost of Monopoly
• In a competitive market equilibrium,
P = MC = MR and total surplus is maximized.
• In the monopoly equilibrium, P > (MR = MC)
– The value to buyers of an additional unit (P)
exceeds the cost of the resources needed to produce
that unit (i.e., MC).
– The monopoly Q (P) is lower than in a competitive
equilibrium
– The monopoly P is higher than in a competitive
equilibrium

Government Intervention and Imperfections in Market
Structure • Increasing competition with anti-monopoly laws
– Regulation
• Public ownership
– Example: Indian Railways
– Problem: Public ownership is usually less efficient
since no profit motive to minimize costs
• Doing nothing
– The foregoing policies all have drawbacks,
so the best policy may be no policy.

Public Policy Toward Monopolies
Failure of Market
Economy
Government
Intervention
Policy Action
Inefficiency
i) Monopoly
Encourage competition Restriction on
monopolies and
restrictive trade
practices

Price Discrimination• Price discrimination is the business practice of
selling the same good at different prices to
different buyers.
• The characteristic used in price discrimination
is willingness to pay (WTP):
– A firm can increase profit by charging a higher price
to buyers with higher WTP.
– Perfect Price Discrimination: Charging each customer
a price according to his/her willingness to pay

Price Discrimination in the Real World
• In the real world, perfect price discrimination
is not possible:
– no firm knows every buyer’s WTP
– buyers do not announce it to sellers
• So, firms divide customers into groups
based on some observable trait
that is likely related to WTP, such as age.

Examples of Price Discrimination
Movie tickets
Discounts for vodafone customers!
Conference registrations
Discounts for early registration.
Discount coupons: Pizza Hut discounts on the next
pizza ordered
Need-based financial aid: Merit and means
scholarships, lower interest rates for agricultural
and export sectors (priority sectors)
Quantity discounts: Group discounts in a museum

Monopolistic Competition
• Imperfect competition refers to those market
structures that fall between perfect
competition and pure monopoly.

Monopolistic Competition
• Markets that have some features of
competition and some features of monopoly.
• Attributes of monopolistic competition:
– Many sellers
– Product differentiation
– Free entry and exit

Monopolistic Competition
• Product Differentiation
– Each firm produces a product that is at least
slightly different from those of other firms.
– Rather than being a price taker, each firm faces a
downward-sloping demand curve.

Monopolistic Competition
• Free Entry or Exit
• Firms can enter or exit the market without
restriction.
• The number of firms in the market adjusts
until economic profits are zero.

COMPETITION WITH DIFFERENTIATED
PRODUCTS
• The Monopolistically Competitive Firm in the
Short Run
– Short-run economic profits encourage new firms
to enter the market. This:
• Increases the number of products offered.
• Reduces demand faced by firms already in the market.
• Incumbent firms’ demand curves shift to the left.
• Demand for the incumbent firms’ products fall, and
their profits decline.

Monopolistic Competition in the Short
Run
Quantity0
Price
Profit-
maximizing
quantity
Price
Demand
MR
ATC
(a) Firm Makes Economic or supernormal Profit
Average
total costProfit
MC

Monopolistic Competitors in the Short
Run
Demand
Quantity0
Price
Price
Loss-
minimizing
quantity
Average
total cost
(b) Firm Makes Subnormal profits or Losses
MR
LossesATC
MC
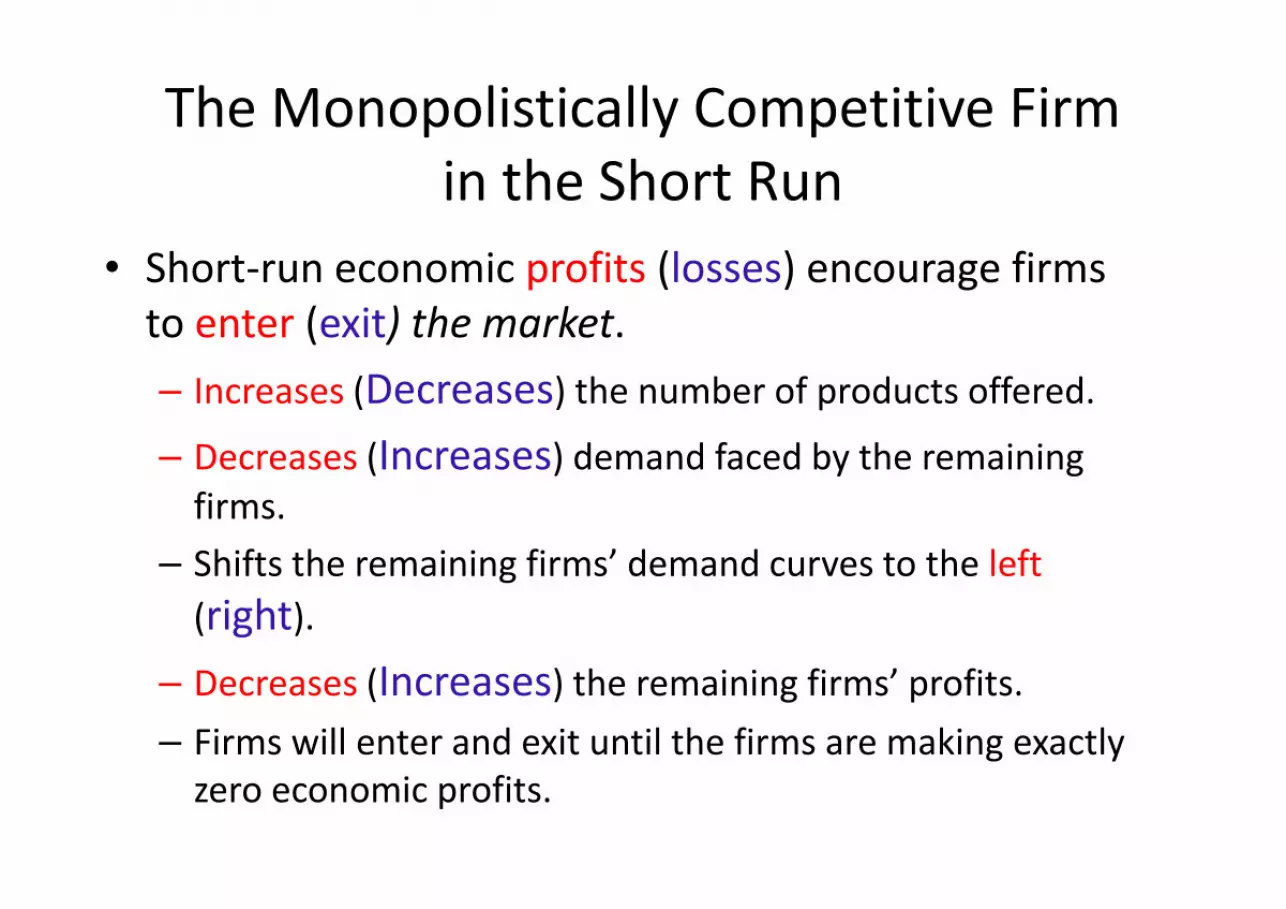
The Monopolistically Competitive Firm
in the Short Run
• Short-run economic profits (losses) encourage firms
to enter (exit) the market.
– Increases (Decreases) the number of products offered.
– Decreases (Increases) demand faced by the remaining
firms.
– Shifts the remaining firms’ demand curves to the left
(right).
– Decreases (Increases) the remaining firms’ profits.
– Firms will enter and exit until the firms are making exactly
zero economic profits.

A Monopolistic Competitor in the Long
Run
Quantity
Price
0
DemandMR
AC
MC
Profit-maximizing
quantity
P = AC
The demand curve is
tangent to the AC
curve.
And this tangency lies
vertically above the
intersection of MR and MC.

Monopolistic versus Perfect
Competition
• There are two noteworthy differences
between monopolistic and perfect
competition:
– Excess capacity
– Markup over marginal cost

Monopolistic versus Perfect
Competition
Quantity0
Price
Demand
(a) Monopolistically Competitive Firm
Quantity0
Price
P = MC P = MR
(demand
curve)
(b) Perfectly Competitive Firm
MCATC
MCATC
MR
Efficient
scale
P
Quantity
produced
Quantity produced =
Efficient scale

The Long-Run Equilibrium
• Two Characteristics
– As in a monopoly, price exceeds marginal cost.
• Profit maximization requires marginal revenue to equal
marginal cost.
• The downward-sloping demand curve makes marginal
revenue less than price.
– As in a competitive market, price equals average
total cost.
• Free entry and exit drive economic profit to zero.

ADVERTISING
• When firms sell differentiated products and
charge prices above marginal cost, each firm
has an incentive to advertise in order to
attract more buyers to its particular product.
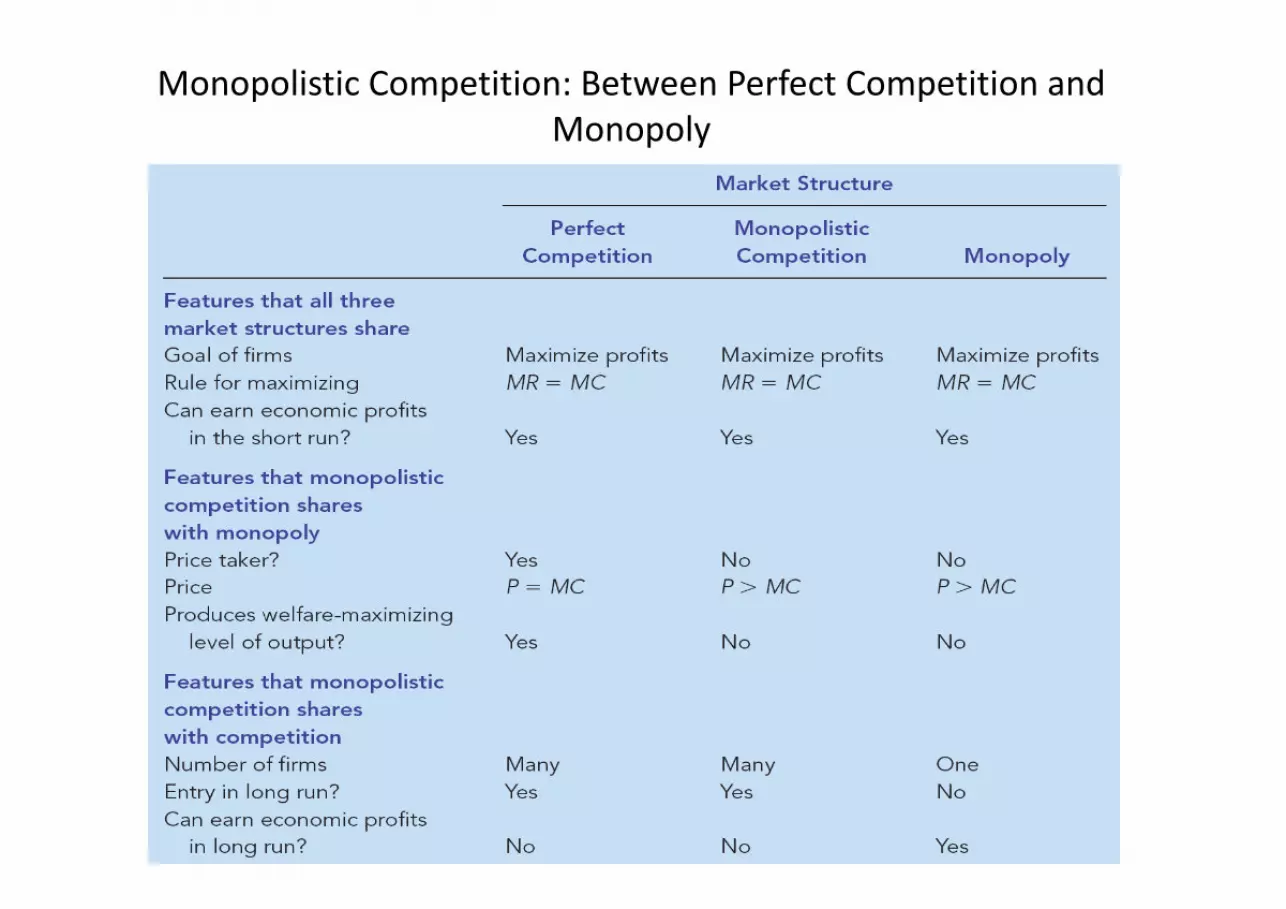
Monopolistic Competition: Between Perfect Competition and
Monopoly

Oligopoly
Only a few sellers, each offering a similar or identical product to the others.
• Because of a few sellers, the key feature of oligopoly is the tension between cooperation and self-interest.
• Characteristics of an Oligopoly Market– A few sellers offering similar or identical products
– Interdependent firms
– Best off cooperating and acting like a monopolist by producing a small quantity of output and charging a price above marginal cost
– A duopoly is an oligopoly with only two members. It is the simplest type of oligopoly.

Market power:• degree of control that a single firm or a small number
of firms (top-four/top-eight/top-ten) have over the price and production decisions in an industry.
• One of the measures of market powers is the Concentration ratio (percentage of total industry output/shipment which is accounted for by the topmost firms).
• Concentration ratio zero for perfect competition and 1 for monopoly.
• Degree of Monopoly power is also measured by how much a firm can charge to the consumers over and above its marginal cost, as given in the formula below. It is also inversely related to the price elasticity of demand.

Competition, Monopolies, and Cartels
• The duopolists/oligopolists may agree on a monopoly outcome.– Collusion
• An agreement among firms in a market about quantities to produce or prices to charge.
– Cartel• A group of firms acting in unison.
• Although oligopolists would like to form cartels and earn monopoly profits, often that is not possible. Antitrust laws prohibit explicit agreements among oligopolists as a matter of public policy.

Oligopoly
�few firms
�either homogeneous or differentiated products
�interdependence of firms - policies of one firm
affect the other firms
�substantial barriers to entry
�E.G. Mobile service providers, power companies

Collusion and Competition
Oligopoly firms may collude (act as a monopoly)
and earn positive profits.
OR
Oligopolists may compete with each other and
drive prices down to where profits are zero.

While it pays for firms to collude, in order to
earn positive profits, it also pays to cheat on
the collusive agreement. If one firm cuts its
price to slightly below the others, it could gain
a lot of business.
If everyone cheats on the agreement, however,
the agreement falls apart.

Collusive agreements less likely
to succeed when
�secret price cuts are difficult and costly to detect.
(Quality changes are difficult to monitor.)
�market conditions are unstable. (Differences in
expectations make it difficult to reach an
agreement.)
�vigorous antitrust action increases the cost of
collusion.

Some oligopolistic markets operate in a
situation of price leadership.
A single firm sets industry price and the
remaining firms charge the same price as
the leader.

Sweezy’s kinked demand curve
model of oligopoly
Assumptions:1. If a firm raises prices, other firms won’t follow and
the firm loses a lot of business. So demand is very responsive or elastic to price increases.
2. If a firm lowers prices, other firms follow and the firm doesn’t gain much business.So demand is fairly unresponsive or inelastic to price decreases.

The Kinked Demand Curve
quantity
D
P*
Q*
Rs

MR Curve
for the top part of the Demand Curve
quantity
D
MR
P*
Q*
Rs

Drawing MR Curve
for the bottom part of the Demand Curve
quantity
D
MR
P*
Q*
Rs

MR Curve
for the bottom part of the Demand Curve
quantity
D
MR
P*
Q*
Rs

The Kinked Demand Curve
and the MR Curve
quantity
D
MR
Q*
P*
Rs

The MC curve intersects the MR curve
in the vertical segment.
quantity
$
D
MR
Q*
P*
MC

If costs shift up slightly, but MC still intersects
MR in the vertical segment, there will be no
quantity
D
MRQ*
P*
MC
MC’change in price.
This price
rigidity/stickiness
is seen in real
world oligopoly
markets.
Rs

The AC curve can be added to the graph. To show
positive profits, part of A C curve must lie under part
of the demand curve.
quantity
D
MRQ*
P*
MC A C
Rs

The Equilibrium for an Oligopoly
• When firms in an oligopoly individually choose
production to maximize profit, they produce
quantity of output greater than the level
produced by monopoly and less than the level
produced by competition.
• The oligopoly price is less than the monopoly
price but greater than the competitive price
(which equals marginal cost).

Equilibrium for an Oligopoly
• Summary
– Possible outcome if oligopoly firms pursue their
own self-interests:
• Joint output is greater than the monopoly quantity but
less than the competitive industry quantity.
• Market prices are lower than monopoly price but
greater than competitive price.
• Total profits are less than the monopoly profit.

Controversies over Policy to regulate
imperfections in the market
• Resale Price Maintenance (or fair trade) – occurs when suppliers (like wholesalers) require
retailers to charge a specific amount
• Predatory Pricing– occurs when a large firm begins to cut the price of
its product(s) with the intent of driving its competitor(s) out of the market
• Tying– when a firm offers two (or more) of its products
together at a single price, rather than separately