price-capping in partially monopolistic electricity markets with an application to italy
TRANSCRIPT
Price capping in partially monopolistic electricity markets
Bruno Boscoa, Lucia Parisioa, Matteo M. Pelagattib,∗
aDepartment of Legal and Economic Systems, Universita degli Studi di Milano-Bicocca,Piazza Ateneo Nuovo 1, 20126 Milano, Italy
bDepartment of Statistics, Universita degli Studi di Milano-Bicocca, Via Bicocca degliArcimboldi 8, 20126 Milan, Italy
Abstract
In this paper we consider an oligopolistic market in which one firm can bemonopolist on her residual demand function and derive implications on theshape of her profit function, which we show may not be concave in price.We propose a simple price-capping rule that induce the pivotal operator tocompete for quantity instead of taking advantage of her monopoly. Then,we analyze the bidding behaviour of the dominant electricity producer oper-ating in the Italian wholesale power market (IPEX). This firm is verticallyintegrated and in many instances she acts as a monopolist on the residualdemand. We find that, contrary to expectations, this pivotal firm refrainsto exploit totally her unilateral market power and, therefore, bids at levelswell below the cap. We discuss such a behaviour and derive implications forthe setting of the price cap.
Keywords: Electricity auctions, capacity constraints, price cap, optimalbiddingJEL: C50; L11; L12; L43; L51; L94; Q41; Q48
1. Introduction
There is a growing body of literature that analyses electricity mar-kets at both theoretical and empirical level. Wholesale electricity markets
∗Corresponding author (Tel +39-02-64485834, Fax +39-02-64485878). We thank theMURST for a PRIN2007 grant and we greately aknowledge ref. (Ricerche per l’economiae la finanza) for providing us with the data necessary for the empirical application in thispaper.
Email addresses: [email protected] (Bruno Bosco),[email protected] (Lucia Parisio), [email protected] (Matteo M.Pelagatti)
Working Paper February 16, 2011
can be modeled as multi-unit auctions where multiple identical objects arebought/sold and demand/supply is not restricted to a single unit. Fromthe theoretical point of view, the analysis concentrates mainly on the prop-erties of the market design (various possible auction formats) and on thestrategic behavior of auction participants whereas the main focus of appliedresearchers is on the estimation of firms’ market power.
From a theoretical point of view, like other cases of auctions for identicaland divisible objects – such as Treasury Bills – electricity auctions are oftenanalyzed as quota or share auctions. Ausubel and Cramton (2002), follow-ing the line of research first introduced by Wilson (1979), found that whenmultiple units are sold simultaneously under the uniform price rule, buyershave an incentive to “shade” their demand (reduce their valuation) for allunits following the first. In this manner they optimally trade-off a lowerprobability of winning on the last units against savings on all units bought.Electricity markets, in which the majority of sellers own a number of gen-erating units, show the same type of incentives on the supply side becauseoverbidding on the last units increases the revenues for all the inframarginalunits despatched in equilibrium. This is easy to understand since in a multi-unit auction with uniform price rule a high price is a public good. A similar(bid shading) result was obtained by Parisio and Bosco (2003, 2008) whorelaxed the assumption of costs common knowledge and derived equilibriumbid functions in both isolated and interconnected electricity markets 1. Theyshow that the extent of bid shading, and therefore the mark-up, dependsamong other things upon the endowments of generation capacity of eachmulti-plant firm. Hortacsu and Puller (2008) characterize the bidding be-havior of electricity generators within the theoretical framework of Wilson’sshare auction. Before them, Wolak (2003) used a similar model of biddingbehavior to recover cost function estimates for electricity generation in theAustralian National Electricity Market. He shows that under the assump-tion of firm-level profit maximization, it is possible to estimate the level ofmarginal costs implied by a given equilibrium price and quantity. Observedbid data can be used to compute directly the Lerner Index of market power.
The finding that firms fail to exploit the full potential of market power inelectricity markets is a quite common result in the applied literature. Onepossible explanation of this apparently suboptimal behavior relies on thefact that firms may be vertically integrated which means that they may be
1Many researchers have implemented and refined this model, for example, Brunekreeft(2001), Garcia-Diaz and Marin (2003), Fabra (2003), Fabra et al. (2006).
2

active on both sides of the auction. Bushnell et al. (2008) analyses theoret-ical and empirical implications of firms that act both as buyers and sellersin electricity auctions. In their model Cournot equilibrium can produceprices lower than perfectly competitive ones when vertical arrangements areconsidered. To the extent that large producers also have even larger re-tail obligations, they may find it profitable to overproduce in order to drivedown their wholesale costs of power purchased for retail services. When thefirm is a net buyer marginal revenue is greater than price and therefore it isprofit maximizing to produce at levels where marginal costs is greater thatprices. Bushnell et al. (2008) found that the vertical relationships betweenproducers and retailers play a key role in determining the competitivenessof the spot markets they analysed (California, New England, and PJM).Their findings support Wolak’s (2000) analysis of the effects of long-termcontracts in the Australian electricity market, as well as Fabra and Toro’s(2005) results for the Spanish market. Also Wolak (2010) emphasises thata supplier’s incentive to exercise unilateral market power can differ dramat-ically from its ability to exercise unilateral market power. This is due tothe presence of fixed-price forward market obligations: only a supplier whoexpects to sell more than its fixed-price forward market obligation in theshort-term market has an incentive to use its ability to exercise unilateralmarket power to raise the short-term price. In this paper we contribute tothe above literature by exploring another possible cause of the lack of marketpower exploitation. Assume that under high demand conditions a produceris indispensable for the equilibrium even if all the competitors’ offered attheir maximum capacity. In this case, that pivotal bidder should in theoryoffer at a price equal to infinity (or at the cap). This in turn implies that hisoptimal profit function should exhibit some non-concavity when the pricereaches the level at which competitors exhaust their capacity. Beyond thatpoint the residual demand becomes constant and coincides with the marketdemand which can be served by the pivotal bidder at almost any price. Weexplore this case and derive implications for the bidding behaviour. Thepaper is organised as follows. In Section 2 we discuss bidding behaviourin electricity auctions and derive the condition for profit maximising be-haviour without imposing any restriction on demand conditions. In Section3 we present a model for the above described pivotal bidder and show, alsowith a numerical example, how demand conditions can affect the shape of hisprofit function for different levels of price. In Section 4 we first describe themain characteristics of the Italian electricity market and then we use datagenerated on that market to test the hypothesis that profit functions maybecome non-concave when the demand level is high. Section 5 concludes.
3
2. Optimal bidding strategies, pivotal bidders and price cappingpolicy
Theoretical and applied analyses of wholesale electricity markets arebased on two alternative strategic models of bidding behaviour, namely theWilson’s Share auction model (Wilson, 1979) and the Supply function equi-librium (SFE) model of Klemperer and Meyer (1989). The former is basedon the assumption that bidders are uncertain about private characteristicsof rivals (e.g. costs, forward contract position) and about demand level,whereas in the latter only demand is ex-ante uncertain to bidders whilecosts level are known. However, under a set of simplifying assumptionsthe FOCs for an optimal bid/supply function coincide in the two models.Whatever the source of uncertainty that characterises the two approaches,it results into randomness of the residual demand facing each bidder andtherefore it is the distribution of the residual demand that is relevant inthe optimal strategy calculation. Other simplifiying assumptions, that arefrequently invoked by both lines of research, are linear and price-inelastic de-mand and constant marginal costs. The optimal supplies of bidders, namelythe optimal quantity to be offered at each possible equilibrium price level,are restricted to be continuously increasing differentiable functions. Bothauction and SFE models assume that the aggregate firm capacity is largerthan the maximum possible level of demand and that there are not pivotalsuppliers. A supplier is said to be pivotal if he/she is able to set the price inthe auction by withholding some portion of its production from the market.It has been recognised that pivotal suppliers are most likely when demand isnear the peak, when the market capacity is limited relative to peak demandad/or when firms capacities are unevenly distributed. One interesting caseemerges when there is only one firm that is pivotal: this happens when allrival firms’ capacity is insufficient to meet demand with positive probability.In this case the pivotal firm is able to set the market price at the maximumallowed value (infinity or at the cap) by witholding its output at prices be-low that value2. The incentive to bid at the highest possible price level forpivotal suppliers is a result common to both auctions and SFE models.
Consider first N multi-plant firms competing in a day-ahead market toget the right to supply electricity at price pe which is the uniform price to bepaid to all units called into operation. Total demand is D = D+ ε, where ε
2For this reason regulators frequently calculate the so-called residual supply index RSIas the ratio of residual supply to the total demand. In an applied analysis Sheffrin (2001)showed that the average price-cost markup goes to zero for a RSI equal to 1.2.
4

is a purely random shift component. Each bidder has costs given by Ci(q),i = 1, . . . , N, for which the hypothesis of private value holds. Auctions takeplace on an hourly basis and we treat each hour as an independent auction.Bidders submit supply schedules q = yi (p) that indicate the optimal quan-tity offered at price level p. We assume supply schedules yi, i = 1, . . . , N ,to be strictly increasing and continuously differentiable.
From the point of view of bidder i, the equilibrium price pe is determinedwhere his supply function yi (·) intersects its residual demand, namely
yi (pe) = D −∑∀j 6=i
yj(pe)
As a consequence, the probability distribution of the market clearing price,conditional on the supply yi (·) can be written as:
H(p, yi(p)
)= Pr
{pe ≤ p|yi(p)
}= Pr
{yi(p) ≤
[D −
∑∀j 6=i
yj(p)]}
Then, ∀p and y(p), H(·, ·) is a probability distribution generated by yj(p),D and N . We assume that H is differentiable in p and y(·). The assumptionthat each y(·) is a strictly increasing function implies thatH has a continuoussupport [p, p].
Following Bushnell et al. (2008) we also assume that at least some of thebidders are vertically integrated firms. This means that they may be simul-taneously sellers and buyers which means that firms may have an upstreamgenerator and a downstream firm that performs the retail activity. We canassume that the quantity bought for retailing in the electricity auction isfixed (due to long term obligations), let it be xi, and that it will be sold ata predetermined price pr.
The expected profit of bidder i can be written as:
E [πi] =
∫ p
p
[peyi(p
e)− Ci
(yi(p
e))
+ (pr − pe)xi]
dH (1)
Equation (1) may be rewritten in variational form as follows:
|K| −∫ p
p
{(yi(p
e)− xi)
+ pey′i(pe)− C ′i
(yi(p
e))y′i(p
e)}H(pe, yi(p
e))
dpe
where K is a constant. Euler’s equation generates an optimal y∗i (pe) suchthat:
pe = C ′i(y∗i (pe)
)+(y∗i (pe)− xi
)H iyi
(pe, y∗i (pe)
)H i
pe(pe, y∗i (pe)
) (2)
5
The numerator on the rhs measures the shift in the probability distribu-tion of the market clearing price due to a change in the supply of bidder iand the denominator is the density of H. Using our definition of H and theassumptions about y(.) it is possible to derive a manageable expression forthe probability ratio in (2), as follows3 :
pe = C ′i(y∗i (pe)
)+
y∗i (pe)− xi∂
∂pe∑N∀j 6=i yj(p
e)(4)
Let RDi (p) := D −∑N∀j 6=i yj(p) be the residual demand facing bidder i.
Then, under the assumption of price-inelastic total demand, RD′i(p) :=− ∂
∂p
∑N∀j 6=i yj(p). Equation (4) can be transformed into a Lerner Index
where the inverse elasticity of the residual demand net of quantities boughtmeasures the incentive a firm has to withhold output in order to raise theshort-term market price (large positive value) and to increase output in orderto lower short term market price (large negative value).(
pe − C ′i(y∗i (pe)
))pe
=(RDi − xi)peRD
′i(p
e)(5)
Equation (5) measures the incentive to use market power when a firm isvertically integrated. If only the production side of the firm is considered (orif the firm does not act as a buyer on the demand side of the power market),then xi is equal to zero and the Lerner index would increase. Therefore weexpect that a vertically integrated firm has less incentive to use his marketpower with respect to a firm who only sells in the market. Due to verticalintegration, the numerator on the rhs of (5) could also be negative. Thishappens when the firm is a net buyer on the market. A profit maximising netbuyer has the incentive to reduce the equilibrium price which results to belower than marginal costs. We therefore conclude that a vertically integratedbidder can be subject to a very different type of incentives depending on its
3Under the same set of assumptions and with full knowledge of bidders’ costs, SFEmodels provide conditions for supply functions yi(p) of firm i such that the clearing pricep maximises profits Πi(p, D) for each possible demand realisation and with yi(p) = D −∑N∀j 6=i yj(p). The optimal bid function is the solution to a system of ordinary differential
equations:N∑∀j 6=i
dyj(p)
dp=
yi(p)
(p− C′i), i = 1, ..., N (3)
It is evident from (4) and (3) that SFE and Share auction models produce the same setof conditions for optimality.
6
net position of the market. This in turn will have effect on the shape of itsprofit funtion, as we will consider in the next section.
3. Capacity constraints and the pivotal bidder
Now suppose that i is the pivotal supplier and that the total demandcannot be satisfied even if all competitors of i offer their total capacity. Thisimplies that there is a price, say p, above which the residual demand facedby i equals a positive constant, say RD:
RDi(p) := D −∑j 6=i
Sj(p) = RD > 0, ∀p > p.
As a consequence, the derivative ddp
∑j 6=i Sj(p) in equations (4) and (3)
equal zero for p > p and the optimal bidding solution for i is to offer (part of)its electricity at price p =∞. This simple result underlines the importance ofsome price capping mechanism in electricity markets with a pivotal supplier.
In order to understand how the price cap should be chosen, let us considerthe profit function of the pivotal supplier i:
πi(p) =
RDi(p) · p− C
(RDi(p)
), for p < p,
RD · p− C(RD), for p ≥ p.
The shape of this curve for p < p depends on the assumptions on how theresidual demand and cost functions behave in that interval, but for p ≥ p,the profit curve is just a straight line with slope RD: the larger the residualdemand that cannot be satisfied by the competitors, the faster the pivotalsupplier’s profit increment. Notice that for p < p the profit function is theusual one, so under standard conditions it will be concave. As described inthe previous Section we expect that since vertical integration modifies theexposure of the firm to the market price, then it would influence the shapeof the profit function. In this case the profit funtion of the pivotal supplierwould become:
πi(p) =
(RDi(p)− xi) · p− C
(RDi(p)
)+ pr · xi, for p < p,(
RD − xi)· p− C(RD) + pr · xi, for p ≥ p.
where pr is the (regulated) selling price for the quantity bought xi. Thereforea supplier can be pivotal and so he can be able to raise substantially themarket price but at the same time he could have a little incentive to exploit
7
its pivotal status. This happens when the firm is not net pivotal, namelywhen
(RD − xi
)< 0. In this case the pivotal quantity RD is less than the
bought quantity xi.We can illustrate the behaviour of the profit function with a numerical
example. Hypothetical profit functions of the pivotal supplier are plottedin Figure 1. These curves are fictional, but an actual profit curve maybe estimated using real auction data and the cost function of the pivotalproducer.
The plots in Figure 1 are based on the hypothetical pivotal supplier’scost function
C(q) := 30 + 200( q
20000
)2,
and on the three following competitor’s aggregate supply functions
S1(p) := min[40000, 45000
(1− 1/(1 + 0.1p0.9)
)], (continuous blue line)
S2(p) := min [40000, 50 + 5000√p ] , (dotted red line)
S3(p) := −40000 + 80000/(1 + e−p/20). (dashed green line)
Cost and supply functions are depicted in Figure 2. As already noticed,these figures are artificial, but quantities should be thought as MWh andprices and costs as Euros. A total competitors’ capacity of 40000 MWh hasbeen supposed for all three supply functions.
The three subplots in Figure 1 refer to the following demand levels:40000 (low demand, dominant supplier not necessary), 42000 (mid demand,monopoly on 2000 MWh), 50000 (high demand, monopoly on 10000 MWh).
By observing Figure 1a, we see that when the dominant supplier is notnecessary for satisfying the total demand, she maximizes her profits by tryingto serve a share of the demand by competing on prices. On the contrary,when the demand cannot be entirely satisfied by the competitors of thedominant supplier (Figure 1, panels b and c), then the latter maximizes herprofit by selling the residual demand RD at infinite price. In the presenceof a vertically integrated pivotal supplier we expect that the profit funtionwould lose part of its linear increasing portion and would become moresimilar to a standard concave profit function.
In this setup, a regulator could force the pivotal supplier to competewith the other suppliers by fixing a price cap that satisfies{
π(pc) < maxp≤p π(p),pc ≥ p,
where p is the price above which RD(p) = RD and pc denotes the price cap.The first condition identifies all the prices for which the profit of the pivotal
8

50 100 150 200 250 300Price
100 000
200 000
300 000
400 000
Profit
(a) Low demand
50 100 150 200 250 300Price
100 000
200 000
300 000
400 000
500 000
600 000
Profit
(b) Mid demand
50 100 150 200 250 300Price
500 000
1.0 ´ 106
1.5 ´ 106
2.0 ´ 106
2.5 ´ 106
3.0 ´ 106
Profit
(c) High demand
Figure 1: Hypothetic profit curves of the pivotal supplier as functions of price.
9

5000 10 000 15 000 20 000Quantity
50
100
150
200
Cost
(a)
50 100 150 200 250 300Price
10 000
20 000
30 000
40 000Supply
(b)
Figure 2: (a) cost function of the pivotal supplier, (b) competitor’s aggregate supplyfunctions.
supplier is not greater than the maximum profit under competition. Thiscondition makes competition more convenient than monopoly, since fixingthe price at the cap would lower profits. The second condition identifies allprices in which the pivotal supplier is exploiting its partial monopoly, whichis the condition under which a price cap should intervene. Unfortunately, insome cases in which the monopolistic residual demand is very high, a pricecap satisfying the two conditions above may not exist.
Figure 3 illustrates how a price cap respecting the two above condi-tions can be chosen. For this example we use the competitors’ supplyfunction S1(p), and two different level of monopolistic residual demand:RD = {2000, 10000}. We see that when the monopolistic residual demandis not too high as in panel (a), there are infinitely many price caps thatwill work. On the contrary, if the demand that cannot be satisfied by thecompetitors is very large, then the profit function may become strictly in-creasing and there is no price cap that is able to foster price competition.In this case the pivotal supplier will always bid the price cap, and this couldbe reasonably fixed at pc = p.
4. Application to the Italian electricity market
4.1. The Italian electricity market
In this section we introduce the main characteristics of the Italian elec-tricity industry and then we analyze the market rules of the Italian wholesaleelectricity market (IPEX).
IPEX started its operations in April 2004 with bidders acting on the sup-ply side only. The demand side of the market became active since January
10

p
50 100 150 200 250 300Price
100 000
200 000
300 000
400 000
500 000
600 000Profit
(a) Mid demand
p
50 100 150 200 250 300Price
500 000
1.0 ´ 106
1.5 ´ 106
2.0 ´ 106
2.5 ´ 106
3.0 ´ 106Profit
(b) High demand
Figure 3: Price cap choice: (a) all the prices in the shaded area respect the price capconditions, (b) no price cap can foster price competition. p.
2005. Since then the participation4 in the IPEX markedly increased: in theyear 2008 there have been 81 operators on the supply side and 91 opera-tors on the demand side. In the same year, the volume of energy exchangedamounted at 232 TWh with a liquidity rate of the 69%. Before liberalizationthe Italian electricity industry was dominated by a state-owned monopolist(Enel) that controlled all the stages of activity, from generation to final sale.By the time the sector was opened to competition a portion of generationcapacity previously controlled by Enel has been sold to newcomers with theintention of creating a more leveled playing field. In Figure 4 we presentdata on market share for years 2007 and 2008.
The increased number of operators in the IPEX did not have much in-fluence on wholesale prices. On the contrary, electricity prices showed anincreasing trend. Table 1 reports annual averages for different time slots likepeak, off-peak. holidays, etc.
Table 1: Mean wholesale electricity prices (Euros)
2005 2006 2007 2008
Total 58.59 74.75 70.99 86.99Week day 64.98 81.43 76.48 91.06
Peak 87.80 108.73 104.90 114.38Off peak 42.15 54.12 48.06 67.75
Holidays 44.33 60.25 58.58 77.88
4Data are taken from the last report published by the GME in 2009, “Annual report2008”.
11

17.1
1.2
1.4
1.4
1.4
1.5
2.2
2.5
4.2
7
7.8
8.6
11.8
31.8
14.7
1.1
1.6
1.4
1.5
1.5
0.8
2.5
3.9
8.1
8.1
9.7
13.5
31.7
0 5 10 15 20 25 30 35
Others
Iride
ERG
Sorgenia
Saras
Electrabel/Acea
EGL AG
Aem/A2A
Tirreno power
Endesa/E.On
Edipower
Eni
Edison
Enel
2008
2007
Figure 4: Market shares of electricity producers
The comparison between the Italian market and other European marketsshow that there exists a significant gap between Italian prices and otherEuropean prices5.
The IPEX is composed by a day-ahead market (MGP), an Infra-daymarket and an ancillary services market (MSD). MGP operates as a dailycompetitive market where hourly price-quantity bids are submitted by gen-erators and by buyers. The market operator (GME) orders bids accordingto a cost reducing merit order for supply and in a willingness to pay or-der for demand. The market equilibrium is calculated in the intersection ofsupply and demand. The resulting equilibrium price (SMP) is paid to alldespatched suppliers. When MGP determines an equilibrium price and acorresponding equilibrium quantity that are compatible with the capacityconstraints of the transmission grid – both “nationally” and locally – thewholesale electricity trade is completed. On the contrary, if the volume of
5For a cointegration analysis of the prices of the main European electricity markets seeBosco et al. (2010)
12

the electricity flow determined in the MGP exceeds the physical limits ofthe grid and in some areas congestions occur, a new determination of zonalprices must be obtained in order to eliminate congestion in those areas. Tothis end the GME uses the bids submitted at the MGP by the generators lo-cated in the congested areas to compute a specific merit order valid for thosezones. Then he allows a flow of electricity in and out of those zones withinthe limits given by the transmission capacity and determines a specific zonalequilibrium.
4.2. A price capping rule for Italy
Since the first operations of the IPEX in April 2004, the Italian day-ahead market rules impose a price cap of 500 Euro/MWh for all plantsbidding in the power exchange. In this section we try to apply the pricecapping rule proposed in Section 3 to the Italian market, in order to assessif the actual price cap is well-grounded or should be revised.
In the previous section we have seen that the largest operator in the Ital-ian market is Enel. The total capacity of Enel’s competitors cannot satisfythe aggregated Italian electricity demand in most o the auctions. Thus, thefirst step we have to go through is the construction of a good approximationof Enel’s cost function in any given auction. At the moment of writing, Enelruns over 600 power plants: 37 are thermoelectric (hydrocarbon-based), 534hydro, 20 wind-based, 2 photovoltaic and 30 geothermal6. Now, since re-newable energy sources have negligible variable costs (approx. zero marginalcosts), we concentrate just on the 37 thermal plants.
Thanks to Ref (Ricerche per l’economia e la finanza)7, which gave usaccess to some of the data that feed their Elfo++ system for the simulationof the Italian electricity market, we can derive the cost function for everythermal plant in Italy. In particular, the cost function of the productionunit j is defined by the quadratic function
Cj(Q) =∑i
κiαij(c2ijQ2 + c1ijQ+ c0ij), (6)
Q is the generated power in MW, κi is the hourly price in Euro/Gcal of fueli, αij ∈ [0, 1], such that
∑i αi = 1, is the fraction of fuel i used by the plant
j and c2ij , c1ij , c0ij are, technical coefficients that characterize the quadraticcost function of plant j with respect to fuel i; their unit of measurement
6Source: www.enel.it7http://www.ref-online.it/
13

is, respectively, Gcal/MW2h, Gcal/MWh and Gcal/h. The index i rangesover the values {1, 2} since the maximum number of fuels used in the plantsis two. The fuel costs κi are, of course, time-varying, and we approximatetheir values, which usually depend on forward contracts, with their meansover a month. It is straightforward to check, by simplifying the various unitof measurement in equation (6), that Cj(Q) is measured in Euro/MWh.The information about the plant is completed by the pair {Q
j, Qj}, which
identifies the minimum and maximum power that the production unit j cansupply.
The aggregate cost function of the whole set of n thermal plants is givenby
C(Q) = minQ1,...,Qn
n∑j=1
Cj(Qj)
such that∑n
j=1Qj = Q and Qj≤ Qj ≤ Qj for j = 1, . . . , n. This con-
strained optimization problem can be solved by using quadratic program-ming algorithms.
In order to build a cost function for a given auction, we merge theELFO++ database with that published by the market operator (GME)whose detailed content is displayed in Table 2. We use the GME auctiondata for determining the quantity of electricity Enel is offering though nonthermal units, and we compute the aggregate cost function using only ther-mal plants whose capacity is actually offered in the auction.
Now we are able to draw the (ex post) profit function of Enel for anyauction. Notice that, since actual supply curves are constrained by theauction rules to be step functions, the profit curve will not be as smooth asthose depicted in Section 3. Moreover, as we have no information on the(hourly) fixed costs that Enel supports, our estimation of the profit functionis valid up to an additive constant. This is really not a limitation for ouranalysis, since we are interested in the shape of the profit function ratherthan in its level.
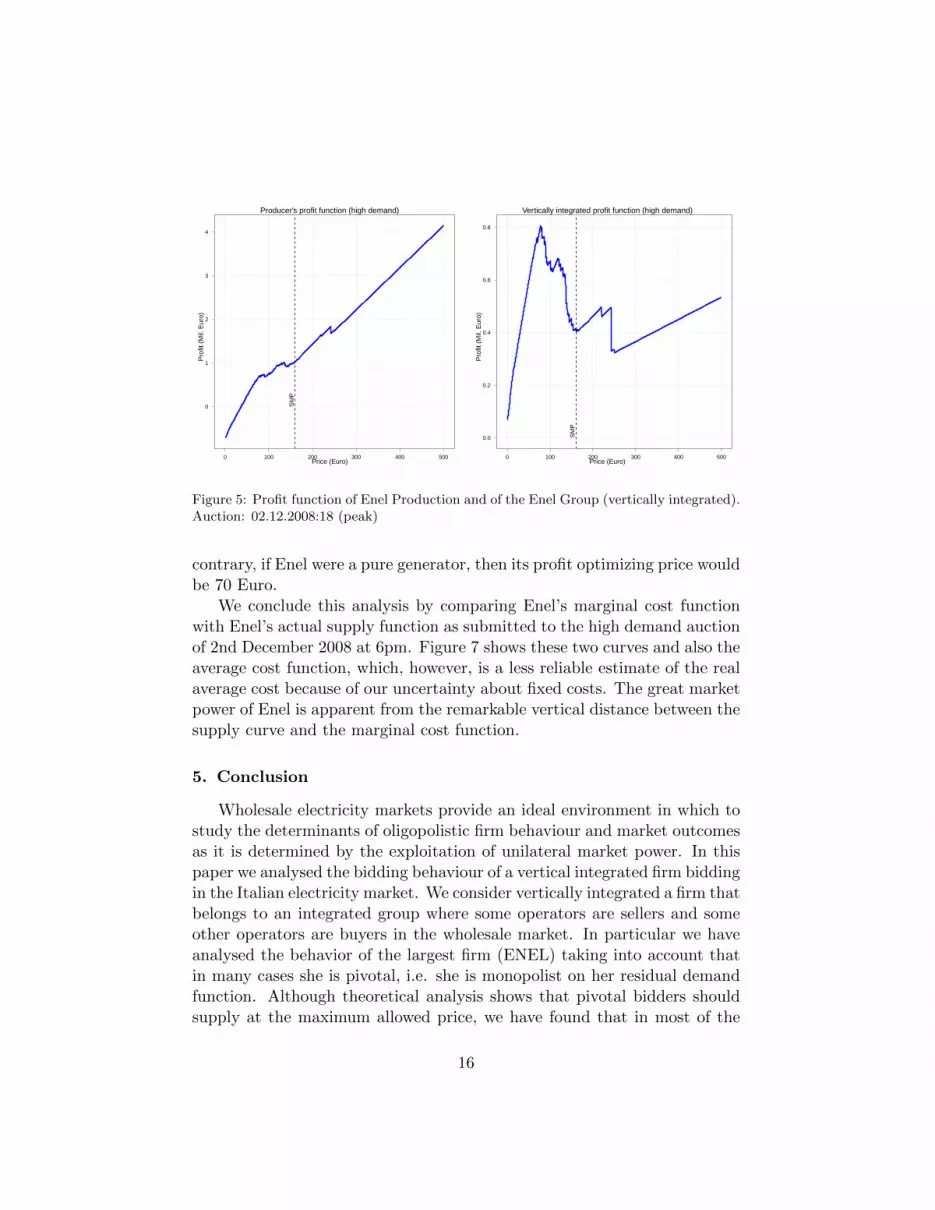
The plots in Figure 5 depict the profit function of Enel Produzione, theelectricity generation company of Enel (left panel), and of the verticallyintegrated group that comprehend Enel Produzione and Enel Trade (fromnow on Enel Group), which is the company that buys energy on the elec-tricity market for Enel (right panel). The system marginal price (SMP) isrepresented as a dashed vertical line and the auction the plots refer to (2ndDecember 2008 at 6pm), is the one with highest demand among all auctionsof December 2008. The shape of the first plot clearly resembles those inthe last panel of Figure 1. The most expensive offer by Enel’s competitors
14

Table 2: Relevant fields in the Italian electricity auctions database†.
Producer (seller) Retailer (buyer)
Operator name Operator namePlant name Unit nameQuantity (MWh) of each offer Quantity (MWh) of each bidPrice (Euro) of each offer Price (Euro) of each bid††
Awarded quantity (MWh) for eachoffer
Awarded quantity (MWh) for eachbid
Awarded price (MWh) for each offer Awarded price (MWh) for each bidZone of each offer (plant) Zone of each bid (unit)Status of the offer: accepted vs. re-jected
Status of the bid: accepted vs. re-jected
† Notice that in the GME database the producer’s (seller’s) bid is named offer, while
the retailer’s (buyer’s) bid is called bid.†† The willingness to buy at any price is coded as zero.
coincides with a price of 250 Euro, so the application of our price-cappingrule would suggest a price cap of 250 Euro. On the other hand the quantityoffered by Enel’s competitors for a price above 160 Euro is less than 4% ofthe their total offered quantity, and some 2% of the aggregated demand, so itwould be interesting to find out if these offers correspond to very expensiveplants or are just a way to “try the luck”.
We derive the Enel Group profit function (πG) using the actual quantity(x) bought by Enel Trade in the same auction:
πG(p) ∝ π(p)− p · x.
If we concentrate on the second panel of Figure 5, we see that the profitfunction of the Enel Group is closer to those in the second panel of Figure1 and the actual price cap of 500 Euro lies in the interval of the admissibleprice caps. Harder to explain is distance between the the SMP (160 Euro)and the optimal price for Enel (77.6 Euro).
Under low demand conditions the profit functions of Enel Produzioneand Enel Group are those represented in Figure 6. The left-hand-side plotis similar to those of panel (a) of Figure 1, while the plot on the right isnon-increasing. In this case Enel is not necessary for market clearing and,therefore, there is no need of a price cap. The SMP (41.7 Euro) is closerto the profit maximizing price for Enel, which would be 15 Euro. On the
15
Producer's profit function (high demand)
Price (Euro)
Pro
fit (
Mil.
Eur
o)
0
1
2
3
4
SM
P
0 100 200 300 400 500
Vertically integrated profit function (high demand)
Price (Euro)
Pro
fit (
Mil.
Eur
o)
0.0
0.2
0.4
0.6
0.8
SM
P
0 100 200 300 400 500
Figure 5: Profit function of Enel Production and of the Enel Group (vertically integrated).Auction: 02.12.2008:18 (peak)
contrary, if Enel were a pure generator, then its profit optimizing price wouldbe 70 Euro.
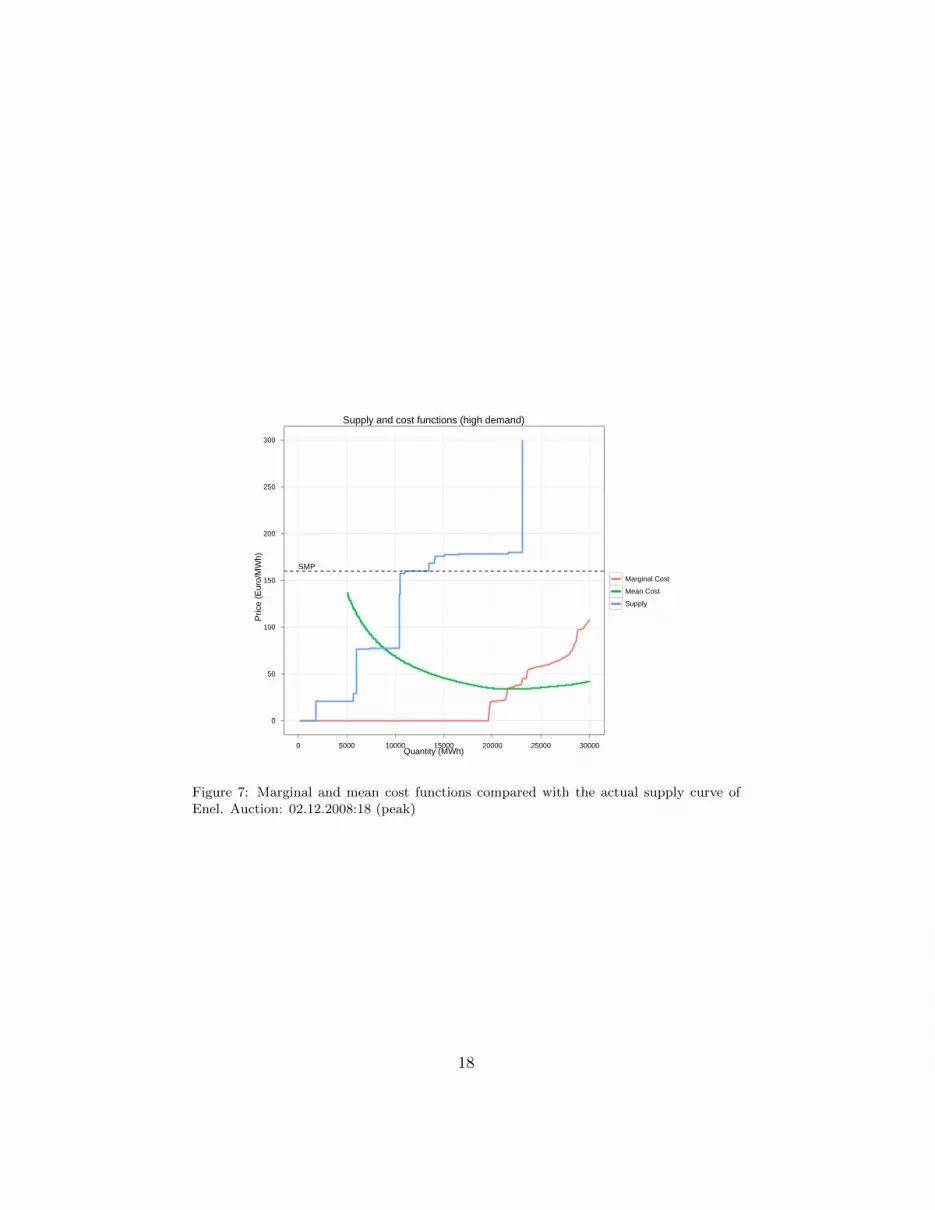
We conclude this analysis by comparing Enel’s marginal cost functionwith Enel’s actual supply function as submitted to the high demand auctionof 2nd December 2008 at 6pm. Figure 7 shows these two curves and also theaverage cost function, which, however, is a less reliable estimate of the realaverage cost because of our uncertainty about fixed costs. The great marketpower of Enel is apparent from the remarkable vertical distance between thesupply curve and the marginal cost function.
5. Conclusion
Wholesale electricity markets provide an ideal environment in which tostudy the determinants of oligopolistic firm behaviour and market outcomesas it is determined by the exploitation of unilateral market power. In thispaper we analysed the bidding behaviour of a vertical integrated firm biddingin the Italian electricity market. We consider vertically integrated a firm thatbelongs to an integrated group where some operators are sellers and someother operators are buyers in the wholesale market. In particular we haveanalysed the behavior of the largest firm (ENEL) taking into account thatin many cases she is pivotal, i.e. she is monopolist on her residual demandfunction. Although theoretical analysis shows that pivotal bidders shouldsupply at the maximum allowed price, we have found that in most of the
16

Producer's profit function (low demand)
Price (Euro)
Pro
fit (
Mil.
Eur
o)
−2.0
−1.5
−1.0
−0.5S
MP
0 100 200 300 400 500
Vertically integrated profit function (low demand)
Price (Euro)
Pro
fit (
Mil.
Eur
o)
−5
−4
−3
−2
−1
SM
P
0 100 200 300 400 500
Figure 6: Profit function of Enel Production and of the Enel Group (vertically integrated).Auction: 17.12.2008:03 (off peak)
cases Enel does not follow this strategy thereby failing to exploit entirely herpotential market power. In the paper we have analysed reasons explainingsuch a behavior and derived numerically a profit function which shows non-concavity with respect to price when the market condition is such that Enel’scompetitors have exhausted their generation capacity . We have shown thatthe main explanation for this apparently non-optimal behaviour is given byvertical integration since the behaviour on the market of Enel appears todepend on her net position on the market. We have also explored the way inwhich the price cap imposed by the Italian market rules may affect biddingbehaviour and we have concluded that for a pure producer/seller the actualprice cap of 500 is far too high and, under high demand conditions it shouldbe halved. On the contrary, for a vertically integrated pivotal supplier theactual cap seems to be reasonably set.
17
Supply and cost functions (high demand)
Quantity (MWh)
Pric
e (E
uro/
MW
h)
0
50
100
150
200
250
300
SMP
0 5000 10000 15000 20000 25000 30000
Marginal Cost
Mean Cost
Supply
Figure 7: Marginal and mean cost functions compared with the actual supply curve ofEnel. Auction: 02.12.2008:18 (peak)
18

References
Ausubel, L., Cramton, P., 2002. Demand reduction and inefficiency in multi-unit auctions, mimeo, University of Maryland.
Bosco, B., Parisio, L., Pelagatti, M., Baldi, F., 2010. Long Run Relations inEuropean Electricity Prices, Journal of Applied Econometrics, forthcom-ing.
Brunekreeft, G., 2001. A multiple-unit, multiple-period auction in theBritish electricity spot market, Energy Economics 23, 99-118.
Bushnell J.B., Mansur, E.T., Saravia, C., 2008. Vertical Arrangements, Mar-ket Structure, and Competition: An Analysis of Restructured U.S. Elec-tricity Markets, American Economic Review 98(1), 237-266.
Fabra, N., 2003. Tacit collusion in repeted auctions: uniform versus discrim-inatory. Journal of Industrial Economics 51, 271-293.
Fabra, N., Toro, J., 2005. Price wars and Collusion in the Spanish ElectricityMarket, International Journal of Industrial Organization 23(3-4), 155-181.
Fabra, N., von der Fehr, N.-H., Harbord, D., 2006. Designing electricityauctions, Rand Journal of Economics 37, 23-46.
Garcia-Diaz, A., Marin, P.L., 2003. Strategic bidding in electricity poolswith short-lived bids: an application to the Spanish market, InternationalJournal of Industrial Organisation 21, 201-222.
Hortacsu, A., Puller, S.L., 2008. Understanding strategic bidding in multi-unit auctions: a case of the Texas electricity market, Rand Journal ofEconomics 39(1), 86-114.
Klemperer, P., Meyer, M., 1989. Supply Function Equilibria in Oligopolyunder Uncertainty, Econometrica 57, 1243-1277.
Parisio, L., Bosco, B., 2003. Market Power and the Power Market: Multi-Unit Bidding and (In)Efficiency in Electricity Auctions, International Taxand Public Finance 10, 377-401.
Parisio, L., Bosco, B., 2008. Electricity prices and cross-border trade: Vol-ume and strategy effects, Energy Economics 30, 1760-1775.
19

Sheffrin, A., 2001. Critical Actions Necessary for Effective Market Monitor-ing, Draft Comments Dept. of Market Analysis, California ISO, FERCRTO Workshop, October 19.
Wolak, F.A., 2000. An Empirical Analysis of the Impact of Edge Contractson Bidding Behaviour in a Competitive Electricity Market, InternationalEconomic Journal 14(2), 1-39.
Wolak, F.A., 2003. Identification and estimation of cost functions using ob-served bid data: an application to electricity markets, in M. Dewatripont,L. P. Hansen, and S. J. Turnovsky, eds., Advances in economics and econo-metrics: theory and applications, Eighth World Congress, Volume II, NewYork: Cambridge University Press, 133-169.
Wolak, F.A., 2010. Using restructured electricity supply industries to un-derstand oligopoly industry outcomes, Utilities Policy 18, 227-246.
Wilson, R.B., 1979. Auctions of shares, Quarterly Journal of Economics 93,675-689.
20