the advertising market in a product oligopoly - citeseerx
TRANSCRIPT

Seediscussions,stats,andauthorprofilesforthispublicationat:https://www.researchgate.net/publication/2323363
TheAdvertisingMarketinaProductOligopoly
Article·October2000
Source:CiteSeer
CITATIONS
63
READS
35
1author:
AnthonyJ.Dukes
UniversityofSouthernCal…
28PUBLICATIONS670CITATIONS
SEEPROFILE
Availablefrom:AnthonyJ.Dukes
Retrievedon:18September2016
THE ADVERSTISINGMARKET IN A PRODUCTOLIGOPOLY�
AnthonyDukesw
A model is developed in which producers in a differentiated productmarket compete in prices and informative advertising. The model alsoincludes commercial media, which are linked to producers through theadvertising market and to consumers through the media market. Weinvestigate how certain market parameters, such as media marketdifferentiation or product market differentiation, affect the competitivelevel advertising chosen in the market. The model shows that lessproduct differentiation or more media differentiation leads to a highermarket level of advertising. In the case of sufficiently high mediadifferentiation, levels of advertising are in excess of the social optimum.
I. INTRODUCTION
This paper addresses the following questions: Why do some productmarkets have more advertising than others and what market propertiescause the market level of advertising to exceed the efficient level? To answerthese questions, we use a model in which two or more producers in adifferentiated product market compete in prices and advertising. Themodelalso includes commercial media who sell advertising space to producers andbroadcast product information in the form of advertising messages toconsumers. The model indicates that less differentiated product marketstend to have higher market levels of advertising levels. Also, a highlydifferentiated media market contributes to excess advertising.There is certainly economic interest in how advertising affects markets
and market allocations given that U.S. advertisers spent $243 billion (2 14 %
of U.S. GDP) on advertising in 2000.1 The importance of advertising inindustrial economics canbe seen in the recentwave ofmediamerger’s such asthat of Viacom and CBS. Because this merger builds such a broad
rBlackwell Publishing Ltd. 2004, 9600Garsington Road, OxfordOX4 2DQ,UK, and 350Main Street,Malden,MA 02148, USA.
327
THE JOURNAL OF INDUSTRIAL ECONOMICS 0022-1821Volume LII September 2004 No. 3
�Two editors and an anonymous referee made a significant number of comments thatgreatly improved this paper. This resarch was initiated at the University of Pittsburgh while inthe doctoral program in the Department of Economics, and support through the AndrewMellonPredoctoral Fellowship is gratefully acknowledged. I amalso grateful toEstherGal-Orfor her advice, guidance and insight.
wAuthor’s affiliation: School of Economics and Management, University of Aarhus,Aarhus, Denmark.email:[email protected]
1 Leading National Advertisers, Advertising Age (2001).
viewership, industry specialists determined that the merger’s ability to attractadvertisers was the key factor in bringing these two companies together.2
Of the economists who have investigated advertising, many haveaddressed the possibility that there exists a socially undesirable excessamount of advertising. Notable examples are Butters [1977], Dixit &Norman [1978], Shapiro [1980],Grossman&Shapiro [1984],Nichols [1985],and Stegeman [1991]. Some studies such as Nelson [1974], Grossman &Shapiro [1984], and von der Fehr & Stevik [1998] have investigated whycertain markets seem to have more advertising than others. These studiesare unified by two assumptions: (1) The sole social benefit of produ-cers’ advertising expenditure is the potential that an advertising messagebrings forth a customer to the product market; (2) Consumers’ choiceshave no impact on the type or amount of advertising they receive. Thepresent model departs from these assumptions for reasons that are madeclear below.From the producer’s point of view, the first of the above assumptions
should be apparent. The producer’s purpose in advertising is to increase thedemand for its product by informing consumers about the product’sexistence, availability, price, etc. or by persuading them that the product bestsuits their preferences. However, consumers get much of this advertisingthrough commercial media, like newspapers, television, and radio, which,due to support by advertising expenditures, are often free to subscribers.This suggests that there is a large social benefit from commercial mediaservices and that any calculation of social welfare from advertisingexpenditures should include such benefits.Relaxing the second assumption, by giving consumers some choice in
advertising exposure, has realistic as well as theoretical appeal. Sinceconsumers make a choice about which medium to subscribe, it is thennatural to assume that they make this decision based on their preferencesover the type and quantity of available media services. For example, if oneradio station devotes 25% of its airtime to advertising and a similar radiostation devotes only 10% to advertising, then perhaps we would expect theformer station to have fewer listeners than the latter station. Consequently,we should expect that stations with more listeners might, ceteris paribus,charge a higher price for its advertising slots since it will be heard by morepotential customers. The theoretical appeal of relaxing this assumption isthat it allows one to endogenize the price of advertising enabling the modelto account for more of the economic forces that determine the producers’choices of advertising levels. The realistic appeal of this comes from evidencethat commercial breaks cause many television viewers to switch to anotherchannel. (See, for example, Siddarth & Chattopadhyay [1998]).
2 See, for example, ‘They Have It All Now,’ Business Week (September 20, 1999).
328 ANTHONY DUKES
r Blackwell Publishing Ltd. 2004.
The model presented in this paper addresses both of these points by usingthree types of agents: producers, media (referred to as stations) andconsumers, interacting through threemarkets. Producers and consumers arelinked by the product market, producers and stations are linked by theadvertising market, and consumers and stations are linked by the mediamarket. In an attempt to capture all social benefits of advertisingexpenditures, welfare calculations include stations’ profits and theconsumers’ benefit from listening. The three-agent model endogenizes theprice of advertising thereby including consumers’ ability to affect theamount of advertising chosen by producers.There is recent work that examines the choices of advertising with respect
to commercial media. In independent work, Motta & Polo [2004]and Nilssen & S�rgard [2001] examine models of producers’ advertisingchoices within amedia industry. Their work focuses on televisionmedia, butcould be generalized to other broadcast media, such as radio. These papersdo not examine welfare implications of advertising, which is done in thepresent paper. Nilssen & S�rgard [2001] examine television stations’investments in program quality, which is not done here. Motta & Polo[2001] examine television station entry, which is discussed here. In a settingsimilar to the present paper, Dukes & Gal-Or [2003] examine exclusiveadvertising contracts and Gal-Or & Dukes [2003] investigate locationalchoice of media.Other models of commercial media include Anderson & Coate [2004],
Masson et al. [1990], Hackner & Nyberg [2001], Gabszewicz, et al. [1999],and Stegeman [2001], as well as the seminal works of Steiner [1952], Beebe[1977] and Spence & Owen [1977]. The present paper is distinguished fromthese by its explicit modeling of individual consumer choice in the productmarket.Advertising in this model takes on an informative role where advertising
messages deliver product price and store location. Consumers’ only sourceof product information is from advertisements. Butters [1977], Grossman &Shapiro [1984], Stegeman [1991], and Stahl [1994] all treat advertising in thisway but come to conflicting conclusions about whether the market providesan efficient level of advertising. Grossman & Shapiro [1984] find thatadvertising levels are excessive. Butters [1977] finds that advertising isexcessive when customers engage in search. On the other hand, Stegeman[1991] and Stahl [1994] present models of informative advertising that showthat the market produces too little advertising as compared to the socialoptimum. The model presented here resolves some of this discrepancy byshowing that advertising can be excessive or underprovided, depending oncharacteristics of the media market. In particular, it is shown thatadvertising levels are excessive when there is high media market differentia-tion and are underprovided by the market when there is low media marketdifferentiation.
ADVERSTISING IN A PRODUCT OLIGOPOLY 329
r Blackwell Publishing Ltd. 2004.

There is also disagreement among theoretical results as to how the degreeof product differentiation affects the equilibriumamount of advertising. Themodel of Grossman & Shapiro [1984] indicates that we should expect moreadvertising in oligopolistic markets where products are more differentiated.The intuition behind this result is that as products become moredifferentiated, producers can charge higher prices, thus raising the marginalbenefit of advertising. The model of von der Fehr & Stevik [1998] assumesthat advertising is persuasive to show that more advertising occurs withsimilar products than with less dissimilar products. This is due to producers’efforts to bring about higher ‘perceived’ product differences on the part ofconsumers. The results of the present model are consistent with those of vonder Fehr & Stevik [1998] with regard to the relationship between productdifferentiation and equilibrium advertising levels. This is also consistentwith empirical examples of industries with heavily advertised products,which exhibit little physical differences. (See Scherer &Ross [1990], pp. 580–586).The paper is organized as follows. The next section sets up the model by
describing the economic agents and their objectives. In Section 3, both thestatic equilibrium as well as the free-entry equilibrium are derived anddiscussed. Section 4 contains the welfare-maximizing outcome andcompares it to the competitive equilibrium. The final section concludes.Proofs of all propositions are contained in the appendix.
II. THEMODEL
There are m producers and n stations serving a set of consumers whoparticipate in a differentiated product market and in a differentiated mediamarket.3 We assume that a consumer’s preference over producers isindependent of her preferences over stations. This independence allows us torepresent the product market and the media market separately, on twodifferent circles each with unit circumference. The m producers are equallyspaced around one circle and the n stations around the other. The same set ofconsumers is uniformly distributed around each circle. Any consumer whotravels some distance to a producer to buy a product bears transportationcosts of tp per unit traveled. Similarly, the unit transportation cost in themedia market is tm. These exogenous variables capture the extent ofcompetition in each of the respective markets. The key results of the modelrely on comparative statics with respect to tp and tm.
3We have simplified the analysis by considering only one product industry. It isacknowledged that media typically serve multiple industries implying relevant inter-industryeffects in the advertisingmarket. To simplify the presentationwhile preserving the intuition,weconsider a single product industry here. The multiple product industry case is discussed inseparate notes, available from the author upon request.
330 ANTHONY DUKES
r Blackwell Publishing Ltd. 2004.

Advertising in this model takes on the role of information wherebyadvertising messages contain information about a product’s existence,location, and price. Consumers who receive no advertising messagesare uninformed about any product and do notmake a purchase. Consumersknow about a product’s existence only if they receive an advertisingmessageabout that product. We assume that consumers can consume at most oneproduct. The informational nature of advertising and its role in adifferentiated product market, which are employed here, have theirfoundation in the works of Butters [1977] and Grossman & Shapiro [1984].To be sure, advertising seldomly takes this form. For instance, advertising
often contains no price information. Furthermore, a great deal ofadvertising is for products whose existence is widely known. Nevertheless,the modeling approach we take here does not restrict us to price advertisingfor unknown products. For example, advertising for a well-known brandserves to remind consumers about the product’s existence of which theymayhave temporarily forgotten.4 With this reminder, they are conscious of thebrand while at the store and observe its price.In the model, stations and producers move first. Stations make program-
ming choices regarding the space allotted for advertising. Simultaneously,producers make their advertising and pricing decisions. A market clearingprice for advertising is determined and the advertising bought and sold.Stationsbroadcast the advertisingmessages, and lastly, consumersmake theirchoices in the media market and product market.
II (i). Consumers
We start by examining consumers’ preferences and then exploring theirdecisions in the product and media markets. Let Fk
i be the number ofadvertisingmessages for product ibroadcast by station k andFk ¼
Pi F
ki be
the total number of advertising messages broadcasted by station k.Consumers receive utility vp from product consumption and vm from puremedia consumption. Media consumption is diminished by advertisingmessages so that a consumer listening to station k receives utility vm � Fk,gross of travel costs.5
4 See, for example, Nelson [1974] for a model of forgetting and the role of advertising.5 Even though advertising is utility diminishing with regard to media choice, it can be said
that it provides an informational benefit, which helps consumers make their product choice.We assume that a listener’s media choice does not depend on this informational benefit.Relaxing this assumption would imply that for each station, consumers form expectationsabout the potential benefit from listening over all possible product choices. Consumers wouldthen incorporate this benefit into theirmedia choice. Ignoring this aspect ofmedia choice limitsapplications of themodel to passive formsofmedia, like television and radio,where subscribersare particularly interested in the programming rather than in the informational benefits of theadvertising. The model is not as well suited, therefore, for applications to print media, such asnewspapers where the subscriber might actively seek out the product information in, forexample, classified ads, sales announcements, or movie show times.
ADVERSTISING IN A PRODUCT OLIGOPOLY 331
r Blackwell Publishing Ltd. 2004.
The utility that a consumer B receives from listening to station k andpurchasing from producer i at a price pi is
UðBÞ ¼ ½vp � pi � tpdiðBÞ� þ ½vm � Fk � tmdkðBÞ�;
where di(B) and dk(B) are the distances to producer i and station k,respectively. We assume that vm>Fk þ tmd
kðBÞ and vp>pi þ tpdiðBÞ for allpossible choices of Fk, pi , and consumers B. The assumption on vm meansthat the entire media market is always served by the n stations and theassumption on vp ensures that all consumers receive surplus fromconsumption of any product.The consumer’s choice in the media market is independent of the product
market implying that consumer B will choose station k over station kþ 1 ifand only if
ð1Þ vm � Fk � tmdkðBÞ>vm � Fkþ1 � tm½1n � dkðBÞ�:
Suppose a listener located between station k and station kþ 1 is indifferentbetween the two stations and denote her distance from station k by �yR. Thenapplying equality to (1) and solving for �yR gives
�yR ¼ 1
2tmFkþ1 � Fk þ tm
n
� �:
Any listener B located between stations k and kþ 1 will listen to station k ifand only if dkðBÞ< �yR. Similarly define �yL as the distance from station k tothe listener between stations k and k� 1 who is indifferent between the twostations. Let Lk denote the size of the entire set of listeners of station k, thenLk ¼ �yL þ �yR, or
ð2Þ Lk ¼ 1
2tmFkþ1 þ Fk�1 � 2Fk þ 2
tm
n
� �;
which we refer to as the listenership of station k.6 Note that under theassumption that vm is sufficiently large,
Pk L
k ¼ 1.Now we turn to the consumer’s choice in the product market and derive
product demands. Denote by jki 2 ½0; 1� the portion of the population
listening to station k that hears the advertising message for product i. Weassume that the variables jk
i and Fki are related by jk
i ¼ AðFki Þ, where A is
one-to-one and denotes various aspects that affect how effectivelyadvertising messages reach the listening audience. Consequently, jk
i ¼AðFk
i Þ is referred to as the reach of advertising messages Fki and denotes the
probability that a consumer listening to station k becomes informed of
6We have implicitly made the additional assumption, without loss of generality, that noconsumer finds it optimal to choose a station that is beyond her nearest neighbors. Forexample, consumer B will never choose to listen to station k� 1 or station kþ 2.
332 ANTHONY DUKES
r Blackwell Publishing Ltd. 2004.

product i. Aspects that determine A may, for instance, include spacingbetween messages and the time of day in which the message is broadcast.One might expect that there exist diminishing returns to advertisingmessages for the following reason: as the portion of informed consumers, j,becomes larger the probability that a new advertising message reachesan uninformed consumer becomes smaller and reaching an additionaluninformed consumer is, therefore, marginally less likely. Henceforthwe impose the following conditions on the advertising reach function:A(0)5 0, 04A(F)41, A
0(F)4 0, and A
0 0(F)o 0 for FX0. In fact, in the
analysis that follows, it will be useful to specify A(.) as in the followingassumption.
Assumption 1: AðFÞ ¼ FZ, F 2 ½0; 1�, Z 2 ð0; 1Þ.7We constrain the choice variableF to be between 0 and1 in order to ensure
that A(F) represents a probability value. A useful interpretation of thevariable F is that it represents the fraction of a finite amount of broadcasttime devoted to advertising messages. At the maximum level, F5 1, thestation’s entire broadcast day is only advertising and, for anyone who is stilllistening to the station, they are informed about the advertised product withprobability one.The exogenous parameter Z is fixed in the unit interval so that A satisfies
the desired derivative and concavity conditions discussed previously. Thisparameter Z can be interpreted as the productivity of an advertisingmessage in which lower values correspond to higher productivity (sinceF 2 ½0; 1�).An arbitrary consumer hears an advertising message by producer i on
station kwith probability jik. This consumer does not listen to station l 6¼ k
and thus does not hear any advertisement associated with Fl.We wish to derive the demand for product i given advertising levels
ððFki Þ
mi¼1Þ
nk¼1. This is complicated by the fact that there are 2m different ways
each consumer canbe informed about products. For example, one consumermay hear advertising messages only from producers 1, 5 and 11 whileanother consumer hears advertising messages from every producer except,say, producer 2.
7Another specification for A can be justified by first observing that the probability that anadvertising message reaches a new consumer given that j of them are currently informed is1� j ¼ 1� AðFÞ. Since A0ðFÞ is the marginal increase in reach due to a unit increase inadvertising messages and is equal to this probability, we have the following first orderdifferential equation:A0ðFÞ ¼ 1� AðFÞ. A solution of which isAðFÞ ¼ 1� e�F. However, thespecification AðFÞ ¼ FZ makes the analysis tractable while preserving the desired derivativeproperties. Furthermore, the exogenous parameter Z allows us to make a comparative staticanalysis with respect to advertising’s productivity.
ADVERSTISING IN A PRODUCT OLIGOPOLY 333
r Blackwell Publishing Ltd. 2004.
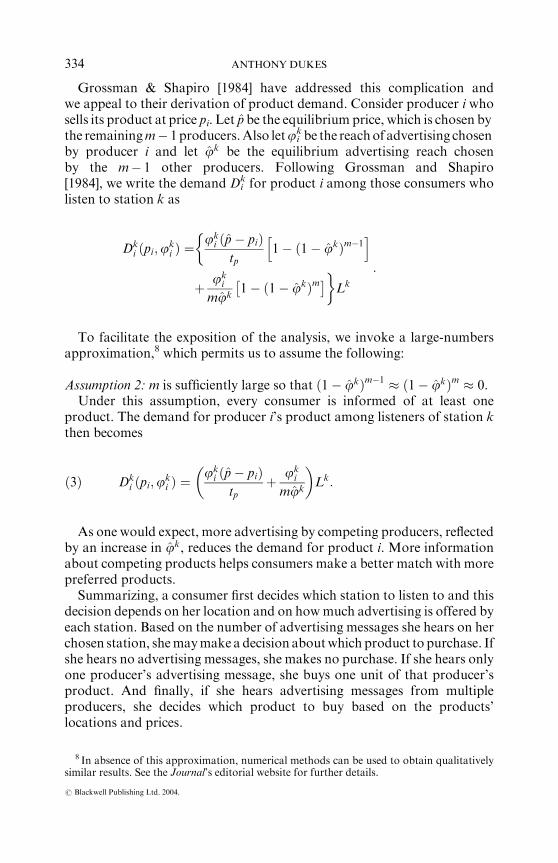
Grossman & Shapiro [1984] have addressed this complication andwe appeal to their derivation of product demand. Consider producer i whosells its product at price pi. Let p be the equilibrium price, which is chosen bythe remainingm� 1producers.Also letji
kbe the reachof advertising chosenby producer i and let jk be the equilibrium advertising reach chosenby the m� 1 other producers. Following Grossman and Shapiro[1984], we write the demand Di
k for product i among those consumers wholisten to station k as
Dki ðpi;jk
i Þ ¼jki ðp� piÞ
tp1� ð1� jkÞm�1h i�
þ jki
mjk1� ð1� jkÞm� ��
Lk
:
To facilitate the exposition of the analysis, we invoke a large-numbersapproximation,8 which permits us to assume the following:
Assumption 2: m is sufficiently large so that ð1� jkÞm�1 � ð1� jkÞm � 0.Under this assumption, every consumer is informed of at least one
product. The demand for producer i’s product among listeners of station kthen becomes
ð3Þ Dki ðpi;jk
i Þ ¼jki ðp� piÞ
tpþ jk
i
mjk
� �Lk:
As one would expect, more advertising by competing producers, reflectedby an increase in jk, reduces the demand for product i. More informationabout competing products helps consumers make a better match with morepreferred products.Summarizing, a consumer first decides which station to listen to and this
decision depends on her location and on howmuch advertising is offered byeach station. Based on the number of advertising messages she hears on herchosen station, shemaymake a decision aboutwhich product to purchase. Ifshe hears no advertising messages, she makes no purchase. If she hears onlyone producer’s advertising message, she buys one unit of that producer’sproduct. And finally, if she hears advertising messages from multipleproducers, she decides which product to buy based on the products’locations and prices.
8 In absence of this approximation, numerical methods can be used to obtain qualitativelysimilar results. See the Journal’s editorial website for further details.
334 ANTHONY DUKES
r Blackwell Publishing Ltd. 2004.
II (ii). Producers
In this subsection, we first discuss the components of producers’ profits andthen derive their strategic choices of advertising and prices given consumers’response to both.Producers face a constantmarginal cost of production c and fixed costs fp.
Profits to producer i can be written as
ð4Þ Pi ¼Xnk¼1
ðpi � cÞDki ðpi;jk
i Þ � akA�1ðjki Þ
� �� fp;
where ak is the price of an advertisingmessageon stationk. Producers take ak
as given. Producers choose the product price, pi, and specify advertisingcoverage ðjk
i Þnk¼1 in order to maximize profits Pi, taking listenership Lk as
given.The first order conditionwith respect to pi gives producer i’s price reaction
function as
ð5Þ pi ¼ 12pþ cð Þ þ
tpP
k jki
jk
�Lk
2mP
k jki L
k:
It is useful to examine the pricing function expressed in (5) with that inSalop [1979]. With complete information (i.e., jk
i ¼ jk ¼ 1 for all k)pricing is consistent with that implied by Salop [1979]. Furthermore,it can be shown that price pi is larger in (5) than in the complete informa-tion case. This illustrates that producers enjoy higher prices as a resultof incomplete information in the product market (Grossman & Shapiro,1984).The first order condition for maximizing (4) with respect to jk
i implies
ð6Þ ak ¼ dA�1ðjki Þ
djki
� ��1
pi � cð Þ p� pi
tpþ 1
mjk
� Lk:
This is producer i’s (inverse) demand for advertising messages on stationk and exhibits the demand property @jk
i
@ak<0, which follows from
the assumptions made on A and from the second order condition.@2Pi=@jk2
i )0:
II (iii). Stations
We now turn to the station’s choice in the media market. Because of thecircular structure of the media market, each station has two neighbors tocompete against for its listenership. Each station k5 1, . . . ,n chooses theamount of time devoted to advertising, Fk.Each station faces no marginal cost of advertising and takes the price of
advertising per listener as given, so that ak ¼ CLk; where C is viewed as
ADVERSTISING IN A PRODUCT OLIGOPOLY 335
r Blackwell Publishing Ltd. 2004.

constant by the station. Recall that producers take ak as given. Therefore, inthe advertising market, each station yields a small degree of market power,knowing that it can commandhigher priceswhen it hasmore listeners.9 Thusprofits are advertising revenue less fixed costs, fm. Therefore, station k’sproblem is to choose Fk in order to maximize Pk ¼ akFk � fm, or
ð7Þ Pk ¼ C
2tmFkþ1 þ Fk�1 � 2Fk þ 2
tm
n
� �Fk � fm:
Maximizing (7) with respect toFk, we can write station k’s reaction functionin terms of advertising space,
ð8Þ Fk ¼ 1
2
Fkþ1 þ Fk�1
2þ tm
n
� �k ¼ 1; . . . ; n:
Notice here that stations are reacting to the advertising levels of their twoneighboring stations as well as to the number of stations, n, in the mediamarket. In particular, as the number of stations grows, station k must cutback on its advertising levels as the competition for a fixed set of listenersbecomes tighter.
III. COMPETITIVE EQUILIBRIUM
Having fully described the three types of agents, we now seek a competitiveequilibrium consisting of product prices, ðpiÞmi¼1, and advertising levels,ððjk
i Þnk¼1Þ
mi¼1, that satisfy all of the agents’ optimization problems. We first
derive the competitive equilibrium in the static model, withm and n fixed, andthen discuss its comparative statics properties. Finally, we derive thecompetitive equilibriumunder the free-entry condition,wheremandn canvary.
III. (i). Static Equilibrium
To derive the static equilibrium, we use all of the agents’ first orderconditions. Specifically, characterizing the optimal choice of the consumerare equations (2) and (3); of the producer, equations (5) and (6); and of thestation, equation (8).In equilibrium, the stations’ reaction functions specified by (8) are satisfied
simultaneously. Furthermore, since stations are symmetric, it can be shownthat (8) implies Fk ¼ tm=n for all k5 1, . . . , n. It follows from (2) thatlistenership is equally divided so that Lk5 1/n. As the number of stationsgrows or differentiation falls, the media market gets crowded and stations
9Given that stations face zero marginal cost of advertising, this assumption is necessary inorder to give stations a definable trade-off. It is assumed that stations possess some degree ofmarket power since each is a producer’s sole source of access to the consumers in its listeningsegment.
336 ANTHONY DUKES
r Blackwell Publishing Ltd. 2004.
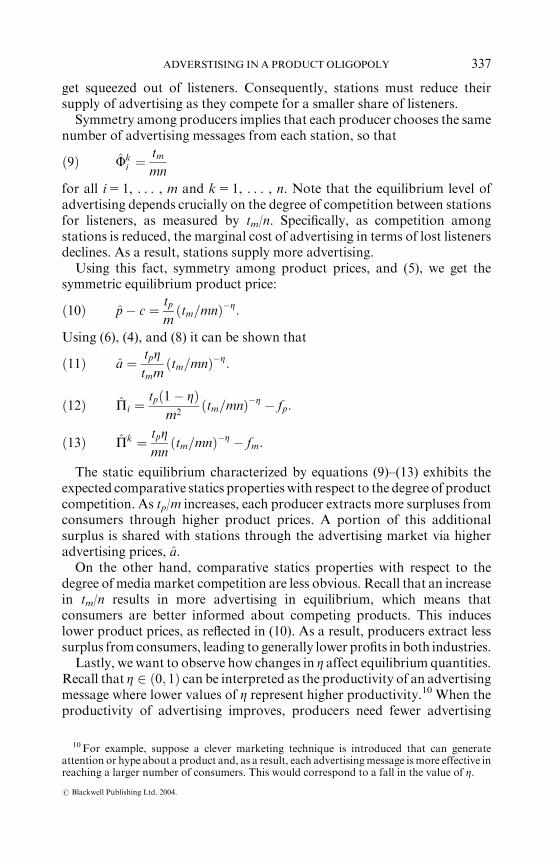
get squeezed out of listeners. Consequently, stations must reduce theirsupply of advertising as they compete for a smaller share of listeners.Symmetry among producers implies that each producer chooses the same
number of advertising messages from each station, so that
ð9Þ Fki ¼
tm
mn
for all i5 1, . . . , m and k5 1, . . . , n. Note that the equilibrium level ofadvertising depends crucially on the degree of competition between stationsfor listeners, as measured by tm/n. Specifically, as competition amongstations is reduced, the marginal cost of advertising in terms of lost listenersdeclines. As a result, stations supply more advertising.Using this fact, symmetry among product prices, and (5), we get the
symmetric equilibrium product price:
ð10Þ p� c ¼ tp
mðtm=mnÞ�Z:
Using (6), (4), and (8) it can be shown that
ð11Þ a ¼ tpZtmm
ðtm=mnÞ�Z:
ð12Þ Pi ¼tpð1� ZÞ
m2ðtm=mnÞ�Z � fp:
ð13Þ Pk ¼ tpZmn
ðtm=mnÞ�Z � fm:
The static equilibrium characterized by equations (9)–(13) exhibits theexpected comparative statics propertieswith respect to the degree of productcompetition. As tp/m increases, each producer extracts more surpluses fromconsumers through higher product prices. A portion of this additionalsurplus is shared with stations through the advertising market via higheradvertising prices, a:On the other hand, comparative statics properties with respect to the
degree of media market competition are less obvious. Recall that an increasein tm/n results in more advertising in equilibrium, which means thatconsumers are better informed about competing products. This induceslower product prices, as reflected in (10). As a result, producers extract lesssurplus fromconsumers, leading to generally lower profits in both industries.Lastly, we want to observe how changes in Z affect equilibrium quantities.
Recall that Z 2 ð0; 1Þ can be interpreted as the productivity of an advertisingmessage where lower values of Z represent higher productivity.10 When theproductivity of advertising improves, producers need fewer advertising
10For example, suppose a clever marketing technique is introduced that can generateattention or hype about a product and, as a result, each advertisingmessage is more effective inreaching a larger number of consumers. This would correspond to a fall in the value of Z.
ADVERSTISING IN A PRODUCT OLIGOPOLY 337
r Blackwell Publishing Ltd. 2004.
messages to obtain their desired reach, thereby reducing the demand foradvertising messages. Since the supply of advertising messages is fixed attm/n, this yields a lower advertising price a. This leads to lower station profitsas well as lower advertising costs for producers. However, more productiveadvertising has an adverse effect on producers’ revenues. Higher advertisingproductivitymakes consumers more informed. On the one hand, this lowersproducers’ revenues. But on the other hand, this also reduces theiradvertising costs. Thus, the impact on producer profits is unclear anddepends on which effect, the advertising cost effect or the revenue effect,dominates.The discussion concerning falling Z has an interesting implication. If
revenue falls more than advertising costs, then producers’ profits willdecrease as a result of better advertising methods. In this case both stationsand producers will have a collective incentive to favor low advertisingproductivity.11
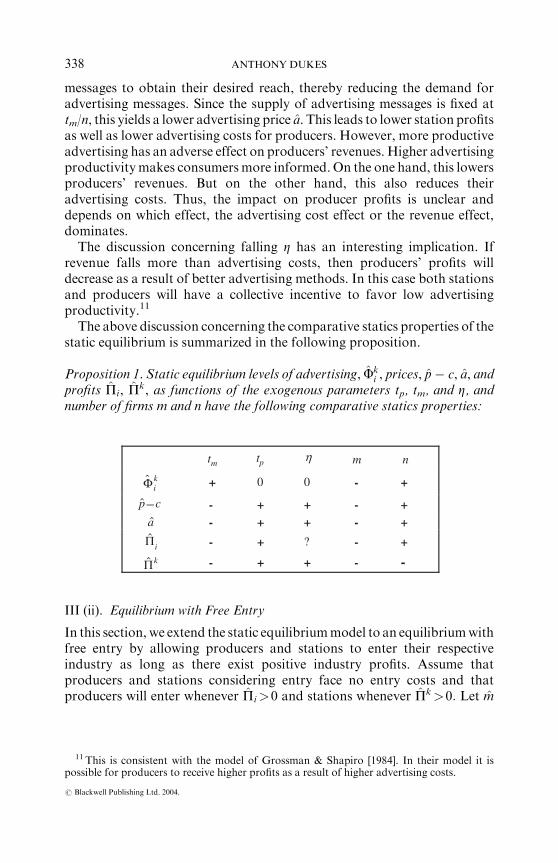
The above discussion concerning the comparative statics properties of thestatic equilibrium is summarized in the following proposition.
Proposition 1. Static equilibrium levels of advertising, Fki , prices, p� c, a, and
profits Pi, Pk, as functions of the exogenous parameters tp, tm, and Z, andnumber of firms m and n have the following comparative statics properties:
III (ii). Equilibrium with Free Entry
In this section, we extend the static equilibriummodel to an equilibriumwithfree entry by allowing producers and stations to enter their respectiveindustry as long as there exist positive industry profits. Assume thatproducers and stations considering entry face no entry costs and thatproducers will enter whenever Pi>0 and stations whenever Pk>0: Let m
mt pt η m n kiΦ
+ +
+
+ +
+ +
+
+ +
+
+ 00
cp−ˆ
--
-
--
-
--
-
-
a
iΠ ?
kΠ
11 This is consistent with the model of Grossman & Shapiro [1984]. In their model it ispossible for producers to receive higher profits as a result of higher advertising costs.
338 ANTHONY DUKES
r Blackwell Publishing Ltd. 2004.

and n be the number of producers and stations, respectively, who enter themarket. Then m and n must satisfy PiðmÞ ¼ 0 and PkðnÞ ¼ 0.12
We are particularly interested in the equilibrium number of advertisingmessages broadcast on one station, denoted FS ¼ mFk
i ¼ tm=n: In section 4,we compare the free entry equilibrium amount FS with the correspondingwelfare maximizing value of advertising. Comparisons are based on thisvariable because this is the number of advertising messages each consumerpotentially hears.Free entry in the media industry has a direct effect on FS through n, the
number of stations. However, because a station’s profit (13) is dependent onthe number of producers, there is an indirect effect on FS through thevariable m:As such, in order to understand how FS is affected by exogenousparameters tm and tp, we first characterize how n, and m are affected withrespect to changes in these parameters. By applying the zero profitconditions to equations (12) and (13), it is verified that m and n are bothincreasing in tp and decreasing in tm.With regard to product market differentiation, higher surpluses are
extracted as tp increases. A portion of these surpluses accrues directly toproducers, inducing product market entry, and indirectly to stations via theadvertising market, which induces media market entry. With more stationsin the media market, each station must advertise less: dFS=dtp<0:A contrasting result is obtained when there is an increase in station
differentiation. Consider a marginal increase in tm. This directly reducesstations’ marginal cost of advertising, in terms of lost listeners, and stationsrespond by selling 1=nmore units of advertising. This is the first order effect.A second order effect on FS acts through station exit – a reduction in n. Asproducers lower their prices in response to more consumer information,stations cannot claim as much surplus through the advertising market andstations exit ðdn=dtm<0Þ. The second order effect supports the first ordereffect and the total effect is
dFS
dtm¼ d
dtm
tm
n
� �¼ 1
n� tm
n2dn
dtm>0:
In Proposition 2, we summarize the comparative statics properties of FS, m,and ndiscussedaboveaswell as boundaryproperties that areused in section4.
Proposition 2. In the equilibrium with free entry, FS, m, and n, as functions ofthe exogenous differentiation parameters tp and tm, have the followingcomparative static and boundary properties.
(i) FS ¼ FSðtþm; t�p Þ; m ¼ mðt�m; tþp Þ ; n ¼ nðt�m; tþp Þ :
12 The existence of m and n is implied byProposition 1 and the fact that limmPiðmÞ ¼ �fp<0and limn PkðnÞ ¼ �fm<0:
ADVERSTISING IN A PRODUCT OLIGOPOLY 339
r Blackwell Publishing Ltd. 2004.
(ii) For any fixed tp>0; FS ¼ FSð0; tpÞ ¼ 0, and there exists �tm>0, whichinduces the corner solution: FS ¼ FSð�tm; tpÞ ¼ 1:
Part (i) of this proposition leads to an interesting result regarding theaggregate level of advertising. In more differentiated media markets,aggregate advertising is higher. But the proposition reveals that moreaggregate advertising is provided by fewer stations.Note also that part (i) of Proposition 2 suggests that inmarkets for similar
products, we should expect more advertising per station. Therefore, theindividual consumer hears more advertising when products are closesubstitutes. Casual observation in certain product markets (e.g., the colamarket) supports such a result. This is in contrast to Grossman & Shapiro[1984], which suggests that there is less advertising when products aresimilar.Part (ii) of the proposition establishes boundary conditions on FS with
respect to tm, which are needed in thewelfare comparison of section 4. It saysthat for any given level of tp, perfectly identical stations (i.e. when tm5 0)broadcast no advertising and that sufficiently differentiated stationsbroadcast enough advertising to fully inform all consumers.
IV. WELFARE ANALYSIS
In this section we determine the socially optimal level of advertising inthe free entry model and compare it to the level obtained in the competi-tive equilibrium. We start by deriving the social welfare, W, aggre-gated all over agents: stations, producers, and consumers. Define socialwelfare to consist of the following components: (1) consumer surplus fromproduct consumption less transportation costs; (2) consumer surplus frommedia consumption less transportation costs; (3) producers’ profits andstations’ profits.Social welfare is maximized with respect to the number of advertising
messages per station per producer, F, the number of producers, m, and thenumber of stations, n. Note that the social planner has the ability to choosethe product price, p, and advertising price, a. But choice of price variables isirrelevant since they serve only to shift surpluses among the agents ratherthan enhance total welfare.Recall that each person consumes one unit of the media good and, under
the large number approximation, Assumption 2, one unit of the productgood. Therefore, we can assign the common gross utility and constantmarginal costs as a fixed value K ¼ vp þ vm � c, which does not enter in thesocial planner’s decision. Hence, welfare is maximized by minimizing thesum of the transportation costs in both markets, the disutility fromadvertising, and the two industries’ fixed costs.
340 ANTHONY DUKES
r Blackwell Publishing Ltd. 2004.

In the media market, consumers travel to the closest station. From Salop[1979], we know that the total transportation costs associated with all nstations is tm/(4n). The calculation of transportation costs in the productmarket is more complicated. We appeal to the derivation of Grossman andShapiro [1984], who show this to be
Tp ¼tp
4m
2
FZ � 1
� �:
Hence, total welfare is expressed as
ð14Þ WðF;m; nÞ ¼ K � tm
4n� tp
4m
2
FZ � 1
� ��mF�mfp � nfm:
A sufficient condition for the existence of an interior solution to the welfare-maximizing problem is that Z41/3. This condition guarantees concavity ofthe welfare expression in (14) and, hence, we restrict the welfare analysis tothis range of Z. Denote the optimizers of W by F�, m�, and n�.In our comparisonof the social optimumand the competitive equilibrium,
we wish to compare per station advertising levels. Denote this quantity byF�
S � m�F�. With this in mind, we present the relevant properties ofF�S,m
�,and n� in the following proposition.
Proposition 3. Assume that Z41/3. There exists an interior solution (F�, m�,n�) to the welfare maximization problem. At this social optimum, F�
S ¼ m�F�
and m� are invariant to changes in tm and n� is increasing in tm.
From the social planner’s perspective, the optimal level of advertising ischosen to balance the social cost of annoyance versus the benefit of reducingtransportation costs in the product market via more information. Thedegree ofmedia differentiation, therefore, does not play a role in the optimallevel of advertising. Similarly, the optimal number of producers, m�, ischosen to balance the cost of entry and the benefit of lower product markettransportation costs and thus does not depend on the level mediadifferentiation as well. For these reasons, the social planner’s choice ofF�and m� (and therefore F�
S ) is invariant to changes in tm.This is not the case for the social planner’s choice of the optimal number of
stations n�. With more stations, there is less distance between them andsubsequently consumers travel shorter distances. The social benefit of morestations is a reduction in media market transportation costs. However, thiscomes at the social cost of higher industry fixed costs.Proposition 2 and 3 can be used to compare the competitive equilibrium
level of advertising FS with the socially optimal levelF�S, which is given in the
following proposition.
ADVERSTISING IN A PRODUCT OLIGOPOLY 341
r Blackwell Publishing Ltd. 2004.
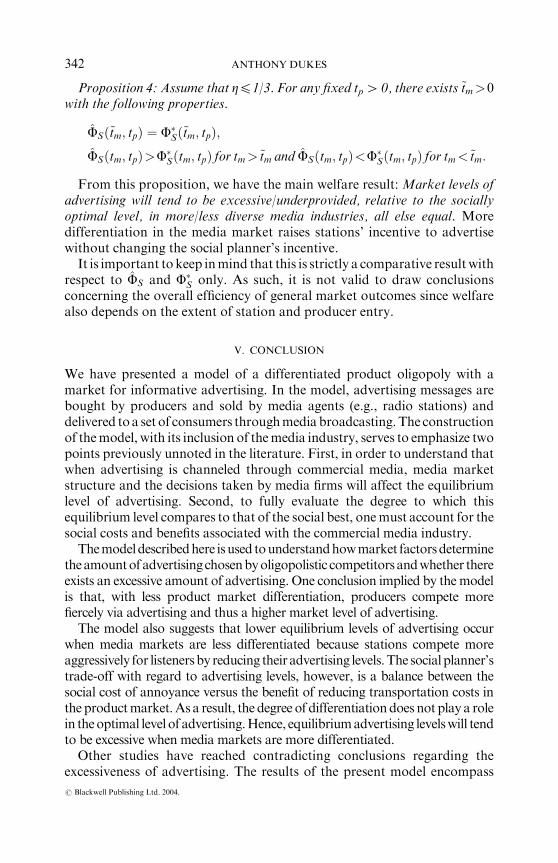
Proposition 4: Assume that Z41/3. For any fixed tp4 0, there exists ~tm>0with the following properties.
FSð~tm; tpÞ ¼ F�Sð~tm; tpÞ;
FSðtm; tpÞ>F�Sðtm; tpÞ for tm>~tm and FSðtm; tpÞ<F�
Sðtm; tpÞ for tm<~tm:
From this proposition, we have the main welfare result: Market levels ofadvertising will tend to be excessive/underprovided, relative to the sociallyoptimal level, in more/less diverse media industries, all else equal. Moredifferentiation in the media market raises stations’ incentive to advertisewithout changing the social planner’s incentive.It is important to keep inmind that this is strictly a comparative resultwith
respect to FS and F�S only. As such, it is not valid to draw conclusions
concerning the overall efficiency of general market outcomes since welfarealso depends on the extent of station and producer entry.
V. CONCLUSION
We have presented a model of a differentiated product oligopoly with amarket for informative advertising. In the model, advertising messages arebought by producers and sold by media agents (e.g., radio stations) anddelivered toa set of consumers throughmediabroadcasting.The constructionof themodel, with its inclusion of themedia industry, serves to emphasize twopoints previously unnoted in the literature. First, in order to understand thatwhen advertising is channeled through commercial media, media marketstructure and the decisions taken by media firms will affect the equilibriumlevel of advertising. Second, to fully evaluate the degree to which thisequilibrium level compares to that of the social best, onemust account for thesocial costs and benefits associated with the commercial media industry.Themodeldescribedhere isused tounderstandhowmarket factorsdetermine
theamountofadvertisingchosenbyoligopolistic competitorsandwhether thereexists an excessive amount of advertising. One conclusion implied by themodelis that, with less product market differentiation, producers compete morefiercely via advertising and thus a higher market level of advertising.The model also suggests that lower equilibrium levels of advertising occur
when media markets are less differentiated because stations compete moreaggressively for listenersby reducing their advertising levels.The socialplanner’strade-off with regard to advertising levels, however, is a balance between thesocial cost of annoyance versus the benefit of reducing transportation costs inthe productmarket.As a result, the degree of differentiationdoes not play a rolein theoptimal levelof advertising.Hence, equilibriumadvertising levelswill tendto be excessive when media markets are more differentiated.Other studies have reached contradicting conclusions regarding the
excessiveness of advertising. The results of the present model encompass
342 ANTHONY DUKES
r Blackwell Publishing Ltd. 2004.

these studies by finding conditions on market characteristics, in particularlevels of media market differentiation, that lead either to excessiveadvertising (as in Grossman & Shapiro [1984], or Butters [1977]) or to anunderprovision of advertising (as in Stegeman [1991], or Stahl [1994]).
APPENDIX
Proof of Proposition 1. Expressions follow directly from symmetry and equations (9)–
(13). (Note that F 2 ½0; 1� implies that the expression F ¼ ðtm=mnÞZ is decreasing Z.)
Proof of Proposition 2. (i) Apply the free entry conditions PiðmÞ ¼ 0 and PkðnÞ ¼ 0 to
equations (12) and (13) and solve simultaneously (with some amount of algebra) to
obtain
m2 ¼ tpð1� ZÞfp
tpZtmfm
� � Z1�Z
and n2 ¼ tpZfm
� �2�Z1�Z fp
tpð1� ZÞ
� �ðtmÞ
�Z1�Z:
Then, by evaluating FS ¼ tm=n, the level of advertising is explicitly expressed as
ðA1Þ FS ¼ tmfm
tpZ
� � 2�Z2�2Z tpð1� ZÞ
fp
� �1=2
:
The comparative statics results are deduced by inspecting these expressions. (ii) Direct
substitution of tm ¼ 0 into (A1) yields FSð0; tpÞ ¼ 0: Setting
�tm ¼ tpZfm
fp
tpð1� ZÞ
� �1�Z2�Z
and substituting into (A1) gives FSð�tm; tpÞ ¼ 1 Q:E:D:
Proof of Proposition 3. Define the following
F1ðF;mÞ � tpZ2m
F�Z�1 �m
F2ðF;mÞ � tp
4m2
2
FZ � 1
� �� fp � F
F3ðnÞ �tm
4n2� fm
which are specified by the marginal derivatives of the welfare function, WðF; m; nÞ,given in (14). Define ðF�; m�; n�Þ as a solution to the set of first order conditions, givenby the system
ðA2Þ F1ðF�;m�Þ ¼ 0
ðA3Þ F2ðF�;m�Þ ¼ 0
ðA4Þ F3ðn�Þ ¼ 0
ADVERSTISING IN A PRODUCT OLIGOPOLY 343
r Blackwell Publishing Ltd. 2004.
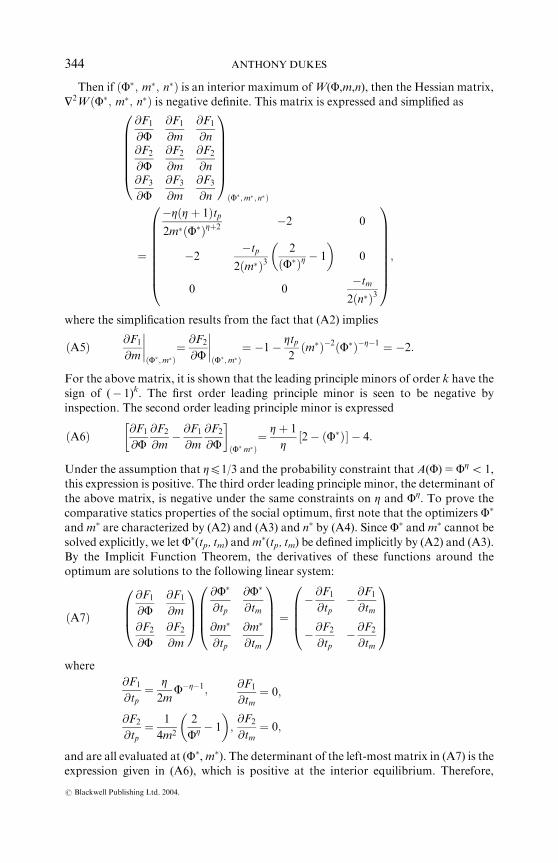
Then if ðF�; m�; n�Þ is an interior maximum ofW(F,m,n), then the Hessian matrix,
H2WðF�; m�; n�Þ is negative definite. This matrix is expressed and simplified as
@F1
@F@F1
@m
@F1
@n@F2
@F@F2
@m
@F2
@n@F3
@F@F3
@m
@F3
@n
0BBBBBB@
1CCCCCCA
ðF�;m� ; n�Þ
¼
�ZðZþ 1Þtp2m�ðF�ÞZþ2
�2 0
�2�tp
2ðm�Þ32
ðF�ÞZ � 1
� �0
0 0�tm
2ðn�Þ3
0BBBBBBBB@
1CCCCCCCCA;
where the simplification results from the fact that (A2) implies
ðA5Þ @F1
@m
����ðF�;m�Þ
¼ @F2
@F
����ðF�;m�Þ
¼ �1� Ztp2
ðm�Þ�2ðF�Þ�Z�1 ¼ �2:
For the above matrix, it is shown that the leading principle minors of order k have the
sign of (� 1)k. The first order leading principle minor is seen to be negative by
inspection. The second order leading principle minor is expressed
ðA6Þ @F1
@F@F2
@m� @F1
@m
@F2
@F
� ðF� m�Þ
¼ Zþ 1
Z2� ðF�Þ½ � � 4:
Under the assumption that Z41/3 and the probability constraint that A(F)5FZo 1,
this expression is positive. The third order leading principle minor, the determinant of
the above matrix, is negative under the same constraints on Z and FZ. To prove the
comparative statics properties of the social optimum, first note that the optimizers F�
and m� are characterized by (A2) and (A3) and n� by (A4). Since F� andm� cannot be
solved explicitly, we letF�(tp, tm) andm�(tp, tm) be defined implicitly by (A2) and (A3).
By the Implicit Function Theorem, the derivatives of these functions around the
optimum are solutions to the following linear system:
ðA7Þ
@F1
@F@F1
@m
@F2
@F@F2
@m
0BB@
1CCA
@F�
@tp
@F�
@tm
@m�
@tp
@m�
@tm
0BBB@
1CCCA ¼
� @F1
@tp� @F1
@tm
� @F2
@tp� @F2
@tm
0BBB@
1CCCA
where
@F1
@tp¼ Z
2mF�Z�1;
@F2
@tp¼ 1
4m2
2
FZ � 1
� �;
@F1
@tm¼ 0;
@F2
@tm¼ 0;
and are all evaluated at (F�,m�). The determinant of the left-most matrix in (A7) is the
expression given in (A6), which is positive at the interior equilibrium. Therefore,
344 ANTHONY DUKES
r Blackwell Publishing Ltd. 2004.
@F�=@tm ¼ @m�=@tm ¼ 0. The comparative statics results concerning n�(tp, tm) are
obtained by examining the explicit solution n� ¼ 12
ffiffiffiffiffiffiffiffiffiffiffiffitm=fm
pimplied by (A4). Q.E.D.
Proof of Proposition 4. The boundary conditions for FS andF�S specified in Proposition
2 imply the existence of some value ~tm such that the competitive outcome delivers the
optimal level of advertising: FSð~tm; tpÞ ¼ F�Sð~tm; tpÞ. Furthermore, since FSðtm; tpÞ is
strictly increasing in tm and F�Sðtm; tpÞ>0 is constant in tm, then for fixed tp: tm
>=<~tmimplies FSðtm; tpÞ>=<F�
Sðtm; tpÞ:
SUPPLEMENTALMATERIAL FOR ANTHONY DUKES, ‘THE ADVERTISING
MARKET IN A PRODUCT OLIGOPOLY,’ THE JOURNAL OF INDUSTRIAL
ECONOMICS, VOL. 50 NO. 3 (SEPTEMBER, 2004), PP. XXX-YYY.
In the main body of the article, we invoke the approximation ð1� jkÞm�1 �ð1� jkÞm � 0. This greatly enhances the tractability of the model by permitting us to
derive analytic results while preserving the economic insight. Without this approxima-
tionwe are still able to characterize the same result, however, with numerical techniques.
The purpose of this appendix is to provide support that the approximation does not
alter the main results of the basic model. We do this by first showing that the
comparative statics of the equilibrium outcome with respect to the key parameters are
identical in both the approximated and un-approximated models. Second we offer
numerical support that welfare optimizers and associated comparative statics are only
modestly affected by the approximation. We also provide intuitive explanations as to
how the approximation affects the incentives of the agents.
Equilibrium outcome
We present here analytical as well as numerical evidence that the approximation does
not significantly alter the qualitative aspects of the equilibrium outcome. It is readily
shown that using the exact formulation of product demand in § II(i), the symmetric
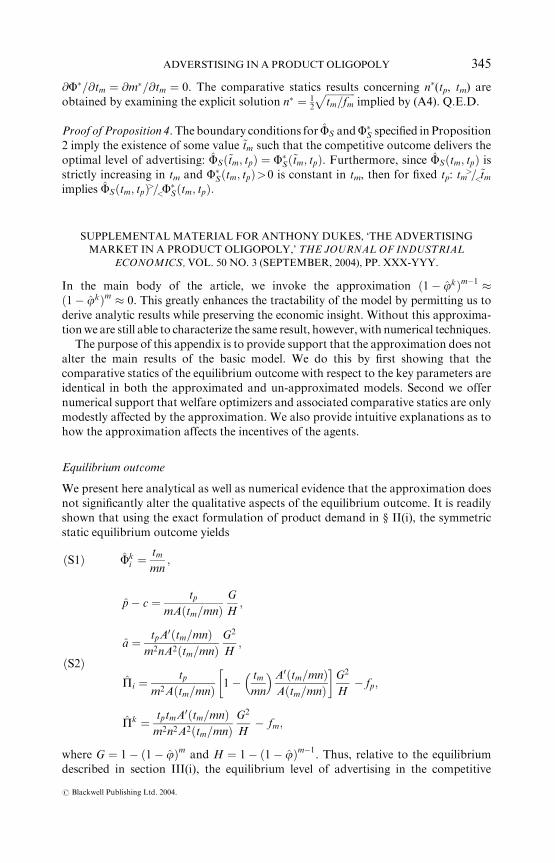
static equilibrium outcome yields
ðS1Þ Fki ¼
tm
mn;
ðS2Þ
p� c ¼ tp
mAðtm=mnÞG
H;
a ¼ tpA0ðtm=mnÞ
m2nA2ðtm=mnÞG2
H;
Pi ¼tp
m2Aðtm=mnÞ 1� tm
mn
� �A0ðtm=mnÞAðtm=mnÞ
� G2
H� fp;
Pk ¼ tptmA0ðtm=mnÞ
m2n2A2ðtm=mnÞG2
H� fm;
where G ¼ 1� ð1� jÞm and H ¼ 1� ð1� jÞm�1. Thus, relative to the equilibrium
described in section III(i), the equilibrium level of advertising in the competitive
ADVERSTISING IN A PRODUCT OLIGOPOLY 345
r Blackwell Publishing Ltd. 2004.

equilibrium remains unchanged; however, product price is scaled by the factorG/H and
advertising price and profits are scaled by the factor G2/H.
To understand this difference, first note that since the stations’ optimal choice is
equivalent, we need only to examine how the producer’s decision is modified under the
relaxed conditions ð1� jÞm�1>0 and ð1� jÞm>0. The former condition implies that
fewer consumers are likely to know about competitors’ products, which, on one hand,
raises the producer’s marginal benefit of raising its price. Consequently, producers
charge a higher price, as is reflected in (S2) since G/H4 1. On the other hand, the
condition ð1� jÞm>0 implies that fewer consumers are participating in the product
market and this tends to reduce product demand. It is ambiguous which effect
dominates as illustrated by the fact that the ratioG2/H can be greater or less than unity.
Competitive aspects among producers and stations are unaltered by the
approximation. First note that both station and producer profits are subject to the
same multiplicative factor, G2/H. Thus, the presence of the approximation conditions
does not alter any competitive aspects in the advertisingmarket.Rather, invoking these
conditions serves to shift some rents from consumers, in equal shares, to stations and
producers when G2/H4 1 and rents to consumers from stations and producers when
G2/Ho 1.
Numerical analysis of the static equilibrium reveals only a slight discrepancy
between actual and approximated profits. Table S1 indicates a typical simulation with
no more than 3% difference in profits. Given such small differences in profits in the
static equilibrium, we expect free entry values of m and n to have generally no
differences in light of the fact that they take integer values. Numerical calculations (not
shown) support this expectation. Moreover, the comparative statics of approximated
profits respect to tp and tm are identical to those of actual profits (see Table S1). This
implies that comparative statics of the actual free entry outcome follows as desired.
Social optimum
The only approximation used in the welfare analysis is ð1� jÞm � 0. We discuss this
approximation with regard to the social planner’s problem and then argue that the
approximation only modestly affects the optimal choice (F�, m�) and that the
comparative statics of this choice is unaffected by the approximation.13
Table S1
StaticEquilibriumComparative Statics (fp50.10, fm50.25, Z50.70)
m N tp tm
Producer Profits Pi Station Profits Pk
Actual Approx Actual Approx
6.0 7.0 10 15 0.0712 0.0713 0.0924 0.09276.0 7.0 10 20 0.0404 0.0401 0.0307 0.03026.0 7.0 10 25 0.0199 0.0198 � 0.0101 � 0.01046.0 7.0 11 15 0.0883 0.0885 0.1267 0.12696.0 7.0 11 20 0.0544 0.0541 0.0588 0.05826.0 7.0 11 25 0.0319 0.0318 0.0139 0.01366.0 8.0 10 20 0.0541 0.0538 0.0196 0.01927.0 7.0 10 20 0.0147 0.0146 0.0177 0.0175
13Note that the approximation has no bearing on the optimal choice n�.
346 ANTHONY DUKES
r Blackwell Publishing Ltd. 2004.
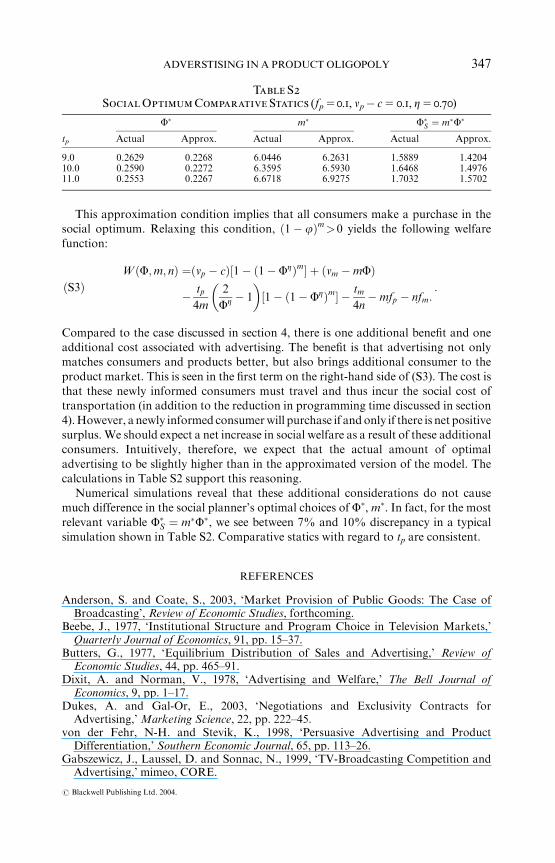
This approximation condition implies that all consumers make a purchase in the
social optimum. Relaxing this condition, ð1� jÞm>0 yields the following welfare
function:
ðS3ÞWðF;m; nÞ ¼ðvp � cÞ½1� ð1� FZÞm� þ ðvm �mFÞ
� tp
4m
2
FZ � 1
� �½1� ð1� FZÞm� � tm
4n�mfp � nfm:
:
Compared to the case discussed in section 4, there is one additional benefit and one
additional cost associated with advertising. The benefit is that advertising not only
matches consumers and products better, but also brings additional consumer to the
product market. This is seen in the first term on the right-hand side of (S3). The cost is
that these newly informed consumers must travel and thus incur the social cost of
transportation (in addition to the reduction in programming time discussed in section
4).However, a newly informed consumerwill purchase if andonly if there is net positive
surplus. We should expect a net increase in social welfare as a result of these additional
consumers. Intuitively, therefore, we expect that the actual amount of optimal
advertising to be slightly higher than in the approximated version of the model. The
calculations in Table S2 support this reasoning.
Numerical simulations reveal that these additional considerations do not cause
much difference in the social planner’s optimal choices of F�, m�. In fact, for the most
relevant variable F�S ¼ m�F�, we see between 7% and 10% discrepancy in a typical
simulation shown in Table S2. Comparative statics with regard to tp are consistent.
REFERENCES
Anderson, S. and Coate, S., 2003, ‘Market Provision of Public Goods: The Case ofBroadcasting’, Review of Economic Studies, forthcoming.
Beebe, J., 1977, ‘Institutional Structure and Program Choice in Television Markets,’Quarterly Journal of Economics, 91, pp. 15–37.
Butters, G., 1977, ‘Equilibrium Distribution of Sales and Advertising,’ Review ofEconomic Studies, 44, pp. 465–91.
Dixit, A. and Norman, V., 1978, ‘Advertising and Welfare,’ The Bell Journal ofEconomics, 9, pp. 1–17.
Dukes, A. and Gal-Or, E., 2003, ‘Negotiations and Exclusivity Contracts forAdvertising,’ Marketing Science, 22, pp. 222–45.
von der Fehr, N-H. and Stevik, K., 1998, ‘Persuasive Advertising and ProductDifferentiation,’ Southern Economic Journal, 65, pp. 113–26.
Gabszewicz, J., Laussel, D. and Sonnac, N., 1999, ‘TV-Broadcasting Competition andAdvertising,’ mimeo, CORE.
Table S2
SocialOptimumComparative Statics (fp50.1, np� c5 0.1, Z50.70)
tp
F� m� F�S ¼ m�F�
Actual Approx. Actual Approx. Actual Approx.
9.0 0.2629 0.2268 6.0446 6.2631 1.5889 1.420410.0 0.2590 0.2272 6.3595 6.5930 1.6468 1.497611.0 0.2553 0.2267 6.6718 6.9275 1.7032 1.5702
ADVERSTISING IN A PRODUCT OLIGOPOLY 347
r Blackwell Publishing Ltd. 2004.
Gal-Or, E. and Dukes, A., 2003, ‘Minimum Differentiation in Commercial MediaMarkets,’ Journal of Economics and Management Strategy, 12, pp. 291–325.
Grossman, G. and Shapiro, C., 1984, ‘Informative Advertising with DifferentiatedProducts,’ Review of Economic Studies, 51, pp. 63–81.
Hackner, J. and Nyberg, S., 2000, ‘Price Competition, Advertising and Media MarketConcentration,’ mimeo, Department of Economics, Stockholm Univeristy.
Masson, R., Mudambi, R. and Reynolds, R., 1990, ‘Oligopoly in Advertiser-SupportedMedia,’ Quarterly Review of Economics and Business, 30, pp. 3–16.
Motta, M. and Polo, M., 2001, ‘Beyond the Spectrum Constraint: Concentration andEntry in the Broadcasting Industry,’ Rivista di Politica Economica, April/May, pp.115–50.
Nelson, P., 1974, ‘Advertising as Information,’ Journal of Political Economy, 82, pp. 729–54.
Nichols, L., 1985, ‘Advertising and Economic Welfare,’ American Economic Review, 75,pp. 213–8.
Nilsson, T. and S�rgard, L., 2003, ‘The TV Industry: Advertising & Programing,’manuscript, University of Oslo and Norwegian School of Economics and BusinessAdministration.
Salop, S., 1979, ‘Monopolistic Competition with Outside Goods,’ The Bell Journal ofEconomics, 10, pp. 141–56.
Scherer, F. and Ross, D., 1990, Industrial Market Structure and Economic Performance,(Houghton-Mifflin, Boston).
Shapiro, C., 1980, ‘Advertising and Welfare: Comment,’ The Bell Journal of Economics,12, pp. 749–51.
Siddarth, S. and Chattopadhyay, A., 1998, ‘To Zap or Not to Zap: A Study of theDeterminants of Channel Switching During Commercials,’Marketing Science, 17, pp.124–38.
Spence, M. and Owen, B., 1977, ‘Television Programming, Monopolistic Competitionand Welfare,’ Quarterly Journal of Economics, 91, pp. 103–26.
Steiner, P., 1952, ‘ProgramPatterns andPreferences, and theWorkability ofCompetitionin Radio Broadcasting,’ Quarterly Journal of Economics, 66, pp. 194–23.
Stahl, D. O., 1994, ‘Oligopolistic Pricing and Advertising,’ Journal of Economic Theory,64, pp. 162–77.
Stegeman, M., 1991, ‘Advertising in Competitive Markets,’ American Economic Review,81, pp. 210–23.
Stegeman, M., 2001, ‘Financing Public Goods Through Advertising,’ working paper,Department of Economics, Virginia Tech.
348 ANTHONY DUKES
r Blackwell Publishing Ltd. 2004.