observations of fourteen pulsar glitches - core
TRANSCRIPT
Observations of Fourteen Pulsar Glitches
A. Krawczyk1, A.G. Lyne2, J.A. Gil1 and B.C. Joshi2,31 Astronomical Centre, Pedagogical University, Lubuska 2, 65-265 Zielona Gora, Poland2 University of Manchester, Nuffield Radio Astronomy Laboratories, Jodrell Bank, Macclesfield, Cheshire, SK11 9DL, UK3 National Center for Radio Astrophysics, Pune University Campus, P. O. Bag 3, Ganeshkhind, Pune, 411007, India
2 May 2003
ABSTRACTAbout 76 glitches in 25 pulsars have been reported to date. Most glitches are ‘giant’,with fractional increases of frequency ∆ν0/ν0 ∼ 10−6. 25 glitches were analysed andpresented by Shemar & Lyne (1996) who detected them mainly at Jodrell Bank duringthe monitoring of a sample of 279 pulsars in a regular timing programme up to MJD49500. This paper is a continuation of their work up to MJD 50500. We present thedetection and analysis of a further 14 glitches in 9 pulsars, 6 of which have glitchedfor the first time since monitoring had started. Eleven of these glitches are small(∆ν0/ν0 ∼ 10−9) and below the completeness threshold of Shemar and Lyne(1996).We report a giant glitch in PSR B1930+22, the second largest reported hitherto, witha ∆ν0/ν0 = 4.5 × 10⁻⁶. We also report four recent glitches in PSR B1737−30 whichcontinues to exhibit frequent glitches. Few of these pulsars show any recovery afterthe glitch.
1 INTRODUCTION
Two kinds of irregularities are observed in the rotation ratesof pulsars, timing noise and glitches. Timing noise is a con-tinuous wandering of the rotation rate, while glitches arecharacterized by a sudden increase in the rate, often fol-lowed by a period of relaxation. They are often revealedby the sudden onset of continually decreasing arrival timeresiduals. Glitches were first observed in the Crab and Velapulsars (?; ?) and it was soon realized that they can be im-portant diagnostic tools for studying neutron star interiors(?; ?). It is widely believed that these events are caused bysudden and irregular transfer of angular momentum from afaster rotating interior superfluid to the solid crust of theneutron star. The result is a sudden fractional increase inthe rotational frequency ν0 of the pulsar with a magnitudein the range 10−10 < ∆ν0/ν0 < 5 × 10⁻⁶. A characteristicfeature of many glitches is a relaxation after the frequencyjump, which may occur over a period of days, months oryears. However, as we present in this paper, small glitchesseem to show little significant relaxation after the glitch.
Although glitches are rather rare phenomena, an in-creasing number of these events have been reported recently(McKenna & Lyne 1990; Shemar & Lyne 1996; Wang et al.2000; this paper), permitting more comprehensive statisticalstudies (Alpar & Baykal 1994; McKenna & Lyne 1990; Lyne,Shemar & Smith 2000). In this paper, we extend the anal-ysis of the Jodrell Bank database by 2.5 year beyond thatof Shemar & Lyne (1996) and seek to lower the detectionthreshold significantly.
2 OBSERVATIONS AND ANALYSIS
Observations were carried out at Jodrell Bank, mostly us-ing the 76-m Lovell radio telescope, but also occasionallyusing the 30-m Mark II telescope. Measurements were madeat intervals of between one and three months, while some,more interesting, pulsars were observed more often. The to-tal list of pulsars that have been observed regularly in thisprogramme at Jodrell Bank is presented in Shemar & Lyne(1996, their Table 1). Those authors analysed the data upto about MJD 49500. This work represents a more detailedstudy of the same data and also extends the analysis on theirlist of pulsars to about MJD 50500. The B1950 and J2000names of these pulsars, their periods and characteristic ages,and the dates spanned by the observations are listed in Table1. The main improvement in the analysis is a more carefulcalibration of the systematic effects which arose from theuse of a variety of filterbanks and dedispersion proceduresover the typically 16-year span of the observations. Greatercare was also exercised in removing data which might havebeen affected by impulsive radio-frequency interference.
Both telescopes were equipped with dual-channel cryo-genic receivers at observing frequencies centered close to 408,610 or 1400 MHz. Each channel was sensitive to one hand ofcircular polarization. The data were dedispersed using filter-banks and folded synchronously with the nominal topocen-tric rotation period of the pulsar for sub-integration periodsof between one and three minutes. An observation consistedtypically of six such integrations which were stored on diskfor subsequent processing.
Total intensity profiles were obtained by adding the sixsub-integrations. These were then cross-correlated with astandard template to give pulse topocentric times of ar-
c© 0000 RAS
brought to you by COREView metadata, citation and similar papers at core.ac.uk
provided by CERN Document Server

Table 1. Data span of Timing Observations used for analysis
PSR J PSR B Period Age MJD RANGE NO OF TOA(s) (Kyr)
0157+6212 0154+61 2.35172383222 200 46866 − 50496 2311740−3015 1737−30 0.60666591713 20 49243 − 51300 2231801−0357 1758−03 0.92148958467 4400 46718 − 50586 1241801−2304 1758−23 0.41579643949 60 49700 − 50687 711803−2137 1800−21 0.133634078897 16 49403 − 50600 1271910−0309 1907−03 0.50460431337 3600 47392 − 50530 921919+0021 1917+00 1.27225573197 2600 48104 − 50640 1751932+2220 1930+22 0.144455311469 40 49402 − 50583 1122257+5909 2255+58 0.368245626351 1000 47523 − 50588 134
Table 2. Assumed Positions of 9 Glitching Pulsars
NAME RA(J2000) Dec(J2000) Reference
B0154+61 01 57 49.91 +62 12 25.328 Martin (2001)B1737−30 17 40 33.82(1) −30 15 43.5(2) Fomalont et al. (1997)B1758−03 18 01 22.66 −03 57 55.39 Martin (2001)B1758−23 18 01 19.803(9) −23 04 44.2(2) Frail et al. (1993)B1800−21 18 03 51.401(4) −21 37 07.34(7) Fomalont et al. (1992)B1907−03 19 10 29.686 −03 09 54.318 Martin (2001)B1917+00 19 19 50.654 +00 21 39.848 Martin (2001)B1930+22 19 32 22.693 +22 20 53.68 This paperB2255+58 22 57 57.741 +59 09 14.917 Martin (2001)
rival which were then corrected to the Solar system barycen-tre using the JPL ephemeris DE200 (?). Assessment of ar-rival time residuals, which are the differences between actualpulse arrival times and times calculated from a simple ro-tational model, provides information about the behaviourof the pulsar rotation. The fitting procedure used a simpleslow-down model involving rotational frequency and its firstderivative. The analysis for each pulsar involves such a fit toa period of time which is devoid of any glitch activity. Thetiming residuals for the whole data set are then inspected vi-sually for the presence of glitches. Pulsar positions assumedin this analysis are given in Table 2. Several of the positionswere obtained from the same timing data described here,using data located well away from glitches (Martin 2001).
The parameters of each glitch were obtained from com-parison of parameters before and after the glitch. Epochsof glitches were determined by requiring a continuity ofphase across the glitch. Pre-glitch parameters were obtainedby fitting a simple pre-glitch slow-down model of the formν(t) = ν0 + ν0t to the data. The observed post-glitch fre-quency residuals are described as a function of the time telapsed since the epoch of the glitch, relative to the pre-glitch ephemeris:
∆ν(t) = ∆νp + ∆νpt + νpt2/2 + ∆ν1e−t/τ1 , (1)
where ∆νp = νp − ν0 and ∆νp = νp − ν0 are differencesbetween post-glitch and pre-glitch parameters. The last termin equation (1) describes an exponentially decaying transientcomponent of post-glitch behaviour, while the penultimateterm represents the large, approximately constant value ofsecond derivative often seen following large glitches after any
short-term transient has decayed. Note that ∆νp and ∆νp
usually differ from the instantaneous changes in ∆νo and itsderivative because of the decaying components. Thus,
∆νp = ∆νo − Σ∆ν1 and ∆νp = ∆νo + Σ∆ν1/τ1 (2)
A more detailed description of the observation system andanalysis can be found in the paper by Shemar & Lyne (1996).
3 RESULTS
The parameters of 14 new glitches found in 9 pulsars aregiven in Table 3, which shows the epoch of the glitch asa Modified Julian Date (MJD), pre-glitch frequency ν0 andits first derivative ν0 at that epoch, glitch fractional parame-ters, and the post-glitch frequency νp and its first derivativeνp. The glitch epoch is estimated in the following manner.First, two solutions for the pulse phase across the glitch wereobtained by extrapolating the pulse ephemeris before and af-ter the glitch respectively. Then, the epoch was estimatedfrom these phases by requiring that the the pulse phase becontinuous across the glitch. The errors quoted in bracketsare twice the standard deviations obtained from the formalfits. However, this procedure could not be used for the glitchin PSR B1930+22 due to lack of sufficient number of mea-surements near the glitch as well as the large magnitude ofthe glitch. The relaxation parameters, νp, ∆ν1 and τ1 areusually insignificant in these glitches and are mentioned inthe text where appropriate.
The frequency residuals for previously unpublishedglitches are presented in the lower panels of Figs. 1, 3, 5−9
c© 0000 RAS, MNRAS 000, 000–000

Table 3. Pre-glitch, glitch and post-glitch parameters for 14 glitches in 9 pulsars. Errors in the least significantplace are given in parentheses.
Pre-glitch Parameters Glitch Parameters Post-glitch ParametersPSR B Epoch ν0 ν0 ∆ν0/ν0 ∆ν0/ν0 νp νp
(MJD) (s−1) (10−15s−2) (10−9) (10−3) (s−1) (10−15s−2)
0154+61 48504(1) 0.42521973638(2) −34.1638(3) 2.46(6) −0.04(1) 0.42521973743(1) −34.1625(1)
1737−30 49451.7(4) 1.6483288501(3) −1265.76(2) 9.5(5) −0.32(2) 1.6483288657(7) −1265.4(2)
49543.93(8) 1.6483203659(8) −1265.3(2) 3.0(6) −0.68(2) 1.6483203709(6) −1264.48(1)
50574.5497(4) 1.6482078436(2) −1264.02(1) 439.3(2) 1.261(2) 1.6482085677(2) −1265.62(2)
50941.6182(2) 1.6481684365(2) −1265.56(1) 1443.0(3) 1.231(5) 1.6481708149(5) −1267.12(6)
1758−03 48016(4) 1.0851988198(2) −3.899(3) 2.9(2) 1.17(9) 1.08519882303(2) −3.903(1)
1758−23 50055.0(4) 2.405065322(2) −653.5(3) 22.6(9) −0.08(2) 2.405065377(1) −653.43(9)
50363.414(4) 2.405047996(1) −653.42(9) 80.6(6) 0.50(2) 2.4050481894(9) −653.75(6)
1800−21 50269.4(1) 7.483583400(1) −7496.36(8) 5.3(2) 0.195(4) 7.483583440(2) −7497.8(3)
1907−03 48241(2) 1.9817509328(1) −8.600(3) 0.60(6) 1.04(4) 1.98175093394(6) −8.609(1)
49219.85(2) 1.98175020655(9) −8.606(2) 1.84(6) 0.28(3) 1.98175021019(6) −8.609(1)
1917+00 50174(2) 0.78600232349(1) −4.741(1) 1.29(3) 0.559(9) 0.78600232450(2) −4.744(4)
1930+22 50264(20) 6.92210791(2) −2756.4(1) 4457(6) 1.7(2) 6.92213877(2) −2761.0(3)
2255+58 49463.2(2) 2.71557492794(4) −42.436(1) 0.92(2) −0.032(2) 2.71557493043(4) −42.434(1)
and Fig. 11, and in the top panel of Fig. 10. They were ob-tained by performing local fits over about 50 days to thearrival time data, and presented relative to a simple slow-down model. Since most of the glitches presented in this pa-per are small, we also usually show their timing residuals inthe upper panels of Figs. 1, 3, 5−9 and Fig. 11 for clarity ofpresentation. The number of available timing measurementsbetween two glitches was small in the case of PSR B1737−30making it difficult to obtain the frequency residuals in themanner described above except in case of two glitches. Thetiming residuals in all these pulsars show the familiar neg-ative change in the gradient after the glitch, correspondingto a spin-up.
Below we describe detailed results of the search forglitches in the improved Jodrell Bank pulsar timing database. Following Shemar & Lyne (1996), we give for eachpulsar the conventional B-name, J-name (?) and the char-acteristic age τ = −ν/2ν.
3.1 PSR B0154+61 (J0157+6212, τ = 200 kyr)
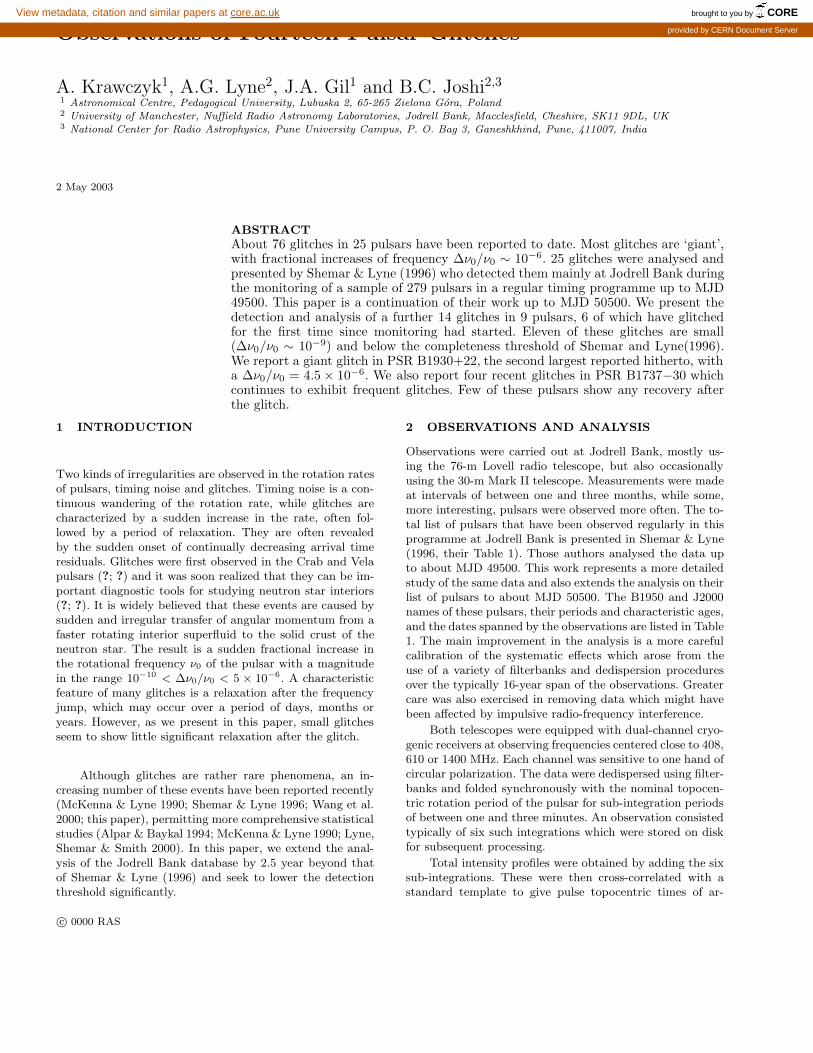
Although data on PSR B0154+61 have been collected atJodrell Bank for more than 10 years since MJD 46866, thispulsar suffered its first observed glitch near MJD 48504. Theglitch was quite small with the size of the frequency jumpequal to 2.46×10⁻⁹ . The frequency and timing residuals areshown in lower and upper panels of Fig. 1, respectively. Thisglitch was not reported by Shemar & Lyne (1996), as it wasbelow their completeness level of 5× 10⁻⁹ in ∆ν0/ν0.
3.2 PSR B1737−30 (J1740−3015, τ = 20.63 kyr)
This pulsar exhibits frequent glitches and nine glitches havebeen reported in the past (McKenna & Lyne 1990; Shemarand Lyne 1996). Our analysis included observations carriedout up to May 1999 for this pulsar (around 51300 MJD).We present four more glitches detected in these data. Thetiming residuals for the two smaller glitches are shown inFigure 2. The other two glitches were large with a ∆ν0/ν0
exceeding 1.0×10⁻⁷. The timing and frequency residuals forthese glitches are shown in Figs. 3a and 3b and the glitchparameters for all the four glitches are presented in Table 3.
The cumulative fractional change in the rotation rate,∆ν0/ν0, for the pulsar is shown in Fig. 4. The dashed - dotline indicates the average rate of fractional spin-up due toglitches. The mean spin-up rate due to glitches, νglitch (SeeLyne et al. 2000), for this pulsar is about 1.4 percent of itsspin-down rate. Thus, a fixed fraction 0.014 of the pulsar’sslowdown is reversed by glitch activity and this is consistentwith statistical estimate in other pulsars (Lyne et al. 2000).Shemar and Lyne (1996) noted that there are two typesof glitches and this is evident from this figure. The largerglitches occur typically 800 days apart whereas the typicalseparation for all the glitches is of the order of 300 days.
3.3 PSR B1758−03 (J1801−0357, τ = 4, 400 kyr)
The rotational frequency and timing residuals for this pul-sar are shown in Fig. 5. It suffered a glitch after 3 years ofregular monitoring at Jodrell Bank and was not reported byShemar & Lyne (1996), being below their sensitivity thresh-old. The size of the frequency jump is rather small, with
c© 0000 RAS, MNRAS 000, 000–000
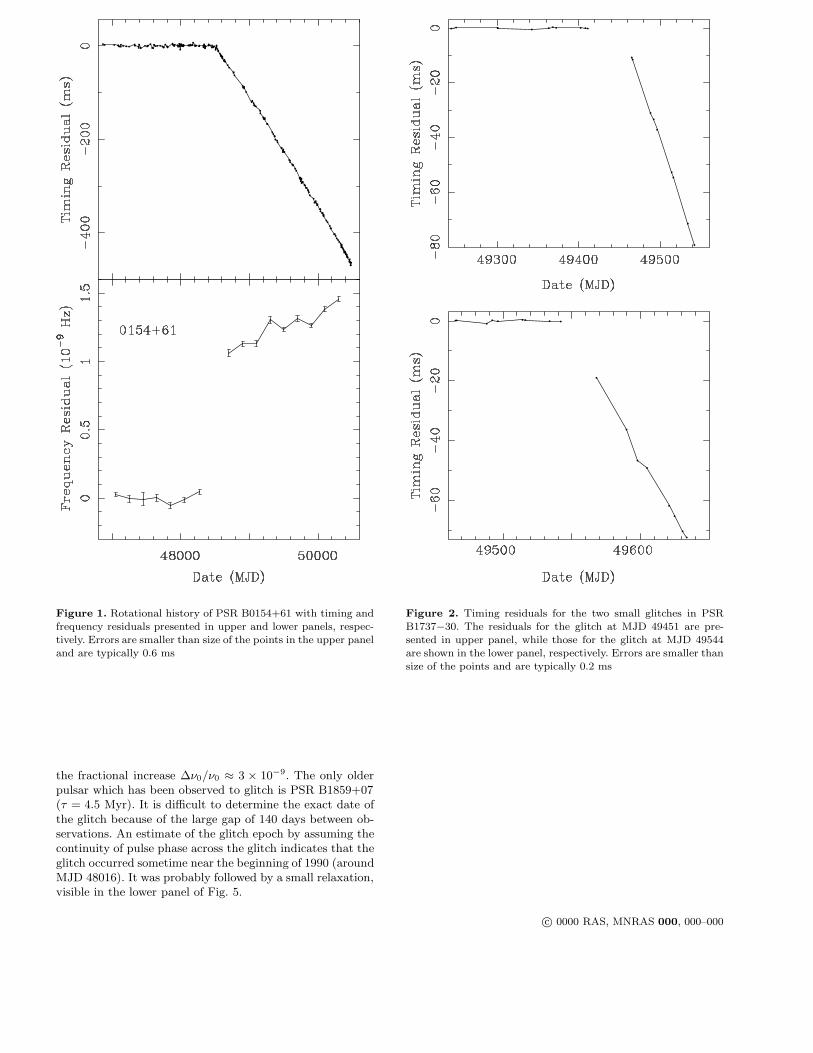
Figure 1. Rotational history of PSR B0154+61 with timing andfrequency residuals presented in upper and lower panels, respec-tively. Errors are smaller than size of the points in the upper paneland are typically 0.6 ms
the fractional increase ∆ν0/ν0 ≈ 3 × 10⁻⁹. The only olderpulsar which has been observed to glitch is PSR B1859+07(τ = 4.5 Myr). It is difficult to determine the exact date ofthe glitch because of the large gap of 140 days between ob-servations. An estimate of the glitch epoch by assuming thecontinuity of pulse phase across the glitch indicates that theglitch occurred sometime near the beginning of 1990 (aroundMJD 48016). It was probably followed by a small relaxation,visible in the lower panel of Fig. 5.
Figure 2. Timing residuals for the two small glitches in PSRB1737−30. The residuals for the glitch at MJD 49451 are pre-sented in upper panel, while those for the glitch at MJD 49544are shown in the lower panel, respectively. Errors are smaller thansize of the points and are typically 0.2 ms
c© 0000 RAS, MNRAS 000, 000–000
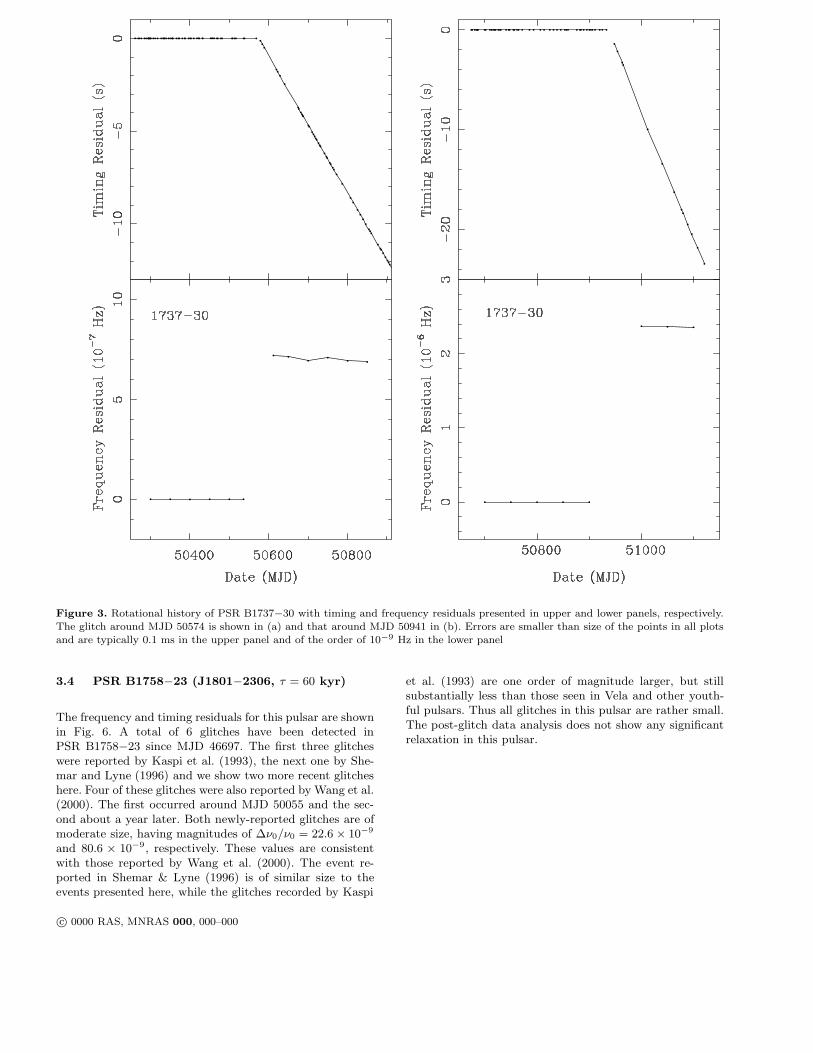
Figure 3. Rotational history of PSR B1737−30 with timing and frequency residuals presented in upper and lower panels, respectively.The glitch around MJD 50574 is shown in (a) and that around MJD 50941 in (b). Errors are smaller than size of the points in all plotsand are typically 0.1 ms in the upper panel and of the order of 10−9 Hz in the lower panel
3.4 PSR B1758−23 (J1801−2306, τ = 60 kyr)
The frequency and timing residuals for this pulsar are shownin Fig. 6. A total of 6 glitches have been detected inPSR B1758−23 since MJD 46697. The first three glitcheswere reported by Kaspi et al. (1993), the next one by She-mar and Lyne (1996) and we show two more recent glitcheshere. Four of these glitches were also reported by Wang et al.(2000). The first occurred around MJD 50055 and the sec-ond about a year later. Both newly-reported glitches are ofmoderate size, having magnitudes of ∆ν0/ν0 = 22.6 × 10⁻⁹
and 80.6 × 10⁻⁹, respectively. These values are consistentwith those reported by Wang et al. (2000). The event re-ported in Shemar & Lyne (1996) is of similar size to theevents presented here, while the glitches recorded by Kaspi
et al. (1993) are one order of magnitude larger, but stillsubstantially less than those seen in Vela and other youth-ful pulsars. Thus all glitches in this pulsar are rather small.The post-glitch data analysis does not show any significantrelaxation in this pulsar.
c© 0000 RAS, MNRAS 000, 000–000
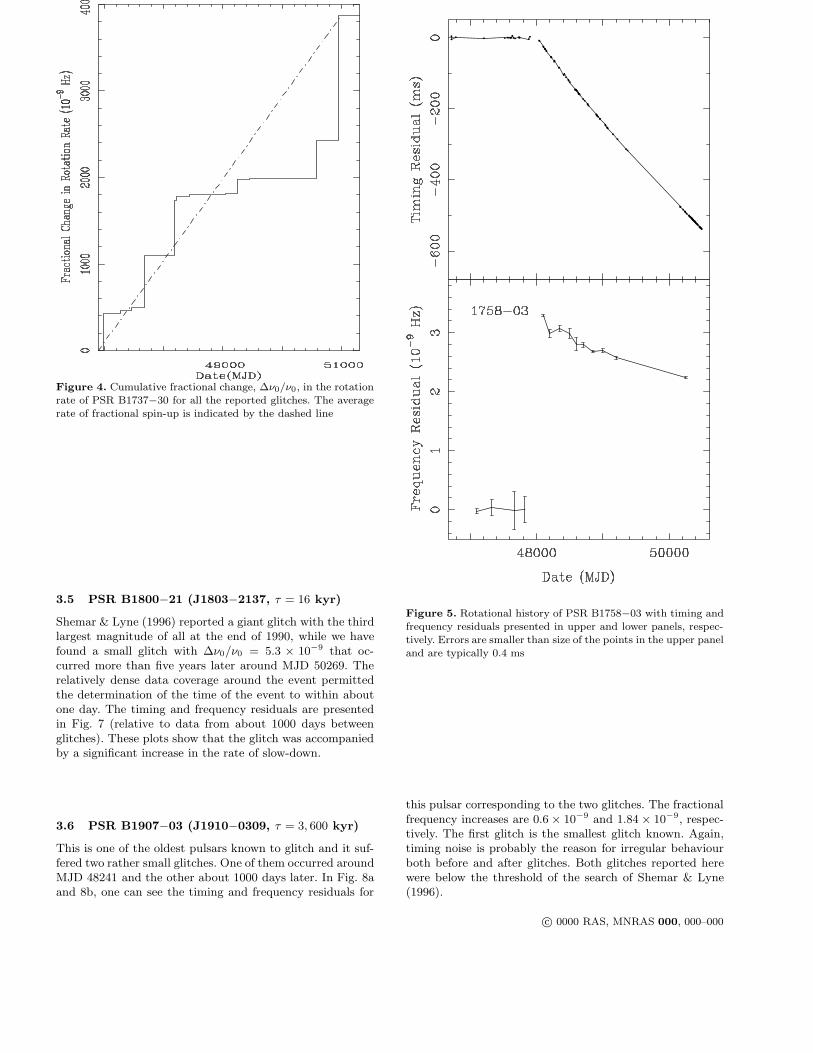
Figure 4. Cumulative fractional change, ∆ν0/ν0, in the rotationrate of PSR B1737−30 for all the reported glitches. The averagerate of fractional spin-up is indicated by the dashed line
3.5 PSR B1800−21 (J1803−2137, τ = 16 kyr)
Shemar & Lyne (1996) reported a giant glitch with the thirdlargest magnitude of all at the end of 1990, while we havefound a small glitch with ∆ν0/ν0 = 5.3 × 10⁻⁹ that oc-curred more than five years later around MJD 50269. Therelatively dense data coverage around the event permittedthe determination of the time of the event to within aboutone day. The timing and frequency residuals are presentedin Fig. 7 (relative to data from about 1000 days betweenglitches). These plots show that the glitch was accompaniedby a significant increase in the rate of slow-down.
3.6 PSR B1907−03 (J1910−0309, τ = 3, 600 kyr)
This is one of the oldest pulsars known to glitch and it suf-fered two rather small glitches. One of them occurred aroundMJD 48241 and the other about 1000 days later. In Fig. 8aand 8b, one can see the timing and frequency residuals for
Figure 5. Rotational history of PSR B1758−03 with timing andfrequency residuals presented in upper and lower panels, respec-tively. Errors are smaller than size of the points in the upper paneland are typically 0.4 ms
this pulsar corresponding to the two glitches. The fractionalfrequency increases are 0.6× 10⁻⁹ and 1.84× 10⁻⁹, respec-tively. The first glitch is the smallest glitch known. Again,timing noise is probably the reason for irregular behaviourboth before and after glitches. Both glitches reported herewere below the threshold of the search of Shemar & Lyne(1996).
c© 0000 RAS, MNRAS 000, 000–000

Figure 6. Rotational history of PSR B1758−23 with timing and frequency residuals presented in upper and lower panels, respectively.The glitch around MJD 50055 is shown in (a) and that around MJD 50363 in (b). Errors are smaller than size of the points in the upperpanels and are typically 0.1 ms
c© 0000 RAS, MNRAS 000, 000–000
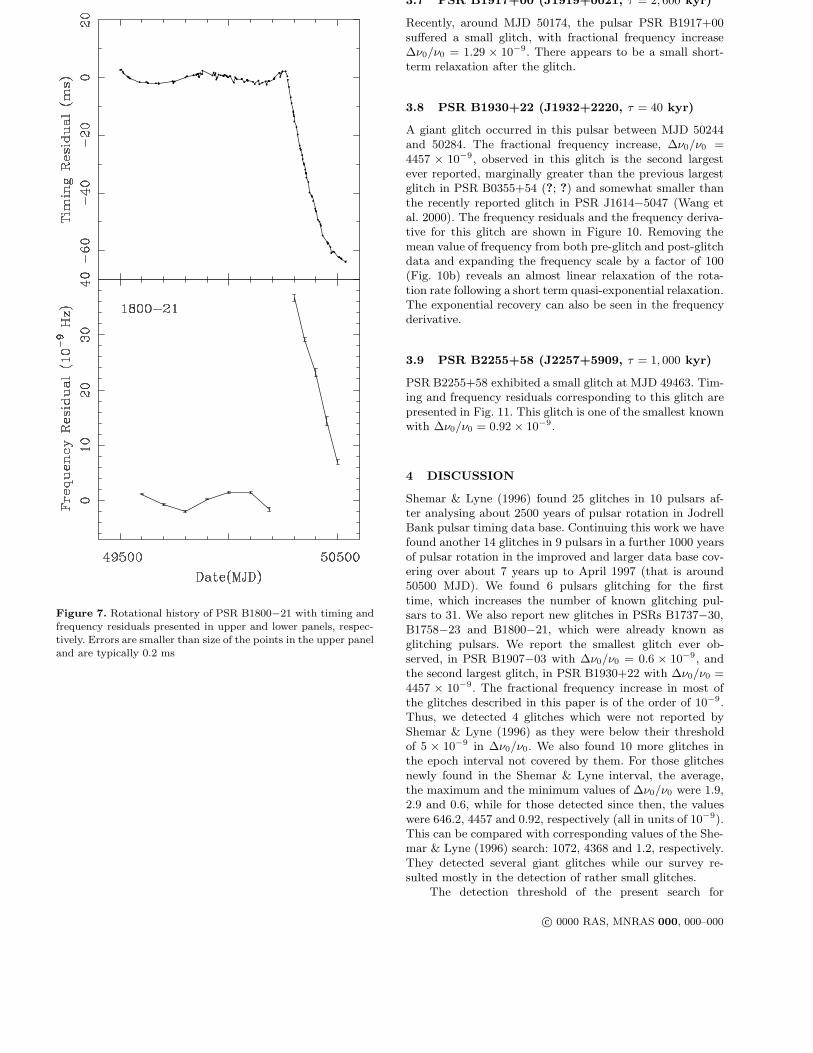
Figure 7. Rotational history of PSR B1800−21 with timing andfrequency residuals presented in upper and lower panels, respec-tively. Errors are smaller than size of the points in the upper paneland are typically 0.2 ms
3.7 PSR B1917+00 (J1919+0021, τ = 2, 600 kyr)
Recently, around MJD 50174, the pulsar PSR B1917+00suffered a small glitch, with fractional frequency increase∆ν0/ν0 = 1.29 × 10⁻⁹. There appears to be a small short-term relaxation after the glitch.
3.8 PSR B1930+22 (J1932+2220, τ = 40 kyr)
A giant glitch occurred in this pulsar between MJD 50244and 50284. The fractional frequency increase, ∆ν0/ν0 =4457 × 10−9, observed in this glitch is the second largestever reported, marginally greater than the previous largestglitch in PSR B0355+54 (?; ?) and somewhat smaller thanthe recently reported glitch in PSR J1614−5047 (Wang etal. 2000). The frequency residuals and the frequency deriva-tive for this glitch are shown in Figure 10. Removing themean value of frequency from both pre-glitch and post-glitchdata and expanding the frequency scale by a factor of 100(Fig. 10b) reveals an almost linear relaxation of the rota-tion rate following a short term quasi-exponential relaxation.The exponential recovery can also be seen in the frequencyderivative.
3.9 PSR B2255+58 (J2257+5909, τ = 1, 000 kyr)
PSR B2255+58 exhibited a small glitch at MJD 49463. Tim-ing and frequency residuals corresponding to this glitch arepresented in Fig. 11. This glitch is one of the smallest knownwith ∆ν0/ν0 = 0.92 × 10⁻⁹.
4 DISCUSSION
Shemar & Lyne (1996) found 25 glitches in 10 pulsars af-ter analysing about 2500 years of pulsar rotation in JodrellBank pulsar timing data base. Continuing this work we havefound another 14 glitches in 9 pulsars in a further 1000 yearsof pulsar rotation in the improved and larger data base cov-ering over about 7 years up to April 1997 (that is around50500 MJD). We found 6 pulsars glitching for the firsttime, which increases the number of known glitching pul-sars to 31. We also report new glitches in PSRs B1737−30,B1758−23 and B1800−21, which were already known asglitching pulsars. We report the smallest glitch ever ob-served, in PSR B1907−03 with ∆ν0/ν0 = 0.6 × 10⁻⁹, andthe second largest glitch, in PSR B1930+22 with ∆ν0/ν0 =4457 × 10−9. The fractional frequency increase in most ofthe glitches described in this paper is of the order of 10−9.Thus, we detected 4 glitches which were not reported byShemar & Lyne (1996) as they were below their thresholdof 5 × 10⁻⁹ in ∆ν0/ν0. We also found 10 more glitches inthe epoch interval not covered by them. For those glitchesnewly found in the Shemar & Lyne interval, the average,the maximum and the minimum values of ∆ν0/ν0 were 1.9,2.9 and 0.6, while for those detected since then, the valueswere 646.2, 4457 and 0.92, respectively (all in units of 10−9).This can be compared with corresponding values of the She-mar & Lyne (1996) search: 1072, 4368 and 1.2, respectively.They detected several giant glitches while our survey re-sulted mostly in the detection of rather small glitches.
The detection threshold of the present search for
c© 0000 RAS, MNRAS 000, 000–000
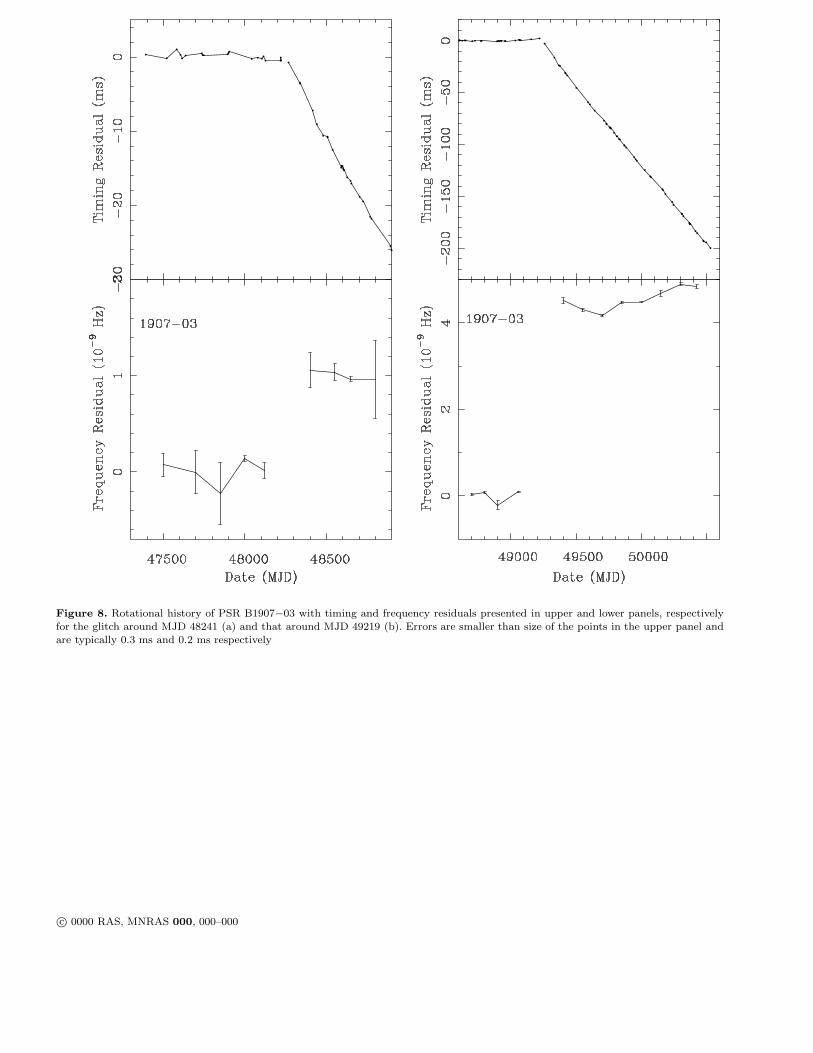
Figure 8. Rotational history of PSR B1907−03 with timing and frequency residuals presented in upper and lower panels, respectivelyfor the glitch around MJD 48241 (a) and that around MJD 49219 (b). Errors are smaller than size of the points in the upper panel andare typically 0.3 ms and 0.2 ms respectively
c© 0000 RAS, MNRAS 000, 000–000
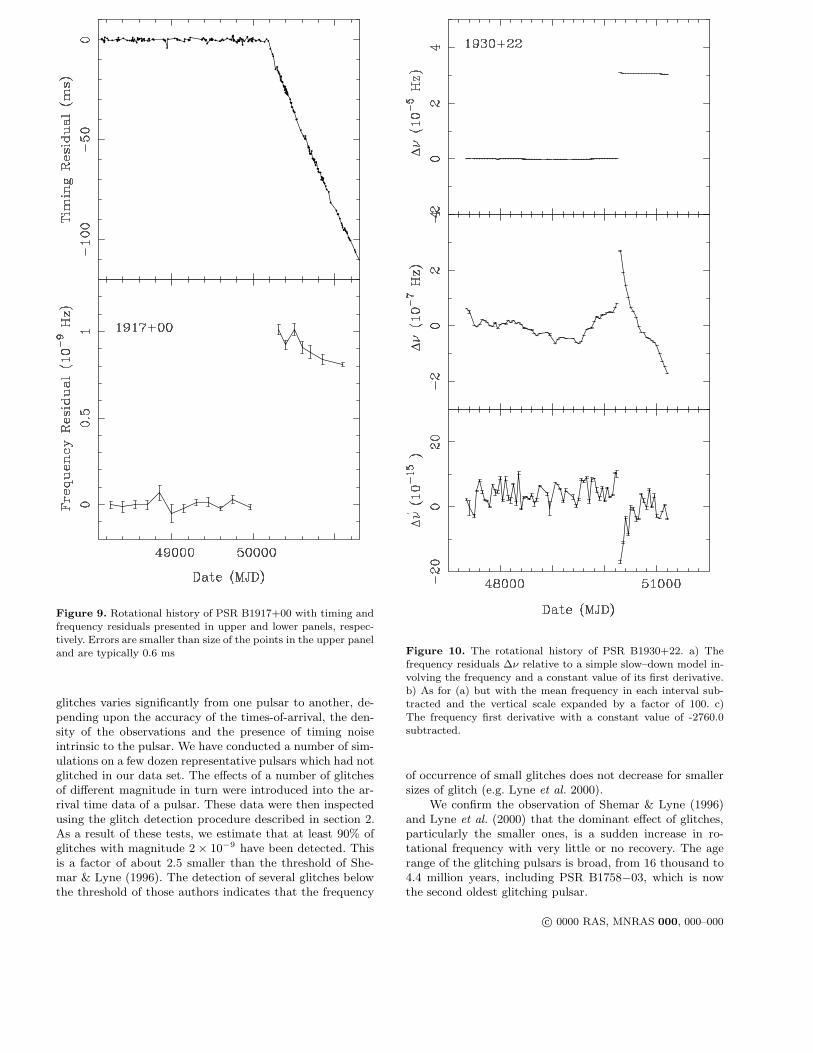
Figure 9. Rotational history of PSR B1917+00 with timing andfrequency residuals presented in upper and lower panels, respec-tively. Errors are smaller than size of the points in the upper paneland are typically 0.6 ms
glitches varies significantly from one pulsar to another, de-pending upon the accuracy of the times-of-arrival, the den-sity of the observations and the presence of timing noiseintrinsic to the pulsar. We have conducted a number of sim-ulations on a few dozen representative pulsars which had notglitched in our data set. The effects of a number of glitchesof different magnitude in turn were introduced into the ar-rival time data of a pulsar. These data were then inspectedusing the glitch detection procedure described in section 2.As a result of these tests, we estimate that at least 90% ofglitches with magnitude 2× 10⁻⁹ have been detected. Thisis a factor of about 2.5 smaller than the threshold of She-mar & Lyne (1996). The detection of several glitches belowthe threshold of those authors indicates that the frequency
Figure 10. The rotational history of PSR B1930+22. a) Thefrequency residuals ∆ν relative to a simple slow–down model in-volving the frequency and a constant value of its first derivative.b) As for (a) but with the mean frequency in each interval sub-tracted and the vertical scale expanded by a factor of 100. c)The frequency first derivative with a constant value of -2760.0subtracted.
of occurrence of small glitches does not decrease for smallersizes of glitch (e.g. Lyne et al. 2000).
We confirm the observation of Shemar & Lyne (1996)and Lyne et al. (2000) that the dominant effect of glitches,particularly the smaller ones, is a sudden increase in ro-tational frequency with very little or no recovery. The agerange of the glitching pulsars is broad, from 16 thousand to4.4 million years, including PSR B1758−03, which is nowthe second oldest glitching pulsar.
c© 0000 RAS, MNRAS 000, 000–000

Figure 11. Rotational history of PSR B2255+58 with timingand frequency residuals presented in upper and lower panels, re-spectively for the glitch around MJD 49463. Errors are smallerthan size of the points in the upper panel and are typically 0.04ms
Acknowledgements This work is supported in part by theKBN Grant 2 P03D 015 12 of the Polish State Committeefor Scientific Research.
c© 0000 RAS, MNRAS 000, 000–000