chandra observations of the young pulsar psr b054069
TRANSCRIPT
arX
iv:a
stro
-ph/
0008
388v
1 2
4 A
ug 2
000
Chandra Observations of the Young Pulsar PSR B0540-69
P. Kaaret1, H.L. Marshall2, T.L. Aldcroft1, D.E. Graessle1, M. Karovska1, S.S. Murray1,
A.H. Rots1, N.S. Schulz2, F.D. Seward1
ABSTRACT
The young pulsar PSR B0540-69 was one of the first targets observed with the ChandraX-Ray Observatory. The high angular resolution of Chandra allows us to resolve the compactnebula surrounding the pulsar. We have determined a position for PSR B0540-69 of R.A. =05h40m11s.221, decl. = −69◦19′54′′.98 (J2000) with a 1σ radial uncertainty of 0.7′′. Combiningour measurements of the pulsar period with previous measurements covering a span of 12 years,we derive a braking index of 2.08. The spectrum of the pulsed emission is consistent with apower-law with a photon index of 1.83 ± 0.13. The compact nebula has a softer spectrum witha photon index of 1.85–2.26.
Subject headings: pulsars: general — pulsars: individual (PSR 0540-69) — stars: neutron — supernovaremnants — X-rays: stars
1. Introduction
PSR B0540–69 is a young, energetic pulsar lo-cated in the Large Magellanic Cloud (LMC) anddiscovered in soft x-rays using the Einstein ob-servatory (Seward, Harnden, & Helfand 1984).The pulsar is similar to the Crab pulsar in pe-riod, 50 ms versus 33 ms for the Crab, charac-teristic spin-down age, 1600 yr versus 1240 yr,and spin-down power, 1.5 × 1038 erg s−1 versus4.7 × 1038 erg s−1. Comparison of detailed obser-vations of PSR B0540–69 versus those of the Crabshould be a useful test of models of young pulsars,their evolution, and their associated nebulae.
Due to the large distance to the LMC, PSRB0540–69 is a faint source. While it has been beenobserved in the x-ray, optical, and radio, relativelylong observations on large telescopes are requiredto obtain good signal to noise and, thus, observa-tional coverage is spotty. Previous observations ofPSR B0540–69 have led to discordant ephemeridesand significant disagreements about the braking
1Harvard-Smithsonian Center for Astrophysics, 60 Gar-
den St., Cambridge, MA 02138, USA2Center for Space Research, Massachusetts Institute of
Technology, Cambridge, MA 02139, USA
index.
Here, we present an analysis of early ChandraX-Ray Observatory observations of PSR B0540–69 made using both the High Resolution Camera(HRC; Murray et al. 1997) and the ACIS imag-ing camera (ACIS-I; Bautz et al. 1998). An earlyanalysis of the HRC data has been previously de-scribed in Gotthelf & Wang (2000) which reportedon the morphology of the spatially resolved neb-ula near the pulsar and outer shell of the remnant.Here, we analyze the HRC data with an improvedaspect solution needed to obtain the correct po-sition for PSR B0540–69 and to remove artifactspresent in the initial processing of the data. Inaddition, we present results on the x-ray spectrumof the pulsar, the compact nebula, and the outerremnant from an analysis of the ACIS data. Wedescribe the observation and our analysis in §2.We present results on the source location, the pul-sar period history, the extent of the nebula, andthe spectrum of the emission in §3. We concludein §4.
2. Observations and Analysis
PSR B0540–69 was observed with the Chan-dra X-Ray Observatory (CXO; Weisskopf 1988)
1
during the verification and checkout phase on 31August 1999 using the High Resolution Camera(HRC; Murray et al. 1997) for a total of 18 ksof good observing time and on 26 August 1999using the ACIS imaging camera (ACIS-I) for a to-tal of 20 ks of good observing time. All obser-vations employed the High-Resolution Mirror As-sembly (HRMA; van Speybroeck et al. 1997).
The absolute time calibration of Chandra hasnot been finalized. For this reason, we use only fre-quency measurements in the analysis below. Theaccuracy of the relative time-tagging within anobservation is determined by the spacecraft clockwhich is stable to better than one part in 109 overone day (Chandra Observatory Proposer’s Guide).The conversion to a barycentric time frame intro-duces an additional frequency uncertainty of lessthan 2×10⁻⁹ in these observations. Thus, the ac-curacy of the barycentric frequency determinationis more than sufficient for the frequency analysispresented below.
2.1. HRC Analysis
The HRC is a microchannel plate imager hav-ing very good spatial and time resolution, but es-sentially no energy resolution. Each photon de-tected by the HRC is time tagged with a precisionof 16 µs and position tagged with a precision of0.132′′. This makes possible time-resolved imag-ing studies. After launch, an error was found inthe HRC wiring which causes the event time tagto actually contain the time of the previous eventtrigger (Seward 2000). Without correction, thisleads to an timing error equal to the time betweensuccessive event triggers. The event trigger rateis typically 250–300 s−1, leading to a typical er-ror of 3–4 ms. A special operating mode for theHRC has been developed in which all event trig-gers are telemetered to the ground and the timingerror can be eliminated by shifting of event timetags. However, in the HRC observation reportedhere, not all event triggers result in valid eventstelemetered to the ground and correction of theevent times is not possible in all cases. Thus, theevent times contain typical errors of 3–4 ms. Thiserror is small relative to the 50 ms period of PSRB0540–69 and does not significantly affect the pe-riod determination or the pulsed-phased resolvedimaging presented below.
This observation of PSR B0540–69 was only the
third observation made with the HRC of a celes-tial source and was performed before the correctfocus position of the HRC was determined. Dur-ing this observation, the HRC was displaced by260 µm from the true focus. This defocuses theimage of an ideal point source, ignoring mirror andaspect imperfections, to an annulus with inner andouter radii of 0.17′′ and 0.33′′.
We applied aspect to X-ray events from theHRC using a version of the Chandra X-Ray Obser-vatory Center (CXC) aspect pipeline (R4CU5, 11-Jan-2000) which utilizes elliptical Gaussian cen-troiding. Use of the improved aspect solution iscritical to obtain correct positions. The relativeaspect reconstruction within the observation waschecked by using the aspect solution for this obser-vation to de-dither the optical guide star centroids.This is similar to the process used to apply as-pect correction to x-ray events. We found no sys-tematic residuals in the de-dithered star images,leading us to conclude that relative aspect duringthe observation is stable to within 0.3′′. The ab-solute accuracy of the aspect reconstruction wastested using a series of observations of 8 HRC-I observations of known x-ray point sources withidentified optical counterparts with very accurateastrometry (Aldcroft et al. 2000). In each case,the derived X-ray source position was comparedwith the known counterpart position to derive thecelestial location error. The absolute source coor-dinate uncertainty is 0.7′′ (1σ radial error).
The data were filtered using event screen-ing techniques (Murray et al. 2000) to eliminate“ghost” events produced by the HRC electronics(Dobrzycki 2000). Screening to eliminate “ghost”events is particularly important due to the bright-ness of PSR B0540–69. The screening removesimage artifacts which could have been incorrectlyinterpreted as features of the x-ray emission.
We extracted an image which shows the pul-sar as a bright point source surrounded by nebu-lar emission with a roughly elliptical shape withan extent of a few arc-seconds. We used cen-troiding as implemented in the standard Chan-dra software routine celldetect to determine theposition of the point source (CIAO V1.1 SoftwareTools Manual). The coordinates found are R.A. =05h40m11s.168, decl. = −69◦19′55′′.12 (J2000).
These coordinates were used to perform an ini-tial barycentric correction employing the JPL DE-
2
405 ephemeris. We searched for pulsations usingthe Z2 statistic also known as the Rayleigh test(e.g. Buccheri, Ozel, & Sacco 1987). As the pulseprofile of PSR B0540–69 is known to be roughlysinusoidal (Seward et al. 1984), we used only thefirst order Z2 statistic. Pulsations were easily de-tected from PSR B0540–69.
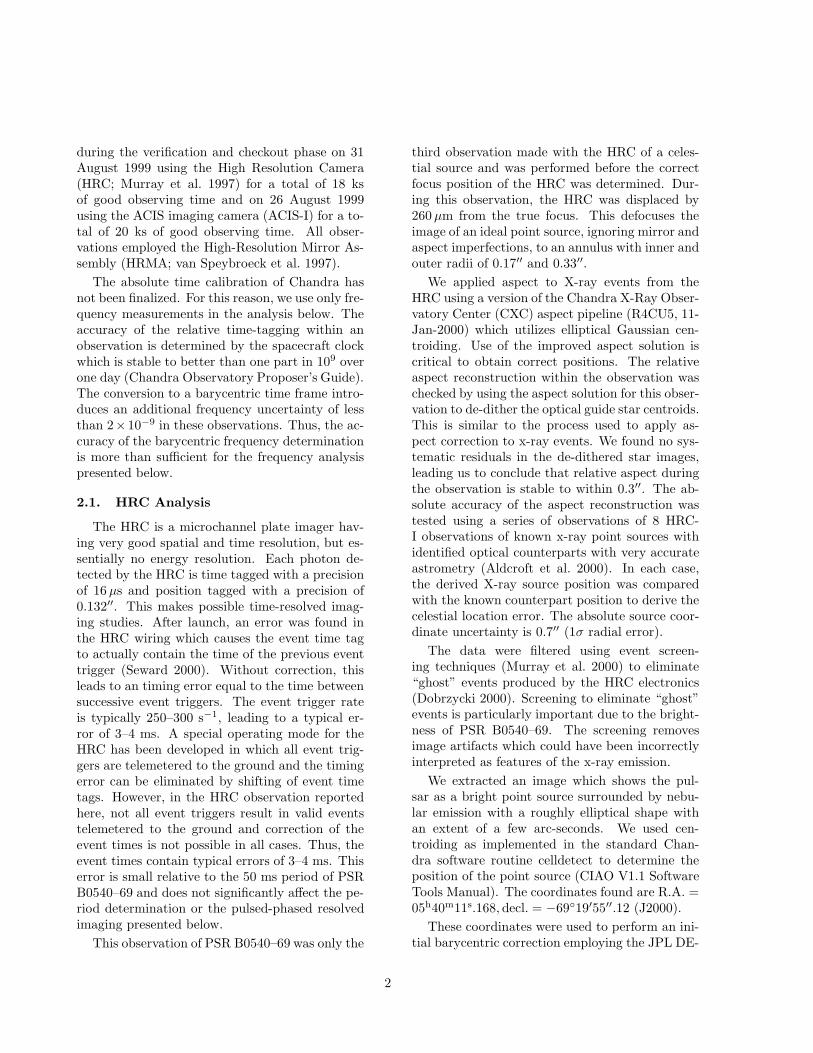
As the diffuse emission from the nebula sur-rounding PSR B0540–69 may affect the positiondetermination, we created a difference image toisolate the pulsed source. We made a “pulsar-on” image using photons taken from an intervalof 0.5 in phase with an offset chosen to maximizethe number of photons selected, and a “pulsar-off”image from the remaining data. The “pulsar-off”image was subtracted from the “pulsar-on” imageto obtain the difference image. All x-ray sources,in particular the constant nebular emission, notpulsed at the folding frequency are removed bythis procedure. The difference image shows only asingle point source.
We note that the “pulsar-off” image does con-tain some pulsar emission because the pulse pro-file is roughly sinusoidal (Seward et al. 1984) andis not zero during the full 0.5 in phase of the“pulsar-off” image. The HRC timing error causessome additional pulsar photons to be shifted intothe “pulsar-off” image, but the effect is relativelysmall since the timing error of 3–4 ms is small com-pared to the phase bin size of 25 ms. The pres-ence of some pulsar emission in the “pulsar-off”image reduces the amplitude of the pulsar peak inthe difference image. However, we found that thedifference image still contains a highly significantpeak at the pulsar position and that use of themaximum size phase bins was advantageous in re-ducing image noise away from the peak where thephoton statistics are much lower. We also notethat the timing error produces a very small netshift of nebular photons into the “pulsar-on” im-age. If the timing error were simply a randomnumber added to the time tag, then the net shiftwould be zero since the number of nebular pho-tons moved from the “pulsar-off” image into the“pulsar-on” image would equal the number movedin the opposite direction. However, since the er-ror is actually a shift of time tags, the fact thatthe event trigger rate is slightly higher during the“pulsar-on” interval (by a factor equal to the pul-sar count rate divided by average total event trig-
4 2 0 -2 -4arcsecond
-4
-2
0
2
4
arcs
econ
d
N
cc
Fig. 1.— Contour plots of emission from PSRB0540–69. The solid contours are the “pulsar-off”phase interval and the dotted are the differenceimage. The cross is the pulsar position. Both im-ages were smoothed with a Gaussian with FWHM= 0.7′′. The contour levels are 0.1, 0.3, 0.5, 0.7,and 0.9 of the peak pixel. The dashed line andarrow labeled “cc” indicate the orientation of theACIS image.
ger rate or roughly 0.3%) produces a net shift. Weestimate that the net shift of nebular photons intothe “pulsar-on” image is less than 0.05%.
Using the position obtained from this differenceimage, we performed a second barycentric correc-tion and selected events within a circle with a ra-dius of 9 HRC pixels (1.1′′) around the differenceimage position. We again searched for pulsationsand found a strongly significant pulsation signal at19.7988001(21) Hz at epoch MDJ 51421.6240; thedigits in parentheses indicate the 1σ uncertainty.
We made a second difference image using thisbest period, see the dotted contours in Fig. 1. Theposition of the source in the two difference imagesagree within 0.3 pixel = 0.04′′. The position fromthe final image is R.A. = 05h40m11s.221, decl. =−69◦19′54′′.98 (J2000). The position uncertaintyis dominated by the accuracy of the aspect recon-struction which we take to be 0.7′′ (1σ radial er-ror). For the difference image, 50% of the fluxis contained with a diameter of 1.3′′. This is sig-nificantly larger than the half-power diameter of
3
0.76′′ measured for AR Lac in calibration observa-tions made to determine the on-orbit point spreadfunction (Jerius et al. 2000), but is consistent withthe expected combined effects of the HRMA point-spread function given the harder spectrum of PSRB0540–69, the relative aspect accuracy measuredfor this observation, the position resolution of theHRC, and the defocusing.
2.2. ACIS Analysis
The ACIS-I camera consists of an array of 4front-illuminated charged coupled devices (CCDs).The physical pixel size is 0.24 µm which at theaim-point of the telescope is comparable to the0.5′′ spatial resolving power of the HRMA. EachCCD contains 1024× 1024 pixels organized into 4readout nodes each of which reads out 1024 rowsand 256 columns of pixels. The pulsar was posi-tioned at the aimpoint of the telescope, which isabout 960 rows away from the readout node onACIS-I device I3. The pulsar and its surround-ing nebula fit very well onto node 3 of device I3,therefore we use only this node in our analysis.The ACIS flight software was set to an on-boardprocessing mode that retains the 3× 3 pixel eventisland.
In order to have sufficient time resolution to re-solve the pulses from PSR B0540–69, the ACIS-Iwas operated in continuous clocking mode (“cc-mode”). In this mode, charge is continually shiftedbetween successive pixels in each row and the pixelat the base of each row is read out after eachcharge transfer. This leads to acquisition of a one-dimensional image each 3.1 ms. The 1-d imageintegrates flux along the readout direction. Thetime of arrival of each photon must be calculatedfrom the time of readout and the (unknown) posi-tion of arrival along the readout direction dividedby the speed of pixel transfer along the readoutdirection.
The data on ground were manually processedthrough the standard CXC pipelines into CXClevel 1 event lists. As software for the analysis ofcc-mode data is not currently available from theCXC, we further processed the ACIS-I data us-ing custom IDL procedures. The pointing direc-tion was transformed to the spacecraft coordinateframe (sy, sz, in detector pixels) so that the eventpositions could be corrected for dither in the detec-tor x direction only via xp = xt + S ∗ δx(ti) + xr,
6 4 2 0 -2 -4 -6Arcsec from pulsar
0
2000
4000
6000
8000
10000
Cou
nts
per
0.2"
bin
40 20 0 -20 -40Arcsec from Pulsar
1
10
100
1000
10000
Cou
nts
per
0.2"
bin
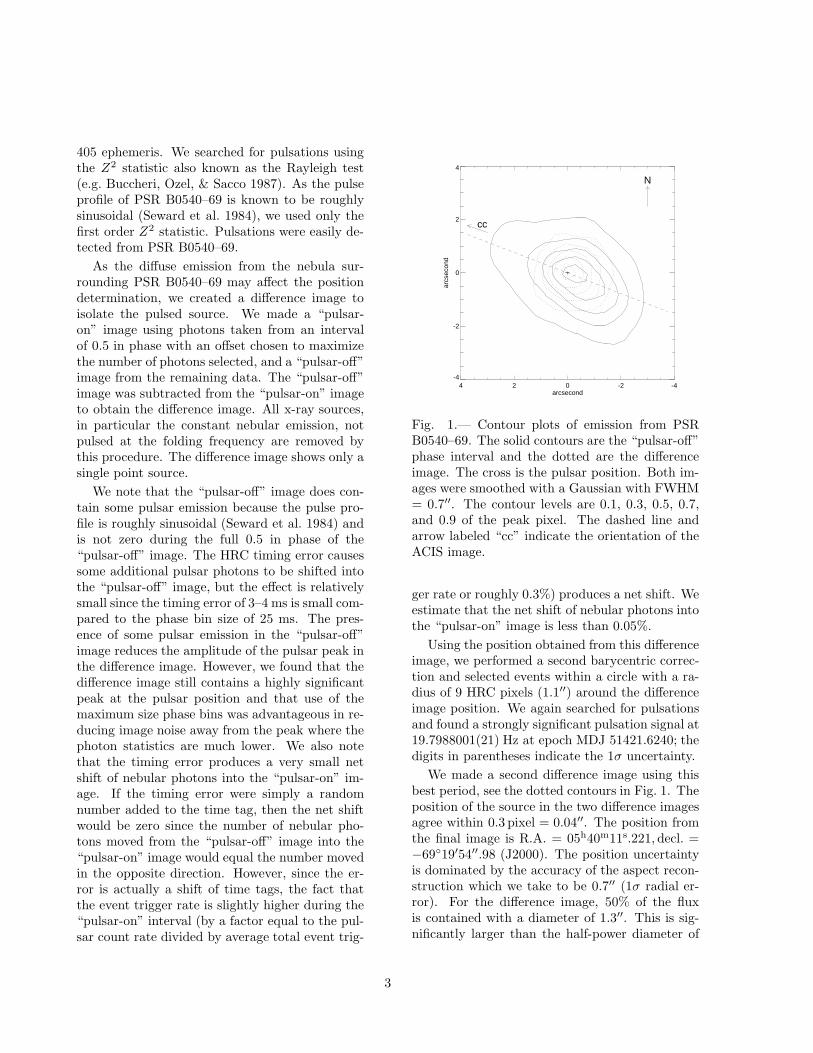
Fig. 2.— One-dimensional images from ACIS-Icc-mode data. The top panel shows two imageprofiles. The solid curve shows events with pulsephases between 0.1 and 0.3 where the pulse is max-imum and the dashed curve shows phases 0.6 to0.8 where the pulse is at minimum. The bottompanel shows the overall profile. The dotted linesindicate the various regions used in the spectralanalysis.
where xp is the position of the event projectedalong a line on the sky (at a position angle of66.97◦), xt is the event coordinate in “tiled” co-ordinates (tdetx), S is the sign of the correctionfor dither (-1 for chips I1 and I3 and +1 for chipsI0 and I2), and xr is a random variable between-0.5 and 0.5 that reduces effects of aliasing. Thespacecraft dither and optical bench distortions areaccounted in the term δx(t), which is the derivedfrom interpolating δx(t) = sz(t)−dzSIM (t), wheredzSIM (t) gives the motion of the science instru-ment module (SIM) measured by the on-boardfiducial lights.
The histogram of the xp values, i.e. the one-dimensional image perpendicular to the readoutdirection, is shown in Fig. 2. For this observa-tion, the 1-d image is along a positive angle of67◦, or approximately ENE, as indicated on theHRC image in Fig. 1. We define the angle alongthe 1-d image as positive to the ENE. A referencepoint is computed by fitting a narrow Gaussian
4
to the brightest pixels, assuming that the syn-chrotron nebula provides a simply sloping back-ground. The profile of the pulsar is well fitted bya Gaussian with a dispersion of 0.30′′, which isconsistent with the telescope point spread func-tion (PSF). The coordinates in Fig. 2 are relativeto the fitted peak position. The sharp peak of thepulsar is flanked by the integrated image of thecompact nebula. The compact nebula brightnessdistribution peaks to the SW from the pulsar po-sition and declines rapidly further SW after thepeak. The brightness falls off more slowly towardthe NE. The compact nebula gives way to a morediffuse remnant, the outer supernova remnant, atabout 5′′ from the pulsar. The diffuse emissionextends to ∼ 35′′ in one direction and is truncatedby a chip gap at 50′′ from the pulsar in the otherdirection.
The event times were constructed using theevent row numbers, yi, an interpolation of thedither and SIM correction, δy(t) = sy(t) −
dySIM (t); the ACIS exposure time to UT lookuptable, tUT (e); the geocenter and solar systembarycenter corrections, dt⊕ and dt⊙; and a ran-dom variable, yr, between 0 and 1 that reduceseffects of aliasing: tTT,i = tUT (ei) + tf (yi +yr) + (tTT − tUT ), where the last term is sim-ply a constant for this observation (64.184 s),tf is the average detector frame shift time inephemeris time units (about 0.00284996 s). Theexposure time to UT lookup table should be ac-curate to less than 1 msec. Finally, the timescorrected to the solar system barycenter (TCB)are ti = tTT,i − δy(tTT,i)+dt⊕(tTT,i)+dt⊙(tTT,i).
We have found that an additional 5 s must beadded to tUT,i in order to match the TT timescomputed for the aspect data. The 5 s offset isa data processing anomaly that has not been ex-plained fully so we merely report that it exists.Specifically, the offset is needed to bring the time-tagged aspect data into concurrence with the time-tagged photon events. Since we believe that theaspect data have “correct” times (based on dataprocessing of other instrument configurations), wehave adjusted the event times. We can state thatthis 5 s offset is good to about 1 s and that it hasnot changed across the observation at this level.More importantly, different cc-mode observations,even ∼ 50 days later, give the same value of theshift to within 1 s, thus the secular variation in
the offset is no larger than 3× 10⁻⁷. If there werea secular drift of this timing offset at this level,then it would produce a 5 ms timing error acrossthe ACIS observations and lead to an error on theperiod roughly twice the statistical error quotedbelow. We use this larger error in the ephemerisfit described below. The barycenter timing correc-tion changes by only 60 ms across the ACIS ob-servation and is approximately quadratic in form,thus a 5 s timing uncertainty produces an uncer-tainty of less than 1.4 × 10⁻⁹ on the barycenterfrequency correction.
The events within 0.7′′ of the peak in thexp distribution were Fourier transformed to ob-tain the candidate pulse frequency and the bestestimate was determined from pulse folding:19.7988900(30) Hz. Two imaging profiles wereobtained by selecting from phases 0.6 to 0.8 wherethe pulse is at a flat minimum, and phases 0.1 to0.3 where the pulse is nearly level at maximum.These two image profiles, along with the profile ofall the emission, are shown in Fig. 2.
2.2.1. Spectral analysis
The observation took place in a period wherethe ACIS instrument experienced large changes inthe spectral response due to low energy cosmicproton impacts. This resulted in a significantlyincreased charge transfer inefficiency (CTI). Thishas two effects on the spectral response. First,the energy scale changes due to charge loss thatis not recovered during the readout, and, second,the introduction of additional electron noise dueto enhanced charge trapping worsens the spectralresolving power.
The focal plane temperature of the device atthe time of the observation was -100◦ C. Unfortu-nately, during this period of change there are noresponse matrices available at a focal plane tem-perature of −100◦ C. However, there are calibra-tion products available for a focal plane temper-ature of −110◦ C. Calibration data indicate thatthroughout most of the energy scale the change inCTI with focal plane temperature is fairly linear.The change in spectral resolution is then assumedto be linear as well. Calibration data also indi-cate how CTI changed during the period of degra-dation. By estimating the change in energy scaledue to CTI as well as taking in account the energyscale shift implied by the temperature change from
5
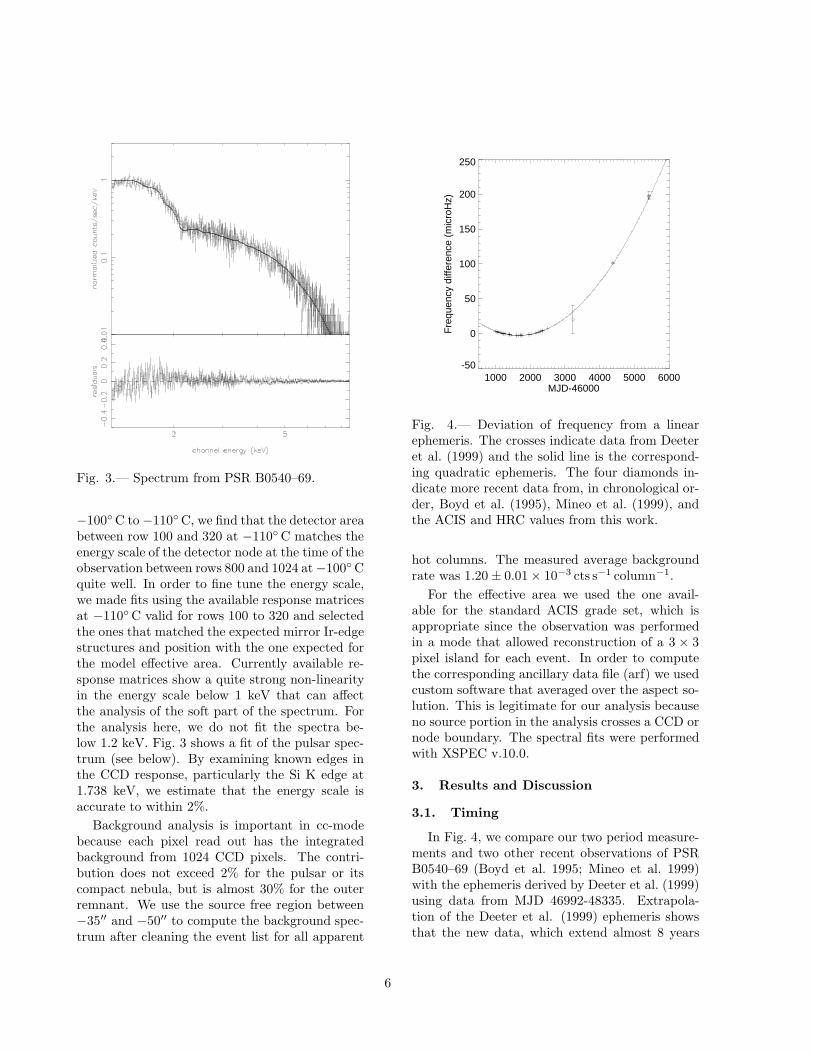
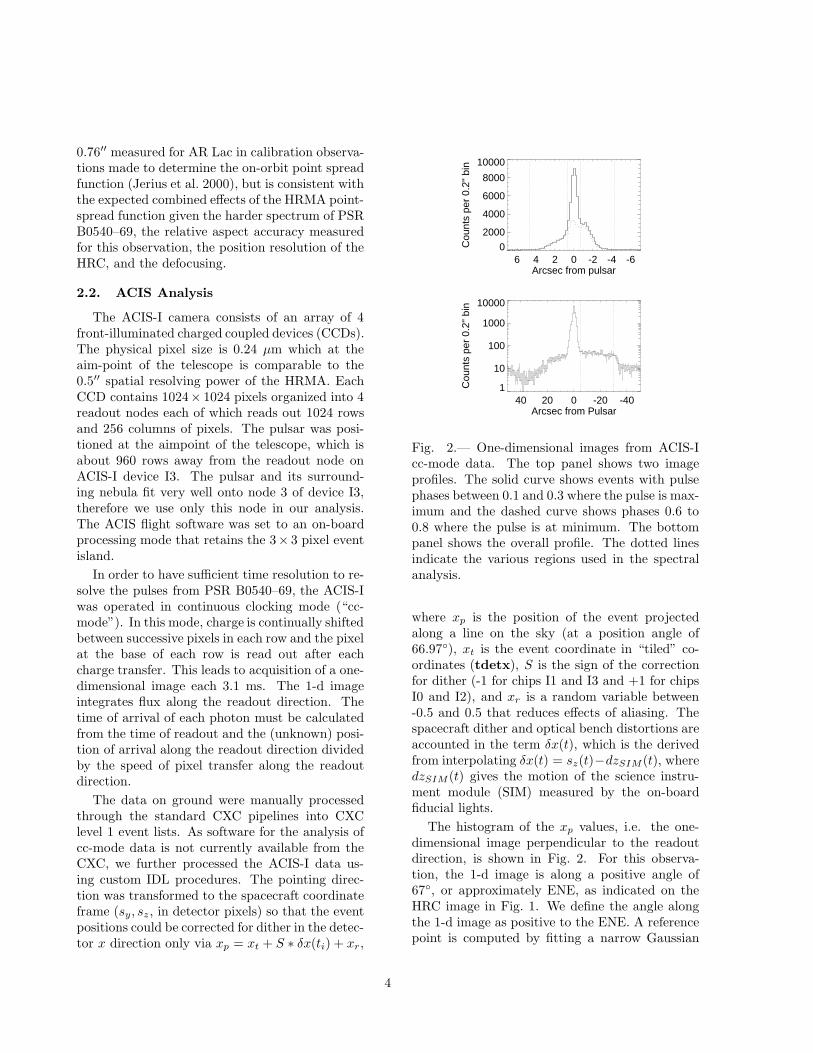
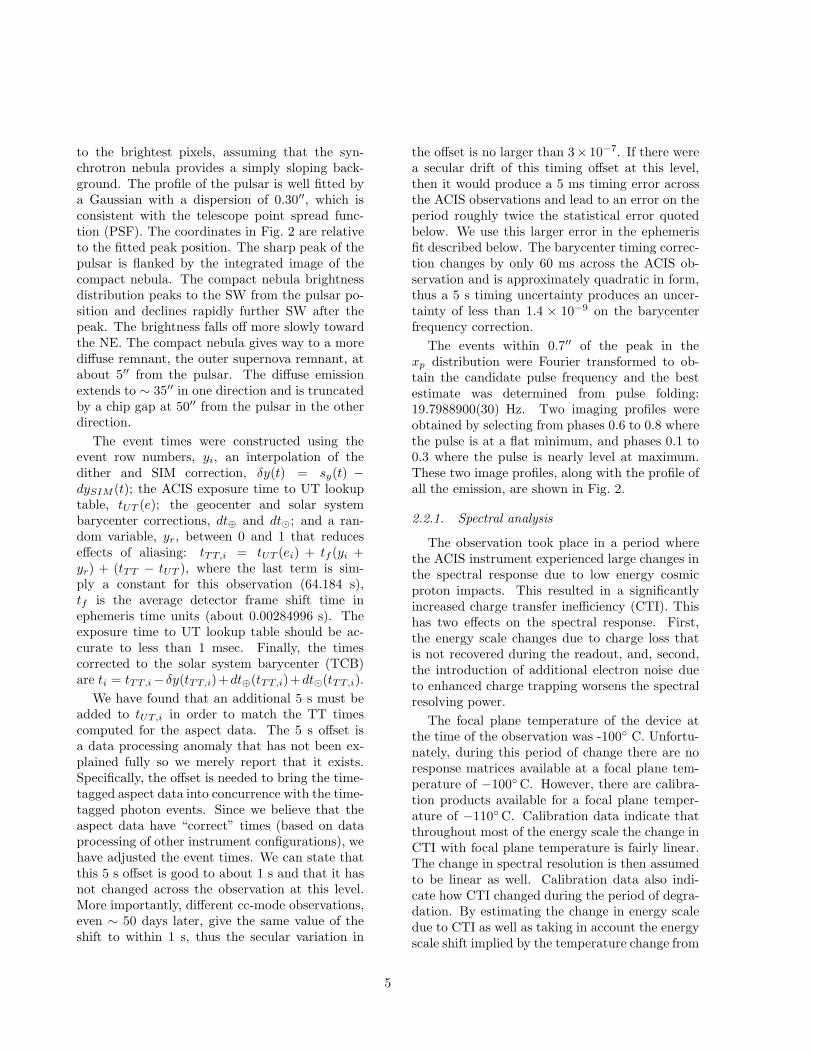
Fig. 3.— Spectrum from PSR B0540–69.
−100◦ C to −110◦ C, we find that the detector areabetween row 100 and 320 at −110◦ C matches theenergy scale of the detector node at the time of theobservation between rows 800 and 1024 at −100◦ Cquite well. In order to fine tune the energy scale,we made fits using the available response matricesat −110◦ C valid for rows 100 to 320 and selectedthe ones that matched the expected mirror Ir-edgestructures and position with the one expected forthe model effective area. Currently available re-sponse matrices show a quite strong non-linearityin the energy scale below 1 keV that can affectthe analysis of the soft part of the spectrum. Forthe analysis here, we do not fit the spectra be-low 1.2 keV. Fig. 3 shows a fit of the pulsar spec-trum (see below). By examining known edges inthe CCD response, particularly the Si K edge at1.738 keV, we estimate that the energy scale isaccurate to within 2%.
Background analysis is important in cc-modebecause each pixel read out has the integratedbackground from 1024 CCD pixels. The contri-bution does not exceed 2% for the pulsar or itscompact nebula, but is almost 30% for the outerremnant. We use the source free region between−35′′ and −50′′ to compute the background spec-trum after cleaning the event list for all apparent
1000 2000 3000 4000 5000 6000MJD-46000
-50
0
50
100
150
200
250
Fre
quen
cy d
iffer
ence
(m
icro
Hz)
Fig. 4.— Deviation of frequency from a linearephemeris. The crosses indicate data from Deeteret al. (1999) and the solid line is the correspond-ing quadratic ephemeris. The four diamonds in-dicate more recent data from, in chronological or-der, Boyd et al. (1995), Mineo et al. (1999), andthe ACIS and HRC values from this work.
hot columns. The measured average backgroundrate was 1.20 ± 0.01 × 10⁻³ cts s−1 column−1.
For the effective area we used the one avail-able for the standard ACIS grade set, which isappropriate since the observation was performedin a mode that allowed reconstruction of a 3 × 3pixel island for each event. In order to computethe corresponding ancillary data file (arf) we usedcustom software that averaged over the aspect so-lution. This is legitimate for our analysis becauseno source portion in the analysis crosses a CCD ornode boundary. The spectral fits were performedwith XSPEC v.10.0.
3. Results and Discussion
3.1. Timing
In Fig. 4, we compare our two period measure-ments and two other recent observations of PSRB0540–69 (Boyd et al. 1995; Mineo et al. 1999)with the ephemeris derived by Deeter et al. (1999)using data from MJD 46992-48335. Extrapola-tion of the Deeter et al. (1999) ephemeris showsthat the new data, which extend almost 8 years
6
Table 1
Spin Parameters for PSR 0540–69.
Parameter Value
t0 (MJD) 47700.0ν0 (Hz) 19.8593584982(40)ν0 (10−10 Hz s−1) -1.8894081(7)ν0 (10−21 Hz s−2) 3.7425(43)n (braking index) 2.0820(24)
Note.—Numbers in parentheses are 1σ
errors in the last quoted digits.
beyond the data used to derive the ephemeris, dif-fer by at most 2σ from the predicted frequencies.We interpret this as a strong indication that thetiming solution found by Deeter et al. (1999) isaccurate. Both Chandra frequencies are consis-tent, within the 1σ errors, with the extrapolationof the Deeter et al. (1999) ephemeris. The HRCfrequency measurement is within 1.9× 10⁻⁶ Hz ofthe predicted value and suggests that no large per-sistent offsets in pulse frequency or its first deriva-tive occurred during the 8 year interval. However,we are unable to rule out small persistent offsets∆ν < 2× 10⁻⁶ Hz or ∆ν < 8× 10⁻¹⁵ Hz s−1, sim-ilar to those reported by Deeter et al. (1999).
We combined our frequency measurements withthose of Boyd et al. (1995), Mineo et al. (1999),and Deeter et al. (1999; specifically the frequencydata used to derive the ephemeris and markedwith note 5 in Table 4) to derive the ephemerisin Table 1. The ephemeris is consistent, withinerrors, with that of Deeter et al. (1999). We finda braking index of n = 2.0820± 0.0024 (1σ uncer-tainty) at an epoch 47700 MJD. This braking in-dex is much lower than the index of 3 expected forenergy loss via electromagnetic dipole radiationand is significantly lower than the indices mea-sured for the Crab pulsar or PSR 1509-58. Thelow value of the braking index may be due to apulsar wind (Manchester & Peterson 1989; Na-gase et al. 1990). The synchrotron nebula mayprovide information on the properties of the pul-sar wind and it would be of interest if the prop-erties of nebulae surrounding young pulsars could
be related to their braking indices. Other possiblereasons for the low value of the braking index aredistortion of the magnetic field lines (Manchester& Taylor 1977), or a time-varying magnetic fieldstrength (Blandford & Romani 1988). Continuedpulse timing of PSR B0540–69 should make it pos-sible to distinguish amongst these alternatives.
3.2. Position
Positions for PSR B0540–69, or its opticalcounterpart, have been reported by Seward etal. (1984) from X-ray imaging, by Deeter et al.(1999) from X-ray and optical timing, by Caraveoet al. (1992) and Schmidtke et al. (1999) from op-tical imaging, and by Shearer et al. (1994) fromtime-resolved optical imaging. Our position is ingood agreement with those of Schmidtke et al.(1999) and Shearer et al. (1994) and marginallyconsistent with that of Caraveo et al. (1992). Theresults of Shearer et al. (1994) indicate that thepulsar may be slightly displaced from the maxi-mum in the steady optical emission identified withthe pulsar by Caraveo et al. (1992) in a directionwhich would improve the agreement with our po-sition measurement. Our HRC position for PSRB0540–69 lies 2.6′′ from the original X-ray posi-tion reported by Seward et al. (1984), althoughwithin the 90% confidence error box. Our posi-tion is 1.8′′ from the position derived from X-raytiming measurements with the Ginga satellite byDeeter et al. (1999). Interestingly, the Deeter etal. (1999) position agrees very well with the otherpositions determinations in declination, but is sig-
7
nificantly displaced from all the other positions inR.A. The location of PSR B0540–69 less than 4◦
from the ecliptic pole may lessen the accuracy ofthe determination of its R.A. from pulse timing.
Because a shift of 2.6′′ in source position will in-duce an annual sinusoidal variation in the barycen-tric pulse arrival times with an amplitude of sev-eral milliseconds, an accurate position is criticalwhen performing a pulse time of arrival (TOA)analysis. Most timing studies of PSR B0540–69have used the original X-ray position and shouldbe reconsidered in light of the more accurate po-sition reported here. In particular, the previousposition uncertainty may have contributed to thedisparate range of braking indices found for PSRB0540–69. Also, the decreased uncertainty in theposition may improve the evidence presented forthe detection of timing noise in PSR B0540–69(Eikenberry, Fazio, & Ransom 1998).
3.3. Nebula
We found a 0.35′′ displacement between thecentroid of the total x-ray emission near PSRB0540–69 and the pulsar itself. This relative dis-placement is significant and represents a physicaloffset between the pulsar and the peak x-ray emis-sion in the nebula similar to the offset seen in theCrab nebula versus pulsar.
The difference image, which isolates the pre-sumably point-like pulsar emission, provides anindication of the point-spread function for a pointsource including the finite resolution of the HRMAand HRC, the effects of the aspect errors, and thefocusing error described above. Comparison of thedifference image and the “pulsar-off” image, whichhighlights the nebular emission by reducing – butnot fully eliminating – the pulsar emission, showsthat the nebula is spatially extended and has acentroid which is slightly WSW from the pulsar,see Fig. 1 in which the dotted contours representthe difference image and the solid contours repre-sent the “pulsar-off” image.
To estimate the true extent of the nebula, weperformed an image deconvolution using the differ-ence image described above to represent the tele-scope point-spread function including the effects ofaspect errors and defocusing. We deconvolved anHRC image binned to 0.26′′ resolution using thestandard Richardson-Lucy technique (Richardson
2 1 0 -1 -2
2 1 0 -1 -2
-2
-1
0
1
2
-2
-1
0
1
2
1 4 16 64 256 1024
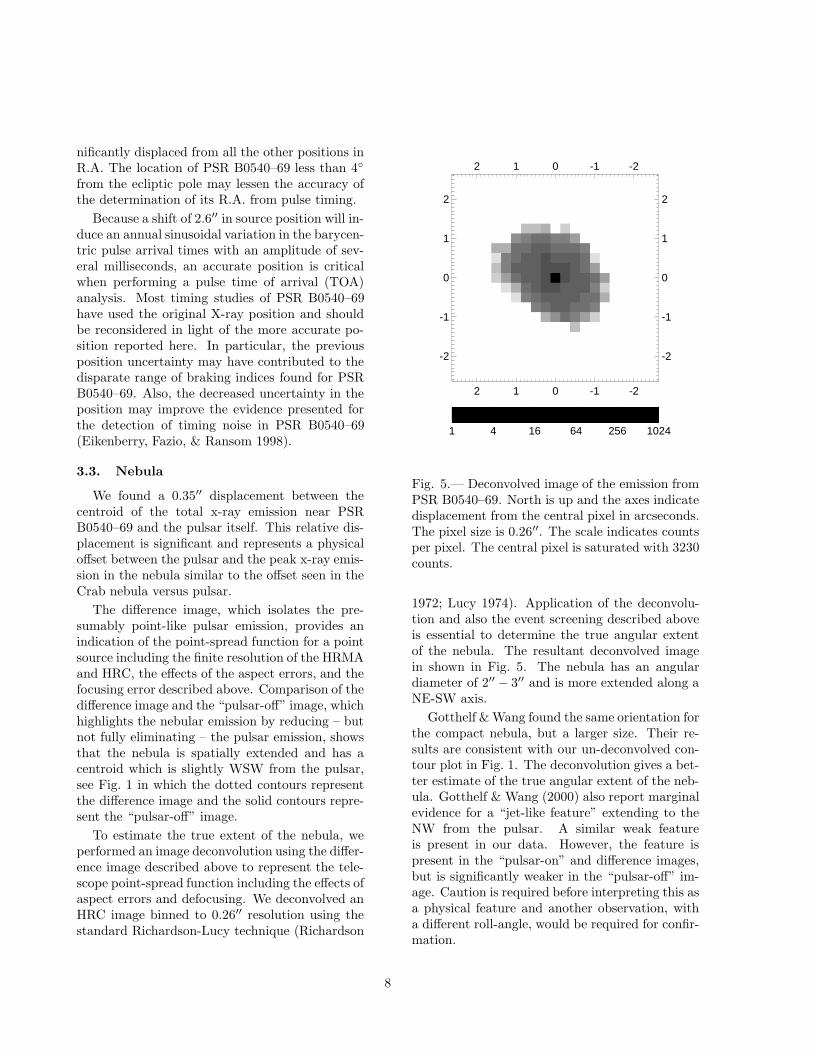
Fig. 5.— Deconvolved image of the emission fromPSR B0540–69. North is up and the axes indicatedisplacement from the central pixel in arcseconds.The pixel size is 0.26′′. The scale indicates countsper pixel. The central pixel is saturated with 3230counts.
1972; Lucy 1974). Application of the deconvolu-tion and also the event screening described aboveis essential to determine the true angular extentof the nebula. The resultant deconvolved imagein shown in Fig. 5. The nebula has an angulardiameter of 2′′ − 3′′ and is more extended along aNE-SW axis.
Gotthelf & Wang found the same orientation forthe compact nebula, but a larger size. Their re-sults are consistent with our un-deconvolved con-tour plot in Fig. 1. The deconvolution gives a bet-ter estimate of the true angular extent of the neb-ula. Gotthelf & Wang (2000) also report marginalevidence for a “jet-like feature” extending to theNW from the pulsar. A similar weak featureis present in our data. However, the feature ispresent in the “pulsar-on” and difference images,but is significantly weaker in the “pulsar-off” im-age. Caution is required before interpreting this asa physical feature and another observation, witha different roll-angle, would be required for confir-mation.
8
The total HRC count rate from the nebula andpulsar within a 4′′ radius is 0.84 counts s−1. As-suming a power-law spectral model with a photonspectral index of 2.0 and an interstellar absorptioncolumn density NH = 4.6 × 1021 cm−2 (see thespectral fitting below) gives an unabsorbed flux of5.8 × 10−11 erg cm−2 s−1 in the 0.2–10 keV band.
3.4. Pulsed emission
The HRC count rate within 1.1′′ of the pulsar is0.38 counts s−1 with 41% of the signal pulsed. Fora narrower radius of 0.6′′, the pulsed fraction in-creases to 55%; however, some of the pulsed emis-sion is lost due to the large PSF during the HRCobservation. We note that the measured pulsefraction is sensitive to the shape of the pulse nearthe maximum and minimum, which may be af-fected by the 3–4 ms timing error in the HRC.Thus, the true pulsed fraction may be somewhathigher than this value.
This pulsed fraction is significantly higher thanpreviously reported, e.g. ∼ 15% from ROSAT(Finley et al. 1993), because Chandra can resolvethe surrounding compact nebula. Using a power-law spectral model with a photon spectral index of1.83 and a column density NH = 4.6 × 1021 cm−2
(see the spectral fitting below) gives an unab-sorbed pulsed flux of 1.1 × 10⁻¹¹ erg cm−2 s−1 inthe 0.2–10 keV band. The off-phase deconvolu-tion (not shown here) shows only a weak pointsource at the pulsar position, indicating that, likethe Crab Pulsar, any steady emission from the pul-sar itself is small compared with the pulsed com-ponent.
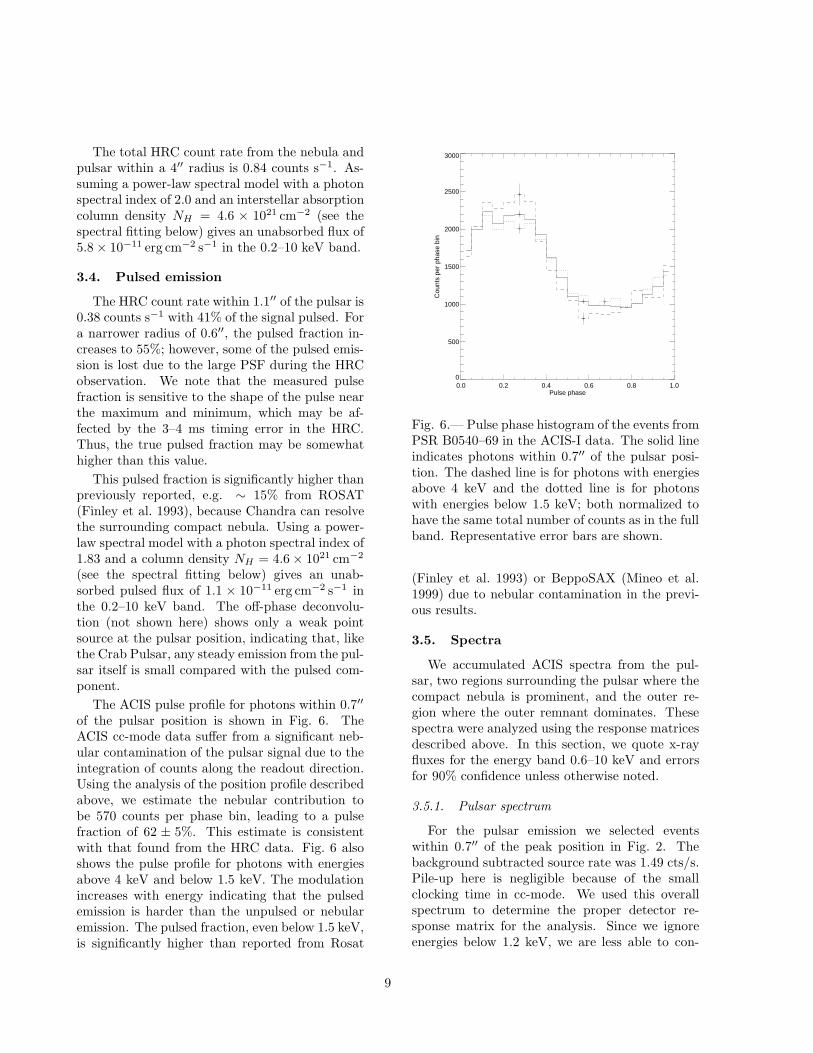
The ACIS pulse profile for photons within 0.7′′
of the pulsar position is shown in Fig. 6. TheACIS cc-mode data suffer from a significant neb-ular contamination of the pulsar signal due to theintegration of counts along the readout direction.Using the analysis of the position profile describedabove, we estimate the nebular contribution tobe 570 counts per phase bin, leading to a pulsefraction of 62 ± 5%. This estimate is consistentwith that found from the HRC data. Fig. 6 alsoshows the pulse profile for photons with energiesabove 4 keV and below 1.5 keV. The modulationincreases with energy indicating that the pulsedemission is harder than the unpulsed or nebularemission. The pulsed fraction, even below 1.5 keV,is significantly higher than reported from Rosat
0.0 0.2 0.4 0.6 0.8 1.0Pulse phase
0
500
1000
1500
2000
2500
3000
Cou
nts
per
phas
e bi
n
Fig. 6.— Pulse phase histogram of the events fromPSR B0540–69 in the ACIS-I data. The solid lineindicates photons within 0.7′′ of the pulsar posi-tion. The dashed line is for photons with energiesabove 4 keV and the dotted line is for photonswith energies below 1.5 keV; both normalized tohave the same total number of counts as in the fullband. Representative error bars are shown.
(Finley et al. 1993) or BeppoSAX (Mineo et al.1999) due to nebular contamination in the previ-ous results.
3.5. Spectra
We accumulated ACIS spectra from the pul-sar, two regions surrounding the pulsar where thecompact nebula is prominent, and the outer re-gion where the outer remnant dominates. Thesespectra were analyzed using the response matricesdescribed above. In this section, we quote x-rayfluxes for the energy band 0.6–10 keV and errorsfor 90% confidence unless otherwise noted.
3.5.1. Pulsar spectrum
For the pulsar emission we selected eventswithin 0.7′′ of the peak position in Fig. 2. Thebackground subtracted source rate was 1.49 cts/s.Pile-up here is negligible because of the smallclocking time in cc-mode. We used this overallspectrum to determine the proper detector re-sponse matrix for the analysis. Since we ignoreenergies below 1.2 keV, we are less able to con-
9
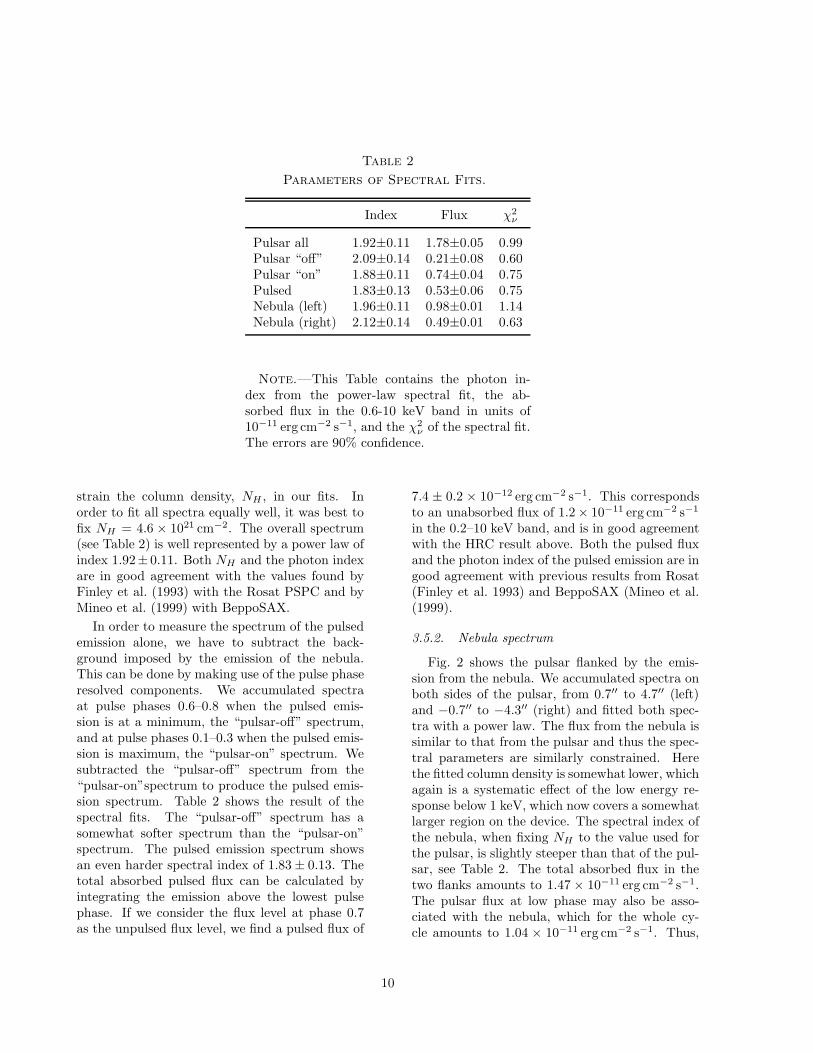
Table 2
Parameters of Spectral Fits.
Index Flux χ2ν
Pulsar all 1.92±0.11 1.78±0.05 0.99Pulsar “off” 2.09±0.14 0.21±0.08 0.60Pulsar “on” 1.88±0.11 0.74±0.04 0.75Pulsed 1.83±0.13 0.53±0.06 0.75Nebula (left) 1.96±0.11 0.98±0.01 1.14Nebula (right) 2.12±0.14 0.49±0.01 0.63
Note.—This Table contains the photon in-dex from the power-law spectral fit, the ab-sorbed flux in the 0.6-10 keV band in units of10−11 erg cm−2 s−1, and the χ2
ν of the spectral fit.The errors are 90% confidence.
strain the column density, NH , in our fits. Inorder to fit all spectra equally well, it was best tofix NH = 4.6 × 1021 cm−2. The overall spectrum(see Table 2) is well represented by a power law ofindex 1.92± 0.11. Both NH and the photon indexare in good agreement with the values found byFinley et al. (1993) with the Rosat PSPC and byMineo et al. (1999) with BeppoSAX.
In order to measure the spectrum of the pulsedemission alone, we have to subtract the back-ground imposed by the emission of the nebula.This can be done by making use of the pulse phaseresolved components. We accumulated spectraat pulse phases 0.6–0.8 when the pulsed emis-sion is at a minimum, the “pulsar-off” spectrum,and at pulse phases 0.1–0.3 when the pulsed emis-sion is maximum, the “pulsar-on” spectrum. Wesubtracted the “pulsar-off” spectrum from the“pulsar-on”spectrum to produce the pulsed emis-sion spectrum. Table 2 shows the result of thespectral fits. The “pulsar-off” spectrum has asomewhat softer spectrum than the “pulsar-on”spectrum. The pulsed emission spectrum showsan even harder spectral index of 1.83 ± 0.13. Thetotal absorbed pulsed flux can be calculated byintegrating the emission above the lowest pulsephase. If we consider the flux level at phase 0.7as the unpulsed flux level, we find a pulsed flux of
7.4 ± 0.2 × 10⁻¹² erg cm−2 s−1. This correspondsto an unabsorbed flux of 1.2 × 10⁻¹¹ erg cm−2 s−1
in the 0.2–10 keV band, and is in good agreementwith the HRC result above. Both the pulsed fluxand the photon index of the pulsed emission are ingood agreement with previous results from Rosat(Finley et al. 1993) and BeppoSAX (Mineo et al.(1999).
3.5.2. Nebula spectrum
Fig. 2 shows the pulsar flanked by the emis-sion from the nebula. We accumulated spectra onboth sides of the pulsar, from 0.7′′ to 4.7′′ (left)and −0.7′′ to −4.3′′ (right) and fitted both spec-tra with a power law. The flux from the nebula issimilar to that from the pulsar and thus the spec-tral parameters are similarly constrained. Herethe fitted column density is somewhat lower, whichagain is a systematic effect of the low energy re-sponse below 1 keV, which now covers a somewhatlarger region on the device. The spectral index ofthe nebula, when fixing NH to the value used forthe pulsar, is slightly steeper than that of the pul-sar, see Table 2. The total absorbed flux in thetwo flanks amounts to 1.47 × 10⁻¹¹ erg cm−2 s−1.The pulsar flux at low phase may also be asso-ciated with the nebula, which for the whole cy-cle amounts to 1.04 × 10⁻¹¹ erg cm−2 s−1. Thus,
10
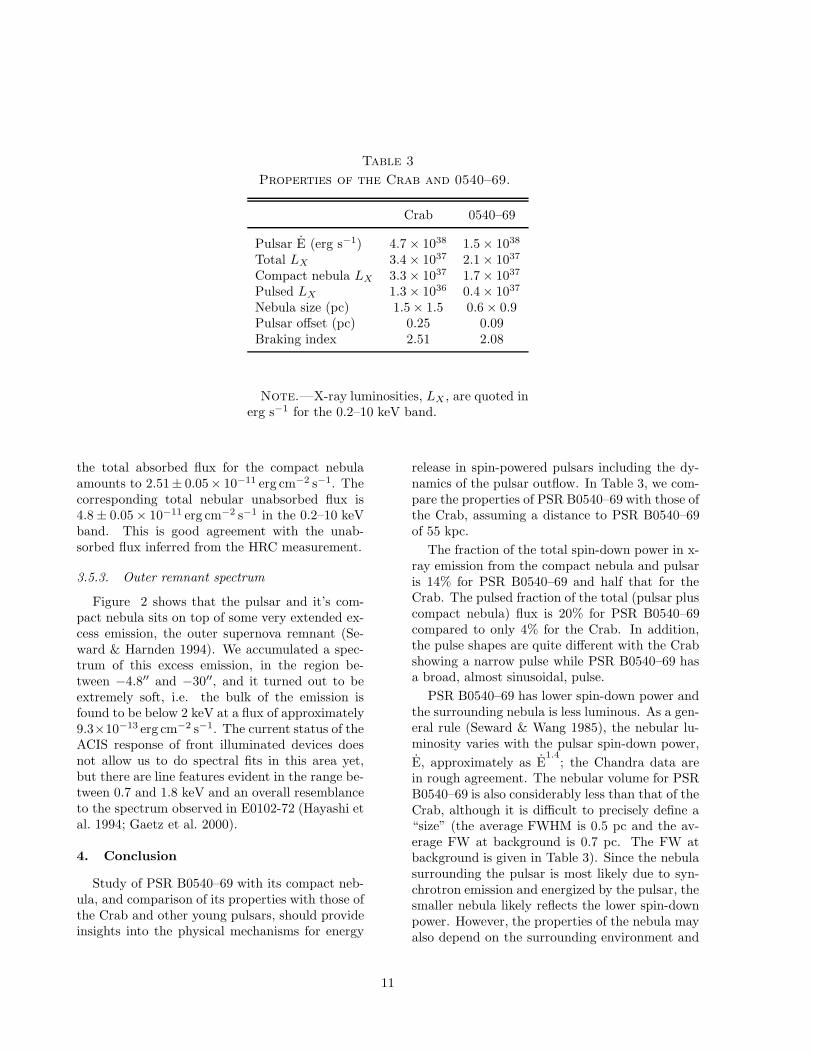
Table 3
Properties of the Crab and 0540–69.
Crab 0540–69
Pulsar E (erg s−1) 4.7 × 1038 1.5 × 1038
Total LX 3.4 × 1037 2.1 × 1037
Compact nebula LX 3.3 × 1037 1.7 × 1037
Pulsed LX 1.3 × 1036 0.4 × 1037
Nebula size (pc) 1.5 × 1.5 0.6 × 0.9Pulsar offset (pc) 0.25 0.09Braking index 2.51 2.08
Note.—X-ray luminosities, LX , are quoted inerg s−1 for the 0.2–10 keV band.
the total absorbed flux for the compact nebulaamounts to 2.51± 0.05× 10⁻¹¹ erg cm−2 s−1. Thecorresponding total nebular unabsorbed flux is4.8 ± 0.05 × 10⁻¹¹ erg cm−2 s−1 in the 0.2–10 keVband. This is good agreement with the unab-sorbed flux inferred from the HRC measurement.
3.5.3. Outer remnant spectrum
Figure 2 shows that the pulsar and it’s com-pact nebula sits on top of some very extended ex-cess emission, the outer supernova remnant (Se-ward & Harnden 1994). We accumulated a spec-trum of this excess emission, in the region be-tween −4.8′′ and −30′′, and it turned out to beextremely soft, i.e. the bulk of the emission isfound to be below 2 keV at a flux of approximately9.3×10−13 erg cm−2 s−1. The current status of theACIS response of front illuminated devices doesnot allow us to do spectral fits in this area yet,but there are line features evident in the range be-tween 0.7 and 1.8 keV and an overall resemblanceto the spectrum observed in E0102-72 (Hayashi etal. 1994; Gaetz et al. 2000).
4. Conclusion
Study of PSR B0540–69 with its compact neb-ula, and comparison of its properties with those ofthe Crab and other young pulsars, should provideinsights into the physical mechanisms for energy
release in spin-powered pulsars including the dy-namics of the pulsar outflow. In Table 3, we com-pare the properties of PSR B0540–69 with those ofthe Crab, assuming a distance to PSR B0540–69of 55 kpc.
The fraction of the total spin-down power in x-ray emission from the compact nebula and pulsaris 14% for PSR B0540–69 and half that for theCrab. The pulsed fraction of the total (pulsar pluscompact nebula) flux is 20% for PSR B0540–69compared to only 4% for the Crab. In addition,the pulse shapes are quite different with the Crabshowing a narrow pulse while PSR B0540–69 hasa broad, almost sinusoidal, pulse.
PSR B0540–69 has lower spin-down power andthe surrounding nebula is less luminous. As a gen-eral rule (Seward & Wang 1985), the nebular lu-minosity varies with the pulsar spin-down power,
E, approximately as E1.4
; the Chandra data arein rough agreement. The nebular volume for PSRB0540–69 is also considerably less than that of theCrab, although it is difficult to precisely define a“size” (the average FWHM is 0.5 pc and the av-erage FW at background is 0.7 pc. The FW atbackground is given in Table 3). Since the nebulasurrounding the pulsar is most likely due to syn-chrotron emission and energized by the pulsar, thesmaller nebula likely reflects the lower spin-downpower. However, the properties of the nebula mayalso depend on the surrounding environment and
11
the past history of the pulsar.
The properties of the surrounding environmentand also of the progenitor may be important indetermining the nature of the outer remnant. InPSR B0540–69, we detect thermal x-ray emissionfrom a surrounding remnant. This is in strong con-trast with the Crab pulsar, where no such remnantexists. The spectrum of the outer remnant of PSRB0540–69 appears to be line driven and thus moreof the category we see in young oxygen-rich super-nova remnants of the Magellanic Clouds (Blair etal. 1999, Gaetz et al. 2000).
PSR B0540–69 and its surrounding nebula area remarkable parallel with the Crab Pulsar andits environment. It is almost certain that thesame physical processes operate in both systems.However, further comparison shows several dis-tinct differences between the two systems, as re-vealed by the observations described above. Ad-ditional Chandra observations would allow us tostudy PSR B0540–69 in detail; making it possibleto search for spectral structure in the synchrotronnebula, as has recently been detected from theCrab (Weisskopf et al. 2000). Confrontation ofdetailed models of the pulsar x-ray emission mech-anism, pulsar wind, synchrotron nebula, and theouter supernova remnant with these observationsshould help advance our understanding of spin-powered pulsars, their outflows, and the nature oftheir progenitors.
We thank Rob Cameron for providing infor-mation on the orbit determination. We grate-fully acknowledge the efforts of the Chandra teamand support from NASA Chandra contract NAS8-39073 and SAO grant SV1-61010. PK acknowl-edges partial support from NASA grant NAG5-7405.
REFERENCES
Aldcroft, T.L. et al. 2000, Proc. SPIE, to appear
Bautz, M.W. et al. 1998, Proc. SPIE, 3444, 210
Blandford, R.D. & Romani, R.W. 1988, MNRAS, 234,57
Buccheri, R., Oel, M.E., & Sacco, B. 1987, A&A, 175,353
Boyd, P.T. et al. 1995, ApJ, 448, 365
Caraveo, P.A., Bignami, G.F., Mereghetti, S., &Mombelli, M. 1992, ApJ, 395, L103
Chanan, G.A., Helfand, D.J., & Reynolds, S.P. 1984,ApJ, 287, L23
Chanan, G.A. & Helfand, D.J. 1990, ApJ, 352, 167
Deeter, J.E., Nagase, F., & Boynton, P.E. 1999, ApJ,512, 300
Dobrzycki, A. 2000, “Caveats Regarding Products inthe Chandra Data Archive – HRC”,http://asc.harvard.edu/cda/caveats.html
Eikenberry, S.S., Fazio, G.G. & Ransom, S.M. 1998,ApJ, 492, 754
Finley, J.P. et al. 1993, ApJ, 410, 323
Gaetz, T.J., Butt Y.M., Edgar R., Eriksen K.,PlucinskyP., Schlegel E., & Smith R.K. 2000, ApJ, to appear,astro-ph/0003355
Gotthelf, E.V. & Wang, Q.D. 2000, ApJ, 532, L117
Hayashi, I., Koyama, K., Ozaki, M., Miyata, E.,Tsunami, H., Hughes, J.P., & Petre, R. 1994, PASJ,46, L121
Jerius, D. et al. 2000, Proc. SPIE, to appear
Lucy, L. B., 1974, AJ, 79, 745
Manchester, R.N. & Taylor, J.H. 1977, Pulsars (SanFrancisco: Freeman)
Manchester, R.N. & Peterson, B.A. 1989, ApJ, 342,L23
Mineo, T. et al. 1999, A&A, 348, 519
Murray, S.S. et al. 1997, Proc. SPIE, 3114, 11
Murray, S.S. et al. 2000, Proc. SPIE, to appear
Nagase, F. et al. 1990, ApJ, 351, L13
Richardson, W. H., 1972, J. Opt. Soc. Am., 62, 55
Schmidtke, P.C. et al. 1999, AJ, 117, 927
Seward, F.D., Harnden, F.R. Jr., & Helfand, D.J.1984, ApJ, 287, L19
Seward, F.D. & Wang, Z.R. 1988, ApJ, 332, 199
Seward, F.D., & Harnden, F.R. Jr. 1994, ApJ, 421,581
Seward, F.D. 2000, “HRC Timing Error”,http://asc.harvard.edu/udocs/hrc/timing.html
Shearer, A. et al. 1999, ApJ, 423, L51
van Speybroeck, L.P. et al. 1997, Proc. SPIE, 3113,89
Weisskopf, M.C. 1988, Space Science Reviews, 47, 47
This 2-column preprint was prepared with the AAS LATEX
macros v5.0.
12