integral observations of the crab pulsar
TRANSCRIPT

arX
iv:a
stro
-ph/
0601
641v
1 2
7 Ja
n 20
06
Astronomy & Astrophysics manuscript no. mineo4305 c© ESO 2008February 5, 2008
INTEGRAL observations of the Crab pulsar
T.Mineo1, C.Ferrigno1, L.Foschini2, A.Segreto1, G.Cusumano1, G.Malaguti2, G.Di Cocco2, C.Labanti2
1 INAF IASF-Pa, via U. La Malfa 153, 90146 Palermo, Italy2 INAF IASF-Bo, via P.Gobetti 101, 40129 Bologna, Italy
Received: ..... ; accepted: ......
ABSTRACT
Aims. The paper presents the timing and spectral analysis of several observations of the Crab pulsar performed with INTEGRALin the energy range 3-500 keV.Methods. All these observations, when summed together provide a high statistics data set which can be used for accurate phaseresolved spectroscopy. A detailed study of the pulsed emission at different phase intervals is performed.Results. The spectral distribution changes with phase showing a characteristic reverse S shape of the photon index. Moreoverthe spectrum softens with energy, in each phase interval, and this behavior is adequately modeled over the whole energy range3-500 keV with a single curved law with a slope variable with Log(E), confirming the BeppoSAX results on the curvature ofthe pulsed emission. The bending parameter of the log-parabolic model is compatible with a single value of 0.14±0.02 over allphase intervals.Conclusions. Results are discussed within the three-dimensional outer gap model.
Key words. stars: neutron - pulsars: general - pulsars: individual: PSR B0531+21 - X-rays: stars
1. Introduction
The Crab pulsar (PSR B0531+21) can be observed in al-most every energy band of the electromagnetic spectrum.Its pulse profile is characterized by a double peak struc-ture with a phase separation of 0.4 that is almost alignedin absolute phase over all wavelengths (Rots et al. 2004;Kuiper et al. 2003; Tennant et al. 2001).
In the X-ray range, the relative intensity, height andwidth of the two peaks vary with energy: the first peak(P1), dominant at low X-ray energies, becomes smallerthan the second one (P2). Moreover, an enhancement withenergy of the bridge between these peaks, usually calledInterpeak (Ip), is also well evident (Mineo et al. 1997,see also Fig.1). At energy above 1 MeV, the morphologychanges abruptly: the first pulse becomes again dominantover the second one and the bridge emission loses signifi-cance; the pulse profile above 30 MeV is similar to the oneobserved at optical wavelengths (Kuiper et al. 2001).A first detailed study of the phase-resolved X-ray spec-tra has been performed by Pravdo et al. (1997), in the5-200 keV energy interval, based on RXTE (PCA andHEXTE) data. Their main result was a variation of thephoton index as function of the pulse phase with a reverseS shape: the spectrum softens starting from the leadingedge of the first peak where it reaches the maximum value,
Send offprint requests to: T. Mineo: [email protected]
it hardens in the interpeak and softens again in the sec-ond peak. The S shape spectral variation with phase hasbeen reported by Massaro et al. (2000) from BeppoSAXdata and by Weisskopf et al. (2004) from Chandra data,even if with lower statistical significance, confirming thesymmetric evolution of the spectral index around the firstpeak. However, the softening of the P1 core respect to theleading edge has been recently questioned by Vivekanand(2002) in a new analysis of RXTE data but performedover the smaller energy range of 5-60 keV.Significant X-ray emission from the pulsar in the off-pulseinterval (phase 0.5-0.9) was discovered by Tennant et al.(2001) with Chandra observations, however, the spectralindex measured in this phase interval suffers of large sta-tistical uncertainty (Weisskopf et al. 2004).
BeppoSAX observations of the Crab pulsar showedthat the photon indices of the pulsed emission sig-nificantly increase with energy maintaining the sameS shape behavior over the 0.1-300 keV energy range(Massaro & Cusumano 2003; Zhang & Cheng 2002). Thespectral index variation has been modeled using a sin-gle curved power law with a slope variable with Log(E)(Massaro et al. 2000). Moreover, applying this model tothree wide phase intervals, the first peak, the Interpeakand the second peak, a single value of ∼ 0.15 for the cur-vature parameter has been measured in the three intervals(Massaro et al. 2001).

2 T. Mineo et al.: INTEGRAL observation of the Crab pulsar
Fig. 1. Crab phase histograms in six energy bands in absolute phase (the main radio pulse at phase 0.0). The lightcurves have different phase resolution according to the statistics available and to the time resolution of the instrument.P1, P2 and Ip phase intervals according to the definition given in Mineo et al. (1997) are indicated in the top leftpanel.
Kuiper et al. (2001) presented a coherent high-energy pic-ture of the Crab pulsar from 0.1 keV up to 10 GeV byusing the high energy γ-ray data from the CGRO satellitetogether with data obtained at X-ray energies from sev-eral observatories. The authors model the 0.1 keV-10 GeVpulsed emission in 7 narrow phase slices with a compositemodel: a power law present in the phase intervals of thetwo main pulses, a curved spectral component required inthe same phase intervals and second broader curved spec-tral component representing mainly the bridge emission.
X-ray observations of Crab pulsar performed with aballoon born experiment report the detection of an emis-
sion line at 440 keV with a flux of (0.86±0.33)×10−4 phcm−2 s−1 (Massaro et al. 1991). Ulmer et al. (1994), us-ing OSSE data, did not detected this line but derived a 3σ upper limit compatible with its presence.
Results on the INTEGRAL observations of the Crabpulsar have already been presented by Kuiper et al.(2003), that studied the instrument absolute timing ac-curacy and by Brandt et al. (2003) who reports results onthe 3-37 keV energy range with the X-ray monitor JEM-X.
In this paper, we present the timing and spectralanalysis of several observations of the Crab pulsar per-formed with SPI, JEM-X, IBIS/ISGRI and IBIS/PICsIT
T. Mineo et al.: INTEGRAL observation of the Crab pulsar 3
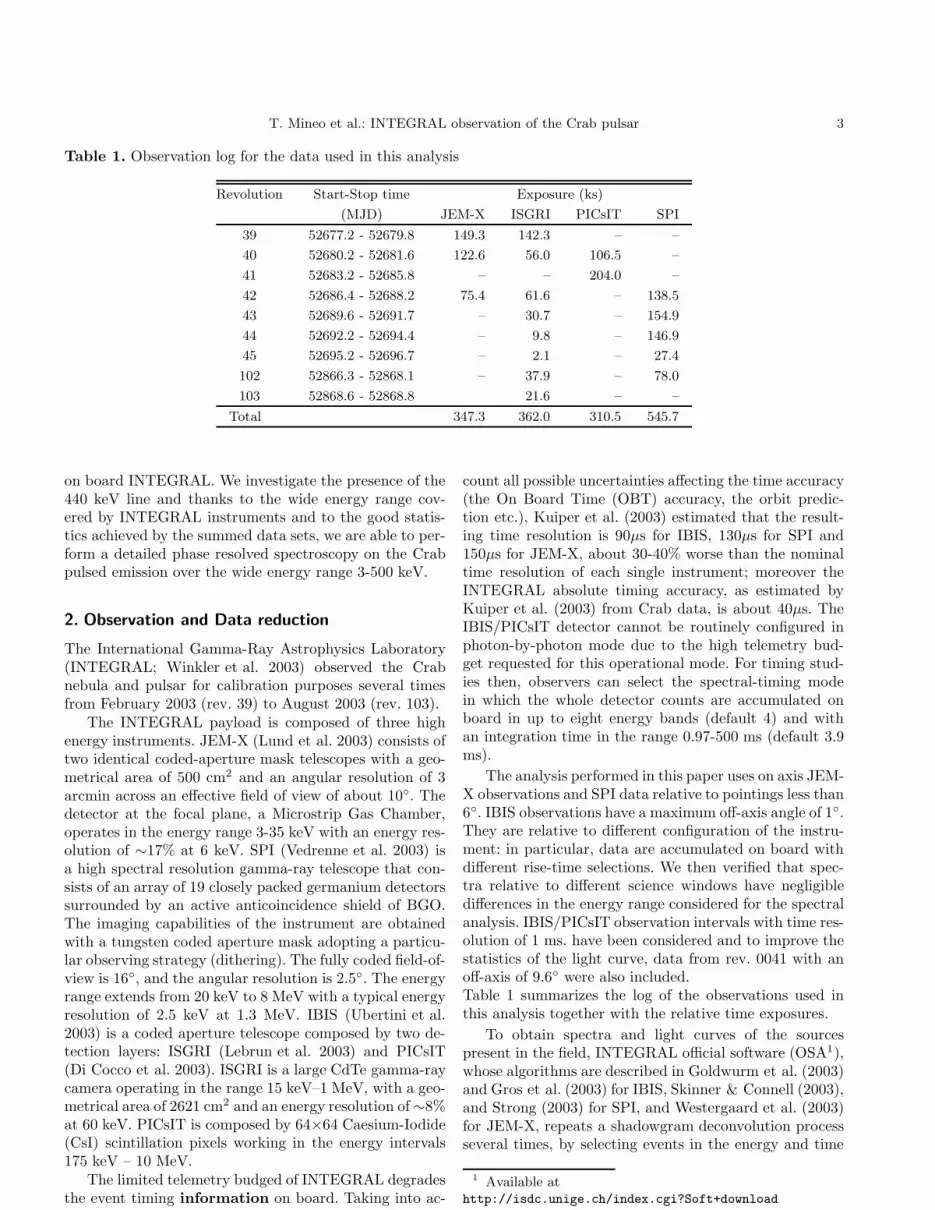
Table 1. Observation log for the data used in this analysis
Revolution Start-Stop time Exposure (ks)
(MJD) JEM-X ISGRI PICsIT SPI
39 52677.2 - 52679.8 149.3 142.3 – –
40 52680.2 - 52681.6 122.6 56.0 106.5 –
41 52683.2 - 52685.8 – – 204.0 –
42 52686.4 - 52688.2 75.4 61.6 – 138.5
43 52689.6 - 52691.7 – 30.7 – 154.9
44 52692.2 - 52694.4 – 9.8 – 146.9
45 52695.2 - 52696.7 – 2.1 – 27.4
102 52866.3 - 52868.1 – 37.9 – 78.0
103 52868.6 - 52868.8 21.6 – –
Total 347.3 362.0 310.5 545.7
on board INTEGRAL. We investigate the presence of the440 keV line and thanks to the wide energy range cov-ered by INTEGRAL instruments and to the good statis-tics achieved by the summed data sets, we are able to per-form a detailed phase resolved spectroscopy on the Crabpulsed emission over the wide energy range 3-500 keV.
2. Observation and Data reduction
The International Gamma-Ray Astrophysics Laboratory(INTEGRAL; Winkler et al. 2003) observed the Crabnebula and pulsar for calibration purposes several timesfrom February 2003 (rev. 39) to August 2003 (rev. 103).
The INTEGRAL payload is composed of three highenergy instruments. JEM-X (Lund et al. 2003) consists oftwo identical coded-aperture mask telescopes with a geo-metrical area of 500 cm2 and an angular resolution of 3arcmin across an effective field of view of about 10◦. Thedetector at the focal plane, a Microstrip Gas Chamber,operates in the energy range 3-35 keV with an energy res-olution of ∼17% at 6 keV. SPI (Vedrenne et al. 2003) isa high spectral resolution gamma-ray telescope that con-sists of an array of 19 closely packed germanium detectorssurrounded by an active anticoincidence shield of BGO.The imaging capabilities of the instrument are obtainedwith a tungsten coded aperture mask adopting a particu-lar observing strategy (dithering). The fully coded field-of-view is 16◦, and the angular resolution is 2.5◦. The energyrange extends from 20 keV to 8 MeV with a typical energyresolution of 2.5 keV at 1.3 MeV. IBIS (Ubertini et al.2003) is a coded aperture telescope composed by two de-tection layers: ISGRI (Lebrun et al. 2003) and PICsIT(Di Cocco et al. 2003). ISGRI is a large CdTe gamma-raycamera operating in the range 15 keV–1 MeV, with a geo-metrical area of 2621 cm2 and an energy resolution of ∼8%at 60 keV. PICsIT is composed by 64×64 Caesium-Iodide(CsI) scintillation pixels working in the energy intervals175 keV – 10 MeV.
The limited telemetry budged of INTEGRAL degradesthe event timing information on board. Taking into ac-
count all possible uncertainties affecting the time accuracy(the On Board Time (OBT) accuracy, the orbit predic-tion etc.), Kuiper et al. (2003) estimated that the result-ing time resolution is 90µs for IBIS, 130µs for SPI and150µs for JEM-X, about 30-40% worse than the nominaltime resolution of each single instrument; moreover theINTEGRAL absolute timing accuracy, as estimated byKuiper et al. (2003) from Crab data, is about 40µs. TheIBIS/PICsIT detector cannot be routinely configured inphoton-by-photon mode due to the high telemetry bud-get requested for this operational mode. For timing stud-ies then, observers can select the spectral-timing modein which the whole detector counts are accumulated onboard in up to eight energy bands (default 4) and withan integration time in the range 0.97-500 ms (default 3.9ms).
The analysis performed in this paper uses on axis JEM-X observations and SPI data relative to pointings less than6◦. IBIS observations have a maximum off-axis angle of 1◦.They are relative to different configuration of the instru-ment: in particular, data are accumulated on board withdifferent rise-time selections. We then verified that spec-tra relative to different science windows have negligibledifferences in the energy range considered for the spectralanalysis. IBIS/PICsIT observation intervals with time res-olution of 1 ms. have been considered and to improve thestatistics of the light curve, data from rev. 0041 with anoff-axis of 9.6◦ were also included.Table 1 summarizes the log of the observations used inthis analysis together with the relative time exposures.
To obtain spectra and light curves of the sourcespresent in the field, INTEGRAL official software (OSA1),whose algorithms are described in Goldwurm et al. (2003)and Gros et al. (2003) for IBIS, Skinner & Connell (2003),and Strong (2003) for SPI, and Westergaard et al. (2003)for JEM-X, repeats a shadowgram deconvolution processseveral times, by selecting events in the energy and time
1 Available athttp://isdc.unige.ch/index.cgi?Soft+download

4 T. Mineo et al.: INTEGRAL observation of the Crab pulsar
Fig. 2. Spectral index vs. phase measured by JEM-X inthe energy range 3-20 keV (top panel), IBIS/ISGRI in theenergy range 20-500 keV (middle panel) and SPI in theenergy range 40-200 keV (bottom panel).
intervals of interest. However, when the source positionshave already been determined (because a priori known orpredetermined by a shadowgram deconvolution), it is al-ternatively possible, to select only the detector pixels fullyilluminated by the source. This method simplifies the ac-cumulation of phase resolved spectra. The amount of illu-mination from a given source, normalized to the maximumillumination value is called Photon Illumination Fraction
Fig. 3. JEM-X, IBIS/ISGRI and SPI spectrum of thephase interval 0.99-1.00 fitted with a single power law
(PIF) and is generated by the standard software for JEM-X and IBIS/ISGRI. For these instruments, we run thestandard pipeline (OSA vers. 4.2) up to the “DEAD” levelthat includes the conversion from detector energy channels(PHA) to energy channels corrected for instrumental ef-fects (PI), the selection for the Good Time Intervals (GTI)and the correction for the instrument dead time and weselected events with PIF= 1. However, IBIS/ISGRI con-version PHA-to-PI has been performed through our owncalibration file generated by one of the authors (A.S.).This file is based on on-ground and in-flight calibration

T. Mineo et al.: INTEGRAL observation of the Crab pulsar 5
data and represents an improvement respect to the stan-dard one (see Appendix A).
No PIF selection is possible for SPI; we then extractedthe list files relative to the whole field of view running thestandard pipeline (OSA vers. 4.2) up to the “COR” levelthat produces corrected events selected for the GTI.
The response matrices used in the analysis of JEM-Xand SPI data are provided by the standard software. TheISGRI response matrix has been generated with our ownsoftware to take into account the new PHA-to-PI calibra-tion file. (see Appendix A).
No response matrix is available for spectral timing datawith IBIS/PICsIT; the presently available matrices are infact suitable only for spectral imaging data. Data from thisdetector have not been included in the spectral analysis.
JEM-X spectral analysis was performed in the energyrange 3-20 keV, IBIS/ISGRI and SPI spectra were fittedin the range 20-500 keV and 40-200 keV, respectively.Errors quoted in the paper are relative to 1 σ confidencelevel for one interesting parameter.
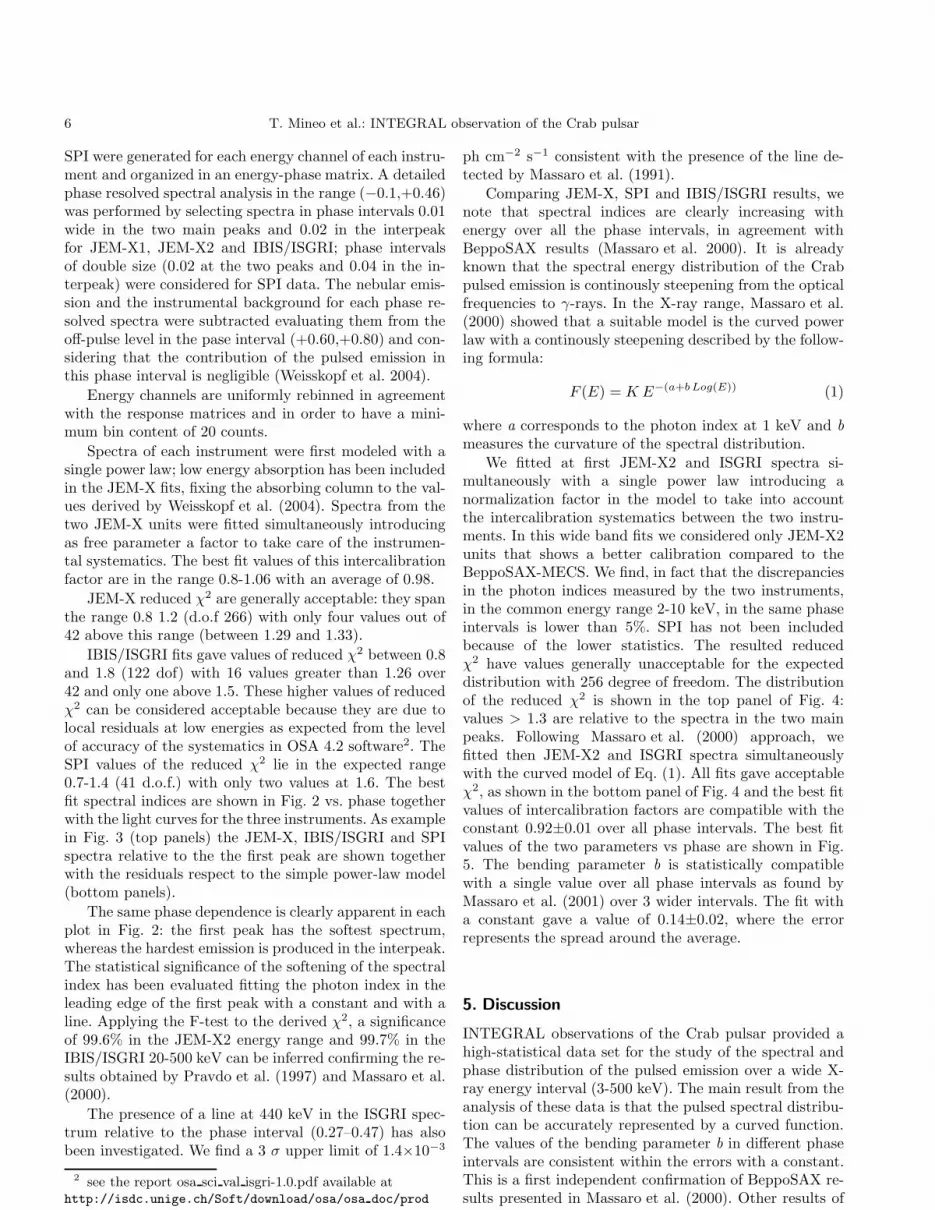
Fig. 4. Frequency histogram of the reduced χ2 for 256 dofobtained fitting simultaneously JEM-X2 and IBIS/ISGRIspectra with a single power law (top panel) and with thecurved model of Eq. (1)
3. Timing Analysis
Arrival times were converted to the Solar SystemBarycentre with the DE200 ephemeris. The values
of P and P in GRO format for each observation(our data set spans several months) were derivedfrom Jodrell Bank Crab Pulsar Monthly Ephemeris(http://www.jb.man.ac.uk/) using contemporary radioephemeris.
Fig. 5. Best fit parameters a and b measured fitting si-multaneously JEM-X2 and IBIS/ISGRI with the curvedmodel of Eq. (1) vs. phase
Phase histograms of the Crab pulsar were evaluatedfor each instrument and each observation using the periodfolding technique and adding the various offsets quoted inWalter et al. (2003) to correct the time relation derivedby the INTEGRAL Science Data Center. The resultingphase histograms in six energy bands from 3 keV to 360keV are shown in Fig. 1 in absolute phase with a phaseresolution ranging from 0.01 (0.33 ms) to 0.03 (1.1 ms)according to the available statistics and to the instrumenttime resolution.The well-known double peaked structure is prominent inall the profiles with a high statistical significance and theknown evolution of the Crab pulse profile with energy canbe observed: the relative intensity of the first pulse respectto the second increases with energies together with thelevel of the bridge emission.
4. Spectral Analysis
Crab pulsar phase histograms with 100 phase bins forJEM-X1, JEM-X2 and IBIS/ISGRI and 50 phase bins for
6 T. Mineo et al.: INTEGRAL observation of the Crab pulsar
SPI were generated for each energy channel of each instru-ment and organized in an energy-phase matrix. A detailedphase resolved spectral analysis in the range (−0.1,+0.46)was performed by selecting spectra in phase intervals 0.01wide in the two main peaks and 0.02 in the interpeakfor JEM-X1, JEM-X2 and IBIS/ISGRI; phase intervalsof double size (0.02 at the two peaks and 0.04 in the in-terpeak) were considered for SPI data. The nebular emis-sion and the instrumental background for each phase re-solved spectra were subtracted evaluating them from theoff-pulse level in the pase interval (+0.60,+0.80) and con-sidering that the contribution of the pulsed emission inthis phase interval is negligible (Weisskopf et al. 2004).
Energy channels are uniformly rebinned in agreementwith the response matrices and in order to have a mini-mum bin content of 20 counts.
Spectra of each instrument were first modeled with asingle power law; low energy absorption has been includedin the JEM-X fits, fixing the absorbing column to the val-ues derived by Weisskopf et al. (2004). Spectra from thetwo JEM-X units were fitted simultaneously introducingas free parameter a factor to take care of the instrumen-tal systematics. The best fit values of this intercalibrationfactor are in the range 0.8-1.06 with an average of 0.98.
JEM-X reduced χ2 are generally acceptable: they spanthe range 0.8 1.2 (d.o.f 266) with only four values out of42 above this range (between 1.29 and 1.33).
IBIS/ISGRI fits gave values of reduced χ2 between 0.8and 1.8 (122 dof) with 16 values greater than 1.26 over42 and only one above 1.5. These higher values of reducedχ2 can be considered acceptable because they are due tolocal residuals at low energies as expected from the levelof accuracy of the systematics in OSA 4.2 software2. TheSPI values of the reduced χ2 lie in the expected range0.7-1.4 (41 d.o.f.) with only two values at 1.6. The bestfit spectral indices are shown in Fig. 2 vs. phase togetherwith the light curves for the three instruments. As examplein Fig. 3 (top panels) the JEM-X, IBIS/ISGRI and SPIspectra relative to the the first peak are shown togetherwith the residuals respect to the simple power-law model(bottom panels).
The same phase dependence is clearly apparent in eachplot in Fig. 2: the first peak has the softest spectrum,whereas the hardest emission is produced in the interpeak.The statistical significance of the softening of the spectralindex has been evaluated fitting the photon index in theleading edge of the first peak with a constant and with aline. Applying the F-test to the derived χ2, a significanceof 99.6% in the JEM-X2 energy range and 99.7% in theIBIS/ISGRI 20-500 keV can be inferred confirming the re-sults obtained by Pravdo et al. (1997) and Massaro et al.(2000).
The presence of a line at 440 keV in the ISGRI spec-trum relative to the phase interval (0.27–0.47) has alsobeen investigated. We find a 3 σ upper limit of 1.4×10⁻³
2 see the report osa sci val isgri-1.0.pdf available athttp://isdc.unige.ch/Soft/download/osa/osa doc/prod
ph cm−2 s−1 consistent with the presence of the line de-tected by Massaro et al. (1991).
Comparing JEM-X, SPI and IBIS/ISGRI results, wenote that spectral indices are clearly increasing withenergy over all the phase intervals, in agreement withBeppoSAX results (Massaro et al. 2000). It is alreadyknown that the spectral energy distribution of the Crabpulsed emission is continously steepening from the opticalfrequencies to γ-rays. In the X-ray range, Massaro et al.(2000) showed that a suitable model is the curved powerlaw with a continously steepening described by the follow-ing formula:
F (E) = K E−(a+b Log(E)) (1)
where a corresponds to the photon index at 1 keV and b
measures the curvature of the spectral distribution.We fitted at first JEM-X2 and ISGRI spectra si-
multaneously with a single power law introducing anormalization factor in the model to take into accountthe intercalibration systematics between the two instru-ments. In this wide band fits we considered only JEM-X2units that shows a better calibration compared to theBeppoSAX-MECS. We find, in fact that the discrepanciesin the photon indices measured by the two instruments,in the common energy range 2-10 keV, in the same phaseintervals is lower than 5%. SPI has not been includedbecause of the lower statistics. The resulted reducedχ2 have values generally unacceptable for the expecteddistribution with 256 degree of freedom. The distributionof the reduced χ2 is shown in the top panel of Fig. 4:values > 1.3 are relative to the spectra in the two mainpeaks. Following Massaro et al. (2000) approach, wefitted then JEM-X2 and ISGRI spectra simultaneouslywith the curved model of Eq. (1). All fits gave acceptableχ2, as shown in the bottom panel of Fig. 4 and the best fitvalues of intercalibration factors are compatible with theconstant 0.92±0.01 over all phase intervals. The best fitvalues of the two parameters vs phase are shown in Fig.5. The bending parameter b is statistically compatiblewith a single value over all phase intervals as found byMassaro et al. (2001) over 3 wider intervals. The fit witha constant gave a value of 0.14±0.02, where the errorrepresents the spread around the average.
5. Discussion
INTEGRAL observations of the Crab pulsar provided ahigh-statistical data set for the study of the spectral andphase distribution of the pulsed emission over a wide X-ray energy interval (3-500 keV). The main result from theanalysis of these data is that the pulsed spectral distribu-tion can be accurately represented by a curved function.The values of the bending parameter b in different phaseintervals are consistent within the errors with a constant.This is a first independent confirmation of BeppoSAX re-sults presented in Massaro et al. (2000). Other results of

T. Mineo et al.: INTEGRAL observation of the Crab pulsar 7
the timing and spectral analysis can be summarized in thefollowing points:
– the spectral distribution changes with phase: the pho-ton index softens towards P1, hardens in the Ip regionand increases again in the second peak with a char-acteristic reverse S shape over the 3-500 keV energyrange;
– the photon index at the P1 leading edge shows asignificative increase both in the JEM-X2 and inthe IBIS/ISGRI energy ranges confirming the resultsobtained by Pravdo et al. (1997) and Massaro et al.(2000) yet questioned by Vivekanand (2002);
– the analysis of IBIS/ISGRI spectrum relative to thephase interval (0.27–0.47) does not rule out the pres-ence of the 440 keV line detected by Massaro et al.(1991).
The value of the bending parameter (0.14±0.02) is sim-ilar to the values obtained for other Crab-like pulsars(de Plaa et al. 2003; Cusumano et al. 2001; Mineo et al.2004) strongly suggesting a common characteristic of thesesources.A log-parabolic spectrum, can be interpreted in term ofthe physics of the particle acceleration. It can be obtainedwhen the acceleration decreases with the particle energyMassaro et al. (2004a,b). In the case of the pulsar envi-ronment, this could result from several crossings of themagnetosphere gaps with a time of permanence inside theacceleration region that decrease with the energy of theparticles.The Spectral Energy Distribution (SED) of the log-parabolic law has a maximum at the energy Ep given by
Ep = 10(2−a)/2 b (2)
Considering the variation with phase of the parameter a,the values of Ep ranges between ∼10 keV and ∼130 keV,in first peak and in the interpeak phase intervals, respec-tively. A possible explanation of the phase variation of themaximum energy is that we are observing photons emit-ted at different levels of the magnetosphere. The three-dimensional outer gap model (Cheng et al. 2000) seems toprovide a viable theoretical description. In the frameworkof this model, curvature gamma-rays are converted intoelectron-positron pairs by the interaction with the mag-netic field and X-ray photons are then radiated by thesesecondary particles as synchrotron emission with a typicalphoton energy Esyn:
Esyn(r) =3
2
(
Ee
mc2
)2he B(r) sinβ(r)
mc(3)
where Ee is the electron energy B(r) is the dipole magneticfield, sin β(r) ∝ (r)1/2 the pitch angle and r the hight fromthe star surface within the magnetosphere. Assuming thatEe is a fraction of the curvature energy estimated as:
Ecur(r) =3
2hγ3
e (r)c
s(r), (4)
where γe(r) ∝ (r)−1/8 is the local Lorentz factor ands(r) ∝ (r)1/2 is the curvature radius, the ratio betweenthe two SED maxima can be related to the ratio of theheight of the emission regions r1 and r2:
Esyn(r1)
Esyn(r2)=
Ecur(r1)
Ecur(r2)
B(r1)
B(r2)
sinβ(r1)
sinβ(r2). (5)
Introducing the dependence from r of each variable wefind the following simplified relation:
Esyn(r1)
Esyn(r2)≃
(
r2
r1
)2.7
. (6)
Results from INTEGRAL spectral phase resolved analysison the two average energies imply a ratio of the heights ofemitting regions of ∼ 0.3-0.4 in agreement with the plot inFig.9 of Cheng et al. (2000) where the level of the emissionregion vs phase computed for the Crab pulsar is shown.
The present analysis of the Crab X-ray pulsed emis-sion confirms that a wide energy band analysis is veryimportant for the study and understanding of the SED ofradio pulsars. Future mission sensitive to the γ rays shouldinclude this source as a primary scientific target.
Acknowledgements. TM is grateful to Enrico Massaro for hishelpful suggestions and discussion on the paper. The authorsthanks the anonimous referee for his/her relevant commentsthat greatly improved the scientific content of the paper.
Appendix A: ISGRI energy correction and
response matrix
The ISGRI detection layer, that consists of an 128×128array of independent CdTe detector pixels, suffer of arather severe ”Charge Loss Effect”, common to this kindof detectors. To take into account these effects, the solu-tion adopted by the calibration team (Lebrun et al. 2003)is to perform an energy correction as a function of thepulse rise-time using multiplicative coefficients stored in a”Look-Up” Table (LUT2). The version of the LUT2 dis-tributed with the OSA software is not yet optimized3, andit introduces artificial features in the spectra, the mostrelevant in the 80 keV region, that are compensated withan ad-hoc modifications of the ISGRI effective area4 (seeleft panel of Fig. A1). However, the intensity of the arti-ficial features strongly depend on the spectral shape andthe analysis of sources with spectral shapes different fromthat of the Crab might be affected.
A new LUT25 based on on-ground and in-flight cal-ibration data has been generated by one of the authorsA.Segreto. The better energy correction is confirmed by
3 See A. Segreto talk at the Internal INTEGRAL workshopavailable athttp://www.rssd.esa.int/Integral/workshops/Jan2005/
4 see the report osa sci val isgri-1.0.pdf available athttp://isdc.unige.ch/Soft/download/osa/osa doc/prod
5 the file is available from the web pagehttp://www.ifc.inaf.it/~ferrigno/integral/ISGRI alternative IC

8 T. Mineo et al.: INTEGRAL observation of the Crab pulsar
Fig.A.1. ISGRI effective area vs energy for the standard software (left panel) and for the A.S. version (right panel).Features in the range 30-40 keV are due to CdTe absorption edges.
the fact that it is no more necessary to introduce ad-hocwiggles in the effective area, as shown in the right panelof Fig. A1. Moreover, the new effective area gives a valueof the Crab spectral index in better agreement with theone quoted in literature and measured by the other in-strument on-board INTEGRAL6 (see also Table A1). InFig. A2, the residuals of the power law fit of the Crabspectrum obtained processing the ISGRI data with thestandard OSA 4.2 response matrix (left panel) and withthe A.S. LUT2 and effective area (right panel) are shown.
Tests on this matrix have been performed analysingsources which are detected with good statistics up to 100–200keV. The spectral parameter derived with the two ma-trices are plotted in Table A1 together with the valuesquoted in literature. The matrix we adopted gives best fitvalues of the spectral parameters in agreement with theones quoted in literature and χ2 values generally lowerthan the one derived from the standard OSA 4.2 matrix.
References
Brandt, S., Budtz-Jørgensen, C., Lund, N., et al. 2003,A&A, 411, L433
Cheng, K. S., Ruderman, M., & Zhang, L. 2000, ApJ, 537,964
Cusumano, G., Mineo, T., Massaro, E., et al. 2001, A&A,375, 397
D’Amico, F., Heindl, W. A., Rothschild, R. E., & Gruber,D. E. 2001, ApJ, 547, L147
de Plaa, J., Kuiper, L., & Hermsen, W. 2003, A&A, 400,1013
Di Cocco, G., Caroli, E., Celesti, E., et al. 2003, A&A,411, L189
Dove, J. B., Wilms, J., Nowak, M. A., Vaughan, B. A., &Begelman, M. C. 1998, MNRAS, 298, 729
Galloway, D. K. 2000, ApJ, 543, L137
6 see the report osa cross cal-1.0.pdf available athttp://isdc.unige.ch/Soft/download/osa/osa doc/prod/
Goldwurm, A., David, P., Foschini, L., et al. 2003, A&A,411, L223
Gros, A., Goldwurm, A., Cadolle-Bel, M., et al. 2003,A&A, 411, L179
Kuiper, L., Hermsen, W., Cusumano, G., et al. 2001,A&A, 378, 918
Kuiper, L., Hermsen, W., Walter, R., & Foschini, L. 2003,A&A, 411, L31
Lebrun, F., Leray, J. P., Lavocat, P., et al. 2003, A&A,411, L141
Lund, N., Budtz-Jørgensen, C., Westergaard, N. J., et al.2003, A&A, 411, L231
Massaro, E. & Cusumano, G. 2003, in Pulsars, AXPsand SGRs Observed with BeppoSAX and OtherObservatories, 15–22
Massaro, E., Cusumano, G., Litterio, M., & Mineo, T.2000, A&A, 361, 695
Massaro, E., Litterio, M., Cusumano, G., & Mineo,T. 2001, in ESA SP-459: Exploring the Gamma-RayUniverse, 229–233
Massaro, E., Matt, G., Salvati, M., et al. 1991, ApJ, 376,L11
Massaro, E., Perri, M., Giommi, P., & Nesci, R. 2004a,A&A, 413, 489
Massaro, E., Perri, M., Giommi, P., Nesci, R., &Verrecchia, F. 2004b, A&A, 422, 103
Mineo, T., Cusumano, G., & Massaro, E. 2004, NuclearPhysics B Proceedings Supplements, 132, 632
Mineo, T., Cusumano, G., Segreto, A., et al. 1997, A&A,327, L21
Pravdo, S. H., Angelini, L., & Harding, A. K. 1997, ApJ,491, 808
Rots, A. H., Jahoda, K., & Lyne, A. G. 2004, ApJ, 605,L129
Skinner, G. & Connell, P. 2003, A&A, 411, L123Strong, A. W. 2003, A&A, 411, L127Tennant, A. F., Becker, W., Juda, M., et al. 2001, ApJ,
554, L173Toor, A. & Seward, F. D. 1974, AJ, 79, 995

T. Mineo et al.: INTEGRAL observation of the Crab pulsar 9
Fig.A.2. Left Panel: Residuals of the power law fit of the Crab spectrum obtained processing ISGRI data withthe standard LUT2 and effective area. Right Panel: Residuals of the power law fit of the Crab spectrum obtainedprocessing ISGRI data with the A.S. LUT2 and effective area
Ubertini, P., Lebrun, F., Di Cocco, G., et al. 2003, A&A,411, L131
Ulmer, M. P., Lomatch, S., Matz, S. M., et al. 1994, ApJ,432, 228
Vedrenne, G., Roques, J.-P., Schonfelder, V., et al. 2003,A&A, 411, L63
Vivekanand, M. 2002, A&A, 391, 1033Walter, R., Favre, P., Dubath, P., et al. 2003, A&A, 411,
L25Weisskopf, M. C., O’Dell, S. L., Paerels, F., et al. 2004,
ApJ, 601, 1050Westergaard, N. J., Kretschmar, P., Oxborrow, C. A.,
et al. 2003, A&A, 411, L257Winkler, C., Courvoisier, T. J.-L., Di Cocco, G., et al.
2003, A&A, 411, L1Zhang, L. & Cheng, K. S. 2002, ApJ, 569, 872
List of Objects
‘Crab’ on page 1‘PSR B0531+21’ on page 1‘GX 1+4’ on page 10‘ Cygnus X1’ on page 10‘Sco X1’ on page 10

10 T. Mineo et al.: INTEGRAL observation of the Crab pulsar
Table A.1. Comparison of the best fit parameters obtained using the standard matrix (ISDC) and the new A.S.version.
Parameter OSA 4.2 A.S. Version Other experiment
Crab nebula+pulsar: Power Lawα 2.19±0.03∗ 2.09±0.03 2.1K (ph cm−2 s−1 KeV−1) 10.2±0.2∗ 9.6±0.2 9.7χ2 (d.o.f.) 5.6 (95) 1.3 (95)
Ref (1)
GX 1+4: Comptonization continuum model (COMPTT in XSPEC)T0 (keV) 1.27 (frozen) 1.27 (frozen) 1.27+1.4
−1.1
Te(keV) 13.5±0.5 12.6±0.4 10.3+13
−9
τ 2.7±0.1 3.3±0.2 3.7+4
−3
K (ph cm−2 s−1 KeV−1) (2.1±0.1)×10−2 (1.9±0.1)×10−2 2.1+2.3
−1.8×10⁻²
χ2 (d.o.f.) 1.5 (58) 1.1 (58)Ref (2)
Cygnus X1: Cut-off power lawα 1.66±0.04∗ 1.45±0.04 1.45±0.01Ec (keV) 158±12∗ 122±7 162±9K (ph cm−2 s−1 KeV−1) 1.7±0.3∗ 1.2±0.3 0.91±0.04χ2 (d.o.f.) 3.2 (48) 1.9 (48)
Ref (3)
Sco X1: Bremstralung + Power lawKT (keV) 4.2±0.1 4.3±0.1 4.51±0.08F lux20−50keV (erg cm−2 s−1) (5.5±0.3)×10−9 (6.5±0.4)×10−9 (7.4±0.6)×10−9
α 2.9±0.2 2.8±0.2 2.4±0.3F lux20−200keV [erg cm−2 s−1] (0.8±0.4)×10−9 (0.7±0.4)×10−9 (1.04±0.08)×10−9
χ2 (d.o.f.) 1.3 (52) 1.4 (52)Ref (4)
∗ Errors are computed introducing systematic errors in order to reduce the χ2 below 2.0(1) Toor & Seward (1974); (2) Galloway (2000); (3) Dove et al. (1998); (4) D’Amico et al. (2001)