x-ray observations of the large magellanic cloud pulsar psr b0540-69 and its pulsar wind nebula
TRANSCRIPT

arX
iv:0
806.
3670
v1 [
astr
o-ph
] 2
3 Ju
n 20
08
Mon. Not. R. Astron. Soc. 000, 1–10 (2008) Printed 6 January 2014 (MN LATEX style file v2.2)
X-ray observations of the Large Magellanic Cloud pulsar
PSR B0540-69 and its PWN
R. Campana,1⋆ T. Mineo,2 A. De Rosa,3 E. Massaro,1 A.J. Dean,4 L. Bassani5
1 Department of Physics, University of Rome “La Sapienza”, Piazzale A. Moro 2, I-00185, Rome, Italy2 INAF/IASF-Palermo, Via U. La Malfa 153, I-90146, Palermo, Italy3 INAF/IASF-Roma, Via Fosso del Cavaliere 100, I-00133, Roma, Italy4 School of Physics and Astronomy, University of Southampton, Highfield, SO17 1BJ, United Kingdom5 INAF/IASF-Bologna, Via P. Gobetti 101, I-40129 Bologna, Italy
Accepted 2008 June 18. Received 2008 June 10; in original form 2008 April 29
ABSTRACTPSR B0540-69 is a young pulsar in the Large Magellanic Cloud that has similarproperties with respect to the Crab Pulsar, and is embedded in a Pulsar Wind Nebula.We have analyzed the complete archival RXTE dataset of observations of this source,together with new Swift-XRT and INTEGRAL-IBIS data. Accurate lightcurves areproduced in various energy bands between 2 and 60 keV, showing no significant energyvariations of the pulse shape. The spectral analysis shows that the pulsed spectrum iscurved, and is best fitted up to 100 keV by a log-parabolic model: this strengthens thesimilarities with the Crab pulsar, and is discussed in the light of a phenomenologicmulticomponent model. The total emission from this source is studied, the relativecontributions of the pulsar and the PWN emission are derived, and discussed in thecontext of other INTEGRAL detected pulsar/PWN systems.
Key words: stars: pulsars: general – stars: pulsars: individual: (PSR B0540-69) –X-rays: stars – gamma rays: observations
1 INTRODUCTION
PSR B0540-69 is situated in the Large Magellanic Cloud,and is one of the few known extragalactic pulsars. Its pulsedemission was discovered by Seward et al. (1984) in the softX-ray band with the Einstein observatory, and thereafteralso in the optical (Middleditch & Pennypacker, 1985) andradio bands (Manchester et al., 1993).
This pulsar is usually referred as the “Crab Twin”, be-cause of the similar period and period derivative with re-spect to the well known Crab Pulsar (PSR B0531+21, seeTable 1 for a comparison). However, their pulse shapes arestrongly different: for the Crab it consists of two peaks, witha phase separation of about 0.4, that are visible at all wave-lengths, while PSR B0540-69 has a single, broadly symmet-ric pulse about 0.5 wide in phase, with some structure atthe maximum.
This pulsar, like the Crab, is also embedded in a Pul-sar Wind Nebula (PWN) that shines in the optical to X-rayband (Serafimovich et al., 2004). This pulsar/PWN systemhas been observed many times in the X-rays, by ROSAT
⋆ E-mail address: [email protected]
Table 1. Comparison between various parameters forCrab Pulsar (PSR B0531+21) and PSR B0540-69.Data are from the ATNF Pulsar Database, available athttp://www.atnf.csiro.au/research/pulsar/psrcat/.
Crab PSR B0540-69
Period P (ms) 33.5 50.5
Period derivative P (×1013 s/s) 4.2 4.8Braking index n 2.5 2.1Distance d (kpc) 2 50Characteristic age τ (yr) 1240 1670Magnetic field Bs (×1012 G) 3.78 4.96Spin-down luminosity (×1038 erg/s) 4.6 1.5
(Finley et al., 1993), GINGA (Deeter et al., 1999), Bep-poSAX (Mineo et al., 1999), ASCA (Hirayama et al., 2002),RXTE (de Plaa et al., 2003), and Chandra (Gotthelf &Wang, 2000; Hwang et al., 2001; Kaaret et al., 2001; Petre etal., 2007). This source is not detected in γ-rays (> 50 MeV),with only upper limits reported by EGRET (Thompson etal., 1994).
In the optical/near UV band PSR B0540-69 is a faint∼22 magnitude source with a power law spectrum having a

2 R. Campana et al.
steep spectral index αν ∼ 1 (Serafimovich et al., 2004) whilethe Crab has a flat spectrum, αν ∼ 0, in the same band.
In the X-rays, this pulsar has a flux of a few milliCrab,and a spectrum fitted by various authors as a power lawwith photon indices in the range from 1.8 to 2.0. De Plaaet al. (2003), using high resolution RXTE spectra, showedevidence for a curved, log-parabolic spectrum, i.e. with theform F (E) = KE−a−b LogE. A similar spectrum has beenobserved also for the Crab pulsar (Massaro et al., 2000, 2006)and few other sources (Cusumano et al., 2001; Mineo et al.,2004).
PSR B0540-69’s PWN (also called N158A) has a torus-like structure, with a major radius of ∼4′′ and with thepresence of jets along the direction of proper motion. Atvariance with the Crab, the PWN of PSR B0540-69 is fur-ther surrounded by a Supernova Remnant (SNR) thermalshell, with a radius of about 30′′, that has radio and soft X-ray emission. Optical (HST; Serafimovich et al., 2004) andX-ray (Chandra; Hwang et al., 2001; Kaaret et al., 2001;Petre et al., 2007) observations showed that the various re-gions of the PWN/SNR system have different brightnessesand spectra, not described by simple power law models.
A first analysis of PSR B0540-69 using INTEGRALdata was performed by Slowikowska et al. (2007), who re-ported pulse profiles in different energy bands and a total,phase-averaged, spatially-extended spectrum.
In this paper we present a comprehensive X/γ-ray studyof this pulsar-PWN system, analyzing in detail the INTE-GRAL observations together with new SWIFT/XRT data.We also exploit the very large RXTE observation dataset ofthis pulsar, which spans a period of more than ten years.
This paper is structured as follows. In Sect. 2 we de-scribe the X-ray observations and data reduction and wepresent our results on the pulsar and PWN spectra. In Sect.3 and 4 we discuss these results and their interpretation alsoin the context of pulsar-PWN high-energy emission models.
2 DATA REDUCTION AND SPECTRALANALYSIS
2.1 Swift XRT
PSR B0540-69 was observed fifteen times in three differentperiods by the XRT (X-Ray Telescope) instrument onboardthe Swift satellite (Gehrels et al. 2004). In Table 2 we reportthe log of these observations, performed between 2005 and2007. XRT is a focusing telescope with a CCD detector, andits useful band of sensitivity is roughly 0.7–7 keV. The mainobserving modes are Photon Counting (PC) and WindowedTiming (WT). In PC mode the data are integrated in a 2.5seconds exposure, retaining full imaging and spectroscopiccapabilities but with very limited time resolution; while inWT mode the central 200 CCD columns (8′ of the field ofview) are continuously registered in one-dimensional mode,with a time resolution of 1.7 ms.
Raw event data (level 1) were reduced followingthe standard pipeline (xrtpipeline v.0.11.6 task) usingthe HEADAS v.6.4 package, including SWIFT softwarev.2.8 and the latest CALDB calibration files. Events werescreened adopting standard grade filtering. The total obser-vation time is respectively 90.4 ks for the PC mode and 23.5
Table 2. Log of XRT observations of PSR B0540-69.
No. ObsID Start date Mode Exposure (s)
01 00053400001 2005 Apr 14 PC 8 41502 00053400002 2005 Apr 19 PC 3 31903 00053400003 2005 Apr 20 PC 6 64404 00053400004 2005 Apr 28 PC 7 34005 00053400005 2005 May 04 PC 8 071
06 00053402001 2006 Jan 26 WT 281507 00053402002 2006 Feb 28 WT 150508 00053402003 2006 Mar 04 WT 16 54809a 00053402004 2006 Apr 18 WT 265109b ” ” PC 3 86610 00053402005 2006 Apr 19 PC 11 20511 00053402006 2006 Apr 20 PC 6 261
12 00053402007 2007 Nov 05 PC 5 14713 00053402008 2007 Nov 08 PC 3 26014 00053402009 2007 Nov 09 PC 11 43115 00053402010 2007 Nov 11 PC 15 438
ks for WT mode. We used the PC mode observations to ob-tain a total (pulsar+PWN) source spectrum, and the WTmode observation to derive the pulsed spectrum.
2.1.1 Photon Counting mode observations
Source spectra were extracted from a circular region of ra-dius 20 pixels (equal to 47′′.2) excluding the central pixelto avoid count rates higher than 0.6 cts/s and thus pile-upcontamination. The PWN radius (∼4′′) is comparable to theXRT point spread function, so this source is almost point-like. Background spectra were extracted from an annularregion outside the source region, with radii of 20 and 50 pix-els respectively. The corresponding Ancillary Response Files(ARF) were generated by means of the xrtmkarf task, tak-ing into account the exposure map generated by the pipeline.
All spectra, rebinned to have at least 20 counts foreach energy channel, were fitted individually with XSPEC v.11.3.1, using an absorbed powerlaw (wabs*powerlaw) model.The results were verified to be consistent, and all were foundto match within the errors: the spectra were then summedtogether. The result is shown in Fig. 1, and the best fit modelhas an hydrogen column density NH = (3.7±0.1)·1021 cm−2
and a photon index Γ = 1.98± 0.02. The reduced χ2 is 1.01for 483 degrees of freedom. The 2–10 keV absorbed flux is(2.61 ± 0.03) · 10−11 erg cm−2 s−1.
It should be noted that our fit assumes Galactic ele-mental abundancies and doesn’t discriminate between MilkyWay and LMC absorption, although the former is aboutone order of magnitude less than the latter. The derivedNH value, therefore, should be regarded as a simple, phe-nomenological parameter for the description of the spec-trum. See Serafimovich et al. (2004) for an extensive discus-sion on the photoelectric absorption in the X-ray spectrumof PSR B0540-69.
Our results are in very good agreement with previousobservations: BeppoSAX LECS and MECS (Mineo et al.1999) data gave in fact NH = (3.7±0.1) ·1021 cm−2 and Γ =1.94± 0.03, also in agreement with previous ROSAT results(Finley et al., 1993). Moreover, summing the Chandra pulsarphase-averaged and PWN spectra determined by Kaaret et

X-ray observations of the PSR B0540-69 3
0.01
0.1
norm
aliz
ed c
ount
s/se
c/ke
V
PSR B0540−69 − Swift/XRT
1 2 5
−4
−2
02
χ
channel energy (keV)
Figure 1. Swift XRT X-ray (0.7–7.14 keV) spectrum of the total(pulsar+PWN) emission from PSR B0540-69.
al. (2001), we also obtain a very good agreement with ourXRT total spectrum (see Figure 10).
We also evaluated what is the contribution of the SNRthermal shell observed by Chandra on the XRT spectrum.From Hwang et al. (2001) it is apparent that, at 20′′–40′′
from the pulsar, the SNR falls within XRT spectral extrac-tion radius. However, the thermal shell is very soft, withalmost all of the emission below 2 keV. Moreover, from theanalysis of Petre et al. (2007), the flux from the shell is onlya few percent of the total PWN emission. Therefore, theSNR contamination on the XRT spectral fit is negligible.
2.1.2 Windowed Timing mode observations
In order to obtain the pulse profile and phase resolved spec-tra, the photon arrival times of the four WT-mode obser-vations (obs. # 06, 07, 08 and 09a, see Table 2), selectingthe events in a 40 pixel-wide box centered on the pulsar po-sition, were reduced to the solar system barycentre, usingJE200 ephemeris and the spacecraft orbital data.
During the observation # 08 the source was erraticallyinside and outside the field of view, therefore considerablyreducing the useful exposure: we selected only the periodswith a count rate higher than 0.5 cts/s, obtaining a totalnet exposure time shorter than 2 ks.
Radio timing observations spanning the XRT dataepoch are not available, therefore we performed a periodsearch, folding the light curves at various trial frequenciesand computing the corresponding χ2 value with respect to aconstant level. Significant pulsation was found only for ob-servations # 05 and 09a, the longest ones. The frequencycorresponding to the maximum χ2 value was thus obtained(Table 3), and the folded lightcurves were arbitrarily shiftedto have the pulse maximum (determined by a Gaussian fit)at the phase 0.5. The curves were then added together. Theresulting total light curve, for a net exposure time of 5472seconds, is shown in Figure 2.
A phase-averaged spectrum was computed and yieldedresults that were perfectly consistent with the PC-modeobservations. We assumed the phases 0.90–1.10 as the off-pulse, representative of the nebular spectrum, while 0.10–0.90 as the pulsar phase. We subtracted the off-pulse from
Table 3. Swift-XRT best fit folding frequencies.
Obs. # ν0 (Hz) Reference epoch (MJD)
06 19.7609226 53761.76209a 19.7595952 53843.561
0 0.5 1 1.5
0.7
0.8
0.9
11.
1
Cou
nts/
s
Phase
PSR B0540−69 − Swift/XRT
Figure 2. Folded lightcurve in 20 phase bins for XRT observa-tions of PSR B0540-69, in the energy range from 0.7 to 7.14 keV.
the pulsed data, obtaining a background-subtracted pulsedspectrum, that was fitted with an absorbed power-law, us-ing the NH value derived from the total emission analysis,obtaining Γ = 1.6 ± 0.2 and a 2–10 keV absorbed flux of(6.4± 0.8) · 10−12 erg cm−2 s−1, in agreement with the pre-vious BeppoSAX observations (Mineo et al., 1999).
2.2 INTEGRAL IBIS/ISGRI
The INTEGRAL (International Gamma Ray AstrophysicsLaboratory) mission observed the Large Magellanic Cloudduring nine orbits in two periods, January 2003 and Jan-uary 2004 (Gotz et al. 2006). This satellite has two main in-struments, the imager IBIS and the spectrometer SPI. IBIS(Imager on Board Integral Satellite, Ubertini et al. 2003) isa coded-mask imager and is constitued by two simultane-ously operating detector layers, ISGRI and PICsIT. ISGRI(Integral Soft Gamma-Ray Imager, Lebrun et al. 2003) isan array of 8 CdTe solid state detection units, each having32×64 pixels, thus making an overall 128×128 array, thathas a 12′ (FWHM) image resolution and a nominal operat-ing range from 15 keV to 1 MeV. Each INTEGRAL orbitlasts about three days and consists of several pointings, be-cause of the “dithering” observational mode. Each pointing,the duration of which is typically half an hour, forms a “Sci-ence Window” (ScW).
PSR B0540-69 was observed during revolutions 27, 28,29, 33, 34, 35 (January 2003) and 150, 151, 152 (January2004). Individual pointings for all the observations per-formed by the first 3.5 years of INTEGRAL observationswere processed using the standard software package OSAv.5.1 (Goldwurm et al., 2003) and mosaicked to obtain anall-sky image. PSR B0540-69 is then detected at 6.5σ sig-nificance for about 221 ks of corrected on-source exposure

4 R. Campana et al.
0.01
2×10
−3
5×10
−3
norm
aliz
ed c
ount
s/se
c/ke
V
PSR B0540−69 − INTEGRAL/IBIS−ISGRI
50
−2
02
χ
channel energy (keV)
Figure 3. INTEGRAL IBIS-ISGRI (20–100 keV) spectrum ofPSR B0540-69.
0.01
0.1
norm
aliz
ed c
ount
s/se
c/ke
V
PSR B0540−69 − Swift/XRT + INTEGRAL/IBIS−ISGRI
1 102 5 20 50
−4
−2
02
χ
channel energy (keV)
Figure 4. Swift XRT (0.7–7.14 keV) and INTEGRAL IBIS-
ISGRI (20–100 keV) spectrum of PSR B0540-69.
(see Bird et al., 2007, for the details of data analysis). Thespectrum is obtained calculating the mean flux in variousenergy bands spanning the range 20–100 keV.
A power-law fit of IBIS data in the 20–100 keV band isreported in Fig. 3. The photon index is Γ = 2.12± 0.25 andthe reduced χ2 is 1.5 (for 5 d.o.f.). The 20–100 keV flux is2.9+0.1
−1.2 · 10−11 erg cm−2 s−1, in agreement with Gotz et al.(2006).
Note that this photon index is steeper than the XRTone, although compatible because of the large uncertainties.In fact, a simultaneous fit of XRT and IBIS data for thetotal source (PSR+PWN) spectrum is reported in Fig. 4.The resulting parameters are: NH = (3.8± 0.1) · 1021 cm−2,Γ = 1.97 ± 0.02 and χ2 = 1.09/489 d.o.f. The intercalibra-tion factor between IBIS and XRT data is f = 1.05 ± 0.08,and clearly the fit is constrained by the high-quality XRTdata. The IBIS spectrum thus can be regarded as a smoothextrapolation of the XRT data.
19.76
19.78
19.80
19.82
Freq
uenc
y (
Hz)
50000 51000 52000 53000 54000Time (MJD)
-6e-05-4e-05-2e-05
02e-054e-05
Res
idua
ls
Figure 5. Eleven years of PSR B0540-69 RXTE-PCA timing. Inthe lower panel are reported the residuals after the fit with Eq.[1], which is shown as the red continuous line in the upper panel.
0 0.5 1 1.5 2
4.15
×10
84.
2×10
84.
25×
108
Cou
nts
Phase
PSR B0540−69 − RXTE/PCA
Figure 6. Total light curve obtained from the full PCA dataset,in the energy range 2–60 keV, with 100 phase bins.
2.3 RXTE
2.3.1 PCA
PSR B0540-69 was observed several times with the RossiX-Ray Timing Explorer (RXTE) satellite. We used data ob-tained with the Proportional Counter Array (PCA, Jahodaet al., 1996) instrument in the Good Xenon mode, that en-sures the full timing accuracy (about 1 µs). PCA is a 1◦
×1◦
collimated array of proportional counters, and is composedof 5 PCUs (Proportional Counter Units). The useful sensi-tivity range is about 2–60 keV.
For the timing analysis we selected all the archive ob-servations having PSR B0540-69 at less than 30′ from thecentre of the field of view (see Table 4) and with a durationlonger than 3000 seconds. The data set spans a 11 years timerange, from 1996 to 2007. The observations were screenedfor South Atlantic Anomaly passages, elevation angle andelectron background, following the standard criteria, andbarycentred using the faxbary task of the FTOOLS pack-age. The total screened exposure time is more than 2 Ms,

X-ray observations of the PSR B0540-69 5
Table 4. Log of RXTE observations of PSR B0540-69. Each proposal ID contains several observations (from 2 to 95). The offset isbetween the center of the pointing field of view and the location of the pulsar. The on-source exposure time is after the screening (PCA)and dead-time (HEXTE) corrections.
Proposal First–Last Offset PCA HEXTE-A HEXTE-BID Observation Date (arcmin) exposure (s) exposure (s) exposure (s)
10206 1996 Aug 11 – 1996 Nov 17 0.30 54 049 35 200 34 95510218 1996 Oct 12 – 1996 Dec 22 25.0 92 086 29 306 29 21210250 1996 Feb 02 – 1996 Oct 04 24.6 37 837 12 422 12 32520188 1996 Nov 30 – 1997 Dec 12 24.5 301 275 118 935 118 11430087 1998 Jan 04 – 1998 Sep 30 24.6 103 455 44 566 44 26540139 1999 Jan 19 – 2000 Feb 15 15.8 185 520 71 834 71 43950103 2000 Mar 13 – 2001 Mar 15 15.8 219 360 178 802 177 32550414 2000 Jun 05 – 2000 Jun 23 0.30 5 552 3 634 3 60160082 2001 Mar 26 – 2003 Feb 21 15.8 281 719 223 510 221 93470092 2002 Mar 21 – 2003 Mar 30 15.8 268 534 233 883 232 73780089 2003 Apr 16 – 2004 Oct 10 15.8 263 151 211 649 210 143
80118 2004 Jan 07 – 2004 Jan 12 24.6 40 977 21 593 21 60690075 2004 Mar 03 – 2005 Mar 29 15.8 83 507 67 633 75 32591060 2005 Jun 20 – 2006 May 28 15.8 47 523 32 707 39 85592010 2006 Apr 25 – 2007 Jun 22 15.8 33 145 27 210 29 755
Total (Ms) — — 2.018 1.313 1.322
a significant improvement, by a factor of ∼3, with respectto the previous RXTE analysis of de Plaa et al. (2003),which had a total exposure of 684 ks. A period search wasperformed for each observation, and the found frequencies(Figure 5) were fitted with a second-order Taylor expansionof the frequency history,
ν(t) = ν0 + ν0(t − t0) +ν0
2(t − t0)
2 (1)
in order to find a satisfactory ephemeris spanning the dataset. The values derived from the fit are, for the time rangein MJD 50100–54100: ν0 = 19.774 Hz, ν0 = −1.87253 ·10−10
Hz/s and ν0 = 3.69 · 10−21 Hz/s2, for the reference epoch t0MJD 52954. In the 11-years time interval of RXTE observa-tions the spin frequency of the pulsar decreases from a valueof about 19.82 Hz to 19.75 Hz. Note that the XRT foldingfrequencies (Sect. 2.1.2) are in good agreement with the ex-trapolation of these ephemeris at the relative epochs. Thevalues of the frequency and its time derivative are in goodagreement with other works (Cusumano et al., 2003; Living-stone et al., 2005; Slowikowska et al., 2007). However, thevalue of the second time derivative is not well constrained bythe fit. Each observation was thus phase-folded. The align-ment between the pulse profiles of each observation was per-formed by a cross-correlation method, first with a sinusoidalfunction in order to have the peak maximum at phase 0.5,then with an analytic template based on the resulting totallight curve. A 100-bin pulse profile in the energy band 2–60keV is showed in Figure 6, and energy-resolved profiles areshowed in Figure 7.
From this figure it is apparent that there is no evidentchange of the light curve shape with energy. Following dePlaa et al. (2003), we fitted the full pulse profile (Figure6) with an analytical model described by the sum of twoGaussians and a constant. We then performed this fit onall the Figure 7 light curves, fixing the central phase andthe widths of the Gaussians at the values determined in thetotal light curve fit, and we found no statistical significantvariation on the relative normalizations of the Gaussians. We
also checked for the stability of the pulse profile, comparingit as observed at various epochs, and we did not found anysignificant changes in shape or flux.
For the spectral extraction we used only the observa-tions pertaining to the last gain epoch (Epoch 5, from May13 2000 onward, proposal ID 50103 to 92010) in order toensure the consistency of the analysis. The resulting datasethas a total exposure of 1.2 Ms. In a similar way with respectto XRT, the phases 0.10–0.90 were selected as the pulsed sig-nal, and the phases 0.90–1.10 as the offpulse, that was sub-tracted on the pulsed signal. Offset-corrected response ma-trices were determined for each observation and each PCU,and added together weighting them by their exposure. Spec-tra were also extracted for each PCU, rebinned to have aminimum of 20 counts for channel (however, the rebinningaffects only the high energy channels, over 30 keV), and ver-ified for consistency.
A power-law fit of the pulsed signal, in the energy range2–30 keV and with NH frozen at the value given by the XRTanalysis, gave the values Γ = 1.89 ± 0.01 and χ2 = 1.14/59d.o.f.; the residuals, however, showed a systematic behaviourtypical of curved spectra, with an excess in the central bins(see Figure 8, left panel). We considered therefore a log-parabolic law, and the fit gave the values a = 1.47 ± 0.01,b = 0.25 ± 0.06 and χ2 = 0.96/58 d.o.f., and the residualsdon’t show any systematic deviation (Figure 8, right panel).We performed an F -test in order to assess the statisticalsignificance of the log-parabolic model versus the power law,and the null hypothesis probability resulted 9.7 · 10−4. The2–10 keV pulsed absorbed flux is 6.5+0.4
−0.7 ·10−12 erg cm−2 s−1,
in agreement with the XRT value.
The 30–60 keV PCA spectrum has a much lower statis-tics. Extending the previous fit up to 60 keV does not alterthe values of the parameters. The 30–60 keV spectrum aloneis well described by a single power law with a photon indexaround 2.
There are some discrepancies with respect to the spec-tral results of de Plaa et al. (2003), both in the curvature

6 R. Campana et al.
Cou
nts
2-4 keV
Cou
nts
4-6 keV
0 0.5 1 1.5Phase
Cou
nts
6-8 keV
8-10 keV
10-12 keV
0 0.5 1 1.5Phase
12-16 keV
16-20 keV
20-30 keV
0 0.5 1 1.5 2Phase
30-60 keV
Figure 7. Light curves in various PCA energy bands, from 2 to 60 keV. The curves are with 50 phase bins, except for the last two thathave 25 bins.
10−
30.
010.
1
norm
aliz
ed c
ount
s/se
c/ke
V
PSR B0540−69 − RXTE/PCA Power law
105 20
−2
02
χ
channel energy (keV)
10−
30.
010.
1
norm
aliz
ed c
ount
s/se
c/ke
V
PSR B0540−69 − RXTE/PCA Log−parabola
105 20
−2
02
χ
channel energy (keV)
Figure 8. Left. Power-law fit of the 2–30 keV PCA pulsed spectrum. Note the systematic, curved behaviour of the residuals. Right.Log-parabolic fit of the spectrum in the same energy range.
parameter and in flux. Firstly, they gave the log-paraboliclaw in terms of natural, instead of decimal, logarithm. How-ever, also correcting for the change of logarithm basis, theircurvature parameter is larger (i.e. the log-parabola is morecurved) than ours. There are many possible explanationsfor the discrepancy: (a) the different methods used to deter-minate the pulsed spectrum (de Plaa et al. determined thepulsed counts excess in 14 energy bins by means of an ana-
lytical fit of the light curve); (b) the different energy rangeof their fit (that included also soft X-ray ROSAT data),together with a different NH value, could affect the curva-ture; (c) their spectral PCA dataset has an exposure (462ks) much smaller than ours (1.2 Ms); and (d) a real changein the spectrum between the calibration epoch 3 (1996-99)dataset used by de Plaa et al. and our epoch 5 dataset (2000-07). Regarding the first of the above points, we determined
X-ray observations of the PSR B0540-69 7
the excess counts in various energy bands by means of ana-lytical fits and we found them in agreement with the pulsedcounts determined by our offpulse-subtraction method. Wealso performed a spectral analysis of the epoch 3 data (pro-posal ID 10206 to 30087) with our approach, and we foundthat both the spectral parameters and the flux are perfectly1σ compatible with the better statistics of the epoch 5 spec-trum. Moreover, the flux values of de Plaa et al. are greaterthan ours by a factor of about 30%. This discrepancy, toogreat to be due only to the different estimation of the pulsedcounts above the offpulse level, could be due to the differentway of estimating the effective exposure time. We verified,in fact, that our data agree very well with the ones of dePlaa et al. when the exposure is reduced by a factor equalto the pulsed phase fraction. Note that the Chandra pulsedspectrum in the range 0.6–10 keV (Kaaret et al., 2001, alsoreported by Serafimovich et al., 2004) matches our data, asseen in Figure 10.
2.3.2 HEXTE
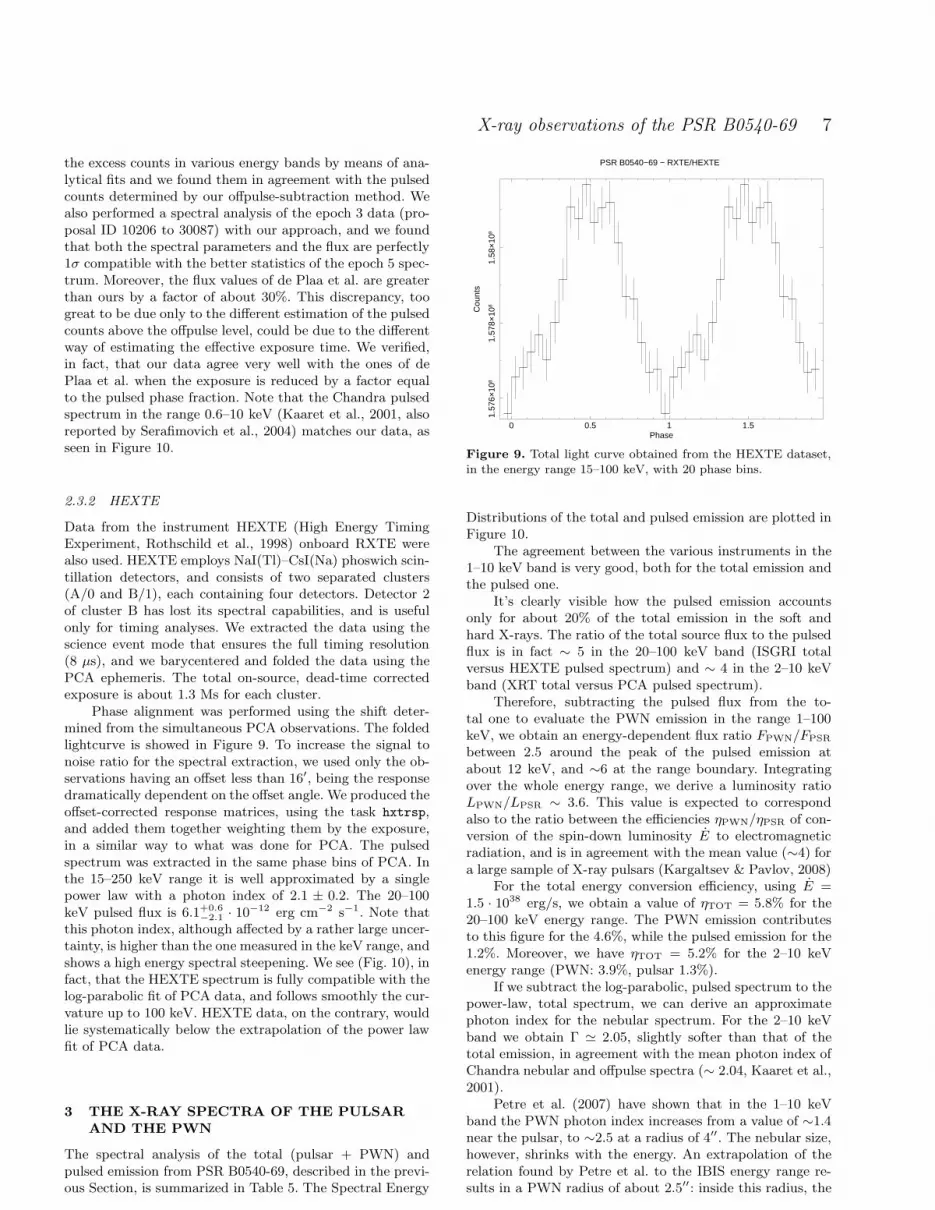
Data from the instrument HEXTE (High Energy TimingExperiment, Rothschild et al., 1998) onboard RXTE werealso used. HEXTE employs NaI(Tl)–CsI(Na) phoswich scin-tillation detectors, and consists of two separated clusters(A/0 and B/1), each containing four detectors. Detector 2of cluster B has lost its spectral capabilities, and is usefulonly for timing analyses. We extracted the data using thescience event mode that ensures the full timing resolution(8 µs), and we barycentered and folded the data using thePCA ephemeris. The total on-source, dead-time correctedexposure is about 1.3 Ms for each cluster.
Phase alignment was performed using the shift deter-mined from the simultaneous PCA observations. The foldedlightcurve is showed in Figure 9. To increase the signal tonoise ratio for the spectral extraction, we used only the ob-servations having an offset less than 16′, being the responsedramatically dependent on the offset angle. We produced theoffset-corrected response matrices, using the task hxtrsp,and added them together weighting them by the exposure,in a similar way to what was done for PCA. The pulsedspectrum was extracted in the same phase bins of PCA. Inthe 15–250 keV range it is well approximated by a singlepower law with a photon index of 2.1 ± 0.2. The 20–100keV pulsed flux is 6.1+0.6
−2.1 · 10−12 erg cm−2 s−1. Note thatthis photon index, although affected by a rather large uncer-tainty, is higher than the one measured in the keV range, andshows a high energy spectral steepening. We see (Fig. 10), infact, that the HEXTE spectrum is fully compatible with thelog-parabolic fit of PCA data, and follows smoothly the cur-vature up to 100 keV. HEXTE data, on the contrary, wouldlie systematically below the extrapolation of the power lawfit of PCA data.
3 THE X-RAY SPECTRA OF THE PULSARAND THE PWN
The spectral analysis of the total (pulsar + PWN) andpulsed emission from PSR B0540-69, described in the previ-ous Section, is summarized in Table 5. The Spectral Energy
0 0.5 1 1.5
1.57
6×10
81.
578×
108
1.58
×10
8
Cou
nts
Phase
PSR B0540−69 − RXTE/HEXTE
Figure 9. Total light curve obtained from the HEXTE dataset,in the energy range 15–100 keV, with 20 phase bins.
Distributions of the total and pulsed emission are plotted inFigure 10.
The agreement between the various instruments in the1–10 keV band is very good, both for the total emission andthe pulsed one.
It’s clearly visible how the pulsed emission accountsonly for about 20% of the total emission in the soft andhard X-rays. The ratio of the total source flux to the pulsedflux is in fact ∼ 5 in the 20–100 keV band (ISGRI totalversus HEXTE pulsed spectrum) and ∼ 4 in the 2–10 keVband (XRT total versus PCA pulsed spectrum).
Therefore, subtracting the pulsed flux from the to-tal one to evaluate the PWN emission in the range 1–100keV, we obtain an energy-dependent flux ratio FPWN/FPSR
between 2.5 around the peak of the pulsed emission atabout 12 keV, and ∼6 at the range boundary. Integratingover the whole energy range, we derive a luminosity ratioLPWN/LPSR ∼ 3.6. This value is expected to correspondalso to the ratio between the efficiencies ηPWN/ηPSR of con-version of the spin-down luminosity E to electromagneticradiation, and is in agreement with the mean value (∼4) fora large sample of X-ray pulsars (Kargaltsev & Pavlov, 2008)
For the total energy conversion efficiency, using E =1.5 · 1038 erg/s, we obtain a value of ηTOT = 5.8% for the20–100 keV energy range. The PWN emission contributesto this figure for the 4.6%, while the pulsed emission for the1.2%. Moreover, we have ηTOT = 5.2% for the 2–10 keVenergy range (PWN: 3.9%, pulsar 1.3%).
If we subtract the log-parabolic, pulsed spectrum to thepower-law, total spectrum, we can derive an approximatephoton index for the nebular spectrum. For the 2–10 keVband we obtain Γ ≃ 2.05, slightly softer than that of thetotal emission, in agreement with the mean photon index ofChandra nebular and offpulse spectra (∼ 2.04, Kaaret et al.,2001).
Petre et al. (2007) have shown that in the 1–10 keVband the PWN photon index increases from a value of ∼1.4near the pulsar, to ∼2.5 at a radius of 4′′. The nebular size,however, shrinks with the energy. An extrapolation of therelation found by Petre et al. to the IBIS energy range re-sults in a PWN radius of about 2.5′′: inside this radius, the

8 R. Campana et al.
Table 5. Results of the spectral analysis. The absorbed flux values are in units of 10−11 erg cm−2 s−1.
Instrument Parameter Flux (2–10 keV) Flux (20–100 keV)
Swift/XRT - Total Γ = 1.98 ± 0.02 2.61 ± 0.03 —
INTEGRAL/IBIS - Total Γ = 2.12 ± 0.25 — 2.9+0.1−1.2
Swift/XRT - Pulsed Γ = 1.6 ± 0.2 0.64 ± 0.08 —
RXTE/PCA - Pulseda = 1.47 ± 0.01
0.65+0.04−0.07 —
b = 0.25 ± 0.06
RXTE/HEXTE - Pulsed Γ = 2.1 ± 0.2 — 0.61+0.06−0.21
10-1
100
101
102
103
Energy (keV)
10-4
10-3
10-2
10-1
E2 F
(E)
(ke
V/c
m2 s)
INTEGRAL IBIS/ISGRI - TotalSWIFT XRT - TotalSWIFT XRT - NebulaSWIFT XRT - PulsedRXTE PCA - PulsedRXTE HEXTE - Pulsed
Figure 10. Spectral Energy Distribution (SED) for the emission from PSR B0540-69 and its PWN. The red continuous line is thelog-parabolic law that fits PCA pulsed data (see Sect. 2.3.1), while the black dotted line is the power-law simultaneous fit of XRT andIBIS total data (see Sect. 2.2). The black dotted and red dashed areas are the ±1σ Chandra pulsed and total (pulsar phase averaged +PWN) data, respectively (from Kaaret et al., 2001, and Serafimovich et al., 2004).
mean photon index is about 1.8. Again, this is consistentwith the derived PWN spectrum obtained subtracting thepulsed contribution to the total spectrum. For the 20–100keV band, being after the peak of the pulsed spectrum, thePWN has an harder spectrum than the total emission, witha photon index around 1.8. This qualitative agreement, how-ever, relies on the assumptions that both the nebular photonindices and the parameterization of the nebular radius couldbe extrapolated to the hard X-rays, and of course it is af-fected by the low statistics data for both the total and thepulsed emission.
It is interesting to compare the soft γ-ray propertiesof PSR B0540-69 with the other INTEGRAL-detected pul-sar/PWN systems (PSR J1846-0258, McBride et al., 2008;PSR J1617-5055, Landi et al., 2007; Vela, Hoffmann et al.,2006; PSR J1513-5906, Forot et al., 2006; PSR J1811-1925,Dean et al., 2008). With η ≃ 5.8% for the total emission,this source has the highest conversion efficiency: the meanof the sample is around 1%, while Vela is a notable excep-
tion with η ≃ 0.02%. Moreover, the ∼2.1 photon index ofPSR B0540-69 fits squarely in the observed range for thissample of IBIS sources (2.0–2.3). The majority of these sys-tems have the hard X-ray emission dominated by the PWN,except for PSR J1617-5055 and PSR J1513-5906. The rel-ative contribution from the pulsar and the PWN, however,differs very much from source to source. A more detailedcomparison will be the subject of a future paper (Dean etal., in preparation).
Most of the INTEGRAL Galactic PWNs are likely as-sociated with HESS TeV sources (e.g. PSR J1617-5055 andPSR J1811-1925). However, estabilishing the PSR B0540-69 possible nebular TeV emission is difficult, because of thelow declination of this source and, mainly, of the high dis-tance. If we assume that the synchrotron nebula poweredby PSR B0540-69 has the same intrinsic TeV brightness ofthe Crab, the ground flux is reduced to a value of the orderof some milliCrab (by a factor ∼400). Very long (>100 h)dedicated HESS pointings, therefore, are required to detect

X-ray observations of the PSR B0540-69 9
10-1
100
101
102
103
Energy (keV)
1035
1036
1037
Lum
inos
ity (
erg/
s)
PSR B0540-69 - Swift XRTPSR B0540-69 - RXTE PCAPSR B0540-69 - RXTE HEXTECrab - BSAX LECS, MECS, HPGSPC, PDSPSR B0540-69 total modelCrab Pulsar total modelC
O
CX
Figure 11. Distance-corrected luminosity for PSR B0540-69 and Crab. The distance values used are d = 50 kpc and d = 2 kpc,respectively. Crab data is from the four NFI onboard BeppoSAX and were taken from Massaro et al. (2006). Also plotted are thelog-parabolic model for PSR B0540-69 (blue dashed line) and the total multicomponent model for Crab (black continuous line, with the
CO and CX components as orange dash-dotted line and violet dash-dot-dotted line). See text for discussion.
the possible emission (Hofmann, 2001). Another intriguingpossibility is that this system lacks an appreciable intrinsicTeV emission. It is thought (de Jager & Djannati-Ataı, 2008)that efficient high energy γ-ray emission is suppressed whenthe synchrotron losses dominates over the Inverse Comptonlosses, and this can happen, for example, for high magneticenergy densites or low background radiation fields, althoughthere is no compelling evidence for both hypotheses.
Petre et al. (2007), under reasonable assumptions, de-rive an equipartition magnetic field for the PWN, and founda value of B ≃ 8 ·10−4 G, higher than that estimated for theCrab by a factor ∼2-3 (de Jager & Harding, 1992), and im-plying a synchrotron lifetime of electrons of about 3 years.The efficiency for the very high energy IC emission shouldtherefore be lower with respect to the Crab, making furtherdifficult the detectability of TeV flux. It will be interestingto see if GLAST will be able to detect nebular emission inthe GeV range, and to check if the derived PWN parametersare consistent with the previous estimates.
Note also that an EGRET source, 3EG J5033-6916,is located about 0.6◦ south-east from the pulsar (thuscompatible with the PSF radius), but its association withPSR B0540-69 is unlikely. This γ-ray source has been in-terpreted as due to diffuse emission originating from theinteraction between cosmic rays and the LMC interstellarmedium (Sreekumar et al., 1992; Lin et al., 1996), and theobserved flux is consistent with the theoretical predictions(Fichtel et al., 1991).
3.1 Pulsed spectrum
Massaro et al. (2006) developed a phenomenological modelof the Crab pulsar X and γ-ray emission, explained as due totwo different emission components CO and CX , having a log-parabolic spectrum with the same curvature (b ≃ 0.16) butdifferent energy peaks and phase distributions. This multi-component (MC) model also describes the energy variationsof the pulse profile. The γ-ray emission above 10 MeV iswell reproduced, both in the total and phase-resolved spec-tra, assuming that the CO and CX have an higher-energycounterpart COγ and CXγ , with the same phase distribu-tions and the same log-parabolic spectra at different peakenergies.
In Figure 11 the pulsed spectra of both PSR B0540-69and Crab are plotted, rescaled for the distance values (weassumed d = 50 kpc and d = 2 kpc, respectively), togetherwith the CO and CX components of the Crab MC model.The emission of PSR B0540-69 is higher by a factor of about2 than the Crab, although the true value is strongly depen-dent on the assumed distance (see Schaefer et al., 2008, for adiscussion on the LMC distance value), but also on the dif-ference in the solid angle subtended by the emission beam,here assumed to be isotropic. If we adopt the distance valuesfrom HSTKP (50.1 ± 2.4 kpc, Freedman et al., 2001), theluminosity ratio lies in the range of 1.1–3.7.
It is interesting to note that, although PSR B0540-69spectral curvature is larger (b ≃ 0.24 versus b ≃ 0.16 for theCrab), the peak energy is sensibly close to the Ep ≃ 12 keVvalue of the CO component of the MC model. The absence

10 R. Campana et al.
of a variation with energy of the light curve also makes plau-sible the interpretation that the PSR B0540-69 emission isonly due to its counterpart of the Crab CO component. Thepulse shapes of these pulsars are however very different, andthis could be due either to different viewing conditions or tounlike properties of the emission regions.
Takata & Chang (2007) recently developed an outer-gap model of Crab and PSR B0540-69 emission, extendingthe emission region also inside the null-charge surface, alongthe last closed field line. Their results are in broad agree-ment with the MC phenomenological model, if we identifythe CO component as due to the emission beyond the nullcharge surface to the light cylinder, and the CX componentas coming from the region below the null charge surfaceup to the neutron star surface. In their model, the X-rayspectrum is due to synchrotron emission from secondary e±
pairs, and has a curved shape similar to our log-parabolic fit.Takata & Chang (2007) explain the different pulse shapesof Crab and PSR B0540-69 assuming a different inclinationangle (α ≃ 50◦ and α ≃ 30◦, respectively) between the spinaxis and the magnetic axis, and a different viewing angle ξ.Also, the latter pulsar has a thicker emission region of thesecondary pairs.
If we assume that also PSR B0540-69 has a COγ com-ponent at the same peak energy (300 MeV) of the Crabequivalent, and with the same relative normalizations of thetwo log-parabolic spectra, we can obtain a value of the fluxat the peak frequency: ∼ 4 · 10−7 MeV cm−2 s−1. This γ-ray flux prediction is of the same order of magnitude withrespect to the one derived from Takata & Chang (2007) byInverse Compton scattering. The predicted pulsed flux isabout one order of magnitude lower than the 5σ one-yearGLAST survey sensitivity1. Note that the EGRET upperlimit (Thompson et al., 1994) is about 10−5 MeV cm−2 s−1
in the energy range above 100 MeV.
4 CONCLUSIONS
PSR B0540-69 is an interesting young pulsar, showing manysimilarities but also some differences with respect to theCrab. The study of this pulsar, although made difficult by itshigh distance and apparent faintness, could help the theoret-ical understanding of the characteristics of the high-energyemission from the pulsars and their PWNs.
With the analysis of the complete RXTE dataset ofobservations of PSR B0540-69, exploiting for the spectralanalysis the longest gain epoch that spans more than halfof these data, together with that of new SWIFT/XRT andINTEGRAL/IBIS data, we have compiled an accurate andup-to-date picture of the emission from this source in theX and soft γ-rays, from 0.7 to 200 keV. Thanks to the fullHEXTE dataset we have also determined the contributionof pulsed hard X-ray emission to the total one.
Regarding the pulsed emission, we confirm the pres-ence of a curved spectrum, peaking at about 12 keV, welldescribed by a log-parabolic law up to &100 keV. We haveshown also that it presents some similarities with the Crabpulsed emission.
1 http://www-glast.slac.stanford.edu/software/IS/glast_lat_performance.htm
We have studied in detail the total (pulsar+PWN)emission from this source, in the energy range 0.7–100 keV,and we have shown that the major (about 75–80%) con-tribution comes from the synchrotron nebula. The compar-ison of PSR B0540-69 with other IBIS pulsar/PWN sys-tems shows that it has the highest conversion efficiency inthe hard X/soft γ-ray band, with similar spectral proper-ties with respect to the other sources. Most of these INTE-GRAL PSR/PWN systems have been associated with HESSsources. PSR B0540-69 looks different, in this respect, notshowing evidence of emission in TeV range. We have dis-cussed the possible instrumental limitations, due to the lowflux and declination, but there is also the possibility thatthis source genuinely lacks TeV emission.
Future observations, especially in the hard X-ray band,will further refine this picture. High angular resolution longChandra X-ray observations will permit an accurate studyof the synchrotron nebula to derive its physical parameters.Additional INTEGRAL pointings will increase the statisticsof the total emission, while the advent of hard X-ray focusingtelescopes, like Simbol-X (Ferrando et al., 2005), will help todisentangle the pulsed emission from the nebular one also inthe HEXTE and IBIS energy range. Moreover, deep GLASTobservations could be useful to estabilish more strict upperlimits to the γ-ray emission from this source.
ACKNOWLEDGMENTS
We thank Vanessa McBride and Raffaella Landi for the helpin data reduction and useful discussions. We also thank theanonymous referee for interesting comments and useful sug-gestions.
REFERENCES
Bird A. J., Malizia A., Bazzano A., et al., (2007), ApJSS,170, 175.Cusumano G., Mineo T., Massaro E., et al., (2001), A&A,375, 397.Cusumano G., Massaro E., Mineo T., (2003), A&A, 402,652.Dean A. J., De Rosa A., McBride V. A., et al., (2008),MNRAS, 384, L29.Deeter J. E., Nagase F., Boynton P. E., (1999), ApJ, 512,300.de Jager O. C. & Harding A. K., (1992), ApJ, 396, 161.de Jager O. C. & Djannati-Ataı A., (2008), Springer Lec-ture Notes on Neutron Stars and Pulsars: 40 years aftertheir discovery, eds. W. Becker, in press [arXiv:0803.0116]de Plaa J., Kuiper L., Hermsen W. (2003), A&A, 400, 1013.Ferrando P., Goldwurm A., Laurent P., et al., (2005), Pro-ceedings of the SPIE, 5900, 195.Fichtel C. E., Ozel M., Stone R., Sreekumar P. (1991), ApJ,374, 134.Finley J. P., Ogelman H., Hasinger G., Trumper J., (1993),ApJ, 410, 323.Freedman W. L., et al. (2001), ApJ, 553, 47.Gehrels N. et al., (2004), ApJ, 611, 1005.Goldwurm A., David P., Foschini L., et al., (2003), A&A,411, L223.

X-ray observations of the PSR B0540-69 11
Gotthelf E. V. & Wang Q. D., (2000), ApJ, 532, L117.Gotz D., Mereghetti S., Merlini D., Sidoli L., Belloni T.,(2006), A&A, 448, 873.Hirayama M., Nagase F., Endo T., Kawai N., Itoh M.,(2002), MNRAS, 333, 603.Hoffmann A. I. D., Horns D., Santangelo A., (2007),Ap&SS, 309, 215.Hofmann W., for the HESS collaboration, (2001), Proceed-ings of the 27th ICRC, 2785.Jahoda K., Swank J. H., Giles A. B., Stark M. J.,Strohmayer T., Zhang W., Morgan, E. H., (1996), EUV, X-ray and Gamma-Ray Instrumentation for Astronomy VII,ed O. H. Siegmund (Bellingham, WA: SPIE), 59.Kaaret P., Marshall H. L., Aldcroft T. L., et al., (2001),ApJ, 546, 1159.Kargaltsev O. & Pavlov G. G., (2008) Proceedings of “40years of pulsars”, AIP Conf. Proc. 983, 171.Landi R., De Rosa A., Dean A. J., et al., (2007), MNRAS,380, 926Lebrun F., Leray J. P., Lavocat P., et al., (2003), A&A,411, L141.Lin Y. C., Bertsch D. L., Dingus B. L., et al., (1996),ApJSS, 105, 331.Livingstone M. A., Kaspi V. M., Gavril F. P., (2005), ApJ,633, 1095.Hwang U., Petre R., Holt S. S., Szymkowiak A. E., (2001),ApJ, 411, L141.Manchester R. N., Mar D. P., Lyne A. G., Kaspi V. M.,Johnston S. (1993), ApJ, 560, 742.Massaro E., Cusumano G., Litterio M., Mineo T., (2000),A&A, 361, 695.Massaro E., Campana R., Cusumano G., Mineo T., (2006),A&A, 459, 859.Mineo T., Cusumano G., Massaro E., (2004), Nucl. Phys.B Proc. Suppl., 132, 632.McBride V. A., Dean A. J., Bazzano A., et al., (2008),A&A, 477, 249.Middleditch J. & Pennypacker C., (1985), Nature, 313, 659.Mineo T., Cusumano G., Massaro E., et al. (1999), A&A,348, 519.Petre R., Hwang U., Holt S. S., Safi-Harb S., Williams R.M., (2007), ApJ, 662, 988.Rothschild R. E., Blanco P. R., Gruber D. E., et al., (1998),ApJ, 496, 538.Schaefer B. E., (2008), AJ, 135, 112.Serafimovich N. I., Shibanov Y. A., Lundqvist P., Soller-man J., (2004), A&A, 425, 1041.Seward F. D., Harnden Jr. F. R., Helfand D. J.., (1984),ApJ, 287, L19.Slowikowska A., Kanbach G., Borkowski J., Becker W.,(2007), Proc. of 363th WE-Heraeus Seminar on “NeutronStars and Pulsars”, MPE Report 291, 44.Sreekumar P., Bertsch D. L., Dingus B. L., et al., (1992),ApJ, 400, L67.Ubertini P., Lebrun F., Di Cocco G., et al., (2003), A&A,411, L131.Takata J. & Chang H.-K., (2007), ApJ, 670, 677Thompson D. J., Arzoumanian Z., Bertsch D. L., et al.,(1994), ApJ, 436, 229.