nitrite uptake and metabolism in human erythrocytes - -orca
TRANSCRIPT

Nitrite Uptake and Metabolism in Human Erythrocytes - A
Source of Vascular Nitric Oxide?
By
Mr Andrew George Finder
B.Sc. (Hons) Pharmacology, Toxicology and Therapeutics, School of Medicine,
University o f Cardiff.
Submitted for
Degree of Philosophiae Doctor (PhD)
Department of Cardiology
Wales Heart Research Institute
School of Medicine
Heath Park
University o f Cardiff
Cardiff
CF14 4XN
July 2009

UMI Number: U584369
All rights reserved
INFORMATION TO ALL USERS The quality of this reproduction is dependent upon the quality of the copy submitted.
In the unlikely event that the author did not send a complete manuscript and there are missing pages, these will be noted. Also, if material had to be removed,
a note will indicate the deletion.
Dissertation Publishing
UMI U584369Published by ProQuest LLC 2013. Copyright in the Dissertation held by the Author.
Microform Edition © ProQuest LLC.All rights reserved. This work is protected against
unauthorized copying under Title 17, United States Code.
ProQuest LLC 789 East Eisenhower Parkway
P.O. Box 1346 Ann Arbor, Ml 48106-1346

This thesis is dedicated to my family, my parents, Caroline & George, my
brother, Ross and my girlfriend Karin.
And is written in loving memory o f my little sister Loma Helen Rose and my
Grandad, Gerald Fred Tarr.
I
DECLARATION
This work has not previously been accepted in substance for any degree and is not concurrently submitted in candidature for any degree.
Signed . . (candidate) Date
STATEMENT 1
This thesis is being submitted in partial fulfilment of the requirements for the degree of PhD.
STATEMENT 2
This thesis is the result o f my own independent work/investigation, except where otherwise stated. Other sources are acknowledged by explicit references.stated, u tner source:
Signed . . . / (candidate) Date ? ? . ? . * . . ,
STATEMENT 3
I hereby give consent for my thesis, if accepted, to be available for photocopying and for inter-library loan, and for the title and summary to be made available to outside organisations.
Signed . . . . (candidate) Date . . ............
II

ACKNOWLEDGEMENTS
The completion o f the body o f work presented within this thesis was dependent upon the
hard work and support o f many people who I owe so much to.
First and foremost I would like to thank Dr Philip James, for giving me the opportunity
to work with him, for giving me the freedom to explore my own ideas, for valuing my opinion
(unless it regarded the use o f specific graphing programs), for being supportive and
compassionate and for his sense o f humour (its not to everyone’s taste but, it did on occasion
make me laugh).
I would also like to thank Dr Keith Morris for his support, his valued opinion but largely
his patience. I am aware that I often asked Keith for help with a problem that I had already
decided was virtually impossible to solve!
I also ow e thanks to some o f my close colleagues. When I started at the Wales Heart
Research Institute I was warmly welcom ed into the ‘brotherhood’ by Drs Afshin Khalatbari and
Stephen Rogers who taught me the black art o f tri-iodide. Stephen in particular has become a
good friend and his input and discussions have proved invaluable. I am also indebted to Dr
Thomas Ingram for his support and advice and particularly for his hard work during the nitrite
infusion study that we jointly completed. Special thanks go to Kate Houghton and Ellen
Pittaway who were a pleasure to work with and have also become good friends and to Janis
Weeks and Joan Parton for their knowledge and technical assistance.
Lastly, I need to thank my family, the last few years have been the toughest for so many
reasons, but the fact that I have completed this thesis is testament to you, I couldn’t have done it
without you all.
British Heart Foundation
III

Table of Contents
1 General Introduction.............................................................................................-11.1 Oxygen Delivery................................................................................. - 11.2 Oxygen Sensing in the Body....................................................................... - 2
1.2.1 The Carotid Body..........................................................................................-31.2.1.1 The Mitochondria................................................................................... - 31.2.1.2 The M embrane....................................................................................... - 41.2.1.3 Non-Mitochondrial Enzymes............................................................... - 41.2.1.4 Hypoxia Inducible Factor......................................................................- 5
1.3 Factors Governing Oxygen Delivery................................................................ - 71.4 The Blood.............................................................................................................. -7
1.4.1 The Red Blood Cell...................................................................................... -71.4.1.1 Erythrocyte Development.....................................................................- 8
1.4.1.2 Erythrocyte Geometric and Rheologic Properties.............................. - 101.4.1.3 The Erythrocyte Membrane................................................................... - 12
1.4.2 Haemoglobin............................................................................................... -141.4.2.1 Haemoglobin Structure..........................................................................- 141.4.2.2 Haemoglobin Structure-Function......................................................... -151.4.2.3 Homotropic Allostery.............................................................................- 171.4.2.4 Heterotropic Allostery............................................................................- 181.4.2.5 Other Allosteric Modulators.................................................................. - 22
1.5 Blood Flow..........................................................................................................-231. 6 Cardiac O utput....................................................................................................-241.7 Vascular Resistance............................................................................................ - 24
1.7.1 Vessel Structure and the Vascular T ree .................................................. - 241.7.2 Control o f Vascular Tone.......................................................................... - 26
1.7.2.1 Neuronal Input and Output.................................................................... - 281.7.2.2 Metabolic Messengers............................................................................-311.7.2.3 Endocrine and Paracrine........................................................................ - 321.7.2.4 Endothelium Derived Mediators of Relaxation...................................- 38
1.8 Nitric Oxide.........................................................................................................-431.8 .1 Nitric Oxide Chemical Identity................................................................ - 431.8.2 Normal in vivo Production........................................................................- 44
1.8.2.1 Nitric Oxide Synthase (NOS)................................................................- 441.8.3 Nitric Oxide Signal Transduction............................................................. - 48
1.8.3.1 Smooth Muscle........................................................................................- 481.8.4 Other Actions o f Nitric Oxide...................................................................- 52
1.8.4.1 Platelets....................................................................................................-521.8.4.2 Cell Proliferation and Angiogenesis.................................................... - 531.8.4.3 Mitochondria........................................................................................... - 531.8.4.4 Protein M odification..............................................................................- 541.8.4.5 Inflammation........................................................................................... - 54
1.9 Nitric Oxide Metabolism in Biological Media............................................... - 561.9.1 Blood............................................................................................................-5 6
1.9.1.1 Plasm a......................................................................................................-5 6
V

1.9.1.2 Erythrocytes..........................................................................................- 59 -1.9.1.3 T issue....................................................................................................... - 6 1 -
1.9.2 Excretion......................................................................................................- 62 -1.10 Biological Activity o f Nitric Oxide Metabolites........................................... - 63 -
1.10.1 The Hb-SNO Theory................................................................................. - 64 -1.10.2 The Nitrite Reduction Theory..................................................................- 6 8 -
1.11 Nitric Oxide Metabolites and Hypoxic Pathologies......................................- 72 -1.12 Nitric Oxide/Nitric Oxide Metabolite Detection in Biological Samples/Systems............................................................................................................ - 73 -
1.12.1 Nitric Oxide................................................................................................ - 73 -1.12.2 Nitrite and Nitrate...................................................................................... - 74 -1.12.3 Haemoglobin-Bound Products.................................................................- 75 -
1.13 Thesis Aims........................................................................................................- 78 -1.13.1 Specific A im s.............................................................................................. - 7 8 -
2 General Methods.................................................................................................. - 80 -2.1 Blood Collection and Processing....................................................................- 80 -
2.1.1 Phlebotomy................................................................................................. - 80 -2.1.2 Blood Sample Processing......................................................................... - 80 -
2.2 Altering Blood Oxygen Saturation..................................................................- 81 -2.3 Ozone Based Chemiluminescence..................................................................- 82 -
2.3.1 Cleavage Reagents.................................................................................... - 83 -2.3.1.1 Tri-Iodide and Modified Tri-Iodide Reagents....................................... - 84 -2.3.1.2 Vanadium III Chloride Reagent......................................................... - 87 -
2.3.2 Pre-Treatments..........................................................................................- 8 8 -2.3.2.1 Acidified Sulphanilamide.................................................................... - 8 8 -2.3.2.2 Mercury Chloride................................................................................. - 89 -
2.3.3 Validation...................................................................................................- 90 -2.3.3.1 Calibration............................................................................................... - 9 0 -2.3.3.2 OBC/Electron Paramagnetic Resonance Spectroscopy Comparison - 92
2.3.4 Protocols......................................................................................................- 95 -2.3.4.1 Measurement o f Plasma/Supernatant Nitric Oxide Species............- 96 -2.3.4.2 Measurement o f Erythrocyte Associated Nitric oxide Species...... - 97 -
2.3.5 Methodological Considerations...............................................................- 98 -2.3.5.1 NOA Sensitivity....................................................................................- 98 -2.3.5.2 Contamination.......................................................................................- 98 -2.3.5.3 Freezing T im e..................................................................................... - 100 -2.3.5.4 Changing pH/Oxygen......................................................................... - 102 -
2.3.6 Analysis...................................................................................................... - 1 0 2 -2.4 Spectrophotometry...........................................................................................- 103 -2.5 M yography........................................................................................................- 1 0 4 -
2.5.1 Test System............................................................................................... - 104 -2.5.2 Experimental Protocol.............................................................................. - 105 -
2.6 Chemicals and Specialist Items...................................................................... - 106 -3 The Metabolism of Nitric Oxide and its Metabolites in Blood, the Influence of Oxygen........................................................................................................................... - 107 -
VI

3.1 Introduction...................................................................................................... - 107 -3.1.1 Nitric Oxide Metabolism in Blood........................................................ - 107 -3.1.2 The Translocation o f Nitric Oxide and its Metabolites in Blood......... - 108 -3.1.3 A im s..........................................................................................................- 1 0 9 -
3.2 Specific Protocols.............................................................................................- 110-3.2.1 Baseline Nitric Oxide Metabolite Measurement................................. - 1 1 0 -3.2.2 Exogenous Nitric Oxide Addition to Erythrocytes............................. - 110-3.2.3 A Real Time Nitric Oxide Reaction M odel......................................... - 111-
3.2.3.1 Nitric Oxide Interaction with Haemoglobin and Erythrocytes - 112-3.2.4 Nitrite Interaction with Erythrocytes.....................................................- 113-
3.3 Statistical Analysis...........................................................................................- 113-3.4 Results............................................................................................................... - 1 1 4 -
3.4.1 Apportionment of Nitric Oxide in Blood............................................. - 114-3.4.1.1 Sample Characteristics........................................................................ - 114-3.4.1.2 Baseline Arterial and Venous samples..............................................- 115-3.4.1.3 Exogenous Nitric Oxide Addition to Arterial and Venous Blood - 1 1 8 -
3.4.2 Real Time Nitric Oxide Reaction M odel.............................................. - 122 -3.4.3 Nitrite Uptake by Erythrocytes................................................................- 127 -
3.5 Discussion.........................................................................................................- 130 -3.5.1 Nitric Oxide Apportionment in B lood................................................. - 130 -3.5.2 Real Time Reaction o f Nitric Oxide with Erythrocytes and Haemoglobin- 133-3.5.3 The Uptake of Nitrite by Erythrocytes..................................................- 137 -
3.6 Summary and Conclusions............................................................................... - 139 -4 Nitrite Induced Vasorelaxation, the Influence of Oxygen........................... -140 -
4.1 Introduction........................................................................................................ - 140 -4.1.1 A im s........................................................................................................... - 1 4 3 -
4.2 Specific Protocols.............................................................................................. - 144 -4.2.1 M yography................................................................................................ - 1 4 4 -4.2.2 Gene Expression S tudy............................................................................- 146 -
4.2.2.1 Sample Generation...............................................................................- 146 -4.2.2.2 Total RNA Extraction......................................................................... - 146 -4.2.2.3 cDNA Generation.................................................................................- 146 -4.2.2.4 Real Time Polymerase Chain Reaction Assay..................................- 147 -
4.2.3 Statistical Analysis................................................................................. - 148 -4.3 Results.................................................................................................................- 1 4 9 -
4.3.1 The Effect of Oxygen...............................................................................- 149 -4.3.2 Pharmacological Inhibitors..................................................................... - 151 -4.3.3 Downstream Mechanisms in Endothelial Denuded and Intact Vessels -152-
4.3.3.1 Endothelium Denuded Vessels...........................................................- 153 -4.3.3.2 Endothelium Intact Vessels................................................................ - 155 -4.3.3.3 Nitric Oxide Dependency and Sources of Nitrite Reduction - 157 -
4.3.4 The Effect of Acute Hypoxia/Nitrite Exposure upon Gene Expression .... - 159 -
4.4 Discussion.......................................................................................................... - 1 6 1 -
VII

4.4.1 Component Pathways............................................................................. -1614.4.2 Nitric Oxide Dependency...................................................................... -1644.4.3 Sources of NO2 ' Reduction....................................................................- 1644.4.4 Vascular Gene Expression.................................................................... -1654.4.5 Implications for in vivo Conditions...................................................... - 167
4.5 Summary and Conclusions................................................................................-1695 Erythrocyte Induced Vasorelaxation: the Influence of Oxygen................. -170
5.1 Introduction........................................................................................................ -1705.1.1 The HbSNO Theory............................................................................... - 1705.1.2 The Haemoglobin Nitrite Reduction Theory....................................... - 1725.1.3 The Adenosine Triphosphate Theory................................................... - 1735.1.4 Current Understanding........................................................................... - 1745.1.5 A im s..........................................................................................................-175
5.2 Specific Protocols...............................................................................................-1765.2.1 M yography.............................................................................................. -1765.2.2 Blood Preparation.................................................................................... -1765.2.3 Erythrocyte Manipulation..................................................................... - 1765.2.4 2,3-DPG....................................................................................................- 1775.2.5 Carbon Monoxide....................................................................................-1785.2.6 Oxygen..................................................................................................... -1785.2.7 Analysis and Statistical Analysis......................................................... - 179
5.3 Results.................................................................................................................- 1805.3.1 The Effect of Haemoglobin Allostery on Erythrocyte InducedVasorelaxation.......................................................................................................... - 1805.3.2 The Effect of Haemoglobin Oxygen Saturation Cycling on theErythrocyte Induced Relaxation............................................................................ - 1825.3.3 Potential Cross-Membrane Transfer o f the Vasorelaxant.................. - 1845.3.4 The Effect o f 2,3-DPG........................................................................... - 1855.3.5 Carbon Monoxide....................................................................................-1875.3.6 O xygen..................................................................................................... -1895.3.7 Vasorelaxation vs. Vasoconstriction.................................................... - 191
5.4 Discussion.........................................................................................................-1925.4.1 Allosteric M odulation............................................................................ - 1925.4.2 Movement and Recycling...................................................................... -1945.4.3 Other Possible M ediators...................................................................... - 196
5.4.3.1 Carbon Monoxide.............................................................................. -1965.4.3.2 Oxygen................................................................................................-198
5.5 Summary and Conclusions............................................................................... - 2026 The Vasodilator Properties of the Nitrite Anion in the Human Circulatory System: the Influence of Oxygen..............................................................................- 204
6 .1 Introduction........................................................................................................ - 2046.1.1 A im s......................................................................................................... -209
6.2 Specific Methods and Protocols...................................................................... -2106.2.1 Subjects.................................................................................................... -2106.2.2 The Environmental Cham ber................................................................ -2106.2.3 Blood Collection and Measurement..................................................... - 211
VIII

6.2.4 Strain Gauge Plethysmography.............................................................. - 2126.2.5 Specific Protocols..................................................................................... - 214
6.2.5.1 Hypoxia/Nitrite.................................................................................... -2146.2.5.2 Hypoxia/Saline.................................................................................... -2156.2.5.3 Normoxia/Nitrite................................................................................. -215
6.2.6 In vitro Nitrite Addition to Erythrocytes...............................................- 2166.2.7 Analysis and Statistical Analysis...........................................................- 216
6.3 Results............................................................................................................... -2176.3.1 Subject Characteristics............................................................................ -2176.3.2 Chamber Parameters................................................................................- 2186.3.3 Haemodynamic Parameters.....................................................................- 2196.3.4 Blood Parameters..................................................................................... -221
6.3.4.1 Blood p H .............................................................................................. - 2216.3.5 Blood Gas Analysis..................................................................................- 2226.3.6 Nitric Oxide Metabolite Levels..............................................................- 224
6.3.6.1 Plasma N itrite...................................................................................... - 2246.3.6.2 Haemoglobin Bound Species............................................................ - 2266.3.6.3 Plasma Nitrate and RSNO/RNNO.....................................................- 228
6.3.7 Forearm Blood F low ............................................................................... - 2306.3.8 Further Interpretation and Comparison................................................. - 2326.3.9 Forearm Blood Flow Observer Variation..............................................- 238
6.4 Discussion.........................................................................................................- 2396.5 Summary and Conclusions..............................................................................-244
7 Overall Conclusions & Insights....................................................................... - 2467.1 Publications...................................................................................................... - 251
IX

COMMONLY USED ABBREVIATIONS
2,3-DPG 2,3-Diphosphoglycerate
3Cs Copper chloride/cysteine/carbon monoxide
AA Arachidonic acid
ANOVA Analysis of variance
AO Aldehyde oxidase
ATP Adenosine triphosphate
Ca2+ Calcium
CaM Calmodulin
cAMP Cyclic adenosine monophosphate
cGMP Cyclic guanosine 3’-5’monophosphate
CO Carbon monoxide
C 0 2 Carbon dioxide
COX Cyclooxygenase
DMSO Dimethyl sulphoxide
EC50 Concentration required to achieve 50% effect
EDRF Endothelium derived relaxing factor
EDTA Ethelene diamine tetra acetic
EPO Erythropoietin
EPR Electron paramagnetic resonance
ETC Electron transport chain
FAD Flavin-adenine dinucleotide
Fe2+ Ferrous iron
Fe3+ Ferric iron
F i0 2 Fraction of inspired oxygen
FMN Flavin mononucleotide
g Gravity
GSNO S-nitrosoglutathione
Hb Haemoglobin
HbA Adult haemoglobin
XI

HbNO Iron nitrosyl haemoglobin
HbSNO S-nitrosohaemoglobin
HC1 Hydrochloric acid
Hg Mercury
HIF-1 a Hypoxia inducible factor-1 a
HPLC High performance liquid chromatography
I2 Iodine
I3' Tri-iodide
K+ Potassium
K3Fem(CN) 6 Potassium ferricyanide
L-NMMA IS^-methyl-L-arginine
N 2O3 Dinitrogen trioxide
NADPH Nicotinamide adenine dinucleotide phosphate
NaOH Sodium hydroxide
NO Nitric oxide
NO' Nitroxyl
NO+ Nitrosonium
NO2 ' Nitrite
NO2 Nitrogen dioxide
NO2 * Nitrogen dioxide (in excited state)
NO3' Nitrate
NOA Nitric oxide analyser
NOS Nitric oxide synthase
NOx Nitrate and nitrite
O2 ' Super oxide
0 2 Oxygen
0 3 Ozone
ODQ 1 H-[ 1,2,4] oxadiazolo[4,3-a]quinoxalin-1 -one
ONOO' Peroxynitrite
P50 Haemoglobin’s 50% oxygen saturation
PE Phenylepherine
XII

p0 2 Oxygen partial pressure
RNNO iV-nitrosamine
RSNO S-nitrosothiol
sGC Soluble guanylate cyclase
VC13 Vanadium chloride
xo Xanthine oxidase
XIII

Chapter One General Introduction
1 General Introduction
The general introduction o f this thesis is intended to introduce the reader to
important background information that is relevant to the findings presented in
subsequent chapters. Each individual results chapter contains an introduction and
discussion that will cover more specific areas and address findings in the literature to
date.
1.1 Oxygen Delivery
The primary function of the cardiovascular and pulmonary systems is to produce
a flow o f oxygenated blood in sufficient supply to maintain aerobic metabolism in all
organs and tissues. The system is required to be energy efficient but also receptive to
changes in cellular metabolic demand. In order to function both at rest and during
demand the system must also match oxygen allocation to metabolic requirements at a
localised level. Once blood enters an area that requires substrates, oxygen should have
the capacity to efficiently move from the blood, across the vessel wall and into the
tissue.
Global oxygen delivery (D0 2 , product of cardiac output and arterial oxygen
content) under normal, resting conditions is more than adequate to meet metabolic
demands/oxygen consumption (V0 2 ) (Figure 1.1). At a tissue level, oxygen delivery is
governed by two processes, convective and diffusive oxygen transport. Convective
transport can be described as the bulk movement o f oxygen in the blood, encompassing
changes in cardiac output and the mechanisms that regulate flow in the microcirculation.
Diffusive oxygen transport simply refers to the movement o f oxygen from the blood into
tissue, down the capillary-intracellular oxygen tension (P0 2 ) gradient and is governed by
arterial oxygen tension (Pao2) [1].

Chapter One General Introduction
$
Lungs + heart
V/Q match/ shunt
D o2
I
- Qt x Cao2
♦Qt — - StagnantX
Pao2 ----- HypoxicX
Hb ----- Anaemia
Tissues 0 2 extraction
Regional distribution 0 2 diffusion
gradient
TISSUEHYPOXIA
- C02 PRODUCTION j
- 0 2 CONSUMPTION IVo*!
IVo? = Qt x (Cao2 - Cvoa)
Cao2 - CvoiExtraction ratio =
(ERoj)
ERo2
Cao2
v Do2 •
RQ
Figure 1.1. Diagrammatic representation o f oxygen transport in the body. Note that oxygen delivery (DO2)
is dependent upon cardiac output (Qt), the arterial partial pressure o f oxygen (PaCh) and the concentration
o f haemoglobin (Hb). A reduction in any o f these parameters can lead to tissue hypoxia. Abbreviations:
V-ventilation; FIC^/FEcvfractional inspired/and mixed expired oxygen concentration; FEco2-fractional
mixed expired carbon dioxide concentration; Qt-cardiac output; PacVPvCb-partial pressure o f
arterial/venous oxygen tension; SaQ,, SvCV saturation o f arterial/venous blood; Ca02/Cv02-oxygen content
o f arterial/mixed venous blood; Hb-haemoglobin concentration; RQ-respiratory quotient; Do2-oxygen
delivery; p50-the p02 at which haemoglobin is 50% saturated. Adapted from [1].
1.2 Oxygen Sensing in the Body
In order to accurately match oxygen delivery to demand, the body requires
methods o f sensing the oxygen level in the blood stream and hence the tissue. This
‘sensing’ is generally believed to be carried out by a structure known as the carotid
body.
- 2 -

Chapter One General Introduction
1.2.1 The Carotid Body
The carotid body represents the primary oxygen sensing site in the vasculature,
located at the bifurcation of the carotid artery. The carotid body is formed from
chemoreceptor cells and is sensitive to changes in pC>2 and to a lesser extent carbon
dioxide/pH and glucose of the blood that continually passes it [2, 3]. Within the carotid
body there are two key cell types, glial-like sustentacular (type II) cells which represent
15-20% of cells and have processes that surround the more abundant, neuron-like
glomus (type I) cells [4]. Glomus cells are thought to be the primary cell type involved
in oxygen sensing, as they are chemoreceptive and release neurotransmitters such as
ATP, dopamine and acetylcholine, in a calcium-dependent manner [5]. As pC>2 levels
fall, the firing o f sensory nerves from the carotid body increases, enhancing the
ventilatory reflex through the respiratory centre to match ventilation on a second to
second basis [6 ]. The oxygen sensing and signalling pathways of the carotid body are
not fully understood, however, a number o f candidate sensors and mechanisms have
been proposed and will be covered in more detail below.
1.2.1.1 The Mitochondria
Mitochondria normally rely on oxygen to synthesise ATP via oxidative
phosphorylation, with oxygen acting as the final acceptor o f the electron transport chain.
In hypoxia, this process cannot occur and so cells switch to anaerobic energy generation
via glycolysis. Hypoxia also brings about other mitochondrial alterations that include
changes in reactive oxygen species level (ROS), cytochrome oxidase activity and ion
channel opening [7]. Inhibitors o f the electron transport chain have been shown to
change the oxygen sensitivity o f glomus cells, mimicking hypoxia [8 ]. However, long
term exposure to these inhibitors abolishes the glomus cell hypoxia sensitivity when
measured by neural discharge [9]. The mechanism by which these mitochondrial
changes result in increased afferent firing and the level at which other pathways (e.g.
hypoxia inducible factor (HIF) [10]) contribute is unclear. However, agents that
uncouple oxidative phosphorylation have been shown to alter calcium levels [1 1 ] which

Chapter One General Introduction
is known to control neurotransmitter release from these cells. Although mitochondria are
clearly sensitive to changes in oxygen, it seems unlikely that cytochrome oxidase is
responsible for ‘continuous’ monitoring o f oxygen level over a broad range of
concentrations given that it has a Km for oxygen o f ~0.1 pmol/L [12] and so the oxygen
level would need to fall significantly before the enzyme would stop binding oxygen and
have reduced function.
1.2.1.2 The Membrane
The increase in cytosolic calcium that triggers transmitter release is thought to be
partly mediated by calcium entry through voltage-gated calcium channels in response to
membrane depolarisation [13]. The membrane potential of glomus cells is largely
controlled by various, different potassium channels [14]. It was first shown that these
channels were oxygen sensitive in the late 1980s [15]; under hypoxic conditions the
channels are inhibited leading to membrane depolarisation, which causes subsequent
changes in intracellular calcium level via other membrane channels. Given that calcium
is thought to control transmitter release, this could provide an alternative oxygen
sensitive mechanism.
1.2.1.3 Non-Mitochondrial Enzymes
NADPH oxidase is a haem containing enzyme expressed in glomus cells and is
postulated to act as an oxygen sensor [16]. NADPH oxidase is known to generate
reactive oxygen species such as superoxide which can in turn form hydrogen peroxide
(H2O2) which can potentially regulate membrane potential via interaction with
potassium channels. The generation o f these species is governed by oxygen, so in
hypoxia hydrogen peroxide production is lower and therefore the open probability of the
potassium channels decreases, resulting in depolarisation. In support of this theory, it
has also been shown that administration of hydrogen peroxide will inhibit carotid body
sensory discharge [17].

Chapter One General Introduction
It is unlikely that any of these proposed mechanisms are mutually exclusive and
so varying contributions from each of these distinct pathways is likely. Although there
are a number o f different suggested ‘oxygen sensor’ pathways in the carotid body, many
of them demonstrate a role for haem-containing enzymes. The carotid body is
representative o f acute oxygen sensing in the body but there are also chronic
physiological responses that are activated by changes in oxygen level.
1.2.1.4 Hypoxia Inducible Factor
The identification o f the transcription factor, hypoxia inducible factor 1 (HIF-1)
was brought about by the discovery o f a genetic response element that controlled
erythropoietin [18]. HIF-1 has now been shown to regulate over seventy distinct genes
that mediate many adaptive physiological responses to hypoxia including angiogenesis,
altered glycolysis and erythropoiesis [19].
HIF-1 is a heterodimeric protein comprised of a constitutively expressed p
subunit and an oxygen regulated a subunit [20]. HIF-1 a is hydroxylated by prolyl
hydroxylases, with oxygen representing a rate-limiting substrate in the process, under
physiological conditions [21]. Hydroxylation is required for HIF-1 a to interact with the
VHL protein forming the recognition component for E3 ubiquitin-ligase [22], binding of
VHL results in ubiquitination and degradation by a 26S proteasome [23, 24]. When cells
become hypoxic, the hydroxylation process is limited and HIF-1 a accumulates before
translocation to the nucleus where it dimerises with HIF-1 p and binds to DNA in genes
with specific nucleotide sequences (Figure 1.2). The hydroxylation process also requires
co-factors such as reduced iron, ascorbate and 2-oxoglutarate. The requirement for these
co-factors closely links the process with both the redox state of the cell and energy
homeostasis.

Chapter One General Introduction
Normoxia Hypoxia
Prolyl andasparaginylhydroxylase
Fe2+, 2-oxogluterate,ascorbate
HIF-1a +VHL
Ubiquitination
Proteasomes
HIF-1accumulation
Prolyl and asparaginyl hydroxylase inhibition
HIF-1aaccumulates
HIF-1a + HIF-1B
HIF-1 activated
GeneTranscription
Figure 1.2. The inhibition and activation pathway of HIF-1 in normoxia and hypoxia respectively. Based
on original schematic from [7]
HIF-1 a is also hydroxylated by factor inhibiting HIF-1 (FIH-1), which prevents
interaction with co-activators CBP and P300 [25, 26]. The co-activators control
interactions with RNA polymerase II and other transcription factors. In hypoxia, FIH-1
is limited and hydroxylation is decreased, which allows the co-activators to interact and
alter target gene expression [27, 28]. FIH-1 also interacts with VHL, linking
transcriptional activity with protein stability [29]. These interactions allow control that is
both rapid and graded, depending on the period and extent of hypoxic exposure.

Chapter One General Introduction
1.3 Factors Governing Oxygen Delivery
Oxygen delivery in the body is governed by, the oxygen carrying capacity o f
blood, blood flow, the efficiency o f the lung/pulmonary gas exchange system and
changes in tissue extraction. This thesis will concentrate on the oxygen carrying
capacity o f blood and the mechanisms involved in controlling blood flow.
1.4 The Blood
The blood is a convective transport medium composed of plasma (-55%),
erythrocytes (—44%, this % is also known as the haematocrit level) and Buffy Coat
(-1% , containing thrombocytes (platelets) and leukocytes (white blood cells)). Plasma is
composed o f -80% water and contains numerous circulating proteins, lipids,
lipoproteins, electrolytes and organic nutrients/waste. Erythrocytes, or red blood cells,
represent the most abundant cell type in blood and are essential for the delivery o f
oxygen to respiring tissues.
1.4.1 The Red Blood Ceil
The pool o f erythrocytes that circulate throughout the body represent an essential
and complex tissue for homeostatic control. In addition to carrying both a substrate and
the metabolic waste products of respiration, erythrocytes interact with other tissues to a
considerable extent. In a healthy human with -5L blood, erythrocytes number
approximately 2.5 xlO 13 cells, a quantity sufficient to meet the requirements of aerobic
respiration. The lifespan o f an erythrocyte is approximately 100 to 120 days, with a
daily loss o f -0.8% to 1.0% of the total circulating mass. To compensate for this loss,
the body has a normal production capacity of -2.5x10 11 cells per day in the bone
marrow [30].

Chapter One General Introduction
1.4.1.1 Erythrocyte Development
The total erythrocyte mass requires precise regulation, the mass must be
sufficient for adequate oxygen delivery without levels being excessively elevated as to
impede blood flow. Levels of circulating erythrocytes are governed by an oxygen
sensitive feedback loop which utilises erythropoietin as a signalling messenger.
Erythropoietin (EPO) is a glycoprotein, largely produced in the kidney by interstitial
fibroblasts [31]. Once systemic, erythropoietin acts upon haemopoietic stem cells found
in the bone marrow via specific cell surface receptors [32].
Early haematopoietic progenitors differentiate into burst-forming unit-erythroid
cells. These burst-forming unit-erythroid cells then further differentiate into colony-
forming unit-erythroid cells and are dependent on EPO for survival [33]. With
continued EPO stimulation, the differentiation pathway moves to erythroblasts, which in
turn enucleate to form reticulocytes and after a few days reticulocytes show loss of
reticulin, resulting in mature erythrocytes. Once the maturation process enters the later
phases, both reticulocytes and erythrocytes cease to express the EPO receptor and so are
unresponsive to further changes in EPO levels [34].
EPO has a terminal half-life o f approximately 5 hours [35]. A number of factors
can affect EPO levels including iron availability, nutritional status, disease,
environmental conditions, and genetic factors (congenital polycythemias). A directly
proportional relationship between erythrocyte production and plasma EPO level does
exist. However, a significant change in EPO plasma levels only results in a modest
increase in the rate o f erythropoiesis, therefore it is time of elevated exposure which is
important, not maximum plasma level achieved. Despite this modest increase in rate, the
downstream effects tend to be prolonged due to the difference in half-life between EPO
and erythrocytes (hrs vs. days). It has been demonstrated that only 30 minutes hypoxia is
required to elevate EPO levels [35], thus a short exposure to elevated EPO levels will
result in prolonged increases in erythrocyte levels.

Chapter One General Introduction
EPO has been demonstrated to directly relax vascular tissue which has been
shown to be dependent upon both the presence o f endothelium and the operation of NOS
[36]. Transgenic mice, engineered to over-express EPO show increases in eNOS
expression, nitric oxide synthesis and nitric oxide inducible relaxation. Despite having
an increased hematocrit (up to 80%), these mice did not exhibit any o f the
accompanying effects o f increased hematocrit, e.g. hypertension or myocardial
infarction [37]. In addition, the effect of EPO upon endothelial upregulation o f eNOS
and nitric oxide production has been shown to be enhanced at lower oxygen tensions
[38]. In contrast, nitric oxide has been shown to suppress haematopoiesis in human cells,
representing a possible ‘feed forward’ mechanism [39]. Haemoglobin mRNA/protein
levels have also been shown to be altered by nitric oxide through a cGMP dependent
mechanism in human erythroid progenitor cells [40].

Chapter One General Introduction
1.4.1.2 Erythrocyte Geometric and Rheologic Properties
Erythrocytes are biconcave in shape and smaller than most other human cells,
with a diameter of approx. 6-8 microns (Figure 1.3).
300 mO
■4--------- Diameter 7.82 p ►
217 mO
Diameter 7.59 p
Volume 94 p3
Surface Area 135 p2
Volume 116 p3
Surface Area 135 p2
131 mO
Diameter 6.78 p
Volume 164 p3
Surface Area 145 p2
Figure 1.3. Geometrical data o f the erythrocyte, measured whilst suspended in buffers with differing
osmolarity values. For reference, normal, isotonic serum tonicity is approximately 270-300 milliosmoles
(mOsm). Based on original figure from [41].
The study of blood rheology involves two key aspects; firstly, blood flow and
secondly the deformation of blood cells. Blood rheology is important in the
cardiovascular system because in addition to vascular tone it is the other key
determinant of vascular resistance. In large vessels, flow is more likely to be altered by
the concentration of erythrocytes. It is in the microcirculation that erythrocyte
deformability, adherence to endothelium and aggregation play a significant role.
- 10-

Chapter One General Introduction
Erythrocyte rheology/deformability can be measured either as a bulk suspension
o f cells or in individual cells. Deformability can be calculated under shear stress
(ektacytometry), by erythrocyte fllterability or analysis of individual cells using a
micropipette [42-44]. The key determinants of erythrocyte deformability are cell
geometry (e.g. the cells surface area to volume ratio), cytoplasmic viscosity and
viscoelastic properties of the erythrocyte membrane.
It has been shown that the viscosity of a haemoglobin solution increases
exponentially when the concentration exceeds 32g/dL [45]. Similarly, when the mean
corpuscular haemoglobin concentration (MCHC) is increased, intracellular viscosity
increases and thus deformability of the erythrocyte decreases [46]. Cytoplasmic
viscosity can also change as a function of temperature and alterations in osmotic balance
that lead to water loss from the cell [47].
The viscous and elastic properties of the membrane are largely governed by the
amount and organisation of cytoskeletal proteins. The interactions of these proteins with
other proteins and the lipid bilayer are o f particular significance [48]. Impairment of
viscoelasticity has been shown to correlate with levels of glycosylated haemoglobin in
diabetics, suggesting a role for cytoskeleton-haemoglobin interaction in deformability
[49]. Erythrocytes which are senescent, abnormally shaped or damaged may be less
deformable and are selectively removed from the circulation.
Nitric oxide donor drug addition to erythrocytes improves deformability in a
dose-dependent manner [50]. The exact mechanism controlling this effect remains
unknown, although it appears to be in part modulated by cGMP. When sGC is blocked,
erythrocyte deformability is impaired, however, this effect can be reversed in a dose-
dependent manner by nitric oxide donors, suggesting the participation of alternative
pathways [50]. It is quite likely that the nitric oxide pathway may involve changes in
phosphorylation o f the cytoskeleton [51]. In this respect, endothelin-1 has been
demonstrated to alter erythrocyte deformability though a pathway regulated by protein
- 11 -

Chapter One General Introduction
kinase C (PKC) [52]. These findings are of particular interest given that erythrocytes
may express a functional eNOS [53].
1.4.1.3 The Erythrocyte Membrane
The erythrocyte membrane is composed o f 3 main elements; membrane lipids,
membrane proteins and cytoskeletal proteins. The structural core o f the erythrocyte
membrane is formed primarily from cholesterol and phospholipid molecules. There are
hundreds o f distinct phospholipids within the membrane, differing with respect to the
polar head group, the carbon back bone and the length and level of unsaturation of the
acyl groups [54]. This diversity in chain length allows the lipids to be packed into the
bilayer in a coordinated fashion, dictating protein-lipid interactions. The bilayer that is
formed is very dynamic, with organised and rapid movement of lipids/embedded
proteins, which gives rise to domains that are rich in specific lipid or protein species
[55]. These domains or ‘rafts’ often have specialist functions such as signal
transduction, with different components working collectively to convey a signal.
A large number o f erythrocyte transmembrane proteins have been characterised.
Broadly, they fall into groups involved in transport, adhesion and cell-cell interactions,
signalling receptors and blood group antigens, for a comprehensive analysis of the
proteome refer to reference [56]. O f specific interest to the current project, are the anion
exchanger AEl/band 3 protein and the macrocomplex which can be formed with other
proteins, in particular, the rhesus (Rh) proteins.
AE1 is an integral membrane protein which is found abundantly in the
erythrocyte membrane (around 106 copies per cell) [57]. AE1 can be separated into its
membrane-spanning domains and its cytoplasmic domains. The 12 membrane spanning
sections o f AE1 catalyse the exchange of anions (C f and HCO3 ) in and out of the
erythrocyte during gas exchange [58]. Carbonic anhydrase II hydrates carbon dioxide to
HCO3' and Ef1’, HCO3' then leaves the cell via AE1 in exchange for Cf, leaving H+ to
bind to haemoglobin and promote the release of oxygen [57]. This process not only
- 12-

Chapter One General Introduction
allows the efficient transport o f carbon dioxide (as HCCV in the plasma) but also
enhances oxygen delivery in the tissue. It has also been recognised that the membrane
spanning domain o f AE1 may signal for the removal o f senescent erythrocytes from the
circulating pool [59].
The C-terminal cytoplasmic domain binds to carbonic anhydrase II and forms a
metabolon to channel HCO3' , facilitating the combined functions of both the enzyme
and channel [60]. The N-terminus binds to a number of proteins such as haemoglobin
[61] and glycolytic enzymes [62-64], but its main function is to anchor the erythrocyte
membrane to the cytoskeleton. Band 3 exists as both dimers and tetramers, in tetrameric
form the protein binds to ankyrin [65] and protein 4.2 [6 6 ] to secure the membrane to
the cytoskeleton.
Part o f the AE1 macrocomplex is formed by the Rh proteins, these Rh
polypetides and Rh associated glycoproteins (RhAG) are thought to act as gas channels,
involved in the transport o f CO2, O2 and interestingly the solo or co-transport of nitric
oxide [57]. Despite the highly diffusible nature of these gases, the co-localisation of
these proteins and their ability to act as channels may aid the efficient transport of gases
across the membrane within the time course of a transitory, circulatory cycle.
- 13-

Chapter One General Introduction
1.4.2 Haemoglobin
Haemoglobin represents one of the most significant and genetically conserved
proteins in the human body. Haemoglobin functions to transiently bind/release oxygen
in the circulation and its ability to perform this function so well is due to its specific
structure.
1.4.2.1 Haemoglobin Structure
Adult haemoglobin (HbA) represents the most important oxygen carrying
protein in the human body. HbA is a heterotetrameric metalloprotein (64,500Da),
consisting o f two a and two (3-globin subunits each bound to haem. During terminal
erythropoiesis huge amounts o f HbA are synthesised, constituting around 95% of the
total mature erythrocyte proteome, a concentration of approximately 35g/dl [67].
The subunits that form HbA adopt a 3-dimensional structure known as the globin
fold. The fold comprises a number of specially arranged helices that form a pocket,
which both encloses and binds to a haem prosthetic group (a planar porphyrin structure
with an iron centre). The haem is linked to the polypeptide subunit via a covalent bond
formed between a nitrogen atom of the proximal histidine (F8 His) and the haem iron
(Figure 1.4d) [6 8 ]. The iron found in the haem group is capable of binding diatomic
gases e.g. molecular oxygen, carbon monoxide and nitric oxide, when it is in the ferrous
state (2+ oxidation state). Diatomic gases bind to the distal side of the haem plane,
opposite the proximal histidine, forming a hexa-coordinate iron structure [6 8 ].
- 14-

Chapter One General Introduction
1.4.2.2 Haemoglobin Structure-Function
The intricate conformational changes that occur in the haemoglobin protein
structure during its binding and releasing o f ligands has given rise to a significant
amount of research into the protein structure-function relationship.
Haemoglobin exists as two classic quaternary structures which are designated R
(relaxed) and T (tense) (Figure 1.4a). Perutz and colleagues identified these exact
structures using X-ray crystallography and their observations generated the concept that
the molecular structure o f a protein can determine its biological function [69]. In vivo,
as each successive oxygen binds, haemoglobin conformation moves through a number
o f states resulting in a transition from T-state to R-state. Within the haemoglobin
structure there are a number of specific structures that are important to this transition
that will be covered below.
The a jpi and (X2P2 interfaces in HbA contain many hydrogen bonds and are
thought to be relatively fixed regardless of changes in quaternary structure [70]. In
contrast, the ot2pi and 011P2 interfaces are subject to notable changes during allosteric
movement between R and T states. Each helix within a subunit is designated a letter, the
p-chain for example has eight helices, A through to H. Regions in the a ip 2 interface in
proximity to the pivot point (FG comer of the a chain and the C helix of the p chain)
stay in contact and are known as the ‘hinge’ [6 8 ]. The point most distant from the pivot
undergoes the largest shift during a conformational change and is known as the ‘switch
region’. During a ‘switch’, P2 9 7 His is displaced to the greatest extent by the turning of
the C helix (oti) from a position between aiPro44 and ajThr41 to a groove between
aiThr38 and ctiThr41 (Figure 1.4C) [6 8 ]. All o f these movements result in a physical
change in haemoglobin conformation that also has different biochemical properties
compared to its non-ligand state.
- 15-

Chapter One General Introduction
a87His
’ v A ,a ,44Pro ' “ ^ j Thr
Figure 1.4. Illustrations of Hb A structure. (A) Deoxy-Hb A, viewed along the 2-fold symmetry axis,
showing the water-filled central cavity. (B) Illustration of the reorientation of a(3 dimers in the T-to-R
transition. The ai|3i dimers of the two conformations, shown in violet toward the rear of the figure, have
been superimposed at the di{3] interface, whilst the a2 and fk subunits of deoxy and carbonmonoxy-Hb are
shown in blue and red, respectively. (C) Switch region of the dj|32 interface of Hb A in the T, R, and R2
conformations, shown in blue, red, and green, respectively. Here, the backbone atoms of residues 38-44
in the dj subunit have been superimposed, to illustrate the relative motion of p297His. (D) The d-subunit
hemes, proximal histidines, and F helices of deoxy-Hb (blue) and carbonmonoxy-Hb (red), with hemes
superimposed. Reproduced from [68].
In addition to the obvious physical differences between the R and T
conformational states, it has been long postulated that the sequence of changes in
quaternary structure when moving from one state to another are responsible for the
varied oxygen affinities of the states. It was always presumed that T state had low
affinity and R state high. Haemoglobin’s relationship with oxygen is altered by both
conformational changes in its protein structure due to substrate (oxygen) binding
- 1 6 -

Chapter One General Introduction
(homotropic allostery) and by effectors that interact with other sites on the protein
(heterotropic allostery).
1.4.2.3 Homotropic Allostery
The proposal o f co-operative oxygen binding by haemoglobin is attributed to a
Danish Physician, the late Christian Bohr. It was the sigmoidal nature of the
haemoglobin oxygen binding curve that stimulated Bohr to generate this concept [71].
At that time it was generally believed that haemoglobin only contained one
haem, it was not until 1925 that Adair showed that there were four haem groups present
in haemoglobin [72]. Once this discovery had been made it became accepted that the
binding of the first oxygen must enhance that of the second and successive oxygen
binding events. Despite these findings, it was still unknown if the mechanism
responsible was via electronic interaction between haem groups or changes in the carrier
protein. A key breakthrough came when Haurowitz demonstrated a change in crystal
structure upon oxygenation [73], suggesting that a change in conformation was
responsible. As more detailed structural information became available, it was clear that,
given the relatively large distance between oxygen binding sites, co-operativity must be
conveyed through the protein structure. In 1970, Perutz, armed with detailed structural
information, proposed novel stereochemical mechanisms to explain the phenomenon
[69]. Perutz noted that specific inter-subunit salt bridges and out-of-plane haem iron
position was present in the T, but not R state [69]. He speculated that when the haem
iron shifts from out-of-plane (with respect to the pyrol nitrogen atoms o f haem) to in
plane this induces displacement o f the proximal F-helix and subsequent helix
rearrangements. These concerted structural changes take place during the T to R
transition in addition to changes in porphyrin sterochemistry, globin structure and at the
subunit interfaces [74]. Given that R state haemoglobin oxygen affinity resembles that
o f free haem subunits, it can be said that it is the structural constraints that stabilise the
T-state and alter affinity to govern co-operativity [74].
- 17-

Chapter One General Introduction
Recently, a new hypothesis has been proposed in which variations in HbA
affinity for oxygen are more likely to be governed by tertiary structural dynamics than
overall quaternary structure changes [75]. This area of research has received an
inordinate amount o f attention and there are many variations in models to explain the
co-operativity phenomenon. As yet a consensus on the different states of haemoglobin
and how they are changed by allosteric effectors is yet to be reached, for a current
review of the topic see [75].
1.4.2.4 Heterotropic Allostery
In addition to the substrate affinity relationship seen in haemoglobin, there are
also sites (other than the oxygen binding pocket) located on haemoglobin where
alternative allosteric regulators can bind and influence oxygen affinity. Principally, these
regulators are respiratory metabolites which aid in the matching of substrate supply to
metabolic demand. It should be noted that binding characteristics can also be regulated
by non-chemical entities, including temperature which can alter oxygen offloading.
1.4.2.4.1 Carbon Dioxide
The efficient transport o f carbon dioxide (CO2) is often said to be of equal
importance to that of oxygen. CO2 is transported in three main forms; dissolved as CO2 ,
as bicarbonate or bound as carbamate (to the amino termini of the globin chains, also
known as carbaminohaemoglobin).
CO2 diffuses out o f respiring tissues into the blood stream, where it enters the
erythrocyte (Figure 1.5). Erythrocytes are significantly more permeable to CO2 than
other cells [76], largely due to specific gaseous exchange channels e.g. AE1 and Rhesus
proteins (previously discussed in section 1.4.1.3, page 12). Once inside the erythrocyte,
CO2 is converted to bicarbonate (HCO3 ) and a proton (H+) by the enzyme, carbonic
anhydrase (CA). Since the initial discovery of CA by Meldrum and Roughton in 1933
[77], a number of CA isoezymes have been found, CA II being particularly abundant in
- 18-

Chapter One General Introduction
erythrocytes with high specific activity (10 times that of CA I) [78]. Once formed
bicarbonate is then free to leave the erythrocyte in exchange for chloride ions, in what is
commonly referred to as the ‘Chloride shift’. As erythrocytes enter the lung the reverse
process occurs, bicarbonate is converted to carbonic acid (H2CO3) which rapidly
dehydrates to water and CO2 , at the same time haemoglobin is re-oxygenated and CO2
stored as carbamate is released. The liberated CO2 then diffuses freely into the lung for
excretion, summarised in figure 1.5. This system is not only key to transport
homeostasis but also plays a notable role in the buffering of blood pH.
r ■'n
Alveolus
Blood CapillaryT issue Blood Capillary
Figure 1.5. Carbon dioxide transport in the blood stream.
1.4.2.4.2 The Bohr Effect
In addition to demonstrating the sigmoidal curve generated by the interaction of
haemoglobin with oxygen, Bohr, with colleagues Hasselbalch and Krogh demonstrated
that the binding curve was sensitive to changes in both CO2 and pH (H+) [79]. Although
carbon dioxide can alter haemoglobin oxygen affinity independently of pH (during
formation of carboxy-haemoglobin), it is the changes in CO2 and concomitant changes
in pH that occur during CO2 transport that produce the ‘Bohr effect’. An increase in CO2
and subsequent reduction in pH shifts the binding curve to the right, increasing the p50
- 19-

Chapter One General Introduction
(oxygen tension required to achieve 50% saturation)(Figure 1.6 ). At a molecular level,
this can be explained in terms of haemoglobin conformational state. As haemoglobin
shifts from the R-state to the T-state the pKa of specific amino acids change (detailed in
Figure 1.7), this change makes them more likely to interact with Bohr protons. When
these protons bind (forming haemoglobinic acid) they stabilise the T-state and delay
transition back to the R-state [80]. The physiological relevance of this shift becomes
apparent in respiring tissues, where CO2 levels are high. Haemoglobin encounters an
area o f low 0 2 /high CO2 and is more likely to offload oxygen and less likely to re-bind,
aiding adequate oxygen delivery. The converse is also true with respect to the effects of
oxygen on C 0 2/H+, known as the ‘Haldane effect’ [81].
100 -1
2 0 -
0 25 50 75 100 125 ISO
O2 tension (mmHg)
Figure 1.6. Influence o f C 0 2 on 0 2 equilibrium curves of blood at 38 °C. Numerical values above each
curve represent the C 0 2 tension in mmHg. Reproduced from [80].
- 2 0 -

Chapter One General Introduction
a-chainc\ 1 /Cls ils
Val - - SerAmino Acid Residue — ArgResidue number 1 131 141
ft-chain o p o * D2 H* d2 h cl d2 h* H\ I / \ / \ I / \ / I
Amino Acid Residue Val His — Lys — His - His
Residue number 1 2 82 143 146
Figure 1.7. Schematic representation o f the major amino acid residues o f the a and p chains o f human Hb
considered to be involved in binding C 0 2 (C), protons (H), chloride ion (Cl) and DPG (D). D,-binding to
one P chain; D2-binding to both P chains; & #-Shared chloride binding sites on a and P chains, respectively;
H*-proton binding in the presence o f DPG. Based on original table from [82].
1.4.2.4.3 2,3-DPG
2,3-Diphosphoglycerate (2,3-DPG or 2,3-BPG) is an organic phosphate
intermediate formed during glycolysis. The intraerythrocytic 2,3-DPG concentration is
approximately equal to the molar concentration o f tetrameric haemoglobin (5mM)[83],
although the amount of free 2,3-DPG is dependent on haemoglobin saturation and can
fall as low as 0.5mM in deoxygenated erythrocytes [84]. It was simultaneously shown
by Chanutin & Cumish [85] and Benesch & Benesch [8 6 ] that organic phosphates could
act as allosteric modulators of haemoglobin. 2,3-DPG binds to histidine, valine or lysine
residues in the p-chains of HbA, forming electrostatic cross-links with residues situated
in the central cavity between the two subunits (Figure 1.7) [87]. In R-state
oxyhaemoglobin this cavity is too small for 2,3-DPG to enter, however, in T-state
binding is very favourable. Through binding to T-state, 2,3-DPG shifts the T-R
equilibrium toward T, shifting the binding curve to the right, which indicates an
enhancement of oxygen offloading with reduced re-capture. Exposure to high altitude
has been demonstrated to increase intraerythrocytic 2,3-DPG levels which may be
necessary for sufficient oxygen delivery, particularly at a capillary level [8 8 ].
-21 -

Chapter One General Introduction
1.4.2.5 Other Allosteric Modulators
O f interest to the current thesis, nitric oxide bound to the 93 position cysteine
residue o f the p chain of haemoglobin (HbSNO) has been shown to produce a rightward
shift in the binding curve, enhancing offloading [89, 90]. Glycosylation o f haemoglobin
has also been shown to cause a slight rightward shift in the oxygen binding curve [91].
Haemoglobin glycosylation in healthy individuals is -5% while in diabetic patients can
range up to 15-20% in some cases. Given these relatively high percentages, the effects
of glycosylation on haemoglobin functionality could potentially be quite dramatic.
It is also well documented that the oxygen binding curve o f foetal haemoglobin
(HbF) is leftward shifted [92]. These altered binding characteristics aid in the transport
of oxygen from the maternal bloodstream across the placenta. In most species the
characteristics o f HbF disappear during the postnatal period. Interestingly, HbF does not
polymerise like sickle haemoglobin (HbS) and so augmentation of HbF levels is now
being considered as a therapeutic option in sickle cell disease [93].
- 2 2 -

Chapter One General Introduction
1.5 Blood Flow
Blood flow at a local level is governed by cardiac output/perfusion pressure and
vascular resistance or tone.
Mathematically, laminar flow in a tube can be described by Darcy’s law, where
flow (F) is dependent upon the pressure gradient (AP) and resistance (R) [94].
F = = ^ rR (i)
To apply this simple equation to the biological setting the components governing
resistance must be taken into account, in particular viscosity. The Hagen-Poisseuille
equation describes this relationship, resistance (R), (v) Viscosity, (L) length of tube and
(r) radius.
R = ( ^ ) ( - )r4 7T (2)
Combining equations 1 and 2 gives equation 3. The important thing to note is
that the relationship between flow and radius is to the fourth power, therefore a 2 -fold
change in radius will give a 16-fold change in flow for example.
P A P . r *™ ^ v . L (3)
In reality, this is only an approximation, as blood does not behave as a
Newtonian fluid i.e. viscosity varies with respect to flow and shear rate, the reader is
directed to an interesting paper regarding the complexities o f the topic by Sirs [95].
- 2 3 -

Chapter One General Introduction
1.6 Cardiac Output
Cardiac output is the product of heart rate and stroke volume. A key factor in the
control of heart rate is the autonomic nervous system; an increase in sympathetic
stimulation to the heart releases noradrenaline which acts via p-adrenoceptors and
results in an increase in heart rate [96]. Stroke volume is governed by myocardial
contractility (also influenced by the autonomic nervous system), pre-load and after-load
[97]. Pre-load is essentially the pressure stretching o f the ventricle after passive filling
and atrial systole. Pre-load is often equated to end-diastolic volume of the left ventricle
and is largely dependent upon venous return and ventricular distensibility [97]. After
load is in essence the pressure that the ventricle must generate in order to contract, i.e.
the force required to overcome aortic pressure, open the aortic valve and eject blood and
is often referred to as end-systolic pressure. After-load is heavily influenced by
peripheral resistance as this tends to be a major factor in determining blood pressure
[97].
1.7 Vascular Resistance
Vascular resistance represents the resistive forces that must be overcome to
produce flow within a vessel. The basic anatomy and biological factors that govern
vascular resistance are covered below.
1.7.1 Vessel Structure and the Vascular Tree
The vascular tree comprises a number of vessels which are distinct at many
levels. In physical terms, arteries are more muscular whereas veins tend to be more
compliant and contain valves to prevent retrograde flow (Figure 1.8). The response of
these different vessels to environment, local and systemic mediators also varies hugely
[98]. It is important to note that despite the various physical differences, all vessels are
lined with endothelial cells that are essential in controlling tone and maintaining the
health of the vessel. Veins generally don’t receive the same research attention as arteries
- 2 4 -

Chapter One General Introduction
have in the past, but the fact that approximately 70% of the total blood volume is found
within the venous circuit, with the majority contained in the small veins and venules
[99], highlight their importance. Given that these vessels represent the primary
capacitance region of the body, minor changes in venous tone can impact significantly
on venous return and thus cardiac output [1 0 0 ], stressing the significance of active
vascular tone control in veins.
Artery
Endothelium
Smooth muscle
artery artery Capillaries
(C)
High
LowLarge Smal Artenotes Capllanes Venules Veinsarteries artenes
Figure 1.8. The structure (A), arrangement (B) and characteristics (C) of arteries and veins. Adapted from
[101].
■Velocity(cm/sec)
peesaUBB(mmHg) 1
- 2 5 -

Chapter One General Introduction
1.7.2 Control of Vascular Tone
The regulated control of vascular tone is so implicit that it occurs via many
different pathways at both a local and whole body level (figure 1.9). The fact that so
many different physiological agents and systems influence blood vessel tone could
suggest significant redundancy. However, because blood vessels play such an important
role in maintaining flow, the presence of multiple pathways allows for compensatory
upregulation in the event of a problem. The origins, control and mechanism of some of
these influences are described below.
- 2 6 -

Chapter One General Introduction
Neurohumoral influences Extravascular influences
NE Endo- en Paracrine influencesANGACh
histamine
PCO;. H-, K- | bradykininadenosine Endothelial influences
PO:
Metabolic influences
Platelets
Endothelium
ErythrocytesNO
O , • ’ATP
shear stressTXA, 5HT
fecilbET-1 ET-1
eN O S COX-1 J CYP450
ANG I ANG II
ET-1 L-Arg NO PGI2 AA
h lz . r x :EDHF ° 2 * "
Smooth MusclecGMP cAMP
K£a "ATP Kca / KATP |
Cardiomyocyte
Figure 1.9. Schematic drawing of an arteriole and the various influences that determine vasomotor tone.
Abbreviations: P 0 2_oxygen tension; TxA2-thromboxane A2 (receptor); 5HT-5-hydroxytryptamine
(receptor); P2X and P2Y, purinergic receptor subtypes 2X and 2Y that mediate ATP-induced
vasoconstriction and vasodilation, respectively; ACh-acetylcholine; M-muscarinic receptor; H] and H2,
histamine receptors type 1 and 2; B2-bradykinin receptor subtype 2; ANG I and ANG II, angiotensin I and
II; AT]-angiotensin II receptor subtype 1; ET-endothelin; ETA and ETB, endothelin receptor subtypes A
and B; A2-adenosine receptor subtype 2; B2-B2-adrenergic receptor; ot] and a 2, a-adrenergic receptors;
NO-nitric oxide; eNOS-endothelial nitric oxide synthase; PGI2-prostacyclin; IP-prostacyclin receptor;
COX-l-cyclooxygenase-1; EDHF-endothelium-derived hyperpolarizing factor; CYP450-cytochrome
Kca- calcium-sensitive K+ channel; KATP-ATP-sensitive K+ channel; Kv-voltage-sensitive K+ channel;
AA-arachidonic acid; L-Arg-L-arginine; 0 2 -, superoxide. Receptors and enzymes are indicated by an oval
or rectangle, respectively. Adapted from [102].
- 2 7 -

Chapter One General Introduction
1.7.2.1 Neuronal Input and Output
The autonomic nervous system (ANS) comprises both afferent and efferent
neurons which connect the central nervous system with visceral effectors. The ANS has
two branches, the sympathetic and parasympathetic (Figure 1.10).
1.7.2.1.1 Afferent Signals
The nucleus tractus solitarius (NTS), found in the dorsomedial region of the
medulla oblongata, receives thousands of afferent input signals each second [103].
Ascending information from baroreceptors represents one of the most significant inputs,
providing tonic and phasic information that can modulate sympathetic outflow to
splanchnic and muscle vasculature to produce adjustment on a second-to-second basis
[104, 105].
A number of functionally different arterial baroreceptors have been found in the
aorta and carotid sinus, they are pressure sensitive and relay information to the
vasomotor centre via the vagus and glossopharyngeal nerves respectively [106].
Additional inputs are also received from cardiopulmonary mechanoreceptors [107],
chemoreceptors that are sensitive to changes in blood/cerebral spinal fluid (CSF)
metabolic metabolites e.g. pCC>2 [108] and pulmonary stretch receptors that respond to
changes in lung volume [109].
- 2 8 -

Chapter One General Introduction
Afferent Central EfferentPathways Pathways Pathways
Sino-AtrialInnervation
Vasom otorInnervation
Sympathetic i chain
Adrenal glands■ Parasympathetic | chain
Medulla
ThoracicSpinalCord
Skin Receptors,N ociceptiveR eceptors ,Som aticReceptors
Pulm onary Stretch receptors
GastrointestinalR eceptors,V iscera lR eceptors
ArterialB aroreceptors,
C hem oreceptors
Higher Brain centres
M echanoceptors
Figure 1.10. A schematic of the autonomic nervous system. Peripheral vascular function is regulated by
the afferent input, central integration, and efferent outflow of the sympathetic nervous system. Afferent
pathways from baroreceptors, pulmonary stretch receptors, cardiac and respiratory mechanoreceptors, and
gastrointestinal and visceral are primarily vagal fibers that receptors feed information to the CNS. The
central integration of the vagal afferent input into the NTS (nucleus tractus solitaruis) is responsible for
initiating the reflex control of the circulation via complex patterns of sympathetic outflow that are
modulated by other neural inputs, peptides and amino acids collectively termed "neuromodulators."
Efferent pathways alter cardiovascular parameters through; initiating hormone release, modulating the
heart and innervating vessels directly. Diagram based on original from [103].
- 2 9 -

Chapter One General Introduction
1.7.2.1.2 Efferent Signals
Efferent signals that control the circulation come from both the sympathetic and
parasympathetic branches of the ANS. Parasympathetic innervation plays a more minor
role, working in opposition to sympathetic drive in the control of the heart and to a
lesser extent in vessels [110]. The sympathetic efferent neurons can be separated into
three groups; barosensitive, thermosensitive and glucosensitive. The thermosensitive
efferents are activated in response to temperature change or emotional stimuli [1 1 1 ],
while glucosensitive efferents are activated by hypoglycaemia or exercise [1 1 2 ]; neither,
however, play a considerable role in cardiovascular control. It is the baroreceptor
efferents that appear to have the most significant role. Found in numerous tissues and
organs, these efferents are highly active (sympathetic tone) even under basal conditions
[113]. Baroreceptor efferents are thought to have roles in both the long and short term
regulation of vascular tone and blood pressure [114]. Interestingly, it has been
demonstrated that nitric oxide and thiol-bound nitric oxide compounds (SNOs) can
modulate the activity of these baroreceptors in vivo [115]. In the majority o f cases, ANS
vessel innervation is mediated by noradrenaline and acetylcholine [116]. Activation of
p-adrenergic receptors on vascular smooth muscle results in vasodilatation, whereas oti
and to a lesser extent tX2 activation produces vasoconstriction [117]. The
parasympathetic stimulation of vascular smooth muscle muscarinic receptors can also
produce vasoconstriction [118]. Endothelial cells have both a and p adrenoceptors;
stimulation of p receptors produces vasodilatation through the release of nitric oxide
[117]. Endothelial cells also produce vasodilatation when stimulated by the primary
parasympathetic neurotransmitter, acetylcholine [118].
- 3 0 -

Chapter One General Introduction
1.7.2.2 Metabolic Messengers
Vessel tone is perhaps unsurprisingly affected by metabolic factors in the blood
stream or within the tissues themselves. The existence of this relationship gives rise to
matching of supply (through alterations o f flow) to demand at a very localised level.
1.7.2.2.1 Carbon Dioxide
Carbon dioxide, or hypercapnic acidosis is know to cause vasodilatation [119].
However, the mechanism of action is incompletely understood and it is unclear whether
carbon dioxide itself or the accompanying change in pH (or both, via alternative
mechanisms) is responsible. Although it is generally perceived that the pH change is
most likely the key mediator [120], there is evidence to suggest that differing
mechanisms involving both carbon dioxide and H+ could be involved [121]. Carbon
dioxide has also been demonstrated to potentiate the effects of nitric oxide in cerebral
arteries [122].
1.7.2.2.2 Adenosine
Adenosine is a by-product o f normal metabolism generated via two distinct
pathways that use either AMP (adenosine monophosphate) or S-adenosylhomocysteine
[123]. Due to this metabolic link, adenosine release increases during cell stress, as seen
with hypoxia, for example [124]. Once released, adenosine acts as a vasorelaxant and
aids to increase flow to areas of oxygen demand. A number of adenosine receptors have
been cloned and have been shown to be G-protein coupled, operating via phospholipases
and/or adenylate cyclase [125, 126]. In addition to its direct vascular effects, adenosine
can also influence the cardiovascular system via platelets, mast cells and the autonomic
nervous system. Interestingly, adenosine has also been shown to promote nitric oxide
release in vascular tissue [127].
-31 -

Chapter One General Introduction
1.7.2.2.3 Oxygen
The effects of pC>2 on vascular contractility have been a point of discussion for
many years [128, 129]. It is clear that most vascular tissue relaxes under hypoxic
conditions; conversely the same is true of constriction in hyperoxic conditions, however
the mechanism still remains unclear. As with most rules, there is an exception; the
pulmonary vasculature behaves in reverse, constricting during hypoxic exposure [130].
Although the mechanism of hypoxic vasodilatation has not been truly defined, there are
several mechanistic theories that have been broadly separated into two groups: those that
involve energy limitation and those associated with a disruption in excitation-
contraction coupling/relaxation mechanism [131]. Our laboratory has previously
published a finding that could explain this phenomenon [132]. At moderately low
oxygen conditions (~5%) a condition arises where NAD(P)H oxidase generation of
superoxide is limited, but nitric oxide synthase production is not (eNOS Km for oxygen
~6-9pM). This produces a situation over a narrow oxygen concentration range where,
despite the same level of production, the relative abundance of nitric oxide is increased
due to decreased superoxide scavenging.
1.7.2.3 Endocrine and Paracrine
As previously mentioned, the control o f vessel tone occurs at both local and
systemic/global levels. Those substances which are known to alter vessel tone are also
released and act in this way i.e. some act in an endocrine or paracrine fashion whilst
others may do both.
1.7.2.3.1 Peptides
A vast number of signalling peptides exist in the circulation and carry out a
number of vascular effects. Primarily, there are those that produce vasoconstriction
(Angiotensin II (AT-II), antidiuretic hormone (ADH), Neuropeptide Y (NPY) and
endothelin (ET)) and those that produce vasodilatation (atrial natriuretic peptide (ANP),
vasoactive intestinal peptide (VIP), substance P (SP), Neurotesin, cacitonin gene-related
- 3 2 -

Chapter One General Introduction
peptide (CGRP) and the kinins). This field is represented by a huge body o f research
that cannot be covered in detail here, therefore detail on some specific signalling
peptides that are o f importance in vascular regulation will be expanded upon.
1.7.2.3.1.1 Bradykinin
Bradykinin is a product of the kallikrein-kinin system (Figure 1.11) and is
generated in blood by converting enzymes found in or on the surface of vascular cells.
The kinins have broad effects that are mediated through two distinct G-protein coupled
receptors (Bj and B2), these include roles in; cardiovascular and renal control,
inflammation and pain [133]. Both receptors are principally linked to phospholipase C
activation, which in turn causes an increase in intracellular calcium from inositol 1,4,5-
trisphosphate (IP3)-mobilised stores [133]. Circulatory actions o f the kinins generally
arise from enzymatic processes which are calcium dependent, in endothelial cells both
nitric oxide and prostacyclin production are stimulated [134]. Bradykinin has also been
shown to initiate endothelium derived hyperpo lari sing factor (EDHF) in the human
forearm [135]. In addition to potent vasodilator effects, bradykinin has actions upon the
heart, altering both heart rate and myocardial contractility [136].
- 3 3 -

Chapter One General Introduction
Prekallikrein
Tissue Kallikrein (hK1)
PlasmaKallikrein
PlasminogenInactive Fragments
PlasminACE, NEP
, Kininase 1 Bradykinin (1 -9)[des-Arg -bradykinin
B1
Receptor
B2
Receptor
ExtracellularProteolysis
Figure 1.11. The kallikrein-kinin system. Abbreviations: ACE-angiotensin-converting enzyme, Bl-rec-
bradykinin 1 receptor, B2-rec-bradykinin 2 receptor, FXII-factor XII, FXIIa-factor Xlla, HK-high-
molecular-weight kininogen, LK-low-molecular-weight kininogen, NEP-neural endopeptidase. Based on
original schematic from [137].
1.7.2.3.1.2 Endothelins
Endothelin is a 21 amino acid residue protein that is released by endothelial cells
and was discovered in the late 1980s [138, 139]. Endothelin is usually cleaved from a
precursor protein and exists as three different isoforms, Endothelin 1, 2 and 3, each
having more or less potency at different receptor subtypes [140]. In mammalian cells,
the endothelins have two cell surface receptor subtypes, ETA and E T b, both operate
through multiple G-protein coupled pathways (Figure 1.12) [141]. Key signalling
mechanisms appear to be through phospholipases, IP3 and changes in intracellular
calcium levels [142]. Different receptor subtypes are found in varying quantities in a
number of different cell types, suggesting that endothelins may participate in a variety of
control mechanisms [143]. In vascular tissue, E T b is found on the endothelium where it
produces vasorelaxation through stimulation of both nitric oxide and prostacyclin
production. Conversely, ETA is found in significant quantities in vascular smooth
- 3 4 -

Chapter One General Introduction
muscle where upon stimulation it produces vasoconstriction (Figure 1.12). Endothelin-1
is released by the endothelium in response to humoral factors and shear stress and is
preferentially released at the basal surface of the cell directly onto the smooth muscle
beneath, the subsequent effect on vascular tone is dependent on both local concentration
and receptor density/subtype distribution [144]. The relative contribution of endothelin
in the control o f vascular tone is known to be different, depending on the circulatory
system studied [145]. Sustained exposure to shear stress reduces endothelin-1
production and is likely to be mediated by increased nitric oxide production and
increased levels o f cyclic guanosine monophosphate (cGMP) [146].
G-Protein Coupled Receptors
ETA
Paracrine (vasoconstrictor)
Actions of ET r Bronchoconstriction,
Aldosterone Secretion
ETB
Non-selective actions + Autocrine effect on Nitric
Oxide/Prostacyclin Synthesis (vasodilatation)
ET- •ET
] ' 1©Al _ 1v—r >
EndotheliumfT p]
NO Pre-j
PGI2
rProET
ACE
Autocrine
Paracrine
Smooth Muscle
Figure 1.12. Several G-protein coupled endothelin receptors have been identified but they are generally
grouped into ETA and ETB according to their main functions (top section o f diagram). The autocrine
(vasodilatator, via nitric oxide, PGI2) and paracrine (vasoconstrictor) effects of ET-1 on vascular smooth
muscle cells (bottom of diagram). In addition, ET-1 is also thought to play a role in the activation
angiotensin converting enzyme (ACE). Based on original schematic from [147].
- 3 5 -

Chapter One General Introduction
1.7.2.3.2 The Renin-Angiotensin System
When the body detects a loss of blood volume or a drop in blood pressure, the
kidneys are stimulated to release renin. Renin is an aspartyl protease that cleaves
angiotensin to angiotensin I. Angiotensin I is then further cleaved by angiotensin
converting enzyme (ACE, found on the endothelial cell surface) to active angiotensin II
(AT-II), summarised in figure 1.13 [148]. In addition to the well-know chronic effects of
AT-II on fluid homeostasis (modulating sodium/water reabsorption in the kidneys, the
thirst centre in the central nervous system and adrenal gland aldosterone release), it also
has both direct and indirect effects upon blood vessel tone. AT-II directly stimulates
angiotensin II type I receptor (AT-IR) present in the vasculature to cause
vasoconstriction and produces changes indirectly by increasing sympathetic tone and
antidiuretic hormone (ADH, also produces vasoconstriction) release [148]. Angiotensin
II type II receptors (AT-IIR) are also known to exist and thought to mediate
vasodilatation [149], however it is AT-I that is highly expressed in adult cardiovascular
tissue [150].
- 3 6 -

Chapter One General Introduction
Renin -♦
Elastase
Cathepsin G
Tissue Plasminogen Activator Bradykinin
Chym ase ACE
DegradationProductsI----------^
Kidney
Liver
Angiotensin
Angiotensin I
Angiotensinogen
A T 1 Receptor A T2 Receptor
i iVasoconstriction Vasodilatation
NAD(P)H O xidase Anti-proliferationActivation
Vascular Hypertrophy
Figure 1.13. Schematic illustration of the renin-angiotensin system including tissue sites, enzymes, and
intermediates, as well as functional impacts on blood vessels. Based on original schematic from [151].
- 3 7 -

Chapter One General Introduction
1.7.2.4 Endothelium Derived Mediators of Relaxation
The endothelium, adjacent to the smooth muscle and blood flow is perfectly
placed to sense changes in smooth muscle or blood and make a corresponding alteration
to address said change. Although the endothelium does produce vasoconstrictors e.g.
endothelin and thromboxane A2, it is the vasodilators that it produces that are essential
for normal vessel health and control, particularly in respect to the altered patency
observed in cardiovascular disease states.
1.7.2.4.1 Eicosanoids
The eicosanoid family encompasses a number of different lipid signalling
molecules that include prostaglandins (PGs), thromboxanes (TXs), leukotrienes (LTs)
and hydroxyeicosatetraenoic acids (HETEs). All members of this family are
biosynthetically derived from the same primary pathway. A change in intracellular
calcium (Ca2+) brought about by physical stimuli, chemical stimuli (e.g. hormones,
autacoids) or receptor operated pathways (e.g. cytokines) leads to activation of
phospholipases, predominantly C or A2 [152]. These phospholipases cleave
phospholipids from the membrane; in humans arachidonic acid is the most abundant
phospholipid precursor. Subsequently, unesterified arachidonic acid (AA) is rapidly
converted to unstable intermediates by either lipoxygenases (LOXs) or prostaglandin H
synthases (also known as the cyclooxygenases (COXs)) [153]. Further conversion by
specific enzymes gives rise to final products that have biological activity (Figure 1.14).
Two isozymes of COX are known to exist: COX-1, which is encoded by a
constitutively expressed gene and COX-2 which is encoded by an immediate response
gene [154]. The majority of cells contain COX-1, whereas only a number of nucleated
cells can increase COX-2 levels upon inflammatory/mitogenic stimuli [155]. Homology
of key residues in the catalytic domains in the two isoforms gives rise to very similar
rates of catalytic activity [156]. Both isoforms contain two distinct catalytic domains.
Firstly, an oxygenase domain that oxygenates and cyclises AA to form an endoperoxide
known as PGG2, which in turn enters the peroxidase domain (thought to operate through
- 3 8 -

Chapter One General Introduction
the enzyme’s haem centre) that converts PGG2 to PGH2 by reducing an OOH group at
position 15 [157]. The cyclooxygenase site of COX-1 is more flexible than that of COX-
2, giving rise to differences in substrate binding [158], this difference is thought to
contribute in the development of more isoform specific antagonists [159].
The biological roles of the eicosanoids are far reaching, with key functions in
inflammatory regulation and a number of vascular effects on both vessels and blood
constituents (e.g. platelets, inflammatory cells) (briefly described in figure 1.14). In the
vasculature, both isoforms of COX have been shown to be localised close to the luminal
surface o f endothelial cells [160]. Close to the interface between vessel wall and blood,
the enzymes are perfectly positioned to generate mediators that effect both platelets and
vascular smooth muscle. The eicosanoids of particular interest in vascular terms are
prostacyclin (PGI2) and thromboxane A2 ((TX)A2).
Prostacyclin is converted from PGH2 by prostacyclin synthase (PGIS), which is
found to be co-localised with COX [161]. Once generated, prostacyclin can exert both
potent vasodilator and anti-thrombotic activities. In vascular smooth muscle,
prostacyclin exerts its effect through a specific G-protein linked receptor (IP), which
upon stimulation results in relaxation that is thought to be mediated through increases in
cAMP and changes in potassium currents [162-164].
Thromboxane A2 is generated from PGH2 by thromboxane synthase (Figure
1.14) and is produced by a number o f cell types, principally activated platelets [165]. In
vascular terms thromboxane A2 is important because it has potent actions in contracting
smooth muscle [166] and is thought to have underlying involvement in hypertension
[167]. The thromboxane A2 receptor is a G-protein coupled receptor that has signal
transduction pathways involving cyclic AMP and the IP3 (inositol 1,4,5-trisphosphate)/
DAG (diacylglycerol) pathway that operates via modulation of intracellular calcium
[168].
- 3 9 -

Chapter One General Introduction
A growing number of publications have shown nitric oxide (endogenous and
exogenous) to increase COX activity in a number of tissues, including vascular tissue
[169-175]. The exact mechanism of the relationship remains to be elucidated, however it
has been suggested that nitric oxide may interact with the haem found in COX to alter
function in some way [176]. Other work suggests that when nitric oxide reacts with
superoxide (O2 ) to from peroxynitrite (ONOO'), it can nitrate a tyrosine residue of
prostacyclin synthase and produce inhibition through steric hindrance [177]. Ironically,
the same process (specific tyrosine nitration) is thought to activate COX [178].
Phosphotpase A 2. C and D
5-Lypoxygenase Epoxygen as es
Cyclooxygenases
(COX 1 and 2}
EETs
Phospholipids
Arachidonic AddLeukotriene ((LT)A 4)
Prostaglandin (PGH 2)
LTB4
• Chemoattractant
Prostacydin (PG I2)
• Vasodilatation
• Inhibition of Platelet Aggregation
Thromboxane ((TX)A 2)
• Vasoconstriction
• Platelet Aggregation
• Bronchospasm
PGE2 p g d 2 p g f 2
• Vasodilatation
• Vascular permeability
• Hyperalgesia
• Modulation of Hormonal Response
Figure 1.14. Biosynthesis of the eicosanoids. Cell stimulation is followed by activation of phospholipases
which liberates arachidonic acid from the membrane, which in turn is converted to unstable intermediates
by distinct oxygenases. (LT)A4 and (PG)H2 are then further metabolised into different bioactive products
by specific enzymes. Based on original schematic from [179].
- 4 0 -

Chapter One General Introduction
1.7.2.4.2 EDHF
In addition to the classic transmitters released by the endothelium, another
‘factor’ exists to control vessel tone that is more elusive. Termed ‘endothelium derived
hyperpolarising factor’ or EDHF this phenomenon is receiving increasing research
interest. EDHF appears to be triggered by a number of endothelial stimuli and ultimately
results in smooth muscle hyperpolarisation and subsequently relaxation. The
mechanisms that commence and propagate EDHF remain unclear, although some
aspects of the phenomenon are understood. EDHF activity is thought to be reliant on
either diffusible factors or contact-mediated mechanisms (Figure 1.15). Many diffusible
factors have been proposed and notably include potassium ions (K+),
epoxyeicosatrienoic acids (EETs) and hydrogen peroxide (H2O2) [180-182]. The transfer
o f ‘signal,’ either diffusible or electrical from endothelial cells to smooth muscle cells is
thought to occur through myo-endothelial gap junctions [183]. It is accepted that,
regardless of mechanism, an increase in endothelial cell intracellular calcium and
activation of specific potassium channels is required for EDHF activity, summarised in
figure 1.15 [184]. It is recognised that the contribution of EDHF to overall control of
vascular tone varies along the vascular tree, becoming more prominent in smaller
vessels [185]. The study of EDHF is commonly carried out in the presence o f both
nitric oxide synthase and cyclooxygenase inhibitors. The use of these agents makes it
difficult to assess the exact, relative contribution of EDHF to overall relaxation due to
compensatory upregulation in the vessel.
-41 -

Chapter One General Introduction
Ach, BK,SP
Endothelium
EDHF.
Hyperpolarisation
‘Ca
Gap Junctions
HyperpolarisationSmoothEDHF
Muscle
Na+/K
ATPase
Hyperpolarisation
Figure 1.15. Schematic description of the main hyperpolarizing mechanisms mediated by EDHF. The
binding of acetylcholine (Ach), bradykinin (BK) and substance P (SP) to their endothelial receptors and
the increase in wall shear stress(s) ( t ) promote EDHF. EDHF can then hyperpolarize the smooth muscle
cells via three principal pathways. 1) EDHF can passively diffuse from the endothelium to activate
calcium-activated potassium (Kca) channels of large conductance (BKCa) located on the smooth muscle
cells thereby promoting the release of K+ and membrane hyperpolarization. 2) EDHF can act in an
autocrine manner to facilitate the activation of the endothelial Kca channels, both small (SKca) and
intermediate (IKca) conductance channels that release K+ and produce hyperpolarization of the
endothelial cells, which is in turn transmitted to the underlying smooth muscle via gap junctions. 3) K+
released from the endothelial SKq , and IKCa channels into the myoendothelial space activates the Na+/K+
ATPase and the inward rectifying potassium channels (KIR) located on the smooth muscle cells
promoting the release of K+ and subsequent hyperpolarization of these cells. Smooth muscle cell
hyperpolarization decreases the open-state of voltage-gate Ca2+ channels, lowering cytosolic Ca2+ and
thereby provoking vasorelaxation. Based on original schematic from [186].
- 4 2 -

Chapter One General Introduction
1.8 Nitric Oxide
Perhaps the most widely studied and understood molecule involved in the control
of vascular tone is nitric oxide or endothelium derived relaxing factor (EDRF). The aims
of this thesis focus on both nitric oxide and its metabolites in terms of their biochemistry
and physiologically relevant bioactivity. Different biological aspects and chemistry of
nitric oxide and its metabolic products are covered in detail below.
1.8.1 Nitric Oxide Chemical Identity
Nitric oxide (NO), or nitrogen monoxide, is composed of a single nitrogen atom
and a single oxygen atom. The simple covalent interaction between these atoms gives
rise to a very chemically active diatomic free radical. It is this chemistry which dictates
the actions of nitric oxide in both simple chemical and biological systems [50].
At the heart of nitric oxide chemistry is the nitrogen oxidation state (Figure
1.16). The capacity o f nitrogen to form compounds in a range of oxidation states, from -
3 to +5, gives rise to a considerable and varied chemistry [187]. Nitric oxide is often
only considered in its free radical form (NO*), however there are two key redox-
activated species o f particular interest, the nitroxyl anion (NO ) and the nitrosonium
cation (NO+), formed by reduction and oxidation of nitric oxide respectively.
- 4 3 -

Chapter One General Introduction
NOONOO
Figure 1.16. The spectrum of nitrogen redox species, extending from fully oxidised (nitrate) to fully
reduced (ammonia). The positioning of nitric oxide, nitrosonium, and nitroxyl at the top of the arc
indicates that these species are relatively easily oxidised or reduced. The presence of the higher oxides on
the left of the arc indicates that reduction of these species back to free radical nitric oxide is relatively
difficult and that they are more easily converted to fully oxidized nitrate. Based on original schematic
from [188].
1.8.2 Normal in vivo Production
The production and release o f nitric oxide by the endothelium can be induced by
both agonists (such bradykinin or acetylcholine [189]) but also by physical stimuli such
as shear stress [190]. The mechanisms that control the production and release o f nitric
oxide traditionally centre on the specialised enzymes that produce it.
1.8.2.1 Nitric Oxide Synthase (NOS)
There are three main iso forms o f nitric oxide synthase, the first to be isolated and
purified was neuronal NOS (nNOS or NOS I) [191], this was quickly followed by the
isolation and cloning o f inducible NOS (iNOS or NOS II) [192] and endothelial NOS
(eNOS or NOS III) [193, 194]. Since this initial classification, a number of additional,
specific splice-variants have now been identified [195]. nNOS and eNOS are
constitutively expressed and are activated by interaction with calcium calmodulin.
- 4 4 -

Chapter One General Introduction
Conversely, iNOS is inducible in expression and is activated even at resting cellular
calcium levels [196]. Structural differences in the different isoforms can be seen in
figure 1.17 below.
C onstitutive
(Ca2+ D ependent)
Inducible
(Ca2+ Independent)
nN O Sa
160kDa
eNO S
135kDa
iNOS
130kDa
P D Z - Arg Heme BHCaM
FMN | ] f m n L FAD NAD(P)H
Zn2+
Myr Palm
CaMArg Heme BH FMN HFAD NAD(P)H |— CFMNN —
CaMArg Heme BH 4 FMN FMN FAD NAD(P)H — C
Zn2+
O xygen ase Domain R eductase Domain
Figure 1.17. A schematic showing the structural arrangement of the three different isoforms of nitric oxide
synthase. Note the myristoylation (Myr) and palmitoylation (Palm) sites of eNOS. Based on original
schematic from [197].
The NOS enzymes are haem-based oxido-reductases that catalyse the conversion
o f the amino acid L-arginine and molecular oxygen to L-citrulline and nitric oxide. The
NOS family o f enzymes contain both an oxygenase and a reductase domain and have
been shown to share close homology with the cytochrome P-450 reductase family of
enzymes [198].
- 4 5 -

Chapter One General Introduction
0 =0 -Citrulline + N = 0 0=0
L-ArginineCaM
FAD
C FMN Heme
BHNAD(P)H JNAD(P)H
FMNHeme0=0
FAD s/ CaM
L-Arginine
N = 0 + Citrullineo=o-
Oxygenase Domain Reductase Domain
Figure 1.18. Schematic of the functional NOS dimer. A functional NOS dimer requires calmodulin (CaM)
and a number of cofactors and substrates. Note the overall oxo-reductase reaction catalyzed in the
presence of sufficient (solid lines), or limiting (dashed lines) substrate and/or BH4 (tetrahydrobiopterin). e-
stands for reducing equivalent. Based on original schematic from [197].
In order to operate, NOS must first form a homodimer through the N-terminal
interface (Figure 1.18) [199]. This dimerisation is stabilised by the co-factors 6(R)-
5,6,7,8-tetrahydrobiopterin (BH4) (which works as a stabiliser in addition to having a
catalytic capacity) and the metallic element, zinc (Zn2+) [200, 201]. The C-terminus
(reductase domain) o f the enzyme shuttles electrons from NADPH (nicotinamide
adenine dinucleotide phosphate) to the co-factors, FMN (flavin mononucleotide) and
FMD (flavin adenine dinucleotide), which are in turn passed to the iron within the N-
terminus, oxygenase domain protoporphorin IX haem [202]. Acting as an electron
acceptor, the haem becomes reduced, enabling the binding of molecular oxygen which
in turn leads to oxidation of the guanido nitrogen of L-arginine to form the stable
intermediate N -hydroxy-L-arginine [203]. A subsequent molecule o f oxygen is then
recruited to convert this intermediate into L-citrulline and Nitric oxide [204] (figure
1.19). Scenarios can arise where substrates/co-factors are limited. This can lead to
- 4 6 -

Chapter One General Introduction
‘uncoupling’ of the enzyme and generation o f oxygen free radicals such as superoxide
(O2 ), peroxynitrite (ONOO ) and hydrogen peroxide (H2 O2) [205] (figures 1.18 and
1.19, dotted lines).
N=0- + CitrulNne0 = 0 + L-Arginine + NAD(P)H
L-Arginine CitrullineNHNH NHNH
HN'HN NH2NH.0=0 -
OH O-OH
Nitricoxide
Heme
h 2oNOS 0 = 0 + 0.5 NAD(P)H
Figure 1.19. Schematic depicting the reactions at the N-terminus, NOS oxygenase Catalytic site.
Simplified reaction mechanism in the presence of sufficient (solid lines), or limiting (dashed lines)
substrate and/or critical cofactors. Based on original schematic from [197].
1.8.2.1.1 eNOS
eNOS is modified at both co- and post-translational levels by myristoylation and
palmitoylation respectively, these modifications function to target eNOS to caveolae
(Figure 1.17) [206, 207]. Caveolae are lipid raft micro-domains that form invaginations
in the plasma membrane and contain specific functional proteins known as the caveolins
[208]. eNOS interacts with the scaffolding domain of caveolin-1, blocking the binding
of calmodulin and inhibiting the enzyme [209]. Upon stimulation (e.g. by shear stress or
by an agonist) intracellular calcium increases, eNOS is released from caveolin-1 and the
inhibitory state of eNOS is reversed by interaction with the calcium/calmodulin complex
or Akt-induced phosphorylation at specific sites [210, 211]. It is also thought that heat
- 4 7 -

Chapter One General Introduction
shock protein 90 (Hsp-90) may also be involved in the allosteric modulation of eNOS
[212]. By targeting eNOS to the plasma membrane and through its interaction with
proteins within the caveolae, the enzyme is perfectly placed to adapt quickly to changes
in shear stress or receptor interaction. Nitric oxide is thought at some level, to control its
own production, in the short-term by inhibitory interactions with eNOS (possibly
through haem binding) [213] and in the long-term via inhibition of eNOS transcription
[214].
1.8.3 Nitric Oxide Signal Transduction.
The solubility of nitric oxide in water is relatively low (~1.9 x KT6 mol cm-3
atm-1 at 25°C) [215]. Given the highly reactive nature o f the molecule and relatively
short distances it can diffuse in biological media [216], its low solubility can be
advantageous. Being hydrophobic in nature allows the molecule to easily pass out of one
cell i.e. the endothelium, and enter another to exert its actions i.e. into smooth muscle to
produce vasorelaxation.
1.8.3.1 Smooth Muscle
When nitric oxide diffuses into smooth muscle cells, it activates the soluble form
of guanylate cyclase (sGC) (Figure 1.20). sGC catalyses the conversion of guanosine
triphosphate (GTP) to the second messenger, cyclic guanosine 3,5,-monphosphate
(cGMP) [217]. As levels of intracellular cGMP rise a number of cGMP-dependent
kinases (e.g. PKGs) become activated [218]. These activated kinases phosphorylate a
number of key target proteins including potassium channels, IRAG (inositol
trisphosphate (IP3) receptor associated cGMP kinase substrate) which inhibits IP3
mediated calcium release and phospholamban, which stimulates SERCA
(sarco/endoplasmic reticulum Ca2+-ATPase) to sequester cytosolic calcium [219-222]
(Figure 1.20). All o f these signalling events serve to reduce intracellular calcium, which
reduces the formation of calcium-calmodulin-myosin light chain kinase complex
(MLCK) and in turn decreases phosphorylation of serine residues in the myosin
- 4 8 -

Chapter One General Introduction
regulatory light chain (MLC), inhibiting vasoconstriction [223]. PKG directly and
cGMP (via unknown mechanisms) are also known to activate myosin light chain
phosphatase (MLCP) which de-phosphorylates MLC, resulting in enhanced
vasorelaxation [224, 225]. The level of cGMP and hence the level o f kinase activation is
controlled by phosphodiesterases (PDEs) that break down cGMP. These enzymes have
received much recent attention with the discovery that novel, pharmaceutical PDE
inhibitors can be used in the treatment of erectile dysfunction [226].
- 4 9 -

Chapter One General Introduction
Stim ulus
* Ca2*
---e N O S ^ N O
EndotheliumCaM
L-Arg+02
VascularSmoothMuscle
GTP cGMP
PKG
PDE
fcAMP
Relaxation
Figure 1.20. Schematic showing the production of nitric oxide in endothelial cells and the mechanism of
action of this mediator on vascular smooth muscle mediated by guanylyl cyclase. The activation of
endothelial receptors produces an increase in calcium entry via channels, and results in a greater
concentration of inositol triphosphate (IP3) in these cells. IP3 subsequently releases calcium from the
endoplasmic reticulum (ER). This increase in intracellular calcium in the endothelium activates
calmodulin (CaM), which in turn activates nitric oxide synthase (NOS). Nitric oxide (NO) is then
produced from its precursor, the amino acid L-arginine (L-Arg). The nitric oxide that is synthesised then
diffuses into the smooth muscle where it activates soluble guanylyl cyclase (GC), forming cyclic
guanosine monophosphate (cGMP) from the guanosine triphosphate (GTP). cGMP activates various
protein kinases (eg. PKG), causing a lowering of intercellular Ca2+ levels, inhibits PDEs to increase cAMP
and can also activate KC channels. All these effects of cGMP produce relaxation of vascular smooth
musle. Based on an original schematic from [227].
- 5 0 -

Chapter One General Introduction
1.8.3.1.1 Soluble Guanylate Cyclase
Soluble guanylate cyclase was first purified in the 1980s [228] and was
subsequently shown to contain haem and to be nitric oxide sensitive [229, 230]. The
enzyme is a large a p heterodimer: haem binds to the N-terminus of the p-chain, while
the catalytic domain is comprised o f elements from both the a and p chains and is
located in the C-terminal region o f the molecule [231]. The traditional model for
activation of sGC proposes that nitric oxide must bind to the haem and disunite the bond
formed between the haem iron and the proximal histidine of the porphyrin structure,
altering the protein conformation and increasing catalytic activity [232, 233]. However,
more recent studies suggest that the process has two steps that are both nitric oxide
dependent [234]. Two theories have been put forward to explain the mechanism of this
phenomenon. The first suggests that a second nitric oxide molecule could bind to the
haem iron to give an NO-Fe-NO complex, further altering the protein structure [235].
The theory is supported by evidence that shows that even when 80% of sGC haem has
nitric oxide bound, the enzyme exhibits only 10% full activity [235]. This suggests there
is a low activity form of sGC that is spectrally indistinguishable from the active NO-Fe
penta co-ordinate complex. The second theory suggests a non-haem nitric oxide binding
site to be responsible. The model is based on the observation that the rate that nitric
oxide dissociates from sGC haem is slower than the rate of deactivation [236]. The
deactivation of sGC is thought to either occur through simple dissociation of nitric oxide
that subsequently reacts with intracellular globins e.g. myoglobin [237], or the iron is
oxidised to Fe (III) with the formation of nitrate [238]. Interestingly, the dissociation of
nitric oxide from sGC has been shown to be 50 times faster in the presence of substrates
(GTP and magnesium ions); this dissociation rate (0.04 s’1) is the fastest reported
dissociation o f nitric oxide from a ferrous haem protein and the finding gives insight
into the control of this enzyme [239].
-51 -

Chapter One General Introduction
1.8.4 Other Actions of Nitric Oxide
The signalling actions of nitric oxide are not limited to relaxation of smooth
muscle or functions in vascular health, they involve diverse roles from
neurotransmission to inhibition o f platelet aggregation. Given the magnitude and
complexity of the signalling roles in question, the next section of this thesis will
concentrate on those that have relevance to the vasculature.
1.8.4.1 Platelets
Nitric oxide generated by the endothelium and by platelets [240] has been shown
to have a number o f effects upon platelet responses. These include inhibition of
aggregation [241], adhesion [242] and recruitment [243]. Although platelet aggregation
is a vital process in the prevention o f bleeding, disorders or over-stimulation of this
process can result in unwanted thrombosis [244]. As in smooth muscle, nitric oxide
signalling in platelets is via cGMP production, leading to a reduction in intracellular
calcium [245, 246]. The cGMP-dependent reduction in intracellular calcium is also
associated with SERCA activation and phosphorylation of phospholamban, as in smooth
muscle [247]. As calcium levels fall, it is thought that the association between platelets
and fibrinogen decreases and the formation of active glycoprotein Ilb/IIIa is inhibited
[248, 249]. cGMP increases cAMP levels by inhibiting its breakdown by PDEs,
producing enhanced cGMP-like activity [250]. In addition, cGMP also inhibits thrombin
mediated activation of phosphoinositide 3-kinase (PI3-K) which normally promotes the
active form of the glycoprotein Ilb/IIIa complex [251].
- 5 2 -

Chapter One General Introduction
1.8.4.2 Cell Proliferation and Angiogenesis
Nitric oxide is intimately involved in the control of angiogenesis via its ability to
alter both cell death signalling and promote cellular proliferation with angiogenesis
attenuated in the absence of nitric oxide [252]. Nitric oxide has been shown to inhibit
the proliferation of vascular smooth muscle [253] and is proposed to operate in this
capacity through both cGMP dependent and independent mechanisms. Through cGMP
dependent mechanisms, nitric oxide increases levels of cAMP and activates protein
kinase A [254]. PKA reduces intracellular calcium levels which counteracts high
calcium fluctuations that are known to promote proliferation [255]. Independently of
cGMP, nitric oxide inhibits the production o f polyamines required for DNA synthesis
through blocking o f critical enzymes, ornithine decarboxylase and arginase [256].
Nitric oxide is also capable o f preventing apoptosis and promoting proliferation of
endothelial cells [257, 258].
1.8.4.3 Mitochondria
Nitric oxide has been shown to interact with a number of metal-centred enzymes
of the electron transport chain (ETC), including Complexes I, II, III and cytochrome c
oxidase (complex IV) [259-261]. The effects o f nitric oxide on the system can be both
reversible and irreversible and appear to be dependent upon concentration [262].
Cytochrome c oxidase is the final enzyme complex of the ETC which catalyses the
reduction o f oxygen to water. Cytochrome c oxidase is inhibited by nitric oxide due to
nitric oxide binding to the haem oxygen site of the enzyme at physiological
concentrations [263]. The inhibition o f cytochrome c oxidase causes a reduction in flux
through the ETC and a block o f cellular respiration [264]. The sensitivity of this
mechanism to changes in nitric oxide to oxygen ratio has been proposed to provide a
potential link between oxygen sensing and respiration [264]. One scenario in which this
reversible/transient mechanism could beneficially alter physiology is in smooth muscle,
where a depletion o f oxygen and consequent change in respiration/nitric oxide
bioavailability could result in vasodilatation [265].
- 5 3 -

Chapter One General Introduction
1.8.4.4 Protein Modification
In addition to classic signalling pathways, nitric oxide is now believed to signal
through modification o f specific proteins, at specific sites. A biologically relevant
example of nitric oxide mediated protein modification is S-nitrosylation of cysteine
residues, which was first shown by Stamler et al in 1992 [266]. Unusually, the covalent
bond formed between nitric oxide and the sulphur of a thiol group is readily reversible
(i.e. could infer an ‘on’ and ‘o ff mechanism) and in light of the fact that nitric oxide can
easily pass from one thiol group to another (transnitrosation) there is a suggestion that S-
nitrosothiol complexes could have roles in cellular signalling [267]. Since the original
observation by Stamler et al [266], hundreds o f target proteins and processes that can be
modulated by S-nitrosylation have been identified, these include regulation of vascular
enzymes such as eNOS [268, 269] and modification of mitochondrial proteins to alter
respiration [270], ion channels [271], plasma proteins (e.g. factor XIII [272]) and
signalling proteins [273].
1.8.4.5 Inflammation
Nitric oxide also plays a number o f essential and wide ranging roles in the
inflammatory response. The release o f inflammatory cytokines causes the activation and
upregulation o f inducible nitric oxide synthase (iNOS) in a wide range of cell types
[274]. The amount o f nitric oxide generated in this response is often considerable when
compared to the average turn over in endothelium, however, the role that nitric oxide
plays is very much dependent upon the site of synthesis, local targets and local
concentration [274]. Nitric oxide is belived to play key signalling roles via the
regulation o f the transcription factor NF-kB [275, 276], which can control processes
such as ECAM (cell surface glycoproteins involved in inflammatory cell adhesion,
rolling and extravsation) expression on the endothelial cell surface [277]. Nitric oxide is
also important in first-line defence providing cytotoxicity against invading parasites,
bacteria and viruses [278, 279].
- 5 4 -

Chapter One General Introduction
Although nitric oxide is clearly essential in the immune response, in scenarios
where production is high (as in sepsis [280]), the ability of nitric oxide to act at multiple
targets, act as an oxidant or antioxidant and form other highly reactive species (e.g.
peroxynitrite) can potentially be detrimental.
- 5 5 -

Chapter One General Introduction
1.9 Nitric Oxide Metabolism in Biological Media
1.9.1 Blood
A proportion of nitric oxide generated by the endothelium inevitably enters the
lumen of the blood vessel where it interacts with blood. The metabolism of nitric oxide
in this setting varies depending on whether the molecule interacts with plasma
constituents or the erythrocytes.
1.9.1.1 Plasma
Nitric oxide metabolism in plasma, as in most aqueous solutions, primarily
proceeds via the autoxidation route where nitric oxide undergoes reaction with
molecular oxygen to yield N 0 2[A] [281, 282].
2NO* + 0 2 2N 02* [A]
Once formed, N 0 2 can undergo further reaction with nitric oxide to form the N-
oxide N20 3[b] [283] or can dimerise to form N20 4 [C1 [284].
N 0 2# + NO’ <-> N20 3 [B]
2N 02* <->N20 4 [C]
In turn, these products may be hydrolysed to yield nitrite (N 02')[D] [285] and
nitrate (N 0 3 )[E] [283], respectively.
N20 3 + H20 -> 2HN02 -» 2N 02- + 2H+ [D]
N20 4 + H20 —> N 0 3 + N 0 2 + 2H+ [E]
- 5 6 -

Chapter One General Introduction
The autoxidation reaction of nitric oxide is second order with respect to nitric
oxide concentration and third order overall [286]. Under normal conditions, where the
oxygen concentration is much higher than the nitric oxide concentration, the half-life is
inversely dependent upon concentration and so the reaction proceeds slowly. This could
explain how nitric oxide appears to have sufficient longevity to induce signalling within
the immediate area of generation. In areas o f high nitric oxide concentration i.e. the
micro-environment surrounding activated macrophages [287], the converse is also true
and the half-life decreases dramatically.
Both nitric oxide itself and the higher N-oxides (e.g. N 20 3 [B] and N20 4[C]) that it
forms are effective nitrosating agents and can interact with nucleophilic centres (-S, -N,
-O, -C) on plasma proteins (e.g. albumin) to generate a number of species [288]. One of
the key nucleophilic groups found on proteins are the thiol (R-S) groups, which are
readily nitrosated via several proposed mechanisms. Nitric oxide itself will react with
both thiols and thiol radicals[F] to generate nitrosothiols (RSNOs) and nitrosothiol
radicals respectively [289]. In the case of direct reaction where a RSNO radical is
formed, the RSNO is stabilised by electron abstraction by another molecule, or by
protonation to form the RSNOH radical [290]. Generally, the formation of RSNO
compounds is thought to proceed via formation of the nitrosonium ion (NO*) formed via
interaction with metals (M) often contained in haem proteins [291][G][H], dinitrosyl iron
complexes^ [292] or via higher N-oxides that have ‘NO+-like’ activity^ 1 [293]. In
areas of low pH, it is also possible for nitrite to generate NO+ and thus RSNOs[M] [294].
NO- + RS* -> RSNO [F]
NO* + M —> MNO —» M(reduced) + NO+ [G]
NO+ + RS' -> RSNO [H]
- 5 7 -

Chapter One General Introduction
RS” NO+\ /
Fe(-I) + R'SH = = > R’S-NO + decomposition products
RS ^ NO+ [I]
N20 3 + RSH -> RSNO + H+ + N 0 2' [J]
N20 4 + RSH -> RSNO + H+ + N 0 3‘ [K]
ONOOH' + RS -» RSNO + HOO' [L]
N 0 2' + H+ + RSH -> RSNO + H20 [M]
Nitric oxide present in plasma also undergoes reactions with oxygen derived free
radicals such as superoxide (O2 ) [295], hydrogen peroxide (H2O2) [296] and the
hydroxyl radical (*OH)[297]. In vivo, there are many sources of superoxide, including
the electron transport chain and enzymes such as xanthine oxidase and NAD(P)H
oxidase [298]. Nitric oxide reacts extremely rapidly with superoxide (6 - 1 0 x 1 0 9 M'V1,
near diffusion limited [299]) to form peroxynitrite (ONOO')[n]. Once formed,
peroxynitrite can be protonated[° ] which leads to rapid decomposition to nitrate^. When
excess nitric oxide is present, peroxynitrite will undergo further reaction to form
nitrite[Q1.
0 2‘ + NO- -> ONOO' [N]
ONOO’ + H+ -> ONOOH [O]
ONOOH OH* + N 0 2* N 0 3' + H+ [P]
ONOO' + NO* 2N 02’ [Q]
- 5 8 -

Chapter One General Introduction
Peroxynitrite is a potent oxidant and can have deleterious effects upon many
biological molecules including lipids, nucleic acids and proteins [300]. To control the
levels of these oxidative species and thus control nitric oxide bioavailability, the body
has a number of clearance mechanisms. Superoxide dismutases (SOD), represent a class
of enzymes that utilise metal cofactors (e.g. copper, zinc, iron, nickel and manganese),
to help scavenge superoxide and catalyse its conversion to hydrogen peroxide [301].
Hydrogen peroxide is then catalysed to water and oxygen by catalase/glutathione
peroxidase or to hypochlorous acid by myeloperoxidase [302]. Both reactive oxygen
(e.g. superoxide) and nitrogen species (e.g. peroxynitrite) have been heavily implicated
in vascular disease states, with over-production of these species closely linked to
endothelial dysfunction [303].
1.9.1.2 Erythrocytes
Although nitric oxide can react with erythrocyte membrane components, it is the
reactions with the haemoglobin contained within the erythrocytes that are more likely to
govern its metabolism. Nitric oxide will react very rapidly with both oxygenated (R-
state) and deoxygenated (T-state) haemoglobin (~107 M '1s '1)[304], however the
metabolites formed in each case are different. When nitric oxide reacts with
oxyhaemoglobin it forms nitrate and met haemoglobin i.e. the oxidation state of the
haem iron goes from 2+ to 3+ in the reaction[R] [305]. Methaemoglobin levels in healthy
individuals are around 1-3% [306] and are kept at this level by NADH-cytochrome bs
reductase and soluble electron carrier cytochrome bs, which converts met haemoglobin
back to deoxyhaemoglobin within the erythrocyte [307].
Hb(Fe2+)0 2 + NO* -> metHb(Fe3+) + N 0 3‘ [R]
The similarities in diatomic spatial structure between nitric oxide and molecular
oxygen denote similar bonding patterns. Like molecular oxygen, nitric oxide rapidly
- 5 9 -

Chapter One General Introduction
bonds in the same binding pocket o f T-state haemoglobin to form iron nitrosyl-
haemoglobin (HbNO)[S] [305].
Hb(Fe2+) + NO* ->• HbNO [S]
The dissociation o f nitric oxide from HbNO is very slow ~10 s [308].
However, in vivo, where partial nitrosylation can occur HbNO is subject to different
metabolism. Stamler and colleagues have demonstrated that partially nitrosylated
haemoglobin can, upon oxygenation, release nitric oxide through haemoglobin
conformational changes where it subsequently binds to conserved cysteine residues in
the 93 position o f P haemoglobin, forming HbSNO[X] [309]. At physiologically relevant
NO:Hb ratios, they report an 80% yield o f HbSNO upon oxygenation [309]. More
recently, Stamler and colleagues have reported that a similar reaction can occur upon
oxygenation o f nitrite/deoxyhaemoglobin mixes [310].
HbNO + 0 2 oxyHbSNO + le + 1H+ [T]
Metabolic products of other nitric oxide reactions e.g. nitrite will also undergo
reactions with both oxy and deoxyhaemoglobin, although at considerably slower rates
than that o f native nitric oxide [311].Nitrite reacts with oxyhaemoglobin in a process
that is thought to be autocatalytic and forms nitratetu] [312].
4Hb(Fe2+)0 2 + 4N 02‘ + 4H+—» 4Hb+ + 0 2 + 2H20 + 4N 03' [U]
The reaction between deoxyhaemoglobin and nitrite is more complex and
involves several component reactions[V][wraY]. The reaction is though to proceed via
the formation of nitrous acid (pH dependent) and result in the final products o f HbNO
and nitrate in a stoichiometric ratio of 1:1 [313]. Nagababu et al also propose that the
nitric oxide formed in this reaction could exists as an unstable met-haemoglobin adduct
(Hb(II)NO+<-»Hb(III)NO) which, in the presence of excess nitric oxide, is thought to
decompose to HbNO and the nitrosonium ion (NO+) [314]. However, spectral and
- 6 0 -

Chapter One General Introduction
reaction rate data suggests that this intermediate is transient and unlikely to accumulate
[315],
H+ + N 02- -> HONO [V]
Hb + HONO -> met Hb + NO +OH [W]
Hb + NO -> HbNO [X]
Hb + ONO' ->• metHb + ‘N 0 22’’ [Y]
1.9.1.3 Tissue
In tissues, nitric oxide is likely to participate in free radical reactions as
previously discussed in plasma, but perhaps more importantly will bind to metal-centred
proteins. The adducts formed with these proteins are usually oxidised to finally form
nitrate, which will inevitably leach into the bloodstream [238]. Nitric oxide will also
form nitrated lipids through reaction with lipid molecules such as those found in the
membrane. Theses molecule have recently started to receive attention after it was
recognised that they can act as potent signalling molecules, particularly in inflammatory
processes [316]. A summary o f the reductive and oxidative reactions of nitric oxide can
be seen in figure 1 .2 1 .
-61 -

Chapter One General Introduction
nh2oh rs-noRONO A RR'N-NO
K RSH XROH X. S RR'NH
reduction oxidation 1n2o «— N O - < N O > N O +
7 K ajy h K v hKN02 ▼ M-NO N02/N20 s T M-NO N02- T M-NO
ONOO- ONOO’ ONOO1ZU X
K RSHN027N0;
n o 2RS-NOn o 3
(N02)
Figure 1.21. A schematic summary o f the reactions o f nitric oxide. M-metal, RSH-Thiol, RSNO-
nitrosothiol, N20-dinitrogen oxide, NH2OH-hydroxylamine, ROH-primary amine, RONO-nitrosamine,
RR’NH-Secondary Amine. Based on original schematic from [317].
1.9.2 Excretion
Nitric oxide and its metabolites are known to leave the body via a number of
routes. Nitric oxide itself can be exhaled, while its metabolites, namely nitrate, can be
excreted via the bowel or principally via the urinary tract [318]. Other products are
thought to be metabolised by the liver, through the urea cycle for excretion as nitrate in
urine [318].
- 6 2 -

Chapter One General Introduction
1.10 Biological Activity of Nitric Oxide Metabolites.
Haemoglobin has historically only been considered in terms of its ability to
quench the biological activity o f nitric oxide. In light of the rapid rate of reaction
between the two and the high concentration o f haemoglobin present in the blood stream,
it has often been questioned as to how it is possible for nitric oxide to exert its effects in
vivo given proximity of the reactants in question. Several factors that are thought to
enhance nitric oxide longevity have been proposed within the vessel setting. Firstly,
haemoglobin contained within erythrocytes does not react as quickly with nitric oxide as
free haem [319], this is thought to be due to membrane impedance [320] or an
‘unstirred’ layer around the erythrocyte that acts to limit diffusion [321, 322]. In
addition, it has been proposed that erythrocytes subjected to laminar flow in the vessel
lumen do not travel in a uniform arrangement [323]. Erythrocytes travel in the area of
fastest flow, down the centre o f the lumen, this creates a ‘red blood cell free zone’
adjacent to the vessel wall and allows nitric oxide to accumulate on the luminal side of
the endothelium (undisturbed by erythrocytes) thereby creating a diffusion gradient
toward the smooth muscle. However, this phenomenon is unlikely to occur in narrow,
resistance vessels, other mechanisms of nitric oxide ‘protection’ and other regulators of
vascular tone (e.g. EDHF) are likely to take precedence in these vessels. Despite these
protective mechanisms, nitric oxide has always been considered a paracrine regulator
acting within a short diffusion distance. However, recognition that some of the
metabolic waste products o f nitric oxide could themselves be bioactive has given rise to
an entirely new field o f research. The relative stability of these metabolites meant that
nitric oxide (as its metabolites) could be preserved and be delivered in an endocrine
fashion to distal sites.
Original proposals for the preservation of bioactive nitric oxide came from the
Stamler laboratory in 1992 [266]. The group discovered that endogenous nitric oxide
could form RSNO compounds with thiol containing plasma proteins, principally
albumin [324]. The proposal underwent further development after the finding that
specific cysteine residues in the p-chains o f haemoglobin could also be nitrosylated and
- 6 3 -

Chapter One General Introduction
convey biological activity [325]. Since these findings, a number of other candidate
metabolites that could conserve nitric oxide bioactivity have been proposed including
HbNO [326], the nitrite anion [327] and nitrated lipids [328]. The majority of suggested
metabolites/mechanisms are centred around two components, erythrocytes and oxygen.
Native erythrocytes have been shown to transiently relax vascular tissue, but only upon
introduction to a hypoxic tissue environment [329]. Collectively, these findings have
given rise to two main theories regarding the mechanism of conserved nitric oxide
bioactivity and erythrocytes, which will be covered in detail below.
1.10.1 The Hb-SNO Theory
After the discovery that the highly conserved p93 cysteine residue of
haemoglobin could be nitrosylated (HbSNO) and produce biological effects [325],
Stamler and colleagues developed a novel concept in which the vasodilator properties of
HbSNO could be matched to oxygen demand in the respiratory cycle (Figure 1.22)
[329]. The theory relies upon the conformational state o f haemoglobin (i.e. oxygen
saturation) and the manner in which this changes over a respiratory cycle.
- 6 4 -

Chapter One General Introduction
V eins Arteries
62 JSsNO
T issu eD elivery
HbfFeNOj
T is s u e s
Figure 1.22. Schematic representation o f the ‘SNO theory’ depicting the human respiratory cycle
involving 3 key gases, NO, C 0 2 and 0 2. The SNO theory suggests that 0 2 and C 02 are the allosteric
effectors that govern the equilibrium between the R-state and T-state structures of Haemoglobin, which in
turn dictates whether nitric oxide bioactivity is dispensed to dilate blood vessels or sequestered thus
constricting them. In theory this process has the ability to couple blood flow to metabolic demand.
Reproduced from [329].
In the venous circulation, haemoglobin is only partially oxygenated and so the
haems that are not carrying oxygen can potentially react with nitric oxide to form
HbNO. When erythrocytes carrying partially nitrosylated haem enter the pulmonary
circulation it is believed that, through oxygen binding and conformational changes of
the haemoglobin protein, nitric oxide is displaced from the oxygen binding pocket and
subsequently reacts with the nearby thiol o f the p chain, generating R-state, HbSNO
[309].
- 6 5 -

Chapter One General Introduction
The re-oxygenated blood carrying HbSNO then passes through the arterial
system to tissues where oxygen is in demand. Here, the reverse process occurs. As
oxygen is offloaded, the haemoglobin conformation changes from R to T-state (HbSNO
being less stable in the T-state) and so SNO is also offloaded, thereby concomitantly
delivering both oxygen and SNO to the tissue. The dependency of p93 cysteine
reactivity upon haemoglobin conformation has been known for sometime [330] and
applies in this situation. One key question of the SNO theory is, how does nitric oxide
escape from the erythrocyte avoiding recapture by haemoglobin? The proposed
mechanism involves transnitrosation, through being transferred from the thiol group of
one protein to another the nitric oxide is effectively protected. The favoured candidate
protein, AE1, also known as membrane protein band III was originally proposed by
Pawloski et al (Figure 1.23) [331]. AE1 is the perfect candidate, positioned close to the
membrane for subsequent transfer, in addition to the cytosolic N-terminus interacting
with T-state haemoglobin to lower oxygen affinity, thereby enhancing oxygen/SNO
offloading. The physiological importance of this interaction can be seen with the use of
DIDS (4,4'-diisothiocyanostilbene-2,2'-disulfonic acid, an AE1 channel blocker),
inhibition by DIDS has been shown to prevent HbSNO vasodilatation of hypoxic aortic
rings [331]. The SNO theory is also supported by in vivo evidence showing an arterial to
venous gradient o f HbSNO concentration, suggesting consumption across the tissue bed
[332].
Overall, the principle role o f erythrocytes is to deliver oxygen, which is largely
governed by blood flow [332]. Therefore the SNO theory suggests that erythrocytes
could have an intrinsic capacity to enhance their primary function.
- 6 6 -

Chapter One General Introduction
cytosol —AE1
Membrane
Figure 1.23. How does nitric oxide liberated from HbSNO leave the red cell? The cytoplasmic domain of
AE1 preferentially binds T-state Hb and thus promotes the R-state to T-state transition of SNO-Hb, which
effects transfer of nitric oxide groups to the membrane. SNO on AE1 is then exported from this site to
thiols outside the erythrocyte e.g. plasma proteins. Thus, the transition from high to low p02 would be
transduced by the interaction of Hb and AE1 into increased export by RBCs of nitric oxide-related
bioactivity and decreased scavenging of endothelial-derived nitric oxide. Adapted from [331].
- 6 7 -

Chapter One General Introduction
1.10.2 The Nitrite Reduction Theory
The vasoactive properties of the nitrite anion have been known for sometime
[333]. However, until recently the biological activity of nitrite has never been
considered in terms o f its position as a circulating metabolite of nitric oxide. Early work
demonstrated that nitrite could be reduced to nitric oxide in a biological setting by
oxidoreductase enzymes, such as xanthine oxidase [334], disproportionation [335] and
deoxyhaemoglobin[w] [336]. These observations, coupled with the fact that an artery to
vein gradient of nitrite had been shown to exist [327], prompted research into the
activation of circulating nitrite in vivo [337]. Overall, this research propagated a novel
idea that linked these facts, with deoxyhaemoglobin nitrite reduction at the heart of the
concept. The next major step in the nitrite field was a proposal by the Gladwin
laboratory, associating the nitrite reduction properties of deoxyhaemoglobin to allosteric
control [313, 338]. This allosteric control proposal gave the research applicability to the
physiological setting and, like the SNO theory, could explain a potential mechanism for
matching vasodilatation/flow to tissue oxygen demand.
Haemoglobin, through a process termed ‘R-state autocatalysis,’ is suggested to
operate maximally as a nitrite reductase at approximately 50% oxygen saturation (P50)
(Figure 1.23a), which is based upon several observations. It is possible for deoxyhaem
within haemoglobin to have allosteric character of both R-state and T-state depending
upon the ligand status of the 3 other haem groups. Nitrite has been show to react
differently with these two conformations, nitrite reductase activity being higher in the so
called R-state deoxyhaem (6 M'V1 vs. 0 . 1 2 M’V 1, R vs. T) [338]. The mechanism is
only based upon these two rate constants. However, within a haemoglobin tetramer, a
global rate constant exists which is dictated by the individual haem groups within it.
These observations have been confirmed by experiments utilising a gel matrix to lock
haemoglobin in specific allosteric configurations whilst monitoring reaction kinetics
[339]. As nitrite reacts with haem in the T-state tetramer, the rate of reaction decreases
as deoxyhaem is consumed. This is balanced by an increasing rate of reaction with R-
state deoxyhaem within the tetramer, which results from, and is stabilised by
- 6 8 -

Chapter One General Introduction
metHb/HbNO formation [338]. It is likely that the increasing rate of nitrite reduction in
the R-state is in some part due to its lower reduction potential i.e. the R-state is more
likely to donate electrons [340]. As levels o f metHb and HbNO increase in the tetramer
the haemoglobin molecule shifts from T-state to R-state. Therefore, a balance point
exists (occurring around 50% saturation/when haemoglobin is in the R2/R3 tetramer
states), where there is sufficient T-state haemoglobin to bind nitrite but also enough R-
state haemoglobin to efficiently catalyse nitrite reduction. This work has all been
performed with high nitrite concentrations using in vitro preparations starting with
purely T-state haem. In vivo, this scenario is unlikely to occur, so how does the theory
translate?
- 6 9 -

Chapter One General Introduction
Deoty haemoglobin Jiaem sites forN O f binding
Increased bimolecular rate constantfor nitrite reduction PK (maximal rate of nitrite reduction and NO generation)
Nitrite reductase activity/NO production
City haemoglobin saturation (%)
Oxygen concentration
Maximal rate o f \ nitrite reduction \ and NO generation
250 nM NO.300 nM NO.
Nitrite reductase activityNO formation / — Bimolecular rate constant
Deoxyhaemoglobin R3-tetramer
N itrite reduction and NOformation
— Psa
Figure 1.23. R-state or allosteric autocatalysis o f nitrite reduction by haemoglobin. A) The rate at which
haemoglobin converts nitrite into nitric oxide (NO) is maximal when it is 50% saturated (P50). This effect
is mechanistically determined by two factors, the availability o f deoxyhaems (reaction substrate) to bind
nitrite, which is maximal in T-state or deoxygenated haemoglobin, and the amount of R-state or
oxygenated haemoglobin tetramer, which increases the intrinsic reactivity o f the haem with nitrite. B) In
the mammalian circulation, the allosteric state of haemoglobin tetramers is modulated primarily by
oxygen ligation such that the in vivo, intrinsic reactivity is therefore dictated by oxygen binding to other
haems on the same tetramer. This model therefore predicts that the most effective tetrameric nitrite
reductase would be the R-state haemoglobin that rapidly deoxygenates during arterial to capillary transit.
The R3 and R2 tetramers would therefore be the most effective nitrite reductases. A1-A5 reflects the
arteriolar size, which decreases at bifurcation points along the vascular tree. Reproduced from [311].
- 7 0 -

Chapter One General Introduction
In vivo, it is believed that oxygen ligation, as opposed to metHb/HbNO, acts as
the R-state stabiliser (Figure 1.23b) [341]. Therefore, in venous deoxygenated blood
maximum reactant levels (high T-state) exist, while in arterial blood the most effective
nitrite reductase, (R-state), exists. Again, this gives rise to a balance point, suggesting
that nitrite reductase activity will be maximal in the rapidly deoxygenating arterial blood
as it crosses the tissue bed. At this point in the vascular tree, it is assumed that the
haemoglobin tetramer will pass from R4 to R3 and R2 (maximal nitrite reduction) before
flipping to the T-states, T2 and Ti [338]. This notion is supported by work demonstrating
that nitrite has maximal effect upon nitric oxide-mediated signalling, vasoactivty and
mitochondrial inhibition when haemoglobin is 50% saturated [342]. Questions as to how
nitric oxide can be formed and leave the erythrocyte to exert an effect, within the time-
course of one arterial to venous transit, and if a saturation near 50% is regularly
achieved in the circulation under normal conditions are still points of debate [343]. In
addition to haemoglobin, other proteins with nitrite reductase activity are under
investigation, such as the previously mentioned oxidoreductase enzymes and myoglobin
found in muscle [344].
-71 -

Chapter One General Introduction
1.11 Nitric Oxide Metabolites and Hypoxic Pathologies.
In addition to nitric oxide and haemoglobin, the other key factor involved in the
mechanism of nitric oxide metabolite actions is a change in oxygen level. In vivo, under
normal conditions, oxygen levels drop over a respiratory cycle, however, dramatic
changes in oxygen level only tend to occur under conditions of serious vascular
pathophysiology. Long term vascular pathology is associated with endothelial
dysfunction and a resultant reduction in so called ‘nitric oxide b ioavailab ilityT he
mechanisms of endothelial dysfunction remain unclear, although there is apparent
evidence for a link with atherosclerosis [345], increases in reactive oxygen species
leading to nitric oxide scavenging and radical damage [346] and altered eNOS levels
and functionality [347, 348]. Endothelial dysfunction and the accompanying reduction
in nitric oxide bioavailabilty are detrimental to the overall health of the vessel and
inhibit the vessel from fully dilating. The inability to accurately control vessel tone can
lead to a reduction in blood flow and oxygen supply that can be devastating, particularly
in high demand organs such as the heart, brain and kidneys. Persistent disease can lead
to narrowing of arteries, such as the coronary arteries o f the heart, causing tissue
hypoxia and angina in the case o f the heart. As the health o f the vessel deteriorates,
atherosclerotic plaques can become unstable and if ruptured they initiate a clotting
cascade that blocks the vessel, resulting in infarction. If and when a clot is cleared, the
vessel and the tissue which it supplies is then subjected to further damage by a process
know as ‘ischaemia-reperfusion injury’[349].
Nitric oxide metabolites have been shown to be beneficial in a number of
hypoxic/ischaemic environments found in the liver [350], the heart [344], the brain
[351] and the kidney [352]. It is these potential therapeutic benefits that warrant further
research into the basic interactions o f nitric oxide and its metabolites and the
mechanisms by which they convey physiologically relevant, bioactivity.
- 7 2 -

Chapter One General Introduction
1.12 Nitric Oxide/Nitric Oxide Metabolite Detection in Biological Samples/Systems
There has long been an interest in the measurement of free nitric oxide, however
its reactive nature and short half-life are the source of a number of practical limitations
in terms o f real time detection. A practical solution to this problem is the measurement
of the more stable metabolites of nitric oxide. The measurement of nitric oxide
metabolites is now common, although disagreements over methodology and measured
levels still ensue. As detection methods have developed and sensitivity improved,
reported blood levels have slowly decreased to a consensus between laboratories of the
level expected in certain media. A review o f methodologies and their development is
covered briefly below with an emphasis on those most commonly and currently used
within the field.
1.12.1 Nitric Oxide
The measurement of free nitric oxide can essentially be split into two different
forms of methodology, those that monitor generation in real time and those that are
cumulative. The real time study o f nitric oxide is largely based around the use of
electrochemical methods, principally electrodes. These electrodes are designed to be
specific for nitric oxide and allow real time and in situ measurement o f in vivo and in
vitro nitric oxide generating systems [353]. Although electrodes represent the most
advanced method o f real time nitric oxide measurement, particularly in situ, they do
have a number of practical limitations. Electrodes often generate non-specific signals
and are sensitive to a number of environmental factors, such a temperature and
movement of the surrounding media, the latter being a major problem for the intra
vascular measurement of nitric oxide in vivo where blood flow is constantly changing.
Cumulative nitric oxide measurement methods exploit the free radical nature of
nitric oxide and its ability to form adducts that have paramagnetic properties. In this way
nitric oxide levels can be assessed via the interaction with specific ‘spin traps’ that bind
- 7 3 -

Chapter One General Introduction
nitric oxide to give altered paramagnetic properties [354]. These paramagnetic species
have unique signals that can be visualised and quantified with electron paramagnetic
resonance spectroscopy (EPR). The generation of unique signals makes EPR
measurement of nitric oxide adducts very specific, however the technique does lack
sensitivity at lower concentrations and signals represent an accumulation of adduct
rather than a real time level.
It is also possible to image and measure nitric oxide using fluorescent probes.
4,5-diaminofluorescein (DAF) is one o f the most widely used probes, however this
probe like many others suffers from a lack of specificity [355]. For this reason,
fluorescent probes are generally no longer used for quantification of nitric oxide.
1.12.2 Nitrite and Nitrate
Nitrite and nitrate represent the most commonly measured metabolic products o f
nitric oxide. Although more stable than free nitric oxide, the measurement of nitric
oxide metabolites does have its own caveats. Firstly, metabolites are present in complex
biological media; secondly, many similar metabolites are present in one sample; thirdly,
levels found in biological samples can be in the low nanomolar range; fourthly, many
chemicals, solutions and equipment contain contamination and lastly, metabolite species
can change from one to another, particularly in the presence of oxygen.
Early methodology quantified nitrite and nitrate using light spectroscopy in
combination with the Griess reagent (N-l-naphthyl-ethylenediamine dihydrochloride,
sulphanilamide and phosphoric acid) in which nitrite forms a coloured azo dye [356].
However, the need for a more precise measurement lead to the development of high
performance liquid chromatography (HPLC) based methodologies [357]. Despite being
more sensitive, these methods do have more general issues, principally pertaining to the
over processing of the sample. Due to the continued risk of contamination and
metabolite stability, methods that employ minimum sample processing are optimal. The
current gold-standard for the measurement o f nitric oxide metabolite species, where
- 7 4 -

Chapter One General Introduction
minimum processing can be used, is ozone based chemiluminescence (OBC). OBC
measures nitric oxide directly, therefore OBC is always linked to a reductive process
that will cleave or reduce nitric oxide metabolites back to free nitric oxide that can be
carried away by a flow o f inert gas for measurement [358]. Initial chemical cleavage
reagents were formed from potassium iodide and acid, however it was recognised that
the reductive power o f this reagent was variable but could however be stabilised by the
addition of excess iodide to the reagent [359], giving rise to the most commonly used
cleavage reagent, tri-iodide. In addition to the measurement o f nitrite, tri-iodide has also
been validated for the measurement o f nitrosothiol compounds (SNOs) [360]. In order to
measure nitrate, a cleavage reagent with increased reductive power is required, the most
commonly used reagent for this purpose is vanadium III chloride in acid at high
temperature [361], which cleaves nitrate, nitrite and RSNO/RNNO compounds back to
nitric oxide.
1.12.3 Haemoglobin-Bound Products
The vast majority o f research regarding nitric oxide metabolites centres on
circulating levels in blood. Nitric oxide metabolites are present in the largest quantity in
the plasma fraction of whole blood but they also enter erythrocytes and directly interact
with haemoglobin, forming HbNO and HbSNO as previously discussed (section 1.9.1.2,
page 59).
HbNO levels can be assessed using light based spectrophotometry [313] and
EPR (electro-paramagnetic resonance spectroscopy) [362]. However, despite the
excellent specificity, sensitivity at lower concentrations, such as those found in
biological samples, is an issue with these methods. OBC linked methodologies are
widely used to measure erythrocyte nitric oxide metabolites and both chemical and non
chemical cleavage methods have been developed. Photolysis is the most commonly used
non-chemical method o f reducing HbNO and RSNO compounds (including HbSNO)
[325]. Photolysis does represent a simple method in terms of chemistry but the need for
sample preparation, expense o f equipment, limited number o f species measured, reduced
- 7 5 -

Chapter One General Introduction
ease of use and questions over specificity [359] have prevented photolysis from being
extensively used in many laboratories for the measurement of metabolites.
Chemical reductive methodologies have also under gone development to make
them more suitable for erythrocyte nitric oxide metabolite quantification. One key
problem with tri-iodide reduction was a phenomenon known as auto-capture. When
nitric oxide is liberated in the reductive mixture it can be re-bound by free haemoglobin
in the purge vessel and cause signal broadening and error in metabolite concentration
quantification. To combat, this problem three different ideas have been put into practice.
The first is an alternative reductive agent containing copper and cysteine that is utilised
with carbon monoxide used as a purging carrier gas at high pressure to block
haemoglobin from binding nitric oxide [363]. This method is limited to the
measurement of RSNO compounds and in addition to its increased health and safety
risk, our laboratory have not found it to be efficient in preventing auto capture. The
second method involves the addition of a stabilisation solution to blood samples that
largely contains hexacyanoferrate, thought to bind haemoglobin and prevent further
reactions before the cleavage in tri-iodide [364]. Unfortunately, the addition of
stabilisation solution results in the need to process samples heavily, introducing
possibility o f contamination and can also cause the inter-conversion of metabolite
species. The third and final method, based on hexacyanoferrate inhibition, was
developed in our laboratory [365]. Hexacyanoferrate is added to the tri-iodide cleavage
reagent and blocks haemoglobin re-capture o f nitric oxide during the cleavage process,
negating the need for sample processing and improving recovery of all cleavable
species. This method and its validation are covered in more detail in the general
methodology of this thesis, in chapter 2 .
Arriving at a consensus point with regard to specific, reproducible methodology
and standardised protocols is the result o f many years of work by a number of people
within our laboratory. I was fortunate enough to work with Dr Stephen Rogers and Dr
Afshin Khlalatbari, when this body o f work was in its infancy, who both dedicated the
work of their doctorates to establishing these methods. Work by Dr Rogers regarding the
- 7 6 -

Chapter One General Introduction
development of modified tri-iodide [365] and more recent progress in our laboratory
have formed the basis of a text book chapter that details the practical aspects of
measuring nitric oxide metabolites in biological media and the reasoning behind the
developments that have been made. In possession of these developed methodologies, it
was possible to investigate nitric oxide metabolites in different model systems. These
investigations formed the primary aims o f this thesis.
- 7 7 -

Chapter One General Introduction
1.13 Thesis Aims
This thesis aims to provide a clearer understanding of the relationship between
nitric oxide, its metabolites and haemoglobin contained within erythrocytes. In addition,
the physiological contributions o f these metabolites will be assessed and their
mechanisms of action both at a simple biochemical level and at a more complex level in
human subjects will be challenged. Overall, this thesis aims to consider the significant
role of oxygen in modulating these mechanisms and physiological outcomes. The
literature to date has two distinct ideas regarding the physiological relevance and
mechanism of action with regard to nitric oxide metabolites, which has led to
publications that are misrepresented, misinterpreted and polar in view. The current work
endeavours to be subjective and critical, taking into account all aspects of published
work in the field and to carry out studies under physiologically relevant conditions.
1.13.1 Specific Aims
• To investigate the effect of oxygen upon the metabolism of nitric oxide and its
metabolites in blood. In addition, novel methodologies will be developed to
consider the movement of these species with respect to blood constituents and
oxygen.
• To determine the acute mechanisms of action by which nitrite affects vascular
tissue, assessing sources o f nitrite reduction and the contribution of altered
oxygen level. The chronic effects of nitrite in the vasculature will be reviewed by
analysis o f gene activation.
• To examine the erythrocyte-induced hypoxic vasodilatation phenomenon in
detail and to provide novel evidence regarding the nature of the vasorelaxant
responsible and the mechanism by which it influences hypoxic vascular tissue.
- 7 8 -

Chapter One General Introduction
• To study the effect o f nitrite supplementation on both physiology and
biochemistry in a human model o f hypoxia. The metabolism of nitrite and the
mechanisms by which it exerts its effects in human vasculature will also be
explored.
- 7 9 -

Chapter Two General Methodology
2 General Methods
2.1 Blood Collection and Processing
2.1.1 Phlebotomy
Subjects gave consent for a sample to be drawn, all procedures were carried out
in line with Cardiff and Vale NHS trust phlebotomy guidance/training and were
approved by a local ethics committee. Blood samples were collected by venepuncture o f
the antecubital veins (median cubital and cephalic veins) using a syringe and butterfly
needle. Samples were then decanted into 4ml K3E EDTA vacutainers (Greiner Bio-One)
to prevent clotting and maintain current oxygen saturation.
2.1.2 Blood Sample Processing
Blood samples, unless otherwise stated, were centrifuged at 2000g for 5 minutes
at 4°C. Usually, the plasma and erythrocyte fractions were immediately separated, while
the Buffy coat was discarded. Fractionated samples for future analysis were then directly
snap-frozen in liquid nitrogen followed by storage at -80°C. Frozen samples, when
required for analysis were rapidly thawed in a water bath at 37°C and immediately
analysed.
- 8 0 -

Chapter Two General Methodology
2.2 Altering Blood Oxygen Saturation
To alter the saturation of erythrocytes, centrifuged erythrocyte samples were first
diluted (usually ~1 in 3, to achieve a final haemoglobin concentration of lOg/dl) in
phosphate buffered saline (PBS, 137 mM NaCl, 2.7 mM KC1 and 10 mM phosphate
buffer solution, pH 7.4 at 25°C). The reconstituted mixture was then loaded into a thin
film rotating tonometer as in figure 2.1. The tonometer is purged with different gas
mixes that interact with the thin film of erythrocytes created upon rotation to rapidly
achieve the desired saturation. The system can be sealed to maintain a specific saturation
and samples can be taken for blood gas analysis. The tonometer utilised for work in this
thesis was developed by Dr Doctor of the Department of Paediatrics and Biochemistry
& Molecular Biophysics, Washington University in St Louis whose laboratory has
previously published established methodology for use of the tonometer [363].
Figure 2.1. Diagrammatic representation o f the thin film rotating tonometer (approximately 200mm in length). As the tonometer rotates a thin film o f suspended erythrocytes is formed around the surface, this creates a large surface area for rapid exchange o f gases, mimicking a circulatory scenario. Picture drawn with the aid o f Ross Pinder.
-8 1 -

Chapter Two General Methodology
2.3 Ozone Based C hem ilum inescence
Ozone based chemiluminescence (OBC) is a measurement technique that
exploits the luminescent nature o f specific chemical reactions. The nitric oxide analyser
(Sievers NOA 270, Boulder, CO, USA) utilises OBC for quantification of nitric oxide
via its reaction with ozone (O3).
The NOA has a specialised reaction cell where a constant amount o f ozone is
generated, the nitric oxide sample in a flow o f inert gas is drawn into the reaction cell
where it reacts with ozone to form ‘excited’ N 0 2*[Z]. This form of N 0 2 is unstable and
so, as electrons in the excited state move back to ground state, they dissipate energy in
the form o f a photon (hv, A-Plank’s constant v-ffequency)[AA] (in the red-infrared ~640-
3000nm, with peak at ~1 lOOnm, [366]).
NO + O3 -» N 0 2* + 0 2 [Z]
NO2 * —> NO2 + hv [AA]
One face o f the reaction cell is a red cut-off lens, which filters the light energy
before it enters a photomultiplier tube (PMT), preventing the detection o f light at other
wavelengths, generated by unwanted reactions. The PMT is formed o f a number of
sensitive surfaces, as a photon hits the first, photosensitive surface an electron is emitted
which in turn hits the second, electron-sensitive surface to release several electrons, as
the process continues down the tube the signal is amplified and can be measured as a
potential difference across the tube in millivolts (mV). Therefore, the change in potential
difference is directly proportional to the number o f photons entering it and thus the
amount o f nitric oxide entering the reaction cell.
- 8 2 -

Chapter Two General Methodology
2.3.1 Cleavage Reagents
The measurement o f nitric oxide (and its metabolites) in the gas phase via OBC
requires cleavage from its parent compound(s) or conversion to its radical form. A
number o f chemical cleavage reagents have been developed for the measurement of
specific metabolites (summarised in table 2 . 1 ) and will be discussed in the following
sections.
Table 2.1. A summary of cleavage reagents used with ozone based chemiluminescence and the species
that they are capable of measuring.
Tri-iodide Vanadium chloride
R eag en t te m p e ra tu re 50 (± 1 )° C 85 (± 1 )°C
Species cleaved o r re d u c e d N O ; , R S N O , N O ; , N O ; , R S N O ,R N N O , R O N O , f c m n o , 'r o n o ,R M N O (w h ere R M N O (w here M is aM is a m e ta l) m eta l)
The cleavage reagent used is loaded into a glass purge vessel with injection port
(custom developed in our laboratory) that is purged with inert gas. The gas carries the
gas phase products formed in the purge vessel to the NOA and also aids homogenous
mixing o f the reagents (Figure 2.2). The reagent is also heated (see Table 2.1) to
increase reaction rate and provide clear sample peaks. 20pl o f anti-foam 204 organic is
added to the cleavage reagent in the purge vessel to prevent foaming upon injection of
samples containing protein. It should be noted that all reagents are freshly prepared on
the day o f use. A sodium hydroxide trap (IN ) and solvent filter is placed between the
refluxing reagents in the purge vessel and the NOA to prevent hot acidic vapours or
liquids from entering the NOA.
- 8 3 -

Chapter Two General Methodology
Inert Carrier Gas
E.g.N*
At Controlled Flow R ate-100-
200 cnr /min1M NaOH
Trap
*■ y
Nitric Oxide Analyser fNOAl
NO + 0 3 —*■ N 02+ 0 2 + hvI
Signal (mV) PMT
Rubber Septum Injection Port
G as Outlet
Purge V essel
Reagents
G as Inlet
Heated Stirrer
Figure 22. A schematic o f the purge vessel apparatus utilised for tri-iodide and modified tri-iodide reagent measurements.
2.3.1.1 Tri-Iodide and Modified Tri-Iodide Reagents
Originally studies utilised a simple mixture o f potassium iodide (KI) and glacial
acetic acid as a cleavage reagent, however the reductive power o f the mix was variable,
so the yield o f nitric oxide from a given sample was not consistent. The requirement for
a reagent with long-term stability that could measure a number of biological nitric oxide
species lead to the development o f ‘tri-iodide’ reagent [359]. The tri-iodide reagent is
essentially the same as the Kl/acid mix, apart from the addition o f iodine crystals to
saturate the solution and promote the generation o f large amounts o f the reductive I3 '
molecule.
• To make the reagent, lg o f potassium iodide was first dissolved into 20ml of
HPLC grade water to give mixture 1. In addition, a second mixture was formed,
comprising 650mg o f iodine crystals and 70ml o f glacial acetic acid [367]. Once
fully dissolved mixture 1 is added to mixture 2 in a fume hood and stirred for 30
minutes prior to use.
- 8 4 -

Chapter Two General Methodology
The measurement o f haemoglobin-bound nitric oxide presents its own
difficulties. When a sample containing haemoglobin is injected into the reaction vessel,
a process known as auto-capture occurs where nitric oxide released from one haem is
immediately scavenged by another. In principle this should only serve to reduce peak
height and broaden signal but not alter the overall area under curve (AUC). However,
our laboratory has previously found that AUC is significantly underestimated in the
presence o f haem, particularly when nitric oxide to haem ratios are low as is the case
with human erythrocyte samples [365]. This observation led our laboratory to develop a
novel cleavage reagent for use with samples that contained haem, known as ‘modified
tri-iodide’ [365]. Modified tri-iodide contains the usual tri-iodide mix but also has
potassium ferricyanide (K3Feni(CN)6)(250mM added 1 in 10 to tri-iodide) added to the
purge vessel. Potassium ferricyanide reacts with haem injected into the purge vessel,
preventing it from undergoing further reactions with free nitric oxide thus preventing
auto-capture (Figure 2.2). Another solution to this problem proposed by the Doctor
group involves purging the vessel with high pressure carbon monoxide as a carrier gas
to also bind and block haem groups. However this method does have a number o f health
and safety considerations [363].
- 8 5 -

Chapter Two General Methodology
.sf”7
i a 7.8-
6.8 5.8-
Tri-iodide +K.CN + K ,F em (CN)<
Sm oothed
i-------- 1---------1-------- 1---------1---------r0 200 400 600 800 1000
Time (seconds)
Raw
Figure 2.2. The measurement o f red blood cell lysate in tri-iodide and modified tri-iodide reagent
mixtures. Example traces o f raw chemiluminescence signals and the same data smoothed for analysis with
Origin (version 7.0) are shown. Injection o f haem based sample into the classic tri-iodide mix does not
give a signal. Addition o f potassium cyanide improves the signal, however, the addition potassium
ferricyanide (K3FeUI(CN)6) (to form modified tri-iodide) restores the signal in full. Reproduced with the
kind permission o f Dr. Stephen Rogers.
- 8 6 -

Chapter Two General Methodology
2.3.1.2 Vanadium III Chloride Reagent
The vanadium chloride reagent is capable of measuring all o f the species that tri
iodide can, but due to its increased reductive power can also reduce nitrate back to nitric
oxide for measurement.
• The vanadium chloride reagent is prepared by creating a saturated solution of
VCl3 (0.785g VCI3 , 20ml HPLC grade water and 80ml of 1M hydrochloric acid).
Once the solution is formed it is mixed for 10 minutes before being filtered to
give the final solution that is blue/turquoise in appearance.
The high temperatures required for the vanadium III chloride assay have led us
to develop a specific glassware set-up. This set-up employs a Liebig condenser which
prevents loss o f reagent and acid vapour damage under reflux. This glassware also
allows for larger reagent volumes and so can cope with multiple sample injections.
Purge Gas Outflow
Cold Water Outflow Leibig
Condenser
Injection PortCold Water Inflow
Large Volume Purge Vessel
Purge Gas Inflow
Figure 2.3. Schematic diagram o f the glassware developed for refluxing vanadium III chloride reagent.
- 8 7 -

Chapter Two General Methodology
2.3.2 Pre-Treatments
Most biological samples contain a number o f nitric oxide species, in order to
measure these individually it is sometimes necessary to employ a pre-treatment to
remove species that are not o f interest. Measurement o f nitric oxide species in our
laboratory involves the use o f two key pre-treatments that will be covered in further
detail below and are summarised in table 2 .2 .
Table 2.2. Summary of pre-treatments used to establish levels o f specific species in biological samples.
Treatment Concentration Use
Acidified sulphanilamide
Mercuric chloride
290 mAf stock (500 mg in l O m L o f l AfHCl)
Add 1 part acidifiedsulfanilamide to 9 parts sample
50 mA/stock (67.9 mg in 5 mL o f HPLC grade water).
Add 1 part to 9 parts sample
Renders nitrite undetectable by OBC.
Requires minimum 15-min incubation in the dark
Cleaves NO from RSNO compounds
2.3.2.1 Acidified Sulphanilamide
Acidified sulphanilamide is used to render nitrite undetectable by OBC (Figure
2.3). Firstly, in an acidic environment nitrite forms the nitrosonium cationIABl The
nitrosonium cation then interacts with sulphanilamide[AC] and ultimately forms a
diazonium salt[AE>1 that is undetectable in tri-iodide/modified tri-iodide or vanadium
linked OBC. The sample is usually incubated for 15 minutes, in the dark (to preserve
any RSNO is the sample).
N 0 2 + H* <-* NO+ + OH' <- HONO [AB]
NO+ + Ar-NH2 — Ar-N2+ + H20 [AC]
Ar’ + Ar-N2+ —► Ar-N=N-Ar‘ [AD]
- 8 8 -

Chapter Two General Methodology
30-i
0 100 200 300 400 500 600 700 800Time (seconds)
Figure 2.4. Raw (Black) and smoothed (red) chemiluminescence trace from injection of plasma (80
seconds) and injection o f plasma incubated with acidified sulphanilamide for 15 minutes (625 seconds).
The plasma signal is largely composed o f nitrite which is rendered undetectable by acidified
sulphanilamide, the remaining signal, seen at 625 seconds, is attributable to RSNO/RNNOs which are
thought to be stable in the acidic environment.
2.3.2.2 Mercury Chloride
Mercury chloride can be used to selectively cleave nitric oxide from RSNO
compounds to generate the nitrosonium cation^AE]. If acidified sulphanilamide is also
present then this will feed into reactions [AC] and [AD], rendering the nitric oxide from
the RSNO undetectable by OBC. The sample is usually incubated for 15 minutes.
2RSNO + Hg2+ — Hg(RS ) 2 + 2NO+ [AE]
- 8 9 -

Chapter Two General Methodology
2.3.3 Validation
2.3.3.1 Calibration
To account for day-to-day variation within the assay, a standard curve was
performed daily (Figure 2.5A). The standards that were used encompass the range o f
concentrations observed in biological samples which is o f particular importance at the
lower end. All standards were prepared fresh daily, nitrite standards ranged from
62.5nM to lOOOnM (200pl injections) (Figure 2.5B), while nitrate standards ranged
from 6.25p.M to lOOpM (20pl injections) (Figure 2.5D). The presence o f potassium
ferricyanide in the tri-iodide mix (modified tri-iodide) did not alter calibration (Figure
2.5C). The accuracy o f the calibration is high (see Figures 2.5B, C and D) and the
relationship between area under curve and concentration was always linear in the tested
range.
- 9 0 -

Chapter Two General Methodology
a>t 2000-3
ot_ 1500-0)
T3C
3 1000-
sV-< 500-
0-0 100 200 300 400 500 600 700 800 9001000
Nitrite (nM)
E w
250 500 750 1M0 1250Time (seco n d s)
2500-
2500-1
2000 -
1500-
r2 | 0.9921500-
0 100 200 300 400 500 600 700 800 9001000I I I I 1------1 T
400 500 600 700 800 9001000 Nitrite (nM)
D10000-1
Nitrate (nM)
Figure 2.5. Calibration of OBC. A) Raw trace (black) and smoothed signal (red) of nitrite standards
(water, 62.5, 125, 250, 500 and lOOOnM) into tri-iodide cleavage reagent. B) Nitrite standard curve in tri
iodide. C) Nitrite standard curve in modified tri-iodide. D) Nitrate standards (water, 6.25, 12.5, 25, 50,
100pM) injected into vanadium III chloride reagent. (n=4 in all cases, each one performed on a different
day).
Our laboratory have previously reported the coefficient of variance to be 7%
intra-assay and 10% inter-assay [368] for the tri-iodide assay, the inter-assay variance
largely arising from day to day NOA variability, which is accounted for by daily
calibration.
7500-
5000-
2500-
0- -
0
-91 -

Chapter Two General Methodology
2.3.3.2 OBC/Electron Paramagnetic Resonance Spectroscopy Comparison
To assess the relative merits o f the modified tri-iodide assay for haemoglobin-
bound nitric oxide (HbNO) measurement, a comparison with electron paramagnetic
resonance spectroscopy (EPR) was performed.
Blood was collected from volunteers, doped with the nitric oxide donor NOC-9
(MAHMA-NONOate; 1 - Hydroxy -2- oxo -3- (N-methyl-6 -aminohexyl) -3- methyl -1-
triazene) at varying final concentrations (1, 10, 50, 500 or lOOOpM) and incubated for 6
minutes at 37°C. Samples were then snap frozen in liquid nitrogen for further analysis.
HbNO was first assessed with modified tri-iodide as per section 2.3.4.2 (page 97). The
same sample was then measured with EPR via the following method.
• Background
EPR is a technique which exploits the unpaired electron(s) o f molecules like nitric
oxide. In this study haemoglobin is behaving like a spin trap, i.e. trapping nitric
oxide from further reaction and influencing the outer valance electron o f nitric oxide.
By manipulating the environment around HbNO with EPR (increasing energy in the
sample with microwaves at a fixed frequency and altering the electron’s magnetic
moment by changing the external magnetic field), an energy absorption spectrum
can be generated (Figure 2.6). This spectrum is very specific to the species being
studied and is very clear as most chemicals and matrices that would cause noise in
other assays do not contain unpaired electrons and are therefore undetectable. The
HbNO spectrum (Figure 2.6) is composed o f a number o f elements but o f interest to
measurement are the three peaks in the centre o f the spectrum. These peaks are
attributable to nitric oxide bound to the a subunits o f deoxyhaemoglobin and are
known as ‘a or alpha, hyperfine’.
- 9 2 -

Chapter Two General Methodology
cS£LU
34583058 3258
Gauss
Figure 2.6. Example o f HbNO EPR spectrum generated by the addition of nitric oxide (equimolar to haem
concentration) to deoxygenated whole blood.
• Method
Samples were loaded into a liquid nitrogen filled insulated EPR Dewar and placed
into the EPR machine cavity. EPR spectra were recorded using a Varian 104 X-band
EPR spectrometer. Typical instrument settings were as follows, gain 4 x 10² xlO -
lOx 103 xlO, time constant 0.25 seconds, Magnetic field strength Gauss 3238, scan
width 500 Gauss, scan time 240 seconds, power lOdB. Using specific EPR software,
alpha hyperfine peak height and area under curve (area under total spectrum) were
measured.
- 9 3 -
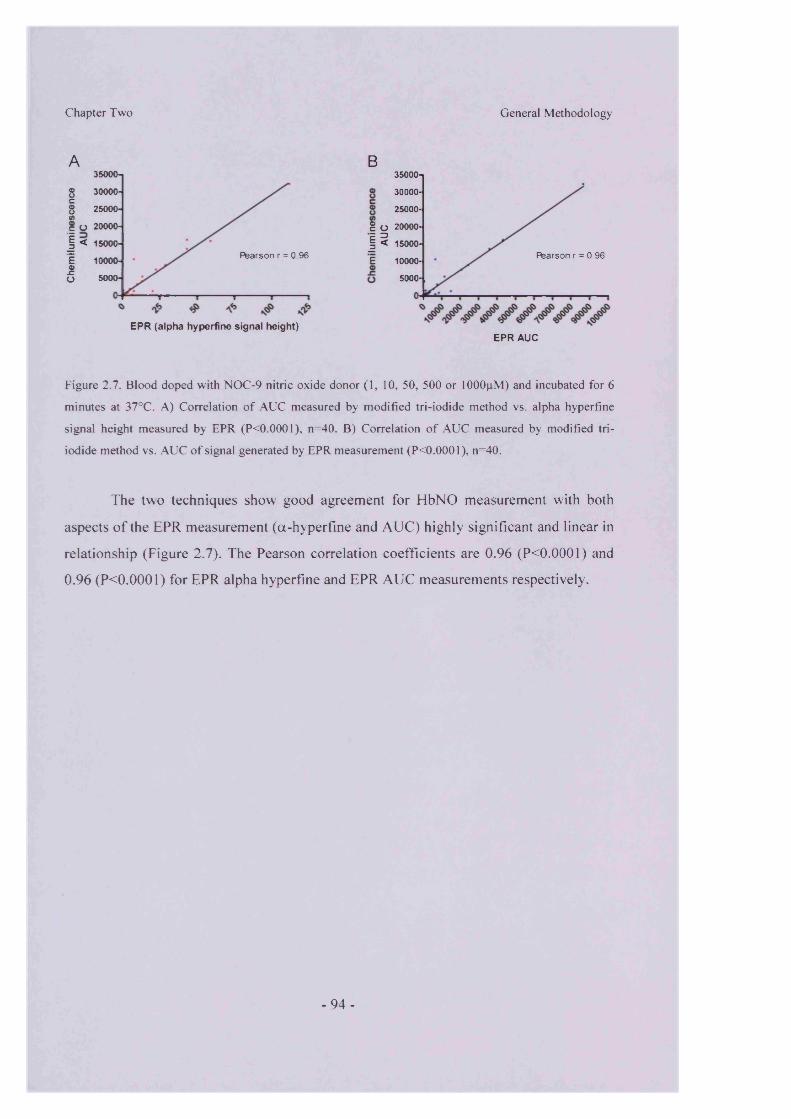
Chapter Two
A35000-j
s 30000-c1 25000-
c O 20000-
! < 15000-
i 10000-£o 5000-
Pearson r = 0.96
EPR (alpha hyperfine signal height)
General Methodology
B35000-1
30000-
25000-
g O 20000- E 3| < 15000-
E 10000-Rearson r = 0.96
5000-
EPR AUC
Figure 2.7. Blood doped with NOC-9 nitric oxide donor (1, 10, 50, 500 or lOOOpM) and incubated for 6
minutes at 37°C. A) Correlation o f AUC measured by modified tri-iodide method vs. alpha hyperfine
signal height measured by EPR (P0.0001), n=40. B) Correlation o f AUC measured by modified tri
iodide method vs. AUC o f signal generated by EPR measurement (P0.0001), n=40.
The two techniques show good agreement for HbNO measurement with both
aspects o f the EPR measurement (a-hyperfine and AUC) highly significant and linear in
relationship (Figure 2.7). The Pearson correlation coefficients are 0.96 (P<0.0001) and
0.96 (P<0.0001) for EPR alpha hyperfine and EPR AUC measurements respectively.
- 9 4 -

Chapter Two General Methodology
2.3.4 Protocols
At the beginning of each analysis session all reagents and standards are freshly
prepared. The NOA is given time to achieve operating temperature before calibration is
commenced, which is completed on a daily basis. The following protocols have been
previously validated in our laboratory [365, 369] and are summarised in figure 2.8.
Whole Blood
Erythrocytetotal
HbNO
Haemoglobin bound nitric oxide species
Centrifugation
Eiyniocyte
sample injectedinto modified tn -iodide reagent
S M H H f l lsample diluted inincubated sample■CM BM
9 1 with HgCl 2 sulphanilamide(5mM final) <21mM final)2001 injected into 200pi injected
into modified tn -nod Bed In ■iodide reagent
PlasmaFraction
200(il neat plasma injected into tri -iodide - reagent
PlasmaNitrite/RSNQ/RNNO
20pl neat plasma injected in vanadium III chloride reagent
1Plasma NOx
Neat plasma diluted 9:1 with 5% acidifiedsulphanilamide and incubated in the dark for IS minutes before 200 |il of sample injected into tri-iodide reagent
RSNO/RNNO
Figure 2.8. Summary of nitric oxide metabolite measurement protocols for blood borne species.
- 9 5 -

Chapter Two General Methodology
2.3.4.1 Measurement of Plasma/Supernatant Nitric Oxide Species
200pl o f neat plasma was injected into 5ml o f refluxing tri-iodide reagent using a
gas tight Hamilton syringe to give a total plasma signal. A duplicate plasma sample was
diluted 9:1 with 5% acidified sulphanilamide (29mM final) to remove nitrite. This
sample was then incubated for 15 minutes in the dark and then 2 0 0 pl injected to provide
a measure o f plasma protein bound nitric oxide species (RSNO and RNNO). The
difference between total injection and RSNO/RNNO injection was taken to represent
plasma nitrite.
In a separate experiment, a further 20pl o f neat plasma was injected into 30ml o f
refluxing vanadium III chloride reagent using a gas tight Hamilton syringe to give a total
plasma NOx measurement. The difference between the total plasma measurement in tri-
iodide and the total plasma NOx in vanadium III chloride reagent was taken to represent
plasma nitrate concentration.
- 9 6 -

Chapter Two General Methodology
2.3.4.2 Measurement of Erythrocyte Associated Nitric oxide Species
200fil o f neat erythrocytes were injected into 8 ml (7.2ml tri-iodide and 0.8ml
potassium ferricyanide) o f modified tri-iodide using a gas-tight Hamilton syringe to
obtain a total erythrocyte measurement. A duplicate red blood cell sample was lysed 1:4
in an acidified sulphanilamide solution (21 mM final) to remove nitrite. This sample was
then incubated for 15 minutes in the dark and then 2 0 0 pl injected into a fresh 8 ml of
modified tri-iodide to provide a measure o f haemoglobin-bound nitric oxide (including
all sulphanilamide stable species). An aliquot o f this sample was also further diluted 9:1
with HgCb (5mM final) and incubated in the dark for 15 minutes, selectively cleaving
nitric oxide from Hb-SNO and injected into modified tri-iodide to provide a measure for
iron nitrosyl haemoglobin (HbNO).
There is a difference between the total erythrocyte and sulphanilamide signals
that is often taken to represent ‘erythrocyte associated nitrite’. The precise source o f this
signal is unknown but is most likely from contaminating plasma, as it is impossible to
remove all plasma even with high speed centrifugation. This thesis acknowledges the
presence o f this nitric oxide metabolite derived signal but because o f the questionable
nature o f this measurement it will not be utilised to form conclusions. Therefore,
validated methodologies for haemoglobin bound species will be used to assess
erythrocyte nitric oxide interaction.
- 9 7 -

Chapter Two General Methodology
2.3.5 Methodological Considerations
2.3.5.1 NOA Sensitivity
The NOA reaction cell is very sensitive to changes in pressure. Reaction cell
pressure is governed by vacuum, in flow o f purge gas and ozone generation. The NOA
maintains the reaction cell under vacuum to evacuate unwanted oxygen and other
reactive gases that may alter nitric oxide ‘detectability’ and to draw the sample into the
reaction cell. In addition, the NOA is also constantly purged by an inert gas (e.g.
nitrogen or argon). This must be kept at a constant flow rate as changes in flow will also
alter both baseline and sensitivity. To maintain flow, the set-up in our laboratory
employs sensitive flow meters to regulate in-flow at the optimum rate.
The other variable that alters machine sensitivity is temperature. The PMT has a
‘dark current’ which is background activity in the tube and is known to be temperature
dependent. The reaction o f nitric oxide and ozone is also temperature dependent. For
these reasons, the Sievers NOA used in our laboratory is internally cooled to -20°C to
reduce background signal and increase sensitivity. The equipment is also set up in a
temperature controlled room to aid consistency.
2.3.5.2 Contamination
Nitrite represents the single most significant cause o f unwanted OBC signal.
Despite careful laboratory practice, nitrite can contaminate samples from a number o f
sources:
1. Buffers and water. Even the purer, high-quality reagents and water contain nitrite
contamination. HPLC-grade water (Fisher) or water for injection (Braun) were found to
contain the least contamination in our laboratory’s experience. However, once open,
these waters also accumulate further nitrite contamination over time. This contamination
is unavoidable, although it can be minimized by good practices and accounted for by
inclusion o f a water injection in the standards used for calibration, which are made up
and tested on a daily basis.
- 9 8 -

Chapter Two General Methodology
2. Plastics are, glassware, and apparatus. All disposable and reusable apparatus will
contain considerable nitrite contamination that can be minimized by repeat washing.
Plasticware in particular can vary vastly depending on both source and batch. The use of
filters and columns in this respect should be avoided. Glassware and syringes should be
cleaned extensively (e.g., overnight in glass cleaner, followed by extensive rinsing with
water). For blood collection, EDTA vacutainers were shown to contain minimum
contamination.
3. Hamilton syringes. Syringes that are in regular use should be acid washed followed
by repeat neutral washes on a regular basis, as residue builds up in both the needle and
in the barrel o f the syringe.
4. Chemicals. All reagents contain a degree o f nitrite contamination, however the use of
calibration and careful practice can remove or reduce their impact.
- 9 9 -

Chapter Two General Methodology
2.3.5.3 Freezing Time
The effect o f long-term freezing has previously been assessed in our laboratory.
The results demonstrate that although total nitric oxide moiety does not change the
apportionment between species can change over time. Some species such as
RSNO/RNNO in plasma (Figure 2.9) and haemoglobin bound species (Figure 2.10) are
not stable over time and are oxidised to nitrite (Figures 2.9 and 2.10 upper panels in both
cases). To prevent this factor from confounding results, all samples in all studies were
measured within 1 week o f collection.
120n100 -
c **■s s« e§ g o
Fresh 1 day 1 week 1 month 3 month 6 month
Freezing time
Fresh 1 day 1 week 1 month 3 month 6 month
Freezing time
Figure 2.9. The effect o f sample freezing on plasma nitrite and protein-bound nitric oxide levels (upper
panel) and plasma protein-bound nitric oxide (lower panel) measured using tri-iodide in conjunction with
ozone based chemiluminescence. Fresh represents snap frozen and immediately measured. Values
presented as mean ± SEM (n = 5). This work was carried out by Dr. Stephen Rogers and is reproduced
from [370], with his kind permission.
- 1 0 0 -

Chapter Two General Methodology
1*3 It -fi-9 -S
e#
■1 ^ *<S
R s4 i 1 day 1 week ln m th 3m m th
Freezing time
140-|
g 1T3 e «
i na -O O
120-
100-
80-g a* w
H t 60-
sis 40-
A 20-
o- fliFtesh 1 day lw eek lm cath 3m m th
Freezing time
Figure 2.10. The effect of sample freezing on red blood cell associated nitrite and haemoglobin-bound
nitric oxide (upper panel) and red blood cell haemoglobin-bound nitric oxide (lower panel) measured
using modified tri-iodide in conjunction with ozone based chemiluminescence. Fresh represents snap
frozen and immediately measured. Values presented as mean ± SEM (n = 5). This work was carried out
by Dr. Stephen Rogers and is reproduced from [370] with his kind permission.
- 101 -

Chapter Two General Methodology
2.3.5.4 Changing pH/Oxygen
Alterations o f pH can lead to in vitro chemistry between nitric oxide metabolite
species with the sample. Even a minor decrease in pH below 7 is enough to reduce some
nitrite back to nitric oxide that can form a number o f species depending on the sample in
question. Changes in oxygen are also important in the case o f RBC nitric oxide
metabolite measurements. A switch in the conformational/oxygenation state of
haemoglobin is believed to alter the location o f nitric oxide within the haemoglobin
structure (e.g., nitric oxide bound to the oxygen binding site [HbNO] or nitric oxide
bound to a cysteine residue o f the haemoglobin p chain [HbSNO]). In this respect, a
policy o f minimum sample processing was always employed.
2.3.6 Analysis
To increase accuracy, signals generated by the NOA are reproduced in the
graphical program, Origin 7.0 (OriginLab Corp., Northampton, MA, USA), this allows
150 point adjacent averaging to smooth the signal and analysis o f area under curve (with
a ‘peak analysis’ add-on). Area under curve is much more sensitive to changes than peak
height, which can vary dramatically depending upon the presence o f different matrices
(e.g. haemoglobin) in the reaction cell, see section 2.3.1.1 (page 84).
- 102-

Chapter Two General Methodology
2.4 Spectrophotometry
To asses the level o f oxygen saturation in some erythrocyte or haemoglobin
samples a UV/visible light absorbance spectrum was taken using a spectrophotometer
(6705 UV/Vis Spectrophotometer, Jenway, UK) (Figure 2.11). Oxygenated
haemoglobin gives a characteristic doublet in the 500-600nm range while deoxygenated
haemoglobin only produces a single peak over the same wavelengths (Figure 2.11). A
sample containing both oxygenated and deoxygenated haemoglobin will give a spectrum
that is a combination of the two and proportions of each can be determined by
comparing sample data with reference base-spectra o f pure, individual species using a
least-squares method [371]. The level o f methaemoglobin can also be monitored with
this method with characteristic changes at ~630nm [372].
400 450 500 550 600 650 700 750W ave lenqth (nm)
Figure 2.11. The light absorbance spectra o f fully oxygenated (red) and full deoxygenated (blue)
haemoglobin in the 450-700nm range.
1111.0-
0.9-— Oxy Haemoglobin— Deoxy Haemoglobin
- 103 -

Chapter Two General Methodology
2.5 Myography
2.5.1 Test System
Male New Zealand White rabbits (2-2.5 kg) were terminally anaesthetised with
sodium pentobarbitone (120 mg/kg, intravenously). The rib cage was then opened and
the aorta was carefully excised and placed in fresh Krebs buffer (NaCl 109.0 mM, KC1
5.36mM, KH2P 0 4 1.17mM, M gS0 4 .7H20 1.21mM, N aH C 03 24.99mM, C6H 120 6
10.99mM, CaCl2 .2H20 1.49mM). The aorta was then cleaned o f minor vessels and
adipose tissue and cut into 8 equally divided 2 mm rings, discarding the tissue most
distal and proximal to the heart (aortic arch and start o f abdominal aorta). For
experiments where endothelium-denuded rings were required, a wooden applicator was
used to gently remove the endothelium. Rings were mounted on matched stainless steel
hooks for isometric tension recording in 8 ml baths containing 5ml o f Krebs’ buffer,
37°C. Output transducer (AD instruments) signals were amplified (Powerlab 8 Sp/octal
bridge (AD Instruments)) and converted for visualisation on ‘Chart for Windows’
(Version 4.1.2, AD Instruments). Aortic rings were maintained at 2g resting tension in
all experiments. For each experiment, eight aortic ring preparations were run in parallel,
n = 1 represents data averaged from 2 individual aortic ring preparations given identical
treatment. % relaxation is the induced decrease in gram tension as a percentage of the
maximum phenylephrine induced contraction.
- 104-

Chapter Two General Methodology
2.5.2 Experimental Protocol
After a one hour equilibration period, ring tension was reset (allowing for
stretch-induced relaxation). All tissue was then exposed to phenylephrine (PE, lpM )
(Sigma), once constriction had reached a plateau, acetylcholine (10 pM) (Sigma) was
added to demonstrate endothelium viability/absence. To accept vascular rings for further
testing, the tissue was expected to relax a minimum o f 50% to acetylcholine when the
endothelium was intact, and show no relaxation, or a small constriction, to acetylcholine
in endothelium denuded vessels. The preconditioning process was then repeated until
consistent PE induced tensions were achieved. Preconditioning was carried out at 95%
0 2/5% C 0 2.
Hypoxic experiments were carried out at ~1% 0 2 (gassed with 95% N 2/5% C 0 2)
as utilised previously in our laboratory [91]. The tissue was kept under hypoxic
conditions for 10 minutes before exposure to PE (3pM, used to achieve the same gram
tension observed at 95% 0 2, ensuring a true % relaxation as opposed to a contractile
artefact). All pharmacological blocking agents were pre-incubated at respective
concentrations and time periods. Hypoxia always caused a degree o f relaxation in PE
pre-constricted aortic rings, above that seen in normoxia.
The slow and continuous relaxation o f isolated vessels during hypoxia, as
observed in the controls o f all our experiments, is an established phenomenon. The
precise cause o f the background vasodilatation remains unknown. Both energy
limitation and interruption o f excitation contraction coupling have been suggested as
possible causes [131]. In our model, hypoxia induced relaxation proceeds to the same
extent independently o f endothelium/NOS (denudation/L-NMMA data). It is important
to note that the smooth muscle cells are not simply dying in hypoxia. After a period o f
hypoxia, tissue can be re-equilibrated in oxygenated buffer and show comparable
contraction and relaxation to exogenous agents.
- 105-

Chapter Two
2.6 Chemicals and Specialist Items
Table 2.3. Chemicals and agents utilised and sources.
General Methodology
Product Source
Krebs BufferSodium Chloride (NaCl)Potassium Chloride (KC1)Potassium Dihydrogen Orthophosphate (KH2P 04) Magnesium Sulphate (MgS04.7H20 )Sodium Hydrogen Carbonate (NaHC03)Glucose (C6H)20 6)Calcium Chloride (CaCl2)
Fisher scientific UK Fisher scientific UK Fisher scientific UK Fisher scientific UK Fisher scientific UK Fisher scientific UK Fisher scientific UK
Reagent ChemicalsHPLC Grade Water Glacial Acetic Acid Hydrochloric Acid ( HCL, 1M)Sodium Hydroxide (NaOH, ION)Dimethyl Sulphoxide (DMSO)Potassium Iodide (KI)Iodine (I2)Potassium Hexacyanoferrate (K3Feni(CN)6)SulphanilamideMercury Chloride (HgCl2)Phenylephrine (PE)Acetylcholine (Ach)Anti-Foam 204 Organic Vanadium Chloride (VC13)Phosphate Buffered saline (PBS) Tablets
Fisher scientific UK Fisher scientific UK Fisher scientific UK Fisher scientific UK Fisher scientific UK Sigma Aldrich UK Sigma Aldrich UK Sigma Aldrich UK Sigma Aldrich UK Sigma Aldrich UK Sigma Aldrich UK Sigma Aldrich UK Sigma Aldrich UK Sigma Aldrich UK Sigma Aldrich UK
Chemical Inhibitors and Agents2,3-Diphosphoglycerate (2,3-DPG)Carbon Monoxide (CO) Gas (90%)95% N2/5% C 02 Speciality Gas Mix 1H [l,2,4]oxadiazolo[4,3-a]quinoxalin-l-one (ODQ) Carboxy-2-phenyl-4,4,5,5-tetramethyl-imidazoline-1 - oxyl-3-oxide (C-PTIO)U-51605IndomethacinRaloxifeneOxypurinolL-NG-Monomethyl Arginine (L-NMMA)
Sigma Aldrich UK (Fluka BioChemica) BOCUK BOCUK
Alexis Bio-Chemicals UK Alexis Bio-Chemicals UK
Cayman Chemicals USA Sigma Aldrich UK Sigma Aldrich UK Sigma Aldrich UK Sigma Aldrich UK
NO DonorsSodium Nitrite (NaN02XLaboratory Grade) Sodium Nitrate (NaN03)Spermine NONOate MAHMA NONOate (NOC-9)
Sigma Aldrich UK Sigma Aldrich UK
Alexis Bio-Chemicals UK Alexis Bio-Chemicals UK
Clinical AgentsSodium Nitrite (Infusion Grade) Saline (Infusion Grade)
Martin Dale UK Baxter Healthcare UK
- 106-

Chapter Three Nitric Oxide, Its Metabolites and Blood
3 The Metabolism of Nitric Oxide and its Metabolites in Blood, the Influence of Oxygen
3.1 Introduction
3.1.1 Nitric Oxide Metabolism in Blood
Nitric oxide derived from the endothelium ultimately enters the blood-stream
either directly as free nitric oxide or as one o f a number o f metabolites. The suggestion
that metabolites o f nitric oxide could behave as stores o f potentially bioactive nitric
oxide (see section 1.10, page 63) implies that the dynamic relationship between these
species and blood constituents is a very important one. The metabolic fate o f nitric oxide
(and its metabolites that are subject to further metabolism) is dependent upon a number
o f factors, such as the concentration o f nitric oxide and other bio-reactants but also the
ability o f the surrounding environment (particularly in vivo) to alter the ‘reactivity-state’
o f said bio-reactants. Ultimately, the study o f this relationship has resulted in much
interest in the measured levels o f nitric oxide metabolites and the dynamic changes
between them. The methods used and information yielded from these measurements has
come under scrutiny [373]. However, with a conversant approach to interpretation,
metabolite levels can be very informative. In this respect, it should be noted that nitric
oxide itself has been demonstrated to have an EC50 o f ~10nM in vascular ring
preparations [374] therefore, at levels that could often be considered negligible as far as
methodological limitations are concerned, nitric oxide is particularly potent.
- 107-

Chapter Three Nitric Oxide, Its Metabolites and Blood
3.1.2 The Translocation of Nitric Oxide and its Metabolites in Blood
In order for both nitric oxide and its metabolites to have biological function, it is
essential that they have the ability to progress from the site o f synthesis to the site of
action. In the vessel, movement is governed by factors such as: reaction with bio
reactants, rate o f diffusion in diverse media, cellular uptake, trans-cellular transport and
the flow o f blood within the lumen [323, 375]. One particular area that has emerged, is
the study o f nitric oxide movement into erythrocytes. Studying the movement o f such a
reactive molecule is inherently complex and most studies have relied upon ‘stop flow’
or competition experiments which present their own difficulties [320, 376].
In contrast, the relative stability o f nitric oxide metabolites reduces the
complexity o f studying their movement. However, practically completing this is not
without complication. Proposition o f the nitrite reduction theory (see section 1.10.2,
page 68) has resulted in increased interest in the movement o f nitrite particularly with
respect to erythrocytes. One aspect o f the theory that has been debated in the literature
surrounds the ability o f nitrite to enter an erythrocyte, be reduced to nitric oxide and
subsequently escape from the erythrocyte to alter biological function during transit
across a single vascular bed [343].
- 108-

Chapter Three Nitric Oxide, Its Metabolites and Blood
3.1.3 Aims
This component o f work was undertaken to:
• Establish the apportionment o f nitric oxide metabolites at baseline in human
blood samples.
• Determine the effect o f oxygen level upon metabolite apportionment.
• Assess the species formed when exogenous nitric oxide is added to human
blood.
• Develop specific methodology for real time assessment o f nitric oxide entry into
erythrocytes and investigate the effect o f haemoglobin oxygen saturation upon
nitric oxide uptake.
• Consider the interaction o f nitrite in the physiological concentration range with
erythrocytes and how this interaction is altered by oxygen.
- 109-

Chapter Three Nitric Oxide, Its Metabolites and Blood
3.2 Specific Protocols
3.2.1 Baseline Nitric Oxide Metabolite Measurement
Baseline samples were taken from consenting male patients undergoing
angiography at the University Hospital o f Wales. Patients receiving acute or chronic
nitrate (i.e. GTN, ISDN) treatment were excluded from the study. Arterial blood
samples were taken via a catheter inserted into the radial artery and venous samples
were taken via a catheter inserted into the antecubital vein. Immediately after collection,
samples underwent blood gas analysis (OSM3, Radiometer, Copenhagen) and were
centrifuged and processed as per section 2.1.2 (page 80). Plasma and erythrocyte
fractions were subsequently analysed via ozone based chemiluminescence as per
sections 2.3.4.1 (page 96) and 2.3.4.2 (page 97) respectively.
3.2.2 Exogenous Nitric Oxide Addition to Erythrocytes
Aliquots o f the arterial and venous samples taken in section 3.2.1 (page 110)
were also exposed to exogenous nitric oxide addition. The nitric oxide donor MAHMA
NONOate (NOC-9, ti/2=2.7 minutes, [377]) was added to all samples to achieve a final
concentration o f 425nM. The NOC-9 molecule is capable o f liberating two moles o f
nitric oxide for every mole o f parent compound, giving a final nitric oxide concentration
o f 850nM. Samples were incubated at 37°C for 30 minutes to allow reactions to
complete before high speed centrifugation (10,000g for 2 minutes). Plasma and
erythrocyte fractions were immediately separated, snap frozen and stored at -80°C for
future analysis. Rapidly thawed plasma and erythrocyte fractions were subsequently
analysed via ozone based chemiluminescence as per sections 2.3.4.1 (page 96) and
2.3.4.2 (page 97) respectively.
- 110-

Chapter Three Nitric Oxide, Its Metabolites and Blood
3.2.3 A Real Time Nitric Oxide Reaction Model
This model utilises ozone-based chemiluminescence, however, it is employed
almost in reverse to usual cleavage reagent methodology (section 2.3, page 82). Instead
o f a cleavage reagent, the purge vessel (figure 2.2) is filled with 5ml o f PBS, maintained
at 25°C and purged with nitrogen. The nitric oxide donor, spermine NONOate (capable
o f liberating two moles o f nitric oxide for every mole o f parent compound) is injected
into the purge vessel to achieve a final concentration o f 38pM (i.e. 76pM nitric oxide).
Unlike NOC-9, spermine NONOate has a relatively long half-life (230 minutes at 22°C,
pH 7.4 in phosphate buffered saline [378]). Upon injection this results in an initial peak
that is followed by a relatively stable, slowly falling, nitric oxide generation level that
represents the balance between nitric oxide generation by spermine NONOate in the
purge vessel and the removal o f nitric oxide by the nitrogen carrier gas (Figure 3.1).
100-1
5 _ 75-S >
50-
= ®I W 25-
0 1000 2000 3000 4000Time (seconds)
Figure 3.1 Example trace o f Spermine NONOate (38pM) injection into PBS at 25°C. An initial spike in
signal is followed by a stable nitric oxide generation baseline that drops slowly over the course o f hours.
Once the baseline is stable, the model can be utilised to study any chemical or
biological sample that behaves as a nitric oxide ‘sink’. The model therefore lends itself
nicely to studying the interaction o f haemoglobin/erythrocytes and nitric oxide.
When a nitric oxide scavenging entity is injected into the system, the signal
drops before returning to baseline upon completion o f the reaction. This process
generates an area below baseline that can be calculated and taken to represent the total
- I l l -

Chapter Three Nitric Oxide, Its Metabolites and Blood
amount o f nitric oxide consumed by the entity in relative terms. The gradient o f the
initial signal decay from baseline can also be utilised to calculate the relative initial rate
o f reaction between nitric oxide and the molecule o f interest.
3.2.3.1 Nitric Oxide Interaction with Haemoglobin and Erythrocytes
Erythrocyte samples were collected from healthy volunteers and processed as
previously described (Section 2.1, page 80). Erythrocytes were diluted ~1 in 300 into
either PBS to study whole cells or HPLC grade water in order to study lysed cells and
adjusted to give a final concentration o f 0.1 g/L.
To alter oxygenation, samples were gently purged with nitrogen or oxygen gas in
a sealed cuvette. The degree o f oxygenation was confirmed by light spectroscopy as per
section 2.4 (page 104). Methaemoglobin levels were monitored at 630nm, but did not
change significantly between samples.
lOpl o f whole or lysed erythrocyte samples were injected giving a final (in purge■y
vessel) haemoglobin concentration o f 0.2 x 10' g/L. Samples were left to run in full i.e.
until the signal had clearly returned to the nitric oxide generation baseline. The nitrogen
purge flow rate was maintained at 200cm3/min in all experiments using an accurate gas
flow meter.
- 112-

Chapter Three Nitric Oxide, Its Metabolites and Blood
3.2.4 Nitrite Interaction with Erythrocytes
Erythrocyte samples were collected from consenting healthy volunteers within
the Wales Heart Research Institute as stated in section 2.1 (page 80). Post centrifugation
(2000g for 5 minutes) separated erythrocytes were reconstituted in phosphate buffered
saline (PBS) to give a final haemoglobin concentration o f lOg/dL and haematocrit o f
-35% , the mix was then placed in a thin film rotating tonometer as described in section
2.2 (page 81). A nitrogen or 95% oxygen purge was utilised to alter the haemoglobin
saturation to either -50% or -100% respectively, saturation was confirmed using a
blood gas analyser (OSM3, Radiometer, Copenhagen). The mix (50 or 100% saturation)
was then separated into aliquots and nitrite o f varying concentrations (150, 250, 450 and
850nM final concentrations respectively) was added and incubated at 37°C. For rate
analysis, samples were taken at 5 min intervals (up to 20 minutes and again at 30
minutes) and centrifuged at high speed (10,000g for 2 minutes) to quench the reaction,
the supernatant and erythrocyte fractions were immediately separated, snap frozen and
stored at -80°C for future analysis. Rapidly thawed supernatant and erythrocyte fractions
were subsequently analysed via ozone-based chemiluminescence as per sections 2.3.4.1
(page 96) and 2.3.4.2 (page 97), respectively.
3.3 Statistical Analysis
For group comparisons the student t-test was utilised, either paired or unpaired
where appropriate. To assess correlations, the Pearson’s correlation coefficient was
used. Data are presented as means and error bars represent the standard error o f the
mean (SEM). A P value o f less than 0.05 was taken to be significant, individual
significance levels are indicated within the figure legends.
- 113-

Chapter Three Nitric Oxide, Its Metabolites and Blood
3.4 Results
3.4.1 Apportionment of Nitric Oxide in Blood
To assess the relative amount o f different nitric oxide metabolite species in blood and
the effect o f haemoglobin oxygen saturation upon apportionment of metabolites both
matched arterial and venous blood samples were collected and analysed.
3.4.1.1 Sample Characteristics
The haemoglobin concentrations o f arterial and venous blood samples were
15.4±0.7 g/dL and 16.0±0.6 g/dL respectively, a paired t-test revealed no significant
difference between the sample groups. Haemoglobin oxygen saturation in arterial blood
measured 97.410.5 % which was significantly higher (P<0.01) than the venous sample
that measured 67.2±4.2 %.
- 1 1 4 -

Chapter Three Nitric Oxide, Its Metabolites and Blood
3.4.1.2 Baseline Arterial and Venous samples
40000-
5 30000-
B
I * 1 2 100-oZ 50-
75-i
Art erial V e n o u s
B lo o d
A rterial V e n o u s
B lo o d
B lo o d
I Plasma Nitrate I Plasma Nitrite I Plasma RSNOI Erythrocyte Associated Signal
I Plasma Nitrite I Plasma RSNOI Erythrocyte Associated Signal
I hi) NO IhbSNO
Figure 3.1. Apportionment o f nitric oxide species in; A) Whole blood B) Whole blood with plasma nitrate
level not shown and C) Erythrocytes bound to haemoglobin. No significant difference in total levels (A)
between Arterial and Venous samples. n=4 in all cases.
The vast majority o f nitric oxide moiety in the blood circulates as nitrate in both
arterial and venous vasculature (Figure 3.1 A). If nitrate is excluded, the remaining
metabolites (nitrite, RSNO and erythrocyte associated signal) account for less than one
percent o f the total metabolite pool (Figure 3 .IB). Interestingly, the total amount o f
nitric oxide moiety does not change in arterial vs. venous blood (Figure 3.1 A).
However, apportionment between different species does change from artery to vein e.g.
haemoglobin bound species and plasma nitrite (Figures 3.1 and 3.2).
- 1 1 5 -

Chapter Three
A40000-
30000-
20000-
1 oooo-
Plasma Nitrate
i---A r t e r i a l
1---V e n o u s
Plasma RSNO
c » ,
2 0 -
Sc
10-
A r t e r i a l V e n o u s
Nitric Oxide, Its Metabolites and Blood
B Plasma Nitrite100-1
sc
2 5 -
V e n o u sA r t e r i a l
60-
50-
40-
| 3 0 -
20-
10-
0A r te r i a l
iV e n o u s
HbSNO40-|
3CH
? 20-
10-
A r t e r i a l V e n o u s
Figure 3.2. Changes in arterial and venous apportionment of nitric oxide metabolites in each of the
individuals tested A) Plasma nitrate is significantly lower in venous blood compared to matched arterial
samples (P<0.001) B) A significant (P<0.05) gradient in plasma nitrite level exists from artery to vein C)
Plasma RSNO, no significant change from arterial to venous D) Nitric oxide bound to the oxygen binding
pocket o f haemoglobin increases significantly (PO.OOI) from artery to vein E) HbSNO levels show a
trend which is higher in arterial samples but is not significantly different from matched venous samples.
n=4 in all cases.
- 1 1 6 -
HbNO

Chapter Three Nitric O xide, Its Metabolites and Blood
The transit from artery to vein and associated change in oxygen level alters the
apportionment o f nitric oxide metabolites. The clearest trends appear to be in plasma
nitrite and HbNO, where plasma nitrite levels decrease from artery to vein, in contrast to
HbNO levels which increase by approximately the same amount across the same
vascular bed (Figure 3.2B and D).
- 117-

Chapter Three Nitric Oxide, Its Metabolites and Blood
3.4.1.3 Exogenous Nitric Oxide Addition to Arterial and Venous Blood
4000(h
S 30000-
® 20000-
B350-|
300-1 250-
5 200-
O 150-
O 100- z50-
0
A rterial
Blood
A rterial
Blood
A rterial V e n o u s
Blood
I Plasma Nitrate ) Plasma Nitrite I Plasma RSNOI Erythrocyte Associated Signal
I Plasma Nitrite I Plasma RSNOI Erythrocyte Associated Signal
JHbNOIhbSNO
Figure 3.3. Apportionment o f nitric oxide species post NOC-9 (425nM) addition in; A) Whole blood B)
Whole blood with plasma nitrate level not shown and C) Erythrocytes bound to haemoglobin. No
significant difference in total levels (A) between Arterial and Venous samples. n=4 in all cases.
The total increase in nitric oxide moiety was the same in arterial and venous
blood (Figure 3.3A) with an overall nitric oxide recovery level of 154.4%. This recovery
level is very acceptable given that 850nM nitric oxide equivalent was added to a ~
30,000nM pool of nitric oxide metabolites. However, it should be noted that the aim of
this study was to asses the apportionment of nitric oxide in relation to blood saturation,
not the addition of nitric oxide per se. The metabolism of exogenously added nitric
oxide to specific species appears to be oxygen dependent.
- 1 1 8 -

10000-1
0Baseline 850nM NO Addition
O 40- z “ 20-
0 I------Baseline 850nM NO Ad
Plasma RSNO HbNO30-|
2c 20-
1O2Oz
10-
850nM NO AdditionBaseline
30-i
2 20-
B 0o* 10H
■ —Baseline
I850nM NO Ac
“ 40-
I 30-
f 20-o
10-
0
HbSNO
i ■Baseline 850nM NO Addition
Figure 3.4. The metabolism o f NOC-9 (425nM) in arterial blood samples. A) Plasma nitrate lev<
Plasma nitrite levels increase significantly upon NOC-9 addition (P<0.05) C) Plasma RSNO levc
HbNO levels E) HbSNO levels appear to increase in all samples, however levels achieved ar
significantly different from baseline. n=4 in all cases.
- 119-

Chapter Three Nitric Oxide, Its Metabolites and Blood
In arterial blood most species appeared to be slightly elevated, however it is the
observed increases in plasma nitrite (P<0.05) and nitrate that account for most of the
exogenously added nitric oxide (Figure 3.4). In venous blood, plasma nitrite levels are
also elevated (P<0.05) (Figure 3.5B), however, there is also a notable increase in HbNO
level (Figure 3.5D).
- 120-

Chapter Three Nitric Oxide, Its Metabolites and Blood
Plasma Nitrate40000-
| 30000-
I 20000Ho
10000-j
0Baseline 850nM NO Addition
B Plasm a Nitrite140-i120-
c 100-80-
O 60-
O 40-20-
Baseline 850nM NO Addition
Plasm a RSNO30-i
2c 20-
fO2Oz
Baseline 850nM NO Addition
HbNO140-i
— 12°- i 100-| ®°" O 60-
O 40- Z“ 20H
0Baseline 850nM NO Addition
HbSNO30-i
Sc 20-
OZoz
10-
850nM NO AdditionBaseline
Figure 3.5. The metabolism of NOC-9 (425nM) in venous blood samples. A) Plasma nitrate levels B)
Plasma nitrite levels increase significantly upon NOC-9 addition (P<0.05) C) Plasma RSNO levels D)
HbNO levels appear to increase in all samples, however levels achieved are not significantly different
from baseline E) HbSNO levels. n=4 in all cases.
- 121 -

Chapter Three Nitric Oxide, Its Metabolites and Blood
3.4.2 Real Time Nitric Oxide Reaction Model
75h
> 50-
0 500 1000 1500 2000 2500Time (seconds)
Figure 3.5. Smoothed trace showing injection o f a lysed erythrocyte sample (1) and injection of the same
but whole erythrocyte sample (2). The whole erythrocyte signal is comprised o f a number of components,
an initial uptake or decay phase (3), a plateau or steady state phase (4) and a return to baseline phase (5).
The injection of whole and lysed erythrocytes into the model produces visually
distinct signals (Figure 3.5). Injection of lysed erythrocytes produces a signal with rapid
decay to a low detected nitric oxide level and completes its reaction within a few
minutes. Conversely, injection of whole erythrocytes produces a signal with a more
modest decay to a level that is much closer to the nitric oxide level detected before
erythrocyte injection, with the reaction completing over a longer period of ~20 minutes.
In order to test the suitability of the model for erythrocyte/haemoglobin testing, a
number of validation experiments were undertaken to establish the characteristics of the
model. The nitric oxide baseline level was found to be directly dependent upon the flow
rate of the purging nitrogen gas, for this reason the nitrogen flow in all experiments was
kept at a constant rate (Figure 3.6A). The relative amount o f nitric oxide consumed upon
injection o f haemoglobin was found to be inversely proportional to the % met
haemoglobin content (Figure 3.6B). All test samples were monitored for changes in
methaemoglobin, however the manipulations used in this chapter did not alter levels
significantly. The amount of haemoglobin injected was found to have a linear
relationship with the relative amount of nitric oxide consumed (Figure 3.6C),
- 1 2 2 -

Chapter Three Nitric Oxide, Its Metabolites and Blood
demonstrating that the model is suitable o f erythrocyte/haemoglobin testing. In addition,
the relative total amount o f nitric oxide consumed was found to be independent of the
extracellular nitric oxide concentration (Figure 3.6D).
2 4000-X r° I2 S . 3000-I EZ 3® « 2000-
1000-
0 10 20 30 40 SO 60 70 80 90
400-1
c _ 300-
0 SO 100 200 250150
Flow rate (cm 3/min)
D
>< c 7500 O o
■=*| | 5000® c > o« o 2500
0.000 0.025 0.050 0.075 0.100 0.125 0.150 0.175
6000-
5000-
« 3 . 4000-
3000-
.2 o 2000-
1 0 0 0 -
Hb Concentration (g/L) Spermine NONOate concentration ( pM)
Figure 3.6. Real time nitric oxide reaction model characteristics A) The effect o f nitrogen purge flow rate
on the baseline line of spermine NONOate (R2=0.984, Pearson’s correlation coefficient^ -0.992,
P 0 .0001 , n=8 ). B) The effect o f met haemoglobin on the relative amount o f nitric oxide consumed by
lysed red blood cells (0.1 g/L) (R2=0.754, Pearson’s correlation coefficient= -0.868, P 0 .0001 , n=40).
Methaemoglobin samples were generated over time by incubation of oxyhaemoglobin with high
concentration nitrite C) The effect of haemoglobin concentration upon the relative amount of nitric oxide
consumed by lysed red blood cells (R2=0.815, Pearson’s correlation coefficient=0.903, P0 .0001 , n=16).
D) The effect o f spermine NONOate concentration on the relative amount o f nitric oxide consumed by
lysed red blood cells (0.1 g/L), no significant difference.
- 1 2 3 -

Chapter Three Nitric Oxide, Its Metabolites and Blood
The starting nitric oxide baseline level was not significantly different between all
groups used for cross comparison (oxy vs. deoxy and whole vs. lysed). This is important
as the baseline level is indicative o f the extracellular nitric oxide concentration in the
purge vessel and although this will not alter total nitric oxide consumption, it could
impact upon the rate o f uptake.
The initial rate o f nitric oxide consumption is significantly slower in whole cells
when compared to their lysed counterparts (Figure 3.7A and B). The initial rate of
oxygenated whole cells is approximately 20 times slower than its lysed counterpart,
while in deoxygenated cells it is approximately 10 times. Independent of oxygenation
level, whole cells consistently consume more nitric oxide than when they are lysed
(Figure 3.7C and D).
- 124-

Chapter Three
A
whole lysedSample
Nitric Oxide, Its Metabolites and Blood
B
I Iwhole lysed
Sample
■3 “g x S
~ 5 3000-
whole lysedSample
5000-1
9 £ 2000-
9 o 1000-1 £C o
whole lysedSample
Figure 3.7. A) Initial rate o f nitric oxide consumption measured as a drop from the spermine NONOate
generated baseline by both whole and lysed oxygenated cells (P<0.001). B) Initial rate o f nitric oxide
consumption by both whole and lysed deoxygenated cells (P<0.001). C) The relative amount o f nitric
oxide consumed by both whole and lysed oxygenated cells (P<0.001). D) The relative amount o f nitric
oxide consumed by both whole and lysed deoxygenated cells (P<0.001). Haemoglobin was normalised to
0.1 g/L in all cases. n=8, met haemoglobin remained unchanged between samples.
The initial rate o f nitric oxide uptake in whole deoxygenated erythrocytes is
more than double that o f oxygenated erythrocytes (Figure 3.8A). Once the same cells are
lysed the relationship is lost with both deoxygenated and oxygenated lysed cells
displaying the same initial rate (Figure 3.8B). A similar pattern occurs with respect to
the relative amount o f nitric oxide consumed. Whole oxygenated erythrocytes consume
significantly more nitric oxide than the same cells in a deoxygenated state (Figure 3.8C).
Again, this relationship is not present if the cells are lysed (Figure 3.8D).
- 125-

Chapter Three Nitric Oxide, Its Metabolites and Blood
Deoxy DeoxyS a m p le S a m p le
4000-
S .2 3000-
2000-
1000-
D
Deoxy
4000-
•Dg | 3000-
Z £ 2000-
| ira £ 1000- a> o a. o
Oxy DeoxySam ple Sam ple
Figure 3.8. A) Initial rate o f nitric oxide consumption, measured as a drop from the spermine NONOate-
generated baseline in whole oxygenated and deoxygenated cells (P<0.05). B) Initial rate of nitric oxide
consumption in lysed oxygenated and deoxygenated cells (i.e. free haemoglobin). C) The relative amount
of nitric oxide consumed by injection o f whole oxygenated and deoxygenated cells into the test system,
(P<0.01). D) The relative amount o f nitric oxide consumed by injection o f lysed oxygenated and
deoxygenated cells into the test system. Haemoglobin was normalised to 0.1 g/L in all cases. n=8 , met
haemoglobin remained unchanged between samples.
- 1 2 6 -

cells, nitrite uptake generally increased as extracellular nitrite concentration incn
However, at lower extracellular concentrations (150nM and 250nM) in the s;
containing fully oxygenated cells, the extracellular nitrite level did not fall signifii
from the starting value over thirty minutes. The same was also true for the pa
oxygenated erythrocyte sample but only at the lowest extracellular nitrite concent
(150nM). Nitrite uptake also increased as haemoglobin oxygen saturation decrease*
relationship only becomes significant at the higher extracellular nitrite concentrate
450nM and 850nM (oxygenated vs. partially oxygenated, P<0.05 and P
respectively), tested after thirty minutes o f incubation.
- 127-

Chapter Three
A
Nitric Oxide, Its Metabolites and Blood
B
4 0 -
- 100-
2cr-»Oz■ -2509c01 -300
c8.crz
-400-
<J -450-
-500-
-550-
0 5 10 15 20 25 30Time (Minutes)
Time (Minutes)
-850nM Nitrite 100% H b 0 2 -450nM Nitrite 100% H b 0 2 -250nM Nitrite 100% HbO 2 - 150nM Nitrite 100% H bQ 2
- K -
-100-
£c -150-r -Oz
-200-
13 ■ ;=>o -300-g
-550
-600-20 25 305 10 150
-850nM Nitrite 50% H bO z -450nM NitritB 50% H b 0 2 -250nM Nitrite 50% H b 0 2 -150nM Nitrite 50% H b 0 2
Figure 3.9. A) Nitrite consumption by erythrocytes at -100% (98.45 ± 0.15%) oxygen saturation. No
significant difference between 0 and 30 time points for 150 and 250nM nitrite, P<0.05 0 vs. 30 time points
for 450 and 850nM. B) Nitrite consumption by erythrocytes at 50% (51.04 ± 0.83%) oxygen saturation.
No significant difference between 0 and 30 time points for 150nM nitrite, P<0.05 0 vs. 30 time points for
250, 450 and 850nM. Change in extracellular nitrite concentration after 30 minutes is significantly
different at 450 and 850nm starting concentration (P<0.05 and P<0.01 respectively), oxygenated vs.
partially oxygenated. Starting concentrations were measured at 852.6 ± 33.1nM, 475.2 ± 26.2nM, 244.4 ±
29.9nM and 177.0 ± 19.0nM respectively. Haemoglobin was normalised to lOg/dL (10.07g/dL ±0.08).
n=4 for all groups, all measurements were made in duplicate and averaged.
- 1 2 8 -

Chapter Three Nitric Oxide, Its Metabolites and Blood
The overall rate o f nitrite uptake, particularly in the physiological range (~50-
250nM, see section 3.5.2 (page 133)), in relative terms is not very rapid (Table 3.1).
This is compounded by high haemoglobin oxygen saturation, where entry to fully
oxygenated samples at lower concentrations is almost negligible. At all extracellular
nitrite concentrations the overall rate is approximately three times faster in partially
oxygenated compared to the corresponding fully oxygenated samples.
Table 3.1. Nitrite consumption rate by erythrocytes ex vivo at 50% (51.04 ± 0.83%) and 100% (98.45 ±
0.15%) oxygen saturation. Samples were taken every 5 minutes over 30 minutes from different starting
concentrations. Starting concentrations were measured at 852.6 ± 33.08nM, 475.2 ± 26.23nM, 244.4 ±
29.9InM and 177.0 ± 18.99nM respectively. Haemoglobin was normalised to lOg/dL (10.07g/dL ±0.08).
Data are expressed as nitrite consumption, nM per minute. n=4 for all groups, all measurements were
made in duplicate and averaged.
Nitrite Consumption
Rate over 30
mins (nM min'1)
±SEM
Approx. Starting Nitrite Concentration:
850nM
450nM 250nM 150nM
50 % Saturation 17.76 ±1.93 8.72±1.27 3.03 ±0.86 1.43 ±0.72
100 % Saturation 6.01 ±1.03 2.52 ±0.30 1.03 ±0.48 0.65 ±0.23
- 129-

Chapter Three Nitric Oxide, Its Metabolites and Blood
3.5 Discussion
3.5.1 Nitric Oxide Apportionment in Blood
Understanding the way in which nitric oxide is apportioned in blood as
individual metabolite species is essential for both the application and interpretation of
nitric oxide metabolite biology. Many early studies based hypotheses and theories for
experimental findings upon changes in specific metabolite levels. In these studies,
species levels (particularly haemoglobin bound species) were reported to be relatively
high, in the micro-molar range [329]. Over time, reported levels have slowly come down
and consensus between the majority o f laboratories exists [369, 379]. However
questions surrounding the niceties of measurement methodology still ensue [373].
Nevertheless, it should be remembered, especially given the relative potency of nitric
oxide, that amount measured does not always infer physiological relevance. The
observed decrease in reported levels is most likely due to improvements in methodology
and a greater awareness o f confounding factors such as nitrite contamination. The
methodologies utilised in this thesis have reported levels (~50-250nM, ~30pM nitrate)
o f individual metabolite species that are in agreement with the values published in more
recent, aforementioned publications [379].
The finding that concentration gradients o f specific nitric oxide metabolites exist
in the circulation when passing from artery to vein (A-V) has been the stimulus o f much
research [337]. The premise o f this research relies heavily upon the assumption that,
when a decrease in a specific metabolite (e.g. plasma nitrite) is observed it must have
been converted back to free, biologically active nitric oxide. In agreement with one
aspect o f this research, this chapter has also demonstrated a concentration gradient of
specific species in human arterial and venous blood samples. Specifically, plasma nitrite
decreases significantly across the vascular bed. However, the results o f this chapter and
other publications [369] do not support the finding that free nitric oxide is produced.
The explanation lies in the oxygen dependent re-apportionment o f species. The results
of this chapter show, regardless o f haemoglobin saturation, that the total amount of
- 130-

Chapter Three Nitric Oxide, Its Metabolites and Blood
nitric oxide moiety does not rapidly change, i.e. although levels o f specific metabolites
change with respect to saturation, the total nitric oxide ‘pool’ remains constant.
Therefore, studying the change o f just one specific metabolite is not sufficient to
appreciate the dynamic interplay that occurs within a physiological system. In this
respect, the results presented in this chapter show a decrease in plasma nitrite A-V that
is matched by a concomitant increase in HbNO, redressing the balance of the total nitric
oxide pool. The concept o f re-apportionment is complex in the in vivo setting where, in
addition to changes in oxygen level, there are both multiple ‘sources’ and ‘sinks’ of
nitric oxide throughout the vascular tree.
As this chapter reveals, the apportionment of metabolites in blood is ultimately
dependent upon haemoglobin saturation. However, overall apportionment is also a
balance between nitric oxide production, consumption and the inter-conversion between
metabolite species. The measurement of nitric oxide metabolites is therefore reflective
o f all o f these processes and should be interpreted with this in mind. It is therefore
unlikely that the measurement o f just one metabolite species will be sufficient to gain
understanding with regard to an overall physiological process (e.g. endothelial nitric
oxide synthase activity) as has been used in previous studies [380, 381]. Indeed, our
own laboratory have demonstrated that inhibition of nitric oxide synthase at baseline in
human subjects effects vessel tone but does not alter nitric oxide metabolite levels in the
short term [369].
The addition o f exogenous nitric oxide to arterial and venous whole blood gives
an insight into the way in which blood metabolises nitric oxide in vivo. In arterial blood,
small increases were seen in most species, however increases in plasma nitrate and a
significant increase in plasma nitrite accounted for the majority o f the metabolised nitric
oxide. The observed increase in plasma nitrate occurred in all samples, but, as a result of
the study having a low number o f samples, was not found to be statistically significant.
Metabolism to these oxidised species corresponds to the relative quantity o f oxygen in
the sample. In the parallel venous samples plasma nitrite again increased significantly,
in addition, the only other species to increase in all venous samples was HbNO. The
-131 -

Chapter Three Nitric Oxide, Its Metabolites and Blood
observed increase in HbNO is to be expected in the venous sample given the increased
availability o f haemoglobin (that is not carrying oxygen) to participate in a binding
reaction with nitric oxide. The fact that plasma nitrite also increased significantly in the
venous sample could possibly reflect an inability o f nitric oxide to rapidly enter the red
blood cell and so free nitric oxide could be oxidised by dissolved oxygen in the plasma
before having the opportunity to enter. Interestingly, in both arterial and venous blood,
exogenously added nitric oxide was metabolised to species that are thought be
biologically active, thereby ‘preserving’ so called nitric oxide activity within the blood.
As with baseline samples, the apportionment o f exogenously added nitric oxide
was dependent upon oxygen level. In broad terms, nitric oxide added to oxygenated,
arterial blood is more likely to undergo oxidation reactions. The same is somewhat true
for partially oxygenated, venous blood, however, haem groups in the sample that do not
have oxygen bound can potentially form HbNO. In this chapter, the same amount of
exogenous nitric oxide was added to both arterial and venous samples i.e. production
was constant and the species that were formed differed depending on oxygen level,
highlighting the difficulties in interpreting A-V gradients of specific species from a
more complex system where production etc can be variable.
The addition o f nitric oxide elevated the total metabolite pool by the same
amount in both arterial and venous samples. The slightly elevated recovery of
exogenously added nitric oxide could either reflect nitrite contamination in NOC-9 (as
occurs with most chemical agents) or systematic error introduced during measurement
(particularly likely with respect to nitrate measurement given its abundance over other
species). However, given that the amount o f exogenous nitric oxide added only
accounted for -2.5% o f the total metabolite pool, this recovery level is very acceptable.
- 132-

Chapter Three Nitric Oxide, Its Metabolites and Blood
3.5.2 Real Time Reaction of Nitric Oxide with Erythrocytes and Haemoglobin
The bioavailability o f nitric oxide within a vessel is largely governed by the
concentration o f and rate of reaction with other bio-reactants. Haemoglobin is thought to
be one o f the most significant ‘inactivators’ o f nitric oxide, due to its high rate of
reaction. However, despite this high rate and the fact that the vessel lumen contains a
considerable amount o f haemoglobin, nitric oxide is still able to carry out its normal
function.
In the early 1990s there was a focus o f research on the simulation of nitric oxide
diffusion in the vessel setting, with prominent work from Jack Lancaster [375, 382].
Lancaster’s early models suggested that the efficient scavenging of nitric oxide by
haemoglobin would prevent it from entering vascular smooth muscle, igniting claims
that EDRF was not in fact nitric oxide. As ideas progressed, the assumptions that had
been made in early modelling work were disputed and previously described phenomena
regarding blood flow were now being considered in this context. Notably, publications
by Butler et al and Vaughn et al described a concept that has come to be known as the
‘red blood cell free zone’ [322, 383]. This work builds on observations of blood flow in
a vessel like structure or tube [384], in simple terms, blood flowing in a tube is
composed o f two elements; an erythrocyte core flowing down the centre of the lumen
and a peripheral plasma layer adjacent to the periphery or endothelium. It is this
erythrocyte free plasma layer that has special relevance to nitric oxide diffusion and
bioactivity. This creates an area where nitric oxide can exist without being scavenged by
erythrocytes and allows the molecule to accumulate. This accumulation creates a
concentration gradient that favours diffusion toward vascular smooth muscle where
nitric oxide acts to produce vasodilatation. The Vaughn group went on to demonstrate
that intravascular flow reduces nitric oxide scavenging by erythrocytes in an isolated
vessel model [323]. This theory goes some way to explaining the ability of nitric oxide
to function in the vessel setting, but other mechanisms are expected play a role. More
recent research and the work o f this chapter have started to focus on the direct
interaction o f nitric oxide with erythrocytes.
- 133-

Chapter Three Nitric Oxide, Its Metabolites and Blood
The preliminary finding of the model developed in this chapter demonstrates that
whole and lysed erythrocytes generate visually distinct signals with regard to nitric
oxide uptake. To further explore this finding, assessments of initial rate of uptake and
total relative nitric oxide consumption were performed.
The measured initial uptake rate is significantly slower (-10-20 times) in whole
erythrocytes compared to the corresponding lysed sample. The encapsulation of
haemoglobin, as in the case o f whole erythrocytes, clearly retards the rate of reaction
with nitric oxide, suggesting an additional mechanism by which nitric oxide may be
protected in the vessel setting. This property o f whole erythrocytes has been investigated
by other research groups, leading to a number o f proposed theories that explain the
mechanism o f limited nitric oxide entry. The Vaughn and Liao group published on the
topic, suggesting that erythrocytes possess an intrinsic barrier to nitric oxide
consumption [320]. The mechanisms involved are thought to stem from a resistance to
transmembrane diffusion or a limited intracellular diffusion mechanism. A competition
model was utilised in these experiments, which was thought to create a homogenous
reaction without extracellular diffusion limitation. The Lancaster group countered this
work, suggesting that the model was inappropriate (in terms o f extracellular diffusion
limitation) and that it is in fact the ‘unstirred layer’ thought to surround erythrocytes that
is the main diffusion barrier, not the membrane [321]. A recent publication utilising
phospholipid vesicles filled with haemoglobin has also provided an alternative
mechanism that does not implicate the membrane per se [385]. The work suggests that
as nitric oxide enters the vesicle and reacts with haemoglobin close to the interior
membrane surface it forms a diffusion barrier, this is thought to retard the reaction with
haemoglobin in the core o f the vesicle and decrease overall reaction rate. As with a
number o f studies o f this type, a ‘stopped-flow’ analysis was utilised. In this method, the
reactants are rapidly mixed and then the products formed (used as surrogate marker
instead o f actual nitric oxide level) are continually measured. In contrast to the model
developed in this chapter, the extracellular nitric oxide level is changing over the course
of the stopped-flow experiment and could potentially influence the measured rate. In
- 134-

Chapter Three Nitric Oxide, Its Metabolites and Blood
this regard, the difference in initial rate between whole and lysed cells was calculated to
be -10-20 times in this chapter, while some reported values have been as much -500
times [320], this could reflect differences in methodology and rate assessment, however,
irrespective o f magnitude, the measured rate is always slower in whole cell preparations.
The results o f this chapter do not fully confirm nor refute any of these diffusion
limitation mechanisms but do provide novel findings that support certain aspects of
these mechanisms. The model developed in this chapter utilises a reaction vessel that is
bubbled to provide a homogenous reaction mixture, theoretically, limitations of
extracellular diffusion should therefore not play a significant role. In this respect, a
diffusion limitation in whole erythrocytes is still observed, suggesting that mechanisms
intrinsic to the cell do play a role. Results obtained in oxygenated and deoxygenated
cells potentially imply a role for intra-erythrocyte diffusion limitation which will be
considered in the later part o f this discussion section.
The overall uptake o f nitric oxide was significantly higher in whole cells
compared to the corresponding lysed samples; the potential reasons for this are two fold:
In its whole form, the cell is more likely to be able to process the influx of nitric oxide.
For example, the cell will have the potential to convert methaemoglobin back to
haemoglobin via methaemoglobin reductase and associated co-factors, allowing further
nitric oxide consumption, a process that is unlikely to occur in the lysed sample.
Secondly, and perhaps more probable, the whole erythrocyte, regardless of containing
haemoglobin could act as a ‘reservoir’ due to the relative partitioning of nitric oxide into
one media vs. another. Nitric oxide, like oxygen, has previously been shown to be -4
times more soluble in liposomes relative to water [386].
As is becoming apparent, the biochemistry of nitric oxide is heavily influenced
by the presence of oxygen in the environment. To this end, the influence of haemoglobin
saturation upon the nitric oxide uptake model was tested. In whole cell samples, the
initial uptake rate was significantly faster (-2 times) in deoxygenated cells compared to
the same cells in an oxygenated state. Given that there is no difference between
- 135-

Chapter Three Nitric Oxide, Its Metabolites and Blood
deoxygenated and oxygenated lysed samples, this implies something intrinsic to the cell
as opposed to a difference in the rate o f reaction between nitric oxide and haemoglobin.
The increased uptake by deoxygenated cells could be due to haemoglobin membrane
interaction. Deoxygenated, but not oxygenated, haemoglobin is known to bind to
proteins (such as AE1) on the interior o f the plasma membrane [387]. This positions the
haemoglobin perfectly, close to the membrane and channels which are thought to
facilitate nitric oxide entry [83], where it can rapidly react with nitric oxide entering the
cell. In support o f this, the uptake o f nitric oxide by erythrocytes has been shown to be
influenced by altering the degree o f AEl-cytoskeleton interaction [388]. The nitric oxide
permeability o f the erythrocyte membrane is also thought to be considerably greater in
deoxygenated cells [389]. These data suggest that differences in diffusion rate
(transmembrane and intraerythrocytic) may be a significant determinant in the
difference in whole and lysed initial uptake rates.
The overall amount o f nitric oxide uptake was significantly higher in oxygenated
whole cells compared to deoxygenated cells. Again, this relationship was absent in the
equivalent lysed samples. Oxygenated haemoglobin in the whole erythrocyte can
potentially consume two molecules o f nitric oxide compared to deoxygenated haem that
has the ability to only bind one. It is possible for the first nitric oxide to react with the
oxygen bound to the haemoglobin forming nitrate and resultant methaemoglobin, the
methaemoglobin is then reduced back to haemoglobin (by methaemoglobin reductase in
the whole cell) which can participate in a second nitric oxide reaction forming HbNO.
This reaction is unlikely to completely cope with very rapid methaemoglobin formation
in this model, however it may account for the increased consumption observed by
oxygenated whole cells.
- 136-

Chapter Three Nitric Oxide, Its Metabolites and Blood
3.5.3 The Uptake of Nitrite by Erythrocytes
Gladwin and colleagues propose that nitrite may behave as a biologically active
source o f nitric oxide that is activated by haemoglobin, maximally around the 50%
saturation point (see section 1.10.2, page 68). For this process to be biologically active
in vivo, nitrite must enter erythrocytes in sufficient quantities, react with haemoglobin
and release free nitric oxide over the course o f a circulatory cycle. The mechanism by
which free nitric oxide is able to escape re-capture by haemoglobin within the
erythrocyte continues to be heavily questioned [343], however, the assessment of nitrite
entry to the erythrocyte has been somewhat neglected.
Wider research to date would suggest that the anion exchanger (AE1) could be a
likely candidate for nitrite entry into the red blood cell. Early work by Shingles et al
demonstrated inhibition o f HCO3 /NO2’ exchange across the erythrocyte membrane with
the AE1 channel blocker DIDS (4,4'-diisothiocyanato-2,2'-stilbenedisulfonate) [390].
However, more recent publications have been unable to demonstrate an effect o f DIDS
[391, 392]. To further explore the possible role of carrier-mediated transport, Jensen
attempted to block transport with phloretin (a general inhibitor of facilitated diffusion),
but again found no influence [391]. Because o f the charged nature o f the nitrite anion it
cannot simply diffuse across the membrane like nitric oxide. Other possible routes of
entry are via diffusion through channels (conductive transport) or diffusion as HNO2 .
Although HNO2 can simply diffuse across the lipid bilayer it has a pKa of ~3.3 [391]
and so is unlikely to form to any great extent at normal extracellular pH. In addition,
intracellular pH is normally lower than extracellular and therefore an outward diffusion
gradient for HNO2 would exist. However, nitrite would be consumed by haemoglobin
inside the cell and so could potentially reverse this gradient. In summary, a likely
candidate is conduction channel diffusion. The results o f this chapter show
concentration dependency and the generally low uptake rates in the physiological nitrite
range that implies diffusion to be responsible, rather than an active uptake process. In
this regard, previous studies have suggested that nitrite entry to erythrocytes is relatively
rapid. However, the extracellular concentrations o f nitrite utilised are often in the
- 137-

Chapter Three Nitric Oxide, Its Metabolites and Blood
millimolar range [391, 392]. The rates observed and mechanistic assumptions derived at
these nitrite concentrations clearly do not translate to mechanisms occurring at
physiological levels. The extrapolation o f findings, generated under non-physiological
conditions, to the physiological setting is a problem that is prominent within the nitric
oxide field. In order to study a system such as nitric oxide metabolism it is often
necessary to introduce species to alter baseline equilibrium. There is not a problem with
this research approach, however it is essential to interpret findings in context.
A number o f publications have previously suggested that nitrite uptake by
erythrocytes under normal conditions is independent o f oxygenation [391, 393]. The
results presented here find that partially oxygenated samples have a higher uptake rate
compared to oxygenated samples, particularly at elevated extracellular nitrite
concentrations. This observed difference in uptake cannot be explained in terms of the
rate o f reaction between haemoglobin and nitrite, as oxyhaemoglobin is reported to react
~10 times faster than deoxy [394], However, the removal o f nitrite by haemoglobin is
still likely to contribute to the force that drives uptake. As with the interaction seen
between erythrocytes and nitric oxide, an intrinsic interaction between haemoglobin and
the cell membrane may have a function. Deoxygenated haemoglobin is known to
interact with channels and the cytoskeleton on the interior membrane surface [387] and
so potentially could alter the entry o f nitrite by association. The diffusion o f nitrite
through membrane channels may also be altered by membrane potential. Changes in
oxygenation are known to alter the membrane potential through mechanisms such as the
Haldane effect (see section 1.4.2.4, page 18) [391].
The sluggish rate o f nitrite uptake by erythrocytes (particularly in an oxygenated
state) at physiologically relevant extracellular nitrite concentrations does not favour a
mechanism by which nitrite, through an erythrocyte/haemoglobin mechanism, effects
vessel tone under basal conditions. The overall importance o f the findings in this chapter
section will be put in context with respect to in vivo data that is presented and discussed
in chapter 6.
- 138-

Chapter Three Nitric Oxide, Its Metabolites and Blood
3.6 Summary and Conclusions
• The apportionment o f nitric oxide and its metabolites in blood is dependent upon
the degree o f haemoglobin oxygen saturation, creating arterio-venous gradients
o f specific species. However, the total nitric oxide metabolite pool remains
relatively constant with decreases in one group of species being compensated for
by increases in another. Apart from nitrate (which is in the pM range), measured
values ranging from ~10-250nM are in agreement with recent publications.
• The metabolism or species formed when exogenous nitric oxide is added to
arterial and venous blood differs. In oxygenated blood, nitric oxide is more likely
to undergo oxidation reactions to form nitrite and nitrate. In venous blood, the
increased availability o f haemoglobin (i.e. with no oxygen bound) leads to the
production o f HbNO. In both cases, some o f the species formed are thought to be
biologically active and may potentially preserve nitric oxide.
• The rate o f initial uptake o f nitric oxide by erythrocytes is -10-20 times slower
than the reaction o f free haemoglobin (lysed cells) with nitric oxide. The exact
mechanisms o f this retarded uptake remain unknown, but the phenomenon may
serve to increase nitric oxide longevity in vivo. In whole erythrocytes, the initial
uptake rate o f nitric oxide is significantly faster (-2 times) in deoxygenated cells,
most likely resulting from an interaction of deoxyhaemoglobin and the
erythrocyte membrane/membrane proteins.
• The uptake o f nitrite by erythrocytes is concentration-dependent and does not
occur at a rapid rate when extracellular nitrite is in the physiological (i.e. plasma
concentration) range. The rate o f uptake is also influenced by haemoglobin
oxygen saturation with partially oxygenated (SaC>2 50%) cells taking up more
nitrite, particularly at high extracellular nitrite concentrations.
- 139-

Chapter Four Nitrite Induced Vasorelaxation
4 Nitrite Induced Vasorelaxation, the Influence of Oxygen
4.1 Introduction
The nitrite anion (NO2 ) represents an interesting constituent o f the nitrogen
oxide(s) (NOx) family in pharmacological terms. The real-time study of nitric oxide has
always posed a problem due to its highly reactive nature: nitrite, although significantly
less potent than nitric oxide, has been utilised as a more stable and practical solution to
this experimental problem. However, nitrite has its own caveats, most notably
contamination in in vitro systems and alternative sources in vivo (e.g. diet) where levels
can be oxygen dependent. Nitrite itself has been known to be vasoactive for a number of
years [395]. Although relatively less potent than pharmaceutical nitrovasodilators,
interest in its mode o f action has recently revived after recognition that it may represent
a circulating source o f bioavailable ‘NO-like’ activity (see section 1.10.2, page 68) and
may have an important role clinically [98].
Nitrite was previously thought to be a relatively inert nitric oxide metabolite,
although current studies now allow us to appreciate the dynamic ‘interplay’ between the
metabolites o f nitric oxide and their potential as physiological effectors (see chapter 3
and [369]). The biological effects o f nitrite are thought to be predominantly mediated
via its reduction back to nitric oxide. Therefore, the mechanisms by which nitrite is
reduced to nitric oxide has become a principal area o f interest within the nitrite field. To
date, research has largely focused upon the reduction o f nitrite by haemoglobin, a
mechanism that is thought to match blood flow and oxygen demand (see section 1.10.2,
page 68). However, this mechanism has not been demonstrated within the in vivo setting
and the original ex vivo vessel work demonstrating enhanced nitrite induced
vasodilatation in hypoxia in the presence o f haemoglobin [337] is yet to be repeated
[315, 396]. Several issues remain with this concept, including the effective entry o f
nitrite into erythrocytes at physiological concentrations (see chapters 3 and 6), and
subsequent escape o f bioavailable nitric oxide from haemoglobin recapture. In addition
to haemoglobin reduction, an alternative mechanism o f nitrite reduction involving
- 140-

Chapter Four Nitrite Induced Vasorelaxation
oxidoreductase enzymes has also been suggested [397]. The proposed mechanism
suggests that the principal route o f nitrite reduction occurs in the vascular tissue via
enzymatic reduction as opposed to in the blood stream via haemoglobin reduction. The
main enzymes thought to be involved are xanthine oxidase (XO) and aldehyde oxidase
(AO) [397], however it has been suggested that nitric oxide synthase [398], myoglobin
[344] and mitochondrial enzymes [399] also have the capacity to reduce nitrite.
Despite the considerable amount o f speculative work surrounding nitrite as both a
circulating vasoactive moiety and a potential therapeutic, very little work regarding its
downstream mechanism o f action has been completed, particularly in hypoxic vessels,
where it is though to be most effectual. Dalsgaard and colleagues have presented some
interesting mechanistic findings from rat aortic rings in hypoxia [396]. The work finds
that in the presence o f cyclooxygenase and nitric oxide synthase inhibitors, nitrite
appears to operate via soluble guanylate cyclase. The authors also fail to show a role for
haemoglobin, mitochondrial bc\ complex or xanthine oxidase in the reduction o f nitrite
and suggest that a mechanism involving the formation o f s-nitrosothiols within smooth
muscle could be involved. More recently, the Zweier group assessed the mechanism of
nitrite-induced vasodilatation, also in hypoxic rat aortic rings [400]. As with the
previous publication, this work was unable to demonstrate the involvement o f xanthine
oxidase or the mitochondrial transport chain, in addition to nitric oxide synthase and
cytochrome P450, in the reduction o f nitrite. They also found that nitrite induced
vasorelaxation could be inhibited by ODQ (lH[l,2,4]oxadiazolo[4,3-a]quinoxalin-l-
one). ODQ is commonly used to inhibit soluble guanylate cyclase, but will bind to a
number o f haem based proteins. To complement the vessel-based work, the authors also
completed some nitric oxide generation measurements from aortic tissue using a nitric
oxide-sensitive electrode to consider the involvement o f haem-based enzymes in nitrite
reduction. The generation o f nitric oxide from the aortic tissue was inhibited by both
heating o f the tissue (to denature proteins) and ODQ. The results suggest that haem-
based tissue enzymes are responsible for nitrite reduction. In the case o f soluble
guanylate cyclase, the enzyme could potentially be acting as both a nitrite reductase and
catalyser o f cGMP production to affect vasorelaxation.

levels both directly and indirectly. Within the cell, nitric oxide is capable of modifyin
proteins via thiol, tyrosine and metal groups, like phosphorylation, these modification
can have huge influences upon the functionality o f the protein. In the short term thes
modifications can influence receptor sensitivity and enzyme or channel activity fc
example. However, if the protein is a transcription factor, then exposure to nitric oxid
can have long lasting effects via alteration o f gene expression (for a comprehensiv
review of nitric oxide signalling particularly with regard to gene expression see [401]
Given these facts, it is important to consider the additional effects of nitrite, not onl
from a clinical dosing or chronic administration point of view, but also in terms of th
potential mechanisms that could be activated in vivo by basal nitrite levels, particular!
during a hypoxic insult. Publications in this area are limited but some studies have bee
completed. One study that utilised a rodent model has demonstrated that twenty foi
hours after high dose nitrite infusion, aortic heme oxygenase-1 and heart heat shoe
protein 70 expression (at a protein level) had been altered, despite plasma nitril
returning to basal levels at the same time point [402].
- 142-

vasodilatation in hypoxia. In addition, the broader effects of nitrite in vascular tissu
will also be investigated in this chapter in order to gain crucial understanding about t
acute effects o f nitrite exposure at a cellular level. Specifically this chapter aims to;
• Assess the effect o f vascular tissue oxygenation upon nitrite-dependc
vasodilatation.
• Investigate the dependency of nitrite-induced vasodilatation upon the formati
o f nitric oxide and elucidate the primary routes o f nitrite reduction witl
hypoxic vascular tissue.
• Establish the down-stream mechanisms involved in nitrite-medial
vasodilatation in hypoxia via the selective blockade of key enzymes/steps witl
vascular signalling cascades.
• Examine the acute effects o f nitrite exposure upon the expression of speci
genes in normoxic and hypoxic vascular tissue.
- 143-

Chapter Four Nitrite Induced Vasorelaxation
4.2 Specific Protocols
4.2.1 Myography
Rabbit aortic rings were harvested, mounted and conditioned as per section 2.5
(page 104). For experiments requiring endothelium-denuded tissue, the lumen of the
ring was gently rubbed with a wooden applicator and absence o f endothelium was then
tested during the experimental protocol by acetylcholine challenge. In hypoxic
experiments, tissue was always exposed to 10 minutes o f hypoxia before phenylephrine
induced pre-constriction (detailed in section 2.5.2, page 105). The final concentration of
nitrite utilised in all experiments was 10pM, an effective concentration previously
established in our laboratory in vitro [98], but also a concentration that is achievable in
vivo, in plasma with pharmacological nitrite dosing [98, 379, 403].
The slow and continuous relaxation o f isolated vessels during hypoxia, as
observed in the controls o f all our experiments, is an established phenomenon. The
precise cause o f vasodilatation remains unknown. Both energy limitation and
interruption o f excitation contraction coupling have been suggested as possible causes
[131]. In our model, hypoxia-induced relaxation is independent o f the endothelium or
NOS (denudation/L-NMMA data). It is important to note that the smooth muscle cells
are not simply dying in hypoxia. After a period o f hypoxia, tissue can be re-equilibrated
in oxygenated buffer and show comparable contraction and relaxation to exogenously
added agents. O f related interest, our laboratory has previously shown that relaxation
induced in arteries and veins by nitric oxide donors (such as GSNO) and nitrite is
enhanced under hypoxic compared to normoxic conditions [91, 98].
All pharmacological inhibitors were incubated for thirty minutes under normoxic
conditions before switching to hypoxic conditions for experimental testing.
Concentrations o f pharmacological inhibitors used were selected after the completion of
concentration curves (see results section o f this chapter) or were based upon values used
in the current literature, CPTIO [404], U-51605 [405], raloxifene and oxypurinol [397],

Chapter Four Nitrite Induced Vasorelaxation
L-NMMA [398] (for values see table 4.1). Pharmacological inhibitors were all dissolved
in dimethyl sulphoxide (DMSO) apart from oxypurinol, which was dissolved in IN
sodium hydroxide (NaOH) and CPTIO and L-NMMA, which were dissolved in Krebs’
buffer. Control experiments to test the effect o f vehicle solutions upon vascular response
to nitrite were completed and showed no demonstrable effect.
Table 4.1. Concentrations and actions o f pharmacological inhibitors utilised. These represent final in-bath
concentrations required or established for maximum effect on nitrite-induced vasodilatation.
Agent Action Final
Concentration
ODQ Soluble Guanylate Cyclase (sGC) Inhibitor 10 pM
Indomethacin Cyclooxygenase Inhibitor (COX) 5 pM
CPTIO Nitric Oxide Scavenger 1 mM
U-51605 Prostacyclin Synthase Inhibitor (PGISi) 10 pM
Raloxifene Aldehyde Oxidase Inhibitor 50 nM
Oxypurinol Xanthine Oxidase Inhibitor 100 pM
L-NMMA eNOS Inhibitor 300 pM
Maximum relaxation was measured twenty minutes post nitrite addition and
expressed as percentage o f the maximum constriction to phenylephrine. The twenty
minute time point is used to reflect total nitrite-induced relaxation, as vasorelaxation to
nitrite was observed to reach a sustained plateau and have had its maximum effect
within this time. When using pharmacological blockers, percentage inhibition is always
with respect to the appropriate control tissue/agent control as some inhibition agents
alter basal tone alone.

Chapter Four Nitrite Induced Vasorelaxation
4.2.2 Gene Expression Study
4.2.2.1 Sample Generation
To study the effects o f oxygen level and nitrite treatment upon the transcription
of specific genes, equal sized aortic rings were prepared and mounted in myograph
tissue baths as per the vascular reactivity studies. The phenylephrine conditioning phase
o f the vascular reactivity protocol was omitted and all experiments were carried out at
two grams o f resting tension. Each pair o f aortic rings were designated to one of four
treatment groups, those incubated in normoxia in the presence o f lOpM nitrite or saline
(0.9% w/v) and those exposed to hypoxia in the presence o f lOpM nitrite or saline
(0.9% w/v). All groups were exposed to the specific treatment (nitrite, saline, hypoxia or
normoxia) for thirty minutes before aortic rings were carefully demounted and rapidly
snap frozen in liquid nitrogen. Thirty minutes o f hypoxic exposure was chosen as it
corresponds to the vascular reactivity studies o f this chapter and an exposure o f this
duration has previously been shown to alter gene transcription in endothelial cells [406].
4.2.2.2 Total RNA Extraction
Samples were homogenised on ice in TRIzol® reagent (Invitrogen) to extract
and stabilise RNA from the sample. RNA was then purified from the homogenate using
a Purelink RNA mini kit (Invitrogen) according to the manufacturer’s instructions. Once
purified, the yield o f RNA was measured using a Nanodrop (Thermo Scientific)
spectrophotometer reading absorbance at 260nm, with RNA integrity assessed from the
ratio o f 260/280 nm absorbance ratio.
4.2.2.3 cDNA Generation
A cDNA library was constructed from RNA samples using a high capacity cDNA
reverse transcription kit (Applied Biosystems), after normalisation for initial sample

Chapter Four Nitrite Induced Vasorelaxation
RNA content. The thermocycling conditions utilised were 25°C for 10 mins, 37°C for
120 mins, 85°C for 5 mins samples were then maintained at 4°C before storage at -80°C.
4.2.2.4 Real Time Polymerase Chain Reaction Assay
COX-2 (cyclooxygenase-2), eNOS (endothelial nitric oxide synthase), GAPDH
(glyceraldehyde 3-phosphate dehydrogenase) and H IF -la (hypoxia inducible factor-1
alpha) mRNA expressions were all analysed on an Applied Biosystems 7500 real-time
polymerase chain reaction (PCR) system using platinum SYBR green qPCR supermix
UDG (Invitrogen). All rabbit primer sequences (table 4.2) were obtained from literature
[407-409] and were constructed by Sigma Aldrich. PCR conditions were 50°C for 2
mins, 95°C for 10 mins, 40 cycles for 15 s at 95°C and 1 min at 60°C, followed by a
melt curve (95°C for 15 s), ramp to 60°C for 1 min and 95°C for 20 s. Conditions were
taken from those optimised in the literature [407].
Estimates o f cDNA abundance were assessed from the portion o f the curve for which
the plot o f the log input amount versus the cycle threshold (Ct) differences resulted in a
slope o f approximately zero, which indicated that the amplicon efficiencies were
approximately equal. The relative quantification o f the target genes was calculated using
the formula 2‘AACT, in which ACt equals the difference between C j values for both target
gene and GAPDH.
Table 4.2. Specific polymerase chain reaction primer nucleiec acid sequences.
HIF-1 alpha sense GGATATAAATTTGGCAAT GCTT CCATHIF-1 alpha anti-sense G AGT GCAGGGT C AG CACT ACTT CGAPDH sense ACTTT GT GAAGCT CATTT CCTGGTAGAPDH anti-sense GT GGTTT GAGGGCT CTTACT CCTTCOX-2 sense GAGAT GAT CTACCCGCCT CACOX-2 anti-sense GATT CATAGGGCTT CAGCeNOS sense GCT GCGCCAGGCT CT CACCTT CeNOS anti-sense GGCT GCAGCCCTTT GCT CT CAA

Chapter Four Nitrite Induced Vasorelaxation
4.2.3 Statistical Analysis
Data was compared using a one way-ANOVA with a Bonferroni’s multiple
comparison post hoc test. All analysis was carried out using Graphpad Prism software
(version 4.0). n=l represents data averaged from a pair o f matched aortic rings in both
vascular reactivity and genetic studies. Data showing time course profiles were
compared statistically over the entire profile. The 20 minute time point was chosen for a
single time point comparison o f total relaxation induced.
- 148-

Chapter Four Nitrite Induced Vasorelaxation
4.3 Results
4.3.1 The Effect of Oxygen
To establish the effect o f oxygen upon vascular constriction in the
aforementioned aortic ring model, vessels were subjected to a phenylephrine
concentration response at both 95 and ~1% oxygen. Vessels constricted with
phenylephrine at 95% oxygen constricted to a maximum o f 8.21 grams, the tension in
these vessels did significantly decrease thereafter (over 2 0 minutes) by a mean value of
1.08 grams (Figure 4.1 A). Vessels constricted at ~1% oxygen also lost a significant
amount o f tension over the 2 0 minute investigation period with the mean loss in tension
(3.08 grams) considerably more than that observed at 95% oxygen (Figure 4 .IB). The
phenylephrine EC50 at 95% oxygen was significantly less from that at 1% oxygen
(P<0.002), indicating that a higher concentration o f phenylephrine is required to achieve
50% of the maximum effect at 1% oxygen.

Chapter Four Nitrite Induced Vasorelaxation
A
O w c3 *
3 O) 4H ■OLLICL
10-,9-8-
7-6-
5-
3-2-
1-
0- 10-8
95% O,
Maximum Constriction Tension 20 minutes Post Maximum
10 10*PE [log]
10 10*
B
T3C
UJCL
1% o1 0 -1
<nL_O)
10*
Maximum Constriction
Tension 20 minutes Post Maximum
PE [log]
Figure 4.1. Phenylephrine concentration response curves at maximum constriction and 20 minutes post
maximum constriction. A) Response at 95% oxygen, and EC50 at maximum, 8.21 ±0.10 grams and
133 ± 6.7 nM respectively, Rmax 20 minutes most maximum constriction 7.10 ± 0.11 grams. R ^
significantly different between maximum and 20 minutes post maximum (**P<0.01) B) Response at -1%
oxygen, R ^ and EC50 at maximum, 6.38 ± 0 .1 8 grams and 1560 ± 289.9 nM respectively, Rmax 20
minutes most maximum constriction 3.02 ± 0.19 grams. R ^ * significantly different between maximum
and 20 minutes post maximum (***P<0.001). EC50 at maximum is significantly different between 95%
oxygen and 1% oxygen (P=0.0023). (n=4 in all cases).
- 1 5 0 -

Chapter Four Nitrite Induced Vasorelaxation
Our laboratory has previously found that the responsiveness of vascular tissue in
this model to S-nitrosoglutathione (GSNO) is increased when the tissue is subjected to
hypoxic conditions [91]. To establish if the model would react in the same way to nitrite
exposure, nitrite vasorelaxation experiments were carried out at both 95 and 1% oxygen.
As is the case with GSNO, the same concentration of nitrite induced significantly more
vasorelaxation in hypoxic tissue compared to normoxic tissue (P<0.0001) (Figure 4.2).
11q10-
Nitrite
Normoxia (95% 0 2)o>
* * *
Hypoxia (1% 0 2)
0 10 20 30 40Time (minutes)
Figure 4.2. Raw trace o f nitrite induced vasorelaxation. Aortic rings were pre-constricted with
phenylephrine (1 xlO^M final at 95% and 3 x lO^M final at 1% oxygen) before addition of nitrite (lOpM
final). Nitrite induced significantly more relaxation in hypoxia (1% oxygen) versus normoxia (95%
oxygen) (***P<0.0001) (n=4).
4.3.2 Pharmacological Inhibitors
The two key inhibitors utilised within this chapter, ODQ and indomethacin were
subjected to concentration-effect testing to establish the appropriate concentration for
maximum effect (Figure 4.3). ODQ gave maximum effect at a final concentration of
10pM, incubation with higher concentrations reduced inhibition, possibly due to toxicity
at these elevated concentrations (Figure 4.3A). Indomethacin in the concentration range
of 1-1 OpM had a similar inhibitor effect (Figure 4.3B), therefore a concentration of 5pM
was chosen for experimentation.
- 151 -

Chapter Four Nitrite Induced Vasorelaxation
100-,
75-
o = °U ^ ^
5 | g 50-|jz S — e g £SS c 25-
J L
I
10
[ODQ] (uM)
B100-i
I 75-
I I I= i -c g £
S 50-
25-
0.1 0 .5 1a t
5 10
[Indomethacin] (uM)
Figure 4.3. % inhibition o f nitrite-induced vascular relaxation, an inhibitor concentration-effect analysis.
A) Inhibition by ODQ over a concentration range, a concentration of lOfiM ODQ gave maximum effect
(lpM versus IOjiM, **P<0.01). A concentration o f lOOfiM was found to have a reduced effect, most
likely due to toxicity. B) Inhibition by indomethacin over a concentration range. No significant difference
was found between the effects o f 1, 5 and lOfiM indomethacin, therefore 5pM was chosen for
experimental testing. (n=4 in all cases).
4.3.3 Downstream Mechanisms in Endothelial Denuded and Intact Vessels
To investigate the role of the endothelium in the downstream mechanisms of
nitrite-induced vasodilatation, both endothelium-intact and -denuded vessels were
assessed. Nitrite consistently induced significant relaxation in hypoxic blood vessels,
regardless of the presence or absence of endothelium (Figures 4.4A and 4.6A). It should
be noted that the time-course of this relaxation is minutes rather than seconds as is seen
with more potent nitric oxide donors, native nitric oxide or RBC-induced hypoxic
vasodilatations (see Chapter 5).
- 1 5 2 -

Chapter Four Nitrite Induced Vasorelaxation
4.3.3.1 Endothelium Denuded Vessels
In vessels that are denuded o f endothelium, ODQ (lOpM) blockade of soluble
guanylate cyclase completely inhibited the nitrite induced relaxation (PO.OOOl,
comparison of entire profile versus appropriate control) (Figure 4.4C). This result was
unaffected by the addition indomethacin (5pM) (PO.OOOl, comparison of entire profile
versus appropriate control) (Figure 4.4D). Incubation with indomethacin alone had no
inhibitory effect upon the nitrite-induced vasodilatation (Figure 4.4B).
-Q-Control - a - Nitrite o Control
-a Nitrite-9 - Indomethacin +
Nitrite
C D10090
80
70
60
50
40
30
2010
c31
5 uj K a.SA8o
Time (min)
100i
90
80
70
60
50
40
30
^ C o n tro l a Nitrite
J -e-O D Q ♦ Nitrite
I*u/ za.
8? 10
0 2 4 6 8 10 12 14 16 18 20
Figure 4.4. 20 minute relaxation profiles o f endothelium denuded aortic rings. A) Nitrite (lOfiM) produces
a marked relaxation compared to control (***P<0.001). B) No inhibition o f nitrite induced relaxation by
Indomethacin (5pM). C) Complete inhibition o f nitrite induced relaxation by ODQ (lOpM) (***P<0.001)
compared to Nitrite alone. D) Complete inhibition o f nitrite induced relaxation by indomethacin (5pM)
and ODQ (lOpM) in combination (***P<0.001) compared to Nitrite alone. (n=5 in all cases).
- 1 5 3 -

Chapter Four Nitrite Induced Vasorelaxation
To simplfy comparisons between groups, the twenty minute time point was chosen, with
maximum response to nitrite typically occurring within this time. A comparison at the
twenty minute time point in endothelium denuded vessels (Figure 4.5) confirms the
findings observed over the entire relaxation profile, with ODQ incubation completely
inhibiting the response to nitrite.
co'505Xjoo
10<h **** * *
■ooo3■oC
lu £ a. S
75-
*■2 3.8O
25-
Figure 4.5. Maximum relaxation induced by nitrite at the 20 minute time point in endothelium denuded
aortic rings. Nitrite produces a marked relaxation compared to control (***P<0.001) which is completely
inhibited ODQ (lOpM) (***P<0.001) compared to Nitrite alone. Indomethacin produced no inhibition in
denuded vessels. (n=5 in all cases).
- 1 5 4 -

iu mu lit i igu it 11 u it p iu iiita u i vasuuiicuauuii aic muuicu 111 m u it uciaii, &um<
interesting dynamics can be observed. The inhibition by ODQ appears to be havinj
maximum effect during the first six minutes, before gradually declining (Figure 4.6C)
Conversely, inhibition by indomethacin appears to be continual throughout (Figun
4.6B). Regardless o f these dynamics, when used in combination, the two agents produc<
complete inhibition throughout (Figure 4.6D).
Interestingly, the use o f COX inhibition in combination with a nitric oxid
scavenger also completely inhibited the response (Figure 4.8). Utilising a prostacyclii
synthase inhibitor (PGISi) (that in itself altered baseline tension) we were able t
demonstrate that prostacyclin was not responsible for the COX-mediated effects (Figur
4.8).
- 155-

Chapter Four Nitrite Induced Vasorelaxation
-■-ControlNitrite
6 8 10 12 14 16 18 20T im e (m in)
B
D
fi ID
-■-Control -*- Nitrite-■-Indomethacin + Nitrite
Time (min)
-•-C ontro l - e - Nitrite -•-Indom ethacin
+ ODQ + Nitrite
Time (min)
-•-Control -* -Nitrite -♦-ODQ + Nitrite
Figure 4.6. 20 minute relaxation profiles of endothelium intact aortic rings. A) Nitrite (lOpM) produces a
marked relaxation compared to control (***P<0.001). B) Partial inhibition o f nitrite induced relaxation by
Indomethacin (5pM). (***P<0.001) significantly different from nitrite alone over the course of the profile
C) Substantial inhibition o f nitrite induced relaxation by ODQ (lOpM) (***P<0.001) compared to nitrite
alone. D) Complete inhibition o f nitrite induced relaxation by indomethacin (5|iM) and ODQ (10p.M) in
combination (***P<0.001) compared to Nitrite alone. ODQ relaxation is significantly different from
indomethacin and ODQ in combination (PO.OOl). (n=5 in all cases).
At the twenty minute time point, nitrite-induced relaxation is partially inhibited by
indomethacin, although the result is not significant (Figure 4.7). ODQ does produce a
significant inhibition (PO.OOl). However, it does not generate the complete inhibition
seen in endothelium-denuded vessels (Figure 4.5). When both ODQ and indomethacin
are used in combination, a complete inhibition of nitrite-induced vasodilatation is
observed after twenty minutes.
- 1 5 6 -

Chapter Four Nitrite Induced Vasorelaxation
100-
^ ^? * „ * „*/ ^ ,*
o f f
S
Figure 4.7. Maximum relaxation induced by nitrite (lOfiM) at the 20 minute time point in endothelium
intact aortic rings. Nitrite produces a marked relaxation compared to control (***P<0.001) which is
inhibited in part by both indomethacin (5pM) and ODQ (IOjiM) (P<0.01) respectively and completely
inhibited by indomethacin (5fiM) and ODQ (lOpM) in combination (***P<0.001) compared to Nitrite
alone. (n=5 in all cases).
4.3.3.3 Nitric Oxide Dependency and Sources of Nitrite Reduction
In light o f previous research, it is likely that nitric oxide could represent a
significant intermediate in the downstream actions o f nitrite. Utilising a nitric oxide
specific scavenger, (CPTIO), the relative contribution o f nitric oxide was assessed. In
endothelium intact vessels, the actions o f nitrite did not appear to be solely dependent
upon its reduction back to nitric oxide, incubation with CPTIO was capable of
abolishing the nitrite-induced vascular response in part, but not completely (Figure 4.8).
Interestingly, inhibition o f soluble guanylate cyclase in combination with a nitric oxide
specific scavenger was capable o f increased inhibition compared to the individual agents
alone, but was not able to produce a full inhibition (Figure 4.8).

Chapter Four Nitrite Induced Vasorelaxation
Given that nitric oxide clearly plays a significant role in the mechanism of
nitrite-induced vasorelaxation, sources of nitrite reduction were examined. Three tissue
based enzymes, xanthine oxidase, aldehyde oxidase and nitric oxide synthase were
considered, using specific pharmacological inhibitors. Aldehyde oxidase was found to
be responsible for a significant amount of nitrite reduction, while inhibition of xanthine
oxidase and nitric oxide synthase fail to have an effect (Figure 4.8). Interestingly, L-
NMMA did not appear to alter the basal hypoxia induced relaxation in control tissue
(data not shown).
a>~ c £ .2 Z rc*4—o JS c ®o5 "o 5 8-C Dc ~o — c^ “
100-
90-80-70^60-50-40-30-20-10-
0 fA X
^ vO
.Ct A®
? X w -v ~ ov
Figure 4.8. % inhibition o f nitrite vasorelaxation in endothelial intact vessels. Inhibitor concentrations
used, ODQ 10(iM, CPTIO ImM, Raloxifene 50nM, Oxypurinol lOOpM, PGI synthase inhibitor lOpM, L-
NMMA 300pM. (n=4 or 5).
- 1 5 8 -

Chapter Four Nitrite Induced Vasorelaxation
4.3.4 The Effect of Acute Hypoxia/Nitrite Exposure upon Gene Expression
To investigate the wider actions o f nitrite in the acute exposure setting, the effect o f
nitrite upon the expression o f specific genes was assessed in normoxia and hypoxia. A
thirty minute exposure to hypoxia increased relative expression levels of both HIF-1 a
and COX-2 (P<0.001) (Figure 4.9A and B). The expression of COX-2 was inhibited by
nitrite in both normoxia and hypoxia, however, the study was not powered to confirm
this statistically. The acute exposure to nitrite and a change in oxygen level did not alter
the expression o f endothelial nitric oxide synthase (Figure 4.9C).
- 159-

Chapter Four Nitrite Induced Vasorelaxation
X 9.u s9- TO <© 0£ o c o O
£ 1
is*
—r £ £ aj ?
eN O S
Figure 4.9. The effect o f acute nitrite exposure upon specific gene expression. A) HIF-1 a expression
levels, exposure to hypoxia increases expression o f HIF-1 a , however the increase is not statistically
significant. B) COX-2 expression levels, exposure to hypoxia significantly increased expression of COX-
2 in the hypoxic control group (PO.OOl versus normoxia nitrite and normoxia control groups) but not in
the hypoxia nitrite group. C) eNOS expression levels, no significant changes in expression between
groups. n=4 in all cases.
- 1 6 0 -

Chapter Four Nitrite Induced Vasorelaxation
4.4 Discussion
Nitrite is capable o f exerting direct vasodilatory effects that are enhanced in the
hypoxic vessel setting. An enhancement in activity of other nitric oxide donors under
hypoxic conditions has previously been reported [91], however the mechanism behind
the observed difference is unknown. It is possible that soluble guanylate cyclase (sGC)
is more responsive to the same nitric oxide stimulus in hypoxia or that down stream
signalling is perhaps more sensitive. In this respect, an experiment involving the
measurement o f cGMP production over a range o f oxygen tensions after stimulation
with known sGC activators could provide important information. The increased activity
o f nitrite in hypoxia represents an interesting and potentially exploitable aspect o f its
pharmacology, consequently, insight into the mechanistic background o f this
pharmacology is therefore o f great value.
It has long been assumed that the vascular actions o f nitrite in hypoxia were
reliant upon the formation o f nitric oxide as an intermediate, with stimulation o f the
classic downstream pathways. This chapter is the first to provide evidence that nitrite
(under hypoxic conditions at physiological pH) is also capable o f exerting physiological
effects independently o f a free nitric oxide intermediate and via the operation o f multiple
signalling pathways.
4.4.1 Component Pathways
The signalling pathways that are stimulated by nitrite in hypoxic vessels appear
to be dependent upon the cell types present in the vessel. In endothelium denuded
vessels, the actions o f nitrite are largely, if not completely mediated via a mechanism
involving sGC. In contrast, despite the same level o f overall vasodilatory response to
nitrite, the actions of nitrite in endothelium intact vessels are mediated via multiple
pathways. In these vessels, nitrite at a pharmacological concentration operates via two
distinct pathways, one controlled by nitric oxide/sGC and the other through COX,
- 161 -

Chapter Four Nitrite Induced Vasorelaxation
although the effect appears to be predominantly signalled through the former. Figure
4.10 depicts a summary o f the potential signalling mechanisms involved.
Raloxifene
VESSELDILATATION
DENUDEDINTACT
Raloxifene ODQ'770
NONO
VESSELDILATATION sGC
COX *— 8 — Indomethacinit e/luct
SMOOTHM USCLE
ENDOTHELIUM
Figure 4.10. Potential pathways that control the nitrite mediated relaxation of hypoxic vessels. Upper
section of diagram depicts denuded tissue where sGC appears to predominantly control relaxation. Lower
section of diagram attempts to show possible pathways in endothelium intact vessels.
Having found that the COX pathway appears to operate independently o f nitric
oxide as an intermediate, this interesting aspect o f the signalling was investigated
further. COX is known to be essential for the generation o f prostacyclin, a key COX
product responsible for vasodilatation in the control o f vessel tone (see section 1.7.2.4,
page 38). To explore the relative contribution o f prostacyclin as opposed other COX-
derived eicosanoids, prostacyclin synthase, which occurs distally to COX in the
prostaglandin biosynthetic pathway, was inhibited using a specific agent. Inhibition o f
- 1 6 2 -

Chapter Four Nitrite Induced Vasorelaxation
prostacyclin synthase did alter the vessel baseline tension, but failed to show an effect
upon the nitrite-induced hypoxic vasodilatation. This suggests either a possible role for
other COX-derived eicosanoids such as PGE2, also known to cause vasodilatation [410]
or an enzymatic function o f COX, possible involving the haem component o f the
enzyme, which could convert nitrite to an alterative bioactive nitrogen species. In
relation, endothelial COX has been demonstrated to be capable o f free radical species
generation under hypoxic conditions [411]. Given that some COX products are
vasoconstrictors, it is also possible that nitrite may have a negative effect upon COX
that could cause an inhibition o f constriction, as opposed to an enhancement o f
relaxation. Previous studies that have investigated nitrite vasodilatation have failed to
recognize these differential signalling pathways, principally due to the pre-incubation o f
tissue with indomethacin and nitric oxide synthase inhibitors [396].
Although the nitrite-induced vasodilatation requires twenty minutes to reach
completion, it is interesting to note the differences in profile between inhibition o f sGC
and COX over the full time course. The inhibition o f COX by indomethacin appears to
be uniform throughout the profile, whereas sGC inhibition (with ODQ) is appreciable in
the first part o f the profile, but appears to tail o ff over the twenty minute period. It is
possible that a sGC mediated mechanism takes precedence during the initial part o f the
nitrite response, especially given the longevity o f nitric oxide which is most likely the
source o f activation. The constant inhibition produced by COX inhibition is more
suggestive o f nitrite having a negative effect upon constriction as opposed to a positive
effect upon relaxation. It would seem that these pathways could be mutually exclusive,
however crosstalk between them cannot be ruled out. It has been demonstrated that
nitric oxide can regulate COX, both increasing activity via a cGMP independent
mechanism [170] or inhibiting activity. The effect o f nitric oxide upon COX is also
thought to be dependent upon the COX isoform in question, i.e. differential effects are
observed with COX-1 compared to COX-2 [412]. In terms o f these two nitrite
stimulated pathways, it is important to remember that inhibition o f one may simply
cause up-regulation o f another, making the relative contribution o f each difficult to
estimate. This difference in profile also reinforces the idea that nitrite may operate via

Chapter Four Nitrite Induced Vasorelaxation
pathways that are separate both physically and with respect to time. However,
irrespective o f the different inhibition profiles, the combination o f sGC and COX
inhibition abolished the response to nitrite throughout the entire profile.
4.4.2 Nitric Oxide Dependency
Inhibition o f sGC or nitric oxide scavenging (using CPTIO), individually or in
combination, was not able to abolish the vascular response to nitrite in hypoxia.
However, the combination o f the two agents was additive, but the results did display
more variability when compared to other agents. CPTIO is a competitive nitric oxide
scavenger, therefore it is possible that some o f the nitric oxide generated may not be
scavenged. This nitric oxide does not appear to be acting through sGC and would need
to be generated in very close proximity to the enzyme it activates. This idea could fit a
model in which an enzyme acts as a source o f nitrite reduction and is simultaneously
stimulated by the generated nitric oxide. This mechanism could be operational in the
case o f COX, for example, where the haem group o f the enzyme could both reduce
nitrite and bind nitric oxide. It has been suggested that nitrite may be capable o f
generating species such as nitrosylated products without the requirement for free nitric
oxide as an intermediate [393]. It is possible that these products may be responsible, in
part, for the actions of nitrite in the ex vivo tissue model o f this chapter, interestingly, the
data would suggest that these products operate through or are generated by a COX
mediated mechanism.
4.4.3 Sources of NO2' Reduction
In spite o f the presence o f different mechanistic pathways, nitric oxide is the
signalling intermediate that appears to be largely responsible for the vascular actions o f
nitrite. Nitrite must be reduced to produce nitrite oxide and this process can occur via
several routes in a biological setting, most notably via enzymatic reduction.
Haemoglobin has been touted as an important nitrite reductase in the in vivo setting (see
section 1 . 1 0 . 2 (page 6 8 ) and chapter 6 ), however the current chapter is concerned with
- 164-

?
Chapter Four Nitrite Induced Vasorelaxation
the direct actions o f nitrite in vascular tissue and those mechanisms that are independent
o f haemoglobin.
The importance o f tissue-based oxidoreductase enzymes in the vascular actions
o f nitrite has recently become apparent, with both xanthine oxidase and aldehyde
oxidase being identified as key reductive enzymes [397]. For normal function, these
oxidoreductase enzymes rely upon the presence o f oxygen. In hypoxia, these enzymes
are capable of reducing alternative substrates such as nitrite [397]. The results o f this
chapter confirm the involvement o f aldehyde oxidase in nitrite-induced hypoxic
vasodilatation, but fail to show a dependence upon xanthine oxidase. This is in
agreement with published reports, showing a more significant role for aldehyde oxidase
in nitrite reduction to nitric oxide at a tissue level [397]. However, a reductase role for
xanthine oxidase cannot be completely discounted because although oxypurinol blocks
the molybdenum site, the flavin site o f the enzyme remains free and could be
functionally active [413]. Other studies have suggested that endothelial nitric oxide
synthase may also function as a reductase [398], however, the results o f this chapter do
not demonstrate a role for the enzyme in nitrite reduction. As is potentially the case with
COX, it is possible that sGC may be acting as both a nitrite reductase and be stimulated
by the subsequently produced nitric oxide. In respect to this point Alzawahra et al have
shown that ODQ prevents the reduction o f nitrite in vascular tissue, suggesting that sGC
could behave as a potential reductase [400].
4.4.4 Vascular Gene Expression
In addition to its effects as a vasodilator, the results o f this chapter demonstrate that
nitrite has additional biological effects at the gene expression level. When aortic tissue
was acutely exposed to hypoxia, the expected increase in H IF -la expression level was
observed (see section 1.2.1.4, page 5). However, the result did not reach statistical
significance, which, could be attributable to the short hypoxic exposure time and the
requirement for repeated testing. Interestingly, hypoxic exposure also resulted in a
significant increase in COX-2 expression, which was blunted by the simultaneous
- 165-

Chapter Four Nitrite Induced Vasorelaxation
exposure to nitrite. However, because the study was under powered the effect o f nitrite
was not found to be significantly different. Nitrite was also able to cause a degree o f
inhibition on COX-2 expression under normoxic conditions, supporting the result
observed in hypoxia.
Hypoxic exposure has previously been demonstrated to increase the expression
o f COX-2 in arterial smooth muscle cells [414]. Although, the effects o f nitrite upon
COX-2 expression have not previously been studied, studies with nitric oxide suggest
that nitric oxide augments, rather than inhibits COX-2 expression [415]. This would
suggest that the inhibitory effects o f nitrite upon COX-2 expression observed here do
not operate via a nitric oxide intermediate or that the aortic tissue utilised in this chapter
responds differently to those previously studied. The majority o f studies have focussed
on gene regulation in inflammatory cells, rather than vascular cells, which are stimulated
with nitric oxide at considerably higher concentrations than those that could be achieved
with the concentration o f nitrite used here. It is therefore possible that the effects of
acute, lower nitrite concentrations on certain gene expression, may differ from those
seen when relatively higher concentration o f nitric oxide donors are utilised.
COX-2 is generally thought to be involved in processes that are pro-
inflammatory [416]. The results presented here would suggest that nitrite could be
acting as an anti-inflammatory agent in the hypoxic vasculature. This effect o f nitrite
would complement its actions as a vasodilator and anti-platelet agent [417], thereby
enhancing its actions as an anti-inflammatory agent.
The final gene studied was endothelial nitric oxide synthase (eNOS). The thirty
minute exposure to both hypoxia and/or nitrite did not significantly alter expression
levels within aortic tissue measured. Previous studies have found that hypoxic exposure
can increase eNOS mRNA expression in human umbilical vein endothelial cells
(HUVECs). However, the hypoxic stimulus utilised was more chronic [418] than the
one used here. It should also be remembered that the tissue sampled in the current model

Chapter Four Nitrite Induced Vasorelaxation
was taken from the complete vessel and therefore, contained both smooth muscle and
endothelial cells, with the former being the most abundant tissue present.
It is possible that nitrite may have the potential to protect hypoxic tissue areas
via a number o f mechanisms, above and beyond a simple increase in blood flow.
Although the changes observed in gene expression are unlikely to have significant
effects at a protein level during this acute exposure, the results o f this study do suggest
that even a short term exposure to increased nitrite levels, particularly in hypoxia, could
impact upon the vasculature in the long term.
4.4.5 Implications for in vivo Conditions
The findings o f this chapter are directly applicable to conditions in which plasma
nitrite is elevated pharmacologically or by diet. A common misconception in the
literature is the extrapolation from studies that are performed by infusing nitrite at
elevated doses to nitrite as a circulating store o f nitric oxide under basal physiological
conditions (200-400 nM nitrite). It must be recognised, therefore, that the component
mechanisms o f nitrite-induced relaxation at higher doses may not be operational at
normal levels, and this is difficult to confirm in vitro and in vivo largely because o f
assay limitations. Given the interest in nitrite as a therapeutic agent, the mechanistic
findings o f this chapter are o f importance. The experimental model utilised is
haemoglobin independent and demonstrates that nitrite alone directly induces vessel
relaxation. However, these results cannot discount a role for deoxyhaemoglobin in vivo;
indeed, it is possible that blood-borne nitric oxide species derived from nitrite during an
infusion could contribute to the modulation o f long-term vessel tone [310].
Although a relatively weak vasodilator compared to pharmacological
nitrodilators, the fact that nitrite clearly dilates hypoxic vessels preferentially implies it
could act as a targeted vasodilator without causing global changes in haemodynamics
(e.g. the fall in blood pressure seen with nitrodilators). The results o f this chapter
provide novel findings regarding the vasodilator mechanisms o f nitrite that now need to

Chapter Four Nitrite Induced Vasorelaxation
be confirmed in vivo following nitrite infusion. It is clear that nitrite has the potential to
alter vessel tone, however the fact that it can also alter signalling at a genetic level after
an acute exposure suggests it may have the potential to impact on the overall health o f
the vessel in addition to affecting vascular tone.
- 168-

Chapter Four Nitrite Induced Vasorelaxation
4.5 Summary and Conclusions
The results o f this chapter demonstrate that nitrite has a varied and complex
pharmacology, with the ability to influence vascular physiology via different
mechanisms and within different time frames. The effects o f nitrite are clearly oxygen
dependent, hypoxia appears to increase both the activation o f nitrite but also the
sensitivity o f vascular tissue to the nitrite derived products that are formed. Specifically
this chapter has demonstrated that:
• The vasodilatory properties o f nitrite are enhanced in hypoxic vascular tissue
• Nitrite-mediated relaxation proceeds via different mechanisms depending upon
the presence or absence of endothelium. In denuded vessels, a soluble guanylate
cyclase-mediated mechanism prevails, while in intact vessels this mechanism is
complemented by an alternative mechanism operating via cyclooxygenase.
• The actions o f nitrite are in part mediated via a nitric oxide intermediate. To
form nitric oxide, nitrite must be reduced and the current model would suggest
that the enzyme, aldehyde oxidase is primarily responsible.
• An acute exposure to hypoxia is capable of altering gene expression.
Specifically, nitrite has the potential to able to inhibit the hypoxia induced
increase in COX-2 expression but requires further investigation.
- 169-

Chapter Five Erythrocyte Induced Vasorelaxation
5 Erythrocyte Induced Vasorelaxation: the Influence of Oxygen
5.1 Introduction
The phenomenon of whole erythrocytes producing vasorelaxation under hypoxic
conditions represents an interesting field o f research that has been investigated for a
number o f years, but the vasorelaxant species and mechanism behind its actions are yet
to be confirmed. Over this time, a number o f different mechanistic theories to explain
this phenomenon have been published and the area still represents a matter o f
contention. A background to the three most prominent suggestions and current
understanding will be covered below.
5.1.1 The HbSNO Theory
The Stamler group had previously demonstrated the vasoactive properties o f
nitric oxide groups attached to proteins via cysteine residues e.g. albumin-SNO [266,
324]. The freely reactive nature o f the cysteine residue in the 93 position o f the 13-
haemoglobin chain (not compromised by steric hindrance) and the fact that its reactivity
was modulated by haemoglobin allostery had been known for nearly 5 decades [330,
419]. However, it was not until 1996 that the Stamler laboratory suggested that nitric
oxide bound to the p93 cysteine residue of haemoglobin may act as a functional
regulator of vessel tone and oxygen delivery [325]. The finding that arterial to venous
gradients in HbSNO and HbNO levels existed, gave rise to a novel mechanism for
HbSNO cycling [332]. Stamler et al proposed that nitric oxide that reacted with partially
oxygenated haemoglobin (forming HbNO) in the venous circuit was displaced upon re
oxygenation in the lung where it was likely to react with proximity thiols, forming
HbSNO. In the tissue, the reverse process is thought to occur, as haemoglobin is
deoxygenated, nitric oxide from HbSNO (thought to be less stable on T-state
haemoglobin [420]) is released. The released nitric oxide is believed to leave the
- 170-

Chapter Five Erythrocyte Induced Vasorelaxation
erythrocyte through a series o f transnitrosation reactions, passing from one protein to
another, AE1 is thought to represent the principal protein involved [331]. AE1 contains
available cysteine residues and is located perfectly in the membrane to interact with
extracellular proteins and with haemoglobin through an intracellular binding site. Given
that deoxyhaemoglobin is know to preferentially bind AE1 [387] it suggests that nitric
oxide from HbSNO could transnitrosate residues o f AE1 upon deoxygenation. This
transfer method would protect nitric oxide from being re-captured by haemoglobin,
allowing it to not only leave that individual erythrocyte but to also preserve nitric oxide
bioactivity in blood. In support o f this mechanism, a number o f publications have shown
extracellular thiols to potentiate erythrocyte induced relaxation [325, 421]. In addition,
the Doctor laboratory have also demonstrated that when isolated erythrocytes are
deoxygenated in the presence o f extracellular N-acetylcysteine (NAC), NAC-SNO
levels increase in proportion to desaturation [422].
In contrast, there is also evidence which disputes a role for HbSNO in
erythrocyte-mediated vasorelaxation. The first publication relates to the formation of
HbSNO, suggesting that oxygenation o f partially nitrosylated haemoglobin (HbNO)
does not alter HbNO levels and so cannot be forming HbSNO [423]. However, this data
only disagrees with the HbSNO cycle theory and does not exclude a role for HbSNO in
the regulation o f vascular tone. Perhaps the most significant evidence to date was that
published by the Patel laboratory using a p-cysteine 93 amino acid substituted mouse
model [424]. The data demonstrate that erythrocytes from mice producing human
haemoglobin with the P-cysteine 93 substituted for an alanine residue can still induce a
hypoxic vasodilatation. This publication also shows that the vasorelaxant response to
erythrocytes, both native and alanine mutants, can be inhibited with L-NMMA (eNOS
inhibitor). However, there are a number o f caveats to this work. Despite substitution of
the P-cysteine 93 residue, the overall erythrocyte SNO content remained unchanged,
suggesting that other nitrosothiols (e.g. GSNO or membrane RSNOs) could still be
responsible for the observed vasoactivity. The investigators also utilise an exercise stress
test to investigate their mouse model. In this respect it should be appreciated that
exercise per se is not a model o f hypoxia, in exercise the increased oxygen demand of
- 171 -

t v « |/v k /v \» w n ^ | / v / \ m i . v . i t vuiiouit/id nidi^au ui uuauiig
Although, the relationship between HbSNO content and haemoglob
conformation [363] and the necessity o f low tissue oxygenation for erythrocy
vasodilatation [331] have been shown, the role o f haemoglobin conformation in tl
release o f a vasoactive moiety has not been fully explored.
5.1.2 The Haemoglobin Nitrite Reduction Theory
The second proposed mechanism involves the reduction of nitrite b
haemoglobin under hypoxic conditions. There have been a number of publications
this area, largely from the Gladwin and Patel laboratories [337, 342, 426], all of whic
essentially propose the same mechanism. Early publications demonstrate that tl
relaxant properties o f nitrite are enhanced in the presence of erythrocytes <
haemoglobin and that deoxygenation o f haemoglobin enhances its ability to reduc
nitrite to free nitric oxide [337]. However, the demonstration o f enhanced relaxation b
erythrocytes and nitrite in combination, reported in the original work by Cosby et al,
yet to be repeated. As time has passed, more recent research papers from this grou
paint a slightly different picture. Firstly, published results do not show an enhancemei
by haemoglobin but rather a lack o f inhibition (haemoglobin usually scavenging nitri
oxide to inhibit relaxation rather than augmenting it), with relaxation identical und<
hypoxia regardless o f the presence o f haemoglobin [426]. Secondly, later publicatior
have completely shifted the focus away from in vitro vessel work and have been largel
based around speculative in vivo mechanisms, where haemoglobin is thought to a<
maximally as a nitrite reductase around the p50 of haemoglobin, see section 1.10.
(page 68). As a suggested mechanism o f erythrocyte-induced hypoxic relaxation, th
nitrite reduction theory remains heavily questioned, especially given that nitrite-derive
- 172-

Chapter Five Erythrocyte Induced Vasorelaxation
relaxations occur over a much longer time frame than the transient relaxation observed
from native erythrocytes (minutes vs. seconds) and th a t free nitric oxide is unlikely to
escape re-capture by haemoglobin [343]. Several m echanism s for the escape of free
nitric oxide (produced from haemoglobin nitrite reduction) from the erythrocyte have
been put forward, including the suggestion that intermediates such as dinitrogen trioxide
(N2O3) could form SNO compounds [424, 427] or as a result o f changes in haemoglobin
reactivity/membrane association [428].
One idea that has linked elements o f this hypothesis to the HbSNO hypothesis is
the observation that haemoglobin can act as an H bSN O synthase, utilising nitrite as a
substrate [310]. However, although it is feasible that th is may occur in the circulation
where haemoglobin allostery is constantly changing, it is unlikely to work in an isolated
system and still ultimately suggests that an SNO is responsible.
5.1.3 The Adenosine Triphosphate Theory
The final mechanism is one that involves adenosine triphosphate (ATP) and,
despite receiving less attention than the previously described mechanisms, is the longest
standing of the three. It was initially shown by B ergfeld and Forrester that, under
hypoxia/hypercapnia, erythrocytes would release A TP [429]. Dietrich et al developed
this observation into a mechanism in which erythrocytes are thought to act as oxygen
sensors and affect vessel tone to meet oxygen dem and [430]. It is believed that when
erythrocytes encounter an area o f low oxygen, they o f f load both oxygen and ATP. The
ATP is then thought to stimulate P2Y receptors on th e endothelium and stimulate the
production o f nitric oxide and prostacyclin [431]. The theory has been tested in isolated
vessel perfusion models, where it was found that w h en erythrocytes were introduced
into hypoxic vessels, both changes in vessel d iam eter and increases in ATP were
observed [432, 433].
While it is plausible that this mechanism co u ld play a role in vivo, there is
evidence that does not support it as a mechanism o f erythrocyte-induced hypoxic
- 173-

Chapter Five Erythrocyte Induced Vasorelaxation
vasodilatation. Principally, it would seem that this mechanism is reliant upon the
endothelium to produce vasorelaxant substances and the erythrocyte mediated
vasodilatation is known to proceed in the absence of endothelium/nitric oxide synthase
[421].
5.1.4 Current Understanding
Although the exact identity o f the vasorelaxant released from erythrocytes and
the mechanism by which it is released remain to be elucidated, there are a number of
known observations (many published from our laboratory) that should be considered
with respect to the results o f this chapter. They are:
• Low tissue oxygenation appears to be essential for erythrocyte induced
vasorelaxation [331].
• Erythrocyte addition to hypoxic tissue produces a transient relaxation that is
followed by a constriction [91].
• The mechanism o f vasorelaxation is mediated via soluble guanylate cyclase and
is inhibited by ODQ [91, 421].
• The vasodilatation mechanism is independent of both the endothelium and nitric
oxide synthases, demonstrated by denudation and the use of L-NMMA/genetic
elimination [91, 421].
• The vasorelaxant response o f erythrocytes from diabetic patients is impaired,
most likely due to haemoglobin glycation [91].
- 174-

Chapter Five Erythrocyte Induced Vasorelaxation
5.1.5 Aims
The true identity o f the vasorelaxant released from erythrocytes remains unknown,
however, investigating the mechanisms which govern its movement and release could be
essential in identifying the molecule responsible. The work of this chapter was
undertaken to perform these investigations and specifically aimed to:
• Assess the haemoglobin allostery dependence of the erythrocyte mediated
hypoxic vasorelaxation.
• Gain understanding with regard to the transport and consumption of the relaxant
entity.
• Consider novel vasorelaxant species that may be responsible.
• Provide evidence that may aid in identifying the exact nature of the relaxant
entity.
- 175-

Chapter Five Erythrocyte Induced Vasorelaxation
5.2 Specific Protocols
5.2.1 Myography
The myography system was set up daily as per section 2.5 (page 104). All
erythrocyte experiments were carried out under the hypoxic protocol at ~1% oxygen
(see section 2.5.2, page 105). To induce relaxation, 20pl of prepared erythrocytes were
injected into the bath at peak constriction using gel loading pipette tips for efficient
delivery.
5.2.2 Blood Preparation
For all protocols, fresh blood samples were collected by venepucture of the
antecubital vein from healthy subjects immediately prior to requirement. Samples were
centrifuged (1200g, 5mins, 4°C) and the plasma and buffy coat were removed as per
section 2.1 (page 80).
5.2.3 Erythrocyte Manipulation
Erythrocytes were diluted (approx. 1 in 10 to give 3g/dL haemoglobin) in
isotonic saline (0.9% w/v, Fresenius Kabi) before loading into the thin film rotating
tonometer (Section 2.2, page 81). Different gas mixtures were then utilised to obtain
samples over a range o f haemoglobin oxygen saturations for subsequent testing. A sub
group of samples were subjected to oxygen cycling to assess the effect o f repeat
oxygenation on relaxation (protocol shown in Figure 5.1). To identify whether the
vasorelaxant moiety was simply passed between the erythrocyte and the extracellular
milieu upon de-oxygenation and re-oxygenation, erythrocyte samples taken to low
saturation had the extracellular milieu removed prior to re-oxygenation by repeated
washing with fresh oxygenated saline, saturation and haemoglobin content were then
reconfirmed (Figure 5.1). All blood gas analysis was carried out using a blood gas
- 1 7 6 -

Chapter Five Erythrocyte Induced Vasorelaxation
analyser (OSM 3 Hemoximer, Radiometer, Copenhagen). All samples underwent a final
centrifugation step to remove saline before addition to the tissue bath.
Gassed with 95% 0 2
R BC sinsolution
Gassed with 95% No
Gassed with 95% 0 2
- 100%Saturated,Sampletaken
- 20%Saturated,Samplestaken
RBCs washed in oxygenated saline
-100% saturated, re-oxygenated sample
-100% saturated, washed and reoxygenated sample
Figure 5.1. A schematic representation o f erythrocyte haemoglobin oxygen saturation cycling and the
samples generated for vasoactivity assessment.
5.2.4 2,3-DPG
2,3-Diphosphoglycerate (2,3-DPG or 2,3-BPG) is an organic phosphate
intermediate formed during glycolysis. The intraerythrocytic 2,3-DPG concentration is
approximately equal to the molar concentration o f tetrameric haemoglobin (5mM)[83],
although the amount o f free 2,3-DPG is dependent on haemoglobin saturation and can
fall as low as 0.5mM in deoxygenated erythrocytes [84]. To assess the effect o f 2,3-
DPG on the erythrocyte mediated hypoxic dilatation, 2,3-DPG was added to the bath
(prior to commencing the hypoxic protocol) at a final concentration of 20pM, equimolar
to the final haemoglobin concentration upon erythrocyte addition to the bath (average
haemoglobin concentration =32.73g/dl ± 0.79 equivalent to 20.2pM haemoglobin in
bath concentration), mimicking the in vivo ratio. In contrast to previous experiments, the
erythrocyte samples were lysed before addition to allow 2,3-DPG to interact with the
haemoglobin (confirmed by centrifugation). All erythrocyte samples were adjusted to
-100% haemoglobin saturation before addition to the bath.
- 1 7 7 -

Chapter Five Erythrocyte Induced Vasorelaxation
5.2.5 Carbon Monoxide
An initial assessment o f the vasorelaxant properties o f carbon monoxide (CO) in
hypoxia and normoxia was made using the carbon monoxide releasing molecule,
CORM-A1 (Na2[H3BC02], 11/2 = 21 minutes, [434]), a kind gift from Dr Roberto
Motterlini, Northwick Park Institute for Medical Research, London. CORM-A1 was
added to the appropriate tissue baths (not in the presence o f erythrocytes) at a final
concentration o f 1 OOpM, although this concentration appears relatively high, it
compensates for CORM-A1 being a relatively slow CO releasing molecule. Maximum
relaxation in this experiment was recorded at the 5 minute time point.
To investigate the role o f carboxyhaemoglobin (HbCO), erythrocytes were
loaded into the thin film rotation tonometer as previously described (section 2.2, page
81), deoxygenated to desired level and exposed to a 90% carbon monoxide gas mixture
to achieve a range o f haemoglobin carbon monoxide saturation levels. Vasoreactivity of
erythrocyte samples was then evaluated as per section 5.2.1 (page 176).
5.2.6 Oxygen
In addition to nitric oxide and carbon monoxide, oxygen is also a diatomic gas
that could interact in a similar way with tissue and can also be bound to haemoglobin in
abundance. To test the actions o f oxygen independently o f haemoglobin upon hypoxic
vascular rings, aliquots o f saline (0.9% w/v) containing different concentrations of
oxygen were introduced to pre-constricted hypoxic tissue rings (see section 2.5.2, page
105). Saline was gassed for 30 minutes with 95% oxygen, 21% oxygen (equivalent to
atmospheric levels) or nitrogen to produce three different oxygen content samples.
lOOpl o f each sample was introduced to separate tissue baths, an increased volume was
used to attempt to adjust the amount o f oxygen added to the bath to within the range of
to that contained within a 20pl sample o f erythrocytes. To assess potential pathways
involved, a subsection o f tissue was pre-incubated with ODQ (lOpM final) to inhibit
soluble guanylate cyclase before the addition o f 1 OOpl saline gassed with 95% oxygen.
- 178-

Chapter Five Erythrocyte Induced Vasorelaxation
5.2.7 Analysis and Statistical Analysis
Erythrocyte-induced relaxation was calculated by taking the actual maximum
relaxation and expressing it as a percentage of the maximum phenylephrine induced
constriction (Figure 5.2). Similarly, erythrocyte induced constriction was calculated by
taking the actual maximum constriction (with respect to the maximum phenylephrine
induced constriction) and expressing it as a percentage of the maximum phenylephrine
induced constriction (Figure 5.2).
Testing between groups was performed using either the student t-test (either
paired or unpaired where appropriate) or an analysis of variance (ANOVA) with an
appropriate post hoc test. To assess correlations, the Pearson’s correlation coefficient
was used. Data are presented as means and error bars represent the standard error of the
mean (SEM). A P value of less than 0.05 was taken to be significant, individual
significance levels are indicated within the figure legends. Generally, n=l represents
data averaged from a matched pair of aortic rings.
Phenylephrine ErythrocyteAddition Addition
to
otcowc
1200 1600
Time (minute*)24 00
Figure 5.2. A representative raw trace of erythrocyte induced vasorelaxation after erythrocyte addition to
pre-constricted hypoxic tissue. Significant time points and tension changes are appropriately marked.
- 179-

Chapter Five Erythrocyte Induced Vasorelaxation
5.3 Results
5.3.1 The Effect of Haemoglobin Allostery on Erythrocyte InducedVasorelaxation
To establish the dependency of the erythrocyte induced vasorelaxation upon
haemoglobin allostery, the vasorelaxant properties of a number of erythrocyte samples
with varying haemoglobin oxygen saturations were tested. Erythrocytes containing
haemoglobin held in the R-state by oxygen bound to all haem groups (-100% HbC>2 ,
high saturation) elicited significantly more relaxation than partially oxygenated samples
(a mixture of R and T-state haemoglobin) that were -50% and -20% saturated (low
saturation) (Figure 5.3).
Figure 5.3. Comparison o f erythrocyte induced vasorelaxation produced by highly oxygen saturated
erythrocytes (average saturation 98.22% ± 0.45, n=13), partially saturated erythrocytes (-50% saturated)
(average saturation 51.43% ± 6.16, n=4) and erythrocytes o f low oxygen saturation (average saturation
20.40% ± 5.28, n=13). Both the -50% saturated and low saturation erythrocytes elicited a significantly
lower level o f relaxation than the highly saturated erythrocytes, **(P<0.01) and ***(P<0.001)
respectively. Groups were compared by one way ANOVA with Bonferroni post hoc test.
14-113-
0-
High S atu ration -5 0 % Low Saturation
- 1 8 0 -

Chapter Five Erythrocyte Induced Vasorelaxation
When a range o f maximum erythrocyte induced relaxation data is correlated
against the corresponding haemoglobin oxygen saturation, a positive linear relationship
is observed (Figure 5.4). This observation directly links haemoglobin allostery
(controlled by oxygen saturation in this case) to the maximum erythrocyte induced
relaxation.
17. 5*1
15.0-
12.5-■o
7.5-
5.0-
2.5-
0.0-0 10 20 30 40 50 60 70 80 90 100
% Haemoglobin Oxygen Saturation
Figure 5.4. Correlation o f erythrocyte induced vasorelaxation vs. % erythrocyte haemoglobin oxygen
saturation. A significant positive correlation (Pearson’s correlation coefficient r=0.82, p<0.0001) exists
between the two variables. (n=30, R2= 0.66).
- 181 -

Chapter Five Erythrocyte Induced Vasorelaxation
5.3.2 The Effect of Haemoglobin Oxygen Saturation Cycling on the Erythrocyte Induced Relaxation
To ascertain whether or not the same erythrocyte sample could achieve repeat
relaxations a preliminary experiment utilising fully oxygenated erythrocytes was
performed (Figure 5.5). Erythrocytes were first added to one hypoxic bath to induce
relaxation (oxygenated erythrocytes) then, because of the isotonic nature of the Krebs’
buffer these cells remained whole and so were recovered, re-oxygenated and introduced
into a second bath to asses repeatability o f relaxation (repeat oxygenated erythrocytes).
Although this preliminary work demonstrated that the same erythrocyte sample could
perform repeat relaxations it was technically difficult to control so a tonometer based
cycling protocol was developed to essentially achieve the conditions.
10.0-1
Figure 5.5. Preliminary experiment where erythrocytes were utilised to induce relaxation (oxygenated
erythrocytes) before being recovered, re-oxygenated and used to perform a repeat relaxation (repeat
oxygenated erythrocytes). n=2.
- 1 8 2 -

Chapter Five Erythrocyte Induced Vasorelaxation
The cycling of haemoglobin oxygenation (oxy to deoxy, thought to enhance
vasorelaxant offloading, followed by a further deoxy to oxy cycle before addition to
bath) using the tonometer protocol did alter the maximum relaxation (a mean relaxation
of 12.00% ± 3.6 vs. 8.28% ± 2.3) induced by erythrocytes (Figure 5.6).
17.5-
15.0-
12.5-
10.0-6£ 7.5-
5.0-
2.5-
0 .0-
Figure 5.6. The effect o f haemoglobin oxygenation cycling. Erythrocyte induced vasorelaxation produced
by highly oxygen saturated red cells (average saturation 98.22% ± 0.45, n=15) compared to highly
saturated red cells which were previously taken down to a deoxygenated saturation o f - 20% (20.68% ±
1.66) before being re-oxygenated (average saturation 97.70% ± 0.39, n=5). No significant difference
exists between the two groups.
- 1 8 3 -

Chapter Five Erythrocyte Induced Vasorelaxation
5.3.3 Potential Cross-Membrane Transfer of the Vasorelaxant
The ability o f the erythrocyte to produce repeated relaxation prompted the
investigation of the movement or recycling of the vasorelaxant in and out of the cell.
Deoxygenation could simply release the vasorelaxant out of the cell, which is
subsequently taken back up upon re-oxygenation. To explore this potential mechanism,
erythrocytes were deoxygenated to a low saturation upon which the extracellular milieu
was removed before re-oxygenation in fresh saline. Erythrocytes that were
deoxygenated, followed by removal of the extracellular milieu and re-oxygenation
induced a mean relaxation o f 13.0% ± 1 . 9 compared to erythrocytes taken immediately
at high saturation 12.0% ± 3 . 6 (Figure 5.7). The removal of the initial extracellular
milieu and replenishment with fresh saline had no statistically significant effect on
erythrocyte-induced vasorelaxation.
10.0-
Figure 5.7. Potential movement o f the vasorelaxant. Erythrocyte induced vasorelaxations produced by
highly saturated red cells (average saturation 98.2% ± 0.5, n=13) compared to highly saturated red cells
which were previously taken down to a deoxygenated saturation o f - 20% (22.4% ± 1.7) then centrifuged
at 1200g before the extracellular solution was removed, erythrocytes were then washed 3 times in
oxygenated saline to increase the haemoglobin oxygen saturation up to —100% (average saturation
98.05% ± 0.65, n=4). No significant difference exists between the two groups.
- 1 8 4 -

Chapter Five Erythrocyte Induced Vasorelaxation
5.3.4 The Effect of 2,3-DPG
To further investigate the role of haemoglobin allostery in the erythrocyte
induced vasorelaxation, the effect that the allosteric modulator 2,3-DPG had (see section
1.4.2.4, page 18) upon maximum relaxation was considered. Because the access of 2,3-
DPG to whole cells is limited, lysed erythrocyte samples had to be utilised. However,
this did not appear to alter the ability of the sample to induce vasorelaxation. The
addition of 2,3-DPG to the bath before erythrocyte addition significantly increased the
maximum relaxation achieved when compared to the respective control group (Figure
5.8).
2,3-DPG Control
Figure 5.8. The effect o f 2,3-DPG on the erythrocyte induced vasorelaxation. Lysed erythrocytes were
added to either control baths or baths containing 20pM 2,3-DPG. The maximum vasorelaxation generated
by erythrocytes in the presence o f 2,3-DPG was significantly *(P= 0.03) higher than the control group.
Average haemoglobin saturation (96.9% ± 0.9). n=4.
One aspect o f the erythrocyte vasorelaxant response that has received less
attention is the vasoconstriction that is observed post relaxation. The magnitude of this
post relaxation vasoconstriction was assessed in the 2,3-DPG treat group vs. the control
group and was found to be higher in the 2,3-DPG group although the difference was not
statistically significant (Figure 5.9).
- 1 8 5 -

Chapter Five Erythrocyte Induced Vasorelaxation
25-|
> " 20-
S 1 1*-I s
1°-CO
2,3-DPG Control
Figure 5.9. The effect o f 2,3-DPG on the erythrocyte induced vasoconstriction. Lysed erythrocytes were
added to either control baths or baths containing 20pM 2,3-DPG. The maximum vasoconstriction
generated (post relaxation) by erythrocytes in the presence of 2,3-DPG was higher than the control group,
although this difference was not found to be statistically significant. Average haemoglobin saturation
(96.28% ± 0.933). n=4.
- 1 8 6 -

Chapter Five Erythrocyte Induced Vasorelaxation
5.3.5 Carbon Monoxide
The identity o f the vasorelaxant released from erythrocytes that is responsible for
inducing the vascular activity, despite several proposed candidates, remains to be
confirmed. In this respect it is important to consider other possible candidates, in the
case o f this chapter, carbon monoxide. Carbon monoxide, released from the carbon
monoxide releasing compound, CORM-A1 was capable o f inducing a significant
relaxation in hypoxic tissue compared to both the hypoxic control and the normoxic
CORM-A1 treated counterpart (Figure 5.10).
_ 90-<D
§ 80-T3 70- o
l l 60-1 s 50-2 a 40- * 1 30-
° 20h
J i o -
J ’ 2?rC*
* 29(V
Figure 5.10. Carbon monoxide induced vasorelaxation in hypoxia and normoxia after 5 minutes exposure
to lOOpM carbon monoxide releasing molecule, CORM-A1. CORM-A1 induced significantly more
relaxation in hypoxia compared to normoxia ** (P=0.001) and compared to the relevant hypoxia control
*(P=0.012). n=4.
- 1 8 7 -

Chapter Five Erythrocyte Induced Vasorelaxation
In preliminary experiments, a stream o f high concentration carbon monoxide gas
was utilised to generate erythrocytes containing 100% HbCO to assess the vasorelaxant
properties o f HbCO. 100% HbCO was found to completely inhibit the ability o f the
erythrocyte to vasodilate hypoxic tissue (data not shown). Given the observed allosteric
control o f this phenomenon, erythrocytes partially saturated with HbCO (-22% HbCO)
were generated and assessed. The partial saturation o f erythrocytes with carbon
monoxide reduced the maximum vasorelaxation achieved, however, due to the power of
the study the result was not found to be statistically significant (Figure 5.11).
10.<H
£■§ 7.5-
I IS i 5.0-™ CL
0 .0-HbCO (-22%)
Figure 5.11. The effect o f partial carbon monoxide saturation upon the erythrocyte induced
vasorelaxation. Partially saturating the haemoglobin of erythrocytes with carbon monoxide (22.00%
HbCO, 78% H b02) reduced vasorelaxation when compared to erythrocytes with fully oxygenated
haemoglobin (97.75%), however the study was not powered to show this difference statistically. Post
relaxation erythrocytes partially saturated with carbon monoxide where recovered and re-tested for HbCO
levels and still exhibited 22.0% saturation. n=4.
- 1 8 8 -

Chapter Five Erythrocyte Induced Vasorelaxation
5.3.6 Oxygen
As a potential candidate for the vasorelaxant released from erythrocytes, the
vasorelaxant properties o f oxygen was assessed on hypoxic tissue, independently o f
haemoglobin. The addition o f oxygenated saline (gassed with 95% oxygen) was capable
o f inducing a significant relaxation (figure 5.12A, PO.OOl) that is comparable to the
relaxation induced by oxygenated, native erythrocytes (Figure 5.13). The degree o f
relaxation observed from saline addition was directly proportional to the oxygen content
of sample (Figure 5.12B). Pre-incubation o f the vascular tissue with ODQ completely
inhibited the relaxation response to oxygenated saline (gassed with 95% oxygen) but
was unable to inhibit the post-vasorelaxation vasoconstriction as seen with native
erythrocyte samples.
3■0C
£ S'&
B11i10-o
I ILU g
5 H
o
T 1r T T25 50 75
% Oxygenation100
Figure 5.12. % relaxation induced by saline samples with varying oxygen content. A) 95% oxygen
saturated saline induced significantly more relaxation than samples gassed with 21% or 0% oxygen
(PO.01 and PO.OOl, respectively). n=4 B) A correlation of relaxation against % oxygenation o f saline
samples added. The two variables correlate significantly and positively (P0 .0001, Pearson’s r
value=0.91, n= 12 pairs).
- 1 8 9 -

Chapter Five Erythrocyte Induced Vasorelaxation
1-o i------------- 1--------------1------------- 1-------
0 5 10 15 20Tim e (M inutes)
Figure 5.13. example traces taken from experiments where either 20pl o f ~100% oxygen saturated
erythrocytes or lOOpl o f saline gassed with 95% oxygen were added to pre-constricted hypoxic vascular
rings.
- 1 9 0 -
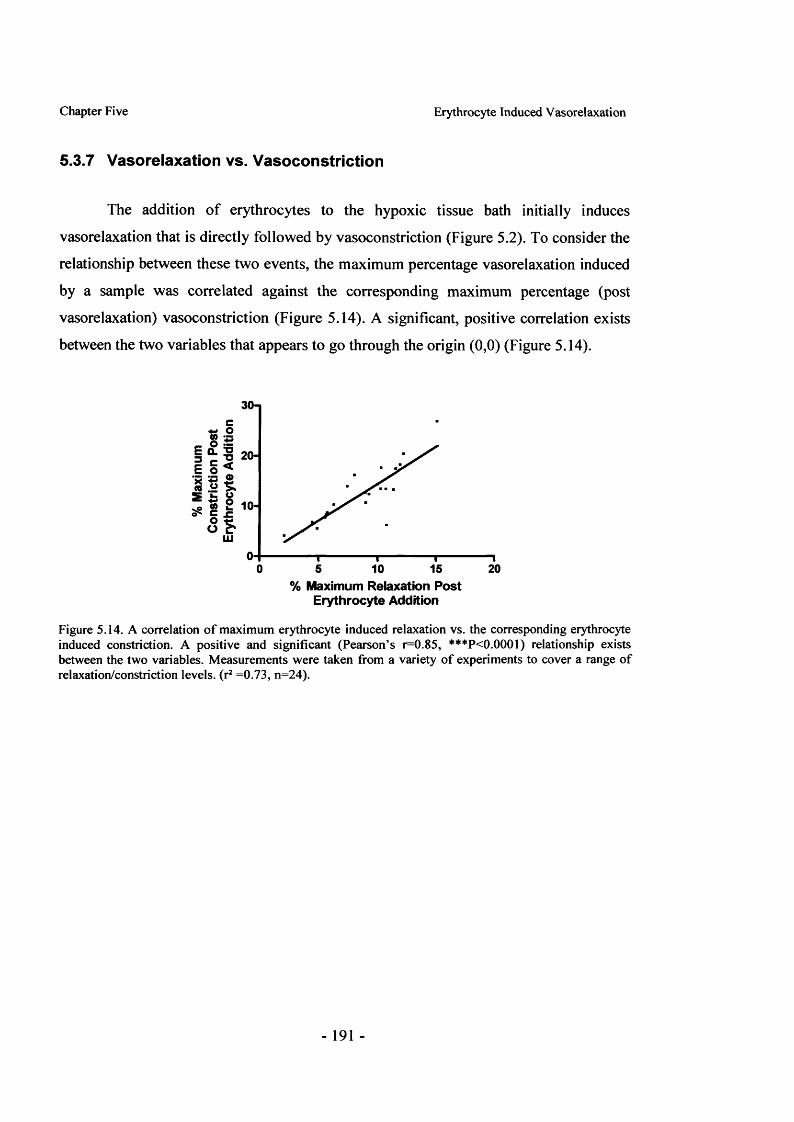
Chapter Five Erythrocyte Induced Vasorelaxation
5.3.7 Vasorelaxation vs. Vasoconstriction
The addition o f erythrocytes to the hypoxic tissue bath initially induces
vasorelaxation that is directly followed by vasoconstriction (Figure 5.2). To consider the
relationship between these two events, the maximum percentage vasorelaxation induced
by a sample was correlated against the corresponding maximum percentage (post
vasorelaxation) vasoconstriction (Figure 5.14). A significant, positive correlation exists
between the two variables that appears to go through the origin (0,0) (Figure 5.14).
30-|
0 15 205 10% Maximum Relaxation Post
Erythrocyte Addition
Figure 5.14. A correlation o f maximum erythrocyte induced relaxation vs. the corresponding erythrocyte induced constriction. A positive and significant (Pearson’s r=0.85, ***P<0.0001) relationship exists between the two variables. Measurements were taken from a variety o f experiments to cover a range of relaxation/constriction levels, (r2 =0.73, n=24).
- 191 -

Chapter Five Erythrocyte Induced Vasorelaxation
5.4 Discussion
The ability o f native human erythrocytes to induce relaxation in the hypoxic
vessel bioassay is well known [331]. This ex vivo response, demonstrated to be at least
in part mediated via soluble guanylate cyclase [421], has been attributed to several
mediators from within the erythrocyte, including SNO-Hb [331], ATP [432] and/or
nitrite [337]. Regardless o f the mediator involved, it is clear that changes in oxygen
level play a significant role in the mechanism with respect to both the erythrocyte and
the tissue.
5.4.1 Allosteric Modulation
A number o f studies have proposed that the mechanism behind the erythrocyte-
induced vasorelaxation is under the control o f haemoglobin allostery, this suggestion is
based largely on data collected from erythrocyte relaxations in tissue baths at varying
oxygen levels [331] and saturation-dependent changes in erythrocyte HbSNO
content/nitrite reductase activity [337, 363]. This chapter contains the first study to
present data on the direct relationship between haemoglobin conformational state and
erythrocyte induced relaxation in a hypoxic tissue environment. The findings
demonstrate that the erythrocyte induced vasorelaxation is dependent on and directly
proportional to haemoglobin allosteric state, in this case controlled by oxygen
saturation. Release o f the vasoactive moiety is therefore reliant on haemoglobin
‘switching’ conformation from R-state to T-state. The results o f this chapter show that
the relationship between haemoglobin conformation and relaxation is linear, favouring a
mechanism by which the vasoactive moiety is offloaded in response to progressive
deoxygenation. This supports the HbSNO theory where the release o f nitric oxide from
HbSNO is thought to be linked to haemoglobin allostery, but disagrees with some
aspects o f the nitrite reduction theory. Although the original investigations into nitrite
reduction by haemoglobin suggested deoxy (T-state) haemoglobin was responsible for
generating nitric oxide [337], more recent publications from the field have suggested the
reduction process to be optimal at the point where haemoglobin is 50% saturated (p50)
- 192-

Chapter Five Erythrocyte Induced Vasorelaxation
[342]. If this mechanism was in operation one would expect a more Gaussian type
distribution between haemoglobin oxygen saturation and erythrocyte induced
vasorelaxation with a maxima at 50% saturation, not the linear relationship observed.
Previous studies have specified the requirement for a lowered tissue oxygen
level in order to produce a vasorelaxant response from erythrocytes [91, 421]. Although
the responsiveness o f tissue to the same nitric oxide-based stimulus is known to be
enhanced in hypoxia [98] it is possible that ‘tissue hypoxia’ per se is not required, but
rather that an environment (hypoxic or otherwise) to drive the transition of haemoglobin
from R to T-state. Unfortunately, this scenario would be unlikely to ever arise in vivo
and would be technically demanding to create ex vivo, restricting the ability to study this
mechanism. One could speculate that it may be feasible to create a ‘donor and recipient’
type set-up, akin to that developed by Loewi [435] in the discovery of acetylcholine,
where one frog heart was stimulated via the vagus nerve and washed, the washings were
simultaneously dripped onto the heart o f a second frog to produce an effect. In this
format, erythrocytes contained in a semi-permeable container could be rapidly
deoxygenated in buffer contained in the first compartment, the buffer would then be
directly passed over oxygenated tissue in a second compartment, to assess the presence
and activity o f a vasorelaxant. This experiment could also address whether or not
erythrocytes need to be in direct contact with the tissue to induce vasorelaxation and
determine if tissue hypoxia is a requirement.
To further investigate the haemoglobin conformational control o f the release
mechanism, the allosteric modulator 2,3-DPG was investigated. 2,3-DPG is known to
shift the oxygen binding curve to the right i.e. it enhances the offloading o f oxygen and
helps to prevent oxygen re-binding to deoxygenated haem in the tissue (see section
1.4.2.4, page 18). The addition o f 2,3-DPG to the bath at a final concentration to match
final haemoglobin concentration was found to increase the maximum vasorelaxation
induced by lysed erythrocytes. This increase in maximum vasorelaxation could be
expected given the positive allosteric actions o f 2,3-DPG on ‘offloading’. In contrast,
the vasoconstriction that occurred post relaxation was found to be unaffected. The
- 193-

Chapter Five Erythrocyte Induced Vasorelaxation
vasoconstriction has previously been attributed to haemoglobin scavenging of
endogenous nitric oxide generated by the endothelium [331]. As in the case of oxygen
re-binding, one would predict 2,3-DPG to aid in the prevention of nitric oxide binding,
however no difference was observed (if anything constriction was increased) suggesting
that scavenging o f nitric oxide is not responsible for the post relaxation vasoconstriction.
If the erythrocyte induced vasorelaxation was to play a role in the control of vascular
tone in vivo it is likely that it may be most beneficial in tissue areas suffering from
vascular disease. In this respect, 2,3-DPG levels have been found to be significantly
increased in diabetic patients, but only in those showing vascular complications [436].
In addition to the obvious oxygen offloading advantages, it is possible that this adaptive
augmentation o f 2,3-DPG levels in some diabetics could also enhance the release of
erythrocyte derived vasorelaxant.
In the assessment o f 2,3-DPG, lysed erythrocyte samples were utilised to allow
2,3-DPG access to the haemoglobin. Erythrocyte lysate was found to still have the
ability to generate vasorelaxation in the model used in this chapter, which carries a
number o f implications. Firstly, it suggests that the mechanism controlling the
vasorelaxation can operate independently o f the erythrocyte membrane or outside the
whole cell scenario, suggesting that the vasorelaxant is associated with haemoglobin and
can work in isolation from the cell. Secondly, this evidence does not support a role for
the ATP release theory as this theory would appear to only function in a whole cell
situation.
5.4.2 Movement and Recycling
It is apparent that allosteric changes in haemoglobin are essential for
vasorelaxant release, but it is unclear as to how much is released upon each hypoxic
exposure or how and if the store can be reloaded. To investigate this, erythrocytes were
subjected to repeat oxygenation cycles and vasorelaxations. The results presented in this
chapter demonstrate that erythrocytes are capable o f producing repeat vasorelaxations
(post deoxygenation) that are not significantly different from initial vasorelaxations.
- 194-

Chapter Five Erythrocyte Induced Vasorelaxation
This suggests that erythrocytes contain a considerable (potentially replenishable) store
o f vasorelaxant which is either not released in its entirety during an individual hypoxic
exposure or is replenished in some way upon re-oxygenation. This raises the question as
to why only a proportion o f vasorelaxant would be released upon each hypoxic
exposure? In the case o f the HbSNO theory it is proposed that the haemoglobin
transition from R-state to T-state that destabilises the thiol bound nitric oxide resulting
in release [363], it is therefore viable that not all HbSNO groups are destabilised and so
not released or that nitric oxide released from one thiol subsequently reacts with a
another thiol (on haemoglobin or in the membrane) and so is also not released from the
erythrocyte. This could explain the ability of erythrocytes to produce repeated
relaxations, indicative o f a vasorelaxant ‘store’, however, it is interesting that the repeat
vasorelaxations are comparable to initial vasorelaxations, suggesting that the store is not
depleting.
The reproducibility o f erythrocyte vasodilatation, despite repeat hypoxic
exposure, could suggest release followed by re-uptake. To address this, experiments
were conducted where erythrocytes were deoxygenated, had the extracellular buffer
removed and then re-oxygenated in fresh buffer. In theory this should prevent the
vasorelaxant from being passed out o f the cell and then taken back up upon re
oxygenation. However the results obtained showed no difference in relaxation between
control samples and those washed in fresh buffer. The vasorelaxant is therefore not
simply passed back and forth between the intra and extra cellular compartments. With
respect to the HbSNO theory, it is possible that nitric oxide could be released from
haemoglobin and bind to membrane thiols and not leave the erythrocyte, particularly as
there are no extracellular ‘acceptor’ thiols present.
- 195-

Chapter Five Erythrocyte Induced Vasorelaxation
5.4.3 Other Possible Mediators
5.4.3.1 Carbon Monoxide
All evidence to date points to the release o f a species that is linked to
haemoglobin allostery and can bind the haem centre o f sGC to produce activation. The
most likely candidates are selected diatomic gases, as these both associate with
haemoglobin and can activate sGC. The potential roles of nitric oxide have already been
researched in depth and are still in question, essentially leaving oxygen and carbon
monoxide. The decision to investigate carbon monoxide as a potential erythrocyte
vasorelaxant was based on a number o f published observations that supported a potential
function o f carbon monoxide, these observations are summarised below;
• The normal circulating level o f HbCO is -1.5% but can range up to around 10-
15% in some cases, particularly in those who smoke [437]. Therefore, based on
normal in vivo haemoglobin concentrations (~2.5mM) at -1% HbCO there is a
considerable circulating concentration o f bound carbon monoxide (-25pM).
• Carbon monoxide is known to produce vasorelaxation that is in some part
mediated via a sGC dependent mechanism [438].
• Encapsulation o f haemoglobin by a phospholipid membrane retards the reaction
o f nitric oxide but not carbon monoxide [385].
• Arteriovenous gradients in HbCO levels have been found in both healthy and
critically ill patients [439].
• The rate o f dissociation o f carbon monoxide is approximate one order of
magnitude faster than that o f nitric oxide (-10 3 vs. ~10'4 s ') [440, 441],
- 196-

Chapter Five Erythrocyte Induced Vasorelaxation
• Extracellular haem groups are capable o f extracting carbon monoxide, but not
nitric oxide from haemoglobin contained within erythrocytes [442].
• Carbon monoxide inhalation has been demonstrated to be protective in scenarios
such as ischemia-reperfusion injury caused during organ transplantation [443].
In light o f these previous observations and given the results of this chapter
showing carbon monoxide to have increased activity in hypoxia (CORM-A1 results), the
vasorelaxant properties o f erythrocytes containing 100% HbCO were tested. The
addition o f carbon monoxide to full saturation was found to completely inhibit the
erythrocyte induced vasorelaxation. The observed inhibition is most likely due to the
stability o f the fully saturated haemoglobin, holding it in the R-state and not allowing
transition from R-state to T-state conformation. This finding led to the working
hypothesis that carbon monoxide could potentially be released from partially carbon
monoxide saturated haemoglobin (balance oxygen saturated) that may still undergo
some conformational changes upon deoxygenation. In support o f this hypothesis, it has
previously been shown that mono-liganded HbCO has a faster dissociation rate than di-
liganded intermediates and that carbon monoxide dissociates faster from a haem than p
haem [444]. In order to investigate this hypothesis, erythrocyte samples containing
-22% HbCO were generated and tested for vasorelaxant properties. The partial
saturation o f haemoglobin with carbon monoxide resulted in a partial inhibition of the
vasorelaxation induced, however, the study was not powered to demonstrate that the
result was statictally significant. In accordance with the allosteric data using oxygen to
control conformation it is likely that even in samples that are only partially saturated
with carbon monoxide, haemoglobin is held in the R-state, therefore insufficient R to T-
state transition occurs to release the full amount o f vasorelaxant and produce maximum
vasorelaxation. It can therefore be concluded from these results that carbon monoxide
bound to haemoglobin is not the intra-erythrocyte species responsible for vasorelaxation
of hypoxic tissue and that the use o f agents that hold haemoglobin in the R-state inhibit
conformation change and similarly inhibit vasorelaxation.
- 197-

Chapter Five Erythrocyte Induced Vasorelaxation
5.4.3.2 Oxygen
Having concluded that carbon monoxide was not responsible for the
vasorelaxant properties o f erythrocytes, the role o f oxygen itself was considered.
Oxygenated saline was capable o f inducing vasorelaxation in hypoxic tissue
independently o f haemoglobin. The vasorelaxation observed was comparable to that
seen with oxygenated erythrocytes and also displayed some post-addition
vasoconstriction, suggesting that oxygen could be the vasorelaxant released from
erythrocytes. In support o f this notion, the oxygenated saline mediated relaxation was
also soluble guanylate cyclase dependent as is the case with that mediated by
erythrocytes. In addition, the degree o f vasorelaxation also directly correlated to the
oxygen content o f the saline added, which is comparable to the direct correlation
between erythrocyte induced vasorelaxation and haemoglobin oxygen saturation. In this
respect, our laboratory has previously shown that the concentration of oxygen in the
tissue bath increases upon the addition o f oxygenated erythrocytes that coincides with
changes in vessel tone [91], in agreement with a role for oxygen within the mechanism.
These results do not discount a role for HbSNO but would suggest that oxygen could be
the primary vasorelaxant released. It is interesting to note that the presence of HbSNO
shifts the haemoglobin binding curve to the right, which would result in increased
oxygen offloading and may explain the link between erythrocyte induced vasorelaxation
and HbSNO content [421].
During the recording o f maximum vasorelaxation, data concerning the
corresponding post-relaxation vasoconstriction was also recorded during many
experiments. These data were subsequently used to create a correlation between the two
variables, maximum vasorelaxation against matched, maximum vasoconstriction. The
correlation is highly significant and the relationship observed between the two is a
positive, linear one, demonstrating that one variable is closely related to the other. Using
linear regression analysis, the data appears to go through the origin, suggesting that if a
given sample were to generate no vasorelaxation, then no post relaxation
vasoconstriction would be observed. This finding cannot be reconciled with the proposal
- 198-

Chapter Five Erythrocyte Induced Vasorelaxation
that the vasoconstriction is produced by haemoglobin scavenging of endogenous nitric
oxide [331] as this should occur independently o f vasorelaxation. After the completion
o f the work contained in this chapter the Stamler group produced new findings and
proposals with regards to the mechanism o f vasoconstriction that occurs post relaxation
[421]. The publication demonstrates that a post relaxation vasoconstriction still occurs
even when the vessel is denuded o f endothelium and that the vasoconstriction is in some
part inhibited by ODQ [421]. It is proposed that the vasoconstriction could therefore be
mediated to some extent by the vasorelaxant entity through a cGMP mediated
mechanism or in the case o f HbSNO, an SNO mediated contractile mechanism [421]. A
dual vasorelaxant/vasoconstrictor mechanism would agree with the correlation between
vasorelaxation and constriction presented in this chapter.
In light o f the fact that oxygen could be the vasorelaxant moiety released by
erythrocytes, can the direct relationship between vasorelaxation and vasoconstriction be
explained by oxygen dependent mechanisms? In terms o f the vasorelaxation there are
two potential mechanistic roles for oxygen: firstly, in hypoxia it is feasible that soluble
guanylate cyclase is more sensitive to binding agonists (such as diatomic gases) so
although less potent than nitric oxide, oxygen could activate soluble guanylate cyclase.
Secondly, the relaxation mechanism could involve endothelial nitric oxide synthase, in
hypoxia the enzyme will not efficiently produce nitric oxide, but a transient burst of
oxygen to the tissue may be sufficient for the enzyme to briefly produce some nitric
oxide to produce a brief relaxation. Although it is possible that nitric oxide synthase
could play some role, the fact that erythrocytes can induce relaxation in endothelium
denuded hypoxic vessels [421] would suggest it not to be the primary pathway involved.
It is clear from the results o f this chapter that hypoxic tissue will not vasoconstrict to the
same extent as normoxic tissue given the same phenylephrine stimulus, suggesting that
contractile mechanisms are limited by hypoxia. It is possible that a burst o f oxygen
could allow mitochondria to aerobically produce ATP, providing the energy required to
generate further constriction to the phenylephrine still present in the bath. This
suggestion could be fitting in a temporal sense as the process o f ATP generation could
take longer than say the direct stimulation o f soluble guanylate cyclase, lending support
- 199-

Chapter Five Erythrocyte Induced Vasorelaxation
to a mechanism where transient vasorelaxation precedes a vasoconstriction that is
related in magnitude.
As the post vasoconstriction is obviously a key element of the erythrocyte-
induced vasorelaxation it is important to consider the net change in vessel tone that is
induced by erythrocytes. In the ex vivo experiments o f this chapter, the percentage
maximum vasoconstriction was comparable, if not higher than the percentage maximum
vasorelaxation. However, this is only maximum vasorelaxation/constriction and
therefore doesn’t describe the change in vessel tone with respect to time. Nevertheless, it
does in some part suggest that within this model there is no overall change in vessel
tone. The idea o f a ‘stalemate’ situation becomes more complex if one assesses it within
the in vivo type setting where there is blood flow. If the vasoconstriction mechanism is a
secondary result o f the vasorelaxant released it will generate both vasorelaxation and
constriction within the same specific tissue area, conversely, if it is caused by the
presence of erythrocytes/haemoglobin in a specific state then in a situation o f flow the
vasoconstriction could effect tissue distal to the site o f relaxation. The distinction
between these mechanisms is an important one because if the latter were true, then due
to the rapid transit o f erythrocytes through the circulation it could be possible to induce
vasorelaxation in the arterioles/capillaries with the vasoconstrictor mechanism acting
further down the vascular tree e.g. in the veins, where it may not be so influential.
Overall, it is plausible that this mechanism, in addition to many others, could
serve to adjust basal tone with respect to oxygen demand. However, it should be noted
that the majority o f erythrocyte-induced vasorelaxations presented in this chapter were
produced by erythrocytes deoxygenated from 100% oxygen saturation down to below
-10% . This dramatic change in oxygen saturation does not usually occur in vivo with
normal arterial to venous transitions being -100% to -75% saturation. Therefore
offloading o f vasorelaxant under normal conditions would be minimal and would occur
in smaller vessels that are unlikely to be capable o f influencing flow to any great extent.
Dramatic differences in saturation are more likely to occur in hypoxic tissue, usually
caused by a restriction in blood flow. In this situation offloading o f vasorelaxant to
- 2 0 0 -

Chapter Five Erythrocyte Induced Vasorelaxation
increase blood supply to the area would be ideal. However, for the mechanism to work
some blood flow is required to continually deliver ‘fresh’ erythrocytes with R-state
haemoglobin that are capable o f changing conformation and thus inducing the required
vasorelaxation.
-201 -

Chapter Five Erythrocyte Induced Vasorelaxation
5.5 Summary and Conclusions
The results o f this chapter have not conclusively elucidated the identity o f the
vasorelaxant released from erythrocytes but do provide significant and persuasive
evidence that oxygen is the primary vasorelaxant involved. The findings do not support
significant roles for either the nitrite or ATP based theories and cannot discount a role
for HbSNO at some level. The results presented in this chapter do reveal some
interesting characteristics with regard to the mechanism of erythrocyte induced
vasorelaxation and provide supporting evidence to suggest that oxygen is the principal
vasorelaxant involved, these are summarised below.
• The conformational shift in haemoglobin protein structure from R-state to T-
state (that is controlled by oxygen saturation both in the reported experiments
and in vivo) appears to be necessary for the induction of vasorelaxation.
Modulators o f haemoglobin allostery, such as 2,3-DPG, are capable of altering
this mechanism.
• The relaxant species released from the erythrocyte must be capable of avoiding
re-capture by or reaction with haemoglobin in the local region of release.
• The vasorelaxant is not simply passed in and out o f the erythrocyte during
oxygenation cycles.
• Erythrocytes contain a store o f vasorelaxant that is either not released in its
entirety upon a single deoxygenation event or is potentially replenishable and
provided the cells are re-oxygenated are capable o f repeat relaxations.
• Vasorelaxation induced by erythrocytes in a hypoxic environment is
accompanied by a post relaxation vasoconstriction. The magnitude of this
vasoconstriction is directly proportional to the preceding vasorelaxation.
- 2 0 2 -

Chapter Five Erythrocyte Induced Vasorelaxation
Therefore, overall change in vessel tone should be considered in terms of net
vasorelaxation and constriction.
• The vasorelaxant is associated with haemoglobin and can induce vasorelaxation
independently o f a whole cell scenario.
• Despite its apparent suitability as an erythrocyte vasorelaxant candidate, carbon
monoxide or HbCO do not appear to be responsible for the vasorelaxation
assessed in the current model.
• A burst o f oxygen delivered to hypoxic tissue is capable of inducing a transient
relaxation. The relaxation is soluble guanylate cyclase dependent and is
comparable to that induced by oxygenated erythrocytes. Oxygen addition also
produces a post-vasorelaxation vasoconstriction, suggesting that both
vasoconstriction and vasorelaxation could be oxygen derived.
• Oxygen is likely to represent the primary vasorelaxant released from
erythrocytes upon an allosteric change stimulated by hypoxia.
-203 -

Chapter Six Properties o f the Nitrite Anion in vivo
6 The Vasodilator Properties of the Nitrite Anion in the Human Circulatory System: the Influence of Oxygen
6.1 Introduction
The vascular actions o f nitrite have been known for more than a century [395],
however the development o f more potent organic nitrates (e.g. glyceryl trinitrate, GTN),
rendered nitrite clinically ‘redundant’. Interest in nitrite as a vasodilator has resurged in
recent times because o f two principal reasons. Firstly, some research suggests that it may
at basal plasma levels, represent a circulating, bioactive nitric oxide metabolite as
apposed to a simple waste product (see section 1.10.2, page 68). Secondly, it has been
proposed that nitrite, although less potent than other agents, may have some clinical
potential in certain, niche settings, because it has targeted actions such as enhanced
activity in hypoxic tissue beds for example [98].
At this point it is imperative to make the distinction between sources, potential
mechanisms and the vascular activity o f endogenous nitrite at basal plasma levels
(~200nM) and at levels elevated by pharmacological nitrite administration.
Basal plasma nitrite levels are a balance between sources/production and
excretion/metabolism. Although vascular nitric oxide is thought to be one o f the principal
sources of plasma nitrite [445], dietary influences can also play a role. In this respect, it
has been demonstrated that the ingestion o f high nitrate foods results in a subsequent
increase in plasma nitrite level which coincides with a reduction in blood pressure and
platelet inhibition, and appears to afford some protection against the damaging effects o f
vascular ischemia [417]. Nitrate administered orally is thought to be converted to nitrite
via bacterial anaerobes in the gastrointestinal tract and it is the generated nitrite absorbed
into the blood stream that is believed to be responsible for the vascular benefits observed
[417]. However, it should be noted that this study is still artificially increasing plasma
nitrite levels considerably above baseline. At basal plasma levels, the ability o f nitrite to
- 2 0 4 -

Chapter Six Properties o f the Nitrite Anion in vivo
alter vascular tone in vivo and the potential mechanism behind this action are largely
theoretical. To date, the contributions o f basal plasma nitrite on vascular tone have not
been demonstrated in vivo and its biological role is inferred from observations such as
arteriovenous plasma nitrite gradients [327]. Although basal plasma nitrite levels
generally lie within a relatively narrow range, changes in level are thought to largely
reflect endothelial function and nitric oxide production. Plasma nitrite levels have been
shown to negatively correlate with the number o f cardiovascular risk factors that a patient
exhibits due to defective production or increased oxidative metabolism of nitric oxide
[380].
A range o f different pharmacological nitrite supplementation studies in animals
have now been published and demonstrate numerous beneficial effects o f nitrite including
protection against ischemia reperfusion in a number o f organs [352, 446] and positive
effects in models o f hypertension [447]. From a clinical perspective, one publication has
also considered blood pressure and nitrite tachyphylaxis in primates, in reference to the
tolerance that is observed clinically with organic nitrates [379]. The study found that,
unlike organic nitrates, nitrite did not cause tachyphylaxis in primates that were
administered a continuous nitrite infusion and daily boluses over two weeks.
Though there is a wealth o f literature on the applications of nitrite in animal
studies, this thesis is primarily concerned with studying the vasoactive properties of
nitrite and its mechanisms o f action with the aim o f assessment in human subjects. In
addition to very early work with nitrite in humans, five modem publications have
assessed infusions o f sodium nitrite in man ([98, 337, 379, 403, 445] summarised in table
6.1). The approach that has been taken in each o f these studies is quite different making
comparison between them difficult. However, there are some common findings and
questions that arise from these studies collectively, including:
• Infusion o f nitrite into the brachial artery, particularly at high doses (above
1 pmole per minute) is capable o f producing vasodilatation in the vascular
bed to which it is infused.
- 2 0 5 -

• Increasing plasma nitrite levels with high dose nitrite significan
increases levels o f haemoglobin-bound nitric oxide (HbNO) in venc
blood.
• Nitrite infusion has a marked effect on vein diameter in addition to
effects in arteries.
• The vasodilator properties o f nitrite are enhanced in hypoxic tissue beds.
• What is the mechanism o f action of nitrite reduction in vivo? Be
haemoglobin and oxidoreductase enzymes have been suggested to redu
nitrite back to nitric oxide, however, in vivo evidence is lacking. O
publication also failed to show a role for xanthine oxidase (XO) as
potential vascular nitrite reductase.
The mechanism by which nitrite produces vasodilatation in vivo has not yet be
demonstrated. However, some mechanisms have been suggested and broadly fall into t\
schools o f thought. The first suggests that erythrocytes are responsible for nitri
activation via the reduction of nitrite to nitric oxide by haemoglobin (see section 1.10.
page 68). The second suggests that nitrite is activated at a tissue level, independently
blood, via reduction to nitric oxide by oxidoreductase enzymes, a hypothesis which
supported by the findings presented in this thesis in chapter 4. Aldehyde oxidase (A(
has been suggested to be the principle enzyme involved [397] although xanthine oxida
(XO), nitric oxide synthase and mitochondrial enzymes have also been implicated [39
399]. These enzymes are also known to more actively reduce nitrite to nitric oxide und
conditions of hypoxia [413].
- 206 -

Table 6 .1. Summary of human nitrite infusion studies
too
Publication
Lauer ctu l. 2001.
Subjects
3 subjects
Cosby el ul. 2006.
Dejam e ta l. 2007.
9 male and 9 female. 10 subjects recalled for low-dose studv.
20 subjects. Average weight 7 1 ±7
kg-
Dose reylmen
Imraancrial sodium nitrite was given at doses from 0.01 to 36 pm ol/m in.
2 x 3 6 ^m ol/m l infused 'a Iml/min for 5mins via the brachial artery o f the study arm . Infusion I before exercise, infusion 2 before exercise with I, - NM M A co-adm inistration. Infusion I and 2 were separated by a 30tnin saline infusion. Total dose received 1,08mmoles, low dose studies were identical but infusions o f 0.36 pm ol/m l were used.
Part A, n=5. Sodium nitrite in saline was infused '<7; 2 m 1/m in for 5 minutes intrabrachial. at escalating doses from 0. 7, 14,28 and 55 to 110 pg/kg/m in. For reference, a dose o f 28 pg/kg/m in for 5 minutes at the average body weight would be equivalent to -1 4 4 pm oles o f nitrite. After dose escalation a rest period o f 180 m inutes was given before a dose o f 28 pg/kg/m in for 5 minutes.
Part B. n*15. Sodium nitrite in saline was infused i%2ml/min for 5 minutes, at escalating doses from 0 .07 ,0 .14 , 0 .35 ,0 .7 . 1.4. 3 .5 ,14 and 28 pg/kg/m in, 10 subjects received a coinfusion o f either oxypurinol (600pg/m in) or ascorbic acid (24mg/min).
Measurements
Forearm blood flow o f the infusion arm was measured by strain gauge plethysmography. Venous blood samples were also taken from the same arm.
Forearm hlood flow o f the infusion arm was measured by strain gauge plethysmography. Arterial and venous blood samples were also taken from the infusion arm for blood gas and nitric oxide m etabolite analysis.
Part A. During dose escalation blood flow m easurem ents (by strain gauge plethysmography) and blood samples were taken from the infusion arm (ipsilateral). After the rest period o f 180 minutes a further infusion was given however m easurem ents were m ade in the contralateral arm.
Part B. Both blood flow m easurem ents and blood samples were taken.
Interventions
Hand grip exercise in the infusion arm
Findings
liven at the highest dose nitrite did not alter forearm blood flow. Using estimations, the authors believe to recover 92 -97% o f nitrite infused into the artery from blood taken from the corresponding vein.
Both doses administered produced increases in plasma nitrite (venous levels rose to -2 2 0 p M ) and forearm blood flow. The findings were unaffected by L -NM M A administration. Nitrite infusion increased haemoglobin bound nitric oxide species and formation was inversely proportional to haemoglobin oxygen saturation.
Part A. Escalating doses o f nitrite were capable o f increasing fore arm blood flow in the ipsilateral arm. Forearm blood flow in the ipsilateral arm was altered within seconds o f comm encing arterial nitrite infusion. An infusion o f 28 pg/kg/m in was capable o f producing increases in forearm blood flow in the contralateral arm after a short time delay (nitrite concentration in contralateral arm ~ I p M ).
Part B. The lowest infusion dose (0.07 pg/kg/m in ) increased venous plasma nitrite to 350nM and was capable o f significantly increasing arterial flow in the ipsilateral arm from 3 ± 0.3 ml/l 00m I/m in to 3.4 ±0.3 ml/IOOml/min ( n - 15). Neither ascorbic acid or oxypurinol altered blood flow responses.
ConfoundingFactors
Very low subject num bers and publication lacks detail with respect to protocol.
High doses administered. Exercise was utilised as a hypoxic stimulus. The latter 9 subjects received a nitrite infusion that contained sodium bicarbonate to titrate the pH to above pH 7.0, raising questions over the pH o f the initial infusion.
Escalating doses were utilised with no tim e to plateaux between each dose. Doses used are also high, escalating up to levelssignificantly higher than thephysiological range.
O=rp
T t
C/7
oTSn>a
o
a.>3o ’3
S'<o

nEfBT3vn
Publication Subjects Dose regimen M easurements Interventions Findings Confounding Factors
M a h e r et 40 P ro to co l A, n o rm o x ia . n“ 26 . F o rearm v e n o u s H y p o x ia w as N itrite w as cap ab le o f in d u cin g H y p o x ia w as *1rf)a t, 2 0 0 7 . S u b jec ts . S o d iu m n itrite w as in fused v o lu m e w as m easu red ind u ced by v e n o d ila ta tio n . w h ich a p p e ar to be ad m in iste red via a v
in tra b ra c h ia l a t the fo llo w in g by rad io n u c le o tid e ad m in istra tio u n c h a n g ed by the h y p o x ic m ask w h ich co u ldrS
e sca la tin g d o se s 4 0 . 100, 314 , 784 , p le th y sm o g ra p h y . n o f 12% in terv en tio n . In co n tra s t, n itrite in tro d u ce v a riab ility .n m o l/m in an d 3 .14 an d 7.84 F o rearm a rte ria l b lo o d o x y g e n via a in d u ced m u ch g rea te r c h a n g es in H y p o x ia i tse lf cau sesp m o l/m in e a ch fo r 3 0 m in u tes. How w as m easu red by
stra in g au g eface m ask c o n ta in in g a
arteria l flow in h y p o x ia c o m p a re d to n o rm o x ia .
v a scu la r c h a n g es w hich o c c u r o v e r
P ro to c o l B, h y p o x ia . n ~ 1 4 . 7 su b je c ts rece iv ed in trab rach ia l n itrite (7 .8 4 p m o l/m in fo r 2 0 m in s) in h y p o x ia fo llo w ed by the sam e in fusion in n o rm o x ia w ith a 60m in sa lin e in fu sio n in be tw een . A fu rth e r 7 su b je c t u n d e rw en t p ro to c o l B with a 3 l4 n m o l/m in in fusion .
p le th y sm o g ra p h y in b o th arm s, c h a n g e in flow in the s tu d y arm w as c o rrec ted for flow in the co n tra la te ra l arm an d e x p re sse d as a ratio . B lo o d sam p les w ere a lso tak en for n itr ic o x id e m etab o lite a ssessm en t.
tw o -w a yv alv e .
h o u rs, in th is s tudy su b je c ts w ere co n s id e red ‘h y p o x ic ' w hen a rteria l s a tu ra tio n had d ro p p ed to a stead y 83 -8 8 % .
M ack et al. 14 S ick le In tra -b ra c h ia l in fusion o f sodium F o rearm b lo o d flow o f N itrite in d u ced an in crease in fo rearm N o true co n tro l2 0 0 8 . cell n itrite a t the fo llo w in g esca la tin g the in fusion arm w as b lo o d flow in the s tu d y arm . su b jec ts, co n tro l d a ta
p a tie n ts (9 d o se s 0 .4 .4 and 40 p m o l/m l a t m easu red by strain R esp o n ses to n itrite in s ick le cell w as taken formI m ale , S 1 m l/m in fo r 5 m in u tes. gau g e p atien ts w ere b lu n ted c o m p ared to p rev io u s s tud ies w here
to fem ale). p le th y sm o g ra p h y . co n tro ls. S od ium n itrite in fu sio n w as n itrite d o seo well to le rated an d d id n o t cau se a d m in iste red w as0 0i B lood sam p le taken
form v e n o u s ca th e te rs o f b o th the in fusion and co n tra la te ra l arm .
h y p o ten s io n o r m eth a e m o g lo b in a e m ia .
d iffe ren t.
*33Ia3'V)o*-+»«-►=ro>Z—trt►go ’3
S'<<■o

Chapter Six Properties of the Nitrite Anion in vivo
6.1.1 Aims
Studying nitrite at basal level in vivo presents many complications, as with any
system it is often necessary to provoke it in some way in order to gain understanding
about the way it operates. The work o f chapter three presented in this thesis demonstrates
that the movement and levels o f circulating nitric oxide metabolites represents a dynamic
equilibrium in vivo, this chapter aims to investigate this dynamic and its physiological
consequences through increasing the circulating nitrite pool by way of a low dose
infusion. Specifically this chapter aims to:
• Assess the interaction between nitrite and erythrocytes with particular
respect to the mechanism o f nitrite induced vasoactivity in vivo.
• Investigate the relationship between plasma nitrite levels and
biochemical/physiological changes in the physiological concentration range.
• Consider the systemic properties and interactions o f nitrite.
• Examine the influence o f oxygen upon the metabolism and vasoactive
properties o f nitrite in the physiological concentration range.
- 2 0 9 -

Chapter Six Properties o f the Nitrite Anion in vivo
6.2 Specific Methods and Protocols
This body o f work was carried out in collaboration with Dr. Thomas Ingram. Dr
Ingram was responsible for securing ethical approval, aiding in the measurement of some
nitric oxide metabolites and analysing the forearm blood flow data that had been
collected.
6.2.1 Subjects
18 healthy male volunteers were recruited locally and all gave informed written
consent to participate. Female subjects were not included in the study because levels of
nitric oxide metabolites are known to be altered by circulating estrogens [448], leading to
cyclical variability which could be confounding. Other exclusion criteria included:
hypertension, hypercholesterolemia, diabetes mellitus, being a current smoker, taking
regular prescription drugs or having a family history o f premature coronary artery
disease. The experimental protocol and recruitment procedure were both approved by the
local research ethics committee.
All subjects were requested to refrain from consuming alcohol, caffeine and foods
with high nitrite/nitrate content (e.g. certain vegetables and red meat, which is often
preserved with high concentration nitrite [449]) for the 12 hours preceding experimental
testing. Detailed subject characteristics will be covered in the results section o f this
chapter.
6.2.2 The Environmental Chamber
To ensure accurate and consistent exposure to hypoxia all hypoxic studies were
carried out in a bespoke environmental chamber (Design Environmental, Ebbw Vale,
UK). The chamber is - I2 0 M 3 and is purged with a high flow o f nitrogen gas mix (via a
number of diffusers that create homogenous mixing) to achieve the desired hypoxic
environment (12% 0 2). The high flow o f gas ensures minimal changes in carbon dioxide
- 2 1 0 -

Chapter Six Properties o f the Nitrite Anion in vivo
level (within the atmospheric range expected at sea level) and that the chamber operates
at normobaric pressure. Because the chamber operates at normobaric pressure, it allows
investigators to enter and exit the chamber without causing significant changes in
chamber oxygen level. The chamber employs a number of highly sensitive, carefully
positioned sensors to constantly monitor and affect changes in temperature, oxygen level
and humidity within the chamber environment. For safety reasons, all parameters were
remotely controlled via an external computer running a custom program (Contour
program, Design Environmental, Ebbw Vale, UK) for control. The chamber was always
run at a constant temperature (see results section) and humidity. Corresponding normoxic
studies were carried out in a similar sized, temperature controlled room at normal
atmospheric oxygen level (21% O2).
6.2.3 Blood Collection and Measurement
Blood samples were collected from a catheter placed in the antecubital vein o f the
non-dominant arm. The same arm was also utilised for the measurement of blood flow,
this procedure involved the inflation o f cuffs around the arm to restrict blood flow,
therefore blood samples taken at specific time points were always collected before the
corresponding flow measurements were made, as cuff inflation will alter
flow/haemoglobin saturation and influence nitric oxide metabolite levels. Samples were
immediately analysed for blood gas readings, processed as per section 2.1.2 (page 80) and
snap frozen for future analysis.
Plasma and erythrocyte samples were rapid thawed for the measurement of
plasma nitrite, nitrate, RSNO/RNNO and haemoglobin bound species (HbNO and
HbSNO) respectively, utilising the ozone based chemiluminescence measurement
protocols detailed in section 2.3.4 (page 95). All samples were tested within one week of
collection.
-211 -

Chapter Six Properties o f the Nitrite Anion in vivo
6.2.4 Strain Gauge Plethysmography
After an initial assessment o f potential methodologies for the non-invasive
measurement o f forearm arterial blood flow, it became clear that strain gauge
plethysmography (SGP) not only represented the most repeatable method, but was well
suited to our study design.
During testing, the subject was in the seated position with the forearm resting
horizontally in a support to reduce unwanted movement. To quantify arterial inflow, a
cuff was first placed around the wrist and inflated to supra-systolic pressure (300mmHg),
a second proximal cuff was placed around the upper arm; this cuff can be rapidly inflated
using a rapid cuff inflator (E20, Hokanson) and air source (AG101, Hokanson). The
proximal cuff is inflated to above venous pressure, but below arterial pressure (50mmHg),
this abruptly stops venous outflow causing the volume o f the limb to increase due to
arterial inflow. A mercury strain gauge plethysmograph is placed between the cuffs,
around the forearm at the point o f largest circumference. The plethysmograph is used to
measure the volume change in the limb, the rate o f volume change being proportional to
arterial flow rate at the moment o f venous occlusion (Figure 6.1). A mercury
plethysmograph is chosen that is 2cm smaller than circumference of the largest part of the
forearm. The plethysmograph is connected to a EC6 interface (Hokanson, WA, USA),
which is routed through an analogue to digital converter (Powerlab, AD instruments) to a
laptop operating the data acquisition program, chart for windows (AD instruments).
Repeat measures were taken a minimum o f 6 times and the average of the 5 most
repeatable measurements was taken as a final reading, expressed as ml o f blood flow per
100ml of tissue, per minute (ml/lOOml/min).
- 2 1 2 -

Chapter Six Properties of the Nitrite Anion in vivo
1:20 1:401:00
Figure 6 .1. Example strain gauge plethysmography trace. The blue line indicates the section o f the trace
used to assess gradient which is proportional to arterial in-flow. The x-axis represents time and the y-axis,
arbitrary un its.
- 2 1 3 -

Chapter Six Properties o f the Nitrite Anion in vivo
6.2.5 Specific Protocols
The study was subdivided into three distinct protocols: the primary study, in which a
sodium nitrite infusion was administered in hypoxia and two control studies in which
saline was administered in hypoxia and sodium nitrite was administered in normoxia.
Details of the individual protocols are outlined below.
6.2.5.1 Hypoxia/Nitrite
12 subjects had all baseline measurements made in the chamber under normoxic (21%
FiCh) conditions before the chamber was sealed and the descent to hypoxia (12% FiC^)
was commenced. The chamber required 60 minutes to achieve 12% FiC>2, during which
time subjects relaxed and acclimatised. A period of 120 minutes at 12% FiC>2 followed,
this time allowed long term hypoxia induced haemodynamic changes (e.g. systemic
vasodilatation and tachycardia) to stabilise, achieving -90% of the maximum anticipated
[450]. Subjects then received a low dose nitrite infusion (Martindale Pharmaceuticals,
Brentwood, UK) (lpmol/mL @ lmL per min for 30 minutes) to raise systemic plasma
nitrite levels by approx. 100% (at peak). Blood samples and measurement of forearm
blood flow were taken throughout (summarised in Figure 6.2).
-2 14 -

Chapter Six Properties of the Nitrite Anion in vivo
21% F i0 2
Nitrite/SalineInfusion
Protocol(s)
1 1 1 1 1 1 I I I0 15 30 45 60 120 180 195 21
t t t t t t t t ‘
Blood Flow i A A A A i Measurement
10 225 210 270 Hypoxia/Saline
l i t t
1 t t21% F i0 2
10
Blood Sample f Taken 1
Blood Flow | M easurement »
Jo J 1 1
1 1
Normoxia/Nitrite5 60 75 105
f i t t
t t t
Figure 6.2. Schematic o f study protocols. Upper panel shows hypoxia/nitrite and hypoxia/saline protocols,
lower panel shows normoxia/nitrite protocol where the initial 3 hours o f equilibration (necessary in the
hypoxic protocol) is omitted. Red and blue arrows indicate time points at which blood samples and blood
flow measurement were taken respectively. Grey infill denotes period o f nitrite/saline infusion.
6.2.5.2 Hypoxia/Saline
An additional 6 subjects underwent the full hypoxia protocol as per 6.2.5.1 but received
an equivalent volume of medical grade saline 0.9% w/v (Figure 6.2, upper panel).
6.2.5.3 Normoxia/Nitrite
6 of the subjects recruited for the hypoxia/nitrite protocol were also recruited for a second
time to participate in a normoxia/nitrite protocol. Subjects essentially underwent the same
protocol as in 6.2.5.1 (receiving the same dose of sodium nitrite) but the protocol was
carried out in normoxia with the initial 3 hour equilibration period omitted (Figure 6.2,
lower panel). Subjects had a 30 minute rest period before the measurement protocol was
commenced.
- 2 1 5 -

Chapter Six Properties o f the Nitrite Anion in vivo
6.2.6 In vitro Nitrite Addition to Erythrocytes
To compare the exposure o f erythrocytes to nitrite via infusion in the in vivo setting,
parameters of interest were also assessed in an ex vivo experimental model, designed to
replicate aspects of the conditions found in vivo. Erythrocytes were collected from
healthy volunteers as previously stated (section 2.1, page 80). Separated erythrocytes
were reconstituted in PBS to give a final haemoglobin concentration o f lOg/dL, the mix
was then placed in a thin film rotating tonometer as previously described (section 2.2,
page 81). A nitrogen purge was utilised to alter the haemoglobin saturation to -50% ,
which was confirmed using a blood gas analyser (OSM3, Radiometer, Copenhagen). The
mix was then separated into aliquots and nitrite o f varying concentrations (up to 850nM
final) was added and incubated for 30 minutes at 37°C before centrifugation (10,000g for
2 minutes). Erythrocyte and supernatant fractions were snap frozen immediately and
stored for future analysis. Upon rapid thawing erythrocyte and supernatant fractions were
assessed for nitrite and HbNO levels as per section 2.3.4 (page 95).
6.2.7 Analysis and Statistical Analysis
Testing between groups was performed using either the student t-test (either paired or
unpaired where appropriate) or an analysis o f variance (ANOVA) (repeat measures
ANOVA where appropriate) with a Bonferroni post hoc test. To assess correlations the
Pearson’s correlation coefficient was used. Data are presented as means and error bars
represent the standard error o f the mean (SEM). Plasma nitrite half-life was calculated
using all data from peak infusion point to 60 minutes post infusion cessation. A P value of
less than 0.05 was taken to be significant, individual significance levels are indicated
within the figure legends. All analysis was performed blinded. ‘No significance’ is
abbreviated to ‘N S’ in some cases. The grey bar in the background o f all graphs
represents the 30 minute period of sodium nitrite or saline infusion.

Chapter Six Properties o f the Nitrite Anion in vivo
6.3 Results
6.3.1 Subject Characteristics
General subject characteristics are detailed in table 6.2 below.
Table 6.2. Summary o f subject characteristics.
Mean Standard Error of Mean
Age (years) 24.2 ± 1.0
Height (cm) 180 ± 1.7
Mass (kg) 78.6 ±2.2
BMI 24.3 ±0.6
Hb (g/dL) 16.4 ±0.3
Participants (n)
Hypoxia/Nitrite 12
Hypoxia/Saline 6
Normoxia/Nitrite 6(note, paired from
hypoxia/nitrite protocol)
- 2 1 7 -

Chapter Six Properties of the Nitrite Anion in vivo
6.3.2 Cham ber Param eters
The environmental chamber provided a controlled atmosphere, with constant
temperature throughout the time course o f the experiment (Figure 6.3). The chamber
required 60 minutes to attain a steady 12% FiC>2 baseline (coming down from 21% O2)
and remained constant for the duration o f the experiment, during which time subjects
‘acclimatised’ to the environment.
25-1 r 28
20 - -26
CM ACo 15-
u_10 -
-24
-22T—-205
L 180«
0 240 270Time (Minutes)
3■o<D0)#-*co
Fi02Temperature
-20 o
Figure 6.3. FiC>2 drops significantly until levels reach 12.0% oxygen after 60 minutes. Over the rest o f the
protocol, oxygen levels are maintained at 12.05 with no significant change. Time point compared by
ANOVA and Bonferroni post test, n=18. Temperature level does not change significantly over the course of
the protocol (mean temperature 21.6 °C ± 0.1), n=18. Shaded area represents period o f nitrite/saline
infusion.
- 2 1 8 -

Chapter Six Properties o f the Nitrite Anion in vivo
6.3.3 Haemodynamic Parameters
Haemodynamic parameters were continually checked throughout all study
protocols for scientific interest but also for safety i.e. to monitor subject well being. Both
study protocols that were carried out in hypoxia significantly increased heart rate over the
initial 3 hours o f the protocol. Once a plateau rate was achieved, no significant changes
were observed over the rest o f the protocol, including pre-, during and post-nitrite/saline
infusion (figure 6.4A and C). Heart rate in the normoxic protocol decreased significantly
over the course o f the entire protocol as subjects relaxed. It should be noted that heart rate
remained unchanged during the infusion period (Figure 6.4E). Within the accuracy o f the
equipment used, blood pressure (systolic and diastolic) remained unchanged throughout
all study protocols (Figure 6.4B, D and F).
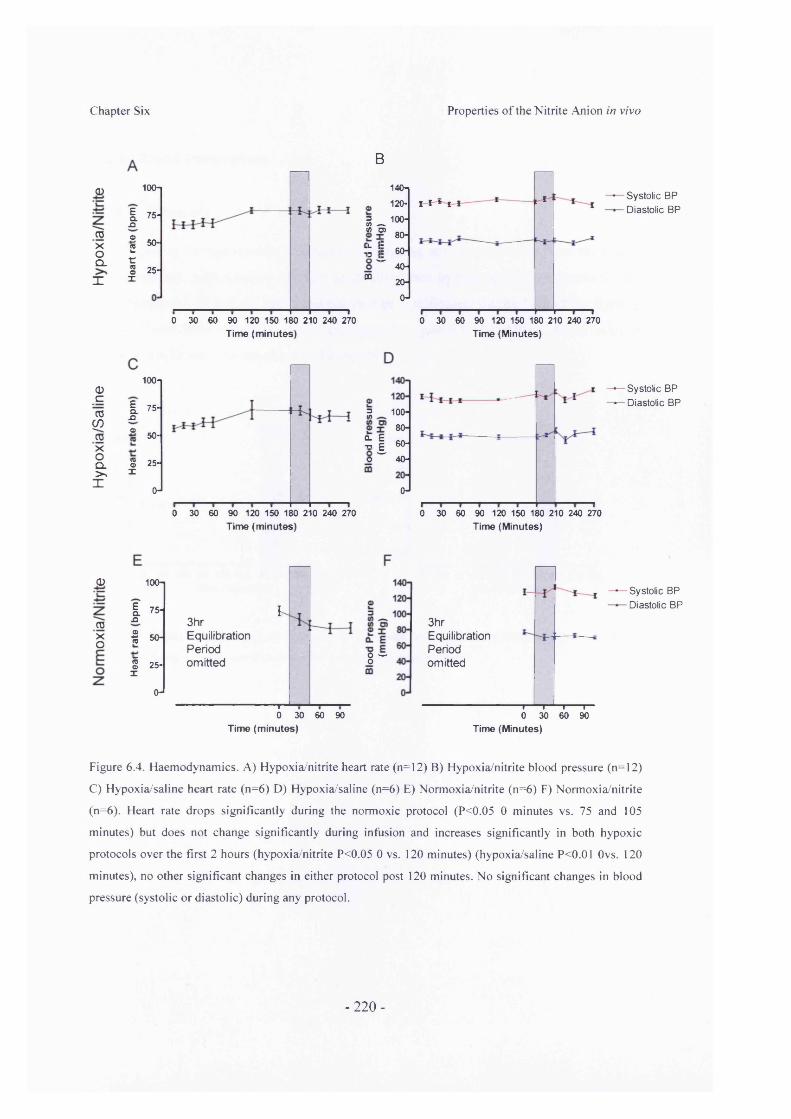
Chapter Six Properties of the Nitrite Anion in vivo
d)
TOxoQ.X
<D_croCOToXoCl>>X
100-1
I ».q
o- 50-2 t:S 25-
X
0 30 60 90 120 150 180 210 240 270
B
Ean®
§x
3(A .—. « O)
140n
120-
100-
80-
% \ - 40-
CQ 20-
0-
£I I * i l LSystolic BP
- Diastolic BP
Time (m inutes)0 30 60 90 120 150 180 210 240 270
Time (Minutes)
100-1— Systolic BP — Diastolic BP75- 5 100-
80-
S I so-O " " 40-
50-
25-
0-1 O-10 30 60 90 120 150 180 210 240 270 0 30 60 90 120 150 180 210 240 270
Time (m inutes) Time (Minutes)
<D
TOXo
100-
I 75.Q
<D15 50-
IoX
25-
0-
3hrEquilibrationPeriodomitted
I
8 w
---------------r0 30 60 90
Time (m inutes)
3hrEquilibrationPeriodomitted
Systolic BP Diastolic BP
i » i r-0 30 60 90
Time (Minutes)
Figure 6.4. Haemodynamics. A) Hypoxia/nitrite heart rate (n=12) B) Hypoxia/nitrite blood pressure (n=12)
C) Hypoxia/saline heart rate (n=6) D) Hypoxia/saline (n=6) E) Normoxia/nitrite (n=6) F) Normoxia/nitrite
(n=6). Heart rate drops significantly during the normoxic protocol (P<0.05 0 minutes vs. 75 and 105
minutes) but does not change significantly during infusion and increases significantly in both hypoxic
protocols over the first 2 hours (hypoxia/nitrite P<0.05 0 vs. 120 minutes) (hypoxia/saline P<0.01 Ovs. 120
minutes), no other significant changes in either protocol post 120 minutes. No significant changes in blood
pressure (systolic or diastolic) during any protocol.
-220-

Chapter Six Properties of the Nitrite Anion in vivo
6.3.4 Blood Parameters
6.3.4.1 Blood pH
Due to the susceptibility of nitrite undergoing acid disproportionation, the effects
of hypoxia and nitrite/saline infusion upon blood free hydrogen ion concentration (pH)
were monitored. Blood pH levels did not change significantly during both of the hypoxic
protocols and remained above pH 7.3 throughout (Figure 6.5). In addition, the infusion of
saline or nitrite also had no effect on blood pH.
7.60*i
7.50-
7.40*
7.30-
7.20J
0 30 60 90 120 150 180 210 240 270
7.60-I
7.50-
7.40-
7.30-
7.20-J
0 30 60 90 120 150 180 210 240 270Time (m inutes) Time (m inutes)
Figure 6.5. Changes in blood pH. A) Hypoxia/nitrite protocol (n=10) B) Hypoxia/saline protocol (n=4). No
significant changes in pH were observed over the course of either protocol.
-221 -

Chapter Six Properties o f the Nitrite Anion in vivo
6.3.5 Blood Gas Analysis
All blood samples taken underwent blood gas analysis to monitor the result of
hypoxic exposure. In both hypoxic protocols, venous pC>2 dropped from ~30mmHg to
~20mmHg after 60 minutes chamber exposure (Figure 6.6A and C). Once p02 levels had
decreased (within 60 minutes), the level remained unchanged over the remaining period
o f the protocol. Similarly, capillary haemoglobin oxygen saturation decreased from 97.75
± 0.2% to 87.67 ± 1.0% (0 vs. 60 minutes, P<0.001, minimum of 82.0 ± 2.4% at 180
minutes) during the hypoxia/nitrite protocol and from 97.83 ± 0.4% to 87.16 ± 0.6% in
the hypoxia/saline protocol (Figure 6.6B and D). Venous haemoglobin saturation during
the normoxia protocol did not significantly change throughout the protocol and had an
average value o f 69 ± 2.5%.
- 2 2 2 -

Chapter Six Properties of the Nitrite Anion in vivo
<l)
roxoCL>>X
45- O) 40- | 35* E_ 30-
25- o . 20- § 15-O 10-
2 5-o-i
0 30 60 90 120 150 180 210 240 270
100-
CM
O 90- n x >. 80- re=5. 70- (05 -
50-*
0 30 60 90 1 20 150 180 210 240 270Time (minutes) Time (minutes)
<D"ajCOroxoCL
X
45-o>I 40-
E 35-£ 30-CM 25-
2 20-Cft3 15-Oc 10-S 5-
o-l
h
i i----- 1— i--- r30 60 90 120 150 180 210 240 270
Time (minutes)
D
aO
100-1
90-
80-
70-
60-
50-1
0 30 60 90 120 150 180 210 240 270Time (minutes)
(D100-1
90-
3hrEquilibrationPeriodomitted
80-
70-
60-
50-1
0 30 60 90Time (minutes)
Figure 6.6. Changes in blood oxygen levels. A) Hypoxia/nitrite protocol, venous p 0 2 levels (n=10). p 0 2
level decreases significantly after 120 minutes and remains at this the decreased level over the remaining
protocol (0 vs. 120-270 minutes P<0.05), B) Hypoxia/nitrite protocol, capillary haemoglobin oxygen
saturation (n=12). Saturation levels decrease after 60 minutes and remain at a reduced level over the
remaining protocol (0 vs. 60-270 minutes P<0.05) C) Hypoxia/saline protocol, venous p 0 2 levels (n= 4).
p 0 2 level decreases significantly after 60 minutes and remains at this the decreased level over the remaining
protocol (0 vs. 60-270 minutes P<0.05) D) Hypoxia saline protocol, capillary haemoglobin oxygen
saturation (n=6). Saturation levels decrease after 45 minutes and remain at a reduced level over the
remaining protocol (0 vs. 45-270 minutes P<0.05). E) Normoxia/nitrite protocol, venous haemoglobin
oxygen saturation (n=6). No significant changes throughout protocol.
- 2 2 3 -

profile for each of the nitric oxide metabolite species. In this way, the conclusions dra
were not based on a single measurement and kinetic information was gained regarding
metabolism of the infused nitrite.
6.3.6.1 Plasma Nitrite
The initial descent to hypoxia over 60 minutes appears to cause an increase
plasma nitrite concentration in both hypoxia study protocols. However, the increase v
not found to be statistically different from the baseline, pre-hypoxia level (Figure 6.
and C) as the study was not powered to investigate such small changes in level,
investigate the effects of a modest increase in plasma nitrite, a low dose infusion \
given over 30 minutes, this elevated plasma nitrite levels in both the normoxia/nitrite <
hypoxia/nitrite protocols (Figure 6.7A and C). Nitrite infusion in the hypoxia/niti
protocol significantly increased levels (180 vs. 195 minutes P<0.001, 180 vs.
P<0.001) with plasma nitrite level being doubled at peak compared to pre-infusion lev<
from 191 ± 12.30nM (180 minutes) to 396 ± 26.38nM (210 minutes), representing a de
change of ~205nM. Plasma nitrite level then returns to baseline 60 minutes after cessati
of infusion (180 vs. 270 minutes, NS).
Plasma nitrite level in the normoxia/nitrite protocol is also increased significan
with infusion (0 vs. 30 P<0.05 and 0 vs. 45 P<0.001) by an amount similar to tl
observed in the hypoxia/nitrite protocol, a change o f 206.3 ± 36.6nM from baseline
peak (0 vs. 45 minutes) (Figure 6.7C). As in the hypoxia/nitrite protocol, plasma niti
levels in the normoxia/nitrite protocol return to baseline within 60 minutes o f infusi
cessation (0 vs. 105 minutes, NS).
- 2 2 4 -

Chapter Six Properties of the Nitrite Anion in vivo
BG)
_C"roCO
xoQ.>X
450- S 400- S 350- 2 300- 2 250- Z 200- re 150-
100-
i 50- 0-
i-----1-----1-----1-----1-----r0 30 60 90 120 150 180 210 240 270
Time (m inutes)
i 1-----1-----1-----i-----1----- r— i0 30 60 90 120 150 180 210 240 270
Time (m inutes)
<1)
gjXoE
450- S 400-— 350- 2 300- £ 250- z 200- <2 150- w 100-
i 0-
3hrEquilibrationPeriodomitted ,
/
0 30 60 90Time (m inutes)
Figure 6.7. Change in plasma nitrite concentration in all three study protocols A) Hypoxia/nitrite protocol.
Plasma nitrite increases significantly when infusion is given (180 vs. 195 minutes P 0 .0 0 1 , 180 vs. 210
minutes P<0.001) and returns to baseline 60 minutes after cessation of infusion (180 vs. 270 minutes, NS).
Although the initial exposure to hypoxia itself seems to increase plasma nitrite levels the observation is not
statistically significant (0 vs. 30 minutes and 0 vs. 180 minutes both NS) (n=12) B) Hypoxia/saline
protocol. No significant changes throughout protocol (n=6). C) Normoxia/nitrite protocol. Plasma nitrite
increase significantly with infusion (0 vs. 30 minutes P<0.05 and 0 vs. 45 minutes P<0.001) which returns
to baseline within 60 minutes of infusion cessation (0 vs. 105 minutes, NS) (n=6).
- 2 2 5 -

Chapter Six Properties o f the Nitrite Anion in vivo
6.3.6.2 Haemoglobin Bound Species
Infusion of low dose sodium nitrite in the hypoxia/nitrite protocol significantly
increased HbNO levels, but only after 30 minutes o f infusion (180 vs. 195 minutes NS,
180 vs. 210 minutes P<0.001) (Figure 6.8A). Overall, HbNO concentrations increased
from 106 ± 19.2 nM to 237 ± 58.4 (180vs. 210 minutes). Interestingly, the level rapidly
returned to pre-infusion baseline within 15 minutes post infusion cessation (180 vs. 225
minutes, NS). HbSNO concentration appeared to be increased by the infusion o f sodium
nitrite, however the increase was not found to be statistically significant (180 vs. 210
minutes, NS) (Figure 6.8B).
An identical 30 minute infusion given during the normoxia/nitrite protocol caused
a moderate increase in HbNO levels, however the increase only became statistically
significant 15 minutes post infusion cessation (28.9 ± 12.4 nM at time 0 vs. 96.6 ± 22.1
nM at time 60, P<0.05). No change in HbSNO level was observed during the
normoxia/nitrite protocol (Figure 6.8F). Both haemoglobin bound species remained
unchanged throughout the hypoxia/saline protocol (Figure 6.8C and D).

Chapter Six Properties o f the Nitrite Anion in vivo
0
roxoQ.>»X
0cro
COgixoQ.>X
350-
O 300- £ 250-
i r 2o°-o E 150- o
100-
50-
0-|LU
B
30 60 90 120 150 180 210 240 270 Time (minutes)
350q300-250-
0 30 60 90 120 150 180 210 240 270Time (minutes)
0 srf ia- 7 I
350-300-
250-200-2 S
S ' S 150-
! 100-B 50-Uj ^
0-
3hrEquilibrationPeriodomitted
i---------------r
0 30 60 90Time (minutes)
</)n
u
UJ
100n
75-
50-
25-
(H0 30 60 90 120 150 180 210 240 270
DozV)aT.i l
UJ
tonIo' S
UJ
100-
75-
50-
25-
0-
Time (minutes)
100-1
75-
50-
25-
0-10 30 60 90 120 150 180 210 240 270
Time (minutes)
3hrEquilibrationPeriodomitted
h
0 30 60 90Time (minutes)
Figure 6.8. Changes in haemoglobin-bound species in all three protocol groups. A) Hypoxia/nitrite
protocol, HbNO concentration levels. When nitrite infusion commences, levels increase but do not become
significant until 30 minutes of infusion have been given (180 vs. 195 minutes NS, 180 vs. 210 minutes
P<0.001) and then return to pre-infusion baseline within 15 minutes o f infusion cessation (180 vs. 225
minutes NS) (n=12). B) Hypoxia/nitrite protocol, HbSNO concentration levels. Although they appear to rise
during infusion, levels do not change significantly during the protocol (n=12). C) and D) Hypoxia/saline
protocol, HbNO and HbSNO concentration levels. Levels o f both species did not change significantly
during the protocol (n= 6 in both cases). E) Normoxia/nitrite protocol, HbNO concentration levels. Levels
do rise moderately but do not become significant until 15 minutes post infusion cessation (0 vs. 60 P<0.05)
(n=6). F) Normoxia/nitrite protocol, HbSNO concentration levels. Levels do not change over the course of
the protocol (n=6).
- 2 2 7 -

Chapter Six Properties o f the Nitrite Anion in vivo
6.3.6.3 Plasma Nitrate and RSNO/RNNO
Levels of plasma nitrate did not change significantly during either o f the hypoxia
protocols (Figure 6.9A, C and E). Levels o f plasma RSNO/RNNO did not change
significantly during any of the three protocols (Figure 6.9B, D and F).
- 2 2 8 -

Chapter Six Properties of the Nitrite Anion in vivo
ICOXoQ.>%X
50-45-40-35-30-2520-1510-
ii+H
~r ■ - 130 60 90 120 150 180 210 240 270
B
50-io 45-zz 40-s 35-o 30-z£
5e 25-jr 20-re 15-Ere
10-5-a. o-l
Time (m inutes)
r i i i r30 60 90 120 150 180 210 240 270
Time (minutes)
0c03
COTOXoCL>
X
5 35"I 3°.“ 25- reE 20-toJS 15- “ ■ 10-
0 30 60 90 120 150 180 210 240 270
D
co
50-i45-40-35-30-
| 2 5 -20-15-10-5-o-l
0 30 60 90 120 150 180 210 240 270Time (m inutes) Time (minutes)
0)•C
TOXo
50- * 4 6 -
X 40-033 35-■e 30-
I 25-<0E 20- 2 15- “■ 10-
3hrEquilibrationPeriodomitted
Y
-i— i— i— i—0 30 60 90
„ 50-O 45- | 40-¥ 35-0 _ 30-| 1 25_ E — 20-re 15-1 10-2 5- “■ 0-*
3hrEquilibrationPeriodomitted A .nr
i i——i--- i—0 30 60 90
Time (m inutes) Time (minutes)
Figure 6.9. Changes in plasma nitrate and RSNO/RNNO concentration over all 3 protocols. A)
Hypoxia/nitrite protocol, plasma nitrate concentration (n=12) B) Hypoxia/nitrite protocol, plasma
RSNO/RNNO level (n=12) C) Hypoxia/saline protocol, plasma nitrate (n=6) D) Hypoxia/saline protocol,
plasma RSNO/RNNO concentration (n=6) E) Normoxia/nitrite protcol, plasma nitrate concentration (n=6)
F) Normoxia/nitrite protcol, RSNO/RNNO concentration (n=6). No statistically significant changes in
nitrate or RSNO/RNNO concentration levels throughout any o f the protocols.
- 2 2 9 -

Chapter Six Properties o f the Nitrite Anion in vivo
6.3.7 Forearm Blood Flow
To assess the physiological effect o f nitric oxide metabolite manipulation through
nitrite infusion, forearm blood flow was measured at specific time points during all three
study protocols. Infusion o f sodium nitrite in the hypoxia/nitrite protocol increased
forearm blood flow significantly (180 vs. 195 minutes, p<0.05. 180 vs. 210 minutes,
p<0.001) (Figure 6.10A). The increased flow returned to baseline 60 minutes after
cessation o f infusion (180 vs. 270 NS). In both the hypoxia/saline and normoxia/nitrite
protocols blood flow remained unchanged throughout (Figure 6.10B and C). Forearm
blood flow was not statically different at the beginning o f the protocol (0 minutes) or at
the pre-infusion point (180 minutes) between groups.
- 2 3 0 -

Chapter Six Properties o f the Nitrite Anion in vivo
<1>
CDXOQ->s
X
° 4.0-
I . ? 3'5'DO £ 3.0-
? 1 2.5-
$ I 2.0-
1 ,0-0 30 60 90 120 1 50 180 210 240 270
Time (m inutes)
03croco"toXoQ.
X
i 4 ° -■§ _ 3.50 .£CO £ 3.0-
I I «I I 2.CU r ,1 1 0-
0 30 60 90 120 150 180 210 240 270Time (m inutes)
0)
CDXo
■§ - O .E 3 -5 E
| I 2-|tr °I I 1So 0
3hrEquilibration ,Periodomitted
----------------- 1— 1 1 r-0 30 60 90
Time (m inutes)
Figure 6.10. Changes in forearm arterial blood flow in all three protocols. A) Hypoxia/nitrite protocol.
Forearm blood flow increased significantly during the infusion period (180 vs. 195 minutes, P<0.05 and
180 vs. 210 minutes, P<0.001) and returned to baseline 60 minutes after cessation of infusion (180 vs. 270
NS) (n=12). B) Hypoxia/saline protocol, no significant changes throughout protocol. (n=6) C)
Normoxia/nitrite protocol. No significant change in forearm blood flow throughout protocol (n=6). No
significant difference in forearm blood flow starting values (0 minutes) or pre-infusion (180/15 minutes)
values between all groups.
- 2 3 1 -

Chapter Six Properties o f the Nitrite Anion in vivo
6.3.8 Further Interpretation and Comparison
To compare the effect o f sodium nitrite infusion on the dynamics o f plasma nitrite
level in hypoxia and normoxia, the profile o f metabolites in each protocol was plotted
(Figure 6.11). The profiles can be seen to be offset, as subjects who participated in the
hypoxia protocol had a slightly elevated plasma nitrite pre-infusion value compared to
their pre-hypoxia, normoxic baseline values and the levels exhibited by the normoxic
controls, however a comparable hypoxia-induced elevation was also observed in those
who participated in the hypoxia/saline protocol.
a> 300-£ 250-Z 200-oj 150-
l -------- 1----- 1------ 1 I15 30 45 60 75 90
Time (minutes)
Hypoxia/NitriteNormoxia/Nitrite
Figure 6.11. The time-corrected change in plasma nitrite level from commencement o f sodium nitrite
infusion to one hour post cessation o f infusion in the hypoxia/nitrite and normoxia/nitrite protocols.
Interestingly, the half-life o f plasma nitrite was calculated to be 21.7 ± 2.9 min in
hypoxia and 21.3 ± 3.4 min in normoxia (Figure 6.12). This parallel can be seen visually
by comparison o f the profiles o f plasma nitrite in normoxia and hypoxia that are similar,
both in terms o f elevation and decay (Figure 6.11).

C h a p te r Six Properties of the Nitrite Anion in vivo
Hypoxia/Nitrite Normoxia/Nltrite Protocol
F ig u re 6.12. Plasma nitrite half-life post infusion cessation in both hypoxia/nitrite and normoxia/nitrite
pro tocols. Hypoxia/nitrite average =21.7±2.9 minutes, (n=12). Normoxia/nitrite average T1/2=21.3±3.4
m inu tes, (n=6).
8Q.V)«T3XOo
450i400-350-300-250-200-
150-100-
50-
60 75 900 15 30 45
3.00
2.75
2.50
2.25
2.00
•n 23 °O CD^ 2J
n> CD> -iL ^' ro
CL
Plasma NitriteFBFHbNO
Time (minutes)
F igure 6.13. Profile o f plasma nitrite, HbNO and forearm blood flow changes in the hypoxia/nitrite protocol
du rin g and 60 minutes post nitrite infusion.
- 2 3 3 -
14933224

Chapter Six Properties o f the Nitrite Anion in vivo
To evaluate potential links between nitric oxide metabolites and altered
physiology within a given protocol, the profile o f change in each parameter was plotted
together (Figure 6.13). In the hypoxia/nitrite protocol, the change in plasma nitrite
concentration and change in forearm blood flow appear to follow a similar profile.
Conversely, HbNO levels in the same protocol appear to rise in response to nitrite
infusion, but only after a delay and then return to baseline upon cessation of nitrite
infusion. The relationship between these parameters can be considered by correlating one
against another (Figure 6.14) Plasma nitrite concentration correlates positively and
significantly with forearm blood flow in the hypoxic environment (Pearson r= 0.43,
p<0.0001) (Figure 6.14A) but not in the normoxic environment (Pearson r=0.032) (Figure
6.14C). In both the hypoxia/nitrite and the normoxia/nitrite protocols, HbNO levels did
not correlate with forearm blood flow (Pearson r= 0.069, NS and-0.143, NS, respectively)
(Figure 6.14B and D).
- 2 3 4 -

Chapter Six Properties of the Nitrite Anion in vivo
<D
TOXoQ.>%X
600-
i 500-
aT 400-
i 300-
| 200- re 100-
0-
F orearm Arterial B lood F low (m l/100m l/m in)
B2
450-c 400-
350-oz 300-■OX 250-
re 200->. 150- ok--C 100-
50-UJ 0-
:*V .
Forearm Arterial B lood Flow (m l/100m l/m in)
<D
TOXoE
600-
| 500-
'o 400-
■| 300-
re 200-
re 100- Q.
0-I—
1.0T ”
1.5—T—2.0
—r—2.5
—I3.0
Forearm Arterial B lood Flow (m l/100m l/m in)
200-
0 150‘ z.DE. 100-re1 50- ££LU 0-
1.0—r—1.5
—T—2.0
—I—2.5
—l3.0
Forearm Arterial B lood Flow (m l/100m l/m in)
Figure 6.14. Correlations of nitric oxide metabolites with forearm blood flow in the hypoxia/nitrite and
normoxia/nitrite protocols. A) Hypoxia/nitrite protocol, plasma nitrite concentration significantly correlates
against forearm blood flow (Pearson’s r=0.432, PO.OOOl, n=93) B) Hypoxia/nitrite protocol, HbNO
concentration does not correlate with forearm blood flow (Pearson’s r= 0.069, NS, n=93) C)
Normoxia/nitrite protocol, plasma nitrite concentration does not correlated with forearm blood flow
(Pearson’s r=0.032, NS, n=30) D) Normoxia/nitrite protocol, HbNO concentration does not correlated with
forearm blood flow (Pearson’s r=-0.215, NS, n=30).
- 2 3 5 -

Chapter Six Properties o f the Nitrite Anion in vivo
To further consider the interesting observation that HbNO levels only increased
after an initial lag and then rapidly decreased when the nitrite infusion ended, the
relationship between HbNO levels and plasma nitrite levels was examined. The
correlation between HbNO and corresponding sample plasma nitrite (all samples taken
from the hypoxia/nitrite group over full hypoxic protocol including baseline and infusion)
although correlate well together (Pearson’s r=0.601), appear to become positive only at
higher plasma nitrite concentrations (Figure 6.15 A).
To explore this observation in more detail, ex vivo erythrocyte samples were
subjected to similar, but more controlled conditions in the laboratory. In an aim to mimic
venous haemoglobin saturation o f the in vivo hypoxic protocols, erythrocytes were
adjusted to 50% haemoglobin oxygen saturation for experimentation. A correlation
between HbNO and corresponding extracellular nitrite in this setting also became more
prominent at higher extracellular nitrite levels (Figure 6.15B) as seen with the samples
collected from the in vivo study. Indeed, intra erythrocyte HbNO levels appeared
unchanged despite varying extra-cellular nitrite concentration within a physiological
range (50-200nM) (Figure 6.15B).

Chapter Six Properties of the Nitrite Anion in vivo
400-350-300-250-200-
150-100-
50-
0-
1 . B\mm /'-i ' -
— I----------- 1—100 200
— I—300 400 500 600
Plasm a [Nitrite] nM
B400-350-300-250
200-
150-
100-
50-0-
, . \ ,i
f
—i—100
— i—200
— I—300
— I—400
— i—500
—I600
Extracellular [Nitrite] nM
Figure 6.15. Correlations o f plasma/extracellular nitrite concentration vs. corresponding HbNO
concentration. A) Samples generated in vivo during the hypoxia/nitrite protocol (in hypoxia only)
(Pearson’s r=0.601, P<0.0001, n=137). B) Samples generated ex vivo after adjusting haemoglobin
concentration to lOg/dL (10.3±0.17) and saturation to 50% (50.3±0.8) followed by incubation with varying
extracellular nitrite concentrations (up to 850nM) for 30 mins at 37°C (Pearson’s r=0.82, P<0.0001, n=103).

Chapter Six Properties o f the Nitrite Anion in vivo
6.3.9 Forearm Blood Flow Observer Variation
To validate assessment o f the strain gauge plethysmography data used to compare
forearm arterial blood flow, a comparison o f data analysed by one observer against a
second observer (Figure 6.16A) and a comparison o f two repeat analyses made by the
same observer (Figure 6.16B) were made using Bland-Altman plots. The bias in both
inter and intra observer measurements was minimal, however the inter-observer plot did
show a trend for over estimation at higher average forearm blood flows by observer 2. All
data presented in the chapter was therefore taken from observer 1, including the intra
observer variability on repeat measures (Figure 6.16B), which shows very little bias.
2.5-12.0-1.5-
o 1.0-oc 0.5-om 0.0-5= -0.5-Q -1.0-
-1.5--2.0--2.5-
■ * . iv » 5 - r J -
Average
B0.75-1
0.50-
« 0.25-
1 0.00-
| j -0.25-
° -0.50-
-0.75-
- 1.00-4.03.53.02.51.5 2.0
BiasSD of bias95% Limit of agreement
From To
BiasSD of bias95% Limit of agreement
From To
-0.2857100.592783
-1.447560.876145
-0.05876670.278843
-0.6052990.487765
Average
Figure 6.16. Bland-Altman plots o f forearm blood flow measurements A) Inter-observer variability, bias
between observer 1 and observer 2 is minimal but does show a trend at higher average blood flows,
(n=140). B) Intra-observer variability, repeated measures made by observer 1, (n=30). Solid line from y-
axis indicates bias level, broken lines indicate upper and lower 95% agreement limits.
- 2 3 8 -

effects o f low dose nitrite supplementation in hypoxic human subjects and to considei
mechanisms o f nitrite processing at low, near basal plasma nitrite levels.
In comparison to the controlled in vitro experiments of a laboratory, completi
study in human subjects can introduce considerable variability. The collection of acci
data for this chapter required the testing protocols to be very controlled. Initially,
pilot studies were completed to hone the protocols and develop data and sar
collection. Efforts to accurately control variables of the experimental procedure cer
on the hypoxic exposure and thus the environmental chamber. Unlike a face mask,
environmental chamber provided a very effective method of producing contrc
hypoxia and allowed for a measured equilibration period for hypoxia indi
physiological changes to take place. The importance o f controlling the hypoxia expo
with an equilibration period became apparent when the data was analysed. In additic
the haemodynamic changes expected in hypoxia, nitric oxide metabolite levels
appeared to be influenced. During the initial 60 minute descent from a FiC>2 of 21'
12% nitric oxide metabolite levels, plasma nitrite in particular appeared to transie
increase before dropping to a stable, but elevated baseline prior to the infusion pei
Although the change did not reach statistical significance, as a result of the study
being powered to assess these low level changes, a corresponding change in c
metabolites suggests the result to be genuine. The exact mechanism behind
observation is unclear, however it is possible that hypoxic exposure may influ
vascular activity, which could occur at many signalling levels including j
transcription, as shown in chapter 4. In this respect, nitric oxide metabolite levels 1
been shown to be increased in groups that inhabit high-altitude areas where atmospf
oxygen levels are low compared to those living at sea level [451].
- 2 3 9 -

nitrite elevation and decay (half-life) was very similar in both the hypoxia/nitrite
normoxia/nitrite protocols. This suggests that nitrite was processed at the same ra
both cases, however, given that physiological effects are observed during
hypoxia/nitrite protocol only, the route o f processing or metabolism clearly mus
different in the two settings.
The mechanism of nitrite-induced vasodilatation appears to be dependent on
key factors: oxygen level and plasma nitrite concentration. Each of these factors wi
discussed with respect to the current suggested mechanisms of activation and findin:
this chapter.
The activation o f nitrite in vivo has thus far been attributed to one of two typ
mechanism, those involving haemoglobin reduction [337] and those involving redu
by tissue enzymes [397]. Nitrite reduction by haemoglobin in vivo is thought t
maximal when haemoglobin is 50% saturated with oxygen [338]. Under nonr
conditions, the haemoglobin o f circulating erythrocytes is unlikely to be de-saturat<
the 50% level, therefore this route o f metabolism and potential source of nitric c
generation is improbable. In contrast, when subjects are exposed to hypoxia, the lev
inspired oxygen could potentially drop sufficiently for a proportion of 50% ox
saturated haemoglobin to occur at specific points in the circulation. Consequently,
mechanism of nitrite reduction could be up-rated in hypoxia and thus may pro
sufficient nitric oxide to alter vessel tone, in apparent agreement with the fine
presented in this chapter. However, the same is true of the oxidoreductase en2
mechanism. In situations where oxygen is plentiful, oxidoreductase enzymes, sue
aldehyde oxidase and xanthine oxidase will catalyse reactions between their no
substrates, conversely, in hypoxic conditions these enzymes will more readily catalysi
- 2 4 0 -

work carried out with very high dose nitrite infusion and is based on the assumption
increases in HbNO levels are a marker o f nitrite interaction with haemoglobin and
potential reduction of nitrite to nitric oxide [337, 379]. The findings of these publicat
show that plasma nitrite, HbNO and changes in blood flow all correlate well with
another after high, incremental nitrite dosing.
A potential role for erythrocytes has previously been implicated from
observation that plasma nitrite and HbNO correlate with one another during infu:
rather than from a measure o f erythrocyte produced nitric oxide. The findings of
chapter using low dose nitrite infusion show a clear correlation between plasma ni
and forearm blood flow, but fail to find the same association with HbNO levels. In
although HbNO levels did increase during infusion after a delay, levels retume
baseline within 15 minutes o f infusion cessation while elevated plasma nitrite levels
increased forearm blood flow persisted. This is surprising, given that haemogl
saturation remained low, plasma nitrite levels remained high and the results of chapi
show nitrite entry to erythrocytes to be enhanced at high extracellular nitrite levels
low oxygen saturation. Taken together, this suggests that haemoglobin reduc
mechanisms involved with high dose nitrite may not be mirrored at low dose and imj
that HbNO is not a good surrogate for haemoglobin nitrite reduction at low ni
concentrations.
In support o f a role for haemoglobin nitrite reduction, the same research group 1
suggested that erythrocytes act as circulating stores o f nitrite, reporting that i
erythrocyte nitrite to represent two thirds o f whole blood nitrite [364]. Despite sin
measured plasma nitrite levels and the use of similar methodology, our laboratory
previously demonstrated a plasma nitrite to erythrocyte associated nitrite signal ratio

ferricyanide/hexacyanoferrate, commonly a potassium salt) to erythrocyte samples. T
is thought to bind haemoglobin and stabilise nitric oxide metabolite species, prevent
inter-conversion, so samples can be processed and stored for future analysis. Howe>
ferricyanide is known to cleave nitric oxide from HbNO and has been used in 1
capacity for quantitative HbNO assays [452]. In addition, it has previously been sho
that nitric oxide cleaved from HbNO subsequently forms nitrite [367]. It therefore folic
that in erythrocyte samples incubated with ‘stabilisation solution’, HbNO would
converted to nitrite and therefore account for the exaggerated intra-erythrocyte nit
levels observed by these investigators, together with expected plasma nitrite levels.
The results o f Chapter 3 demonstrate that nitrite entry at physiological extracelli
nitrite levels (~200nM) is a relatively slow process, particularly at high haemoglo
oxygen saturation. This chapter finds both in vivo and in vitro in deoxygenated conl
blood samples that HbNO formation (thought of as a marker of nitrite haemoglo
interaction), does not occur appreciably when extracellular/plasma nitrite levels are k
However, as extracellular nitrite levels are augmented, the amount of HbNO does tl
increase in a uniform fashion. In the in vivo study, HbNO levels did increase dur
nitrite infusion but only after a delay and returned to baseline within 15 minutes
infusion cessation. The delay in formation agrees with the slow entry rate of nitrite £
the rapid decrease post infusion cessation is most likely due to metabolism of HbNO
haemoglobin is oxygenated across the lung [332]. It should be noted that this delaj
increase is not simply a methodological issue. Pre-infusion HbNO levels in
hypoxia/nitrite protocol were ~100nM and chapter 3 of this thesis demonstrates that i
methodology utilised is capable o f distinguishing changes in HbNO at a le1
considerably below this.
- 2 4 2 -

Chapter Six Properties o f the Nitrite Anion in vivo
The fact that nitrite entry into erythrocytes is slow and that HbNO levels do not
appear to correlate with changes in physiology, suggests that the haemoglobin nitrite
reduction mechanism does not play a significant role in the vascular effects o f nitrite at
low, near-basal plasma nitrite levels. It is therefore more likely that the vasoactive
properties o f nitrite at low dose are mediated via reduction in the tissue. This agrees with
the work o f chapter 4 in a isolated vessel model, where vasorelaxation was independent
o f haemoglobin and appeared to be considerably mediated by aldehyde oxidase. The
extrapolation o f findings, generated under non-physiological conditions with high dose
infusion, to the physiological setting is a problem that is prominent within the nitric oxide
field. The data presented in this chapter suggests this extrapolation not to be valid and,
even if haemoglobin was capable o f reducing nitrite to nitric oxide, its ability to escape
recapture by haemoglobin to affect vessel tone is still questionable.
It is clear that circulating plasma nitrite is involved in the flux o f nitric oxide
moiety, whether basal levels o f plasma nitrite play a role in controlling vessel tone in vivo
remains to be demonstrated. However, the findings o f this chapter would suggest that
activation o f nitrite in the circulation by haemoglobin is unlikely to play a significant role
at these lower plasma nitrite levels. Importantly, it seems that nitrite even at lower doses
does appear to be capable o f altering vascular tone given a provoking environment (e.g.
hypoxia). Its potential as a therapeutic agent relies upon its ability to only act in tissues
where it is required. This targeted action could be o f great benefit in pathologies where
there are specific sites o f poor blood flow or hypoxia in which nitrite could improve
regional blood flow without causing dramatic changes in global haemodynamics i.e.
cause hypotension.
- 2 4 3 -
Chapter Six Properties o f the Nitrite Anion in vivo
6.5 Summary and Conclusions
The work o f this chapter does not discount that circulating nitrite may interact
slowly with blood and vascular tissue, contributing to the overall flux of nitric oxide
metabolites. However, it does question the mechanisms by which nitrite can change
vascular tone, particularly in the physiological plasma nitrite concentration range. Some
interesting and perhaps unexpected findings have also been revealed through this work
and specific points are summarised below.
• The infusion o f low dose sodium nitrite is capable o f altering arterial
forearm blood flow in hypoxia but not normoxia suggesting an enhancement
o f nitrite vasoactivity under hypoxic conditions.
• The elevation and decay profiles o f infused nitrite are similar in normoxia
and hypoxia. This is unexpected, given that nitrite uptake by erythrocytes
was enhanced under deoxygenated conditions (chapter 3), suggesting that
metabolism o f low dose nitrite by erythrocytes plays a very minor role in
overall nitrite metabolism.
• In hypoxia, forearm blood flow correlates with plasma nitrite level but not
with HbNO levels advocating a minimal role for erythrocytes in nitrite
activation.
• Both in vivo and vitro in deoxygenated blood, intra-erythrocyte HbNO does
not appear to be formed to any great extent at basal plasma nitrite levels.
• The haemoglobin-dependent mechanisms o f nitrite-induced vasodilatation
thought to be involved at high dose do not appear to be involved at low or
basal plasma nitrite levels.

1 '
Chapter Six Properties o f the Nitrite Anion in vivo
The vasoactive properties o f nitrite at low plasma nitrite levels are most
likely mediated via tissue enzymes.
Therapeutically, high dose nitrite is not required to produce a vasodilatory
effect in hypoxic vasculature.
- 2 4 5 -

Chapter Seven Conclusions & Insights
7 Overall Conclusions & Insights
The aims o f this thesis were to consider nitric oxide metabolites in terms of their
biochemistry and physiological actions with particular reference to the effect o f oxygen
upon these biological aspects. The thesis also aimed to challenge the current
understanding with respect to the related mechanistic pathways involved. The results
presented herein provide insight into a number o f mechanisms that relate to nitric oxide
metabolite bioactivity and have discovered novel aspects o f signalling pathways and the
molecules that control them.
It is apparent that nitric oxide metabolites represent a dynamic group o f molecules
that are, at some level, bioactive. Despite the vast amounts o f research in the field, this
work has shown me that a number o f common misconceptions and extrapolations
regarding the chemistry and biological activity o f these metabolites exist within the
literature, particularly with respect to mechanisms o f action. The field has run away with
some suggested mechanisms that are in essence theoretical with very little basic science
foundation. The repeated publication o f these suggested modes o f operation has occurred
so extensively and over such a lengthy period o f time that one could be mistaken in
thinking that they had been confirmed and are thus fact. It is therefore imperative that
findings regarding any aspect o f nitric oxide metabolite behaviour be considered in the
context o f the experimental setting utilised. In this respect, one can essentially divide the
study of nitric oxide metabolites into two groups based upon the concentration of
metabolites in question, i.e. assessing the biological aspects o f nitric oxide metabolites at
a basal level or in scenarios where levels have been artificially increased. Obviously the
in vivo mechanisms involved in the metabolism and biological activity o f metabolites do
not obey this divide and most likely operate in a continuum, however, it is these settings
in which the metabolite field pursues answers and therefore the context in which results
must be contemplated.
At basal levels, it is unclear as to whether or not nitric oxide metabolites possess
any functional roles. A huge literature exists surrounding the actions of plasma nitrite at a

u i i a m a i u i c n i u i v ; u a i u c meiaDome pool is in a continual state ot tlux, with leve
any one metabolite heavily influenced by both the local level of other metabolites
local changes in oxygenation. These findings are in close agreement with previous v
from our laboratory showing that although individual metabolite species change ac
the coronary circulation, there is no global change in metabolites, just oxygen depent
reapportionment. Under basal conditions, the circulating level of nitrite appears tc
stable and controlled, with the plasma nitrite level o f subjects studied in chapto
showing very little variance at baseline, for example. In relation, when erythrocytes v
exposed to extracellular nitrite in the physiological range very little nitrite entered
cells, however the rate o f entry was found to be oxygen dependent. Nitrite does have
potential to cause a number o f additional side effects at a cellular level, particularl
high concentration, via disruption o f ionic balance or in the case o f the erythroc
methaemoglobinaemia. Therefore, it is perhaps not surprising that plasma levels are 1
within a tight range and specific cell types are resistant to extreme nitrite influx. In
opinion, the field to date has focused too heavily upon the direct actions of nitric o?
and its metabolites rather than the molecules, such as oxygen, that influence so m
aspects o f their biology.
The involvement o f the erythrocyte in nitric oxide metabolite biochemistry still repres<
a contentious element o f the nitric oxide field, particularly in regard to the functior
haemoglobin. Haemoglobin has been implicated in two distinct ways, firstly as a nil
reductase and secondly as a form o f stored/bioactive nitric oxide, HbSNO. Both of tf
proposed mechanisms are dependent upon oxygenation or haemoglobin allostery
generate a species that can alter vessel tone, thereby theoretically matching respirat
demand with blood flow at regional level. As with many systems of nature, it ma
perfect sense to link these two factors that are ultimately dependent upon one another,
is the case with most good theories, these are particularly difficult to question or oppc
- 2 4 7 -

© ................ ..xvimtw u i i u j i u n . iais.v.11 l u g c u i g i , w i u i u i c l a c i u m i m i m e e i
erythrocytes is limited, it would suggest that although nitrite reduction by haemo;
may be energetically possible, a functional role for this mechanism seems improba
should be noted, however, that these observations were gained through manipii
nitrite concentration level, although in the case o f the in vivo study, very modestl
within the physiological range.
To date, the erythrocyte induced hypoxic vasodilatation has been largely ascribed
actions o f HbSNO. However, conclusive evidence demonstrating HbSNO to t
mediator involved has thus far not been published. There is no doubt that HbSNO, 1
SNO compounds, does have vasoactive properties. Nonetheless, a number of aspe
the erythrocyte induced vasorelaxation do not support a role for HbSNO. This th<
the first to document significant and persuasive evidence to suggest that the media
the erythrocyte induced vasorelaxation is in fact oxygen. A role for oxygen as the pr
mediator o f this phenomenon can be reconciled with the majority of current literatui
will hopefully form the basis o f another ‘good theory’ that researchers will contir
question. These findings do not discount a role for HbSNO, but do suggest that it
the principal mediator involved. There are, however, many potential roles for thiol 1
nitric oxide in vivo, not only from a vasodilatory point of view but from a signalling
As with many protein modifications, such as phosphorylation, the significance of
oxide thiol modification is coming to fruition. With thousands of potential target thi<
a vast range o f proteins from membrane receptors to transcription factors, it is clea
the potential signalling and regulatory roles of SNOs are huge and not just limited a<
in the vascular setting.
Certain aspects o f work piloted during the compilation of this thesis unfortunately <
not be fully developed. One particular subsection of work that I believe warrants fi
- 2 4 8 -

Chapter Seven Conclusions & Insights
investigation surrounds the application o f the models developed and novel findings of this
thesis to research the disease, diabetes mellitus. Diabetes mellitus represents a very
interesting setting in which to study nitric oxide metabolites and erythrocytes as the
disease progression is known to dramatically affect the cardiovascular system and to
modify haemoglobin through glycosylation. Some initial findings are summarised below;
• Preliminary findings from the real time nitric oxide reaction model show that the
haemoglobin o f diabetic patients reacts with and processes nitric oxide differently,
depending upon the level o f haemoglobin glycosylation (HbAlc).
• Chapter 5 demonstrated that the erythrocyte induced hypoxic vasodilatation was
dependent upon haemoglobin allostery. As haemoglobin oxygen binding is altered
in diabetics, erythrocyte induced vasorelaxation was assessed with a range of
diabetic blood samples. When tested, it appears that diabetic erythrocytes may
give a reduced response in the hypoxic myography model that correlates with the
degree o f haemoglobin glycosylation (HbAlc). It is not clear if this is a direct
haemoglobin oxygen offloading effect or if H bA lc is purely a marker of other
diabetes induced changes within the erythrocyte.
• Another key aspect o f this thesis has focused on the processing of nitrite by
erythrocytes. Using some simple experiments where whole blood was doped with
nitrite before centrifugation over a range o f speeds it appears that nitrite does not
partition uniformly between plasma and erythrocyte fraction when comparing
control blood against blood form a diabetic patient. This could be due to
differences in membrane oxidation between diabetics and controls but could have
implications with regard to nitrite bioactivity. In a separate experiment using
nitrite and erythrocyte ghosts, it appears that there is also a source o f nitrite
reduction within the erythrocyte membrane. If nitrite is more likely to associate
with the erythrocyte in some cases this could provide an enhanced route for the
conversion o f nitrite to more biologically active species.

Chapter Seven Conclusions & Insights
A direct role for nitric oxide metabolites as clinical therapeutics seems quite
limited. Nitrite carries the most potential but may only show real benefit above and
beyond existing treatments in very niche settings where tissue hypoxia is a key element.
The true value o f nitric oxide metabolites or the erythrocyte-induced hypoxic
vasodilatation may ultimately come from more indirect manipulative processes. To
achieve this and exploit these systems in full, it is essential that mechanisms of both
molecular bioactivity and system dysfunction in disease states are fully explored. The
results o f this thesis contribute to the understanding with regards to mechanism, however
the next step is to find a way o f exploiting this novel information in the disease setting.
Overall, it is clear that the diatomic gases are not only important signalling
molecules but can also dictate the responsiveness o f many enzymes and tissue systems.
However, it is oxygen that governs the formation, metabolism and biological activity o f
nitric oxide metabolites, is responsible for erythrocyte induced hypoxic vasodilatation and
which ultimately dictates the health o f all tissues, including those of the cardiovascular
system. In this sense, it is not surprising that haemoglobin can also play an important role,
but the results o f this thesis would point to that being one o f transportation and storage of
gaseous diatoms, rather than an enzymatic converter or reductase. Nitric oxide is a very
important signalling molecule that has duly received a significant amount o f attention,
however I conclude that it is the somewhat neglected grandparent of the family, oxygen,
which provides fundamental control and is a prerequisite of signalling in this setting.

Chapter Seven Conclusions & Insights
7.1 Publications
Text Book Chapters
Pinder AG, Roger SC, Khalatbari A, Ingram TE, James PE. The measurement of nitric
oxide and its metabolites in biological samples by ozone based chemiluminescence.
Chapter 2, Redox-Mediated Signal Transduction. Humana Press, Methods Mol Biol.
2009;476:10-27.
Peer Reviewed Publications
Pinder AG, Rogers SC, Morris KM and James PE. Haemoglobin saturation controls the
red blood cell mediated hypoxic vasorelaxation. Adv Exp Med Biol. 2009;645:13-20.
Ingram TE, Pinder AG, Milsom AB, Rogers SC, Thomas DE, James PE. Blood vessel
specific vasoactivity to nitrite under normoxic and hypoxic conditions. Adv Exp Med Biol.
2009;645:21-5.
Pinder AG, James PE. When does low oxygen become hypoxia? Implications for nitrite
reduction. Circ Res. 2009 Feb 13;104(3):e25-6.
Pinder AG, Pittaway E, Morris K, James PE. Nitrite directly vasodilates hypoxic
vasculature via nitric oxide dependent and independent pathways. British Journal o f
Pharmacology, 2009 Aug;157(8):1523-30.
Ingram TE, Pinder AG, Bailey DM, James PE, Fraser AG. Low-dose sodium nitrite
produces sustained pulmonary vasodilation in hypoxic human subjects. AJP, 2009 (In
Press).

Chapter Seven Conclusions & Insights
Pinder AG, Ingram TE, Bailey DM, Morris K, James PE. Elevated Plasma nitrite causes
vasodilation o f hypoxic, but not normoxic vessels: a role for the red cell? 2009
(submitted).
Pinder AG, Rogers SC, James PE. Oxygen mediates the erythrocyte induced
vasorelaxation in hypoxic vasculature, (manuscript in preparation).
Published Scientific Abstracts and presented Abstracts.
P inder AG, Rogers SC, Morris KM and James PE. Haemoglobin saturation controls the
red blood cell mediated hypoxic vasorelaxation. The 35th meeting o f the International
Society o f Oxygen Transport to Tissue. August 26-30. 2007. Uppsala, Sweden. Adv Exp
Med Biol. 2009;645:13-20.
Ingram TE, P inder AG, Bailey DM, Fraser AG, James PE. Low dose IV nitrite dilates
both peripheral and central vessels in hypoxia - a potential new therapy for ischaemia.
Presented at the British Cardiovascular Society Annual Scientific Conference 2-4 June
2008 Manchester. Heart 2008; 94(S1):A83
Ingram TE, P inder AG, Milsom AB, Rogers SC, Thomas DE, James PE. Blood vessel• • • t h •specific vasoactivity to nitrite under normoxic and hypoxic conditions. The 35 meeting
of the International Society o f Oxygen Transport to Tissue. August 26-30. 2007. Uppsala,
Sweden. Adv Exp Med Biol. 2009;645:21-5.
James PE, Maher AR, Milsom AB, Rogers SC, P inder AG, Gunaruwan P, Frenneaux
MP. The vascular response to exogenous nitrite in humans under normoxia and hypoxia.
The 35th meeting o f the International Society o f Oxygen Transport to Tissue. August 26-
30. 2007. Uppsala, Sweden.
- 2 5 2 -

Pinder AG, Pittaway E, Rogers SC, Morris K, James PE. Nitrite dependen
independent hypoxic vasorelaxation: a mechanistic insight. Presented at the UI
forum, London, UK, August, 2008.
Ingram TE, P inder AG, Pittaway E, Fraser AG, James PE. Nitrite associated hy
vasodilatation in man: The pulmonary circulation is more susceptible to the vasoc
effects of nitrite than the systemic circulation. Presented at the 5th International
Oxide Conference, Bregenz, Austria, August, 2008. Nitric Oxide, Volume 19, Suppl
1, 2008, Page 38.
Pinder AG, Ingram TE, Bailey DM, Fraser AG, James PE. Low dose systemic
infusion to healthy human subjects in a hypoxic environmental chamber. Presented
5th International Nitric Oxide Conference, Bregenz, Austria, August, 2008. Nitric C
Volume 19, Supplement 7, 2008, Page 55.
Pinder AG, Pittaway E, Morris K, James PE. Haemoglobin-independent Pathwa;
Nitrite Induced. Vasorelaxation. Present at Festschrift Symposium for Prof.
Broadley, Autonomic, Respiratory and Cardiovascular Pharmacology Sept.
Autonomic and Autocoidpharmacology, volume 29, 2009, page 105.
-2 53 -

Avjvo.
Pinder AG, Pittaway E, Rogers SC, Morris K, James PE. Nitrite dependeni
independent hypoxic vasorelaxation: a mechanistic insight. Presented at the UF
forum, London, UK, August, 2008.
Pittaway E, P inder AG, Morris KM, James PE. Haemoglobin-independent i
hypoxic vasodilatation. Presented at the UK NO forum, London, UK, August, 2008
Pinder AG, Ingram TE, Bailey DM, Fraser AG, James PE. Low dose systemic i
infusion to healthy human subjects in a hypoxic environmental chamber. Presented
5th International Nitric Oxide Conference, Bregenz, Austria, August, 2008.
Presented at the UK NO forum, London, UK, August, 2008.
- 2 5 4 -

References
References
1. Leach, R.M. and D.F. Treacher, The pulmonary physician and critical care. 6.
Oxygen transport: the relation between oxygen delivery and consumption. Thorax,
1992. 47(11): p. 971-8.
2. Fitzgerald, R.S., et al., Ventilatory Response to Transient Perfusion o f Carotid
Chemoreceptors. Am J Physiol, 1964. 207: p. 1305-13.
3. Pardal, R. and J. Lopez-Bameo, Low glucose-sensing cells in the carotid body.
NatNeurosci, 2002. 5(3): p. 197-8.
4. Pardal, R., et al., Glia-like stem cells sustain physiologic neurogenesis in the adult
mammalian carotid body. Cell, 2007. 131(2): p. 364-77.
5. Nurse, C.A., Neurotransmission and neuromodulation in the chemosensory
carotid body. Auton Neurosci, 2005. 120(1-2): p. 1-9.
6. Lahiri, S. and R.G. DeLaney, Stimulus interaction in the responses o f carotid
body chemoreceptor single afferent fibers. Respir Physiol, 1975. 24(3): p. 249-66.
7. Lahiri, S., et al., Oxygen sensing in the body. Prog Biophys Mol Biol, 2006. 91(3):
p. 249-86.
8. Mulligan, E., S. Lahiri, and B.T. Storey, Carotid body 02 chemoreception and
mitochondrial oxidative phosphorylation. J Appl Physiol, 1981. 51(2): p. 438-46.
9. Mulligan, E. and S. Lahiri, Separation o f carotid body chemoreceptor responses
to 0 2 and C 02 by oligomycin and by antimycin A. Am J Physiol, 1982. 242(3): p.
C200-6.
10. Baby, S.M., A. Roy, and S. Lahiri, Role o f mitochondria in the regulation o f
hypoxia-inducible factor-1 alpha in the rat carotid body glomus cells. Histochem
Cell Biol, 2005.124(1): p. 69-76.
- 2 5 5 -

References
11. Buckler, K.J. and R.D. Vaughan-Jones, Effects o f mitochondrial uncouplers on
intracellular calcium, p H and membrane potential in rat carotid body type I cells.
J Physiol, 1998. 513 ( P t 3): p. 819-33.
12. Wilson, D.F., et al., The oxygen dependence o f mitochondrial oxidative
phosphorylation measured by a new optical method for measuring oxygen
concentration. J Biol Chem, 1988. 263(6): p. 2712-8.
13. Lopez-Bameo, J., R. Pardal, and P. Ortega-Saenz, Cellular mechanism o f oxygen
sensing. Annu Rev Physiol, 2001. 63: p. 259-87.
14. Patel, A.J. and E. Honore, Molecular physiology o f oxygen-sensitive potassium
channels. Eur Respir J, 2001. 18(1): p. 221-7.
15. Lopez-Bameo, J., et al., Chemotransduction in the carotid body: K+ current
modulated by P 02 in type I chemoreceptor cells. Science, 1988. 241(4865): p.
580-2.
16. Acker, H., et al., Indications to an NADPH oxidase as a possible p 0 2 sensor in
the rat carotid body. FEBS Lett, 1989. 256(1-2): p. 75-8.
17. Cross, A.R., et al., Involvement o f an NAD(P)H oxidase as a p 0 2 sensor protein
in the rat carotid body. Biochem J, 1990. 272(3): p. 743-7.
18. Goldberg, M.A., S.P. Dunning, and H.F. Bunn, Regulation o f the erythropoietin
gene: evidence that the oxygen sensor is a heme protein. Science, 1988.
242(4884): p. 1412-5.
19. Semenza, G.L., Targeting HIF-1 fo r cancer therapy. Nat Rev Cancer, 2003.
3(10): p. 721-32.
20. Wang, G.L. and G.L. Semenza, Purification and characterization o f hypoxia-
inducible factor 1. J Biol Chem, 1995. 270(3): p. 1230-7.
- 2 5 6 -

recognition in signaling. Science, 2002. 296(5574): p. 1886-9.
23. Maxwell, P.H., et al., The tumour suppressor protein VHL targets hyp
inducible factors for oxygen-dependent proteolysis. Nature, 1999. 399(673
271-5.
24. Kallio, P.J., et al., Regulation o f the hypoxia-inducible transcription factor L
by the ubiquitin-proteasome pathway. J Biol Chem, 1999. 274(10): p. 6519-2
25. Dann, C.E., 3rd, R.K. Bruick, and J. Deisenhofer, Structure o f factor-inhl
hypoxia-inducible factor 1: An asparaginyl hydroxylase involved in the hy
response pathway. Proc Natl Acad Sci U S A , 2002. 99(24): p. 15351-6.
26. Lando, D., et al., FIH-1 is an asparaginyl hydroxylase enzyme that regulaU
transcriptional activity o f hypoxia-inducible factor. Genes Dev, 2002. 16(1
1466-71.
27. Dames, S.A., et al., Structural basis fo r Hif-1 alpha /CBP recognition i
cellular hypoxic response. Proc Natl Acad Sci U S A , 2002. 99(8): p. 5271-6.
28. Freedman, S.J., et al., Structural basis for recruitment o f CBP/p300 by hyp
inducible factor-1 alpha. Proc Natl Acad Sci U S A , 2002. 99(8): p. 5367-72.
29. Mahon, P.C., K. Hirota, and G.L. Semenza, FIH-1: a novel protein that inh
with HIF-1 alpha and VHL to mediate repression o f HIF-1 transcriptional ac
Genes Dev, 2001.15(20): p. 2675-86.
30. Elliott, S., E. Pham, and I.C. Macdougall, Erythropoietins: a common mechi
o f action. Exp Hematol, 2008. 36(12): p. 1573-84.
- 2 5 7 -

References
31. Koury, S.T., M.C. Bondurant, and M.J. Koury, Localization o f erythropoietin
synthesizing cells in murine kidneys by in situ hybridization. Blood, 1988. 71(2):
p. 524-7.
32. Jones, S.S., et al., Human erythropoietin receptor: cloning, expression, and
biologic characterization. Blood, 1990. 76(1): p. 31-5.
33. Broudy, V.C., et al., Erythropoietin receptor characteristics on primary human
erythroid cells. Blood, 1991. 77(12): p. 2583-90.
34. Sawada, K., et al., Purification o f human erythroid colony-forming units and
demonstration o f specific binding o f erythropoietin. J Clin Invest, 1987. 80(2): p.
357-66.
35. Eckardt, K.U., et al., Rate o f erythropoietin formation in humans in response to
acute hypobaric hypoxia. J Appl Physiol, 1989. 66(4): p. 1785-8.
36. Iversen, P.O., et al., Human cytokines modulate arterial vascular tone via
endothelial receptors. Pflugers Arch, 1999. 439(1-2): p. 93-100.
37. Ruschitzka, F.T., et al., Nitric oxide prevents cardiovascular disease and
determines survival in polyglobulic mice overexpressing erythropoietin. Proc Natl
Acad Sci U S A , 2000. 97(21): p. 11609-13.
38. Beleslin-Cokic, B.B., et al., Erythropoietin and hypoxia stimulate erythropoietin
receptor and nitric oxide production by endothelial cells. Blood, 2004. 104(7): p.
2073-80.
39. Maciejewski, J.P., et al., Nitric oxide suppression o f human hematopoiesis in
vitro. Contribution to inhibitory action o f interferon-gamma and tumor necrosis
factor-alpha. J Clin Invest, 1995. 96(2): p. 1085-92.
40. Cokic, V.P., et al., Hydroxyurea induces fetal hemoglobin by the nitric oxide-
dependent activation o f soluble guanylyl cyclase. J Clin Invest, 2003. 111(2): p.
231-9.
- 2 5 8 -

References
41. Evans, E. and Y.C. Fung, Improved measurements o f the erythrocyte geometry.
Microvasc Res, 1972. 4(4): p. 335-47.
42. Watanabe, N., et al., Deformability o f human red blood cells exposed to a uniform
shear stress as measured by a cyclically reversing shear flow generator. Physiol
Meas, 2007. 28(5): p. 531-45.
43. Arai, K., et al., Further investigations o f red cell deformability with nickel mesh.
Biorheology, 1990. 27(1): p. 47-65.
44. Wang, X., et al., Biorheological Properties o f Reconstructed Erythrocytes and its
Function o f Carrying-Releasing Oxygen. A rtif Cells Blood Substit Immobil
Biotechnol, 2009: p. 1-7.
45. Chien, S., S. Usami, and J.F. Bertles, Abnormal rheology o f oxygenated blood in
sickle cell anemia. J Clin Invest, 1970. 49(4): p. 623-34.
46. Morse, P.D., 2nd and J.A. Warth, Direct measurement o f the internal viscosity o f
sickle erythrocytes as a function o f cell density. Biochim Biophys Acta, 1990.
1053(1): p. 49-55.
47. Daveloose, D., et al., A new spin label method fo r the measurement o f erythrocyte
internal microviscosity. Biochim Biophys Acta, 1983. 763(1): p. 41-9.
48. Nash, G.B. and W.B. Gratzer, Structural determinants o f the rigidity o f the red
cell membrane. Biorheology, 1993. 30(5-6): p. 397-407.
49. Symeonidis, A., et al., Impairment o f erythrocyte viscoelasticity is correlated with
levels o f glycosylated haemoglobin in diabetic patients. Clin Lab Haematol, 2001.
23(2): p. 103-9.
50. Bor-Kucukatay, M., et al., Effects o f nitric oxide on red blood cell deformability.
Am J Physiol Heart Circ Physiol, 2003. 284(5): p. H I577-84.
- 2 5 9 -

I
References
51. Oonishi, T., K. Sakashita, and N. Uyesaka, Regulation o f red blood cell
filterability by Ca2+ influx and cAMP-mediated signaling pathways. Am J
Physiol, 1997. 273(6 Pt 1): p. C l828-34.
52. Sakashita, K., et al., Endothelin-1 improves the impaired filterability o f red blood
cells through the activation o f protein kinase C. Jpn J Physiol, 1999. 49(1): p.
113-20.
53. Kleinbongard, P., et al., Red blood cells express a functional endothelial nitric
oxide synthase. Blood, 2006. 107(7): p. 2943-51.
54. Myher, J.J., A. Kuksis, and S. Pind, Molecular species o f glycerophospholipids
and sphingomyelins o f human erythrocytes: improved method o f analysis. Lipids,
1989. 24(5): p. 396-407.
55. Kuypers, F.A., Membrane lipid alterations in hemoglobinopathies. Hematology
Am Soc Hematol Educ Program, 2007. 2007: p. 68-73.
56. Pasini, E.M., et al., In-depth analysis o f the membrane and cytosolic proteome o f
red blood cells. Blood, 2006. 108(3): p. 791-801.
57. Bruce, L., Mutations in band 3 and cation leaky red cells. Blood Cells Mol Dis,
2006. 36(3): p. 331-6.
58. Tanner, M.J., The structure and function o f band 3 (AE1): recent developments
(review). Mol Membr Biol, 1997. 14(4): p. 155-65.
59. Turrini, F., et al., Clustering o f integral membrane proteins o f the human
erythrocyte membrane stimulates autologous IgG binding, complement
deposition, and phagocytosis. J Biol Chem, 1991. 266(35): p. 23611-7.
60. Sterling, D., R.A. Reithmeier, and J.R. Casey, A transport metabolon. Functional
interaction o f carbonic anhydrase II and chloride/bicarbonate exchangers. J Biol
Chem, 2001. 276(51): p. 47886-94.
- 2 6 0 -

I
References
61. Walder, J.A., et al., The interaction o f hemoglobin with the cytoplasmic domain o f
band 3 o f the human erythrocyte membrane. J Biol Chem, 1984. 259(16): p.
10238-46.
62. Murthy, S.N., et al., The aldolase-binding site o f the human erythrocyte
membrane is at the NH2 terminus o f band 3. J Biol Chem, 1981. 256(21): p.
11203-8.
63. Jenkins, J.D., D.P. Madden, and T.L. Steck, Association o f phosphofructokinase
and aldolase with the membrane o f the intact erythrocyte. J Biol Chem, 1984.
259(15): p. 9374-8.
64. Rogalski, A.A., T.L. Steck, and A. Waseem, Association o f glyceraldehyde-3-
phosphate dehydrogenase with the plasma membrane o f the intact human red
blood cell. J Biol Chem, 1989. 264(11): p. 6438-46.
65. Michaely, P. and V. Bennett, The ANK repeats o f erythrocyte ankyrin form two
distinct but cooperative binding sites fo r the erythrocyte anion exchanger. J Biol
Chem, 1995. 270(37): p. 22050-7.
66. Rybicki, A.C., et al., Increased rotational mobility and extractability o f band 3
from protein 4.2-deficient erythrocyte membranes: evidence o f a role for protein
4.2 in strengthening the band 3-cytoskeleton linkage. Blood, 1996. 88(7): p. 2745-
53.
67. Yu, X., et al., An erythroid chaperone that facilitates folding o f alpha-globin
subunits fo r hemoglobin synthesis. J Clin Invest, 2007. 117(7): p. 1856-65.
68. Lukin, J.A. and C. Ho, The structure—function relationship o f hemoglobin in
solution at atomic resolution. Chem Rev, 2004. 104(3): p. 1219-30.
69. Perutz, M.F., Stereochemistry o f cooperative effects in haemoglobin. Nature,
1970. 228(5273): p. 726-39.
-261 -

?
References
70. Silva, M.M., P.H. Rogers, and A. Amone, A third quaternary structure o f human
hemoglobin A at 1.7-A resolution. J Biol Chem, 1992. 267(24): p. 17248-56.
71. Bohr, C., Theoretische Behandlung der Quantitativen Verhaltnis bei der Sauer-
stojfaufnahme des Hamoglobin. Zentr Physiol, 1903. 17: p. 682-689.
72. Adair, G.S., A Critical Study o f the Direct Method o f Measuring the Osmotic
Pressure o f haemoglobin. Proc. Roy. Soc (London) Ser. A, 1925. 108A: p. 627-
637.
73. Haurowitz, F., Das Gleichgewicht zwischen Hamoglobin und Sauerstoff. Hoppe-
Seyler's Z Physiol Chem 1938. 254: p. 266-274.
74. Paoli, M., et al., Tension in haemoglobin revealed by Fe-His(F8) bond rupture in
the fully liganded T-state. J Mol Biol, 1997. 271(2): p. 161-7.
75. Yonetani, T. and M. Laberge, Protein dynamics explain the allosteric behaviors o f
hemoglobin. Biochim Biophys Acta, 2008. 1784(9): p. 1146-58.
76. Endeward, V., et al., Red cell membrane C02 permeability in normal human
blood and in blood deficient in various blood groups, and effect o f DIDS. Transfus
Clin Biol, 2006. 13(1-2): p. 123-7.
77. Meldrum, N.U. and F.J. Roughton, Carbonic anhydrase. Its preparation and
properties. J Physiol, 1933. 80(2): p. 113-42.
78. Geers, C. and G. Gros, Carbon dioxide transport and carbonic anhydrase in blood
and muscle. Physiol Rev, 2000. 80(2): p. 681-715.
79. Bohr, C., K.A. Hasselbalch, and K. Krogh, Ueber einen in Biologischer
Beziehung Wichtigen Einfluss den die Kohlen-sauerspannung des Blutes
Aufdessen Sauer-stoffbindung ubt. Skand. Arch. Physiol., 1904. 15: p. 401-412.
- 2 6 2 -

f
References
80. Jensen, F.B., Red blood cell pH, the Bohr effect, and other oxygenation-linked
phenomena in blood 02 and C02 transport. Acta Physiol Scand, 2004. 182(3): p.
215-27.
81. Christiansen, J., C.G. Douglas, and J.S. Haldane, The absorption and dissociation
o f carbon dioxide by human blood. J Physiol, 1914. 48(4): p. 244-71.
82. Nielsen, M.S. and R.E. Weber, Antagonistic interaction between oxygenation-
linked lactate and C 02 binding to human hemoglobin. Comp Biochem Physiol A
Mol Integr Physiol, 2007. 146(3): p. 429-34.
83. De Rosa, M.C., et al., The plasma membrane o f erythrocytes plays a fundamental
role in the transport o f oxygen, carbon dioxide and nitric oxide and in the
maintenance o f the reduced state o f the heme iron. Gene, 2007. 398(1-2): p. 162-
71.
84. Bunn, H.F., B.J. Ransil, and A. Chao, The interaction between erythrocyte
organic phosphates, magnesium ion, and hemoglobin. J Biol Chem, 1971.
246(17): p. 5273-9.
85. Chanutin, A. and R.R. Cumish, Effect o f organic and inorganic phosphates on the
oxygen equilibrium o f human erythrocytes. Arch Biochem Biophys, 1967. 121(1):
p. 96-102.
86. Benesch, R. and R.E. Benesch, The effect o f organic phosphates from the human
erythrocyte on the allosteric properties o f hemoglobin. Biochem Biophys Res
Commun, 1967. 26(2): p. 162-7.
87. Amone, A., X-ray diffraction study o f binding o f 2,3-diphosphoglycerate to
human deoxyhaemoglobin. Nature, 1972. 237(5351): p. 146-9.
88. Lenfant, C., et al., Effect o f altitude on oxygen binding by hemoglobin and on
organic phosphate levels. J Clin Invest, 1968. 47(12): p. 2652-6.
- 2 6 3 -

f
References
89. Clementi, M.E., et al., Effect o f nitric oxide on the transport and release o f oxygen
in feta l blood. Biochem Biophys Res Commun, 2003. 302(3): p. 515-9.
90. Patel, R.P., et al., Biochemical characterization o f human S-nitrosohemoglobin.
Effects on oxygen binding and transnitrosation. J Biol Chem, 1999. 274(22): p.
15487-92.
91. James, P.E., et al., Vasorelaxation by red blood cells and impairment in diabetes:
reduced nitric oxide and oxygen delivery by glycated hemoglobin. Circ Res, 2004.
94(7): p. 976-83.
92. Merlet-Benichou, C., [Oxygen transport by the fetal blood]. Poumon Coeur, 1975.
31(4): p. 197-203.
93. Sedgewick, A.E., et al., BCL11A is a major HbF quantitative trait locus in three
different populations with beta-hemoglobinopathies. Blood Cells Mol Dis, 2008.
41(3): p. 255-8.
94. Darcy, H., Les Fontaines Publiques de la Ville de Dijon. 1856, Dalmont, Paris, p.
647. .
95. Sirs, J.A., The flow o f human blood through capillary tubes. J Physiol, 1991. 442:
p. 569-83.
96. Choate, J.K., et al., Sympathetic control o f heart rate in nNOS knockout mice. Am
J Physiol Heart Circ Physiol, 2008. 294(1): p. H354-61.
97. Ganong, W.F., Review o f Medical Physiology. 22nd ed. 2005: McGraw Hill.
98. Maher, A.R., et al., Hypoxic modulation o f exogenous nitrite-induced vasodilation
in humans. Circulation, 2008. 117(5): p. 670-7.
99. Wang, S.Y., et al., Splanchnic venous pressure-volume relation during
experimental acute ischemic heart failure. Differential effects o f hydralazine,
enalaprilat, and nitroglycerin. Circulation, 1995. 91(4): p. 1205-12.
- 2 6 4 -

References
100. Pang, C.C., Autonomic control o f the venous system in health and disease: effects
o f drugs. Pharmacol Ther, 2001. 90(2-3): p. 179-230.
101. Sadava, D., et al., Life: The Science o f Biology. 8 ed, ed. D. Sadava. 2006: W. H.
Freeman. 1121.
102. Duncker, D.J. and R.J. Bache, Regulation o f coronary blood flow during exercise.
Physiol Rev, 2008. 88(3): p. 1009-86.
103. Ebert, T.J. and D.F. Stowe, Neural and endothelial control o f the peripheral
circulation—implications fo r anesthesia: Part I. Neural control o f the peripheral
vasculature. J Cardiothorac Vase Anesth, 1996.10(1): p. 147-58.
104. Abboud, F.M., et al., Carotid and cardiopulmonary baroreceptor control o f
splanchnic and forearm vascular resistance during venous pooling in man. J
Physiol, 1979. 286: p. 173-84.
105. Johnson, J.M., et al., Human splanchnic and forearm vasoconstrictor responses to
reductions o f right atrial and aortic pressures. Circ Res, 1974. 34(4): p. 515-24.
106. Seagard, J.L., et al., Selective contribution o f two types o f carotid sinus
baroreceptors to the control o f blood pressure. Circ Res, 1993. 72(5): p. 1011-22.
107. Julius, S., et al., Cardiopulmonary mechanoreceptors and renin release in
humans. Fed Proc, 1983. 42(10): p. 2703-8.
108. Ainslie, P.N. and J. Duffin, Integration o f cerebrovascular C02 reactivity and
chemoreflex control o f breathing: mechanisms o f regulation, measurement and
interpretation. Am J Physiol Regul Integr Comp Physiol, 2009.
109. Shepherd, J.T., The lungs as receptor sites fo r cardiovascular regulation.
Circulation, 1981. 63(1): p. 1-10.
- 2 6 5 -

References
110. Gray, A.L., et al., Parasympathetic control o f the heart. II. A novel
interganglionic intrinsic cardiac circuit mediates neural control o f heart rate. J
Appl Physiol, 2004. 96(6): p. 2273-8.
111. Janig, W. and H.J. Habler, Neurophysiological analysis o f target-related
sympathetic pathways—from animal to human: similarities and differences. Acta
Physiol Scand, 2003. 177(3): p. 255-74.
112. Vollmer, R.R., et al., Adrenal epinephrine and norepinephrine release to
hypoglycemia measured by microdialysis in conscious rats. Am J Physiol, 1997.
273(5 Pt 2): p. R1758-63.
113. Chevalier-Cholat, A.M. and A. Friggi, Carotid sinus, aortic and subclavian
baroreceptor activities during cardiopulmonary bypass in rabbits. J Physiol
(Paris), 1976. 72(8): p. 971-86.
114. Guyenet, P.G., The sympathetic control o f blood pressure. Nat Rev Neurosci,
2006. 7(5): p. 335-46.
115. Matsuda, T., et al., Modulation o f baroreceptor activity by nitric oxide and S-
nitrosocysteine. Circ Res, 1995. 76(3): p. 426-33.
116. Anderson, R.L., I.L. Gibbins, and J.L. Morris, Non-noradrenergic sympathetic
neurons project to extramuscular feed arteries and proximal intramuscular
arteries o f skeletal muscles in guinea-pig hindlimbs. J Auton Nerv Syst, 1996.
61(1): p. 51-60.
117. Guimaraes, S. and D. Moura, Vascular adrenoceptors: an update. Pharmacol Rev,
2001. 53(2): p. 319-56.
118. van Zwieten, P.A., et al., The parasympathetic system and its muscarinic
receptors in hypertensive disease. J Hypertens, 1995. 13(10): p. 1079-90.
119. Hessellund, A., C. Aalkjaer, and T. Bek, Effect o f acidosis on isolated porcine
retinal vessels. Curr Eye Res, 2006. 31(5): p. 427-34.
- 2 6 6 -

w
References
120. Kontos, H.A., A.J. Raper, and J.L. Patterson, Analysis o f vasoactivity o f local pH,
PC02 and bicarbonate on pial vessels. Stroke, 1977. 8(3): p. 358-60.
121. Tian, R., et al., Role o f extracellular and intracellular acidosis fo r hypercapnia-
induced inhibition o f tension o f isolated rat cerebral arteries. Circ Res, 1995.
76(2): p. 269-75.
122. Toda, N., K. Ayajiki, and T. Okamura, Hypercapnia relaxes cerebral arteries and
potentiates neurally-induced relaxation. J Cereb Blood Flow Metab, 1996. 16(5):
p. 1068-74.
123. Sparks, H.V., Jr. and H. Bardenheuer, Regulation o f adenosine formation by the
heart. Circ Res, 1986. 58(2): p. 193-201.
124. Feoktistov, I., et al., Hypoxia modulates adenosine receptors in human endothelial
and smooth muscle cells toward an A2B angiogenic phenotype. Hypertension,
2004. 44(5): p. 649-54.
125. Parsons, M., et al., Distinct cardioprotective effects o f adenosine mediated by
differential coupling o f receptor subtypes to phospholipases C and D. Faseb J,
2000. 14(10): p. 1423-31.
126. Abebe, W. and S.J. Mustafa, A l adenosine receptor-mediated Ins(l,4,5)P3
generation in allergic rabbit airway smooth muscle. Am J Physiol, 1998. 275(5 Pt
1): p. L990-7.
127. Ray, C.J. and J.M. Marshall, The cellular mechanisms by which adenosine evokes
release o f nitric oxide from rat aortic endothelium. J Physiol, 2006. 570(Pt 1): p.
85-96.
128. Detar, R., Mechanism o f physiological hypoxia-induced depression o f vascular
smooth muscle contraction. Am J Physiol, 1980. 238(6): p. H761-9.
129. Jackson, W.F., Arteriolar oxygen reactivity: where is the sensor? Am J Physiol,
1987. 253(5 Pt 2): p. HI 120-6.
- 2 6 7 -

T-
References
130. Thilenius, O.G. and C. Derenzo, Hypoxic pulmonary vasoconstriction in
unanaesthetized dogs with constant arterial P-C02 and pH. Clin Sci, 1969. 37(3):
p. 731-7.
131. Shimizu, S., et al., Effects o f hypoxia on isometric force, intracellular Ca(2+), pH,
and energetics in porcine coronary artery. Circ Res, 2000. 86(8): p. 862-70.
132. James, P.E., et al., Oxygen indirectly regulates nitric oxide availability. Adv Exp
Med Biol, 2003. 510: p. 139-43.
133. Marceau, F. and D. Regoli, Bradykinin receptor ligands: therapeutic perspectives.
Nat Rev Drug Discov, 2004. 3(10): p. 845-52.
134. Batenburg, W.W., et al., Mediators o f bradykinin-induced vasorelaxation in
human coronary microarteries. Hypertension, 2004. 43(2): p. 488-92.
135. Honing, M.L., et al., Bradykinin-induced vasodilation o f human forearm
resistance vessels is primarily mediated by endothelium-dependent
hyperpolarization. Hypertension, 2000. 35(6): p. 1314-8.
136. Cheng, C.P., et al., Functional effects o f endogenous bradykinin in congestive
heart failure. J Am Coll Cardiol, 1998. 31(7): p. 1679-86.
137. Phipps, J.A. and E.P. Feener, The kallikrein-kinin system in diabetic retinopathy:
lessons fo r the kidney. Kidney Int, 2008. 73(10): p. 1114-9.
138. Yanagisawa, M., et al., A novel peptide vasoconstrictor, endothelin, is produced
by vascular endothelium and modulates smooth muscle Ca2+ channels. J
Hypertens Suppl, 1988. 6(4): p. S I88-91.
139. Yanagisawa, M., et al., A novel potent vasoconstrictor peptide produced by
vascular endothelial cells. Nature, 1988. 332(6163): p. 411-5.
- 2 6 8 -

References
140. Inoue, A., et al., The human endothelin family: three structurally and
pharmacologically distinct isopeptides predicted by three separate genes. Proc
Natl Acad Sci U S A , 1989. 86(8): p. 2863-7.
141. Sakurai, T., M. Yanagisawa, and T. Masaki, Molecular characterization o f
endothelin receptors. Trends Pharmacol Sci, 1992. 13(3): p. 103-8.
142. Reynolds, E.E., L.L. Mok, and S. Kurokawa, Phorbol ester dissociates
endothelin-stimulated phosphoinositide hydrolysis and arachidonic acid release
in vascular smooth muscle cells. Biochem Biophys Res Commun, 1989. 160(2): p.
868-73.
143. Masaki, T., J.R. Vane, and P.M. Vanhoutte, International Union o f Pharmacology
nomenclature o f endothelin receptors. Pharmacol Rev, 1994. 46(2): p. 137-42.
144. Masaki, T., Possible role o f endothelin in endothelial regulation o f vascular tone.
Annu Rev Pharmacol Toxicol, 1995. 35: p. 235-55.
145. Merkus, D., et al., Contribution o f endothelin and its receptors to the regulation o f
vascular tone during exercise is different in the systemic, coronary and pulmonary
circulation. Cardiovasc Res, 2003. 59(3): p. 745-54.
146. Kuchan, M.J. and J.A. Frangos, Shear stress regulates endothelin-1 release via
protein kinase C and cGMP in cultured endothelial cells. Am J Physiol, 1993.
264(1 Pt 2): p. H I50-6.
147. Nussey, S.S. and S.A. Whitehead, Endocrinology: An Integrated Approach. Vol.
1. 2001: Informa Healthcare. 376.
148. Lavoie, J.L. and C.D. Sigmund, Minireview: overview o f the renin-angiotensin
system—an endocrine and paracrine system. Endocrinology, 2003. 144(6): p.
2179-83.
149. Batenburg, W.W., et al., Angiotensin II type 2 receptor-mediated vasodilation in
human coronary microarteries. Circulation, 2004. 109(19): p. 2296-301.
- 2 6 9 -

References
150. Shanmugam, S., P. Corvol, and J.M. Gasc, Ontogeny o f the two angiotensin II
type 1 receptor subtypes in rats. Am J Physiol, 1994. 267(6 Pt 1): p. E828-36.
151. Rush, J.W. and C.D. Aultman, Vascular biology o f angiotensin and the impact o f
physical activity. Appl Physiol Nutr Metab, 2008. 33(1): p. 162-72.
152. Dennis, E.A., Diversity o f group types, regulation, and function ofphospholipase
A2. J Biol Chem, 1994. 269(18): p. 13057-60.
153. Harizi, H. and N. Gualde, The impact o f eicosanoids on the crosstalk between
innate and adaptive immunity: the key roles o f dendritic cells. Tissue Antigens,
2005. 65(6): p. 507-14.
154. Chang, Y.W., et al., Differential regulation o f cyclooxygenase 2 expression by
small GTPases Ras, R a d , and RhoA. J Cell Biochem, 2005. 96(2): p. 314-29.
155. Smith, W.L., R.M. Garavito, and D.L. DeWitt, Prostaglandin endoperoxide H
synthases (cyclooxygenases)-l and -2. J Biol Chem, 1996. 271(52): p. 33157-60.
156. Barnett, J., et al., Purification, characterization and selective inhibition o f human
prostaglandin G/H synthase 1 and 2 expressed in the baculovirus system. Biochim
Biophys Acta, 1994. 1209(1): p. 130-9.
157. Kulmacz, R.J., R.B. Pendleton, and W.E. Lands, Interaction between peroxidase
and cyclooxygenase activities in prostaglandin-endoperoxide synthase.
Interpretation o f reaction kinetics. J Biol Chem, 1994. 269(8): p. 5527-36.
158. Luong, C., et al., Flexibility o f the NSAID binding site in the structure o f human
cyclooxygenase-2. Nat Struct Biol, 1996. 3(11): p. 927-33.
159. Kurumbail, R.G., et al., Structural basis fo r selective inhibition o f
cyclooxygenase-2 by anti-inflammatory agents. Nature, 1996. 384(6610): p. 644-
8 .
- 2 7 0 -

References
160. Spencer, A.G., et al., Subcellular localization o f prostaglandin endoperoxide H
synthases-1 and -2 by immunoelectron microscopy. J Biol Chem, 1998. 273(16):
p. 9886-93.
161. Liou, J.Y., et al., Colocalization o f prostacyclin synthase with prostaglandin H
synthase-1 (PGHS-1) but not phorbol ester-induced PGHS-2 in cultured
endothelial cells. J Biol Chem, 2000. 275(20): p. 15314-20.
162. Vegesna, R.V. and J. Diamond, Elevation o f cyclic AMP by prostacyclin is
accompanied by relaxation o f bovine coronary arteries and contraction o f rabbit
aortic rings. Eur J Pharmacol, 1986. 128(1-2): p. 25-31.
163. Yamaki, F., et al., MaxiK channel-mediated relaxation o f guinea-pig aorta
following stimulation o f IP receptor with beraprost via cyclic AMP-dependent and
-independent mechanisms. Naunyn Schmiedebergs Arch Pharmacol, 2001. 364(6):
p. 538-50.
164. Tanaka, Y., et al., New insights into the intracellular mechanisms by which PGI2
analogues elicit vascular relaxation: cyclic AMP-independent, Gs-protein
mediated-activation o f MaxiK channel. Curr Med Chem Cardiovasc Hematol
Agents, 2004. 2(3): p. 257-65.
165. Hamberg, M., J. Svensson, and B. Samuelsson, Thromboxanes: a new group o f
biologically active compounds derived from prostaglandin endoperoxides. Proc
Natl Acad Sci U S A , 1975. 72(8): p. 2994-8.
166. Yamamoto, K., et al., Thromboxane A2 receptor-mediated signal transduction in
rabbit aortic smooth muscle cells. Gen Pharmacol, 1995. 26(7): p. 1489-98.
167. Liel, N., et al., Increased platelet thromboxane A2/prostaglandin H2 receptors in
patients with pregnancy induced hypertension. Thromb Res, 1993. 70(3): p. 205-
10.
168. Nakahata, N., Thromboxane A2: physiology/pathophysiology, cellular signal
transduction and pharmacology. Pharmacol Ther, 2008. 118(1): p. 18-35.
-271 -

References
169.
170.
171.
172.
173.
174.
175.
176.
177.
178.
Sautebin, L., et al., Modulation by nitric oxide o f prostaglandin biosynthesis in the
rat. Br J Pharmacol, 1995. 114(2): p. 323-8.
Salvemini, D., et al., Nitric oxide activates cyclooxygenase enzymes. Proc Natl
Acad Sci U S A , 1993. 90(15): p. 7240-4.
Davidge, S.T., et al., Nitric oxide produced by endothelial cells increases
production o f eicosanoids through activation o f prostaglandin H synthase. Circ
Res, 1995. 77(2): p. 274-83.
Salvemini, D., et al., Endogenous nitric oxide enhances prostaglandin production
in a model o f renal inflammation. J Clin Invest, 1994. 93(5): p. 1940-7.
Salvemini, D., et al., Regulation o f prostaglandin production by nitric oxide; an in
vivo analysis. Br J Pharmacol, 1995. 114(6): p. 1171-8.
Salvemini, D. and J.L. Masferrer, Interactions o f nitric oxide with
cyclooxygenase: in vitro, ex vivo, and in vivo studies. Methods Enzymol, 1996.
269: p. 12-25.
Sautebin, L., et al., Endogenous nitric oxide increases prostaglandin biosynthesis
in carrageenin rat paw oedema. Eur J Pharmacol, 1995. 286(2): p. 219-22.
Tsai, A.L., C. Wei, and R.J. Kulmacz, Interaction between nitric oxide and
prostaglandin Hsynthase. Arch Biochem Biophys, 1994. 313(2): p. 367-72.
Schmidt, P., et al., Specific nitration at tyrosine 430 revealed by high resolution
mass spectrometry as basis fo r redox regulation o f bovine prostacyclin synthase. J
Biol Chem, 2003. 278(15): p. 12813-9.
Schildknecht, S., M. Bachschmid, and V. Ullrich, Peroxynitrite provides the
peroxide tone fo r PGHS-2-dependent prostacyclin synthesis in vascular smooth
muscle cells. Faseb J, 2005. 19(9): p. 1169-71.
- 2 7 2 -

References
179. Maclouf, J., G. Folco, and C. Patrono, Eicosanoids and iso-eicosanoids:
constitutive, inducible and transcellular biosynthesis in vascular disease. Thromb
Haemost, 1998. 79(4): p. 691-705.
180. Fleming, I., et al., Epoxyeicosatrienoic acids regulate Trp channel dependent
Ca2+ signaling and hyperpolarization in endothelial cells. Arterioscler Thromb
Vase Biol, 2007. 27(12): p. 2612-8.
181. Matoba, T., et al., Hydrogen peroxide is an endothelium-derived hyperpolarizing
factor in mice. J Clin Invest, 2000. 106(12): p. 1521-30.
182. Gillham, J.C., et al., Regulation o f endothelial-dependent relaxation in human
systemic arteries by SKCa andIKCa channels. Reprod Sci, 2007.14(1): p. 43-50.
183. Taylor, H.J., et al., Gap junction-dependent increases in smooth muscle cAMP
underpin the EDHF phenomenon in rabbit arteries. Biochem Biophys Res
Commun, 2001. 283(3): p. 583-9.
184. Sandow, S.L., Factors, fiction and endothelium-derived hyperpolarizing factor.
Clin Exp Pharmacol Physiol, 2004. 31(9): p. 563-70.
185. Nagao, T. and P.M. Vanhoutte, Endothelium-derived hyperpolarizing factor and
endothelium-dependent relaxations. Am J Respir Cell Mol Biol, 1993. 8(1): p. 1-
6 .
186. Bellien, J., C. Thuillez, and R. Joannides, Contribution o f endothelium-derived
hyperpolarizing factors to the regulation o f vascular tone in humans. Fundam
Clin Pharmacol, 2008. 22(4): p. 363-77.
187. Bonner, F.T. and G. Steadman, The Chemistry o f Nitric Oxide and redox related
species, in Methods in Nitric Oxide Research., M. Feelisch and J. Stamler,
Editors. 1996, John Wiley & Sons. p. 3-18.
- 2 7 3 -

f
References
188. Gow, A.J., The biological chemistry o f nitric oxide as it pertains to the
extrapulmonary effects o f inhaled nitric oxide. Proc Am Thorac Soc, 2006. 3(2):
p. 150-2.
189. Rees, D.D., R.M. Palmer, and S. Moncada, Effect o f SKF 525A on the release o f
nitric oxide and prostacyclin from endothelial cells. Eur J Pharmacol, 1988.
150(1-2): p. 149-54.
190. Miller, V.M. and P.M. Vanhoutte, Enhanced release o f endothelium-derived
factor (s) by chronic increases in blood flow. Am J Physiol, 1988. 255(3 Pt 2): p.
H446-51.
191. Bredt, D.S. and S.H. Snyder, Isolation o f nitric oxide synthetase, a calmodulin-
requiring enzyme. Proc Natl Acad Sci U S A , 1990. 87(2): p. 682-5.
192. Yui, Y., et al., Purification o f nitric oxide synthase from rat macrophages. J Biol
Chem, 1991. 266(19): p. 12544-7.
193. Pollock, J.S., et al., Purification and characterization o f particulate endothelium-
derived relaxing factor synthase from cultured and native bovine aortic
endothelial cells. Proc Natl Acad Sci U S A, 1991. 88(23): p. 10480-4.
194. Forstermann, U., et al., Calmodulin-dependent endothelium-derived relaxing
factor/nitric oxide synthase activity is present in the particulate and cytosolic
fractions o f bovine aortic endothelial cells. Proc Natl Acad Sci U S A, 1991.
88(5): p. 1788-92.
195. Newton, D.C., et al., Translational regulation o f human neuronal nitric-oxide
synthase by an alternatively spliced 5'-untranslated region leader exon. J Biol
Chem, 2003. 278(1): p. 636-44.
196. Nathan, C. and Q.W. Xie, Nitric oxide synthases: roles, tolls, and controls. Cell,
1994. 78(6): p. 915-8.
- 2 7 4 -

References
197. Mungrue, I.N., M. Husain, and D.J. Stewart, The role o f NOS in heart failure:
lessons from murine genetic models. Heart Fail Rev, 2002. 7(4): p. 407-22.
198. Bredt, D.S., et al., Cloned and expressed nitric oxide synthase structurally
resembles cytochrome P-450 reductase. Nature, 1991. 351(6329): p. 714-8.
199. Baek, K.J., et al., Macrophage nitric oxide synthase subunits. Purification,
characterization, and role o f prosthetic groups and substrate in regulating their
association into a dimeric enzyme. J Biol Chem, 1993. 268(28): p. 21120-9.
200. Rafferty, S.P., et al., Stoichiometric arginine binding in the oxygenase domain o f
inducible nitric oxide synthase requires a single molecule o f tetrahydrobiopterin
per dimer. Biochem Biophys Res Commun, 1999. 257(2): p. 344-7.
201. Hemmens, B., et al., Role o f bound zinc in dimer stabilization but not enzyme
activity o f neuronal nitric-oxide synthase. J Biol Chem, 2000. 275(46): p. 35786-
91.
202. Alderton, W.K., C.E. Cooper, and R.G. Knowles, Nitric oxide synthases:
structure, function and inhibition. Biochem J, 2001. 357(Pt 3): p. 593-615.
203. Abu-Soud, H.M., et al., The ferrous-dioxy complex o f neuronal nitric oxide
synthase. Divergent effects o f L-arginine and tetrahydrobiopterin on its stability. J
Biol Chem, 1997. 272(28): p. 17349-53.
204. Korth, H.G., et al., On the mechanism o f the nitric oxide synthase-catalyzed
conversion o f N omega-hydroxyl-L-arginine to citrulline and nitric oxide. J Biol
Chem, 1994. 269(27): p. 17776-9.
205. Berka, V., L.H. Wang, and A.L. Tsai, Oxygen-induced radical intermediates in
the nNOS oxygenase domain regulated by L-arginine, tetrahydrobiopterin, and
thiol. Biochemistry, 2008. 47(1): p. 405-20.
-275 -

References
206. Garcia-Cardena, G., et al., Targeting o f nitric oxide synthase to endothelial cell
caveolae via palmitoylation: implications for nitric oxide signaling. Proc Natl
Acad Sci U S A , 1996. 93(13): p. 6448-53.
207. Liu, J., G. Garcia-Cardena, and W.C. Sessa, Palmitoylation o f endothelial nitric
oxide synthase is necessary fo r optimal stimulated release o f nitric oxide:
implications fo r caveolae localization. Biochemistry, 1996. 35(41): p. 13277-81.
208. Rothberg, K.G., et al., Caveolin, a protein component o f caveolae membrane
coats. Cell, 1992. 68(4): p. 673-82.
209. Ju, H., et al., Direct interaction o f endothelial nitric-oxide synthase and caveolin-1
inhibits synthase activity. J Biol Chem, 1997. 272(30): p. 18522-5.
210. Feron, O., et al., Dynamic regulation o f endothelial nitric oxide synthase:
complementary roles o f dual acylation and caveolin interactions. Biochemistry,
1998. 37(1): p. 193-200.
211. Garcia-Cardena, G., et al., Endothelial nitric oxide synthase is regulated by
tyrosine phosphorylation and interacts with caveolin-1. J Biol Chem, 1996.
271(44): p. 27237-40.
212. Garcia-Cardena, G., et al., Dynamic activation o f endothelial nitric oxide synthase
by Hsp90. Nature, 1998. 392(6678): p. 821-4.
213. Buga, G.M., et al., Negative feedback regulation o f endothelial cell function by
nitric oxide. Circ Res, 1993. 73(5): p. 808-12.
214. Grumbach, I.M., et al., A negative feedback mechanism involving nitric oxide and
nuclear factor kappa-B modulates endothelial nitric oxide synthase transcription.
J Mol Cell Cardiol, 2005. 39(4): p. 595-603.
215. Zacharia, I.G. and W.M. Deen, Diffusivity and solubility o f nitric oxide in water
and saline. Ann Biomed Eng, 2005. 33(2): p. 214-22.
- 2 7 6 -

F
References
216. Malinski, T., et al., Diffusion o f nitric oxide in the aorta wall monitored in situ by
porphyrinic microsensors. Biochem Biophys Res Commun, 1993. 193(3): p.
1076-82.
217. Kimura, H. and F. Murad, Two forms o f guanylate cyclase in mammalian tissues
and possible mechanisms fo r their regulation. Metabolism, 1975. 24(3): p. 439-
45.
218. Gill, G.N., et al., Purification and characterization o f 3':5'-cyclic GMP-dependent
protein kinase. Proc Natl Acad Sci U S A , 1976. 73(11): p. 3918-22.
219. Schlossmann, J., et al., Regulation o f intracellular calcium by a signalling
complex o f IRAG, IP3 receptor and cGMP kinase Ibeta. Nature, 2000. 404(6774):
p. 197-201.
220. Cornwell, T.L., et al., Regulation o f sarcoplasmic reticulum protein
phosphorylation by localized cyclic GMP-dependent protein kinase in vascular
smooth muscle cells. Mol Pharmacol, 1991. 40(6): p. 923-31.
221. Simmerman, H.K. and L.R. Jones, Phospholamban: protein structure, mechanism
o f action, and role in cardiac function. Physiol Rev, 1998. 78(4): p. 921-47.
222. Sausbier, M., et al., Mechanisms o f NO/cGMP-dependent vasorelaxation. Circ
Res, 2000. 87(9): p. 825-30.
223. Horowitz, A., et al., Mechanisms o f smooth muscle contraction. Physiol Rev,
1996. 76(4): p. 967-1003.
224. Etter, E.F., et al., Activation o f myosin light chain phosphatase in intact arterial
smooth muscle during nitric oxide-induced relaxation. J Biol Chem, 2001.
276(37): p. 34681-5.
225. Surks, H.K., et al., Regulation o f myosin phosphatase by a specific interaction
with cGMP- dependent protein kinase Ialpha. Science, 1999. 286(5444): p. 1583-
7.
- 2 7 7 -

References
226.
227.
228.
229.
230.
231.
232.
233.
234.
Boolell, M., et al., Sildenafil: an orally active type 5 cyclic GMP-specific
phosphodiesterase inhibitor fo r the treatment o f penile erectile dysfunction. Int J
Impot Res, 1996. 8(2): p. 47-52.
Ortega Mateo, A. and A. Amaya Aleixandre de, Nitric oxide reactivity and
mechanisms involved in its biological effects. Pharmacol Res, 2000. 42(5): p. 421-
7.
Gerzer, R., F. Hofmann, and G. Schultz, Purification o f a soluble, sodium-
nitroprusside-stimulated guanylate cyclase from bovine lung. Eur J Biochem,
1981.116(3): p. 479-86.
Gerzer, R., E.W. Radany, and D.L. Garbers, The separation o f the heme and
apoheme forms o f soluble guanylate cyclase. Biochem Biophys Res Commun,
1982.108(2): p. 678-86.
Ohlstein, E.H., K.S. Wood, and L.J. Ignarro, Purification and properties o f heme-
deficient hepatic soluble guanylate cyclase: effects o f heme and other factors on
enzyme activation by NO, NO-heme, and protoporphyrin IX. Arch Biochem
Biophys, 1982. 218(1): p. 187-98.
Poulos, T.L., Soluble guanylate cyclase. Curr Opin Struct Biol, 2006. 16(6): p.
736-43.
Wedel, B., et al., Mutation o f His-105 in the beta 1 subunit yields a nitric oxide-
insensitive form o f soluble guanylyl cyclase. Proc Natl Acad Sci U S A , 1994.
91(7): p. 2592-6.
Ignarro, L.J., et al., Activation o f purified guanylate cyclase by nitric oxide
requires heme. Comparison o f heme-deficient, heme-reconstituted and heme-
containing forms o f soluble enzyme from bovine lung. Biochim Biophys Acta,
1982. 718(1): p. 49-59.
Zhao, Y., et al., A molecular basis fo r nitric oxide sensing by soluble guanylate
cyclase. Proc Natl Acad Sci U S A , 1999. 96(26): p. 14753-8.
- 2 7 8 -

235.
236.
237.
238.
239.
240.
241.
242.
243.
244.
245.
References
Russwurm, M. and D. Koesling, NO activation o f guanylyl cyclase. Embo J, 2004.
23(22): p. 4443-50.
Cary, S.P., J.A. Winger, and M.A. Marietta, Tonic and acute nitric oxide signaling
through soluble guanylate cyclase is mediated by nonheme nitric oxide, ATP, and
GTP. Proc Natl Acad Sci U S A , 2005.102(37): p. 13064-9.
Andriambeloson, E. and P.K. Witting, Chemical regulation o f nitric oxide: a role
fo r intracellular myoglobin? Redox Rep, 2002. 7(3): p. 131-6.
Dierks, E.A. and J.N. Burstyn, The deactivation o f soluble guanylyl cyclase by
redox-active agents. Arch Biochem Biophys, 1998. 351(1): p. 1-7.
Kharitonov, V.G., et al., Dissociation o f nitric oxide from soluble guanylate
cyclase. Biochem Biophys Res Commun, 1997. 239(1): p. 284-6.
Radomski, M.W., R.M. Palmer, and S. Moncada, An L-arginine/nitric oxide
pathway present in human platelets regulates aggregation. Proc Natl Acad Sci U
S A, 1990. 87(13): p. 5193-7.
Azuma, H., M. Ishikawa, and S. Sekizaki, Endothelium-dependent inhibition o f
platelet aggregation. Br J Pharmacol, 1986. 88(2): p. 411-5.
Konishi, R., et al., Nitric oxide prevents human platelet adhesion to fiber
membranes in whole blood. Asaio J, 1996. 42(5): p. M850-3.
Freedman, J.E., et al., Nitric oxide released from activated platelets inhibits
platelet recruitment. J Clin Invest, 1997. 100(2): p. 350-6.
Ovize, M., et al., Inhibition o f coronary artery thrombosis by SIN-1, a donor o f
nitric oxide. J Cardiovasc Pharmacol, 1990. 16(4): p. 641-5.
Moro, M.A., et al., cGMP mediates the vascular and platelet actions o f nitric
oxide: confirmation using an inhibitor o f the soluble guanylyl cyclase. Proc Natl
Acad Sci U S A , 1996. 93(4): p. 1480-5.
- 2 7 9 -

References
246. Rao, G.H., et al., Influence o f nitric oxide on agonist-mediated calcium
mobilization in platelets. Biochem Med Metab Biol, 1990. 43(3): p. 271-5.
247. Trepakova, E.S., R.A. Cohen, and V.M. Bolotina, Nitric oxide inhibits
capacitative cation influx in human platelets by promoting
sarcoplasmic/endoplasmic reticulum Ca2+-ATPase-dependent refilling o f Ca2+
stores. Circ Res, 1999. 84(2): p. 201-9.
248. Michelson, A.D., et al., Effects o f nitric oxide/EDRF on platelet surface
glycoproteins. Am J Physiol, 1996. 270(5 Pt 2): p. H I640-8.
249. Mendelsohn, M.E., et al., Inhibition o f fibrinogen binding to human platelets by S-
nitroso-N-acetylcysteine. J Biol Chem, 1990. 265(31): p. 19028-34.
250. Bowen, R. and R.J. Haslam, Effects o f nitrovasodilators on platelet cyclic
nucleotide levels in rabbit blood; role fo r cyclic AMP in synergistic inhibition o f
platelet function by SIN-1 and prostaglandin El. J Cardiovasc Pharmacol, 1991.
17(3): p. 424-33.
251. Pigazzi, A., et al., Nitric oxide inhibits thrombin receptor-activating peptide-
induced phosphoinositide 3-kinase activity in human platelets. J Biol Chem, 1999.
274(20): p. 14368-75.
252. Murohara, T., et al., Role o f endothelial nitric oxide synthase in endothelial cell
migration. Arterioscler Thromb Vase Biol, 1999. 19(5): p. 1156-61.
253. Garg, U.C. and A. Hassid, Nitric oxide-generating vasodilators and 8-bromo-
cyclic guanosine monophosphate inhibit mitogenesis and proliferation o f cultured
rat vascular smooth muscle cells. J Clin Invest, 1989. 83(5): p. 1774-7.
254. Cornwell, T.L., et al., Inhibition o f smooth muscle cell growth by nitric oxide and
activation o f cAMP-dependent protein kinase by cGMP. Am J Physiol, 1994.
267(5 Pt 1): p. C1405-13.
- 2 8 0 -

References
255. Nilsson, J., et al., The calcium antagonist nifedipine inhibits arterial smooth
muscle cell proliferation. Atherosclerosis, 1985. 58(1-3): p. 109-22.
256. Ignarro, L.J., et al., Role o f the arginine-nitric oxide pathway in the regulation o f
vascular smooth muscle cell proliferation. Proc Natl Acad Sci U S A , 2001. 98(7):
p. 4202-8.
257. Rossig, L., et al., Nitric oxide inhibits caspase-3 by S-nitrosation in vivo. J Biol
Chem, 1999. 274(11): p. 6823-6.
258. Ziche, M., et al., Nitric oxide mediates angiogenesis in vivo and endothelial cell
growth and migration in vitro promoted by substance P. J Clin Invest, 1994.
94(5): p. 2036-44.
259. Welter, R., L. Yu, and C.A. Yu, The effects o f nitric oxide on electron transport
complexes. Arch Biochem Biophys, 1996. 331(1): p. 9-14.
260. Wainio, W.W., Reactions o f cytochrome oxidase. J Biol Chem, 1955. 212(2): p.
723-33.
261. Cassina, A. and R. Radi, Differential inhibitory action o f nitric oxide and
peroxynitrite on mitochondrial electron transport. Arch Biochem Biophys, 1996.
328(2): p. 309-16.
262. Brown, G.C., Nitric oxide and mitochondrial respiration. Biochim Biophys Acta,
1999.1411(2-3): p. 351-69.
263. Cleeter, M.W., et al., Reversible inhibition o f cytochrome c oxidase, the terminal
enzyme o f the mitochondrial respiratory chain, by nitric oxide. Implications for
neurode generative diseases. FEBS Lett, 1994. 345(1): p. 50-4.
264. Clementi, E., et al., On the mechanism by which vascular endothelial cells
regulate their oxygen consumption. Proc Natl Acad Sci U S A , 1999. 96(4): p.
1559-62.
-281 -

References
265. Palacios-Callender, M., et al., Cytochrome c oxidase regulates endogenous nitric
oxide availability in respiring cells: a possible explanation for hypoxic
vasodilation. Proc Natl Acad Sci U S A , 2007. 104(47): p. 18508-13.
266. Stamler, J.S., et al., S-nitrosylation o f proteins with nitric oxide: synthesis and
characterization o f biologically active compounds. Proc Natl Acad Sci U S A ,
1992. 89(1): p. 444-8.
267. Stubauer, G., A. Giuffre, and P. Sarti, Mechanism o f S-nitrosothiol formation and
degradation mediated by copper ions. J Biol Chem, 1999. 274(40): p. 28128-33.
268. Erwin, P.A., et al., Receptor-regulated dynamic S-nitrosylation o f endothelial
nitric-oxide synthase in vascular endothelial cells. J Biol Chem, 2005. 280(20): p.
19888-94.
269. Erwin, P.A., et al., Subcellular targeting and differential S-nitrosylation o f
endothelial nitric-oxide synthase. J Biol Chem, 2006. 281(1): p. 151-7.
270. Foster, M.W. and J.S. Stamler, New insights into protein S-nitrosylation.
Mitochondria as a model system. J Biol Chem, 2004. 279(24): p. 25891-7.
271. Tjong, Y.W., et al., Elevated endogenous nitric oxide increases Ca2+ flux via L-
type Ca2+ channels by S-nitrosylation in rat hippocampal neurons during severe
hypoxia and in vitro ischemia. Free Radic Biol Med, 2007. 42(1): p. 52-63.
272. Catani, M.V., et al., Inhibition o f clotting factor XIII activity by nitric oxide.
Biochem Biophys Res Commun, 1998. 249(1): p. 275-8.
273. Azad, N., et al., S-nitrosylation o f Bcl-2 inhibits its ubiquitin-proteasomal
degradation. A novel antiapoptotic mechanism that suppresses apoptosis. J Biol
Chem, 2006. 281(45): p. 34124-34.
274. Clancy, R.M., A.R. Amin, and S.B. Abramson, The role o f nitric oxide in
inflammation and immunity. Arthritis Rheum, 1998. 41(7): p. 1141-51.
- 2 8 2 -

References
275. Colasanti, M. and T. Persichini, Nitric oxide: an inhibitor o f NF-kappaB/Rel
system in glial cells. Brain Res Bull, 2000. 52(3): p. 155-61.
276. Peng, H.B., P. Libby, and J.K. Liao, Induction and stabilization o f I kappa B
alpha by nitric oxide mediates inhibition o f NF-kappa B. J Biol Chem, 1995.
270(23): p. 14214-9.
277. Grisham, M.B., D.N. Granger, and D.J. Lefer, Modulation o f leukocyte-
endothelial interactions by reactive metabolites o f oxygen and nitrogen: relevance
to ischemic heart disease. Free Radic Biol Med, 1998. 25(4-5): p. 404-33.
278. Fang, F.C., Perspectives series: host/pathogen interactions. Mechanisms o f nitric
oxide-related antimicrobial activity. J Clin Invest, 1997. 99(12): p. 2818-25.
279. Nathan, C.F. and J.B. Hibbs, Jr., Role o f nitric oxide synthesis in macrophage
antimicrobial activity. Curr Opin Immunol, 1991. 3(1): p. 65-70.
280. Hauser, B., et al., Nitric oxide synthase inhibition in sepsis? Lessons learned from
large-animal studies. Anesth Analg, 2005. 101(2): p. 488-98.
281. Ford, P.C., D.A. Wink, and D.M. Stanbury, Autoxidation kinetics o f aqueous
nitric oxide. FEBS Lett, 1993. 326(1-3): p. 1-3.
282. Wink, D.A., et al., Reactions o f the bioregulatory agent nitric oxide in oxygenated
aqueous media: determination o f the kinetics fo r oxidation and nitrosation by
intermediates generated in the NO/02 reaction. Chem Res Toxicol, 1993. 6(1): p.
23-7.
283. Gratzel, M., et al., Pulse radiolytic investigation o f some elementary processes o f
the oxidation and reduction o f the nitrite anion (in German). Ber. Bunsen-Ges.
Phys. C hem ., 1969. 73: p. 646-653.
284. Gratzel, M., A. Henglein, and S. Taniguchi, Pulse radiolytic observations on the
reduction o f the N03- ion and on the formation and decay o f pernitrous acid in
- 2 8 3 -

References
aqueous solution (in German). Ber. Bunsen-Ges. Phys. Chem. , 1970. 74: p.
292-298.
285. Kelm, M. and J. Schrader, Control o f coronary vascular tone by nitric oxide. Circ
Res, 1990. 66(6): p. 1561-75.
286. Pogrebnaya, V.L., et al., Oxidation o f nitric oxide in the liquid phase. J App Chem
USSR, 1975. 48: p. 954-958.
287. Ischiropoulos, H., L. Zhu, and J.S. Beckman, Peroxynitrite formation from
macrophage-derived nitric oxide. Arch Biochem Biophys, 1992. 298(2): p. 446-
51.
288. Ewing, J.F., et al., Nitrosylated bovine serum albumin derivatives as
pharmacologically active nitric oxide congeners. J Pharmacol Exp Ther, 1997.
283(2): p. 947-54.
289. van der Vliet, A., et al., Formation o f S-nitrosothiols via direct nucleophilic
nitrosation o f thiols by peroxynitrite with elimination o f hydrogen peroxide. J Biol
Chem, 1998. 273(46): p. 30255-62.
290. Gow, A.J., et al., Biological significance o f nitric oxide-mediated protein
modifications. Am J Physiol Lung Cell Mol Physiol, 2004. 287(2): p. L262-8.
291. Wade, R.S. and C.E. Castro, Redox reactivity o f iron(III) porphyrins and heme
proteins with nitric oxide. Nitrosyl transfer to carbon, oxygen, nitrogen, and
sulfur. Chem Res Toxicol, 1990. 3(4): p. 289-91.
292. Boese, M., et al., S-nitrosation o f serum albumin by dinitrosyl-iron complex. J
Biol Chem, 1995. 270(49): p. 29244-9.
293. Espey, M.G., et al., Mechanisms o f cell death governed by the balance between
nitrosative and oxidative stress. Ann N Y Acad Sci, 2000. 899: p. 209-21.
- 2 8 4 -

References
294. Saville, B., A Scheme fo r the Colorimetric Determination o f Microgram Amounts
o f Thiols. Analyst, 1958. 83: p. 670-672.
295. Packer, M.A. and M.P. Murphy, Peroxynitrite formed by simultaneous nitric oxide
and superoxide generation causes cyclosporin-A-sensitive mitochondrial calcium
efflux and depolarisation. Eur J Biochem, 1995. 234(1): p. 231-9.
296. Noronha-Dutra, A.A., M.M. Epperlein, and N. Woolf, Reaction o f nitric oxide
with hydrogen peroxide to produce potentially cytotoxic singlet oxygen as a model
fo r nitric oxide-mediated killing. FEBS Lett, 1993. 321(1): p. 59-62.
297. Dalloz, F., et al., In vitro studies o f interactions o f NO. donor drugs with
superoxide and hydroxyl radicals. Mol Cell Biochem, 1997. 177(1-2): p. 193-200.
298. Berry, C., et al., Investigation into the sources o f superoxide in human blood
vessels: angiotensin II increases superoxide production in human internal
mammary arteries. Circulation, 2000. 101(18): p. 2206-12.
299. Estevez, A.G. and J. Jordan, Nitric oxide and superoxide, a deadly cocktail. Ann
N Y Acad Sci, 2002. 962: p. 207-11.
300. Di Mascio, P., B. Dewez, and C.R. Garcia, Ghost protein damage by peroxynitrite
and its protection by melatonin. Braz J Med Biol Res, 2000. 33(1): p. 11-7.
301. McCord, J.M. and I. Fridovich, Superoxide dismutase. An enzymic function for
erythrocuprein (hemocuprein). J Biol Chem, 1969. 244(22): p. 6049-55.
302. Worlitzsch, D., et al., Catalase, myeloperoxidase and hydrogen peroxide in cystic
fibrosis. Eur Respir J, 1998. 11(2): p. 377-83.
303. Bouloumie, A., et al., Endothelial dysfunction coincides with an enhanced nitric
oxide synthase expression and superoxide anion production. Hypertension, 1997.
30(4): p. 934-41.
- 2 8 5 -

References
304. Cooper, C.E., Nitric oxide and iron proteins. Biochim Biophys Acta, 1999.
1411(2-3): p. 290-309.
305. Wennmalm, A., et al., Nitric oxide synthesis and metabolism in man. Ann N Y
Acad Sci, 1994. 714: p. 158-64.
306. Shuval, H.I. and N. Gruener, Epidemiological and toxicological aspects o f
nitrates and nitrites in the environment. Am J Public Health, 1972. 62(8): p. 1045-
52.
307. Borgese, N., G. Pietrini, and S. Gaetani, Concentration o f NADH-cytochrome b5
reductase in erythrocytes o f normal and methemoglobinemic individuals
measured with a quantitative radioimmunoblotting assay. J Clin Invest, 1987.
80(5): p. 1296-302.
308. Sharma, V.S. and H.M. Ranney, The dissociation o f NO from nitrosylhemoglobin.
J Biol Chem, 1978. 253(18): p. 6467-72.
309. Gow, A.J. and J.S. Stamler, Reactions between nitric oxide and haemoglobin
under physiological conditions. Nature, 1998. 391(6663): p. 169-73.
310. Angelo, M., D.J. Singel, and J.S. Stamler, An S-nitrosothiol (SNO) synthase
function o f hemoglobin that utilizes nitrite as a substrate. Proc Natl Acad Sci U S
A, 2006. 103(22): p. 8366-71.
311. Lundberg, J.O., E. Weitzberg, and M.T. Gladwin, The nitrate-nitrite-nitric oxide
pathway in physiology and therapeutics. Nat Rev Drug Discov, 2008. 7(2): p.
156-67.
312. Kosaka, H. and I. Tyuma, Mechanism o f autocatalytic oxidation o f oxyhemoglobin
by nitrite. Environ Health Perspect, 1987. 73: p. 147-51.
313. Huang, K.T., et al., The reaction between nitrite and deoxyhemoglobin.
Reassessment o f reaction kinetics and stoichiometry. J Biol Chem, 2005. 280(35):
p. 31126-31.
- 2 8 6 -

References
314. Nagababu, E., S. Ramasamy, and J.M. Rifkind, Intermediates detected by visible
spectroscopy during the reaction o f nitrite with deoxyhemoglobin: the effect o f
nitrite concentration and diphosphoglycerate. Biochemistry, 2007. 46(41): p.
11650-9.
315. Luchsinger, B.P., et al., Assessments o f the chemistry and vasodilatory activity o f
nitrite with hemoglobin under physiologically relevant conditions. J Inorg
Biochem, 2005. 99(4): p. 912-21.
316. Kalyanaraman, B., Nitrated lipids: a class o f cell-signaling molecules. Proc Natl
Acad Sci U S A , 2004. 101(32): p. 11527-8.
317. Stamler, J.S. and M. Feelisch, Biochemistry o f Nitric Oxide and Redox-Related
Species, in Methods in Nitric Oxide Research, J.S. Stamler and M. Feelisch,
Editors. 1996, John Wiley & Sons. p. 19-28.
318. Kelm, M., Nitric oxide metabolism and breakdown. Biochim Biophys Acta, 1999.
1411(2-3): p. 273-89.
319. Liu, X., et al., Diffusion-limited reaction o f free nitric oxide with erythrocytes. J
Biol Chem, 1998. 273(30): p. 18709-13.
320. Vaughn, M.W., et al., Erythrocytes possess an intrinsic barrier to nitric oxide
consumption. J Biol Chem, 2000. 275(4): p. 2342-8.
321. Liu, X., et al., Nitric oxide uptake by erythrocytes is primarily limited by
extracellular diffusion not membrane resistance. J Biol Chem, 2002. 277(29): p.
26194-9.
322. Butler, A.R., I.L. Megson, and P.G. Wright, Diffusion o f nitric oxide and
scavenging by blood in the vasculature. Biochim Biophys Acta, 1998. 1425(1): p.
168-76.
323. Liao, J.C., et al., Intravascular flow decreases erythrocyte consumption o f nitric
oxide. Proc Natl Acad Sci U S A , 1999. 96(15): p. 8757-61.
- 2 8 7 -

References
324. Stamler, J.S., et al., Nitric oxide circulates in mammalian plasma primarily as an
S-nitroso adduct o f serum albumin. Proc Natl Acad Sci U S A , 1992. 89(16): p.
7674-7.
325. Jia, L., et al., S-nitrosohaemoglobin: a dynamic activity o f blood involved in
vascular control. Nature, 1996. 380(6571): p. 221-6.
326. Gladwin, M.T., et al., Relative role o f heme nitrosylation and beta-cysteine 93
nitrosation in the transport and metabolism o f nitric oxide by hemoglobin in the
human circulation. Proc Natl Acad Sci U S A , 2000. 97(18): p. 9943-8.
327. Gladwin, M.T., et al., Role o f circulating nitrite and S-nitrosohemoglobin in the
regulation o f regional blood flow in humans. Proc Natl Acad Sci U S A , 2000.
97(21): p. 11482-7.
328. Baker, P.R., et al., Red cell membrane and plasma linoleic acid nitration
products: synthesis, clinical identification, and quantitation. Proc Natl Acad Sci U
S A, 2004. 101(32): p. 11577-82.
329. McMahon, T.J., et al., Nitric oxide in the human respiratory cycle. Nat Med,
2002. 8(7): p. 711-7.
330. Brunori, M., et al., Studies on the oxidation-reduction potentials o f heme proteins.
VI. Human hemoglobin treated with various sulfhydryl reagents. J Biol Chem,
1967. 242(10): p. 2295-300.
331. Pawloski, J.R., D.T. Hess, and J.S. Stamler, Export by red blood cells o f nitric
oxide bioactivity. Nature, 2001. 409(6820): p. 622-6.
332. Stamler, J.S., et al., Blood flow regulation by S-nitrosohemoglobin in the
physiological oxygen gradient. Science, 1997. 276(5321): p. 2034-7.
333. Furchgott, R.F. and S. Bhadrakom, Reactions o f strips o f rabbit aorta to
epinephrine, isopropylarterenol, sodium nitrite and other drugs. J Pharmacol Exp
Ther, 1953. 108(2): p. 129-43.
- 2 8 8 -

References
334. Godber, B.L., et al., Reduction o f nitrite to nitric oxide catalyzed by xanthine
oxidoreductase. J Biol Chem, 2000. 275(11): p. 7757-63.
335. Zweier, J.L., et al., Enzyme-independent formation o f nitric oxide in biological
tissues. Nat Med, 1995. 1(8): p. 804-9.
336. Doyle, M.P., et al., Kinetics and mechanism o f the oxidation o f human
deoxyhemoglobin by nitrites. J Biol Chem, 1981. 256(23): p. 12393-8.
337. Cosby, K., et al., Nitrite reduction to nitric oxide by deoxyhemoglobin vasodilates
the human circulation. Nat Med, 2003. 9(12): p. 1498-505.
338. Huang, Z., et al., Enzymatic function o f hemoglobin as a nitrite reductase that
produces NO under aliosteric control. J Clin Invest, 2005. 115(8): p. 2099-107.
339. Roche, C.J., et al., Nitrite reductase activity o f sol-gel-encapsulated
deoxyhemoglobin. Influence o f quaternary and tertiary structure. J Biol Chem,
2006. 281(48): p. 36874-82.
340. Taboy, C.H., et al., Concentration-dependent effects o f anions on the anaerobic
oxidation o f hemoglobin and myoglobin. J Biol Chem, 2000. 275(50): p. 39048-
54.
341. Gladwin, M.T., R. Grubina, and M.P. Doyle, The new chemical biology o f nitrite
reactions with hemoglobin: R-state catalysis, oxidative denitrosylation, and nitrite
reductase/anhydrase. Acc Chem Res, 2009. 42(1): p. 157-67.
342. Crawford, J.H., et al., Hypoxia, red blood cells, and nitrite regulate NO-dependent
hypoxic vasodilation. Blood, 2006. 107(2): p. 566-74.
343. Allen, B.W. and C.A. Piantadosi, How do red blood cells cause hypoxic
vasodilation? The SNO-hemoglobin paradigm. Am J Physiol Heart Circ Physiol,
2006. 291(4): p. H1507-12.
- 2 8 9 -

References
344. Hendgen-Cotta, U.B., et al., Nitrite reductase activity o f myoglobin regulates
respiration and cellular viability in myocardial ischemia-reperfusion injury. Proc
Natl Acad Sci U S A , 2008. 105(29): p. 10256-61.
345. Harrison, D.G., et al., Alterations o f vascular reactivity in atherosclerosis. Circ
Res, 1987. 61(5 Pt 2): p. 1174-80.
346. Higashi, Y., et al., Endothelial function and oxidative stress in cardiovascular
diseases. Circ J, 2009. 73(3): p. 411-8.
347. Oemar, B.S., et al., Reduced endothelial nitric oxide synthase expression and
production in human atherosclerosis. Circulation, 1998. 97(25): p. 2494-8.
348. Zou, M.H., C. Shi, and R.A. Cohen, Oxidation o f the zinc-thiolate complex and
uncoupling o f endothelial nitric oxide synthase by peroxynitrite. J Clin Invest,
2002.109(6): p. 817-26.
349. Puri, P.S., et al., Alterations in energy metabolism and ultrastructure upon
reperfusion o f the ischemic myocardium after coronary occlusion. Am J Cardiol,
1975. 36(2): p. 234-43.
350. Lu, P., et al., Nitrite-derived nitric oxide by xanthine oxidoreductase protects the
liver against ischemia-reperfusion injury. Hepatobiliary Pancreat Dis Int, 2005.
4(3): p. 350-5.
351. Kawaguchi, A.T., et al., S-nitrosylated pegylated hemoglobin reduces the size o f
cerebral infarction in rats. A rtif Organs, 2009. 33(2): p. 183-8.
352. Tripatara, P., et al., Nitrite-derived nitric oxide protects the rat kidney against
ischemia/reperfusion injury in vivo: role fo r xanthine oxidoreductase. J Am Soc
Nephrol, 2007.18(2): p. 570-80.
353. Zhang, X., Real time and in vivo monitoring o f nitric oxide by electrochemical
sensors—from dream to reality. Front Biosci, 2004. 9: p. 3434-46.
- 2 9 0 -

References
354. Yoshioka, T., N. Iwamoto, and K. Ito, An application o f electron paramagnetic
resonance to evaluate nitric oxide and its quenchers. J Am Soc Nephrol, 1996.
7(6): p. 961-5.
355. Zhang, X., et al., Interfering with nitric oxide measurements. 4,5-
diaminofluorescein reacts with dehydroascorbic acid and ascorbic acid. J Biol
Chem, 2002. 277(50): p. 48472-8.
356. Giustarini, D., et al., Adaptation o f the Griess reaction for detection o f nitrite in
human plasma. Free Radic Res, 2004. 38(11): p. 1235-40.
357. El Menyawi, I., et al., Measurement o f serum nitrite/nitrate concentrations using
high-performance liquid chromatography. J Chromatogr B Biomed Sci Appl,
1998. 706(2): p. 347-51.
358. Fontijn, A., A.J. Sabadell, and R.J. Ronco, Homogeneous chemiluminescent
measurement o f nitric oxide with ozone. Implications for continuous selective
monitoring o f gaseous air pollutants. Analytical Chemistry, 1970. 42(6): p. 575-
579.
359. Samouilov, A. and J.L. Zweier, Development o f chemiluminescence-based
methods fo r specific quantitation o f nitrosylated thiols. Anal Biochem, 1998.
258(2): p. 322-30.
360. Wang, X., et al., Measurement o f nitric oxide levels in the red cell: validation o f
tri-iodide-based chemiluminescence with acid-sulfanilamide pretreatment. J Biol
Chem, 2006. 281(37): p. 26994-7002.
361. Braman, R.S. and S.A. Hendrix, Nanogram nitrite and nitrate determination in
environmental and biological materials by vanadium (III) reduction with
chemiluminescence detection. Anal Chem, 1989. 61(24): p. 2715-8.
362. Kon, H., Paramagnetic resonance study o f Nitric Oxide hemoglobin. J Biol Chem,
1968.243(16): p. 4350-7.
- 2 9 1 -

References
363. Doctor, A., et al., Hemoglobin conformation couples erythrocyte S-nitrosothiol
content to 02 gradients. Proc Natl Acad Sci U S A , 2005. 102(16): p. 5709-14.
364. Dejam, A., et al., Erythrocytes are the major intravascular storage sites o f nitrite
in human blood. Blood, 2005. 106(2): p. 734-9.
365. Rogers, S.C., et al., Detection o f human red blood cell-bound nitric oxide. J Biol
Chem, 2005. 280(29): p. 26720-8.
366. Hampl, V., C.L. Walters, and S.L. Archer, Determination o f Nitric Oxide By
Chemiluminescence Reaction with Ozone, in Methods in Nitric Oxide Research,
J.S. Stamler and M. Feelisch, Editors. 1996, John Wiley & Sons. p. 309-318.
367. Yang, B.K., et al., Methodologies fo r the sensitive and specific measurement o f S-
nitrosothiols, iron-nitrosyls, and nitrite in biological samples. Free Radic Res,
2003. 37(1): p. 1-10.
368. Bailey, D.M., et al., Altered free radical metabolism in acute mountain sickness:
implications fo r dynamic cerebral autoregulation and blood-brain barrier
function. J Physiol, 2009. 587(Pt 1): p. 73-85.
369. Rogers, S.C., et al., NO metabolite flux across the human coronary circulation.
Cardiovasc Res, 2007. 75(2): p. 434-41.
370. Pinder, A.G., et al., The measurement o f nitric oxide and its metabolites in
biological samples by ozone-based chemiluminescence. Methods Mol Biol, 2008.
476: p. 11-28.
371. Gow, A.J., et al., The oxyhemoglobin reaction o f nitric oxide. Proc Natl Acad Sci
U S A , 1999. 96(16): p. 9027-32.
372. Bradley, W.G., Jr. and P.G. Schmidt, Effect o f methemoglobin formation on the
MR appearance o f subarachnoid hemorrhage. Radiology, 1985. 156(1): p. 99-
103.
- 2 9 2 -

References
373. Hausladen, A., et al., Assessment o f nitric oxide signals by triiodide
chemiluminescence. Proc Natl Acad Sci U S A , 2007. 104(7): p. 2157-62.
374. Carter, T.D., N. Bettache, and D. Ogden, Potency and kinetics o f nitric oxide-
mediated vascular smooth muscle relaxation determined with flash photolysis o f
ruthenium nitrosyl chlorides. Br J Pharmacol, 1997. 122(6): p. 971-3.
375. Lancaster, J.R., Jr., Simulation o f the diffusion and reaction o f endogenously
produced nitric oxide. Proc Natl Acad Sci U S A , 1994. 91(17): p. 8137-41.
376. Azarov, I., et al., Nitric oxide scavenging by red blood cells as a function o f
hematocrit and oxygenation. J Biol Chem, 2005. 280(47): p. 39024-32.
377. Seccia, M., et al., Inhibition o f Cu2+-induced LDL oxidation by nitric oxide: a
study using donors with different half-time o f NO release. Biochem Biophys Res
Commun, 1996. 220(2): p. 306-9.
378. McNaught, K.S. and G.C. Brown, Nitric oxide causes glutamate release from
brain synaptosomes. JNeurochem, 1998. 70(4): p. 1541-6.
379. Dejam, A., et al., Nitrite infusion in humans and nonhuman primates: endocrine
effects, pharmacokinetics, and tolerance formation. Circulation, 2007. 116(16): p.
1821-31.
380. Kleinbongard, P., et al., Plasma nitrite concentrations reflect the degree o f
endothelial dysfunction in humans. Free Radic Biol Med, 2006. 40(2): p. 295-302.
381. Kleinbongard, P., et al., Plasma nitrite reflects constitutive nitric oxide synthase
activity in mammals. Free Radic Biol Med, 2003. 35(7): p. 790-6.
382. Lancaster, J.R., Jr., Diffusion o f free nitric oxide. Methods Enzymol, 1996. 268: p.
31-50.
383. Vaughn, M.W., L. Kuo, and J.C. Liao, Effective diffusion distance o f nitric oxide
in the microcirculation. Am J Physiol, 1998. 274(5 Pt 2): p. H1705-14.
- 2 9 3 -

References
384. Bugliarello, G. and J. Sevilla, Velocity distribution and other characteristics o f
steady and pulsatile blood flow in fine glass tubes. Biorheology, 1970. 7(2): p. 85-
107.
385. Sakai, H., et al., Encapsulation o f concentrated hemoglobin solution in
phospholipid vesicles retards the reaction with NO, but not CO, by intracellular
diffusion barrier. J Biol Chem, 2008. 283(3): p. 1508-17.
386. Moller, M., et al., Direct measurement o f nitric oxide and oxygen partitioning into
liposomes and low density lipoprotein. J Biol Chem, 2005. 280(10): p. 8850-4.
387. Chu, H., et al., Characterization o f the deoxyhemoglobin binding site on human
erythrocyte band 3: implications fo r 02 regulation o f erythrocyte properties.
Blood, 2008.111(2): p. 932-8.
388. Huang, K.T., et al., Modulation o f nitric oxide bioavailability by erythrocytes.
Proc Natl Acad Sci U S A , 2001. 98(20): p. 11771-6.
389. Huang, K.T., Z. Huang, and D.B. Kim-Shapiro, Nitric oxide red blood cell
membrane permeability at high and low oxygen tension. Nitric Oxide, 2007.
16(2): p. 209-16.
390. Shingles, R., M.H. Roh, and R.E. McCarty, Direct measurement o f nitrite
transport across erythrocyte membrane vesicles using the fluorescent probe, 6-
methoxy-N-(3-sulfopropyl) quinolinium. J Bioenerg Biomembr, 1997. 29(6): p.
611-6.
391. Jensen, F.B., Nitrite transport into pig erythrocytes and its potential biological
role. Acta Physiol Scand, 2005. 184(3): p. 243-51.
392. May, J.M., et al., Nitrite uptake and metabolism and oxidant stress in human
erythrocytes. Am J Physiol Cell Physiol, 2000. 279(6): p. C l946-54.
- 2 9 4 -

References
393. Feelisch, M., et al., Tissue processing o f nitrite in hypoxia: an intricate interplay
o f nitric oxide-generating and -scavenging systems. J Biol Chem, 2008. 283(49):
p. 33927-34.
394. Grubina, R., et al., Concerted nitric oxide formation and release from the
simultaneous reactions o f nitrite with deoxy- and oxyhemoglobin. J Biol Chem,
2007. 282(17): p. 12916-27.
395. Atkinson, G.A., The Pharmacology o f the Nitrites and Nitro-Glycerine. J Anat
Physiol, 1888. 22(Pt 2): p. 225-39.
396. Dalsgaard, T., U. Simonsen, and A. Fago, Nitrite-dependent vasodilation is
facilitated by hypoxia and is independent o f known NO-generating nitrite
reductase activities. Am J Physiol Heart Circ Physiol, 2007. 292(6): p. H3072-8.
397. Li, H., et al., Nitric oxide production from nitrite occurs primarily in tissues not in
the blood: critical role o f xanthine oxidase and aldehyde oxidase. J Biol Chem,
2008. 283(26): p. 17855-63.
398. Webb, A.J., et al., Mechanisms underlying erythrocyte and endothelial nitrite
reduction to nitric oxide in hypoxia: role fo r xanthine oxidoreductase and
endothelial nitric oxide synthase. Circ Res, 2008. 103(9): p. 957-64.
399. Nohl, H., et al., Mitochondria recycle nitrite back to the bioregulator nitric
monoxide. Acta Biochim Pol, 2000. 47(4): p. 913-21.
400. Alzawahra, W.F., et al., Heme proteins mediate the conversion o f nitrite to nitric
oxide in the vascular wall. Am J Physiol Heart Circ Physiol, 2008. 295(2): p.
H499-508.
401. Bogdan, C., Nitric oxide and the regulation o f gene expression. Trends Cell Biol,
2001.11(2): p. 66-75.
402. Bryan, N.S., et al., Nitrite is a signaling molecule and regulator o f gene
expression in mammalian tissues. Nat Chem Biol, 2005.1(5): p. 290-7.
- 2 9 5 -

References
403. Mack, A.K., et al., Sodium nitrite promotes regional blood flow in patients with
sickle cell disease: a phase / / / / study. Br J Haematol, 2008.142(6): p. 971-8.
404. Tambyraja, A.L., et al., Glutathione supplementation to University o f Wisconsin
solution causes endothelial dysfunction. Transpl Immunol, 2007. 18(2): p. 146-50.
405. Myung, S.C., et al., Vasomotor action o f insulin on the rabbit normal cavernous
smooth muscle. Eur J Pharmacol, 2006. 536(1-2): p. 142-7.
406. Chen, S.C., et al., Acute hypoxia to endothelial cells induces activating
transcription factor 3 (ATF3) expression that is mediated via nitric oxide.
Atherosclerosis, 2008. 201(2): p. 281-8.
407. Emans, P.J., et al., A novel in vivo model to study endochondral bone formation;
HIF-1 alpha activation and BMP expression. Bone, 2007. 40(2): p. 409-18.
408. Tang, F.T., et al., Crocetin improves endothelium-dependent relaxation o f
thoracic aorta in hypercholesterolemic rabbit by increasing eNOS activity.
Biochem Pharmacol, 2006. 72(5): p. 558-65.
409. Amico, C., et al., Differential expression o f cyclooxygenase-1 and
cyclooxygenase-2 in the cornea during wound healing. Tissue Cell, 2004. 36(1):
p. 1-12.
410. Davis, R.J., et al., EP4 prostanoid receptor-mediated vasodilatation o f human
middle cerebral arteries. Br J Pharmacol, 2004. 141(4): p. 580-5.
411. Rieger, J.M., A.R. Shah, and J.M. Gidday, Ischemia-reperfusion injury o f retinal
endothelium by cyclooxygenase- and xanthine oxidase-derived superoxide. Exp
Eye Res, 2002. 74(4): p. 493-501.
412. Clancy, R., et al., Nitric oxide synthase/COX cross-talk: nitric oxide activates
COX-1 but inhibits COX-2-derived prostaglandin production. J Immunol, 2000.
165(3): p. 1582-7.
- 2 9 6 -

References
413. Li, H., et al., Characterization o f the magnitude and kinetics o f xanthine oxidase-
catalyzed nitrite reduction. Evaluation o f its role in nitric oxide generation in
anoxic tissues. J Biol Chem, 2001. 276(27): p. 24482-9.
414. Yang, X., et al., Hypoxic induction o f cox-2 regulates proliferation o f human
pulmonary artery smooth muscle cells. Am J Respir Cell Mol Biol, 2002. 27(6): p.
688-96.
415. Moon, T.C. and A.D. Befus, Exogenous nitric oxide regulates cyclooxygenase-2
expression and prostaglandin D(2) generation through p38 MAPK in mouse hone
marrow-derived mast cells. Free Radic Biol Med, 2008. 45(6): p. 780-8.
416. Mitchell, J.A., S. Larkin, and T.J. Williams, Cyclooxygenase-2: regulation and
relevance in inflammation. Biochem Pharmacol, 1995. 50(10): p. 1535-42.
417. Webb, A.J., et al., Acute blood pressure lowering, vasoprotective, and antiplatelet
properties o f dietary nitrate via bioconversion to nitrite. Hypertension, 2008.
51(3): p. 784-90.
418. Coulet, F., et al., Identification o f hypoxia-response element in the human
endothelial nitric-oxide synthase gene promoter. J Biol Chem, 2003. 278(47): p.
46230-40.
419. Chiancone, E., et al., Kinetics o f the reaction o f the "masked" and "free"
sulfhydryl groups o f human hemoglobin with p-mercuribenzoate. J Biol Chem,
1970. 245(16): p. 4105-11.
420. Stamler, J.S., et al., (S)NO signals: translocation, regulation, and a consensus
motif. Neuron, 1997. 18(5): p. 691-6.
421. Diesen, D.L., D.T. Hess, and J.S. Stamler, Hypoxic vasodilation by red blood
cells: evidence fo r an s-nitrosothiol-based signal. Circ Res, 2008. 103(5): p. 545-
53.
- 2 9 7 -

References
422. Palmer, L.A., et al., S-nitrosothiols signal hypoxia-mimetic vascular pathology. J
Clin Invest, 2007. 117(9): p. 2592-601.
423. Huang, K.T., et al., Lack o f allosterically controlled intramolecular transfer o f
nitric oxide from the heme to cysteine in the beta subunit o f hemoglobin. Blood,
2006.107(7): p. 2602-4.
424. Isbell, T.S., et al., SNO-hemoglobin is not essential for red blood cell-dependent
hypoxic vasodilation. Nat Med, 2008. 14(7): p. 773-7.
425. Marriott, J.F. and J.M. Marshall, Effects o f hypoxia upon contractions evoked in
isolated rabbit pulmonary artery by potassium and noradrenaline. J Physiol,
1990. 422: p. 15-28.
426. Isbell, T.S., M.T. Gladwin, and R.P. Patel, Hemoglobin oxygen fractional
saturation regulates nitrite-dependent vasodilation o f aortic ring bioassays. Am J
Physiol Heart Circ Physiol, 2007. 293(4): p. H2565-72.
427. Basu, S., et al., Catalytic generation o f N203 by the concerted nitrite reductase
and anhydrase activity o f hemoglobin. Nat Chem Biol, 2007. 3(12): p. 785-94.
428. Gladwin, M.T., Hemoglobin as a nitrite reductase regulating red cell-dependent
hypoxic vasodilation. Am J Respir Cell Mol Biol, 2005. 32(5): p. 363-6.
429. Bergfeld, G.R. and T. Forrester, Release o f ATP from human erythrocytes in
response to a brief period o f hypoxia and hypercapnia. Cardiovasc Res, 1992.
26(1): p. 40-7.
430. Ellsworth, M.L., et al., The erythrocyte as a regulator o f vascular tone. Am J
Physiol, 1995. 269(6 Pt 2): p. H2155-61.
431. Corr, L. and G. Bumstock, Analysis o f P2-purinoceptor subtypes on the smooth
muscle and endothelium o f rabbit coronary artery. J Cardiovasc Pharmacol, 1994.
23(5): p. 709-15.
- 2 9 8 -

References
432. Dietrich, H.H., et al., Red blood cell regulation o f microvascular tone through
adenosine triphosphate. Am J Physiol Heart Circ Physiol, 2000. 278(4): p.
HI 294-8.
433. Sprague, R.S., et al., Rabbit erythrocytes release ATP and dilate skeletal muscle
arterioles in the presence o f reduced oxygen tension. Pharmacol Rep, 2009. 61(1):
p. 183-90.
434. Motterlini, R., et al., Bioactivity and pharmacological actions o f carbon
monoxide-releasing molecules. Curr Pharm Des, 2003. 9(30): p. 2525-39.
435. Loewi, O., Uber humoral Ubertragbarkeit der Herznervenwirkung. Pflugers
Arch. Ges. Physiol., 1921. 189: p. 239.
436. Puxeddu, A., et al., Red cell 2,3-DPG levels in diabetic vasculopathy. Acta
Diabetol Lat, 1979.16(4): p. 311-5.
437. Zwart, A., E.J. van Kampen, and W.G. Zijlstra, Results o f routine determination
o f clinically significant hemoglobin derivatives by multicomponent analysis. Clin
Chem, 1986. 32(6): p. 972-8.
438. Foresti, R., et al., Vasoactive properties o f CORM-3, a novel water-soluble carbon
monoxide-releasing molecule. Br J Pharmacol, 2004. 142(3): p. 453-60.
439. Meyer, J., et al., Arterio-venous carboxyhemoglobin difference suggests carbon
monoxide production by human lungs. Biochem Biophys Res Commun, 1998.
244(1): p. 230-2.
440. Sharma, V.S., M.R. Schmidt, and H.M. Ranney, Dissociation o f CO from
carboxyhemoglobin. J Biol Chem, 1976. 251(14): p. 4267-72.
441. Azizi, F., et al., Rates o f nitric oxide dissociation from hemoglobin. Free Radic
Biol Med, 2005. 39(2): p. 145-51.
- 2 9 9 -

References
442. Chou, K.J., J. Dodd, and J.C. Liao, Interactions o f nitrosylhemoglobin and
carboxyhemoglobin with erythrocyte. Nitric Oxide, 2008. 18(2): p. 122-35.
443. Faleo, G., et al., Carbon monoxide ameliorates renal cold ischemia-reperfusion
injury with an upregulation o f vascular endothelial growth factor by activation o f
hypoxia-inducible factor. Transplantation, 2008. 85(12): p. 1833-40.
444. Samaja, M., et al., The dissociation o f carbon monoxide from hemoglobin
intermediate. J Biol Chem, 1987. 262(10): p. 4528-33.
445. Lauer, T., et al., Plasma nitrite rather than nitrate reflects regional endothelial
nitric oxide synthase activity but lacks intrinsic vasodilator action. Proc Natl Acad
Sci U S A , 2001. 98(22): p. 12814-9.
446. Jung, K.H., et al., Early intravenous infusion o f sodium nitrite protects brain
against in vivo ischemia-reperfusion injury. Stroke, 2006. 37(11): p. 2744-50.
447. Beier, S., et al., Antihypertensive effect o f oral nitrite uptake in the spontaneously
hypertensive rat. Arzneimittelforschung, 1995. 45(3): p. 258-61.
448. Rosselli, M., et al., Circulating nitrite/nitrate levels increase with follicular
development: indirect evidence fo r estradiol mediated NO release. Biochem
Biophys Res Commun, 1994. 202(3): p. 1543-52.
449. Bryan, N.S., et al., Dietary nitrite supplementation protects against myocardial
ischemia-reperfusion injury. Proc Natl Acad Sci U S A , 2007. 104(48): p. 19144-
9.
450. Dorrington, K.L., et al., Time course o f the human pulmonary vascular response
to 8 hours o f isocapnic hypoxia. Am J Physiol, 1997. 273(3 Pt 2): p. HI 126-34.
451. Erzurum, S.C., et al., Higher blood flow and circulating NO products offset high-
altitude hypoxia among Tibetans. Proc Natl Acad Sci U S A , 2007. 104(45): p.
17593-8.
- 3 0 0 -

452.
References
Vitturi, D.A., et al., Regulation o f nitrite transport in red blood cells by
hemoglobin oxygen fractional saturation. Am J Physiol Heart Circ Physiol, 2009.
296(5): p. H I398-407.
- 3 0 1 -