manuscript.pdf - -orca
TRANSCRIPT

This is a n Op e n Acces s doc u m e n t dow nloa d e d fro m ORCA, Ca r diff U nive r si ty 'sins ti t u tion al r e posi to ry: h t t p s://o rc a.c a r diff.ac.uk/109 3 5 2/
This is t h e a u t ho r’s ve r sion of a wo rk t h a t w as s u b mi t t e d to / a c c e p t e d forp u blica tion.
Cit a tion for final p u blish e d ve r sion:
Deb n a t h , Kum a r Bisw ajit a n d Mou r s h e d, Mo nju r 2 0 1 8. Cor r u p tionsignifica n tly inc r e a s e s t h e c a pi t al cos t of po w e r pl a n t s in d eveloping con t ex ts.
F ro n tie r s in E n e r gy Res e a r c h 6 , 8 . 1 0.33 8 9/fe n r g .2 01 8.00 0 0 8 filefile
P u blish e r s p a g e: h t t p s://www.fron tie r sin.o rg/ a r ticles/10.33 8 9/fe n r g...< h t t p s://www.fron tie r sin.o r g/ a r ticle s/10.33 8 9/fen r g.20 1 8.00 0 0 8/a b s t r a c t >
Ple a s e no t e: Ch a n g e s m a d e a s a r e s ul t of p u blishing p roc e s s e s s uc h a s copy-e di ting,
for m a t ting a n d p a g e n u m b e r s m ay no t b e r eflec t e d in t his ve r sion. For t h ed efini tive ve r sion of t his p u blica tion, ple a s e r ef e r to t h e p u blish e d sou rc e. You
a r e a dvise d to cons ul t t h e p u blish e r’s ve r sion if you wish to ci t e t his p a p er.
This ve r sion is b ein g m a d e av ailable in a cco r d a n c e wit h p u blish e r policie s.S e e
h t t p://o rc a .cf.ac.uk/policies.h t ml for u s a g e policies. Copyrigh t a n d m o r al r i gh t sfor p u blica tions m a d e available in ORCA a r e r e t ain e d by t h e copyrig h t
hold e r s .
Corruption significantly increases the capital cost of power plants in developing contexts
Kumar Biswajit Debnath1*, Monjur Mourshed1 1
1School of Engineering, Cardiff University, Cardiff, UK 2
* Correspondence: 3 Kumar Biswajit Debnath 4 [email protected] 5
Keywords: Corruption, power plant, energy sector, capital cost, developing context. 6
Abstract 7
Emerging economies with rapidly growing population and energy demand, own some of the most 8 expensive power plants in the world. We hypothesized that corruption has a relationship with the 9 capital cost of power plants in developing countries such as Bangladesh. For this study, we analyzed 10 the capital cost of 61 operational and planned power plants in Bangladesh. Initial comparison study 11 revealed that the mean capital cost of a power plant in Bangladesh is twice than that of the global 12 average. Then, the statistical analysis revealed a significant correlation between corruption and the 13 cost of power plants, indicating that higher corruption leads to greater capital cost. The high up-front 14 cost can be a significant burden on the economy, at present and in the future, as most are financed 15 through international loans with extended repayment terms. There is, therefore, an urgent need for the 16 review of the procurement and due diligence process of establishing power plants, and for the 17 implementation of a more transparent system to mitigate adverse effects of corruption on 18 megaprojects. 19
1 Introduction 20
Bangladesh is the world’s eighth most populous country of 161 million people with annual 21 population and GDP growth rates of 1.2% and 6.6% respectively (WB, 2016). While the population 22 grew linearly, electricity consumption per capita increased exponentially since 1970, as shown in 23 Figure 1A and G. The GDP-electricity elasticity of the country exhibits a strong linear relationship 24 (R2= 0.989); electricity consumption increased by 4.15 kWh/capita for every US$ increase in 25 GDP/capita in 1971-2011 (Figure 2). Moreover, past research indicates a unidirectional causal 26 relationship is running from electricity consumption to investment and economic growth in 27 Bangladesh—implying that over time, increasing electricity consumption results in higher economic 28 growth (Masuduzzaman, 2012). Therefore, the government aimed towards giving access to electricity 29 all households by 2021 (BPDB, 2015). The causal relationship between economic growth and 30 electricity consumption illustrated in Figure 2 and available literature suggested that, as more people 31 get access to electricity, the demand of electric power may increase significantly as Bangladesh aims 32 at transition from a lower-middle-income to a middle-income country by 2021 (MoF, 2011) and 33 developed by 2040 (FE, 2015; Jalil & Islam, 2010). The required additional economic growth is 34 expected to result from the expansion and development of the energy-intensive manufacturing and 35 service sectors (ILO & IILS, 2013; Nath, 2012; ADB, 2016). 36
Corruption increases power plant’s cost
2
This is a provisional file, not the final typeset article
The power sector in Bangladesh underwent several significant restructurings since its humble 37 beginning at the turn of the 20th century. Electricity was provided only to the wealthy residents in the 38 capital with small power plants (Omprasad, 2016) but gradually shifted its focus towards serving 39 essential businesses and industries by 1947 (Ebinger, 2011). Post-independence evolution of the 40 power sector is illustrated in Figure 1, which commenced with the establishment of Bangladesh 41 Power Development Board (BPDB) and Rural Electrification Board (REB) in 1972 and 1977, to 42 foster economic development in urban and rural areas respectively (BPDB, 2017; BREB, 2016). In 43 light of increasing demand in divisional cities and the need for interconnection, East and West zones 44 were connected by a 230 kV transmission line in 1982 (Ebinger, 2011). Despite the expansion of the 45 grid, most of the population did not have access to uninterrupted electricity supply (Figure 1B). 46 Morover, only 62.4% of the population has access to grid electricity in 2014 (WB, 2016). 47
National Energy Policy 1994 paved the way for deregulation to encourage broader participation in 48 power generation (Ebinger, 2011). Publicly-owned Rural Power Company Limited (RPCL) was set 49 up as the first independent power producer (IPP) in the same year (Mourshed, 2013). Privately 50 owned IPPs started operation in 1997, under the build-own-operate (BOO) model of public-private 51 partnership (PPP). The effects of increased generation can be seen in the economic growth in the 52 subsequent decades. The average GDP growth rate of 3.8% in the 1980s rose to 4.8%, 5.6%, 6.2% by 53 1990s, 2000s and mid-2010s respectively (Figure 1C). Further deregulation allowed the 54 establishment of rental power plants (RPPs) on 3- and 15-year contracts to meet the peak demand 55 (Figure 1E) (MoF, 2009). 56
<Insert Figure 1 about here> 57
Most RPPs are oil based that relies on imported petroleum as Bangladesh has insufficient oil reserve. 58 By increasing oil dependency (Mujeri, et al., 2014), the energy sector was exposed to the volatile 59 international oil market (Mourshed, 2013). Energy sector subsidies have escalated because of 60 growing import prices for fuels to encounter the accelerated energy demand (Mujeri, et al., 2014). 61 Moreover, the lack of adequate governance acted as an incentive for corruption to grow in the energy 62 sector of Bangladesh (Khan & Rasheduzzman, 2013; Ahmed, 2011; Khatun & Ahamad, 2013). 63 Public sector generation capacity has increased exponentially between 1970 and 1997. The growth in 64 the public sector slowed down when the private sector began supplementing generation in 1997 65 (Figure 1E and F). Majority of the increase since 1997 came from the private sector and the trend is 66 projected to continue towards an installed capacity of 33.7 GW by 2030 (JICA & TEPCO, 2011) 67 from 13.7 GW in 2017 (BPDB, 2017). 68
<Insert Figure 2 about here> 69
In the case of fuel types, increased oil-based RPPs have changed the generation fuel-mix within five 70 years of their expansion. Figure 1H illustrates that 80% of installed capacity in 2010 was based on 71 natural gas (hereafter gas only), which reduced to 68% in 2015 (MoF, 2010). Although the increase 72 in oil-based generation was suggested as short-term quick-fix to meet the burgeoning growth in 73 demand for electricity, the overall direction of generation fuel mix is sub-optimal. The 2010 Power 74 Sector Master Plan (PSMP2010) focuses on coal-based generation increase to a fuel mix of coal-gas-75 others (50%-25%-25%) in 2030 (JICA & TEPCO, 2011), which is a significant departure from the 76 mix of gas-liquid fuel-renewables (54%-28%-8%) in 1980 (Figure 1D). Although the number of 77 privately owned power plants are five times in number than that of public ones, public sectors have 78 1.66 times greater installed capacity than that of the private counterpart (BPDB, 2017). Most of the 79 public generation capacity in Bangladesh is divided into four subsidiaries such as Ashuganj Power 80
Corruption increases power plant’s cost
3
Station Company Limited (APSCL), Electricity Generation Company of Bangladesh (EGCB), North-81 West Power Generation Company Limited (NWPGCL) and West Zone Power Distribution Company 82 Limited (WZPDCL). BPDB is the sole purchaser of the generated electricity, which is then 83 transmitted via the Power Grid Company of Bangladesh Limited (PGCB) and distributed by State-84 owned area-based distribution companies. At present, bulk generation is centralized and mostly fossil 85 fuel based. However, there are decentralized renewable power generation projects such as mini-grid, 86 solar home systems (SHS) have been operational and under development for off-grid rural and 87 remote areas. The government have targeted to generate 10% of the total electricity from renewable 88 resources by 2021 (IDCOL, 2017). Although, IDCOL is aiming towards total SHS installed capacity 89 of 200 MW by 2021, and installing 50 solar mini-grid by 2018 (IDCOL, 2017), the cumulative 90 capacity of the off-grid generation will contribute very little to the electricity supply. Bangladesh 91 takes a considerable amount of loans from national and international funding bodies for establishing 92 power plants. Therefore, they would need to borrow a significant amount of loan to construct the 93 substantial number of stations to achieve a 20 GW of additional installed capacity by 2030 than that 94 of 2017 (BPDB, 2017; JICA & TEPCO, 2011). With considerable capital costs involved and 95 previous evidence of corruption in the energy sector (Khan & Rasheduzzman, 2013; Ruth, 2002) as 96 well as in public procurement (Mahmood, 2010), the utilization of massive amount of money can 97 prove to be a significant concern in Bangladesh. 98
There have been different studies on the relationship between corruption and cost of big public 99 projects. Study on Italian high-speed railways megaprojects demonstrated that corruption worsens 100 both cost and temporal performance (Locatelli, et al., 2017). This study also identified the project 101 contexts such as the discretionary power of officials, economic rents of policy/decision makers and 102 weak institutions would make a country ideal for corruption. Another study demonstrated that capital 103 cost of IPPs selected without competitive bidding was 44-56% higher than that of with competitive 104 bidding in developing countries including Bangladesh (Phadke, 2009). However, only two projects 105 with competitive bidding (4.87% of the total projects analysed) were considered in the case of 106 Bangladesh. Therefore, the result was generic for developing countries, and the conclusion was not 107 robust for Bangladesh. In another research, the Malaysian context was analysed to find the reasons 108 behind corruption were an abuse of power, opportunity and moral compromise within the 109 government officials (Othman, et al., 2014). Also, different studies suggest that the ongoing 110 corruption can be controlled via random and regular supervision, severe punishment and prosecution 111 of corrupt personnel, and anti-corruption awareness development (Zou, 2006; De Chiara & Livio, 112 2017). Although the literature suggests that government personals are mostly responsible for active 113 corruption by asking bribes, the private sector can also contribute by acting as passive corruption 114 through approaching bureaucrats by offering bribes (Capasso & Santoro, 2017). However, there is a 115 gap in the literature regarding studies on cost evolution of energy sector in developing economies 116 such as Bangladesh, and their relation to corruption, due to the lack of political transparency and 117 data. There are two objectives of this paper. Initially, to investigate the capital cost of establishing 118 various power plants in Bangladesh and compare with other countries, regions and world, to find any 119 differences. Furthermore, to understand the reason behind the differences, we hypothesized that 120 corruption might have influenced the capital cost of power plants in Bangladesh. The correlation 121 between the capital cost of the power plants and Corruption Perceptions Index (CPI) of Bangladesh 122 was examined to test the hypothesis. 123
2 Methodology 124
The study was conducted in three stages. First, annual (BPDB, 2008; BPDB, 2009; BPDB, 2010; 125 BPDB, 2011; BPDB, 2012; BPDB, 2013; BPDB, 2014; BPDB, 2015; KPCL, 2014), project 126
Corruption increases power plant’s cost
4
This is a provisional file, not the final typeset article
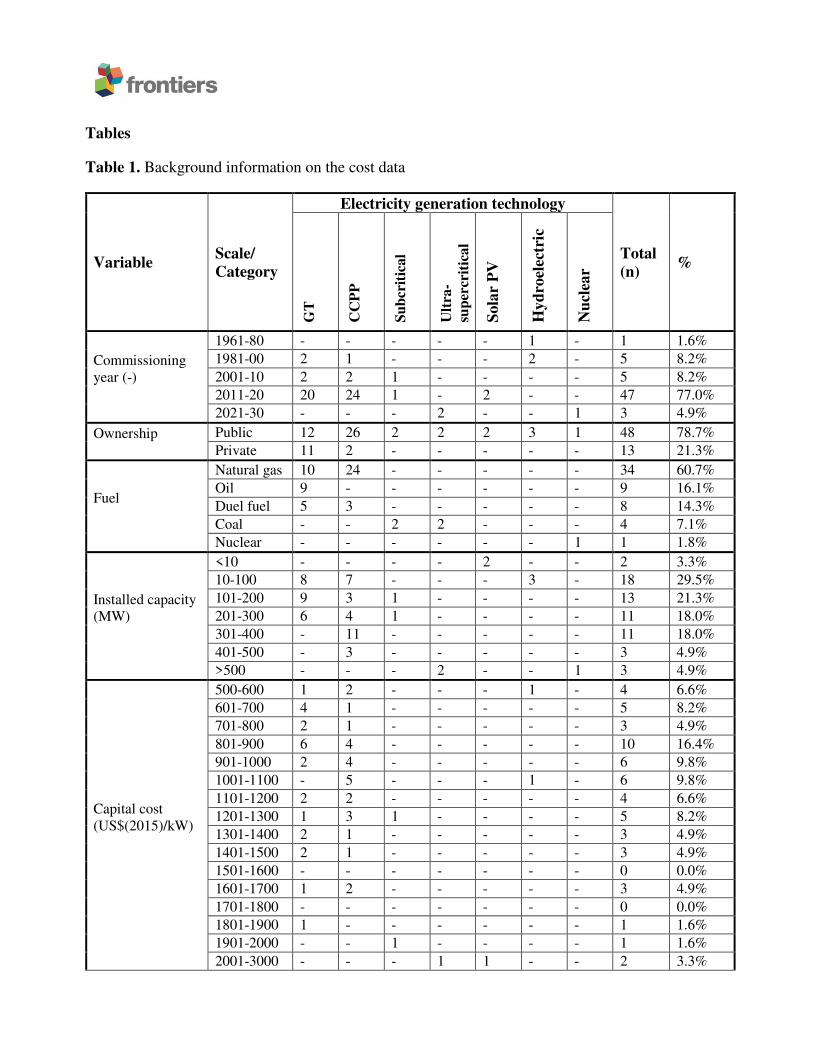
(APSCL, 2015; CPGCBL, 2015; EGCBL, 2015; APSCL, 2015) and financial aid reports (IDCOL, 127 2015; WB, 2017) from national bodies and international organizations were reviewed to develop a 128 capital cost database of power plants in Bangladesh. Capital cost refers to all the expenses incurred 129 before a plant becomes operational and comprises the cost associated with the acquisition of land; 130 permits and legal matters; plant equipment and construction; financing; and the commissioning of the 131 plant. Independent scrutiny of public expenditure does not feature strongly in Bangladesh’s 132 governance structure. Hence, the total capital cost or the breakdown of the capital cost of all the 133 operational power plants is not publicly available. There were 100 public power plants in January 134 2016, of which 96 were operational (BPDB, 2017). We collected primary data such as installed 135 capacity, commissioning year, fuel and owner of 165 units from 113 public and private operational 136 Bangladeshi power plants in January 2016. The number of public and private owned units were 80 137 (6968 MW) and 85 (5566 MW) respectively. Among the operational units, ninety-five utilize gas, 138 and seven are dual fuel type, of which four can use gas and heavy fuel oil (HFO). The rest of the 139 three dual-fuel plants utilize high-speed diesel (HSD) and gas. Moreover, only HFO and HSD based 140 units were 32 and 23 respectively. Two units were coal-based, and four units were hydroelectric. 141 Also, there was a 500 MW interconnection with India in Khulna. Due to data constraints, the capital 142 cost of 61 fossils (gas, coal and petroleum) and renewable (nuclear, hydro, the wind and solar) power 143 plants in Bangladesh commissioned since 1962 and planned up to 2030, were collected (Table 1). Of 144 the 61 plants, 34 are operational, and 27 are under construction, repair or future planned. The study 145 had to test the hypothesis with lower data constrain and bias generated by it because of unavailability 146 of cost data. The government has started to provide cost data since 2007 through the annual reports 147 (BPDB, 2017). With more data and transparency in the future, the studies regarding cost can be 148 improved to make the power plants more cost-effective. 149
Among the analyzed 61 power plant units, gas, HFO/HSD/duel fuel, coal, nuclear and renewable 150 based were 34, 17, four, one and five respectively. Moreover, 48 are public, and thirteen are privately 151 operated. All the future and under-construction power plants are government owned. Among the nine 152 analyzed duel fuel power plant units, three utilize HFO and gas, of which two are public, and one is 153 privately owned. Six duel fuel power plant units use HSD and gas, of which one is private, and five 154 are publicly owned. There are only nine HFO based power plant units, of which two are planned for 155 future and rest of them are operational. All the HFO based functional power plants are privately 156 owned. In the case of coal-based power plants units, only two are functional, and three are planned 157 for future, and all of them are publicly owned. Similarly, all the renewable power plants are 158 government owned, of which one is the Kaptai hydroelectric plant (5 units) and two small solar 159 energy plants. The only planned nuclear power plant (Rooppur 1 and 2) would be publicly owned 160 too. Three phases (Unit 1 and 2; Unit 3; Unit 4 and 5) of Kaptai hydroelectric power plant was 161 considered separately because three stages had different cost individually. Among the coal power 162 generation technologies, domestic coal-fueled subcritical plants were built in Barapukuria. Moreover, 163 two new ultra-supercritical plants are under construction which would operate with imported coal. 164 Cost per installed capacity in kW in a specific year of construction of the power plant was calculated 165 and converted to the US dollar (USD) equivalent using the currency exchange rate with Bangladeshi 166 Taka (BDT) on December 31 of the same year, obtained from Bangladesh Bank (BB, 2016). In cases 167 where a power plant is going to be built after 2015, the cost was converted to 2015 USD using BDT 168 to USD exchange rate on December 31, 2015. Then the historical cost data was converted using 169 Consumer Price Index (Coinnews, 2016) of 2015 USD so that all cost can be compared on the 2015 170 USD basis. 171
<Insert Table 1 about here> 172
Corruption increases power plant’s cost
5
Second, country- and region-wise capital costs of power plants for the same technology used in 173 Bangladesh were collected from the International Energy Agency’s (IEA) World Energy Investment 174 Outlook 2014 (IEA, 2014) for USA, Japan, Russia, China, India, Brazil, Europe, the Middle East and 175 Africa. There were three data points for all the countries for 2012, 2020, and 2035. Data for Sri 176 Lanka were collected from ‘Long-Term Generation Expansion Planning Studies 2015- 2034’ for 177 2015 (Samarasekara & Silva, 2015). In the case of USA, further data on cost and performance of 178 power generation technologies were collected from National Renewable Energy Laboratory (NREL) 179 to augment the IEA data (NREL, 2012). There were ten data points for the cost data from NREL for 180 2008, 2010, 2015, 2020, 2025, 2030, 2035, 2040, 2045 and 2050. Also, CPI score between 1995 and 181 2016 was collected from Transparency International (TI) (TI, 2017). 182
Third, the average cost of power plants in Bangladesh was compared with that of the identified 183 countries, regions and the World using 2015 as a base year. The evolution of cost was also analysed 184 for both public and private sectors in Bangladesh. Pearson’s test was conducted at normalised capital 185 cost and CPI score to examine the effect of corruption on power plant capital cost in Bangladesh. CPI 186 data is available only from 1995, which reduced the sample size down to 31 for the correlation study. 187 Among the collected cost data, power plants commissioned from 2004 to 2015 were considered. 188 There were no cost data available for any power plants established between 1995 and 2003. There 189 were also some cost data for power plants built before 1995. As the CPI index started in 1995, the 190 cost data before that was not considered for the correlation study. As the sample size is less than 50, 191 Shapiro-Wilk and Kolmogorov-Smirnov test of normality were conducted (Ghasemi & Zahediasl, 192 2012) and Table 2 indicated that the distribution of interval data was normal, supporting the selection 193 of Pearson’s test. 194
<Insert Table 2 about here> 195
3 Discussion 196
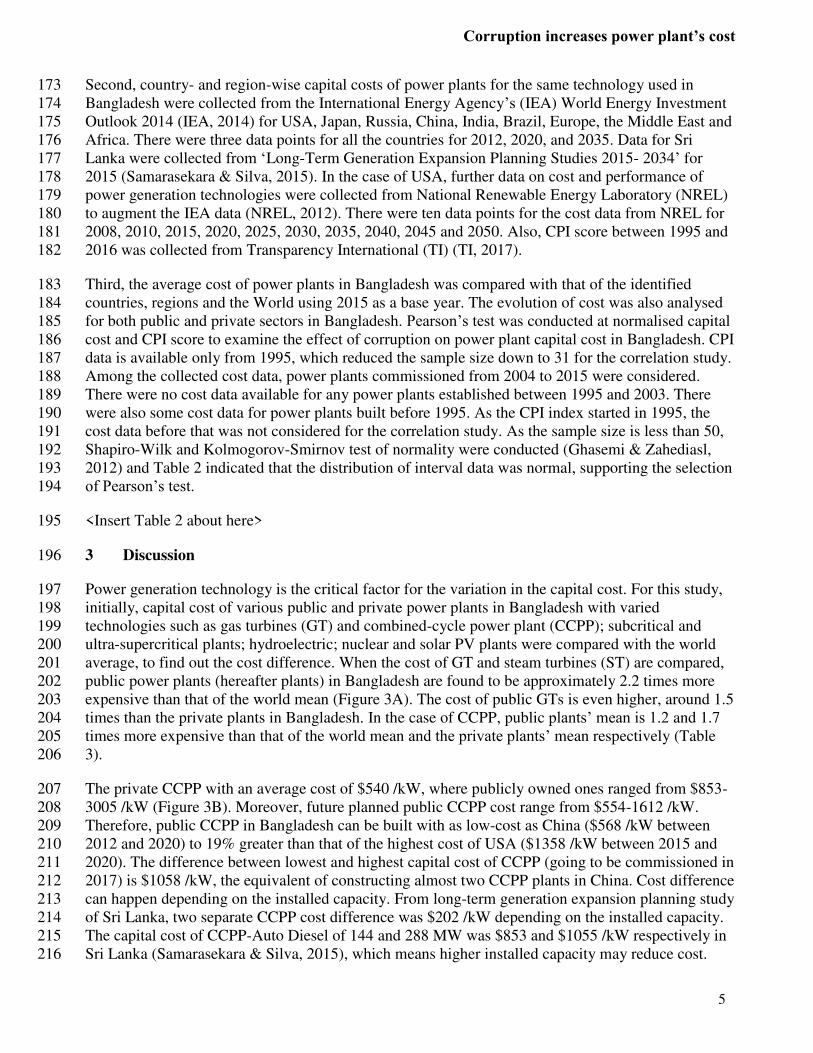
Power generation technology is the critical factor for the variation in the capital cost. For this study, 197 initially, capital cost of various public and private power plants in Bangladesh with varied 198 technologies such as gas turbines (GT) and combined-cycle power plant (CCPP); subcritical and 199 ultra-supercritical plants; hydroelectric; nuclear and solar PV plants were compared with the world 200 average, to find out the cost difference. When the cost of GT and steam turbines (ST) are compared, 201 public power plants (hereafter plants) in Bangladesh are found to be approximately 2.2 times more 202 expensive than that of the world mean (Figure 3A). The cost of public GTs is even higher, around 1.5 203 times than the private plants in Bangladesh. In the case of CCPP, public plants’ mean is 1.2 and 1.7 204 times more expensive than that of the world mean and the private plants’ mean respectively (Table 205 3). 206
The private CCPP with an average cost of $540 /kW, where publicly owned ones ranged from $853-207 3005 /kW (Figure 3B). Moreover, future planned public CCPP cost range from $554-1612 /kW. 208 Therefore, public CCPP in Bangladesh can be built with as low-cost as China ($568 /kW between 209 2012 and 2020) to 19% greater than that of the highest cost of USA ($1358 /kW between 2015 and 210 2020). The difference between lowest and highest capital cost of CCPP (going to be commissioned in 211 2017) is $1058 /kW, the equivalent of constructing almost two CCPP plants in China. Cost difference 212 can happen depending on the installed capacity. From long-term generation expansion planning study 213 of Sri Lanka, two separate CCPP cost difference was $202 /kW depending on the installed capacity. 214 The capital cost of CCPP-Auto Diesel of 144 and 288 MW was $853 and $1055 /kW respectively in 215 Sri Lanka (Samarasekara & Silva, 2015), which means higher installed capacity may reduce cost. 216
Corruption increases power plant’s cost
6
This is a provisional file, not the final typeset article
However, in the case of Bangladesh, Siddhirganj 335 MW and Bibiana (South) 383 MW CCPP plant 217 would cost $1612 /kW and $873 /kW respectively (operational by 2017). Though Bibiana (South) 218 has 48 MW higher installed capacity than that of the Siddhirganj, it would cost approximately half. 219 On the other hand in the private sector, Meghnaghat 450 MW CCPP (Unit 2) was constructed with 220 $560 /kW in 2014. 221
Figure 3C and D compares the cost of coal power plants. The subcritical coal plant, capital cost range 222 from $1245-$1923 /kW, which is higher than the expense of the USA in the upper bound, and Africa 223 in lower bound. However, the cost of the proposed ultra-supercritical power plant is going to be 224 highest compared to the rest of the world (Figure 3D). 225
<Insert Figure 3 about here> 226
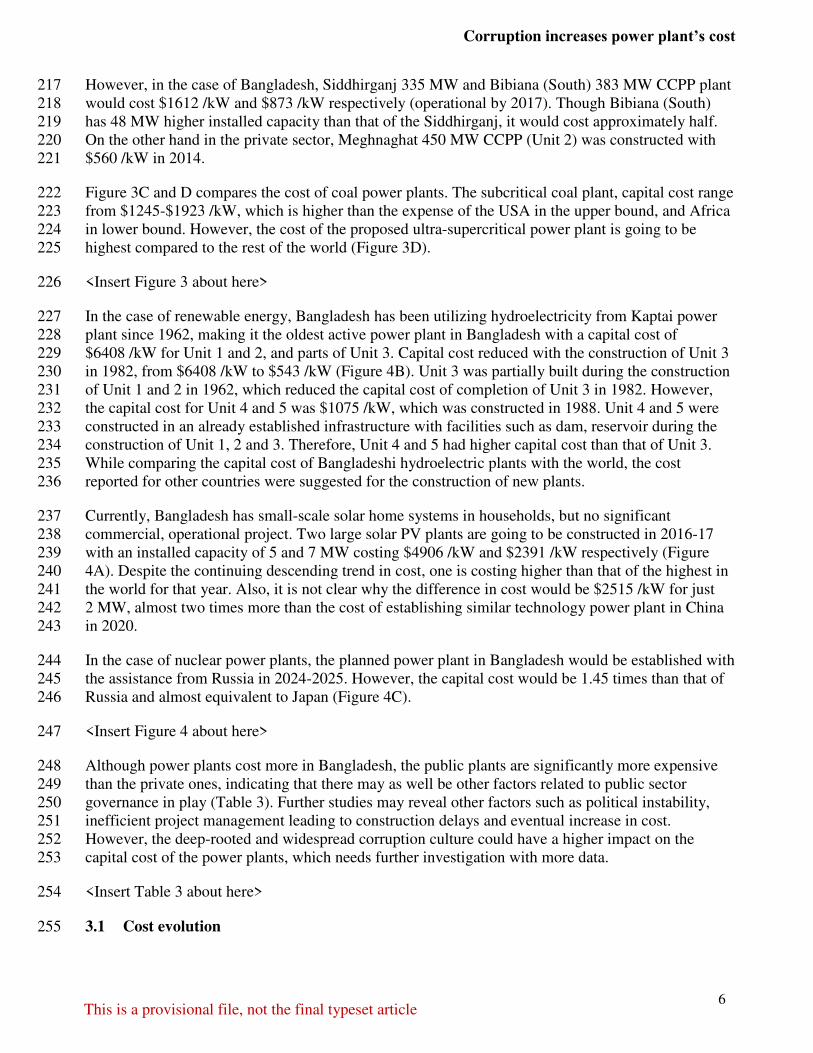
In the case of renewable energy, Bangladesh has been utilizing hydroelectricity from Kaptai power 227 plant since 1962, making it the oldest active power plant in Bangladesh with a capital cost of 228 $6408 /kW for Unit 1 and 2, and parts of Unit 3. Capital cost reduced with the construction of Unit 3 229 in 1982, from $6408 /kW to $543 /kW (Figure 4B). Unit 3 was partially built during the construction 230 of Unit 1 and 2 in 1962, which reduced the capital cost of completion of Unit 3 in 1982. However, 231 the capital cost for Unit 4 and 5 was $1075 /kW, which was constructed in 1988. Unit 4 and 5 were 232 constructed in an already established infrastructure with facilities such as dam, reservoir during the 233 construction of Unit 1, 2 and 3. Therefore, Unit 4 and 5 had higher capital cost than that of Unit 3. 234 While comparing the capital cost of Bangladeshi hydroelectric plants with the world, the cost 235 reported for other countries were suggested for the construction of new plants. 236
Currently, Bangladesh has small-scale solar home systems in households, but no significant 237 commercial, operational project. Two large solar PV plants are going to be constructed in 2016-17 238 with an installed capacity of 5 and 7 MW costing $4906 /kW and $2391 /kW respectively (Figure 239 4A). Despite the continuing descending trend in cost, one is costing higher than that of the highest in 240 the world for that year. Also, it is not clear why the difference in cost would be $2515 /kW for just 241 2 MW, almost two times more than the cost of establishing similar technology power plant in China 242 in 2020. 243
In the case of nuclear power plants, the planned power plant in Bangladesh would be established with 244 the assistance from Russia in 2024-2025. However, the capital cost would be 1.45 times than that of 245 Russia and almost equivalent to Japan (Figure 4C). 246
<Insert Figure 4 about here> 247
Although power plants cost more in Bangladesh, the public plants are significantly more expensive 248 than the private ones, indicating that there may as well be other factors related to public sector 249 governance in play (Table 3). Further studies may reveal other factors such as political instability, 250 inefficient project management leading to construction delays and eventual increase in cost. 251 However, the deep-rooted and widespread corruption culture could have a higher impact on the 252 capital cost of the power plants, which needs further investigation with more data. 253
<Insert Table 3 about here> 254
3.1 Cost evolution 255
Corruption increases power plant’s cost
7
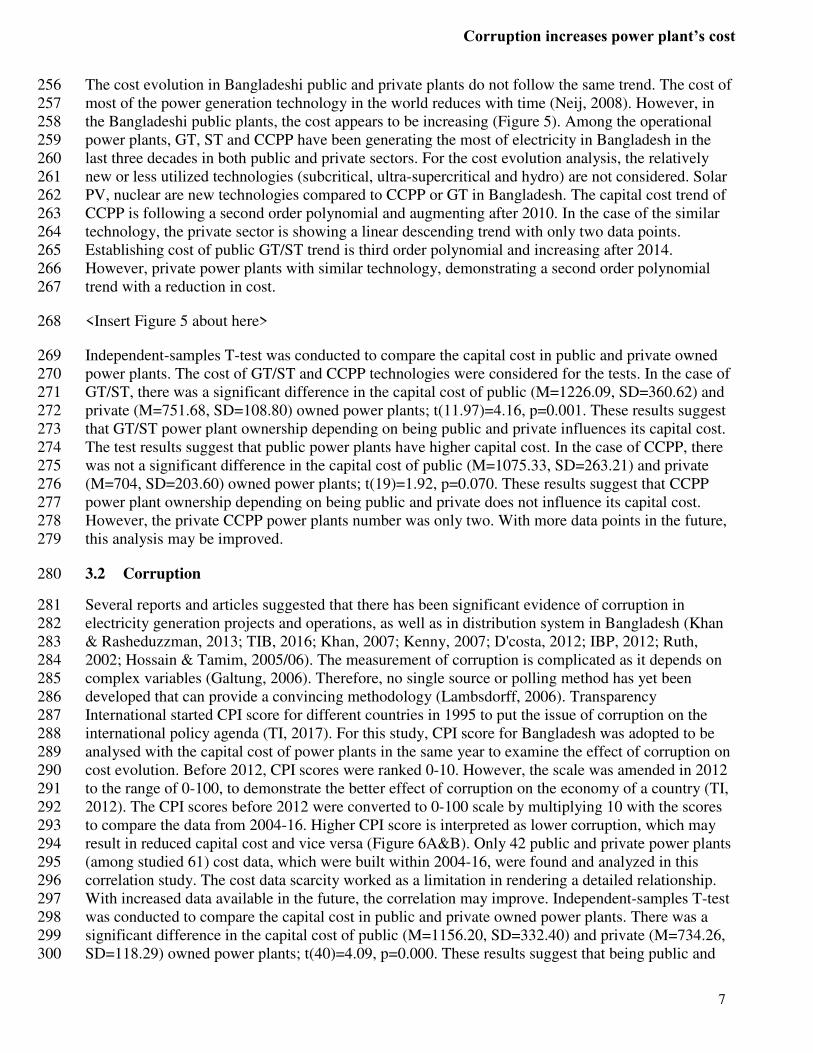
The cost evolution in Bangladeshi public and private plants do not follow the same trend. The cost of 256 most of the power generation technology in the world reduces with time (Neij, 2008). However, in 257 the Bangladeshi public plants, the cost appears to be increasing (Figure 5). Among the operational 258 power plants, GT, ST and CCPP have been generating the most of electricity in Bangladesh in the 259 last three decades in both public and private sectors. For the cost evolution analysis, the relatively 260 new or less utilized technologies (subcritical, ultra-supercritical and hydro) are not considered. Solar 261 PV, nuclear are new technologies compared to CCPP or GT in Bangladesh. The capital cost trend of 262 CCPP is following a second order polynomial and augmenting after 2010. In the case of the similar 263 technology, the private sector is showing a linear descending trend with only two data points. 264 Establishing cost of public GT/ST trend is third order polynomial and increasing after 2014. 265 However, private power plants with similar technology, demonstrating a second order polynomial 266 trend with a reduction in cost. 267
<Insert Figure 5 about here> 268
Independent-samples T-test was conducted to compare the capital cost in public and private owned 269 power plants. The cost of GT/ST and CCPP technologies were considered for the tests. In the case of 270 GT/ST, there was a significant difference in the capital cost of public (M=1226.09, SD=360.62) and 271 private (M=751.68, SD=108.80) owned power plants; t(11.97)=4.16, p=0.001. These results suggest 272 that GT/ST power plant ownership depending on being public and private influences its capital cost. 273 The test results suggest that public power plants have higher capital cost. In the case of CCPP, there 274 was not a significant difference in the capital cost of public (M=1075.33, SD=263.21) and private 275 (M=704, SD=203.60) owned power plants; t(19)=1.92, p=0.070. These results suggest that CCPP 276 power plant ownership depending on being public and private does not influence its capital cost. 277 However, the private CCPP power plants number was only two. With more data points in the future, 278 this analysis may be improved. 279
3.2 Corruption 280
Several reports and articles suggested that there has been significant evidence of corruption in 281 electricity generation projects and operations, as well as in distribution system in Bangladesh (Khan 282 & Rasheduzzman, 2013; TIB, 2016; Khan, 2007; Kenny, 2007; D'costa, 2012; IBP, 2012; Ruth, 283 2002; Hossain & Tamim, 2005/06). The measurement of corruption is complicated as it depends on 284 complex variables (Galtung, 2006). Therefore, no single source or polling method has yet been 285 developed that can provide a convincing methodology (Lambsdorff, 2006). Transparency 286 International started CPI score for different countries in 1995 to put the issue of corruption on the 287 international policy agenda (TI, 2017). For this study, CPI score for Bangladesh was adopted to be 288 analysed with the capital cost of power plants in the same year to examine the effect of corruption on 289 cost evolution. Before 2012, CPI scores were ranked 0-10. However, the scale was amended in 2012 290 to the range of 0-100, to demonstrate the better effect of corruption on the economy of a country (TI, 291 2012). The CPI scores before 2012 were converted to 0-100 scale by multiplying 10 with the scores 292 to compare the data from 2004-16. Higher CPI score is interpreted as lower corruption, which may 293 result in reduced capital cost and vice versa (Figure 6A&B). Only 42 public and private power plants 294 (among studied 61) cost data, which were built within 2004-16, were found and analyzed in this 295 correlation study. The cost data scarcity worked as a limitation in rendering a detailed relationship. 296 With increased data available in the future, the correlation may improve. Independent-samples T-test 297 was conducted to compare the capital cost in public and private owned power plants. There was a 298 significant difference in the capital cost of public (M=1156.20, SD=332.40) and private (M=734.26, 299 SD=118.29) owned power plants; t(40)=4.09, p=0.000. These results suggest that being public and 300
Corruption increases power plant’s cost
8
This is a provisional file, not the final typeset article
private owned influences its capital cost. The test results suggest that public power plants have higher 301 capital cost. 302
<Insert Figure 6 about here> 303
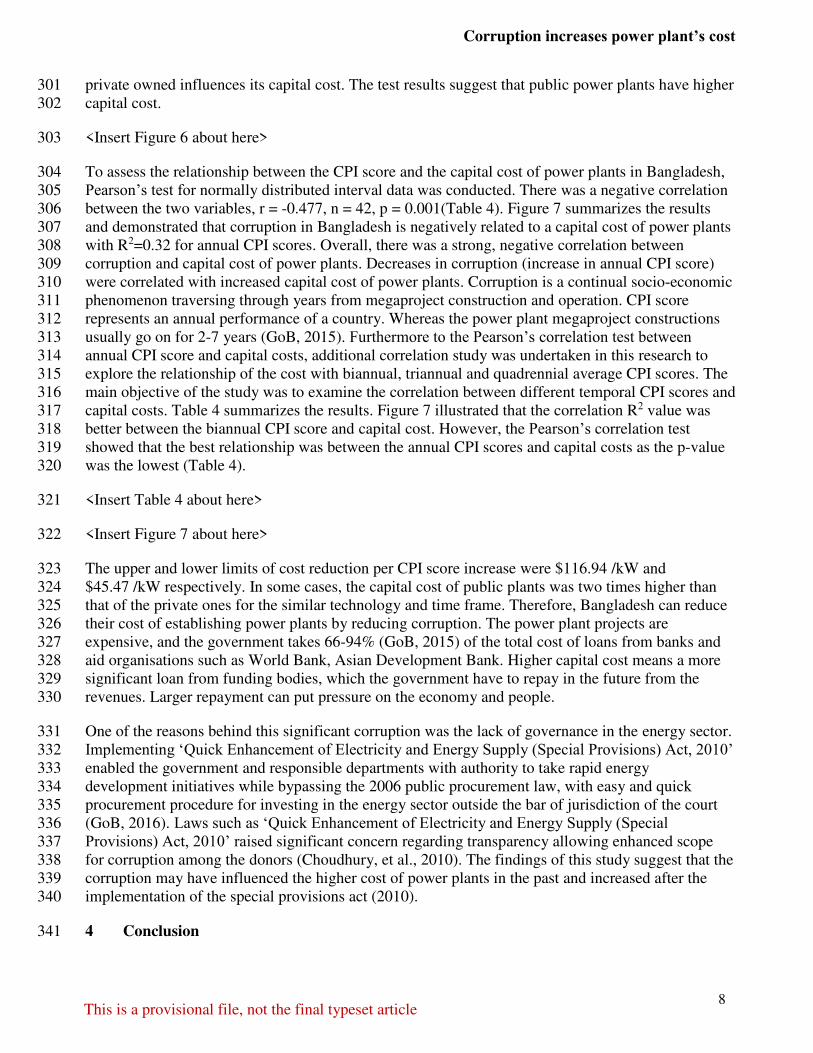
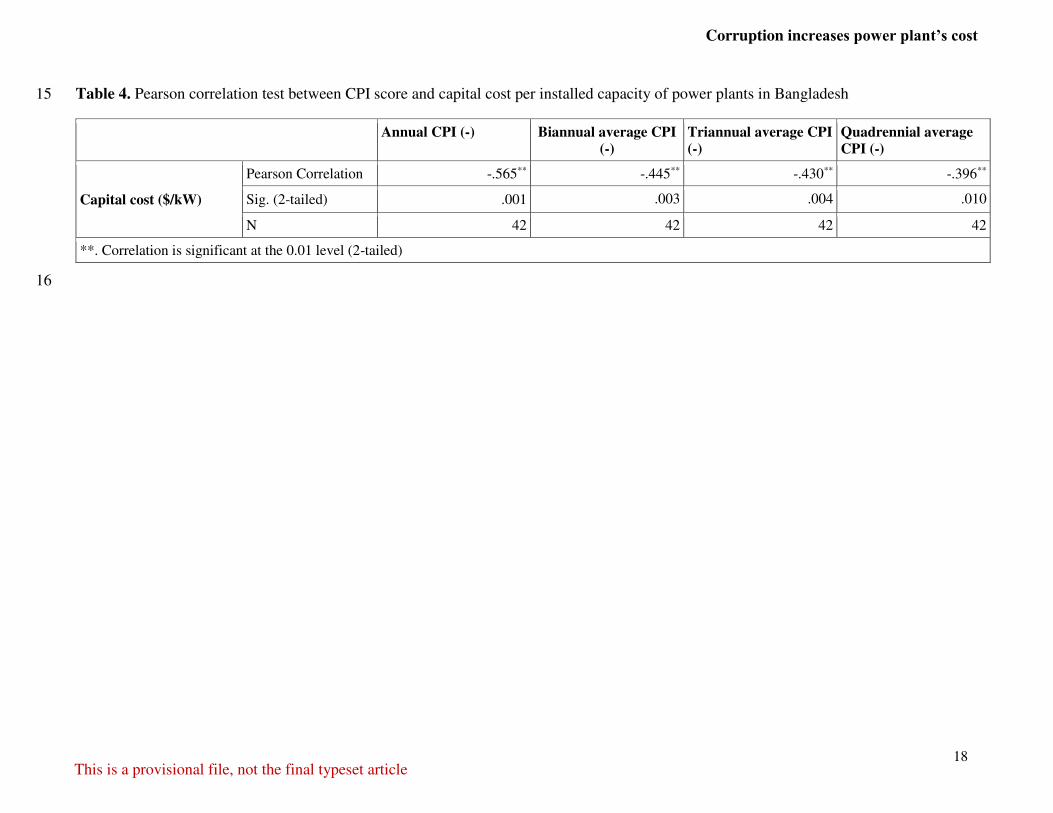
To assess the relationship between the CPI score and the capital cost of power plants in Bangladesh, 304 Pearson’s test for normally distributed interval data was conducted. There was a negative correlation 305 between the two variables, r = -0.477, n = 42, p = 0.001(Table 4). Figure 7 summarizes the results 306 and demonstrated that corruption in Bangladesh is negatively related to a capital cost of power plants 307 with R2=0.32 for annual CPI scores. Overall, there was a strong, negative correlation between 308 corruption and capital cost of power plants. Decreases in corruption (increase in annual CPI score) 309 were correlated with increased capital cost of power plants. Corruption is a continual socio-economic 310 phenomenon traversing through years from megaproject construction and operation. CPI score 311 represents an annual performance of a country. Whereas the power plant megaproject constructions 312 usually go on for 2-7 years (GoB, 2015). Furthermore to the Pearson’s correlation test between 313 annual CPI score and capital costs, additional correlation study was undertaken in this research to 314 explore the relationship of the cost with biannual, triannual and quadrennial average CPI scores. The 315 main objective of the study was to examine the correlation between different temporal CPI scores and 316 capital costs. Table 4 summarizes the results. Figure 7 illustrated that the correlation R2 value was 317 better between the biannual CPI score and capital cost. However, the Pearson’s correlation test 318 showed that the best relationship was between the annual CPI scores and capital costs as the p-value 319 was the lowest (Table 4). 320
<Insert Table 4 about here> 321
<Insert Figure 7 about here> 322
The upper and lower limits of cost reduction per CPI score increase were $116.94 /kW and 323 $45.47 /kW respectively. In some cases, the capital cost of public plants was two times higher than 324 that of the private ones for the similar technology and time frame. Therefore, Bangladesh can reduce 325 their cost of establishing power plants by reducing corruption. The power plant projects are 326 expensive, and the government takes 66-94% (GoB, 2015) of the total cost of loans from banks and 327 aid organisations such as World Bank, Asian Development Bank. Higher capital cost means a more 328 significant loan from funding bodies, which the government have to repay in the future from the 329 revenues. Larger repayment can put pressure on the economy and people. 330
One of the reasons behind this significant corruption was the lack of governance in the energy sector. 331 Implementing ‘Quick Enhancement of Electricity and Energy Supply (Special Provisions) Act, 2010’ 332 enabled the government and responsible departments with authority to take rapid energy 333 development initiatives while bypassing the 2006 public procurement law, with easy and quick 334 procurement procedure for investing in the energy sector outside the bar of jurisdiction of the court 335 (GoB, 2016). Laws such as ‘Quick Enhancement of Electricity and Energy Supply (Special 336 Provisions) Act, 2010’ raised significant concern regarding transparency allowing enhanced scope 337 for corruption among the donors (Choudhury, et al., 2010). The findings of this study suggest that the 338 corruption may have influenced the higher cost of power plants in the past and increased after the 339 implementation of the special provisions act (2010). 340
4 Conclusion 341
Corruption increases power plant’s cost
9
As a rapidly developing economy, Bangladesh has been establishing and will continue to build more 342 power plants to support the growing demand for electricity. Literature suggested that there is a lack 343 of research on the cost analysis of the rapidly growing energy sector in Bangladesh; partially because 344 of the data inadequacy and lack of transparency in the government. Initially, a cost databased was 345 compiled from different resources for this study. For analyzing the cost of installing power plants in 346 Bangladesh, the cost (public and private) data were compared with the world. The results 347 demonstrated an intriguing aspect of a rapidly developing economy. Most of the public plants 348 showed higher capital cost compared to the world average. Also, the cost of similar power generation 349 technologies in private and public sector has a significant difference in Bangladesh. On top of the 350 higher capital cost, the cost evolution demonstrated that cost of establishing public power plants is 351 augmenting with time, whereas its opposite in private sector as well as in the world. In the case of 352 expanding cost, this study showed a significant correlation between corruption and higher cost of 353 power plants. Higher corruption may increase the cost of a power plant in a developing context such 354 as Bangladesh. 355
This study renders the opportunity to focus on the amendable condition of corruption within the 356 governmental system to reduce the cost of establishing public power plants in Bangladesh. The 357 government should implement more transparent and supervised system for establishing power plants 358 to reduce the adverse influences of corruption on the megaprojects. Otherwise, there is a possibility 359 the expensive power plants would become into ‘white elephant’ projects (Ross & Staw, 1993; Lewis 360 & Williams, 1985), where the output is smaller than that of investment. The higher cost would 361 impose an additional burden on the future economy. 362
References 363
ADB, 2016. Bangladesh: Consolidating Export-led Growth, s.l.: Asian Development Bank. 364
Ahmed, Z., 2011. Electricity Crisis of Bangladesh: Result of Organizational Inefficiency?. Energy 365 and Environment Research, 1(1), p. 12. 366
APSCL, 2015. Ashuganj Power Station Company LTD.. [Online] 367 Available at: http://www.apscl.com/plant_status.php 368 [Accessed 2015]. 369
APSCL, 2015. Power Generation Development Plan-2012, Ashuganj, s.l.: Ashuganj Power Station 370 Company LTD.. 371
BB, 2016. Exchange rate of Taka. [Online] 372 Available at: https://www.bb.org.bd/econdata/exchangerate.php 373 [Accessed 2016]. 374
BPDB, 2008. Annual report 2007-2008, Dhaka: Bangladesh Power Development Board. 375
BPDB, 2009. Annual Report 2008-2009, Dhaka: Bangladesh Power Development Board. 376
BPDB, 2010. Annual report 2009-2010, Dhaka: Bangladesh Power Development Board. 377
BPDB, 2011. Annual report 2010-2011, Dhaka: Bangladesh Power Development Board. 378
BPDB, 2012. Annual report 2011-2012, Dhaka: Bangladesh Power Development Board. 379
Corruption increases power plant’s cost
10
This is a provisional file, not the final typeset article
BPDB, 2013. Annual report 2012-2013, Dhaka: Bangladesh Power Development Board. 380
BPDB, 2014. Annual report 2013-2014, Dhaka: Bangladesh Power Development Board. 381
BPDB, 2015. Annual report 2014-2015, Dhaka: Bangladesh Power Development Board. 382
BPDB, 2017. [Online] 383 Available at: http://www.bpdb.gov.bd/bpdb/ 384 [Accessed August 2017]. 385
BREB, 2016. History of Rural Electrification in Bangladesh. [Online] 386 Available at: http://www.reb.gov.bd/index.php/2-reb 387
Capasso, S. & Santoro, L., 2017. Active and Passive Corruption: Theory and Evidence. European 388 Journal of Political Economy. 389
Choudhury, S. R. et al., 2010. Evaluation of the Implementation of the Paris Declaration, Phase – II, 390 Country Evaluation Bangladesh, s.l.: Natural Resources Planners Ltd. Dhaka, Bangladesh. 391
Coinnews, 2016. Consumer Price Index Data from 1913 to 2016. [Online] 392 Available at: http://www.usinflationcalculator.com/inflation/consumer-price-index-and-annual-393 percent-changes-from-1913-to-2008/ 394 [Accessed 2016]. 395
CPGCBL, 2015. Coal Power Generation Company Bangladesh Limited. [Online] 396 Available at: http://www.cpgcbl.gov.bd/?page_id=73 397 [Accessed 2015]. 398
D'costa, B., 2012. Bangladesh in 2011. Asian Survey, 52(1), pp. 147-156. 399
De Chiara, A. & Livio, L., 2017. The threat of corruption and the optimal supervisory task. Journal 400 of Economic Behavior & Organization, Volume 133, pp. 172-186. 401
Ebinger, C. K., 2011. Energy and Security in South Asia: Cooperation Or Conflict?. s.l.:Brookings 402 Institution Press. 403
EGCBL, 2015. Electricity Generation Company of Bangladesh Limited. [Online] 404 Available at: http://www.egcb.com.bd/120mw.php 405
FE, 2015. Bangladesh to be developed country by 2040. The Financial Express, 21 6. 406
Galtung, F., 2006. Measuring the immeasurable: boundaries and functions of (macro) corruption 407 indices. Measuring corruption, Volume 101. 408
Ghasemi, A. & Zahediasl, S., 2012. Normality tests for statistical analysis: a guide for non-409 statisticians. International journal of endocrinology and metabolism, 10(2), p. 486. 410
GoB, 2015. Annual report 2015, Dhaka: Power devision, Ministry of Power, Energy and Mineral 411 Resources (MPEMR). 412
Corruption increases power plant’s cost
11
GoB, 2016. Quick Enhancement of Electricity and Energy Supply (Special Provisions) Act, 2010, 413 Dhaka: Ministry of Power, Energy & Mineral Resources, Government of the People’s Republic of 414 Bangladesh . 415
Hossain, I. & Tamim, M., 2005/06. Energy and Sustainable Development in Bangladesh, s.l.: HELIO 416 International’. 417
IBP, 2012. Bangladesh Country Study Guide: Strategic Information and Developments. 418 s.l.:International Business Publications, USA. 419
IDCOL, 2015. Annual Environmental and Social Compliance Audit: 108 MW Power Project at 420 Kolagaon, Chittagong, Bangladesh , s.l.: Infrastructure Development Company Limited (IDCOL). 421
IDCOL, 2017. Renewable energy. [Online] 422 Available at: http://idcol.org/home/penergy 423
IEA, 2014. Assumed investment costs, operation and maintenance costs and efficiencies in the IEA 424 World Energy Investment Outlook 2014, s.l.: International Energy Agency. 425
ILO & IILS, 2013. Bangladesh: seeking better employment conditions for better socioeconomic 426 outcomes, s.l.: ILO, Geneva, Switzerland. 427
Jalil, M. A. & Islam, M. S., 2010. Towards a long-term development vision for Bangladesh: some 428 socioeconomic and legal aspects. Asian Culture and History, 2(2), p. 58. 429
JICA & TEPCO, 2011. The study for master plan on coal power development in the People ’s 430 Republic of Bangladesh, Power System Master Plan 2010, s.l.: Energy and Meneral Resources, 431 Ministry of Power, People’s Republic of Bangladesh. 432
Kenny, C., 2007. Infrastructure governance and corruption: where next?. s.l.:World Bank 433 Publications. 434
Khan, M. Z. H. & Rasheduzzman, M., 2013. Performance of the Power Sector of Bangladesh: 435 Governance Failures and Remedial Measures, s.l.: Transparency International Bangladesh. 436
Khan, S., 2007. Honesty = Success, Dishonesty = Failure An overview of power sector unbundling in 437 Bangladesh (1996-2006). The Daily Star, 01, 2(1). 438
Khatun, F. & Ahamad, M., 2013. FDI in the Energy and Power Sector and Economic Growth in 439 Bangladesh, s.l.: CPD-CMI Working Paper Series. 440
KPCL, 2014. Annual report , s.l.: Khulna Power Company Ltd.. 441
Lambsdorff, J. G., 2006. Measuring corruption--the validity and precision of subjective indicators 442 (CPI). Measuring corruption, Volume 81, p. 81. 443
Lewis, J. & Williams, A., 1985. The Sines Project: Portugal's growth centre or white elephant?. Town 444 Planning Review, 56(3), p. 339. 445
Corruption increases power plant’s cost
12
This is a provisional file, not the final typeset article
Locatelli, G., Mariani, G., Sainati, T. & Greco, M., 2017. Corruption in public projects and 446 megaprojects: There is an elephant in the room!. International Journal of Project Management, 447 35(3), pp. 252-268. 448
Mahmood, S. A. I., 2010. Public procurement and corruption in Bangladesh confronting the 449 challenges and opportunities. Journal of public administration and policy research, 2(6), p. 103. 450
Masuduzzaman, M., 2012. Electricity consumption and economic growth in Bangladesh: Co-451 integration and causality analysis. Global Journal of Management and Business Research, 12(11). 452
MoF, 2009. Invigorating Investment Initiative through Public Private Partnership: A Position Paper, 453 Dhaka, Bangladesh: Ministry of Finance, Government of Bangladesh. 454
MoF, 2010. Towards Revamping Power and Energy Sector: A Road Map, Dhaka, Bangladesh: 455 Ministry of Finance, Government of Bangladesh. 456
MoF, 2011. Power and Energy Sector Road Map: An Update, Dhaka, Bangladesh: Government of 457 Bangladesh. 458
Mourshed, M., 2013. Pitfalls of oil-based expansion of electricity generation in a developing context. 459 Energy Strategy Reviews, 1(3), pp. 205-210. 460
Mujeri, M. K., Chowdhury, T. T. & Shahana, S., 2014. Energy Sector in Bangladesh: An agenda for 461 reforms, Ontario, Canada: International Institute for Sustainable Development. 462
Nath, N. C., 2012. Manufacturing Sector of Bangladesh-Growth, Structure and Strategies for Future 463 Development. s.l., s.n. 464
Neij, L., 2008. Cost development of future technologies for power generation—A study based on 465 experience curves and complementary bottom-up assessments. Energy policy, 36(6), pp. 2200-2211. 466
NREL, 2012. COST AND PERFORMANCE DATA FOR POWER GENERATION TECHNOLOGIES, 467 s.l.: National Renewable Energy Laboratory. 468
Omprasad, G., 2016. Structure, Growth and Associated Problems in Bangladesh Power Sector: A 469 Glance Into The PreReform Period. Indian Journal of Applied Research, 6(6). 470
Othman, Z., Shafie, R. & Hamid, F. Z. A., 2014. Corruption-Why do they do it?. Procedia-Social 471 and Behavioral Sciences, Volume 164, pp. 248-257. 472
Phadke, A., 2009. How many Enrons? Mark-ups in the stated capital cost of independent power 473 producers'(IPPs') power projects in developing countries. Energy, 34(11), pp. 1917-1924. 474
Ross, J. & Staw, B. M., 1993. Organizational escalation and exit: Lessons from the Shoreham nuclear 475 power plant. Academy of Management Journal, 36(4), pp. 701-732. 476
Ruth, M., 2002. Corruption and the Energy Sector, Washington, DC: Management Systems 477 International. 478
Samarasekara, M. B. & Silva, M. T. D., 2015. Long Term Generation Expansion Planning Studies 479 2015- 2034, Colombo: Ceylon Electricity Board, Sri Lanka. 480
Corruption increases power plant’s cost
13
TI, 2012. Corruption Perceptions Index (CPI). [Online] 481 Available at: https://www.transparency.org/ 482 [Accessed 14 12 2016]. 483
TI, 2017. Corruption perceptions index : Overview. [Online] 484 Available at: https://www.transparency.org/research/cpi/overview 485 [Accessed 2017]. 486
TI, 2017. Corruption Perceptions Index: Overview. [Online] 487 Available at: https://www.transparency.org/research/cpi 488 [Accessed 2017]. 489
TIB, 2016. Anti-corruption agency strengthening initiative: Assessment of the Bangladesh Anti-490 corruption agency 2016, s.l.: Transparency International Bangaldesh. 491
WB, 2016. World DataBank. [Online] 492 Available at: http://data.worldbank.org/ 493
WB, 2017. Siddhirganj Power Project. [Online] 494 Available at: http://projects.worldbank.org/P095965/siddhirganj-peaking-power-495 project?lang=en&tab=documents&subTab=projectDocuments 496
Zou, P. X., 2006. Strategies for minimizing corruption in the construction industry in China. Journal 497 of construction in Developing Countries, 11(2), pp. 15-29. 498
499
500
Tables
Table 1. Background information on the cost data
Variable Scale/ Category
Electricity generation technology
Total (n)
%
GT
CC
PP
Su
bcr
itic
al
Ult
ra-
sup
ercr
itic
al
Sola
r P
V
Hyd
roel
ectr
ic
Nu
clea
r
Commissioning year (-)
1961-80 - - - - - 1 - 1 1.6%
1981-00 2 1 - - - 2 - 5 8.2%
2001-10 2 2 1 - - - - 5 8.2%
2011-20 20 24 1 - 2 - - 47 77.0%
2021-30 - - - 2 - - 1 3 4.9%
Ownership
Public 12 26 2 2 2 3 1 48 78.7%
Private 11 2 - - - - - 13 21.3%
Fuel
Natural gas 10 24 - - - - - 34 60.7%
Oil 9 - - - - - - 9 16.1%
Duel fuel 5 3 - - - - - 8 14.3%
Coal - - 2 2 - - - 4 7.1%
Nuclear - - - - - - 1 1 1.8%
Installed capacity (MW)
<10 - - - - 2 - - 2 3.3%
10-100 8 7 - - - 3 - 18 29.5%
101-200 9 3 1 - - - - 13 21.3%
201-300 6 4 1 - - - - 11 18.0%
301-400 - 11 - - - - - 11 18.0%
401-500 - 3 - - - - - 3 4.9%
>500 - - - 2 - - 1 3 4.9%
Capital cost (US$(2015)/kW)
500-600 1 2 - - - 1 - 4 6.6%
601-700 4 1 - - - - - 5 8.2%
701-800 2 1 - - - - - 3 4.9%
801-900 6 4 - - - - - 10 16.4%
901-1000 2 4 - - - - - 6 9.8%
1001-1100 - 5 - - - 1 - 6 9.8%
1101-1200 2 2 - - - - - 4 6.6%
1201-1300 1 3 1 - - - - 5 8.2%
1301-1400 2 1 - - - - - 3 4.9%
1401-1500 2 1 - - - - - 3 4.9%
1501-1600 - - - - - - - 0 0.0%
1601-1700 1 2 - - - - - 3 4.9%
1701-1800 - - - - - - - 0 0.0%
1801-1900 1 - - - - - - 1 1.6%
1901-2000 - - 1 - - - - 1 1.6%
2001-3000 - - - 1 1 - - 2 3.3%

Corruption increases power plant’s cost
15
3001-4000 - 1 - 1 - - - 2 3.3%
4001-5000 - - - - 1 - - 1 1.6%
5001-6000 - - - - - - 1 1 1.6%
>6000 - - - - - 1 - 1 1.6%
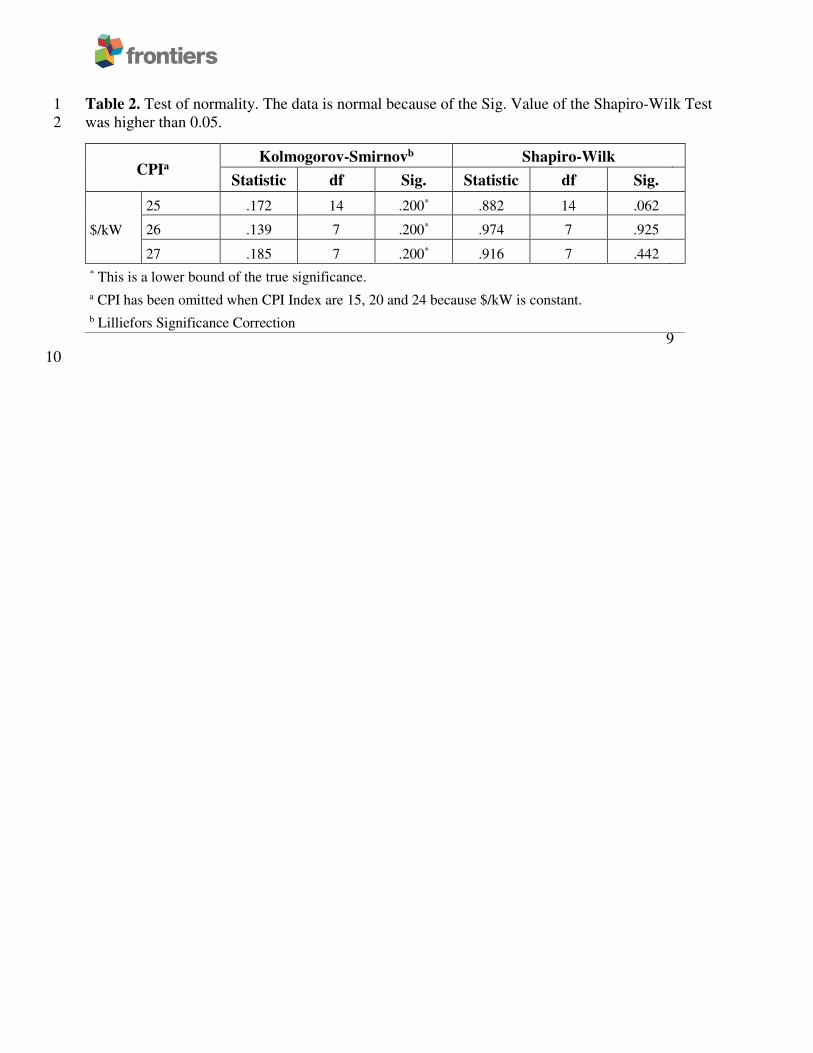
Table 2. Test of normality. The data is normal because of the Sig. Value of the Shapiro-Wilk Test 1 was higher than 0.05. 2
3
4
5
6
7 8 9
10
CPIa Kolmogorov-Smirnovb Shapiro-Wilk
Statistic df Sig. Statistic df Sig.
$/kW
25 .172 14 .200* .882 14 .062
26 .139 7 .200* .974 7 .925
27 .185 7 .200* .916 7 .442
* This is a lower bound of the true significance.
a CPI has been omitted when CPI Index are 15, 20 and 24 because $/kW is constant.
b Lilliefors Significance Correction

Table 3. The capital cost of power generation plants in the World and Bangladesh. Power plants in Bangladesh are further disaggregated 11 into public and private. Historical and projected costs are rounded to the nearest US$ (2015). 12
13
14
Fuel Technology
Capital cost (US$(2015)/kW)
World Bangladesh (public) Bangladesh (private) Difference in Mean
Min Max Mean SD Min Max Mean SD Min Max Mean SD Public &
Private
World &
Public
World &
Private
Natural gas, oil
Gas turbine (GT)
361 741 551 190 680 1823 1177 336 545 1495 819 235 258 -626 -268
CCPP* 568 1381 974 407 545 3005 1164 505 560 848 704 144 460 -189 270
Coal Subcritical 619 2168 1394 774 1245 1924 1584 479
-191
Ultra-supercritical
826 2374 1600 774 2867 3820 3343 477
-1743
Renewable
Solar PV* 1910 6198 4054 2144 2391 4907 3649 1258
405
Hydro-electric*
1755 3977 2866 1111 543 6409 2676 2648
190
Nuclear Nuclear** 2065 6883 4474 2409
5625 5625
* CCGT, Solar photovoltaics - Large-scale and Hydropower - large-scale in International Energy Agency’s (IEA) World Energy Investment Outlook 2014 (IEA, 2014)
** There is only one planned nuclear power plant in Bangladesh. Caution should, therefore, be applied when interpreting the difference in mean.
Corruption increases power plant’s cost
18
This is a provisional file, not the final typeset article
Table 4. Pearson correlation test between CPI score and capital cost per installed capacity of power plants in Bangladesh 15
Annual CPI (-) Biannual average CPI (-)
Triannual average CPI (-)
Quadrennial average CPI (-)
Capital cost ($/kW)
Pearson Correlation -.565** -.445** -.430** -.396**
Sig. (2-tailed) .001 .003 .004 .010
N 42 42 42 42
**. Correlation is significant at the 0.01 level (2-tailed)
16
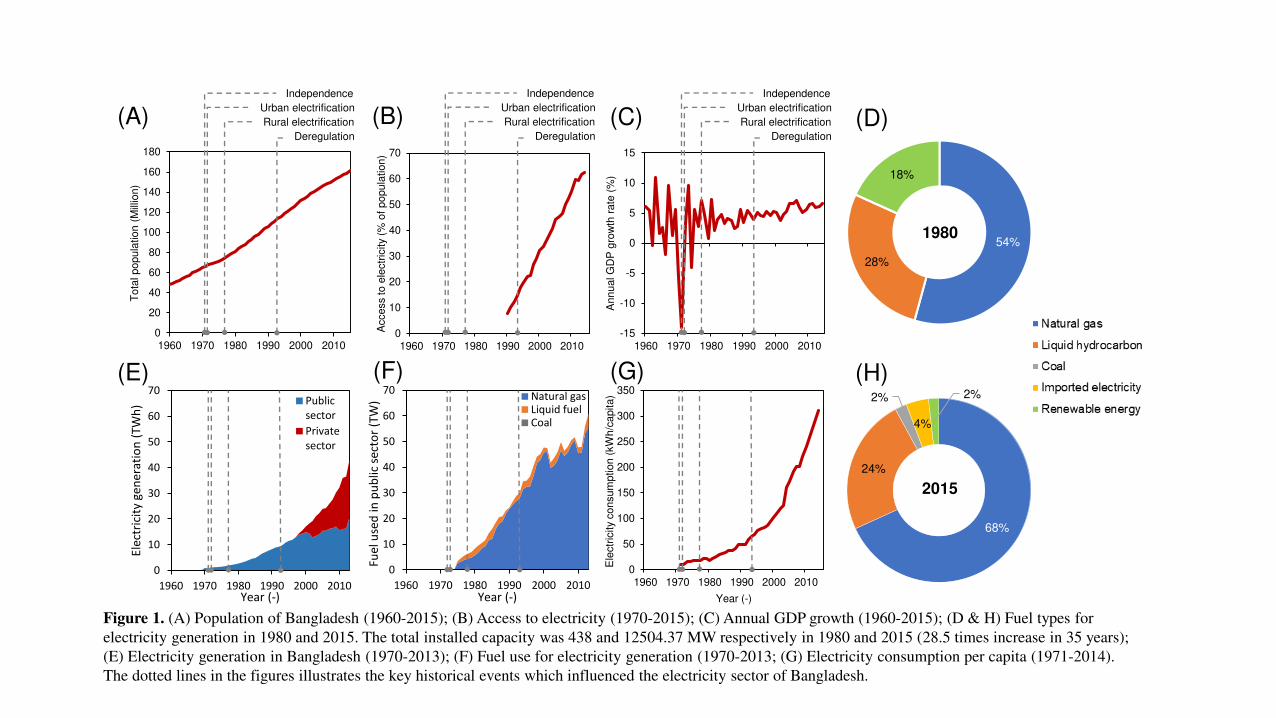
Figure 1. (A) Population of Bangladesh (1960-2015); (B) Access to electricity (1970-2015); (C) Annual GDP growth (1960-2015); (D & H) Fuel types for
electricity generation in 1980 and 2015. The total installed capacity was 438 and 12504.37 MW respectively in 1980 and 2015 (28.5 times increase in 35 years);
(E) Electricity generation in Bangladesh (1970-2013); (F) Fuel use for electricity generation (1970-2013; (G) Electricity consumption per capita (1971-2014).
The dotted lines in the figures illustrates the key historical events which influenced the electricity sector of Bangladesh.
0
20
40
60
80
100
120
140
160
180
1960 1970 1980 1990 2000 2010
0
50
100
150
200
250
300
350
1960 1970 1980 1990 2000 2010
Year (-)
-15
-10
-5
0
5
10
15
1960 1970 1980 1990 2000 2010
Annual G
DP
gro
wth
rate
(%
)
0
10
20
30
40
50
60
70
1960 1970 1980 1990 2000 2010
Access to e
lectr
icity
(% o
f popula
tio
n)
0
10
20
30
40
50
60
70
1960 1970 1980 1990 2000 2010
Ele
ctri
city
ge
ne
rati
on
(T
Wh
)
Year (-)
Public
sector
Private
sector
0
10
20
30
40
50
60
70
1960 1970 1980 1990 2000 2010
Fu
el
use
d i
n p
ub
lic
sect
or
(TW
)
Year (-)
Natural gas
Liquid fuel
Coal
Independence
Urban electrification
Rural electrification
DeregulationT
ota
l popula
tio
n (
Mill
ion)
68%
24%
2%
4%
2%
2015
54%
28%
18%
1980
(A) (B) (C)
(E) (F) (G)
(D)
(H)
Ele
ctr
icity
consum
ptio
n (
kW
h/c
apita)
Independence
Urban electrification
Rural electrification
Deregulation
Independence
Urban electrification
Rural electrification
Deregulation
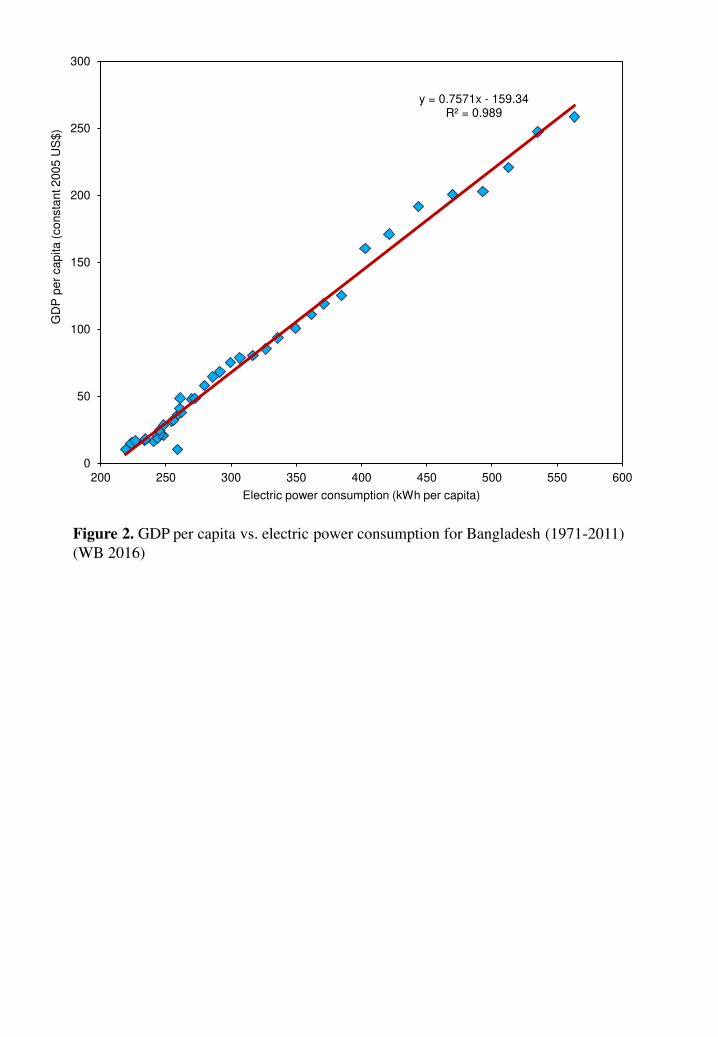
Figure 2. GDP per capita vs. electric power consumption for Bangladesh (1971-2011)
(WB 2016)
y = 0.7571x - 159.34R² = 0.989
0
50
100
150
200
250
300
200 250 300 350 400 450 500 550 600
GD
P p
er
ca
pita
(co
nsta
nt 2
00
5 U
S$
)
Electric power consumption (kWh per capita)
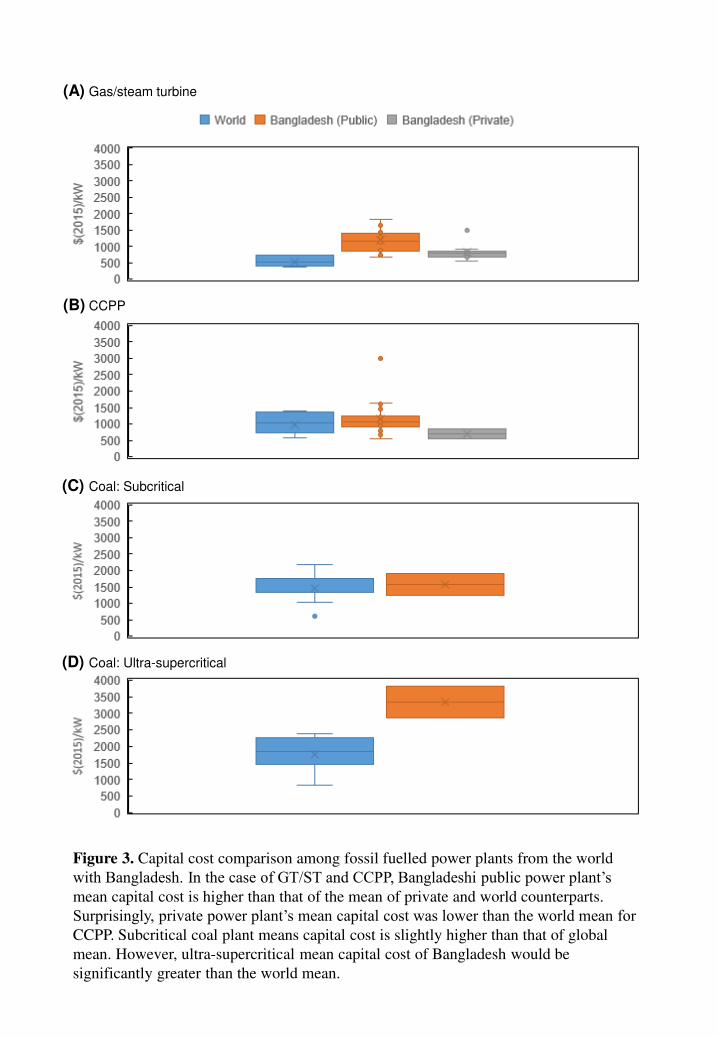
Figure 3. Capital cost comparison among fossil fuelled power plants from the world
with Bangladesh. In the case of GT/ST and CCPP, Bangladeshi public power plant’s mean capital cost is higher than that of the mean of private and world counterparts.
Surprisingly, private power plant’s mean capital cost was lower than the world mean for CCPP. Subcritical coal plant means capital cost is slightly higher than that of global
mean. However, ultra-supercritical mean capital cost of Bangladesh would be
significantly greater than the world mean.
(A) Gas/steam turbine
(B) CCPP
(C) Coal: Subcritical
(D) Coal: Ultra-supercritical
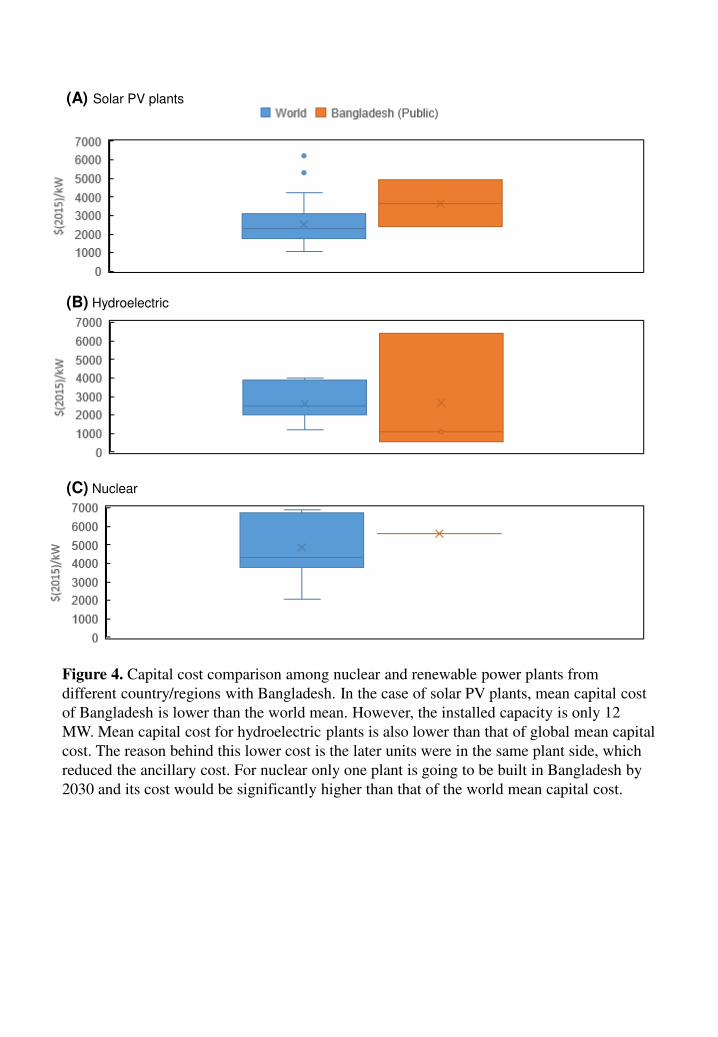
Figure 4. Capital cost comparison among nuclear and renewable power plants from
different country/regions with Bangladesh. In the case of solar PV plants, mean capital cost
of Bangladesh is lower than the world mean. However, the installed capacity is only 12
MW. Mean capital cost for hydroelectric plants is also lower than that of global mean capital
cost. The reason behind this lower cost is the later units were in the same plant side, which
reduced the ancillary cost. For nuclear only one plant is going to be built in Bangladesh by
2030 and its cost would be significantly higher than that of the world mean capital cost.
(C) Nuclear
(A) Solar PV plants
(B) Hydroelectric
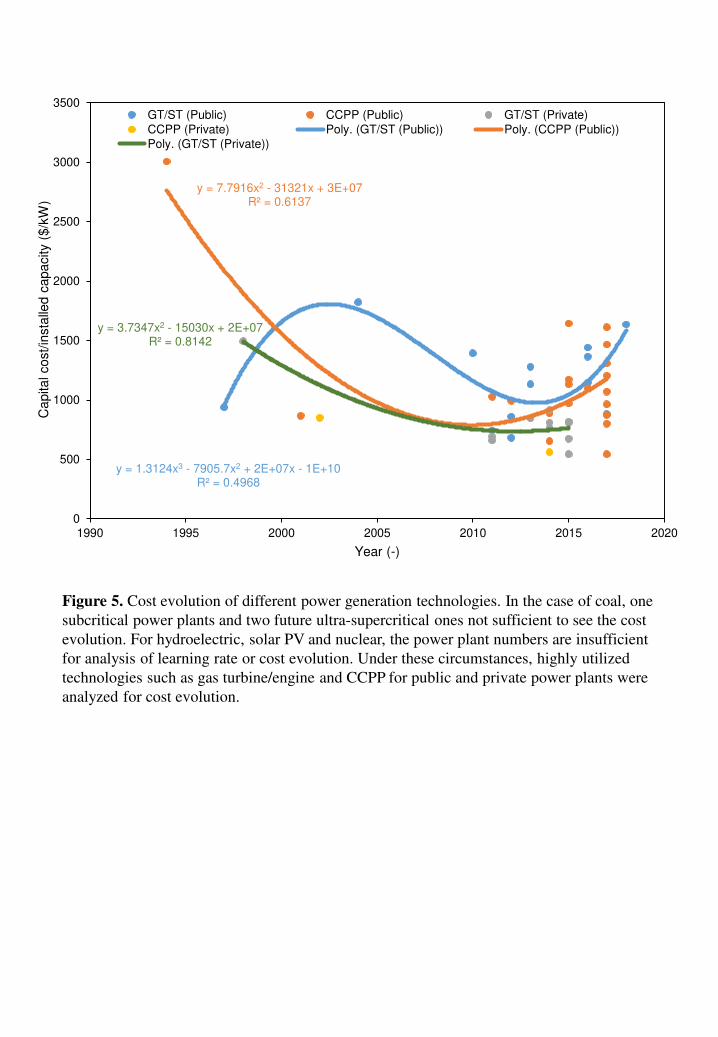
Figure 5. Cost evolution of different power generation technologies. In the case of coal, one
subcritical power plants and two future ultra-supercritical ones not sufficient to see the cost
evolution. For hydroelectric, solar PV and nuclear, the power plant numbers are insufficient
for analysis of learning rate or cost evolution. Under these circumstances, highly utilized
technologies such as gas turbine/engine and CCPP for public and private power plants were
analyzed for cost evolution.
y = 1.3124x3 - 7905.7x2 + 2E+07x - 1E+10R² = 0.4968
y = 7.7916x2 - 31321x + 3E+07R² = 0.6137
y = 3.7347x2 - 15030x + 2E+07R² = 0.8142
0
500
1000
1500
2000
2500
3000
3500
1990 1995 2000 2005 2010 2015 2020
Capita
l cost/in
sta
lled c
apacity
($/k
W)
Year (-)
GT/ST (Public) CCPP (Public) GT/ST (Private)CCPP (Private) Poly. (GT/ST (Public)) Poly. (CCPP (Public))Poly. (GT/ST (Private))
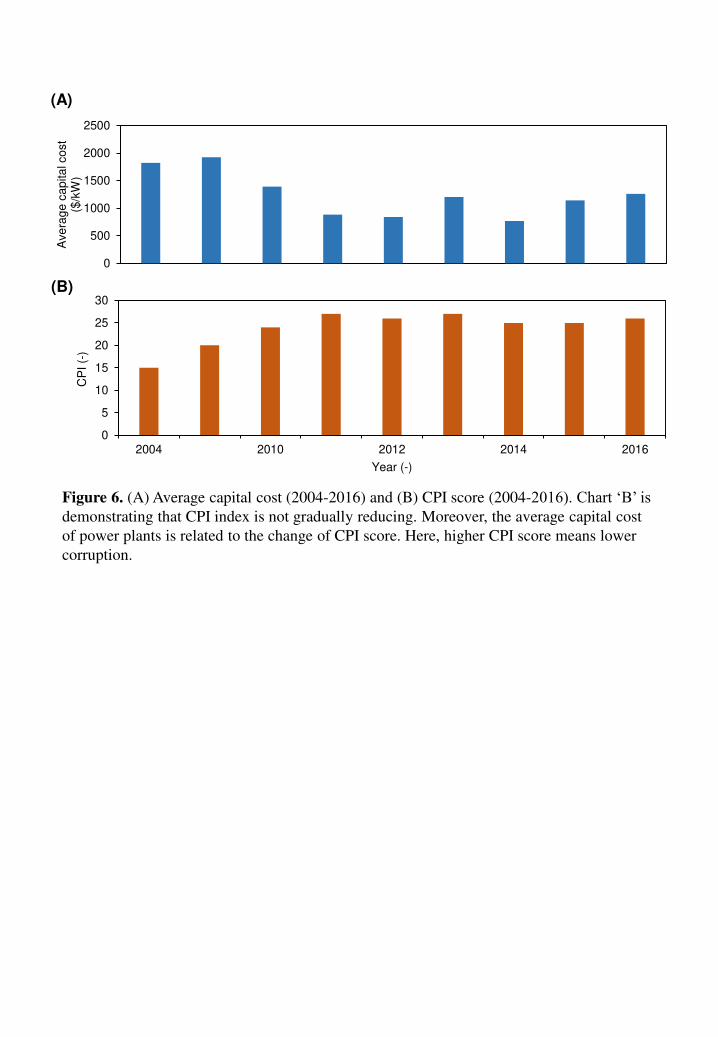
Figure 6. (A) Average capital cost (2004-2016) and (B) CPI score (2004-2016). Chart ‘B’ is demonstrating that CPI index is not gradually reducing. Moreover, the average capital cost
of power plants is related to the change of CPI score. Here, higher CPI score means lower
corruption.
0
5
10
15
20
25
30
2004 2010 2012 2014 2016
CP
I (-
)
Year (-)
(A)
0
500
1000
1500
2000
2500
Ave
rag
e c
ap
ita
l co
st
($/k
W)
(B)
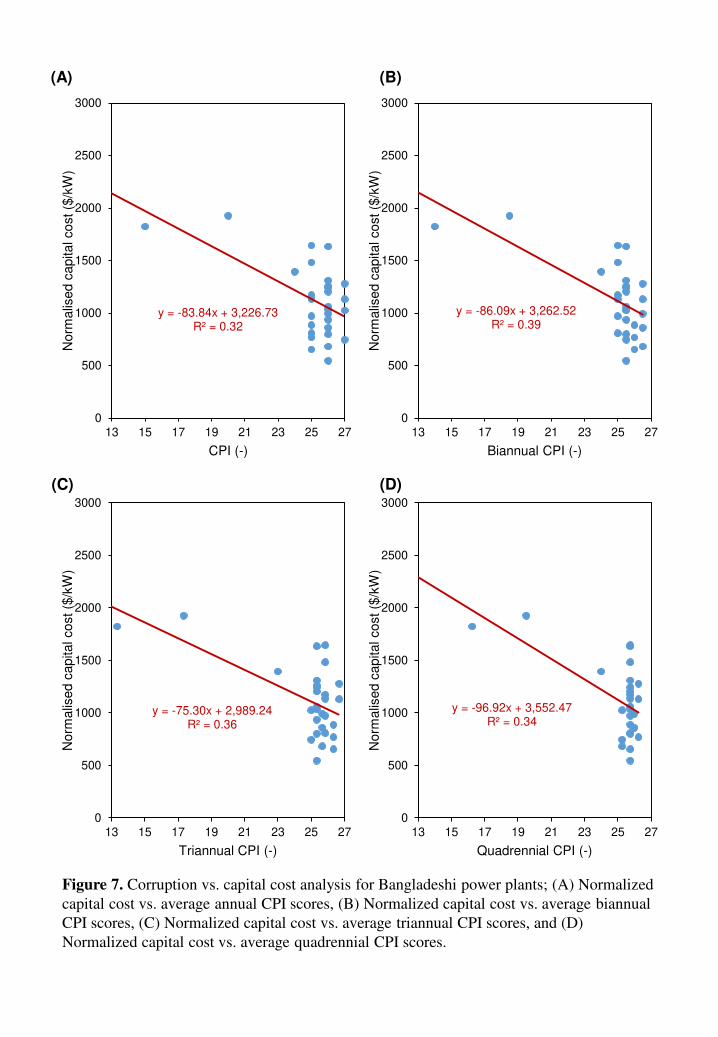
Figure 7. Corruption vs. capital cost analysis for Bangladeshi power plants; (A) Normalized
capital cost vs. average annual CPI scores, (B) Normalized capital cost vs. average biannual
CPI scores, (C) Normalized capital cost vs. average triannual CPI scores, and (D)
Normalized capital cost vs. average quadrennial CPI scores.
y = -86.09x + 3,262.52R² = 0.39
0
500
1000
1500
2000
2500
3000
13 15 17 19 21 23 25 27
Norm
alis
ed c
apital cost ($
/kW
)
Biannual CPI (-)
(A) (B)
y = -75.30x + 2,989.24R² = 0.36
0
500
1000
1500
2000
2500
3000
13 15 17 19 21 23 25 27
Norm
alis
ed c
apital cost ($
/kW
)
Triannual CPI (-)
y = -96.92x + 3,552.47R² = 0.34
0
500
1000
1500
2000
2500
3000
13 15 17 19 21 23 25 27
Norm
alis
ed c
apital cost ($
/kW
)
Quadrennial CPI (-)
y = -83.84x + 3,226.73R² = 0.32
0
500
1000
1500
2000
2500
3000
13 15 17 19 21 23 25 27
Norm
alis
ed c
apital cost ($
/kW
)
CPI (-)
(C) (D)