nia elin owen - -orca
TRANSCRIPT
THE EFFECT OF INCREASED KERBSIDE PROVISION AND MATERIALS RECOVERY FACILITY DEVELOPMENT ON
RECYCLING RATES IN A RURAL COMMUNITY
A Thesis submitted to Cardiff University for the Degree of
Doctor of Philosophy
By
Nia Elin Owen
Institute of Sustainability, Energy and Environmental Management, School of Engineering, Cardiff University.
January 2009
UMI Number: U585152
All rights reserved
INFORMATION TO ALL USERS The quality of this reproduction is dependent upon the quality of the copy submitted.
In the unlikely event that the author did not send a complete manuscript and there are missing pages, these will be noted. Also, if material had to be removed,
a note will indicate the deletion.
Dissertation Publishing
UMI U585152Published by ProQuest LLC 2013. Copyright in the Dissertation held by the Author.
Microform Edition © ProQuest LLC.All rights reserved. This work is protected against
unauthorized copying under Title 17, United States Code.
ProQuest LLC 789 East Eisenhower Parkway
P.O. Box 1346 Ann Arbor, Ml 48106-1346
DECLARATION
This work has not previously been accepted in substance for any degree and is not being concurrently submitted in candidature for any degree.
Signed: $ / { & . . . . ......
Date: 10/01/2009
STATEMENT 1
This thesis is being submitted in partial fulfilment of the requirements for the degree of PhD.
10/01/2009
Signed:
Date:
STATEMENT 2
This thesis is the result of my own independent work/ investigation, except where otherwise stated. Other sources are acknowledged by explicit references.
Signed:
Date: 10/01/2009
........
STATEMENT 3
I hereby give consent for my thesis, if accepted, to be available for photocopying and for inter-library loan, and for the title and summary to be made available to outside organisations.
Date: 10/01/2009
SUMMARY
Traditionally, the UK has relied heavily on landfill as a means of dealing with its MSW, However, the UK waste management industry is undergoing a significant period of change as a result of legislative drivers implemented on an European level. The key driver is the Landfill Directive, which has set targets for the reduction of the quantity of biodegradable waste sent to landfill. This Directive has been implemented in Wales by the Landfill Allowance Scheme (LAS), which essentially sets each local authority an annual tonnage of Biodegradable Municipal Waste (BMW) which it can landfill. Failure to comply with the annual target can result in significant financial penalties which are set at £200 per tonne landfilled over the target. This driver coupled with the ever increasing landfill tax, which is set to increase by £8 per annum, is making alternatives to landfill become more economically viable.
As well as these statutory drivers, there are also non-statutory drivers. In Wales, the Welsh Assembly Government (WAG) issued the non-statutory requirement for local authorities to achieve 40% recycling and composting by 2009/10, with a minimum of 15% recycling and 15% composting. It has also been announced that post 2010, the targets are likely to increase rapidly, culminating in a 70% recycling and composting target by 2024/25.
This thesis uses a case study authority to investigate whether a Materials Recovery Facility (MRF) coupled with changes to its kerbside provision could assist the region to meet its LAS and WAG targets. Key aspects of the thesis include:
• a compositional analysis of household waste within the case study authority, to ascertain the quantities of material available for diversion via a dry recyclate and organics collection scheme;
• a review of a variety of different MRFs within the UK and overseas to determine best practice operations;
• the development of a MRF conceptual design based on the information obtained from compositional analysis and the process reviews conducted on other MRFs;
• the efficiency testing of the MRF commissioned within the case study authority to determine its performance and areas which could be improved; and,
• the modelling of various scenarios to determine what changes could be made to waste management practices so as to maximise the quantity of material diverted from landfill, and assist the authority to meet its LAS and WAG targets.
The compositional anal) sis stud) identified that the average household waste generation within the Case Stud) Authority was 14.9 kg/hh/wk, which was lower than the Welsh average figure of 17 kg/hh/wk. Participating households typically segregated 4.7 kg/hh/wk and 3.0 kg/hh/wk of dry recyclate and organic material respectively. It was also interesting to note that the compositional analysis established that the average BMW content within the Case Stud) Authority was 72%, which was significantly higher than the 61% used to define MSW for the LAS purposes.
An efficiency study carried out on the first phase of the MRF implementation highlighted that when processing a residual waste (black bag) stream 11.2% was recovered in the form of dry recyclate, and 27.7% in the form of a mechanically segregated fine organic stream (less than 50mm fraction). When processing a dry recyclate stream, the efficiency stud) identified that 95% of the material was recovered for recycling; however, two-thirds of this was in the form of a low grade paper product, which was sensitive to market changes.
The thesis highlights that a MRF has a significant role to play in an integrated solution for municipal waste management; however, it is clear that ultimately some form of thermal process will be required for the residual waste stream in order for local authorities to comply with the LAS targets.
ACKNOWLEDGEMENTS
The author would like to thank colleagues at LAS Recycling Ltd for their time during the project. In particular the author wishes to recognise the contribution made by Chris Saunders, Mark Saunders and Fred Bartlett for their help and support in undertaking this study. The author also recognises the assistance given by the MRF staff, during the waste classifications and MRF trials carried out. The author would also like to thank the members of the Ceredigion County Council waste team whose assistance in the organisation of trials, and provision of data was invaluable.
Specifically, my thanks to Professors Tony Griffiths and Keith Williams for their guidance and input, and their willingness to get involved in the ‘dirtier’ end of the investigation. I would also like to thank my late colleague Dr Tom Woollam, for his support and advice throughout.
The financial support given by LAS Recycling and the DTI via the Knowledge Transfer Partnership project is also gratefully acknowledged.
TABLE OF CONTENTS
PAGE NO.DECLARATION iSUMMARY iiACKNOWLEDGEMENTS iiiTABLE OF CONTENTS ivLIST OF FIGURES viiLIST OF TABLES ixACRONYMS/ABBREVIATIONS xi
INTRODUCTION 11.1 W hat is W aste? 21.2 W aste and Recyclate Arisings
1.2.1 Waste and Recyclate Management and3
Arisings in the EU 1.2.2 Waste and Recyclate Management and
3
Arisings in the UK 71.2.3 Waste and Recyclate Management and Arisings in Wales 8
1.3 Historical Background of W aste Management Legislation 101.4 Case Study Area - Ceredigion 171.5 Aims and Objectives 191.6 Structure of the Thesis 19
REVIEW OF WASTE AND RECYCLING 212.1 Introduction 222.2 Factors which affect waste and recyclate arisings 232.3 Options in W aste Management 26
2.3.1 Landfill 272.3.2 Thermal Processes 272.3.3 Composting 292.3.4 Anaerobic Digestion 292.3.5 Mechanical Biological Treatment (MBT) 302.3.6 Centralised and Kerbside Sorting of Recyclate 31
2.4 The Case Study Authority - Their Approach 322.4.1 Introduction 322.4.2 History of Kerbside Recycling Provision 37
2.5 Summary 42
CHARACTERISATION OF HOUSEHOLD WASTE 433.1 Introduction 443.2 Methodology 46
3.2.1 Background 463.2.2 Waste Characterisation Protocol 50
3.2.2.1 Study A rea Selection 503.2.2.2 Set Out Rate Survey 513.2.2.3 Sample Collection 523.2.2.4 Waste Characterisation 53
3.3 Results 563.4 ' Discussion 67
3.4.1 Dry Recyclables 673.4.1.1 Overview 673.4.1.2 Paper and Cardboard 733.4.1.3 Plastics 74
3.4.2 Organics IS3.4.3 Residual Waste 783.4.4 Total Household Waste 803.4.5 Townsend Index 86
3.5 Summary 88
MATERIALS RECOVERY FACILITIES 904.1 Introduction 914.2 Equipment 92
4.2.1 Material Preparation 924.2.2 Material Transportation 934.2.3 Sorting Equipment 93
4.3 Manual Operations 984.4 Dirty vs Clean MRF Scenarios 1014.5 Process Reviews 103
4.5.1 Clean MRFs 1044.5.2 Dirty MRFs 1214.5.3 Comparison 129
4.6 Development of MRF Conceptual Design 135
5. OPERATIONAL ASPECTS OF THE MATERIALS RECOVERYFACILITY 1415.1 Introduction 1425.2 Process Design and Implementation 1435.3 MRF Development Stages 1485.4 Performance of the New MRF 151
5.4.1 Introduction 1515.4.2 Methodology 1525.4.3 Results and Discussion 155
5.4.3.1 Introduction 1555.4.3.2 Set Old Survey 1555.4.3.3 Commingled Feed Operation 1585.4.3.4 Clear Bag Operation 1665.4.3.5 Cost Benefit Analysis 172
5.5 Summary 111
6. EFFECT OF INCREASED KERBSIDE PROVISION AND MRFDEVELOPMENT 1756.1 Introduction 1766.2 Methodology 1776.3 Results and Discussion 178
6.3.1 Introduction 1786.3.2 Current Scenario 1846.3.3 Alternative Scenarios 188
6.3.3.1 Scenario 1 1891 6.3.3.2 Scenario 2 191
v
6.3.3.3 Scenario 36.3.3.4 Scenario 46.3.3.5 Scenario 56.3.3.6 Scenario 6
1921941961982006.4 Summary
7. CONCLSIONS AND FUTURE W ORK7.1 Conclusions7.2 Recommendations for Future W ork
205206 211
REFERENCES 212
Appendices available on CD at the rear of the thesis Appendix A - Townsend Score Appendix B - W aste Characterisation Data Appendix C - MRF Process Reviews Appendix D - MRF Efficiency Data
LIST OF FIGURES
Figure No._______________________ Description_______________________Page No.1.1 Annual Waste Composition 2002 in the EU-15 by Sector 31.2 Variations in MSW Management across Europe 41.3 MSW Composition for a selection of European Countries 61.4 Estimated Total Annual Waste Arisings in the UK by sector 81.5 Waste Hierarchy 161.6 Map of Wales showing Local Authority Boundaries 172.1 Example of a Compartmentalized Vehicle used for Kerbside
Sorting of Recyclate32
2.2 Map of Ceredigion indicating CA site and recycling bank locations
33
2.3 MSW Generation and recycling & composting rate in Case Study Authority
35
2.4 MSW Collection Tonnage and Composition in Case Study Authority in 2003/04
36
2.5 MSW Collection Tonnage and Composition in Case Study Authority in 2006/07
36
2.6 Pedestrian Controlled Vehicle 392.7 Recyclate Source Tonnage and Composition in Case Study
Authority in 2003/0441
2.8 Recyclate Source Tonnage and Composition in Case Study Authority in 2006/07
41
3.1 Relationship between Set Out Rate and Townsend Index Score for the Case Study Authority
87
3.2 Relationship between Household Waste Arisings, Recyclate and Organics with the Townsend Index
87
4.1 Ballistic Separator Paddles 964.2 Plastic and Paper Optical Sorters 974.3 Cutts Recycling MRF Layout 1074.4 NEWS MRF Layout 1104.5 R U Recycling MRF Layout 1134.6 Blue Mountain Recycling MRF Layout 1154.7 V-Screen at Blue Mountain Recycling MRF 1164.8 12 Pronged Stars for use in Angled Screen at Recycle America
MRF, York118
4.9 Guelph Wet Dry + MRF Layout 1204.10 Trailer Loading Bays at Guelph Wet Dry + MRF 1214.11 Flowsheet for Yorwaste MRF 1234.12 Flowsheet for Meddill MRF 1254.13 Flowsheet for Albacete MRF 1284.14 Relationship between Throughput and Residue per Picker for
Reviewed Single Stream MRFs131
4.15 Relationship between Throughput and Residue per Picker for Reviewed Single Stream MRFs (excluding Guelph & Cutts MRFs)
132
4.16 Relationship between Output Streams Segregated by Automated Means plotted against Residue for Reviewed Single Stream MRFs
134
135
136138144145147149159162167180185
DescriptionGraph of Output Streams Segregated by Automated Meansplotted against Residue for Reviewed Single Stream MRFsexcluding Guelph and Blue Mountain MRFsKey Components of MRF ProcessesMRF Conceptual Design highlighting process componentsMRF Conceptual DesignMRF Development Phase 1MRF Development Phase 2Flow Diagram for Pilot MRFCommingled Input SummaryBlack Bag Stream Input SummaryClear Bag Stream Input SummaryMSW Types and Destinations in Case Study AuthorityAnnual Assessment of Current Performance in Case StudyAuthorityScenario 1 - Continue as per Current Scheme but with Composting of FinesScenario 5 - Continue as per Current Scheme but with all RCV Material processed in the MRF
viii

LIST OF TABLES
Table No. Description Page No.1.1 The Average Welsh MSW Composition 101.2 Annual BMW Landfill Allowance for Wales until 2009/10 141.3 MSW Composition 182.1 Examples of MSW Composition 232.2 MSW Generation for Different Household Types 242.3 General Composition of MSW in Winter and Summer 262.4 MSW Generation and recycling and composting rates in the
Case Study Authority35
2.5 BMW Landfill Allowance for Case Study Authority 373.1 Sample Location and Collection Dates 523.2 Set Out Rate Data for Location A - Winter 583.3 Set Out Rate Data for Location A - Summer 583.4 Set Out Rate Data for Location B - Winter 593.5 Set Out Rate Data for Location B - Summer 593.6 Set Out Rate Data for Location C - Winter 603.7 Set Out Rate Data for Location C - Summer 603.8 Waste Classification Data for Location A - Winter 613.9 Waste Classification Data for Location A - Summer 623.10 Waste Classification Data for Location B - Winter 633.11 Waste Classification Data for Location B - Summer 643.12 Waste Classification Data for Location C - Winter 653.13 Waste Classification Data for Location C - Summer 663.14 Dry Recyclable Data for Sampling Locations 683.15 Dry Recyclable Composition for Sampling Locations 723.16 Composition of Dry Recyclate Stream for Case Study Authority 723.17 Set out rates, non-requested material and recovery of dry
recyclate for participating household in the Authority73
3.18 Paper and cardboard composition in the Case Study Authority 743.19 Plastic composition in the Case Study Authority 753.20 Organics data for sampling locations 763.21 Arisings, non-requested material and recovery of putrescibles
from participating household in the Authority77
3.22 Residual Waste Arisings for Sampling Locations 793.23 Residual Waste Composition for Sampling Locations 793.24 Average Household Waste Arisings for Sampling Locations 813.25 Total Waste Composition for Sampling Locations 853.26 Total Average Weighted Household Waste Composition for
Case Study Area85
4.1 Reaction Times for Various Material Types in Different Stream Types
99
4.2 Sorting Rates per Person for Various Material Types 1004.3 Summary of Milton Keynes MRF Features 1054.4 Summary of NEWS MRF Features 1094.5 Summary of R U Recycling MRF Features 1124.6 Summary of Blue Mountain Recycling MRF Features 1144.7 Summary of Guelph MRF Features 1184.8 Summary of Yorwaste MRF Features 122
Table No. Description Page No.4.9 Summary of Meddill MRF Features 1244.10 Summary of Albacete MRF Features 1274.11 Throughput per Picker for Reviewed MRFs 1304.12 Proportion of Output Streams Segregated by Automated Means 1335.1 Average Pilot MRF Performance Data 1505.2 Average Recovery of Recyclate form Black Bags in Pilot MRF 1515.3 Raw weekly set out data for existing kerbside recycling scheme
areas156
5.4 Raw weekly set out data for new kerbside recycling scheme areas
156
5.5 Set Out Survey Results for Existing Kerbside Recycling Scheme Areas
157
5.6 Comparison of Set Out Data for Existing and New Kerbside Recycling Areas (August 2006)
158
5.7 Black Bag Fines Stream Analysis 1645.8 Black Bag Residual Stream Analysis 1645.9 Recovery of Material Streams from the Black Bag 165
5.10 MRF Efficiency Study Summary 1665.11 Clear Bag Fines Stream Analysis 1705.12 Clear Bag Residual Stream Analysis 1705.13 Recovery of Material Streams from the Clear Bag 1715.14 MRF Efficiency Study Summary 1716.1 BMW Landfill Allowance for Case Study Authority 1776.2 MSW Generation, and Recycling and Composting Rates for
Case Study Authority179
6.3 2006/07 MSW Arisings for Case Study Authority 1826.4 MRF Efficiency Study Summary 1836.5 Summary of BMW Diversion via Current Scenario and
Scenarios 1-6200
ACRONYMS/ ABBREVIATIONS
ABPR Animal By-Products RegulationsACORN A Classification of Rural NeighbourhoodsAH Additional HouseholdsAWC Alternative Weekly CollectionBHS Bulk Handling SystemsBMW Biodegradable Municipal WasteBOD Biochemical Oxygen DemandCA Site Civic Amenity SiteCIWM Chartered Institution of Wastes ManagementDEFRA Department of the Environment, Food and Rural AffairsDETR Department of the Environment, Transport and RegionsDOE Department of the EnvironmentDTI Department of Trade and IndustryEC European CommissionEEA European Environment AgencyEPA90 Environmental Protection Act 1990EU European UnionEU-15 15 member states of the EU prior to enlargement in 2004GDP Gross Domestic ProductHDPE High Density PolyethyleneHWRC Household Waste Recycling CentresIPI International Paper Industrieskg kilogramskg/hh/wk kilograms per household per weekLAS Landfill Allowance SchemeLATS Landfill Allowance Trading SchemeLAWDC Local Authority Waste Disposal CompanyLDPE Low Density PolyethyleneMBP Mechanical Biological Pre-treatmentMBT Mechanical Biological TreatmentMRF Materials Recovery FacilityMSW Municipal Solid WasteMSWSF Mixed Solid Waste Sorting FacilitiesNEWS Norfolk Environmental Waste ServicesoA % of MRF Streams Segregated by Automated MeansOECD Organisation for Economic Cooperation and DevelopmentPCV Pedestrian Controlled VehiclePET Polyethylene TerephthalatePP PolypropylenePS PolystyrenePVC Polyvinyl Chloride

R Recovery of Targeted MaterialRCT Rhondda Cynon T affRCV Refuse Collection VehicleRDF Refuse Derived FuelS Weekly Set OutSI Statutory InstrumentT tonnesTOC Total Organic CarbonTp Throughput per pickertph tonnes per hourTRecS Total Recycling SystemsUK United KingdomUSA United Stales of AmericaWAG Welsh Assmbly GovernmentWCA Waste Collection AuthorityWDA Waste Disposal AuthorityA Change

Chapter 1
CHAPTER 1:Introduction
1
Chapter 1
1.1 WHAT IS WASTE?
Waste can be defined simply as anything that is no longer needed that is thrown away.
There are a number of legal definitions for waste, these include:
• the European Union (EU) defines waste as “an object the holder discards^ intends to
discard or is required to discard” is waste under the Waste Framework Directive
(European Directive 75/442/EC as amended);
• the United Kingdom (UK) Environmental Protection Act 1990 (chapter 43)
indicated waste includes “any substance which constitutes a scrap material, an
effluent or other unwanted surplus arising from the application of any process or
any substance or article which requires to be disposed of which has been broken,
worn out, contaminated or otherwise spoiled; this is supplemented with anything
which is discarded otherwise dealt with as if it were waste shall be presumed to be
waste unless the contrary is proved;” (OPSI, 1990) and,
• the UK Waste Management Licensing Regulations 1994 define waste as “any
substance or object which the producer or the person in possession of it, discards or
intends or is required to discard but with exception of anything excluded from the
scope of the Waste Directive” (OPSI, 1994).
The types of waste produced can be further classified, for example, in terms o f the sector
from which the waste is produced, for example municipal waste, industrial waste,
construction and demolition waste, agricultural waste and so forth.
2

Chapter 1
1.2 WASTE AND RECYCLABLE ARISINGS
1.2.1 Waste and Recyclable Management and Arisings in the EU
It is estimated that approximately 1.4 billion tonnes of waste are generated each year in the
15 member states of the EU (EU-15), these are the 15 members states in the period prior to
enlargement in 2004, i.e. Austria, Belgium, Denmark, Finland, France, Germany, Greece,
Ireland, Italy, Luxembourg, the Netherlands, Portugal, Spain, Sweden and the United
Kingdom (Eurostat, 2005). Figure 1.1 shows the proportion of different wastes generated
per sector in 2002 in the EU-15. This Figure highlights that the construction and
manufacturing industries account for 58%, while municipal waste only accounts for 15%
of the total waste arisings in the EU-15.
OtherMunicipal Waste 1% Mining & Quarrying
15% i8%
Agriculture & Fores try 2%
Manufacturing Industry Construction \ / 24%
34%
Energy Production, Water Purification &
Distribution6%
Figure 1.1: EU-15 Waste Composition by sector in 2002 (Eurostat, 2005)
3

Chapter 1
It is estimated that each person in the EU generates approximately 534kg of Municipal
Solid Waste (MSW) per annum (Eurostat 2005). Generation is higher in the EU-15 states
however at 574 kg per person per annum, compared to the newer member states at 312 kg
per person per annum (Eurostat 2005). The management of this waste varies greatly
between member states, this is highlighted in Figure 1.2, which displays variations in
MSW management across a selection of EU member states. It should be noted that the
definition of MSW varies among member states, therefore only broad comparisons can be
made between countries.
100%
90% -H
80%
70%
60% H
50%
40%
30%
20%
10%
0%
& I 0i I I ! I ICO 9 43 € c
oCL CO
o
EU-16
□ Landfilling □ Incineration without energy recovery □ Incineration with energy recovery □Composting □ Recycling □ Other
Figure 1.2: Variations in MSW Management across Europe (Eurostat, 2005)
Figure 1.2 clearly highlights that all of the newer member states have a high reliance on
landfill as a means of dealing with MSW, indeed Bulgaria deals with 100% of MSW in
this manner. However, it is interesting to note that of the EU-15 member states, Greece,
4

Chapter 1
Ireland, the United Kingdom, Italy, Portugal, Spain, and Finland dispose of more than 55%
of their MSW to landfill, compared with Denmark, Belgium, the Netherlands, Sweden and
Germany which dispose of less than 25% o f MSW to landfill. In contrast to other member
states, incineration is the main method of waste disposal in Denmark, with more than 50%
of their MSW being treated in that manner. The Figure also highlights that Belgium
composts or recycles the greatest proportion o f its MSW stream, accounting for over 50%;
closely followed by the Netherland and Germany which both recycle and compost over
45% of its MSW stream. It can also be seen that high recycling countries also have high
incineration rates. The Figure also highlights the UK’s reliance on landfill as over 75% of
MSW is landfilled. This dependence in the UK has generally been due to low cost,
availability and its applicability for a wide range o f wastes. However, the UK is simply
running out of space and alternative solutions need to be found.
The composition of MSW varies considerably, due to factors such as socio-economic
conditions, level of industrialisation and type o f industry present, geographic location,
climate, population density, collection system, recycling systems present, public attitudes
etc. Seasonality also has a significant effect on composition, in that garden waste is greater
in the summer months, which increase waste arisings. Tourism can also have a seasonal
effect on MSW composition, for example influxes of tourists in the summer months to
seaside resorts (Williams, 2005). As a result of these effects along with lifestyle and
cultural differences, MSW composition varies from country to country. Factors which
affect waste composition are discussed further in section 2.2.
Figure 1.3 highlights the significant variation in MSW composition among a selection of
EU member states. The organic fraction varies considerably across the member states,
5

Chapter 1
ranging from about 20% for the UK, Ireland and Finland, to 51% in Greece. Similarly the
paper fraction ranges from 8% for Bulgaria to 43% in Finland. The Figure demonstrates
that in the UK that over 50% of MSW consists of paper and organic material; the paper
fraction represents the main component, representing approximately 32% of MSW,
followed by the organic fraction which constitutes about 20% of MSW, with the plastic
and other waste fractions contributing the bulk of material to the remaining MSW. In
contrast, the MSW composition for the Netherlands highlights again the paper and organic
material constitute the majority of the MSW stream, at approximately 68%; however, the
organic fraction is double that of the UK at about 40%, and paper constitutes a lesser
fraction, at about 28%.
100%
90%
80%
70%
60%
50% H
40%
30%
20%
10%
0%
z>
CO
□ Other Waste □ Organic □ Metals □ Glass □ Plastics □ Textiles □ Paper
Figure 1.3: MSW Composition for a selection of European Countries (European
Commission, 2003)
6
Chapter 1
It is important to note that the definition of MSW varies between member states, which has
an impact on compositional analysis undertaken, and therefore care must be taken when
comparing member states. For example, in the UK waste from households accounts for
82% of MSW; however, in Ireland waste from households only accounts for 58%, and in
Finland only accounts for 42% (Eurostat, 2005).
1.2.2 Waste and Recyclable Management and Arisings in the UK
It is estimated that in 2004 approximately 335 millions tonnes of waste was generated in
the UK; these data includes 100 million tonnes o f mineral waste from mining and
quarrying which is not defined as a controlled waste (exempt from control by the EU
Waste Framework Directive), and 220 million tonnes of controlled waste from households
and industry. It must be noted that these figures do not take account of organic wastes
such as manure and straw produced in the agricultural sector (DEFRA, 2006). Figure 1.4
shows the proportion of various types of waste in the UK waste stream based on this data.
This Figure highlights that household waste represents 9% of total waste production, which
is lower than the 15% for the EU-15 as a whole, as previously identified in Figure 1.1.
This thesis focuses on municipal solid waste (MSW) only, which consists of household
waste and other wastes collected by a waste collection authority, for example commercial
or industrial waste and waste from public parks. The UK produces approximately 35
million tonnes of MSW each year (DEFRA, 2007). Much of the MSW stream however
may be reused, and therefore must be considered as a resource for industrial production or
energy generation. Other types of waste are outside the scope of this thesis.
7

Chapter 1
Estimated total annual waste arisings by sector: 2004
<1%
■ Agrcuture (mc.Rshtng)
Mining and Quarrying 32% 29%
■ Sewage sludge
■ Dredgod materials
Household
■ Commercia o f <1%
Industrial5%
Construction and Demolition13% 9%
12%
Figure 1.4: Estimated Total Annual Waste Arisings in the UK in 2004 by Sector
(DEFRA, 2006)
The problem with waste management practices in the UK and in many other countries
worldwide is that they depend heavily on landfill as a means of dealing with waste
generated. (Denison et al. 1994).
1.2J Waste and Recyclable Management and Arisings in Wales
In 2004/05, 1.93 million tonnes of MSW was produced in Wales, this total showed an
increase of 6% on the 2003/04 figure of 1.82 million tonnes. Landfill was the dominant
waste disposal method in 2004/05, with 78% of MSW being sent to landfill. This was a
decrease however on the proportion of MSW being sent to landfill, with 82% being sent to
8
Chapter 1
landfill in 2003/04. Of the remaining material (22%), 15% was recycled and 7% was
composted (National Assembly for Wales, 2006).
Within the MSW stream, waste from household sources, that is from regular refuse
collection, civic amenity sites, material collected for recycling and composting and bulky
waste collections represented S2% of the MSW stream at 1.58 million tonnes. This
equates to an average of 24.3 kg of waste being produced per household each week in
2004/05. Data collated by the National Assembly showed that of this 24.3 kg,
householders on average placed 19.7 kg of waste at the kerbside each week for collection
(National Assembly for Wales, 2006).
Between 2001 and 2003, a municipal waste analysis was carried out in Wales by AEA
Technology on behalf o f the National Assembly for Wales (National Assembly for Wales,
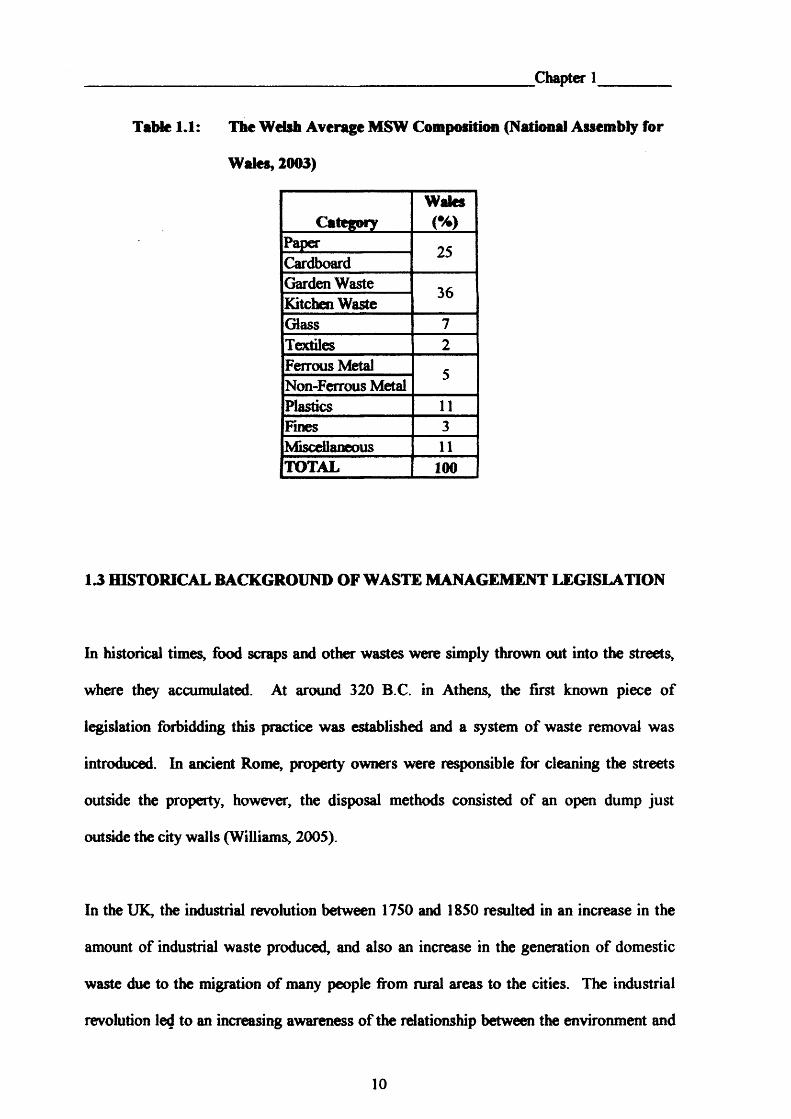
2003). The study found that the composition of MSW in Wales was as shown in Table 1.1.
The bulk of MSW in Wales consists o f garden and kitchen waste which constitutes 36% of
the total, followed by 25% in the form of paper and cardboard. Hence, 61% of the MSW
stream is biodegradable.
9
Chapter 1
Table 1.1: The Welsh Average MSW Composition (National Assembly for
Wales, 2003)
CategoryWales
<%)Paper 25CardboardGarden Waste 36Kitchen WasteGlass 7Textiles 2Ferrous Metal 5Non-Ferrous MetalPlastics 11Fines 3Miscellaneous 11TOTAL 100
13 HISTORICAL BACKGROUND OF WASTE MANAGEMENT LEGISLATION
In historical times, food scraps and other wastes were simply thrown out into the streets,
where they accumulated. At around 320 B.C. in Athens, the first known piece of
legislation forbidding this practice was established and a system of waste removal was
introduced. In ancient Rome, property owners were responsible for cleaning the streets
outside the property, however, the disposal methods consisted of an open dump just
outside the city walls (Williams, 2005).
In the UK, the industrial revolution between 1750 and 1850 resulted in an increase in the
amount of industrial waste produced, and also an increase in the generation of domestic
waste due to the migration of many people from rural areas to the cities. The industrial
revolution led to an increasing awareness of the relationship between the environment and
10
Chapter 1
public health. As a result, a series o f Nuisance Removal and Disease Prevention Acts were
introduced during the nineteenth century, which gave local authorities the power to set up
teams of inspectors to deal with offensive trades and control pollution within city limits.
These Acts were reinforced by the Public Health Act of 1875 which placed a duty on local
authorities to arrange for the collection and disposal of waste. The first refuse incinerator
was built in 1875 as a means o f waste disposal, and by 1912 there were over 300
incinerators in the UK. Incineration was second to the main method of waste disposal
which was open dumping (both legally and illegally). Fire and vermin however were a
risk; hence, waste was buried to minimise these risks; there was little consideration given
to the effects of landfill gas emissions and leachate (Williams 2005).
The Public Health Act of 1936 introduced a provision whereby District Councils had to
collect waste if they so wished, and if they opted to not do so, members of the public were
entitled to claim 5 shillings per day for failure to collect. It was not until the late 1960s and
1970s however that waste management improved significantly in the UK, this was a result
of a number of toxic chemicals being dumped, such as the case of drums of cyanide being
dumped on a site used as a playground near Nuneaton in 1972. These cases led to pressure
being placed on the Government to introduce stricter controls on waste disposal, which
were the Deposit of Poisonous Waste Act 1972 and the Control of Pollution Act 1974
(Williams 2005). The main criticism of this latter act was that it merely created a
framework to deal with the issue of waste disposal, it did not tackle the issue o f increasing
waste generation.
The Control of Pollution Act 1974 was superseded by the Environmental Protection Act
1990 (hereafter referred to as EPA90) which set out the UK waste strategy and introduced
11
Chapter 1
integrated poUution control Integrated Pollution Control was based on the notion that the
environmental impacts o f a process on air, water and land are viewed as a whole. Prior to
this they were subject to separate controls. EPA90 is a framework Act, which essentially
means that the requirements o f the Act will be implemented by a number of regulations.
EPA90 introduced the notion o f "duty of care’, which is essentially a measure to ensure the
safe storage, handling and transport o f waste by authorised people and to authorised sites
for treatment/ disposal (Open University 1993).
The 1995 Environment Act established the Environment Agency and also introduced the
principle of 'producer responsibility’, its aim being to encourage the producer o f a product
to become more responsible for dealing with the waste produced due to the production of
that product, and therefore increase the re-use or recycling o f waste materials (Williams
2005).
The European Union also acts as a driver for UK legislation by the introduction of
Directives, which set out standards and procedures which must then be implemented in the
member states including the UK via each member’s legislative system.
The main EU measure was the 1975 Waste Framework Directive (75/442/EEC) as
amended by the Framework Directive on Waste (91/156/EEC) and the Decision on Waste
(96/330/EC). This Directive requires waste to be dealt by measures that do not endanger
the environment or human health; that is, it set the foundation for sustainable waste
management. The Waste Directive states that waste must be managed "without causing a
nuisance through noise or odours”. As a means of minimising these environmental
impacts, the Council Directive 1999/31/EC on the landfill of waste (commonly referred to
12

Chapter 1
as the Landfill Directive) was introduced by the European Commission (EC) in 1999,
which was transposed to UK law through the Landfill (England and Wales) Regulations
2002. The aim of this legislation is to prevent, or reduce as far as possible, the adverse
environmental effects of landfill (Holgate, 2002).
The requirements of the Landfill Directive include the following:
• sites are classified into three categories: hazardous, non-hazardous or inert,
depending on the type of waste they receive;
• biodegradable waste is progressively diverted away from landfills in line with the
targets stipulated in the Directive;
• certain hazardous and other wastes, including liquids are prohibited from landfills;
and
• pre-treatment of waste prior to landfilling is required after 16th July 2004 (Holgate,
2002).
The amount of biodegradable waste landfilled must be reduced in line with the following
targets in order for the UK to comply with the Landfill Directive:
• to 75% of the biodegradable waste produced in 1995, by 2010;
• to 50% of the biodegradable waste produced in 1995, by 2013; and
• to 35% of the biodegradable waste produced in 1995, by 2020 (Holgate 2002 and
Audit Commission in Wales, 2005).
The Landfill Directive has been implemented differently in each part of the UK. In Wales,
this was implemented by means of the Landfill Allowance Scheme (Wales) Regulations
2004 (Statutory Instrument No. 1490). Under this scheme, each local authority is allocated
13
Chapter 1
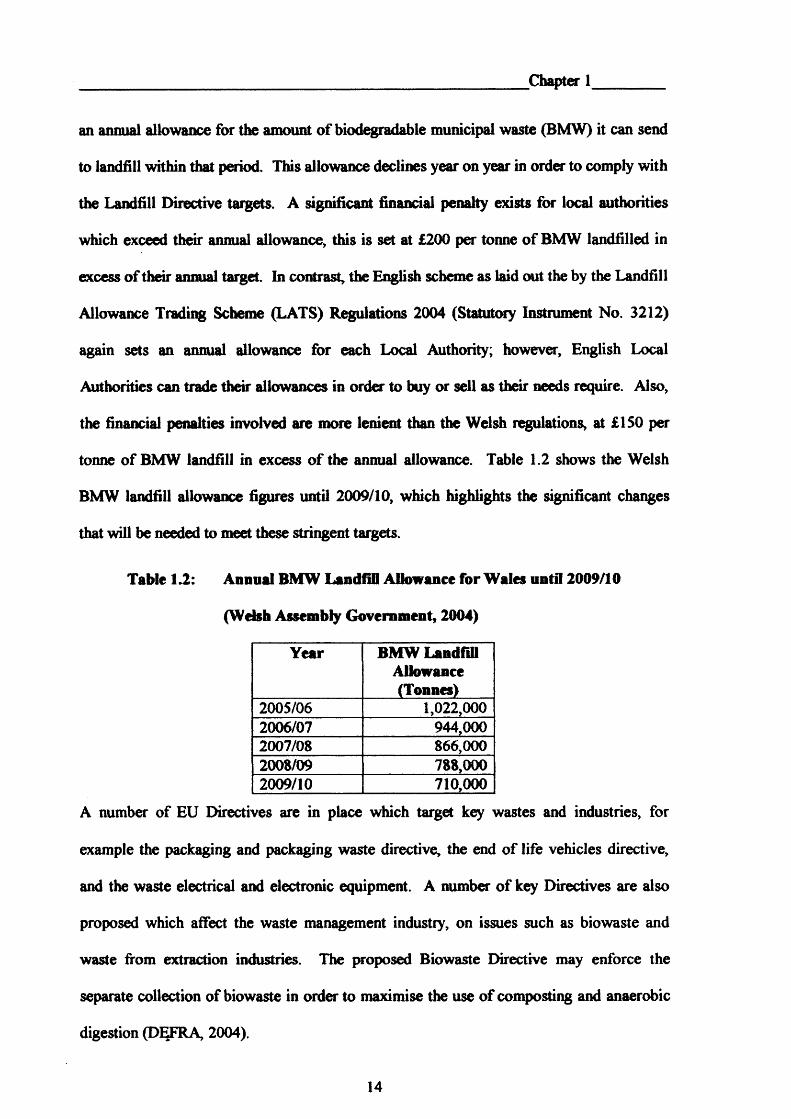
an annual allowance for the amount of biodegradable municipal waste (BMW) it can send
to landfill within that period. This allowance declines year on year in order to comply with
the Landfill Directive targets. A significant financial penalty exists for local authorities
which exceed their annual allowance, this is set at £200 per tonne of BMW landfilled in
excess of their annual target. In contrast, the English scheme as laid out the by the Landfill
Allowance Trading Scheme (LATS) Regulations 2004 (Statutory Instrument No. 3212)
again sets an annual allowance for each Local Authority; however, English Local
Authorities can trade their allowances in order to buy or sell as their needs require. Also,
the financial penalties involved are more lenient than the Welsh regulations, at £150 per
tonne of BMW landfill in excess o f the annual allowance. Table 1.2 shows the Welsh
BMW landfill allowance figures until 2009/10, which highlights the significant changes
that will be needed to meet these stringent targets.
Table 1.2: Annual BMW Landfill Allowance for Wales until 2009/10
(Welsh Assembly Government, 2004)
Year BMW Landfill Allowance (Tonnes)
2005/06 1,022,0002006/07 944,0002007/08 866,0002008/09 788,0002009/10 710,000
A number of EU Directives are in place which target key wastes and industries, for
example the packaging and packaging waste directive, the end of life vehicles directive,
and the waste electrical and electronic equipment. A number o f key Directives are also
proposed which affect the waste management industry, on issues such as biowaste and
waste from extraction industries. The proposed Biowaste Directive may enforce the
separate collection of biowaste in order to maximise the use of composting and anaerobic
digestion (DEFRA, 2004).
14

Chapter 1
The Welsh Assembly Government published its own waste strategy 'Wise about Waste' in
2002, with its general aim being to reduce the amount of waste disposed of in landfill sites
and to increase recycling and source segregated composting. This general aim was broken
down into set targets; these are:
• by 2003/04 achieve at least 15% recycling/ composting of MSW with a minimum
of 5% composting and 5% recycling;
• by 2006/07 achieve at least 25% recycling/ composting of MSW with a minimum
of 10% composting and 10% recycling; and
• by 2009/10 achieve at least 40% recycling/ composting o f MSW with a minimum
of 15% composting and 15% recycling (Friends of the Earth 2002; National
Assembly for Wales 2002).
It has also been announced by WAG, that targets are likely to increase post 2010 as
follows:
• 52% recycling and composting by 2012/13;
• 58% recycling and composting by 2015/16;
• 64% recycling and composting by 2019/20; and,
• 70% recycling and composting by 2024/25 (Welsh Assembly
Government, 2007).
No information is yet available as to whether these targets will be statutory or non*
statutory.
As a result of these regulations and targets, and in particular the landfill regulations, the
waste management industry in the UK will have to undergo a radical change in order to
meet the targets required by law. The aim of these regulations is essentially to create a
15

Chapter 1
more sustainable approach to waste management, and a greater utilisation of the waste
hierarchy.
A waste hierarchy can be traced back to the 1970s, when the environmental movement
developed the hierarchy, and argued that waste was made up of different materials, and as
a result the different fractions should be treated differently, i.e. some should not be
produced in the first place, some should be re-used, some recycled and composted, some
should be burnt, and some should be buried (Schall, 1992). It was not until the 1991
‘Waste Management Paper on Recycling’ (Department of the Environment, 1991) that the
waste hierarchy was officially recognised by the Government. This version of the waste
hierarchy is shown in Figure 1.5. The waste hierarchy was then updated by ‘Making
Waste Work’ (DETR, 1995), to the version that is still used today. This is illustrated in
Figure 1.5.
kc-u .̂'
M aterials R ecyclin g Rccovcrv
Energy Recovery
Landfill Incineration
Waste Minimization
Reduction
Re-use
Rcemcry including materials recycling, composting and
energy recovery
Disposal, landfill and incineration withoutrecovery
‘Waste Management Paper on Recycling' Waste Hierarchy Making Waste Work’ Waste Hierarchy
Figure 1.5 Waste Hierarchy (Department of the Environment, 1991 and
DETR, 1995)
X
16
Chapter 1
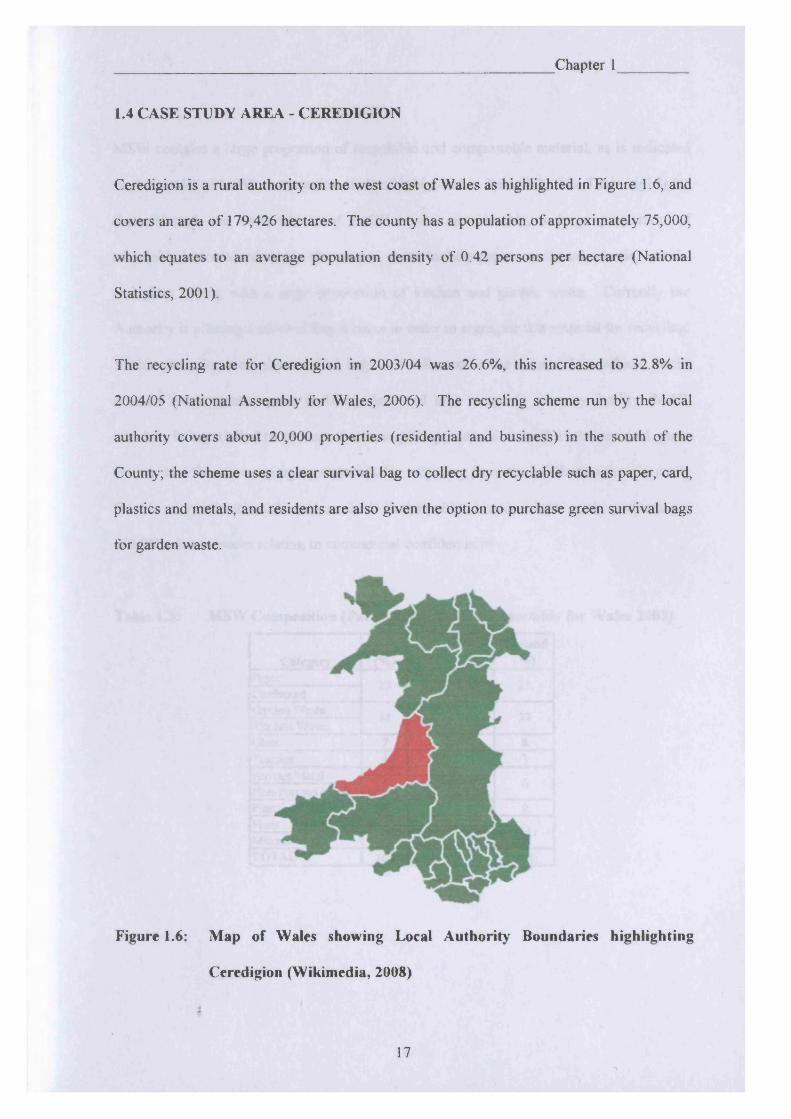
1.4 CASE STUDY AREA - CEREDIGION
Ceredigion is a rural authority on the west coast of Wales as highlighted in Figure 1.6, and
covers an area of 179,426 hectares. The county has a population of approximately 75,000,
which equates to an average population density of 0.42 persons per hectare (National
Statistics, 2001).
The recycling rate for Ceredigion in 2003/04 was 26.6%, this increased to 32.8% in
2004/05 (National Assembly for Wales, 2006). The recycling scheme run by the local
authority covers about 20,000 properties (residential and business) in the south of the
County; the scheme uses a clear survival bag to collect dry recyclable such as paper, card,
plastics and metals, and residents are also given the option to purchase green survival bags
for garden waste.
Figure 1.6: Map of Wales showing Local Authority Boundaries highlighting
Ceredigion (Wikimedia, 2008)
I
17
Chapter 1
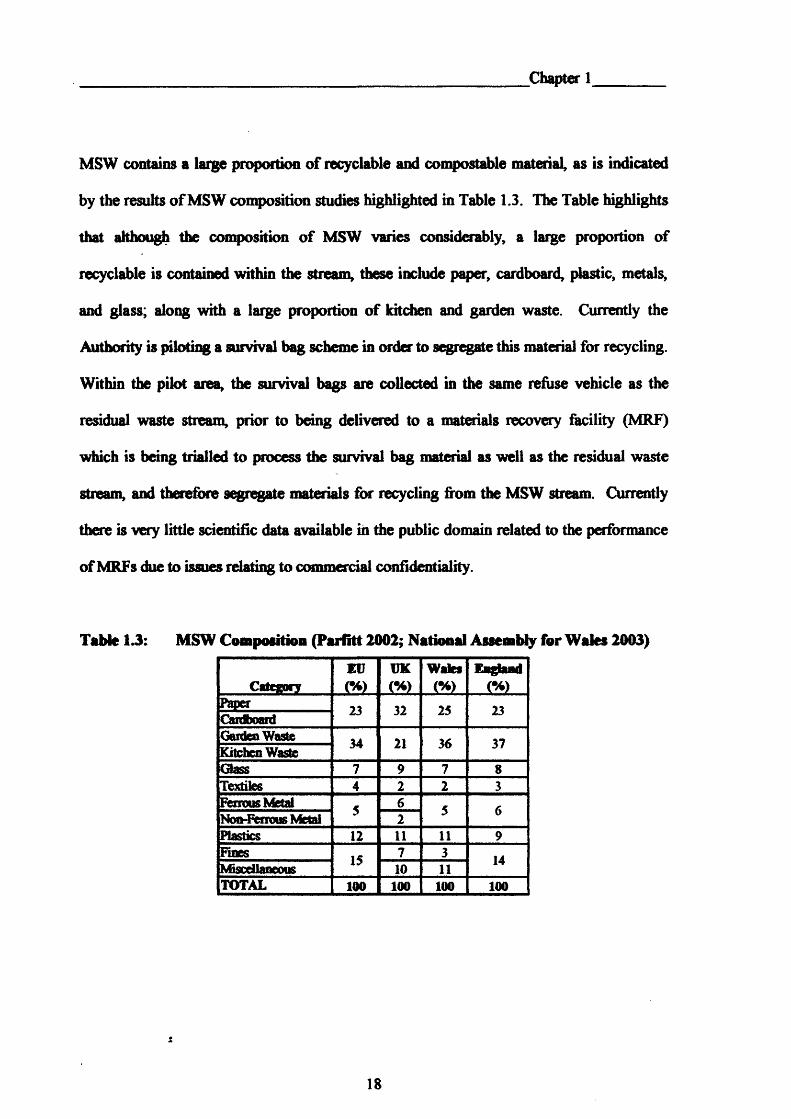
MSW contains a large proportion of recyclable and compostable material, as is indicated
by the results o f MSW composition studies highlighted in Table 1.3. The Table highlights
that although the composition o f MSW varies considerably, a large proportion of
recyclable is contained within the stream, these include paper, cardboard, plastic, metals,
and glass; along with a large proportion of kitchen and garden waste. Currently the
Authority is piloting a survival bag scheme in order to segregate this material for recycling.
Within the pilot area, the survival bags are collected in the same refuse vehicle as the
residual waste stream, prior to being delivered to a materials recovery facility (MRF)
which is being trialled to process the survival bag material as well as the residual waste
stream, and therefore segregate materials for recycling from the MSW stream. Currently
there is very little scientific data available in the public domain related to the performance
of MRFs due to issues relating to commercial confidentiality.
Table 13: MSW Composition (Parfitt 2002; National Assembly for Wales 2003)
CategoryEUw
UK(% }
Wales
w CA)Paper 23 32 25 23* * ___ aa--------- aundDonaGarden Waste 34 21 36 37Kitchen Wastefitagg 7 9 7 8Textiles 4 2 2 3Ferrous Metal 5 6 5 6Non-Ferrous Metal 2Nasties 12 11 11 9Fines 15 7 3 14Miscellaneous 10 11TOTAL 100 100 100 100
18
Chapter 1
1.5 AIMS AND OBJECTIVES
This thesis will examine Materials Recovery Facilities (MRFs) and increased kerbside
provision as a means of diverting recyclable materials contained in household waste away
from landfill. Considerable variation was observed in MRFs in terms of the separation
processes utilised, type of material processed and so forth, and the thesis will examine this
variation and their flexibility in terms of fitting into a local authorities waste strategy.
The thesis will present data obtained for composition of household waste within the case
study authority, and using this information a design for a MRF will be developed, which
will be commissioned within the case study authority, and its performance analysed. This
will then allow modelling to be carried out on the case study authority’s municipal solid
waste (MSW) stream data, in order to assess the impact o f the MRF and increased kerbside
provision on the study authority’s performance in terms of meeting statutory and non-
statutory targets.
1.6 STRUCTURE OF THE THESIS
Chapter 2 of the thesis examines the factors which affect household waste arisings, and the
various options available for dealing with it. Waste management in the case study area is
discussed, giving a historical perspective on the provision of recycling services within the
local authority.
19
Chapter 1
Chapter 3 presents the results of the waste characterization survey conducted within the
study area, and assesses variations on both a seasonal basis and socio-economic basis
across the local authority.
Chapter 4 introduces MRFs, outlining the variety of separation processes which are
commonly used, and the difference between dirty and clean MRF operations. This chapter
also details the results from process reviews undertaken at a number of MRFs both in the
UK and overseas.
Chapter 5 details the development o f the MRF, and also the results of a MRF efficiency
trial conducted to assess performance and areas to target for improvement.
Chapter 6 examines the impact o f MRF development and increased kerbside provision on
the recycling and composting rates achieved by the case study authority. The impact on
biodegradable municipal waste (BMW) diversion is also assessed in this chapter.
Chapter 7 concludes the thesis, and proposes areas for future research.
20

Chapter 2
CHAPTER 2:Review of Waste & Recycling
in the Case Study Area
21

Chapter 2
2.1 INTRODUCTION
Municipal Solid Waste (MSW) should be treated as a resource as it contains many
materials which can be reused or recycled such as glass, metals, and paper along with
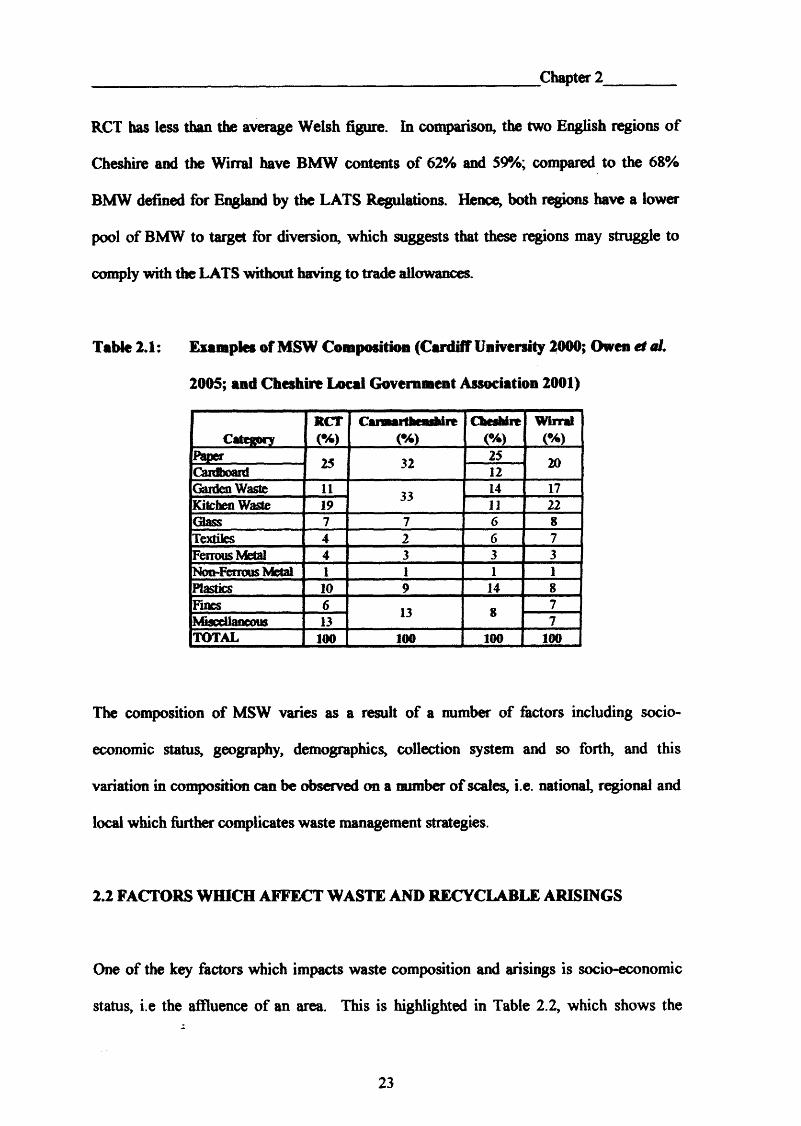
biodegradable material (DETR, 2000). This is highlighted in Table 2.1 which shows the
results of a variety of waste characterisation studies that have been completed. This Table
has been constructed based on data obtained from four studies conducted in four regions of
the UK, these are Rhondda Cynon Taf (RCT) County Borough Council, Carmarthenshire
County Council, Cheshire and the Wirral. It is clear that there are significant variations in
the MSW composition of the four regions. For example, the paper and cardboard content
ranges from 20% for the Wirral to 37% for Cheshire, this variation can be explained by the
variations in socio-economic status o f the areas, in that more affluent areas tend to read
more broadsheet newspapers, and therefore generate a greater proportion of paper waste.
Garden and kitchen waste varies considerably, ranging from 25% for Cheshire to 39% for
the Wirral. Significant variation is also seen in the textiles fraction, with both Welsh
regions (RCT and Carmarthenshire) having a lower proportion (4% and 2% respectively)
than the English regions (Cheshire and the Wirral) (6% and 7% respectively). There is
also a variation in the plastics component of the MSW stream across the four regions,
ranging from 8% in the Wirral to 14% in Cheshire.
The BMW content of the MSW streams for the four regions also varies considerably. The
data show that the two Welsh regions of RCT and Carmarthenshire had BMW contents of
55% and 65% respectively, compared to the 61% defined for Wales in the Landfill
Allowance Scheme (Wales) Regulations. Therefore, the data in Table 2.1 suggests that
Carmarthenshire has a greater pool of material to target in terms of BMW diversion, while
22
Chapter 2
RCT has less than the average Welsh figure. In comparison, the two English regions o f
Cheshire and the Wirral have BMW contents of 62% and 59%; compared to the 68%
BMW defined for England by the LATS Regulations. Hence, both regions have a lower
pool of BMW to target for diversion, which suggests that these regions may struggle to
comply with the LATS without having to trade allowances.
Table 2.1: Examples of MSW Composition (Cardiff University 2000; Owen et of.
2005; and Cheshire Local Government Association 2001)
CategoryRCT(% )
C uauu th tm U itC%>
Cheshire<%)
W irral(%)
Paper 25 32 25 20Cardboard 12Garden Waste 11 33 14 17Kitchen Waste 19 11 22Glass 7 7 6 8Textiles 4 2 6 7Ferrous Metal 4 3 3 3Non-Ferrous Metal 1 1 1 1Plastics 10 9 14 8Fines 6 13 8 7Miscellaneous 13 7TOTAL 100 100 100 100
The composition of MSW varies as a result of a number of factors including socio
economic status, geography, demographics, collection system and so forth, and this
variation in composition can be observed on a number of scales, i.e. national, regional and
local which further complicates waste management strategies.
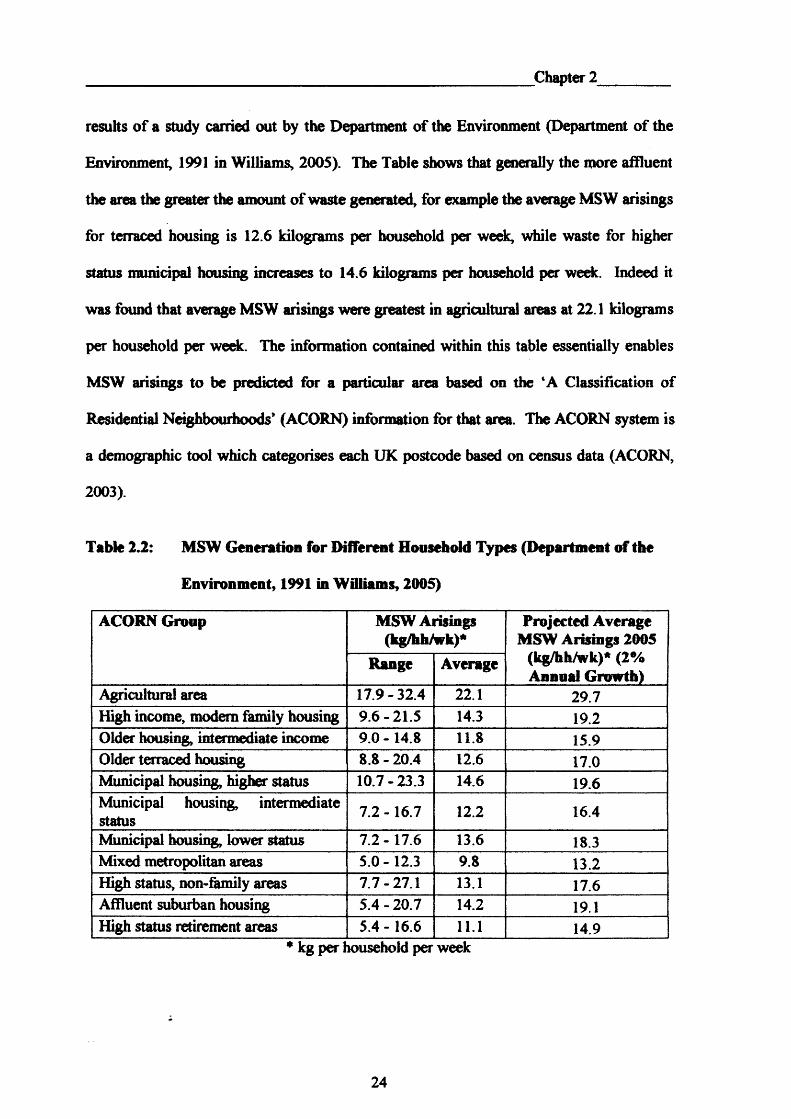
2.2 FACTORS WHICH AFFECT WASTE AND RECYCLABLE ARISINGS
One of the key factors which impacts waste composition and arisings is socio-economic
status, i.e the affluence of an area. This is highlighted in Table 2.2, which shows the
23
Chapter 2
results of a study carried out by the Department of the Environment (Department of the
Environment, 1991 in Williams, 2005). The Table shows that generally the more affluent
the area the greater the amount of waste generated, for example the average MSW arisings
for terraced housing is 12.6 kilograms per household per week, while waste for higher
status municipal housing increases to 14.6 kilograms per household per week. Indeed it
was found that average MSW arisings were greatest in agricultural areas at 22.1 kilograms
per household per week. The information contained within this table essentially enables
MSW arisings to be predicted for a particular area based on the ‘A Classification of
Residential Neighbourhoods’ (ACORN) information for that area. The ACORN system is
a demographic tool which categorises each UK postcode based on census data (ACORN,
2003).
Table 2.2: MSW Generation for Different Household Types (Department of the
Environment, 1991 in Williams, 2005)
ACORN Group MSW Arisings (kg/hh/wk)*
Projected Average MSW Arisings 2005
(kg/hh/wk)* (2% Annual Growth)
Range Average
Agricultural area 17.9-32.4 22.1 29.7High income, modem family housing 9.6-21.5 14.3 19.2Older housing, intermediate income 9.0 - 14.8 11.8 15.9Older terraced housing 8.8 - 20.4 12.6 17.0Municipal housing, higher status 10.7-23.3 14.6 19.6Municipal housing, intermediate status 7.2 - 16.7 12.2 16.4
Municipal housing, lower status 7.2 - 17.6 13.6 18.3Mixed metropolitan areas 5.0-12.3 9.8 13.2High status, non-family areas 7.7-27.1 13.1 17.6Affluent suburban housing 5.4-20.7 14.2 19.1High status retirement areas 5.4 - 16.6 11.1 14.9
* kg per household per week
24
Chapter 2
However, it must be noted that the information contained in Table 2.2 does not take into
account variations in the method of waste collection, for example the use of wheelie bins,
or the traditional dust bin, which can have an impact on waste generation. Also, this
information does not provide any information on compositional changes to the waste
stream in relation to socio-economic status.
The data from the Department of the Environment study contained in Table 2.2 was
published in 1991, and is therefore somewhat dated. Hence, the average data were
projected with an annual growth rate o f 2% to gain an indication o f the data for 2005 in
order to compare with the average Welsh MSW arisings figure for 2004/05 of 24.3
kg/hh/wk (National Assembly for Wales, 2006). From the Table it can be seen that the
projected average MSW arisings for 2005 ranged from 13.2 kg/hh/wk for a mixed
metropolitan area to 29.7 kg/hh/wk for an agricultural area. It can also be noted that it is
only the average figure of 29.7 kg/hh/wk which exceeds the 24.3 kg/hh/wk figure reported
for Wales in 2004/05, with all other projected average figures being below 19.6 kg/hh/wk.
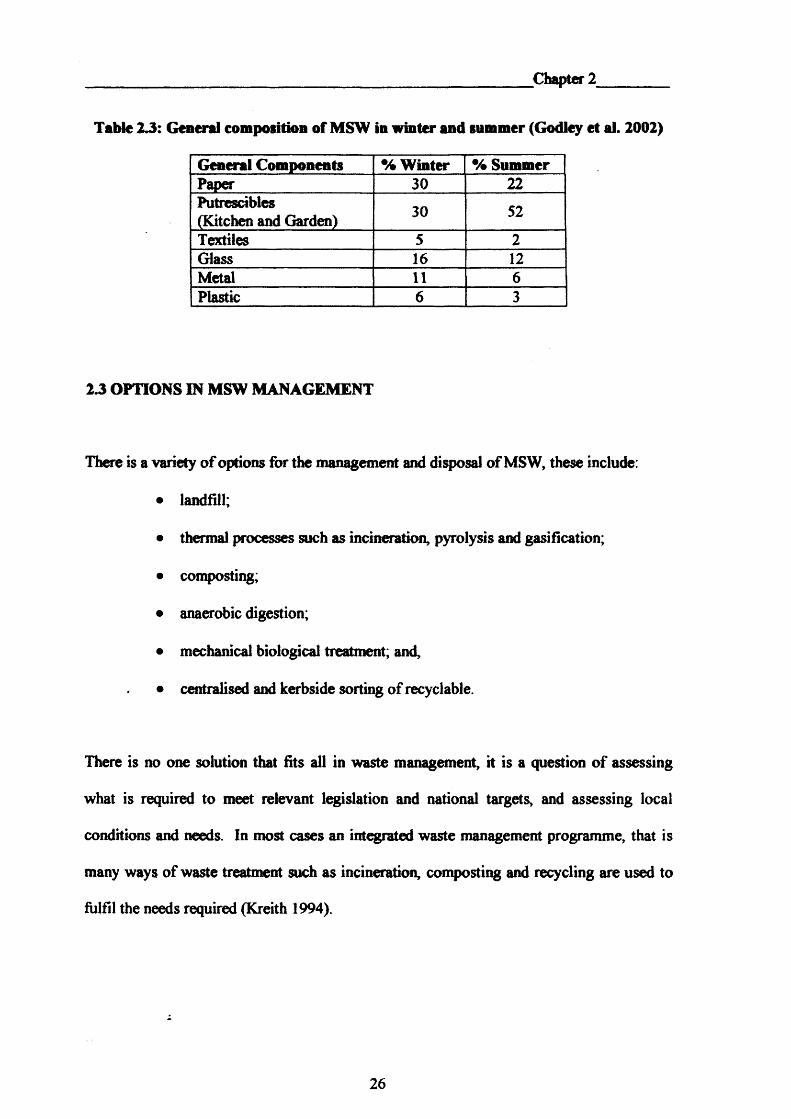
Seasonality is another key factor which impacts on waste composition and recycling. For
example garden waste is greatest during the growing season, and therefore has a significant
impact on both arisings and composition (Franklin, 1994). Table 2.3 highlights the impact
of garden waste on MSW composition. The Table shows the results of a study that found
that the putrescible fraction o f MSW increased from 30 to 52% between the Winter and
Summer study.
25
Chapter 2
Table 23: General composition of MSW in winter and summer (Godley et al. 2002)
General Components % Winter % SummerPaper 30 22Putrescibles 30 52(Kitchen and Garden)Textiles 5 2Glass 16 12Metal 11 6Plastic 6 3
23 OPTIONS IN MSW MANAGEMENT
There is a variety o f options for the management and disposal of MSW, these include:
• landfill;
• thermal processes such as incineration, pyrolysis and gasification;
• composting;
• anaerobic digestion;
• mechanical biological treatment; and,
• centralised and kerbside sorting of recyclable.
There is no one solution that fits all in waste management, it is a question of assessing
what is required to meet relevant legislation and national targets, and assessing local
conditions and needs. In most cases an integrated waste management programme, that is
many ways of waste treatment such as incineration, composting and recycling are used to
fulfil the needs required (Kreith 1994).
26

.Chapter 2
23.1 Landfill
Landfill is the oldest and most widely used method for waste disposal, whereby waste is
placed in a void in the ground which is lined to minimise pollution. The landfilling of
organic wastes is an environmental problem in terms of the leachate it produces during
decomposition which requires treatment, also decomposition in an anaerobic environment
generates methane, which is a potent 'greenhouse’ gas; indeed it is about 21 times more
potent than carbon dioxide (Biomass Energy Centre, 2008). Landfills generate
approximately 40 million tonnes of methane worldwide. In the UK and Europe, landfills
are the first (48%) and second (31%) largest sources of anthropogenic methane
respectively (Hilger and Humer, 2003).
Another problem with the landfilling of waste is that the material may remain biologically
and chemically active for as much as 10,000 years, and the containment around landfills
will not last this length of time. Hence, the purpose of containment methods is to create
time to treat and manage the leachate from the landfill (Joseph, 1996). Landfills are
becoming scarce in the UK, simply because there is very little void space remaining in
which to engineer new landfill sites. As a result of this and increasing landfill tax imposed
by the UK government, landfill disposal costs are increasing rapidly, which as a result are
making other waste treatment and disposal options more attractive.
2.3.2 Thermal Processes
Thermal processes for waste treatment include the more common process of incineration
and newer processes such as pyrolysis and gasification.
27
Chapter 2
Incineration is a chemical process in which the combustible fractions of the waste are
combined with oxygen, forming mostly carbon dioxide and water, i.e. oxidation. This
results in the release o f thermal energy. Incineration can reduce the total volume of MSW
by as much as 95%. Two types o f output material remain at the end of an incineration
process, these are 'bottom ash' and 'fly ash'. Much of the material will be present in the
form of 'bottom ash', this is a non-hazardous material and can be disposed of to landfill, or
can be reused, for example in road construction. However, 'fly ash' which contains heavy
metals, polycyclic aromatic hydrocarbons, etc. is a hazardous material and must be
disposed o f to hazardous waste landfill. The heat produced as a result o f incineration can
also be recovered for use in power generation (Knox, 2005).
Incinerators are commonly used in many countries, for example the Netherlands and Japan.
In the UK, however there is strong public opposition to incineration, as a result of the
poorly operated incineration plants that have been in operation in the UK in the past. The
Waste Incineration Directive (No. 2000/76/EC) has imposed strict rules for the incineration
of waste material, which has resulted in a significant improvement in the quality of
emissions from incinerators.
The other two forms of thermal treatment are pyrolysis and gasification. Pyrolysis is a
thermal process which in contrast to incineration occurs in the absence of oxygen, which
typically occurs in the range o f400 to 800°C, and produces by-products which can be used
as fuels. The process conditions can be modified to produce either a solid char, gas or
liquid/oil product. In contrast, gasification is the thermal processing of the wastes with
oxygen in the form of air, steam or pure oxygen to produce a gas, ash and tar products.
28

Chapter 2
The operating temperatures are much higher than those for pyrolysis, being 800-1100°C
for air gasification and 1000-1400°C for oxygen gasification. The gas product is typically
used by direct combustion in a boiler or furnace, and the heat energy is used for process
heat or to produce steam for electricity generation (Knox 2005).
2 3 3 Composting
Composting is a biological process where the organic material is allowed to decompose
under controlled conditions. The decomposition and transformation of the material is
carried out by bacteria, fungi and other micro-organisms. Composting can reduce the
volume of the raw organic material by up to 50%, and the material produced can also be
used as a soil conditioner or mulch. This material can be a high-quality product if the input
material is source segregated; however, the composting of mixed, solid waste may cause
problems in terms of contaminants and loss of valuable resources. Non-compostable
materials in MSW such as glass, heavy metals and plastic contaminate the final compost
product and therefore impacts on quality, and limits its application (Denison et al. 1994;
and Diaz et al. 1994).
23.4 Anaerobic Digestion
Anaerobic digestion has been widely used to treat sewage sludge and agricultural waste for
many years, but has only recently been applied to municipal wastes. Essentially the waste
is degraded in an anaerobic environment to produce a stabilised waste which is disinfected
and deodorised. The process generates methane and carbon dioxide, and the methane can
be used to produce energy (Williams 2005; and Golueke 1977).
29
Chapter 2
2.3.5 Mechanical Biological Treatment (MBT)
Mechanical biological treatment (MBT) (also known as mechanical biological pre
treatment (MBP), is a two step approach to waste management in that initially mechanical
separation is used to separate recyclable materials such as glass, plastic and metal, the
remaining material is then treated biologically by means of composting, anaerobic
digestion etc. Hence, there is no single form of MBT, there are a variety of methods for
carrying out this technique, i.e. it is a mixture of processing operations (Kebekus et al.
2000; and Damiecki 2002).
MBT may be used as a means of treating waste prior to landfill, but it may also be used for
the production of refuse derived fuels (RDF). Disposing o f the treated material in landfill,
has a number of advantages, these include:
• reduction in the amount of waste sent to landfill;
• the waste sent to landfill is stabilized i.e. reduction in biodegradability;
• significant reduction in methane generation once material is landfilled;
• significant reduction in Biochemical Oxygen Demand (BOD) and Total Organic
Carbon (TOC) in the leachate; and,
• saving in landfill volume due to mass reduction in both the mechanical and
biological stages (Bockreis etal. 2003; Damiecki 2002, Adani etal. 2000, Kebekus
et al. 2000, and B inner 2002).
30
Chapter 2
2.3.6 Centralised and Kerbside Sorting of Recyclable
When collecting material for recycling, there are two main options for sorting, that is, the
material can either be sorted at a centralised facility, i.e. a materials recovery facility
(MRF) or materials reclamation facility, or it can be sorted at the kerbside into
compartmentalised vehicles. Centralised sorting has a higher capital investment cost than
kerbside sorting as more equipment is needed for the sorting activity, and it is often said
that the quality o f the segregated material is less than that for kerbside sorting; however,
the on-going costs are generally lower.
A MRF consists of a number of unit operations (both mechanical and manual), receives,
separates and prepares recyclable materials for marketing to end-user manufacturers. The
unit operations employed in processing recyclable materials include baling, magnetic
separation, screening, size reduction, air classification, eddy current separation, and can
flattening and densifications (Spencer 1994). There are two distinct types of MRF, those
that process source segregated mixed recyclable, commonly referred as 'clean MRFs’, and
those that process household waste, commonly referred to as 'dirty MRFs*.
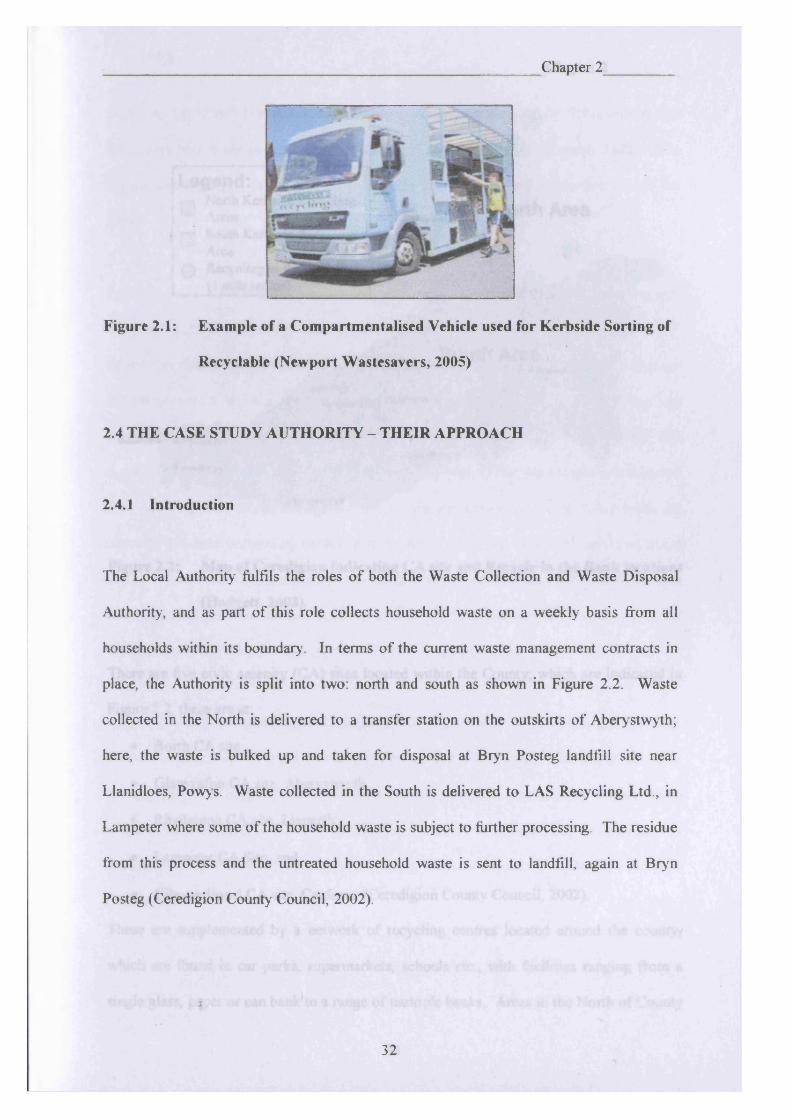
Kerbside sorting of recyclable is where material is sorted by operatives into various
stillages of a collection vehicle at the kerbside as shown in see Figure 2.1. The segregated
material is then returned to a bulking facility, where some basic processing such as
separation of steel and aluminium cans, and the baling of the recovered material for more
cost effective transportation to the reprocessor is carried out.
31
Chapter 2
Figure 2.1: Example of a Compartmentalised Vehicle used for Kerbside Sorting of»
Recyclable (Newport Wastesavers, 2005)
2.4 THE CASE STUDY AUTHORITY - THEIR APPROACH
2.4.1 Introduction
The Local Authority fulfils the roles of both the Waste Collection and Waste Disposal
Authority, and as part of this role collects household waste on a weekly basis from all
households within its boundary. In terms of the current waste management contracts in
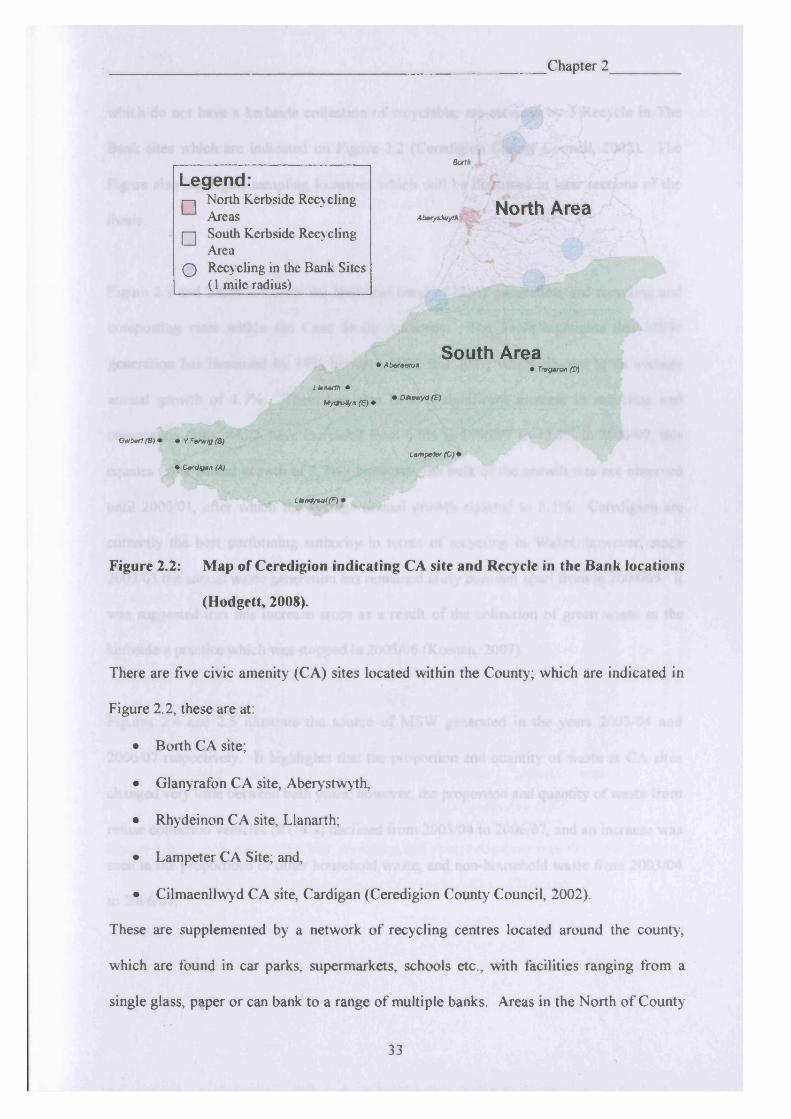
place, the Authority is split into two: north and south as shown in Figure 2.2. Waste
collected in the North is delivered to a transfer station on the outskirts of Aberystwyth;
here, the waste is bulked up and taken for disposal at Bryn Posteg landfill site near
Llanidloes, Powy s. Waste collected in the South is delivered to LAS Recycling Ltd., in
Lampeter where some of the household waste is subject to further processing. The residue
from this process and the untreated household waste is sent to landfill, again at Bryn
Posteg (Ceredigion County Council, 2002).
%
32
Chapter 2
Legend:r— I North Kerbside Recycling
Areasj—j South Kerbside Recycling
AreaQ Recycling in the Bank Sites
(1 mile radius)
Sort/i
Aber/BtMyth North Area
South AreaLhnarti •
Mydrofyn (E) •
• Aberaeron • Tregaron (D)
• D*tawyd(E)
Gwbert (B) • • YFenrtg(B)
• Cardigan (A)Lampeter (C) •
LMmfysul(Ff
Figure 2.2: Map of Ceredigion indicating CA site and Recycle in the Bank locations
(Hodgett, 2008).
There are five civic amenity (CA) sites located within the County; which are indicated in
Figure 2.2, these are at:
• Borth CA site;
• Glanyrafon CA site, Abery stwyth,
• Rhydeinon CA site, Llanarth;
• Lampeter CA Site; and,
• Cilmaenllwyd CA site, Cardigan (Ceredigion County Council, 2002).
These are supplemented by a network of recycling centres located around the county,
which are found in car parks, supermarkets, schools etc., with facilities ranging from a
single glass, paper or can bank to a range of multiple banks. Areas in the North of County
33
Chapter 2
which do not have a kerbside collection of recyclable, are serviced by 5 Recycle in The
Bank sites which are indicated on Figure 2.2 (Ceredigion County Council, 2002). The
Figure also highlights sampling locations which will be discussed in later sections o f the
thesis.
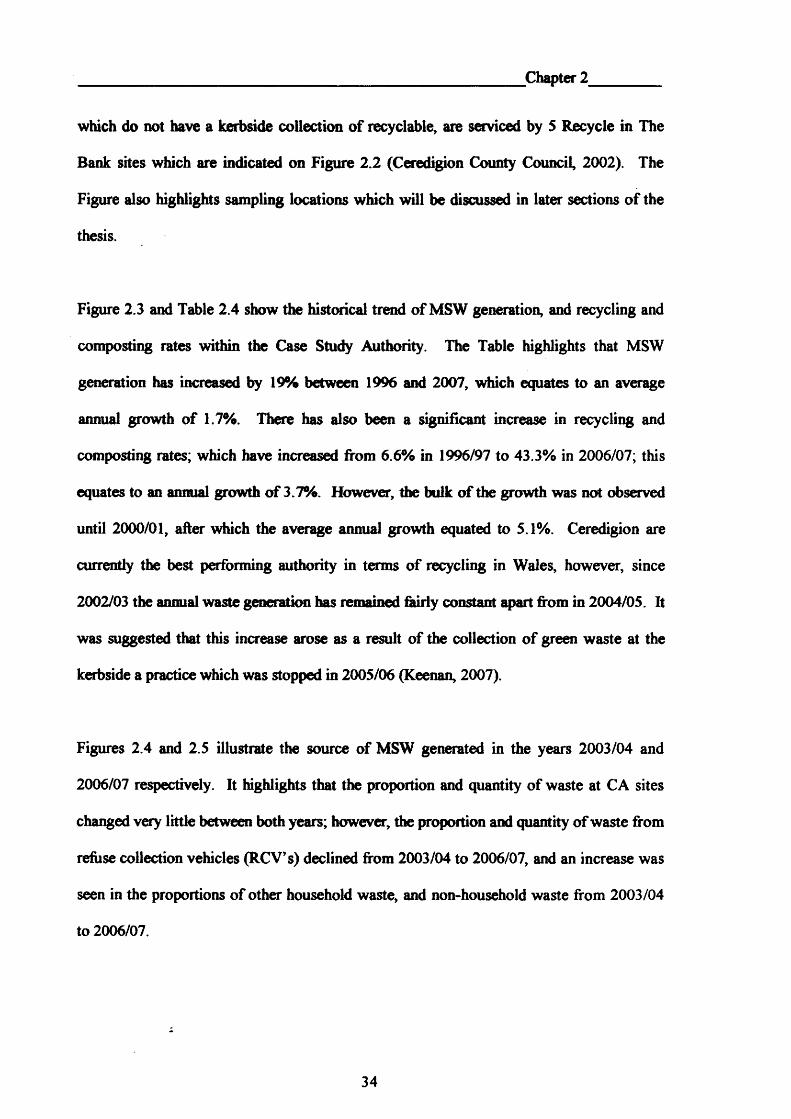
Figure 2.3 and Table 2.4 show the historical trend of MSW generation, and recycling and
composting rates within the Case Study Authority. The Table highlights that MSW
generation has increased by 19% between 1996 and 2007, which equates to an average
annual growth of 1.7%. There has also been a significant increase in recycling and
composting rates; which have increased from 6.6% in 1996/97 to 43.3% in 2006/07; this
equates to an annual growth of 3.7%. However, the bulk of the growth was not observed
until 2000/01, after which the average annual growth equated to 5.1%. Ceredigion are
currently the best performing authority in terms of recycling in Wales, however, since
2002/03 the annual waste generation has remained fairly constant apart from in 2004/05. It
was suggested that this increase arose as a result of the collection of green waste at the
kerbside a practice which was stopped in 2005/06 (Keenan, 2007).
Figures 2.4 and 2.5 illustrate the source of MSW generated in the years 2003/04 and
2006/07 respectively. It highlights that the proportion and quantity of waste at CA sites
changed very little between both years; however, the proportion and quantity of waste from
refuse collection vehicles (RCV’s) declined from 2003/04 to 2006/07, and an increase was
seen in the proportions of other household waste, and non-household waste from 2003/04
to 2006/07.
34

Chapter 2
Table 2.4: MSW generation and recycling and composting rates in the Case Study
Authority (Ceredigion County Council 2002 and Keenan 2007)
Year MSWGenerated
<T)
Recycling&
Composting Rate (%)
1996/97 33,275 6.6
2000/01 37,873 12.8
2002/03 40,389 20.4
2003/04 40,794 28.6
2004/05 43,549 35.9
2005/06 40,801 35.6
2006/07 40,140 43.3
50,000
45,000 45
40,000
35,000 35
30,000
25,000 25
20,000 20 ,6 o>
15 |15,000
10,000 10 S.
5,000
2000/01 2002/03 2003/04y mt
| M S W Generated (T) Recycling & Composting Rate (%)]
Figure 2.3: MSW generation and recycling and composting rates in the Case Study
Authority (Ceredigion County Council 2002 and Keenan 2007)
t
35

Chapter 2
N on-H ouseho ld102
0.2%
C A & B ring 16,639 4 0 .0 %
24.90659 .8%
Total Tonnage - 41,647(Data in tonnes unless otherwise stated)
Figure 2.4: MSW Collection Tonnage and Composition in the Case Study
Authority 2003/04 (Keenan 2007)
The most significant challenge facing the Authority at this time is that of the Landfill
Allowance Scheme (LAS). This places an annual allowance in terms o f the amount of
Biodegradable Municipal Waste (BMW) which it can send to landfill.
Non-Household560
1.4%
CA & Bring 15574 39 .5% ,
Other Household 896
Total Tonnage - 39y459
(Data in tonnes unless otherwise stated)Figure 2.5: MSW Collection Tonnage and Composition in the Case Study
Authority 2006/07 (Keenan 2007)
36

Chapter 2
Table 2.5 shows the annual BMW allowance for the Authority from 2005 to 2020. In the
year 2005/06, the Environment Agency reports that the Authority met their landfill
allowance target, by sending 17,450 tonnes to landfill (Environment Agency, 2006). This
illustrates that the Authority have very little safety margin in place in order to meet their
targets, and it is critical that action is taken to remedy this situation as soon as possible.
Indeed LAS modelling demonstrated that fines of the order of £1.6 million could be
imposed on the Case Study Authority by the Welsh Assembly if they do not make any
changes to their waste management strategy (Griffiths et al. 2005).
Table 2.5: BMW Landfill Allowance for Case Study Authority (Griffiths et al, 2005)
Year
BMWLandfill
Allowance(tonnes)
2005/6 18,6202006/7 17,4612007/8 16,3032008/9 15,145
2009/10 13,9872010/11 12,7282011/12 11,5832012/13 10,5402013/14 9,5922014/15 8,7282015/16 7,9432016/17 7,2282017/18 6,5772018/19 5,9852019/20 5,446
2.4.2 History of Kerbside Recycling Provision
Kerbside recycling was first introduced in the Case Study Authority in 2003; this first
foray into offering kerbside recycling was a small pilot scheme which operated in the
37

Chapter 2
county town of Cardigan and the surrounding areas. This scheme involved the provision
of two survival bags to householders: a clear bag for mixed dry recyclable, that is paper,
card, plastic, tins and cans, and a green bag for kitchen waste (excluding meat) and garden
waste. These two bags were issued free of charge to the 3000 households covered by the
pilot scheme area. These bags were collected on a weekly basis, in the same vehicle as
that used for their normal refuse collection; that is, the coloured survival bags are collected
mixed with the black bag (residual waste) stream. The survival bags survive the
compaction exerted on them by the RCVs, as the bags are made of a thicker gauge of
plastic and also have air holes at the bottom of the bags, so that when the bags are
compacted, air can escape and hence the bags do not burst. The RCVs then delivered the
collected material (i.e. residual waste, clear and green bags) to a pilot dirty MRF at LAS
Recycling Ltd in Lampeter. This was a very basic process where initially the coloured
bags were removed from the picking belt, and the remaining residual waste was then sorted
to recover recyclable, paper, cardboard and plastics were manually removed from the
waste stream, and an overband magnet and eddy current separator were used to remove the
steel and aluminium cans. The clear bags were then batched through the same process to
recover the recyclable from this segregated stream. Organic material from the green bags
was composted in an in-vessel composting process (Keenan 2007 and Saunders 2007).
During 2004, a kerbside sorting pilot scheme commenced in the town of Lampeter, and
was run by Ceredigion Recycling Authority in conjunction with the Case Study Authority
as a result of funding obtained via a Strategic Recycling Scheme grant. This scheme
provided households in Lampeter with a green box, into which paper, cardboard, plastic
bottles, glass bottles, tins and cans could be placed. These were then collected on a weekly
basis by one of two pedestrian controlled vehicles (PCV) as shown in Figure 2.6, which
38
Chapter 2
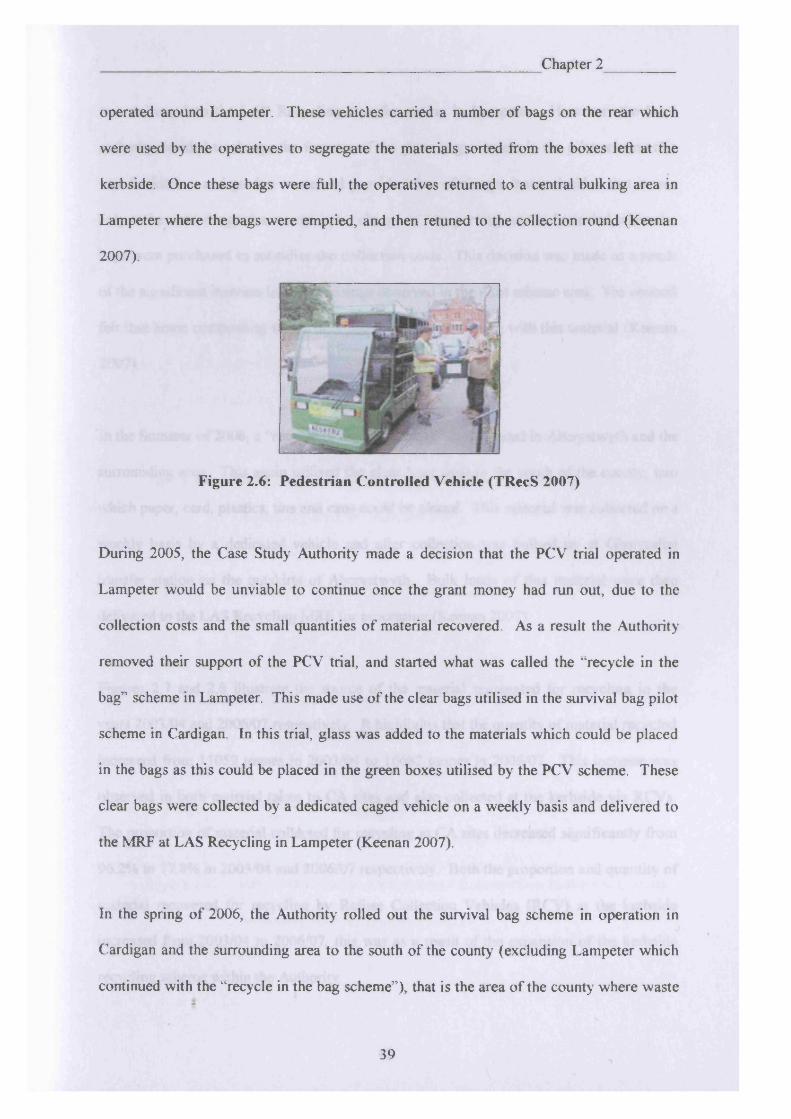
operated around Lampeter. These vehicles carried a number of bags on the rear which
were used by the operatives to segregate the materials sorted from the boxes left at the
kerbside. Once these bags were full, the operatives returned to a central bulking area in
Lampeter where the bags were emptied, and then retuned to the collection round (Keenan
2007).
Figure 2.6: Pedestrian Controlled Vehicle (TRecS 2007)
During 2005, the Case Study Authority made a decision that the PCV trial operated in
Lampeter would be unviable to continue once the grant money had run out, due to the
collection costs and the small quantities of material recovered. As a result the Authority
removed their support of the PCV trial, and started what was called the ‘‘recycle in the
bag” scheme in Lampeter. This made use of the clear bags utilised in the survival bag pilot
scheme in Cardigan. In this trial, glass was added to the materials which could be placed
in the bags as this could be placed in the green boxes utilised by the PCV scheme. These
clear bags were collected by a dedicated caged vehicle on a weekly basis and delivered to
the MRF at LAS Recycling in Lampeter (Keenan 2007).
In the spring of 2006, the Authority rolled out the survival bag scheme in operation in
Cardigan and the surrounding area to the south of the county (excluding Lampeter which
continued with the “recycle in the bag scheme”), that is the area of the county where waste
39
Chapter 2
was delivered to the LAS Recycling transfer station in Lampeter. However, the local
authority decided to change the features of the green bag; whereas in the pilot scheme this
was for kitchen and garden waste and provided free of charge, it was decided that it was
only to be used for garden waste and a charge o f 20p per bag was to be levied when the
bags were purchased to subsidise the collection costs. This decision was made as a result
of the significant increase in waste arisings observed in the pilot scheme area. The council
felt that home composting would be a better method of dealing with this material (Keenan
2007).
In the Summer o f2006, a “recycle in the bag scheme” commenced in Aberystwyth and the
surrounding area. This again utilised the clear bags used in the south of the county, into
which paper, card, plastics, tins and cans could be placed. This material was collected on a
weekly basis by a dedicated vehicle and after collection was bulked up at Glanyrafon
transfer station on the outskirts of Aberystwyth. Bulk loads o f this material were then
delivered to the LAS Recycling MRF for processing (Keenan 2007).
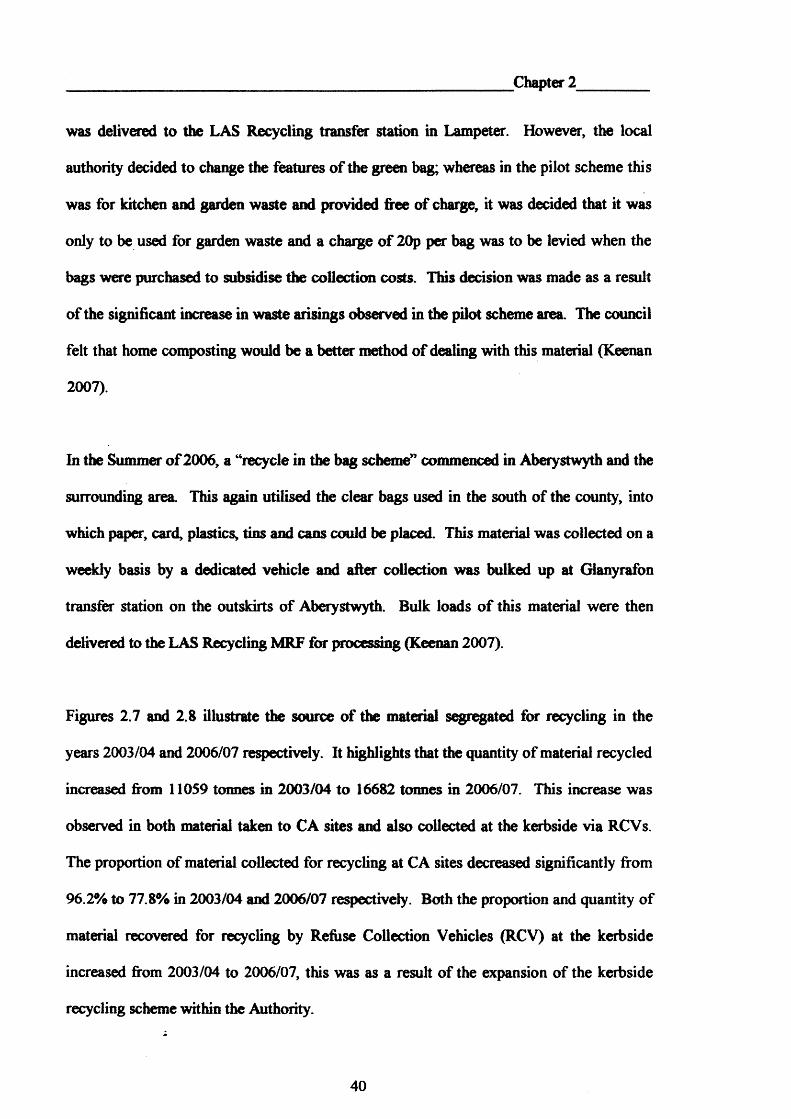
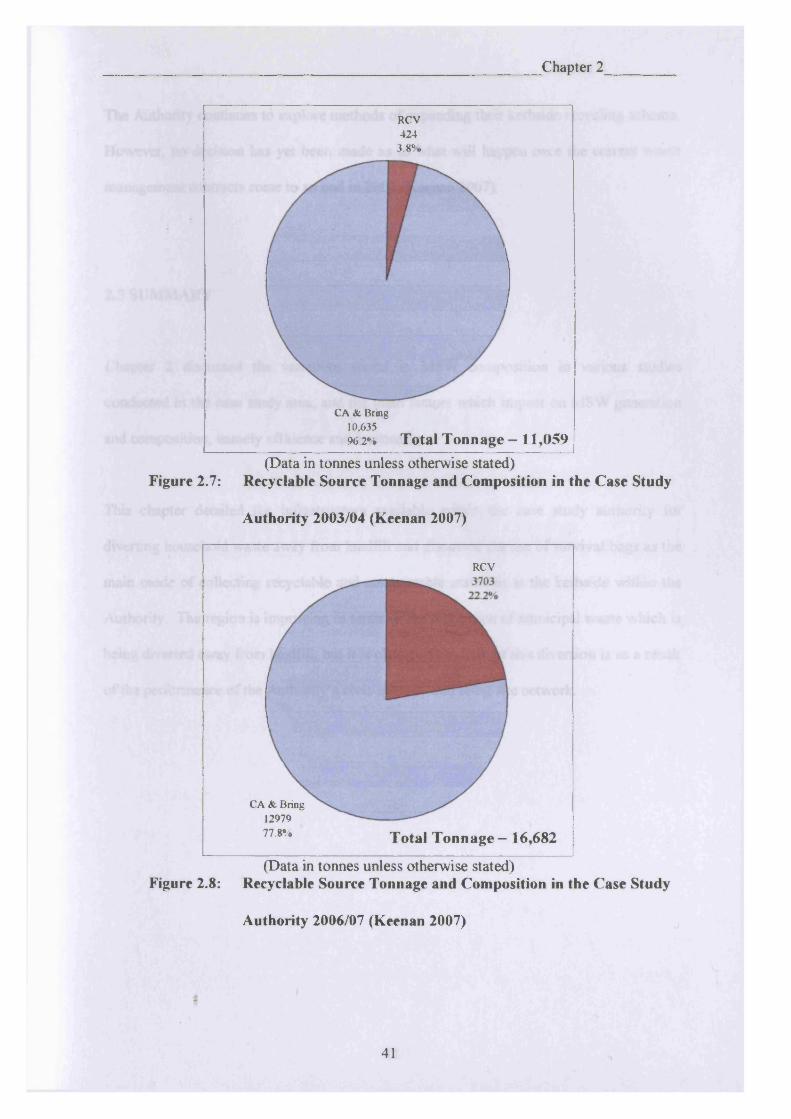
Figures 2.7 and 2.8 illustrate the source of the material segregated for recycling in the
years 2003/04 and 2006/07 respectively. It highlights that the quantity of material recycled
increased from 11059 tonnes in 2003/04 to 16682 tonnes in 2006/07. This increase was
observed in both material taken to CA sites and also collected at the kerbside via RCVs.
The proportion of material collected for recycling at CA sites decreased significantly from
96.2% to 77.8% in 2003/04 and 2006/07 respectively. Both the proportion and quantity of
material recovered for recycling by Refuse Collection Vehicles (RCV) at the kerbside
increased from 2003/04 to 2006/07, this was as a result of the expansion of the kerbside
recycling scheme within the Authority.
40
Chapter 2
R C V
4 2 43 .8 ° i
C A & B ring
10,63596 .2% Total Tonnage - 11,059
(Data in tonnes unless otherwise stated)Figure 2.7: Recyclable Source Tonnage and Composition in the Case Study
Authority 2003/04 (Keenan 2007)
R C V
C A & B ring
12979 77.8*/* Total Tonnage - 16,682
(Data in tonnes unless otherwise stated)Figure 2.8: Recyclable Source Tonnage and Composition in the Case Study
Authority 2006/07 (Keenan 2007)
41
Chapter 2
The Authority continues to explore methods of expanding their kerbside recycling scheme.
However, no decision has yet been made as to what will happen once the current waste
management contracts come to an end in 2008 (Keenan 2007).
2.5 SUMMARY
Chapter 2 discussed the variations found in MSW composition in various studies
conducted in the case study area, and the main factors which impact on MSW generation
and composition, namely affluence and seasonality.
This chapter detailed the infrastructure available within the case study authority for
diverting household waste away from landfill and discussed the use of survival bags as the
main mode of collecting recyclable and compostable materials at the kerbside within the
Authority. The region is improving in terms of the proportion of municipal waste which is
being diverted away from landfill, but it is clear that the bulk o f this diversion is as a result
of the performance of the Authority’s civic amenity and bring site network.
42

Chapter 3
CHAPTER 3: Characterisation of Household Waste
43

Chapter 3
3.1 INTRODUCTION
This chapter will consider the total household waste composition in the case study area, as
well as the composition of dry recyclable, organics collection and residual waste. Weekly
set out in the kerbside recycling scheme will also be discussed. The main thrust of the
discussion will look at the variation in composition at various sampling locations within
the study area and also the seasonal variation in waste composition. This chapter will
further consider the potentially recoverable fraction of household waste and the capture of
this material in the established kerbside recycling scheme.
The quantity of waste generated per household varies significantly. Numerous studies
have been conducted on the factors impacting on waste generation and composition. These
factors include socio-economic factors, population growth, location, seasonality for
example. Research has shown that the generation of MSW is linked to the economic
development of a location, i.e., as the Gross Domestic Product (GDP) increases, so too
does MSW generation (Stanners and Bordeau 1995). Changes in housing trends also
affects MSW generation, for example a growth in single occupancy households tends to
increase waste generation (OECD, 2004).
Changes are also observed in waste composition, which varies on an international, national
and even local scale. Waste composition is dependent on a number of factors including,
level of industrialisation and type of industry, location, climate, collection system,
population density, legislative controls, seasonality and public attitudes. For example
affluent areas tend to generate high levels of glass and paper in their household waste
stream, a sign that a large amount of jars and bottles are used (cooking sauces, wine) and
44

Chapter 3
also that broad sheet newspapers may be read. Less affluent areas tend to have lower
levels of paper and glass, but high levels of combustibles, mainly from disposal nappies.
Garden waste also increases during the summer months, which varies waste composition
on a seasonal basis. The influx of tourists to areas can also affect waste composition (DoE,
1994 and Williams, 2005).
Waste characterisation studies highlight the changes in waste generation habits over the
years. One of the most notable changes has been the decrease in the ash content of
household waste, which has been as a result of the move away from coal fires in the 1950s
and 1960s;. Plastics are another notable change, as their introduction has added new
elements to the household waste stream (Open University 1993, in Williams, 2005). These
differences highlight changing consumer practices, and predictions for future changes to
consumer practices and consequently waste composition are highly important to both the
government to meet targets and also the waste management industry.
Household waste generally consists of the following materials:
• paper and cardboard, that is newspapers, magazines, containers, and other
packaging;
• glass containers, e.g. jars, and bottles;
• ferrous metals, e.g. steel food and beverage cans;
• non-ferrous metals, that is beverage cans, aluminium foil;
• plastic containers and film;
• food waste, that is food preparation wastes such as vegetable peelings, leftover food
etc.;
• garden waste, that is grass, leaves, tree and plant clippings etc.;
45
Chapter 3
• textiles; and,
• other miscellaneous wastes.
It is vital that waste characterisation studies are conducted in order to determine the
suitability and effectiveness of various waste management options. This work is needed to
ensure that quality data are obtained for the case study authority, which can be used in the
MRF design process, and also can be used for modelling purposes to determine the
effectiveness of alternative kerbside schemes for example. The composition data can also
be used to analyse the effectiveness of current kerbside schemes, for example the
proportion of targeted materials recovered, and the significance of contamination problems
(Owen et al., 2006a).
3.2 METHODOLOGY
3.2.1 Background
Waste characterisation is essentially the breakdown of the waste into various categories,
and these can be expressed as a percentage of the whole material. A number of waste
characterisation studies have been completed, however, there is no nationally accepted
method; hence, it can be difficult to compare results from different studies (Parfitt 2002;
National Assembly for Wales 2003; Cheshire Local Government Association 2001).
Waste characterisation data however vary significantly from area to area, and it is critical
that Local Authorities within the UK collate this data so that they can be used in the design
of waste management schemes, and also for the purposes of monitoring such schemes.
46
Chapter 3
There are three main steps to characterise waste:
• select sample locations;
• obtain samples; and,
• categorise into type and mass.
Any samples collected must be representative of the whole area. The samples should be
random, but with care not to collect from only areas of similar socio-economic status as
that may not be representative of an area as a whole (only collecting from a council estate
would bias the data). If samples are taken from a collection vehicle, the sample must again
be taken randomly from that vehicle, this could be achieved for example by using a cone
and quartering method for obtaining the sample (Woodcock and Mason, 1995).
It is vitally important when collecting any sample to obtain a large enough sample so that it
is representative of the material as a whole, without the sample being too large to handle
practicably. This is in order to ensure that any data obtained from the sample is accurate
and is representative of the material as a whole. In terms of statistics, accuracy is
dependent on the size and number of samples taken. Household waste is essentially a
combination of a variety of materials, therefore determining the required sample size is
difficult.
A number of studies have looked at the sample size required when analysing household
waste. A study by Van den Broek and Kirov suggests that to obtain a representative
sample, 1.3% of household waste in an area should be sampled (Van den Broek and Kirov,
1971). For the whole of the case study area, approximately 90 tonnes of household waste
47

Chapter 3
is collected by Refuse Collection Vehicles (RCV’s) each day. Hence, in accordance with
Van den Broek and Kirov’s study 1.17 tonnes of RCV material would be a representative
sample for the case study authority as a whole. For the households which were part of the
pilot kerbside recycling schemes within the case study authority, approximately 16 tonnes
of household waste was collected per day; hence, a 208kg sample would be representative
for the pilot kerbside recycling schemes areas. Another study conducted by MEL suggests
that 500kg of household waste containing fragments up to 300mm in diameter would be
sufficient to provide a representative sample (MEL, 1996). A study carried out in the USA
in the 1970s found that the standard deviation in results from samples were as valid from
samples of 100kg to those of 800kg, that is the accuracy of the data from the 100kg sample
were similar to the data obtained from 800kg samples (MEL, 1996). Also, a study by
Moore et al, suggests that a sampling size of 100kg has an accuracy with a 90% confidence
limit (Moore et ah, 1995). As a result, a characterisation methodology was developed
based on sample sizes of approximately 500kg which would give results with a maximum
standard error of 10% (Emery et ah, 2000a; Emery et ah, 2000b; and Emery et ah, 2002).
Any sorting activity can be carried out by two means: by hand or by machine. Hand
sorting is a labour intensive operation, but is a highly effective option. Essentially the
sample of waste is sorted manually into various categories until there is no residue. The
sample can either be obtained from a collection vehicle or collected directly from homes.
The latter is the preferred option as it reduces the compaction and contamination of
different wastes, which makes the sorting process easier and more accurate. The health
aspects of this option are an important consideration, by its nature household waste is a
biologically active material. Hence, there are risks from bioaerosols and other biological
matter. There are also health risks from broken glass, used needles and so forth. It is
48
Chapter 3
crucial that these risks are minimised by carrying out a risk assessment, and implementing
control measures to minimise the risks identified, for example sorting the material in a well
ventilated area, the use of appropriate safety equipment and ensuring that sorting personnel
have adequate immunisations.
Machine separation is a more complex method and would be on the basis of a MRF. A
conveyor belt would be used to carry the waste to various separating systems, which could
include magnets, vibrating screens, etc. Though effective there are some inherent
problems in these processes and would not get near to the accuracy of hand separation.
Magnets can often miss objects if a larger fragment of a different material covers them.
Similarly large ferrous fragments can pick up smaller fragments of other materials when
being attracted to the magnets this in turn again causes contamination. This problem would
not occur with hand separation.
The sorting categories used for various studies are very similar; however, there are many
variations in the sub-categories. The best option is to sort the sample into as many sub
categories as possible within the time constraints of the project as it is then possible to
combine some of these together to enable more accurate comparisons to be made with
other studies.
49
Chapter 3
3.2.2 Waste Characterisation Protocol
3.2.2.1 Study Area Selection
The aim of the study was to determine the composition of household waste in the case
study area, to assess the effects of seasonality, and also to assess variation across a number
of sampling locations. The study also looked at the performance of the existing kerbside
recycling scheme. Hence, the potential sampling locations were limited to those areas
which already had a kerbside recycling scheme in place. Within the study, the
performance in rural and urban areas within the local authority were to be investigated;
however, this was confined to the survival bag scheme, as the alternative recycling scheme
was only found in an urban area. Sampling locations were governed to some extent by the
collection days and routes. For each day a list of potential areas was drawn up, to aid the
selection of three sampling locations to represent the following areas: urban survival bag
scheme, rural survival bag scheme, and box scheme areas.
The Townsend Index is a score for socio-economic status and further information on the
Townsend Index score can be found in Appendix A. The score for the Townsend Index
was calculated from four of the 2001 census variables, these are unemployment,
overcrowding, lack of owner occupied accommodation and lack of car ownership. The
more negative the Townsend Index score, the more affluent the area, and the more positive
the score the more deprived the area (Woollam et al., 2003b). Using the 2001 census data,
the Townsend Index scores were determined to aid the selection of sampling locations
within the case study area.
50
Chapter 3
At the time of the first characterisation in February 2005, only a small proportion of
households were covered by a kerbside recycling scheme as discussed in Chapter 2.
Hence, the choice of sampling locations was very limited, and as a result three sampling
locations were selected:
• A (Cardigan Mwldan) - urban survival bag scheme area;
• B (Gwbert and Y Ferwig) - rural survival bag scheme area; and,
• C (Lampeter) - kerbside box scheme area.
Figure 2.2 highlights the locations of these sampling locations within the case study
authority. Therefore, when assessing the seasonal variation in September 2005, the same
three sampling locations were used for comparison. However, as a result of a change by
the local authority in the Lampeter area, namely a move away from the kerbside box
scheme to a clear bag scheme, and the fact that all recyclable is collected in Lampeter on
the same day of the week, the sample study within Lampeter had to be changed so that
clear bags and residual waste could be collected on the same day; however, a location
within a similar demographic area to the previous study was selected.
3.2.22 Set Out Rate Survey
Prior to the start of the study, a set out rate survey was carried out to determine set out rates
and the ratio of black bags to recycling bags/ boxes.
I. A survey was conducted in the study areas on the day of collection, the
information collected was as follows:
a. date and time
b. street name
cf number of households in street
51

Chapter 3
d. number of houses participating in the recycling scheme, i.e. at least one bag/
box set out
e. number of black bags
f. number of recycling containers
2. Step 1 was repeated for each street/ cul de sac/ estate etc.
3. Data obtained from the set out rate survey was input into a spreadsheet to enable
comparisons to be made between areas in terms of performance.
3.2.2.3 Sample Collection
The methodology for sample collection was adapted from the method used to carry out a
waste characterisation on household waste (black bag material only) at Rhondda Cynon
Taf (RCT) County Borough Council (Emery et al., 2000b). The procedure used is shown
in steps A to E:
A. Samples were collected from homes by the sample team to minimise compaction
and contamination of the material, which will make the waste classification process
easier and will also improve the accuracy of the exercise.
B. The locations to be covered on the various days are shown in Table 3.1.
Table 3.1: Sample Locations and Collection Dates
Sampling TownsendLocation Winter 2005 Summer 2005 Index Score
A Mon04/03/05
Fri16/9/05 +0.83
B Mon Mon -2.1128/02/05 19/09/05C Tue 01/03/05 (Vi)
Thurs 03/04/05 04)Mon
12/09/05 +2.80
52
Chapter 3
C. Samples were collected from different waste collection routes and types of location,
for example towns, villages, hamlets, to determine if there were any differences in
their performance.
D. Sample size for the waste classification exercise was typically 1000kg
(approximately 30 households who were participating in the recycling scheme,
except in the black bag area where waste from 30 households was collected). The
only exception was in the case of the two survival bag schemes as there may not be
many green/ brown organic bags due to the time of year. Therefore, as many
green/ brown bags as possible were collected from the households.
E. After collection, samples were returned to site and sorted as shown in section
3.2.2.4
3.2.2.4 Waste Characterisation
The methodology for the characterisation was adapted from the method used to carry out a
waste characterisation on household waste (black bag material only) at RCT County
Borough Council (Emery et al., 2000b). The method is as follows:
I. The samples were returned to site and taken over the weighbridge and the total mass
determined minus the mass of the vehicle.
II. The bag types were sorted into the following categories, that is black, clear (dry
recyclable) and green (organic) bags. Each bag type was then weighed on the
weighbridge to determine the mass of each of the three fractions.
III. The black bags were hand sorted first. The bags were simply emptied onto the
sorting table (Dimensions 2m x 4m).
53

Chapter 3
IV. The material was Hand sorted into the relevant bins/ boxes/ bags for each of the
following categories:
o Paper and Cardboard:
■ Bin 1: Newspapers
■ Bin 2: Magazines
■ Bin 3: Other Paper
■ Bin 4: Liquid Cartons
■ Bin 5: Card Packaging
■ Bin 6: Composite Packaging
o Glass:
■ Bin 7: Brown glass bottles
■ Bin 8: Green glass bottles
■ Bin 9: Clear glass bottles
■ Bin 10: Broken brown glass
■ Bin 11: Broken green Glass
■ Bin 12: Broken clear glass
o Ferrous Metals:
■ Bin 13: Beverage cans
■ Bin 14: Food cans
■ Bin 15: Batteries
■ Bin 16: Other cans
■ Bin 17: Other ferrous
o Non-ferrous metals:
■ Bin 18: Beverage cans
■ Bin 19: Foil
54
Chapter 3
■ Bin 20: Other
o Plastic
■ Bin 21: PET (Polyethylene Terephtalate)
■ Bin 22: HDPE (High Density Polyethylene)
■ Bin 23: PVC (Polyvinyl Chloride
■ Bin 24: LDPE (Low Density Polyethylene)
■ Bin 25: PP (Polypropylene)
■ Bin 26: PS (Polystyrene)
■ Bin 27: Other
o Putrescible:
■ Bin 27: Garden waste
■ Bin 28: Kitchen waste - animal products
■ Bin 29: Kitchen waste - non-animal products
■ Bin 30: Other putrescible
o Textiles:
■ Bin 31: Textiles
o Others:
■ Bin 32: Fines
■ Bin 33: Inert
■ Bin 34: Miscellaneous
V. The contents of each component bin was weighed (remembering to take account of
the mass of the bin) to obtain the mass of each fraction present. A 75kg balance with
an accuracy of 50g was used.
55
Chapter 3
VI. Once weighed, the sorted material was removed from the bins and placed in a
relevant section for recycling. If the segregated material was destined for disposal to
landfill, this was placed in a different location.
VII. Once the above operations were completed, the sorting table was cleared for the next
task.
VIII. The dry recyclable bags were the next type to be hand sorted. The bags were emptied
onto the sorting table.
EX. Steps IV to VIII were repeated for the dry recyclable bags.
X. The organic bags were then placed on the sorting table. Each bag was opened, and
any contamination (i.e. non-organic material) was removed and placed into the
relevant bin.
XI. Repeat steps V to VHI as for black and dry recyclable bags.
XII. The next stage was to enter the results into a spreadsheet to determine the waste
composition as a percentage of the total, and to give indications of waste generated
per household. Recovery rates as a percentage of the total potential recyclable
available were also determined.
XHI. A comparison was made of the weighbridge results with the summation of the 34
sorted categories.
3.3 RESULTS
Tables 3.2 to 3.7 highlights the raw data collated for sampling locations A, B and C. These
tables identify the set out data collated for the sampling location during the Winter and
Summer studies. The data collated included the number of households within the sampling
area (Ht), the number of bags set out by householders and the number of households
56
Chapter 3
setting out in the kerbside recycling scheme (Hs). These data enabled the calculation of
weekly set out (S), as follows:
S(%) = — xlOO Hy
Since set out was assessed during the Winter and Summer period, an assessment of
improvements to the effectiveness of the kerbside recycling scheme can be made.
Tables 3.8 to 3.13 show the raw data obtained from the waste classification exercise at
sampling locations A, B and C for both the Winter and Summer periods. A further
breakdown of the waste classification data at Location C is shown in Appendix B. The
data includes the number of households from which waste was collected, and a breakdown
of the sample into the 34 sorting categories. This provides a compositional analysis of the
residual (black bag) waste stream, the dry recyclable (clear bag) stream, and the organics
(green bag) stream by percentage and also by mass. The figures for these three streams are
directly combined to provide the total household waste composition data for the sampling
location.
An assessment of contamination was also highlighted for the clear and green bag streams.
This is quantified by taking account of the material streams not requested in the clear and
green bag streams, and therefore can be quantified in terms of both mass and percentage.
An assessment of seasonality can also be undertaken since data was collected in both the
Winter and Summer periods.
Further analysis on these data and the data for the other sampling locations is discussed in
the remaining sections of this chapter.
57

Table 3.2: Set Out Rate Data for Location A - Winter
Date: 03/02/2005Time: 7.30-9.30amE.D. Cardigan MwldanStreet Ger y Meini
(6-12)HeolHelyg
GreenlandMeadows
HeolOnnen
GrovePark
Maesglas(1-20)
YRhos Maesglas (150- 159 & 175-179
TOTAL
No. Households 6 31 25 10 24 20 38 15 169No. Black Bags 6 23 23 4 12 20 32 20 140No. Clear Bags 6 12 5 2 12 8 19 5 69No. Green Bags 0 11 4 3 9 3 7 6 43No. Households Participating 3 11 8 3 18 7 16 7 73No. Households with no rubbish/ recycling set out 2 9 11 4 8 5 10 5 54Recycling Scheme Set Out Rate (%) 50.0 36.5 32.0 30.0 76.0 35.0 42.1 46.7 43.2Average no. black bags per household 1.0 0.7 0.9 0.4 0.5 1.0 0.8 1.3 0.8Average no. clear bags per household 1.0 0.4 0.2 0.2 0.5 0.4 0.5 0.3 0.4Average no. green bags per household 0.0 0.4 0.2 0.3 0.4 0.2 0.2 0.4 0.3
Table 3.3: Set Out Rate Data for Location A- Summer
Date:Time:E.D.
07/10/20057.30-9.30amCardigan Mwldan
Street Ger y Meini (6-12)
HeolHelyg
GreenlandMeadows
HeolOnnen
GrovePark
Maesglas(1-20)
YRhos Maesglas (150- 159 & 175-179
TOTAL
No. Households 6 31 25 10 24 20 38 15 169No. Black Bags 7 37 38 10 37 23 44 15 211No. Clear Bags 7 12 10 7 17 4 24 2 83No. Green Bags 6 11 10 7 16 4 14 11 79No. Households Participating 4 15 15 7 17 3 22 5 88No. Households with no rubbish/ recycling set out 1 4 3 0 2 3 4 2 19Recycling Scheme Set Out Rate (%) 66.7 48.4 60.0 70.0 70.8 15.0 57.9 33.3 62.1Average no. black bags per household 1.2 1.2 1.5 1.0 1.5 1.2 1.2 1.0 1.2Average no. clear bags per household 1.2 0.4 0.4 0.7 0.7 0.2 0.6 0.1 0.5Average no. green bags per household 1.0 0.4 0.4 0.7 0.7 0.2 0.4 0.7 0.5
Chapter 3
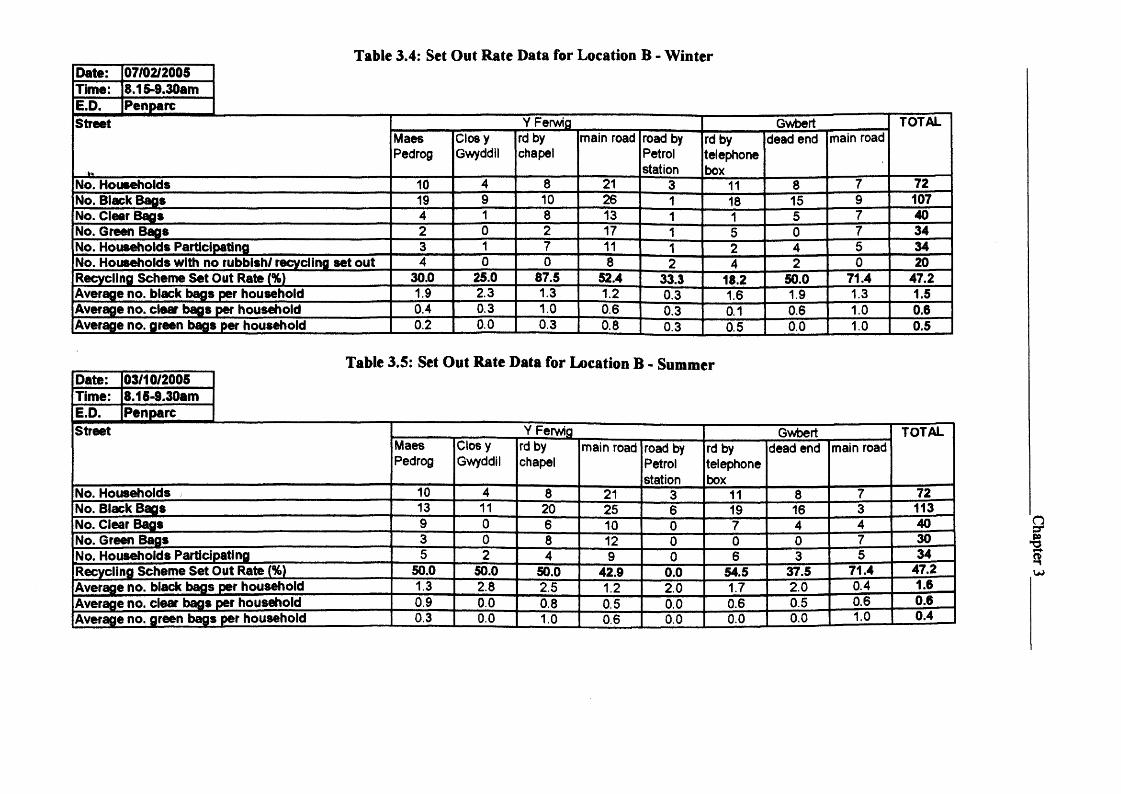
Table 3.4: Set Out Rate Data for Location B - WinterDate: 07/02/2005Time: 8.15-9.30amE.D. PenparcStreet Y Ferwia Gwbert TOTAL
MaesPedrog
ClosyGwyddil
rd by chapel
main road road byPetrolstation
rd bytelephonebox
dead end main road
No. Households 10 4 8 21 3 11 8 7 72No. Black Bags 19 9 10 26 1 18 15 9 107No. Clear Bags 4 1 8 13 1 1 5 7 40No. Green Bags 2 0 2 17 1 5 0 7 34No. Households Participating 3 1 7 11 1 2 4 5 34No. Households with no rubbish/ recycling set out 4 0 0 8 2 4 2 0 20Recycling Scheme Set Out Rate {%) 30.0 25.0 87.5 52.4 33.3 18.2 50.0 71.4 47.2Average no. black bags per household 1.9 2.3 1.3 1.2 0.3 1.6 1.9 1.3 1.5Average no. clear bags per household 0.4 0.3 1.0 0.6 0.3 0.1 0.6 1.0 0.6Average no. green bags per household 0.2 0.0 0.3 0.8 0.3 0.5 0.0 1.0 0.5
Table 3.5: Set Out Rate Data for Location B - SummerDate: 03/10/2005Time: 8.15-9.30amE.D. PenparcStreet Y Ferwia Gwbert TOTAL
MaesPedrog
ClosyGwyddil
rd by chapel
main road road byPetrolstation
rd bytelephonebox
dead end main road
No. Households 10 4 8 21 3 11 8 7 72No. Black Bags 13 11 20 25 6 19 16 3 113No. Clear Bags 9 0 6 10 0 7 4 4 40No. Green Bags 3 0 8 12 0 0 0 7 30No. Households Participating 5 2 4 9 0 6 3 5 34Recycling Scheme Set Out Rate (%) 50.0 50.0 50.0 42.9 0.0 54.5 37.5 71.4 47.2Average no. black bags per household 1.3 2.8 2.5 1.2 2.0 1.7 2.0 0.4 1.6Average no. clear bags per household 0.9 0.0 0.8 0.5 0.0 0.6 0.5 0.6 0.6Average no. green bags per household 0.3 0.0 1.0 0.6 0.0 0.0 0.0 1.0 0.4
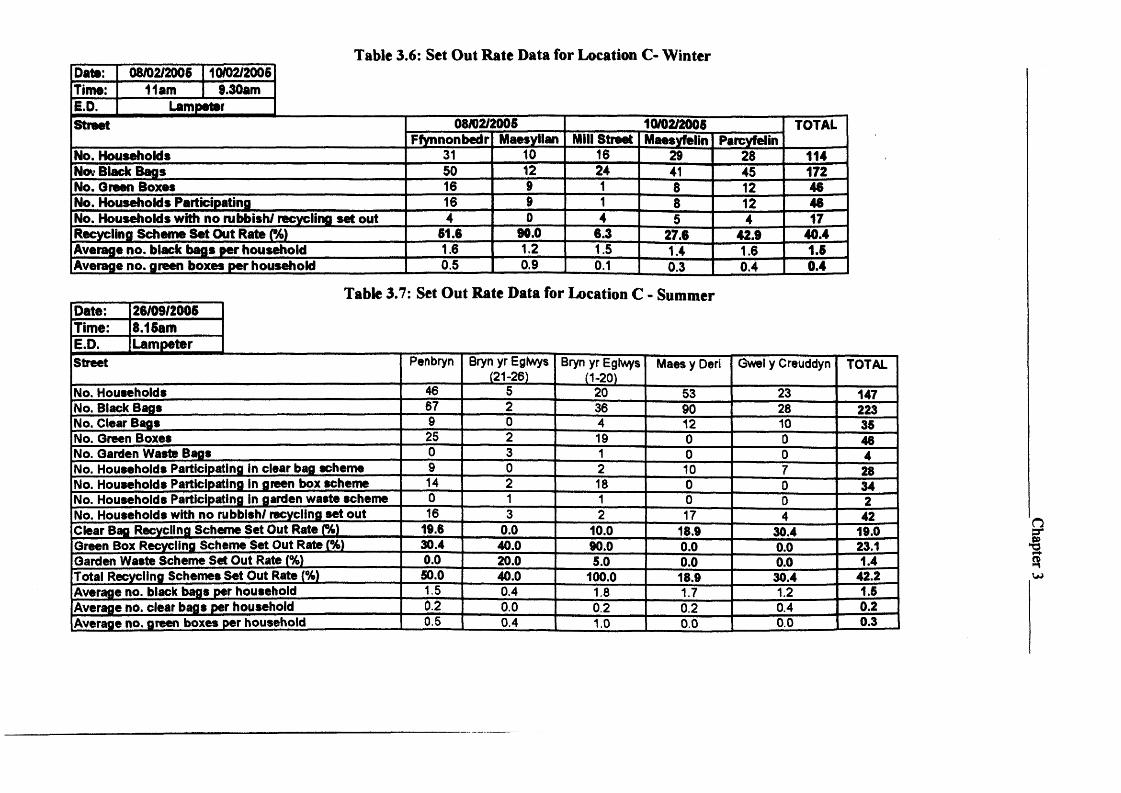
Table 3.6: Set Out Rate Data for Location C- WinterDate: 08/02/2006 10/02/2006Time: 11am 9.30amE.D. LampeterStreet 08/02/2006 10/02/2005 TOTAL
Ffynnonbedr Maesyllan Mill Street Maesyfelin ParcyfelinNo. Households 31 10 16 29 28 114Not* Black Bags 50 12 24 41 45 172No. Green Boxes 16 9 1 8 12 46No. Households Participating 16 9 1 8 12 46No. Households with no rubbish/ recycling set out 4 0 4 5 4 17Recycling Scheme Set Out Rate (%) 61.6 90.0 6.3 27.6 42.9 40.4Average no. black bags per household 1.6 1.2 1.5 1.4 1.6 1.5Average no. green boxes per household 0.5 0.9 0.1 0.3 0.4 0.4
Table 3.7: Set Out Rate Data for Location C - SummerDate: 26/09/2005Time: 8.15amE.D. LampeterStreet Penbryn Bryn yr Eglwys
(21-26)Bryn yr Eglwys
- (1-20)Maes y Deri Gwel y Creuddyn TOTAL
No. Households 46 5 20 53 23 147No. Black Bags 67 2 36 90 28 223No. Clear Bags 9 0 4 12 10 35No. Green Boxes 25 2 19 0 0 46No. Garden Waste Bags 0 3 1 0 0 4No. Households Participating in clear bag scheme 9 0 2 10 7 28No. Households Participating in green box scheme 14 2 18 0 0 34No. Households Participating in garden waste scheme 0 1 1 0 0 2No. Households with no rubbish/ recycling set out 16 3 2 17 4 42Clear Bag Recycling Scheme Set Out Rate (%) 19.6 0.0 10.0 18.9 30.4 19.0Green Box Recycling Scheme Set Out Rate (%) 30.4 40.0 90.0 0.0 0.0 23.1Garden Waste Scheme Set Out Rate (%) 0.0 20.0 5.0 0.0 0.0 1.4Total Recycling Schemes Set Out Rate (%) 50.0 40.0 100.0 18.9 30.4 42.2Average no. black bags per household 1.5 0.4 1.8 1.7 1.2 1.5Average no. clear bags per household 0.2 0.0 0.2 0.2 0.4 0.2Average no. green boxes per household 0.5 0.4 1.0 0.0 0.0 0.3
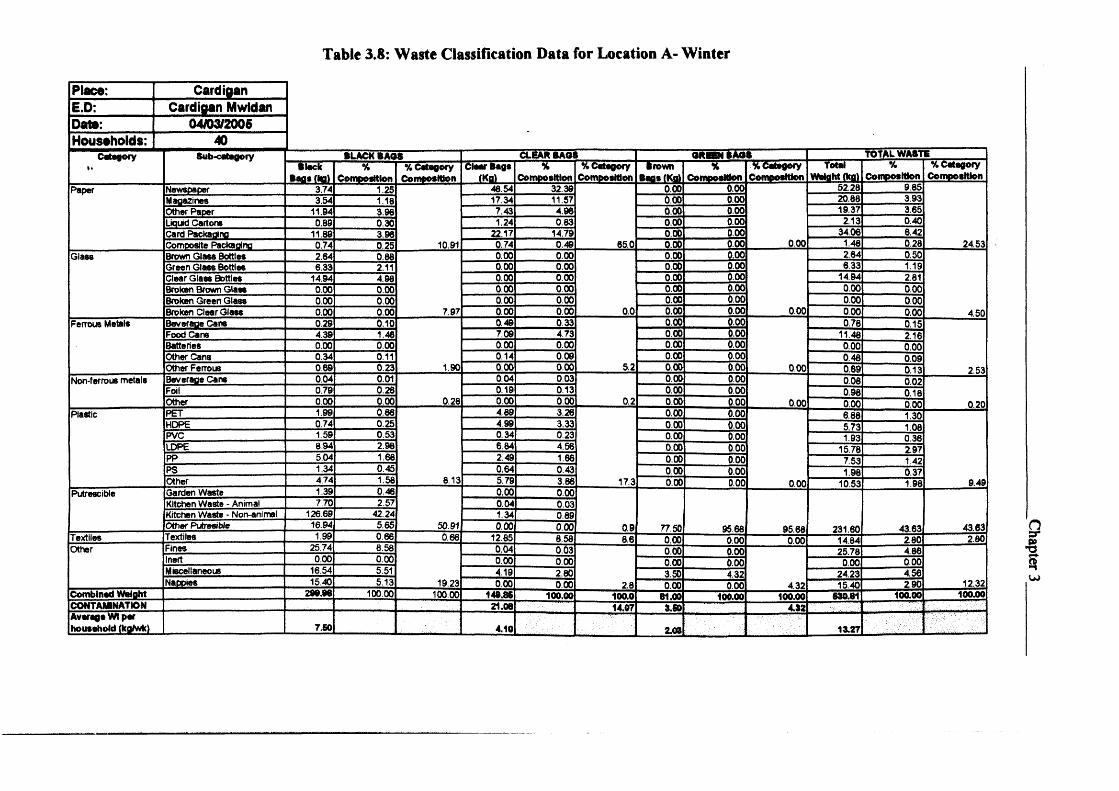
Table 3.8: Waste Classification Data for Location A- Winter
Place: Cardiganm b Cardigan Mwldan
Date: 04/03/2006Households: 40
Categoryi.
Sub-category •LACK BAGS CLEAR KAOS ORKNM 08 TOTAL WASTE•lack
•age (kg)%
Composition% Category
CompositionClear •age
(Kg)%
Composition% Category
CompositionBrown
Bags (Kg)*
Composition% Category
CompositionTotal
WMght(kg)%
Composition% Category
CompositionPaper Newspaper 3.74 1.25 48.54 32.39 0.00 0.00 52.28 9.85
Magazines 3.54 1.18 17.34 11.57 0.00 0.00 20.68 3.93Other Paper 11.94 3.98 7.43 4.96 0.00 0.00 19.37 3.65Liquid Cartons 0.09 0.30 1.24 0.83 0.00 0.00 2.13 0.40Card Packaging 11.80 3.96 22.17 14.79 0.00 0.00 34.06 6.42Composite Packaging 0.74 0.25 10.91 0.74 0.49 65.0 0.00 0.00 0.00 1.48 0.28 24.53
Glass Brown Glass Bottles 2.64 0.88 0.00 0.00 0.00 0.00 2.64 0.50Green Glass Bottles 6.33 2.11 0.00 0.00 0.00 0.00 6.33 1.19Clear Glass Bottles 14.94 4.98 0.00 0.00 0.00 0.00 14.94 2.81Broken Brown Glass 0.00 0.00 0.00 000 0.00 0.00 0.00 0.00Broken Green Glass 0.00 0.00 0.00 0.00 0.00 0.00 0.00 0.00Broken Clear Glass 0.00 0.00 7.97 0.00 0.00 0.0 0.00 0.00 0.00 0.00 0.00 4.50
Ferrous Metals Beverage Cans 0.29 0.10 0.49 0.33 0.00 0.00 0.7B 0.15Food Cans 4.39 1.46 7.09 4.73 0.00 0.00 11.48 2.16Batteries 0.00 0.00 0.00 0.00 0.00 0.00 0.00 0.00Other Cans 0.34 0.11 0.14 009 0.00 0.00 0.48 0.09Other Ferrous 0.69 0.23 1.90 0.00 0.00 5.2 0.00 0.00 0.00 0.69 0.13 2.53
Non-ferrous metals Beverage Cane 0.04 0.01 0.04 0.03 0.00 0.00 0.08 0.02Foil 0.79 0.26 0.19 0.13 0.00 0.00 0.98 0.18Other 0.00 0.00 0.28 0.00 0.00 0.2 0.00 0.00 0.00 0.00 0.00 0.20
Plastic PET 1.90 0.66 4.89 3.26 0.00 0.00 6.68 1.30HDPE 0.74 0.25 4.99 3.33 0.00 0.00 5.73 1.08PVC 1.59 0.53 0.34 0.23 0.00 0.00 1.93 0.36LDPE 8.94 2.98 6.84 4.56 0.00 0.00 15.78 2.97PP 5.04 1.68 2.49 1.66 0.00 0.00 7.53 1.42PS 1.34 0.45 0.64 0.43 0.00 0.00 1.98 0.37Other 4.74 1.58 8.13 5.79 3.86 17.3 0.00 0.00 0.00 10.53 1.98 9.49
Putrescible Garden Waste 1.39 0.46 0.00 0.00Kitchen Waste - Animal 7.70 2.57 0.04 0.03Kitchen Waste - Non-animal 126.69 42.24 1.34 0.89Other Putreaible 16.94 5.65 50.91 0.00 0.00 0.9 77.50 95.66 95.68 231.60 43.63 43.63
Textiles Textiles 1.99 0.66 0.66 12.85 8.58 8.6 0.00 0.00 0.00 14.84 2.80 2.80Other Fines 25.74 8.58 0.04 0.03 0.00 0.00 25.78 4.86
Inert 0.00 0.00 0.00 0.00 0.00 0.00 0.00 0.00Miscellaneous 16.54 5.51 4.19 2.80 3.50 4.32 24.23 4.56Nappies 15.40 5.13 19.23 0.00 0.00 2.8 0.00 0.00 4.32 15.40 2.90 12.32
Combined Weight 299.98 100.00 100.00 149.86 100.00 100.0 81.00 100.00 100.00 630.81 100.00 100.00CONTAMINATION 21.08 14.07 3.60 4.32Average Wt per household (kg/wk) 7.60 4.10 2.08 13.27
Chapter 3
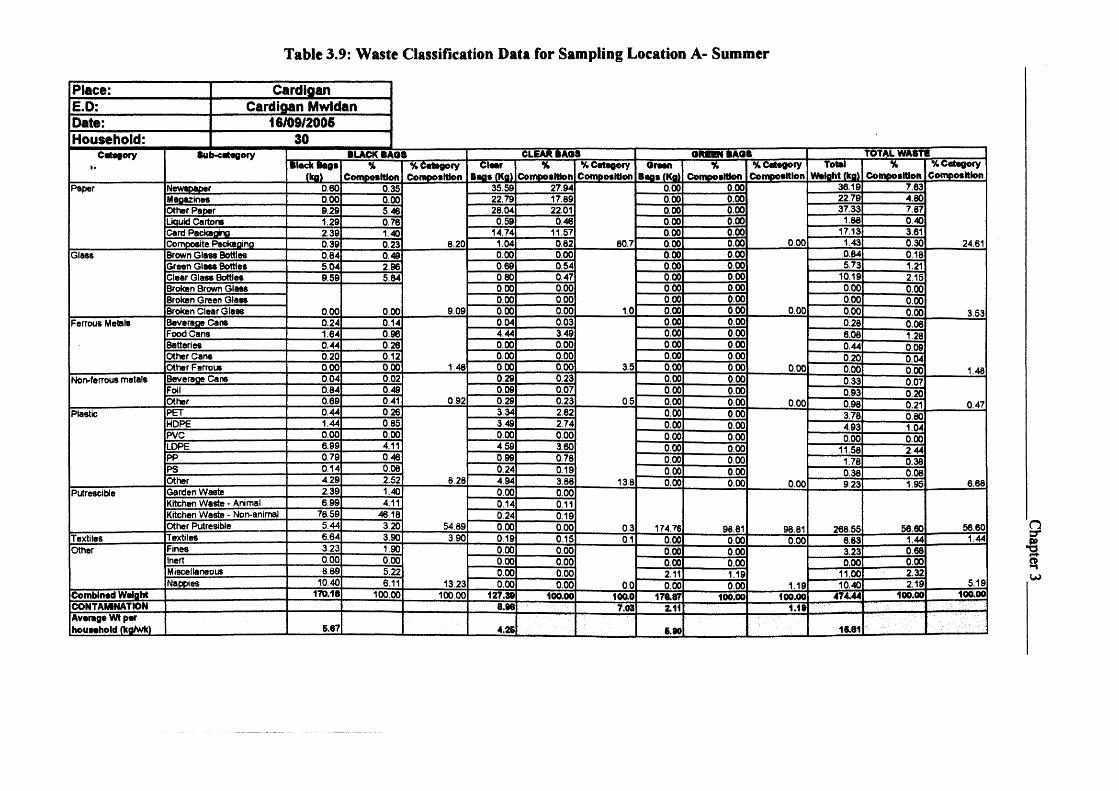
Table 3.9: Waste Classification Data for Sampling Location A- Summer
Place: CardiganE.D: Cardigan MwldanDate: 16/09/2006Household: 30
Category»>
Sub-category BLACK BAQS CLEAR BAQS QRESN BAQS TOTAL WASTEBlade Bags
m Composition% Category
CompositionClear
Bags (Kg)%
Composition% Category
CompositionQreen
B*gs (Kg)%
Composition% Category
CompositionTotal
Weight (kg)%
Composition% Category
CompositionPaper Newsoaoer 0.60 0.35 35.59 27.94 0.00 0.00 36.19 7.63
Magazines 0.00 0.00 22.79 17.89 0.00 0.00 22.79 4.80Other Paper 9.29 5.46 28.04 22.01 0.00 0.00 37.33 7.87Liquid Cartons 1.29 0.76 0.59 0.46 0.00 0.00 1.88 0.40Card Packaging 2.39 1.40 14.74 11.57 0.00 0.00 17.13 3.61Composite Packaging 0.39 0.23 8.20 1.04 0.82 80.7 0.00 0.00 0.00 1.43 0.30 24.61
Glass Brown Glass Bottles 0.84 0.49 0.00 0.00 0.00 0.00 0.64 0.18Green Glass Bottles 5.04 2.96 0.69 0.54 0.00 0.00 5.73 1.21Clear Glass Bottles 9.59 5.64 0.60 0.47 0.00 0.00 10.19 2.15Broken Brown Glass 0.00 0.00 0.00 0.00 0.00 0.00Broken Green Glass 0.00 0.00 0.00 0.00 0.00 0.00Broken Clear Glass 0.00 0.00 9.09 0.00 0.00 1.0 0.00 0.00 0.00 0.00 0.00 3.53
Ferrous Metals Beverage Cans 0.24 0.14 0.04 0.03 0.00 0.00 0.28 0.06Food Cans 1.64 0.96 4.44 3.49 0.00 0.00 6.06 1.28Batteries 0.44 0.26 0.00 0.00 0.00 0.00 0.44 0.09Other Cans 0.20 0.12 0.00 0.00 0.00 0.00 0.20 0.04Other Ferrous 0.00 0.00 1.48 0.00 0.00 3.5 0.00 0.00 0.00 0.00 0.00 1.48
Non-ferrous metals Beverage Cans 0.04 0.02 0.29 0.23 0.00 0.00 0.33 0.07Foil 0.84 0.49 0.09 0.07 0.00 0.00 0.93 0.20Other 0.69 0.41 0.92 0.29 0.23 0.5 0.00 0.00 0.00 0.98 0.21 0.47
Plastic PET 0.44 0.26 3.34 2.62 0.00 0.00 3.78 0.80HOPE 1.44 0.85 3.49 2.74 0.00 0.00 4.93 1 04PVC 0.00 0.00 0.00 0.00 0.00 0.00 0.00 0.00LDPE 6.99 4.11 4.59 3.60 0.00 0.00 11.58 2.44PP 0.79 0.46 0.99 0.78 0.00 0.00 1.78 0.38PS 0.14 0.08 0.24 0.19 0.00 0.00 0.38 0.06Other 4.29 2.52 8.28 4.94 3.88 13.8 0.00 0.00 0.00 9 23 1.95 6.68
Putrescible Garden Waste 2.39 1.40 0.00 0.00Kitchen Waste - Animal 6.99 4.11 0.14 0.11Kitchen Waste - Non-animal 7B.59 46.18 0.24 0.19Other Putresible 5.44 3.20 54.89 0.00 0.00 0.3 174.76 98.81 98.61 268.55 56.60 56.60
Textiles Textiles 6.64 3.90 3.90 0.19 0.15 0.1 0.00 0.00 0.00 6.63 1.44 1.44Other Fines 3.23 1.90 0.00 0.00 0.00 0.00 3.23 0.68
Inert 0.00 0.00 0.00 0.00 0.00 0.00 0.00 0.00Miscellaneous 6.89 5.22 0.00 0.00 2.11 1.19 11.00 2.32Nappies 10.40 6.11 13.23 0.00 0.00 0.0 0.00 0.00 1.19 10.40 2.19 5.19
Combined Weight 170.18 100.00 100.00 127.39 100.00 100.0 176.87 100.00 100.00 474.44 100.00 100.00CONTAMINATION 8.96 7.03 2.11 1.19Average Wt per household (kg/wk) 6.67 4.26 6.90 16.81
Chapter 3
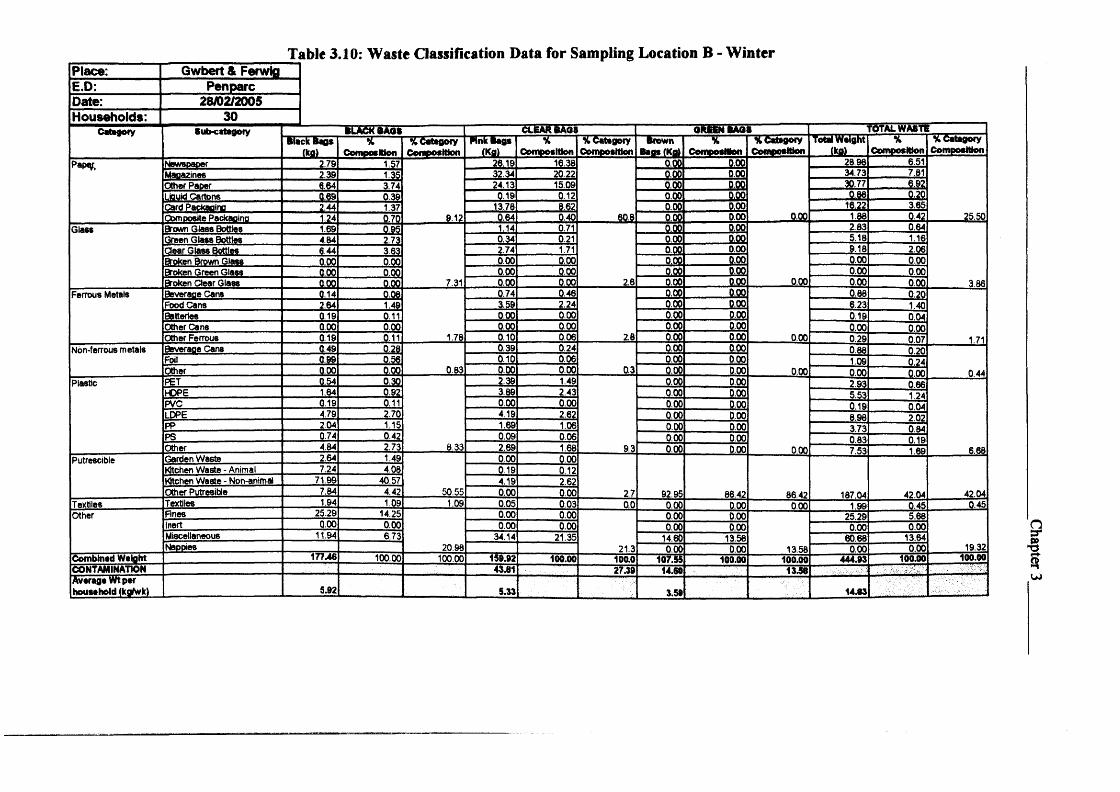
Table 3.10: Waste Classification Data for Sampling Location B - WinterPlace: Gwbert & FerwlgE.D: PenparcDate: 28/02/2005Households: 30
Category Sub-category BLACK BAQS CLEAR BAOS OREENBAOS TOTAL WASTEBlack Bag*
(kg)%
Composition% Category
CompositionPink Bags
(Kg)%
Composition% Category Composition
Brown Bags (Kg)
i .Composition
% Category Composition
Total Weight (kg)
%Composition
% Category Composition
Papqj, Newspaper 2.79 1.57
9.12
26.19 16.38
60.8
0.00 0.00
0.00
28.98 6.51
25.50
Macazinee 2.39 1.35 32.34 20.22 0.00 0.00 34.73 7.81Other Paoer 6.64 3.74 24.13 15.09 0.00 0.00 30.77 6.92Lduid Cartons 0.69 0.39 0.19 0.12 0.00 0.00 0.88 0.20Card Packaaina 2.44 1.37 13.78 8.62 0.00 0.00 16.22 3.85
1.24 0.70 0.64 0.40 0.00 0.00 1.88 0.42Glass Brown Glass Bottles 1.69 0.95
7.31
1.14 0.71
2.6
0.00 0.00
0.00
2.83 0.64
3.86
Green Glass Bottles 4.64 2.73 0.34 0.21 0.00 0.00 5.18 1.16◦e a r Glass Bottles 6.44 3.63 2.74 1.71 0.00 0.00 9.18 2.06Broken Brown Glass 0.00 0.00 0.00 0.00 0.00 0,00 0.00 0.00Broken Green Glass 0.00 0.00 0.00 0.00 0.00 0.00 0.00 0.00Broken Clear Glass 0.00 0.00 0.00 0.00 0.00 0,00 0.00 0.00
Ferrous Metals Beveraoe Cans 0.14 0.08
1.78
0.74 0.46
2.8
0.00 000
0.00
0.88 0.20
1.71
Food Cans 2.64 1.49 3.59 2.24 0.00 0.00 6.23 1.40Batteries 0.19 0.11 0.00 0.00 0.00 0.00 0.19 0.04Other Cans 0.00 0.00 0.00 0.00 0.00 0.00 0.00 0.00Other Ferrous 0.19 0.11 0.10 0.06 0.00 0.00 0.29 0.07
Non-ferrous metals Beveraoe Cans 0.49 0.28
0.83
0.39 0.24
0.3
0.00 0.00
0.00
0.88 0.20
0.44Foil 0.99 0.56 0.10 0.06 0.00 0.00 1.09 0.24Other 0.00 0.00 0.00 0.00 0.00 0.00 0.00 0.00
Plastic PET 0.54 0.30
8.33
2.39 1.49
9.3
0.00 0.00
0.00
2.93 066
6.68
HOPE 1.64 092 3.89 243 0.00 0.00 5.53 1 24PVC 0.19 0.11 0.00 0.00 0.00 0.00 0.19 004LDPE 4.79 2.70 4.19 2.62 0.00 0.00 8.98 2 02PP 204 1.15 1.89 1.06 0.00 0.00 3.73 084PS 0.74 0.42 0.09 0.06 0.00 0.00 0.83 0 19Other 4.84 2.73 2.69 1.88 0.00 0.00 7.53 1.69
Putrescible Garden Waste 2.64 1.49
50.55
0.00 0.00
2.7 92.95 86.42 86.42 187.04 42.04 42.04
Wtchen Waste - Animal 7.24 4.08 0.19 0.12Wtchen Waste - Non-animal 71.99 40.57 4.19 2.62Other Putresible 7.84 4.42 0.00 0.00
T extiles Textiles 1.94 1.09 1.09 0.05 0.03 0.0 0.00 0.00 0.00 1.99 0.45 0.45Other Fines 25.29 14.25
20.98
0.00 0.00
21.3
0.00 0.00
13.58
25.29 5.68
19.32
Inert 0.00 0.00 0.00 0.00 0.00 0.00 0.00 0.00Miscellaneous 11.94 6.73 34.14 21.35 14.60 13.58 60.68 13.64NaDDies 0.00 0.00 0.00 0.00
Combined Weight 17746 100.00 100.00 1&9.92 100.00 100.0 107.5& 100.00 100.00 444.93 100.00 100.00CONTAMINATION 43.81 27.39 14.60 13.58Average Wt per household (kg/wk) 5.92 5.33 3.59 14.83
Chapter 3
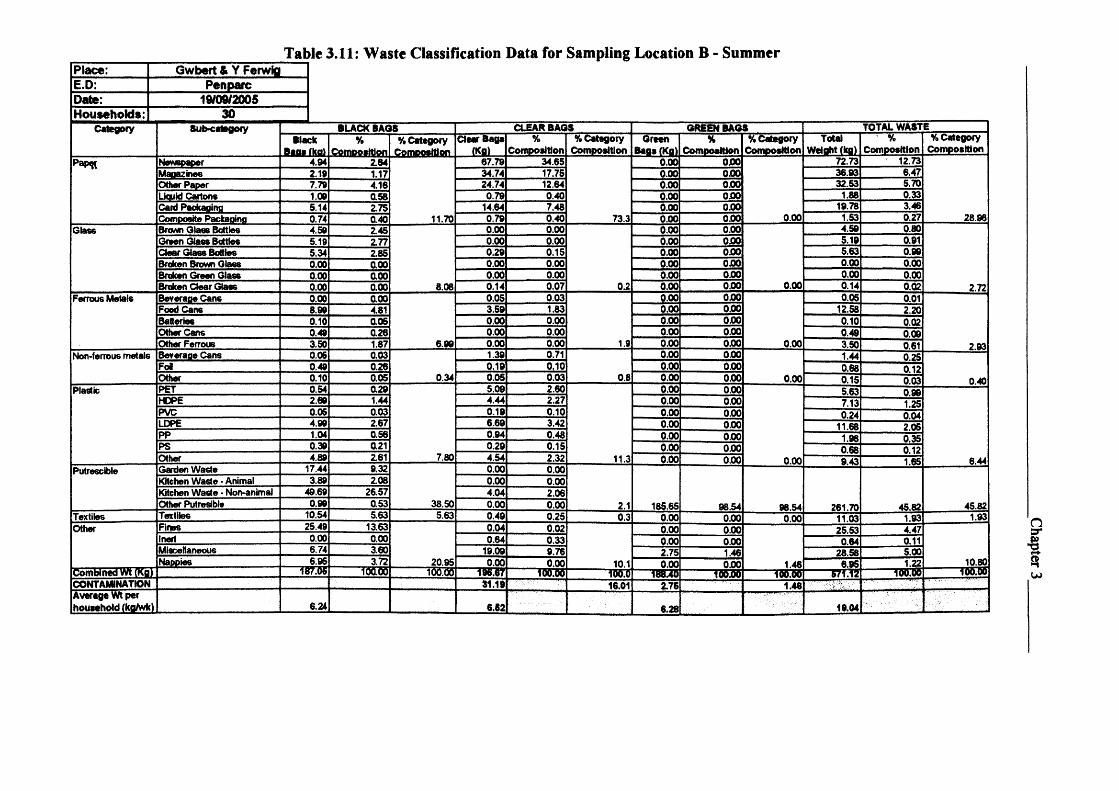
Table 3.11: Waste Classification Data for Sampling Location B - SummerPlace: Gwbert & Y FerwigE.D: PenparcDate: 19/00/2005Households: 30
Category Sub-category BLACK BAGS CLEAR BAGS GREBI BAGS TOTAL WASTEBlack
Baas(ka)%
Composition% Category
CompositionClear Bags
(Kg)%
Composition% Category
CompositionGreen
Bags (Kg)%
Composition% Category
CompositionTotal
Weight (kg)%
Composition% Category
CompositionPaP* Newspaper 4.94 2.64
11.70
67.79 34.65
73.3
0.00 OJOO
0.00
72.73 12.73
28.96
Maoazines 2.19 1.17 34.74 17.75 0.00 000 36.93 6.47Other Paper 7.79 4.16 24.74 12.64 0.00 000 32.53 5.70Liouid Cartons 1.09 0.58 0.79 0.40 0.00 000 1.88 0.33Caid Packagina 5.14 2.75 14.64 7.48 0.00 000 19.78 3.46I!j
0.74 0.40 0.79 0.40 0.00 000 1.53 0.27Glass Brovm Glass Bottles 4.59 2.45
8.08
0.00 0.00
0.2
0.00 0.00
0.00
4.59 0.80
2.72
Green Glass Battles 5.19 2.77 0.00 0.00 0.00 0.00 5.19 0.91Clear Glass Bottles 5.34 2.85 0.29 0.15 0.00 ooo 5.63 0.99Broken Brown Glass 0.00 0.00 0.00 0.00 0.00 000 0.00 0.00Broken Green Glass 0.00 0.00 0.00 0.00 0.00 0.00 0.00 0.00Broken Clear Glass 0.00 0.00 0.14 0.07 0.00 0.00 0.14 0.02
Ferrous Metals Beveraoe Cans 0.00 0.00
6.99
0.05 0.03
1.9
0.00 0.00
0.00
0.05 0.01
2.93
Food Cans 8.99 4.81 3.59 1.83 0.00 000 12.58 2.20Batteries 0.10 0.05 0.00 0.00 0.00 0.00 0.10 0.02Other Cans 0.49 0.26 0.00 0.00 0.00 0.00 0.49 0.09Other Ferrous 3.50 1.87 0.00 0.00 0.00 0.00 3.50 0.61
Non-ferrous metals Beveraoe Cans 0.05 0.03
0.34
1.39 0.71
0.8
0.00 0.00
0.00
1.44 0.25
0.40Foi 0.49 0.26 0.19 0.10 0.00 0.00 0.68 0.12Other 0.10 0.05 0.05 0.03 0.00 0.00 0.15 0.03
Plastic PET 0.54 029
7.80
5.09 2.60
11.3
0.00 0.00
0.00
5.63 0.99
6.44
HDPE 2.69 1.44 4.44 2.27 0.00 0.00 7.13 1.25PVC 0.05 0.03 0.19 0.10 0.00 0.00 0.24 0.04LOPE 4.99 Z67 6.69 3.42 0.00 0.00 11.68 2.05PP 1.04 056 0.94 0.48 0.00 0.00 1.98 0.35PS 0.39 021 0.29 0.15 0.00 0.00 0.68 0.12Other 4.89 261 4.54 2.32 0.00 0.00 9.43 1.65
Putre6cible Garden Waste 17.44 9.32
38.50
0.00 0.00
2.1 185.65 98.54 98.54 261.70 45.82 45.82
Kitchen Waste • Animal 3.89 2.08 0.00 0.00Kitchen Waste - Non-animal 49.69 26.57 4.04 2.06Other Putresiblo 0.99 053 0.00 0.00
Textiles Textiles 10.54 5.63 5.63 0.49 0.25 0.3 0.00 0.00 0.00 11.03 1.93 1.93Other Fines 25.49 13.63
20.95
0.04 0.02
10.1
0.00 0.00
1.46
25.53 4.47
10.80
Inert 0.00 0.00 0.64 0.33 0.00 0.00 0.64 0.11Miscellaneous 6.74 3.60 19.09 9.76 2.75 1.46 28.58 5.00Nappies 6.95 3.72 0.00 0.00 0.00 0.00 6.95 1.22
Combined wt (Kg) 187.06 10000 100.00 - ■ tw :b7 ......... 100.60 ....106.0 '188.40 10036 160.60 " 57112 10630 1O630CONTAMINATION 31.19 16.01 2.76 1.46Average Wt per household (kg/wk) 6.24 6.62 6.28 19.04
Chapter 3
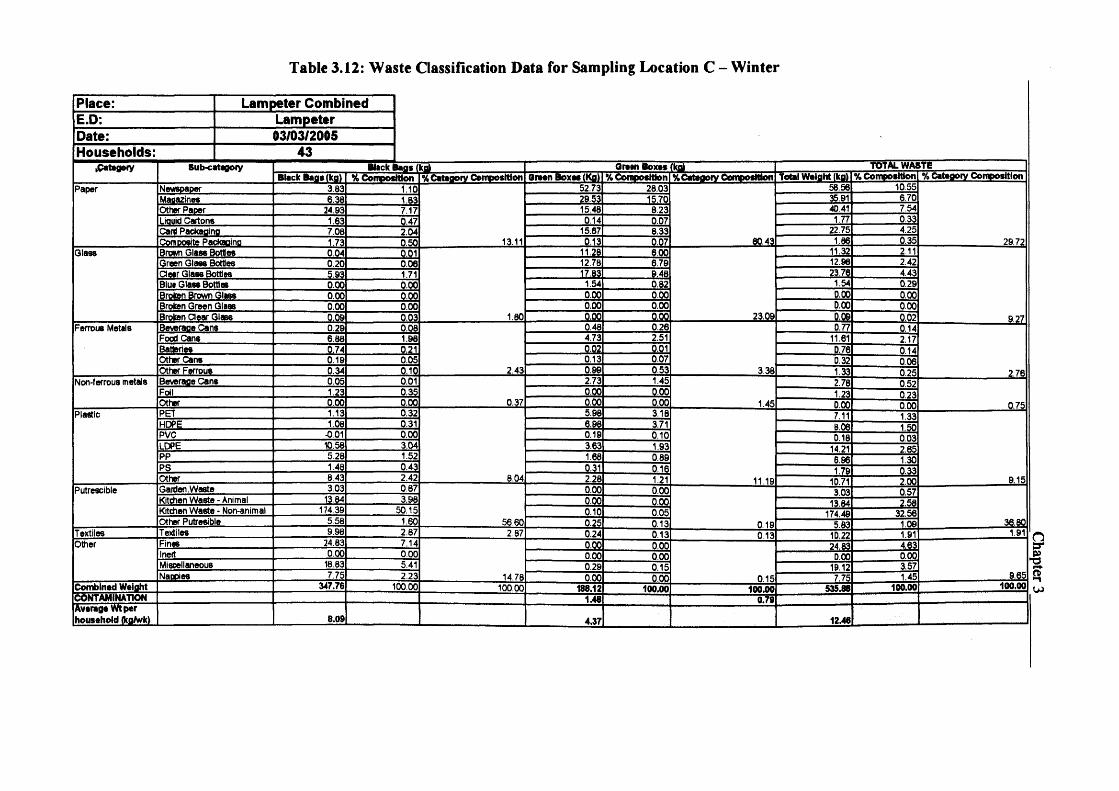
Table 3.12: Waste Classification Data for Sampling Location C - Winter
Lampeter Combined Lampeter
Place:E.DDateHouseholds:
Oreen Boxst(kg)Qreen Boxes (Kg> I % Composition| %Category Composition % Category Composition% Composition% Category Composition
10.5556.5652.733.83 26.03NewspaperPaper 1.106.7035.91Magazines 6.38 15.707.5440.4115.48Other Paper 8.2324.930.331.770.14Liquid Cartons 1.63 0.070.474.2522.7515.67Card Packaging 7.08 8.332.040.351.8660.43mComposite Packaging 13.11 ML 29.721.73 M 0
0.01 11.3211.28Brown Glass Bottles 6.00Glass 0.0412.98 2.4212.78Green Glass Bottles 6.790.20 0.0623.78 4.43&4§
0.821.71
1.54 0.291.54Blut Glass Bottles 0.00 0.00D.000.00 0.000.00Broten Brown Glass 0.000000.00 0.00Broten Green Glass 0.000.00
23.09Broten Clear Glass 1.80 0.020.03 9.270.48 0.26 077Beverage CansFerrous Metals 0.29 0.08 0.144.73 2.51Food Cans 11.616.88 1.98 2.17
0.01m0.13
Ml 0.21 076 0.140.07Other Cans 0.19 0.05 032 0.060.532430.34 0.10 3.38 1.33 0.25 2.76
2.73 1.450.05 0.01Non-ferrous metals 2.78 0.520.000.35Foil 1.23 m
0.000.00 0.000.00 0.00 0.37Other 1.45 0.00 0.755.981.13 0.32 3.18Plastic 7.11 1.33
1.08 0.31HOPE 3.710.10
B.06 1.50-0.01 0.00 0.19PVC 0.18 0.0310.58 3.04 3.63LDPE 1.93 14.21 2.655.28 1.52 1.68PP 6.96 1.30
0.43148PS 0.16 1.79 0.338.43 2.42 6.04Other 2.28 9.1511.19 2.0010.713.03 0.87Garden Waste 0.00Putrescible 0.00 0.573.0313.84 3.98Kitchen Waste - Animal m 0.00 13.84174.39 50.15Kitchen Waste - Non-animal 0.10 0.05 32.56174.495.58 1.60Other Putresible 56.60 36.800.25 0.13 1.090.19 5.839.98Textiles 2.87 1.91Textiles 2.87 0.24 0,13 1.910.13 1D.22
24.83 7.14FinesInert
Other 0.00 4.630.00 24.830.00 0.00 0.00 0.000.00 D.00
18.83 5.41Miscellaneous 3.570.29 0.15 19.127.75 9.65Nappies 2.23 1.4514.78
100.000.00 7.750.00 0.15347.76 100.00Combined Weight 100.00 100.001.12 535.88100.00
CONTAMINATION 0.79
8.09 4.37
Chapter 3

Table 3.13: Waste Classification Data for Sampling Location C - Summer
Place: LampeterE.D: LampeterDate: 12/09/2005Households: 22Category
I t
Sub-category BLACK BAGS CLEAR BAGS TOTAL WASTEBlack Bags
(kg)%
Composition% Category
CompositionClear Bags
(Kg)%
Composition% Category
CompositionTotal Weight
(kg)%
Composition% Category
CompositionPaper Newspaper 2.30 1.20 26.00 24.16 28.48 9.26
Magazines 2.04 1.02 22.30 20.74 24.43 7.94Other Paper 10.74 5.38 9.19 8.51 19.93 6.48Liquid Cartons 1.10 0.60 0.19 0.18 1.38 0.45Card Packaging 3.14 1.57 12.24 11.34 15.38 5.00Composite Packaging 0.60 0.35 10.11 1.50 1.47 66.40 2.28 0.74 29.86
Glam Brown Glass Bottles o . o s 0.03 3.44 3.19 3.40 1.13Green Glass Bottles 0.05 0.03 0.24 0.22 0.29 0.09Clear Glass Bottles 4.64 2.32 3.44 3.19 8.08 2.63Broken Brown Glass 0.00 0.00 0.00 0.00 0.00 0.00Broken Green Glass 0.00 0.00 0.00 0.00 0.00 0.00Broken Clear Glass 0.00 0.00 2.37 1.19 1.10 7.70 1.19 0.39 4.24
Ferrous Metals Beveraoe Cans 0.24 0.12 0.44 0.41 0.68 0.22Food Cans 2.40 1.25 1.10 1.10 3.68 1.20Batteries 0.00 0.00 0.01 0.01 0.01 0.00Other Cans 0.60 0.35 0.00 0.00 0.69 0.22Other Ferrous 1.50 0.80 2.51 0.04 0.04 1.56 1.63 0.53 2.17
Non-ferrous metals Beverage Cans 0.00 0.05 0.50 0.55 0.68 0.22Foil 1.04 0.52 0.09 0.08 1.13 0.37Other 0.54 0.27 0.84 0.10 0.09 0.72 0.64 0.21 0.80
Plastic PET 0.00 0.50 3.54 3.28 4.53 1.47HDPE 1.74 0.87 4.69 4.34 6.43 2.09PVC 0.00 0.00 0.04 0.04 0.04 0.01LOPE 8.90 4.50 1.99 1.84 10.98 3.57PP 3.79 1.90 0.84 0.78 4.63 1.50PS 1.00 0.55 0.34 0.31 1.43 0.46Other 7.39 3.70 12.01 1.94 1.80 12.39 9.33 3.03 12.14
Putrescible Garden Waste 9.74 4.88 0.00 0.00 0.74 3.17Kitchen Waste - Animal 20.40 10.21 0.00 0.00 20.40 6.63Kitchen Waste - Non-animal 00.39 45.25 0.24 0.22 90.63 29.45Other Putresible 0.00 0.00 60.34 0.00 0.00 0.22 0.00 0.00 39.25
Textiles Textiles 4.60 2.35 2.35 0.00 0.00 0.00 4.69 1.52 1.52Other Fines 4.90 2.50 0.00 0.00 4.99 1.62
Inert 0.20 0.10 0.00 0.00 0.20 0.06Miscellaneous 5.40 2.75 11.89 11.01 17.38 5.65Nappies 8.25 4.13 9.48 0.00 0.00 11.01 8.25 2.68 10.02
Combined Weight 199.75 100.00 100.00 107.07 100.00 100.00 307.72 100.00 100.00CONTAMINATION 16.20Average Wt per household (kg/wk) 9.06 4.91 13.99
Chapter 3

Chapter 3
3.4 DISCUSSION
3.4.1 Dry Recyclables
3.4.1.1 Overview
Sample locations A and B are covered by a two bag survival scheme, that is, a clear bag is
used for dry recyclables and a green bag used for organic material. Table 3.14 shows that
the amount of dry recyclables collected per household per week, the Winter classification
was greater in location B at 5.3kg compared to 4.1kg for location A. The non-requested
fraction (contamination) present in the bags at this time was greater in location B than in
location A, being 27.4% and 14.1% respectively. By taking these contamination figures
into account, the true recyclable weight for participating households in both areas were
3.8kg in location B and 3.5kg in location A. In the Summer classification, the amount of
dry recyclable collected from participating households was again greater in location B at
6.5 kg/hh/wk, compared to 4.3 kg/hh/wk in location A. The non-requested fraction
(contamination) was considerably lower than in the winter classification, being 16% and
7% at locations B and A respectively. By taking account of the non-requested fraction, the
true recyclable mass collected at the kerbside for participating households in locations A
and B were 4.0 kg/hh/wk and 5.5 kg/hh/wk respectively.
Location C has a kerbside segregated recycling scheme, and the mass of dry recyclables
collected from participating households was 4.4 kg/hh/wk and 4.9 kg/hh/wk for the Winter
and Summer classification respectively. The non-requested fraction for location C was
significantly lower than in the other sampling locations during the winter classification at
67
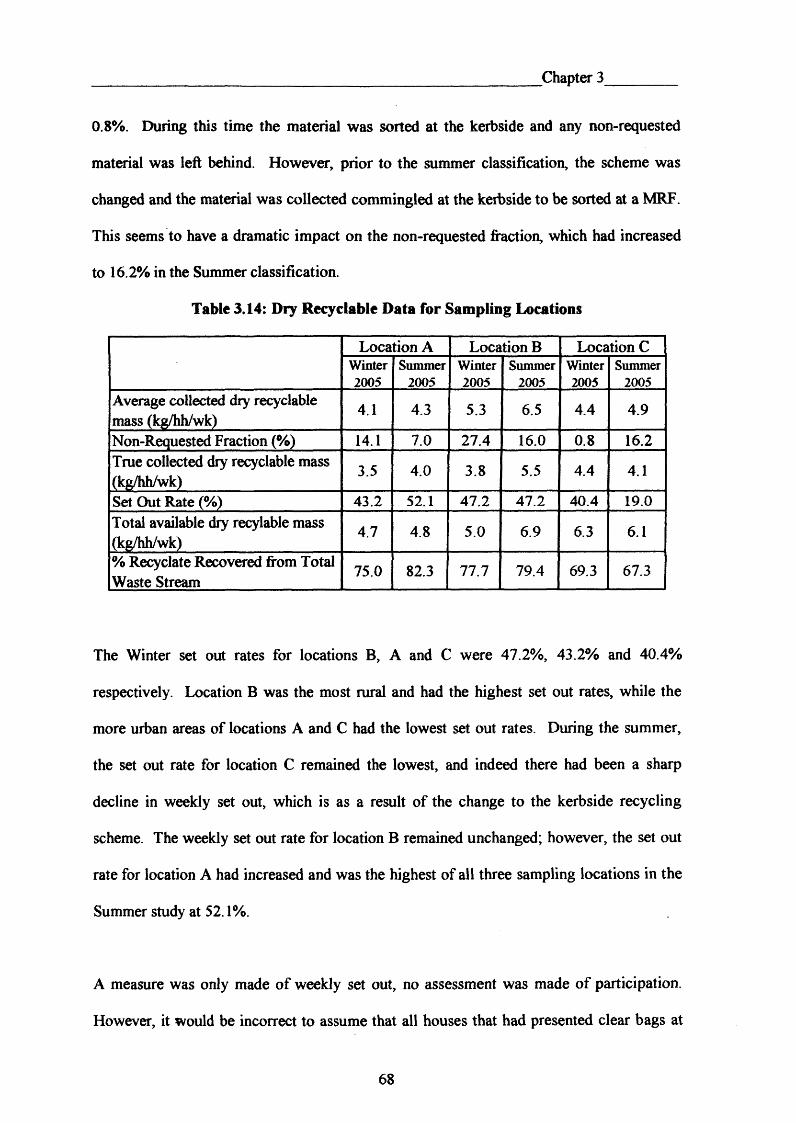
Chapter 3
0.8%. During this time the material was sorted at the kerbside and any non-requested
material was left behind. However, prior to the summer classification, the scheme was
changed and the material was collected commingled at the kerbside to be sorted at a MRF.
This seems to have a dramatic impact on the non-requested fraction, which had increased
to 16.2% in the Summer classification.
Table 3.14: Dry Recyclable Data for Sampling Locations
Location A Location B Location CWinter2005
Summer2005
Winter2005
Summer2005
Winter2005
Summer2005
Average collected dry recyclable mass (kg/hh/wk)
4.1 4.3 5.3 6.5 4.4 4.9
Non-Requested Fraction (%) 14.1 7.0 27.4 16.0 0.8 16.2True collected dry recyclable mass (kg/hh/wk)
3.5 4.0 3.8 5.5 4.4 4.1
Set Out Rate (%) 43.2 52.1 47.2 47.2 40.4 19.0Total available dry recylable mass (kg/hh/wk)
4.7 4.8 5.0 6.9 6.3 6.1
% Recyclate Recovered from Total Waste Stream
75.0 82.3 77.7 79.4 69.3 67.3
The Winter set out rates for locations B, A and C were 47.2%, 43.2% and 40.4%
respectively. Location B was the most rural and had the highest set out rates, while the
more urban areas of locations A and C had the lowest set out rates. During the summer,
the set out rate for location C remained the lowest, and indeed there had been a sharp
decline in weekly set out, which is as a result of the change to the kerbside recycling
scheme. The weekly set out rate for location B remained unchanged; however, the set out
rate for location A had increased and was the highest of all three sampling locations in the
Summer study at 52.1%.
A measure was only made of weekly set out, no assessment was made of participation.
However, it would be incorrect to assume that all houses that had presented clear bags at
68
Chapter 3
the kerbside at the time of the survey, would do so every week, likewise it would be
inaccurate to assume that houses which had not presented clear bags at the kerbside did not
participate at other times. That is, some residents may set out clear bags on a weekly basis,
while others may set out clear bags whenever the bag becomes full and so forth. The case
study authority conducted a survey into their kerbside recycling scheme over a period of
three weeks, the results of the survey indicate that of those residents which participated in
the scheme, 49% put out a clear bag each week, 27% put out a clear bag twice during the
survey, and 23% only presented a clear bag once during the survey (Ceredigion County
Council, 2007). Similar studies have been conducted in other parts of the UK, for example
a participation survey conducted over an 8 week period in RCT found that of those
participating in the recycling scheme, 57% set out recyclable on a weekly basis, 10% on a
fortnightly basis, and 33% on a random basis, which was defined as those that participated
less than 75% of the time (Woollam, 2006).
Table 3.14 also presents the total available dry recyclable at each sampling location, which
is based on the total amount of requested material available within the entire household
waste stream. This then enables the percentage of recyclable recovered from the waste
stream in participating households in each sampling location to be calculated. As can be
seen there was a substantial variation in the recovery of dry recyclable varying from 69.3%
in location C to 77.7% in location B during the Winter study. During the Summer study,
the results in the two survival bag sampling locations (A and B) had increased from the
Winter study, but that for location C was slightly lower at 67.3%. The highest performing
location during the Summer study was location A with a 82.3% recovery of material. This
data illustrates that there is scope for improvement in all sampling areas in terms of
householders segregating greater quantities of material for recycling.
Chapter 3
Table 3.15 shows the composition data of the dry recyclable component in the three study
areas. They highlight that paper and card constitute the largest fraction in all three study
areas, representing in excess of 60% for all sampling locations in both the Winter and
Summer. This highlights that this scheme can have a significant impact in diverting BMW
away from landfill.
Another significant stream in all sampling locations was the plastics stream which ranged
from 9% to 17% at locations B and A respectively for the Winter classification, and ranged
from 11% to 14% at locations B and A respectively for the Summer classification.
Glass was only collected in the recycling scheme at location C and indeed was the second
largest fraction being 24% in the Winter classification. However, by the Summer
classification the proportion of glass in the dry recyclable stream had declined, although it
continued to be accepted by the new kerbside recycling scheme in operation.
At location B, the ‘other’ category constituted 21% of the recyclable waste stream in the
Winter classification which was essentially due to the bags being used for general MSW,
which had a significant impact on the quality of the recyclable, due to this contamination.
Although this had declined to 10% in the Summer classification, the bags continued to be
misused for general household waste. These results highlight that rogue users of the
scheme have a great impact on the overall performance of the recycling schemes, and
targeted education and awareness is required to improve this.
70
Chapter 3
Table 3.16 shows the weighted dry recyclable composition and arisings for participating
households within the case study authority, and shows that the overall average dry
recyclable arisings within the Authority was 4.65 kg/hh/wk. The results also highlight that
there was little difference in dry recyclable arisings in participating households, being 4.41
kg/hh/wk in the winter and 4.89 kg/hh/wk for the summer classification. The most
significant seasonal change observed was an increase in the amount paper and card within
the recyclable stream, increasing from 62.2% to 73.8% for the Winter and Summer
classifications respectively. The only other stream which varies significantly between both
seasons is the glass stream. However, in contrast to the paper and card stream, the glass
content declined from 9.5% to 2.3% for the Winter and Summer classifications
respectively.
Table 3.17 highlights that the average set out rate in the recycling schemes run by the case
study authority was 42%, which is inline with what is being achieved by other local
authorities in Wales and in wider areas of the UK (Woollam 2006; Bristol City Council
2000; Wilson and Williams 2007; Lyas et al. 2005; WRAP 2006). The Table also shows
the level of non-requested material in the dry recyclable stream. The results indicate that
the levels of non-requested materials were very similar for both classifications, being on
average 12.7%. The results show that there was a slight increase in the amount of
recyclable recovered in the summer classification compared to the winter classification,
being 73.5% and 77.2% for the Winter and Summer classifications respectively, with an
average figure of 75.4%.
71
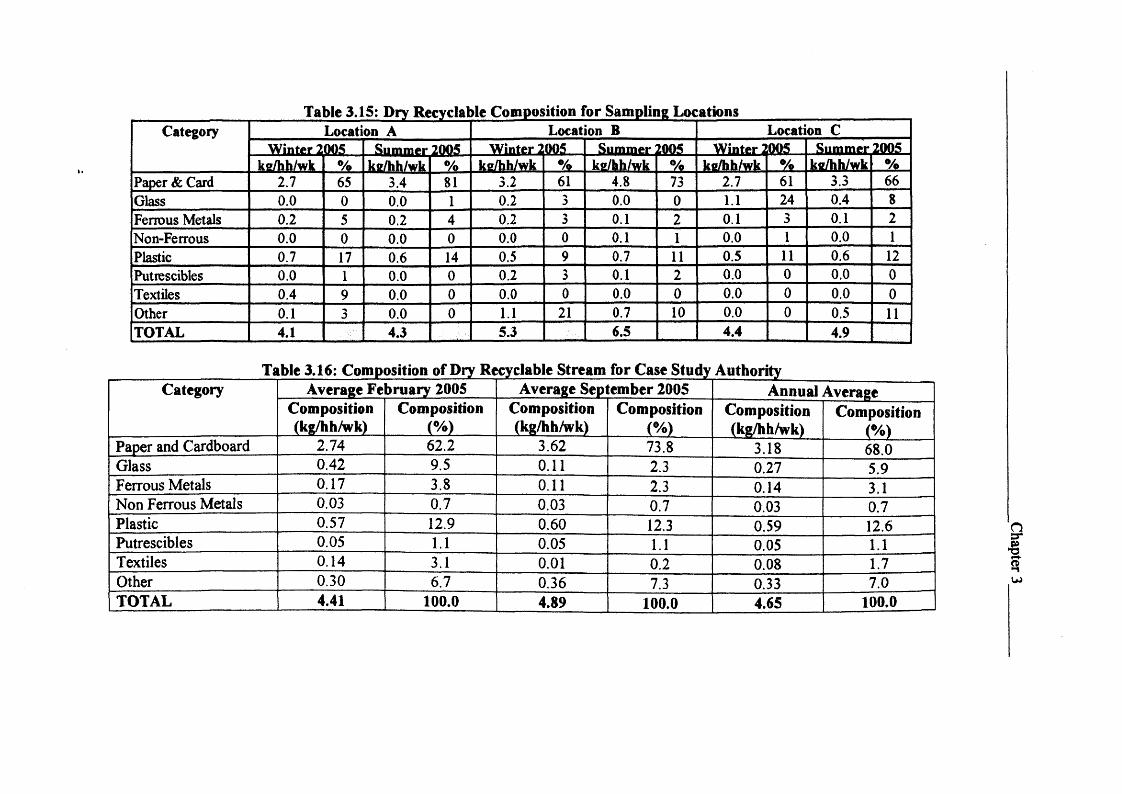
Table 3.15: Dry Recyclable Composition for Sampling LocationsCategory Location A Location B Location C
Winter 2005 Summer 2005 Winter 2095 Summer 2005 Winter 2005 Summer 2005kg/hh/wk % kg/hh/wk % kg/hh/wk % kg/hh/wk % kg/hh/wk % kg/hh/wk %
Paper & Card 2.7 65 3.4 81 3.2 61 4.8 73 2.7 61 3.3 66Glass 0.0 0 0.0 1 0.2 0.0 0 1.1 24 0.4 8Ferrous Metals 0.2 5 0.2 4 0.2 3 0.1 2 0.1 3 0.1 2Non-Ferrous 0.0 0 0.0 0 0.0 0 0.1 1 0.0 1 0.0 1Plastic 0.7 17 0.6 14 0.5 9 0.7 11 0.5 11 0.6 12Putrescibles 0.0 1 0.0 0 0.2 3 0.1 2 0.0 0 0.0 0Textiles 0.4 9 0.0 0 0.0 0 0.0 0 0.0 0 0.0 0Other 0.1 3 0.0 0 1.1 21 0.7 10 0.0 0 0.5 11TOTAL 4.1 4.3 5.3 6.5 4.4 4.9
Table 3,16: Composition of Pry Recyclable Stream for Case Study AuthorityCategory Average February 2005 Average Sepltember 2005 Annual Average
Composition(kg/hh/wk)
Composition..... (% ).... .
Composition(kg/hh/wk)
Composition(%)
Composition(kg/hh/wk)
Composition(%)
Paper and Cardboard 2.74 62.2 3.62 73.8 3.18 68.0Glass 0.42 9.5 0.11 2.3 0.27 5.9Ferrous Metals 0.17 3.8 0.11 2.3 0.14 3.1Non Ferrous Metals 0.03 0.7 0.03 0.7 0.03 0.7Plastic 0.57 12.9 0.60 12.3 0.59 12.6Putrescibles 0.05 1.1 0.05 1.1 0.05 1.1Textiles 0.14 3.1 0.01 0.2 0.08 1.7Other 0.30 6.7 0.36 7.3 0.33 7.0TOTAL 4.41 100.0 4.89 100.0 4.65 100.0

Chapter 3
Table 3.17: Set out Rates, Non-Requested Material and Recovery of Dry Recyclable
for Participating Households in the Case Study Authority
Average W inter 2005
Average Summer 2005
AnnualAverage
Set Out Rate (%) 43% 41% 42%Non-requested material (%) 12.6 12.8 12.7Recovery (%) 73.5 77.2 75.35
3.4.1.2 Paper and Cardboard
The results in Table 3.18 highlight the average amounts of different paper and cardboard
types found in the dry recyclable stream within the case study area. The results highlight
that the four largest fractions are newspaper, magazines, cardboard and other paper which
account for over 98% of the paper and cardboard stream in the dry recyclable bag in both
the winter and summer classifications.
The Table highlights that in the winter classification, the newspaper and magazines
categories account for the greatest recovery, being 92.6% and 86.4% respectively, which
are closely followed by the cardboard category which has a recovery rate of 70.8%. The
other significant recovery rate was observed for the other paper category at 52.5%. The
remaining categories of liquid cartons and composite packaging, were not requested in the
kerbside recycling scheme; however, recovery rates 25.0% and 20.0% were observed.
This emphasises that awareness of the materials requested by the kerbside scheme could be
improved. However, it is clear from the data collected for the Summer classification that
awareness remained an issue, indeed the situation had worsened, as the recovery rates for
these non-requested fractions were 33.3% and 66.7% for the liquid cartons and composite
73
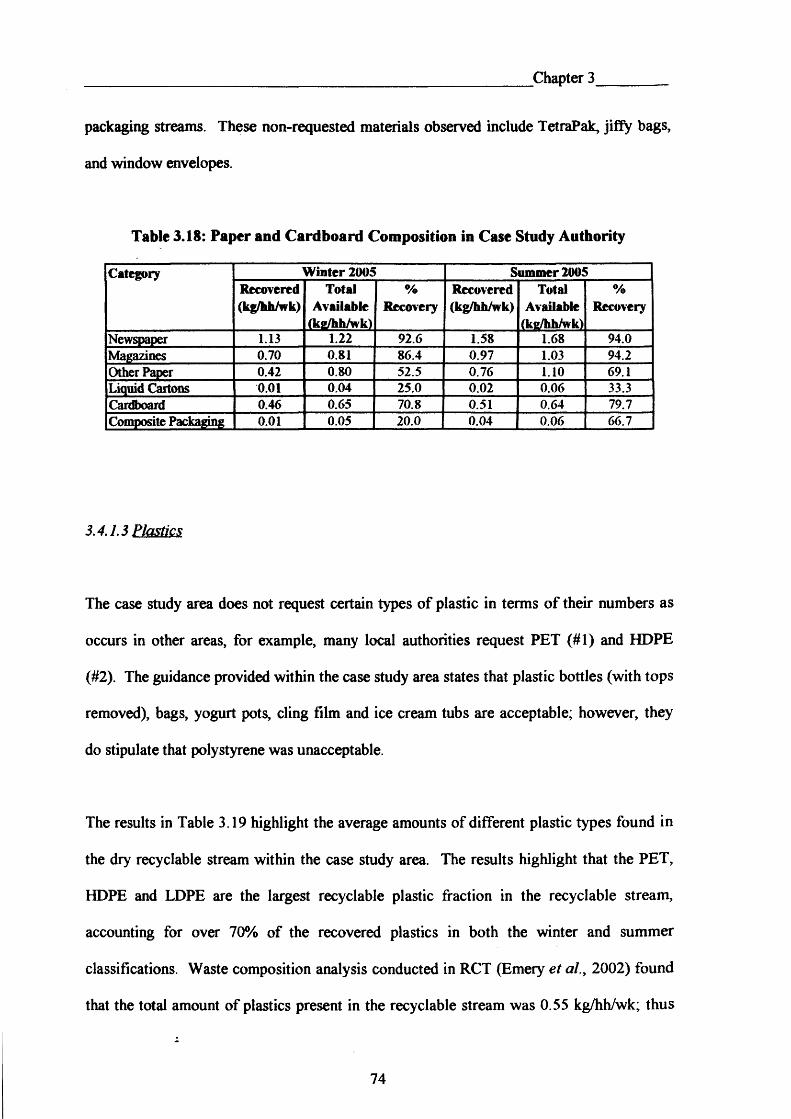
Chapter 3
packaging streams. These non-requested materials observed include TetraPak, jiffy bags,
and window envelopes.
Table 3.18: Paper and Cardboard Composition in Case Study Authority
Category Winter 2005 Summer 2005Recovered(kg/hh/wk)
TotalAvailable
(kg/hh/wk)
%Recovery
Recovered(kg/hh/wk)
TotalAvailable
(kg/hh/wk)
%Recovery
Newspaper 1.13 1.22 92.6 1.58 1.68 94.0Magazines 0.70 0.81 86.4 0.97 1.03 94.2Other Paper 0.42 0.80 52.5 0.76 1.10 69.1Liquid Cartons 0.01 0.04 25.0 0.02 0.06 33.3Cardboard 0.46 0.65 70.8 0.51 0.64 79.7Composite Packaging 0.01 0.05 20.0 0.04 0.06 66.7
3.4.1.3 Plastics
The case study area does not request certain types of plastic in terms of their numbers as
occurs in other areas, for example, many local authorities request PET (#1) and HDPE
(#2). The guidance provided within the case study area states that plastic bottles (with tops
removed), bags, yogurt pots, cling film and ice cream tubs are acceptable; however, they
do stipulate that polystyrene was unacceptable.
The results in Table 3.19 highlight the average amounts of different plastic types found in
the dry recyclable stream within the case study area. The results highlight that the PET,
HDPE and LDPE are the largest recyclable plastic fraction in the recyclable stream,
accounting for over 70% of the recovered plastics in both the winter and summer
classifications. Waste composition analysis conducted in RCT (Emery et al.y 2002) found
that the total amount of plastics present in the recyclable stream was 0.55 kg/hh/wk; thus
74
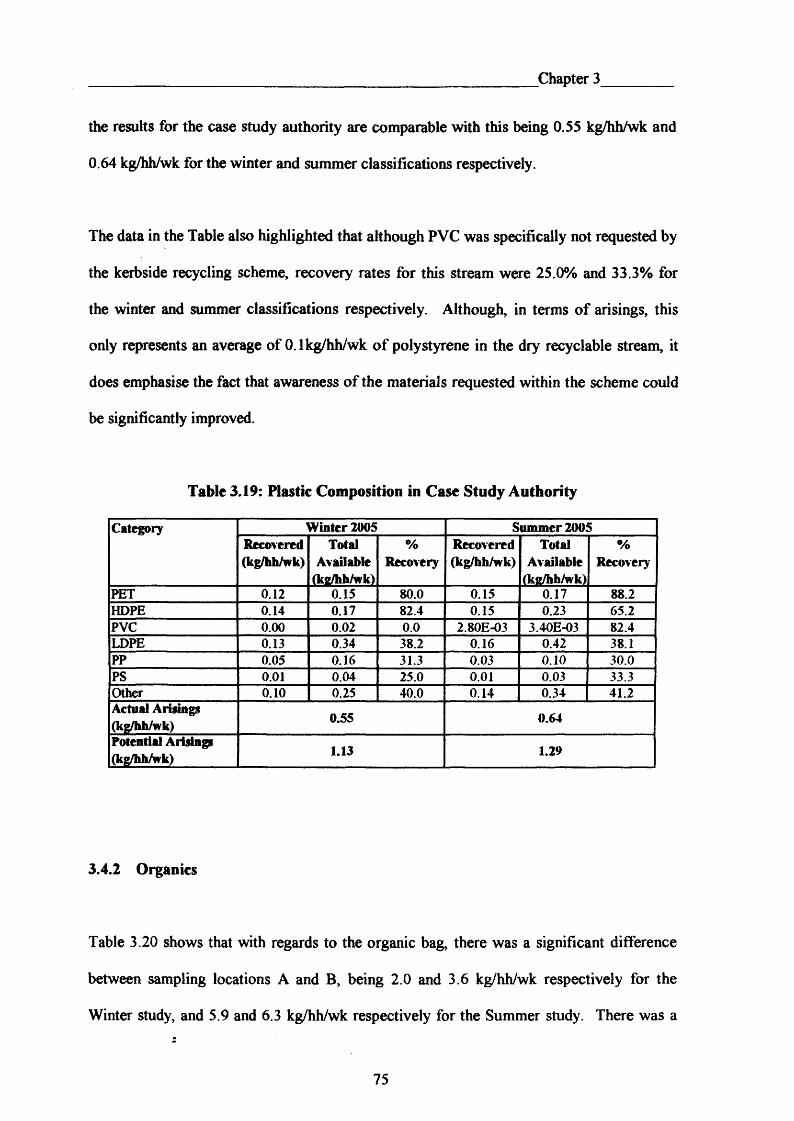
Chapter 3
the results for the case study authority are comparable with this being 0.55 kg/hh/wk and
0.64 kg/hh/wk for the winter and summer classifications respectively.
The data in the Table also highlighted that although PVC was specifically not requested by
the kerbside recycling scheme, recovery rates for this stream were 25.0% and 33.3% for
the winter and summer classifications respectively. Although, in terms of arisings, this
only represents an average of 0.1 kg/hh/wk of polystyrene in the dry recyclable stream, it
does emphasise the fact that awareness of the materials requested within the scheme could
be significantly improved.
Table 3.19: Plastic Composition in Case Study Authority
Category Winter 2005 Summer 2005Recovered(kg/hh/wk)
TotalAvailable
(kg/hh/wk)
%Recovery
Recovered(kg/hh/wk)
TotalAvailable
(kg/hh/wk)
%Recovery
PET 0.12 0.15 80.0 0.15 0.17 88.2HDPE 0.14 0.17 82.4 0.15 0.23 65.2PVC 0.00 0.02 0.0 2.80E-03 3.40E-03 82.4LDPE 0.13 0.34 38.2 0.16 0.42 38.1PP 0.05 0.16 31.3 0.03 0.10 30.0PS 0.01 0.04 25.0 0.01 0.03 33.3Other 0.10 0.25 40.0 0.14 0.34 41.2Actual Ariaags (kg/hh/wk) 0.55 0.64
Potential Arisings (kg/hh/wk) 1.13 1.29
3.4.2 Organics
Table 3.20 shows that with regards to the organic bag, there was a significant difference
between sampling locations A and B, being 2.0 and 3.6 kg/hh/wk respectively for the
Winter study, and 5.9 and 6.3 kg/hh/wk respectively for the Summer study. There was a
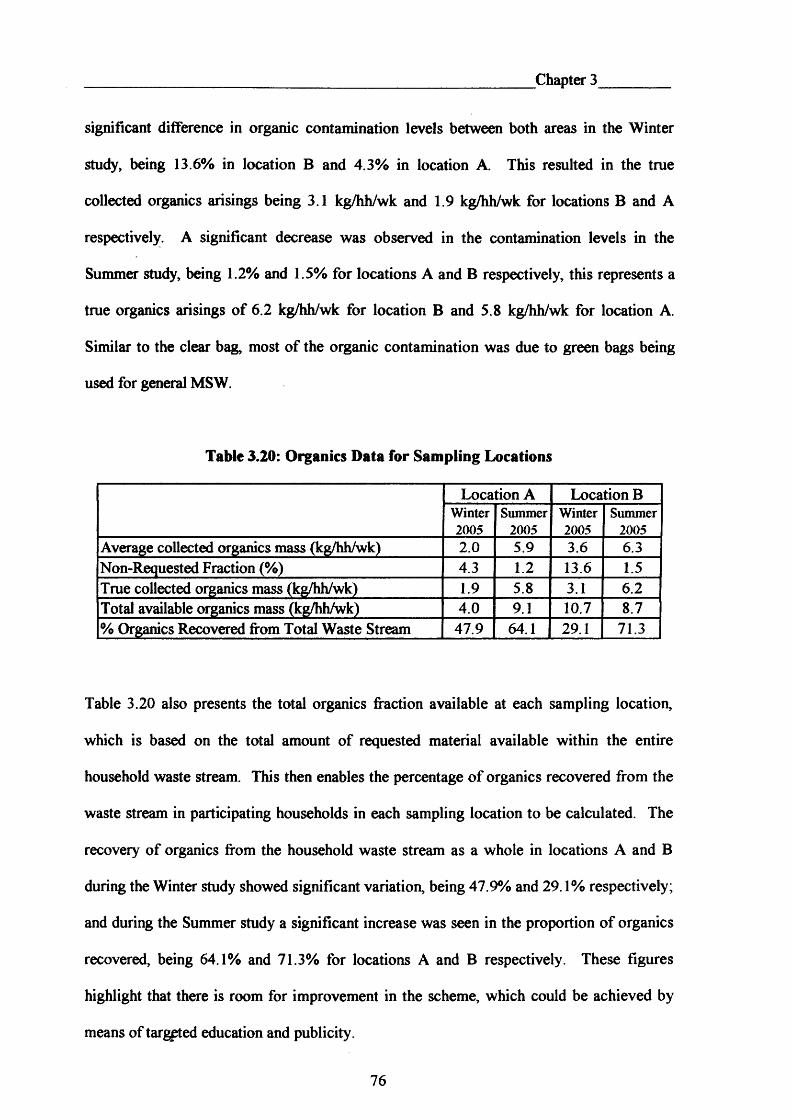
Chapter 3
significant difference in organic contamination levels between both areas in the Winter
study, being 13.6% in location B and 4.3% in location A. This resulted in the true
collected organics arisings being 3.1 kg/hh/wk and 1.9 kg/hh/wk for locations B and A
respectively. A significant decrease was observed in the contamination levels in the
Summer study, being 1.2% and 1.5% for locations A and B respectively, this represents a
true organics arisings of 6.2 kg/hh/wk for location B and 5.8 kg/hh/wk for location A.
Similar to the clear bag, most of the organic contamination was due to green bags being
used for general MSW.
Table 3.20: Organics Data for Sampling Locations
Location A Location BWinter2005
Summer2005
Winter2005
Summer2005
Average collected organics mass (kg/hh/wk) 2.0 5.9 3 .6 6.3Non-Requested Fraction (%) 4.3 1.2 13.6 1.5True collected organics mass (kg/hh/wk) 1.9 5.8 3.1 6.2Total available organics mass (kg/hh/wk) 4.0 9.1 10.7 8.7% Organics Recovered from Total Waste Stream 47.9 64.1 29.1 71.3
Table 3.20 also presents the total organics fraction available at each sampling location,
which is based on the total amount of requested material available within the entire
household waste stream. This then enables the percentage of organics recovered from the
waste stream in participating households in each sampling location to be calculated. The
recovery of organics from the household waste stream as a whole in locations A and B
during the Winter study showed significant variation, being 47.9% and 29.1% respectively;
and during the Summer study a significant increase was seen in the proportion of organics
recovered, being 64.1% and 71.3% for locations A and B respectively. These figures
highlight that there is room for improvement in the scheme, which could be achieved by
means of targeted education and publicity.
76
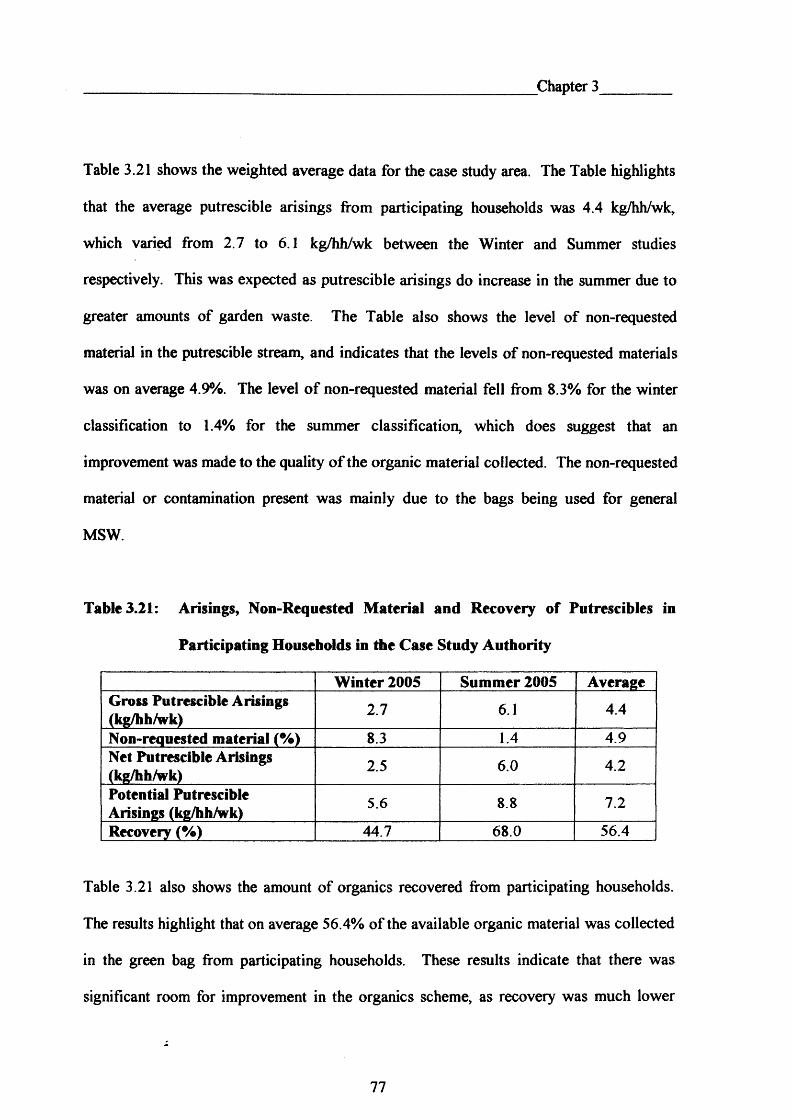
Chapter 3
Table 3.21 shows the weighted average data for the case study area. The Table highlights
that the average putrescible arisings from participating households was 4.4 kg/hh/wk,
which varied from 2.7 to 6.1 kg/hh/wk between the Winter and Summer studies
respectively. This was expected as putrescible arisings do increase in the summer due to
greater amounts of garden waste. The Table also shows the level of non-requested
material in the putrescible stream, and indicates that the levels of non-requested materials
was on average 4.9%. The level of non-requested material fell from 8.3% for the winter
classification to 1.4% for the summer classification, which does suggest that an
improvement was made to the quality o f the organic material collected. The non-requested
material or contamination present was mainly due to the bags being used for general
MSW.
Table 3.21: Arisings, Non-Requested Material and Recovery of Putrescibles in
Participating Households in the Case Study Authority
Winter 2005 Summer 2005 AverageGross Putrescible Arisings (kg/hh/wk) 2.7 6.1 4.4
Non-requested material (%) 8.3 1.4 4.9Net Putrescible Arisings (kg/hh/wk) 2.5 6.0 4.2
Potential Putrescible Arisings (kg/hh/wk) 5.6 8.8 7.2
Recovery (%) 44.7 68.0 56.4
Table 3.21 also shows the amount of organics recovered from participating households.
The results highlight that on average 56.4% of the available organic material was collected
in the green bag from participating households. These results indicate that there was
significant room for improvement in the organics scheme, as recovery was much lower
77
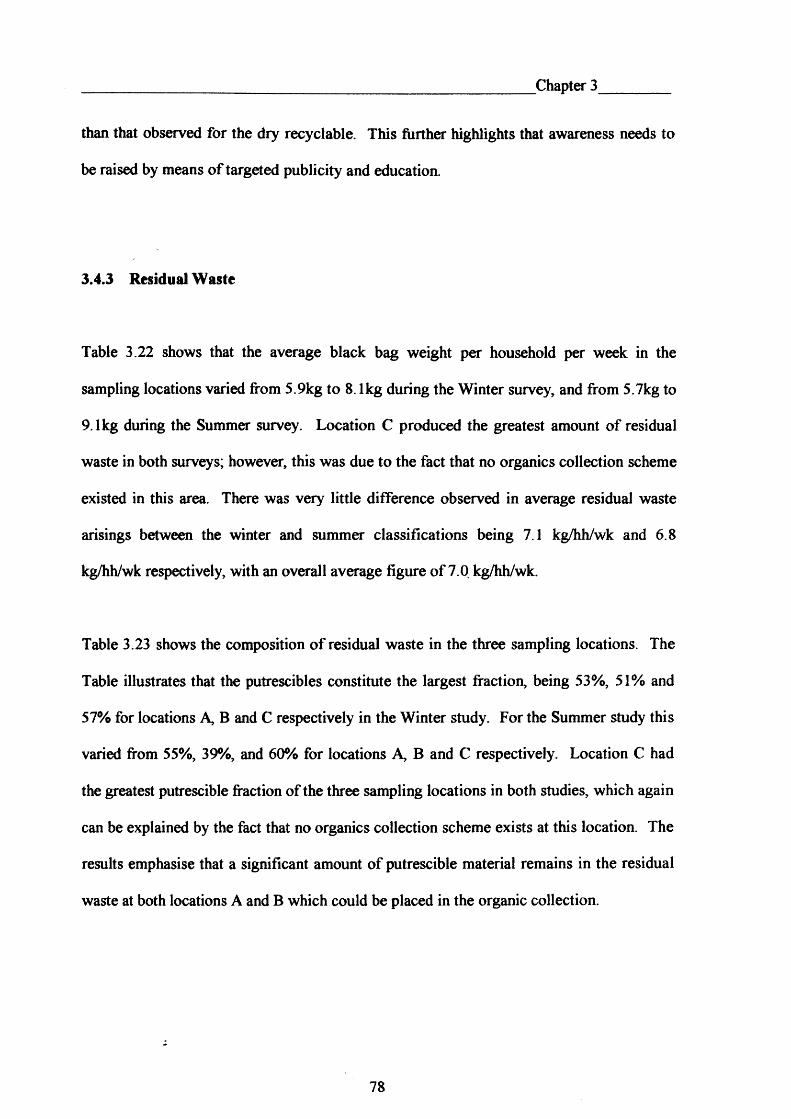
Chapter 3
than that observed for the dry recyclable. This further highlights that awareness needs to
be raised by means of targeted publicity and education.
3.4.3 Residual Waste
Table 3.22 shows that the average black bag weight per household per week in the
sampling locations varied from 5.9kg to 8.1kg during the Winter survey, and from 5.7kg to
9.1kg during the Summer survey. Location C produced the greatest amount of residual
waste in both surveys; however, this was due to the fact that no organics collection scheme
existed in this area. There was very little difference observed in average residual waste
arisings between the winter and summer classifications being 7.1 kg/hh/wk and 6.8
kg/hh/wk respectively, with an overall average figure of 7.0 kg/hh/wk.
Table 3.23 shows the composition of residual waste in the three sampling locations. The
Table illustrates that the putrescibles constitute the largest fraction, being 53%, 51% and
57% for locations A, B and C respectively in the Winter study. For the Summer study this
varied from 55%, 39%, and 60% for locations A, B and C respectively. Location C had
the greatest putrescible fraction of the three sampling locations in both studies, which again
can be explained by the fact that no organics collection scheme exists at this location. The
results emphasise that a significant amount of putrescible material remains in the residual
waste at both locations A and B which could be placed in the organic collection.
78
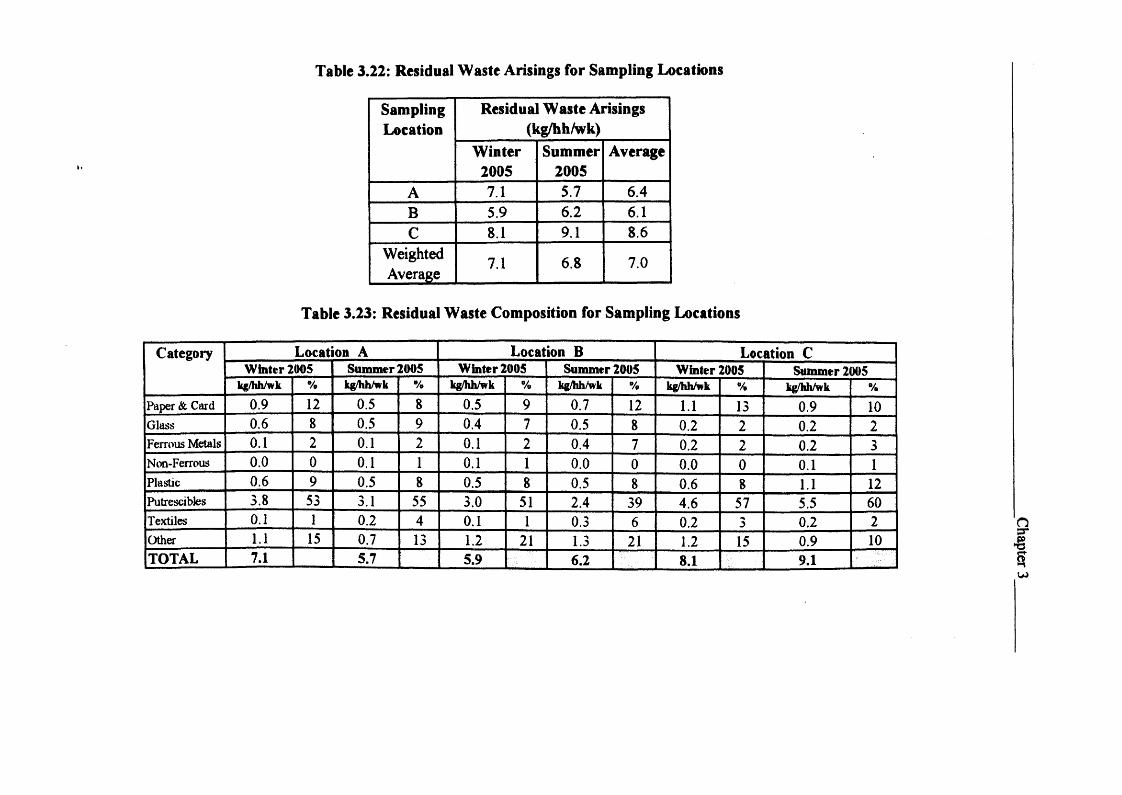
Table 3.22: Residual Waste Arisings for Sampling Locations
SamplingLocation
Residual Waste Arisings (kg/hh/wk)
Winter200S
Summer2005
Average
A 7.1 5.7 6.4B 5.9 6.2 6.1C 8.1 9.1 8.6
WeightedAverage
7.1 6.8 7.0
Table 3.23: Residual Waste Composition for Sampling Locations
Category Location A Location B Location CWinter 2005 Summer 2005 Winter 2005 Summer 2005 Winter 2005 Summer 2005
kg/hh/wk % kg/hh/wk % kg/hh/wk % kg/hh/wk % kg/hh/wk % kg/hh/wk %Paper & Card 0.9 12 0.5 8 0.5 9 0.7 12 1.1 13 0.9 10Glass 0.6 8 0.5 9 0.4 7 0.5 8 0.2 2 0.2 2Ferrous Metals 0.1 2 0.1 2 0.1 2 0.4 7 0.2 2 0.2 3Non-Ferrous 0.0 0 0.1 1 0.1 1 0.0 0 0.0 0 0.1 1Plastic 0.6 9 0.5 8 0.5 8 0.5 8 0.6 8 1.1 12Putrescibles 3.8 53 3.1 55 3.0 51 2.4 39 4.6 57 5.5 60Textiles 0.1 1 0.2 4 0.1 1 0.3 6 0.2 •> 0.2 2Other 1.1 15 0.7 13 1.2 21 1.3 21 1.2 15 0.9 10TOTAL 7.1 5.7 5.9 6.2 8.1 9.1

Chapter 3
In locations A and B, the ‘other’ fraction was the next largest fraction, which varied from
15% to 13% for the Winter and Summer classifications at locations A, and 21% for both
Winter and Summer classifications at locations B. This was mainly as a result of the
presence of fines, which arise from coal household heating, and also due to the presence of
nappies.
Paper and card was also a significant component of the residual waste stream, which
represented 12%, 9% and 13% for the Winter study in locations A, B and C respectively,
and 8%, 12% and 10% respectively for the Summer study. Again, much of this material
could be diverted via the kerbside recycling scheme. Similarly glass, metals and plastics
remain in the residual waste stream, and much of this could also be diverted via the
kerbside recycling scheme.
Given the significant quantity of recyclable and organics remaining in the residual waste
stream, this again emphasises the need for targeted awareness and education in order to
segregate this material via the kerbside recycling scheme.
3.4.4 Total Household Waste
Table 3.24 highlights the average household waste arisings for each sampling location, the
results varied from 12.5kg in location C, to 14.8kg in location B during the winter, and
from 14.0kg in location C, to 19.1kg in Location B during the summer study. The results
highlight that the most rural area, i.e. location B generated the greatest amount of waste of
all three study areas in both the winter and summer analysis. The weighted average for all
80
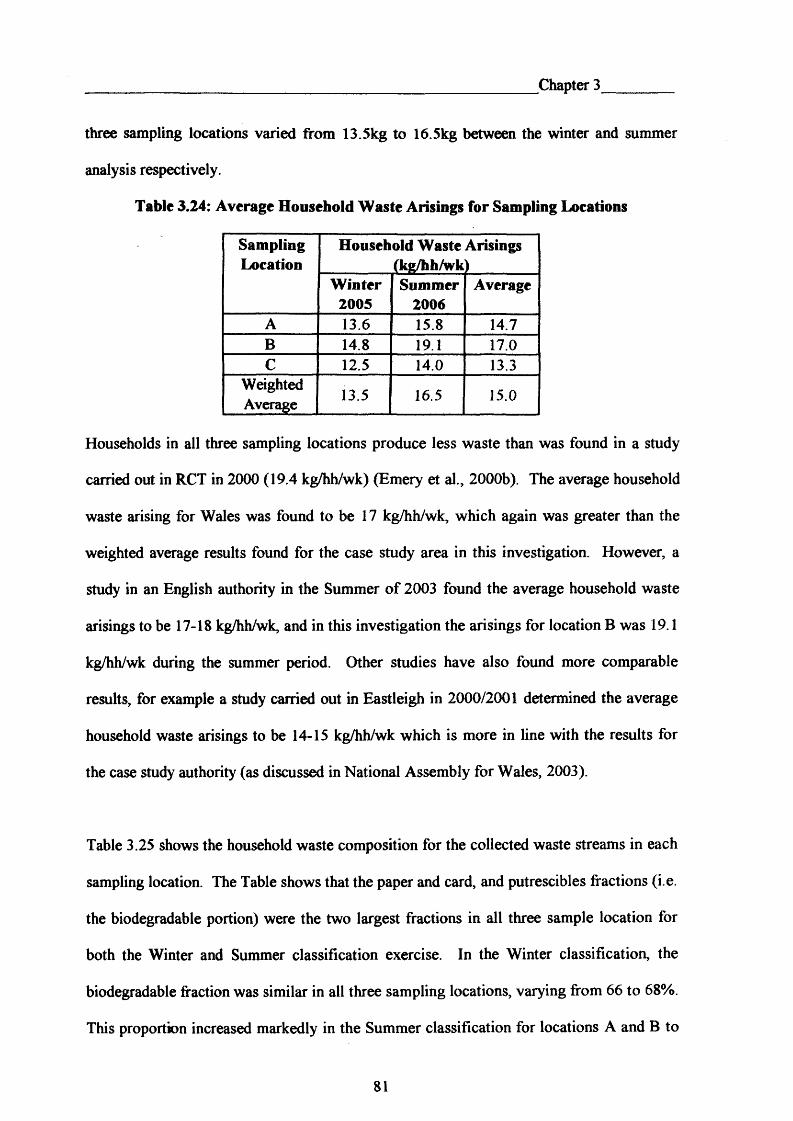
Chapter 3
three sampling locations varied from 13.5kg to 16.5kg between the winter and summer
analysis respectively.
Table 3.24: Average Household Waste Arisings for Sampling Locations
SamplingLocation
Household Waste Arisings (kg/hh/wk)
W inter2005
Summer2006
Average
A 13.6 15.8 14.7B 14.8 19.1 17.0C 12.5 14.0 13.3
WeightedAverage 13.5 16.5 15.0
Households in all three sampling locations produce less waste than was found in a study
carried out in RCT in 2000 (19.4 kg/hh/wk) (Emery et al., 2000b). The average household
waste arising for Wales was found to be 17 kg/hh/wk, which again was greater than the
weighted average results found for the case study area in this investigation. However, a
study in an English authority in the Summer of 2003 found the average household waste
arisings to be 17-18 kg/hh/wk, and in this investigation the arisings for location B was 19.1
kg/hh/wk during the summer period. Other studies have also found more comparable
results, for example a study carried out in Eastleigh in 2000/2001 determined the average
household waste arisings to be 14-15 kg/hh/wk which is more in line with the results for
the case study authority (as discussed in National Assembly for Wales, 2003).
Table 3.25 shows the household waste composition for the collected waste streams in each
sampling location. The Table shows that the paper and card, and putrescibles fractions (i.e.
the biodegradable portion) were the two largest fractions in all three sample location for
both the Winter and Summer classification exercise. In the Winter classification, the
biodegradable fraction was similar in all three sampling locations, varying from 66 to 68%.
This proportion increased markedly in the Summer classification for locations A and B to
81
Chapter 3
82% and 78% respectively. However, the Summer biodegradable fraction for location C
remained similar to that in the winter, increasing from 66% to 69%. In terms of the
statutory requirement to divert BMW from landfill, the Landfill Allowance Scheme
(Wales) Regulations 2004 (Statutory Instrument Number 1490) defines MSW in Wales as
containing 61% BMW. Hence, it can be seen that in all three sampling locations, the value
of 61% was exceeded in both the winter and summer classifications.
Fractions of glass, ferrous metals, non-ferrous metals, and textiles were comparable in all
three sampling locations. There was almost double the proportion of glass present in the
waste stream in location C in the Winter classification compared to all of the other results.
An anomaly can also be seen in terms of the proportion of plastics in the household waste
stream, the proportion was greater in the Summer classification at location C, compared to
all of the other results.
The ‘other’ component is a significant contributor to the waste composition and arisings in
each sampling location. In the Winter classification, the ‘other’ category represented 19%
at location B, which was significantly greater than the other two sampling locations being
12% and 10% for locations A and C respectively. The ‘other’ category consisted of fines,
inert material, nappies and miscellaneous, and had a substantial impact on the waste stream
in both locations A and B. Indeed, at location A the fines and miscellaneous sub-divisions
constituted 9% of the total waste stream, and the miscellaneous sub-division constituted
14% of the total waste stream in Location B. In the Summer classification, ‘other’ fraction
was similar for locations B and C being 11% and 10% respectively. At location A this
fraction was half of that in the other Summer sampling locations, representing only 5% of
the household waste stream.
82
Chapter 3
Comparing the results for location A, with the average Welsh composition as shown in
Table 1.1 (National Assembly for Wales, 2003), it can be seen that for the winter
classification, paper and card, metals and textiles were present in similar quantities to the
Welsh average proportions of 25%, 5% and 2% respectively. Glass was lower than the
Welsh average of 7%, this may be due to the use of bottle banks. The significant
difference, was the putrescible fraction, which was significantly higher in location A, than
the Welsh average figure of 36%. For the Summer classification, the results highlight that
although the paper and card fraction was present in similar quantities to the Wales figure of
25%, the remaining categories showed marked variations. For example, putrescibles
constituted a significantly larger fraction at 57%, compared to the Welsh Average of 36%.
Plastics represented considerably less o f the waste stream in location A being 7%
compared to the Welsh Average of 11%. Metals constituted only 2% of the waste stream
in location A compared to the Welsh figure of 5%.
Comparing the data for location B to the Wales composition (National Assembly for
Wales, 2003), highlights that in the Winter classification paper and card levels were similar
in proportion to the figure for Wales at 25%. Glass was lower which again may be due to
the use of bottle banks. Also, metals were half the figure of 5% quoted for Wales. Again,
the putrescible fraction was significantly greater than the Welsh average. The Summer
classification data highlights that paper and card level at 29% was slightly greater than the
values quoted for Wales and RCT which was 25%. Again, glass and metals were
significantly lower than the Welsh figures, and the putrescible fraction was greater than the
Welsh average.
83
Chapter 3
The winter classification data for location C, highlights that paper and card make up more
of the waste stream at 30% than the Welsh average of 25%. The total metal content was
less than the Wales figure of 5%. Furthermore, putrescibles and textiles were found in
similar proportions to the Wales study. The Summer classification data highlights again
that the putrescible component of the household waste stream was 39%, only slightly
greater than the Wales value of 36%. Similarly, the plastics component in the Location C
waste stream was similar to the Wales at 12%. The glass and metal contents were lower
than the figures quoted for Wales being 4.2% and 3.0% respectively.
Table 3.26 highlights the weighted average mass of eight major components analysed in
the household waste stream within the case study authority for the Winter and Summer
classifications. The Winter classification data highlights that there was approximately 8%
more paper and card present in the household waste stream than in studies conducted for
Wales and RCT. The results highlight that there was significantly more putrescibles in the
waste stream at 41%, compared to the figures quoted for Wales and RCT, being 36% and
30% respectively. The results also show that there was less metals, glass and plastic in the
Case Study household waste stream, compared to figure produced for Wales. The Summer
classification data shows that there were similar proportions of paper and card, and textiles
present in the household waste stream as in studies conducted for Wales. A significant
difference however between the data is that the putrescible element of the waste stream
was significantly greater for the case study authority than was found in other studies. The
results also show that there were less proportions of metals, glass and plastics present in
the household waste stream compared to Wales and RCT (National Assembly for Wales,
2003; Emery et al., 2000b; Owen et al.y 2007a).
84

Table 3.25: Total Waste Composition for Sampling LocationsCategory Locat ion A Location B Location C
Winter 2005 Summer 2005 Winter 2005 Summer 2005 Winter 2005 Summer 2005
kg/hh/wk % kg/hh/wk % kg/hh/wk % kg/hh/wk % kg/hh/wk % kg/hh/wk %Paper & Card 3.4 25 3.9 25 3.8 26 5.5 29 3.8 30 4.2 30Glass 0.7 5 0.6 4 0.6 4 0.5 3 1.1 9 0.6 4Ferrous Metals 0.4 3 0.2 1 0.3 2 0.6 3 0.4 3 0.3 2Non-Ferrous 0.0 0 0.1 0 0.0 0 0.1 0 0.1 1 0.1 1Plastic 1.2 9 1.1 7 1.0 7 1.2 6 1.1 9 1.7 12Putrescibles 5.8 43 9.0 57 6.2 42 8.7 46 4.5 36 5.5 39Textiles 0.4 3 0.2 1 0.0 0 0.4 2 0.3 2 0.2 2Other 1.6 12 0.8 5 2.8 19 2.1 11 1.3 10 1.4 10TOTAL 13.6 15.8 14.8 19.1 12.5 14.0
Table 3.26: Total Weighted Average Household Waste Composition for Case Study AreaCategory Winter 2005 Summer 2005 Average
kg/hh/wk % kg/hh/wk % kg/hh/wk %Paper & Card 3.6 26.7 4.2 25.2 3.9 25.8Glass 0.8 5.9 0.5 3.0 0.7 4.3Ferrous Metals 0.4 3.0 0.3 2.1 0.4 2.5Non-Ferrous Metals 0.1 0.7 0.1 0.5 0.1 0.6Plastic 1.1 8.1 1.2 7.1 1.1 7.6Putrescibles 5.5 40.7 8.7 52.7 7.1 47.3Textiles 0.2 1.5 0.3 1.5 0.2 1.5Other 1.8 13.3 1.3 8.0 1.6 10.4TOTAL 13.5 100.0 16.5 100.0 15.0 100.0

Chapter 3
The results also highlight that there was an increase in household waste arisings in the
summer classification compared to the winter classification, being 16.5 kg/hh/wk
compared to 13.5 kg/hh/wk. This increase was mainly observed in the paper and card, and
putrescible fractions, which are the biodegradable components of MSW. An increase in
the putrescible fraction was expected as the amount of garden waste produced was greater
during the summer than the winter. The Biodegradable Municipal Waste (BMW) fraction
is defined as putrescible, wood, paper and card. The average BMW fraction for the case
study authority was 72.4%, which was significantly greater than the 61% BMW fraction
stated for Wales. Thus, a greater pool of material was available which can be targeted to
meet their Landfill Allowance Scheme Targets.
3.4.5 Townsend Index
Townsend Index is used as a measure of affluence/ socio-economic activity, and a negative
value shows greater affluence and a positive score less affluence. Further information on
the derivation of the Townsend Index is highlighted in Appendix A. Figure 3.1 highlights
that a typical linear relationship exists between set out rate (from the Winter study) and
Townsend Index in the case study authority. The Figure also highlights that this trend was
observed in another study conducted in RCT. Indeed the results for RCT and the case
study authority are similar in that areas of the same Townsend Index score have similar
weekly set out rates. For example, from Figure 3.1a Townsend score of -2, would relate
to a weekly set out rate of 47% in the case study authority and a figure of 48% in RCT;
while a Townsend score of +2, would relate to set out rates of 42% and 38% for the case
study authority and RCT respectively (Woollam, 2006).
86
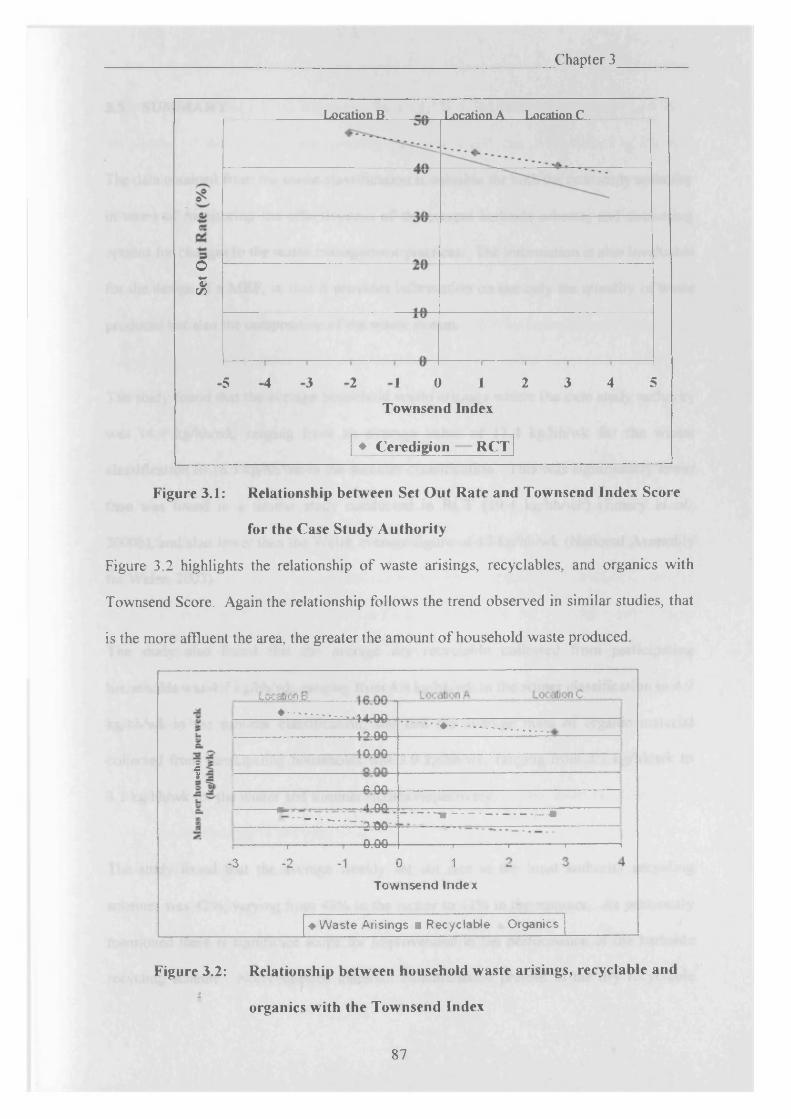
Chapter 3
Location B Location A Location C.
01
•2 2 4 5•5 4 3 1 0 1 3
Townsend Index
♦ Ceredigion RCT
Figure 3.1: Relationship between Set Out Rate and Townsend Index Score
for the Case Study Authority
Figure 3.2 highlights the relationship of waste arisings, recyclables, and organics with
Townsend Score. Again the relationship follows the trend observed in similar studies, that
is the more affluent the area, the greater the amount of household waste produced.
—
1
UwqUU'l O ___ ______
* ................................ ad........ . — ■ f 4 - y y -4 o nr\ ........" ........................................... ..
1A A A------ - ----------
ft AA- - — - - — - A AA
TT' * ? AA------------, ---------------------------- •
----------- ^w
----------------- ,-----------------------OrOO- ----------- ,---------------- ,-----------------,---------------- j
-3 - 2 - 1 0 1
Townsend Index
♦ W aste Arisings ■ Recyclable Organics
Figure 3.2: Relationship between household waste arisings, recyclable and!
organics with the Townsend Index
87
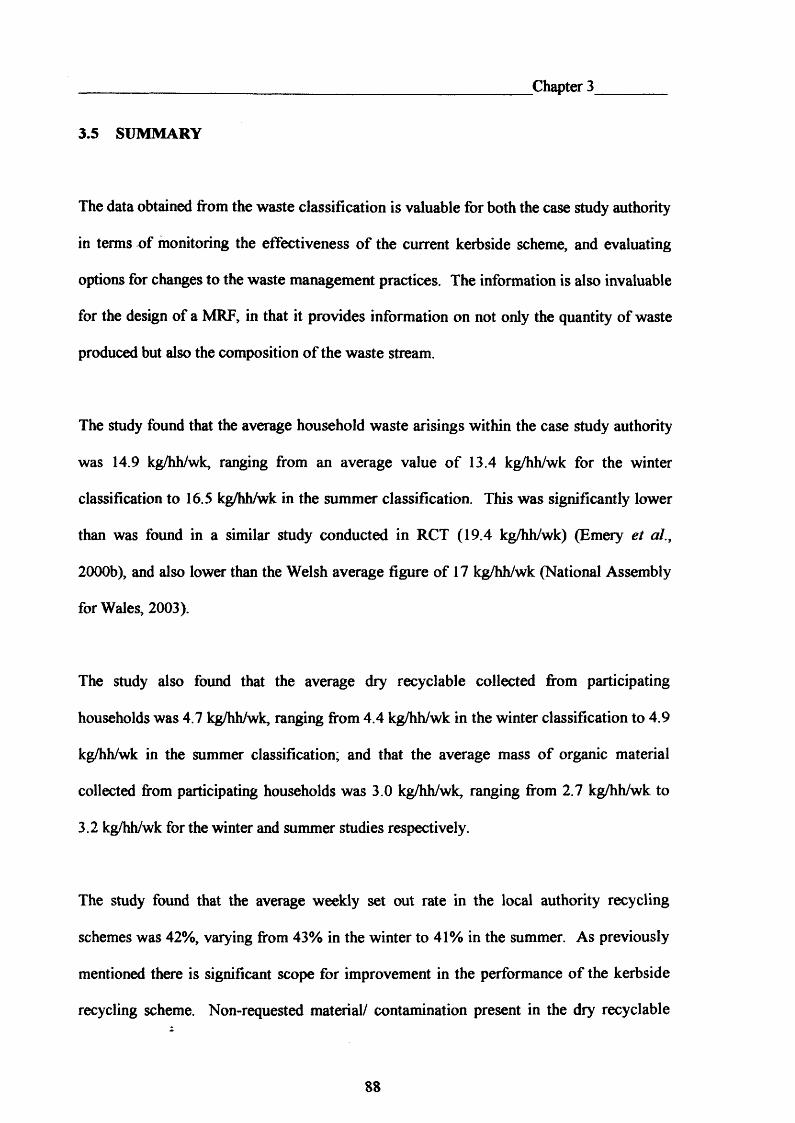
Chapter 3
3.5 SUMMARY
The data obtained from the waste classification is valuable for both the case study authority
in terms o f monitoring the effectiveness of the current kerbside scheme, and evaluating
options for changes to the waste management practices. The information is also invaluable
for the design of a MRF, in that it provides information on not only the quantity of waste
produced but also the composition of the waste stream.
The study found that the average household waste arisings within the case study authority
was 14.9 kg/hh/wk, ranging from an average value of 13.4 kg/hh/wk for the winter
classification to 16.5 kg/hh/wk in the summer classification. This was significantly lower
than was found in a similar study conducted in RCT (19.4 kg/hh/wk) (Emery et al.9 2000b), and also lower than the Welsh average figure of 17 kg/hh/wk (National Assembly
for Wales, 2003).
The study also found that the average dry recyclable collected from participating
households was 4.7 kg/hh/wk, ranging from 4.4 kg/hh/wk in the winter classification to 4.9
kg/hh/wk in the summer classification; and that the average mass of organic material
collected from participating households was 3.0 kg/hh/wk, ranging from 2.7 kg/hh/wk to
3.2 kg/hh/wk for the winter and summer studies respectively.
The study found that the average weekly set out rate in the local authority recycling
schemes was 42%, varying from 43% in the winter to 41% in the summer. As previously
mentioned there is significant scope for improvement in the performance of the kerbside
recycling scheme. Non-requested material/ contamination present in the dry recyclable
88

Chapter 3
stream was on average 11%, and varied from 12.5% in the winter classification to 10% in
the summer classification. This contamination was largely due to the misuse of the clear
bags; these bags were provided free of charge to householders while black bags were not.
Thus, many householders used the clear bags for general household waste. This has an
impact on the quality of material available for recovery, and the case study authority must
impose stricter controls at the kerbside to reduce the level of contamination within this dry
recyclable stream. Similarly, non-requested material or contamination was an issue in the
putrescible stream i.e. green bags, and ranged from 8.3% in the winter classification to
1.3% in the summer classification.
It was interesting to note that the biodegradable content of household waste was found to
be 72%, which was significantly greater than the 61% used to define the Landfill
Allowance Scheme figures for Wales; hence, the case study authority has a larger pool of
organic material to target in order to comply with the stringent Landfill Allowance targets.
However, much of this biodegradable material remained in the residual waste stream.
Thus, two options are available for the case study authority, these are:
• The case study authority could significantly improve its performance in terms of
the Landfill Allowance scheme by increasing the number of households
participating in the scheme, and also increasing the amount of organic material
being segregated at the kerbside by the householder. This could be achieved by
targeted education and awareness.
• Alternatively, processing of residual waste could recover material from
householders that do not participate in the scheme, i.e. participation in a residual
waste processing route would be 100% by definition. Hence, significant quantities
of recyclables and organics could be segregated by processing this stream.
89

Chapter 4
CHAPTER 4: Material Recovery Facilities
90

Chapter 4
4.1 INTRODUCTION
Material Recovery Facilities (MRFs) (sometimes called Material Recycling Facilities or
Material Reprocessing Facilities) can be defined as “a central operation where source-
segregated, dry recyclable materials are sorted, mechanically or manually, to market
specifications for processing into secondary materials” (CIWM, 2000). This definition
however only covers a MRF that is commonly referred to as ‘clean’, that is one which
processes source segregated dry recyclable. This definition by CIWM does not cover other
types of facilities such as ‘dirty* MRFs or mixed solid waste sorting facilities (MSWSF),
i.e. processes which recover material for recycling from mixed household waste and
commercial and industrial waste.
There are potentially many possible designs which could be used. Therefore, it is difficult
to define a ‘typical’ process. Broadly speaking MRFs can be split into two categories,
these being ‘clean’ and ‘dirty’. Within these categories however processes can range from
a ‘low-tech’ to a ‘high-tech’ facility. At its simplest a ‘low-tech’ process can simply be a
raised conveyor on which the materials pass and are handsorted, while a ‘high-tech’
facility can consist of a fully automated system and utilise various unit operations which
exploit the differences in the properties of the recyclable. The decision as to whether to
install a ‘low-tech’ or ‘high-tech’ operation can be difficult as there are benefits to each
type.
The advantages of a ‘low-tech’ operation are:
• lower capital cost than a ‘high-tech’ MRF; and,
91
Chapter 4
• increased flexibility in terms o f the segregated material, i.e. if there are changes in
the market, operatives can be instructed to pick in a different manner.
The disadvantages of a ‘low-tech* operation are:
• higher operating costs than a ‘high-tech* MRF; and,
• lower throughput and efficiency than a ‘high-tech’ MRF.
The advantages of a ‘high-tech* operation are:
• lower operating costs than a ‘low-tech* MRF;
• generally have greater throughput of material than a ‘low-tech* MRF; and,
• have higher efficiencies than a ‘low-tech’ MRF.
The disadvantages of a ‘high-tech’ operation are:
• higher capital costs than a ‘low-tech’ MRF; and,
• risk that material would have to be stockpiled in the event of equipment failure.
4.2 EQUIPMENT
The main types of equipment used in MRFs are those for:
• material preparation, e.g. bag splitters, and feed hoppers;
• material transportation, e.g. conveyors; and,
• material separation, e.g. overband magnets, ballistic separators and disc screens.
4.2.1 Material Preparation
The key pieces of equipment which are used for material preparation include: bag splitters,
shredders, balers and compactors. Bag splitters as the name suggests are used to open
92
Chapter 4
bagged material which enters the MRF. Bag splitters usually consist of a hopper with a
conveyor system at the bottom, this feeds the material towards a rotating drum, this drum
traps, opens and empties the bag, without damaging the contents of the bags. As well as
opening bags, the bag splitter also acts as a metering system for the infeed into the plant, to
ensure a continuous smooth flow of material (Okay Engineering Services Ltd., 2005).
4.2.2 Material Transportation
The key piece of equipment which are used for material transportation are conveyors.
There are a variety of different type of conveyors, ranging from infloor conveyors, which
can be used to load material into the MRF or used in an automated baling system, to
picking belts, which as the name suggests are used at sorting stations, to enable operatives
to sort material.
4.2.3 Sorting Equipment
There is a huge variety of different technologies utilised for material separation. These
differing pieces of equipment have the same ultimate purpose, that is to utilise the differing
properties of different material types in order to separate material from the incoming waste
stream. The main equipment groups for material separation are:
• air classifiers;
• magnetic separation;
• size classifiers; and,
• optical sorting.
93
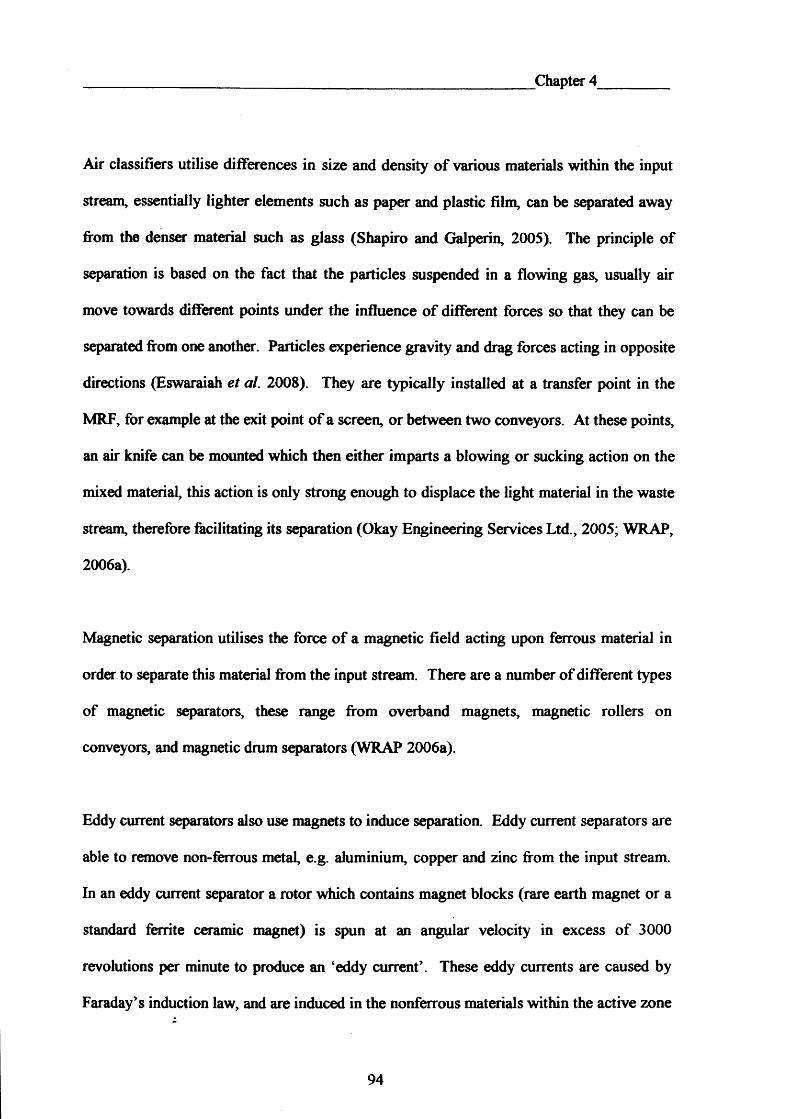
Chapter 4
Air classifiers utilise differences in size and density of various materials within the input
stream, essentially lighter elements such as paper and plastic film, can be separated away
from the denser material such as glass (Shapiro and Galperin, 2005). The principle of
separation is based on the fact that the particles suspended in a flowing gas, usually air
move towards different points under the influence of different forces so that they can be
separated from one another. Particles experience gravity and drag forces acting in opposite
directions (Eswaraiah et al. 2008). They are typically installed at a transfer point in the
MRF, for example at the exit point of a screen, or between two conveyors. At these points,
an air knife can be mounted which then either imparts a blowing or sucking action on the
mixed material, this action is only strong enough to displace the light material in the waste
stream, therefore facilitating its separation (Okay Engineering Services Ltd., 2005; WRAP,
2006a).
Magnetic separation utilises the force of a magnetic field acting upon ferrous material in
order to separate this material from the input stream. There are a number of different types
of magnetic separators, these range from overband magnets, magnetic rollers on
conveyors, and magnetic drum separators (WRAP 2006a).
Eddy current separators also use magnets to induce separation. Eddy current separators are
able to remove non-ferrous metal, e.g. aluminium, copper and zinc from the input stream.
In an eddy current separator a rotor which contains magnet blocks (rare earth magnet or a
standard ferrite ceramic magnet) is spun at an angular velocity in excess of 3000
revolutions per minute to produce an ‘eddy current’. These eddy currents are caused by
Faraday’s induction law, and are induced in the nonferrous materials within the active zone
94

Chapter 4
of the separator as a response to the magnetic field. The interaction between the eddy
currents and the magnetic field results in repulsive electrodynamic forces on the nonferrous
materials within the active zone, thus allowing the nonferrous metals to be separated from
the input stream (Alumatter 2007; WRAP 2006a; Lungu, 2005). The magnitude of these
repulsive forces is dependant on the electrical conductivity of the nonferrous material, as
the conductivity influences the size of the eddy currents induced (Zhang et al. 1998).
Size classifiers utilise the different sizes o f materials in the waste stream in order to
separate material from the input stream. There are various means of achieving this,
ranging from trommels, vibrating screens, to disc screens. A trommel screen is basically a
large rotating cylinder, which is set on an incline. As material tumbles within the trommel
it travels down the inclined screen, and as it does some of the material is able to pass
through the apertures. Thus the input stream is split into two fractions, these being the
oversize, i.e. material which is larger at least in one dimension than the aperture size, and
the undersize, which are those that are smaller than the aperture size in at least one
dimension (WRAP 2006a).
Vibrating screens work in a similar manner, again they have a set aperture size but instead
of tumbling the material, the vibrating action of the screen agitates the material on the
screen thereby facilitating the separation into two fractions (WRAP 2006a).
Disc screens consist of several rows of discs, and these range in shape depending on the
manufacturer, but are typically oblong in shape. These discs spin in the direction of
material flow, and the aperture size between each disc governs the size of the material
segregated. Large surface size (or two-dimensional) material such as newspapers and
95

Chapter 4
cardboard, move up the incline of rotating discs, while smaller material such as containers
are bounced in the air and roll off the screen (OKay Engineering 2005; WRAP 2006a).
Ballistic separators sort material by shape and weight, that is they are able to sort two
dimensional material and light material, e.g. paper, and plastic film, which travel up the
inclined ballistic separator from three dimensional and heavy material such as containers
which tend to roll back over the end of the ballistic separator. Figure 4.1 shows a view of
the paddles used on a ballistic separator; as can be seen in this Figure there are holes in the
paddles, which allow a third stream to be separated, referred to as a 1 fines’ fraction (Okay
Engineering Services Ltd. 2005; WRAP 2006a).
Figure 4.1: Ballistic Separator Paddles (Okay Engineering Services Ltd., 2005)
Optical sorters are commonly used to separate various plastic types from a mixed stream;
however, they can also be used to sort paper. Optical sorters can be used to segregate
plastics by plastic type, for example PET and HDPE, and also by colour; hence, this
equipment can be used to segregate natural HDPE from coloured HDPE (TiTech 2006;
Zeiger 2004; Tachwali etal. 2007). Optical sorters employ a laser technique using Raman
scattering spectroscopy to scan the contents of a moving conveyor belt to identify the
constituents of the targeted material. Visible light is used to determine the colour of the
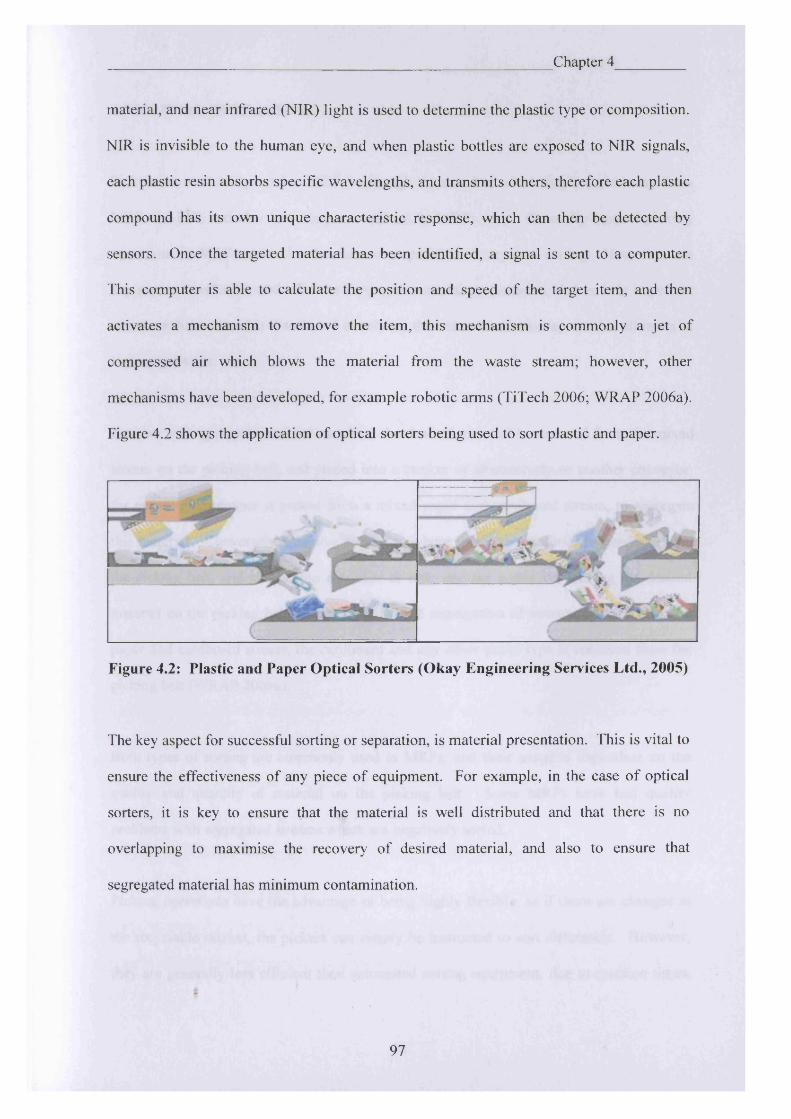
Chapter 4
material, and near infrared (NIR) light is used to determine the plastic type or composition.
NIR is invisible to the human eye, and when plastic bottles are exposed to NIR signals,
each plastic resin absorbs specific wavelengths, and transmits others, therefore each plastic
compound has its own unique characteristic response, which can then be detected by
sensors. Once the targeted material has been identified, a signal is sent to a computer.
This computer is able to calculate the position and speed of the target item, and then
activates a mechanism to remove the item, this mechanism is commonly a jet of
compressed air which blows the material from the waste stream; however, other
mechanisms have been developed, for example robotic arms (TiTech 2006; WRAP 2006a).
Figure 4.2 shows the application of optical sorters being used to sort plastic and paper.
Figure 4.2: Plastic and Paper Optical Sorters (Okay Engineering Services Ltd., 2005)
The key aspect for successful sorting or separation, is material presentation. This is vital to
ensure the effectiveness of any piece of equipment. For example, in the case of optical
sorters, it is key to ensure that the material is well distributed and that there is no
overlapping to maximise the recovery of desired material, and also to ensure that
segregated material has minimum contamination.
97
Chapter 4
4.3 MANUAL OPERATIONS
Pickers are commonly used in MRFs, although the extent to which they are used vary from
MRF to MRF, and also how they are utilised in MRFs vary. Generally manual picking
operations in MRFs can either be classed as positive or negative sorting. However, one
key aspect to effective and efficient sorting is material presentation, that is, it is important
to ensure that material is distributed evenly on the belt with no overlap, so that all material
is clearly visible.
Positive sorting may be defined as where the desired material is removed from the mixed
stream on the picking belt, and placed into a bunker or alternatively to another conveyor,
for example newspaper is picked from a mixed paper and cardboard stream, to segregate
this material. Conversely, negative sorting is where unwanted material is removed from
the picking belt, and placed into a bunker or onto another conveyor, leaving the desired
material on the picking belt, for example for the segregation of newspaper from a mixed
paper and cardboard stream, the cardboard and any other paper type is removed from the
picking belt (WRAP 2006a).
Both types of sorting are commonly used in MRFs, and their usage is dependant on the
quality and quantity of material on the picking belt. Some MRFs have had quality
problems with segregated streams which are negatively sorted.
Picking operations have the advantage of being highly flexible, as if there are changes in
the recyclable market, the pickers can simply be instructed to sort differently. However,
they are generally less efficient than automated sorting equipment, due to reaction times,
98
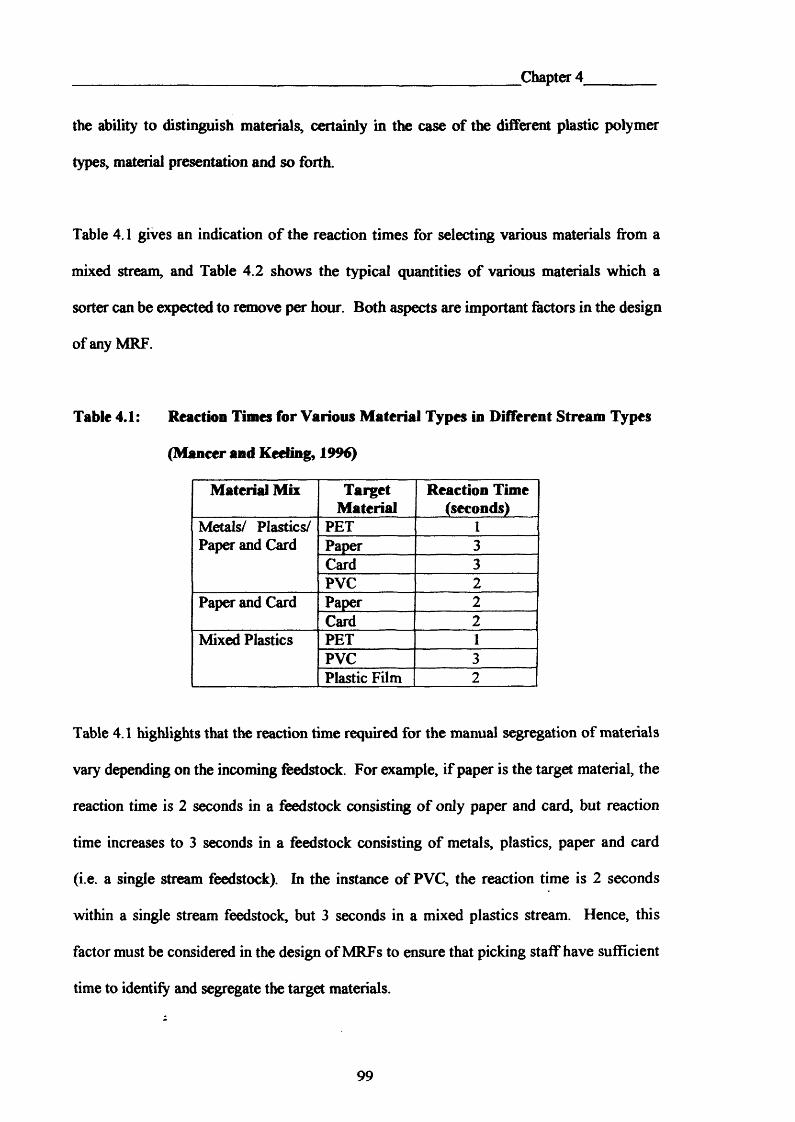
Chapter 4
the ability to distinguish materials, certainly in the case of the different plastic polymer
types, material presentation and so forth.
Table 4.1 gives an indication of the reaction times for selecting various materials from a
mixed stream, and Table 4.2 shows the typical quantities of various materials which a
sorter can be expected to remove per hour. Both aspects are important factors in the design
of any MRF.
Table 4.1: Reaction Times for Various Material Types in Different Stream Types
(Mancer and Keeling, 1996)
Material Mix TargetMaterial
Reaction Time (seconds)
Metals/ Plastics/ Paper and Card
PET 1Paper 3Card 3PVC 2
Paper and Card Paper 2Card 2
Mixed Plastics PET 1PVC 3Plastic Film 2
Table 4.1 highlights that the reaction time required for the manual segregation of materials
vary depending on the incoming feedstock. For example, if paper is the target material, the
reaction time is 2 seconds in a feedstock consisting of only paper and card, but reaction
time increases to 3 seconds in a feedstock consisting of metals, plastics, paper and card
(i.e. a single stream feedstock). In the instance of PVC, the reaction time is 2 seconds
within a single stream feedstock, but 3 seconds in a mixed plastics stream. Hence, this
factor must be considered in the design of MRFs to ensure that picking staff have sufficient
time to identify and segregate the target materials.
99

Chapter 4
Table 4.2 indicates the typical sorting rates per person for a variety of material types.
Studies have shown that paper and card typically have the greatest sorting rates, with both
material types ranging from 680 to 4,545 kg per person per hour. Plastics tend to have the
lowest sorting rate with PET ranging from 160 to 250 kg per person per hour, and plastic
film only having a sorting rate of 20 to 36 kg per person per hour (Mancer and Keeling,
1996; Dubanowitz, 2000; and Siegler and Perkins, 1999). This is an important factor in
deciding whether to segregate materials manually or automatically, or if at all, depending
on the market rate of the material type.
Table 4.2: Sorting Rates per Person for Various Material Types (Mancer and
Keeling, 1996; Dubanowitz, 2000; and Siegler and Perkins, 1999)
Material Sorting Rate (kg/hr) per person
PET 160-250Paper 680-4545Card 680-4545PVC 240Glass 409-818Plastic Film 20-36Textiles 180
Another important aspect for any MRF which utilises manual labour is the working
environment. It is vitally important, that conditions comply with health and safety
requirements, and that action is taken to minimise exposure to dust, and also to minimise
exposure to hazardous items in the feedstock such as broken glass, needles and so forth.
100
Chapter 4
4.4 DIRTY vs. CLEAN MRF SCENARIOS
Clean MRFs are facilities which recover material for recycling from source segregated
mixed dry recyclable. The incoming material may be presented in a number of different
formats, these can be grouped as follows:
• single stream, i.e. mixed paper, cardboard and containers, which may or may not
include glass; and,
• two stream, i.e. one stream containing paper and cardboard, and the other
containing mixed containers, which are then fed into different locations in the
MRF.
As well as the above, material can also be presented to the MRF bagged or loose.
Typically clean MRFs recover in excess of 90% of the feedstock as recyclable, which is
then sold to reprocessors. There will always be some material which is rejected, for
example material such as some types of plastics which cannot be easily recycled and
therefore go to landfill.
The advantages of a clean MRF are:
• recover higher quality materials for recycling as the material is free from food
waste etc.;
• high processing efficiency;
• health and safety conditions within a clean MRF are generally better than in a dirty
MRF; and,
• proven around the world.
101
Chapter 4
The disadvantages of a clean MRF are:
• a source segregated kerbside collection system is needed to provide the feedstock
required for the MRF; hence, there are increased collection rounds with associated
impact on traffic movement and air quality; and,
• the performance of the MRF is highly dependant on participation within the
kerbside scheme.
Dirty MRFs are facilities which recover recyclable material from municipal solid waste
(MSW). Some more advanced facilities may also recover biodegradable material which
may be sent for anaerobic digestion or in-vessel composting, or a high calorific value
stream which can be converted to produce a refuse derived fuel (RDF). Typically a dirty
MRF generally recover approximately 15-20% as dry recyclable, which are then sold to
reprocessors.
The advantages of a dirty MRF are:
• a dirty MRF utilises the existing MSW collection infrastructure; hence, collection
rounds are unchanged and environmental impacts in terms of air quality and
transportation remain the same; and,
• performance is not dependant on householder participation as householders are not
required to change their behaviour, therefore participation in the scheme is 100%
by definition.
The disadvantages of a dirty MRF are:
• contamination of potentially recyclable material with food waste, garden waste etc.
impacts on the performance of the MRF;
102

Chapter 4
• generally lower income is obtained for the sale o f the recovered recyclable as they
are generally of lower quality; and,
• use of dirty MRFs does not encourage householders to change their behaviour in
terms of waste minimisation and recycling.
4.5 PROCESS REVIEWS
Reviews were carried out at a number of facilities both in the UK and overseas. These
covered both ‘clean’ and ‘dirty’ MRFs, which also ranged from ‘low-tech’ to ‘high-tech’
operations. All detailed reviews for the 16 MRFs reviewed can be found in Appendix C.
The following ‘clean’ MRFs were reviewed:
• City and County of Cardiff MRF, Cardiff UK;
• Norfolk Environmental Waste Services (NEWS) MRF, Norfolk, UK;
• Cutts Recycling MRF, Milton Keynes, UK;
• R U Recycling, Billingham, UK;
• Recycle America MRF, Greyslake, Illinois, USA;
• Pacific Rim Recycling, Benicia, California, USA;
• Upper Valley Waste Disposal Services, Napa Valley, California, USA;
• West County Resource Recycling, Richmond, California, USA;
• Rumpke MRF, Columbus, Ohio;
• Blue Mountain Recycling, Philadelphia, Pennsylvania, USA;
103
Chapter 4
• Recycle America, York, Pennsylvania, USA;
• Guelph Wet Dry + Facility, Guelph, Ontario, Canada; and,
• International Paper Industries (DPI) Ltd., Winnipeg, Manitoba, Canada.
Similarly, reviews were also carried out on ‘dirty’ MRFS, those reviewed were:
• Yorwaste MRF, Searner Carr, Scarborough, UK;
• Albacete MRF, Albacete, Spain; and,
• Meddill MRF, Chicago, Illinois, USA.
The process reviews undertaken at MRFs were invaluable as they enable a better
understanding of the capabilities and limitations of each of the processes, quality and
durability of the equipment and quality of the processed recyclable. As well as operational
problems experienced with equipment, any improvements planned and also an indication
of costs associated with the facility can be gained.
4.5.1 Clean MRFs
The clean facilities reviewed varied in terms of the feedstock they processed, and also in
the level of technology used. By reviewing a range of equipment a better understanding of
the variation in MRFs can be developed.
Of the MRFs reviewed, the UK MRFs which stood out were the Milton Keynes MRF
operated by Cutts Recycling, and the NEWS MRF in Norfolk. The Cutts Recycling
Facility is a highly flexible process as it is able to process a variety of feedstocks, which is
104
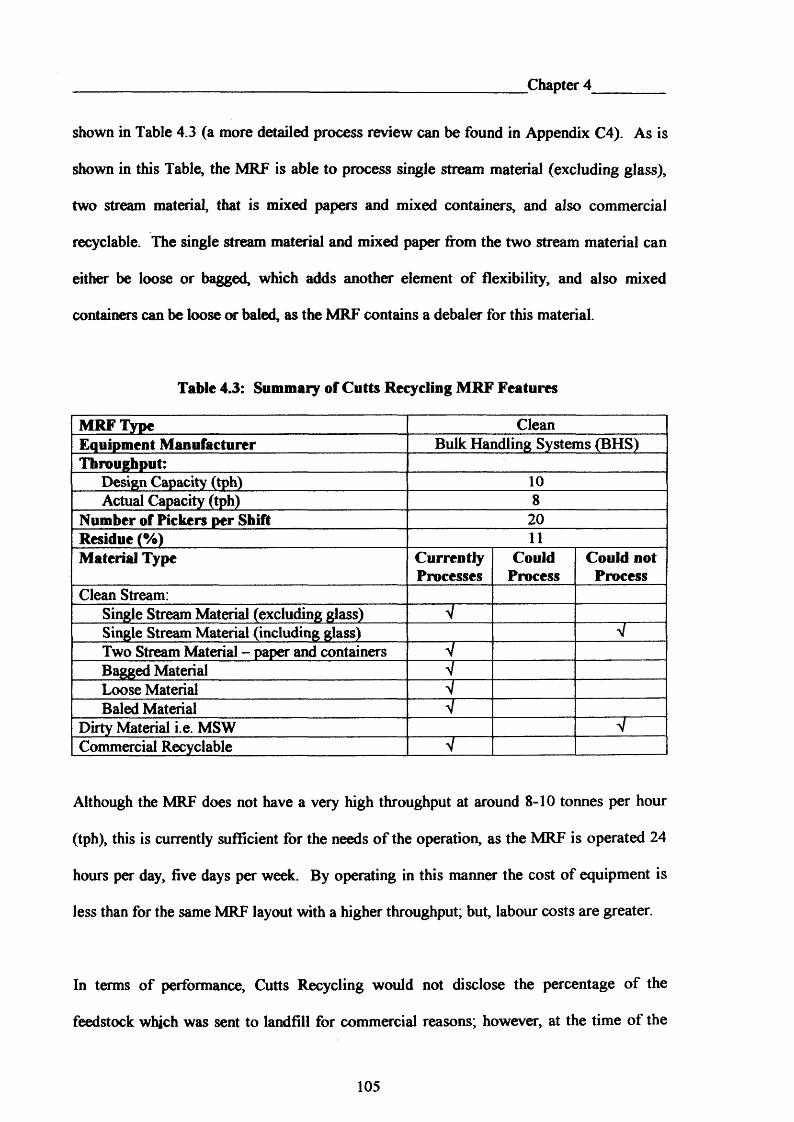
Chapter 4
shown in Table 4.3 (a more detailed process review can be found in Appendix C4). As is
shown in this Table, the MRF is able to process single stream material (excluding glass),
two stream material, that is mixed papers and mixed containers, and also commercial
recyclable. The single stream material and mixed paper from the two stream material can
either be loose or bagged, which adds another element o f flexibility, and also mixed
containers can be loose or baled, as the MRF contains a debaler for this material.
Table 4.3: Summary of Cutts Recycling MRF Features
MRF Type CleanEquipment Manufacturer Bulk Handling Systems (BHS)Throughput:
Design Capacity (tph) 10Actual Capacity (tph) 8
Number of Pickers per Shift 20Residue (%) 11Material Type Currently
ProcessesCould
ProcessCould not Process
Clean Stream:Single Stream Material (excluding glass) VSingle Stream Material (including glass) VTwo Stream Material - paper and containers VBagged Material VLoose Material VBaled Material V
Dirty Material i.e. MSW VCommercial Recyclable V
Although the MRF does not have a very high throughput at around 8-10 tonnes per hour
(tph), this is currently sufficient for the needs o f the operation, as the MRF is operated 24
hours per day, five days per week. By operating in this manner the cost of equipment is
less than for the same MRF layout with a higher throughput; but, labour costs are greater.
In terms of performance, Cutts Recycling would not disclose the percentage of the
feedstock which was sent to landfill for commercial reasons; however, at the time of the
105
Chapter 4
visit, the MRF was processing single stream material and by visual inspection, it is
estimated that less than 10% of the feedstock is sent to landfill.
The process flowsheet for the Cutts Recycling MRF is shown in Figure 4.3. This Figure
highlights that the key piece of separation equipment used at the MRF is a Bulk Handling
Systems (BHS) disc screen which is used to separate the two dimensional fraction from the
three dimensional fraction, i.e. essentially split the feed into two streams: paper and
containers. Sorting of the paper stream is a manually intensive operation. While the
sorting of the container stream is highly automated, with manual picking only used for
polyvinyl chloride (PVC), and to remove any non-requested material from the stream. At
the end of the container line, manual pickers remove any missed material which is then
sent around the container line again. Ferrous metal is removed by means o f an overband
magnet, and non-ferrous metals is removed by means of an eddy current separator. Plastic
bottles are sent through a bottle flattener which apparently aids the performance o f optical
sorting equipment, prior to being sent through two twin block optical sorters which
segregate PET and HDPE, and sorts them into two colour grades as shown in the
flowchart.
To summarise, twelve materials were able to be segregated in the MRF for reprocessing,
six streams were segregated manually, these were predominantly the two dimensional
streams of:
• cardboard;
• plastic recycling sacks;
• newspapers and magazines;
. • mixed paper;
106
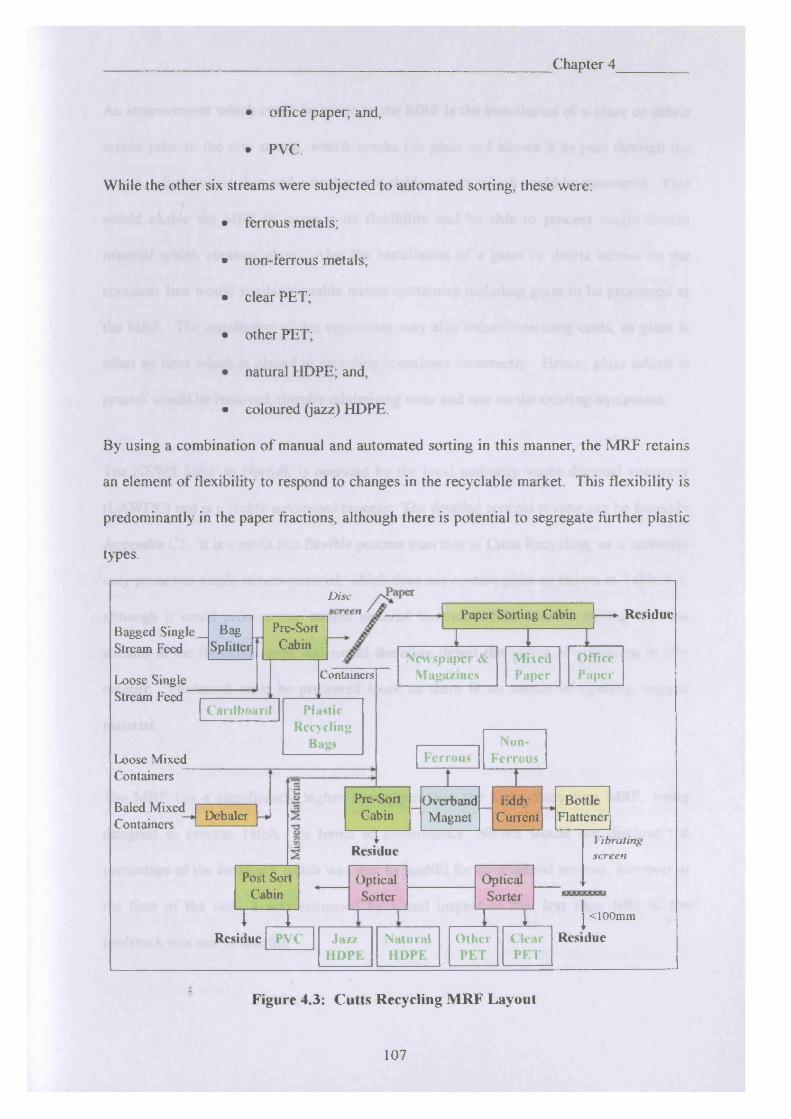
Chapter 4
• office paper; and,
• PVC.
While the other six streams were subjected to automated sorting, these were:
• ferrous metals;
• non-ferrous metals;
• clear PET;
• other PET;
• natural HDPE; and,
• coloured (jazz) HDPE.
By using a combination of manual and automated sorting in this manner, the MRF retains
an element of flexibility to respond to changes in the recyclable market. This flexibility is
predominantly in the paper fractions, although there is potential to segregate further plastic
types.
Disc
Bagged Single^ Stream Feed
Loose Single Stream Feed
Loose Mixed Containers
Baled Mixed Containers
Bag Splitter
Pre-SortCabin
Cardboard
Containers
PlasticRecycling
Bags
Debaler
IPaper Sorting Cabin
HNewspaper &
MagazinesMixedPaper
7Residue
OfficePaper
Pre-SortCabin
~ i —
Ferrousn zOverbandMagnet
Non-Ferrous
J ZEddy
CurrentBottle
Flattener
rzri Residue
Post Sort Cabin
OpticalSorter
OpticalSorter
Residue PVC JazzHDPE
NaturalHDPE
□
Vibratingscreen
OtherPET
ClearPET
| <100m m
Residue
iFigure 4.3: Cutts Recycling MRF Layout
107
Chapter 4
An improvement which could be made to the MRF is the installation of a glass or debris
screen prior to the disc screen, which breaks the glass and allows it to pass through the
screen, which would then add a further recyclable stream which could be recovered. This
would enable the MRF to increase its flexibility and be able to process single stream
material which contains glass. Also the installation of a glass or debris screen on the
container line would similarly enable mixed containers including glass to be processed at
the MRF. The installation of this equipment may also reduce operating costs, as glass is
often an item which is placed in recycling containers incorrectly. Hence, glass which is
present would be removed, thereby minimising wear and tear on the existing equipment.
The NEWS MRF in Norfolk is operated by the local authority waste disposal company
(LAWDC) and is a highly automated process. The detailed process review can be found in
Appendix C3. It is a much less flexible process than that of Cutts Recycling, as it currently
only processes single stream material, which does not contain glass as shown in Table 4.4,
although it could process two stream material but this would involve mixing the two
streams at the feedstock area, and would therefore defeat the object of collecting in this
manner. Feedstock must be presented loose as there is no means of opening bagged
material.
The MRF has a significantly higher throughput than the Cutts Recycling MRF, being
designed to process 18tph. In terms of performance, NEWS would not disclose the
percentage of the feedstock which was sent to landfill for commercial reasons; however at
the time of the visit, it was estimated by visual inspection that less than 10% of the
feedstock was sent to landfill.
108
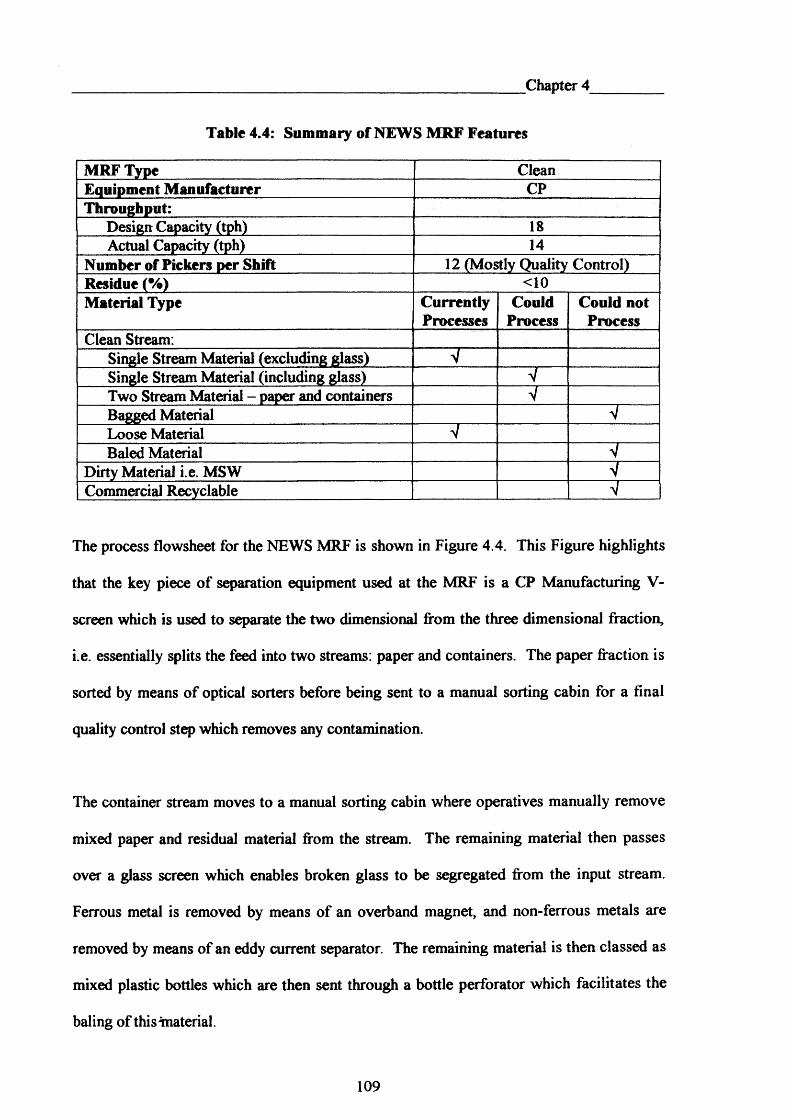
Chapter 4
Table 4.4: Summary of NEWS MRF Features
MRF Type CleanEquipment Manufacturer CPThroughput:
Design Capacity (tph) ISActual Capacity (tph) 14
Number of Pickers per Shift 12 (Mostly Quality Control)Residue (%) <10Material Type Currently
ProcessesCould
ProcessCould not Process
Clean Stream.Single Stream Material (excluding glass) VSingle Stream Material (including glass) VTwo Stream Material - paper and containers VBagged Material VLoose Material VBaled Material V
Dirty Material i.e. MSW VCommercial Recyclable V
The process flowsheet for the NEWS MRF is shown in Figure 4.4. This Figure highlights
that the key piece of separation equipment used at the MRF is a CP Manufacturing V-
screen which is used to separate the two dimensional from the three dimensional fraction,
i.e. essentially splits the feed into two streams: paper and containers. The paper fraction is
sorted by means of optical sorters before being sent to a manual sorting cabin for a final
quality control step which removes any contamination.
The container stream moves to a manual sorting cabin where operatives manually remove
mixed paper and residual material from the stream. The remaining material then passes
over a glass screen which enables broken glass to be segregated from the input stream.
Ferrous metal is removed by means of an overband magnet, and non-ferrous metals are
removed by means of an eddy current separator. The remaining material is then classed as
mixed plastic bottles which are then sent through a bottle perforator which facilitates the
baling of thisinaterial.
109
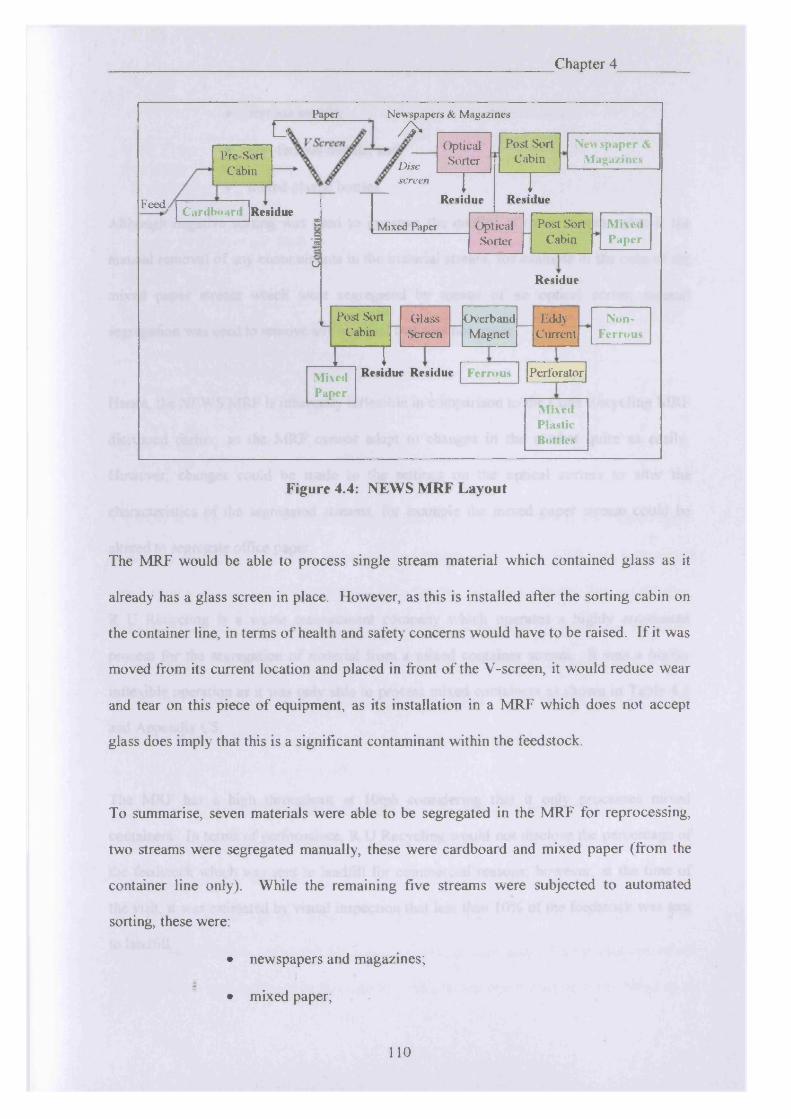
Chapter 4
cP a p e r
Pre-SortCabin
Newspapers & Magazines
/ >
Discscreen
Feed, Cardboard ResidueEcicO
Mixed Paper
OpticalSorter
Post Sort Cabin
Newspaper & Magazines
1Residue
1Residue
Optical P ost Sort MixedSorter Cabin Paper
Residue
m
Post Sort G lass Overband EddyCabin Screen M agnet Current
Non-Ferrous
MixedPaper
Residue Residue Ferrous Perforator
IMixedPlasticBottles
Figure 4.4: NEWS MRF Layout
The MRF would be able to process single stream material which contained glass as it
already has a glass screen in place. However, as this is installed after the sorting cabin on
the container line, in terms of health and safety concerns would have to be raised. If it was
moved from its current location and placed in front of the V-screen, it would reduce wear
and tear on this piece of equipment, as its installation in a MRF which does not accept
glass does imply that this is a significant contaminant within the feedstock.
To summarise, seven materials were able to be segregated in the MRF for reprocessing,
two streams were segregated manually, these were cardboard and mixed paper (from the
container line only). While the remaining five streams were subjected to automated
sorting, these were:
• newspapers and magazines;I
• mixed paper;
110
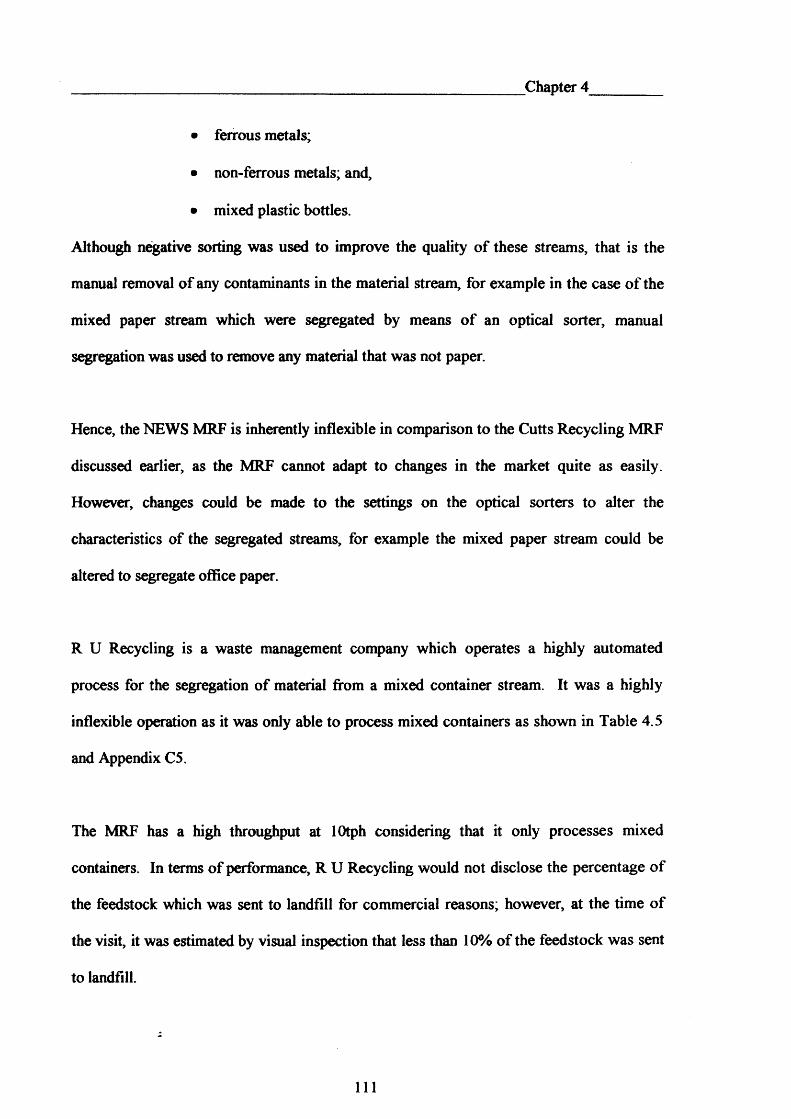
Chapter 4
• ferrous metals;
• non-ferrous metals; and,
• mixed plastic bottles.
Although negative sorting was used to improve the quality of these streams, that is the
manual removal of any contaminants in the material stream, for example in the case of the
mixed paper stream which were segregated by means of an optical sorter, manual
segregation was used to remove any material that was not paper.
Hence, the NEWS MRF is inherently inflexible in comparison to the Cutts Recycling MRF
discussed earlier, as the MRF cannot adapt to changes in the market quite as easily.
However, changes could be made to the settings on the optical sorters to alter the
characteristics of the segregated streams, for example the mixed paper stream could be
altered to segregate office paper.
R U Recycling is a waste management company which operates a highly automated
process for the segregation of material from a mixed container stream. It was a highly
inflexible operation as it was only able to process mixed containers as shown in Table 4.5
and Appendix C5.
The MRF has a high throughput at lOtph considering that it only processes mixed
containers. In terms of performance, R U Recycling would not disclose the percentage of
the feedstock which was sent to landfill for commercial reasons; however, at the time of
the visit, it was estimated by visual inspection that less than 10% of the feedstock was sent
to landfill.
I l l
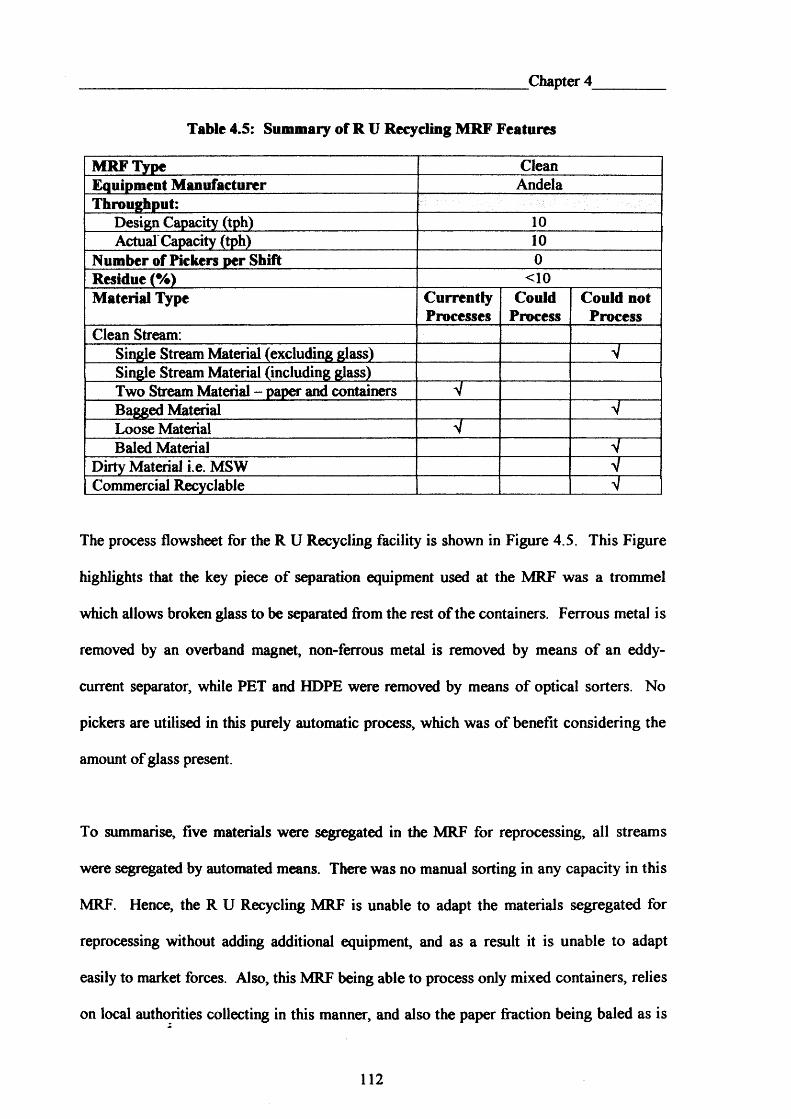
Chapter 4
Table 4.5: Summary of R U Recycling MRF Features
MRF Type CleanEquipment Manufacturer AndelaThroughput:
Design Capacity (tph) 10Actual Capacity (tph) 10
Number of Pickers per Shift 0Residue (%) <10Material Type Currently
ProcessesCould
ProcessCould not Process
Clean Stream:Single Stream Material (excluding glass) VSingle Stream Material (including glass)Two Stream Material - paper and containers VBagged Material >/Loose Material VBaled Material V
Dirty Material i.e. MSW VCommercial Recyclable ■ 1
The process flowsheet for the R U Recycling facility is shown in Figure 4.5. This Figure
highlights that the key piece of separation equipment used at the MRF was a trommel
which allows broken glass to be separated from the rest of the containers. Ferrous metal is
removed by an overband magnet, non-ferrous metal is removed by means of an eddy-
current separator, while PET and HDPE were removed by means of optical sorters. No
pickers are utilised in this purely automatic process, which was of benefit considering the
amount of glass present.
To summarise, five materials were segregated in the MRF for reprocessing, all streams
were segregated by automated means. There was no manual sorting in any capacity in this
MRF. Hence, the R U Recycling MRF is unable to adapt the materials segregated for
reprocessing without adding additional equipment, and as a result it is unable to adapt
easily to market forces. Also, this MRF being able to process only mixed containers, relies
on local authorities collecting in this manner, and also the paper fraction being baled as is
112
Chapter 4
or processed elsewhere. The MRF could be developed into a single stream facility by
adding a screen, ballistic separator or trommel at the front end of the plant to split paper
and containers, and the segregated containers could then be processed on the existing
container line, while a new line would have to be added to process the paper. This would
be a significant investment, and is theoretically possible; however, space constraints in the
building would not allow this development to occur on this site.
Feedstock Overband Glass Trommel Screen Eddy— *■
Non-Magnet Breaker
1Current Ferrous
Ferrous
Glass
SurgeHopper
OverhandMagnet~ ~ r ~
Pulveriserx :Glass
ResidueScreen
IResidue
OpticalSorter
OpticalSorter
Residue
PET
HDPE
Figure 4.5: R U Recycling MRF Layout
Of the MRFs reviewed, the overseas facilities which stood out were the Blue Mountain
Recycling MRF in Philadelphia, Recycle America MRF at York, EPI MRF at Winnipeg,
and the Guelph Wet Dry+ Facility in Ontario. These MRFs were very different in their
design and operation; however, these are examples of good practice in terms of the design
and/ or operation of each of these facilities.
2
113

Chapter 4
The Blue Mountain Recycling MRF located in Philadelphia was similar to the Cutts
Recycling operation in that it was a highly flexible operation as it was able to process a
variety of feedstocks as shown in Table 4.6 and Appendix Cl 1.
Although the MRF does not have a very high throughput at around 7-9tph, this was
sufficient for the needs of the operation, as the MRF is operated 24 hours per day, five
days per week. Again, by operating in this manner the cost of equipment was less than for
the same MRF layout, but with a higher throughput, however, labour costs are greater.
In terms of performance, Blue Mountain Recycling stated that only 1.3% of incoming
material was sent to landfill, and that all residual material was inspected before leaving the
facility and that if this material contained in excess of 20% recyclable, the material was
reprocessed in the MRF. No data were available to back up this very high figure for
landfill diversion for commercial reasons.
Table 4.6: Summary of Blue Mountain Recycling MRF Features
MRF Type CleanEquipment Manufacturer CPThroughput:
Design Capacity (tph) 9Actual Capacity (tph) 7-9
Number of Pickers per Shift 15Residue (%) 1.3Material Type Currently
ProcessesCould
ProcessCould not
ProcessClean Stream:
Single Stream Material (excluding glass) 4Single Stream Material (including glass)Two Stream Material - paper and containers > TBagged Material VLoose Material " v ........Baled Material V
Dirty Material i.e. MSW VCommercial Recyclables
114
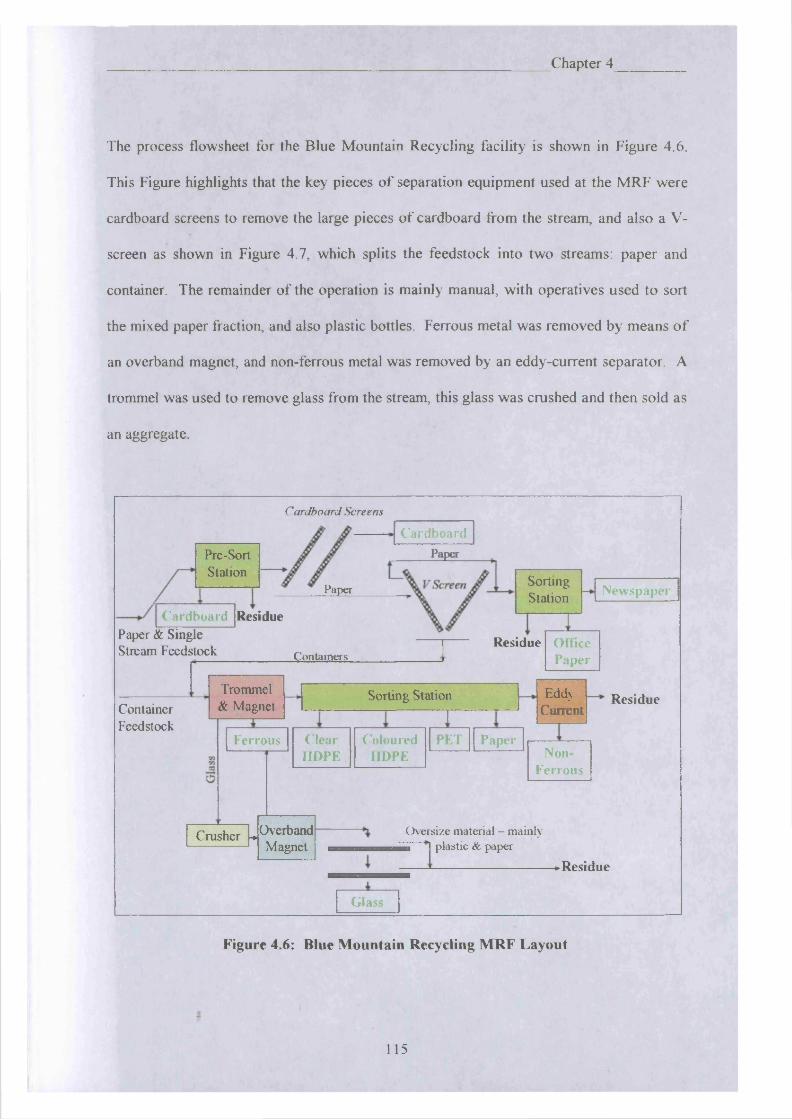
__________________________________________________________Chapter 4_________
The process flowsheet for the Blue Mountain Recycling facility is shown in Figure 4.6.
This Figure highlights that the key pieces of separation equipment used at the MRF were
cardboard screens to remove the large pieces of cardboard from the stream, and also a V-
screen as shown in Figure 4.7, which splits the feedstock into two streams: paper and
container. The remainder of the operation is mainly manual, with operatives used to sort
the mixed paper fraction, and also plastic bottles. Ferrous metal was removed by means of
an overband magnet, and non-ferrous metal was removed by an eddy-current separator. A
trommel was used to remove glass from the stream, this glass was crushed and then sold as
an aggregate.
Cardboard Screens
Pre-SortStation
CardboardPaper
Paper
Cardboard ResiduePaper & Single Stream Feedstock
SortingStation
ContainersResidue
Newspaper
OfficePaper
ContainerFeedstock
Trommel & Magnet
Crusher ■+
Sorting Station
rEddy
CurrentResidue
Ferrous Clear Coloured PET PaperHDPE HDPE Non-
Ferrous
OverbandMagnet
Oversize material - mainly plastic & paper
Residue
Glass
Figure 4.6: Blue Mountain Recycling MRF Layout
115
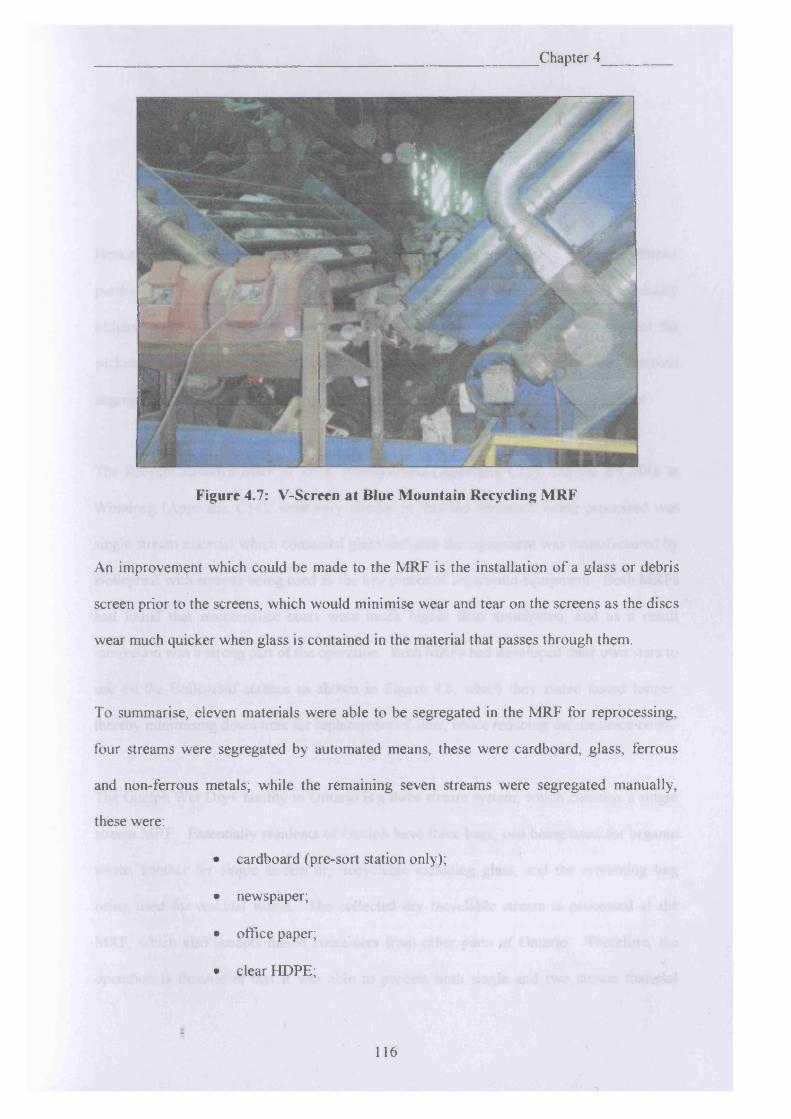
Chapter 4
Figure 4.7: V-Screen at Blue Mountain Recycling MRF
An improvement which could be made to the MRF is the installation of a glass or debris
screen prior to the screens, which would minimise wear and tear on the screens as the discs
wear much quicker when glass is contained in the material that passes through them.
To summarise, eleven materials were able to be segregated in the MRF for reprocessing,
four streams were segregated by automated means, these were cardboard, glass, ferrous
and non-ferrous metals; while the remaining seven streams were segregated manually,
these were:
• cardboard (pre-sort station only);
• newspaper;
• office paper;
• clear HDPE;
116
Chapter 4
• coloured HDPE;
• PET; and
• mixed paper.
Hence, the Blue Mountain MRF is able to adapt quite easily to changing market conditions
particularly in relation to the container line, for example, if it became economically
unfeasible to sort HDPE into clear and coloured grades, they could simply instruct the
pickers to segregate mixed HDPE. There is also some scope to alter the materials
segregated in the paper stream also, for example changing office paper to mixed paper.
The Recycle America MRF at York, Pennsylvania (Appendix C l2), and the IPI MRF at
Winnipeg (Appendix C l4), were very similar in that the feedstock being processed was
single stream material which contained glass and also the equipment was manufactured by
Bollegraaf with screens being used as the key pieces of separation equipment. Both MRFs
had found that maintenance costs were much higher than anticipated, and as a result
innovation was a strong part of the operation. Both MRFs had developed their own stars to
use on the Bollegraaf screens as shown in Figure 4.8, which they stated lasted longer,
thereby minimising down time for replacement of stars, hence reducing maintenance costs.
The Guelph Wet Dry+ facility in Ontario is a three stream system, which contains a single
stream MRF. Essentially residents of Guelph have three bags, one being used for organic
waste, another for single stream dry recyclable including glass, and the remaining bag
being used for residual waste. The collected dry recyclable stream is processed at the
MRF, which also accepts mixed containers from other parts of Ontario. Therefore, the
operation is flexible in that it was able to process both single and two stream material
117

Chapter 4
which contain glass, and commercial recyclable, and also it was able to process both
bagged and loose material as shown in Table 4.7 and Appendix C l3.
Figure 4.8: 12 Pronged Stars for use in Angled Screen at Recycle America MRF, York
Table 4.7: Summary of Guelph MRF Features
MRF Type CleanEquipment Manufacturer BHSThroughput:
Design Capacity (tph) 15-20Actual Capacity (tph) 15-20
Number of Pickers per Shift 20Residue (%) 40Material Type Currently
ProcessesCould
ProcessCould not
ProcessClean Stream:
Single Stream Material (excluding glass) VSingle Stream Material (including glass) ..... T ......Two Stream Material - paper and containers VBagged Material ' ^ 1Loose Material VBaled Material V
Dirty Material i.e. MSW VCommercial Recyclable V
118
_________________________________________________________Chapter 4_________
The performance of the MRF was very disappointing in that 40% of the incoming mixed
recyclable was sent to landfill. Based on visual inspection, this was due to a lack of
maintenance, as the discs on the BHS disc screen were highly worn and clearly needed
replacing. As a result, the screen was not performing as it should, and this affected the
performance of the downstream equipment. It also seemed that the equipment was not set
up correctly. The whole MRF needs to be looked at closely as the loss of this much
recyclable to landfill is a considerable cost, and maintaining the system correctly would
reduce this cost.
The process flowsheet for Guelph MRF is shown in Figure 4.9. This highlights that the
key separation equipment were the disc screens which were used to split the material into
container and paper fractions. Much of the remaining operation was manual with the
exception of ferrous metal being removed by means of an overband magnet, and non-
ferrous metal removed by means of an eddy-current separator. A glass screen was also
used in the latter stages to break the glass and remove the glass from the container line.
To summarise, nine materials were segregated in the MRF for reprocessing, the vast
majority o f these were manually segregated, with only steel, glass and aluminium
segregated by automated means. Hence, the Guelph facility is able to adapt quite easily to
changing market conditions as the pickers can simply be instructed to alter their picking
regimes.
An improvement which could be made to the MRF, is that another glass screen could be
installed before the disc screens. This would minimise wear and tear on the screens as the
discs wear much quicker when glass is contained in the material that passes through them.
119
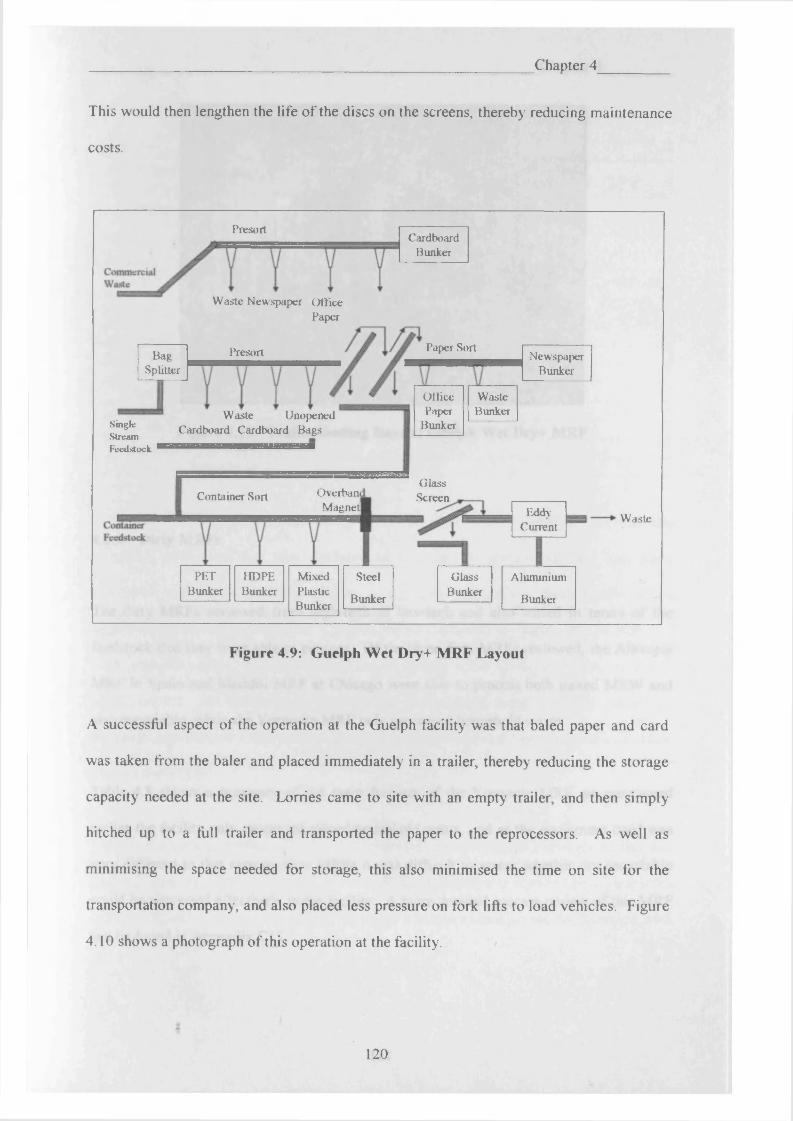
Chapter 4
This would then lengthen the life of the discs on the screens, thereby reducing maintenance
costs.
PresortCardboard
Bunker
Waste Newspaper Office Paper
Paper SortPresortBagSplitter
NewspaperBunker
OfficePaper
Bunker
WasteBunkerWaste Unopened
Cardboard Cardboard BagsSingleStreamFeedstock
GlassScreenOverbani
Magnet]Container Sort
EddyCurrent
Waste
PETBunker
HDPEBunker
MixedPlasticBunker
AluminiumSteel GlassBunkerBunker Bunker
Figure 4.9: Guelph Wet Dry+ MRF Layout
A successful aspect of the operation at the Guelph facility was that baled paper and card
was taken from the baler and placed immediately in a trailer, thereby reducing the storage
capacity needed at the site. Lorries came to site with an empty trailer, and then simply
hitched up to a full trailer and transported the paper to the reprocessors. As well as
minimising the space needed for storage, this also minimised the time on site for the
transportation company, and also placed less pressure on fork lifts to load vehicles. Figure
4.10 shows a photograph of this operation at the facility.
120

Chapter 4
Figure 4.10: Trailer loading Bays at Guelph Wet Dry+ MRF
4.5.2 Dirty MRFs
The dirty MRFs reviewed from high-tech to low-tech and also varied in terms of the
feedstock that they were able to process. Of the three dirty MRFs reviewed, the Albacete
MRF in Spain and Meddill MRF at Chicago were able to process both mixed MSW and
also recyclable, while the Yorwaste MRF only processed household waste.
Table 4.8 shows a summary of the main features of the Yorwaste MRF, as mentioned
earlier the facility only processed mixed household waste, and as the equipment used was
very different to that seen in other MRFs it was difficult to assess whether dry recyclable
could be processed effectively in the facility. A more detailed process review of this MRF
can be found in Appendix C l5.
i
121
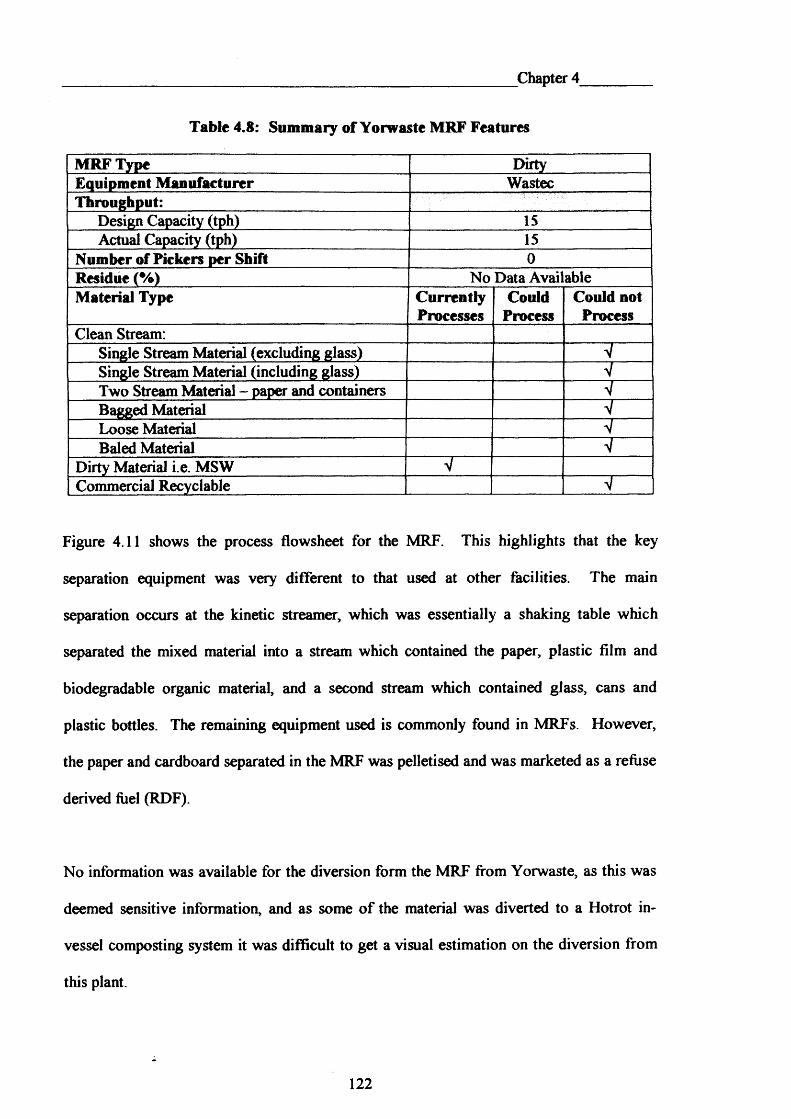
Chapter 4
Table 4.8: Summary of Yorwaste MRF Features
MRF Type DirtyEquipment Manufacturer WastecThroughput:
Design Capacity (tph) 15Actual Capacity (tph) 15
Number of Pickers per Shift 0Residue (%) No Data Avai ableMaterial Type Currently Could Could not
Processes Process ProcessClean Stream:
Single Stream Material (excluding glass) VSingle Stream Material (including glass) VTwo Stream Material - paper and containers VBagged Material VLoose Material VBaled Material V
Dirty Material i.e. MSW VCommercial Recyclable V
Figure 4.11 shows the process flowsheet for the MRF. This highlights that the key
separation equipment was very different to that used at other facilities. The main
separation occurs at the kinetic streamer, which was essentially a shaking table which
separated the mixed material into a stream which contained the paper, plastic film and
biodegradable organic material, and a second stream which contained glass, cans and
plastic bottles. The remaining equipment used is commonly found in MRFs. However,
the paper and cardboard separated in the MRF was pelletised and was marketed as a refuse
derived fuel (RDF).
No information was available for the diversion form the MRF from Yorwaste, as this was
deemed sensitive information, and as some of the material was diverted to a Hotrot in
vessel composting system it was difficult to get a visual estimation on the diversion from
this plant.
122
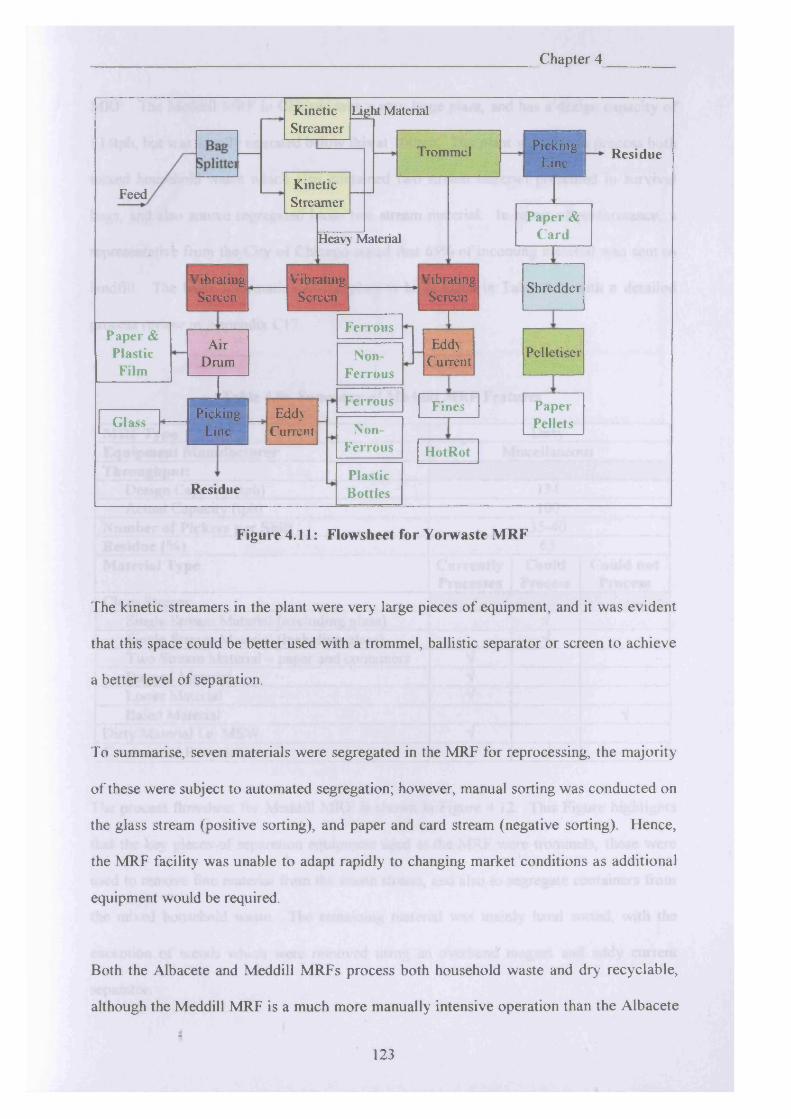
Chapter 4
KineticStreamer
L ight M aterial
PickingLine
Trommel Residue
KineticStreamerFeed
Paper & CardH eavy M aterial
VibratingScreen
VibratingScreen
VibratingScreen Shredder
FerrousPaper & Plastic Film
EddyCurrent
AirDrum
PelletiserNon-Ferrous
Ferrous PaperPellets
FinesPickingLine
EddyCurrentGlass Non-
Ferrous HotRot
PlasticBottlesResidue
Figure 4.11: Flowsheet for Yorwaste MRF
The kinetic streamers in the plant were very large pieces of equipment, and it was evident
that this space could be better used with a trommel, ballistic separator or screen to achieve
a better level of separation.
To summarise, seven materials were segregated in the MRF for reprocessing, the majority
of these were subject to automated segregation; however, manual sorting was conducted on
the glass stream (positive sorting), and paper and card stream (negative sorting). Hence,
the MRF facility was unable to adapt rapidly to changing market conditions as additional
equipment would be required.
Both the Albacete and Meddill MRFs process both household waste and dry recyclable,
although the Meddill MRF is a much more manually intensive operation than the Albacete
I123
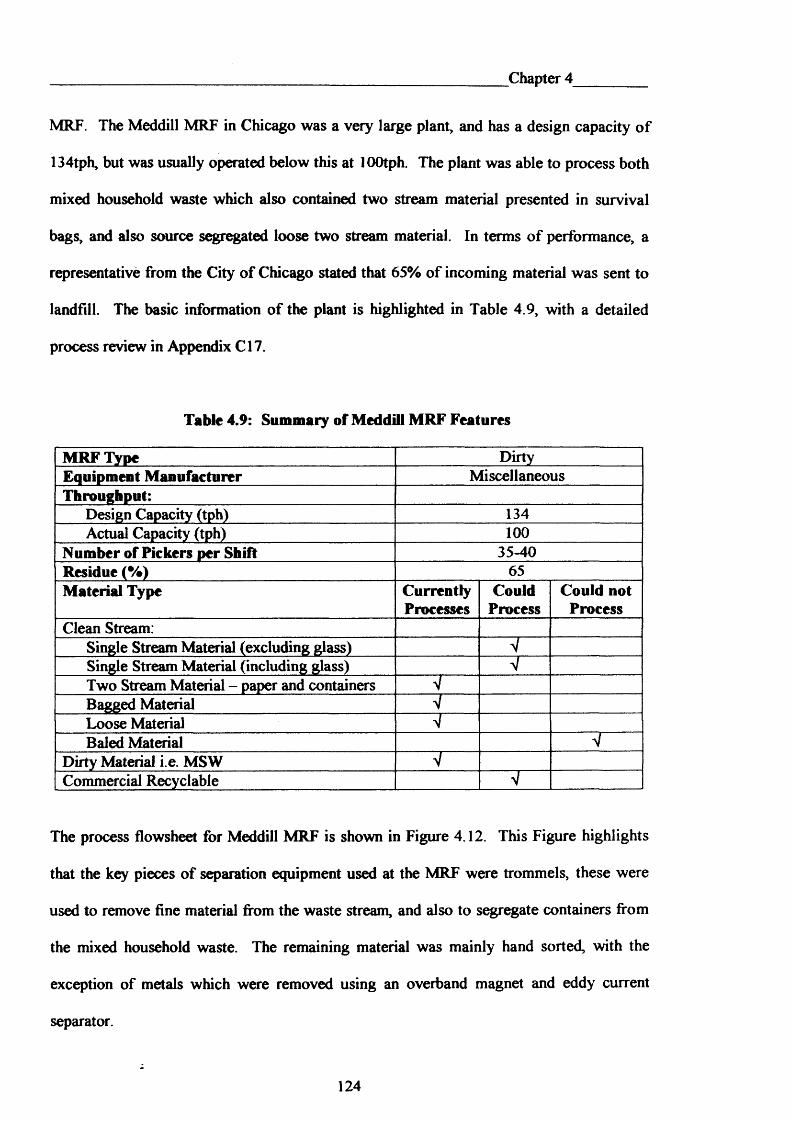
Chapter 4
MRF. The Meddill MRF in Chicago was a very large plant, and has a design capacity of
134tph, but was usually operated below this at lOOtph. The plant was able to process both
mixed household waste which also contained two stream material presented in survival
bags, and also source segregated loose two stream material. In terms of performance, a
representative from the City of Chicago stated that 65% of incoming material was sent to
landfill. The basic information of the plant is highlighted in Table 4.9, with a detailed
process review in Appendix C l7.
Table 4.9: Summary of Meddill MRF Features
MRF Type DirtyEquipment Manufacturer MiscellaneousThroughput:
Design Capacity (tph) 134Actual Capacity (tph) 100
Number of Pickers per Shift 35-40Residue (%) 65Material Type Currently
ProcessesCould
ProcessCould not
ProcessClean Stream:
Single Stream Material (excluding glass) VSingle Stream Material (including glass) VTwo Stream Material - paper and containers VBagged Material VLoose Material VBaled Material
Dirty Material i.e. MSW VCommercial Recyclable V
The process flowsheet for Meddill MRF is shown in Figure 4.12. This Figure highlights
that the key pieces of separation equipment used at the MRF were trommels, these were
used to remove fine material from the waste stream, and also to segregate containers from
the mixed household waste. The remaining material was mainly hand sorted, with the
exception of metals which were removed using an overband magnet and eddy current
separator.
124

Chapter 4
Waste to Landfill
Paper Feedstock
ContainerFeedstock
Manual Fibre Sort
Various Paper Bunkers
Manual Container Sort
\i \iVarious Plastic Bunkers
Overhandet Manual Container Sort
EddyCurrent
M̂n
MSWTrommel
GlassShakerTable MSW
TrommelMSW Feedstock
Rejects YardWaste
Various Plastic Bunkers
Air *Bag Bag
c I
lit A1 SteelClass.
1Splitter Splitter s l ii m Bunker Bunker
Paper Sorting Lines
V VNewspaper Cardboard
~ T ~
MLxedPaper
~TT~
GlassBunker
Figure 4.12: Flowsheet for Meddill MRF
Thirteen materials were segregated in the MRF for reprocessing, those segregated by
automated means were:
• glass;
• steel;
• aluminium; and
• fines fraction (less than 2 inches).
The remaining streams were manually segregated, and consisted of:
• cardboard;
• newspapers;
• magazines;
• mixed paper;
125
Chapter 4
• mixed plastic bottles;
• plastic film;
• hard plastic (for example garden furniture);
• green waste; and,
• wood.
As a result of the manually intensive operation, the MRF was able to readily adjust its
operations to cater for changes within the recyclable market, by instructing its pickers to
sort in a different manner.
Health and safety was very poor in the plant, and the conditions were not ideal for the staff.
It was a very dusty and hot environment to work in. The facility would benefit by adding
dust extraction and air conditioning systems for the sorting cabins. In terms of
improvements, the MRF would benefit from increased automation, for example the use of
an optical sorter for sorting plastic bottles.
The Albacete MRF was a much smaller facility than the Meddill MRF; it had a throughput
of 30tph. Again, the plant processed both mixed household waste and mixed containers;
however, this was in a different manner to the Meddill MRF, as mixed containers were
batched through the dirty MRF line on 1 day per week. In terms of performance, a
representative from the MRF stated that 44% of incoming material was sent to landfill,
which was significantly better than the performance of Meddill MRF. Again, the basic
features are highlighted in Table 4.10, with a more detailed review in Appendix C l6.
126

Chapter 4
Table 4.10: Summary of Albacete MRF Features
MRF Type DirtyEquipment Manufacturer StadlerThroughput:
Design Capacity (tph) 30Actual Capacity (tph) 30
Number of Pickers per Shift 5 (Quality Control)Residue (%) 44Material Type Currently
ProcessesCould
ProcessCould not Process
Clean Stream:Single Stream Material (excluding glass) 7 .......Single Stream Material (including glass)Two Stream Material - paper and containers VBagged Material VLoose Material VBaled Material V
Dirty Material i.e. MSW VCommercial Recyclable
The process flowsheet for Albacete MRF is shown in Figure 4.13. This Figure highlights
that the key pieces of separation equipment used at the MRF were again trommels which
were used to remove fine organic material from the waste stream, and also to segregate the
containers and paper fractions from the mixed household waste. The container and paper
fractions were then conveyed to a ballistic separator which further cleaned up the streams,
enabling all the paper and plastic film to be removed. The remaining mixed containers
were then sorted in a highly automated operation with an overband magnet, eddy current
separator and optical sorters were utilised to segregate the ferrous metals, non-ferrous
metal and various plastic types respectively. It was disappointing to note that no sorting
was carried out on the mixed paper and film fraction; however, there was not a market for
this material in Spain at the time of visit.
127

Chapter 4
>90mm >250mmTrommel Trommel
1 250-400mm
Bag Splitter
Oversize90-250mmF e e d /
30tph MSWPaper &
FilmBallisticSeparator
Fines•3V S3
- _OverhandMagnetFerrous
HDPEOptical
SorterMixedPlastic PET
OpticalSorter Beverage
C artons MixedPlastic
ResidueEddyCurrent Non-Ferrous
Figure 4.13: Flowsheet for Albacete MRF
To summarise, eight materials were segregated automatically in the MRF for reprocessing;
however, staff were employed in a quality control role to remove any contaminants from
the segregated streams. The MRF would be limited in its response to changing market
conditions, as a result of the minimal manual operations in place; however, a limited
number of changes could be made to the settings of the optical sorters in relation to
plastics. Other than this, additional investment would be required to purchase other
equipment, such as conveyors and picking platforms for sorting of the paper and cardboard
streams.
I
128
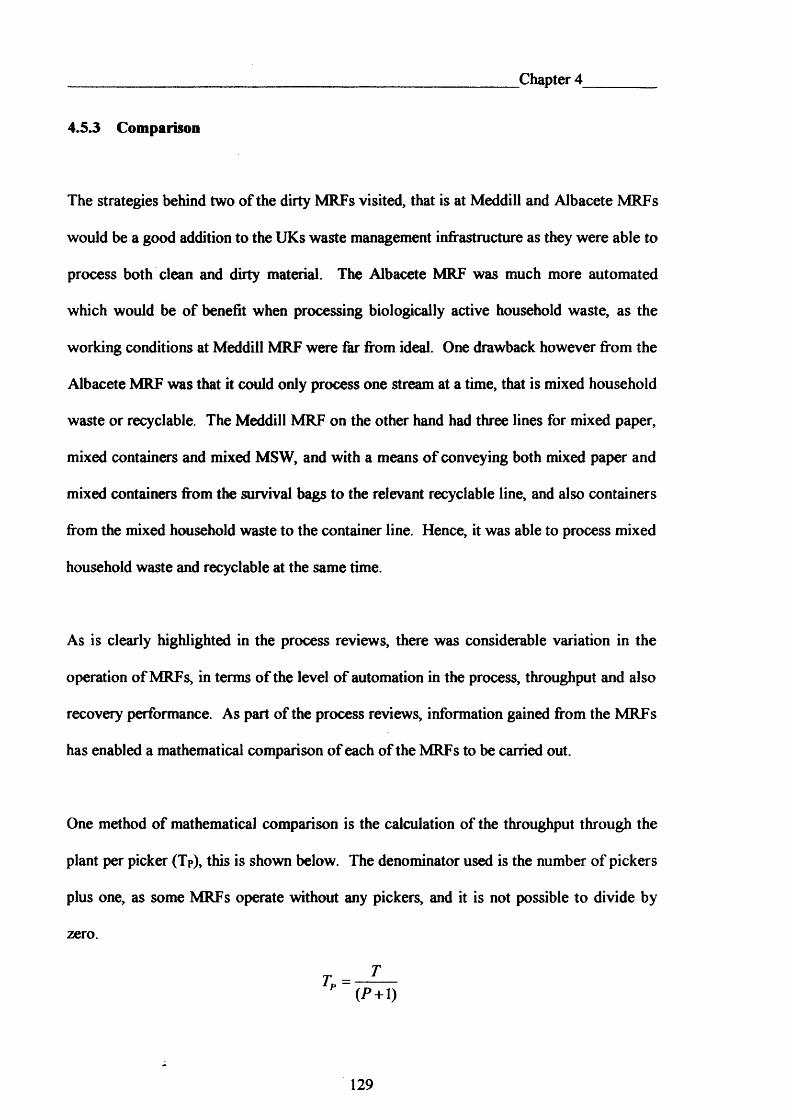
Chapter 4
4.5.3 Comparison
The strategies behind two of the dirty MRFs visited, that is at Meddill and Albacete MRFs
would be a good addition to the UKs waste management infrastructure as they were able to
process both clean and dirty material. The Albacete MRF was much more automated
which would be of benefit when processing biologically active household waste, as the
working conditions at Meddill MRF were far from ideal. One drawback however from the
Albacete MRF was that it could only process one stream at a time, that is mixed household
waste or recyclable. The Meddill MRF on the other hand had three lines for mixed paper,
mixed containers and mixed MSW, and with a means of conveying both mixed paper and
mixed containers from the survival bags to the relevant recyclable line, and also containers
from the mixed household waste to the container line. Hence, it was able to process mixed
household waste and recyclable at the same time.
As is clearly highlighted in the process reviews, there was considerable variation in the
operation of MRFs, in terms of the level of automation in the process, throughput and also
recovery performance. As part of the process reviews, information gained from the MRFs
has enabled a mathematical comparison of each of the MRFs to be carried out.
One method of mathematical comparison is the calculation of the throughput through the
plant per picker (Tp), this is shown below. The denominator used is the number of pickers
plus one, as some MRFs operate without any pickers, and it is not possible to divide by
zero.
129

Chapter 4
Where ‘T is the average throughput through the MRF in tonnes per hour, and ‘P* is the
number of pickers employed at the MRF per shift.
The formula returns a value, which give an indication of the level of automation in the
plant. Generally, the value increases as a MRF operation becomes more automated. Table
4.11 shows the Tp values for a selection of the MRFs reviewed in this section.
Table 4.11: Throughput per Picker (Tp) for Reviewed MRFs
MRFType
MRF Feedstock Type TP(T/hr/Person)
Clean NEWS, Norfolk Single Stream 1.08Cutts Recycling, Milton Keynes Single Stream 0.38Recycle America Grayslake Single Stream 0.77West Coast Recycling Single Stream 1.42Blue Mountain Recycling Single Stream 0.56Guelph Wet Dry+ Single Stream 0.95City of Cardiff MRF Single Stream 0.54Rumpke MRF, Columbus, Ohio Single Stream 0.65R U Recycling, Darwen Mixed Containers 10.00
Dirty Yorwaste Mixed MSW 15.00Albacete MRF Mixed MSW & Recyclable 5.00Meddill MRF, Chicago Mixed MSW & Recyclable 2.44
It can clearly be seen that the values for Tp are lower for single stream MRFs reviewed
than the mixed container and dirty MRFs reviewed, which indicates that these are
generally less automated than other operations, although values vary significantly from
0.38 to 1.42.
However, this index cannot be used in isolation, as a MRF with a high Tp value could
simply be underperforming, i.e. the residue remaining from the process may be very high
as the MRF is simply not employing enough pickers. Hence, it is vitally important to
consider the Tp values together with percentage of processed material lost as residue.
130
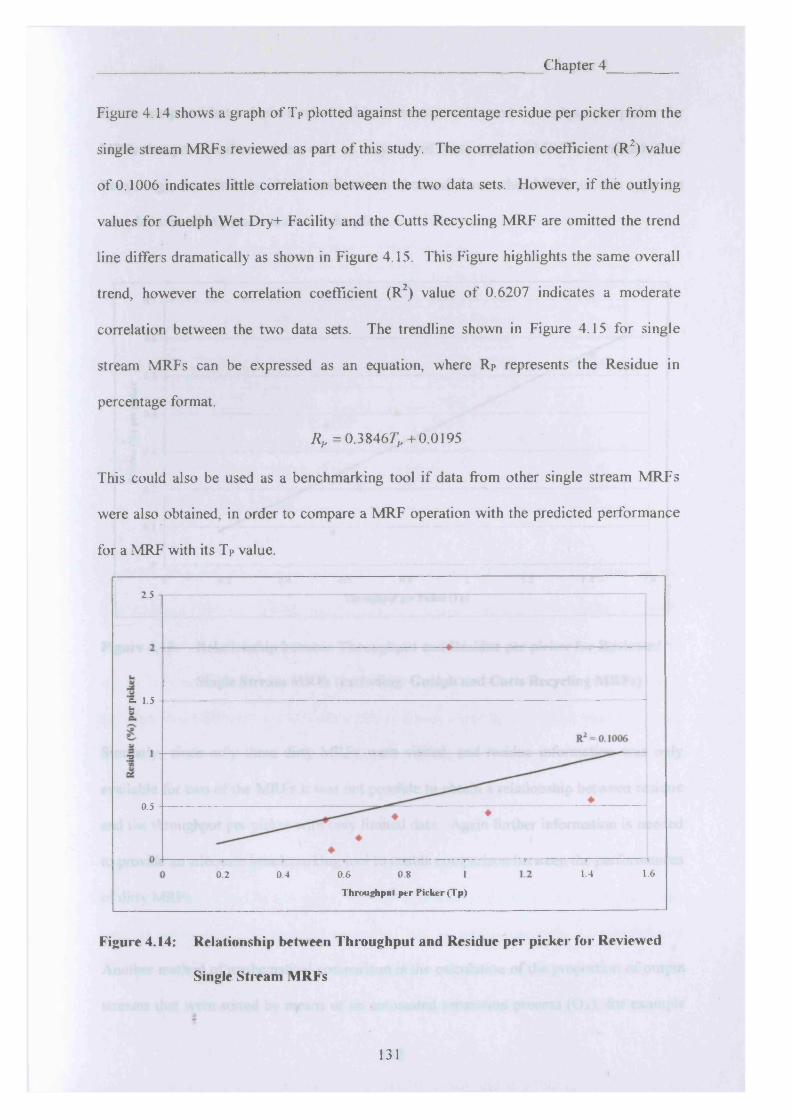
Chapter 4
Figure 4.14 shows a graph of Tp plotted against the percentage residue per picker from the
single stream MRFs reviewed as part of this study. The correlation coefficient (R2) value
of 0.1006 indicates little correlation between the two data sets. However, if the outlying
values for Guelph Wet Dry+ Facility and the Cutts Recycling MRF are omitted the trend
line differs dramatically as shown in Figure 4.15. This Figure highlights the same overall
trend, however the correlation coefficient (R2) value of 0.6207 indicates a moderate
correlation between the two data sets. The trendline shown in Figure 4.15 for single
stream MRFs can be expressed as an equation, where Rp represents the Residue in
percentage format.
Rp =0.38467;+0.0195
This could also be used as a benchmarking tool if data from other single stream MRFs
were also obtained, in order to compare a MRF operation with the predicted performance
for a MRF with its TP value.
2.5
c. 1.5
s
0.5
1.61.40.6 0.8 1
Throughput per Picker (Tp)
0.2 0.4
Figure 4.14: Relationship between Throughput and Residue per picker for Reviewed
Single Stream MRFs
131
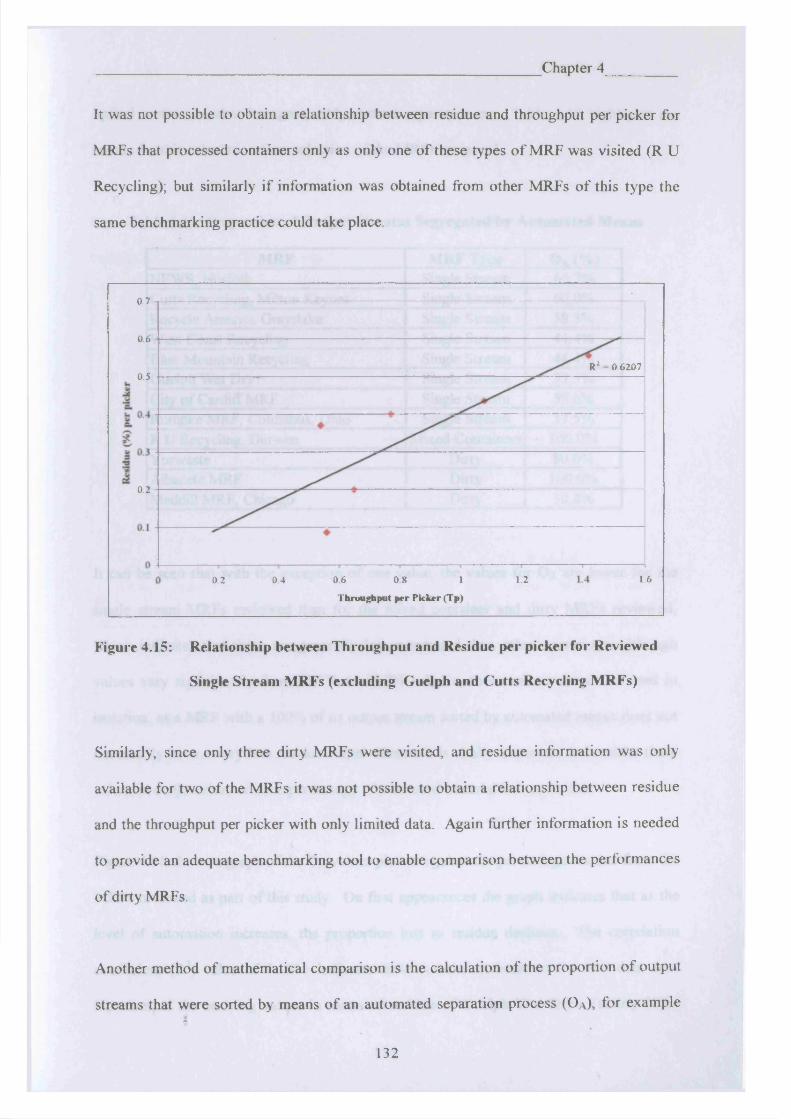
Chapter 4
It was not possible to obtain a relationship between residue and throughput per picker for
MRFs that processed containers only as only one of these types o f MRF was visited (R U
Recycling); but similarly if information was obtained from other MRFs of this type the
same benchmarking practice could take place.
0.7
0.6
R2 = 0.62070.5
0.2
1.60.6 1.20.2 0.4 0.8 1
Throughput per Picker (Tp)
Figure 4.15: Relationship between T hroughput and Residue per picker for Reviewed
Single Stream MRFs (excluding Guelph and C utts Recycling M RFs)
Similarly, since only three dirty MRFs were visited, and residue information was only
available for two of the MRFs it was not possible to obtain a relationship between residue
and the throughput per picker with only limited data. Again further information is needed
to provide an adequate benchmarking tool to enable comparison between the performances
of dirty MRFs.
Another method of mathematical comparison is the calculation of the proportion of output
streams that were sorted by means of an automated separation process ( O a ) , for exampleI
132
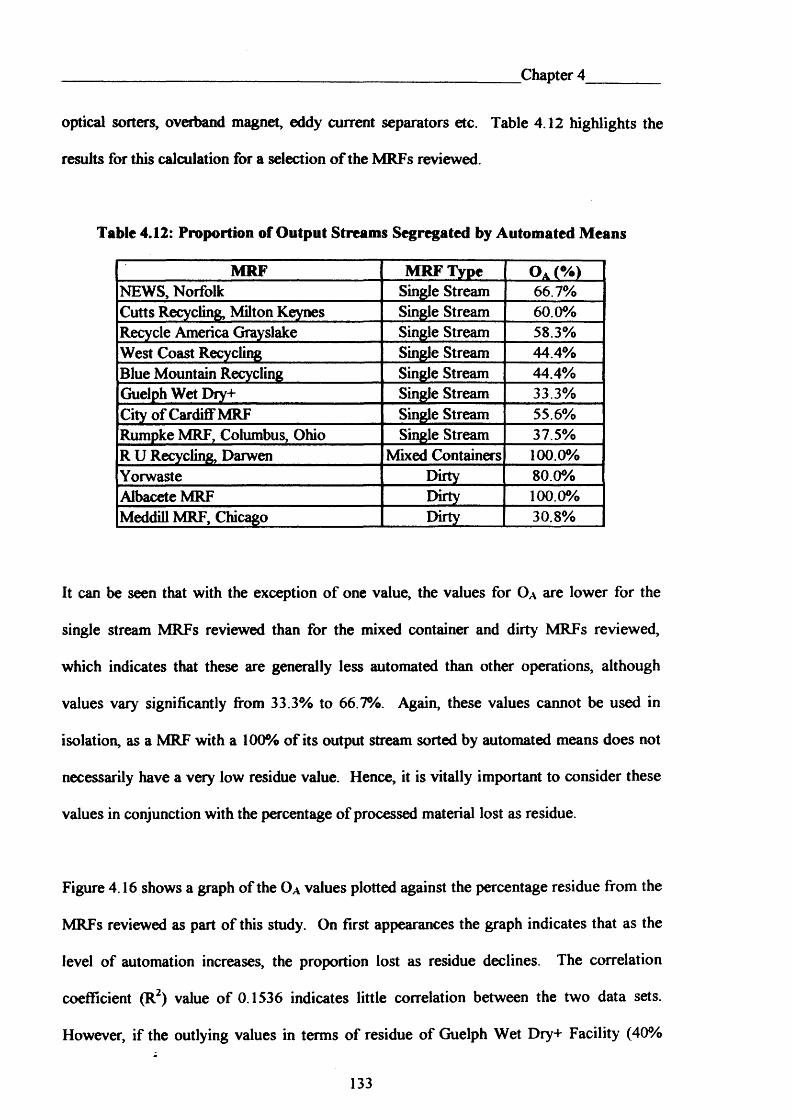
Chapter 4
optical sorters, overband magnet, eddy current separators etc. Table 4.12 highlights the
results for this calculation for a selection o f the MRFs reviewed.
Table 4.12: Proportion of Output Streams Segregated by Automated Means
MRF MRF Type o A(%)NEWS, Norfolk Single Stream 66.7%Cutts Recycling, Milton Keynes Single Stream 60.0%Recycle America Grayslake Single Stream 58.3%West Coast Recycling Single Stream 44.4%Blue Mountain Recycling Single Stream 44.4%Guelph Wet Dry+ Single Stream 33.3%City of Cardiff MRF Single Stream 55.6%Rumpke MRF, Columbus, Ohio Single Stream 37.5%R U Recycling, Darwen Mixed Containers 100.0%Yorwaste Dirty 80.0%Albacete MRF Dirty 100.0%Meddill MRF, Chicago Dirty 30.8%
It can be seen that with the exception of one value, the values for O a are lower for the
single stream MRFs reviewed than for the mixed container and dirty MRFs reviewed,
which indicates that these are generally less automated than other operations, although
values vary significantly from 33.3% to 66.7%. Again, these values cannot be used in
isolation, as a MRF with a 100% of its output stream sorted by automated means does not
necessarily have a very low residue value. Hence, it is vitally important to consider these
values in conjunction with the percentage of processed material lost as residue.
Figure 4.16 shows a graph of the Oa values plotted against the percentage residue from the
MRFs reviewed as part of this study. On first appearances the graph indicates that as the
level of automation increases, the proportion lost as residue declines. The correlation
coefficient (R2) value of 0.1536 indicates little correlation between the two data sets.
However, if the outlying values in terms of residue of Guelph Wet Dry+ Facility (40%
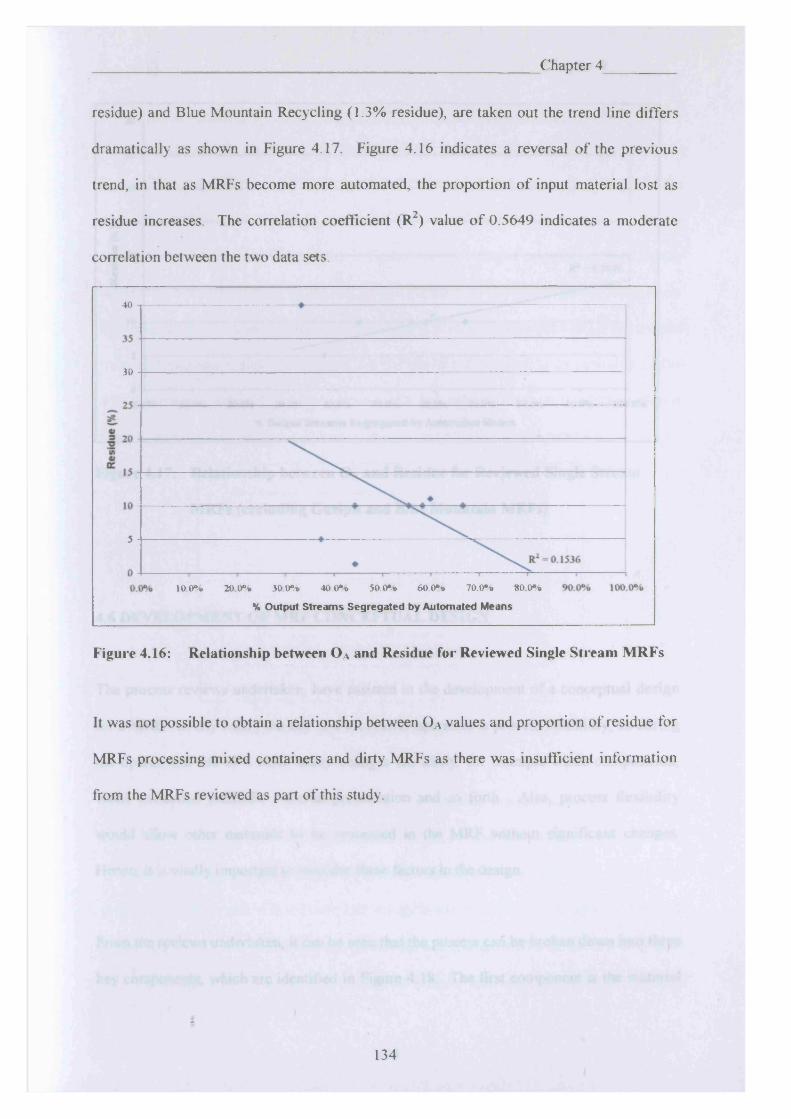
Chapter 4
residue) and Blue Mountain Recycling (1.3% residue), are taken out the trend line differs
dramatically as shown in Figure 4.17. Figure 4.16 indicates a reversal of the previous
trend, in that as MRFs become more automated, the proportion of input material lost as
residue increases. The correlation coefficient (R2) value of 0.5649 indicates a moderate
correlation between the two data sets.
40
30
10.0% 20 0% 30 .0% 4 0 .0 % 50 .0% 60 .0% 70 .0% 80 0%
% Output Streams Segregated by Automated Means
Figure 4.16: Relationship between O a and Residue for Reviewed Single S tream M RFs
It was not possible to obtain a relationship between 0 A values and proportion of residue for
MRFs processing mixed containers and dirty MRFs as there was insufficient information
from the MRFs reviewed as part of this study.
t
134
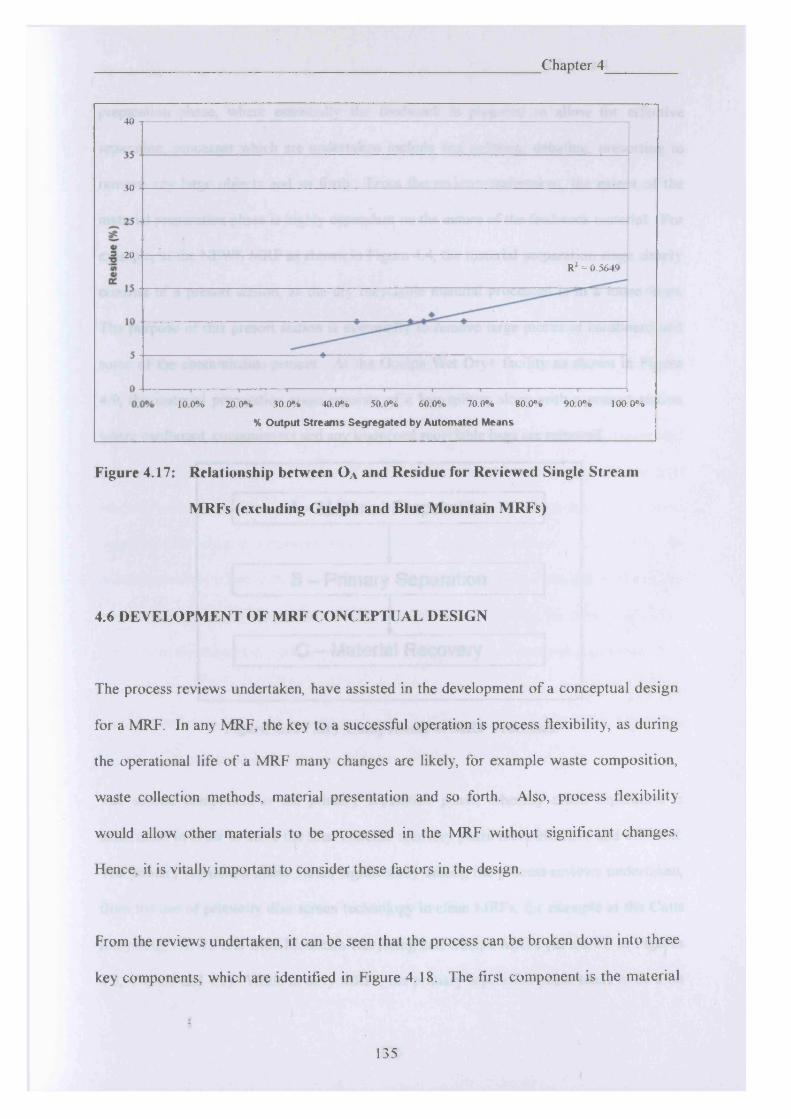
Chapter 4
40
30
3 20R 2 = 0 .5 6 4 9
1 0 0 % 20 .0% 30 .0% 40 0 % 5 0 0 % 60 0% 70.0% 80 .0% 90 0 % 100.0%
% Output Streams Segregated by Automated Means
Figure 4.17: Relationship between Oa and Residue for Reviewed Single Stream
MRFs (excluding Guelph and Blue Mountain MRFs)
4.6 DEVELOPMENT OF MRF CONCEPTUAL DESIGN
The process reviews undertaken, have assisted in the development of a conceptual design
for a MRF. In any MRF, the key to a successful operation is process flexibility, as during
the operational life of a MRF many changes are likely, for example waste composition,
waste collection methods, material presentation and so forth. Also, process flexibility
would allow other materials to be processed in the MRF without significant changes.
Hence, it is vitally important to consider these factors in the design.
From the reviews undertaken, it can be seen that the process can be broken down into three
key components, which are identified in Figure 4.18. The first component is the material
I
135
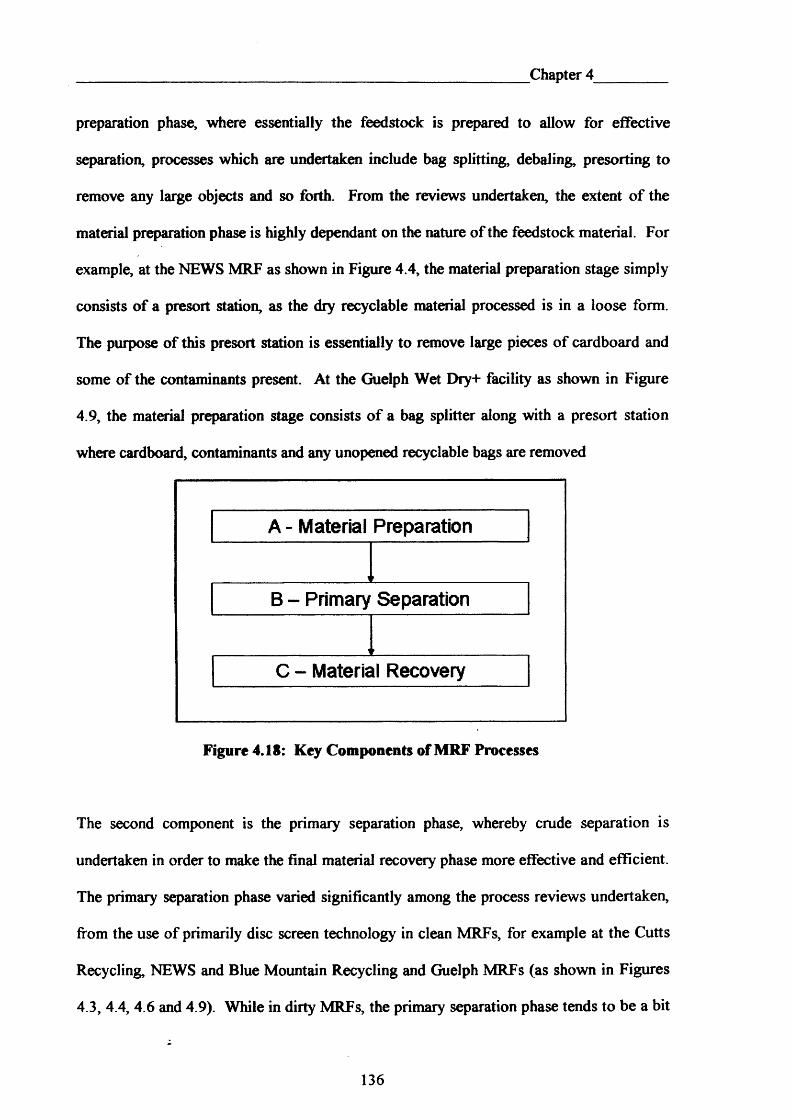
Chapter 4
preparation phase, where essentially the feedstock is prepared to allow for effective
separation, processes which are undertaken include bag splitting, debaling, presorting to
remove any large objects and so forth. From the reviews undertaken, the extent of the
material preparation phase is highly dependant on the nature of the feedstock material. For
example, at the NEWS MRF as shown in Figure 4.4, the material preparation stage simply
consists of a presort station, as the dry recyclable material processed is in a loose form.
The purpose of this presort station is essentially to remove large pieces of cardboard and
some of the contaminants present. At the Guelph Wet Dry+ facility as shown in Figure
4.9, the material preparation stage consists o f a bag splitter along with a presort station
where cardboard, contaminants and any unopened recyclable bags are removed
C - Material Recovery
B - Primary Separation
A - Material Preparation
Figure 4.18: Key Components of MRF Processes
The second component is the primary separation phase, whereby crude separation is
undertaken in order to make the final material recovery phase more effective and efficient.
The primary separation phase varied significantly among the process reviews undertaken,
from the use of primarily disc screen technology in clean MRFs, for example at the Cutts
Recycling NEWS and Blue Mountain Recycling and Guelph MRFs (as shown in Figures
4.3, 4.4, 4.6 and 4.9). While in dirty MRFs, the primary separation phase tends to be a bit
136

___________________________________ Chapter 4_________
more complex. In the dirty MRFs reviewed, the primary separation phase ranged from the
use of kinetic streamers, a trommel and vibrating screens at the Yorwaste facility (as
shown in Figure 4.11), to the use of trommels and ballistic separators at the Albacete MRF
as can be seen in Figure 4.13.
The final material recovery phase essentially is the separation of the materials required for
reprocessing, the extent of which is highly dependant on market conditions but also on the
type of segregation utilised. Segregation can either be manual or automated as discussed
previously, and the MRFs reviewed ranged from being fully automated, to being
intensively manual operations. For example at the NEWS, R U Recycling, Yorwaste and
Albacete MRFs as shown in Figures 4.4, 4.5, 4.11 and 4.13 respectively, the material
recovery phase was fully automated and consisted of sorting equipment such as overband
magnets, eddy current separators, optical sorters, and air classifiers. In contrast, the
material recovery phase at the Blue Mountain Recycling, Guelph and Meddill MRFs utilise
more manual sorting. The manual sorting was used for segregating the paper and plastic
streams, while automated sorting was used for the segregation of steel and aluminium.
Figure 4.19 shows the flowsheet for the conceptual design of the MRF which highlights
the three component phases of the process.
The material preparation phase indicated by the letter A in Figure 4.19 consists of a presort
station and bag splitter. At the presort station bulky items are removed, which allows large
bulky objects (such as microwaves, furniture and so forth) which could cause damage to
the equipment to be removed. The remaining material then continues to a bag opener,
which opens any bagged material and liberates the contents. The addition of a bag splitter
137

Chapter 4
within the conceptual design enables the MRF to be more flexible in terms of the feedstock
processed, as loose and bagged material could be processed.
FeedstockA1 ....... "
Presort Station -----*| Bulky Items...... r '
Bag OpeneT
Fines<5 Ornm
Trammel |>55mm B
Ballistic Separator^Containers j
Paper, Card & Plastic Film
Steel ■*— -i
Overband Magnet
PlasticBottles
1 IOptical Sorter
* ___i
Steel
Aluminium
Eddy Current Separator
EEResidue
1PickingStation
CardI
| Plastic News &Film Pams
Figure 4.19: Conceptual MRF Design Flowchart highlighting process components
The primary separation phase (identified by the letter B in Figure 4.19), consists of a
trommel and bag splitter. The material from the bag splitter enters a trommel which
screens at 55mm, which removes the finer fraction of the feedstock, for example organic
material, bottle tops, shredded paper, broken glass and so forth. The inclusion of a
trommel screening at 55mm within the conceptual design enables the MRF to process
household waste which contains a large organic fraction, and thereby clean the recyclable
stream contained within waste stream.
The oversize fraction from the trommel, i.e. material greater than 55mm, then continues to
a ballistic separator. The ballistic separator sorts material by shape and weight; and hence,
138
Chapter 4
splits the material into two streams, these being a two dimensional and light material
stream, such as paper, cardboard, plastic film etc., and a three dimensional and heavy
material stream, namely containers, for example.
The material recovery phase consists of a picking station to manually sort the two
dimensional stream segregated by the ballistic separator, and an overband magnet, optical
sorter and eddy current separator to segregate the three dimensional stream.
At the sorting station, operatives manually segregate paper, cardboard and plastic film, and
any material that is not picked is a residue from the process and is sent for disposal.
Depending on the incoming feedstock, the picking regime at this stage could be altered; for
example if the incoming material had a high proportion of newspapers, a negative picking
action could be utilised at this stage. That is, pickers would remove any material which
was not newspaper in order to clean that particular material stream.
The container stream from the ballistic separator then continues to a series of automated
unit operations, these being an overband magnet to remove the steel cans from the stream,
an optical sorter to remove mixed plastic bottles, and an eddy current separator to remove
the aluminium stream, and also to remove any missed steel. Any remaining material is
sent for disposal.
This design is flexible in that a variety of materials could be processed, namely:
• single stream dry recyclable that is either loose or bagged;
• municipal solid waste; and,
• two stream dry recyclable that is either loose or bagged.
139
Chapter 4
To farther improve process flexibility, other feedpoints could include:
• loose mixed containers could be fed into the plant onto the container line after
the ballistic separator; and,
• loose mixed paper could be fed into the MRF onto the paper, cardboard and
plastic film line after the ballistic separator.
Hence, if there were any changes to the collection operation, these could be handled
without the need for significant changes to the process. Also, as the paper and card are
manually sorted, any changes in these markets could be readily addressed by instructing
pickers to sort in a different manner.
140

Chapter 5
CHAPTER 5: Operational Aspects of the Materials Recovery Facility
141
5.1 INTRODUCTIONChapter 5
This chapter will look at the critical aspects of the MRF, and identify the crucial
parameters considered in the design as discussed in chapter 4. The results of an efficiency
study conducted following the installation o f the MRF is also considered. The main thrust
of the discussion will look at the performance of the MRF, and identify areas for process
improvement in order to maximise the diversion of material away from landfill.
The facility was used to process the case study authority’s household waste and dry
recyclable streams. Thus the plant was used to process two distinctly different streams of
material, ranging from the ‘dirty’ stream of household waste, and the ‘clean; stream of
segregated dry recyclable. The facility aimed to divert material from landfill, by
recovering the following:
• paper;
• cardboard;
• plastic bottles;
• plastic film;
• steel cans;
• scrap metal;
• aluminium;
• source segregated garden waste; and,
• mechanically segregated putrescible material.
142
Chapter 5
5.2 PROCESS DESIGN AND IMPLEMENTATION
The conceptual design of the MRF has already been discussed in section 4.6; however, it
was important that this conceptual design was discussed with the parties involved in the
project, primarily the waste management contractor, and also the case study authority
albeit at a lesser extent.
It soon became apparent that the waste management contractor, wished to develop the
MRF in a phased manner, so as to stage the costs of the installation. The contractor made a
decision that they wished to install and commission the MRF in two phases (Saunders,
2007). Hence, the MRF conceptual design as shown in Figure 5.1 needed to be adapted to
consider the phased implementation, as well as taking into account various parameters
such as throughput.
In addition to the design criteria, the decision was also taken to allow sufficient additional
capacity to process increased quantities of material in the future, and decided that the MRF
should be able to process 50,000 tonnes per annum of household waste. Hence, based on
the operation cycle of 20 hours per day, 5 days per week, and 50 weeks of the year the
MRF needed to be able to process 10 tonnes per hour in order to meet the desired annual
output.
During the planning stage, when discussing plans with various manufacturers, the
Company was given the opportunity to acquire second hand equipment from a MRF which
was processing dry recyclable, and deemed this too good an offer to refuse. This
equipment consisted of a trommel, a number of conveyors, and picking platforms. Hence,
143

Chapter 5
the design of the MRF needed further adaption to consider this equipment. The crucial
aspect was that the second hand conveyors were operated at fixed not variable speed. This
was not ideal particularly when wishing to process two different material streams. This
was an opportunity not to be missed however, and a decision would be taken at a later date
based on the success o f the MRF project as to whether variable speed conveyors would be
purchased to further improve the performance of the MRF.
Fines <50mm
PlasticBottles
Steel
Aluminium
Feedstock1
Presort Station
IBulk> Items
Bag Opener
Trommel|>55m m
Ballistic Separator Paper. Card & Plastic Film
,, Containers PickingStationSteel Overband Magnet
Optical SorterI ~: z
Eddy Current Separator
Residue
Card Plastic News &Film Pams
Figure 5.1: MRF Conceptual Design
As a result of these constraints, the conceptual design was split to allow the development to
occur in two phases. Essentially phase 1 would greatly increase the capacity of processing
in the facility, and phase 2 would have a beneficial impact in terms of both the quantity and
quality of the material segregated.
t
144
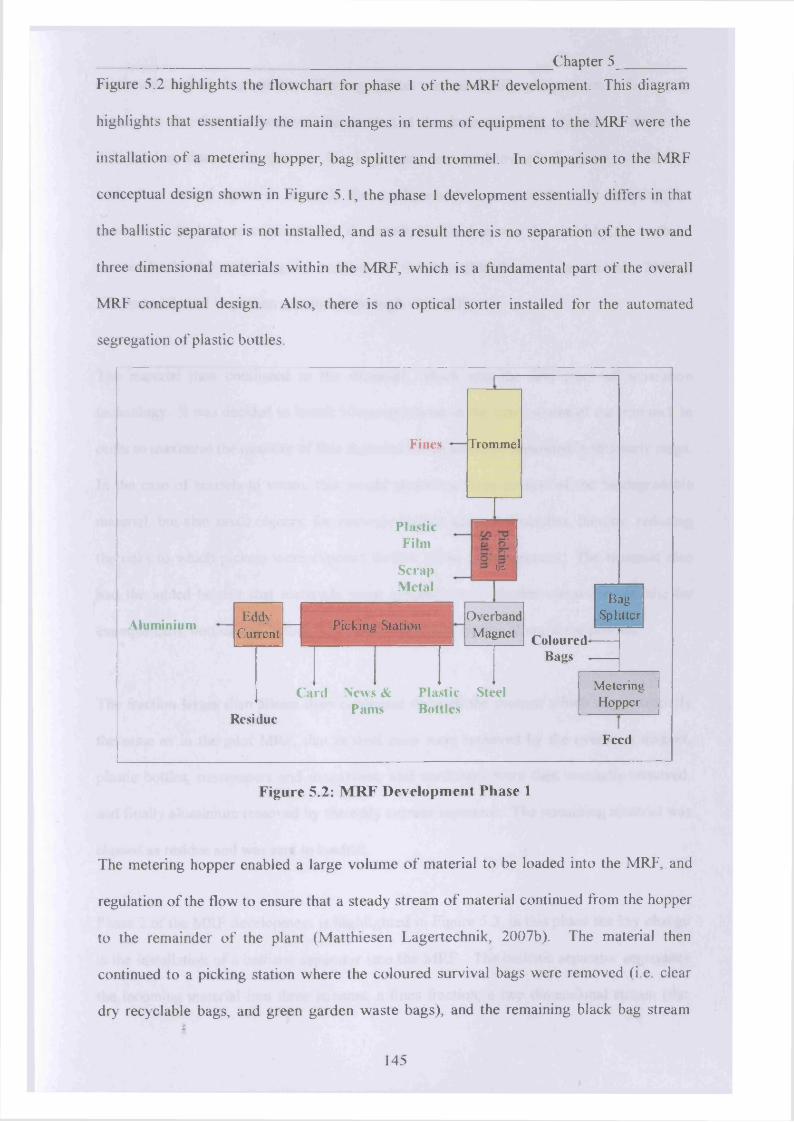
Chapter 5
Figure 5.2 highlights the flowchart for phase 1 of the MRF development. This diagram
highlights that essentially the main changes in terms of equipment to the MRF were the
installation of a metering hopper, bag splitter and trommel. In comparison to the MRF
conceptual design shown in Figure 5.1, the phase 1 development essentially differs in that
the ballistic separator is not installed, and as a result there is no separation of the two and
three dimensional materials within the MRF, which is a fundamental part of the overall
MRF conceptual design. Also, there is no optical sorter installed for the automated
segregation of plastic bottles.
Aluminium
Fines
PlasticFilm
ScrapMetal
ColouredBags
Plastic Steel Bottles
Card News & Pams
Residue
EddyCurrent
BagSplitterOverhand
Magnet
oo
MeteringHopper
Trommel
Picking Station
Feed
Figure 5.2: MRF Development Phase 1
The metering hopper enabled a large volume o f material to be loaded into the MRF, and
regulation of the flow to ensure that a steady stream of material continued from the hopper
to the remainder o f the plant (Matthiesen Lagertechnik, 2007b). The material then
continued to a picking station where the coloured survival bags were removed (i.e. clear
dry recyclable bags, and green garden waste bags), and the remaining black bag streami
145
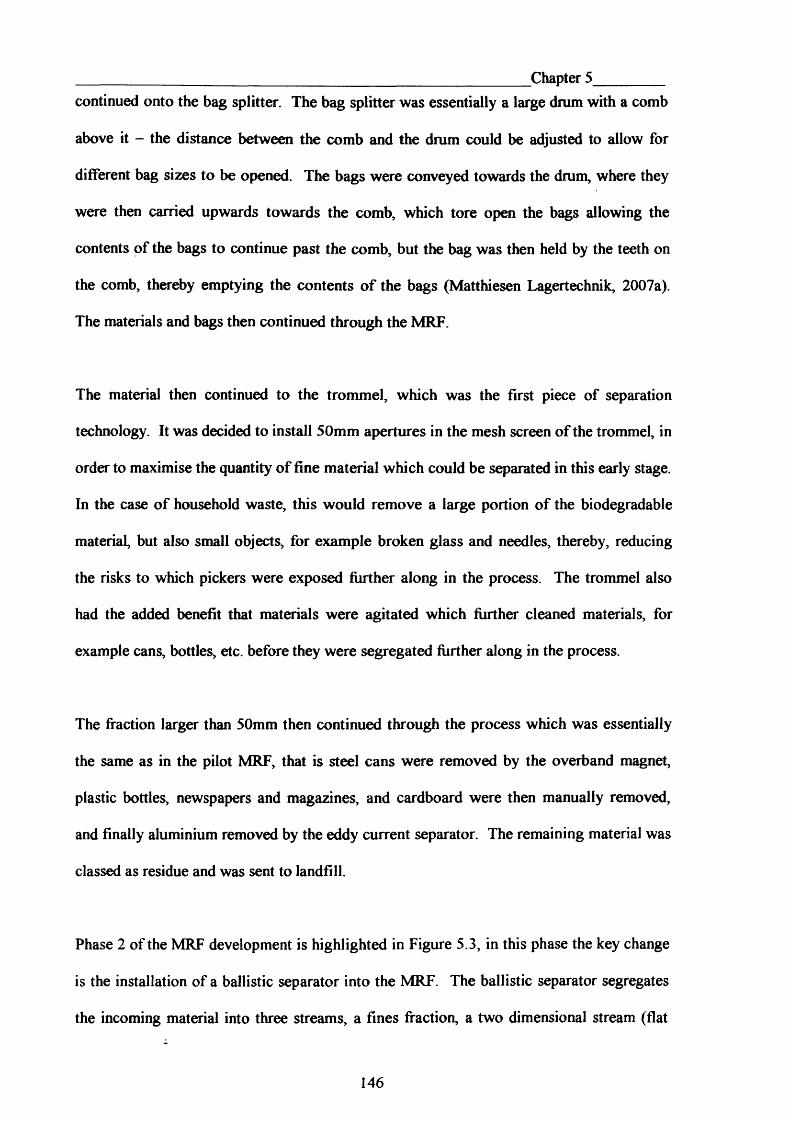
Chapter 5continued onto the bag splitter. The bag splitter was essentially a large drum with a comb
above it - the distance between the comb and the drum could be adjusted to allow for
different bag sizes to be opened. The bags were conveyed towards the drum, where they
were then carried upwards towards the comb, which tore open the bags allowing the
contents of the bags to continue past the comb, but the bag was then held by the teeth on
the comb, thereby emptying the contents of the bags (Matthiesen Lagertechnik, 2007a).
The materials and bags then continued through the MRF.
The material then continued to the trommel, which was the first piece of separation
technology. It was decided to install 50mm apertures in the mesh screen of the trommel, in
order to maximise the quantity of fine material which could be separated in this early stage.
In the case of household waste, this would remove a large portion of the biodegradable
material, but also small objects, for example broken glass and needles, thereby, reducing
the risks to which pickers were exposed further along in the process. The trommel also
had the added benefit that materials were agitated which further cleaned materials, for
example cans, bottles, etc. before they were segregated further along in the process.
The fraction larger than 50mm then continued through the process which was essentially
the same as in the pilot MRF, that is steel cans were removed by the overband magnet,
plastic bottles, newspapers and magazines, and cardboard were then manually removed,
and finally aluminium removed by the eddy current separator. The remaining material was
classed as residue and was sent to landfill.
Phase 2 of the MRF development is highlighted in Figure 5.3, in this phase the key change
is the installation of a ballistic separator into the MRF. The ballistic separator segregates
the incoming material into three streams, a fines fraction, a two dimensional stream (flat
146
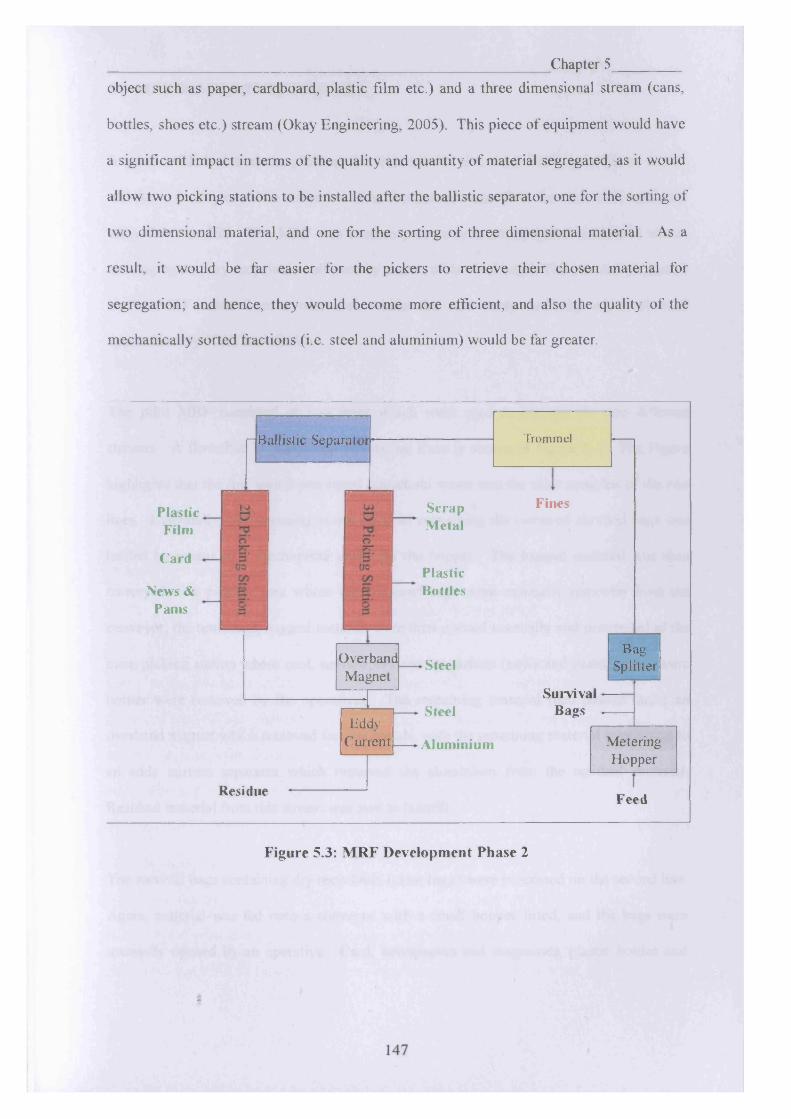
Chapter 5
object such as paper, cardboard, plastic film etc.) and a three dimensional stream (cans,
bottles, shoes etc.) stream (Okay Engineering, 2005). This piece of equipment would have
a significant impact in terms of the quality and quantity of material segregated, as it would
allow two picking stations to be installed after the ballistic separator, one for the sorting of
two dimensional material, and one for the sorting of three dimensional material. As a
result, it would be far easier for the pickers to retrieve their chosen material for
segregation; and hence, they would become more efficient, and also the quality of the
mechanically sorted fractions (i.e. steel and aluminium) would be far greater.
Ballistic Separator
FinesScrapMetal
PlasticFilm
CardPlasticBottlesNews &
Pams
Steel
SurvivalBagsSteel
Aluminium
Residue Feed
BagSplitter
EddyCurrent
OverbandMagnet
MeteringHopper
Trommel
Figure 5.3: MRF Development Phase 2

5.3 MRF DEVELOPMENT STAGESChapter 5
A pilot MRF had been in place at the contractor’s site since 2003, in order to assess
whether a facility could be utilised to divert household waste from the case study authority
away from landfill. The MRF was used to process both unsegregated household waste,
and segregated dry recyclable collected by means of survival bags. The material processed
in the MRF came from a trial area within the case study authority which covered
approximately 3000 households.
The pilot MRF consisted of two lines which were used to process the two different
streams. A flowchart of these two processing lines is shown in Figure 5.4. The Figure
highlights that the line which processed household waste was the most complex of the two
lines. Essentially, the incoming waste material containing the coloured survival bags was
loaded by means of a mechanised grab into the hopper. The bagged material was then
conveyed to a picking area where the coloured bags were manually removed from the
conveyor, the remaining bagged material were then opened manually and proceeded to the
main picking station where card, newspapers and magazines (news and pams), and plastic
bottles were removed by the operatives. The remaining material then passed under an
overband magnet which removed ferrous metals, with the remaining material continuing to
an eddy current separator which removed the aluminium from the residual material.
Residual material from this stream was sent to landfill.
The survival bags containing dry recyclable (clear bags) were processed on the second line.
Again, material was fed onto a conveyor with a small hopper fitted, and the bags were
manually opened by an operative. Card, newspapers and magazines, plastic bottles and
148
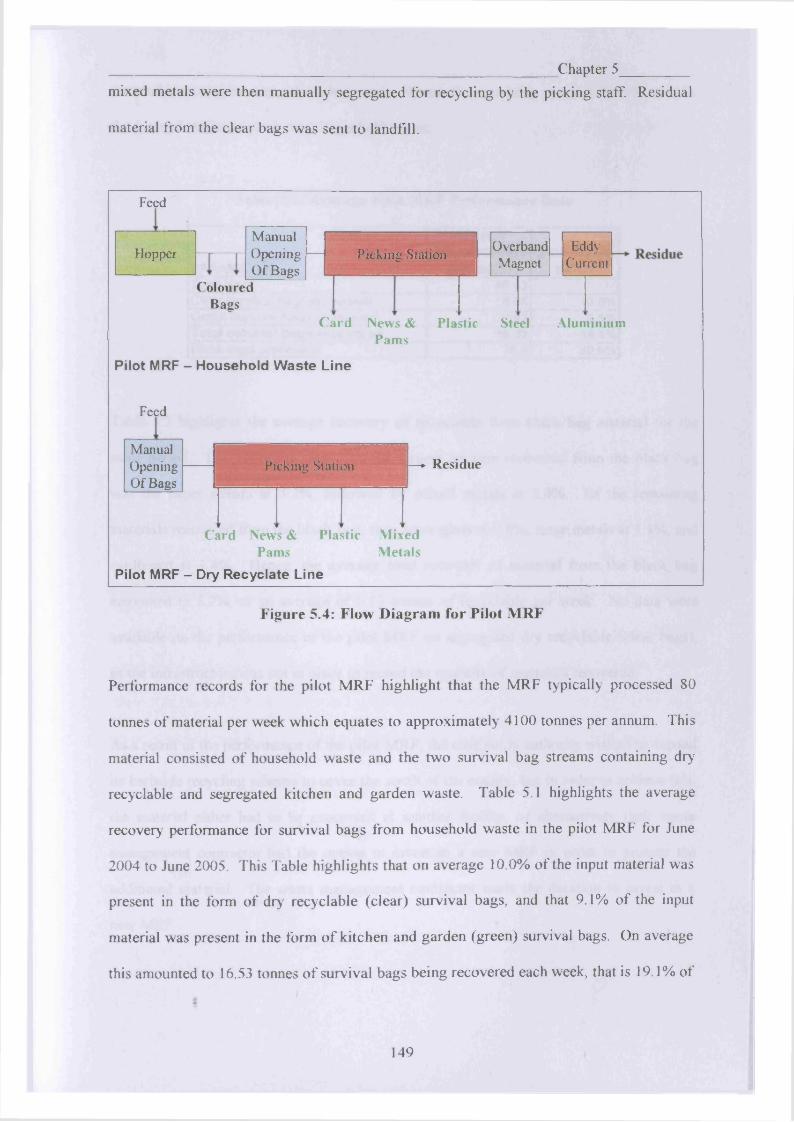
_________________ Chapter 5_________mixed metals were then manually segregated for recycling by the picking staff. Residual
material from the clear bags was sent to landfill.
Feed
ColouredBags
EddyCurrent
OverhandMagnet
Manual Opening Of Bags
Hopper Picking Station
Card News & Plastic Steel Aluminium Pams
Pilot MRF - Household Waste Line
Feed
ManualOpening Picking Station —► ResidueOf Bags
Card News & Plastic M ixed Pams M etals
Pilot MRF - Dry Recyclate Line
Figure 5.4: Flow Diagram for Pilot MRF
Performance records for the pilot MRF highlight that the MRF typically processed 80
tonnes of material per week which equates to approximately 4100 tonnes per annum. This
material consisted of household waste and the two survival bag streams containing dry-
recyclable and segregated kitchen and garden waste. Table 5.1 highlights the average
recovery performance for survival bags from household waste in the pilot MRF for June
2004 to June 2005. This Table highlights that on average 10.0% of the input material was
present in the form of dry recyclable (clear) survival bags, and that 9.1% of the input
material was present in the form of kitchen and garden (green) survival bags. On average
this amounted to 16.53 tonnes of survival bags being recovered each week, that is 19.1% of
149
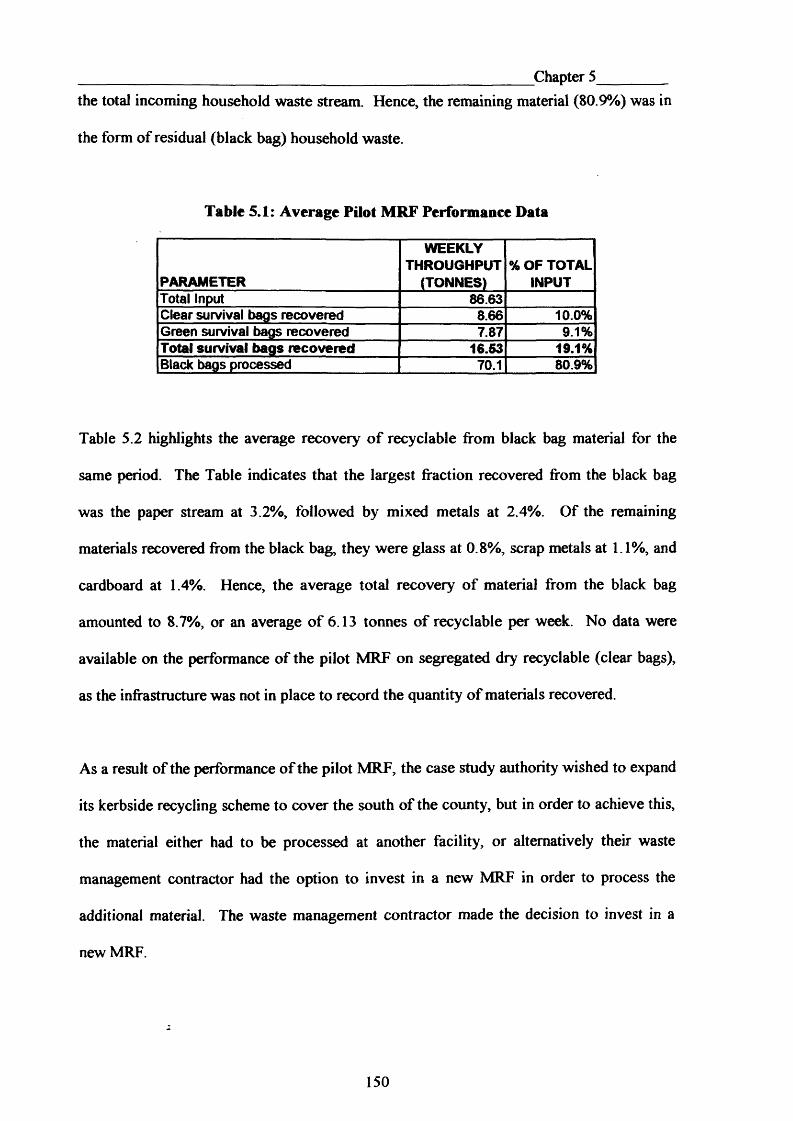
_________________________________________________________Chapter 5_________the total incoming household waste stream. Hence, the remaining material (80.9%) was in
the form of residual (black bag) household waste.
Table 5.1: Average Pilot MRF Performance Data
PARAMETER
WEEKLYTHROUGHPUT
(TONNES)% OF TOTAL
INPUTTotal Input 86.63Clear survival bags recovered 8.66 10.0%Green survival bags recovered 7.87 9.1%Total survival bags recovered 16.53 19.1%Black bags processed 70.1 80.9%
Table 5.2 highlights the average recovery o f recyclable from black bag material for the
same period. The Table indicates that the largest fraction recovered from the black bag
was the paper stream at 3.2%, followed by mixed metals at 2.4%. Of the remaining
materials recovered from the black bag, they were glass at 0.8%, scrap metals at 1.1%, and
cardboard at 1.4%. Hence, the average total recovery of material from the black bag
amounted to 8.7%, or an average of 6.13 tonnes of recyclable per week. No data were
available on the performance of the pilot MRF on segregated dry recyclable (clear bags),
as the infrastructure was not in place to record the quantity of materials recovered.
As a result of the performance of the pilot MRF, the case study authority wished to expand
its kerbside recycling scheme to cover the south of the county, but in order to achieve this,
the material either had to be processed at another facility, or alternatively their waste
management contractor had the option to invest in a new MRF in order to process the
additional material. The waste management contractor made the decision to invest in a
new MRF.
150
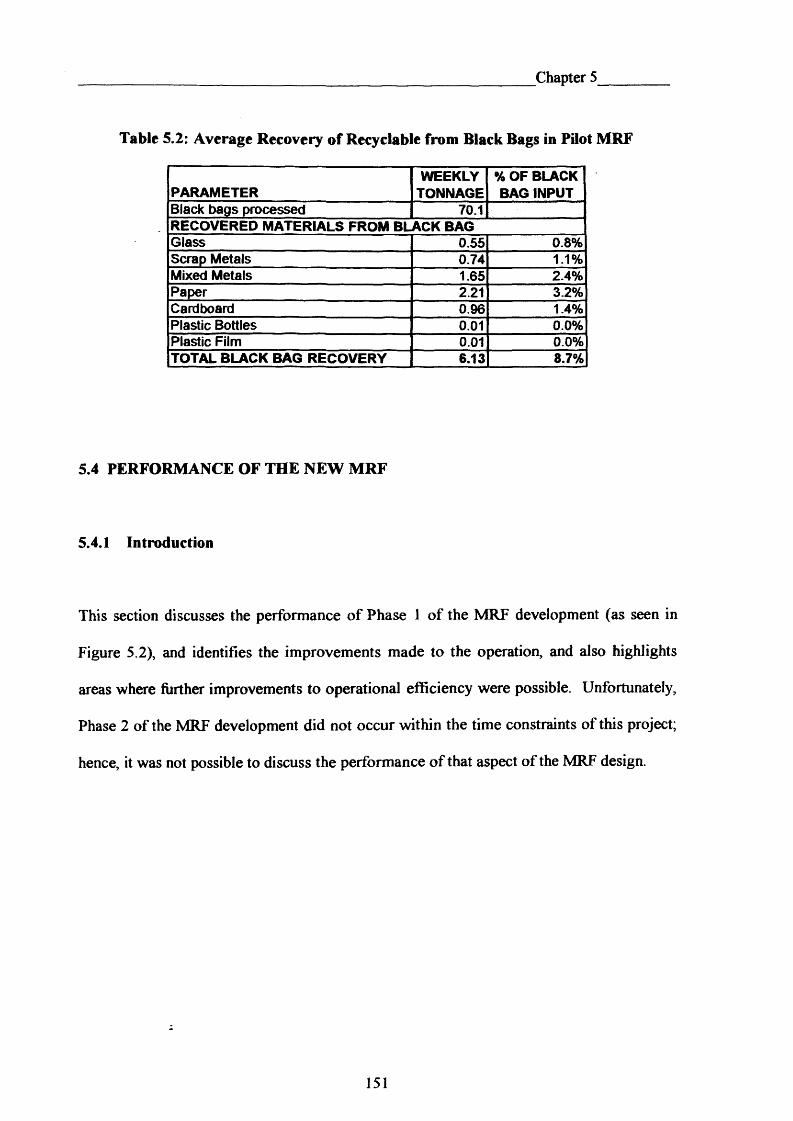
Chapter 5
Table 5.2: Average Recovery of Recyclable from Black Bags in Pilot MRF
PARAMETERWEEKLY
TONNAGE% OF BLACK BAG INPUT
Black bags processed 70.1RECOVERED MATERIALS FROM BLACK BAGGlass 0.55 0.8%Scrap Metals 0.74 1.1%Mixed Metals 1.65 2.4%Paper 2.21 3.2%Cardboard 0.96 1.4%Plastic Bottles 0.01 0.0%Plastic Film 0.01 0.0%TOTAL BLACK BAG RECOVERY 6.13 8.7%
5.4 PERFORMANCE OF THE NEW MRF
5.4.1 Introduction
This section discusses the performance of Phase 1 of the MRF development (as seen in
Figure 5.2), and identifies the improvements made to the operation, and also highlights
areas where further improvements to operational efficiency were possible. Unfortunately,
Phase 2 of the MRF development did not occur within the time constraints of this project;
hence, it was not possible to discuss the performance of that aspect of the MRF design.
151
_________________________________________________________ Chapter_5_________5.4.2 Methodology
Prior to carrying out the efficiency study, a set out survey was carried out in August 2006
in areas which had previously had set out surveys carried out in order to assess if any
changes had occurred. Set out surveys were also carried out in similar areas which were
new to the kerbside recycling scheme in order to compare performance between the
existing and new areas.
The methodology for the set out survey was the same as that used previously in this study,
see section 3.2.2.2. After the set out surveys had been completed, the MRF efficiency
analysis was carried out, the method for this is shown in steps I to XX.
I. Ensure the facility is empty of material i.e. all cages and belts are empty, and
residual waste area is clear of material.
II. Segregate approximately 25 tonnes of incoming weighed commingled waste ready
for use in the efficiency study. Record the weight of this material.
III. Load some of this material into the metering hopper.
IV. Begin operating MRF as normal. Note the time that the MRF begins operating.
V. All operators are to work at their normal stations, at their normal pace and in the
normal way.
152
Chapter 5_________VI. The metering hopper is to be topped up as normal to allow a continuous feed in to
the MRF.
VII. Cages and other containers are to be removed and replaced when they are full,
ensuring that the weight o f the removed container is recorded, and the recovered
material is to be placed in the designated sorting area ready for further analysis.
VIII. Samples of the residual waste are to be taken on a regular basis, these samples are
to be weighed and placed in the designated sorting area for further analysis.
IX. Samples of the fines material recovered by the trommel are to be taken on a regular
basis, these samples are to be weighed and placed in the designated sorting area for
further analysis.
X. Once the material has finished going through the MRF, note the time.
XI. Remove all cages, weigh them and take to the designated area for sorting.
XII. Remove all residual waste from the residual waste bay and record the mass via the
weighbridge.
XIII. Contamination of each dry recyclable is to be measured by removing any
contamination from the material, and weighing the contamination in order to
calculate the % by weight of contamination in each dry recyclable stream.
153

Chapter 5XTV. The residual sample is then to be sorted in the designated sorting area. This is to be
handsorted into the relevant bin for the categories used in the sorting methodology
discussed in section 3.2.2.4 part IV. Weigh the contents of each component bin
(remembering to take account of the mass of the bin) to obtain the mass of each
fraction present. A 75kg balance with an accuracy of 50g was used. Once weighed
the sorted material was removed from the bins,
XV. Clear the sorting area ready to sort the fines sample.
XVI. Hand sort the fines sample into a smaller set of categories, these are:
• Organic Material
• Glass
• Batteries
• Metals
• Plastic
• Cork
Weigh the contents of each component fraction (remembering to take account of
the mass of the container) to obtain the mass of each fraction present. A 75kg
balance with an accuracy of 50g was used. Once weighed the sorted material was
removed from the containers.
XVII. The next step is to carry out the steps III to XVI for the dry recyclables (clear bags)
feed. The clear bag material segregated from the commingled feed are to be used,
topped up to approximately 5 tonnes with other Ceredigion clear bags. The weight
of the additional clear bags are to be recorded to enable a known weight of clear
bags input into the MRF to be calculated.
154
XVIII. Repeat steps III to XVI for the clear bag material.Chapter 5
XIX. The next stage was to enter the results into a spreadsheet to determine the
performance of the MRF, and to indicate what proportion of materials were being
missed in both the commingled and clear bag feeds. Recovery rates as a percentage
of the total potential recyclables available will also be determined.
XX. A comparison was made of the weighbridge results with the summation of each
segregated material fraction as a check to ensure accuracy of the results.
5.4.3 Results and Discussion
5.4.3.1 Introduction
This section discusses the findings of the set out survey and efficiency study carried out in
September 2006.
5.4.3.2 Set Out Survey
Tables 5.3 and 5.4 highlight the raw data collected for the weekly set out data, and include
data for existing and new kerbside recycling scheme areas.
Table 5.5 shows the summary of the set out survey carried out in three areas for which
previous data was available. These areas were the same as those used in the waste
classification study discussed in Chapter 3 and are indicated on the map of the case study
authority shown in Figure 2.2, and were as follows:
155
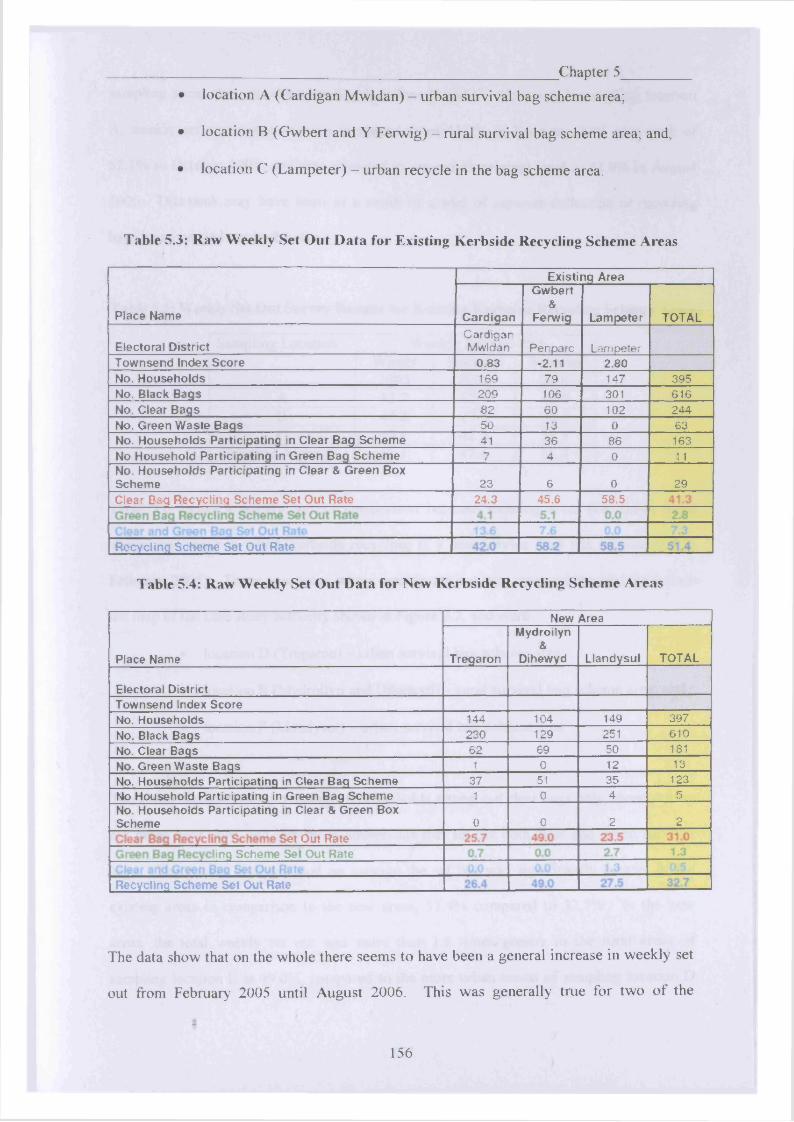
Chapter 5• location A (Cardigan Mwldan) - urban survival bag scheme area;
• location B (Gwbert and Y Ferwig) - rural survival bag scheme area; and,
• location C (Lampeter) - urban recycle in the bag scheme area.
Table 5.3: Raw Weekly Set O ut D ata for Existing K erbside Recycling Scheme Areas
Place Name
Existing Area
Cardigan
Gwbert&
Ferwig Lampeter TOTAL
Electoral DistrictCardiganMwldan Perparc Lampeter
Townsend Index Score 0.83 -2.11 2.80No. Households 169 79 14? 395No. Black Baqs 209 106 301 616No. Clear Bags 82 60 102 244No. Green Waste Baqs 50 13 0 63No. Households Participating in Clear Bag Scheme 41 36 86 163No Household Participating in Green Bag Scheme 7 4 0 11No. Households Participating in Clear & Green Box Scheme 23 6 0 29Clear Baq Recycling Scheme Set Out Rate 24.3 45.6 58.5
Recycling Scheme Set Out Rate
Table 5.4: Raw Weekly Set Out D ata for New K erbside Recycling Scheme A reas
New Area
Place Name Tregaron
Mydroilyn&
Dihewyd Llandysul TOTAL
Electoral DistrictTownsend Index ScoreNo. Households 144 104 149 397No. Black Bags 230 129 251 610No. Clear Baqs 62 69 50 181No. Green Waste Baqs 1 0 12 13No. Households Participating in Clear Baq Scheme 37 51 35 123No Household Participating in Green Bag Scheme 1 0 4 5No. Households Participating in Clear & Green Box Scheme 0 0 2 2
Set Out Rateing Scheme Set Out Rate
Recycling Scheme Set Out Rate
The data show that on the whole there seems to have been a general increase in weekly set
out from February 2005 until August 2006. This was generally true for two of the
156
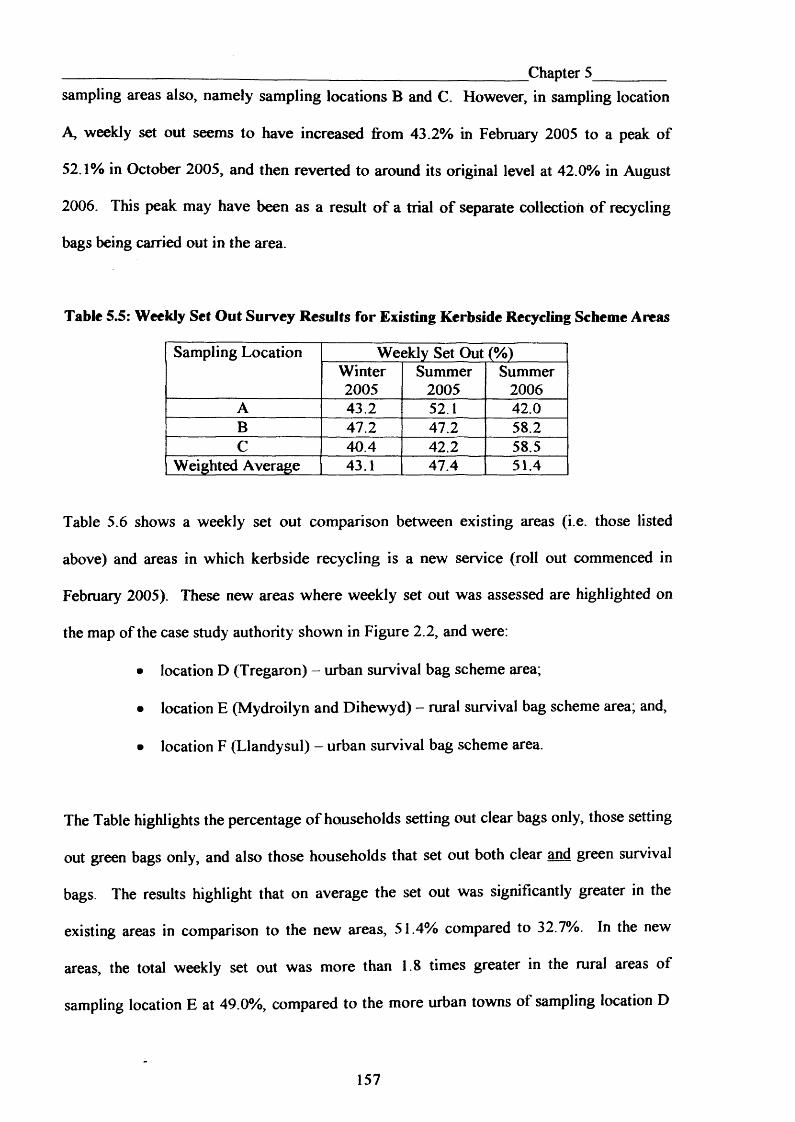
_______________________ Chapter_5_________sampling areas also, namely sampling locations B and C. However, in sampling location
A, weekly set out seems to have increased from 43.2% in February 2005 to a peak of
52.1% in October 2005, and then reverted to around its original level at 42.0% in August
2006. This peak may have been as a result o f a trial of separate collection of recycling
bags being carried out in the area.
Table 5.5: Weekly Set Out Survey Results for Existing Kerbside Recycling Scheme Areas
Sampling Location Weekly Set Out (%)Winter2005
Summer2005
Summer2006
A 43.2 52.1 42.0B 47.2 47.2 58.2C 40.4 42.2 58.5
Weighted Average 43.1 47.4 51.4
Table 5.6 shows a weekly set out comparison between existing areas (i.e. those listed
above) and areas in which kerbside recycling is a new service (roll out commenced in
February 2005). These new areas where weekly set out was assessed are highlighted on
the map of the case study authority shown in Figure 2.2, and were:
• location D (Tregaron) - urban survival bag scheme area;
• location E (Mydroilyn and Dihewyd) - rural survival bag scheme area; and,
• location F (Llandysul) - urban survival bag scheme area.
The Table highlights the percentage of households setting out clear bags only, those setting
out green bags only, and also those households that set out both clear and green survival
bags. The results highlight that on average the set out was significantly greater in the
existing areas in comparison to the new areas, 51.4% compared to 32.7%. In the new
areas, the total weekly set out was more than 1.8 times greater in the rural areas of
sampling location E at 49.0%, compared to the more urban towns of sampling location D
157

Chapter 5and F at 26.4% and 27.5% respectively. However, this trend was not reflected in the
existing areas, although the set out between sampling location E was of the same order as
that for sampling location B, the set out rate for the town of sampling location C was
similar. Green bags are under utilised within the new recycling scheme areas, this is likely
to be as a result of the charge for the bags which is now imposed by the council.
Table 5.6: Comparison of Set Out for Existing and New Kerbside Recycling Areas
(Aug 2006)
Existing Kerbside Recycling Scheme Areas
New Kerbside Recycling Scheme Areas
SamplingLocation
Clear
Bag
Set
Out
(%)
Green
Bag
Set
Out
(%)
Clear
&
Green
Bag
Set
Out
(%)
Total
W
eekly
Set
Out
(%)
SamplingLocation
Clear
Bag
Se
t Out
(%)
Green
Bag
Se
t Out
(%)
Clear
&
Green
Bag
Set
Out
(%)
1To
tal
Week
ly Se
t Ou
t (%
) |
A 24.3 4.1 13.6 42.0 D 25.7 0.7 0.0 26.4B 45.6 5.1 7.6 58.2 E 49.0 0.0 0.0 49.0C 58.5 0.0 0.0 58.5 F 23.5 2.7 1.3 27.5
WeightedAverage 41.3 2.8 7.3 51.4 Weighted
Average 31.0 1.3 0.5 32.7
5.4.3.3 Commingled Feed Operation
The raw data for the MRF efficiency study can be found in Appendix D. Figure 5.5 shows
an overview of the commingled feed operation. The Figure shows a flowchart which
depicts the MRF operation, and highlights input material, unit operations and outputs.
Also included in the flowchart is a mass balance, this essentially identifies of the material
initially input into the MRF (25,140kg), what quantity of material is present in the various
output streams, that is in the form of fines, plastic bottles, cans and so forth. As well as the
mass of material, the flowchart also shows the percentage of material segregated as a
particular output stream in relation to the input material.
158
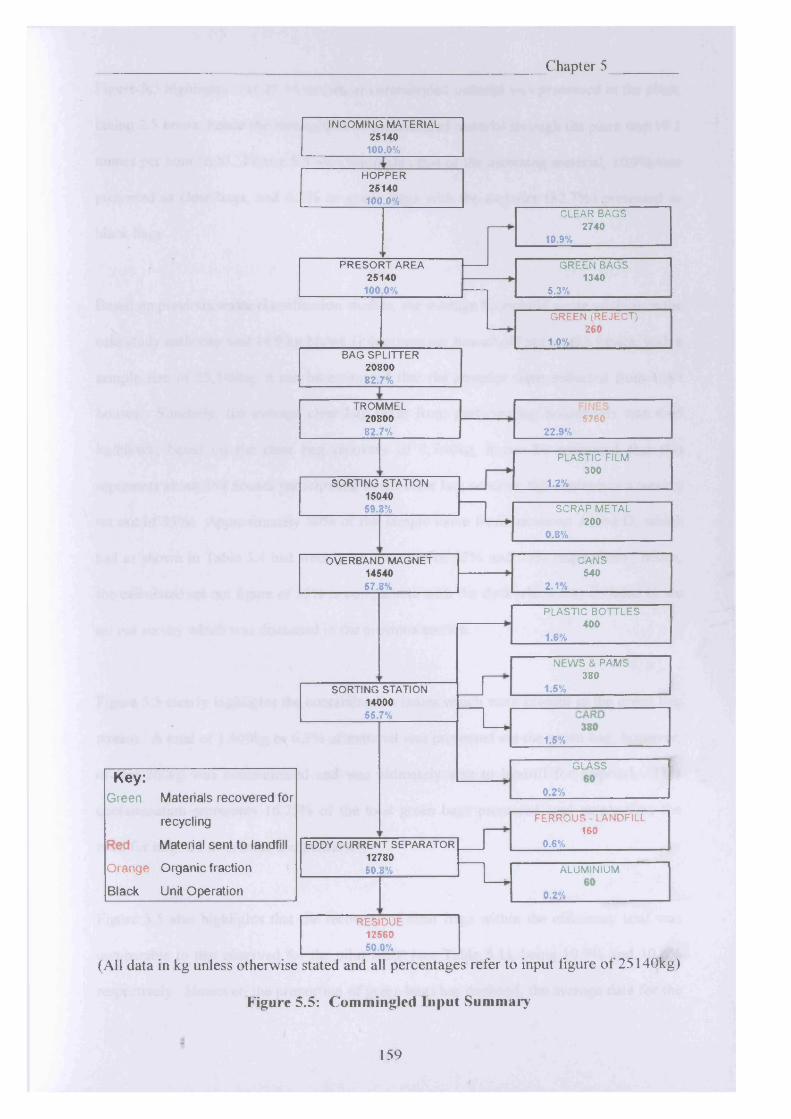
Chapter 5
SORTING STATION 14000$5.7%
10.9%
CLEAR BAGS 2740
5.3%
GREEN BAGS 1340
GREEN (REJECT) 260
1.0%_______________
PLASTIC FILM 300
1.2%____________
22.9%5760
EDDY CURRENT SEPARATOR 1278050.8%___________
SORTING STATION 1504059.8%
RESIDUE1256050.0%
OVERBAND MAGNET 1454057.8%_______
SCRAP METAL 200
0 .8%____________
2.1%
CANS540
1.5%
PLASTIC BOTTLES 400
1.6%________________
INCOMING MATERIAL 25140
100.0%
TROMMEL2080082.7%
0 .2%
ALUMINIUM
NEWS & PAMS 380
1.5%___________
BAG SPLITTER 2080082.7%
HOPPER25140100.0%
FERROUS - LANDFILL 160
0.6%________________
PRESORT AREA 25140
100.0%
0.2%
GLASSKey:
Green Materials recovered for
recycling
Material sent to landfill
Orange Organic fraction
Black Unit Operation
(All data in kg unless otherwise stated and all percentages refer to input figure of 25140kg)
Figure 5.5: Commingled Input Summary'
159
_______________________________________ Chapter 5_Figure 5.5 highlights that 25.14 tonnes of commingled material was processed in the plant,
taking 2.5 hours; hence the throughput of commingled material through the plant was 10.1
tonnes per hour (tph). Figure 5.5 also highlights that of the incoming material, 10.9% was
presented as clear bags, and 6.3% as green bags with the majority (82.7%) presented as
black bags.
Based on previous waste classification studies, the average household waste arisings in the
case study authority was 14.9 kg/hh/wk (kilograms per household per week); hence, with a
sample size of 25,140kg, it can be estimated that the samples were collected from 1687
houses. Similarly, the average clear bag mass from participating households was 4.65
kg/hh/wk; based on the clear bag recovery o f 2,740kg, it can be estimated that this
represents about 589 houses participating in the clear bag scheme; this represents a weekly
set out of 35%. Approximately 80% of the sample came from locations A and D, which
had as shown in Table 5.4 had weekly set out rates of 42% and 26% respectively; hence,
the calculated set out figure of 35% is comparable with the data which was collated in the
set out survey which was discussed in the previous section.
Figure 5.5 clearly highlights the contamination issues which were present in the green bag
stream. A total of 1,600kg or 6.3% of material was presented via the green bag; however,
of this 260kg was contaminated and was ultimately sent to landfill for disposal. This
contamination represents 16.25% of the total green bags presented, and emphasises the
need for targeted awareness and education.
Figure 5.5 also highlights that the recovery of clear bags within the efficiency trial was
comparable to that observed for the pilot MRF (see Table 5.1), being 10.9% and 10.0%
respectively. However, the proportion of green bags has declined, the average data for the
160
__________________________________ Chapter 5_________pilot MRF highlights that on average 9.1% of the incoming material was presented in this
manner; however during the efficiency trial a figure of 6.3% was observed. This was
likely to be as a result o f the case study authority implementing a charge for the purchase
of the green survival bags, as opposed to providing them free of charge to householders.
Figure 5.5 further highlights that 22.9% o f the incoming commingled material was
segregated by the trommel and that 51.6% of the incoming commingled material is sent to
landfill. 1.0% was in the form of contaminated green bags which were landfilled, 0.6%
was in the form of highly contaminated ferrous material from the eddy current separator,
with the remaining 50.0% unsegregated during the process and coming out of the end of
the process as residue, making a total of 51.6%. However, since all material which passes
the presort station is black bag material, it is better to express this as a separate flowsheet,
this is shown in Figure 5.6.
Figure 5.6 shows an overview of the black bag stream. This Figure highlights that 61.2%
of the black bag material is sent to landfill, and that 27.7% of the material was recovered
by the trommel as fines (material with a diameter of less than 50mm). In terms of
performance, this Figure highlights that excluding the fines, the MRF was able to recover
11.2% of the incoming black bag material as dry recyclable, compared to 8.7% for the pilot
MRF (as shown in Table 5.2); hence, the recovery performance of the phase 1 MRF in
terms of dry recyclable was 1.3 times greater than that of the pilot MRF.
161
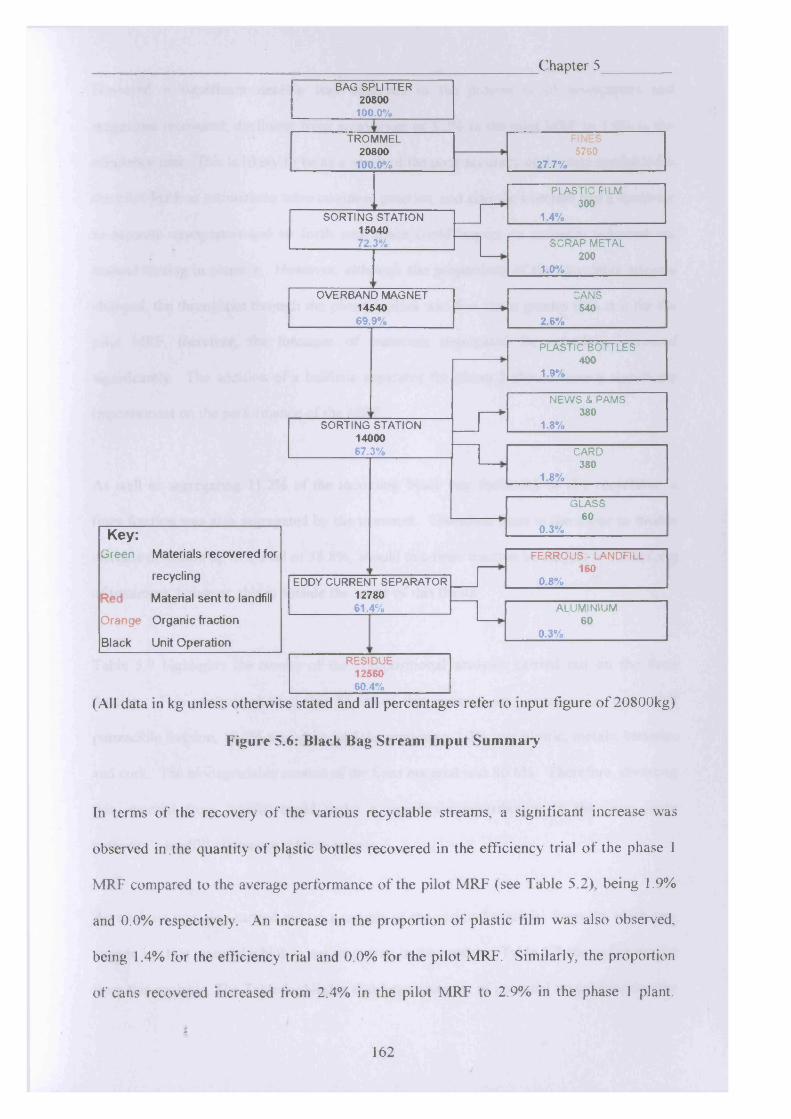
Chapter 5
SORTING STATION 1400067.3%
27.7%5760
SCRAP METAL 200
1.0%__________
PLASTIC BOTTLES 400
1.9%____________
1.8%
CARD380
2.6%
CANS540
NEWS & PAMS 380
1.8% ________
PLASTIC FILM 300
1.4%_________
RESIDUE1256060.4%
BAG SPLITTER 20800
100 .0%
EDDY CURRENT SEPARATOR 12780
__________ 61.4%__________
0.3%
GLASS60
FERROUS - LANDFILL 160
0.8% _________
0.3%
ALUMINIUM60
OVERBAND MAGNET 14540
______ 69.9%_______
TROMMEL20800
100.0%
SORTING STATION 1504072.3%
Key:Green Materials recovered for
recycling
Material sent to landfill
Orange Organic fraction
Black Unit Operation
(All data in kg unless otherwise stated and all percentages refer to input figure of 20800kg)
Figure 5.6: Black Bag Stream Input Summary
In terms of the recovery of the various recyclable streams, a significant increase was
observed in the quantity of plastic bottles recovered in the efficiency trial of the phase 1
MRF compared to the average performance of the pilot MRF (see Table 5.2), being 1.9%
and 0.0% respectively. An increase in the proportion of plastic film was also observed,
being 1.4% for the efficiency trial and 0.0% for the pilot MRF. Similarly, the proportion
of cans recovered increased from 2.4% in the pilot MRF to 2.9% in the phase 1 plant.
I162

Chapter 5However, a significant decline was observed in the proportion of newspapers and
magazines recovered, declining from an average of 3.2% in the pilot MRF to 1.8% in the
efficiency trial. This is likely to be as a result of the poor accuracy of the data available for
the pilot MRF as estimations were common practise, and also the trommel had a tendency
to separate newspapers and so forth and hence could impact on recovery achieved via
manual sorting in phase 1. However, although the proportions of the recyclable streams
changed, the throughput through the phase 1 plant was five times greater than that for the
pilot MRF, therefore, the tonnages o f materials segregated for recycling increased
significantly. The addition of a ballistic separator for phase 2 should have a significant
improvement on the performance of the MRF.
As well as segregating 11.2% of the incoming black bag feedstock as dry recyclable, a
fines fraction was also segregated by the trommel. Therefore there is the scope to further
increase diversion up to a level of 38.8%, should this fines fraction be subject to some form
of treatment; however, this is outside the scope of this thesis.
Table 5.7 highlights the results of the compositional analysis carried out on the fines
fraction. This analysis showed that 86.6% of this material was organic, i.e. paper and
putrescible fraction, 10.2% was glass, and the remaining 3.2% was plastic, metals, batteries
and cork. The biodegradable content of the fines material was 86.6%. Therefore, diverting
this material from landfill could make a significant contribution to the case study
authority’s landfill allowance scheme targets.
An analysis was also carried out on a sample of the residual material from the black bag
stream, i.e. that material which is not recovered in the process. Table 5.8 shows the results
from this analysis. The Table highlights that large amounts of potential recyclables remain
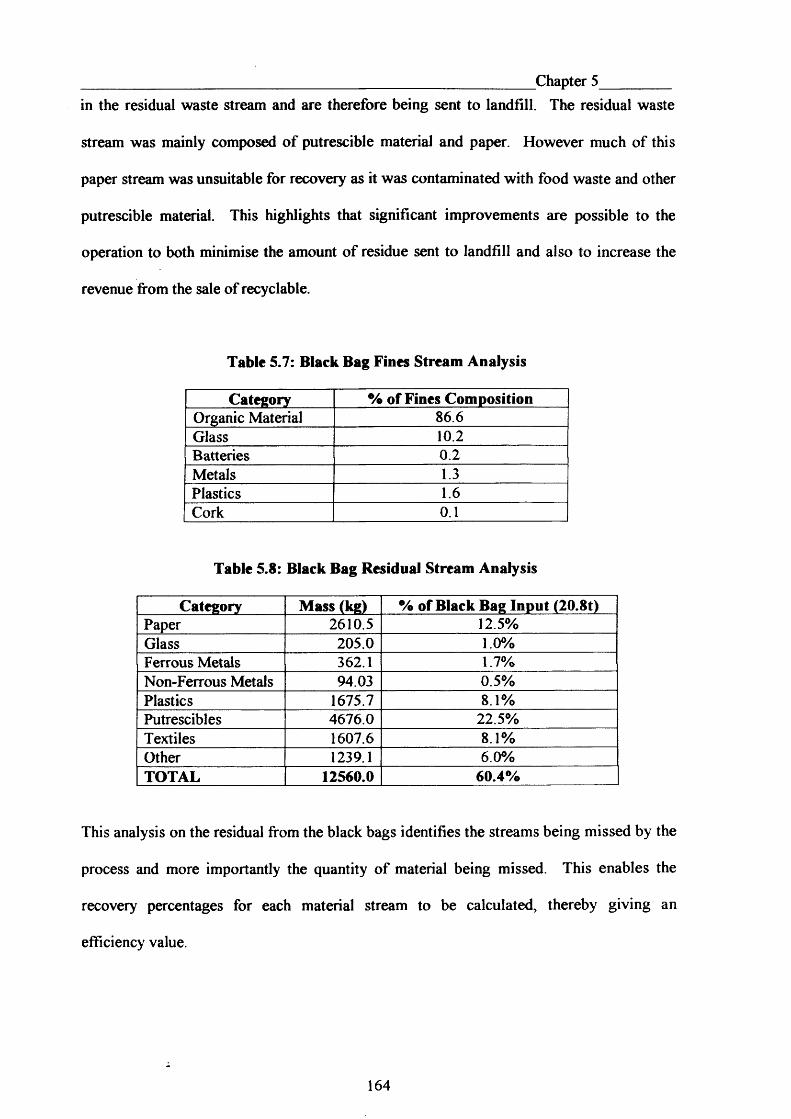
Chapter 5in the residual waste stream and are therefore being sent to landfill. The residual waste
stream was mainly composed of putrescible material and paper. However much of this
paper stream was unsuitable for recovery as it was contaminated with food waste and other
putrescible material. This highlights that significant improvements are possible to the
operation to both minimise the amount of residue sent to landfill and also to increase the
revenue from the sale of recyclable.
Table 5.7: Black Bag Fines Stream Analysis
Category % of Fines CompositionOrganic Material 86.6Glass 10.2Batteries 0.2Metals 1.3Plastics 1.6Cork 0.1
Table 5.8: Black Bag Residual Stream Analysis
Category Mass (kg) % of Black Bag Input (20.8t)Paper 2610.5 12.5%Glass 205.0 1.0%Ferrous Metals 362.1 1.7%Non-Ferrous Metals 94.03 0.5%Plastics 1675.7 8.1%Putrescibles 4676.0 22.5%Textiles 1607.6 8.1%Other 1239.1 6.0%TOTAL 12560.0 60.4%
This analysis on the residual from the black bags identifies the streams being missed by the
process and more importantly the quantity of material being missed. This enables the
recovery percentages for each material stream to be calculated, thereby giving an
efficiency value.
164
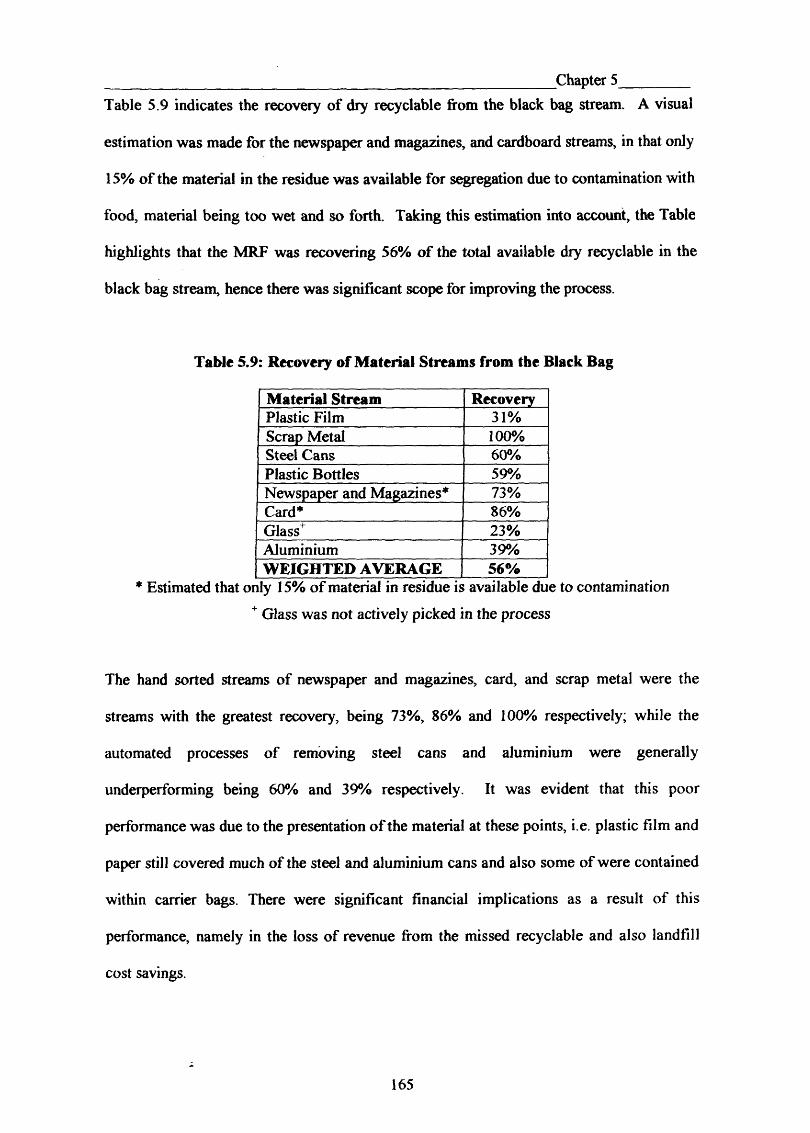
Chapter 5Table 5.9 indicates the recovery of dry recyclable from the black bag stream. A visual
estimation was made for the newspaper and magazines, and cardboard streams, in that only
15% of the material in the residue was available for segregation due to contamination with
food, material being too wet and so forth. Taking this estimation into account, the Table
highlights that the MRF was recovering 56% of the total available dry recyclable in the
black bag stream, hence there was significant scope for improving the process.
Table 5.9: Recovery of Material Streams from the Black Bag
Material Stream RecoveryPlastic Film 31%Scrap Metal 100%Steel Cans 60%Plastic Bottles 59%Newspaper and Magazines* 73%Card* 86%Glass+ 23%Aluminium 39%WEIGHTED AVERAGE 56%
* Estimated that only 15% of material in residue is available due to contamination
+ Glass was not actively picked in the process
The hand sorted streams of newspaper and magazines, card, and scrap metal were the
streams with the greatest recovery, being 73%, 86% and 100% respectively; while the
automated processes of removing steel cans and aluminium were generally
underperforming being 60% and 39% respectively. It was evident that this poor
performance was due to the presentation of the material at these points, i.e. plastic film and
paper still covered much of the steel and aluminium cans and also some of were contained
within carrier bags. There were significant financial implications as a result of this
performance, namely in the loss of revenue from the missed recyclable and also landfill
cost savings.
165
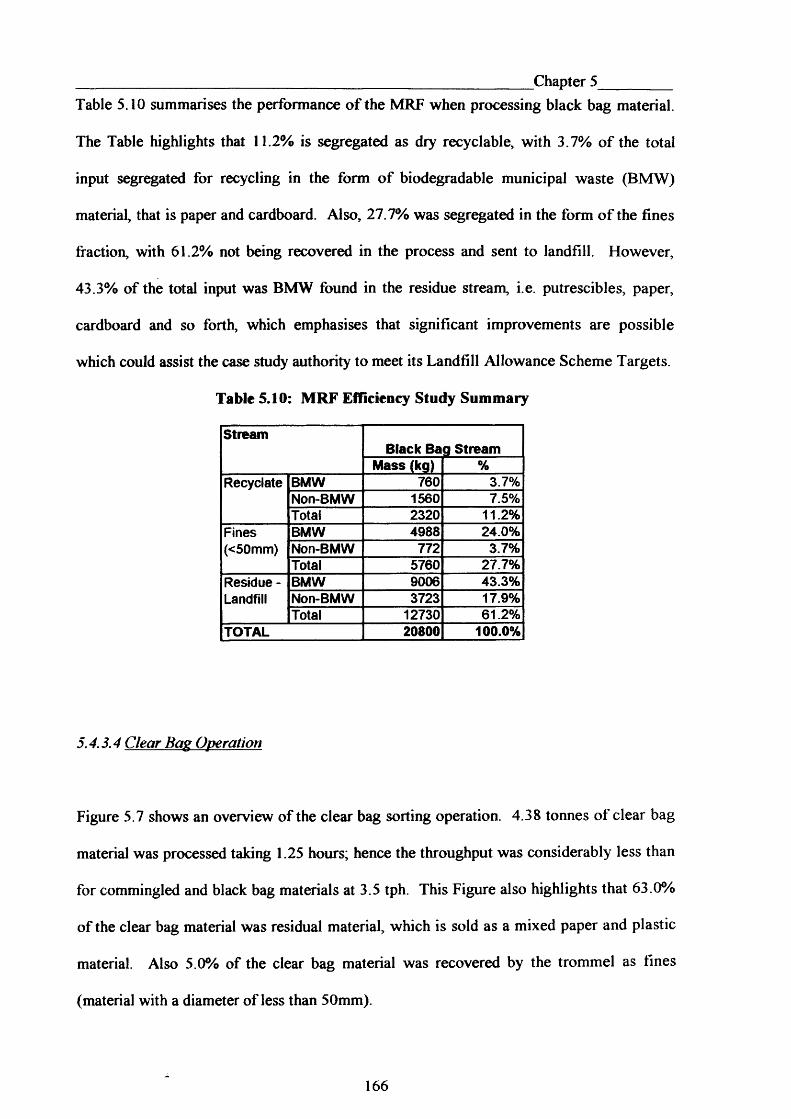
Chapter 5Table 5.10 summarises the performance of the MRF when processing black bag material.
The Table highlights that 11.2% is segregated as dry recyclable, with 3.7% of the total
input segregated for recycling in the form of biodegradable municipal waste (BMW)
material, that is paper and cardboard. Also, 27.7% was segregated in the form o f the fines
fraction, with 61.2% not being recovered in the process and sent to landfill. However,
43.3% of the total input was BMW found in the residue stream, i.e. putrescibles, paper,
cardboard and so forth, which emphasises that significant improvements are possible
which could assist the case study authority to meet its Landfill Allowance Scheme Targets.
Table 5.10: MRF Efficiency Study Summary
StreamBlack Bag S tream
M ass (kg) %Recyclate BMW 760 3.7%
Non-BMW 1560 7.5%Total 2320 11.2%
Fines(<50mm)
BMW 4988 24.0%Non-BMW 772 3.7%Total 5760 27.7%
Residue - Landfill
BMW 9006 43.3%Non-BMW 3723 17.9%Total 12730 61.2%
TOTAL 20800 100.0%
5.4.3.4 Clear Bag Operation
Figure 5.7 shows an overview of the clear bag sorting operation. 4.38 tonnes of clear bag
material was processed taking 1.25 hours; hence the throughput was considerably less than
for commingled and black bag materials at 3.5 tph. This Figure also highlights that 63.0%
of the clear bag material was residual material, which is sold as a mixed paper and plastic
material. Also 5.0% of the clear bag material was recovered by the trommel as fines
(material with a diameter of less than 50mm).
166
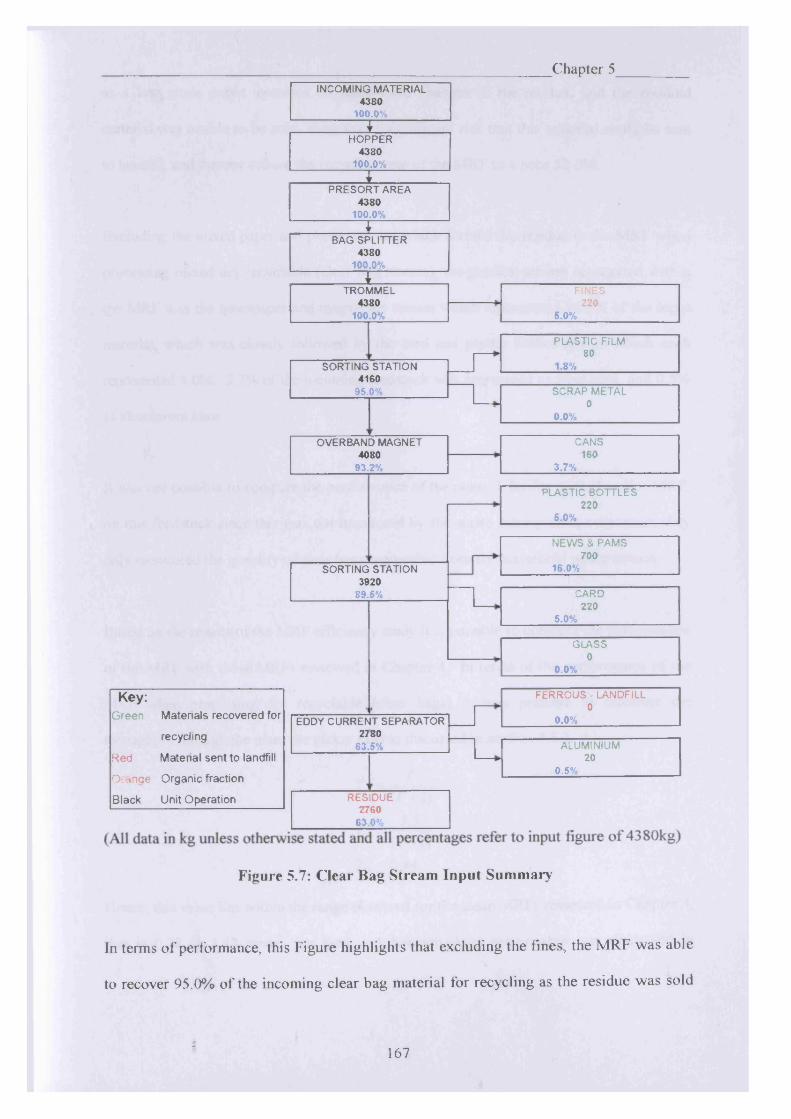
Chapter 5INCOMING MATERIAL
4380100 .0%
IHOPPER
4380100.0%
IPRESORT AREA
4380100.0%
IBAG SPLITTER
4380100.0%
ITROMMEL
4380100.0%
SORTING STATION 4160
05.0%
OVERBAND MAGNET 4080
93.2%
SORTING STATION 3920
89.5%
Key:Green Materials recovered for
recyclingRed Material sent to landfillOrange Organic fractionBlack Unit Operation
EDDY CURREN 27
63.
IT SEPARATOR 805%
RESIDUE2760
63.0%
FINES220
5.0%
PLASTIC FILM 80
1.8%
SCRAP METAL 0
0 .0%
CANS160
3.7%
PLASTIC BOTTLES 220
5.0%
NEWS & PAMS 700
16.0%
CARD220
5.0%
GLASS0
0 .0%
FERROUS - LANDFILL 0
0 .0%
ALUMINIUM20
0.5% ____
Figure 5.7: C lear Bag S tream Inp u t Sum m ary
In terms of performance, this Figure highlights that excluding the fines, the MRF was able
to recover 95.0% of the incoming clear bag material for recycling as the residue was sold
z167
______________________ ;________________________________ Chapter_5_________as a low grade paper, however, if there were changes to the market, and the residual
material was unable to be sold, there was a significant risk that this material could be sent
to landfill, and thereby reduce the recycling rate of the MRF to a poor 32.0%.
Excluding the mixed paper and plastic stream which formed the residue in the MRF when
processing mixed dry recyclable (clear bag stream), the greatest stream segregated within
the MRF was the newspaper and magazines stream which represented 16.0% of the input
material, which was closely followed by the card and plastic bottles stream which each
represented 5.0%. 3.7% of the incoming feedstock was segregated as steel cans, and 0.5%
as aluminium cans.
It was not possible to compare the performance of the phase 1 facility with the pilot MRF,
on this feedstock since this was not monitored by the waste management contractor, they
only monitored the quantity of clear bags segregated from the household waste stream.
Based on the results of the MRF efficiency study it is possible to compare the performance
of the MRF with those MRFs reviewed in Chapter 4. In terms of the performance o f the
MRF when processing dry recyclable (clear bags), it was possible to calculate the
throughput through the plant per picker (Tp) as discussed in section 4.5.3.
T(F + l)
3.5 (7 + 1)
Tp = 0.44
Hence, this value lies within the range observed for the clean MRFs reviewed in Chapter 4,
that is 0.38 to 1.42 tonnes per hour. A benchmarking relationship was discussed in
168
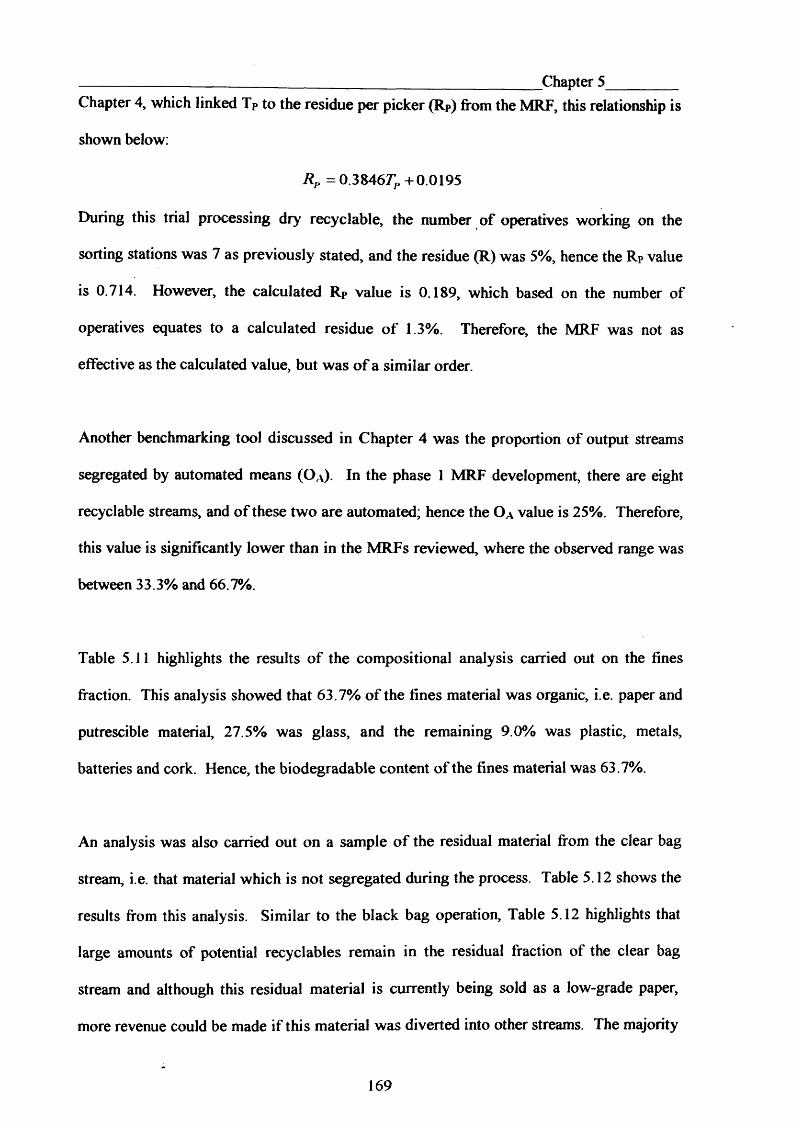
___________________ Chapter 5_________Chapter 4, which linked Tp to the residue per picker (Rp) from the MRF, this relationship is
shown below:
RP = 0.3846TP + 0.0195
During this trial processing dry recyclable, the number of operatives working on the
sorting stations was 7 as previously stated, and the residue (R) was 5%, hence the Rp value
is 0.714. However, the calculated Rp value is 0.189, which based on the number of
operatives equates to a calculated residue o f 1.3%. Therefore, the MRF was not as
effective as the calculated value, but was o f a similar order.
Another benchmarking tool discussed in Chapter 4 was the proportion of output streams
segregated by automated means ( O a ) . In the phase 1 MRF development, there are eight
recyclable streams, and of these two are automated; hence the Oa value is 25%. Therefore,
this value is significantly lower than in the MRFs reviewed, where the observed range was
between 33.3% and 66.7%.
Table 5.11 highlights the results o f the compositional analysis carried out on the fines
fraction. This analysis showed that 63.7% of the fines material was organic, i.e. paper and
putrescible material, 27.5% was glass, and the remaining 9.0% was plastic, metals,
batteries and cork. Hence, the biodegradable content of the fines material was 63.7%.
An analysis was also carried out on a sample of the residual material from the clear bag
stream, i.e. that material which is not segregated during the process. Table 5.12 shows the
results from this analysis. Similar to the black bag operation, Table 5.12 highlights that
large amounts of potential recyclables remain in the residual fraction of the clear bag
stream and although this residual material is currently being sold as a low-grade paper,
more revenue could be made if this material was diverted into other streams. The majority
169
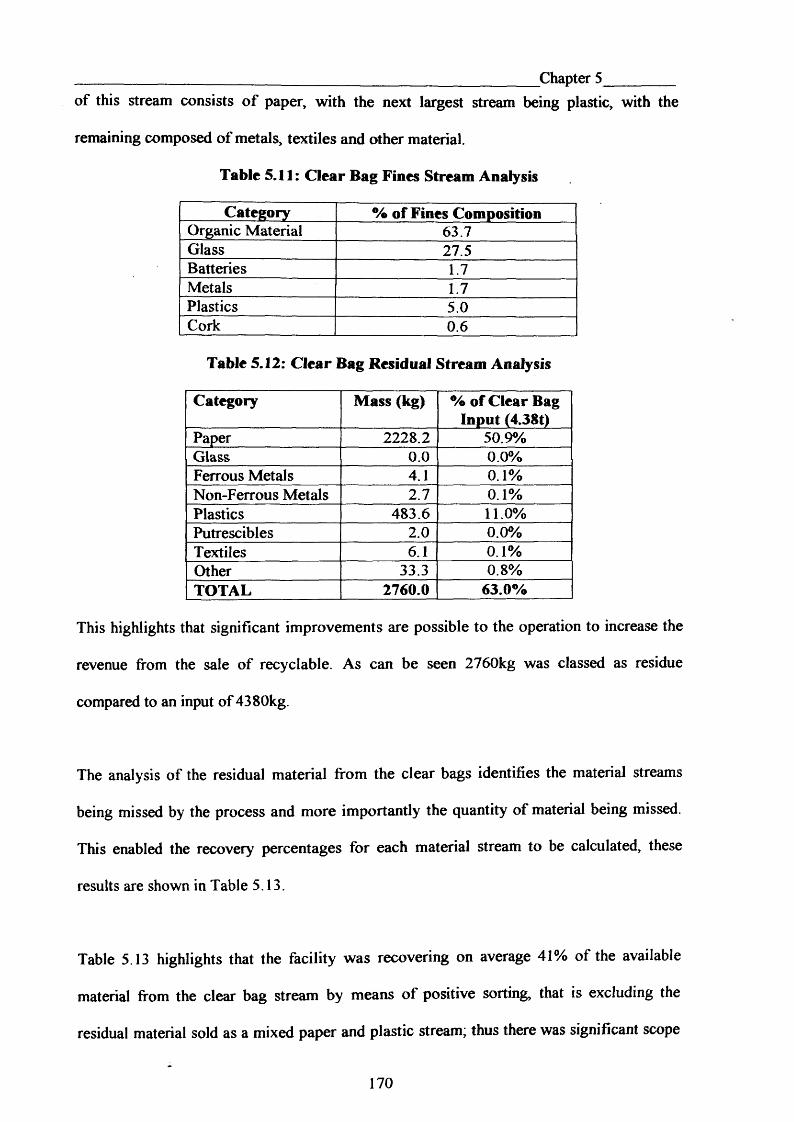
Chapter 5of this stream consists o f paper, with the next largest stream being plastic, with the
remaining composed of metals, textiles and other material.
Table 5.11: Clear Bag Fines Stream Analysis
Category % of Fines CompositionOrganic Material 63.7Glass 27.5Batteries 1.7Metals 1.7Plastics 5.0Cork 0.6
Table 5.12: Clear Bag Residual Stream Analysis
Category Mass (kg) % of Clear Bag Input (4.38t)
Paper 2228.2 50.9%Glass 0.0 0.0%Ferrous Metals 4.1 0.1%Non-Ferrous Metals 2.7 0.1%Plastics 483.6 11.0%Putrescibles 2.0 0.0%Textiles 6.1 0.1%Other 33.3 0.8%TOTAL 2760.0 63.0%
This highlights that significant improvements are possible to the operation to increase the
revenue from the sale of recyclable. As can be seen 2760kg was classed as residue
compared to an input of 4380kg.
The analysis of the residual material from the clear bags identifies the material streams
being missed by the process and more importantly the quantity of material being missed.
This enabled the recovery percentages for each material stream to be calculated, these
results are shown in Table 5.13.
Table 5.13 highlights that the facility was recovering on average 41% of the available
material from the clear bag stream by means of positive sorting, that is excluding the
residual material sold as a mixed paper and plastic stream; thus there was significant scope
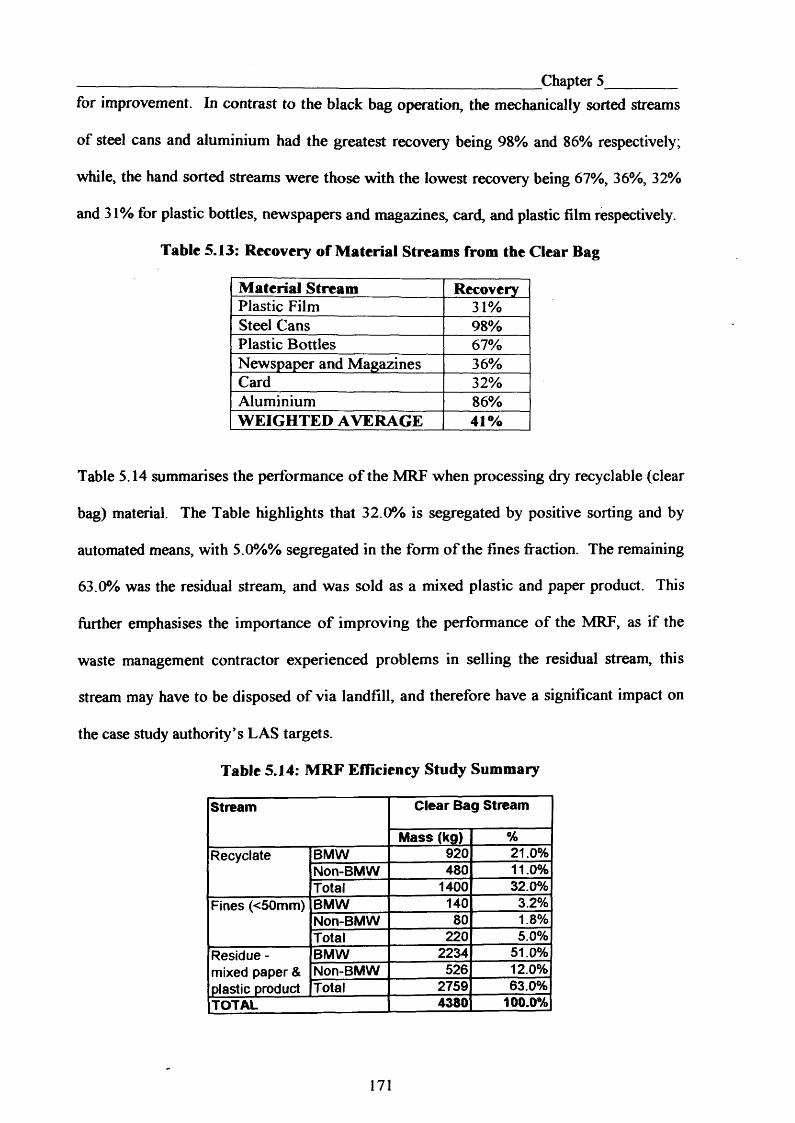
Chapter 5_________for improvement. In contrast to the black bag operation, the mechanically sorted streams
of steel cans and aluminium had the greatest recovery being 98% and 86% respectively;
while, the hand sorted streams were those with the lowest recovery being 67%, 36%, 32%
and 31% for plastic bottles, newspapers and magazines, card, and plastic film respectively.
Table 5.13: Recovery of Material Streams from the Clear Bag
Material Stream RecoveryPlastic Film 31%Steel Cans 98%Plastic Bottles 67%Newspaper and Magazines 36%Card 32%Aluminium 86%WEIGHTED AVERAGE 41%
Table 5.14 summarises the performance o f the MRF when processing dry recyclable (clear
bag) material. The Table highlights that 32.0% is segregated by positive sorting and by
automated means, with 5.0%% segregated in the form of the fines fraction. The remaining
63.0% was the residual stream, and was sold as a mixed plastic and paper product. This
further emphasises the importance of improving the performance of the MRF, as if the
waste management contractor experienced problems in selling the residual stream, this
stream may have to be disposed of via landfill, and therefore have a significant impact on
the case study authority’s LAS targets.
Table 5.14: MRF Efficiency Study Summary
Stream C lear Bag Stream
M ass (kg) %Recyclate BMW 920 21.0%
Non-BMW 480 11.0%Total 1400 32.0%
Fines (<50mm) BMW 140 3.2%Non-BMW 80 1.8%Total 220 5.0%
Residue - mixed paper & plastic product
BMW 2234 51.0%Non-BMW 526 12.0%Total 2759 63.0%
TOTAL 4380 100.0%
171
5.4.3.S Cost Bern fit A na/vsisChapter 5
Based on the results of the MRF efficiency study a cost benefit analysis was undertaken to
further analyse the impact of the second phase of the MRF development. The cost benefit
analysis takes into account the capitol costs of the ballistic separator along with the
additional maintenance, belt replacement and electricity usage costs. The cost benefit
analysis estimated that the installation of a ballistic separator would generate an additional
revenue of £111,633 per year, resulting in an overall payback period of 1.3 years (Owen
2007c). Hence, this analysis further reinforces that additional recovery in the MRF is
required, and that this additional expenditure is economically viable.
5.5 SUMMARY
The results highlight that the first phase o f the MRF development has enabled an increased
amount of material to be segregated from MSW collected within the Case Study Authority.
This efficiency study has also identified that the MRF has an increased throughput;
however, along with this greater processing capacity, greater quantities of material are able
to be recovered, thereby reducing the quantity of material sent to landfill.
The efficiency study highlighted that in terms of black bag material, the first phase of the
MRF development was able to recover a greater proportion of dry recyclable, increasing
from 8.7% for the pilot MRF to 11.2% for the phase one MRF. Along with the dry
recyclable stream, the MRF was also able to segregate a further 27.7% as a fines fraction,
that is material which is less than 50mm. This was a highly organic stream, and had a
BMW content of 86.6%, and options for the processing of this material to divert this
172
___________________ Chapter 5_________stream away from landfill were being considered, however, this was outside of the scope of
this study.
The efficiency study also highlighted that the MRF was recovering 56% of the available
material in the black bag stream, and therefore indicates that there was significant scope
for improving the process. Greatest recovery was observed in the hand sorted streams of
newspaper and magazines, card, scrap metal, and plastic bottles; while the automated
processes of removing steel cans and aluminium were generally underperforming. The
poor performance o f the automated processes was as a result of the presentation of the
material at these points, i.e. plastic film and paper still covered much of this material and
also some of this material was in carrier bags. The installation of the ballistic separator in
the phase two MRF development should have a significant impact upon the recovery rate
within the MRF, particularly for these underperforming automated processes, as
presentation of the material will be significantly improved. It is also important to note the
variation in the belt speed between the pilot and phase 1 MRFs, the belt speed was
considerably slower in the pilot MRF and therefore allowed pickers more opportunity to
recover the paper and plastic film streams, which thereby improved the automated sorting
of steel and aluminium.
The efficiency study also provided information on the performance of the MRF when
processing dry recyclable (clear bag material), the first phase of the MRF development was
able to recover 95% of the input material. However, this processing of dry recyclable
resulted in a very large stream of low grade paper product (63% of input material), and as a
result the waste management contractor was heavily reliant on favourable market
conditions for the sale of this material. The further development of the MRF in line with
phase two developments should result in improving the quality of this large stream and the
173
___________________ _______________ Chapter 5_________other recovered streams, and therefore the processing o f this dry recyclable material should
be more secure in terms o f being able to sell the recovered material.
The efficiency study further identified that the MRF was recovering 41% of the available
material in the dry recyclable stream by means of manual and automated positive sorting,
which again highlights that there was significant scope for improving the process. In
contrast to the black bag operation, greatest recovery was observed in the automated
segregation processes, i.e. the steel and aluminium cans streams, with the recovery rates
being 98% and 86% respectively. While, the hand sorted streams of plastic bottles,
newspapers and magazines, card, and plastic film were those with the lowest recovery
rates.
The results from the efficiency study highlights that a further separation process is required
in the MRF, as the presentation of material does not allow both manual and automated
separation to occur to their potential. It is vital that another separation stage is installed in
the MRF as is planned in Phase 2 in order to maximise the performance of the MRF. A
ballistic separator would have the benefit o f reducing the amount of material on the sorting
belts, thereby improving the hand sorting stages and also the performance o f the equipment
in terms of presentation. As well as this, a cost benefit analysis undertaken found that a
ballistic separator would generate an additional revenue of £111,633 per annum, resulting
in an overall payback period of 1.3 years.
The next chapter will look at how the MRF" development impacts upon the performance of
the Case Study Authority in terms of recycling and composting performance, and also
BMW diversion.
174

Chapter 6
CHAPTER 6:Effect of Increased Kerbside
Provision & MRF Development
175
Chapter 6
6.1 INTRODUCTION
This chapter will consider the impact of the MRF development and increased kerbside
recycling provision within the case study authority and their impact on the recycling
performance as well as biodegradable municipal waste (BMW) diversion. This chapter
will also consider how changes to the kerbside provision could impact upon recycling rates
and BMW diversion.
The main thrust of the discussion will look at the means by which the waste management
contractor and the case study authority are able to improve their respective performances
with reference to the stringent targets that the Case Study Authority are required to deliver
in order to meet the requirements of the EU Landfill Directive (Audit Commission in
Wales 2005, Griffiths et a l 2005).
The critical targets which the Authority must meet are the Landfill Allowance Scheme
(LAS) targets, these are shown in Table 6.1. The Table highlights the significant decline in
the quantity of BMW which can be landfilled. In conjunction with the LAS targets, there
are also non-statutory recycling and composting targets imposed by the Welsh Assembly
Government (WAG). The main target is to achieve 40% recycling and composting of
MSW with a minimum of 15% composting and 15% recycling by 2009/10 (Friends of the
Earth 2002, National Assembly for Wales 2002). It has also been announced by WAG,
that targets are likely to increase post 2010 as follows:
• 52% recycling and composting by 2012/13;
• 58% recycling and composting by 2015/16;
• 64% recycling and composting by 2019/20; and,
176

Chapter 6
• 70% recycling and composting by 2024/25 (Welsh Assembly
Government, 2007).
Table 6.1: BMW Landfill Allowance for Case Study Authority (Griffiths et al. 2005)
YearBMW
LandfillAllowance(tonnes)
2005/6 18,6202006/7 17,4612007/8 16,3032008/9 15,1452009/10 13,9872010/11 12,7282011/12 11,5832012/13 10,5402013/14 9,5922014/15 8,7282015/16 7,9432016/17 7,2282017/18 6,5772018/19 5,9852019/20 5,446
6.2 METHODOLOGY
The data used in the analysis will be location wide data provided by the local authority
(Keenan, 2007), in order to analyse the general trends, and also from the waste
management contractor in order to assess the performance of the MRF.
The case study authority generates data on a quarterly basis for submission into the
national WasteDataFlow system (WasteDataFlow 2003), which is used to monitor
performance in terms of BMW diversion, and also in terms of Welsh Assembly
177
Chapter 6
Government (WAG) recycling and composting targets. The waste management contractor
also generates data on a quarterly basis for the Case Study Authority to aid in its
submission for WasteDataFlow, this includes a separate section for the performance of the
MRF. WasteDataFlow is also used by the Government in order to produce national
statistics on waste and can also be used as an evidence base in order to guide future
Government Policy (WasteDataFlow 2003). These data enable a profile of municipal
waste within the Authority to be mapped, and the performance of the MRF based on the
MRF efficiency study (see Chapter 5) to be superimposed onto the Authority data. This
enables the impact of the MRF on the Authority’s recycling rates to be evaluated.
6.3 RESULTS & DISCUSSION
6.3.1 Introduction
Table 6.2 highlights the total MSW generated within the Case Study Authority from the
period 2003/04 to 2006/07 and its total recycling and composting rates for the same period.
The data highlights that over the last four years, MSW generation within the Authority has
been reasonably consistent at around 40,000 tonnes per annum, with the exception of
2004/05 when the MSW generation was 43,458 tonnes per annum. During this period the
recycling and composting rate has increased dramatically from 28.6.9% to 43.3%, with the
greatest increase occurring in 2006/07.
178
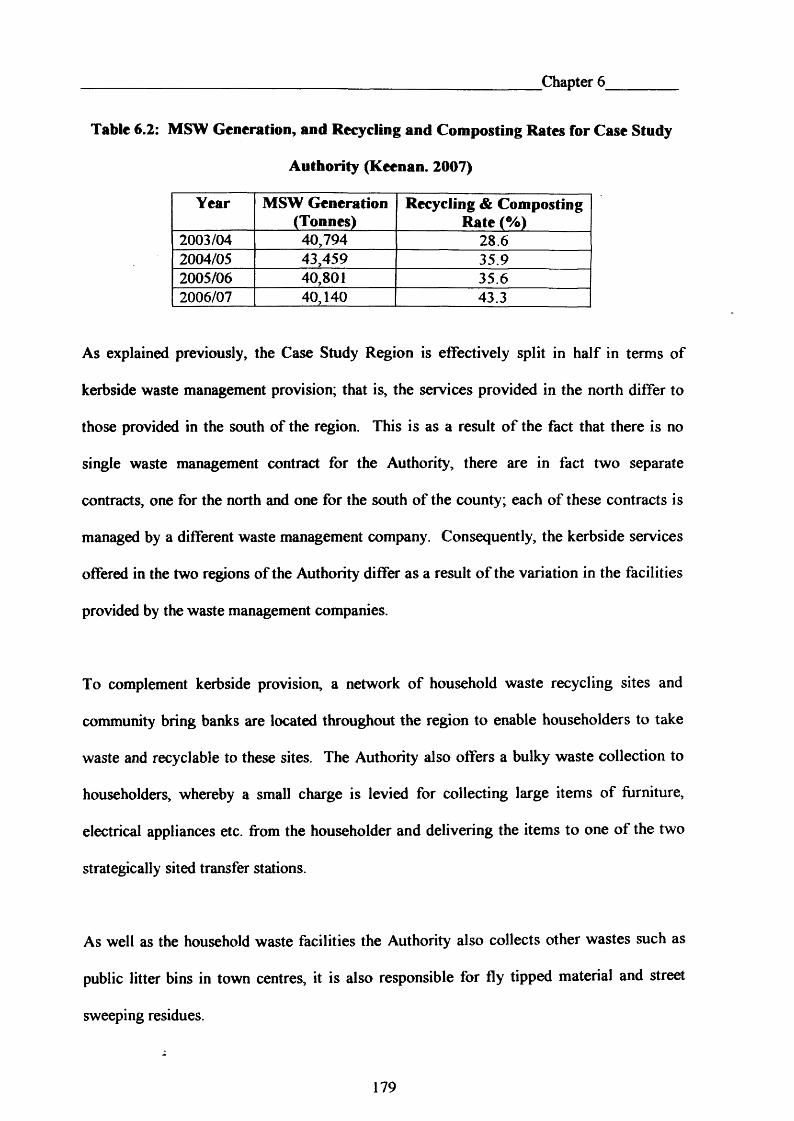
Chapter 6
Table 6.2: MSW Generation, and Recycling and Composting Rates for Case Study
Authority (Keenan. 2007)
Year MSW Generation (Tonnes)
Recycling & Composting Rate (%)
2003/04 40,794 28.62004/05 43,459 35.92005/06 40,801 35.62006/07 40,140 43.3
As explained previously, the Case Study Region is effectively split in half in terms of
kerbside waste management provision; that is, the services provided in the north differ to
those provided in the south of the region. This is as a result of the fact that there is no
single waste management contract for the Authority, there are in fact two separate
contracts, one for the north and one for the south of the county; each of these contracts is
managed by a different waste management company. Consequently, the kerbside services
offered in the two regions of the Authority differ as a result of the variation in the facilities
provided by the waste management companies.
To complement kerbside provision, a network of household waste recycling sites and
community bring banks are located throughout the region to enable householders to take
waste and recyclable to these sites. The Authority also offers a bulky waste collection to
householders, whereby a small charge is levied for collecting large items of furniture,
electrical appliances etc. from the householder and delivering the items to one of the two
strategically sited transfer stations.
As well as the household waste facilities the Authority also collects other wastes such as
public litter bins in town centres, it is also responsible for fly tipped material and street
sweeping residues.
179
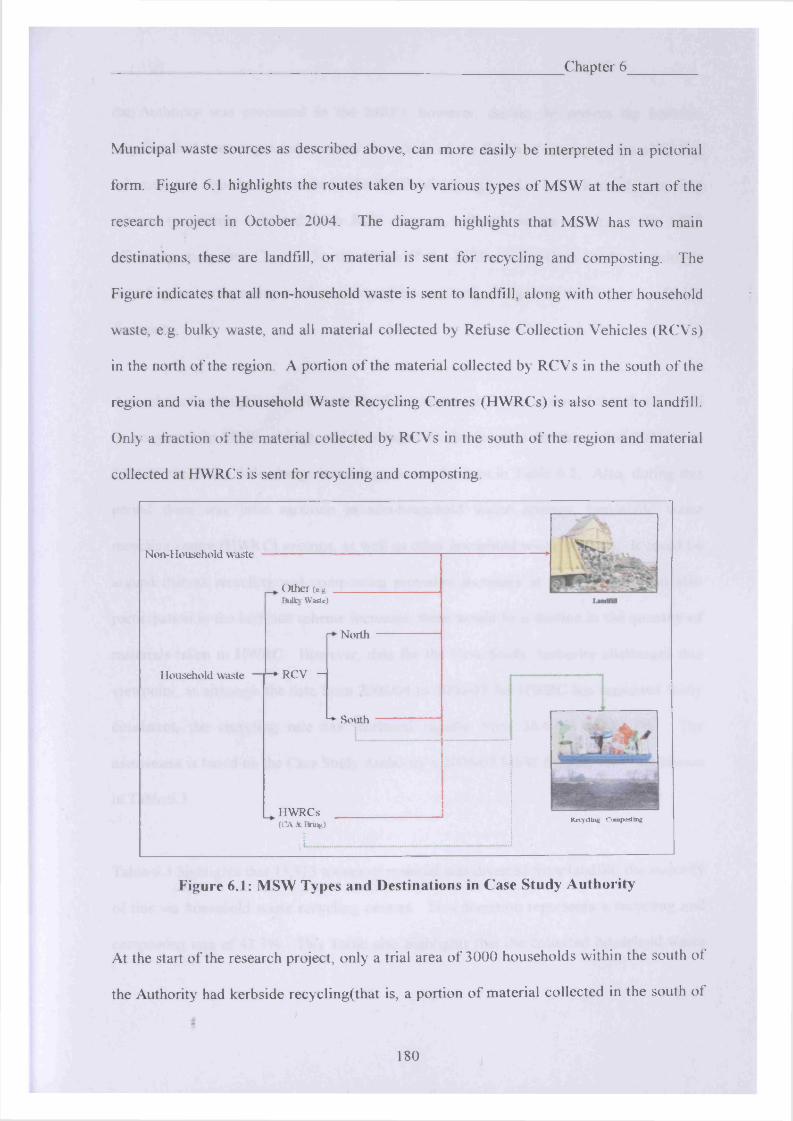
Chapter 6
M unicipal w aste sources as described above, can m ore easily be interpreted in a pictorial
form. Figure 6.1 highlights the routes taken by various types o f M SW at the start o f the
research project in O ctober 2004 . T he diagram h igh lights that M SW has tw o main
destinations, these are landfill, or material is sent for recycling and com posting . The
Figure indicates that all non-household w a ste is sent to landfill, a long w ith other household
waste, e.g. bulky w aste, and all material co llected by R efu se C o llection V eh ic le s (R C V s)
in the north o f the region. A portion o f the material co llec ted by R C V s in the south o f the
region and via the H ousehold W aste R ecycling C entres (H W R C s) is a lso sent to landfill.
O nly a fraction o f the material co llected by R C V s in the south o f the region and material
collected at H W R C s is sent for recycling and com posting.
Non-Household waste
Other (eg.B u lk s W a s te )
Household waste * RCV —
North
1-*‘ Southt
HWRCs(O A At B r n ig )
Recycling Composting
Figure 6.1: MSW Types and Destinations in Case Study Authority
At the start o f the research project, on ly a trial area o f 3 0 0 0 household s w ith in the south o f
the Authority had kerbside recycling(that is, a portion o f material co llected in the south o f
180
Chapter 6
the Authority was processed in the MRF); however, during the project the kerbside
recycling had been expanded to cover the whole of the South of the region (survival bag
scheme), and also the main town in the North of the region also had a kerbside recycling
scheme (separately collected from RCV stream). Based on the results of the MRF
efficiency study (see Chapter 5), the effect of the MRF on the Case Study Authority’s
recycling and composting performance can be assessed, along with the impact on BMW
diversion.
A number of assumptions were made for this assessment, it was assumed that there would
be no growth in MSW arisings, which is based on the fact that for the period 2003/04 to
2006/07 there was little change in arisings, as can be seen in Table 6.2. Also, during this
period there was little variation in non-household waste arisings, household waste
recycling centre (HWRC) arisings, as well as other household waste arisings. It could be
argued that as recycling and composting provision increases at the kerbside, and also
participation in the kerbside scheme increases, there would be a decline in the quantity of
materials taken to HWRC. However, data for the Case Study Authority challenges this
viewpoint, as although the data from 2003/04 to 2006/07 for HWRC has remained fairly
consistent, the recycling rate has increased rapidly from 28.6.9% to 43.3%. The
assessment is based on the Case Study Authority’s 2006/07 MSW figures, these are shown
in Table 6.3.
Table 6.3 highlights that 15,713 tonnes of material was diverted from landfill, the majority
of this via household waste recycling centres. This diversion represents a recycling and
composting rate of 43.3%. This Table also highlights that the collected household waste
181
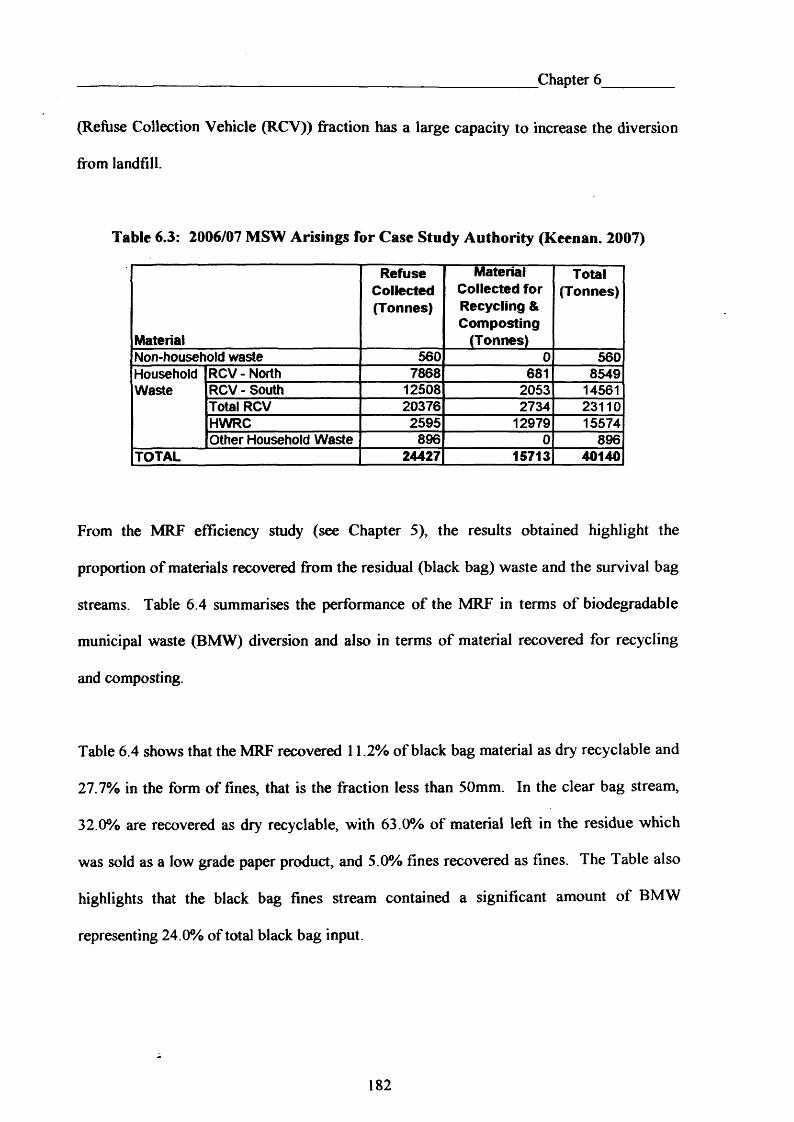
Chapter 6
(Refuse Collection Vehicle (RCV)) fraction has a large capacity to increase the diversion
from landfill.
Table 6.3: 2006/07 MSW Arisings for Case Study Authority (Keenan. 2007)
Material
RefuseCollected(Tonnes)
Material Collected for Recycling & Composting
(Tonnes)
Total(Tonnes)
Non-household waste 560 0 560HouseholdWaste
RCV-North 7868 681 8549RCV - South 12508 2053 14561Total RCV 20376 2734 23110HWRC 2595 12979 15574Other Household Waste 896 0 896
TOTAL 24427 15713 40140
From the MRF efficiency study (see Chapter 5), the results obtained highlight the
proportion of materials recovered from the residual (black bag) waste and the survival bag
streams. Table 6.4 summarises the performance of the MRF in terms of biodegradable
municipal waste (BMW) diversion and also in terms of material recovered for recycling
and composting.
Table 6.4 shows that the MRF recovered 11.2% of black bag material as dry recyclable and
27.7% in the form of fines, that is the fraction less than 50mm. In the clear bag stream,
32.0% are recovered as dry recyclable, with 63.0% of material left in the residue which
was sold as a low grade paper product, and 5.0% fines recovered as fines. The Table also
highlights that the black bag fines stream contained a significant amount of BMW
representing 24.0% of total black bag input.
182
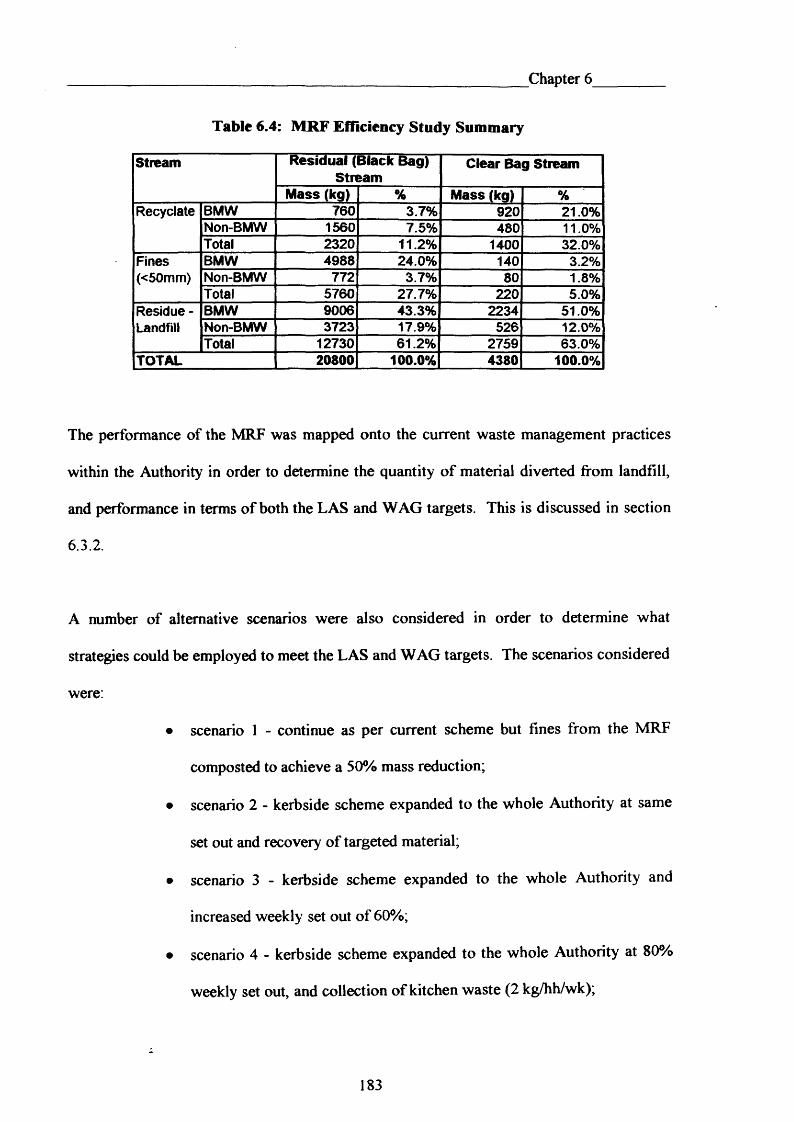
Chapter 6
Table 6.4: MRF Efficiency Study Summary
Stream Residual (Black Bag) Stream
Clear Bag Stream
Mass (kg) % Mass (kg) %Recyclate BMW 760 3.7% 920 21.0%
Non-BMW 1560 7.5% 480 11.0%Total 2320 11.2% 1400 32.0%
Fines(<50mm)
BMW 4988 24.0% 140 3.2%Non-BMW 772 3.7% 80 1.8%Total 5760 27.7% 220 5.0%
Residue - Landfill
BMW 9006 43.3% 2234 51.0%Non-BMW 3723 17.9% 526 12.0%Total 12730 61.2% 2759 63.0%
TOTAL 20800 100.0% 4380 100.0%
The performance of the MRF was mapped onto the current waste management practices
within the Authority in order to determine the quantity of material diverted from landfill,
and performance in terms of both the LAS and WAG targets. This is discussed in section
6.3.2.
A number of alternative scenarios were also considered in order to determine what
strategies could be employed to meet the LAS and WAG targets. The scenarios considered
were:
• scenario 1 - continue as per current scheme but fines from the MRF
composted to achieve a 50% mass reduction;
• scenario 2 - kerbside scheme expanded to the whole Authority at same
set out and recovery of targeted material;
• scenario 3 - kerbside scheme expanded to the whole Authority and
increased weekly set out of 60%;
• scenario 4 - kerbside scheme expanded to the whole Authority at 80%
weekly set out, and collection of kitchen waste (2 kg/hh/wk);
183
_______________________________________________ Chapter 6_
• scenario 5 - as scenario 4 but with collection of kitchen waste at 4
kg/hh/wk; and,
• scenario 6 - current kerbside scheme expanded to entire county with all
RCV material processed in the MRF.
6.3.2 Current Scenario
Figure 6.2 shows the current scenario resulted to MSW management within the Case Study
Authority. The Figure highlights that MSW is split into two distinct categories within the
authority, these are household and non-household waste. The non-household waste
category mainly consists of street sweeping waste generated within the Authority and
amounts to 560 tonnes, and based on the 61% BMW definition used for LAS purposes, the
BMW content is 342 tonnes. This non-household waste stream is sent to landfill without
further processing or treatment.
The household waste stream, can be further split into household waste recycling centre
(HWRC) and RCV streams. Material from the HWRC network across the Authority is
either landfilled or recycled/ composted. The quantity of material from HWRCs which is
sent to landfill amounts to 2595 tonnes, which equates to 1583 tonnes of BMW (based on
61% definition), while the quantity segregated for recycling and composting is much
greater at 12,979 tonnes. The BMW fraction for this material was calculated based on
information provided by the Authority, and amounted to 7,528 tonnes, that is 58%
biodegradable (Keenan, 2007).
184
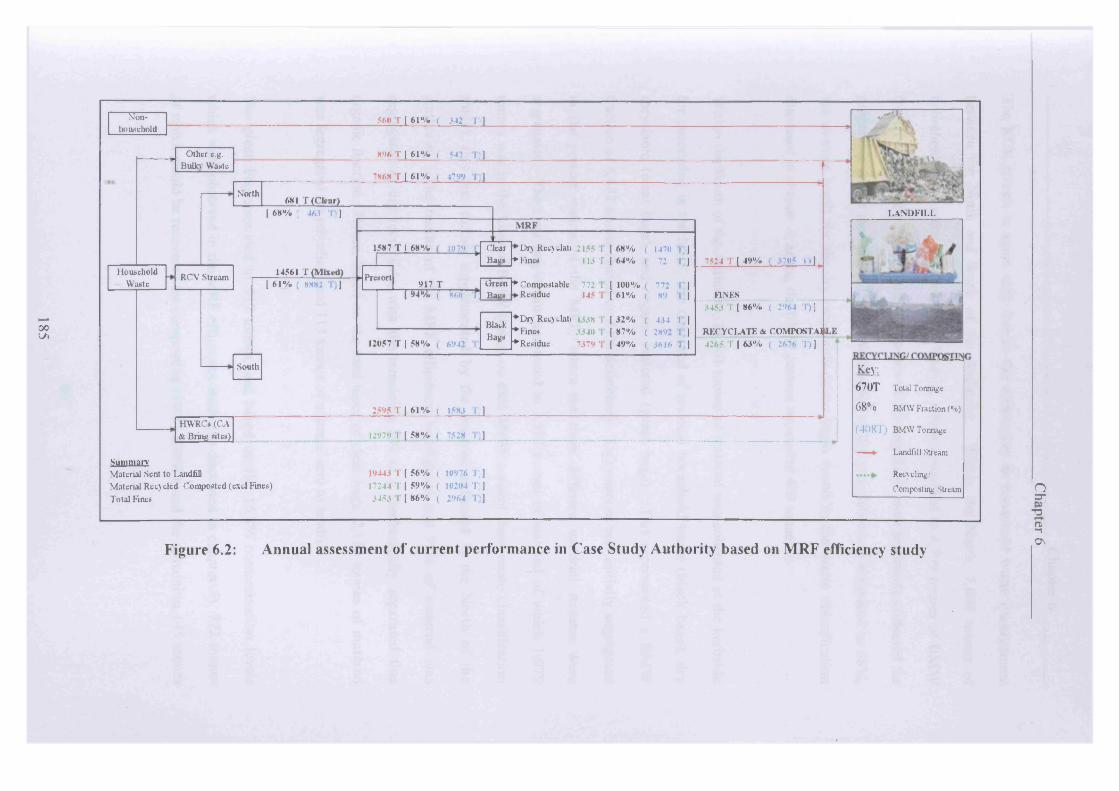
00k/1
SJon-household
560 T [6 1 % ( 342 T;1
Other e.g. Bulb Waste
896 T [ 61% ( 547 1,1
HouseholdWaste
North
7868 T [ 61% i 4799 11
681 T (Clear)
RCV Stream
( 68% ; 463 I ,]
14561 T (Mixed)[ 61% H H H Z J
South
1587 T 168% l<>"9 \
Presort
MRF
ClearBags r» Fines
"Dry Recyclati 2155 I [ 68% ( 1470 1 ) 113 T I 64% ( 72 T ]
917 T_______ J Green f* Compostable 772 1 [ 1UU% i 772 T )94% ( ^ n Batts Residue 145 I [6 1 % ( x<> g]
12057 T [ 58% , 6942 1
BlackBags
♦Dry Recyclati | 1* | [ 32% ( 444 ! )♦Fines 3340 I [8 7 % ( 289 )♦Residue 7379 1 [ 49% < 3616 1 ]
LANDFILL
7524 1 [ 49% t ;0 5 T )J
FINES4453 1 [ 86% ( 2964 I >]
RECYCLATE & COMTOSTA1ILE4265 I [ 64% ( 267r. 1)1
2595 T [ 61% ( 1583 Tj]HWRCs (CA & Bring sites) i;» '9 i (5 8 % ( 7526 I ]
SummaryMaterial Sent to LandfillMaterial Recycled Composted (excl Fines)Total Fines
19443 T [ 56% ( 10976 T)] 17244 1 ( 59% ( 10204 T; ] 3453 1 [ 86% i 2964 1 j
Key:670T Total Tonnage
68% BMW Fraction (%)
f408T; BMW Tonnage
— Landfill Stream
Recycling/
Composting Stream
Figure 6.2: Annual assessment of current performance in Case Study Authority based on MRF efficiency study
nr r~oCb"nOS
Chapter 6
The RCV stream is again split due to the differences in household waste management
between the North and South of the Authority. Within the North, 7,868 tonnes of
household waste were sent directly to landfill, which amounted to 4,799 tonnes of BMW
(based on 61% definition), while 681 tonnes of dry recyclable were separately collected for
processing within the MRF. The BMW fraction of dry recyclable was estimated to 68%,
the average result for the dry recyclable (clear bags) found in the waste classification
discussed in chapter 3; hence, the BMW content equated to 463 tonnes.
Within the South of the Authority, 14,561 tonnes of material was collected at the kerbside
for processing in the MRF, this consisted of residual household waste (black bags), dry
recyclable (clear bags), and organic material (green bags). This represented a BMW
fraction of 8,882 tonnes (based on 61% definition). This material was initially segregated
in the presort station of the MRF, where the three different material streams were
segregated. The clear bag stream amounted to 1,587 tonnes of material of which 1,079
tonnes was in the form of BMW (based on 68% BMW content from waste classification
study), this was further supplemented by the material collected in the North of the
Authority. The results of the MRF efficiency highlighted that 95% of material was
segregated as dry recyclable, with the remaining 5% as a mechanically separated fine
organic fraction. Hence, based on the total input of clear bags, 2,155 tonnes of material
was segregated for recycling, and 113 tonnes of material sent to landfill.
The green bag amounted to 917 tonnes, and based on the 15.8% contamination levels
which were observed in the MRF efficiency study (as discussed in chapter 5), 772 tonnes
of which would be recovered for composting (100% BMW), and the remaining 145 tonnes
186
________________________________________ Chapter 6_
sent to landfill as contamination, which represented 89 tonnes of BMW landfilled (based
on 61% definition).
The black bag stream contained materials from both households participating within the
kerbside recycling scheme, and those that did not, and consisted of 12,057 tonnes of
material. The data from the MRF efficiency study highlighted that 11.2% of black
material is recovered in the form of dry recyclable, and 27.7% as a mechanically separated
fines stream. Therefore, based on the annual input, 1,338 tonnes o f dry recyclable was
recovered for recycling, 3,340 tonnes o f fine organic material was segregated, and 7,349
tonnes of material was sent to landfill.
Therefore, the Figure highlights that based on the current kerbside recycling regime and set
out rate, 12,979 tonnes would be diverted from landfill from household waste recycling
centres (HWRC), and the MRF could divert 4,265 tonnes in the form of dry recyclable and
source segregated organics, with a further 3,453 tonnes of mechanically separated fine
organic material. This is a total diversion of 20,697 tonnes of MSW from landfill, which
represents a diversion of 51.6% (recycling and composting rate of 43.0% as fines fraction
cannot be included as the material is not source segregated), with 19.2% of the material
diverted being directly attributed to the MRF.
However, since the fines are currently used as landfill daily cover, the fines are not truly
diverted from landfill. Hence, excluding the fines, the diversion from landfill would
reduce to 17,244 tonnes or 43.0%. Based on the earlier assumption that there would be no
growth in MSW arisings, this would result in the Case Study Authority meeting the WAG
target of 40% by 2009/10.
187
Chapter 6
In terms of BMW sent to landfill, based on MSW being defined as 61% biodegradable,
342 tonnes would be landfilled from non-household waste, 547 tonnes from other
household waste, 1,583 tonnes from HWRCs, and 4,799 tonnes from the RCV fraction not
processed in the MRF. As well, as these tonnages, the MRF residue sent to landfill
amounts to 7,524 tonnes, of which 3,705 tonnes are BMW. Consequently, this scenario
would result in the Authority landfilling 10,976 tonnes of BMW for the year, and thereby it
would meet their 2009/10, 2010/11 and 2011/12 landfill allowance targets of 13,987,
12,728 and 11,583 tonnes respectively but would fail their targets after this point.
Again, due to the usage of the fines, which were effectively landfilled, this would increase
the amount of BMW landfilled to 13,940 tonnes. Therefore, the Authority would just meet
their landfill allowance target in 2009/10, but the safety margin is minimal. Hence, it
would not be wise to continue in the same vain as failure could result in the authority being
subjected to a significant fine. In Wales, the fine is set at £200 per tonne landfilled in
excess of the landfill allowance target plus the infraction costs from the European Union if
the county as a whole failed to meet its target (Audit Commission in Wales, 2005).
6.3.3 Alternative Scenarios
This section will consider the impacts of the various scenarios on the performance of the
Authority in terms of both the LAS and WAG targets.
188
Chapter 6
6.3.3.1 Scenario 1
Figure 6.3 highlights the changes if the fines stream from the MRF was composted and
achieved a 50% mass reduction. The data within the figure highlight that this scenario
could potentially allow the same quantity of material to be diverted from landfill, i.e.
51.6% diversion.
However, in the current scenario the fines were used as landfill daily cover, thus, they
cannot contribute to the true diversion number; hence, by composting the fines 50% less
material is used as landfill daily cover, and therefore contributes to the amount of material
landfilled. That is, the 3,453 tonnes of fines segregated in the MRF, would be composted
to obtain a 50% mass reduction, resulting in 1,727 tonnes of composted fines with a BMW
tonnage value of 1,485 tonnes.
Therefore, 11,689 tonnes of BMW is effectively landfilled, and assuming no growth in
waste arisings, this would allow the case study authority to meet its landfill allowance
target until 2010/11. Also, since there is no change to the recyclable and source-segregated
organic material recovered for recycling, the WAG recycling and composting rate remains
at 43.0%, thus, the Case Study Authority would meet the WAG target of 40% by 2009/10.
This scenario depicted in Figure 6.3 meets both the WAG and LAS targets for 2009/10, but
fails to meet the requirements of the landfill allowance scheme. However, options need to
be considered in order to meet the LAS targets post 2011, and also the more stringent
WAG targets after 2010.
189
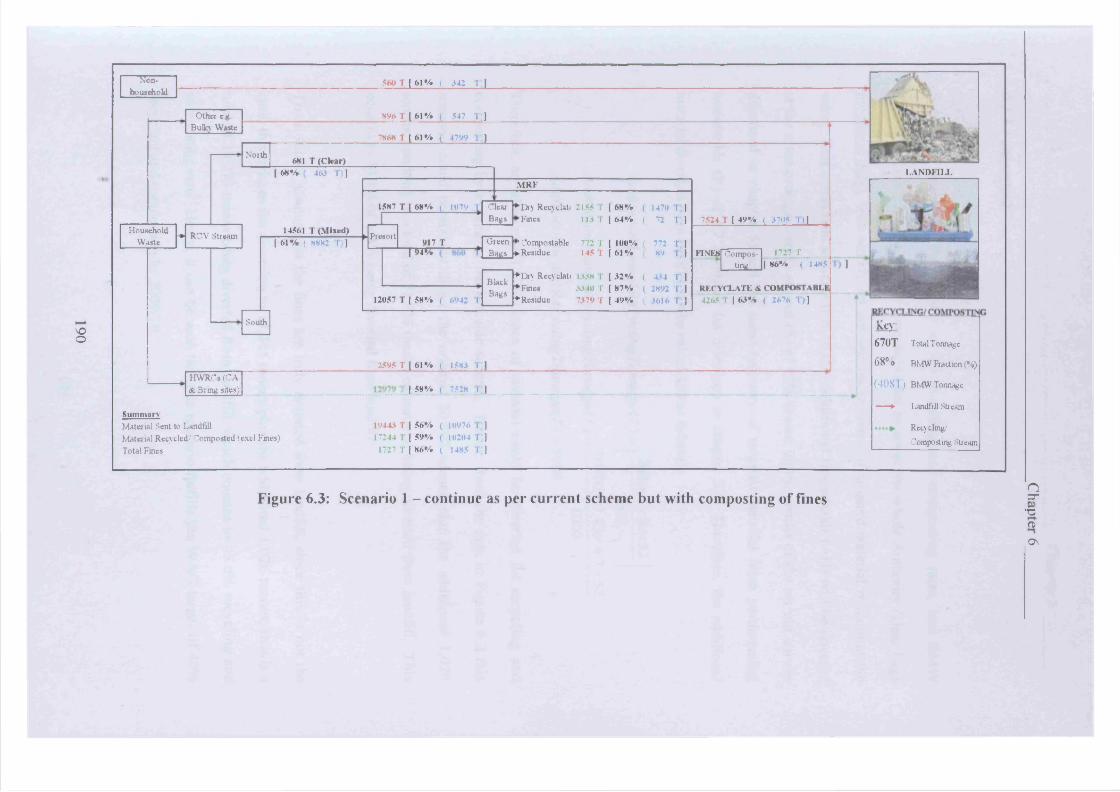
VOO
Non-household
560 T [ 6 1 % ( 342 r ]
Other eg Bulky Waste
HouseholdWaste
North
896 T [ 61% ( 547 T; 1
7868 H 61% ( 4799 T ]
681 T (Clear)
-* RCV Stream
68% 463 T ))
14561 T (Mixed)( 61% ; 8882 I :]
South
1587 T [ 68% ( 1079 | Clear Bags
Presort
M R F
♦Dry Recvclati 2155 i [68% 1470 IFines 113 I [64% | 72 T
917 Ti !>4% r
Green kCompostable 772 T [ 100% f 772 TBa^sJ* Residue 145 r [61% i 89 r
12057 T [ 58V. , 6942 I
BlackBags
♦Dry Recyclati 1338 I- [ 32% | 434 T♦Fines 3340 I [ 87% ( 2892 T♦Residue 7379 T [49% i 3616 T
7524 I [ 4 9 % ( 371)5 I)]
FINES Composting
1727 T_____[ 86% ( 1485
RECYCLATE & COMPOSTABLE421.5 I | 63% ( 2676 1)]
HWRCs (CA ABiing sites)
2595 T [ 61% ( 1583 1 ]
L A N D F I L L
SummaryMater ial Sent to LandfillMaterial Recycled/ Composted (excl Fmes)Total Fines
i [ 58% ( -528 I ]
19443 T [ 56% ( UI976 I ] 17244 T [ 59% ( 10204 T ]
1727 T [ 86% ( 1485 T;J
Key:670T Total Tonnage
68% BMW Fraction (%)
(408T) BMW Tonnage
— Landfill Stream
Recycling/
Composting Str eam
Figure 6.3: Scenario 1 - continue as per current scheme but with composting of FinesnD“•aCbOs
Chapter 6
6.3.3.2 Scenario 2
Scenario 2 highlights the changes to the recycling and composting rates, and BMW
diversion if the kerbside scheme were expanded to cover the whole Authority (clear bass
processed onlvl with weekly set out and the recovery of targeted material remaining the
same. This assessment assumes that 10,000 Additional Households (AH) will be covered
at the same average weekly set out (S) of 42% (based on the results of the set out survey
discussed in chapter 5) and the same recovery of targeted material from participating
households (R) of 4.7 kg/hh/wk (as discussed in chapter 3). Therefore, the additional
material diverted from landfill can be calculated as follows:
AdditionalAnnual Re cyclingTormage(T) = ^
AdditionalAnnual Re cyclingTonnage(T) = x 4.7 x 52
AdditionalAnriual Re cyclingTonnage(T) = 1026
Therefore, an additional 1,026 tonnes of material could be diverted for recycling and
composting by expanding the kerbside scheme. Hence, from the data in Figure 6.2 this
scenario could potentially divert the original 20,697 tonnes plus the additional 1,026
tonnes, resulting in a total of 21,723 tonnes of material being diverted from landfill. This
equates to 54.1% of MSW being diverted from landfill.
These values assume that the fines are truly diverted from landfill, since this is not the
case, this reduces the diversion to 17,244 tonnes plus the additional 1,026 tonnes, that is a
total of 18,270 tonnes being diverted from landfill, which equates to 45.6% recycling and
composting rate. Hence, it can be seen that this scenario fulfills the WAG target of 40%
recycling and composting by 2009/10.
AH x S x R x 52 1000
10000x0.42x4.7 1000

_____________________________________ Chapter 6__
In terms of BMW diversion, scenario 2 would reduce the quantity of BMW landfilled by
the Case Study Authority. From the waste classification studies completed (see chapter 3),
the BMW content of a clear bag was found to be 68% of the total contents. Hence, based
on the fact that this scenario would result in an additional 1,026 tonnes of material being
diverted, 68% of this stream would be biodegradable; hence 698 tonnes of material would
be diverted from landfill. Therefore, from Figure 6.2 if the fines stream was diverted from
landfill, the quantity o f BMW sent to landfill would reduce from 10,976 tonnes to 9,940
tonnes of BMW per annum, and thereby would meet their LAS targets until 2012/13.
Again, due to the situation with the fines being used for landfill daily cover, the fines were
effectively landfilled, hence, this increases the amount of BMW landfilled to 12,904
tonnes. Therefore, the Authority would meet their 2009/10 LAS target, but would fail to
meet them in subsequent years. Further scenarios require consideration in order to provide
a longer term solution.
6.S.3.3 Scenario 3
Scenario 3 highlights the changes to the recycling and composting rates, and BMW
diversion if the kerbside scheme were covered the whole Authority (clear bags processed
only), with weekly set out increased to 60% (that is a change in weekly set out (AS) of
18% from that in scenario 2) and the recovery of targeted material (R) remaining the same
at 4.7 kg/hh/wk. From the 2001 census, the number of households (H) within the case
study boundary is 32,000, therefore, the additional material diverted from landfill can be
calculated as follows:
192
Chapter 6
Additional A nnual Re cyclingTonnage(J) —-----
AdditionalAnnual Re cyclingTonnage(T) = 1408
AdditionalAnnual Re cycIingTonnage(T) = H x ASxRx 52 1000
32000x0.18x4.7x521000
Therefore, an additional 1,408 tonnes o f material could be diverted for recycling and
composting by having a kerbside scheme which operated throughout the region. Hence,
from the data for Scenario 2, this scenario could result in 23,131 tonnes (21,723T + 1408T)
being diverted from landfill, equating to 57.6% of MSW being diverted from landfill.
This assumes that the fines are truly diverted from landfill, since this is not the case, this
reduces the diversion to 20,167 tonnes (18,759T + 1,408T), which equates to a 50.2%
recycling and composting rate. Hence, it can be seen that this scenario comfortably fulfills
the WAG target of 40% by 2009/10, but would fail to meet the WAG target of 52% by
2012/13 (as discussed in section 1.3).
In terms of BMW diversion, based on the fact that this scenario would result in an
additional 1,408 tonnes of material being diverted compared to that in Scenario 2, 68% of
this stream would be biodegradable; hence an additional 957 tonnes of material would be
diverted.
Therefore, if the fines stream was diverted from landfill, the quantity of BMW sent to
landfill would reduce from 9,940 tonnes (as in scenario 2) to 8,983 tonnes of BMW per
annum (9,940T - 957T), and thereby the Authority would meet their 2009/10 landfill
allowance target of 13,987 tonnes and also their 2012/13 landfill allowance target of
10,540 tonnes.
193
______________ Chapter 6_________
Again, due to the situation with the fines being used for landfill daily cover, the fines were
effectively landfilled, thus, this increases the amount of BMW landfilled to 11,947 tonnes
(12,904T - 957T). Therefore, the Authority would meet their LAS target in 2009/10 but
would fail to meet their 2011/12 target o f 11,583 tonnes.
6.3.3.4 Scenario 4
Scenario 4 indicates the changes to the recycling and composting rates, and BMW
diversion if the kerbside scheme covered the whole Authority, with weekly set out
increasing to 80% (that is a change in weekly set out (AS) of 38% from that in scenario 2)
and the recovery of targeted material in the clear bag (Rc) remained the same at
4.7kg/hh/wk. This scenario also adds a kitchen waste collection to the kerbside recycling
scheme, and assumes a kitchen waste recovery (Rk) of 2kg/hh/wk at the kerbside, and
again that weekly set out (S) in the kitchen waste collection scheme would be 80%.
Hence, this scenario builds on that described in scenario 2, and the additional material
diverted from landfill can be calculated as follows:
H x ASxR„ x52AdditionalAnnualTonnage(T) =
1000+
H x S x R k x 52 1000
^ 32000 x 0.38 x 4.7 x 52 32000 x 0.8 x 2 x 52AdditionalAnrmalTonnage{T) = ---------- 1000------------- *---------- 1000---------
AdditionalAnnual Tonnage(T) = 2972 + 2662 A dditionalA nnual Tonnage (7) = 5634
Therefore, an extra 5,634 tonnes of material could be diverted for recycling and
composting via this scenario than that assessed in Scenario 2. Hence, from the data for
Scenario 2, this scenario could result in 27,357 tonnes (21,723T + 5,634T), or 68.2% of
MSW being diverted from landfill.
194

____________________ Chapter 6_________
The above assumes that the fines are truly diverted from landfill, since this is not the case,
this reduces the diversion to 24,393 tonnes (18,759T + 5,634T), which equates to a 60.8%
recycling and composting rate. Hence, it can be seen that this scenario far exceeds the
WAG target of 40% by 2009/10, and will meet the proposed recycling and composting
targets of 52% by 2012/13 and 58% by 2015/16 if there is no increase in waste arisings and
no change to waste composition.
In terms of BMW diversion, scenario 4 would fiirther reduce the quantity of BMW
landfilled by the Case Study Authority. As discussed previously, the BMW content of a
clear bag (Bc) was found to be 68%, and the BMW content of kitchen waste (Bk) would be
100%. Therefore, the additional BMW diversion potential if this scenario was
implemented can be calculated as follows:
H x A S x R x 52xB,AdditionalAnmialBMWTonnage{T) =
1000+
H x S x R k x 52xBk 1000
32000 X 0.38 X 4.7 x 52 x 0.68 32000 x 0.8 x 2 x 52 x 1.0AdditionalA nnualBMWlonnage ( 7) = ------------------------------------1--------------— ------------* v ’ 1000 1000
AdditionalAnnualBMWTonnage{T) = 2021 + 2662 AdditionalAnnuaIBMWTonnage(T) = 4683
Therefore, from the data for Scenario 2 if the fines stream was diverted from landfill, the
quantity of BMW sent to landfill would reduce from 9,940 tonnes to 5,257 tonnes of BMW
per annum, and thereby the Authority would meet their 2009/10, 2012/13 and 2019/20
landfill allowance target of 13987, 10,540 and 5,446 tonnes.
Again, due to the situation with the fines being used for landfill daily cover, the fines were
effectively landfilled, hence, this increases the amount of BMW landfilled to 8,221 tonnes
(12,904T - 4,683T). Hence, the Authority would meet their 2009/10 and 2012/13 landfill
allowance targets of 13,987 and 10,450 tonnes.
195

Chapter 6
Scenario 4 can potentially allow the Case Study Authority to comfortably meet the WAG
targets for 2009/10 and 2012/13, and could potentially provide a more long term answer if
a solution is found for the fines stream.
6.3.3.5 Scenario 5
Scenario 5 builds on scenario 4 and assumes that a kitchen waste collection would recover
4 kg/hh/wk instead of the figure o f 2 kg/hh/wk used in scenario 4. This figure was used in
this scenario as a kitchen waste collection in RCT was recovering between 4 and 6 kg per
household per week (Lewis, 2008). Hence, this scenario builds on that described in
scenario 4, and assumes that the weekly set out (S) remains at 80%, but an additional
kitchen waste recovery (Rk) o f 2kg/hh/wk at the kerbside from participating households
would be collected. Thus, the additional material diverted from landfill can be calculated
as follows:
\ H x S x R k x 52AdditionalAnnualTonnage\T} — -------i q q q -----------
AdditionalAnnualTonnage(T) = 32000 x0^ x 2x52
AdditionalAnnualTonnage(T) = 2662
Therefore, an extra 2,662 tonnes o f material could be diverted for recycling and
composting via this scenario than that assessed in Scenario 4. Hence, from the data for
Scenario 4, this scenario could result in 30,019 tonnes (27,357T + 2,662T), or 74.7% of
MSW being diverted from landfill.
H x S x R k x 52 1000
32000x0.8x2x 1000
2662
196
Chapter 6
The above assumes that the fines are truly diverted from landfill, since this is not the case,
this reduces the diversion to 27,055 tonnes (24,393T + 2,662T), which equates to a 67.4%
recycling and composting rate. Hence, it can be seen that this scenario far exceeds the
WAG target o f 40% by 2009/10, and will meet the proposed recycling and composting
targets of 52% by 2012/13, 58% by 2015/16 and 64% by 2019/20 if there is no increase in
waste arisings and no change to waste composition.
In terms of BMW diversion, scenario 5 would further reduce the quantity of BMW
landfilled by the case study authority. As discussed previously, the BMW content of
kitchen waste (Bt) would be 100%. Therefore, the additional BMW diversion potential
would again be 2,662 tonnes. Therefore, from the data for Scenario 4 if the fines stream
was diverted from landfill, the quantity o f BMW sent to landfill would reduce from 5,257
tonnes to 2,595 tonnes of BMW per annum, and thereby the Authority would comfortably
meet their 2019/20 landfill allowance target o f 5,446 tonnes.
Again, due to the situation with the fines being used for landfill daily cover, the fines were
effectively landfilled, hence, this increases the amount of BMW landfilled to 5,559 tonnes
(8,22IT - 2,662T). Hence, the Authority would meet their LAS targets until 2018/19.
Scenario 5 can potentially allow the case study authority to comfortably meet both the
WAG and LAS targets until 2018/19. However, this scenario would be difficult to achieve
through the use of a voluntary scheme.
197
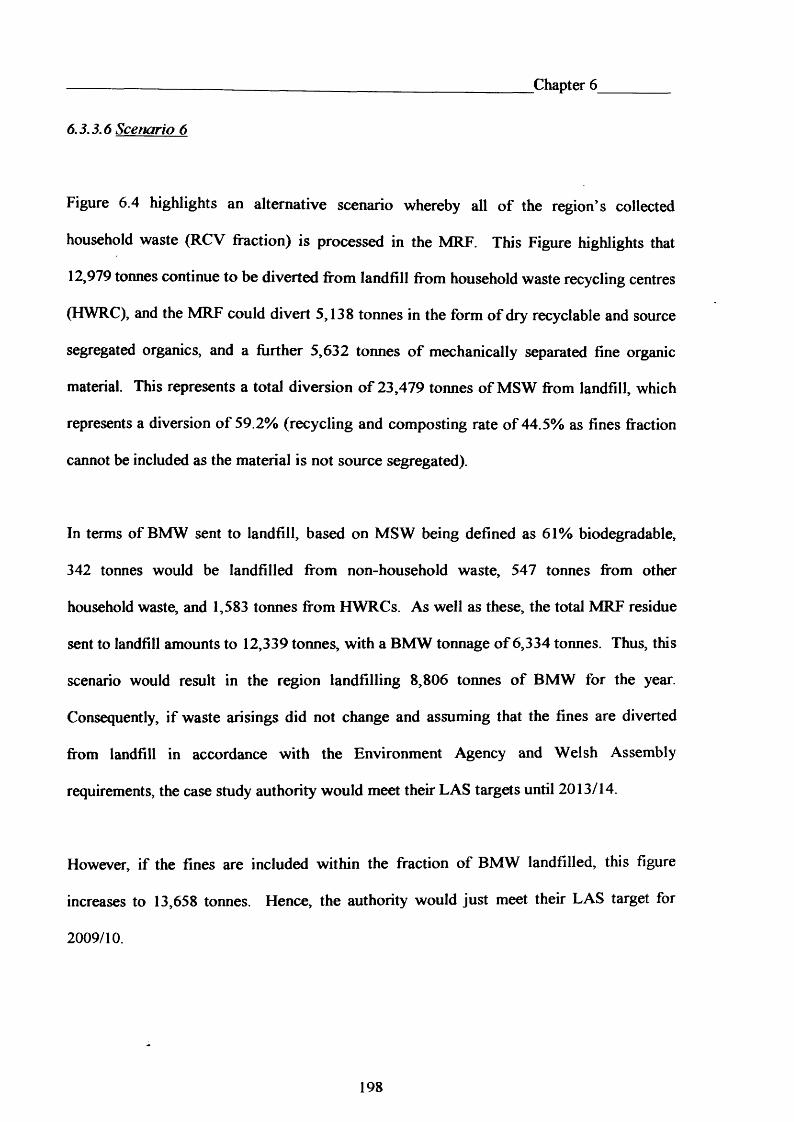
Chapter 6
6.3.3.6 Scenario 6
Figure 6.4 highlights an alternative scenario whereby all of the region’s collected
household waste (RCV fraction) is processed in the MRF. This Figure highlights that
12,979 tonnes continue to be diverted from landfill from household waste recycling centres
(HWRC), and the MRF could divert 5,138 tonnes in the form of dry recyclable and source
segregated organics, and a further 5,632 tonnes o f mechanically separated fine organic
material. This represents a total diversion o f 23,479 tonnes of MSW from landfill, which
represents a diversion of 59.2% (recycling and composting rate of 44.5% as fines fraction
cannot be included as the material is not source segregated).
In terms of BMW sent to landfill, based on MSW being defined as 61% biodegradable,
342 tonnes would be landfilled from non-household waste, 547 tonnes from other
household waste, and 1,583 tonnes from HWRCs. As well as these, the total MRF residue
sent to landfill amounts to 12,339 tonnes, with a BMW tonnage o f 6,334 tonnes. Thus, this
scenario would result in the region landfilling 8,806 tonnes of BMW for the year.
Consequently, if waste arisings did not change and assuming that the fines are diverted
from landfill in accordance with the Environment Agency and Welsh Assembly
requirements, the case study authority would meet their LAS targets until 2013/14.
However, if the fines are included within the fraction of BMW landfilled, this figure
increases to 13,658 tonnes. Hence, the authority would just meet their LAS target for
2009/10.
198
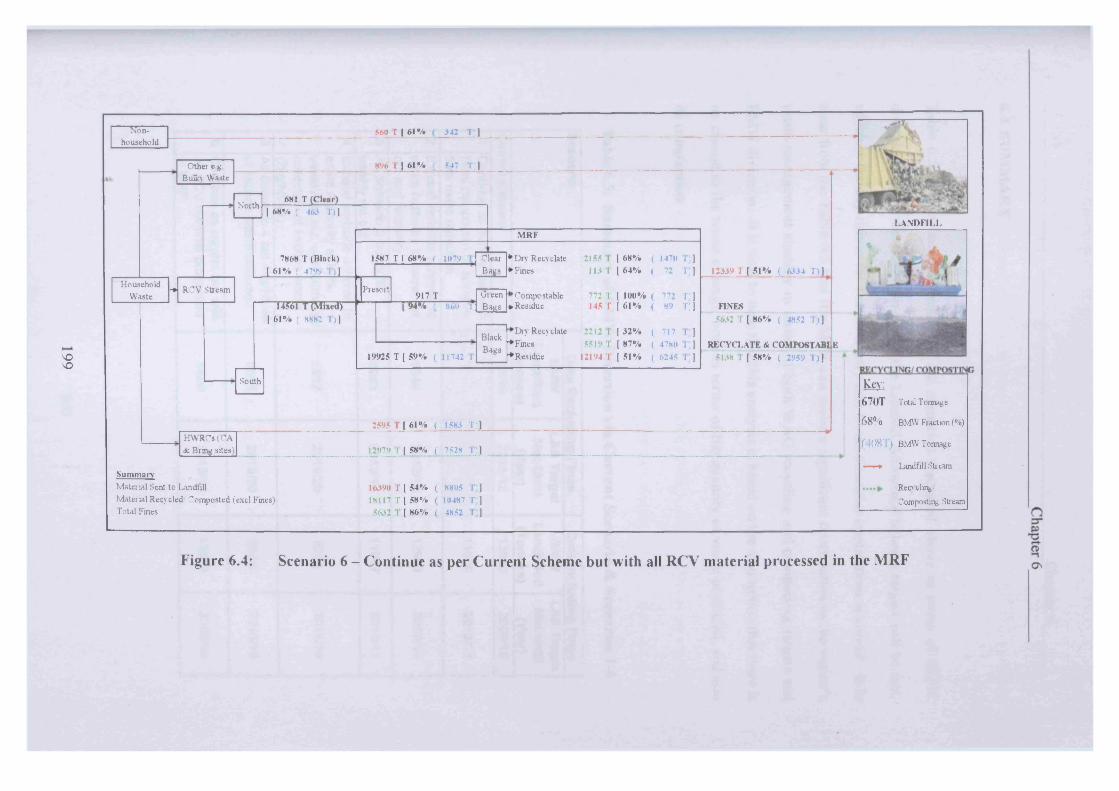
VOVO
Non 560 r [61% 342 T ]household
Other eg Buikv Waste
896 T[ 61% i 54' I ]
HouseholdWaste
North
-*■ RCV Stream
681 T (Clear)[ 68*/# ( 463 T)]
7868 T (Black)[ 61% ( 4799 1)1
T U 5 T T 1 W[61% ( 8882 I)]
South
1587 T I 68% , 1079
Presort
MRF
ClearB ags
♦D iy Re eye late 2155 I [ 68% < 1470 i ]•Fines 113 1 [ 64% ( 72 T ]
917 T94% ; sivi) r
yneen
-Baa.►Compostable 772 T [ 100% ( 772 T ]~ 1 145 T [61% ( 89 T; j> Residue
19925 T [ 59% i 11742 I
BlackBags
Dry Recyclate ♦Fines ♦Residue
2212 I [ 32% ( 717 I ]551'* i [87% ( 4780 r:j
12194 T [51% ( 6245 1 ]
12339 T [ 51% ( <5334 T)]
FINES5632 I [86% < 4852 l»]
RECYCLATE & COMPOSTABLE5138 I [ 58% ( 2959 D ]
HWRC-S (CA & Bring sites)
2595 I [ 61% ( 1583 T;]
LANDFILL
12979 I [ 58% ( 7528 I )
SummaryMaterial Sent to LandfillMaterial Recycled/ Composted (excl Fines)Total Fines
16390 T [ 54% ( 8805 T ]18117 T [ 58% ( 10487 T ]5632 1 [ 86% ( 4852 I ]
m i67UT Total Tonnage
68% BMW Fraction (%)
(408T) BMW Tonnage
— Landfill Stream
Recycling/Composting SUeam
Figure 6.4: Scenario 6 - Continue as per Current Scheme but with all RCV material processed in the MRF
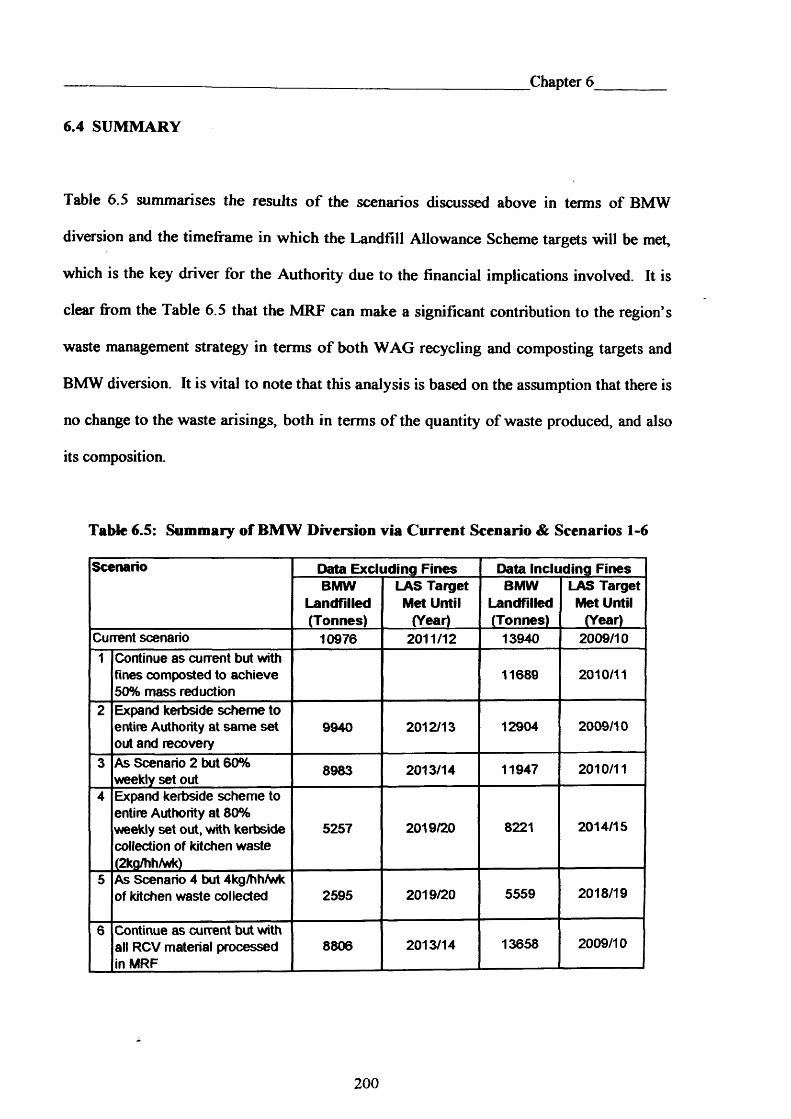
Chapter 6
6.4 SUMMARY
Table 6.5 summarises the results o f the scenarios discussed above in terms of BMW
diversion and the timeframe in which the Landfill Allowance Scheme targets will be met,
which is the key driver for the Authority due to the financial implications involved. It is
clear from the Table 6.5 that the MRF can make a significant contribution to the region’s
waste management strategy in terms o f both WAG recycling and composting targets and
BMW diversion. It is vital to note that this analysis is based on the assumption that there is
no change to the waste arisings, both in terms o f the quantity of waste produced, and also
its composition.
Table 6.5: Summary of BMW Diversion via Current Scenario & Scenarios 1-6
Scenario Data Excluding Fines Data Including FinesBMW
Landfilled(Tonnes)
LAS Target Met Until
(Year)
BMWLandfilled(Tonnes)
LAS Target Met Until
(Year)Current scenario 10976 2011/12 13940 2009/101 Continue as current but with
fines composted to achieve 50% mass reduction
11689 2010/11
2 Expand kerbside scheme to entire Authority at same set out and recovery
9940 2012/13 12904 2009/10
3 As Scenario 2 but 60% weekly set out 8983 2013/14 11947 2010/11
4 Expand kerbside scheme to entire Authority at 80% weekly set out, with kerbside collection of kitchen waste (2kq/hh/wk)
5257 2019/20 8221 2014/15
5 As Scenario 4 but 4kg/hh/wk of kitchen waste collected 2595 2019/20 5559 2018/19
6 Continue as current but with all RCV material processed in MRF
8806 2013/14 13658 2009/10
2 0 0

__________________ ____________ ____________________________ Chapter 6_________
Table 6.5 highlights that the MRF can have a significant impact on whether the region will
meet its annual LAS targets, regardless of whether the fines are subject to some form of
treatment in order to be diverted from landfill. However, if this material is treated it
provides a significant cushion by which the region can meet its targets. Currently, this
material is composted in a manner which is not compliant with the Animal By-Products
Regulations (ABPR) and is used as an engineering material in landfill, namely as daily
landfill cover. Hence, this material currently still counts towards the region’s landfill
allowance figures (DEFRA, 2006a; and Environment Agency, 2005).
If the material was composted in compliance with ABPR and used in the same manner, it
would still contribute to Ceredigion’s landfill allowance figure; however, the reduction in
biodegradability of the material would have to be taken into account. That is, if 100 tonnes
of fines at 100% biodegradability were sent to landfill, all 100 tonnes would count towards
Ceredigion’s BMW landfill allowance limit. However, if 100 tonnes of fines at 50%
biodegradability were sent to landfill, only 50 tonnes would count towards Ceredigion’s
BMW landfill allowance limit. This is a more attractive scenario for Ceredigion than what
was occurring at the time of the study; however long term a more viable solution is needed
(DEFRA, 2006a; and Environment Agency, 2005).
Scenarios 4 and 5 which both consider a kitchen waste collection offered to householders,
are the scenarios which meet the LAS targets most comfortably, and therefore the region
must consider this for future plans. Indeed, the targets proposed by WAG post 2010,
include a target for source-segregated kitchen waste, although it is not yet clear whether
these targets will be statutory or non-statutory (Welsh Assembly Government, 2007).
2 0 1

____________________________________ Chapter 6_____
However, both of these scenarios consider a very high set out rate of 80%, which in reality
would be extremely difficult to achieve with a voluntary system.
There may be political changes that take place which would force the general public to
participate in kerbside recycling schemes, for example ‘pay as you throw’ schemes, or
compulsory participation (e.g. fines for ‘non-recyclers’). Indeed at a recent conference, it
was stated by the Minister for the Environment and Sustainability and the head of waste
strategy at the Welsh Assembly Government that it may become a statutory duty for the
householder to recycle (Davidson 2008, and Rees 2008). Many other countries operate
such systems and their recycling and composting performance is significantly better than
that observed within the UK, numerous studies have found that in such schemes higher
levels of both set out and material diversion are found (Folz and Hazlett 1991; Platt et al.
1991; Everett and Pierce 1993; Noehammer and Byer, 1997; WARMER Bulletin 2002;
CIWM 2003).
Alternative Weekly Collection (AWC) schemes have attracted a significant amount of
interest in recent years. These schemes may be defined as where one type of material is
collected on one week (week 1) and a different type of material the following week (week
2). Where AWC schemes have been implemented where there is an alternate collection of
residual waste and recyclable material, data have shown that significant increases in
diversion are observed. For example the Vale Royal Borough Council in England
increased their household waste recycling rate from 15% in 2003/04 to 40% in 2004/05
due to the implementation of an AWC scheme (WRAP, 2005).
2 0 2
__________________ ______________________________ Chapter 6_________
The priority for the region must be compliance with the LAS targets as these are statutory
targets and there are potential significant financial penalties involved. Currently WAG
recycling and composting targets are non-statutory, although it is important that the
Authority do not dismiss these targets, as they could become statutory targets in the future.
It is clear that without changes to legislation or the political will to introduce an AWC
scheme for example, it will be very difficult for the Authority to comply with the
requirements of the LAS scheme. This scheme is essentially a penalty for landfilling
BMW, therefore a guaranteed solution which does not depend on public participation
would be some other form o f disposal route, namely a thermal process. Thus, if the
Authority were to send the residual MSW for thermal processing as opposed to the
material being landfilled, this would enable it to safely meet the requirements of the LAS
scheme. Current thinking within the Authority is to consider thermal processing of MSW,
however, no decision has been made in terms o f the type of thermal process to be utilised
or whether the Authority will procure its own thermal process or enter a contract with a
waste management contractor with a suitable facility. It is imperative that these important
decisions are taken as soon as possible, as time is a significant factor in relation to the
planning, installation and commissioning of thermal waste treatment plants.
It must be noted that the results in this chapter only consider the mass balances for the
various scenarios based on the results obtained in the waste classification study (see
chapter 3), and the MRF efficiency study (see Chapter 5). However, a number o f other
factors must be considered by the Authority prior to determining what changes are needed
to their waste management strategy. These are:
203

________________________________________ Chapter 6_
• cost - that is the cost of funding the proposed changes;
• life cycle assessment - i.e. is their a net environmental benefit to
collecting the stream;
• health and safety - i.e. do the proposed changes affect the working
conditions that operatives are exposed to, e.g. bioaerosols, weight of
containers; and
• ease of use o f the proposed changes to the general public.
However, such decisions are down to the Authority to determine which direction their
waste management strategy will take, in order to meet the stringent Landfill Allowance
Scheme targets and also the non-statutory Welsh Assembly Government recycling and
composting targets.
204
Chapter 7
CHAPTER 7: Conclusions &
Recommendations
205

Chapter 7
7.1 CONCLUSIONS
The significant changes that have taken place in terms of waste management legislation in
recent times are mainly as a result o f changes at an EU level, and as a result the waste
management industry is undergoing a period of significant change within the UK. The UK
has traditionally been heavily reliant on landfill as a means of dealing with its ever
increasing levels o f municipal solid waste (MSW); however, as a result of EU drivers
alternative means of dealing with MSW such as kerbside recycling, composting and
thermal processes are increasing in popularity within the UK.
Local authorities have a significant role to play as essentially they have the power to
deliver these statutory and non-statutory targets on a local level. Traditionally waste
management strategies have included the provision o f Household Waste Recycling Centres
(HWRCs) and kerbside recycling schemes for the segregation of recyclable and
compostable materials away from the general waste stream.
This thesis has examined how a materials recovery facility (MRF) could assist a local
authority to meet the required statutory and non-statutory targets. The Case Study
Authority operated a kerbside recycling scheme which utilised survival bags for the
collection of dry recyclable and garden waste, these survival bags were collected at the
same time and in the same vehicle as the residual waste (black bag) stream. The rationale
for this type of scheme, being that as the Case Study Authority was rural in nature, the
transportation costs involved in operating a separate collection was deemed prohibitive.
Along with this survival bag scheme, the Authority had a network of five HWRCs which
206
-------------------- —_______ Chapter 7_________
traditionally had been very well used by householders, and made a significant contribution
to the Authority’s recycling and composting targets.
The household waste stream within the Authority was analysed in order to determine the
composition of the waste stream, and also the quantities of waste generated by
householders. This analysis was conducted in an area where the survival bags were in
operation, and as a result data was obtained on the dry recyclable, organic and residual
waste streams. This analysis determined that the average household waste generation
within the region was 14.9 kg/hh/wk, which ranged from 13.4 kg/hh/wk in the Winter to
16.5 kg/hh/wk in the Summer. These figures are lower than the Welsh average figure of
17 kg/hh/wk (National Assembly for Wales, 2003). Participating households typically
generated 4.7 kg/hh/wk and 3.0 kg/hh/wk o f segregated dry recyclable and organic
material respectively.
The compositional analysis of the household waste stream established that the average
BMW content was 72%, which was significantly higher than the 61% used to define MSW
for the Landfill Allowance Scheme (LAS) figures for Wales. Hence, the region has a
larger pool of BMW to target in order to comply with the stringent LAS targets. However,
the performance at the time of the compositional analysis highlighted that much of this
biodegradable material remained in the residual waste (black bag) stream, it was not
diverted via the dry recyclable or organic collection schemes available to householders.
Thus, this emphasises the need for Authority to increase the amount of biodegradable
material segregated by householders, which could be achieved by targeted education and
awareness. However, during the study there was a shift in the policy of the region, and a
charge was implemented for the organic waste collection scheme, which had the effect of
207
_______________________________________ Chapter 7_____
reducing the quantity o f BMW diverted via the kerbside recycling scheme. The rational
behind this being that by collecting this material, garden waste which previously had not
entered the waste stream was being collected, which resulted in a substantial increase of
approximately 3000 tonnes o f annual MSW ari sings. An alternative means o f recovering
this BMW would be to process the residual waste, as such a scheme would not be bound
by the participation of householders.
A number of MRFs were visited both in the UK and overseas, which consisted of both
clean and dirty MRFs, and a review o f each process enabled best practice ideas to be
developed, which coupled with the waste composition and generation data for the region
enabled a MRF conceptual design to be developed. It was clear from the MRF process
reviews undertaken that process flexibility was the key factor to consider in any MRF
design, as it would enable the MRF to adapt to changes in the market, and also to be able
to process different material streams. The design which was developed was flexible in that
it was able to process both dry recyclable and residual waste (black bag stream), and
thereby enable the region to segregate BMW via both the kerbside recycling scheme and
the residual waste stream. This conceptual design was adapted to allow for a phased
implementation of the MRF so as to minimise the financial outlay for the waste
management contractor.
An efficiency study carried out on the first phase of the MRF implementation highlighted
that when processing a residual waste (black bag) stream, the recovery of dry recyclable
increased from 8.7% for the pilot MRF to 11.2% for the phase 1 MRF, but as well as an
increase in the proportion of dry recyclable collected, the throughput through the plant
increased five fold. As well as the dry recyclable stream, the MRF also segregated a
208
___________________________________ Chapter 7_________
mechanically segregated fine organic stream (less than 50mm fraction), which accounted
for 27.7% of input material with a BMW content of 86.6%. This stream had the benefit of
improving the quality of the dry recyclable streams, and also a health and safety benefit as
much of the biologically active material was segregated before picking operatives came
into contact with the waste stream. The segregation of this material also enabled research
to be carried out on some form o f waste process to be carried out on this material in order
to divert this material away from landfill; however, that activity was outside the scope of
this study.
The efficiency study highlighted that the MRF was recovering 56% of the available dry
recyclable within the residual waste stream, with the manual picking operations generally
achieving a higher recovery rate, compared with the automated processes used for
aluminium and steel. This was as a result of poor presentation, as a result o f plastic film,
paper and card covering much of the conveyor at the automated sorting stations.
When processing a dry recyclable stream, the efficiency study identified that 95% of the
material was recovered for recycling; however, two-thirds of this was in the form of a low
grade paper product, which was essentially the residual material within the MRF when
processing this material. In terms of positive sorting activity, 41% of material was
recovered, and in contrast to the residual waste efficiency results the automated processes
outperformed the manual picking operations.
It was evident from the efficiency study on both residual and dry recyclable streams, that
anther form of segregation was needed in the MRF in order to make the process more
efficient. This will be delivered via the next phase of the MRF development with the
209
_________________ Chapter 7_________
installation of a ballistic separator, which will enable the two dimensional and light
material such as paper, card and plastic film, to be separated from the three dimensional
and heavy objects such as cans and bottles. This will enable the sorting operations to be
more effective and efficient.
The data obtained in the MRF efficiency study enabled a modelling activity to be carried
out on the Case Study Authority’s annual MSW data. This thesis has found a MRF of this
type can have a significant impact upon the performance o f the region in terms of both
LAS and WAG targets. Current thinking within the region is the investigation into thermal
processes for the treatment of waste streams destined for landfill; however, it is vital that
the region give consideration to the WAG targets post 2010, as it has been announced that
a target of 70% recycling and composting by 2024/25 will be implemented, and it is not
yet clear whether these will become statutory targets.
An integrated approach will be needed to meet both LAS and WAG targets, and the MRF
can play a significant role in that approach. Changes will be needed to the waste
management approach in the region, and it may be that approaches such as alternative
weekly collection (for example Vale Royal Borough Council), a strict no side waste policy
etc. are introduced in order force householders to participate in the kerbside recycling
scheme. However, it must be remembered that with such schemes, strict enforcement is
required in order to avoid contamination problems in the dry recyclable and organic waste
collection schemes.
This thesis has a made a contribution to research in this field, particularly in relation to the
efficiencies and operating conditions o f MRFs, as such detailed information is unique and
2 1 0
_______________________________________________ Chapter 7_
rarely made public by waste management companies for commercial purposes. As a
result, the impact of MRFs can be more accurately modelled on local authority waste
arisings, to assess options for landfill diversion.
7.2 RECOMMENDATIONS FOR FUTURE W ORK
It is recommended that future research be conducted into the following areas:
• an efficiency study into the second phase o f the MRF development, in order to
ascertain the impact of the additional equipment on the performance of the MRF,
and also the MRFs impact on the region’s LAS and WAG targets;
• further development of benchmarking tools in order to enable comparisons to be
made between MRFs, consideration needs to be given to contamination levels
within the feedstock material;
• a study on the costs of separate collection versus survival bag collection within the
region;
• an examination of the impact o f Alternate Weekly Collections on waste
composition and arisings; and,
• an assessment of the BMW content of the Welsh municipal waste stream, as this
thesis clearly finds that the BMW content of the waste stream within the case study
authority is significantly higher than the 61% used throughout Wales.
2 1 1

References
REFERENCES
2 1 2

References
ACORN (2003) What is ACORN? [Online]. Available from: w w w .c a c i.c o .uk/acorn
[Accessed: 01/07/08].
Adani F., Scatigna L., & Genevini P. (2000) Biostabilisation of Mechanically Separated
Municipal Solids Waste Fraction. Waste Management and Research, 18: 471-477.
Alumatter (2007) Case Study: Eddy Current Separation [Online] Available from:
http:-valum inium .m atter.prg.uk/conten t-h tm l/eng/d efau lt.asp7eatid~ 17 2 & p a g e id ^ 2 1444165
66 [Accessed: 01/03/08]
Anonymous (2007) Recycle in the Bag Scheme (South) Participation Study. Internal
report by Ceredigion County Council Waste Management Section.
Anonymous (2002) Waste Management Strategy - Final Report. Ceredigion County
Council.
Audit Commission in Wales (2005) Themed Paper 9: Waste Management [Online]
Available from: http: w w w .w a o .^ o v.uk a ssets /en g lish d o cu m en ts W aste M ana g em en t_
Them ed_Paper_9. pdf [Accessed: 12/12/06].
Binner, E. (2002) The Impact of Mechanical-Biological Pre-treatment on Landfill
Behaviour [Online]. Available from:
http://eiiropa.eu .int co m m e n v ir o n m ent,\va s t c com post,p reseijtatio iis binnei jjd t
[Accessed: 04/11/03].
213
References
Biomass Energy Centre. (2008) Why use biomass? [Online] Available from:
http://w w \v.b iom assen ergycen tre .org .u k /p orta l/p age? p a g e id ~ 7 6 .15068& dad=portal& sc
hem a=PO R T A L [Accessed: 01/07/08].
Bockreis, A., Steinberg, I., Rohde, C., and Jager, J. (2003) Gaseous emissions of
mechanically-biologically pre-treated waste from long-term experiments. Proceedings
Sardinia 2003, Ninth International Waste Management and Landfill Symposium.
Bristol City Council (2000) Draft Household Waste Management Strategy [Online]
Available from: http://w w w .a21 ita lv .it/a21 ita ly /en v ip la n s/g u id e lin es/rea d in g /w a ste /
B risto l_w aste-strategy_00_en . pd f [Accessed: 01/03/08].
Cardiff University (2000) Analysis o f Waste Entering a Typical Small Landfill Site in the
South Wales Valleys, Phase 2, July 2000, Report No. 2683.
Chartered Institution of Wastes Management (CIWM) (2003) Waste Collection: To
Charge or Not to Charge. CIWM Business Services Ltd.
Chartered Institution of Wastes Management (CIWM) (2000) Materials Recovery
Facilities. CIWM Business Services Ltd.
Cheshire Local Government Association (2001) Household Waste Composition Report
[Online]. Available from: www .cheshirc.gov.uk/waste Down 1oa^isiijmisehojd^
W aste C om position [Accessed: 21/03/05].
214
References
Composting Association. (2003) Information Sheet 6: Review of proposed permanent and
transitional measures fro the EU Animal By-Products Regulation [Online]. Available
from: w \vw .com p ost.org .u k .,'im ages_clien t/resource/06% 20E U % 2Q A nim al% 20B y-
P roducts% 20R egulation .pdf [Accessed: 11/09/03].
Control of Pollution Act 1974 (c.40)
Council Directive (EC) No. 75/442/EEC on Waste
Council Directive (EC) No. 99/31/EC o f 26 April 1999 on the landfill of waste
Council Directive (EC) No. 2000/76/EC of 4 December 2000 on the incineration of waste
Damiecki, R (2002) Mechanical-Biological Pretreatment of Municipal Solid Waste.
Orbit, 2(1): 31-36.
Davidson, J. (2008) Waste in Wales: regulatory and policy directions. 2nd Waste in
Wales Conference, Cardiff. May 2008.
Denison, R.A., Ruston, J., Tryens, J., and Diedrich, R. (1994) Environmental Perspectives
In: Handbook of Solid Waste Management. By: Kreith, F (ed). McGraw Hill, USA. Pp
3.1-3.36
Department of the Environment (1991) Waste Management Paper No. 28: Recycling — A
memorandum providing guidance to local authorities on recycling. HMSO, London.
215

References
DEFRA (2 0 0 7 ) Key Facts about Waste and Recycling: Municipal Waste Management
United Kingdom 2 0 0 5 /0 6 [Online] Available from: w w w . defra. gov .uk/environm ent/
statistics/w aste/kffw rkf20 .h tm [Accessed: 0 1 /0 5 /0 8 ] .
DEFRA (2006) Key Facts about Waste and Recycling: Estimated Total Waste Arisings
by Sector [Online] Available from: h ttp . w w w .defra .gov .uk /en v iron m en t/sta tistics/w aste/
kt7w rkfU2.htm [Accessed: 01/08/07].
DEFRA (2006a) Guidance on the Landfill Allowance Scheme: Municipal Waste [Online]
Available from: http : //www . de fra . gov.uk/ EN V I RONMENT / W AS T E /1 o ca I a u t h /1 a t s /
pdf /la t srauni cipalwas tegui a a n e e .pdf [Accessed: 18/11/06].
DEFRA (2004) Waste and Resources - R&D Strategy [Online]. Available from:
http://www.defra.gov.uk/environmenrw-aste/w-ip.Tesearch/pdffrdstrategy.pdf [Accessed:
01/05/08].
DEFRA (2003) Waste and your Duty o f Care [Online]. Available from: www.deffa.
gov.uk/environment/waste/management/doc.index [Accessed: 12/06/03].
DEFRA (2003a) Key Facts about Waste and Recycling [Online] Available from:
w w w '.defra.gov.uk environm ent statistics w a ste wrklD 2.htm [Accessed: 19/05/03].
DETR. (2000a) Waste Strategy 2000 for England and Wales: Part 1. HMSO, Norwich.
DETR. (2000b) Waste Strategy 2000 for England and Wales. Part 2. HMSO, Norwich.
216

References
Department of the Environment (1991) The Analysis and Prediction of Household Waste
Arisings: Controlled Waste Management Report, CWM/037/91. HMSO, London,
Department of the Environment (1994) National Household Waste Analysis Project -
Report on Composition and Weight Data. Department of the Environment report CWM
082/94. HMSO, London.
Deposit of Poisonous Wastes Act 1972 (c.21)
DETR (2000) Waste Strategy 2000 for England and Wales: Part 2. HMSO, Norwich.
DETR (1995) Making Waste Work, Cm 3040. HMSO, London
Diaz, L., Savage, G.M, and Golueke, C.G. (1994) Composting of Municipal Solid
Wastes In: Handbook of Solid Waste Management. By: Kreith, F (ed). McGraw Hill,
USA. Pp 10.1-10.68.
Dubanowitz, A.J. (2000) Design of a Materials Recovery Facility (MRF) for Processing
the Recyclable Materials of New York City’s Municipal Solid Waste [Online]. Available
from: http ://w w w .seas.co ium bia.edu earth dubanm rf.pdt [Accessed: 27/01/07].
Emery, A,. Gibbs, A.J. & Myrddin, S. (2000a) Bi-annual Report, Cardiff University’s
Waste Research Station.
217

References
Emery, A., Gibbs, A .J., Griffiths, A.J., Myrddin, S. & Williams, K.P. (2000b) Analysis of
Waste Entering a Typical Small Landfill Site in the South Wales Valleys - Phase 2 Report
on Further Composition and Weight Data. Cardiff University Report No. 2683.
Emery, A,D. Woollam, T., Marsh, R., Griffiths, A.J., & Williams, K.P. (2002) Review of
a Pilot Kerbside Recycling Scheme and Recycled Material Analysis in a Typical Welsh
Valleys Community. Cardiff University Report No. 2947.
Environment Act 1995 (c.25)
Environment Agency (2006) Landfill Allowance Scheme Wales: Monitoring Report
2005/06 [Online] Available from: w w w .en v iro n m en t-a g en cy .g o v .u k /co m m o n d a ta /
acrobat/main body 14 6 4 2 9 0 .p d f [Accessed: 01/08/07]
Environment Agency (2005) An Environment Agency Guide to assist those considering
the Mechanical Biological Treatment of Waste [Online] Available from:
http: 7w w w .surreyln e .g o v .uk sccw e b site s c c w sp u b lica tion s.n st? 8 S 7 ec2 4 9 6 eS a b e8 18 0 2 5 6 c
670041 a 5 0a /e08eb 6265db f58c 18025 714d 003 ca652/$F IL E /6% 20M B T % 20ou tp ut% 20gu id
an c e%2 0-% 2 Q%2 OE n v i r o n m e n t %2 0 A g e n cy .p d f [Accessed: 18/11 /06].
Environmental Protection Act 1990 (c.43)
Eswaraiah, C., Kavitha, T., Vidyasagarm S. and Narayanan, S.S. (2008) Classification of
metals and plastics from printed circuit boards (PCB) using air classifiers. Chemical
Engineering and Processing: Process Intensification. 47: 565-576,
218

References
European Commission (2003) Waste Generated and Treated in Europe. Office for
Official Publications of the European Communities, Luxembourg.
EUROSTAT (2005) Waste Generated and Treated in Europe [Online] Available from:
http://epp-eurostat.cec.eu.int/cache/ITY__OFFPUB/KS-69-05-755/EN/KS-69-Q5-755-
EN.PDF [Accessed: 01/08/07].
Everett, J. and Pierce J. (1993) Curbside Recycling in the USA: Convenience and
Mandatory Participation. Waste Management and Research, 11: 49-61.
Folz, D. and Hazlett, J. (1991) Public Participation and Recycling Performance:
Explaining Program Success. Public Administration Review 51, 526-532.
Franklin, M.A. (1994) Solid Waste Stream Characteristics. In: Handbook of Solid Waste
Management. By: Kreith, F (ed). McGraw Hill, USA. Pp 3.1-3.36
Friends of the Earth (2002) Fact Sheet: EU Landfill Directive and Waste Strategy
[Online]. Available from: w w w .fo e .c o u k /resou rce/lactsh eets/eu l a n d t i l l d i re c t iv c .pdt
[Accessed: 08/12/07].
Godley, A.R, Evans, T.D., Alker, G. and Davies, R.D. (2002) Research analysis of the
market potential for lower grade composted materials in the UK [Online]. Available from:
w w w . wrap. o rg^ukjpubli A n aly si soft h e M a jk e tP o te ii^
postedM aterialsintheU k.pdf [Accessed: 11/09/03].
219

References
Golueke, C.G. (1977) Biological Reclamation of Solid Wastes. Rodale Press,
Pennsylvania.
Griffiths, A.J.; Williams, K.P.; and Owen, N.E. (2005) The Implications of the Landfill
Allowance Scheme Regulations for Ceredigion County Council. Cardiff University.
Hilger, H. and Humer, M. (2003) Biotic Landfill Cover Treatments for Mitigating
Methane Emissions. Environmental Monitoring and Assessment, 84: 71-84.
Hodgett, B. (2008) Personal Communication.
Holgate, G. (2002) Implementation of the EC Landfill Directive: the Landfill (England
and Wales) Regulations 2002. Land Contamination and Reclamation, 10(2): 101-105.
Joseph, J. (1996) The Waste Management Industry. Land Contamination & Reclamation,
4(3): 215 -216.
Kebekus, F., Dilewski, G. and Drees, K-T. (2000) Mechanical-Biological Waste
Treatment [Online]. Available from: w w w . gtz de/m ba dow n load dm « e. pdt [Accessed:
01/08/07].
Keenan, A. (2007) Personal Communication.
2 2 0
References
Knox, A (2005) An overview of incineration and EfW technology as applied to the
management of MSW [Online] Available from: w w w .o n eia .ca /tlle s /E F W % 2 0 -
% 20K nox. p d f [Accessed: 01/05/08].
Kreith, F. (1994) Introduction. In: Handbook of Solid Waste Management. By: Kreith, F
(ed). McGraw Hill, USA. Pp 1.1-1.24
Landfill Allowance Scheme (Wales) Regulations 2004 (Statutory Instrument No. 1490)
Landfill Allowance Trading Scheme (LATS) Regulations 2004 (Statutory Instrument No.
3212)
Landfill (England and Wales) Regulations 2002 (Statutory Instrument No. 1559)
Lewis, K. (2008) Personal Communication.
Lungu, M. (2005) Separation of small nonferrous particles using an angular rotary drum
eddy-current separator with permanent magnets. International Journal o f Mineral
Processing, 78(1): 22-30.
Lyas, J.K., Shaw, P. J. and Van Vugt, M. (2005) Kerbside Recycling in the London
Borough of Havering: Progress and Priorities. Resources Conservation and Recycling,
45(1): 1-17.
2 2 1
References
Mancer, A.G.R.; and Keeling, A.A. (1996) Practical Handbook of Processing and
Recycling Municipal Waste. Lewis Publishers, London.
MEL Research Ltd. (1999) Waste Analysis for Energy From Waste Plant Operators.
Energy From Waste Foundation.
Moore, S., Grime, P., Kung, B. (1995) Urban Solid Waste Characterisation, AWD.
National Assembly for Wales (2 0 0 6 ) Municipal Waste Management Report for Wales
2 0 0 4 /0 5 [Online] Available from: h ttp ://n e \v .w a les .gov .uk /top ics/env ironm entcou ntryside
/epq/w aste_recycling/M unicipal w a ste m n gm n t_survey? lan g= en [Accessed: 0 1 /0 8 /0 7 ].
National Assembly for Wales (2 0 0 3 ) The Composition of Municipal Solid Waste in
Wales [Online]. Available from: w w w w ales, g o v .u k /su b ien v iron m en t/con ten t/w aste/
com position, pt 1 -e .p d f [Accessed: 1 5 /0 3 /0 5 ],
National Assembly for Wales (2002) Wise about Waste. National Assembly for Wales.
National Statistics (2001) Statistics by Area Name [Online]. Available from:
http://neighbourhoodstatistics.gov.uk [Accessed: 14/03/05].
Newport Wastesavers (2005) Kerbside Collection [Online] Available from: w w w.
w astesavers.co.uk kerb side-collection [Accessed: 01/08/07],
2 2 2
References
Noehammer, H. and Byer, P. (1997) Effect of Design Variables on Participation in
Residential Curbside Recycling Programs. Waste Management and Research, 15: 407-
427.
Nuisance Removal and Diseases Prevention Act 1848 (11 and 12 Viet, c 123)
OECD (2004) Addressing the Economics of Waste. Organisation of Economic
Cooperation and Development.
Okay Engineering (2005) Which Screen do I need? [Online] Available from:
http: w w w okav-co.uk/products mrrs \vhich one, htm [Accessed: 01/03/08].
Okay Engineering Services Ltd. (2005) Commingled MRFs [Online]. Available from:
w w w .okav.co.uk/products nirfs com m in g led .h tm [Accessed: 14/12/06].
Office of Public Sector Information (OPSI). (1990) Environmental Protection Act 1990
(chapter 43) [Online]. Available from:
w w w . op si. gov .uk /ac ts acts 1990 U k p ga_ 19900043 en 1. htm [Accessed: 01/07/08].
Office of Public Sector Information (OPSI). (1994) Waste Management Licensing
Regulations 1994 (Statutory Instrument Number 1056) [Online]. Available from:
w w w . op si. g o v . uk / si si 199 4 /u k si_ 19 9 4 1 056_en_l .htm [Accessed: 01/07/08].
223
References
Owen, N.E., Griffiths, A.J., Williams, K.P and Woollam, T.C. (2005) Characterisation of
Household Waste in Carmarthenshire and Ceredigion County Councils. Cardiff
University. Report Number 3100.
Owen, N.E., Griffiths, A.J., and Williams, K.P. (2006a) The Need for Good Waste
Compositional Data as a Prerequisite for the Design o f a MRF. WASTE 2006 Conference,
Stratford upon Avon. April 2006.
Owen, N.E., Griffiths, A.J., and Williams, K.P. (2006b) A Review of Existing Recycling
Activities and its Influence on New MRF Design. WASTE 2006 Conference, Stratford
upon Avon. April 2006.
Owen, N.E., Griffiths, A.J., Williams, K.P and Woollam, T.C. (2007a) Waste
Composition - An Integral Requirement for Monitoring Changes to Waste Management
Practices. 22nd International Conference on Solid Waste, Philadelphia, USA. April 2007.
Owen, N.E., Griffiths, A.J., Williams, K.P and Woollam, T.C. (2007b) ‘Dirty’ MRFs and
their Role in Assisting a UK Local Authority Divert Waste away from Landfill. 22nd
International Conference on Solid Waste, Philadelphia, USA. April 2007.
Owen, N.E., Griffiths, A.J., and Williams, K.P. (2007c) Materials Recovery Facility:
Efficiency and Cost Benefit Analysis. Cardiff University Report No. 3141.
224

References
Parfitt, J. (2002) Analysis o f Household Waste Composition and Factors Driving Waste
Increases [Online] Available from: http://www.number-
10.gov.uk/su/waste/report/downloads/composition.pdf [Accessed: 21/03/05].
Platt, B., Docherty, C., Broughton, A. and Morris, D. (1991) Beyond 40%: Record
Setting Recycling and Composting Programs. Washington DC, USA 1991.
Public Health Act 1875 (38 and 39 Viet, c 55)
Public Health Act 1936 (c.49)
Rees, A. (2008) Waste in Wales under review: an outline of change. 2nd Waste in Wales
Conference, Cardiff. May 2008.
Saunders, S.M. (2007) Personal Communication.
Schall. J. (1992) Does the Waste Hierarchy Make Sense? A technical, economic and
environmental justification for the priority of source reduction and recycling. Working
Paper No. 1 Solid Waste Programme, Yale University.
Shapiro, M. and Galperin, V. (2005) Air Classification of Solid Particles: A Review.
Chemical Engineering and Processing, 44: 279-285
225
References
Siegler, T. and Perkins, R. (1999) Sorting Plastic Bottles [Online]. Available from:
http://www.plasticsresource.eom/s plasticsresource/doc.asp°TRACKID=&CID=175&DID
=476 [Accessed: 27/01/07],
Spencer, D.B. (1994) Recycling. In: Handbook of Solid Waste Management. By: Kreith,
F (ed). McGraw Hill, USA. Pp 9.1-9.128
Stanners, D, and Bordeau, P. (1995) Europe’s Environment. The Dobris Assessment,
European Environment Agency, Copenhagen.
Tachwali, Y., Al-Assaf, Y. and Al-Ali, A .R (2007) Automatic multistage classification
system for plastic bottles recycling. Resources, Conservation and Recycling, 52(2): 266-
285.
TiTech (2006) Technology [Online]. Available from:
http:/ /www .titech. coni det’au 11 a s p ° ITE\1 ID 495 [Accessed: 01/03/08].
Total Recycling Systems (TRecS) Limited (2007) The Company [Online] Available
from: http:/ www.t-rec-s.com company. htm [Accessed: 01/08/07].
Van den Broek, E. & Kirov, N.Y. (1971) The Characterisation of municipal solid waste,
Solid Waste Treatment and Disposal, Ann Arbour Scientific Publications.
WARMER Bulletin (2002) Best Practice Evaluation of Local Authority Waste Charging
Schemes. WARMER Bulletin, 85: 14-15
226
References
WasteDataFlow (2003) What is WasteDataFlow? [Online]. Available from:
www.wastedatatlow.org [Accessed: 03/01/07].
Welsh Assembly Government (2007) Dramatic New Targets for Rubbish Recycling
[Online] Available from: http://new.wales.gov.uk/news/ThirdAssembly/
LocalGovernment/2007/1743159/?lang=en [Accessed: 03/01/07].
Welsh Assembly Government (2004) Landfill Allowance Scheme: Allocation of
Allowances [Online] Available from: http://new.wales.gov.uk/ [Accessed: 03/01/07],
Wikimedia (2008) Image - Wales Ceredigion [Online]. Available from:
http .'//commons, wikimedia, org wiki 1 mage: Wales_Ceredigion. png [Accessed: 01/07/08].
Williams, M.C. (1994) Integrated Municipal Waste Management. In: Handbook of Solid
Waste Management. By: Kreith, F (ed). McGrawHill, USA. Pp 2.1-2.16.
Williams, P.T. (2005) Waste Treatment and Disposal. Wiley and Sons, Chichester.
Wilson, C.D.H and Williams, I.D. (2007) Kerbside Collection: A Case Study from the
North West of England. Resources Conservation and Recycling, 52(2): 381-394.
Woodcock, C.R. and Mason, J.S. (1995) Bulk Solids Handling: An Introduction to
Practice and Technology. Springer.
227

References
Woollam, T. (2006) Increasing the Diversion of Household Waste through Kerbside
Recycling Systems. Cardiff University PhD Thesis.
WRAP (2006) Improving the Performance of Waste Diversion Schemes: A Good
Practice Guide to Monitoring and Evaluation [Online] Available from:
www.wrap.org.uk/downloadsMonitoring_and_evaluation_guidance_-
llill document.942et795.pdf [Accessed: 01/03/08]
WRAP (2006a) Materials Recovery Facilities [Online] Available from:
http: www.wrap.org.uk/downloads MRF__v6_19Dec06 LC.97adb99b.3528.pdf
[Accessed: 12/12/08].
WRAP (2005) Alternate Week Collections: Guidance for Local Authorities. ENTEC.
ISBN: 1-84405-195-1.
Zeiger, E. (2004) Sorting PET Flakes [Online]. Available from www.mogensen.de
[Accessed: 12/12/08].
Zhang, S., Forssberg, E , Arvidson, B. and Moss, W. (1998) Aluminium recovery from
electronic scrap by High-Force® eddy current separators. Resources, Conservation and
Recyclings 23(4): 225-241.