declaration - -orca - cardiff university
TRANSCRIPT

I
DECLARATION
This work has not previously been accepted in substance for any degree and is not concurrently
submitted in candidature for any degree.
Signed ………………………………………… (candidate) Date: 30th September 2013
STATEMENT 1
This thesis is being submitted in partial fulfilment of the requirements for the degree of PhD.
Signed ………………………………………… (candidate) Date: 30th September 2013
STATEMENT 2
This thesis is the result of my own independent work/investigation, except where otherwise stated.
Other sources are acknowledged by explicit references.
Signed ………………………………………… (candidate) Date: 30th September 2013
STATEMENT 3
I hereby give consent for my thesis, if accepted, to be available for photocopying and for inter-
library loan, and for the title and summary to be made available to outside organisations.
Signed ………………………………………… (candidate) Date: 30th September 2013
STATEMENT 4
I hereby give consent for my thesis, if accepted, to be available for photocopying and for inter-
library loans after expiry of a bar on access previously approved by the Graduate
Development Committee.
Signed ………………………………………… (candidate) Date: 30th September 2013

II
ACKNOWLEDGEMENTS
I would like to sincerely thank the following people for their help and support throughout
my PhD studies:
• Prof. Esh Mahenthiralingam and Dr. Julian Marchesi for their excellent supervision, guidance and patience at all times.
• Dr. Sue Plummer and Dr. Iveta Garaiova, from Cultech Ltd. for their expertise and enthusiasm for the project.
• Prof Martin Maiden, Dr. Keith Jolley and Dr. Holly Bratcher for their assistance in resequencing, assembling and comparing Lactobacillus genomes.
• Prof. Peter Vandamme and Dr. Maarten Aerts, for the provision of LAB isolates and training on MALDI-TOF mass spectrometry.
• The BBSRC for funding this studentship (Doctoral Training Grant BB/F016557/1), and Cultech Ltd. for additional funding as CASE sponsors of this project.
• My mum Anne, and brother Tim, for their help and support.
• My friends and colleagues at Cardiff University; Dr. Laura Rushton, James Evans, Laura Morris, Beky Weiser, Dr. Phil Norville and Dr. Judith White.
III
SCIENTIFIC CONFERENCES AND AWARDS
Analysis of the strain diversity of Lactobacillus acidophilus: an important probiotic
bacterium (2010) South Wales and South West Microbiology Forum. Cardiff University,
Wales, UK. Oral and poster presentation
Molecular identification and genetic diversity of the probiotic species Lactobacillus
acidophilus (2011) FEMS congress of European Microbiologists. Geneva, Switzerland.
Poster presentation.
Strain-level diversity analysis of Lactobacillus acidophilus reveals a domesticated,
clonal probiotic species with limited host range (2012) Society for General
Microbiology Spring Meeting. Dublin, Ireland. Poster presentation. Awarded a Society for
General Microbiology travel grant
Strain-level diversity analysis of Lactobacillus acidophilus reveals evidence of a clonal
probiotic species with high carriage rate in humans (2012) All Wales and South West
Microbiology Forum. Oral presentation. Awarded the Society for General Microbiology
Communication Prize
Clonality of the bacterial probiotic species Lactobacillus acidophilus (2012)
Microbiology and Infection Translational Research Group (MITReG) Postgraduate Day.
Swansea University, Wales, UK. Oral presentation. Awarded 1st prize for oral
presentations.
Strain-level diversity analysis of Lactobacillus acidophilus reveals evidence of a clonal
probiotic species with high carriage rate in humans (2013) FEMS congress of
European Microbiologists. Leipzig, Germany. Poster presentation. Awarded a Society for
General Microbiology travel grant
IV
PUBLICATIONS
Bull, M. J., Marchesi, J. R., Vandamme, P., Plummer, S. & Mahenthiralingam, E.
(2012) Minimum taxonomic criteria for bacterial genome sequence depositions and
announcements. Journal of Microbiological Methods, 89 (1) 18-21.
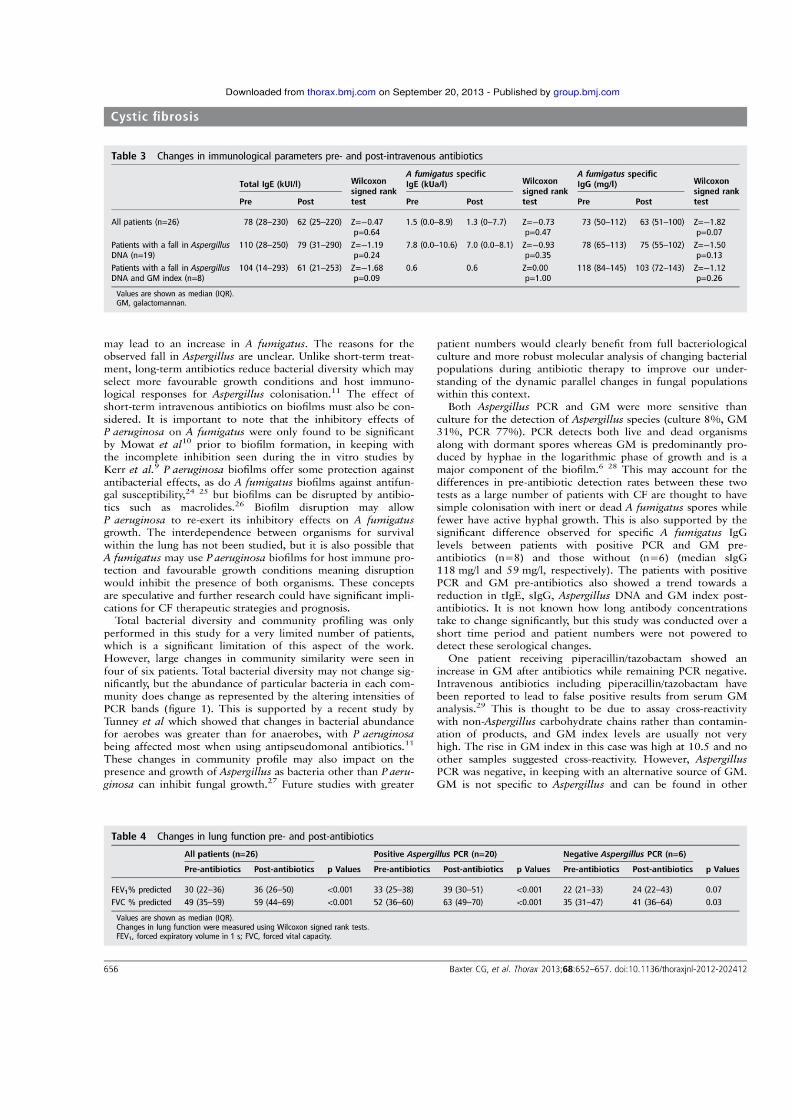
Baxter, C. G., Rautemaa, R., Jones, A. M., Webb, A. K., Bull, M., Mahenthiralingam,
E. & Denning, D. W. (2013) Intravenous antibiotics reduce the presence of Aspergillus in
adult cystic fibrosis sputum. Thorax, 68 (7) 652-657.
Bull, M. J., Plummer, S., Marchesi, J. and Mahenthiralingam, E. (2013) The life
history of a commercial probiotic: The revisionary taxonomy and physiological
characteristics of Lactobacillus acidophilus. (Submitted to FEMS Microbiology Letters).
V
SUMMARY
Introduction
Over time and concurrent development of methods to identify and characterise bacteria, the
lactic acid bacteria (LAB) have undergone multiple taxonomic revisions. As a result of the
revisionary nature of LAB taxonomy, the historical characterisation of Lactobacillus
acidophilus has struggled with misidentification and misrepresentation. Now however, due to
its global use in food products for both flavour and probiotic effect, L. acidophilus is now one
of the most well physiologically characterised Lactobacillus species. Bifidobacterium bifidum
and Bifidobacterium animalis subsp. lactis are also LAB that are considered to have probiotic
effects. Here modern high-throughput next generation comparative genomic techniques are
used alongside conventional biochemical and molecular typing methods to analyse the sub-
species level diversity of these three probiotic species.
Results
Randomly Amplified Polymorphic DNA (RAPD) profile similarity analysis showed limited
strain-level diversity of L. acidophilus. A species specific marker test was developed for L.
acidophilus and used to search for L. acidophilus in wild rodent and human faeces. No L.
acidophilus was detected in wild rodent faeces and its carriage in human faeces was highly
variable. High-throughput next generation sequencing was used to resequence the genomes of
28 L. acidophilus isolates. Comparing these sequences indicated a high level of genomic
conservation in L. acidophilus, which was reflected by limited phenotypic diversity.
Comparative genomics in Bifidobacterium animalis subsp. lactis supported the hypothesis that
it is a clonally monophyletic species, whereas B. bifidum strains were genomically diverse.
Conclusions
Methods for phenotypically characterising and typing LAB have generally been superseded in
accuracy by DNA sequence based methods. Probiotic bacteria display a range of subspecies
level population structures. Commercial and culture collection L. acidophilus isolates did not
significantly differ phenotypically, but were distinct when their genome sequences are
compared. B. bifidum was genotypically diverse at the subspecies level, while B. animalis
subsp. lactis appeared to be clonally monophyletic. Comparative genomics and genome
(re)sequencing of probiotic bacteria will become a “gold standard” method for characterisation
and typing of isolates.
VI
CONTENTS
DECLARATION ................................................................................................................................ I
ACKNOWLEDGEMENTS .................................................................................................................. II
SCIENTIFIC CONFERENCES AND AWARDS ..................................................................................... III
PUBLICATIONS ............................................................................................................................. IV
SUMMARY .................................................................................................................................... V
LIST OF FIGURES ......................................................................................................................... XII
LIST OF TABLES ..........................................................................................................................XV
LIST OF ABBREVIATIONS ......................................................................................................... XVII
1. INTRODUCTION .................................................................................................................. 1
1.1. Probiotic bacteria – A general introduction .............................................................. 1
1.1.1. Delivery of probiotics ................................................................................................ 1
1.1.2. History of probiotics and probiotic food products ..................................................... 2
1.1.3. Common probiotics and their selection criteria ......................................................... 3
1.1.4. Mode of action and clinical implications of probiotics ............................................. 5
1.2. The Lactic Acid Bacteria ............................................................................................. 7
1.2.1. Uses of LAB .............................................................................................................. 7
1.2.2. History and Taxonomy of the lactobacilli ................................................................. 8
1.3. Lactobacillus acidophilus ........................................................................................... 15
1.3.1. L. acidophilus strains and their history .................................................................... 15
1.3.2. Basic features of L. acidophilus ............................................................................... 20
1.3.3. Genomics of L. acidophilus ..................................................................................... 23
1.3.4. Food and industrial use of L. acidophilus ................................................................ 26

VII
1.3.5. Probiotic strains of L. acidophilus ........................................................................... 26
1.3.6. Probiotic characteristics and physiology ................................................................. 27
1.3.7. L. acidophilus: Summary and Perspective ............................................................... 30
1.4. The genus Bifidobacterium ........................................................................................ 31
1.4.1. Taxonomy and identification ................................................................................... 31
1.4.2. Bifidobacterium genomics ....................................................................................... 34
1.4.3. Physiological and probiotic characteristics ............................................................. 38
1.4.4. Bifidobacterium animalis subsp. lactis .................................................................... 41
1.4.5. Bifidobacterium bifidum .......................................................................................... 43
1.5. Examining strain-level diversity ............................................................................... 44
1.5.1. DNA fingerprinting methods ................................................................................... 44
1.5.2. DNA sequence-based methods ................................................................................ 45
1.5.3. Species specific probes based on ribosomal RNA sequences ................................. 46
1.5.4. The post-genomic era .............................................................................................. 47
1.6. Project Aims ............................................................................................................... 48
2. ANALYSIS OF THE SUB-SPECIES LEVEL DIVERSITY OF LACTOBACILLUS STRAINS AND
DEVELOPMENT OF NOVEL TOOLS FOR DETECTION OF L. ACIDOPHILUS .......................................... 52
2.1. Introduction ................................................................................................................ 52
2.1.1. Specific aims ............................................................................................................ 55
2.2. Methods ....................................................................................................................... 56
2.2.1. Storage of bacterial isolates ..................................................................................... 56
2.2.2. Growth conditions ................................................................................................... 56
2.2.3. Rapid DNA extraction from colony material .......................................................... 56
2.2.4. Generation of RAPD fingerprints ............................................................................ 56
2.2.5. Analysis of RAPD fingerprints ................................................................................ 57
2.2.6. PCR amplification of PAU regions specific to L. acidophilus ................................ 57

VIII
2.2.7. Determination of the pure-culture detection limit of the L. acidophilus specific marker
PCR .......................................................................................................................... 58
2.2.8. Isolating LAB from the faeces of wild rodents ....................................................... 58
2.2.9. Bacterial 16S rRNA gene amplification of LAB isolates cultivated from wild rodents
................................................................................................................................. 59
2.2.10. Extraction of total faecal DNA from rodent faecal pellets ...................................... 59
2.2.11. Extraction of total faecal DNA from human faeces ................................................ 60
2.3. Results ......................................................................................................................... 61
2.3.1. RAPD fingerprinting of LAB isolates ..................................................................... 61
2.3.2. Development of a specific test for L. acidophilus ................................................... 68
2.3.3. PAU-based specific markers in culture-dependent and culture-independent applications
................................................................................................................................. 74
2.4. Discussion ................................................................................................................... 82
2.4.1. Strain typing LAB using RAPD profile similarity analysis .................................... 82
2.4.2. PAU regions as specific marker regions for L. acidophilus .................................... 84
2.4.3. Host range of L. acidophilus .................................................................................... 86
2.5. Conclusions ................................................................................................................. 88
3. MINIMUM TAXONOMIC CRITERIA FOR BACTERIAL GENOME SEQUENCE DEPOSITIONS ....... 90
3.1. Introduction ................................................................................................................ 90
3.1.1. Specific aims ............................................................................................................ 92
3.2. Results ......................................................................................................................... 93
3.2.1. Methods required to implement the bioinformatic workflow .................................. 93
3.2.2. A simple bioinformatic workflow for classification of bacterial genomes ............. 94
3.2.3. Application of the bioinformatic workflow to the L. acidophilus 30SC genome ... 98
.............................................................................................................................................. 101
3.3. Discussion ................................................................................................................. 102
3.4. Conclusions ............................................................................................................... 104

IX
4. POPULATION GENOMICS OF L. ACIDOPHILUS .................................................................. 106
4.1. Introduction .............................................................................................................. 106
4.1.1. Genomics in LAB .................................................................................................. 106
4.1.2. Application of novel genome surveying strategies ................................................ 107
4.1.3. Specific Aims ......................................................................................................... 111
4.2. Methods ..................................................................................................................... 112
4.2.1. Genome resequencing strategies ............................................................................ 112
4.2.2. Implementation of gene-by-gene analysis approaches .......................................... 118
4.2.3. Gene-by-gene population genomics analyses using BIGSdb ................................ 120
4.2.4. Implementation of BIGSdb-based analyses ........................................................... 121
4.2.5. Exposure of L. acidophilus NCFM to Methyl Methane Sulphonate (MMS) ........ 122
4.3. Results ....................................................................................................................... 124
4.3.1. Small scale L. acidophilus evolutionary genomics ................................................ 124
4.3.2. Expanded L. acidophilus genomic diversity study ................................................ 128
4.3.3. L. acidophilus CRISPR region diversity ............................................................... 141
4.3.4. Mutagenesis of L. acidophilus NCFM with MMS ................................................ 145
4.4. Discussion ................................................................................................................. 150
4.4.1. Small scale L. acidophilus genomic diversity survey ............................................ 150
4.4.2. Large scale L. acidophilus genomic diversity survey............................................ 151
4.4.3. Exposure of L. acidophilus to MMS ...................................................................... 155
4.4.4. Summary and perspective ...................................................................................... 156
4.5. Conclusions ............................................................................................................... 157
5. PHENOTYPIC DIVERSITY OF LACTOBACILLUS ISOLATES ................................................... 158
5.1. Introduction .............................................................................................................. 158
5.1.1. Specific Aims ......................................................................................................... 160
5.2. Methods ..................................................................................................................... 161
X
5.2.1. Evaluation of Lactobacillus carbohydrate fermentation profiles using the API 50CHL
system .................................................................................................................... 161
5.2.2. Measuring Lactobacillus growth rates ................................................................... 161
5.2.3. Gross proteome analysis using matrix-assisted laser desorption/ionization-time-of-flight
mass spectrometry (MALDI-TOF MS) ................................................................. 164
5.3. Results ....................................................................................................................... 168
5.3.1. Carbohydrate fermentation by Lactobacillus isolates ........................................... 168
5.3.2. Lactobacillus growth characteristics ..................................................................... 171
5.3.3. Comparison of the gross proteome of Lactobacillus isolates ................................ 174
5.4. Discussion ................................................................................................................. 181
5.4.1. Carbohydrate fermentation profiles of L. acidophilus isolates .............................. 181
5.4.2. Growth kinetics ...................................................................................................... 182
5.4.3. MALDI-TOF MS profiling of Lactobacillus isolates ........................................... 183
5.4.4. Summary and perspective ...................................................................................... 184
5.5. Conclusions ............................................................................................................... 186
6. COMPARATIVE GENOMICS OF COMMERCIAL BIFIDOBACTERIUM STRAINS ....................... 187
6.1. Introduction .............................................................................................................. 187
6.1.1. Specific Aims ......................................................................................................... 189
6.2. Methods ..................................................................................................................... 190
6.2.1. Commercial Bifidobacterium genome resequencing ............................................. 190
6.2.2. Genomic diversity analysis of bifidobacteria using rMLST .................................. 190
6.2.3. Genomic diversity analysis of B. bifidum and B. animalis subsp. lactis strains using
“Genome-wide” MLST ......................................................................................... 191
6.2.4. Development of specific markers for B. bifidum ................................................... 191
6.3. Results ....................................................................................................................... 196
6.3.1. Application of rMLST to Bifidobacterium genomes ............................................. 196
6.3.2. genome-wide MLST .............................................................................................. 198
XI
6.3.3. Development and testing of a PCR test for the presence of B. bifidum ................. 202
6.4. Discussion ................................................................................................................. 205
6.4.1. Application of rMLST to bifidobacterial strains ................................................... 205
6.4.2. Genomic diversity of B. animalis subsp. lactis strains .......................................... 206
6.4.3. Genomic diversity of B. bifidum strains ................................................................ 207
6.4.4. Development and testing of a B. bifidum specific marker ..................................... 208
6.4.5. Summary and implications for commercial Bifidobacterium isolates ................... 209
6.5. Conclusions ............................................................................................................... 211
7. GENERAL CONCLUSIONS, DISCUSSION AND PERSPECTIVE ............................................... 212
7.1.1. Conclusions ............................................................................................................ 212
7.1.2. Deliverable tools and strategies for translation to industry (Cultech) ................... 219
7.1.3. General discussion ................................................................................................. 221
7.1.4. Directions for future research ................................................................................ 224
7.1.5. Collaborative research extending the methods and skills developed within this project
............................................................................................................................... 225
8. REFERENCES .................................................................................................................. 226
9. APPENDICES ................................................................................................................... 249
9.1. Appendix one ............................................................................................................ 249
9.2. Appendix two ............................................................................................................ 254
XII
LIST OF FIGURES
Figure 1.1: History of L. acidophilus in the context of the evolving taxonomy of the
Lactobacillus genus ............................................................................................................. 10
Figure 1.2: Phylogenetic placement of the L. acidophilus phylogenetic subgroup within the
Lactobacillus genus ............................................................................................................. 14
Figure 1.3: Major genomic, biosynthetic and probiotic characteristics of L. acidophilus .. 17
Figure 1.4: Colony morphotypes of L. acidophilus ............................................................. 21
Figure 1.5: Phylogenetic relationships within the Bifidobacterium genus .......................... 32
Figure 2.1: Clustered RAPD profiles from multiple re-typing of L. acidophilus LMG
9433T as an internal control. ................................................................................................ 65
Figure 2.2: Clustered RAPD profiles of Lactobacillus and Enterococcus isolates from a
range of isolation dates and sources. ................................................................................... 66
Figure 2.3: Three PAU regions of the L. acidophilus NCFM genome ............................... 70
Figure 2.4: Detection limits of L. acidophilus specific markers in pure culture. ................ 72
Figure 2.5: LAB isolated from wild rodent faeces .............................................................. 77
Figure 2.6: Examining adult total faecal DNA from (i) Adults from Republic of Côte
d'Ivoire and (ii) healthy human males enrolled on a probiotic (Lab4®) feeding trial (pre-
feeding), for the presence of L. acidophilus using PAU-based L. acidophilus specific
marker .................................................................................................................................. 80
Figure 2.7: Examining total faecal DNA from rats after feeding of the Lab4® probiotic
(Lab4®) for the presence of L. acidophilus using PAU-based L. acidophilus specific
marker .................................................................................................................................. 81
Figure 3.1: Bioinformatic work flow for assignment of taxonomic status to a bacterial
genome. ............................................................................................................................... 96
Figure 3.2: Whole genome comparison of L. acidophilus 30SC to L. acidophilus NCFM
and L. amylovorus GRL1118. ............................................................................................. 97
Figure 3.3: Phylogenetic trees of lactobacilli related to L. acidophilus 30SC. ................. 100
Figure 3.4: Phylogenetic tree of pheS genes of lactobacilli related to L. acidophilus 30SC
........................................................................................................................................... 101
XIII
Figure 4.1: BIGSDB Structure and analysis pipelines ........................................................ 119
Figure 4.2: Whole genome comparison of L. acidophilus NCFM to L. acidophilus CUL21
and L. acidophilus CUL60. ............................................................................................... 125
Figure 4.3: Phylogenetic trees of Lactobacilli closely related to L. acidophilus .............. 127
Figure 4.4: Neighbour Joining phylogeny of concatenated ribosomal protein genes from L.
acidophilus group isolates ................................................................................................. 129
Figure 4.5: Neighbour-Net of concatenated sequences of all protein coding genes from L.
acidophilus isolates. .......................................................................................................... 131
Figure 4.6: L. acidophilus NCFM protein coding loci found in other L. acidophilus
isolates. .............................................................................................................................. 133
Figure 4.7: Variably present protein coding loci ............................................................... 135
Figure 4.8: Variable loci in L. acidophilus genome sequences ......................................... 138
Figure 4.9: Selected diverse loci in L. acidophilus ........................................................... 141
Figure 4.10: L. acidophilus CRISPR sequences ................................................................ 143
Figure 4.11: The effect of MMS on L. acidophilus NCFM at a range of exposure
concentrations and times. .................................................................................................. 146
Figure 4.12: RAPD profiles of mutagenized L. acidophilus NCFM isolates .................... 148
Figure 5.1: Three growth parameters calculated using grofit ............................................ 163
Figure 5.2: Carbohydrate fermentation profiles of Lactobacillus isolates ........................ 170
Figure 5.3: Growth parameters of Lactobacillus isolates .................................................. 172
Figure 5.4: MALDI-TOF spectra of three Lactobacillus isolates and their relation to
MALDI-TOF fingerprints ................................................................................................. 176
Figure 5.5: Clustered MALDI-TOF profiles generated by Lactobacillus isolates ............ 178
Figure 5.6: Diversity of Lactobacillus MALDI-TOF profiles .......................................... 179
Figure 5.7: Diversity of L. acidophilus MALDI-TOF profiles ......................................... 180
Figure 6.1: Bifidobacterium genus rMLST Neighbour-net ............................................... 197

XIV
Figure 6.2: Percentage of protein coding loci found in B. animalis subsp. lactis strains and
B. bifidum strains ............................................................................................................... 200
Figure 6.3: Examining adult total faecal DNA from healthy human males enrolled on a
probiotic (Lab4®) feeding trial (pre-feeding), for the presence of B. bifidum .................. 204

XV
LIST OF TABLES
Table 1.1 Bacterial species commonly used in commercial probiotic formulations. ............ 4
Table 1.2: Lactobacillus strains used in probiotic yoghurts or yoghurt-like products. ....... 11
Table 1.3: Phylogenetic grouping of the genus Lactobacillus ............................................ 12
Table 1.4: L. acidophilus isolates and their pseudonyms .................................................... 19
Table 1.5: Completed and published genome sequences from the L. acidophilus group ... 24
Table 1.6: Completed Bifidobacterium genome sequences................................................. 36
Table 2.1: LAB isolates, their RAPD profile types and isolation sources .......................... 62
Table 2.2: RAPD profile type represented by LAB ............................................................ 67
Table 2.3: PCR primer sequences for L. acidophilus specific PCR, based on PAU regions
............................................................................................................................................. 71
Table 2.4: Specificity of PAU-based L. acidophilus specific markers ................................ 73
Table 4.1: Velvet assembly statistics of Lactobacillus isolate genomes ........................... 114
Table 4.2: Genome sequences of L. acidophilus group isolates deposited in the PubMLST
database for this study ....................................................................................................... 115
Table 4.3: Sequences similar to polymorphic CRISPR spacers ........................................ 144
Table 4.4: Genome sequences generated for mutagenized L. acidophilus NCFM isolates
........................................................................................................................................... 147
Table 4.5: Sequence changes in polymorphic loci from L. acidophilus NCFM isolates
exposed to 5% (v/v) MMS for 10 minutes ........................................................................ 149
Table 5.1: Lactobacillus and Enterococcus isolates used in MALDI-TOF proteome
analysis .............................................................................................................................. 165
Table 5.2: Significant differences in growth parameters between groups of Lactobacillus
isolates ............................................................................................................................... 173
Table 6.1: Commercial Bifidobacterium isolates resequenced as part of this study ......... 193
Table 6.2: Bifidobacterium genome sequences used in this study .................................... 194
Table 6.3: PCR primers for B. bifidum ORF BBB_0726 specific marker region ............. 195
XVI
Table 6.4: Loci absent from B. animalis subsp. lactis HN019 and CUL 34 ..................... 199
Table 6.5: Protein coding loci with identical DNA sequence in all B. bifidum genomes . 201
Table 6.6: Specific marker region in Bifidobacterium genomes ....................................... 203
XVII
LIST OF ABBREVIATIONS
ABC ATP binding cassette
CAN Acetonitrile
ATCC American Type Culture Collection
BIGSdb Bacterial Isolate Genome Sequence Database
BLAST Basic local alignment tool
bp Base pairs
CDS Coding sequences
cfu colony forming units
CHCA α-cyano-4-hydroxycinnamic acid
CRISPR Clustered Regularly Interspaced Short Palindromic Repeats
DMSO Dimethylsulfoxide
DNA Deoxyribonucleic acid
dNTPs deoxyribonucleotide triphosphates
DSM (DSMZ) German collection of Microoragnisms and Cell Cultures
EDTA Ethylenediaminetetraacetic acid
EPS Exopolysaccharide
EU European Union
F6PPK fructose-6-phosphoketolase
FAO Food and Agriculture Organisation
FDA Foods and Drugs Administration
FIC Fractional inhibitory concentration
FOS Fructooligosaccharide
GC Guanine-Cytosine
XVIII
GIT Gastrointestinal Tract
GOS Galactooligosaccharide
GRAS Generally Regarded As Safe
HGT Horizontal gene transfer
HMO Human Milk Oligosaccharide
IBD Inflammatory Bowel Disease
IMG Integrated Microbial Genomes
LAB Lactic Acid Bacteria
Lab4® Cultech Ltd. probiotic supplement
LMG Belgian co-ordinated collections of micro-organisms, Gent.
Nd:YAG Neodymium-doped yttrium aluminum garnet
NGS Next Generation Sequencing
m/z Mass-to-charge (ratio)
MALDI-TOF Matrix Assisted Laser Desorption/Ionisation - Time Of Flight
MLST Multi-locus sequence typing
MMS Methylmethane Sulphonate
MRS de Man, Rogosa and Sharpe (agar / broth)
MS Mass spectrometry
NADH Nicotinamide adenine dinucleotide
NCIMB National Collection of Industrial, Food and Marine Bacteria, UK
NCBI National Centre of Biotechnology and Information
NCTC National Collection of Type Cultures
NJ Neighbour Joining
nMDS Non-metic multi-dimensional scaling
ORF Open Reading Frame
PAU Potential Autonomous Unit

XIX
PCR Polymerase chain reaction
PFGE Pulse field gel electrophoresis
PROSAFE Biosafety Assessment of Probiotics used for Human Consumption
R R statistical software
RAPD Random amplified polymorphic DNA
RDP Ribosomal Database Project
rep repetitive extragenic palindromic
RFLP Restricted fragment length polymorphism
rMLST Ribosomal Multi Locus Sequence Typing
RNA ribonucleic acid
rRNA Ribosomal ribonucleic acid
SDS Sodium Dodecyl Sulphate
SEM Standard Error of the Mean
SNPs Single Nucleotide Polymorphisms
Taq Thermus aquaticus
TFA trifluoroacetic acid
UPGMA Unweighted Pair Group Method with Arithmetic Mean
UTI Urinary Tract Infection
V Volt
WHO World Health Organisation
CHAPTER ONE - INTRODUCTION
1
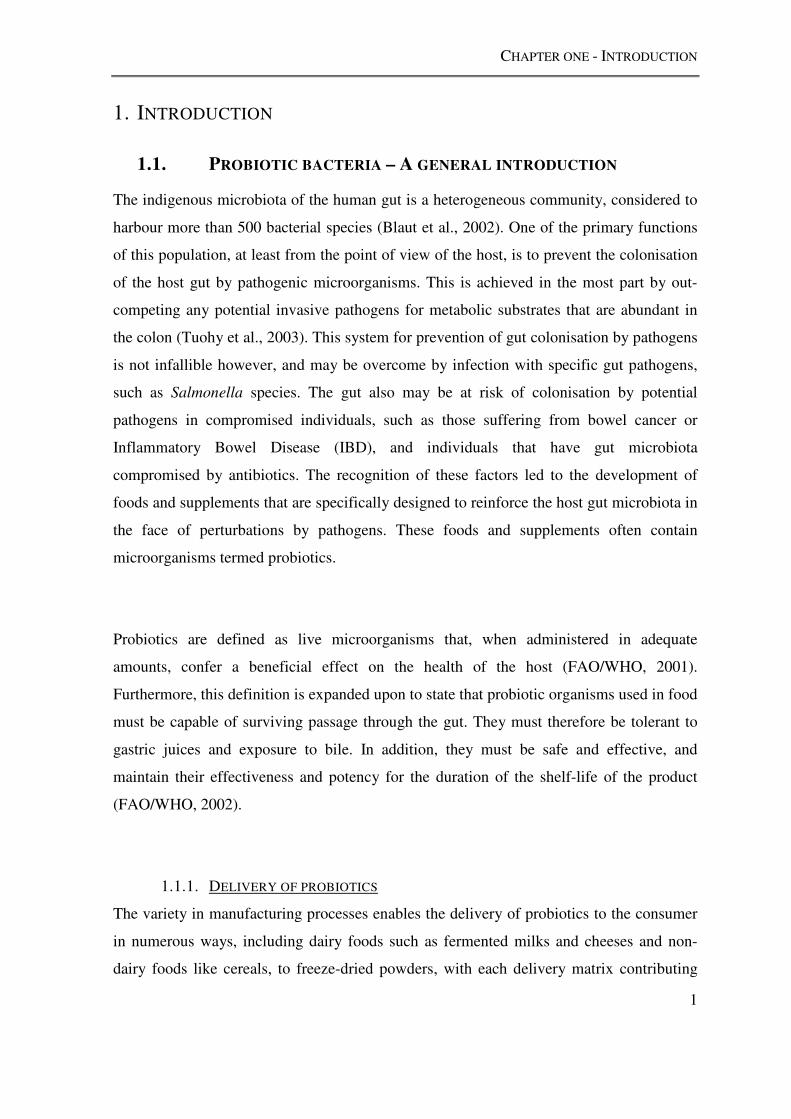
1. INTRODUCTION
1.1. PROBIOTIC BACTERIA – A GENERAL INTRODUCTION
The indigenous microbiota of the human gut is a heterogeneous community, considered to
harbour more than 500 bacterial species (Blaut et al., 2002). One of the primary functions
of this population, at least from the point of view of the host, is to prevent the colonisation
of the host gut by pathogenic microorganisms. This is achieved in the most part by out-
competing any potential invasive pathogens for metabolic substrates that are abundant in
the colon (Tuohy et al., 2003). This system for prevention of gut colonisation by pathogens
is not infallible however, and may be overcome by infection with specific gut pathogens,
such as Salmonella species. The gut also may be at risk of colonisation by potential
pathogens in compromised individuals, such as those suffering from bowel cancer or
Inflammatory Bowel Disease (IBD), and individuals that have gut microbiota
compromised by antibiotics. The recognition of these factors led to the development of
foods and supplements that are specifically designed to reinforce the host gut microbiota in
the face of perturbations by pathogens. These foods and supplements often contain
microorganisms termed probiotics.
Probiotics are defined as live microorganisms that, when administered in adequate
amounts, confer a beneficial effect on the health of the host (FAO/WHO, 2001).
Furthermore, this definition is expanded upon to state that probiotic organisms used in food
must be capable of surviving passage through the gut. They must therefore be tolerant to
gastric juices and exposure to bile. In addition, they must be safe and effective, and
maintain their effectiveness and potency for the duration of the shelf-life of the product
(FAO/WHO, 2002).
1.1.1. DELIVERY OF PROBIOTICS
The variety in manufacturing processes enables the delivery of probiotics to the consumer
in numerous ways, including dairy foods such as fermented milks and cheeses and non-
dairy foods like cereals, to freeze-dried powders, with each delivery matrix contributing
CHAPTER ONE - INTRODUCTION
2
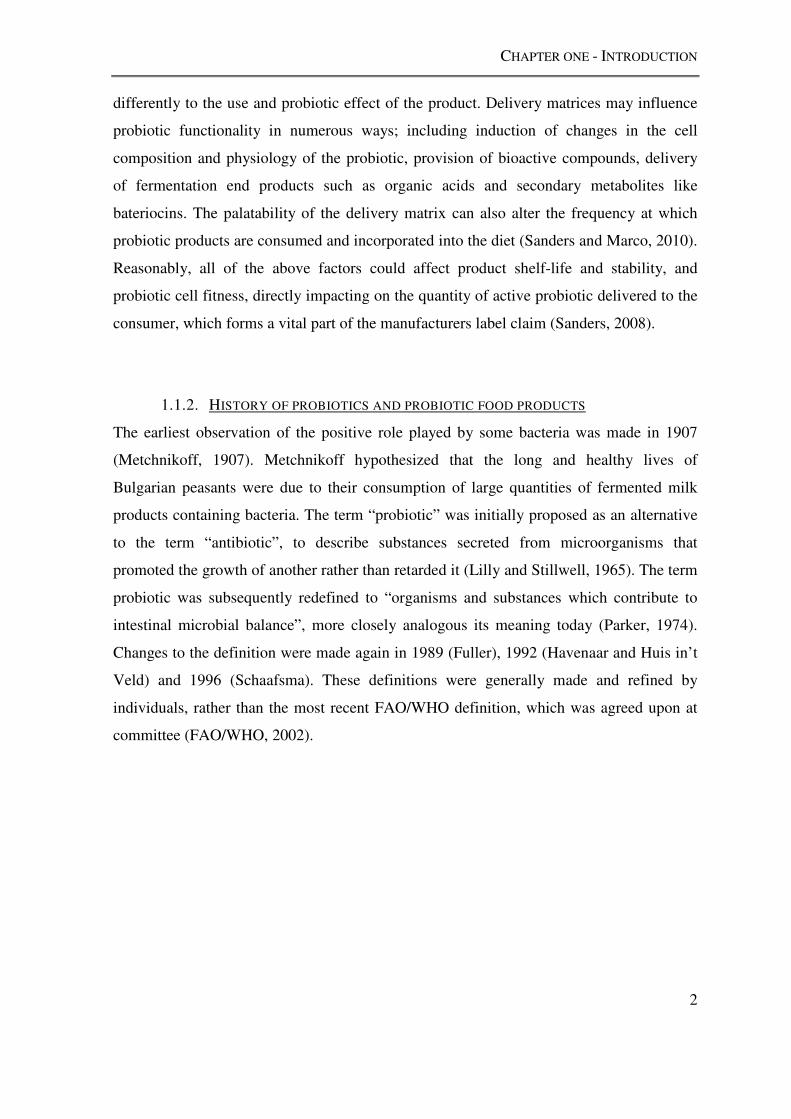
differently to the use and probiotic effect of the product. Delivery matrices may influence
probiotic functionality in numerous ways; including induction of changes in the cell
composition and physiology of the probiotic, provision of bioactive compounds, delivery
of fermentation end products such as organic acids and secondary metabolites like
bateriocins. The palatability of the delivery matrix can also alter the frequency at which
probiotic products are consumed and incorporated into the diet (Sanders and Marco, 2010).
Reasonably, all of the above factors could affect product shelf-life and stability, and
probiotic cell fitness, directly impacting on the quantity of active probiotic delivered to the
consumer, which forms a vital part of the manufacturers label claim (Sanders, 2008).
1.1.2. HISTORY OF PROBIOTICS AND PROBIOTIC FOOD PRODUCTS
The earliest observation of the positive role played by some bacteria was made in 1907
(Metchnikoff, 1907). Metchnikoff hypothesized that the long and healthy lives of
Bulgarian peasants were due to their consumption of large quantities of fermented milk
products containing bacteria. The term “probiotic” was initially proposed as an alternative
to the term “antibiotic”, to describe substances secreted from microorganisms that
promoted the growth of another rather than retarded it (Lilly and Stillwell, 1965). The term
probiotic was subsequently redefined to “organisms and substances which contribute to
intestinal microbial balance”, more closely analogous its meaning today (Parker, 1974).
Changes to the definition were made again in 1989 (Fuller), 1992 (Havenaar and Huis in’t
Veld) and 1996 (Schaafsma). These definitions were generally made and refined by
individuals, rather than the most recent FAO/WHO definition, which was agreed upon at
committee (FAO/WHO, 2002).
CHAPTER ONE - INTRODUCTION
3
1.1.3. COMMON PROBIOTICS AND THEIR SELECTION CRITERIA
The choice of organisms to administer as probiotic supplements is largely historical and
does not necessarily take into account the mode of therapeutic or prophylactic action of the
organism. The historical definition of an organism as probiotic is largely based on years of
administration to humans with no harmful side effects. Kopp-Hoolihan (2001) sets out a
range of criteria that should be met by probiotic organisms:
1. The ability to exert a beneficial effect on the host
2. The ability to survive transit through the gastrointestinal tract
3. The ability to adhere to the intestinal epithelial cell lining
4. The ability to produce antimicrobial substances towards pathogens
5. The ability to stabilise the intestinal microbiota
Probiotics added to food generally meet at least one of these criteria. There is also a
practical concern for companies that market probiotics, formulations must have a
reasonable shelf-life and maintain a consistent number of viable organisms during on-shelf
storage i.e. in between quality control checks and consumption. Table 1.1 lists organisms
that are commonly added to commercial probiotic formulations intended for human
consumption, and describes studies of their efficacy in vivo. The most widely used
probiotic organisms belong to the Lactic Acid Bacteria (LAB) (section 1.2). The genera
Lactobacillus and Bifidobacterium are the most extensively studied of the LAB.
CHAPTER ONE - INTRODUCTION
4
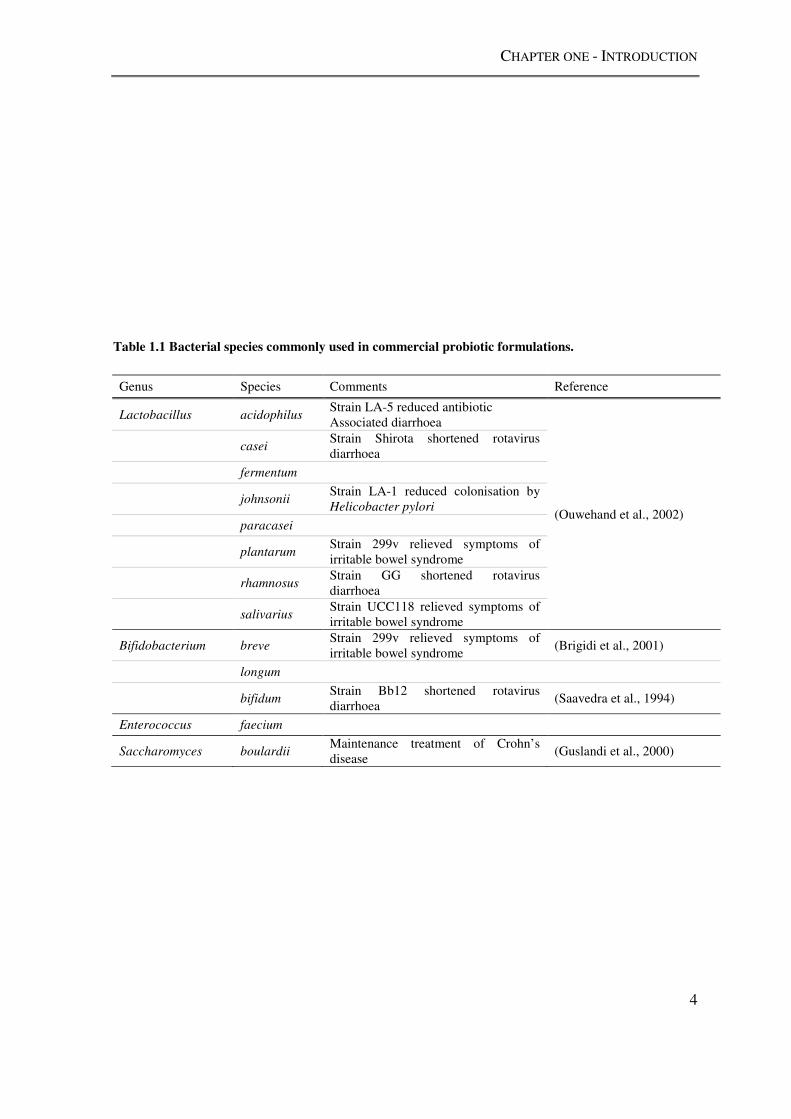
Table 1.1 Bacterial species commonly used in commercial probiotic formulations.
Genus Species Comments Reference
Lactobacillus acidophilus Strain LA-5 reduced antibiotic Associated diarrhoea
(Ouwehand et al., 2002)
casei Strain Shirota shortened rotavirus diarrhoea
fermentum
johnsonii Strain LA-1 reduced colonisation by Helicobacter pylori
paracasei
plantarum Strain 299v relieved symptoms of irritable bowel syndrome
rhamnosus Strain GG shortened rotavirus diarrhoea
salivarius Strain UCC118 relieved symptoms of irritable bowel syndrome
Bifidobacterium breve Strain 299v relieved symptoms of irritable bowel syndrome
(Brigidi et al., 2001)
longum
bifidum Strain Bb12 shortened rotavirus diarrhoea
(Saavedra et al., 1994)
Enterococcus faecium
Saccharomyces boulardii Maintenance treatment of Crohn’s disease
(Guslandi et al., 2000)
CHAPTER ONE - INTRODUCTION
5
1.1.4. MODE OF ACTION AND CLINICAL IMPLICATIONS OF PROBIOTICS
There are many products available that contain probiotic bacteria, although little in vivo
evidence exists to document the means by which probiotics confer a beneficial effect on
the host. Therapeutically, probiotics have been used to modulate immunity, lower
cholesterol, treat rheumatoid arthritis, prevent cancer, improve lactose intolerance, and
prevent or reduce the effects of atopic dermatitis, Crohn's disease, diarrhoea, and
constipation as well as candidiasis and urinary tract infections (UTI) (Reid, 1999).
The adherence of probiotic organisms to intestinal muscosal cells is observed in vitro
(Greene and Klaenhammer, 1994) and again, is considered to be a vital property of
probiotic organisms. Little however, is known about persistence times and processes
associated with probiotics in vitro, and this is set to remain the case until a gut model that
is suitably analogous to that of a human is developed. Adherence to intestinal cells may not
occur in vivo at efficiencies suggested by in vitro experimentation, as probiotic feeding
studies have shown short persistence times of Lactobacillus acidophilus administered
within a probiotic capsule (Mahenthiralingam et al., 2009), and their application is
certainly not followed by a high level of intestinal colonisation. Other health promoting
aspects of probiotics include: the suggested sequestration of low-density lipoproteins
(Taylor and Williams, 1998) implicated in increased risk of heart disease, improved lactose
digestion in lactose intolerant individuals (Sanders, 1993) and immune enhancement in
infants (Schiffrin et al., 1995).
The production of antimicrobial compounds is thought to be an important factor that
allows specifically Lactobacillus spp. to competitively exclude harmful or pathogenic
organisms from the human gut. The antimicrobial compounds produced by Lactobacillus
species in oxygen depleted environments, such as the human gut, include lactic acid,
diacetyl and β-hydroxypropionaldehyde. Also produced in vitro are bacteriocidal and
bacteriostatic peptides that have the ability to influence the growth of numerous organisms,
including members of the genus Lactobacillus (Sanders and Klaenhammer, 2001) and
other, less closely related foodbourne, disease-causing organisms (Gilliland and Speck,
CHAPTER ONE - INTRODUCTION
6
1977). The in vivo production of bacteriocins and bacteriostatic compounds and their
subsequent role in the gut is much more poorly documented.
CHAPTER ONE - INTRODUCTION
7
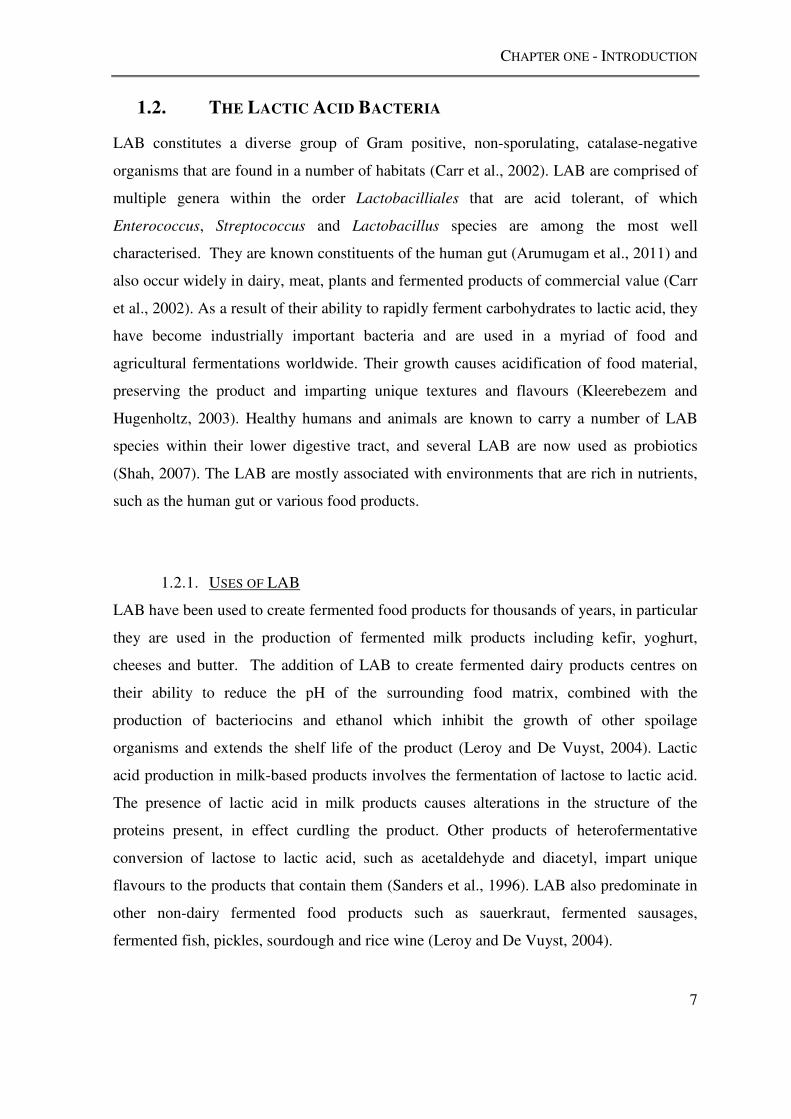
1.2. THE LACTIC ACID BACTERIA
LAB constitutes a diverse group of Gram positive, non-sporulating, catalase-negative
organisms that are found in a number of habitats (Carr et al., 2002). LAB are comprised of
multiple genera within the order Lactobacilliales that are acid tolerant, of which
Enterococcus, Streptococcus and Lactobacillus species are among the most well
characterised. They are known constituents of the human gut (Arumugam et al., 2011) and
also occur widely in dairy, meat, plants and fermented products of commercial value (Carr
et al., 2002). As a result of their ability to rapidly ferment carbohydrates to lactic acid, they
have become industrially important bacteria and are used in a myriad of food and
agricultural fermentations worldwide. Their growth causes acidification of food material,
preserving the product and imparting unique textures and flavours (Kleerebezem and
Hugenholtz, 2003). Healthy humans and animals are known to carry a number of LAB
species within their lower digestive tract, and several LAB are now used as probiotics
(Shah, 2007). The LAB are mostly associated with environments that are rich in nutrients,
such as the human gut or various food products.
1.2.1. USES OF LAB
LAB have been used to create fermented food products for thousands of years, in particular
they are used in the production of fermented milk products including kefir, yoghurt,
cheeses and butter. The addition of LAB to create fermented dairy products centres on
their ability to reduce the pH of the surrounding food matrix, combined with the
production of bacteriocins and ethanol which inhibit the growth of other spoilage
organisms and extends the shelf life of the product (Leroy and De Vuyst, 2004). Lactic
acid production in milk-based products involves the fermentation of lactose to lactic acid.
The presence of lactic acid in milk products causes alterations in the structure of the
proteins present, in effect curdling the product. Other products of heterofermentative
conversion of lactose to lactic acid, such as acetaldehyde and diacetyl, impart unique
flavours to the products that contain them (Sanders et al., 1996). LAB also predominate in
other non-dairy fermented food products such as sauerkraut, fermented sausages,
fermented fish, pickles, sourdough and rice wine (Leroy and De Vuyst, 2004).

CHAPTER ONE - INTRODUCTION
8
1.2.2. HISTORY AND TAXONOMY OF THE LACTOBACILLI
Lactobacillus is a highly heterogeneous genus, encompassing bacteria with a wide range of
biochemical and physiological properties (Felis and Dellaglio, 2007, Salvetti et al., 2012).
The genus Lactobacillus is the largest of those that belong to the LAB, with 185 species
validly described at the time of writing, and increasing substantially from 145 in 2008 as a
result of the reclassification of multiple species (Claesson et al., 2008, Euzéby, 1997).
From the initial description of the species Lactobacillus acidophilus in 1920 (Holland)
until around 1970, many Lactobacillus isolates from human mucosal surfaces were
collectively identified as L. acidophilus (Figure 1.1). The identification of isolates using
traditional phenotypic characteristics such as the fermentation of carbohydrates and
cellular morphology, combined with the lack of a robust taxonomical framework, had
historically led to such Lactobacillus isolates being incorrectly designated at the genus
level. The development of polyphasic taxonomic approaches and use of
molecular/genomic systematics has greatly improved the classification of Lactobacillus
species, and are a prerequisite characterisation step for probiotic lactobacilli marketed
commercially (Vankerckhoven et al., 2008).
Traditionally, the identification of lactobacilli has been mostly undertaken phenotypically,
based in the most part on the fermentation of carbohydrates, cellular morphology and
Gram staining (Tynkkynen et al., 1999). Key phenotypic characteristics of lactobacilli
include cells shaped as rods or coccobacilli, metabolism of carbohydrates by fermentation
and microaerophilic oxygen requirements. They are chemoorganotrophic, requiring rich
media for growth (Felis and Dellaglio, 2007). Phenotypic methods of identification are still
in use, but in more recent years the taxonomy of the Lactobacillus genus has changed,
based on the advent of genomic structure analysis and the further elucidation of
phylogenetic relationships between Lactobacillus species (Holzapfel et al., 2001). It is now
considered that the identification of some Lactobacillus species by biochemical methods
alone is not reliable (Schleifer et al., 1995).
CHAPTER ONE - INTRODUCTION
9
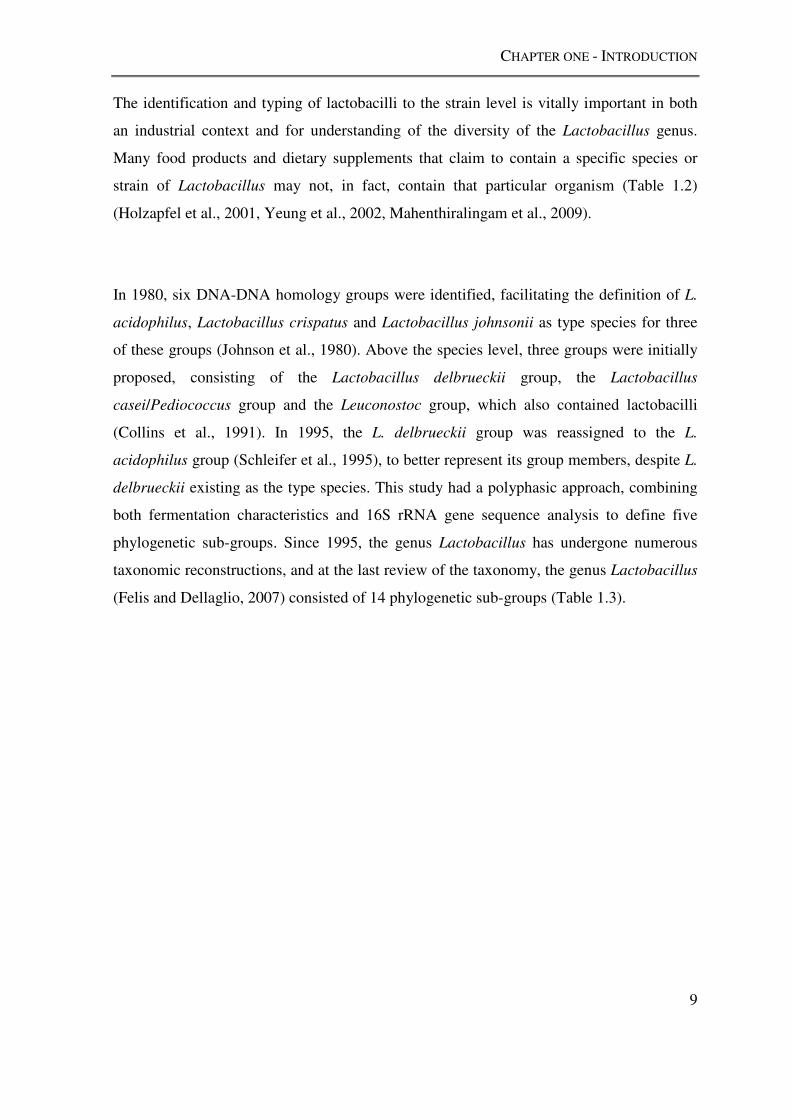
The identification and typing of lactobacilli to the strain level is vitally important in both
an industrial context and for understanding of the diversity of the Lactobacillus genus.
Many food products and dietary supplements that claim to contain a specific species or
strain of Lactobacillus may not, in fact, contain that particular organism (Table 1.2)
(Holzapfel et al., 2001, Yeung et al., 2002, Mahenthiralingam et al., 2009).
In 1980, six DNA-DNA homology groups were identified, facilitating the definition of L.
acidophilus, Lactobacillus crispatus and Lactobacillus johnsonii as type species for three
of these groups (Johnson et al., 1980). Above the species level, three groups were initially
proposed, consisting of the Lactobacillus delbrueckii group, the Lactobacillus
casei/Pediococcus group and the Leuconostoc group, which also contained lactobacilli
(Collins et al., 1991). In 1995, the L. delbrueckii group was reassigned to the L.
acidophilus group (Schleifer et al., 1995), to better represent its group members, despite L.
delbrueckii existing as the type species. This study had a polyphasic approach, combining
both fermentation characteristics and 16S rRNA gene sequence analysis to define five
phylogenetic sub-groups. Since 1995, the genus Lactobacillus has undergone numerous
taxonomic reconstructions, and at the last review of the taxonomy, the genus Lactobacillus
(Felis and Dellaglio, 2007) consisted of 14 phylogenetic sub-groups (Table 1.3).
CHAPTER ONE - INTRODUCTION
10
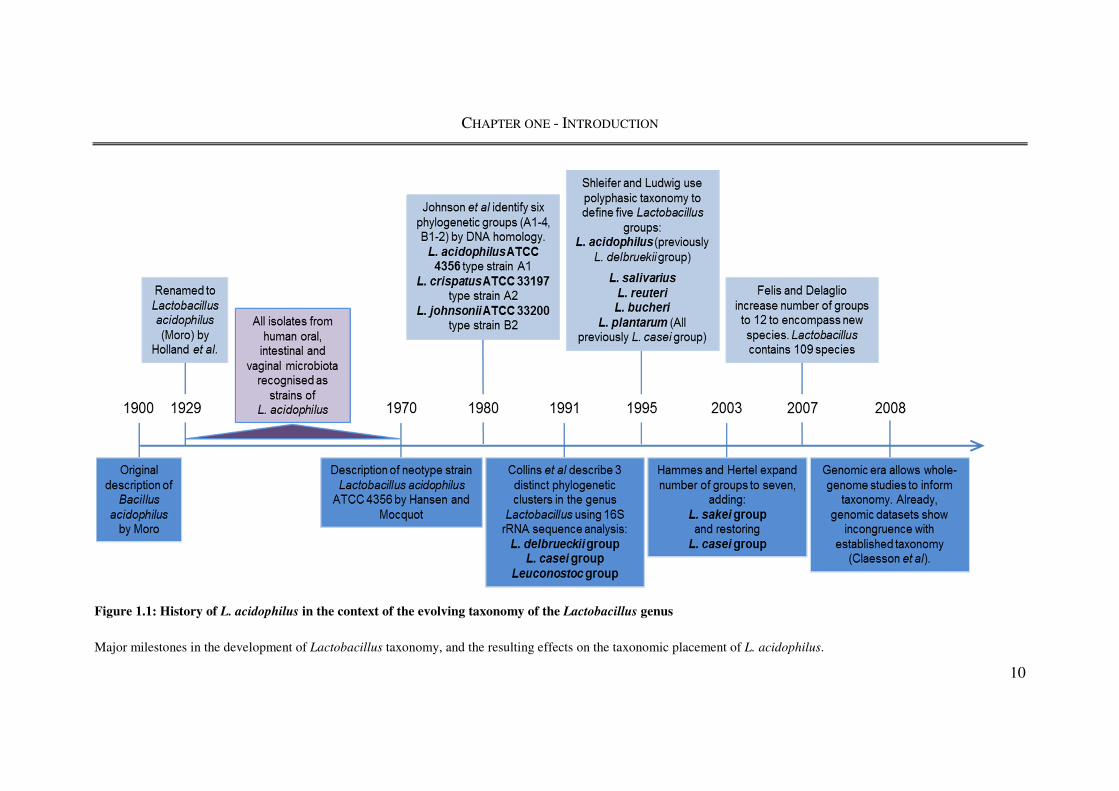
Figure 1.1: History of L. acidophilus in the context of the evolving taxonomy of the Lactobacillus genus
Major milestones in the development of Lactobacillus taxonomy, and the resulting effects on the taxonomic placement of L. acidophilus.
CHAPTER ONE - INTRODUCTION
11
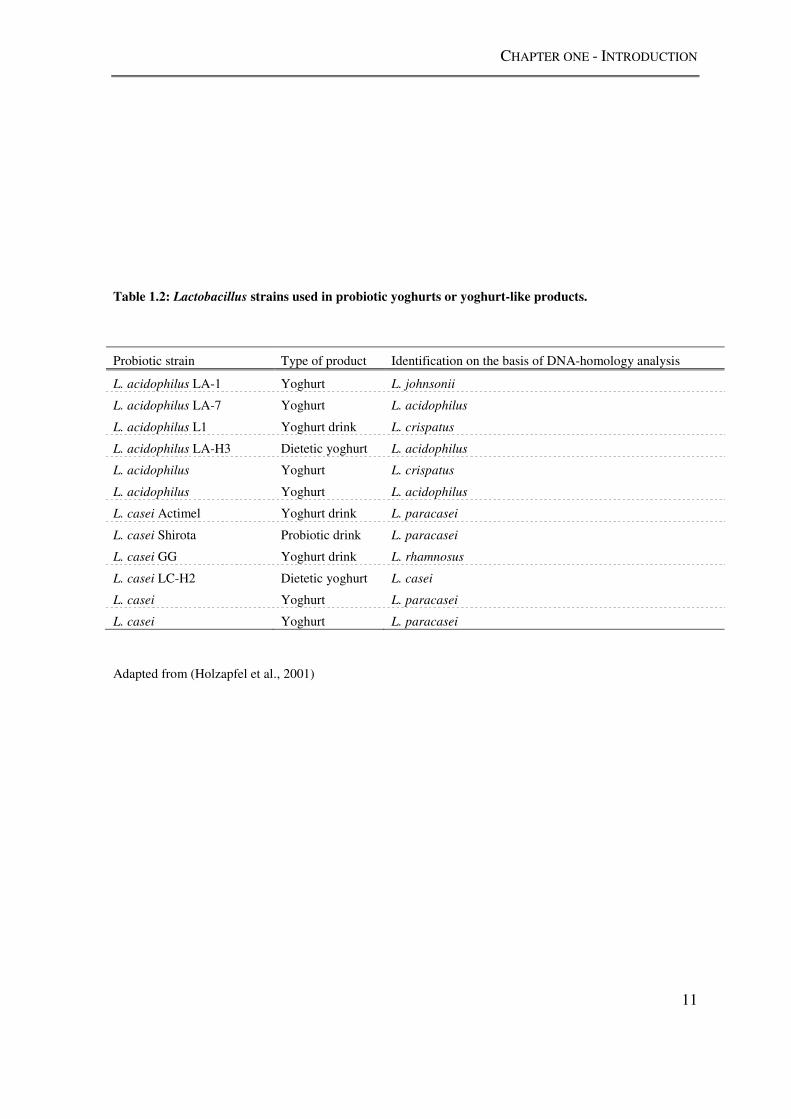
Table 1.2: Lactobacillus strains used in probiotic yoghurts or yoghurt-like products.
Adapted from (Holzapfel et al., 2001)
Probiotic strain Type of product Identification on the basis of DNA-homology analysis
L. acidophilus LA-1 Yoghurt L. johnsonii
L. acidophilus LA-7 Yoghurt L. acidophilus
L. acidophilus L1 Yoghurt drink L. crispatus
L. acidophilus LA-H3 Dietetic yoghurt L. acidophilus
L. acidophilus Yoghurt L. crispatus
L. acidophilus Yoghurt L. acidophilus
L. casei Actimel Yoghurt drink L. paracasei
L. casei Shirota Probiotic drink L. paracasei
L. casei GG Yoghurt drink L. rhamnosus
L. casei LC-H2 Dietetic yoghurt L. casei
L. casei Yoghurt L. paracasei
L. casei Yoghurt L. paracasei
CHAPTER ONE - INTRODUCTION
12
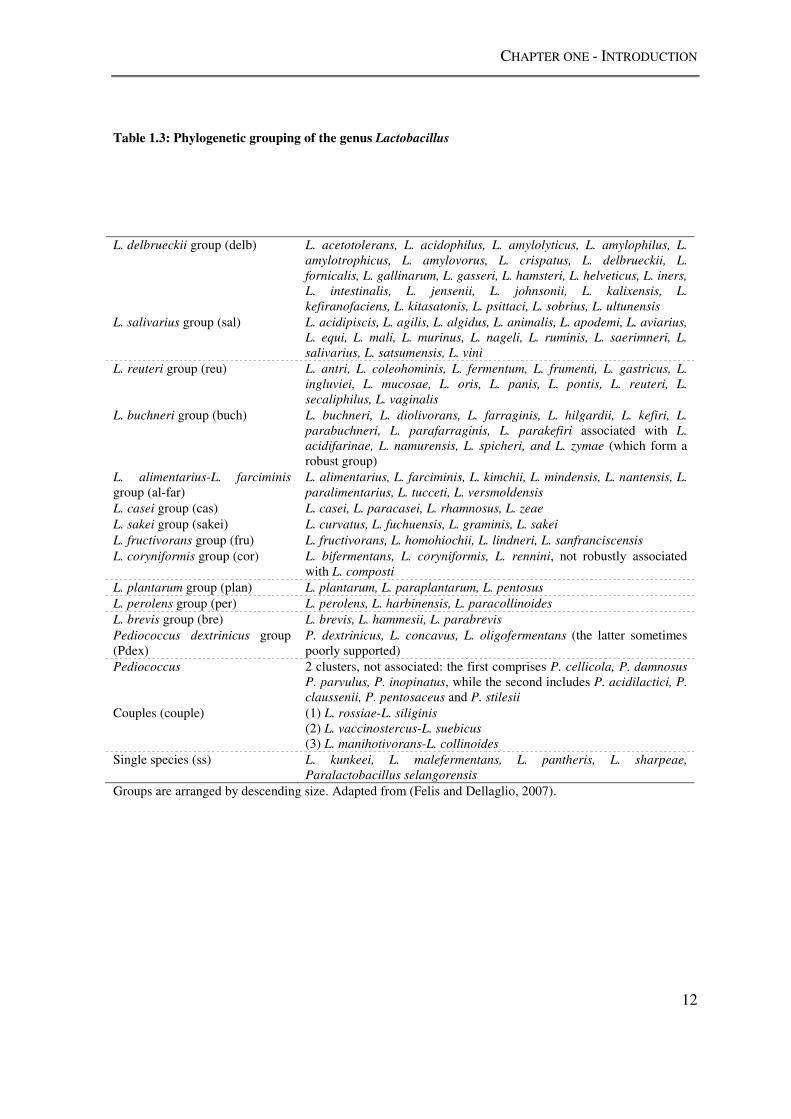
Table 1.3: Phylogenetic grouping of the genus Lactobacillus
Groups are arranged by descending size. Adapted from (Felis and Dellaglio, 2007).
L. delbrueckii group (delb) L. acetotolerans, L. acidophilus, L. amylolyticus, L. amylophilus, L.
amylotrophicus, L. amylovorus, L. crispatus, L. delbrueckii, L.
fornicalis, L. gallinarum, L. gasseri, L. hamsteri, L. helveticus, L. iners,
L. intestinalis, L. jensenii, L. johnsonii, L. kalixensis, L.
kefiranofaciens, L. kitasatonis, L. psittaci, L. sobrius, L. ultunensis
L. salivarius group (sal) L. acidipiscis, L. agilis, L. algidus, L. animalis, L. apodemi, L. aviarius,
L. equi, L. mali, L. murinus, L. nageli, L. ruminis, L. saerimneri, L.
salivarius, L. satsumensis, L. vini
L. reuteri group (reu) L. antri, L. coleohominis, L. fermentum, L. frumenti, L. gastricus, L.
ingluviei, L. mucosae, L. oris, L. panis, L. pontis, L. reuteri, L.
secaliphilus, L. vaginalis
L. buchneri group (buch) L. buchneri, L. diolivorans, L. farraginis, L. hilgardii, L. kefiri, L.
parabuchneri, L. parafarraginis, L. parakefiri associated with L.
acidifarinae, L. namurensis, L. spicheri, and L. zymae (which form a robust group)
L. alimentarius-L. farciminis group (al-far)
L. alimentarius, L. farciminis, L. kimchii, L. mindensis, L. nantensis, L.
paralimentarius, L. tucceti, L. versmoldensis
L. casei group (cas) L. casei, L. paracasei, L. rhamnosus, L. zeae
L. sakei group (sakei) L. curvatus, L. fuchuensis, L. graminis, L. sakei
L. fructivorans group (fru) L. fructivorans, L. homohiochii, L. lindneri, L. sanfranciscensis
L. coryniformis group (cor) L. bifermentans, L. coryniformis, L. rennini, not robustly associated with L. composti
L. plantarum group (plan) L. plantarum, L. paraplantarum, L. pentosus
L. perolens group (per) L. perolens, L. harbinensis, L. paracollinoides
L. brevis group (bre) L. brevis, L. hammesii, L. parabrevis
Pediococcus dextrinicus group (Pdex)
P. dextrinicus, L. concavus, L. oligofermentans (the latter sometimes poorly supported)
Pediococcus 2 clusters, not associated: the first comprises P. cellicola, P. damnosus
P. parvulus, P. inopinatus, while the second includes P. acidilactici, P.
claussenii, P. pentosaceus and P. stilesii Couples (couple) (1) L. rossiae-L. siliginis
(2) L. vaccinostercus-L. suebicus (3) L. manihotivorans-L. collinoides
Single species (ss) L. kunkeei, L. malefermentans, L. pantheris, L. sharpeae,
Paralactobacillus selangorensis
CHAPTER ONE - INTRODUCTION
13
The L. acidophilus group is one of the most well-defined and deep-branching
Lactobacillus phylogenetic sub-group (Figure 1.2). Although its definition is partially
based on DNA-DNA homology, the genomic GC content of constituent species ranges
from 32-50% (Felis and Dellaglio, 2007), which is much larger than normally accepted for
well-defined bacterial genera (Schleifer and Ludwig, 1995). The dawning of the post-
genomic era has now added more tools to the taxonomist’s toolkit, providing clarification
and as well as further insight into how the taxonomy of the most challenging and complex
bacterial groups can be resolved. Recent research into the relatedness of species in the L.
acidophilus group has used polyphasic taxonomy, combining traditional phenotypic
characteristics such as sugar fermentation patterns (Yeung et al., 2004), sequence analyses
of genes such as 16S rRNA, rpoA, pheS (Naser et al., 2007), groEL (Claesson et al., 2008),
tuf (Ventura et al., 2003) and DNA fingerprinting methods such as rep-PCR (Gevers et al.,
2001) and Pulsed-Field Gel Electrophoresis (PFGE) (Yeung et al., 2004). Despite highly
variable GC content, analyses have shown remarkable congruence with genome
microarrays and genomic sequence comparisons, indicating that the L. acidophilus
phylogenetic sub-group is a natural bacterial group. Genome sequencing now offers a
definitive means to identify Lactobacillus species and strains (Claesson et al., 2007,
Claesson et al., 2008, Salvetti et al., 2012, Bull et al., 2012).

CHAPTER ONE - INTRODUCTION
14
Figure 1.2: Phylogenetic placement of the L. acidophilus phylogenetic subgroup within the
Lactobacillus genus
A phylogenetic tree of aligned 16S rRNA gene sequences from type strains of the L. acidophilus
phylogenetic sub group (indicated with a brace) and representative type strains from the other Lactobacillus
phylogenetic sub groups. The tree was rooted with the 16S rRNA gene from Bacillus subtilis DSM10. The
genetic distance scale, bootstrap values and GenBank nucleotide accession numbers are indicated.
CHAPTER ONE - INTRODUCTION
15
1.3. LACTOBACILLUS ACIDOPHILUS
Lactobacillus acidophilus is a LAB species, widely recognised to have probiotic effects
and is the most commonly suggested organism for dietary use (Shah, 2007). It is
commonly added to yoghurt and fermented milk products, with approximately 80% of the
yoghurts produced in the United States in 2006 containing L. acidophilus (Sanders, 2003).
L. acidophilus isolates also form part of the natural human microbiota and have been
cultured from oral, digestive and vaginal tracts. By virtue of its widespread use in industry,
its probiotic effects and human association, L. acidophilus has become one of the most
well-studied LAB species. L. acidophilus was also the main focus of this PhD study as a
bacterial species used by the commercial sponsor of this work (see section 1.6). Key
research on L. acidophilus, spanning its original isolation from the human gut, through to
its genomic and molecular characterization (Figure 1.1) and its major genomic,
biosynthetic and probiotic characteristics (Figure 1.3) is summarised below.
1.3.1. L. ACIDOPHILUS STRAINS AND THEIR HISTORY
Within the L. acidophilus group, there are some 20 species additional to L. acidophilus
sensu stricto (Table 1.3). It is vital at this point to distinguish between the strain- and
species-level classifications of constituent isolates within this group. Much of the early
research into the L. acidophilus group blurs the lines between bacterial “strains” of the L.
acidophilus phylogenetic sub-group, which would now be considered as Lactobacillus
species that belong to the L. acidophilus group, and the present definition of a bacterial
strain, which is deemed to be a sub-species level taxonomic unit (Klein et al., 1998, Kullen
et al., 2000). Considerable research effort has contributed to the revisionary nature of
Lactobacillus taxonomy, which is important for correctly identifying phylogenetic
relationships between species, ensuring species are correctly represented by their type
strains, and grouping strains and species in a congruent manner. A lack of rigor and
historical understanding of the literature surrounding L. acidophilus taxonomy may have
also contributed to confusion in identifying the species and strains being studied. The
reassignment, for example, of a strain once belonging to L. acidophilus (Tuomola and
Salminen, 1998) to Lactobacillus johnsonii, as an entirely separate species (Pridmore et al.,
CHAPTER ONE - INTRODUCTION
16
2004), had sound systematic support, although some later studies have failed to adopt the
correct taxonomic nomenclature (Pimentel et al., 2012).

CHAPTER ONE - INTRODUCTION
17
Figure 1.3: Major genomic, biosynthetic and probiotic characteristics of L. acidophilus
Historically, L. acidophilus has been known for its probiotic effects in humans. Through further
characterisation of this effect, and the determination of the genome sequence of L. acidophilus NCFM, many
biosynthetic capabilities of L. acidophilus have been described.
CHAPTER ONE - INTRODUCTION
18
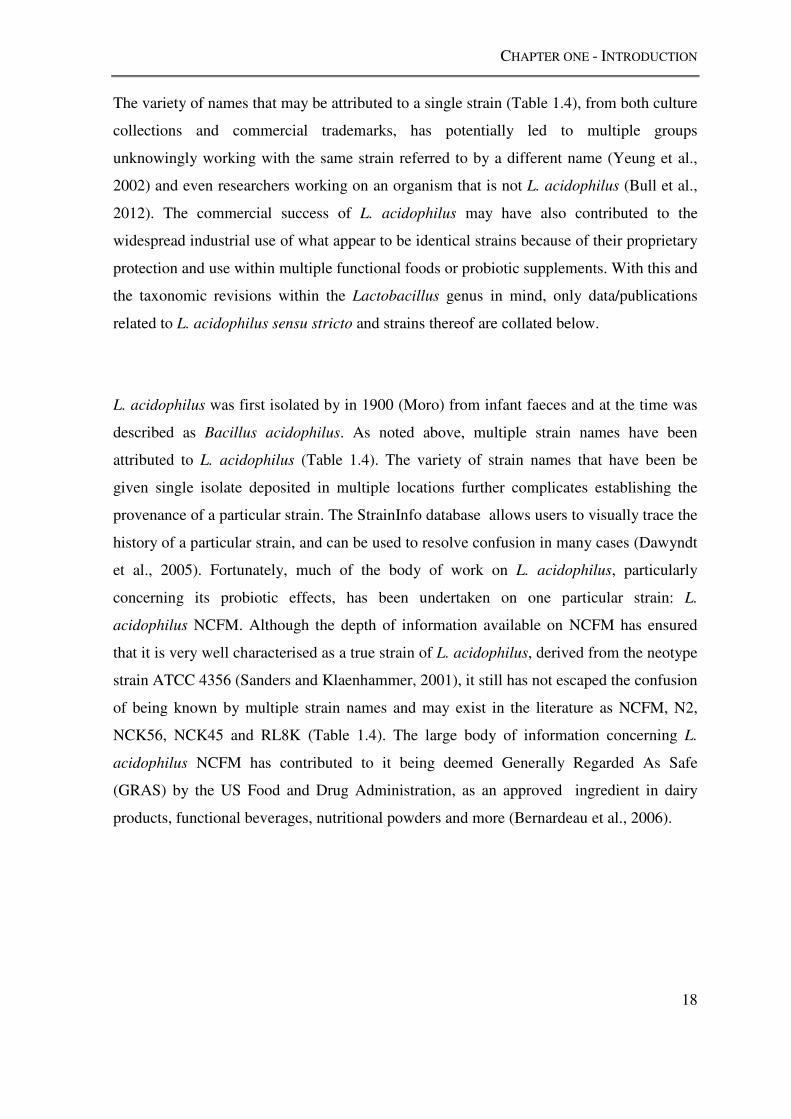
The variety of names that may be attributed to a single strain (Table 1.4), from both culture
collections and commercial trademarks, has potentially led to multiple groups
unknowingly working with the same strain referred to by a different name (Yeung et al.,
2002) and even researchers working on an organism that is not L. acidophilus (Bull et al.,
2012). The commercial success of L. acidophilus may have also contributed to the
widespread industrial use of what appear to be identical strains because of their proprietary
protection and use within multiple functional foods or probiotic supplements. With this and
the taxonomic revisions within the Lactobacillus genus in mind, only data/publications
related to L. acidophilus sensu stricto and strains thereof are collated below.
L. acidophilus was first isolated by in 1900 (Moro) from infant faeces and at the time was
described as Bacillus acidophilus. As noted above, multiple strain names have been
attributed to L. acidophilus (Table 1.4). The variety of strain names that have been be
given single isolate deposited in multiple locations further complicates establishing the
provenance of a particular strain. The StrainInfo database allows users to visually trace the
history of a particular strain, and can be used to resolve confusion in many cases (Dawyndt
et al., 2005). Fortunately, much of the body of work on L. acidophilus, particularly
concerning its probiotic effects, has been undertaken on one particular strain: L.
acidophilus NCFM. Although the depth of information available on NCFM has ensured
that it is very well characterised as a true strain of L. acidophilus, derived from the neotype
strain ATCC 4356 (Sanders and Klaenhammer, 2001), it still has not escaped the confusion
of being known by multiple strain names and may exist in the literature as NCFM, N2,
NCK56, NCK45 and RL8K (Table 1.4). The large body of information concerning L.
acidophilus NCFM has contributed to it being deemed Generally Regarded As Safe
(GRAS) by the US Food and Drug Administration, as an approved ingredient in dairy
products, functional beverages, nutritional powders and more (Bernardeau et al., 2006).
CHAPTER ONE - INTRODUCTION
19
Table 1.4: L. acidophilus isolates and their pseudonyms
a American Type Culture Collection, USA b Deutsche Sammlung von Mikroorganismen und Zellkulturen, Germany c Belgian Co-ordinated Collections of Micro-organisms, Belgium d National Collection of Industrial, Food and Marine Bacteria, UK
ATCCa DSMZb BCCM/LMGc NCIMBd Other Key Names Notes ATCC 314 LMG 11467
ATCC 832 LMG 11428 NCIMB 1723
ATCC 4355 LMG 11469
ATCC 4356 T
DSM 20079 T
LMG 13550 T LMG 7943 T LMG 8150 T LMG 9433 T
NCIMB 701748 T NCIMB 8690 T
NCFB 1748 T NCTC 12980 T
Neotype strain (Hansen & Mocquot, 1970)
ATCC 4357 DSM 20242 LMG 11430 NCIMB 8607
LMG 13003
ATCC 4796 LMG 11470 Draft genome sequence (Human Microbiome Project) (Turnbaugh,
et al., 2007)
ATCC 9224
LMG 11429 LMG 11472 LMG 19170
NCIMB 8116
ATCC 13651 DSM 9126 LMG 11466 NCIMB 701360
ATCC 700396
NCFM, N2, NCK56, NCK45, RL8K
Derived from ATCC 4356 T (Sanders & Klaenhammer, 2001) Genome sequence (Altermann, et al., 2005)

CHAPTER ONE - INTRODUCTION
20
1.3.2. BASIC FEATURES OF L. ACIDOPHILUS
L. acidophilus is a short (2–10 µm) Gram-positive rod that grows optimally from 37°C to
42°C (Altermann et al., 2005) and is able to grow at temperatures as high as 45°C. The
species achieves its highest growth rates in slightly acidic media of pH 5.5-6.0, and growth
ceases below pH 4.0 (Shah, 2007). It is an obligate homofermenter producing lactic acid
from fermentation of carbohydrates and is among the least oxygen tolerant lactobacilli
(Archibald and Fridovich, 1981, Claesson et al., 2007).
From examination of the biosynthetic pathways encoded within its genome, L. acidophilus
is auxotrophic for 14 amino acids and seems unable to synthesise multiple cofactors and
vitamins including riboflavin, vitamin B6, nicotinate, nicotinamide, biotin, and folate
(Altermann et al., 2005). These deficits in anabolic capacity are exemplified by the need to
use nutrient rich media such as deMan, Rogosa and Sharpe (MRS) agar (de Man et al.,
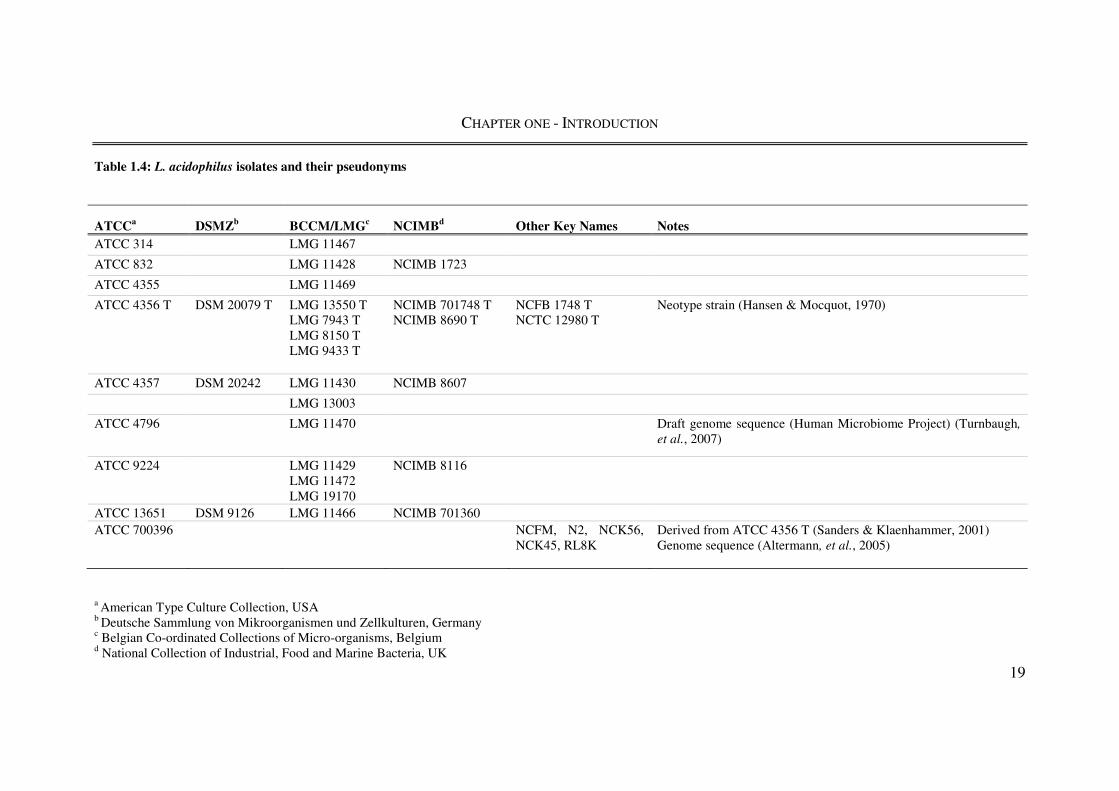
1960, Morishita et al., 1981) for its routine culture. L. acidophilus forms at least two
colony morphotypes when grown under standard culture conditions on MRS agar, referred
to as rough and smooth colonies (Figure 1.4). The proportion of rough to smooth colony
morphotypes exhibited by L. acidophilus is influenced by the exposure to antibiotics such
as Penicillin G (Khaleghi et al., 2011) or bile (Khaleghi et al., 2010), which causes a dose-
dependent proportional shift towards the smooth morphotype.
CHAPTER ONE - INTRODUCTION
21
Figure 1.4: Colony morphotypes of L. acidophilus
Panel A shows the “rough” colony morphotype, panel B the smooth colony morphotype at 25x magnification
on MRS agar after 24h incubation at 37°C
CHAPTER ONE - INTRODUCTION
22
Although L. acidophilus has been isolated from multiple human-associated sources (Ahrné
et al., 1998, Kulp and Rettger, 1924, Rogosa and Sharpe, 1960) recent phylogenomic
characterization by Claesson et al (2008) established that the most likely environmental
niche of L. acidophilus was the GI tract, with other lactobacilli broadly inhabiting plants
and meat. The neotype L. acidophilus strain ATCC 4356 was described as isolated from
the human microbiota, although the records do not give the precise bodily location from
where it was isolated.
Metagenomic studies indicate that lactobacilli may compose just 0.2-1% of the total
microbiota in the human colon and faeces and also show that their prevalence is highly
variable between individuals (Kleerebezem and Vaughan, 2009, Walter, 2008). This
suggests that L. acidophilus may be just a small and variable fraction of this small carriage
of the genus. Culture-independent studies from other hosts also show wide variations in the
prevalence of this LAB species. For example L. acidophilus was present as the most
abundant member of the lactobacilli in broiler chickens (Lu et al., 2003), while in contrast,
a total absence of L. acidophilus was found in pigs (Leser et al., 2002). Culture-dependent
techniques suggest that the lactobacilli in pigs are largely comprised of the L. acidophilus
group, although no L. acidophilus species were isolated (Korhonen et al., 2007). Overall,
gut carriage of L. acidophilus appears highly variable.
1.3.2.1. Colony-based strain typing and tracking of L. acidophilus in
the human gut
Human gut passage of L. acidophilus has been modelled in a probiotic capsule feeding
study (Mahenthiralingam et al., 2009). Participants were pre-screened for faecal presence
of L. acidophilus using culture-based methods in tandem with DNA fingerprinting to
identify the Lactobacillus strain being administered. Three of the 12 participants were
found to be culture positive for L. acidophilus prior to probiotic feeding, indicating faecal
carriage of L. acidophilus in humans is not universal (Mahenthiralingam et al., 2009).
After feeding (5.6 x 10⁹ viable bacteria per capsule, taken daily), the administered L.
acidophilus strain was detected in 10 out of the 12 subjects, reaching cultivatable levels as
CHAPTER ONE - INTRODUCTION
23
high as 1 x 10⁷ colony forming units per gram of faeces in 3 of the volunteers
(Mahenthiralingam et al., 2009). Longterm carriage of L. acidophilus for 28 days post-
feeding was detected in 3 subjects, who notably did not culture L. acidophilus before
feeding. Overall, these results suggest that dietary intake is a major influence on the human
carriage of L. acidophilus.
1.3.3. GENOMICS OF L. ACIDOPHILUS
The genome sequence of L. acidophilus NCFM was the third of the Lactobacillus genomes
to be published, behind Lactobacillus plantarum WCFS1 (Kleerebezem et al., 2003) and L.
johnsonii NCC 533 (Pridmore et al., 2004); it was the first genome sequence from an L.
acidophilus phylogenetic sub-group species (Table 1.5). In silico analyses of the L.
acidophilus NCFM shows it is able to synthesise only a limited number of amino acids
(cysteine, serine, and aspartate) and to compensate its genome is enriched in genes coding
for amino acid transport and fermentative functions (Altermann et al., 2005).
Prophages and horizontally transferred elements are common features of LAB genomes
(Foschino et al., 2001). In silico analysis of the L. acidophilus NCFM genome did not
uncover any complete prophages, but three regions constructed from remnants of prophage
were discovered due to their constituent ORFs showing homology to phage genes. These
three regions were designated as Potential Autonomous Units (PAU) 1-3. All are present
within the first 500 ORF of the genome and consist of a core of seven ORF. Further
analysis in silico predicted a core consisting of an integrase, IntG, a replication protein,
RepA, and a DNA segregation ATPase, FtsK, involved in DNA partitioning. The study
suggests that PAU3 either evolved in a different organism and was acquired later or was
the most ancient integration event into the chromosome. The study also suggested that due
to the high degree of similarity between RepA, FtsK, and the two hypothetical proteins
flanking FtsK between PAU1 and PAU2 suggested a more recent duplication of PAU1,
resulting in PAU2.
CHAPTER ONE - INTRODUCTION
24
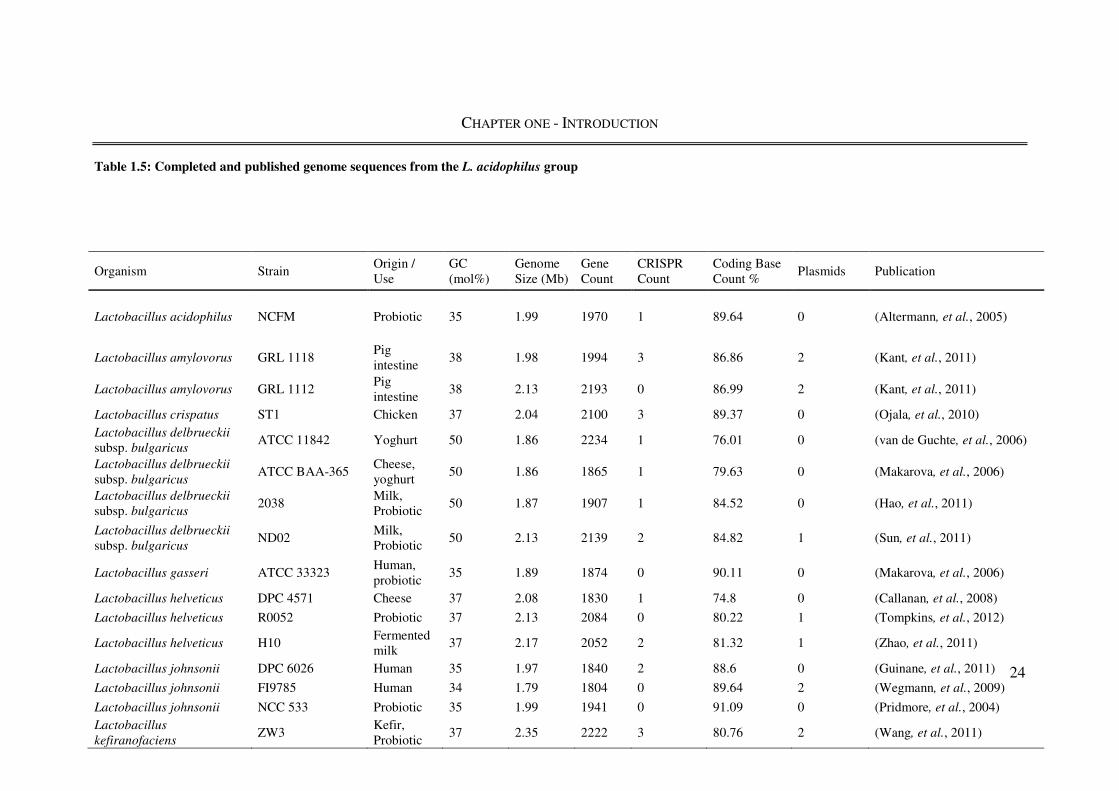
Table 1.5: Completed and published genome sequences from the L. acidophilus group
Organism Strain Origin / Use
GC (mol%)
Genome Size (Mb)
Gene Count
CRISPR Count
Coding Base Count %
Plasmids Publication
Lactobacillus acidophilus NCFM Probiotic 35 1.99 1970 1 89.64 0 (Altermann, et al., 2005)
Lactobacillus amylovorus GRL 1118 Pig intestine
38 1.98 1994 3 86.86 2 (Kant, et al., 2011)
Lactobacillus amylovorus GRL 1112 Pig intestine
38 2.13 2193 0 86.99 2 (Kant, et al., 2011)
Lactobacillus crispatus ST1 Chicken 37 2.04 2100 3 89.37 0 (Ojala, et al., 2010)
Lactobacillus delbrueckii
subsp. bulgaricus ATCC 11842 Yoghurt 50 1.86 2234 1 76.01 0 (van de Guchte, et al., 2006)
Lactobacillus delbrueckii
subsp. bulgaricus ATCC BAA-365
Cheese, yoghurt
50 1.86 1865 1 79.63 0 (Makarova, et al., 2006)
Lactobacillus delbrueckii
subsp. bulgaricus 2038
Milk, Probiotic
50 1.87 1907 1 84.52 0 (Hao, et al., 2011)
Lactobacillus delbrueckii
subsp. bulgaricus ND02
Milk, Probiotic
50 2.13 2139 2 84.82 1 (Sun, et al., 2011)
Lactobacillus gasseri ATCC 33323 Human, probiotic
35 1.89 1874 0 90.11 0 (Makarova, et al., 2006)
Lactobacillus helveticus DPC 4571 Cheese 37 2.08 1830 1 74.8 0 (Callanan, et al., 2008)
Lactobacillus helveticus R0052 Probiotic 37 2.13 2084 0 80.22 1 (Tompkins, et al., 2012)
Lactobacillus helveticus H10 Fermented milk
37 2.17 2052 2 81.32 1 (Zhao, et al., 2011)
Lactobacillus johnsonii DPC 6026 Human 35 1.97 1840 2 88.6 0 (Guinane, et al., 2011)
Lactobacillus johnsonii FI9785 Human 34 1.79 1804 0 89.64 2 (Wegmann, et al., 2009)
Lactobacillus johnsonii NCC 533 Probiotic 35 1.99 1941 0 91.09 0 (Pridmore, et al., 2004)
Lactobacillus
kefiranofaciens ZW3
Kefir, Probiotic
37 2.35 2222 3 80.76 2 (Wang, et al., 2011)
CHAPTER ONE - INTRODUCTION
25
The amino acid biosynthetic capability of L. acidophilus NCFM is limited, with only
cysteine, serine and aspartate capable of being synthesised de novo. Subsequently seven
derivatives may be synthesised from these three. There were no predicted biosynthesis
pathways (de novo or by conversion) for the remaining amino acids. This restricted
biosynthesis capability is mirrored by the inability of L. acidophilus NCFM to synthesise
most vitamins and cofactors. This degree of auxotrophy is likely influenced by the nutrient
rich environments in which L. acidophilus inhabits (e.g. the human gut) and is reflected by
its demanding nutrient requirements when grown on synthetic media (Morishita et al.,
1981).
The comparatively small (1,993,564 bp) genome of L. acidophilus has a low (35%)
average GC content, compared to other members of the L. acidophilus phylogenetic sub-
group (mean GC content = 40%), which have an upper range of 50% GC (L. delbrueckii
subsp. bulgaricus). The GC content of the L. acidophilus genome rises to 50% in the four
regions containing rRNA genes as expected (Altermann et al., 2005). Other than GC
content, basic genomic attributes such as size and gene content do not vary significantly
from other member of the L. acidophilus group. Plasmids are also common features of
members of the L. acidophilus group, present in seven of the 16 strains detailed in Table
1.5. Their distribution is heterogeneous, with multiple strains of some species with the
same number of plasmids (L. amylovorus), some species showing strains with and without
plasmids (L. johnsonii and L. helveticus) and others showing no evidence of plasmids at all
(L. acidophilus and L. gasseri). Despite the lack of L. acidophilus NCFM and L. johnsonii
NCC533 plasmids, a recent study examining phylogenetic trees of 401 proteins identified
Horizontal Gene Transfer (HGT) of up to 40% of the core genome genes between the two
species, causing an unprecedented level of phylogenetic incongruence (Nicolas et al.,
2007).
CHAPTER ONE - INTRODUCTION
26
1.3.4. FOOD AND INDUSTRIAL USE OF L. ACIDOPHILUS
L. acidophilus is a major commercial LAB species, present in products including milk,
yoghurt and toddler formula, as well as in dietary supplements with reported probiotic
effects (Altermann et al., 2005, Sanders and Klaenhammer, 2001). It is part of many
undefined starter cultures for milk fermentation, a preservation process that was developed
in the Early Neolithic era and has been used in the production of traditional fermented
foods for more than 10,000 years (Tamime, 2002). Its slow growth in milk (Azcarate-Peril
et al., 2009) means that most of the fermentation in fermented milk products is achieved
with a yoghurt starter culture (e.g. Lactobacillus delbrueckii subsp. bulgaricus and
Streptococcus thermophilus) and then L. acidophilus is subsequently added for additional
probiotic value (Shah, 2000) in functional milk products.
1.3.5. PROBIOTIC STRAINS OF L. ACIDOPHILUS
Probiotic bacterial strains are commonly mislabelled or unlabelled in products, often due to
the difficulties in discerning both species and strains of Lactobacillus (Yeung et al., 2002).
The primary commercial probiotic strains of L. acidophilus are described by Shah (2007)
and include L. acidophilus LA-1 and LA-5 (Chr. Hansen, Denmark), NCFM (Dansico,
Madison, US), DDS-1 (Nebraska Cultures, Nebraska, US) and SBT-2026 (Snow Brand
Milk Products, Tokyo, Japan). L. acidophilus NCFM was developed as a major
commercial strain, has identical fermentation and growth characteristics to the type strain
ATCC 4356T and is also closely related in PFGE profile (Sanders and Klaenhammer,
2001). Although similar information regarding the derivation of L. acidophilus LA-5 is
limited, L. acidophilus isolated from products claimed to contain L. acidophilus LA-5
produced DNA fingerprints with a high degree of similarity (91.9%) to the type strain L.
acidophilus ATCC 4356 by Randomly Amplified Polymorphic DNA (RAPD) fingerprint
analysis (Schillinger et al., 2003). L. acidophilus LA-1 is no longer available as a product
from Chr. Hansen . A wealth of research dedicated to “L. acidophilus La1” a commercial
strain marketed by Nestlé may also be found in the published literature (Link-Amster et al.,

CHAPTER ONE - INTRODUCTION
27
1994). However, this strain has subsequently been taxonomically reassigned to L. johnsonii
and has a genome sequence available as L. johnsonii NCC 533 (Pridmore et al., 2004).
Comparative information on the differences in probiotic effect between each commercial
strain is not available, however, it is recognised, that different Lactobacillus species may
display similar probiotic effects in vitro, yet have markedly divergent properties when
assessed in vivo (Ibnou-Zekri et al., 2003).
1.3.6. PROBIOTIC CHARACTERISTICS AND PHYSIOLOGY
The probiotic effects of L. acidophilus NCFM are well characterised, aided recently by the
availability of its genome sequence and the necessity of in-depth characterisation for
application for GRAS status. Although a genome sequence is not available, L. acidophilus
LA-5 is similarly characterised for patent claim information. The characterisation of
probiotic strains may be broadly divided into two categories. The first is desirable probiotic
physiology demonstrable in vitro such as stability in products (Shah, 2000), resistance to
bile (Khaleghi et al., 2010, Pfeiler et al., 2007, Pfeiler and Klaenhammer, 2009) and
tolerance to low pH (Azcarate-Peril et al., 2004, Azcarate-Peril et al., 2005), adherence to
human enterocytes in cell culture (Buck et al., 2005), antimicrobial production (Sanders
and Klaenhammer, 2001, Tabasco et al., 2009) and lactase activity (Sanders et al., 1996).
The second category encompasses the gross probiotic effect observable in the context of
feeding studies such as mediation of host immune response (Bron et al., 2012), lowering
host serum cholesterol (Shah, 2007), improving host lactose metabolism (Gilliland, 1989)
and preventing or treating infection (Wang et al., 2004). Several recent feeding trails have
also shown that consumption of probiotic products containing L. acidophilus NCFM in
combination with Bifidobacterium species can produce health benefits in the hose, the
“gold-standard” for a probiotic label claim. For example, they reduce bloating in adults
with functional bowel disorders (Ringel-Kulka et al., 2011) and suppress cold and
influenza-like symptoms in children (Leyer et al., 2009).
CHAPTER ONE - INTRODUCTION
28
Analysis of the L. acidophilus NCFM genome sequence has directly facilitated the
functional characterisation of its ability to tolerate exposure to both low pH and bile,
important factors for a probiotic organism that must pass through the gastrointestinal tract.
Functional microarray experiments with L. acidophilus NCFM showed upregulation of
transcripts from three transporter genes (two major facilitator [MFC] superfamily and the
permease component of an ABC transporter) in the presence of bile (Pfeiler et al., 2007).
Similar transporters had previously been shown in other species to be involved in bile
efflux from the cell (Solheim et al., 2007). Furthermore, a study that generated deletion
mutants lacking these three transporter genes showed a significant decrease in their ability
to survive in bile (Pfeiler and Klaenhammer, 2009). L. acidophilus NCFM is also able to
survive exposure to pH 3.0 for 5 hours with no loss of viability (Azcarate-Peril et al.,
2004), with a two component regulatory system, similar to the lisRK system in Listeria
monocytogenes, implicated in its ability to sense and react to changes in extracellular pH.
L. acidophilus is able to utilise a variety of carbon sources for growth (Sanders and
Klaenhammer, 2001, Yeung et al., 2004), but a comprehensive understanding of the
mechanisms behind the uptake and metabolism of carbon sources has not yet been
achieved. A study describing several genetic loci responsible for carbohydrate metabolism
again demonstrated the utility of the L. acidophilus complete genome sequence (Barrangou
et al., 2006). Several classes of transporter (ATP-binding cassette, phosphoenol-pyruvate
phosphotransferase system and galatoside pentose hexuronide permease) were found to be
induced in the presence of their respective substrates but repressed in the presence glucose,
suggesting that carbohydrate metabolism in L. acidophilus is strongly regulated by
catabolite repression. The strong link between carbohydrate source and regulation of sugar
uptake and metabolism genes likely contributes to the competitive ability of L. acidophilus
in the human gastrointestinal tract. The metabolism of these complex carbohydrates also
provides a function that is not present in humans and other microbiota, potentially
enriching the growth of L. acidophilus and other probiotic LAB in the human
gastrointestinal tract (Zhu et al., 2009).
CHAPTER ONE - INTRODUCTION
29
Studies have demonstrated the ability of L. acidophilus to adhere to human Caco-2
enterocytes in vitro. An analysis of the adhesion factors involved in L. acidophilus NCFM-
Caco-2 epithelial cell interaction found significant involvement of S-layer proteins, linked
to the gene slpA, fibronectin binding protein (FbpA) and mucin binding protein (Mub)
(Buck et al., 2005). Alhtough these in vitro results suggest that L. acidophilus can colonise
the gastrointestinal tract, the low dominance seen in metagenomic studies (Kleerebezem
and Vaughan, 2009, Walter, 2008), and the lack of persistence seen in probiotic feeding
studies (Mahenthiralingam et al., 2009), indicates that L. acidophilus may not have
primarily evolved as a human gastrointestinal tract organism.
One genomic feature that does vary considerably across Lactobacillus genomes are
clustered regularly spaced short palindromic repeat (CRISPR) regions. CRISPRs were
first described in LAB (Bolotin et al., 2004), are commonly identified in Lactobacillus
genomes from the L. acidophilus phylogenetic subgroup (Table 1.5) and beyond, with
approximately half (26/53) of the sequenced Lactobacillus genomes possessing CRISPR
regions, as identified by BlastP (Koonin and Makarova, 2009). The L. acidophilus NCFM
CRISPR region has features characteristic of these regions, being approximately 1.5 kb in
size and composed of 32 near-perfect 29 base repeats, interspersed with unique 32 base
spacer DNAs (Altermann et al., 2005). No physiological function was attributed to
CRISPR regions at the time of the NCFM genome publication (Altermann et al., 2005),
however subsequent observations that the unique CRISPR spacer sequences were almost
identical to fragments of virus and plasmid genes led to the hypothesis that CRISPR
regions may be involved in defence against selfish DNA elements (Makarova et al., 2011).
This has been validated by the demonstration that a short phage-like sequence inserted into
the CRISPR locus of Streptococcus thermophilus conferred resistance against its cognate
phage (Barrangou et al., 2007).
Prophages and phage interactions are commonly encountered in both the study of LAB
genomics and the large scale manufacture of fermented products by LAB (Mahony et al.,
2012), where as a result of the economic implications of a large-scale phage contamination
CHAPTER ONE - INTRODUCTION
30
in dairy fermentations, many LAB phages have been well characterised (Brüssow, 2001).
The genome sequence of L. acidophilus NCFM revealed evidence of three isolated phage
remnants, or Potential Autonomous Units (PAUs) designated PauLA-I-III. Each PAU is
composed of seven core ORFs, with synteny and ORF size highly conserved between
PauLA-I and PauLA-II, with PauLA-III lacking a single ORF of hypothetical function. The
high degree of similarity between PauLA-I and PauLA-II suggests that these may have
been formed following a duplication event, and PauLA-III was evolved in a different
organism and was integrated at a different time to the progenitor or PauLA-I and PauLA-II
(Altermann et al., 2005). Interestingly, there is an absence of literature on functional
bacteriophages capable of infecting strains of L. acidophilus sensu stricto compared to
other members of L. acidophilus phylogenetic sub-group.
1.3.7. L. ACIDOPHILUS: SUMMARY AND PERSPECTIVE
L. acidophilus is an important commercial bacterium with a long history that plays a
pivotal role in the characterisation of the genus Lactobacillus. However, given the highly
progressive nature of Lactobacillus taxonomy, L. acidophilus as a species has struggled
with being misidentified and misrepresented in its past characterisation. Given the
increased regulatory criteria being placed on the definition and sale of microbial species as
probiotics, L. acidophilus strain NCFM has emerged as one of the most well characterized
probiotics within this species. However, for other areas of study such as the investigation
of environmental niches or microbial composition of fermented foods, care should be taken
to clearly identify if L. acidophilus sensu stricto strains are present, and going forward it
will be important to clarify data provided for both (i) the species level Lactobacillus
identification, by ensuring new publications are not made with references to old taxonomic
names, and (ii) the strain level identification of L. acidophilus, by conducting comparisons
to well characterised control strains. Ensuring that these parameters are clearly defined for
L. acidophilus will overcome problems with the multiple strain names used for the same
original “isolate” greatly improve our understanding of this biotechnologically important
Lactobacillus species.
CHAPTER ONE - INTRODUCTION
31
1.4. THE GENUS BIFIDOBACTERIUM
All members of the genus Bifidobacterium are non-motile, non-sporulating, non-gas-
producing and catalase-negative (except Bifidobacterium indicum and Bifidobacterium
asteroids) members of the Actinomycetales branch of the high–G+C Gram-positive
bacteria. Generally, Bifidobacteria are anaerobic, although some species can tolerate
oxygen (Ventura et al., 2004). All species described so far are grouped in six different
ecological niches: the human intestine, oral cavity, the animal gastrointestinal tract (GIT),
the insect intestine and sewage, although a faecal contamination event may have caused the
rare latter case (De Dea Lindner et al., 2007).
1.4.1. TAXONOMY AND IDENTIFICATION
Bifidobacteria were first isolated from faeces of a breast-fed infant in 1899 (Tissier, 1900),
were named Bacillus bifidus. Their morphological and physiological features however,
which are similar to those of lactobacilli, meant that they were classified as members of the
genus Lactobacillus for a large part of the 20th century have only been recognized as a
different genus relatively recently. The majority of today’s species were originally isolated
from mammalian GITs (Schell et al., 2002). There are now 38 validly described species
belonging to the Bifidobacterium genus, with four taxa (Bifidobacterium animalis,
Bifidobacterium longum, Bifidobacterium pseudolongum and Bifidobacterium
thermacidophilum) further divided into subspecies, all of which display greater than 93%
identity of their 16S rRNA gene sequences (Miyake et al., 1998) (Figure 1.5).
Traditional identification and typing of bifidobacteria was similar to lactobacilli, with the
methods relying on examining phenotypic characteristics to differentiate species.
Enzymatic and carbohydrate acidification profiles were instrumental in characterising new
isolates and redefining clusters of species (Bahaka et al., 1993). These carbohydrate
fermentation patterns have been shown to be more related to strains than species however
(Roy and Ward, 1990, Roy et al., 1996), and more appropriate methods have since been
applied.
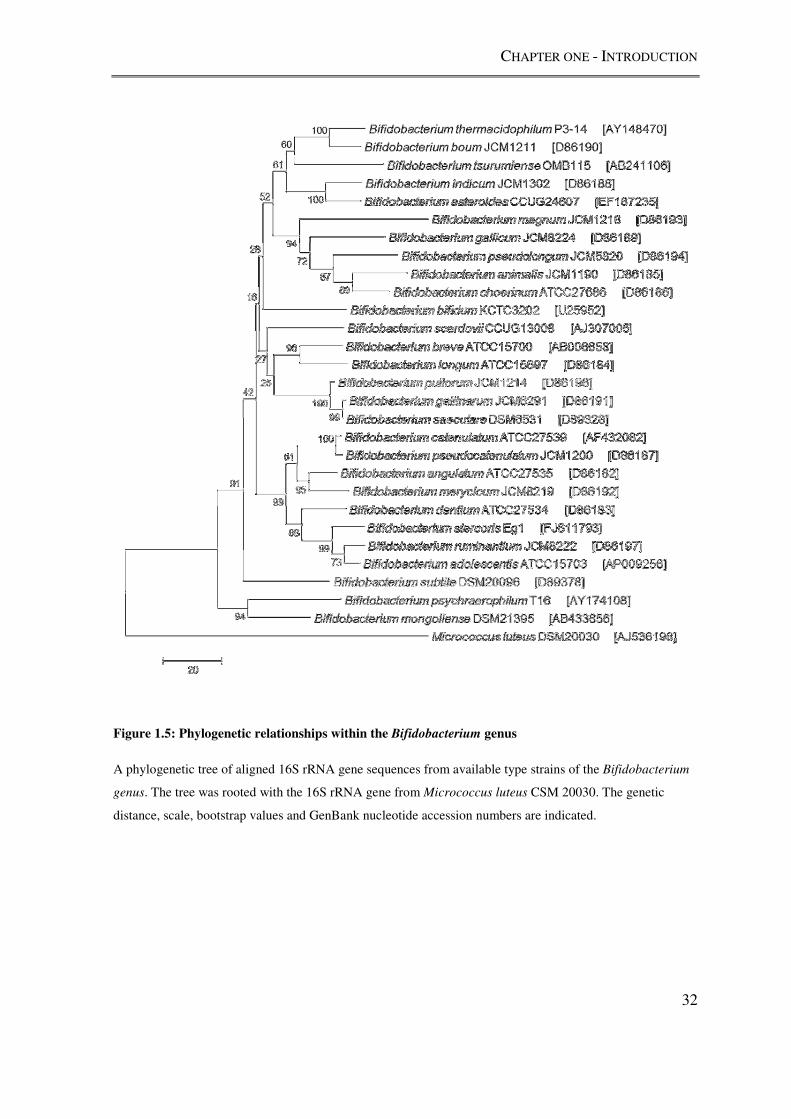
CHAPTER ONE - INTRODUCTION
32
Figure 1.5: Phylogenetic relationships within the Bifidobacterium genus
A phylogenetic tree of aligned 16S rRNA gene sequences from available type strains of the Bifidobacterium
genus. The tree was rooted with the 16S rRNA gene from Micrococcus luteus CSM 20030. The genetic
distance, scale, bootstrap values and GenBank nucleotide accession numbers are indicated.
CHAPTER ONE - INTRODUCTION
33
16S rRNA gene sequence homology analysis has proved a powerful method for analysing
phylogenetic relationships between other bacteria (Stackebrandt and Goebel, 1994).
Bifidobacterium 16S rRNA gene sequences showed only 7% difference across the whole
genus (Zhu et al., 2003), with four groups of species showing just 1% sequence divergence
across multiple species (Miyake et al., 1998), too similar to differentiate between these
species. DNA-DNA hybridisation was subsequently evaluated as a superior method for
speciating closely related bifidobacterial species. Other conserved macromolecules such as
the tuf gene encoding the Tu elongation factor, recA encoding recombinase A and groEL
gene have all been proposed as alternative molecular chronometers for bifidobacteria
(Ventura et al., 2004).
Molecular fingerprinting methods such as RAPD (Vincent et al., 1998, Simpson et al.,
2003) and PFGE using XbaI (McCartney et al., 1996, Simpson et al., 2003) have been used
successfully to describe both intra- and inter-species diversity of bifidobacteria. In the
current era of relatively inexpensive and highly accurate genome resequencing however,
the next “gold-standard” of isolate identification and elucidation of taxonomic and
phylogenetic relationships is the complete genome sequence of an isolate.

CHAPTER ONE - INTRODUCTION
34
1.4.2. BIFIDOBACTERIUM GENOMICS
Currently, the genus Bifidobacterium is represented by 38 species, of which 10 have at
least one isolate with its genome completely sequenced and publically available (Table
1.6). This is in direct contrast to the Lactobacillus genus whose widespread use as active
ingredients in functional foods, and their extreme phylogenetic, phenotypic and ecological
diversity has ensured many more representative genomes have been decoded (Ventura et
al., 2009a). The generation and analysis of bifidobacterial genome sequences has forged
the discovery and analysis of genetic and metabolic characteristics of these important
probiotic bacteria, alongside enhancing knowledge of their evolutionary relationships.
1.4.2.1. Comparative genomics
The chromosomes of bifidobacteria range in size from 1.9 to 2.8 Mb, with a GC content of
between 59 and 63% (Table 1.6). This is again in direct contrast to the genomes of
lactobacilli, which have much greater diversity of both size (Ventura et al., 2012) and GC
content (Table 1.5). It should be pointed out however, that bifidobacteria with reduced
genomes are extensively used in functional foods, and therefore may have been propagated
for a considerable length of evolutionary time in synthetic media. It has been demonstrated
that such treatment of bifidobacteria may cause genome decay (Lee et al., 2008), with
isolates losing apparently dispensable regions of their chromosomes in an environment
different from their original ecological niche.
Extrachromosomal elements in the form of plasmids are common amongst all bacteria. B.
longum strains show some diversity in the number of plasmids harboured (Table 1.6), with
B. longum subsp. longum DJO10A harbouring two plasmids, pDOJH10L (10 kb) and
pDOJH10S (3.6 kb) (Bottacini et al., 2010), while B. longum subsp. longum NCC2705
possesses a single plasmid, pBLO1 (3.6 kb) (Schell et al., 2002). All other sequenced
genomes appear to lack plasmids. There are no obvious unusual species-specific features
with regard to the coding density.
CHAPTER ONE - INTRODUCTION
35
A comparison of genomes across the whole Bifidobacterium genus showed that the
bifidobacterial pan-genome was likely to consist of more than 5000 genes (Bottacini et al.,
2010), more than double the coding capacity of a single bifidobacterial genome. The core
genome shared by all bifidobacterial isolates was 967 genes, with mostly housekeeping
function (replication, transcription, translation, cell envelope biosynthesis and signal
transduction) (Bottacini et al., 2010). Genes unique to each genome ranged from 21 to 230
across the nine genomes studied, with many of unknown function (Bottacini et al., 2010),
although given the propensity of bifidobacteria to dispense of genomic regions not useful
to their present lifestyle and niche, they are likely to have a specialized role within that
particular niche (Turroni et al., 2011).
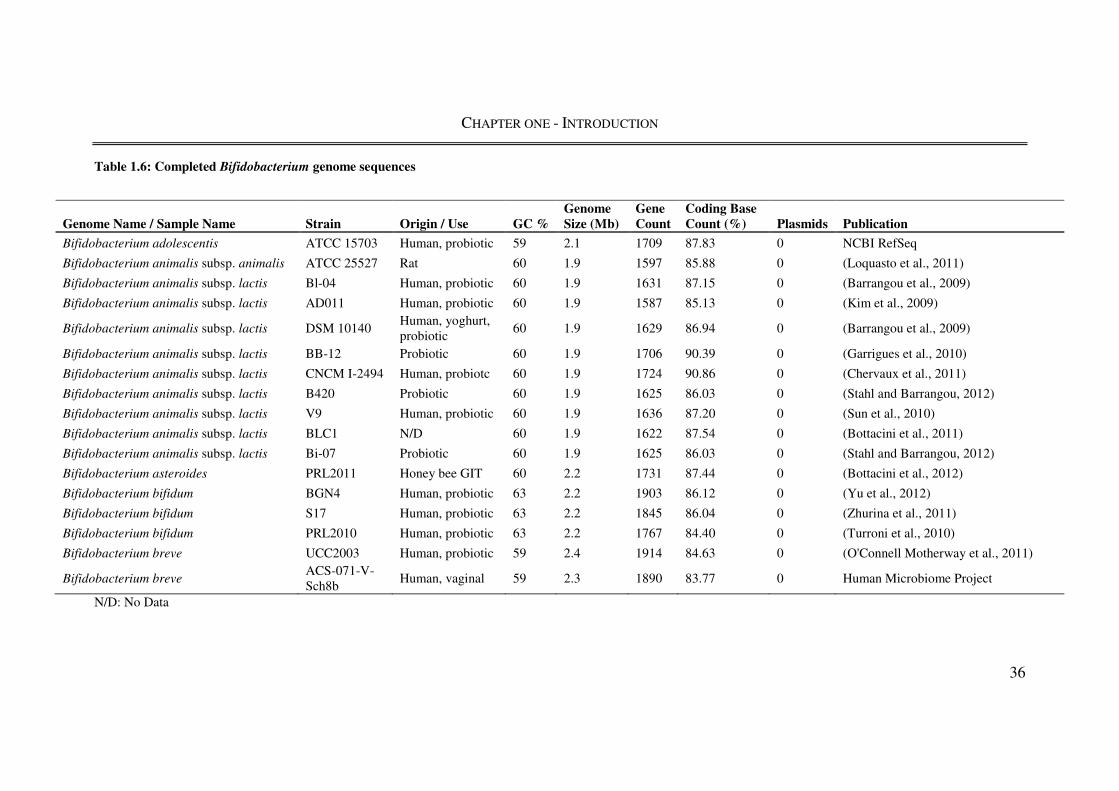
CHAPTER ONE - INTRODUCTION
36
Table 1.6: Completed Bifidobacterium genome sequences
N/D: No Data
Genome Name / Sample Name Strain Origin / Use GC % Genome Size (Mb)
Gene Count
Coding Base Count (%) Plasmids Publication
Bifidobacterium adolescentis ATCC 15703 Human, probiotic 59 2.1 1709 87.83 0 NCBI RefSeq
Bifidobacterium animalis subsp. animalis ATCC 25527 Rat 60 1.9 1597 85.88 0 (Loquasto et al., 2011)
Bifidobacterium animalis subsp. lactis Bl-04 Human, probiotic 60 1.9 1631 87.15 0 (Barrangou et al., 2009)
Bifidobacterium animalis subsp. lactis AD011 Human, probiotic 60 1.9 1587 85.13 0 (Kim et al., 2009)
Bifidobacterium animalis subsp. lactis DSM 10140 Human, yoghurt, probiotic
60 1.9 1629 86.94 0 (Barrangou et al., 2009)
Bifidobacterium animalis subsp. lactis BB-12 Probiotic 60 1.9 1706 90.39 0 (Garrigues et al., 2010)
Bifidobacterium animalis subsp. lactis CNCM I-2494 Human, probiotc 60 1.9 1724 90.86 0 (Chervaux et al., 2011)
Bifidobacterium animalis subsp. lactis B420 Probiotic 60 1.9 1625 86.03 0 (Stahl and Barrangou, 2012)
Bifidobacterium animalis subsp. lactis V9 Human, probiotic 60 1.9 1636 87.20 0 (Sun et al., 2010)
Bifidobacterium animalis subsp. lactis BLC1 N/D 60 1.9 1622 87.54 0 (Bottacini et al., 2011)
Bifidobacterium animalis subsp. lactis Bi-07 Probiotic 60 1.9 1625 86.03 0 (Stahl and Barrangou, 2012)
Bifidobacterium asteroides PRL2011 Honey bee GIT 60 2.2 1731 87.44 0 (Bottacini et al., 2012)
Bifidobacterium bifidum BGN4 Human, probiotic 63 2.2 1903 86.12 0 (Yu et al., 2012)
Bifidobacterium bifidum S17 Human, probiotic 63 2.2 1845 86.04 0 (Zhurina et al., 2011)
Bifidobacterium bifidum PRL2010 Human, probiotic 63 2.2 1767 84.40 0 (Turroni et al., 2010)
Bifidobacterium breve UCC2003 Human, probiotic 59 2.4 1914 84.63 0 (O'Connell Motherway et al., 2011)
Bifidobacterium breve ACS-071-V-Sch8b
Human, vaginal 59 2.3 1890 83.77 0 Human Microbiome Project
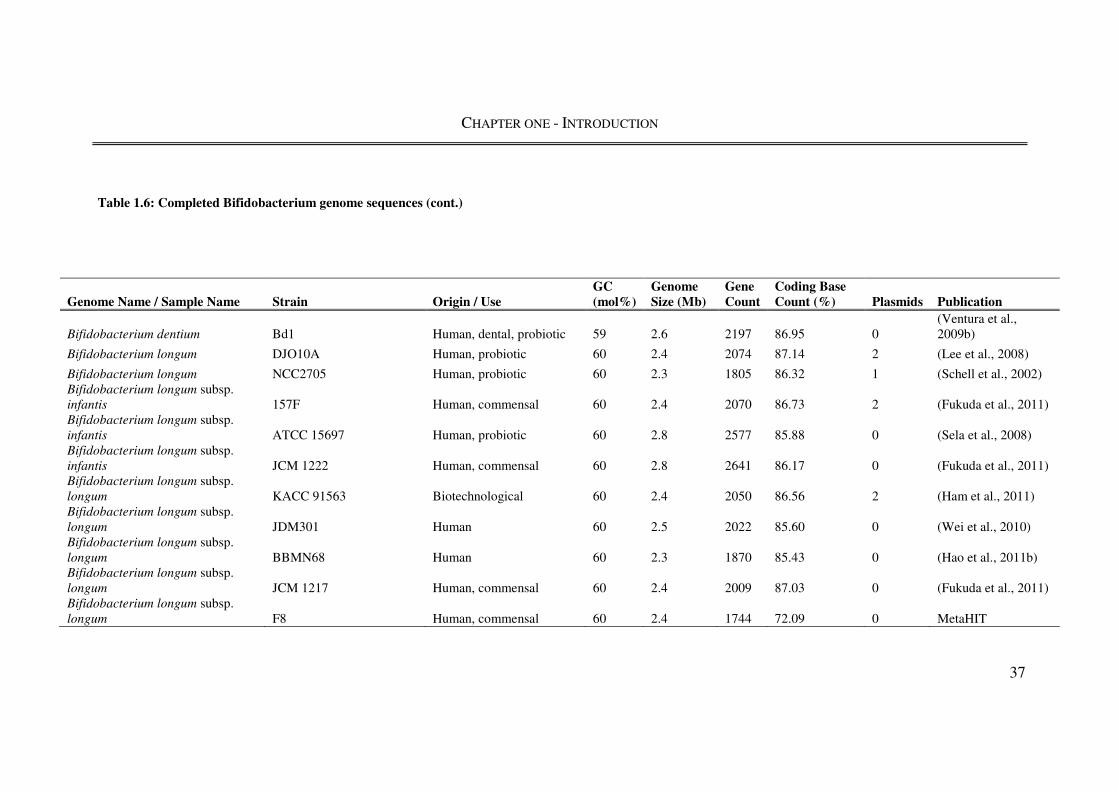
CHAPTER ONE - INTRODUCTION
37
Table 1.6: Completed Bifidobacterium genome sequences (cont.)
Genome Name / Sample Name Strain Origin / Use GC (mol%)
Genome Size (Mb)
Gene Count
Coding Base Count (%) Plasmids Publication
Bifidobacterium dentium Bd1 Human, dental, probiotic 59 2.6 2197 86.95 0 (Ventura et al., 2009b)
Bifidobacterium longum DJO10A Human, probiotic 60 2.4 2074 87.14 2 (Lee et al., 2008)
Bifidobacterium longum NCC2705 Human, probiotic 60 2.3 1805 86.32 1 (Schell et al., 2002) Bifidobacterium longum subsp. infantis 157F Human, commensal 60 2.4 2070 86.73 2 (Fukuda et al., 2011) Bifidobacterium longum subsp. infantis ATCC 15697 Human, probiotic 60 2.8 2577 85.88 0 (Sela et al., 2008) Bifidobacterium longum subsp. infantis JCM 1222 Human, commensal 60 2.8 2641 86.17 0 (Fukuda et al., 2011) Bifidobacterium longum subsp. longum KACC 91563 Biotechnological 60 2.4 2050 86.56 2 (Ham et al., 2011) Bifidobacterium longum subsp. longum JDM301 Human 60 2.5 2022 85.60 0 (Wei et al., 2010) Bifidobacterium longum subsp. longum BBMN68 Human 60 2.3 1870 85.43 0 (Hao et al., 2011b) Bifidobacterium longum subsp. longum JCM 1217 Human, commensal 60 2.4 2009 87.03 0 (Fukuda et al., 2011) Bifidobacterium longum subsp. longum F8 Human, commensal 60 2.4 1744 72.09 0 MetaHIT
CHAPTER ONE - INTRODUCTION
38
1.4.3. PHYSIOLOGICAL AND PROBIOTIC CHARACTERISTICS
1.4.3.1. Carbohydrate metabolism
Carbohydrate metabolism is particularly instrumental in the life of Bifidobacteria in the
mammalian GIT, with the availability of many complex polysaccharides (e.g. xylose and
arabinose containing compounds) that are beyond the hydrolysing capability of host
enzymes, which are mostly restricted to disaccharides (e.g. lactose and sucrose) and
specific polysaccharides such as starch (Ventura et al., 2007b). These more complex
polysaccharides would be unavailable to the host if the diverse mixture of anaerobic
bacteria (including bifidobacteria) were not present in the gut. This is a mutually beneficial
relationship, were the host gains carbon and energy through short-chain fatty acid
absorption, and the bacterial community have access to a wide variety of glycans in a
protected anoxic environment (Ventura et al., 2007b). For context, bacteria such as
Lactobacillus tend to be more numerous in the upper GIT (Vaughan et al., 2005) where
they ferment relatively simple mono- and di-saccharides, and bifidobacteria more common
in the lower GIT where their success is likely due to their capacity to metabolise the
complex carbohydrates that are more common in the large intestine.
Bifidobacterial genomes contain genes that reflect their adaptation to the GIT niche,
exemplified by the large number of genes encoding carbohydrate-modifying enzymes,
such as glycosyl hydrolases, sugar ABC transporters, and PEP-PTS (PEP—
phosphoenolpyruvate; PTS—phosphotransferase system) components, all of which are
needed for the metabolism of carbohydrates (Barrangou et al., 2009, Kim et al., 2009,
Schell et al., 2002). Additionally a large number of genes are predicted to be involved in
sugar metabolism, with almost half of these are devoted to carbohydrate uptake, by means
of ABC transporters, permeases and proton symporters, rather than through PEP-PTS
transport (Ventura et al., 2012).
Hexose sugars are metabolised through a metabolic pathway unique to bifidobacteria,
referred to as the “bifid-shunt”, which is built around the fructose-6-phosphoketolase
CHAPTER ONE - INTRODUCTION
39
enzyme (F6PPK.) (de Vries and Stouthamer, 1967). This enzyme is considered to be a
taxonomic marker for the family of Bifidobacteriaceae (Felis and Dellaglio, 2007). When
operated in tandem with enzymes for transporting carbohydrates, encoded in the rest of the
bifidobacterial genome, the bifid-shunt confers a competitive advantage on Bifidobacteria
by producing more ATP from the same quantity of carbohydrate than fermentative
pathways, like those operating in homofermentative LAB for example (Pokusaeva et al.,
2011).
1.4.3.2. Temperature and oxygen requirements
Bifidobacteria display niche specific growth temperature requirements, with isolates from
humans GIT able to grow at temperatures ranging between 36°C and 38°C. In contrast,
Bifidobacterium species isolated from animals GITs show growth at higher temperatures
(41°C to 43°C), with B. thermacidophilum exhibiting a maximal growth temperature of
49.5 °C (Ventura et al., 2004), showing general adaptations to temperature conditions in
their respective niches.
Bifidobacteria are described as strict anaerobes although some species (B. lactis, B.
aerophilum and B. psychroaerophilum) can tolerate oxygen (Ventura et al., 2004). The
biochemistry of oxygen requirements is different for each bifidobacterial species, with
weak catalase activity or the presence of NADH oxidase able to confer oxygen tolerance,
by removing or avoiding the synthesis of hydrogen peroxide (de Vries and Stouthamer,
1968). In species that are highly sensitive to oxygen, accumulation of hydrogen peroxide is
the principal reason for reduced metabolism since its presence inactivates F6PPK, a key
enzyme of the “Bifid-shunt” (Ventura et al., 2004).
CHAPTER ONE - INTRODUCTION
40
1.4.3.3. Probiotic effect and host interactions
There is economical interest in the probiotic effect of bifidobacterial isolates, and
numerous strains are added in high numbers (commonly greater than 109 cfu per dose) to
products to create functional foods (Stanton et al., 2005). When applied to the human GIT,
probiotic microorganisms have a potentially symbiotic relationship with their host,
contributing to host nutrition by impacting on intestinal cell proliferation and
differentiation, modulating the host immune system, competitively excluding pathogenic
microorganisms and supressing intestinal inflammation (Saxelin et al., 2005). In the
bifidobacterial context, probiotic effect is built on the foundation of carbohydrate
metabolism combined with the highly efficient bifid-shunt pathway. The complex
carbohydrates that are not able to be digested by the endogenous, host enzymatic suite
(including fructo-oligosaccharides (FOS), galacto-oligosaccharides (GOS), gluco-
oligosaccharides, xylo-oligosaccharides, inulin, starch, arabinoxylan and arabinogalactan,
lactulose and raffinose (Guarner and Malagelada, 2003, Turroni et al., 2011)) constitute
fermentable substrates for intestinal bacteria such as Bifidobacterium.
In neonates, human milk is often the only source of nutrition. It contains Human Milk
Oligosaccharides (HMO), complex oligosaccharides that are central carbohydrate
constituents of this nutrient-rich food (Asakuma et al., 2008). These complex
oligosaccharides are built from N-acetylglucosamine, D-glucose, D-galactose, L-fucose
and N-acetylneuraminic acid residues in a large variety of carbohydrate configurations
(Sela and Mills, 2010). Bifidobacteria and other early colonisers of the human gut are
capable of degrading HMOs and isolates of B. bifidum and B. longum from infants are
typically do so, although isolates recovered from adults are usually not able to utilise
HMOs (Sela and Mills, 2010), potentially due to genome reduction of non-essential genes.
Bifidobacterial genome sequences all appear encode extracellular polysaccharide (EPS),
which may be implicated in adherence to host cells in the GIT and potentially confers
increased levels of resilience to stomach acids and bile salts (Perez et al., 1998, Ventura et
al., 2007a), which is important in a probiotic context and especially so if the probiotic is
CHAPTER ONE - INTRODUCTION
41
fed in a “live culture” that must traverse the entirety of the GIT. Additionally, the genomes
of both lower-GIT (Klijn et al., 2005) and oral (Ventura et al., 2009b) originating
bifidobacteria are predicted to encode glycoprotein fimbriae-like structures, which are
implicated in microbial adhesion and colonization of host epithelial cell surfaces in other,
well-studied, probiotic bacteria (Kankainen et al., 2009).
1.4.4. BIFIDOBACTERIUM ANIMALIS SUBSP. LACTIS
1.4.4.1. Characteristics and physiology
Bifidobacterium animalis subsp. lactis is commonly found in the GIT of healthy humans
and the infant gut microbiota, primarily in faecal (Turroni et al., 2009) and ileal (Wall et
al., 2007) samples. It is also the most common Bifidobacterium species used as a probiotic
in commercial dairy products in both North America and Europe (Gueimonde et al., 2004,
Masco et al., 2005). By virtue of its wide use and commercial probiotic importance, many
studies have been undertaken using strains of B. animalis subsp. lactis to elucidate their
potentially probiotic effects. Potential probiotic effects include survival in the GIT (Wall et
al., 2007), modification of host fecal flora (Bartosch et al., 2005), modulation of the host
immune response (Paineau et al., 2008), adherance to human epithelial cells in vitro (Gopal
et al., 2001) and prevention of microbial gastroenteritis and colitis (Philippe et al., 2011).
In addition to the above specific probiotic properties, B. animalis subsp. lactis retains the
ability of the rest of the genus to metabolise oligosaccharides that are not digestible by the
host, contributing to its ability to compete in the human gut (Barrangou et al., 2009). The
described benefits linked with certain strains of B. animalis subsp. lactis have resulted in
their inclusion in a large array of dietary supplements and foods (see Table 1.1), including
dairy products such as yoghurt.
Despite the commercial and probiotic significance of B. animalis subsp. lactis however,
methods for differentiating B. animalis subsp. lactis at the strain-level has proved
challenging, due to the genetic identity of the species as determined by PFGE (Briczinski
and Roberts, 2006) and other nucleic acid-based techniques such as ERIC-PCR (Ventura
CHAPTER ONE - INTRODUCTION
42
and Zink, 2002a). Currently, eight B. animalis subsp. lactis genome sequences are
complete and publically available (Table 1.6), providing both reference sequences for
ongoing metagenomic analyses of the human environment, and a detailed insight into the
strain-level diversity of B. animalis subsp. lactis.
1.4.4.2. Strain-level diversity
A recent study by Milani et al (2013) used comparative genome sequence analysis to
establish the strain-level diversity of B. animalis subsp. lactis at the genomic level. Very
high genome sequence similarity was observed between strains of B. animalis subsp.
lactis, corroborated by a high degree of conservation in terms of genome size,
organization, and sequence (Milani et al., 2013). It was postulated that the isogenic nature
of all B. animalis subsp. lactis strains, combined with the overall absence of polymorphism
was symptomatic of a genetically monomorphic subspecies. A pan-genome analysis of the
B. animalis subsp. lactis taxon indicated a closed pan-genome, suggesting no new genetic
coding ability will be discovered by additional genomic resequencing attempts (Milani et
al., 2013). This signifies that B. animalis subsp. lactis is a highly clonal, potentially
recently evolved, taxon from the B. animalis species, although alternatively, the
resequenced strains may all be members of the same clade and the genetic diversity of B.
animalis subsp. lactis may not be adequately represented within these strains. The only
validated difference between strains of B. animalis subsp. lactis was found in the non-
coding CRISPR region (Section 1.3.3), where three homology groups were observed with
19, 20 and 23 CRISPR repeats respectively (Milani et al., 2013).
1.4.4.3. Strain typing
Briczinski et al (2009) proposed a method for differentiating between strains of B. animalis
subsp. lactis using Single Nucleotide Polymorphisms (SNPs), insertions and deletions. 24
strains of B. animalis subsp. lactis were indistinguishable by both PFGE and RAPD using
seven arbitrary primer sets (Briczinski et al., 2009). Strain-specific differences in sugar
fermentation patterns were observed, although differences depended on the original culture
medium for each isolate, with the exception of glucose uptake, whose rate correlated with a
CHAPTER ONE - INTRODUCTION
43
SNP in the glucose transporter glcU (Briczinski et al., 2009). In the 50 variable genetic loci
(SNPs), transporters and CRISPR elements were highly represented, perhaps indicating
selective pressure on hypervariable loci (CRISPR) and genes involved in adaptation to an
environmental niche (transcriptional regulators, carbohydrate uptake and metabolism)
(Briczinski et al., 2009). The type strain, B. animalis subsp. lactis DSMZ 10140, was the
most genetically distinct from the rest of the species, with other isolates falling into distinct
families of strains, broadly correlating with the single SNP in glcU and therefore rate of
glucose metabolism (Briczinski et al., 2009).
1.4.5. BIFIDOBACTERIUM BIFIDUM
1.4.5.1. Probiotic Characteristics
Bifidobacterium bifidum is one of the four major bifidobacterial species commonly
detected in adult and infant faeces (Matsuki et al., 2003). Healthy infants were found to
have proportionally high levels of faecal B. bifidum compared to infants that displayed
raised immunoglobulin E (IgE) responses to common environmental antigens, indicating
that they were allergic (He et al., 2001). When fed in combination with antibiotics, B.
bifidum OFR9 and prevented an overall decrease in the numbers of bifidobacteria in the
gut, and restored the gut microbiota to normal more rapidly than just antibiotic (Chung et
al., 1997). Other potential probiotic characteristics of strains of B. bifidum include
modulation of the host immune response (Ko et al., 1999, Park et al., 2002), production of
bifidocin B, a bacteriocin (Yildirim et al., 1999). B. bifidum PRL2010 is also able utilise
host-derived glycans such as mucin (Turroni et al., 2010).
CHAPTER ONE - INTRODUCTION
44
1.5. EXAMINING STRAIN-LEVEL DIVERSITY
Strain typing of bacteria is based on the assumption that the clonal descendants of a single
ancestor will share characteristics that will differ from those of unrelated strains. These
characteristics should be diverse within the species yet both stable and easily measurable.
Many common bacterial typing methods have been adapted to encompass the typing of
lactobacilli. The typing methods detailed below require the prior cultivation of isolates to
be typed, in order to obtain either separate colonies or pure cultures (Dykes and von Holy,
1994).
1.5.1. DNA FINGERPRINTING METHODS
1.5.1.1. Pulsed Field Gel Electrophoresis (PFGE)
PFGE allows the high-resolution separation of DNA fragments of a larger size than
permitted in traditional gel electrophoresis with the use of a continually reorienting (or
pulsed) electric field. In PFGE, the complete bacterial genome is digested with a sparsely-
cutting restriction enzyme (such as NotI or SfiI for lactobacilli (Tynkkynen et al., 1999))
and then subjected to pulsed-field gel electrophoresis in order to separate the fragments of
DNA. Tynkkynen et al. (1999) suggest that PFGE is the most discriminatory method for
typing isolates of Lactobacillus rhamnosus and Lactobacillus casei.
1.5.1.2. RAPD Fingerprinting
RAPD fingerprinting uses short (usually ~10 bp) oligonucleotides with a random sequence
as a primer in a low stringency PCR. The primers anneal to complementary or partially
complementary regions on the target DNA. When the primers anneal on opposite strands
within approximately 1 kb of one another, a PCR amplicon is generated. The PCR product
is then subjected to separation by size by electrophoresis, and a RAPD fingerprint is
created. This method generally allows differentiation between species and to some extent,
strains within a species (Satokari et al., 2003). RAPD fingerprinting has been widely
applied to the LAB (Du Plessis and Dicks, 1995). RAPD fingerprinting is generally

CHAPTER ONE - INTRODUCTION
45
considered to be simple and rapid, although care needs to be taken to ensure the
reproducibility of results generated by this PCR-based method.
1.5.1.3. Repetitive Element PCR Fingerprinting
Rep-PCR genomic fingerprinting makes use of DNA primers complementary to naturally
occurring, highly conserved, repetitive DNA sequences, present in multiple copies in the
genomes of several Gram-positive bacteria, including lactobacilli (Stephenson et al.,
2009). There are three families of repetitive sequences; the 35-40 bp repetitive extragenic
palindromic (REP) sequence, the 124-127 bp enterobacterial repetitive intergenic
consensus (ERIC) sequence (de Bruijn, 1992), and the 154 bp BOX element (Gevers et al.,
2001). These sequences are well distributed in intergenic positions around the genome.
PCR primers have been designed to allow DNA synthesis outward from the inverted
repeats in REP and ERIC, and from the boxA subunit of BOX. This PCR leads to the
amplification of distinct genomic regions located between REP, ERIC or BOX elements.
The corresponding procedures are referred to as REP-PCR, ERIC-PCR and BOX-PCR
genomic fingerprinting respectively. The PCR amplicons may then be resolved using
agarose gel electrophoresis, yielding a rep-PCR genomic fingerprint. REP-PCR and ERIC-
PCR have been applied to lactobacilli, and have shown excellent discriminatory ability at
the subspecies level (Gevers et al., 2001, Ventura and Zink, 2002b).
1.5.2. DNA SEQUENCE-BASED METHODS
1.5.2.1. Multi Locus Sequence Typing (MLST)
MLST was developed by Maiden et al (1998) for typing Neiserria meningitidis and has
been effectively applied to strain typing of bacterial pathogens such as Escherichia coli
(Lacher et al., 2007) and the Burkholderia cepacia complex (Baldwin et al., 2005). MLST
schemes for species of LAB, including Lactobacillus plantarum (de las Rivas et al., 2006)
and L. casei (Cai et al., 2007) have also been developed. MLST relies on partially
sequencing six or seven ‘housekeeping’ genes, allowing the characterisation of alleles at
CHAPTER ONE - INTRODUCTION
46
relatively conserved genomic loci, and as such, may differentiate between bacterial strains
with much greater resolution than rRNA gene sequence analysis, which relies on
polymorphism at a single locus. Each unique sequence type at each locus is designated a
number, and hence strains may be defined by their seven-number sequence type. The
MLST scheme for L. casei targets the genes encoding the following proteins: protein
elongation factor EF-2 (fusA), isoleucyl-tRNA synthetase (ileS), GTP-binding protein
LepA (lepA), leucyl-tRNA synthetase (leuS), CTP synthetase (pyrG), recombinase A
(recA) and ATP-dependent DNA helicase (recG). The L. plantarum MLST scheme targets
the genes encoding the following proteins: phosphoglucomutase (pgm), D-alanine-D-
alanine ligase (ddl), B subunit of DNA gyrase (gyrB), ATPase subunit of
phosphoribosylaminoimidazole carboxylase (purK1), glutamate dehydrogenase (gdh),
DNA mismatch repair protein (mutS) and transketolase (tkt4).
1.5.3. SPECIES SPECIFIC PROBES BASED ON RIBOSOMAL RNA SEQUENCES
Numerous specific oligonucleotide probes, specifically targeting rRNA genes, have been
designed for different species of human intestine occurring lactobacilli (Satokari et al.,
2003). These are designed by analysing the sequence of rRNA genes to discover variable
regions that contain information suggestive of phylogenetic groupings of different levels.
Probes may therefore be designed to detect and differentiate organisms at the group, genus,
species or strain level, providing there is sufficient sequence diversity at each level.
Lactobacilli present a challenge when designing probes that differentiate at the genus level
or below because of their phylogenetic heterogeneity.
The development of species specific probes allows the detection of specific DNA
sequences by PCR. This, in turn, allows quantification of these sequences in the
environment, providing information concerning the quantity of the organism to which the
sequence is specific. Number of sequences present and numbers of viable organisms are
not directly equivalent however, as most species possess more than one copy of the rRNA
gene sequence in question, and the presence of a specific sequence does not indicate a
viable organism.
CHAPTER ONE - INTRODUCTION
47
1.5.4. THE POST-GENOMIC ERA
1.5.4.1. Comparative genomics
The advent of relatively cheap and highly accurate next-generation sequencing
technologies has made the reseqeuncing of bacterial strains a viable laboratory method for
strain typing, which also provides a vast amount of information supplementary to strain
type. The decoding of an isolate’s genome sequence is the ultimate genotyping method (Li
et al., 2009). The progressive gathering of genotyping information from DNA
fingerprinting methods to whole genome sequencing has driven improvements in
taxonomical accuracy across all bacterial species; pathogens, industrial organisms and
probiotics. Relevant examples of the use of comparative genomics in the wider context of
this study are provided for the lactobacilli (Section 1.2.2) and B. animalis subsp. lactis
(Section 1.4.4.2). Recently, the development of ribosomal MLST (rMLST) provides
resolution from the sub-species level to the whole bacterial domain, by indexing variation
of sequences that encode ribosomal proteins (rps genes) (Jolley et al., 2012), and is
discussed in more detail in Chapters 4 and 6.
CHAPTER ONE - INTRODUCTION
48
1.6. PROJECT AIMS
Probiotic bacteria are a diverse and heterogeneous group of organisms that have been
utilised since the turn of the century for their health benefits and for thousands of years in
fermented dairy and other products. Comparatively little is known about their population
biology and evolution, specific mode of action, and their effects on both the metabolites
and indigenous microbiota of the human gut.
This PhD, a Collaborative Awards in Science and Engineering (CASE) studentship was
funded by the Biotechnology and Biological Sciences Research Council (BBSRC) in
collaborative partnerhip with Cultech Ltd., an internationally recognised innovator and
premium quality manufacturer within the nutritional supplement industry, based in Port
Talbot, Wales, UK. The questions and aims investigated in this study reflect their
commercial interests, characterising and examining the diversity of probiotic bacteria at
the molecular level, with specific focus on isolates used by Cultech Ltd. To bring a genetic
context to the phenotypic information available on the bacteria used by Cultech Ltd., state-
of-the-art next-generation sequencing combined with genome-scale analysis techniques
was used to build upon classical strain typing methods.
Cultech Ltd. produce four different nutritional supplements, three for the UK and one for
the North American markets, all of which contain the Lab4® probiotic mixture. Lab4®
consists of two strains of L. acidophilus, CUL 21 and CUL 60 and two bifidobacterial
strains B. bifidum CUL 20 and B. animalis subsp. lactis CUL 34. Clinical trials conducted
with the Lab4® probiotic mixture have been shown prevent atopic sensitization and atopic
eczema when administered to pregnant women and infants aged 0-6 months (Allen et al.,
2012), significantly reduce total symptoms and improve quality of life in diagnosed IBS
sufferers (Williams et al., 2009) and reduce the incidence of Clostridium difficile-
associated diarrhoea in hospitalised patients (Plummer et al., 2004).
CHAPTER ONE - INTRODUCTION
49
The specific objectives of this PhD study were to characterise a selection of these bacteria
as follows:
Strain typing Lactobacillus acidophilus
o The major focus of the PhD study was L. acidophilus and evaluation of genetic
typing methods for this species were investigated in order to:
� Establish the sub-species level diversity of L. acidophilus using Randomly
Amplified Polymorphic DNA (RAPD) fingerprint analysis
� Develop robust molecular markers for detecting L. acidophilus at the species
level
� Test molecular markers in culture independent approach using a diverse
range of samples to investigate L. acidophilus distribution
Minimum taxonomic criteria for bacterial genome sequence depositions
o During the course of the PhD, an announcement of the genome sequence of L.
acidophilus strain 30SC was made (reference). When the 30SC genome was
compared to the L. acidophilus senso stricto genomes as part of ongoing work, it
became clear that the 30SC isolate was not a member of this species. The
following analyses were performed to establish the correct species-identity of
strain 30SC:
� Analyse the phylogenetic placement of L. acidophilus 30SC using its recently
published genome sequence
� Construct Lactobacillus phylogenies using simple analyses based on the 16S
rRNA gene sequence
� Construct Lactobacillus phylogenies using simple analyses based on the
sequence of other phylogenetic marker genes such as gyrase B
� Set out a simple standard bioinformatic process that can be applied to newly
generated genome sequences to ensure that they are accurately assigned to
the genus or species level before deposition to a database and subsequent
announcement
CHAPTER ONE - INTRODUCTION
50
Lactobacillus acidophilus genomics and population structure
o To enhance the strain level diversity analysis performed using RAPD, next-
generation sequencing and cutting edge genomic comparative techniques were
used to:
� Obtain whole genome sequences for three isolates of L. acidophius; two
commercial isolates (CUL21 and CUL60) and an isolate with an early
deposition date (LMG 11428)
� Use comparative genomics to establish the diversity of commercial isolates
� Expand genomic information on L. acidophilus strains by resequencing the
genomes of 28 L. acidophilus isolates
� Apply Methyl Methane Sulphonate (MMS) to L. acidophilus to alkylate
DNA and potentially induce mutations that could later be detected by DNA
resequencing
� Establish evolutionary history of L. acidophilus isolates
� Investigate potential basis for limited isolate genetic diversity
Phenotypic diversity of Lactobacillus
o To complement the genetic analysis of L. acidophilus, phenotyping analysis was
carried out to:
� Examine species-level differences in Lactobacillus in the metabolism of
carbohydrates using API 50CHL and evaluate as a method for identifying L.
acidophilus
� Evaluate the use of Matrix Assisted Laser Desorption/Ionisation – Time Of
Flight (MALDI-TOF) mass spectrometry as a tool to examine the gross
proteome of Lactobacillus isolates
� Assess the use of MALDI-TOF MS as an identification tool for Lactobacillus
isolates on both the species and strain levels
� Establish the strain-level diversity of the gross proteome of L. acidophilus
� Measure growth kinetics of L. acidophilus strains

CHAPTER ONE - INTRODUCTION
51
Genomic diversity of bifidobacteria
o As a final component of this PhD study, preliminary genomic analysis of two
Bifidobacterium isolates used by Cultech Ltd was carried out in order to:
� Obtain whole genome sequences for two commercial bifidobacterial isolates,
Bifidobacterium bifidum CUL20 and Bifidobacterium animalis subsp. lactis
CU34
� Use comparative genomics to establish the evolutionary history of
commercial isolates
� Develop robust molecular markers for detecting Bifidobacterium bifidum
and Bifidobacterium animalis subsp. lactis at the species level
� Test molecular markers in culture independent approach to establish efficacy
and to investigate distribution of bifidobacteria.
CHAPTER TWO – STRAIN DIVERSITY OF LACTOBACILLUS AND DEVELOPMENT OF DETECTION
TOOLS
52
2. ANALYSIS OF THE SUB-SPECIES LEVEL DIVERSITY OF
LACTOBACILLUS STRAINS AND DEVELOPMENT OF NOVEL TOOLS
FOR DETECTION OF L. ACIDOPHILUS
2.1. INTRODUCTION
Development and subsequent use of accurate tools for identifying lactobacilli at the species
and sub-species level is vitally important, particularly of organisms that are used in
commercial environments and food products such as starter-cultures for fermentation and
probiotics. Sub-species level identification to identify strains of lactobacilli is important in
the biotechnology industry, which requires tools to monitor, for example; the use of
proprietary or patented strains, for quality control of batches of these organisms, or to
distinguish between probiotic strains and those occurring naturally in the host
gastrointestinal tract. It is also crucial to be able to compare clinical isolates and
biotechnological strains and to be able to ascertain and monitor the genetic stability of
commercial strains (Klein et al., 1998).
Molecular genotyping approaches are usually undertaken when studying the epidemiology
of infectious disease pathogens; however, this study has used molecular genotyping to
assess the intra-species diversity of a single probiotic bacterium, L. acidophilus, in the
context of other closely-related species, belonging to the remarkably large and diverse
Lactobacillus genus. Given that probiotic effect is often specific to a particular strain
(Ouwehand et al., 2002, Luyer et al., 2005), accurate identification of cultures presumed to
have probiotic properties is essential. It is accepted that probiotics should be classified and
identified using internationally recognised methods such as Pulsed-Field Gel
Electrophoresis, DNA-DNA hybridisation and 16S RNA gene sequencing (Pineiro and
Stanton, 2007). Bacterial 16S rRNA gene sequencing is commonly used as a rapid and
effective means of determining a genus- or species-level taxonomic identification although
it provides little to no strain information (Naser et al., 2007). In biotechnological and
industrial applications, identification is traditionally limited to these techniques and
CHAPTER TWO – STRAIN DIVERSITY OF LACTOBACILLUS AND DEVELOPMENT OF DETECTION
TOOLS
53
conventional phenotypic identification using physiological parameters, rather than more
modern methods practised in a research setting.
Traditionally, the identification of lactobacilli has been based mainly on fermentation of
carbohydrates, morphology, and Gram staining, and these methods are still used. However,
in recent years, the taxonomy has changed considerably with the increasing knowledge of
the genomic structure and phylogenetic relationships between Lactobacillus species (Klein
et al., 1998, Stiles and Holzapfel, 1997). Modern methods of strain typing are typically
based on PCR, for example, random amplified polymorphic DNA (RAPD); or DNA
fingerprinting method based on the restriction enzyme digestion of DNA, such as PFGE
and ribotyping (Tynkkynen et al., 1999). In RAPD analysis, short DNA oligos of arbitrary
sequence are used as PCR primers that produce amplification product patterns that are
specific to each individual strain. PFGE relies on rare-cutting enzymes to digest genomic
DNA into large fragments which are subsequently separated by electrophoresis, generating
a fingerprint unique to each strain, while ribotyping uses rRNA genes or their spacer
regions as probes that hybridize to genomic restriction fragments. Mainly due to
methodological differences, discrepancies are often seen in the results of these techniques,
and as such, any subspecies taxonomic assignation should be achieved as part of a
polyphasic taxonomic approach (Vandamme et al., 1996).
Previous work has shown that when RAPD analysis was applied to a small collection of
six reference isolates, L. acidophilus appeared to have very limited strain-level diversity
(Mahenthiralingam et al., 2009). To increase the scope and depth of analysis beyond that
of the previous study (Mahenthiralingam et al., 2009), this chapter presents a strain-level
diversity analysis of a disparate group of LAB isolates, with particular focus on L.
acidophilus reference and commercial isolates using RAPD analysis. An L. acidophilus
specific PCR test was also developed in order to screen disparate niches for L. acidophilus,
to expand and develop the range of isolates studied beyond those used in industrial

CHAPTER TWO – STRAIN DIVERSITY OF LACTOBACILLUS AND DEVELOPMENT OF DETECTION
TOOLS
54
processes or collected as reference strains, and overall, to ensure that the range of isolates
tested fully represent the strain level diversity of L. acidophilus as a LAB species.
CHAPTER TWO – STRAIN DIVERSITY OF LACTOBACILLUS AND DEVELOPMENT OF DETECTION
TOOLS
55
2.1.1. SPECIFIC AIMS
The aims of this chapter were as follows:
• Investigate the sub-species level diversity of L. acidophilus using Randomly
Amplified Polymorphic DNA (RAPD) fingerprint analysis.
• Develop robust molecular markers for detecting L. acidophilus at the species level.
• Develop molecular markers for each commercial L. acidophilus isolate using
genome sequence information to investigate targets.
• Test molecular markers in culture independent approach using a diverse range of
samples to investigate L. acidophilus distribution.

CHAPTER TWO – STRAIN DIVERSITY OF LACTOBACILLUS AND DEVELOPMENT OF DETECTION
TOOLS
56
2.2. METHODS
2.2.1. STORAGE OF BACTERIAL ISOLATES
Stocks of bacterial isolates were prepared by resuspending fresh colonial growth from a
pure culture plate into broth MRS (Oxoid, Basingstoke, UK) (de Man et al., 1960)
containing 8% (v/v) DMSO or 15% (w/v) glycerol. Stocks were then maintained at
– 80ºC.
2.2.2. GROWTH CONDITIONS
Unless otherwise stated, bacterial isolates were revived from frozen stocks and cultured on
a MRS (de Man et al., 1960) agar at 37ºC. Liquid cultures (24 hours) were prepared by
inoculating 3 ml of MRS broth media with a single colony from a revival plate, tubes were
then incubated, statically at 37ºC for 24-48 hours, depending on the growth requirements
of each isolate.
2.2.3. RAPID DNA EXTRACTION FROM COLONY MATERIAL
A single bacterial colony from a pure culture plate (with < 72 hours’ growth) was
aseptically transferred to 50 µl of 5% (w/v) chelex® 100 resin solution (Biorad,
Hertfordshire, UK, sterilised by autoclaving prior to use). DNA extraction was performed
by heating the sample to 98°C on a heated block for a 5 minute cycle, then immediately
placing the sample at 4ºC for 5 minutes. This process was repeated twice. Samples were
then centrifuged briefly at 800 x g to sediment the resin and cellular debris and the
supernatant containing the crude DNA removed for subsequent use.
2.2.4. GENERATION OF RAPD FINGERPRINTS
RAPD analysis was carried out as described by (Mahenthiralingam et al., 1996a). Primer
272, 5’- TGC GCG CGG G -3’ (MWG Biotech, Covent Garden, London) was used for all
reactions; reagents were from Qiagen (Qiagen, Crawley, Sussex, UK). Profile analysis was
performed in 25 µl reaction mixtures containing: 1x PCR buffer, 1 x Q-solution, 3 mM

CHAPTER TWO – STRAIN DIVERSITY OF LACTOBACILLUS AND DEVELOPMENT OF DETECTION
TOOLS
57
MgCl2, 200 µm dNTPs mixture, 1.6 µM RAPD primer, 1 U of Taq polymerase and 2 µl of
DNA template obtained by Chelex protocol. PCR thermal cycles were performed using a
BioRad C1000 thermal cycler (BioRad, Hemel Hempstead, United Kingdom) as follows: 5
minutes at 94ºC, 4 cycles of 5 minutes at 36ºC, 5 minutes at 72ºC, 5 minutes at 94ºC, 30
cycles of 1 minute at 94ºC, 1 minute at 36ºC, 2 minutes at 72ºC followed by a final
extension time of 10 minutes at 72ºC. 1 µl of the product was run on an Agilent
Bioanalyser 2100 (Agilent, Santa Clara, US) using a DNA 7500 chip according to the
manufacturer’s protocol.
2.2.5. ANALYSIS OF RAPD FINGERPRINTS
Electropherogram data from the BioAnalyzer, in the form of a csv file, was converted to a
GelCompar II (v6.6.8)-compatible format using a dedicated script provided by Applied
Maths (Sint-Martens-Latem, Belgium) was applied to each csv-file to convert the profiles
to a GelCompar-compatible format. Internal marker bands were then removed and band-
searching set to a minimum profiling value of 2.0%. Similarity between fingerprints was
calculated using the Pearson coefficient. Dendrograms were constructed by the unweighted
pair group method with arithmetic means (UPGMA).
2.2.6. PCR AMPLIFICATION OF PAU REGIONS SPECIFIC TO L. ACIDOPHILUS
PAU gene amplification was used to identify the presence of L. acidophilus. PCR primers
were generated using Primer3 (Rozen and Skaletsky, 2000) and are listed in Table 2.3. A
25 µl PCR mixture was set up as follows: 1x PCR buffer, 1x Q-solution, 100 µM final
concentration of dNTPs, 0.4 µM final concentration of each primer, 2 µl of template DNA
(extracted with Chelex (section 2.2.3), from total faecal DNA (Sections 2.2.10 and 2.2.11)
or from the first round of PCR), and 1 U of Taq DNA polymerase. The nested PCR was
carried out in two stages using a BioRad C1000 thermal cycler (BioRad, Hemel
Hempstead, United Kingdom) the first using the program; 96°C for 1 min, then 30 cycles
of 60 sec at 96ºC, 60 sec at 56ºC, 60 sec at 72ºC, then a final step at 72ºC for 10 min. The
product from this PCR was then used as the template DNA for the second round of PCR
using the program; 95°C for 2 min, then 35 cycles of 30 sec at 94ºC, 30 sec at 52ºC, 90 sec

CHAPTER TWO – STRAIN DIVERSITY OF LACTOBACILLUS AND DEVELOPMENT OF DETECTION
TOOLS
58
at 72ºC, then a final step at 72ºC for 5 min. The resulting PCR products were visualised by
agarose gel electrophoresis on a 1.5% (w/v) gel.
2.2.7. DETERMINATION OF THE PURE-CULTURE DETECTION LIMIT OF THE L.
ACIDOPHILUS SPECIFIC MARKER PCR
A bacterial suspension of L. acidophilus NCFM was serially diluted in MRS broth. To
enumerate, triplicate 10 µl drops were aspirated onto the surface of MRS agar plates and
incubated at 37ºC for 24 hours. Individual colonies were counted and the number of viable
cells calculated and expressed as colony forming units per ml (CFU/ml). DNA was
extracted from suspensions at each dilution using the following method: Cells were
pelleted by centrifugation 1,200 x g for 10 min. The pellet was resuspended in 100 µl of
TE (10 mM Tris-Cl pH8, 10 mM EDTA, pH 8) and transferred to a 2 ml screw-cap
microcentrifuge tube containing approximately 0.5 ml of 0.1 mm diameter Zirconium
beads (Biospec Products, Bartlesville, Oklahoma) and 500 µl lysis buffer (50 mM Tris-Cl
pH8, 70 mM EDTA pH8, 1% (w/v) SDS) with 0.5 mg/ml Pronase (Roche, Hertfordshire,
UK). The bacteria were then lysed by a 10 sec pulse on a mini bead-beater device (Biospec
Products) and incubation at 37˚C for 1 hour to digest proteins. 200 µl of saturated
ammonium acetate was then added, followed by a 5 sec pulse on the bead-beater device.
The tubes were then centrifuged for 1 min at 16,100 x g, followed by the addition of 600 µl
of chloroform. The tubes were pulsed on the bead-beater device for 5 sec and then phases
were separated by centrifugation for 7 min at 16,100 x g. Genomic DNA was collected
from the cleared aqueous phase by ethanol precipitation. After the DNA pellet was washed
with 70% (v/v) ethanol and vacuum dried it was resuspended in 50 – 300 µl low EDTA-TE
(10 mM Tris-Cl pH 8, 0.1 mM EDTA) with RNase A at 0.5 µg/ml. The extracted DNA
was then used as template DNA as described in (Section 2.2.6).
2.2.8. ISOLATING LAB FROM THE FAECES OF WILD RODENTS
Wild rodents were trapped near Llysdinam in Wales, UK using baited live-capture
Longworth traps that were set overnight. Faeces was collected from the traps aseptically
and stored in 1.5ml Eppendorf tubes at -20°C. LAB were isolated from mouse faeces by
CHAPTER TWO – STRAIN DIVERSITY OF LACTOBACILLUS AND DEVELOPMENT OF DETECTION
TOOLS
59
disrupting a thawed faecal pellet in 1.5ml Maximum Recovery Diluent (MRD; Oxoid,
Basingstoke, UK). Serial dilutions were then plated onto MRS agar supplemented with 120
units per ml of Polymixin B (Sigma Aldrich, Gillingham, UK), and incubated at 37°C for
72 hours. Fresh colonies were simultaneously picked into 50 µl of 5% (w/v) Chelex resin
for RAPD typing and testing with PAU-based specific marker PCR and into MRS broth for
growth before storage at -80°C (Section 2.2.1).
2.2.9. BACTERIAL 16S RRNA GENE AMPLIFICATION OF LAB ISOLATES CULTIVATED
FROM WILD RODENTS
16S rRNA gene amplification and sequencing was used to identify the bacteria isolated
from wild rodent faeces. Primers 27F (5’- AGA GTT TGA TC(AC) TGG CTC AG -3’)
and 1492R (5’- GGT TAC CTT GTT ACG ACT T -3’) (Lane, 1991) were used to amplify
the near full length 16S rRNA gene as follows. A 50 µl PCR mixture was set up as
follows: 1X PCR buffer, 1 X Q-solution, 100 µM final concentration of dNTPs, 0.4 µM
final concentration of each primer, 3 µl of Chelex template DNA, and 1 U of Taq DNA
polymerase. PCR was carried out in BioRad C1000 thermal cycler (BioRad, Hemel
Hempstead, United Kingdom) as follows: 95°C for 2 min, then 35 cycles of 30 sec at 94ºC,
30 sec at 52ºC, 90 sec at 72ºC, then a final step at 72ºC for 5 min. The resulting PCR
product was analysed by agarose gel electrophoresis and sequenced on the forward strand
using primer 27F and the reverse strand with primer 1492R in order to obtain a full length
sequence of the 16S rRNA gene. Sequencing reactions were carried out using Applied
Biosystems Big Dye Terminator ready reaction mix version 3.1, with subsequent analysis
on an Applied Biosystems ABI-Prism 3100 automated sequencer. Alignments were
constructed with BioEdit v7.2.1(Ibis Biosciences, Carlsbad, US) and phylogenetic trees
were constructed using MEGA 4 (Tamura et al., 2007).
2.2.10. EXTRACTION OF TOTAL FAECAL DNA FROM RODENT FAECAL PELLETS
Total faecal DNA was extracted from the faecal of wild rodents and rodents on the Lab4®
probiotic feeding trial using a FastDNA Spin Kit for Soil (Qbiogene Inc., Carlsbad, CA)
and following the manufacturer’s instructions.
CHAPTER TWO – STRAIN DIVERSITY OF LACTOBACILLUS AND DEVELOPMENT OF DETECTION
TOOLS
60
2.2.11. EXTRACTION OF TOTAL FAECAL DNA FROM HUMAN FAECES
DNA was extracted from human faecal material using the QIAamp® DNA Stool Mini Kit
(Qiagen, Crawley, Sussex, UK) following the manufacturer’s instructions, modified to
include an additional disruption step. 0.5 g of 0.1 mm zirconium beads (Biospec Products,
Bartlesville, Oklahoma) were added to each sample, which was subsequently disrupted in
three one-minute bursts using a Fastprep® machine with a 24x2ml adaptor (MP
Biomedicals, Solon, US).
CHAPTER TWO – STRAIN DIVERSITY OF LACTOBACILLUS AND DEVELOPMENT OF DETECTION
TOOLS
61
2.3. RESULTS
For clarity, the results were divided into three parts, the first (Section 2.3.1) concerns the
application of RAPD profile similarity analysis to a collection of LAB isolates, with
particular emphasis on L. acidophilus, which included two L. acidophilus isolates from the
Cultech Lab4® probiotic supplement (CUL21 and CUL60). The assembled collection of L.
acidophilus isolates (Table 2.1) were originally isolated from a relatively limited range of
locations, with the majority from commercial products (dairy, probiotic and other
fermented products) and Cultech products, and were all associated with human processes.
The second part (Section 2.3.2) describes the development of a reliable method for
detecting L. acidophilus from collection both cultured and uncultured samples. The third
(Section 2.3.2) seeks to expand the scope of the isolate collection by applying the
developed method to samples from a variety of hosts, also allowing investigation into the
distribution of L. acidophilus in various hosts.
2.3.1. RAPD FINGERPRINTING OF LAB ISOLATES
2.3.1.1. Validation of RAPD fingerprinting method for LAB isolates
A broad collection of 72 LAB isolates from a variety of isolation sources (Table 2.1) was
used to assess the discriminatory ability and reproducibility of the RAPD fingerprinting
method when applied to a large collection of LAB isolates, with the broad emphasis on
assessing the genetic diversity of LAB isolates and primary goal of defining overall
diversity within L. acidophilus. The use of primer 272 (Mahenthiralingam et al., 1996b) for
RAPD fingerprinting of LAB was validated by generating least five PCR products of
differing size for each of the isolates. The use of the Bioanalyzer greatly reduced between-
gel profile variation seen between standard 1.5% (w/v) agarose gels, indicated by repeated
typing of a control strain showing at least 90.6% profile stability (Figure 2.1). The stability
and reproducibility of the control fingerprint over time shows the value of RAPD as strain
typing method for analysing isolates over a long time period.
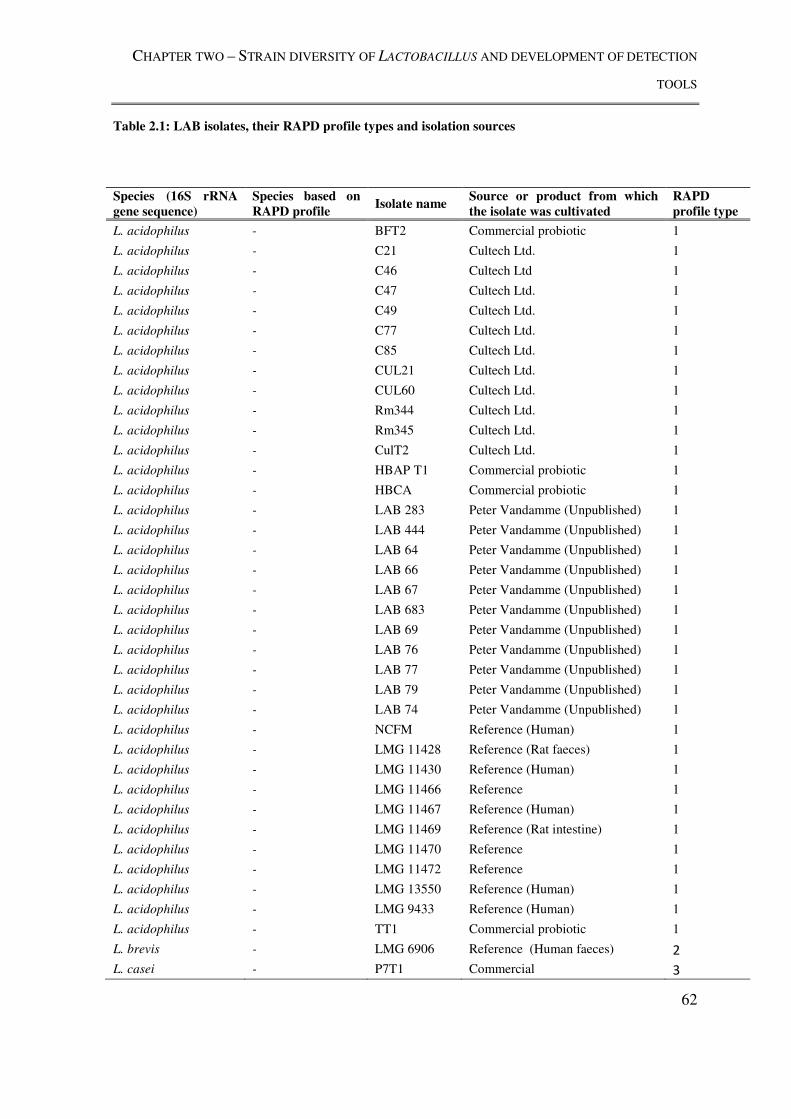
CHAPTER TWO – STRAIN DIVERSITY OF LACTOBACILLUS AND DEVELOPMENT OF DETECTION
TOOLS
62
Table 2.1: LAB isolates, their RAPD profile types and isolation sources
Species (16S rRNA gene sequence)
Species based on RAPD profile
Isolate name Source or product from which the isolate was cultivated
RAPD profile type
L. acidophilus - BFT2 Commercial probiotic 1
L. acidophilus - C21 Cultech Ltd. 1
L. acidophilus - C46 Cultech Ltd 1
L. acidophilus - C47 Cultech Ltd. 1
L. acidophilus - C49 Cultech Ltd. 1
L. acidophilus - C77 Cultech Ltd. 1
L. acidophilus - C85 Cultech Ltd. 1
L. acidophilus - CUL21 Cultech Ltd. 1
L. acidophilus - CUL60 Cultech Ltd. 1
L. acidophilus - Rm344 Cultech Ltd. 1
L. acidophilus - Rm345 Cultech Ltd. 1
L. acidophilus - CulT2 Cultech Ltd. 1
L. acidophilus - HBAP T1 Commercial probiotic 1
L. acidophilus - HBCA Commercial probiotic 1
L. acidophilus - LAB 283 Peter Vandamme (Unpublished) 1
L. acidophilus - LAB 444 Peter Vandamme (Unpublished) 1
L. acidophilus - LAB 64 Peter Vandamme (Unpublished) 1
L. acidophilus - LAB 66 Peter Vandamme (Unpublished) 1
L. acidophilus - LAB 67 Peter Vandamme (Unpublished) 1
L. acidophilus - LAB 683 Peter Vandamme (Unpublished) 1
L. acidophilus - LAB 69 Peter Vandamme (Unpublished) 1
L. acidophilus - LAB 76 Peter Vandamme (Unpublished) 1
L. acidophilus - LAB 77 Peter Vandamme (Unpublished) 1
L. acidophilus - LAB 79 Peter Vandamme (Unpublished) 1
L. acidophilus - LAB 74 Peter Vandamme (Unpublished) 1
L. acidophilus - NCFM Reference (Human) 1
L. acidophilus - LMG 11428 Reference (Rat faeces) 1
L. acidophilus - LMG 11430 Reference (Human) 1
L. acidophilus - LMG 11466 Reference 1
L. acidophilus - LMG 11467 Reference (Human) 1
L. acidophilus - LMG 11469 Reference (Rat intestine) 1
L. acidophilus - LMG 11470 Reference 1
L. acidophilus - LMG 11472 Reference 1
L. acidophilus - LMG 13550 Reference (Human) 1
L. acidophilus - LMG 9433 Reference (Human) 1
L. acidophilus - TT1 Commercial probiotic 1
L. brevis - LMG 6906 Reference (Human faeces) 2
L. casei - P7T1 Commercial 3
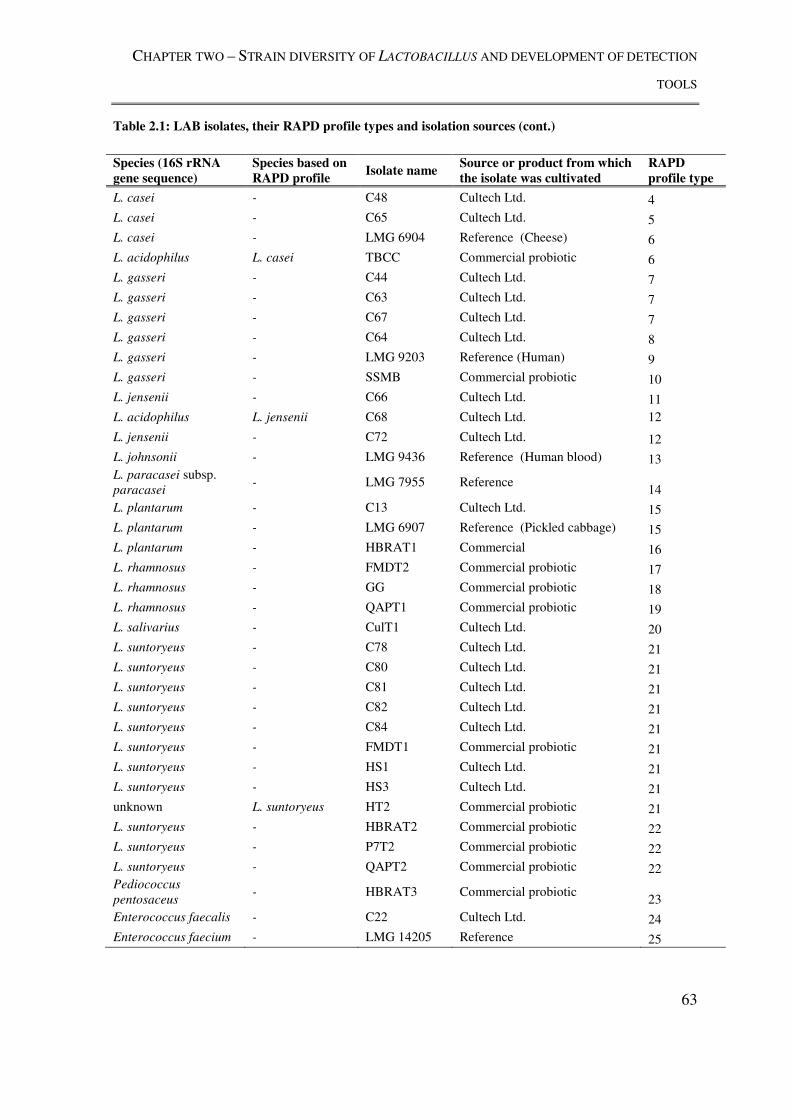
CHAPTER TWO – STRAIN DIVERSITY OF LACTOBACILLUS AND DEVELOPMENT OF DETECTION
TOOLS
63
Table 2.1: LAB isolates, their RAPD profile types and isolation sources (cont.)
Species (16S rRNA gene sequence)
Species based on RAPD profile
Isolate name Source or product from which the isolate was cultivated
RAPD profile type
L. casei - C48 Cultech Ltd. 4
L. casei - C65 Cultech Ltd. 5
L. casei - LMG 6904 Reference (Cheese) 6
L. acidophilus L. casei TBCC Commercial probiotic 6
L. gasseri - C44 Cultech Ltd. 7
L. gasseri - C63 Cultech Ltd. 7
L. gasseri - C67 Cultech Ltd. 7
L. gasseri - C64 Cultech Ltd. 8
L. gasseri - LMG 9203 Reference (Human) 9
L. gasseri - SSMB Commercial probiotic 10
L. jensenii - C66 Cultech Ltd. 11
L. acidophilus L. jensenii C68 Cultech Ltd. 12
L. jensenii - C72 Cultech Ltd. 12
L. johnsonii - LMG 9436 Reference (Human blood) 13 L. paracasei subsp. paracasei
- LMG 7955 Reference 14
L. plantarum - C13 Cultech Ltd. 15
L. plantarum - LMG 6907 Reference (Pickled cabbage) 15
L. plantarum - HBRAT1 Commercial 16
L. rhamnosus - FMDT2 Commercial probiotic 17
L. rhamnosus - GG Commercial probiotic 18
L. rhamnosus - QAPT1 Commercial probiotic 19
L. salivarius - CulT1 Cultech Ltd. 20
L. suntoryeus - C78 Cultech Ltd. 21
L. suntoryeus - C80 Cultech Ltd. 21
L. suntoryeus - C81 Cultech Ltd. 21
L. suntoryeus - C82 Cultech Ltd. 21
L. suntoryeus - C84 Cultech Ltd. 21
L. suntoryeus - FMDT1 Commercial probiotic 21
L. suntoryeus - HS1 Cultech Ltd. 21
L. suntoryeus - HS3 Cultech Ltd. 21
unknown L. suntoryeus HT2 Commercial probiotic 21
L. suntoryeus - HBRAT2 Commercial probiotic 22
L. suntoryeus - P7T2 Commercial probiotic 22
L. suntoryeus - QAPT2 Commercial probiotic 22 Pediococcus
pentosaceus - HBRAT3 Commercial probiotic
23
Enterococcus faecalis - C22 Cultech Ltd. 24
Enterococcus faecium - LMG 14205 Reference 25
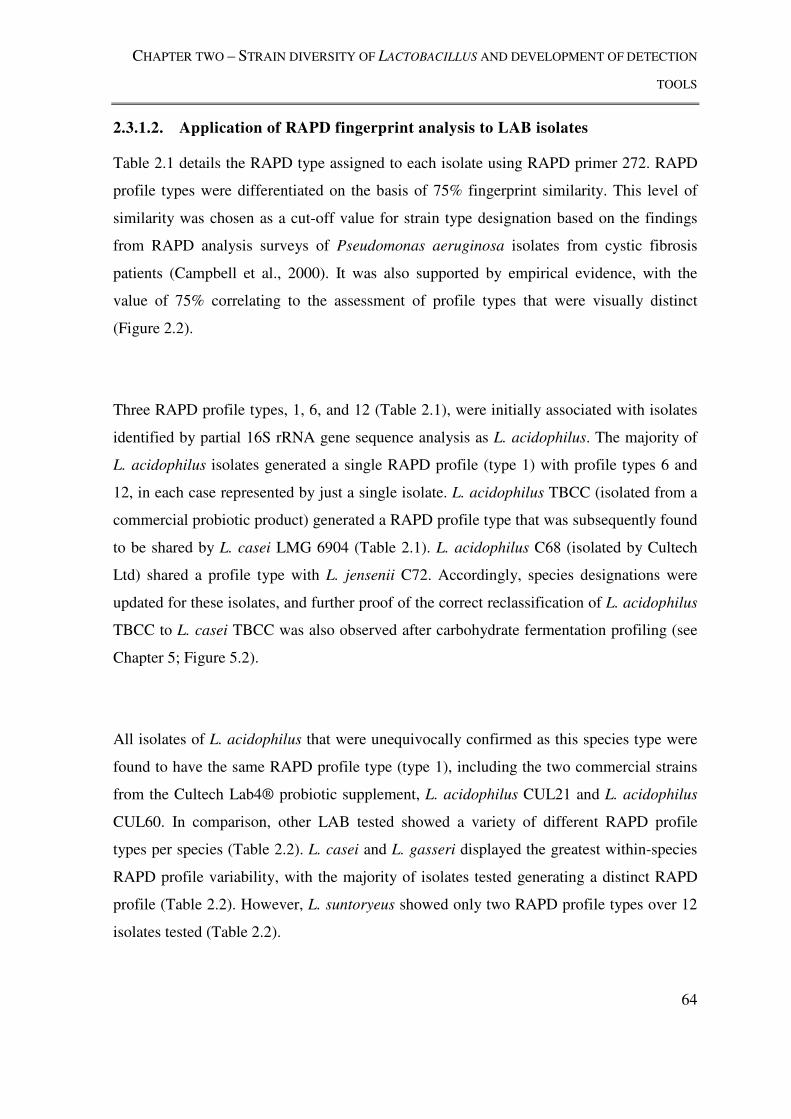
CHAPTER TWO – STRAIN DIVERSITY OF LACTOBACILLUS AND DEVELOPMENT OF DETECTION
TOOLS
64
2.3.1.2. Application of RAPD fingerprint analysis to LAB isolates
Table 2.1 details the RAPD type assigned to each isolate using RAPD primer 272. RAPD
profile types were differentiated on the basis of 75% fingerprint similarity. This level of
similarity was chosen as a cut-off value for strain type designation based on the findings
from RAPD analysis surveys of Pseudomonas aeruginosa isolates from cystic fibrosis
patients (Campbell et al., 2000). It was also supported by empirical evidence, with the
value of 75% correlating to the assessment of profile types that were visually distinct
(Figure 2.2).
Three RAPD profile types, 1, 6, and 12 (Table 2.1), were initially associated with isolates
identified by partial 16S rRNA gene sequence analysis as L. acidophilus. The majority of
L. acidophilus isolates generated a single RAPD profile (type 1) with profile types 6 and
12, in each case represented by just a single isolate. L. acidophilus TBCC (isolated from a
commercial probiotic product) generated a RAPD profile type that was subsequently found
to be shared by L. casei LMG 6904 (Table 2.1). L. acidophilus C68 (isolated by Cultech
Ltd) shared a profile type with L. jensenii C72. Accordingly, species designations were
updated for these isolates, and further proof of the correct reclassification of L. acidophilus
TBCC to L. casei TBCC was also observed after carbohydrate fermentation profiling (see
Chapter 5; Figure 5.2).
All isolates of L. acidophilus that were unequivocally confirmed as this species type were
found to have the same RAPD profile type (type 1), including the two commercial strains
from the Cultech Lab4® probiotic supplement, L. acidophilus CUL21 and L. acidophilus
CUL60. In comparison, other LAB tested showed a variety of different RAPD profile
types per species (Table 2.2). L. casei and L. gasseri displayed the greatest within-species
RAPD profile variability, with the majority of isolates tested generating a distinct RAPD
profile (Table 2.2). However, L. suntoryeus showed only two RAPD profile types over 12
isolates tested (Table 2.2).
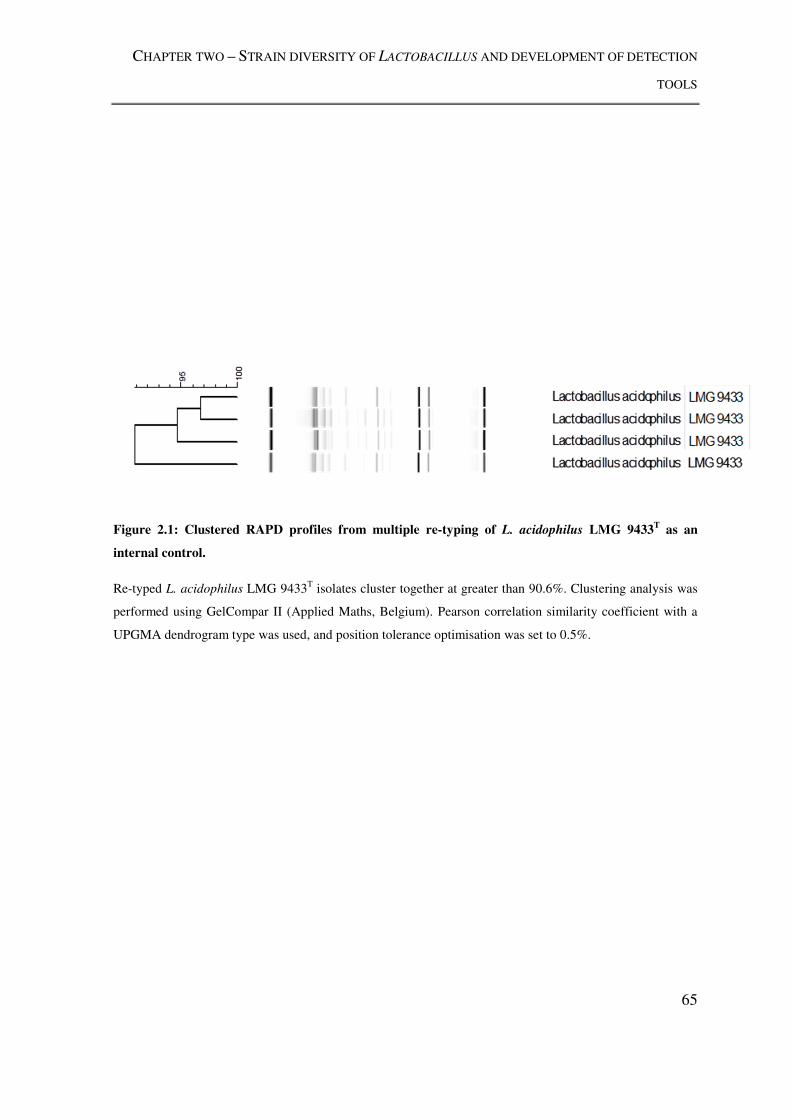
CHAPTER TWO – STRAIN DIVERSITY OF LACTOBACILLUS AND DEVELOPMENT OF DETECTION
TOOLS
65
Figure 2.1: Clustered RAPD profiles from multiple re-typing of L. acidophilus LMG 9433T as an
internal control.
Re-typed L. acidophilus LMG 9433T isolates cluster together at greater than 90.6%. Clustering analysis was
performed using GelCompar II (Applied Maths, Belgium). Pearson correlation similarity coefficient with a
UPGMA dendrogram type was used, and position tolerance optimisation was set to 0.5%.
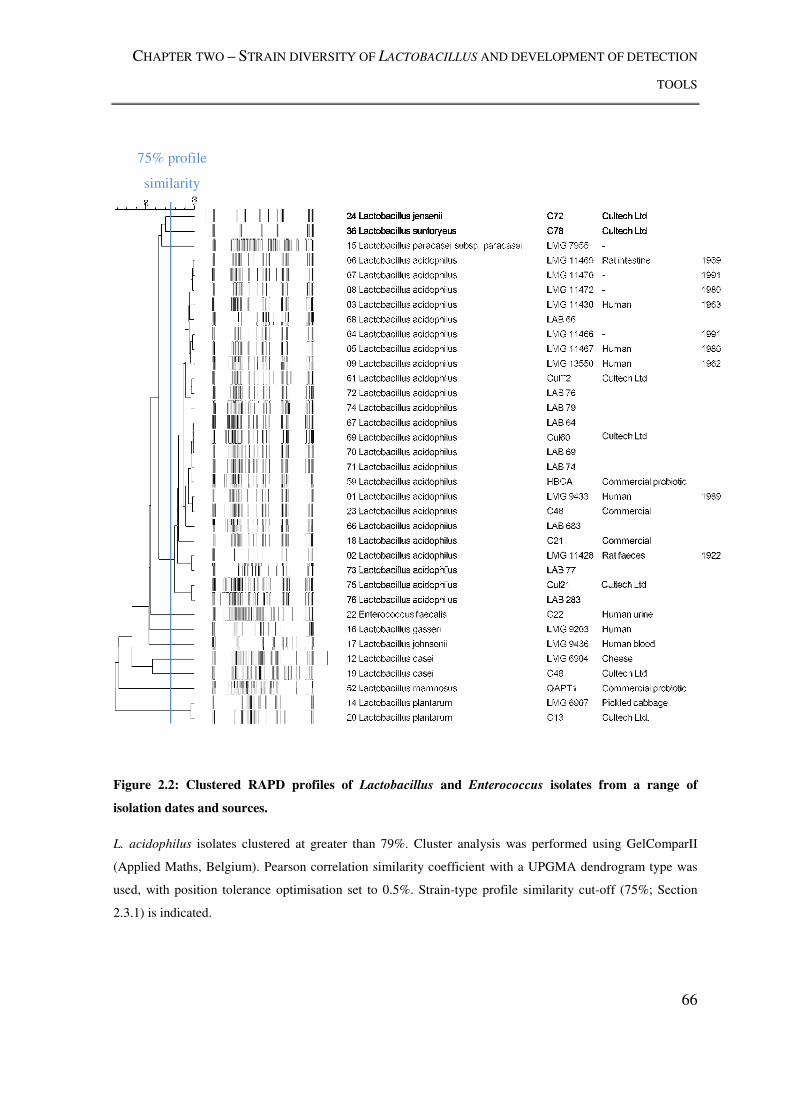
CHAPTER TWO – STRAIN DIVERSITY OF LACTOBACILLUS AND DEVELOPMENT OF DETECTION
TOOLS
66
Figure 2.2: Clustered RAPD profiles of Lactobacillus and Enterococcus isolates from a range of
isolation dates and sources.
L. acidophilus isolates clustered at greater than 79%. Cluster analysis was performed using GelComparII
(Applied Maths, Belgium). Pearson correlation similarity coefficient with a UPGMA dendrogram type was
used, with position tolerance optimisation set to 0.5%. Strain-type profile similarity cut-off (75%; Section
2.3.1) is indicated.
75% profile
similarity
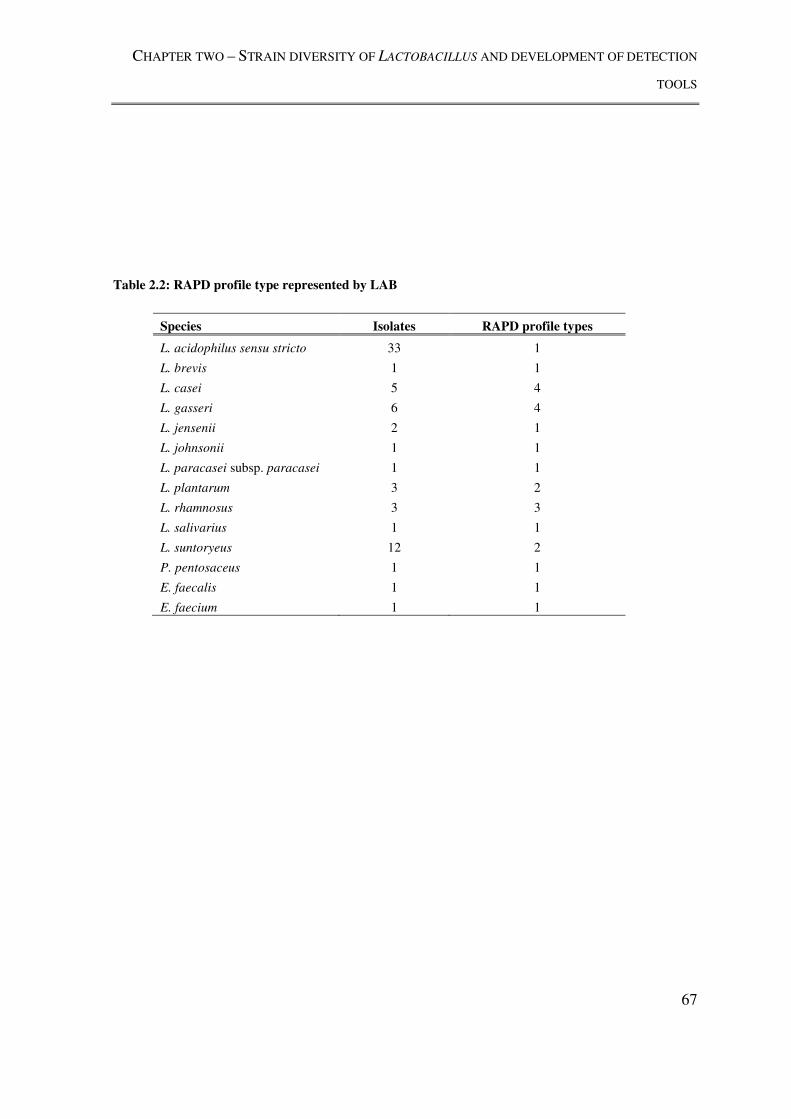
CHAPTER TWO – STRAIN DIVERSITY OF LACTOBACILLUS AND DEVELOPMENT OF DETECTION
TOOLS
67
Table 2.2: RAPD profile type represented by LAB
Species Isolates RAPD profile types
L. acidophilus sensu stricto 33 1
L. brevis 1 1
L. casei 5 4
L. gasseri 6 4
L. jensenii 2 1
L. johnsonii 1 1
L. paracasei subsp. paracasei 1 1
L. plantarum 3 2
L. rhamnosus 3 3
L. salivarius 1 1
L. suntoryeus 12 2
P. pentosaceus 1 1
E. faecalis 1 1
E. faecium 1 1
CHAPTER TWO – STRAIN DIVERSITY OF LACTOBACILLUS AND DEVELOPMENT OF DETECTION
TOOLS
68
2.3.2. DEVELOPMENT OF A SPECIFIC TEST FOR L. ACIDOPHILUS
2.3.2.1. Development of the Potentially Autonomous Units (PAUs) of L.
acidophilus as species specific markers
The three PAU regions of L. acidophilus were selected as prospective targets for
development as species-specific markers because of their unique nature within the L.
acidophilus NCFM genome (Figure 2.3). As an initial screening procedure, the DNA
sequences corresponding to target ORFs within the PAU region (Table 2.3) were searched
against the non-redundant nucleotide database at the National Centre for Biotechnology
Information (NCBI) to establish their specificity. Only sequences belonging to L.
acidophilus were returned as similar (100% coverage, 100% identity, e=0), indicating that
the only record of the PAU regions in the NCBI’s nucleotide database were from L.
acidophilus.
The LBA0479 open reading frame within the Pau3 region was selected as a gene target and
a simple PCR test for PAU DNA was devised using primers FPau3 and RPau3 (Table 2.3).
Initial testing indicated that these PCR primers would allow detection of approximately
5000 colony forming units (cfu) in pure culture. In order to decrease the number of L.
acidophilus cfu able to be detected by this test, a further, nested, PCR primer set was
designed. The target sequences of these PCR primers are interior to FPau3 and RPau3, and
coupled with a second thermal cycle, decreased the detection limit of the PAU specific
marker test to 50 cfu in pure culture (Figure 2.4) .
The specificity of the PAU specific marker system was tested using DNA extracted from
relevant LAB cultures. The test panel was composed of DNA extracted from a panel of 32
LAB species and a single isolate of B. cepacia J2315 (Table 2.4). The panel of 32 LAB
comprised of 25 L. acidophilus isolates from various isolation sources and dates, as well as
reference isolates of L. casei, L. plantarum, L. paracasei subsp. paracasei, L. gasseri and
CHAPTER TWO – STRAIN DIVERSITY OF LACTOBACILLUS AND DEVELOPMENT OF DETECTION
TOOLS
69
L. johnsonii (Table 2.1). Also included were two L. acidophilus isolates reclassified by
RAPD profile similarity analysis; L. casei (L. acidophilus) TBCC and L. jensenii (L.
acidophilus) C68. For the purpose of testing the sensitivity and specificity of the L.
acidophilus specific marker system, the 25 isolates that generated a type 1 RAPD profile
were considered to be L. acidophilus sensu stricto
The PAU-based L. acidophilus specific marker test was 100% specific for identification of
L. acidophilus isolates when compared with other LAB species. All reference isolates from
other LAB species failed to generate a positive PCR product, as did B. cepacia. Also, the
two re-classified isolates; L. casei (L. acidophilus) TBCC and L. jensenii (L. acidophilus)
C68, did not amplify the specific marker region. The PAU3 PCR was not successful at
detecting all L. acidophilus isolates of RAPD profile type 1 however, producing a
sensitivity of 92% within this species, with isolates LMG 11466 and LMG 11469 proving
negative for amplification of the specific LBA0479 ORF (Table 2.4). After resequencing
the genomes of these isolates, they were found to lack the PAU3 region (See Section
4.3.2.2.2). All commercial commercial isolates, including L. acidophilus CUL21 and
CUL60 from the Lab4® complex probiotic, were found to amplify the specific marker
region.
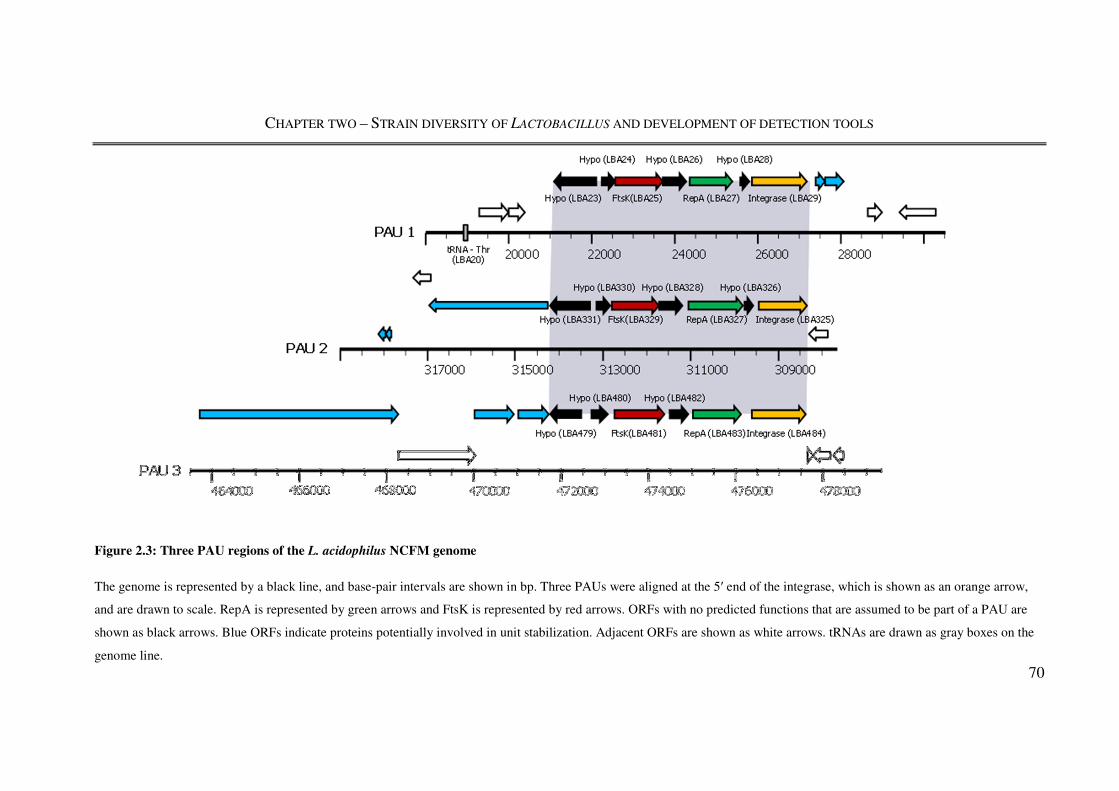
CHAPTER TWO – STRAIN DIVERSITY OF LACTOBACILLUS AND DEVELOPMENT OF DETECTION TOOLS
70
Figure 2.3: Three PAU regions of the L. acidophilus NCFM genome
The genome is represented by a black line, and base-pair intervals are shown in bp. Three PAUs were aligned at the 5′ end of the integrase, which is shown as an orange arrow,
and are drawn to scale. RepA is represented by green arrows and FtsK is represented by red arrows. ORFs with no predicted functions that are assumed to be part of a PAU are
shown as black arrows. Blue ORFs indicate proteins potentially involved in unit stabilization. Adjacent ORFs are shown as white arrows. tRNAs are drawn as gray boxes on the
genome line.

CHAPTER TWO – STRAIN DIVERSITY OF LACTOBACILLUS AND DEVELOPMENT OF DETECTION TOOLS
71
Table 2.3: PCR primer sequences for L. acidophilus specific PCR, based on PAU regions
Primer Name ORFa ORF Function ORF Size (bp) Orientation Tm Sequence
Product size (bp)
FPau3 LBA479 hypothetical 702
Forward 58.75 TGATAATGACCCAATAACAATCG 535
RPau3 Reverse 60.73 GGTCAAGACTGTGTGTAACAATGG FPau3_NESTED
LBA479 hypothetical 702 Forward 53.14 TCCTAGAATGGTAAGAGATTGGCGGGA
405 RPau3_NESTED Reverse 53.82 AGCAAATGCTGTGAAGCATCAGGTGT aORF designations extracted from L. acidophilus NCFM genome sequence (GenBank accession: CP000033)
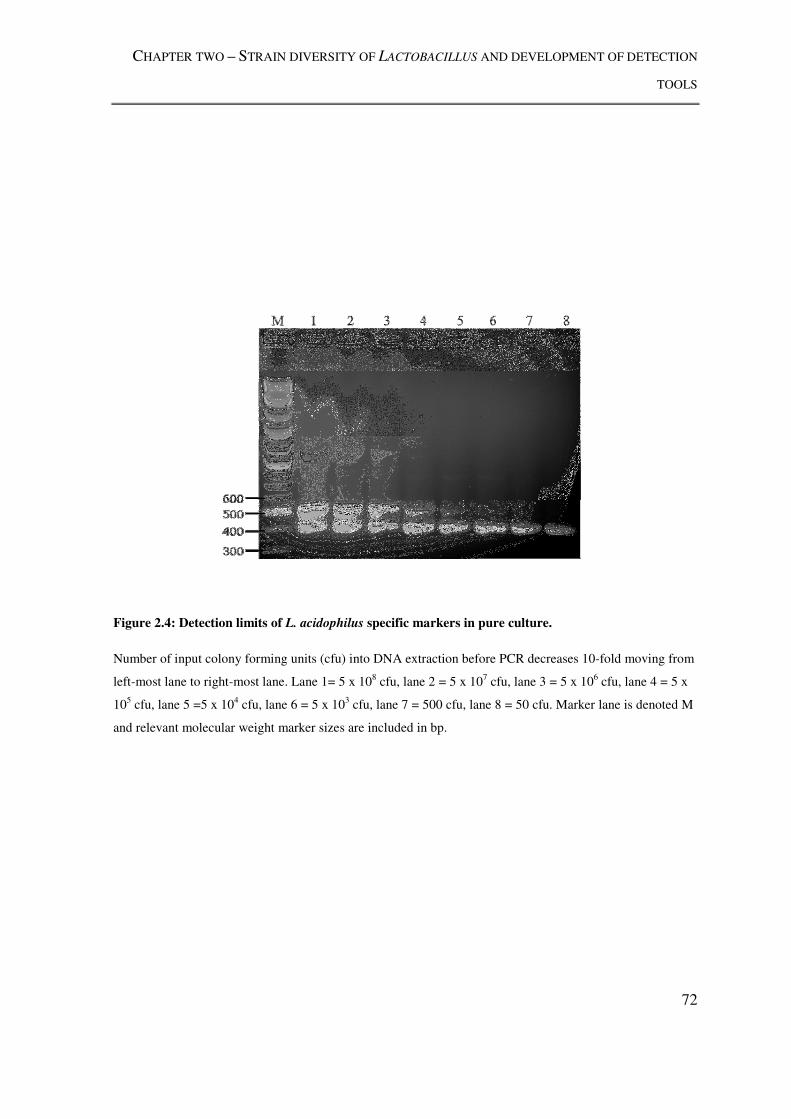
CHAPTER TWO – STRAIN DIVERSITY OF LACTOBACILLUS AND DEVELOPMENT OF DETECTION
TOOLS
72
Figure 2.4: Detection limits of L. acidophilus specific markers in pure culture.
Number of input colony forming units (cfu) into DNA extraction before PCR decreases 10-fold moving from
left-most lane to right-most lane. Lane 1= 5 x 10⁸ cfu, lane 2 = 5 x 10⁷ cfu, lane 3 = 5 x 10⁶ cfu, lane 4 = 5 x
105 cfu, lane 5 =5 x 10⁴ cfu, lane 6 = 5 x 10³ cfu, lane 7 = 500 cfu, lane 8 = 50 cfu. Marker lane is denoted M
and relevant molecular weight marker sizes are included in bp.
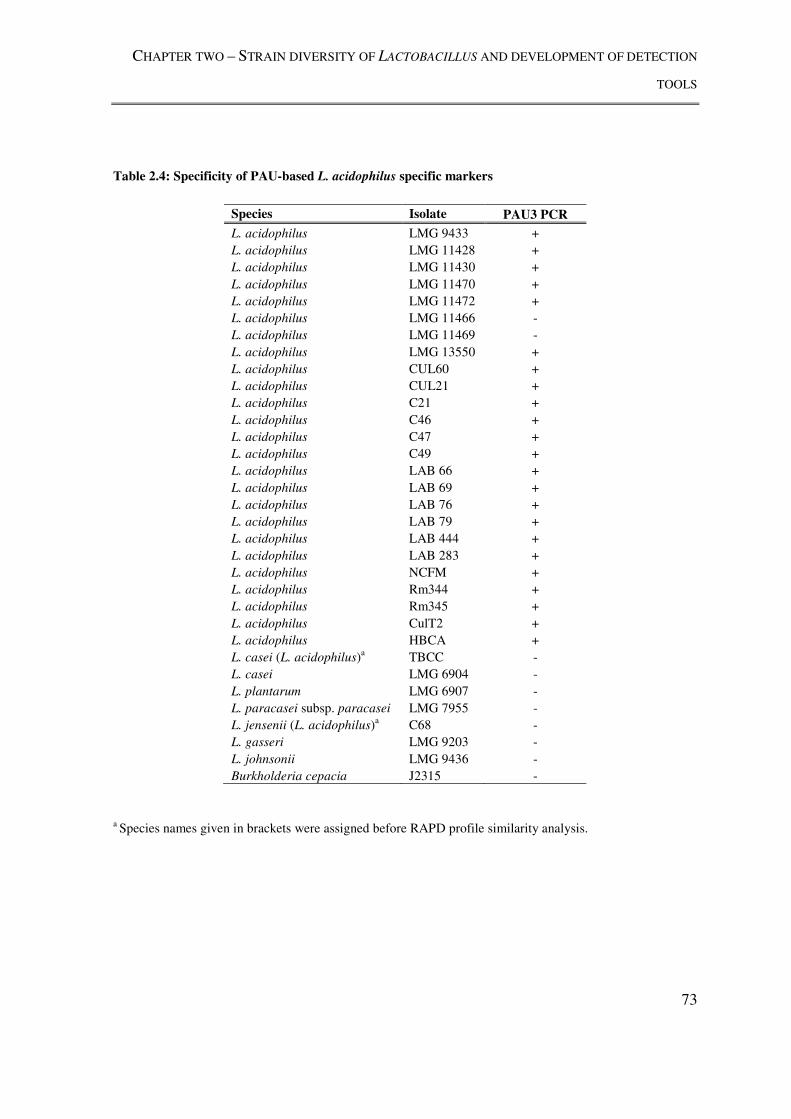
CHAPTER TWO – STRAIN DIVERSITY OF LACTOBACILLUS AND DEVELOPMENT OF DETECTION
TOOLS
73
Table 2.4: Specificity of PAU-based L. acidophilus specific markers
Species Isolate PAU3 PCR
L. acidophilus LMG 9433 +
L. acidophilus LMG 11428 +
L. acidophilus LMG 11430 +
L. acidophilus LMG 11470 +
L. acidophilus LMG 11472 +
L. acidophilus LMG 11466 -
L. acidophilus LMG 11469 -
L. acidophilus LMG 13550 +
L. acidophilus CUL60 +
L. acidophilus CUL21 +
L. acidophilus C21 +
L. acidophilus C46 +
L. acidophilus C47 +
L. acidophilus C49 +
L. acidophilus LAB 66 +
L. acidophilus LAB 69 +
L. acidophilus LAB 76 +
L. acidophilus LAB 79 +
L. acidophilus LAB 444 +
L. acidophilus LAB 283 +
L. acidophilus NCFM +
L. acidophilus Rm344 +
L. acidophilus Rm345 +
L. acidophilus CulT2 +
L. acidophilus HBCA +
L. casei (L. acidophilus)a TBCC -
L. casei LMG 6904 -
L. plantarum LMG 6907 -
L. paracasei subsp. paracasei LMG 7955 -
L. jensenii (L. acidophilus)a C68 -
L. gasseri LMG 9203 -
L. johnsonii LMG 9436 -
Burkholderia cepacia J2315 -
a Species names given in brackets were assigned before RAPD profile similarity analysis.

CHAPTER TWO – STRAIN DIVERSITY OF LACTOBACILLUS AND DEVELOPMENT OF DETECTION
TOOLS
74
2.3.3. PAU-BASED SPECIFIC MARKERS IN CULTURE-DEPENDENT AND CULTURE-
INDEPENDENT APPLICATIONS
2.3.3.1. Isolation of L. acidophilus from mouse faeces
With the intention of expanding the host diversity of the LAB examined in this study, the
PAU-based specific markers were applied in a culture-dependent approach to LAB isolated
from faecal pellets of wild rodents. A total of 45 wild rodents were trapped over a 24 hour
period consisting of; 25 bank voles (Myodes glareolus), 11 wood mice (Apodemus
sylvaticus), six yellow-necked mice (Apodemus flavicollis), and three common shrews
(Sorex araneus). Faecal pellets from traps containing more than one rodent were discarded.
Faecal pellets were obtained from 37 of the traps. Briefly, the faecal pellets collected from
wild rodents were homogenised and diluted before spreading onto MRS agar to enrich for
growth of LAB. Colonies were screened based on their morphology, and any resembling L.
acidophilus were selected for further analysis. In addition, colonies were also picked at
random to populate the LAB isolate collection with a diversity of isolates. In total, 70
colonies were isolated from 37 wild rodent faecal pellets.
Immediately prior to storage of the picked colonies, a rapid DNA extraction using
Chelex® resin was performed and this DNA was used as input for PCRs amplifying part of
the 16S rRNA gene and the L. acidophilus specific PAU marker region. Additionally, a
RAPD-PCR using PCR primer 272 was undertaken on each colony. Total faecal DNA was
also extracted from any remaining faecal material and was used as input for a nested PCR
targeting the L. acidophilus specific PAU marker region to detect the presence of L.
acidophilus using a culture-independent approach.
A phylogeny based on the partial 16S rRNA gene sequences of the isolated LAB showed
the dominant isolated species to be L. animalis and L. murinus. Isolates belonging to the L.
acidophilus group were captured, but these belonged to L. intestinalis rather than L.
acidophilus species (Figure 2.5). No L. acidophilus was isolated, with, no isolates testing
CHAPTER TWO – STRAIN DIVERSITY OF LACTOBACILLUS AND DEVELOPMENT OF DETECTION
TOOLS
75
positive for the PAU-based L. acidophilus marker region and no RAPD profile matching
the unique L. acidophilus profile type (type 1, Table 2.1, Figure 2.1). Finally, when applied
to total faecal DNA extracted from wild rodent faeces in a culture-independent approach,
the PAU-based L. acidophilus specific marker PCR detected no L. acidophilus at either the
first round (detects more than approximately 5,000 cfu) or the second round (detects more
than approximately 50 cfu).
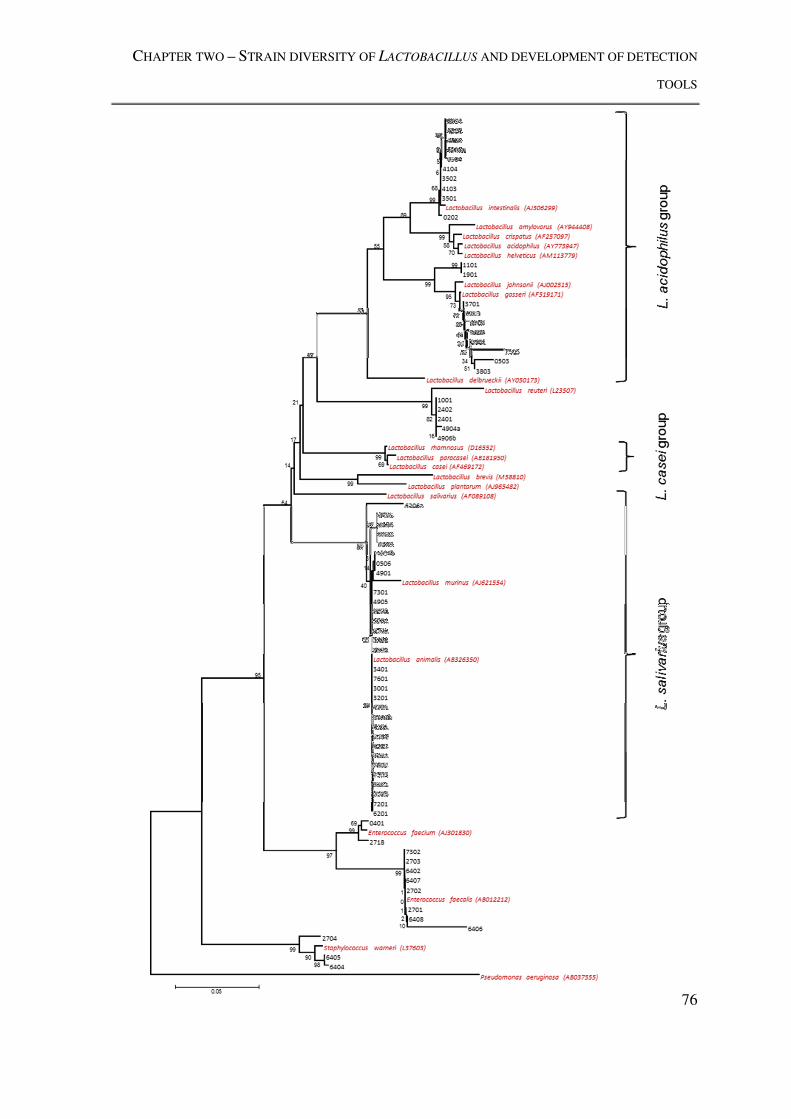
CHAPTER TWO – STRAIN DIVERSITY OF LACTOBACILLUS AND DEVELOPMENT OF DETECTION
TOOLS
76

CHAPTER TWO – STRAIN DIVERSITY OF LACTOBACILLUS AND DEVELOPMENT OF DETECTION
TOOLS
77
← Previous page
Figure 2.5: LAB isolated from wild rodent faeces
Neighbour-joining tree based on the 16S rRNA gene sequences of LAB isolated from wild rodents. Isolates
(coded in black text) are compared to relevant reference sequences (red text, GenBank accession nos.
indicated). Above-species-level groups are indicated with a brace. Alignments over 398 positions, 1000
replicates generated bootstrap figures, scale is indicated in substitutions-per-site. The tree is rooted with
Pseudomonas aeruginosa 16S rRNA gene sequence.

CHAPTER TWO – STRAIN DIVERSITY OF LACTOBACILLUS AND DEVELOPMENT OF DETECTION
TOOLS
78
2.3.3.2. Culture-independent application of L. acidophilus specific PAU-based
markers
To further test the ability of the PAU-based marker test to detect L. acidophilus DNA in
total faecal DNA from a range of host species and systems, total faecal DNA was prepared
from (i) adults from the Republic of Côte d'Ivoire, (ii) healthy human males enrolled on a
probiotic (Lab4®) feeding trial, (iii) rats enrolled on a Lab4® probiotic feeding trial, and
(iv) wild rodent faeces, and used a template DNA for the L. acidophilus specific PAU-
based marker PCR.
No adults from Republic of Côte d'Ivoire tested positive for more than 5,000 cfu of L.
acidophilus (Figure 2.6, panels (i)A and (i)B). After the second round of PCR, 6/19
individuals tested positive for PAU DNA indicating that between 50-5,000 cfu of L.
acidophilus was present in these samples (Figure 2.6, panels (i)B, lanes 9, 12, 13, 15, 18
and 19). When the same test was applied to sixteen healthy human adults enrolled on a
Lab4® probiotic feeding trial (pre-feeding samples), four participants tested positive for
PAU DNA representative of more than 5,000 cfu of L. acidophilus being present (Figure
2.6, panel (ii)A, lanes 2, 6, 7 and 10). An additional eight tested positive for PAU DNA
when the second round PCR was carried out to detect between 50-5,000 cfu of L.
acidophilus (Figure 2.6, panel (ii)B, lanes 5, 8, 9, 11, 13, 14, 15 and 16).
When applied to total faecal DNAs from rats that were being fed the probiotic Lab4®
mixture, no individuals were found to be carrying PAU DNA representative of greater than
5,000 cfu of L. acidophilus (Figure 2.7, panel A). However, the majority of rats (10/11)
were found to be carrying the PAU marker at a level representing between 50 and 5,000
cfu of L. acidophilus (Figure 2.7, panel B). When the same test was applied to total faecal
DNA extracted from wild rodents, no detectable levels of L. acidophilus were seen with
the specific marker test.

CHAPTER TWO – STRAIN DIVERSITY OF LACTOBACILLUS AND DEVELOPMENT OF DETECTION
TOOLS
79
(i)
(ii)
CHAPTER TWO – STRAIN DIVERSITY OF LACTOBACILLUS AND DEVELOPMENT OF DETECTION
TOOLS
80
←Previous Page
Figure 2.6: Examining adult total faecal DNA from (i) Adults from Republic of Côte d'Ivoire and (ii)
healthy human males enrolled on a probiotic (Lab4®) feeding trial (pre-feeding), for the presence of L.
acidophilus using PAU-based L. acidophilus specific marker
Panel (iA) shows PCR products from 19 total faecal DNAs (lanes 1-19), a negative PCR water control (lane
20) and L. acidophilus NCFM DNA as a positive control (lane 21). Panel (iB) shows the same, with an
additional L. acidophilus NCFM DNA positive control for the second round of PCR (lane 22) and an
additional water PCR control for the second round of PCR (lane 23). Panel (iiA) shows 16 total faecal DNAs
(lanes 1-16), an L. acidophilus NCFM DNA as a positive control (lane 17) and a negative PCR water control
(lane 18). Panel (iB) shows the same, with an additional L. acidophilus NCFM DNA positive control for the
second round of PCR (lane 19) and an additional water PCR control for the second round of PCR (lane 20).
Lane M contains molecular size marker with sizes of relevant bands given in bp.
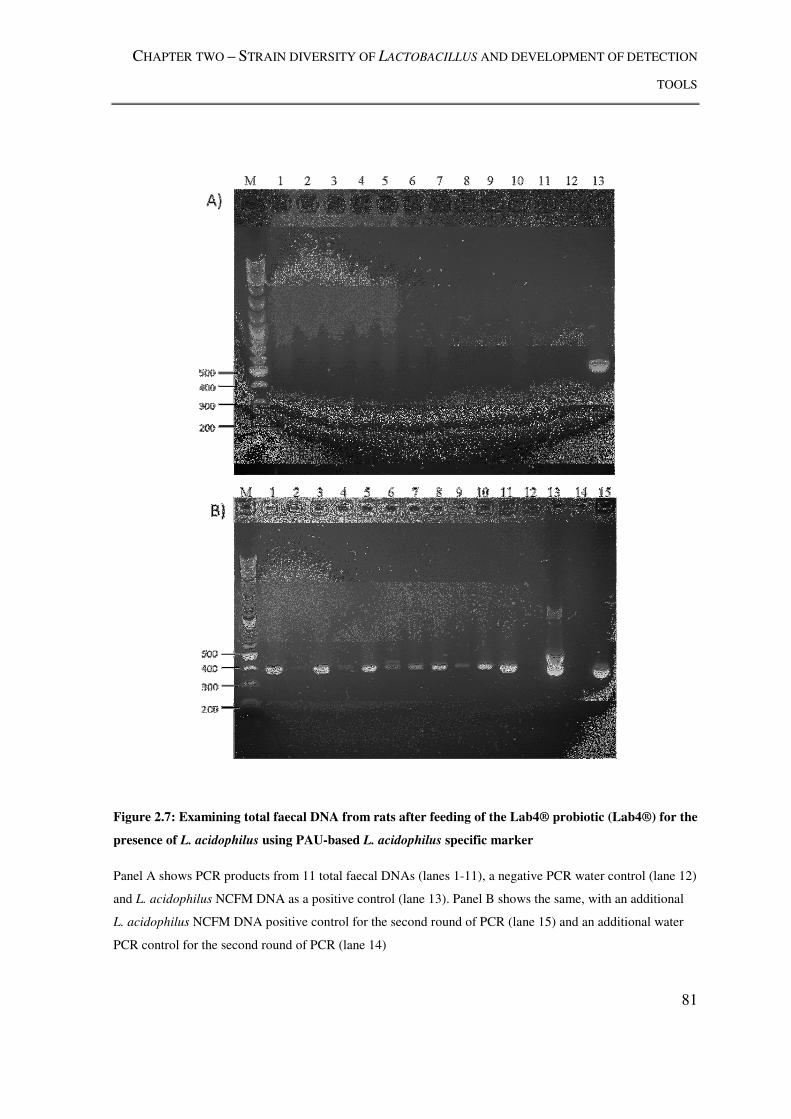
CHAPTER TWO – STRAIN DIVERSITY OF LACTOBACILLUS AND DEVELOPMENT OF DETECTION
TOOLS
81
Figure 2.7: Examining total faecal DNA from rats after feeding of the Lab4® probiotic (Lab4®) for the
presence of L. acidophilus using PAU-based L. acidophilus specific marker
Panel A shows PCR products from 11 total faecal DNAs (lanes 1-11), a negative PCR water control (lane 12)
and L. acidophilus NCFM DNA as a positive control (lane 13). Panel B shows the same, with an additional
L. acidophilus NCFM DNA positive control for the second round of PCR (lane 15) and an additional water
PCR control for the second round of PCR (lane 14)
CHAPTER TWO – STRAIN DIVERSITY OF LACTOBACILLUS AND DEVELOPMENT OF DETECTION
TOOLS
82
2.4. DISCUSSION
2.4.1. STRAIN TYPING LAB USING RAPD PROFILE SIMILARITY ANALYSIS
2.4.1.1. Typing Lactobacillus isolates
PCR-electrophoresis-based strain typing methods, particularly RAPD, have previously
been criticised for their low repeat reproducibility (Maukonen et al., 2003). The
reproducibility of RAPD profiles for the same isolate, generated at multiple time points
and on different microfluidics chips, showed that the use of the Bioanalyzer microfluidics
platform in this study reduced repeat variability to less than 10%, less than half the profile
variability expected to be seen within a single profile type (Figure 2.1). This allowed
RAPD to be performed on a large collection of LAB isolates by enabling accurate
comparisons of RAPD profiles generated on different microfluidics chips. This supported
previous work that showed the microfluidics system was advantageous over agarose gel
electrophoresis (Cooper et al., 2008), where comparisons can only be drawn with any
accuracy from a small dataset on a single agarose gel.
RAPD profile similarity analysis was successfully applied to 75 LAB isolates, belonging to
14 distinct species. High quality RAPD profiles for all 75 LAB isolates, which were
originally isolated from a wide range of sources and years, were generated and
subsequently compared to examine the genetic diversity of LAB isolates, with particular
emphasis on L. acidophilus isolates. Across the 14 LAB species examined, the study
identified distinct 25 RAPD profile types, based on 75% profile similarity (Table 2.1).
Generally, there was high intra-specific RAPD profile variation. L. casei, L. gasseri, L.
jensenii, L. plantarum, L. suntoryeus and L. rhamnosus all generated at least two distinct
RAPD profiles per species, although the 12 isolates identified as L. suntoryeus showed
only two RAPD profile types. The high level of sub-species diversity is consistent with
levels seen in other studies on L. plantarum (Aznar and Chenoll, 2006), L. rhamnosus
(Vancanneyt et al., 2006), L. casei (Roy et al., 1999) and L. gasseri (Du Plessis and Dicks,
CHAPTER TWO – STRAIN DIVERSITY OF LACTOBACILLUS AND DEVELOPMENT OF DETECTION
TOOLS
83
1995). L suntoryeus is somewhat of a special case, as its 16S rRNA gene is 99.3% similar
to L. helveticus (Cachat and Priest, 2005). Since the proposal of L. suntoryeus as novel
species, sequence similarity analyses of housekeeping genes (atpA, rpoA, pheS, tuf, slp and
groEL) have shown high relatedness between it and L. helveticus, leading to designation of
L. suntoryeus as taxonomic unit with the species L. helveticus (Naser et al., 2006). , The
two taxonomic groups could be clearly distinguished, however, by Amplified Fragment
Length Polymorphism (AFLP) (Naser et al., 2006). In the current study two RAPD profile
type were captured for isolates designated as L. suntoryeus, correlating to the
reclassification of L. helveticus and identification of at least two taxonimic groups within
this species (Naser et al., 2006).
2.4.1.2. Typing L. acidophilus
Despite numerous studies detailing the application of RAPD strain typing to other LAB
species (section 2.4.1.1) there has been little work to establish the diversity of L.
acidophilus at the strain level, despite its broad commercial importance. Numerous studies
have evaluated the interspecific diversity of the L. acidophilus group (Johnson et al., 1980,
Berger et al., 2007, Schillinger et al., 2003), but this is the first to examine such a number
of strictly L. acidophilus species isolates in the context of other LAB. In contrast to the
relatively high level of intra-specific RAPD profile diversity of the other LAB isolates
tested, 10 reference, 15 commercial probiotic and 11 other isolates of L. acidophilus were
assigned the same RAPD type (type 1). The reference isolates were originally deposited
into culture collections in disparate years (Figure 2.2) and were originally isolated from
various hosts and systems (Table 2.1), including rat faeces (L. acidophilus LMG 11428),
humans (L. acidophilus LMG 9433). When expanded to cover isolates from industrial
applications such as in probiotic products (L. acidophilus CUL21 and L. acidophilus
CUL60), the current study has arguably one of the widest scopes for capturing strain
diversity within this species.

CHAPTER TWO – STRAIN DIVERSITY OF LACTOBACILLUS AND DEVELOPMENT OF DETECTION
TOOLS
84
Although RAPD data should be used only tentatively to describe genetic relatedness
between isolates of LAB, this study also demonstrated the power of RAPD as a strain
typing method across multiple LAB. With this fact in mind, since this study demonstrated
that the numerous isolations of L. acidophilus (disparate both geographically and
temporally), all had the same RAPD profile type, it suggests that either: (i) L. acidophilus
may be a monophyletic Lactobacillus taxon, (ii) that the examined isolates belonged to the
same evolutionary clade, or (iii) the isolates examined do not fully represent the diversity
of L. acidophilus strains. To examine the latter question of whether full isolate diversity
had been captured, an accurate cultivation-independent method of identifying L.
acidophilus using the PAU-region was devised in order to rapidly identify whether it was
present in other hosts, such as wild rodents. If L. acidophilus DNA was detected in these
faecal samples, then a cultivation-based approach could be applied to collect these isolates
and add further diversity to the isolate collections available for RAPD genotyping analysis.
2.4.2. PAU REGIONS AS SPECIFIC MARKER REGIONS FOR L. ACIDOPHILUS
Previous studies have developed PCR primers or specific oligonucleotide probes for L.
acidophilus targeting the 23S rRNA gene (Pot et al., 1993), the ribosomal intergenic spacer
(ITS) region (Song et al., 2000) and the 16S rRNA gene (Walter et al., 2000). The
sequence identity observed in the 16S rRNA gene of the L. acidophilus group which is
>99% in between certain species (Sarmiento-Rubiano et al., 2010) makes it a challenging
target for species-specific probes design. This high level of identity may also account for
the reduced specificity of probes based on the rDNA region and raises the question of
developing marker regions from other genomic loci would prove a more accurate means to
differentiate between Lactobacillus species.
A simple PCR test for the presence of PAU3 was developed with the design of PCR
primers to amplify a region of an ORF present in PAU3 (Figure 2.3, Table 2.3). As L.
acidophilus NCFM is the only complete genome sequence available, this study screened
32 lactobacilli (25 L. acidophilus isolates) to examine the distribution of PAU3 among
lactobacilli and hence validate the region as one specific to L. acidophilus. All but two

CHAPTER TWO – STRAIN DIVERSITY OF LACTOBACILLUS AND DEVELOPMENT OF DETECTION
TOOLS
85
isolates (LMG 11466 and LMG 11469) designated as L. acidophilus tested positive for the
PAU3 specific marker (confirmed by DNA sequence), and no other lactobacilli (including
members of the L. acidophilus group) cross-reacted with the specific PCR primers. The
lack of the PAU3 marker region in L. acidophilus LMG 11466 and LMG 11467 was
attributed to an absence of this DNA after genome re-sequencing (see Chapter 4) PAU
regions are phage remnants and instability is associated with these mobile elements
(Altermann et al., 2005, Brüssow, 2001). Further discussion of the genomics of this region
is provided in Chapter 4.
The PAU region of the L. acidophilus NCFM genome was originally selected as a potential
L. acidophilus specific target region based on its highly conserved sequence within
genome sequenced L. acidophilus isolates and because it was unique in sequence to L.
acidophilus isolates when tested with a nucleotide Blast (BlastN). Recent analyses have
shown however, that PAU region structural homologues exist in L. johnsonii NCC533,
Lactococcus lactis subsp. cremoris SK11 and Streptococcus agalacticae NEM316
(Altermann and Klaenhammer, 2011). The amino acid sequences of these regions are less
conserved between species than they are within the same genome, that is to say PAU3 is
more similar to PAU2 and PAU1in L. acidophilus than it is to any PAU analogues in other
species, although functional classification of the genes in these regions is conserved,
suggesting that these elements arose from different roots (Altermann and Klaenhammer,
2011). The wider than anticipated distribution of these elements, which combine
characteristics of both bacteriophage and plasmid DNA, suggests that they are not peculiar
to the L. acidophilus genome, but potentially represent a whole class of mobile genetic
elements that may be sub-divided into distinct families. No function or in vivo activity has
yet been attributed to these regions (Altermann and Klaenhammer, 2011). Despite the
presence of the these structural homologues in other LAB species, the LBA479 ORF
probes developed to detect the L. acidophilus PAU3 remain 100% specific for this region
as the PCR primers in terms of sequence homology and are mis-matched in these other
PAU homologous regions.
CHAPTER TWO – STRAIN DIVERSITY OF LACTOBACILLUS AND DEVELOPMENT OF DETECTION
TOOLS
86
2.4.3. HOST RANGE OF L. ACIDOPHILUS
2.4.3.1. Searching for L. acidophilus in wild rodents
The detection limit of the specific marker test improved to 50 cfu by developing a nested
PCR primer set, combined with a two-round PCR thermal cycling program. When applied
to total DNA extracted from wild rodent faeces, no PAU DNA was detected, indicating an
absence, or at least undetectable levels of L. acidophilus present. Culture-independent
studies have shown that lactobacilli represent between 5 and 8% of the total sequence reads
from the natural rodent gut, however their high species-level diversity would cause the
abundance of a single species to be relatively low (Brooks et al., 2003, Tomas et al., 2012).
When applied to rodents that were being fed the Lab4® probiotic, whose proportional
presence of L. acidophilus was expected to be higher as they had been fed over 109 L.
acidophilus each day, the PAU-based specific marker system was able to detect L.
acidophilus in 91% of rat faeces.
Using a culture-based approach, no L. acidophilus was isolated from the faeces of wild
rodents. Proportionally large numbers of L. animalis and L. murinus were isolated, which
was to be expected as both naturally reside in the gut of rodents (Fraga et al., 2005, Sarma-
Rupavtarm et al., 2004). RAPD profile similarity analysis also showed no isolates with
similar profiles to L. acidophilus, ensuring that the PAU-based L. acidophilus specific
marker did not fail to identify any L. acidophilus that may have been present. Rodents such
as rats and mice are commonly used to model systems of human disease, and metagenomic
studies of rodents with perturbations of their normal gut microbiota abound (Turnbaugh et
al., 2006, Murphy et al., 2010, Turnbaugh et al., 2008). These studies are performed on
laboratory-bred and raised animals that certainly do not have a “wild type” microbiota.
L. acidophilus is well documented as a human associated organism with a human gut-
specific gene set, functionally different to that of Lactobacillus helveticus, a species found
in dairy products that shares 98.4% 16S rRNA sequence identity (O'Sullivan et al., 2009).
CHAPTER TWO – STRAIN DIVERSITY OF LACTOBACILLUS AND DEVELOPMENT OF DETECTION
TOOLS
87
This study was able to detect L. acidophilus in human faeces in a semi-quantitative culture-
independent manner, with between 32 and 75% of studied individuals appearing to carry L.
acidophilus at a level over the lower detection limit of the specific marker test. This wide
range of carriage rates of L. acidophilus in humans is reflected by what we already know
about the “patchy” distribution of L. acidophilus in healthy adults from culture-based
(Mahenthiralingam et al., 2009) and culture-independent studies (Kleerebezem and
Vaughan, 2009, Walter, 2008). It should be noted however, that use of the 16S rRNA gene
as molecular target for indexing microbial diversity in the GIT may give a broad overview;
it is not effective at distinguishing some Lactobacillus to the species level because of the
high 16S rRNA gene similarity. The development of next-generation sequencing
technologies promising increased sequence read length at no detriment to overall diversity
indexed will allow improved species-level assignments based solely on the extra
phylogenetic information afforded by increased read lengths.

CHAPTER TWO – STRAIN DIVERSITY OF LACTOBACILLUS AND DEVELOPMENT OF DETECTION
TOOLS
88
2.5. CONCLUSIONS
The main conclusions from this chapter are as follows:
1) RAPD profile similarity analysis is an effective method of both identifying LAB
and examining their sub-species level genetic diversity. It was highly reproducible
and could be successfully applied to a large collection of LAB isolates.
2) LAB generally show a relatively high amount of sub-species level diversity. The
exceptions to this rule are L. suntoryeus-L. helveticus and L. acidophilus. L.
acidophilus isolates were from disparate isolation locations, deposition dates and
host species. All L. acidophilus sensu stricto isolates generated a single RAPD
profile type, based on 75% profile similarity, indicating the possibility that L.
acidophilus isolates were all from a single strain type.
3) To ensure that the genetic diversity of L. acidophilus was reflected by the isolates
tested, wild rodents were surveyed for the presence of L. acidophilus both culture
dependently and independently. The PAU-based specific marker test proved
effective at detecting L. acidophilus specifically. No L. acidophilus was found in
wild rodents and the human carriage rate was variable.
4) Further work, at a discriminatory power above that of RAPD, is necessary study to
examine the genetic structure of L. acidophilus as a species and whether it is
clonally monophyletic.

CHAPTER TWO – STRAIN DIVERSITY OF LACTOBACILLUS AND DEVELOPMENT OF DETECTION
TOOLS
89

CHAPTER THREE - MINIMUM TAXONOMIC CRITERIA FOR BACTERIAL GENOME SEQUENCE
DEPOSITIONS
90
3. MINIMUM TAXONOMIC CRITERIA FOR BACTERIAL GENOME
SEQUENCE DEPOSITIONS
The majority of the analyses and discussion within this chapter was published within:
“BULL, M. J., MARCHESI, J. R., VANDAMME, P., PLUMMER, S. &
MAHENTHIRALINGAM, E. 2012. Minimum taxonomic criteria for bacterial genome
sequence depositions and announcements. Journal of Microbiological Methods, 89, 18-21”
3.1. INTRODUCTION
The genomic revolution has impacted multiple fields of microbiology facilitating the
application of DNA sequence-based analyses to numerous questions in ecology, infection and
industry (Medini et al., 2008). Bacterial genome sequence information is highly accessible
and with minimal training researchers that are not specialists in a given field can use it to
develop a wealth of molecular tools such as strain or species-specific PCR markers. In doing
so, however, researchers are heavily reliant on the accurate deposition of data associated with
genome sequences and the genetic databases. Although the taxonomy of many bacterial
groups continues to change, the use of correct nomenclature for bacterial species is part of a
fundamental language that allows microbiologists to communicate with each other and across
other disciplines. Hence, when the species nomenclature associated with a bacterial genome
sequence is incorrect it can have broad implications and impact on a multitude of fields. In
2008 (Field et al.) recognised the need for minimum descriptive criteria for genomes and
metagenomes. They provided examples of data deposition records listing multiple criteria that
included taxonomic status as a leading descriptor (Claesson et al., 2008). However, correctly
assigning taxonomic status to an organism’s genome is generally left to the research group
submitting the sequence. With the current level of sequence data being deposited, it is
CHAPTER THREE - MINIMUM TAXONOMIC CRITERIA FOR BACTERIAL GENOME SEQUENCE
DEPOSITIONS
91
difficult for the DNA databases to further analyse the sequences and ensure that the
taxonomic status of a genome is correct.
The availability of a complete bacterial genome sequence facilitates the application of several
bioinformatic analyses to enable the source organism to be assigned to formally classified
species or phylogenetic groups (Coenye et al., 2005). For all newly determined bacterial
genomes it should therefore be relatively straightforward to systematically classify the
bacterium from which the genome originates. However, the deposition of genome sequences
assigned to the wrong systematic nomenclature may still occur if the sequences are not
carefully analysed in a taxonomic context. Oh et al. (2011) recently deposited a genome
sequence for Lactobacillus acidophilus 30SC, a bacterial isolate recovered from swine gut.
The taxonomy of the genus Lactobacillus has changed considerably in recent years rendering
biochemical or phenotypic analysis alone unable to permit accurate species identification for
several constituent groups. For the existing Lactobacillus species however, DNA sequence-
based methods can facilitate their accurate assignment at the species level (Naser et al., 2007).
By examination of the L. acidophilus 30SC genome using just two defining characteristics, its
full length 16S rRNA gene phylogeny and two conserved protein-encoding gene phylogenies,
we were able to demonstrate that the genome sequence in fact must have originated from a
strain of Lactobacillus amylovorus. To reduce the potential for such misclassification in
future, we outline a simple bioinformatic analysis scheme and a minimum set of taxonomic
criteria that should be applied to bacterial genomes before their formal deposition and
announcement to the microbiology community.
CHAPTER THREE - MINIMUM TAXONOMIC CRITERIA FOR BACTERIAL GENOME SEQUENCE
DEPOSITIONS
92
3.1.1. SPECIFIC AIMS
The aims of this chapter were as follows:
1) Analyse the phylogenetic placement of L. acidophilus 30SC using its recently
published genome sequence.
2) Construct Lactobacillus phylogenies using straightforward analyses based on the 16S
rRNA gene sequence.
3) Construct Lactobacillus phylogenies using analyses based on the sequence of other
phylogenetic marker genes such as gyrase B.
4) Set out a standard bioinformatic process that can be applied to newly generated
genome sequences to ensure that they are accurately assigned to the genus or species
level before deposition to a database and subsequent announcement.
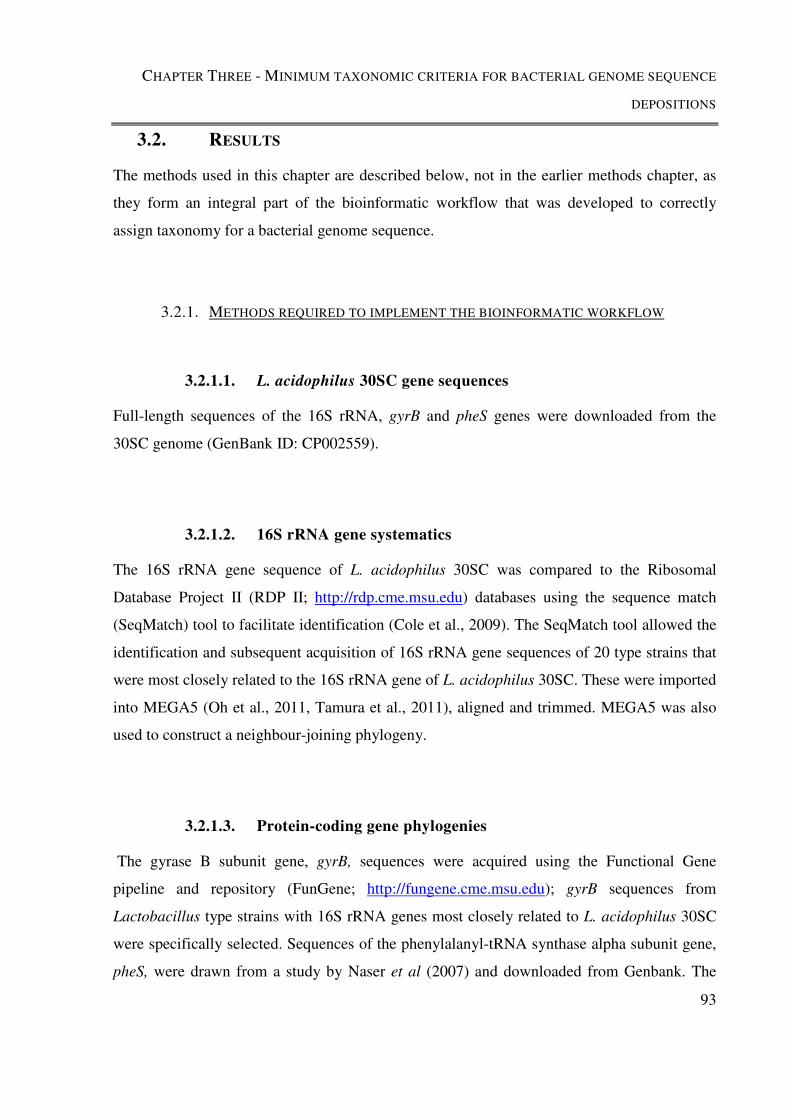
CHAPTER THREE - MINIMUM TAXONOMIC CRITERIA FOR BACTERIAL GENOME SEQUENCE
DEPOSITIONS
93
3.2. RESULTS
The methods used in this chapter are described below, not in the earlier methods chapter, as
they form an integral part of the bioinformatic workflow that was developed to correctly
assign taxonomy for a bacterial genome sequence.
3.2.1. METHODS REQUIRED TO IMPLEMENT THE BIOINFORMATIC WORKFLOW
3.2.1.1. L. acidophilus 30SC gene sequences
Full-length sequences of the 16S rRNA, gyrB and pheS genes were downloaded from the
30SC genome (GenBank ID: CP002559).
3.2.1.2. 16S rRNA gene systematics
The 16S rRNA gene sequence of L. acidophilus 30SC was compared to the Ribosomal
Database Project II (RDP II; http://rdp.cme.msu.edu) databases using the sequence match
(SeqMatch) tool to facilitate identification (Cole et al., 2009). The SeqMatch tool allowed the
identification and subsequent acquisition of 16S rRNA gene sequences of 20 type strains that
were most closely related to the 16S rRNA gene of L. acidophilus 30SC. These were imported
into MEGA5 (Oh et al., 2011, Tamura et al., 2011), aligned and trimmed. MEGA5 was also
used to construct a neighbour-joining phylogeny.
3.2.1.3. Protein-coding gene phylogenies
The gyrase B subunit gene, gyrB, sequences were acquired using the Functional Gene
pipeline and repository (FunGene; http://fungene.cme.msu.edu); gyrB sequences from
Lactobacillus type strains with 16S rRNA genes most closely related to L. acidophilus 30SC
were specifically selected. Sequences of the phenylalanyl-tRNA synthase alpha subunit gene,
pheS, were drawn from a study by Naser et al (2007) and downloaded from Genbank. The
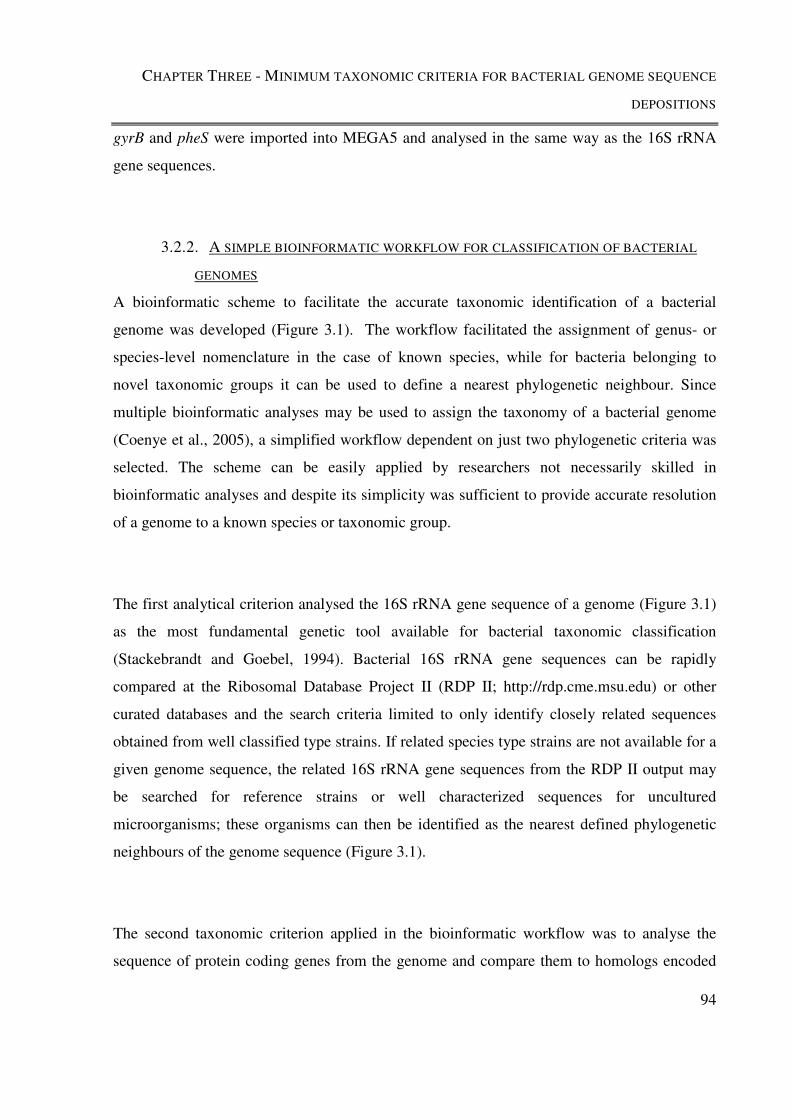
CHAPTER THREE - MINIMUM TAXONOMIC CRITERIA FOR BACTERIAL GENOME SEQUENCE
DEPOSITIONS
94
gyrB and pheS were imported into MEGA5 and analysed in the same way as the 16S rRNA
gene sequences.
3.2.2. A SIMPLE BIOINFORMATIC WORKFLOW FOR CLASSIFICATION OF BACTERIAL
GENOMES
A bioinformatic scheme to facilitate the accurate taxonomic identification of a bacterial
genome was developed (Figure 3.1). The workflow facilitated the assignment of genus- or
species-level nomenclature in the case of known species, while for bacteria belonging to
novel taxonomic groups it can be used to define a nearest phylogenetic neighbour. Since
multiple bioinformatic analyses may be used to assign the taxonomy of a bacterial genome
(Coenye et al., 2005), a simplified workflow dependent on just two phylogenetic criteria was
selected. The scheme can be easily applied by researchers not necessarily skilled in
bioinformatic analyses and despite its simplicity was sufficient to provide accurate resolution
of a genome to a known species or taxonomic group.
The first analytical criterion analysed the 16S rRNA gene sequence of a genome (Figure 3.1)
as the most fundamental genetic tool available for bacterial taxonomic classification
(Stackebrandt and Goebel, 1994). Bacterial 16S rRNA gene sequences can be rapidly
compared at the Ribosomal Database Project II (RDP II; http://rdp.cme.msu.edu) or other
curated databases and the search criteria limited to only identify closely related sequences
obtained from well classified type strains. If related species type strains are not available for a
given genome sequence, the related 16S rRNA gene sequences from the RDP II output may
be searched for reference strains or well characterized sequences for uncultured
microorganisms; these organisms can then be identified as the nearest defined phylogenetic
neighbours of the genome sequence (Figure 3.1).
The second taxonomic criterion applied in the bioinformatic workflow was to analyse the
sequence of protein coding genes from the genome and compare them to homologs encoded

CHAPTER THREE - MINIMUM TAXONOMIC CRITERIA FOR BACTERIAL GENOME SEQUENCE
DEPOSITIONS
95
within the related species/phylogenetic groups revealed by the initial 16S rRNA gene analysis
(Figure 3.1). Analysis of protein-coding genes such as recA (Eisen, 1995) or gyrB
(Yamamoto and Harayama, 1996), has been shown to be highly effective in assigning the
taxonomy of species with particularly conserved 16S rRNA gene sequences. However, since
protein-coding gene phylogenies may not always be congruent with the 16S rRNA gene for
many bacterial species due to the lower taxonomic resolution of the latter ribosomal gene and
the possibility of recombination and lateral gene transfer (Lukjancenko et al., 2011), we
suggest two or more protein-coding genes should be examined to bring a finer resolution to
the taxonomic placement of a genome (Figure 3.1).
In addition to using the latter databases to compare the 16S rRNA gene and selected protein-
coding gene, phylogenetic trees of both taxonomic markers should also be constructed using
the sequences from the most closely related species (Figure 3.1). This step will ensure that an
accurate evolutionary placement of genome can be made and avoid assigning relatedness
based on the percentage match of DNA sequences. Examination of the 16S rRNA gene and
protein-coding gene phylogenies should also be made to ensure they are consistent in their
assignment of the nearest match to the genome. On the basis of these combined analyses the
correct up-to-date bacterial nomenclature can be obtained from the List of Prokaryotic names
with Standing in Nomenclature (LSPN; http://www.bacterio.cict.fr). If the genome does not
match a validly named species in terms of its 16S rRNA or protein-coding gene analyses, its
nearest well characterized phylogenetic neighbour should be provided (Figure 3.1).
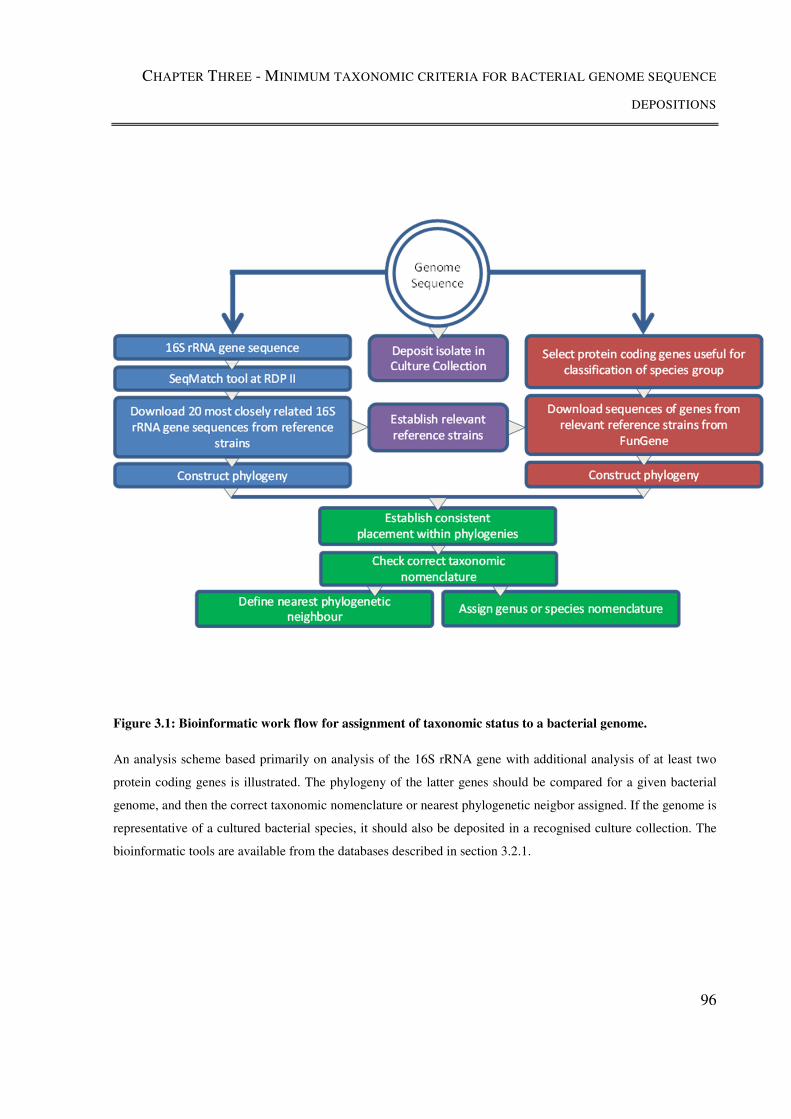
CHAPTER THREE - MINIMUM TAXONOMIC CRITERIA FOR BACTERIAL GENOME SEQUENCE
DEPOSITIONS
96
Figure 3.1: Bioinformatic work flow for assignment of taxonomic status to a bacterial genome.
An analysis scheme based primarily on analysis of the 16S rRNA gene with additional analysis of at least two
protein coding genes is illustrated. The phylogeny of the latter genes should be compared for a given bacterial
genome, and then the correct taxonomic nomenclature or nearest phylogenetic neigbor assigned. If the genome is
representative of a cultured bacterial species, it should also be deposited in a recognised culture collection. The
bioinformatic tools are available from the databases described in section 3.2.1.
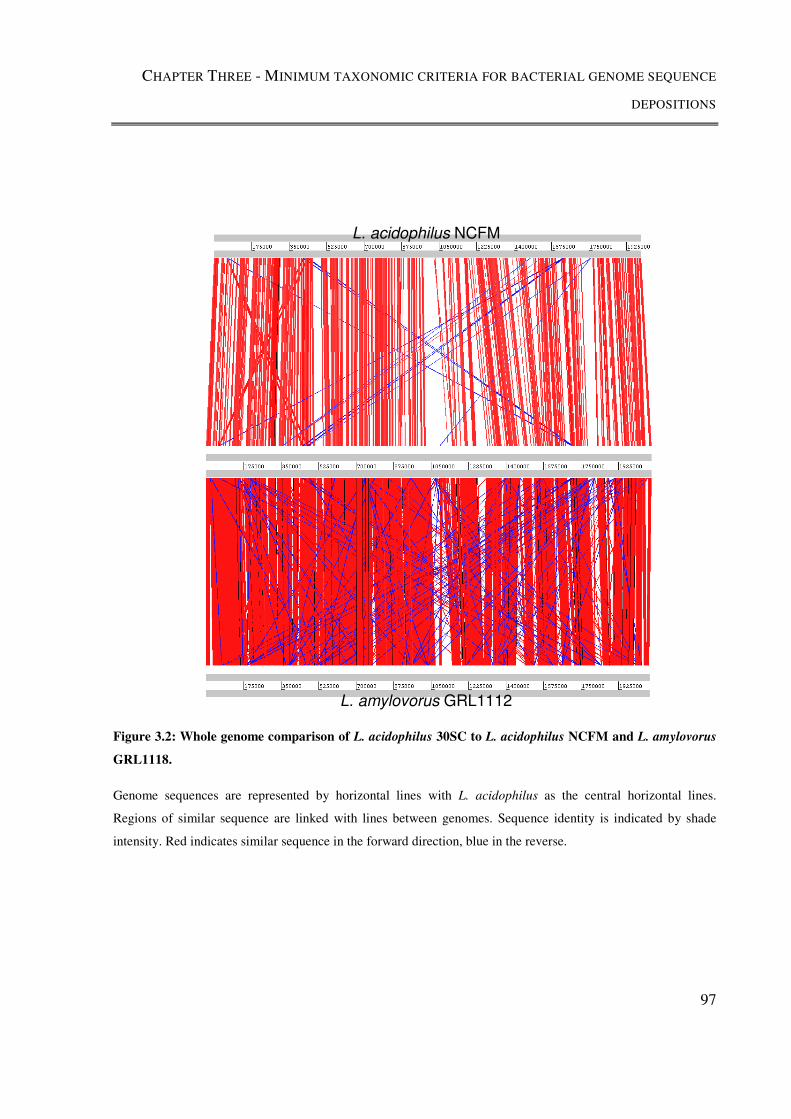
CHAPTER THREE - MINIMUM TAXONOMIC CRITERIA FOR BACTERIAL GENOME SEQUENCE
DEPOSITIONS
97
Figure 3.2: Whole genome comparison of L. acidophilus 30SC to L. acidophilus NCFM and L. amylovorus
GRL1118.
Genome sequences are represented by horizontal lines with L. acidophilus as the central horizontal lines.
Regions of similar sequence are linked with lines between genomes. Sequence identity is indicated by shade
intensity. Red indicates similar sequence in the forward direction, blue in the reverse.
L. acidophilus NCFM
L. amylovorus GRL1112

CHAPTER THREE - MINIMUM TAXONOMIC CRITERIA FOR BACTERIAL GENOME SEQUENCE
DEPOSITIONS
98
3.2.3. APPLICATION OF THE BIOINFORMATIC WORKFLOW TO THE L. ACIDOPHILUS
30SC GENOME
After deposition of the L. acidophilus 30SC genome, we performed a genome comparison to
that of L. acidophilus NCFM, a well characterized probiotic strain of this species (Altermann
et al., 2005), and observed that the two genomes were not closely related when compared
using the Artemis Comparison Tool (ACT; Figure 3.2). The L. acidophilus 30SC genome
sequence clearly showed greater identity with the genome sequence of L. amylovorus
UCC1118 (indicated by the deeper shade of red) than the genome sequence of L. acidophilus
NCFM (lighter shade of red). We therefore applied the bioinformatic analysis scheme and
minimum criteria (Figure 3.1) to L. acidophilus 30SC genome to clarify its taxonomic
assignment. Use of the SeqMatch tool at the RDP II demonstrated that the L. acidophilus
30SC 16S rRNA gene was most closely related to L. amylovorus sequences. After
downloading and phylogenetically analysing the full length 16S rRNA genes for 20 type
strains of the most closely related Lactobacillus species, the resulting tree also demonstrated
that L. acidophilus 30SC sequence was most similar to that of L. amylovorus LMG 9496T
(Figure 3.3, panel A; 99.8% identity). The 16S rRNA gene for the L. acidophilus-type strain,
LMG 9433T, placed in a completely distinct phylogenetic cluster (Figure 3.3, panel A; 98.2%
identity).
Since the taxonomy of genus Lactobacillus has been heavily revised in recent years by the
description of numerous new species and because the discriminatory power of the 16S rRNA
gene for differentiation of its constituent taxa is limited for several clusters of species, we
searched the available literature to identify protein-coding genes which were useful for
species identification. The gyrB gene had been used as part of a multilocus sequence typing
(MLST) scheme for Lactobacillus plantarum strains (de las Rivas et al., 2006). We therefore
used the FunGene database to compare the gyrB from the L. acidophilus 30SC genome to the
gyrB genes available for type strains of those Lactobacillus species that were most closely
related by analysis of the 16S rRNA gene (Figure 3.3, panel A). The gyrB phylogeny
demonstrated that the L. acidophilus 30SC gyrB sequence was most similar to that of L.
amylovorus LMG 9496T (Figure 3.3, panel B; 99.8% identity). The gyrB sequence of the L.

CHAPTER THREE - MINIMUM TAXONOMIC CRITERIA FOR BACTERIAL GENOME SEQUENCE
DEPOSITIONS
99
acidophilus type strain, LMG 9433T, clustered separately from that of strain 30SC (Figure
3.3, panel A) and was considerably less similar (88.1% identity).
Although the gyrB analysis was consistent with the 16S rRNA gene assignment, in order to
avoid over reliance on a single-protein gene we searched the literature for an additional
protein-coding gene useful for Lactobacillus systematics. Naser et al. (Naser et al., 2007) had
examined the pheS gene and demonstrated that it offered a discriminatory means of species
identification within the genus Lactobacillus. The pheS gene of the L. acidophilus 30SC
genome was 99.1% similar to that of L. amylovorus and phylogenetically clustered with this
species (Figure 3.4); it was not closely related to the L. acidophilus pheS sequence (Figure
3.4, 88.7% identity). Overall, even though the gyrB (Figure 3.3, panel B) and pheS (Figure
3.4) phylogenetic trees were not absolutely congruent with 16S rRNA gene phylogeny across
all the Lactobacillus species examined, the respective L. acidophilus 30SC sequences were
consistently placed adjacent L. amylovorus as the nearest phylogenetic neighbour and
indicating this species is the most likely taxonomic group to which the 30SC isolate belonged.
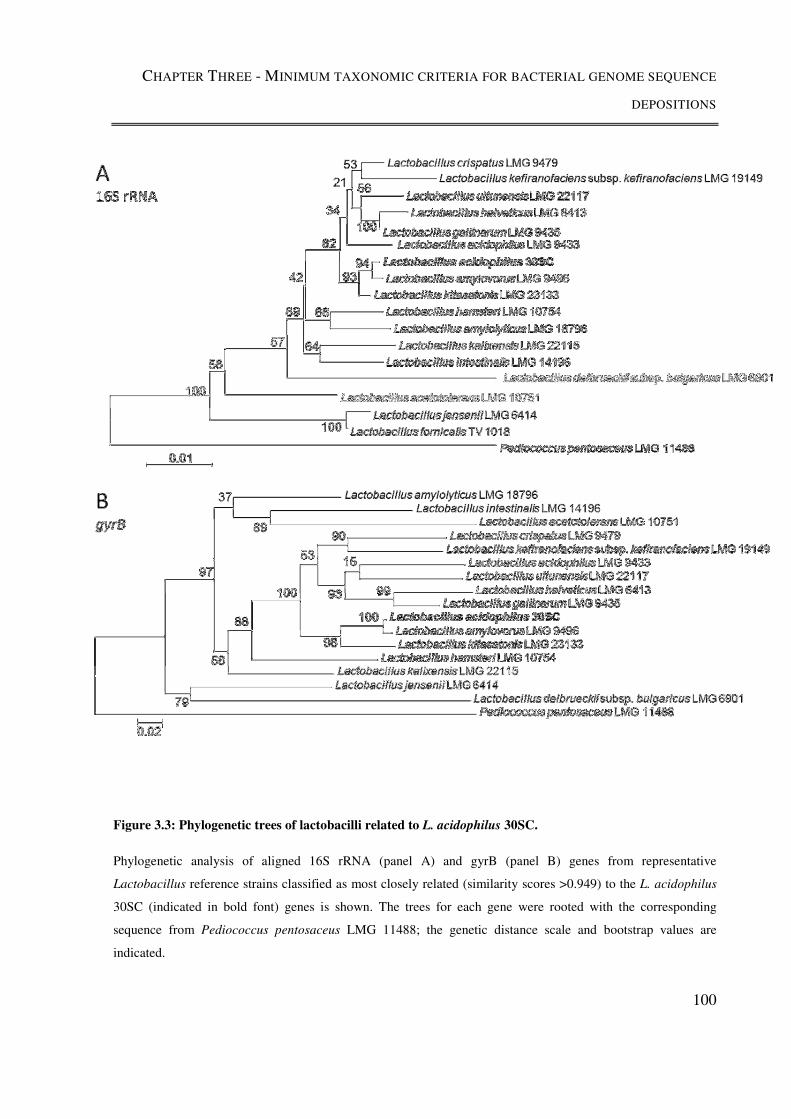
CHAPTER THREE - MINIMUM TAXONOMIC CRITERIA FOR BACTERIAL GENOME SEQUENCE
DEPOSITIONS
100
Figure 3.3: Phylogenetic trees of lactobacilli related to L. acidophilus 30SC.
Phylogenetic analysis of aligned 16S rRNA (panel A) and gyrB (panel B) genes from representative
Lactobacillus reference strains classified as most closely related (similarity scores >0.949) to the L. acidophilus
30SC (indicated in bold font) genes is shown. The trees for each gene were rooted with the corresponding
sequence from Pediococcus pentosaceus LMG 11488; the genetic distance scale and bootstrap values are
indicated.
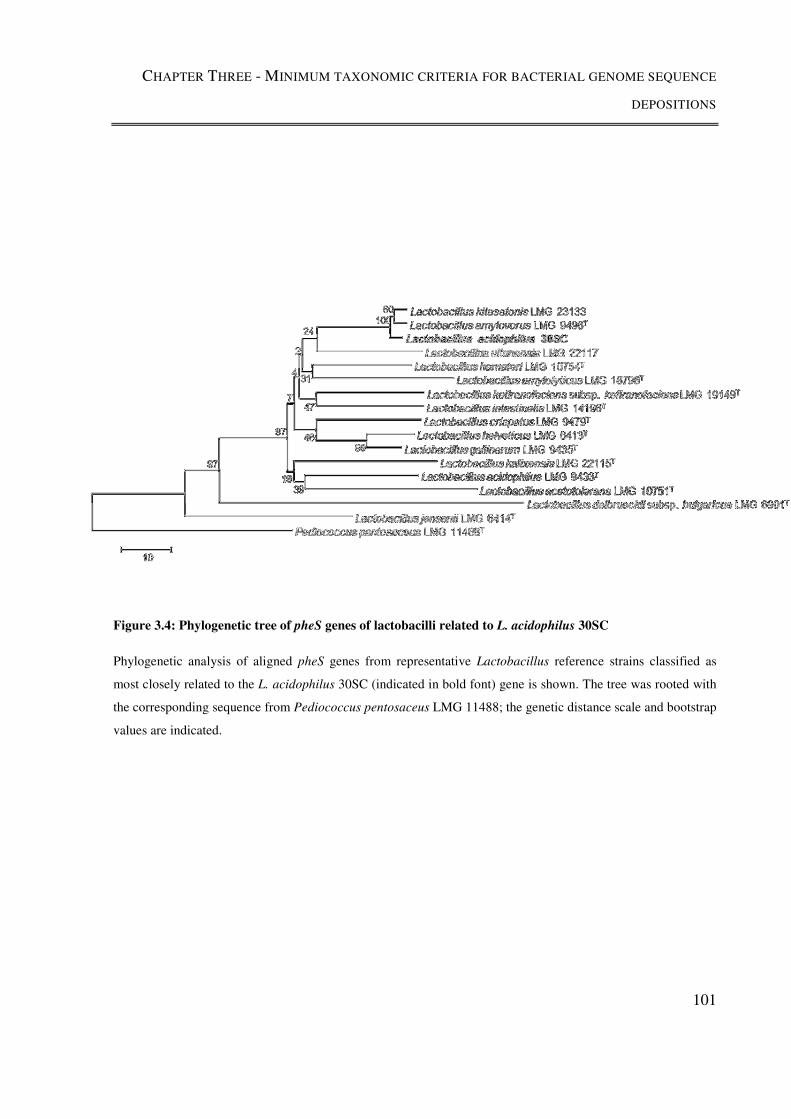
CHAPTER THREE - MINIMUM TAXONOMIC CRITERIA FOR BACTERIAL GENOME SEQUENCE
DEPOSITIONS
101
Figure 3.4: Phylogenetic tree of pheS genes of lactobacilli related to L. acidophilus 30SC
Phylogenetic analysis of aligned pheS genes from representative Lactobacillus reference strains classified as
most closely related to the L. acidophilus 30SC (indicated in bold font) gene is shown. The tree was rooted with
the corresponding sequence from Pediococcus pentosaceus LMG 11488; the genetic distance scale and bootstrap
values are indicated.
CHAPTER THREE - MINIMUM TAXONOMIC CRITERIA FOR BACTERIAL GENOME SEQUENCE
DEPOSITIONS
102
3.3. DISCUSSION
With the continued improvement and innovation in technology, particularly the advent of
next-generation sequencers, researchers have unprecedented access to nucleotide sequence
data. There is no doubt that the massive expansion of DNA sequence datasets has
considerably advanced the study of life sciences, however, there is also a feeling that our
ability to collect sequence data far surpasses our ability and power to analyse it (Brenner,
2010). In addition, as more sequence analysis tools are developed to enable large scale data
mining, the outputs from these analyses may have less value if the original sequence data
inputs are poorly characterised at source. Here we illustrate an example of how such
oversights are still occurring in genomic microbiology, with the taxonomically incorrect
deposition and announcement of the L. acidophilus 30SC genome (Oh et al., 2011). Using a
straightforward analysis based on two minimal criteria, assignment via the 16S rRNA gene
and protein-coding gene phylogenies; we have clearly demonstrated that the L. acidophilus
30SC genome most likely derives from a strain of L. amylovorus (Figure 3.3).
Many disciplines rely heavily on taxonomic nomenclature to provide a common language that
can be understood by both specialist researchers and also extend into wider public
understanding. Taxonomy is particularly important in microbiology where there is such an
extensive diversity of organisms, that a microbial commons and systematic guidelines are
absolutely vital for advancement of the discipline (Moore et al., 2010). Like many
microorganisms, the lactic acid bacteria, within which L. amylovorus and L. acidophilus
reside, are of considerable ecological, clinical and commercial interest (Pfeiler and
Klaenhammer, 2007). The widespread use of these bacteria as probiotics and diary starter
cultures forms a multi-million dollar industry, with basic researchers, industry and regulatory
agencies demanding much clearer definitions of Lactobacillus strains. The incorrect
deposition of the strain 30SC genome as a representative of the species L. acidophilus may
potentially have had significant future ramifications, especially since genomes for these
bacteria are now being obtained by non-specialist researchers and commercial groups.
CHAPTER THREE - MINIMUM TAXONOMIC CRITERIA FOR BACTERIAL GENOME SEQUENCE
DEPOSITIONS
103
In summary, we suggest the need for a systematic review of the way genome sequence data is
deposited and propose a simple, minimum-standard system for characterisation of new
bacterial genome sequences prior to their announcement. We have proposed an analytical
scheme which is straightforward and for the most part can be performed using publicly
available databases and software, to compare the 16S rRNA gene and at least two protein-
coding genes from a given genome. For researchers skilled in bioinformatic analyses, this
scheme could easily be expanded to include analyses of multiple protein coding genes such as
those used in MLST schemes (de las Rivas et al., 2006), the average nucleotide identity of
shared genes or even whole genome phylogenies (Konstantinidis and Tiedje, 2005). In
addition, we also suggest that if the genome sequence is for an easily cultured microorganism,
that the corresponding strain is deposited in a recognised International Depository Authority
culture collection and hence can be easily analysed by the research community (Figure 3.3);
this will add considerable future value to a microbial genome sequence. We hope that our
illustration of genome misclassification and a simple bioinformatic workflow to avoid it will
increase the consistency of future genome sequence taxonomy. This will ensure that users of
these incredibly valuable genomic datasets, particularly those who are not specialists in the
field, can be confident in the identity of a deposited sequence.
CHAPTER THREE - MINIMUM TAXONOMIC CRITERIA FOR BACTERIAL GENOME SEQUENCE
DEPOSITIONS
104
3.4. CONCLUSIONS
The conclusions from this chapter are as follows:
1) The developed bioinformatic workflow successfully identified that the L.
acidophilus 30SC genome was wrongly attributed to L. acidophilus. DNA
biomarker genes used for this bioinformatics workflow, the 16S rRNA, gyrB and
pheS genes, all showed greater similarity to L. amylovorus LMG 9496.
Secondarily, whole genome comparisons of available L. acidophilus and L.
amylovorus genome sequences also showed that the genome of L. acidophilus
30SC showed greater synteny with L. amylovorus UCC1118 than L. acidophilus
NCFM.
2) The reliance of future analyses on the attached metadata of genome sequence
depositions means that it is imperative that this metadata is correct, particularly the
species name that is attached to the genome record. The proliferation of genome
resequencing means that a technology once restricted to the cutting-edge of
genomics is now available to a wider audience, including non-specialists and
commercial parties. The development of a simple bioinformatic workflow for
classifying a genome sequence will ensure that users of a deposited sequence can
be confident of its identity and nomenclature.
3) Organisms of considerable ecological, clinical and commercial interest, like L.
acidophilus and L. amylovorus, may have probiotic effects that are strain-specific.
Therefore, ensuring that a genome sequence for one of these bacteria is assigned
the correct taxonomic nomenclature is vitally important. In addition, the regulatory
standards for including bacteria in probiotic and food-related products continue to
be developed, with accurate descriptions of the organisms present now a
fundamental criterion.

CHAPTER THREE - MINIMUM TAXONOMIC CRITERIA FOR BACTERIAL GENOME SEQUENCE
DEPOSITIONS
105
Note added in proof:
Analysis of glycolysis and pentose phosphate pathways across Lactobacillales to depict
evolution of this order recently corroborated the phylogenetic placement and
reclassification of L. acidophilus 30SC. Salvetti et al (2013) used genome sequences from
42 LAB and inferred phylogeny using the concatenated sequences of 42 ribosomal
proteins. Subsequently, the distribution and organisation of 42 genes related to glycolysis
and the pentose phosphate pathway was analysed. L. acidophilus 30SC was identical to L.
amylovorus GRL1112 at all ribosomal sites and all glycolysis pathway loci. Interestingly,
L. acidophilus 30SC differed to L. amylovorus GRL1112 at only a single locus of its
pentose phosphate pathway.
CHAPTER FOUR – POPULATION GENOMICS OF L. ACIDOPHILUS
106
4. POPULATION GENOMICS OF L. ACIDOPHILUS
4.1. INTRODUCTION
4.1.1. GENOMICS IN LAB
Numerous approaches have been used to explore the relationships and species assignments
of members of the LAB (see Section 1.3.1). These include DNA-DNA hybridization, 16S
rRNA gene sequence analysis, phenotypic characteristics and sequence analysis of other
phylogenetic marker genes. These analyses have ranged in taxonomic breadth from
examining all LAB (Makarova et al., 2006, O'Sullivan et al., 2009), to all lactobacilli
(Claesson et al., 2008), to the L. acidophilus group (Berger et al., 2007), to strains of a
single Lactobacillus species (Hao et al., 2011a). The evolution of techniques for
identifying and classifying bacteria has impacted on the taxonomy of the LAB, resulting in
numerous species re-classifications and re-definitions of above-species-level taxonomic
groups (Salvetti et al., 2012).
The recent availability of whole genome sequences of probiotic bacteria, and the reduction
in financial investment and expertise required to re-sequence new isolates for species that
already have a representative genome-sequenced isolate, has made the use of genome
sequences to characterise bacteria, a viable proposition for a growing number of the
scientific community. Bacterial genome sequencing is now being carried out by a large
number of research laboratories and commercial enterprises, to examine environmental
and health-related issues.
Several post-genomic studies have been undertaken on various taxonomic levels within the
LAB. These include the examination of phylogenetic relationships between bacteria on
the i) genus level from both a phylogenetic (Makarova et al., 2006, Coenye and
Vandamme, 2003) and functional (Klaenhammer et al., 2005, O'Sullivan et al., 2009)
perspective, ii) group level (Berger et al., 2007) and iii) the species level in both
CHAPTER FOUR – POPULATION GENOMICS OF L. ACIDOPHILUS
107
Lactococcus lactis (Passerini et al., 2010) and L. plantarum (Molenaar et al., 2005). No
single study however, has fully utilised next-generation sequencing technologies in
combination with highly efficient genome assembly and analysis methods to carry out
genomic diversity profiling of a large cohort of isolates of a single LAB species. In this
section, the genomic diversity of L. acidophilus was explored at multiple taxonomic levels.
During the study, access to next-generation sequencing (NGS) technologies altered so
much that two approaches were used. The first used single genome re-sequencing by a
commercial sequence provider and illustrates how genome sequencing technologies have
made single genome resequencing economically viable. The second approach used
massively-parallel genome resequencing and assembly technologies provided by an
academic genome sequencing centre, together with the analysis on a web-based database
(Jolley and Maiden, 2010), and illustrates how decoding of tens of bacterial genomes is
now a viable prospect for LAB researchers
4.1.2. APPLICATION OF NOVEL GENOME SURVEYING STRATEGIES
4.1.2.1. Analysing multiple bacterial genomes
The advent of massively parallel sequencing technologies has revolutionised phylogenetic
data collection with massively multiplexed, high-throughput, short-read sequencing
making it possible to obtain DNA sequence for virtually every locus of a genome in an
achievable time-frame and at economical cost (Medini et al., 2008). With the decline in
costs of genome sequencing, it is now more economical to derive an MLST profile
(normally the partial sequencings of seven house-keeping gene loci) by sequencing the
entire genome of an isolate and extracting the sequences of the relevant loci, than the
classical method of amplifying each locus with specific PCR primers and Sanger
sequencing the resulting product (Sheppard et al., 2012). The derivation of a complete
genome sequence for isolates of interest undoubtedly provides a wide range of
opportunities to improve the understanding of epidemiology and functional biology of
bacterial populations, far beyond a simple MLST scheme. There are various approaches to
CHAPTER FOUR – POPULATION GENOMICS OF L. ACIDOPHILUS
108
describe genome sequence variation among bacterial isolates, and these, together with
other interesting variable loci which can be mined from the data are discussed below.
4.1.2.2. Analysis of genomes using a reference genome sequence
The mapping of sequence data from multiple isolates to a finished reference genome
sequence allows the identification of polymorphic sites compared to this reference isolate.
This can be accomplished with relative ease and is computationally, orders of magnitude
less intensive than a de novo sequence assembly. Analysis of Single Nucleotide
Polymorphisms (SNPs) generated by read mapping has been used to compare genomes of
clinically important pathogens (Harris et al., 2010) and probiotic species (Briczinski et al.,
2009). The results should however, be interpreted with some degree of caution. Parallel
sequencing technologies are relatively more error prone than classical sequencing
technologies, and read mappings will be highly dependent on the finished reference
sequence to which variation is mapped. Therefore, the reference sequence used should be
highly representative of the isolates that are being compared to it, as variation in genes that
are not present in the reference genome cannot be detected
4.1.2.3. Analysis of genomes using gene-by-gene comparison to a reference
sequence
An alternative to the reference genome sequence assembly approach is a de novo,
reference-free assembly, followed by gene-by-gene comparisons to a reference sequence
(Jolley and Maiden, 2010). The unit of comparison and analysis then becomes a more
functional unit (i.e. the gene[s]), rather than the whole genome. In this case, “the gene” as
a unit of comparison may be extended to include any identifiable unit of analysis,
including but not limited to sequences found at a particular genetic locus, given coding
sequences (CDS) or any other identifiable sequence motif whether it be nucleotide or
protein (Sheppard et al., 2012). The variation between genomes is then categorised one
“gene” unit at a time, essentially in the same way the variation between MLST loci is
described (Maiden, 2006). Although MLST schemes to date are generally composed of
seven loci there is no reason, other than balancing the economy of research investment
with information return, that the scheme should not be extended to encompass more loci.
CHAPTER FOUR – POPULATION GENOMICS OF L. ACIDOPHILUS
109
As the investment in generating a genome sequence assembly for a single isolate is now
small enough to be a viable proposition for many researchers, MLST may now be
extended to incorporate all loci defined within a particular reference genome sequence, as
such creating a “genome-wide” MLST scheme (Sheppard et al., 2012).
There are several advantages to the gene-by-gene approach when compared to approaches
that rely on multiple- or pairwise-alignment of whole genome sequences for the
identification of SNPs (Sheppard et al., 2012). Comparisons are performed using “gene”-
length units that can be compared to establish the total diversity in each one of these
regions, removing the need for closely related reference sequences for mapping. This
increases the scope of the approach to handle genomes from diverse sources. Secondarily,
the gene-by-gene approach is particularly well-suited to analysing the output from de novo
sequence assemblers, which often produce partial, draft genome sequences comprised of
multiple contigs. Thirdly, any sequencing errors that are introduced by the parallel
sequencing technology are screened out by ensuring that sequencing depth is great enough
to identify them in the assembly process. The main limitation of the gene-by-gene
approach is similar to that of the whole genome mapping approach, in that variation can
only be captured in loci already defined in the reference gene set, so information outside of
these regions will not be analysed, and the reference gene set will be expected to define the
whole set of loci to be compared. Also, this technique relies heavily on the ability of the de
novo assembly to construct draft genomes composed of a few, long contigs. The success of
generating such contigs is linked to the genome sequence features of the isolates studied,
with small, low complexity, low GC genomes ideal for this analysis. It is also highly
dependent on the sequencing quality obtained and type of NGS technology applied.
4.1.2.4. CRISPR regions
A detailed discussion of CRISPR regions in L. acidophilus can be found in Chapter 1.
CRISPR regions have been found in over half of the genome sequences available for
lactobacilli, although they vary in sequence considerably across the genus Lactobacillus.
CHAPTER FOUR – POPULATION GENOMICS OF L. ACIDOPHILUS
110
In Escherichia coli, CRISPR regions are highly variable, and can be used as strain specific
markers (Díez-Villaseñor et al., 2010). Given that RAPD profile similarity analysis of L.
acidophilus isolates shows limited diversity (Chapter 3), the CRISPR regions of this
species investigated further as loci with the greatest chance of variation between highly
clonal isolates, as seen in B. animalis subsp. lactis (Milani et al., 2013) .
4.1.2.5. Mutagenesis of L. acidophilus
The human GIT has been designated as the natural niche of L. acidophilus (O'Sullivan et
al., 2009). The gut is known to be potentially mutagenic environment (Hirayama et al.,
2000), with multiple metabolites, particularly those generating from anaerobic
fermentation, capable of inducing genetic mutations. The stability of L. acidophilus RAPD
profiles generated by isolates passaged through the human GIT (Mahenthiralingam et al.,
2009) suggested that either the environment is not sufficiently mutagenic to induce
sequence variation detectable at such a granular level, or that L. acidophilus is capable of
efficiently repairing DNA damage and maintaining a highly stable genome. Exposure to
the chemical mutagen Methyl Methanesulphonate (MMS) has been shown to induce
mutations in wide range of bacteria, including mutations that result in detectable
phenotypes in Lactobacillus delbrueckii ATCC 9649 (Demirci and Pometto, 1992), a
member of the L. acidophilus taxonomic sub-group. Given the successful use of MMS in a
closely related species, it was used to further investigate the susceptibility of L.
acidophilus to the type of chemical mutation that might occur in the human GIT.
CHAPTER FOUR – POPULATION GENOMICS OF L. ACIDOPHILUS
111
4.1.3. SPECIFIC AIMS
The aims of this chapter were as follows:
� Conduct a small-scale genome diversity survey using reference mapping of
sequencing reads, combined with SNP discovery.
� Expand genomic information on L. acidophilus isolates by resequencing the
genomes of a diverse collection of isolates from commercial applications and
culture collections.
� Conduct a wider-scale genomic diversity study to establish evolutionary
history of L. acidophilus isolates using a gene-by-gene comparative approach
applied via rMLST at the genus-species level and genome-wide MLST at the
species-strain level.
� Investigate the diversity of the CRISPR region of the L. acidophilus genome.
� Investigate mutability of L. acidophilus using Methyl Methane Sulphonate
(MMS) to alkylate DNA and induce mutations, using genome resequencing
and gene-by-gene comparisons to detect any DNA sequence changes that
occurred.
CHAPTER FOUR – POPULATION GENOMICS OF L. ACIDOPHILUS
112
4.2. METHODS
4.2.1. GENOME RESEQUENCING STRATEGIES
Two different genome resequencing strategies were employed, reflecting the development
of Illumina sequencing technology. The first was applied on a small scale at higher cost,
and the second was applied on a larger scale as follows.
4.2.1.1. Small-scale genome resequencing and comparison strategy
High molecular weight genomic DNA was extracted from the growth of single-colony
overnight cultures with a Wizard genomic DNA purification kit (Promega, Southampton,
United Kingdom). Genomic DNA libraries were prepared and single-reads were sequenced
by GATC Biotech (Konstanz, Germany) using an Illumina HiSeq2000 with 50 bp
sequence read length. Single reads were aligned to the L. acidophilus NCFM complete
genome sequence (GenBank: CP00003) using Burrows-Wheeler Alignment Tool (bwa)
(Li and Durbin, 2009), and a consensus sequence created. Consensus sequences were
aligned with Mugsy (Angiuoli and Salzberg, 2011). Phylogenies were calculated using
MEGA 5.1 (Tamura et al., 2011). Whole genome sequence similarity was visualised with
the Artemis Comparison Tool (Carver et al., 2005).
4.2.1.2. Large-scale genome resequencing and comparison strategy
As previously, high molecular weight genomic DNA was extracted from the growth of
single-colony overnight cultures with a Wizard genomic DNA purification kit (Promega,
Southampton, United Kingdom). Genomic libraries were prepared and DNA sequenced at
the Wellcome Trust Centre for Human Genetics, Oxford, UK
(http://www.well.ox.ac.uk/ogc/home). All genomic libraries were pooled in equimolar
amounts and analysed in a single flow cell lane of the Illumina HiSeq2000, generating 100
bp paired-end reads. At this stage, the 50 bp single-reads were introduced from the small-
scale genome resequencing study along with 100 bp paired-end reads from two L.
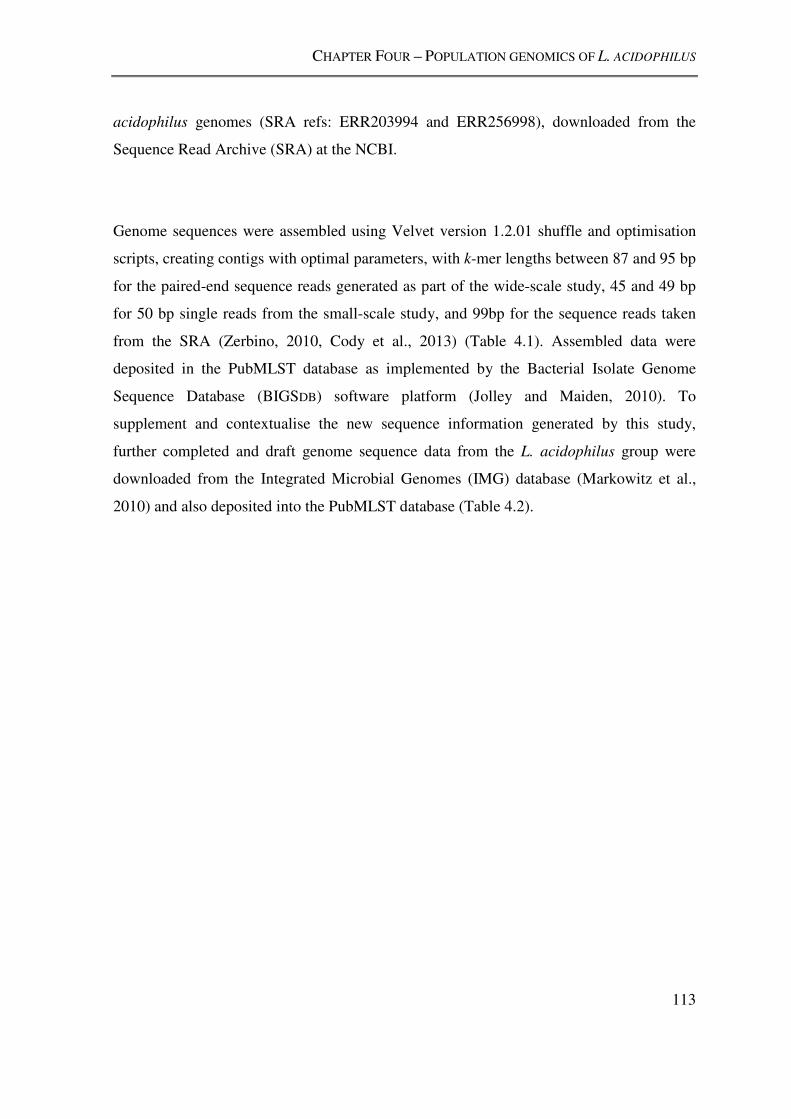
CHAPTER FOUR – POPULATION GENOMICS OF L. ACIDOPHILUS
113
acidophilus genomes (SRA refs: ERR203994 and ERR256998), downloaded from the
Sequence Read Archive (SRA) at the NCBI.
Genome sequences were assembled using Velvet version 1.2.01 shuffle and optimisation
scripts, creating contigs with optimal parameters, with k-mer lengths between 87 and 95 bp
for the paired-end sequence reads generated as part of the wide-scale study, 45 and 49 bp
for 50 bp single reads from the small-scale study, and 99bp for the sequence reads taken
from the SRA (Zerbino, 2010, Cody et al., 2013) (Table 4.1). Assembled data were
deposited in the PubMLST database as implemented by the Bacterial Isolate Genome
Sequence Database (BIGSDB) software platform (Jolley and Maiden, 2010). To
supplement and contextualise the new sequence information generated by this study,
further completed and draft genome sequence data from the L. acidophilus group were
downloaded from the Integrated Microbial Genomes (IMG) database (Markowitz et al.,
2010) and also deposited into the PubMLST database (Table 4.2).

CHAPTER FOUR – POPULATION GENOMICS OF L. ACIDOPHILUS
114
Table 4.1: Velvet assembly statistics of Lactobacillus isolate genomes
Species Isolate Number of sequence reads
Sequence Read Length
Contig N50
Number of Contigs >1Kb
Lactobacillus acidophilus C21 10353702 100 182313 28
Lactobacillus acidophilus C46 10776998 100 172985 29
Lactobacillus acidophilus C47 8590468 100 182321 30
Lactobacillus acidophilus C49 9788514 100 182321 29
Lactobacillus acidophilus CUL 21 8648162 100 183130 30
Lactobacillus acidophilus CUL 60 8372568 100 182851 25
Lactobacillus acidophilus CulT2 6977356 100 183128 29
Lactobacillus acidophilus HBCA 9716532 100 182325 25
Lactobacillus acidophilus LAB 283 10694936 100 120702 28
Lactobacillus acidophilus LAB 66 10941612 100 167481 33
Lactobacillus acidophilus LAB 69 11762534 100 172941 30
Lactobacillus acidophilus LAB 76 10244062 100 167485 33
Lactobacillus acidophilus LMG 11428 11780070 100 81116 55
Lactobacillus acidophilus LMG 11466 10754308 100 228858 24
Lactobacillus acidophilus LMG 11467 12324202 100 242199 21
Lactobacillus acidophilus LMG 11469 13525190 100 143813 31
Lactobacillus acidophilus LMG 11470 12022574 100 167948 33
Lactobacillus acidophilus LMG 11472 12067104 100 167526 34
Lactobacillus acidophilus LMG 13550 11520676 100 173001 28
Lactobacillus acidophilus LMG 9433 7833202 100 167519 29
Lactobacillus acidophilus NCFM 8119384 100 174801 28
Lactobacillus acidophilus NCFM 1-1 7787216 100 183130 26
Lactobacillus acidophilus NCFM 1-2 10458212 100 167511 36
Lactobacillus acidophilus NCFM 2-1 9941284 100 173994 30
Lactobacillus acidophilus NCFM 2-4 8684056 100 182321 32
Lactobacillus acidophilus NCFM 3-1 6974196 100 182317 31
Lactobacillus acidophilus NCFM 3-2 9596090 100 182321 33
Lactobacillus acidophilus Rm 344 9981982 100 184420 21
Lactobacillus acidophilus Rm 345 13810300 100 183241 23
Lactobacillus acidophilus CUL 60 S 18965596 51 81591 50
Lactobacillus acidophilus LMG 11428 S 31352785 51 120621 42
Lactobacillus acidophilus CUL 21 S 23488108 51 78118 48
Lactobacillus acidophilus ERR203994 2601602 100 242509 24
Lactobacillus acidophilus ERR256998 6433322 100 167515 23
Lactobacillus gasseri LMG 9203 6505684 100 257847 14
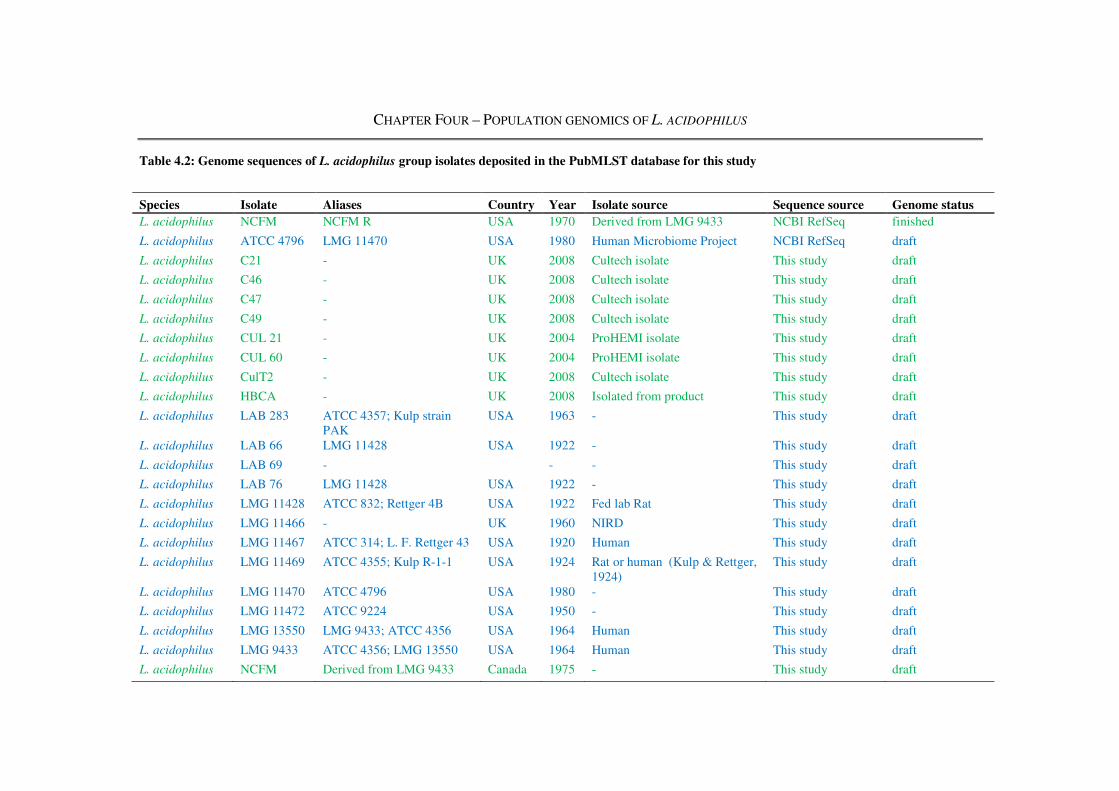
CHAPTER FOUR – POPULATION GENOMICS OF L. ACIDOPHILUS
Table 4.2: Genome sequences of L. acidophilus group isolates deposited in the PubMLST database for this study
Species Isolate Aliases Country Year Isolate source Sequence source Genome status L. acidophilus NCFM NCFM R USA 1970 Derived from LMG 9433 NCBI RefSeq finished
L. acidophilus ATCC 4796 LMG 11470 USA 1980 Human Microbiome Project NCBI RefSeq draft
L. acidophilus C21 - UK 2008 Cultech isolate This study draft
L. acidophilus C46 - UK 2008 Cultech isolate This study draft
L. acidophilus C47 - UK 2008 Cultech isolate This study draft
L. acidophilus C49 - UK 2008 Cultech isolate This study draft
L. acidophilus CUL 21 - UK 2004 ProHEMI isolate This study draft
L. acidophilus CUL 60 - UK 2004 ProHEMI isolate This study draft
L. acidophilus CulT2 - UK 2008 Cultech isolate This study draft
L. acidophilus HBCA - UK 2008 Isolated from product This study draft
L. acidophilus LAB 283 ATCC 4357; Kulp strain PAK
USA 1963 - This study draft
L. acidophilus LAB 66 LMG 11428 USA 1922 - This study draft
L. acidophilus LAB 69 - - - This study draft
L. acidophilus LAB 76 LMG 11428 USA 1922 - This study draft
L. acidophilus LMG 11428 ATCC 832; Rettger 4B USA 1922 Fed lab Rat This study draft
L. acidophilus LMG 11466 - UK 1960 NIRD This study draft
L. acidophilus LMG 11467 ATCC 314; L. F. Rettger 43 USA 1920 Human This study draft
L. acidophilus LMG 11469 ATCC 4355; Kulp R-1-1 USA 1924 Rat or human (Kulp & Rettger, 1924)
This study draft
L. acidophilus LMG 11470 ATCC 4796 USA 1980 - This study draft
L. acidophilus LMG 11472 ATCC 9224 USA 1950 - This study draft
L. acidophilus LMG 13550 LMG 9433; ATCC 4356 USA 1964 Human This study draft
L. acidophilus LMG 9433 ATCC 4356; LMG 13550 USA 1964 Human This study draft
L. acidophilus NCFM Derived from LMG 9433 Canada 1975 - This study draft
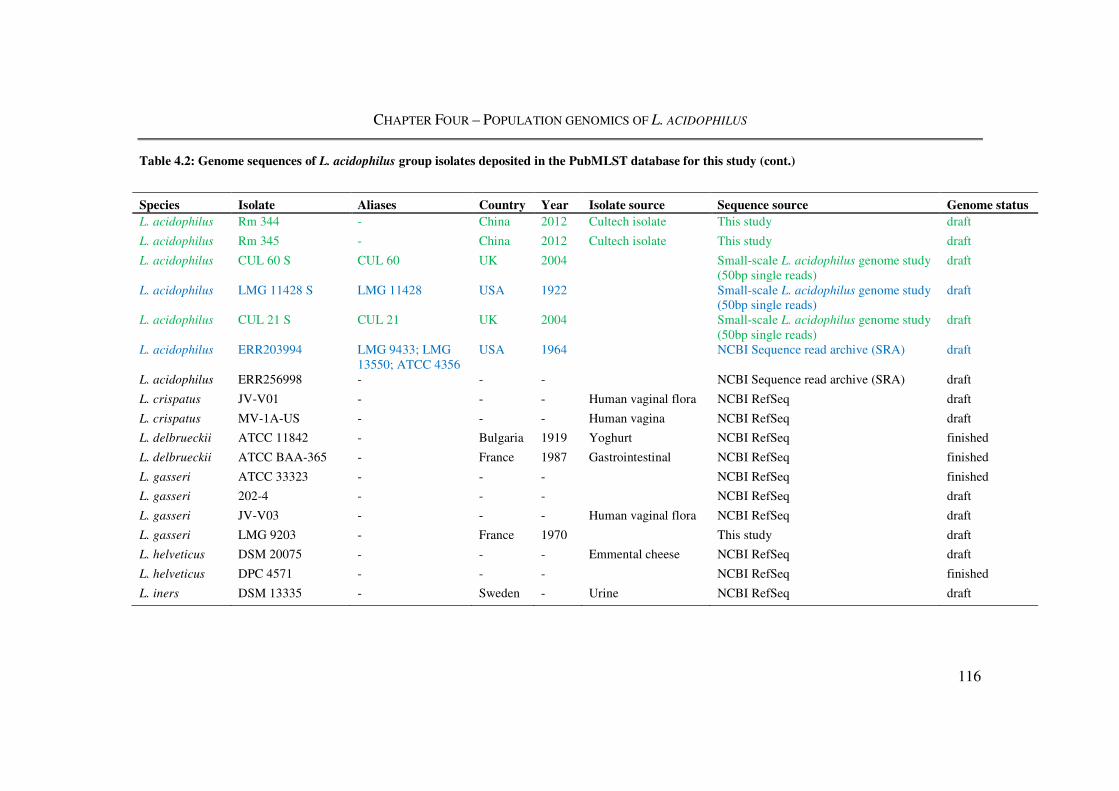
CHAPTER FOUR – POPULATION GENOMICS OF L. ACIDOPHILUS
116
Table 4.2: Genome sequences of L. acidophilus group isolates deposited in the PubMLST database for this study (cont.)
Species Isolate Aliases Country Year Isolate source Sequence source Genome status L. acidophilus Rm 344 - China 2012 Cultech isolate This study draft
L. acidophilus Rm 345 - China 2012 Cultech isolate This study draft
L. acidophilus CUL 60 S CUL 60 UK 2004 Small-scale L. acidophilus genome study (50bp single reads)
draft
L. acidophilus LMG 11428 S LMG 11428 USA 1922 Small-scale L. acidophilus genome study (50bp single reads)
draft
L. acidophilus CUL 21 S CUL 21 UK 2004 Small-scale L. acidophilus genome study
(50bp single reads)
draft
L. acidophilus ERR203994 LMG 9433; LMG
13550; ATCC 4356
USA 1964 NCBI Sequence read archive (SRA) draft
L. acidophilus ERR256998 - - - NCBI Sequence read archive (SRA) draft
L. crispatus JV-V01 - - - Human vaginal flora NCBI RefSeq draft
L. crispatus MV-1A-US - - - Human vagina NCBI RefSeq draft
L. delbrueckii ATCC 11842 - Bulgaria 1919 Yoghurt NCBI RefSeq finished
L. delbrueckii ATCC BAA-365 - France 1987 Gastrointestinal NCBI RefSeq finished
L. gasseri ATCC 33323 - - - NCBI RefSeq finished
L. gasseri 202-4 - - - NCBI RefSeq draft
L. gasseri JV-V03 - - - Human vaginal flora NCBI RefSeq draft
L. gasseri LMG 9203 - France 1970 This study draft
L. helveticus DSM 20075 - - - Emmental cheese NCBI RefSeq draft
L. helveticus DPC 4571 - - - NCBI RefSeq finished
L. iners DSM 13335 - Sweden - Urine NCBI RefSeq draft

CHAPTER FOUR – POPULATION GENOMICS OF L. ACIDOPHILUS
117
Table 4.2: Genome sequences of L. acidophilus group isolates deposited in the PubMLST database for this study (cont.)
Rows containing data relating to L. acidophilus records are coloured based on their history; commercial isolates in green and culture collection isolates in blue
Species Isolate Aliases Country Year Isolate source Sequence source Genome status
L. jensenii 269-3 - - Human vaginal cavity NCBI RefSeq draft
L. jensenii JV-V16 - USA Human vagina NCBI RefSeq draft
L. jensenii 27-2-CHN - - Human vagina NCBI RefSeq draft
L. jensenii 115-3-CHN - - Human vagina NCBI RefSeq draft
L. johnsonii FI9785 - - Human vagina NCBI RefSeq finished
L. johnsonii ATCC 33200 - Belgium Human blood NCBI RefSeq draft
L. johnsonii NCC 533 - - Faeces NCBI RefSeq finished
L. ultunensis DSM16047 - Sweden Human NCBI RefSeq draft

CHAPTER FOUR – POPULATION GENOMICS OF L. ACIDOPHILUS
118
4.2.2. IMPLEMENTATION OF GENE-BY-GENE ANALYSIS APPROACHES
4.2.2.1. Generation and storage of data using BIGSDB
The three main data components of this approach were generated as follows: i) isolate
genome sequencing and storage of sequence information, ii) a record of isolate provenance
and other phenotypic characteristics, and iii) reference tables of predefined allele
sequences for the loci of interest. All of these components were implemented in the
Bacterial Isolate Genome Sequence Database (BIGSDB) (Jolley and Maiden, 2010)
(http://pubmlst.org/software/database/bigsdb/). BIGSDB is a scalable, open-source, web-
accessible database which provides tools to store, retrieve and analyse linked phenotypic
and genotypic information (Figure 4.1). The BIGSDB sequence repository may be
populated with any amount of sequence data, from single gene sequences to finished
genome sequences, as well as multiple contigs that make up the genome sequence of single
re-sequenced isolates. When coupled with extensive information about an isolate, for
example provenance data such as isolation date and location, or phenotypic characteristics
such as antimicrobial susceptibility and auxotrophy, the BIGSDB provided a
comprehensive toolkit for analysing the structure and function of bacteria using a
population genomics approach (Jolley and Maiden, 2010).
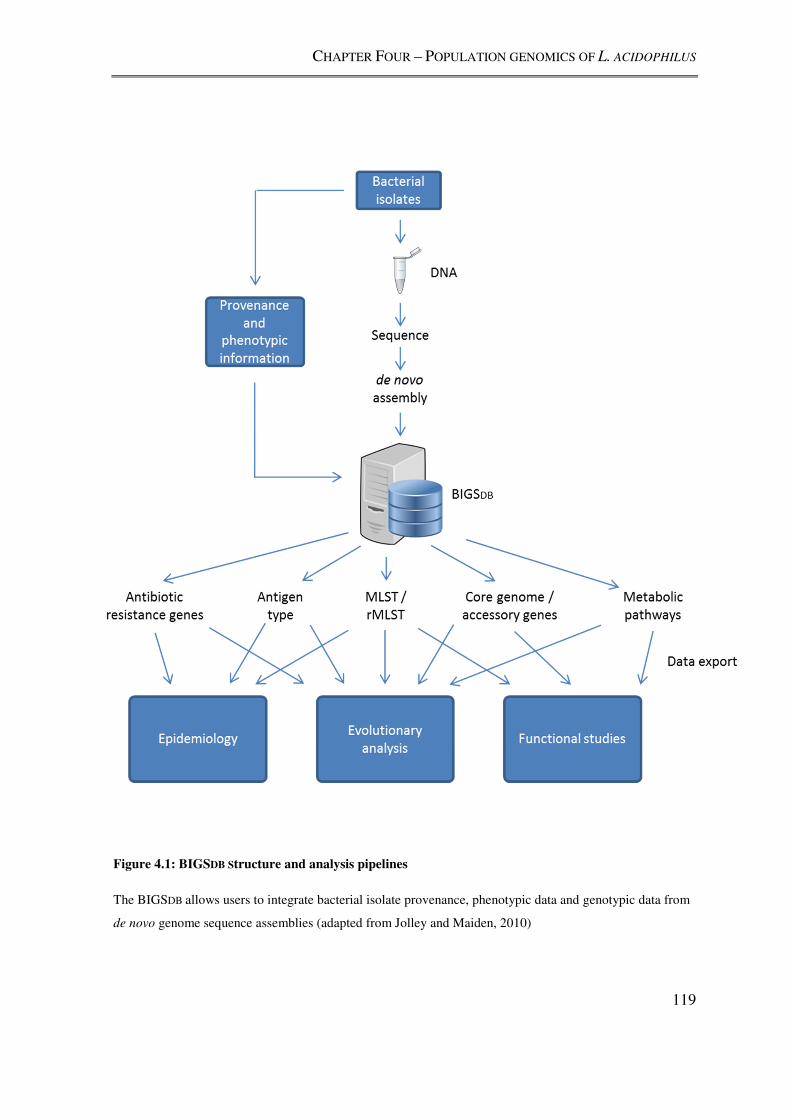
CHAPTER FOUR – POPULATION GENOMICS OF L. ACIDOPHILUS
119
Figure 4.1: BIGSDB Structure and analysis pipelines
The BIGSDB allows users to integrate bacterial isolate provenance, phenotypic data and genotypic data from
de novo genome sequence assemblies (adapted from Jolley and Maiden, 2010)
CHAPTER FOUR – POPULATION GENOMICS OF L. ACIDOPHILUS
120
4.2.3. GENE-BY-GENE POPULATION GENOMICS ANALYSES USING BIGSDB
4.2.3.1. Ribosomal MLST (rMLST)
Classical MLST schemes typically analyse between six and eight housekeeping loci,
providing a means of reliably identifying relationships between bacteria (Gevers et al.,
2005). However, there has been concerns raised that indexing variation at less than eight
loci may not provide the resolution to differentiate very closely related organisms
(Achtman, 2008). At the other end of the scale, it is difficult to apply an MLST scheme
based on eight loci across more distantly related bacteria, and this has meant that several
different MLST schemes must be devised to cover a bacterial genus, each one unique to a
particular species or closely related group of organisms. Classical MLST schemes may
also not provide a practical combined taxonomic and typing approach at all levels of
bacterial diversity (Jolley et al., 2012).
To address the limitations of classical MLST, BIGSDB may be used to implement
ribosomal MLST (rMLST), a combined taxonomic and typing approach, and natural
extension of the original seven locus MLST scheme (Jolley et al., 2012). rMLST provides
resolution from the sub-species level to the whole bacterial domain, by indexing variation
of sequences that encode ribosomal proteins (rps genes) (Jolley et al., 2012). Each draft
genome sequence is searched for each rps locus first using BlastN at a cutoff of 70%
identity over at least 50% the alignment. If no gene is identified, the stringency of the
BlastN search is iteratively lowered by 5% identity to 50% identity over 50% alignment. If
no locus is identified, the search is switched to TBlastX and the same iterative process
undertaken. This allows diverse rps gene sequences to be identified, and each new
sequence encountered is assigned a unique number, as in MLST. The final rMLST profile
for each bacterial isolate comprises of a series of number defining unique sequences at
genomic loci encoding 53 ribosomal proteins. rMLST has been applied in diverse systems
including reclassifying Neisseria species (Bennett et al., 2012) and studying the
epidemiology of pathogenic Campylobacter species (Cody et al., 2013).

CHAPTER FOUR – POPULATION GENOMICS OF L. ACIDOPHILUS
121
4.2.3.2. “Genome-wide” MLST
When examining closely related isolates, especially those of a single species, BIGSDB
also allows the user to create a “genome-wide” MLST scheme to index diversity at every
locus defined within a reference sequence (Jolley and Maiden, 2010). Each locus is
defined in an annotated reference sequence and iteratively searched for in the draft genome
sequence of each isolate to be compared in the same way as rMLST searches for the rps
genes. This allows the user to profile the genomic diversity of isolates genome-wide.
Genome-wide MLST has been utilised to study the population genomics of
Campylobacter (Sheppard et al., 2012), Neisseria (Bennett et al., 2012) and Streptococcus
(Jolley and Maiden, 2010).
4.2.4. IMPLEMENTATION OF BIGSDB-BASED ANALYSES
Relationships among isolates from the L. acidophilus group were established using
phylogenetic networks based on rMLST sequences (Section 4.2.3.1). The 53 ribosomal
subunit loci identified in the automated annotation process were compared among all
isolates using the BIGSDB Genome Comparator module. The distance matrix generated on
the basis of shared alleles was visualized with the Neighbor-Net algorithm (Bryant and
Moulton, 2004), implemented in SplitsTree version 4.8 (Huson and Bryant, 2006) within
the BIGSDB Web-interface.
Isolates of L. acidophilus species were further analysed with the BIGSDB Genome
Comparator at all loci defined in L. acidophilus NCFM to generate a distance matrix based
on shared alleles; the matrix was visualized with Neighbor-net as above. This algorithm
does not assume a tree-like structure for the data and resolves interrelationships among
isolates as a phylogenetic network where appropriate. This algorithm accommodates
departures from tree-like phylogeny, which for example, can result from horizontal gene
transfer (Cody et al., 2013). Furthermore, the Genome Comparator was used to establish
both presence/absence and count the number of allelic differences at a particular locus. At
each locus, a consensus sequence was created from all alleles and the mean distance of all
CHAPTER FOUR – POPULATION GENOMICS OF L. ACIDOPHILUS
122
alleles from the consensus sequence was calculated to provide a measure of allelic
diversity per-locus. The most diverse loci were assumed to have a non-zero mean distance
value. Isolates were clustered hierarchically using Ward's method based on their allelic
profiles at loci with non-zero mean distances, using the heatmap2 function in the package
gplots (Gregory R. Warnes et al., 2013) in R statistical software (R Development Core
Team, 2012). Heatmaps were coloured using the colour palettes available in the
RColorBrewer package (Neuwirth, 2011).
In order to examine sequence differences at genomic loci not defined in the L. acidophilus
NCFM genome sequence, the L. acidophilus NCFM CRISPR sequence was downloaded
and used to probe other L. acidophilus genome sequence data using BLAST+ tools
implemented via the BIGSDB Web-interface (Camacho et al., 2009). Complete CRISPR
sequences with 1 kb of flanking sequence on each side were downloaded and compared
using the CRISPRtionary: Dictionary Creator tool, at the CRISPRdb (http://crispr.u-
psud.fr/crispr/) (Grissa et al., 2007). Incomplete or partially assembled CRISPR regions
were excluded from further analysis.
4.2.5. EXPOSURE OF L. ACIDOPHILUS NCFM TO METHYL METHANE SULPHONATE
(MMS)
Mutagenesis with MMS was performed in two stages, the first to estimate an MMS
exposure that would ensure a 99% reduction in viability of a culture of L. acidophilus
NCFM, and the second to mutagenise L. acidophilus NCFM with three sequential
exposures to MMS, retaining two isolates for genome resequencing at each culture passage
stage as follows. Overnight cultures of L. acidophilus NCFM were grown at 37°C in MRS
broth. Input bacterial suspensions were enumerated using a viable drop count method.
Serial dilutions were performed in MRS broth; 10 µl drops of bacterial suspension were
aspirated onto the surface of an MRS agar plate in triplicate and incubated at 37°C for 24
hours. Individual colonies were counted and the number of viable cells estimated.
CHAPTER FOUR – POPULATION GENOMICS OF L. ACIDOPHILUS
123
MMS was added to 1 ml of suspension to a final concentration of 3, 4 or 5% (v/v) for
exposure times of 10, 15 and 30 minutes. After exposure, suspensions were separated with
centrifugation and the supernatant containing MMS aspirated. 1 ml of fresh MRS broth
was added to the pellet to re-suspend, and the drop count enumeration procedure was
repeated to establish the output from the test. A percentage reduction in culture viability
was calculated using the ratio of output enumeration to input enumeration.
Subsequently, L. acidophilus NCFM cultures were subjected to three rounds of
mutagenesis by exposure to MMS at 5 % (v/v) for 15 minutes, an exposure which resulted
in 99% loss of viability. As previously, 1 ml of bacterial overnight culture was
enumerated, exposed to MMS, enumerated again to confirm the 99% reduction in viability
and then frozen at -80°C after the addition of 8% DMSO as a cryoprotectant. This freezer
stock was revived onto MRS agar and fresh overnight bacterial cultures were inoculated
from three colonies. High molecular weight DNA was prepared from two overnight
bacterial cultures as described previously (Section 4.2.1.2) and the third was subjected to
the same MMS mutagenesis exposure. This was repeated for a third round, ensuring DNA
was prepared from six MMS-exposed single colony-based isolate cultures. High molecular
weight DNA from these isolates was subject to the same sequencing and assembly
procedures described in Section 4.2.1.2, RAPD PCR as described in Chapter 2, and
assembled data were deposited in the PubMLST database before further analysis. The
Genome Comparator tool implemented in the BIGSDB was used to identify loci that had
different alleles to the reference L. acidophilus NCFM genome. These were assumed to be
mutations induced by exposure to MMS.
CHAPTER FOUR – POPULATION GENOMICS OF L. ACIDOPHILUS
124
4.3. RESULTS
The results are divided into three subsections as follows. The first describes a small scale
L. acidophilus genomic diversity survey, mapping the genomes of three L. acidophilus
isolates; CUL21 and CUL60 from the Lab4® capsule and L. acidophilus LMG 11428, a
culture collection isolate with the earliest-recorded deposition date (1922, Table 4.2). The
second section describes a large-scale genomic diversity survey of L. acidophilus isolates.
Overall, 30 L. acidophilus genome sequences were included in this broader study,
reflecting the progressive shift toward attaining highly-economical (virtually) complete
prokaryotic genome sequences. Finally, the third results section sought to establish why so
little genomic variation was observed between L. acidophilus isolates, particularly
considering their reported ecological niche, the GIT, is a known mutagenic environment.
4.3.1. SMALL SCALE L. ACIDOPHILUS EVOLUTIONARY GENOMICS
A visual comparison of the genome sequence of L. acidophilus NCFM with L. acidophilus
CUL21 and CUL60, showed synteny across the entirety of their genome sequences (Figure
4.2). Single Nucleotide Polymorphism (SNP) detection identified a total of 87
polymorphisms between L. acidophilus CUL21 and L. acidophilus NCFM, of which 13
were non-coding, 22 encoded synonymous mutations and 48 encoded non-synonymous
mutations. Between L. acidophilus NCFM and L. acidophilus CUL60, a total of 85 SNPs
were observed, 15 non-coding, 21 encoding synonymous mutations and 49 encoding non-
synonymous mutations. Of 364 SNPs between L. acidophilus LMG11428 and L.
acidophilus NCFM, 48 were non-coding, 57 encoded synonymous mutations and the
remaining 258 encoded none non-synonymous mutations. When SNP locations were
compared for all strains, 76 SNPs were found to have identical locations and with same
alternate base call at each of these positions for CUL21, CUL60 and LMG 11428.
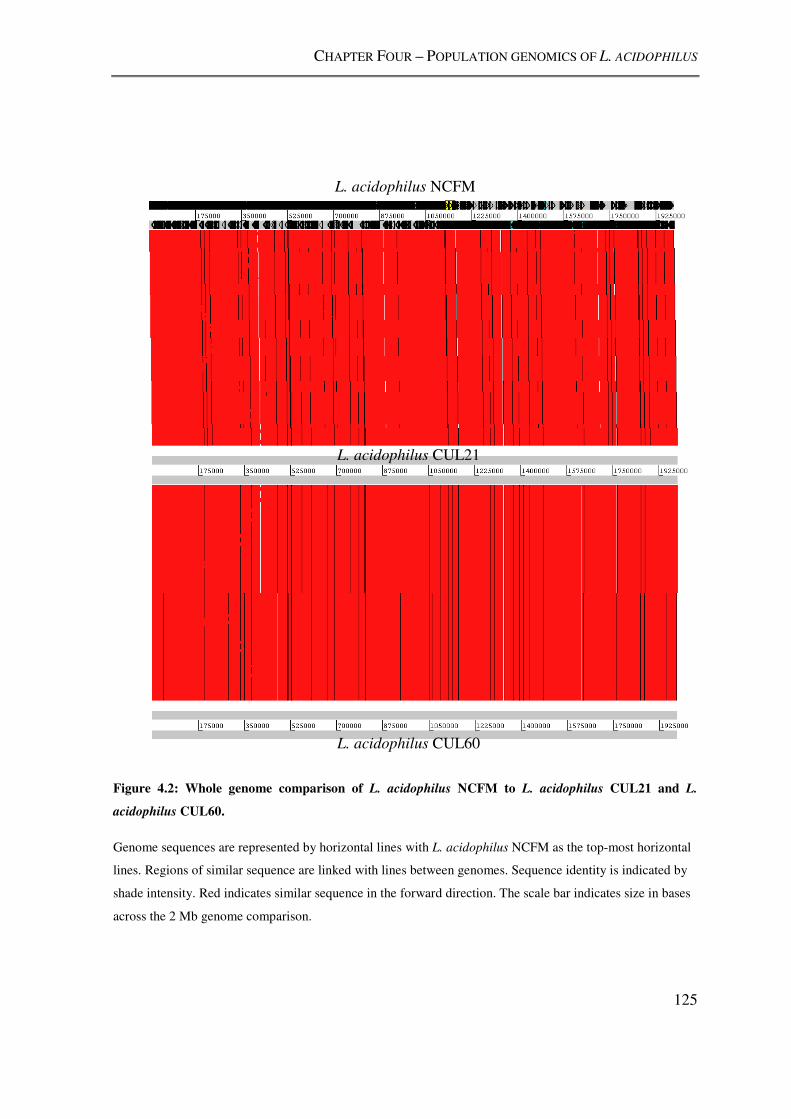
CHAPTER FOUR – POPULATION GENOMICS OF L. ACIDOPHILUS
125
Figure 4.2: Whole genome comparison of L. acidophilus NCFM to L. acidophilus CUL21 and L.
acidophilus CUL60.
Genome sequences are represented by horizontal lines with L. acidophilus NCFM as the top-most horizontal
lines. Regions of similar sequence are linked with lines between genomes. Sequence identity is indicated by
shade intensity. Red indicates similar sequence in the forward direction. The scale bar indicates size in bases
across the 2 Mb genome comparison.
L. acidophilus NCFM
L. acidophilus CUL21
L. acidophilus CUL60
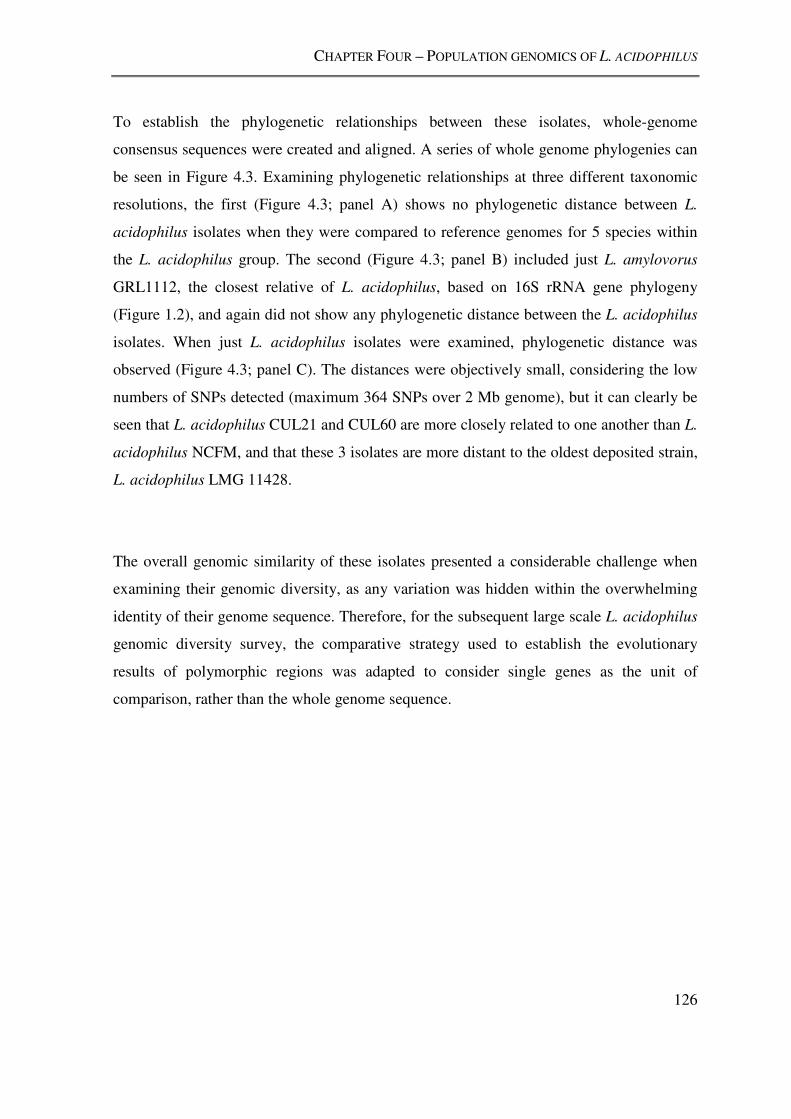
CHAPTER FOUR – POPULATION GENOMICS OF L. ACIDOPHILUS
126
To establish the phylogenetic relationships between these isolates, whole-genome
consensus sequences were created and aligned. A series of whole genome phylogenies can
be seen in Figure 4.3. Examining phylogenetic relationships at three different taxonomic
resolutions, the first (Figure 4.3; panel A) shows no phylogenetic distance between L.
acidophilus isolates when they were compared to reference genomes for 5 species within
the L. acidophilus group. The second (Figure 4.3; panel B) included just L. amylovorus
GRL1112, the closest relative of L. acidophilus, based on 16S rRNA gene phylogeny
(Figure 1.2), and again did not show any phylogenetic distance between the L. acidophilus
isolates. When just L. acidophilus isolates were examined, phylogenetic distance was
observed (Figure 4.3; panel C). The distances were objectively small, considering the low
numbers of SNPs detected (maximum 364 SNPs over 2 Mb genome), but it can clearly be
seen that L. acidophilus CUL21 and CUL60 are more closely related to one another than L.
acidophilus NCFM, and that these 3 isolates are more distant to the oldest deposited strain,
L. acidophilus LMG 11428.
The overall genomic similarity of these isolates presented a considerable challenge when
examining their genomic diversity, as any variation was hidden within the overwhelming
identity of their genome sequence. Therefore, for the subsequent large scale L. acidophilus
genomic diversity survey, the comparative strategy used to establish the evolutionary
results of polymorphic regions was adapted to consider single genes as the unit of
comparison, rather than the whole genome sequence.
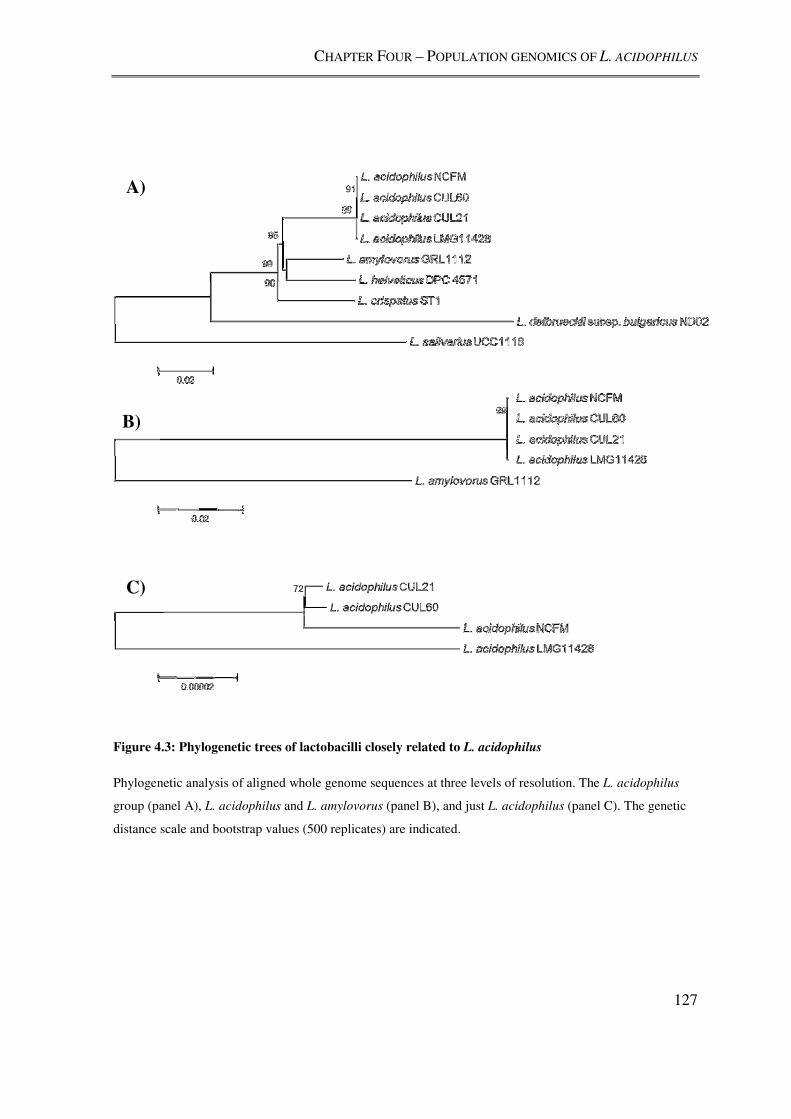
CHAPTER FOUR – POPULATION GENOMICS OF L. ACIDOPHILUS
127
Figure 4.3: Phylogenetic trees of lactobacilli closely related to L. acidophilus
Phylogenetic analysis of aligned whole genome sequences at three levels of resolution. The L. acidophilus
group (panel A), L. acidophilus and L. amylovorus (panel B), and just L. acidophilus (panel C). The genetic
distance scale and bootstrap values (500 replicates) are indicated.
A)
B)
C)
CHAPTER FOUR – POPULATION GENOMICS OF L. ACIDOPHILUS
128
4.3.2. EXPANDED L. ACIDOPHILUS GENOMIC DIVERSITY STUDY
4.3.2.1. Assessing genomic diversity of the L. acidophilus group using rMLST
To contextualise the diversity of L. acidophilus isolates, rMLST was performed on isolates
from the L. acidophilus group. 53 genes that encode ribosomal proteins were identified in
all genome sequences (25 L. acidophilus isolates represented by 30 genome sequences, and
19 other L. acidophilus group genome sequences). The rps genes represent 20,640
nucleotides in L. acidophilus NCFM and hence account for any observed variation in just
over 1% of its total genome sequence.
A Neighbour Joining phylogenetic tree of the concatenated sequences of all rMLST loci
was able to resolve each species within the L. acidophilus group (Figure 4.4), despite some
species sharing 99% of their 16S rRNA gene sequences (Bull et al., 2012). The phylogeny
illustrates the strain level diversity of the L. acidophilus group, with L. gasseri, L.
johnsonii, L. delbruekii and L. helveticus isolates diverging earlier than isolates of L.
jensenii and L. acidophilus. L. acidophilus isolates fall as a single group, diverging early
from other L. acidophilus group species, and also diverging recently among themselves.
Further analysis of isolates of L. acidophilus was conducted using DNA sequence from all
protein coding regions to improve resolution.

CHAPTER FOUR – POPULATION GENOMICS OF L. ACIDOPHILUS
129
Figure 4.4: Neighbour Joining phylogeny of concatenated ribosomal protein genes from L. acidophilus
group isolates
The tree was based on the concatenated sequences of 53 rps loci (20, 640 nucleotides). A bootstrap test of
reliability was performed for 500 replications.
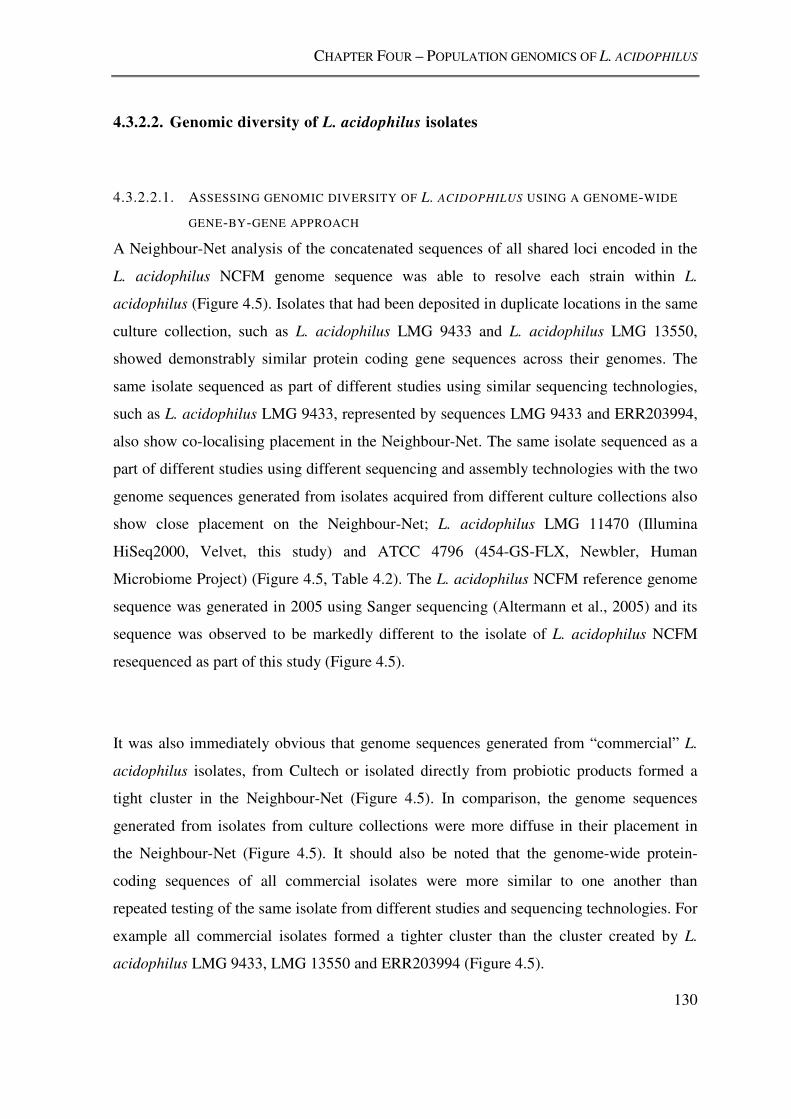
CHAPTER FOUR – POPULATION GENOMICS OF L. ACIDOPHILUS
130
4.3.2.2. Genomic diversity of L. acidophilus isolates
4.3.2.2.1. ASSESSING GENOMIC DIVERSITY OF L. ACIDOPHILUS USING A GENOME-WIDE
GENE-BY-GENE APPROACH
A Neighbour-Net analysis of the concatenated sequences of all shared loci encoded in the
L. acidophilus NCFM genome sequence was able to resolve each strain within L.
acidophilus (Figure 4.5). Isolates that had been deposited in duplicate locations in the same
culture collection, such as L. acidophilus LMG 9433 and L. acidophilus LMG 13550,
showed demonstrably similar protein coding gene sequences across their genomes. The
same isolate sequenced as part of different studies using similar sequencing technologies,
such as L. acidophilus LMG 9433, represented by sequences LMG 9433 and ERR203994,
also show co-localising placement in the Neighbour-Net. The same isolate sequenced as a
part of different studies using different sequencing and assembly technologies with the two
genome sequences generated from isolates acquired from different culture collections also
show close placement on the Neighbour-Net; L. acidophilus LMG 11470 (Illumina
HiSeq2000, Velvet, this study) and ATCC 4796 (454-GS-FLX, Newbler, Human
Microbiome Project) (Figure 4.5, Table 4.2). The L. acidophilus NCFM reference genome
sequence was generated in 2005 using Sanger sequencing (Altermann et al., 2005) and its
sequence was observed to be markedly different to the isolate of L. acidophilus NCFM
resequenced as part of this study (Figure 4.5).
It was also immediately obvious that genome sequences generated from “commercial” L.
acidophilus isolates, from Cultech or isolated directly from probiotic products formed a
tight cluster in the Neighbour-Net (Figure 4.5). In comparison, the genome sequences
generated from isolates from culture collections were more diffuse in their placement in
the Neighbour-Net (Figure 4.5). It should also be noted that the genome-wide protein-
coding sequences of all commercial isolates were more similar to one another than
repeated testing of the same isolate from different studies and sequencing technologies. For
example all commercial isolates formed a tighter cluster than the cluster created by L.
acidophilus LMG 9433, LMG 13550 and ERR203994 (Figure 4.5).
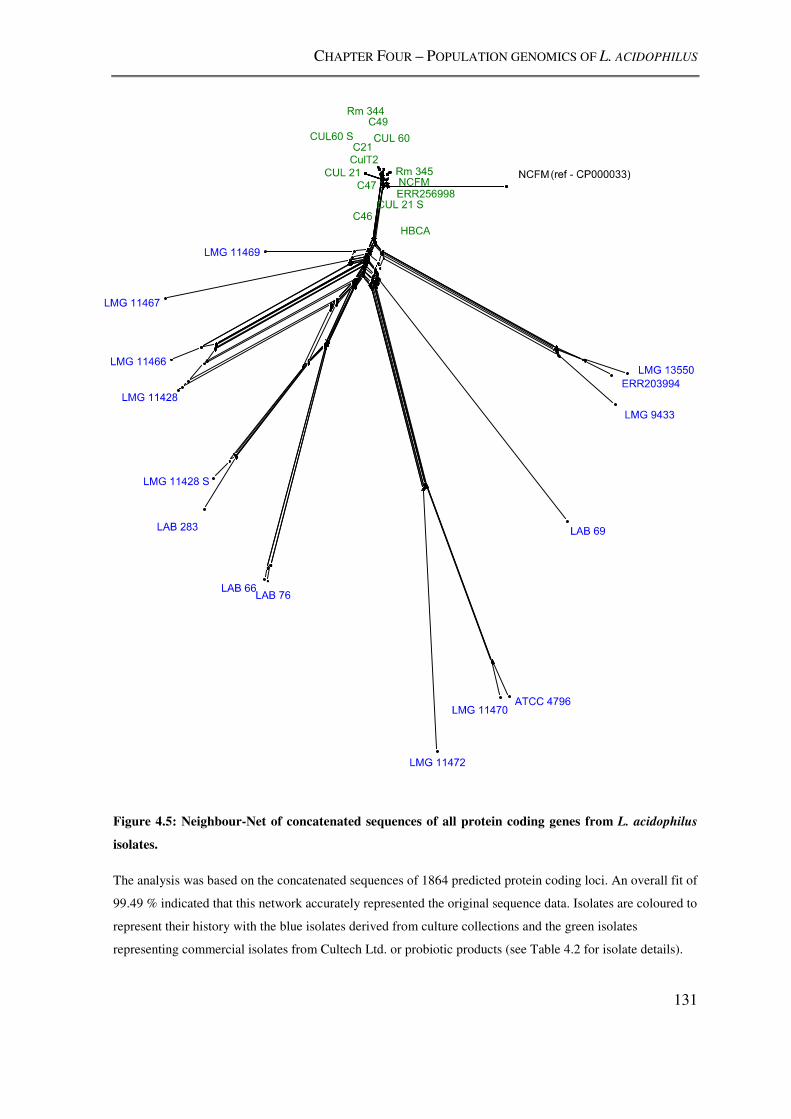
CHAPTER FOUR – POPULATION GENOMICS OF L. ACIDOPHILUS
131
Figure 4.5: Neighbour-Net of concatenated sequences of all protein coding genes from L. acidophilus
isolates.
The analysis was based on the concatenated sequences of 1864 predicted protein coding loci. An overall fit of
99.49 % indicated that this network accurately represented the original sequence data. Isolates are coloured to
represent their history with the blue isolates derived from culture collections and the green isolates
representing commercial isolates from Cultech Ltd. or probiotic products (see Table 4.2 for isolate details).
CHAPTER FOUR – POPULATION GENOMICS OF L. ACIDOPHILUS
132
4.3.2.2.2. REGIONS NOT PRESENT IN L. ACIDOPHILUS ISOLATES
All L. acidophilus isolates shared a markedly high (1828/1862) number of protein coding
DNA sequences with L. acidophilus NCFM reference to which they were compared
(Figure 4.6). The remaining loci that were variably present in L. acidophilus isolates are
shown in Figure 4.7. Interestingly, the majority of these fluctuating loci were attributed to
the three PAU regions of L. acidophilus NCFM (see Section 1.3.3) or loci closely
associated with these regions. An additional variant region was composed of three
consecutive gene loci, LBA0058, LBA0059 and LBA0060, also encoded within phage-
related DNA, but distinct from the PAU DNA. When isolates of L. acidophilus were
separated based on their history (commercial and culture collection), differences in the
distribution of the three PAU regions was evident. The PAU1 locus was widely distributed
across all isolates, culture collection and commercial, with the exception of CUL21 and
C47. Both of these isolates are from Cultech, with CUL21 used as part of the Lab4®
probiotic. Other commercial isolates had the other PAU regions, 2 and 3, intact and shared
more loci found in L. acidophilus NCFM than isolates from culture collections (Figure
4.7). Culture collection isolates demonstrated more variably present all loci, including
PAU2 and PAU3, and other coding regions (Figure 4.7).
CHAPTER FOUR – POPULATION GENOMICS OF L. ACIDOPHILUS
133
Figure 4.6: L. acidophilus NCFM protein coding loci found in other L. acidophilus isolates.
The distribution of all protein-coding loci defined in the L. acidophilus NCFM genome sequence, in all other
L. acidophilus isolates is represented. 1828 loci are found in all isolates, 17 loci are found in between 90%
and 95% of isolates etc.
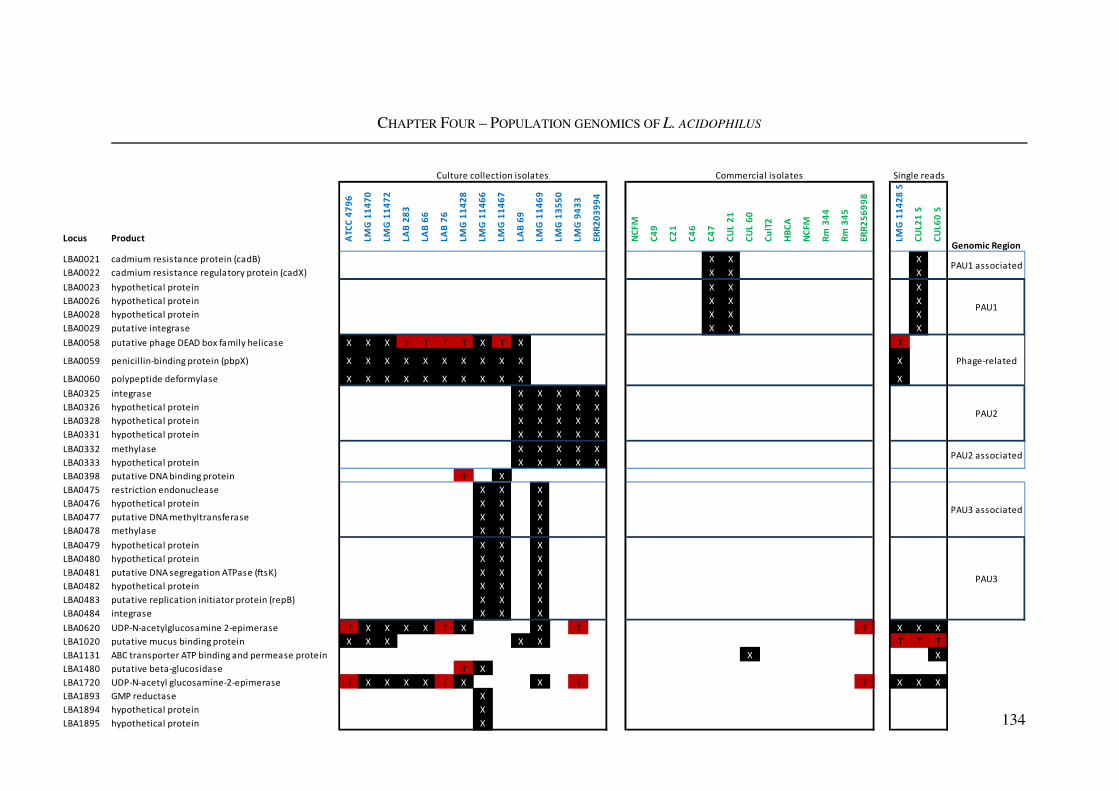
CHAPTER FOUR – POPULATION GENOMICS OF L. ACIDOPHILUS
134
Locus Product AT
CC
47
96
LM
G 1
14
70
LM
G 1
14
72
LA
B 2
83
LA
B 6
6
LA
B 7
6
LM
G 1
14
28
LM
G 1
14
66
LM
G 1
14
67
LA
B 6
9
LM
G 1
14
69
LM
G 1
35
50
LM
G 9
43
3
ER
R2
03
99
4
NC
FM
C4
9
C2
1
C4
6
C4
7
CU
L 2
1
CU
L 6
0
Cu
lT2
HB
CA
NC
FM
Rm
34
4
Rm
34
5
ER
R2
56
99
8
LM
G 1
14
28
S
CU
L2
1 S
CU
L6
0 S
LBA0021 cadmium resistance protein (cadB) 1 1 1 1 1 1 1 1 1 1 1 1 1 1 1 1 1 1 X X 1 1 1 1 1 1 1 1 X 1
LBA0022 cadmium resistance regulatory protein (cadX) 1 1 1 1 1 1 1 1 1 1 1 1 1 1 1 1 1 1 X X 1 1 1 1 1 1 1 1 X 1
LBA0023 hypothetical protein 1 1 3 1 1 1 1 1 1 2 1 1 1 1 1 1 1 1 X X 1 1 1 1 1 1 1 1 X 1
LBA0026 hypothetical protein 1 1 1 1 1 1 1 1 1 1 1 1 1 1 1 1 1 1 X X 1 1 1 1 1 1 1 1 X 1
LBA0028 hypothetical protein 1 1 1 1 1 1 1 1 1 1 1 1 1 1 1 1 1 1 X X 1 1 1 1 1 1 1 1 X 1
LBA0029 putative integrase 1 1 2 1 1 1 1 1 1 1 1 2 2 2 1 1 1 1 X X 1 1 1 1 1 1 1 1 X 1
LBA0058 putative phage DEAD box family helicase X X X T T T T X T X 1 1 1 1 1 1 1 1 1 1 1 1 1 1 1 1 1 T 1 1
LBA0059 penicillin-binding protein (pbpX) X X X X X X X X X X 1 1 1 1 1 1 1 1 1 1 1 1 1 1 1 1 1 X 1 1
LBA0060 polypeptide deformylase X X X X X X X X X X 1 1 1 1 1 1 1 1 1 1 1 1 1 1 1 1 1 X 1 1
LBA0325 integrase 1 1 1 1 1 1 1 1 1 X X X X X 1 1 1 1 1 1 1 1 1 1 1 1 1 1 1 1
LBA0326 hypothetical protein 1 1 2 1 1 1 1 1 1 X X X X X 1 1 1 1 1 1 1 1 1 1 1 1 1 1 1 1
LBA0328 hypothetical protein 1 1 1 1 1 1 1 1 1 X X X X X 1 1 1 1 1 1 1 1 1 1 1 1 1 1 1 1
LBA0331 hypothetical protein 1 1 1 1 1 1 1 1 1 X X X X X 1 1 1 1 1 1 1 1 1 1 1 1 1 1 1 1
LBA0332 methylase 2 2 2 1 1 1 1 1 1 X X X X X 1 1 1 1 1 1 1 1 1 1 1 1 1 1 1 1
LBA0333 hypothetical protein 1 1 1 1 1 1 1 1 1 X X X X X 1 1 1 1 1 1 1 1 1 1 1 1 1 1 1 1
LBA0398 putative DNA binding protein 1 1 1 2 1 1 T 4 X 3 1 1 1 1 1 1 1 1 1 1 1 1 1 1 1 1 1 2 1 1
LBA0475 restriction endonuclease 2 2 1 3 4 4 3 X X 1 X 1 1 1 1 1 1 1 1 1 1 1 1 1 1 1 1 3 1 1
LBA0476 hypothetical protein 2 2 6 3 4 4 3 X X 5 X 7 7 7 1 1 1 1 1 1 1 1 1 1 1 1 1 3 1 1
LBA0477 putative DNA methyltransferase 1 1 2 1 1 1 1 X X 1 X 3 4 3 1 1 1 1 1 1 1 1 1 1 1 1 1 1 1 1
LBA0478 methylase 1 1 1 1 1 1 1 X X 1 X 1 1 1 1 1 1 1 1 1 1 1 1 1 1 1 1 1 1 1
LBA0479 hypothetical protein 1 1 1 1 1 1 1 X X 1 X 1 1 1 1 1 1 1 1 1 1 1 1 1 1 1 1 1 1 1
LBA0480 hypothetical protein 1 1 1 1 1 1 1 X X 1 X 1 1 1 1 1 1 1 1 1 1 1 1 1 1 1 1 1 1 1
LBA0481 putative DNA segregation ATPase (ftsK) 1 1 1 1 1 1 1 X X 1 X 1 1 1 1 1 1 1 1 1 1 1 1 1 1 1 1 1 1 1
LBA0482 hypothetical protein 1 1 1 1 1 1 1 X X 1 X 1 1 1 1 1 1 1 1 1 1 1 1 1 1 1 1 1 1 1
LBA0483 putative replication initiator protein (repB) 1 1 1 1 1 1 1 X X 1 X 1 1 1 1 1 1 1 1 1 1 1 1 1 1 1 1 1 1 1
LBA0484 integrase 1 1 1 1 1 1 1 X X 1 X 2 2 2 1 1 1 1 1 1 1 1 1 1 1 1 1 1 1 1
LBA0620 UDP-N-acetylglucosamine 2-epimerase T X X X X T X 2 2 3 X 2 T 2 1 2 2 2 2 2 2 2 2 2 3 3 T X X X
LBA1020 putative mucus binding protein X X X 4 4 4 4 4 4 X X 5 6 5 1 2 2 2 3 3 2 2 2 2 2 2 2 T T T
LBA1131 ABC transporter ATP binding and permease protein 1 1 1 2 2 2 1 1 1 1 1 1 1 1 1 1 1 1 1 1 X 1 1 1 1 1 1 2 1 X
LBA1480 putative beta-glucosidase 1 1 1 2 3 3 T X 1 1 1 1 1 1 1 1 1 1 1 1 1 1 1 1 1 1 1 2 1 1
LBA1720 UDP-N-acetyl glucosamine-2-epimerase T X X X X T X 1 1 2 X 1 T 1 1 1 1 1 1 1 1 1 1 1 2 2 T X X X
LBA1893 GMP reductase 1 1 1 1 1 1 1 X 1 2 1 1 3 1 1 1 1 1 1 1 1 1 1 1 1 1 1 1 1 1
LBA1894 hypothetical protein 1 1 1 1 1 1 1 X 2 1 1 1 1 1 1 1 1 1 1 1 1 1 1 1 1 1 1 1 1 1
LBA1895 hypothetical protein 1 1 1 1 1 1 1 X 1 1 1 1 1 1 1 1 1 1 1 1 1 1 1 1 1 1 1 1 1 1
PAU3
PAU3 associated
PAU2 associated
PAU1 associated
Genomic Region
Phage-related
Culture collection isolates Commercial isolates Single reads
PAU1
PAU2
CHAPTER FOUR – POPULATION GENOMICS OF L. ACIDOPHILUS
135
← Previous Page
Figure 4.7: Variably present protein coding loci
Loci are defined in the L. acidophilus NCFM genome sequence (GenBank: CP000033), and representative
predicted gene products from the same sequence are listed. Completely missing loci are noted with an X, and
truncated loci, indication that a proportion of the locus present at the end of a sequence contig, are noted with
a T. The three PAU regions and phage related DNA within of the L. acidophilus NCFM genome are marked
(add the genomic region header and phage-related DNA label), and isolate names are coloured blue for
culture collection isolates and green for commercial isolates. Also included in a separate column is the
analysis of the genome sequences generated from the small scale genome resequencing study (section 4.3.1)
4.3.2.2.3. LOCI SHOWING SEQUENCE DIVERSITY
Sequence diversity was estimated by calculating mean distances for all protein coding loci
defined in the L. acidophilus NCFM reference genome. A consensus sequence was
generated from the sequences of all isolates at each locus, and then the distance of each
individual isolate sequence from this consensus derived for each locus. The mean of these
distances provided a simple way of assessing diversity at each protein coding locus. A
mean distance of zero was observed at over 70% of genomic loci (1305/1864). The
remaining loci that showed non-zero mean distances were filtered to remove: i) truncated
loci present at the ends of sequence contigs, and ii) paralogous loci that were mostly
attributed to multicopy transposases. The remaining loci were then compared across all
isolates, and each time a new sequence was encountered, this was assigned a new “allele”
number. An “allelic profile” for each isolate was then generated, similar to a traditional
MLST scheme, but encompassing only the diverse protein coding loci. Ten different alleles
were encountered at the most diverse locus and this variation in correlation with the
genome sequences was used to generate a heatmap of locus diversity (Figure 4.8). When
isolates were clustered based on the similarity of their allelic profiles, culture collection
isolates again clearly separated from commercial isolates (Figure 4.8). Commercial isolates
were much more homogenous in their allelic profiles, and more similar in sequence to L.
acidophilus NCFM. The culture collection isolates were much more diverse, although
CHAPTER FOUR – POPULATION GENOMICS OF L. ACIDOPHILUS
136
duplicate isolates from different culture collections such as L. acidophilus ATCC 4796 and
LMG 11470, and L. acidophilus LMG 9433, LMG 13550 and ERR203994, clustered
together respectively.

CHAPTER FOUR – POPULATION GENOMICS OF L. ACIDOPHILUS
138
← Previous page
Figure 4.8: Variable loci in L. acidophilus genome sequences
L. acidophilus genome sequences (columns) are represented by their most diverse loci (rows), forming an
allelic profile for each isolate. Each locus in each genome sequence is coloured from red to green relative to
its allele number (1 is red, 10 is green). As new allele numbers are assigned only when a new sequence is
encountered at that particular locus, the most diverse alleles have a larger amount of green cells. The genome
sequences are clustered according to their allelic profile similarity, and the loci according to their overall
diversity. Again, genome sequences are coloured based on their history, culture collection isolates in blue and
commercial isolates in green. Two clusters of diverse loci examined in further detail are highlighted in purple
(Group 2) and orange (Group 1).
Two groups of diverse loci, group 1 and group 2, were identified in heatmap analysis
(Figure 1.8) and further details on these coding sequences is provided in Figure 4.9. The
group 1 loci (Figure 1.9; orange font) were highly diverse in isolates from culture
collections, yet distinctly homogenous in commercial isolates. Loci encoding outer-
membrane and transport-related functions were most diverse coding sequences in these
group 1 loci (LBA1300, LBA0166 and LBA1463). LBA1146 displayed a similar level of
diversity but has no annotated function attributed, although it has close (>80% sequence
identity) homologues in Lactobacillus kefiranofaciens ZW3 and Lactobacillus crispatus
ST1. LBA1360 and LBA0079 were less diverse and also associated with cross-membrane
transport. Although up to ten different alleles were encountered at these loci, overall mean
distances were below 0.008 and generally in the range of 0.001 to 0.002 (Figure 1.9).
The second group of diverse loci, group 2, (Figure 1.9, purple font), were entirely
homogenous in sequence in the commercial isolates, and diverse in the culture collection
isolates, but less so than the group 1 sequences. Two loci had large mean distances
(LBA0327 and LBA0329, 0.043 and 0.038 respectively), but this may be attributed to
them being part of PAU2, of which parts were observed to be variably present in L.
acidophilus isolates (Section 4.3.2.2.2). Of the remaining loci within group 2, three

CHAPTER FOUR – POPULATION GENOMICS OF L. ACIDOPHILUS
139
(LBA0293, LBA0408 and LBA1384) were associated with “housekeeping” type products
such as ribosomal proteins and DNA repair.
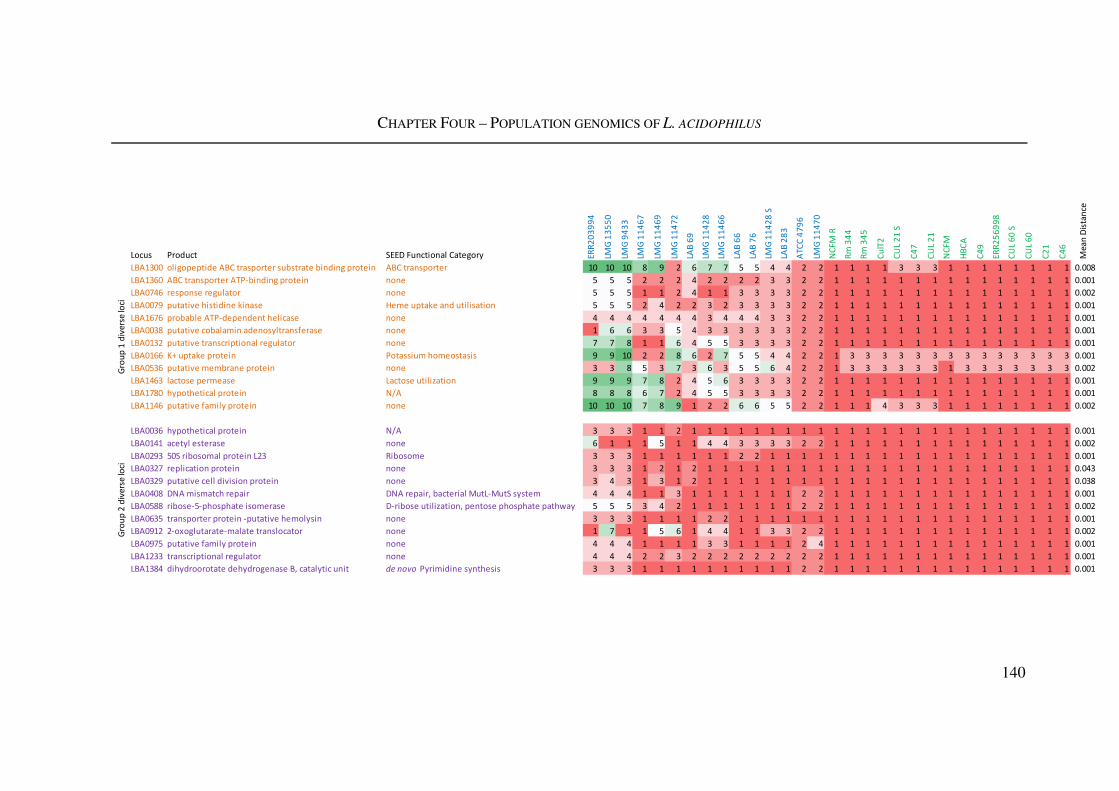
CHAPTER FOUR – POPULATION GENOMICS OF L. ACIDOPHILUS
140
Locus Product SEED Functional Category ER
R2
03
99
4
LMG
13
55
0
LMG
94
33
LMG
11
46
7
LMG
11
46
9
LMG
11
47
2
LAB
69
LMG
11
42
8
LMG
11
46
6
LAB
66
LAB
76
LMG
11
42
8 S
LAB
28
3
AT
CC
47
96
LMG
11
47
0
NC
FM
R
Rm
34
4
Rm
34
5
Cu
lT2
CU
L 2
1 S
C4
7
CU
L 2
1
NC
FM
HB
CA
C4
9
ER
R2
56
99
8
CU
L 6
0 S
CU
L 6
0
C2
1
C4
6
Me
an
Dis
tan
ce
LBA1300 oligopeptide ABC trasporter substrate binding protein ABC transporter 10 10 10 8 9 2 6 7 7 5 5 4 4 2 2 1 1 1 1 3 3 3 1 1 1 1 1 1 1 1 0.008
LBA1360 ABC transporter ATP-binding protein none 5 5 5 2 2 2 4 2 2 2 2 3 3 2 2 1 1 1 1 1 1 1 1 1 1 1 1 1 1 1 0.001
LBA0746 response regulator none 5 5 5 1 1 2 4 1 1 3 3 3 3 2 2 1 1 1 1 1 1 1 1 1 1 1 1 1 1 1 0.002
LBA0079 putative histidine kinase Heme uptake and utilisation 5 5 5 2 4 2 2 3 2 3 3 3 3 2 2 1 1 1 1 1 1 1 1 1 1 1 1 1 1 1 0.001
LBA1676 probable ATP-dependent helicase none 4 4 4 4 4 4 4 3 4 4 4 3 3 2 2 1 1 1 1 1 1 1 1 1 1 1 1 1 1 1 0.001
LBA0038 putative cobalamin adenosyltransferase none 1 6 6 3 3 5 4 3 3 3 3 3 3 2 2 1 1 1 1 1 1 1 1 1 1 1 1 1 1 1 0.001
LBA0132 putative transcriptional regulator none 7 7 8 1 1 6 4 5 5 3 3 3 3 2 2 1 1 1 1 1 1 1 1 1 1 1 1 1 1 1 0.001
LBA0166 K+ uptake protein Potassium homeostasis 9 9 10 2 2 8 6 2 7 5 5 4 4 2 2 1 3 3 3 3 3 3 3 3 3 3 3 3 3 3 0.001
LBA0536 putative membrane protein none 3 3 8 5 3 7 3 6 3 5 5 6 4 2 2 1 3 3 3 3 3 3 1 3 3 3 3 3 3 3 0.002
LBA1463 lactose permease Lactose utilization 9 9 9 7 8 2 4 5 6 3 3 3 3 2 2 1 1 1 1 1 1 1 1 1 1 1 1 1 1 1 0.001
LBA1780 hypothetical protein N/A 8 8 8 6 7 2 4 5 5 3 3 3 3 2 2 1 1 1 1 1 1 1 1 1 1 1 1 1 1 1 0.001
LBA1146 putative family protein none 10 10 10 7 8 9 1 2 2 6 6 5 5 2 2 1 1 1 4 3 3 3 1 1 1 1 1 1 1 1 0.002
LBA0036 hypothetical protein N/A 3 3 3 1 1 2 1 1 1 1 1 1 1 1 1 1 1 1 1 1 1 1 1 1 1 1 1 1 1 1 0.001
LBA0141 acetyl esterase none 6 1 1 1 5 1 1 4 4 3 3 3 3 2 2 1 1 1 1 1 1 1 1 1 1 1 1 1 1 1 0.002
LBA0293 50S ribosomal protein L23 Ribosome 3 3 3 1 1 1 1 1 1 2 2 1 1 1 1 1 1 1 1 1 1 1 1 1 1 1 1 1 1 1 0.001
LBA0327 replication protein none 3 3 3 1 2 1 2 1 1 1 1 1 1 1 1 1 1 1 1 1 1 1 1 1 1 1 1 1 1 1 0.043
LBA0329 putative cell division protein none 3 4 3 1 3 1 2 1 1 1 1 1 1 1 1 1 1 1 1 1 1 1 1 1 1 1 1 1 1 1 0.038
LBA0408 DNA mismatch repair DNA repair, bacterial MutL-MutS system 4 4 4 1 1 3 1 1 1 1 1 1 1 2 2 1 1 1 1 1 1 1 1 1 1 1 1 1 1 1 0.001
LBA0588 ribose-5-phosphate isomerase D-ribose utilization, pentose phosphate pathway 5 5 5 3 4 2 1 1 1 1 1 1 1 2 2 1 1 1 1 1 1 1 1 1 1 1 1 1 1 1 0.002
LBA0635 transporter protein -putative hemolysin none 3 3 3 1 1 1 1 2 2 1 1 1 1 1 1 1 1 1 1 1 1 1 1 1 1 1 1 1 1 1 0.001
LBA0912 2-oxoglutarate-malate translocator none 1 7 1 1 5 6 1 4 4 1 1 3 3 2 2 1 1 1 1 1 1 1 1 1 1 1 1 1 1 1 0.002
LBA0975 putative family protein none 4 4 4 1 1 1 1 3 3 1 1 1 1 2 4 1 1 1 1 1 1 1 1 1 1 1 1 1 1 1 0.001
LBA1233 transcriptional regulator none 4 4 4 2 2 3 2 2 2 2 2 2 2 2 2 1 1 1 1 1 1 1 1 1 1 1 1 1 1 1 0.001
LBA1384 dihydroorotate dehydrogenase B, catalytic unit de novo Pyrimidine synthesis 3 3 3 1 1 1 1 1 1 1 1 1 1 2 2 1 1 1 1 1 1 1 1 1 1 1 1 1 1 1 0.001
Gro
up
1 d
ive
rse
loci
Gro
up
2 d
ive
rse
loci
CHAPTER FOUR – POPULATION GENOMICS OF L. ACIDOPHILUS
141
←Previous page
Figure 4.9: Selected diverse loci in L. acidophilus
Two groups of selected diverse loci in L. acidophilus, group 1 and group 2, are expanded from Figure 4.8.
Loci are coloured as per Figure 4.8 and their SEED functional categories listed. The allelic profile of each
isolate at each of these loci is coloured in the same way as Figure 4.8. The overall mean distance of each
locus is noted. (again add sub-header labels to group 1 and 2).
4.3.3. L. ACIDOPHILUS CRISPR REGION DIVERSITY
All complete (on a single sequence contig) CRISPR regions from L. acidophilus isolates
were extracted and analysed (Figure 4.10). The archetypal L. acidophilus CRISPR
sequence is defined in the genome sequence of L. acidophilus NCFM, and consists of 33
units of a repeat region and a spacer region. The L. acidophilus NCFM CRISPR had the
full gamut of spacer sequences and comprised the longest sequence length of 1980 bp. The
shortest CRISPR sequences were 1493 bp in length, and missing up to four spacers (Figure
4.10; L. acidophilus LMG 13550, LMG 9433, ERR203994 and C46). Four regions of
diversity in L. acidophilus CRISPR sequences were identified. BlastN was used to find
similar sequences to these polymorphic spacers (Table 4.3). Unexpectedly, seven out of
eight of thee polymorphic spacers showed at least partial similarity to L. acidophilus
ribosomal protein encoding genes (Table 4.3).
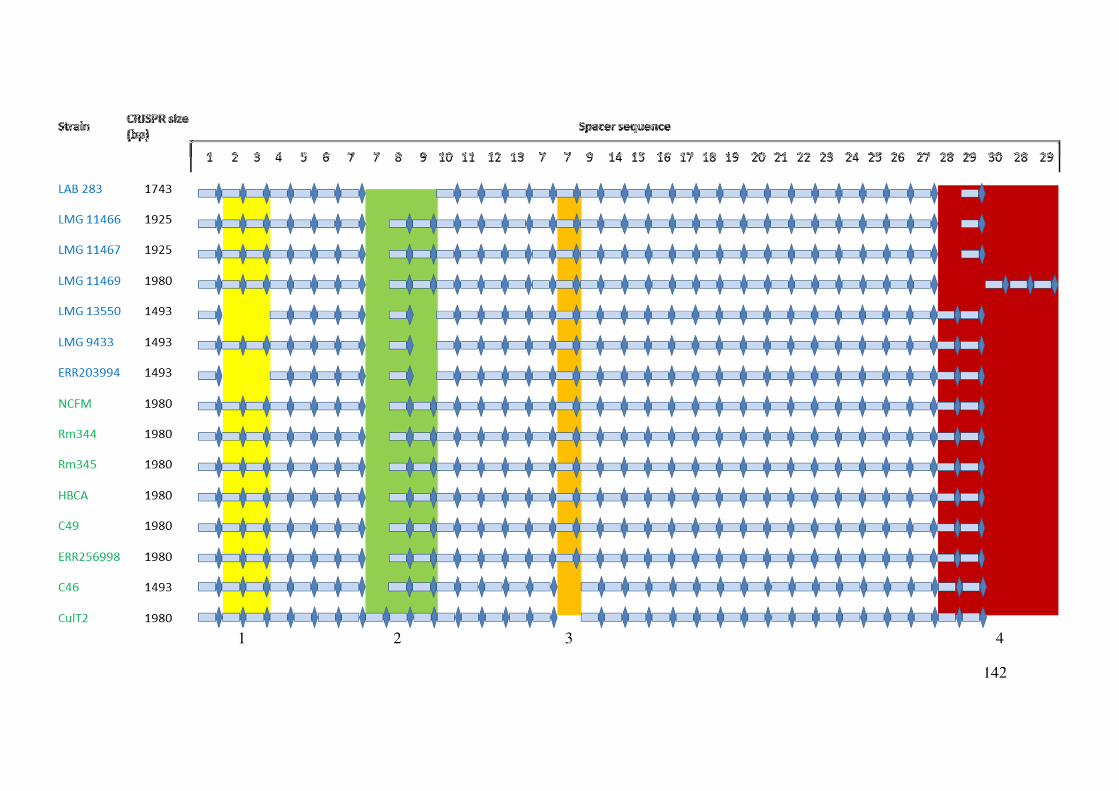
142
1 2 3 4
CHAPTER FOUR – POPULATION GENOMICS OF L. ACIDOPHILUS
143
←Previous page
Figure 4.10: L. acidophilus CRISPR sequences
The complete CRISPR region from each L. acidophilus isolate is represented by a series of repeats (dark blue
diamond) and unique spacers (light blue oblong). Each unique spacer sequence is assigned a new number,
which can be seen above its relevant spacer oblong. Four regions of polymorphism are highlighted with
coloured boxes, and numbered below. The size of each CRISPR region is given in bp.
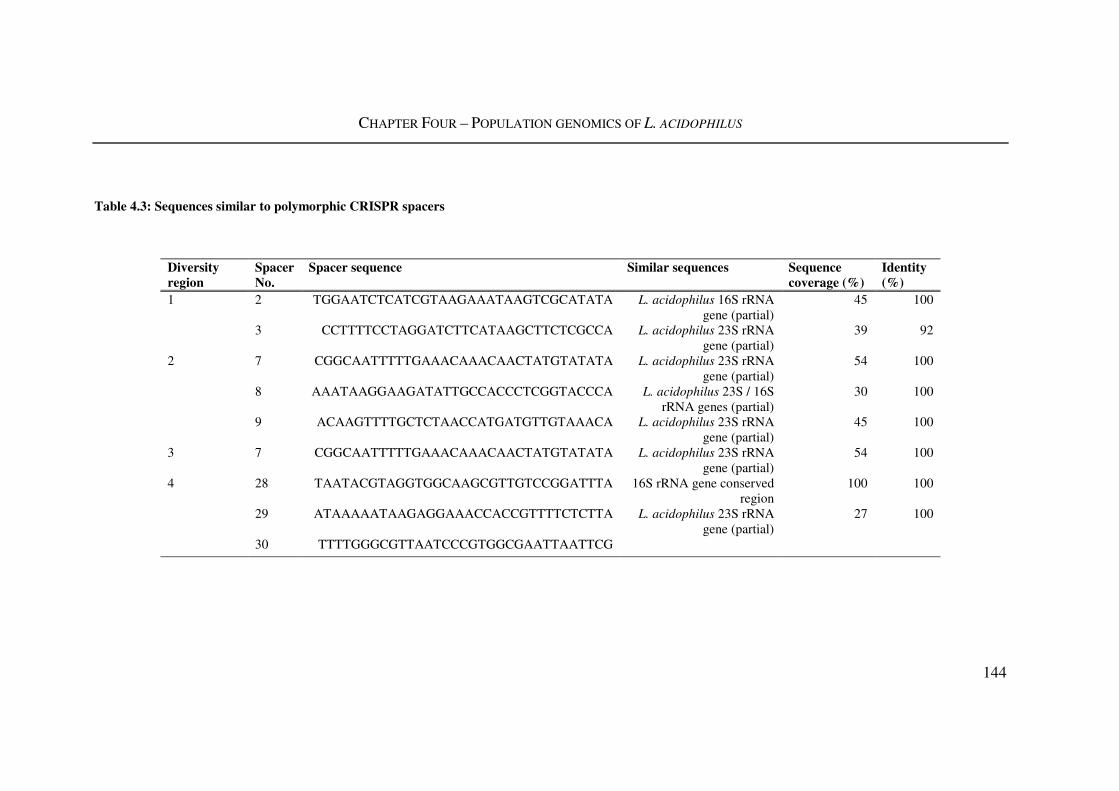
CHAPTER FOUR – POPULATION GENOMICS OF L. ACIDOPHILUS
144
Table 4.3: Sequences similar to polymorphic CRISPR spacers
Diversity region
Spacer No.
Spacer sequence Similar sequences Sequence coverage (%)
Identity (%)
1 2 TGGAATCTCATCGTAAGAAATAAGTCGCATATA L. acidophilus 16S rRNA gene (partial)
45 100
3 CCTTTTCCTAGGATCTTCATAAGCTTCTCGCCA L. acidophilus 23S rRNA gene (partial)
39 92
2 7 CGGCAATTTTTGAAACAAACAACTATGTATATA L. acidophilus 23S rRNA gene (partial)
54 100
8 AAATAAGGAAGATATTGCCACCCTCGGTACCCA L. acidophilus 23S / 16S rRNA genes (partial)
30 100
9 ACAAGTTTTGCTCTAACCATGATGTTGTAAACA L. acidophilus 23S rRNA gene (partial)
45 100
3 7 CGGCAATTTTTGAAACAAACAACTATGTATATA L. acidophilus 23S rRNA gene (partial)
54 100
4 28 TAATACGTAGGTGGCAAGCGTTGTCCGGATTTA 16S rRNA gene conserved region
100 100
29 ATAAAAATAAGAGGAAACCACCGTTTTCTCTTA L. acidophilus 23S rRNA gene (partial)
27 100
30 TTTTGGGCGTTAATCCCGTGGCGAATTAATTCG

CHAPTER FOUR – POPULATION GENOMICS OF L. ACIDOPHILUS
145
4.3.4. MUTAGENESIS OF L. ACIDOPHILUS NCFM WITH MMS
To replicate and exceed the mutagenic capacity of the GIT as the natural niche of L.
acidophilus, strain NCFM was exposed to MMS, which causes DNA alkylation and
double-stranded DNA breaks. The range of exposure strategies was chosen based on
successful previous mutagenesis of L. delbrueckii (Demirci and Pometto, 1992). L
acidophilus NCFM was exposed to MMS at final media concentrations of ranging from
3% to 5% (v/v) for durations of 10, 15 and 30 minutes. An exposure of 15 minutes to
5%(v/v) MMS was selected as the exposure required to reduce viability of the bacterial
culture by 99% (Figure 4.11). Three exposures were performed at this MMS exposure
condition and duplicate isolates collected after each exposure and their genomic DNA re-
sequenced (Table 4.4). No gross differences in genome structure between the MMS
exposed isolates and the parent L. acidophilus NCFM isolate were observed using RAPD
profile comparisons (Figure 4.12).
Draft genomes were assembled for each isolate, and their sequences compared at all
protein coding loci defined in the L. acidophilus NCFM genome sequence, as in Section
4.3.2. Of 1862 protein coding loci, 1732 were identical in all isolates. The remaining
polymorphic loci were screened for paralogous and truncated loci, and after their removal
38 polymorphic loci were available to elucidate the results of MMS exposure (Table 4.5).
None of these loci differed to the L. acidophilus NCFM reference sequence by more than
two nucleotides, and polymorphisms in isolates from the first exposure to MMS (1-1 and
1-2) were rarely preserved in isolates from the third exposure to MMS (3-1 and 3-2).
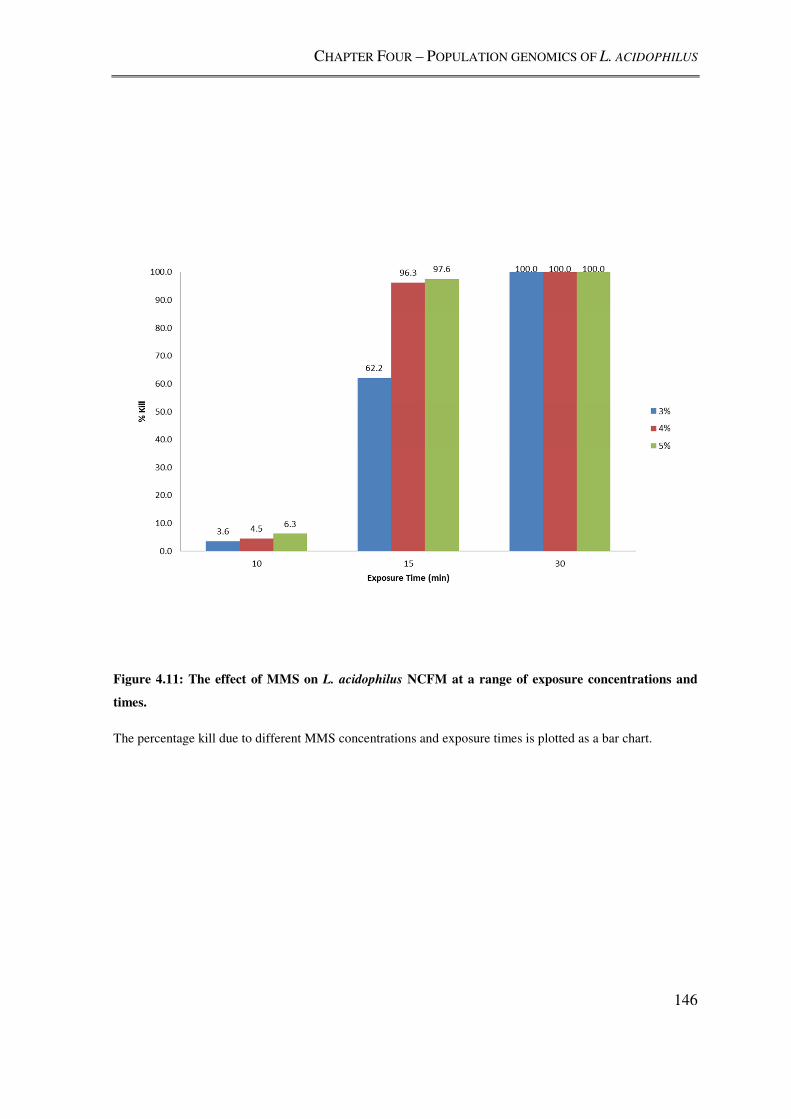
CHAPTER FOUR – POPULATION GENOMICS OF L. ACIDOPHILUS
146
Figure 4.11: The effect of MMS on L. acidophilus NCFM at a range of exposure concentrations and
times.
The percentage kill due to different MMS concentrations and exposure times is plotted as a bar chart.
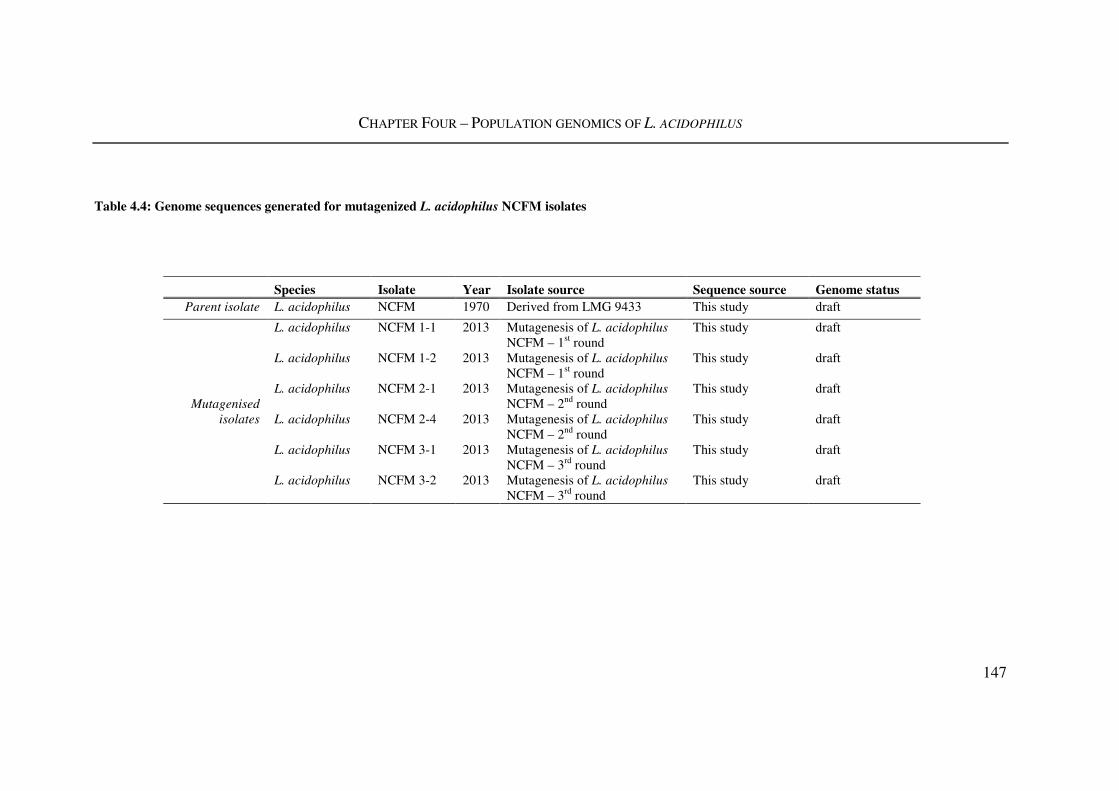
CHAPTER FOUR – POPULATION GENOMICS OF L. ACIDOPHILUS
147
Table 4.4: Genome sequences generated for mutagenized L. acidophilus NCFM isolates
Species Isolate Year Isolate source Sequence source Genome status Parent isolate L. acidophilus NCFM 1970 Derived from LMG 9433 This study draft
Mutagenised
isolates
L. acidophilus NCFM 1-1 2013 Mutagenesis of L. acidophilus NCFM – 1st round
This study draft
L. acidophilus NCFM 1-2 2013 Mutagenesis of L. acidophilus NCFM – 1st round
This study draft
L. acidophilus NCFM 2-1 2013 Mutagenesis of L. acidophilus NCFM – 2nd round
This study draft
L. acidophilus NCFM 2-4 2013 Mutagenesis of L. acidophilus NCFM – 2nd round
This study draft
L. acidophilus NCFM 3-1 2013 Mutagenesis of L. acidophilus NCFM – 3rd round
This study draft
L. acidophilus NCFM 3-2 2013 Mutagenesis of L. acidophilus NCFM – 3rd round
This study draft
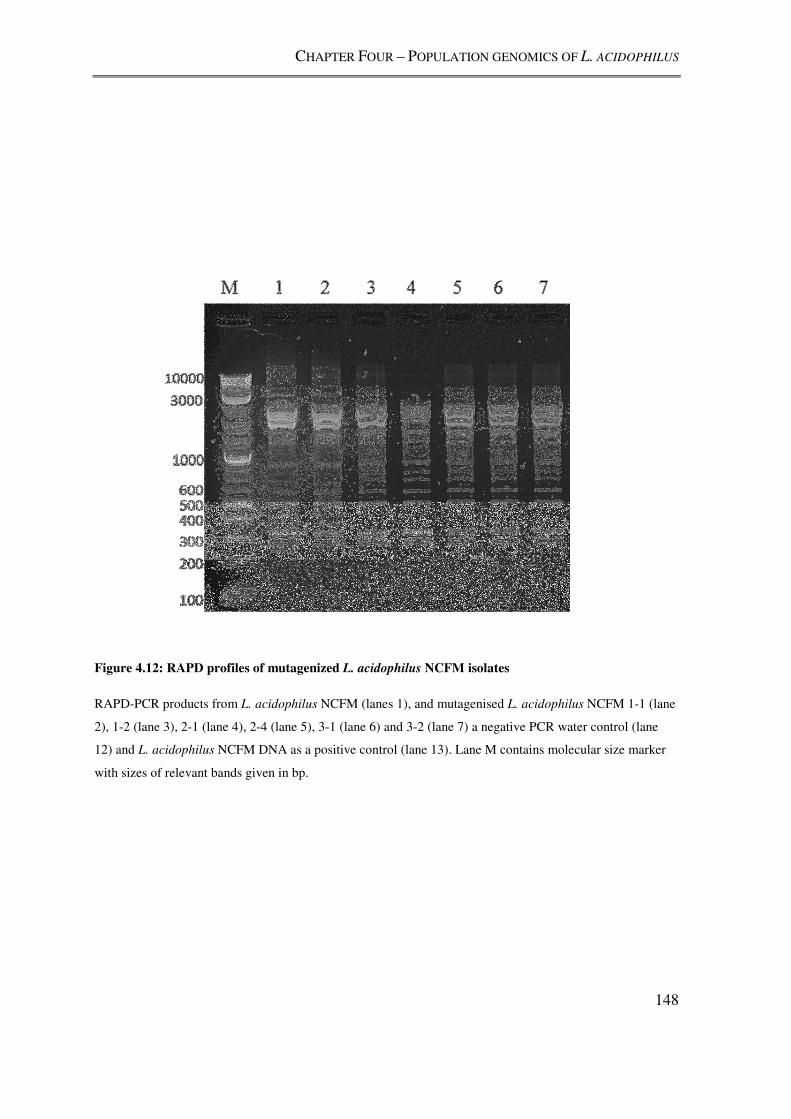
CHAPTER FOUR – POPULATION GENOMICS OF L. ACIDOPHILUS
148
Figure 4.12: RAPD profiles of mutagenized L. acidophilus NCFM isolates
RAPD-PCR products from L. acidophilus NCFM (lanes 1), and mutagenised L. acidophilus NCFM 1-1 (lane
2), 1-2 (lane 3), 2-1 (lane 4), 2-4 (lane 5), 3-1 (lane 6) and 3-2 (lane 7) a negative PCR water control (lane
12) and L. acidophilus NCFM DNA as a positive control (lane 13). Lane M contains molecular size marker
with sizes of relevant bands given in bp.
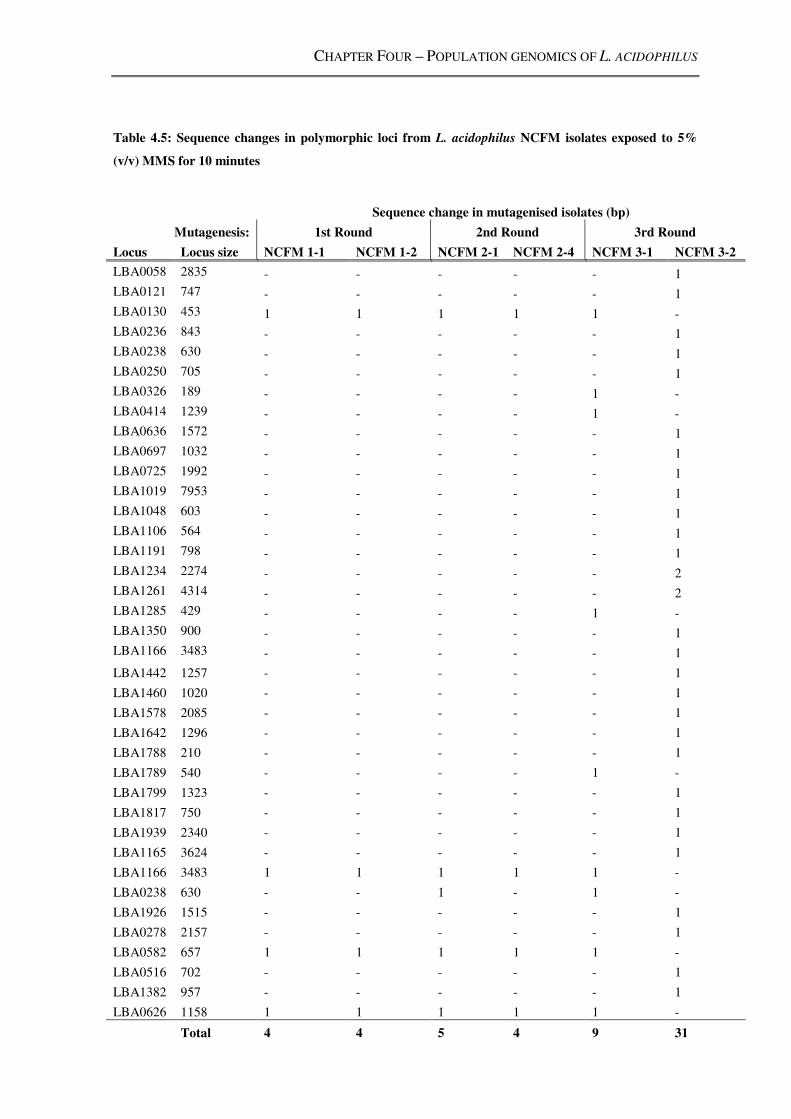
CHAPTER FOUR – POPULATION GENOMICS OF L. ACIDOPHILUS
Table 4.5: Sequence changes in polymorphic loci from L. acidophilus NCFM isolates exposed to 5%
(v/v) MMS for 10 minutes
Sequence change in mutagenised isolates (bp)
Mutagenesis: 1st Round 2nd Round 3rd Round
Locus Locus size NCFM 1-1 NCFM 1-2 NCFM 2-1 NCFM 2-4 NCFM 3-1 NCFM 3-2
LBA0058 2835 - - - - - 1
LBA0121 747 - - - - - 1
LBA0130 453 1 1 1 1 1 -
LBA0236 843 - - - - - 1
LBA0238 630 - - - - - 1
LBA0250 705 - - - - - 1
LBA0326 189 - - - - 1 -
LBA0414 1239 - - - - 1 -
LBA0636 1572 - - - - - 1
LBA0697 1032 - - - - - 1
LBA0725 1992 - - - - - 1
LBA1019 7953 - - - - - 1
LBA1048 603 - - - - - 1
LBA1106 564 - - - - - 1
LBA1191 798 - - - - - 1
LBA1234 2274 - - - - - 2
LBA1261 4314 - - - - - 2
LBA1285 429 - - - - 1 -
LBA1350 900 - - - - - 1
LBA1166 3483 - - - - - 1
LBA1442 1257 - - - - - 1
LBA1460 1020 - - - - - 1
LBA1578 2085 - - - - - 1
LBA1642 1296 - - - - - 1
LBA1788 210 - - - - - 1
LBA1789 540 - - - - 1 -
LBA1799 1323 - - - - - 1
LBA1817 750 - - - - - 1
LBA1939 2340 - - - - - 1
LBA1165 3624 - - - - - 1
LBA1166 3483 1 1 1 1 1 -
LBA0238 630 - - 1 - 1 -
LBA1926 1515 - - - - - 1
LBA0278 2157 - - - - - 1
LBA0582 657 1 1 1 1 1 -
LBA0516 702 - - - - - 1
LBA1382 957 - - - - - 1
LBA0626 1158 1 1 1 1 1 -
Total 4 4 5 4 9 31

CHAPTER FOUR – POPULATION GENOMICS OF L. ACIDOPHILUS
150
4.4. DISCUSSION
Genome resequencing analysis was successful in uncovering variation within L.
acidophilus isolates which was not observed by RAPD as a low resolution pattern
matching typing technique. It also illustrated how both the ability to generate genome
sequences and analyse them has progressed in a relatively short space of time within this
PhD study. Although genome resequencing corroborated the findings of RAPD that
indicated L. acidophilus was a highly clonal species, it was able to reveal that commercial
isolates in current use show even less diversity than other more “historical” isolates from
recognised culture collections. Variation in the PAU regions selected as species-specific
markers was also observed as well as intriguing differences in the CRISPR regions. The
significance of these findings is discussed below.
4.4.1. SMALL SCALE L. ACIDOPHILUS GENOMIC DIVERSITY SURVEY
The genomes of two commercial isolates, L. acidophilus CUL21 and CUL60 were
resequenced and reads were mapped to the L. acidophilus NCFM reference sequence. The
whole genome was the unit of comparison in this instance, and polymorphism was
measured at the single nucleotide level. The level of genomic identity conserved between
these commercial isolates and L. acidophilus NCFM was exceptionally high. A recent
study (Stahl and Barrangou, 2013) yielded similar levels of identity when recently applied
to L. acidophilus La-14, a commercial isolate used in probiotic products produced by
Danisco (Copenhagen, Denmark). Overall, 95 SNPs were discovered between L.
acidophilus La-14 and L. acidophilus NCFM, similar to the 87 and 85 SNPs observed in
this study between L. acidophilus NCFM and L. acidophilus CUL21 and CUL60
respectively (Stahl and Barrangou, 2013). The inclusion of the genome sequence of L.
acidophilus LMG 11428, a culture collection isolate, showed more overall polymorphisms,
but whole genome phylogenies were only able to resolve L. acidophilus isolates when only
L. acidophilus genome sequences were compared (Figure 4.3).
CHAPTER FOUR – POPULATION GENOMICS OF L. ACIDOPHILUS
151
When examining diversity at the scale of the whole genome sequence, highly related
sequences such as those generated by L. acidophilus isolates present a particular problem.
The polymorphic regions, which are the important areas from the point of view of a
genomic diversity study, are lost against the backdrop of overwhelming sequence identity.
Purely phylogenetic information can be extracted from these SNPs, and phylogenetic
analyses built on sequences composed of solely polymorphic positions, as in pathogenic
Salmonella, where SNP information was used to inform epidemiology (Okoro et al., 2012).
The subsequent large scale L. acidophilus study, as an alternative to SNP mapping, took a
more functional approach to examining genomic diversity by examining each protein
coding locus defined in a reference genome sequence (L. acidophilus NCFM).
4.4.2. LARGE SCALE L. ACIDOPHILUS GENOMIC DIVERSITY SURVEY
4.4.2.1. Gene-by-gene analysis approach
4.4.2.1.1. RMLST OF L. ACIDOPHILUS GROUP ISOLATES
Indexing the variation of 53 rps loci, which are shared and functionally conserved amongst
all members of the domain (Roberts et al., 2008) allows a natural combination and
extension of both 16S rRNA gene sequence comparison and traditional MLST to provide
resolution from the strain to the domain level (Jolley et al., 2012). Despite the overall
genomic diversity within the L. acidophilus group, the 16S rRNA gene sequences between
some of its members are highly conserved (Bull et al., 2012). This makes the L.
acidophilus group an ideal candidate for testing the resolution of the rMLST approach, as
the 16S rRNA gene phylogenetic trees traditionally used to study evolutionary history are
unstable because of their level of sequence conservation (Figure 1.2). A simple Neighbour
Joining (NJ) phylogenetic tree based on the sequences of the rps genes was able to group
isolates of all species together and illustrated the strain-level variation in rps genes seen in
other Lactobacillus species (Figure 4.4). The phylogeny was also better supported than the
16S rRNA gene-based NJ phylogeny drawn from similar isolates (Figure 1.2), suggesting
rMLST could provide a greater insight into the evolutionary history of the genus
Lactobacillus than simple 16S rRNA phylogenies.
CHAPTER FOUR – POPULATION GENOMICS OF L. ACIDOPHILUS
152
4.4.2.1.2. GENOME-WIDE ANALYSES
Numerous studies have used comparative genomics to identify genomic similarities and
differences within the LAB (Makarova et al., 2006, Coenye and Vandamme, 2003,
O'Sullivan et al., 2009) and at the species level within the L. acidophilus group (Berger et
al., 2007). No single study however, has conducted a comparative genomics analysis
encompassing such a large number of LAB isolates below the species level. This should be
considered a fundamental gap in knowledge concerning probiotic bacteria, as probiotic
characteristics in many species are unique to a single strain (see Section 2.1). Elucidating
the underlying genomic foundations for probiotic phenotypes should be a key target for
investigating the mode-of-action of bacterial probiotics. As far as we are aware, this study
is the first within the genus Lactobacillus to use next-generation DNA sequencing
technology combined with a functional, gene-by-gene diversity analysis approach to assess
the relatedness and intraspecies diversity of a single probiotic species.
4.4.2.2. Variably present loci
Maintenance of prophage regions within a genome has been shown to affect growth rate
and other physiological characteristics such as virulence in pathogenic bacteria (Clark et
al., 2012). A small number of protein coding loci were variably present in all isolates, with
many of these loci found within regions that show homology to phage-genes (Altermann et
al., 2005). Examination of protein sequences show PAU1 and PAU2 are the most closely
related, with PAU3 significantly different (Altermann et al., 2005). Two conflicting
hypotheses for the origin of the PAU regions are proposed, the first that PAU3 evolved in a
different organism and was the latest acquisition and the second that PAU3 was the most
ancient integration event and subsequently underwent a duplication event to form PAU1
(Altermann et al., 2005). The presence of PAU1 in L. acidophilus LMG 11466, LMG
11467 and LMG 11469, which show no evidence of the presence of PAU3, suggests that
PAU3 did indeed evolve in a different organism and was the most recent integration event.
There is evidence that PAU region functional homologs exist in other LAB (Altermann
and Klaenhammer, 2011). L. acidophilus LMG 11466 and LMG 11469 were both shown
to lack the region targeted by the L. acidophilus specific marker PCR developed in Chapter
2, confirming the negative result shown in Table 2.4.
CHAPTER FOUR – POPULATION GENOMICS OF L. ACIDOPHILUS
153
Generally, loci annotated in the L. acidophilus NCFM genome sequence were found in all
commercial isolates, with the exception of L. acidophilus CUL21 and C47, which lacked
PAU1 associated loci. The same situation was not reflected in the culture collection
isolates, which were much more diverse in the loci that were absent in their genomes
(Figure 4.8 and Figure 4.9). The commercial isolates were more similar to themselves and
L. acidophilus NCFM than they were to the culture collection isolates which were largely
more diverse. The predicted exoproteomes, i.e. the entire set of bacterial proteins predicted
to be found in the extracellular milieu (Desvaux et al., 2009) in all isolates of L.
acidophilus are highly comparable. That is to say, without considering the impact of
individual gene sequence on the physiology and characteristics of a strain, the proteins and
hence functions that encoded by each gene in the genome of each strain are largely
identical.
4.4.2.3. Diverse protein-coding genomic loci
The commercial and culture collection isolates of L. acidophilus share almost all protein
coding loci defined in the L. acidophilus NCFM genome sequence. Two populations
emerge when the sequences of these loci are examined and grouped based on allelic profile
similarity. These two groups directly reflect the history of the isolates contained within
them; culture collection or commercial. The variable loci of commercial isolates of L.
acidophilus were more similar in sequence to L. acidophilus NCFM and formed a
homogenous cluster. Similarly to the distribution of absent loci, culture collection isolates
formed a more heterogeneous group, distinct from the commercial isolates. No functional
category of loci appeared to be more diverse in the genome sequences of culture collection
isolates.
One possible explanation for this is the global propagation, storage and repeated re-use of
commercial probiotic isolates of L. acidophilus, directly related to L. acidophilus NCFM.
In a similar case in a different probiotic species, two commercial isolates of L. casei,
isolated directly from probiotic products produced by different companies were found to
share a virtually identical genome sequence, encoding a comparable exoproteome and
CHAPTER FOUR – POPULATION GENOMICS OF L. ACIDOPHILUS
154
displaying just 29 SNPs (Douillard et al., 2013). These data and the results of our study
indicated that human practice in terms of the use of probiotic LAB or diary starter cultures
may be restricting the “natural” evolution of these bacteria, leading the widespread
distribution of highly clonal strains.
4.4.2.4. CRISPR regions
The CRISPR regions of L. acidophilus isolates were examined as a non-protein-coding
region that is typically diverse at the sub-species level in LAB, for example, when diversity
in CRISPR loci was indexed in 124 strains of Streptococcus thermophilus, 109 different
CRISPR arrangements were observed (Horvath et al., 2008). CRISPR regions are usually
referred to as CRISPR-Cas (where Cas stands for CRISPR-associated proteins). The Cas
genes are normally located within 1kb of the CRISPR locus. They are predicted to be
involved in integration of new spacer DNA (Koonin and Makarova, 2009). No Cas genes
are present in the L. acidophilus genome sequence, which might explain why diversity in
the CRISPR region of L. acidophilus appears to be driven more by loss of spacer regions
rather than acquisition of new spacer regions (Figure 4.10).
L. acidophilus NCFM has a single spacer region that shows 100% sequence identity to its
own 16S rRNA gene (Spacer 28, Table 4.3) (Stern et al., 2010). This type self-targeting
CRISPR spacer is uncommon, with 0.4% of CRISPR spacers surveyed by Stern et al
(2010) having incorporated self-genes. The acquisition of self-targeting spacers is also
hypothesised to be an accident caused by CRISPR insertion mechanism (Cas genes) and
may potentially lead to deleterious effects on the cell (Stern et al., 2010). The fitness cost
of self-targeting spacer regions has been demonstrated in E. coli, where isolates containing
them were seen to have highly degenerated Cas systems (Díez-Villaseñor et al., 2010).
Here, a parallel is drawn in L. acidophilus where, to alleviate the deleterious effect of a
self-targeting CRISPR spacer, L. acidophilus has lost all associated Cas genes, and
therefore the diversity of these CRISPR regions is not driven by spacer acquisition,
specifically those of a self-targeting nature, in this group of isolates.

CHAPTER FOUR – POPULATION GENOMICS OF L. ACIDOPHILUS
155
4.4.3. EXPOSURE OF L. ACIDOPHILUS TO MMS
Exposure to 5%(v/v) MMS for 15 minutes was required to kill 99% of L. acidophilus
NCFM, directly comparable to the Ethyl Methanesulphonate (EMS) exposure conditions
required to kill 99% of L. delbrueckii subsp. delbrueckii ATCC 9649 (4.5%(v/v) for 15
minutes) (Demirci and Pometto, 1992). In L. delbrueckii subsp. delbrueckii ATCC 9649,
no attempt was made to establish the genetic impact of the mutagenesis procedure. Demirci
(1992) selected for a mutants that were more tolerant to (d-)-lactic acid by coupling the
exposure to EMS with exposure to levels of (d-)-lactic acid above the minimum inhibitory
concentration seen in the wild type isolate. This stabilised the random mutagenesis
procedure and resulted in an induced, measurable phenotype in their mutants (Demirci and
Pometto, 1992).
L. acidophilus NCFM mutants generated in this study were random with no stabilising
pressure to enhance a particular phenotype. No observable differences were detected
between the RAPD profiles generated by the MMS exposed isolates and the parent L.
acidophilus NCFM isolate, although this was not unexpected as RAPD is a particularly
granular method for examining genomic diversity. This was reinforced when the genome
sequences of the MMS exposed isolates showed just 38 polymorphic loci across all
exposed isolates, with polymorphic sequence less than two nucleotides in every case. It
should be noted however, that this analysis only analysed coding regions of the L.
acidophilus genome, and mutagenesis is under greater selective pressure in these regions
than the intergenic sequence (Lobry and Sueoka, 2002). However, this variation after a few
culture passages in the presence of mutagen does demonstrate that L. acidophilus may
evolve rapidly as a result of mutation. It re-enforces the hypothesis that the stability seen in
commercial isolates is a result of derivation from a single clone which has been kept stable
as a result of industry practice.
CHAPTER FOUR – POPULATION GENOMICS OF L. ACIDOPHILUS
156
4.4.4. SUMMARY AND PERSPECTIVE
The coding capacity displayed by the L. acidophilus isolates examined in this study is
highly clonal, with 98% of the protein coding loci found in L. acidophilus NCFM present
in all other isolates tested. This group of organisms provides a unique opportunity to
examine whether diverse probiotic characteristics are a function of genes that are present
or absent or, if a level playing field of genes are present, very small changes in the
sequence of those genes have a marked effect on the overall probiotic capacity of an
isolate. Our study presents an interesting challenge for the bacterial species concept (Fraser
et al., 2009), and whether or not bacterial “strains” meaningfully exist as discreet units of
sequence diversity in the wider continuum of bacterial species. Although as taxonomic
units they may display an array of different sequence types, bacterial strains and species
should be defined by measurable and stable phenotypic characteristics. If minor variations
in sequence truly influence probiotic effect, low resolution measures of strain type, such as
RAPD profile or PFGE profile, are not sufficient to identify a strain. This means that future
identification of a probiotic strain of L. acidophilus should be based at least on the
sequence of a polymorphic genomic locus, or more likely on a whole genome sequence.
In addition, commercially marketing a particular strain of L. acidophilus should be
dependent on a unique phenotypic characteristic. At this stage however, the homogeneity
of the genome sequences of commercial isolates of L. acidophilus, also provides
companies with the opportunity to assume that evidence of probiotic effect demonstrated in
studies undertaken on one particular isolate of L. acidophilus would support their own
strains equally as well. The demonstration of unique or enhanced probiotic ability in a
single isolate will set it apart from the others, and this cannot be achieved in any
meaningful way until detailed phenotypic studies encompassing the diversity of isolates
seen in this study are conducted.
CHAPTER FOUR – POPULATION GENOMICS OF L. ACIDOPHILUS
157
4.5. CONCLUSIONS
The conclusions from this chapter are as follows:
1. rMLST (rps) gene-based phylogenies are a more effective and stable method for
establishing phylogenetic relationships within the L. acidophilus group than
traditional 16S rRNA gene phylogenies.
2. Variably present genomic loci were dominated by genes associated with phage-
related regions (PAU). PAU1 was the most widely distributed phage related region,
PAU2 and PAU3 were present in all commercial isolates but only some culture
collection isolates.
3. Overall, the sequences of 70% of the protein coding loci defined in L. acidophilus
NCFM were highly conserved in all other L. acidophilus, from both commercial
applications and culture collections.
4. When genomic diversity was indexed at all protein-coding loci defined in the L.
acidophilus NCFM genome, two clear divisions of isolates were observed, clearly
reflecting whether the isolate had come from a commercial or culture collection
background. Commercial L. acidophilus isolates formed a more homogenous group
than the more diverse culture collection isolates. The homogeneity of the group of
L. acidophilus isolates of commercial origin suggests that they are a single clone
propagated for used in probiotic products globally.
5. When exposed to levels of a chemical mutagen seen to cause mutations detectable
as phenotypes in L. delbrueckii, analysis of the genome sequences of MMS
exposed L. acidophilus NCFM showed 38 polymorphic loci that were shared
between six isolates. This demonstrated that L. acidophilus was capable of genomic
change as a result of mutation, and suggests that the homogeneity seen in
commercial isolates is a result of their industrial heritage and propagation practice.
CHAPTER FIVE – PHENOTYPIC DIVERSITY OF LACTOBACILLUS ISOLATES
158
5. PHENOTYPIC DIVERSITY OF LACTOBACILLUS ISOLATES
5.1. INTRODUCTION
A range of biochemical, physiological, chemotaxonomic, and more recently, nucleic-acid-
based methods such as 16S rRNA gene sequence analysis and multilocus sequence typing
(MLST) comprise the set of tools useful for obtaining a polyphasic identification and
characterisation of both novel and known bacterial isolates (Sintchenko et al., 2007).
Historically, the phenotypic methods for characterisation have informed today’s bacterial
taxonomy. The advent of modern rapid, cost effective and highly accurate methods for
analysing nucleic acids has caused phenotypic methods for characterising bacteria to take
somewhat of a back seat in typing, identification and taxonomy. The application of
techniques for accurately and rapidly identifying and characterising bacteria however, is
essential to numerous fields in microbiology (De Bruyne et al., 2011). From a commercial
probiotic perspective it is important to select bacterial isolates that have desirable
phenotypic characteristics, particularly the ability to grow to high densities in as little time
as possible.
The characterisation of bacterial isolates by profiling their ability to ferment carbohydrate
substrates has long been a staple method of distinguishing between LAB, and indeed forms
the basis of the primary divisor of LAB into those that are obligately homofermentative,
those that are obligately heterofermentative and those that are facultatively
heterofermentative (Hammes and Vogel, 1995). The API 50 CH test evaluates the ability
of isolates to ferment 50 carbohydrate substrates, allowing discrimination up to the species
level when compared with a database of known biochemical profiles (Boyd et al., 2005).
Matrix-assisted laser desorption/ionization-time-of-flight mass spectrometry (MALDI-
TOF MS) is a novel rapid and high-throughput method, that has been recently introduced
as a tool for bacterial taxonomy and characterisation, and has been applied to a number of
taxa (Zhu et al., 2013) (Kern et al., 2013), including lactobacilli (Angelakis et al., 2011)

CHAPTER FIVE – PHENOTYPIC DIVERSITY OF LACTOBACILLUS ISOLATES
159
(Dušková et al., 2012). MALDI-TOF MS has the ability to analyse complex peptide
mixtures, such as intact bacterial cells or total protein extracts from bacterial cultures.
Previous chapters have indexed the diversity of Lactobacillus, particularly L. acidophilus
at the nucleic acid level, finding little variation between L. acidophilus isolates. In this
chapter the phenotypic diversity of L. acidophilus was examined at multiple taxonomic
levels. At the species level, carbohydrate fermentation characteristics were evaluated, and
at the isolate level growth parameters and gross proteomes were compared between
isolates.
CHAPTER FIVE – PHENOTYPIC DIVERSITY OF LACTOBACILLUS ISOLATES
160
5.1.1. SPECIFIC AIMS
The aims of this chapter were as follows:
� Examine species-level differences in Lactobacillus in the metabolism of
carbohydrates using API 50CHL and evaluate it as a method for identifying
L. acidophilus.
� Measure parameters of growth (length of lag phase, maximum growth rate
and maximum culture density) of L. acidophilus to determine if isolate to
isolate differences exist.
� Evaluate the use of Matrix Assisted Laser Desorption/Ionisation – Time Of
Flight (MALDI-TOF) mass spectrometry as a tool to examine the gross
proteome of Lactobacillus isolates.
� Assess the use of MALDI-TOF MS as an identification tool for Lactobacillus
isolates on both the species and strain levels.
CHAPTER FIVE – PHENOTYPIC DIVERSITY OF LACTOBACILLUS ISOLATES
161
5.2. METHODS
5.2.1. EVALUATION OF LACTOBACILLUS CARBOHYDRATE FERMENTATION PROFILES
USING THE API 50CHL SYSTEM
Lactobacillus isolates were grown on MRS agar at 37°C for 24 h, as described previously.
As per the manufacturer’s instructions, single colonies from each culture were suspended
in API 50 CHL medium (BioMérieux, France). The suspension was transferred into API
50 CH strips (BioMérieux, France). All wells were overlaid with sterile mineral oil ensure
anaerobic metabolism. API strips were incubated at 37°C as recommended by the
manufacturer. Changes in the colour of wells were recorded after 24 and 48 h. API test kit
results were interpreted using the Analytical Profile Index (API) database of the apiweb™
software (version 4.0; BioMérieux, Marcy l'Etoile, France).
5.2.2. MEASURING LACTOBACILLUS GROWTH RATES
5.2.2.1. Bioscreen C
The growth dynamics of L. acidophilus isolates LMG 11470, LMG 11428, LMG 9433,
NCFM, CUL 21, CUL60, Rm 344; L. casei LMG 6904 and six MMS exposed L.
acidophilus (see Section 4.2.5) were examined using a Bioscreen Microbiolgical Growth
analyser C (Labsystems, Finland). Lactobacillus isolates were cultured as previously
described (Section 2.2.2). 3 ml overnight (18 h) cultures were diluted to an optical density
of 1±0.2 (600nm), then diluted 10-fold and transferred to triplicate wells of a Bioscreen
microplate (200 µl). Growth analysis was performed for 48 hours at 37°C; turbidity
measurements were taken at 15 minute intervals using a wide-band filter (450-580 nm),
after shaking the microplates for 10 seconds at an intermediate intensity. Experiments were
repeated with different starting cultures to obtain two biological replicates with a combined
total of six technical replicates.
CHAPTER FIVE – PHENOTYPIC DIVERSITY OF LACTOBACILLUS ISOLATES
162
5.2.2.2. Estimation of growth parameters
Before analysis, to prepare the data, the mean optical density of triplicate blank wells (with
no inoculum) was subtracted from each test well and growth curves were trimmed to 20 h
to ensure that curves were fitted correctly. Growth parameters were then estimated using
the gcFit function within the grofit package (Kahm et al., 2010) in R statistical software (R
Development Core Team, 2012). Briefly, a model-free spline was fitted to logarithmically
transformed optical density data (solid red line, Figure 5.1) and visually checked for
accuracy. Any wells that generated poorly fitted splines were discarded from further
analysis. Accurately placed splines were then used to estimate three growth parameters for
each well; length of lag phase, maximum growth rate and maximum culture density
reached (Figure 5.1). All of the above parameters were calculated for each well and
exported from the software.
5.2.2.3. Comparing growth parameters
Growth parameters generated by Lactobacillus isolates were grouped, as in Chapter 4, into
six groups; L. acidophilus culture collection isolates (LMG 11470, LMG 11428 and LMG
9433), L. acidophilus commercial isolates (NCFM, CUL 21, CUL60 and Rm 344), non- L.
acidophilus isolates (L. casei LMG 6904) and three groups of MMS exposed L.
acidophilus NCFM isolates, one from each round of exposure to MMS (see Section 4.2.5).
Boxplots were generated using the boxplot function in R statistical software (R
Development Core Team, 2012).
Data were tested for normality using the Shapiro-Wilk test in R statistical software (R
Development Core Team, 2012). Significant differences between groups were investigated
using the Kruskall-Wallis H-test followed by pairwise, post-hoc Mann-Whitney U tests
with the familywise error rate controlled using Bonferroni correction in IBM Statistics 20
(IBM Corporation, New York, US).
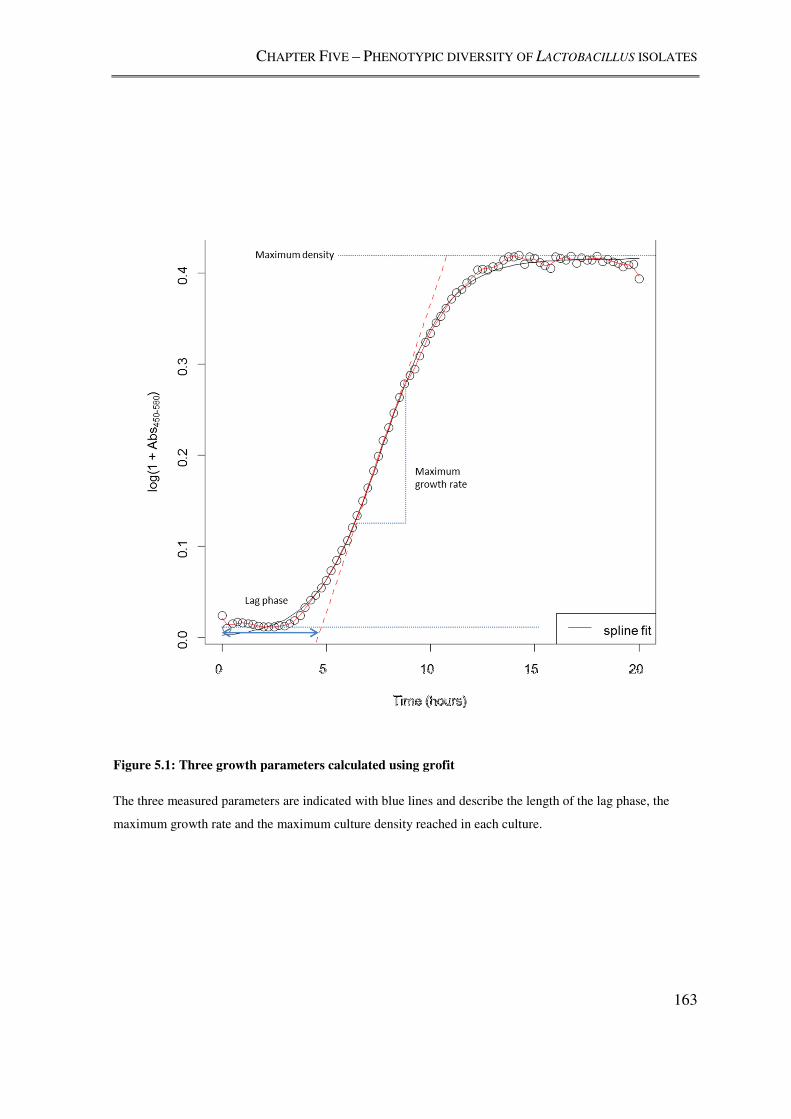
CHAPTER FIVE – PHENOTYPIC DIVERSITY OF LACTOBACILLUS ISOLATES
163
Figure 5.1: Three growth parameters calculated using grofit
The three measured parameters are indicated with blue lines and describe the length of the lag phase, the
maximum growth rate and the maximum culture density reached in each culture.

CHAPTER FIVE – PHENOTYPIC DIVERSITY OF LACTOBACILLUS ISOLATES
164
5.2.3. GROSS PROTEOME ANALYSIS USING MATRIX-ASSISTED LASER
DESORPTION/IONIZATION-TIME-OF-FLIGHT MASS SPECTROMETRY (MALDI-TOF
MS)
5.2.3.1. Bacterial strains
Proteomes of L. acidophilus isolates and isolates of other LAB were examined with
MALDI-TOF MS (Table 5.1). Strains were resuscitated from charcoal transport swabs
(Fisher Scientific, UK) onto MRS agar at 37 °C for 24h. After resuscitation, strains were
grown anerobically on MRS agar at 37 °C for 24 h and checked for purity. Prior to
MALDI-TOF MS analysis, the strains were subcultured at least twice.
5.2.3.2. Sample preparation – “Cell extract”
The crude protein sample preparation protocol is described in detail by De Bruyne et al
(2011). Briefly, α-cyano-4-hydroxycinnamic acid (CHCA) (5 mg/ml):acetonitrile
(ACN):water:trifluoroacetic acid (TFA) are combined in the ratio 50:48:2 to form a matrix-
organic solvent mixture as described by Williams et al (2003). Chemicals were of high
performance liquid chromatography (HPLC) grade quality. 1 µL of bacterial cells
(manipulated by Looplast® inoculation loops) was washed in HPLC grade water and
ethanol. 70% formic acid and pure ACN were added in a 1:1 (v/v) ratio to the bacterial
pellet, and the suspension mixed by vortex for 30 s. The supernatant, obtained after
microcentrifugation, was then transferred into a new tube, forming the “cell extract”. Cell
extracts (1.5 µL) were then transferred to the spot sites on a 384-well stainless steel target
plate and air-dried for about 10 min. The matrix–organic solvent mixture (1 µL) was added
to the spots and allowed to dry. Each sample was spotted at least in quadruplicate, to verify
reproducibility. The samples were allowed to air-dry at room temperature, inserted into the
mass spectrometer and subjected to MALDI-TOF MS analysis.
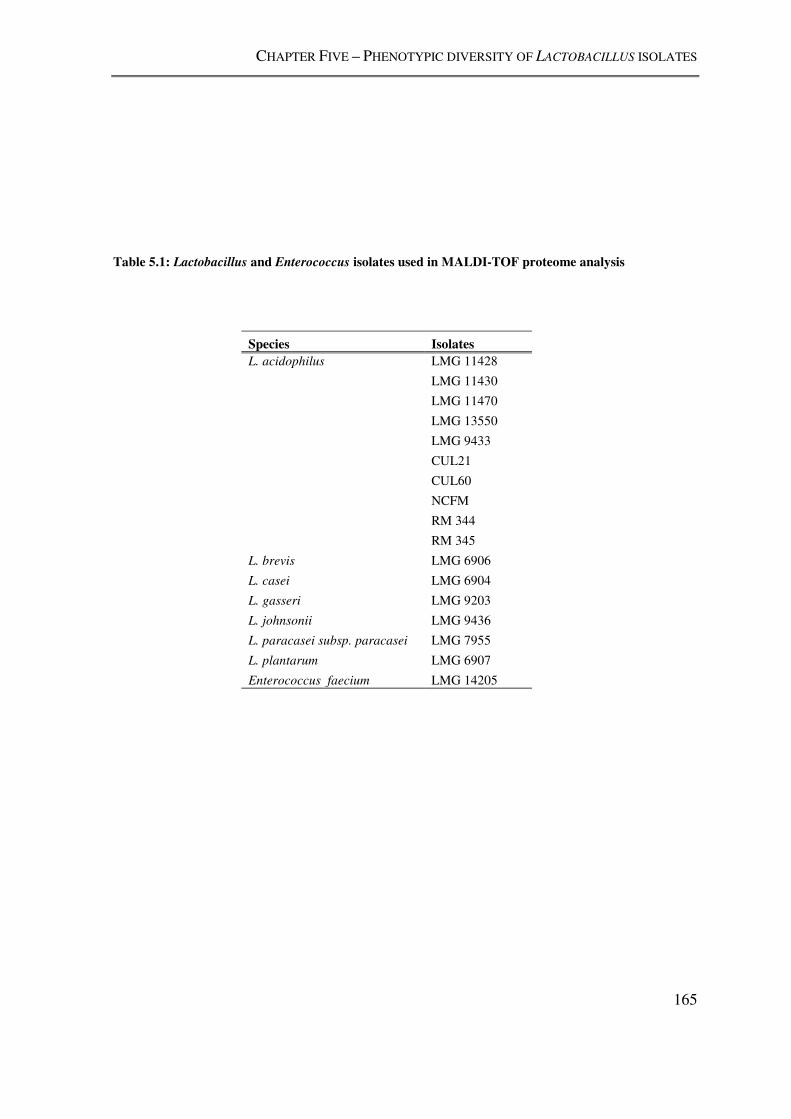
CHAPTER FIVE – PHENOTYPIC DIVERSITY OF LACTOBACILLUS ISOLATES
165
Table 5.1: Lactobacillus and Enterococcus isolates used in MALDI-TOF proteome analysis
Species Isolates L. acidophilus LMG 11428
LMG 11430
LMG 11470
LMG 13550
LMG 9433
CUL21
CUL60
NCFM
RM 344
RM 345
L. brevis LMG 6906
L. casei LMG 6904
L. gasseri LMG 9203
L. johnsonii LMG 9436
L. paracasei subsp. paracasei LMG 7955
L. plantarum LMG 6907
Enterococcus faecium LMG 14205
CHAPTER FIVE – PHENOTYPIC DIVERSITY OF LACTOBACILLUS ISOLATES
166
5.2.3.3. MALDI-TOF MS sample analysis
Prior to analysis, the mass spectrometer was externally calibrated with a peptide mix of
adrenocorticotropic hormone (ACTH) (18-39), insulin (bovine), ubiquitine, cytochrome
c and myoglobin. The matrix solution and external calibration peptide mix were mixed
in a 1:1 (v/v) ratio and spotted (1 µl) on the designated calibration spots on the 384-well
target plate. The 4800 Plus MALDI TOF/TOF™ Analyzer (Applied Biosystems,
Framingham, MA, USA) was used in the linear mode. The mass spectrometer uses a
200-Hz frequency tripled Nd:YAG laser, operating at a wavelength of 355 nm. Ions
generated by the MALDI process were accelerated at 20 kV through a grid at 19.3 kV
into a linear, field-free drift region and subsequently into the detector. The detector, an
electron multiplier, detected and counted the generated ions. For each spot, 40 sub-
spectra for each of 50 randomized positions within the spot (2000 spectra/spot) were
collected and presented as one main spectrum. MALDI-TOF mass spectra were
generated in the mass range 2–20 kDa. Laser intensity was set between 3600 and 3800
V, obtaining signal intensities between 5 × 10² and 1 × 10⁴. Data were collected in an
automated fashion using random sampling over the sample spot.
5.2.3.4. Data pre-processing
Raw data were extracted as .t2d files from the 4800 Plus MALDI TOF/TOF™
Analyzer. The t2d files were imported in the Data Explorer 4.0 software (Applied
Biosystems, CA, USA) and transformed to text files. These text files consisted of an
array containing the signal intensity for each 0.5 mass-to-charge ratio (m/z) value. A
Data Explorer script (De Bruyne et al., 2011) was used to export the peak list of each of
the samples from one spot set to separate text files, which were used as input files for
the BioNumerics 6.0 software package (Applied-Maths, Sint-Martens-Latem, Belgium).
In BioNumerics 6.0 a densitometric curve was reconstructed, plotting signal intensity
against (m/z). This workflow was integrated into a script to facilitate the import of the
normalized peak lists as densitometric curves. Since all measurements were performed
after calibration of the 4800 Plus MALDI TOF/TOF™ Analyzer, data could be
considered normalized, and additional normalization of the experiment type was not
performed. Data were reduced and de-noised using the methods described by De
CHAPTER FIVE – PHENOTYPIC DIVERSITY OF LACTOBACILLUS ISOLATES
167
Bruyne et al (2011). The quality of each spectrum was evaluated using the following
criteria; minimum signal intensity of 1000 units, less than 30% leading slope into
spectrum and more than five peaks. Any spectra not meeting these criteria were
removed from further analysis.
5.2.3.5. Data analysis
Similarities between densiometric curves generated by each spot were calculated using
curve-based (Pearson Product Moment Correlation Coefficient, PMCC) measures and
clustering was initially performed using the unweighted paired-group method with
arithmetic mean (UPGMA) method. Multi-dimensional scaling (MDS) was used for the
visualization of the likeliness of data, for example, for exploring similarities or
dissimilarities. The MDS approach started with a matrix of data similarities generated in
BioNumerics 6.0. This was then imported into IBM Statistics 20 and similarities were
plotted in 2-dimensional space using a non-linear least squares fit, to minimise the
distances between the data points, known as Multidimensional Scaling. The resulting
data positions were visualised in a 2-dimensional scatter plot using Microsoft Excel.

CHAPTER FIVE – PHENOTYPIC DIVERSITY OF LACTOBACILLUS ISOLATES
168
5.3. RESULTS
For clarity, the results were divided into three parts, the first (Section 5.3.1) concerns
the elucidation of carbohydrate fermentation profiles of L. acidophilus isolates. These
included two L. acidophilus isolates from the Cultech Lab4® probiotic supplement
(CUL21 and CUL60), L. acidophilus isolates from culture collections, and L. casei (L.
acidophilus) TBCC, which was re-classified from L. acidophilus to L. casei in Chapter
2 based on its RAPD profile. The second part (Section 5.3.2) describes the comparison
of growth characteristics of L. acidophilus isolates from culture collections, commercial
applications and those that were exposed to the mutagen MMS (Section 4.2.5). The
third (Section 5.3.3) compares gross proteomes of Lactobacillus isolates using MALDI-
TOF MS.
5.3.1. CARBOHYDRATE FERMENTATION BY LACTOBACILLUS ISOLATES
The API 50CHL test was used to evaluate the carbohydrate fermentation characteristics
of L. acidophilus isolates. Figure 5.2 catalogues the ability of eight L. acidophilus
isolates and L. casei TBCC to ferment 20 carbohydrate substrates. The fermentation
characteristics of L. casei TBCC were markedly different to the L. acidophilus isolates
tested. L. casei TBCC did not ferment D-maltose or sucrose, both of which were
fermented by 100% of L. acidophilus isolates. L. casei TBCC was also able to ferment
D-mannitol, arbutin, D-melezitose, D-tagatose and potassium gluconate, none of which
were fermented by any L. acidophilus isolates (Figure 5.2). The apiweb™ fermentation
profile analysis software classified this profile as L. paracasei subsp. paracasei,
although it was still assumed to be a doubtful designation. Among L. acidophilus
isolates, API 50 CHL profiles showed a large degree of heterogeneity. This was
reflected in the apiweb™ classifications for each of the profiles, which classified five
isolates as L. acidophilus with a good or acceptable profile, two isolates as L.
acidophilus with doubtful or not valid profiles and a single isolate as Lactobacillus to
the genus level (Figure 5.2).
CHAPTER FIVE – PHENOTYPIC DIVERSITY OF LACTOBACILLUS ISOLATES
169
Four carbohydrates; D-glucose, Esculin, D-maltose and D-saccharose were fermented
by 100% of L. acidophilus isolates, with the fermentation of D-maltose and D-
saccharose clearly differentiating between L. casei TBCC and L. acidophilus isolates.
D-galactose, D-fructose, D-mannose, salicin and D-trehalose were fermented by 87.5%
of L. acidophilus isolates, although the lack of ability to ferment all of these substrates
was not restricted to a single L. acidophilus isolate. L. acidophilus CUL 60 was able to
ferment the largest array of carbohydrate substrates (15). L. acidophilus NCFM and
LMG 11470 fermented 14 carbohydrates, LMG 11472 and LMG 11467 fermented 12,
LMG 9433 fermented 11, and LMG 11428 and LMG 11466 fermented 10. There was
no clear distinction in the fermentation profiles of isolates from culture collections (L.
acidophilus LMG 11470, LMG 11472, LMG 11467, LMG 9433, LMG 11428 and
LMG 11466) and those from commercial applications (L. acidophilus NCFM and
CUL60).
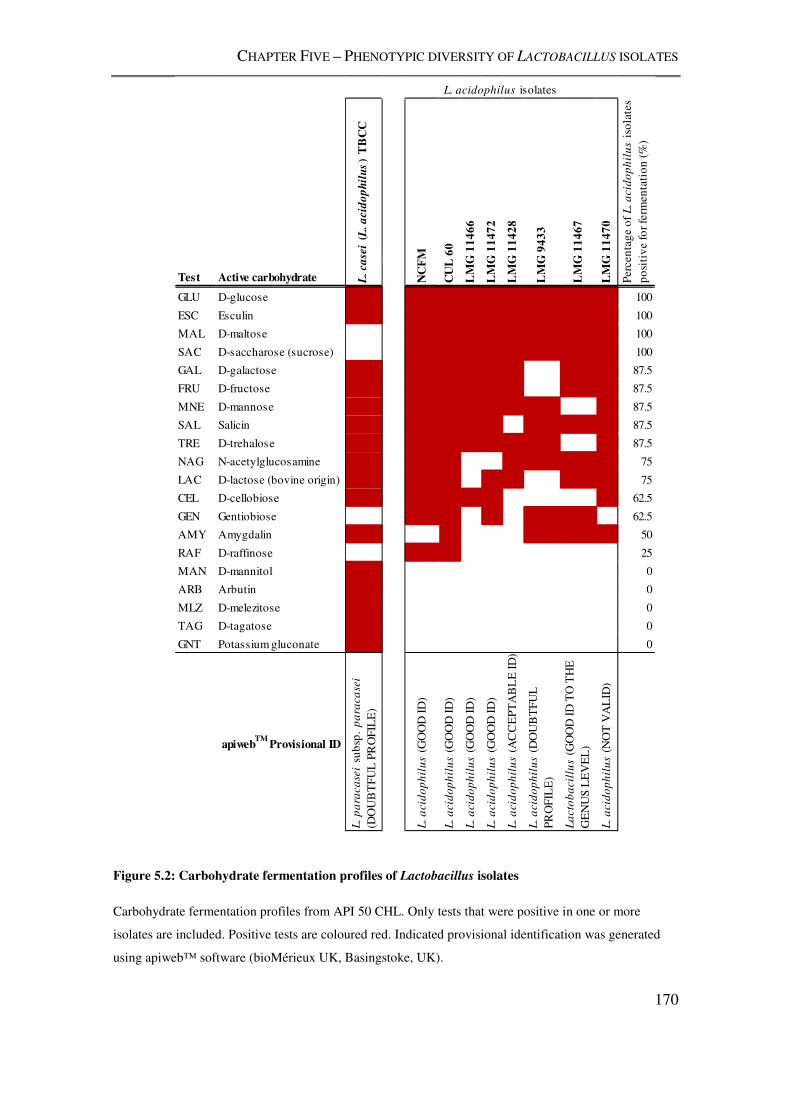
CHAPTER FIVE – PHENOTYPIC DIVERSITY OF LACTOBACILLUS ISOLATES
170
Figure 5.2: Carbohydrate fermentation profiles of Lactobacillus isolates
Carbohydrate fermentation profiles from API 50 CHL. Only tests that were positive in one or more
isolates are included. Positive tests are coloured red. Indicated provisional identification was generated
using apiweb™ software (bioMérieux UK, Basingstoke, UK).
Test Active carbohydrate
GLU D-glucose 1 1 1 1 1 1 1 1 1 100
ESC Esculin 1 1 1 1 1 1 1 1 1 100
MAL D-maltose 0 1 1 1 1 1 1 1 1 100
SAC D-saccharose (sucrose) 0 1 1 1 1 1 1 1 1 100
GAL D-galactose 1 1 1 1 1 1 0 1 1 87.5
FRU D-fructose 1 1 1 1 1 1 0 1 1 87.5
MNE D-mannose 1 1 1 1 1 1 1 0 1 87.5
SAL Salicin 1 1 1 1 1 0 1 1 1 87.5
TRE D-trehalose 1 1 1 1 1 1 1 0 1 87.5
NAG N-acetylglucosamine 1 1 1 0 0 1 1 1 1 75
LAC D-lactose (bovine origin) 1 1 1 0 1 1 0 1 1 75
CEL D-cellobiose 1 1 1 1 1 0 0 0 1 62.5
GEN Gentiobiose 0 1 1 0 1 0 1 1 0 62.5
AMY Amygdalin 1 0 1 0 0 0 1 1 1 50
RAF D-raffinose 0 1 1 0 0 0 0 0 0 25
MAN D-mannitol 1 0 0 0 0 0 0 0 0 0
ARB Arbutin 1 0 0 0 0 0 0 0 0 0
MLZ D-melezitose 1 0 0 0 0 0 0 0 0 0
TAG D-tagatose 1 0 0 0 0 0 0 0 0 0
GNT Potassium gluconate 1 0 0 0 0 0 0 0 0 0
apiwebTM
Provisional ID
L. p
ara
ca
sei
sub
sp.
pa
raca
sei
(DO
UB
TF
UL
PR
OF
ILE
)
L. a
cid
op
hil
us
(G
OO
D I
D)
L. a
cid
op
hil
us
(GO
OD
ID
)
L. a
cid
op
hil
us
(GO
OD
ID
)
L. a
cid
op
hil
us
(GO
OD
ID
)
L. a
cid
op
hil
us
(AC
CE
PT
AB
LE
ID
)
L. a
cid
op
hil
us
(DO
UB
TF
UL
PR
OF
ILE
)
La
cto
ba
cil
lus
(GO
OD
ID
TO
TH
E
GE
NU
S L
EV
EL
)
L. a
cid
op
hil
us
(NO
T V
AL
ID)
L. ca
sei
(L. a
cid
op
hil
us
) T
BC
C
Per
cen
tag
e o
f L
. a
cid
op
hil
us
iso
late
s
po
siti
ve
for
ferm
enta
tio
n (
%)
L. acidophilus isolates
NC
FM
CU
L 6
0
LM
G 1
1466
LM
G 1
1472
LM
G 1
1428
LM
G 9
433
LM
G 1
1467
LM
G 1
1470
CHAPTER FIVE – PHENOTYPIC DIVERSITY OF LACTOBACILLUS ISOLATES
171
5.3.2. LACTOBACILLUS GROWTH CHARACTERISTICS
L. acidophilus isolates were divided into five groups, the first representing culture
collection isolates, the second commercial isolates and three groups representing the
three rounds of exposure to MMS (see Chapter 4). L. casei LMG 6904 was included for
comparison, as a non-L. acidophilus isolate. The growth kinetics of these groups are
represented by three parameters defined in Figure 5.1, which include length of lag
phase, maximum growth rate and maximum culture density. The spread of these data is
shown in Figure 5.3. None of the data generated for any of the three parameters was
normally distributed when tested with the Shapiro-Wilk test, so differences between
groups were tested for significance using the non-parametric Kruskall-Wallis H-test,
which was corrected for tied ranks, followed by post-hoc pairwise Mann-Whitney U
tests with Dunn-Bonferroni correction.
All growth parameters showed significant differences across groups. The Kruskal-
Wallis test revealed a significant effect of group on maximum culture density
(χ2=83.51, d.f.=5, p < 0.01), maximum growth rate (χ2=49.39, d.f.=5, p < 0.01) and lag
time (χ2=37.37, d.f.=5, p < 0.01). Pairwise comparisons of groups for each growth
parameter are given in Table 5.2. The non-L. acidophilus group grew to significantly
higher maximum culture density than all other groups except MMS 3. No significant
differences were observed between the culture collection and commercial groups, or
between either of the latter groups and the MMS exposed groups. The culture collection
group had a significantly lower maximum growth rate than all groups except the
commercial group, between which there was no significant difference. Commercial
isolates also had a lower maximum growth rate than the non- L. acidophilus group and
the MMS 1 group. The MMS exposed groups (MMS 1, MMS 2 and MMS 3) had
significantly longer lag phases than the culture collection group and the commercial
group. No significant difference was observed in the lag phases of the commercial and
culture collection groups, or between these groups and the non- L. acidophilus group.
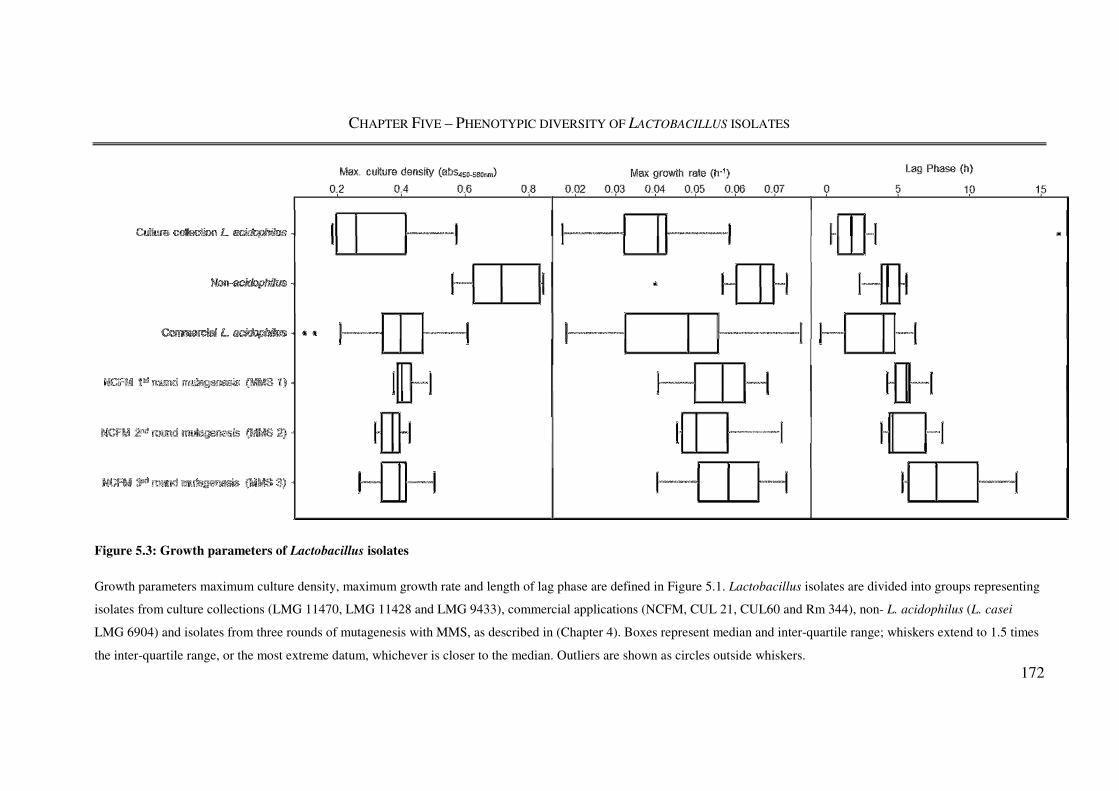
CHAPTER FIVE – PHENOTYPIC DIVERSITY OF LACTOBACILLUS ISOLATES
172
Figure 5.3: Growth parameters of Lactobacillus isolates
Growth parameters maximum culture density, maximum growth rate and length of lag phase are defined in Figure 5.1. Lactobacillus isolates are divided into groups representing
isolates from culture collections (LMG 11470, LMG 11428 and LMG 9433), commercial applications (NCFM, CUL 21, CUL60 and Rm 344), non- L. acidophilus (L. casei
LMG 6904) and isolates from three rounds of mutagenesis with MMS, as described in (Chapter 4). Boxes represent median and inter-quartile range; whiskers extend to 1.5 times
the inter-quartile range, or the most extreme datum, whichever is closer to the median. Outliers are shown as circles outside whiskers.

CHAPTER FIVE – PHENOTYPIC DIVERSITY OF LACTOBACILLUS ISOLATES
173
Table 5.2: Significant differences in growth parameters between groups of Lactobacillus isolates
Statistics are reported as effect size, followed by significance if greater than 0.05. Comparisons with no
significant differences are reported with NSD.
Maximum culture density
Culture collection
Commercial NSD
Non-L. acidophilus 5. 61, <0.01 3. 91, <0.01
MMS 1 NSD NSD 4. 08, <0.01
MMS 2 NSD NSD 4. 56, <0.01 NSD
MMS 3 3. 61, <0.01 NSD NSD NSD NSD
Cu
ltu
re c
olle
ctio
n
Co
mm
erc
ial
No
n-L
. a
cid
op
hilu
s
MM
S 1
MM
S 2
MM
S 3
Max growth rate
Culture collection
Commercial NSD
Non-L. acidophilus 4. 84, <0.01 3.19, <0.05
MMS 1 5. 56, <0.01 3.27, <0.05 NSD
MMS 2 4. 08, <0.01 NSD NSD NSD
MMS 3 4. 91, <0.01 NSD NSD NSD NSD
Cu
ltu
re c
olle
ctio
n
Co
mm
erc
ial
No
n-L
. a
cid
op
hilu
s
MM
S 1
MM
S 2
MM
S 3
Lag phase
Culture collection
Commercial NSD
Non-L. acidophilus NSD NSD
MMS 1 8. 15, <0.01 6.45, <0.01 3.42, <0.01
MMS 2 5. 18, <0.01 3.25, <0.05 NSD 2.97, <0.05
MMS 3 5. 34, <0.01 3.53, <0.01 NSD NSD NSD
Cu
ltu
re c
olle
ctio
n
Co
mm
erc
ial
No
n-L
. a
cid
op
hilu
s
MM
S 1
MM
S 2
MM
S 3
CHAPTER FIVE – PHENOTYPIC DIVERSITY OF LACTOBACILLUS ISOLATES
174
5.3.3. COMPARISON OF THE GROSS PROTEOME OF LACTOBACILLUS ISOLATES
MALDI-TOF MS was used to examine the gross proteome of Lactobacillus isolates with
particular emphasis on L. acidophilus isolates. A scaling workflow of data analysis was
undertaken, represented by the progression of data quantity displayed in three MALDI-
TOF profiles in Figure 5.4, to tens of profiles analysed and displayed in Figure 5.5, to
finally hundreds of profile similarities easily visualised in Figure 5.6.
When visualised at the single profile level with no similarity analysis undertaken (Figure
5.4), L. acidophilus profiles are visually similar, and the included L. brevis profile is
markedly different. When examined based on MALDI-TOF profile similarity (Figure 5.5),
all L. acidophilus isolates cluster together at greater than 81% MALDI-TOF profile
similarity. Repeat testing of the same isolates of L. gasseri LMG 9203, L. johnsonii LMG
9436 and E. faecium LMG 14205 show profile stabilities of 95.7%, 94.7% and 94.5%
respectively (Figure 5.5). The MALDI-TOF profiles generated by L. gasseri LMG 9203
and L. johnsonii LMG 9436 show 64.6% similarity to each other (Figure 5.5).
Non-metric multidimensional scaling (nMDS) allows the visualisation of hundreds of
MALDI-TOF profiles in low-dimensional (in this case two-dimensional) space. More
similar MALDI-TOF profiles are plotted as points with low Euclidian distances between,
and more dissimilar MALDI-TOF profiles are plotted more disparately on a set of arbitrary
axes. When applied to Lactobacillus isolates, this approach visualised the high level of
MALDI-TOF profile conservation of repeat tests of the same strain i.e. profiles generated
by the same isolate occupy similar space within the nMDS plot (Figure 5.6). L. gasseri
LMG 9203 and L. johnsonii LMG 9436 occupy a similar area on the nMDS plot (Figure
5.6), although their profiles share 64.5 % similarity (Figure 5.5). All other Lactobacillus
species formed distinct clusters (Figure 5.6). All L. acidophilus isolates shared the same
area on the nMDS plot, although diversity in profiles can be observed (81.0% profile
similarity in Figure 5.5 and distance between points in (Figure 5.6). To reflect the two
groups of L. acidophilus genotypes observed in Chapter 4 and Section 5.3.2, the MALDI-
TOF nMDS plot was coloured to represent culture collection and commercial L.
acidophilus. No clear distinction was seen in the graph area occupied by these two groups.

CHAPTER FIVE – PHENOTYPIC DIVERSITY OF LACTOBACILLUS ISOLATES
175
This indicates that the diversity of L. acidophilus MALDI-TOF profiles generated by L.
acidophilus isolates cannot be explained by differences between these two groups.
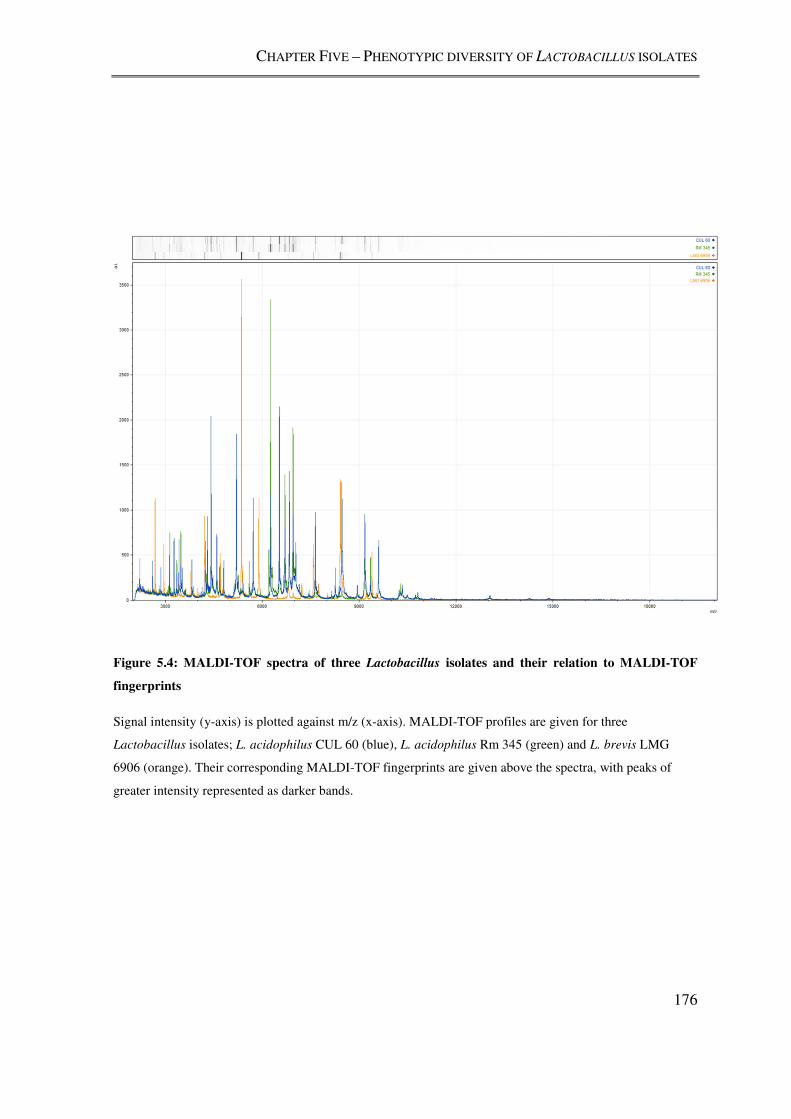
CHAPTER FIVE – PHENOTYPIC DIVERSITY OF LACTOBACILLUS ISOLATES
176
Figure 5.4: MALDI-TOF spectra of three Lactobacillus isolates and their relation to MALDI-TOF
fingerprints
Signal intensity (y-axis) is plotted against m/z (x-axis). MALDI-TOF profiles are given for three
Lactobacillus isolates; L. acidophilus CUL 60 (blue), L. acidophilus Rm 345 (green) and L. brevis LMG
6906 (orange). Their corresponding MALDI-TOF fingerprints are given above the spectra, with peaks of
greater intensity represented as darker bands.

177
47.8
CHAPTER FIVE – PHENOTYPIC DIVERSITY OF LACTOBACILLUS ISOLATES
178
← Previous page
Figure 5.5: Clustered MALDI-TOF profiles generated by Lactobacillus isolates
L. johnsonii (orange), L. gasseri (blue), L. acidophilus (red) and E. faecium (green) MALDI-TOF profiles
were clustered using BioNumerics 6.0 (Applied Maths, Belgium). Pearson correlation similarity coefficient
with a UPGMA dendrogram type was used, and position tolerance optimisation was set to 2%. Pertinent
profile similarity values are indicated in red text adjacent to the corresponding node.

CHAPTER FIVE – PHENOTYPIC DIVERSITY OF LACTOBACILLUS ISOLATES
179
Figure 5.6: Diversity of Lactobacillus MALDI-TOF profiles
MALDI-TOF profile distance scores are plotted in two dimensions, axes are arbitrary. Distances between profiles are represented by Euclidian distance, i.e. more similar profiles
are plotted as points closer together. Distances were calculated using the Pearson correlation similarity coefficient and position tolerance optimisation was set to 2%. Coordinates
were calculated using multidimensional scaling. .
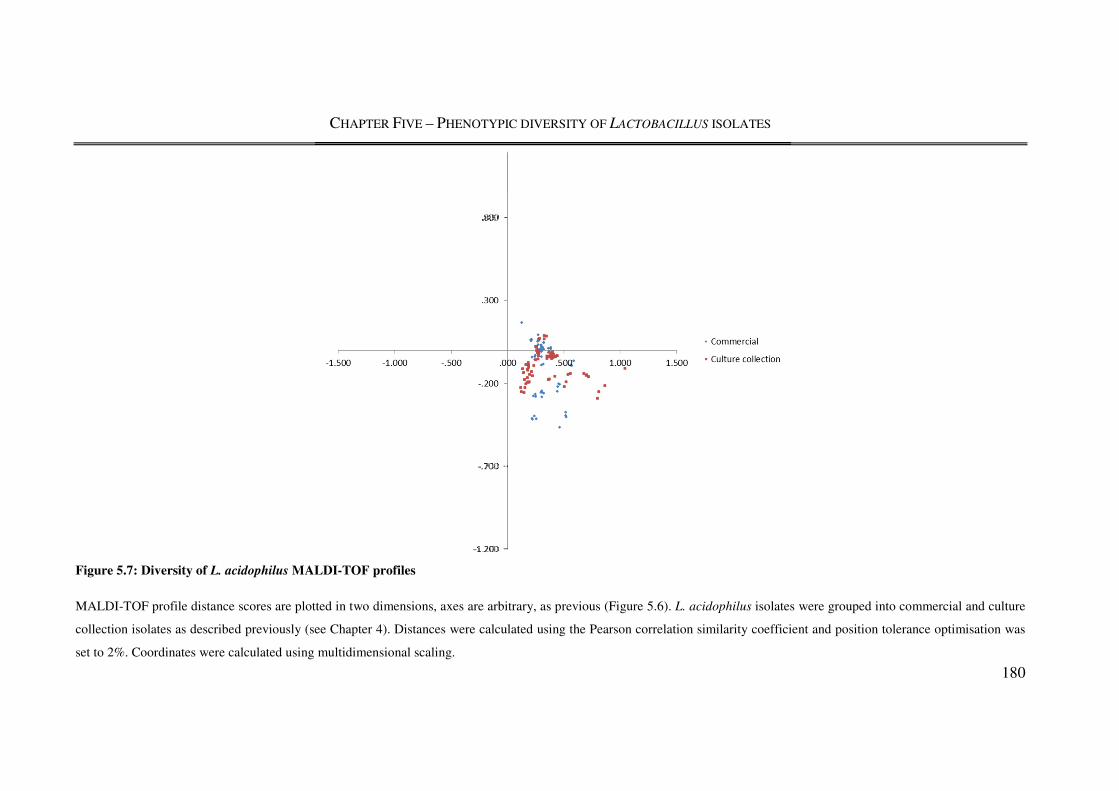
CHAPTER FIVE – PHENOTYPIC DIVERSITY OF LACTOBACILLUS ISOLATES
180
Figure 5.7: Diversity of L. acidophilus MALDI-TOF profiles
MALDI-TOF profile distance scores are plotted in two dimensions, axes are arbitrary, as previous (Figure 5.6). L. acidophilus isolates were grouped into commercial and culture
collection isolates as described previously (see Chapter 4). Distances were calculated using the Pearson correlation similarity coefficient and position tolerance optimisation was
set to 2%. Coordinates were calculated using multidimensional scaling.
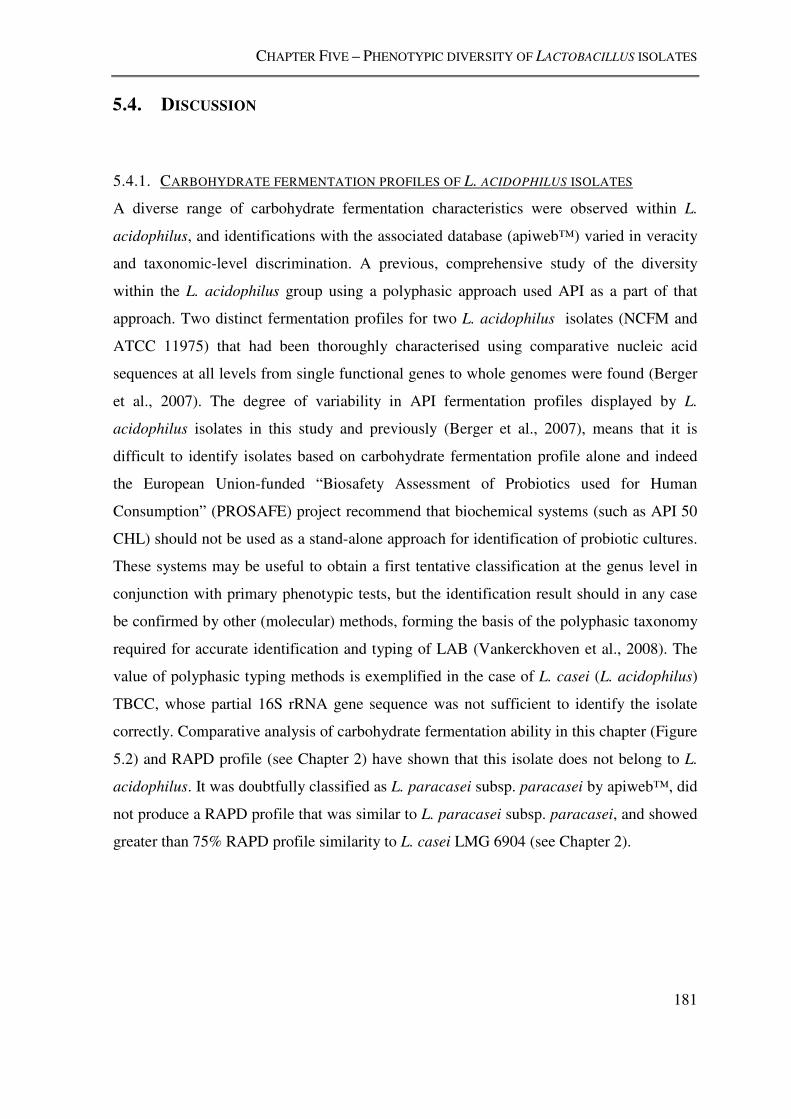
CHAPTER FIVE – PHENOTYPIC DIVERSITY OF LACTOBACILLUS ISOLATES
181
5.4. DISCUSSION
5.4.1. CARBOHYDRATE FERMENTATION PROFILES OF L. ACIDOPHILUS ISOLATES
A diverse range of carbohydrate fermentation characteristics were observed within L.
acidophilus, and identifications with the associated database (apiweb™) varied in veracity
and taxonomic-level discrimination. A previous, comprehensive study of the diversity
within the L. acidophilus group using a polyphasic approach used API as a part of that
approach. Two distinct fermentation profiles for two L. acidophilus isolates (NCFM and
ATCC 11975) that had been thoroughly characterised using comparative nucleic acid
sequences at all levels from single functional genes to whole genomes were found (Berger
et al., 2007). The degree of variability in API fermentation profiles displayed by L.
acidophilus isolates in this study and previously (Berger et al., 2007), means that it is
difficult to identify isolates based on carbohydrate fermentation profile alone and indeed
the European Union-funded “Biosafety Assessment of Probiotics used for Human
Consumption” (PROSAFE) project recommend that biochemical systems (such as API 50
CHL) should not be used as a stand-alone approach for identification of probiotic cultures.
These systems may be useful to obtain a first tentative classification at the genus level in
conjunction with primary phenotypic tests, but the identification result should in any case
be confirmed by other (molecular) methods, forming the basis of the polyphasic taxonomy
required for accurate identification and typing of LAB (Vankerckhoven et al., 2008). The
value of polyphasic typing methods is exemplified in the case of L. casei (L. acidophilus)
TBCC, whose partial 16S rRNA gene sequence was not sufficient to identify the isolate
correctly. Comparative analysis of carbohydrate fermentation ability in this chapter (Figure
5.2) and RAPD profile (see Chapter 2) have shown that this isolate does not belong to L.
acidophilus. It was doubtfully classified as L. paracasei subsp. paracasei by apiweb™, did
not produce a RAPD profile that was similar to L. paracasei subsp. paracasei, and showed
greater than 75% RAPD profile similarity to L. casei LMG 6904 (see Chapter 2).
CHAPTER FIVE – PHENOTYPIC DIVERSITY OF LACTOBACILLUS ISOLATES
182
5.4.2. GROWTH KINETICS
Diversity in L. acidophilus growth characteristics was observed, and differences were
measureable at a statistically significant level. The most marked differences between
groups were seen between L. acidophilus isolates and the non- L. acidophilus out-group.
This was particularly exemplified by the greater culture density reached by the non- L.
acidophilus group, which was significantly higher than all other groups except the MMS3
group containing isolates exposed to MMS three times. The ability of an isolate to grow to
high densities is presumably a useful trait from a commercial probiotic perspective,
particularly in the case of large-scale cultures that are freeze-dried and added into dairy
products, but in capsules. Within the L. acidophilus groups, no significant differences in
any growth characteristics were observed between the culture collection and commercial
groups, which were assigned to isolates based on the diversity of their genome sequences
(see Chapter 4). This indicates that the small differences observed in gene sequence and
content between these groups isolates do not have a significant impact on their growth
characteristics. It should be noted however, that translating these effects from the
microculture discussed in this chapter to the large-scale cultures required for industrial
production of probiotic products should be done with caution, as just a small increase in
the size of the culture vessel may have profound effects on the growth characteristics of a
particular strain (Arnold et al., 1999).
The groups containing isolates that were exposed to MMS once, twice or three times
(MMS1, MMS2 and MMS3 respectively) were originally derived from L. acidophilus
NCFM, a member of the commercial L. acidophilus group. Drawing comparisons between
the MMS exposed isolates and the commercial L. acidophilus group showed no significant
difference in overall culture density reached. The MMS1 group had a weakly (p<0.05)
significantly increased growth compared to the commercial L. acidophilus group, but no
other growth-rate effects were observed. The effect of MMS exposure is most obviously
observed when comparing the lag-times of exposed isolates to their parent culture
collection isolates; all are significantly longer. The phenomenon of sub-lethal stress
resulting in increased culture lag-times is well documented in Lactobacillus (Smelt et al.,
2002) and other genera (Guillier et al., 2005), and it appears that exposure to MMS has
induced the same response in L. acidophilus NCFM.

CHAPTER FIVE – PHENOTYPIC DIVERSITY OF LACTOBACILLUS ISOLATES
183
5.4.3. MALDI-TOF MS PROFILING OF LACTOBACILLUS ISOLATES
Several recommendations were made by the EU-PROSAFE project as areas for further
research in the area of identification of LAB (Vankerckhoven et al., 2008). MALDI-TOF
MS profile analysis was implicated as a highly desirable, rapid and cost-effective
phenotypic method to augment and validate sequence-based taxonomy and identification
schemes for commercial probiotic LAB cultures (Vankerckhoven et al., 2008). Automated
systems using MALDI-TOF MS to identify unknown isolates are already commercially
available (Bruker Daltonik GmbH, 2010), but identification by these systems is achieved
by matching new MALDI-TOF profile entries with a database of known profiles and
calculating similarity scores (Bruker Daltonik GmbH, 2010). The approach used in this
chapter used only data generated by this study in a purely comparative way. As the
characterisation of the isolates tested has been undertaken on multiple levels, from DNA
fingerprinting (see Chapter 2) to whole genome sequence (see Chapter 4), this chapter
describes a purely comparative study that illustrates the power of MALDI-TOF MS profile
analysis to both accurately place similar Lactobacillus isolates close together, and
disparate isolates further apart (Section 5.3.3; Figure 5.6). The developed workflow
allowed visualisation and validation of data on multiple scales, from comparisons of single
MALDI-TOF MS spectra, to comparisons of more than 100 Lactobacillus profiles.
MALDI-TOF MS profile analysis has been shown to accurately resolve closely related
LAB species in the genera Leuconostoc and Pediococcus (De Bruyne et al., 2011), and the
data presented in this chapter suggest that it is a similar case for Lactobacillus. MALDI-
TOF MS profile analysis also has the potential to resolve isolates at the sub-species level
(Vargha et al., 2006), with a strain-level resolution comparative to that of MLST in certain
studies (De Bruyne et al., 2011). The advantages of MALDI-TOF include that it does not
require genomic DNA, removing the cultivation step before DNA extraction required for
MLST; that it requires no previous knowledge of DNA sequence in order to design
efficient PCR primers targeting housekeeping genes which is essential for MLST and that
bacterial colonies may be analysed directly, enabling extremely fast typing of isolates.
When applied to Lactobacillus isolates from food products using the Bruker BioTyper
system (Bruker Daltonik GmbH, 2010), MALDI-TOF MS and PCR-based identification
concurred in 95.6% of isolates (Dušková et al., 2012). The approach taken in this chapter
CHAPTER FIVE – PHENOTYPIC DIVERSITY OF LACTOBACILLUS ISOLATES
184
was able to classify all Lactobacillus species tested into different profile types, with the
exception of L. gasseri LMG 9203 and L. johsonii LMG 9436, both closely related
members of the L. acidophilus phylogenetic subgroup. This again illustrates the value of a
polyphasic approach to typing, as the additional information gathered from RAPD profile
similarity analysis (see Chapter 2) allows the classification of these two isolates as two
distinct taxa.
When considered as a single taxonomic entity, L. acidophilus isolates generated diverse
MALDI-TOF profiles, although all isolates were more similar to other L. acidophilus
isolates than any other Lactobacillus species, and no obvious divergent groups of L.
acidophilus were observed (Figure 5.6). When divided into the groups devised by genomic
analysis (see Chapter 4), the diversity of MALDI-TOF profiles both within and between
culture collection and commercial isolates was approximately equal (Figure 5.7), i.e. the
variation in MALDI-TOF profiles generated by L. acidophilus isolates was not associated
with their genome sequence. Additionally, the most genomically homogenous group of L.
acidophilus isolates, those from commercial probiotic products, generated a range of
MALDI-TOF profiles similar in diversity to the more genomically diverse culture
collection isolates (Figure 5.7). In a species that shows greater genomic conservation than
L. acidophilus; Bifidobacterium animalis subsp. lactis, MALDI-TOF profiles were seen to
vary by up to 4% (Ruiz-Moyano et al., 2012). This shows that there is at least some
MALDI-TOF profile variation that cannot be explained by genetic diversity been isolates,
and is more likely attributable to sample preparation and growth conditions (Liu et al.,
2007).
5.4.4. SUMMARY AND PERSPECTIVE
The variation in phenotypic characteristics of L. acidophilus isolates observed in this
chapter is typical of phenotypic approaches to characterising bacteria in general. The
phenotype of a particular isolate may be influenced by a vast array of external factors,
including but not limited to culture conditions (e.g. temperature and oxygen availability)
stress and growth phase. This makes generating consistent results particularly difficult, and
because of this, phenotypic approaches have been complemented and to a large extent

CHAPTER FIVE – PHENOTYPIC DIVERSITY OF LACTOBACILLUS ISOLATES
185
superseded by genotypic approaches (Stackebrandt et al., 2002). As identified by the EU-
PROSAFE project (Vankerckhoven et al., 2008), the accurate identification of probiotic
cultures is imperative, particularly if they are sold commercially. This chapter emphasises
the requirement for a polyphasic approach to probiotic characterisation, and using both
genotypic and phenotypic elements as part of that approach ensures a comprehensive
description of a probiotic culture.

CHAPTER FIVE – PHENOTYPIC DIVERSITY OF LACTOBACILLUS ISOLATES
186
5.5. CONCLUSIONS
The main conclusions from this chapter are as follows:
5) Carbohydrate fermentation profiles of L. acidophilus isolates vary considerably.
The API 50 CHL test was unable to classify well classified isolates based on
carbohydrate fermentation ability alone.
6) The carbohydrate fermentation profile of L. casei (L. acidophilus) TBCC was
markedly different to L. acidophilus profiles. The reclassification of this isolate
based on RAPD profile analysis is supported by the API 50 CHL test.
7) There were no significant differences in maximum culture density, maximum
growth rate or lag time between culture collection and commercial L. acidophilus
isolates.
8) MMS exposed L. acidophilus isolates did not grow to different culture densities or
with different maximum growth rates to their parent, commercial L. acidophilus
group. The lag phase of all MMS exposed isolates was significantly longer than the
commercial L. acidophilus group.
9) MALDI-TOF profile analysis was able to differentiate all tested Lactobacillus
species, with the exception of L. gasseri and L. johsonii. L. acidophilus isolates
showed diversity in their generated MALDI-TOF profiles which was not related to
their genotypes.

CHAPTER SIX – COMPARATIVE GENOMICS OF COMMERCIAL BIFIDOBACTERIUM STRAINS
187
6. COMPARATIVE GENOMICS OF COMMERCIAL BIFIDOBACTERIUM
STRAINS
6.1. INTRODUCTION
The human GIT is host to a large, diverse and dynamic microbial community, of which
Bifidobacterium is a dominant genus (Gill et al., 2006). The overall number and
composition of bifidobacterial species in the human intestine is dynamic over time
(Barrangou et al., 2009). From birth, particularly following vaginal delivery, the GIT of
healthy neonates is colonised by bifidobacteria, especially in breast-fed infants during early
life (Jost et al., 2012). Variation in the composition of the gut microbiota between
individuals however, is remarkable in infants (Jost et al., 2012), and this is reflected in the
variation of dominant genera seen in different metagenomic studies of the human gut
microbiota (Gill et al., 2006, Palmer et al., 2007, Ley et al., 2008). The microbiome of the
infant GIT becomes more diverse as the diet encompasses greater complexity, although
Bifidobacterium is typically the dominant genus until weaning (Jost et al., 2012).
Bifidobacteria are also intensively used in functional foods, as they may exert a health
benefit on their human host (see Chapter 1). The causal molecular mechanisms for these
health-promoting activities however, are still relatively uncharacterised. Recently, the
sequencing and analysis of genome sequences of probiotic bacteria, specifically aimed at
the discovery of genetic determinants responsible for the adaptation to the gastrointestinal
tract of their host, has been referred to as “probiogenomics” (Ventura et al., 2012).
Combined with in vivo and in vitro characterisation of bacterial-host interactions,
probiogenomics offers a powerful means to elucidate the molecular mechanisms behind
beneficial probiotic effects.
Bifidobacterium animalis subsp. lactis is a Gram-positive lactic acid bacterium commonly
found in the GIT of healthy humans (Turroni et al., 2009). From a probiotic perspective,
the benefits associated with strains of B. animalis subsp. lactis have resulted in their
CHAPTER SIX – COMPARATIVE GENOMICS OF COMMERCIAL BIFIDOBACTERIUM STRAINS
188
inclusion in the human diet via a large array of dietary supplements and foods, including
dairy products such as yoghurts (Barrangou et al., 2009). As a result, B. animalis subsp.
lactis has become the most common bifidobacterium species utilised as a probiotic in
commercial dairy products in North America and Europe (Gueimonde et al., 2004).
Despite this extensive commercial and probiotic importance, the strain-level differentiation
of B. animalis subsp. lactis using classical genotyping techniques such as PFGE (Section
1.5.1.1) has been hindered by the high genetic similarity of these organisms. Fortunately,
the availability of genome sequences for nine B. animalis subsp. lactis isolates (Table 1.6)
allows an unprecedented ability to identify the genetic and pan-genome variation within
this species and in comparison to other members of the genus. From examination of these
genomes, the extent of genetic variability occurring among members of B. animalis subsp.
lactis has been shown to be remarkably low (Milani et al., 2013).
Studies of the ecology of Bifidobacterium bifidum show a similar niche to B. animalis
subsp. lactis, as another dominant species within the infant GIT microbiota (Turroni et al.,
2009). In contrast to B. animalis subsp. lactis, gross genomic statistics relating to draft and
complete genome sequences of B. bifidum strains show that genome size, GC (%) content
and number of ORFs are variable between strains. B. bifidum strains have also seen use in
multiple probiotic and food supplements (Shah et al., 1995, Masco et al., 2005), including
the Lab4® formulation used by Cultech Ltd. As a final component of this PhD study,
phylogenomic analysis of B. bifidum and B. animalis subsp. lactis isolates was conducted
to examine the genomic similarity and phylogenetic placement of two commercial
Bifidobacterium isolates, B. bifidum CUL 20 and B. animalis subsp. lactis CUL 34, used as
part of the Lab4® probiotic produced by Cultech Ltd.
CHAPTER SIX – COMPARATIVE GENOMICS OF COMMERCIAL BIFIDOBACTERIUM STRAINS
189
6.1.1. SPECIFIC AIMS
The aims of this chapter were as follows:
� Obtain draft genome sequences for two commercial Bifidobacterium isolates,
Bifidobacterium bifidum CUL 20 and Bifidobacterium animalis subsp. lactis
CUL 34
� Use comparative genomics to establish the evolutionary history and
phylogenetic placement of commercial isolates
� Develop molecular markers for detecting Bifidobacterium bifidum at the
species level
� Test molecular markers in culture independent approach to establish their
efficacy and investigate distribution of bifidobacteria within the GIT.
CHAPTER SIX – COMPARATIVE GENOMICS OF COMMERCIAL BIFIDOBACTERIUM STRAINS
190
6.2. METHODS
6.2.1. COMMERCIAL BIFIDOBACTERIUM GENOME RESEQUENCING
As previously (see Section 4.2.1.2), high molecular weight genomic DNA was extracted
from the growth of single-colony overnight cultures (see Section 2.2.2) with a Wizard
genomic DNA purification kit (Promega, Southampton, United Kingdom), following the
manufacturer’s instructions. Genomic DNA libraries were prepared and single-reads were
sequenced by GATC Biotech (Konstanz, Germany) using an Illumina HiSeq2000 with 50
bp sequence read length. Genome sequences were assembled using Velvet version 1.2.01
shuffle and optimisation scripts, creating contigs with optimal parameters, with k-mer
lengths between 21 and 51 bp (Table 6.1) (Zerbino, 2010, Cody et al., 2013). Assembled
data were deposited in the PubMLST database as implemented by the Bacterial Isolate
Genome Sequence Database (BIGSDB) software platform (Jolley and Maiden, 2010). To
supplement and contextualise the new sequence information generated by this study,
further completed and draft genome sequence data from strains of B. bifidum, B. animalis
subsp. lactis and other bifidobacteria were downloaded from the Integrated Microbial
Genomes (IMG) database (Markowitz et al., 2010) and also deposited into the PubMLST
database (Table 6.2).
6.2.2. GENOMIC DIVERSITY ANALYSIS OF BIFIDOBACTERIA USING RMLST
Relationships between Bifidobacterium genomes, from genus- to strain-level, were
identified using phylogenetic networks based on rMLST sequences. The 53 ribosomal
subunit loci identified in the automated annotation process (described in Section 4.2.2)
were compared among all isolates using the BIGSDB Genome Comparator module. The
distance matrix generated on the basis of shared alleles was visualized with the Neighbor-
Net algorithm (Bryant and Moulton, 2004), implemented in SplitsTree version 4.8 (Huson
and Bryant, 2006) within the BIGSDB Web-interface (Jolley and Maiden, 2010).

CHAPTER SIX – COMPARATIVE GENOMICS OF COMMERCIAL BIFIDOBACTERIUM STRAINS
191
6.2.3. GENOMIC DIVERSITY ANALYSIS OF B. BIFIDUM AND B. ANIMALIS SUBSP. LACTIS
STRAINS USING “GENOME-WIDE” MLST
Genome sequences of B. bifidum and B. animalis subsp. lactis isolates were analysed at the
strain level using BIGSDB Genome Comparator. The genome sequences of B. animalis
subsp. lactis strains were compared at all loci defined in the genome sequence of the type
strain DSM 10140 (GenBank accession: CP001606). For the B. bifidum genomes loci
comparison was made against those defined in B. bifidum BGN4 (GenBank accession:
CP001361) because it was the genome sequence with the largest number of defined loci
currently available. Presence/absence of each locus in all genomes was established and
sequence variation indexed at each locus, using the approach described in Chapter 4.
6.2.4. DEVELOPMENT OF SPECIFIC MARKERS FOR B. BIFIDUM
Regions of the B. bifidum genome that were unique to this species were found using
INSIGNIA (Phillippy et al., 2009). Their distribution in all B. bifidum genomes including
B. bifidum CUL 20 was confirmed using the BlastN function implemented by the BIGSDB
(Jolley and Maiden, 2010). PCR primers targeting a selected unique region (ORF
BBB_0726; see results) were designed using Primer3 (Table 6.3) (Rozen and Skaletsky,
2000). A second set of nested PCR primers was designed in the same way to improve on
the sensitivity of the PCR (see Section 2.2.6). The specific marker PCR was tested on total
faecal DNA extracted from the faeces of 10 healthy human adult males taking part in a
Lab4® probiotic feeding trial (see Section 2.3.3.2). DNA samples tested corresponded to
pre-feeding time points when the individuals were not taking probiotic containing B.
bifidum CUL20 and 3 additional probiotic bacteria (see Chapter 1).
A nested PCR test for the presence of the region specific to B. bifidum was carried out as
follows. A 25 µl PCR mixture was set up as follows: 1x PCR buffer, 1x Q-solution, 100
µM final concentration of dNTPs, 0.4 µM final concentration of each primer, 2 µl of
template DNA (extracted from total faecal DNA (Sections 2.2.10 and 2.2.11) or from the
first round of PCR), and 1 U of Taq DNA polymerase. The nested PCR was carried out in
two stages using a BioRad C1000 thermal cycler (BioRad, Hemel Hempstead, United
Kingdom) the first using the program; 94°C for 180 sec, then 30 cycles of 30 sec at 94ºC, 2

CHAPTER SIX – COMPARATIVE GENOMICS OF COMMERCIAL BIFIDOBACTERIUM STRAINS
192
min at 59ºC, 60 sec at 72ºC, then a final step at 72ºC for 10 min. The product from this
PCR was then used as the template DNA for the second round of PCR using the same
program. The resulting PCR products were visualised by agarose gel electrophoresis on a
1.5% (w/v) gel.
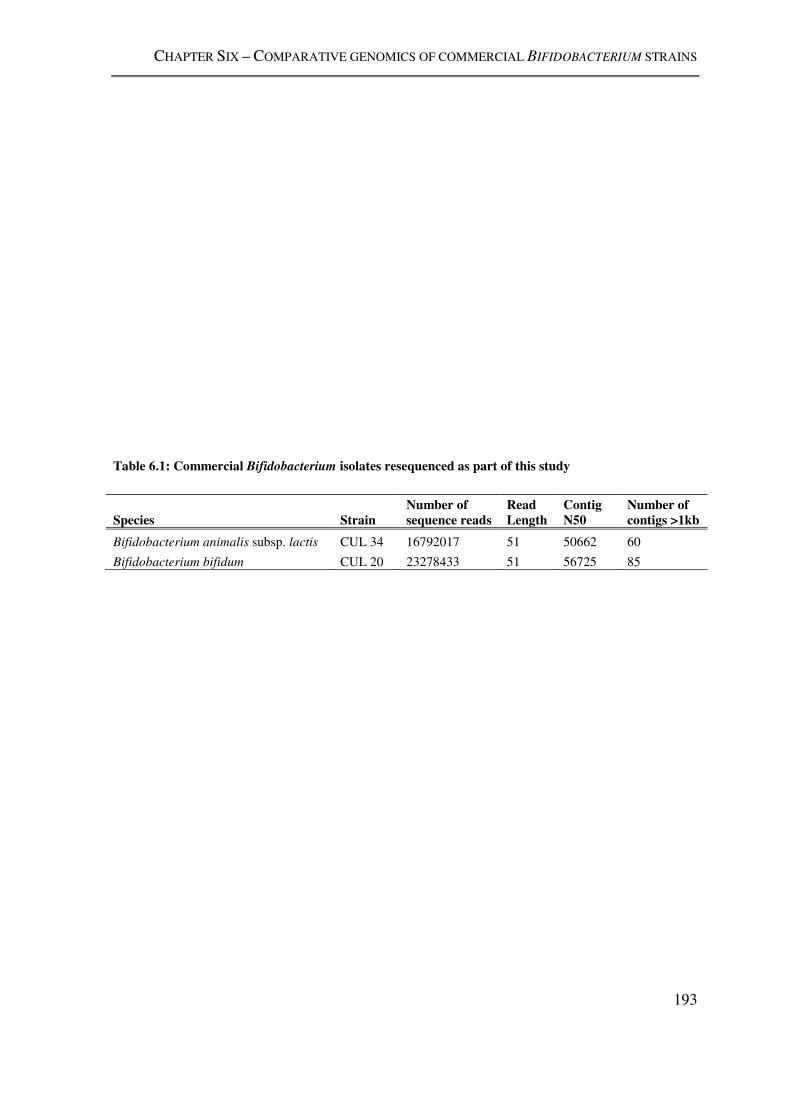
CHAPTER SIX – COMPARATIVE GENOMICS OF COMMERCIAL BIFIDOBACTERIUM STRAINS
193
Table 6.1: Commercial Bifidobacterium isolates resequenced as part of this study
Species Strain Number of sequence reads
Read Length
Contig N50
Number of contigs >1kb
Bifidobacterium animalis subsp. lactis CUL 34 16792017 51 50662 60
Bifidobacterium bifidum CUL 20 23278433 51 56725 85
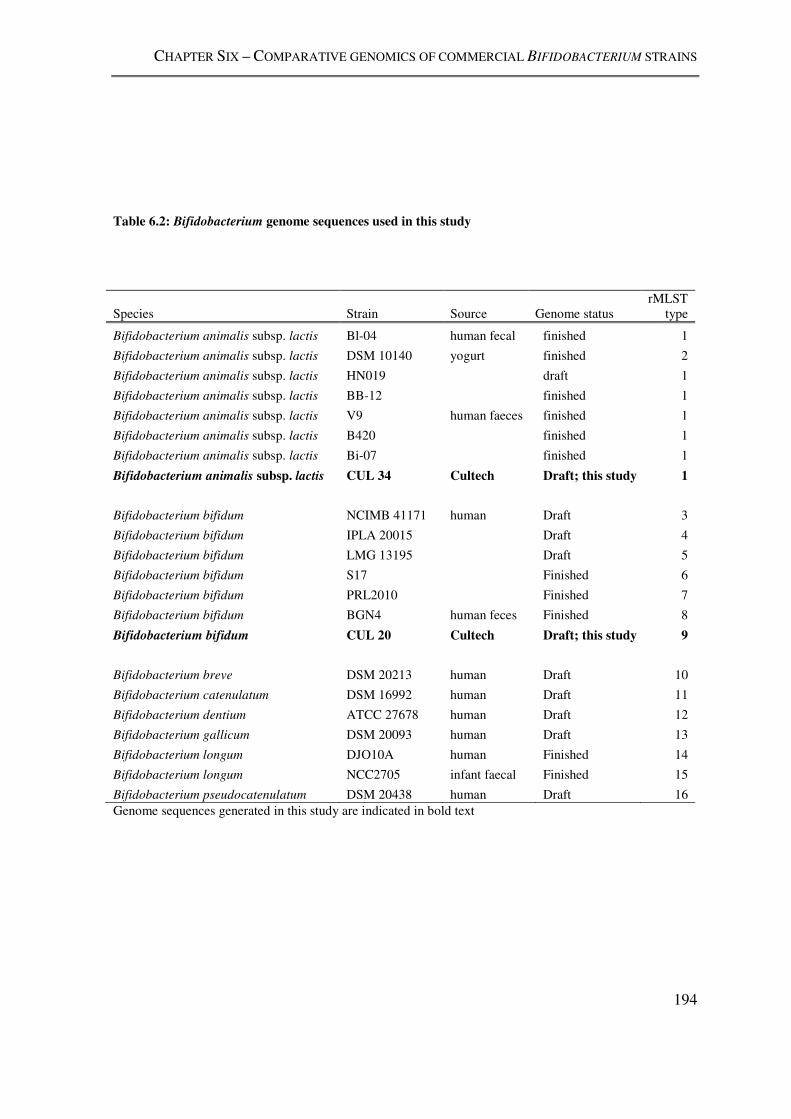
CHAPTER SIX – COMPARATIVE GENOMICS OF COMMERCIAL BIFIDOBACTERIUM STRAINS
194
Table 6.2: Bifidobacterium genome sequences used in this study
Species Strain Source Genome status rMLST
type
Bifidobacterium animalis subsp. lactis Bl-04 human fecal finished 1
Bifidobacterium animalis subsp. lactis DSM 10140 yogurt finished 2
Bifidobacterium animalis subsp. lactis HN019 draft 1
Bifidobacterium animalis subsp. lactis BB-12 finished 1
Bifidobacterium animalis subsp. lactis V9 human faeces finished 1
Bifidobacterium animalis subsp. lactis B420 finished 1
Bifidobacterium animalis subsp. lactis Bi-07 finished 1
Bifidobacterium animalis subsp. lactis CUL 34 Cultech Draft; this study 1
Bifidobacterium bifidum NCIMB 41171 human Draft 3
Bifidobacterium bifidum IPLA 20015 Draft 4
Bifidobacterium bifidum LMG 13195 Draft 5
Bifidobacterium bifidum S17 Finished 6
Bifidobacterium bifidum PRL2010 Finished 7
Bifidobacterium bifidum BGN4 human feces Finished 8
Bifidobacterium bifidum CUL 20 Cultech Draft; this study 9
Bifidobacterium breve DSM 20213 human Draft 10
Bifidobacterium catenulatum DSM 16992 human Draft 11
Bifidobacterium dentium ATCC 27678 human Draft 12
Bifidobacterium gallicum DSM 20093 human Draft 13
Bifidobacterium longum DJO10A human Finished 14
Bifidobacterium longum NCC2705 infant faecal Finished 15
Bifidobacterium pseudocatenulatum DSM 20438 human Draft 16
Genome sequences generated in this study are indicated in bold text
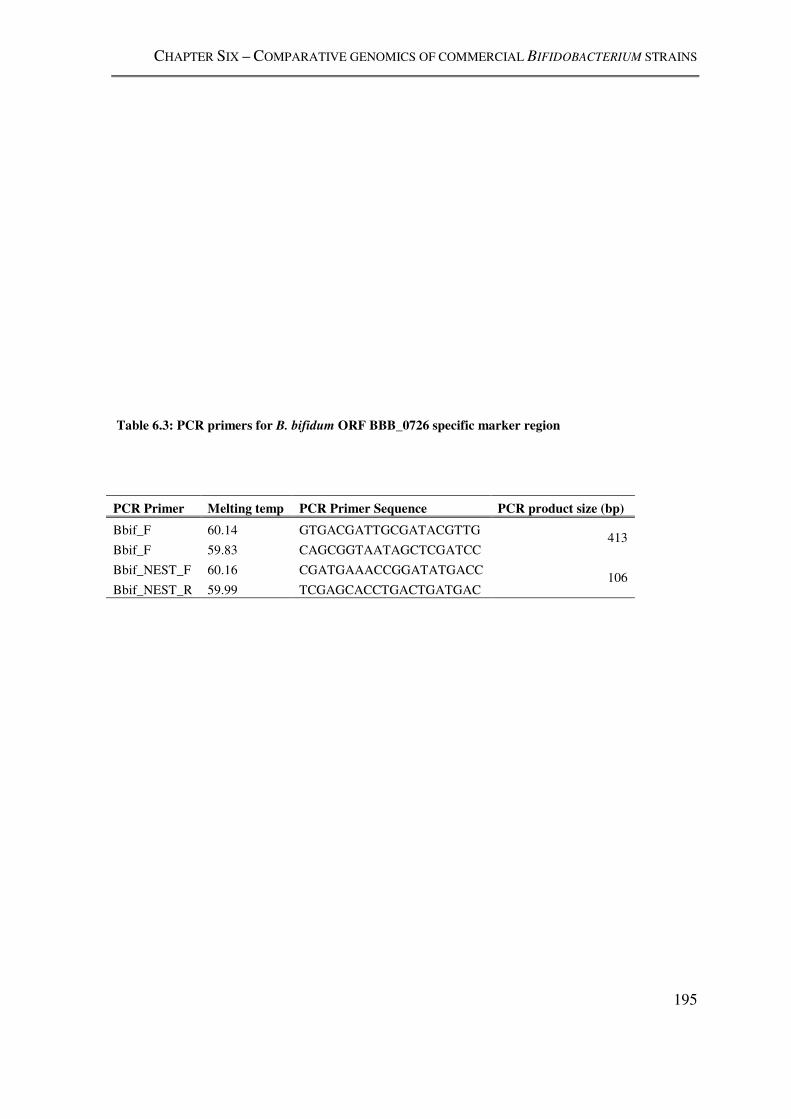
CHAPTER SIX – COMPARATIVE GENOMICS OF COMMERCIAL BIFIDOBACTERIUM STRAINS
195
Table 6.3: PCR primers for B. bifidum ORF BBB_0726 specific marker region
PCR Primer Melting temp PCR Primer Sequence PCR product size (bp)
Bbif_F 60.14 GTGACGATTGCGATACGTTG 413
Bbif_F 59.83 CAGCGGTAATAGCTCGATCC
Bbif_NEST_F 60.16 CGATGAAACCGGATATGACC 106
Bbif_NEST_R 59.99 TCGAGCACCTGACTGATGAC

CHAPTER SIX – COMPARATIVE GENOMICS OF COMMERCIAL BIFIDOBACTERIUM STRAINS
196
6.3. RESULTS
This results section is divided into three sections as follows. The first applied comparative
genomic methods, to examine genus and strain level diversity of Bifidobacterium using
rMLST. The second applied intraspecies, genome-wide comparisons of B. bifidum and B.
animalis subsp. lactis genomes, respectively, to examine the diversity of each species at all
protein coding loci as defined by a reference genome sequence. The third evaluated a PCR
test for the presence of B. bifidum using a specific marker sequence identified via a
comparative genomics approach (Phillippy et al., 2007, Phillippy et al., 2009).
6.3.1. APPLICATION OF RMLST TO BIFIDOBACTERIUM GENOMES
rMLST was applied to the genome sequences of eight bifidobacterial species, including
two isolates resequenced as part of this study; B. animalis subsp. lactis CUL34 and B.
bifidum CUL 20. A Neighbour-net generated from the concatenated sequences of 52 rps
protein coding loci placed B. bifidum CUL 20 within a diverse group of other B. bifidum
isolates (Figure 6.1). In contrast, the B. animalis subsp. lactis CUL 34 strains was located
within a group of highly related B. animalis subsp. lactis genomes, which were not clearly
resolved by Neighbour-net analysis (Figure 6.1). Correlating to this observation, each B.
bifidum genome tested had a unique rMLST profile (rMLST type 3 – 9; Table 6.2), while
all rMLST profiles generated for B. animalis subsp. lactis isolates were identical (sequence
type 1; Table 6.2), with the exception of B. animalis subsp. lactis DSM 10140, which
differed by a single nucleotide at a single locus resulting in a different overall rMLST type
(rMLST type 2; Table 6.2).
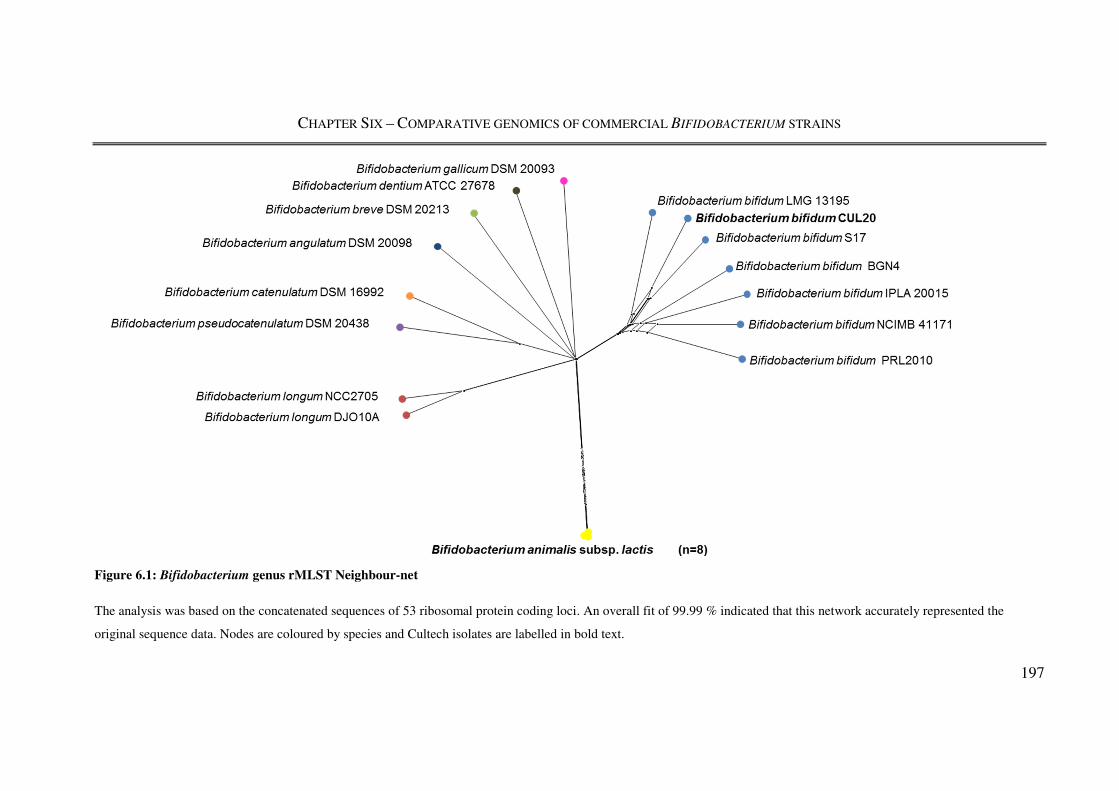
CHAPTER SIX – COMPARATIVE GENOMICS OF COMMERCIAL BIFIDOBACTERIUM STRAINS
197
Figure 6.1: Bifidobacterium genus rMLST Neighbour-net
The analysis was based on the concatenated sequences of 53 ribosomal protein coding loci. An overall fit of 99.99 % indicated that this network accurately represented the
original sequence data. Nodes are coloured by species and Cultech isolates are labelled in bold text.

CHAPTER SIX – COMPARATIVE GENOMICS OF COMMERCIAL BIFIDOBACTERIUM STRAINS
198
6.3.2. GENOME-WIDE MLST
As rMLST was unable to differentiate B. animalis subsp. lactis isolates, genome-wide
MLST (Section 4.2.3.1) was used to compare genome sequences of eight isolates. When
searched for protein coding loci defined in genome sequence of the B. animalis subsp.
lactis type strain, DSM 10140, of 1560 defined loci 1554 (99.6%) were found in all B.
animalis subsp. lactis genomes tested (Figure 6.2). Of the remaining six protein coding
loci, five were absent only from B. animalis subsp. lactis HN019 and a single protein
coding locus absent from B. animalis subsp. lactis CUL 34 (Table 6.4). When examined at
the sequence level in all B. animalis subsp. lactis isolates, just 58 loci were found to have
coding sequences with internal nucleotide diversity. 1470 (94%) loci had identical
sequences in all isolates, while 26 loci were found to have identical sequences in all
isolates apart from B. animalis subsp. lactis DSM 10140.
In contrast, B. bifidum was considerably more diverse when all protein coding loci
corresponding to those defined in the genome sequence of B. bifidum BGN4 were
examined. The mean B. bifidum genome size was larger (2.2 Mb ± SEM = 0.014) than that
of B. animalis subsp. lactis genome (1.94 ± SEM = 0.002), and had 17% more protein
coding loci defined within its genome sequence. Of the 1835 protein coding loci defined in
the B. bifidum BGN4 genome sequence, 1565 (85%) were present in all other B. bifidum
genome sequences analysed (Figure 6.2). 18 (<1%) protein coding loci defined in the
genome sequence of B. bifidum BGN4 were identical in all other B. bifidum strains at the
sequence level (Table 6.5). When the sequences of the shared loci of B. bifidum were
analysed, there was no evidence of groups of genome sequences, each sequence was
equally as distant from those within the other genome sequences.

CHAPTER SIX – COMPARATIVE GENOMICS OF COMMERCIAL BIFIDOBACTERIUM STRAINS
199
Table 6.4: Loci absent from B. animalis subsp. lactis HN019 and CUL 34
X indicates missing locus
T indicates truncated locus
Locus Product Sequence length
Genome position HN019 CUL 34
Balat 0510 50S ribosomal protein L31 210 604073 X T
Balat 0523 50S ribosomal protein L31 213 622554 X T
Balat 1572 ABC transporter solute-binding protein 1335 1854711 T X
Balat 1582 NAD synthetase 537 1868120 X -
Balat 1583 NAD+ synthetase 1335 1868691 X -
Balat 1584 hypothetical protein 270 1870189 X -

CHAPTER SIX – COMPARATIVE GENOMICS OF COMMERCIAL BIFIDOBACTERIUM STRAINS
200
Figure 6.2: Percentage of protein coding loci found in B. animalis subsp. lactis strains and B. bifidum
strains
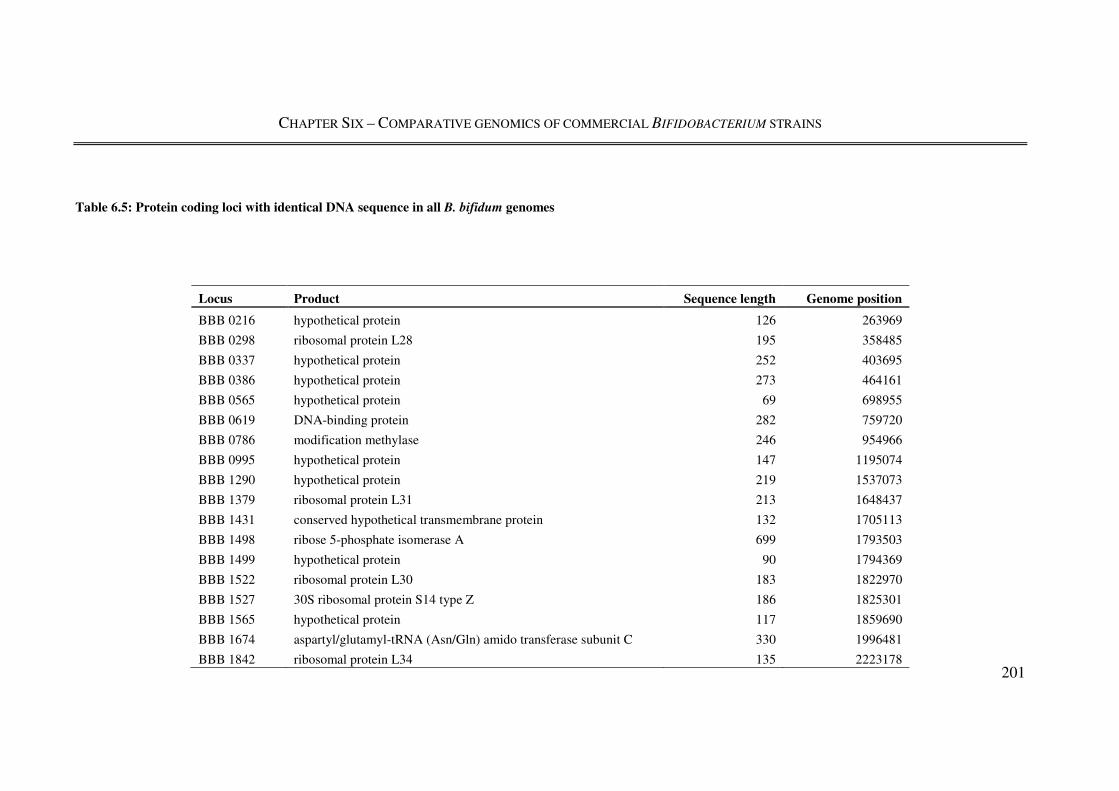
CHAPTER SIX – COMPARATIVE GENOMICS OF COMMERCIAL BIFIDOBACTERIUM STRAINS
201
Table 6.5: Protein coding loci with identical DNA sequence in all B. bifidum genomes
Locus Product Sequence length Genome position
BBB 0216 hypothetical protein 126 263969
BBB 0298 ribosomal protein L28 195 358485
BBB 0337 hypothetical protein 252 403695
BBB 0386 hypothetical protein 273 464161
BBB 0565 hypothetical protein 69 698955
BBB 0619 DNA-binding protein 282 759720
BBB 0786 modification methylase 246 954966
BBB 0995 hypothetical protein 147 1195074
BBB 1290 hypothetical protein 219 1537073
BBB 1379 ribosomal protein L31 213 1648437
BBB 1431 conserved hypothetical transmembrane protein 132 1705113
BBB 1498 ribose 5-phosphate isomerase A 699 1793503
BBB 1499 hypothetical protein 90 1794369
BBB 1522 ribosomal protein L30 183 1822970
BBB 1527 30S ribosomal protein S14 type Z 186 1825301
BBB 1565 hypothetical protein 117 1859690
BBB 1674 aspartyl/glutamyl-tRNA (Asn/Gln) amido transferase subunit C 330 1996481
BBB 1842 ribosomal protein L34 135 2223178
CHAPTER SIX – COMPARATIVE GENOMICS OF COMMERCIAL BIFIDOBACTERIUM STRAINS
202
6.3.3. DEVELOPMENT AND TESTING OF A PCR TEST FOR THE PRESENCE OF B. BIFIDUM
Using INSIGNIA, the single copy ORF defined as BBB_0726 which encoded a
predicted phosphomannomutase within the genome sequence of B. bifidum BGN4 was
selected as a likely unique marker for B. bifidum. The ORF had the following features:
(i) 1176 bp in length; (ii) encoded a protein of 275 amino acids, with a predicted
molecular mass of 29,937 Da; and (iv) encoded a phosphomannomutase Pfam domain
predicted to be involved in the synthesis of GDP-mannose and dolichol-phosphate-
mannose.
To establish the wider prevalence and conservation of ORF BBB_0726, its nucleotide
sequence was used to probe all Bifidobacterium genome sequences available at the
BIGSDB using BlastN (Table 6.6). Only B. bifidum genomes showed the presence of the
complete sequence, producing, 1176 bp alignment lengths that were representative of
conservation of across the entire gene sequence. The alignments were used to design
specific PCR markers for B. bifidum specifically avoiding any mismatches; similarly,
nested PCR primers were designed to internal conserved regions of BBB_0726 to allow
potential detection of low levels of B. bifidum DNA.
The B. bifidum specific markers were tested on total faecal DNA prepared from XX
healthy male adults enrolled on a probiotic (Lab4®) feeding trial in a semi-quantitative
manner, as no detection limits were defined for this test. After a first round of PCR, two
participants tested positive for B. bifidum (Figure 6.3, panel a, lanes 1 and 6). After the
second, nested round of PCR, all participants tested positive for the B. bifidum specific
marker (Figure 6.3, panel b). PCR products were subsequently sequenced and
confirmed to be identical in sequence to BBB_0726.

CHAPTER SIX – COMPARATIVE GENOMICS OF COMMERCIAL BIFIDOBACTERIUM STRAINS
203
Table 6.6: Specific marker region in Bifidobacterium genomes
Species Strain % identity
Alignment length (bp) Mismatches Gaps
B. bifidum NCIMB 41171 99.23 1076 9 0
B. bifidum IPLA 20015 99.23 1076 9 0
B. bifidum LMG 13195 99.40 1076 7 0
B. bifidum S17 99.83 1076 2 0
B. bifidum PRL2010 99.74 1076 3 0
B. bifidum BGN4 98.89 1076 13 0
B. bifidum CUL 20 100.00 1076 0 0
B. longum DJO10A 75.79 318 65 11
B. longum NCC2705 75.79 318 65 11
B. longum ATCC 55813 75.79 318 65 11
B. longum CCUG 52486 75.79 318 65 11
B. longum ATCC 15697 75.47 318 66 11
B. breve DSM 20213 75.82 273 60 5
B. dentium Bd1 77.16 232 51 2
B. dentium ATCC 27678 77.16 232 51 2
B. catenulatum DSM 16992 76.45 242 50 7
B. animalis subsp. lactis HN019 76.02 246 52 7
B. animalis subsp. lactis CUL 34 76.02 246 52 7
B. animalis subsp. lactis Bl-04 76.02 246 52 7
B. animalis subsp. lactis DSM 10140 76.02 246 52 7
B. animalis subsp. lactis AD011 76.02 246 52 7
B. animalis subsp. lactis BB-12 76.02 246 52 7
B. animalis subsp. lactis V9 76.02 246 52 7
B. animalis subsp. lactis B420 76.02 246 52 7
B. animalis subsp. lactis Bi-07 76.02 246 52 7
B. angulatum DSM 20098 74.00 200 52 0
B. adolescentis ATCC 15703 73.31 236 51 8
B. pseudocatenulatum DSM 20438 73.37 199 53 0
B. gallicum DSM 20093 92.16 51 4 0
B. adolescentis L2-32 72.77 235 54 9
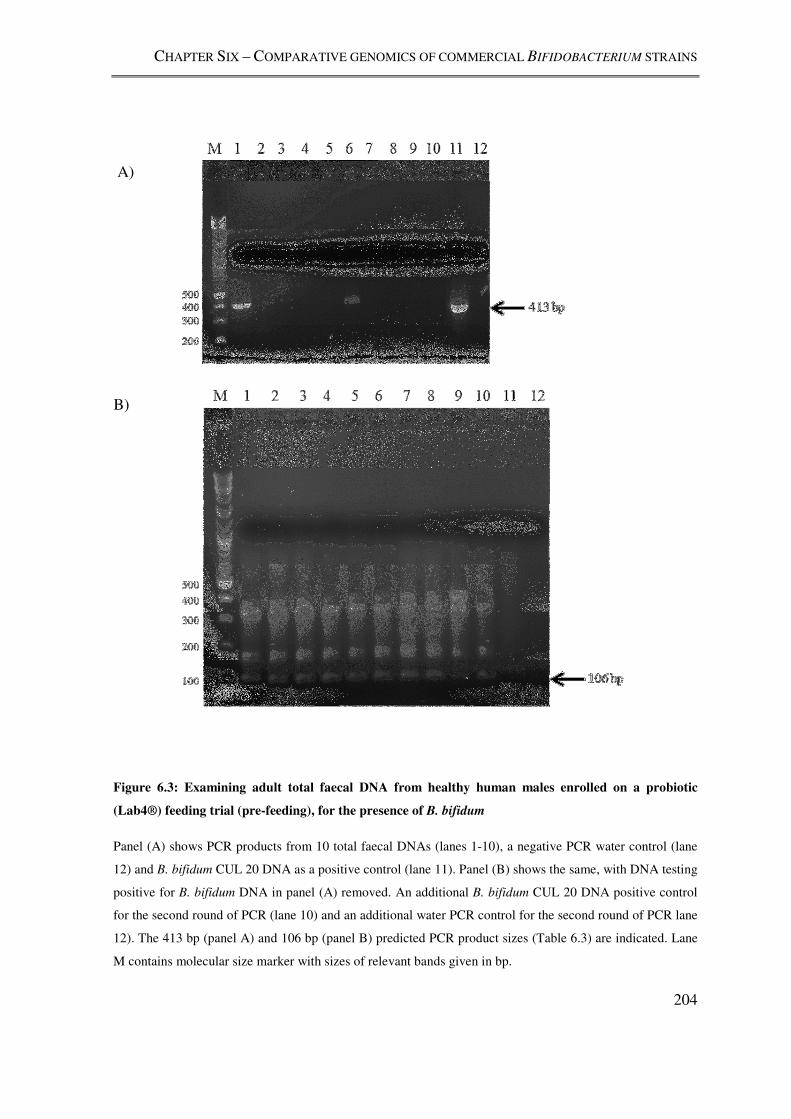
CHAPTER SIX – COMPARATIVE GENOMICS OF COMMERCIAL BIFIDOBACTERIUM STRAINS
204
Figure 6.3: Examining adult total faecal DNA from healthy human males enrolled on a probiotic
(Lab4®) feeding trial (pre-feeding), for the presence of B. bifidum
Panel (A) shows PCR products from 10 total faecal DNAs (lanes 1-10), a negative PCR water control (lane
12) and B. bifidum CUL 20 DNA as a positive control (lane 11). Panel (B) shows the same, with DNA testing
positive for B. bifidum DNA in panel (A) removed. An additional B. bifidum CUL 20 DNA positive control
for the second round of PCR (lane 10) and an additional water PCR control for the second round of PCR lane
12). The 413 bp (panel A) and 106 bp (panel B) predicted PCR product sizes (Table 6.3) are indicated. Lane
M contains molecular size marker with sizes of relevant bands given in bp.
A)
B)
CHAPTER SIX – COMPARATIVE GENOMICS OF COMMERCIAL BIFIDOBACTERIUM STRAINS
205
6.4. DISCUSSION
Overall, the genus Bifidobacterium encompasses a large amount of genomic diversity and
a wide pan-genome, with few functions shared across all species. In fact, the gene pool
pertaining to the whole genus is more than twice the size of a single bifidobacterial
genome, and the pan-genome of the genus is described as open (Bottacini et al., 2010).
Within bifidobacterial species however, the story is very different. Genomic diversity
exists, but individual species are more likely to form discreet pan-genomic units within
themselves (Bottacini et al., 2010). Here we indexed the genomic diversity in two different
bifidobacterial species, B. animalis subsp. lactis and B. bifidum, and found the possessed
differing levels of intraspecies genomic identity. This was most clearly reflected when the
number of genomic loci that share identical sequences across all isolates of a species was
examined; 96% of loci examined were identical in sequence among the in B. animalis
subsp. lactis genomes, contrasting with less than 1% of loci sharing the same sequence in
the B. bifidum genomes examined.
6.4.1. APPLICATION OF RMLST TO BIFIDOBACTERIAL STRAINS
The diversity of B. animalis subsp. lactis and B. bifidum genomes was well reflected by the
rMLST analysis (Figure 6.1). The Neighbour-net showed the high level of rps gene
sequence conservation in all B. animalis subsp. lactis genomes, which was also echoed
when observed at the genome-wide level. In contrast B. bifidum, exhibited much greater
diversity in rps gene sequence, mirrored by its more diverse genome-wide MLST profile,
with conserved sequences detected across all genomes for just 18 loci. rMLST is a useful
tool therefore, for reflecting genomic diversity of bifidobacteria using a limited set of
phylogenetic markers that describes genome evolution across a diverse range of
Bifidobacterium isolates, without the need to investigate phylogeny based on an entire
core-genome as in Bottacini et al (2010).
CHAPTER SIX – COMPARATIVE GENOMICS OF COMMERCIAL BIFIDOBACTERIUM STRAINS
206
6.4.2. GENOMIC DIVERSITY OF B. ANIMALIS SUBSP. LACTIS STRAINS
It is clear that B. animalis subsp. lactis isolates have highly conserved genome sequences,
with all isolates for which genomes are available being highly congruent in sequence.
Previous research has shown that for 10 B. animalis subsp. lactis isolates that were
examined, shared more than 99.82% sequence identity across their entire genome
sequences and possessed 1,518 identical ORFs (Milani et al., 2013). Milani et al (2013)
used a manual annotation approach to assign protein coding regions to each genome
individually, and subsequently compared predicted proteomes of strains to find that only 3
ORFs were variable in presence among the isolates examined although their existence was
not experimentally validated. This highlights the variability inherent in annotating genome
sequences, particularly when multiple annotation platforms are used.
The genome-wide MLST approach does not suffer this pitfall, as it only requires a single
reference annotation set to which other genome sequences are compared, either as contigs
or as a complete genome sequence. Here we found no evidence of the 3 variable ORFS
encoded in any B. animalis subsp. lactis genomes in comparison to the Milani et al. (2013)
study. When examined for the presence of all protein coding loci defined in the type strain
B. animalis subsp. lactis DSM10140, just six loci were found to be variably present, and
with the entire set missing from B. animalis subsp. lactis HN019 and a single ORF, Balat
1572 missing from CUL34, the only draft genome sequences included in this analysis
(Table 6.4). The truncation of two loci; Balat_0510 and Balat_0523, in B. animalis subsp.
lactis suggests that they are present, but at the border of a contig. Both ORFs are identical
in sequence in B. animalis subsp. lactis suggesting that the truncation occurred as a result
of an assembly fault. The draft genome of B. animalis subsp. lactis HN019 is smaller
(1916 kb) than the complete genomes of all other B. animalis subsp. lactis isolates (1938
kb), so it was inevitable that sequence data would be seen as absent in the comparative
analysis. To confirm the true absence of these ORFs, experimental validation via
amplification and sequencing of this genomic region would be required.
CHAPTER SIX – COMPARATIVE GENOMICS OF COMMERCIAL BIFIDOBACTERIUM STRAINS
207
The addition of the draft genome sequence data generated from B. animalis subsp. lactis
CUL34 did not alter hypothesis that B. animalis subsp. lactis is a highly clonal taxon with
its genomic content encoding markedly similar exoproteomes. The reason for the highly
isogenic nature of this species may be a recent divergence from B. animalis subsp.
animalis by reductive adaptation to growth in yoghurt (Lee and O'Sullivan, 2010). B.
animalis subsp. lactis genomes are unique within bifidobacteria because they have no
genes, or an incomplete number, predicted to be involved in the utilisation of complex
carbohydrate and polyols such as arabinofuran, arabinogalactan, arabinan, cyclodextrin,
xylan and sugar alcohols (Lee and O'Sullivan, 2010). The ability to utilise complex
carbohydrates is a common feature of GIT adapted bacteria, and the prolonged exposure of
bifidobacteria to environmental niches with less complex nutrient availability has been
shown to cause deletion of superfluous genomic loci (Lee et al., 2008). The genome
reduction evolutionary step from B. animalis subsp. animalis to B. animalis subsp. lactis
may also have implications for its probiotic ability, as bifidobacteria with reduced genomes
have been shown to be less competitive than their progenitor strains with larger genomes
(Lee et al., 2008).
6.4.3. GENOMIC DIVERSITY OF B. BIFIDUM STRAINS
In direct contrast to B. animalis subsp. lactis, B. bifidum genomes are considerably more
diverse in both presence and absence of protein coding loci, as well as the nucleotide
sequences of loci that are present. B. bifidum genomes shared fewer loci between one
another than B. animalis subsp. lactis genomes, as evidenced by a lower percentage of loci
present in 100% of genomes, and increased numbers of loci present in just one or more
genomes (Figure 6.2). The loci that are conserved in sequence in all B. bifidum strains
commonly encode proteins that are related to the ribosome (Table 6.5), whose sequence is
would be expected to be highly conserved within species (Yutin et al., 2012). Another
frequently encountered feature of B. bifidum genomics reflected in this analysis (Table 6.4)
was the large numbers of ORFs of unknown function. It has been hypothesised that the
proteins encoded by these hypothetical loci may play important roles in the interaction of
bifidobacteria with the human host (Gueimonde et al., 2012). Further research will be
needed to define these exact functions however. Previous comparative genomic analysis of
eight B. bifidum strains indicated that there were large regions of the genome that vary both
CHAPTER SIX – COMPARATIVE GENOMICS OF COMMERCIAL BIFIDOBACTERIUM STRAINS
208
in presence and sequence among the strains analysed (Turroni et al., 2010), corroborating
the findings of our own study.
6.4.4. DEVELOPMENT AND TESTING OF A B. BIFIDUM SPECIFIC MARKER
A simple species-specific PCR test for B. bifidum based on conservation of the species-
unique BBB_0726 ORF was developed (Table 6.3). In this study, access to a limited
number bifidobacterial isolates or defined strains meant that the specificity of the region
was tested in silico using tools at the BIGSDB (Section 6.4.4), and when the NCBI non-
redundant database is search using BlastN, only sequences matching B. bifidum genomes
are returned. BBB_0726 is predicted to encode a phosphomannomutase, an isomerase that
catalyses the structural rearrangement between alpha-D-mannose 1-phosphate and D-
mannose 6-phosphate. It is a carbohydrate-modifying enzyme that is part of the
glycosylation pathway, which is well developed in Bifidobacterium species (Barrangou et
al., 2009, Kim et al., 2009, Schell et al., 2002). The sequence of BBB_0726 was greater
than 98% conserved in B. bifidum and was much more divergent in sequence in other
bifidobacteria (Table 6.6), making it an excellent candidate for further development and
evaluation as a species-specific marker gene.
The B. bifidum BBB_0276 marker showed in a semi-quantitative manner that 20% of
healthy individuals tested were carrying B. bifidum at the higher detection limit, and the
remaining 80% carried B. bifidum at levels higher than the lower detection limit, which in
a similar test in L. acidophilus correlate to approximately 50 cfu and 5,000 cfu
respectively. Bifidobacteria are found in relatively high numbers (up to 37% of total 16S
rRNA gene sequences) in the human gut (Hill et al., 2010a), particularly in infants (up to
80% of total 16S rRNA gene sequences) (Turroni et al., 2009). Culture-independent
studies using the 16S rRNA gene as a broad phylogenetic marker do not accurately
distinguish these bacteria to the species level, and as such there is little reliable quantitative
information available on the exact distribution of B. bifidum in the human gut.

CHAPTER SIX – COMPARATIVE GENOMICS OF COMMERCIAL BIFIDOBACTERIUM STRAINS
209
This limited understanding of bacterial species distribution is especially evidenced in
culture-independent studies markers other than the 16S rRNA gene, for example the groEL
gene, is used to establish diversity profiles of the faecal microbiota (Hill et al., 2010a). Hill
et al (2010a) hypothesise that the use of 16S rRNA to speciate bacteria in metagenomic
studies underrepresents bifidobacterial species by up to 35%. Specific markers for B.
bifidum based on the 16S rRNA gene have been previously described (Matsuki et al., 1998,
Matsuki et al., 2003). A PCR test based on the 16S rRNA gene is useful for identification
of pure cultures and presence/absence of the target organism in a qualitative approach. The
multi-copy nature of the 16S rRNA operon in B. bifidum (approximately two copies per
chromosome (Candela et al., 2004)) however, means that its utility for enumeration of cells
is surpassed by a probe targeting a single-copy gene, such as BBB_0726. Further study to
evaluate the detection limit of this test and additional development of a fully quantitative
qRT-PCR test for B. bifidum based on BBB_0726 could be an excellent way to accurately
quantify levels of B. bifidum in faecal material, especially when applied in a probiotic
feeding trial.
6.4.5. SUMMARY AND IMPLICATIONS FOR COMMERCIAL BIFIDOBACTERIUM ISOLATES
The comparative genomic approach taken in this study corroborates existing information
concerning the diversity of B. animalis subsp. lactis, namely that it is a clonal
monophyletic taxon. Credible hypotheses for the highly clonal genome of this species have
been presented and the addition of the genome sequence of B. animalis subsp. lactis CUL
34 follows the same pattern. B. bifidum is a more genomically diverse species, with the
inclusion of the genome sequence of B. bifidum CUL 20 into analyses showing previously
unseen sequences at some loci.
The highly clonal and reduced genomes of B. animalis subsp. lactis isolates means that
data collected for a particular isolate can be extrapolated across the whole species with
reasonable confidence. From a commercial perspective, this suggests that any claims made
on probiotic products containing B. animalis subsp. lactis will be challenging to justify as
specific to that particular product. The case for individual strains and distinct probiotic
effects of B. bifidum is much more clear-cut, as although 85% of loci were shared between

CHAPTER SIX – COMPARATIVE GENOMICS OF COMMERCIAL BIFIDOBACTERIUM STRAINS
210
all strains, their sequences were divergent and suggests they would encode unique
probiotic activities at the strain level.
CHAPTER SIX – COMPARATIVE GENOMICS OF COMMERCIAL BIFIDOBACTERIUM STRAINS
211
6.5. CONCLUSIONS
The conclusions from this chapter are as follows:
6. rMLST (rps) gene-based phylogenies are an effective and method for establishing
both phylogenetic relationships and indexing genomic diversity within the genus
Bifidobacterium.
7. Previous studies showing the clonality of B. animalis subsp. lactis isolates were
corroborated with the genome-wide MLST approach. B. animalis subsp. lactis
CUL 34 is a clonal member of this monophyletic taxon.
8. B. bifidum genome sequences were considerably more diverse, reflected in both
rMLST and genome-wide MLST analyses. B. bifidum CUL 20 represents a novel
strain with a genome sequence diverse from other isolates of B. bifidum.
9. The development of a B. bifidum specific PCR test, based on a single copy gene, is
useful for detecting the presence of B. bifidum in total faecal DNA. Its specificity
will require further testing, however if validated it could be further developed into a
fully quantitative species-specific probe.
CHAPTER SEVEN – GENERAL DISCUSSION, PERSPECTIVE AND CONCLUSIONS
212
7. GENERAL CONCLUSIONS, DISCUSSION AND PERSPECTIVE
7.1.1. CONCLUSIONS
A comprehensive study describing the diversity of probiotic bacteria at the strain level was
undertaken. Particularly in the case of L. acidophilus, a diversity analysis encompassing the
number of isolates investigated in this study has never been undertaken. The techniques and
methods applied reflected changing times in molecular strain-typing. Isolates of three major
probiotic species were characterised and typed using classical phenotypic techniques,
genotyped using conventional DNA fingerprinting techniques, which was then extended to
the most novel, state-of-the-art whole-genome resequencing strategies. By using this range of
methods we were able to index the variation between them at multiple levels, right down to
the resolution of single nucleotide polymorphisms. The use of newly-developed next
generation sequencing techniques also allowed the detailed examination of a hitherto
unachievable number of genome sequences.
Below are the main conclusions from this study:
1. L. acidophilus isolates show limited genetic diversity when assessed with RAPD.
When their whole genome sequences are compared however, they separate into two
broad groups representing commercial isolates and culture collection isolates,
although the differences between the groups are small and the L. acidophilus core
genome is stable across all isolates tested (Chapters 2 and 4).
RAPD profile similarity analysis is an effective and highly reproducible method of examining
their sub-species level genetic diversity. The L. acidophilus isolates we examined were from
disparate isolation locations, deposition dates and host species. A single RAPD profile type,
based on 75% profile similarity, was generated by all L. acidophilus isolates tested. This
indicated that L. acidophilus isolates were all of a single strain type at the level of resolution
CHAPTER SEVEN – GENERAL DISCUSSION, PERSPECTIVE AND CONCLUSIONS
213
offered by RAPD analysis. Absolute genetic identity of these isolates could not be
conclusively verified using RAPD profile similarity analysis alone, so further investigation at
a discriminatory power beyond that of RAPD, was undertaken examine the underlying genetic
structure of L. acidophilus and whether, as a species, it truly is clonally monophyletic.
Further to an initial survey with RAPD profile similarity analysis, a whole genome
resequencing and comparison strategy was undertaken on a large collection of L. acidophilus
isolates. This provided insight into the level of genomic variation required to translate to a
significantly different RAPD profile type. L. acidophilus isolates broadly divided into two
groups, representing isolates from culture collections and commercial isolates sold as
probiotic supplements or cultivated from products. Limited RAPD profile variation had been
observed within L. acidophilus isolates, but this did not correlate to the commercial or culture
collection heritage of the isolates tested.
Commercial use or marketing a particular strain of L. acidophilus should be dependent on a
unique phenotypic characteristic in relation to is probiotic or food-additive properties. Given
the extensive homogeneity of the genome sequences of commercial isolates of L. acidophilus,
our results potentially provides companies with the opportunity to assume that evidence of
probiotic effect demonstrated in studies undertaken on one particular isolate of L. acidophilus
would support their own strains equally as well. The demonstration of unique or enhanced
probiotic ability in a single isolate may however set it apart from the others, but the validity of
such a property may be questionable until detailed phenotypic studies encompassing the
diversity of isolates seen in this study are conducted.
With very minor phenotypic differences among the L. acidophilus isolates observed in growth
rate and protein-profile, it is hard to imagine given the level of clonal identity and limited
number of non-synonymous mutations that any phenotypes of the isolates will differ greatly.
This leads to hypothesis that more than any other factor, the commercial success of L.
acidophilus lies in its stability and possession of phenotypes that have remained unaffected by
CHAPTER SEVEN – GENERAL DISCUSSION, PERSPECTIVE AND CONCLUSIONS
214
evolution due to mutation or horizontal gene transfer events. Perhaps like many other
organisms it has been “domesticated” to be man’s best friend when it comes to the microbial
enhancement it brings to dairy products and digestive supplements used by humans over the
ages.
2. L. acidophilus is a minor constituent of the GIT microbiota that is variably present
in humans and was not detected in wild rodents (Chapter 2).
To attempt to ensure that the true genetic diversity of L. acidophilus was reflected by the
isolates examined and to reduce the bias of our collection toward commercial and culture
collection isolates, wild rodent faeces was examined as potential source of natural L.
acidophilus isolates. To effectively search for L. acidophilus in wild rodent faeces, a species-
specific molecular marker for L. acidophilus was developed and proved highly effective for
detecting this species. No L. acidophilus was cultivated from wild rodent faeces or detected
via the cultivation-independent approach, indicating that was either absent or present in
numbers too low to detect within rodent faeces. Overall, our survey of wild rodents suggests
that they do not naturally carry L. acidophilus within their GIT tract. Wider surveys of animal
species using these tools may now be carried out to identify potential sources organisms
beyond man and domesticated animals.
Also in the course of this study, the distribution of L. acidophilus human GIT carriage was
estimated on a small-scale in healthy adults, using the species specific PAU-region PCR test.
As with the wild rodent study, these probes were applied to total DNA extracted from faeces
as an indicator of GIT carriage. When estimated in this way, it was shown that L. acidophilus
carriage was highly variable, with between 32% and 75% of individuals carrying L.
acidophilus at a low level. Corresponding culture independent studies indicate that lactobacilli
may compose just 0.2-1% of the total microbiota in the human colon and faeces and also
show that their prevalence is highly variable between individuals (Kleerebezem and Vaughan,
2009, Walter, 2008). Metagenomic studies commonly use molecular markers to elucidate
bacterial community structure, particularly the sequence of the bacterial 16S rRNA gene. As
CHAPTER SEVEN – GENERAL DISCUSSION, PERSPECTIVE AND CONCLUSIONS
215
was shown in Chapter 3, the 16S rRNA gene sequences of certain Lactobacillus isolates are
more than 98% similar when assessed across their whole length (>1200 bp) and potentially
more similar if just a partial 16S rRNA gene sequence is used. To fully capture the diversity
of Lactobacillus an alternative, more diverse molecular marker should be employed in culture
independent diversity studies.
The gene that encodes the universal 60-kDa chaperonin protein Hsp60 has been used to study
the diversity of Bifidobacterium in the GIT (Hill et al., 2010b) and may be a good alternative
to the 16S rRNA gene for profiling very diverse communities of bacteria that contain clusters
of very closely related species, such as the lactobacilli (Blaiotta et al., 2008). As a corollary,
the diversity of the gut microbiome may not be particularly well estimated by studies that use
faecal samples as an endpoint for community profiling, although it is a non-invasive method.
Overall, gut carriage of L. acidophilus appears highly variable and while the species is clearly
capable surviving passage through the gastrointestinal tract of humans (Mahenthiralingam et
al., 2009), it is questionable as to whether the gut is the optimal or ancestral niche of this
species.
3. Comparative genomics and genome (re)sequencing of probiotic bacteria will become
a “gold standard” method for characterisation and typing of isolates, and it is
imperative that the metadata attached to publically available genome sequence
information should be scrutinised stringently to ensure accuracy before subsequent
analysis (Chapters 3, 4 and 6).
We showed that the genome sequence of L. acidophilus 30SC was wrongly attributed to L.
acidophilus, when it was more similar to L. amylovorus (Bull et al., 2012). The reliance of
future analyses on the data provided with genome sequence depositions means that it is
imperative that this metadata is correct. Fundamental components of this data are the correct
taxonomic placement and species name that is attached to the genome record. The
proliferation of genome resequencing means that a technology once restricted to the cutting-
CHAPTER SEVEN – GENERAL DISCUSSION, PERSPECTIVE AND CONCLUSIONS
216
edge of genomics is now available to a wider audience, including non-specialists and
commercial parties. They may be unaware of such misidentification, and assume that a
genome sequence deposited in a curated database and announced in a well-respected journal
is to be trusted without performing their own analysis. Secondarily, organisms of considerable
ecological, clinical and commercial interest, like L. acidophilus and L. amylovorus, may have
probiotic effects that are strain-specific, and therefore ensuring that genome sequences of
these bacteria are assigned the correct taxonomic nomenclature is vitally important. With a
complete genome, researchers have all the information required to obtain the correct
taxonomic nomenclature or evolutionary placement of a bacteria isolate.
To provide all interested parties, but particularly those that are not specialist genome (re)-
sequencing laboratories, with a simple and effective method for establishing the provenance
of their genome sequence, a bioinformatics workflow was developed. 16S rRNA, gyrB and
pheS genes were designated as DNA biomarker genes and when applied to the L. acidophilus
30SC genome sequence the bioinformatics workflow showed that its genome was more
similar to L. amylovorus LMG 9496. Secondarily, whole genome comparisons of available L.
acidophilus and L. amylovorus genome sequences also showed that the genome of L.
acidophilus 30SC showed greater synteny with L. amylovorus UCC1118 than L. acidophilus
NCFM. This simple bioinformatic workflow and the need for correct genome taxonomy
placement were recently validated by Mende et al. (2013), who developed a fully automated
bioinformatic pipeline for bacteria species assignment using genome sequence data. Once it is
certain that the data accompanying genome sequences are correct, the ability to integrate
genome sequence data with a comparison platform, such as the BIGSDB, means that future
phylogenetic analyses will be carried out using all of the information available within a
genome sequence, attaching to it any pertinent phenotypic or physiological information that
may be required for comparison. This type of analysis lends itself to investigating the
evolution of particular physiological characteristics of bacterial strains and species.

CHAPTER SEVEN – GENERAL DISCUSSION, PERSPECTIVE AND CONCLUSIONS
217
4. Methods for phenotypically characterising and typing LAB have generally been
superseded in accuracy by DNA sequence based methods. Commercial and culture
collection L. acidophilus isolates do not significantly differ phenotypically (Chapter
5).
Conventional biochemical methods for identifying L. acidophilus such as carbohydrate
fermentation profiling show that isolates of vary considerably in their phenotype. However,
by their very nature, phenotyping tests like the API 50 CHL are less sensitive than typing tests
based on nucleic acids, i.e. a single isolate may display a wide range of phenotypic test results
and still be classified as the same species. The number of variable traits assessed by API 50
CHL is limited and cannot compare to either variation inherent in DNA sequence or
potentially, the stability offered when the background genotype is stable and invariant as seen
with L. acidophilus. This means that without any a priori knowledge of an isolate, API tests
are demonstrably less accurate and reliable than DNA sequence based methods. They should
no longer be used as a tool for commercial L. acidophilus quality control or typing unknown
isolates, particularly when there are more accurate, faster and cheaper molecular methods to
achieve the same result.
There were no detected significant differences in growth kinetics between culture collection
and commercial L. acidophilus isolates. MMS exposed L. acidophilus isolates did not grow to
different culture densities or with different maximum growth rates in comparison to their
parental commercial L. acidophilus strain NCFM however, as a group, they did have a longer
lag phase. L. acidophilus isolates showed limited diversity in MALDI-TOF profiles which
was not related to their genotypes. Given that commercial L. acidophilus isolates were
genomically homogenous, they did display a degree of phenotypic diversity when analysed
with MALDI-TOF MS and API 50CHL carbohydrate profiling. As this diversity does not
have an obvious foundation in the genome, it may be possible that exogenous circumstances
such as culture conditions, stress, or the inherent differences in handling cells within these
procedures leads to the minor phenotypic diversity seen in L. acidophilus. Potentially, if the
proprietary status of commercial L. acidophilus isolates is lost because they are not
demonstrably genomically different from company to company, the ability to manipulate and

CHAPTER SEVEN – GENERAL DISCUSSION, PERSPECTIVE AND CONCLUSIONS
218
obtain a stable and defining phenotype of probiotic L. acidophilus isolates could form new
criteria from which to derive patents.

CHAPTER SEVEN – GENERAL DISCUSSION, PERSPECTIVE AND CONCLUSIONS
219
7.1.2. DELIVERABLE TOOLS AND STRATEGIES FOR TRANSLATION TO INDUSTRY (CULTECH)
7.1.2.1. Specific markers for L. acidophilus and B. bifidum
Species specific markers based on the PAU3 region in L. acidophilus, and a unique
phosphomannomutase gene in B. bifidum, were developed as part of this study (Chapter 2 and
Chapter 6). These molecular tools may be used to track these species as part of a culture-
based feeding study, expanding on previous work which used RAPD profiles to type isolates
(Mahenthiralingam et al., 2009), increasing throughput and ensuring a positive/negative test
rather than one that relies on matching DNA fingerprints. When used in a culture independent
context, the specific marker tests were designed as a two stage, nested PCR and hence
provided a level of semi-quantitative information about the numbers of their respective target
organisms. The single copy nature of the gene targets for these probes make them excellent
candidates for development into a fully quantitative qRT-PCR test. This would allow future
probiotic feeding studies to accurately enumerate numbers of L. acidophilus and B. bifidum,
both before and after feeding, to examine the dynamics of the impact made on the gut
microbiota in terms of probiotic numbers.
7.1.2.2. Development of a simple method for describing genome sequences before
deposition
As previously discussed, the ever decreasing costs of high-throughput next-generation
sequencing technologies means that genome (re)sequencing is becoming available to
commercial enterprises and non-experts, instead of being restricted to a few, expert groups.
Many commercial laboratories still use phenotypic techniques such as carbohydrate
fermentation profiling to identify unknown isolates, and this data should not be relied upon
alone to inform the metadata attached to a genome sequence. The developed bioinformatic
workflow (Chapter 3) allows non-expert groups to confidently identify a genome sequence,
and make a good estimate of its taxonomic placement. The genome sequence also provides an
all-encompassing measure of quality control and stability of commercial strains and in future
should be used as the gold standard measure for probiotic regulation and patent/commercial
claims.
CHAPTER SEVEN – GENERAL DISCUSSION, PERSPECTIVE AND CONCLUSIONS
220
7.1.2.3. Draft genome sequences for all isolates within the Lab4® probiotic
supplement
In 2008 (Vankerckhoven et al.) it was identified that conventional biochemical methods for
characterising probiotic bacteria were insufficient and should be supplemented with molecular
methods performed by an expert laboratory, such as those that maintain culture collections.
With probiotic sales in the ascendancy, an important part of the marketing of probiotic
products is the ability to label these foods with a health claim. Any petition to a regulatory
agency for a health claim will have to name or describe the active ingredients in the product to
be approved and provide evidence of efficacy (Farnworth, 2008). Polyphasic characterization
combining phenotypic, biochemical, genotypic, and whole genome-sequencing results is
considered to be the only way to reliably identify bacteria to the strain level (Mainville et al.,
2006), which is important as even closely related bacterial species can have different probiotic
properties. To obtain a health claim for a probiotic product, food manufacturers will have to
precisely define their microorganism (Farnworth, 2008, Vankerckhoven et al., 2008). The
availability of a set of almost-complete, draft genome sequences for the four probiotic strains
marketed by Cultech, given in the context of other commercially available strains, provides
invaluable information concerning their identity at a more complete level than can be
achieved with all other existing methods such as RAPD, PFGE, carbohydrate utilisation
profiling and MALDI-TOF MS.

CHAPTER SEVEN – GENERAL DISCUSSION, PERSPECTIVE AND CONCLUSIONS
221
7.1.3. GENERAL DISCUSSION
The implications and questions-raised during this study in the wider context of commercial
probiotic usage and their history are discussed below. Focussed discussion of the results
generated in each chapter is available at the end of each chapter and summarised here (see
Section 7.1.1).
7.1.3.1. Why is L. acidophilus used as a probiotic?
The historical background for the use of L. acidophilus as a probiotic is well documented, but
what was known as L. acidophilus in 1920 is vastly different to what is known as L.
acidophilus sensu stricto in the present day (Figure 1.1). The elucidation of the probiotic
functionality and physiology of L. acidophilus was undertaken after its status as a probiotic
organism had been decided and “grandfathered-in” from the broader, historical definition of
L. acidophilus. With the knowledge of the minor role of lactobacilli (L. acidophilus in
particular) in the human GIT, at least in terms of it proportional representation, the question of
why L. acidophilus is used as a probiotic is raised.
Historically, soured milk drinks were originally developed as preservation methods for milk
products, and there are references to sour milk or fermented cultures as far back as the Bible
(Anukam and Reid, 2007). Probiotic theory is attributed to Elie Metchnikoff who noted that
the regular consumption of lactic acid bacteria in fermented dairy products, such as yoghurt,
was associated with enhanced health and longevity in Bulgarian peasant populations. He
linked this to the ‘Bulgarian bacillus’, a constituent of fermented milk products, which was
discovered by a 27-year old Bulgarian physician Stamen Grigorov. Grigorov later had noted
that bacteria in yogurt and other fermented milk products aided digestion and improved the
immune system laying the foundations of potential probiotic health benefits (Grigoroff, 1905).
Metchnikoff formalised this notion and posed the idea that aging was related to toxic bacteria
in the gut. He proposed that if milk (kefir) soured with Bulgarian bacillus (now known as L.
bulgaricus subsp. bulgaricus) was drunk regularly it mitigated the effects of aging and
CHAPTER SEVEN – GENERAL DISCUSSION, PERSPECTIVE AND CONCLUSIONS
222
“autointoxication” (Metchnikoff, 1907). A substantial number of studies were undertaken by
contemporaries of Metchnikoff, investigating the effect of the application of L. bulgaricus
subsp. bulgaricus to rabbits, guinea pigs and monkeys (Bested et al., 2013); preparations
containing the bacterium were also made commercially available. Experimentation in 1920
showed that all attempts to colonise the GIT of humans with L. bulgaricus subsp. bulgaricus
failed, whereas what was known as L. acidophilus at the time (Figure 1.1) was able to
colonise successfully (Cheplin and Rettger, 1920). This led to the broad commercial adoption
of L. acidophilus as a probiotic.
As a result of the commercial adoption of L. acidophilus, a great deal of its probiotic
physiology has been documented ex vivo, under laboratory culture conditions and in isolation
from the other microbiota that make up the highly complex and diverse gut. It therefore
remains to be shown whether the same ex vivo probiotic physiologies are observed in the
diverse and competitive GIT environment. Seemingly, the study of L. acidophilus in a
probiotic context has been undertaken rather top down manner, deriving from the isolation of
isolates capable of passage and apparent colonisation of the gut. What we now know to be a
diverse group of lactose producing bacteria, originally used to preserve food whose
consumption was postulated to prolong the life of early 20th century Bulgarians, were
assumed to be probiotic. One could sceptically propose that the study of probiotic physiology
markers for species “assumed to be probiotic” are often undertaken largely to support the
conclusion that the particular species is probiotic. The high genomic and proteomic stability
of L. acidophilus sensu stricto isolates observed in this study may go some way to explain the
continued widespread commercial use and probiotic success it has. Such stability provides a
guarantee that it can be grown and packaged reproducibly, remain unaffected by
mutation/gene transfer/gene loss, and hence provide the same probiotic health effects over and
over again. These are fundamental characteristics needed for commercial success of any
product, and hence L. acidophilus can be likened to a stable currency for the probiotic market.

CHAPTER SEVEN – GENERAL DISCUSSION, PERSPECTIVE AND CONCLUSIONS
223
7.1.3.2. Commercial implications of clonal probiotics
It is highly likely that the global use of probiotic bacteria by man has influenced their
genomic diversity, and ultimately even altered their population structure. This study shows
that commercial probiotic isolates of L. acidophilus are genotypically more similar to
themselves than isolates that have not been marketed as probiotic supplements. The
homogeneity of genome sequences of commercial L. acidophilus isolates raises the question;
what is the value of typing strains using molecular techniques such as RAPD, PFGE and
MLST if appreciable sequence variation is not seen until the species level? The inability to
distinguish one company’s proprietary L. acidophilus isolate from another using methods
such as PFGE, RAPD and MLST means that products will not satisfy the product label claim
criteria set out by Farnworth (2008), unless L. acidophilus is treated as a clonally
monophyletic species with no single proprietary isolates. Given the rapid ascent of next
generation sequencing technologies, defining the genome of probiotic strains should now
supersede the criteria set out by Farnworth et al. (2008)as a much more meaningful genotypic
measure.

CHAPTER SEVEN – GENERAL DISCUSSION, PERSPECTIVE AND CONCLUSIONS
224
7.1.4. DIRECTIONS FOR FUTURE RESEARCH
1. Establish the link between phenotype and genotype of L. acidophilus isolates. Even
though the overall coding capacity of L. acidophilus genomes is very similar, does
the difference in sequence within genes appreciably alter probiotic physiology?
The effect of gene sequence on single probiotic physiological characteristics could be tested
ex vivo using previously described assays that measure features such as tolerance to bile
(Pfeiler et al., 2007) and low pH (Azcarate-Peril et al., 2004), ability to adhere to epithelial
cells (Buck et al., 2005) and production of antimicrobial compounds (Tabasco et al., 2009).
This would provide a demonstrable measure of how the probiotic effect differs in each
particular isolate, and presumably would be useful for companies marketing L. acidophilus
probiotics to differentiate their proprietary isolate from a competitor’s. Moreover, given that
we know the genetic basis for gene differences between the genome sequenced isolates, we
are in a position to try to model exactly which pathways these minor differences would alter.
2. Extend the semi-quantitative species specific molecular probes for L. acidophilus
and B. bifidum into a fully quantitative test using quantitative PCR (qPCR).
Highly specific, fully quantitative probes for probiotic species are useful in feeding trials. The
function of a probiotic largely occurs in the large intestine, so therefore it must be established
whether the probiotic reaches the large intestine, and in what numbers. Follow up validation
of the PAU3 and B. bifidum PCRs using quantitative real time PCR approaches will be
required to test their efficacy for strain quantitation and tracking.
CHAPTER SEVEN – GENERAL DISCUSSION, PERSPECTIVE AND CONCLUSIONS
225
7.1.5. COLLABORATIVE RESEARCH EXTENDING THE METHODS AND SKILLS DEVELOPED
WITHIN THIS PROJECT
During this study, a feeding trial using the Cultech Lab4® probiotic supplement was ongoing
in healthy human male adults. To rapidly and cost-effectively profile the bacterial diversity of
faecal samples taken from this study, Ribosomal Intergenic Spacer Analysis (RISA) was
trialled as a method for examining the variable intergenic spacer region of the bacterial
ribosomal operon. The profiles generated were compared in a similar approach to the RAPD
profile generated in Chapter 2. The exceptionally high bacterial diversity of human faeces,
coupled with groups of very closely related species meant that this technique was not
effective for profiling bacterial diversity of the GIT.
During the course of this PhD, an opportunity to use RISA in a much less diverse bacterial
system arose. RISA was used to great effect to profile the bacterial diversity of cystic fibrosis
(CF) sputum. CF sputum diversity is variable between individuals, and many of the bacteria
present are undetectable by commonly used culture-based methods. Anaerobic bacteria also
grow to high densities in CF sputum and these are not captured by routine aerobic culture
used in standard diagnosis of CF infection. Very low diversity or monoculture sputum is
associated with rapid decline in host prognosis. It is therefore vital to quickly and accurately
profile the diversity of CF sputum to correctly treat the condition. The initial analysis
validating the RISA could be used to qualitatively measure changes in bacteria diversity
within CF sputum was published as part of:
Baxter, C. G., Rautemaa, R., Jones, A. M., Webb, A. K., Bull, M., Mahenthiralingam, E.
& Denning, D. W. (2013) Intravenous antibiotics reduce the presence of Aspergillus in adult
cystic fibrosis sputum. Thorax, 68 (7) 652-657.
A copy of this publication is included as Appendix 2 and further studies using the RISA
method to examine CF infection are in preparation.
REFERENCES
226
8. REFERENCES
Achtman, M. (2008) Evolution, population structure, and phylogeography of genetically monomorphic
bacterial pathogens. Annual Review of Microbiology, 62 53-70.
Ahrné, S., Nobaek, S., Jeppsson, B., Adlerberth, I., Wold, A. E. & Molin, G. (1998) The normal
Lactobacillus flora of healthy human rectal and oral mucosa. Journal of Applied Microbiology, 85 (1) 88-94.
Allen, S., Jordan, S., Storey, M., Thornton, C., Gravenor, M., Garaiova, I., Jones, R., Macfarlane, T., Seager, A., Manshian, B., Moller, M., Omakobia, M., Plummer, S., Wang, D. & Morgan, G. (2012) Probiotics and atopic eczema: a double-blind randomised controlled trial. Archives of
Disease in Childhood, 97 (Suppl 1) A2.
Altermann, E. & Klaenhammer, T. R. (2011) Group-specific comparison of four lactobacilli isolated from
human sources using differential blast analysis. Genes & Nutrition, 6 (3) 319-340.
Altermann, E., Russell, W. M., Azcarate-Peril, M. A., Barrangou, R., Buck, B. L., McAuliffe, O., Souther, N., Dobson, A., Duong, T., Callanan, M., Lick, S., Hamrick, A., Cano, R. & Klaenhammer, T. R. (2005) Complete genome sequence of the probiotic lactic acid bacterium
Lactobacillus acidophilus NCFM. Proceedings of the National Academy of Sciences of the United
States of America, 102 (11) 3906-3912.
Angelakis, E., Million, M., Henry, M. & Raoult, D. (2011) Rapid and accurate bacterial identification in
probiotics and yoghurts by MALDI-TOF mass spectrometry. Journal of Food Science, 76 (8)
M568-572.
Angiuoli, S. V. & Salzberg, S. L. (2011) Mugsy: fast multiple alignment of closely related whole genomes.
Bioinformatics, 27 (3) 334-342.
Anukam, K. C. & Reid, G. (eds.) 2007. Probiotics: 100 years (1907-2007) after Elie Metchnikoff's
observations, Spain: Formatex.org.
Archibald, F. S. & Fridovich, I. (1981) Manganese, superoxide dismutase, and oxygen tolerance in some
lactic acid bacteria. Journal of Bacteriology, 146 (3) 928-936.
Arnold, R. J., Karty, J. A., Ellington, A. D. & Reilly, J. P. (1999) Monitoring the growth of a bacteria
culture by MALDI-MS of whole cells. Analytical Chemistry, 71 (10) 1990-1996.
Arumugam, M., Raes, J., Pelletier, E., Le Paslier, D., Yamada, T., Mende, D. R., Fernandes, G. R., Tap, J., Bruls, T., Batto, J.-M., Bertalan, M., Borruel, N., Casellas, F., Fernandez, L., Gautier, L., Hansen, T., Hattori, M., Hayashi, T., Kleerebezem, M., Kurokawa, K., Leclerc, M., Levenez, F., Manichanh, C., Nielsen, H. B., Nielsen, T., Pons, N., Poulain, J., Qin, J., Sicheritz-Ponten, T., Tims, S., Torrents, D., Ugarte, E., Zoetendal, E. G., Wang, J., Guarner, F., Pedersen, O., de Vos, W. M., Brunak, S., Dore, J., Meta, H. I. T. C., Weissenbach, J., Erlich, S. D. & Bork, P. (2011) Enterotypes of the human gut microbiome. Nature, 473 (7346) 174-180.
Asakuma, S., Urashima, T., Akahori, M., Obayashi, H., Nakamura, T., Kimura, K., Watanabe, Y., Arai, I. & Sanai, Y. (2008) Variation of major neutral oligosaccharides levels in human colostrum.
European Journal of Clinical Nutrition, 62 (4) 488-494.

REFERENCES
227
Azcarate-Peril, M. A., Altermann, E., Hoover-Fitzula, R. L., Cano, R. J. & Klaenhammer, T. R. (2004)
Identification and inactivation of genetic loci involved with Lactobacillus acidophilus acid
tolerance. Applied and Environmental Microbiology, 70 (9) 5315-5322.
Azcarate-Peril, M. A., McAuliffe, O., Altermann, E., Lick, S., Russell, W. M. & Klaenhammer, T. R. (2005) Microarray analysis of a two-component regulatory system involved in acid resistance and
proteolytic activity in Lactobacillus acidophilus. Applied and Environmental Microbiology, 71 (10)
5794-5804.
Azcarate-Peril, M. A., Tallon, R. & Klaenhammer, T. R. (2009) Temporal gene expression and probiotic
attributes of Lactobacillus acidophilus during growth in milk. Journal of Dairy Science, 92 (3) 870-
886.
Aznar, R. & Chenoll, E. (2006) Intraspecific diversity of Lactobacillus curvatus, Lactobacillus plantarum,
Lactobacillus sakei, and Leuconostoc mesenteroides associated with vacuum-packed meat product
spoilage analyzed by randomly amplified polymorphic DNA PCR. Journal of Food Protection, 69 (10) 2403-2410.
Bahaka, D., Neut, C., Khattabi, A., Monget, D. & Gavini, F. (1993) Phenotypic and genomic analyses of
human strains belonging or related to Bifidobacterium longum, Bifidobacterium infantis, and
Bifidobacterium breve. International Journal of Systematic Bacteriology, 43 (3) 565-573.
Baldwin, A., Mahenthiralingam, E., Thickett, K. M., Honeybourne, D., Maiden, M. C. J., Govan, J. R., Speert, D. P., LiPuma, J. J., Vandamme, P. & Dowson, C. G. (2005) Multilocus sequence typing
scheme that provides both species and strain differentiation for the Burkholderia cepacia complex.
Journal of Clinical Microbiology, 43 (9) 4665-4673.
Barrangou, R., Azcarate-Peril, M. A., Duong, T., Conners, S. B., Kelly, R. M. & Klaenhammer, T. R. (2006) Global analysis of carbohydrate utilization by Lactobacillus acidophilus using cDNA
microarrays. Proceedings of the National Academy of Sciences of the United States of America, 103 (10) 3816-3821.
Barrangou, R., Briczinski, E. P., Traeger, L. L., Loquasto, J. R., Richards, M., Horvath, P., Coûté-Monvoisin, A.-C., Leyer, G., Rendulic, S., Steele, J. L., Broadbent, J. R., Oberg, T., Dudley, E. G., Schuster, S., Romero, D. A. & Roberts, R. F. (2009) Comparison of the complete genome
sequences of Bifidobacterium animalis subsp. lactis DSM 10140 and Bl-04. Journal of
Bacteriology, 191 (13) 4144-4151.
Barrangou, R., Fremaux, C., Deveau, H., Richards, M., Boyaval, P., Moineau, S., Romero, D. A. & Horvath, P. (2007) CRISPR provides acquired resistance against viruses in prokaryotes. Science,
315 (5819) 1709-1712.
Bartosch, S., Woodmansey, E. J., Paterson, J. C. M., McMurdo, M. E. T. & Macfarlane, G. T. (2005)
Microbiological effects of consuming a synbiotic containing Bifidobacterium bifidum,
Bifidobacterium lactis, and oligofructose in elderly persons, determined by real-time polymerase
chain reaction and counting of viable bacteria. Clinical Infectious Diseases, 40 (1) 28-37.
Bennett, J. S., Jolley, K. A., Earle, S. G., Corton, C., Bentley, S. D., Parkhill, J. & Maiden, M. C. (2012)
A genomic approach to bacterial taxonomy: an examination and proposed reclassification of species
within the genus Neisseria. Microbiology, 158 (Part 6) 1570-1580.

REFERENCES
228
Berger, B., Pridmore, R. D., Barretto, C., Delmas-Julien, F., Schreiber, K., Arigoni, F. & Brussow, H. (2007) Similarity and differences in the Lactobacillus acidophilus group identified by polyphasic
analysis and comparative genomics. Journal of Bacteriology, 189 (4) 1311-1321.
Bernardeau, M., Guguen, M. & Vernoux, J. P. (2006) Beneficial lactobacilli in food and feed: long-term
use, biodiversity and proposals for specific and realistic safety assessments. FEMS Microbiology
Reviews, 30 (4) 487-513.
Bested, A., Logan, A. & Selhub, E. (2013) Intestinal microbiota, probiotics and mental health: from
Metchnikoff to modern advances: Part I - autointoxication revisited. Gut Pathogens, 5 (1) 5.
Blaiotta, G., Fusco, V., Ercolini, D., Aponte, M., Pepe, O. & Villani, F. (2008) Lactobacillus strain
diversity based on partial hsp60 gene sequences and design of PCR-restriction fragment length
polymorphism assays for species identification and differentiation. Applied and Environmental
Microbiology, 74 (1) 208-215.
Blaut, M., Collins, M. D., Welling, G. W., Doré, J., van Loo, J. & de Vos, W. (2002) Molecular
biological methods for studying the gut microbiota: the EU human gut flora project. British Journal
of Nutrition, 87 (Supplement 2) 203-211.
Bolotin, A., Quinquis, B., Renault, P., Sorokin, A., Ehrlich, S. D., Kulakauskas, S., Lapidus, A., Goltsman, E., Mazur, M., Pusch, G. D., Fonstein, M., Overbeek, R., Kyprides, N., Purnelle, B., Prozzi, D., Ngui, K., Masuy, D., Hancy, F., Burteau, S., Boutry, M., Delcour, J., Goffeau, A. & Hols, P. (2004) Complete sequence and comparative genome analysis of the dairy bacterium
Streptococcus thermophilus. Nature Biotechnology, 22 (12) 1554-1558.
Bottacini, F., Dal Bello, F., Turroni, F., Milani, C., Duranti, S., Foroni, E., Viappiani, A., Strati, F., Mora, D., van Sinderen, D. & Ventura, M. (2011) Complete genome sequence of
Bifidobacterium animalis subsp. lactis BLC1. Journal of Bacteriology, 193 (22) 6387-6388.
Bottacini, F., Medini, D., Pavesi, A., Turroni, F., Foroni, E., Riley, D., Giubellini, V., Tettelin, H., van Sinderen, D. & Ventura, M. (2010) Comparative genomics of the genus Bifidobacterium.
Microbiology, 156 (11) 3243-3254.
Bottacini, F., Milani, C., Turroni, F., Sánchez, B., Foroni, E., Duranti, S., Serafini, F., Viappiani, A., Strati, F., Ferrarini, A., Delledonne, M., Henrissat, B., Coutinho, P., Fitzgerald, G. F., Margolles, A., van Sinderen, D. & Ventura, M. (2012) Bifidobacterium asteroides PRL2011
genome analysis reveals clues for colonization of the insect gut. PLoS ONE, 7 (9) e44229.
Boyd, M. A., Antonio, M. A. & Hillier, S. L. (2005) Comparison of API 50 CH strips to whole-
chromosomal DNA probes for identification of Lactobacillus species. Journal of Clinical
Microbiology, 43 (10) 5309-5311.
Brenner, S. (2010) Sequences and consequences. Philosophical Transactions of the Royal Society B:
Biological Sciences, 365 (1537) 207-212.
Briczinski, E. P., Loquasto, J. R., Barrangou, R., Dudley, E. G., Roberts, A. M. & Roberts, R. F. (2009)
Strain-specific genotyping of Bifidobacterium animalis subsp. lactis by using single-nucleotide
polymorphisms, insertions, and deletions. Applied and Environmental Microbiology, 75 (23) 7501-
7508.
Briczinski, E. P. & Roberts, R. F. (2006) Technical note: a rapid pulsed-field gel electrophoresis method
for analysis of bifidobacteria. Journal of Dairy Science, 89 (7) 2424-2427.

REFERENCES
229
Brigidi, P., Vitali, B., Swennen, E., Bazzocchi, G. & Matteuzzi, D. (2001) Effects of probiotic
administration upon the composition and enzymatic activity of human fecal microbiota in patients
with irritable bowel syndrome or functional diarrhea. Research in Microbiology, 152 (8) 735-741.
Bron, P. A., van Baarlen, P. & Kleerebezem, M. (2012) Emerging molecular insights into the interaction
between probiotics and the host intestinal mucosa. Nature Reviews Microbiology, 10 (1) 66-78.
Brooks, S. P., McAllister, M., Sandoz, M. & Kalmokoff, M. L. (2003) Culture-independent phylogenetic
analysis of the faecal flora of the rat. Canadian Journal of Microbiology, 49 (10) 589-601.
Bruker Daltonik GmbH (2010) Application note #MT-80 microorganism identification and classification
based on MALDI-TOF MS fingerprinting with MALDI biotyper.
Brüssow, H. (2001) Phages of dairy bacteria. Annual Review of Microbiology, 55 283-303.
Bryant, D. & Moulton, V. (2004) Neighbor-net: an agglomerative method for the construction of
phylogenetic networks. Molecular Biology and Evolution, 21 (2) 255-265.
Buck, B. L., Altermann, E., Svingerud, T. & Klaenhammer, T. R. (2005) Functional analysis of putative
adhesion factors in Lactobacillus acidophilus NCFM. Applied and Environmental Microbiology, 71 (12) 8344-8351.
Bull, M. J., Marchesi, J. R., Vandamme, P., Plummer, S. & Mahenthiralingam, E. (2012) Minimum
taxonomic criteria for bacterial genome sequence depositions and announcements. Journal of
Microbiological Methods, 89 (1) 18-21.
Cachat, E. & Priest, F. G. (2005) Lactobacillus suntoryeus sp. nov., isolated from malt whisky distilleries.
International Journal of Systematic and Evolutionary Microbiology, 55 (1) 31-34.
Cai, H., Rodriguez, B. T., Zhang, W., Broadbent, J. R. & Steele, J. L. (2007) Genotypic and phenotypic
characterization of Lactobacillus casei strains isolated from different ecological niches suggests
frequent recombination and niche specificity. Microbiology, 153 (8) 2655-2665.
Camacho, C., Coulouris, G., Avagyan, V., Ma, N., Papadopoulos, J., Bealer, K. & Madden, T. (2009)
BLAST+: architecture and applications. BMC Bioinformatics, 10 (1) 421.
Campbell, M., Mahenthiralingam, E. & Speert, D. P. (2000) Evaluation of random amplified
polymorphic DNA typing of Pseudomonas aeruginosa. Journal of Clinical Microbiology, 38 (12)
4614-4615.
Candela, M., Vitali, B., Matteuzzi, D. & Brigidi, P. (2004) Evaluation of the rrn operon copy number in
Bifidobacterium using real-time PCR. Letters in Applied Microbiology, 38 (3) 229-232.
Carr, F. J., Chill, D. & Maida, N. (2002) The lactic acid bacteria: A literature survey. Critical Reviews in
Microbiology, 28 281-370.
Carver, T. J., Rutherford, K. M., Berriman, M., Rajandream, M.-A., Barrell, B. G. & Parkhill, J. (2005) ACT: the Artemis comparison tool. Bioinformatics, 21 (16) 3422-3423.
Cheplin, H. A. & Rettger, L. F. (1920) Studies on the transformation of the intestinal flora, with special
reference to the implantation of Bacillus acidophilus: II. Feeding experiments on man. Proceedings
of the National Academy of Sciences of the United States of America, 6 (12) 704-705.
REFERENCES
230
Chervaux, C., Grimaldi, C., Bolotin, A., Quinquis, B., Legrain-Raspaud, S., van Hylckama Vlieg, J. E. T., Denariaz, G. & Smokvina, T. (2011) Genome sequence of the probiotic strain Bifidobacterium
animalis subsp. lactis CNCM I-2494. Journal of Bacteriology, 193 (19) 5560-5561.
Chung, Y.-J., Kim, S.-K. & Choi, E.-C. (1997) The effects of Bifidobacterium bifidum OFR9, a strain
resistant to antituberculosis and antileprosy agents, on fecal flora in mice. The Journal of General
and Applied Microbiology, 43 (1) 61-66.
Claesson, M. J., van Sinderen, D. & O'Toole, P. W. (2007) The genus Lactobacillus - a genomic basis for
understanding its diversity. FEMS Microbiology Letters, 269 (3) 22-28.
Claesson, M. J., van Sinderen, D. & O'Toole, P. W. (2008) Lactobacillus phylogenomics - towards a
reclassification of the genus. International Journal of Systematic and Evolutionary Microbiology,
58 (12) 2945-2954.
Clark, C. G., Grant, C. C., Pollari, F., Marshall, B., Moses, J., Tracz, D. M. & Gilmour, M. W. (2012)
Effects of the Campylobacter jejuni CJIE1 prophage homologs on adherence and invasion in
culture, patient symptoms, and source of infection. BMC Microbiology, 12 269.
Cody, A. J., McCarthy, N. D., Jansen van Rensburg, M., Isinkaye, T., Bentley, S. D., Parkhill, J., Dingle, K. E., Bowler, I. C., Jolley, K. A. & Maiden, M. C. (2013) Real-time genomic
epidemiological evaluation of human Campylobacter isolates by use of whole-genome multilocus
sequence typing. Journal of Clinical Microbiology, 51 (8) 2526-2534.
Coenye, T., Gevers, D., Van de Peer, Y., Vandamme, P. & Swings, J. (2005) Towards a prokaryotic
genomic taxonomy. FEMS microbiology Reviews, 29 (2) 147-167.
Coenye, T. & Vandamme, P. (2003) Extracting phylogenetic information from whole-genome sequencing
projects: the lactic acid bacteria as a test case. Microbiology, 149 (Pt 12) 3507-3517.
Cole, J. R., Wang, Q., Cardenas, E., Fish, J., Chai, B., Farris, R. J., Kulam-Syed-Mohideen, A. S., McGarrell, D. M., Marsh, T., Garrity, G. M. & Tiedje, J. M. (2009) The Ribosomal Database
Project: improved alignments and new tools for rRNA analysis. Nucleic Acids Research, 37 (Database issue) D141-145.
Collins, M. D., Rodrigues, U., Ash, C., Aguirre, M., Farrow, J. A. E., Martinez-Murcia, A., Phillips, B. A., Williams, A. M. & Wallbanks, S. (1991) Phylogenetic analysis of the genus Lactobacillus and
related lactic acid bacteria as determined by reverse transcriptase sequencing of 16S rRNA. FEMS
Microbiology Letters, 77 (1) 5-12.
Cooper, I. R., White, J., Mahenthiralingam, E. & Hanlon, G. W. (2008) Long-term persistence of a
single Legionella pneumophila strain possessing the mip gene in a municipal shower despite
repeated cycles of chlorination. The Journal of hospital infection, 70 (2) 154-159.
Dawyndt, P., Vancanneyt, M., de Meyer, H. & Swings, J. (2005) Knowledge accumulation and resolution
of data inconsistencies during the integration of microbial information sources. IEEE Transactions
on Knowledge and Data Engineering, 17 (8) 1111-1126.
de Bruijn, F. J. (1992) Use of repetitive (repetitive extragenic palindromic and enterobacterial repetitive
intergeneric consensus) sequences and the polymerase chain reaction to fingerprint the genomes of
Rhizobium meliloti isolates and other soil bacteria. Applied and Environmental Microbiology, 58 (7)
2180-2187.
REFERENCES
231
De Bruyne, K., Slabbinck, B., Waegeman, W., Vauterin, P., De Baets, B. & Vandamme, P. (2011)
Bacterial species identification from MALDI-TOF mass spectra through data analysis and machine
learning. Systematic and Applied Microbiology, 34 (1) 20-29.
De Dea Lindner, J., Canchaya, C., Zhang, Z., Neviani, E., Fitzgerald, G. F., van Sinderen, D. & Ventura, M. (2007) Exploiting Bifidobacterium genomes: The molecular basis of stress response.
International Journal of Food Microbiology, 120 (1–2) 13-24.
de las Rivas, B., Marcobal, A. & Munoz, R. (2006) Development of a multilocus sequence typing method
for analysis of Lactobacillus plantarum strains. Microbiology, 152 (1) 85-93.
de Man, J. C., Rogosa, M. & Sharpe, M. E. (1960) A medium for the cultivation of lactobacilli. Journal of
Applied Microbiology, 23 130-135.
de Vries, W. & Stouthamer, A. H. (1967) Pathway of glucose fermentation in relation to the taxonomy of
bifidobacteria. Journal of Bacteriology, 93 (2) 574-576.
de Vries, W. & Stouthamer, A. H. (1968) Fermentation of glucose, lactose, galactose, mannitol, and xylose
by bifidobacteria. Journal of Bacteriology, 96 (2) 472-478.
Demirci, A. & Pometto, A., III (1992) Enhanced production of d(−)-lactic acid by mutants of Lactobacillus
delbrueckii ATCC 9649. Journal of Industrial Microbiology, 11 (1) 23-28.
Desvaux, M., Hebraud, M., Talon, R. & Henderson, I. R. (2009) Secretion and subcellular localizations
of bacterial proteins: a semantic awareness issue. Trends in Microbiology, 17 (4) 139-145.
Díez-Villaseñor, C., Almendros, C., García-Martínez, J. & Mojica, F. J. M. (2010) Diversity of CRISPR
loci in Escherichia coli. Microbiology, 156 (5) 1351-1361.
Douillard, F. P., Kant, R., Ritari, J., Paulin, L., Palva, A. & de Vos, W. M. (2013) Comparative genome
analysis of Lactobacillus casei strains isolated from Actimel and Yakult products reveals marked
similarities and points to a common origin. Microbial Biotechnology, 6 (5) 576-587.
Du Plessis, E. M. & Dicks, L. M. T. (1995) Evaluation of random amplified polymorphic DNA (RAPD)-
PCR as a method to differentiate Lactobacillus acidophilus, Lactobacillus crispatus, Lactobacillus
amylovorus, Lactobacillus gallinarum, Lactobacillus gasseri, and Lactobacillus johnsonii. Current
Microbiology, 31 (2) 114-118.
Dušková, M., Šedo, O., Kšicová, K., Zdráhal, Z. & Karpíšková, R. (2012) Identification of lactobacilli
isolated from food by genotypic methods and MALDI-TOF MS. International Journal of Food
Microbiology, 159 (2) 107-114.
Dykes, G. A. & von Holy, A. (1994) Strain typing in the genus Lactobacillus. Letters in Applied
Microbiology, 19 (2) 63-66.
Eisen, J. A. (1995) The RecA protein as a model molecule for molecular systematic studies of bacteria:
comparison of trees of RecAs and 16S rRNAs from the same species. Journal of Molecular
Evolution, 41 (6) 1105-1123.
Euzéby, J. P. (1997) List of bacterial names with standing in nomenclature: a folder available on the
internet. International Journal of Systematic Bacteriology, 47 (2) 590-592.
REFERENCES
232
FAO/WHO. Evaluation of health and nutritional properties of powder milk and live lactic acid bacteria.
Food and Agriculture Organization of the United Nations and World Health Organization Expert
Consultation Report, 2001 Cordoba, Argentina. 1-34.
FAO/WHO (2002) Guidelines for the evaluation of probiotics in food. Food and Agriculture Organization
of the United Nations and World Health Organization Working Group Report. London, Ontario.
Farnworth, E. R. (2008) The evidence to support health claims for probiotics. Journal of Nutrition, 138 (6)
1250-1254.
Felis, G. E. & Dellaglio, F. (2007) Taxonomy of lactobacilli and bifidobacteria. Current Issues in Intestinal
Microbiology, (8) 44-61.
Field, D., Garrity, G., Gray, T., Morrison, N., Selengut, J., Sterk, P., Tatusova, T., Thomson, N., Allen, M. J., Angiuoli, S. V., Ashburner, M., Axelrod, N., Baldauf, S., Ballard, S., Boore, J., Cochrane, G., Cole, J., Dawyndt, P., De Vos, P., DePamphilis, C., Edwards, R., Faruque, N., Feldman, R., Gilbert, J., Gilna, P., Glockner, F. O., Goldstein, P., Guralnick, R., Haft, D., Hancock, D., Hermjakob, H., Hertz-Fowler, C., Hugenholtz, P., Joint, I., Kagan, L., Kane, M., Kennedy, J., Kowalchuk, G., Kottmann, R., Kolker, E., Kravitz, S., Kyrpides, N., Leebens-Mack, J., Lewis, S. E., Li, K., Lister, A. L., Lord, P., Maltsev, N., Markowitz, V., Martiny, J., Methe, B., Mizrachi, I., Moxon, R., Nelson, K., Parkhill, J., Proctor, L., White, O., Sansone, S. A., Spiers, A., Stevens, R., Swift, P., Taylor, C., Tateno, Y., Tett, A., Turner, S., Ussery, D., Vaughan, B., Ward, N., Whetzel, T., San Gil, I., Wilson, G. & Wipat, A. (2008) The minimum
information about a genome sequence (MIGS) specification. Nature Biotechnology, 26 (5) 541-547.
Foschino, R., Picozzi, C. & Galli, A. (2001) Comparative study of nine Lactobacillus fermentum
bacteriophages. Journal of Applied Microbiology, 91 (3) 394-403.
Fraga, M., Scavone, P. & Zunino, P. (2005) Preventive and therapeutic administration of an indigenous
Lactobacillus sp. strain against Proteus mirabilis ascending urinary tract infection in a mouse
model. Antonie Van Leeuwenhoek, 88 (1) 25-34.
Fraser, C., Alm, E. J., Polz, M. F., Spratt, B. G. & Hanage, W. P. (2009) The bacterial species challenge:
Making sense of genetic and ecological diversity. Science, 323 (5915) 741-746.
Fukuda, S., Toh, H., Hase, K., Oshima, K., Nakanishi, Y., Yoshimura, K., Tobe, T., Clarke, J. M., Topping, D. L., Suzuki, T., Taylor, T. D., Itoh, K., Kikuchi, J., Morita, H., Hattori, M. & Ohno, H. (2011) Bifidobacteria can protect from enteropathogenic infection through production of
acetate. Nature, 469 (7331) 543-547.
Fuller, R. (1989) Probiotics in man and animals. Journal of Applied Bacteriology, 66 (5) 365-378.
Garrigues, C., Johansen, E. & Pedersen, M. B. (2010) Complete genome sequence of Bifidobacterium
animalis subsp. lactis BB-12, a widely consumed probiotic strain. Journal of Bacteriology, 192 (9)
2467-2468.
Gevers, D., Cohan, F. M., Lawrence, J. G., Spratt, B. G., Coenye, T., Feil, E. J., Stackebrandt, E., Van de Peer, Y., Vandamme, P., Thompson, F. L. & Swings, J. (2005) Opinion: Re-evaluating
prokaryotic species. Nature Reviews Microbiology, 3 (9) 733-739.
Gevers, D., Huys, G. & Swings, J. (2001) Applicability of rep-PCR fingerprinting for identification of
Lactobacillus species. FEMS Microbiology Letters, 205 31-36.
REFERENCES
233
Gill, S. R., Pop, M., DeBoy, R. T., Eckburg, P. B., Turnbaugh, P. J., Samuel, B. S., Gordon, J. I., Relman, D. A., Fraser-Liggett, C. M. & Nelson, K. E. (2006) Metagenomic analysis of the
human distal gut microbiome. Science, 312 (5778) 1355-1359.
Gilliland, S. E. (1989) Acidophilus milk products: a review of potential benefits to consumers. Journal of
Dairy Science, 72 (10) 2483-2494.
Gilliland, S. E. & Speck, M. L. (1977) Antagonistic action of Lactobacillus acidophilus toward intestinal
and foodborne pathogens in associative cultures. Journal of Food Protection, 40 820-823.
Gopal, P. K., Prasad, J., Smart, J. & Gill, H. S. (2001) In vitro adherence properties of Lactobacillus
rhamnosus DR20 and Bifidobacterium lactis DR10 strains and their antagonistic activity against an
enterotoxigenic Escherichia coli. International Journal of Food Microbiology, 67 (3) 207-216.
Greene, J. D. & Klaenhammer, T. R. (1994) Factors involved in adherence of lactobacilli to human Caco-2
cells. Applied and Environmental Microbiology, 60 (12) 4487-4494.
Gregory R. Warnes, Ben Bolker, Lodewijk Bonebakker, Robert Gentleman, Wolfgang Huber, Andy Liaw, Thomas Lumley, Martin Maechler, Arni Magnusson, Steffen Moeller, Marc Schwartz & Bill Venables (2013) gplots: Various R programming tools for plotting data.
Grigoroff, S. (1905) "Etude sur le lait fermenté comestible : le 'Kissélo-mléko' de Bulgarie". Revue
Médicale de la Suisse Romande (in French). Geneva: Librairie de L’Université.
Grissa, I., Vergnaud, G. & Pourcel, C. (2007) The CRISPRdb database and tools to display CRISPRs and
to generate dictionaries of spacers and repeats. BMC Bioinformatics, 8 (1) 172.
Guarner, F. & Malagelada, J.-R. (2003) Gut flora in health and disease. Lancet, 361 (9356) 512-519.
Gueimonde, M., Delgado, S., Mayo, B., Ruas-Madiedo, P., Margolles, A. & de los Reyes-Gavilán, C. G. (2004) Viability and diversity of probiotic Lactobacillus and Bifidobacterium populations included
in commercial fermented milks. Food Research International, 37 (9) 839-850.
Gueimonde, M., Ventura, M., Margolles, A. & Sánchez, B. (2012) Genome sequence of the
immunomodulatory strain Bifidobacterium bifidum LMG 13195. Journal of Bacteriology, 194 (24)
6997.
Guillier, L., Pardon, P. & Augustin, J.-C. (2005) Influence of stress on individual lag time distributions of
Listeria monocytogenes. Applied and Environmental Microbiology, 71 (6) 2940-2948.
Guslandi, M., Mezzi, G., Sorghi, M. & Testoni, P. A. (2000) Saccharomyces boulardii in maintenance
treatment of Crohn's disease. Digestive Diseases and Sciences, 45 (7) 1462-1464.
Ham, J.-S., Lee, T., Byun, M.-J., Lee, K.-T., Kim, M.-K., Han, G.-S., Jeong, S.-G., Oh, M.-H., Kim, D.-H. & Kim, H. (2011) Complete genome sequence of Bifidobacterium longum subsp. longum
KACC 91563. Journal of Bacteriology, 193 (18) 5044.
Hammes, W. P. & Vogel, R. F. (1995) The genus Lactobacillus. In: Wood, B. J. B. & Holzapfel, W. H.
(eds.) The Genera of Lactic Acid Bacteria. Glasgow: Blackie Academic & Professional.
Hao, P., Zheng, H., Yu, Y., Ding, G., Gu, W., Chen, S., Yu, Z., Ren, S., Oda, M., Konno, T., Wang, S., Li, X., Ji, Z.-S. & Zhao, G. (2011a) Complete sequencing and pan-genomic analysis of
Lactobacillus delbrueckii subsp. bulgaricus reveal its genetic basis for industrial yogurt production.
PLoS ONE, 6 (1) e15964.
REFERENCES
234
Hao, Y., Huang, D., Guo, H., Xiao, M., An, H., Zhao, L., Zuo, F., Zhang, B., Hu, S., Song, S., Chen, S. & Ren, F. (2011b) Complete genome sequence of Bifidobacterium longum subsp. longum
BBMN68, a new strain from a healthy Chinese centenarian. Journal of Bacteriology, 193 (3) 787-
788.
Harris, S. R., Feil, E. J., Holden, M. T., Quail, M. A., Nickerson, E. K., Chantratita, N., Gardete, S., Tavares, A., Day, N., Lindsay, J. A., Edgeworth, J. D., de Lencastre, H., Parkhill, J., Peacock, S. J. & Bentley, S. D. (2010) Evolution of MRSA during hospital transmission and intercontinental
spread. Science, 327 (5964) 469-474.
Havenaar, R. & Huis in’t Veld, J. H. J. (1992) Probiotics: A general view. In: Wood, B. J. B. (ed.) The
Lactic Acid Bacteria Volume 1. Springer US.
He, F., Ouwehand, A. C., Isolauri, E., Hashimoto, H., Benno, Y. & Salminen, S. (2001) Comparison of
mucosal adhesion and species identification of bifidobacteria isolated from healthy and allergic
infants. FEMS Immunology & Medical Microbiology, 30 (1) 43-47.
Hill, J. E., Fernando, U. W. M., Zello, G. A., Tyler, R. T., Dahl, W. J. & Kessel, A. G. V. (2010a)
Improvement of the representation of bifidobacteria in fecal microbiota metagenomic libraries by
application of the cpn60 universal primer cocktail. Applied and Environmental Microbiology, 76 (13) 4550-4552.
Hill, J. E., Fernando, W. M. U., Zello, G. A., Tyler, R. T., Dahl, W. J. & Kessel, A. G. V. (2010b)
Improvement of the representation of bifidobacteria in fecal microbiota metagenomic libraries by
application of the cpn60 universal primer cocktail. Applied and Environmental Microbiology, 76 (13) 4550-4552.
Hirayama, K., Baranczewski, P., Akerlund, J. E., Midtvedt, T., Moller, L. & Rafter, J. (2000) Effects of
human intestinal flora on mutagenicity of and DNA adduct formation from food and environmental
mutagens. Carcinogenesis, 21 (11) 2105-2111.
Holland, D. (1920) Generic index of the commoner forms of bacteria. Journal of Bacteriology, 5 215-229.
Holzapfel, W. H., Haberer, P., Geisen, R., Bjorkroth, J. & Schillinger, U. (2001) Taxonomy and
important features of probiotic microorganisms in food and nutrition. The American Journal of
Clinical Nutrition, 73 (2) 365S-373S.
Horvath, P., Romero, D. A., Coûté-Monvoisin, A.-C., Richards, M., Deveau, H., Moineau, S., Boyaval, P., Fremaux, C. & Barrangou, R. (2008) Diversity, activity, and evolution of CRISPR loci in
Streptococcus thermophilus. Journal of Bacteriology, 190 (4) 1401-1412.
Huson, D. H. & Bryant, D. (2006) Application of phylogenetic networks in evolutionary studies. Molecular
Biology and Evolution, 23 (2) 254-267.
Ibnou-Zekri, N., Blum, S., Schiffrin, E. J. & Weid, T. v. d. (2003) Divergent patterns of colonization and
immune response elicited from two intestinal Lactobacillus strains that display similar properties in
vitro. Infection and Immunity, 71 (1) 428-436.
Johnson, J. L., Phelps, C. F., Cummins, C. S., London, J. & Gasser, F. (1980) Taxonomy of the
Lactobacillus acidophilus group. International Journal of Systematic Bacteriology, 30 (1) 53-68.
Jolley, K. A., Bliss, C. M., Bennett, J. S., Bratcher, H. B., Brehony, C., Colles, F. M., Wimalarathna, H., Harrison, O. B., Sheppard, S. K., Cody, A. J. & Maiden, M. C. (2012) Ribosomal multilocus
REFERENCES
235
sequence typing: universal characterization of bacteria from domain to strain. Microbiology, 158 (Pt
4) 1005-1015.
Jolley, K. A. & Maiden, M. C. (2010) BIGSdb: Scalable analysis of bacterial genome variation at the
population level. BMC Bioinformatics, 11 595.
Jost, T., Lacroix, C., Braegger, C. P. & Chassard, C. (2012) New insights in gut microbiota establishment
in healthy breast fed neonates. PLoS ONE, 7 (8) e44595.
Kahm, M., Hasenbrink, G., Lichtenberg-Frate, H., Ludwig, J. & Kschischo, M. (2010) {grofit}: Fitting
biological growth curves with {R}. Journal of Statistical Software, 33 (7) 1-21.
Kankainen, M., Paulin, L., Tynkkynen, S., von Ossowski, I., Reunanen, J., Partanen, P., Satokari, R., Vesterlund, S., Hendrickx, A. P. A., Lebeer, S., De Keersmaecker, S. C. J., Vanderleyden, J., Hämäläinen, T., Laukkanen, S., Salovuori, N., Ritari, J., Alatalo, E., Korpela, R., Mattila-Sandholm, T., Lassig, A., Hatakka, K., Kinnunen, K. T., Karjalainen, H., Saxelin, M., Laakso, K., Surakka, A., Palva, A., Salusjärvi, T., Auvinen, P. & de Vos, W. M. (2009) Comparative
genomic analysis of Lactobacillus rhamnosus GG reveals pili containing a human- mucus binding
protein. Proceedings of the National Academy of Sciences of the United States of America, 106 (40)
17193-17198.
Kern, C. C., Usbeck, J. C., Vogel, R. F. & Behr, J. (2013) Optimization of matrix-assisted-laser-
desorption–ionization-time-of-flight mass spectrometry for the identification of bacterial
contaminants in beverages. Journal of Microbiological Methods, 93 (3) 185-191.
Khaleghi, M., Kasra Kermanshahi, R. & Zarkesh-Esfahani, S. H. (2011) Effects of penicillin G on
morphology and certain physiological parameters of Lactobacillus acidophilus ATCC 4356.
Journal of Microbiology and Biotechnology, 21 (8) 822-829.
Khaleghi, M., Kermanshahi, R. K., Yaghoobi, M. M., Zarkesh-Esfahani, S. H. & Baghizadeh, A. (2010) Assessment of bile salt effects on S-layer production, slp gene expression and some
physicochemical properties of Lactobacillus acidophilus ATCC 4356. Journal of Microbiology and
Biotechnology, 20 (4) 749-756.
Kim, J. F., Jeong, H., Yu, D. S., Choi, S.-H., Hur, C.-G., Park, M.-S., Yoon, S. H., Kim, D.-W., Ji, G. E., Park, H.-S. & Oh, T. K. (2009) Genome sequence of the probiotic bacterium Bifidobacterium
animalis subsp. lactis AD011. Journal of Bacteriology, 191 (2) 678-679.
Klaenhammer, T. R., Barrangou, R., Buck, B. L., Azcarate-Peril, M. A. & Altermann, E. (2005)
Genomic features of lactic acid bacteria effecting bioprocessing and health. FEMS Microbiology
Reviews, 29 (3) 393-409.
Kleerebezem, M., Boekhorst, J., van Kranenburg, R., Molenaar, D., Kuipers, O. P., Leer, R., Tarchini, R., Peters, S. A., Sandbrink, H. M., Fiers, M. W. E. J., Stiekema, W., Lankhorst, R. M. K., Bron, P. A., Hoffer, S. M., Groot, M. N. N., Kerkhoven, R., de Vries, M., Ursing, B., de Vos, W. M. & Siezen, R. J. (2003) Complete genome sequence of Lactobacillus plantarum WCFS1.
Proceedings of the National Academy of Sciences of the United States of America, 100 (4) 1990-
1995.
Kleerebezem, M. & Hugenholtz, J. (2003) Metabolic pathway engineering in lactic acid bacteria. Current
Opinion in Biotechnology, 14 (2) 232-237.
REFERENCES
236
Kleerebezem, M. & Vaughan, E. E. (2009) Probiotic and gut lactobacilli and bifidobacteria: molecular
approaches to study diversity and activity. Annual Review of Microbiology, 63 269-290.
Klein, G., Pack, A., Bonaparte, C. & Reuter, G. (1998) Taxonomy and physiology of probiotic lactic acid
bacteria. International Journal of Food Microbiology, 41 (2) 103-125.
Klijn, A., Mercenier, A. & Arigoni, F. (2005) Lessons from the genomes of bifidobacteria. FEMS
Microbiology Reviews, 29 (3) 491-509.
Ko, E. J., Goh, J. S., Lee, B. J., Choi, S. H. & Kim, P. H. (1999) Bifidobacterium bifidum exhibits a
lipopolysaccharide-like mitogenic activity for murine B lymphocytes. Journal of Dairy Science, 82 (9) 1869-1876.
Konstantinidis, K. T. & Tiedje, J. M. (2005) Genomic insights that advance the species definition for
prokaryotes. Proceedings of the National Academy of Sciences of the United States of America, 102 (7) 2567-2572.
Koonin, E. V. & Makarova, K. S. (2009) CRISPR-Cas: an adaptive immunity system in prokaryotes.
F1000 Biology Reports, 1 (95).
Kopp-Hoolihan, L. (2001) Prophylactic and therapeutic uses of probiotics: A review. Journal of the
American Dietetic Association, 101 (2) 229-241.
Korhonen, J. M., Sclivagnotis, Y. & Wright, A. v. (2007) Characterization of dominant cultivable
lactobacilli and their antibiotic resistance profiles from faecal samples of weaning piglets. Journal
of Applied Microbiology, 103 (6) 2496-2503.
Kullen, M. J., Sanozky-Dawes, R. B., Crowell, D. C. & Klaenhammer, T. R. (2000) Use of the DNA
sequence of variable regions of the 16S rRNA gene for rapid and accurate identification of bacteria
in the Lactobacillus acidophilus complex. Journal of Applied Microbiology, 89 (3) 511-516.
Kulp, W. L. & Rettger, L. F. (1924) Comparative study of Lactobacillus acidophilus and Lactobacillus
bulgaricus. Journal of Bacteriology, 9 (4) 357-395.
Lacher, D. W., Steinsland, H., Blank, T. E., Donnenberg, M. S. & Whittam, T. S. (2007) Molecular
evolution of typical enteropathogenic Escherichia coli: Clonal analysis by multilocus sequence
typing and virulence gene allelic profiling. Journal of Bacteriology, 189 (2) 342-350.
Lane, D. J. (1991) 16S/23S rRNA sequencing. In: Stackebrandt, E. & Goodfellow, M. (eds.) Nucleic Acid
Techniques in Bacterial Systematics. Chichester, UK: John Wiley and Sons.
Lee, J.-H. & O'Sullivan, D. J. (2010) Genomic insights into bifidobacteria. Microbiology and Molecular
Biology Reviews, 74 (3) 378-416.
Lee, J. H., Karamychev, V. N., Kozyavkin, S. A., Mills, D., Pavlov, A. R., Pavlova, N. V., Polouchine, N. N., Richardson, P. M., Shakhova, V. V., Slesarev, A. I., Weimer, B. & O'Sullivan, D. J. (2008) Comparative genomic analysis of the gut bacterium Bifidobacterium longum reveals loci
susceptible to deletion during pure culture growth. BMC Genomics, 9 247.
Leroy, F. & De Vuyst, L. (2004) Lactic acid bacteria as functional starter cultures for the food fermentation
industry. Trends in Food Science & Technology, 15 (2) 67-78.

REFERENCES
237
Leser, T. D., Amenuvor, J. Z., Jensen, T. K., Lindecrona, R. H., Boye, M. & Møller, K. (2002) Culture-
independent analysis of gut bacteria: the pig gastrointestinal tract microbiota revisited. Applied and
Environmental Microbiology, 68 (2) 673-690.
Ley, R. E., Hamady, M., Lozupone, C., Turnbaugh, P. J., Ramey, R. R., Bircher, J. S., Schlegel, M. L., Tucker, T. A., Schrenzel, M. D., Knight, R. & Gordon, J. I. (2008) Evolution of mammals and
their gut microbes. Science, 320 (5883) 1647-1651.
Leyer, G. J., Li, S., Mubasher, M. E., Reifer, C. & Ouwehand, A. C. (2009) Probiotic effects on cold and
influenza-like symptom incidence and duration in children. Pediatrics, 124 (2) 172-179.
Li, H. & Durbin, R. (2009) Fast and accurate short read alignment with Burrows-Wheeler transform.
Bioinformatics, 25 (14) 1754-1760.
Li, W., Raoult, D. & Fournier, P.-E. (2009) Bacterial strain typing in the genomic era. FEMS Microbiology
Reviews, 33 (5) 892-916.
Lilly, D. M. & Stillwell, R. H. (1965) Probiotics: Growth-promoting factors produced by microorganisms.
Science, 147 (3659) 747-748.
Link-Amster, H., Rochat, F., Saudan, K. y., Mignot, O. & Aeschlimann, J. m. (1994) Modulation of a
specific humoral immune response and changes in intestinal flora mediated through fermented milk
intake. FEMS Immunology and Medical Microbiology, 10 (1) 55-63.
Liu, H., Du, Z., Wang, J. & Yang, R. (2007) Universal sample preparation method for characterization of
bacteria by matrix-assisted laser desorption ionization-time of flight mass spectrometry. Applied
and Environmental Microbiology, 73 (6) 1899-1907.
Lobry, J. R. & Sueoka, N. (2002) Asymmetric directional mutation pressures in bacteria. Genome Biology,
3 (10) RESEARCH0058.
Loquasto, J. R., Barrangou, R., Dudley, E. G. & Roberts, R. F. (2011) Short communication: The
complete genome sequence of Bifidobacterium animalis subspecies animalis ATCC 25527T and
comparative analysis of growth in milk with B. animalis subspecies lactis DSM 10140T. Journal of
Dairy Science, 94 (12) 5864-5870.
Lu, J., Idris, U., Harmon, B., Hofacre, C., Maurer, J. J. & Lee, M. D. (2003) Diversity and succession of
the intestinal bacterial community of the maturing broiler chicken. Applied and Environmental
Microbiology, 69 (11) 6816-6824.
Lukjancenko, O., Ussery, D. W. & Wassenaar, T. M. (2011) Comparative genomics of Bifidobacterium,
Lactobacillus and related probiotic genera. Microbial ecology, 63 (3) 651-673.
Luyer, M. D., Buurman, W. A., Hadfoune, M., Speelmans, G., Knol, J., Jacobs, J. A., Dejong, C. H., Vriesema, A. J. & Greve, J. W. (2005) Strain-specific effects of probiotics on gut barrier integrity
following hemorrhagic shock. Infection and Immunity, 73 (6) 3686-3692.
Mahenthiralingam, E., Campbell, M., Foster, J., Lam, J. & Speert, D. (1996a) Random amplified
polymorphic DNA typing of Pseudomonas aeruginosa isolates recovered from patients with cystic
fibrosis. Journal of Clinical Microbiology, 34 (5) 1129-1135.
Mahenthiralingam, E., Campbell, M. E., Foster, J., Lam, J. S. & Speert, D. P. (1996b) Random
amplified polymorphic DNA typing of Pseudomonas aeruginosa isolates recovered from patients
with cystic fibrosis. Journal of Clinical Microbiology, 34 (5) 1129-1135.
REFERENCES
238
Mahenthiralingam, E., Marchbank, A., Drevinek, P., Garaiova, I. & Plummer, S. (2009) Use of colony-
based bacterial strain typing for tracking the fate of Lactobacillus strains during human
consumption. BMC Microbiology, 9 (251) 251.
Mahony, J., Ainsworth, S., Stockdale, S. & van Sinderen, D. (2012) Phages of lactic acid bacteria: the
role of genetics in understanding phage-host interactions and their co-evolutionary processes.
Virology, 434 143-150.
Maiden, M. C. (2006) Multilocus sequence typing of bacteria. Annual Review of Microbiology, 60 561-588.
Maiden, M. C. J., Bygraves, J. A., Feil, E., Morelli, G., Russell, J. E., Urwin, R., Zhang, Q., Zhou, J., Zurth, K., Caugant, D. A., Feavers, I. M., Achtman, M. & Spratt, B. G. (1998) Multilocus
sequence typing: A portable approach to the identification of clones within populations of
pathogenic microorganisms. Proceedings of the National Academy of Sciences of the United States
of America, 95 (6) 3140-3145.
Mainville, I., Robert, N., Lee, B. & Farnworth, E. R. (2006) Polyphasic characterization of the lactic acid
bacteria in kefir. Systematic and Applied Microbiology, 29 (1) 59-68.
Makarova, K., Slesarev, A., Wolf, Y., Sorokin, A., Mirkin, B., Koonin, E., Pavlov, A., Pavlova, N., Karamychev, V., Polouchine, N., Shakhova, V., Grigoriev, I., Lou, Y., Rohksar, D., Lucas, S., Huang, K., Goodstein, D. M., Hawkins, T., Plengvidhya, V., Welker, D., Hughes, J., Goh, Y., Benson, A., Baldwin, K., Lee, J. H., Diaz-Muniz, I., Dosti, B., Smeianov, V., Wechter, W., Barabote, R., Lorca, G., Altermann, E., Barrangou, R., Ganesan, B., Xie, Y., Rawsthorne, H., Tamir, D., Parker, C., Breidt, F., Broadbent, J., Hutkins, R., O'Sullivan, D., Steele, J., Unlu, G., Saier, M., Klaenhammer, T., Richardson, P., Kozyavkin, S., Weimer, B. & Mills, D. (2006)
Comparative genomics of the lactic acid bacteria. Proceedings of the National Academy of Sciences
of the United States of America, 103 15611-15616.
Makarova, K. S., Haft, D. H., Barrangou, R., Brouns, S. J. J., Charpentier, E., Horvath, P., Moineau, S., Mojica, F. J. M., Wolf, Y. I., Yakunin, A. F., van der Oost, J. & Koonin, E. V. (2011)
Evolution and classification of the CRISPR–Cas systems. Nature Reviews Microbiology, 9 (6) 467-
477.
Markowitz, V. M., Chen, I. M., Palaniappan, K., Chu, K., Szeto, E., Grechkin, Y., Ratner, A., Anderson, I., Lykidis, A., Mavromatis, K., Ivanova, N. N. & Kyrpides, N. C. (2010) The
integrated microbial genomes system: an expanding comparative analysis resource. Nucleic Acids
Research, 38 (Database issue) D382-390.
Masco, L., Huys, G., De Brandt, E., Temmerman, R. & Swings, J. (2005) Culture-dependent and culture-
independent qualitative analysis of probiotic products claimed to contain bifidobacteria.
International Journal of Food Microbiology, 102 (2) 221-230.
Matsuki, T., Watanabe, K. & Tanaka, R. (2003) Genus- and species-specific PCR primers for the
detection and identification of bifidobacteria. Current Issues in Intestinal Microbiology, 4 (2) 61-69.
Matsuki, T., Watanabe, K., Tanaka, R. & Oyaizu, H. (1998) Rapid identification of human intestinal
bifidobacteria by 16S rRNA-targeted species- and group-specific primers. FEMS Microbiology
Letters, 167 (2) 113-121.
Maukonen, J., Matto, J., Wirtanen, G., Raaska, L., Mattila-Sandholm, T. & Saarela, M. (2003)
Methodologies for the characterization of microbes in industrial environments: a review. Journal of
Industrial Microbiology and Biotechnology, 30 (6) 327-356.
REFERENCES
239
McCartney, A. L., Wenzhi, W. & Tannock, G. W. (1996) Molecular analysis of the composition of the
bifidobacterial and Lactobacillus microflora of humans. Applied and Environmental Microbiology,
62 (12) 4608-4613.
Medini, D., Serruto, D., Parkhill, J., Relman, D. A., Donati, C., Moxon, R., Falkow, S. & Rappuoli, R. (2008) Microbiology in the post-genomic era. Nature Reviews Microbiology, 6 (6) 419-430.
Mende, D. R., Sunagawa, S., Zeller, G. & Bork, P. (2013) Accurate and universal delineation of
prokaryotic species. Nature Methods, 10 (9) 881-884.
Metchnikoff, E. (1907) Lactic acid as inhibiting intestinal putrefaction. In: Mitchell, P. C. (ed.) The
prolongation of life: optimistic studies. London: Heinemann.
Milani, C., Duranti, S., Lugli, G. A., Bottacini, F., Strati, F., Arioli, S., Foroni, E., Turroni, F., van Sinderen, D. & Ventura, M. (2013) Comparative genomics of Bifidobacterium animalis subsp.
lactis reveals a strict monophyletic bifidobacterial taxon. Applied and Environmental Microbiology,
79 (14) 4304-4315.
Miyake, T., Watanabe, K., Watanabe, T. & Oyaizu, H. (1998) Phylogenetic analysis of the genus
Bifidobacterium and related genera based on 16S rDNA sequences. Microbiology and Immunology,
42 (10) 661-667.
Molenaar, D., Bringel, F., Schuren, F. H., de Vos, W. M., Siezen, R. J. & Kleerebezem, M. (2005)
Exploring Lactobacillus plantarum genome diversity by using microarrays. Journal of
Bacteriology, 187 (17) 6119-6127.
Moore, E. R., Mihaylova, S. A., Vandamme, P., Krichevsky, M. I. & Dijkshoorn, L. (2010) Microbial
systematics and taxonomy: relevance for a microbial commons. Research in Microbiology, 161 (6)
430-438.
Morishita, T., Deguchi, Y., Yajima, M., Sakurai, T. & Yura, T. (1981) Multiple nutritional requirements
of lactobacilli: genetic lesions affecting amino acid biosynthetic pathways. Journal of Bacteriology,
148 (1) 64-71.
Moro, E. (1900) Ueber die nach Gram farbbaren bacillen des säuglingsstuhles. Wiener klinische
Wochenschrift, 13 114-115.
Murphy, E. F., Cotter, P. D., Healy, S., Marques, T. M., O'Sullivan, O., Fouhy, F., Clarke, S. F., O'Toole, P. W., Quigley, E. M., Stanton, C., Ross, P. R., O'Doherty, R. M. & Shanahan, F. (2010) Composition and energy harvesting capacity of the gut microbiota: relationship to diet,
obesity and time in mouse models. Gut, 59 (12) 1635-1642.
Naser, S. M., Dawyndt, P., Hoste, B., Gevers, D., Vandemeulebroecke, K., Cleenwerck, I., Vancanneyt, M. & Swings, J. (2007) Identification of lactobacilli by pheS and rpoA gene sequence analyses.
International Journal of Systematic and Evolutionary Microbiology, 57 2777-2789.
Naser, S. M., Hagen, K. E., Vancanneyt, M., Cleenwerck, I., Swings, J. & Tompkins, T. A. (2006)
Lactobacillus suntoryeus Cachat and Priest 2005 is a later synonym of Lactobacillus helveticus
(Orla-Jensen 1919) Bergey et al. 1925 (Approved Lists 1980). International Journal of Systematic
and Evolutionary Microbiology, 56 (2) 355-360.
Neuwirth, E. (2011) RColorBrewer: ColorBrewer palettes.
REFERENCES
240
Nicolas, P., Bessières, P., Ehrlich, S. D., Maguin, E. & van de Guchte, M. (2007) Extensive horizontal
transfer of core genome genes between two Lactobacillus species found in the gastrointestinal tract.
BMC Evolutionary Biology, 7 (1).
O'Connell Motherway, M., Zomer, A., Leahy, S. C., Reunanen, J., Bottacini, F., Claesson, M. J., O'Brien, F., Flynn, K., Casey, P. G., Munoz, J. A., Kearney, B., Houston, A. M., O'Mahony, C., Higgins, D. G., Shanahan, F., Palva, A., de Vos, W. M., Fitzgerald, G. F., Ventura, M., O'Toole, P. W. & van Sinderen, D. (2011) Functional genome analysis of Bifidobacterium breve
UCC2003 reveals type IVb tight adherence (Tad) pili as an essential and conserved host-
colonization factor. Proceedings of the National Academy of Sciences of the United States of
America, 108 (27) 11217-11222.
O'Sullivan, O., O'Callaghan, J., Sangrador-Vegas, A., McAuliffe, O., Slattery, L., Kaleta, P., Callanan, M., Fitzgerald, G. F., Ross, R. P. & Beresford, T. (2009) Comparative genomics of lactic acid
bacteria reveals a niche-specific gene set. BMC Microbiology, 9 50.
Oh, S., Roh, H., Ko, H. J., Kim, S., Kim, K. H., Lee, S. E., Chang, I. S., Kim, S. & Choi, I. G. (2011)
Complete genome sequencing of Lactobacillus acidophilus 30SC, isolated from swine intestine.
Journal of Bacteriology, 193 (11) 2882-2883.
Okoro, C. K., Kingsley, R. A., Connor, T. R., Harris, S. R., Parry, C. M., Al-Mashhadani, M. N., Kariuki, S., Msefula, C. L., Gordon, M. A., de Pinna, E., Wain, J., Heyderman, R. S., Obaro, S., Alonso, P. L., Mandomando, I., MacLennan, C. A., Tapia, M. D., Levine, M. M., Tennant, S. M., Parkhill, J. & Dougan, G. (2012) Intracontinental spread of human invasive Salmonella
Typhimurium pathovariants in sub-Saharan Africa. Nature Genetics, 44 (11) 1215-1221.
Ouwehand, A. C., Salminen, S. & Isolauri, E. (2002) Probiotics: an overview of beneficial effects. Antonie
Van Leeuwenhoek, 82 (1-4) 279-289.
Paineau, D., Carcano, D., Leyer, G., Darquy, S., Alyanakian, M.-A., Simoneau, G., Bergmann, J.-F., Brassart, D., Bornet, F. & Ouwehand, A. C. (2008) Effects of seven potential probiotic strains on
specific immune responses in healthy adults: a double-blind, randomized, controlled trial. FEMS
Immunology & Medical Microbiology, 53 (1) 107-113.
Palmer, C., Bik, E. M., DiGiulio, D. B., Relman, D. A. & Brown, P. O. (2007) Development of the human
infant intestinal microbiota. PLoS Biology, 5 (7) e177.
Park, J.-H., Um, J.-I., Lee, B.-J., Goh, J.-S., Park, S.-Y., Kim, W.-S. & Kim, P.-H. (2002) Encapsulated
Bifidobacterium bifidum potentiates intestinal IgA production. Cellular Immunology, 219 (1) 22-27.
Parker, R. B. (1974) Probiotics, the other half of the antibiotic story. Animal Nutritional Health, (29) 4-8.
Passerini, D., Beltramo, C., Coddeville, M., Quentin, Y., Ritzenthaler, P., Daveran-Mingot, M.-L. & Le Bourgeois, P. (2010) Genes but not genomes reveal bacterial domestication of Lactococcus Lactis.
PLoS ONE, 5 (12) e15306.
Perez, P. F., Minnaard, Y., Disalvo, E. A. & De Antoni, G. L. (1998) Surface properties of bifidobacterial
strains of human origin. Applied and Environmental Microbiololgy, 64 (1) 21-26.
Pfeiler, E. A., Azcarate-Peril, M. A. & Klaenhammer, T. R. (2007) Characterization of a novel bile-
inducible operon encoding a two-component regulatory system in Lactobacillus acidophilus.
Journal of Bacteriology, 189 4624-4634.
REFERENCES
241
Pfeiler, E. A. & Klaenhammer, T. R. (2007) The genomics of lactic acid bacteria. Trends in Microbiology,
15 (12) 546-553.
Pfeiler, E. A. & Klaenhammer, T. R. (2009) Role of transporter proteins in bile tolerance of Lactobacillus
acidophilus. Applied and Environmental Microbiology, 75 (18) 6013-6016.
Philippe, D., Favre, L., Foata, F., Adolfsson, O., Perruisseau-Carrier, G., Vidal, K., Reuteler, G., Dayer-Schneider, J., Mueller, C. & Blum, S. (2011) Bifidobacterium lactis attenuates onset of
inflammation in a murine model of colitis. World Journal of Gastroenterology, 17 (4) 459-469.
Phillippy, A. M., Ayanbule, K., Edwards, N. J. & Salzberg, S. L. (2009) Insignia: a DNA signature search
web server for diagnostic assay development. Nucleic Acids Research, 37 (Suppl 2) W229-W234.
Phillippy, A. M., Mason, J. A., Ayanbule, K., Sommer, D. D., Taviani, E., Huq, A., Colwell, R. R., Knight, I. T. & Salzberg, S. L. (2007) Comprehensive DNA signature discovery and validation.
PLoS Computational Biology, 3 (5) e98.
Pimentel, L. L., Mättö, J., Malcata, F. X., Pintado, M. E. & Saarela, M. (2012) Survival of potentially
probiotic enterococci in dairy matrices and in the human gastrointestinal tract. International Dairy
Journal, 27 (1–2) 53-57.
Pineiro, M. & Stanton, C. (2007) Probiotic bacteria: Legislative framework— requirements to evidence
basis. The Journal of Nutrition, 137 (3) 850S-853S.
Plummer, S., Weaver, M. A., Harris, J. C., Dee, P. & Hunter, J. (2004) Clostridium difficile pilot study:
effects of probiotic supplementation on the incidence of C. difficile diarrhoea. International
Microbiology, 7 (1) 59-62.
Pokusaeva, K., Fitzgerald, G. F. & van Sinderen, D. (2011) Carbohydrate metabolism in Bifidobacteria.
Genes & Nutrition, 6 (3) 285-306.
Pot, B., Hertel, C., Ludwig, W., Descheemaeker, P., Kersters, K. & Schleifer, K. H. (1993) Identification
and classification of Lactobacillus acidophilus, L. gasseri and L. johnsonii strains by SDS-PAGE
and rRNA-targeted oligonucleotide probe hybridization. Journal of General Microbiology, 139 (3)
513-517.
Pridmore, R. D., Berger, B., Desiere, F., Vilanova, D., Barretto, C., Pittet, A.-C., Zwahlen, M.-C., Rouvet, M., Altermann, E., Barrangou, R., Mollet, B., Mercenier, A., Klaenhammer, T., Arigoni, F. & Schell, M. A. (2004) The genome sequence of the probiotic intestinal bacterium
Lactobacillus johnsonii NCC 533. Proceedings of the National Academy of Sciences of the United
States of America, 101 (8) 2512-2517.
R Development Core Team (2012) R: A language and environment for statistical computing. Vienna,
Austria: R Foundation for Statistical Computing.
Reid, G. (1999) The scientific basis for probiotic strains of Lactobacillus. Applied and Environmental
Microbiology, 65 (9) 3763-3766.
Ringel-Kulka, T., Palsson, O. S., Maier, D., Carroll, I., Galanko, J. A., Leyer, G. & Ringel, Y. (2011)
Probiotic bacteria Lactobacillus acidophilus NCFM and Bifidobacterium lactis Bi-07 versus
placebo for the symptoms of bloating in patients with functional bowel disorders: a double-blind
study. Journal of Clinical Gastroenterology, 45 (6) 518-525.
REFERENCES
242
Roberts, E., Sethi, A., Montoya, J., Woese, C. R. & Luthey-Schulten, Z. (2008) Molecular signatures of
ribosomal evolution. Proceedings of the National Academy of Sciences of the United States of
America, 105 (37) 13953-13958.
Rogosa, M. & Sharpe, M. E. (1960) Species differentiation of human vaginal lactobacilli. Journal of
General Microbiology, 23 (1) 197-201.
Roy, D. & Ward, P. (1990) Evaluation of rapid methods for differentiation of Bifidobacterium species.
Journal of Applied Microbiology, 69 (5) 739-749.
Roy, D., Ward, P. & Champagne, G. (1996) Differentiation of bifidobacteria by use of pulsed-field gel
electrophoresis and polymerase chain reaction. International Journal of Food Microbiology, 29 (1)
11-29.
Roy, D., Ward, P. & Vincent, D. (1999) Strain identification of probiotic Lactobacillus casei-related
isolates with randomly amplified polymorphic DNA and pulsed-field gel electrophoresis methods.
Biotechnology Techniques, 13 (12) 843-847.
Rozen, S. & Skaletsky, H. J. (2000) Primer3 on the www for general users and for biologist programmers.
In: Misener, S. & Krawetz, S. A. (eds.) Bioinformatics Methods and Protocols: Methods in
Molecular Biology. Totowa: Humana Press Inc.
Ruiz-Moyano, S., Tao, N., Underwood, M. A. & Mills, D. A. (2012) Rapid discrimination of
Bifidobacterium animalis subspecies by matrix-assisted laser desorption ionization-time of flight
mass spectrometry. Food Microbiology, 30 (2) 432-437.
Saavedra, J. M., Bauman, N. A., Oung, I., Perman, J. A. & Yolken, R. H. (1994) Feeding of
Bifidobacterium bifidum and Streptococcus thermophilus to infants in hospital for prevention of
diarrhoea and shedding of rotavirus. Lancet, 344 (8929) 1046-1049.
Salvetti, E., Fondi, M., Fani, R., Torriani, S. & Felis, G. E. (2013) Evolution of lactic acid bacteria in the
order Lactobacillales as depicted by analysis of glycolysis and pentose phosphate pathways.
Systematic and Applied Microbiology, 36 (5) 291-305.
Salvetti, E., Torriani, S. & Felis, G. E. (2012) The genus Lactobacillus: A taxonomic update. Probiotics
and Antimicrobial Proteins, 4 (4) 217-226.
Sanders, M. E. (1993) Summary of the conclusions from a consensus panel of experts on health attributes
on lactic cultures: significance to fluid milk products containing cultures. Journal of Dairy Science,
76 1819-1828.
Sanders, M. E. (2003) Probiotics: considerations for human health. Nutrition reviews, 61 (3) 91-99.
Sanders, M. E. (2008) Probiotics: definition, sources, selection, and uses. Clinical Infectious Diseases, 46 (Supplement 2) S58-S61.
Sanders, M. E. & Klaenhammer, T. R. (2001) Invited review: The scientific basis of Lactobacillus
acidophilus NCFM functionality as a probiotic. Journal of Dairy Science, 84 (2) 319-331.
Sanders, M. E. & Marco, M. L. (2010) Food formats for effective delivery of probiotics. Food Science and
Technology, 1 65-85.
Sanders, M. E., Walker, D. C., Walker, K. M., Aoyama, K. & Klaenhammer, T. R. (1996) Performance
of commercial cultures in fluid milk applications. Journal of Dairy Science, 79 (6) 943-955.

REFERENCES
243
Sarma-Rupavtarm, R. B., Ge, Z., Schauer, D. B., Fox, J. G. & Polz, M. F. (2004) Spatial distribution and
stability of the eight microbial species of the altered Schaedler flora in the mouse gastrointestinal
tract. Applied and Environmental Microbiology, 70 (5) 2791-2800.
Sarmiento-Rubiano, L.-A., Berger, B., Moine, D., Zuniga, M., Perez-Martinez, G. & Yebra, M. (2010)
Characterization of a novel Lactobacillus species closely related to Lactobacillus johnsonii using a
combination of molecular and comparative genomics methods. BMC Genomics, 11 (1) 504.
Satokari, R. M., Vaughan, E. E., Smidt, H., Saarela, M., Mättö, J. & de Vos, W. M. (2003) Molecular
approaches for the detection and identification of bifidobacteria and lactobacilli in the human
gastrointestinal tract. Systematic and Applied Microbiology, 26 (4) 572-584.
Saxelin, M., Tynkkynen, S., Mattila-Sandholm, T. & de Vos, W. M. (2005) Probiotic and other functional
microbes: from markets to mechanisms. Current Opinion in Biotechnology, 16 (2) 204-211.
Schaafsma, G. (1996) State of art concerning probiotic strains in milk products. Iinternational Dairy Food
Nutritional News Letters, (5) 23-24.
Schell, M. A., Karmirantzou, M., Snel, B., Vilanova, D., Berger, B., Pessi, G., Zwahlen, M.-C., Desiere, F., Bork, P., Delley, M., Pridmore, R. D. & Arigoni, F. (2002) The genome sequence of
Bifidobacterium longum reflects its adaptation to the human gastrointestinal tract. Proceedings of
the National Academy of Sciences of the United States of America, 99 (22) 14422-14427.
Schiffrin, E. J., Rochat, F., Link-Amster, H., Aeschlimann, J. M. & Donnet-Hughes, A. (1995)
Immunomodulation of human blood cells following the ingestion of lactic acid bacteria. Journal of
Dairy Science, 78 (3) 491-497.
Schillinger, U., Yousif, N. M. K., Sesar, L. & Franz, C. M. A. P. (2003) Use of group-specific and RAPD-
PCR analyses for rapid differentiation of Lactobacillus strains from probiotic yogurts. Current
Microbiology, 47 (6) 453-456.
Schleifer, K.-H., Ehrmann, M., Beimfohr, C., Brockmann, E., Ludwig, W. & Amann, R. (1995)
Application of molecular methods for the classification and identification of lactic acid bacteria.
International Dairy Journal, 5 (8) 1081-1094.
Schleifer, K.-H. & Ludwig, W. (1995) Phylogeny of the genus Lactobacillus and related genera. Systematic
Applied Microbiology, (18) 461–467.
Sela, D. A., Chapman, J., Adeuya, A., Kim, J. H., Chen, F., Whitehead, T. R., Lapidus, A., Rokhsar, D. S., Lebrilla, C. B., German, J. B., Price, N. P., Richardson, P. M. & Mills, D. A. (2008) The
genome sequence of Bifidobacterium longum subsp. infantis reveals adaptations for milk utilization
within the infant microbiome. Proceedings of the National Academy of Sciences of the United States
of America, 105 (48) 18964-18969.
Sela, D. A. & Mills, D. A. (2010) Nursing our microbiota: molecular linkages between bifidobacteria and
milk oligosaccharides. Trends in Microbiology, 18 (7) 298-307.
Shah, N. P. (2000) Probiotic bacteria: selective enumeration and survival in dairy foods. Journal of Dairy
Science, 83 (4) 894-907.
Shah, N. P. (2007) Functional cultures and health benefits. International Dairy Journal, 17 (11) 1262-1277.
REFERENCES
244
Shah, N. P., Lankaputhra, W. E. V., Britz, M. L. & Kyle, W. S. A. (1995) Survival of Lactobacillus
acidophilus and Bifidobacterium bifidum in commercial yoghurt during refrigerated storage.
International Dairy Journal, 5 (5) 515-521.
Sheppard, S. K., Jolley, K. A. & Maiden, M. C. J. (2012) A gene-by-gene approach to bacterial population
genomics: Whole genome MLST of Campylobacter. Genes, 3 (2) 261-277.
Simpson, P. J., Stanton, C., Fitzgerald, G. F. & Ross, R. P. (2003) Genomic diversity and relatedness of
bifidobacteria isolated from a porcine cecum. Journal of Bacteriology, 185 (8) 2571-2581.
Sintchenko, V., Iredell, J. R. & Gilbert, G. L. (2007) Pathogen profiling for disease management and
surveillance. Nature Reviews Microbiology, 5 (6) 464-470.
Smelt, J. P. P. M., Otten, G. D. & Bos, A. P. (2002) Modelling the effect of sublethal injury on the
distribution of the lag times of individual cells of Lactobacillus plantarum. International Journal of
Food Microbiology, 73 (2–3) 207-212.
Solheim, M., Aakra, A., Veb, H., Snipen, L. & Nes, I. F. (2007) Transcriptional responses of Enterococcus
faecalis v583 to bovine bile and sodium dodecyl sulfate. Applied and Environmental Microbiology,
73 (18) 5767-5774.
Song, Y.-L., Kato, N., Liu, C.-X., Matsumiya, Y., Kato, H. & Watanabe, K. (2000) Rapid identification
of 11 human intestinal Lactobacillus species by multiplex PCR assays using group- and species-
specific primers derived from the 16S-23S rRNA intergenic spacer region and its flanking 23S
rRNA. FEMS Microbiology Letters, 187 (2) 167-173.
Stackebrandt, E., Frederiksen, W., Garrity, G. M., Grimont, P. A., Kampfer, P., Maiden, M. C., Nesme, X., Rossello-Mora, R., Swings, J., Truper, H. G., Vauterin, L., Ward, A. C. & Whitman, W. B. (2002) Report of the ad hoc committee for the re-evaluation of the species
definition in bacteriology. International Journal of Systematic and Evolutionary Microbiology, 52 (3) 1043-1047.
Stackebrandt, E. & Goebel, B. M. (1994) Taxonomic note: A place for DNA-DNA reassociation and 16S
rRNA sequence analysis in the present species definition in bacteriology. International Journal of
Systematic Bacteriology, 44 (4) 846-849.
Stahl, B. & Barrangou, R. (2012) Complete genome sequences of probiotic strains Bifidobacterium
animalis subsp. lactis B420 and Bi-07. Journal of Bacteriology, 194 (15) 4131-4132.
Stahl, B. & Barrangou, R. (2013) Complete Genome Sequence of Probiotic Strain Lactobacillus
acidophilus La-14. Genome Announcements, 1 (3).
Stanton, C., Ross, R. P., Fitzgerald, G. F. & Van Sinderen, D. (2005) Fermented functional foods based
on probiotics and their biogenic metabolites. Current Opinion in Biotechnology, 16 (2) 198-203.
Stephenson, D. P., Moore, R. J. & Allison, G. E. (2009) Comparison and utilization of repetitive-element
PCR techniques for typing Lactobacillus isolates from the chicken gastrointestinal tract. Applied
and Environmental Microbiology, 75 (21) 6764-6776.
Stern, A., Keren, L., Wurtzel, O., Amitai, G. & Sorek, R. (2010) Self-targeting by CRISPR: gene
regulation or autoimmunity? Trends in Genetics, 26 (8) 335-340.
Stiles, M. E. & Holzapfel, W. H. (1997) Lactic acid bacteria of foods and their current taxonomy.
International Journal of Food Microbiology, 36 (1) 1-29.
REFERENCES
245
Sun, Z., Chen, X., Wang, J., Gao, P., Zhou, Z., Ren, Y., Sun, T., Wang, L., Meng, H., Chen, W. & Zhang, H. (2010) Complete genome sequence of probiotic Bifidobacterium animalis subsp. lactis
strain V9. Journal of Bacteriology, 192 (15) 4080-4081.
Tabasco, R., García-Cayuela, T., Peláez, C. & Requena, T. (2009) Lactobacillus acidophilus La-5
increases lactacin B production when it senses live target bacteria. International Journal of Food
Microbiology, 132 (2-3) 109-116.
Tamime, A. Y. (2002) Fermented milks: a historical food with modern applications - a review. European
Journal of Clinical Nutrition, 56 (Suppl 4) 2-15.
Tamura, K., Dudley, J., Nei, M. & Kumar, S. (2007) MEGA4: Molecular Evolutionary Genetics Analysis
(MEGA) software version 4.0. Molecular Biology and Evolution, 24 (8) 1596-1599.
Tamura, K., Peterson, D., Peterson, N., Stecher, G., Nei, M. & Kumar, S. (2011) MEGA5: molecular
evolutionary genetics analysis using maximum likelihood, evolutionary distance, and maximum
parsimony methods. Molecular Biology and Evolution, 28 (10) 2731-2739.
Taylor, G. R. & Williams, C. M. (1998) Effects of probiotics and prebiotics on blood lipids. British Journal
of Nutrition, 80 (4) S225-230.
Tissier, H. (1900). Recherchers sur la flora intestinale normale et pathologique du nourisson. PhD Thesis,
University of Paris.
Tomas, J., Langella, P. & Cherbuy, C. (2012) The intestinal microbiota in the rat model: major
breakthroughs from new technologies. Animal Health Research Reviews, 13 (1) 54-63.
Tuohy, K. M., Probert, H. M., Smejkal, C. W. & Gibson, G. R. (2003) Using probiotics and prebiotics to
improve gut health. Drug Discovery Today, 8 (15) 692-700.
Tuomola, E. M. & Salminen, S. J. (1998) Adhesion of some probiotic and dairy Lactobacillus strains to
Caco-2 cell cultures. International Journal of Food Microbiology, 41 (1) 45-51.
Turnbaugh, P. J., Bäckhed, F., Fulton, L. & Gordon, J. I. (2008) Diet-induced obesity is linked to
marked but reversible alterations in the mouse distal gut microbiome. Cell Host & Microbe, 3 (4)
213-223.
Turnbaugh, P. J., Ley, R. E., Mahowald, M. A., Magrini, V., Mardis, E. R. & Gordon, J. I. (2006) An
obesity-associated gut microbiome with increased capacity for energy harvest. Nature, 444 (7122)
1027-1131.
Turroni, F., Bottacini, F., Foroni, E., Mulder, I., Kim, J. H., Zomer, A., Sanchez, B., Bidossi, A., Ferrarini, A., Giubellini, V., Delledonne, M., Henrissat, B., Coutinho, P., Oggioni, M., Fitzgerald, G. F., Mills, D., Margolles, A., Kelly, D., van Sinderen, D. & Ventura, M. (2010)
Genome analysis of Bifidobacterium bifidum PRL2010 reveals metabolic pathways for host-derived
glycan foraging. Proceedings of the National Academy of Sciences of the United States of America,
107 (45) 19514-195149.
Turroni, F., Foroni, E., Pizzetti, P., Giubellini, V., Ribbera, A., Merusi, P., Cagnasso, P., Bizzarri, B., de'Angelis, G. L., Shanahan, F., van Sinderen, D. & Ventura, M. (2009) Exploring the diversity
of the bifidobacterial population in the human intestinal tract. Applied and Environmental
Microbiology, 75 (6) 1534-1545.
REFERENCES
246
Turroni, F., van Sinderen, D. & Ventura, M. (2011) Genomics and ecological overview of the genus
Bifidobacterium. International Journal of Food Microbiology, 149 (1) 37-44.
Tynkkynen, S., Satokari, R., Saarela, M., Mattila-Sandholm, T. & Saxelin, M. (1999) Comparison of
ribotyping, randomly amplified polymorphic DNA analysis, and pulsed-field gel electrophoresis in
typing of Lactobacillus rhamnosus and L. casei strains. Applied and Environmental Microbiology,
65 (9) 3908-3914.
Vancanneyt, M., Huys, G., Lefebvre, K., Vankerckhoven, V., Goossens, H. & Swings, J. (2006)
Intraspecific genotypic characterization of Lactobacillus rhamnosus strains intended for probiotic
use and isolates of human origin. Applied and Environmental Microbiology, 72 (8) 5376-5383.
Vandamme, P., Pot, B., Gillis, M., de Vos, P., Kersters, K. & Swings, J. (1996) Polyphasic taxonomy, a
consensus approach to bacterial systematics. FEMS Microbiology Reviews, 60 (2) 407-438.
Vankerckhoven, V., Huys, G., Vancanneyt, M., Vael, C., Klare, I., Romond, M.-B., Entenza, J. M., Moreillon, P., Wind, R. D., Knol, J., Wiertz, E., Pot, B., Vaughan, E. E., Kahlmeter, G. & Goossen, H. (2008) Biosafety assessment of probiotics used for human consumption:
recommendations from the EU-PROSAFE project. 19 (2) 102–114.
Vargha, M., Takáts, Z., Konopka, A. & Nakatsu, C. H. (2006) Optimization of MALDI-TOF MS for
strain level differentiation of Arthrobacter isolates. Journal of Microbiological Methods, 66 (3)
399-409.
Vaughan, E. E., Heilig, H. G., Ben-Amor, K. & de Vos, W. M. (2005) Diversity, vitality and activities of
intestinal lactic acid bacteria and bifidobacteria assessed by molecular approaches. FEMS
Microbiology Reviews, 29 (3) 477-490.
Ventura, M., Canchaya, C., Fitzgerald, G. F., Gupta, R. S. & van Sinderen, D. (2007a) Genomics as a
means to understand bacterial phylogeny and ecological adaptation: the case of bifidobacteria.
Antonie Van Leeuwenhoek, 91 (4) 351-372.
Ventura, M., Canchaya, C., Meylan, V., Klaenhammer, T. R. & Zink, R. (2003) Analysis,
characterization, and loci of the tuf genes in Lactobacillus and Bifidobacterium species and their
direct application for species identification. Applied and Environmental Microbiology, 69 (11)
6908-6922.
Ventura, M., O'Connell-Motherway, M., Leahy, S., Moreno-Munoz, J. A., Fitzgerald, G. F. & van Sinderen, D. (2007b) From bacterial genome to functionality; case bifidobacteria. International
Journal of Food Microbiology, 120 (1–2) 2-12.
Ventura, M., O'Flaherty, S., Claesson, M. J., Turroni, F., Klaenhammer, T. R., van Sinderen, D. & O'Toole, P. W. (2009a) Genome-scale analyses of health-promoting bacteria: probiogenomics.
Nature Reviews Microbiology, 7 (1) 61-71.
Ventura, M., Turroni, F. & van Sinderen, D. (2012) Probiogenomics as a tool to obtain genetic insights
into adaptation of probiotic bacteria to the human gut. Bioengineered Bugs, 3 (2) 73-79.
Ventura, M., Turroni, F., Zomer, A., Foroni, E., Giubellini, V., Bottacini, F., Canchaya, C., Claesson, M. J., He, F., Mantzourani, M., Mulas, L., Ferrarini, A., Gao, B., Delledonne, M., Henrissat, B., Coutinho, P., Oggioni, M., Gupta, R. S., Zhang, Z., Beighton, D., Fitzgerald, G. F., O'Toole, P. W. & van Sinderen, D. (2009b) The Bifidobacterium dentium Bd1 genome sequence
reflects its genetic adaptation to the human oral cavity. PLoS Genetics, 5 (12) e1000785.
REFERENCES
247
Ventura, M., van Sinderen, D., Fitzgerald, G. & Zink, R. (2004) Insights into the taxonomy, genetics and
physiology of bifidobacteria. Antonie Van Leeuwenhoek, 86 (3) 205-223.
Ventura, M. & Zink, R. (2002a) Rapid identification, differentiation, and proposed new taxonomic
classification of Bifidobacterium lactis. Applied and Environmental Microbiology, 68 (12) 6429-
6434.
Ventura, M. & Zink, R. (2002b) Specific identification and molecular typing analysis of Lactobacillus
johnsonii by using PCR-based methods and pulsed-field gel electrophoresis. FEMS Microbiology
Letters, 217 (2) 141-154.
Vincent, D., Roy, D., Mondou, F. & Déry, C. (1998) Characterization of bifidobacteria by random DNA
amplification. International Journal of Food Microbiology, 43 (3) 185-193.
Wall, R., Hussey, S. G., Ryan, C. A., O'Neill, M., Fitzgerald, G., Stanton, C. & Ross, R. P. (2007)
Presence of two Lactobacillus and Bifidobacterium probiotic strains in the neonatal ileum. ISME
Journal, 2 (1) 83-91.
Walter, J. (2008) Ecological role of lactobacilli in the gastrointestinal tract: Implications for fundamental
and biomedical research. Applied and Environmental Microbiology, 74 (16) 4985-4996.
Walter, J., Tannock, G. W., Tilsala-Timisjarvi, A., Rodtong, S., Loach, D. M., Munro, K. & Alatossava, T. (2000) Detection and identification of gastrointestinal Lactobacillus species by
using denaturing gradient gel electrophoresis and species-specific PCR primers. Applied and
Environmental Microbiology, 66 (1) 297-303.
Wang, K.-Y., Li, S.-N., Liu, C.-S., Perng, D.-S., Su, Y.-C., Wu, D.-C., Jan, C.-M., Lai, C.-H., Wang, T.-N. & Wang, W.-M. (2004) Effects of ingesting Lactobacillus- and Bifidobacterium-containing
yogurt in subjects with colonized Helicobacter pylori. The American Journal of Clinical Nutrition,
80 (3) 737-741.
Wei, Y.-X., Zhang, Z.-Y., Liu, C., Zhu, Y.-Z., Zhu, Y.-Q., Zheng, H., Zhao, G.-P., Wang, S. & Guo, X.-K. (2010) Complete genome sequence of Bifidobacterium longum JDM301. Journal of
Bacteriology, 192 (15) 4076-4077.
Williams, E. A., Stimpson, J., Wang, D., Plummer, S., Garaiova, I., Barker, M. E. & Corfe, B. M. (2009) Clinical trial: a multistrain probiotic preparation significantly reduces symptoms of irritable
bowel syndrome in a double-blind placebo-controlled study. Alimentary Pharmacology &
Therapeutics, 29 (1) 97-103.
Williams, T., Andrzejewski, D., Lay, J. & Musser, S. (2003) Experimental factors affecting the quality
and reproducibility of MALDI TOF mass spectra obtained from whole bacteria cells. Journal of the
American Society for Mass Spectrometry, 14 (4) 342-351.
Yamamoto, S. & Harayama, S. (1996) Phylogenetic analysis of Acinetobacter strains based on the
nucleotide sequences of gyrB genes and on the amino acid sequences of their products.
International Journal of Systematic and Evolutionary Microbiology, 46 (2) 506-511.
Yeung, P. S. M., Kitts, C. L., Cano, R., Tong, P. S. & Sanders, M. E. (2004) Application of genotypic and
phenotypic analyses to commercial probiotic strain identity and relatedness. Journal of Applied
Microbiology, 97 (5) 1095-1104.
REFERENCES
248
Yeung, P. S. M., Sanders, M. E., Kitts, C. L., Cano, R. & Tong, P. S. (2002) Species-specific
identification of commercial probiotic strains. Journal of Dairy Science, 85 (5) 1039-1051.
Yildirim, Z., Winters, D. K. & Johnson, M. G. (1999) Purification, amino acid sequence and mode of
action of bifidocin B produced by Bifidobacterium bifidum NCFB 1454. Journal of Applied
Microbiology, 86 (1) 45-54.
Yu, D. S., Jeong, H., Lee, D.-H., Kwon, S.-K., Song, J. Y., Kim, B. K., Park, M.-S., Ji, G. E., Oh, T. K. & Kim, J. F. (2012) Complete genome sequence of the probiotic bacterium Bifidobacterium
bifidum strain BGN4. Journal of Bacteriology, 194 (17) 4757-4758.
Yutin, N., Puigbò, P., Koonin, E. V. & Wolf, Y. I. (2012) Phylogenomics of prokaryotic ribosomal
proteins. PLoS ONE, 7 (5) e36972.
Zerbino, D. R. (2010) Using the Velvet de novo assembler for short-read sequencing technologies. Current
Protocols in Bioinformatics, Chapter 11 Unit 11 5.
Zhu, B., Xiao, D., Zhang, H., Zhang, Y., Gao, Y., Xu, L., Lv, J., Wang, Y., Zhang, J. & Shao, Z. (2013)
MALDI-TOF MS distinctly differentiates nontypable Haemophilus influenzae from Haemophilus
haemolyticus. PLoS ONE, 8 (2) e56139.
Zhu, L., Li, W. & Dong, X. (2003) Species identification of genus Bifidobacterium based on partial hsp60
gene sequences and proposal of Bifidobacterium thermacidophilum subsp. porcinum subsp. nov.
International Journal of Systematic and Evolutionary Microbiology, 53 (5) 1619-1623.
Zhu, Y., Zhang, Y. & Li, Y. (2009) Understanding the industrial application potential of lactic acid bacteria
through genomics. Applied Microbiology and Biotechnology, 83 (4) 597-610.
Zhurina, D., Zomer, A., Gleinser, M., Brancaccio, V. F., Auchter, M., Waidmann, M. S., Westermann, C., van Sinderen, D. & Riedel, C. U. (2011) Complete genome sequence of Bifidobacterium
bifidum S17. Journal of Bacteriology, 193 (1) 301-302.

APPENDICES
249
9. APPENDICES
9.1. APPENDIX ONE
BULL, M. J., MARCHESI, J. R., VANDAMME, P., PLUMMER, S. & MAHENTHIRALINGAM, E. 2012.
Minimum taxonomic criteria for bacterial genome sequence depositions and announcements.
Journal of Microbiological Methods, 89 (1) 18-21.

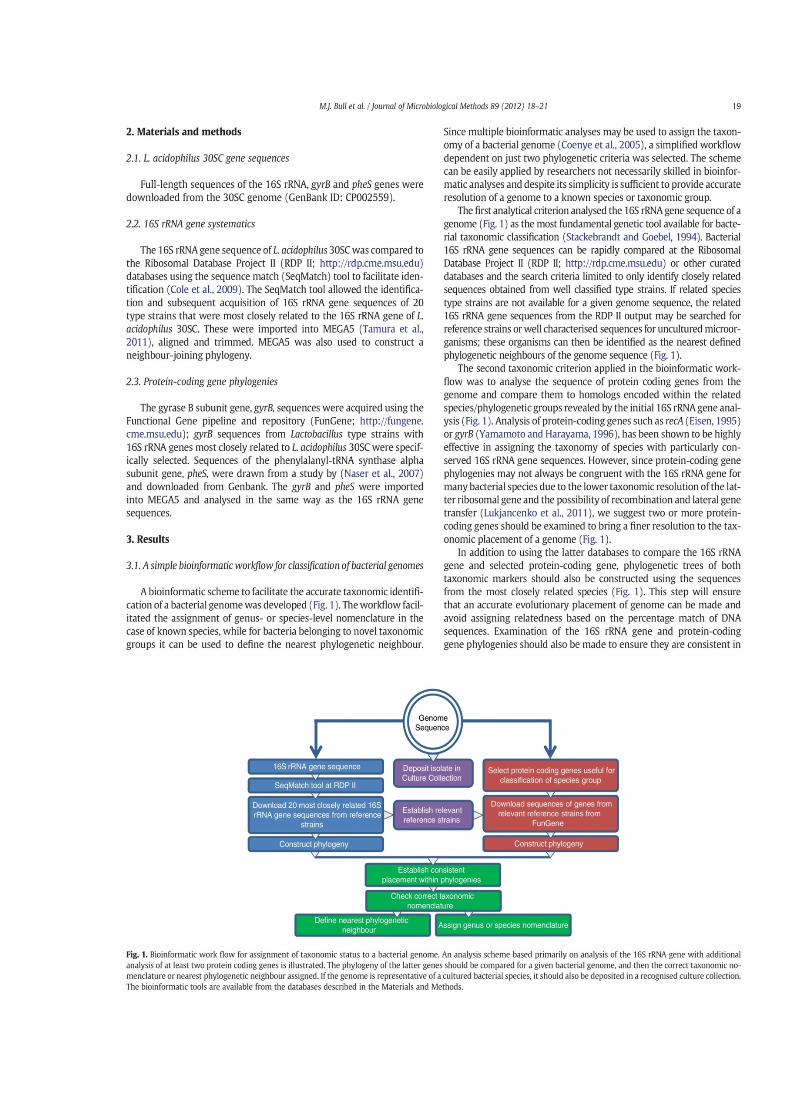
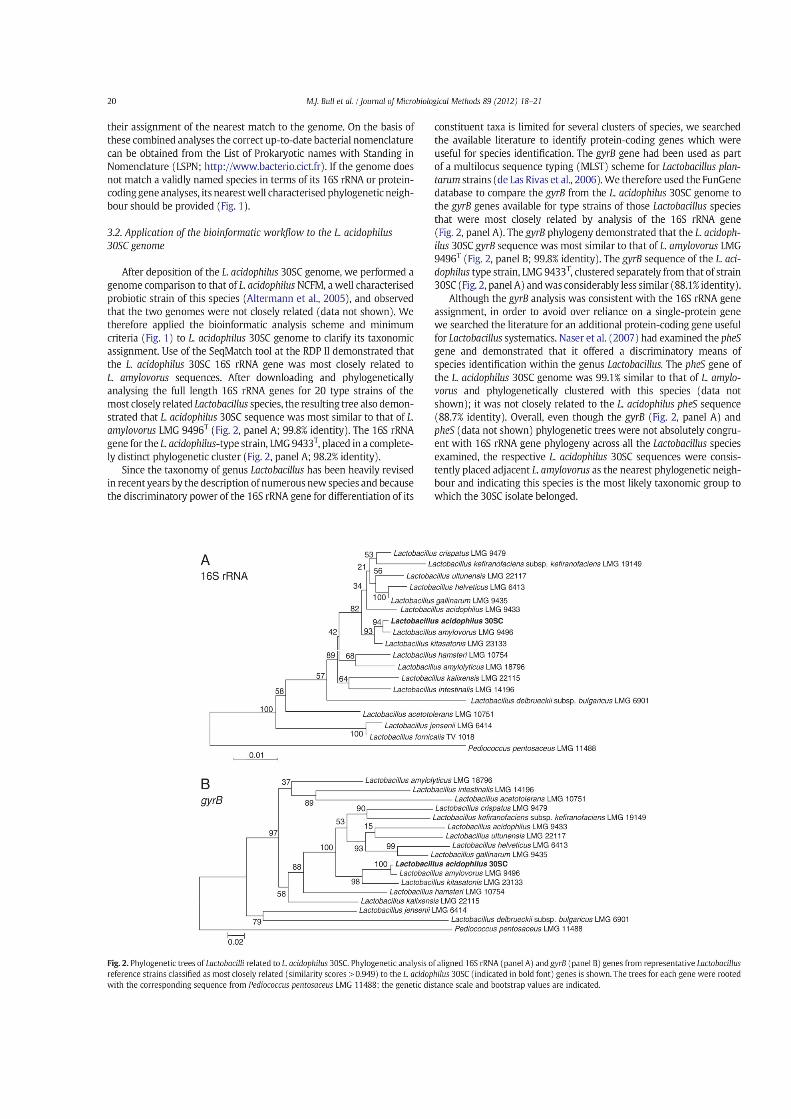
9.2. APPENDIX TWO
BAXTER, C. G., RAUTEMAA, R., JONES, A. M., WEBB, A. K., BULL, M., MAHENTHIRALINGAM, E.
& DENNING, D. W. 2013. Intravenous antibiotics reduce the presence of Aspergillus in adult
cystic fibrosis sputum. Thorax, 68 (7) 652-657.